XMG SECTOR high-end desktop PC with Intel Core i9-13900K and Nvidia GeForce RTX 4090 reviewed

Many people associate Schenker with powerful laptops. The added "XMG" branding indicates high-end gaming devices, which meanwhile also include desktop PCs. In this review, we'll be focusing on the Intel-based XMG SECTOR. The base configuration is priced at €1,239 (US$1,306) and ships with an Intel Core i5-12400F, 16 GB of RAM and an Nvidia GeForce RTX 3060. Our review unit is a high-end model featuring a Core i9-13900K and a GeForce RTX 4090, but it also carries a very hefty price tag of about €4,700 (US$4,956). However, thanks to the many options offered by the XMG shop, you can equipped the PC with various hardware components and assemble a system tailored specifically to your needs.
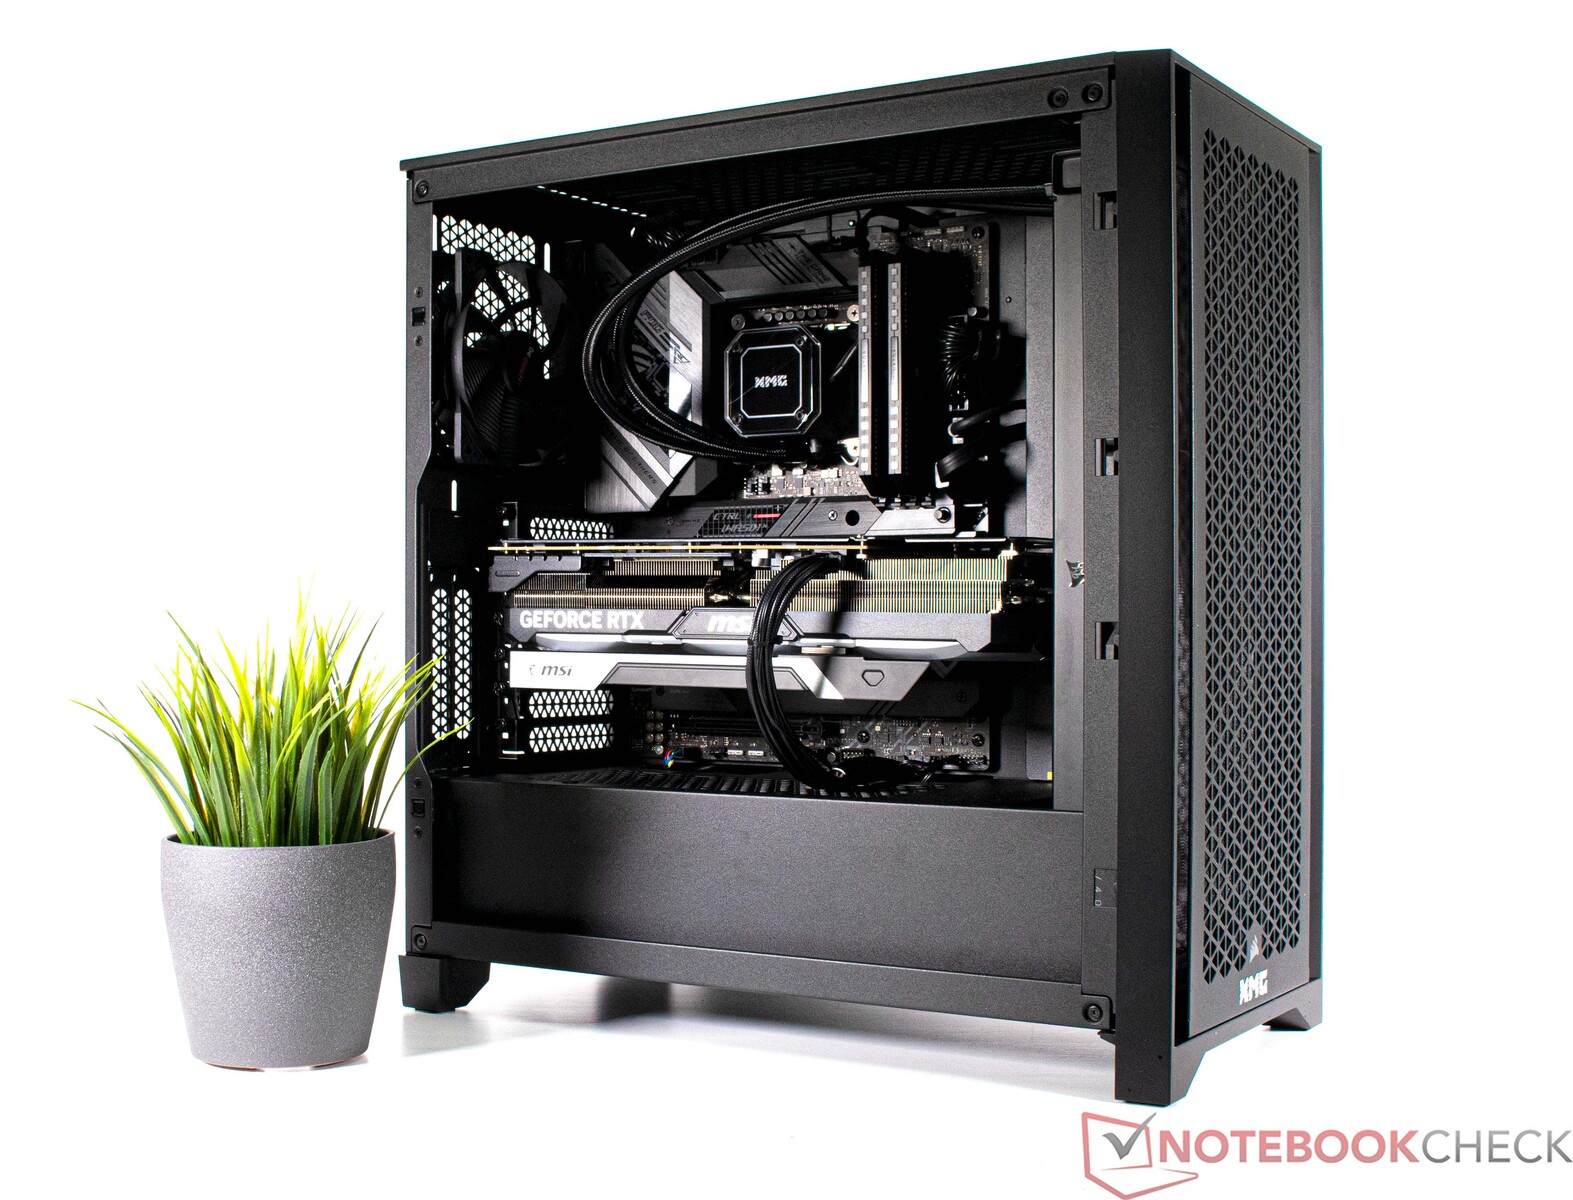
A detailed look at the XMG SECTOR Intel
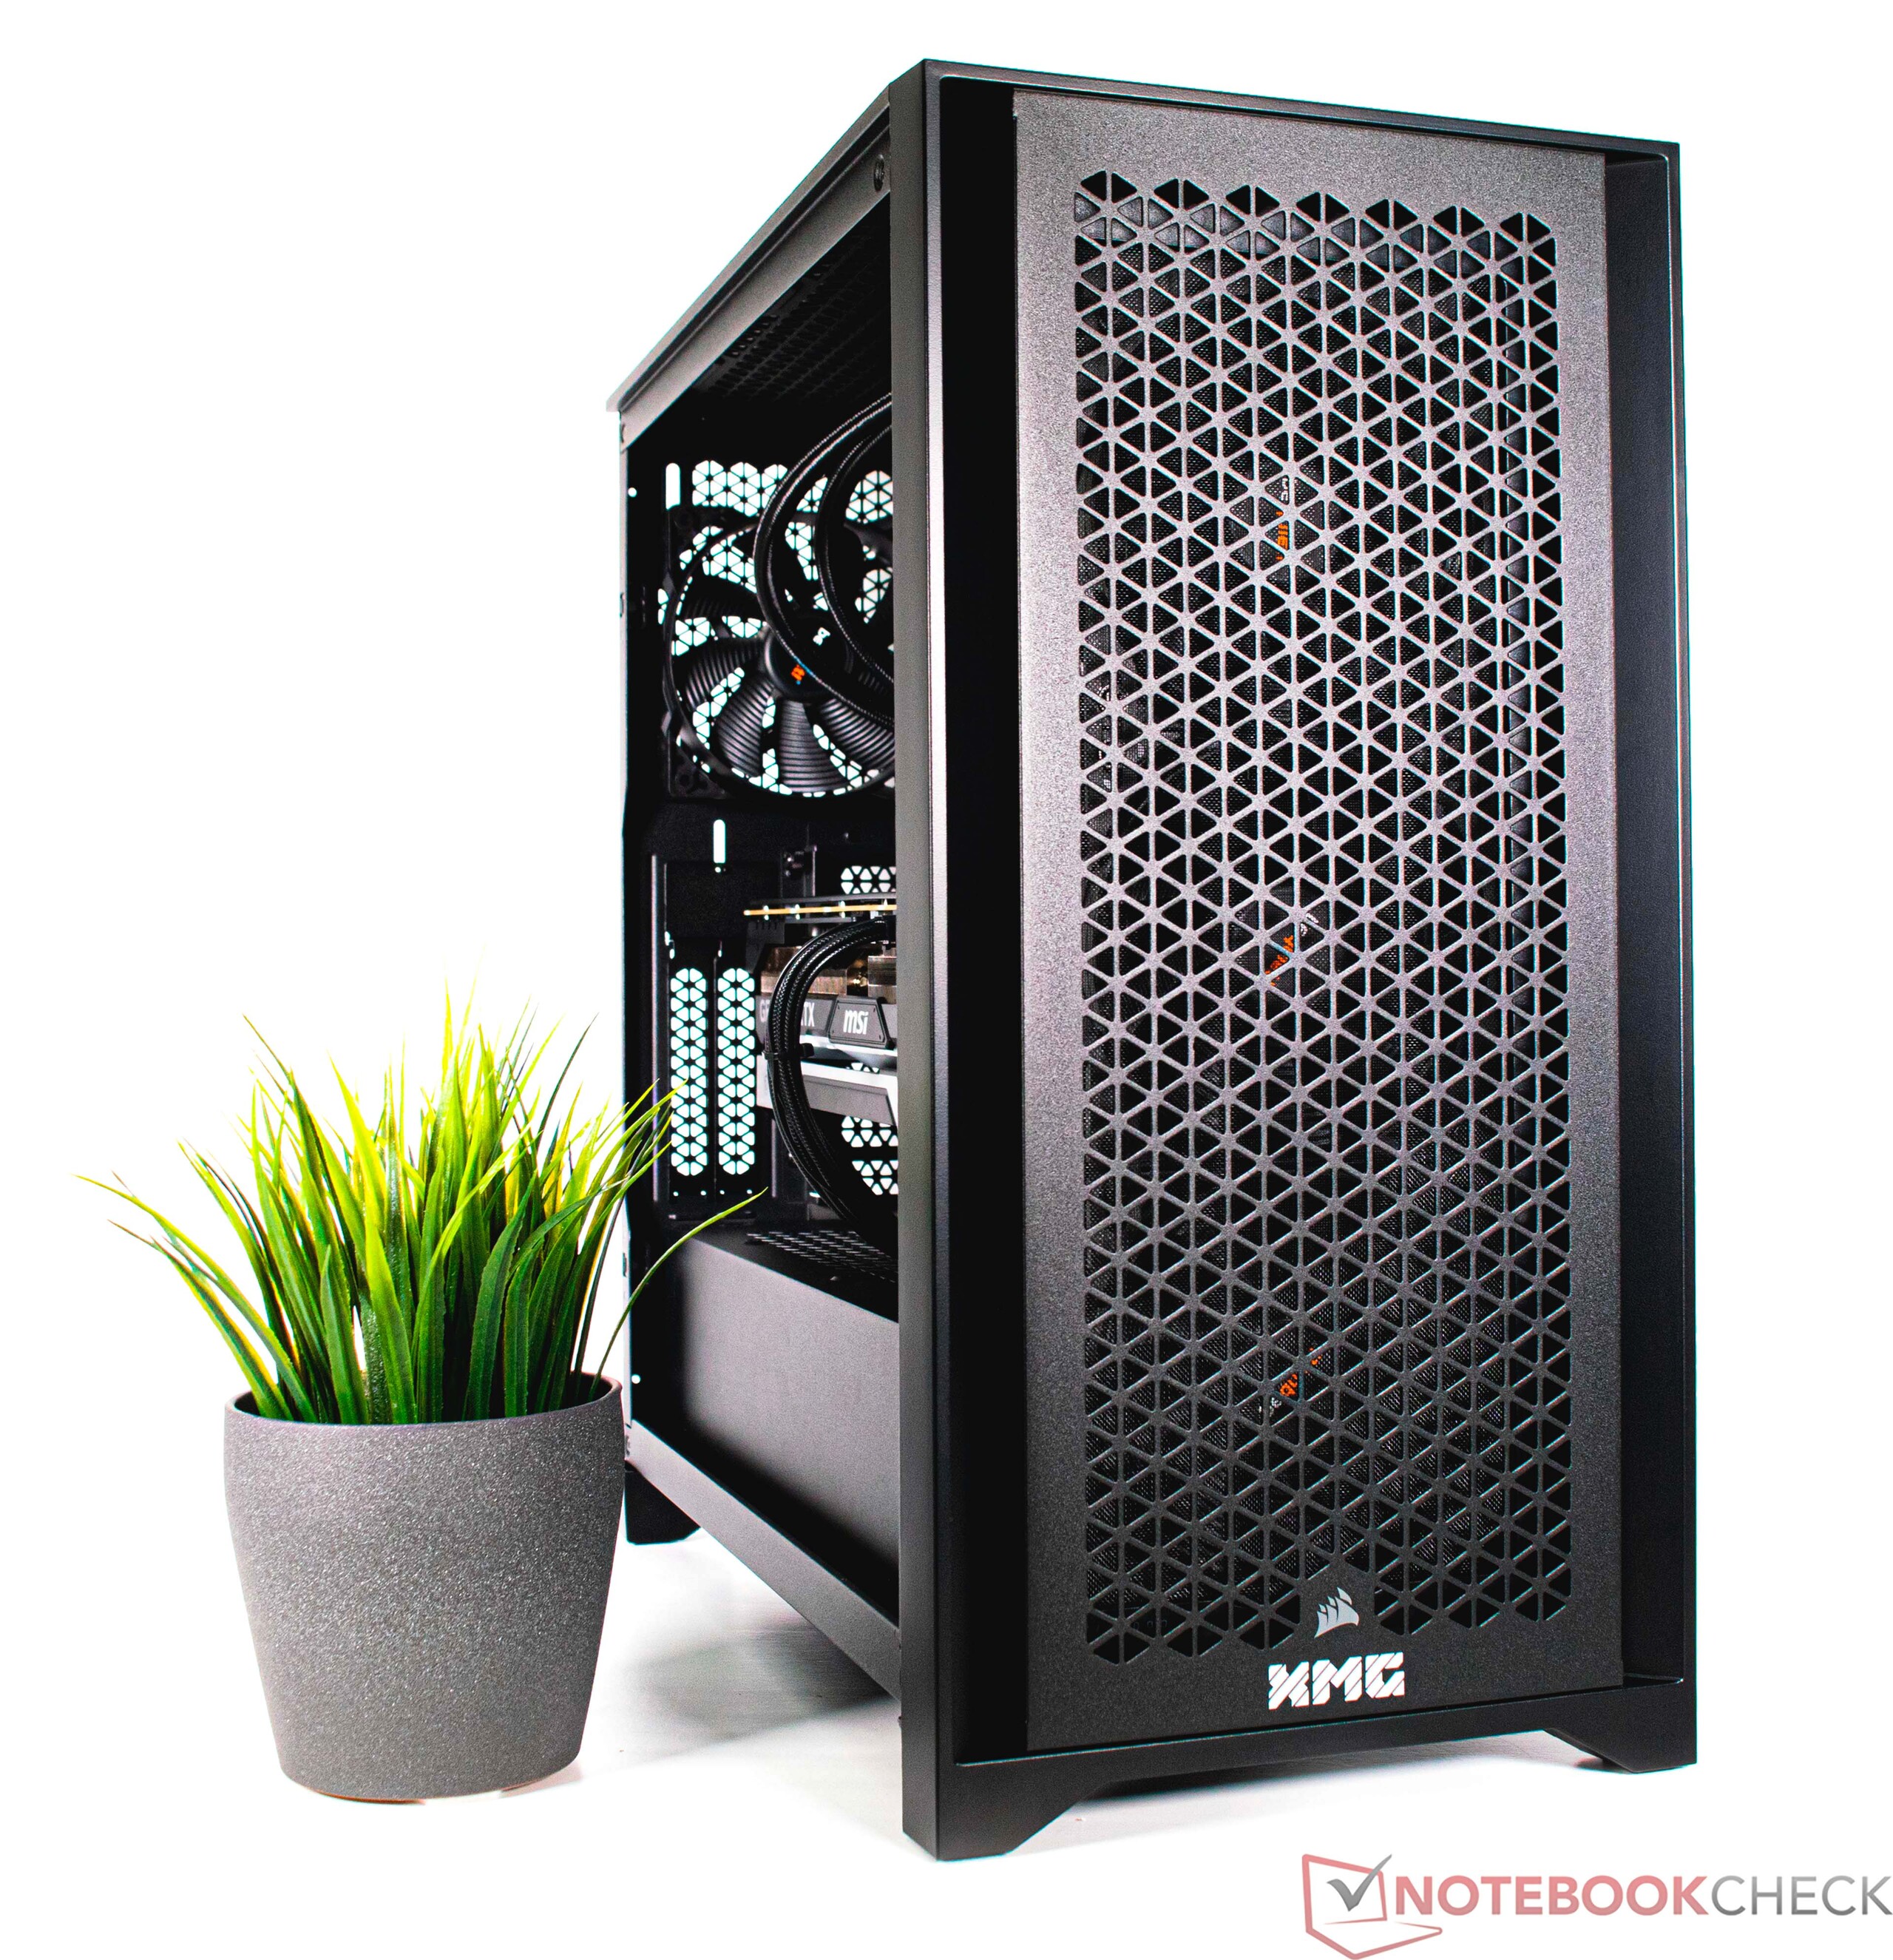

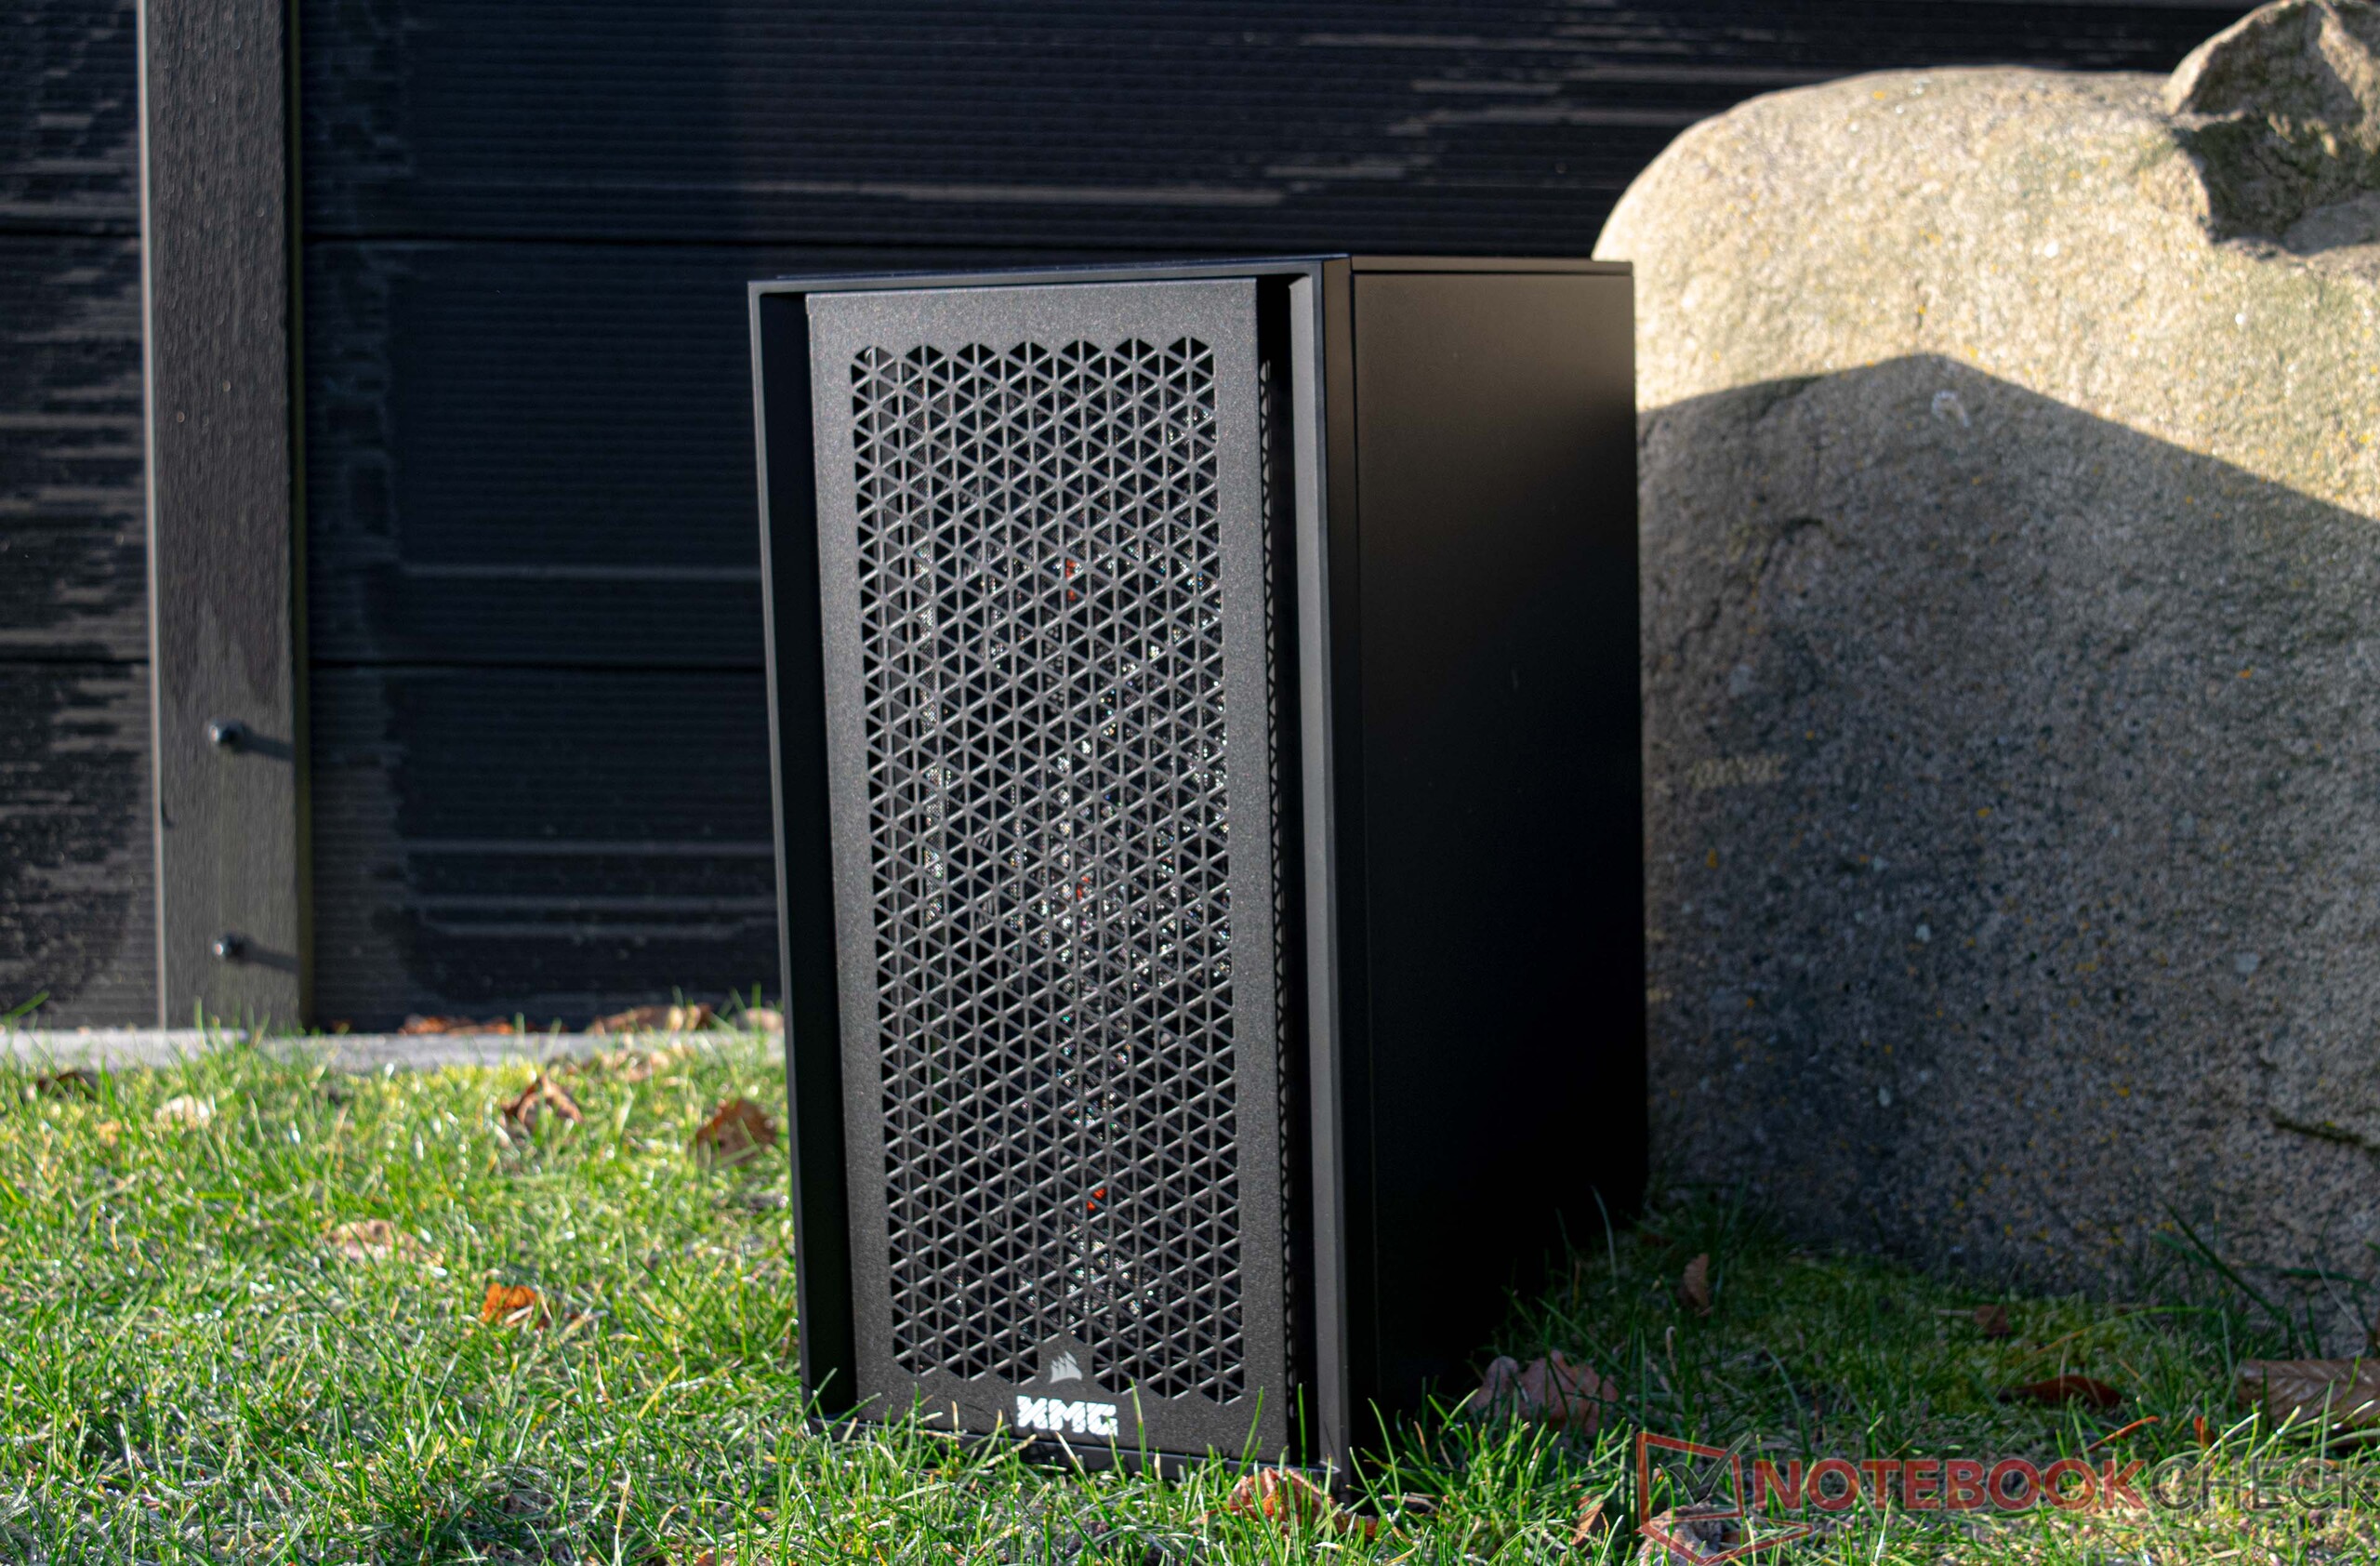
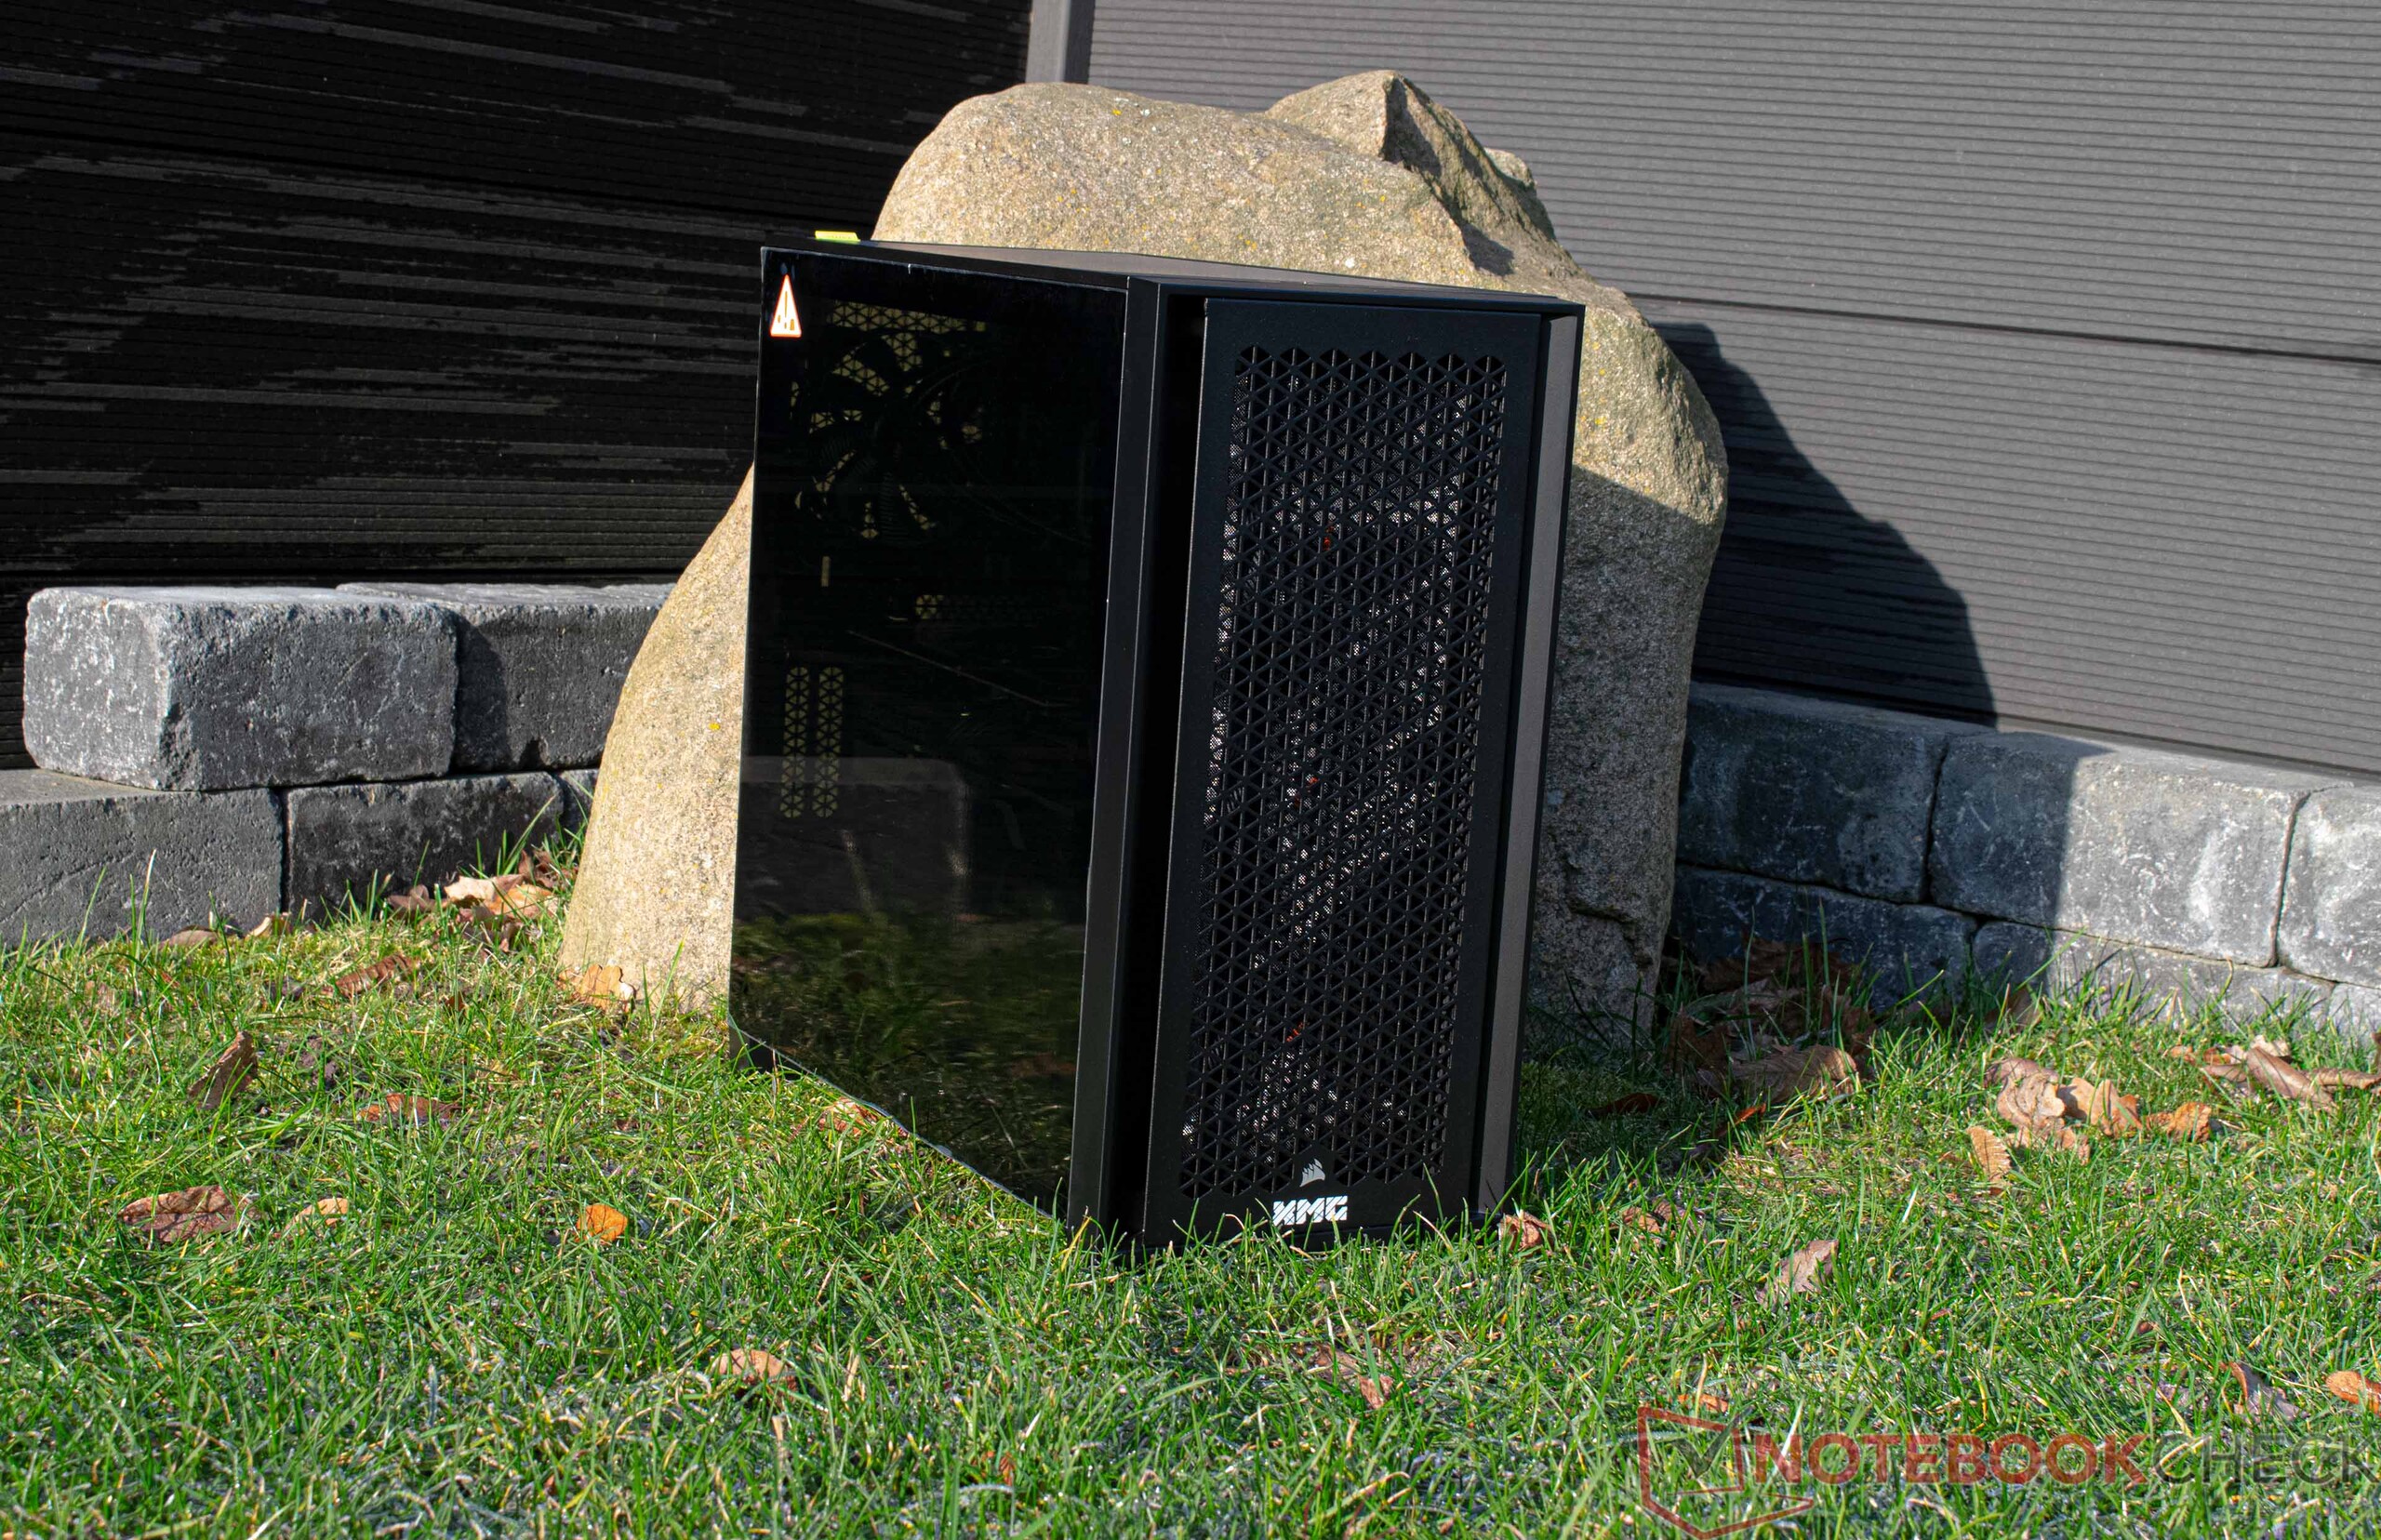
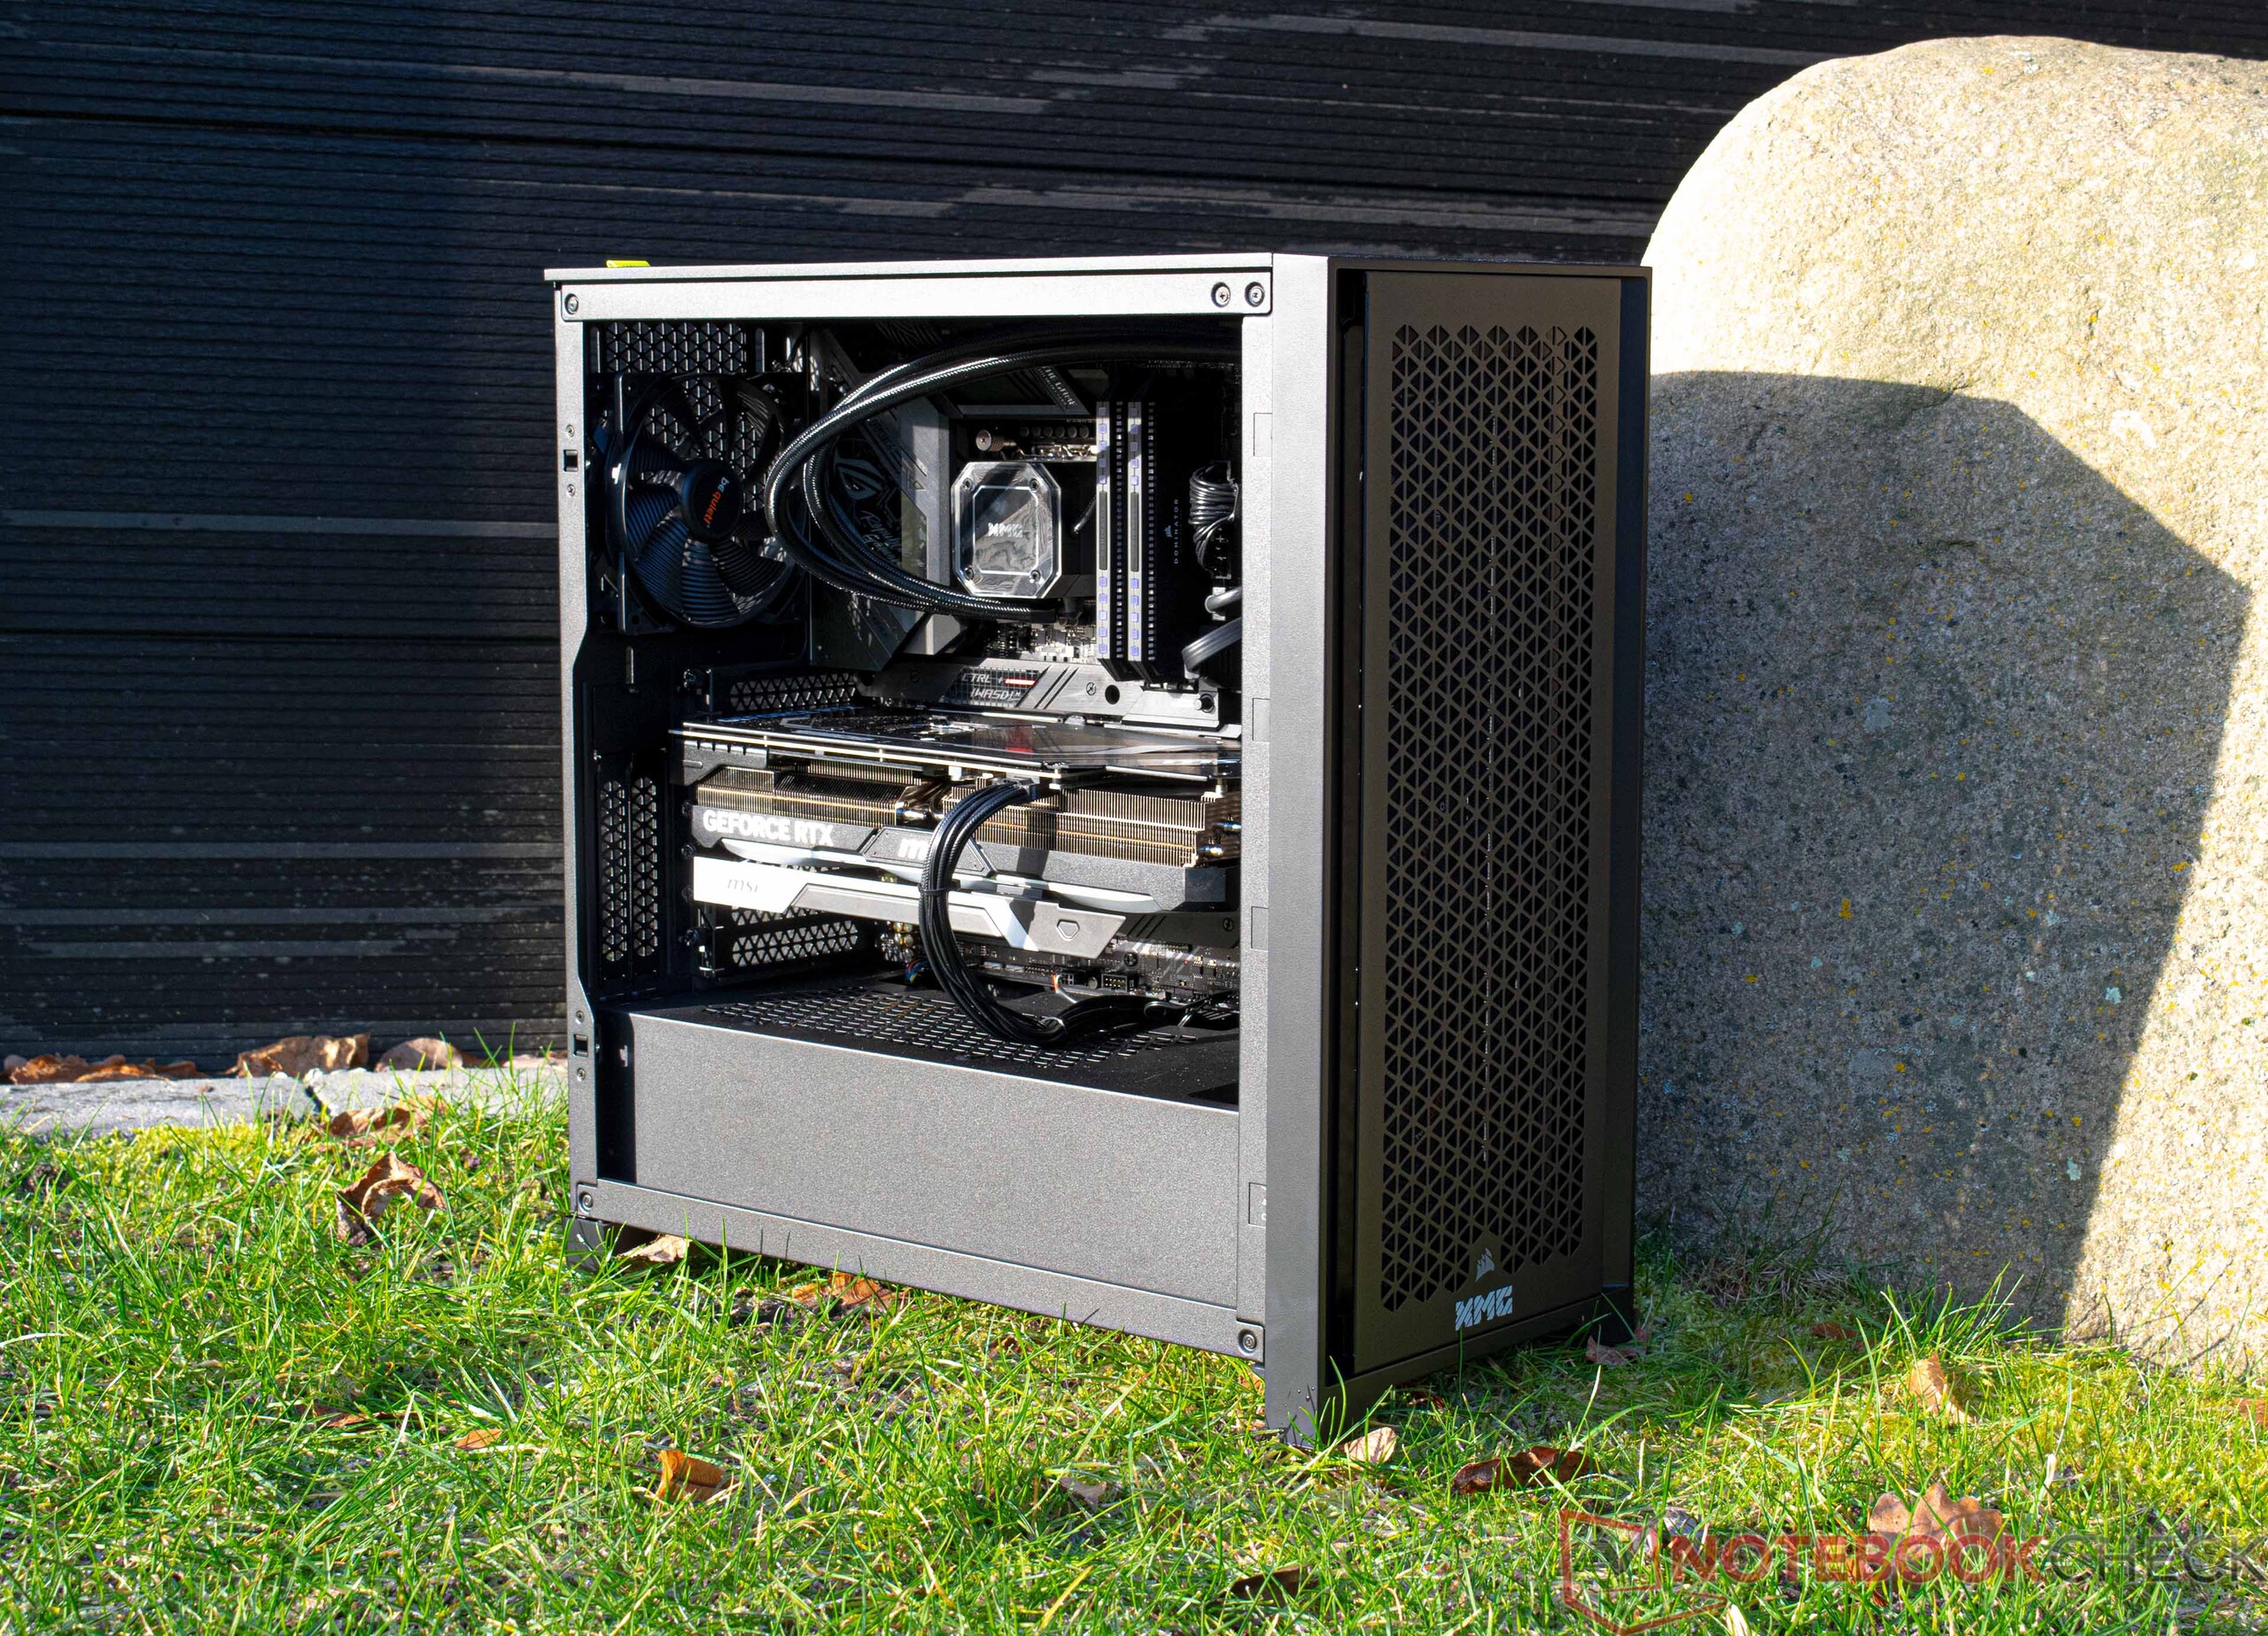
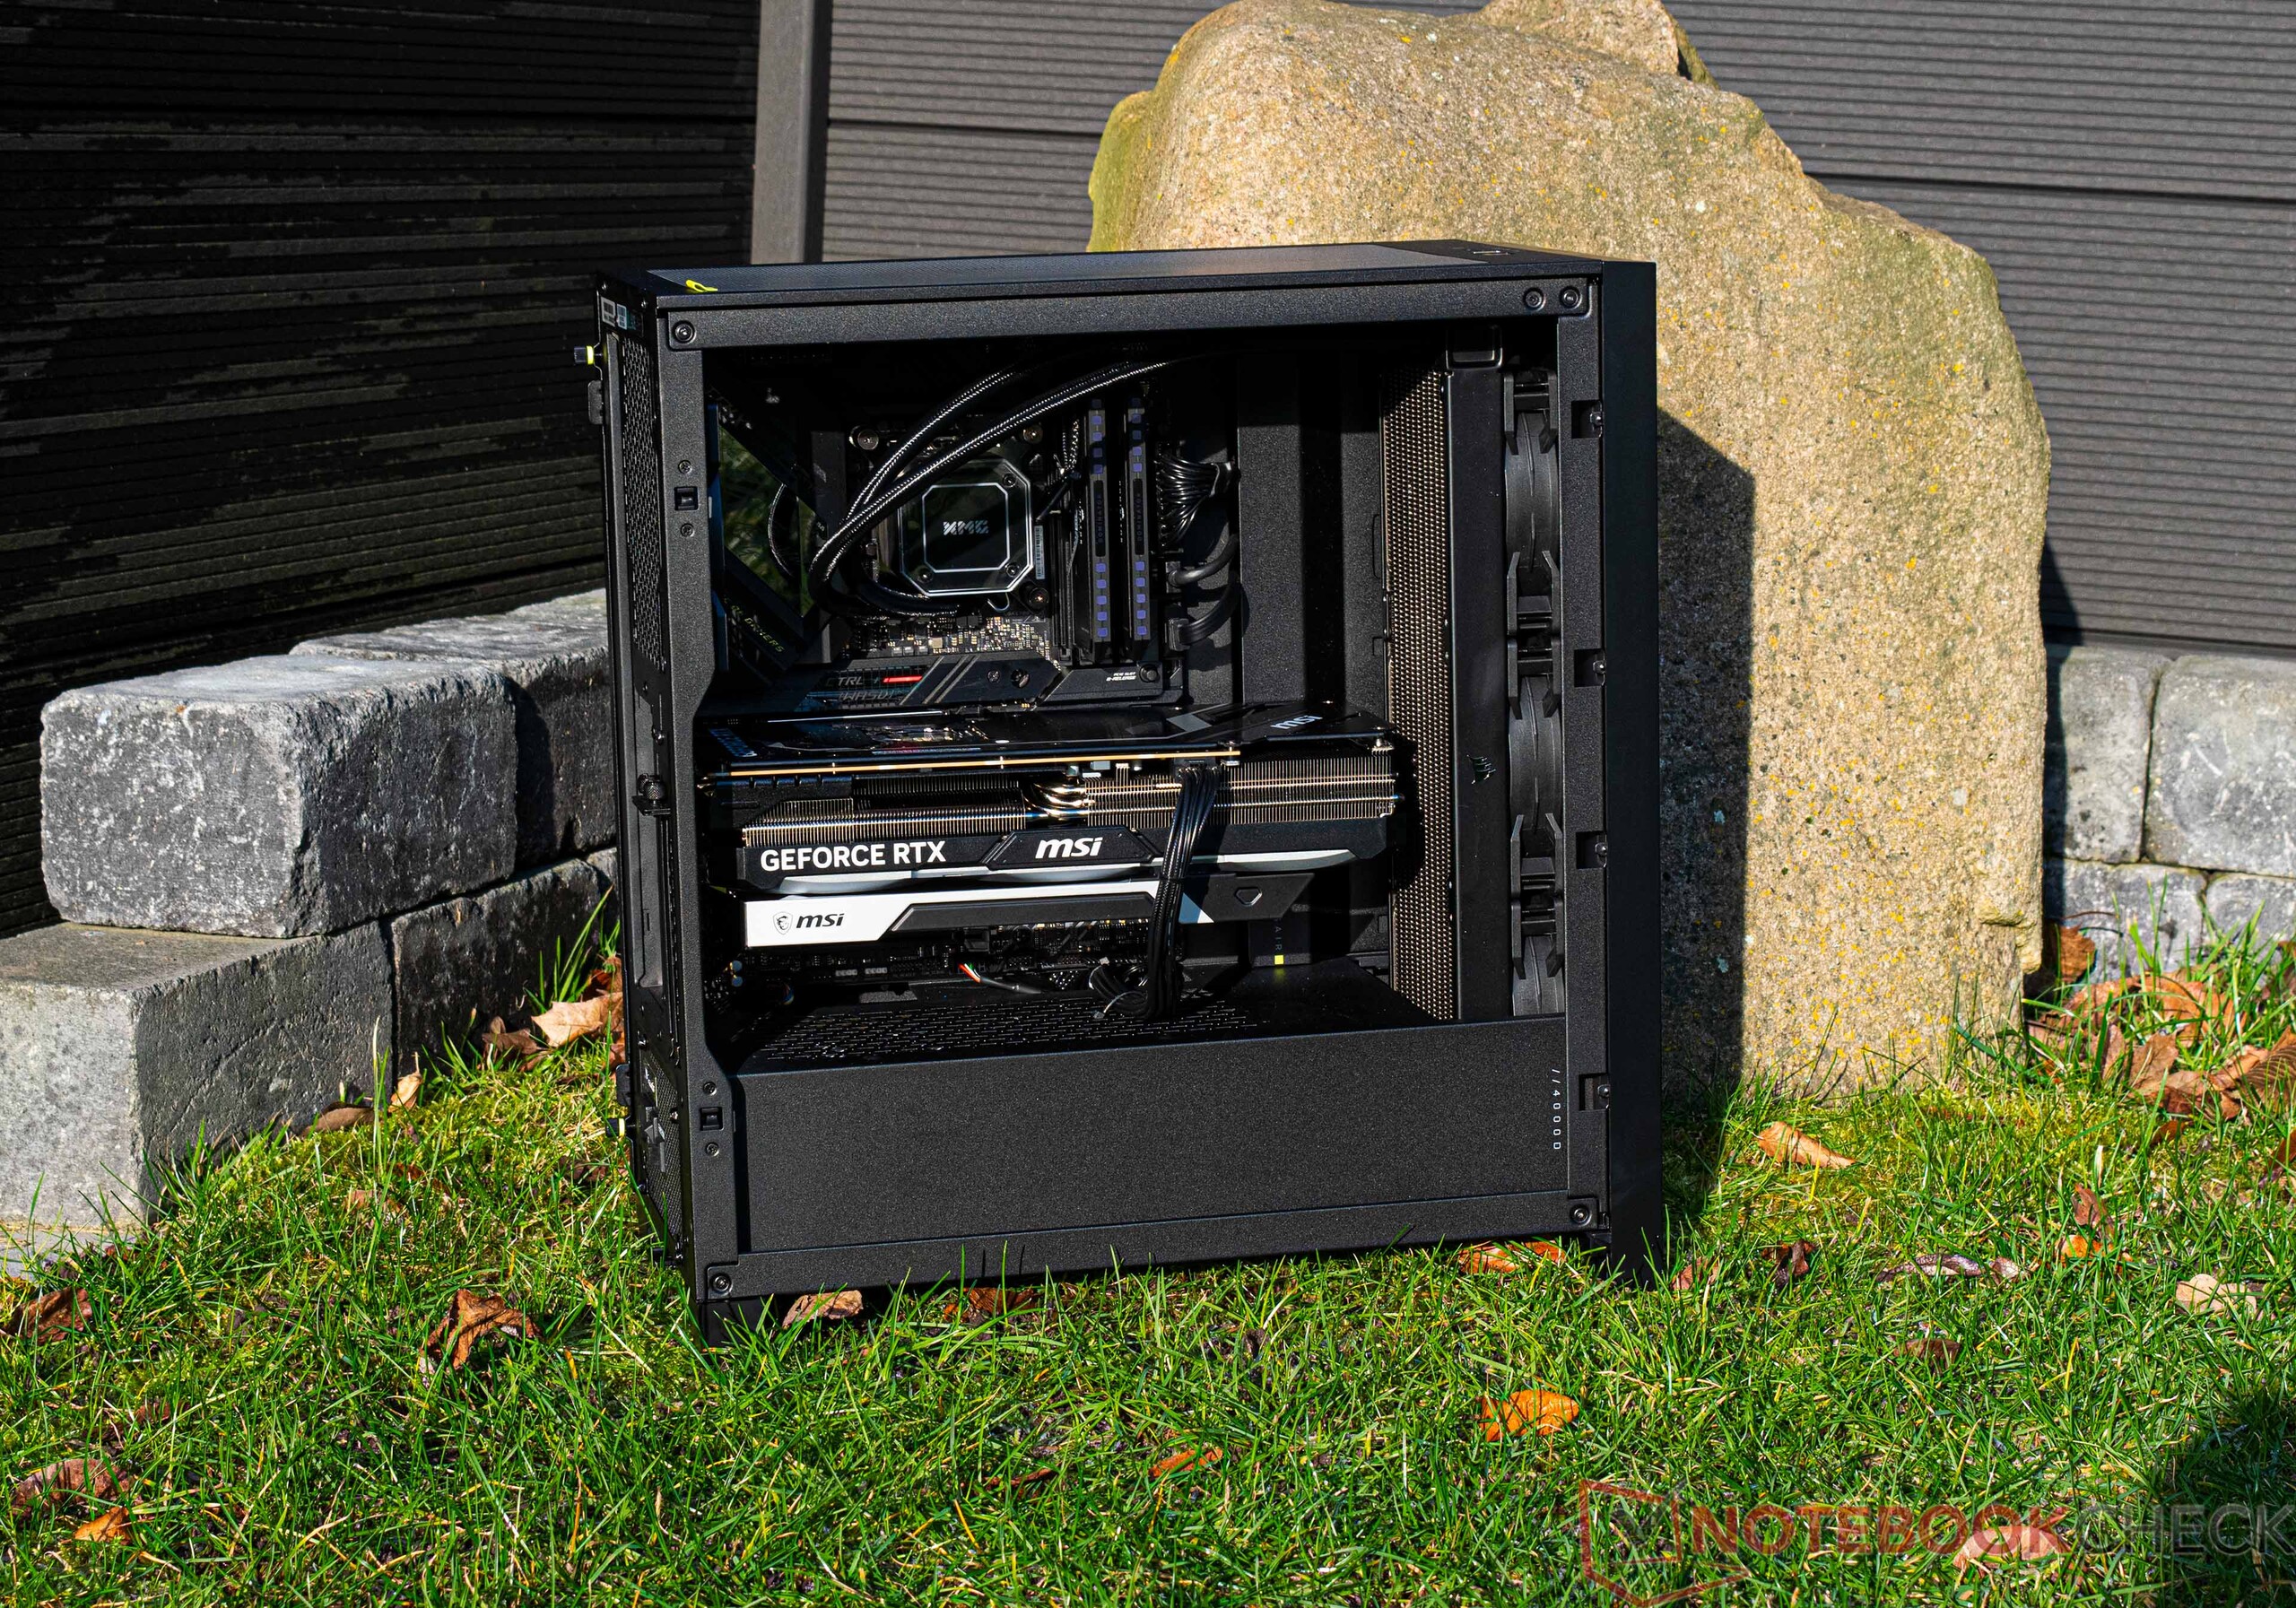
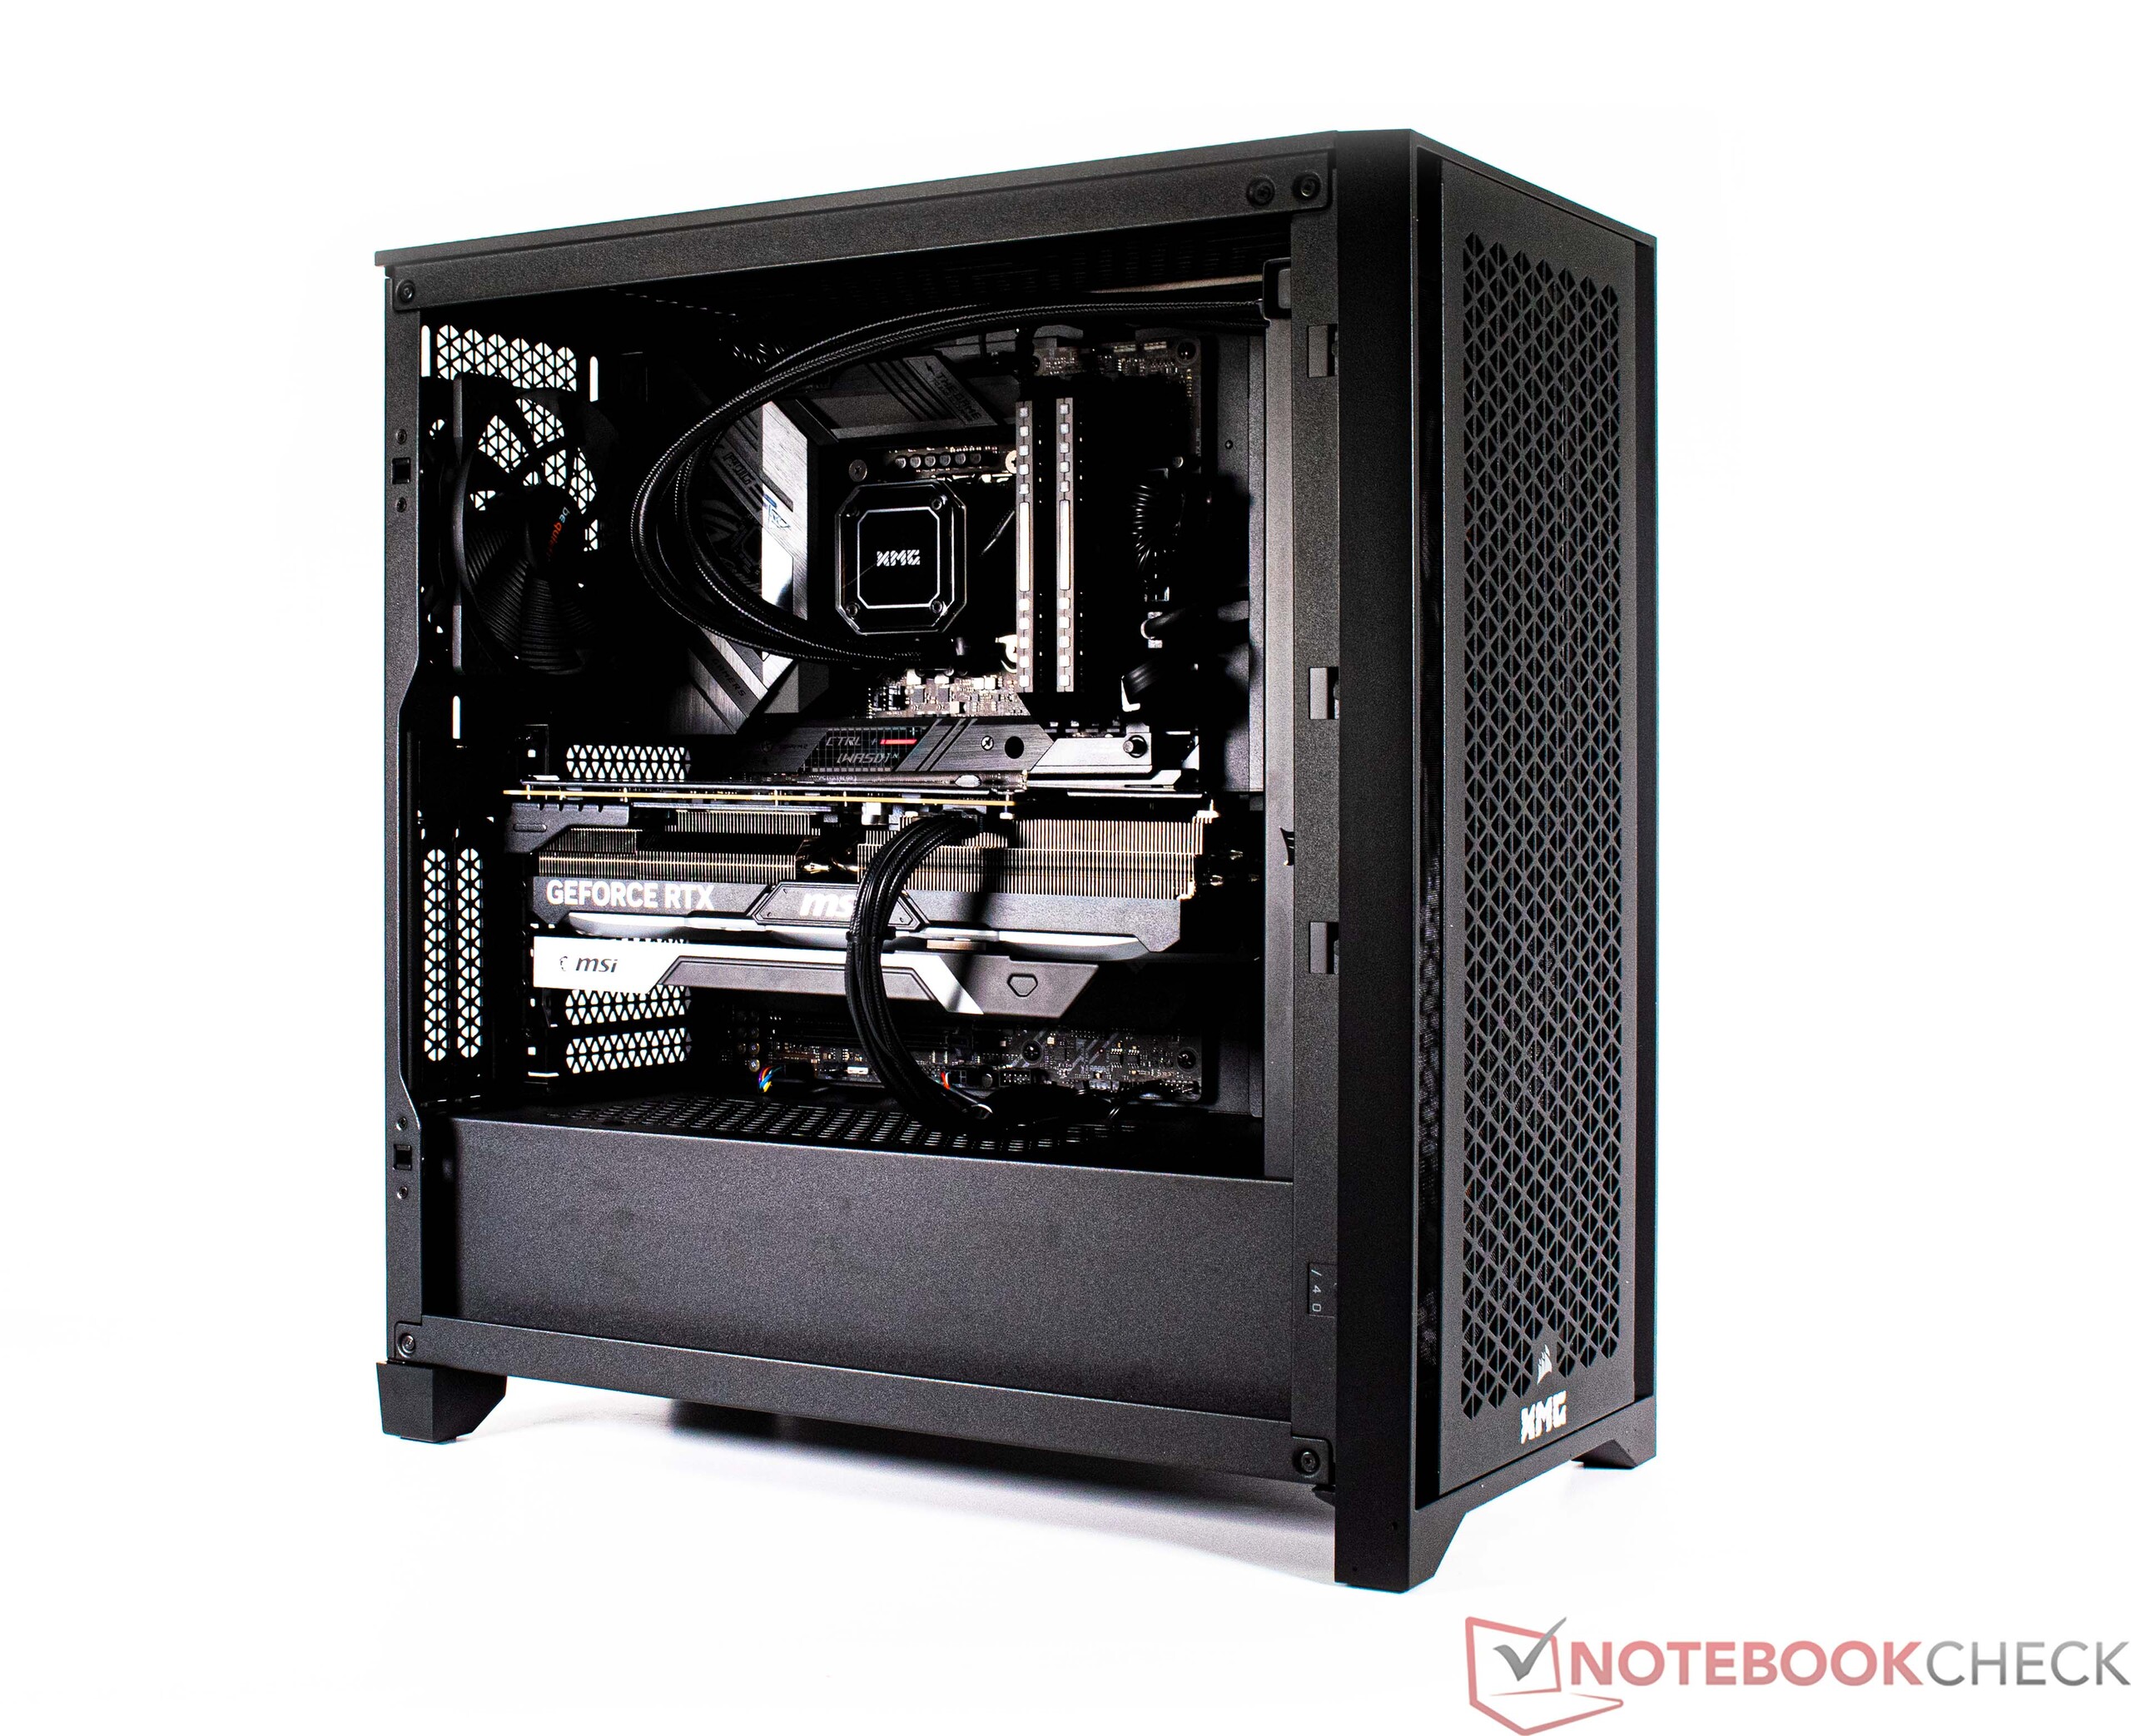
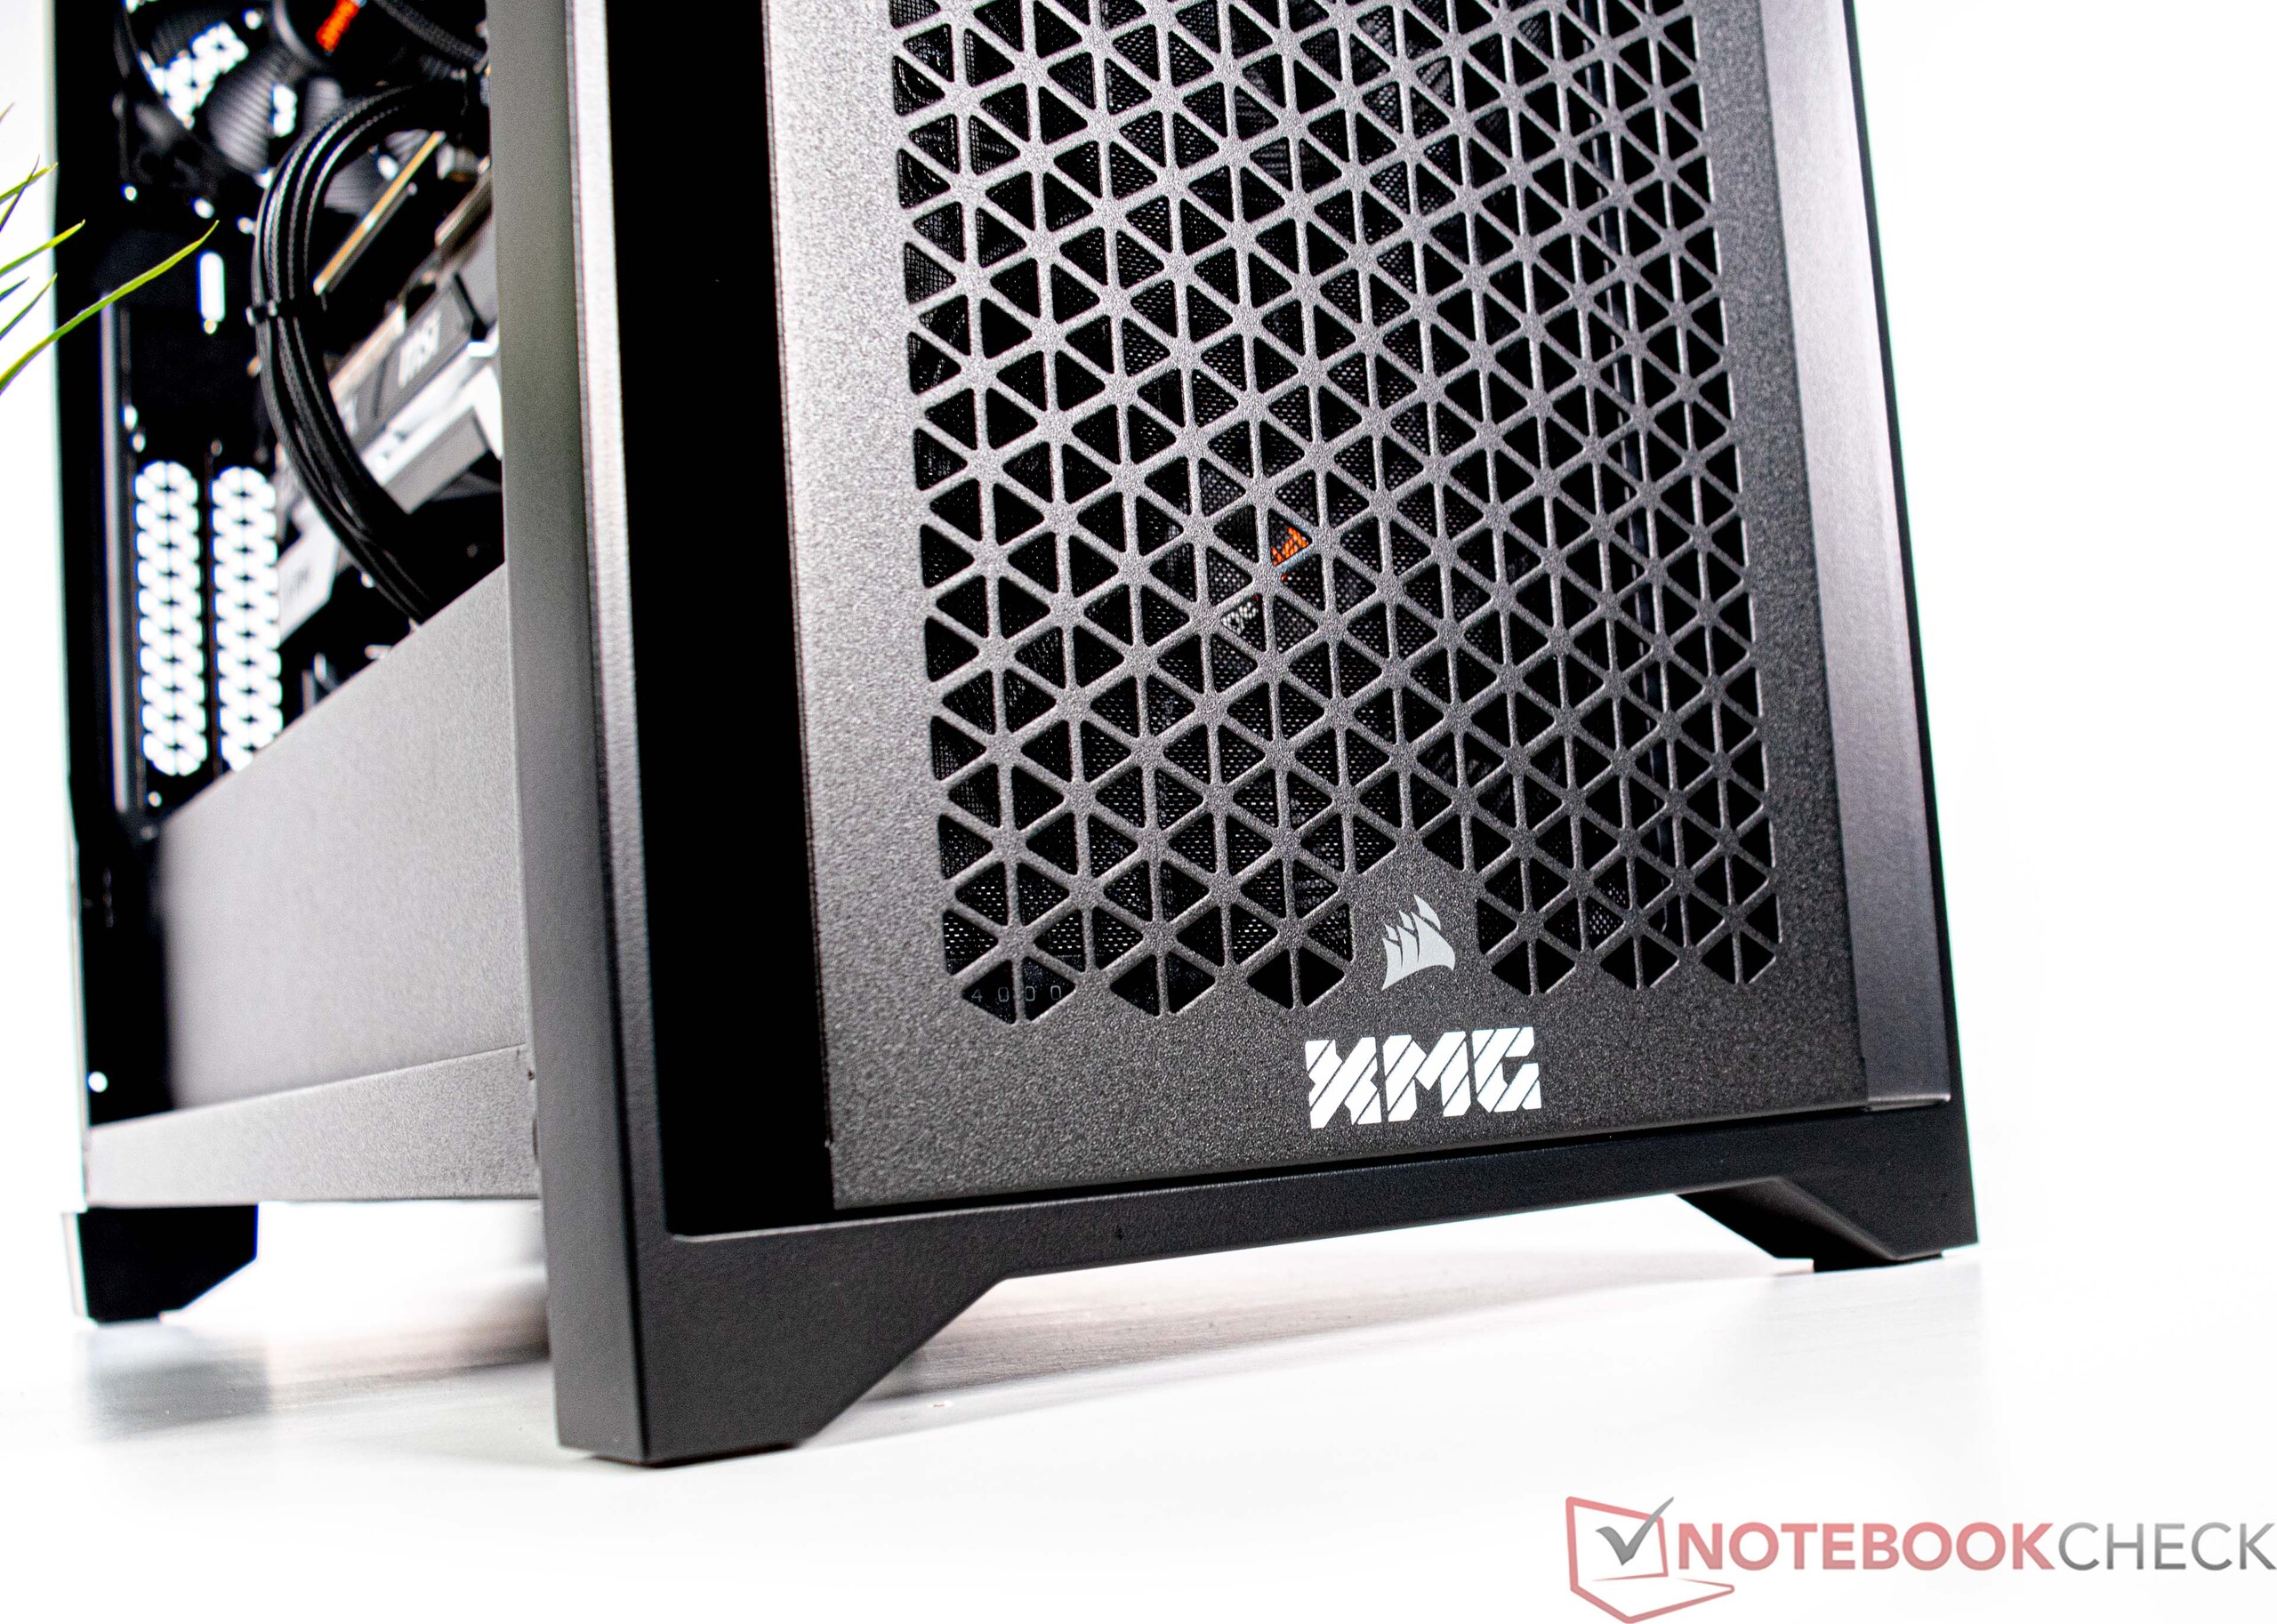
Case - Corsair 4000D Airflow
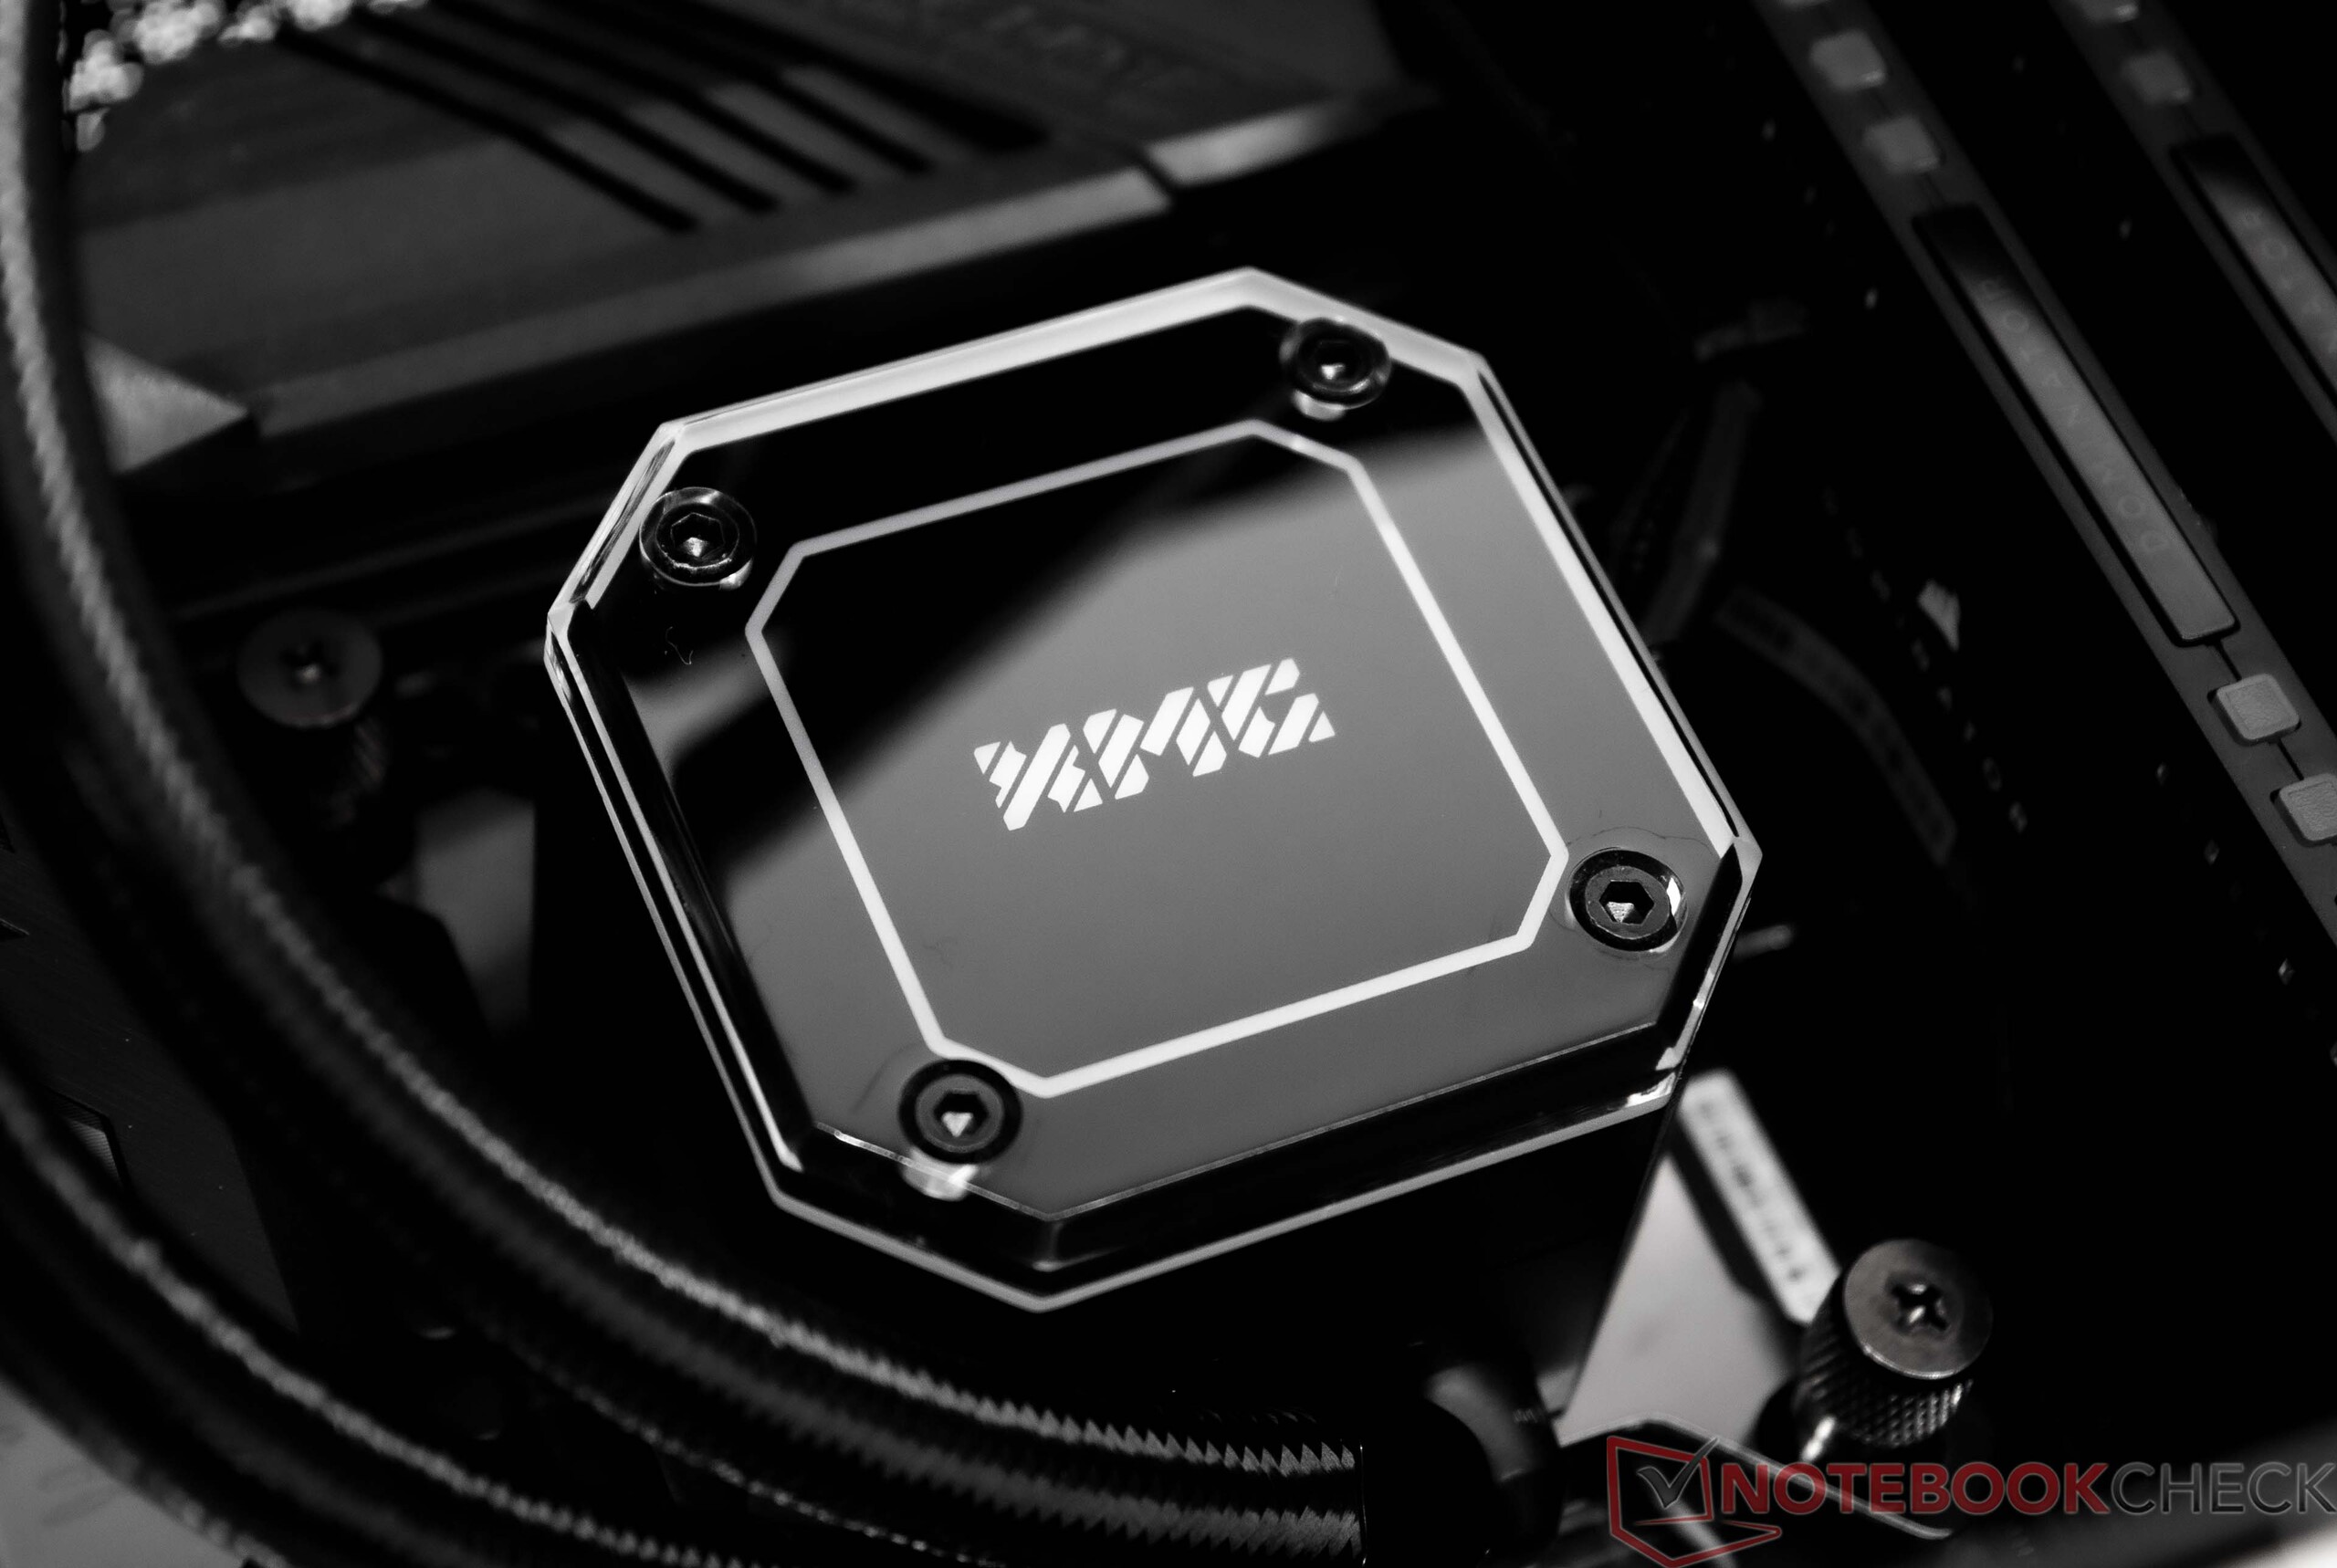
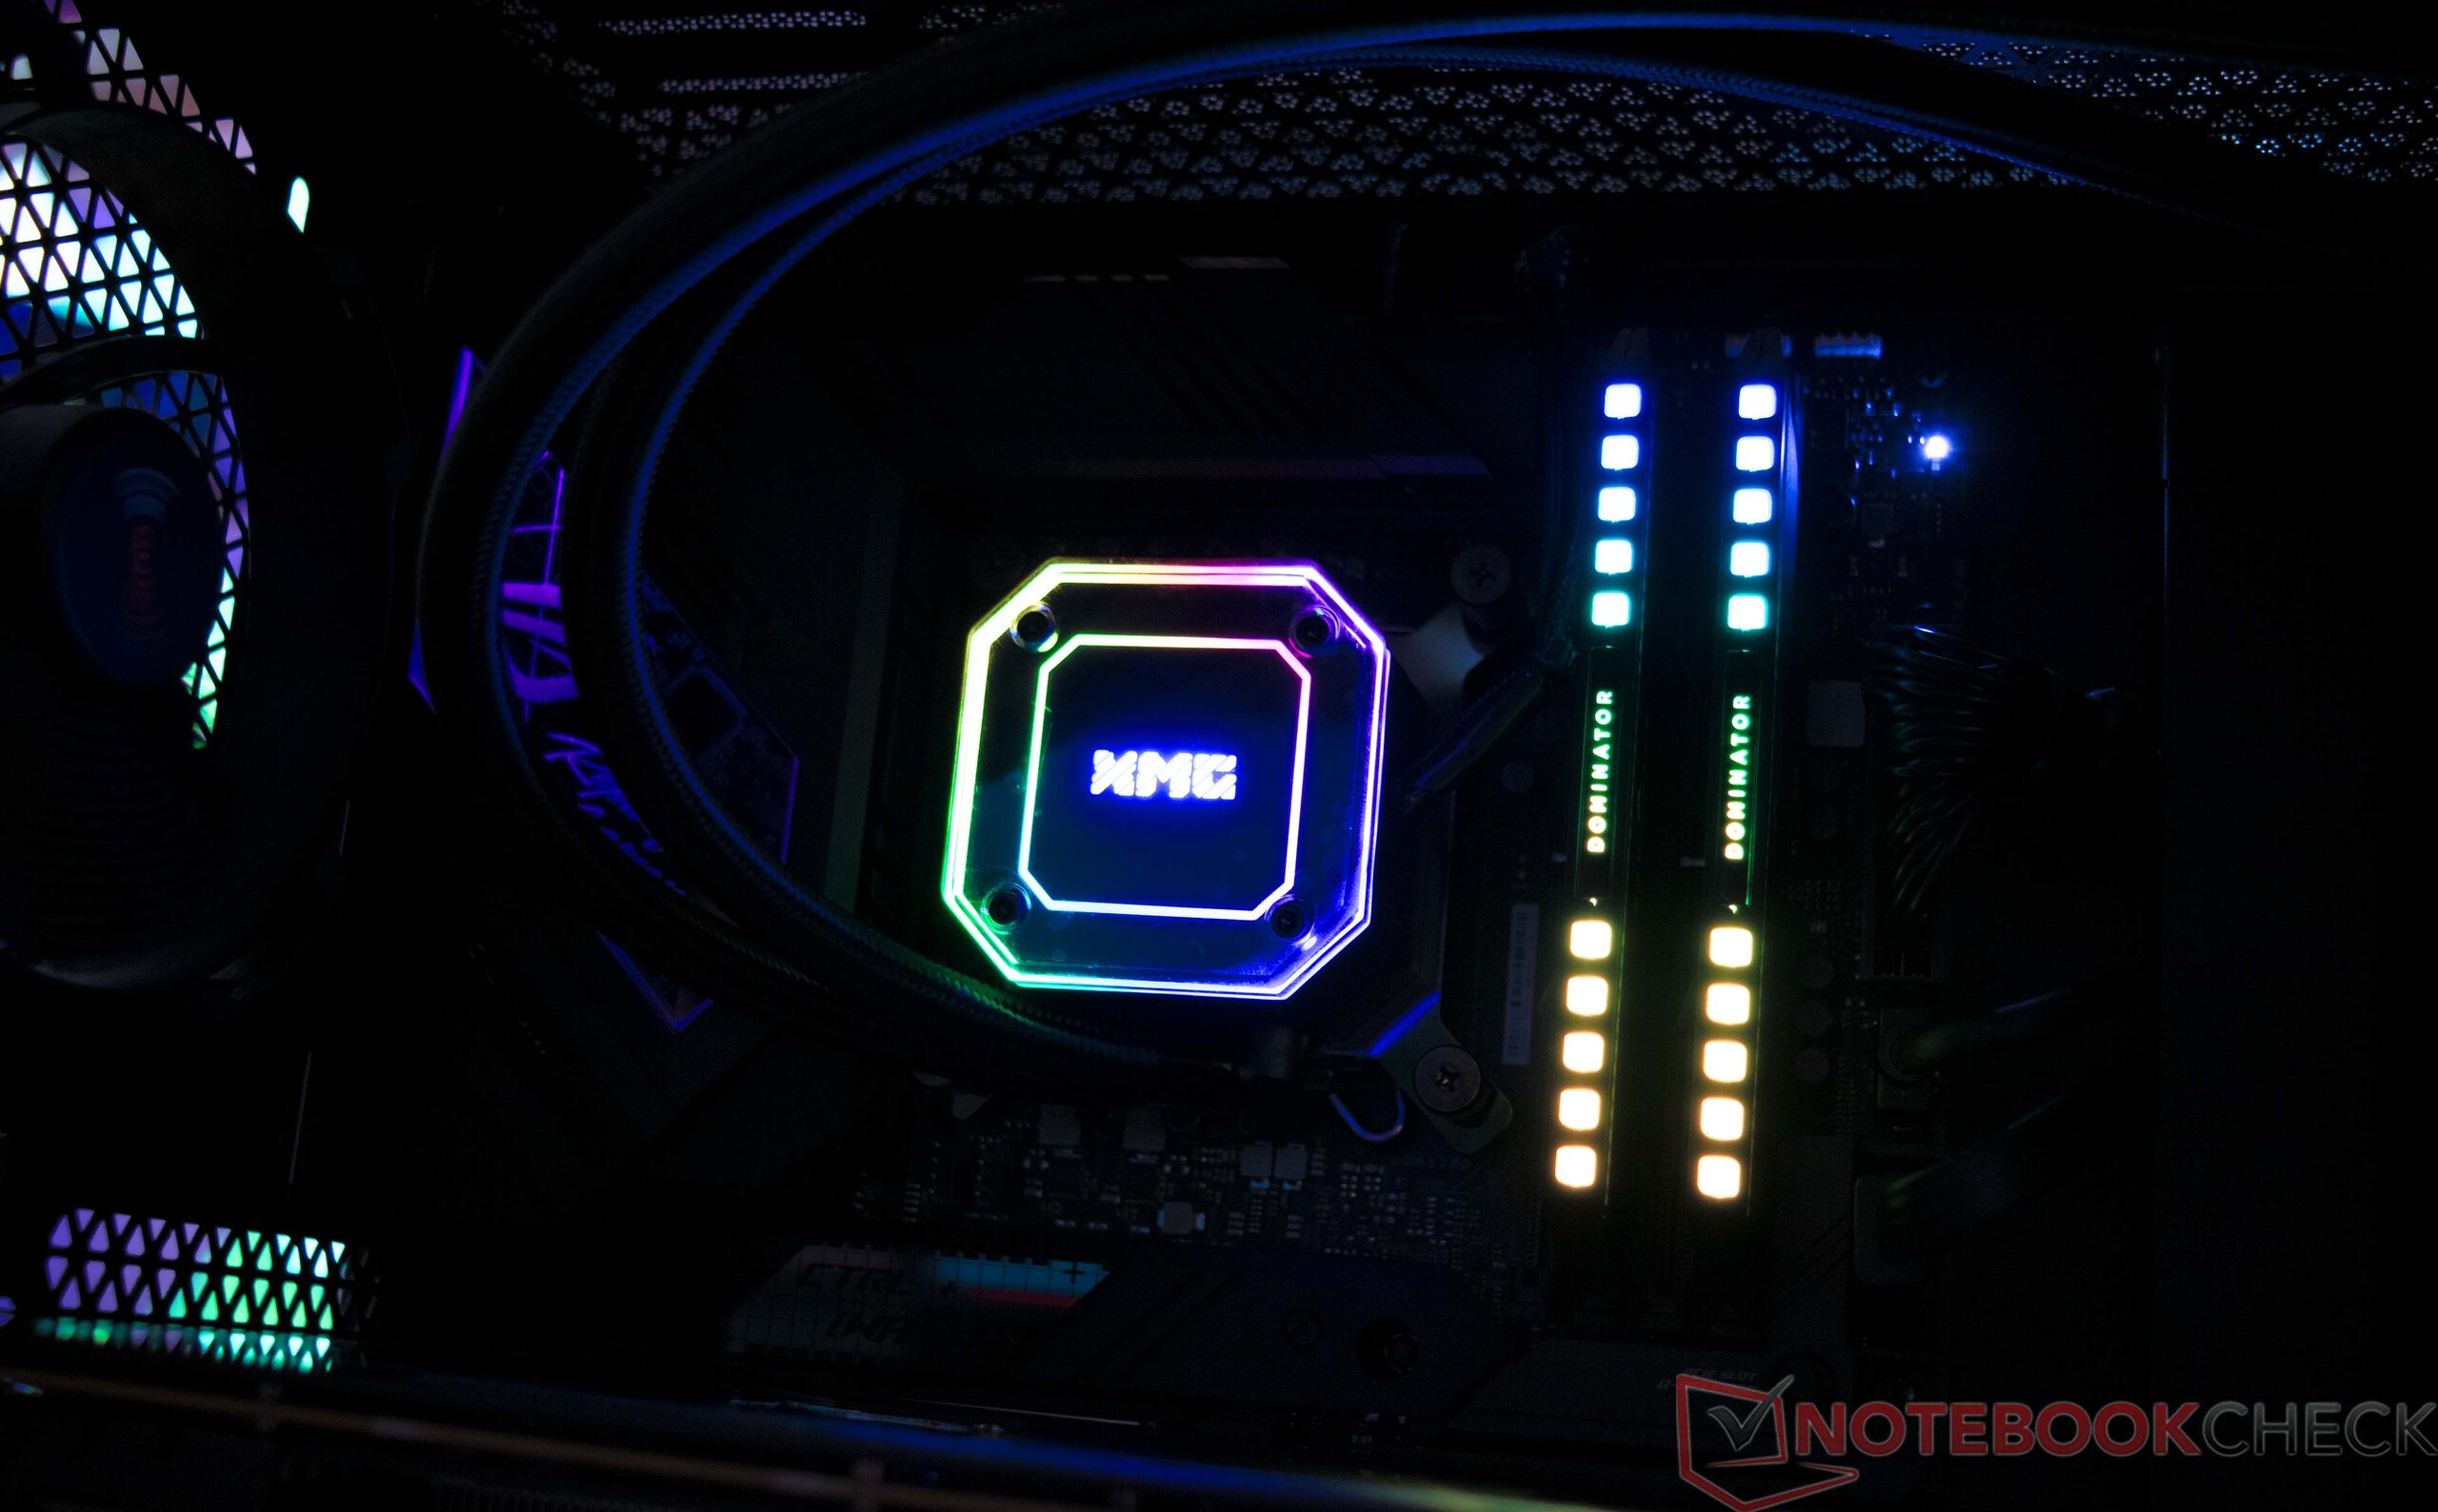
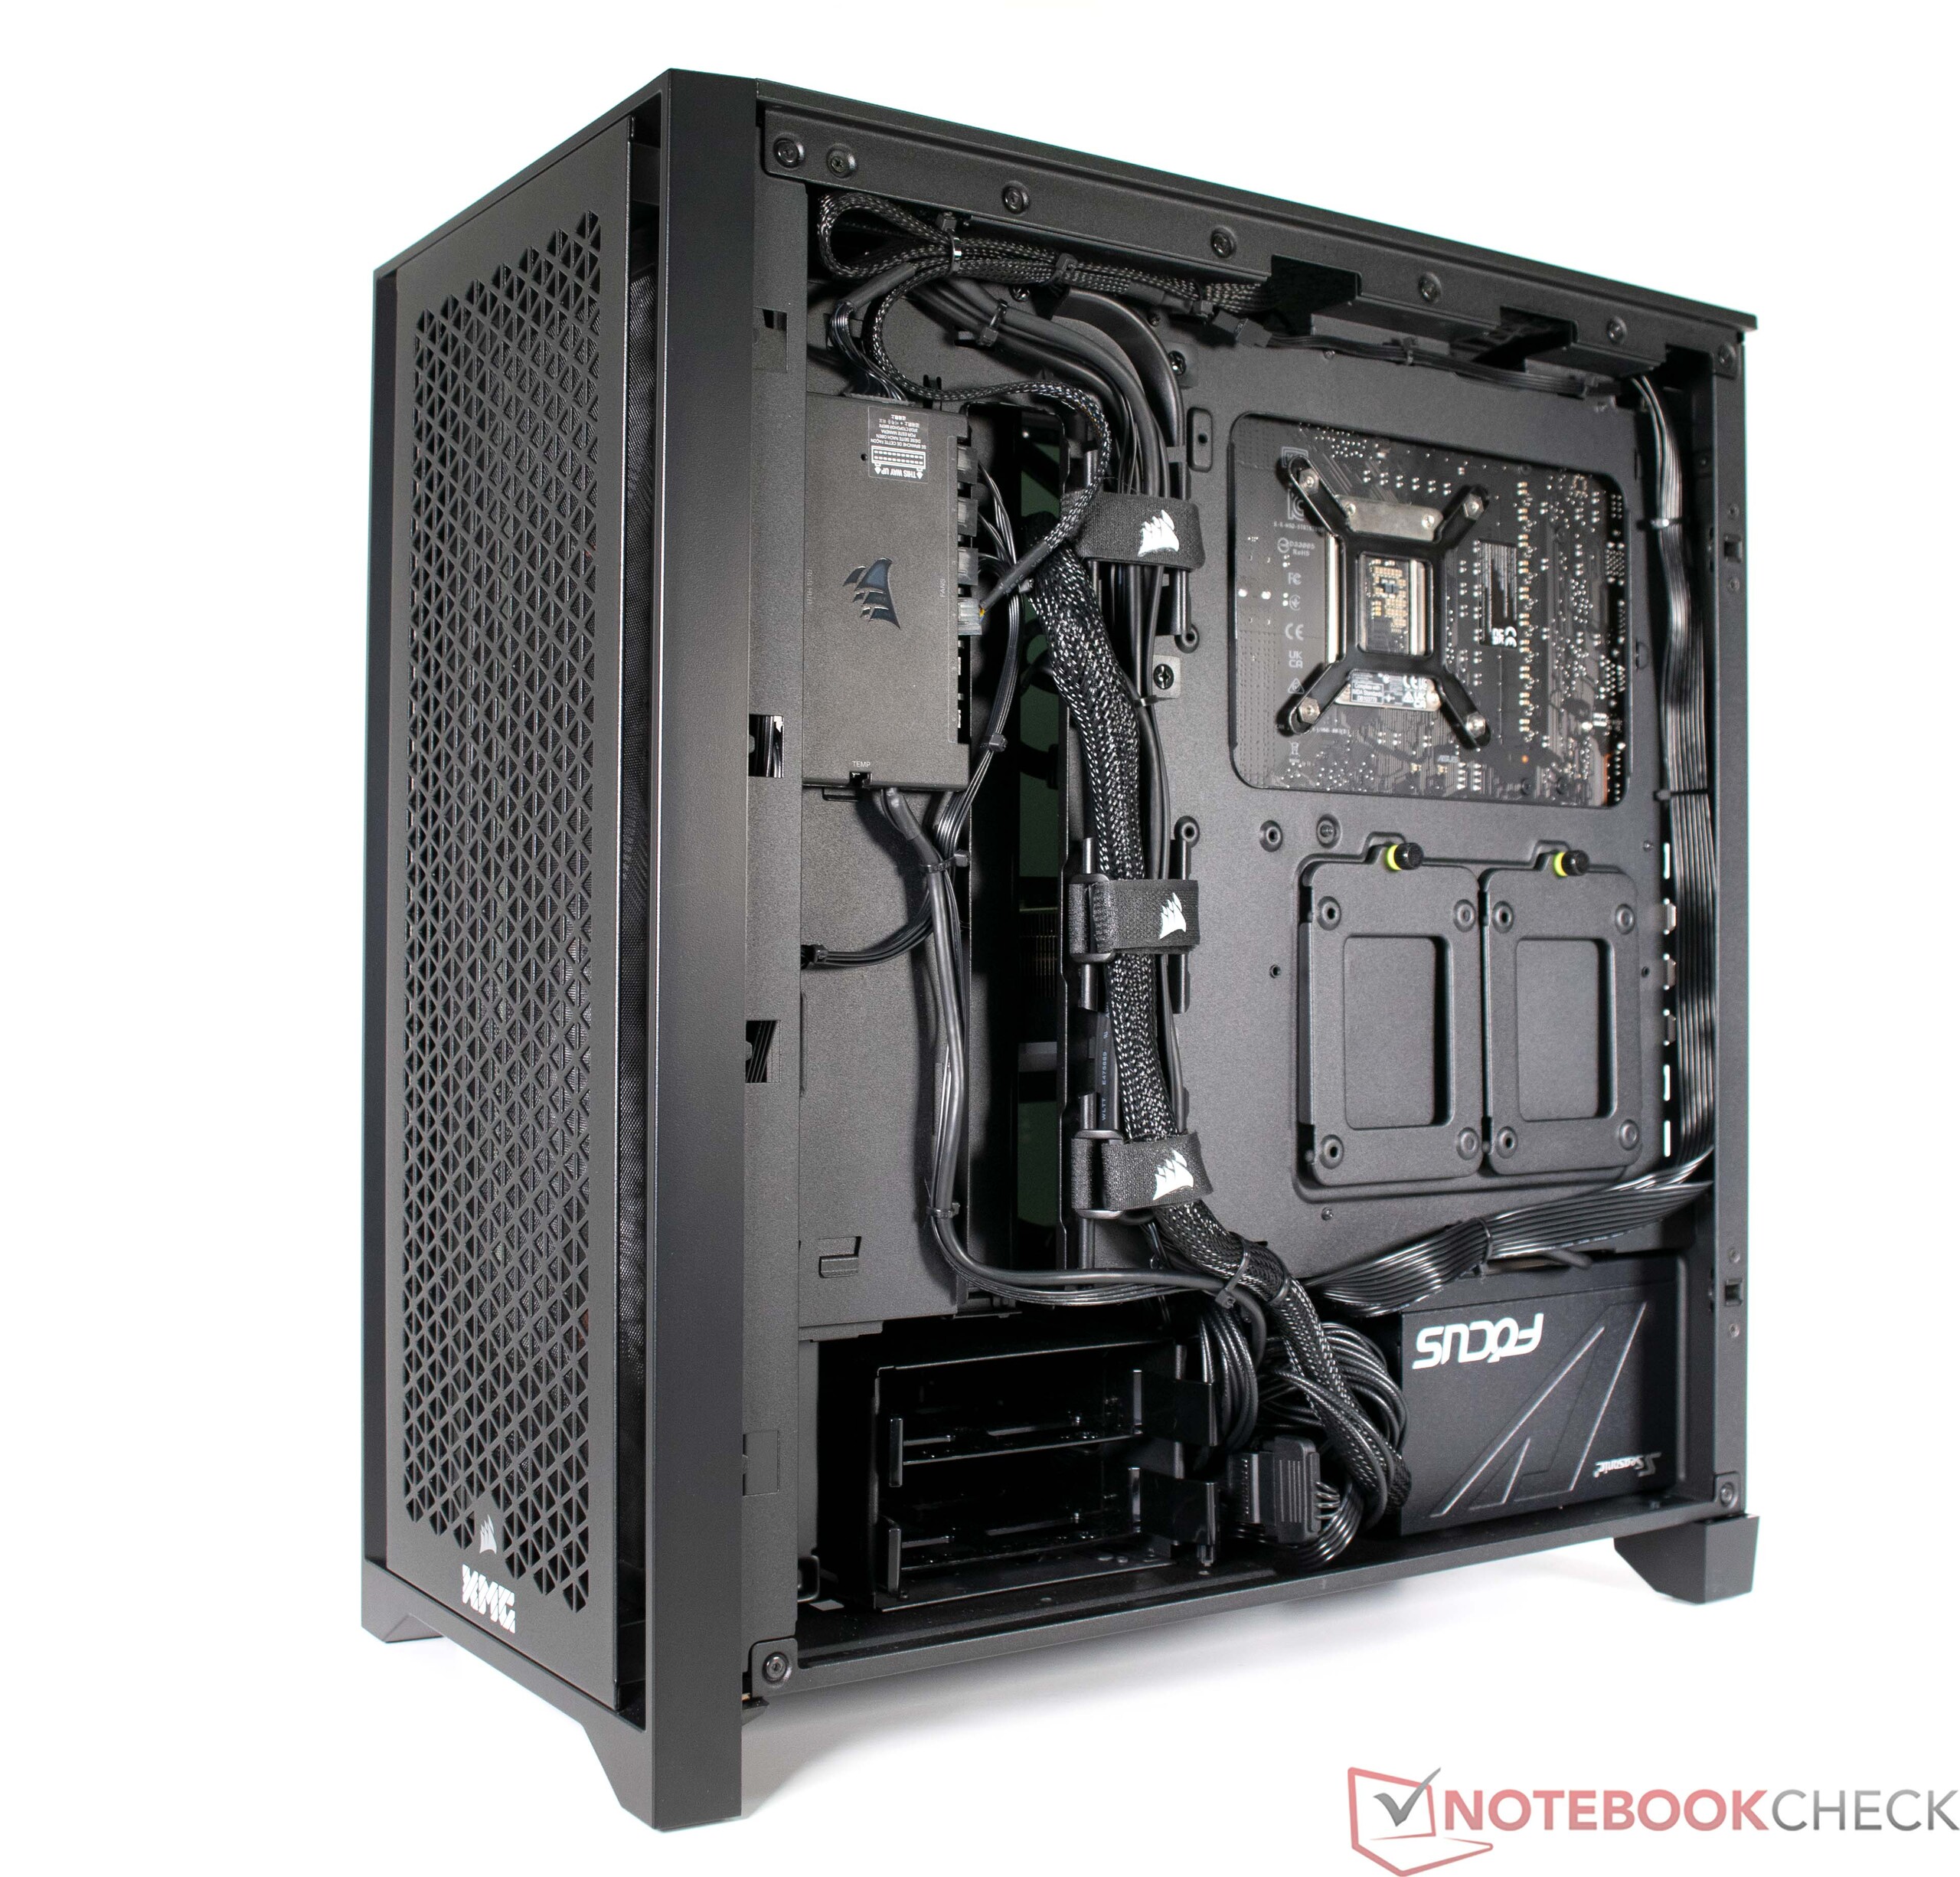
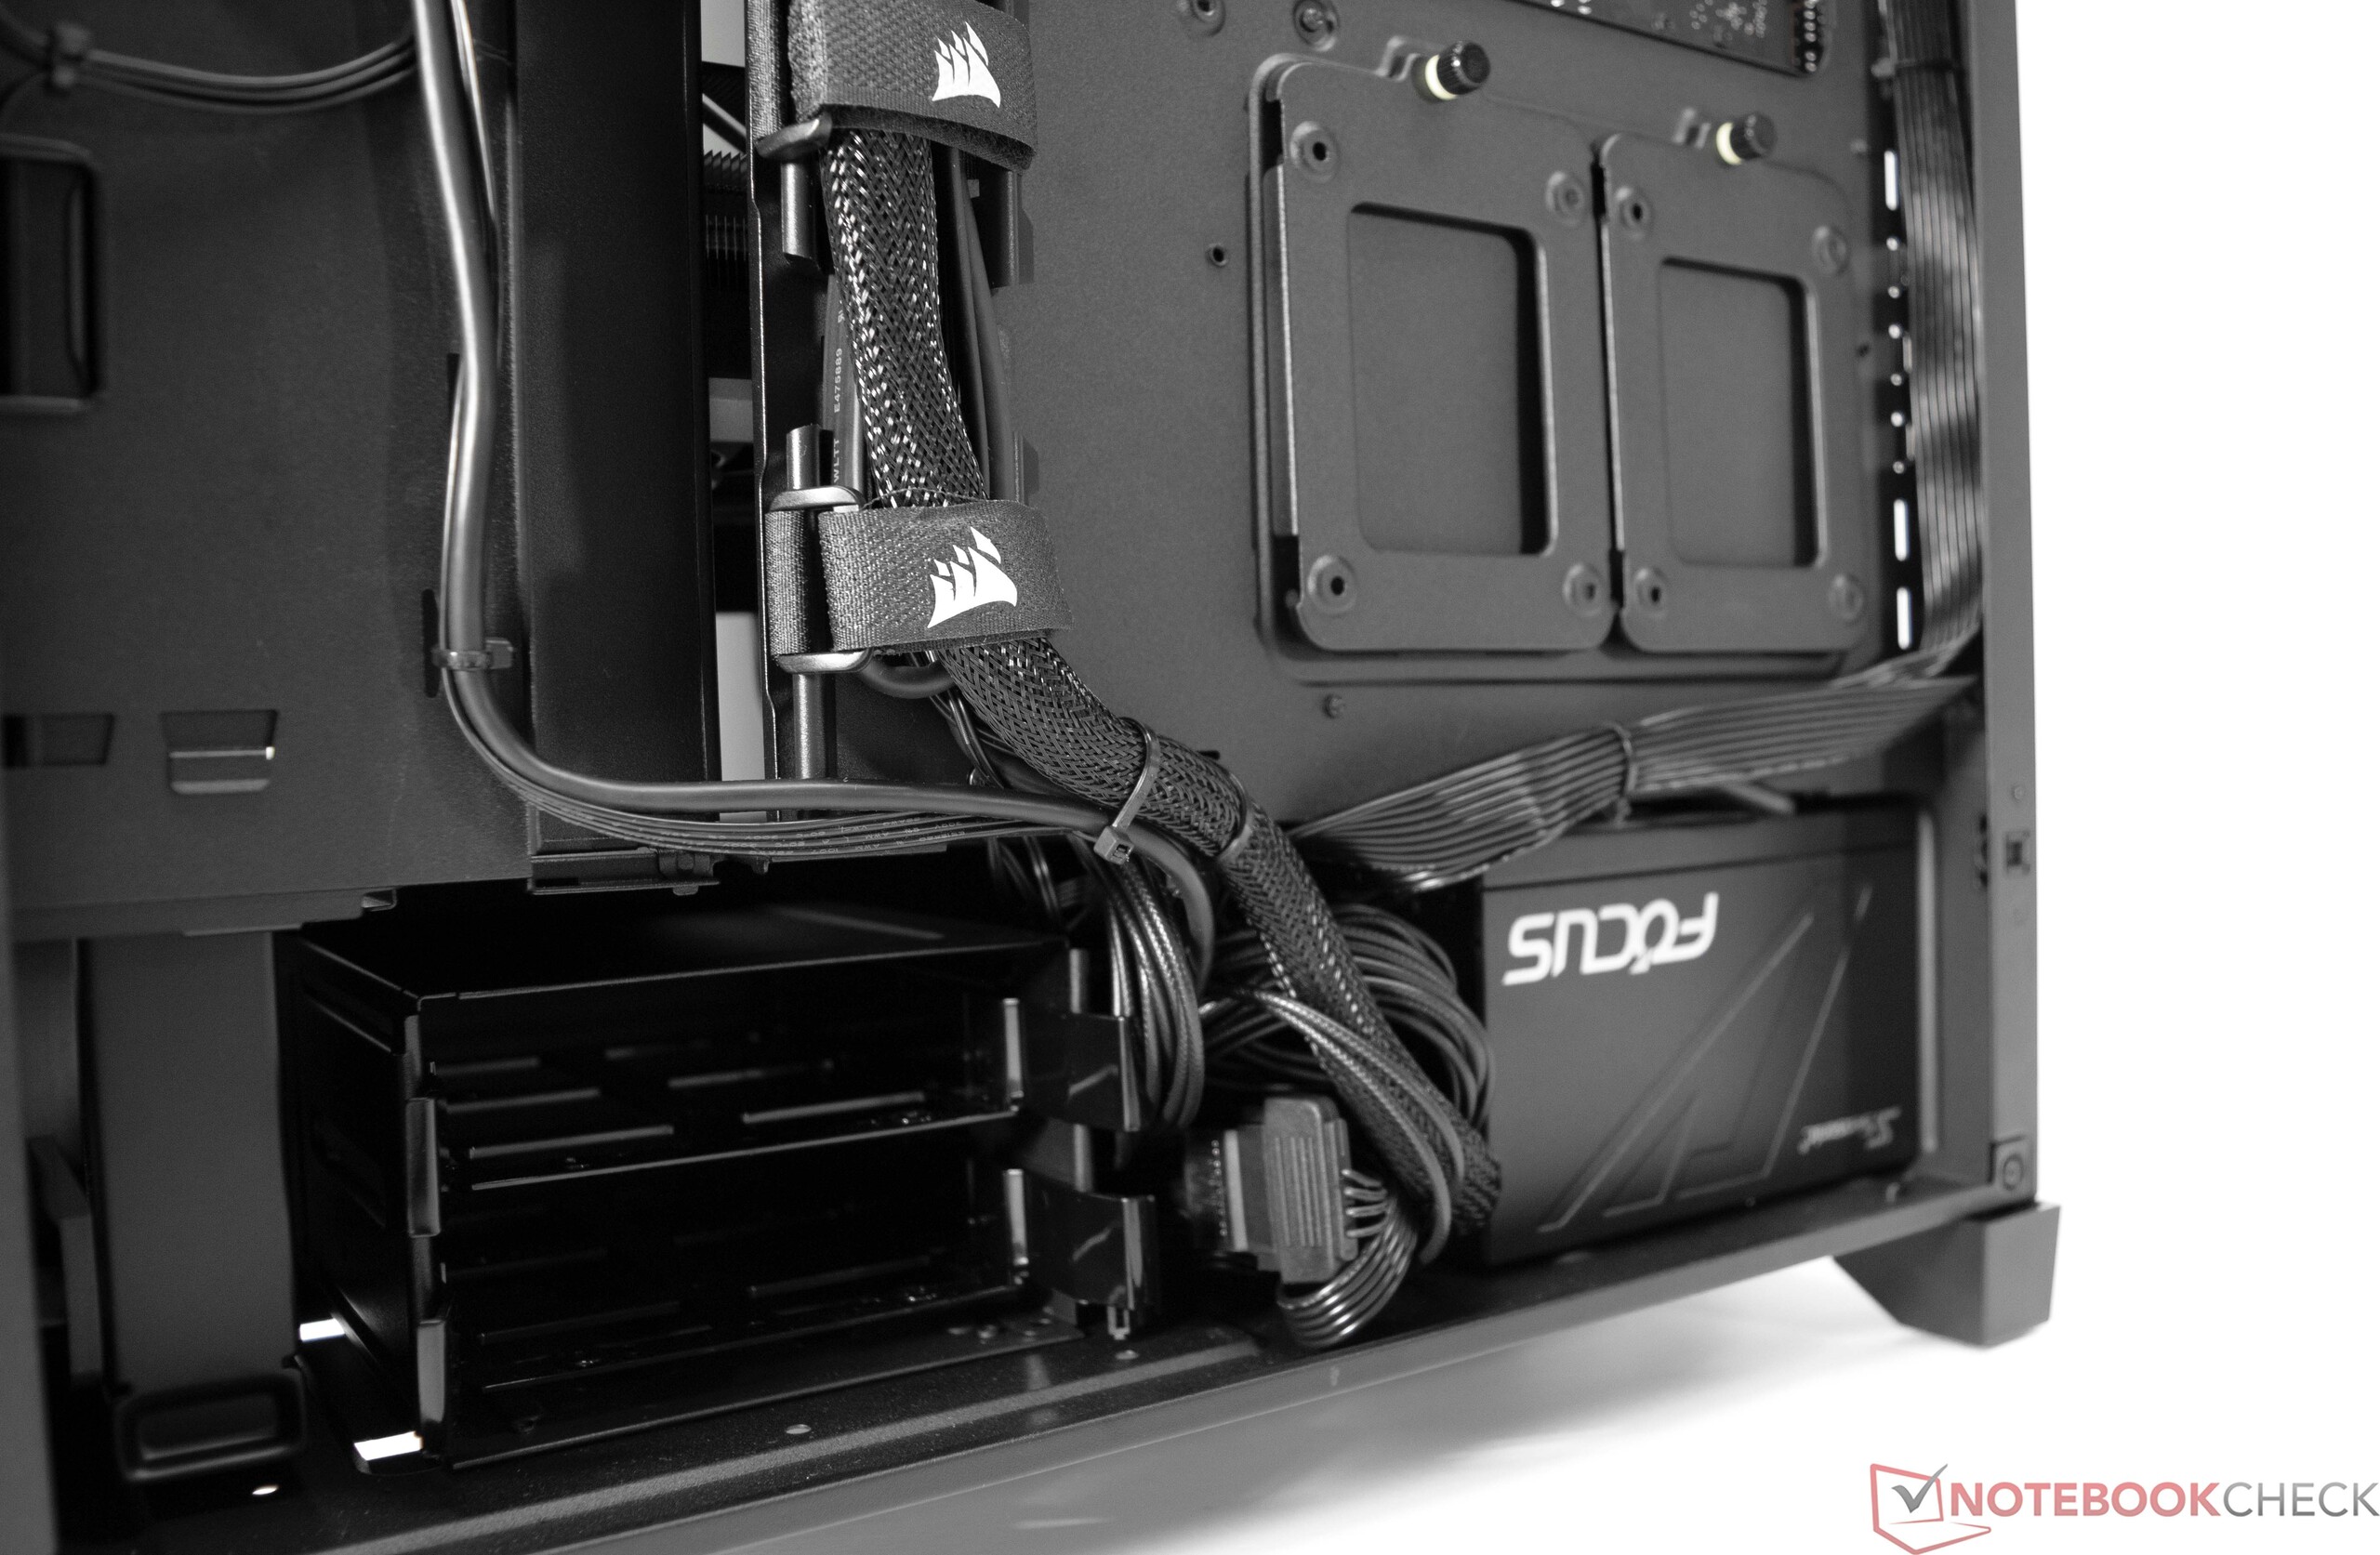
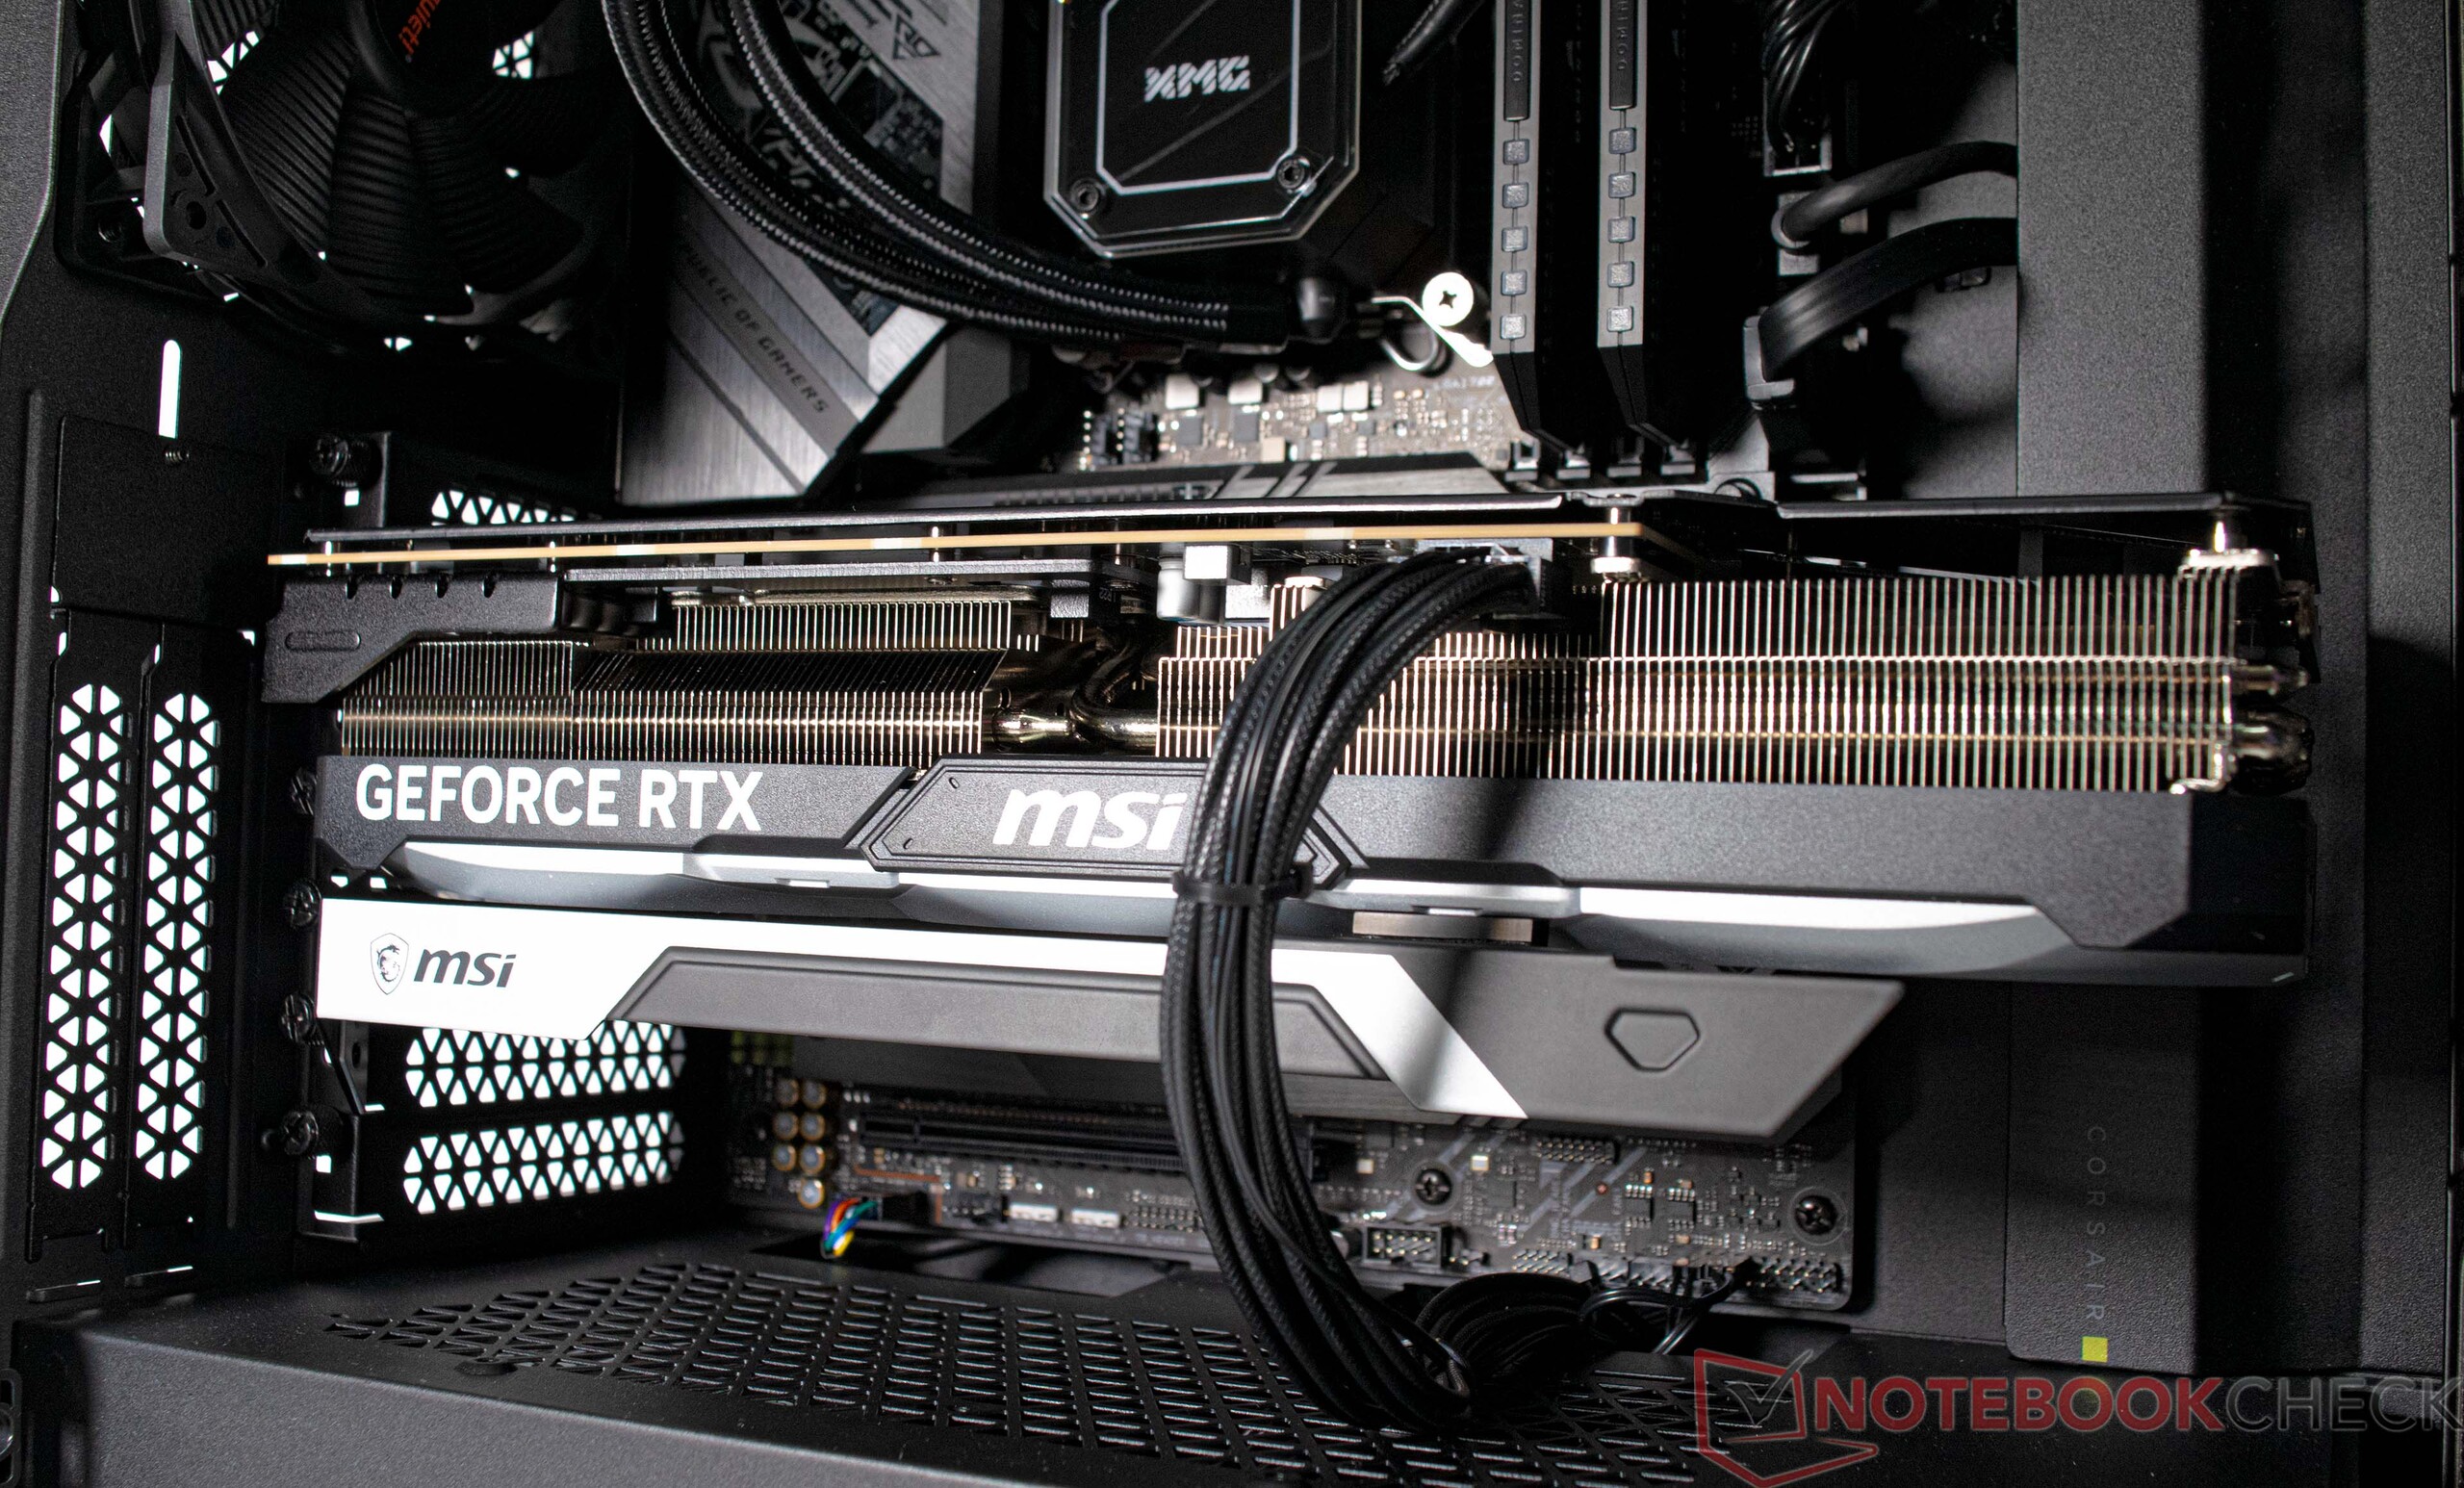
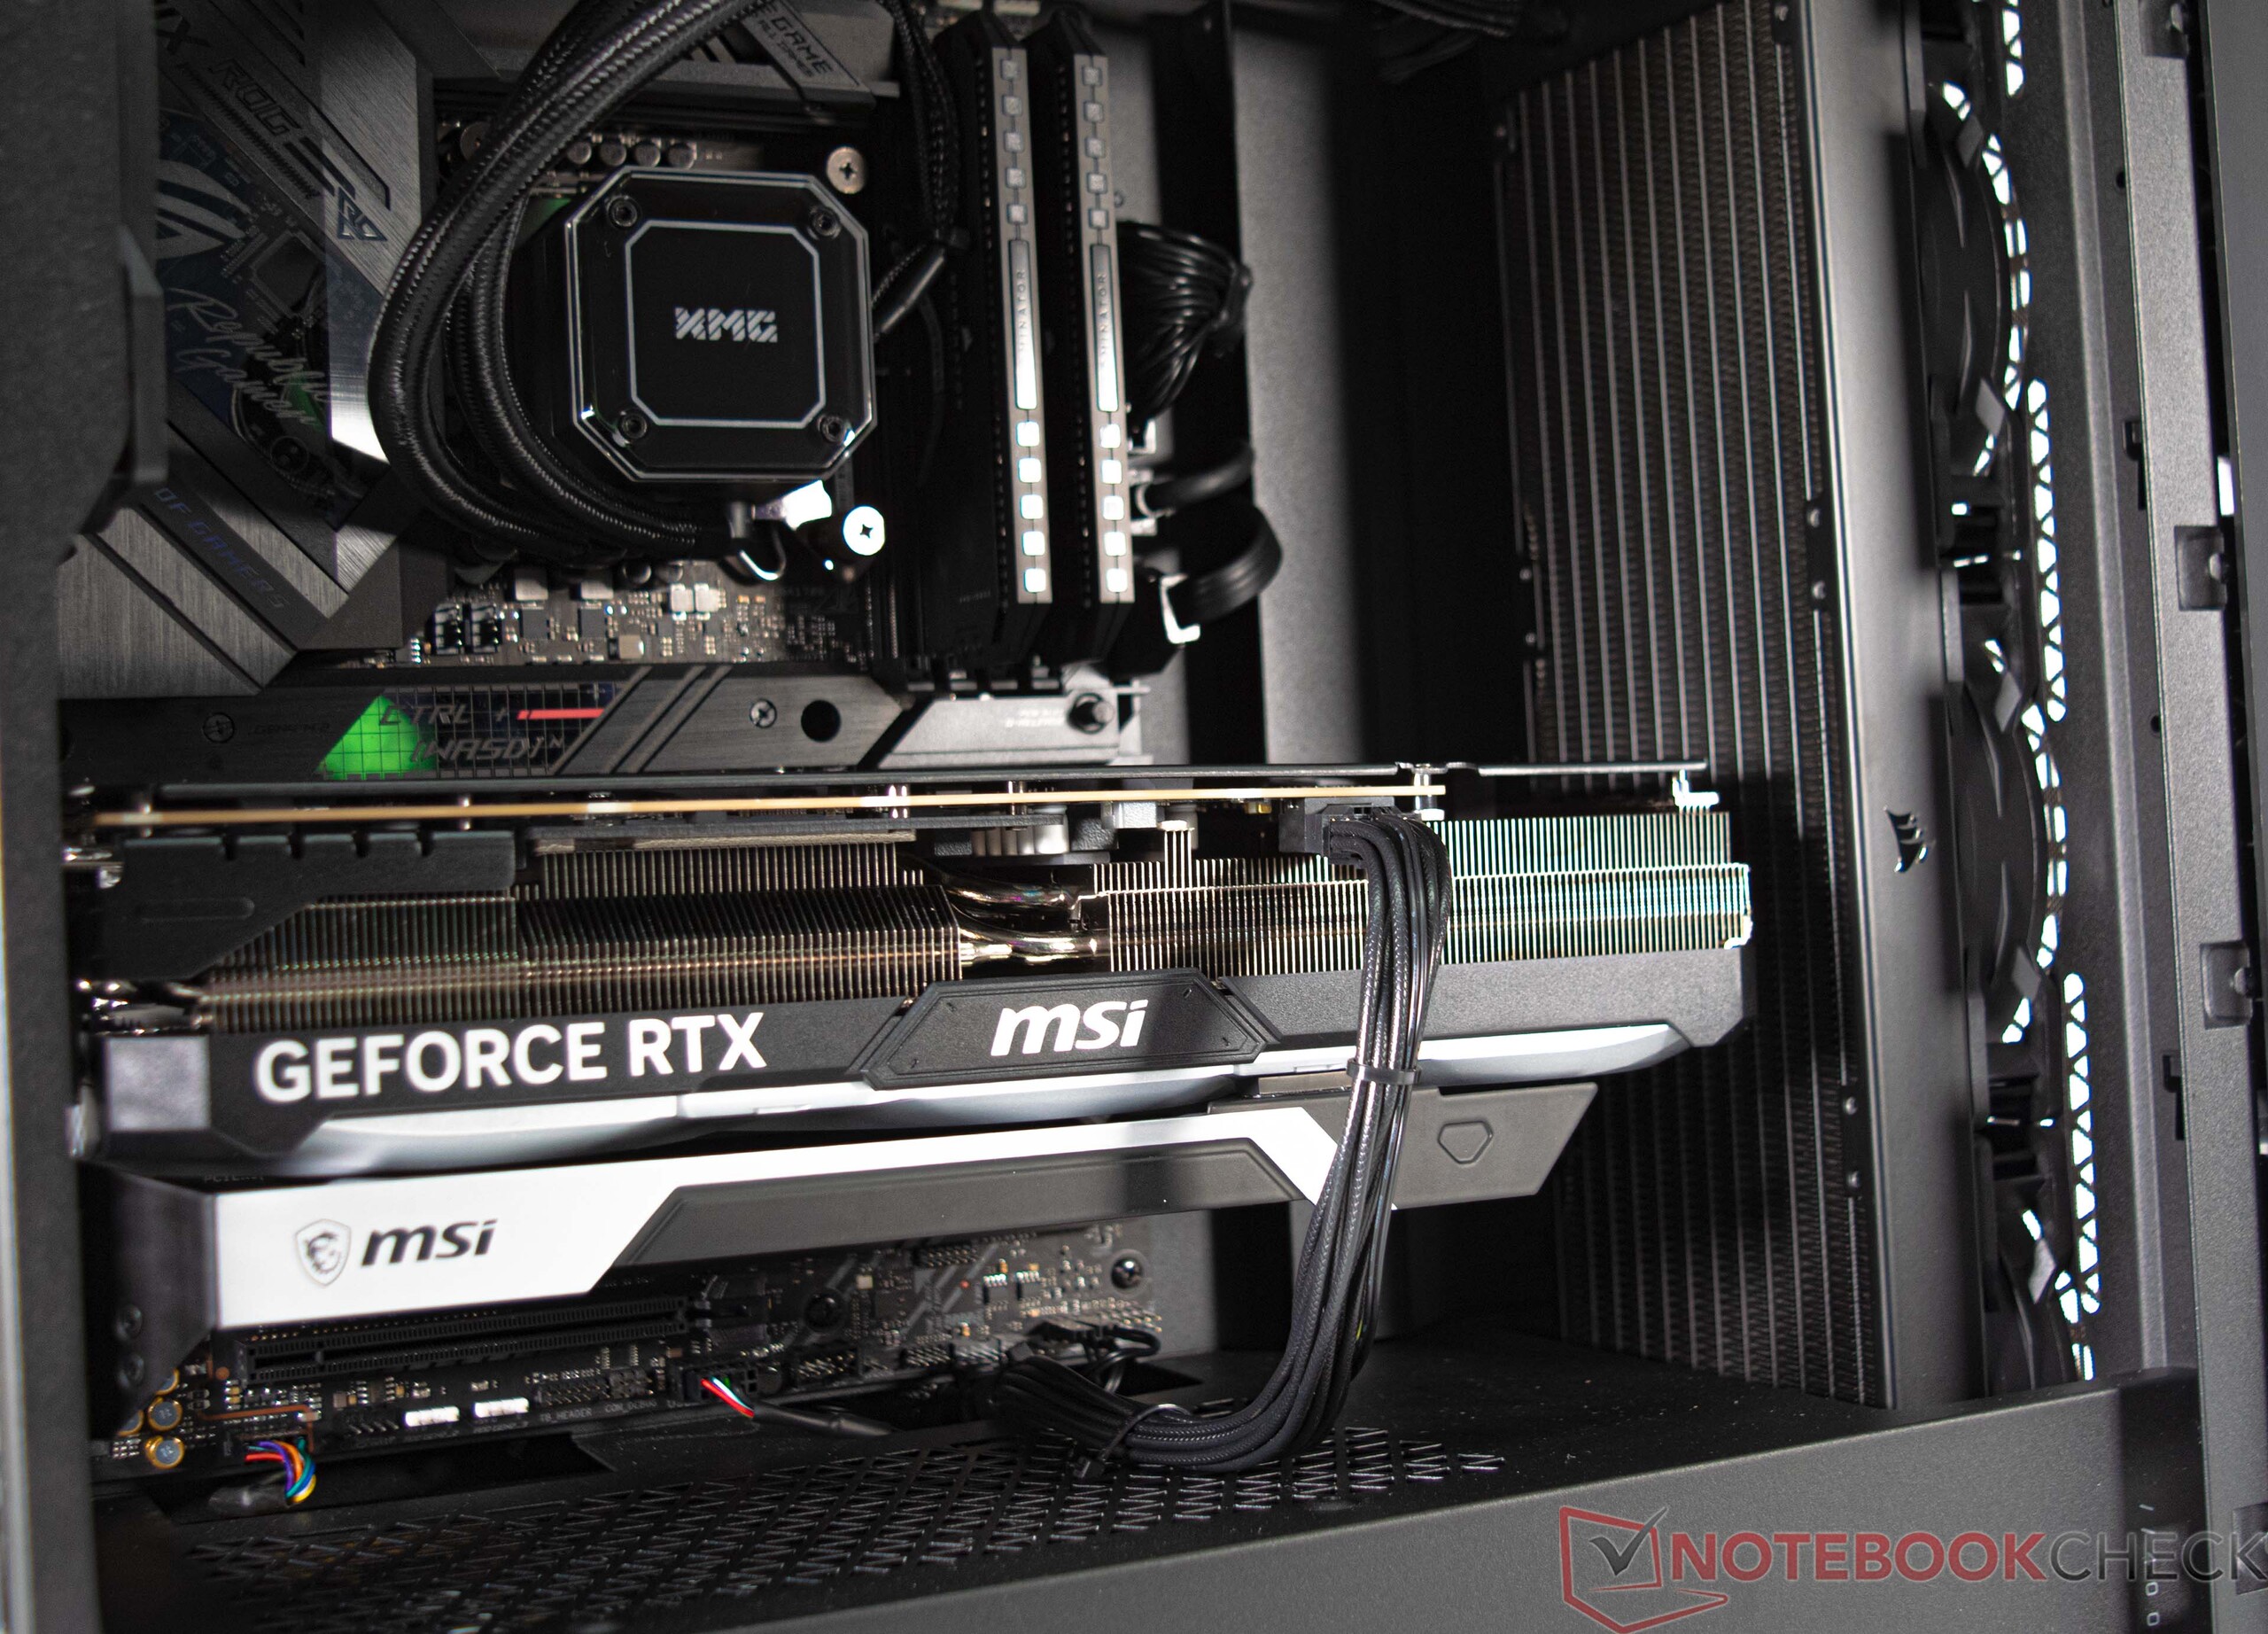
Schenker has installed the hardware of the XMG SECTOR Intel in a black Corsair 4000D Airflow. The case has a dark glass window to showcase the components inside with lighting effects. However, the included AIO cooler and Corsair Dominator RGB memory modules are the only sources of lighting in our review configuration.
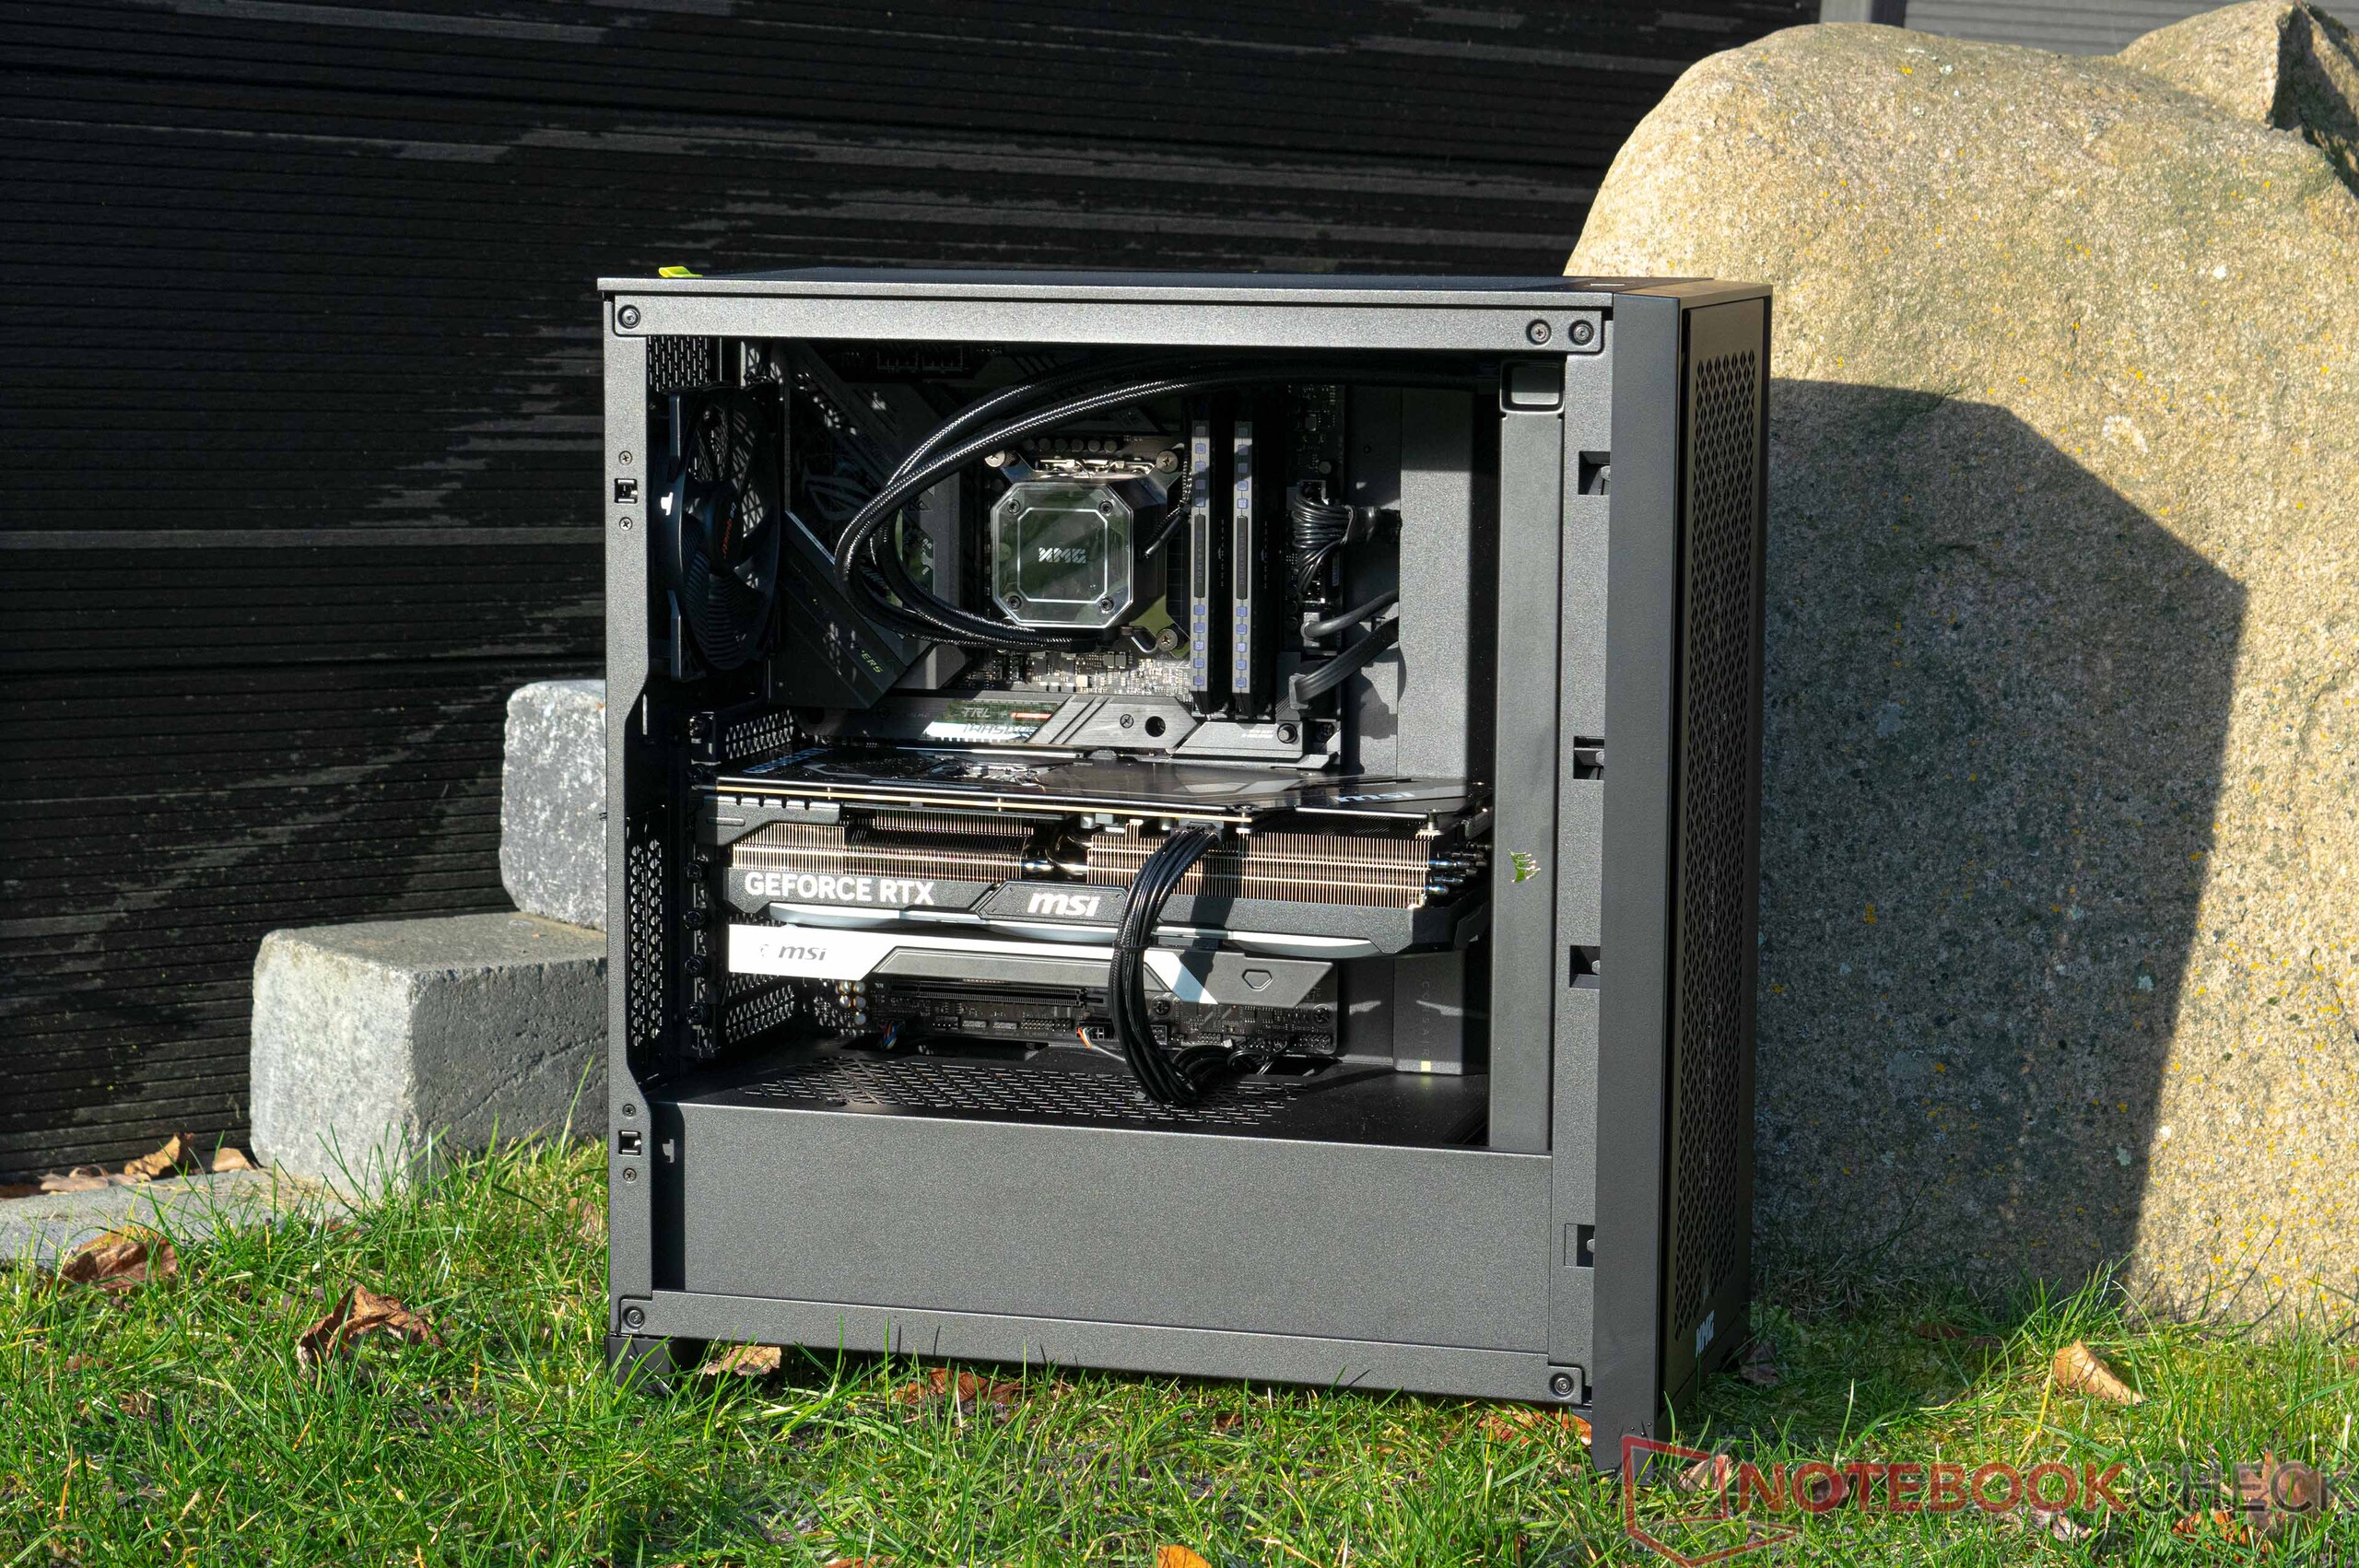
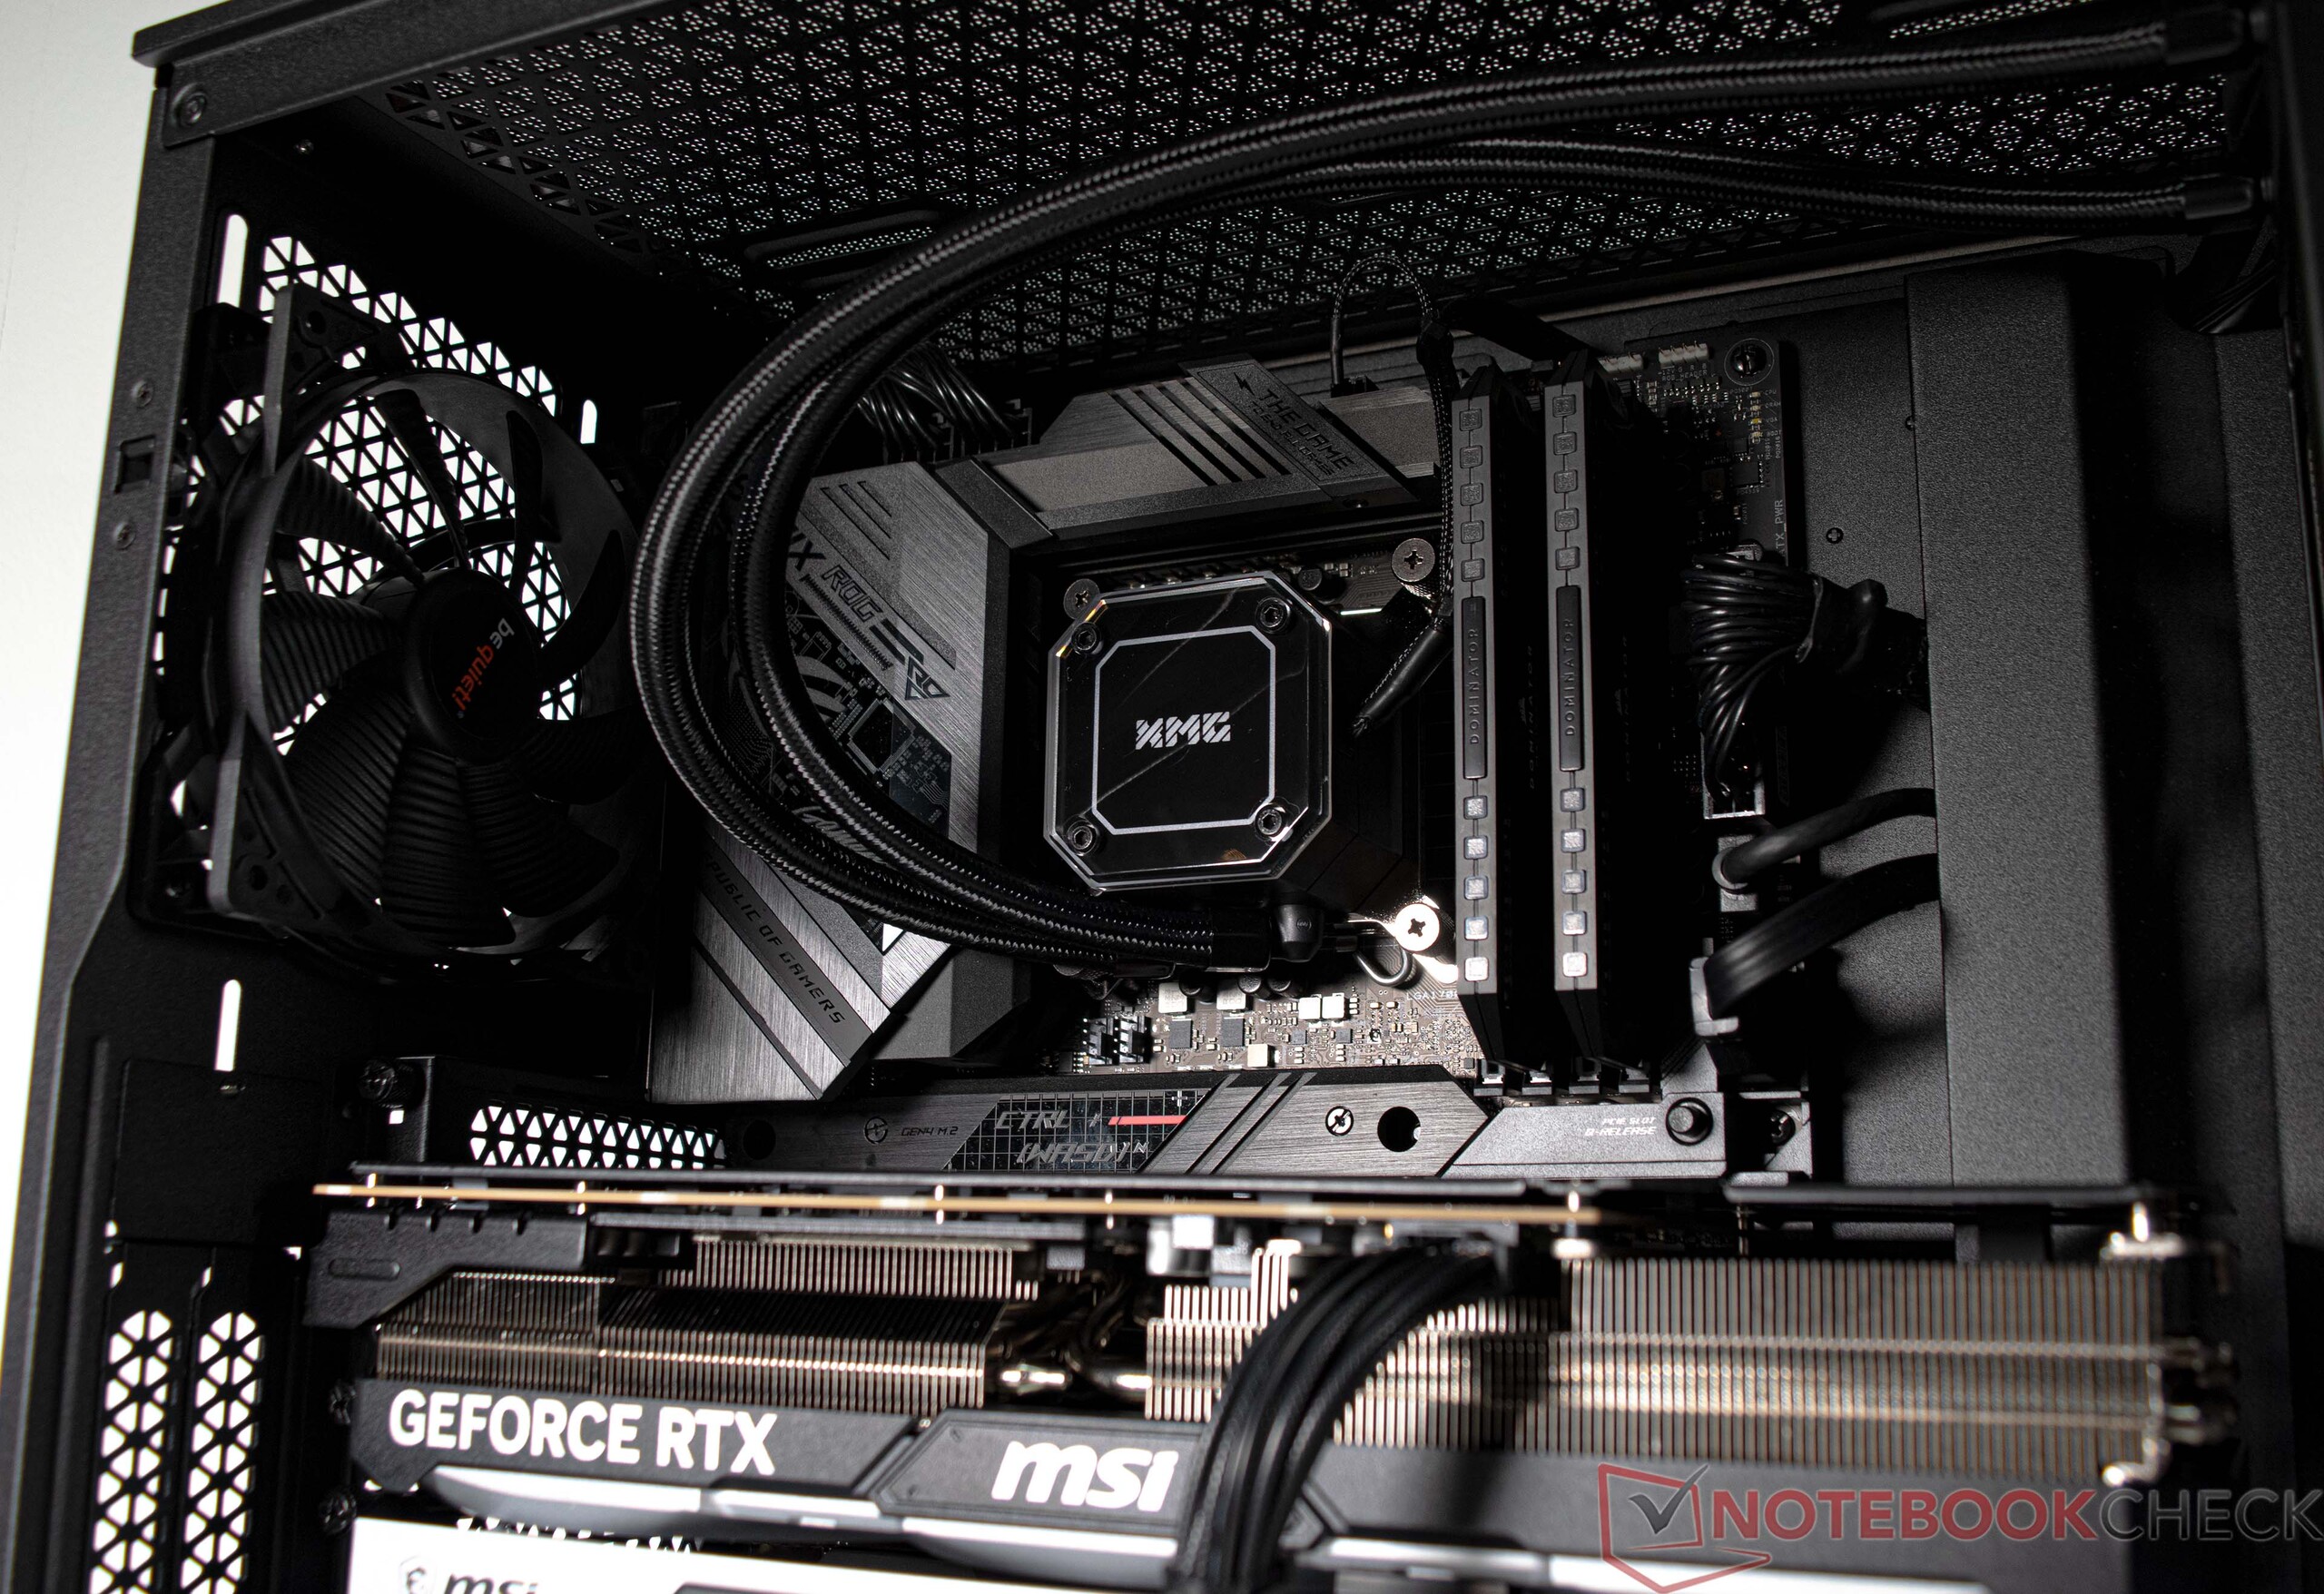
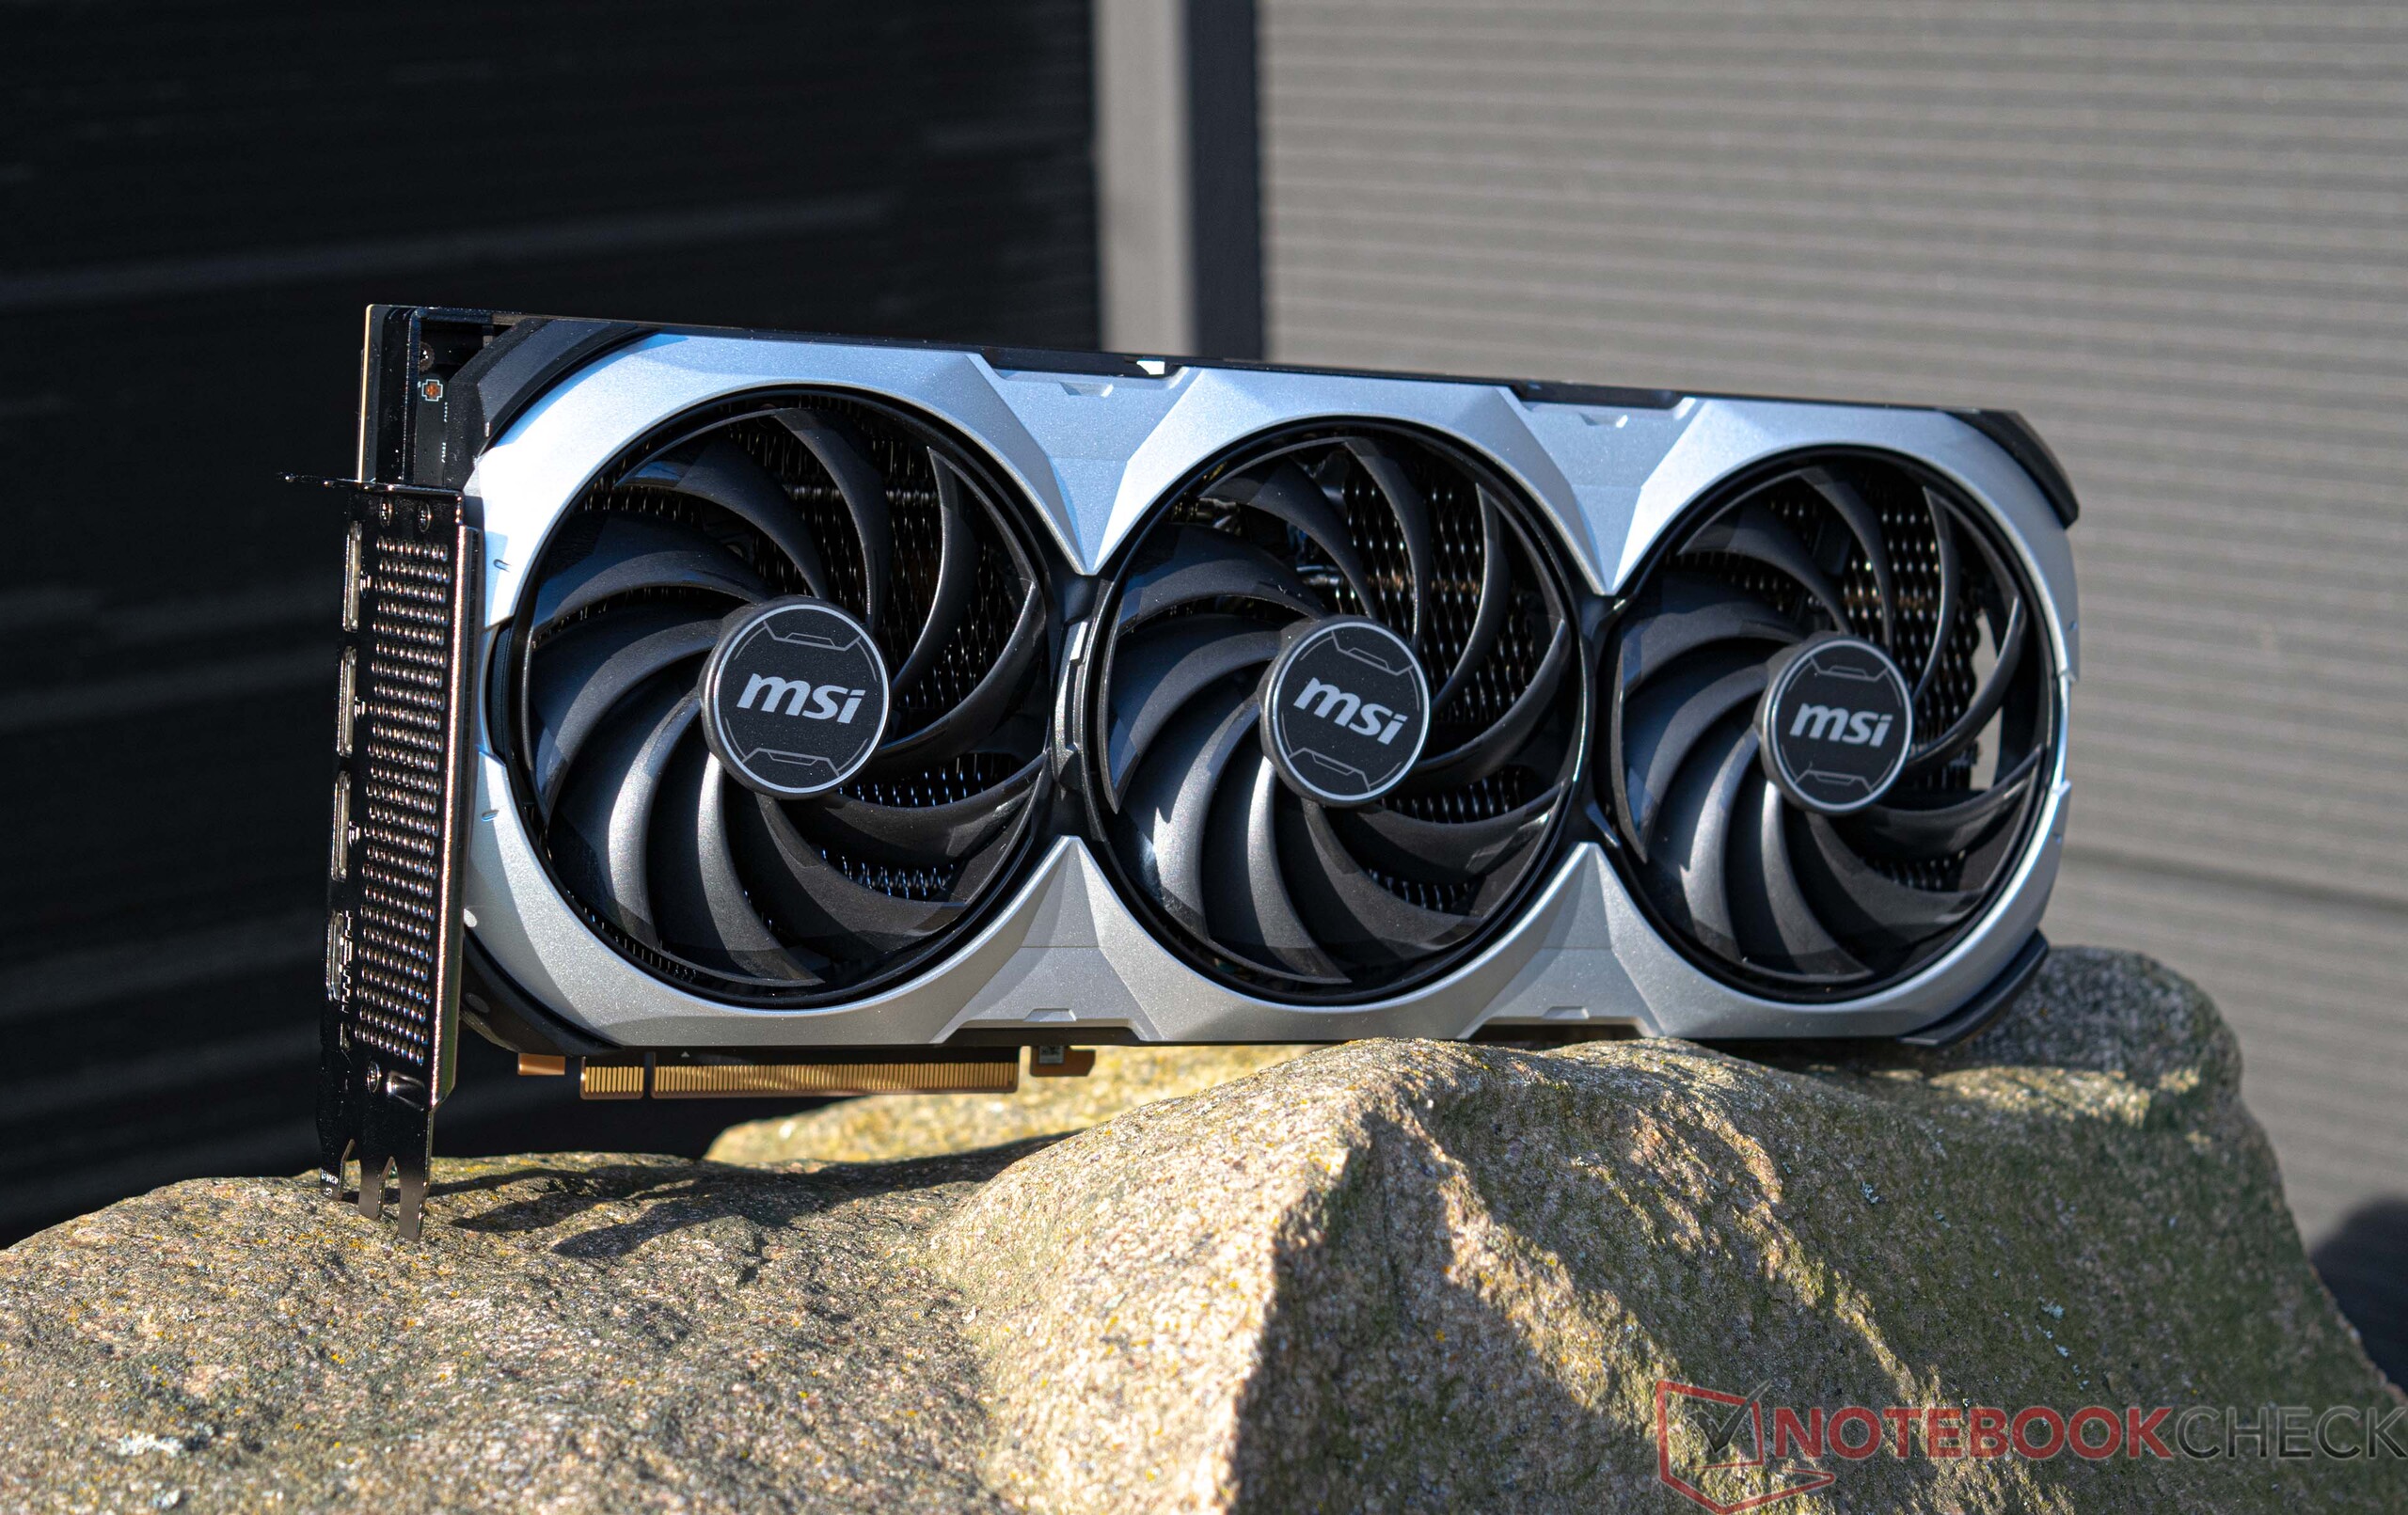
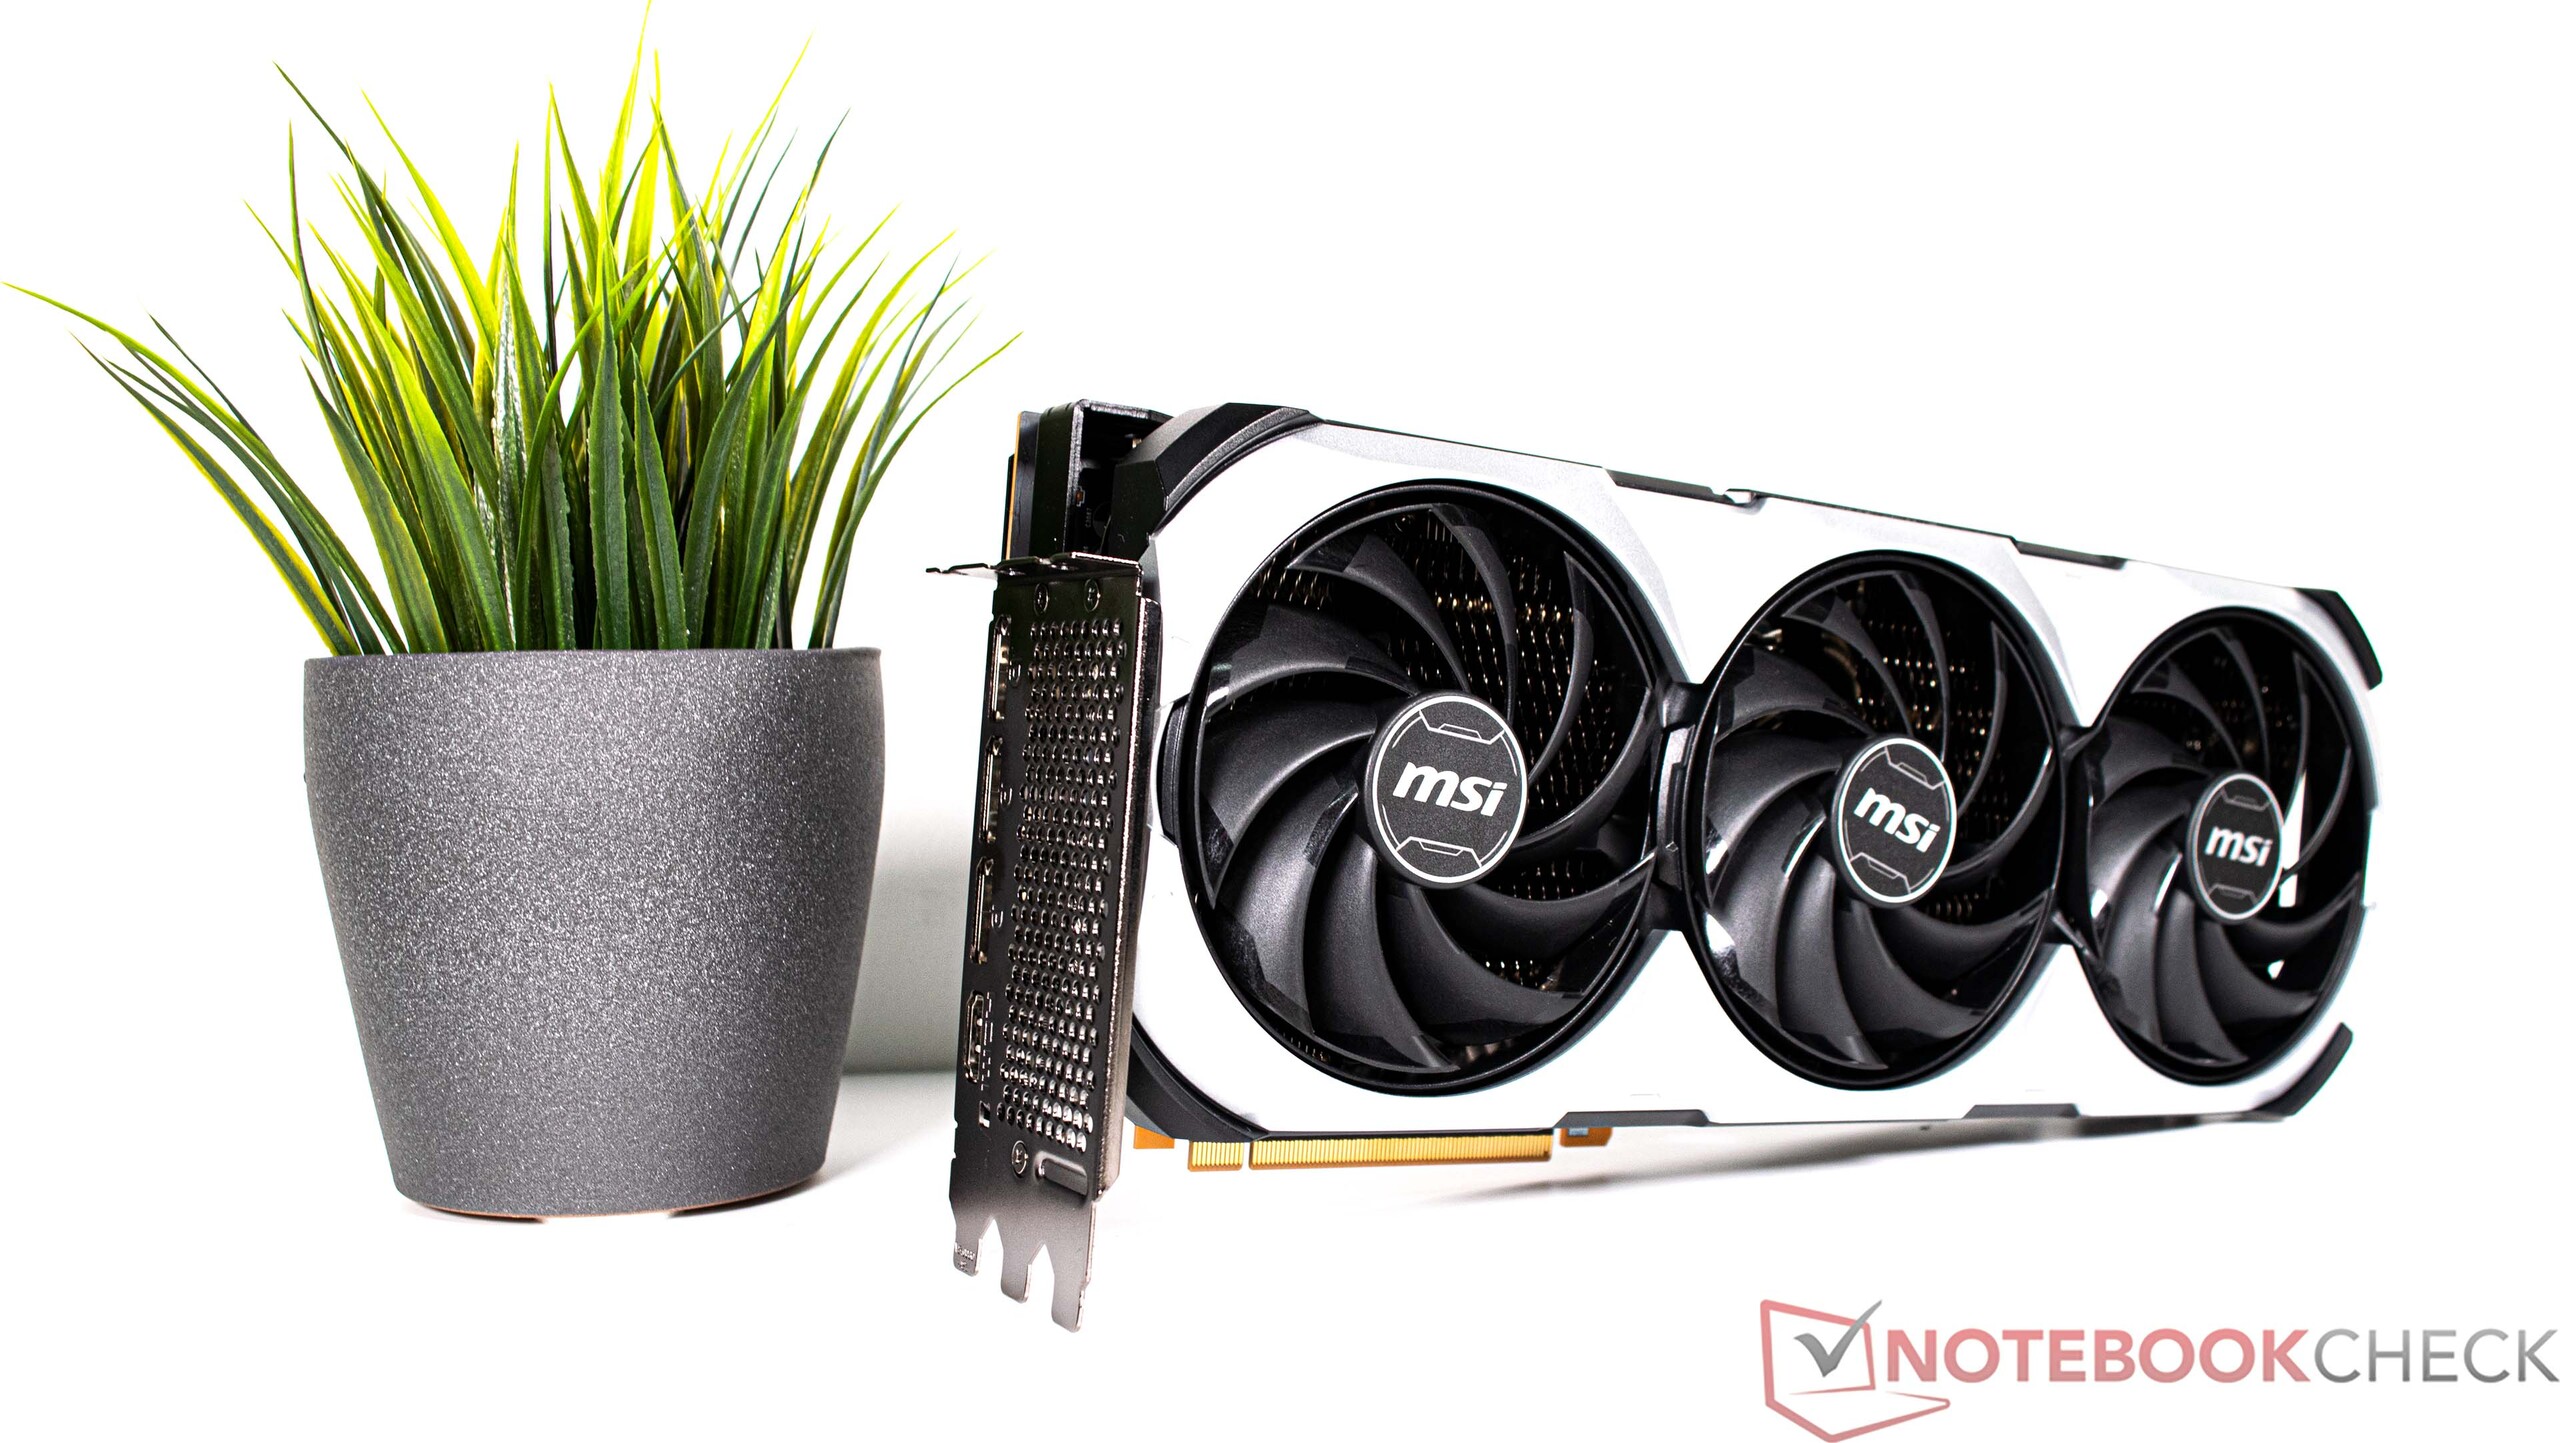
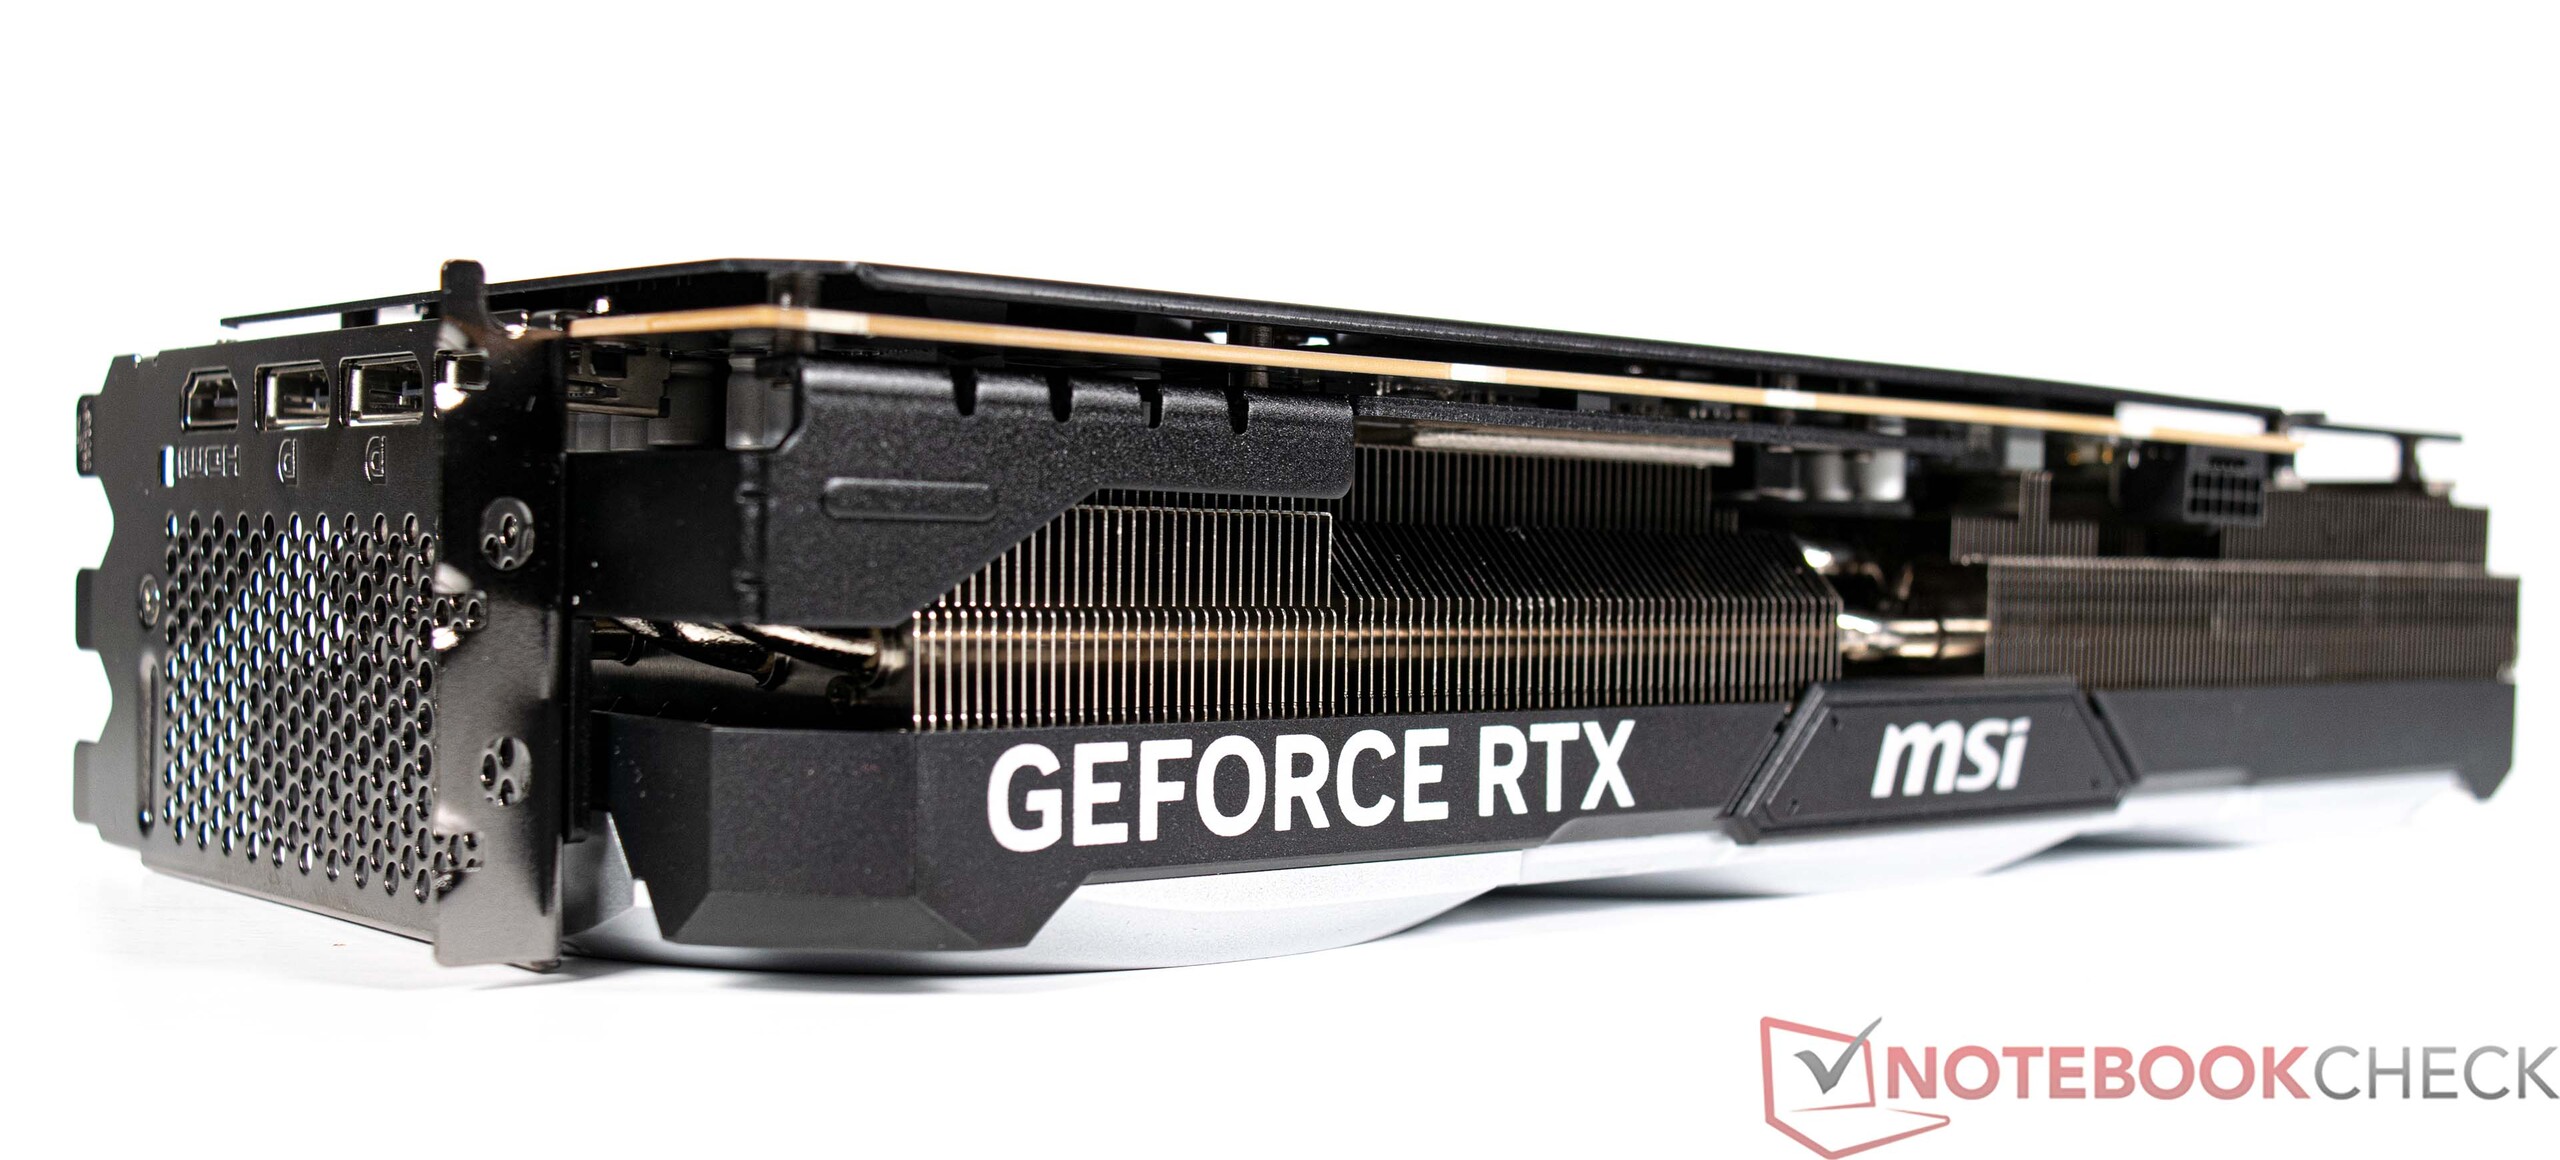
The Corsair 4000D Airflow is fundamentally a very premium case with sufficient space to house numerous components. Even the massive MSI GeForce RTX 4090 VENTUS 3X can fit in the case easily.
Specifications
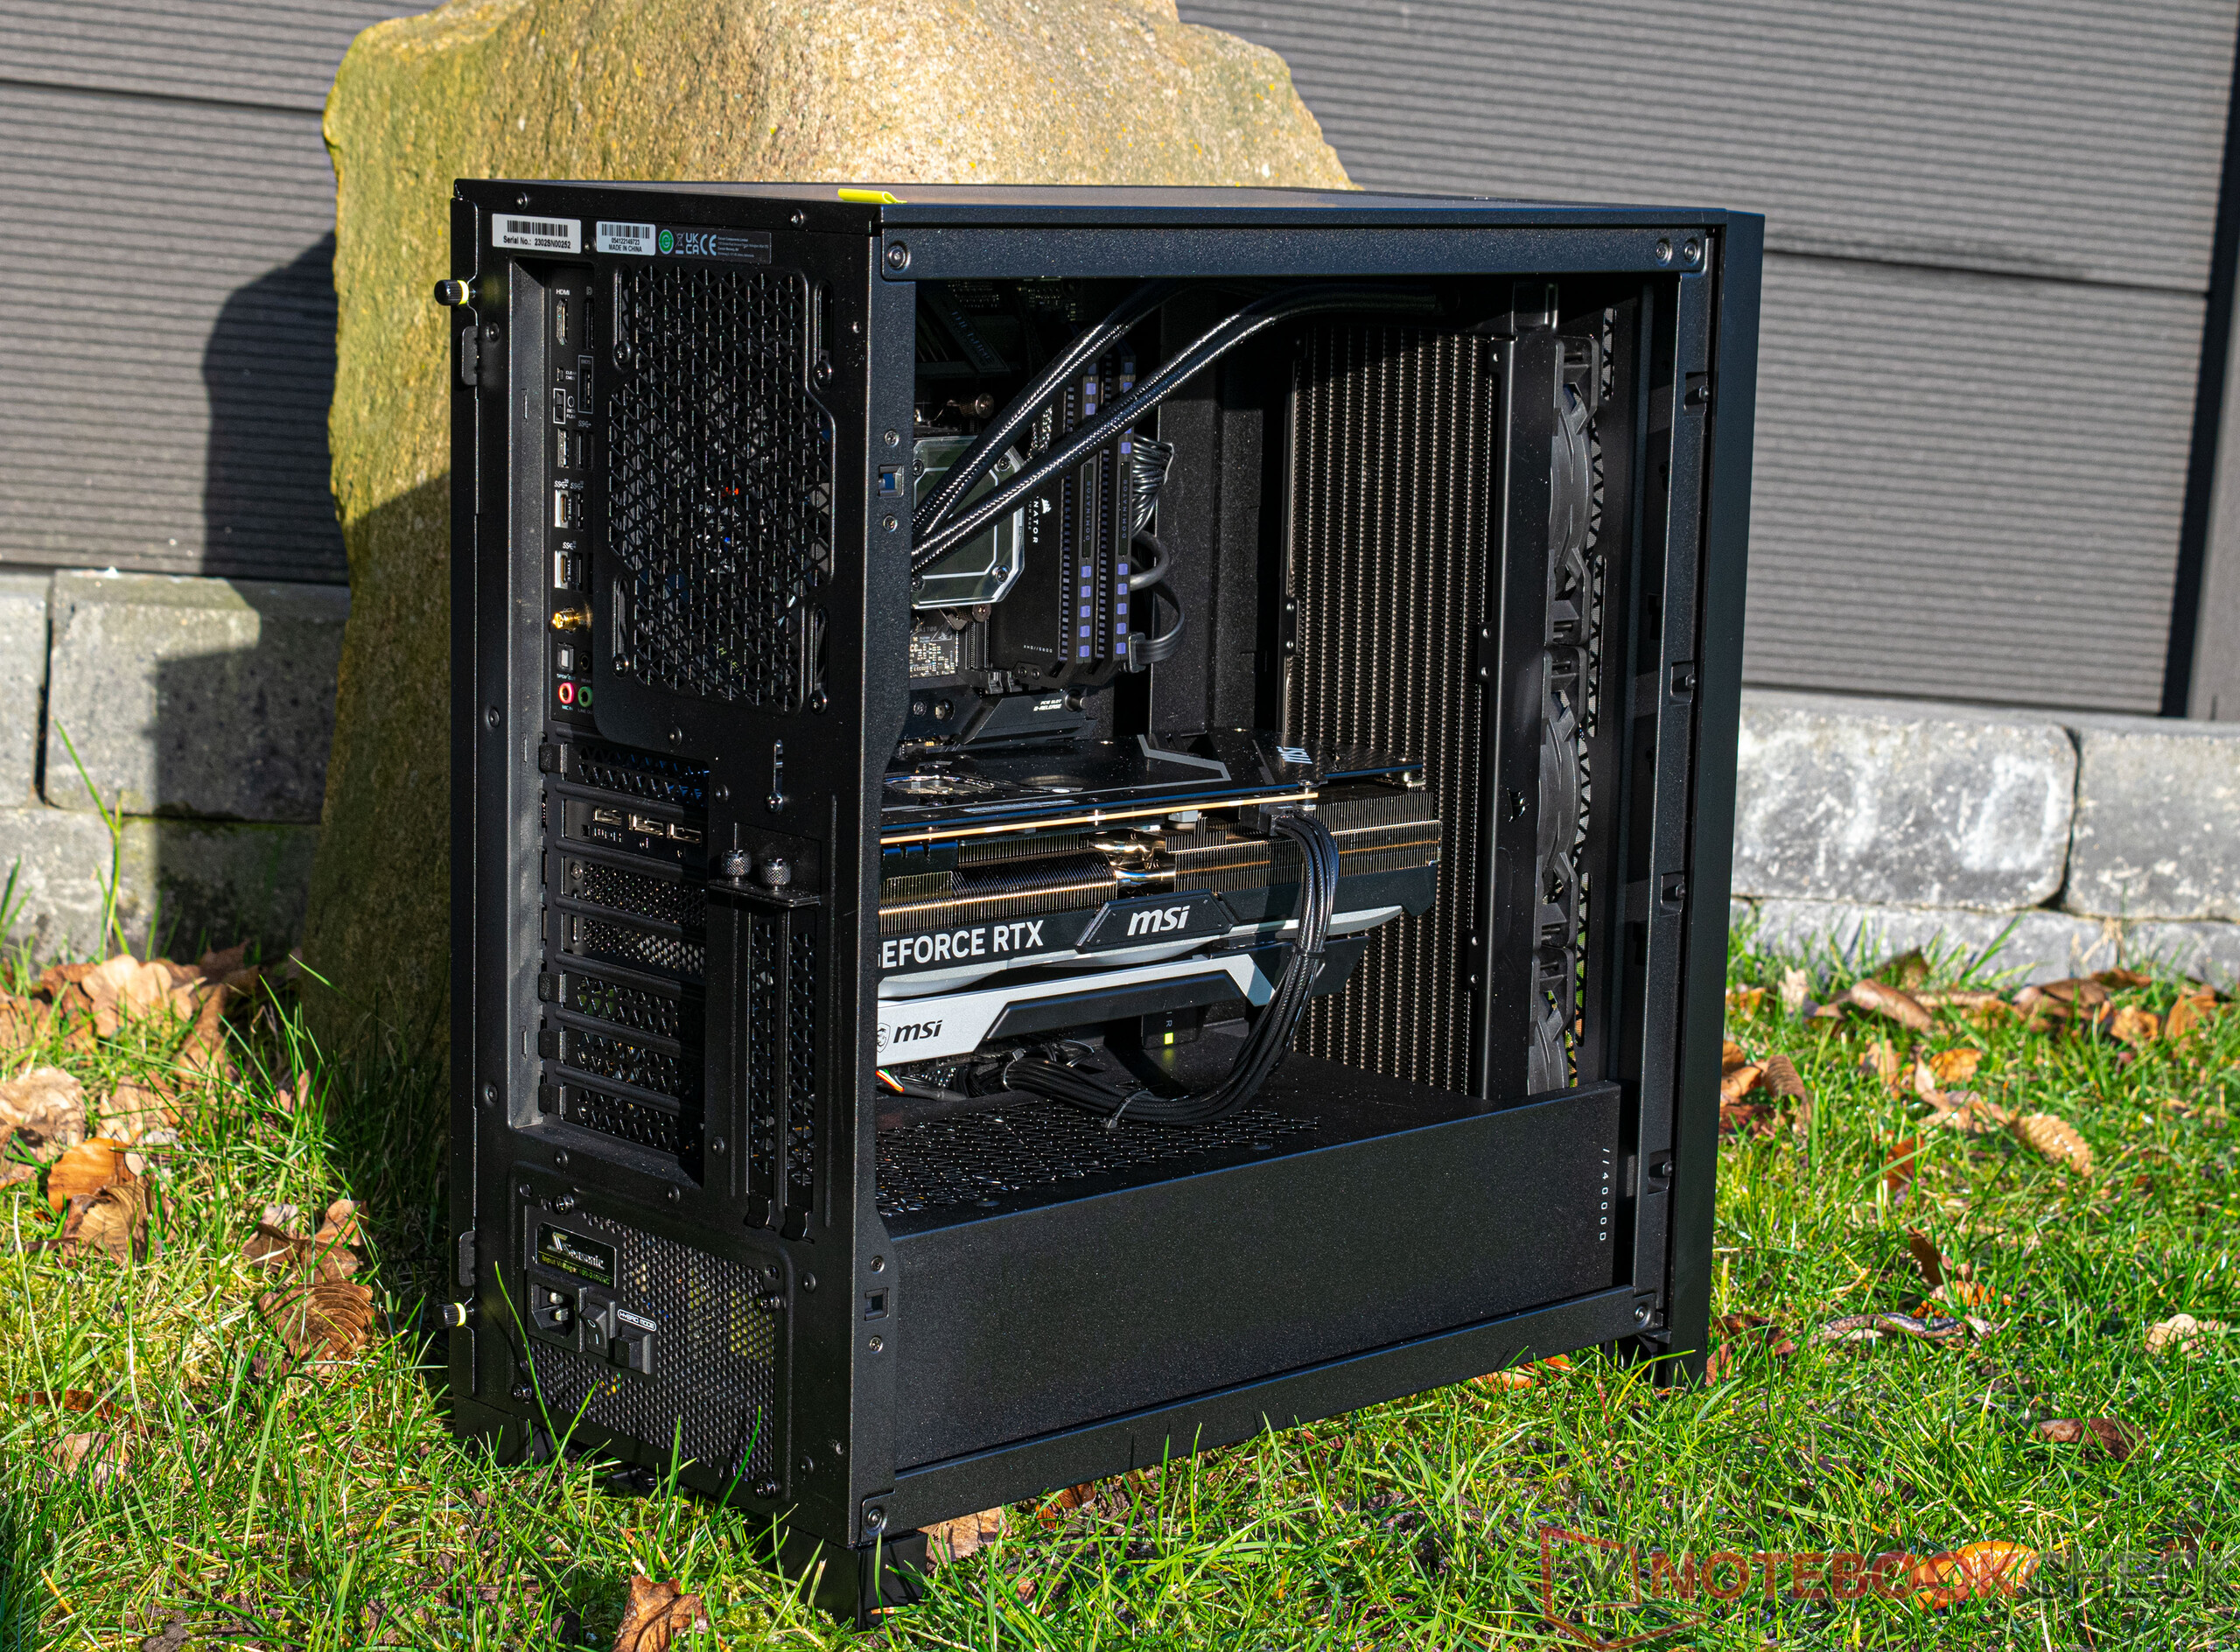
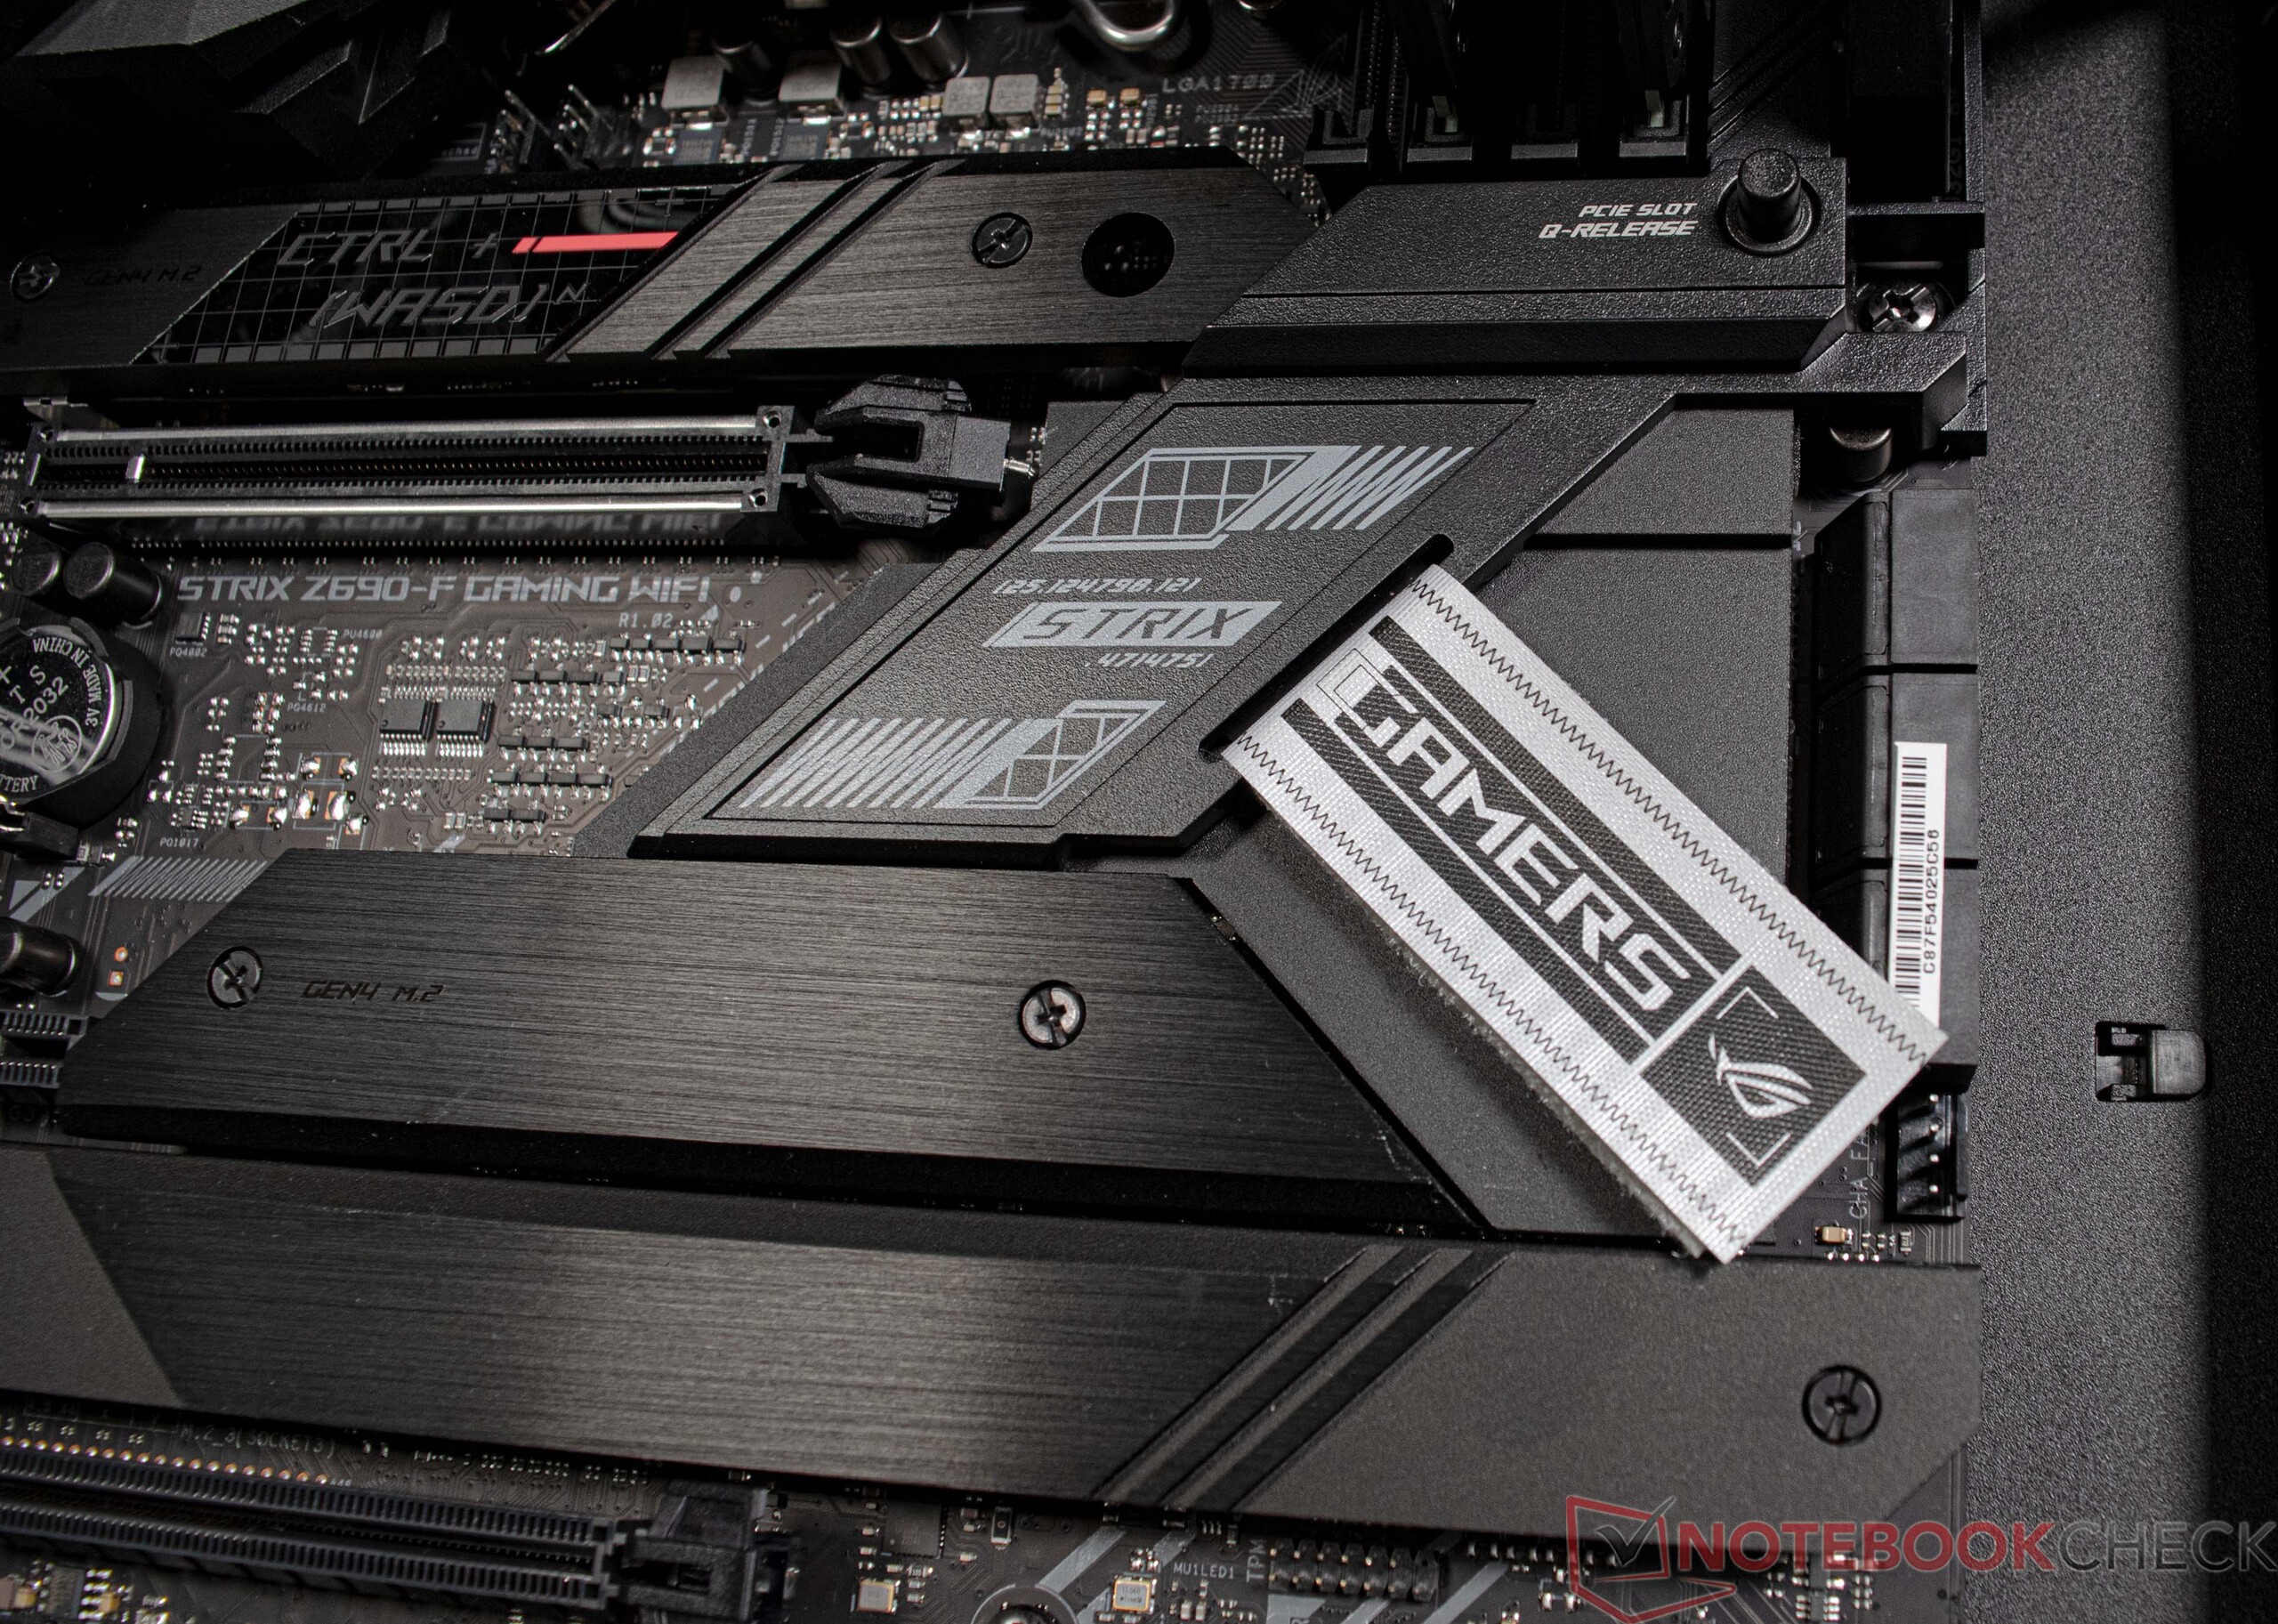
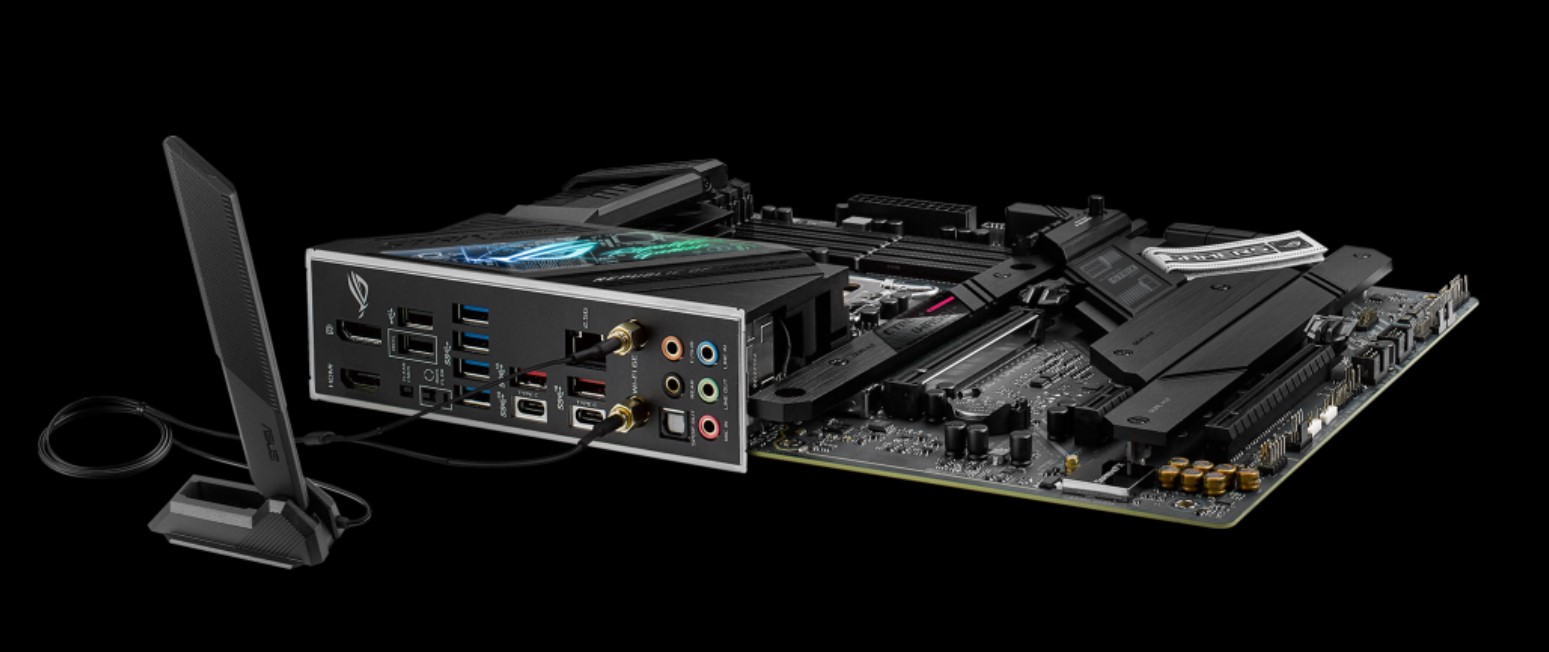
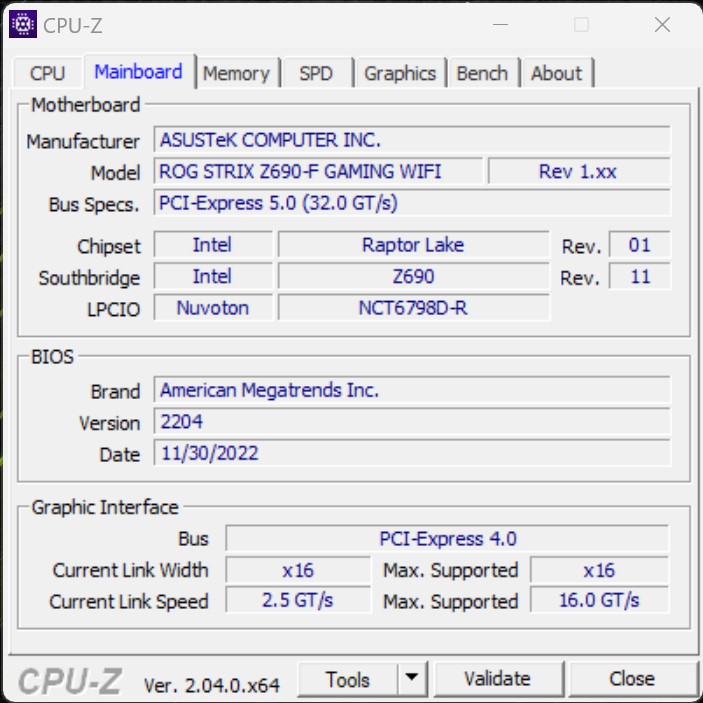
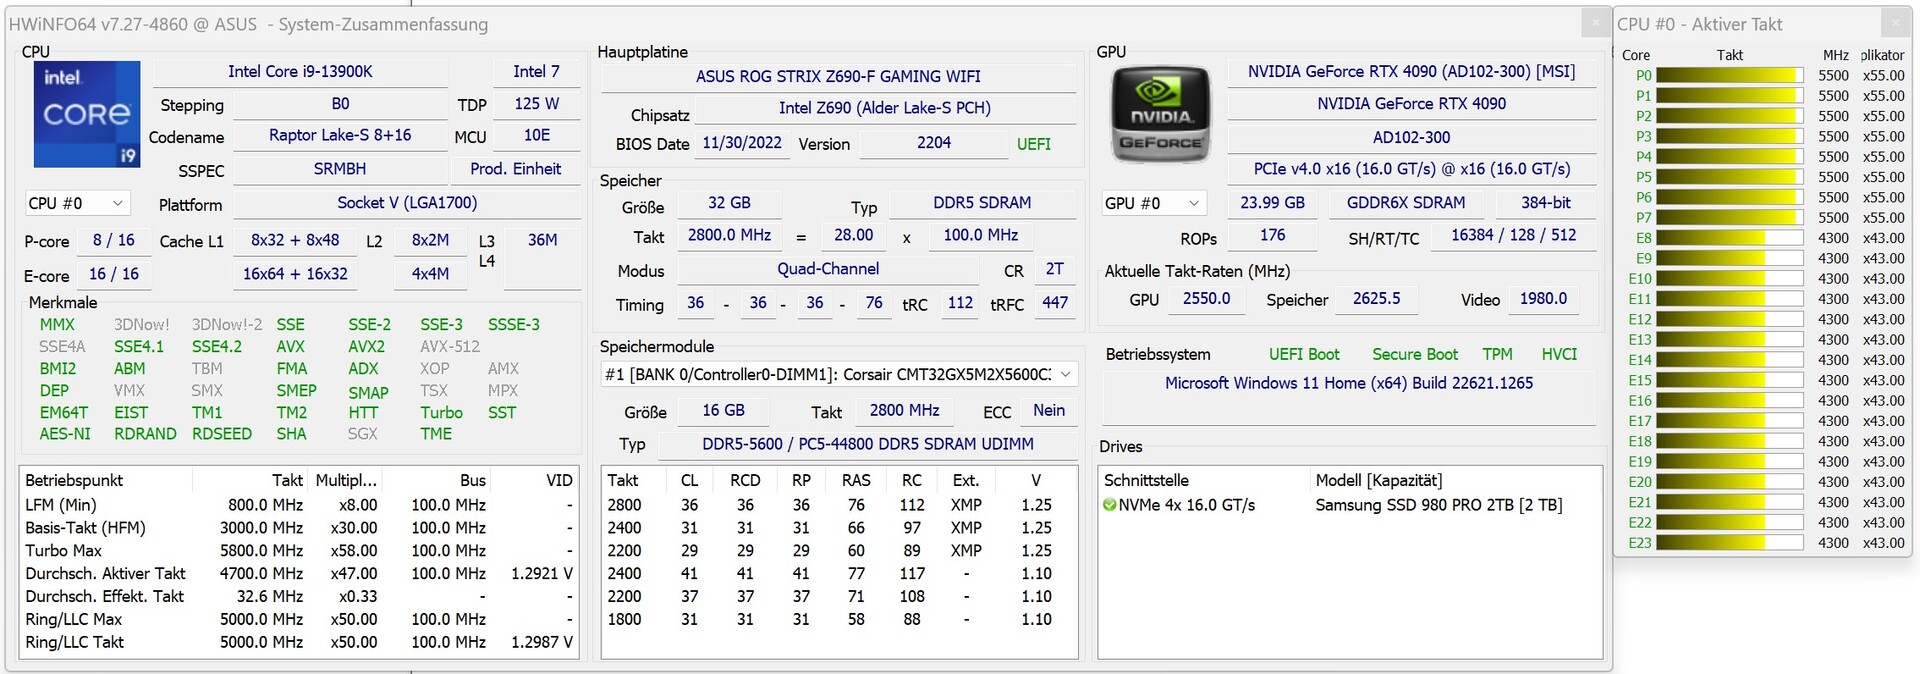
Practically no compromises have been made in terms of I/O ports. For example, the included motherboard (Asus ROG Strix Z690-F Gaming) offers a myriad of USB interfaces and modern ports for networking. Furthermore, it can accommodate up to four M.2 SSDs and 128 GB of DDR5 RAM and comes with 6x SATA 6Gb/s connectors. Users have direct access to one USB-A and one USB-C ports on the front panel of the Corsair 4000D Airflow. The display outputs available depend on the graphics card in the system. Our review unit has three DisplayPorts and one HDMI output. If your system isn't fitted with a non-F CPU, you can use the processor's integrated GPU for video output as an alternative to the dedicated graphics card. There are also various ways to drive displays from the motherboard.
Connectivity
An Intel Wi-Fi 6E AX211 wireless module is installed on the Asus ROG Strix Z690-F Gaming. We weren't fully impressed by the module's performance when testing it with our reference router, the Asus ROG Rapture GT-AXE11000. The recorded transfer rates were below our expectations when the system was connected to the 5G network. After switching to a 6G connection, the transfer rates improved substantially. As an alternative, the motherboard in our review unit also has an RJ45 interface that supports speeds of up to 2.5 Gbit/s.
Accessories
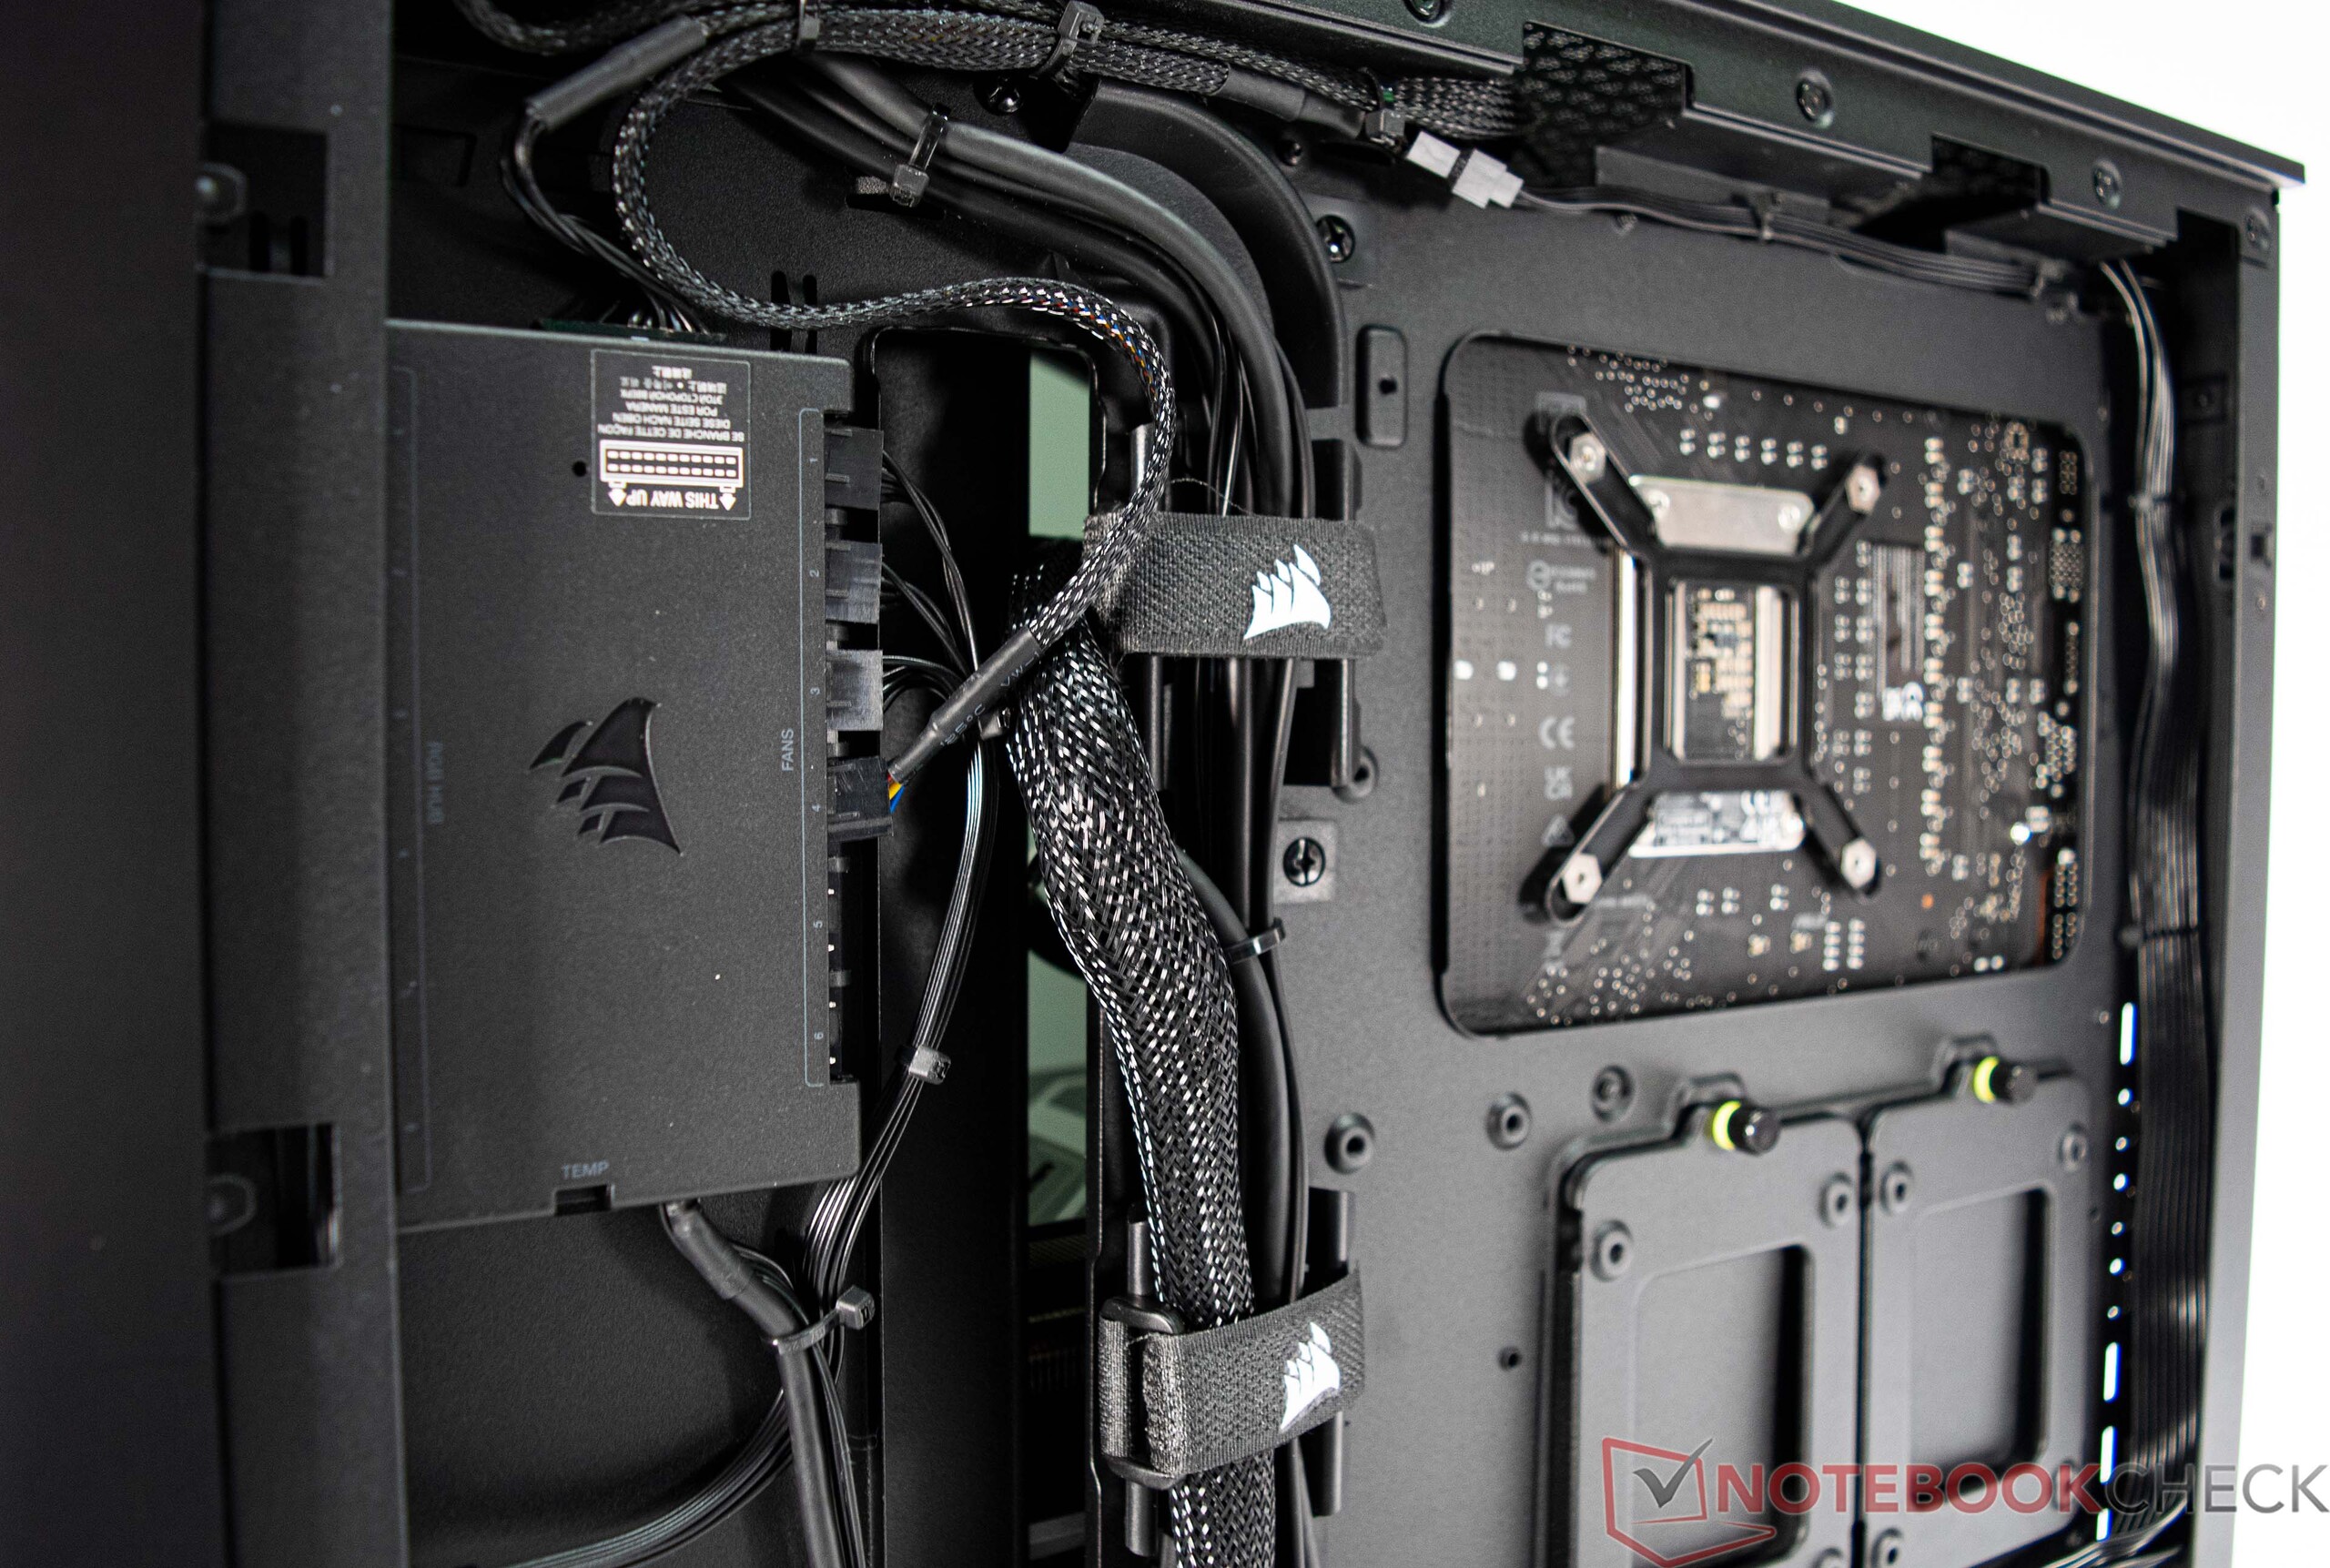
In the box, besides the computer itself, you'll find various motherboard accessories such as cables and Wi-Fi antennas as well as unused cables belonging to the power supply, which is fully modular.
Maintenance
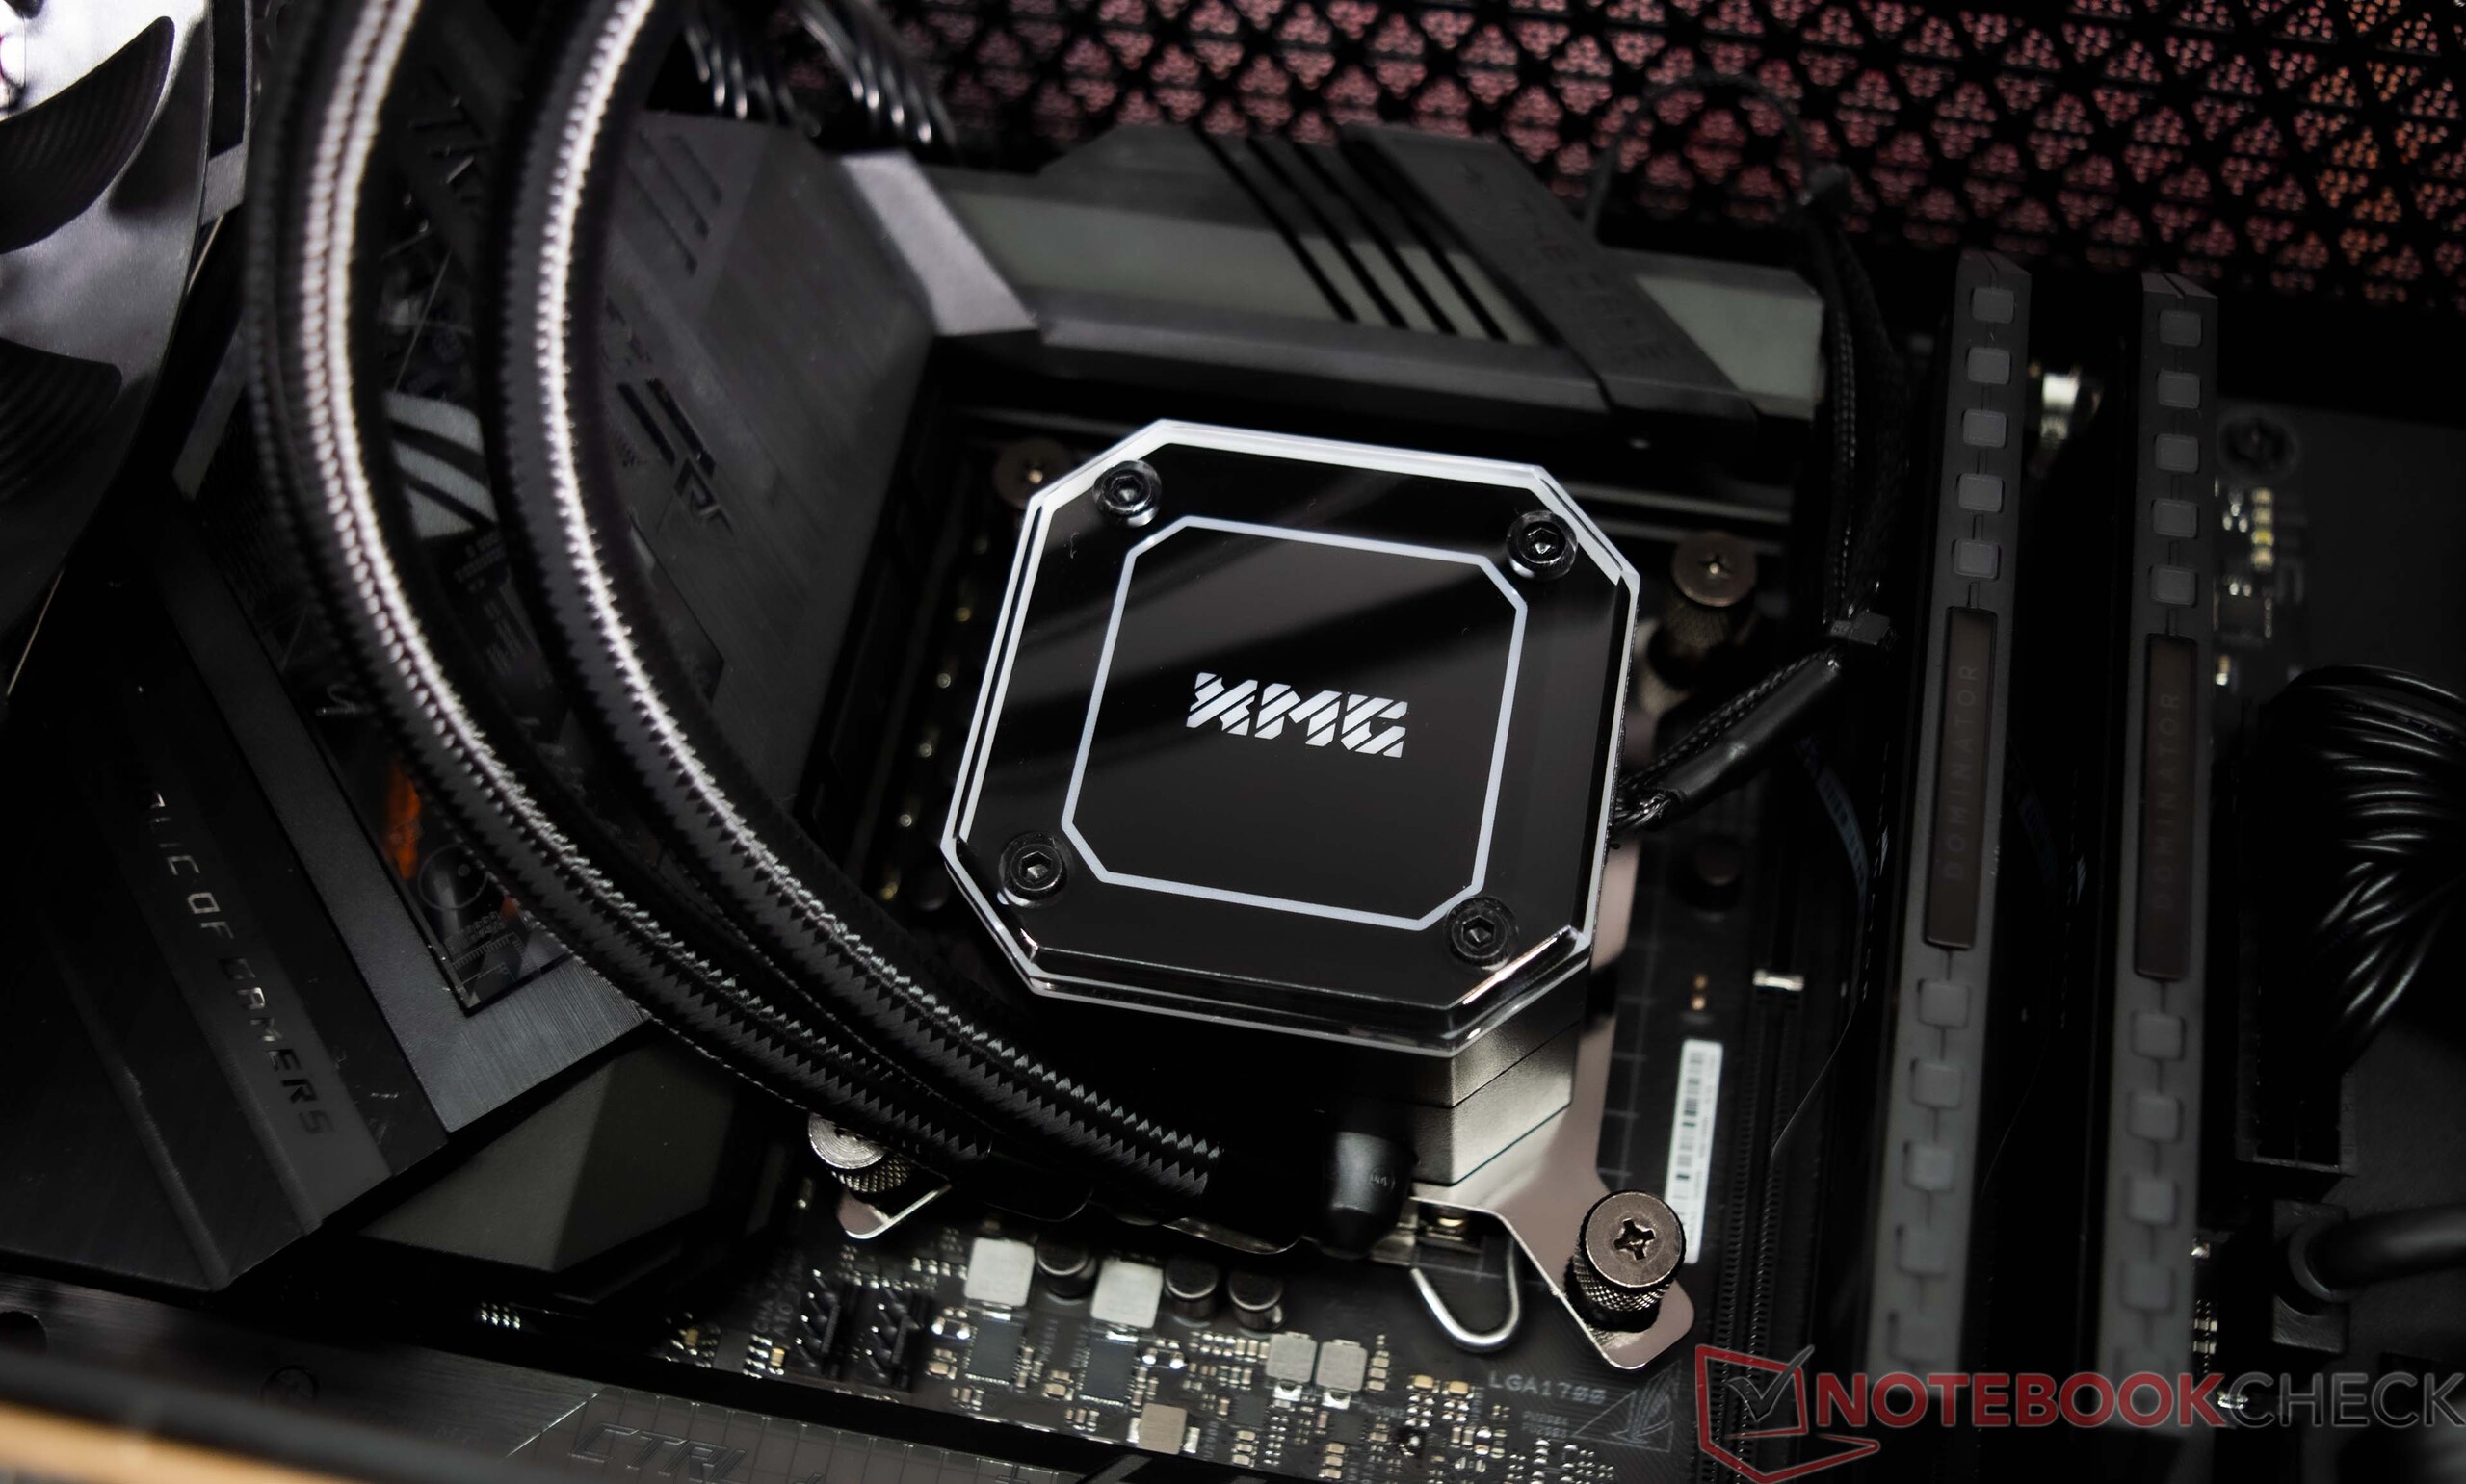
Maintaining the XMG SECTOR Intel is a breeze. The side panels on the Corsair 4000D Airflow can be easily removed, allowing you to clean off any dust on the fans quickly and conveniently. The included Corsair iCUE H150i Elite Capellix is a high-performance AIO cooling solution that doesn't require a great deal of maintenance.
Warranty
Schenker provides a 36-month base warranty with pickup & return service on every XMG SECTOR Intel. There is, however, no option to extend the warranty period during the ordering process.
Performance - second-fastest Intel CPU meets fastest GPU
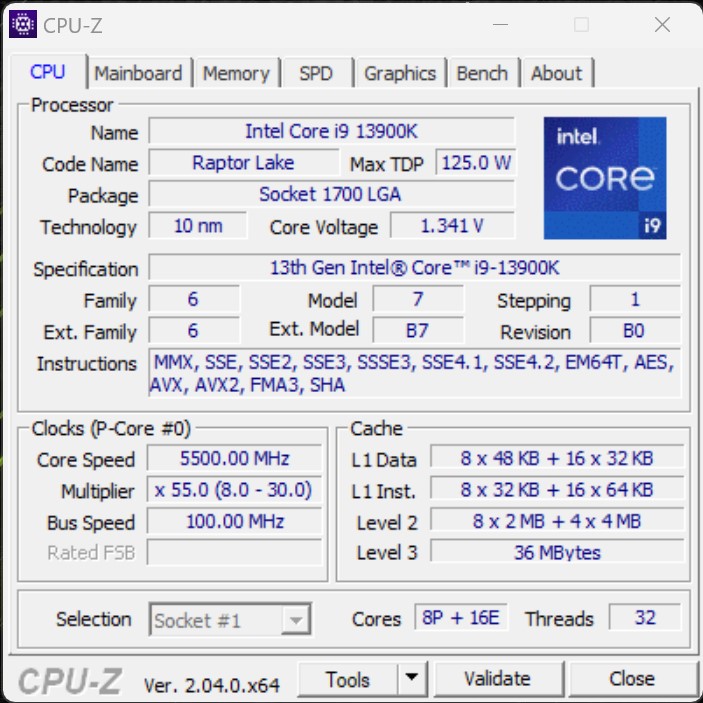
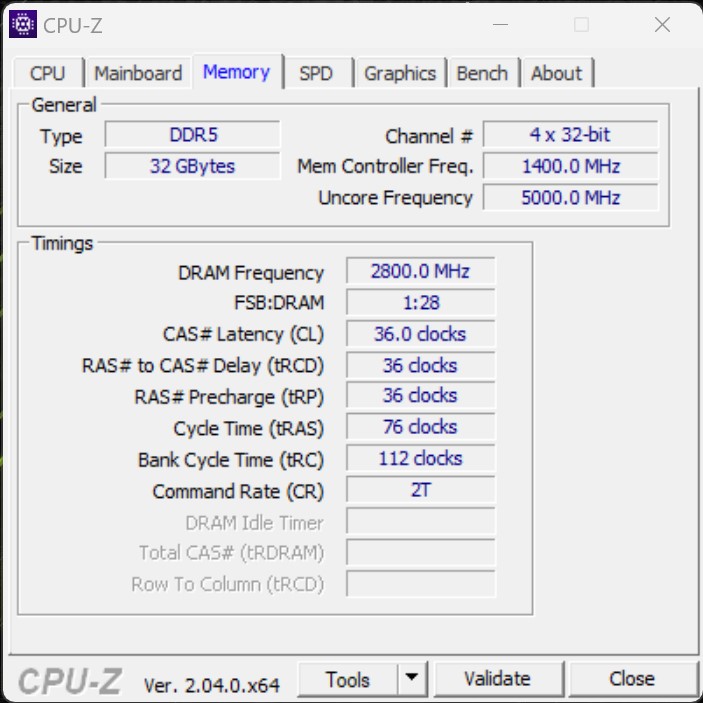
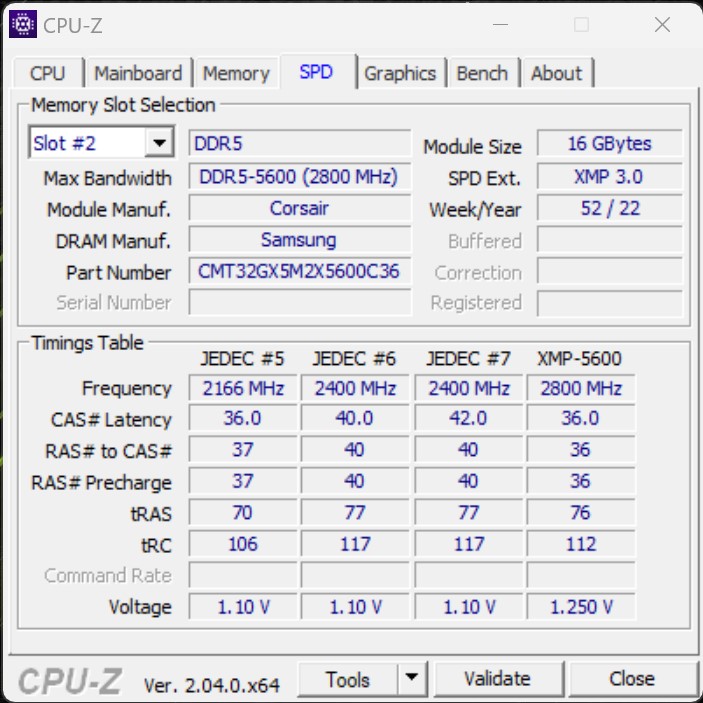
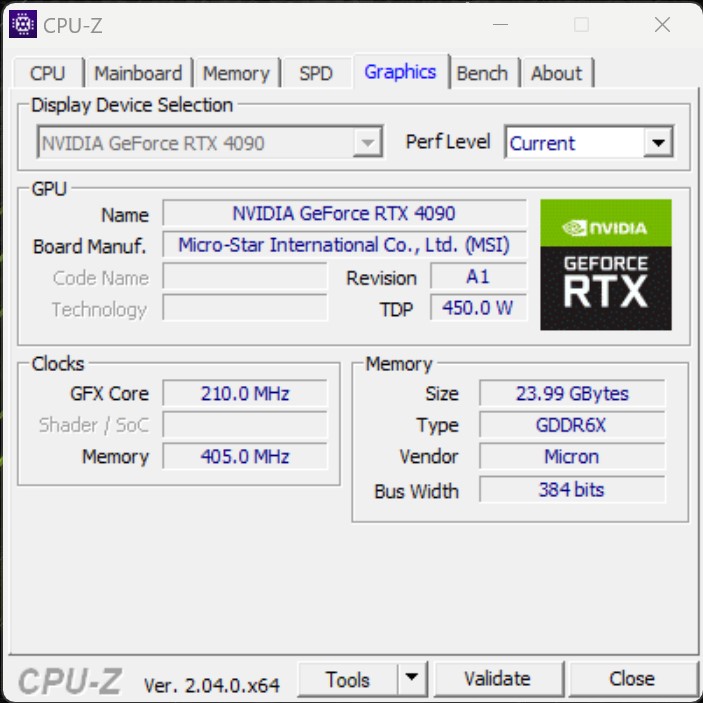
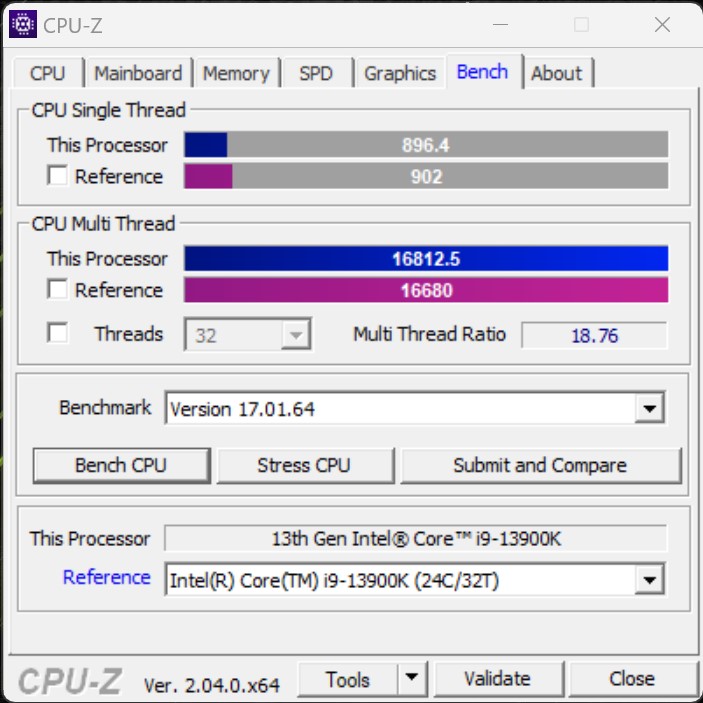
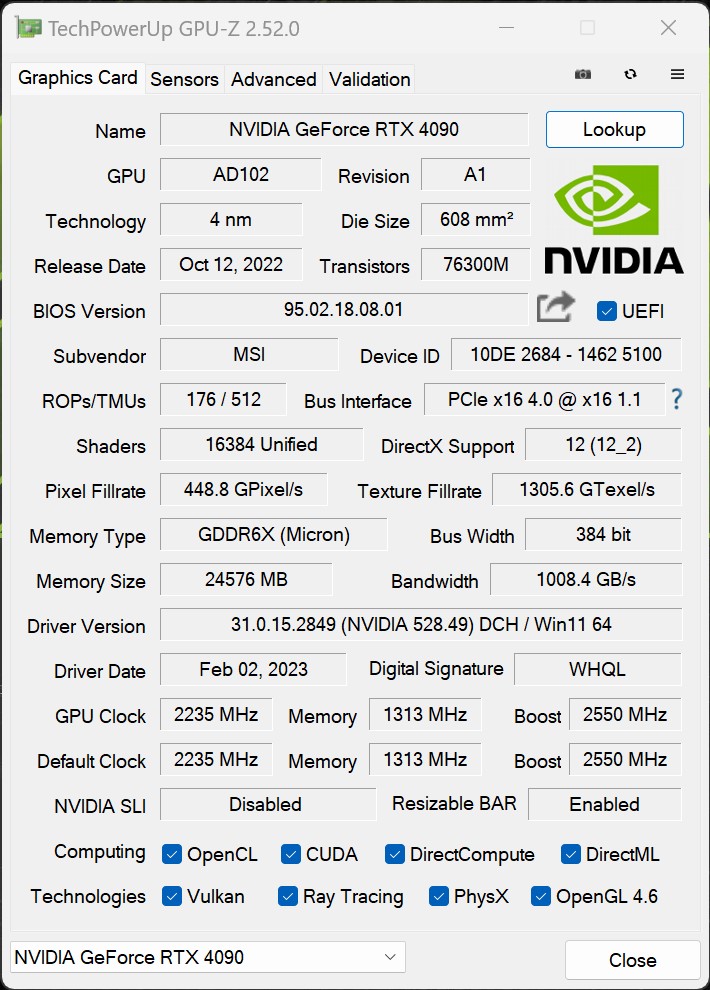
The XMG SECTOR Intel in this review is equipped with the second-fastest Intel gaming CPU – the Core i9-13900K. The processor is flanked by 32 GB of memory and an SSD with a whopping 2 TB capacity, meaning the system has enough storage to accommodate PC games with large install size. The included graphics card is an MSI GeForce RTX 4090 VENTUS 3X, which is the fastest GPU for the consumer market right now.
Test conditions
All performance-related tests were carried out with the power profile set to "High performance" so that we can get the best possible results. Moreover, the manufacturer already disabled all restrictions on CPU power usage in the BIOS. As a result, the Core i9-13900K was not limited to a max power draw of 253 watts (the CPU's PL2). We only switched to a different power plan when measuring power consumption and noise levels. Refer to this page to find out more about our test criteria.
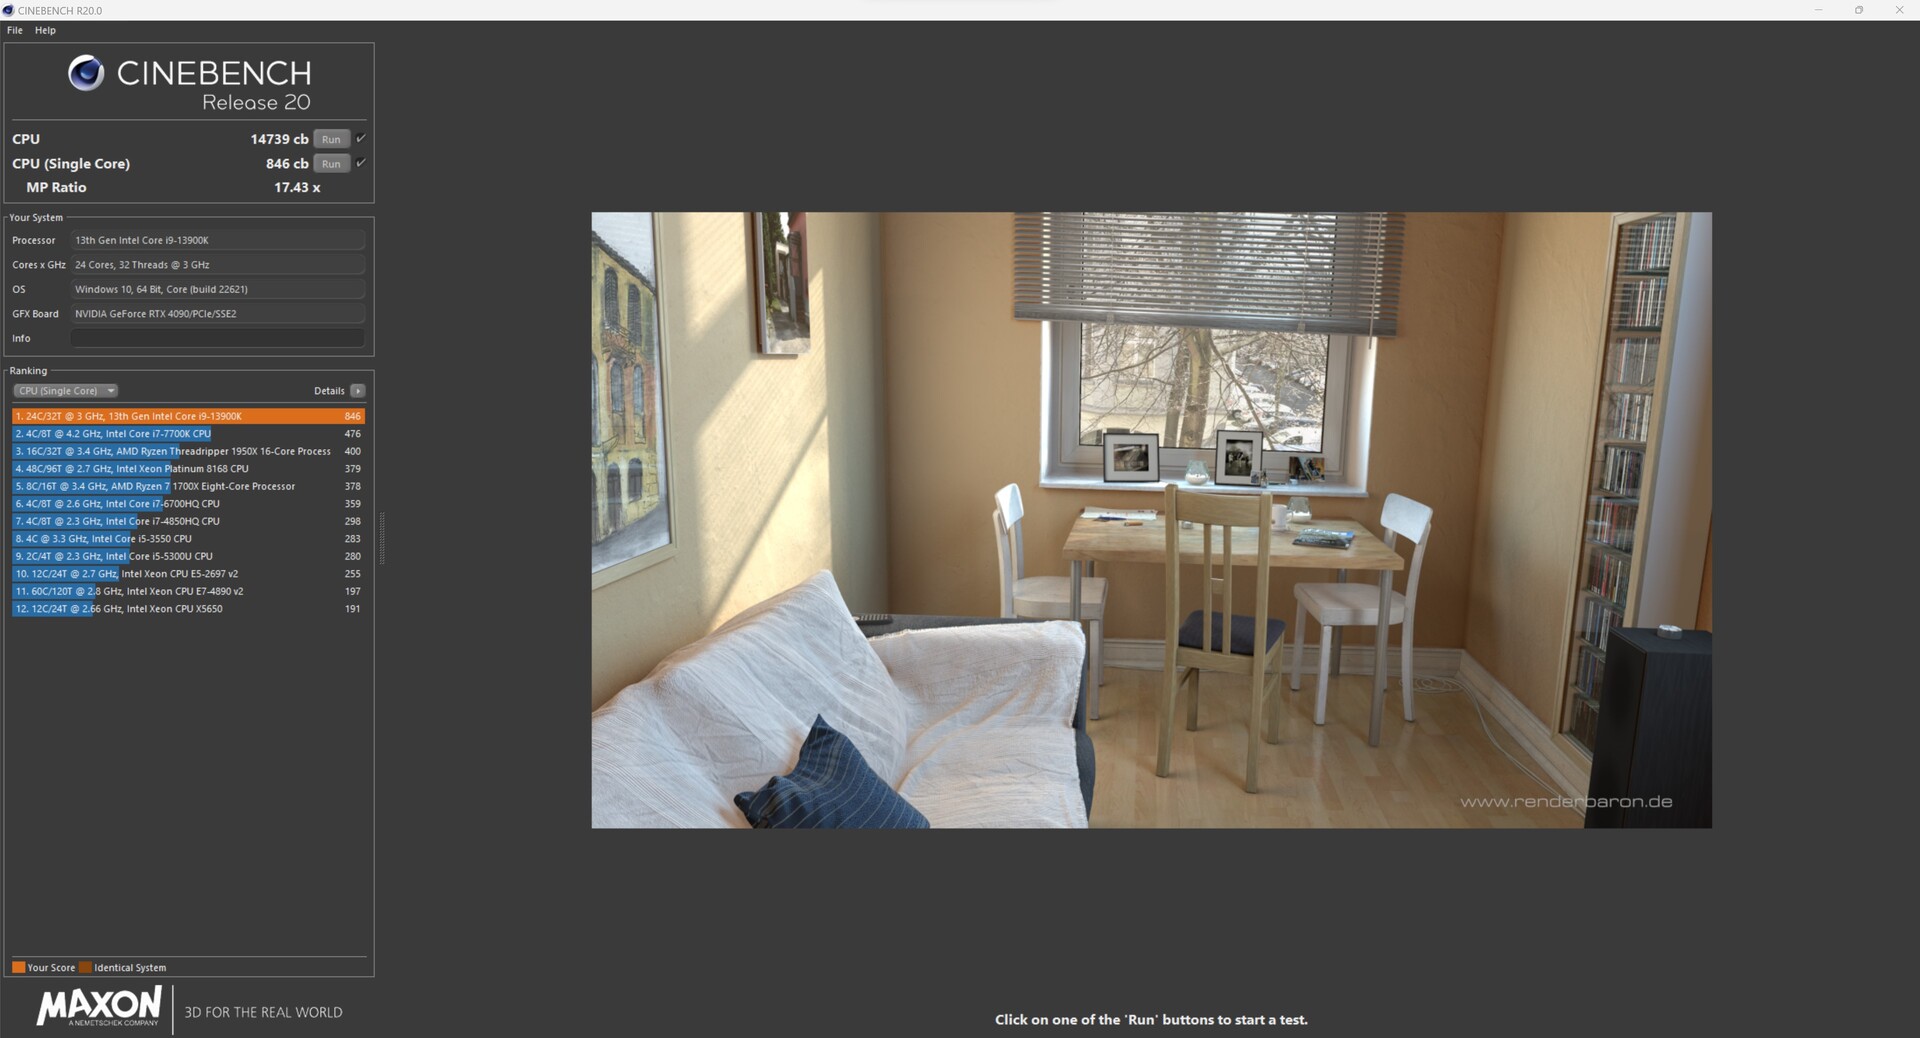
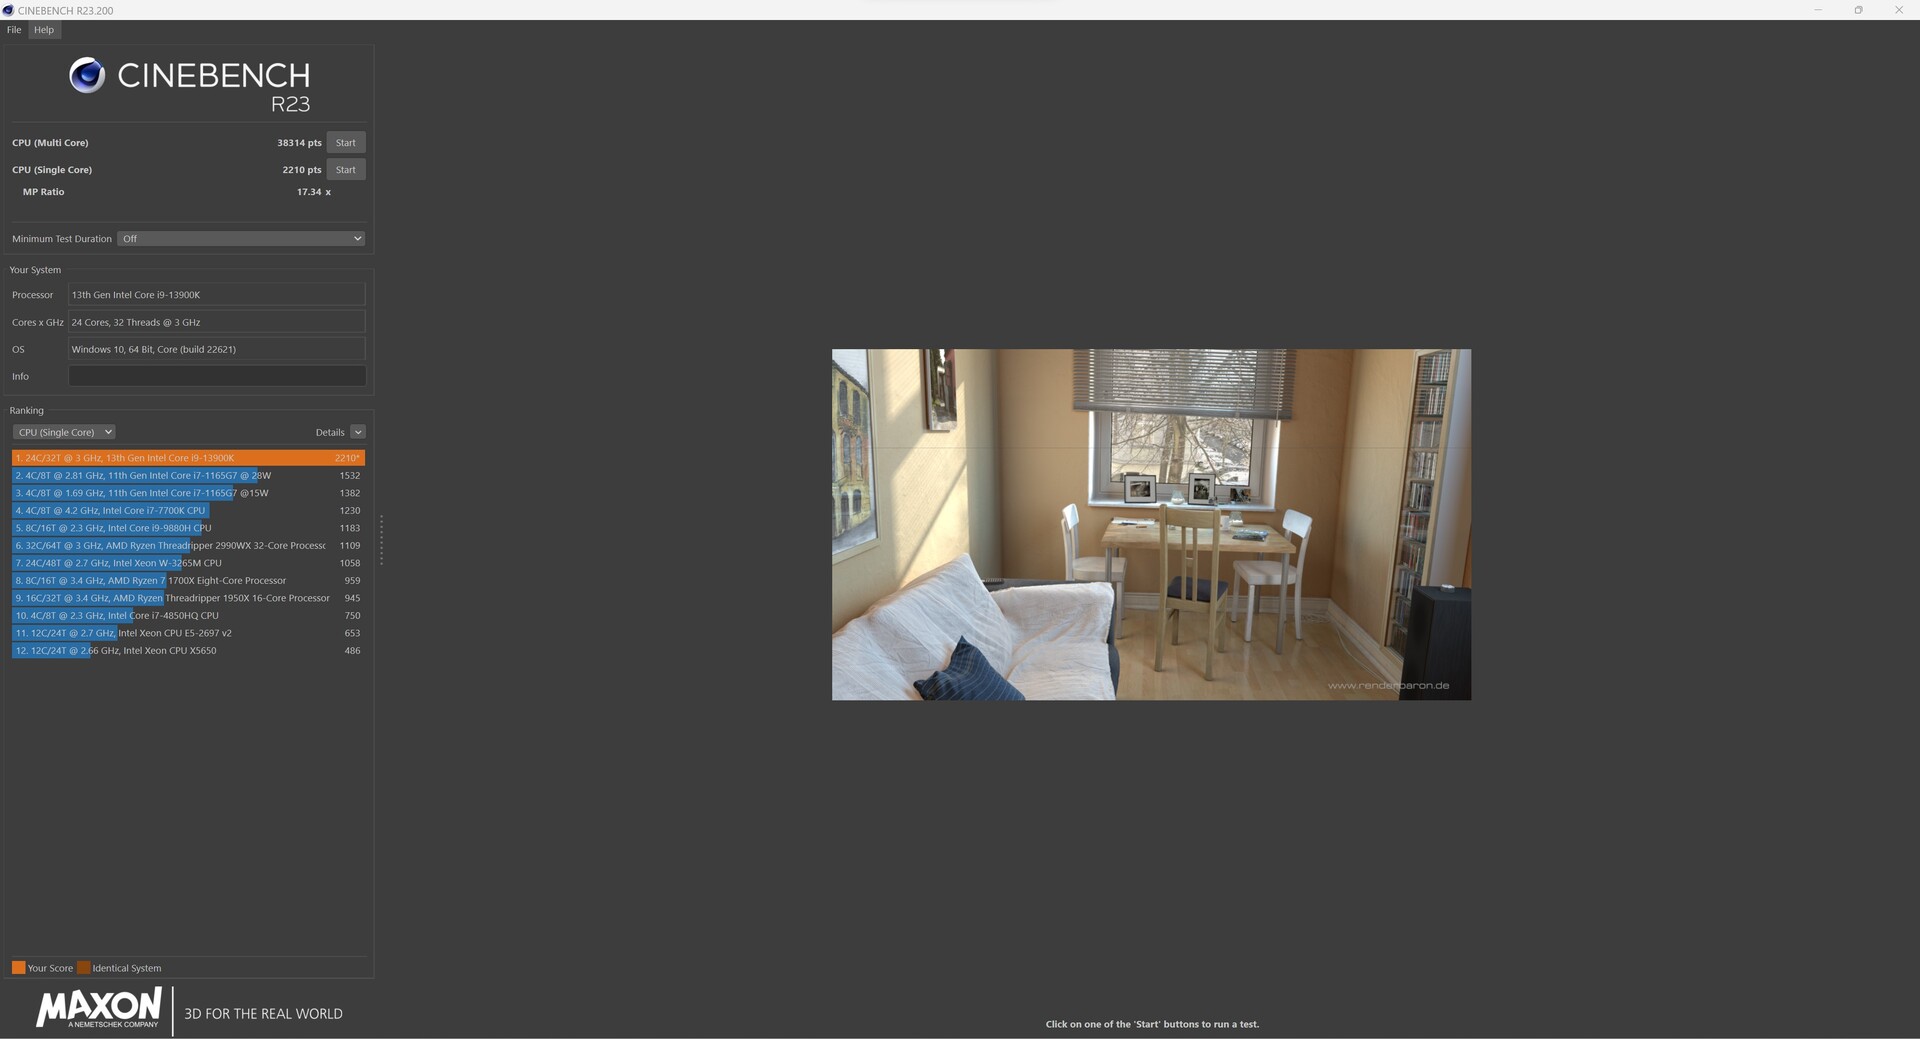
Processor
Our XMG SECTOR Intel is powered by a Core i9-13900K, which is Intel's second-fastest gaming CPU at the moment. The results produced by the review unit are as good as one might expect. It is neck and neck with the other devices in our comparison. When it comes to performance rating, the difference between the XMG SECTOR and the similarly specced test system is extremely small at just 2% and can almost be attributed to measuring tolerances.
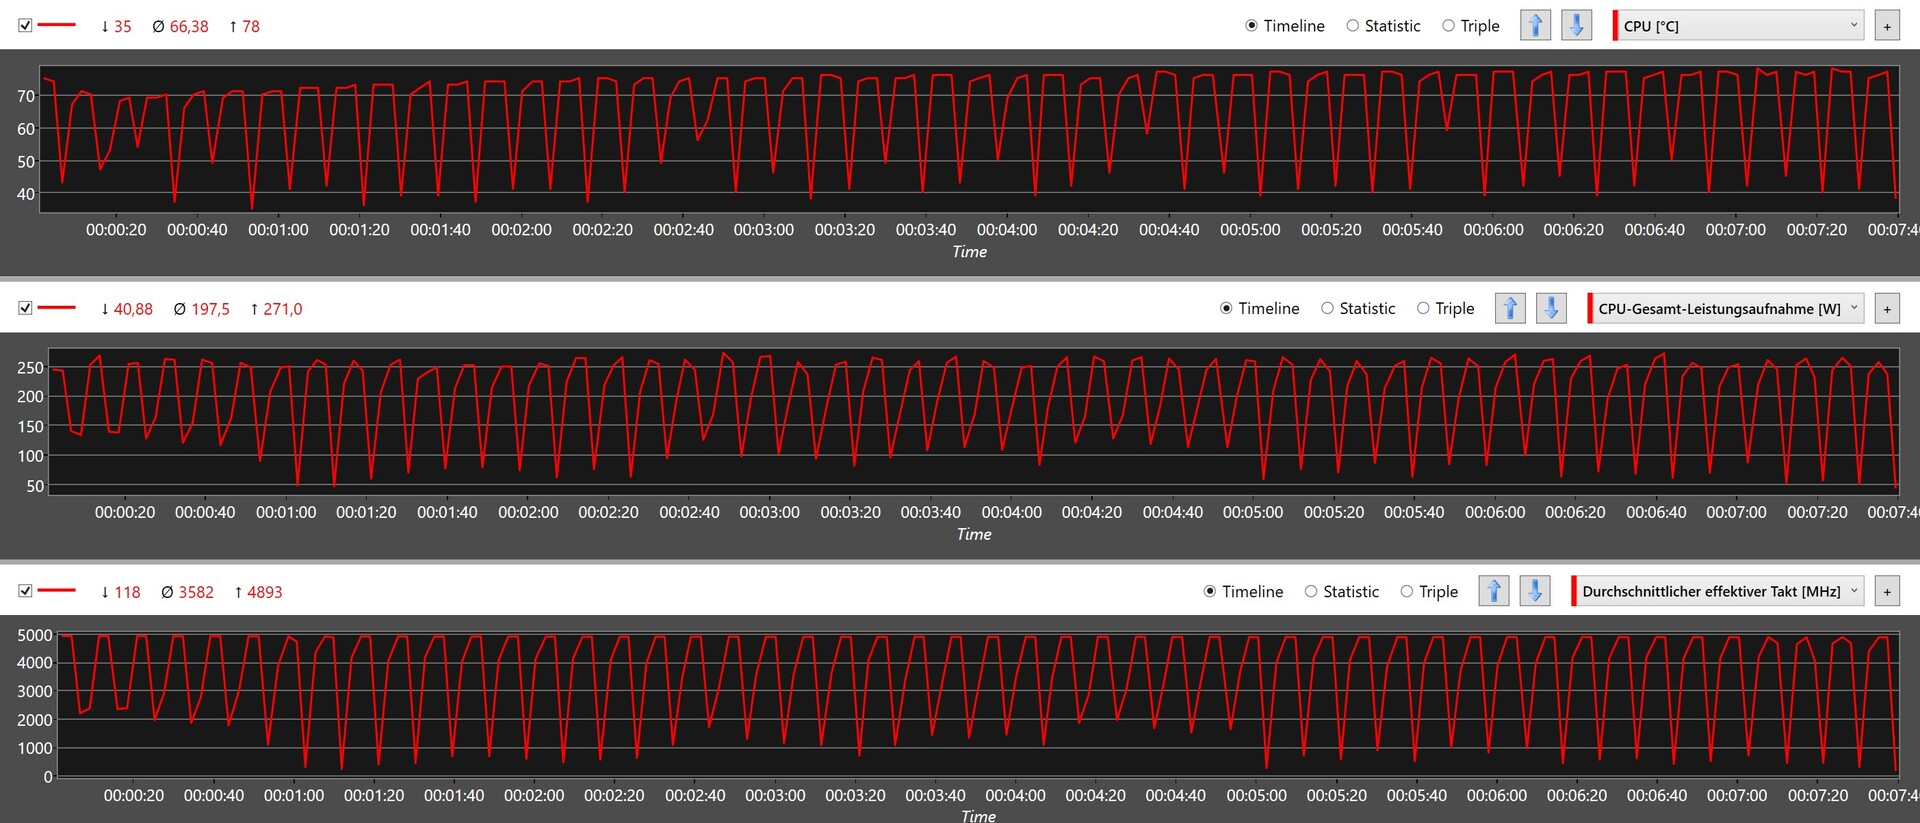
The processor isn't bound by any power limits because all restrictions have been lifted. Consequently, the CPU's performance is limited by temperature, which goes hand in hand with the AIO cooler installed.
You can find more processor benchmarks on this page.
* ... smaller is better
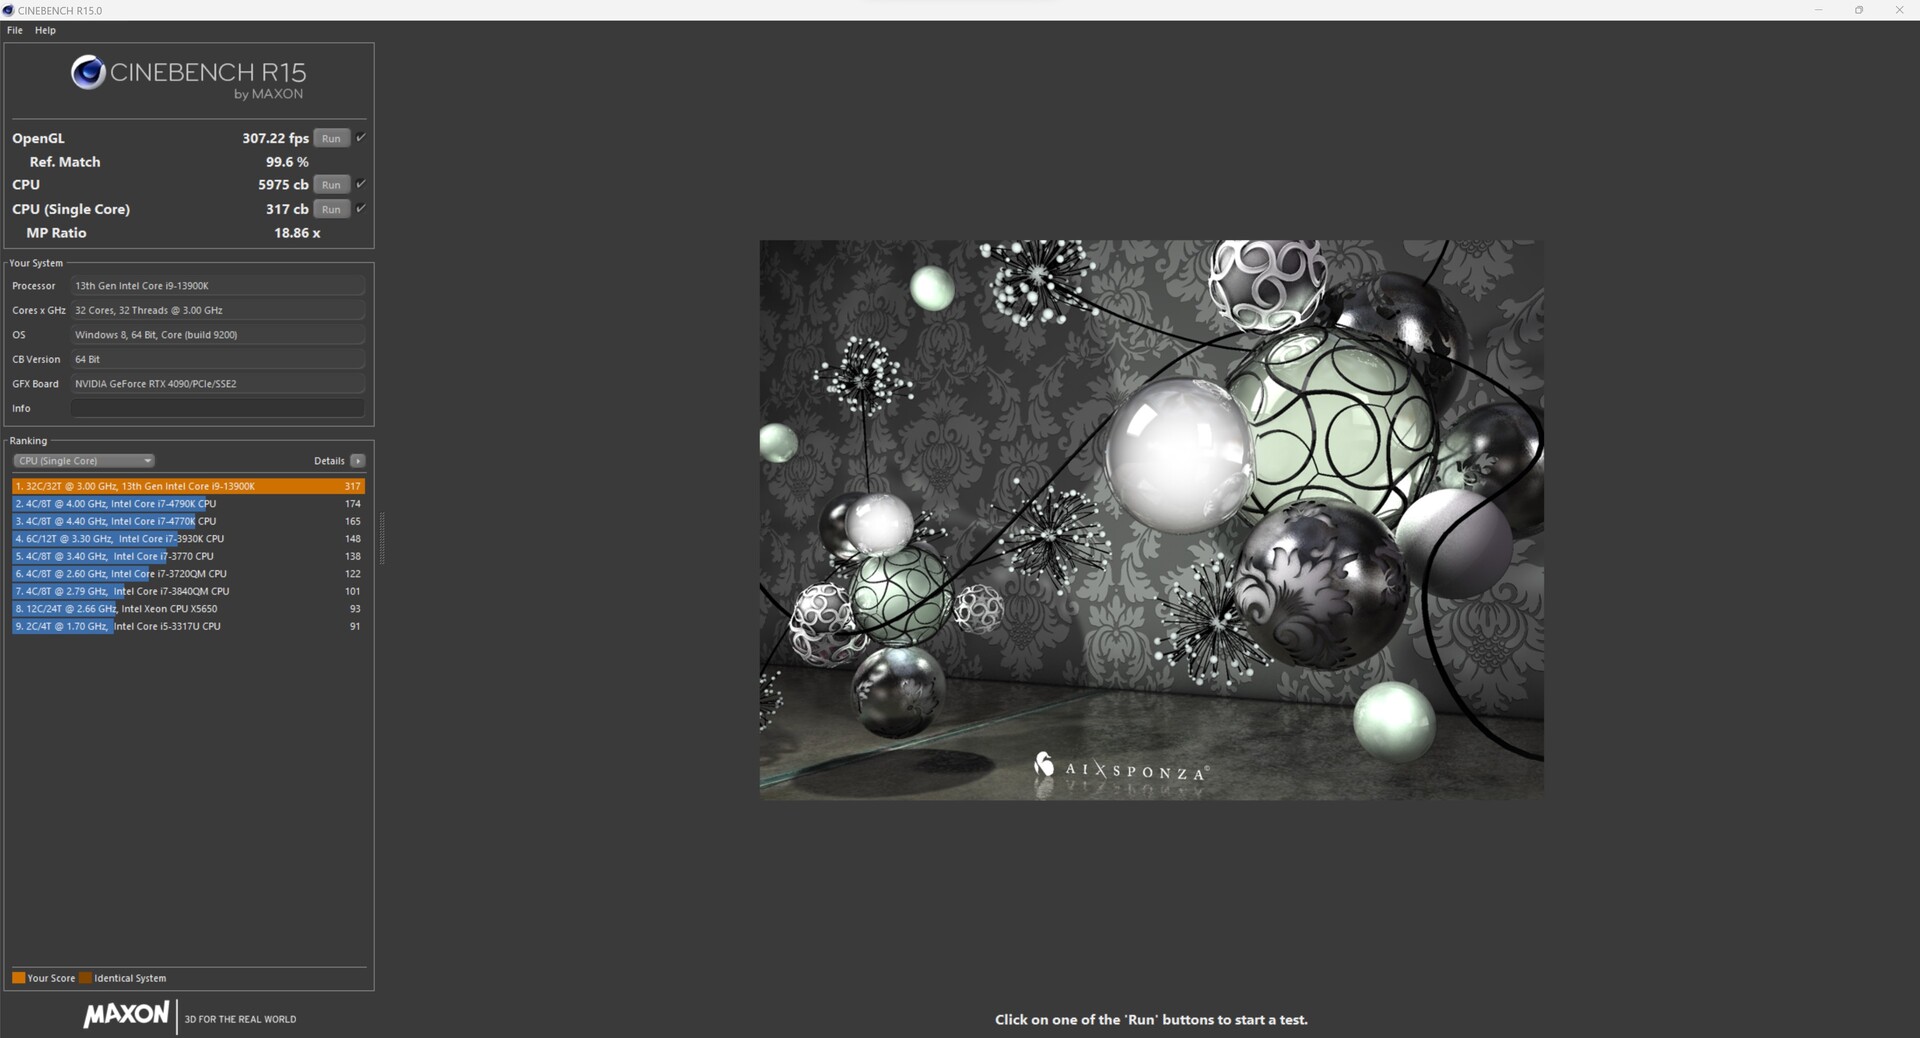
XMG SECTOR Intel in Cinebench R15 Multi loop
Running Cinebench R15 in a loop gave us a first look at how efficient the cooling solution is in the PC. There wasn't any noticeable drop in performance after the first few runs. The XMG SECTOR Intel performed very well, receiving an average score of 5,917.
System performance
The XMG SECTOR Intel was extremely snappy in synthetic benchmarks, thus putting itself on par with the competitors. On top of that, our review unit delivered outstanding performance in AIDA64 memory tests and managed to secure the top spot thanks to its fast memory (DDR5-5600) and low latencies. During our time with the XMG SECTOR Intel, it consistently ran very fast without any significant latency.
| Performance rating - Percent | |
| AMD Ryzen 9 7900X | |
| NVIDIA GeForce RTX 3090 Founders Edition | |
| Intel Core i9-13900K | |
| Schenker XMG SECTOR, i9 13900K, RTX 4090 | |
| Intel Core i5-13600K | |
| Intel NUC13 Raptor Canyon | |
| Corsair One i300 | |
| Intel Core i9-12900K | |
| Intel Dragon Canyon NUC - RTX 3060 | |
| Minisforum Neptune Series NAD9 | |
| AIDA64 / Memory Copy | |
| Schenker XMG SECTOR, i9 13900K, RTX 4090 | |
| Intel Core i9-13900K | |
| Average Intel Core i9-13900K (68722 - 80203, n=4) | |
| Corsair One i300 | |
| Intel Core i9-12900K | |
| NVIDIA GeForce RTX 3090 Founders Edition | |
| Intel Core i5-13600K | |
| Average of class Desktop (54743 - 98416, n=21, last 2 years) | |
| AMD Ryzen 9 7900X | |
| Intel NUC13 Raptor Canyon | |
| Minisforum Neptune Series NAD9 | |
| Intel Dragon Canyon NUC - RTX 3060 | |
| AIDA64 / Memory Read | |
| Schenker XMG SECTOR, i9 13900K, RTX 4090 | |
| Intel Core i9-13900K | |
| Average Intel Core i9-13900K (73392 - 88780, n=4) | |
| Intel Core i9-12900K | |
| NVIDIA GeForce RTX 3090 Founders Edition | |
| Intel Core i5-13600K | |
| Average of class Desktop (58375 - 110448, n=21, last 2 years) | |
| AMD Ryzen 9 7900X | |
| Corsair One i300 | |
| Intel NUC13 Raptor Canyon | |
| Intel Dragon Canyon NUC - RTX 3060 | |
| Minisforum Neptune Series NAD9 | |
| AIDA64 / Memory Write | |
| NVIDIA GeForce RTX 3090 Founders Edition | |
| Average of class Desktop (60635 - 93889, n=21, last 2 years) | |
| Schenker XMG SECTOR, i9 13900K, RTX 4090 | |
| AMD Ryzen 9 7900X | |
| Intel Core i9-13900K | |
| Average Intel Core i9-13900K (68948 - 78678, n=4) | |
| Intel Core i9-12900K | |
| Intel Core i5-13600K | |
| Corsair One i300 | |
| Intel NUC13 Raptor Canyon | |
| Minisforum Neptune Series NAD9 | |
| Intel Dragon Canyon NUC - RTX 3060 | |
| AIDA64 / Memory Latency | |
| Minisforum Neptune Series NAD9 | |
| Intel NUC13 Raptor Canyon | |
| Average of class Desktop (68.5 - 168, n=21, last 2 years) | |
| Intel Dragon Canyon NUC - RTX 3060 | |
| Corsair One i300 | |
| Intel Core i5-13600K | |
| Average Intel Core i9-13900K (72.6 - 93.4, n=4) | |
| Intel Core i9-13900K | |
| Schenker XMG SECTOR, i9 13900K, RTX 4090 | |
| AMD Ryzen 9 7900X | |
| NVIDIA GeForce RTX 3090 Founders Edition | |
* ... smaller is better
Mass storage
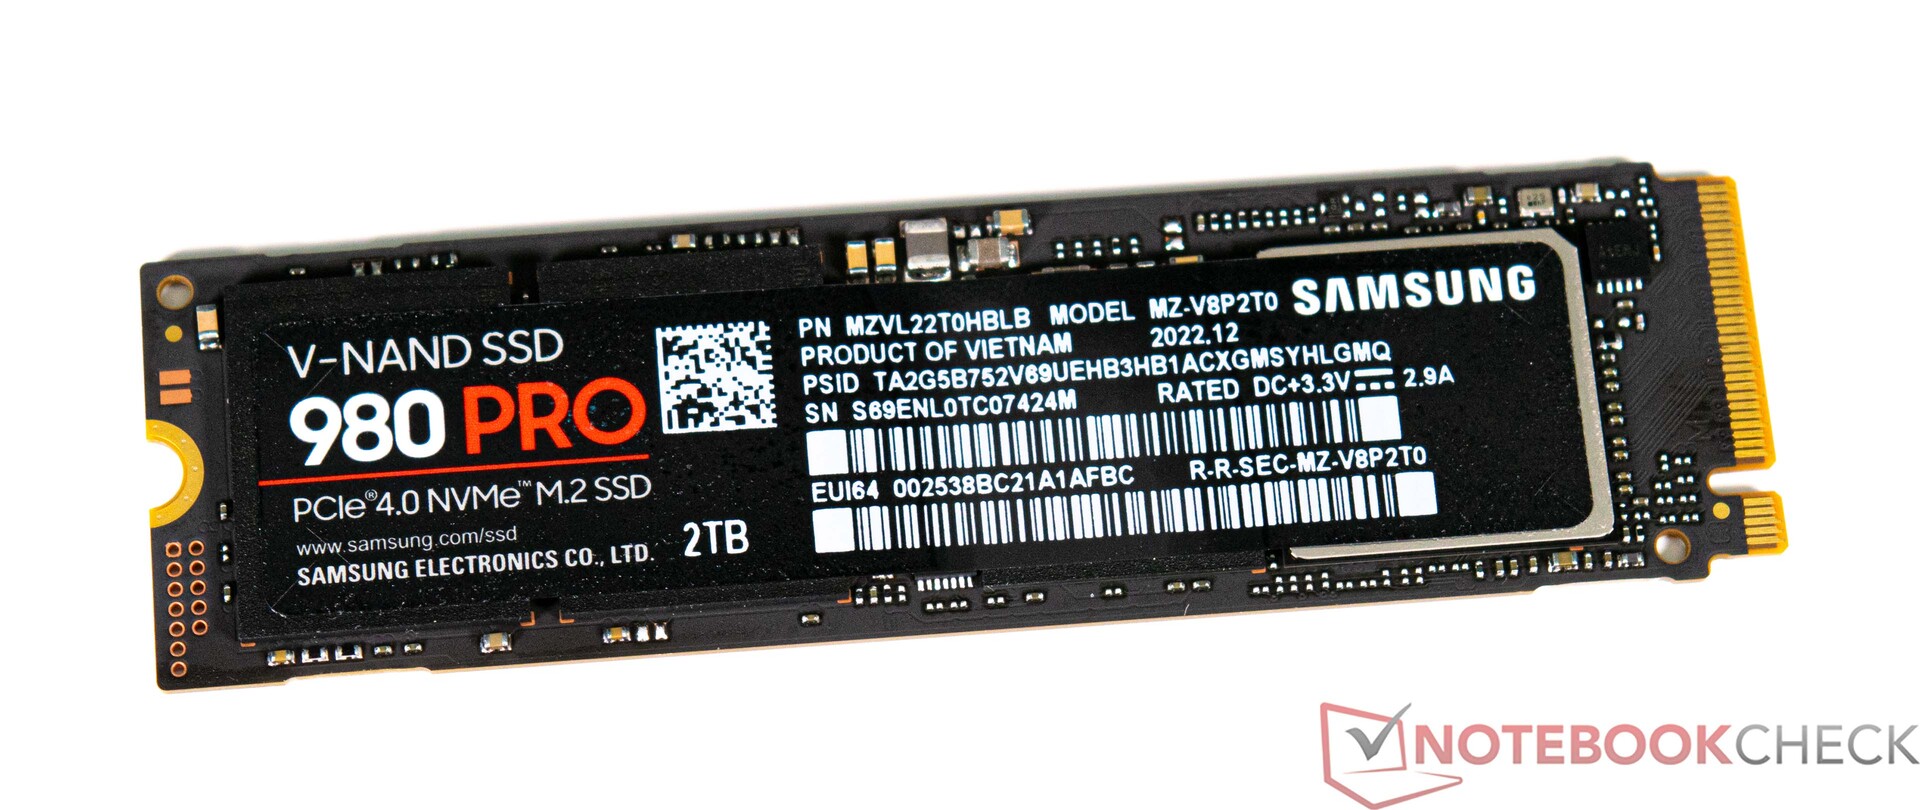
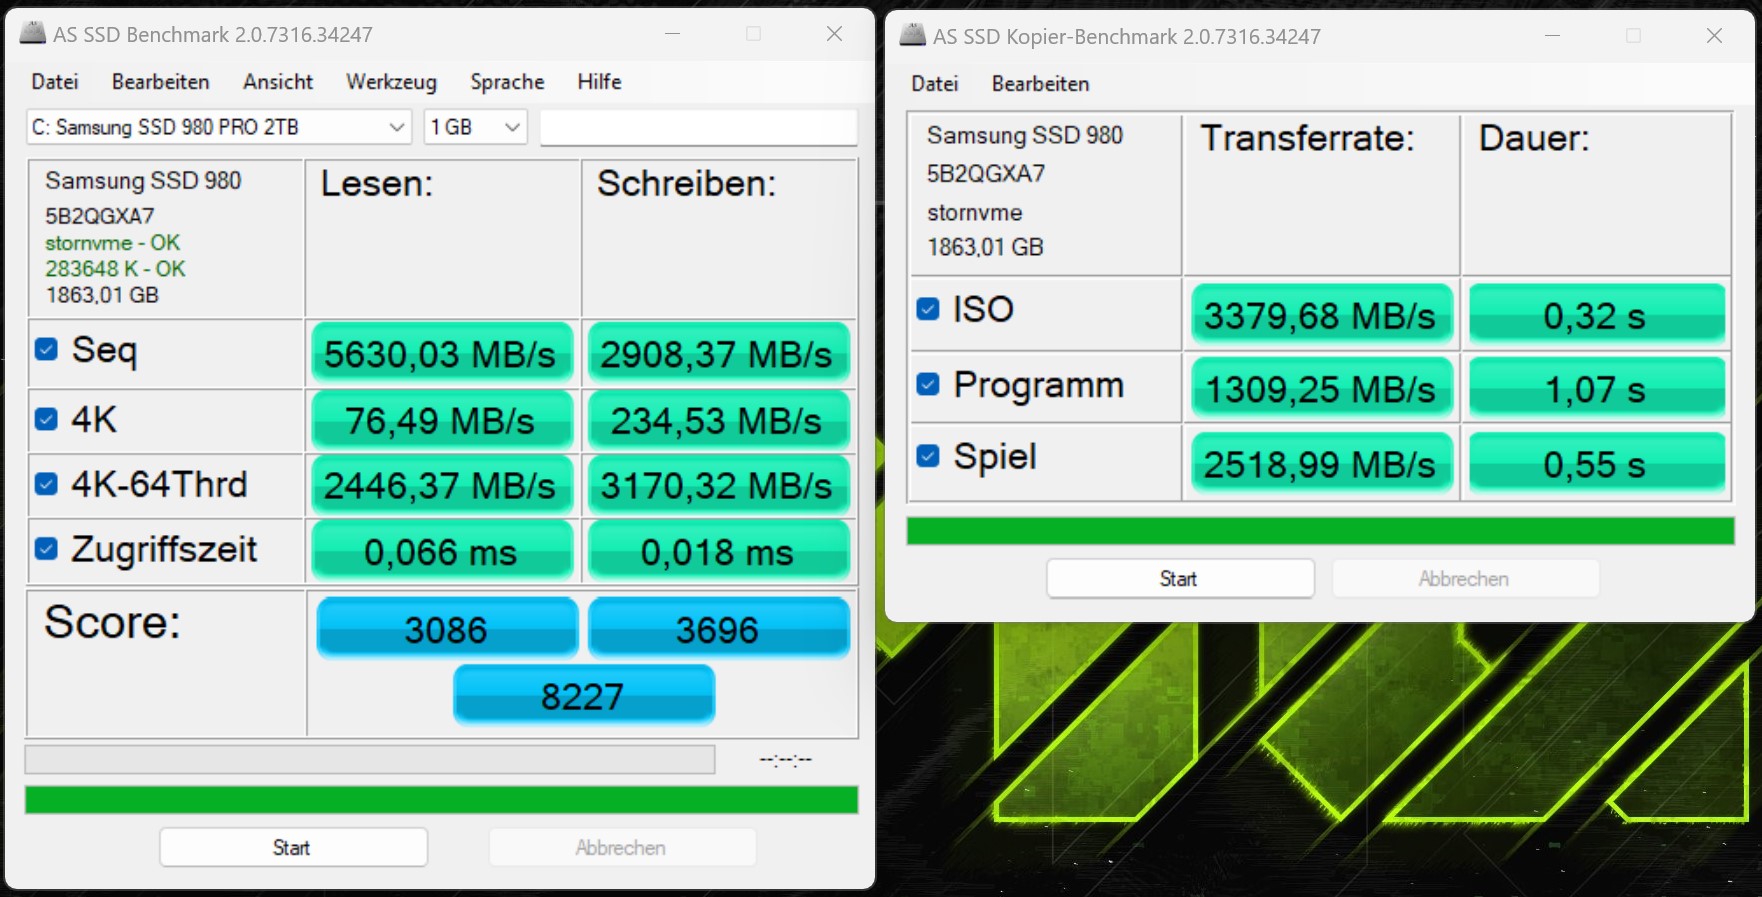
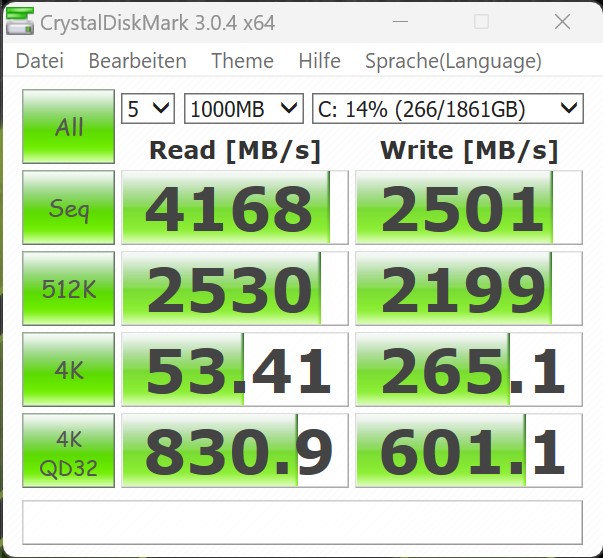
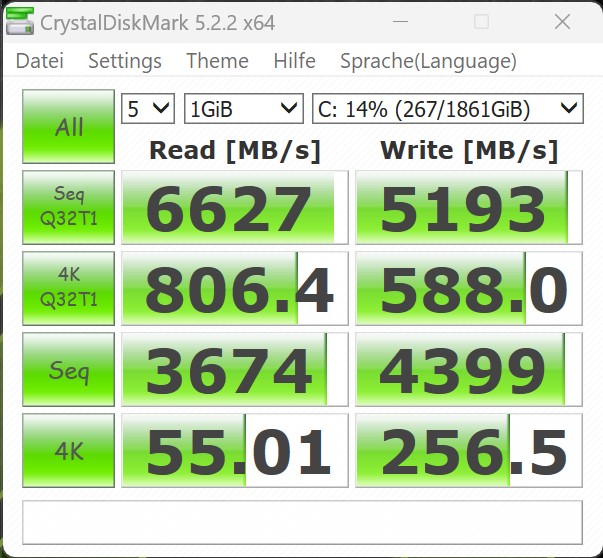
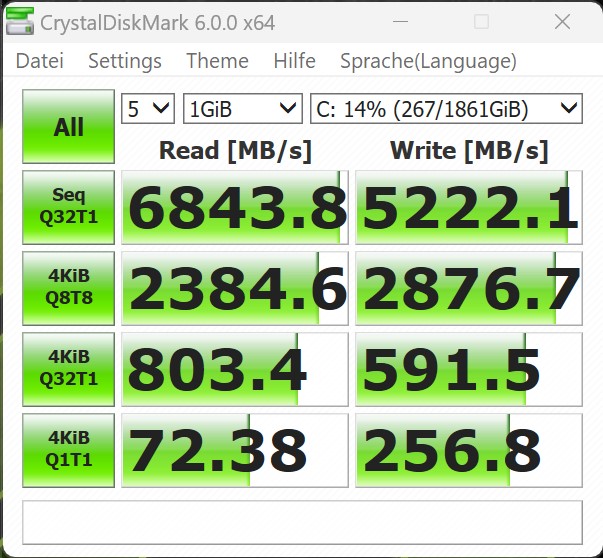
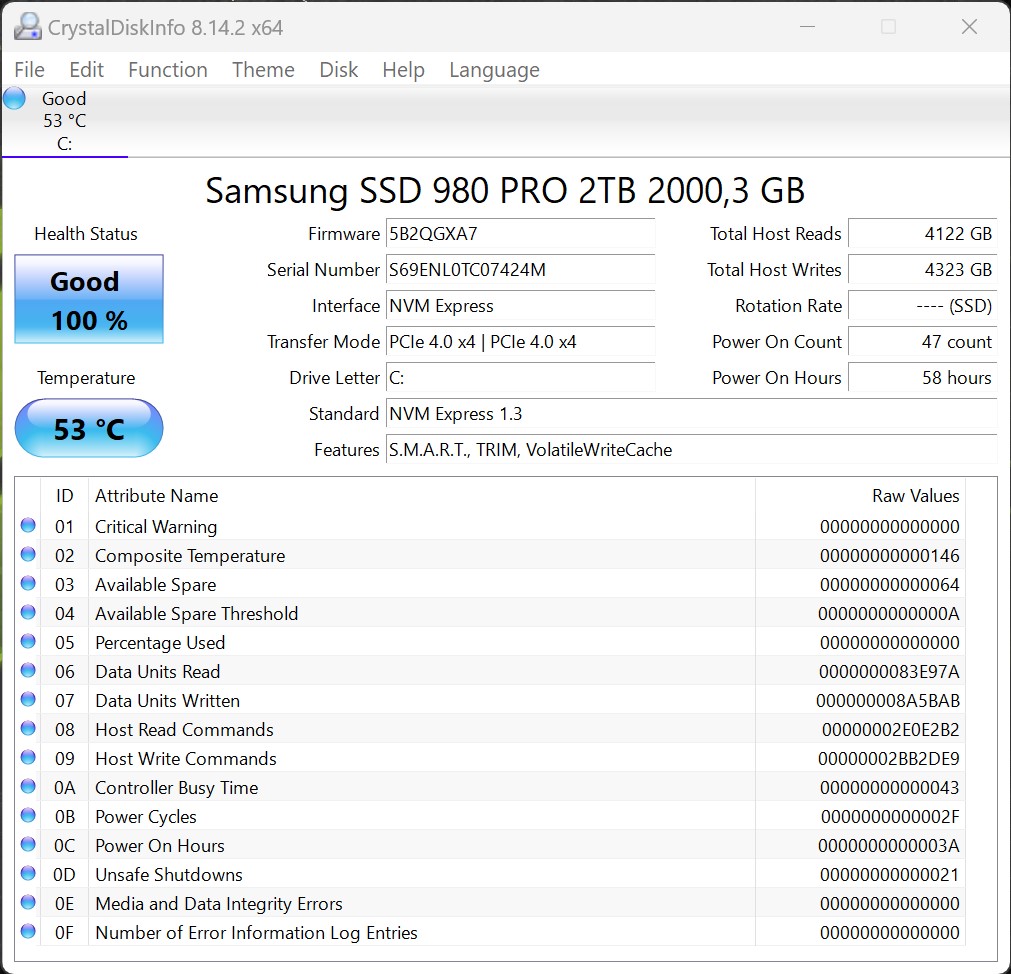
Our review unit is fitted with a super speedy Samsung NVMe SSD. The Samsung 980 Pro is one of the fastest consumer-grade SSDs. This is something we can also see in benchmarks: the drive almost consistently outperformed the storage solutions in competing devices. Only the Kingston Fury Renegade in the Intel NUC13 Raptor Canyon was able to surpass the performance of the Samsung 980 Pro in AS-SSD Benchmark. That said, this is enough for the Samsung SSD to come in first in the overall rating. Even during the stress test, the drive managed to maintain a high read speed over an extended period, indicating that the SSD cooling is highly effective.
You can install up to three more M.2 SSDs on the Asus ROG Strix Z690-F Gaming. There is also the option to connect even more storage drives via SATA.
Refer to our storage device comparison table for more information and benchmarks.

| Drive Performance rating - Percent | |
| Average of class Desktop | |
| Schenker XMG SECTOR, i9 13900K, RTX 4090 | |
| Corsair One i300 | |
| NVIDIA GeForce RTX 3090 Founders Edition | |
| Intel NUC13 Raptor Canyon | |
| Intel Core i5-13600K | |
| Intel Core i9-13900K | |
| Minisforum Neptune Series NAD9 | |
| Intel Core i9-12900K -11! | |
| Intel Dragon Canyon NUC - RTX 3060 -11! | |
* ... smaller is better
Sustained Read: DiskSpd Read Loop, Queue Depth 8
Graphics card - No compromise with the GeForce RTX 4090
Synthetic benchmarks
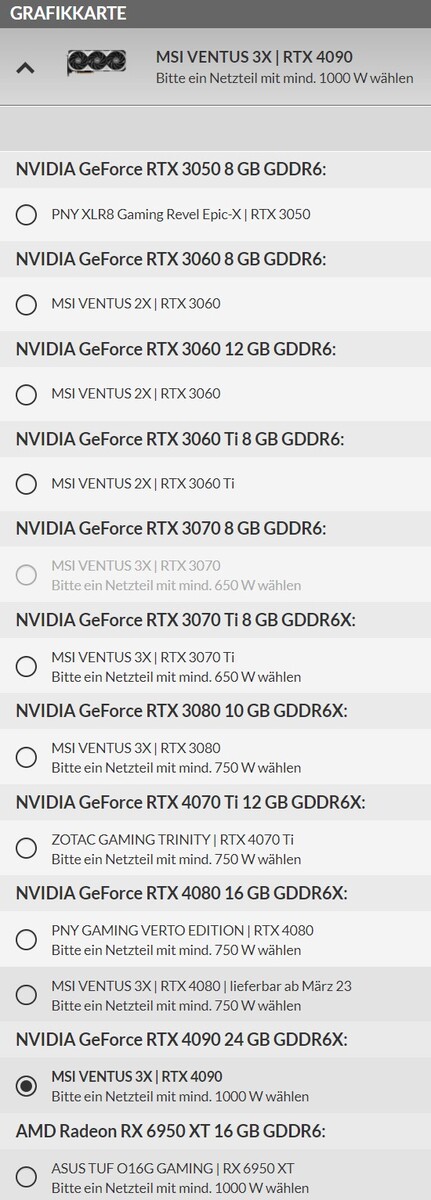
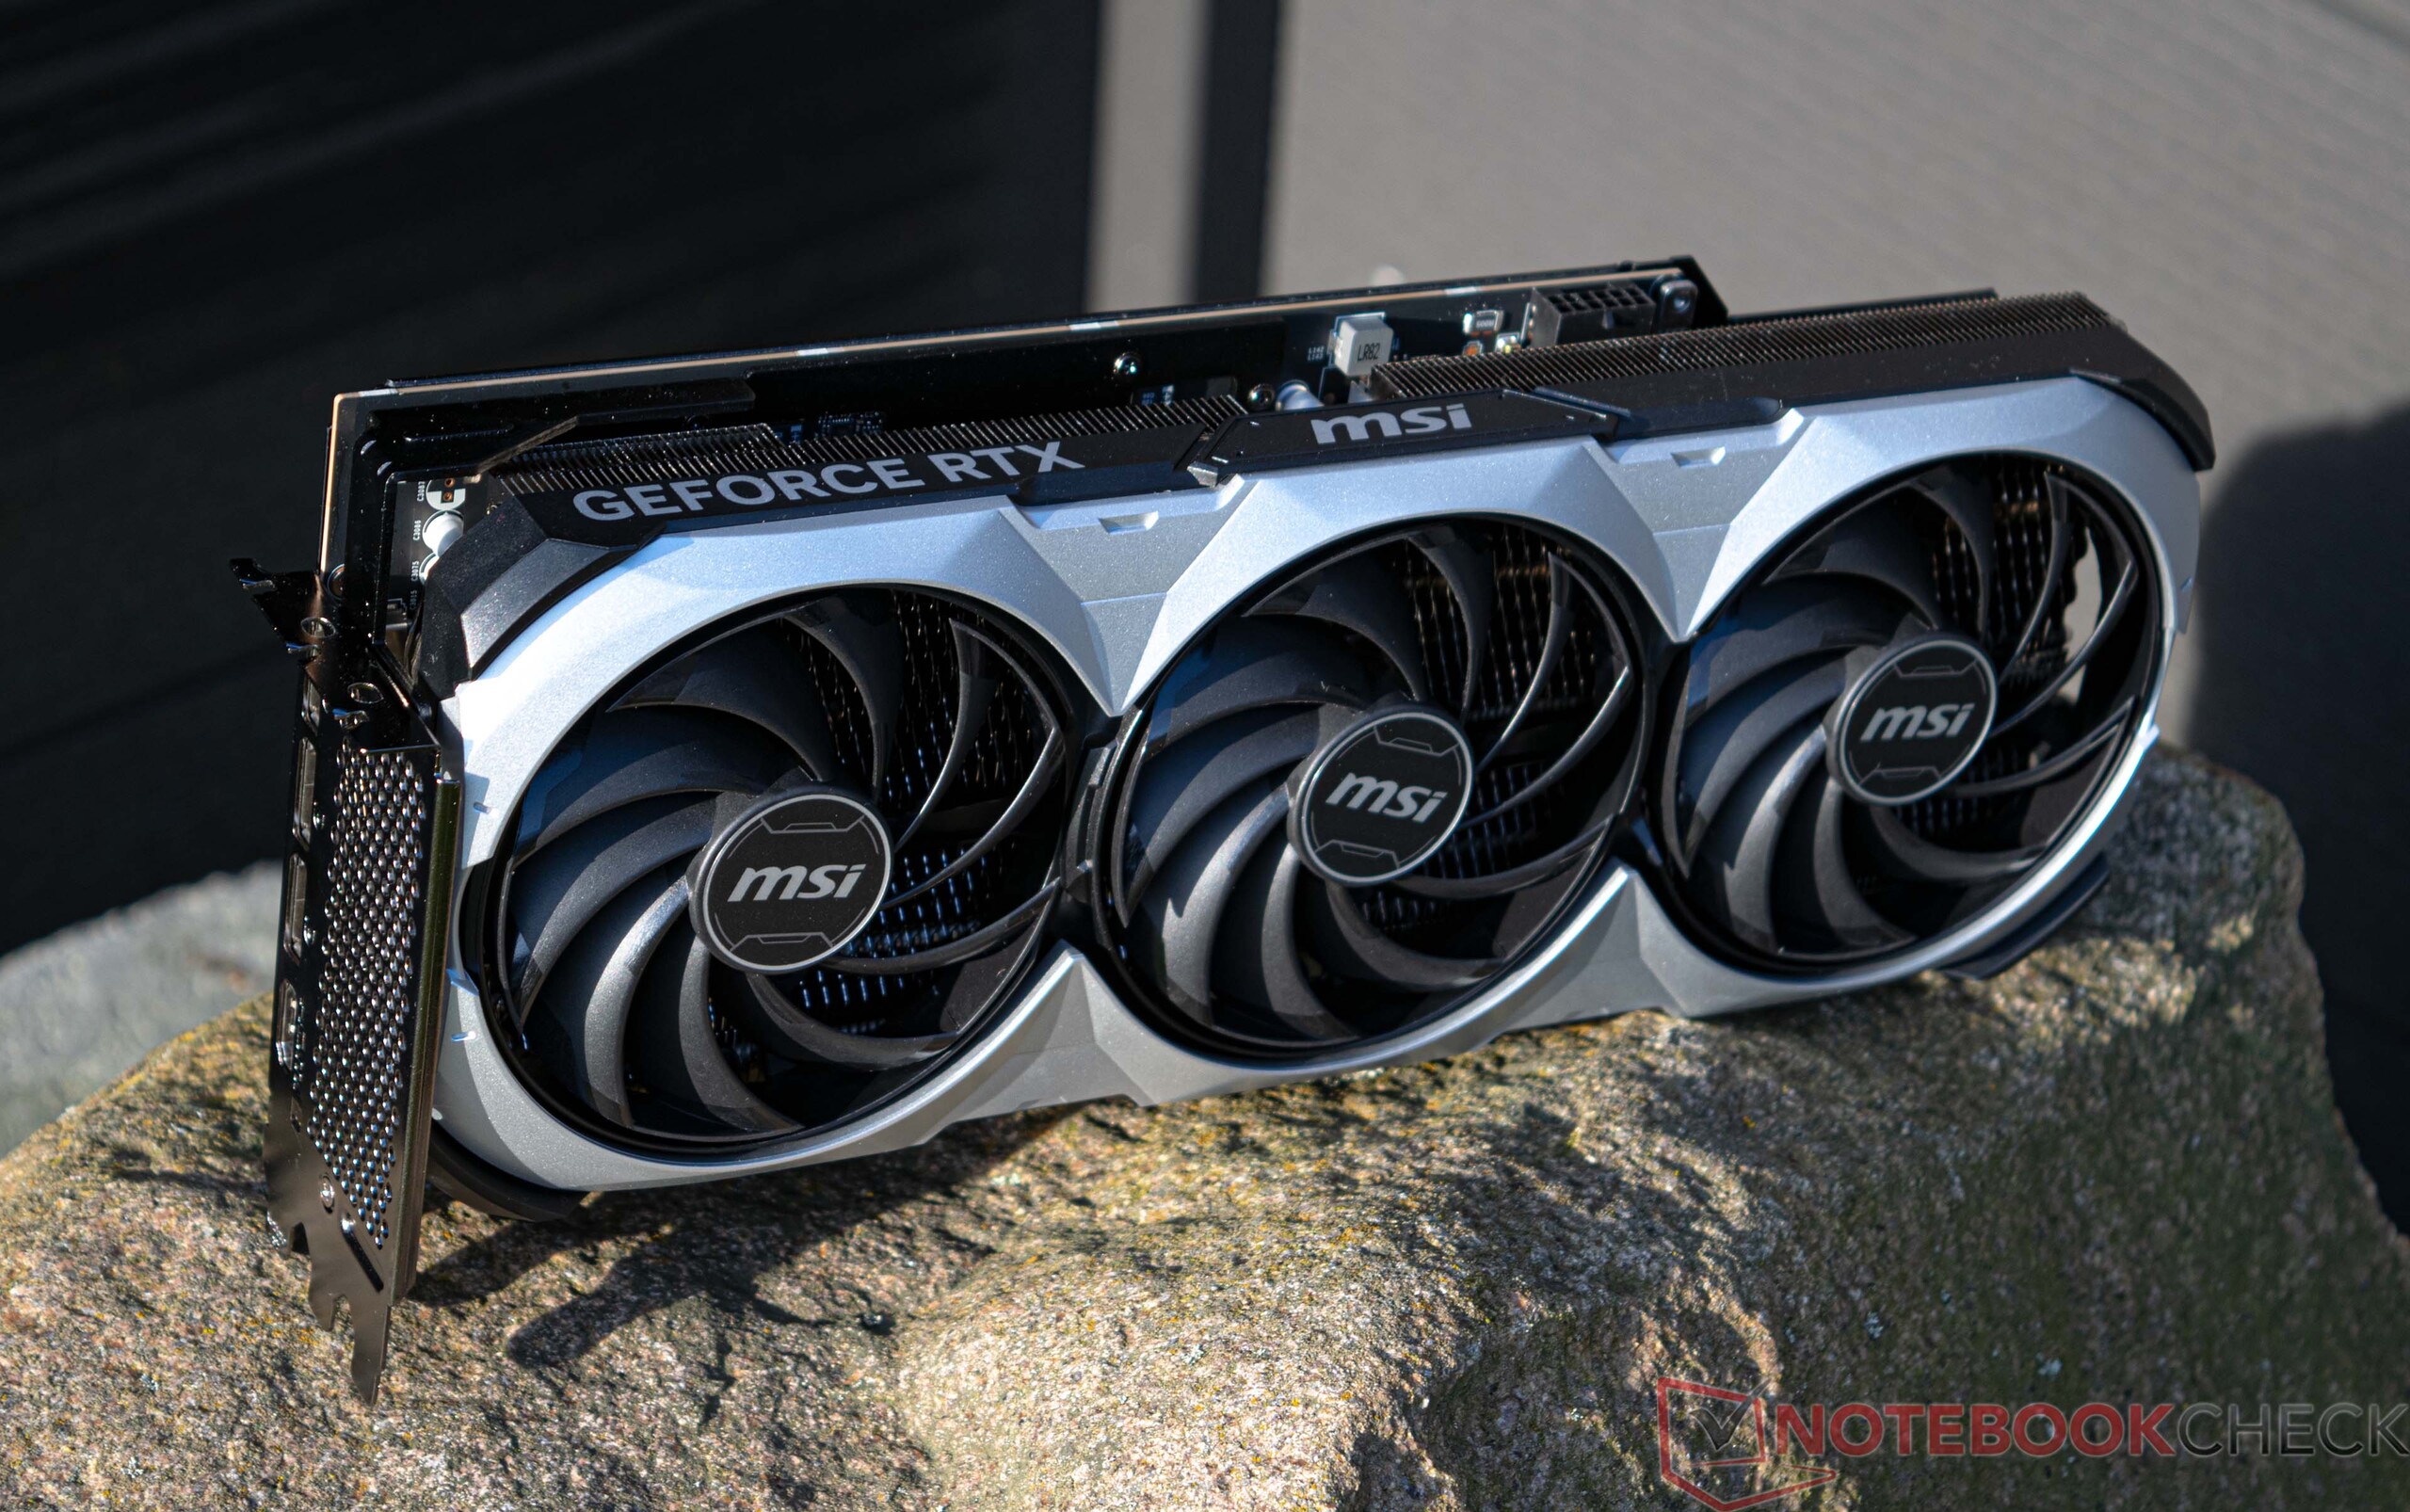
Our review sample is equipped with the fastest consumer graphics card right now – the Nvidia GeForce RTX 4090. The GPU delivered immensely high performance in all our synthetic tests, which is very much in line with our expectations. In conjunction with the Core i9-13900K, the review unit landed in the second place in the 3DMark rating. The first place was claimed by another GeForce RTX 4090, this time a model from KFA2. Nonetheless, the MSI GeForce RTX 4090 VENTUS 3X can hold its own very well against the KFA2 card. The MSI model takes up a large amount of space in the XMG SECTOR Intel. However, MSI has decided not to give the card any fancy lighting effects. The flagship Nvidia GPU has a considerable lead over high-end AMD graphics cards. The configurator lets you choose from a wide range of Nvidia 30 and 40 Series graphic cards. If you absolutely want an AMD card in your system, your only option here is a Radeon RX 6950 XT. AMD's 7000 Series cards are currently not available for selection.
Head on over to this page for more technical information on the Nvidia GeForce RTX 4090.
Visit our GPU comparison table for more information and benchmark results.
Compute benchmarks and professional applications
| 3DMark 05 Standard | 68661 points | |
| 3DMark 06 Standard Score | 70557 points | |
| 3DMark Vantage P Result | 133759 points | |
| 3DMark 11 Performance | 62922 points | |
| 3DMark Ice Storm Standard Score | 257615 points | |
| 3DMark Cloud Gate Standard Score | 85474 points | |
| 3DMark Fire Strike Score | 45450 points | |
| 3DMark Fire Strike Extreme Score | 37831 points | |
| 3DMark Time Spy Score | 32024 points | |
Help | ||
Gaming Performance
The great results seen in the synthetic benchmarks are reinforced by the excellent gaming performance of the XMG SECTOR Intel. Needless to say, the GeForce RTX 4090 plays a crucial role in this. But you'll also need an extremely fast CPU in order to effectively tap into the power of the fastest Nvidia GPU. Similarly, we recommend playing games mostly at 2160p and max settings so that you can take advantage of the graphics card's performance in the first place. Those who only game at 1080p can just go for an RTX 4070 Ti and save themselves quite a lot of money.
Special RTX features such as DLSS 3.0 and frame generation (FG) are currently exclusive to the RTX 40 Series cards. This means if you want to enjoy these new features, you have no other choice than to get an RTX 40 Series GPU. The XMG SECTOR Intel is capable of running all the games tested smoothly at 2160p and max settings. Furthermore, those who want to enable ray tracing can mostly use the feature without any limitations. But some games, such as Cyberpunk 2077, can bring even a high-end rig like the XMG SECTOR to its knees. Enabling DLSS will help the PC run these games smoothly again at 2160p. On their part, AMD offers a similar feature in the form of FSR. Ultimately, it is up to game developers to implement these features. You can visit this page to find a list of games that either already support DLSS 3.0 or will do so in future.
| Metro Exodus - 1920x1080 Ultra Quality DXR AF:16x | |
| NVIDIA GeForce RTX 4090 | |
| AMD Radeon RX 7900 XTX | |
| NVIDIA GeForce RTX 4080 | |
| NVIDIA GeForce RTX 4090 | |
| AMD Radeon RX 7900 XT | |
| NVIDIA GeForce RTX 3080 Ti | |
| NVIDIA GeForce RTX 3090 | |
| Far Cry 6 - 1920x1080 Ultra Graphics Quality + HD Textures + DXR AA:T | |
| NVIDIA GeForce RTX 4080 | |
| AMD Radeon RX 7900 XTX | |
| AMD Radeon RX 7900 XT | |
| NVIDIA GeForce RTX 4090 | |
| NVIDIA GeForce RTX 4090 | |
| NVIDIA GeForce RTX 3080 Ti | |
| NVIDIA GeForce RTX 3090 | |
| AMD Radeon RX 6800 | |
| AMD Radeon RX 6950 XT | |
| Cyberpunk 2077 1.6 | |
| 3840x2160 Ray Tracing Ultra Preset (DLSS off) | |
| NVIDIA GeForce RTX 4090 | |
| NVIDIA GeForce RTX 4090 (1.6) | |
| NVIDIA GeForce RTX 4080 (1.6) | |
| NVIDIA GeForce RTX 3090 (1.6) | |
| AMD Radeon RX 7900 XTX (1.61) | |
| NVIDIA GeForce RTX 3080 Ti (1.61) | |
| AMD Radeon RX 7900 XT (1.61) | |
| AMD Radeon RX 6800 (1.61) | |
| 1920x1080 Ray Tracing Ultra Preset (DLSS off) | |
| NVIDIA GeForce RTX 4090 | |
| NVIDIA GeForce RTX 4090 (1.6) | |
| NVIDIA GeForce RTX 4080 (1.6) | |
| NVIDIA GeForce RTX 3080 Ti (1.61) | |
| NVIDIA GeForce RTX 3090 (1.6) | |
| AMD Radeon RX 7900 XTX (1.61) | |
| AMD Radeon RX 7900 XT (1.61) | |
| AMD Radeon RX 6800 (1.61) | |
| Control - 1920x1080 High Quality Preset & High Ray Tracing Preset (DX12) | |
| NVIDIA GeForce RTX 4090 | |
| NVIDIA GeForce RTX 4080 | |
| NVIDIA GeForce RTX 4090 | |
| AMD Radeon RX 7900 XTX | |
| NVIDIA GeForce RTX 3080 Ti | |
| AMD Radeon RX 7900 XT | |
| AMD Radeon RX 6950 XT | |
| Ghostwire Tokyo - 1920x1080 Highest Settings + Maximum Ray Tracing | |
| NVIDIA GeForce RTX 4090 | |
| NVIDIA GeForce RTX 4090 | |
| NVIDIA GeForce RTX 4080 | |
| AMD Radeon RX 7900 XTX | |
| NVIDIA GeForce RTX 3080 Ti | |
| AMD Radeon RX 7900 XT | |
| Guardians of the Galaxy - 1920x1080 Ultra Preset + Ultra Ray-Tracing | |
| NVIDIA GeForce RTX 4090 | |
| AMD Radeon RX 7900 XTX | |
| AMD Radeon RX 7900 XT | |
| The Callisto Protocol - 1920x1080 Ultra Preset (without FSR Upscaling) + Full Ray-Tracing | |
| AMD Radeon RX 7900 XTX | |
| NVIDIA GeForce RTX 4090 | |
| NVIDIA GeForce RTX 4090 | |
| AMD Radeon RX 7900 XT | |
| NVIDIA GeForce RTX 3080 Ti | |
| AMD Radeon RX 6800 | |
| low | med. | high | ultra | QHD | 4K DLSS | 4K | |
|---|---|---|---|---|---|---|---|
| GTA V (2015) | 187.6 | 187.6 | 187 | 165.9 | 166.3 | 187.5 | |
| The Witcher 3 (2015) | 731.4 | 664.6 | 613.4 | 314.1 | 282 | ||
| Dota 2 Reborn (2015) | 287.9 | 258.5 | 256.3 | 219.7 | 226.8 | ||
| Final Fantasy XV Benchmark (2018) | 234 | 232 | 227 | 224 | 155.7 | ||
| X-Plane 11.11 (2018) | 237 | 209 | 160.6 | 139.3 | |||
| Far Cry 5 (2018) | 240 | 208 | 201 | 187 | 187 | 173 | |
| Strange Brigade (2018) | 627 | 506 | 506 | 506 | 488 | 281 | |
| Shadow of the Tomb Raider (2018) | 300 | 288 | 285 | 282 | 269 | 186 | |
| Far Cry New Dawn (2019) | 206 | 188 | 180 | 161 | 164 | 152 | |
| Metro Exodus (2019) | 260 | 235 | 191.9 | 177.3 | 165 | 136.3 | |
| Control (2019) | 233 | 233 | 233 | 232 | 114.4 | ||
| Borderlands 3 (2019) | 243 | 213 | 197.3 | 182.9 | 182.5 | 132.9 | |
| F1 2020 (2020) | 521 | 445 | 431 | 395 | 386 | 282 | |
| F1 2021 (2021) | 632 | 585 | 501 | 277 | 267 | 196.6 | |
| Far Cry 6 (2021) | 213 | 187.4 | 168.7 | 166.8 | 163.8 | 133.4 | |
| Guardians of the Galaxy (2021) | 220 | 220 | 219 | 216 | 215 | 214 | |
| Forza Horizon 5 (2021) | 285 | 245 | 244 | 187 | 178 | 148 | |
| God of War (2022) | 263 | 263 | 255 | 203 | 173.4 | 125.1 | |
| GRID Legends (2022) | 311 | 286 | 258 | 248 | 242 | 191.4 | |
| Cyberpunk 2077 1.6 (2022) | 195 | 185 | 182 | 181 | 167 | 80 | |
| Ghostwire Tokyo (2022) | 278 | 275 | 273 | 272 | 266 | 174.7 | |
| Tiny Tina's Wonderlands (2022) | 413 | 355 | 309 | 280 | 224 | 128.4 | |
| F1 22 (2022) | 415 | 377 | 364 | 195.4 | 149.7 | 81.1 | |
| A Plague Tale Requiem (2022) | 188.6 | 175.4 | 158.5 | 147.8 | 104.6 | 193.6 | 74.7 |
| Uncharted Legacy of Thieves Collection (2022) | 139.5 | 138.1 | 137.1 | 136.6 | 134.9 | 99.1 | |
| Call of Duty Modern Warfare 2 2022 (2022) | 248 | 247 | 232 | 230 | 187 | 215 | 128 |
| Spider-Man Miles Morales (2022) | 169.9 | 163.3 | 150.9 | 149.3 | 127.4 | 126.8 | |
| The Callisto Protocol (2022) | 234.8 | 224 | 204.9 | 203.8 | 184.8 | 124.9 | |
| The Witcher 3 v4 (2023) | 304 | 271 | 218 | 198.8 | 154.1 | 199.7 |
Emissions
Noise emissions
Based on our measurements, the system is relatively quiet at idle and produces only 32 dB(A) of noise. Under an average load, the computer is audible but still quiet because the graphics card can still be passively cooled. The case fans and the three GPU fans only spin up when the system is under heavy load. Our sound level meter measured a peak noise level of 40.6 dB(A) during the stress test.
Noise level
| Idle |
| 32 / 32.1 / 32.3 dB(A) |
| Load |
| 32.4 / 40.6 dB(A) |
 | ||
30 dB silent 40 dB(A) audible 50 dB(A) loud |
||
min: | ||
Temperature
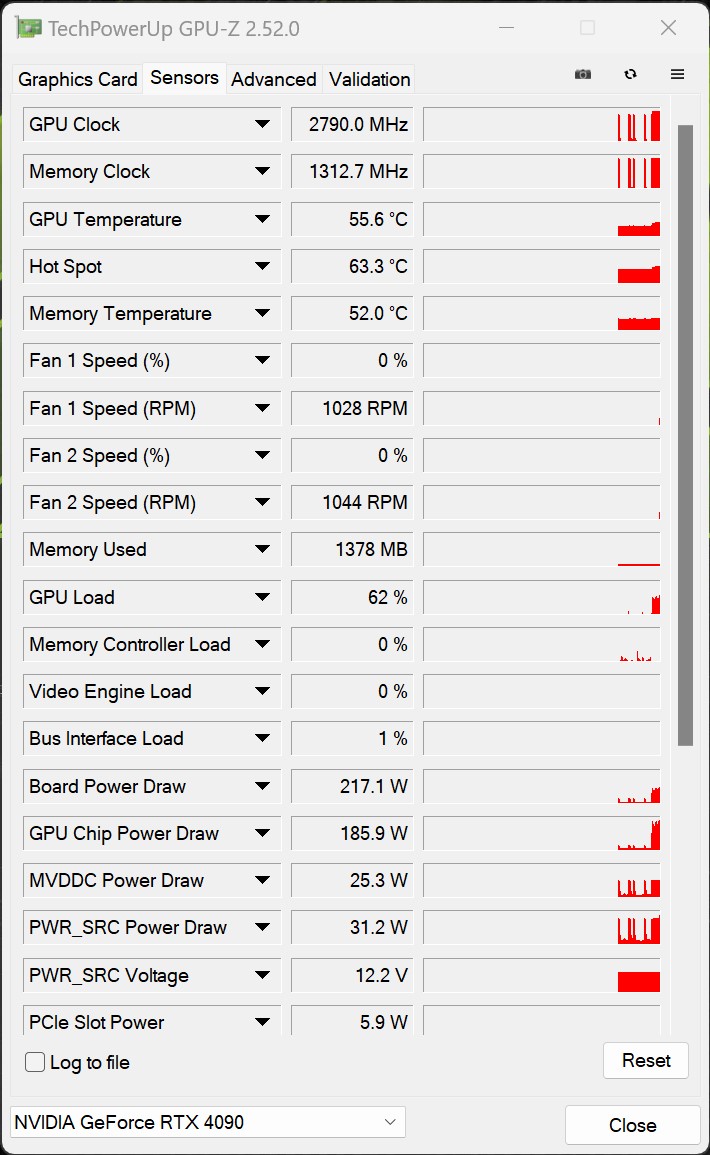
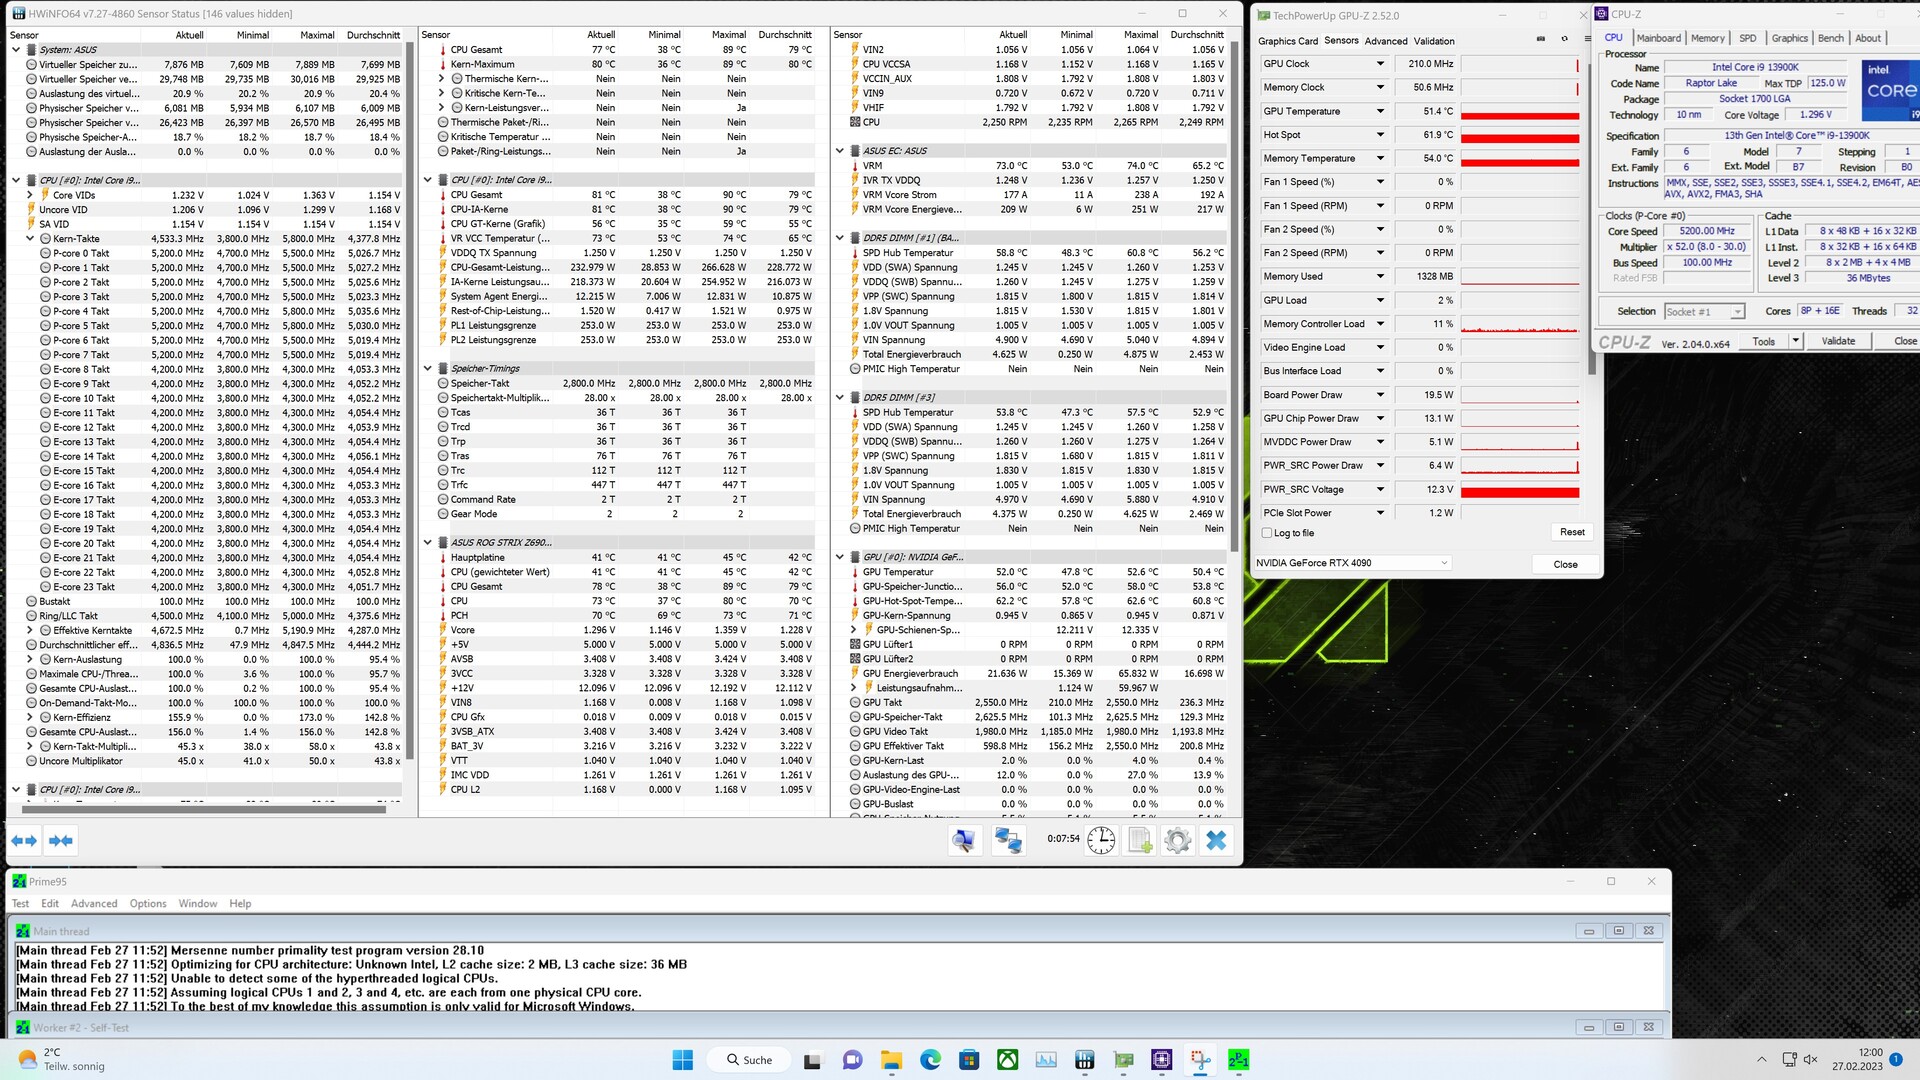
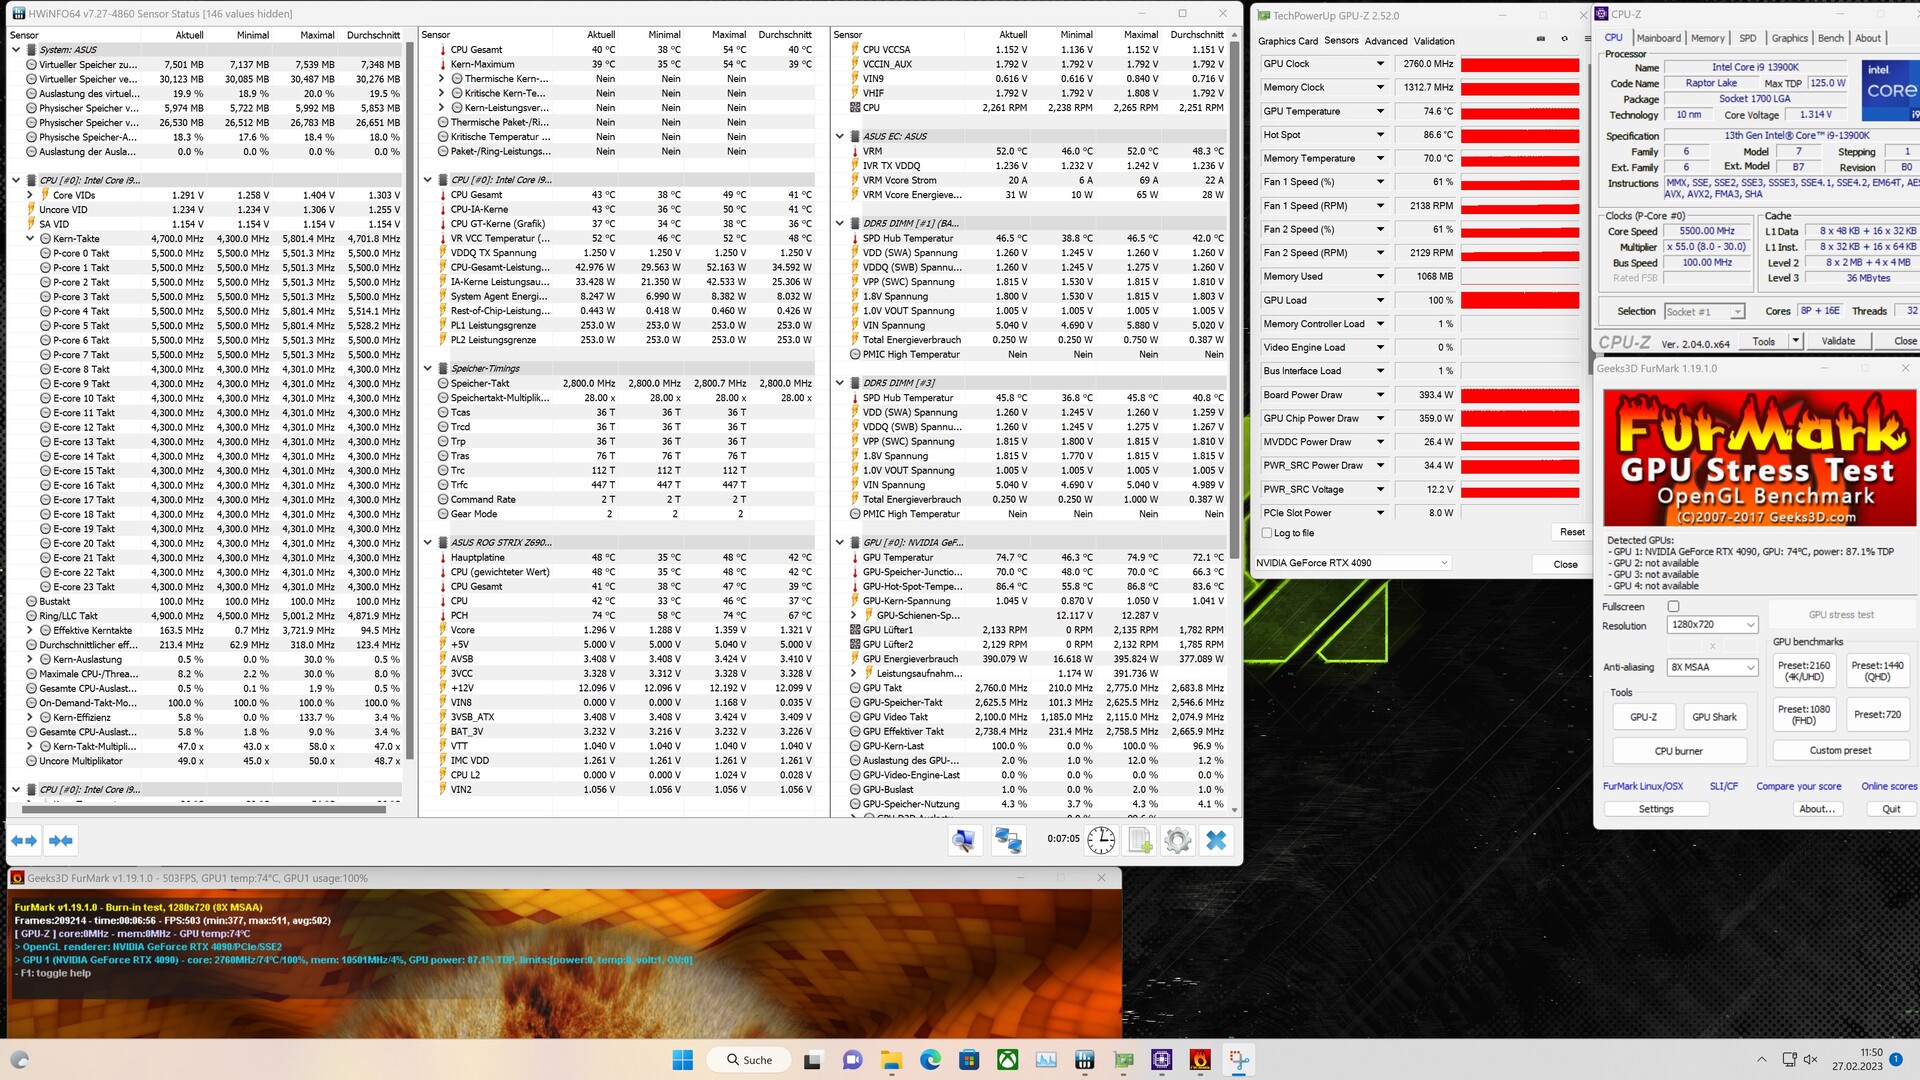
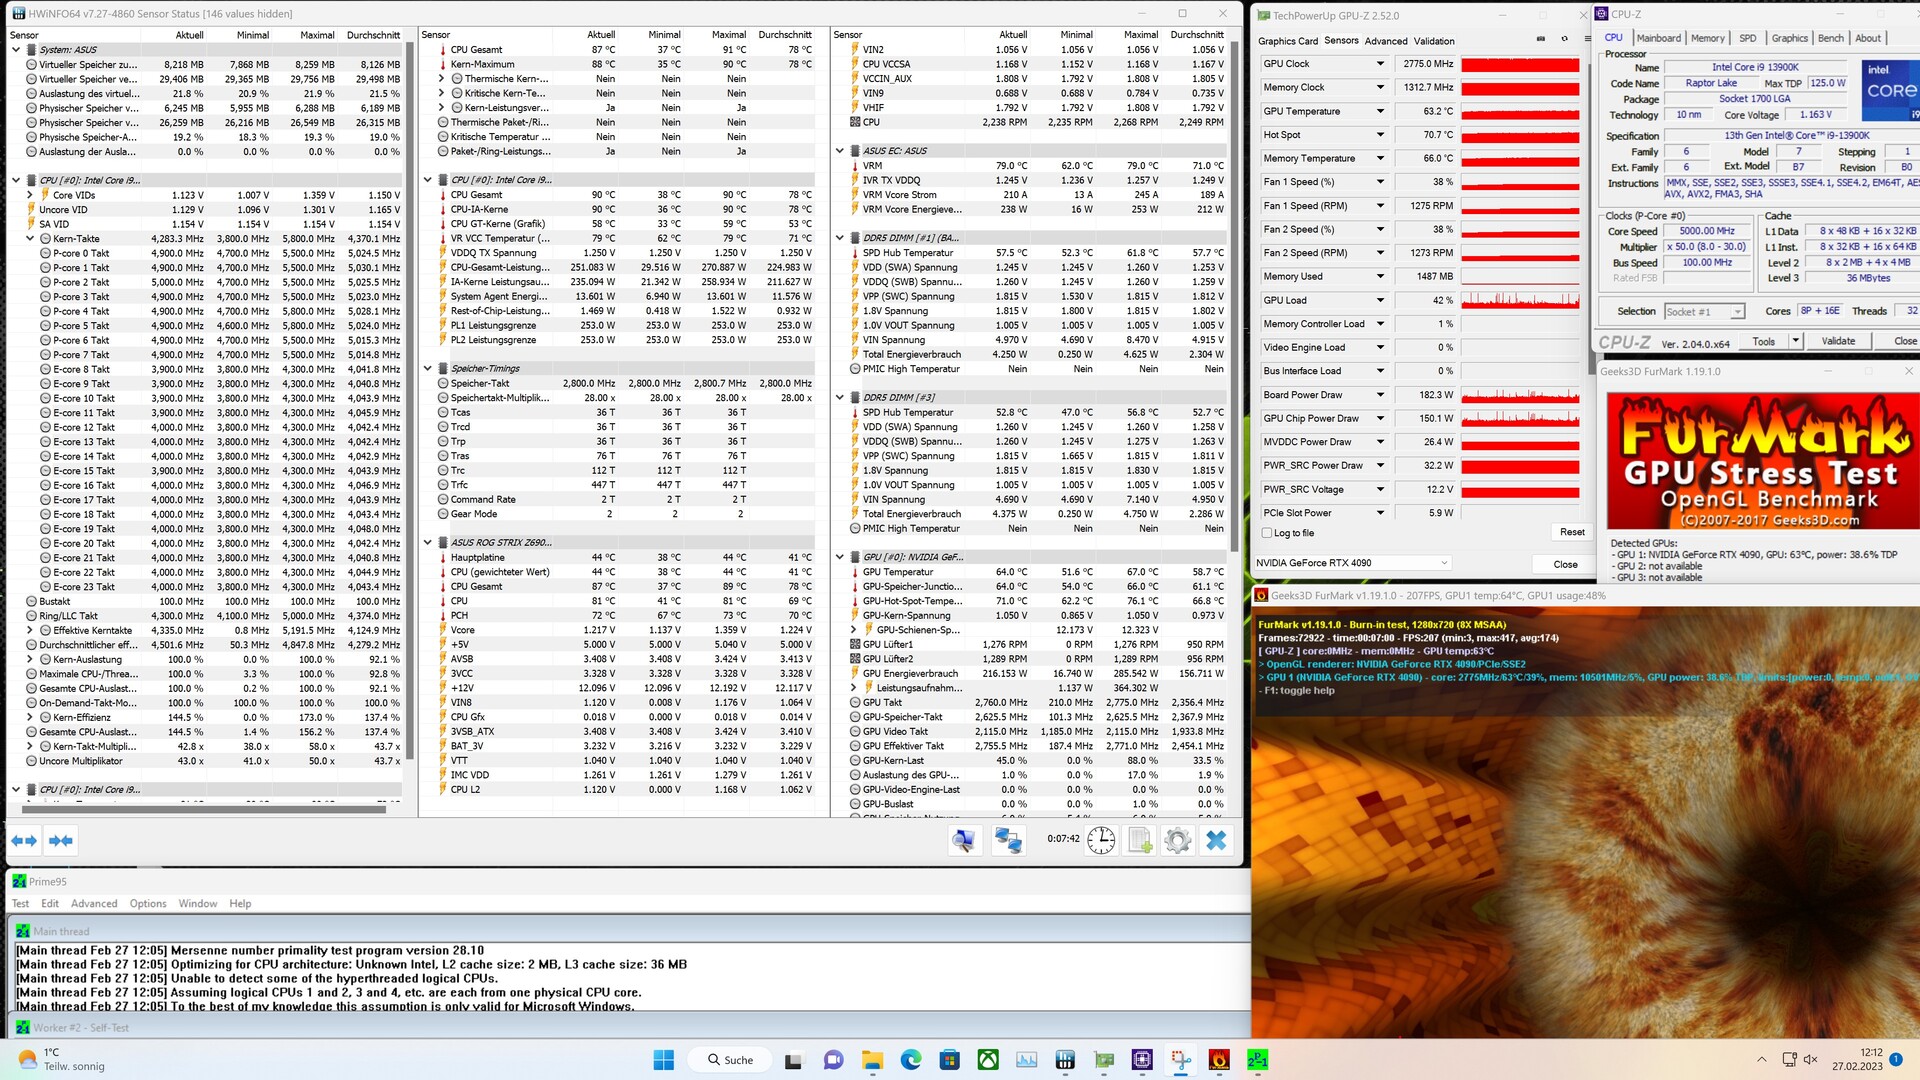
The XMG SECTOR Intel is designed to draw in cool air from the front and direct warm air out of the case at the top and back. But the system only uses one fan to remove warm air from the case. There are no fans installed at the top. Nevertheless, the Corsair 4000D Airflow makes use of three intake fans to create a positive pressure so that warm air can be pushed out of the case. The 360 mm radiator of the AIO cooler is mounted right behind the front panel to ensure optimal cooling of the processor. In the stress test, we saw the CPU reaching as high as 90°C (195°F) with an average power draw of 228 watts, whilst GPU temperatures hit nearly 75°C (167°F), which is completely safe.
Power consumption
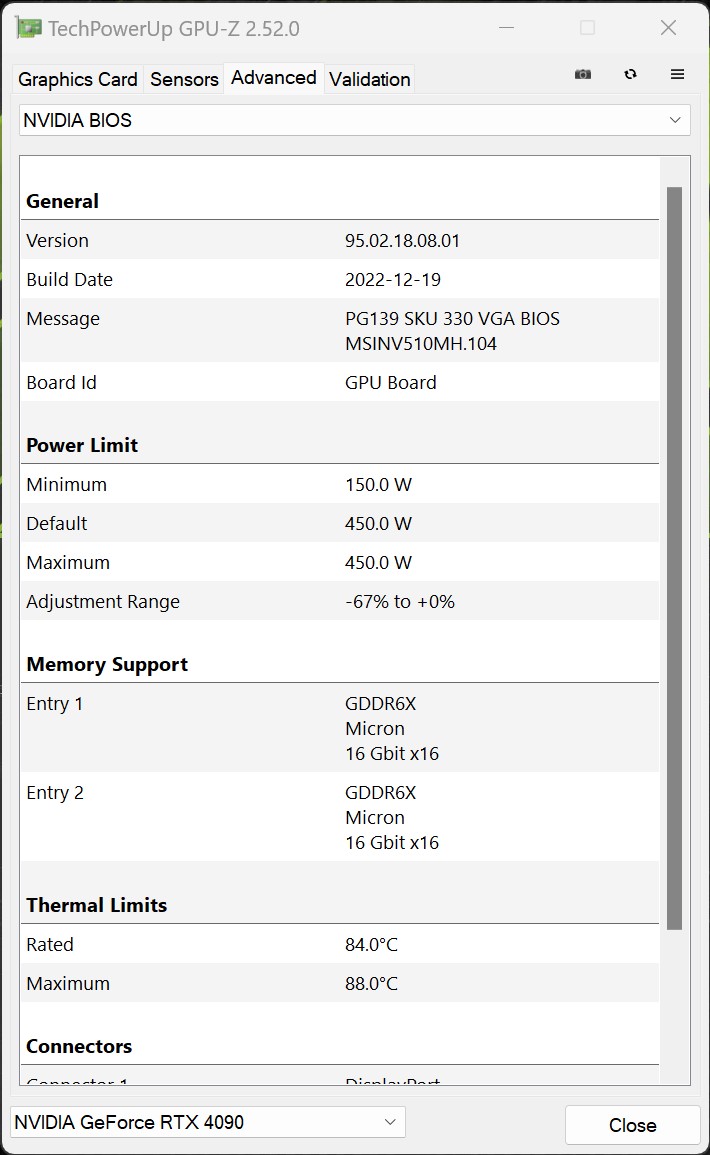
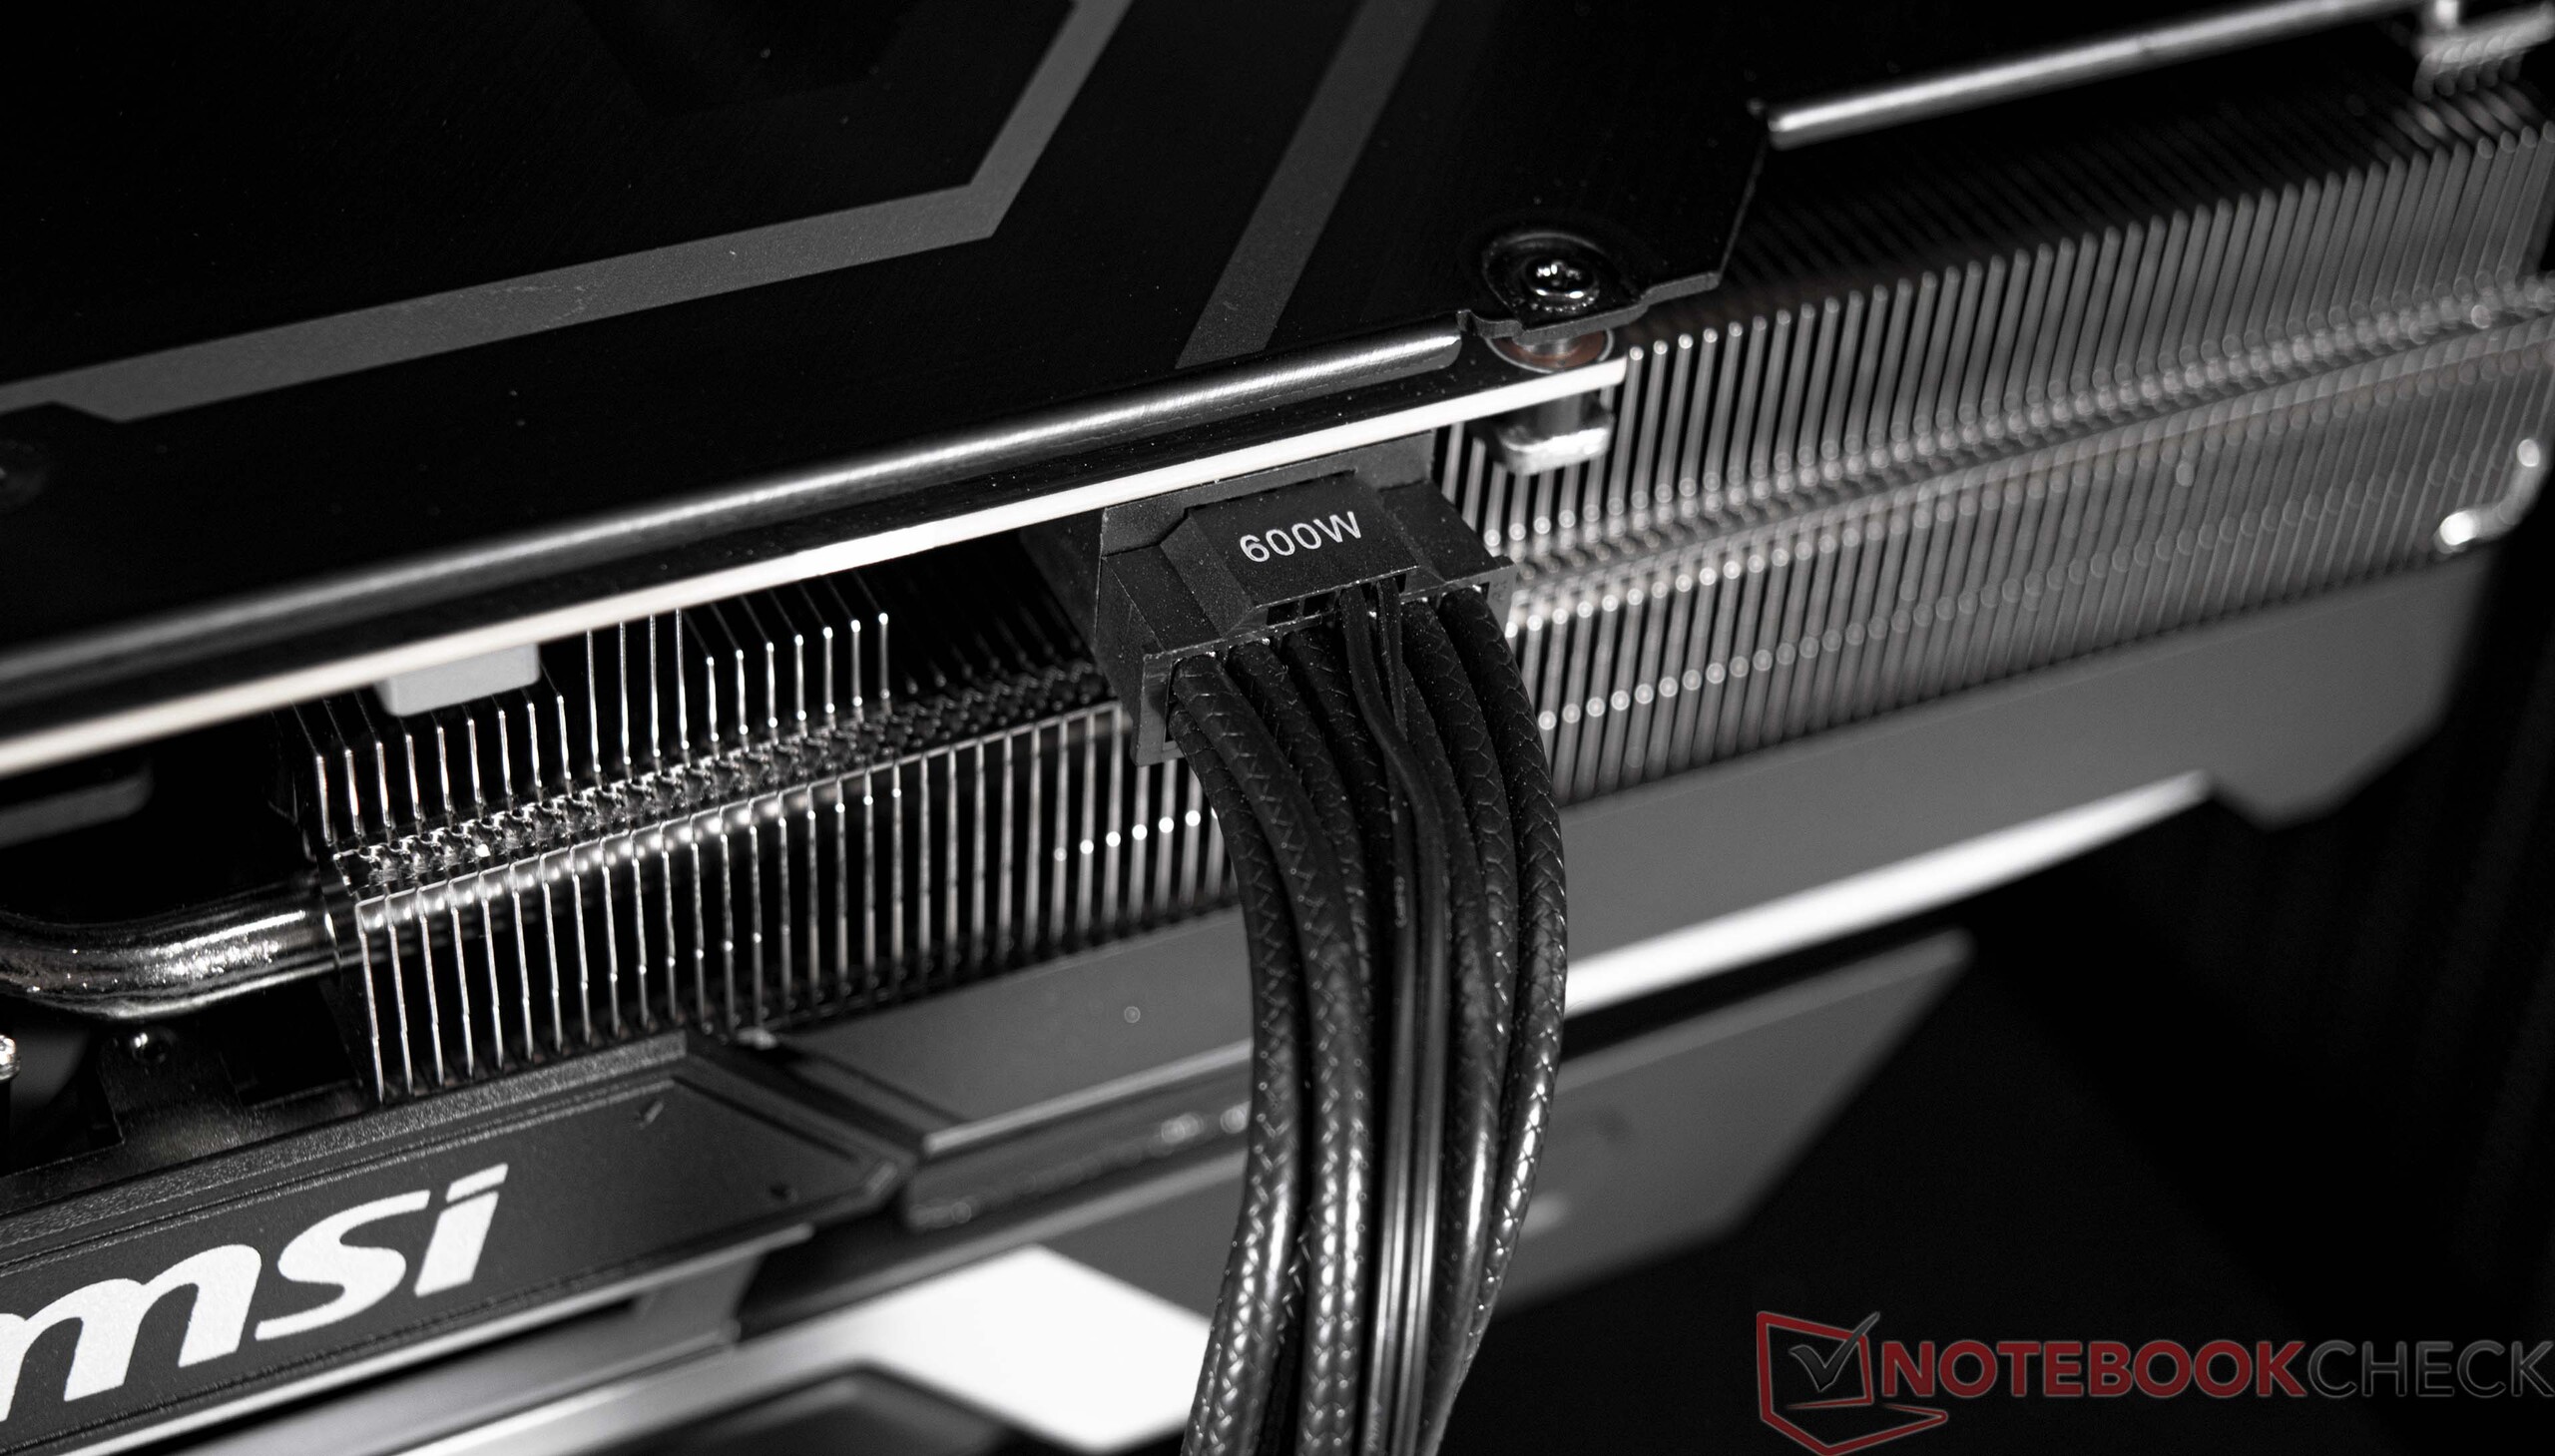
The whole system is powered by a Seasonic PSU rated at 1000 watts. During our testing, the power supply had no problem providing the components with enough energy even under full load. Given all the high-end components inside, it's obvious that the system isn't going to be light on power usage. Power consumption was around 78 to 96 watts at idle, which is still acceptable. By contrast, the 1000-watt power supply had to deliver an average of 511 watts during gaming. We noticed some occasional major spikes in power draw, but even the usage peaks of up to 778 watts didn't push the PSU to its limits. In the comparison, the review unit is just slightly behind our GPU test system with a similar graphics card.
| Power Consumption / The Witcher 3 ultra (external Monitor) | |
| AMD Radeon RX 6950 XT | |
| NVIDIA GeForce RTX 3090 Ti (Idle: 102 W) | |
| NVIDIA GeForce RTX 3090 | |
| NVIDIA GeForce RTX 4090 | |
| NVIDIA GeForce RTX 3080 12 GB | |
| NVIDIA GeForce RTX 4090 | |
| AMD Radeon RX 6900 XT (Idle: 99.15 W) | |
| Power Consumption / FurMark 1.19 GPU Stress Test (external Monitor) | |
| NVIDIA GeForce RTX 4090 | |
| AMD Radeon RX 6950 XT | |
| NVIDIA GeForce RTX 3090 | |
| NVIDIA GeForce RTX 3080 12 GB | |
| AMD Radeon RX 6900 XT (Idle: 99.15 W) | |
| NVIDIA GeForce RTX 4090 | |
* ... smaller is better
| Off / Standby | |
| Idle | |
| Load |
|
Key:
min: | |
Power consumption with external monitor
Pros
Cons
Verdict - Blazingly fast gaming PC
Featuring an Intel Core i9-13900K and an Nvidia GeForce RTX 4090, our review configuration of the XMG SECTOR Intel is one of the fastest gaming PCs you can assemble right now. The system also sits on a fairly modern foundation, even though its motherboard "only" has the Z690 chipset. Despite this, the system uses DDR5 memory. What's more, its storage drive delivers solid performance and, with a capacity of 2 TB, even offers enough space to hold many games.
Based on an Intel Core i9-13900K, the XMG SECTOR Intel offers excellent performance for a whole host of use cases. In conjunction with the GeForce RTX 4090, the system is currently one of the fastest gaming PCs available on the market.
Our review unit has such immensely high performance at its disposal that it can run all modern games smoothly at 2160p. The system is certainly not a steal at around €4,600 (US$4,851). Nevertheless, the configuration makes sense if you want to play the latest games without any compromise. A similarly specced AMD system with a Ryzen 9 7950X (also available in the shop as XMG SECTOR AMD) costs roughly €300 (US$316) more.
Price and availability
The XMG SECTOR Intel is available from Schenker's online shop bestware.com and costs roughly €4,600 (US$4,851). You can also select components based on your specific needs using the comprehensive configurator.
Schenker XMG SECTOR, i9 13900K, RTX 4090
- 03/04/2023 v7 (old)
Sebastian Bade
Transparency
The selection of devices to be reviewed is made by our editorial team. The test sample was provided to the author as a loan by the manufacturer or retailer for the purpose of this review. The lender had no influence on this review, nor did the manufacturer receive a copy of this review before publication. There was no obligation to publish this review. As an independent media company, Notebookcheck is not subjected to the authority of manufacturers, retailers or publishers.
This is how Notebookcheck is testing
Every year, Notebookcheck independently reviews hundreds of laptops and smartphones using standardized procedures to ensure that all results are comparable. We have continuously developed our test methods for around 20 years and set industry standards in the process. In our test labs, high-quality measuring equipment is utilized by experienced technicians and editors. These tests involve a multi-stage validation process. Our complex rating system is based on hundreds of well-founded measurements and benchmarks, which maintains objectivity. Further information on our test methods can be found here.

