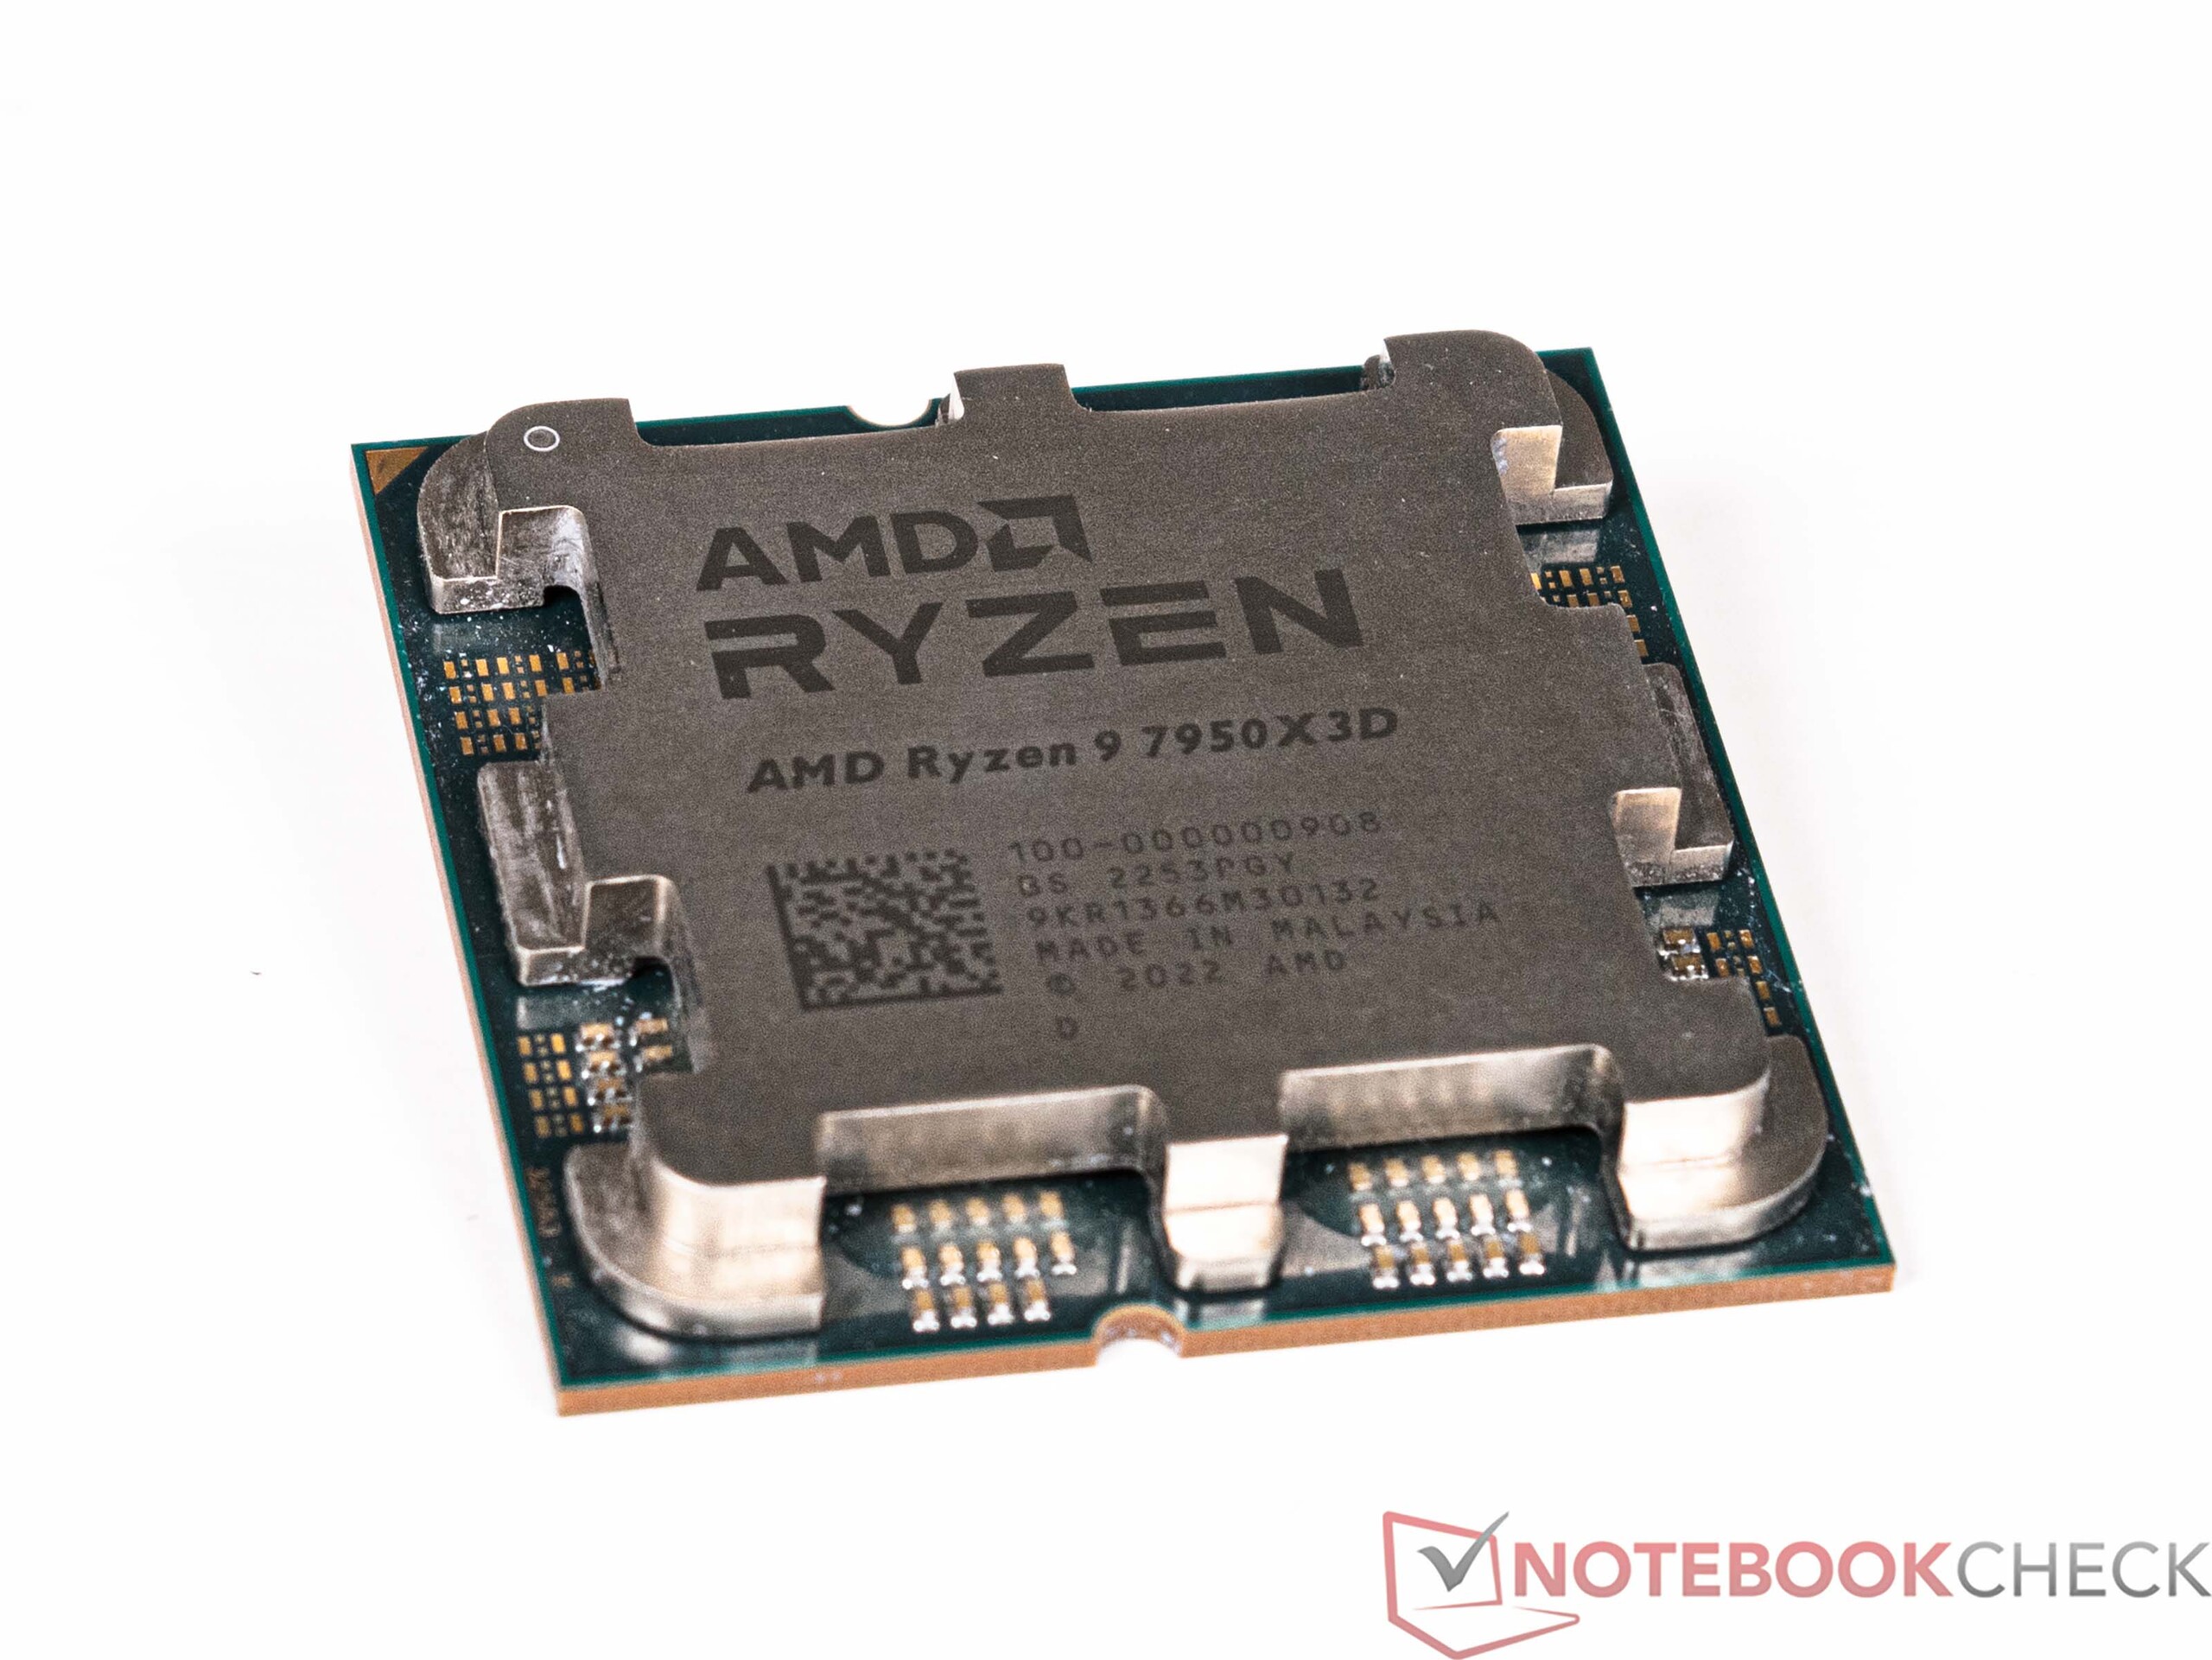
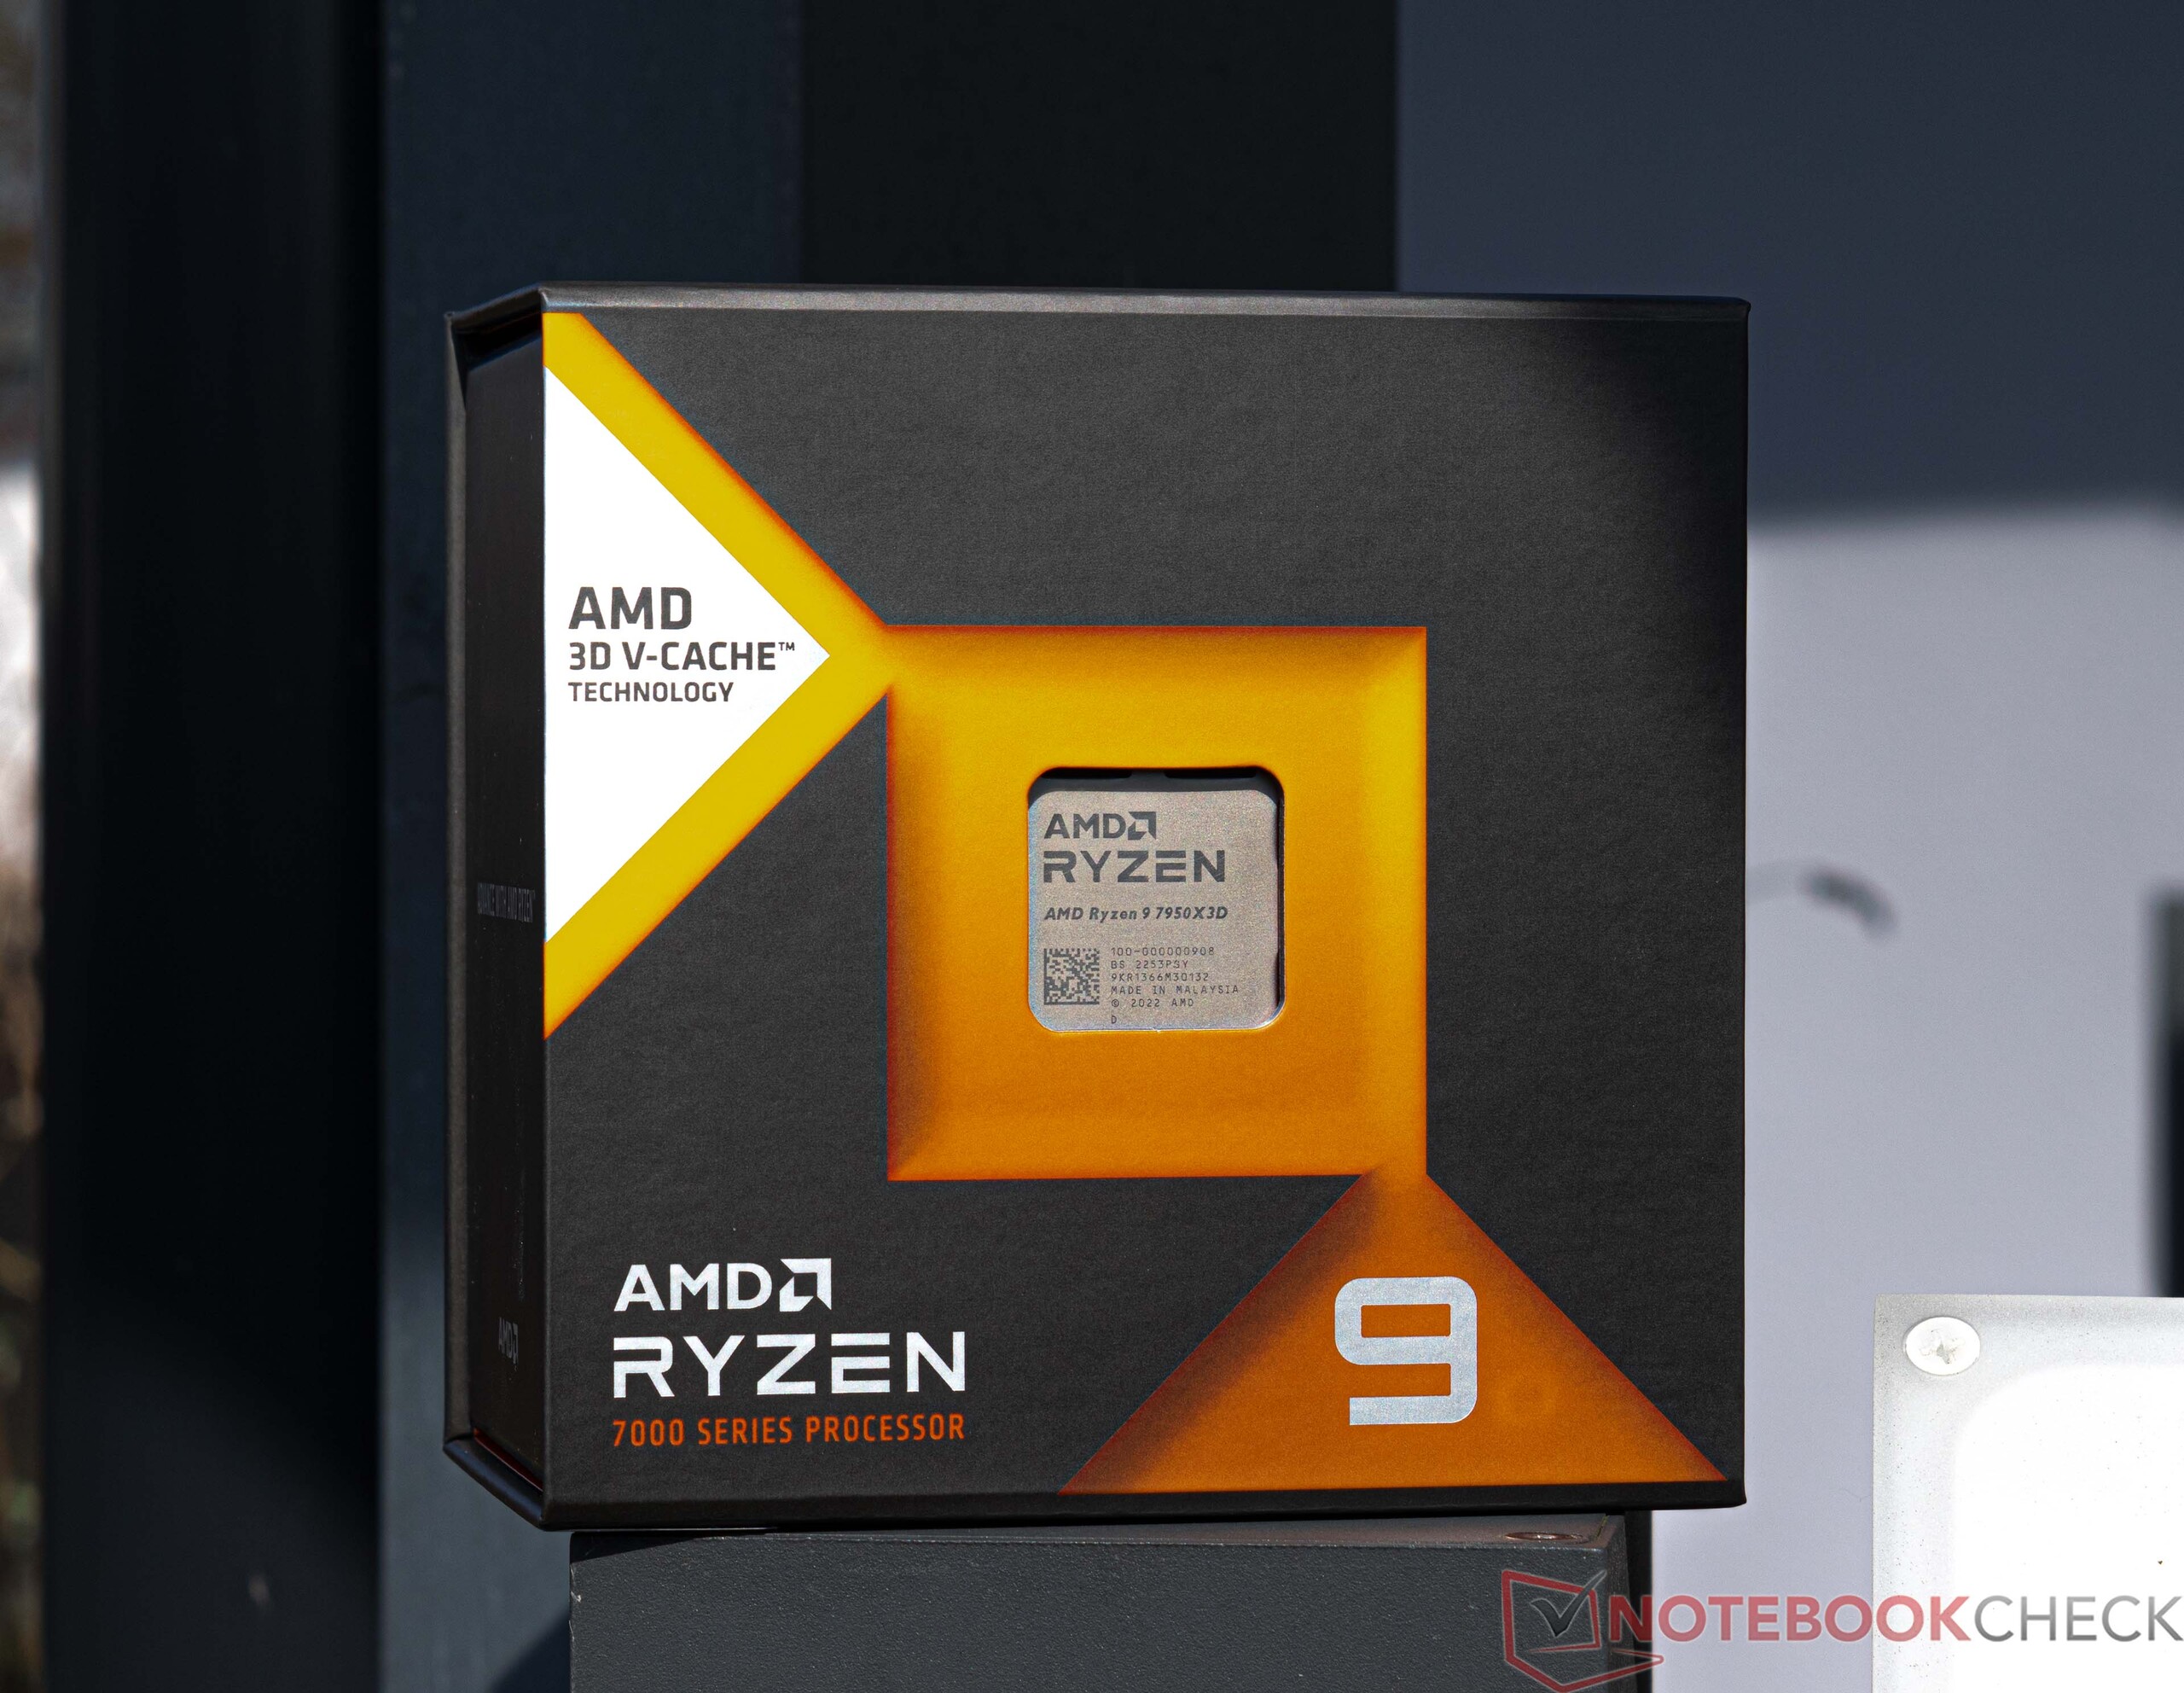
AMD Ryzen 9 7950X3D Desktop CPU review: New gaming flagship with 3D V-Cache on AM5 socket
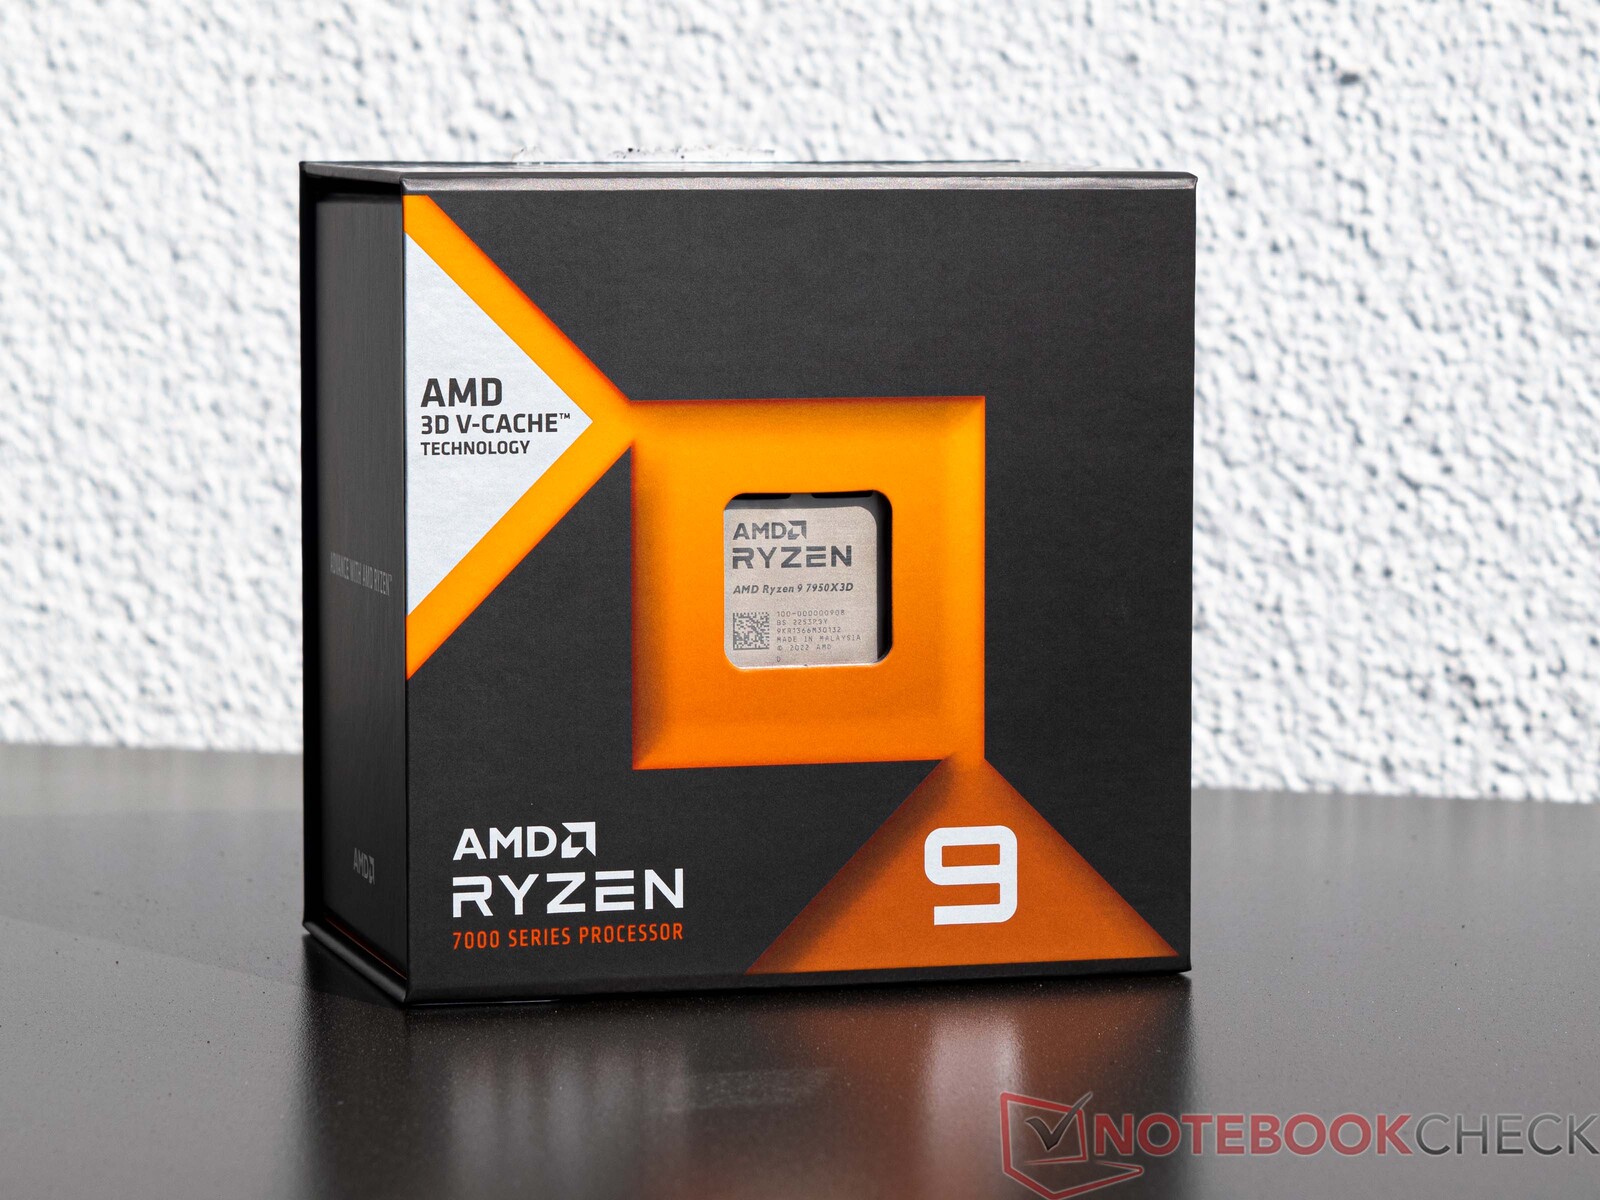
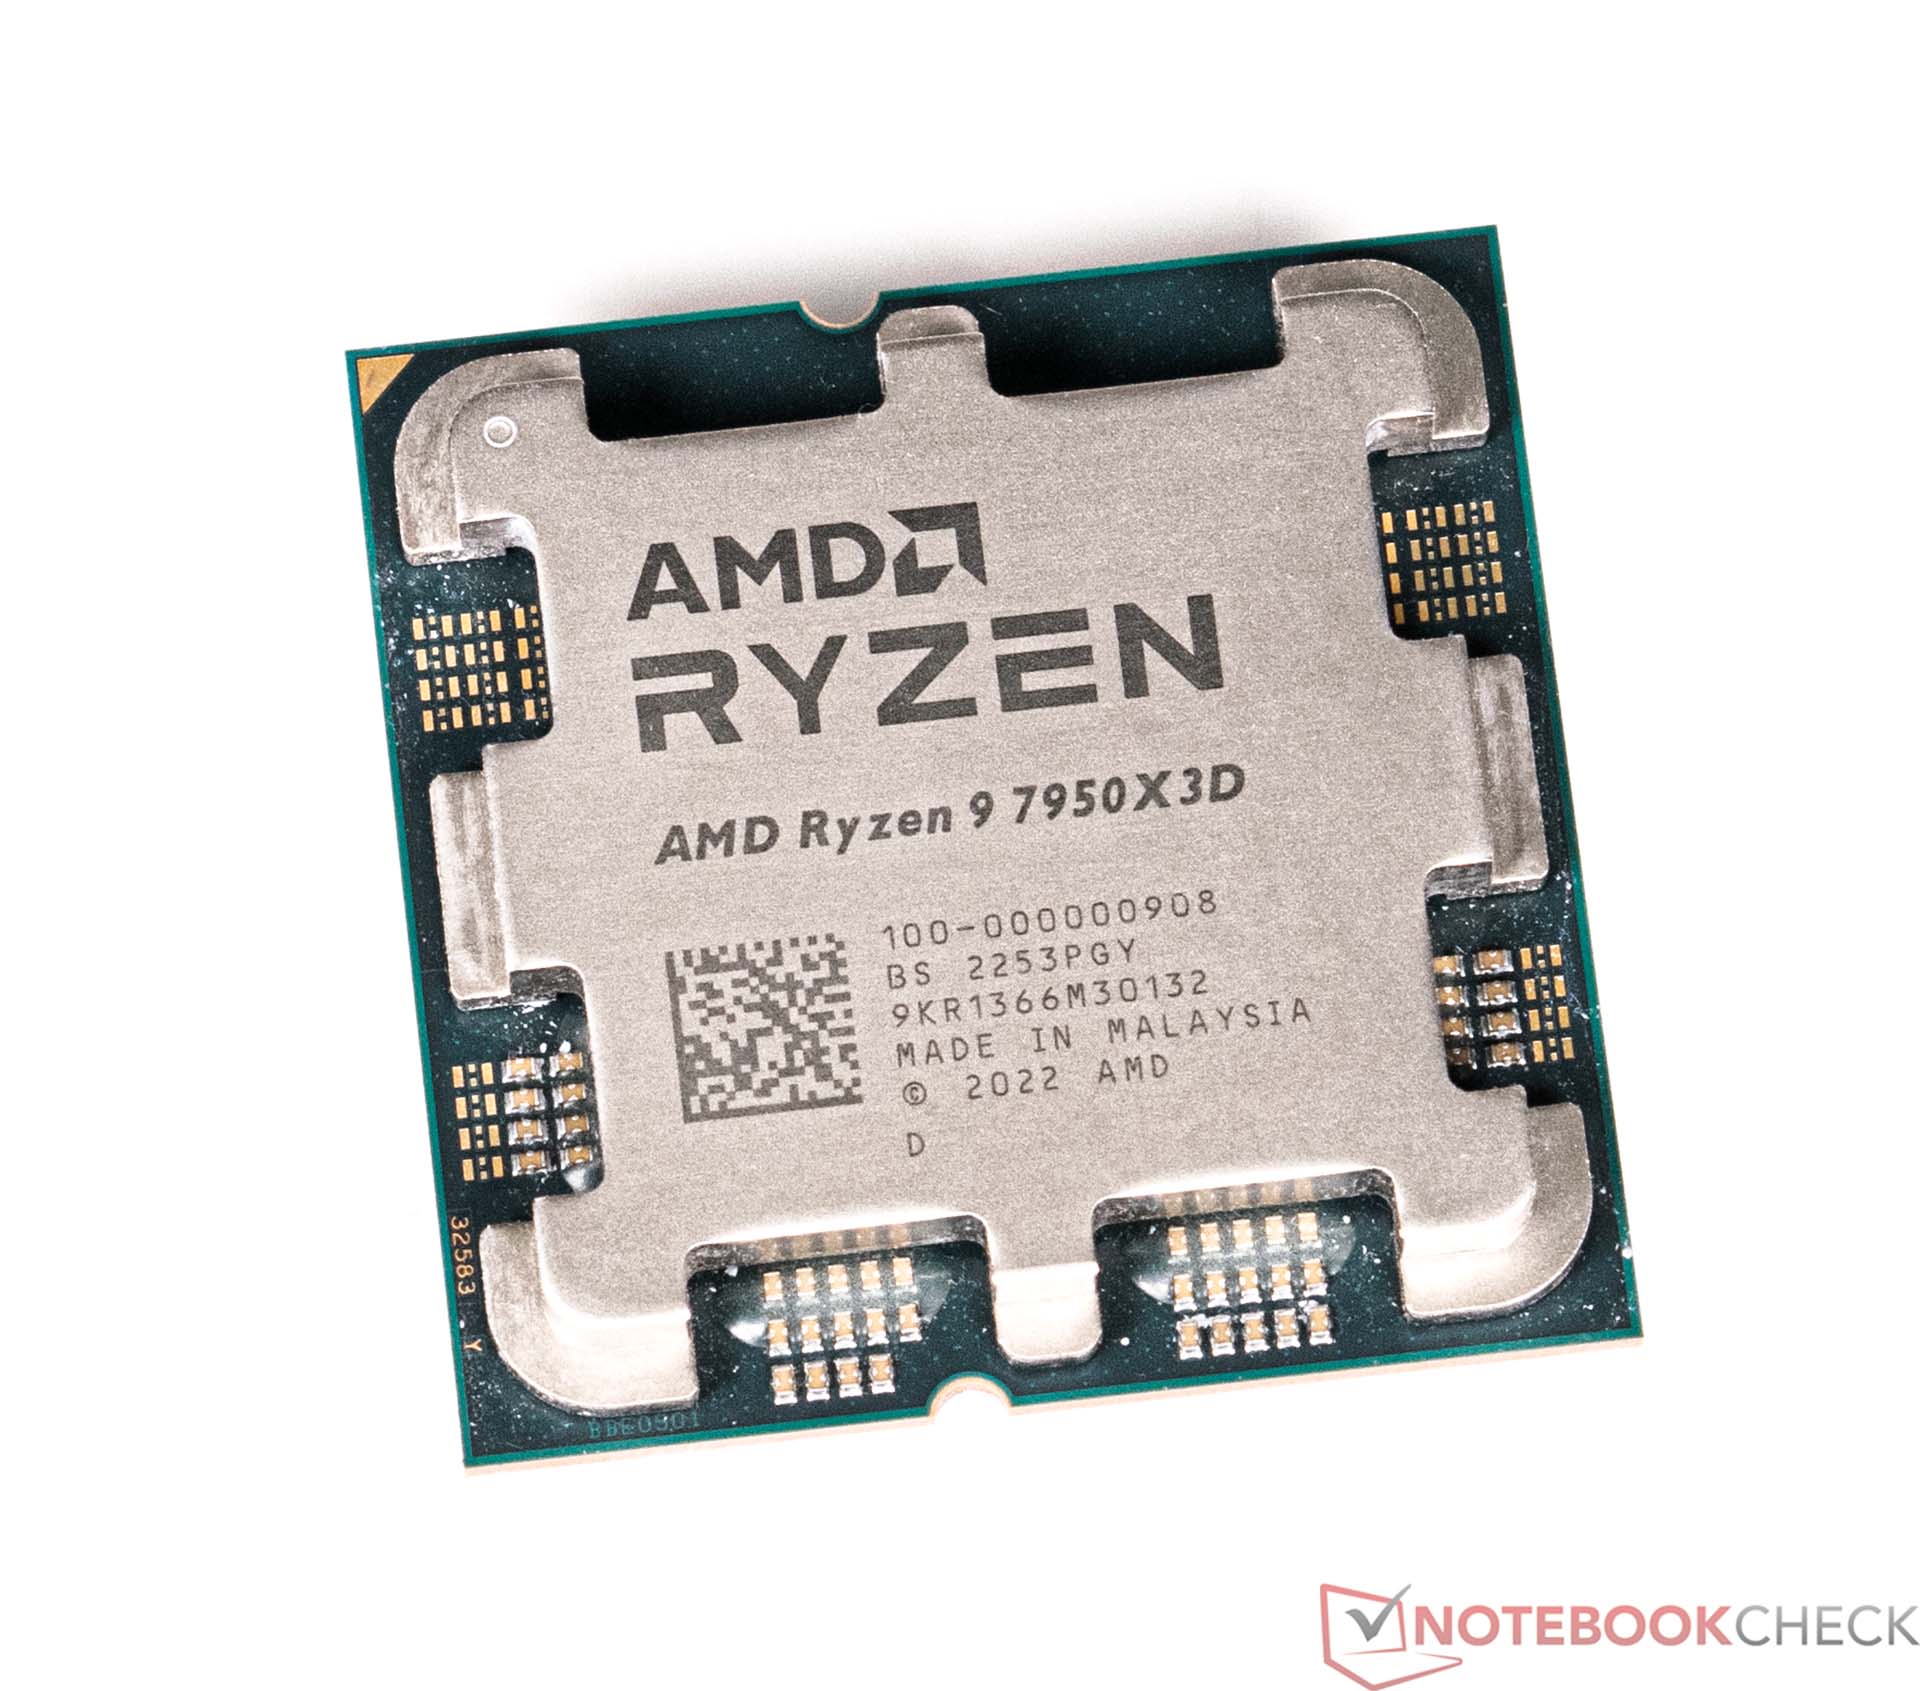
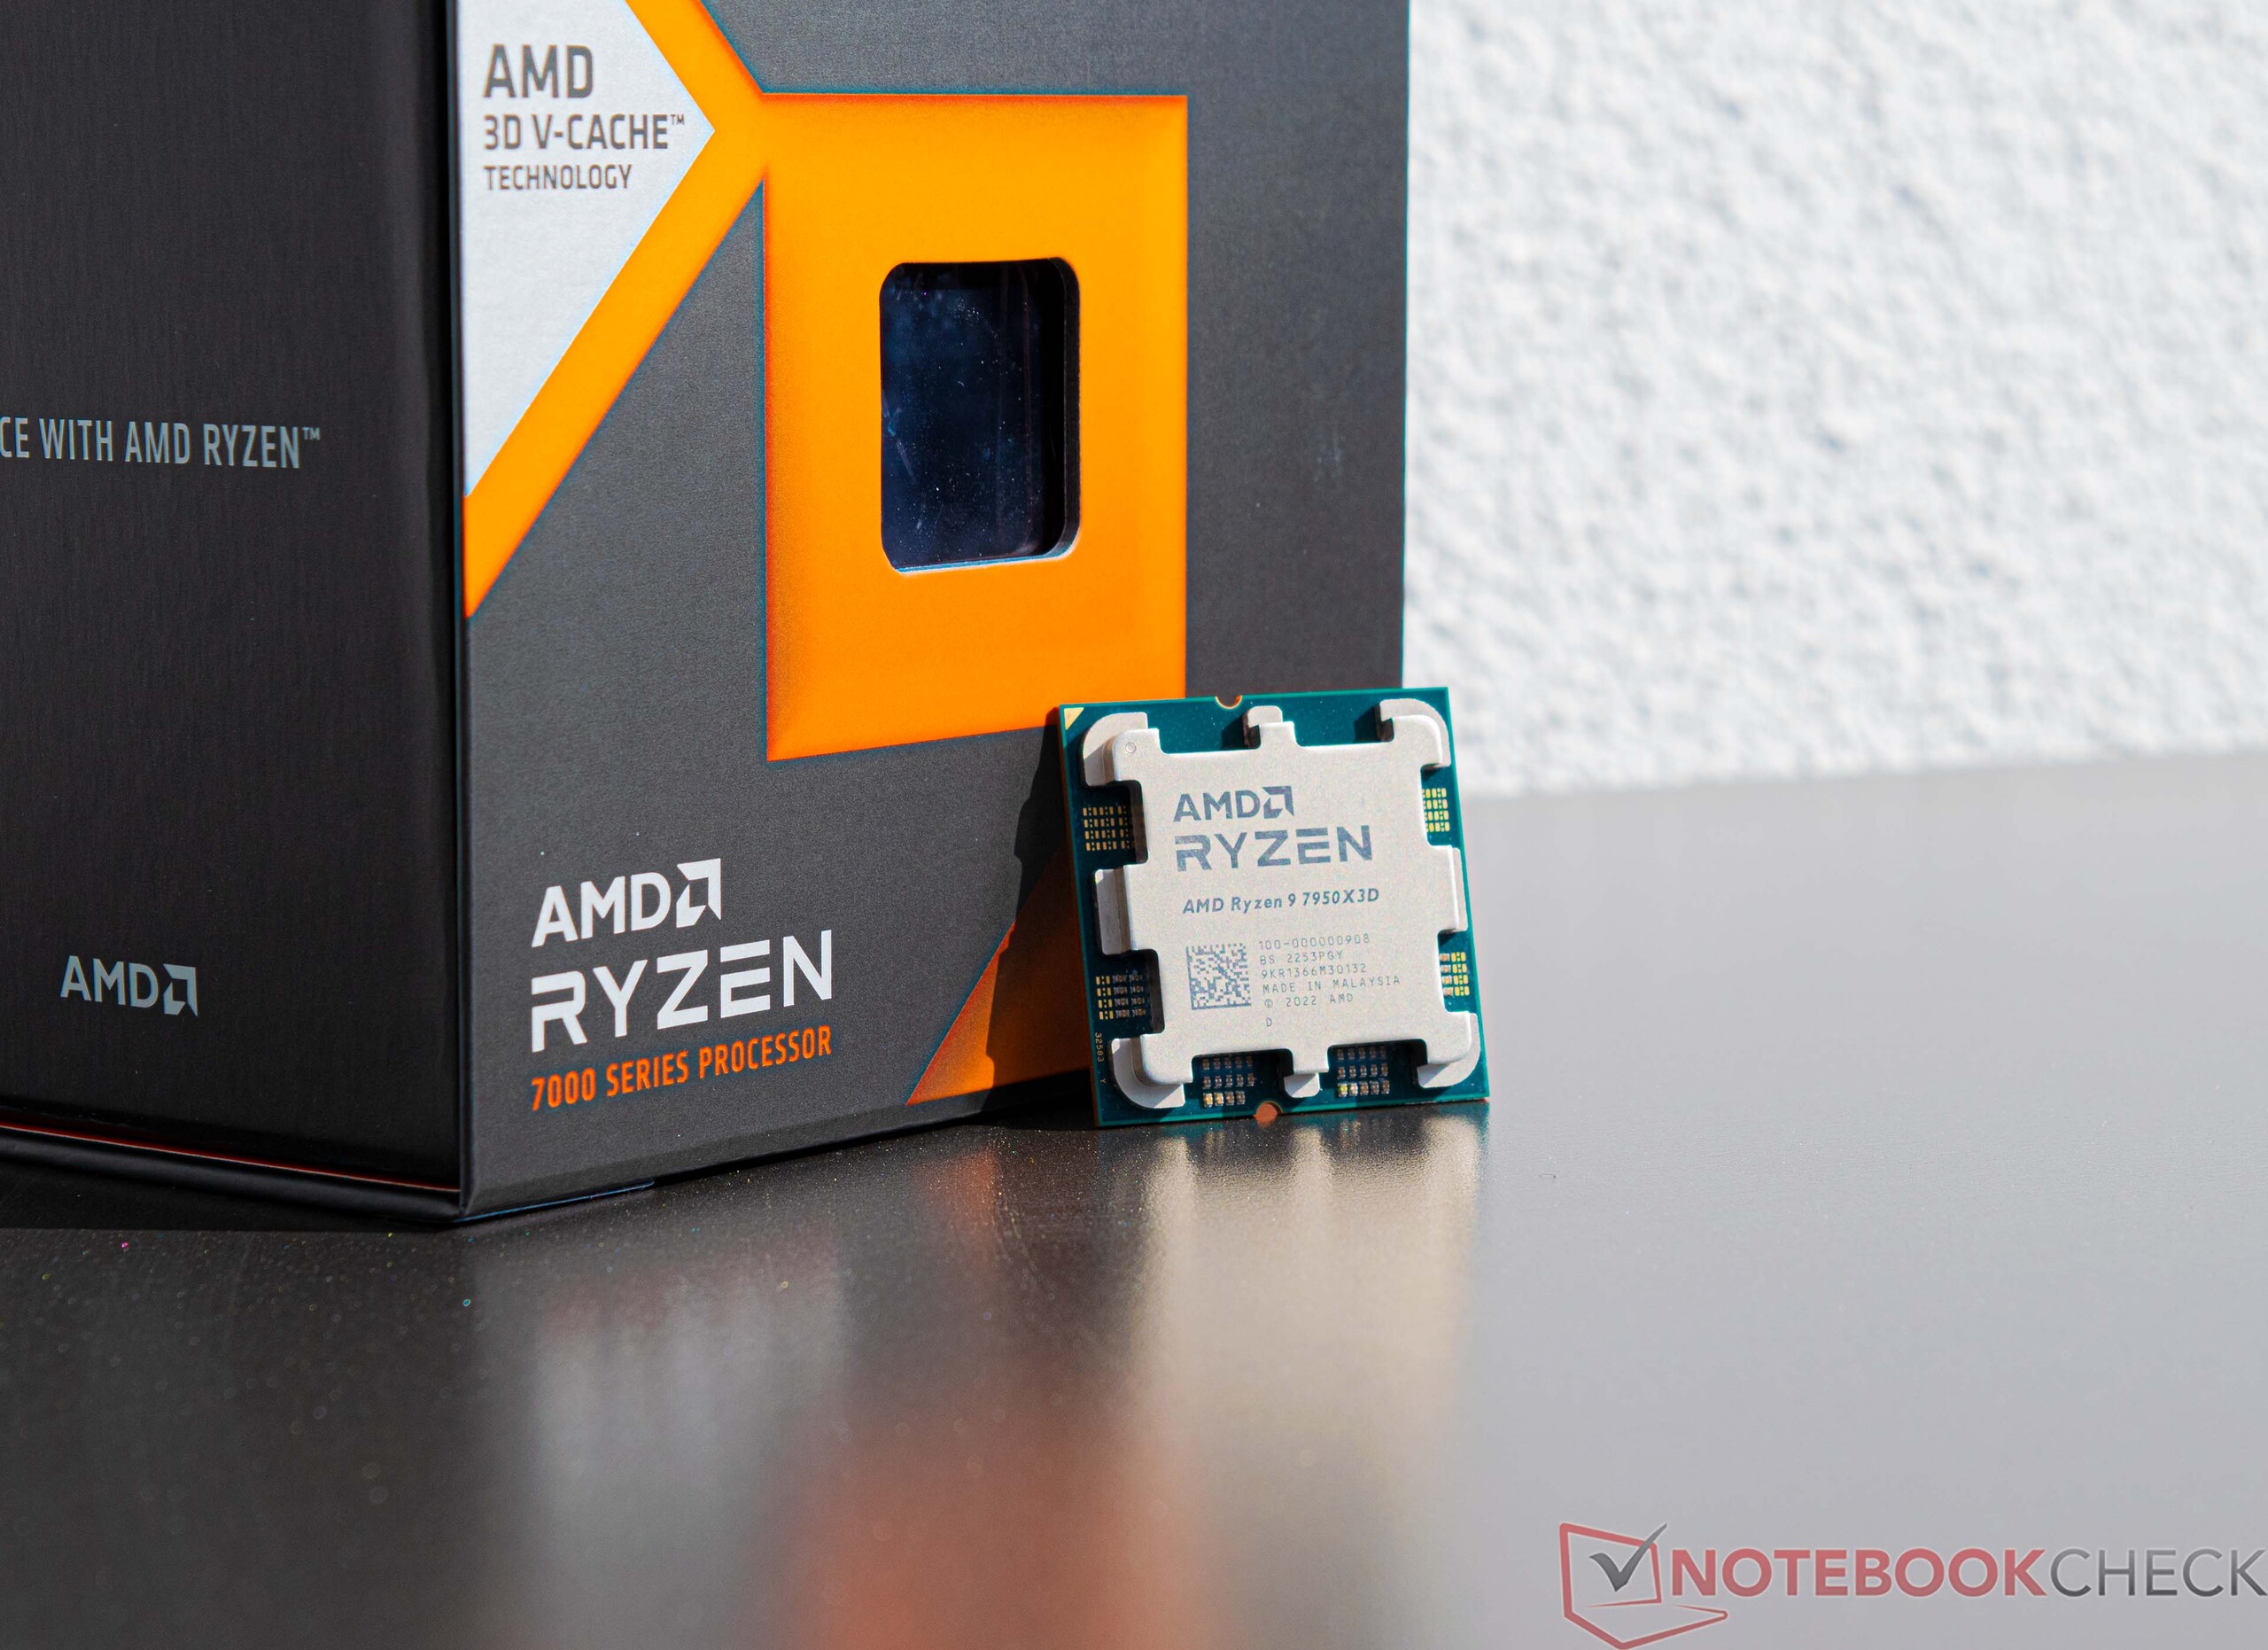
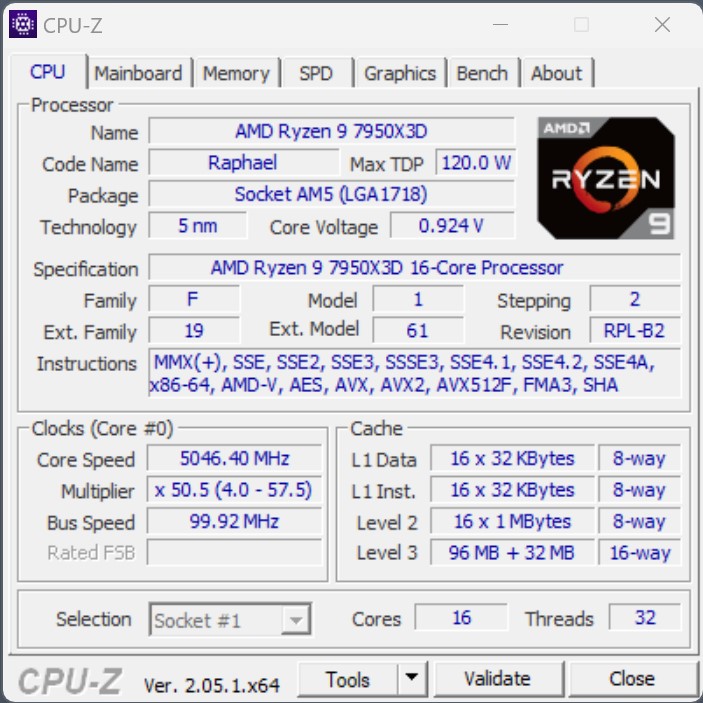
It hasn't been long after the AM5 platform for AMD's new Ryzen 7000 processors was introduced, before the manufacturer already announced the X3D models for the AM5 socket at CES in Las Vegas in January. What makes these models special is their 3D V-Cache, which is supposed to ensure a significant performance improvement when gaming. Already with the older AM4 socket, you were able to achieve a very good gaming performance with the AMD Ryzen 7 5800X3D. But based on the AM4 socket, that was the only CPU that was equipped with the 3D V-Cache. Now things are different with the new AM5 platform, and three models were announced at the beginning of the year. Starting with the AMD Ryzen 9 7950X3D together with the AMD Ryzen 9 7900X3D, the AMD Ryzen 7 7800X3D is supposed to follow in April 2023. For most gamers, the last processor should be the most interesting model of the series, not only because of the price. The internal construction of the two 12 and 16 core processors is designed with only one CCD including the fast 3D V-Cache. To understand this, you have to know that one CCD unites 8 CPU cores as a cluster. In the AMD Ryzen 9 7950X3D and AMD Ryzen 9 7950X there are 2 CCDs with 8 cores each, making a total of 16 cores available to the user. But this also means that the AMD Ryzen 9 7950X3D only offers 8 cores based on the fast 3D V-Cache. The second CCD is equipped only with the "regular" cache. For the smaller Ryzen 9 7900X3D, which continues to come with 12 computing cores, it is correspondingly 6 cores of the 2 CCDs that can access 3D V-Cache.
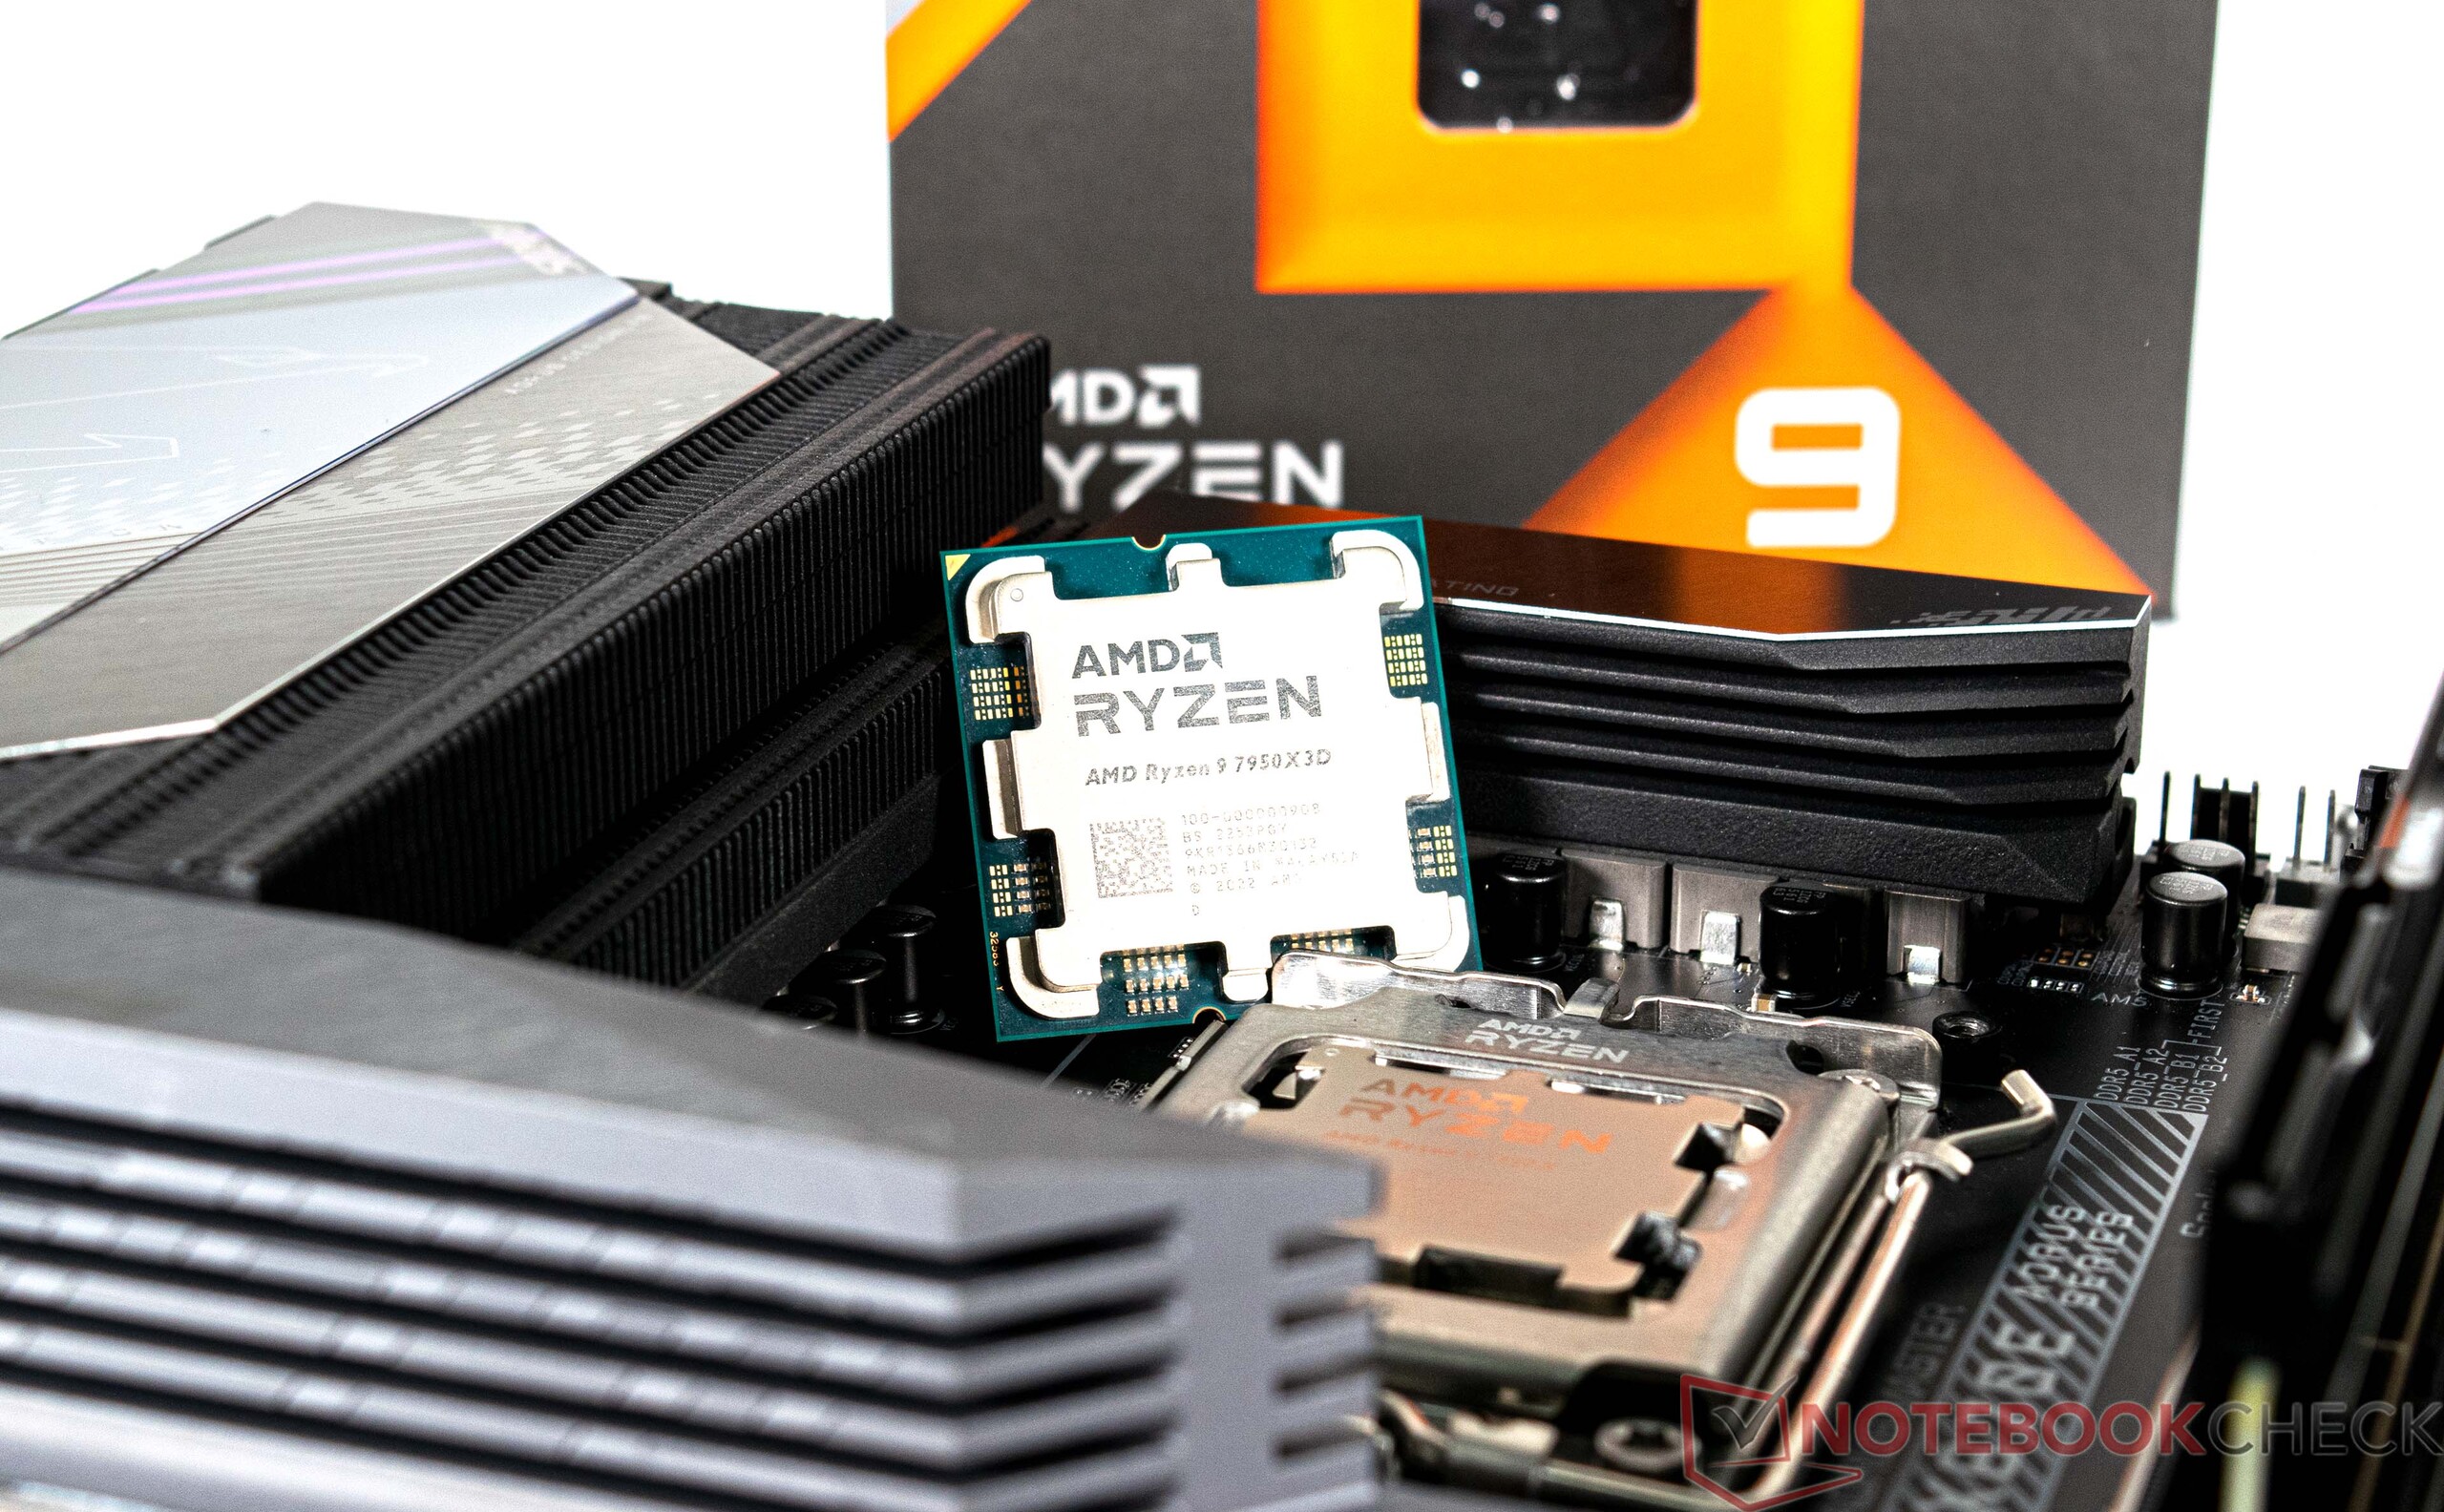
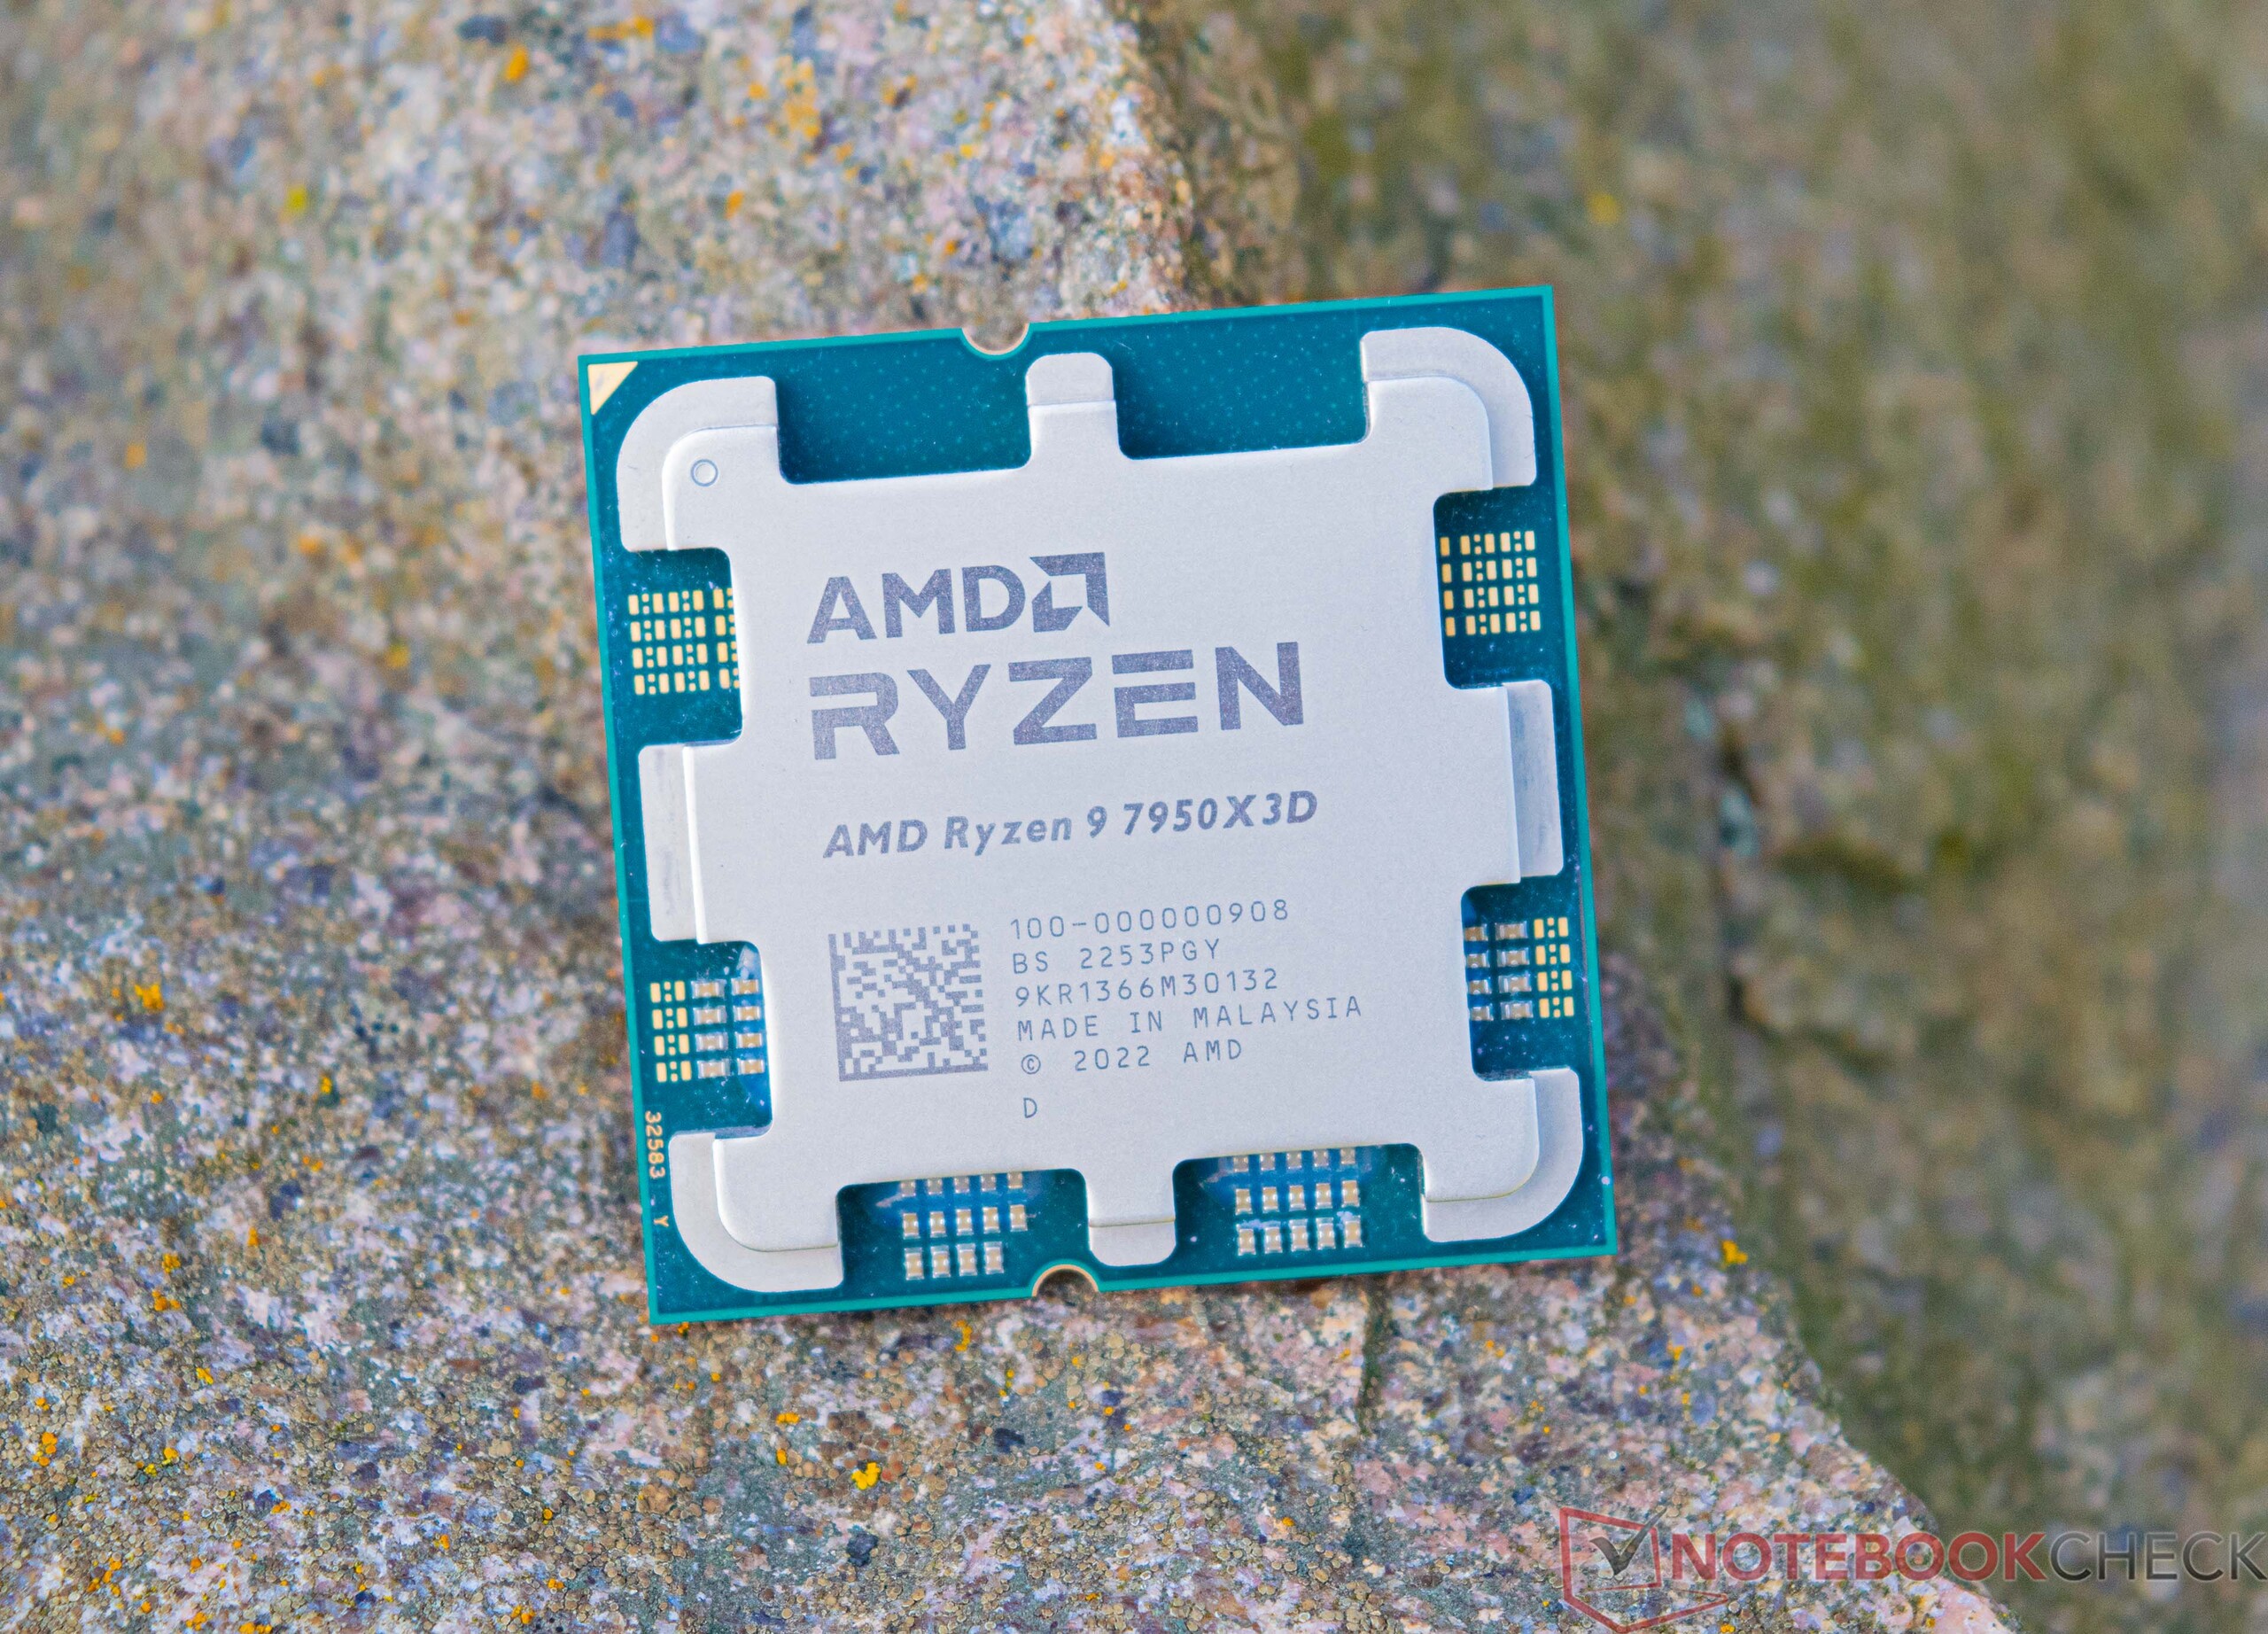
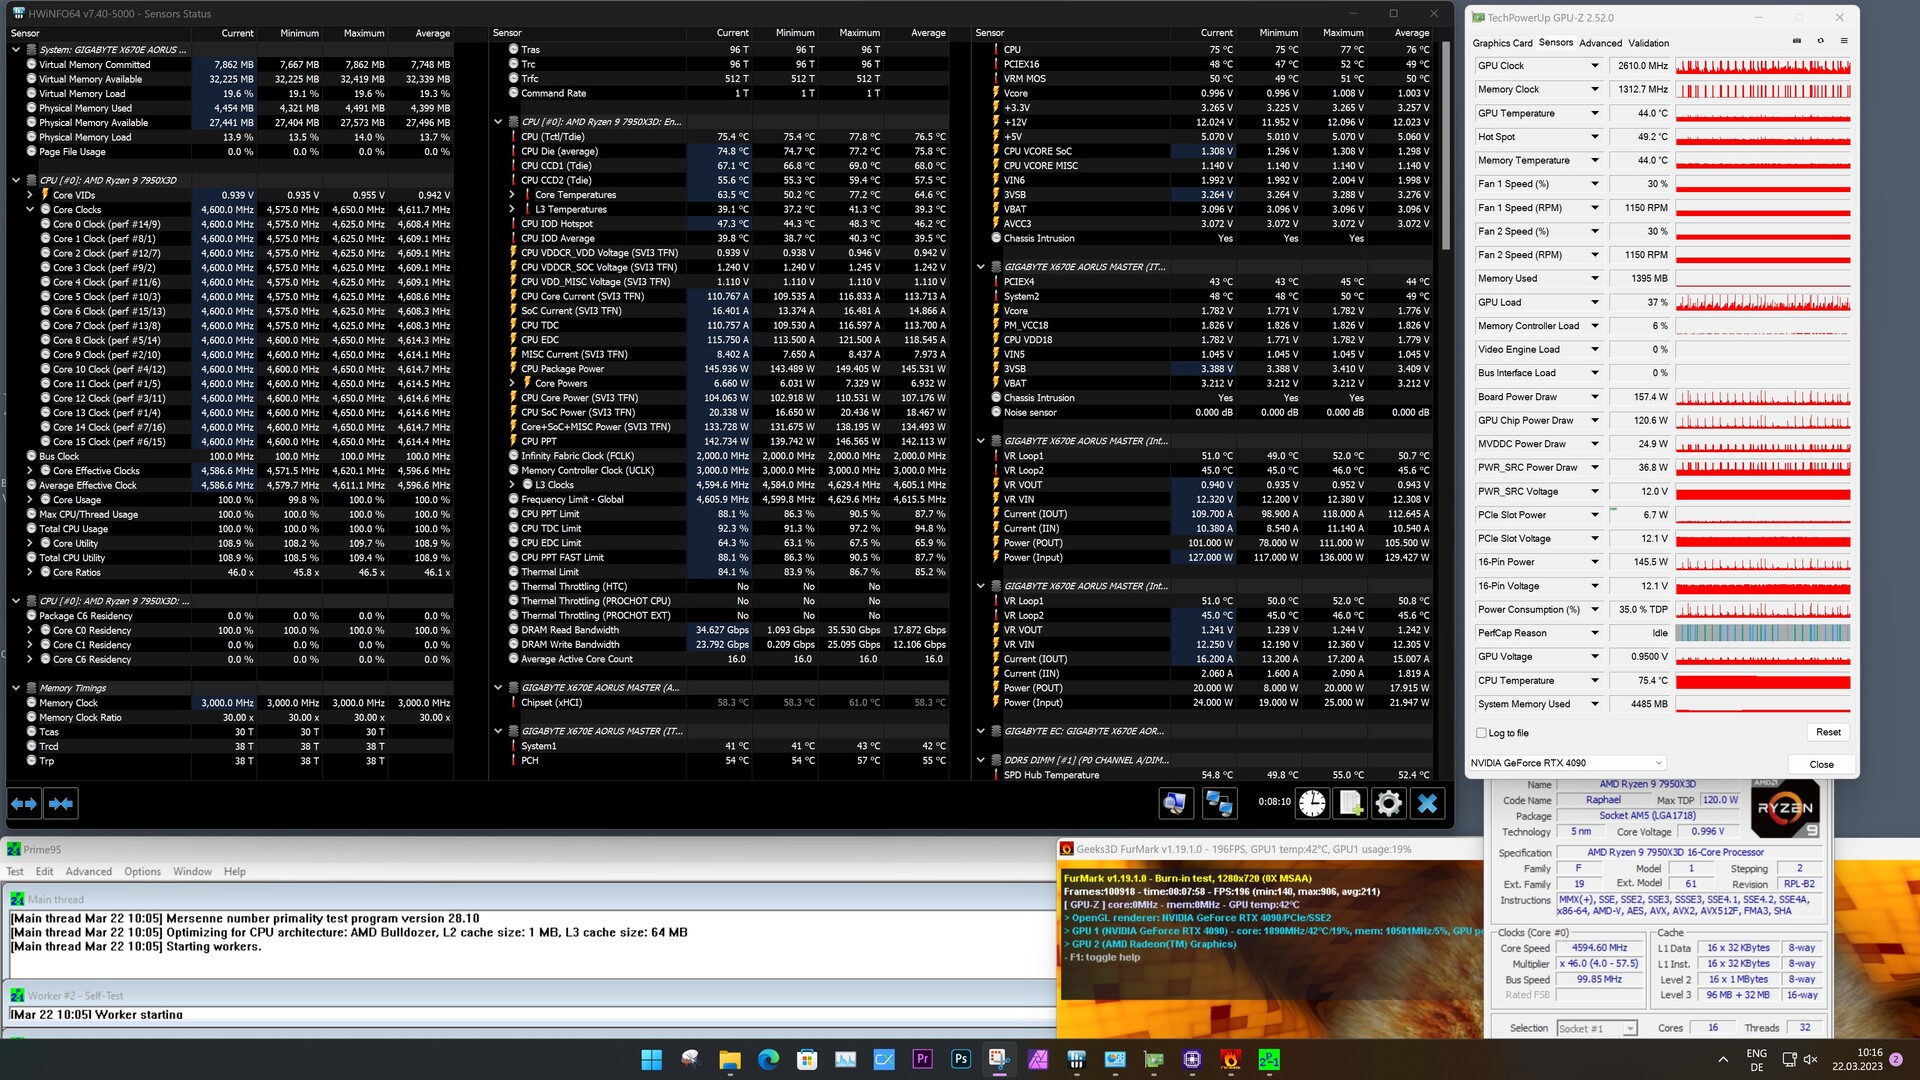
In this review, we take a look at the AMD Ryzen 9 7950X3D, which is the new flagship of the AM5 platform. For smooth operation, you definitely have to install the most current chipset driver to make sure that the assignment of processes in the background always works correctly and without any problems. Basically, the internals of the AMD Ryzen 9 7950X3D are similarly constructed as the non-X3D version, which means that the two CCDs are connected to the I/O die via the Infinity Fabric.
In terms of the power consumption, we don't see much of a disadvantage compared to the Ryzen 9 models until now, since the TDP of the X3D processors is only 120 watts. However, the maximum PPT (Package Power Tracking) is now only 162 watts (whereas it was 230 watts before). You can find out later in our test, whether the reduction of the power consumption has any effects and if so, what they are.
Overview of the AMD Ryzen 7000 Family
| Model | Cores/Threads | Basic Clock Speed | Turbo Speed | L2-Cache | L3-Cache | TDP | PPT | Launch Price |
|---|---|---|---|---|---|---|---|---|
| Ryzen 9 7950X3D | 16/32 | 4.2 GHz | 5.7 GHz | 16x 1 MB | 128 MB | 120 Watt | 162 Watt | 699 USD |
| Ryzen 9 7950X | 16/32 | 4.5 GHz | 5.7 GHz | 16x 1 MB | 64 MB | 170 Watt | 230W | 699 USD |
| Ryzen 9 7900X3D | 12/24 | 4.4 GHz | 5.6 GHz | 12x 1 MB | 128 MB | 120 Watt | 162 Watt | 599 USD |
| Ryzen 9 7900X | 12/24 | 4.7 GHz | 5.6 GHz | 12x 1 MB | 64 MB | 170 Watt | 230W | 549 USD |
| Ryzen 7 7800X3D | 8/16 | 4.2 GHz | 5.0 GHz | 8x 1 MB | 96 MB | 120 Watt | 162 Watt | 549 USD |
| Ryzen 7 7700X | 8/16 | 4.5 GHz | 5.4 GHz | 8x 1 MB | 32 MB | 105 Watt | 142W | 399 USD |
| Ryzen 5 7600X | 6/12 | 4.7 GHz | 5.3 GHz | 6x 1 MB | 32 MB | 105 Watt | 142W | 299 USD |
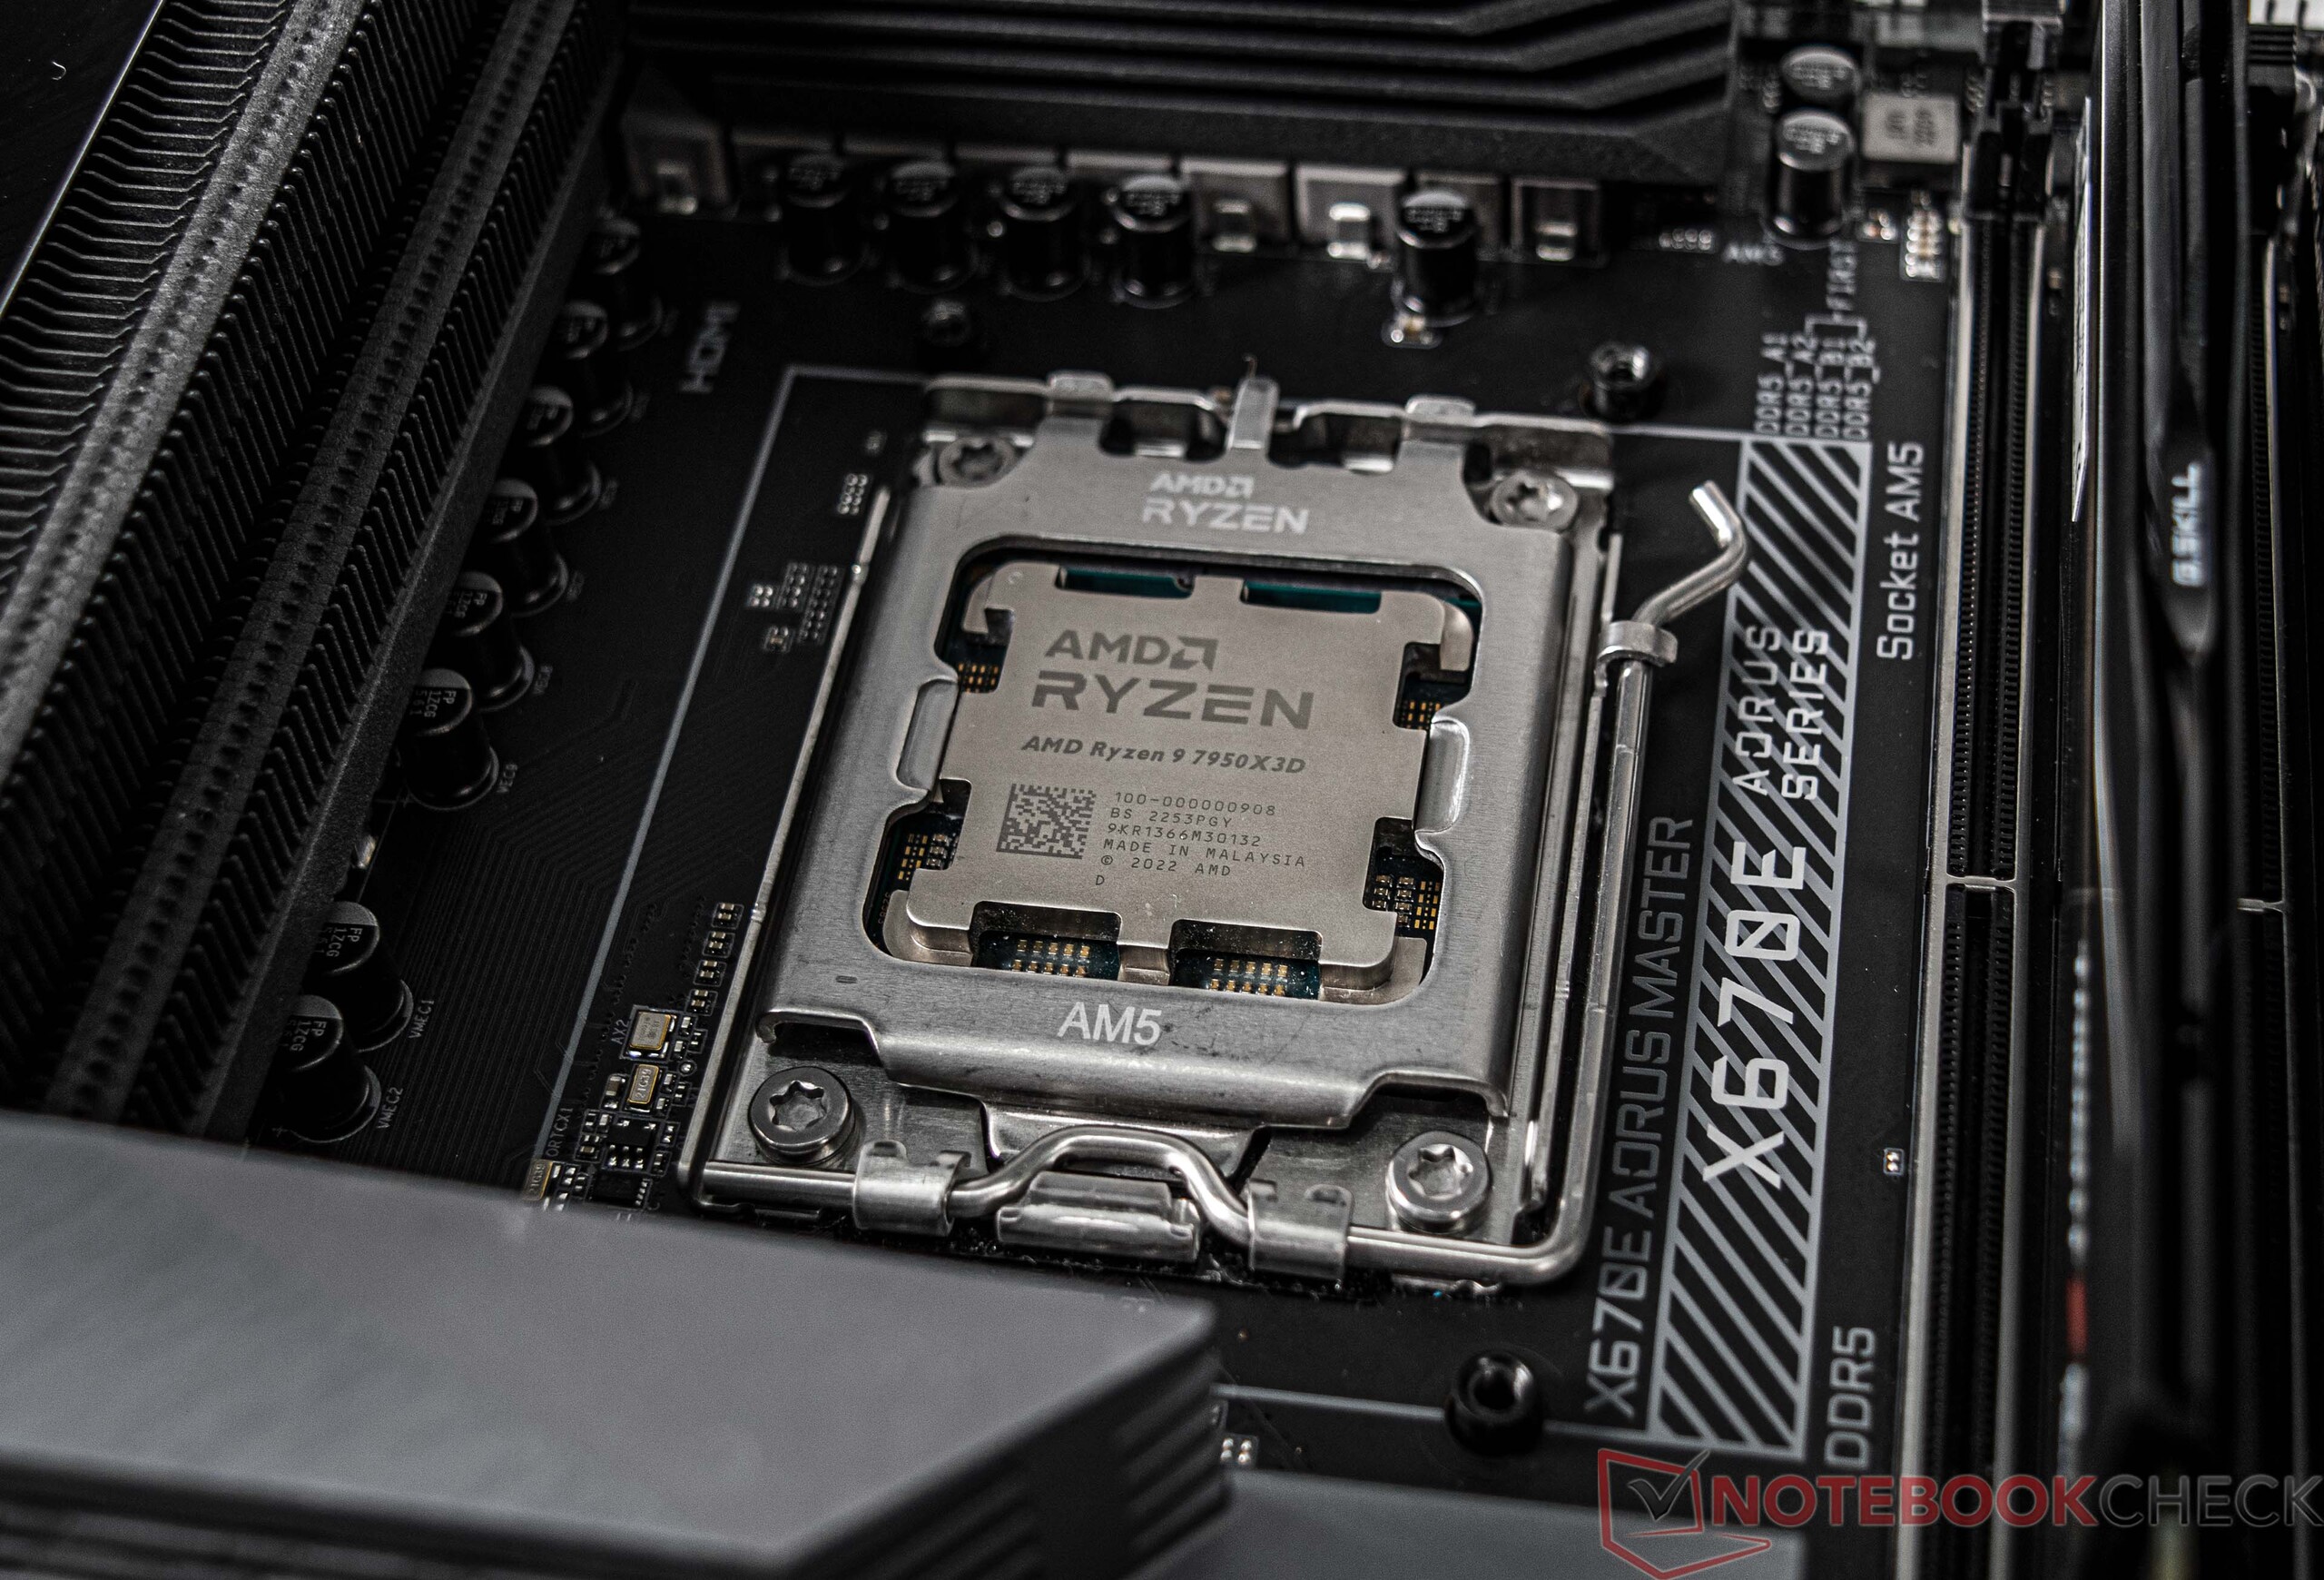
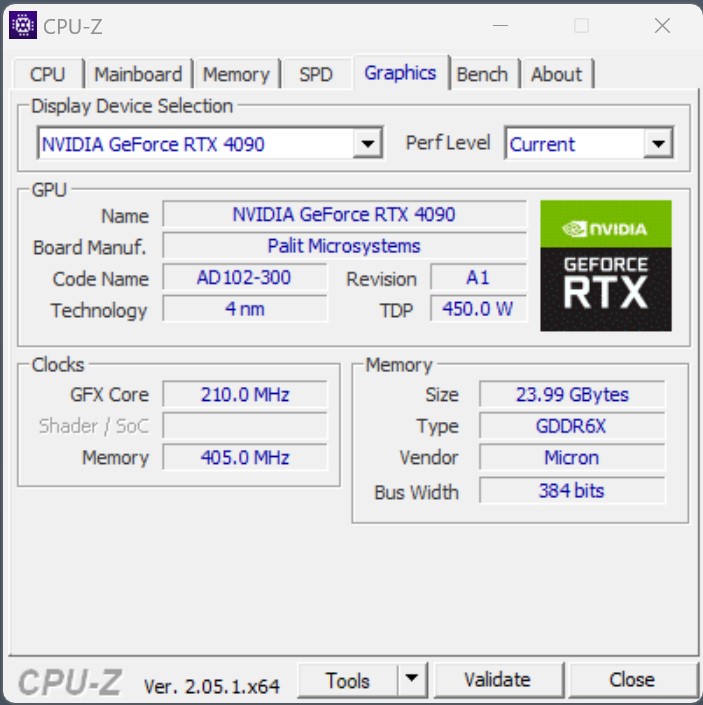
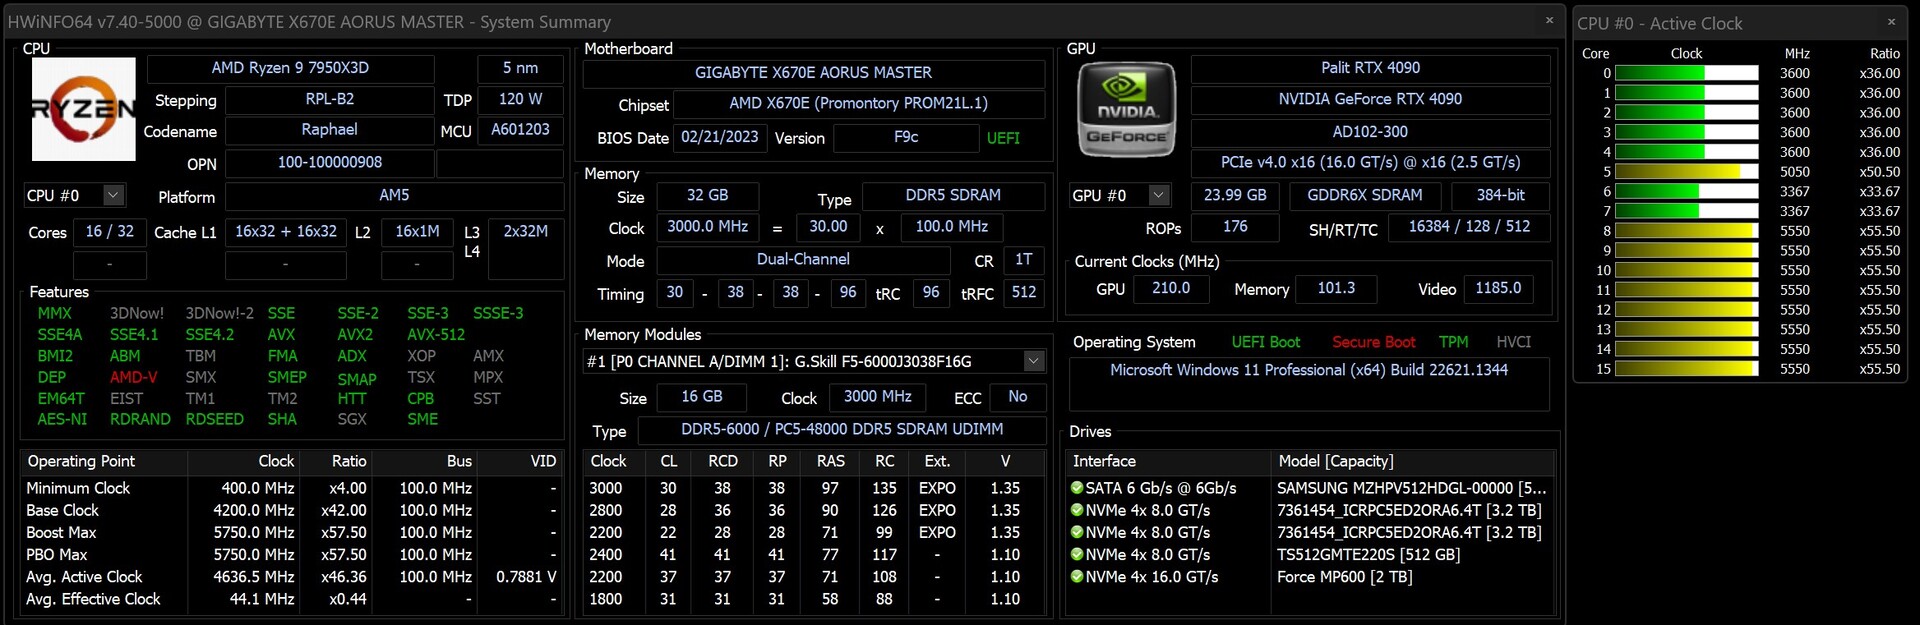
The Test System in Detail
We use the following system for the benchmarks and tests below:
- Streacom BC1 V2 Open Benchtable
- AMD Ryzen 9 7950X3D
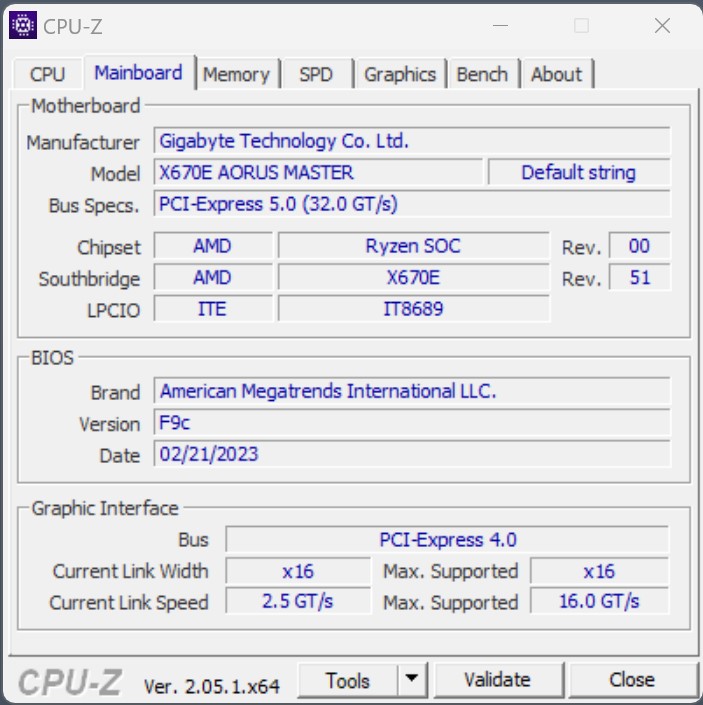
- Gigabyte X670E Aorus Master, BIOS: F9c
- Palit GeForce RTX 4090 GameRock OC
- Custom loop water cooling (pump: Alphacool Aquastream XT Ultra, radiator: Watercool MO-RA3 420 LT BLACK)
- EVGA SuperNOVA P+ 1.600W
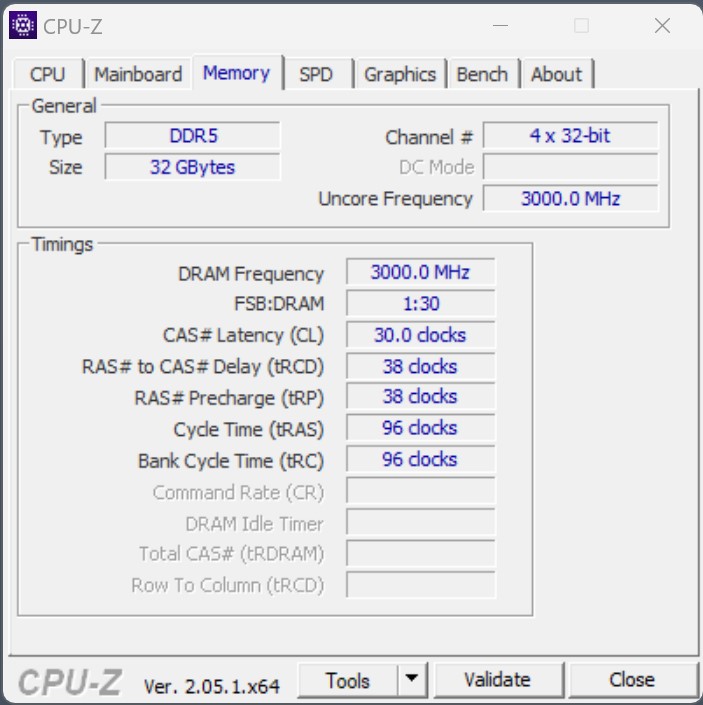
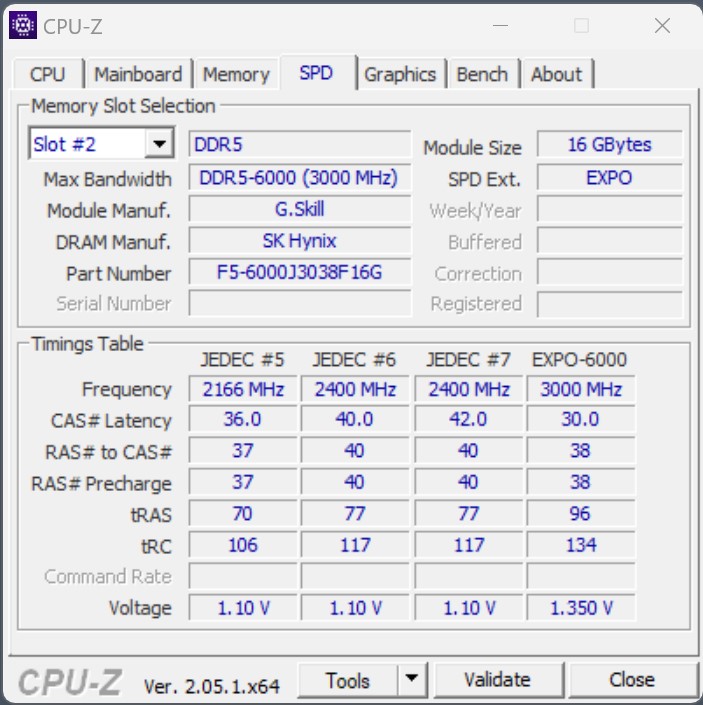
- G.Skill Trident Z5 Neo DDR5-6000 2x 16 GB, EXPO (DDR5-6000 CL30-38-38-96)
- Intel Optane 905P 480 GB PCIe SSD
- Intel SSD DC P4618 PCIe 3.1 x8 6.4 TB (for gaming)
- Microsoft Windows 11 Professional 64-Bit (version 22H2)

Processor Benchmarks
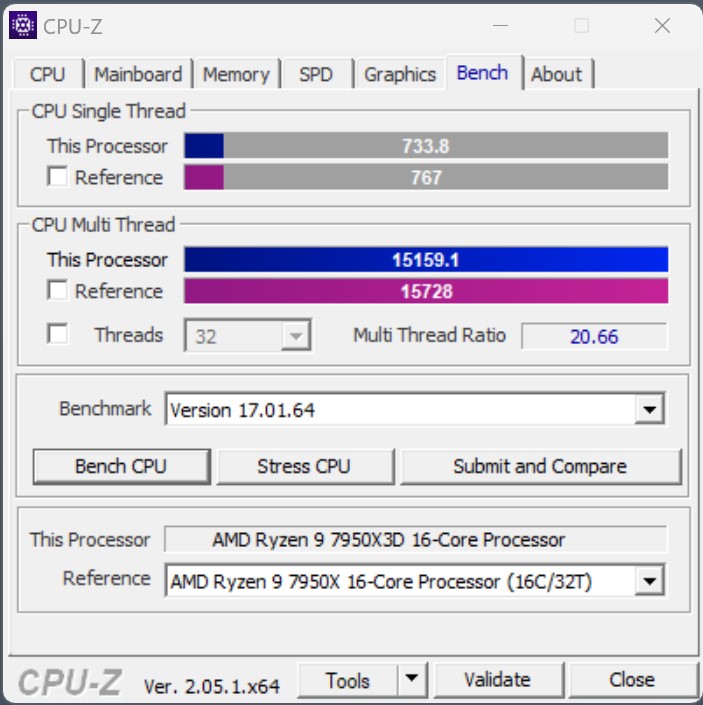
We were already able to get an idea of the enormous performance capabilities of the AMD Ryzen 9 7950X. At the same time, the Intel Core i9-13900K was still slightly faster in terms of the pure CPU performance. With the AMD Ryzen 9 7950X3D we were still a bit skeptical in the beginning, since the low maximum power consumption of the CPU still raised some questions for us. But after our initial CPU tests, we were very surprised about the very good performance development of the AMD Ryzen 9 7950X3D despite this. Overall, it is sufficient to place second in this comparison. AMD's previous top model, the AMD Ryzen 9 7950X, now has to be content with third place. At the same time, we are still seeing an Intel Core i9-13900K at the top of our performance ratings. However, first and second place are only separated by a single percentage point, which subjectively has no relevance in everyday operation.
If you look at the single tests, you can see some strengths at times, but also weaknesses, resulting in a good average compared to Intel's Core i9-13900K. By using the 3D V-Cache, AMD was able to slightly improve the IPC of the 16-core processor. At the same time, we also see a slight disadvantage in the multi-core benchmarks, which can be traced back to a lower clock speed under load. However, the efficiency AMD was able to produce with its new Ryzen 9 7950X3D is still considerable. For comparison, without power limits the Intel Core i9-13900K is throttled only by the temperatures, which almost always reach the 100 °C (212 °F) mark under load. But it wasn't only a few times that we saw more than 300 watts in our tests in the Cinebench R15 Multi test. The AMD Ryzen 9 7950X was a bit more efficient, even though it almost always reached the 230 watts. And now we are seeing an AMD Ryzen 9 7950X3D delivering a similarly good performance at only 162 watts. This is definitely a path pointing in the right direction.
You can find additional benchmarks on the processors here.
| Performance rating - Percent | |
| Intel Core i9-13900K | |
| AMD Ryzen 9 7950X | |
| AMD Ryzen 9 7950X3D | |
| Intel Core i7-13700K | |
| AMD Ryzen 9 7900X | |
| AMD Ryzen 9 5950X | |
| Cinebench R15 | |
| CPU Single 64Bit | |
| Intel Core i9-13900K | |
| AMD Ryzen 9 7950X3D | |
| AMD Ryzen 9 7900X | |
| AMD Ryzen 9 7950X | |
| Intel Core i7-13700K | |
| AMD Ryzen 9 5950X | |
| CPU Multi 64Bit | |
| AMD Ryzen 9 7950X | |
| Intel Core i9-13900K | |
| AMD Ryzen 9 7950X3D | |
| AMD Ryzen 9 7900X | |
| Intel Core i7-13700K | |
| AMD Ryzen 9 5950X | |
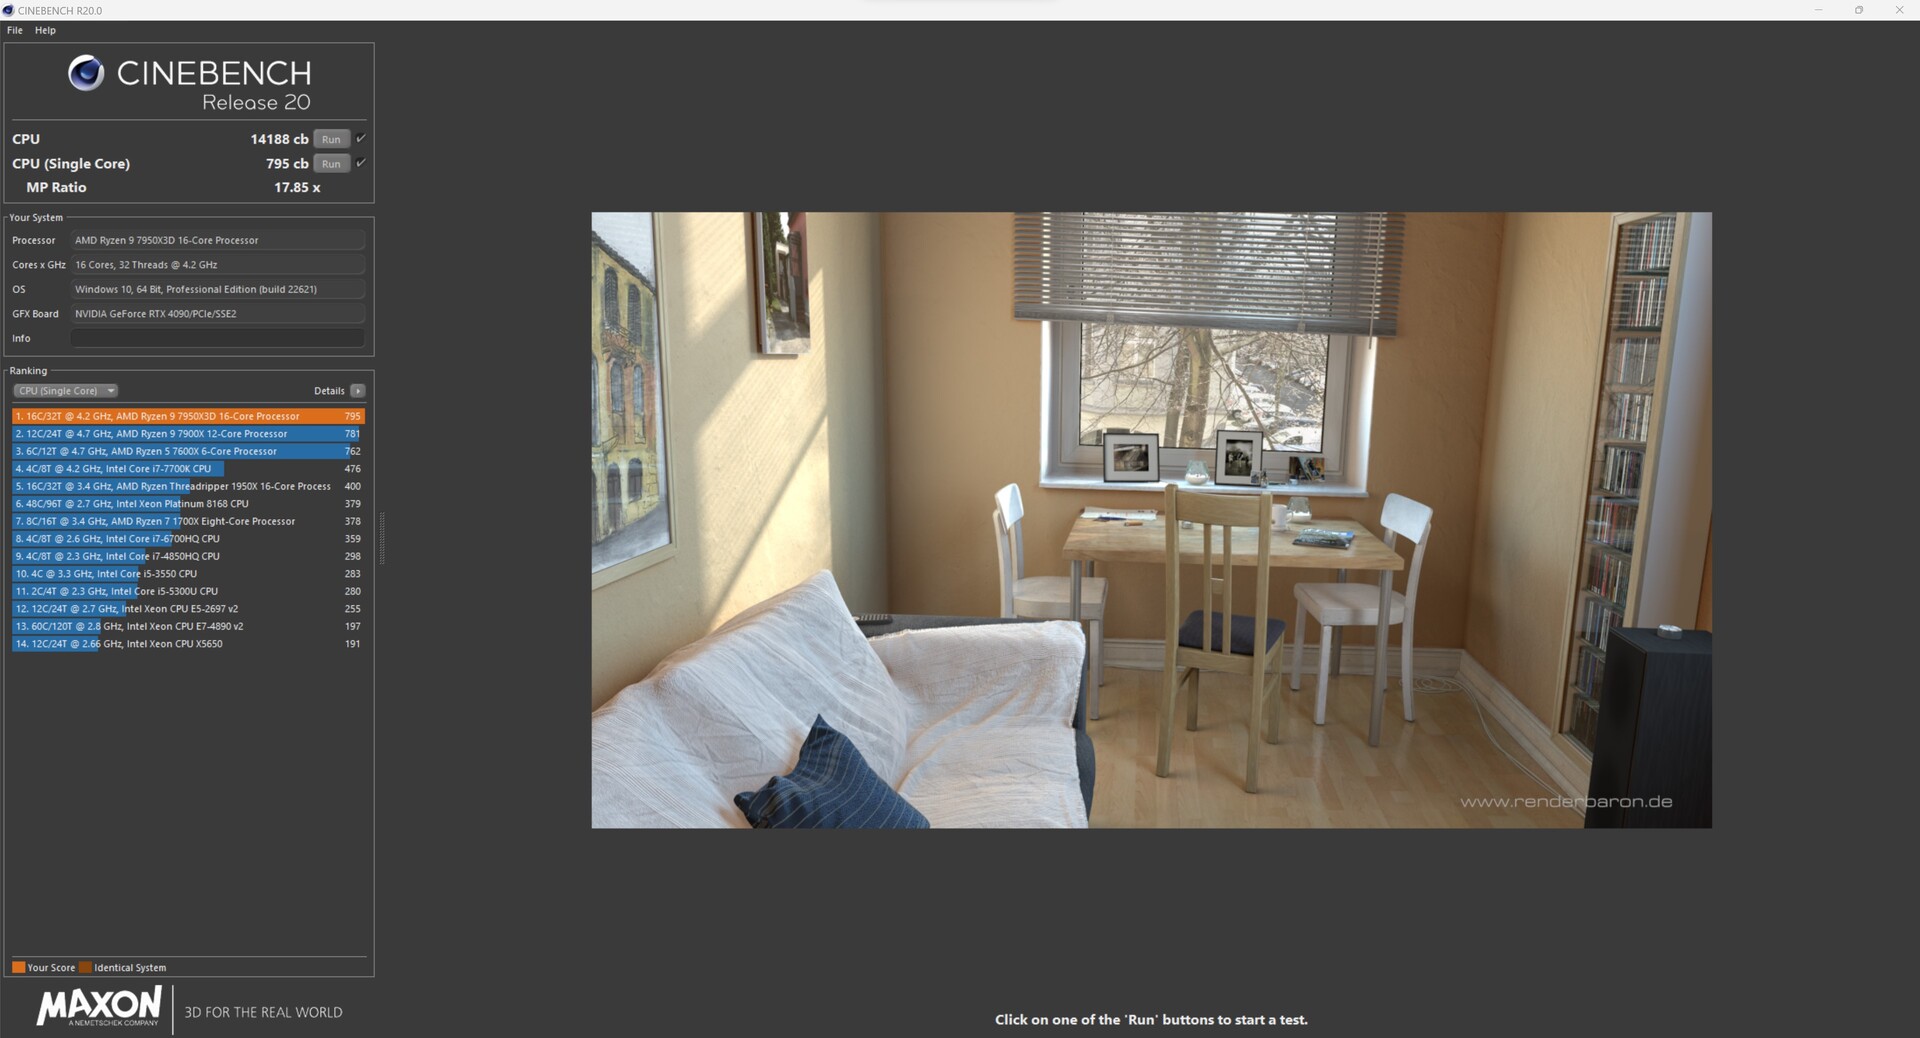
| Cinebench R20 | |
| CPU (Single Core) | |
| Intel Core i9-13900K | |
| Intel Core i7-13700K | |
| AMD Ryzen 9 7950X3D | |
| AMD Ryzen 9 7900X | |
| AMD Ryzen 9 7950X | |
| AMD Ryzen 9 5950X | |
| CPU (Multi Core) | |
| Intel Core i9-13900K | |
| AMD Ryzen 9 7950X | |
| AMD Ryzen 9 7950X3D | |
| Intel Core i7-13700K | |
| AMD Ryzen 9 7900X | |
| AMD Ryzen 9 5950X | |
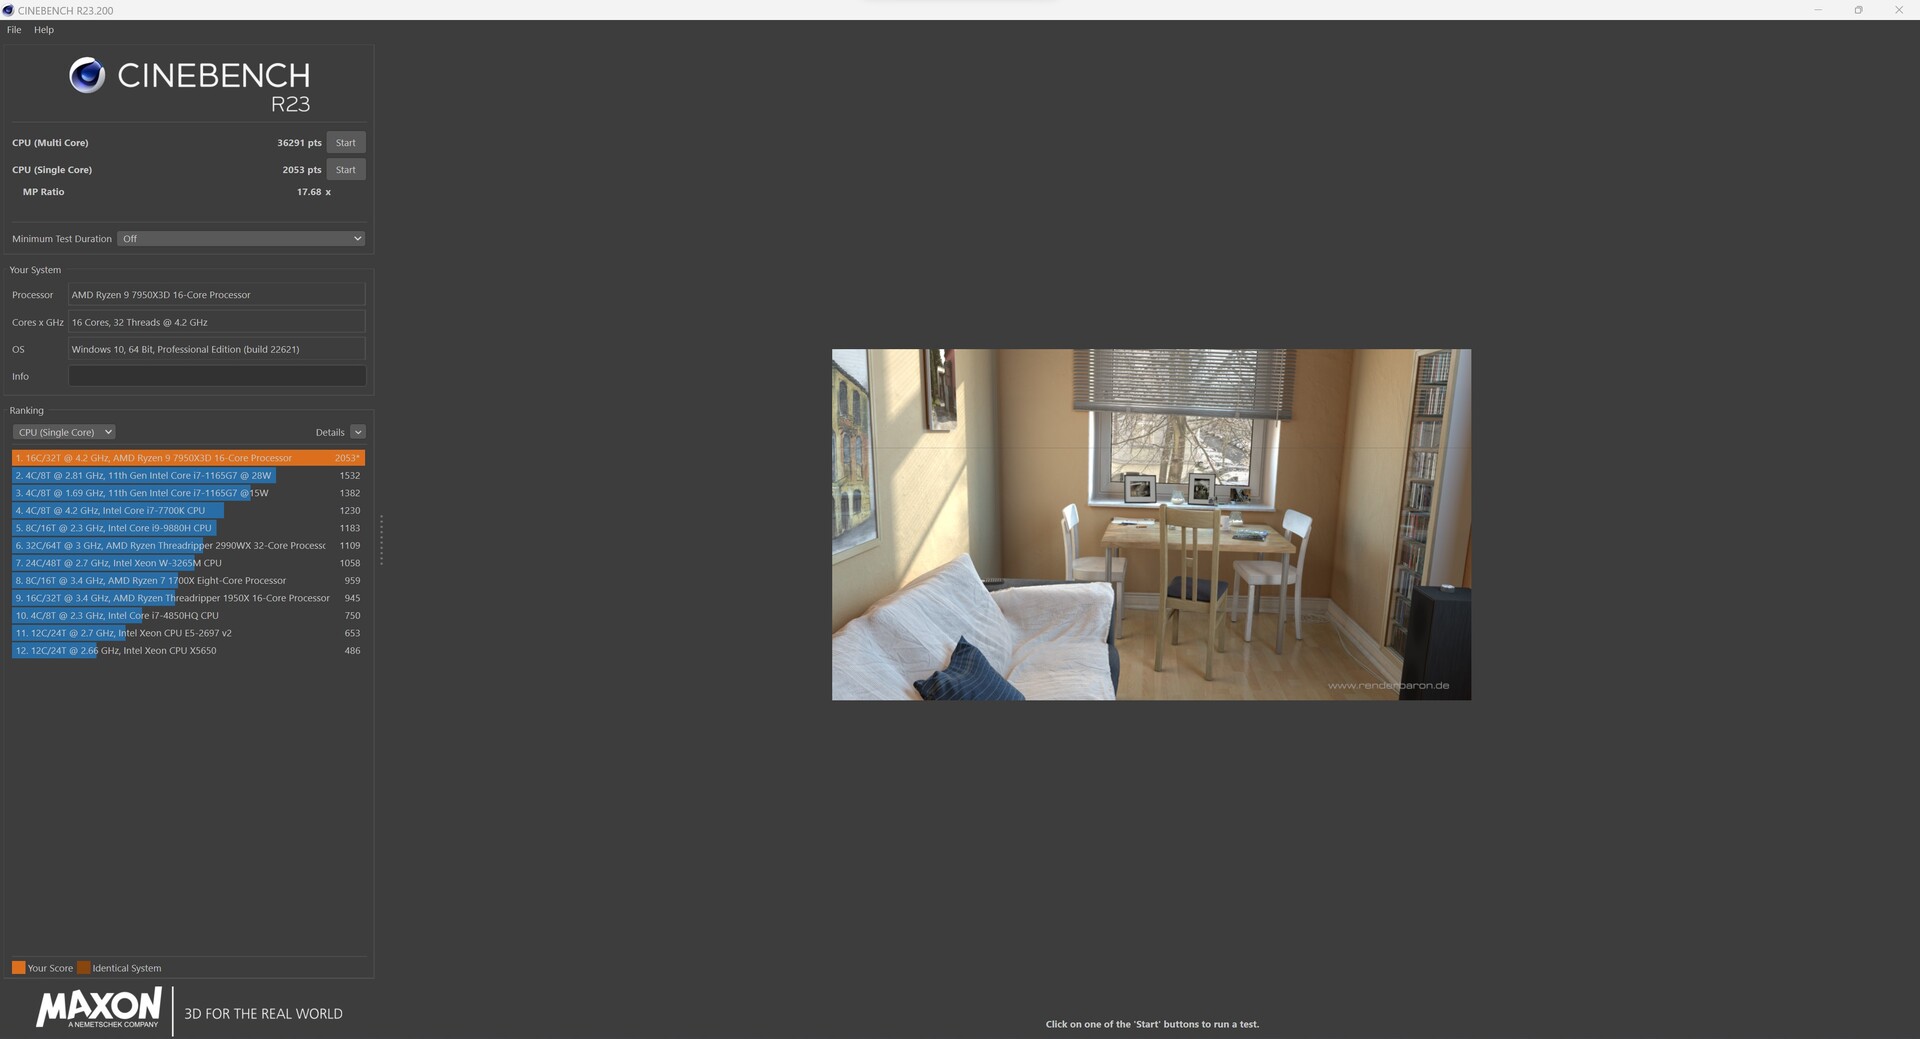
| Cinebench R23 | |
| Single Core | |
| Intel Core i9-13900K | |
| Intel Core i7-13700K | |
| AMD Ryzen 9 7950X3D | |
| AMD Ryzen 9 7900X | |
| AMD Ryzen 9 7950X | |
| AMD Ryzen 9 5950X | |
| Multi Core | |
| Intel Core i9-13900K | |
| AMD Ryzen 9 7950X | |
| AMD Ryzen 9 7950X3D | |
| Intel Core i7-13700K | |
| AMD Ryzen 9 7900X | |
| AMD Ryzen 9 5950X | |
| Cinebench R11.5 | |
| CPU Single 64Bit | |
| Intel Core i9-13900K | |
| AMD Ryzen 9 7950X3D | |
| AMD Ryzen 9 7900X | |
| AMD Ryzen 9 7950X | |
| Intel Core i7-13700K | |
| AMD Ryzen 9 5950X | |
| CPU Multi 64Bit | |
| Intel Core i9-13900K | |
| AMD Ryzen 9 7950X | |
| AMD Ryzen 9 7950X3D | |
| AMD Ryzen 9 7900X | |
| Intel Core i7-13700K | |
| AMD Ryzen 9 5950X | |
| Blender - v2.79 BMW27 CPU | |
| AMD Ryzen 9 5950X | |
| AMD Ryzen 9 7900X | |
| Intel Core i7-13700K | |
| AMD Ryzen 9 7950X3D | |
| AMD Ryzen 9 7950X | |
| Intel Core i9-13900K | |
| wPrime 2.10 | |
| 32m | |
| AMD Ryzen 9 5950X | |
| Intel Core i7-13700K | |
| AMD Ryzen 9 7950X3D | |
| Intel Core i9-13900K | |
| AMD Ryzen 9 7900X | |
| AMD Ryzen 9 7950X | |
| 1024m | |
| Intel Core i7-13700K | |
| Intel Core i9-13900K | |
| AMD Ryzen 9 5950X | |
| AMD Ryzen 9 7900X | |
| AMD Ryzen 9 7950X3D | |
| AMD Ryzen 9 7950X | |
| X264 HD Benchmark 4.0 | |
| Pass 1 | |
| Intel Core i9-13900K | |
| Intel Core i7-13700K | |
| AMD Ryzen 9 7950X3D | |
| AMD Ryzen 9 7950X | |
| AMD Ryzen 9 7900X | |
| AMD Ryzen 9 5950X | |
| Pass 2 | |
| AMD Ryzen 9 7950X | |
| Intel Core i9-13900K | |
| AMD Ryzen 9 7950X3D | |
| AMD Ryzen 9 7900X | |
| Intel Core i7-13700K | |
| AMD Ryzen 9 5950X | |
| WinRAR - Result | |
| AMD Ryzen 9 7900X | |
| AMD Ryzen 9 7950X3D | |
| AMD Ryzen 9 7950X | |
| Intel Core i9-13900K | |
| Intel Core i7-13700K | |
| AMD Ryzen 9 5950X | |
| TrueCrypt | |
| AES Mean 100MB | |
| AMD Ryzen 9 7950X | |
| Intel Core i9-13900K | |
| AMD Ryzen 9 5950X | |
| AMD Ryzen 9 7950X3D | |
| Intel Core i7-13700K | |
| AMD Ryzen 9 7900X | |
| Twofish Mean 100MB | |
| Intel Core i9-13900K | |
| AMD Ryzen 9 7950X | |
| AMD Ryzen 9 7950X3D | |
| Intel Core i7-13700K | |
| AMD Ryzen 9 5950X | |
| AMD Ryzen 9 7900X | |
| Serpent Mean 100MB | |
| Intel Core i9-13900K | |
| AMD Ryzen 9 7950X | |
| AMD Ryzen 9 7950X3D | |
| AMD Ryzen 9 5950X | |
| Intel Core i7-13700K | |
| AMD Ryzen 9 7900X | |
| Geekbench 5.5 | |
| Multi-Core | |
| AMD Ryzen 9 7950X3D | |
| Intel Core i9-13900K | |
| AMD Ryzen 9 7950X | |
| AMD Ryzen 9 7900X | |
| Intel Core i7-13700K | |
| AMD Ryzen 9 5950X | |
| Single-Core | |
| AMD Ryzen 9 7950X3D | |
| Intel Core i9-13900K | |
| AMD Ryzen 9 7900X | |
| AMD Ryzen 9 7950X | |
| Intel Core i7-13700K | |
| AMD Ryzen 9 5950X | |
| Geekbench 5.0 | |
| 5.0 Multi-Core | |
| Intel Core i9-13900K | |
| AMD Ryzen 9 7950X3D | |
| AMD Ryzen 9 7950X | |
| AMD Ryzen 9 7900X | |
| Intel Core i7-13700K | |
| AMD Ryzen 9 5950X | |
| 5.0 Single-Core | |
| Intel Core i9-13900K | |
| AMD Ryzen 9 7900X | |
| AMD Ryzen 9 7950X3D | |
| AMD Ryzen 9 7950X | |
| Intel Core i7-13700K | |
| AMD Ryzen 9 5950X | |
| Geekbench 4.4 | |
| 64 Bit Single-Core Score | |
| Intel Core i9-13900K | |
| AMD Ryzen 9 7950X3D | |
| AMD Ryzen 9 7900X | |
| AMD Ryzen 9 7950X | |
| Intel Core i7-13700K | |
| AMD Ryzen 9 5950X | |
| 64 Bit Multi-Core Score | |
| AMD Ryzen 9 7950X3D | |
| Intel Core i9-13900K | |
| AMD Ryzen 9 7950X | |
| AMD Ryzen 9 7900X | |
| Intel Core i7-13700K | |
| AMD Ryzen 9 5950X | |
| 3DMark 11 - 1280x720 Performance Physics | |
| AMD Ryzen 9 7950X3D | |
| AMD Ryzen 9 7950X | |
| Intel Core i9-13900K | |
| Intel Core i7-13700K | |
| AMD Ryzen 9 7900X | |
| AMD Ryzen 9 5950X | |
| 7-Zip 18.03 | |
| 7z b 4 | |
| AMD Ryzen 9 7950X3D | |
| AMD Ryzen 9 7950X | |
| Intel Core i9-13900K | |
| AMD Ryzen 9 5950X | |
| AMD Ryzen 9 7900X | |
| Intel Core i7-13700K | |
| 7z b 4 -mmt1 | |
| AMD Ryzen 9 7950X3D | |
| AMD Ryzen 9 7900X | |
| AMD Ryzen 9 7950X | |
| Intel Core i9-13900K | |
| Intel Core i7-13700K | |
| AMD Ryzen 9 5950X | |
| HWBOT x265 Benchmark v2.2 - 4k Preset | |
| AMD Ryzen 9 7950X | |
| Intel Core i9-13900K | |
| AMD Ryzen 9 7950X3D | |
| AMD Ryzen 9 7900X | |
| Intel Core i7-13700K | |
| AMD Ryzen 9 5950X | |
| R Benchmark 2.5 - Overall mean | |
| AMD Ryzen 9 5950X | |
| Intel Core i7-13700K | |
| AMD Ryzen 9 7950X | |
| AMD Ryzen 9 7900X | |
| AMD Ryzen 9 7950X3D | |
| Intel Core i9-13900K | |
| LibreOffice - 20 Documents To PDF | |
| AMD Ryzen 9 5950X | |
| AMD Ryzen 9 7950X3D | |
| Intel Core i9-13900K | |
| AMD Ryzen 9 7950X | |
| AMD Ryzen 9 7900X | |
| Intel Core i7-13700K | |
| WebXPRT 3 - Overall | |
| AMD Ryzen 9 7950X3D | |
| AMD Ryzen 9 7900X | |
| Intel Core i9-13900K | |
| AMD Ryzen 9 7950X | |
| Intel Core i7-13700K | |
| AMD Ryzen 9 5950X | |
| Mozilla Kraken 1.1 - Total | |
| AMD Ryzen 9 5950X | |
| Intel Core i7-13700K | |
| AMD Ryzen 9 7950X | |
| AMD Ryzen 9 7950X3D | |
| Intel Core i9-13900K | |
| AMD Ryzen 9 7900X | |
| 3DMark | |
| 1920x1080 Fire Strike Physics | |
| Intel Core i9-13900K | |
| AMD Ryzen 9 7950X | |
| Intel Core i7-13700K | |
| AMD Ryzen 9 7950X3D | |
| AMD Ryzen 9 7900X | |
| AMD Ryzen 9 5950X | |
| 2560x1440 Time Spy CPU | |
| Intel Core i9-13900K | |
| Intel Core i7-13700K | |
| AMD Ryzen 9 7950X3D | |
| AMD Ryzen 9 7900X | |
| AMD Ryzen 9 7950X | |
| AMD Ryzen 9 5950X | |
* ... smaller is better
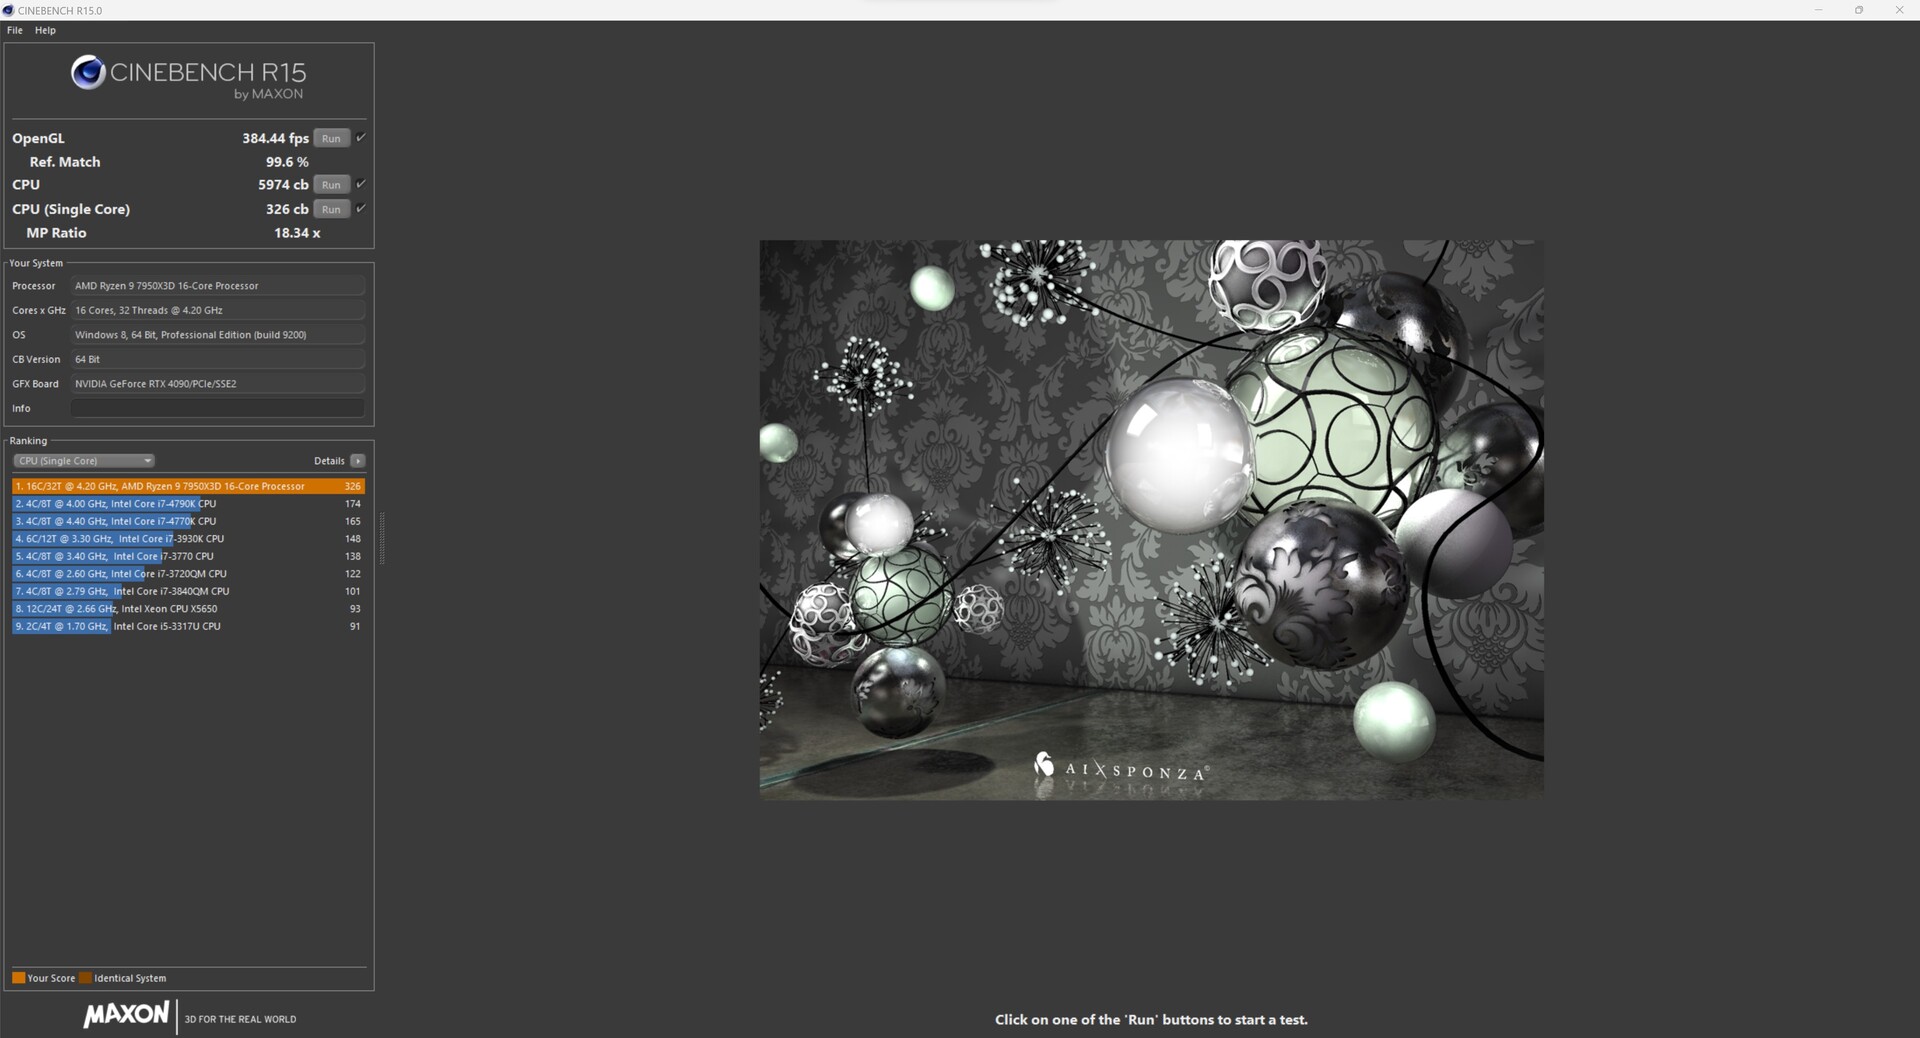
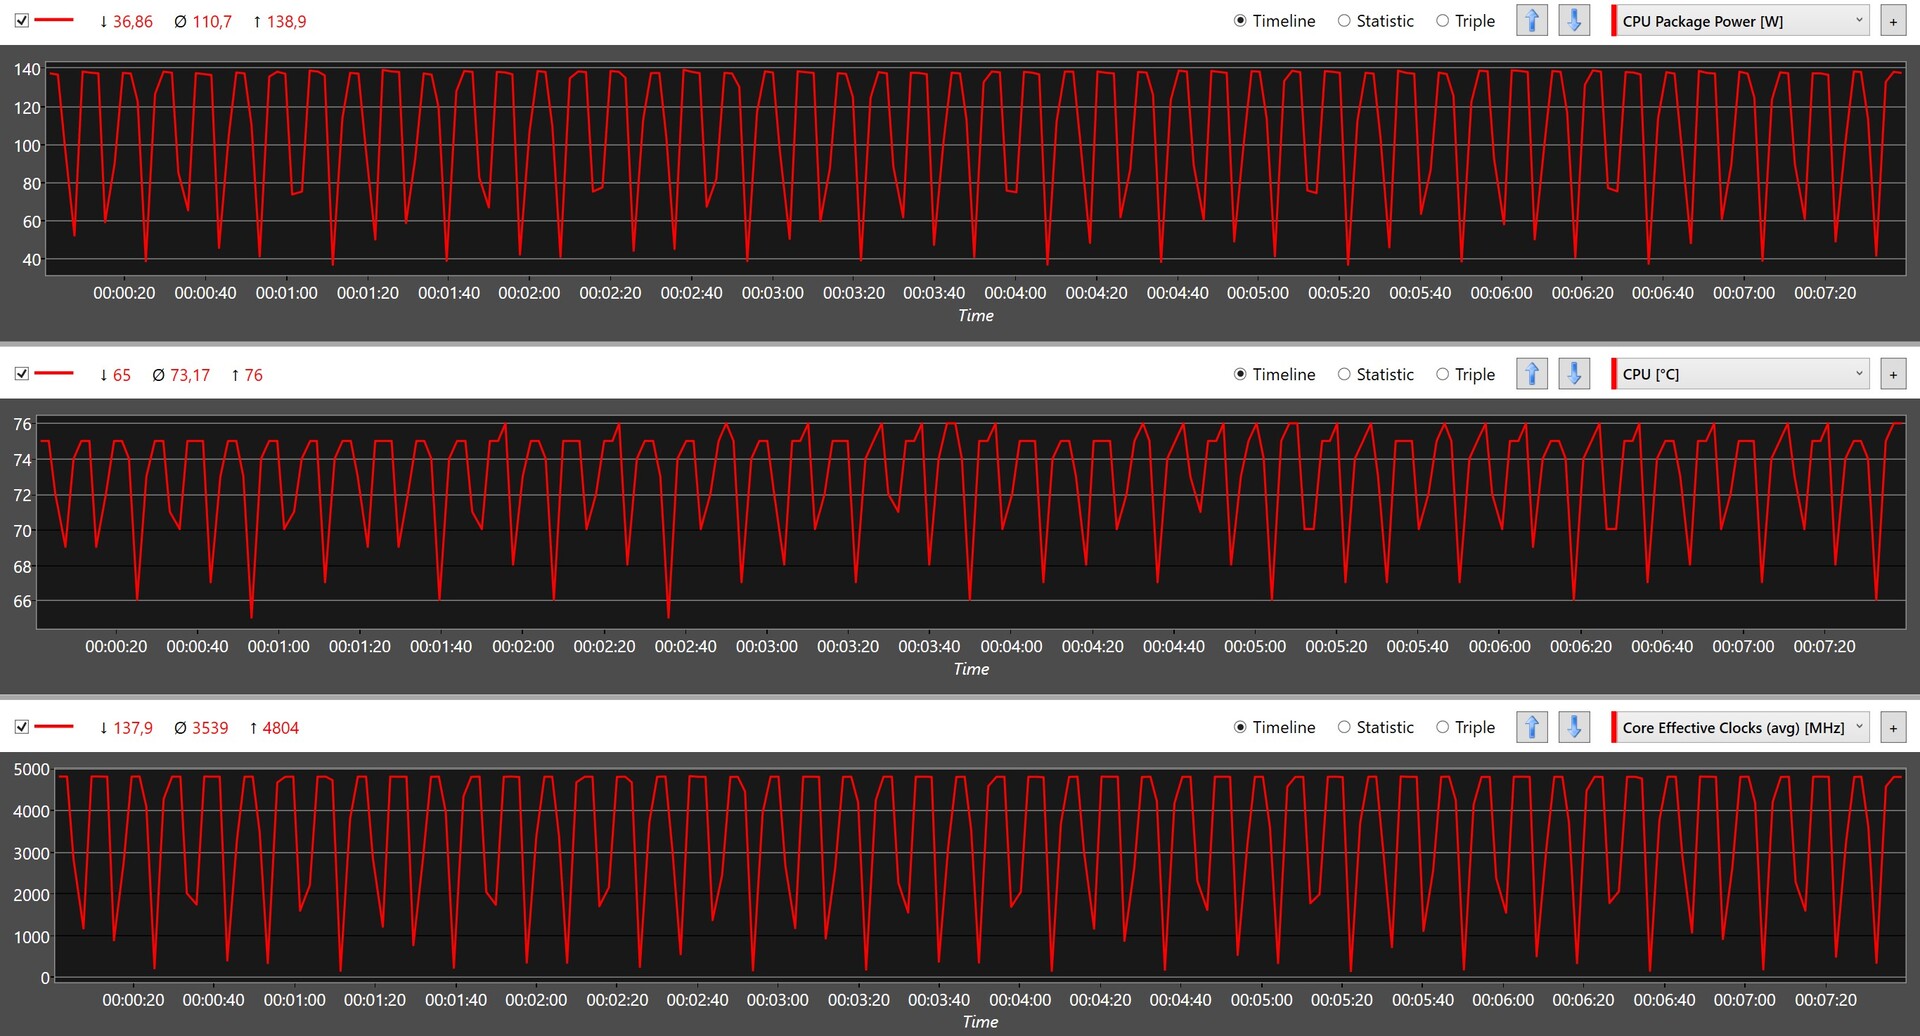
AMD Ryzen 9 7950X3D vs. Cinebench R15 Multi loop
The high multithread performance that we see during a single run in the Cinebench R15 Multi test can also be maintained constantly in our test setting. All the results of the Cinebench R15 Multi loop vary only to a very small extent. With an average of 5,942 points, our AMD Ryzen 9 7950X3D places third in this comparison, while the AMD Ryzen 9 7950X and Intel Core i9-13900K are still able to deliver a slightly higher constant performance.
Synthetic Benchmarks and Application Performance
In the synthetic application benchmarks, we see a similar head-to-head race between all the top models. The AMD Ryzen 9 7950X3D and AMD Ryzen 9 7950X show the same speed in the measured performance ratings, and with the Core i9-13900K Intel is again a small step ahead. However, you won't notice any difference in everyday operation. In the RAM tests, all the current Ryzen 7000 CPUs benefit from DDR5, allowing them to generate a significantly higher data throughput. The Intel systems we list in our comparison here were also run with DDR5-RAM in the tests at that time.
| Performance rating - Percent | |
| Intel Core i9-13900K | |
| AMD Ryzen 9 7950X | |
| AMD Ryzen 9 7950X3D | |
| Intel Core i7-13700K | |
| AMD Ryzen 9 7900X | |
| AMD Ryzen 9 5950X | |
| PCMark 10 | |
| Productivity | |
| AMD Ryzen 9 7950X3D | |
| AMD Ryzen 9 7950X | |
| Intel Core i7-13700K | |
| AMD Ryzen 9 7900X | |
| Intel Core i9-13900K | |
| AMD Ryzen 9 5950X | |
| Essentials | |
| Intel Core i9-13900K | |
| AMD Ryzen 9 7900X | |
| AMD Ryzen 9 7950X | |
| AMD Ryzen 9 7950X3D | |
| Intel Core i7-13700K | |
| AMD Ryzen 9 5950X | |
| 3DMark | |
| 1920x1080 Fire Strike Physics | |
| Intel Core i9-13900K | |
| AMD Ryzen 9 7950X | |
| Intel Core i7-13700K | |
| AMD Ryzen 9 7950X3D | |
| AMD Ryzen 9 7900X | |
| AMD Ryzen 9 5950X | |
| 2560x1440 Time Spy CPU | |
| Intel Core i9-13900K | |
| Intel Core i7-13700K | |
| AMD Ryzen 9 7950X3D | |
| AMD Ryzen 9 7900X | |
| AMD Ryzen 9 7950X | |
| AMD Ryzen 9 5950X | |
| 3DMark 11 - 1280x720 Performance Physics | |
| AMD Ryzen 9 7950X3D | |
| AMD Ryzen 9 7950X | |
| Intel Core i9-13900K | |
| Intel Core i7-13700K | |
| AMD Ryzen 9 7900X | |
| AMD Ryzen 9 5950X | |
| CrossMark - Overall | |
| Intel Core i9-13900K | |
| AMD Ryzen 9 7950X | |
| AMD Ryzen 9 7900X | |
| Intel Core i7-13700K | |
| AMD Ryzen 9 7950X3D | |
| AMD Ryzen 9 5950X | |
| AIDA64 / Memory Copy | |
| Intel Core i9-13900K | |
| AMD Ryzen 9 7950X3D | |
| Intel Core i7-13700K | |
| AMD Ryzen 9 7900X | |
| AMD Ryzen 9 7950X | |
| AMD Ryzen 9 5950X | |
| Average of class (4514 - 234662, n=2197) | |
| AIDA64 / Memory Read | |
| Intel Core i9-13900K | |
| Intel Core i7-13700K | |
| AMD Ryzen 9 7950X3D | |
| AMD Ryzen 9 7950X | |
| AMD Ryzen 9 7900X | |
| AMD Ryzen 9 5950X | |
| Average of class (4031 - 271066, n=2159) | |
| AIDA64 / Memory Write | |
| AMD Ryzen 9 7950X3D | |
| AMD Ryzen 9 7900X | |
| AMD Ryzen 9 7950X | |
| Intel Core i9-13900K | |
| Intel Core i7-13700K | |
| Average of class (3506 - 242868, n=2164) | |
| AMD Ryzen 9 5950X | |
| AIDA64 / Memory Latency | |
| Average of class (6.1 - 536, n=2226) | |
| Intel Core i9-13900K | |
| Intel Core i7-13700K | |
| AMD Ryzen 9 5950X | |
| AMD Ryzen 9 7950X3D | |
| AMD Ryzen 9 7950X | |
| AMD Ryzen 9 7900X | |
* ... smaller is better
Gaming Benchmarks
In the gaming tests, we take a look at probably the most interesting part, since the AMD Ryzen 9 7950X3D clearly targets the high-end gaming area. In this price class, the processor is exclusively targeted toward enthusiasts, similarly to how Intel does with its Core i9 models. In the direct comparison, the AMD Ryzen 9 7950X3D surpasses the Intel Core i9-13900K and is able to gain an advantage of 9% in the games we compare here. Compared to the AMD Ryzen 9 7950X, we see a performance increase of about 6%, but this represents an average. When we get close to the absolute CPU limit at 720p, the new AMD Ryzen 9 7950X3D is able to increase the performance by 20% at times. Measured with the 4K Ultra preset, the advantage disappears due to the GPU limit.
However, from time to time we also find some games that aren't able to deal as optimally with the 3D V-Cache. At times, this also might be related to an incorrect CPU core assignment, for example when games only support 4 cores. The combination of an AMD Ryzen 9 7950X3D and the Nvidia GeForce RTX 4090 is the best that you can currently configure in the consumer area. So it is not surprising that all the games we tested here could always be reproduced smoothly even in 2,160p at maximum detail settings.
Gaming Performance in Direct Comparison with Intel
| Performance rating - Percent | |
| AMD Ryzen 9 7950X3D | |
| AMD Ryzen 9 7950X | |
| Intel Core i9-13900K | |
| Intel Core i7-13700K | |
| F1 22 | |
| 1920x1080 Low Preset AA:T AF:16x | |
| AMD Ryzen 9 7950X3D | |
| AMD Ryzen 9 7950X | |
| Intel Core i9-13900K | |
| Intel Core i7-13700K | |
| 3840x2160 Ultra High Preset AA:T AF:16x | |
| AMD Ryzen 9 7950X | |
| Intel Core i7-13700K | |
| AMD Ryzen 9 7950X3D | |
| Intel Core i9-13900K | |
| Far Cry 5 | |
| 1280x720 Low Preset AA:T | |
| AMD Ryzen 9 7950X3D | |
| AMD Ryzen 9 7950X | |
| Intel Core i7-13700K | |
| Intel Core i9-13900K | |
| 3840x2160 Ultra Preset AA:T | |
| AMD Ryzen 9 7950X3D | |
| AMD Ryzen 9 7950X | |
| Intel Core i9-13900K | |
| Intel Core i7-13700K | |
| X-Plane 11.11 | |
| 1280x720 low (fps_test=1) | |
| Intel Core i9-13900K | |
| AMD Ryzen 9 7950X3D | |
| Intel Core i7-13700K | |
| AMD Ryzen 9 7950X | |
| 3840x2160 high (fps_test=3) | |
| AMD Ryzen 9 7950X3D | |
| Intel Core i9-13900K | |
| AMD Ryzen 9 7950X | |
| Intel Core i7-13700K | |
| Final Fantasy XV Benchmark | |
| 1280x720 Lite Quality | |
| Intel Core i7-13700K | |
| AMD Ryzen 9 7950X | |
| Intel Core i9-13900K | |
| AMD Ryzen 9 7950X3D | |
| 3840x2160 High Quality | |
| AMD Ryzen 9 7950X3D | |
| AMD Ryzen 9 7950X | |
| Intel Core i7-13700K | |
| Intel Core i9-13900K | |
| Dota 2 Reborn | |
| 1280x720 min (0/3) fastest | |
| AMD Ryzen 9 7950X3D | |
| AMD Ryzen 9 7950X | |
| Intel Core i9-13900K | |
| Intel Core i7-13700K | |
| 3840x2160 ultra (3/3) best looking | |
| AMD Ryzen 9 7950X3D | |
| AMD Ryzen 9 7950X | |
| Intel Core i9-13900K | |
| Intel Core i7-13700K | |
| The Witcher 3 | |
| 1024x768 Low Graphics & Postprocessing | |
| AMD Ryzen 9 7950X3D | |
| AMD Ryzen 9 7950X | |
| Intel Core i9-13900K | |
| Intel Core i7-13700K | |
| 3840x2160 High Graphics & Postprocessing (Nvidia HairWorks Off) | |
| AMD Ryzen 9 7950X | |
| Intel Core i9-13900K | |
| Intel Core i7-13700K | |
| AMD Ryzen 9 7950X3D | |
| F1 2021 | |
| 3840x2160 Ultra High Preset + Raytracing AA:T AF:16x | |
| AMD Ryzen 9 7950X3D | |
| Intel Core i7-13700K | |
| Intel Core i9-13900K | |
| AMD Ryzen 9 7950X | |
| 1280x720 Ultra Low Preset | |
| AMD Ryzen 9 7950X3D | |
| AMD Ryzen 9 7950X | |
| Intel Core i9-13900K | |
| Intel Core i7-13700K | |
| Shadow of the Tomb Raider | |
| 1280x720 Lowest Preset | |
| AMD Ryzen 9 7950X3D | |
| AMD Ryzen 9 7950X | |
| Intel Core i9-13900K | |
| Intel Core i7-13700K | |
| 3840x2160 Highest Preset AA:T | |
| Intel Core i7-13700K | |
| AMD Ryzen 9 7950X3D | |
| AMD Ryzen 9 7950X | |
| Intel Core i9-13900K | |
| GRID Legends | |
| 1280x720 Low Preset | |
| AMD Ryzen 9 7950X | |
| Intel Core i9-13900K | |
| Intel Core i7-13700K | |
| AMD Ryzen 9 7950X3D | |
| 3840x2160 Ultra Preset | |
| AMD Ryzen 9 7950X | |
| AMD Ryzen 9 7950X3D | |
| Intel Core i7-13700K | |
| Intel Core i9-13900K | |
| Borderlands 3 | |
| 1280x720 Very Low Overall Quality (DX11) | |
| AMD Ryzen 9 7950X3D | |
| Intel Core i9-13900K | |
| AMD Ryzen 9 7950X | |
| Intel Core i7-13700K | |
| 3840x2160 Badass Overall Quality (DX11) | |
| Intel Core i7-13700K | |
| AMD Ryzen 9 7950X3D | |
| AMD Ryzen 9 7950X | |
| Intel Core i9-13900K | |
| Tiny Tina's Wonderlands | |
| 1280x720 Lowest Preset (DX12) | |
| AMD Ryzen 9 7950X3D | |
| AMD Ryzen 9 7950X | |
| Intel Core i9-13900K | |
| Intel Core i7-13700K | |
| 3840x2160 Badass Preset (DX12) | |
| AMD Ryzen 9 7950X3D | |
| Intel Core i7-13700K | |
| AMD Ryzen 9 7950X | |
| Intel Core i9-13900K | |
| God of War | |
| 1280x720 Low Preset | |
| AMD Ryzen 9 7950X3D | |
| AMD Ryzen 9 7950X | |
| Intel Core i9-13900K | |
| Intel Core i7-13700K | |
| 3840x2160 Ultra Preset | |
| AMD Ryzen 9 7950X3D | |
| Intel Core i7-13700K | |
| Intel Core i9-13900K | |
| AMD Ryzen 9 7950X | |
| Far Cry New Dawn | |
| 1280x720 Low Preset | |
| AMD Ryzen 9 7950X3D | |
| Intel Core i9-13900K | |
| Intel Core i7-13700K | |
| AMD Ryzen 9 7950X | |
| 3840x2160 Ultra Preset | |
| AMD Ryzen 9 7950X3D | |
| Intel Core i9-13900K | |
| AMD Ryzen 9 7950X | |
| Intel Core i7-13700K | |
| Far Cry 6 | |
| 1280x720 Low Graphics Quality | |
| AMD Ryzen 9 7950X3D | |
| AMD Ryzen 9 7950X | |
| Intel Core i9-13900K | |
| Intel Core i7-13700K | |
| 3840x2160 Ultra Graphics Quality + HD Textures AA:T | |
| AMD Ryzen 9 7950X3D | |
| AMD Ryzen 9 7950X | |
| Intel Core i7-13700K | |
| Intel Core i9-13900K | |
AMD Ryzen 9 7950X3D with Nvidia GeForce RTX 4090
| low | med. | high | ultra | QHD | 4K DLSS | 4K | |
|---|---|---|---|---|---|---|---|
| GTA V (2015) | 188 | 187.6 | 187.5 | 160.2 | 160.9 | 186.5 | |
| The Witcher 3 (2015) | 864.7 | 825.1 | 657.2 | 305 | 275.2 | ||
| Dota 2 Reborn (2015) | 314.1 | 287.6 | 285 | 252.7 | 245.4 | ||
| Final Fantasy XV Benchmark (2018) | 234 | 233 | 232 | 225 | 157.6 | ||
| X-Plane 11.11 (2018) | 225 | 215 | 187.1 | 158.4 | |||
| Far Cry 5 (2018) | 299 | 269 | 262 | 248 | 246 | 182 | |
| Strange Brigade (2018) | 672 | 543 | 532 | 524 | 501 | 285 | |
| Shadow of the Tomb Raider (2018) | 383 | 371 | 372 | 361 | 315 | 187.6 | |
| Far Cry New Dawn (2019) | 255 | 225 | 218 | 199 | 200 | 171 | |
| Metro Exodus (2019) | 293 | 260 | 224 | 193.5 | 178.9 | 139.4 | |
| Control (2019) | 240 | 240 | 240 | 218 | 137.1 | 112.5 | |
| Borderlands 3 (2019) | 308 | 273 | 255 | 242 | 223 | 136.4 | |
| F1 2020 (2020) | 594 | 503 | 496 | 453 | 425 | 288 | |
| F1 2021 (2021) | 682 | 642 | 526 | 271 | 271 | 203 | |
| Far Cry 6 (2021) | 255 | 233 | 215 | 208 | 202 | 140.9 | |
| Guardians of the Galaxy (2021) | 266 | 266 | 266 | 266 | 265 | 193 | |
| Forza Horizon 5 (2021) | 357 | 283 | 275 | 214 | 201 | 166 | |
| God of War (2022) | 356 | 330 | 279 | 208 | 180.1 | 130.1 | |
| GRID Legends (2022) | 289 | 269 | 245 | 234 | 233 | 196.8 | |
| Cyberpunk 2077 1.6 (2022) | 252 | 248.4 | 238.5 | 238.2 | 167.3 | 82.6 | |
| Tiny Tina's Wonderlands (2022) | 477 | 395 | 328 | 299 | 234 | 131.3 | |
| F1 22 (2022) | 475 | 444 | 417 | 204 | 158.9 | 82.3 | |
| The Quarry (2022) | 444 | 345 | 302 | 263 | 195.2 | 81.6 | |
| A Plague Tale Requiem (2022) | 203 | 197.9 | 184.4 | 162.3 | 124.9 | 150.2 | 77 |
| Uncharted Legacy of Thieves Collection (2022) | 150.2 | 149.2 | 145.3 | 145.6 | 144 | 103.9 | |
| Call of Duty Modern Warfare 2 2022 (2022) | 334 | 301 | 249 | 241 | 191 | 185 | 129 |
| Spider-Man Miles Morales (2022) | 214 | 206 | 187.3 | 187.2 | 179.9 | 130 | |
| The Callisto Protocol (2022) | 282.1 | 269 | 264.9 | 230.6 | 195.1 | 126.4 | |
| High On Life (2023) | 437 | 390 | 331 | 300 | 224 | 107 | |
| The Witcher 3 v4 (2023) | 351 | 305 | 245 | 226 | 223 | 149.6 | |
| Dead Space Remake (2023) | 286 | 281 | 261 | 258 | 199.3 | 106.5 | |
| Hogwarts Legacy (2023) | 181.8 | 166 | 143.1 | 132.1 | 130.2 | 77.5 | |
| Returnal (2023) | 283 | 281 | 258 | 235 | 187 | 119 | |
| Atomic Heart (2023) | 331 | 279 | 262 | 230 | 184 | 111.8 | |
| Company of Heroes 3 (2023) | 414 | 393.9 | 362.7 | 356.3 | 315.9 | 213.9 | |
| Sons of the Forest (2023) | 156 | 151.5 | 145.5 | 145.3 | 140.8 | 128 |
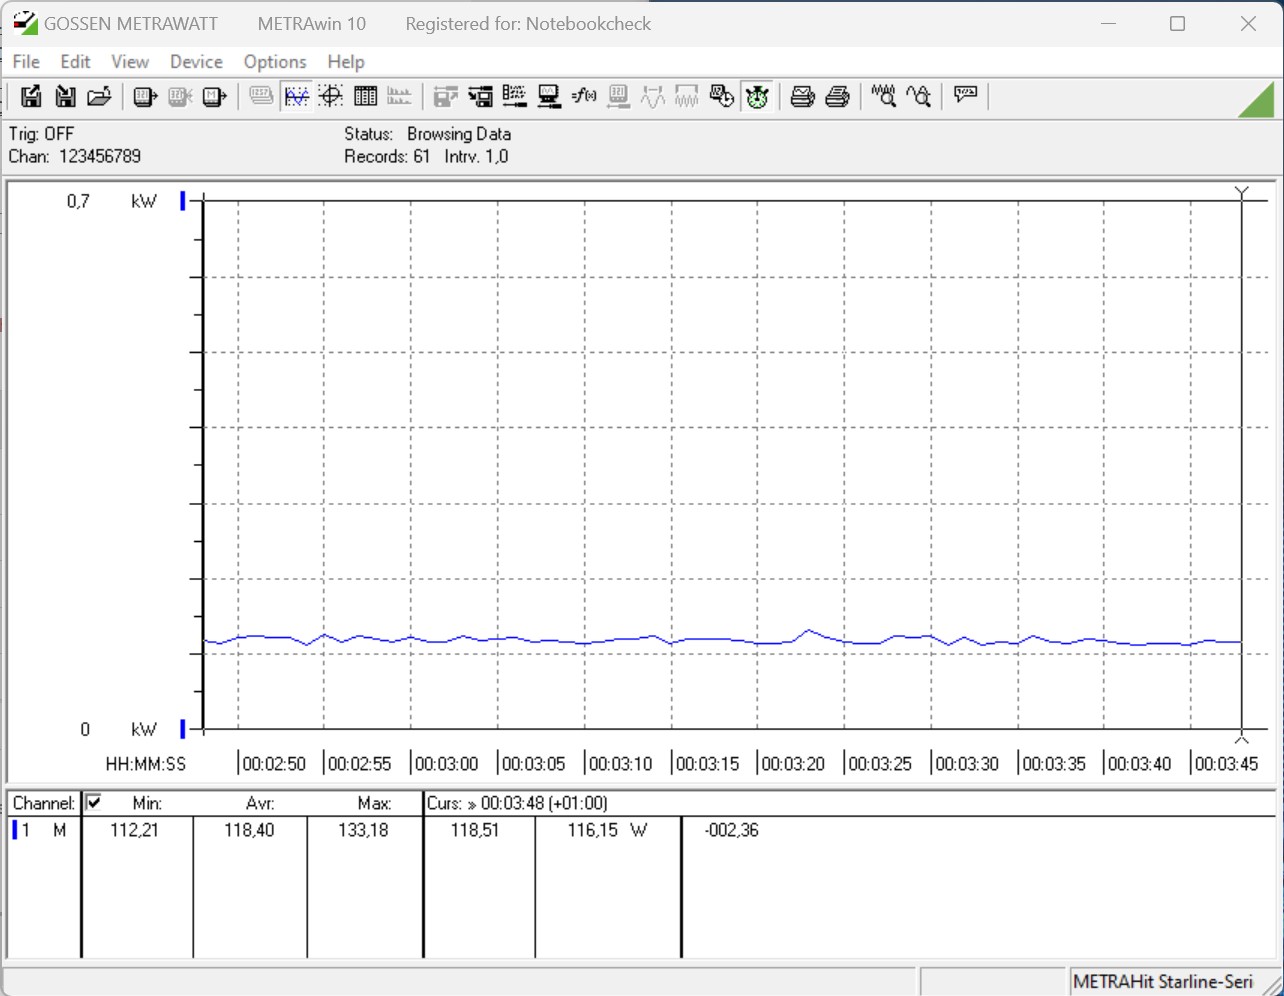
Power Consumption - Surprisingly efficient
We were already very positively surprised by the performance of the AMD Ryzen 9 7950X3D. In addition, we must not forget that AMD specifies a TDP of only 120 watts for all the current X3D models. The more power-hungry X models are able to consume up to 50 watts more, with up to 170 watts, when the power limits are active.
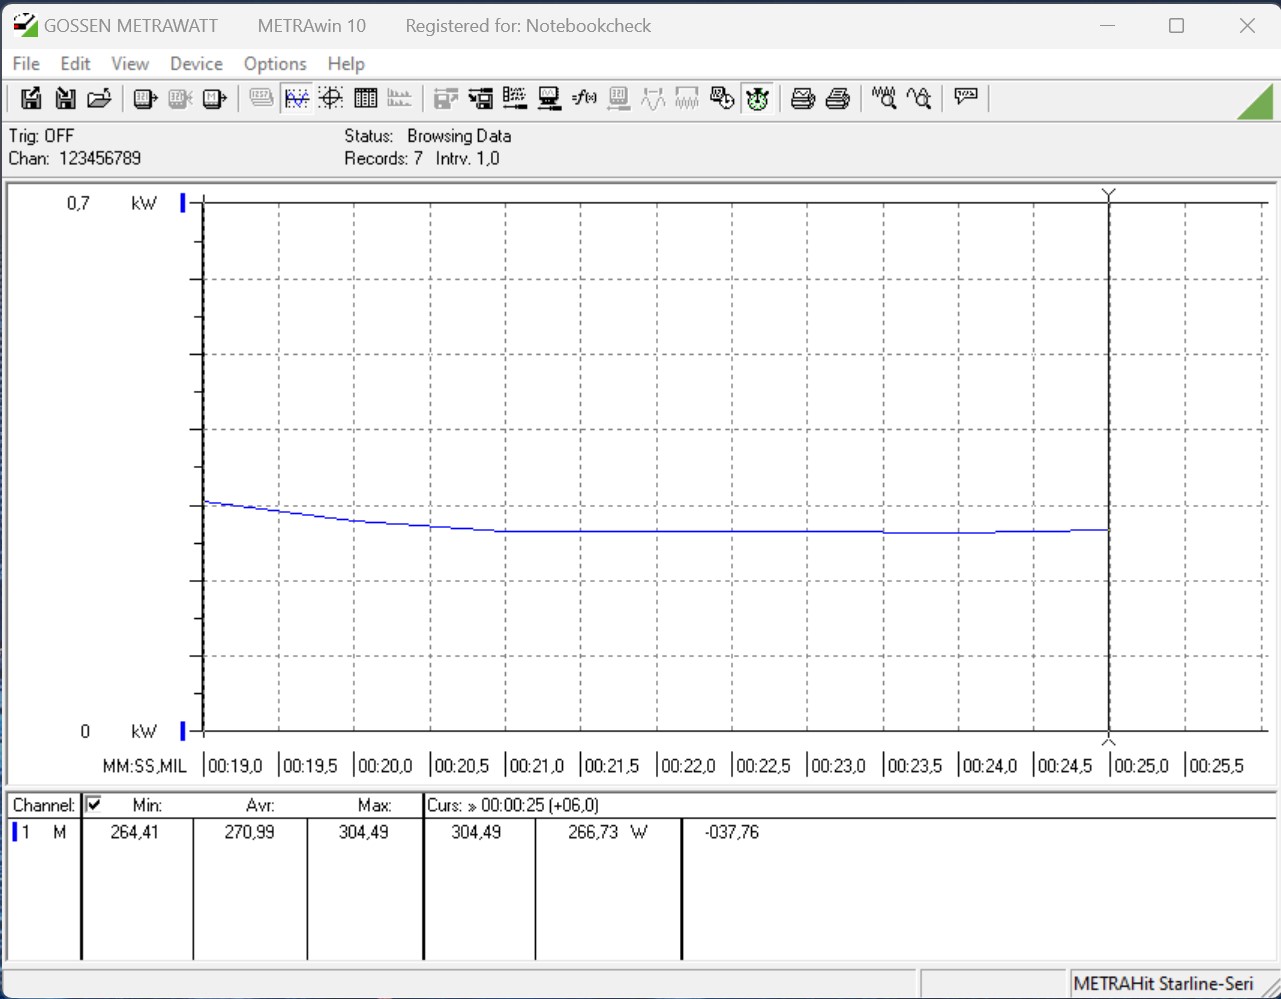
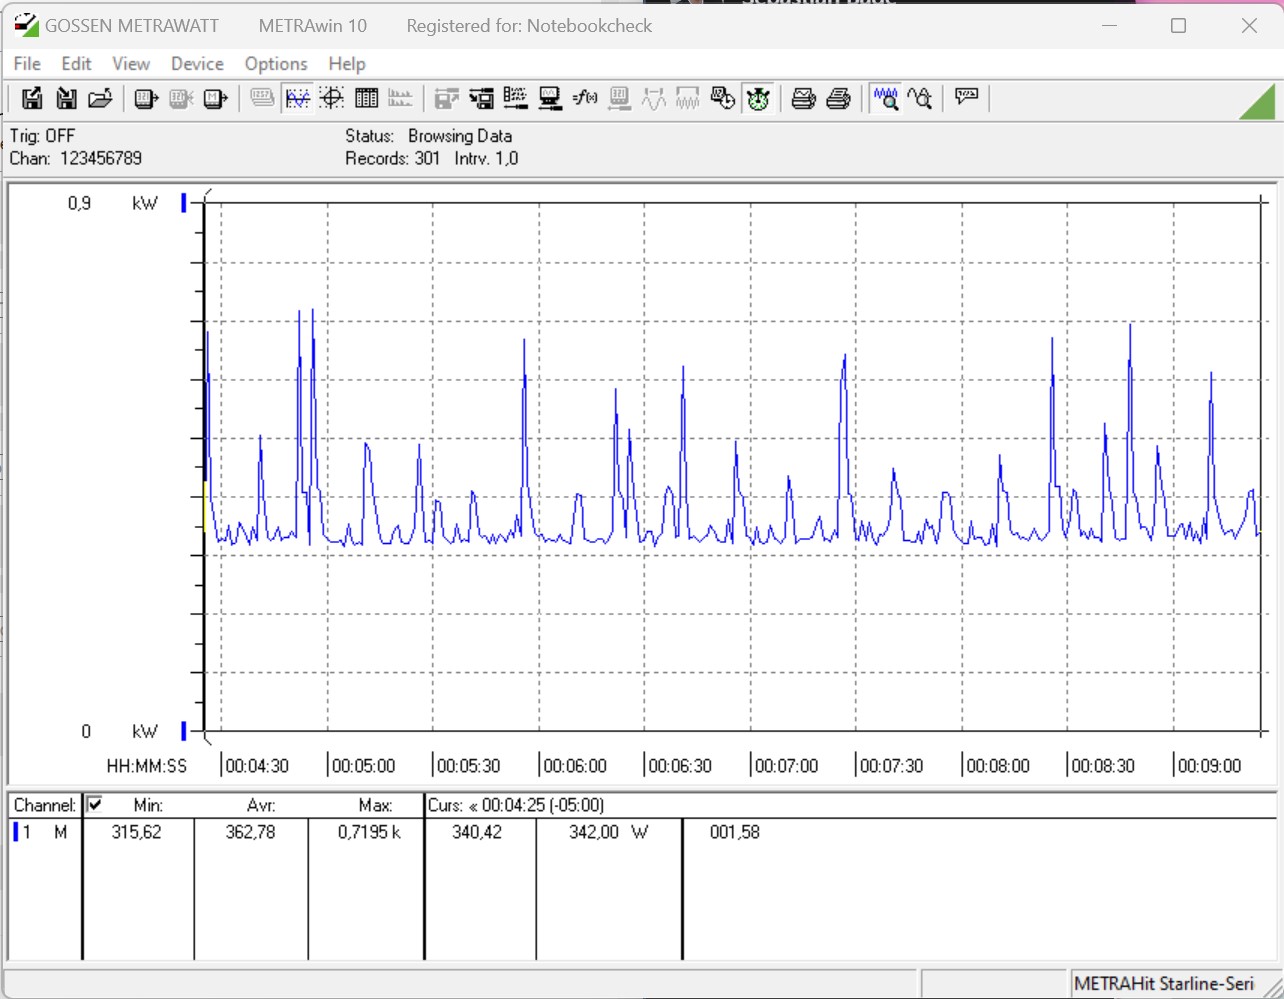
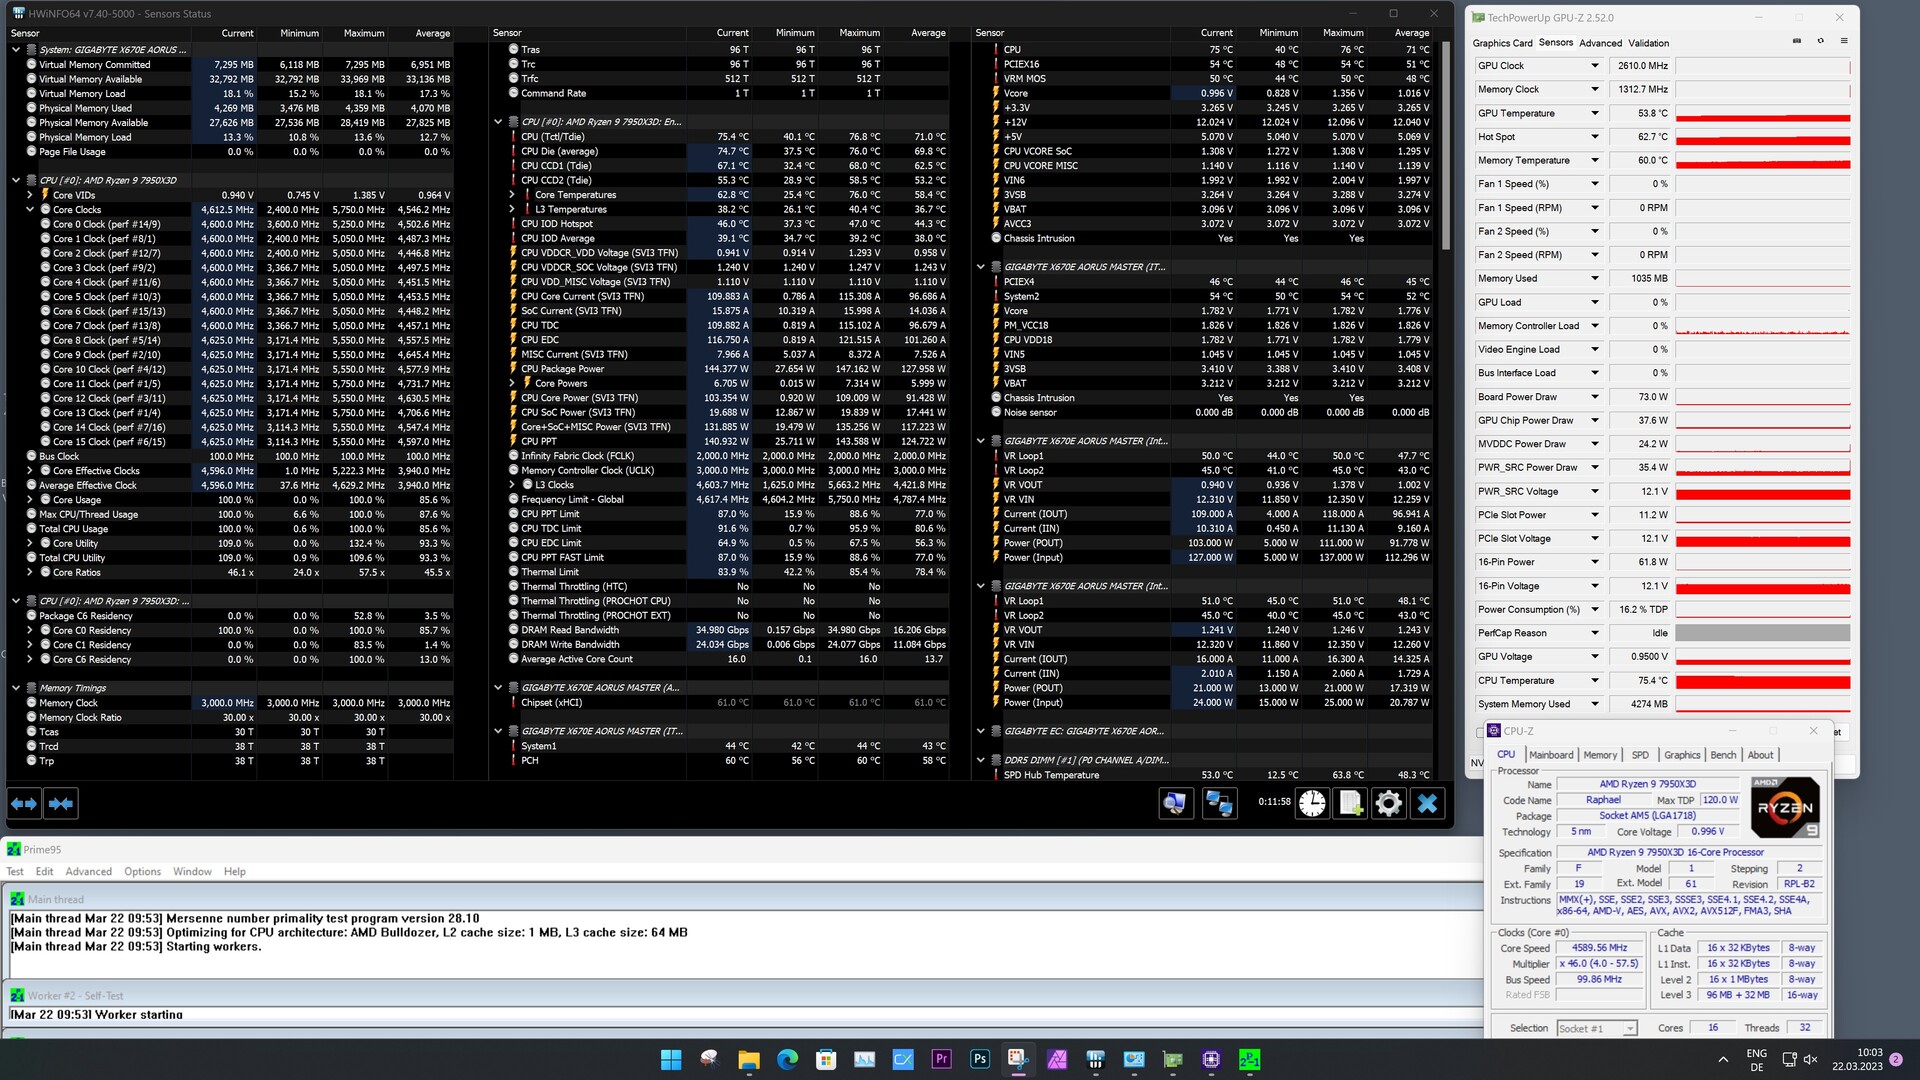
However, during idle operation we see a relatively high power consumption of more than 100 watts together with our test mainboard (Gigabyte X670E Aorus Master). But our initial disenchantment is then only followed by positive results, and at only 273 watts in the Cinebench R15 Multi test, we measure a significantly lower consumption than we see with the competitors in this price class. This also shows in the Prime95 stress test as well as during gaming. However, the latter isn't very CPU heavy, so the advantage to the Intel Core i9-13900K is significantly smaller. The Nvidia GeForce RTX 4090 ensures the largest part of the advantage while gaming.
Compared to the Intel Core i9-13900K, we see a significantly higher efficiency in the AMD Ryzen 9 7950X3D. Considering the Cinebench R15 Multi test result, the AMD flagship is surpassed, but at 21.9 points per watt, the newest 16-core processor is significantly further ahead of the Intel competitor. For comparison, the Intel Core i9-13900K only reaches 12.9 points per watt.
Due to the low maximum power consumption, the cooling system can also turn out a bit smaller. However, you should also keep in mind that AMD has set 89 °C (192 °F) as the maximum temperature for the AMD Ryzen 9 7950X3D, before the CPU has to be throttled. In the AMD Ryzen 9 7950X, the temperature limit was still 95 °C (203 °F). The Intel Core i9-13900K is only throttled from 100 °C (212 °F) when the power limits are deactivated. During our stress test, at no time do we exceed the limit of 80 °C (176 °F) in our test setting, but what is responsible is the good cooling. In the same test setting, the AMD Ryzen 9 7900X became significantly hotter reaching more than 90 °C (194 °F). Our recommendation for a suitable cooling therefore goes to a 240 AiO solution or a powerful air cooler. The Noctua NH-D15 recommends itself here, if you want to avoid using an AiO solution.
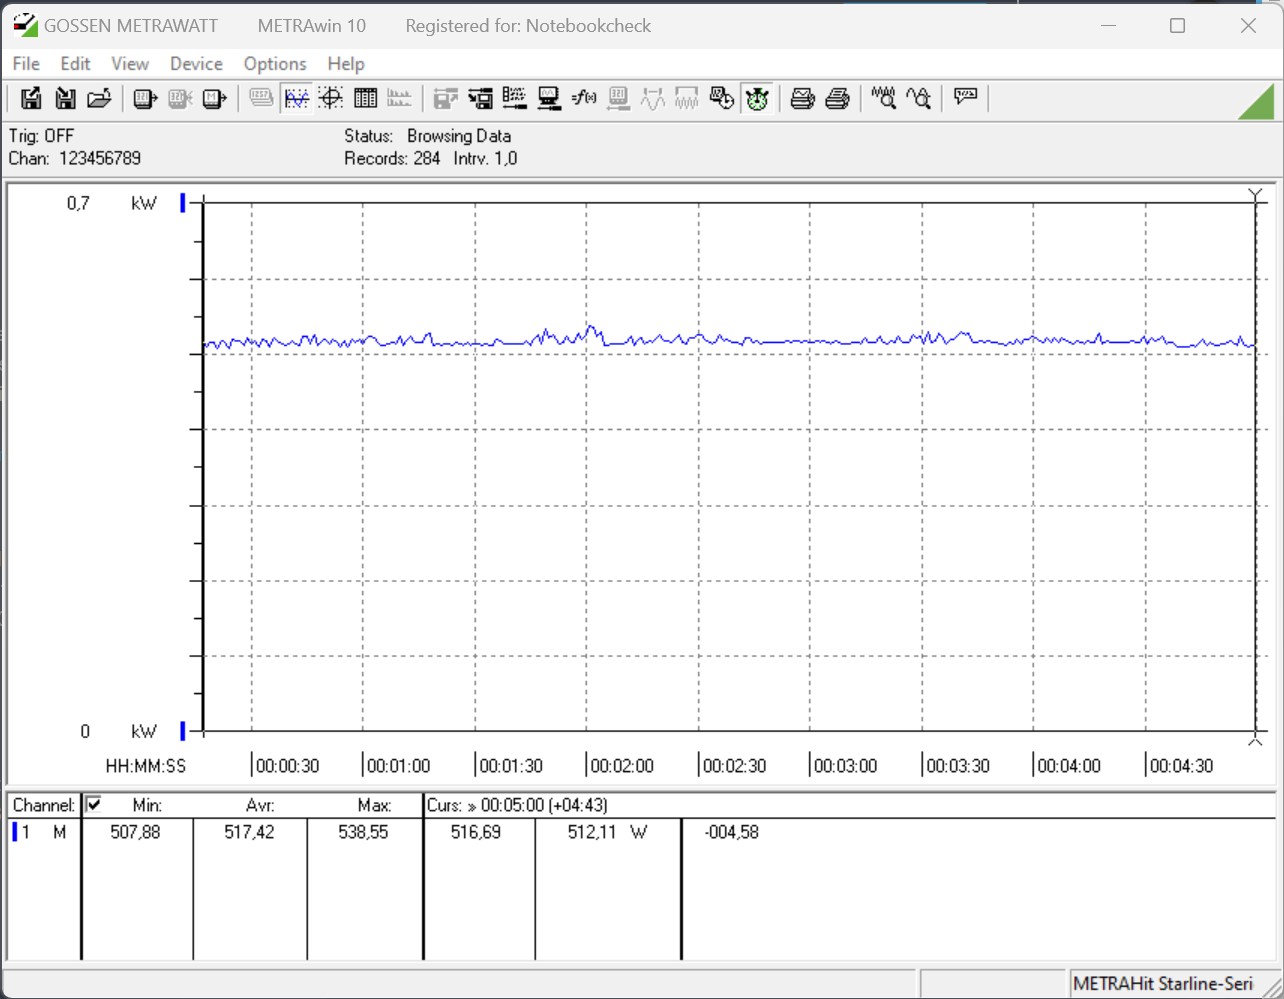
| Power Consumption / Cinebench R15 Multi (external Monitor) | |
| Intel Core i9-13900K | |
| AMD Ryzen 9 7950X (Idle: 95.2 W) | |
| Intel Core i7-13700K | |
| AMD Ryzen 9 7900X | |
| AMD Ryzen 9 7950X3D | |
| AMD Ryzen 9 5950X (Idle: 78 W) | |
| Power Consumption / Cinebench R15 Multi Efficiency (external Monitor) | |
| AMD Ryzen 9 7950X3D | |
| AMD Ryzen 9 5950X | |
| AMD Ryzen 9 7950X | |
| AMD Ryzen 9 7900X | |
| Intel Core i9-13900K | |
| Power Consumption / Prime95 V2810 Stress (external Monitor) | |
| Intel Core i9-13900K | |
| Intel Core i7-13700K | |
| AMD Ryzen 9 7950X (Idle: 95.2 W) | |
| AMD Ryzen 9 7900X | |
| AMD Ryzen 9 7950X3D | |
| AMD Ryzen 9 5950X (Idle: 78 W) | |
| Power Consumption / The Witcher 3 ultra (external Monitor) | |
| AMD Ryzen 9 7900X | |
| AMD Ryzen 9 7950X (Idle: 95.2 W) | |
| Intel Core i7-13700K | |
| Intel Core i9-13900K | |
| AMD Ryzen 9 7950X3D | |
| AMD Ryzen 9 5950X (Idle: 78 W) | |
* ... smaller is better
Power Consumption With External Monitor
Pros
Cons
Verdict - Extremely fast and very efficient

The new AM5 socket hasn't been available on the market for long, and AMD already offers new and faster CPUs. After their initial presentation at CES in January 2023, the expectations on the performance of the new X3D processors were high. In our current test of the AMD Ryzen 9 7950X3D, we determined that AMD did many things right, even if the costs of the platform are relatively high, as long as it should be a X670 basis. Due to the requirement for DDR5, you have to pay more for the working memory than DDR4 would cost.
The performance of the AMD Ryzen 9 7950X3D is convincing throughout, even if the pure multi-core performance turns out slightly worse in comparison with the competitors. When gaming, the AMD Ryzen 9 7950X3D is again able to make up for this, placing first with a clear advantage. The largest difference can be seen in terms of the power consumption. In our tests, the AMD Ryzen 9 7950X3D turns out to be an extremely efficient CPU. The performance is by no means any worse than that of the current top models, and under load the AMD Ryzen 9 7950X3D is always significantly more efficient in terms of the power consumption. Because of this, you also won't need to have a very powerful cooling system, since it is much easier to control the AMD Ryzen 9 7950X3D under load than an Intel Core i9-13900k or AMD Ryzen 9 7950X.
AMD's Ryzen 9 7950X3D delivers an excellent performance in all areas, and is additionally almost always very efficient, which is a trend that we have often missed recently.
To summarize, we note that with the AMD Ryzen 9 7950X3D, AMD offers the currently fastest gaming CPU on the market. However, it often depends on the specific game, whether it is able to deliver the full performance connected with the correct thread assignment. Due to the hybrid structure coming from the two different CCDs, it is not always a given that the CCD with the 3D V-Cache is preferred.
Price and Availability
The AMD Ryzen 9 7950X3D is listed for $699 but currently shown as out of stock in the AMD web shop and similarly in other places such as Newegg. So those who currently want to by an AMD Ryzen 9 7950X3D have to bring some patience and perhaps also some luck or extra money. Amazon currently lists it for $1019 with only few units available. The situation seems to be better with the slightly smaller AMD Ryzen 9 7900X3D, and AMD lists it for $599.
Transparency
The selection of devices to be reviewed is made by our editorial team. The test sample was given to the author by the manufacturer free of charge for the purposes of review. There was no third-party influence on this review, nor did the manufacturer receive a copy of this review before publication. There was no obligation to publish this review. As an independent media company, Notebookcheck is not subjected to the authority of manufacturers, retailers or publishers.
This is how Notebookcheck is testing
Every year, Notebookcheck independently reviews hundreds of laptops and smartphones using standardized procedures to ensure that all results are comparable. We have continuously developed our test methods for around 20 years and set industry standards in the process. In our test labs, high-quality measuring equipment is utilized by experienced technicians and editors. These tests involve a multi-stage validation process. Our complex rating system is based on hundreds of well-founded measurements and benchmarks, which maintains objectivity. Further information on our test methods can be found here.

