Notebookcheck Logo

Intel Core Ultra X9 388H

Intel Ultra X9 388H

The Intel Core Ultra X9 388H is a fast high-end 16-core SoC of the Panther Lake family and top model with 12 Xe3 GPU cores. Furthermore, the SoC includes 18 MB Cache and support for vPro managment features (vPro eligibility).

The 388H integrates a compute tile manufactured by Intel in the new 18A (1.8nm) process with 4 large Cougar Cove P-cores clocked at up to 5.1 GHz, 8 Darkmont E-cores and another 4 Darkmont LP (low power) E-cores. Furthermore, the new NPU 5 with 50 TOPS INT 8 and an IPU 7.5 image processor are included.

The GPU tile contains a big and fast iGPU with 12 Xe3 cores and ray tracing support clocked at up to 2.5 GHz that can rival entry level dedicated GPUs.

The third chiplet integrates the platform controller with 12 PCIe lanes, 4x Thunderbolt 4, Wi-Fi 7 (R2) and Bluetooth Core 6.0. GPU and platform controller are manufactured by TSMC.

The power consumption is specified from 15 W (minimum assured power) over 25 Watt (processor base power PL1) up to 80 W (maximum Turbo power).

CodenamePanther Lake
SeriesIntel Panther Lake

Series: Panther Lake Panther Lake

Intel Core Ultra X9 388H « 1.6 - 5.1 GHz16 / 16 cores18 MB L3
Intel Core Ultra X9 378H compare1.6 - 5 GHz16 / 16 cores18 MB L3
Intel Core Ultra X7 368H compare1.6 - 5 GHz16 / 16 cores18 MB L3
Intel Core Ultra 9 386H compare1.6 - 4.9 GHz16 / 16 cores18 MB L3
Intel Core Ultra X7 358H compare1.5 - 4.8 GHz16 / 16 cores18 MB L3
Intel Core Ultra 7 366H compare1.6 - 4.8 GHz16 / 16 cores18 MB L3
Intel Core Ultra 7 356H compare1.5 - 4.7 GHz16 / 16 cores18 MB L3
Intel Arc G3 Extreme compare1.5 - 4.7 GHz14 / 14 cores12 MB L3
Intel Arc G3 compare1.5 - 4.6 GHz14 / 14 cores12 MB L3
Intel Core Ultra 5 338H compare1.5 - 4.7 GHz12 / 12 cores18 MB L3
Intel Core Ultra 7 365 compare1.8 - 4.8 GHz8 / 8 cores12 MB L3
Intel Core Ultra 7 355 compare1.7 - 4.7 GHz8 / 8 cores12 MB L3
Intel Core Ultra 5 336H compare1.5 - 4.6 GHz12 / 12 cores18 MB L3
Intel Core Ultra 5 335 compare1.6 - 4.6 GHz8 / 8 cores12 MB L3
Intel Core Ultra 5 325 compare1.6 - 4.5 GHz8 / 8 cores12 MB L3
Intel Core Ultra 5 332 compare1.9 - 4.4 GHz6 / 6 cores12 MB L3
Intel Core Ultra 5 322 compare1.9 - 4.4 GHz6 / 6 cores12 MB L3
Clock Rate1600 - 5100 MHz
Level 2 Cache12.5 MB
Level 3 Cache18 MB
Number of Cores / Threads16 / 16
4 x 5.1 GHz Intel Cougar Cove P-Core
8 x 4.0 GHz Intel Darkmont E-Core
4 x 3.7 GHz Intel Darkmont LP E-Core
Power Consumption (TDP = Thermal Design Power)25 Watt
TDP Turbo PL280 Watt
Manufacturing Technology1.8 nm
Max. Temperature100 °C
SocketFCBGA2540
GPUIntel Arc B390 12 Xe3 Panther Lake iGPU ( - 2500 MHz)
NPU / AI50 TOPS INT8
Chip AI180 TOPS INT8
64 Bit64 Bit support
Architecturex86
Announcement Date01/05/2026
Product Link (external)www.intel.com

Benchmarks

Performance Rating - CB R15 + R20 + 7-Zip + X265 + Blender + 3DM11 CPU
43.2 pt (72%)
Restrict / Search: Model: Max. age: years
Cinebench 2026 - Cinebench 2026 CPU Single Thread
533 Points (72%)
Cinebench 2026 - Cinebench 2026 CPU Multi
4044 Points (40%)
Cinebench 2024 - Cinebench 2024 CPU Single Core
min: 129     avg: 129.4     median: 129.4 (64%)     max: 129.8 Points
Cinebench 2024 - Cinebench 2024 CPU Multi Core
min: 794     avg: 1018     median: 1022.5 (19%)     max: 1172 Points
Cinebench R23 - Cinebench R23 Multi Core
min: 17663     avg: 18911     median: 18911 (18%)     max: 20159 Points
Restrict / Search: Model: Max. age: years
Cinebench R23 - Cinebench R23 Single Core
min: 2188     avg: 2201     median: 2200.5 (89%)     max: 2213 Points
Restrict / Search: Model: Max. age: years
Cinebench R20 - Cinebench R20 CPU (Single Core)
min: 832     avg: 833     median: 833 (90%)     max: 834 Points
Cinebench R20 - Cinebench R20 CPU (Multi Core)
min: 7008     avg: 7436     median: 7436 (18%)     max: 7864 Points
Cinebench R15 - Cinebench R15 CPU Multi 64 Bit
min: 2712     avg: 2955     median: 2955 (19%)     max: 3198 Points
Restrict / Search: Model: Max. age: years
0651301952603253904555205856507157808459109751040110511701235130013651430149515601625169017551820188519502015208021452210227523402405247025352600266527302795286029252990305531203185Tooltip
Cinebench R15 - Cinebench R15 CPU Single 64 Bit
min: 306     avg: 309.5     median: 309.5 (86%)     max: 313 Points
Restrict / Search: Model: Max. age: years
7-Zip 18.03 - 7-Zip 18.03 Multi Thread 4 runs
min: 62372     avg: 65361     median: 65361 (38%)     max: 68350 MIPS
7-Zip 18.03 - 7-Zip 18.03 Single Thread 4 runs
min: 6655     avg: 6677     median: 6677 (76%)     max: 6699 MIPS
HWBOT x265 Benchmark v2.2 - HWBOT x265 4k Preset
min: 20.6     avg: 22.2     median: 22.2 (39%)     max: 23.7 fps
05101520253035Tooltip
Blender - Blender 3.3 Classroom CPU *
min: 282     avg: 304     median: 304 (4%)     max: 326 Seconds
Blender - Blender 2.79 BMW27 CPU *
min: 170     avg: 184     median: 184 (1%)     max: 198 Seconds
R Benchmark 2.5 - R Benchmark 2.5 *
min: 0.4045     avg: 0.4     median: 0.4 (9%)     max: 0.4052 sec
3DMark 11 - 3DM11 Performance Physics
min: 20134     avg: 21660     median: 21659.5 (53%)     max: 23185 Points
3DMark - 3DMark Cloud Gate Physics
15300 Points (39%)
3DMark - 3DMark Fire Strike Standard Physics
min: 28159     avg: 30586     median: 30586 (55%)     max: 33013 Points
3DMark - 3DMark Time Spy CPU
min: 12782     avg: 13998     median: 13997.5 (59%)     max: 15213 Points
Geekbench 6.6 - Geekbench 6.6 Single-Core
min: 3020     avg: 3038     median: 3027 (70%)     max: 3066 points
Geekbench 6.6 - Geekbench 6.6 Multi-Core
min: 16568     avg: 17395     median: 17694 (60%)     max: 17924 points
Restrict / Search: Model: Max. age: years
Geekbench 5.5 - Geekbench 5.1 - 5.5 64 Bit Single-Core
min: 2191     avg: 2208     median: 2207.5 (74%)     max: 2224 points
Geekbench 5.5 - Geekbench 5.1 - 5.5 64 Bit Multi-Core
min: 15933     avg: 16642     median: 16641.5 (30%)     max: 17350 points
Mozilla Kraken 1.1 - Kraken 1.1 Total Score *
min: 430     avg: 430.5     median: 430.5 (1%)     max: 431 ms
Octane V2 - Octane V2 Total Score
110858 Points (72%)
WebXPRT 4 - WebXPRT 4 Score
min: 314     avg: 316     median: 316 (79%)     max: 318 Points
WebXPRT 3 - WebXPRT 3 Score
min: 339     avg: 346.5     median: 346.5 (58%)     max: 354 Points
CrossMark - CrossMark Overall
min: 2048     avg: 2102     median: 2101.5 (74%)     max: 2155 Points
Power Consumption - Prime95 Power Consumption - external Monitor *
min: 55.8     avg: 66.7     median: 66.7 (12%)     max: 77.6 Watt
0510152025303540455055606570758085Tooltip
Power Consumption - Cinebench R15 Multi Power Consumption - external Monitor *
min: 62.4     avg: 75.3     median: 75.3 (14%)     max: 88.2 Watt
0510152025303540455055606570758085Tooltip
Power Consumption - Idle Power Consumption - external Monitor *
min: 2.55     avg: 4.3     median: 4.3 (3%)     max: 5.99 Watt
012345678910111213Tooltip
Power Consumption - Idle Power Consumption 150cd 1min *
min: 3.17     avg: 5     median: 5 (4%)     max: 6.83 Watt
012345678910111213Tooltip
Power Consumption - Power Efficiency - Cinebench R15 Multi external Monitor
min: 36.3     avg: 39.9     median: 39.9 (30%)     max: 43.5 Points per Watt
- Range of benchmark values
red legend - Average benchmark values
* Smaller numbers mean a higher performance

Amazon Logo
  • $2,487.91
    ASUS Zenbook Duo Laptop (2026), Dual 14” OLED 3K 144Hz Touch Display, Intel Core Ultra X9 388H, Intel Arc Graphics, 32GB RAM, 1TB SSD, Sleeve and Stylus Included, WiFi 7, Windows 11, Moher Gray
  • $699.00
    HP 15 Laptop (15.6" FHD Touchscreen, Intel Core i5-1334U (> i7-1255U), 32GB RAM, 1TB SSD) for Business, Students, Home, 10-Hour Long Battery Life, Webcam, Wi-Fi 6, Numpad, Fast Charge, Win 11 Pro
  • $869.00
    HP Pavilion x360 Convertible 15.6-inch Touchscreen Laptop, 11th Gen Intel Core i5-1135G7, Intel Iris Xe Graphics, 8 GB RAM, 512 GB SSD, HD Micro-Edge Display, Windows 10 Home (15-dq2020nr, 2020)
  • $159.00
    ASUS Laptop L510 Ultra Thin Laptop, 15.6” FHD Display, Intel Celeron N4020 Processor, 4GB RAM, 64GB Storage, Windows 11 Home in S Mode, 1 Year Microsoft 365, Star Black, L510MA-DS02
  • $240.43
    HP EliteBook 840 G3 14" FHD (1920x1080) Business Laptop Computer, Intel Core i7-6600 Up to 3.40GHz Notebook PC, 16GB RAM, 256GB SSD, Type-C, Windows 11 Pro (Renewed)

Add one or more devices and compare

In the following list you can select (and also search for) devices that should be added to the comparison. You can select more than one device.

search for model:
v1.35
log 11. 09:50:36

#0 ran 0s before starting gpusingle class +0s ... 0s

#1 no ids found in url (should be separated by "_") +0s ... 0s

#2 not redirecting to Ajax server +0s ... 0s

#3 did not recreate cache, as it is less than 5 days old! Created at Thu, 11 Jun 2026 09:46:03 +0200 +0.003s ... 0.003s

#4 composed specs +0.01s ... 0.013s

#5 did output specs +0s ... 0.013s

#6 getting avg benchmarks for device 20016 +0.037s ... 0.049s

#7 got single benchmarks 20016 +0.014s ... 0.063s

#8 got avg benchmarks for devices +0s ... 0.063s

#9 min, max, avg, median took s +1.612s ... 1.675s

#10 return log +0.34s ... 2.014s

Reviews for the Intel Core Ultra X9 388H processor

Intel Arc B390 performance and efficiency analysis. (Image Source: Intel)

Intel Panther Lake Arc B390 performance and efficiency analysis: Intel's new iGPU trades blows with the Nvidia GeForce RTX 4050

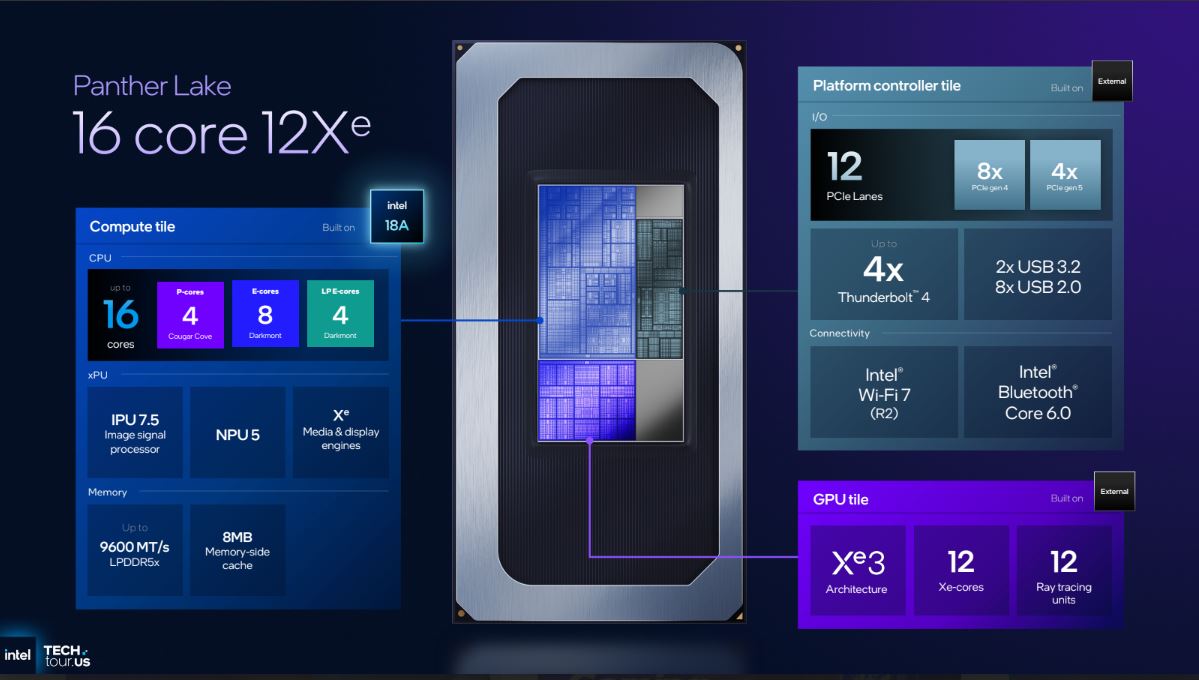
The new Panther Lake processors from Intel not only offer more CPU performance, but above all utilize a very fast integrated graphics card. The Arc B390 is around 70% faster than the previous iGPUs and can even keep up with the GeForce RTX 4050 Laptop GPU. Update: More comparisons with AMD Strix Halo
Intel Core Ultra X9 388H, Arc B390 Panther Lake iGPU, 14", 1.7 kg
Intel Panther Lake Core Ultra X9 388H performance analysis - Outpaces Arrow Lake and exceeds Zen 5 in efficiency

Intel Panther Lake Core Ultra X9 388H performance analysis - Outpaces Arrow Lake and exceeds Zen 5 in efficiency

Intel's new mobile processors, codenamed Panther Lake, aim to deliver improved performance and efficiency, according to the manufacturer. We tested the latest top model with the Core Ultra X9 388H to see what the new generation truly offers in terms of performance and efficiency. Update: Additional benchmarks of the Core Ultra X7 and AMD Strix Halo
Intel Core Ultra X9 388H, Arc B390 Panther Lake iGPU, 14", 1.7 kg
Asus ZenBook Duo UX8407 convertible review - Intel Panther Lake is a game-changer

Asus ZenBook Duo UX8407 convertible review - Intel Panther Lake is a game-changer

Asus has redesigned its dual-screen ZenBook Duo convertible for 2026, making it better in multiple respects. These include the new Intel Panther Lake processor with more efficient CPU cores and a so much faster iGPU that can just about make the GeForce RTX 4050 irrelevant. Update: Memory latency & additional gaming benchmarks
Intel Core Ultra X9 388H, Arc B390 Panther Lake iGPU, 14", 1.7 kg

Asus ProArt PZ14 HT7407: Intel Arc B390 12 Xe3 Panther Lake iGPU, 14.00", 1.5 kg
  External Review » Asus ProArt PZ14 HT7407

Lenovo ThinkPad X9-15p: Intel Arc B390 12 Xe3 Panther Lake iGPU, 15.30", 1.5 kg
  External Review » Lenovo ThinkPad X9-15p

Acer Swift Go 16 AI SFG16-171: Intel Arc B390 12 Xe3 Panther Lake iGPU, 16.00", 1.3 kg
  External Review » Acer Swift Go 16 AI SFG16-171

Asus ZenBook Duo UX8407AA: Intel Arc B390 12 Xe3 Panther Lake iGPU, 14.00", 1.7 kg
  External Review » Asus ZenBook Duo UX8407AA

Acer Swift 16 AI SF16-71T: Intel Arc B390 12 Xe3 Panther Lake iGPU, 16.00", 1.6 kg
  External Review » Acer Swift 16 AI SF16-71T

   » Acer Swift 16 stays cool even under stress

Asus ZenBook Duo UX8407AA: Intel Arc B390 12 Xe3 Panther Lake iGPU, 14.00", 1.7 kg
   » Asus' new Zenbook Duo UX8407 is easily the best dual-screen convertible

   » No chance for AMD: Intel Panther Lake Core Ultra X9 388H trounces AMD Strix Halo at low power signaling handheld gaming domination in 2026

Google LogoAdd as a preferred source on Google
Mail Logo

» Mobile CPU Comparison
Comparison of all mobile CPU series

» Mobile Processors - Benchmarklist
Benchmarklist of all known CPUs that are used in laptops (desktop and laptop CPUs)

Other CPUs of the series Panther Lake

» Intel Core Ultra X9 388H
   16x 1.6 GHz - 5.1 GHz
» Intel Core Ultra X9 378H
   16x 1.6 GHz - 5 GHz
» Intel Core Ultra X7 368H
   16x 1.6 GHz - 5 GHz
» Intel Core Ultra 9 386H
   16x 1.6 GHz - 4.9 GHz
» Intel Core Ultra X7 358H
   16x 1.5 GHz - 4.8 GHz
» Intel Core Ultra 7 366H
   16x 1.6 GHz - 4.8 GHz
» Intel Core Ultra 7 356H
   16x 1.5 GHz - 4.7 GHz
» Intel Arc G3 Extreme
   14x 1.5 GHz - 4.7 GHz
» Intel Arc G3
   14x 1.5 GHz - 4.6 GHz
» Intel Core Ultra 5 338H
   12x 1.5 GHz - 4.7 GHz
» Intel Core Ultra 7 365
   8x 1.8 GHz - 4.8 GHz
» Intel Core Ultra 7 355
   8x 1.7 GHz - 4.7 GHz
» Intel Core Ultra 5 336H
   12x 1.5 GHz - 4.6 GHz
» Intel Core Ultra 5 335
   8x 1.6 GHz - 4.6 GHz
» Intel Core Ultra 5 325
   8x 1.6 GHz - 4.5 GHz
» Intel Core Ultra 5 332
   6x 1.9 GHz - 4.4 GHz
» Intel Core Ultra 5 322
   6x 1.9 GHz - 4.4 GHz

Surrounding CPUs

+ AMD Ryzen AI Max 385
   8x 3.6 GHz - 5 GHz
+ AMD Ryzen 9 8940HX
   16x 2.4 GHz - 5.3 GHz
+ Apple M3 Max 14-Core
   14x 2.75 GHz - 4.06 GHz
+ Apple M5 9-Core
   9x 3.05 GHz - 4.61 GHz
+ Intel Core i7-14700HX
   20x 3.9 GHz - 5.5 GHz
» Intel Core Ultra X9 388H
   16x 1.6 GHz - 5.1 GHz
- AMD Ryzen 7 8840HX
   12x 2.9 GHz - 5.1 GHz
- AMD Ryzen 9 8945HX
   16x 2.5 GHz - 5.4 GHz
- Qualcomm Snapdragon X2 Elite X2E-84-100
   12x 3.4 GHz - 4.7 GHz
- Qualcomm Snapdragon X2 Elite X2E-80-100
   12x 3.4 GHz - 4.7 GHz
- AMD Ryzen 9 7845HX
   12x 3 GHz - 5.2 GHz
Klaus Hinum (Update: 2026-01- 8)