Battle of the titans: The ultimate 16-inch gaming laptop showdown for 2024
Where power meets style (mostly) – the ultimate high-end gaming laptop comparison.
Powerful CPUs, Nvidia's fastest mobile GPUs, the best MiniLED or OLED screens, and a plethora of additional feats and features that are supposed to deliver the best high-end mobile gaming experience. We put the flagships from Razer, Alienware, Lenovo, Asus ROG and XMG through their paces to see what they bring to the table, and if they are worth their eyewatering sticker price.Sambit Saha, Alexander Wätzel, 👁 Alexander Wätzel Published 🇩🇪 🇫🇷 ...
Verdict - the results may surprise you
When it comes to overall performance, we have one clear outlier: the Alienware X16. While it manages to be relatively quiet in balanced mode, it can't back up its lower performance scores with longer battery life, and considering the display situation, it’s also one of the hardest laptops to recommend today.
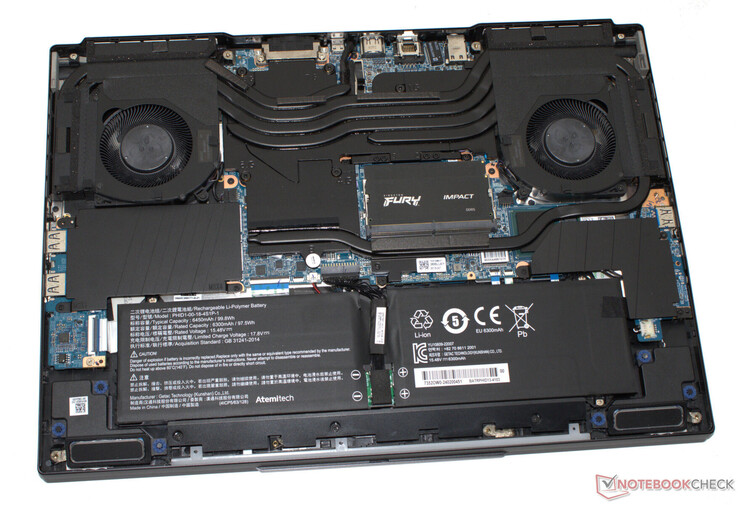
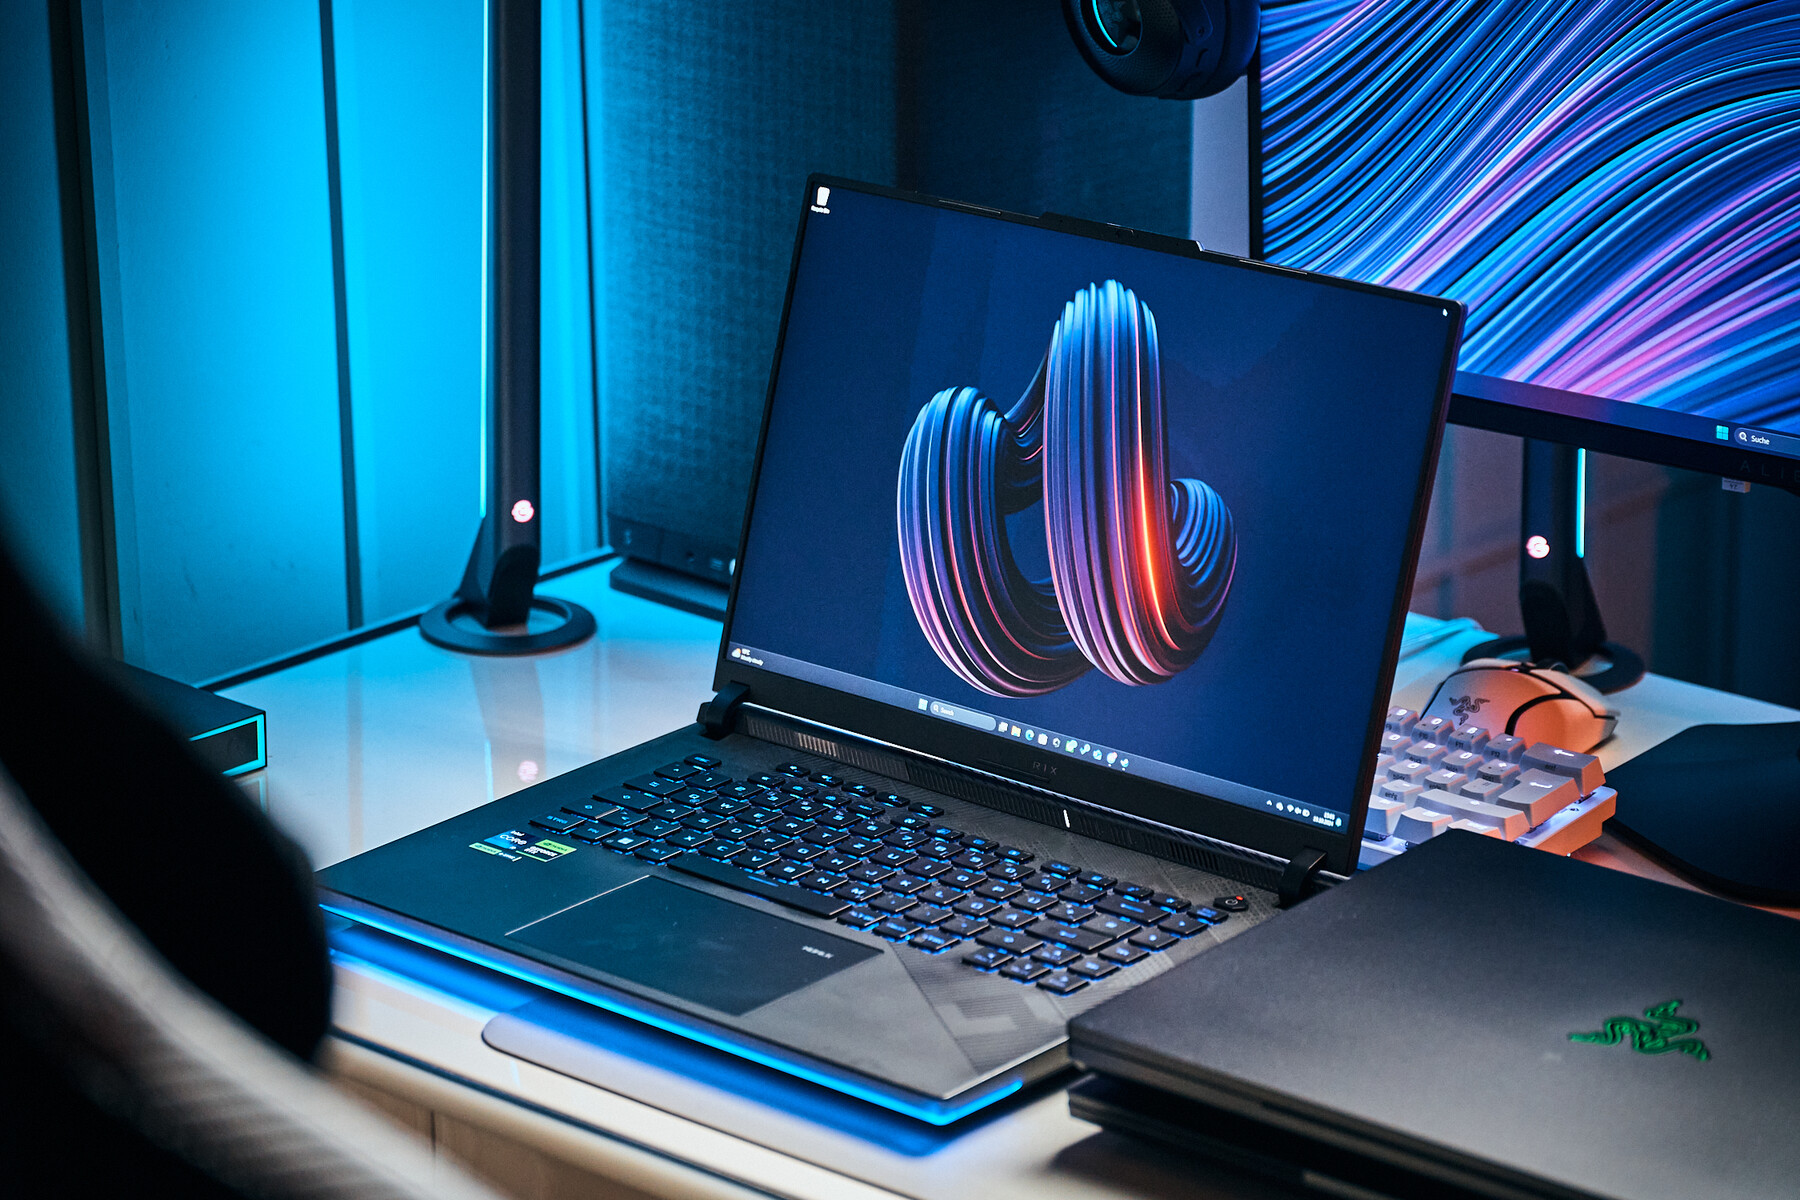
For those after the fastest gaming laptop across all sizes, who can also live with a solid if somewhat “boring” IPS display, the XMG Neo 16 is your best bet. With stellar build quality, an optional water cooler, and ample tweaking potential, it’s the perfect choice for the speed enthusiast.
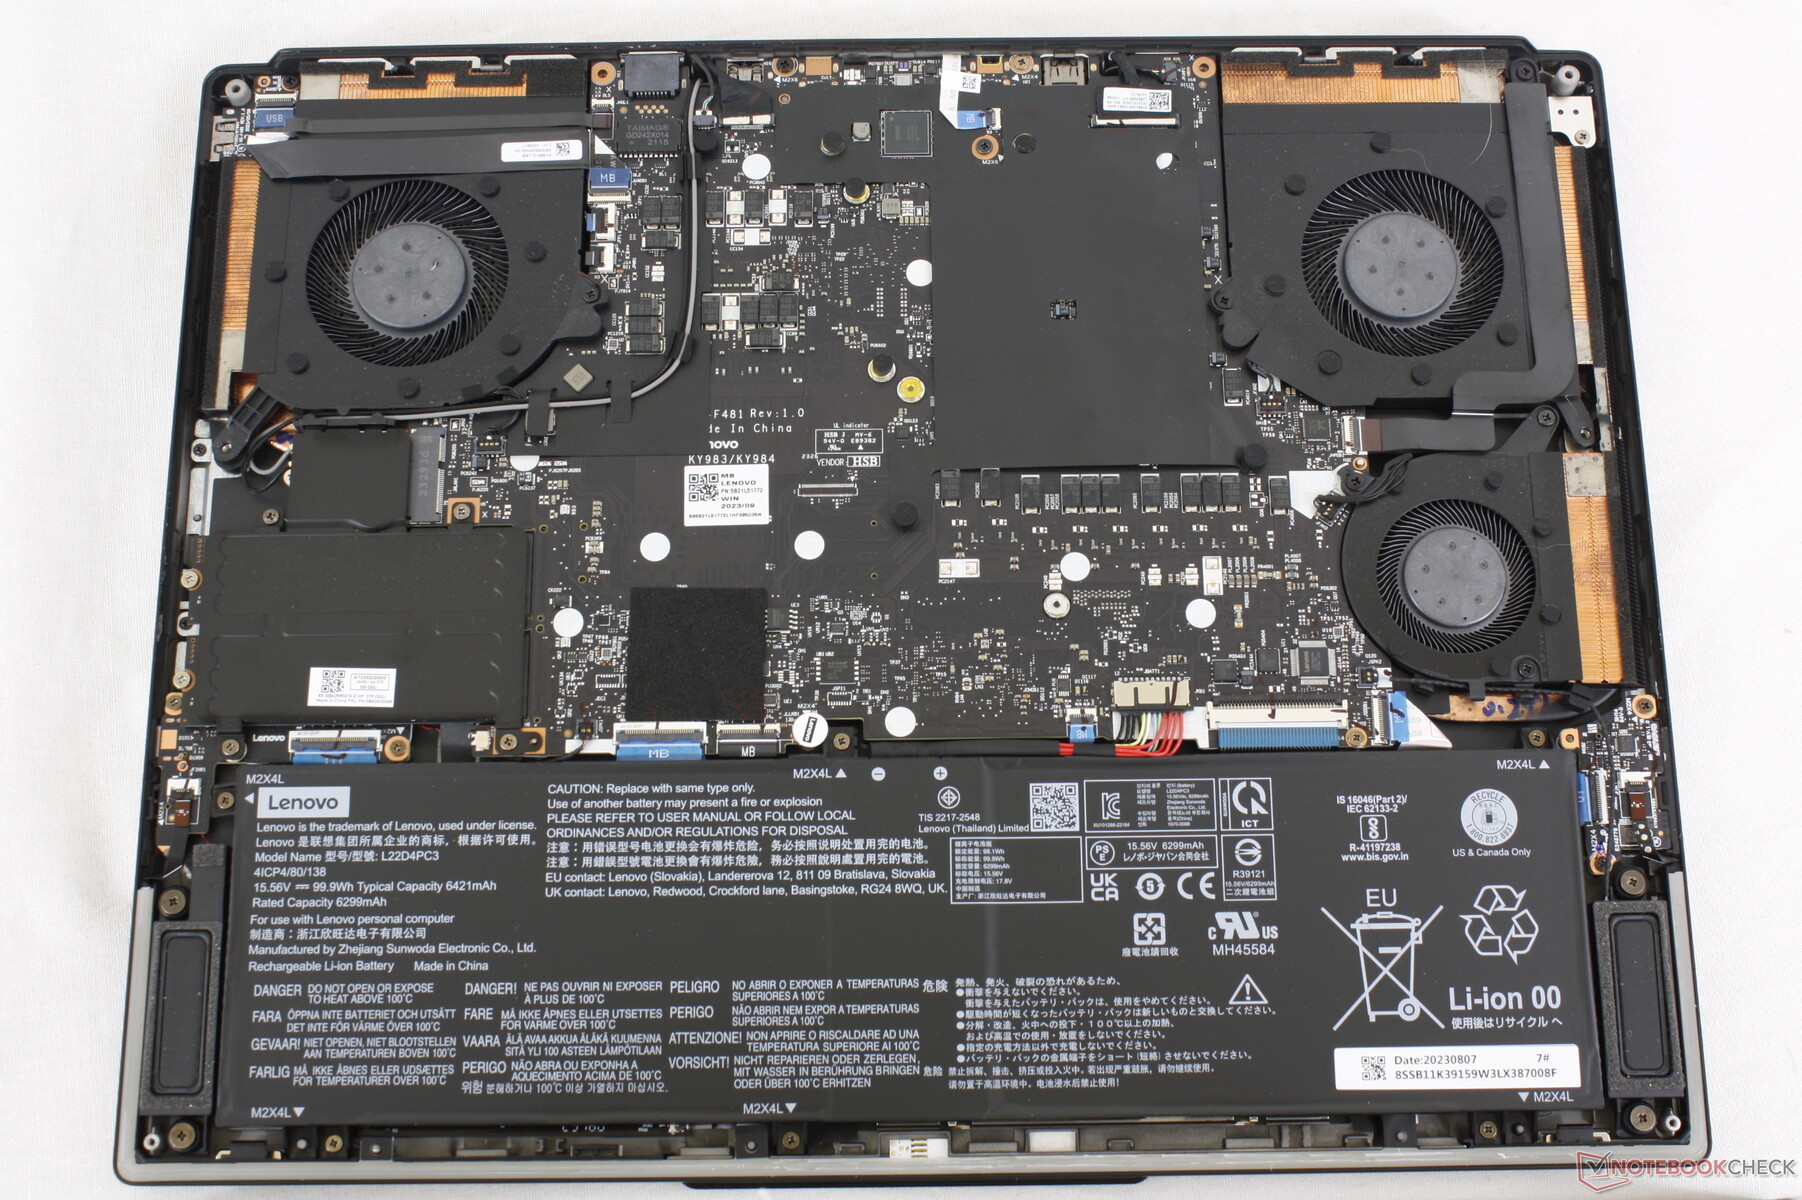
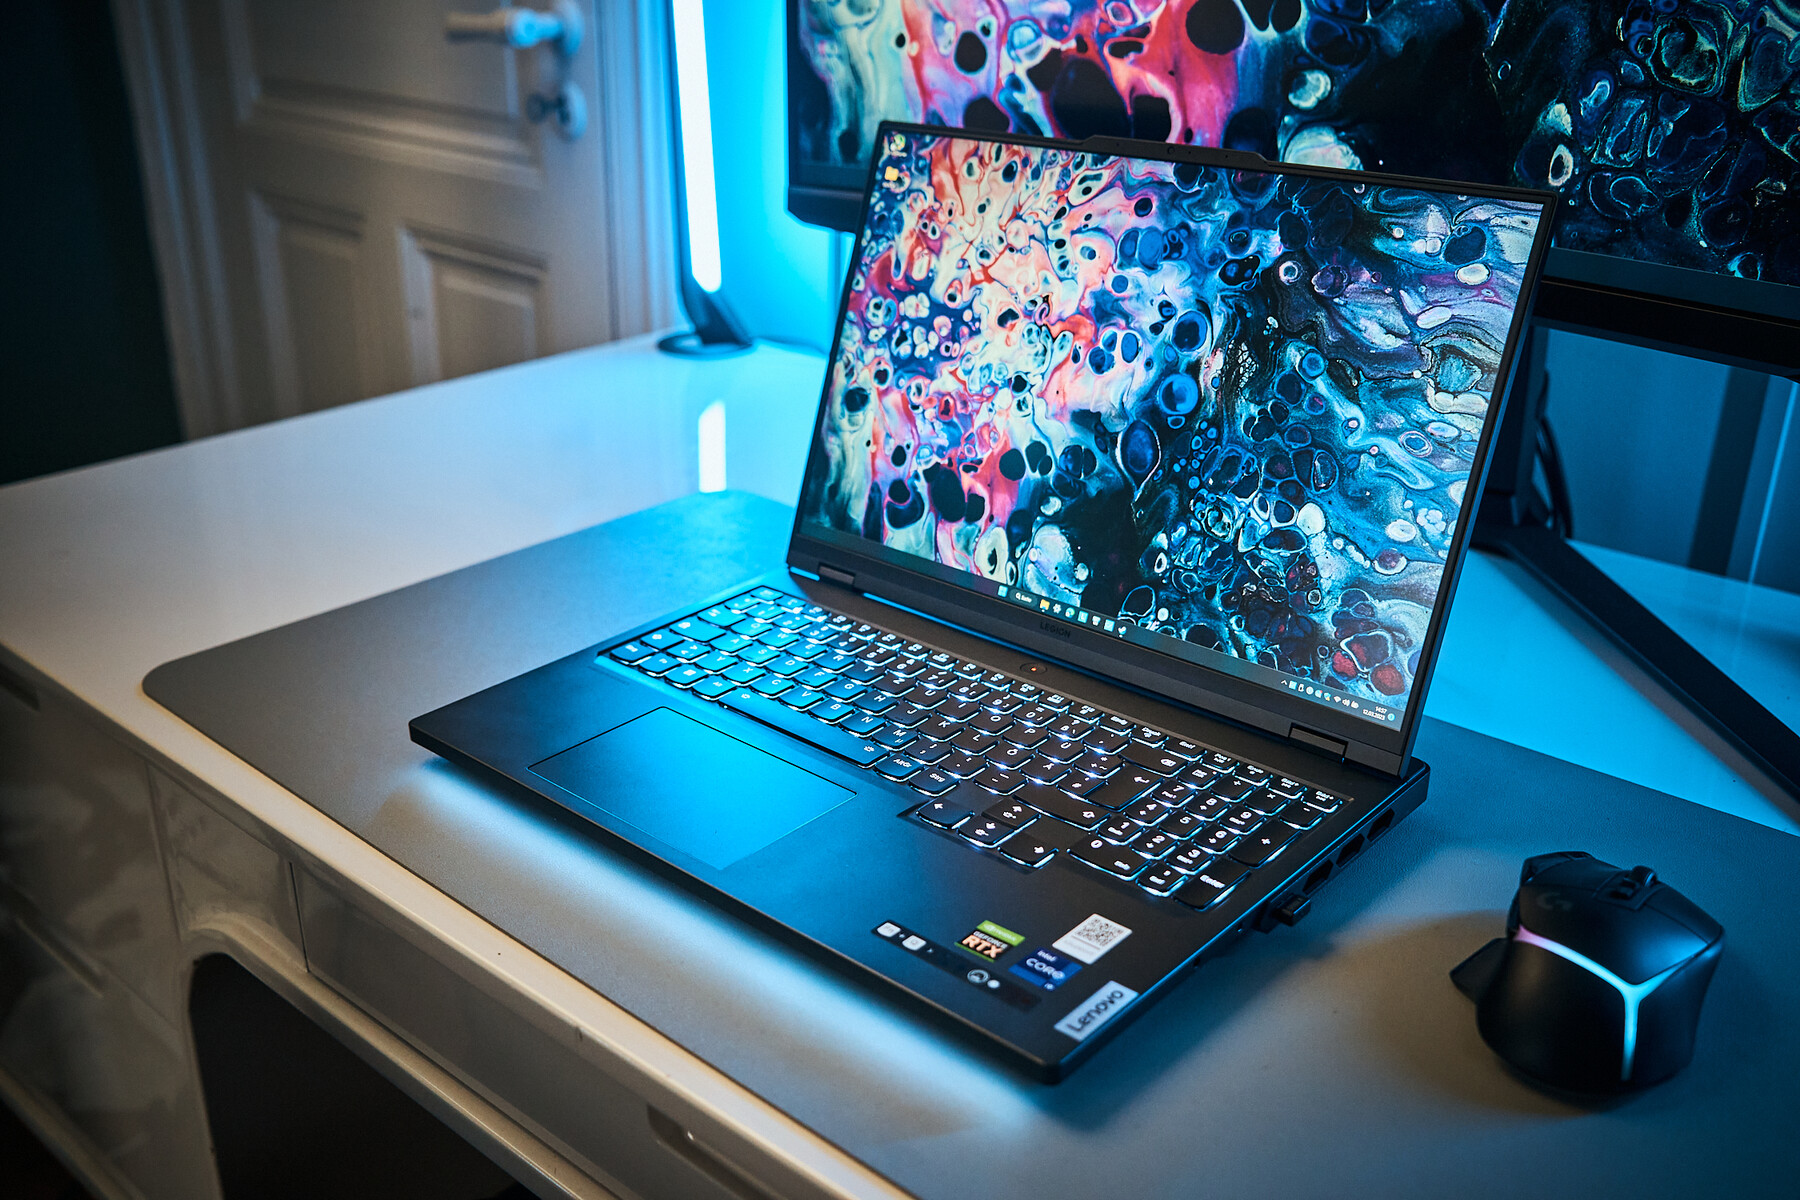
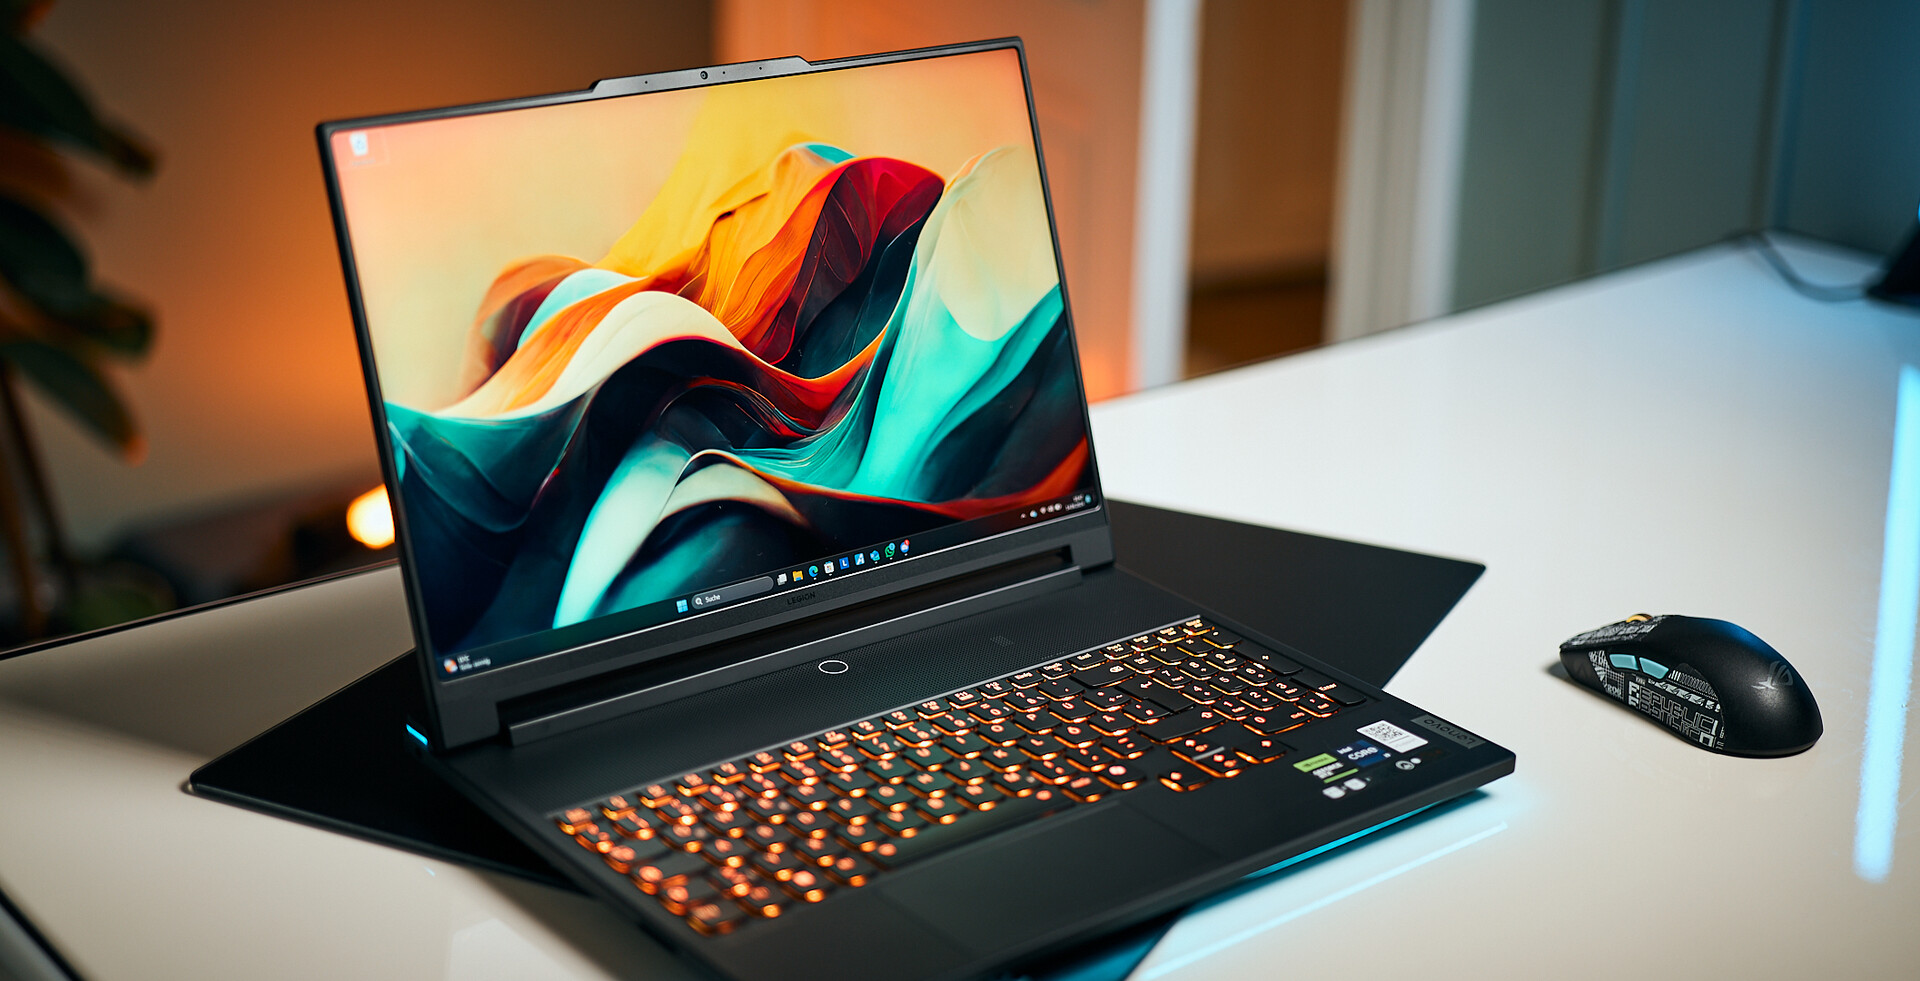
The Legion 9 is a bit of a mixed bag. Its overall feel and chassis quality are outstanding; we love the keyboard, its aesthetics are impressive, and the display makes games look gorgeous. Performance can be a hit or a miss. It's still good overall but then again, this is a very expensive laptop, and given that its lower-tier sibling is nearly as fast, you’d really have to want that MiniLED panel... which we could certainly understand.
The Legion Pro 7 is the workhorse for almost anything you can do with a notebook today. Its great for games and also excels at content creation. Very much like the Alienware, Lenovo puts them on sale very frequently, so you can definitely get a very good deal for what is a very good notebook.
The Razer Blade 16 is likely the best choice for creators, as the cost can be justified if used for income-generating work. Its stellar OLED display, solid I/O, adequate if not class-leading performance, sleek design, and well-controlled noise profile make it a great option for work and play alike.
As for the ROG Scar Strix 16, if we ignored its aesthetic and focused solely on performance, ports, display, and fan noise behaviour, it would be one of the best laptops today. But, while its chassis is sturdy, it simply does not feel as premium as our other contenders, and you would have to either like or be able to accept its more "aggressive" styling.
Price and Availability
It should come as no surprise that those on the lookout for top-tier specs will have to pay top-tier prices. For an incredible $4,199, the Razer Blade 16 comes with an RTX 4090 in addition to the powerful Core i9-14900HX paired with 32 GB of memory and a 2 TB SSD. For a marginally lower price of $3,604, Lenovo's Legion Pro 7 offers a comparably powerful setup of an RTX 4090, Core i9-14900HX, 32 GB of RAM, and a smaller 1 TB SSD.
The Legion 9, also from Lenovo, doubles down on storage and memory with a 2 TB SSD and 64 GB of RAM, costing an eye-watering $4,594. At around $3,800, the XMG Neo 16 balances an RTX 4090 and Core i9-14900HX with 32 GB of RAM and a 1 TB SSD. Lastly, the Asus Strix Scar 16 offers a powerful RTX 4090 and i9-14900HX configuration along with 16 GB of RAM and 2 TB storage.
Potential Competitors in Comparison
Image | Model / Review | Price | Weight | Height | Display |
|---|---|---|---|---|---|
1. 89.5% v7 (old)  | Lenovo Legion Pro 7 16IRX9H Intel Core i9-14900HX ⎘ NVIDIA GeForce RTX 4080 Laptop GPU ⎘ 32 GB Memory, 1024 GB SSD | Amazon: List Price: 2999 Euro | 2.7 kg | 21.95 mm | 16.00" 2560x1600 189 PPI IPS |
2. 87.6% v7 (old)  | Asus ROG Strix Scar 16 G634JZR Intel Core i9-14900HX ⎘ NVIDIA GeForce RTX 4080 Laptop GPU ⎘ 32 GB Memory, 2048 GB SSD | Amazon: List Price: 3199 EUR | 2.7 kg | 30.4 mm | 16.00" 2560x1600 189 PPI Mini LED |
3.  | Asus ROG Strix Scar 16 G634JYR Intel Core i9-14900HX ⎘ NVIDIA GeForce RTX 4090 Laptop GPU ⎘ 32 GB Memory | Amazon: List Price: 3499€ | 2.7 kg | 30.4 mm | 16.00" 2560x1600 189 PPI IPS |
4. 91.1% v7 (old)  | Razer Blade 16 2024, RTX 4090 Intel Core i9-14900HX ⎘ NVIDIA GeForce RTX 4090 Laptop GPU ⎘ 32 GB Memory, 2048 GB SSD | Amazon: List Price: 4850 Euro | 2.5 kg | 22 mm | 16.00" 2560x1600 189 PPI OLED |
5. 88.4% v7 (old) 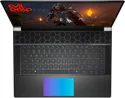 | Alienware x16 R2 P120F Intel Core Ultra 9 185H ⎘ NVIDIA GeForce RTX 4080 Laptop GPU ⎘ 32 GB Memory, 1024 GB SSD | Amazon: List Price: 3200 USD | 2.7 kg | 18.57 mm | 16.00" 2560x1600 189 PPI IPS |
6. 83.9%  | Lenovo Legion 9 16IRX9, RTX 4090 Intel Core i9-14900HX ⎘ NVIDIA GeForce RTX 4090 Laptop GPU ⎘ 64 GB Memory, 2048 GB SSD | Amazon: List Price: 4899 Euro | 2.5 kg | 22.7 mm | 16.00" 3200x2000 236 PPI MiniLED |
7.  | Lenovo Legion Pro 7 16IRX9H, RTX 4090 Intel Core i9-14900HX ⎘ NVIDIA GeForce RTX 4090 Laptop GPU ⎘ 32 GB Memory | List Price: 3600€ | 2.6 kg | 25.9 mm | 16.00" 2560x1600 189 PPI IPS |
8. 85.5%  | Schenker XMG Neo 16 (Early 24) Intel Core i9-14900HX ⎘ NVIDIA GeForce RTX 4090 Laptop GPU ⎘ 32 GB Memory, 1024 GB SSD | Amazon: List Price: 3800 Euro | 2.5 kg | 26.6 mm | 16.00" 2560x1600 189 PPI IPS |
Imagine you have some cash lying around, like a lot of cash, and you want to spend it on a gaming laptop. But not just any laptop, but literally the best money can buy, with as little compromise as somehow possible!
Well, then, you have come to the right place; since we are dealing with the creme de la creme of 16" gaming laptops today, you can buy from almost all manufacturers right now. We are not just talking pure specs, but every one of these notebooks is decked out with features, nifty little extras, gorgeous displays (for the most part, at least) and pretty much everything else you could ask for if you are looking at burning something north of 3,000 bucks to get the best, somewhat mobile gaming experience.
We have been daily-driving each and every one of these for at least a few weeks over the past couple of months, and while we will mostly likely not going to tell you which one is the best since that is, as always, a very subjective and personal decision, we will let you know what we liked and what we didn't, to give you some pointers what you should look out for.
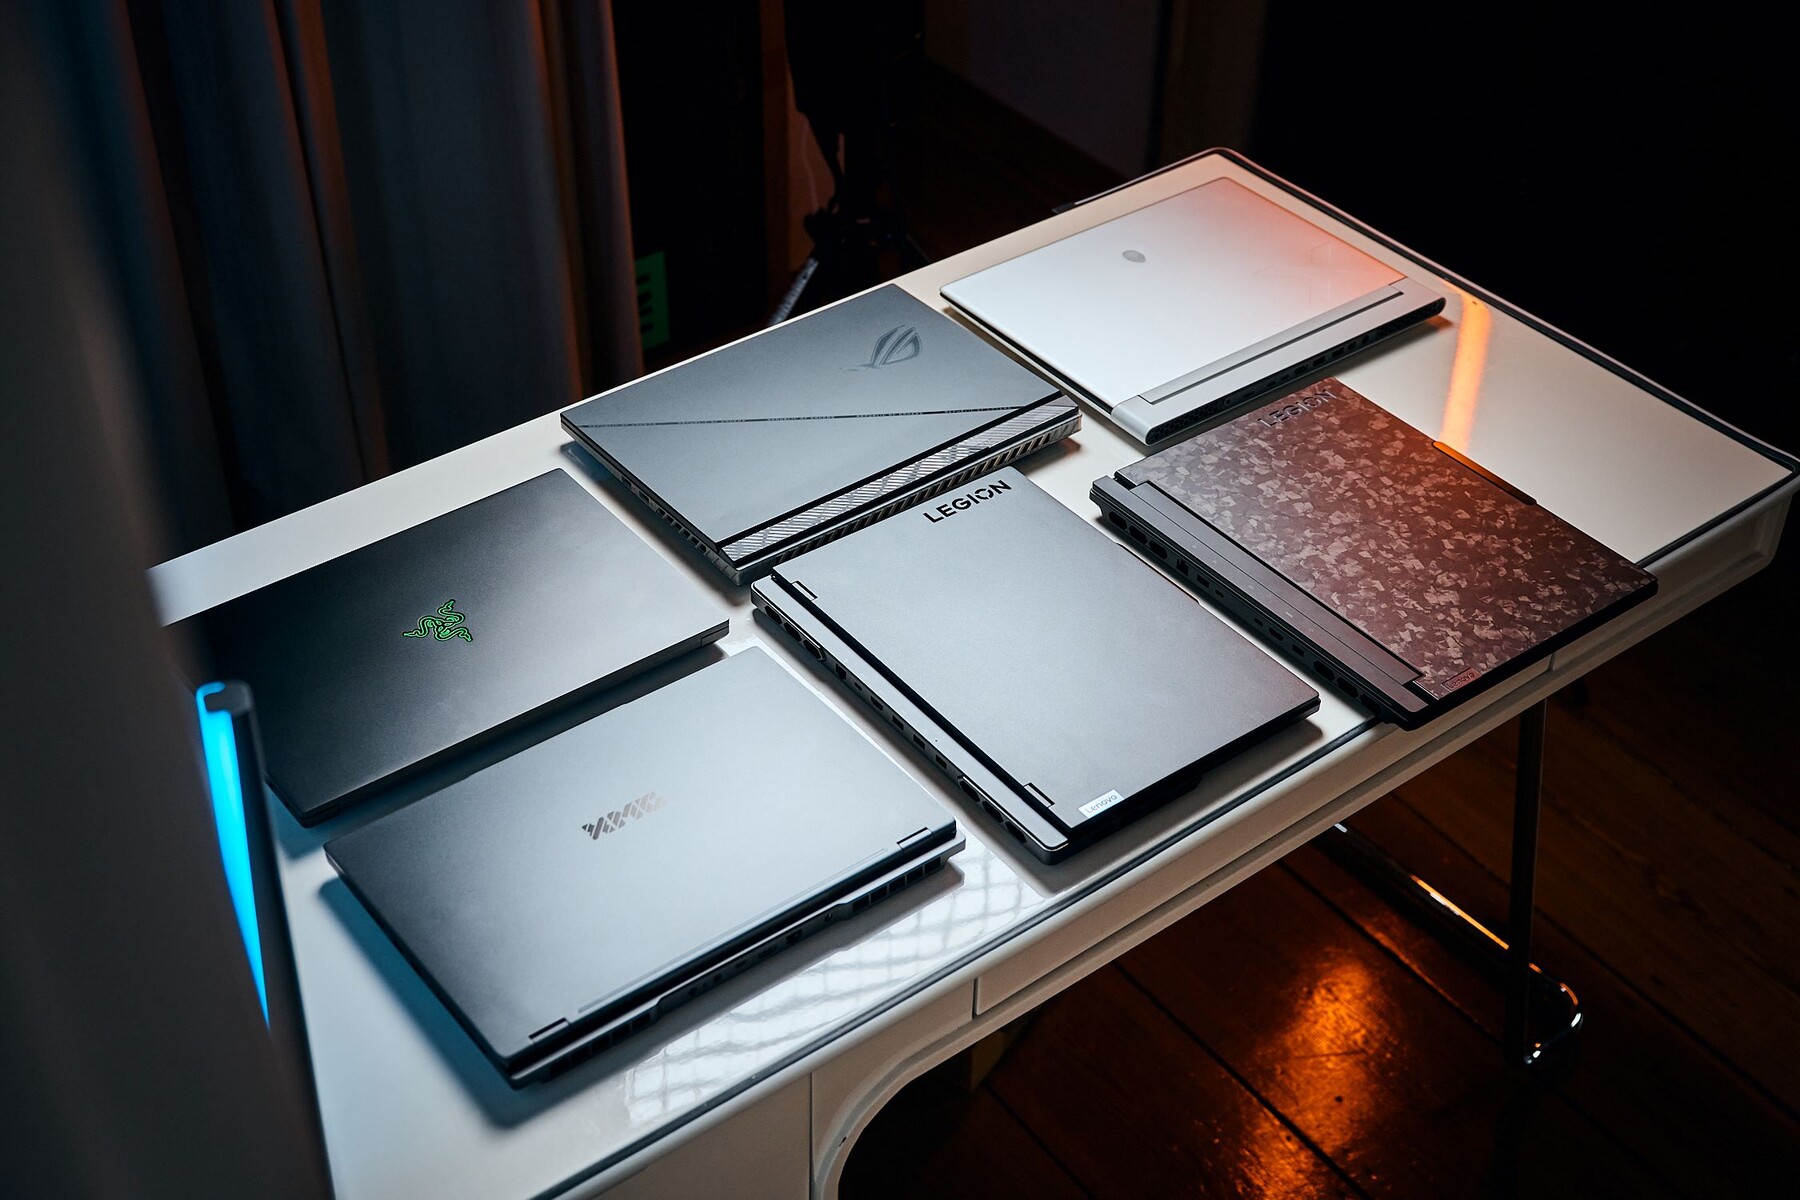
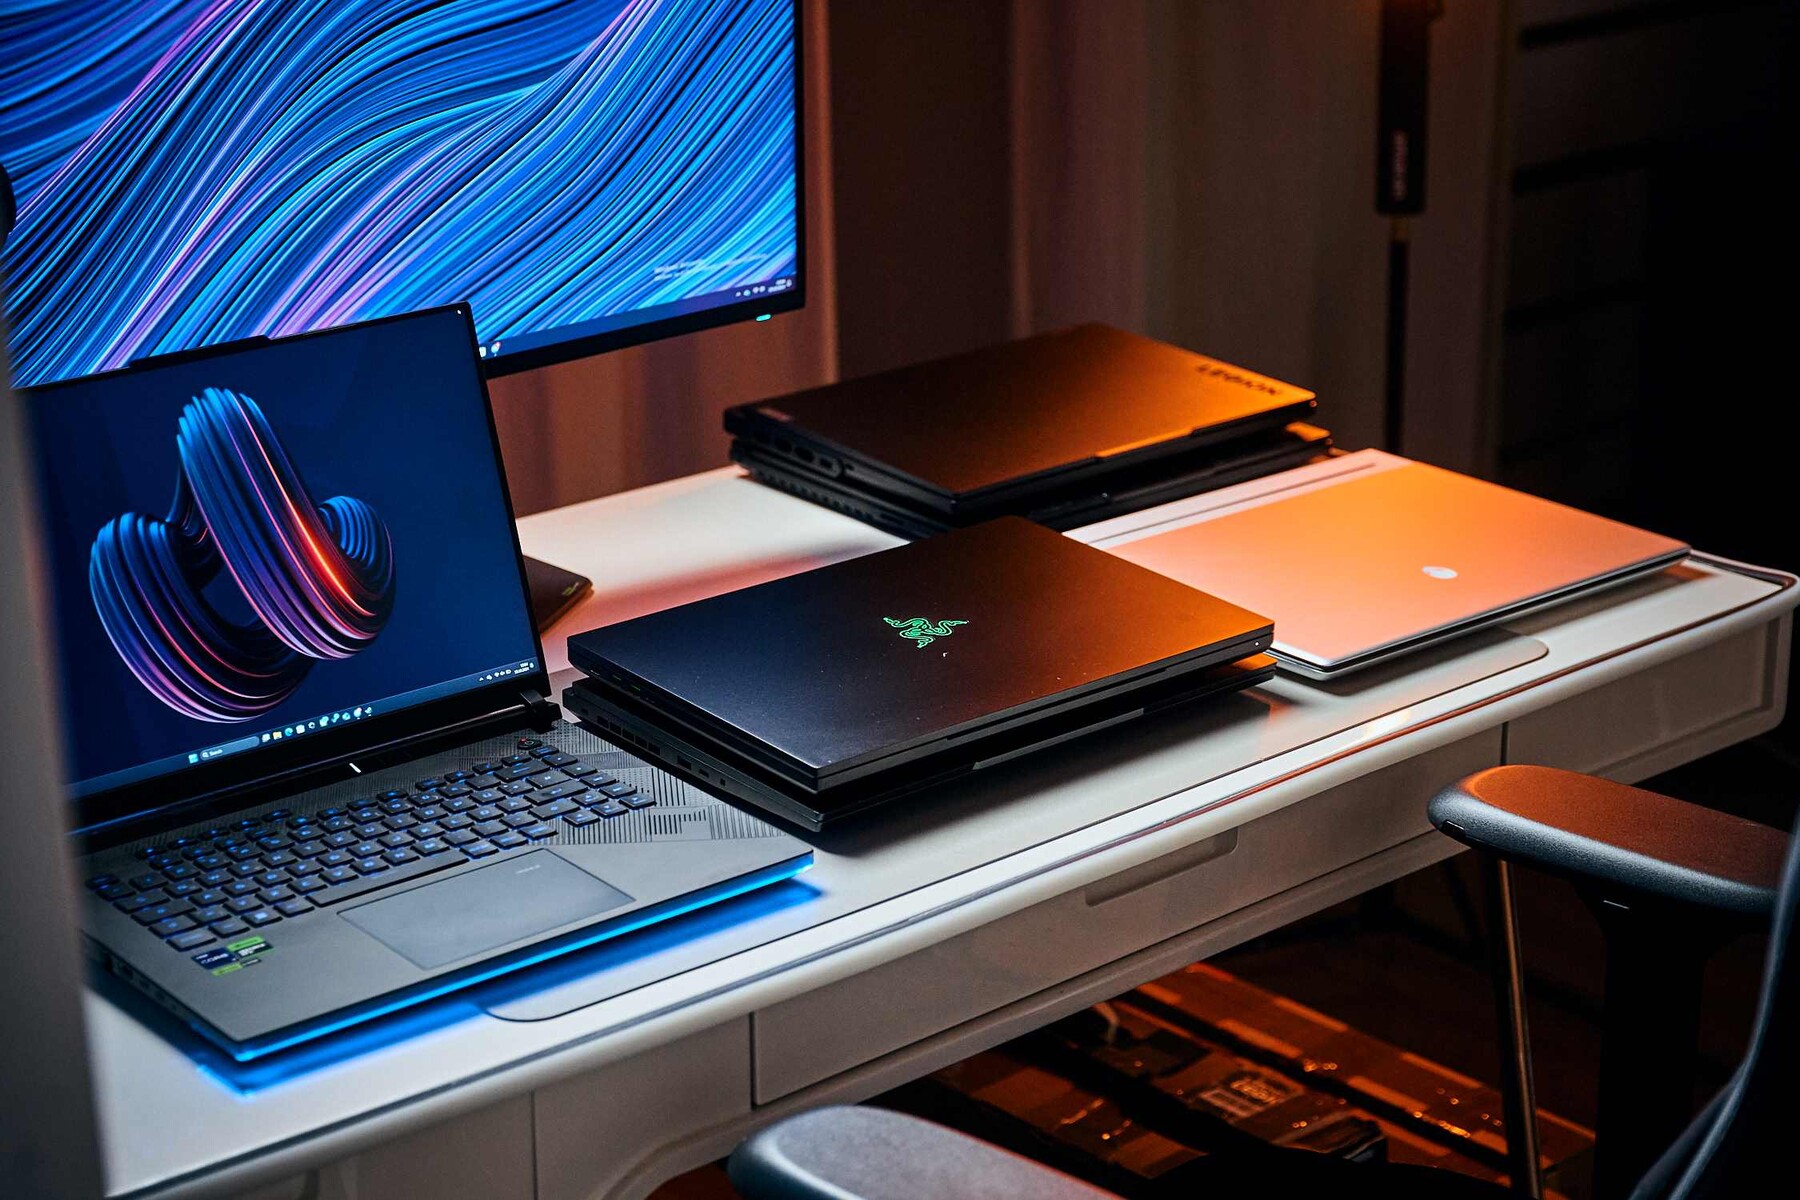
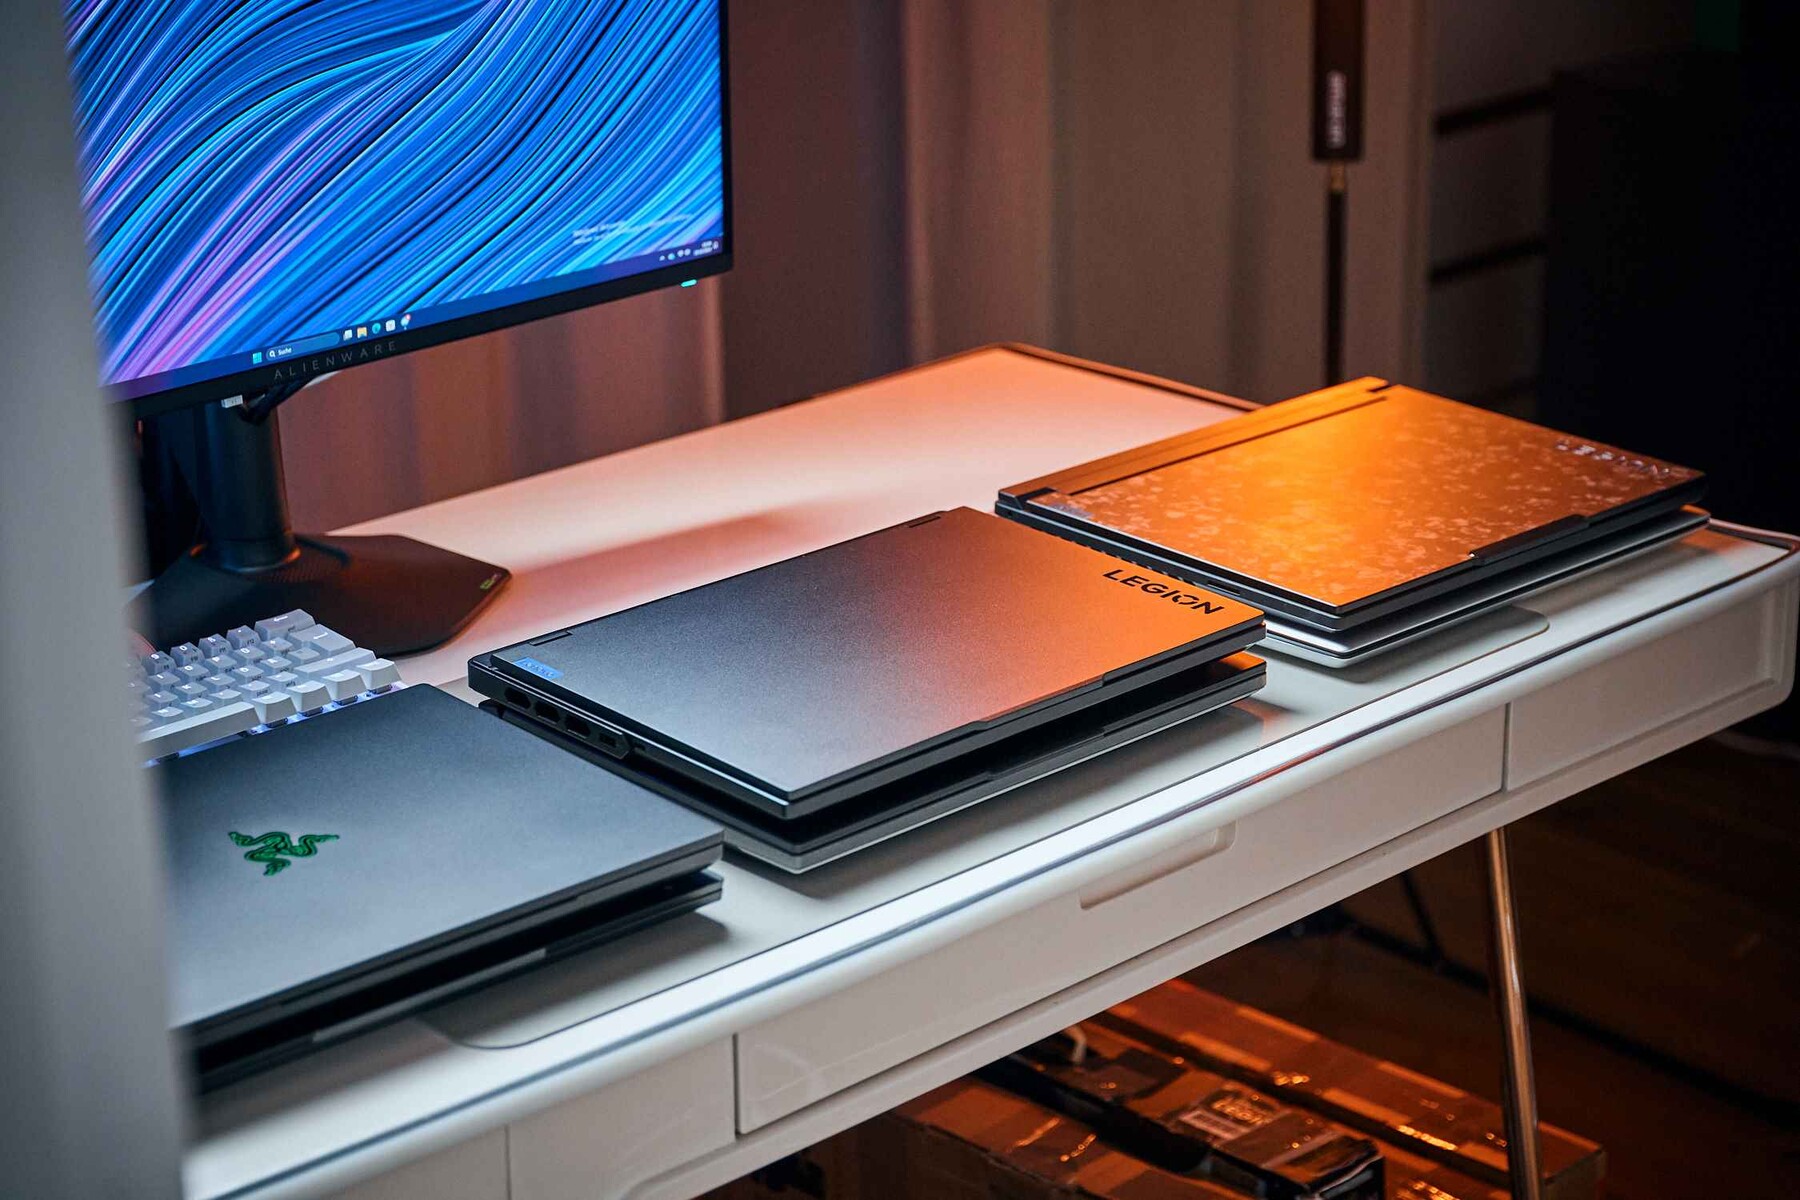
Case - Looks matter, or do they?
Before we get to the inner workings of our flagship gamers today, let's start with the exteriors. If you spend that kind of money, you are not only buying the performance but also investing in style.
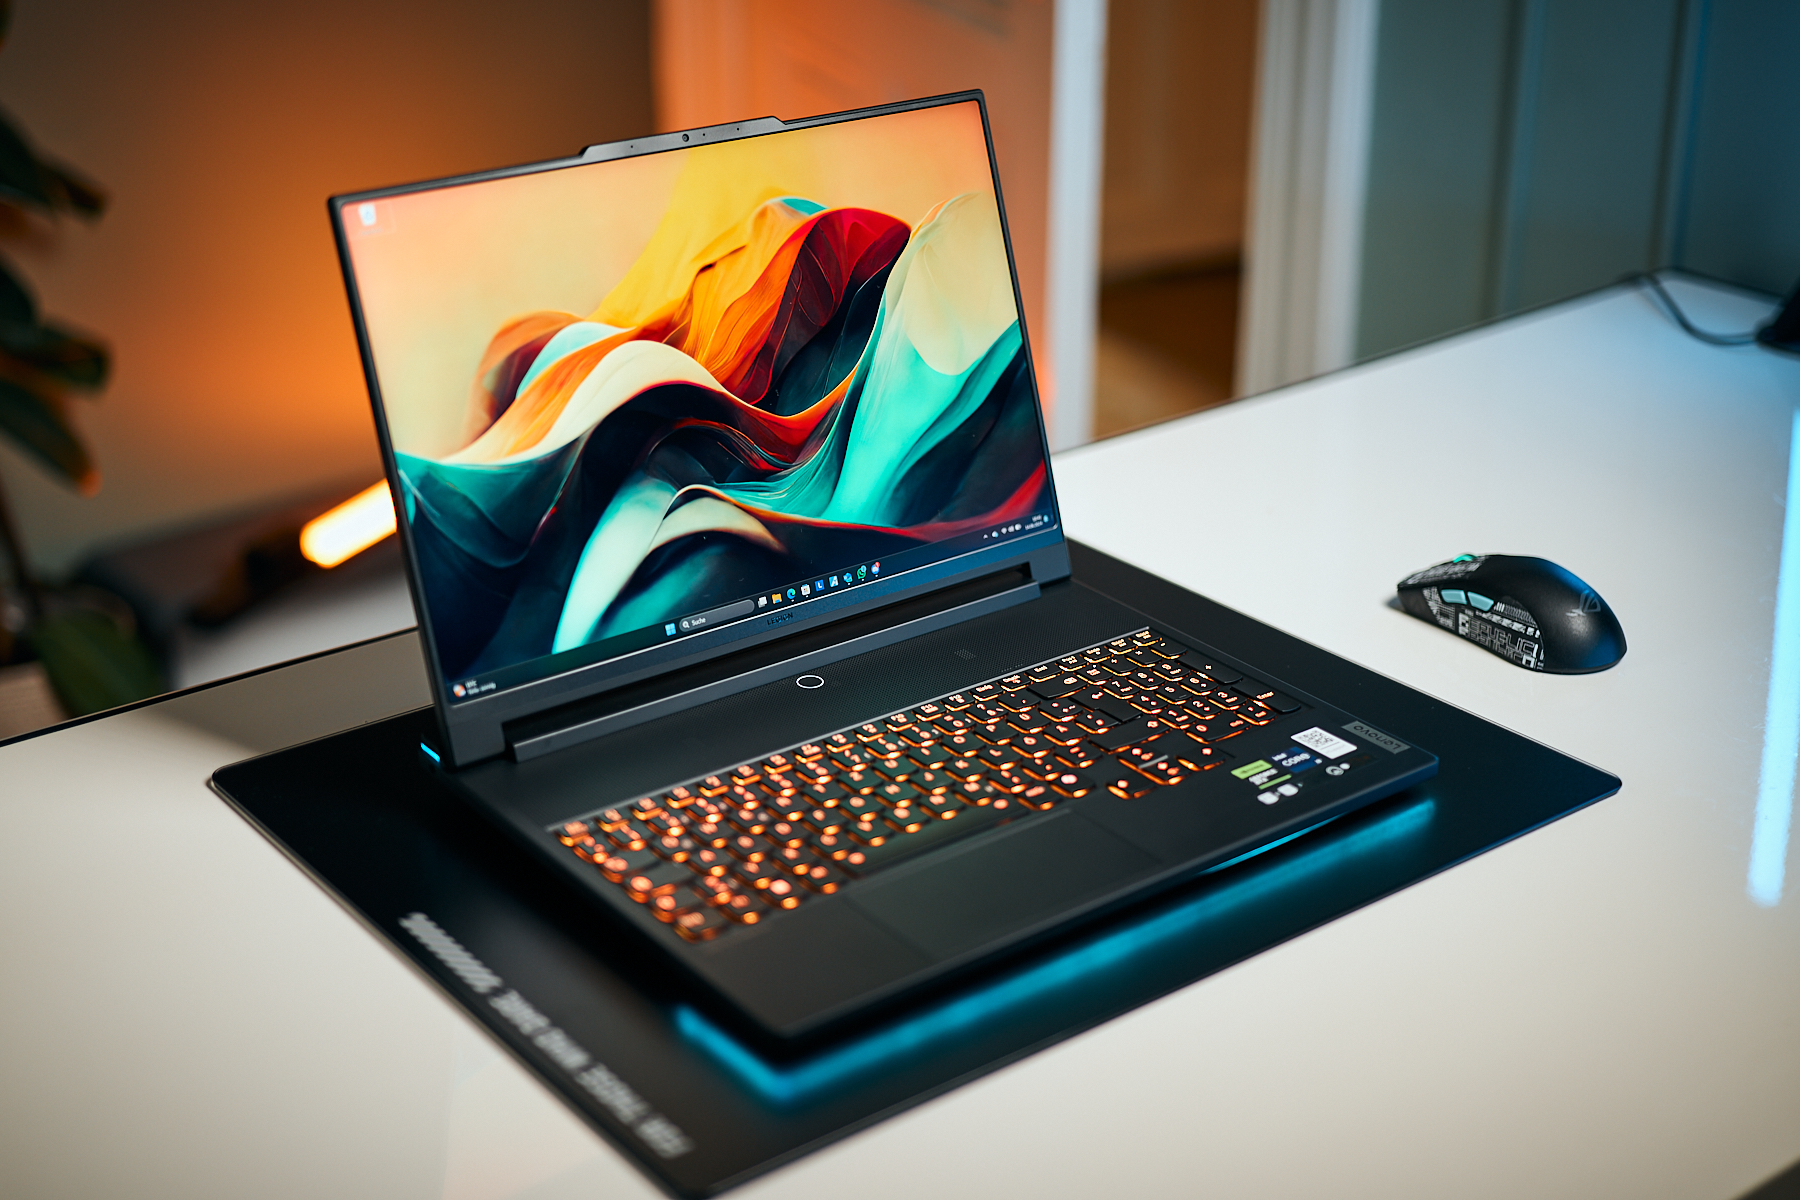
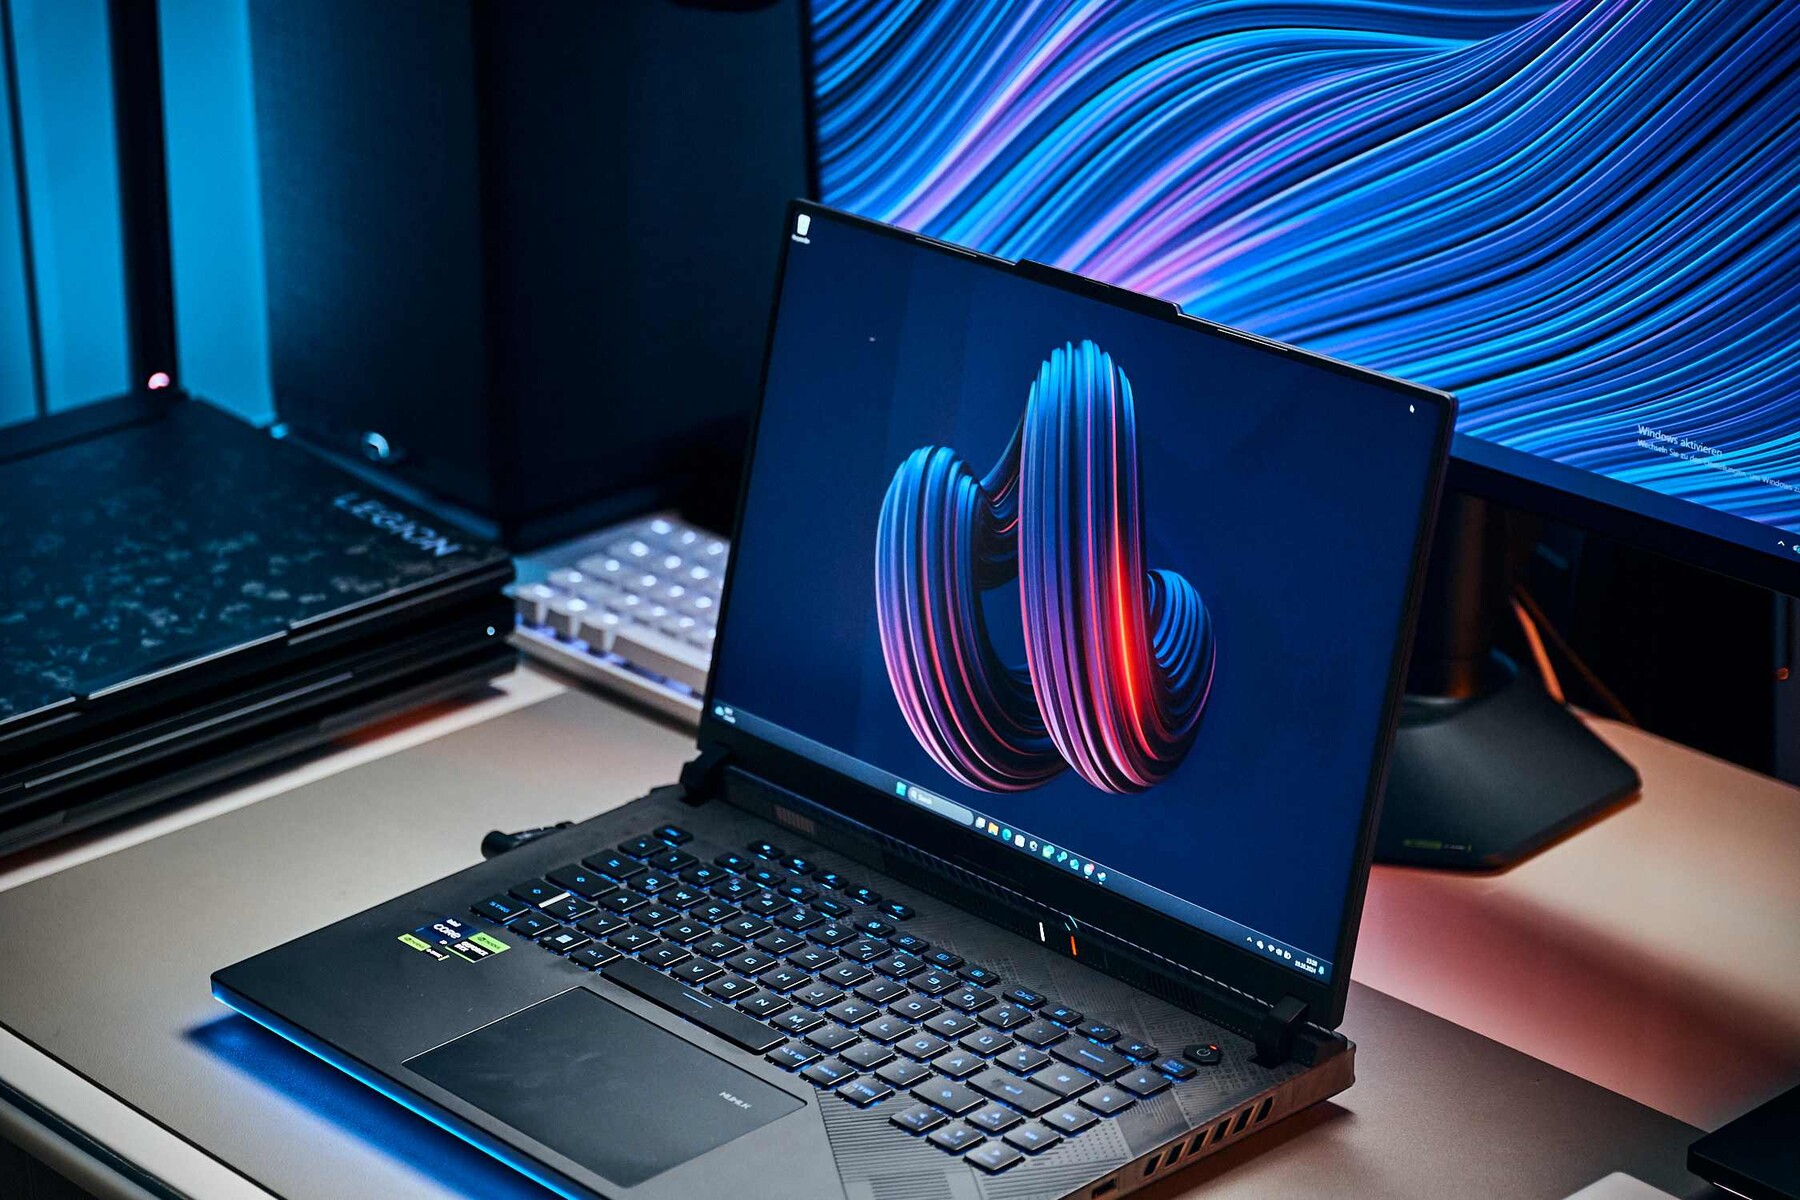
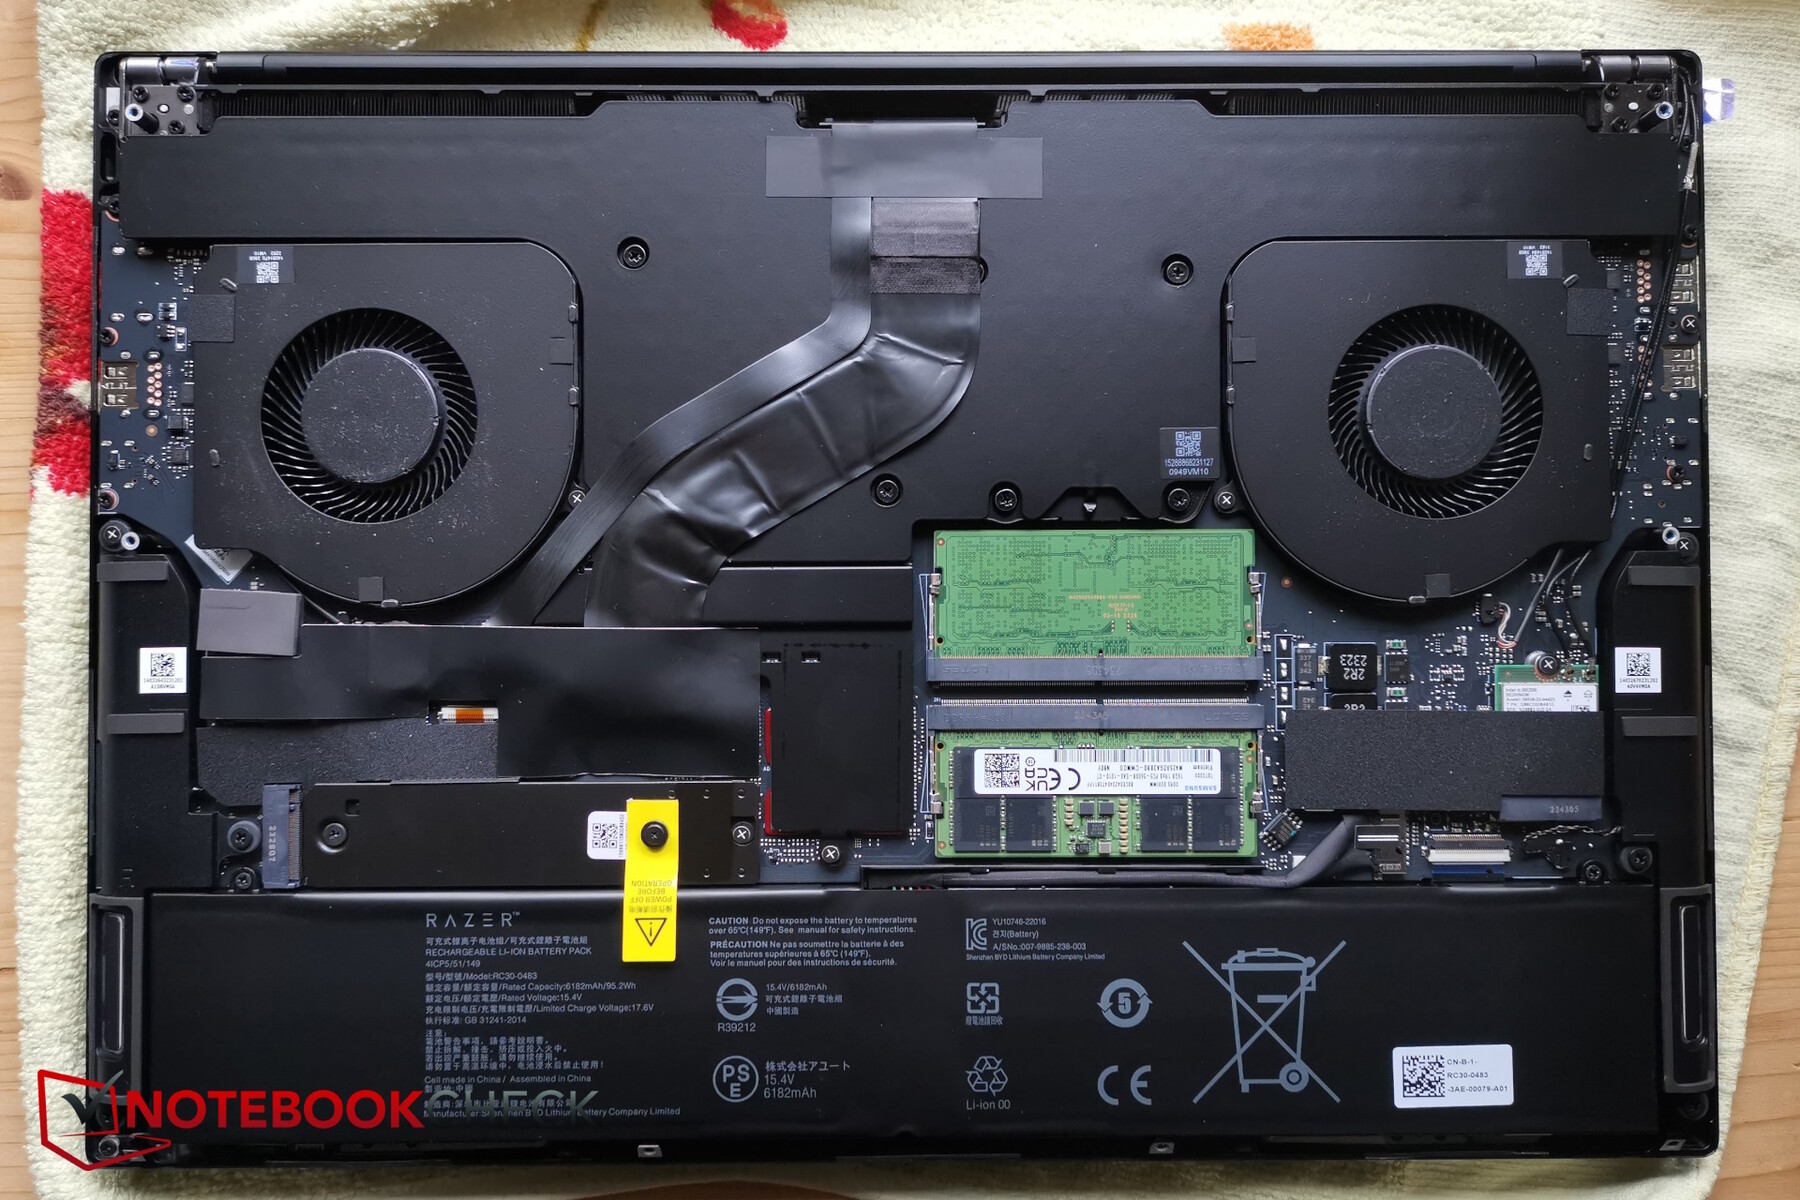
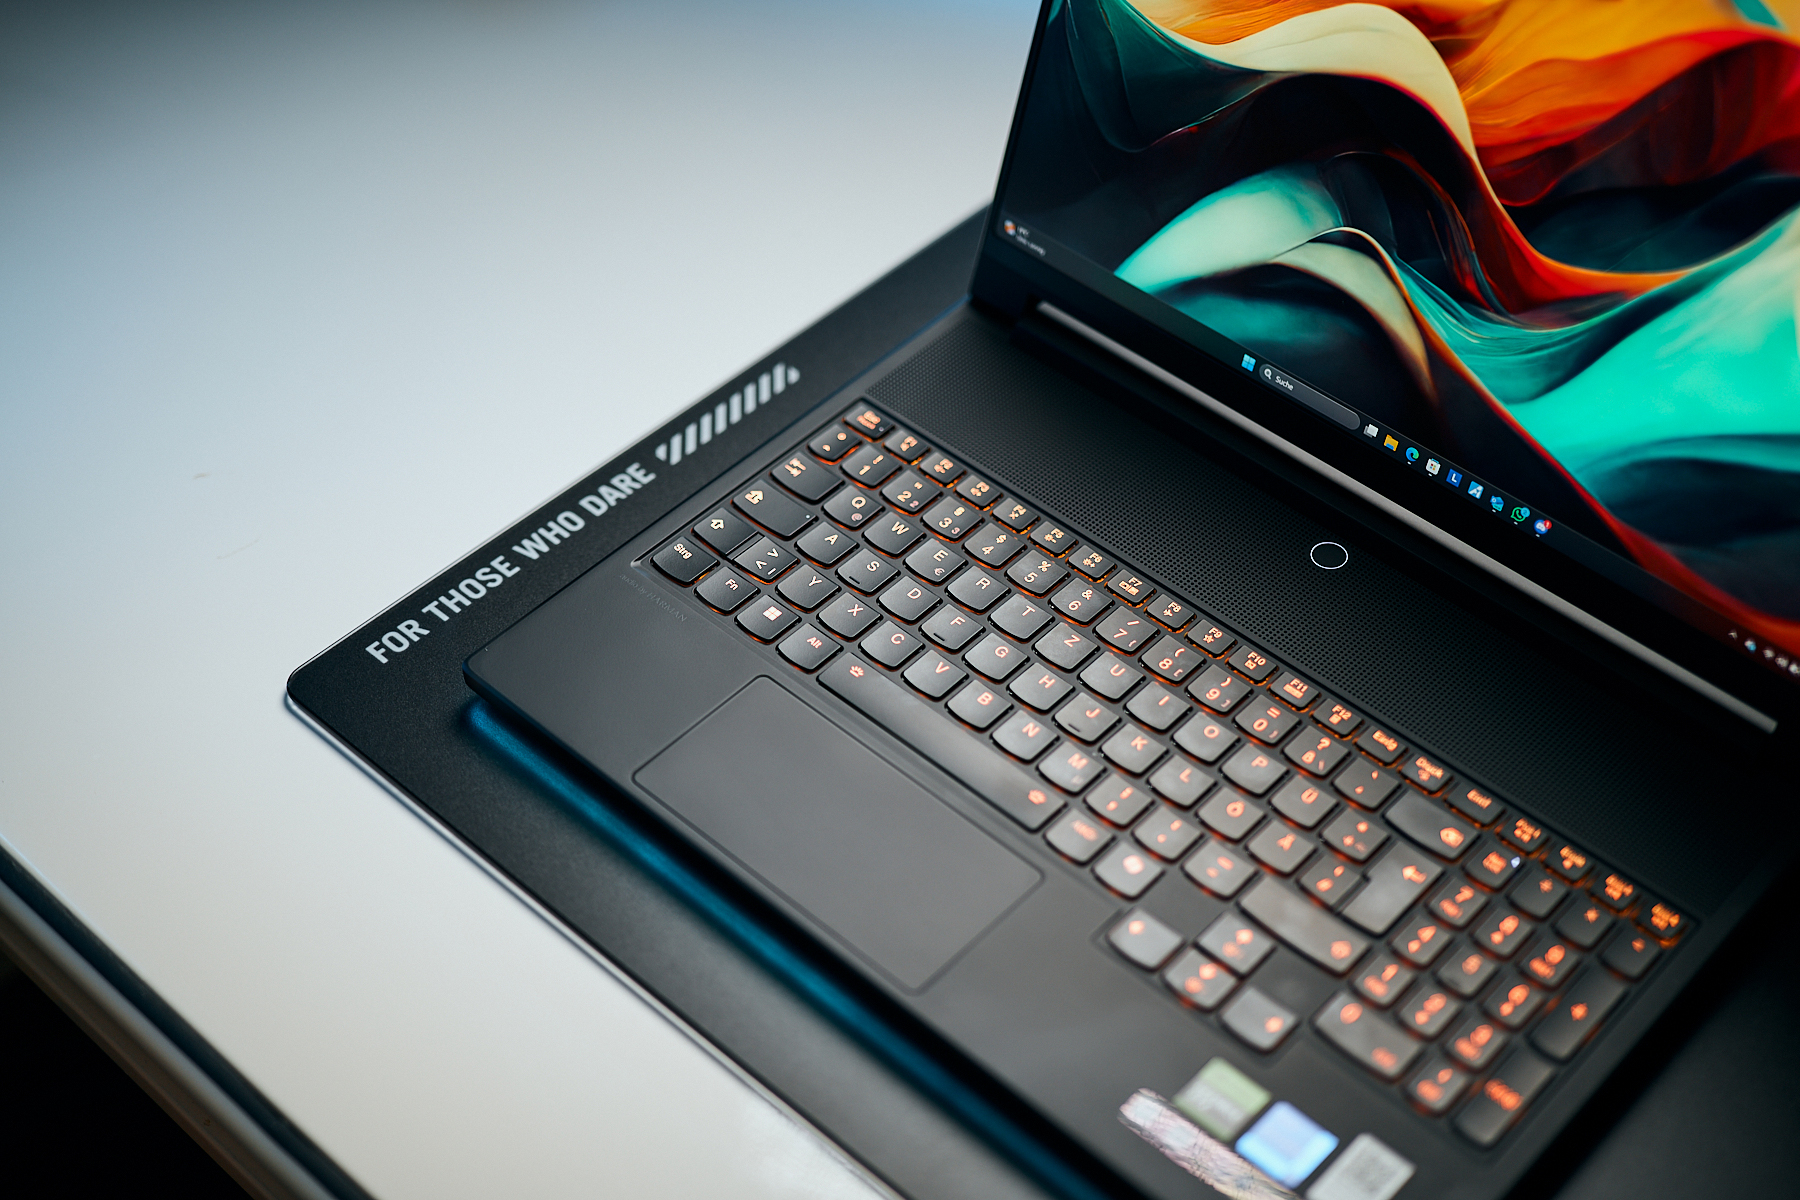
Right off the bat, we have to give credit to the Razer and the Legion 9. The Razer is not only one of the most compact 16-inch laptops with that kind of power; it is also arguably the sleekest, featuring super clean and subtle aesthetics—if you can overlook the flashy green logo. The legion is also quite subdued, albeit in a slightly different way, but if you want to, you can also light it up like a Christmas tree with a fair bit of RGB all around the chassis. In our opinion, it earns extra style points for its unique carbon fibre look, giving it an overall special appearance you might appreciate when investing this kind of money.
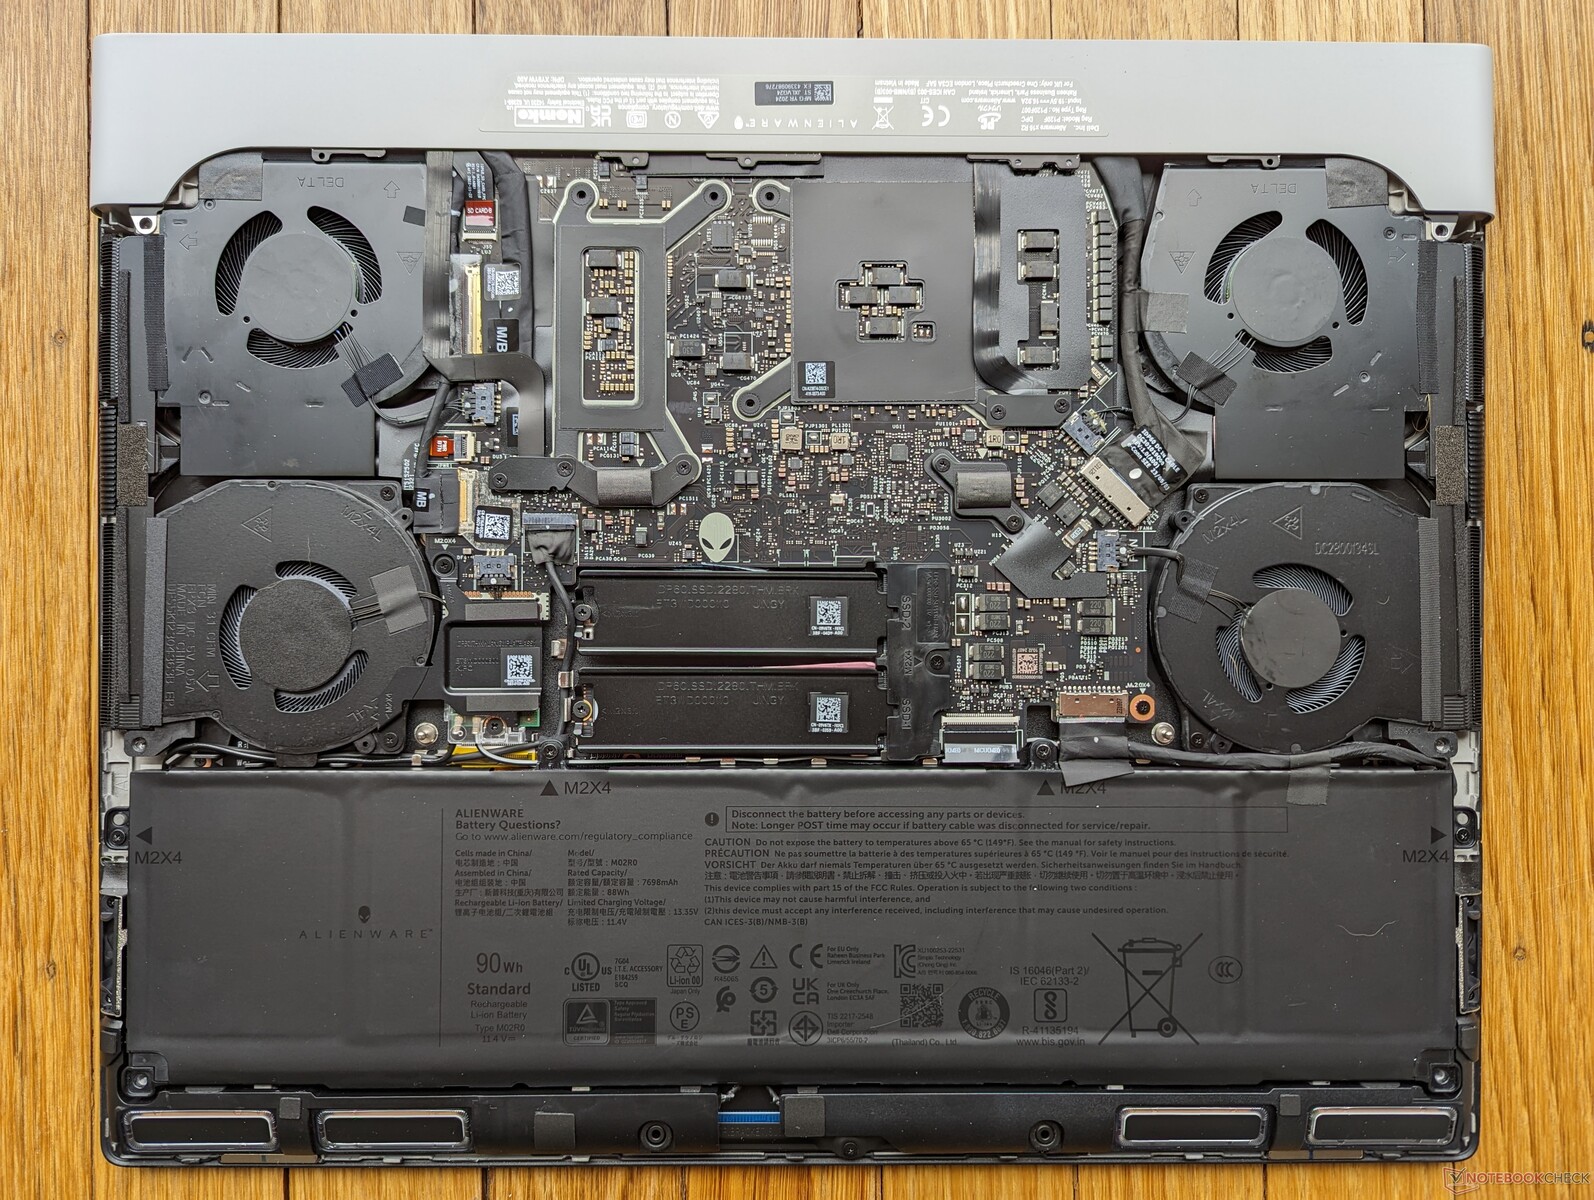
The Alienware X16 (available on Amazon) follows a similar path, although its chassis design may be more polarizing. Personally, we love it, but for some, it might simply be too much, which is understandable. While it is one of the slimmest notebooks with full-powered high-end GPUs available right now, it is also one of the largest which you should definitely keep in mind when shopping for this one.
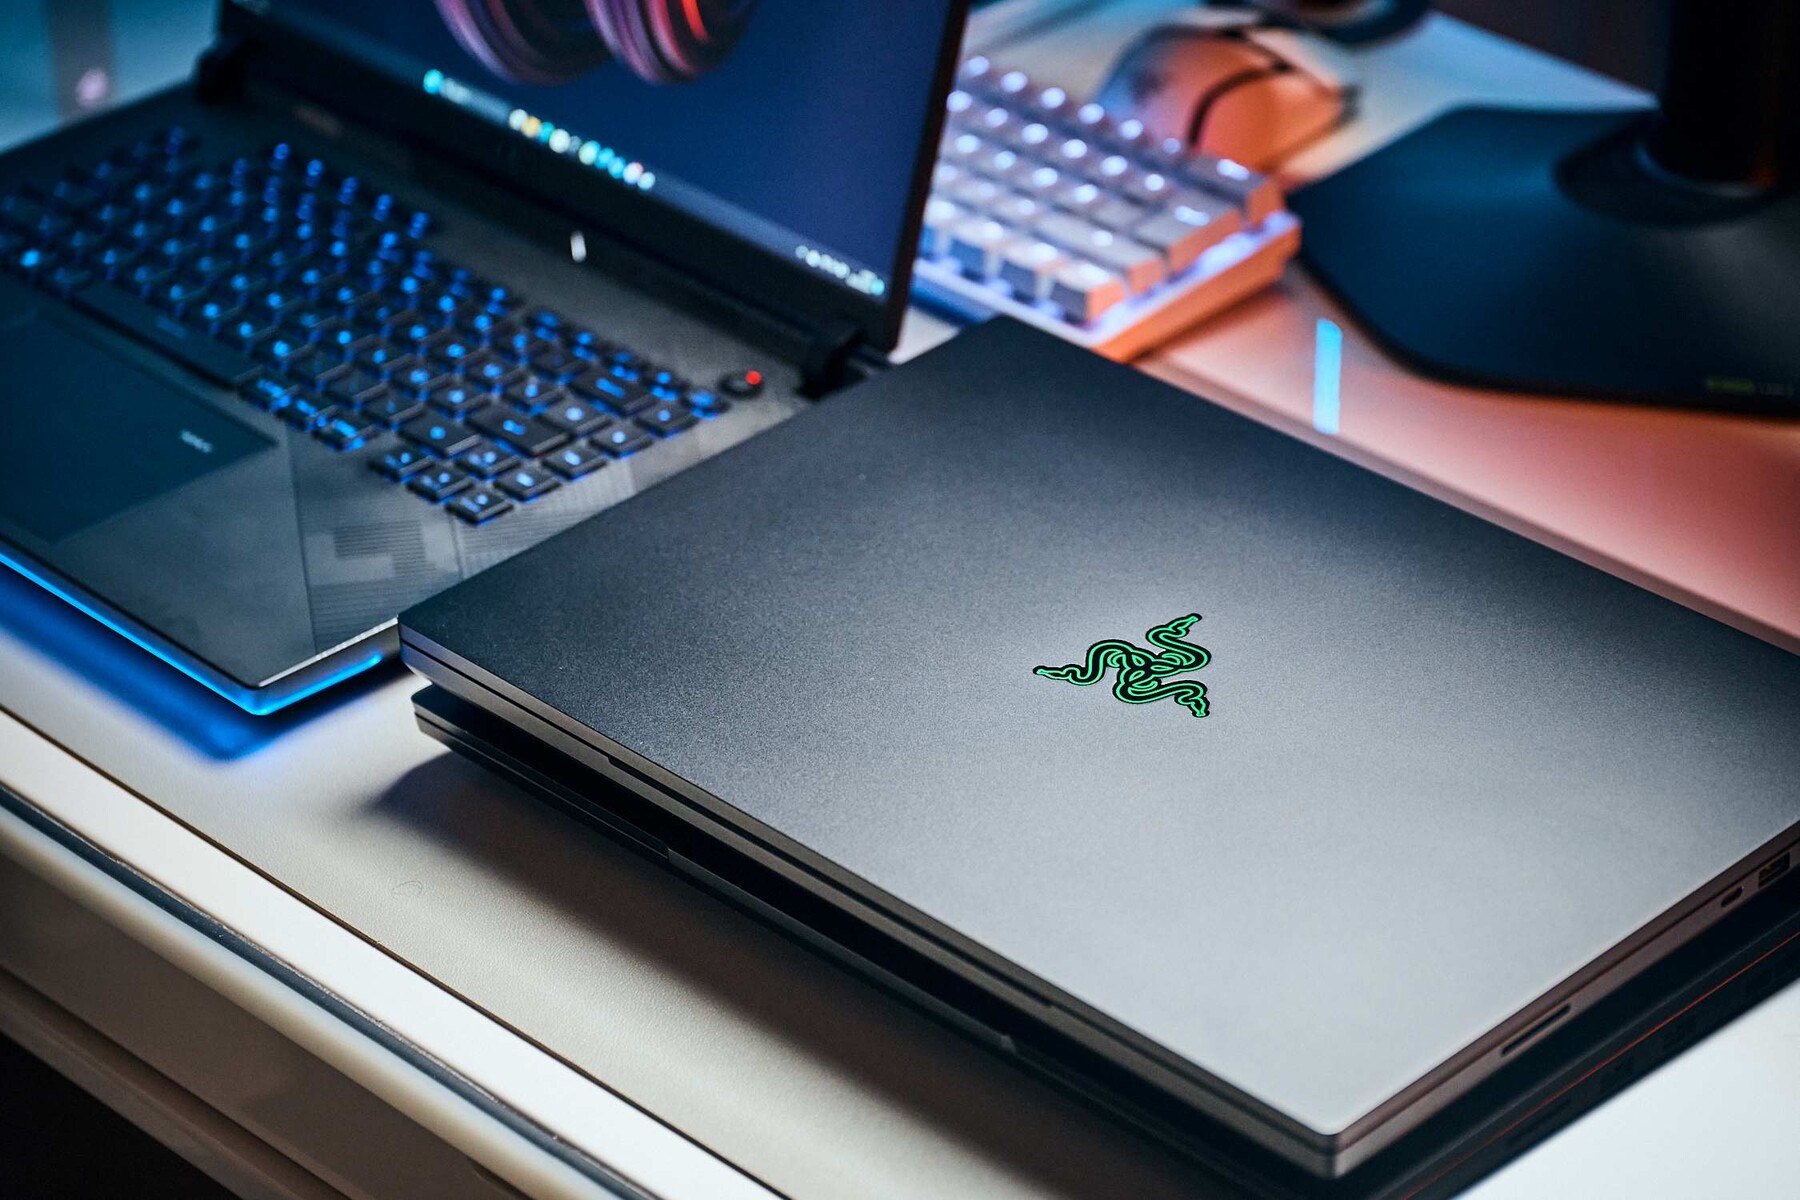
If subtlety is your thing, the XMG Neo 16 is your wolf in sheep's clothing. It looks almost dull compared to some of our other options, but it's cleanly designed, with premium materials and some RGB bits around, if you want to let the world know you are, in fact, a true gamer. The Legion Pro 7 follows in the same direction but adds a few more visual cues, hinting at its intended use case.

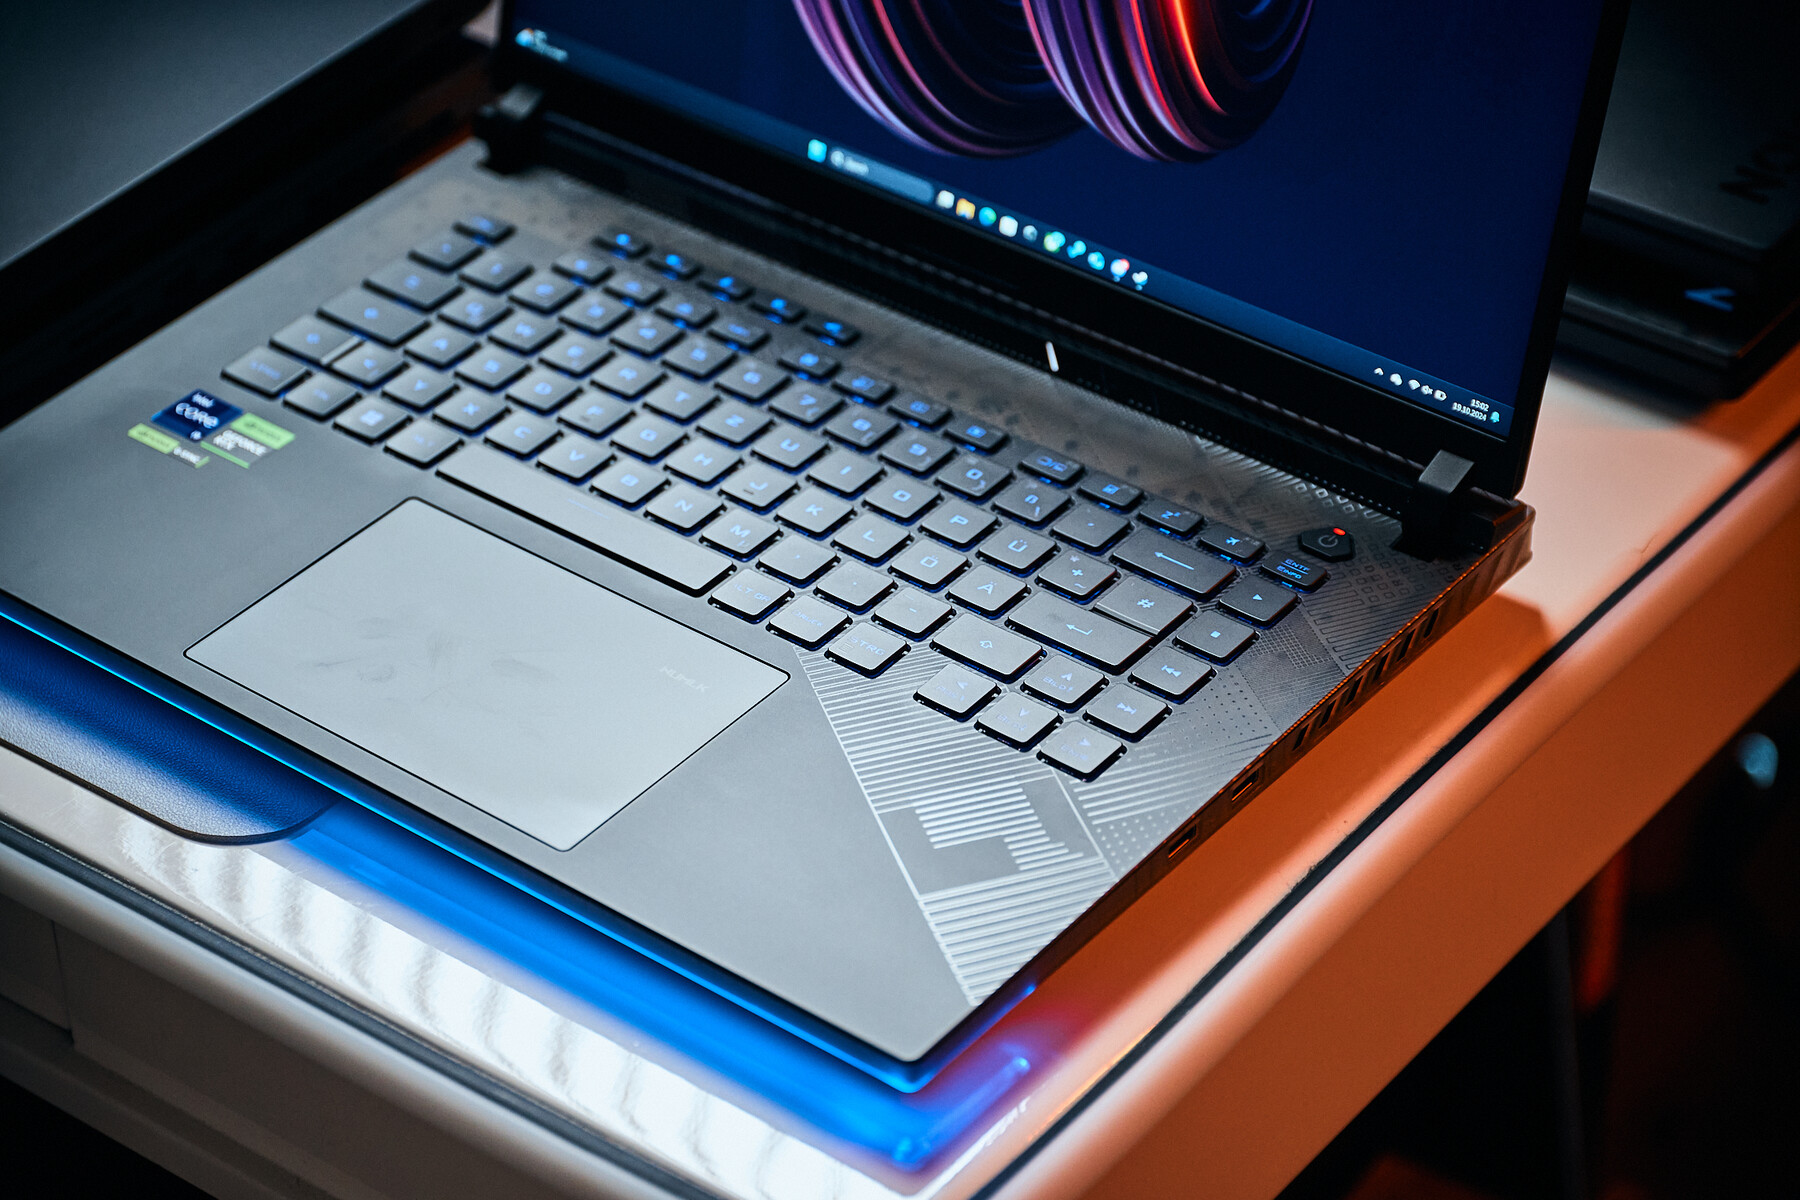
The ROG Scar is essentially the exact opposite, with a design that screams "gaming laptop," unfortunately not in a favorable way, in our opinion. It’s just a little too over-the-top, though this will boil down to personal taste. In terms of material selection and overall premium feel, it is also the weakest of the bunch, featuring a plastic body—albeit a sturdy one.
If we were to rank them, the Alienware X16 would be next, followed by the Pro 7 and the Neo 16, the Blade 16, and Legion, which would basically share first place.
That doesn't mean the X16 or Pro 7 are poorly made laptops; it’s just that the other three take it a step further, in our opinion.
Connectivity - the more, the merrier!
Regarding ports, we should not find too much to complain about, but as with most things in life, the devil is in the details. While we really like the overall selection and placement of the Legion Pro 7, its three USB-A ports are of the slower 3.2 Gen 1 variety, which might be a bit of a bummer if you work with high-speed storage a lot.
The higher-end Legion 9 trades one of the USB-A ports for a USB-C of the same standard and adds a full-size SD card reader, albeit with very slow transfer rates. However, it bumps up the LAN connection to 2.5 GbE, and both USB-Cs on the back are full Thunderbolt 4 ports.
The XMG shares its selection and layout with the Pro 7 but also adds an SD card reader, again with pretty average transfer speeds at best. The Blade performs much better in this regard, featuring the fastest reader of the bunch. While you will have to make do without a network jack, all three USB-A ports are of the faster 3.2 Gen 2 variety, alongside a USB-C of the same standard and an additional Thunderbolt 4.
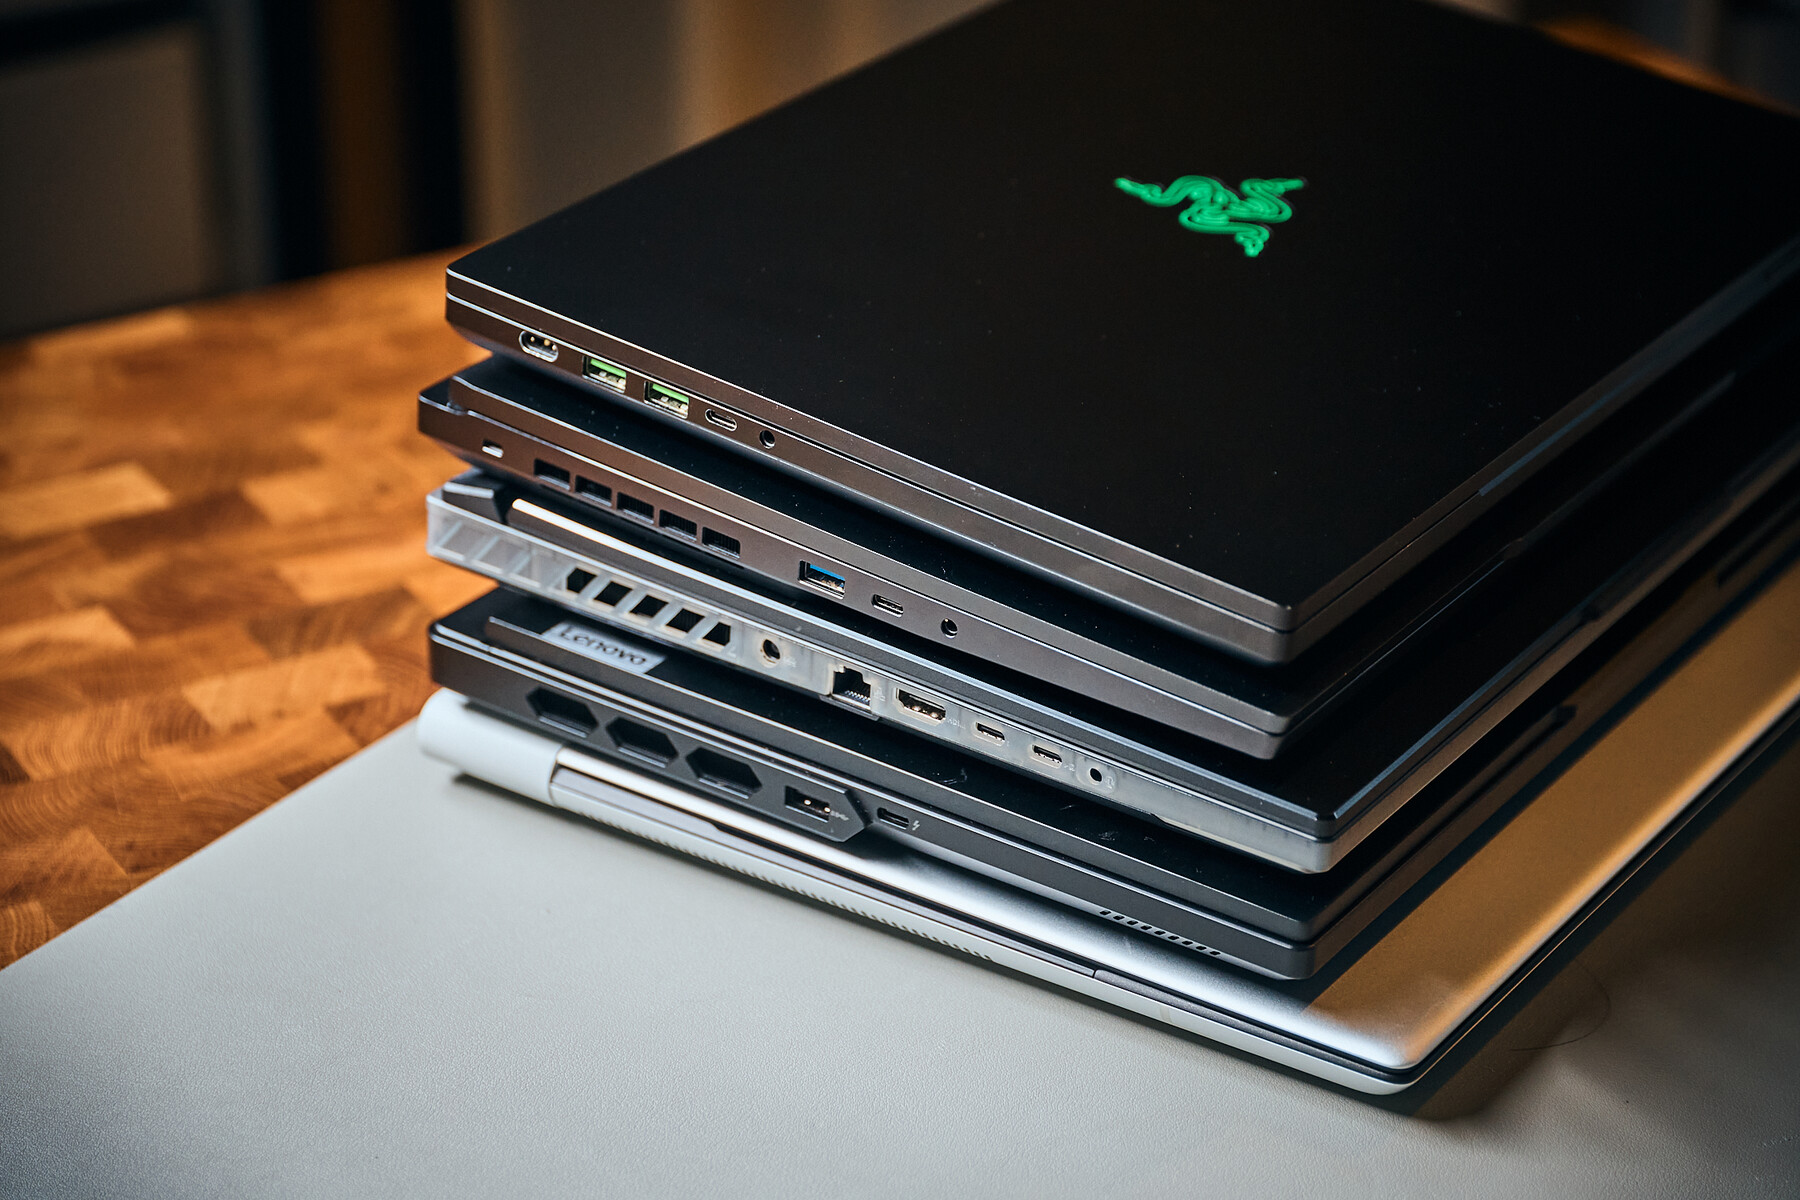
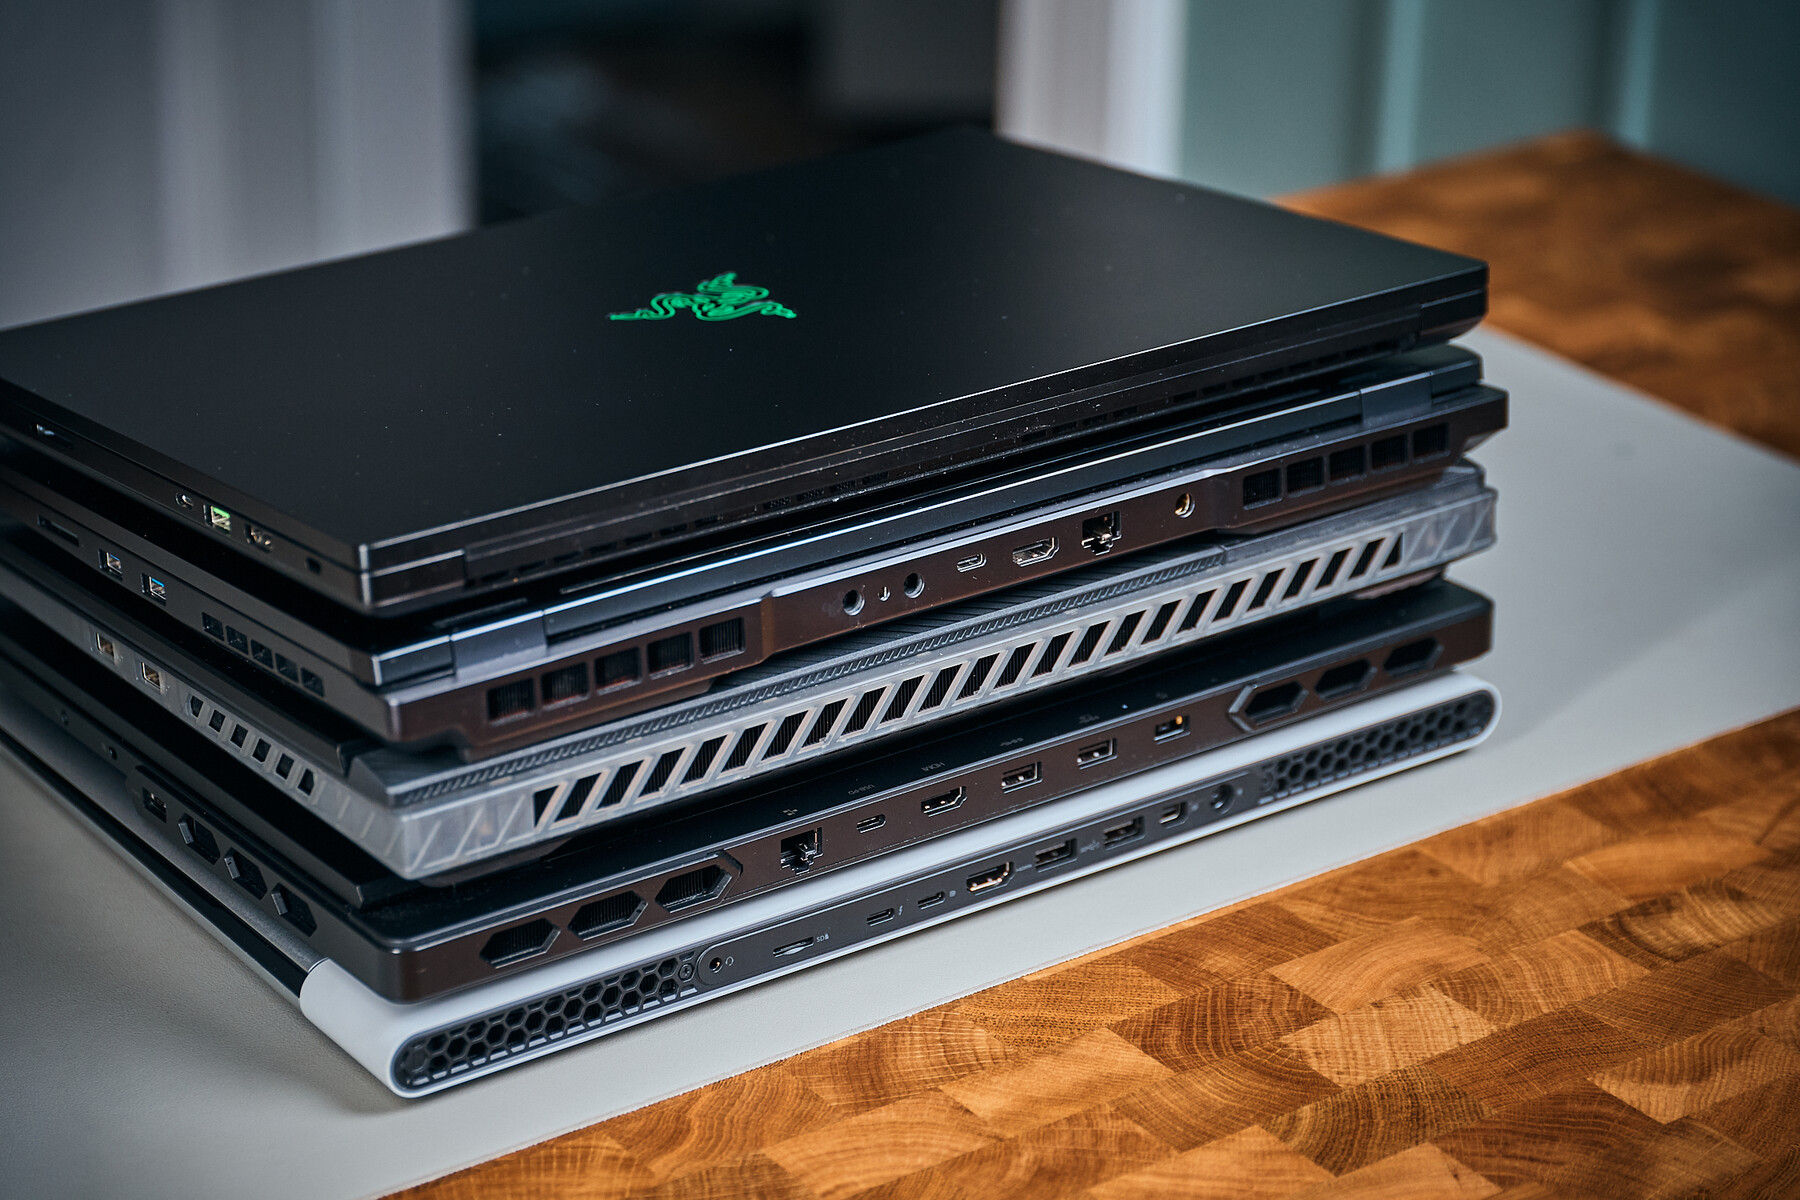
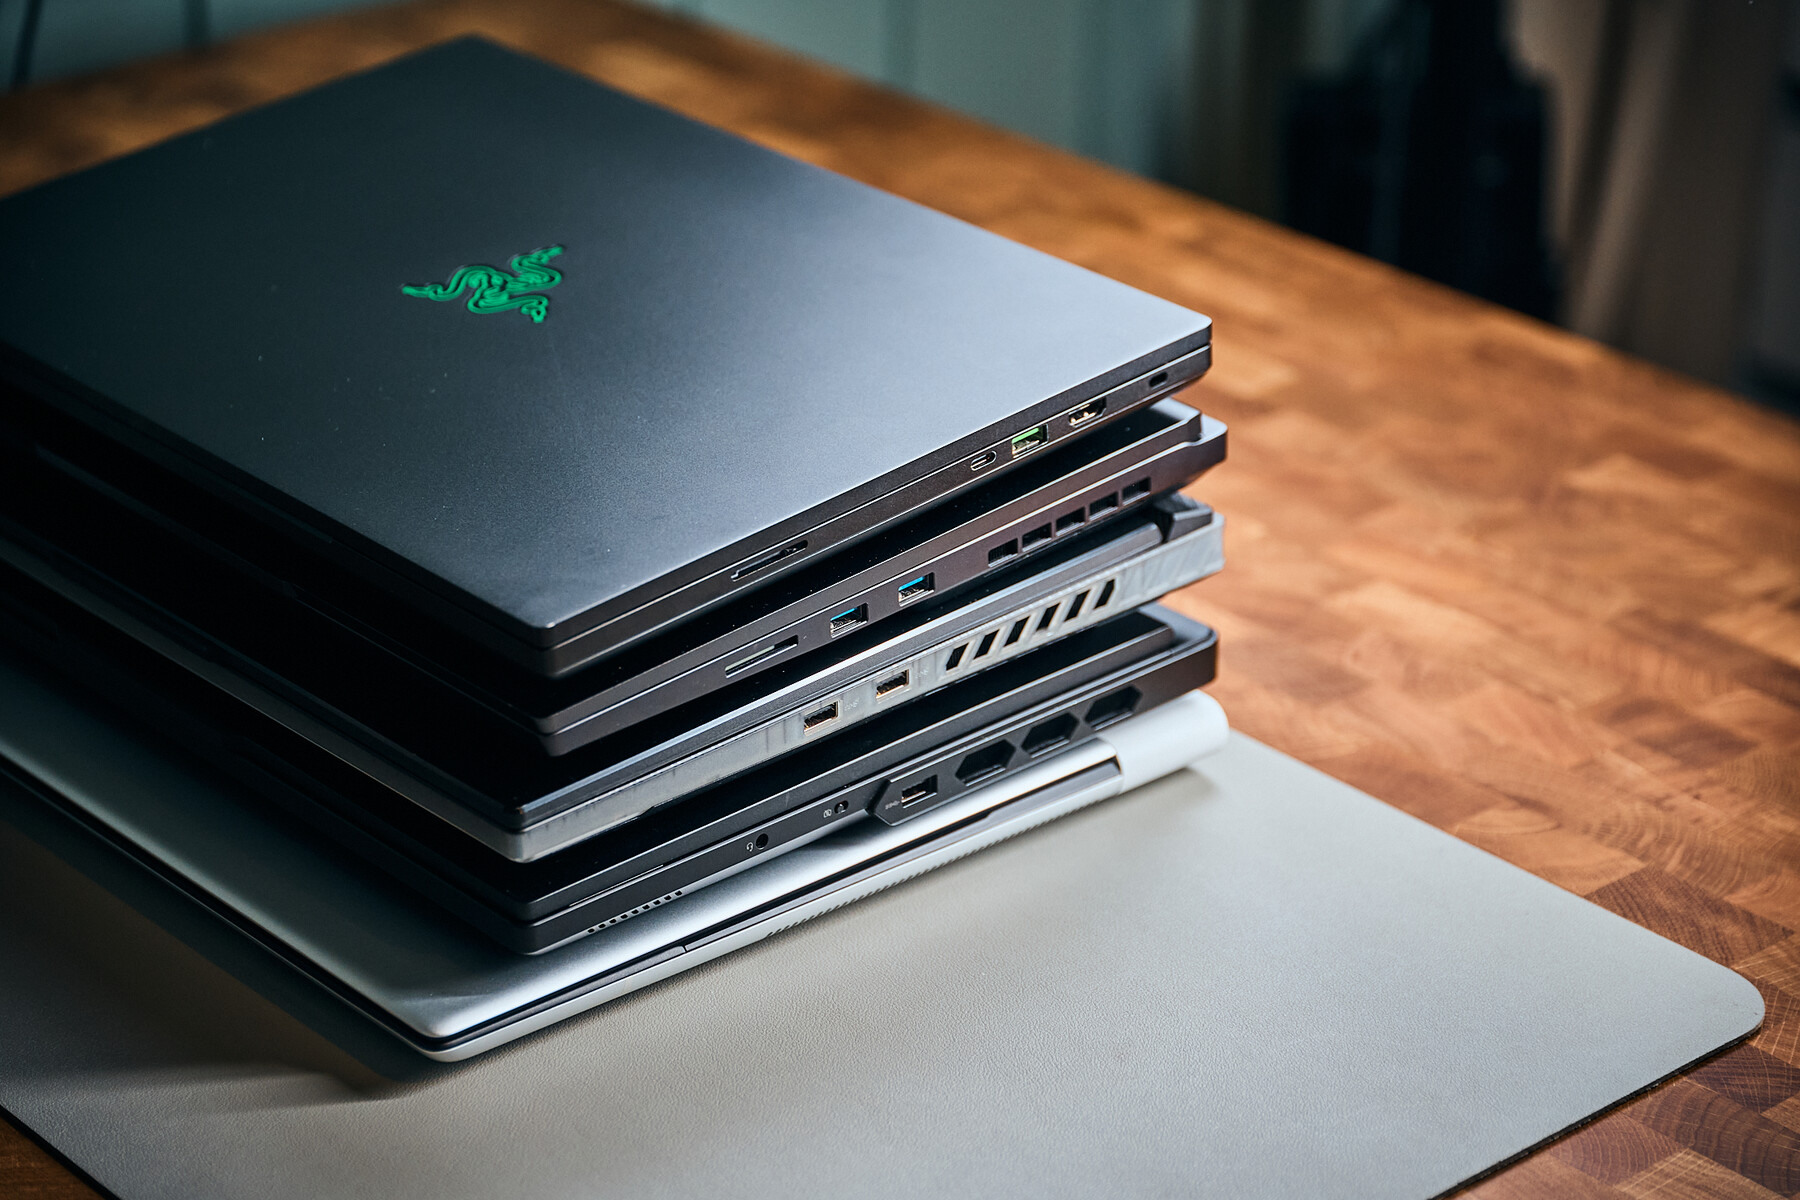
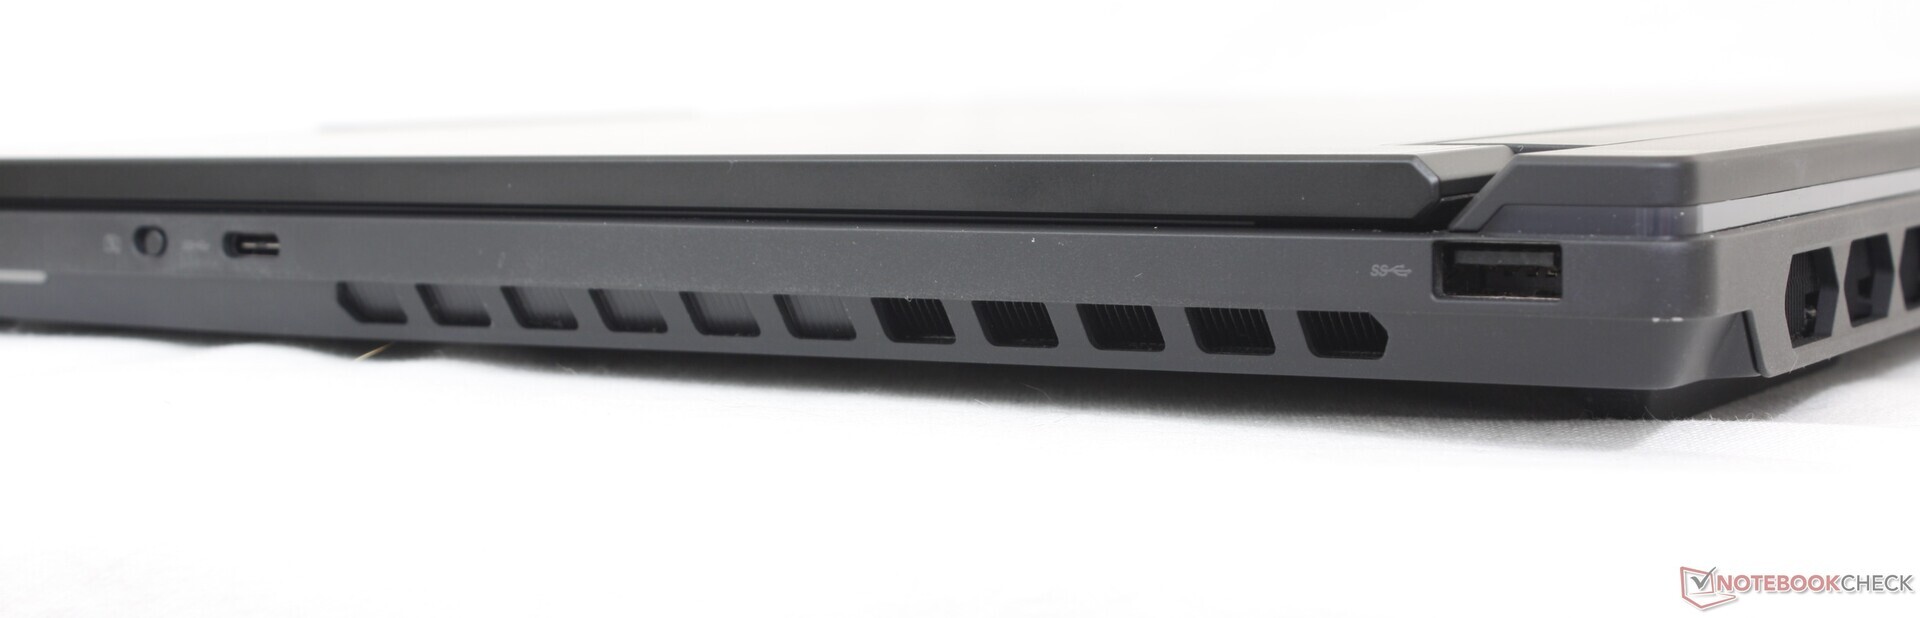
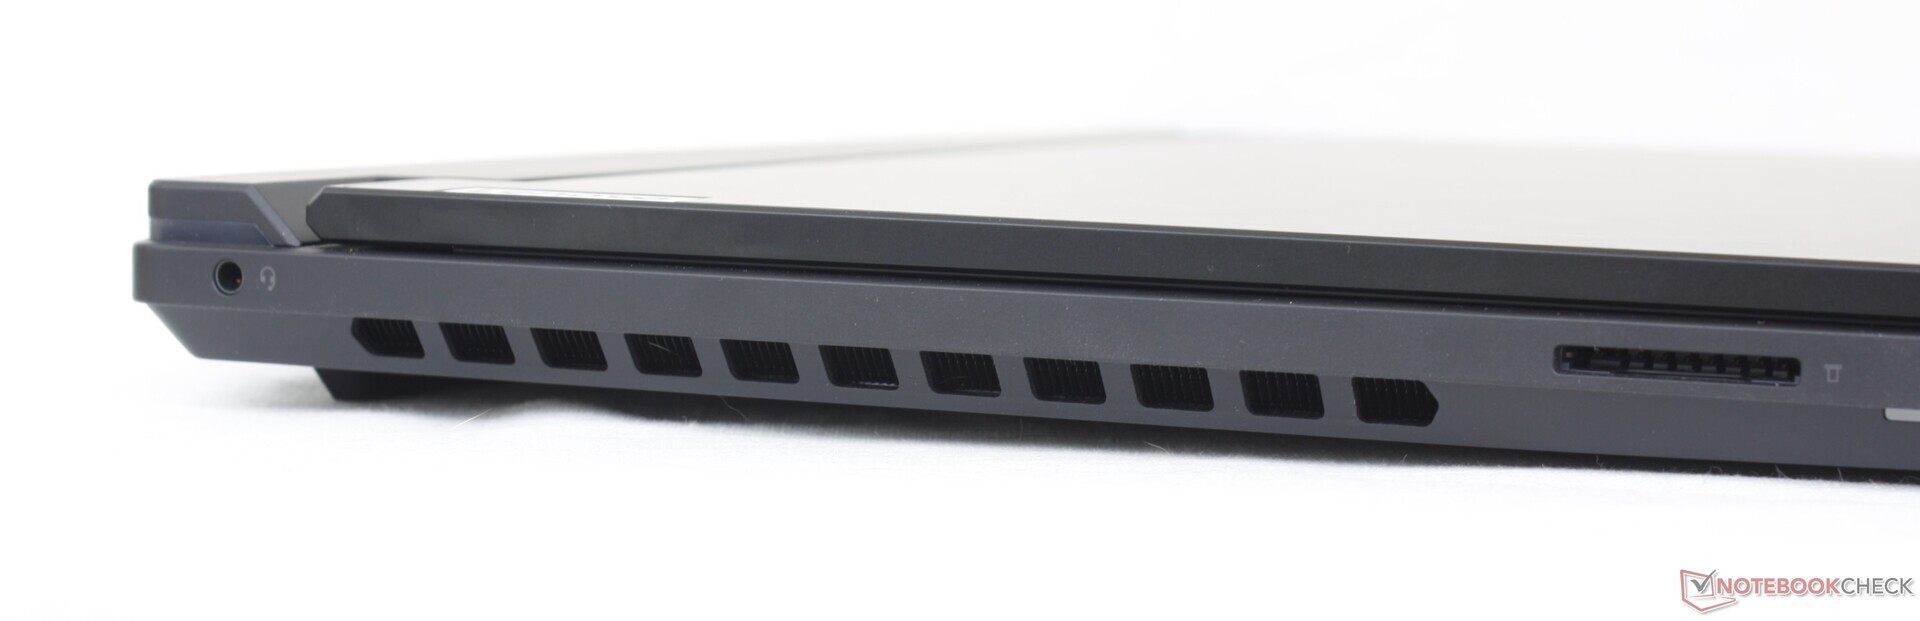
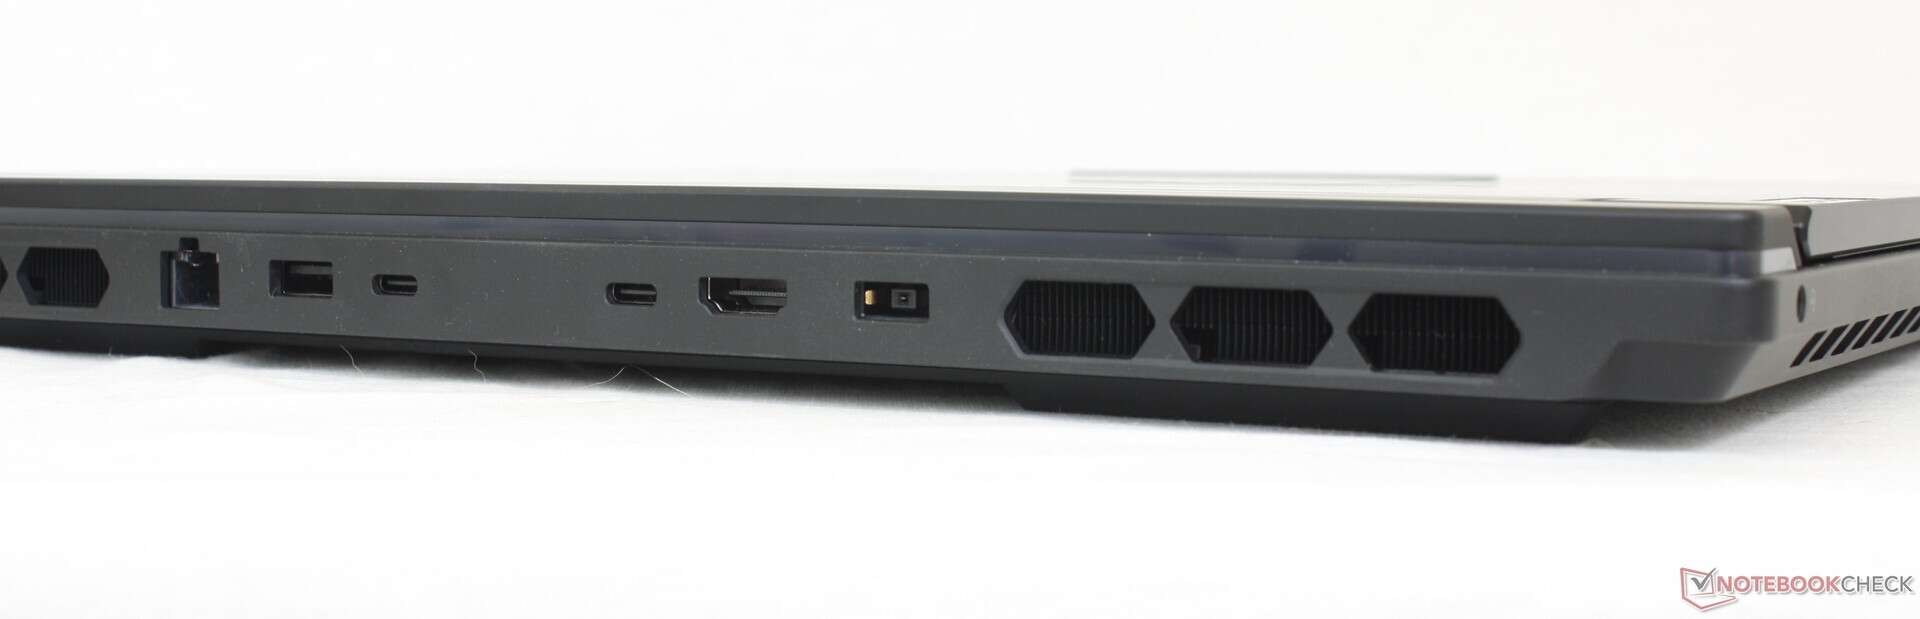
The Scar, on the other hand, almost shares the selection of the Blade but adds the 2.5 GbE connection back in for one of the USB-As. It also offers a more even layout, even though you might prefer USB-A and C ports on each side.
The Alienware X16 is special, having literally everything on the back, which does make for some very clean looking setups, but puts some often used ports quite far out of reach.
The selection offers no reason to complain, and it's also the only 16” to feature a dedicated mini display port, leaving both USB-Cs for peripherals. Its SD card reader can almost rival the Blade 16, but unfortunately, it's only of the smaller and less practical micro SD variety.
| SD Card Reader | |
| average JPG Copy Test (av. of 3 runs) | |
| Razer Blade 16 2024, RTX 4090 | |
| Alienware x16 R2 P120F (AV PRO microSD 128 GB V60) | |
| Average of class Gaming (20.9 - 210, n=54, last 2 years) | |
| Schenker XMG Neo 16 (Early 24) (AV PRO microSD 128 GB V60) | |
| Lenovo Legion 9 16IRX9, RTX 4090 | |
| maximum AS SSD Seq Read Test (1GB) | |
| Alienware x16 R2 P120F (AV PRO microSD 128 GB V60) | |
| Razer Blade 16 2024, RTX 4090 | |
| Average of class Gaming (25.5 - 261, n=51, last 2 years) | |
| Lenovo Legion 9 16IRX9, RTX 4090 | |
| Schenker XMG Neo 16 (Early 24) (AV PRO microSD 128 GB V60) | |
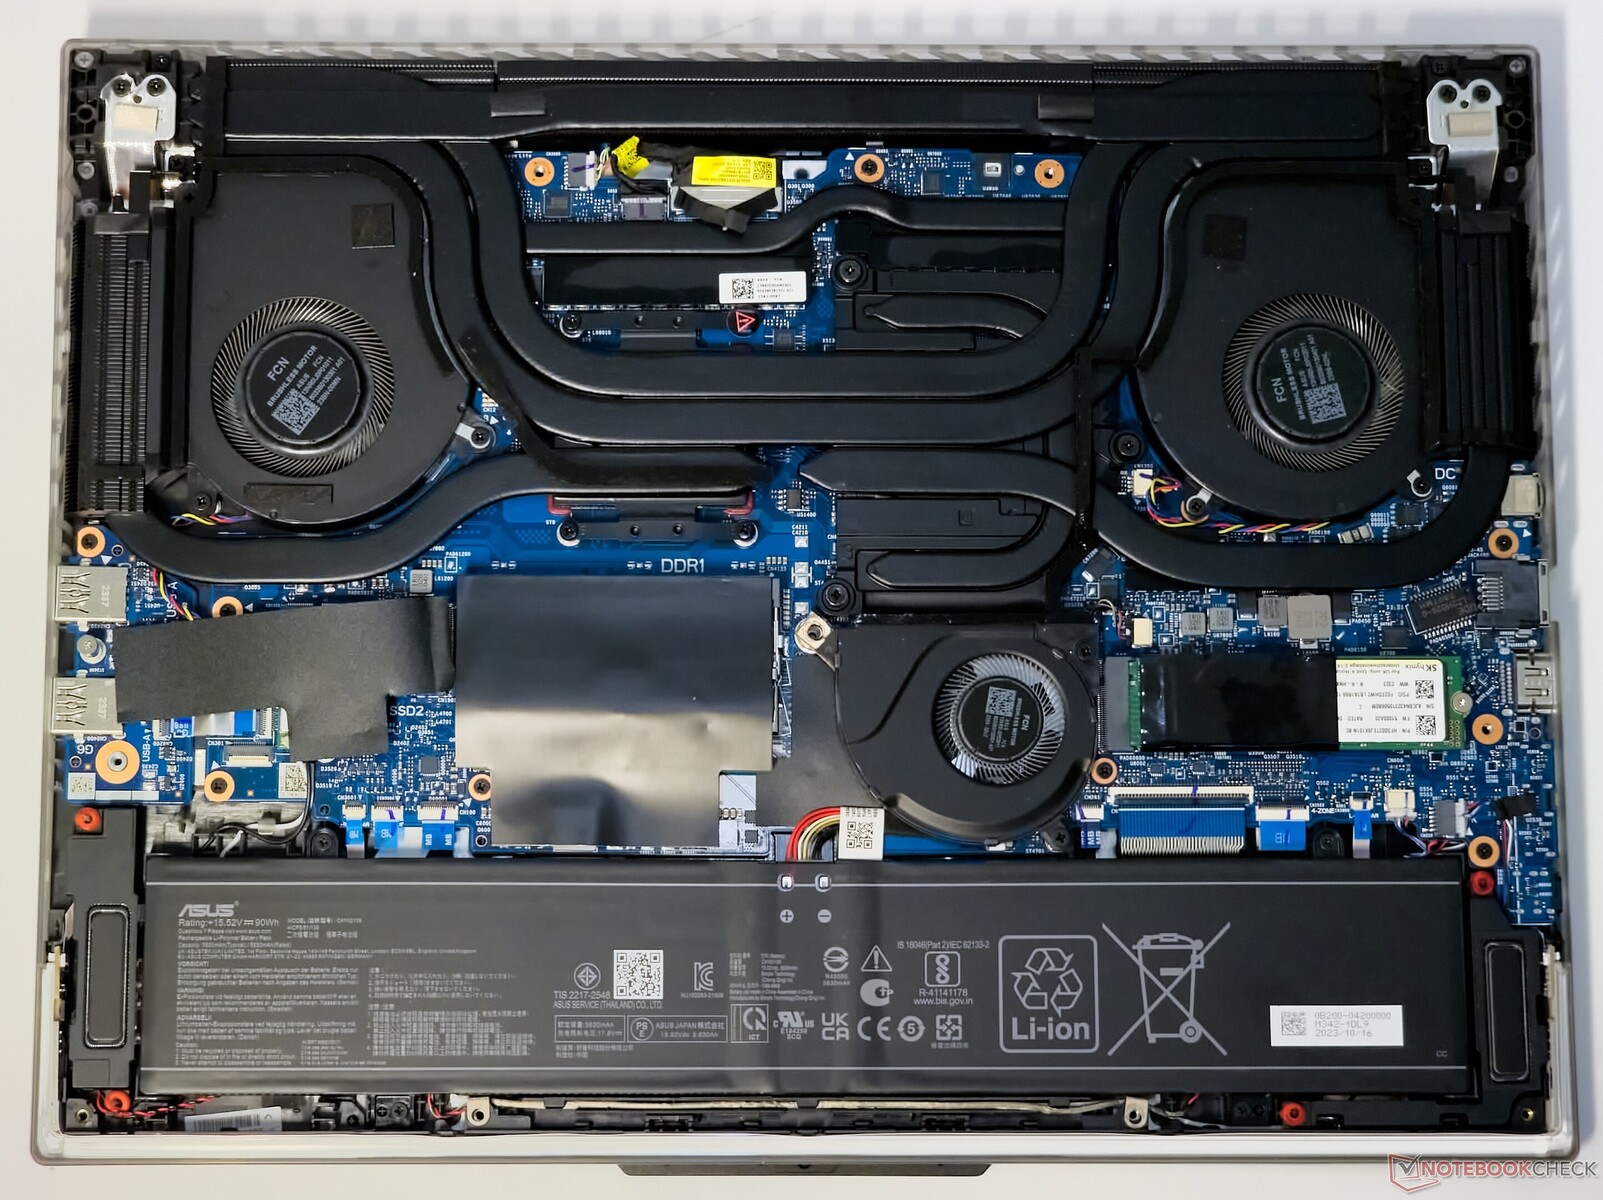
Maintenance
The Alienware X16 also offers the most limited maintenance and upgrade or repair options. While the memory is the fastest in our comparison group today its also soldered, leaving you with only 2 NVMe slots for at least some form of upgradeability.
All of the remaining options also give you access to two SO-DIMMS, even though that is more theoretical on the Legion 9, since the flipped motherboard would require quite a bit of additional disassembly to allow for memory expansion.

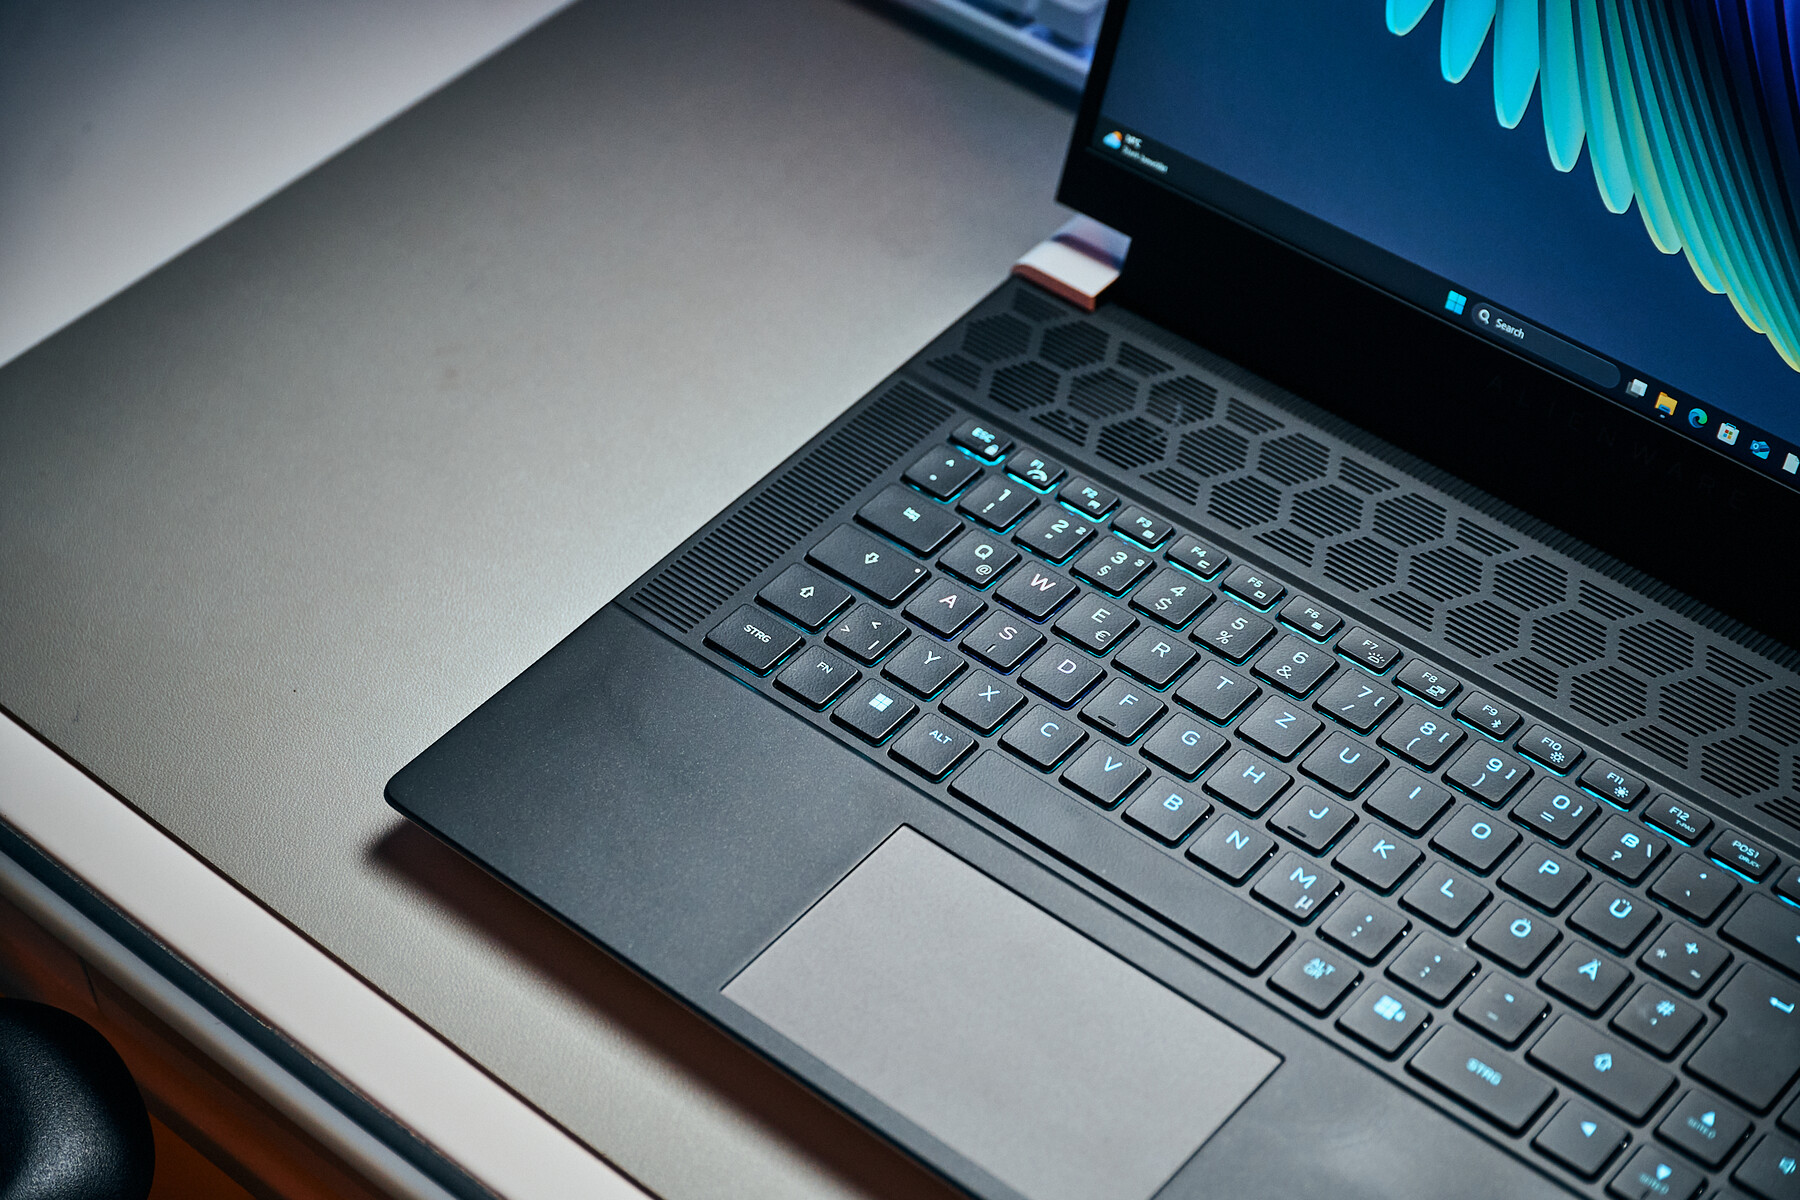
Input Devices - a personal choice
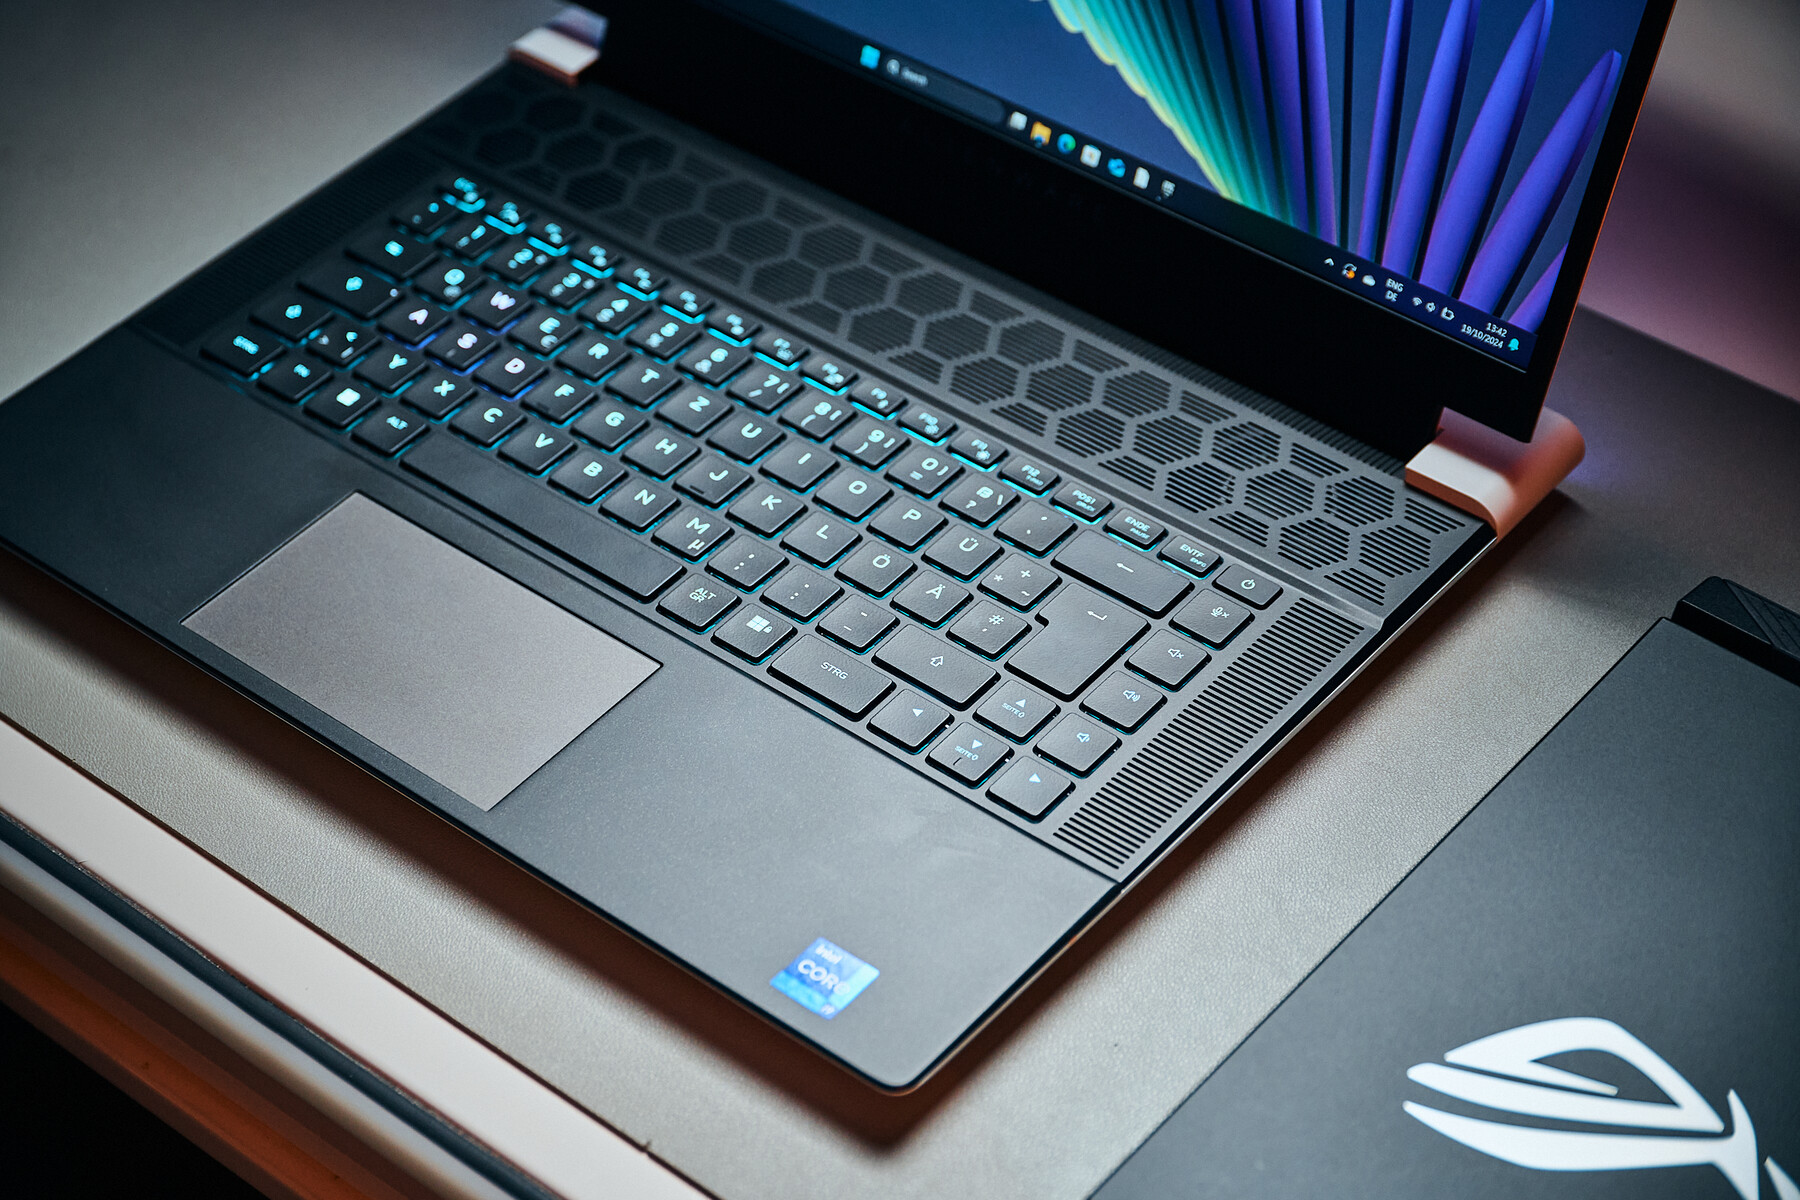
When it comes to inputs, it will most likely come down to personal preference, even though objectively, the Blade 16 has the least amount of travel and this “flat” feel that takes some time to get used to.
On the other hands is has by far the biggest trackpad … if you are into that.
The Legion 9 and the Alienware sacrifice a lot of click pad area for their keyboards, but subjectively, these are our absolute favorites. Solid travel and a very clear pressure point make for a very satisfying typing experience. The Legion is especially amazing in this regard since the absence of even the slightest flex in the keyboard area makes for a very precise feel. The Neo 16 and the Legion Pro 7 are both way above average with a clean layout and a solid feel for both work and play.

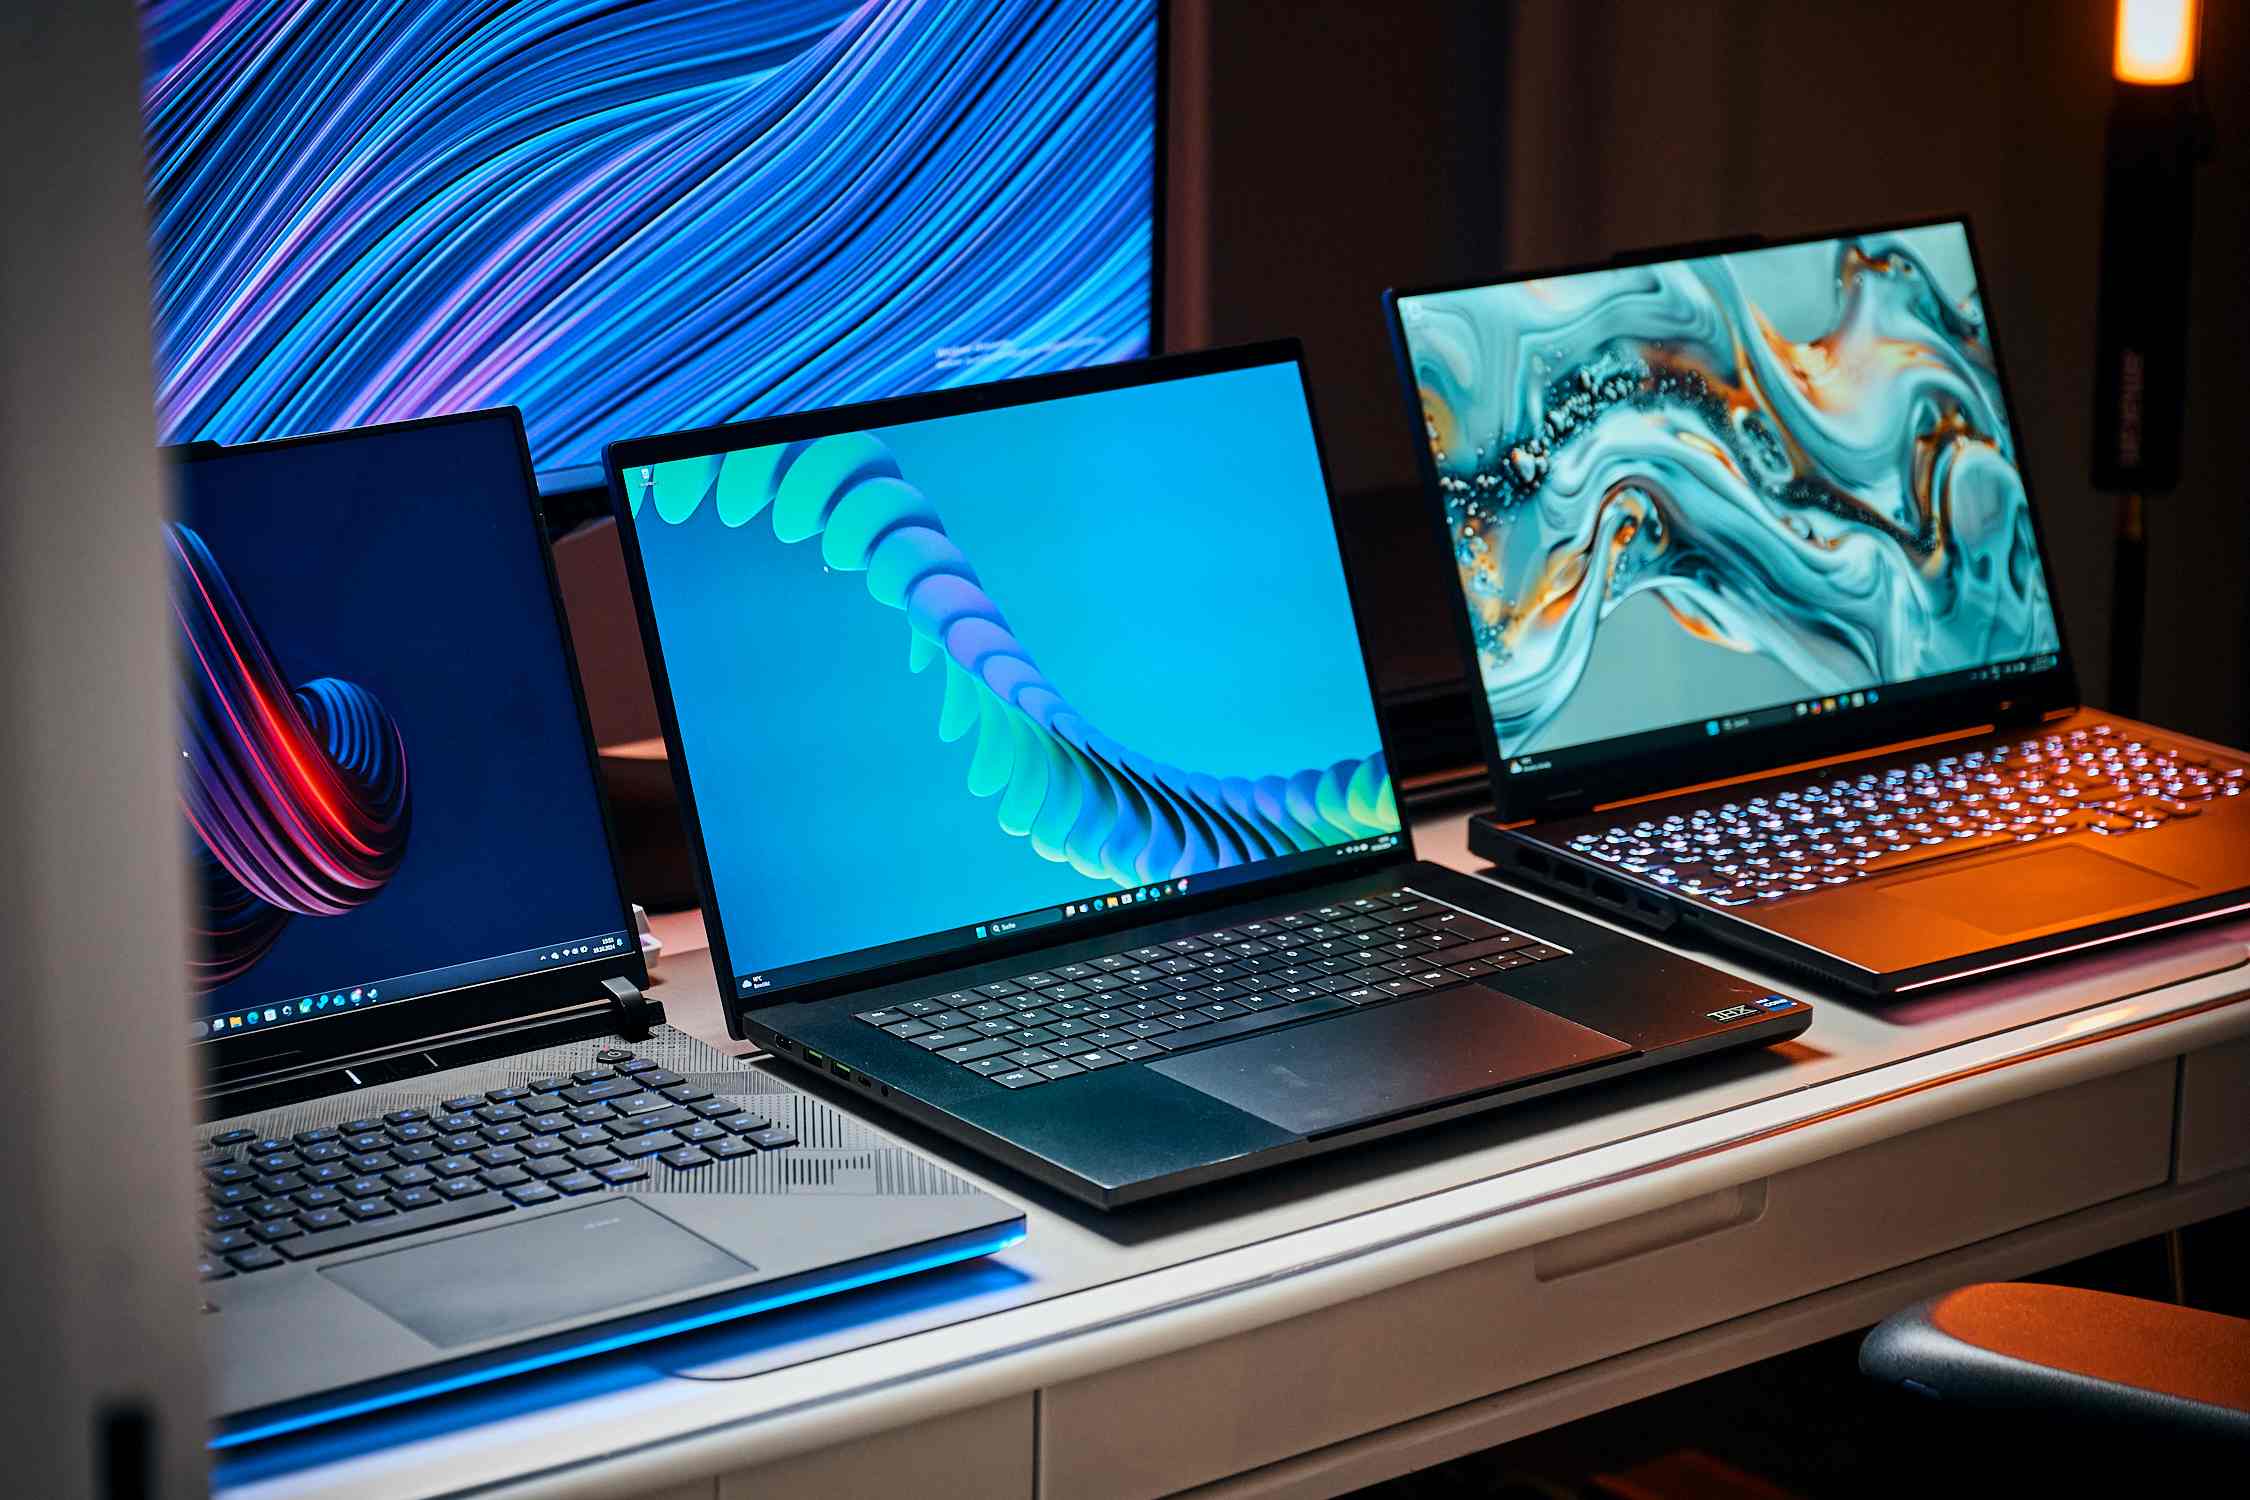
Displays - OLEDs, MiniLEDs and plain ol' IPS nt
In the display department, we actually encountered the biggest differences between our high-end contenders today. Your decision here will depend on how much you are willing to spend on your visual experience and HDR eye candy.
Both the Legion 9 and the Scar 16 come with a MiniLED display. The Lenovo is betting on a higher overall resolution with a 165Hz refresh rate and the highest average brightness of all laptops today, while the ROG is treating you with a QHD+ 240Hz panel, with the same above 1000 Nits peak HDR brightness.
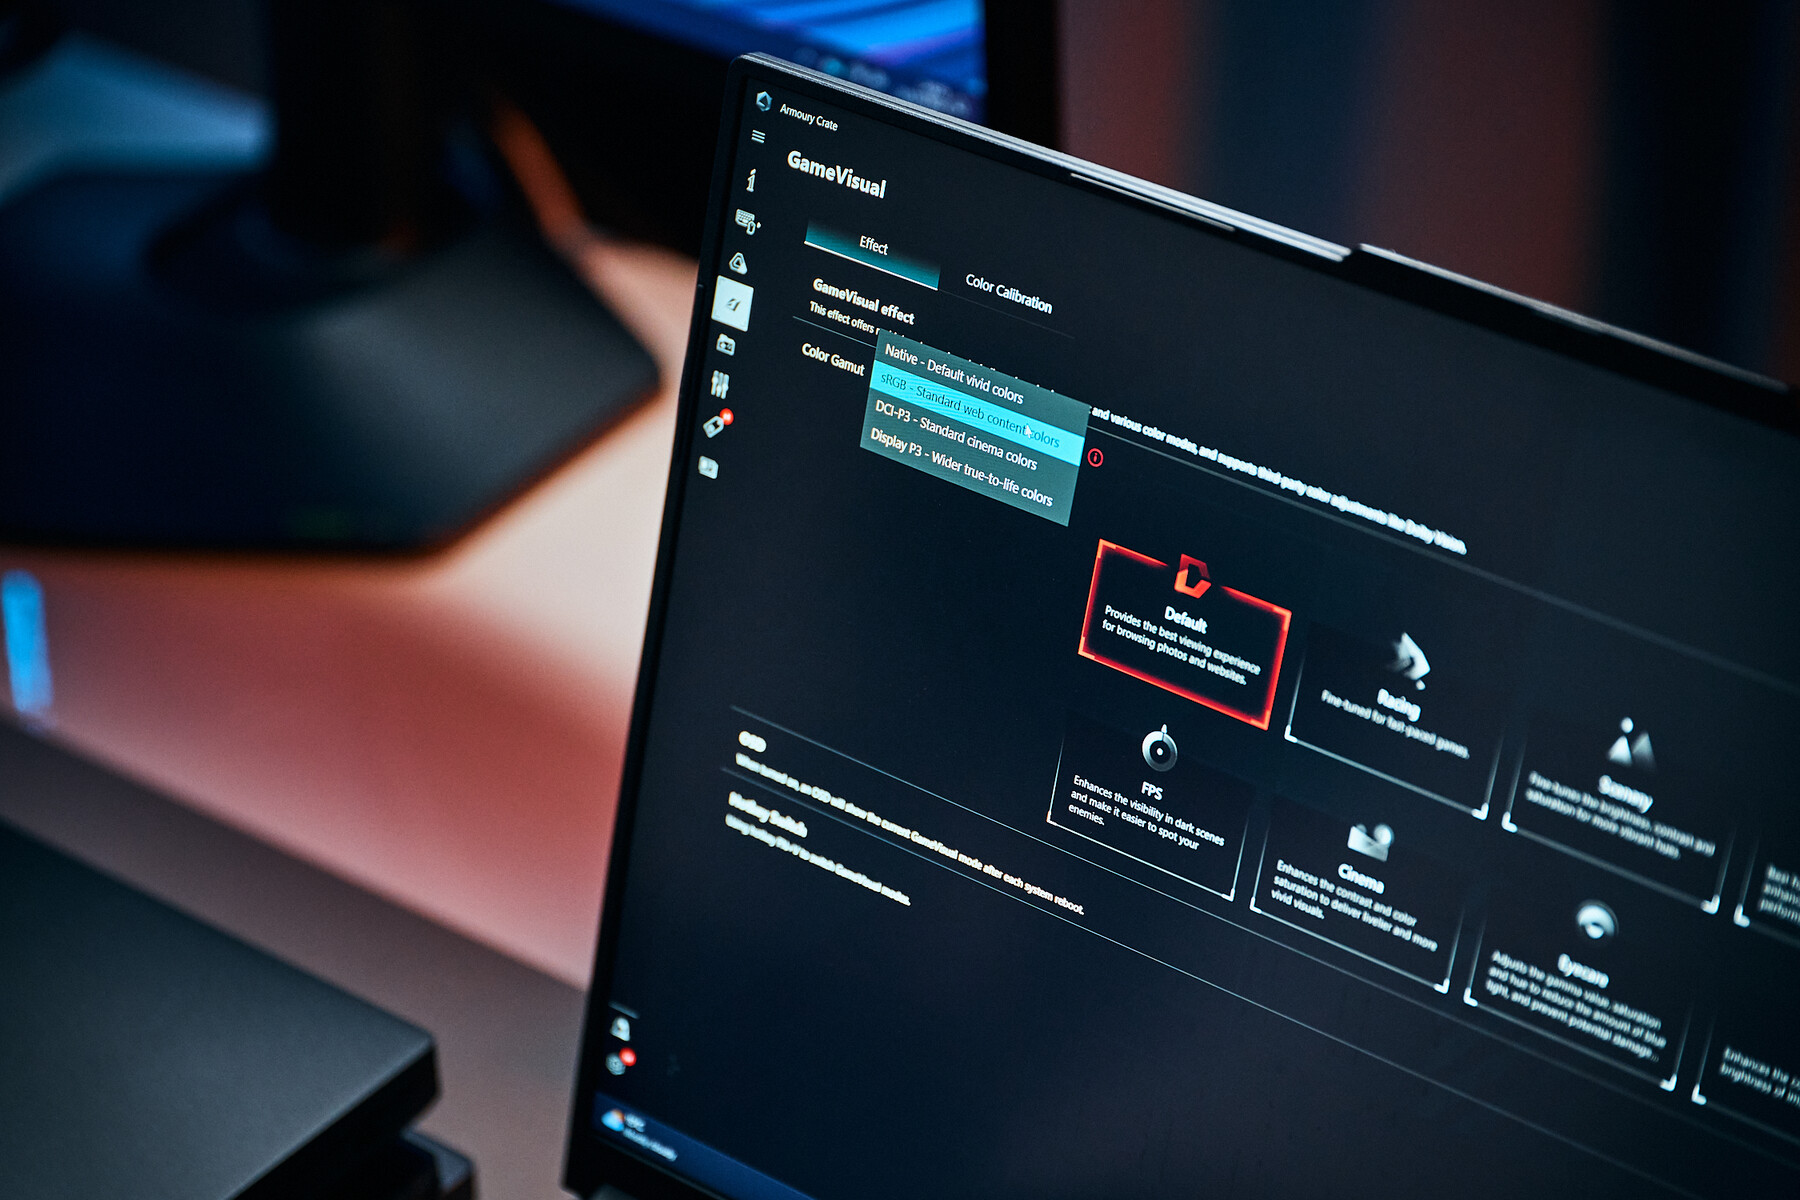
The Scar's display offers a few additional content-creator creature comforts since it gives you more control with switchable local dimming and pre-calibrated color profiles, which are vary handy for certain color grading workflows, and unfortunately missing on the Legion.
The Blade 16 (available on Amazon) is our only OLED option today, featuring the same resolution and refresh rate as the Scar. However, as is typical for self-emitting tech, you would have to sacrifice overall brightness for the most natural color and contrast rendition.
If you do not care about HDR, the Legion Pro 7 also offers a lot. Its still pretty bright IPS panel has stellar colour gamut coverage, solid contrast, and very accurate factory calibration. As for the X16 and the XMG Neo 16, we’d call it a tie. While the XMG boasts higher brightness, it only covers the sRGB gamut. Alienware, on the other hand, offers more vibrant colors but has barely acceptable brightness values for such a high-end machine.


| Lenovo Legion Pro 7 16IRX9H BOE CQ NE16QDM-NZB, IPS, 2560x1600, 16", 240 Hz | Asus ROG Strix Scar 16 G634JZR BOE NE160QDM-NM7, Mini LED, 2560x1600, 16", 240 Hz | Razer Blade 16 2024, RTX 4090 Samsung SDC41AB (ATNA60DL03-0), OLED, 2560x1600, 16", 240 Hz | Alienware x16 R2 P120F BOE B160QAN, IPS, 2560x1600, 16", 240 Hz | Lenovo Legion 9 16IRX9, RTX 4090 CSOT T3 MNG007ZA2-2, MiniLED, 3200x2000, 16", 165 Hz | Schenker XMG Neo 16 (Early 24) BOE NE160QDM-NZA, IPS, 2560x1600, 16", 240 Hz | |
|---|---|---|---|---|---|---|
| Display | ||||||
| Display P3 Coverage (%) | 98.5 | 99.8 | 99.1 | 98.3 | 95.3 | 70.2 |
| sRGB Coverage (%) | 99.9 | 100 | 99.9 | 100 | 99.9 | 98 |
| AdobeRGB 1998 Coverage (%) | 86.7 | 90.8 | 95.6 | 88.8 | 86.6 | 70.6 |
| Response Times | ||||||
| Response Time Grey 50% / Grey 80% * (ms) | 12.6 ? | 5 ? | 0.24 ? | 3.9 ? | 12.6 ? | 11.2 ? |
| Response Time Black / White * (ms) | 5.8 ? | 10.4 ? | 0.4 ? | 7.8 ? | 10 ? | 5.1 ? |
| PWM Frequency (Hz) | 2040 ? | 960 | 5430 | |||
| PWM Amplitude * (%) | 8 | |||||
| Screen | ||||||
| Brightness middle (cd/m²) | 487 | 490 | 418 | 348.4 | 631 | 530 |
| Brightness (cd/m²) | 460 | 487 | 420 | 340 | 664 | 497 |
| Brightness Distribution (%) | 88 | 94 | 98 | 90 | 91 | 85 |
| Black Level * (cd/m²) | 0.42 | 0.4 | 0.02 | 0.33 | 0.03 | 0.53 |
| Contrast (:1) | 1160 | 1225 | 20900 | 1056 | 21033 | 1000 |
| Colorchecker dE 2000 * | 1.12 | 1.08 | 1.07 | 2.68 | 2.68 | 3.21 |
| Colorchecker dE 2000 max. * | 2.26 | 2.38 | 4.04 | 4.14 | 6.41 | 5.8 |
| Colorchecker dE 2000 calibrated * | 0.54 | 0.9 | 1.07 | 0.42 | 2.68 | 1.44 |
| Greyscale dE 2000 * | 1.4 | 1.1 | 1.12 | 3.4 | 2.71 | 4.2 |
| Gamma | 2.242 98% | 2.13 103% | 2.29 96% | 2.41 91% | 2.27 97% | 2.226 99% |
| CCT | 6809 95% | 6724 97% | 6417 101% | 6083 107% | 6135 106% | 6448 101% |
| Total Average (Program / Settings) |
* ... smaller is better
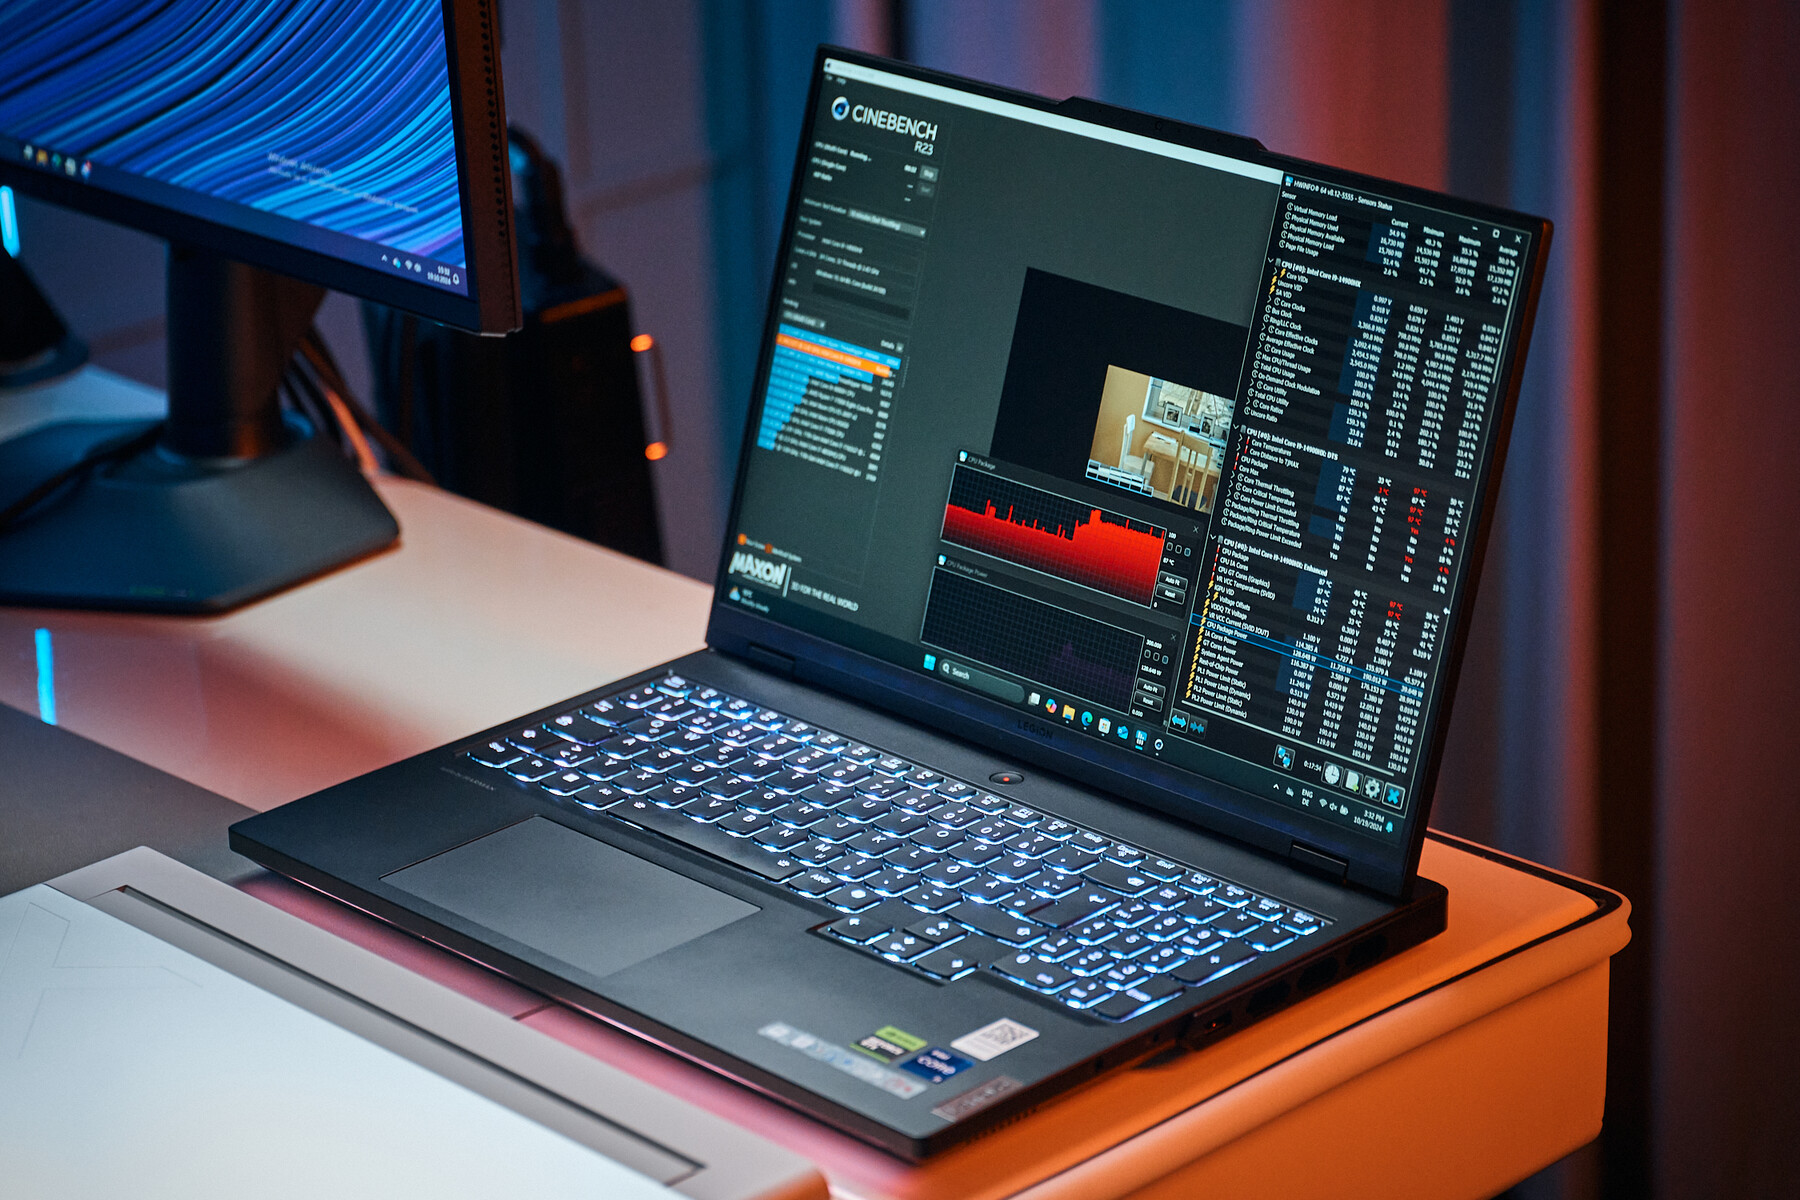
Performance - Impressive, except for one
Processor
On the CPU side, it is going to be especially interesting since most of our competitors bet on the same silicon: Intel's high-end flagship, the Core i9-14900HX.
In our CPU rating, a collection of all sorts of tests, the XMG Neo 16 is sitting on top, with quite the substantial lead, considering we are mostly talking about the same CPU here. The Legion Pro 7 is quite close, though, followed by the ROG Scar 16, while the Legion 9 falls even behind Razer's Blade 16 due to less-than-stellar single-core performance.
Of course, the Alienware does not stand a chance since it is betting on a Meteor Lake CPU with fewer cores and much lower power levels.
This does not mean that much in today’s world of more GPU-bound games, but it is still something to look out for, especially if you want to achieve higher fps in faster games, which ask for a lot more pure CPU grunt, or if you intend to use your shiny new notebooks for certain workflows that would require a faster CPU.
Cinebench R15 Multi Loop
Cinebench R23: Multi Core | Single Core
Cinebench R20: CPU (Multi Core) | CPU (Single Core)
Cinebench R15: CPU Multi 64Bit | CPU Single 64Bit
Blender: v2.79 BMW27 CPU
7-Zip 18.03: 7z b 4 | 7z b 4 -mmt1
Geekbench 6.7: Multi-Core | Single-Core
Geekbench 5.5: Multi-Core | Single-Core
HWBOT x265 Benchmark v2.2: 4k Preset
LibreOffice : 20 Documents To PDF
R Benchmark 2.5: Overall mean
| CPU Performance rating | |
| Schenker XMG Neo 16 (Early 24) | |
| Lenovo Legion Pro 7 16IRX9H | |
| Asus ROG Strix Scar 16 G634JZR | |
| Razer Blade 16 2024, RTX 4090 | |
| Average Intel Core i9-14900HX | |
| Lenovo Legion 9 16IRX9, RTX 4090 | |
| Average of class Gaming | |
| Alienware x16 R2 P120F | |
| Cinebench R23 / Multi Core | |
| Schenker XMG Neo 16 (Early 24) | |
| Lenovo Legion Pro 7 16IRX9H | |
| Lenovo Legion 9 16IRX9, RTX 4090 | |
| Asus ROG Strix Scar 16 G634JZR | |
| Razer Blade 16 2024, RTX 4090 | |
| Average Intel Core i9-14900HX (17078 - 36249, n=37) | |
| Average of class Gaming (10488 - 40970, n=110, last 2 years) | |
| Alienware x16 R2 P120F | |
| Cinebench R23 / Single Core | |
| Schenker XMG Neo 16 (Early 24) | |
| Lenovo Legion Pro 7 16IRX9H | |
| Asus ROG Strix Scar 16 G634JZR | |
| Average Intel Core i9-14900HX (1720 - 2245, n=37) | |
| Razer Blade 16 2024, RTX 4090 | |
| Average of class Gaming (1166 - 2356, n=110, last 2 years) | |
| Lenovo Legion 9 16IRX9, RTX 4090 | |
| Alienware x16 R2 P120F | |
| Cinebench R20 / CPU (Multi Core) | |
| Schenker XMG Neo 16 (Early 24) | |
| Lenovo Legion Pro 7 16IRX9H | |
| Lenovo Legion 9 16IRX9, RTX 4090 | |
| Asus ROG Strix Scar 16 G634JZR | |
| Average Intel Core i9-14900HX (6579 - 13832, n=37) | |
| Razer Blade 16 2024, RTX 4090 | |
| Average of class Gaming (4029 - 16108, n=109, last 2 years) | |
| Alienware x16 R2 P120F | |
| Cinebench R20 / CPU (Single Core) | |
| Schenker XMG Neo 16 (Early 24) | |
| Asus ROG Strix Scar 16 G634JZR | |
| Lenovo Legion Pro 7 16IRX9H | |
| Average Intel Core i9-14900HX (657 - 859, n=37) | |
| Razer Blade 16 2024, RTX 4090 | |
| Average of class Gaming (442 - 895, n=109, last 2 years) | |
| Lenovo Legion 9 16IRX9, RTX 4090 | |
| Alienware x16 R2 P120F | |
| Cinebench R15 / CPU Multi 64Bit | |
| Schenker XMG Neo 16 (Early 24) | |
| Lenovo Legion 9 16IRX9, RTX 4090 | |
| Asus ROG Strix Scar 16 G634JZR | |
| Lenovo Legion Pro 7 16IRX9H | |
| Razer Blade 16 2024, RTX 4090 | |
| Average Intel Core i9-14900HX (3263 - 5589, n=38) | |
| Average of class Gaming (1578 - 6271, n=109, last 2 years) | |
| Alienware x16 R2 P120F | |
| Cinebench R15 / CPU Single 64Bit | |
| Asus ROG Strix Scar 16 G634JZR | |
| Lenovo Legion Pro 7 16IRX9H | |
| Razer Blade 16 2024, RTX 4090 | |
| Schenker XMG Neo 16 (Early 24) | |
| Average Intel Core i9-14900HX (247 - 323, n=37) | |
| Average of class Gaming (188.8 - 343, n=109, last 2 years) | |
| Lenovo Legion 9 16IRX9, RTX 4090 | |
| Alienware x16 R2 P120F | |
| Blender / v2.79 BMW27 CPU | |
| Alienware x16 R2 P120F | |
| Average of class Gaming (80 - 330, n=107, last 2 years) | |
| Average Intel Core i9-14900HX (91 - 206, n=37) | |
| Razer Blade 16 2024, RTX 4090 | |
| Asus ROG Strix Scar 16 G634JZR | |
| Lenovo Legion 9 16IRX9, RTX 4090 | |
| Lenovo Legion Pro 7 16IRX9H | |
| Schenker XMG Neo 16 (Early 24) | |
| 7-Zip 18.03 / 7z b 4 | |
| Schenker XMG Neo 16 (Early 24) | |
| Lenovo Legion 9 16IRX9, RTX 4090 | |
| Lenovo Legion Pro 7 16IRX9H | |
| Asus ROG Strix Scar 16 G634JZR | |
| Razer Blade 16 2024, RTX 4090 | |
| Average Intel Core i9-14900HX (66769 - 136645, n=37) | |
| Average of class Gaming (33491 - 148086, n=108, last 2 years) | |
| Alienware x16 R2 P120F | |
| 7-Zip 18.03 / 7z b 4 -mmt1 | |
| Asus ROG Strix Scar 16 G634JZR | |
| Schenker XMG Neo 16 (Early 24) | |
| Lenovo Legion Pro 7 16IRX9H | |
| Average Intel Core i9-14900HX (5452 - 7545, n=37) | |
| Razer Blade 16 2024, RTX 4090 | |
| Average of class Gaming (4199 - 7436, n=108, last 2 years) | |
| Lenovo Legion 9 16IRX9, RTX 4090 | |
| Alienware x16 R2 P120F | |
| Geekbench 6.7 / Multi-Core | |
| Schenker XMG Neo 16 (Early 24) | |
| Asus ROG Strix Scar 16 G634JZR | |
| Lenovo Legion Pro 7 16IRX9H | |
| Razer Blade 16 2024, RTX 4090 | |
| Lenovo Legion 9 16IRX9, RTX 4090 | |
| Average Intel Core i9-14900HX (13158 - 19665, n=37) | |
| Average of class Gaming (6625 - 22104, n=109, last 2 years) | |
| Alienware x16 R2 P120F | |
| Geekbench 6.7 / Single-Core | |
| Schenker XMG Neo 16 (Early 24) | |
| Lenovo Legion Pro 7 16IRX9H | |
| Asus ROG Strix Scar 16 G634JZR | |
| Average Intel Core i9-14900HX (2419 - 3129, n=37) | |
| Razer Blade 16 2024, RTX 4090 | |
| Average of class Gaming (1490 - 3259, n=109, last 2 years) | |
| Lenovo Legion 9 16IRX9, RTX 4090 | |
| Alienware x16 R2 P120F | |
| Geekbench 5.5 / Multi-Core | |
| Schenker XMG Neo 16 (Early 24) | |
| Lenovo Legion 9 16IRX9, RTX 4090 | |
| Asus ROG Strix Scar 16 G634JZR | |
| Lenovo Legion Pro 7 16IRX9H | |
| Average Intel Core i9-14900HX (8618 - 23194, n=37) | |
| Razer Blade 16 2024, RTX 4090 | |
| Average of class Gaming (6460 - 27010, n=108, last 2 years) | |
| Alienware x16 R2 P120F | |
| Geekbench 5.5 / Single-Core | |
| Asus ROG Strix Scar 16 G634JZR | |
| Schenker XMG Neo 16 (Early 24) | |
| Razer Blade 16 2024, RTX 4090 | |
| Lenovo Legion Pro 7 16IRX9H | |
| Average Intel Core i9-14900HX (1669 - 2210, n=37) | |
| Average of class Gaming (986 - 2474, n=108, last 2 years) | |
| Lenovo Legion 9 16IRX9, RTX 4090 | |
| Alienware x16 R2 P120F | |
| HWBOT x265 Benchmark v2.2 / 4k Preset | |
| Schenker XMG Neo 16 (Early 24) | |
| Lenovo Legion Pro 7 16IRX9H | |
| Asus ROG Strix Scar 16 G634JZR | |
| Lenovo Legion 9 16IRX9, RTX 4090 | |
| Razer Blade 16 2024, RTX 4090 | |
| Average Intel Core i9-14900HX (16.8 - 38.9, n=37) | |
| Average of class Gaming (11.5 - 44.3, n=108, last 2 years) | |
| Alienware x16 R2 P120F | |
| LibreOffice / 20 Documents To PDF | |
| Lenovo Legion 9 16IRX9, RTX 4090 | |
| Average of class Gaming (19 - 88.8, n=108, last 2 years) | |
| Asus ROG Strix Scar 16 G634JZR | |
| Razer Blade 16 2024, RTX 4090 | |
| Alienware x16 R2 P120F | |
| Average Intel Core i9-14900HX (19 - 85.1, n=37) | |
| Lenovo Legion Pro 7 16IRX9H | |
| Schenker XMG Neo 16 (Early 24) | |
| R Benchmark 2.5 / Overall mean | |
| Alienware x16 R2 P120F | |
| Lenovo Legion 9 16IRX9, RTX 4090 | |
| Average of class Gaming (0.3439 - 0.759, n=109, last 2 years) | |
| Lenovo Legion Pro 7 16IRX9H | |
| Average Intel Core i9-14900HX (0.3604 - 0.4859, n=37) | |
| Razer Blade 16 2024, RTX 4090 | |
| Asus ROG Strix Scar 16 G634JZR | |
| Schenker XMG Neo 16 (Early 24) | |
* ... smaller is better
System Performance
System performance shows all contenders relatively close to each other, and since we have been able to test both the 4080 and 4090 SKUs of the Legion Pro 7 and the Strix Scar 16, we can see how much of a difference NVIDIA's mobile flagship can make in the end.
Subjectively, all notebooks are more than fast enough for almost anything we can throw at them, and we also tried all of them for our videos, which was a very enjoyable experience on all laptops from a performance perspective. With this amount of computing horsepower in a mobile package, each of these makes for a great workstation if you also want to get stuff done.
| PCMark 10 / Score | |
| Schenker XMG Neo 16 (Early 24) | |
| Lenovo Legion Pro 7 16IRX9H | |
| Asus ROG Strix Scar 16 G634JYR | |
| Average Intel Core i9-14900HX, NVIDIA GeForce RTX 4080 Laptop GPU (7703 - 9223, n=7) | |
| Lenovo Legion Pro 7 16IRX9H, RTX 4090 | |
| Razer Blade 16 2024, RTX 4090 | |
| Average of class Gaming (5828 - 11574, n=94, last 2 years) | |
| Lenovo Legion 9 16IRX9, RTX 4090 | |
| Asus ROG Strix Scar 16 G634JZR | |
| Alienware x16 R2 P120F | |
| PCMark 10 / Essentials | |
| Lenovo Legion Pro 7 16IRX9H | |
| Average Intel Core i9-14900HX, NVIDIA GeForce RTX 4080 Laptop GPU (11255 - 12600, n=7) | |
| Asus ROG Strix Scar 16 G634JZR | |
| Asus ROG Strix Scar 16 G634JYR | |
| Schenker XMG Neo 16 (Early 24) | |
| Lenovo Legion 9 16IRX9, RTX 4090 | |
| Razer Blade 16 2024, RTX 4090 | |
| Lenovo Legion Pro 7 16IRX9H, RTX 4090 | |
| Average of class Gaming (8810 - 12600, n=98, last 2 years) | |
| Alienware x16 R2 P120F | |
| PCMark 10 / Productivity | |
| Schenker XMG Neo 16 (Early 24) | |
| Lenovo Legion Pro 7 16IRX9H | |
| Razer Blade 16 2024, RTX 4090 | |
| Average of class Gaming (6845 - 18766, n=96, last 2 years) | |
| Asus ROG Strix Scar 16 G634JYR | |
| Average Intel Core i9-14900HX, NVIDIA GeForce RTX 4080 Laptop GPU (6662 - 11410, n=7) | |
| Lenovo Legion 9 16IRX9, RTX 4090 | |
| Lenovo Legion Pro 7 16IRX9H, RTX 4090 | |
| Alienware x16 R2 P120F | |
| Asus ROG Strix Scar 16 G634JZR | |
| PCMark 10 / Digital Content Creation | |
| Asus ROG Strix Scar 16 G634JZR | |
| Asus ROG Strix Scar 16 G634JYR | |
| Schenker XMG Neo 16 (Early 24) | |
| Average Intel Core i9-14900HX, NVIDIA GeForce RTX 4080 Laptop GPU (14211 - 16246, n=7) | |
| Lenovo Legion Pro 7 16IRX9H, RTX 4090 | |
| Lenovo Legion Pro 7 16IRX9H | |
| Average of class Gaming (7602 - 19657, n=96, last 2 years) | |
| Lenovo Legion 9 16IRX9, RTX 4090 | |
| Razer Blade 16 2024, RTX 4090 | |
| Alienware x16 R2 P120F | |
* ... smaller is better
GPU Performance - is the RTX 4090 Laptop worth it?

Looking at our synthetic GPU results, the Legion Pro 7 demonstrates that it’s worth questioning whether to shell out for the 4090 configurations, as most of today’s contenders are also available with a 4080. The difference here is measurable—as shown by the Pro 7 and Scar 16—but it’s definitely not night and day.
However, for some workflows, especially in video editing or basically anything that needs a lot of VRAM, you should still consider the memory configuration between these cards here, beyond just pure speed.
Gaming Performance - fast and faster.
Our gaming rating—a collection of new and older games tested at 1080p to stress both the CPU and GPU equally—also shows that a fast CPU and consistently high power levels for both core components can be almost more important than a beefier GPU, as demonstrated once more by the Pro 7. Meanwhile, the XMG Neo 16 is simply mopping the floor with its competitors here.
Please be aware that due to time constraints, we have only been able to run a limited number of tests on the Scar 16 and Legion Pro 7 RTX 4090 configurations, which is why their respective results are missing in our gaming rating.
That said, the differences among all our contenders are, again, not earth-shattering, except for the X16, which trails behind quite a bit—but that’s to be expected given the overall weaker silicon.
In Cyberpunk, a more GPU-bound title that better represents modern games, our results align more closely with general expectations, especially when going beyond 1080p. Even the slower CPU in the Alienware doesn’t demand a huge compromise in actual FPS as long as the GPU is provided with sufficient wattage, which is quite impressive for the X16’s slim chassis.
The distinction between NVIDIA’s high-end mobile GPUs is also much more noticeable here, and the Neo 16 impressively showcases what the 4090 Laptop can achieve under optimal conditions.
Emissions
System Noise
According to our measured results, the Blade 16 is supposed to be the quietest machine, but that does not tell the whole story.
While it may be a lot less noisy on paper, the fans emit a sort of high-pitched wine, that we found quite a bit more distracting than the “louder” but lower sound emitted from the Legions or the Alienware for example.
| Lenovo Legion Pro 7 16IRX9H GeForce RTX 4080 Laptop GPU, i9-14900HX, SK Hynix HFS001TEJ9X115N | Asus ROG Strix Scar 16 G634JZR GeForce RTX 4080 Laptop GPU, i9-14900HX, SK hynix PC801 HFS002TEJ9X101N | Razer Blade 16 2024, RTX 4090 GeForce RTX 4090 Laptop GPU, i9-14900HX, Samsung PM9A1 MZVL22T0HBLB | Alienware x16 R2 P120F GeForce RTX 4080 Laptop GPU, Ultra 9 185H, WDC PC SN810 1TB | Lenovo Legion 9 16IRX9, RTX 4090 GeForce RTX 4090 Laptop GPU, i9-14900HX, Micron 3400 2TB MTFDKBA2T0TFH | Schenker XMG Neo 16 (Early 24) GeForce RTX 4090 Laptop GPU, i9-14900HX, Samsung 990 Pro 1 TB | |
|---|---|---|---|---|---|---|
| Noise | ||||||
| off / environment * (dB) | 24 | 21.07 | 23 | 23.4 | 23 | 26 |
| Idle Minimum * (dB) | 25 | 29.75 | 23 | 23.8 | 23 | 28 |
| Idle Average * (dB) | 30 | 29.75 | 23 | 28.5 | 23 | 29 |
| Idle Maximum * (dB) | 45 | 29.75 | 27.66 | 28.5 | 23 | 31 |
| Load Average * (dB) | 50 | 54.85 | 43.76 | 28.8 | 39 | 51 |
| Witcher 3 ultra * (dB) | 54 | 57.8 | 46.81 | 49.5 | 55.32 | 54 |
| Load Maximum * (dB) | 56 | 58 | 50.37 | 54.2 | 55.56 | 56 |
* ... smaller is better
Temperature
With a maximum upper side temperature of 45°C and a maximum bottom temperature of 49°C under load, the Razer Blade 16 stands out as one of the coolest laptops, making it a desirable alternative for consumers who value lower operating temperatures. Closely after are the Lenovo Legion Pro 7 and Lenovo Legion 9, which both have a top temperature of about 46°C, but have somewhat higher bottom temperatures of 49°C and 56°C, respectively. With a top temperature of 51°C and a bottom temperature of 50.8°C, the Alienware X16 performs similarly.
The Schenker XMG Neo 16 is notable for its outstanding cooling efficiency when it is at rest. It has one of the lowest idle temperatures in this mode, with a bottom temperature of only 27°C and an upper-side temperature of 38°C. The Asus ROG Strix Scar 16 on the other hand, which can reach 52.2°C while under load, tends to run a little hotter than the others. All things considered, these laptops exhibit a variety of thermal performance, with the Schenker XMG Neo 16 exhibiting the finest idle cooling management and the Razer Blade 16 performing exceptionally well under loaded conditions.
| Lenovo Legion Pro 7 16IRX9H Intel Core i9-14900HX, NVIDIA GeForce RTX 4080 Laptop GPU | Asus ROG Strix Scar 16 G634JZR Intel Core i9-14900HX, NVIDIA GeForce RTX 4080 Laptop GPU | Razer Blade 16 2024, RTX 4090 Intel Core i9-14900HX, NVIDIA GeForce RTX 4090 Laptop GPU | Alienware x16 R2 P120F Intel Core Ultra 9 185H, NVIDIA GeForce RTX 4080 Laptop GPU | Lenovo Legion 9 16IRX9, RTX 4090 Intel Core i9-14900HX, NVIDIA GeForce RTX 4090 Laptop GPU | Schenker XMG Neo 16 (Early 24) Intel Core i9-14900HX, NVIDIA GeForce RTX 4090 Laptop GPU | |
|---|---|---|---|---|---|---|
| Heat | ||||||
| Maximum Upper Side * (°C) | 46 | 47.8 | 45 | 51 | 56 | 47 |
| Maximum Bottom * (°C) | 49 | 52.2 | 45 | 50.8 | 53 | 56 |
| Idle Upper Side * (°C) | 38 | 32.4 | 29 | 36.6 | 38 | 27 |
| Idle Bottom * (°C) | 37 | 33 | 30 | 35.2 | 39 | 27 |
* ... smaller is better
Battery Life
Given the performance we are dealing with here and considering that we can only access this performance when connected to power, it should not be the biggest surprise that we will not get all-day battery life from any of these laptops in front of us. That said, the Scar performs admirably, while the Alienware just disappoints, which is even more surprising considering it is supposed to have the most efficient CPU.
| Lenovo Legion Pro 7 16IRX9H i9-14900HX, GeForce RTX 4080 Laptop GPU, 99.9 Wh | Asus ROG Strix Scar 16 G634JZR i9-14900HX, GeForce RTX 4080 Laptop GPU, 90 Wh | Razer Blade 16 2024, RTX 4090 i9-14900HX, GeForce RTX 4090 Laptop GPU, 95.2 Wh | Alienware x16 R2 P120F Ultra 9 185H, GeForce RTX 4080 Laptop GPU, 90 Wh | Lenovo Legion 9 16IRX9, RTX 4090 i9-14900HX, GeForce RTX 4090 Laptop GPU, 99.99 Wh | Schenker XMG Neo 16 (Early 24) i9-14900HX, GeForce RTX 4090 Laptop GPU, 99.8 Wh | Average of class Gaming | |
|---|---|---|---|---|---|---|---|
| Battery runtime | |||||||
| WiFi v1.3 (h) | 6.2 | 7.2 | 5.5 | 3.2 | 4.8 | 5.8 | 7.04 ? |
| H.264 (h) | 7.5 | 7.6 | 4.9 | 7 | 8.26 ? | ||
| Witcher 3 ultra (h) | 1 | ||||||
| Load (h) | 0.9 | 1.3 | 2.2 | 2 | 1.47 ? | ||
| Reader / Idle (h) | 10 | 8.71 ? |
Conclusion
As we have said in the beginning, naming one of our contenders the best high-end gaming laptop of all time is simply not possible. Each has unique strengths and weaknesses that you will either appreciate or be willing to live with.
That said, the Alienware X16 is the least balanced laptop, but it's also the most affordable, especially if you find it on sale. The Legion Pro 7, on the other hand, is very balanced and does not require a loan as well.
The remaining options are definitely their respective companies' halo products, which offer great displays, amazing performance, and that little "extra" with a price tag to match.
Transparency
The selection of devices to be reviewed is made by our editorial team. The test sample was provided to the author as a loan by the manufacturer or retailer for the purpose of this review. The lender had no influence on this review, nor did the manufacturer receive a copy of this review before publication. There was no obligation to publish this review. As an independent media company, Notebookcheck is not subjected to the authority of manufacturers, retailers or publishers.
This is how Notebookcheck is testing
Every year, Notebookcheck independently reviews hundreds of laptops and smartphones using standardized procedures to ensure that all results are comparable. We have continuously developed our test methods for around 20 years and set industry standards in the process. In our test labs, high-quality measuring equipment is utilized by experienced technicians and editors. These tests involve a multi-stage validation process. Our complex rating system is based on hundreds of well-founded measurements and benchmarks, which maintains objectivity. Further information on our test methods can be found here.
