Verdict — XPS Reborn
Like the new XPS 14, the 2026 XPS 16 addresses some of the top concerns about the 2025 model for an overall better user experience. The system is now much lighter and more travel-friendly with a cleaner visual aesthetic and no frustrating touch-sensitive keys. The move to Panther Lake has also significantly improved performance-per-watt to boost runtimes by several hours at the very least.
A key reason for the leaner, quieter, and more compact design this year can be attributed to one major change: no more discrete graphics options. No dGPU means the system can get away with smaller PCBs, a smaller cooling solution, and a thinner profile for an overall lighter model. Users will be sacrificing graphics performance as the integrated GPU of Panther Lake — as efficient as it may be — can't match the raw power of a GeForce RTX 5070 on the outgoing Dell 16 Premium. External GPUs can get around this limitation, but content creators or gamers demanding more graphics performance on-the-go may find better value from the 2025 model.
The slimmer and more focused design of the new XPS 16 can sometimes feel barebones when compared to some competitors. Alternatives like the Samsung Galaxy Book6 Ultra or Asus Zenbook S16 feature more integrated ports or even support for secondary M.2 SSDs to reduce reliance on adapters or docking stations.
Pros
Cons
Price and Availability
Dell is now shipping the XPS 16 starting at $1750 for the Core Ultra 5 325 configuration as reviewed up to $2160 for the Core Ultra X7 358H OLED touchscreen configuration.
Table of Contents
- Verdict — XPS Reborn
- Specifications
- Case — So Much Lighter Than Before
- Connectivity
- Input Devices — Say Goodbye To Touch-Sensitive Keys
- Display — One Of The Best FHD+ IPS Panels
- Performance — Betting It All On Panther Lake
- Emissions — Quieter, But Still Quite Warm
- Energy Management — Panther Lake Is King Of Efficiency
- Notebookcheck Rating
- Potential Competitors in Comparison
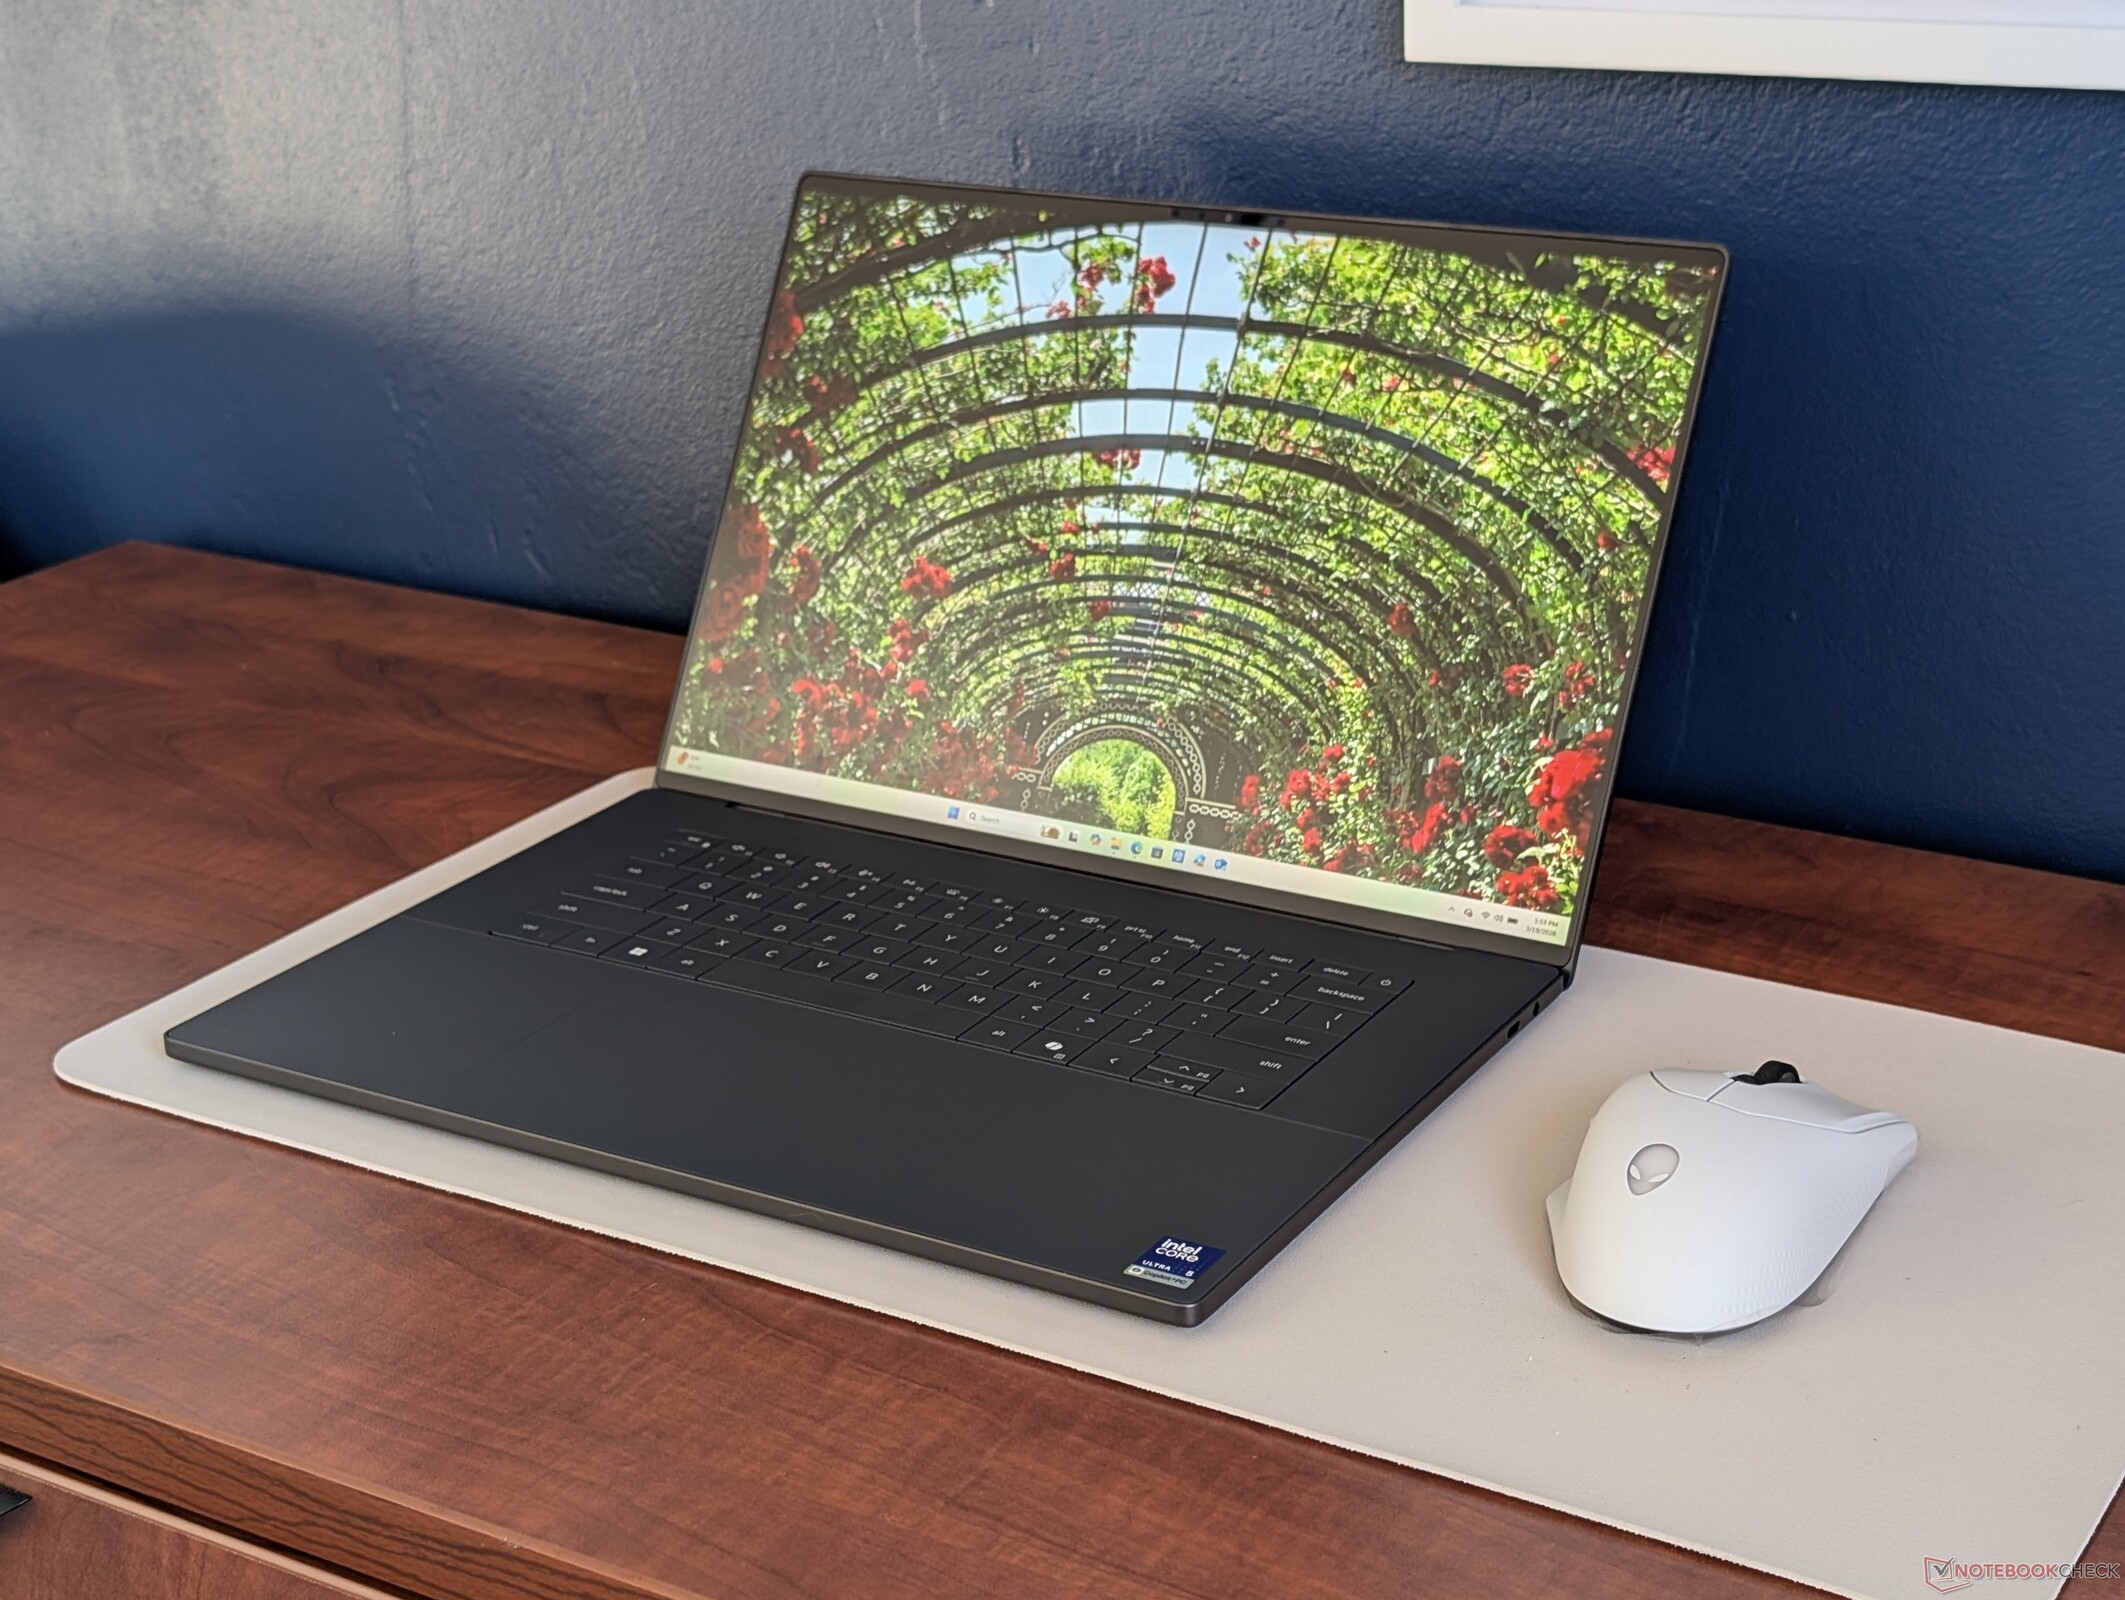
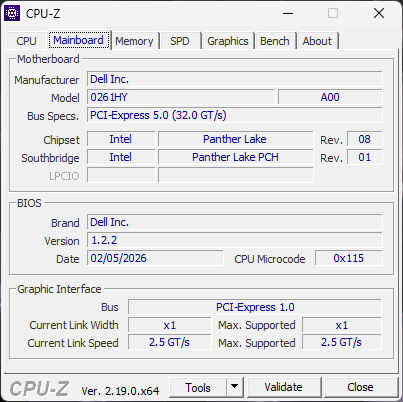
Unveiled at CES 2026 alongside the new XPS 14, the 2026 XPS 16 is a revival for the series after having skipped the "XPS" branding last year in favor of the "Dell 16 Premium" name. The new model carries not only the latest Intel Panther Lake processor options, but also an updated chassis design for a revamped user experience when compared to previous years.
Our test unit is the base configuration with the Core Ultra 5 325 CPU and FHD+ 120 Hz IPS display for approximately $1700. Higher-end configurations include the Core Ultra 7 355, Core Ultra X7 358H, and OLED 120 Hz touchscreen for almost $2200. All options at the time of publishing ship with only integrated graphics.
Alternatives to the Dell XPS 16 include other high-end 16-inch multimedia machines like the Samsung Galaxy Book6 Ultra, Asus Zenbook S16, or Lenovo Yoga Pro 9 16.
More Dell reviews:
Specifications
Case — So Much Lighter Than Before
The redesigned chassis bears little resemblance to the outgoing Dell 16 Premium or 2024 XPS 16. It nevertheless consists of the same materials as the 2026 XPS 14 and so our impressions on the XPS 14 translate to the new XPS 16. Rigidity feels just as good as before but with boxier edges and corners that more closely mimic the visual style of the MacBook Pro 16.
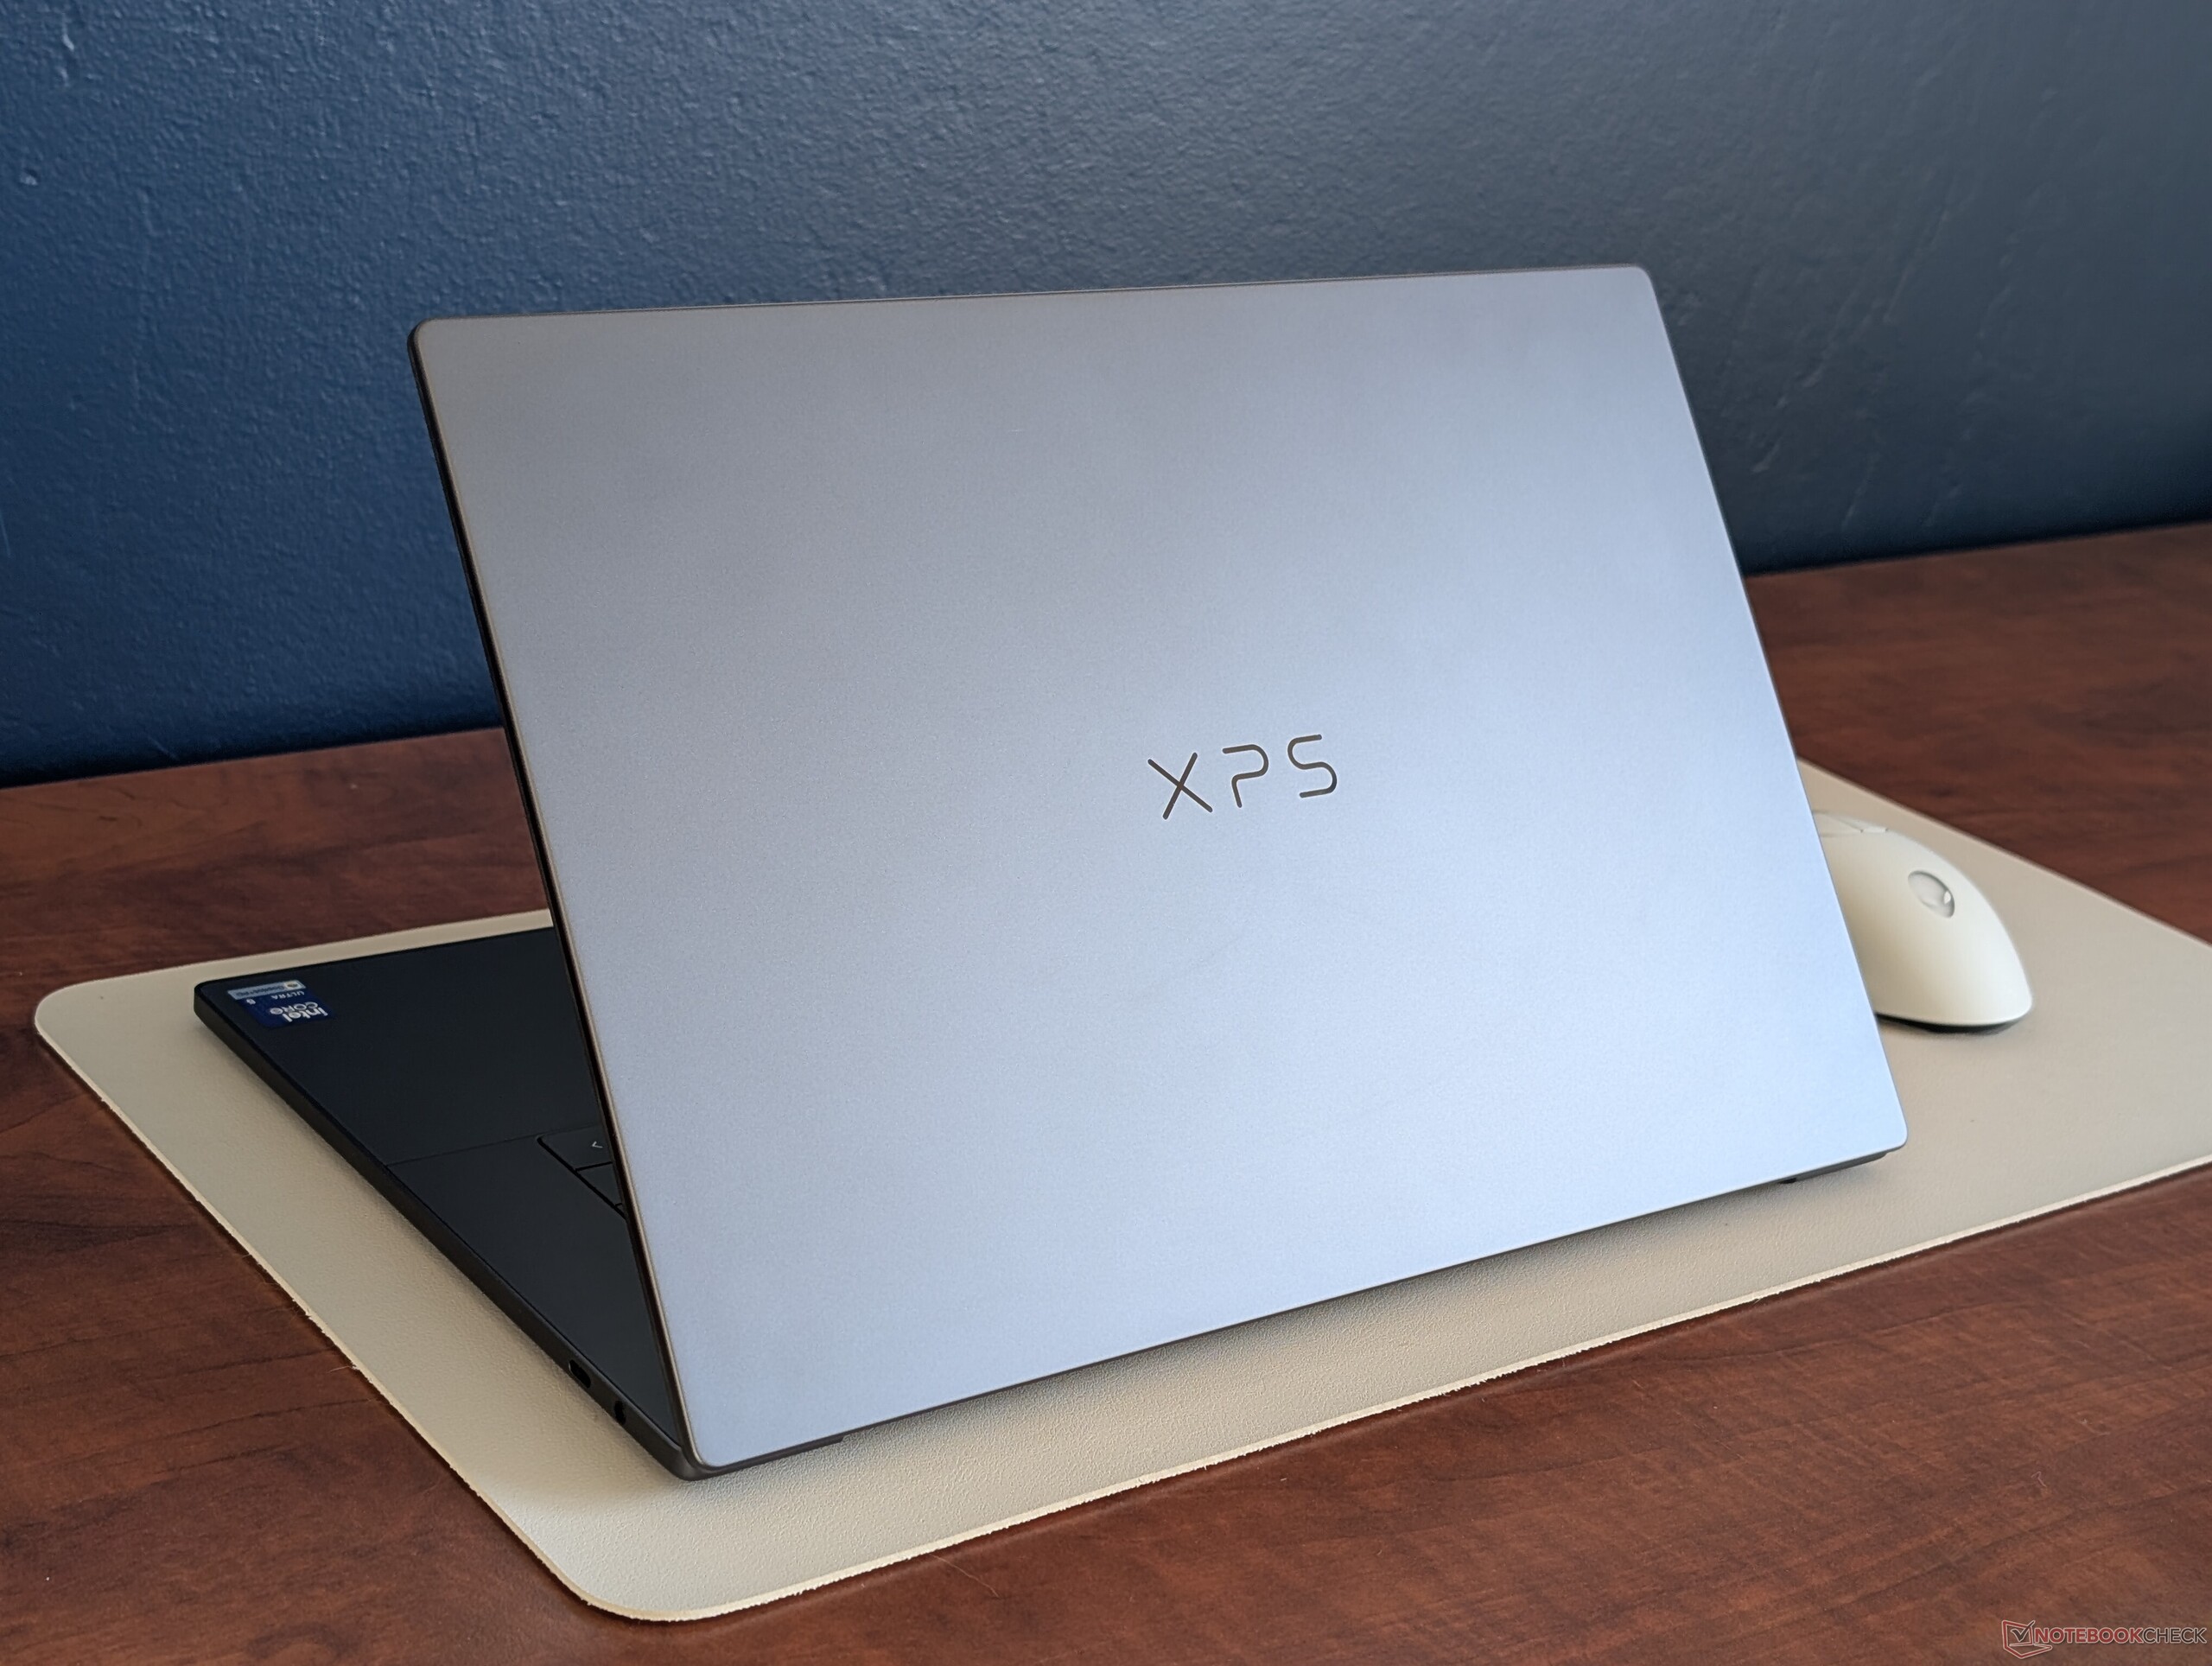
The size and weight differences between the new XPS 16 and older XPS 16 (or Dell 16 Premium) are significant. The updated model is noticeably smaller in length, width, and height while being much lighter by about 600 grams. These changes were made possible largely by dropping discrete graphics options and vapor chamber cooling when transitioning to the new XPS 16 design. Screen size has also been slightly reduced from 16.3-inch to 16.0-inch.


Connectivity
All three USB-C ports now support Thunderbolt 4 whereas this was no true on last year's model. Unfortunately, Dell has dropped the MicroSD card slot to the chagrin of DSLR owners.
Competing models like the Asus Zenbook S16 or Lenovo Yoga Pro 9 16IAH10 tend to have more integrated ports and options than the Dell.


Communication

Webcam
The camera has been upgraded from 2 MP on the Dell 16 Premium to 8 MP on the new XPS 16. While IR is supported, there is still no physical camera shutter.


Maintenance
Servicing procedures are completely different from last year's XPS 16 design but otherwise nearly identical to the new XPS 14 as detailed here. Instead of removing the bottom panel, users must carefully remove the keyboard deck to access the motherboard and so the process is slightly more involved.
Upgrade options are unfortunately very limited. The model supports just a single M.2 SSD and no other upgradeable components despite the large 16-inch form factor.

Sustainability
Dell claims 75 percent recycled aluminum for the top and bottom covers, 50 percent recycled cobalt for the battery, 90 percent recycled steel for the keycaps, 100 percent recycled copper for the battery PCB, and 10 percent recycled glass for the OLED configuration. The packaging is fully recyclable and plastic-free.
Accessories And Warranty
There are no extras in the box other than the AC adapter and paperwork. The usual one-year limited manufacturer warranty applies if purchased in the US with extension options of up to four years.
Input Devices — Say Goodbye To Touch-Sensitive Keys
Keyboard
Dell has (thankfully) dropped the controversial touch-sensitive keys on last year's model for a more traditional approach. In fact, key size and feedback are identical to the new XPS 14 for the same typing experience between them despite the larger form factor of our XPS 16.
Touchpad
Unlike the keyboard, the clickpad takes advantage of the larger 16-inch form factor as its surface area is slightly larger than the clickpad on the XPS 14 (~15.2 x 9 cm vs. ~15.2 x 7.5 cm). Traction is ultra-smooth, but multi-touch or drag-and-drop actions are still difficult due to the shallow and weak feedback. The "invisible" clickpad arguably still favors form over function.


Display — One Of The Best FHD+ IPS Panels
Two display options are available:
- 1920 x 1200, 100% sRGB, IPS, non-touch, 1 - 120 Hz, matte
- 3200 x 2000, 100% DCI-P3, OLED, touchscreen, 20 - 120 Hz, DisplayHDR 500, glossy
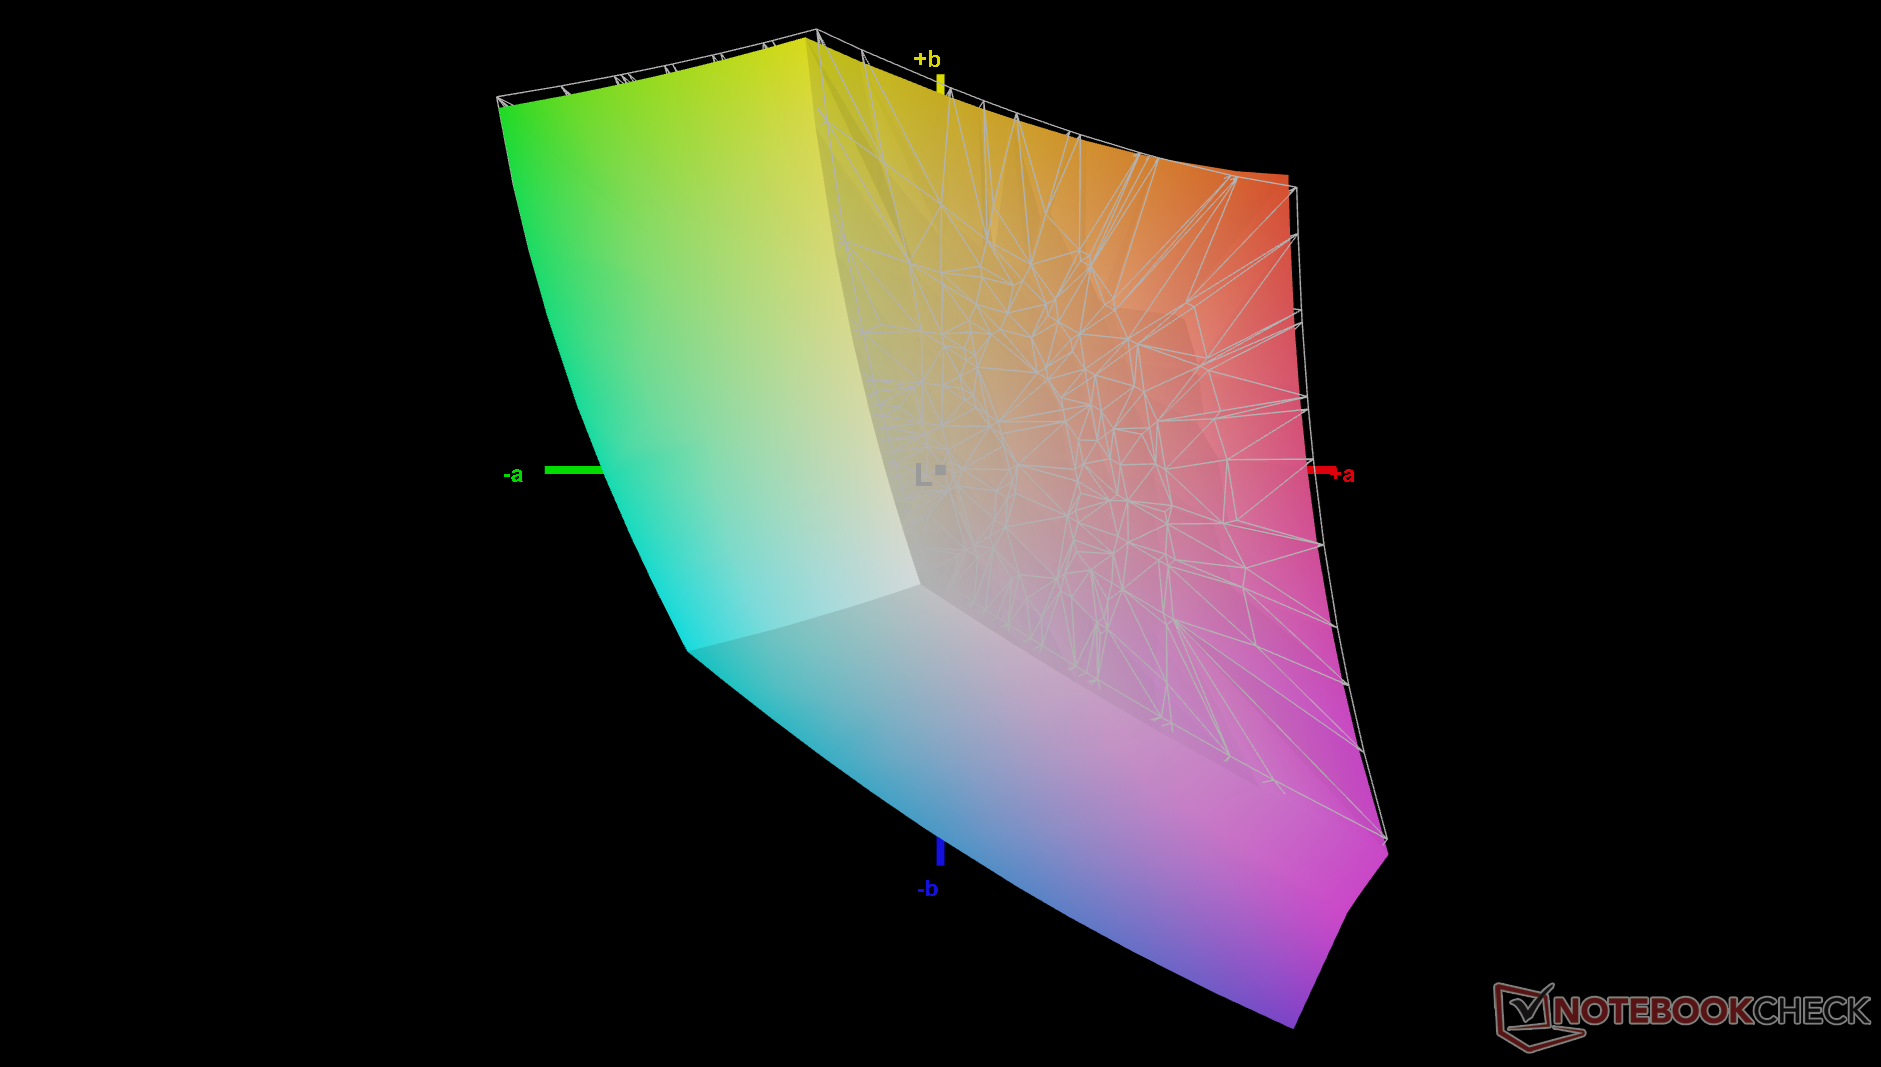
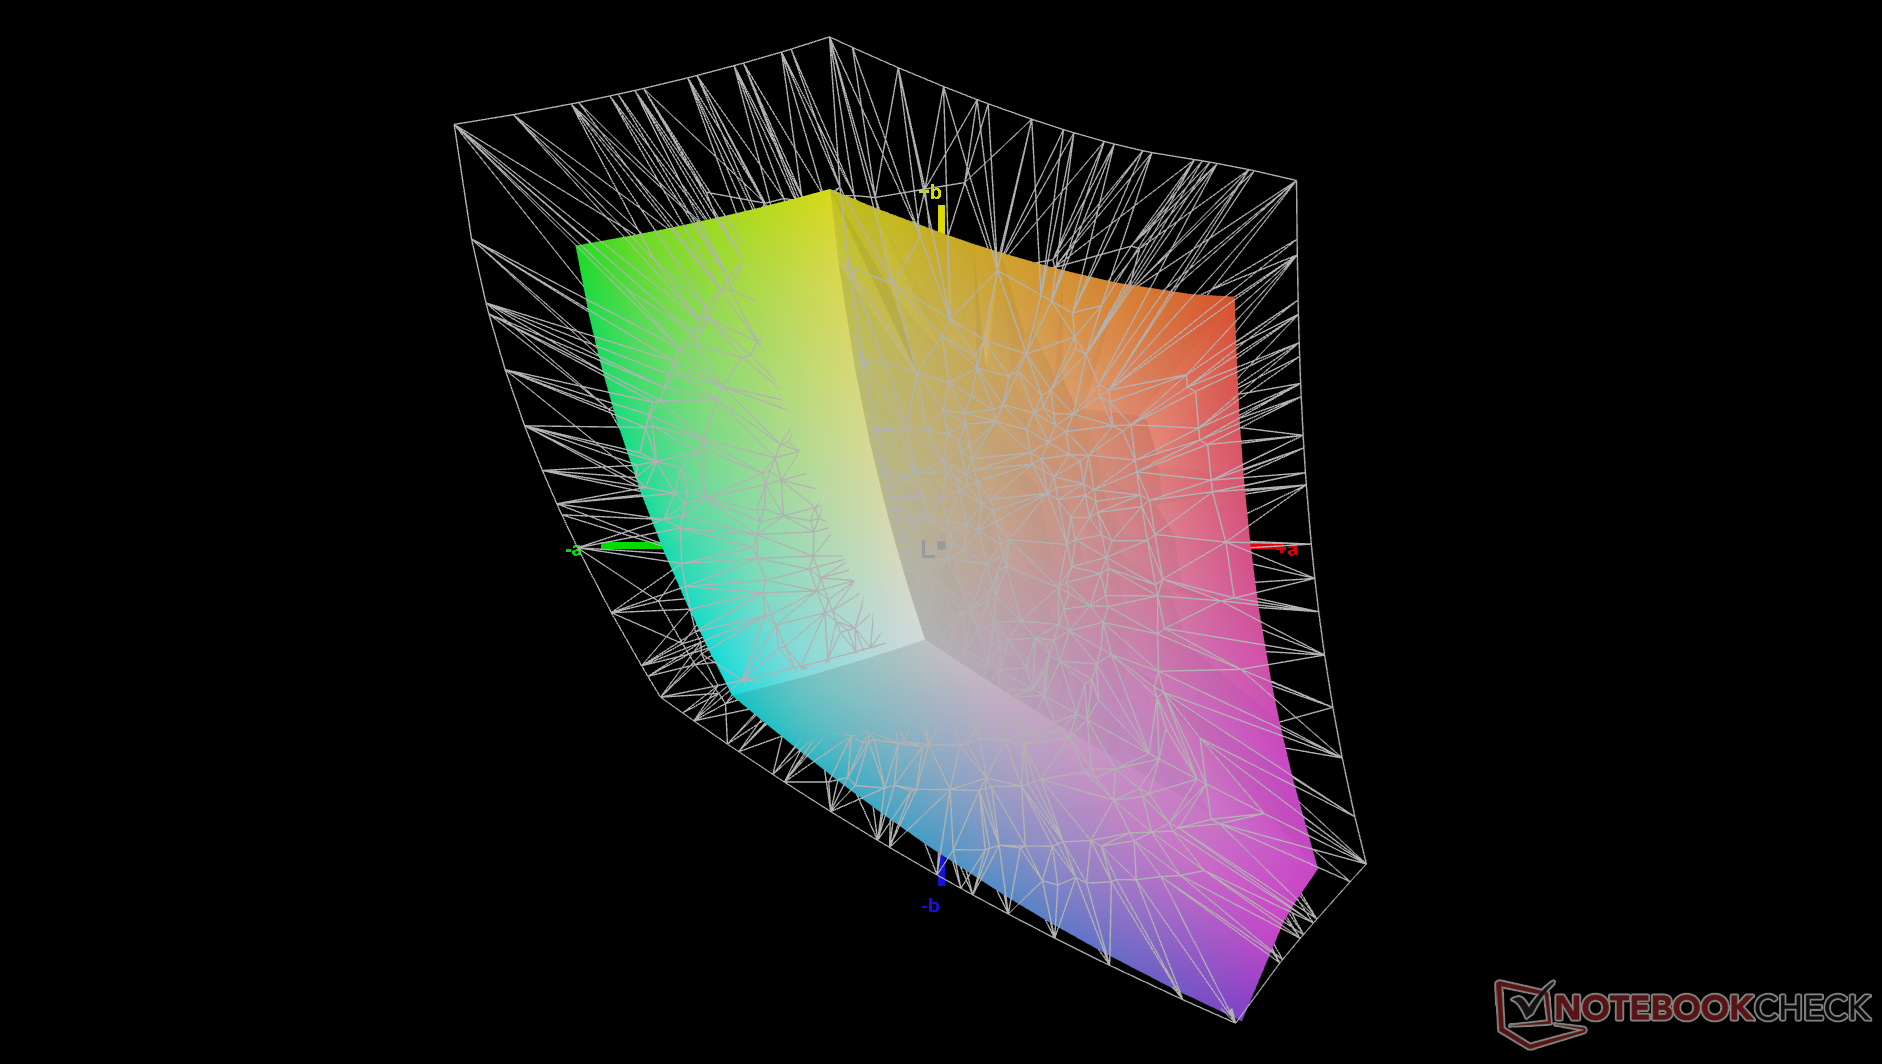
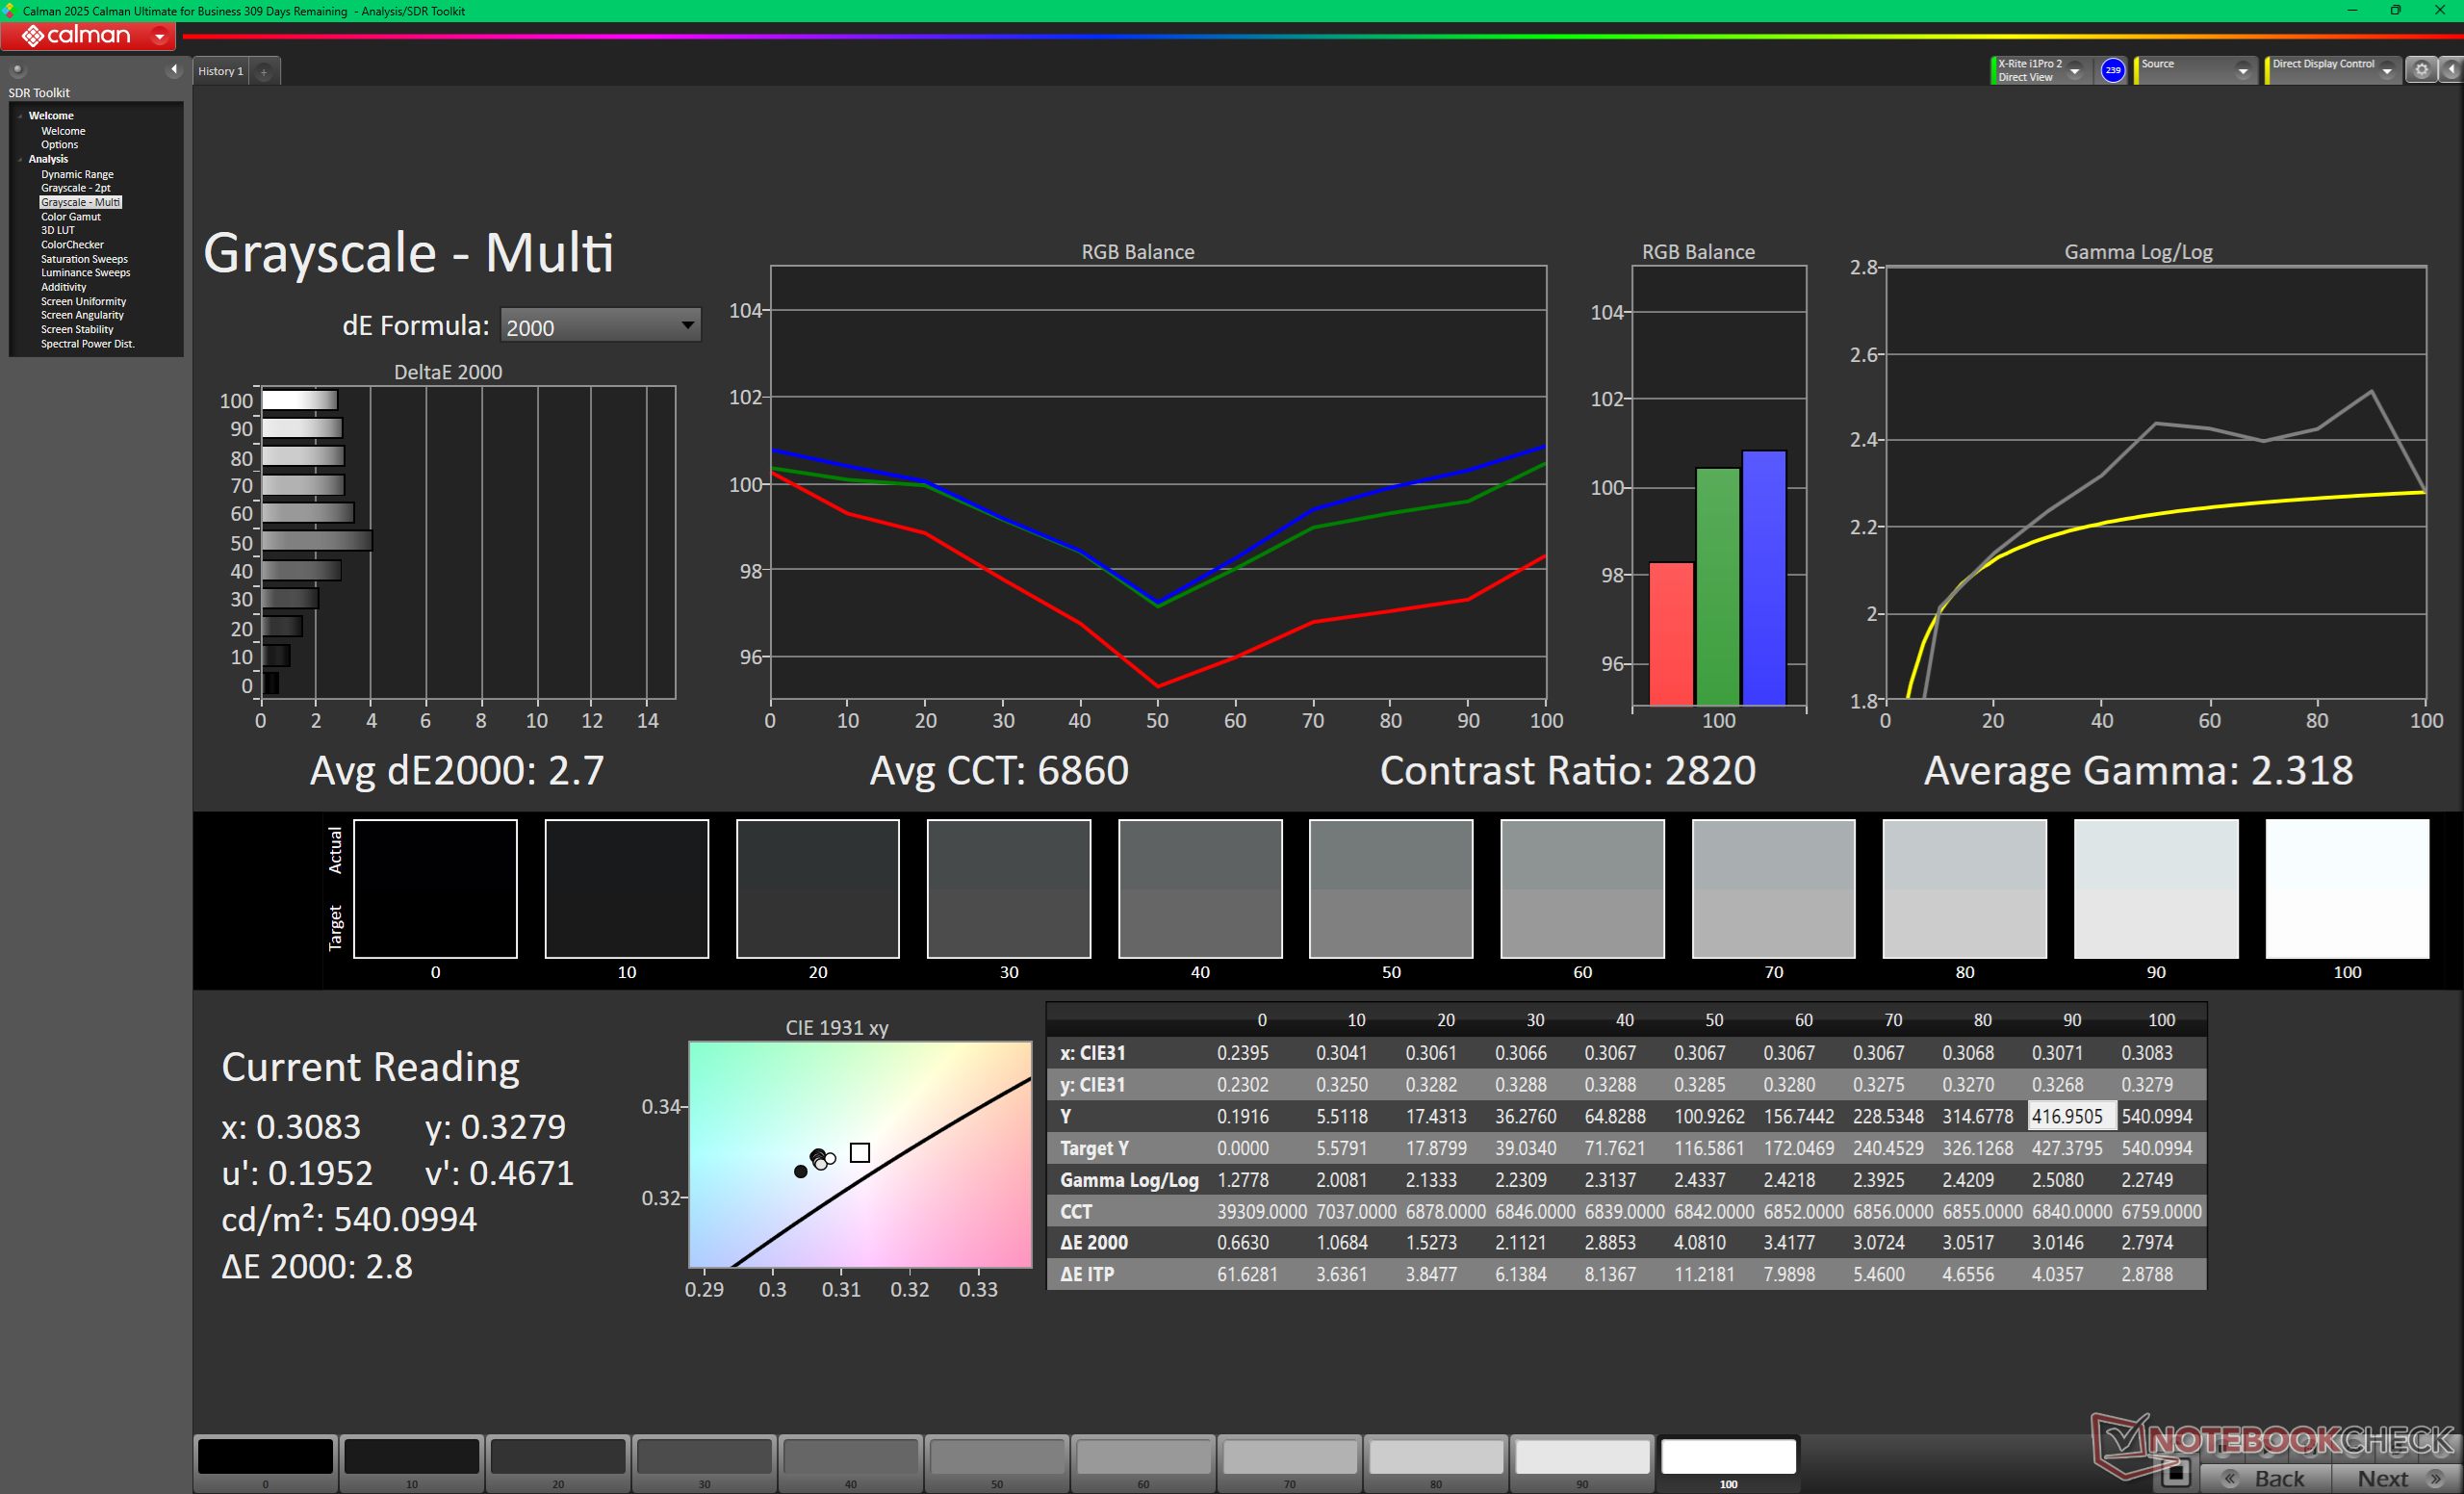
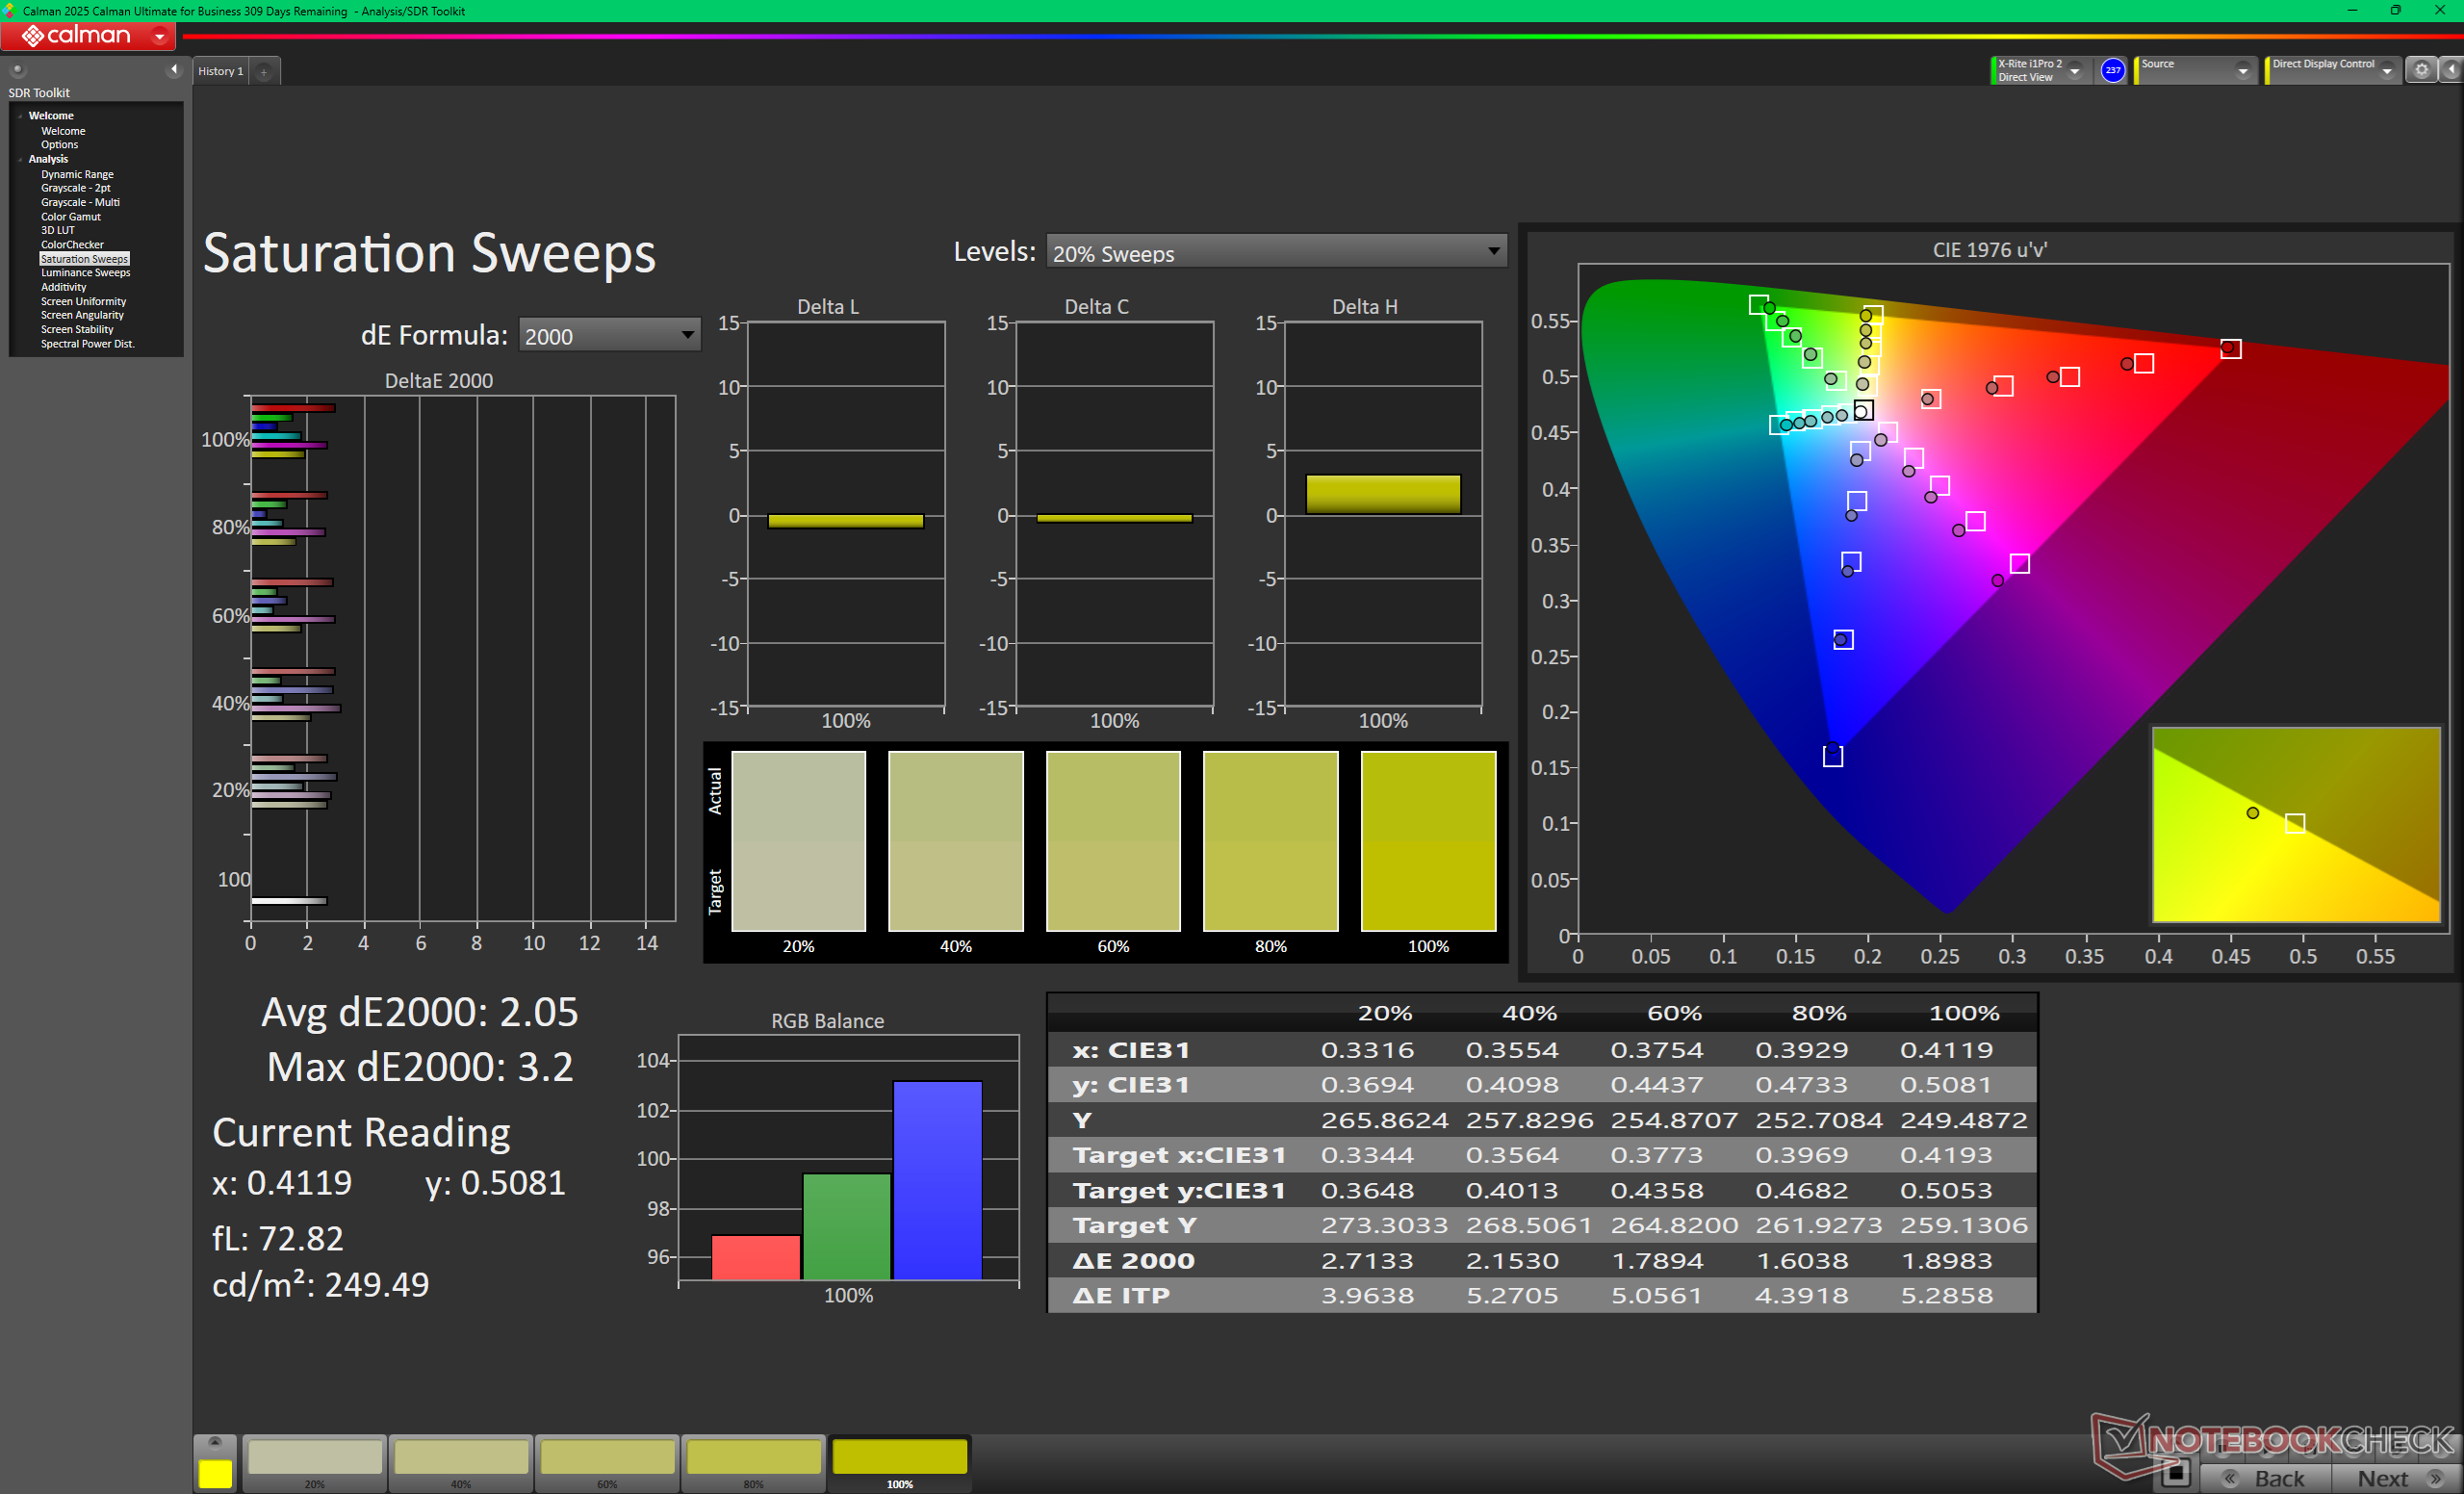
The base display offers a very high contrast ratio of ~2000:1 especially for an IPS panel. Image quality is surprisingly sharp for a matte overlay while the full sRGB colors should satisfy most general users or casual content creators. Deeper P3 colors, HDR support, or touchscreen functionality are available only on the pricier OLED configuration.
Note that VRR is disabled by default. Users can enable VRR via the Windows Advanced Display options. The 1 Hz minimum refresh rate is a unique feature of the base panel not found on most other laptops.


| |||||||||||||||||||||||||
Brightness Distribution: 92 %
Center on Battery: 534.6 cd/m²
Contrast: 2056:1 (Black: 0.26 cd/m²)
ΔE ColorChecker Calman: 2.53 | ∀{0.5-29.43 Ø4.73}
calibrated: 1.26
ΔE Greyscale Calman: 2.7 | ∀{0.09-98 Ø4.97}
67.7% AdobeRGB 1998 (Argyll 3D)
97.4% sRGB (Argyll 3D)
66.2% Display P3 (Argyll 3D)
Gamma: 2.32
CCT: 6860 K
| Dell XPS 16 Core Ultra 5 325 LG Philips 160WUX, IPS, 1920x1200, 16", 120 Hz | Dell XPS 16 9640 SDC4196, OLED, 3840x2400, 16.3", 90 Hz | Lenovo Yoga Pro 9 16IAH10 RTX 5050 ATNA60HR04-0, OLED, 2880x1800, 16", 120 Hz | Samsung Galaxy Book6 Ultra ATNA60HR05-0, OLED, 2880x1800, 16", 120 Hz | Asus ZenBook S16 UM5606GA ATNA60HR07-0, OLED, 2880x1800, 16", 120 Hz | MSI Prestige 16 AI Evo B2HMG B160QAN03_R, IPS, 2560x1600, 16", 60 Hz | |
|---|---|---|---|---|---|---|
| Display | 27% | 25% | 31% | 24% | ||
| Display P3 Coverage (%) | 66.2 | 98.3 48% | 97 47% | 99.8 51% | 96.4 46% | |
| sRGB Coverage (%) | 97.4 | 100 3% | 99.9 3% | 100 3% | 99.7 2% | |
| AdobeRGB 1998 Coverage (%) | 67.7 | 87.8 30% | 85.3 26% | 94 39% | 84.3 25% | |
| Response Times | 98% | 99% | 98% | -12% | ||
| Response Time Grey 50% / Grey 80% * (ms) | 39.3 ? | 0.82 ? 98% | 0.5 ? 99% | 1.27 ? 97% | 51.5 ? -31% | |
| Response Time Black / White * (ms) | 26 ? | 0.85 ? 97% | 0.4 ? 98% | 0.43 ? 98% | 24.3 ? 7% | |
| PWM Frequency (Hz) | 360 ? | 1200 | 240 ? | 960 ? | ||
| PWM Amplitude * (%) | 37 | 100 | 56 | |||
| Screen | 8% | -15% | 26% | 18% | -55% | |
| Brightness middle (cd/m²) | 534.6 | 366 -32% | 471.7 -12% | 499 -7% | 465 -13% | 471 -12% |
| Brightness (cd/m²) | 515 | 367 -29% | 474 -8% | 505 -2% | 466 -10% | 455 -12% |
| Brightness Distribution (%) | 92 | 96 4% | 98 7% | 97 5% | 99 8% | 92 0% |
| Black Level * (cd/m²) | 0.26 | 0.2 23% | ||||
| Contrast (:1) | 2056 | 2355 15% | ||||
| Colorchecker dE 2000 * | 2.53 | 1.3 49% | 3.53 -40% | 0.9 64% | 1 60% | 5.8 -129% |
| Colorchecker dE 2000 max. * | 4.57 | 3.6 21% | 6.31 -38% | 2.1 54% | 3 34% | 10.8 -136% |
| Colorchecker dE 2000 calibrated * | 1.26 | 1 21% | 1.9 -51% | |||
| Greyscale dE 2000 * | 2.7 | 2.2 19% | 2.6 4% | 1.6 41% | 1.9 30% | 7.8 -189% |
| Gamma | 2.32 95% | 2.14 103% | 2.24 98% | 2.22 99% | 2.19 100% | 2.07 106% |
| CCT | 6860 95% | 6680 97% | 6292 103% | 6445 101% | 6458 101% | 7262 90% |
| Total Average (Program / Settings) | 44% /
27% | -15% /
-15% | 50% /
39% | 49% /
36% | -14% /
-32% |
* ... smaller is better
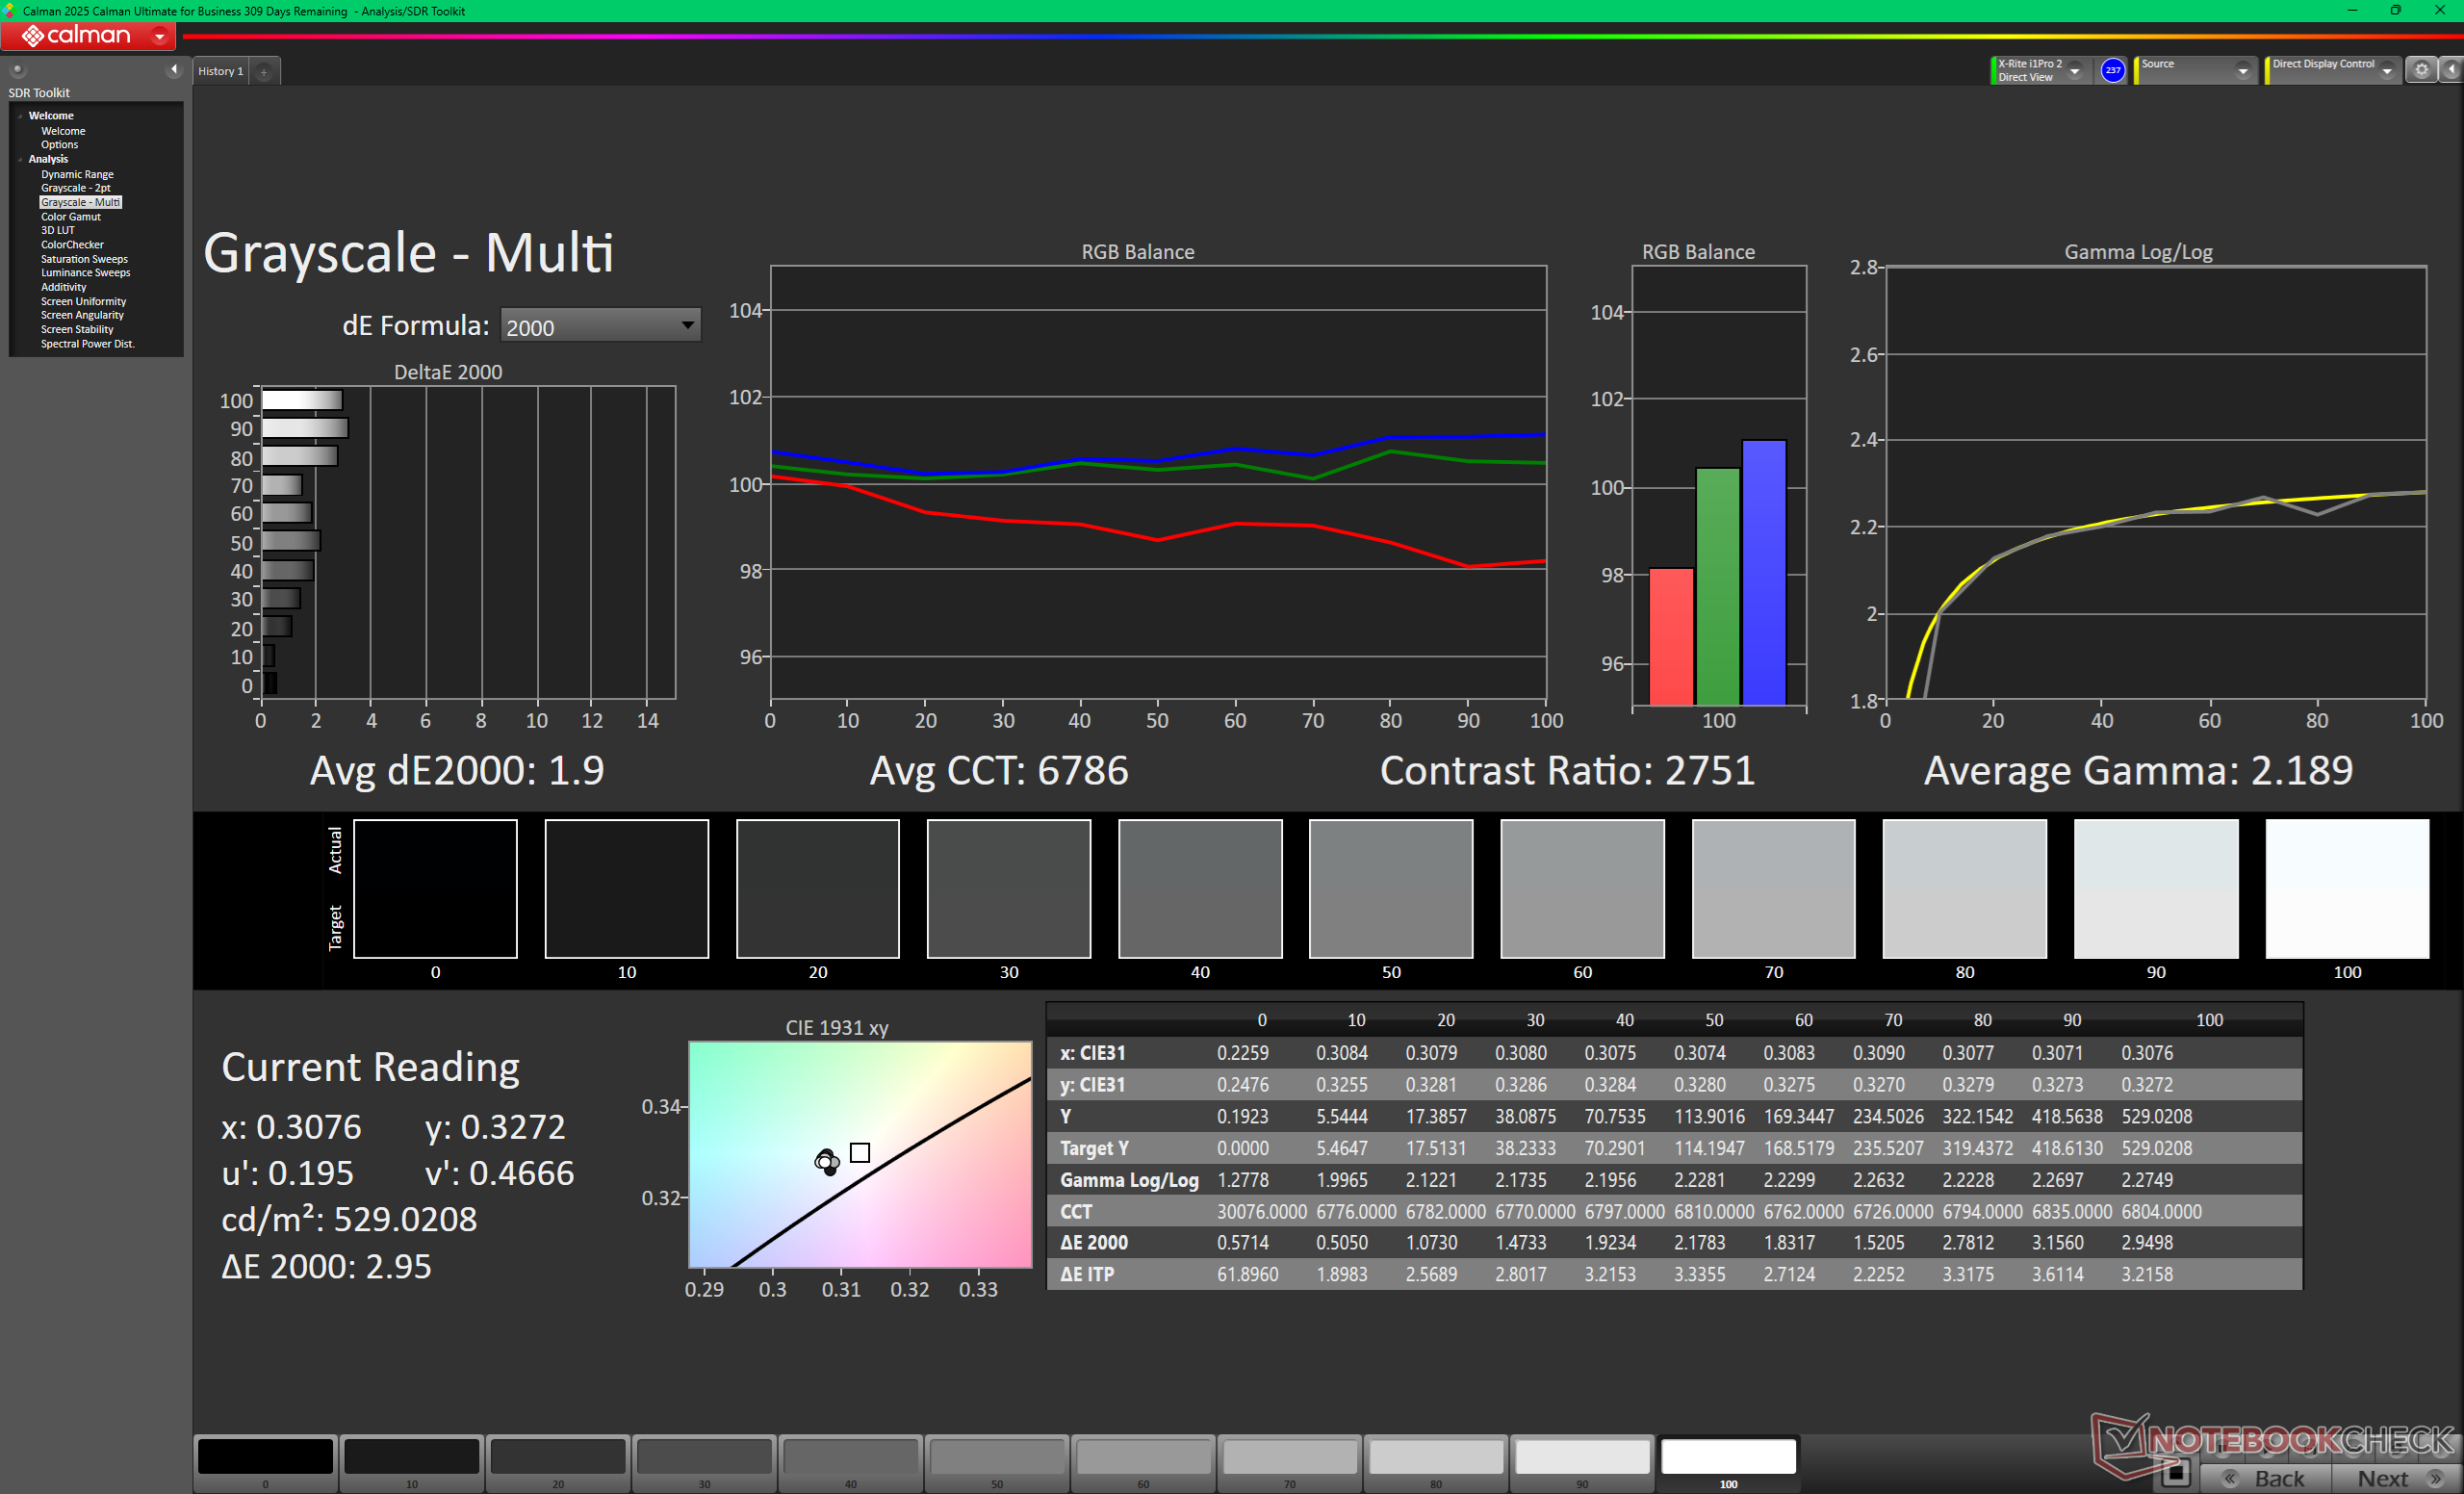
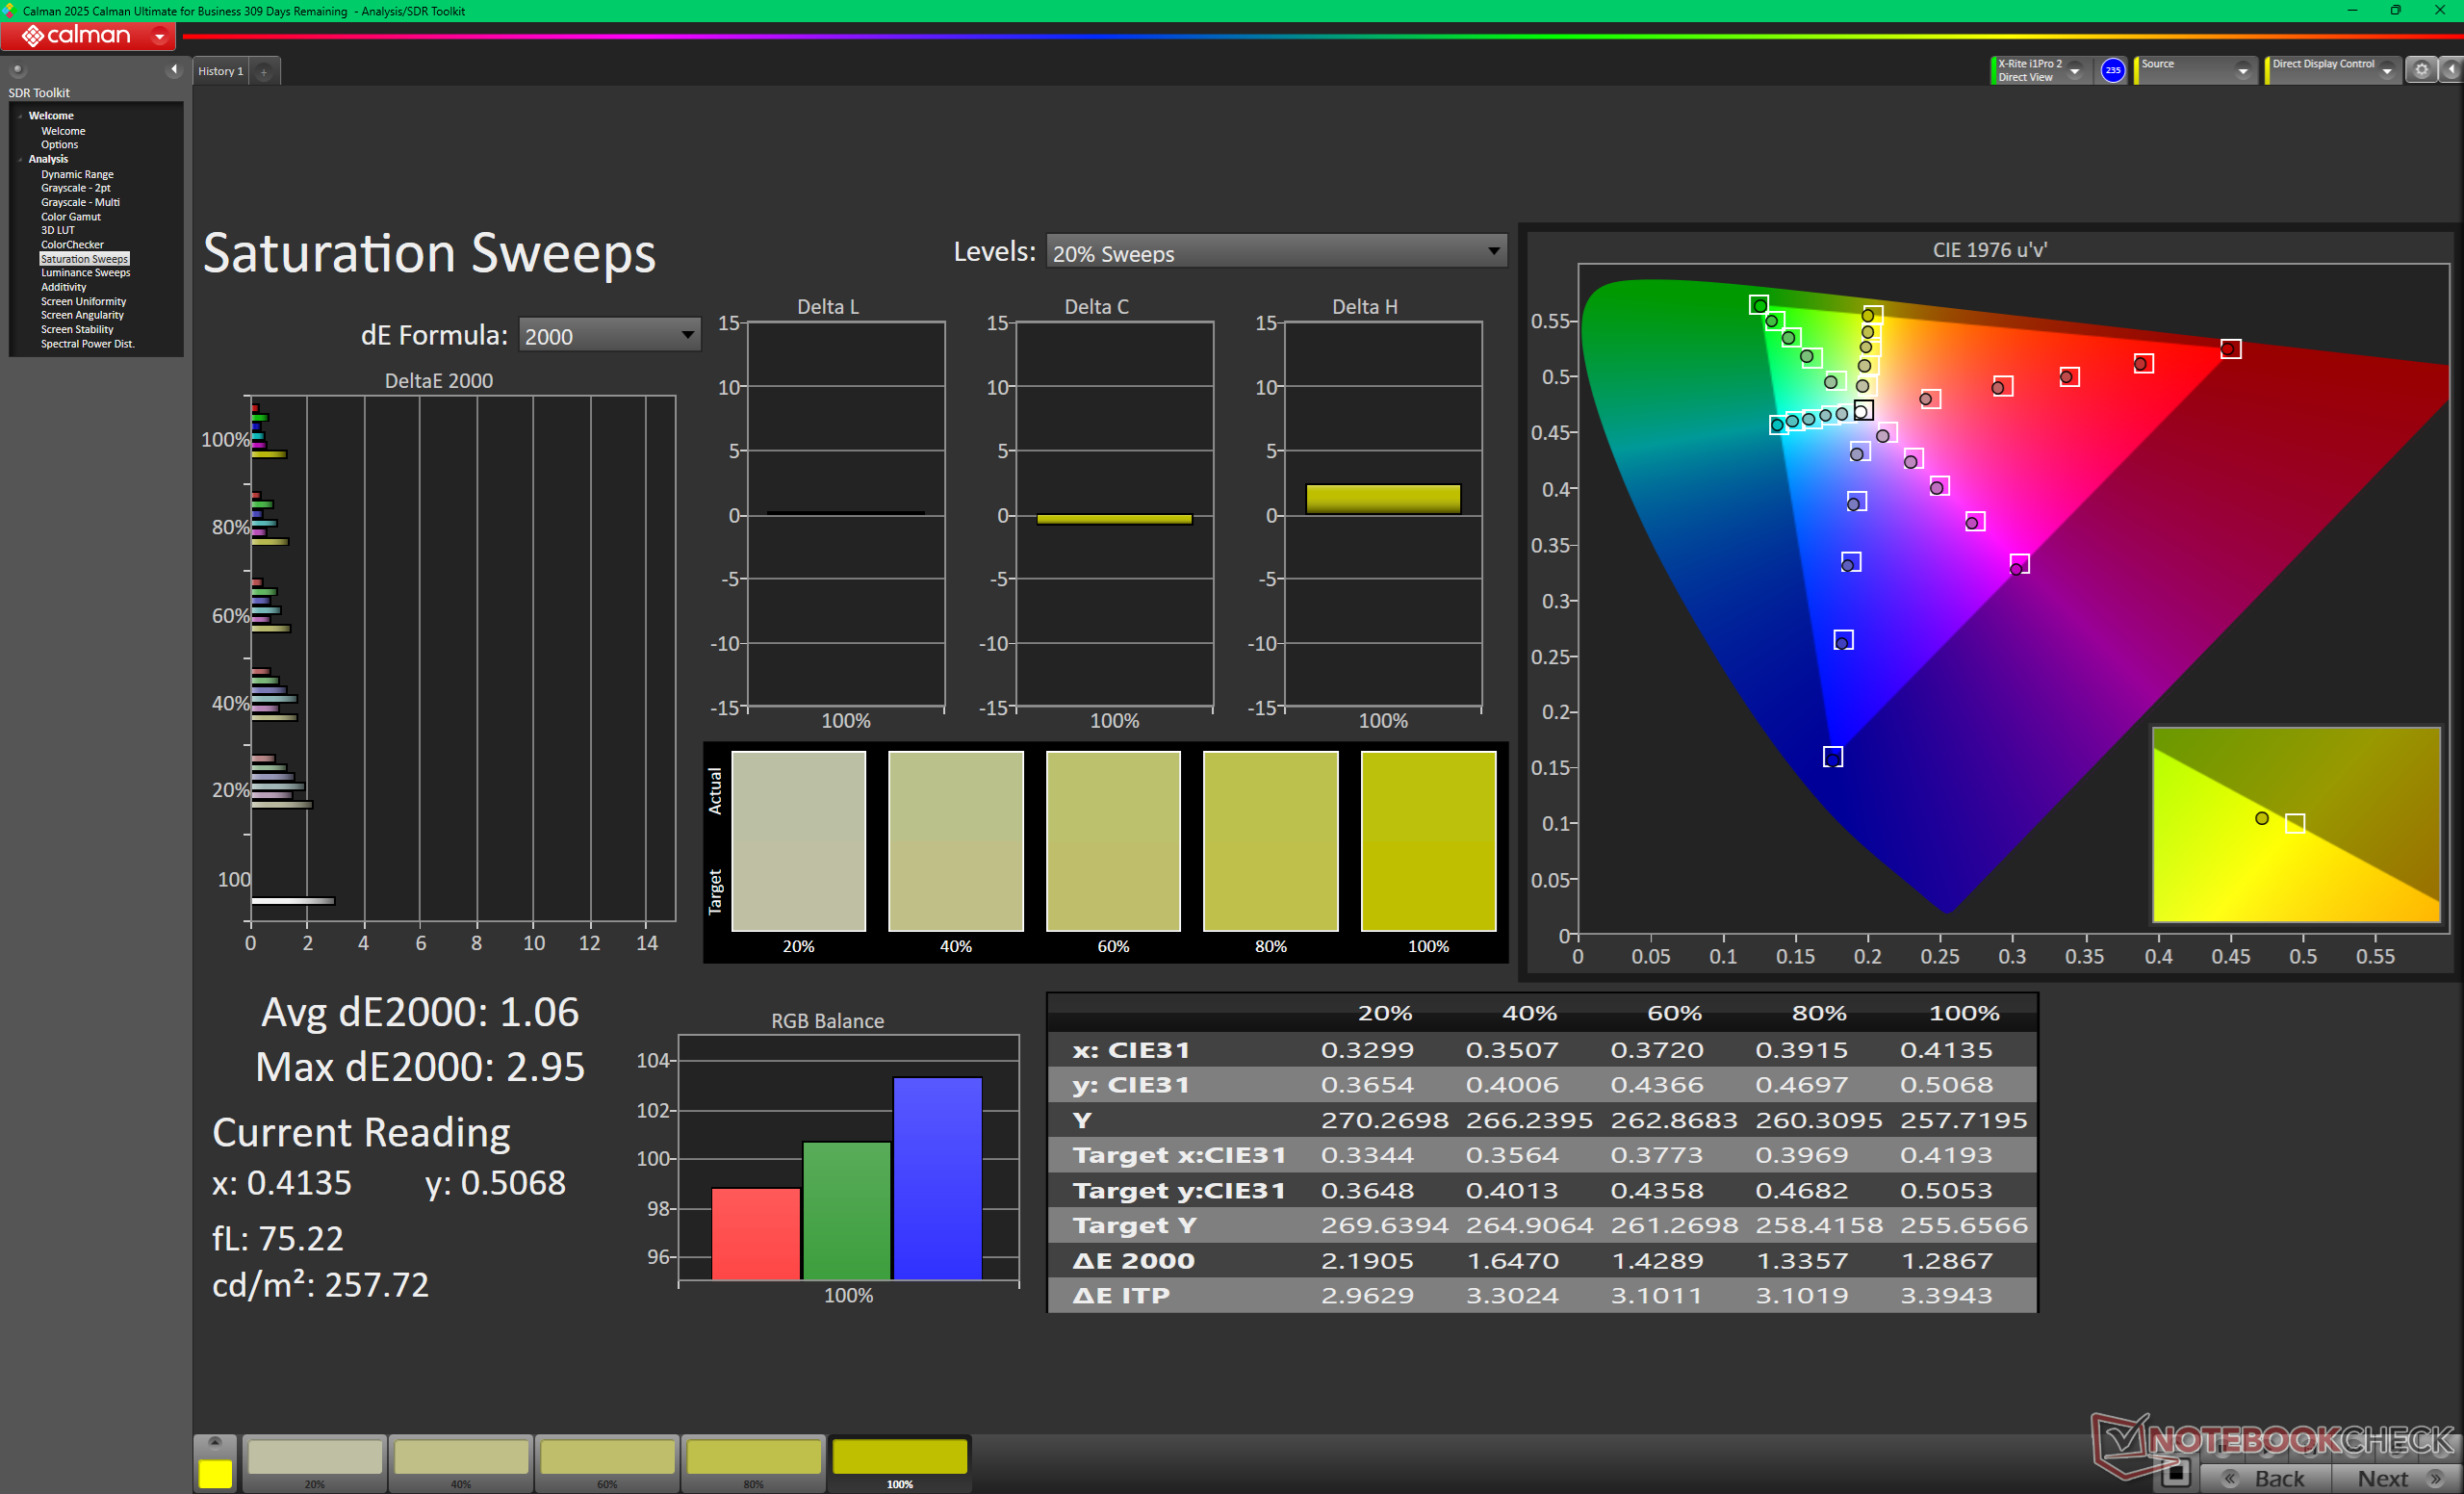
The display comes decently calibrated out of the box with some room for improvement. Calibrating with our own X-Rite colorimeter, for example, would improve the already low average grayscale and color deltaE values from 2.7 and 2.53 to just 1.9 and 1.26, respectively. Our calibrated ICM profile above is available to download above for free.


Display Response Times
| ↔ Response Time Black to White | ||
|---|---|---|
| 26 ms ... rise ↗ and fall ↘ combined | ↗ 11.7 ms rise | 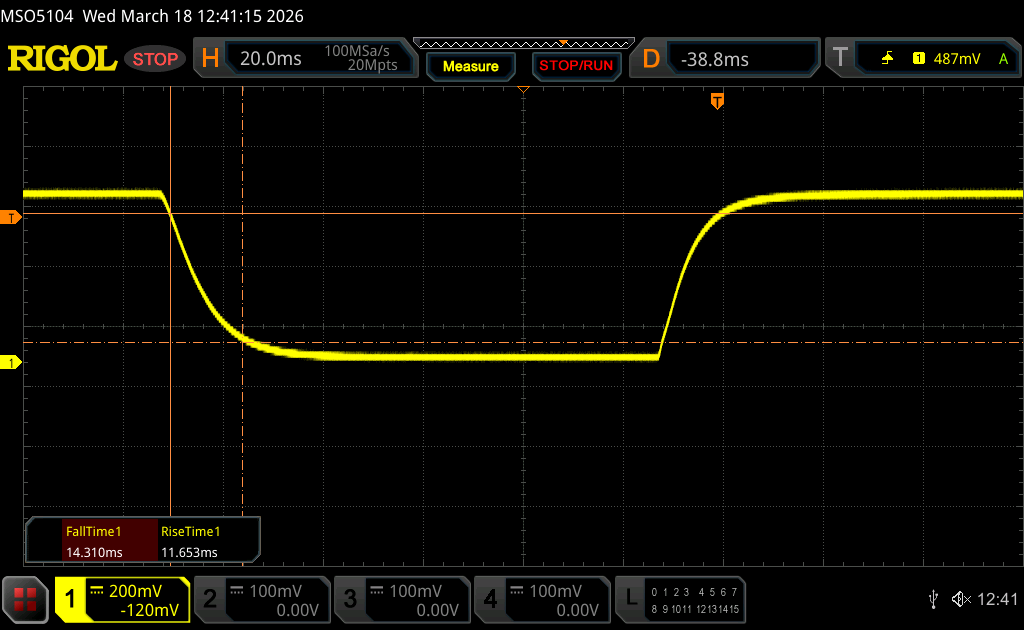 |
| ↘ 14.3 ms fall | ||
| The screen shows relatively slow response rates in our tests and may be too slow for gamers. In comparison, all tested devices range from 0.1 (minimum) to 240 (maximum) ms. » 62 % of all devices are better. This means that the measured response time is worse than the average of all tested devices (19.9 ms). | ||
| ↔ Response Time 50% Grey to 80% Grey | ||
| 39.3 ms ... rise ↗ and fall ↘ combined | ↗ 18.1 ms rise | 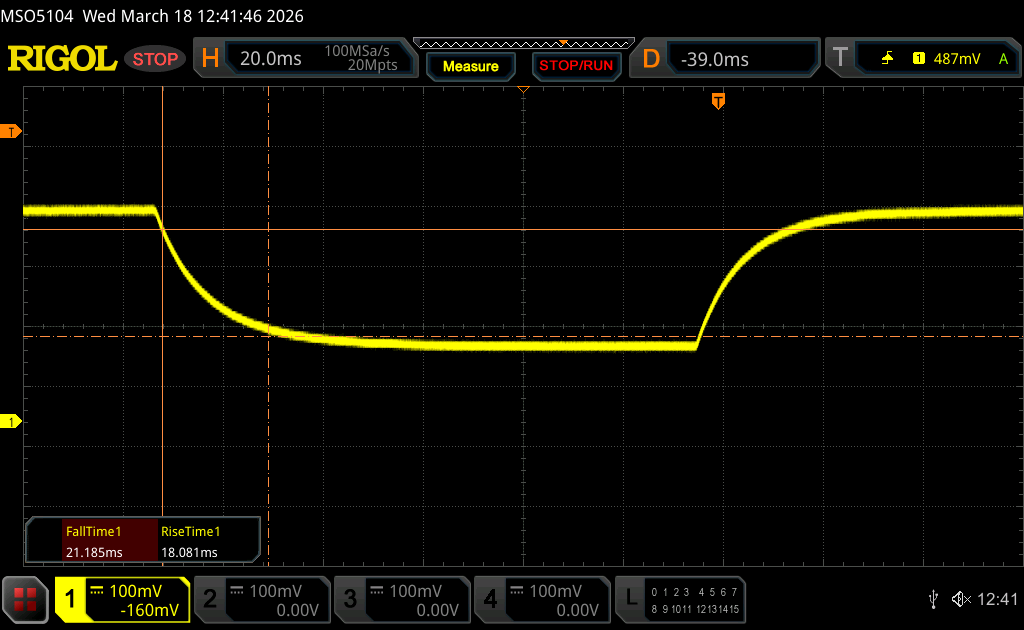 |
| ↘ 21.2 ms fall | ||
| The screen shows slow response rates in our tests and will be unsatisfactory for gamers. In comparison, all tested devices range from 0.165 (minimum) to 636 (maximum) ms. » 60 % of all devices are better. This means that the measured response time is worse than the average of all tested devices (31.1 ms). | ||
Screen Flickering / PWM (Pulse-Width Modulation)
| Screen flickering / PWM not detected | 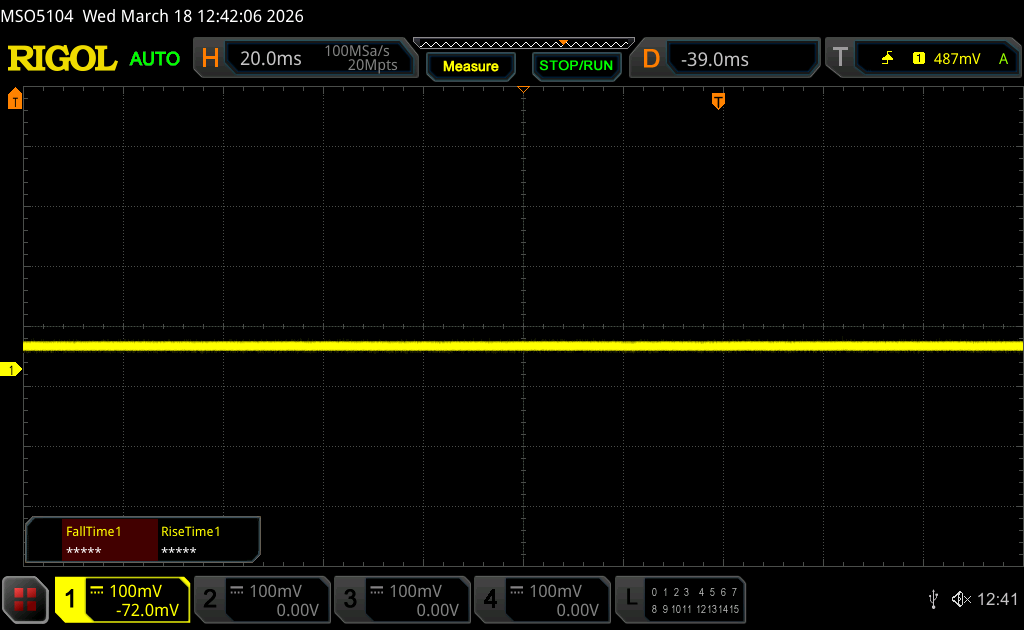 | ||
In comparison: 52 % of all tested devices do not use PWM to dim the display. If PWM was detected, an average of 7798 (minimum: 5 - maximum: 343500) Hz was measured. | |||
Outdoor visibility is decent when under shade due to the relatively bright 500-nit backlight and matte overlay. Otherwise, colors become too washed out if under direct sunlight.


Performance — Betting It All On Panther Lake
Testing Conditions
We set Windows and Dell Optimizer to Performance mode prior to running the benchmarks below.
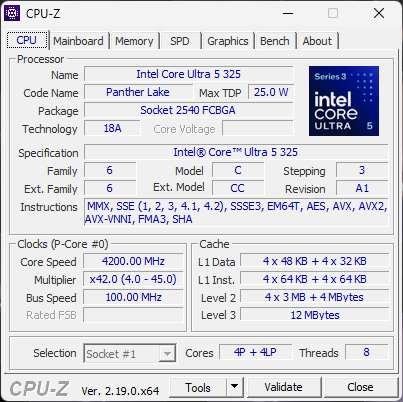
Processor
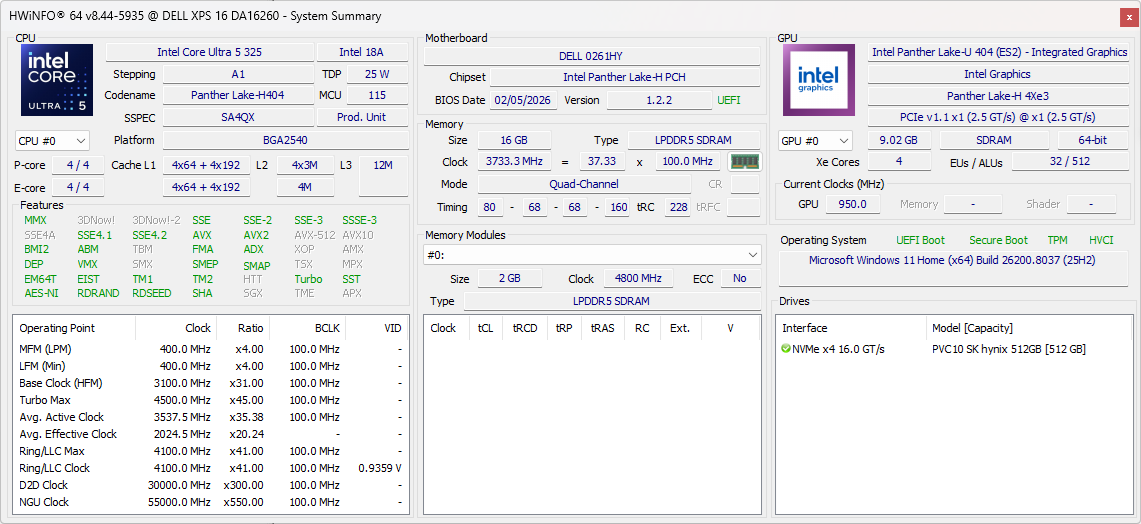
The base Core Ultra 5 325 is somewhat slow for an H-series CPU as it's only 10 percent faster than the ULV Core Ultra 7 258V when it comes to multi-thread performance. In fact, upgrading from the Core Ultra 5 325 to the Core Ultra 7 355 configuration is only expected to improve performance by about 5 percent since they both share identical core counts and cache sizes. Users would have to upgrade to the higher-end Core Ultra X7 358H instead for a much more significant 70 percent increase in raw processor performance.
Cinebench R15 Multi Loop
Cinebench R23: Multi Core | Single Core
Cinebench R20: CPU (Multi Core) | CPU (Single Core)
Cinebench R15: CPU Multi 64Bit | CPU Single 64Bit
Blender: v2.79 BMW27 CPU
7-Zip 18.03: 7z b 4 | 7z b 4 -mmt1
Geekbench 6.7: Multi-Core | Single-Core
Geekbench 5.5: Multi-Core | Single-Core
HWBOT x265 Benchmark v2.2: 4k Preset
LibreOffice : 20 Documents To PDF
R Benchmark 2.5: Overall mean
* ... smaller is better
AIDA64: FP32 Ray-Trace | FPU Julia | CPU SHA3 | CPU Queen | FPU SinJulia | FPU Mandel | CPU AES | CPU ZLib | FP64 Ray-Trace | CPU PhotoWorxx | CPU CheckMate
| Performance rating | |
| Asus ZenBook S16 UM5606GA -1! | |
| Lenovo Yoga Pro 9 16IAH10 RTX 5050 -1! | |
| Samsung Galaxy Book6 Ultra -1! | |
| Dell XPS 16 9640 -1! | |
| MSI Prestige 16 AI Evo B2HMG -1! | |
| Dell XPS 16 Core Ultra 5 325 -1! | |
| Average Intel Core Ultra 5 325 -1! | |
| AIDA64 / FP32 Ray-Trace | |
| Asus ZenBook S16 UM5606GA (v6.92.6600) | |
| Lenovo Yoga Pro 9 16IAH10 RTX 5050 (v6.92.6600) | |
| Samsung Galaxy Book6 Ultra (v8.20.8100) | |
| MSI Prestige 16 AI Evo B2HMG (v6.92.6600) | |
| Dell XPS 16 9640 (v6.92.6600) | |
| Dell XPS 16 Core Ultra 5 325 (v8.20.8100) | |
| Average Intel Core Ultra 5 325 (11016 - 11977, n=2) | |
| AIDA64 / FPU Julia | |
| Lenovo Yoga Pro 9 16IAH10 RTX 5050 (v6.92.6600) | |
| Samsung Galaxy Book6 Ultra (v8.20.8100) | |
| Asus ZenBook S16 UM5606GA (v6.92.6600) | |
| MSI Prestige 16 AI Evo B2HMG (v6.92.6600) | |
| Dell XPS 16 9640 (v6.92.6600) | |
| Dell XPS 16 Core Ultra 5 325 (v8.20.8100) | |
| Average Intel Core Ultra 5 325 (57164 - 62102, n=2) | |
| AIDA64 / CPU SHA3 | |
| Samsung Galaxy Book6 Ultra (v8.20.8100) | |
| Lenovo Yoga Pro 9 16IAH10 RTX 5050 (v6.92.6600) | |
| Asus ZenBook S16 UM5606GA (v6.92.6600) | |
| MSI Prestige 16 AI Evo B2HMG (v6.92.6600) | |
| Dell XPS 16 9640 (v6.92.6600) | |
| Dell XPS 16 Core Ultra 5 325 (v8.20.8100) | |
| Average Intel Core Ultra 5 325 (2508 - 2718, n=2) | |
| AIDA64 / CPU Queen | |
| Asus ZenBook S16 UM5606GA (v6.92.6600) | |
| Dell XPS 16 9640 (v6.92.6600) | |
| MSI Prestige 16 AI Evo B2HMG (v6.92.6600) | |
| Lenovo Yoga Pro 9 16IAH10 RTX 5050 (v6.92.6600) | |
| AIDA64 / FPU SinJulia | |
| Asus ZenBook S16 UM5606GA (v6.92.6600) | |
| Dell XPS 16 9640 (v6.92.6600) | |
| Lenovo Yoga Pro 9 16IAH10 RTX 5050 (v6.92.6600) | |
| MSI Prestige 16 AI Evo B2HMG (v6.92.6600) | |
| Samsung Galaxy Book6 Ultra (v8.20.8100) | |
| Dell XPS 16 Core Ultra 5 325 (v8.20.8100) | |
| Average Intel Core Ultra 5 325 (4409 - 4414, n=2) | |
| AIDA64 / FPU Mandel | |
| Lenovo Yoga Pro 9 16IAH10 RTX 5050 (v6.92.6600) | |
| Samsung Galaxy Book6 Ultra (v8.20.8100) | |
| Asus ZenBook S16 UM5606GA (v6.92.6600) | |
| MSI Prestige 16 AI Evo B2HMG (v6.92.6600) | |
| Dell XPS 16 9640 (v6.92.6600) | |
| Dell XPS 16 Core Ultra 5 325 (v8.20.8100) | |
| Average Intel Core Ultra 5 325 (30237 - 33224, n=2) | |
| AIDA64 / CPU AES | |
| Asus ZenBook S16 UM5606GA (v6.92.6600) | |
| Dell XPS 16 9640 (v6.92.6600) | |
| Lenovo Yoga Pro 9 16IAH10 RTX 5050 (v6.92.6600) | |
| MSI Prestige 16 AI Evo B2HMG (v6.92.6600) | |
| Samsung Galaxy Book6 Ultra (v8.20.8100) | |
| Dell XPS 16 Core Ultra 5 325 (v8.20.8100) | |
| Average Intel Core Ultra 5 325 (37348 - 37641, n=2) | |
| AIDA64 / CPU ZLib | |
| Lenovo Yoga Pro 9 16IAH10 RTX 5050 (v6.92.6600) | |
| Dell XPS 16 9640 (v6.92.6600) | |
| Samsung Galaxy Book6 Ultra (v8.20.8100) | |
| Asus ZenBook S16 UM5606GA (v6.92.6600) | |
| MSI Prestige 16 AI Evo B2HMG (v6.92.6600) | |
| Dell XPS 16 Core Ultra 5 325 (v8.20.8100) | |
| Average Intel Core Ultra 5 325 (596 - 627, n=2) | |
| AIDA64 / FP64 Ray-Trace | |
| Asus ZenBook S16 UM5606GA (v6.92.6600) | |
| Lenovo Yoga Pro 9 16IAH10 RTX 5050 (v6.92.6600) | |
| Samsung Galaxy Book6 Ultra (v8.20.8100) | |
| MSI Prestige 16 AI Evo B2HMG (v6.92.6600) | |
| Dell XPS 16 9640 (v6.92.6600) | |
| Dell XPS 16 Core Ultra 5 325 (v8.20.8100) | |
| Average Intel Core Ultra 5 325 (5761 - 6324, n=2) | |
| AIDA64 / CPU PhotoWorxx | |
| Samsung Galaxy Book6 Ultra (v8.20.8100) | |
| Lenovo Yoga Pro 9 16IAH10 RTX 5050 (v6.92.6600) | |
| MSI Prestige 16 AI Evo B2HMG (v6.92.6600) | |
| Dell XPS 16 Core Ultra 5 325 (v8.20.8100) | |
| Average Intel Core Ultra 5 325 (53916 - 58393, n=2) | |
| Asus ZenBook S16 UM5606GA (v6.92.6600) | |
| Dell XPS 16 9640 (v6.92.6600) | |
| AIDA64 / CPU CheckMate | |
| Samsung Galaxy Book6 Ultra (v8.20.8100) | |
| Dell XPS 16 Core Ultra 5 325 (v8.20.8100) | |
| Average Intel Core Ultra 5 325 (2643 - 2730, n=2) | |
System Performance
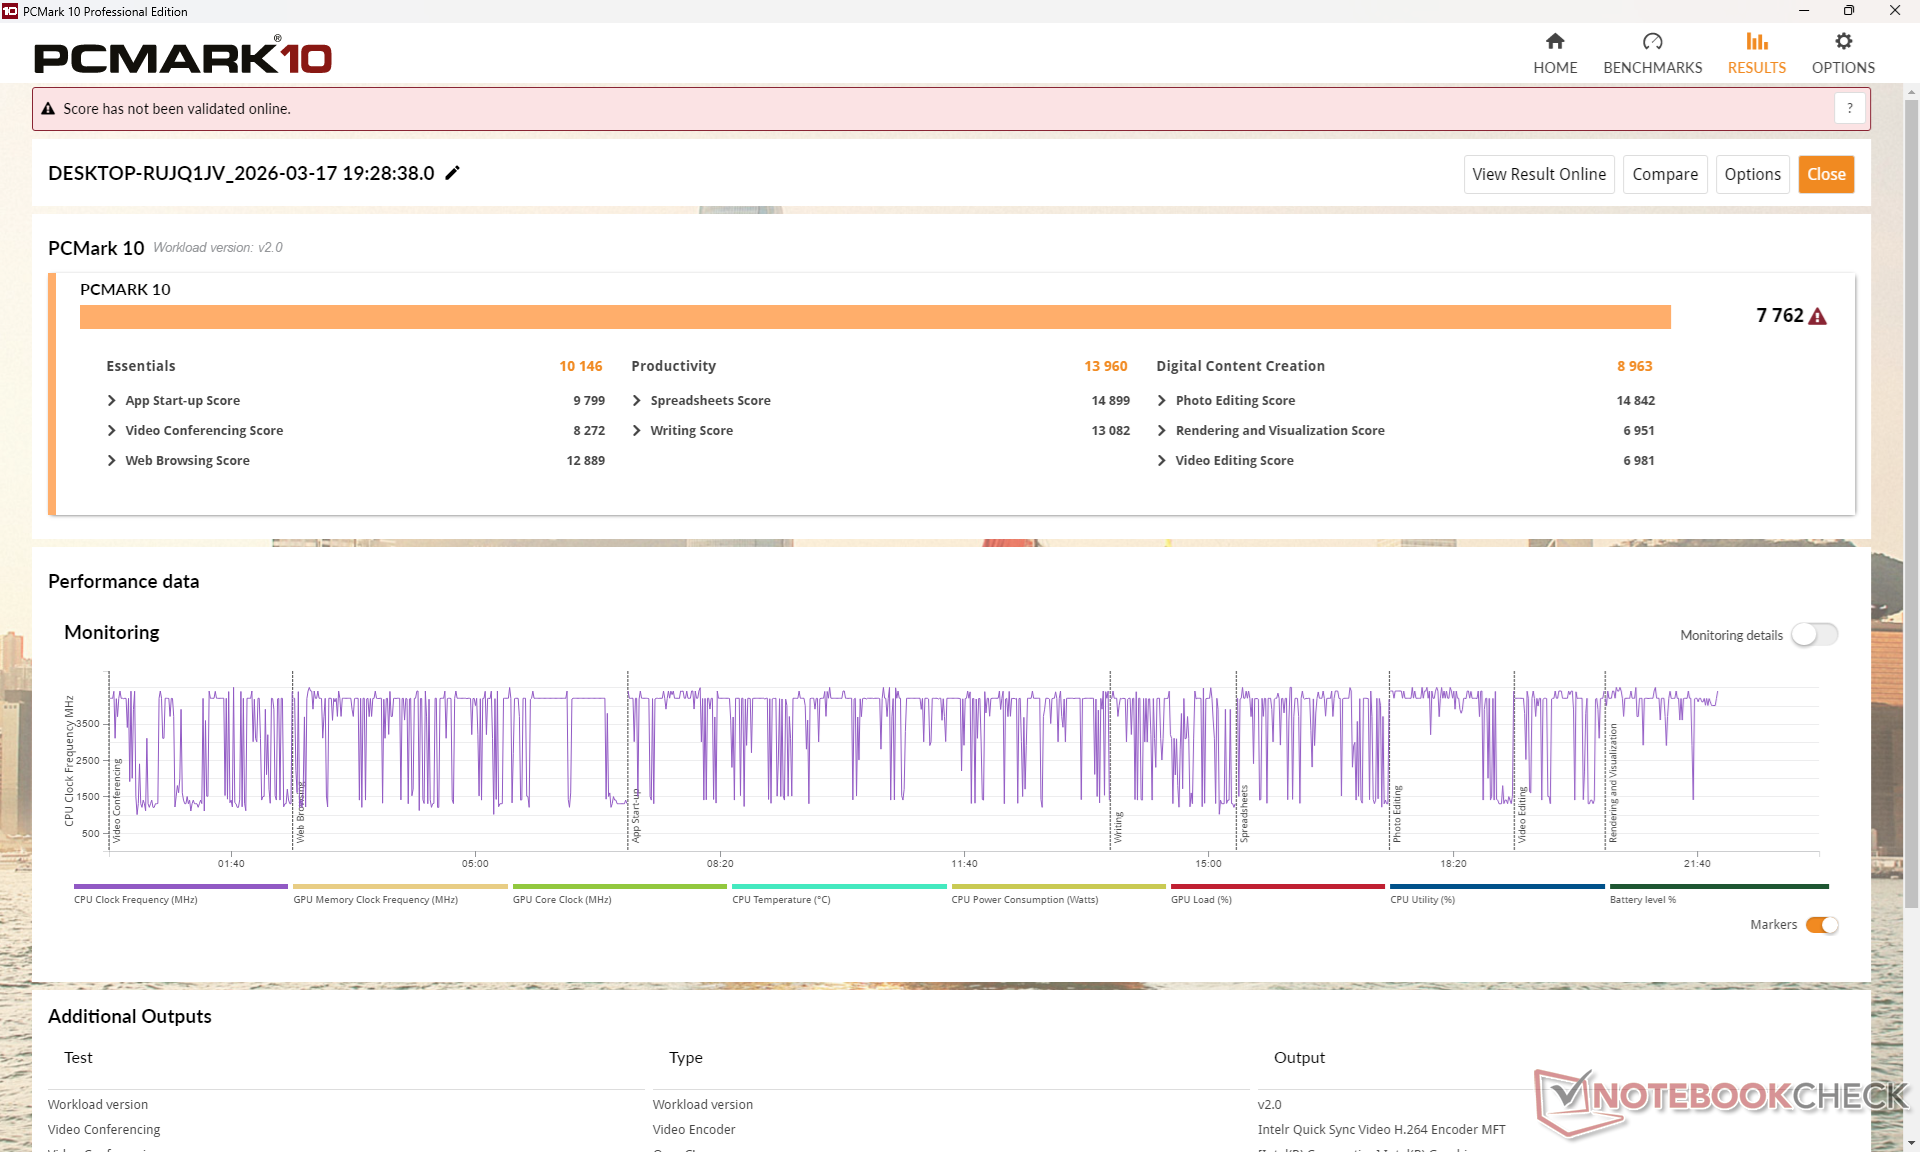
PCMark 10: Score | Essentials | Productivity | Digital Content Creation
CrossMark: Overall | Productivity | Creativity | Responsiveness
WebXPRT 3: Overall
WebXPRT 4: Overall
Mozilla Kraken 1.1: Total
Geekbench AI: Single Precision GPU 1.7 | Half Precision GPU 1.7 | Quantized GPU 1.7
| Performance rating | |
| Lenovo Yoga Pro 9 16IAH10 RTX 5050 | |
| Samsung Galaxy Book6 Ultra | |
| MSI Prestige 16 AI Evo B2HMG -3! | |
| Dell XPS 16 9640 -4! | |
| Asus ZenBook S16 UM5606GA -3! | |
| Average Intel Core Ultra 5 325, Intel Graphics 4 Xe3 Panther Lake iGPU | |
| Dell XPS 16 Core Ultra 5 325 | |
| PCMark 10 / Score | |
| Lenovo Yoga Pro 9 16IAH10 RTX 5050 | |
| Samsung Galaxy Book6 Ultra | |
| Asus ZenBook S16 UM5606GA | |
| MSI Prestige 16 AI Evo B2HMG | |
| Dell XPS 16 Core Ultra 5 325 | |
| Average Intel Core Ultra 5 325, Intel Graphics 4 Xe3 Panther Lake iGPU (7532 - 7762, n=2) | |
| Dell XPS 16 9640 | |
| PCMark 10 / Essentials | |
| MSI Prestige 16 AI Evo B2HMG | |
| Lenovo Yoga Pro 9 16IAH10 RTX 5050 | |
| Asus ZenBook S16 UM5606GA | |
| Dell XPS 16 9640 | |
| Average Intel Core Ultra 5 325, Intel Graphics 4 Xe3 Panther Lake iGPU (10146 - 10402, n=2) | |
| Dell XPS 16 Core Ultra 5 325 | |
| Samsung Galaxy Book6 Ultra | |
| PCMark 10 / Productivity | |
| Samsung Galaxy Book6 Ultra | |
| Lenovo Yoga Pro 9 16IAH10 RTX 5050 | |
| Asus ZenBook S16 UM5606GA | |
| Dell XPS 16 Core Ultra 5 325 | |
| Average Intel Core Ultra 5 325, Intel Graphics 4 Xe3 Panther Lake iGPU (12413 - 13960, n=2) | |
| MSI Prestige 16 AI Evo B2HMG | |
| Dell XPS 16 9640 | |
| PCMark 10 / Digital Content Creation | |
| Lenovo Yoga Pro 9 16IAH10 RTX 5050 | |
| Samsung Galaxy Book6 Ultra | |
| MSI Prestige 16 AI Evo B2HMG | |
| Dell XPS 16 9640 | |
| Asus ZenBook S16 UM5606GA | |
| Average Intel Core Ultra 5 325, Intel Graphics 4 Xe3 Panther Lake iGPU (8963 - 8979, n=2) | |
| Dell XPS 16 Core Ultra 5 325 | |
| CrossMark / Overall | |
| MSI Prestige 16 AI Evo B2HMG | |
| Lenovo Yoga Pro 9 16IAH10 RTX 5050 | |
| Samsung Galaxy Book6 Ultra | |
| Dell XPS 16 9640 | |
| Average Intel Core Ultra 5 325, Intel Graphics 4 Xe3 Panther Lake iGPU (1666 - 1772, n=2) | |
| Dell XPS 16 Core Ultra 5 325 | |
| Asus ZenBook S16 UM5606GA | |
| CrossMark / Productivity | |
| MSI Prestige 16 AI Evo B2HMG | |
| Lenovo Yoga Pro 9 16IAH10 RTX 5050 | |
| Dell XPS 16 9640 | |
| Samsung Galaxy Book6 Ultra | |
| Average Intel Core Ultra 5 325, Intel Graphics 4 Xe3 Panther Lake iGPU (1581 - 1715, n=2) | |
| Asus ZenBook S16 UM5606GA | |
| Dell XPS 16 Core Ultra 5 325 | |
| CrossMark / Creativity | |
| MSI Prestige 16 AI Evo B2HMG | |
| Lenovo Yoga Pro 9 16IAH10 RTX 5050 | |
| Samsung Galaxy Book6 Ultra | |
| Dell XPS 16 9640 | |
| Asus ZenBook S16 UM5606GA | |
| Average Intel Core Ultra 5 325, Intel Graphics 4 Xe3 Panther Lake iGPU (1889 - 1917, n=2) | |
| Dell XPS 16 Core Ultra 5 325 | |
| CrossMark / Responsiveness | |
| MSI Prestige 16 AI Evo B2HMG | |
| Dell XPS 16 9640 | |
| Samsung Galaxy Book6 Ultra | |
| Lenovo Yoga Pro 9 16IAH10 RTX 5050 | |
| Average Intel Core Ultra 5 325, Intel Graphics 4 Xe3 Panther Lake iGPU (1338 - 1544, n=2) | |
| Asus ZenBook S16 UM5606GA | |
| Dell XPS 16 Core Ultra 5 325 | |
| WebXPRT 3 / Overall | |
| MSI Prestige 16 AI Evo B2HMG | |
| Lenovo Yoga Pro 9 16IAH10 RTX 5050 | |
| Samsung Galaxy Book6 Ultra | |
| Asus ZenBook S16 UM5606GA | |
| Average Intel Core Ultra 5 325, Intel Graphics 4 Xe3 Panther Lake iGPU (282 - 308, n=2) | |
| Dell XPS 16 9640 | |
| Dell XPS 16 Core Ultra 5 325 | |
| WebXPRT 4 / Overall | |
| MSI Prestige 16 AI Evo B2HMG | |
| Lenovo Yoga Pro 9 16IAH10 RTX 5050 | |
| Samsung Galaxy Book6 Ultra | |
| Average Intel Core Ultra 5 325, Intel Graphics 4 Xe3 Panther Lake iGPU (267 - 276, n=2) | |
| Dell XPS 16 Core Ultra 5 325 | |
| Dell XPS 16 9640 | |
| Asus ZenBook S16 UM5606GA | |
| Mozilla Kraken 1.1 / Total | |
| Dell XPS 16 Core Ultra 5 325 | |
| Average Intel Core Ultra 5 325, Intel Graphics 4 Xe3 Panther Lake iGPU (492 - 497, n=2) | |
| Asus ZenBook S16 UM5606GA | |
| Samsung Galaxy Book6 Ultra | |
| Lenovo Yoga Pro 9 16IAH10 RTX 5050 | |
| MSI Prestige 16 AI Evo B2HMG | |
| Geekbench AI / Single Precision GPU 1.7 | |
| Samsung Galaxy Book6 Ultra | |
| Lenovo Yoga Pro 9 16IAH10 RTX 5050 | |
| Dell XPS 16 Core Ultra 5 325 | |
| Average Intel Core Ultra 5 325, Intel Graphics 4 Xe3 Panther Lake iGPU (n=1) | |
| Geekbench AI / Half Precision GPU 1.7 | |
| Lenovo Yoga Pro 9 16IAH10 RTX 5050 | |
| Samsung Galaxy Book6 Ultra | |
| Dell XPS 16 Core Ultra 5 325 | |
| Average Intel Core Ultra 5 325, Intel Graphics 4 Xe3 Panther Lake iGPU (n=1) | |
| Geekbench AI / Quantized GPU 1.7 | |
| Samsung Galaxy Book6 Ultra | |
| Lenovo Yoga Pro 9 16IAH10 RTX 5050 | |
| Dell XPS 16 Core Ultra 5 325 | |
| Average Intel Core Ultra 5 325, Intel Graphics 4 Xe3 Panther Lake iGPU (n=1) | |
* ... smaller is better
| PCMark 10 Score | 7762 points | |
Help | ||
| AIDA64 / Memory Copy | |
| Samsung Galaxy Book6 Ultra | |
| Dell XPS 16 Core Ultra 5 325 | |
| Lenovo Yoga Pro 9 16IAH10 RTX 5050 | |
| MSI Prestige 16 AI Evo B2HMG | |
| Asus ZenBook S16 UM5606GA | |
| Average Intel Core Ultra 5 325 (89482 - 100226, n=2) | |
| Dell XPS 16 9640 | |
| AIDA64 / Memory Read | |
| Samsung Galaxy Book6 Ultra | |
| Asus ZenBook S16 UM5606GA | |
| Lenovo Yoga Pro 9 16IAH10 RTX 5050 | |
| Dell XPS 16 Core Ultra 5 325 | |
| Dell XPS 16 9640 | |
| Average Intel Core Ultra 5 325 (74747 - 86178, n=2) | |
| MSI Prestige 16 AI Evo B2HMG | |
| AIDA64 / Memory Write | |
| Samsung Galaxy Book6 Ultra | |
| Asus ZenBook S16 UM5606GA | |
| Dell XPS 16 Core Ultra 5 325 | |
| Lenovo Yoga Pro 9 16IAH10 RTX 5050 | |
| Average Intel Core Ultra 5 325 (92966 - 107858, n=2) | |
| Dell XPS 16 9640 | |
| MSI Prestige 16 AI Evo B2HMG | |
| AIDA64 / Memory Latency | |
| Dell XPS 16 9640 | |
| MSI Prestige 16 AI Evo B2HMG | |
| Lenovo Yoga Pro 9 16IAH10 RTX 5050 | |
| Average Intel Core Ultra 5 325 (102 - 108.4, n=2) | |
| Asus ZenBook S16 UM5606GA | |
| Dell XPS 16 Core Ultra 5 325 | |
| Samsung Galaxy Book6 Ultra | |
* ... smaller is better
DPC Latency
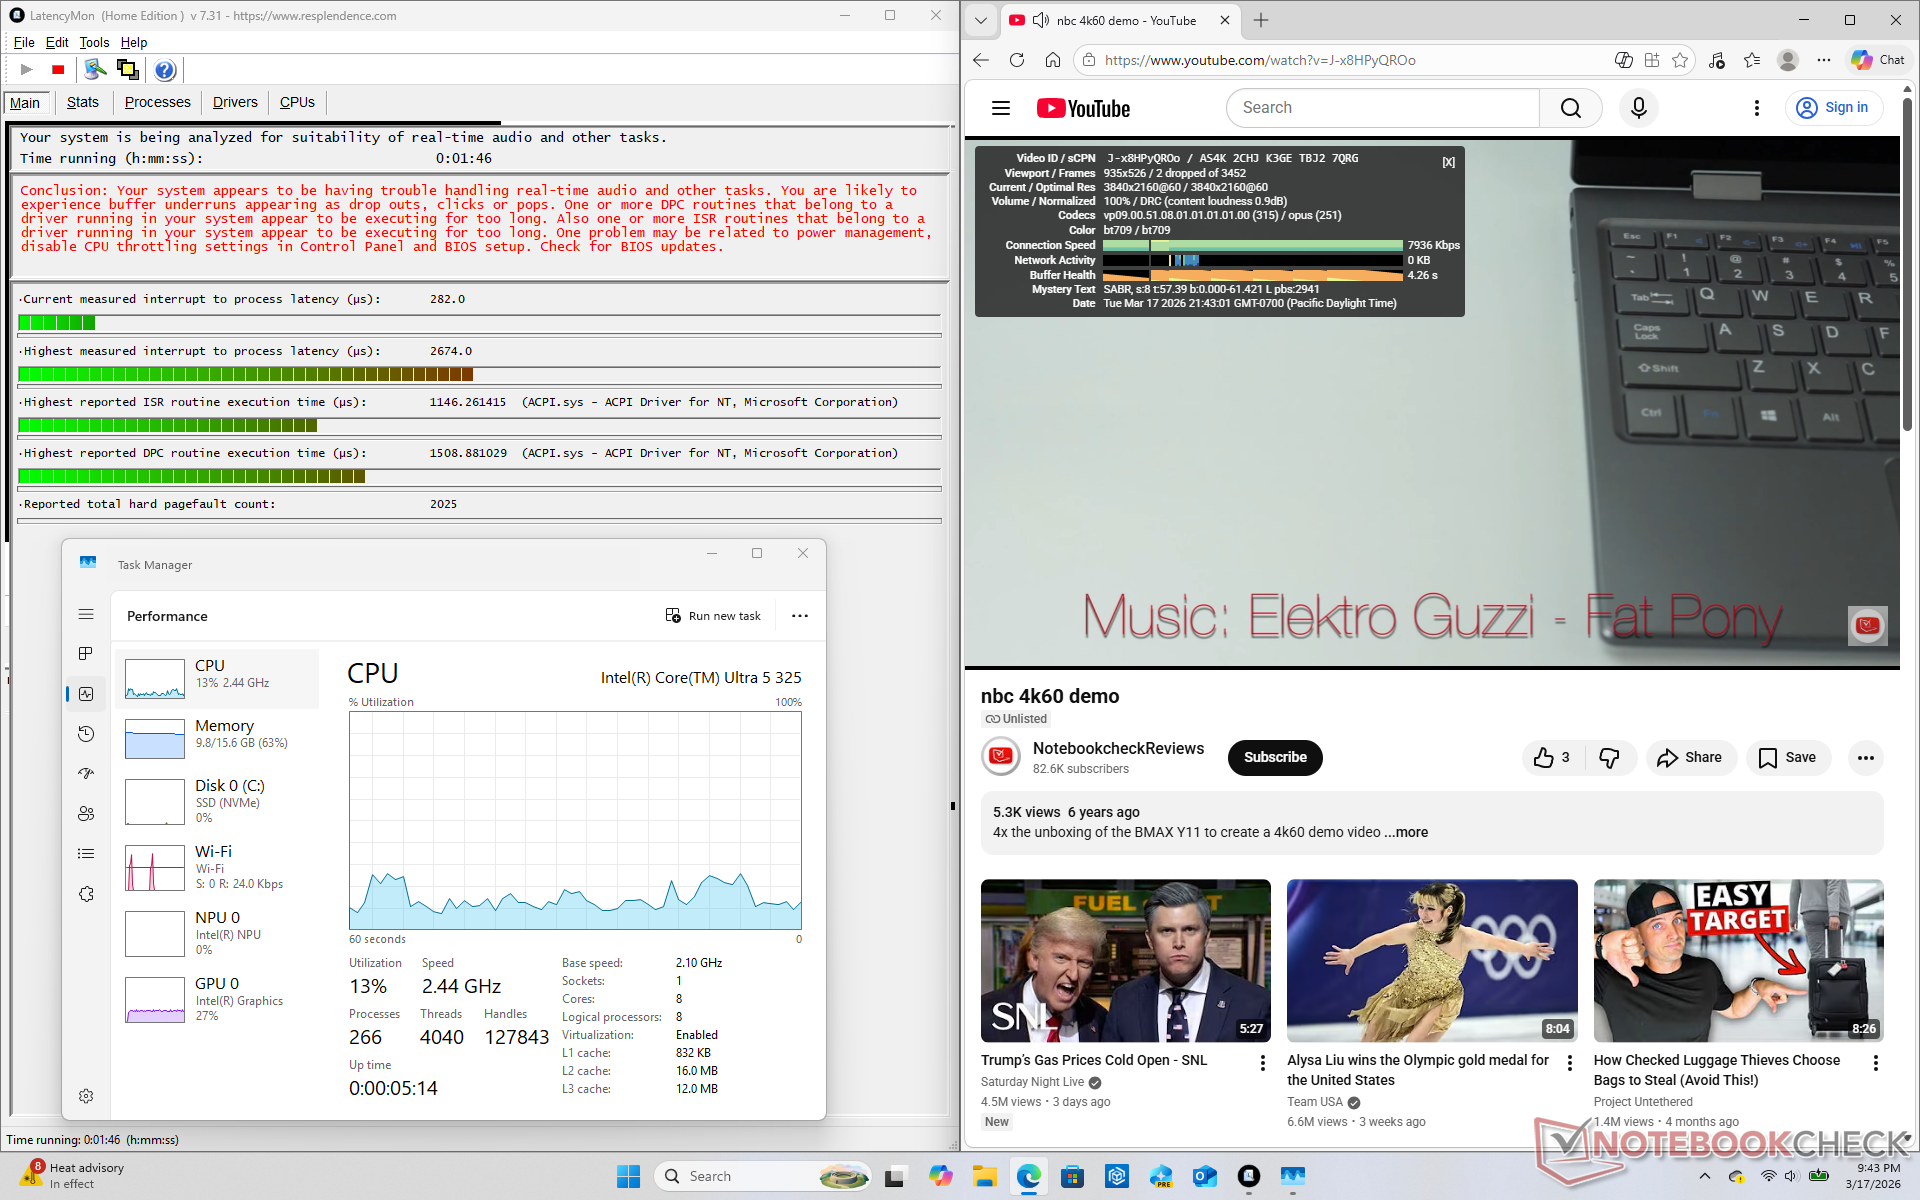
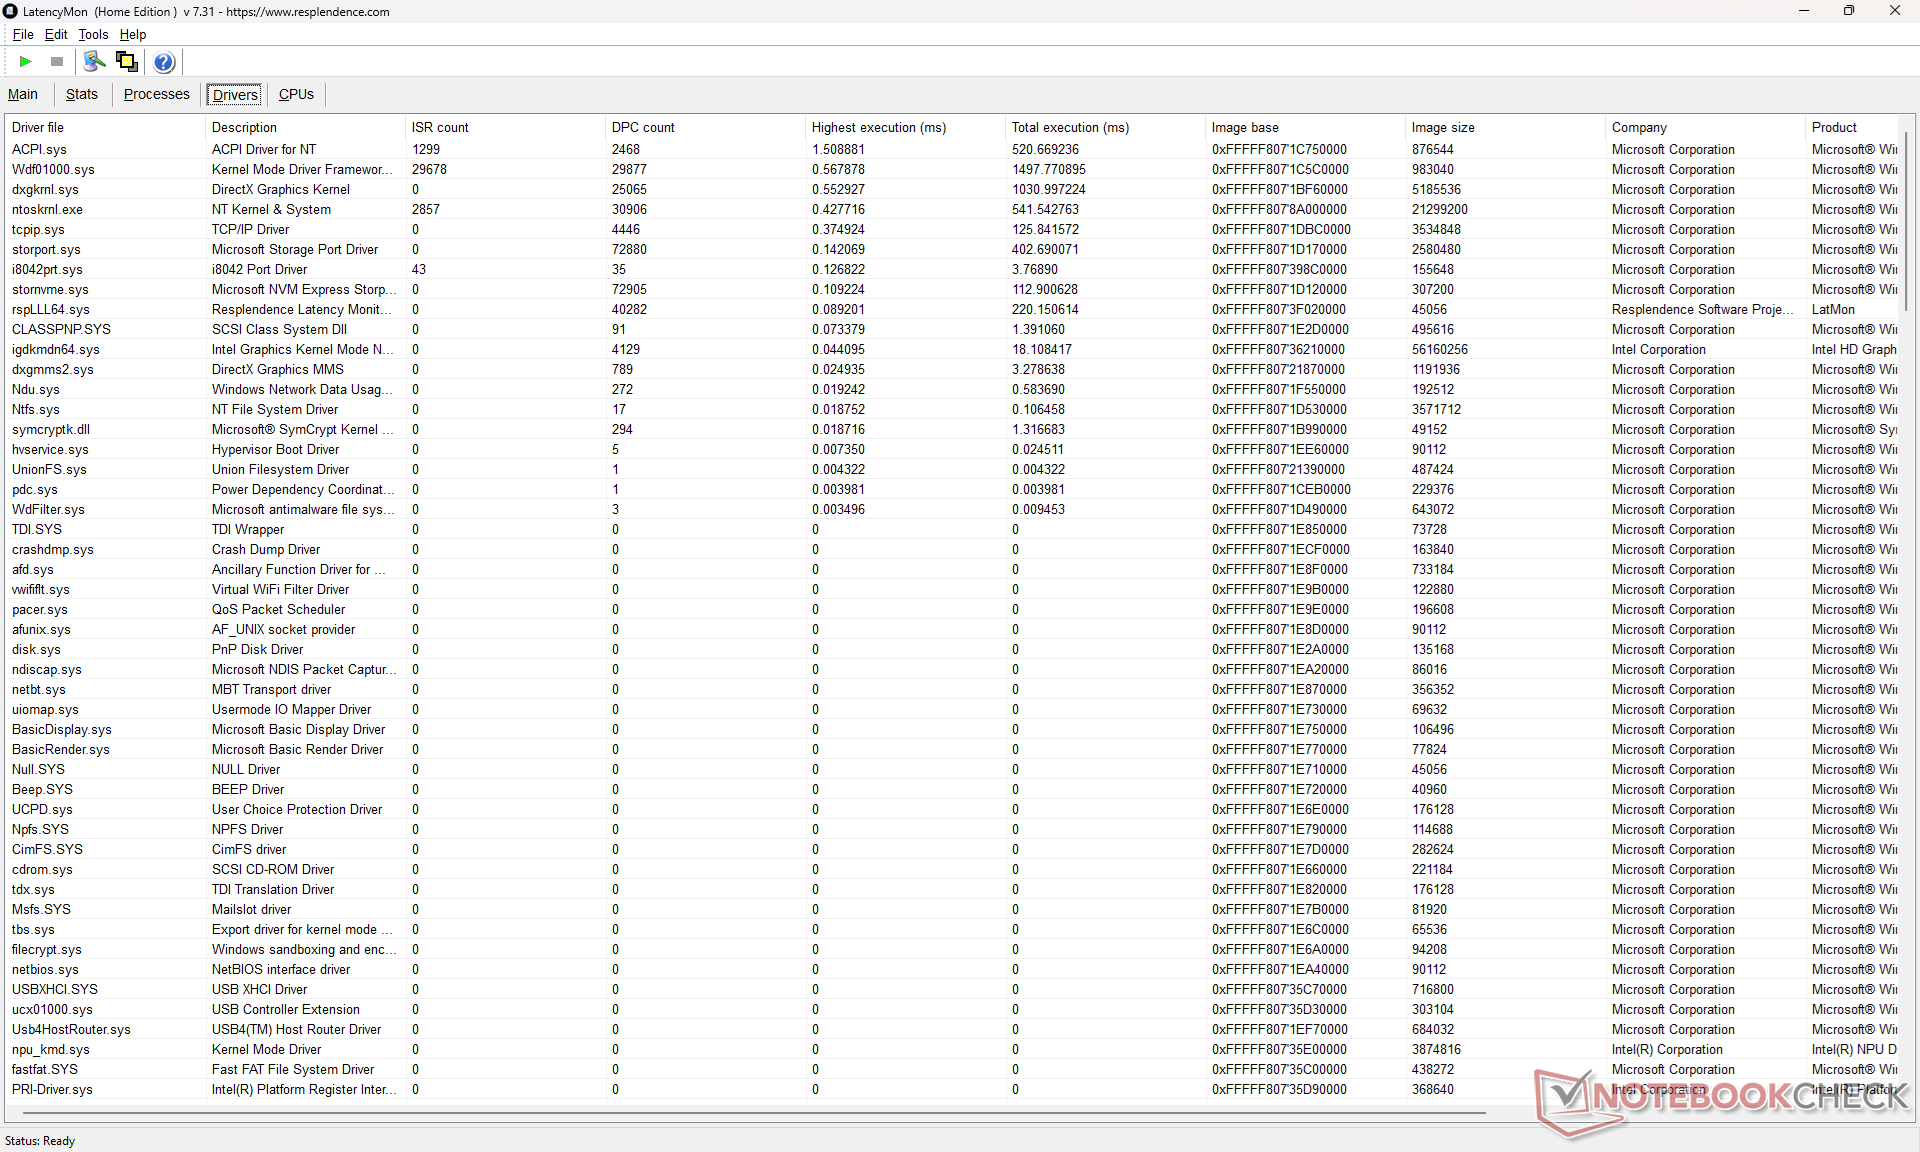
| DPC Latencies / LatencyMon - interrupt to process latency (max), Web, Youtube, Prime95 | |
| Lenovo Yoga Pro 9 16IAH10 RTX 5050 | |
| Dell XPS 16 Core Ultra 5 325 | |
| MSI Prestige 16 AI Evo B2HMG | |
| Dell XPS 16 9640 | |
| Samsung Galaxy Book6 Ultra | |
| Asus ZenBook S16 UM5606GA | |
* ... smaller is better
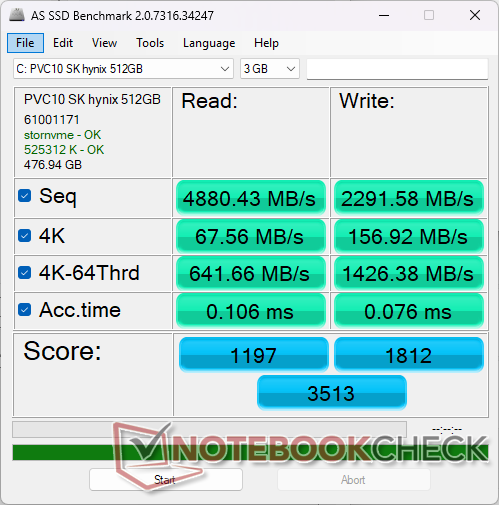
Storage Devices
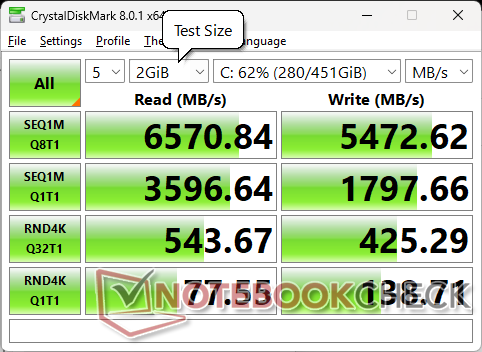
The SK Hynix PVC10 PCIe4 x4 NVMe SSD can sustain transfer rates of up to 6600 MB/s without any throttling issues as shown by the DiskSpd loop test results below. Note that higher-end configurations of the XPS 16 come with optional PCIe5 SSDs instead.


| Drive Performance rating - Percent | |
| MSI Prestige 16 AI Evo B2HMG | |
| Dell XPS 16 9640 | |
| Lenovo Yoga Pro 9 16IAH10 RTX 5050 | |
| Asus ZenBook S16 UM5606GA | |
| Samsung Galaxy Book6 Ultra | |
| Dell XPS 16 Core Ultra 5 325 | |
* ... smaller is better
Disk Throttling: DiskSpd Read Loop, Queue Depth 8
GPU Performance
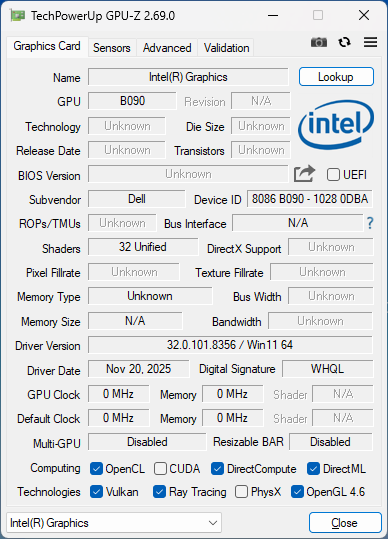
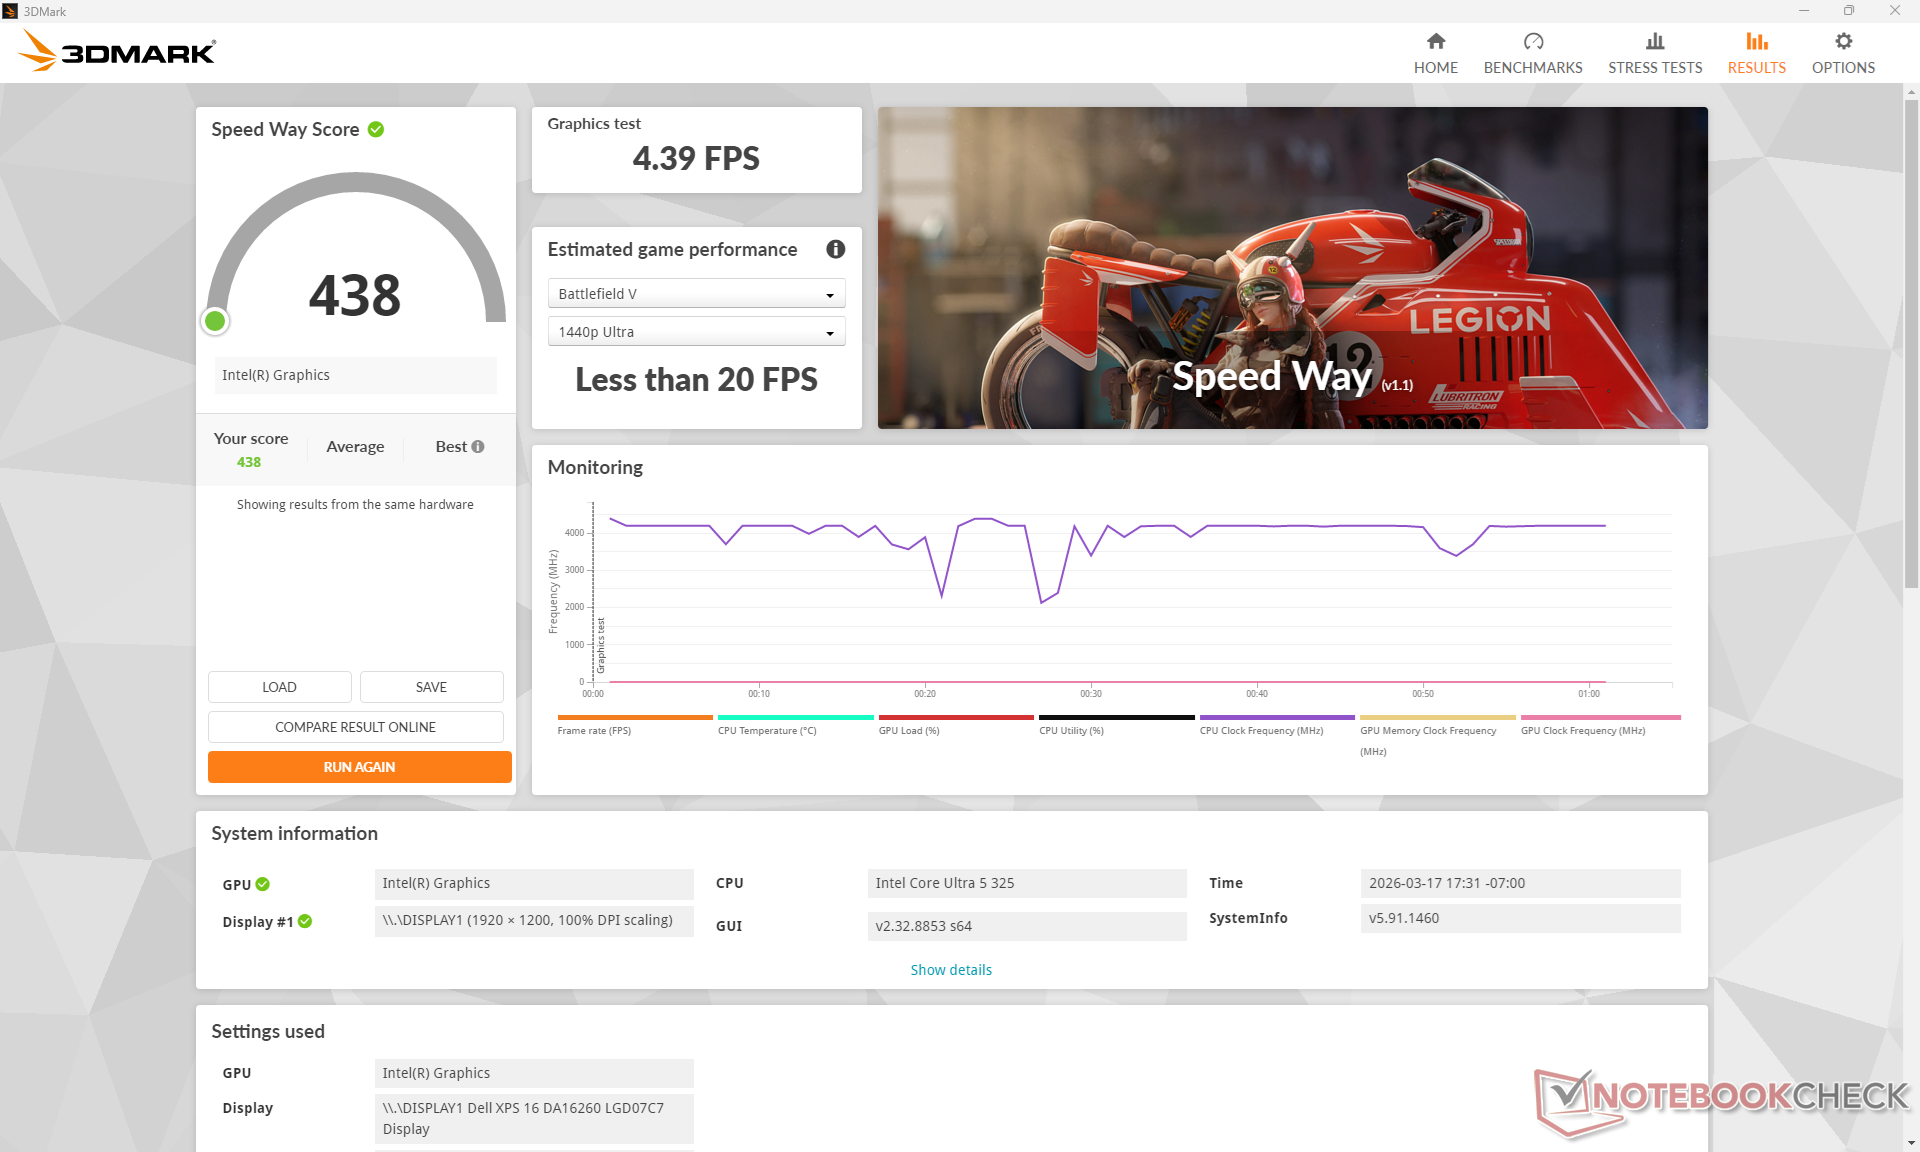
The Panther Lake Xe3 4 is one of the slowest integrated solutions from the Panther Lake lineup. Performance levels are most similar to the two-generation old Arc 8 or the AMD Radeon 680M. Upgrading to the Core Ultra 7 355 configuration will not improve graphics performance by significant margins as the CPU uses the same Xe3 4 iGPU. Instead, users have to upgrade to the Core Ultra X7 358H with integrated Arc B390 graphics for a more massive 2.5x performance increase as shown by the tables below.
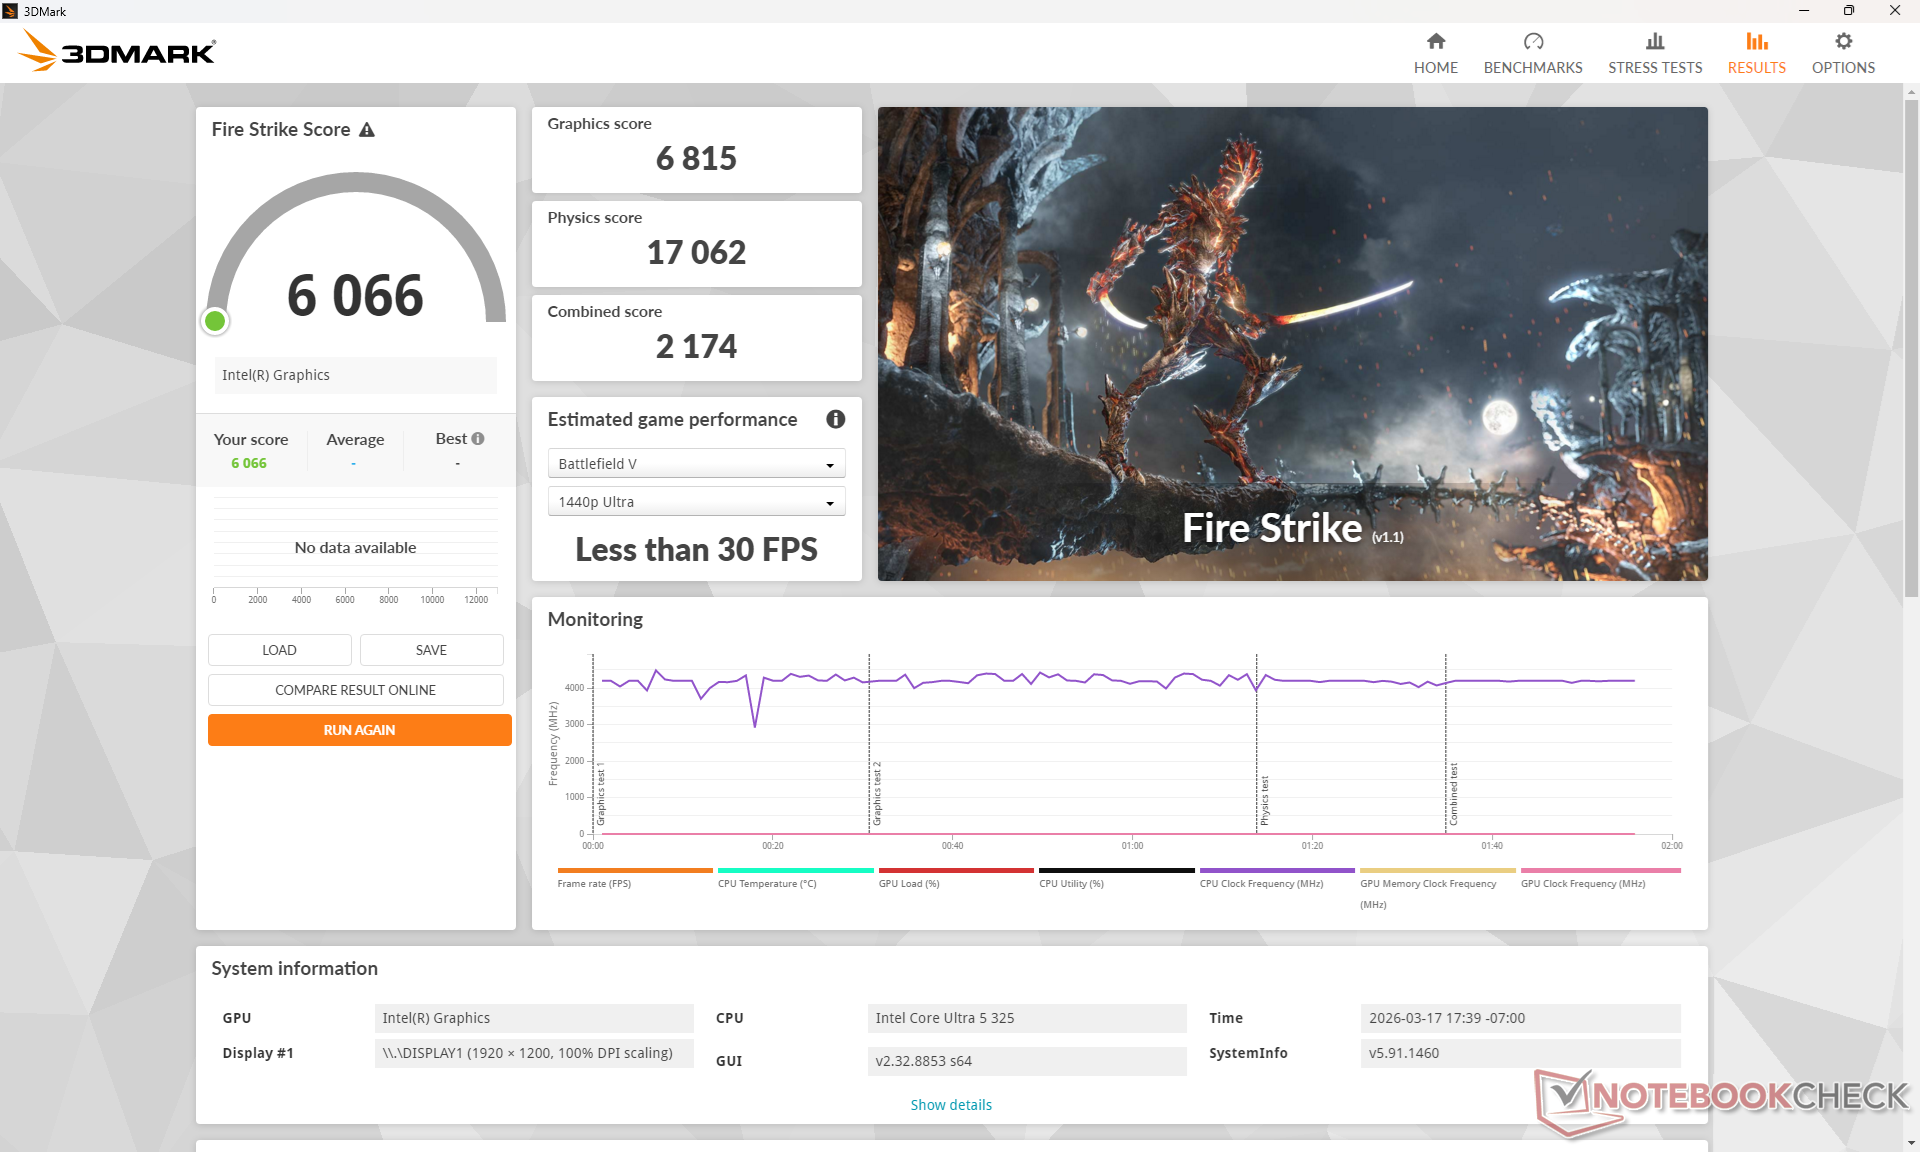
| Power Profile | Graphics Score | Physics Score | Combined Score |
| Performance Mode | 6815 | 17062 | 2174 |
| Balanced Mode | 6633 (-3%) | 16820 (-1%) | 2039 (-6%) |
| Battery Power | 6480 (-5%) | 17601 (+3%) | 2140 (-2%) |
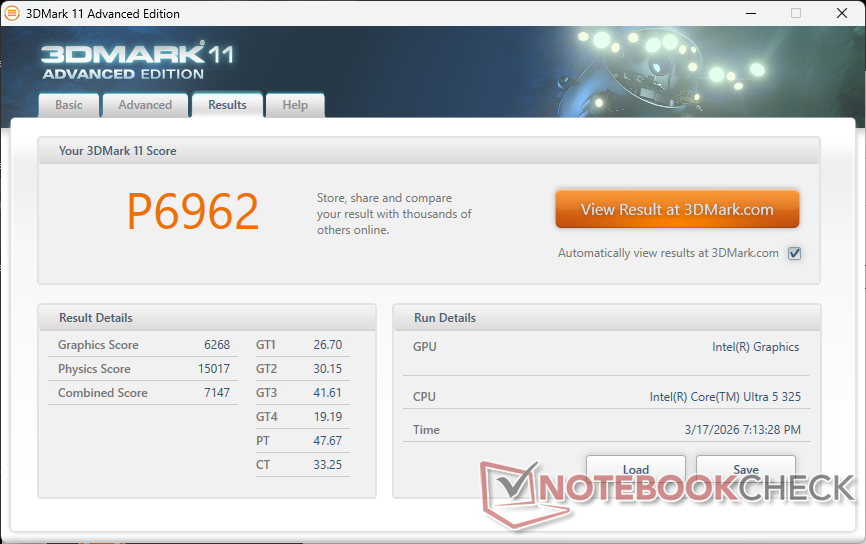
| 3DMark 11 Performance | 6962 points | |
| 3DMark Cloud Gate Standard Score | 26419 points | |
| 3DMark Fire Strike Score | 6066 points | |
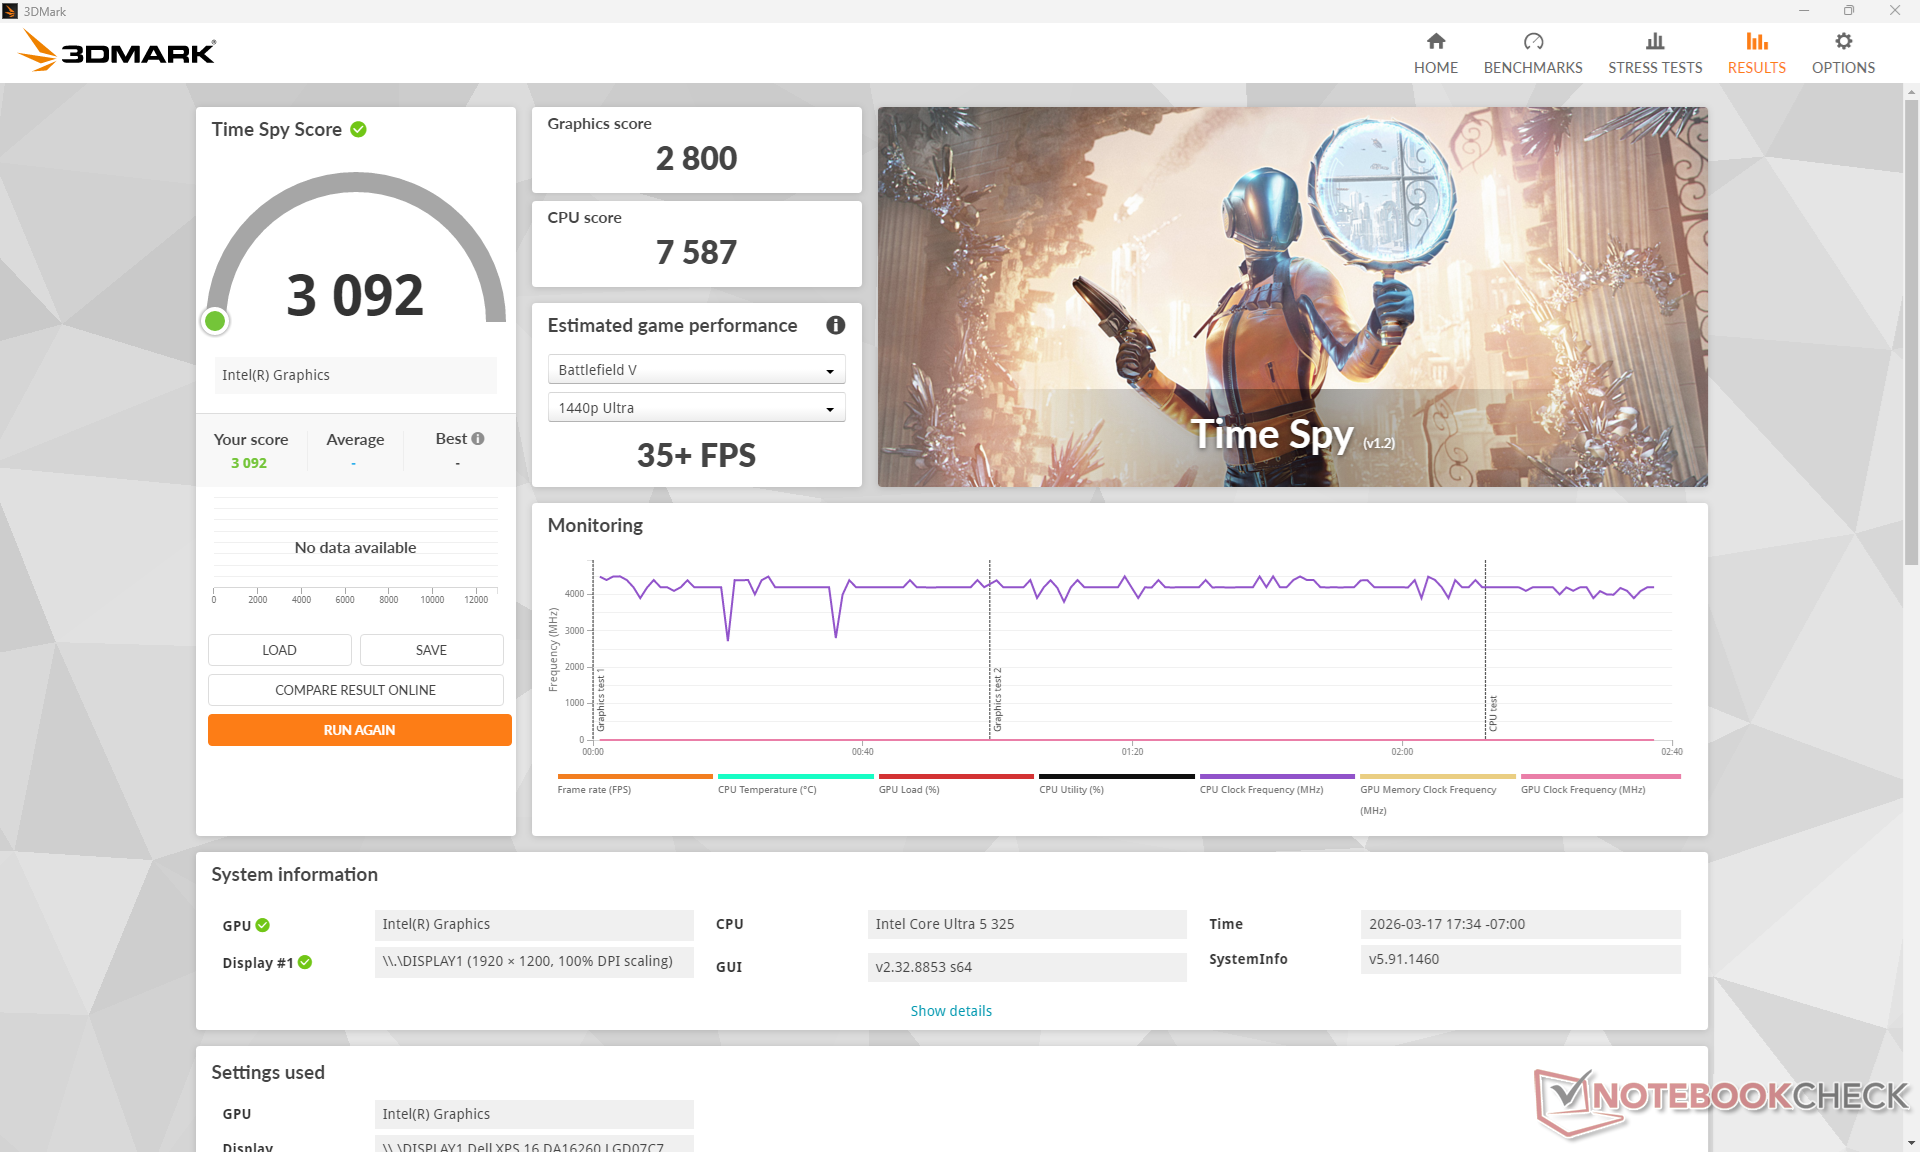
| 3DMark Time Spy Score | 3092 points | |
Help | ||
* ... smaller is better
| Performance rating - Percent | |
| Samsung Galaxy Book6 Ultra | |
| Lenovo Yoga Pro 9 16IAH10 RTX 5050 | |
| Dell XPS 16 9640 | |
| Asus ZenBook S16 UM5606GA | |
| MSI Prestige 16 AI Evo B2HMG | |
| Dell XPS 16 Core Ultra 5 325 | |
| Cyberpunk 2077 - 1920x1080 Ultra Preset (FSR off) | |
| Samsung Galaxy Book6 Ultra | |
| Lenovo Yoga Pro 9 16IAH10 RTX 5050 | |
| Dell XPS 16 9640 | |
| MSI Prestige 16 AI Evo B2HMG | |
| Asus ZenBook S16 UM5606GA | |
| Dell XPS 16 Core Ultra 5 325 | |
| Baldur's Gate 3 - 1920x1080 Ultra Preset AA:T | |
| Samsung Galaxy Book6 Ultra | |
| Lenovo Yoga Pro 9 16IAH10 RTX 5050 | |
| Dell XPS 16 9640 | |
| Asus ZenBook S16 UM5606GA | |
| MSI Prestige 16 AI Evo B2HMG | |
| Dell XPS 16 Core Ultra 5 325 | |
| GTA V - 1920x1080 Highest AA:4xMSAA + FX AF:16x | |
| Samsung Galaxy Book6 Ultra | |
| Lenovo Yoga Pro 9 16IAH10 RTX 5050 | |
| Dell XPS 16 9640 | |
| Asus ZenBook S16 UM5606GA | |
| Dell XPS 16 Core Ultra 5 325 | |
| MSI Prestige 16 AI Evo B2HMG | |
| Final Fantasy XV Benchmark - 1920x1080 High Quality | |
| Samsung Galaxy Book6 Ultra | |
| Lenovo Yoga Pro 9 16IAH10 RTX 5050 | |
| Dell XPS 16 9640 | |
| MSI Prestige 16 AI Evo B2HMG | |
| Asus ZenBook S16 UM5606GA | |
| Dell XPS 16 Core Ultra 5 325 | |
| Strange Brigade - 1920x1080 ultra AA:ultra AF:16 | |
| Samsung Galaxy Book6 Ultra | |
| Lenovo Yoga Pro 9 16IAH10 RTX 5050 | |
| Dell XPS 16 9640 | |
| MSI Prestige 16 AI Evo B2HMG | |
| Asus ZenBook S16 UM5606GA | |
| Dell XPS 16 Core Ultra 5 325 | |
| Dota 2 Reborn - 1920x1080 ultra (3/3) best looking | |
| Lenovo Yoga Pro 9 16IAH10 RTX 5050 | |
| Samsung Galaxy Book6 Ultra | |
| Dell XPS 16 9640 | |
| Asus ZenBook S16 UM5606GA | |
| MSI Prestige 16 AI Evo B2HMG | |
| Dell XPS 16 Core Ultra 5 325 | |
| X-Plane 11.11 - 1920x1080 high (fps_test=3) | |
| Lenovo Yoga Pro 9 16IAH10 RTX 5050 | |
| Dell XPS 16 9640 | |
| Dell XPS 16 9640 | |
| Samsung Galaxy Book6 Ultra | |
| Asus ZenBook S16 UM5606GA | |
| MSI Prestige 16 AI Evo B2HMG | |
| Dell XPS 16 Core Ultra 5 325 | |
Cyberpunk 2077 ultra FPS Chart
| low | med. | high | ultra | |
|---|---|---|---|---|
| GTA V (2015) | 162.4 | 158.1 | 51.8 | 20.8 |
| Dota 2 Reborn (2015) | 102.9 | 89 | 72.6 | 68.4 |
| Final Fantasy XV Benchmark (2018) | 66.3 | 35.4 | 25.1 | |
| X-Plane 11.11 (2018) | 37.8 | 30.6 | 22.9 | |
| Strange Brigade (2018) | 107.3 | 38.2 | 35.9 | 43.3 |
| Baldur's Gate 3 (2023) | 27.4 | 22.2 | 19 | 18.7 |
| Cyberpunk 2077 (2023) | 35.2 | 27 | 23.8 | 19.9 |
| F1 24 (2024) | 55.6 | 52.7 | 40.8 | 13.2 |
Emissions — Quieter, But Still Quite Warm
System Noise
Fan noise is much quieter than the outgoing Dell 16 Premium in essentially all scenarios. The system is able to remain silent or inaudible for longer periods when compared to most other laptops. For example, fan noise doesn't audibly pick up when running the 3DMark06 until more than two-thirds into the first benchmark scene whereas the noise would pick up much sooner and louder on the ZenBook S16.
Fan noise when gaming would settle between 38 and 44 dB(A) which is still quieter than last year's model or the aforementioned Asus under similar conditions.


Noise level
| Idle |
| 22.9 / 22.9 / 23.9 dB(A) |
| Load |
| 34.8 / 43.3 dB(A) |
 | ||
30 dB silent 40 dB(A) audible 50 dB(A) loud |
||
min: | ||
| Dell XPS 16 Core Ultra 5 325 Ultra 5 325, Intel Graphics 4 Xe3 PTL | Dell XPS 16 9640 Ultra 7 155H, GeForce RTX 4070 Laptop GPU | Lenovo Yoga Pro 9 16IAH10 RTX 5050 Ultra 9 285H, GeForce RTX 5050 Laptop | Samsung Galaxy Book6 Ultra Ultra 7 356H, GeForce RTX 5070 Laptop | Asus ZenBook S16 UM5606GA Ryzen AI 9 465, Radeon 880M | MSI Prestige 16 AI Evo B2HMG Ultra 9 285H, Arc 140T | |
|---|---|---|---|---|---|---|
| Noise | -11% | -12% | -12% | -15% | -5% | |
| off / environment * (dB) | 22.8 | 24.5 -7% | 24.6 -8% | 25.1 -10% | 24.9 -9% | 23.6 -4% |
| Idle Minimum * (dB) | 22.9 | 24.5 -7% | 24.6 -7% | 25.1 -10% | 24.9 -9% | 23.6 -3% |
| Idle Average * (dB) | 22.9 | 24.5 -7% | 24.6 -7% | 25.1 -10% | 24.9 -9% | 23.6 -3% |
| Idle Maximum * (dB) | 23.9 | 27.5 -15% | 26.8 -12% | 25.1 -5% | 24.9 -4% | 26.2 -10% |
| Load Average * (dB) | 34.8 | 39.6 -14% | 32.8 6% | 36.9 -6% | 45.7 -31% | 37.1 -7% |
| Cyberpunk 2077 ultra * (dB) | 38 | 51.8 -36% | 48.5 -28% | 49 -29% | 42.1 -11% | |
| Load Maximum * (dB) | 43.3 | 49.7 -15% | 51.8 -20% | 48.5 -12% | 50.4 -16% | 42.1 3% |
| Witcher 3 ultra * (dB) | 49.7 |
* ... smaller is better
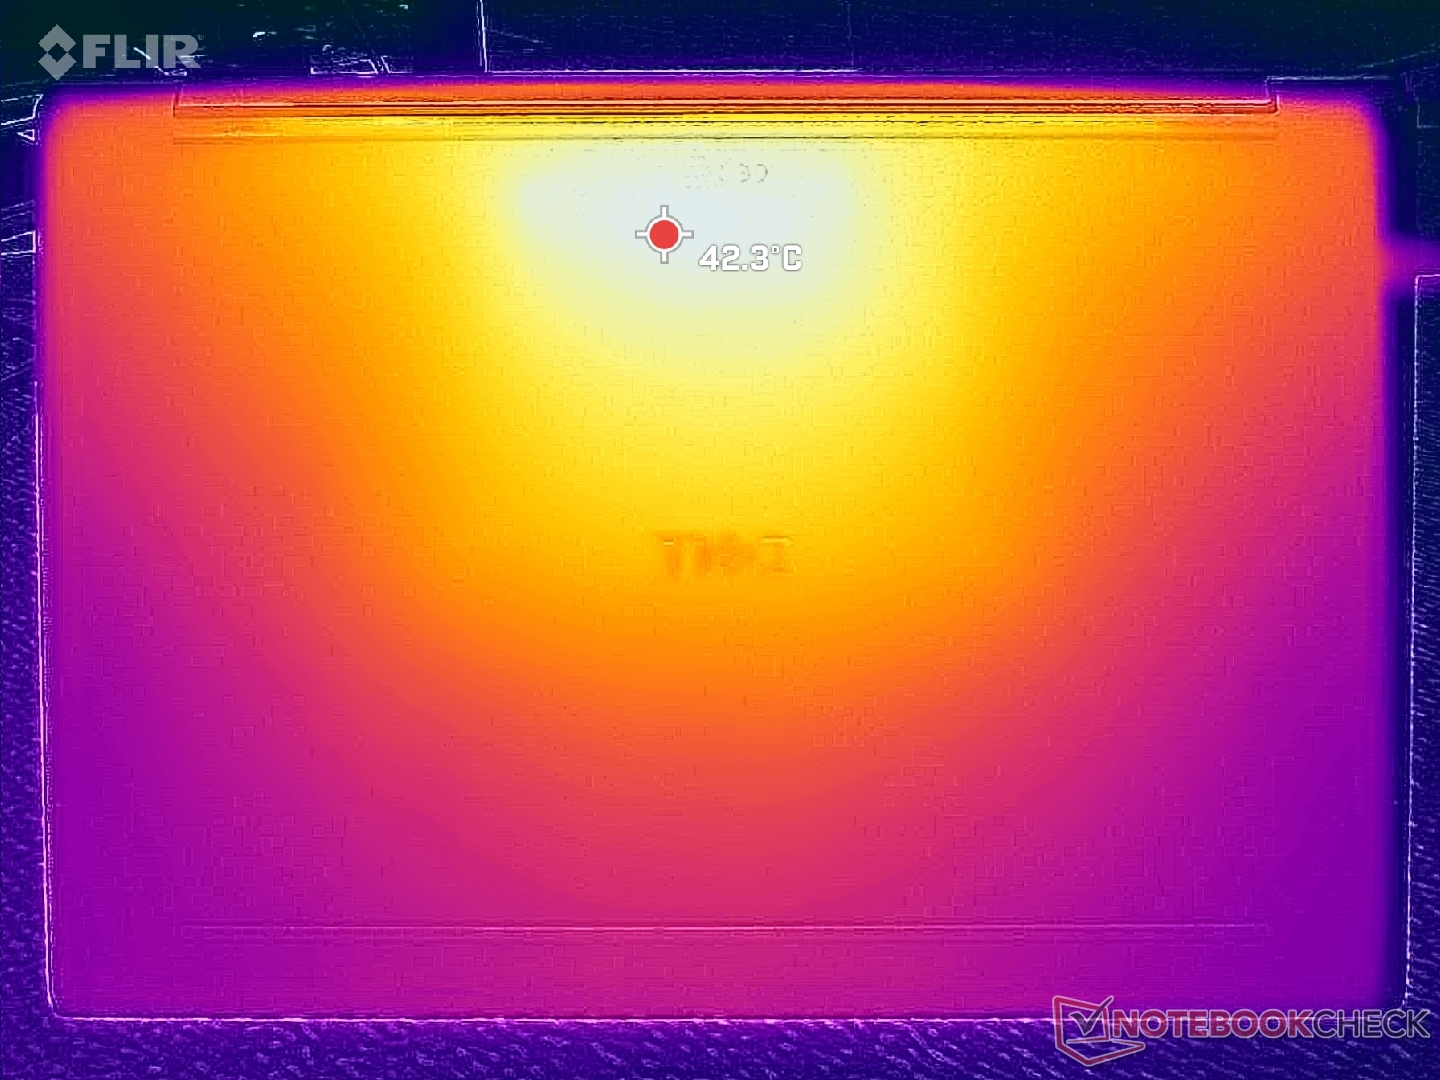
Temperature
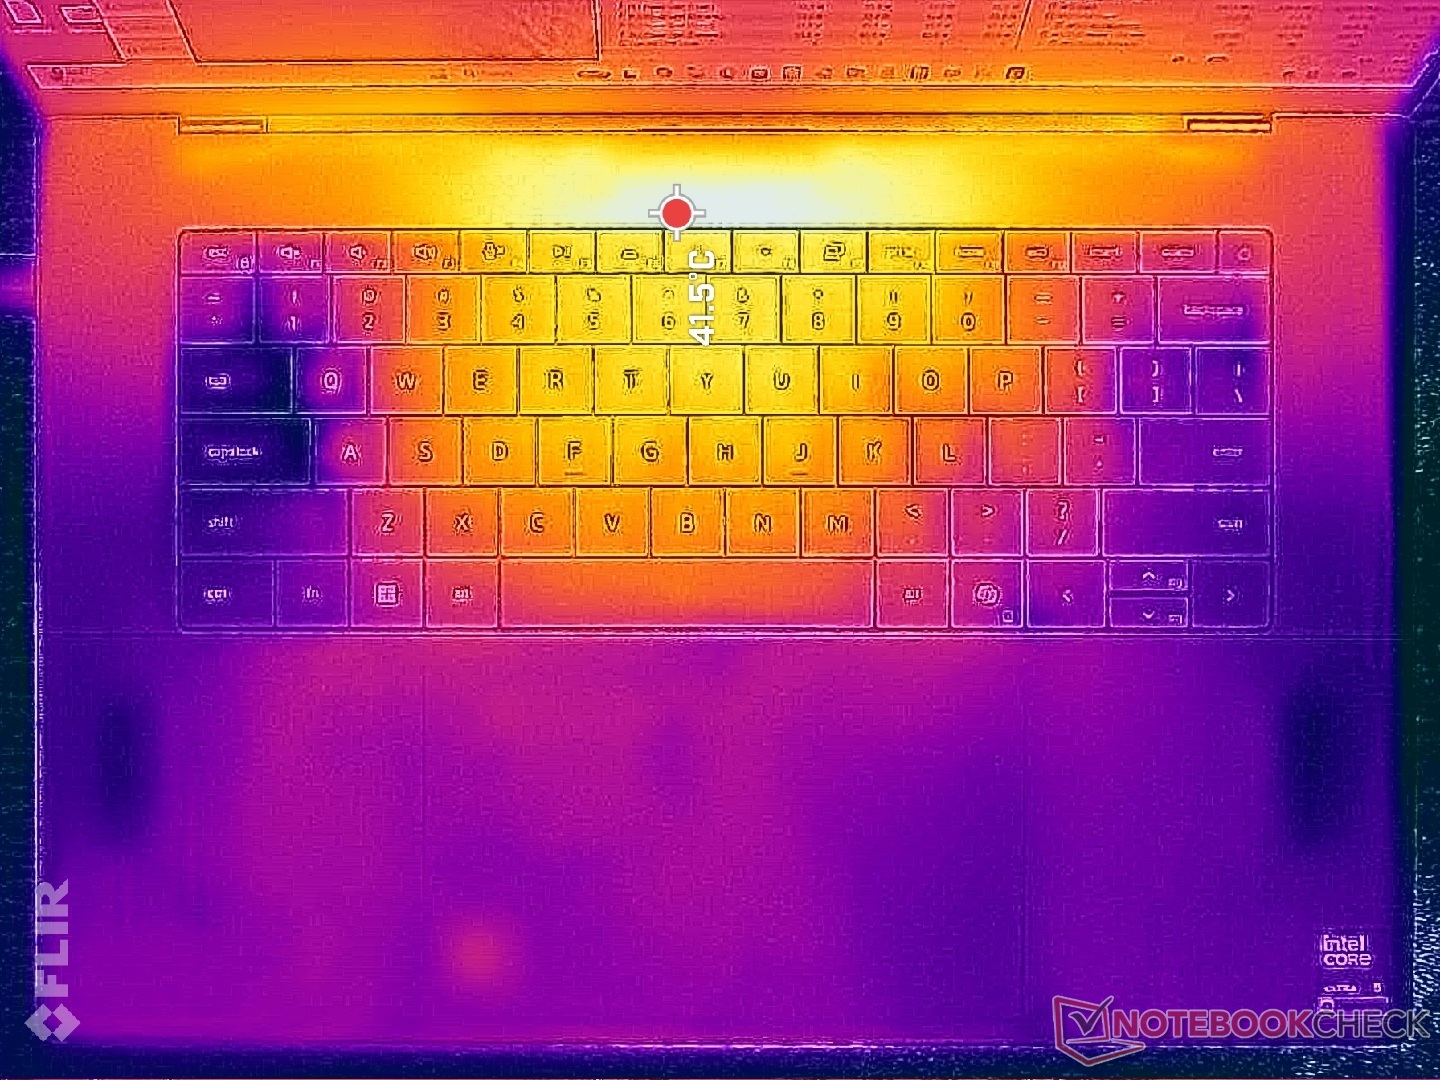
Surface temperatures are warmer than expected especially since the new XPS 16 doesn't carry any discrete graphics. Hot spots can reach over 43 C when running demanding loads like games compared to just 37 C on last year's heavier Dell 16 Premium with discrete GeForce RTX 5070 graphics.
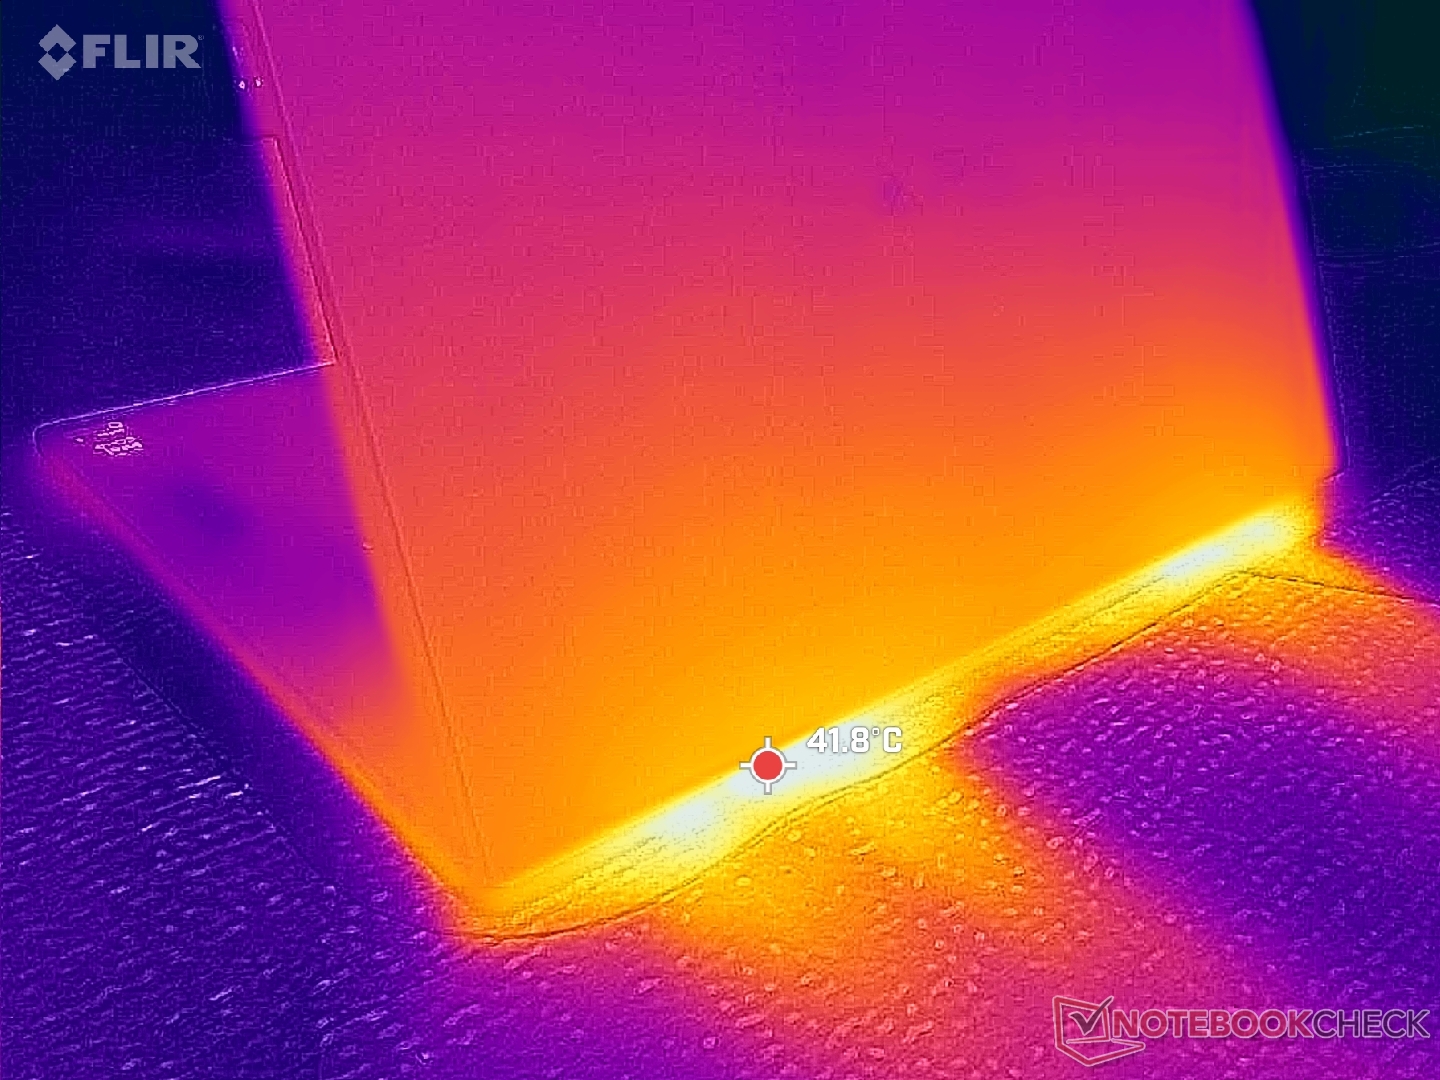

(±) The maximum temperature on the upper side is 43.8 °C / 111 F, compared to the average of 36.8 °C / 98 F, ranging from 21 to 71 °C for the class Multimedia.
(±) The bottom heats up to a maximum of 42 °C / 108 F, compared to the average of 39.1 °C / 102 F
(+) In idle usage, the average temperature for the upper side is 22.4 °C / 72 F, compared to the device average of 31.3 °C / 88 F.
(±) 3: The average temperature for the upper side is 35.3 °C / 96 F, compared to the average of 31.3 °C / 88 F for the class Multimedia.
(+) The palmrests and touchpad are cooler than skin temperature with a maximum of 31.6 °C / 88.9 F and are therefore cool to the touch.
(-) The average temperature of the palmrest area of similar devices was 28.7 °C / 83.7 F (-2.9 °C / -5.2 F).


| Dell XPS 16 Core Ultra 5 325 Ultra 5 325, Intel Graphics 4 Xe3 PTL | Dell XPS 16 9640 Ultra 7 155H, GeForce RTX 4070 Laptop GPU | Lenovo Yoga Pro 9 16IAH10 RTX 5050 Ultra 9 285H, GeForce RTX 5050 Laptop | Samsung Galaxy Book6 Ultra Ultra 7 356H, GeForce RTX 5070 Laptop | Asus ZenBook S16 UM5606GA Ryzen AI 9 465, Radeon 880M | MSI Prestige 16 AI Evo B2HMG Ultra 9 285H, Arc 140T | |
|---|---|---|---|---|---|---|
| Heat | -4% | -9% | -8% | -9% | -13% | |
| Maximum Upper Side * (°C) | 43.8 | 39.4 10% | 34.4 21% | 42.7 3% | 43.4 1% | 48.1 -10% |
| Maximum Bottom * (°C) | 42 | 36.9 12% | 41.4 1% | 49.1 -17% | 46.2 -10% | 51.6 -23% |
| Idle Upper Side * (°C) | 23.2 | 28.2 -22% | 28.6 -23% | 25.4 -9% | 26.5 -14% | 25.9 -12% |
| Idle Bottom * (°C) | 23.6 | 27.4 -16% | 31.8 -35% | 25.5 -8% | 27 -14% | 25.2 -7% |
* ... smaller is better
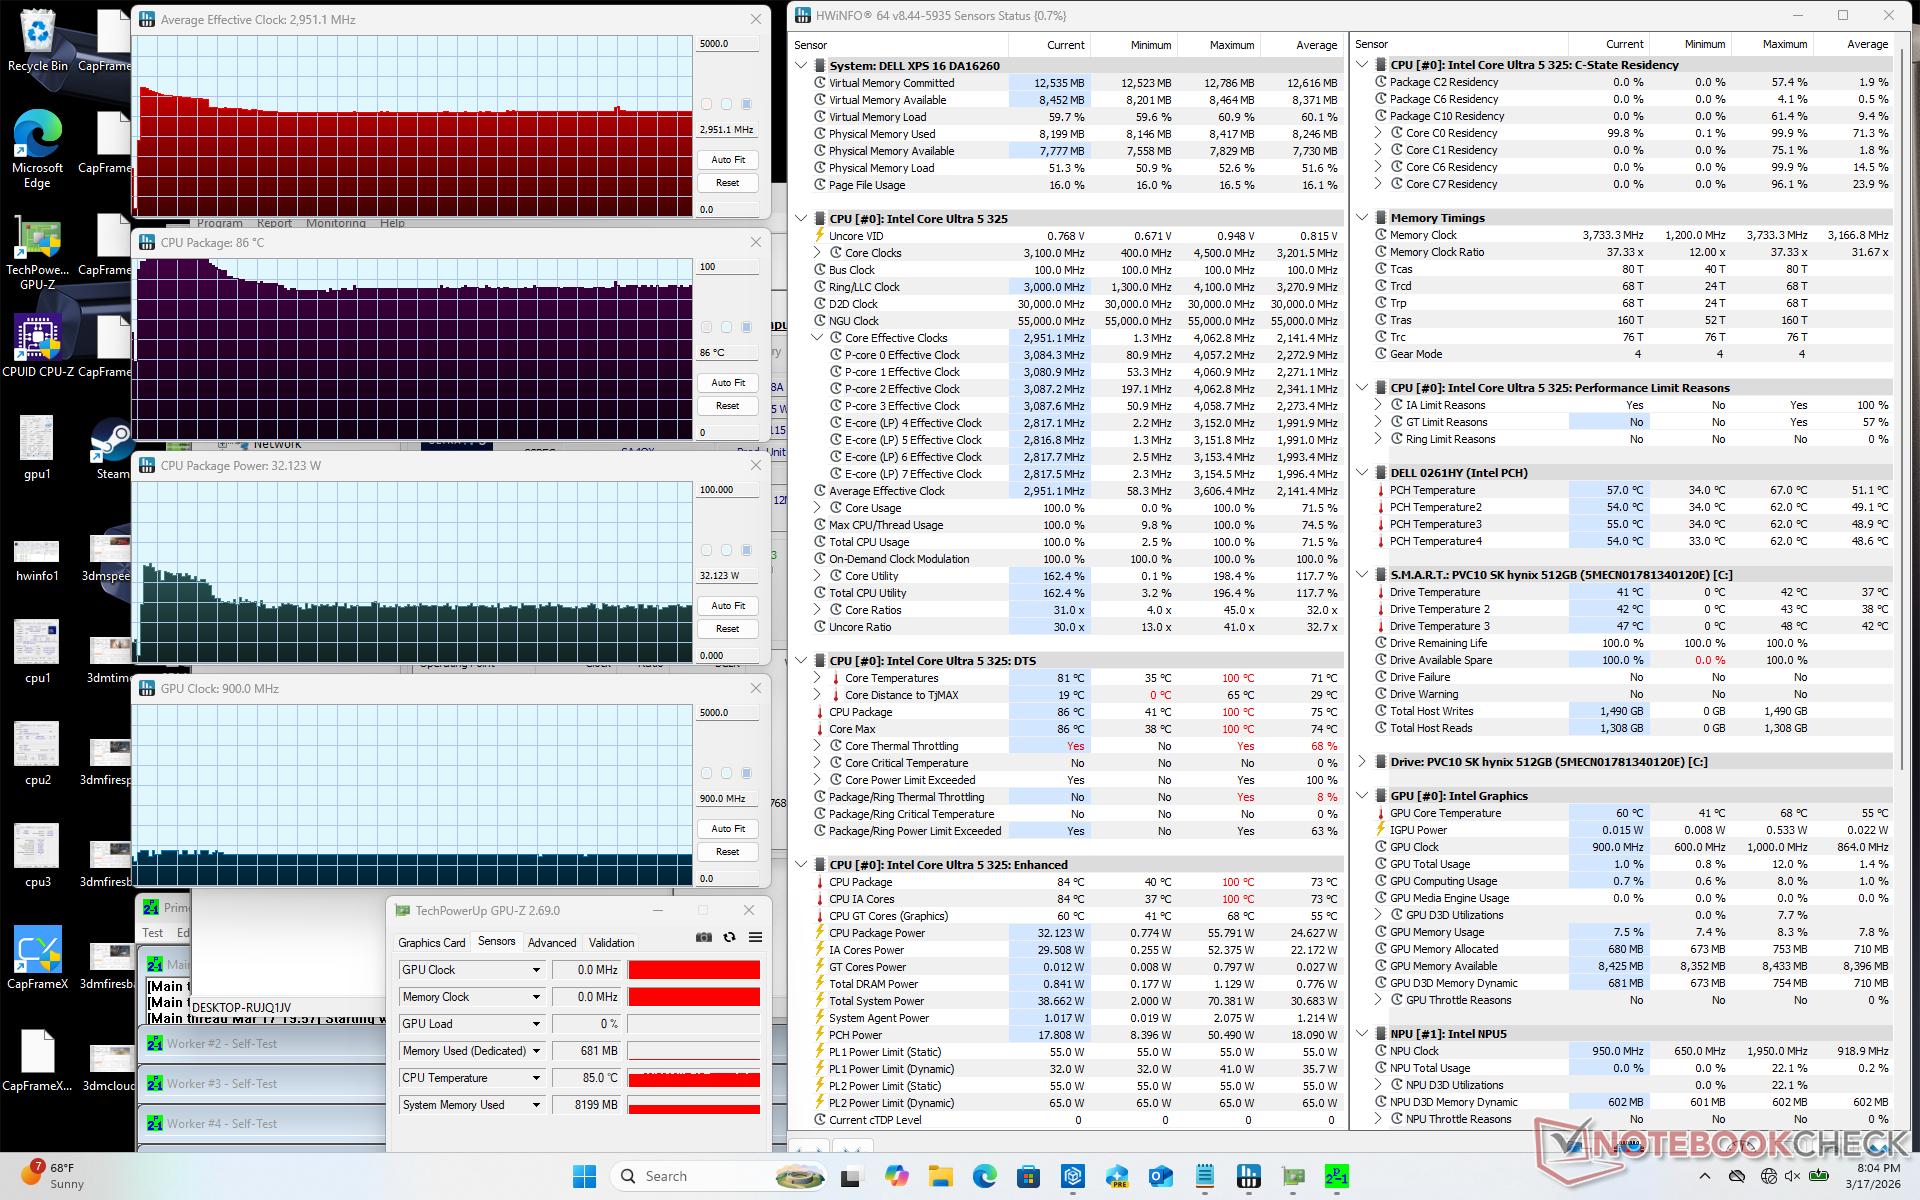
Stress Test
The processor can become quite warm when stressed. When running Prime95, for example, the CPU would boost to 3.6 GHz, 54 W, and 100 C lasting for just a few seconds before falling and stabilizing at 3.0 GHz and 32 W in order to maintain a more reasonable core temperature of 86 C. In comparison, the Core Ultra 7 in the 2025 Dell 16 Premium would stabilize at a warmer temperature of 93 C when under similar conditions. It's likely that the new XPS 16 would also stabilize at core temperatures above 90 C when configured with the much faster Core Ultra X7 instead of our Core Ultra 5.
When running Cyberpunk 2077 to represent a more balanced CPU-GPU load, core temperature would stabilize at a very toasty 89 C compared to 75 C on the 2025 XPS 16 with faster GeForce RTX graphics. The generally warmer core temperatures are likely responsible for the warmer surface temperatures mentioned above.
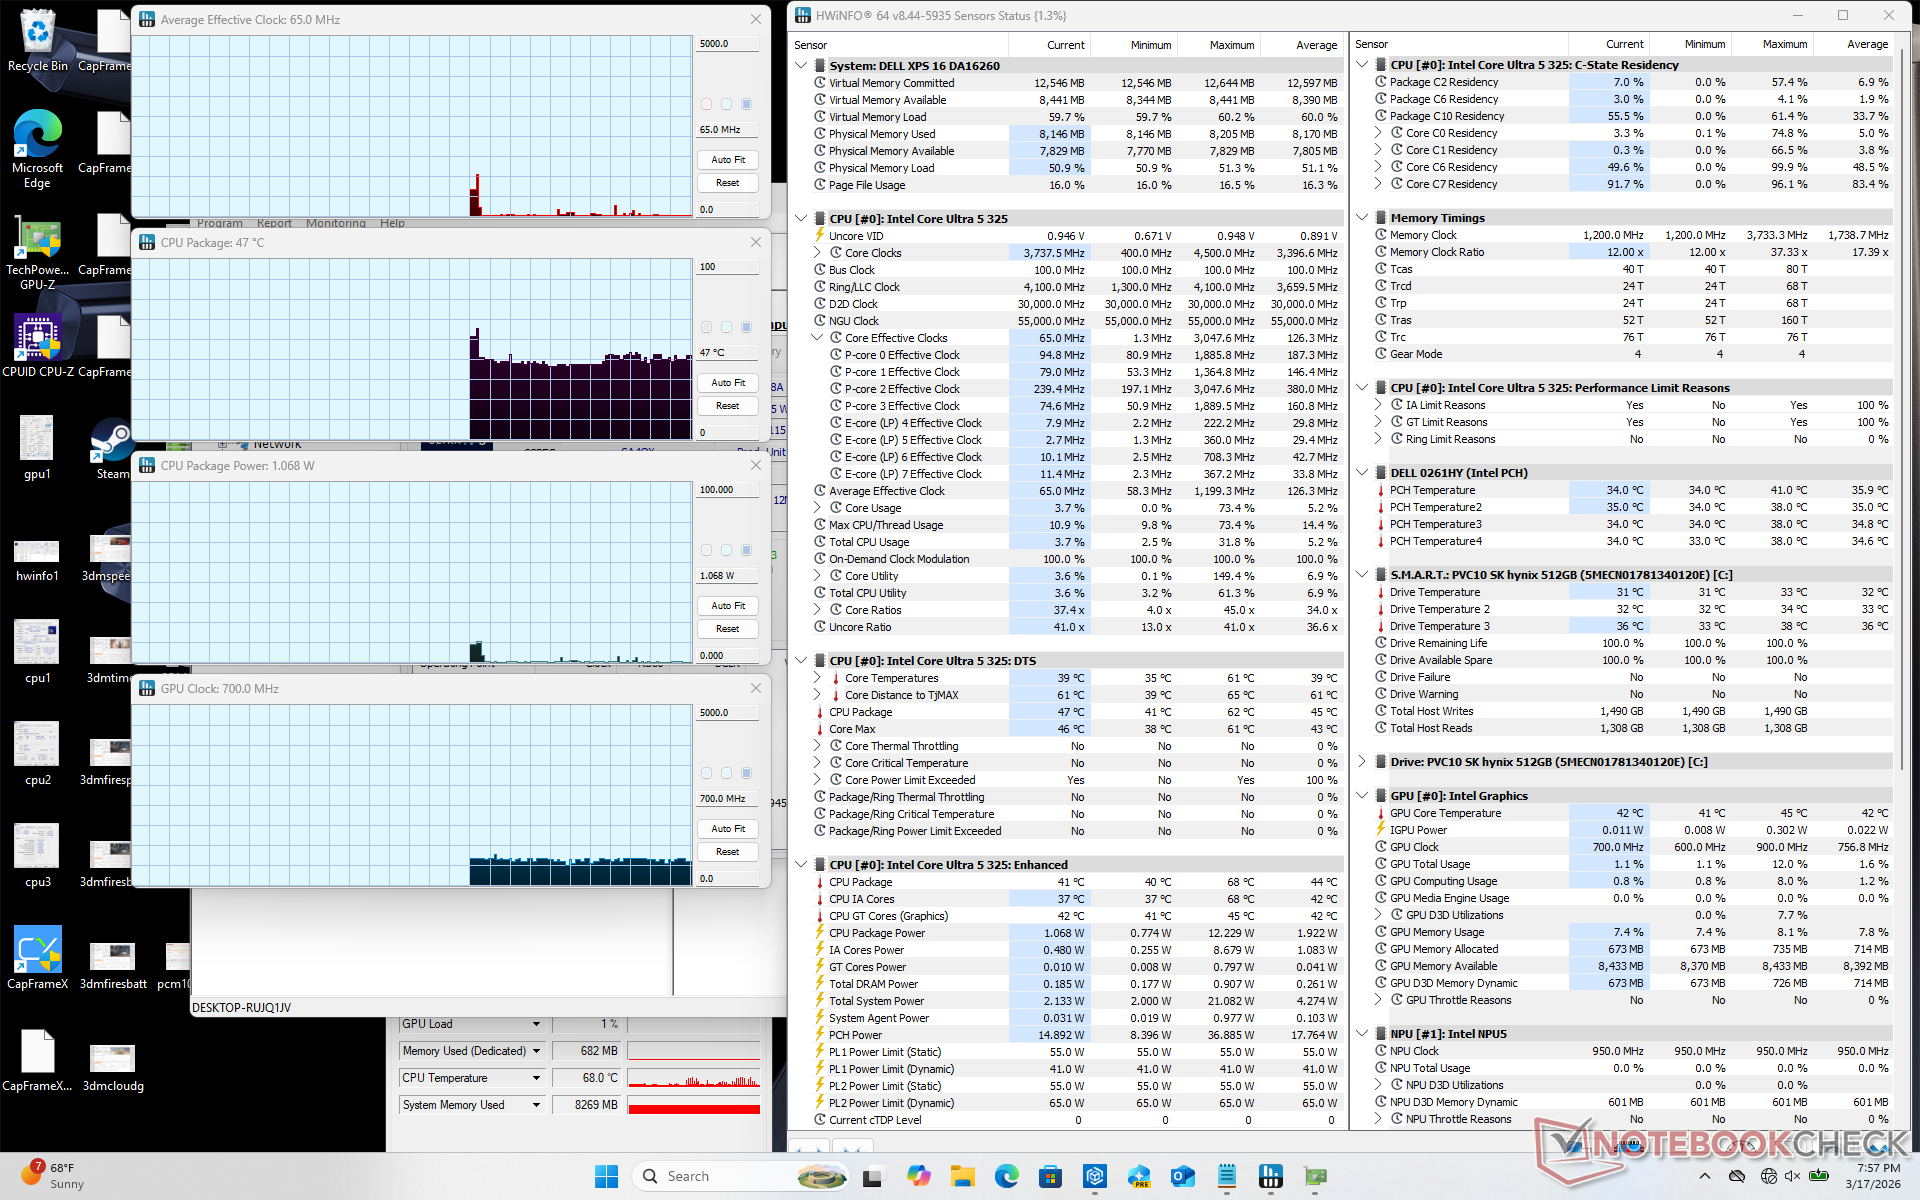
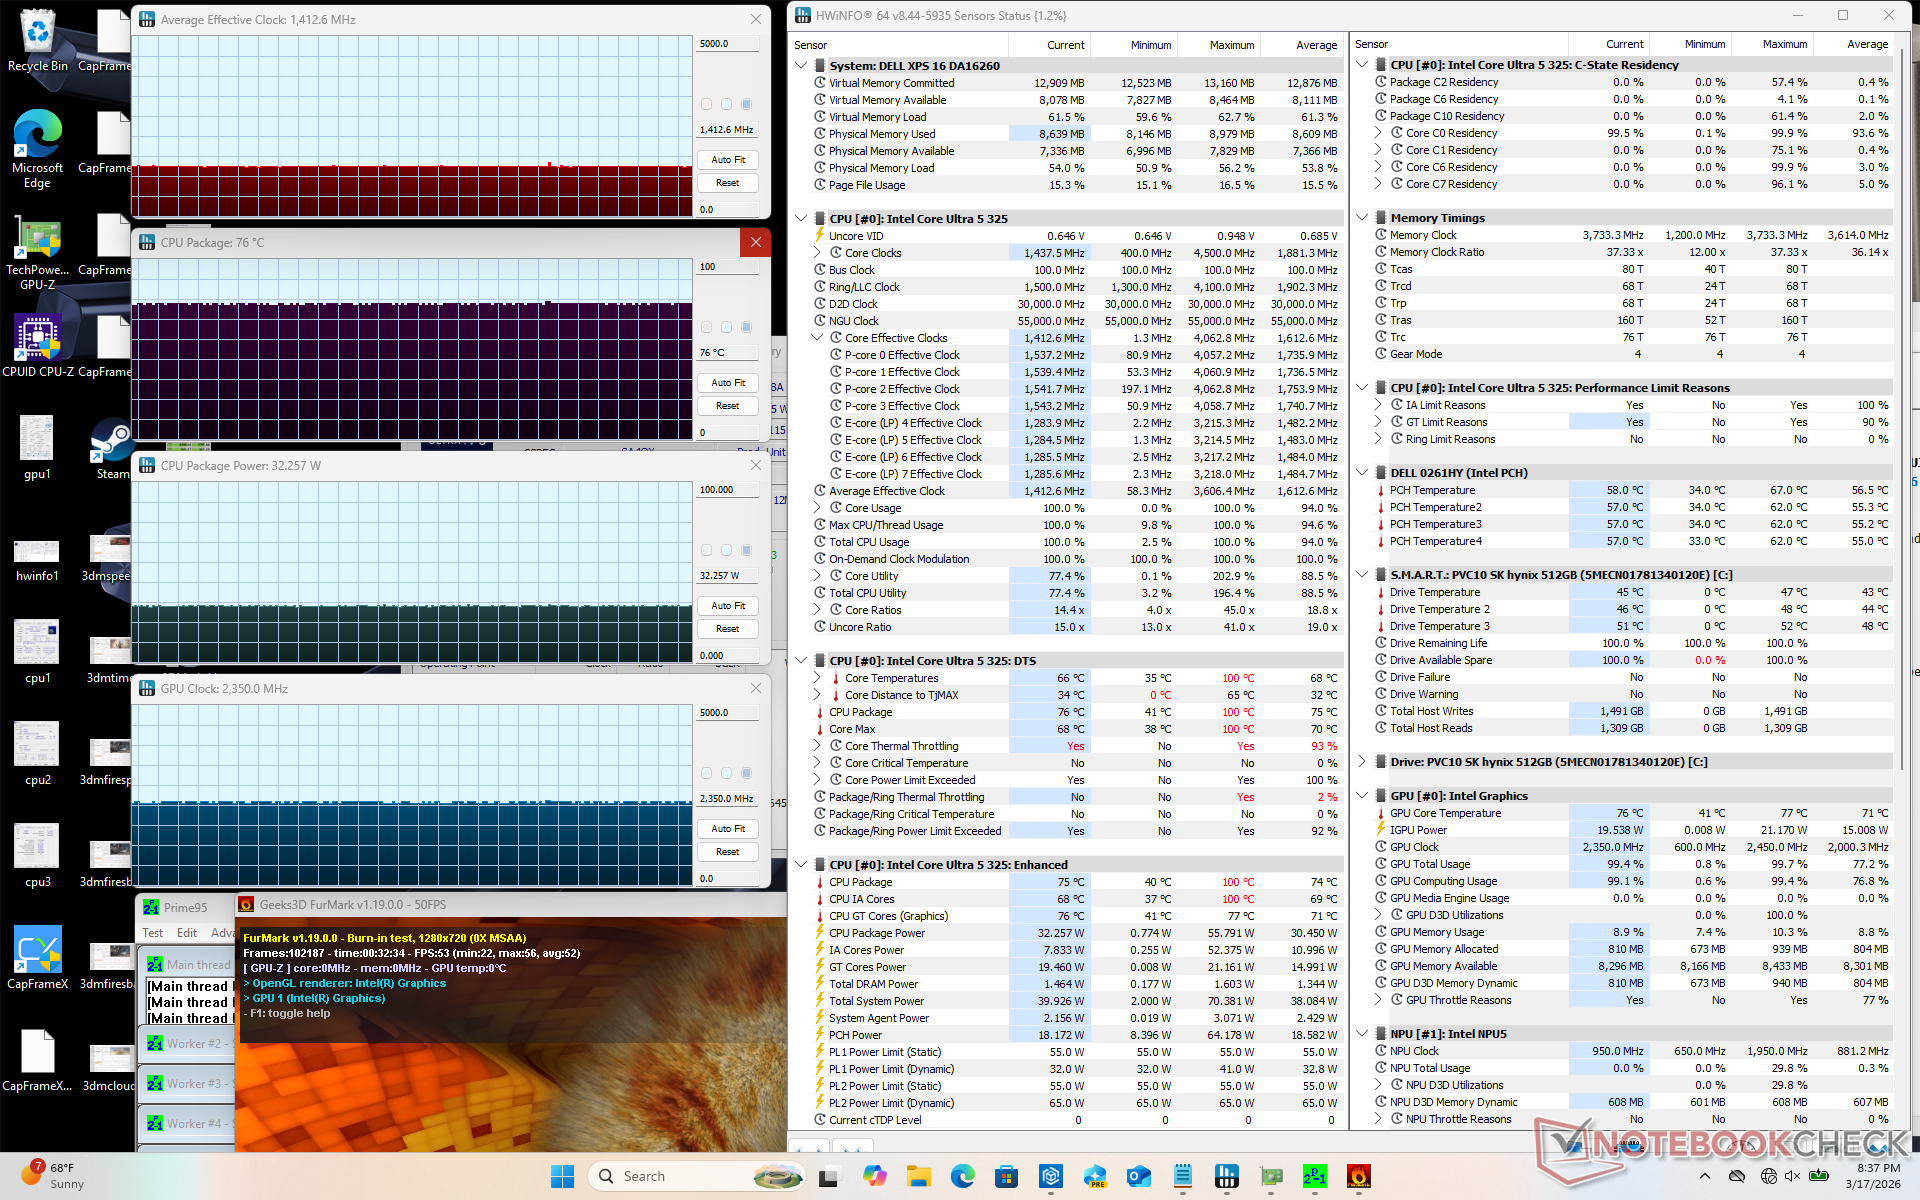
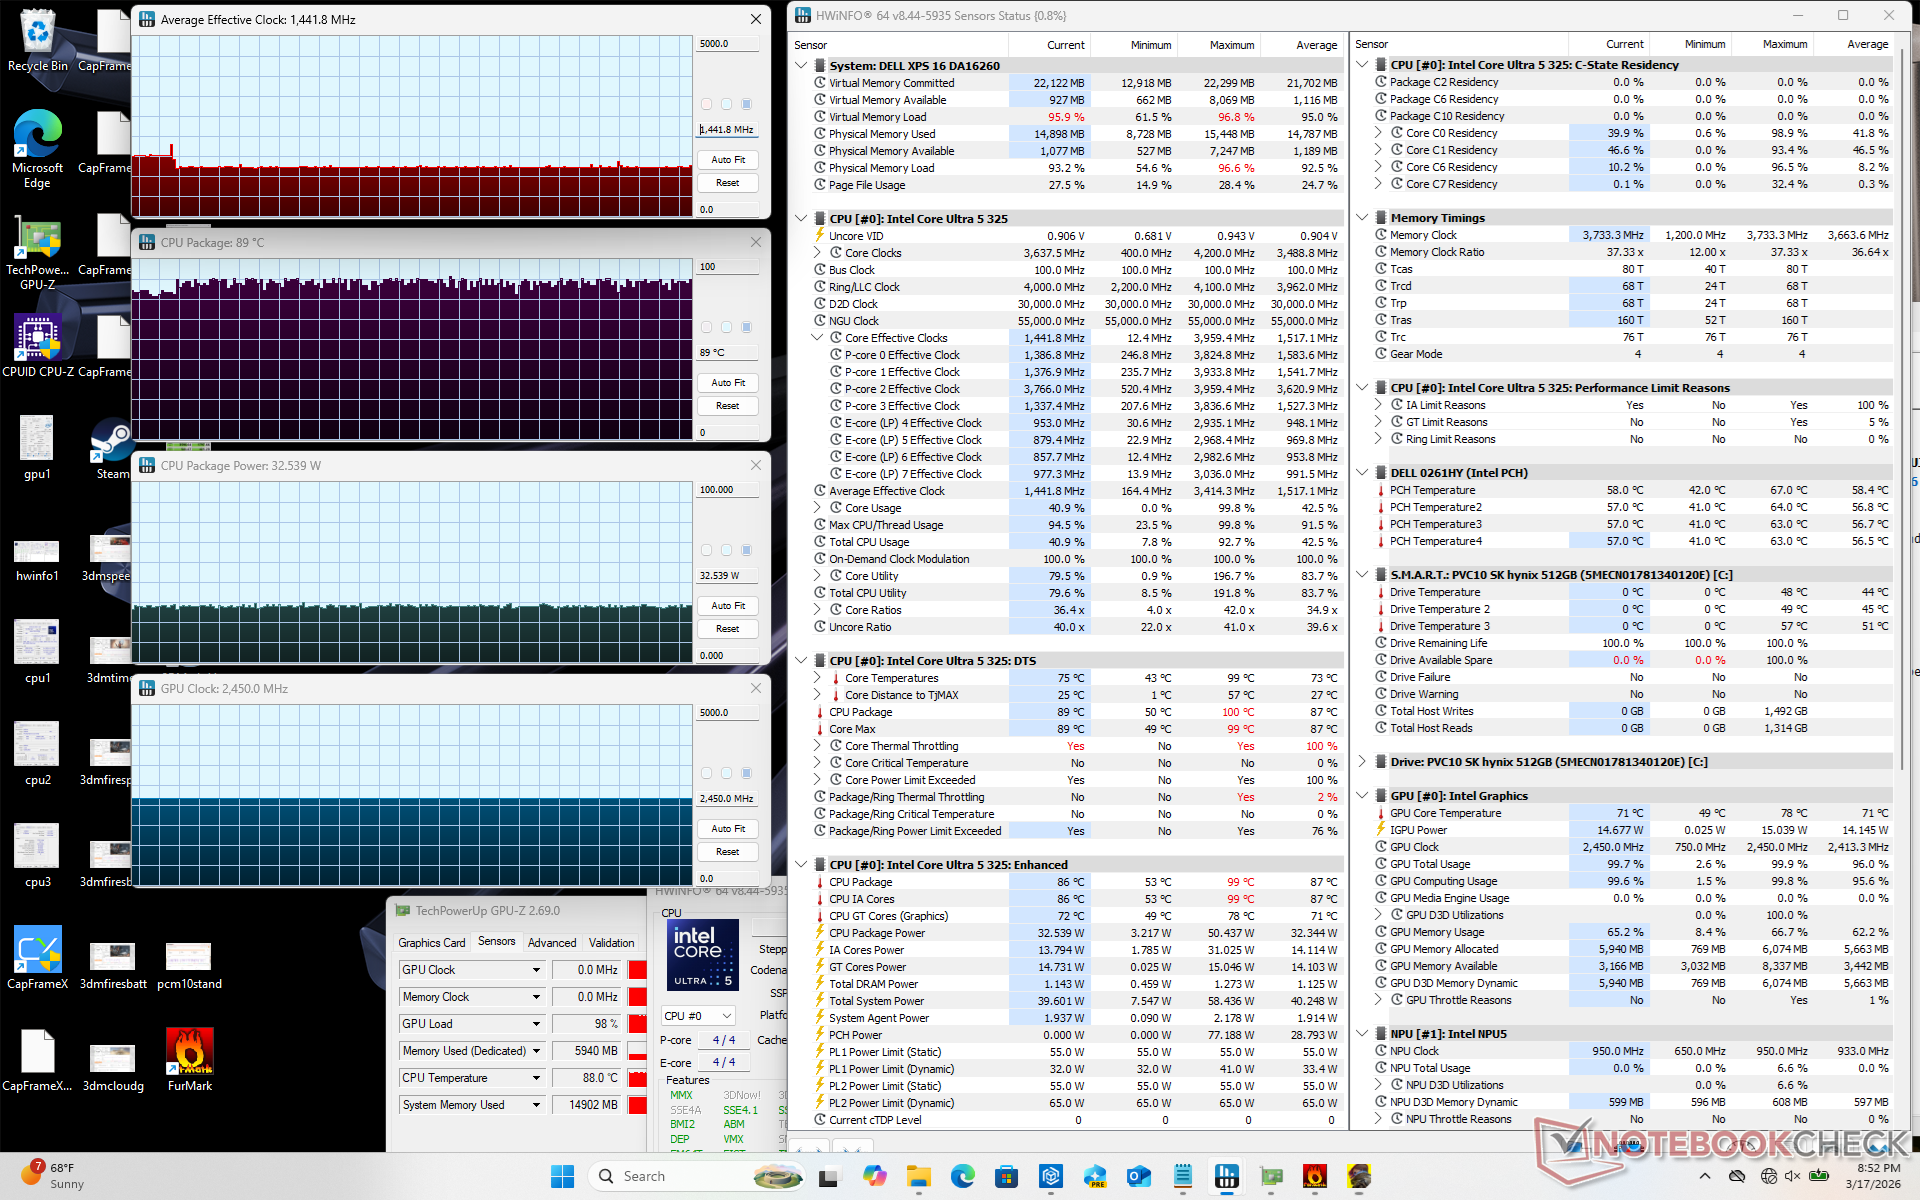
| Average CPU Clock (GHz) | GPU Clock (MHz) | Average CPU Temperature (°C) | |
| System Idle | -- | -- | 47 |
| Prime95 Stress | 3.0 | -- | 86 |
| Prime95 + FurMark Stress | 1.4 | 2350 | 76 |
| Cyberpunk 2077 Stress | 1.4 | 2450 | 89 |
Speakers

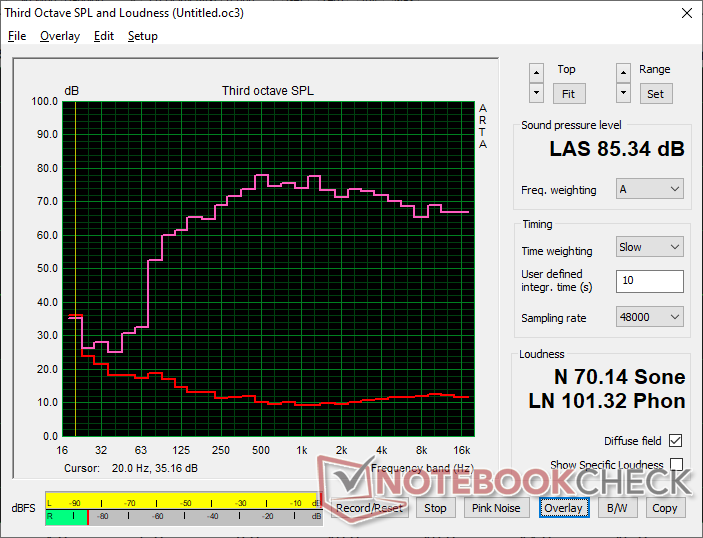
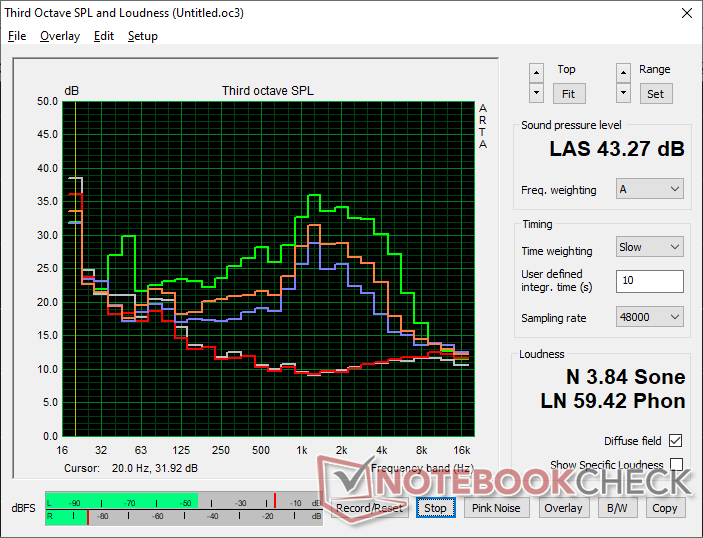
Dell XPS 16 Core Ultra 5 325 audio analysis
(+) | speakers can play relatively loud (85.3 dB)
Bass 100 - 315 Hz
(±) | reduced bass - on average 6.1% lower than median
(+) | bass is linear (5.6% delta to prev. frequency)
Mids 400 - 2000 Hz
(+) | balanced mids - only 3.2% away from median
(+) | mids are linear (4.6% delta to prev. frequency)
Highs 2 - 16 kHz
(+) | balanced highs - only 2.4% away from median
(+) | highs are linear (3.3% delta to prev. frequency)
Overall 100 - 16.000 Hz
(+) | overall sound is linear (7% difference to median)
Compared to same class
» 5% of all tested devices in this class were better, 1% similar, 94% worse
» The best had a delta of 5%, average was 17%, worst was 45%
Compared to all devices tested
» 1% of all tested devices were better, 0% similar, 99% worse
» The best had a delta of 4%, average was 24%, worst was 134%
Apple MacBook Pro 16 2021 M1 Pro audio analysis
(+) | speakers can play relatively loud (84.7 dB)
Bass 100 - 315 Hz
(+) | good bass - only 3.8% away from median
(+) | bass is linear (5.2% delta to prev. frequency)
Mids 400 - 2000 Hz
(+) | balanced mids - only 1.3% away from median
(+) | mids are linear (2.1% delta to prev. frequency)
Highs 2 - 16 kHz
(+) | balanced highs - only 1.9% away from median
(+) | highs are linear (2.7% delta to prev. frequency)
Overall 100 - 16.000 Hz
(+) | overall sound is linear (4.6% difference to median)
Compared to same class
» 0% of all tested devices in this class were better, 0% similar, 100% worse
» The best had a delta of 5%, average was 17%, worst was 45%
Compared to all devices tested
» 0% of all tested devices were better, 0% similar, 100% worse
» The best had a delta of 4%, average was 24%, worst was 134%
Energy Management — Panther Lake Is King Of Efficiency
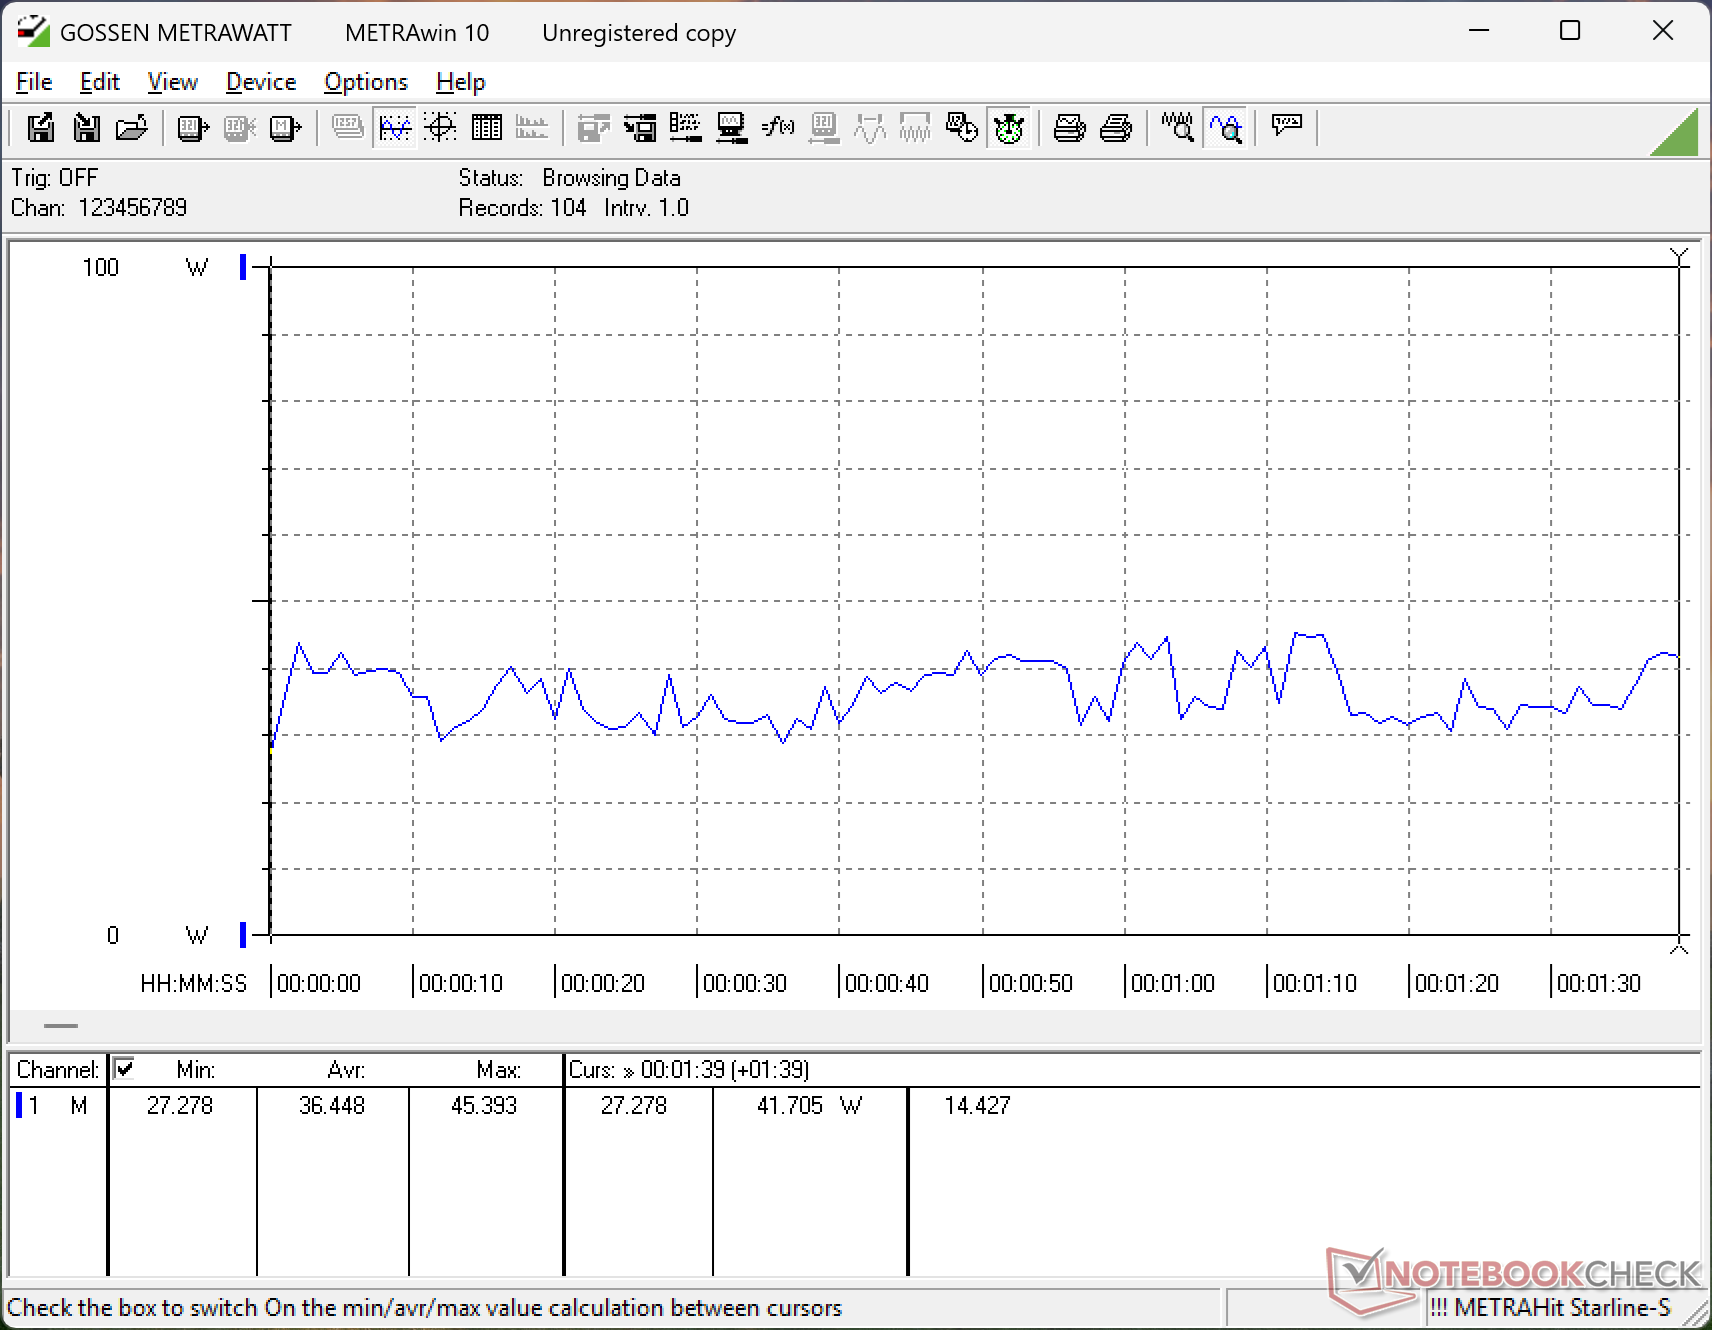
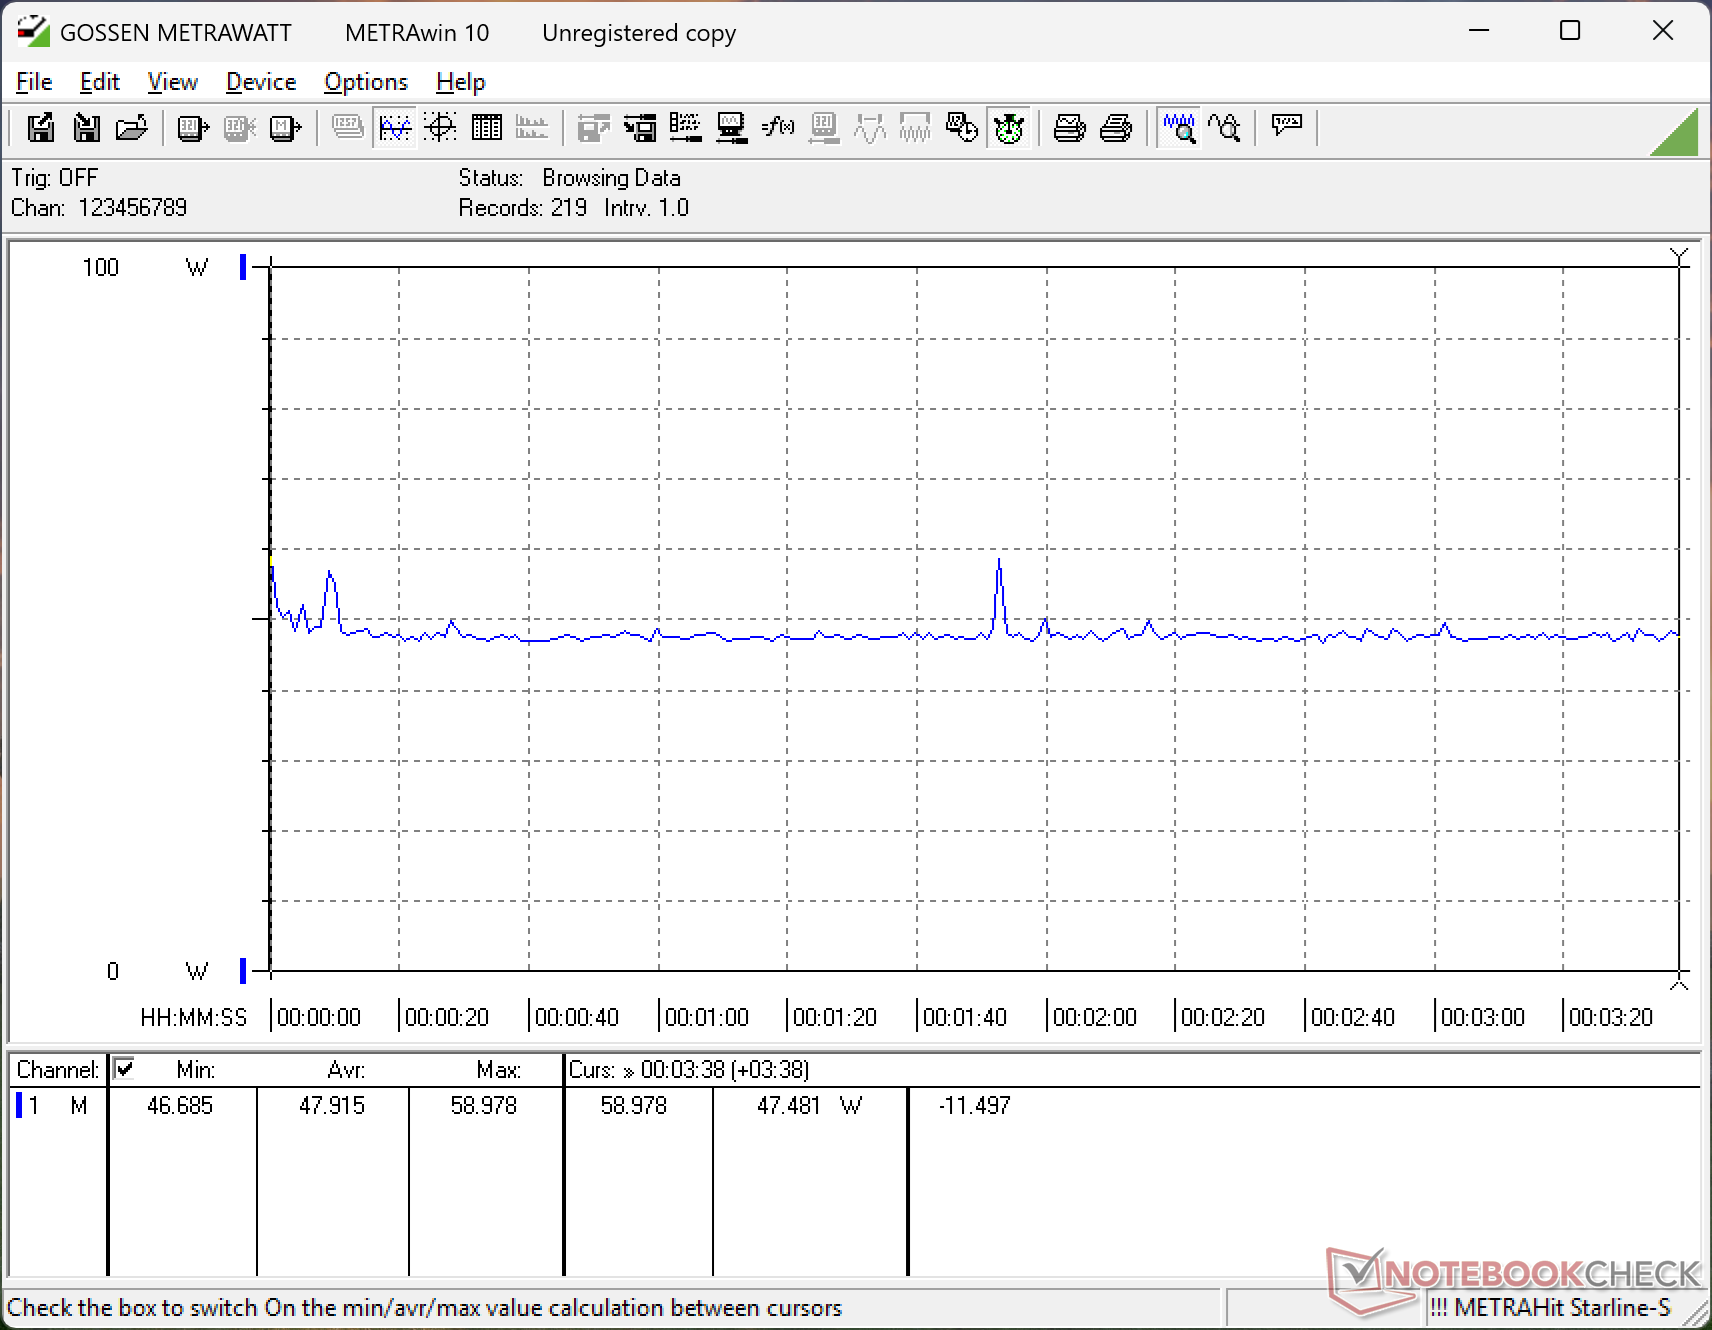
Power Consumption
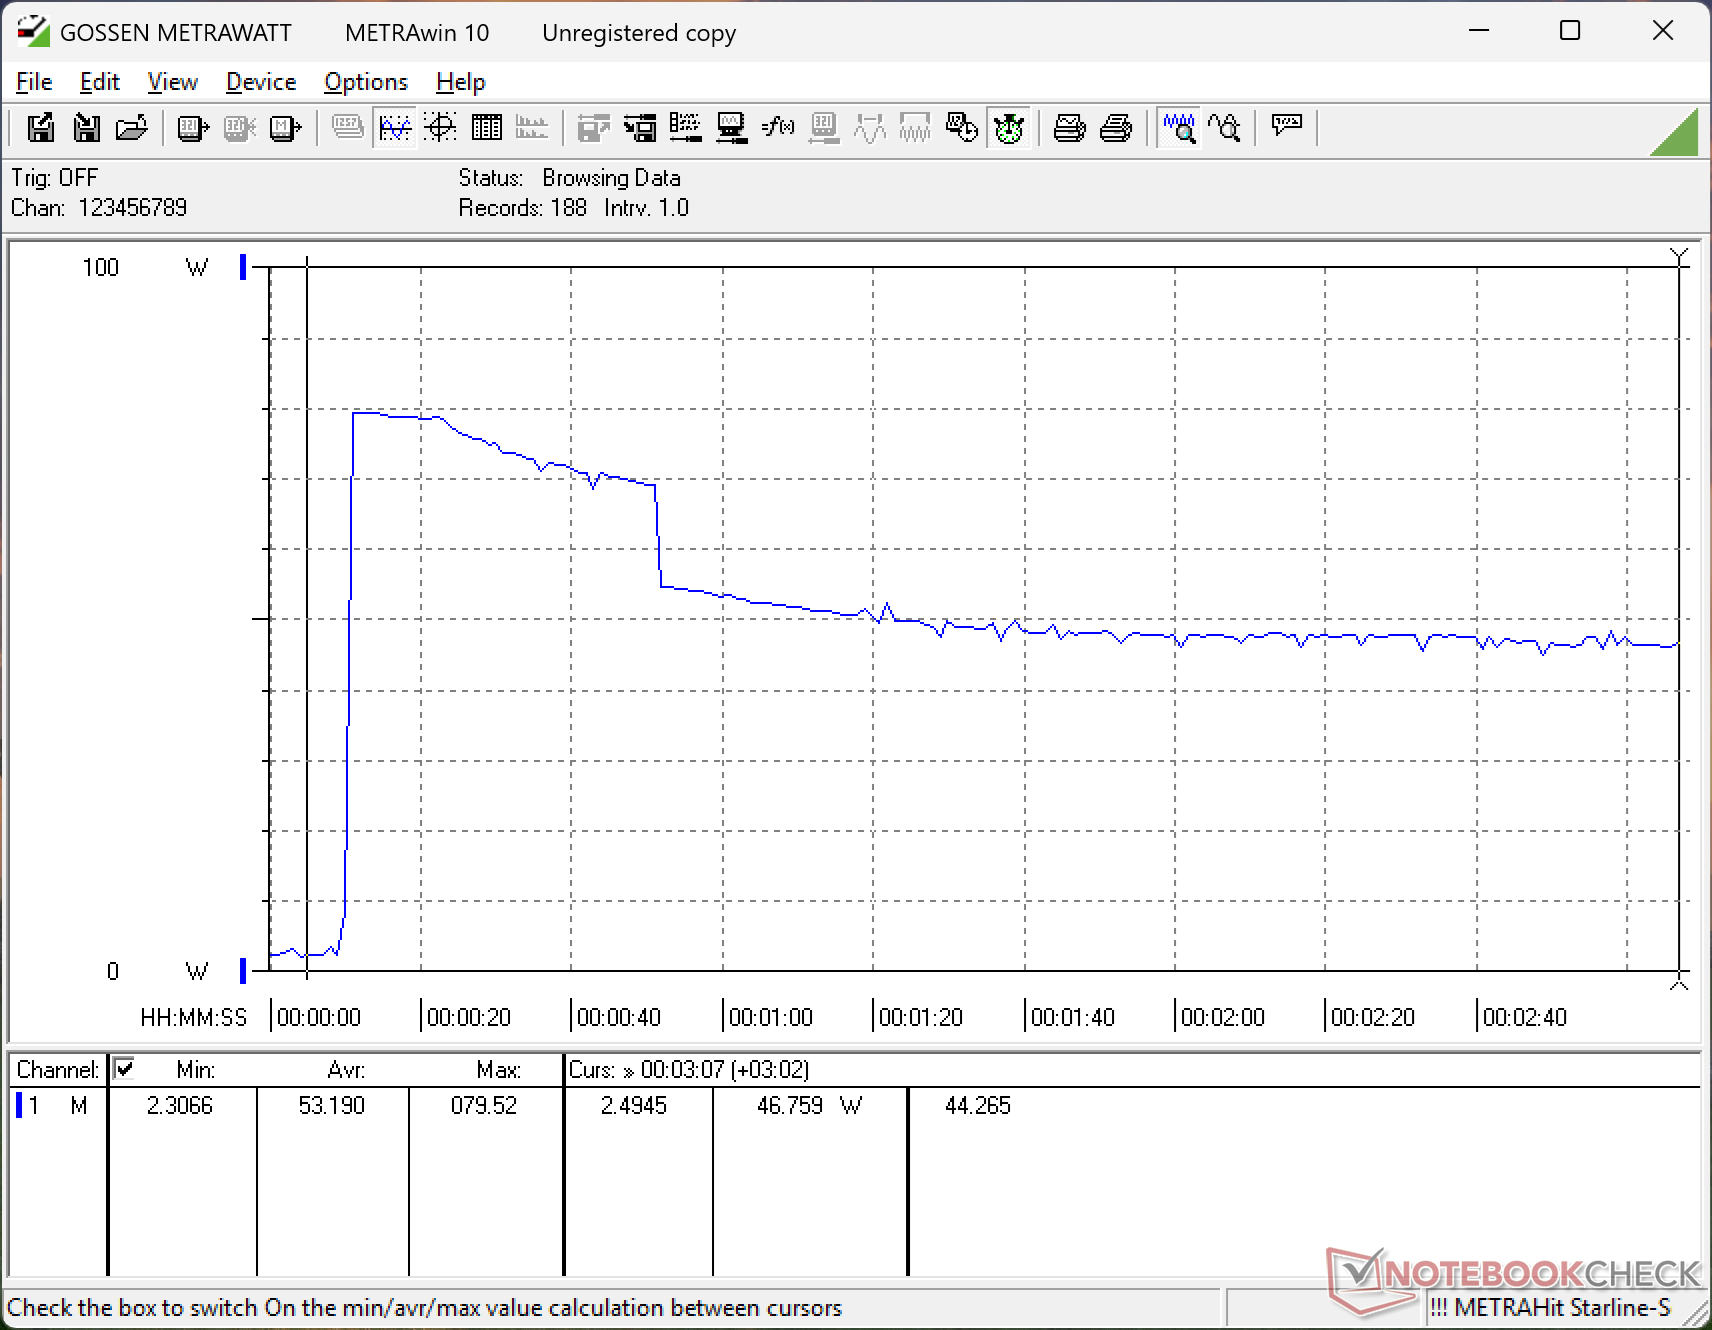
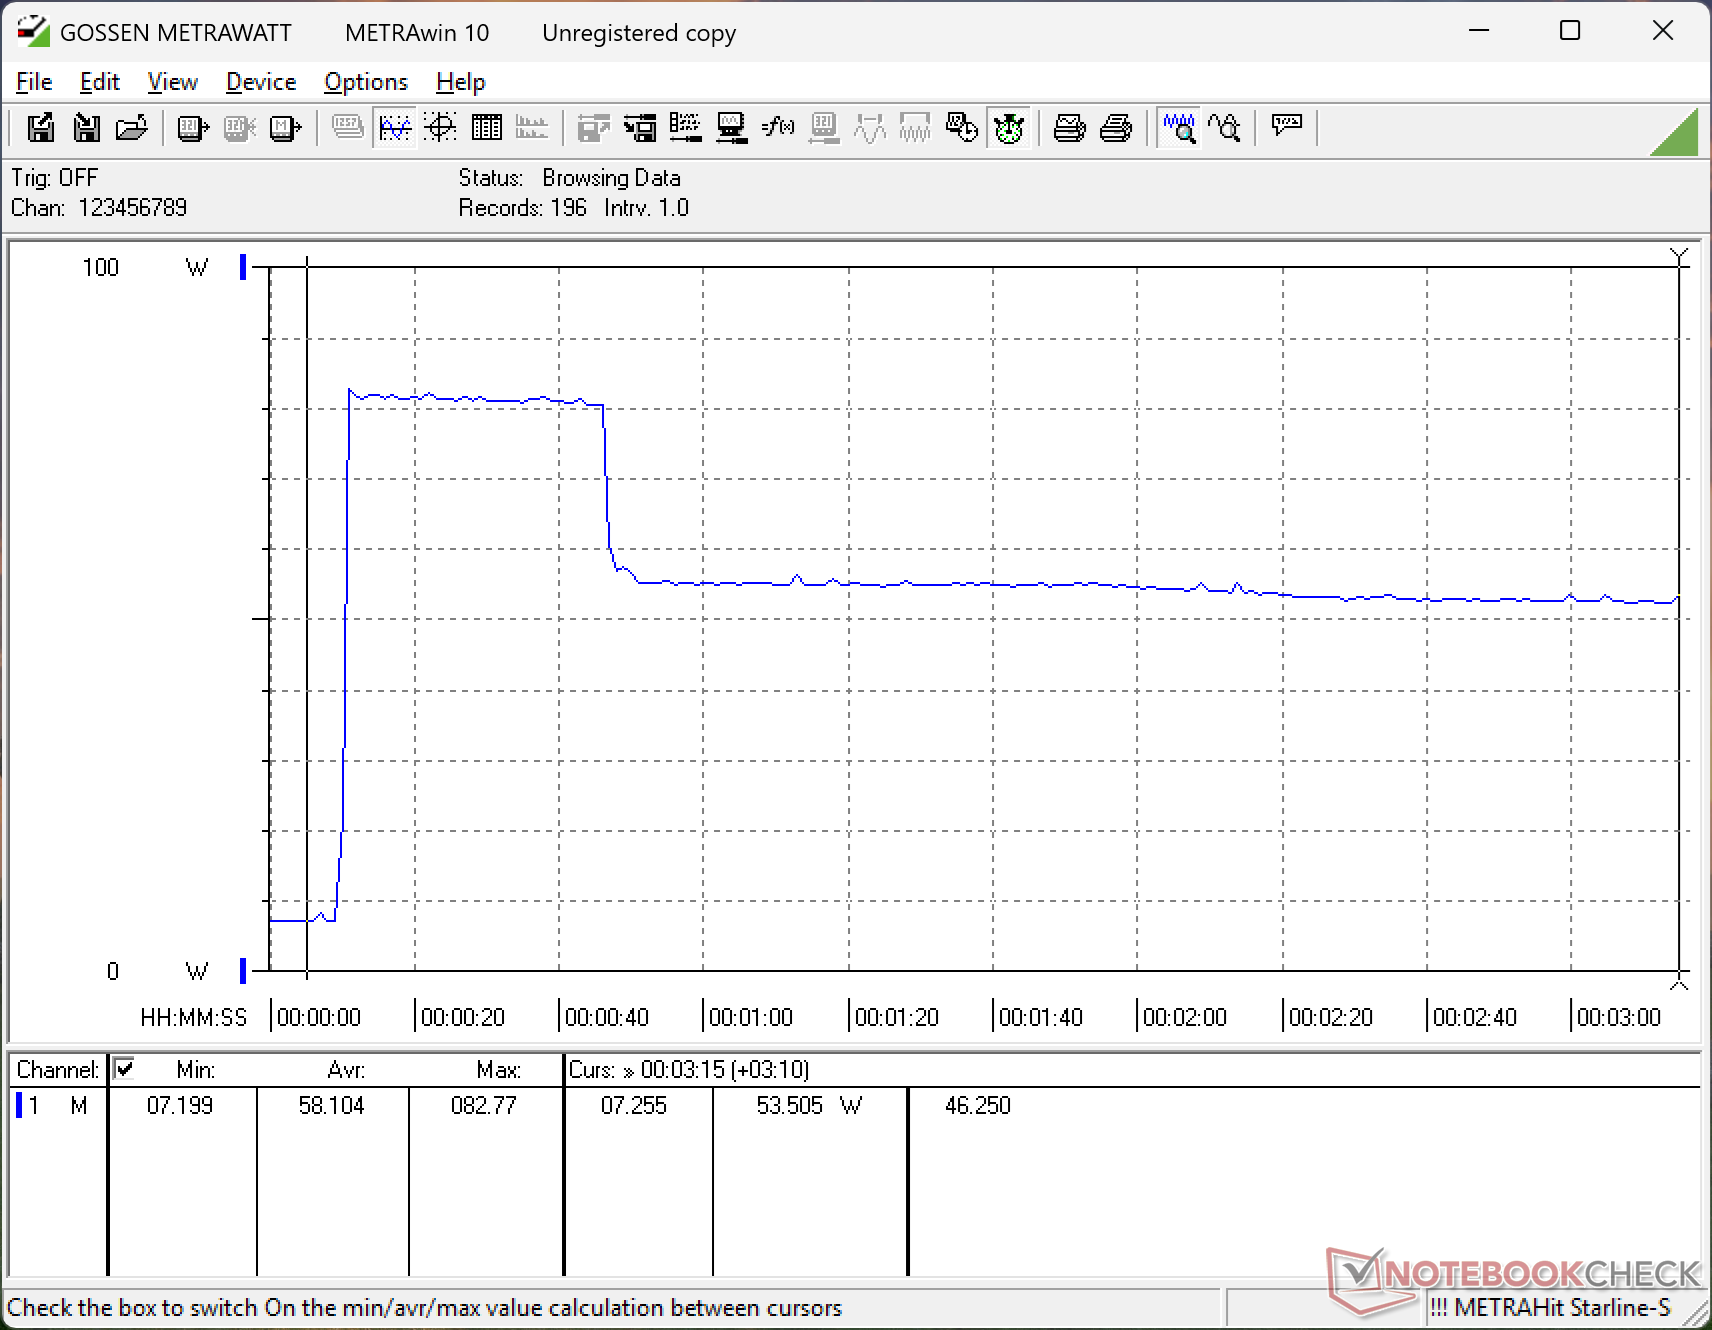
Panther Lake adopts the efficiency of Lunar Lake-V with the raw performance of Arrow Lake-H for the best of both worlds. Idling on desktop at the lowest brightness setting would consume just 1.3 W which is extremely low especially for a 16-inch form factor. Consumption would remain very low at just under 50 W when running games due to the lack of a discrete GPU. If configured with the Core Ultra X7 instead, consumption when gaming would be just a few watts more based on our time with the XPS 14 for some of the highest performance-per-watt numbers of any iGPU laptop.
We're able to record a temporary maximum draw of 83 W from the small (~10.2 x 5.5 x 2.2 cm) 100 W universal USB-C AC adapter when the CPU is fully stressed.
| Off / Standby | |
| Idle | |
| Load |
|
Key:
min: | |
| Dell XPS 16 Core Ultra 5 325 Ultra 5 325, Intel Graphics 4 Xe3 PTL, SK hynix PVC10 HFS512GEM4X182N, IPS, 1920x1200, 16" | Dell 16 Premium DA16250 Ultra 7 255H, GeForce RTX 5070 Laptop, Kioxia BG6 KBG6AZNV1T02, OLED, 3840x2400, 16.3" | Lenovo Yoga Pro 9 16IAH10 RTX 5050 Ultra 9 285H, GeForce RTX 5050 Laptop, WD PC SN7100S SDFPMSL-1T00-1101, OLED, 2880x1800, 16" | Samsung Galaxy Book6 Ultra Ultra 7 356H, GeForce RTX 5070 Laptop, Samsung PM9C1b MZVL81T0HFLB-00BH1, OLED, 2880x1800, 16" | Asus ZenBook S16 UM5606GA Ryzen AI 9 465, Radeon 880M, SanDisk PC SN5100S, OLED, 2880x1800, 16" | MSI Prestige 16 AI Evo B2HMG Ultra 9 285H, Arc 140T, Micron 2500 1TB MTFDKBA1T0QGN, IPS, 2560x1600, 16" | |
|---|---|---|---|---|---|---|
| Power Consumption | -225% | -261% | -119% | -65% | -93% | |
| Idle Minimum * (Watt) | 1.3 | 6.5 -400% | 6.8 -423% | 4.4 -238% | 3.7 -185% | 4.4 -238% |
| Idle Average * (Watt) | 4.5 | 8.1 -80% | 20.1 -347% | 6.4 -42% | 7.4 -64% | 9.2 -104% |
| Idle Maximum * (Watt) | 4.6 | 33 -617% | 21.6 -370% | 7.1 -54% | 9.5 -107% | 9.5 -107% |
| Load Average * (Watt) | 36.5 | 88.9 -144% | 87.6 -140% | 55.1 -51% | 57.9 -59% | 66.9 -83% |
| Cyberpunk 2077 ultra external monitor * (Watt) | 45.4 | 108.9 -140% | 147.9 -226% | 133 -193% | 57 -26% | 67.4 -48% |
| Cyberpunk 2077 ultra * (Watt) | 47.9 | 108.7 -127% | 148.2 -209% | 134.3 -180% | 58.5 -22% | 68.8 -44% |
| Load Maximum * (Watt) | 82.8 | 138.3 -67% | 173.5 -110% | 143.9 -74% | 76.9 7% | 102.9 -24% |
* ... smaller is better
Power Consumption Cyberpunk / Stress Test
Power Consumption external Monitor
Battery Life

Dell advertises a battery life of up to 31 hours based on their in-house WLAN testing criteria. When testing under our own WLAN conditions, however, we're able to record a runtime of almost 27 hours which is still insanely impressive given that the 70 Wh battery capacity is actually on the small side for a 16-inch form factor.
| Dell XPS 16 Core Ultra 5 325 Ultra 5 325, Intel Graphics 4 Xe3 PTL, 70 Wh | Dell XPS 16 9640 Ultra 7 155H, GeForce RTX 4070 Laptop GPU, 99.5 Wh | Lenovo Yoga Pro 9 16IAH10 RTX 5050 Ultra 9 285H, GeForce RTX 5050 Laptop, 84 Wh | Samsung Galaxy Book6 Ultra Ultra 7 356H, GeForce RTX 5070 Laptop, 80.2 Wh | Asus ZenBook S16 UM5606GA Ryzen AI 9 465, Radeon 880M, 83 Wh | MSI Prestige 16 AI Evo B2HMG Ultra 9 285H, Arc 140T, 99.9 Wh | |
|---|---|---|---|---|---|---|
| Battery runtime | -61% | -60% | -37% | -51% | -38% | |
| WiFi v1.3 (h) | 26.6 | 10.5 -61% | 10.7 -60% | 16.8 -37% | 13.1 -51% | 16.5 -38% |
| H.264 (h) | 16.5 | 20.8 | ||||
| Load (h) | 1.5 | 2.4 |
Notebookcheck Rating
The 2026 XPS 16 sacrifices discrete GPU options for a leaner, lighter, quieter, longer-lasting and more efficient design.
Dell XPS 16 Core Ultra 5 325
- 03/20/2026 v8
Allen Ngo
 Total Sustainability Score:
 Potential Competitors in Comparison
Image | Model / Review | Price | Weight | Height | Display |
|---|---|---|---|---|---|
1. 84.2%  | Dell XPS 16 Core Ultra 5 325 Intel Core Ultra 5 325 ⎘ Intel Graphics 4 Xe3 Panther Lake iGPU ⎘ 16 GB Memory, 512 GB SSD | Amazon: 1. $2,685.51 Dell Premium 16 (XPS 16 2025... 2. $2,599.00 Dell Premium 16 (XPS 16 2025... 3. $1,977.99 Dell Premium 16 (Previously ... List Price: 1600 USD | 1.7 kg | 15.4 mm | 16.00" 1920x1200 142 PPI IPS |
2. 87.9%  | Dell 16 Premium DA16250 Intel Core Ultra 7 255H ⎘ NVIDIA GeForce RTX 5070 Laptop ⎘ 32 GB Memory, 1024 GB SSD | Amazon: List Price: 3300 USD | 2.3 kg | 18.7 mm | 16.30" 3840x2400 278 PPI OLED |
3. 88.8%  | Lenovo Yoga Pro 9 16IAH10 RTX 5050 Intel Core Ultra 9 285H ⎘ NVIDIA GeForce RTX 5050 Laptop ⎘ 32 GB Memory, 1024 GB SSD | Amazon: List Price: 1800 USD | 2 kg | 17.9 mm | 16.00" 2880x1800 212 PPI OLED |
4. 90.7%  | Samsung Galaxy Book6 Ultra Intel Core Ultra 7 356H ⎘ NVIDIA GeForce RTX 5070 Laptop ⎘ 32 GB Memory, 1000 GB SSD | Amazon: List Price: 3599€ | 1.9 kg | 15.4 mm | 16.00" 2880x1800 212 PPI OLED |
5. 86.6%  | Asus ZenBook S16 UM5606GA AMD Ryzen AI 9 465 ⎘ AMD Radeon 880M ⎘ 32 GB Memory, 1024 GB SSD | Amazon: List Price: 1799€ | 1.5 kg | 12.9 mm | 16.00" 2880x1800 212 PPI OLED |
6. 82.8%  | MSI Prestige 16 AI Evo B2HMG Intel Core Ultra 9 285H ⎘ Intel Arc Graphics 140T ⎘ 32 GB Memory, 1024 GB SSD | Amazon: 1. $1,479.00 MSI Prestige 16 AI+ Evo 16" ... 2. $1,397.87 MSI Prestige 14 AI+ EVO PRE1... 3. $1,199.00 msi Prestige A16 AI+ (2025) ... | 1.6 kg | 18.95 mm | 16.00" 2560x1600 189 PPI IPS |
Transparency
The selection of devices to be reviewed is made by our editorial team. The test sample was freely purchased by the author at his/her own expense. The lender had no influence on this review, nor did the manufacturer receive a copy of this review before publication. There was no obligation to publish this review. As an independent media company, Notebookcheck is not subjected to the authority of manufacturers, retailers or publishers.
This is how Notebookcheck is testing
Every year, Notebookcheck independently reviews hundreds of laptops and smartphones using standardized procedures to ensure that all results are comparable. We have continuously developed our test methods for around 20 years and set industry standards in the process. In our test labs, high-quality measuring equipment is utilized by experienced technicians and editors. These tests involve a multi-stage validation process. Our complex rating system is based on hundreds of well-founded measurements and benchmarks, which maintains objectivity. Further information on our test methods can be found here.
