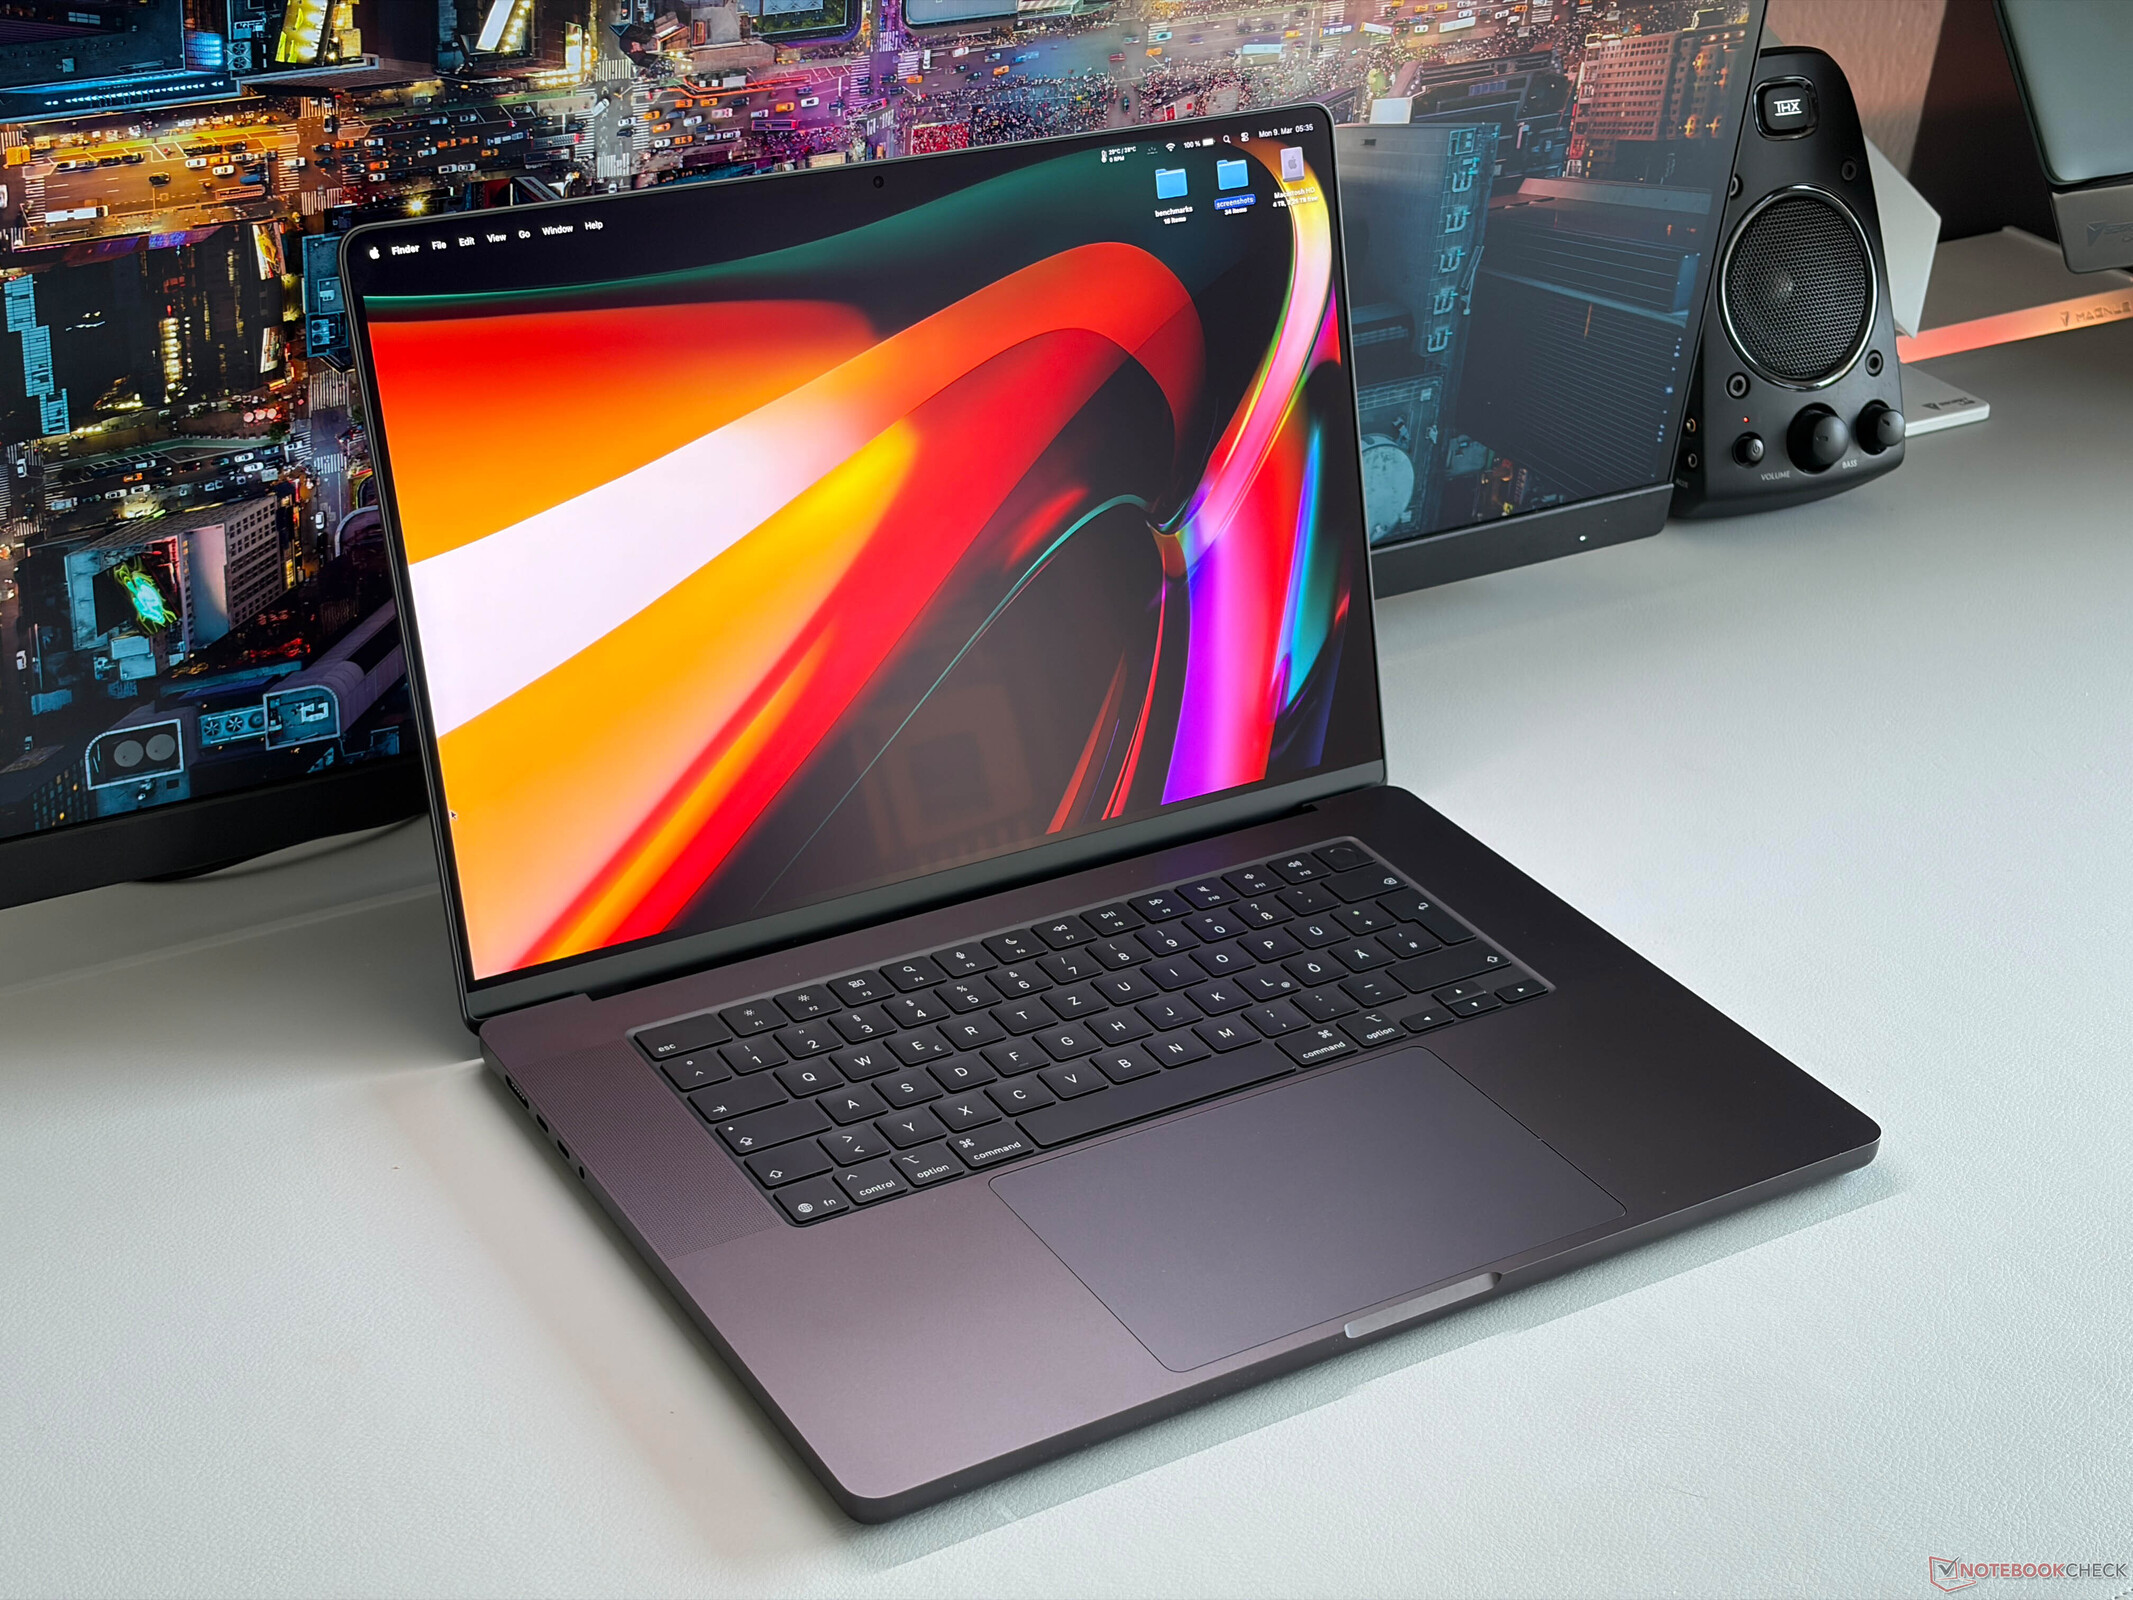
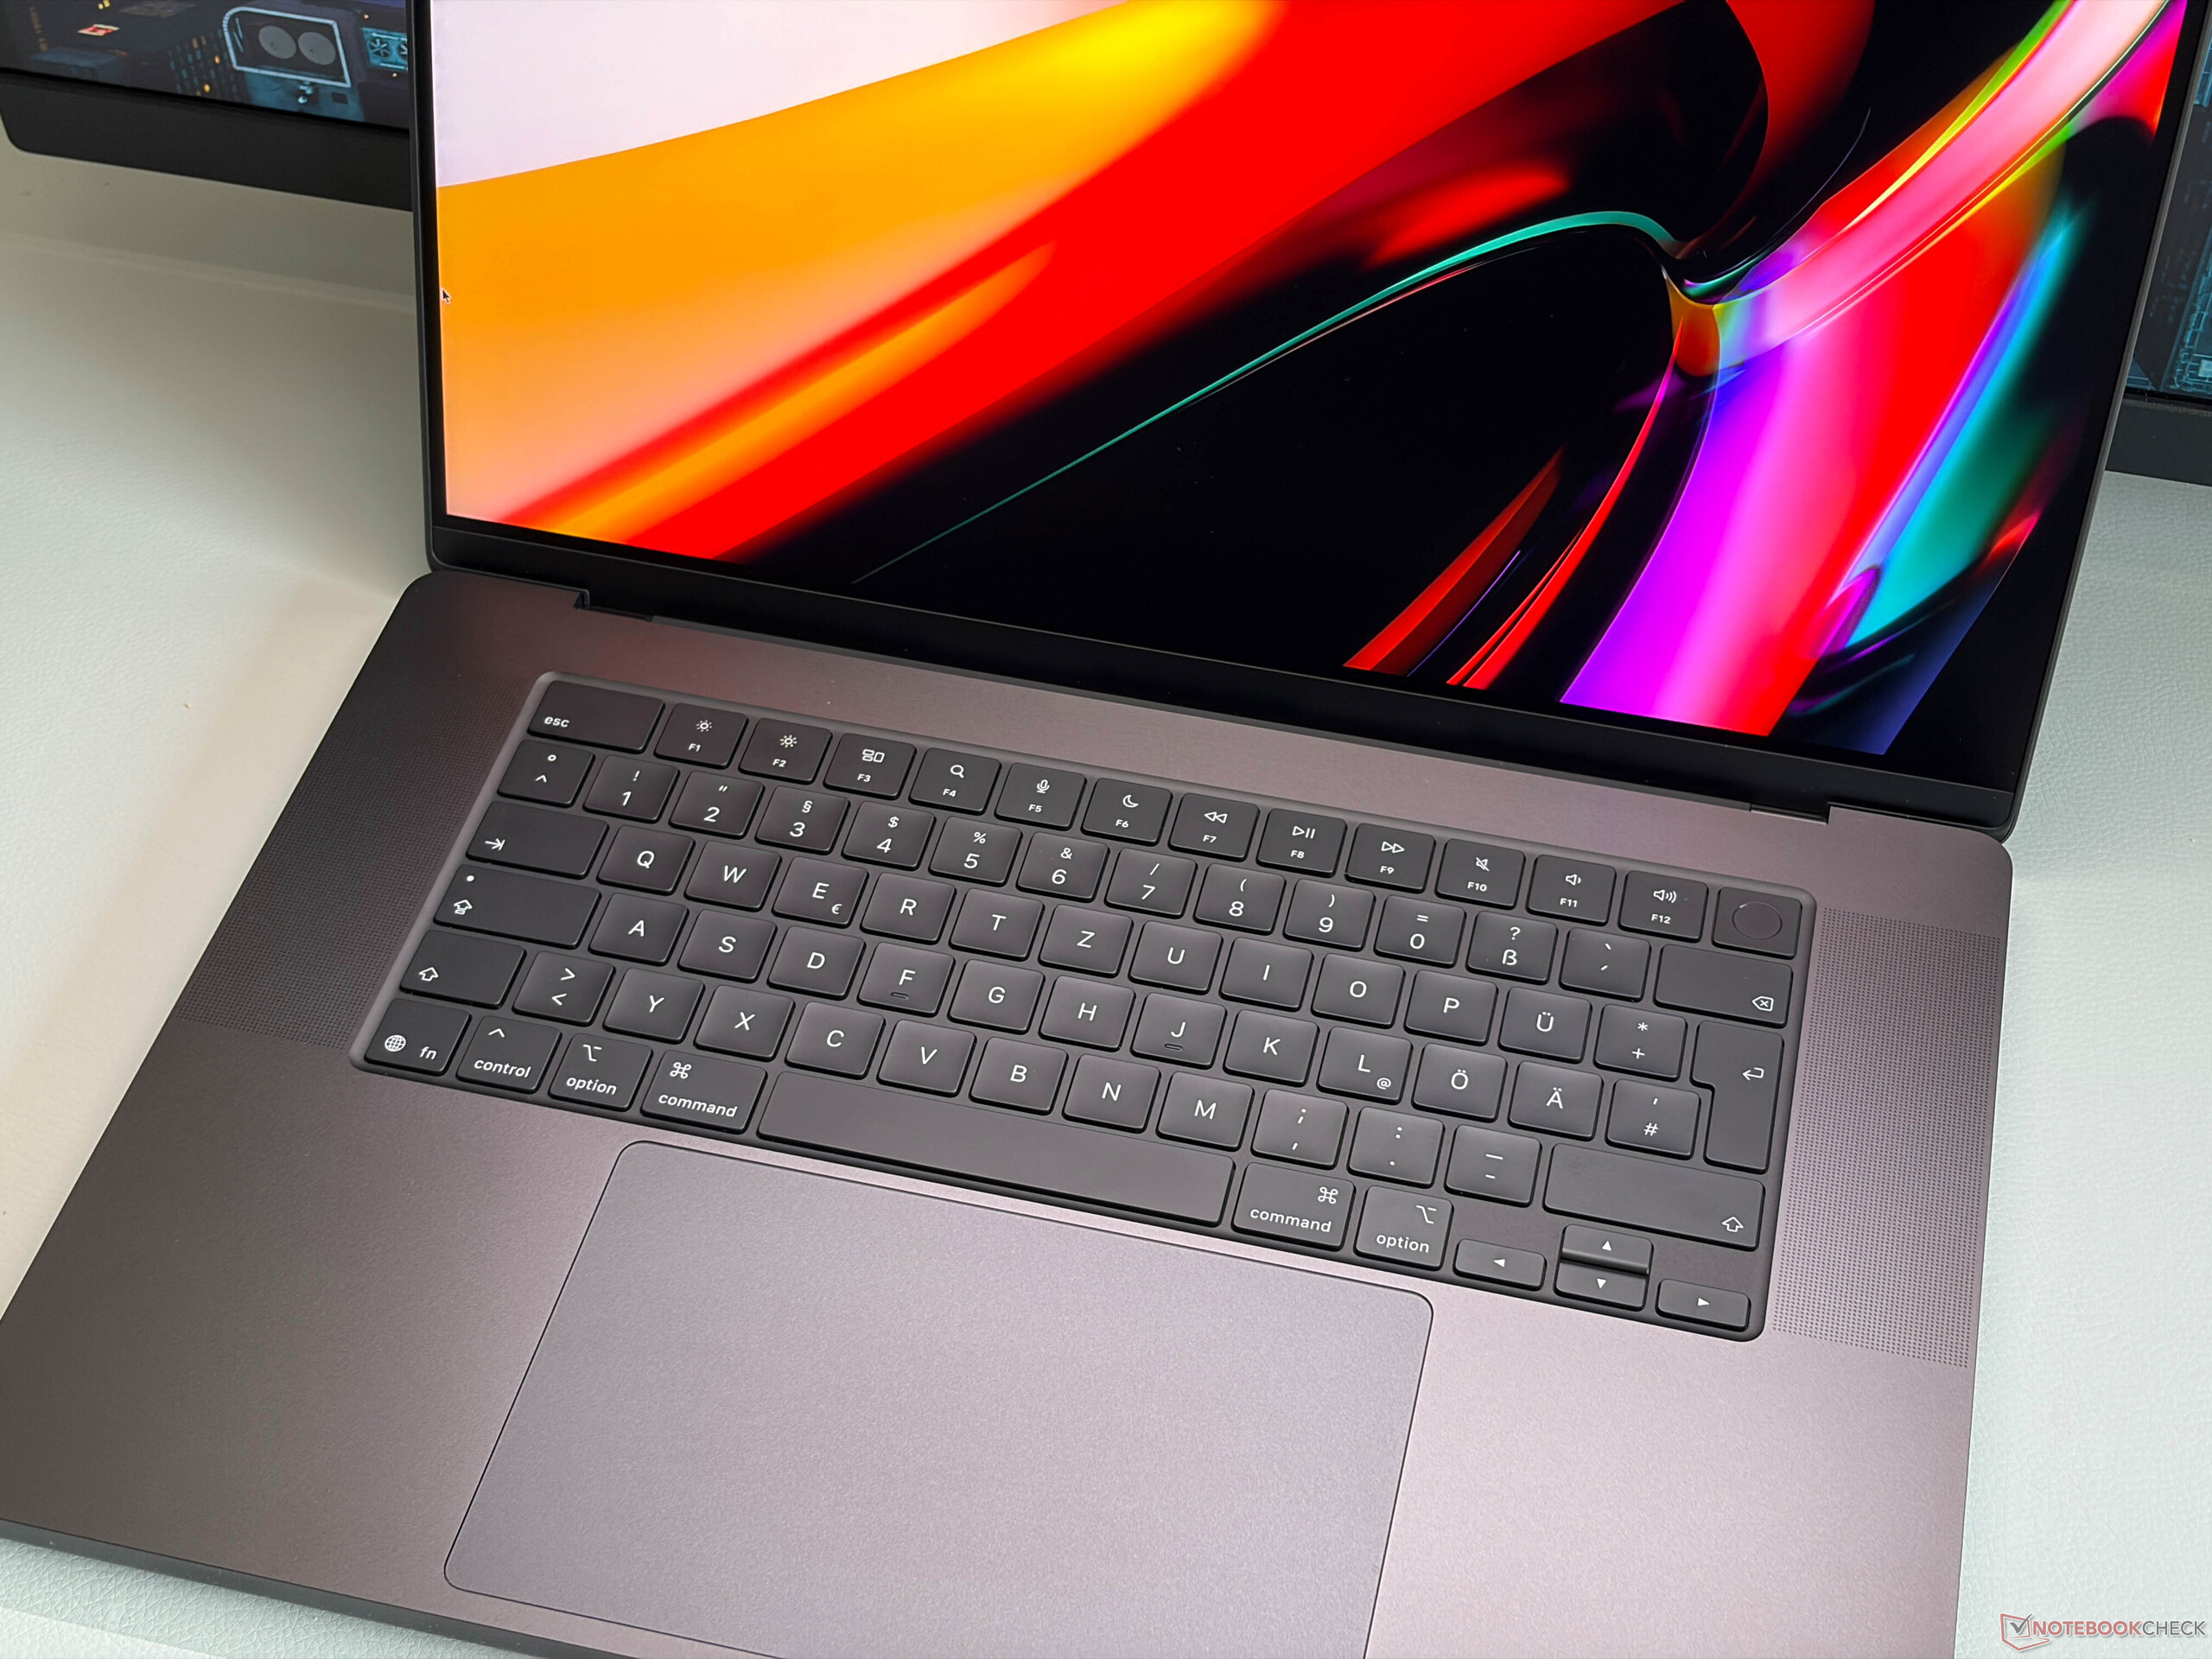
Verdict - M5 Pro is a perfect fit for the MacBook Pro 16
The new Apple M5 Pro SoC is a perfect fit for the MacBook Pro 16 because it can utilize the full performance of the chip without throttling. We see noticeable performance advantages over the previous M4 Pro chip (~20 % CPU, 30-50 % GPU) and Apple also includes Wi-Fi 7 as well as much faster PCIe 5.0 SSDs. The battery runtime is a bit shorter compared to our previous M4 Pro review unit, but the additional RAM most likely increases the power consumption as well.
Other aspects remain unchanged, which means you get Thunderbolt 5 ports, but still no SD Express support for the card reader. The Mini-LED panel is still among the best, and the optional matte surface is big advantage over most rivals; only Lenovo offers a matte Tandem-OLED panel in the ThinkPad T1g. The MacBook also stays very quiet in most scenarios.
Prices are still high, especially when you add upgrades. Windows laptops with the RTX 5070 offer more GPU performance, even though the MacBook is obviously not limited to 8 GB VRAM, which is a big advantage for creative workflows. The included 140W PSU is also insufficient, even though the issue is not nearly as bad as on the M5 Max model, which we will see in the upcoming review of the MacBook Pro 14 M5 Max.
All in all, the MacBook Pro 16 got even better with the new M5 Pro chip and additions like Wi-Fi 7 as well as PCIe 5.0.
Pros
Cons
Table of Contents
Apple launches the updated MacBook Pro 16 with the new M5 Pro SoC. The base model for $2699 features 24 GB and now comes with twice the storage at 1 TB, which is also faster than before (PCIe 5.0). Wi-Fi 7 is included as well. Our review unit has some pricey upgrades (matte nano-texture display, 64 GB RAM, 4 TB SSD storage), which increases the price to $4449.
Specifications
Changes compared to the MacBook Pro 16 M4 Pro
Apple did not change the chassis, which includes the connectivity (3x Thunderbolt 5) as well as the 12 MP center stage webcam as well as the input devices and the Mini-LED panel. Please see our comprehensive review of the M4 Pro MacBook Pro 16 for more information on these topics. The maintenance options are still limited to the fans and the battery, while all the other components are soldered.
The SD-card reader also stayed the same, which means the performance is good for the UHS standard, but the latest SD Express standard is not supported. The new Apple N1 chip provides Wi-Fi 7 as well as Bluetooth 6 and the transfer rates in our test were very high and stable.


| SD Card Reader | |
| average JPG Copy Test (av. of 3 runs) | |
| Lenovo ThinkPad T1g Gen 8 21TD003GE (ADATA SD8.0 Express 512 GBAV Pro V60) | |
| Lenovo ThinkPad T1g Gen 8 21TD003GE (Angelbird AV Pro V60) | |
| Asus ProArt P16 H7606WP (Angelbird AV Pro V60) | |
| Apple MacBook Pro 16 2024 M4 Pro (Angelbird AV Pro V60) | |
| Apple MacBook Pro 16 2026 M5 Pro (Angelbird AV Pro V60) | |
| Average of class Multimedia (23 - 531, n=41, last 2 years) | |
| Lenovo Yoga Pro 9i 16 RTX 5070 (Angelbird AV Pro V60) | |
| Samsung Galaxy Book6 Ultra (Angelbird AV Pro V60) | |
| maximum AS SSD Seq Read Test (1GB) | |
| Lenovo ThinkPad T1g Gen 8 21TD003GE (ADATA SD8.0 Express 512 GB) | |
| Lenovo ThinkPad T1g Gen 8 21TD003GE (Angelbird AV Pro V60) | |
| Asus ProArt P16 H7606WP (Angelbird AV Pro V60) | |
| Apple MacBook Pro 16 2024 M4 Pro (Angelbird AV Pro V60) | |
| Apple MacBook Pro 16 2026 M5 Pro (Angelbird AV Pro V60) | |
| Average of class Multimedia (37.3 - 1455, n=40, last 2 years) | |
| Lenovo Yoga Pro 9i 16 RTX 5070 (Angelbird AV Pro V60) | |
| Samsung Galaxy Book6 Ultra (Angelbird AV Pro V60) | |
| Networking | |
| Apple MacBook Pro 16 2026 M5 Pro | |
| iperf3 transmit AXE11000 | |
| iperf3 receive AXE11000 | |
| Samsung Galaxy Book6 Ultra | |
| iperf3 transmit AXE11000 | |
| iperf3 receive AXE11000 | |
| Lenovo ThinkPad T1g Gen 8 21TD003GE | |
| iperf3 transmit AXE11000 | |
| iperf3 receive AXE11000 | |
| Lenovo Yoga Pro 9i 16 RTX 5070 | |
| iperf3 transmit AXE11000 | |
| iperf3 receive AXE11000 | |
| Apple MacBook Pro 16 2024 M4 Pro | |
| iperf3 transmit AXE11000 | |
| iperf3 receive AXE11000 | |
| Asus ProArt P16 H7606WP | |
| iperf3 transmit AXE11000 | |
| iperf3 receive AXE11000 | |
Sustainability
Apple offers a comprehensive environmental report including data about the CO2 emissions as well as recycled contents. The following image shows exemplary data for the base model of the MacBook Pro 16 M5 Pro and the highest shown M5-Pro-SKU with 48 GB RAM and 1 TB SSD storage has a carbon footprint of 284 kg CO2e.

Update - Temporal Dithering
We tested the Mini-LED panel of the MacBook Pro 16 for temporal dithering. It uses a regular IPS screen, but with Mini-LED backlighting, so this might be a potential issue just like we saw on the MacBook Neo. However, as shown by the video below, there are no signs of temporal dithering (60 % gray, 153 153 153).
Performance - M5 Pro & PCIe 5.0
The new MacBook Pro 16 is always equipped with the fastest M5 Pro chip with 18 CPU cores and 20 GPU cores. You also get at least 24 GB LPDDR5x-9600 RAM and 1 TB of faster PCIe 5.0 storage.


Testing Conditions
The MacBook Pro offers three different performance modes: the default Auto mode, Low Power & High Power. The maximum CPU performance is only available in High Power mode, while the GPU and gaming performances do not differ. We used the High Power mode for our benchmarks to show the maximum performance potential of the M5 Pro. All three modes are also available on battery power with the same performance figures.
| CPU (Watts) | CB2024 Multi (points) |
GPU (Watts) | Steel Nomad (points) |
Cyberpunk 2077 1080p Ultra (fps) |
TDP Stress test CPU&GPU (Watts) |
max. fan noise (dB(A)) | |
|---|---|---|---|---|---|---|---|
| Low Power | 12 | 853 | 8 | 1266 | 31.1 | 10 | inaudible (1400 rpm) |
| Auto | 72/52 | 1537 | 38 | 2314 | 57.5 | 88/50 | 41.6 (3600 rpm) |
| High Power | 72/62 | 2053 | 38 | 2323 | 57.5 | 92/70 | 51.7 -> 49.6 (4600 rpm) |
Processor - M5 Pro with 18 CPU cores
The MacBook Pro 16 is equipped with the new M5 Pro SoC that uses 18 CPU cores (6 super cores, 12 performance cores) and it is identical to the CPU of the new M5 Max. Please see our CPU analysis for more information about the chip details and efficiency figures.
As shown in the table above, the CPU consumes up to 72 Watts under load and settles at 62 Watts under sustained workloads, so the overall performance is very stable. The benchmark results are very good and the new M5 Pro CPU is a little bit faster than the old M4 Max and around 20 % faster than the previous M4 Pro. However, this also means the new M5 Max is actually not much faster than the old M4 Max.
Cinebench 2024: CPU Multi Core | CPU Single Core
Geekbench 6.7: Multi-Core | Single-Core
| CPU Performance rating | |
| Apple MacBook Pro 16 2026 M5 Pro | |
| Average Apple M5 Pro 18-Core | |
| Apple MacBook Pro 16 M4 Max | |
| Apple MacBook Pro 16 2024 M4 Pro | |
| Lenovo Yoga Pro 9i 16 RTX 5070 | |
| Lenovo ThinkPad T1g Gen 8 21TD003GE | |
| Samsung Galaxy Book6 Ultra | |
| Asus ProArt P16 RTX 5090 | |
| Asus ProArt P16 H7606WP | |
| Average of class Multimedia | |
| Cinebench 2024 / CPU Multi Core | |
| Apple MacBook Pro 16 2026 M5 Pro | |
| Average Apple M5 Pro 18-Core (n=1) | |
| Apple MacBook Pro 16 M4 Max | |
| Apple MacBook Pro 16 M4 Max | |
| Apple MacBook Pro 16 2024 M4 Pro | |
| Asus ProArt P16 RTX 5090 | |
| Samsung Galaxy Book6 Ultra | |
| Asus ProArt P16 H7606WP | |
| Lenovo Yoga Pro 9i 16 RTX 5070 | |
| Lenovo ThinkPad T1g Gen 8 21TD003GE | |
| Average of class Multimedia (327 - 2437, n=76, last 2 years) | |
| Cinebench 2024 / CPU Single Core | |
| Apple MacBook Pro 16 2026 M5 Pro | |
| Average Apple M5 Pro 18-Core (n=1) | |
| Apple MacBook Pro 16 2024 M4 Pro | |
| Apple MacBook Pro 16 M4 Max | |
| Average of class Multimedia (72.5 - 201, n=60, last 2 years) | |
| Lenovo Yoga Pro 9i 16 RTX 5070 | |
| Lenovo ThinkPad T1g Gen 8 21TD003GE | |
| Samsung Galaxy Book6 Ultra | |
| Asus ProArt P16 H7606WP | |
| Asus ProArt P16 RTX 5090 | |
| Geekbench 6.7 / Multi-Core | |
| Apple MacBook Pro 16 2026 M5 Pro | |
| Average Apple M5 Pro 18-Core (n=1) | |
| Apple MacBook Pro 16 M4 Max | |
| Apple MacBook Pro 16 2024 M4 Pro | |
| Lenovo Yoga Pro 9i 16 RTX 5070 | |
| Lenovo ThinkPad T1g Gen 8 21TD003GE | |
| Samsung Galaxy Book6 Ultra | |
| Asus ProArt P16 RTX 5090 | |
| Asus ProArt P16 H7606WP | |
| Average of class Multimedia (4983 - 29415, n=72, last 2 years) | |
| Geekbench 6.7 / Single-Core | |
| Apple MacBook Pro 16 2026 M5 Pro | |
| Average Apple M5 Pro 18-Core (n=1) | |
| Apple MacBook Pro 16 M4 Max | |
| Apple MacBook Pro 16 2024 M4 Pro | |
| Lenovo Yoga Pro 9i 16 RTX 5070 | |
| Lenovo ThinkPad T1g Gen 8 21TD003GE | |
| Asus ProArt P16 RTX 5090 | |
| Asus ProArt P16 H7606WP | |
| Average of class Multimedia (1534 - 4335, n=71, last 2 years) | |
| Samsung Galaxy Book6 Ultra | |
System Performance
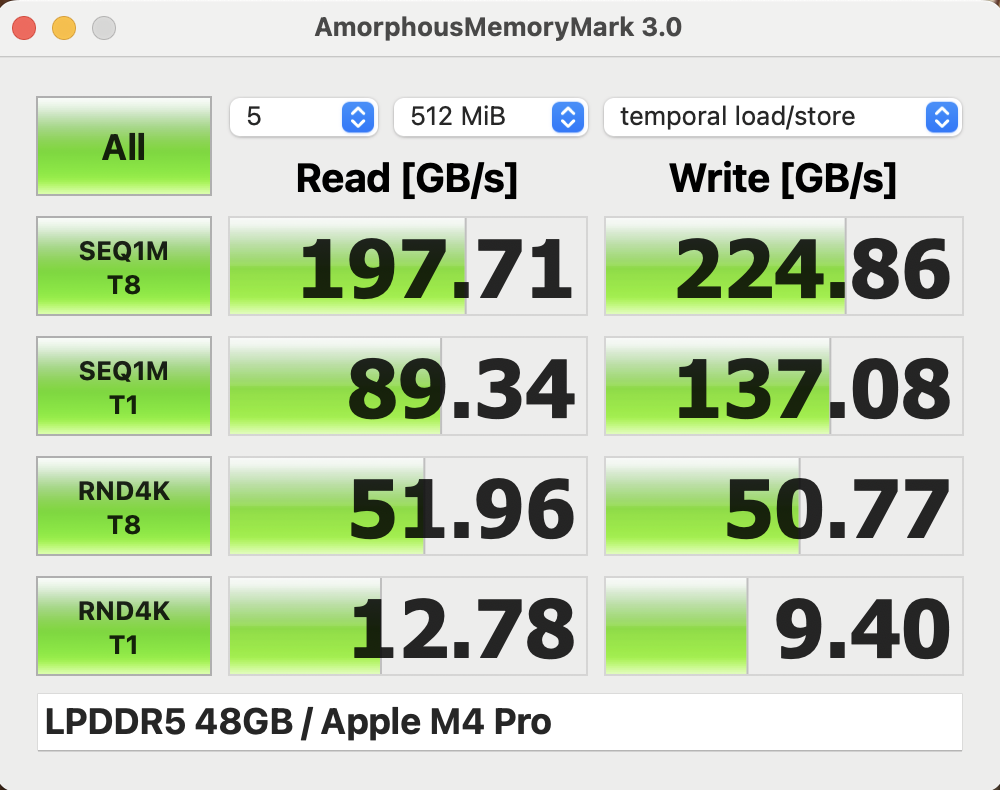
The subjective system performance is once again excellent and the benchmark results support this impression. Apple also increased the memory bandwidth slightly compared to the M4 Pro. Overall, you will not notice a difference compared to the more expensive MacBook Pro models with the M5 Max or the much more affordable base model of the MacBook Pro 16 M5 or the old MacBook Pro 16 M4 Pro in everyday scenarios.

CrossMark: Overall | Productivity | Creativity | Responsiveness
WebXPRT 3: Overall
WebXPRT 4: Overall
Mozilla Kraken 1.1: Total
| Performance rating | |
| Apple MacBook Pro 16 2026 M5 Pro | |
| Average Apple M5 Pro 18-Core, Apple M5 Pro 20-Core GPU | |
| Apple MacBook Pro 16 2024 M4 Pro | |
| Lenovo ThinkPad T1g Gen 8 21TD003GE | |
| Lenovo Yoga Pro 9i 16 RTX 5070 | |
| Average of class Multimedia | |
| Asus ProArt P16 H7606WP | |
| Samsung Galaxy Book6 Ultra | |
| Asus ProArt P16 RTX 5090 | |
| CrossMark / Overall | |
| Apple MacBook Pro 16 2026 M5 Pro | |
| Average Apple M5 Pro 18-Core, Apple M5 Pro 20-Core GPU (n=1) | |
| Lenovo ThinkPad T1g Gen 8 21TD003GE | |
| Apple MacBook Pro 16 2024 M4 Pro | |
| Lenovo Yoga Pro 9i 16 RTX 5070 | |
| Asus ProArt P16 RTX 5090 | |
| Samsung Galaxy Book6 Ultra | |
| Asus ProArt P16 H7606WP | |
| Average of class Multimedia (866 - 2728, n=63, last 2 years) | |
| CrossMark / Productivity | |
| Apple MacBook Pro 16 2026 M5 Pro | |
| Average Apple M5 Pro 18-Core, Apple M5 Pro 20-Core GPU (n=1) | |
| Lenovo ThinkPad T1g Gen 8 21TD003GE | |
| Apple MacBook Pro 16 2024 M4 Pro | |
| Lenovo Yoga Pro 9i 16 RTX 5070 | |
| Asus ProArt P16 RTX 5090 | |
| Average of class Multimedia (931 - 2489, n=63, last 2 years) | |
| Asus ProArt P16 H7606WP | |
| Samsung Galaxy Book6 Ultra | |
| CrossMark / Creativity | |
| Apple MacBook Pro 16 2026 M5 Pro | |
| Average Apple M5 Pro 18-Core, Apple M5 Pro 20-Core GPU (n=1) | |
| Apple MacBook Pro 16 2024 M4 Pro | |
| Lenovo ThinkPad T1g Gen 8 21TD003GE | |
| Lenovo Yoga Pro 9i 16 RTX 5070 | |
| Asus ProArt P16 RTX 5090 | |
| Samsung Galaxy Book6 Ultra | |
| Asus ProArt P16 H7606WP | |
| Average of class Multimedia (907 - 3465, n=63, last 2 years) | |
| CrossMark / Responsiveness | |
| Lenovo ThinkPad T1g Gen 8 21TD003GE | |
| Apple MacBook Pro 16 2026 M5 Pro | |
| Average Apple M5 Pro 18-Core, Apple M5 Pro 20-Core GPU (n=1) | |
| Lenovo Yoga Pro 9i 16 RTX 5070 | |
| Apple MacBook Pro 16 2024 M4 Pro | |
| Samsung Galaxy Book6 Ultra | |
| Average of class Multimedia (605 - 2024, n=63, last 2 years) | |
| Asus ProArt P16 H7606WP | |
| Asus ProArt P16 RTX 5090 | |
| WebXPRT 3 / Overall | |
| Apple MacBook Pro 16 2026 M5 Pro | |
| Average Apple M5 Pro 18-Core, Apple M5 Pro 20-Core GPU (n=1) | |
| Apple MacBook Pro 16 2024 M4 Pro | |
| Lenovo Yoga Pro 9i 16 RTX 5070 | |
| Average of class Multimedia (136.4 - 596, n=66, last 2 years) | |
| Asus ProArt P16 H7606WP | |
| Lenovo ThinkPad T1g Gen 8 21TD003GE | |
| Samsung Galaxy Book6 Ultra | |
| Asus ProArt P16 RTX 5090 | |
| WebXPRT 4 / Overall | |
| Apple MacBook Pro 16 2026 M5 Pro | |
| Average Apple M5 Pro 18-Core, Apple M5 Pro 20-Core GPU (n=1) | |
| Apple MacBook Pro 16 2024 M4 Pro | |
| Lenovo Yoga Pro 9i 16 RTX 5070 | |
| Lenovo ThinkPad T1g Gen 8 21TD003GE | |
| Samsung Galaxy Book6 Ultra | |
| Average of class Multimedia (167.3 - 402, n=68, last 2 years) | |
| Asus ProArt P16 H7606WP | |
| Asus ProArt P16 RTX 5090 | |
| Mozilla Kraken 1.1 / Total | |
| Samsung Galaxy Book6 Ultra | |
| Average of class Multimedia (228 - 835, n=69, last 2 years) | |
| Asus ProArt P16 H7606WP | |
| Lenovo ThinkPad T1g Gen 8 21TD003GE | |
| Lenovo Yoga Pro 9i 16 RTX 5070 | |
| Asus ProArt P16 RTX 5090 | |
| Apple MacBook Pro 16 2024 M4 Pro | |
| Apple MacBook Pro 16 2026 M5 Pro | |
| Average Apple M5 Pro 18-Core, Apple M5 Pro 20-Core GPU (n=1) | |
* ... smaller is better
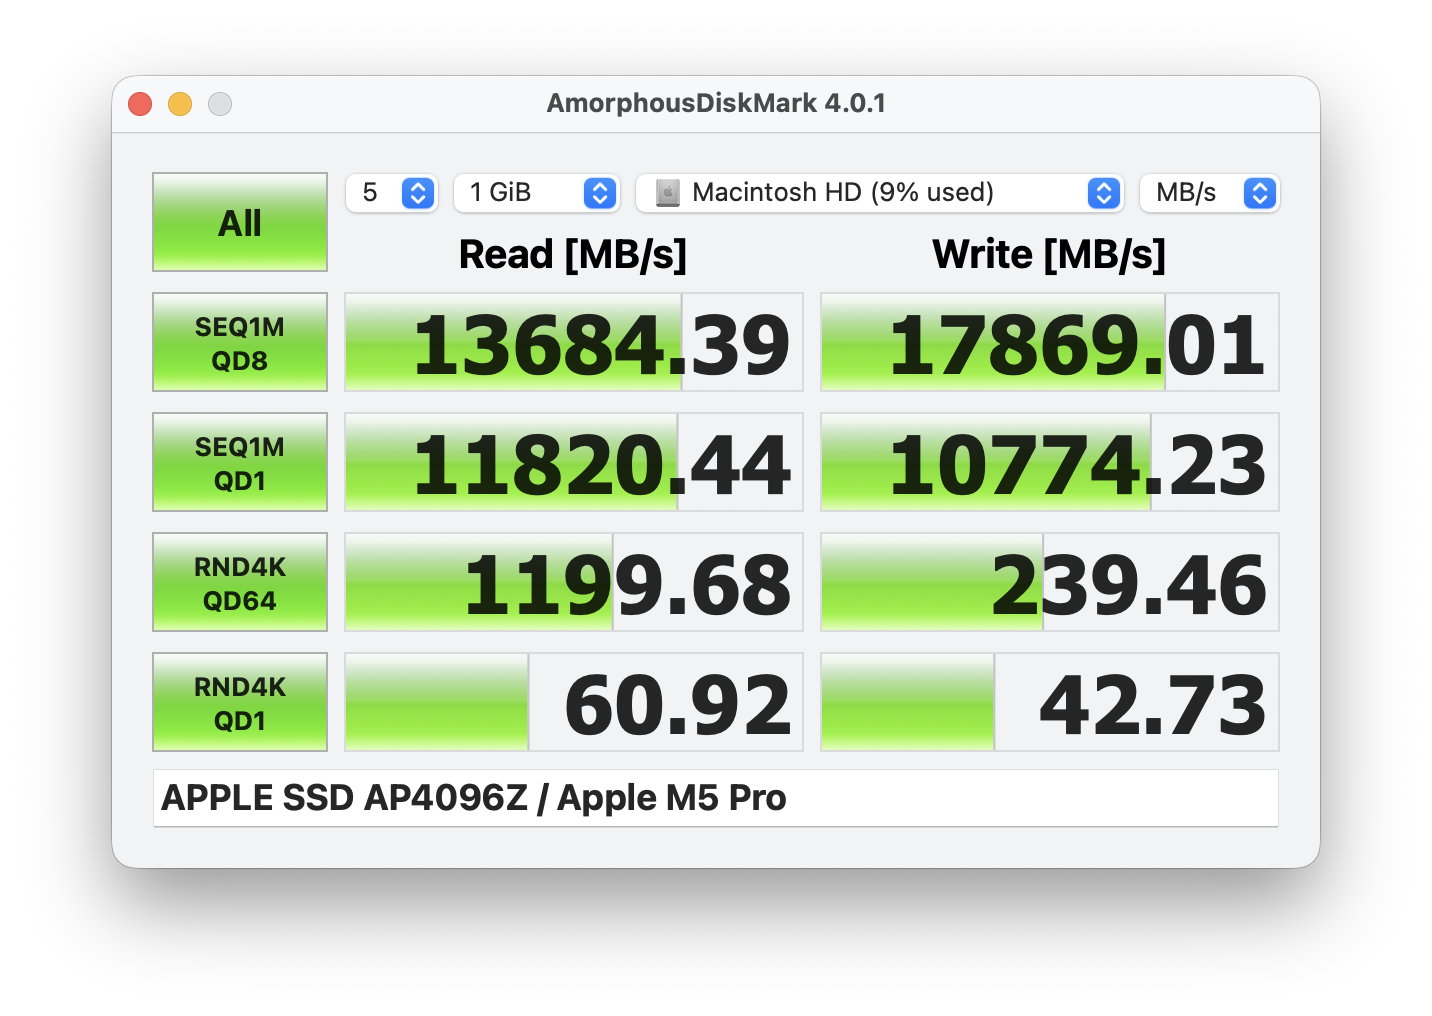
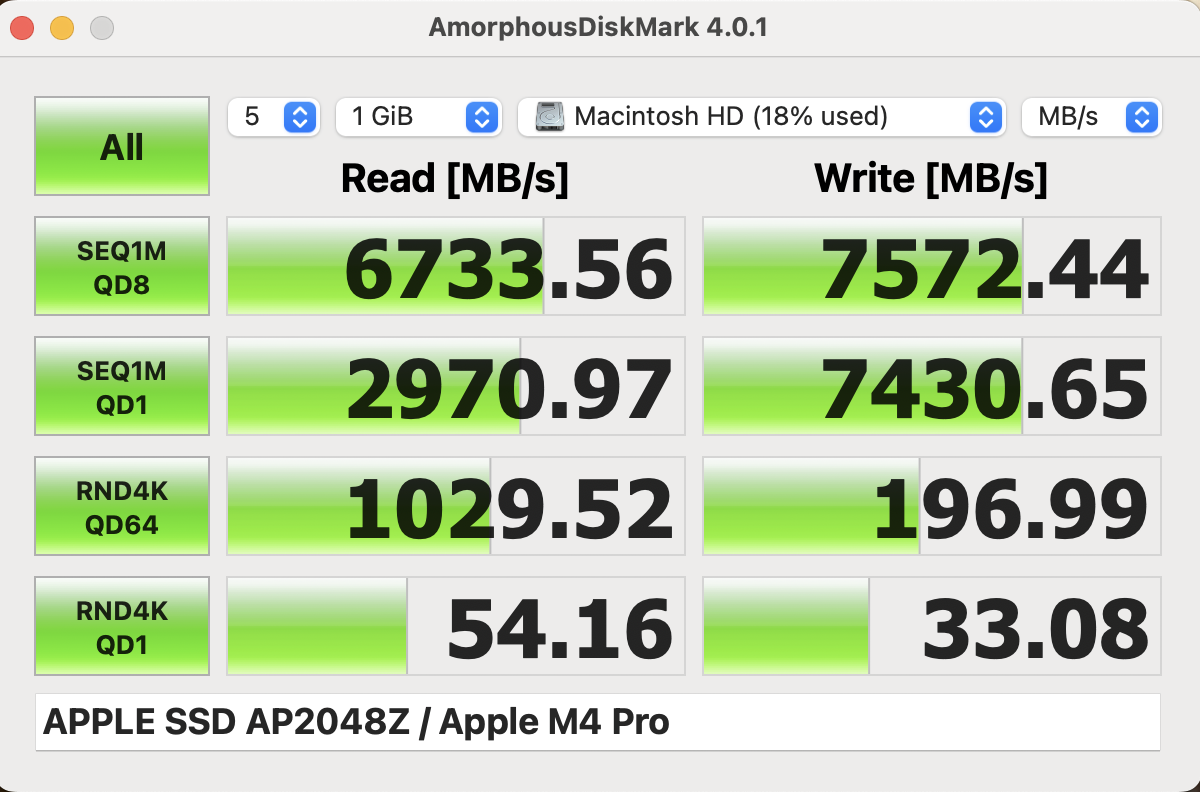
Storage Devices
Apple now uses faster PCIe 5.0 SSDs and our test unit with the 4 TB version manages extremely high peak transfer rates of 17 GB/s.
GPU Performance

The new 20-core GPU of the M5 Pro is a big improvement over the previous M4 Pro and we see improvements between 30-50 % in the synthetic benchmarks. Compared to Windows rivals, the GPU performance is about 15 % slower than the RTX 5070 you will find in most multimedia laptops. The gaming performance depends a lot on the title. While the M5 Pro is close to the RTX 5070 in Baldur's Gate 3, for example, it is much slower both in Cyberpunk 2077 as well as Assassin's Creed Shadows.
The GPU performance is completely stable, both under sustained workloads as well as battery power, which is not the case for Windows laptops with dGPUs. Please see our dedicated GPU analysis for more information as well as performance and efficiency data on the new M5 Pro GPU.
| 3DMark Steel Nomad Score | 2323 points | |
| 3DMark Steel Nomad Light Score | 10018 points | |
Help | ||
| Blender / v3.3 Classroom METAL | |
| Apple MacBook Pro 16 2023 M3 Pro | |
| Apple MacBook Pro 14 2025 M5 | |
| Apple MacBook Pro 14 2024 M4 Pro Entry | |
| Average of class Multimedia (17.8 - 68, n=5, last 2 years) | |
| Apple MacBook Pro 16 2026 M5 Pro | |
| Average Apple M5 Pro 20-Core GPU (n=1) | |
| Apple MacBook Pro 16 2023 M3 Max | |
| Apple MacBook Pro 16 M4 Max | |
| Blender / v3.3 Classroom OPTIX/RTX | |
| Average of class Multimedia (12 - 105, n=23, last 2 years) | |
| Lenovo Yoga Pro 9i 16 RTX 5070 | |
| Lenovo ThinkPad T1g Gen 8 21TD003GE | |
| Samsung Galaxy Book6 Ultra | |
| Asus ProArt P16 H7606WP | |
| Asus ProArt P16 RTX 5090 | |
| Blender / v3.3 Classroom CUDA | |
| Average of class Multimedia (20 - 186, n=23, last 2 years) | |
| Lenovo ThinkPad T1g Gen 8 21TD003GE | |
| Lenovo Yoga Pro 9i 16 RTX 5070 | |
| Samsung Galaxy Book6 Ultra | |
| Asus ProArt P16 H7606WP | |
| Asus ProArt P16 RTX 5090 | |
| Blender / v3.3 Classroom CPU | |
| Apple MacBook Pro 14 2025 M5 | |
| Average of class Multimedia (134.5 - 1042, n=64, last 2 years) | |
| Apple MacBook Pro 16 2023 M3 Pro | |
| Samsung Galaxy Book6 Ultra | |
| Lenovo ThinkPad T1g Gen 8 21TD003GE | |
| Lenovo Yoga Pro 9i 16 RTX 5070 | |
| Apple MacBook Pro 14 2024 M4 Pro Entry | |
| Asus ProArt P16 H7606WP | |
| Asus ProArt P16 RTX 5090 | |
| Apple MacBook Pro 16 2023 M3 Max | |
| Apple MacBook Pro 16 M4 Max | |
| Apple MacBook Pro 16 2026 M5 Pro | |
| Average Apple M5 Pro 20-Core GPU (n=1) | |
* ... smaller is better
| low | med. | high | ultra | QHD | |
|---|---|---|---|---|---|
| Baldur's Gate 3 (2023) | 130.8 | 100.4 | 87.5 | 83.8 | 56.7 |
| Cyberpunk 2077 (2023) | 100.7 | 80.3 | 66.5 | 57.8 | 33.4 |
| Total War Pharaoh (2023) | 74.4 | 62.1 | 55.4 | 54 | 53.9 |
| Assassin's Creed Shadows (2025) | 50 | 46 | 40 | 26 | 22 |
Update: Creator Benchmarks
The MacBook Pro lineup is very popular among content creators, so we performed additional benchmarks for Adobe Photoshop, Premiere Pro, Lightroom as well as DaVinci Resolve. The results for the M5 Pro are impressive and either clearly beat or are on par with the mobile version of the GeForce RTX 5090 with 24 GB VRAM in the Asus ProArt P16. Both the Galaxy Book6 Ultra (Core Ultra 356H + RTX 5070) as well as the Asus ROG Z13 (Ryzen AI Max+ 395 w/ Radeon 8060S & 128 GB RAM) are clearly beaten.
| Laptop | Photoshop 1.0.6 (PS Version 27.4) | Premiere Pro STANDARD 2.0.1 (Premiere Version 26) | Premiere Pro EXTENDED 2.0.1 (Premiere Version 26) | Lightroom Class STANDARD 1.0.0 (LR Version 15.2) | Lightroom Class EXTENDED 1.0.0 (LR Version 15.2) | Resolve STANDARD 2.0.0 (Resolve Version 20.3-Studio) | Resolve EXTENDED 2.0.0 (Resolve Version 20.3-Studio) |
|---|---|---|---|---|---|---|---|
| Apple MacBook Pro 16 (M5 Pro 20-core GPU) | 15271 | 105296 | 89026 | 12739 | 12418 | 83560 | 58878 |
| Asus ROG Z13-KJP (AMD Ryzen Max+ 8060S) | 11932 | 57481 | 48777 | 10013 | 9480 | 53737 | 36070 |
| Asus ROG Zephyrus G14 (Ryzen 9 7940HS + RTX 4090) | 8205 | 77019 | 61578 | 5713 | 68314 | 50936 | |
| Samsung Galaxy Book6 Ultra (Core Ultra 7 365H + RTX 5070) | 8070 | 87446 | Did not run | 9290 | 9141 | 70531 | 50519 |
| Asus ProArt P16 (Ryzen 9 HX370 + RTX5090) | 10096 | 107130 | 82933 | 6709 | 8667 | 85114 | 63907 |
Emissions & Power Consumption
System Noise
The combination of the efficient M5 Pro chip and the defensive fan curve once again results in a very quiet everyday laptop. The fans are often turned off and the first fan stage at 1400 rpm is inaudible, so the laptop also stays silent when you stress it a bit more. Gaming is also very efficient and only results in 33 dB(A) & 2600 rpm, while our stress test shortly leads to more than 51 dB(A), which then levels off at 49.6 dB(A) and 4600 rpm. In Auto mode, we measure up to 41.6 dB(A) and 3600rpm, which is a bit quieter than before. In Low Power mode, the laptop stays inaudible (1400rpm). There were no issues with other electronic nosies.
Noise level
| Idle |
| 25.4 / 25.4 / 25.4 dB(A) |
| Load |
| 25.4 / 51.7 dB(A) |
 | ||
30 dB silent 40 dB(A) audible 50 dB(A) loud |
||
min: | ||
| Apple MacBook Pro 16 2026 M5 Pro M5 Pro 18-Core, M5 Pro 20-Core GPU | Samsung Galaxy Book6 Ultra Ultra 7 356H, GeForce RTX 5070 Laptop | Lenovo ThinkPad T1g Gen 8 21TD003GE Ultra 9 285H, GeForce RTX 5070 Laptop | Asus ProArt P16 RTX 5090 Ryzen AI 9 HX 370, GeForce RTX 5090 Laptop | Lenovo Yoga Pro 9i 16 RTX 5070 Ultra 9 285H, GeForce RTX 5070 Laptop | Apple MacBook Pro 16 2024 M4 Pro M4 Pro 14-Core, M4 Pro 20-Core GPU | |
|---|---|---|---|---|---|---|
| Noise | -11% | -12% | -21% | -17% | 6% | |
| off / environment * (dB) | 25.4 | 25.1 1% | 25 2% | 24.2 5% | 24.1 5% | 24 6% |
| Idle Minimum * (dB) | 25.4 | 25.1 1% | 25 2% | 24.2 5% | 24.1 5% | 24 6% |
| Idle Average * (dB) | 25.4 | 25.1 1% | 25 2% | 27.6 -9% | 24.1 5% | 24 6% |
| Idle Maximum * (dB) | 25.4 | 25.1 1% | 27.3 -7% | 32.6 -28% | 25.1 1% | 24 6% |
| Load Average * (dB) | 25.4 | 36.9 -45% | 37.3 -47% | 42.6 -68% | 44.2 -74% | 25.3 -0% |
| Cyberpunk 2077 ultra * (dB) | 33.6 | 48.5 -44% | 47.8 -42% | 51.2 -52% | 52.7 -57% | 33.9 -1% |
| Load Maximum * (dB) | 51.7 | 48.5 6% | 47.8 8% | 53.2 -3% | 52.7 -2% | 42.3 18% |
* ... smaller is better
Temperature
The temperatures are no problem and we only measure little more than 40 °C under load. During the stress test, the M5 Pro consumes up to 92 Watts and then settles at 70 Watts in High Power mode (or 88/50 Watts in Auto, respectively).
(±) The maximum temperature on the upper side is 40.6 °C / 105 F, compared to the average of 36.8 °C / 98 F, ranging from 21 to 71 °C for the class Multimedia.
(±) The bottom heats up to a maximum of 42.4 °C / 108 F, compared to the average of 39.1 °C / 102 F
(+) In idle usage, the average temperature for the upper side is 23.5 °C / 74 F, compared to the device average of 31.3 °C / 88 F.
(-) 3: The average temperature for the upper side is 38.2 °C / 101 F, compared to the average of 31.3 °C / 88 F for the class Multimedia.
(+) The palmrests and touchpad are reaching skin temperature as a maximum (32.8 °C / 91 F) and are therefore not hot.
(-) The average temperature of the palmrest area of similar devices was 28.7 °C / 83.7 F (-4.1 °C / -7.3 F).


| Apple MacBook Pro 16 2026 M5 Pro M5 Pro 18-Core, M5 Pro 20-Core GPU | Samsung Galaxy Book6 Ultra Ultra 7 356H, GeForce RTX 5070 Laptop | Lenovo ThinkPad T1g Gen 8 21TD003GE Ultra 9 285H, GeForce RTX 5070 Laptop | Asus ProArt P16 RTX 5090 Ryzen AI 9 HX 370, GeForce RTX 5090 Laptop | Lenovo Yoga Pro 9i 16 RTX 5070 Ultra 9 285H, GeForce RTX 5070 Laptop | Apple MacBook Pro 16 2024 M4 Pro M4 Pro 14-Core, M4 Pro 20-Core GPU | |
|---|---|---|---|---|---|---|
| Heat | -9% | -10% | -13% | -11% | 3% | |
| Maximum Upper Side * (°C) | 40.6 | 42.7 -5% | 44.7 -10% | 47 -16% | 41.8 -3% | 42.7 -5% |
| Maximum Bottom * (°C) | 42.4 | 49.1 -16% | 42.8 -1% | 51.6 -22% | 47.9 -13% | 43.1 -2% |
| Idle Upper Side * (°C) | 23.8 | 25.4 -7% | 26.9 -13% | 24.9 -5% | 26.3 -11% | 21.5 10% |
| Idle Bottom * (°C) | 23.6 | 25.5 -8% | 27.3 -16% | 25.5 -8% | 27.6 -17% | 21.5 9% |
* ... smaller is better
Speakers
Even though the competition caught up and most expensive multimedia laptops offer good sound systems, Apple is still a little step ahead and the six-speaker sound system in the MacBook Pro 16 remains one of the best in a laptop.
Apple MacBook Pro 16 2026 M5 Pro audio analysis
(+) | speakers can play relatively loud (84.7 dB)
Bass 100 - 315 Hz
(+) | good bass - only 4.9% away from median
(+) | bass is linear (6% delta to prev. frequency)
Mids 400 - 2000 Hz
(+) | balanced mids - only 1% away from median
(+) | mids are linear (2.7% delta to prev. frequency)
Highs 2 - 16 kHz
(+) | balanced highs - only 2.7% away from median
(+) | highs are linear (2.9% delta to prev. frequency)
Overall 100 - 16.000 Hz
(+) | overall sound is linear (5.2% difference to median)
Compared to same class
» 1% of all tested devices in this class were better, 1% similar, 98% worse
» The best had a delta of 5%, average was 17%, worst was 45%
Compared to all devices tested
» 0% of all tested devices were better, 0% similar, 100% worse
» The best had a delta of 4%, average was 23%, worst was 134%
Samsung Galaxy Book6 Ultra audio analysis
(+) | speakers can play relatively loud (85.6 dB)
Bass 100 - 315 Hz
(±) | reduced bass - on average 5.9% lower than median
(±) | linearity of bass is average (7.9% delta to prev. frequency)
Mids 400 - 2000 Hz
(+) | balanced mids - only 3.7% away from median
(+) | mids are linear (4.3% delta to prev. frequency)
Highs 2 - 16 kHz
(+) | balanced highs - only 2.2% away from median
(+) | highs are linear (3.4% delta to prev. frequency)
Overall 100 - 16.000 Hz
(+) | overall sound is linear (7.3% difference to median)
Compared to same class
» 6% of all tested devices in this class were better, 1% similar, 94% worse
» The best had a delta of 5%, average was 17%, worst was 45%
Compared to all devices tested
» 1% of all tested devices were better, 0% similar, 99% worse
» The best had a delta of 4%, average was 23%, worst was 134%
Lenovo ThinkPad T1g Gen 8 21TD003GE audio analysis
(+) | speakers can play relatively loud (85.6 dB)
Bass 100 - 315 Hz
(±) | reduced bass - on average 9.3% lower than median
(±) | linearity of bass is average (11.9% delta to prev. frequency)
Mids 400 - 2000 Hz
(+) | balanced mids - only 2.5% away from median
(+) | mids are linear (4% delta to prev. frequency)
Highs 2 - 16 kHz
(+) | balanced highs - only 3.4% away from median
(±) | linearity of highs is average (7.5% delta to prev. frequency)
Overall 100 - 16.000 Hz
(+) | overall sound is linear (8.7% difference to median)
Compared to same class
» 11% of all tested devices in this class were better, 2% similar, 87% worse
» The best had a delta of 5%, average was 17%, worst was 45%
Compared to all devices tested
» 3% of all tested devices were better, 1% similar, 97% worse
» The best had a delta of 4%, average was 23%, worst was 134%
Asus ProArt P16 RTX 5090 audio analysis
(±) | speaker loudness is average but good (80.8 dB)
Bass 100 - 315 Hz
(+) | good bass - only 3.3% away from median
(±) | linearity of bass is average (7.7% delta to prev. frequency)
Mids 400 - 2000 Hz
(+) | balanced mids - only 2.9% away from median
(+) | mids are linear (1.9% delta to prev. frequency)
Highs 2 - 16 kHz
(+) | balanced highs - only 4.1% away from median
(+) | highs are linear (5.5% delta to prev. frequency)
Overall 100 - 16.000 Hz
(+) | overall sound is linear (8.3% difference to median)
Compared to same class
» 9% of all tested devices in this class were better, 2% similar, 89% worse
» The best had a delta of 5%, average was 17%, worst was 45%
Compared to all devices tested
» 2% of all tested devices were better, 1% similar, 97% worse
» The best had a delta of 4%, average was 23%, worst was 134%
Lenovo Yoga Pro 9i 16 RTX 5070 audio analysis
(±) | speaker loudness is average but good (81.4 dB)
Bass 100 - 315 Hz
(±) | reduced bass - on average 5.5% lower than median
(±) | linearity of bass is average (7.5% delta to prev. frequency)
Mids 400 - 2000 Hz
(+) | balanced mids - only 1.7% away from median
(+) | mids are linear (3.1% delta to prev. frequency)
Highs 2 - 16 kHz
(±) | reduced highs - on average 6.2% lower than median
(+) | highs are linear (3.9% delta to prev. frequency)
Overall 100 - 16.000 Hz
(+) | overall sound is linear (9.7% difference to median)
Compared to same class
» 13% of all tested devices in this class were better, 1% similar, 85% worse
» The best had a delta of 5%, average was 17%, worst was 45%
Compared to all devices tested
» 4% of all tested devices were better, 1% similar, 95% worse
» The best had a delta of 4%, average was 23%, worst was 134%
Power Consumption

The idle consumption is a bit higher compared to the MacBook Pro 16 M4 Pro we tested, but you also have to take the additional RAM into account. The consumption under load is also a bit higher than before, but still lower compared to Windows rivals. Under maximum load, the 140W PSU of the MBP 16 is the limiting factor for a little while, before the consumption eventually settles at around 134 Watts. With a 180W PSU, we measured a maximum consumption of 147 Watts. The difference is not huge, but the battery is slightly drained in these combined workloads, even though the battery indicator still shows 100 % and the little LED on the MagSafe connector stays green. Our measurement device on the other hand clearly shows that the battery is charged after the stress test, so Apple is hiding the fact that the original PSU is insufficient.
| Off / Standby | |
| Idle | |
| Load |
|
Key:
min: | |
| Apple MacBook Pro 16 2026 M5 Pro M5 Pro 18-Core, M5 Pro 20-Core GPU, Apple SSD AP4096Z, Mini-LED, 3456x2234, 16.2" | Samsung Galaxy Book6 Ultra Ultra 7 356H, GeForce RTX 5070 Laptop, Samsung PM9C1b MZVL81T0HFLB-00BH1, OLED, 2880x1800, 16" | Lenovo ThinkPad T1g Gen 8 21TD003GE Ultra 9 285H, GeForce RTX 5070 Laptop, Samsung PM9E1 MZVLC2T0HBLD, Tandem-OLED, 3200x2000, 16" | Asus ProArt P16 RTX 5090 Ryzen AI 9 HX 370, GeForce RTX 5090 Laptop, Micron 2500 2TB MTFDKBA2T0QGN-1BN1AABGA, OLED, 3840x2400, 16" | Lenovo Yoga Pro 9i 16 RTX 5070 Ultra 9 285H, GeForce RTX 5070 Laptop, WD PC SN7100S SDFPMSL-1T00-1101, OLED, 3200x2000, 16" | Apple MacBook Pro 16 2024 M4 Pro M4 Pro 14-Core, M4 Pro 20-Core GPU, Apple SSD AP2048Z, Mini-LED, 3456x2234, 16.2" | Average Apple M5 Pro 20-Core GPU | Average of class Multimedia | |
|---|---|---|---|---|---|---|---|---|
| Power Consumption | 5% | -20% | -61% | -43% | 3% | 0% | 18% | |
| Idle Minimum * (Watt) | 4.4 | 4.4 -0% | 8.5 -93% | 10.9 -148% | 8.8 -100% | 4.6 -5% | 4.4 ? -0% | 5.68 ? -29% |
| Idle Average * (Watt) | 18.3 | 6.4 65% | 13.6 26% | 12.1 34% | 16.1 12% | 16.8 8% | 18.3 ? -0% | 10.2 ? 44% |
| Idle Maximum * (Watt) | 18.4 | 7.1 61% | 14.1 23% | 12.5 32% | 16.5 10% | 17.1 7% | 18.4 ? -0% | 12.4 ? 33% |
| Load Average * (Watt) | 84.2 | 55.1 35% | 84.5 -0% | 129.3 -54% | 89.3 -6% | 76.4 9% | 84.2 ? -0% | 65.4 ? 22% |
| Cyberpunk 2077 ultra external monitor * (Watt) | 79.8 | 133 -67% | 118.1 -48% | 172.8 -117% | 157.9 -98% | 79.3 1% | ||
| Cyberpunk 2077 ultra * (Watt) | 82.5 | 134.3 -63% | 120.3 -46% | 176.6 -114% | 160.6 -95% | 83.4 -1% | ||
| Load Maximum * (Watt) | 145 | 143.9 1% | 143 1% | 233.9 -61% | 177.4 -22% | 138.1 5% | 145 ? -0% | 113.3 ? 22% |
* ... smaller is better
Power Consumption Cyberpunk / Stress Test
Power Consumption external Monitor
Battery Life
Following the slightly higher idle power consumption, we can also see a slight drop of battery runtime. In our Wi-Fi test at 150 nits, the runtime is now 18.5 hours, so one hour shorter compared to the previous model. The result is still excellent though and clearly superior to most Windows alternatives, only Samsung's Galaxy Book6 Ultra can keep up despite the much smaller battery. At full display brightness, the result is once again lower than before at 6.6 vs 7.3 hours, while the Galaxy Book6 Ultra is clearly ahead at 8.4 hours (but at a lower brightness of 500 vs. ~630 nits on the MBP 16).
Notebookcheck Rating
Apple MacBook Pro 16 2026 M5 Pro
- 03/09/2026 v8
Andreas Osthoff
 Total Sustainability Score:
 Potential Competitors in Comparison
Image | Model / Review | Price | Weight | Height | Display |
|---|---|---|---|---|---|
1. 92.3% 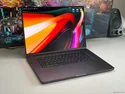 | Apple MacBook Pro 16 2026 M5 Pro Apple M5 Pro 18-Core ⎘ Apple M5 Pro 20-Core GPU ⎘ 64 GB Memory, 4096 GB SSD | Amazon: List Price: 5298€ | 2.1 kg | 16.8 mm | 16.20" 3456x2234 254 PPI Mini-LED |
2. 90.7%  | Samsung Galaxy Book6 Ultra Intel Core Ultra 7 356H ⎘ NVIDIA GeForce RTX 5070 Laptop ⎘ 32 GB Memory, 1000 GB SSD | Amazon: List Price: 3599€ | 1.9 kg | 15.4 mm | 16.00" 2880x1800 212 PPI OLED |
3. 92.4%  | Lenovo ThinkPad T1g Gen 8 21TD003GE Intel Core Ultra 9 285H ⎘ NVIDIA GeForce RTX 5070 Laptop ⎘ 64 GB Memory, 2048 GB SSD | Amazon: List Price: 4500€ | 1.9 kg | 15.8 mm | 16.00" 3200x2000 236 PPI Tandem-OLED |
4. 89.7%  | Asus ProArt P16 RTX 5090 AMD Ryzen AI 9 HX 370 ⎘ NVIDIA GeForce RTX 5090 Laptop ⎘ 64 GB Memory, 2048 GB SSD | Amazon: List Price: 4799€ | 2 kg | 18.3 mm | 16.00" 3840x2400 283 PPI OLED |
5. 90.4%  | Lenovo Yoga Pro 9i 16 RTX 5070 Intel Core Ultra 9 285H ⎘ NVIDIA GeForce RTX 5070 Laptop ⎘ 64 GB Memory, 1024 GB SSD | Amazon: List Price: 2800€ | 1.9 kg | 17.9 mm | 16.00" 3200x2000 236 PPI OLED |
6. 93%  | Apple MacBook Pro 16 2024 M4 Pro Apple M4 Pro 14-Core ⎘ Apple M4 Pro 20-Core GPU ⎘ 48 GB Memory, 2048 GB SSD | Amazon: List Price: 4219€ | 2.1 kg | 16.8 mm | 16.20" 3456x2234 254 PPI Mini-LED |
Transparency
The selection of devices to be reviewed is made by our editorial team. The test sample was provided to the author as a loan by the manufacturer or retailer for the purpose of this review. The lender had no influence on this review, nor did the manufacturer receive a copy of this review before publication. There was no obligation to publish this review. As an independent media company, Notebookcheck is not subjected to the authority of manufacturers, retailers or publishers.
This is how Notebookcheck is testing
Every year, Notebookcheck independently reviews hundreds of laptops and smartphones using standardized procedures to ensure that all results are comparable. We have continuously developed our test methods for around 20 years and set industry standards in the process. In our test labs, high-quality measuring equipment is utilized by experienced technicians and editors. These tests involve a multi-stage validation process. Our complex rating system is based on hundreds of well-founded measurements and benchmarks, which maintains objectivity. Further information on our test methods can be found here.
