
Verdict - The MacBook Pro 14 cannot handle the M5 Max
The new MacBook Pro 14 with the M5 Max SoC is problematic and while you get familiar advantages like the excellent chassis design, modern ports, excellent speakers, great Mini-LED panel (with a matte option) and long battery runtimes, the 14-inch chassis and the cooling simply cannot handle the M5 Max adequately. This results in serious thermal throttling and we also experienced very inconsistent CPU performance, something that did not happen on our MacBook Pro 16 with the M5 Pro. We definitely think the M5 Max is a better option for the larger 16-inch model.
High power limits also result in loud fans and the power adapter is also insufficient. It should not surprise anyone that a 96 Watt power adapter might be struggling when the M5 Max alone can draw 96 Watts at the beginning of the stress test. This also happens while gaming, where you need the High Power mode to get consistent results and the battery level dropped by around 10 % when we played the native Cyberpunk 2077 version. Apple also limits the power input to 97 Watts, even if you use a 140 Watt PSU from or a generic 180W USB-C charger. Considering our measurements on the larger MacBook Pro 16 with the M5 Pro, we suspect the MacBook Pro 14 with the M5 Max will actually consume more than 140 Watts in peak load scenarios, so it has to use the battery as well.
Still, even with these issues, the MBP 14 is still one of the most powerful 14-inch laptops and the two main rivals are the Asus ROG Zephyrus G14, which is available with the mobile RTX 5080 or the Asus ProArt PX13 with the AMD Strix Halo Ryzen AI Max+ 395 & Radeon 8060S (also 128 GB RAM), but the screens on both models are just not comparable to the excellent Mini-LED panel of the MacBook Pro 14 and both alternatives do not stand a chance in terms of CPU performance, either.
All in all, this is still a very good multimedia laptop, but the new M5 Pro is just a better fit for the 14-inch chassis. If you want or need the M5 Max, you should be aware that the performance in the 14-inch model will be lower compared to the MacBook Pro 16.
Pros
Cons
Price and Availability
The new MacBook Pro 14 with the M5 Max chip starts at $3599 on Amazon. Our review unit with all the upgrades has to be purchased directly from Apple and costs $7049.
Table of Contents
- Verdict - The MacBook Pro 14 cannot handle the M5 Max
- Specifications
- Changes compared to previous the MacBook Pro 14 M4 Pro
- Performance - M5 Max with inconsistent performance
- Update: Creator Benchmarks
- Emissions - Loud under load
- Energy Management - Insufficient power adapter
- Notebookcheck Rating
- Potential Competitors in Comparison
Apple's new flagship chip is called the M5 Max and we test it in the latest iteration of the compact MacBook Pro 14. Other updates for the 2026 model year include Wi-Fi 7 as well as Bluetooth 6 via Apple's own N1 chip as well as faster PCIe 5.0 SSDs. Our review until is the maximum spec with all possible upgrades, so it is the fastest version of the M5 Max with the 40-core GPU, 128 GB LPDDR5x-9600 RAM, 8 TB SSD storage and the matte Mini-LED panel for an eye-watering price of $7049. We have already looked at the new MacBook Pro 16 with the M5 Pro chip and also checked CPU as well as GPU performance of the new M5 Pro and M5 Max chips in our analysis articles, which are linked below:
Specifications
Changes compared to previous the MacBook Pro 14 M4 Pro
Apple did not change the chassis, which includes the connectivity (3x Thunderbolt 5) as well as the 12 MP center stage webcam, the input devices and the Mini-LED panel. Please see our in-depth review of the M4 Pro MacBook Pro 14 for more information on these topics. The maintenance options are still limited to the fans and the battery, while all the other components are soldered.
The SD-card reader also stayed the same, which means the performance is good for the UHS standard, but the latest SD Express standard is not supported. The new Apple N1 chip provides Wi-Fi 7 as well as Bluetooth 6 and the transfer rates in our test were very high and stable. However, the new Apple N1 chip only supports Wi-Fi 7 with 160 MHz, not 320 MHz as you get on most Windows laptops. We are currently expecting the arrival of Wi-Fi 7 routers and will test the Wi-Fi 7 performance as quickly as possible.


| SD Card Reader | |
| average JPG Copy Test (av. of 3 runs) | |
| Razer Blade 14 2025 (Angelbird AV Pro V60) | |
| Asus ROG Zephyrus G14 2025 GA403WW (Angelbird AV Pro V60) | |
| Apple MacBook Pro 14 2024 M4 Pro (Angelbird AV Pro V60) | |
| Apple MacBook Pro 14 2026 M5 Max (Angelbird AV Pro V60) | |
| Average of class Multimedia (23 - 531, n=41, last 2 years) | |
| Schenker Key 14 (M24) (Angelbird AV Pro V60) | |
| Acer Predator Triton 14 AI PT14-52 (Angelbird AV Pro V60) | |
| maximum AS SSD Seq Read Test (1GB) | |
| Apple MacBook Pro 14 2024 M4 Pro (Angelbird AV Pro V60) | |
| Apple MacBook Pro 14 2026 M5 Max (Angelbird AV Pro V60) | |
| Razer Blade 14 2025 (Angelbird AV Pro V60) | |
| Asus ROG Zephyrus G14 2025 GA403WW (Angelbird AV Pro V60) | |
| Average of class Multimedia (37.3 - 1455, n=40, last 2 years) | |
| Schenker Key 14 (M24) (Angelbird AV Pro V60) | |
| Acer Predator Triton 14 AI PT14-52 (Angelbird AV Pro V60) | |
| Networking | |
| Apple MacBook Pro 14 2026 M5 Max | |
| iperf3 transmit AXE11000 | |
| iperf3 receive AXE11000 | |
| Apple MacBook Pro 14 2024 M4 Pro | |
| iperf3 transmit AXE11000 | |
| iperf3 receive AXE11000 | |
| Acer Predator Triton 14 AI PT14-52 | |
| iperf3 transmit AXE11000 | |
| iperf3 receive AXE11000 | |
| Razer Blade 14 2025 | |
| iperf3 transmit AXE11000 | |
| iperf3 receive AXE11000 | |
| HP ZBook Ultra G1a A3ZQ0ET | |
| iperf3 transmit AXE11000 | |
| iperf3 receive AXE11000 | |
| iperf3 transmit AXE11000 6GHz | |
| iperf3 receive AXE11000 6GHz | |
| Asus ROG Zephyrus G14 2025 GA403WW | |
| iperf3 transmit AXE11000 | |
| iperf3 receive AXE11000 | |
| Schenker Key 14 (M24) | |
| iperf3 transmit AXE11000 | |
| iperf3 receive AXE11000 | |
Sustainability
Apple offers a comprehensive environmental report including data about the CO2 emissions as well as recycled contents. The following image shows exemplary data for the base model of the MacBook Pro 16 M5 Pro and the highest shown MacBook Pro 14 model with the M5-Max-SKU (32-core GPU, 36 GB RAM, 2 TB SSD) has a carbon footprint of 261 kg CO2e.

Performance - M5 Max with inconsistent performance


Testing Conditions
The MacBook Pro offers three different performance modes: Automatic, High Power & Low Power and we have summarized the effects of the three different modes in the table below. All three modes are also available on battery power with the same performance figures. If you want the maximum CPU and GPU performance, you must use the High Power mode, so we used it for our tests as well. However, the maximum power limits shown are only reached for one or two seconds on the 14-inch model and it will almost immediately throttle down. While the GPU performance was reproducible, we had issues with the CPU performance and encountered Cinebench 2024 Multi scores ranging between ~1400 and the maximum of 2073 points with the consumption dropping below 40 Watts at times, even though the testing conditions for the runs were pretty much identical. We are not really sure what is going on here, maybe Apple will fix this behavior with a software update. As of now, you will not get very consistent CPU performance under sustained workloads.
| CPU (Watts) | CB2024 Multi (points) |
GPU (Watts) | Steel Nomad (points) |
Cyberpunk 2077 1080p Ultra (fps) |
TDP Stress test CPU&GPU (Watts) |
max. fan noise (dB(A)) | |
|---|---|---|---|---|---|---|---|
| Low Power | 13 | 897 | 8.2 | 1654 | 23.4 | 12 | 24.1 (2400 rpm) |
| Auto | 75/36 | 1407 | 60/32 | 3698 | 54.1 | 84/30 | 41.4 (5150 rpm) |
| High Power | 75/52 | 2073 | 72/44 | 3947 | 54.6 | 96/42 | 53.2 (7500 rpm) |
Processor
The new M5 Max offers 18 processor cores and we have already talked about the technical details in our CPU analysis. The single-core performance is excellent and we see an advantage of around 12 % in single-core tests and similar to all the other M5 SoCs. The multi-core performance is a different story though. Yes, the performance in Geekbench with very shot peak load phases is 14 % higher compared to M4 Max, but if we look at the Cinebench 2024 Multi test, which takes a couple of minutes, the performance is pretty much identical to the M4 Max. As mentioned before, the multi-core CPU performance was also not stable and varied between 1400 and more than 2000 points (including everything in-between) from one run to another, despite similar circumstances. We are not sure why the M5 Max performs this way and we did not experience these issues on the new MacBook Pro 16 with M5 Pro. During the 30-minute stress test of Cinebench 2024 Multi, the performance dropped by 24 %.
Cinebench 2024: CPU Multi Core | CPU Single Core
Geekbench 6.7: Multi-Core | Single-Core
| CPU Performance rating | |
| Average Apple M5 Max | |
| Apple MacBook Pro 14 2026 M5 Max | |
| Apple MacBook Pro 16 M4 Max | |
| Apple MacBook Pro 14 2024 M4 Pro | |
| Asus ProArt PX13 HN7306EA | |
| Asus ROG Zephyrus G14 2025 GA403WW | |
| HP ZBook Ultra G1a A3ZQ0ET | |
| Average of class Multimedia | |
| Razer Blade 14 2025 | |
| Acer Predator Triton 14 AI PT14-52 | |
| Schenker Key 14 (M24) | |
| Cinebench 2024 / CPU Multi Core | |
| Average Apple M5 Max (2073 - 2437, n=2) | |
| Apple MacBook Pro 14 2026 M5 Max | |
| Apple MacBook Pro 16 M4 Max | |
| Apple MacBook Pro 16 M4 Max | |
| Asus ProArt PX13 HN7306EA | |
| Apple MacBook Pro 14 2024 M4 Pro | |
| HP ZBook Ultra G1a A3ZQ0ET | |
| Asus ROG Zephyrus G14 2025 GA403WW | |
| Razer Blade 14 2025 | |
| Average of class Multimedia (327 - 2437, n=76, last 2 years) | |
| Schenker Key 14 (M24) | |
| Acer Predator Triton 14 AI PT14-52 | |
| Cinebench 2024 / CPU Single Core | |
| Average Apple M5 Max (200 - 201, n=2) | |
| Apple MacBook Pro 14 2026 M5 Max | |
| Apple MacBook Pro 16 M4 Max | |
| Apple MacBook Pro 14 2024 M4 Pro | |
| Acer Predator Triton 14 AI PT14-52 | |
| Average of class Multimedia (72.5 - 201, n=60, last 2 years) | |
| Asus ROG Zephyrus G14 2025 GA403WW | |
| Asus ProArt PX13 HN7306EA | |
| Razer Blade 14 2025 | |
| HP ZBook Ultra G1a A3ZQ0ET | |
| Schenker Key 14 (M24) | |
| Geekbench 6.7 / Multi-Core | |
| Apple MacBook Pro 14 2026 M5 Max | |
| Average Apple M5 Max (29000 - 29415, n=4) | |
| Apple MacBook Pro 16 M4 Max | |
| Apple MacBook Pro 14 2024 M4 Pro | |
| Asus ProArt PX13 HN7306EA | |
| Asus ROG Zephyrus G14 2025 GA403WW | |
| HP ZBook Ultra G1a A3ZQ0ET | |
| Razer Blade 14 2025 | |
| Average of class Multimedia (4983 - 29415, n=72, last 2 years) | |
| Schenker Key 14 (M24) | |
| Acer Predator Triton 14 AI PT14-52 | |
| Geekbench 6.7 / Single-Core | |
| Apple MacBook Pro 14 2026 M5 Max | |
| Average Apple M5 Max (4200 - 4335, n=4) | |
| Apple MacBook Pro 14 2024 M4 Pro | |
| Apple MacBook Pro 16 M4 Max | |
| Asus ProArt PX13 HN7306EA | |
| Asus ROG Zephyrus G14 2025 GA403WW | |
| Average of class Multimedia (1534 - 4335, n=71, last 2 years) | |
| Razer Blade 14 2025 | |
| Acer Predator Triton 14 AI PT14-52 | |
| HP ZBook Ultra G1a A3ZQ0ET | |
| Schenker Key 14 (M24) | |
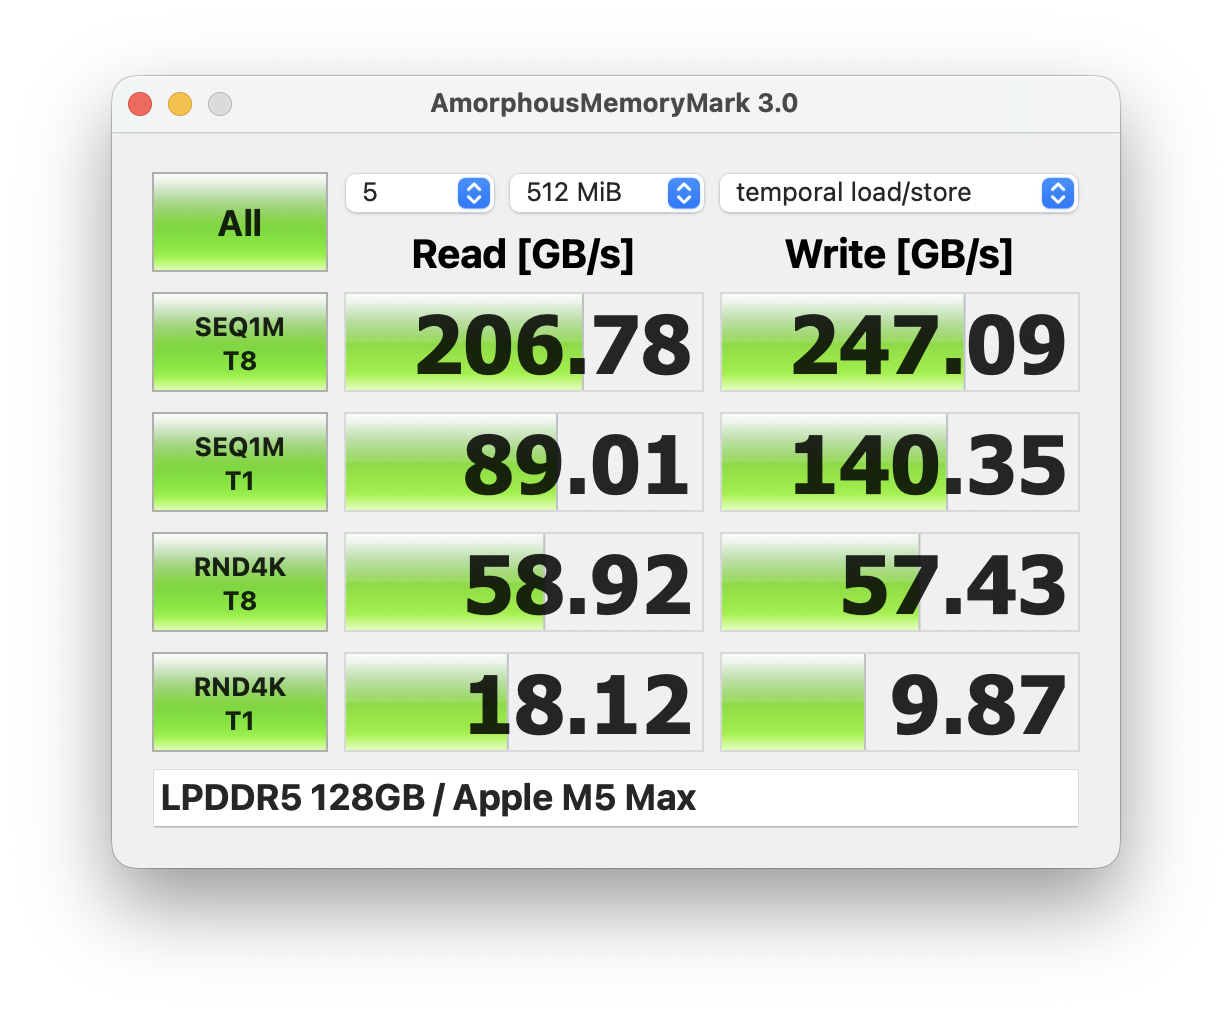
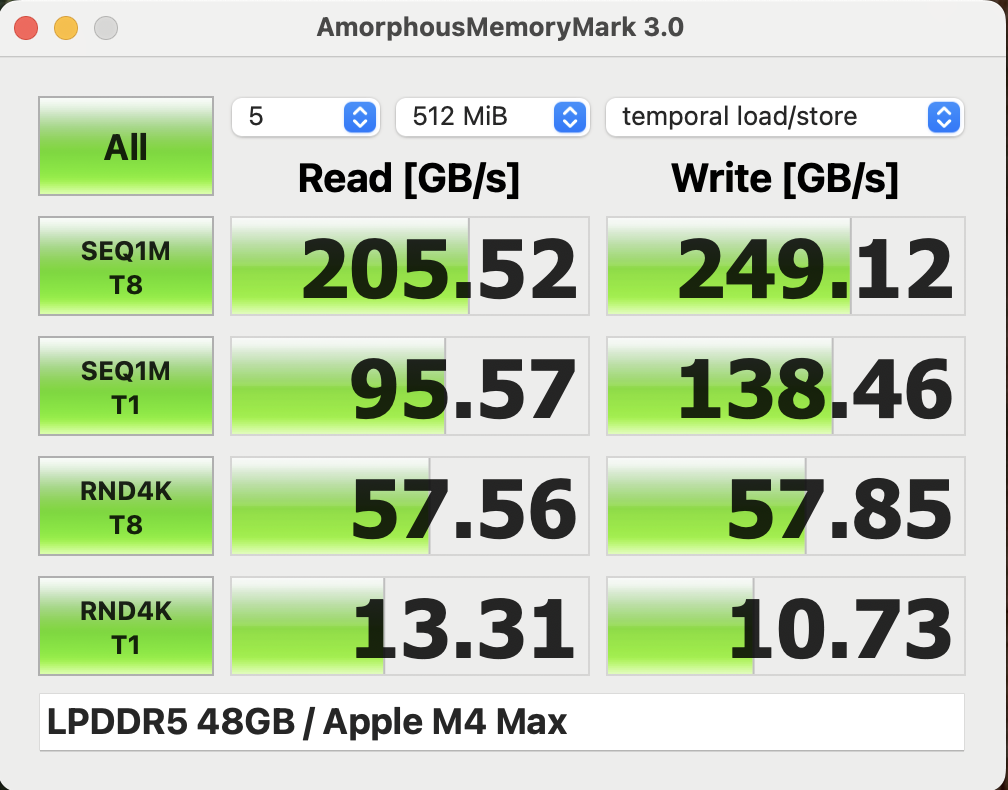
System Performance
The subjective performance impression is excellent, but to be fair, this is the case for every modern MacBook with the M5 chip since the high single-core performance (in combination with fast SSD storage) is a key factor for everyday workloads. With our maxed-out review unit (128 GB RAM) you will not have any troubles during heavy multi-tasking and there are not many other devices with this much RAM out there, usually only AMD Strix Halo systems like the Asus ProArt PX13. The memory performance stayed pretty much the same compared to the previous M4 Max SoC.
CrossMark: Overall | Productivity | Creativity | Responsiveness
WebXPRT 3: Overall
WebXPRT 4: Overall
Mozilla Kraken 1.1: Total
| Performance rating | |
| Apple MacBook Pro 14 2026 M5 Max | |
| Average Apple M5 Max, Apple M5 Max 40-Core GPU | |
| Apple MacBook Pro 14 2024 M4 Pro | |
| Asus ProArt PX13 HN7306EA | |
| Asus ROG Zephyrus G14 2025 GA403WW | |
| Razer Blade 14 2025 | |
| Average of class Multimedia | |
| HP ZBook Ultra G1a A3ZQ0ET | |
| Acer Predator Triton 14 AI PT14-52 | |
| Schenker Key 14 (M24) | |
| CrossMark / Overall | |
| Apple MacBook Pro 14 2026 M5 Max | |
| Average Apple M5 Max, Apple M5 Max 40-Core GPU (n=1) | |
| Apple MacBook Pro 14 2024 M4 Pro | |
| Asus ProArt PX13 HN7306EA | |
| Asus ROG Zephyrus G14 2025 GA403WW | |
| Razer Blade 14 2025 | |
| Average of class Multimedia (866 - 2728, n=63, last 2 years) | |
| HP ZBook Ultra G1a A3ZQ0ET | |
| Schenker Key 14 (M24) | |
| Acer Predator Triton 14 AI PT14-52 | |
| CrossMark / Productivity | |
| Apple MacBook Pro 14 2026 M5 Max | |
| Average Apple M5 Max, Apple M5 Max 40-Core GPU (n=1) | |
| Apple MacBook Pro 14 2024 M4 Pro | |
| Asus ProArt PX13 HN7306EA | |
| Razer Blade 14 2025 | |
| Asus ROG Zephyrus G14 2025 GA403WW | |
| Average of class Multimedia (931 - 2489, n=63, last 2 years) | |
| Schenker Key 14 (M24) | |
| Acer Predator Triton 14 AI PT14-52 | |
| HP ZBook Ultra G1a A3ZQ0ET | |
| CrossMark / Creativity | |
| Apple MacBook Pro 14 2026 M5 Max | |
| Average Apple M5 Max, Apple M5 Max 40-Core GPU (n=1) | |
| Asus ProArt PX13 HN7306EA | |
| Apple MacBook Pro 14 2024 M4 Pro | |
| Asus ROG Zephyrus G14 2025 GA403WW | |
| HP ZBook Ultra G1a A3ZQ0ET | |
| Razer Blade 14 2025 | |
| Average of class Multimedia (907 - 3465, n=63, last 2 years) | |
| Acer Predator Triton 14 AI PT14-52 | |
| Schenker Key 14 (M24) | |
| CrossMark / Responsiveness | |
| Apple MacBook Pro 14 2026 M5 Max | |
| Average Apple M5 Max, Apple M5 Max 40-Core GPU (n=1) | |
| Razer Blade 14 2025 | |
| Schenker Key 14 (M24) | |
| Asus ProArt PX13 HN7306EA | |
| Apple MacBook Pro 14 2024 M4 Pro | |
| Asus ROG Zephyrus G14 2025 GA403WW | |
| Average of class Multimedia (605 - 2024, n=63, last 2 years) | |
| HP ZBook Ultra G1a A3ZQ0ET | |
| Acer Predator Triton 14 AI PT14-52 | |
| WebXPRT 3 / Overall | |
| Apple MacBook Pro 14 2026 M5 Max | |
| Average Apple M5 Max, Apple M5 Max 40-Core GPU (n=1) | |
| Apple MacBook Pro 14 2024 M4 Pro | |
| Asus ROG Zephyrus G14 2025 GA403WW | |
| Average of class Multimedia (136.4 - 596, n=66, last 2 years) | |
| Asus ProArt PX13 HN7306EA | |
| Acer Predator Triton 14 AI PT14-52 | |
| Razer Blade 14 2025 | |
| Schenker Key 14 (M24) | |
| HP ZBook Ultra G1a A3ZQ0ET | |
| WebXPRT 4 / Overall | |
| Apple MacBook Pro 14 2026 M5 Max | |
| Average Apple M5 Max, Apple M5 Max 40-Core GPU (n=1) | |
| Apple MacBook Pro 14 2024 M4 Pro | |
| HP ZBook Ultra G1a A3ZQ0ET | |
| Average of class Multimedia (167.3 - 402, n=68, last 2 years) | |
| Acer Predator Triton 14 AI PT14-52 | |
| Asus ROG Zephyrus G14 2025 GA403WW | |
| Razer Blade 14 2025 | |
| Asus ProArt PX13 HN7306EA | |
| Schenker Key 14 (M24) | |
| Mozilla Kraken 1.1 / Total | |
| Schenker Key 14 (M24) | |
| Acer Predator Triton 14 AI PT14-52 | |
| Asus ProArt PX13 HN7306EA | |
| Average of class Multimedia (228 - 835, n=69, last 2 years) | |
| Razer Blade 14 2025 | |
| HP ZBook Ultra G1a A3ZQ0ET | |
| Asus ROG Zephyrus G14 2025 GA403WW | |
| Apple MacBook Pro 14 2024 M4 Pro | |
| Apple MacBook Pro 14 2026 M5 Max | |
| Average Apple M5 Max, Apple M5 Max 40-Core GPU (n=1) | |
* ... smaller is better
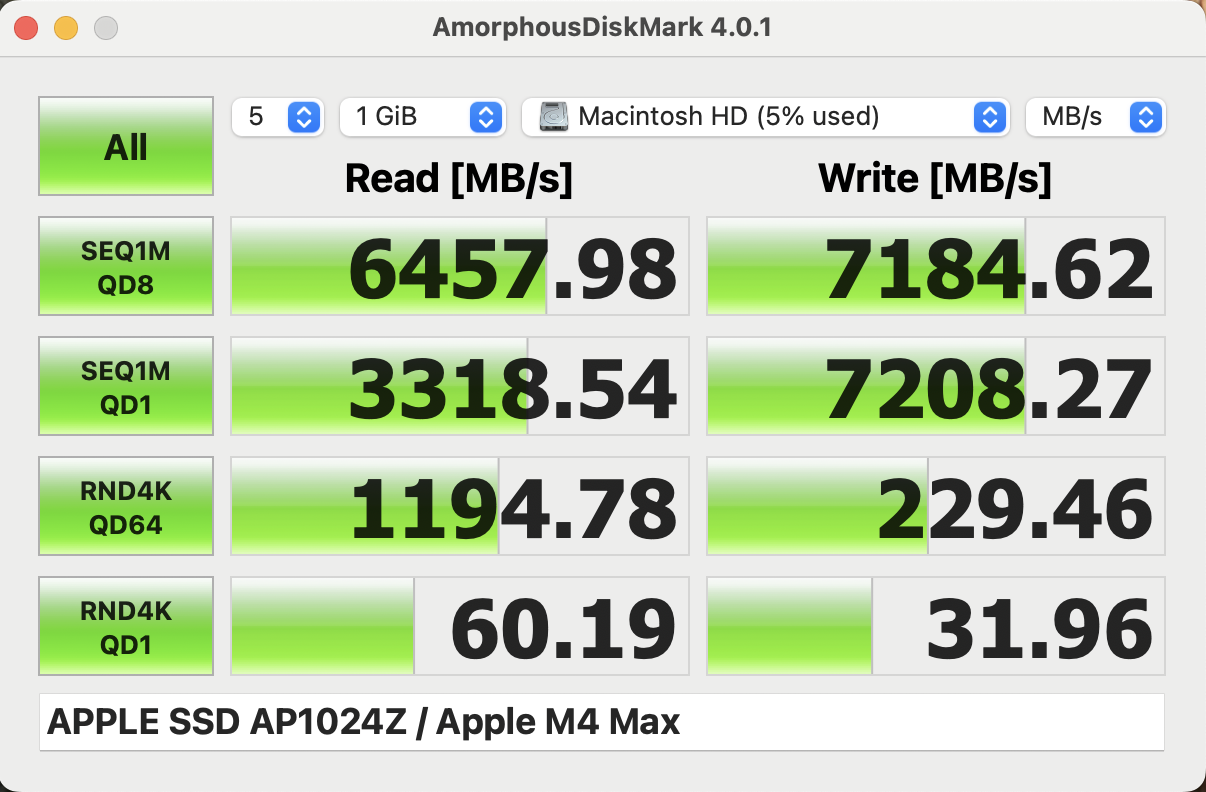
Storage Devices
Apple now uses PCIe 5.0 SSDs and the performance of our review unit with the 8 TB option is excellent with transfer rates of up to 20 GB/s. It is also one of the few 14-inch laptops with up to 8 TB storage.

GPU Performance
Our review unit is equipped with the fastest 40-core M5 Max GPU and we talked about the technical details in our GPU analysis. The GPU draws up to 72 Watts under load, but only for 1-2 seconds before it drops to 55 and later to just 44 Watts in High Power mode (60/32W in Automatic mode). We see an advantage of 8-14 % advantage over the old M4 Max in the 3DMark tests and the M5 Max is also close to the mobile RTX 5080 in the ROG Zephyrus G14. In shorter benchmarks like Cinebench 2024 or Geekbench, the performance advantage over the M4 Max is even bigger. The larger MacBook Pro 16 with the M5 Max should perform even better in the GPU tests.
Sustained workloads will result in some throttling, even in High Power mode with 92.6 % (74.99 % in Automatic mode) as shown in the screenshots below.


| 3DMark Steel Nomad Score | 3924 points | |
| 3DMark Steel Nomad Light Score | 16191 points | |
Help | ||
| Blender / v4.3 Barbershop Metal | |
| Apple MacBook Pro 14 2026 M5 Max | |
| Average Apple M5 Max 40-Core GPU (n=1) | |
| Average of class Multimedia (83.2 - 100, n=2, last 2 years) | |
| Apple MacBook Pro 16 M4 Max | |
| Blender / v4.3 Barbershop OPTIX | |
| Average of class Multimedia (58 - 305, n=6, last 2 years) | |
| HP ZBook X G1i 16 | |
| Zotac GeForce RTX 5060 Low Profile | |
| MSI Crosshair 18 HX AI A2XW | |
| HP Omen 17z-db100 | |
| Asus ROG NUC 15-90AS00I1 | |
| Lenovo Legion 9 18IAX10 | |
| HP ZBook Fury G1i 18 | |
| MSI Stealth 18 HX AI A2XW | |
| Blender / v4.3 Barbershop CPU | |
| Average of class Multimedia (722 - 5186, n=25, last 2 years) | |
| HP Omen 17z-db100 | |
| HP ZBook X G1i 16 | |
| Zotac GeForce RTX 5060 Low Profile | |
| HP ZBook Fury G1i 18 | |
| MSI Stealth 18 HX AI A2XW | |
| MSI Crosshair 18 HX AI A2XW | |
| Apple MacBook Pro 16 M4 Max | |
| Asus ROG NUC 15-90AS00I1 | |
| Apple MacBook Pro 14 2026 M5 Max | |
| Average Apple M5 Max 40-Core GPU (n=1) | |
| Lenovo Legion 9 18IAX10 | |
| Blender / v3.3 Classroom METAL | |
| Average of class Multimedia (17.8 - 68, n=5, last 2 years) | |
| Apple MacBook Pro 14 2026 M5 Max | |
| Average Apple M5 Max 40-Core GPU (n=1) | |
| Apple MacBook Pro 16 M4 Max | |
* ... smaller is better
Gaming Performance
We focus on native games for our performance tests and the results are pretty good. In all three tested titles (Cyberpunk 2077, Baldur's Gate 3 & Assassin's Creed Shadows), the M5 Max SoC can keep up with the mobile GeForce RTX 5070 and clearly beats the Radeon 8060S (Strix Halo). However, the performance is once again not completely stable, even though the drop happens very quickly. During our Cyberpunk 2077 throttling test, the initial fps number is 86, but it quickly drops to 80 after a couple of seconds, which mirrors the result of the Steel Nomad stress test.
| low | med. | high | ultra | QHD | 4K | |
|---|---|---|---|---|---|---|
| Baldur's Gate 3 (2023) | 184.6 | 149.2 | 123.6 | 122.1 | 83.3 | 46.8 |
| Cyberpunk 2077 (2023) | 136.4 | 120.4 | 103.1 | 91.3 | 54.6 | 23.8 |
| Total War Pharaoh (2023) | 55.2 | 55 | 50.1 | |||
| Assassin's Creed Shadows (2025) | 69 | 65 | 58 | 41 | 35 | 24 |
Update: Creator Benchmarks
The MacBook Pro lineup is very popular among content creators, so we performed additional benchmarks for Adobe Photoshop, Premiere Pro, Lightroom as well as DaVinci Resolve. The results for the M5 Pro in the MBP 16 were are impressive and either clearly beat or were on par with the mobile version of the GeForce RTX 5090 with 24 GB VRAM in the Asus ProArt P16. The M5 Max in the MacBook Pro 14, however. While we see similar performance figures in more CPU bound tests, there is a major advantage over the M5 Pro in GPU bound tests like Premiere Pro or Davinci Resolve.
| Laptop | Photoshop 1.0.6 (PS Version 27.4) | Premiere Pro STANDARD 2.0.1 (Premiere Version 26) | Premiere Pro EXTENDED 2.0.1 (Premiere Version 26) | Lightroom Class STANDARD 1.0.0 (LR Version 15.2) | Lightroom Class EXTENDED 1.0.0 (LR Version 15.2) | Resolve STANDARD 2.0.0 (Resolve Version 20.3-Studio) | Resolve EXTENDED 2.0.0 (Resolve Version 20.3-Studio) |
|---|---|---|---|---|---|---|---|
| Apple MacBook Pro 14 (M5 Max 40-core GPU | 15775 | 149151 | 117719 | 9496 | 12558 | 115172 | 82713 |
| Apple MacBook Pro 16 (M5 Pro 20-core GPU) | 15271 | 105296 | 89026 | 12739 | 12418 | 83560 | 58878 |
| Asus ROG Z13-KJP (AMD Ryzen Max+ 8060S) | 11932 | 57481 | 48777 | 10013 | 9480 | 53737 | 36070 |
| Asus ROG Zephyrus G14 (Ryzen 9 7940HS + RTX 4090) | 8205 | 77019 | 61578 | 5713 | 68314 | 50936 | |
| Samsung Galaxy Book6 Ultra (Core Ultra 7 365H + RTX 5070) | 8070 | 87446 | Did not run | 9290 | 9141 | 70531 | 50519 |
| Asus ProArt P16 (Ryzen 9 HX370 + RTX5090) | 10096 | 107130 | 82933 | 6709 | 8667 | 85114 | 63907 |
Emissions - Loud under load
System Noise
The MacBook Pro 14 is once again a very quiet device in everyday situations and the first fan stage 2400 rpm only results in a barely audible fan murmur. If you stress the components (individually or alone), however, the small 14-inch laptop will be loud, especially in High Power mode. We measure up to 53.2 dB(A) (~7500 rpm) in our stress test and 47.8 dB(A) (~6200 rpm) while gaming. The fans stay much quieter in Automatic mode at up to 41.4 dB(A) (~5150 rpm) and barely audible in Low Power mode at 24.1 dB(A) (~2400 rpm). Our review unit did not experience any other electronic noises.
Noise level
| Idle |
| 23.1 / 23.1 / 23.1 dB(A) |
| Load |
| 36.8 / 53.2 dB(A) |
 | ||
30 dB silent 40 dB(A) audible 50 dB(A) loud |
||
min: | ||
| Apple MacBook Pro 14 2026 M5 Max M5 Max, M5 Max 40-Core GPU | Apple MacBook Pro 14 2024 M4 Pro M4 Pro 14-Core, M4 Pro 20-Core GPU | Acer Predator Triton 14 AI PT14-52 Core Ultra 9 288V, GeForce RTX 5070 Laptop | Razer Blade 14 2025 Ryzen AI 9 365, GeForce RTX 5070 Laptop | HP ZBook Ultra G1a A3ZQ0ET Ryzen AI Max PRO 390, Radeon 8050S | Asus ROG Zephyrus G14 2025 GA403WW Ryzen AI 9 HX 370, GeForce RTX 5080 Laptop | Schenker Key 14 (M24) Ultra 7 155H, GeForce RTX 4060 Laptop GPU | |
|---|---|---|---|---|---|---|---|
| Noise | 4% | -12% | -9% | -2% | -20% | -19% | |
| off / environment * (dB) | 23.1 | 23.9 -3% | 24.9 -8% | 23.7 -3% | 24.6 -6% | 23.3 -1% | 25.5 -10% |
| Idle Minimum * (dB) | 23.1 | 23.9 -3% | 24.9 -8% | 23.7 -3% | 24.6 -6% | 29.1 -26% | 25.5 -10% |
| Idle Average * (dB) | 23.1 | 23.9 -3% | 24.9 -8% | 23.7 -3% | 24.6 -6% | 29.1 -26% | 26.5 -15% |
| Idle Maximum * (dB) | 23.1 | 23.9 -3% | 30.5 -32% | 27 -17% | 24.6 -6% | 29.1 -26% | 30.3 -31% |
| Load Average * (dB) | 36.8 | 30.2 18% | 36.1 2% | 44.9 -22% | 40.7 -11% | 54.4 -48% | 49.3 -34% |
| Cyberpunk 2077 ultra * (dB) | 47.8 | 44.5 7% | 57.9 -21% | 54.6 -14% | 45.4 5% | 54.4 -14% | 57.8 -21% |
| Load Maximum * (dB) | 53.2 | 44.5 16% | 57.9 -9% | 54.6 -3% | 45.4 15% | 54.4 -2% | 57.8 -9% |
* ... smaller is better
Temperature
While idling or under light workloads, the aluminum surfaces stay very cool. If you really stress the system, however, the center area of the keyboard will get quite warm at more than 47 °C, which is definitely noticeable, but you can still type. The bottom panel stays noticeably cooler though with just 40 °C, so it is no problem to use the MBP 14 on your lap, even if you really stress it. The 96W power adapter gets pretty hot at more than 50 °C.
During the stress test, the M5 Max SoC will draw up to 96 Watts in High Power mode, but very quickly drops to just 46 and later 42 Watts (~85 °C). In Automatic mode, the values are lower at 84/46/30 Watts (80 °C) and just 12 Watts (66 °C) in Low Power mode.
(-) The maximum temperature on the upper side is 47 °C / 117 F, compared to the average of 36.8 °C / 98 F, ranging from 21 to 71 °C for the class Multimedia.
(±) The bottom heats up to a maximum of 40.5 °C / 105 F, compared to the average of 39.1 °C / 102 F
(+) In idle usage, the average temperature for the upper side is 22.9 °C / 73 F, compared to the device average of 31.3 °C / 88 F.
(-) 3: The average temperature for the upper side is 39 °C / 102 F, compared to the average of 31.3 °C / 88 F for the class Multimedia.
(+) The palmrests and touchpad are cooler than skin temperature with a maximum of 30.7 °C / 87.3 F and are therefore cool to the touch.
(±) The average temperature of the palmrest area of similar devices was 28.7 °C / 83.7 F (-2 °C / -3.6 F).


| Apple MacBook Pro 14 2026 M5 Max M5 Max, M5 Max 40-Core GPU | Apple MacBook Pro 14 2024 M4 Pro M4 Pro 14-Core, M4 Pro 20-Core GPU | Acer Predator Triton 14 AI PT14-52 Core Ultra 9 288V, GeForce RTX 5070 Laptop | Razer Blade 14 2025 Ryzen AI 9 365, GeForce RTX 5070 Laptop | HP ZBook Ultra G1a A3ZQ0ET Ryzen AI Max PRO 390, Radeon 8050S | Asus ROG Zephyrus G14 2025 GA403WW Ryzen AI 9 HX 370, GeForce RTX 5080 Laptop | Schenker Key 14 (M24) Ultra 7 155H, GeForce RTX 4060 Laptop GPU | |
|---|---|---|---|---|---|---|---|
| Heat | 0% | -11% | -20% | -16% | -24% | -31% | |
| Maximum Upper Side * (°C) | 47 | 47.3 -1% | 42.9 9% | 47 -0% | 43 9% | 51.2 -9% | 43.1 8% |
| Maximum Bottom * (°C) | 40.5 | 44.2 -9% | 47.4 -17% | 49.6 -22% | 40.4 -0% | 50.3 -24% | 51.3 -27% |
| Idle Upper Side * (°C) | 23.3 | 22.1 5% | 27.3 -17% | 29.8 -28% | 31.2 -34% | 30.2 -30% | 33.2 -42% |
| Idle Bottom * (°C) | 23.4 | 22.1 6% | 28.1 -20% | 30.7 -31% | 32.5 -39% | 30.9 -32% | 38.3 -64% |
* ... smaller is better
Speakers
The six-speaker sound system is not quite as good as on the larger 16-inch MacBook Pro, but it is not far off and still beats even the best Windows competitors like the ROG Zephyrus G14.
Apple MacBook Pro 14 2026 M5 Max audio analysis
(+) | speakers can play relatively loud (83.1 dB)
Bass 100 - 315 Hz
(+) | good bass - only 4.5% away from median
(±) | linearity of bass is average (7.1% delta to prev. frequency)
Mids 400 - 2000 Hz
(+) | balanced mids - only 1.3% away from median
(+) | mids are linear (2.5% delta to prev. frequency)
Highs 2 - 16 kHz
(+) | balanced highs - only 3.3% away from median
(+) | highs are linear (3.7% delta to prev. frequency)
Overall 100 - 16.000 Hz
(+) | overall sound is linear (6.5% difference to median)
Compared to same class
» 4% of all tested devices in this class were better, 1% similar, 95% worse
» The best had a delta of 5%, average was 17%, worst was 45%
Compared to all devices tested
» 1% of all tested devices were better, 0% similar, 99% worse
» The best had a delta of 4%, average was 23%, worst was 134%
Acer Predator Triton 14 AI PT14-52 audio analysis
(+) | speakers can play relatively loud (90.7 dB)
Bass 100 - 315 Hz
(±) | reduced bass - on average 11.9% lower than median
(±) | linearity of bass is average (10.3% delta to prev. frequency)
Mids 400 - 2000 Hz
(±) | higher mids - on average 10.1% higher than median
(+) | mids are linear (6.9% delta to prev. frequency)
Highs 2 - 16 kHz
(±) | reduced highs - on average 5.2% lower than median
(+) | highs are linear (4.4% delta to prev. frequency)
Overall 100 - 16.000 Hz
(±) | linearity of overall sound is average (17.9% difference to median)
Compared to same class
» 54% of all tested devices in this class were better, 9% similar, 37% worse
» The best had a delta of 6%, average was 18%, worst was 132%
Compared to all devices tested
» 37% of all tested devices were better, 8% similar, 55% worse
» The best had a delta of 4%, average was 23%, worst was 134%
Razer Blade 14 2025 audio analysis
(±) | speaker loudness is average but good (79.6 dB)
Bass 100 - 315 Hz
(±) | reduced bass - on average 9% lower than median
(±) | linearity of bass is average (7.4% delta to prev. frequency)
Mids 400 - 2000 Hz
(±) | higher mids - on average 9% higher than median
(+) | mids are linear (5.4% delta to prev. frequency)
Highs 2 - 16 kHz
(+) | balanced highs - only 3.2% away from median
(+) | highs are linear (5% delta to prev. frequency)
Overall 100 - 16.000 Hz
(±) | linearity of overall sound is average (15.1% difference to median)
Compared to same class
» 32% of all tested devices in this class were better, 6% similar, 62% worse
» The best had a delta of 6%, average was 18%, worst was 132%
Compared to all devices tested
» 21% of all tested devices were better, 4% similar, 75% worse
» The best had a delta of 4%, average was 23%, worst was 134%
HP ZBook Ultra G1a A3ZQ0ET audio analysis
(+) | speakers can play relatively loud (85.3 dB)
Bass 100 - 315 Hz
(±) | reduced bass - on average 11.2% lower than median
(±) | linearity of bass is average (11.5% delta to prev. frequency)
Mids 400 - 2000 Hz
(±) | higher mids - on average 5.7% higher than median
(+) | mids are linear (5.6% delta to prev. frequency)
Highs 2 - 16 kHz
(+) | balanced highs - only 3.3% away from median
(+) | highs are linear (5.6% delta to prev. frequency)
Overall 100 - 16.000 Hz
(+) | overall sound is linear (11.5% difference to median)
Compared to same class
» 14% of all tested devices in this class were better, 4% similar, 82% worse
» The best had a delta of 7%, average was 17%, worst was 35%
Compared to all devices tested
» 8% of all tested devices were better, 2% similar, 90% worse
» The best had a delta of 4%, average was 23%, worst was 134%
Asus ROG Zephyrus G14 2025 GA403WW audio analysis
(±) | speaker loudness is average but good (81.2 dB)
Bass 100 - 315 Hz
(+) | good bass - only 2.8% away from median
(±) | linearity of bass is average (8.1% delta to prev. frequency)
Mids 400 - 2000 Hz
(+) | balanced mids - only 3.9% away from median
(+) | mids are linear (5.6% delta to prev. frequency)
Highs 2 - 16 kHz
(±) | reduced highs - on average 5.9% lower than median
(+) | highs are linear (4.3% delta to prev. frequency)
Overall 100 - 16.000 Hz
(+) | overall sound is linear (10.4% difference to median)
Compared to same class
» 6% of all tested devices in this class were better, 2% similar, 92% worse
» The best had a delta of 6%, average was 18%, worst was 132%
Compared to all devices tested
» 5% of all tested devices were better, 1% similar, 93% worse
» The best had a delta of 4%, average was 23%, worst was 134%
Schenker Key 14 (M24) audio analysis
(±) | speaker loudness is average but good (81.5 dB)
Bass 100 - 315 Hz
(-) | nearly no bass - on average 29.9% lower than median
(±) | linearity of bass is average (7.9% delta to prev. frequency)
Mids 400 - 2000 Hz
(±) | higher mids - on average 5.3% higher than median
(+) | mids are linear (5.9% delta to prev. frequency)
Highs 2 - 16 kHz
(+) | balanced highs - only 2.1% away from median
(+) | highs are linear (2.8% delta to prev. frequency)
Overall 100 - 16.000 Hz
(±) | linearity of overall sound is average (20.9% difference to median)
Compared to same class
» 71% of all tested devices in this class were better, 8% similar, 21% worse
» The best had a delta of 5%, average was 17%, worst was 45%
Compared to all devices tested
» 57% of all tested devices were better, 8% similar, 35% worse
» The best had a delta of 4%, average was 23%, worst was 134%
Energy Management - Insufficient power adapter
Power Consumption

The power consumption is a big issue for the M5 Max model, because the 96W PSU is simply insufficient. In High Power mode, which is required to get the best and most stable performance, the battery drained by around 10 % when we played the native version of Cyberpunk 2077 and even 15 % during our stress test. Two things are especially problematic: Firstly, Apple limits the power input to ~97 Watts, so it makes no difference whether you use the included 96W PSU, the larger 140W PSU from the MacBook Pro 16 or an even more powerful 180W USB-C charger. Secondly, Apple tries to hide the fact that the battery has to be drained under load as long as possible, because the battery indicator still shows 100 % and the MagSafe LED stays green, while our measurement device clearly showed that the battery has to be recharged. In short peak load scenarios (which are more common), this gives the user the impression everything is fine and the 96W PSU is sufficient. When the load continues, the battery percentage will eventually drop by a couple of percent (from 100 to 97, for example). Based on our power measurements of the larger MacBook Pro 16 with M5 Pro, we suspect the actual consumption under load is above 140 Watts.
| Off / Standby | |
| Idle | |
| Load |
|
Key:
min: | |
| Apple MacBook Pro 14 2026 M5 Max M5 Max, M5 Max 40-Core GPU, Apple SSD AP8192Z, Mini-LED, 3024x1964, 14.2" | Apple MacBook Pro 14 2024 M4 Pro M4 Pro 14-Core, M4 Pro 20-Core GPU, Apple SSD AP2048Z, MiniLED, 3024x1964, 14.2" | Acer Predator Triton 14 AI PT14-52 Core Ultra 9 288V, GeForce RTX 5070 Laptop, Micron 3400 1TB MTFDKBA1T0TFH, OLED, 2880x1800, 14.5" | Razer Blade 14 2025 Ryzen AI 9 365, GeForce RTX 5070 Laptop, Samsung PM9A1 MZVL21T0HCLR, OLED, 2880x1800, 14" | HP ZBook Ultra G1a A3ZQ0ET Ryzen AI Max PRO 390, Radeon 8050S, SK hynix PC801 HFS001TEJ9X101N, IPS LED, 1920x1200, 14" | Asus ROG Zephyrus G14 2025 GA403WW Ryzen AI 9 HX 370, GeForce RTX 5080 Laptop, WD PC SN740 SDDPNQE-2T00, OLED, 2880x1800, 14" | Schenker Key 14 (M24) Ultra 7 155H, GeForce RTX 4060 Laptop GPU, Samsung 990 Pro 1 TB, IPS, 2880x1800, 14" | Average Apple M5 Max 40-Core GPU | Average of class Multimedia | |
|---|---|---|---|---|---|---|---|---|---|
| Power Consumption | 9% | -58% | -78% | -9% | -61% | -55% | 0% | -21% | |
| Idle Minimum * (Watt) | 2.5 | 2.17 13% | 9.3 -272% | 9.3 -272% | 4.5 -80% | 6.7 -168% | 5.8 -132% | 2.5 ? -0% | 5.68 ? -127% |
| Idle Average * (Watt) | 11.6 | 10.9 6% | 12.2 -5% | 11.1 4% | 7.5 35% | 8.8 24% | 10.8 7% | 11.6 ? -0% | 10.2 ? 12% |
| Idle Maximum * (Watt) | 11.8 | 11 7% | 12.5 -6% | 11.2 5% | 8.3 30% | 9.3 21% | 11.1 6% | 11.8 ? -0% | 12.4 ? -5% |
| Load Average * (Watt) | 95.6 | 74.3 22% | 68.4 28% | 91.9 4% | 80.7 16% | 121.5 -27% | 87.4 9% | 95.6 ? -0% | 65.4 ? 32% |
| Cyberpunk 2077 ultra external monitor * (Watt) | 86.4 | 80.5 7% | 132.2 -53% | 168.6 -95% | 104.1 -20% | 155.5 -80% | 169.1 -96% | ||
| Cyberpunk 2077 ultra * (Watt) | 89.4 | 134 -50% | 171.5 -92% | 106.5 -19% | 157.4 -76% | 175.3 -96% | |||
| Load Maximum * (Watt) | 98.8 | 98.1 1% | 145.4 -47% | 195 -97% | 125.1 -27% | 218.1 -121% | 183 -85% | 98.8 ? -0% | 113.3 ? -15% |
* ... smaller is better
Power Consumption Cyberpunk / Stress Test
Power Consumption external Monitor
Battery Life
The 72.4 Wh battery still provides excellent battery runtimes, especially at a lower panel brightness of 150 nits. We recorded more than 15 hours in our Wi-Fi test and even slightly more than 20 hours in our video test. These results are far superior to any Windows rival with powerful components. If you increase the panel brightness, however, the runtime will drop significantly and our Wi-Fi test only ran for 6 hours at max. SDR brightness (~640 nits without ambient light sensor). If you really push the system, you can drain the battery in under one hour, and you can actually reach 3 % battery (where the system reduces the performance dramatically and still runs for a couple of minutes) from 100 % in just 49 minutes. The charging time is around 1.5 hours (50 % after 28 minutes).
| Apple MacBook Pro 14 2026 M5 Max M5 Max, M5 Max 40-Core GPU, 72.4 Wh | Apple MacBook Pro 14 2024 M4 Pro M4 Pro 14-Core, M4 Pro 20-Core GPU, 72.6 Wh | Acer Predator Triton 14 AI PT14-52 Core Ultra 9 288V, GeForce RTX 5070 Laptop, 76 Wh | Razer Blade 14 2025 Ryzen AI 9 365, GeForce RTX 5070 Laptop, 72 Wh | HP ZBook Ultra G1a A3ZQ0ET Ryzen AI Max PRO 390, Radeon 8050S, 74.5 Wh | Asus ROG Zephyrus G14 2025 GA403WW Ryzen AI 9 HX 370, GeForce RTX 5080 Laptop, 73 Wh | Schenker Key 14 (M24) Ultra 7 155H, GeForce RTX 4060 Laptop GPU, 80 Wh | Average of class Multimedia | |
|---|---|---|---|---|---|---|---|---|
| Battery runtime | 1% | -41% | -22% | -6% | -6% | -50% | 9% | |
| H.264 (h) | 20.2 | 19.8 -2% | 10.9 -46% | 15 -26% | 16.4 ? -19% | |||
| WiFi v1.3 (h) | 15.2 | 15.8 4% | 9 -41% | 8.9 -41% | 10.5 -31% | 10.5 -31% | 7.6 -50% | 12.2 ? -20% |
| Load (h) | 1 | 1.2 20% | 1.2 20% | 1.4 40% | 1.662 ? 66% |
Notebookcheck Rating
Apple MacBook Pro 14 2026 M5 Max
- 03/11/2026 v8
Andreas Osthoff
 Total Sustainability Score:
 Potential Competitors in Comparison
Image | Model / Review | Price | Weight | Height | Display |
|---|---|---|---|---|---|
1. 90.2%  | Apple MacBook Pro 14 2026 M5 Max Apple M5 Max ⎘ Apple M5 Max 40-Core GPU ⎘ 128 GB Memory, 8192 GB SSD | Amazon: List Price: 8589€ | 1.6 kg | 15.5 mm | 14.20" 3024x1964 254 PPI Mini-LED |
2. 91.8%  | Apple MacBook Pro 14 2024 M4 Pro Apple M4 Pro 14-Core ⎘ Apple M4 Pro 20-Core GPU ⎘ 48 GB Memory, 2048 GB SSD | Amazon: List Price: 3989 Euro | 1.6 kg | 15.5 mm | 14.20" 3024x1964 254 PPI MiniLED |
3. 82.3%  | Acer Predator Triton 14 AI PT14-52 Intel Core Ultra 9 288V ⎘ NVIDIA GeForce RTX 5070 Laptop ⎘ 32 GB Memory, 1024 GB SSD | Amazon: List Price: 2999€ | 1.6 kg | 17.31 mm | 14.50" 2880x1800 234 PPI OLED |
4. 87.2%  | Razer Blade 14 2025 AMD Ryzen AI 9 365 ⎘ NVIDIA GeForce RTX 5070 Laptop ⎘ 32 GB Memory, 1024 GB SSD | Amazon: List Price: 2399€ | 1.6 kg | 16.2 mm | 14.00" 2880x1800 243 PPI OLED |
5. 85.4%  | HP ZBook Ultra G1a A3ZQ0ET AMD Ryzen AI Max PRO 390 ⎘ AMD Radeon 8050S ⎘ 32 GB Memory, 1024 GB SSD | Amazon: List Price: 2545 Euro | 1.6 kg | 19 mm | 14.00" 1920x1200 162 PPI IPS LED |
6. 88.9%  | Asus ROG Zephyrus G14 2025 GA403WW AMD Ryzen AI 9 HX 370 ⎘ NVIDIA GeForce RTX 5080 Laptop ⎘ 64 GB Memory, 2048 GB SSD | Amazon: List Price: 3899€ | 1.6 kg | 18.3 mm | 14.00" 2880x1800 243 PPI OLED |
7. 82.8%  | Schenker Key 14 (M24) Intel Core Ultra 7 155H ⎘ NVIDIA GeForce RTX 4060 Laptop GPU ⎘ 32 GB Memory, 1024 GB SSD | Amazon: 1. $68.79 PowerHOOD 20V AC/DC Adapter ... 2. $72.78 Onerbl AC-DC Adapter for Cha... 3. $71.28 duskhoot 20V AC/DC Adapter f... List Price: 1890€ | 1.7 kg | 19.9 mm | 14.00" 2880x1800 243 PPI IPS |
Transparency
The selection of devices to be reviewed is made by our editorial team. The test sample was provided to the author as a loan by the manufacturer or retailer for the purpose of this review. The lender had no influence on this review, nor did the manufacturer receive a copy of this review before publication. There was no obligation to publish this review. As an independent media company, Notebookcheck is not subjected to the authority of manufacturers, retailers or publishers.
This is how Notebookcheck is testing
Every year, Notebookcheck independently reviews hundreds of laptops and smartphones using standardized procedures to ensure that all results are comparable. We have continuously developed our test methods for around 20 years and set industry standards in the process. In our test labs, high-quality measuring equipment is utilized by experienced technicians and editors. These tests involve a multi-stage validation process. Our complex rating system is based on hundreds of well-founded measurements and benchmarks, which maintains objectivity. Further information on our test methods can be found here.
