Verdict - The MacBook Pro M5 is now much faster
Apple has once again significantly boosted performance with its new M5 SoC, which is currently by far the fastest single-core processor available on the market. The improvements in its multi-core and graphics performance over the old M4 SoC are now even greater. Plus, the speed of the SSDs has been increased to PCIe 4.0 levels.
Cooling is still taken care of by a single fan, which, to be fair, you can't really hear during everyday use. It only gets super loud when the CPU is under full load, and in this case, the two-fan system from the more expensive MBP models would definitely have been the better choice. Apple has also cut corners when it comes to the device's connectivity, because while the new iPad Pro M5 already supports Wi-Fi 7 (and the upcoming MacBooks with the M5 Pro/Max will probably do so too), the base model has stuck with Wi-Fi 6.
Otherwise, many of the MacBook Pro 14's features remain excellent, and the matte display option is a blessing if you find yourself easily annoyed by reflections. The base model has a starting price of $1,599, but Apple has removed the power adapter from the package. You should also hold off on upgrades for the base model, as the MacBooks with the M5 Pro SoCs might eventually be the better choice.
Pros
Cons
Price and availability
The base model of the MacBook Pro 14 M5 is currently available on Amazon for $1,584.
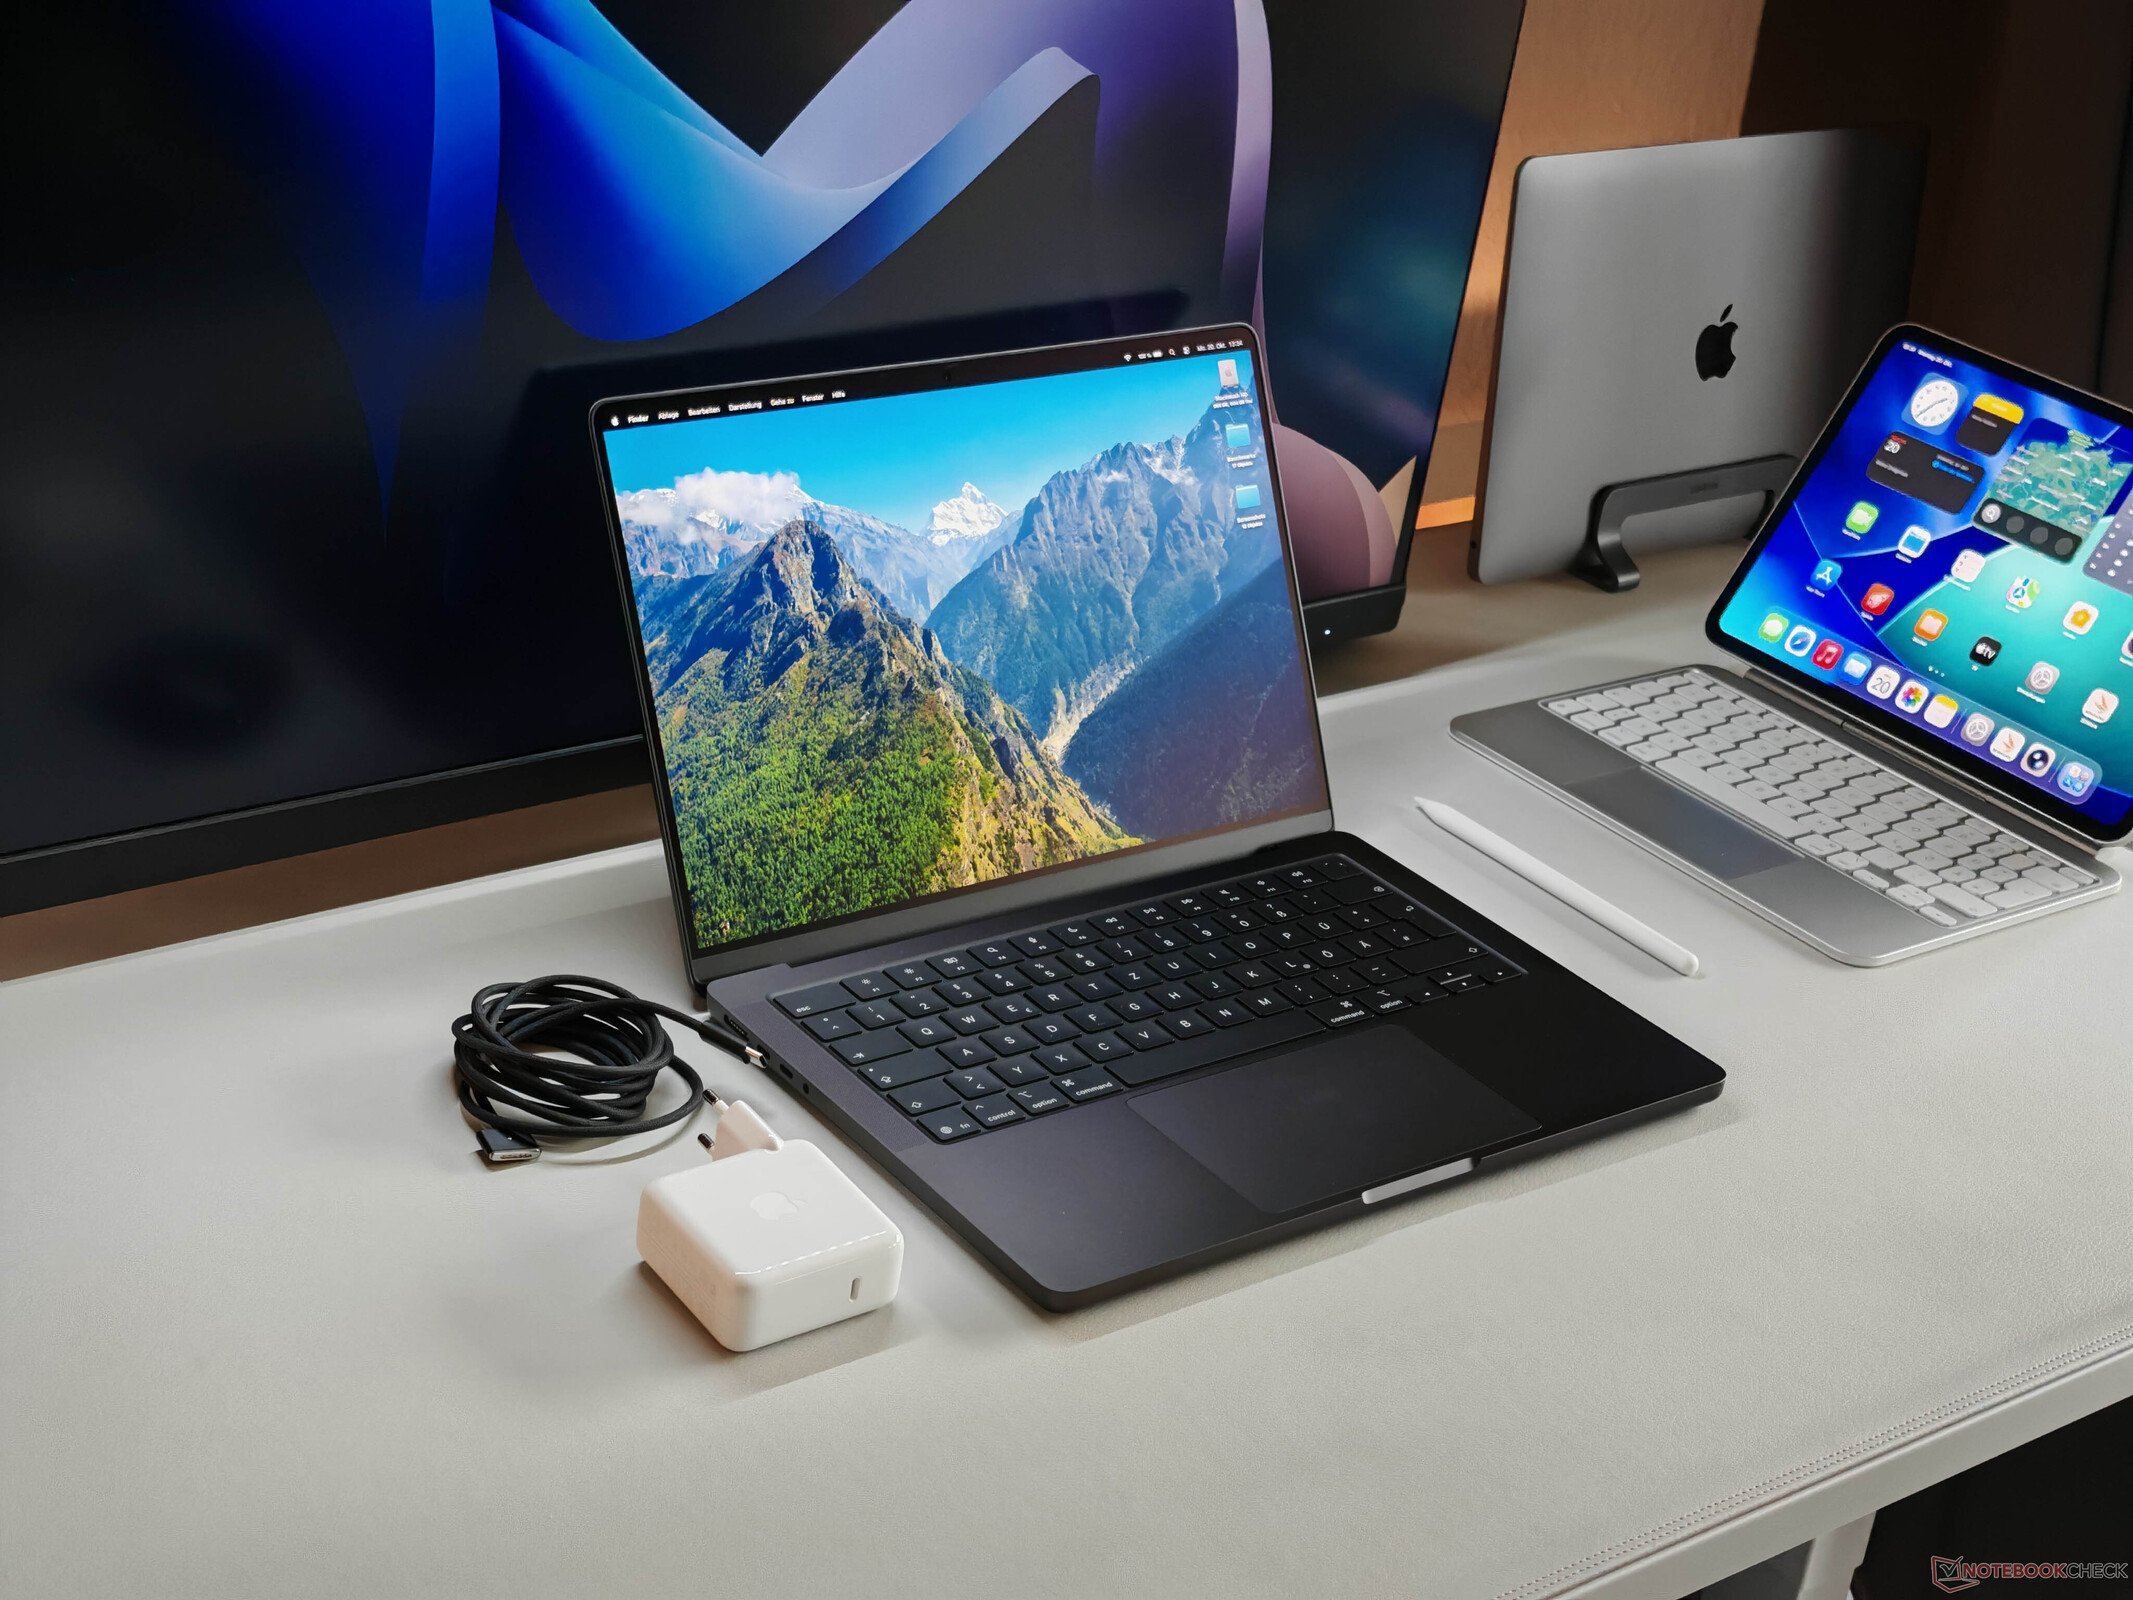
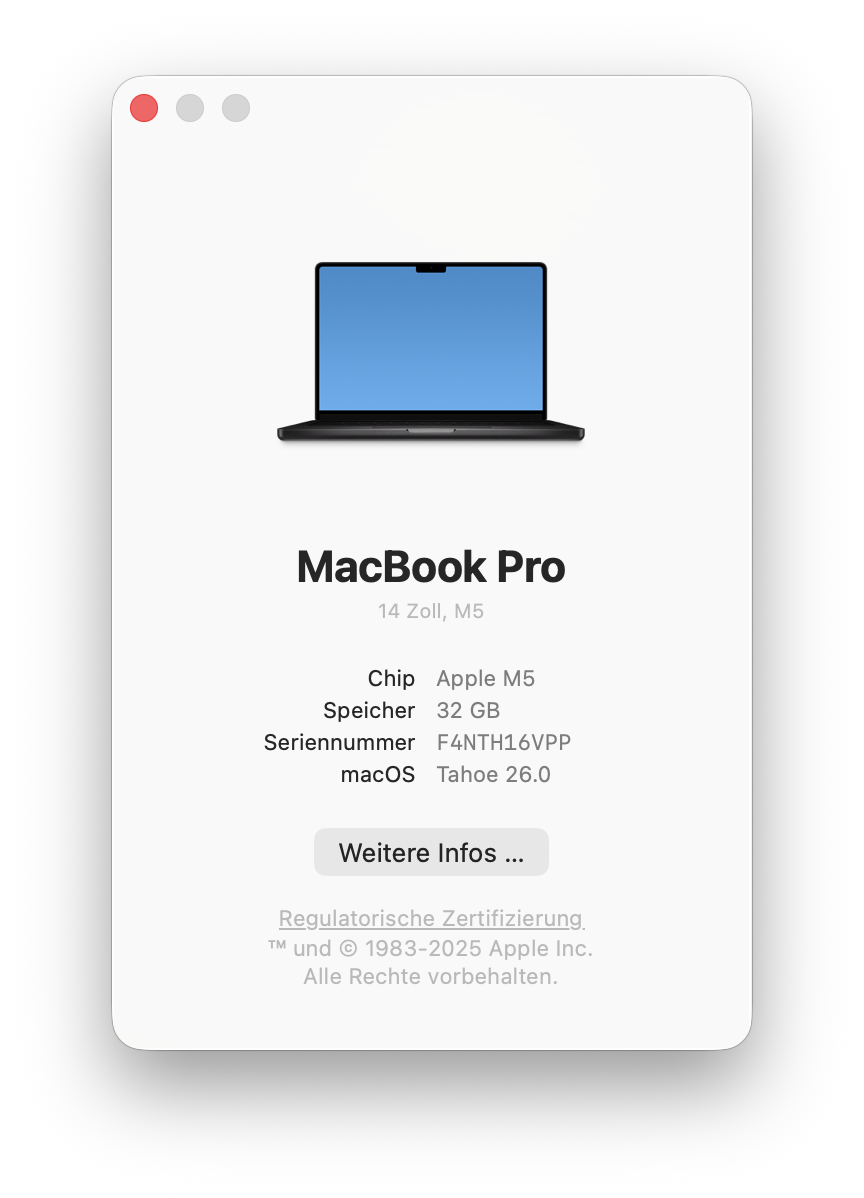
The base model of the MacBook Pro 14 is once again the first MacBook that Apple has equipped with its brand-new M5 processor generation. Its base price has dropped by $100 to $1,599, which gets you the M5 with 10 cores, 16 GB of RAM, and 512 GB of SSD storage. However, a charger is no longer included in the package. Our test device features a 1 TB SSD, 32 GB RAM, and the nano-texture glass option for the mini-LED panel, which is why its total price in this case rises to a whopping $3,000.
Specifications
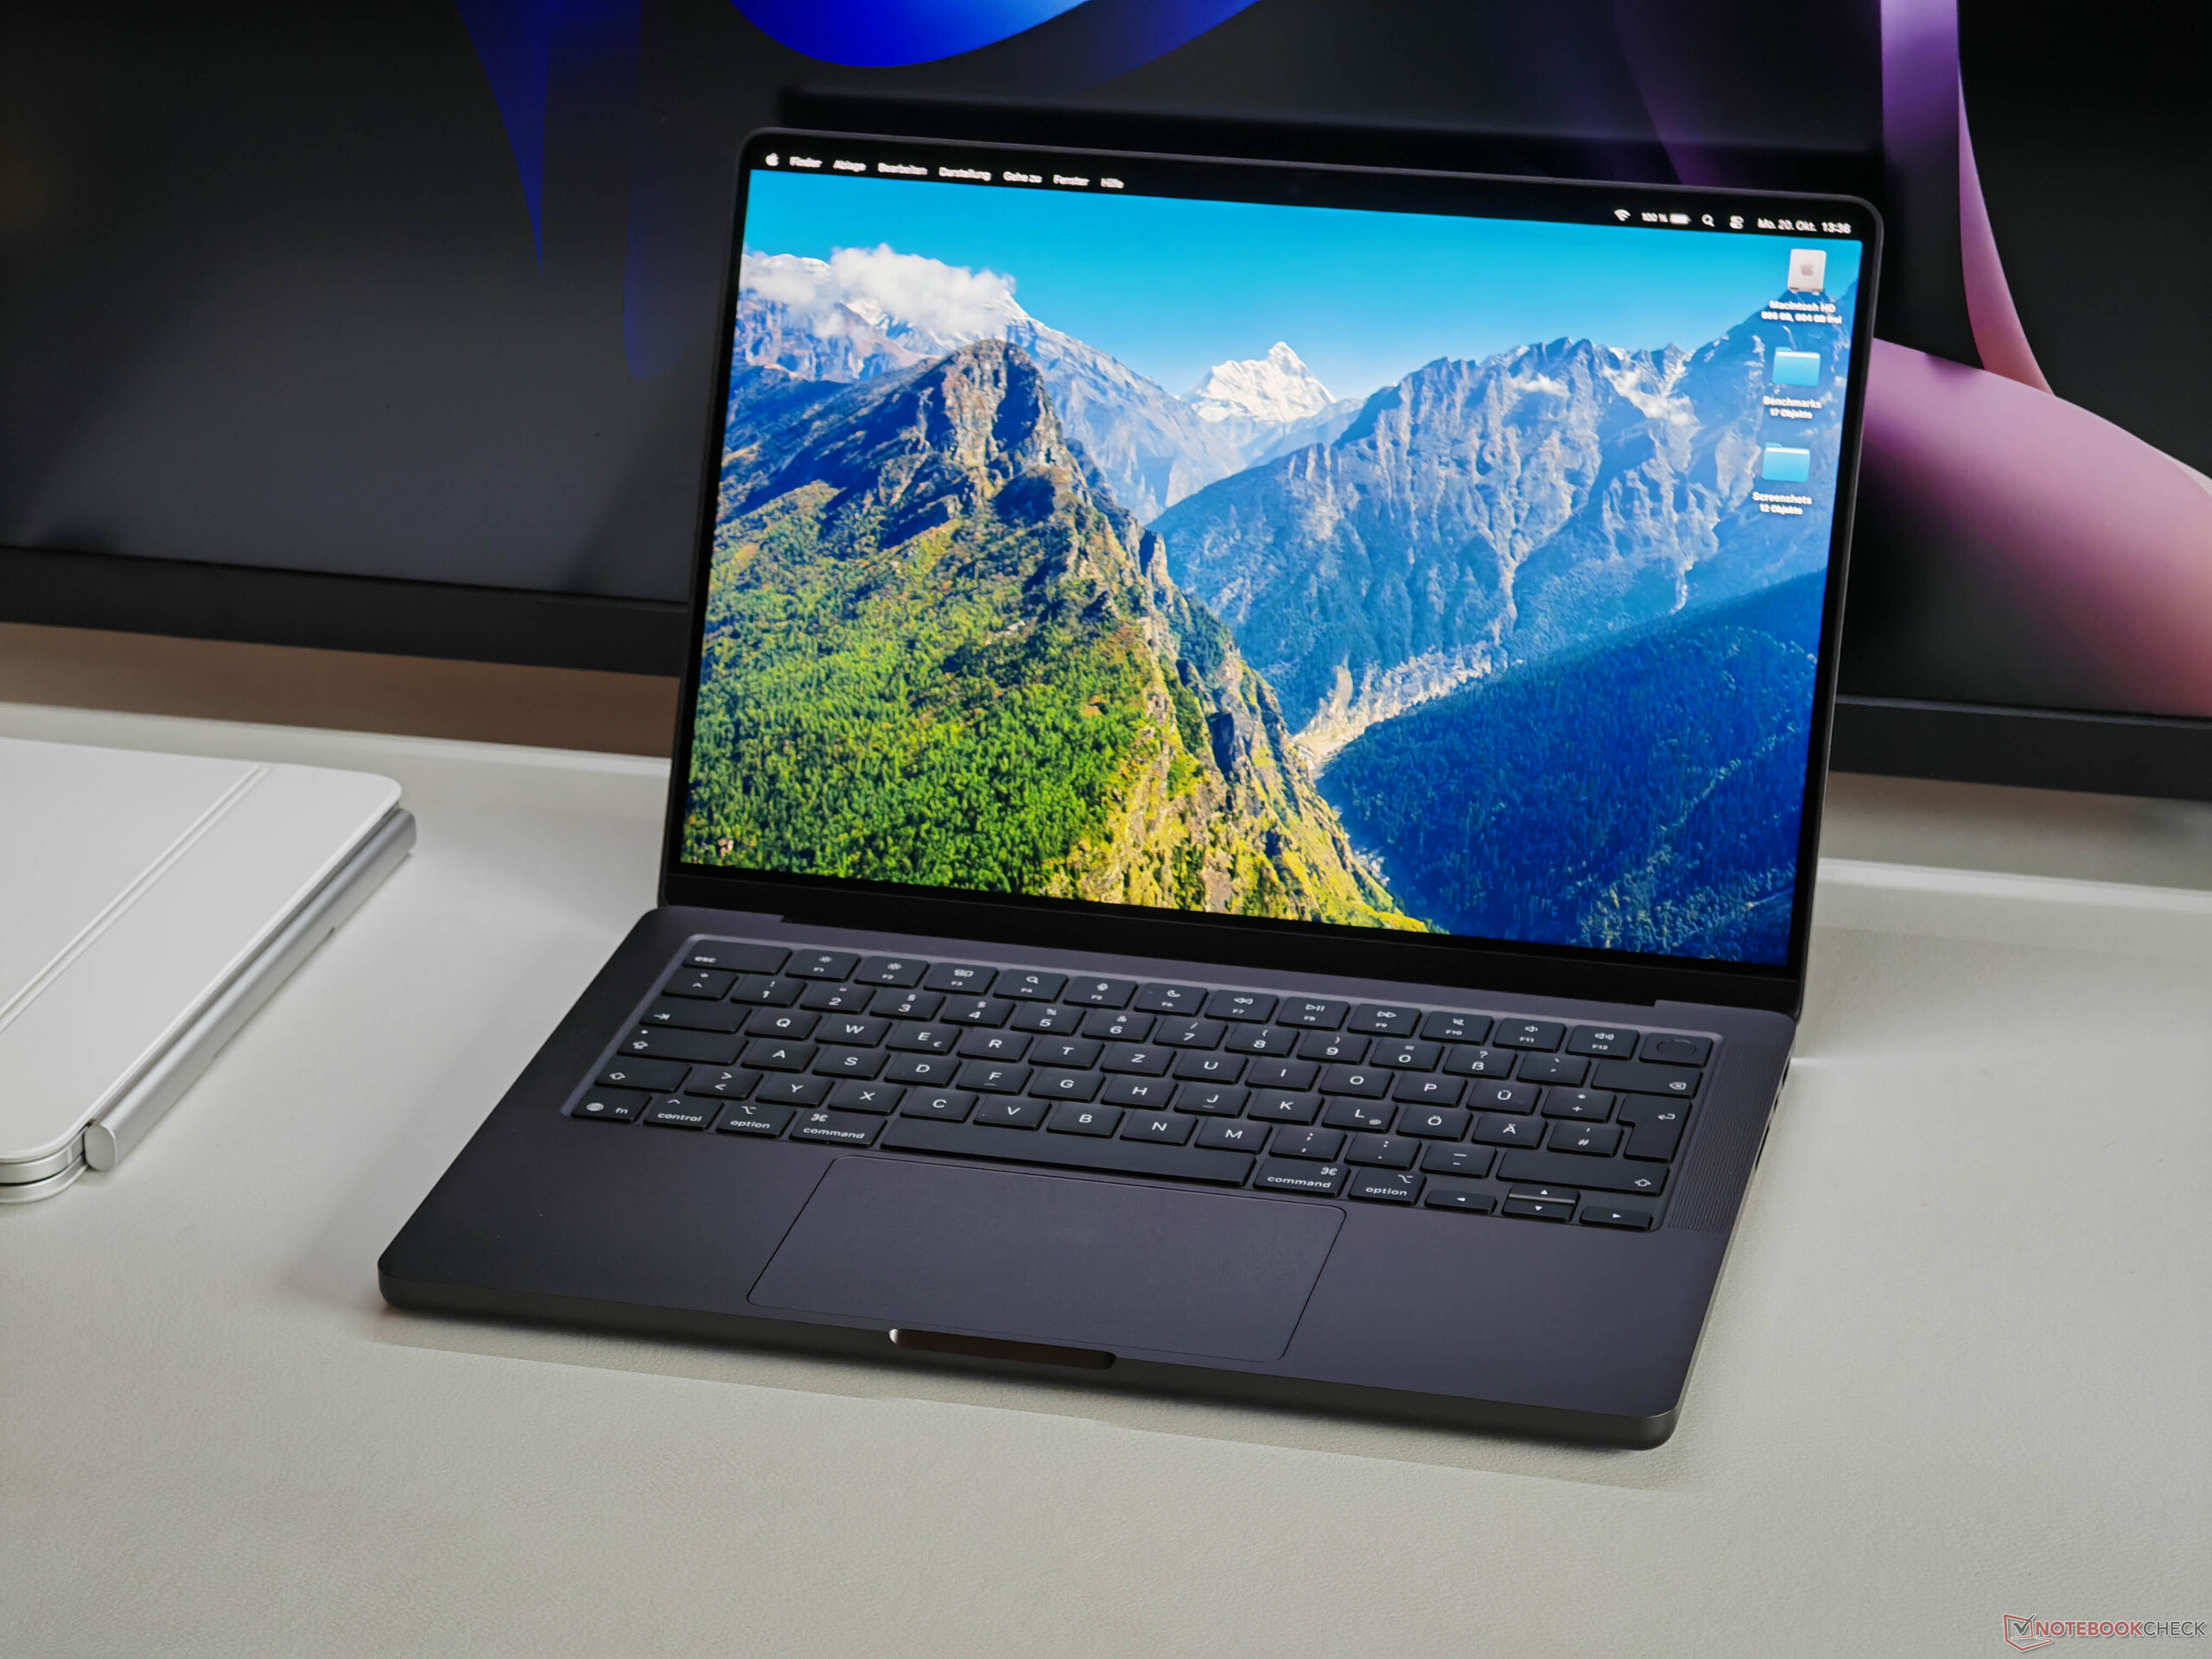
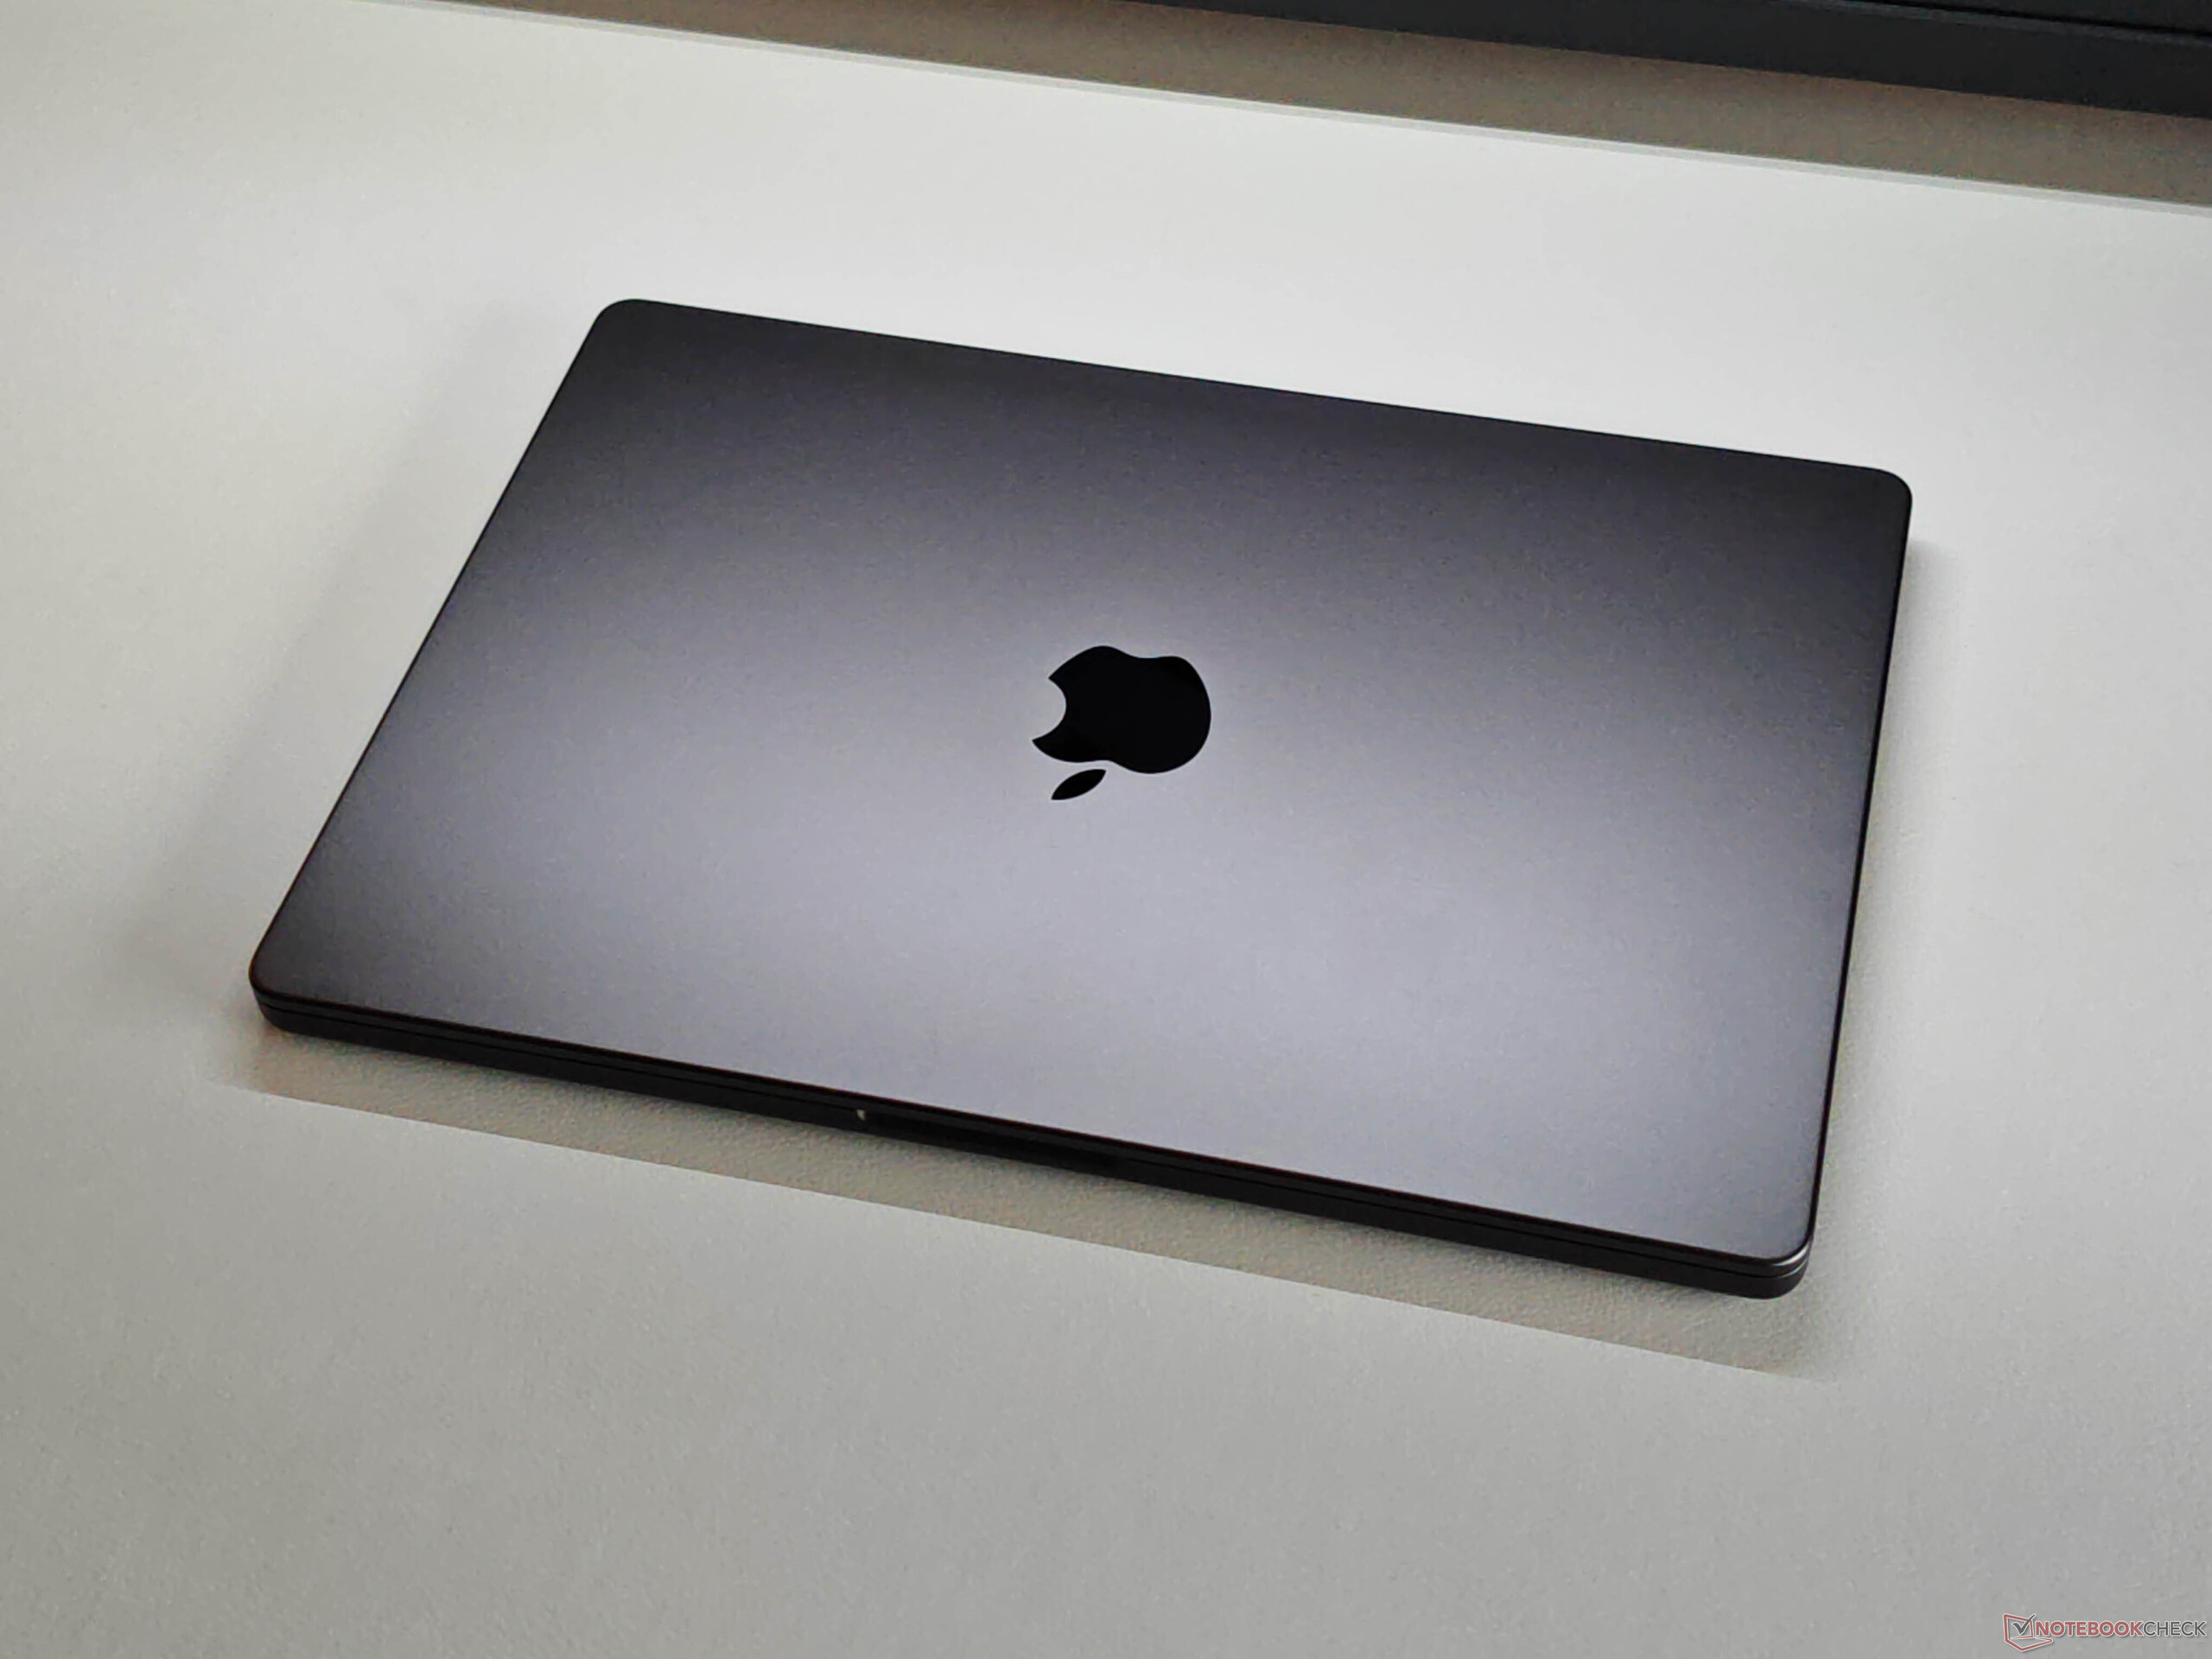
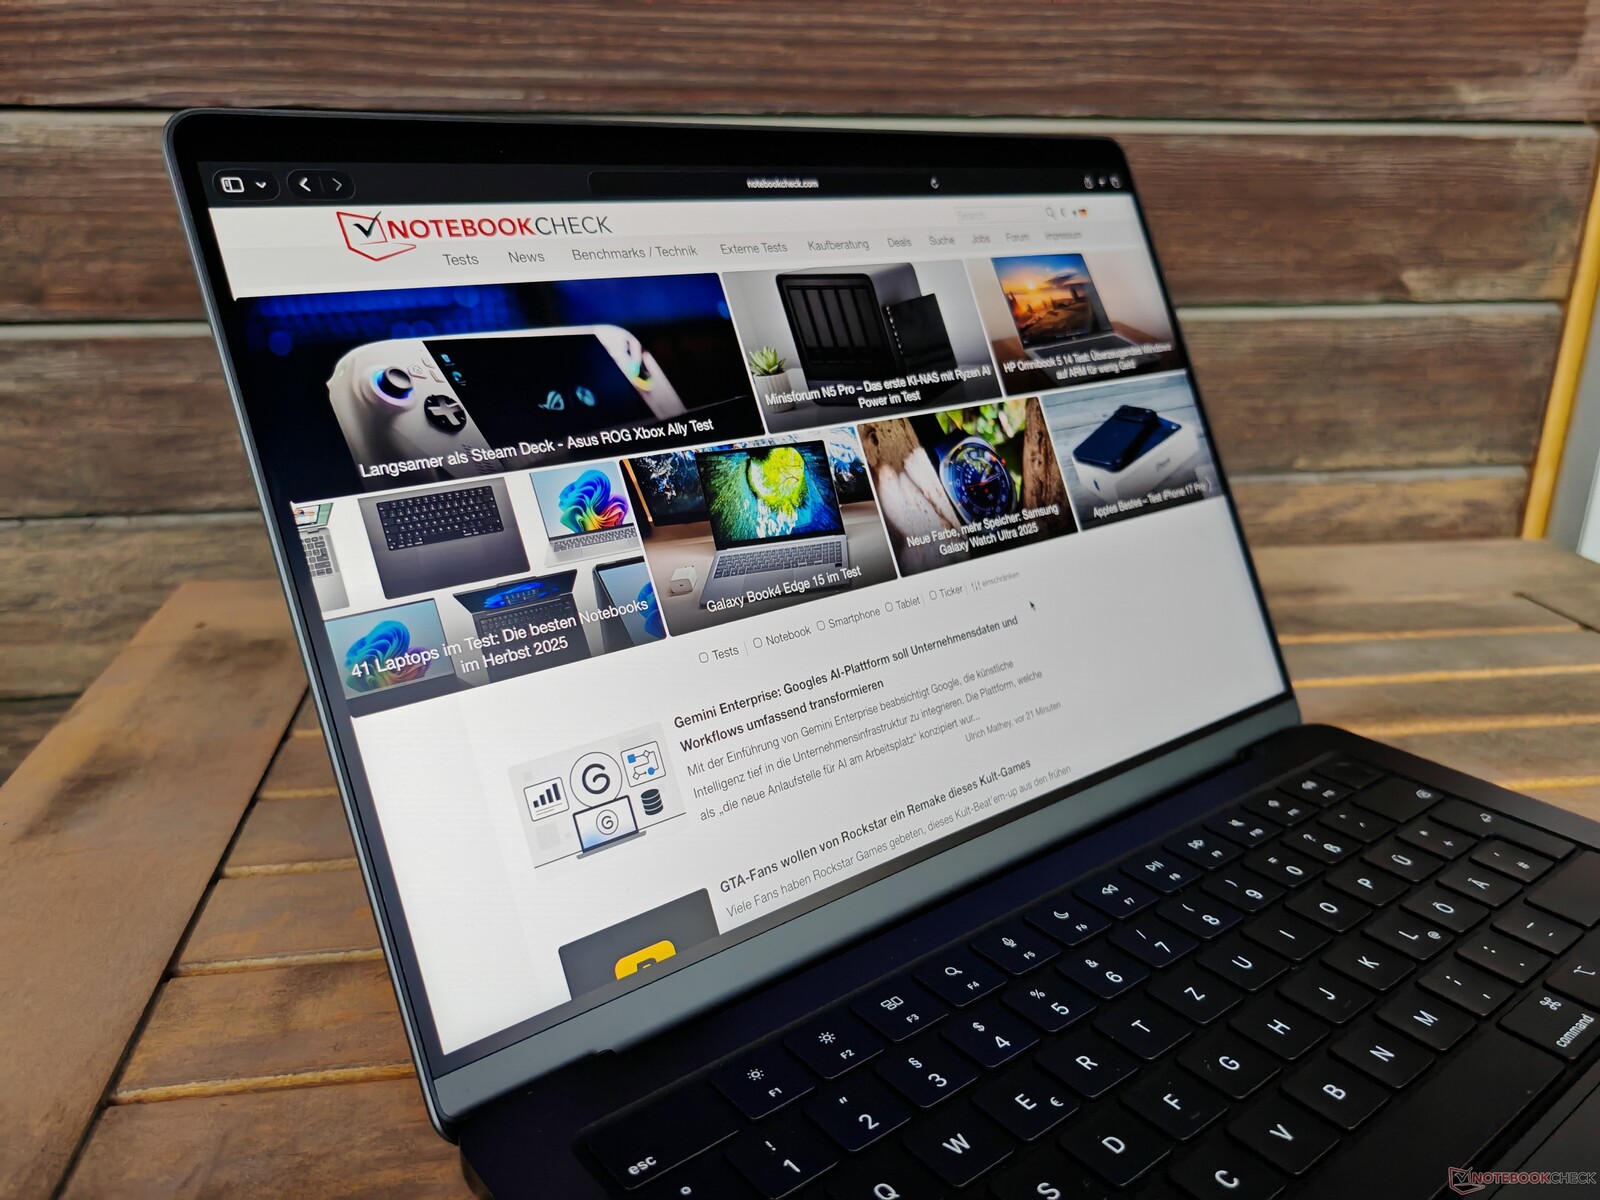
Case & connectivity
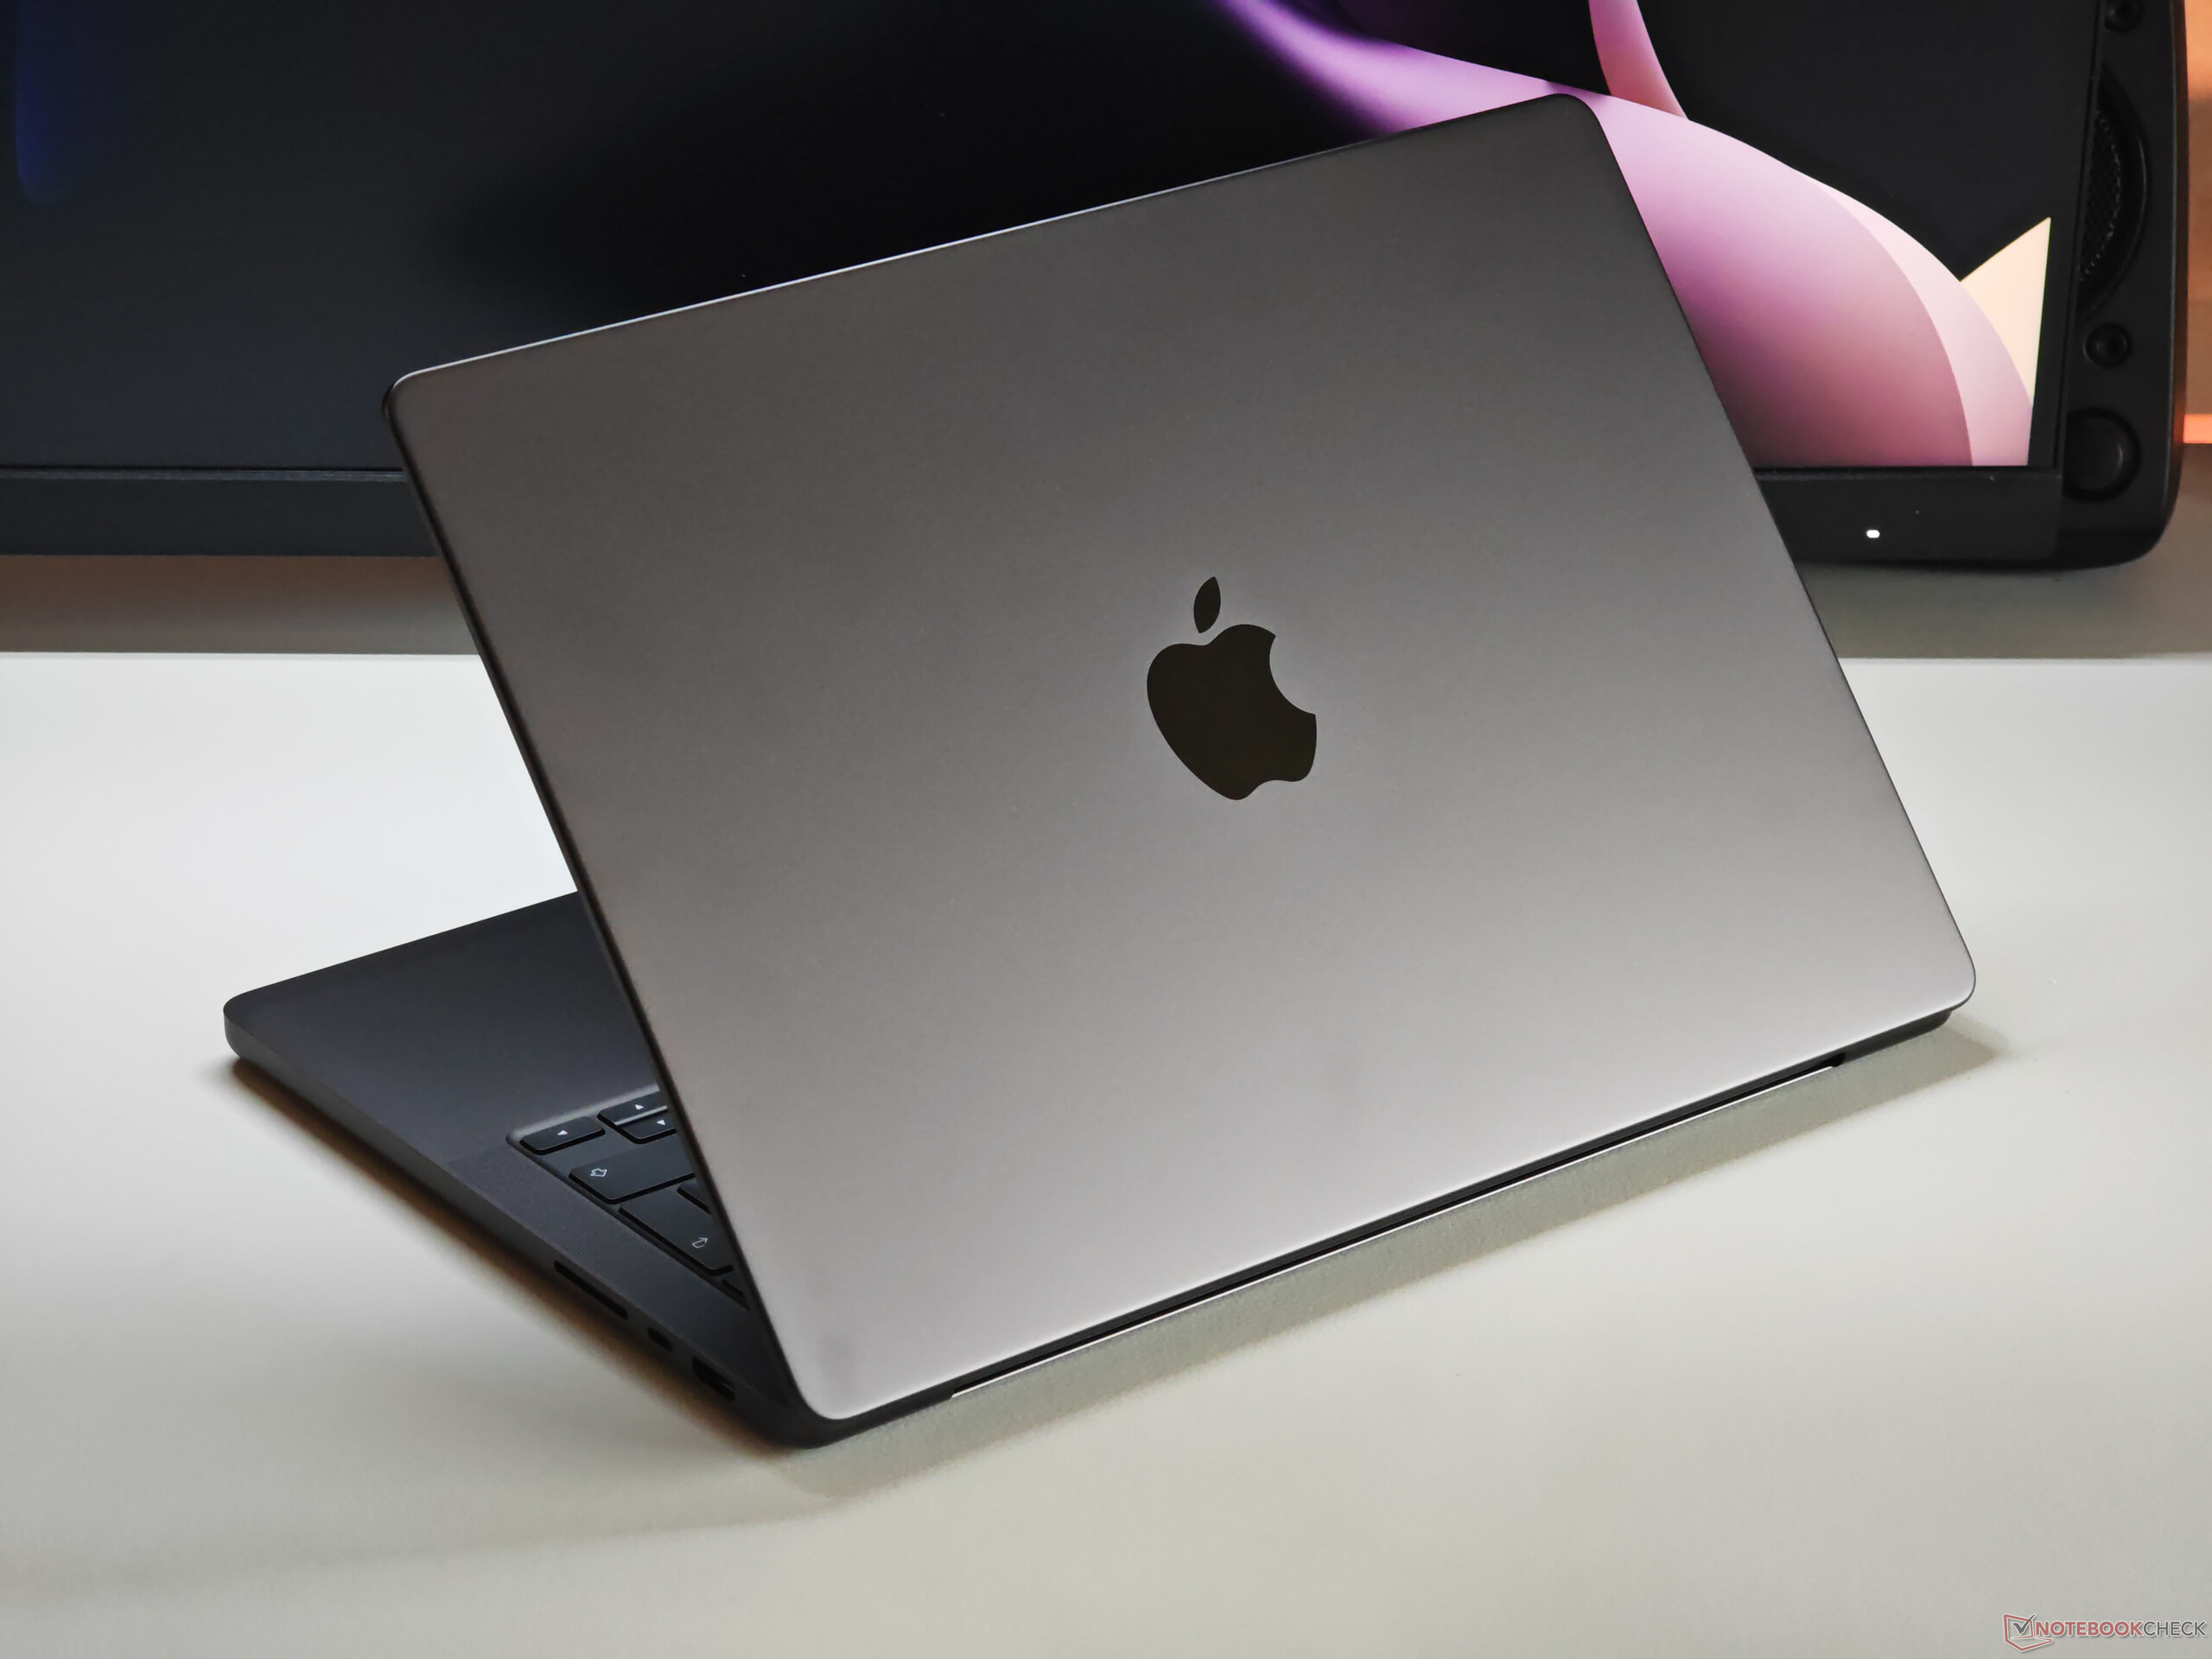
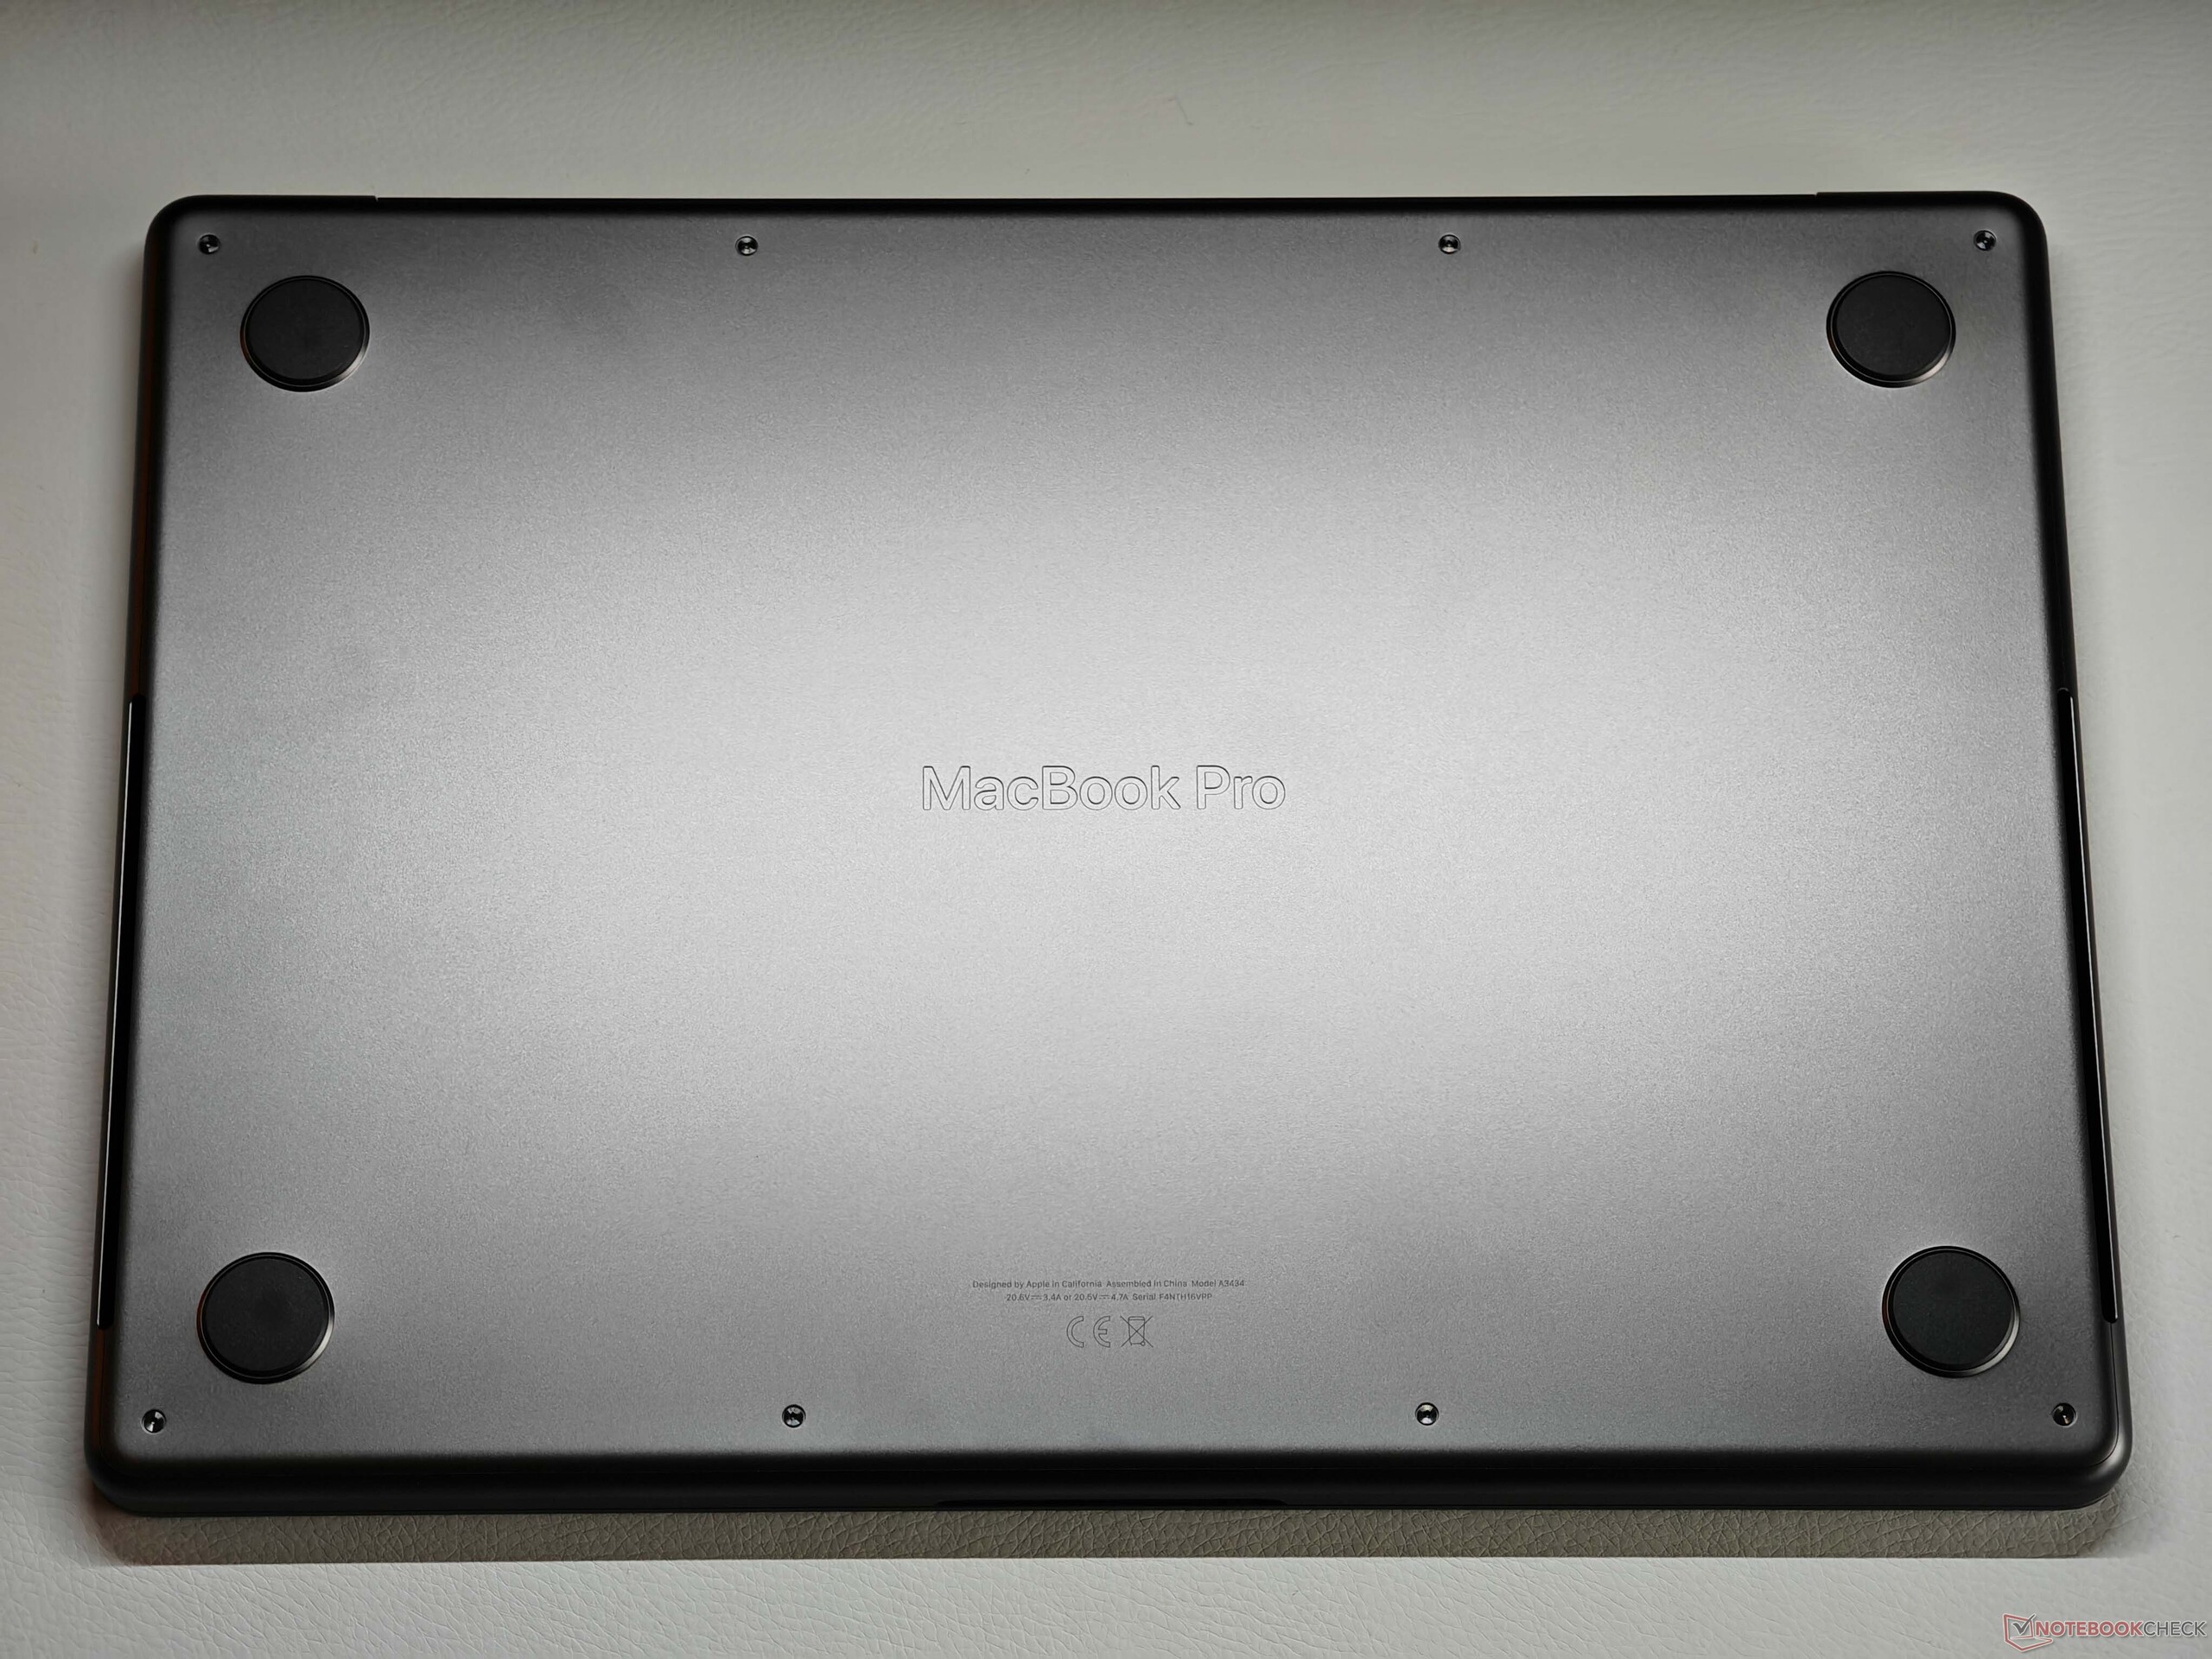
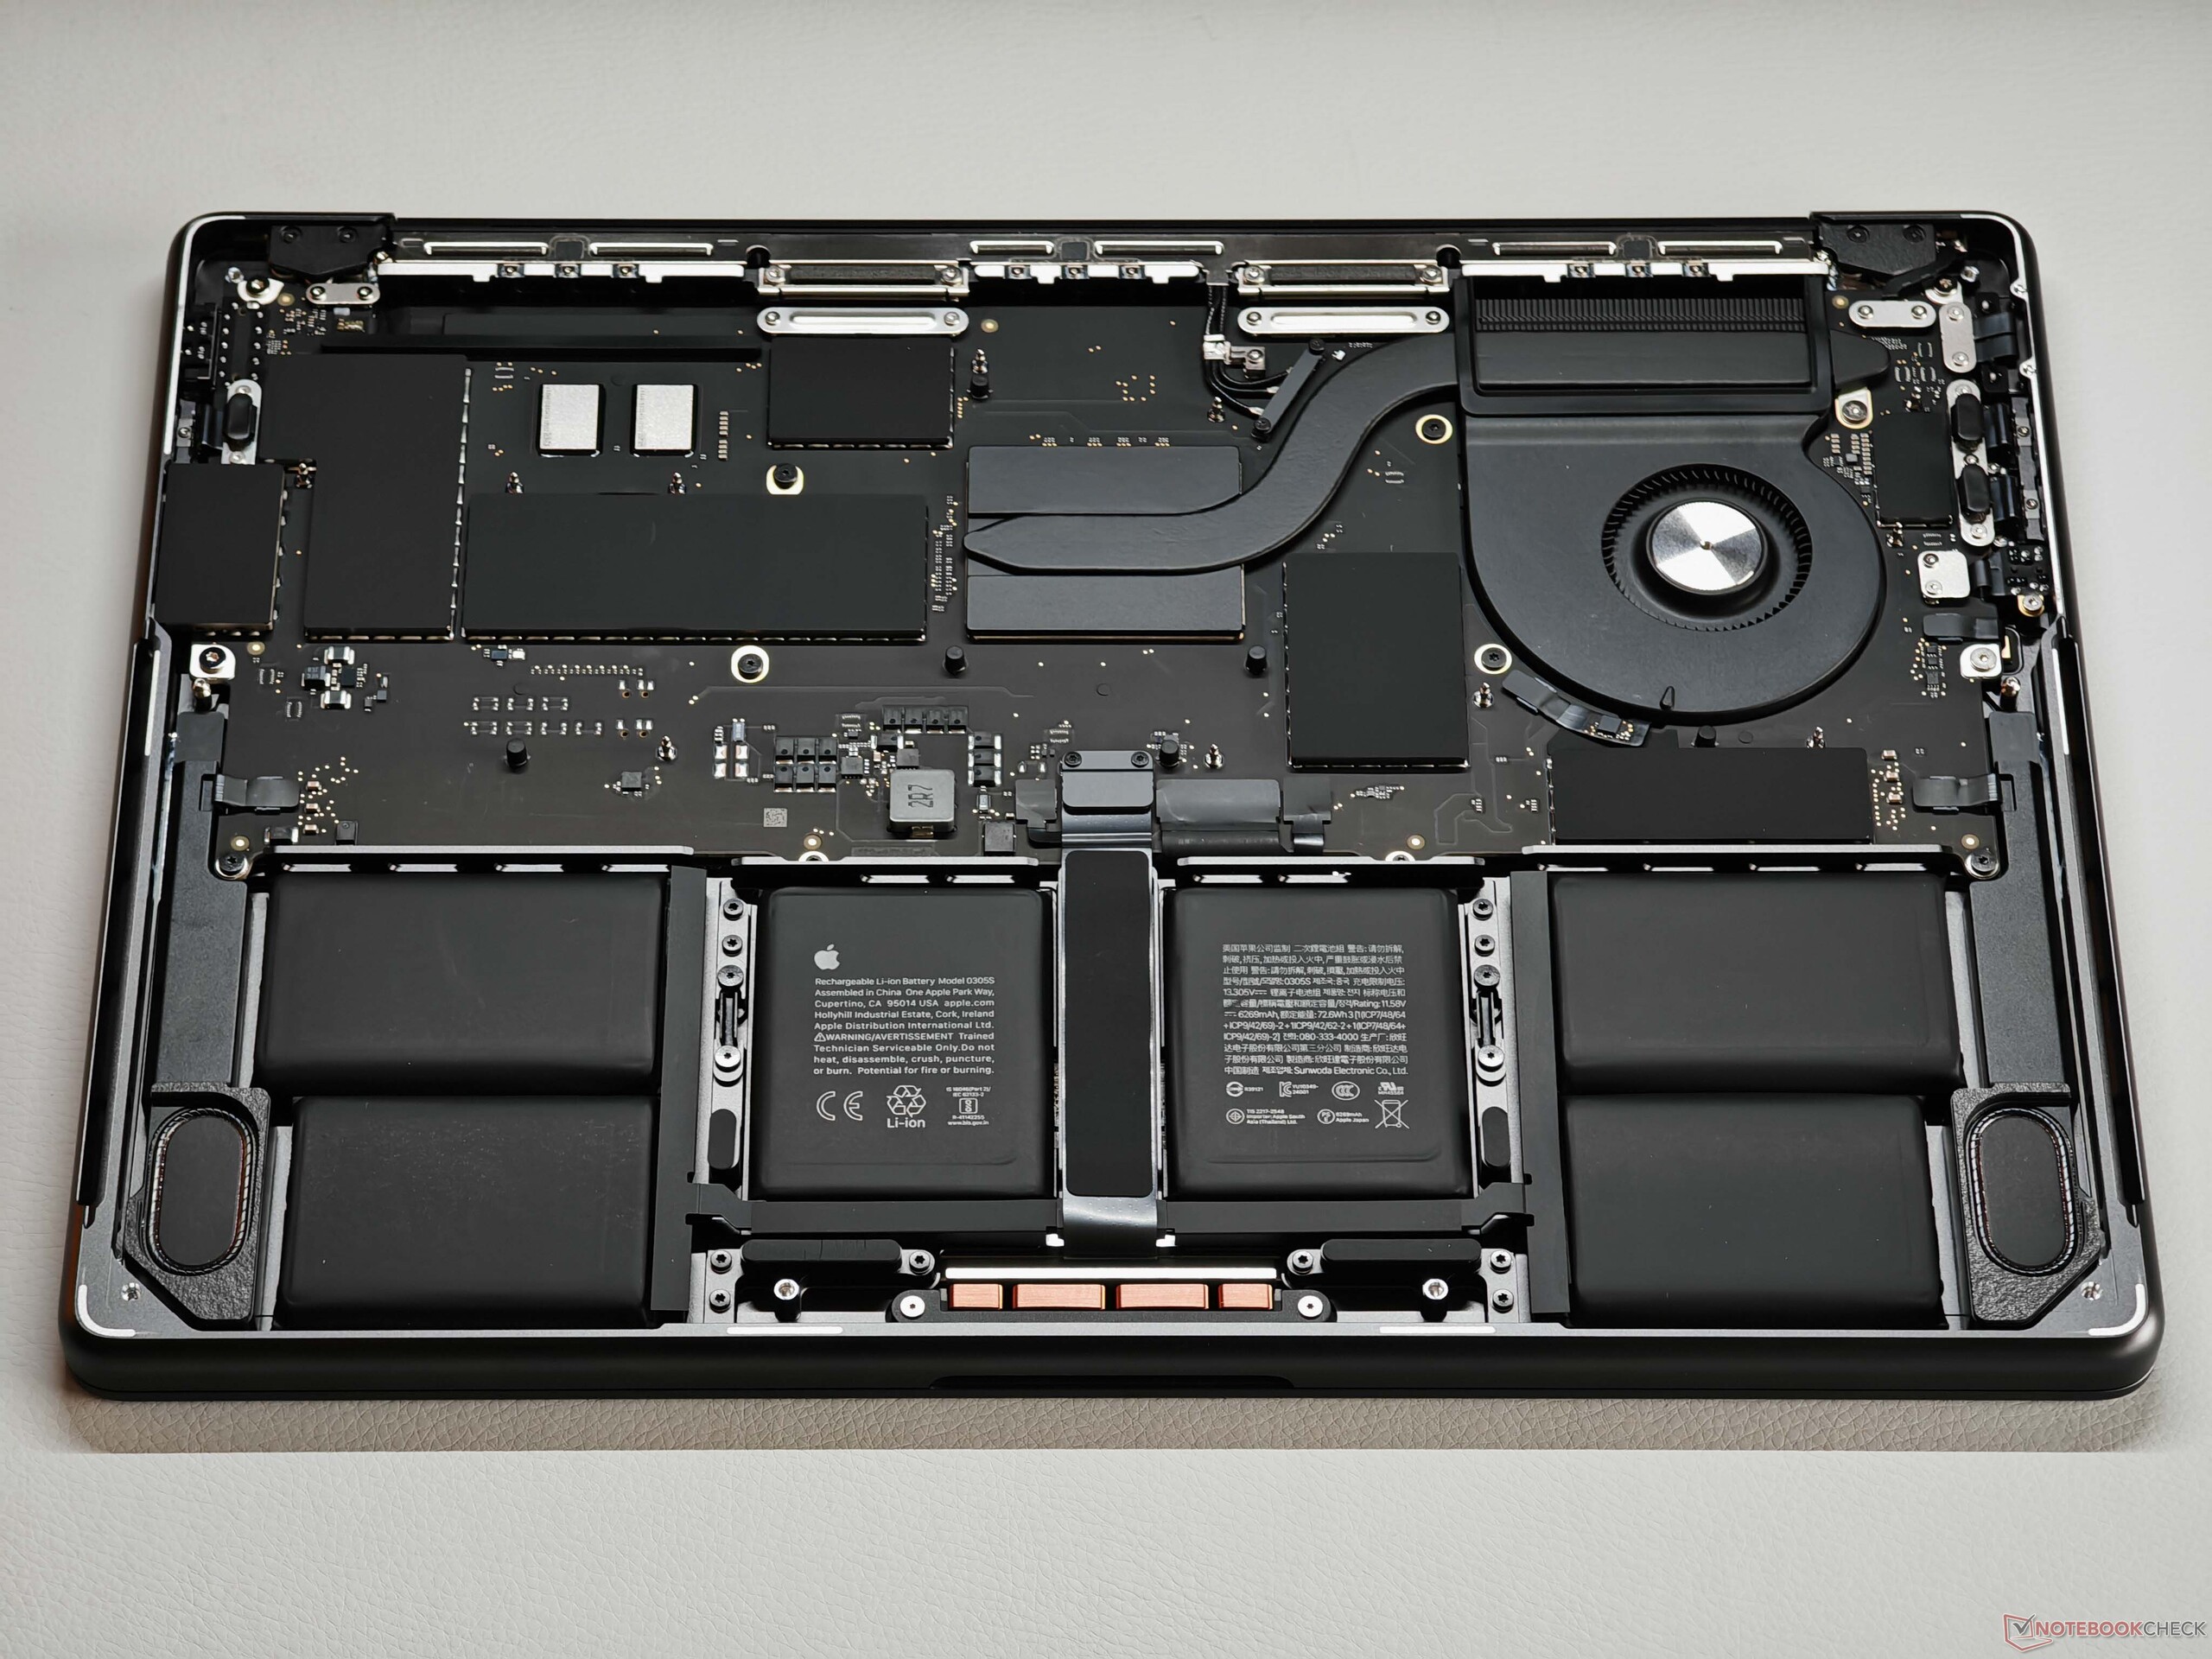
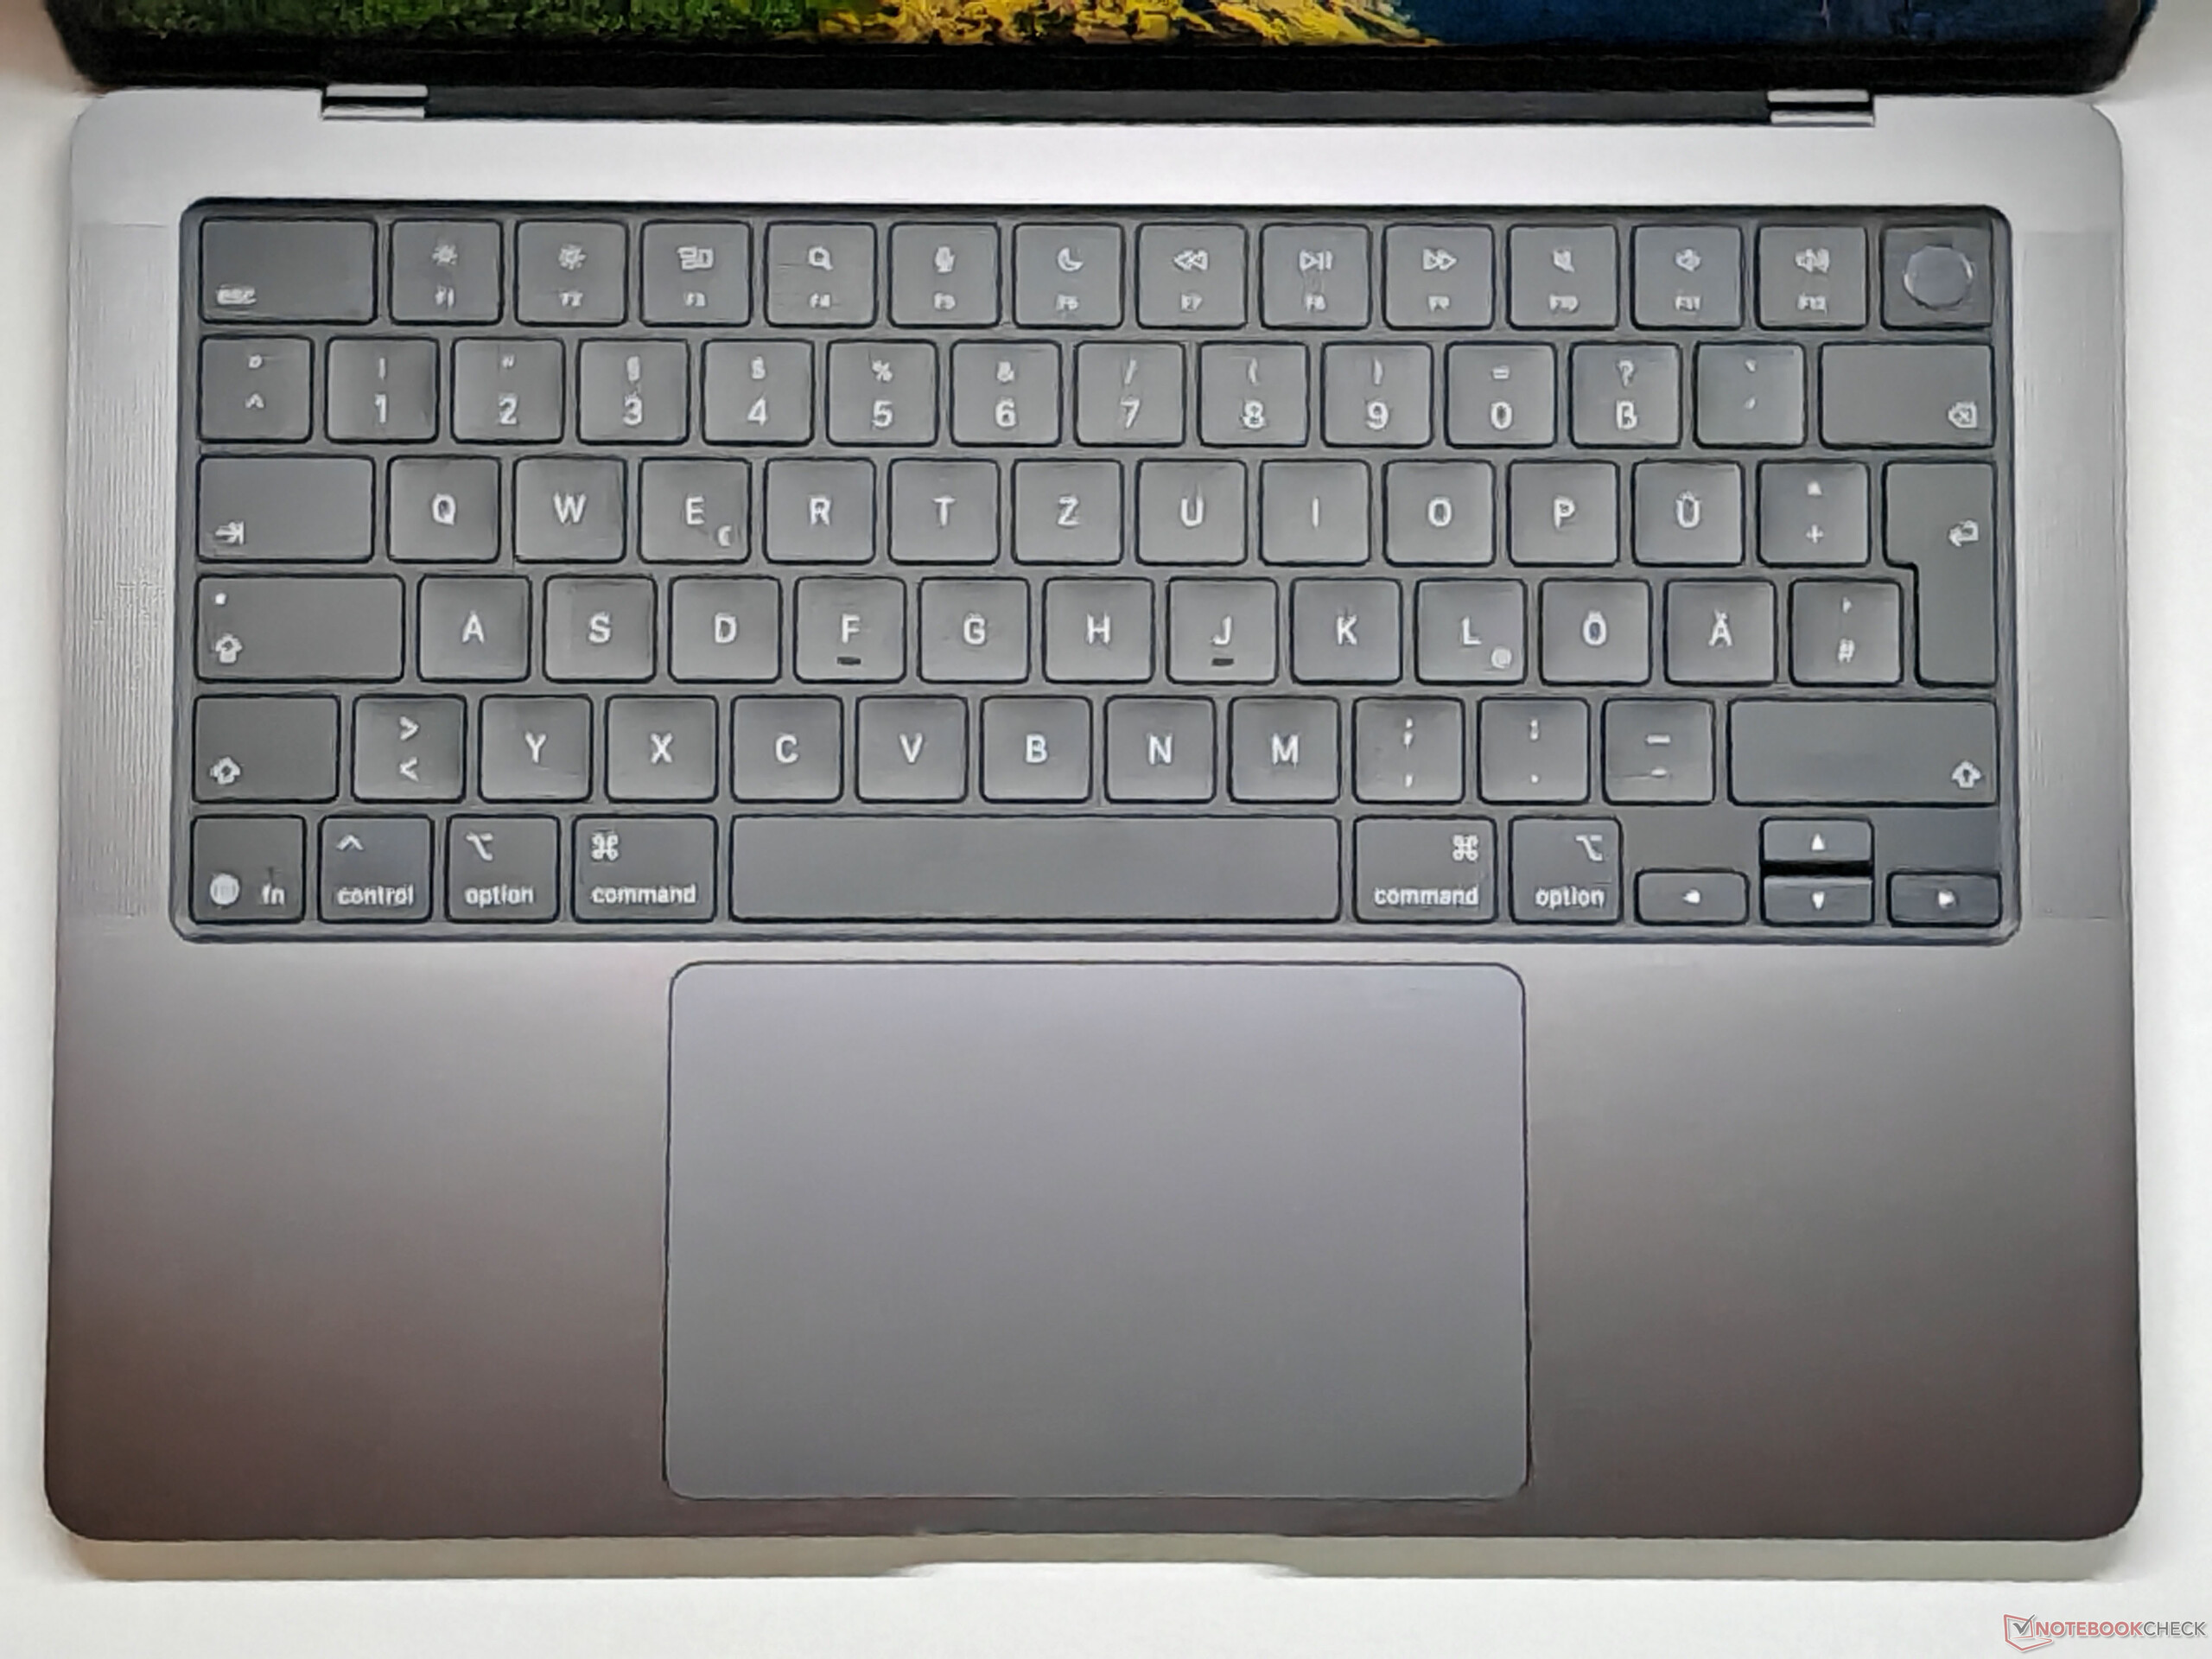
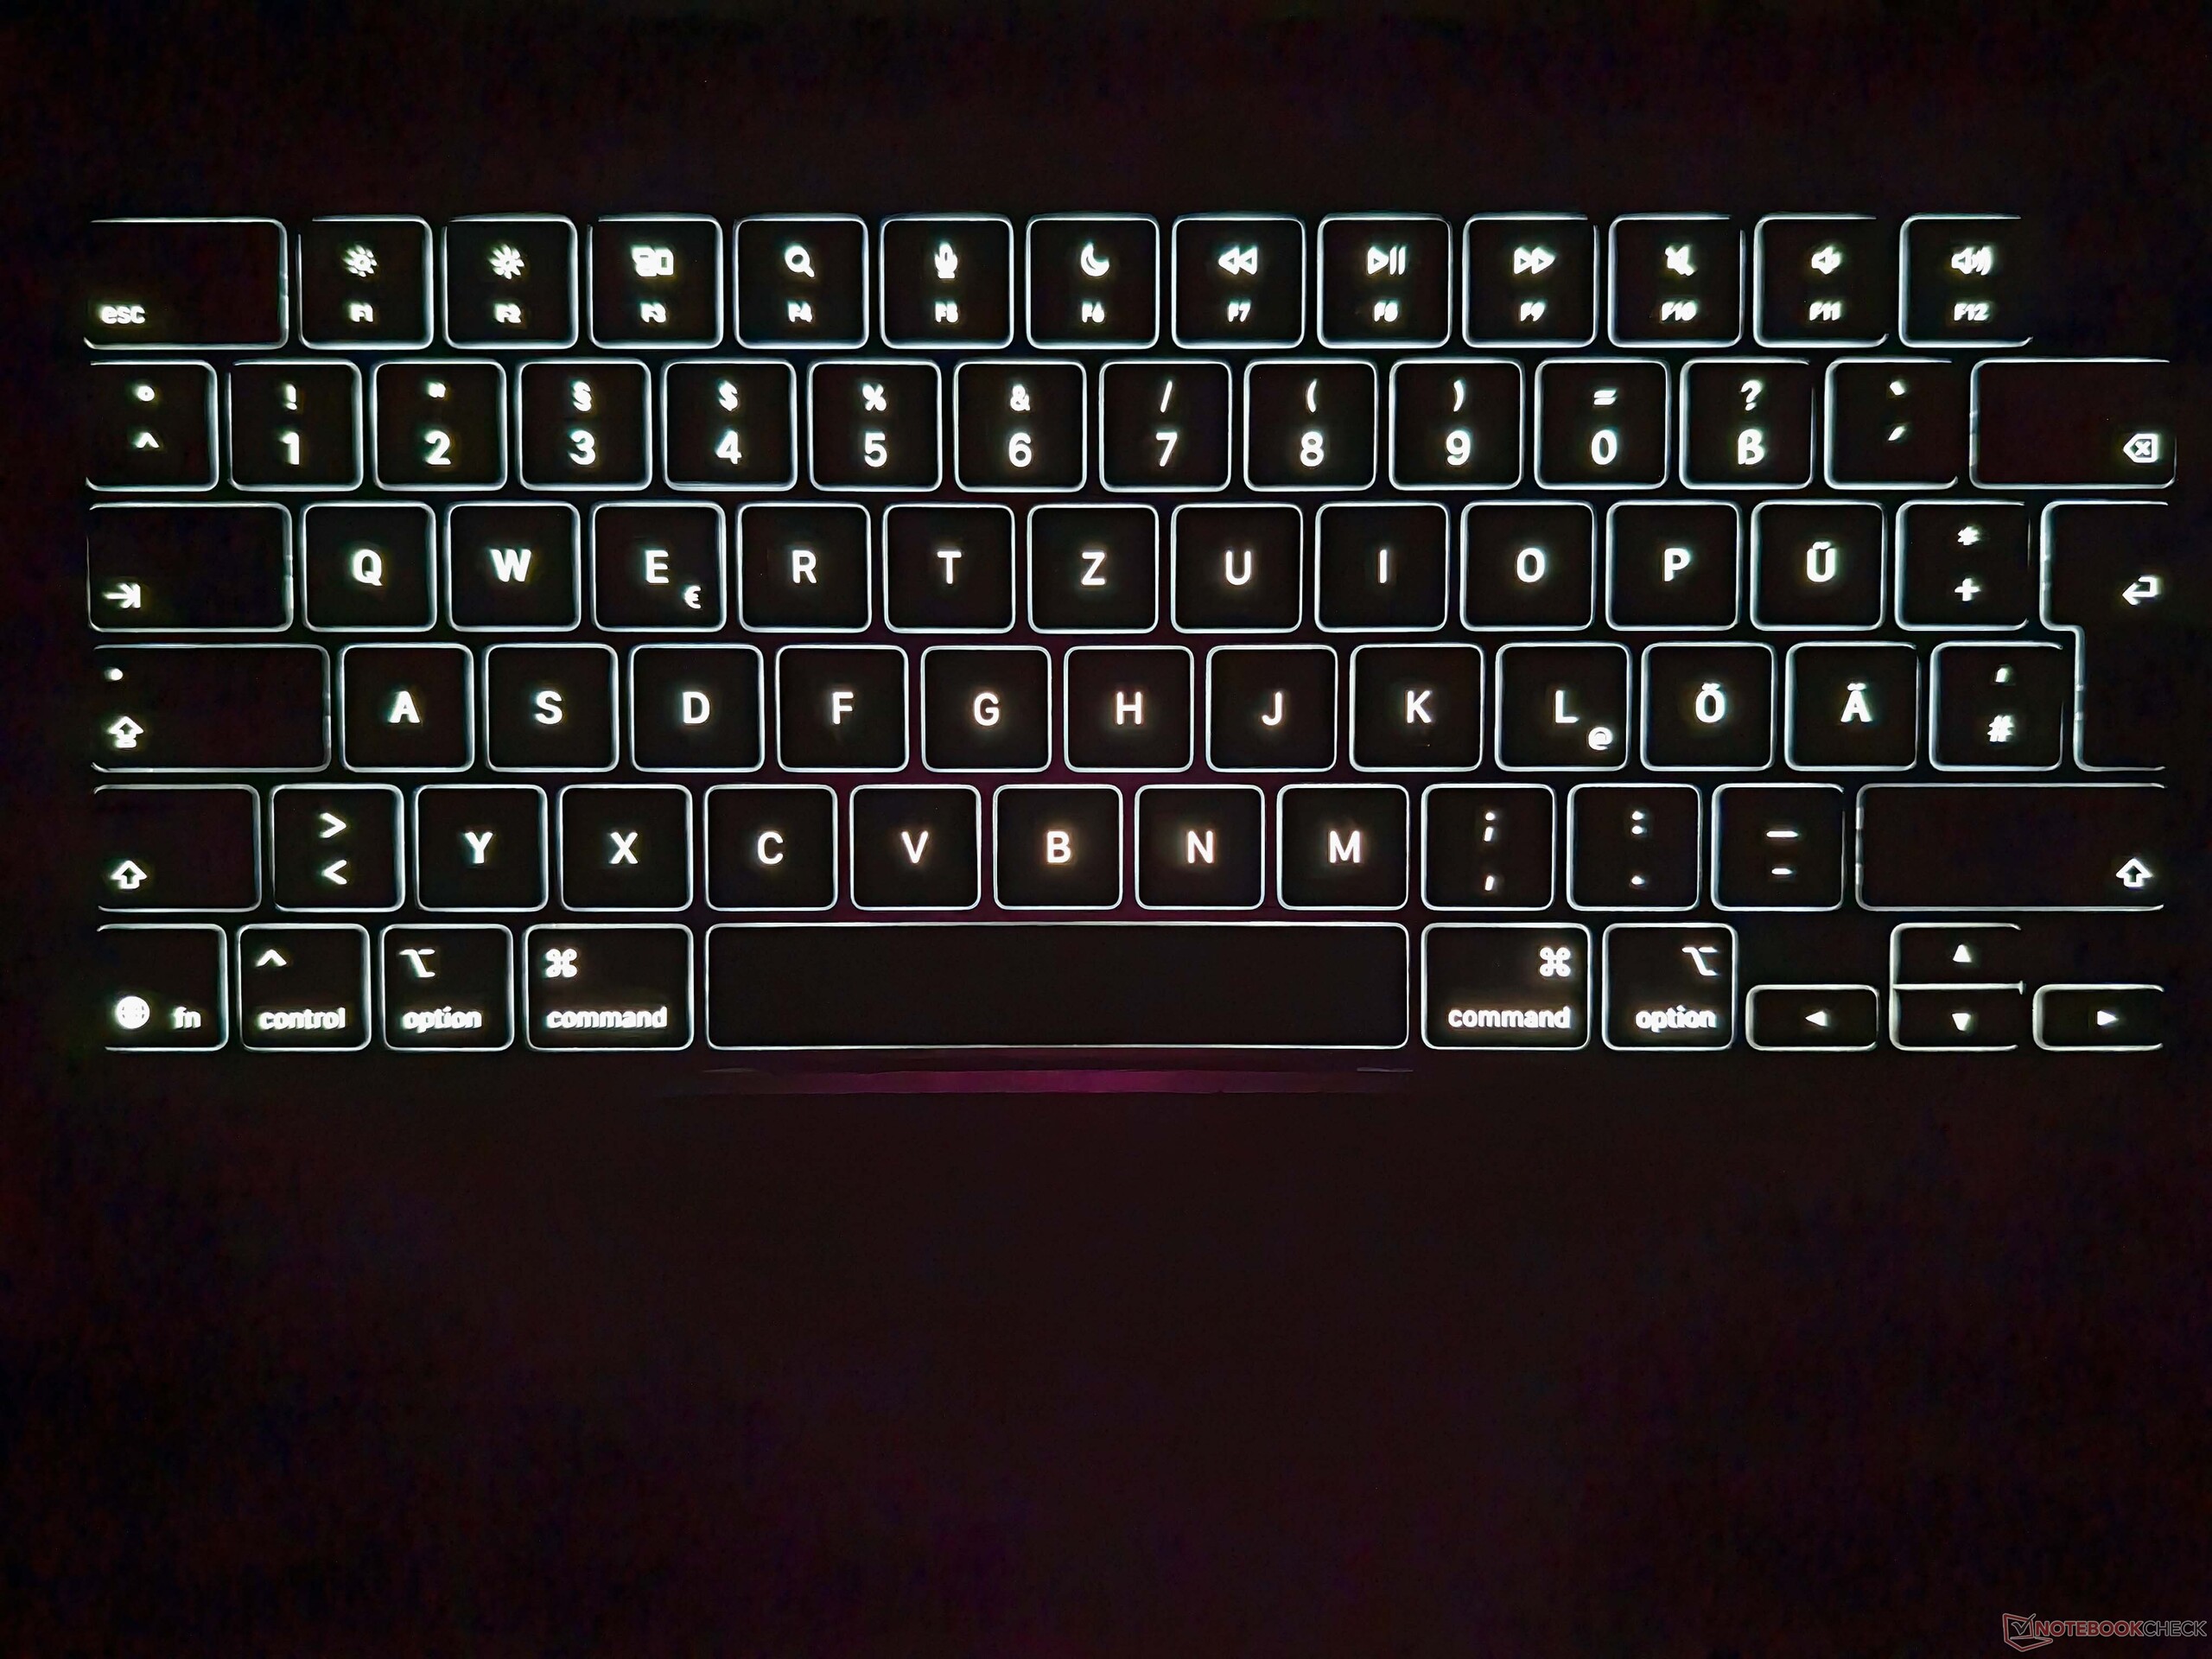
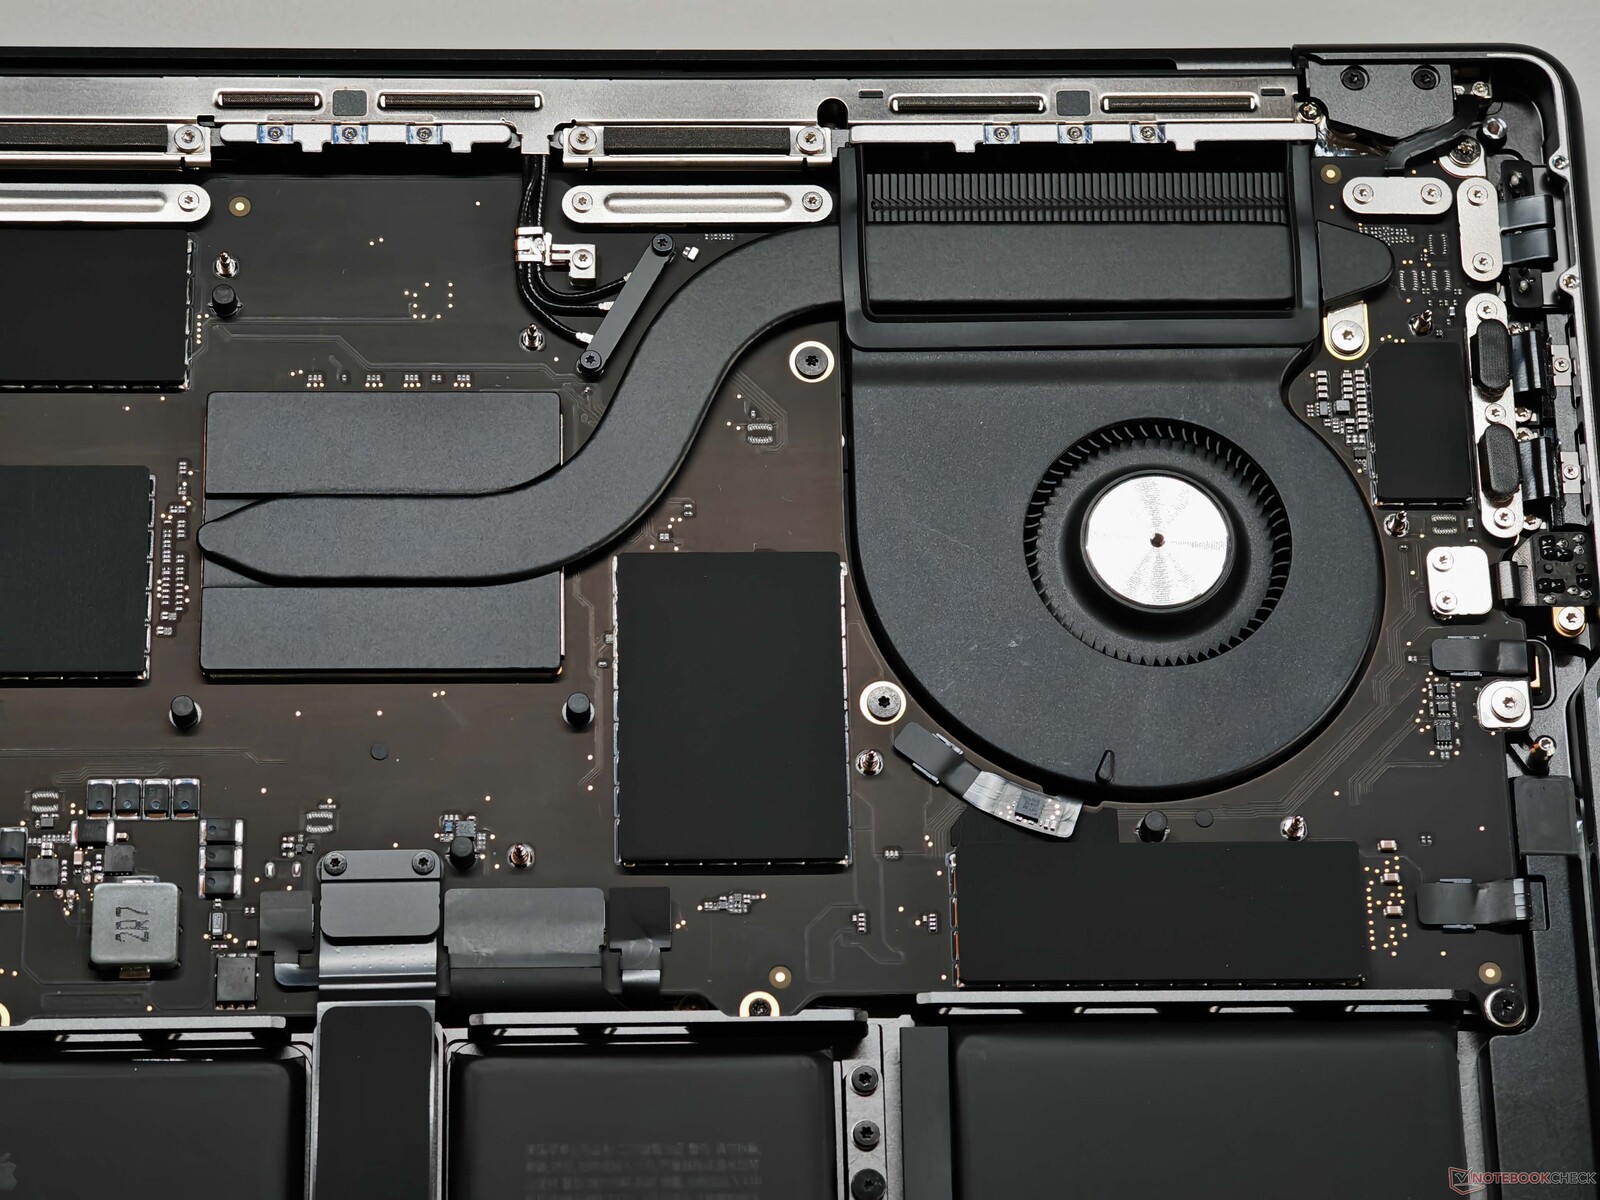
No changes have been made to the laptop's case, ports, or input devices compared to the previous model. Its aluminum unibody construction is still excellently crafted and super sturdy. However, there continue to be virtually no maintenance options. Although the lower case cover can be removed, only the fan can be cleaned inside.
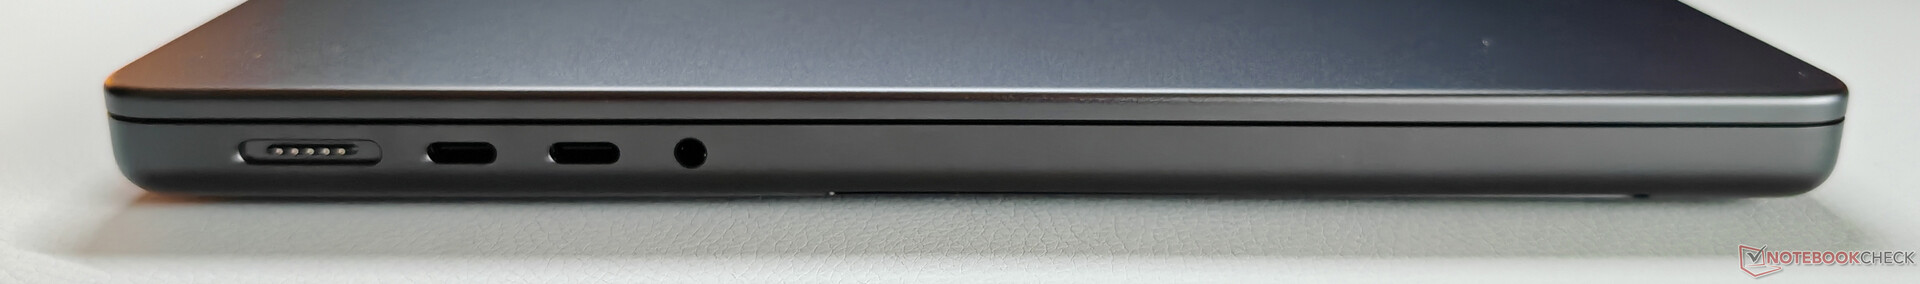
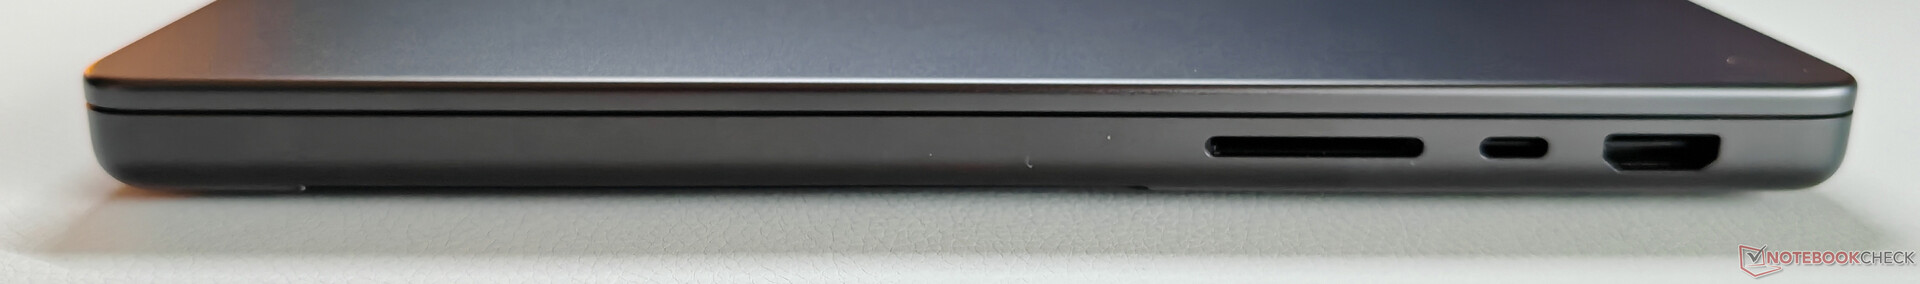
Its ports and connectivity have all remained the same. The fact that there's still no sign of Thunderbolt 5 (unlike on the more expensive Pro models) shouldn't be a problem for most users. More annoying is its lack of Wi-Fi 7, which the new iPad Pro (also equipped with the M5) now offers. Presumably, the M5 Pro models of the MacBook will also support Wi-Fi 7.
| SD Card Reader | |
| average JPG Copy Test (av. of 3 runs) | |
| Apple MacBook Pro 14 2024 M4 Pro (Angelbird AV Pro V60) | |
| Apple MacBook Pro 14 2025 M5 | |
| Average of class Multimedia (23 - 531, n=41, last 2 years) | |
| maximum AS SSD Seq Read Test (1GB) | |
| Apple MacBook Pro 14 2024 M4 Pro (Angelbird AV Pro V60) | |
| Apple MacBook Pro 14 2025 M5 | |
| Average of class Multimedia (37.3 - 1455, n=40, last 2 years) | |
| Networking | |
| Apple MacBook Pro 14 2025 M5 | |
| iperf3 transmit AXE11000 | |
| iperf3 receive AXE11000 | |
| Dell 14 Premium | |
| iperf3 transmit AXE11000 | |
| iperf3 receive AXE11000 | |
| iperf3 transmit AXE11000 6GHz | |
| iperf3 receive AXE11000 6GHz | |
| Apple MacBook Pro 14 2024 M4 Pro | |
| iperf3 transmit AXE11000 | |
| iperf3 receive AXE11000 | |
| HP EliteBook X G1a 14 AI | |
| iperf3 transmit AXE11000 | |
| iperf3 receive AXE11000 | |
| iperf3 transmit AXE11000 6GHz | |
| iperf3 receive AXE11000 6GHz | |
| Lenovo Yoga Pro 7 14ASP G9 | |
| iperf3 transmit AXE11000 | |
| iperf3 receive AXE11000 | |
| Lenovo Yoga Slim 7X 14Q8X9 | |
| iperf3 transmit AXE11000 | |
| iperf3 receive AXE11000 | |
| iperf3 transmit AXE11000 6GHz | |
| iperf3 receive AXE11000 6GHz | |


Sustainability
Apple has provided a comprehensive environmental report for the MacBook Pro M5. Both the device itself and its packaging are made largely from recycled materials. The model with a 1 TB SSD and 24 GB RAM is predicted to have a carbon footprint of 185 kg over its expected lifetime.
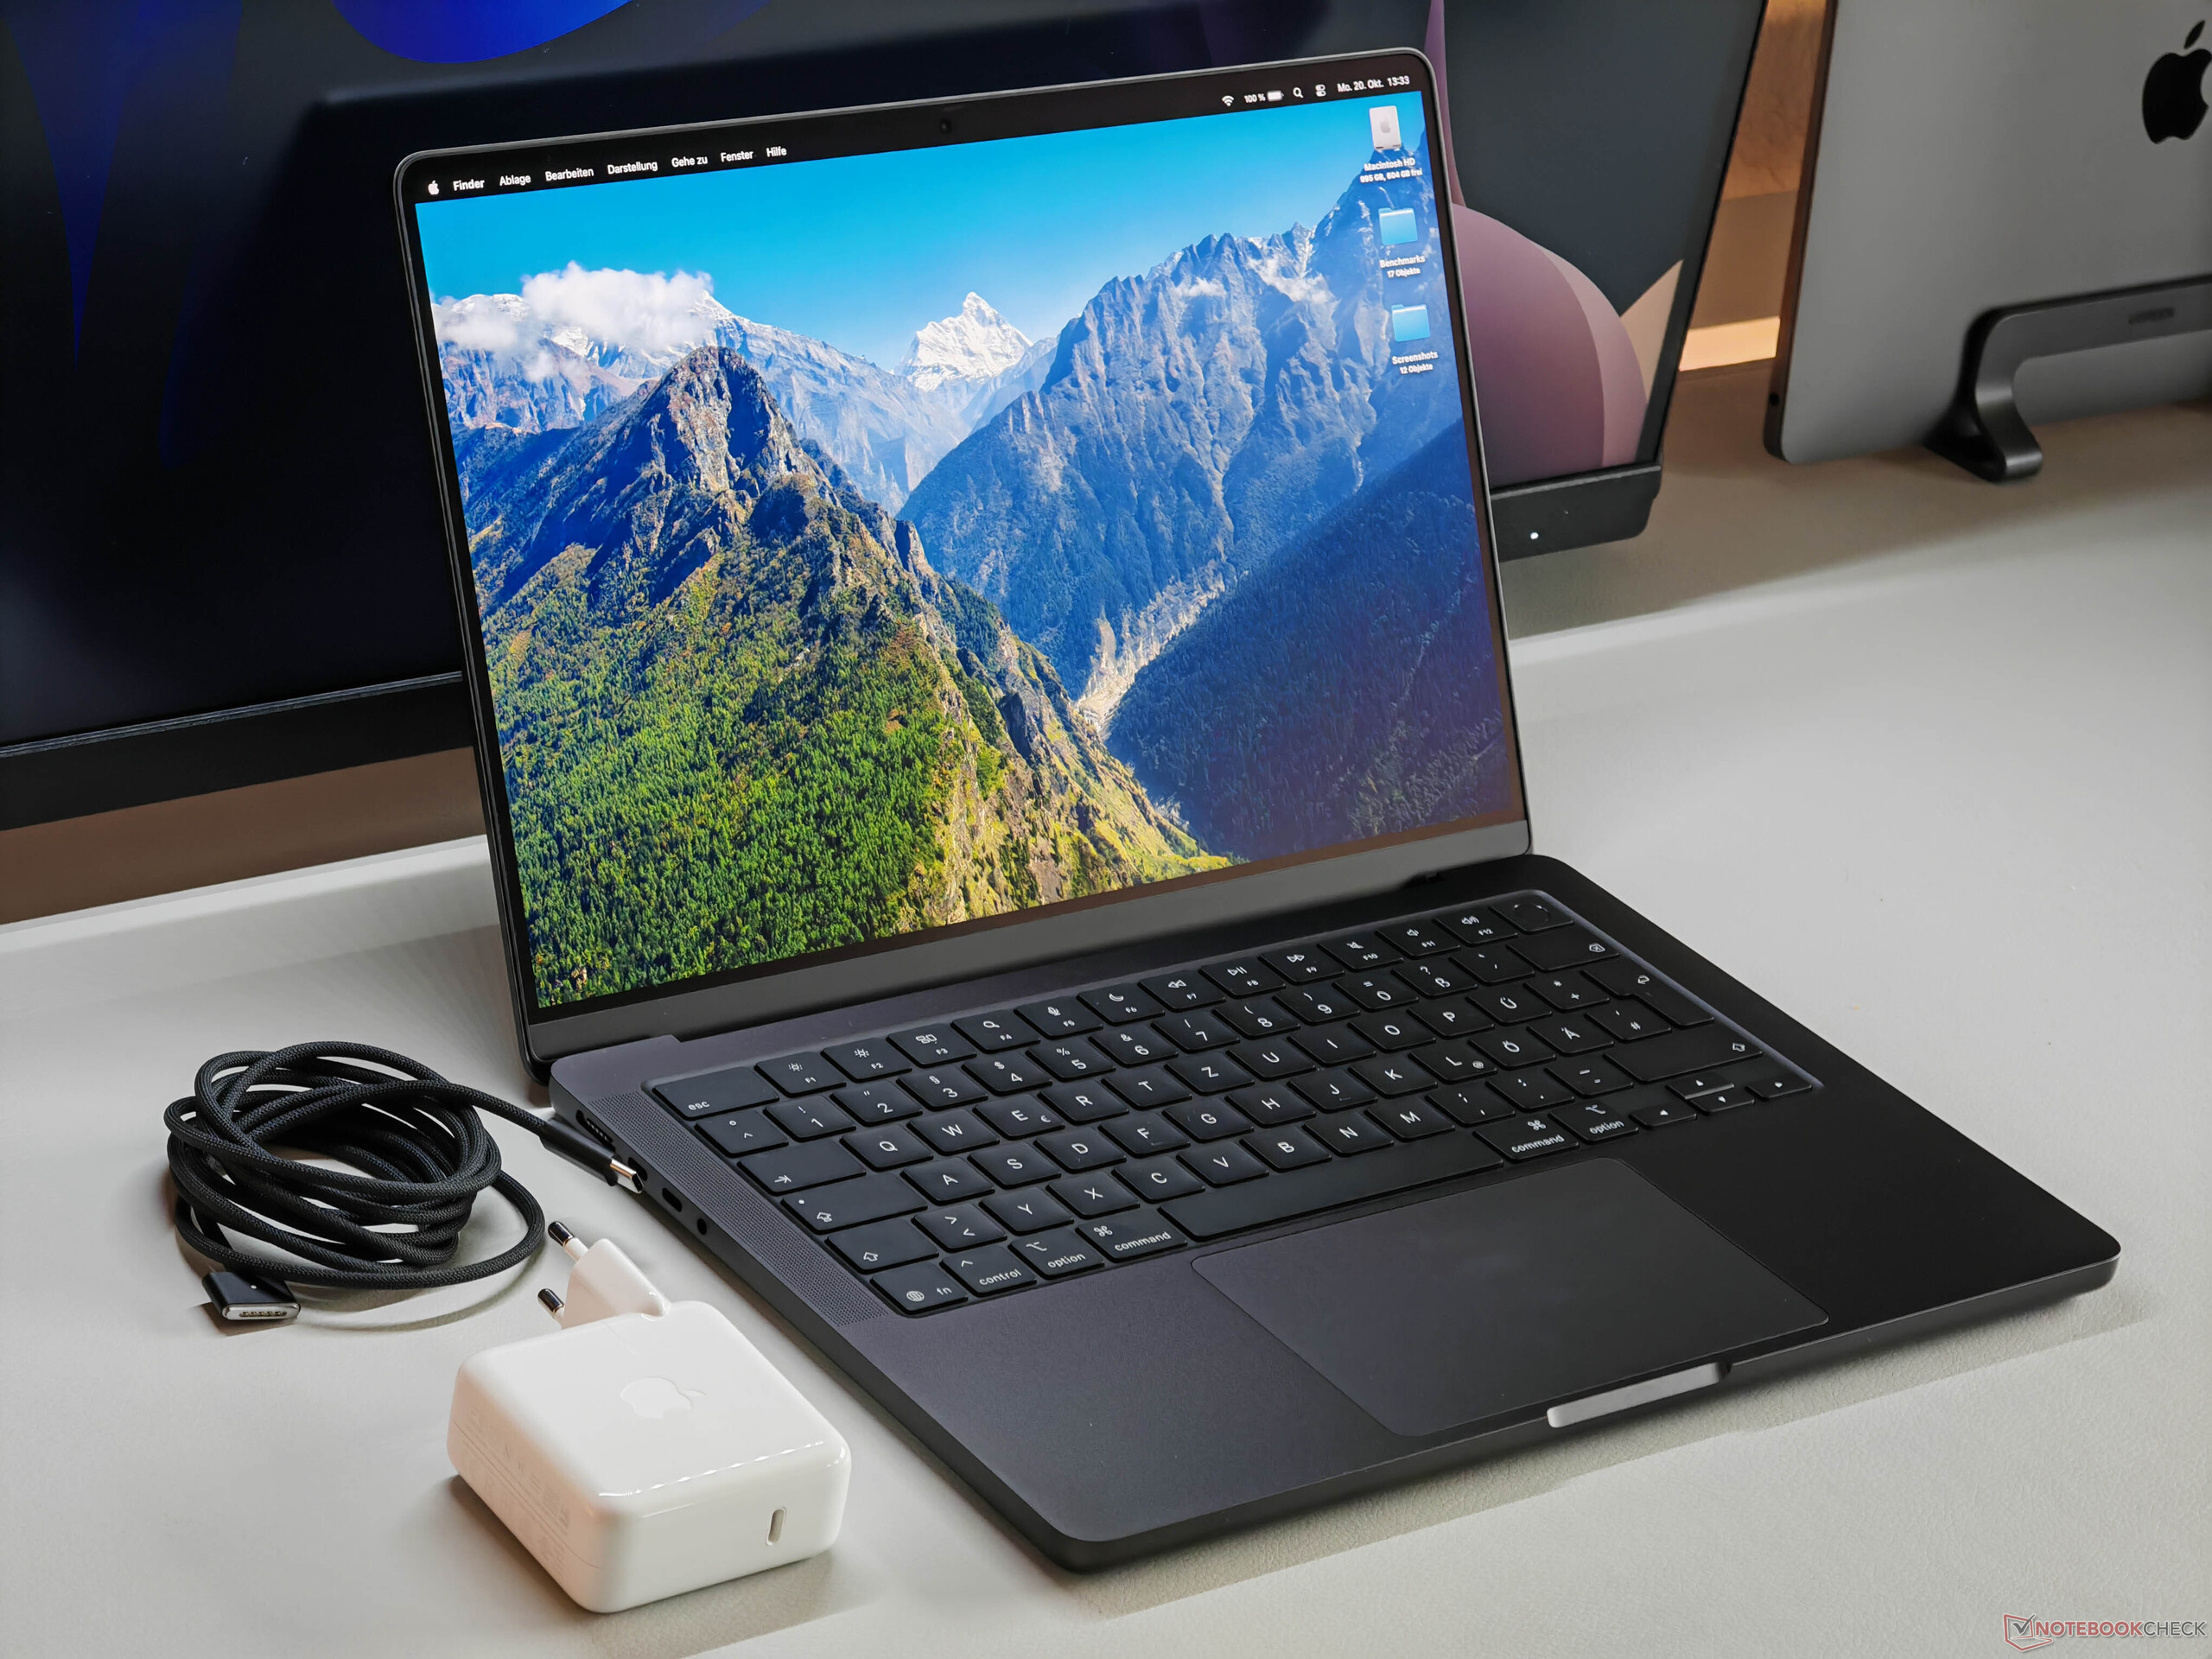
Display - Mini-LED with nano-textured glass
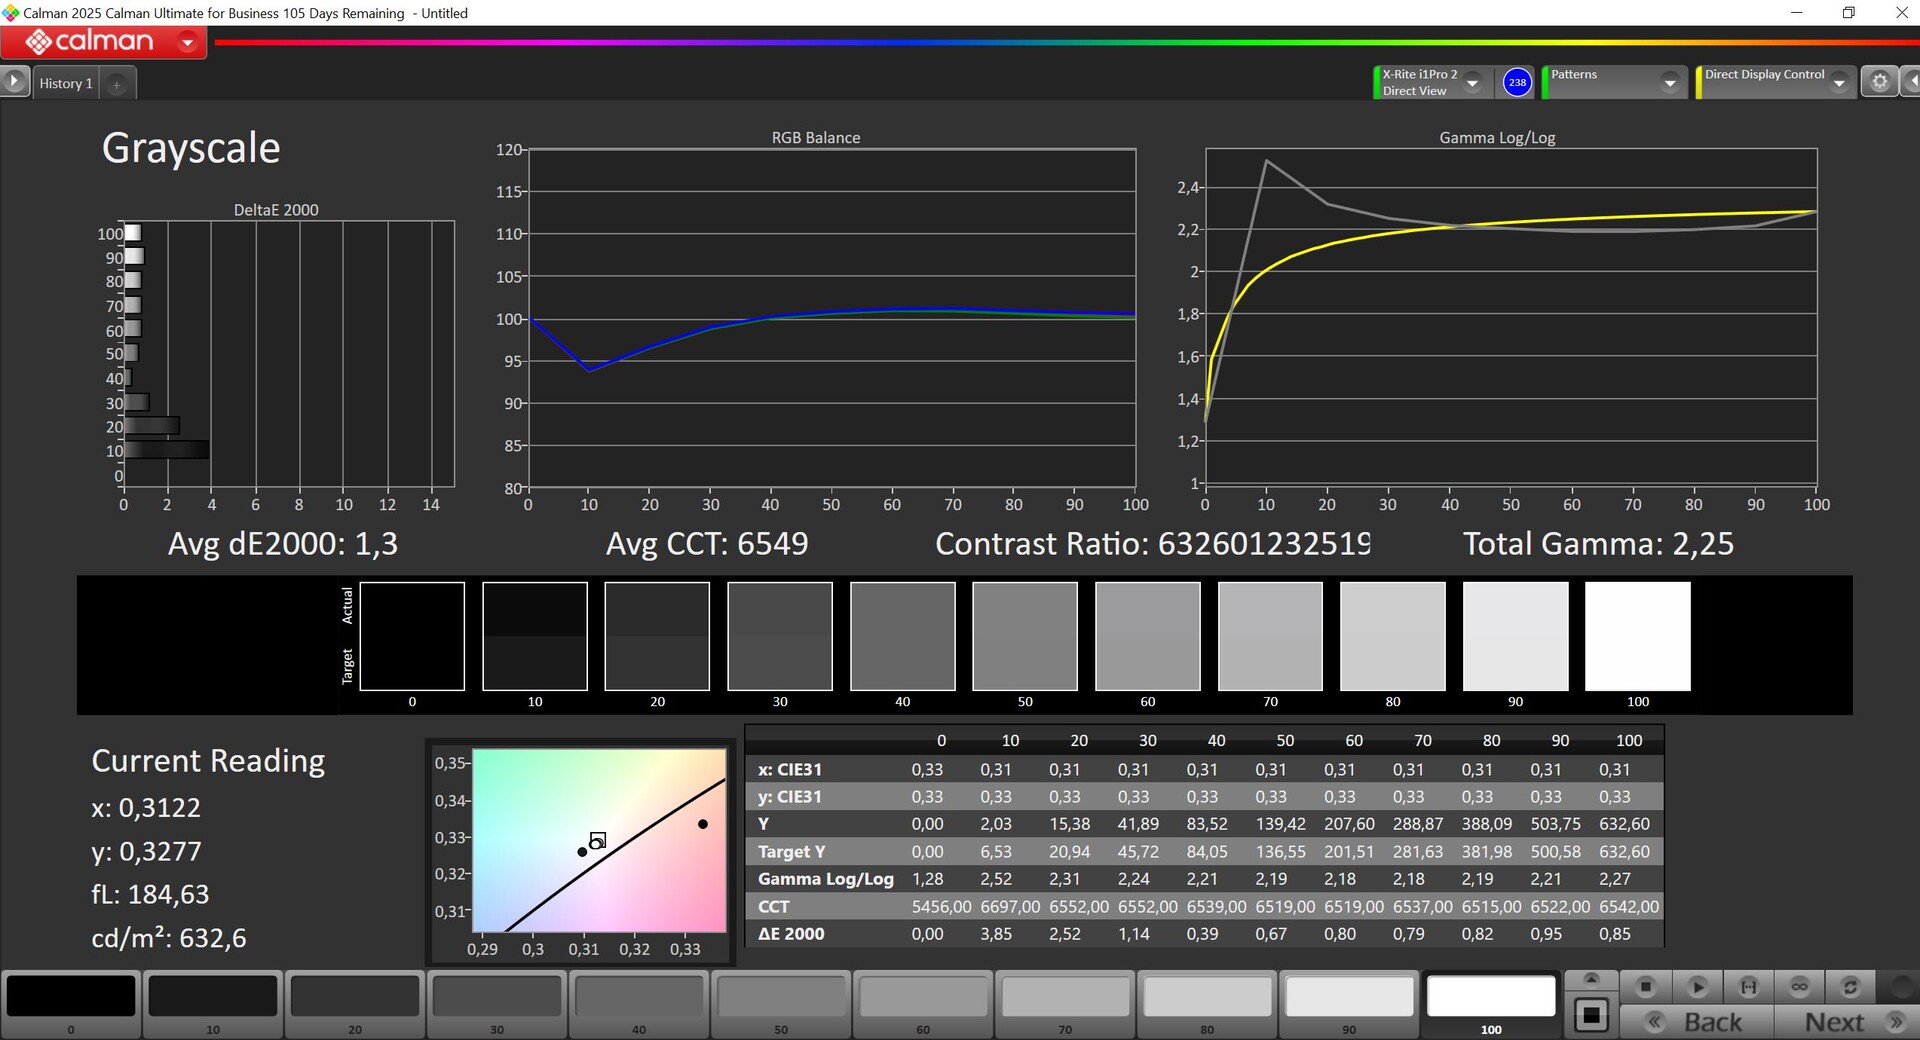
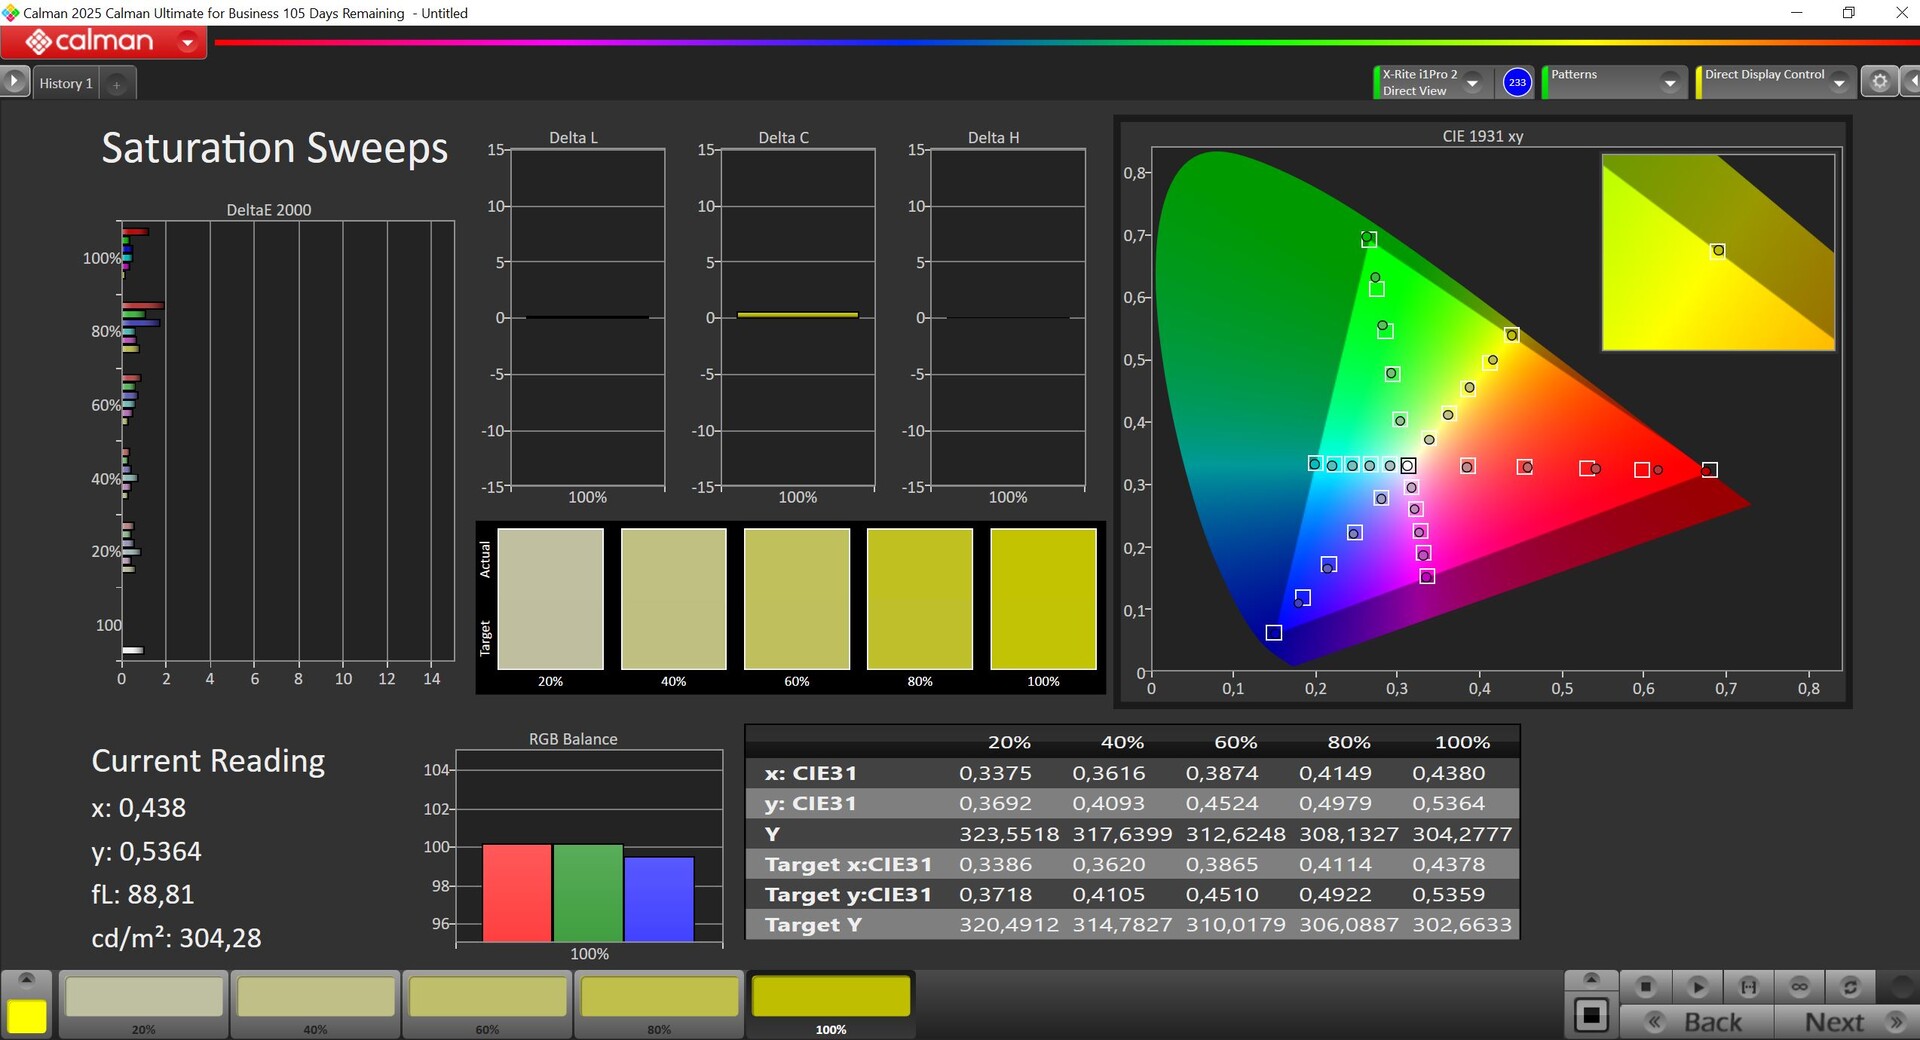
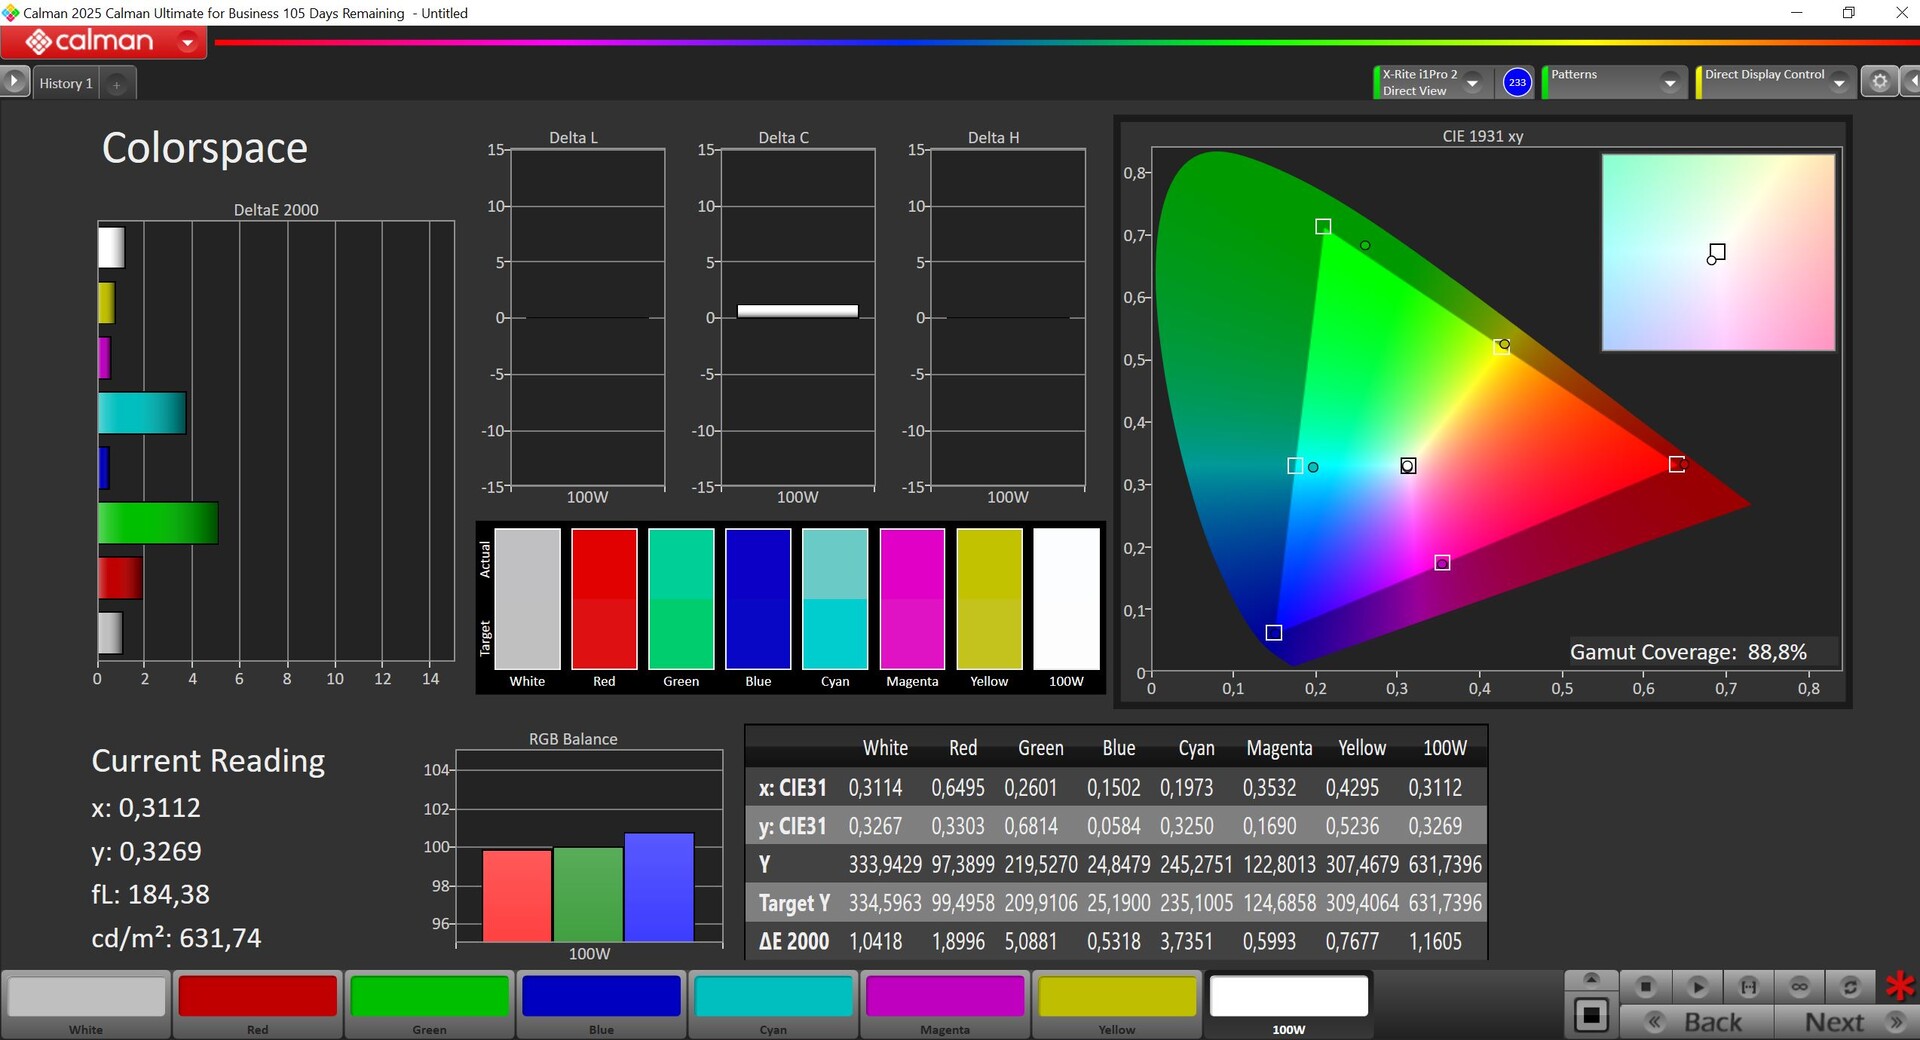
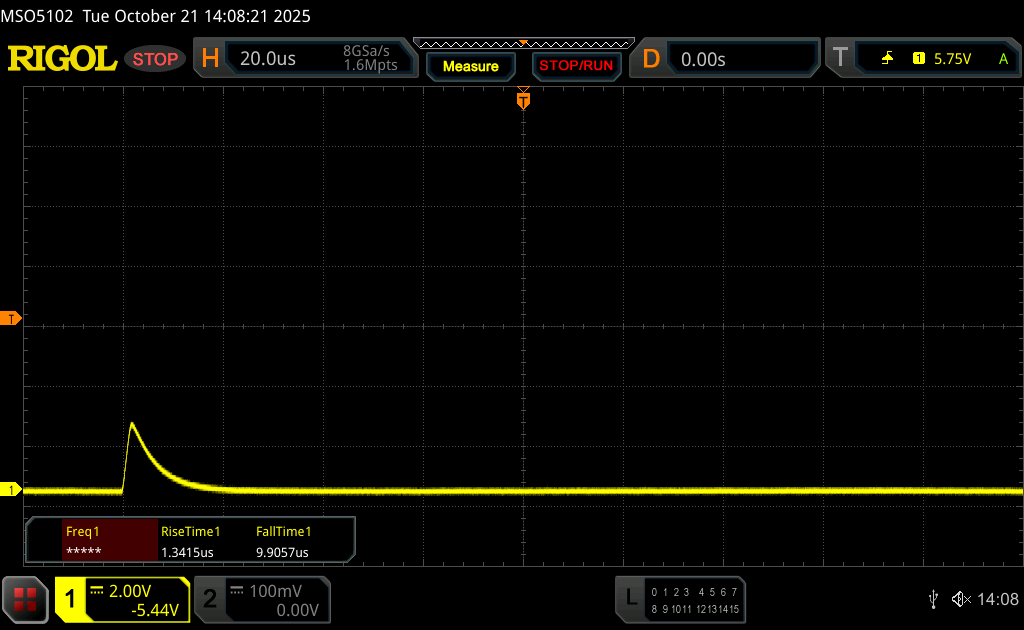
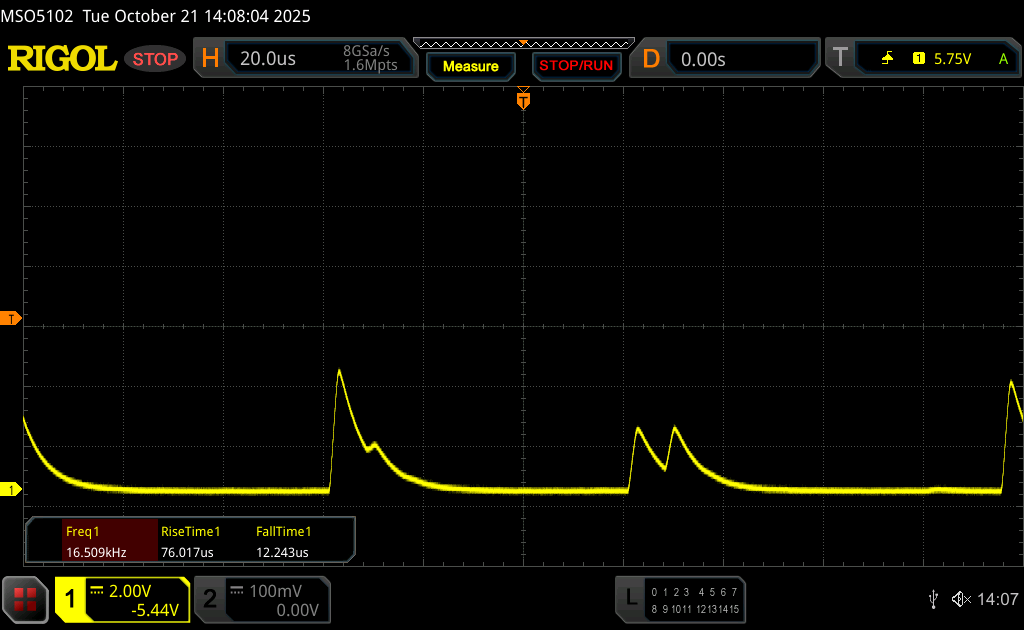
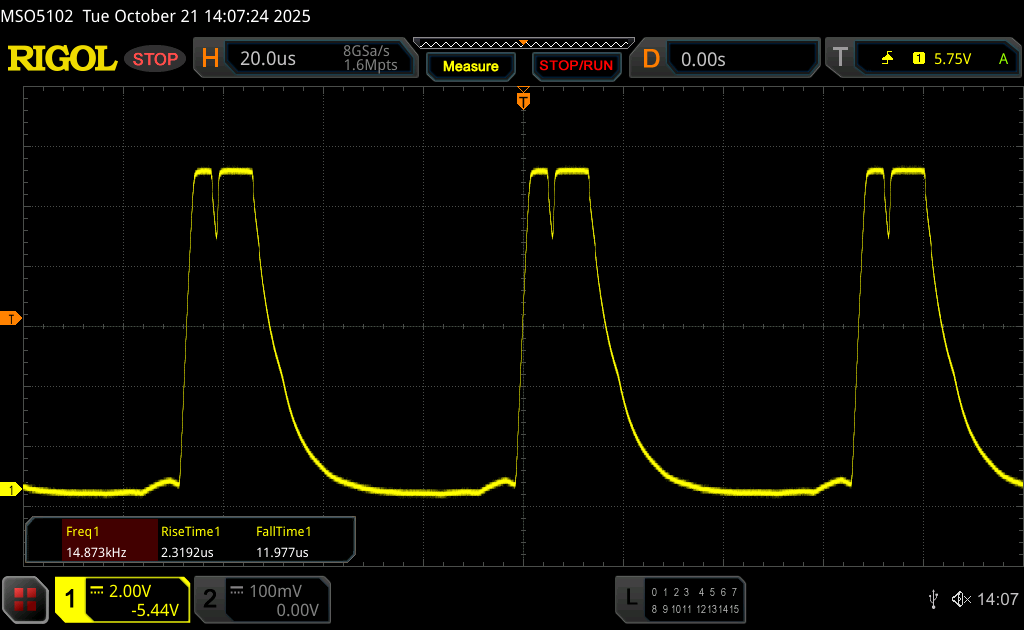
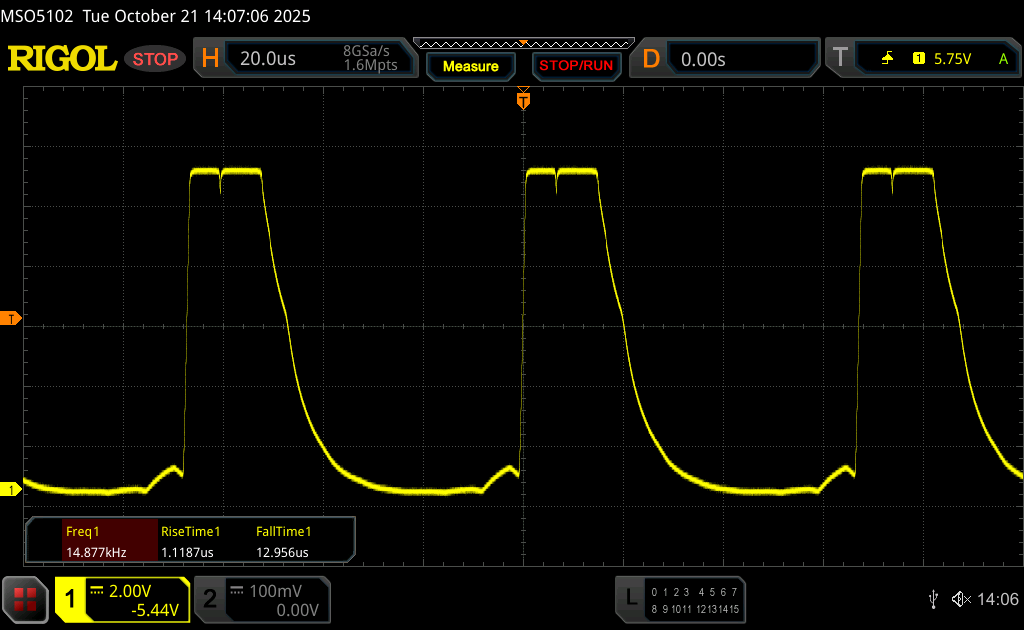
Apple continues to rely on the familiar Mini LED panel. Buyers can also choose a matte version (+$150), which we had available to us during our test. Its image quality suffers minimally as a result of the matte surface and colors aren't quite as brilliant, but in turn, you get to work in bright environments without having to contend with annoying reflections. The Mini LED backlight flickers constantly at a very high frequency of just under 15 kHz, so there should be no problems for sensitive users. Unfortunately, due to this flickering, we couldn't accurately determine the screen's response times, so our measurement results are only of limited significance. Together with its 120 Hz refresh rate, there are no problems whatsoever with visible ghosting.
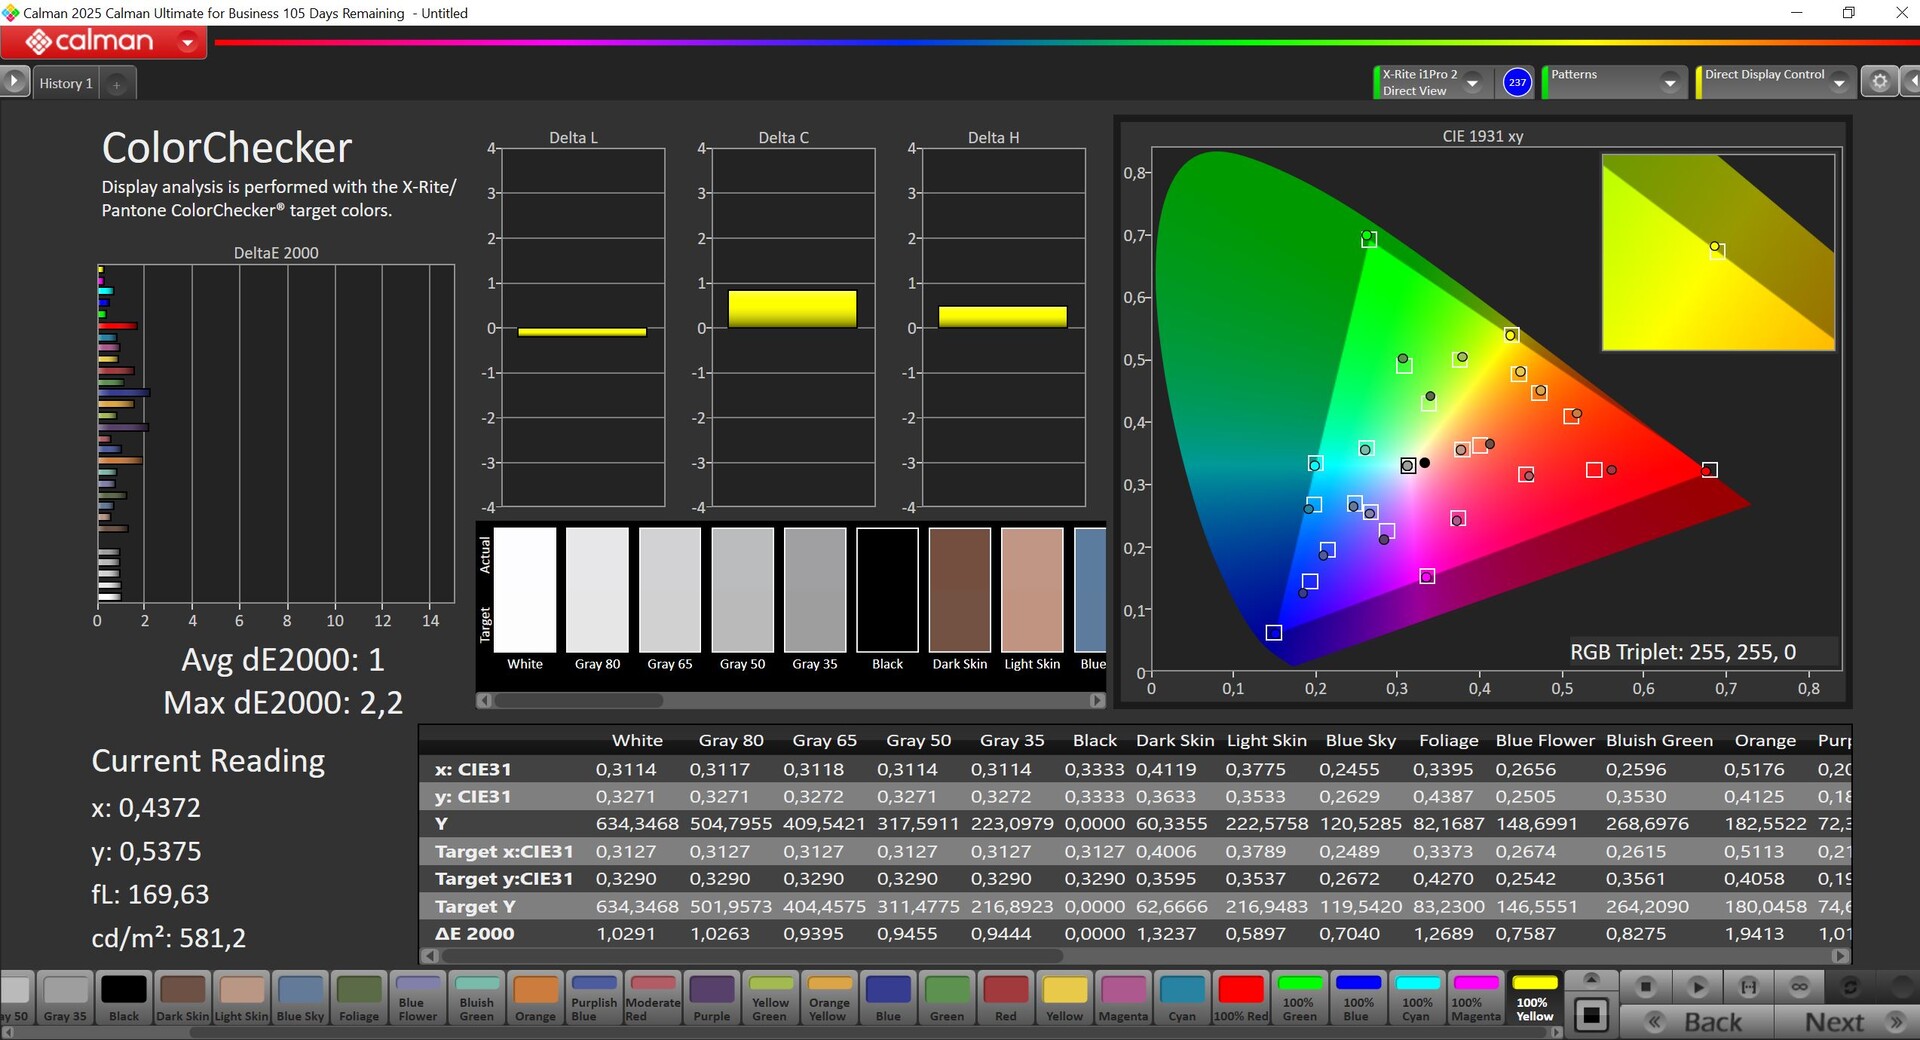
In terms of its brightness, everything remains as before. In SDR mode, we measured more than 600 cd/m², or up to 1,000 cd/m² in bright environments with the ambient light sensor activated. In HDR mode, we noted just under 1,600 cd/m². It still handles HDR content extremely well. The system automatically recognizes such content and adjusts the brightness accordingly. Its color accuracy is very good right out of the box.
| |||||||||||||||||||||||||
Brightness Distribution: 92 %
Center on Battery: 633 cd/m²
Contrast: ∞:1 (Black: 0 cd/m²)
ΔE ColorChecker Calman: 1 | ∀{0.5-29.43 Ø4.72}
ΔE Greyscale Calman: 1.3 | ∀{0.09-98 Ø4.97}
88.8% AdobeRGB 1998 (Argyll 3D)
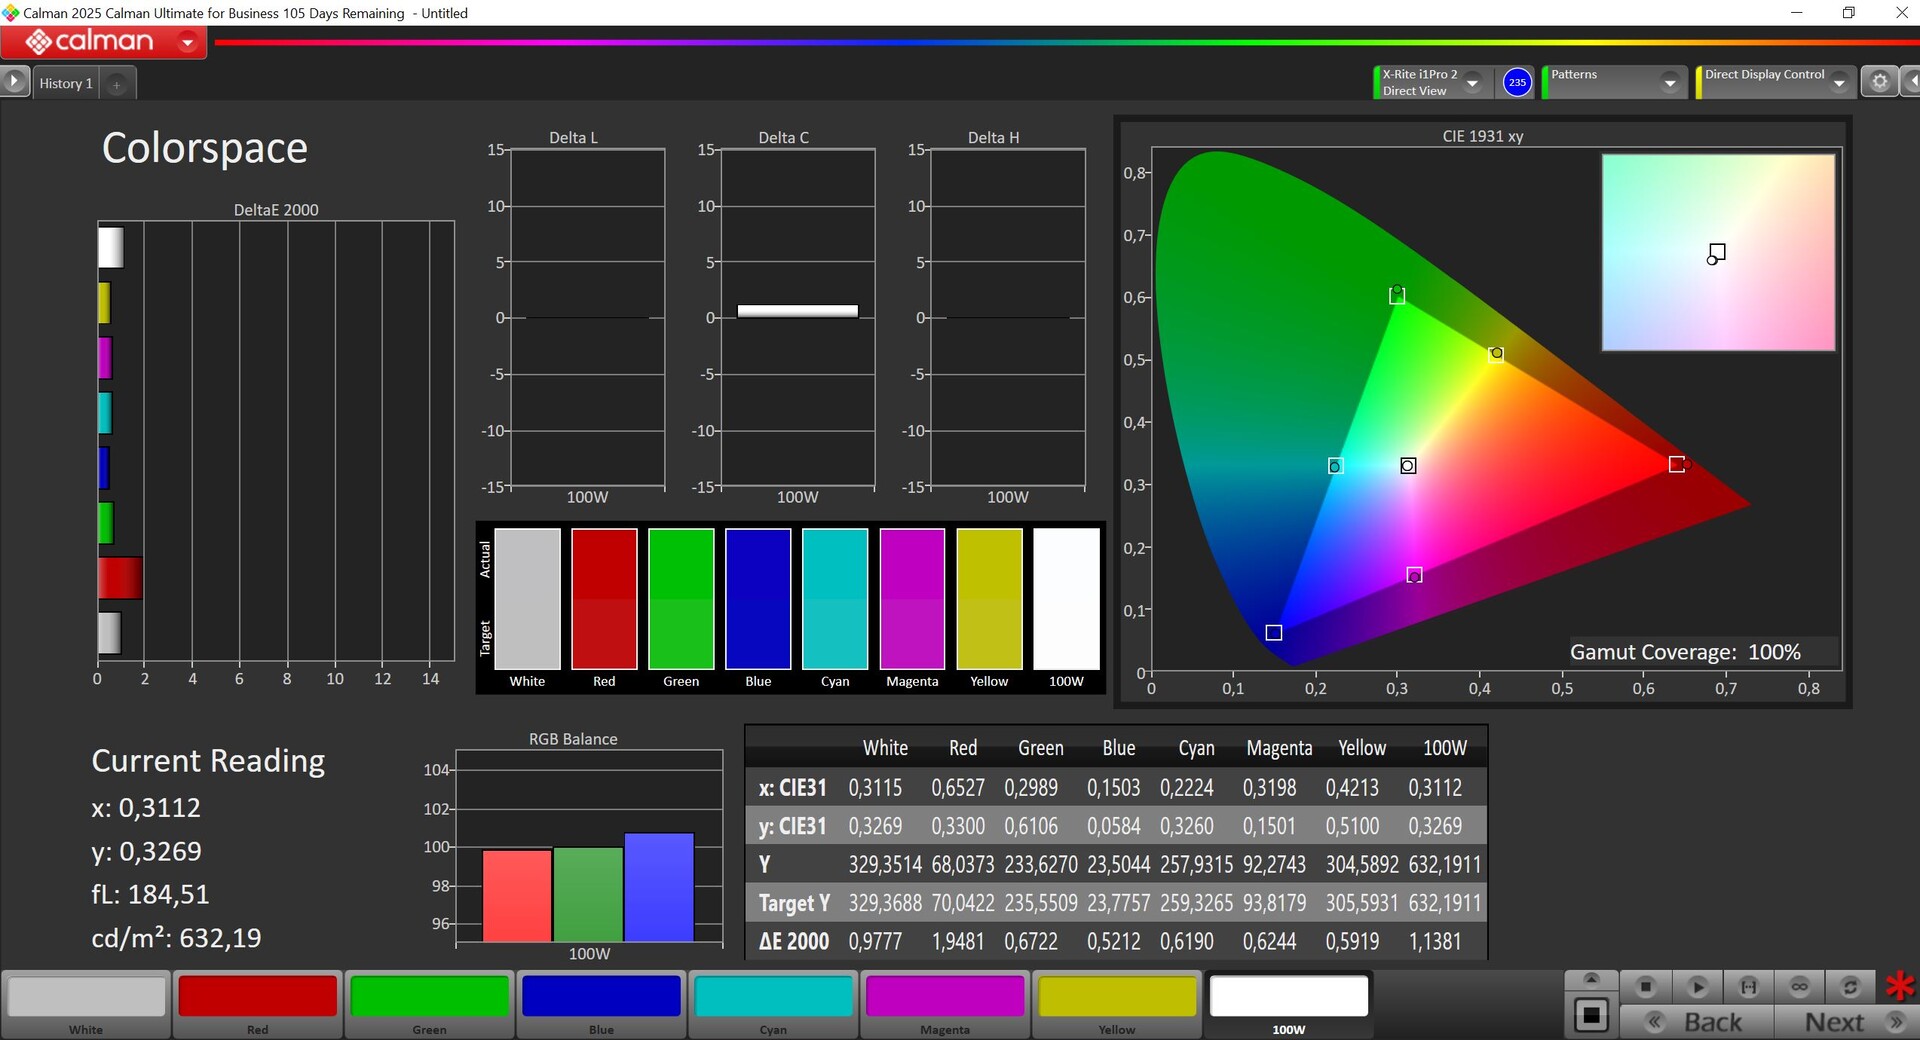
100% sRGB (Argyll 3D)
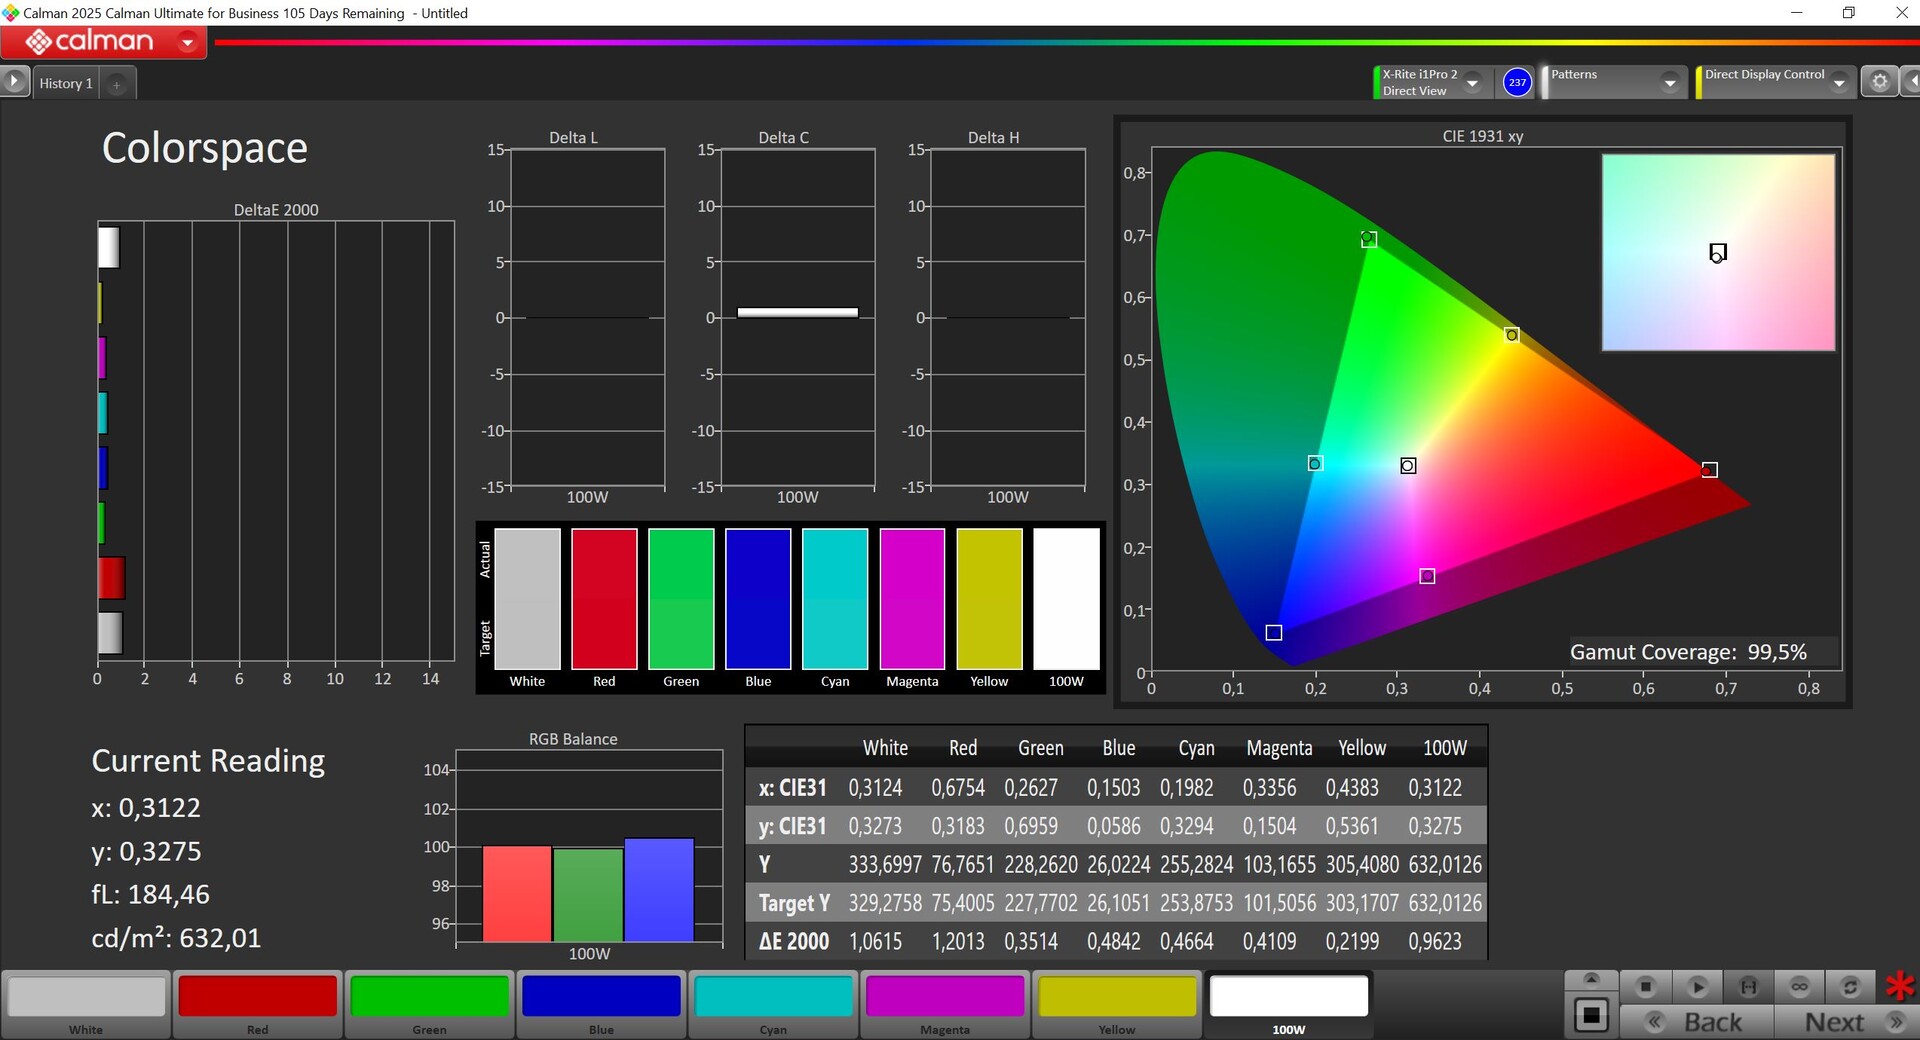
99.5% Display P3 (Argyll 3D)
Gamma: 2.2
CCT: 6549 K
| Apple MacBook Pro 14 2025 M5 Mini-LED, 3024x1964, 14.2", 120 Hz | Dell 14 Premium Samsung 145FB02, OLED, 3200x2000, 14.5", 120 Hz | Apple MacBook Pro 14 2024 M4 Pro MiniLED, 3024x1964, 14.2", 120 Hz | HP EliteBook X G1a 14 AI LG Philips LGD07A1, IPS, 1920x1200, 14", 60 Hz | Lenovo Yoga Pro 7 14ASP G9 LEN145WQ+, OLED, 3072x1920, 14.5", 120 Hz | Lenovo Yoga Slim 7X 14Q8X9 LEN145WQ+, OLED, 2944x1840, 14.5", 90 Hz | |
|---|---|---|---|---|---|---|
| Display | -1% | 0% | -24% | -1% | 0% | |
| Display P3 Coverage (%) | 99.5 | 99.3 0% | 99.6 0% | 62.6 -37% | 98 -2% | 97.3 -2% |
| sRGB Coverage (%) | 100 | 100 0% | 100 0% | 93.2 -7% | 99.9 0% | 100 0% |
| AdobeRGB 1998 Coverage (%) | 88.8 | 87.2 -2% | 89 0% | 64 -28% | 88.1 -1% | 90.8 2% |
| Response Times | 90% | -36% | 11% | 79% | 88% | |
| Response Time Grey 50% / Grey 80% * (ms) | 49.4 ? | 0.72 ? 99% | 77.2 ? -56% | 55.8 ? -13% | 0.44 ? 99% | 0.39 ? 99% |
| Response Time Black / White * (ms) | 47 ? | 0.96 ? 98% | 71.6 ? -52% | 30.5 ? 35% | 0.61 ? 99% | 0.71 ? 98% |
| PWM Frequency (Hz) | 14900 | 475 | 14880 ? | 240 ? | 360 ? | |
| PWM Amplitude * (%) | 90 | 23 74% | 90 -0% | 56 38% | 30 67% | |
| Screen | -111% | 20% | -237% | -16% | -37% | |
| Brightness middle (cd/m²) | 633 | 349.3 -45% | 638 1% | 442.8 -30% | 400 -37% | 472 -25% |
| Brightness (cd/m²) | 619 | 352 -43% | 621 0% | 412 -33% | 403 -35% | 475 -23% |
| Brightness Distribution (%) | 92 | 98 7% | 95 3% | 87 -5% | 97 5% | 97 5% |
| Black Level * (cd/m²) | 0.22 | |||||
| Colorchecker dE 2000 * | 1 | 3.47 -247% | 0.6 40% | 5.92 -492% | 1 -0% | 1.4 -40% |
| Colorchecker dE 2000 max. * | 2.2 | 7.38 -235% | 1.4 36% | 10.46 -375% | 2.8 -27% | 4.1 -86% |
| Greyscale dE 2000 * | 1.3 | 2.6 -100% | 0.8 38% | 7.6 -485% | 1.3 -0% | 2 -54% |
| Gamma | 2.2 100% | 2.22 99% | 2.22 99% | 2.22 99% | 2.23 99% | 2.21 100% |
| CCT | 6549 99% | 6758 96% | 6430 101% | 6728 97% | 6586 99% | 6493 100% |
| Colorchecker dE 2000 calibrated * | 1.3 | 1.31 | ||||
| Contrast (:1) | 2013 | |||||
| Total Average (Program / Settings) | -7% /
-33% | -5% /
1% | -83% /
-134% | 21% /
12% | 17% /
3% |
* ... smaller is better
Display Response Times
| ↔ Response Time Black to White | ||
|---|---|---|
| 47 ms ... rise ↗ and fall ↘ combined | ↗ 26.8 ms rise | 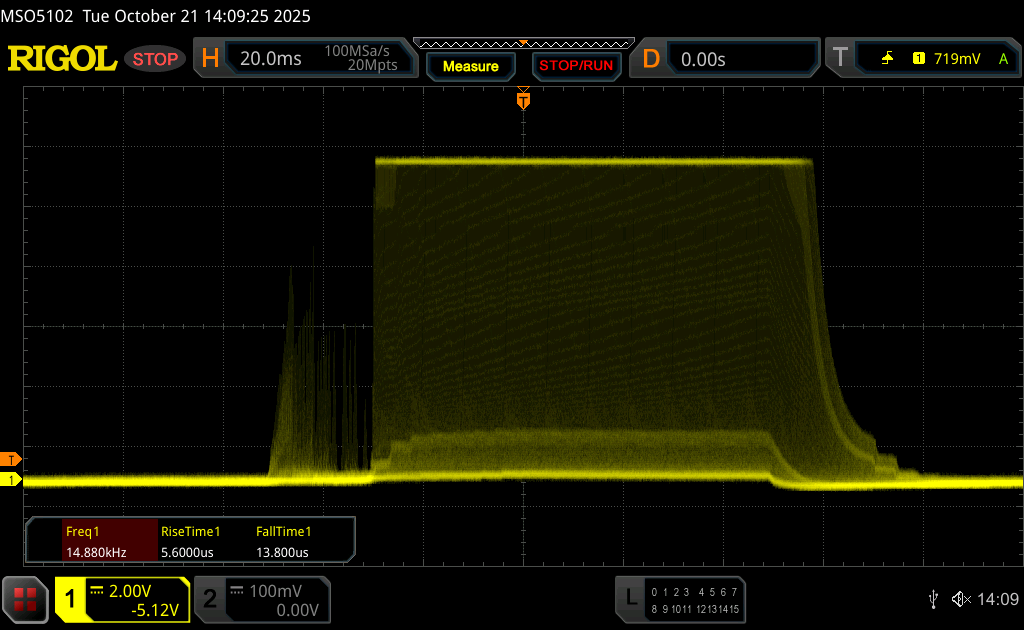 |
| ↘ 20.2 ms fall | ||
| The screen shows slow response rates in our tests and will be unsatisfactory for gamers. In comparison, all tested devices range from 0.1 (minimum) to 240 (maximum) ms. » 99 % of all devices are better. This means that the measured response time is worse than the average of all tested devices (19.8 ms). | ||
| ↔ Response Time 50% Grey to 80% Grey | ||
| 49.4 ms ... rise ↗ and fall ↘ combined | ↗ 20.8 ms rise | 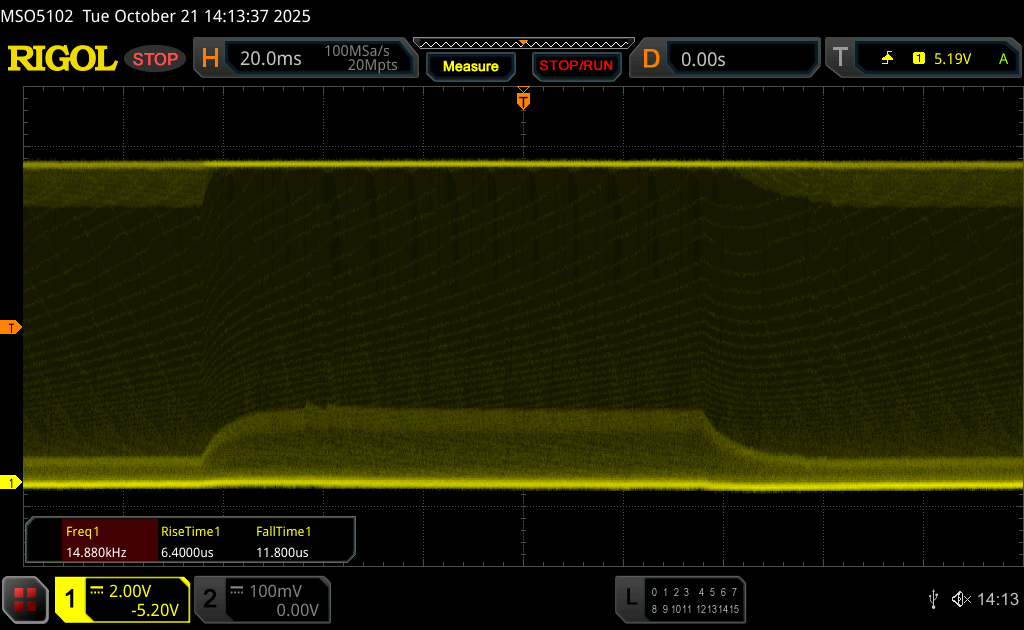 |
| ↘ 28.6 ms fall | ||
| The screen shows slow response rates in our tests and will be unsatisfactory for gamers. In comparison, all tested devices range from 0.165 (minimum) to 636 (maximum) ms. » 85 % of all devices are better. This means that the measured response time is worse than the average of all tested devices (31 ms). | ||
Screen Flickering / PWM (Pulse-Width Modulation)
| Screen flickering / PWM detected | 14900 Hz Amplitude: 90 % | 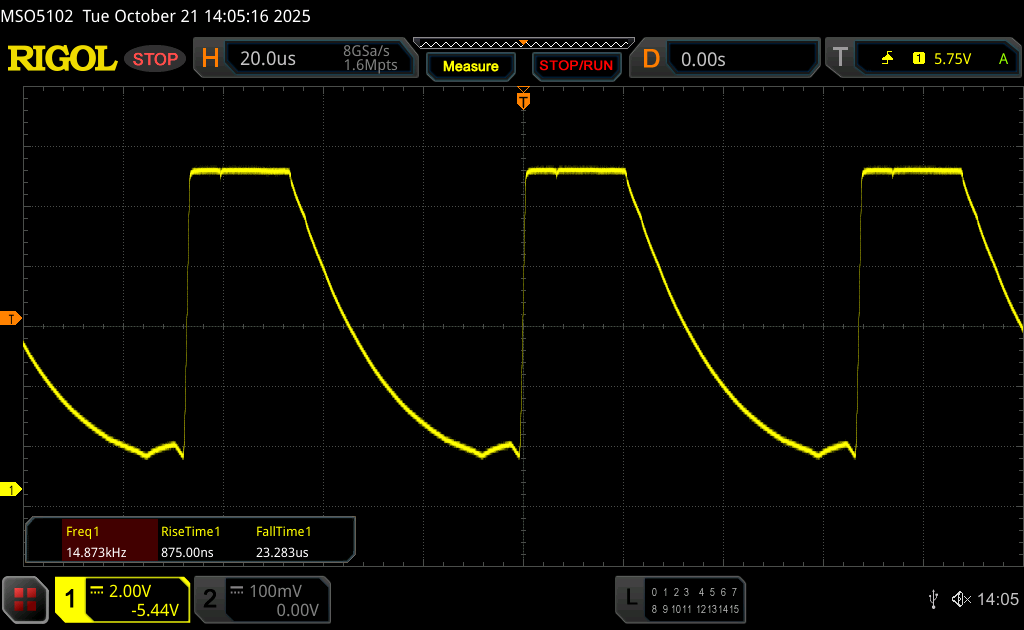 | |
The display backlight flickers at 14900 Hz (worst case, e.g., utilizing PWM) . The frequency of 14900 Hz is quite high, so most users sensitive to PWM should not notice any flickering. In comparison: 52 % of all tested devices do not use PWM to dim the display. If PWM was detected, an average of 7747 (minimum: 5 - maximum: 343500) Hz was measured. | |||


Performance - The M5 SoC with 32 GB RAM
The MacBook Pro 14 comes exclusively fitted with the faster M5 SoC, which features 10 CPU cores and 10 GPU cores. You can choose between 16, 24, or 32 GB of RAM, which cannot be expanded.
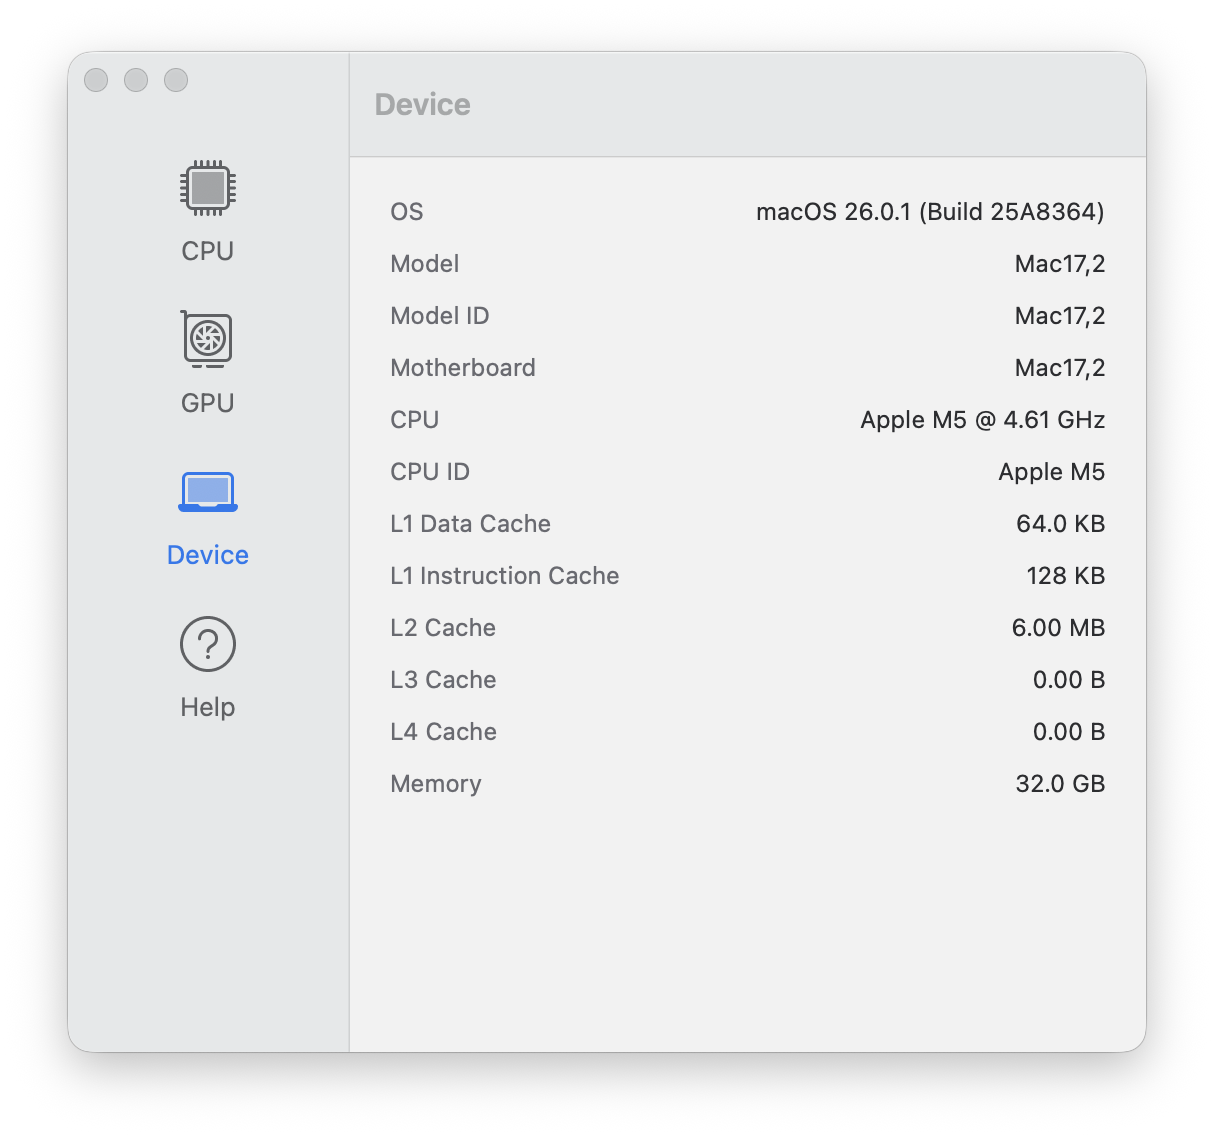
Processor - Apple M5
The new M5 SoC is still manufactured using the 3 nm process and once again features 10 cores. Four of these are fast performance cores that reach up to 4.608 GHz, and six are efficiency cores with a maximum clock speed of 3.048 GHz. The processor can consume a maximum of 30.5 watts and then quickly settles at 27.5 watts. For more detailed information and efficiency values, please refer to our analysis article on the new Apple M5.
Its single-core performance in particular is once again impressive, and Apple has been able to further extend its already immense advantage. Compared to the M4 generation, the advantage is 10-13 percent. The rest of the competition from AMD, Intel, and Qualcomm doesn't stand a chance here.
In the multi-core tests, we even saw a 19% performance increase, and the new M5 outperformed the old M3 Pro with 12 cores. For comparison, current competing models from AMD and Intel require around 70-80 watts TDP to achieve this multi-core performance. Its performance remains completely stable in battery mode.
Cinebench 2024: CPU Multi Core | CPU Single Core
Geekbench 6.7: Multi-Core | Single-Core
| CPU Performance rating | |
| Apple MacBook Pro 14 2024 M4 Pro | |
| Apple MacBook Pro 14 2024 M4 Pro Entry | |
| Apple MacBook Pro 14 2025 M5 | |
| Average Apple M5 10-Core | |
| Apple MacBook Pro 14 2024 M4 | |
| Apple MacBook Pro 16 2023 M3 Pro | |
| Apple MacBook Pro 14 2023 M3 Pro | |
| Average of class Multimedia | |
| Dell 14 Premium -1! | |
| Lenovo Yoga Pro 7 14ASP G9 | |
| HP EliteBook X G1a 14 AI | |
| Lenovo Yoga Slim 7X 14Q8X9 | |
| Cinebench 2024 / CPU Multi Core | |
| Apple MacBook Pro 14 2024 M4 Pro | |
| Apple MacBook Pro 14 2024 M4 Pro Entry | |
| Apple MacBook Pro 14 2024 M4 Pro Entry | |
| Apple MacBook Pro 14 2025 M5 | |
| Average of class Multimedia (327 - 2437, n=76, last 2 years) | |
| Apple MacBook Pro 16 2023 M3 Pro | |
| Average Apple M5 10-Core (957 - 1172, n=3) | |
| Lenovo Yoga Pro 7 14ASP G9 | |
| HP EliteBook X G1a 14 AI | |
| Apple MacBook Pro 14 2024 M4 | |
| Lenovo Yoga Slim 7X 14Q8X9 | |
| Apple MacBook Pro 14 2023 M3 Pro | |
| Cinebench 2024 / CPU Single Core | |
| Apple MacBook Pro 14 2025 M5 | |
| Average Apple M5 10-Core (199 - 200, n=3) | |
| Apple MacBook Pro 14 2024 M4 Pro | |
| Apple MacBook Pro 14 2024 M4 Pro Entry | |
| Apple MacBook Pro 14 2024 M4 | |
| Apple MacBook Pro 14 2023 M3 Pro | |
| Apple MacBook Pro 16 2023 M3 Pro | |
| Average of class Multimedia (72.5 - 201, n=60, last 2 years) | |
| Dell 14 Premium | |
| Lenovo Yoga Pro 7 14ASP G9 | |
| Lenovo Yoga Slim 7X 14Q8X9 | |
| HP EliteBook X G1a 14 AI | |
System performance
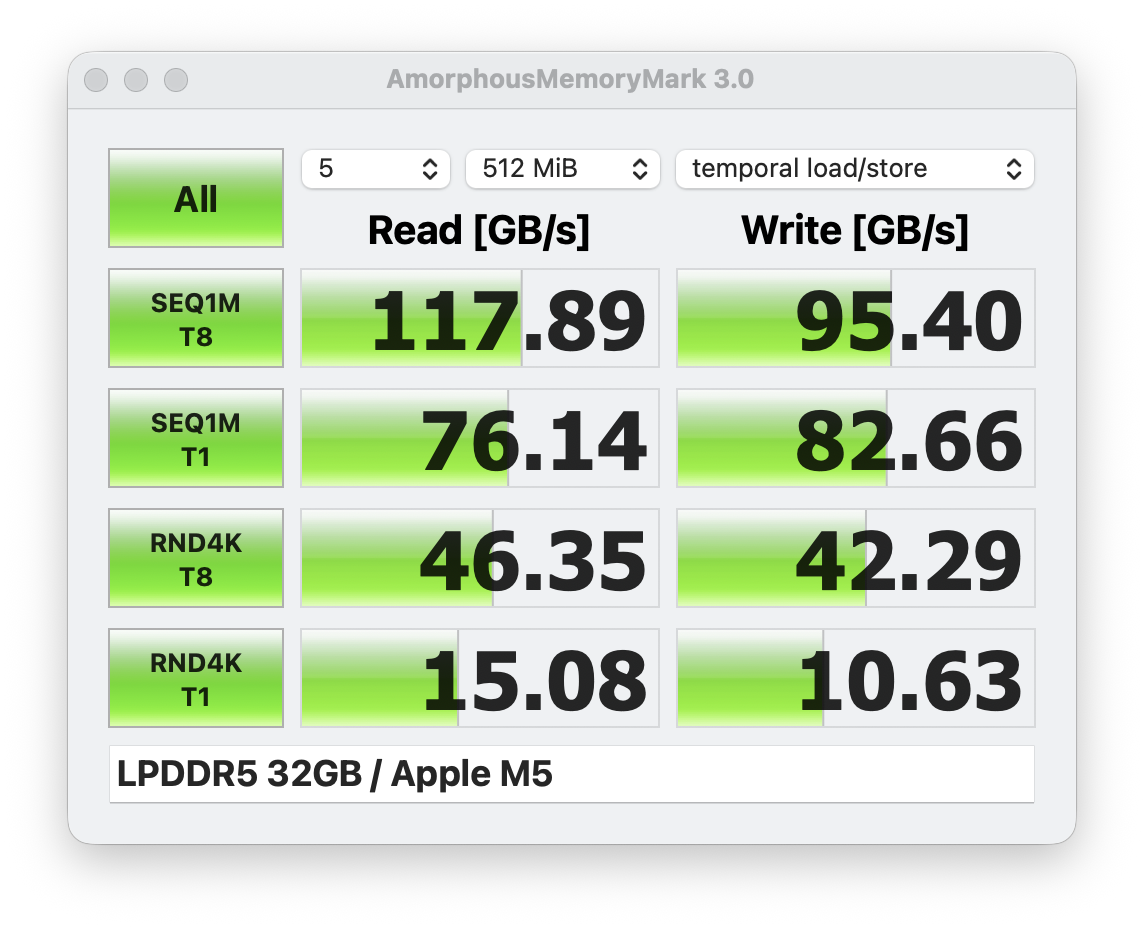
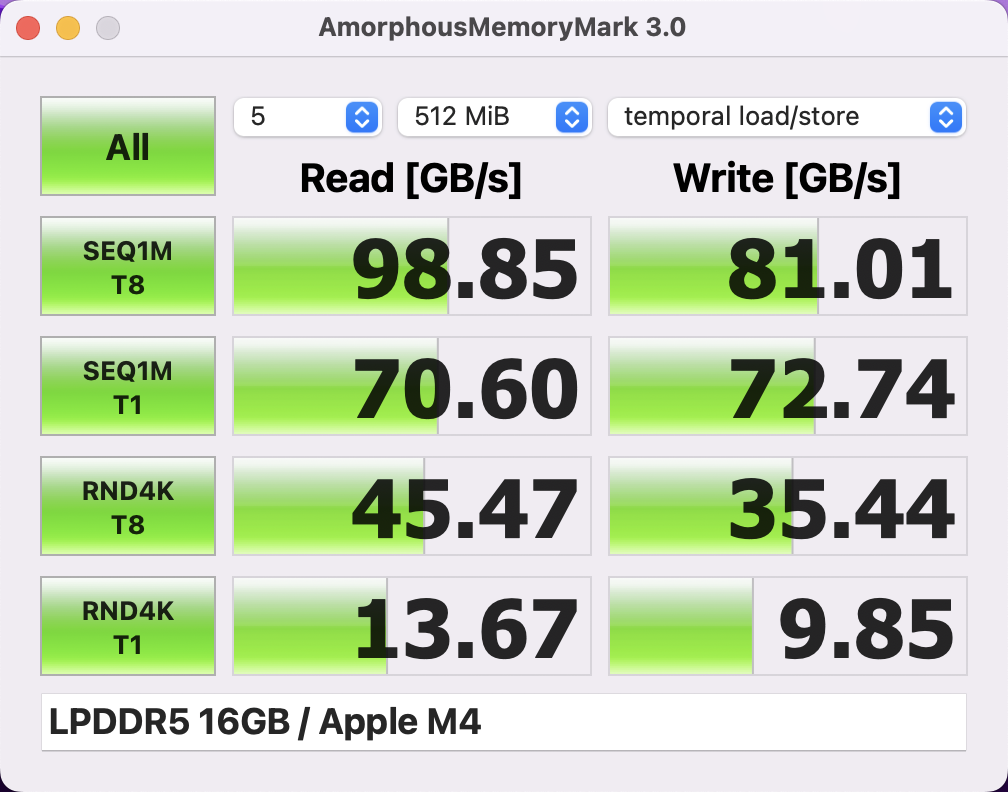
The MacBook Pro M5 is an extremely responsive laptop, and its results in the synthetic benchmarks were outstanding. Its memory bandwidth has been improved compared to the old M4 chips.
CrossMark: Overall | Productivity | Creativity | Responsiveness
WebXPRT 3: Overall
WebXPRT 4: Overall
Mozilla Kraken 1.1: Total
| Performance rating | |
| Apple MacBook Pro 14 2025 M5 | |
| Average Apple M5 10-Core, Apple M5 10-Core GPU | |
| Apple MacBook Pro 14 2024 M4 Pro | |
| Apple MacBook Pro 14 2024 M4 Pro Entry | |
| Apple MacBook Pro 14 2024 M4 | |
| Average of class Multimedia | |
| HP EliteBook X G1a 14 AI | |
| Lenovo Yoga Pro 7 14ASP G9 | |
| Dell 14 Premium | |
| Lenovo Yoga Slim 7X 14Q8X9 | |
| CrossMark / Overall | |
| Apple MacBook Pro 14 2025 M5 | |
| Average Apple M5 10-Core, Apple M5 10-Core GPU (2129 - 2426, n=3) | |
| Apple MacBook Pro 14 2024 M4 Pro | |
| Apple MacBook Pro 14 2024 M4 Pro Entry | |
| Apple MacBook Pro 14 2024 M4 | |
| Average of class Multimedia (866 - 2728, n=63, last 2 years) | |
| HP EliteBook X G1a 14 AI | |
| Lenovo Yoga Pro 7 14ASP G9 | |
| Dell 14 Premium | |
| Lenovo Yoga Slim 7X 14Q8X9 | |
| CrossMark / Productivity | |
| Apple MacBook Pro 14 2025 M5 | |
| Average Apple M5 10-Core, Apple M5 10-Core GPU (2036 - 2344, n=3) | |
| Apple MacBook Pro 14 2024 M4 Pro | |
| Apple MacBook Pro 14 2024 M4 Pro Entry | |
| Apple MacBook Pro 14 2024 M4 | |
| Average of class Multimedia (931 - 2489, n=63, last 2 years) | |
| Dell 14 Premium | |
| HP EliteBook X G1a 14 AI | |
| Lenovo Yoga Pro 7 14ASP G9 | |
| Lenovo Yoga Slim 7X 14Q8X9 | |
| CrossMark / Creativity | |
| Apple MacBook Pro 14 2025 M5 | |
| Average Apple M5 10-Core, Apple M5 10-Core GPU (2620 - 2820, n=3) | |
| Apple MacBook Pro 14 2024 M4 Pro | |
| Apple MacBook Pro 14 2024 M4 Pro Entry | |
| Apple MacBook Pro 14 2024 M4 | |
| Average of class Multimedia (907 - 3465, n=63, last 2 years) | |
| Lenovo Yoga Pro 7 14ASP G9 | |
| HP EliteBook X G1a 14 AI | |
| Dell 14 Premium | |
| Lenovo Yoga Slim 7X 14Q8X9 | |
| CrossMark / Responsiveness | |
| Apple MacBook Pro 14 2025 M5 | |
| Apple MacBook Pro 14 2024 M4 | |
| Average Apple M5 10-Core, Apple M5 10-Core GPU (1307 - 1712, n=3) | |
| Apple MacBook Pro 14 2024 M4 Pro | |
| Apple MacBook Pro 14 2024 M4 Pro Entry | |
| Average of class Multimedia (605 - 2024, n=63, last 2 years) | |
| HP EliteBook X G1a 14 AI | |
| Dell 14 Premium | |
| Lenovo Yoga Pro 7 14ASP G9 | |
| Lenovo Yoga Slim 7X 14Q8X9 | |
| WebXPRT 3 / Overall | |
| Apple MacBook Pro 14 2024 M4 Pro | |
| Apple MacBook Pro 14 2025 M5 | |
| Apple MacBook Pro 14 2024 M4 Pro Entry | |
| Average Apple M5 10-Core, Apple M5 10-Core GPU (480 - 540, n=3) | |
| Apple MacBook Pro 14 2024 M4 | |
| Lenovo Yoga Slim 7X 14Q8X9 | |
| Average of class Multimedia (136.4 - 596, n=66, last 2 years) | |
| HP EliteBook X G1a 14 AI | |
| Lenovo Yoga Pro 7 14ASP G9 | |
| Dell 14 Premium | |
| WebXPRT 4 / Overall | |
| Apple MacBook Pro 14 2025 M5 | |
| Average Apple M5 10-Core, Apple M5 10-Core GPU (376 - 384, n=3) | |
| Apple MacBook Pro 14 2024 M4 Pro | |
| Apple MacBook Pro 14 2024 M4 Pro Entry | |
| Apple MacBook Pro 14 2024 M4 | |
| Lenovo Yoga Slim 7X 14Q8X9 | |
| Average of class Multimedia (167.3 - 402, n=68, last 2 years) | |
| Dell 14 Premium | |
| Lenovo Yoga Pro 7 14ASP G9 | |
| HP EliteBook X G1a 14 AI | |
| Mozilla Kraken 1.1 / Total | |
| Dell 14 Premium | |
| HP EliteBook X G1a 14 AI | |
| Lenovo Yoga Slim 7X 14Q8X9 | |
| Average of class Multimedia (228 - 835, n=69, last 2 years) | |
| Lenovo Yoga Pro 7 14ASP G9 | |
| Apple MacBook Pro 14 2024 M4 | |
| Apple MacBook Pro 14 2024 M4 Pro Entry | |
| Apple MacBook Pro 14 2024 M4 Pro | |
| Average Apple M5 10-Core, Apple M5 10-Core GPU (228 - 243, n=3) | |
| Apple MacBook Pro 14 2025 M5 | |
* ... smaller is better
Storage device
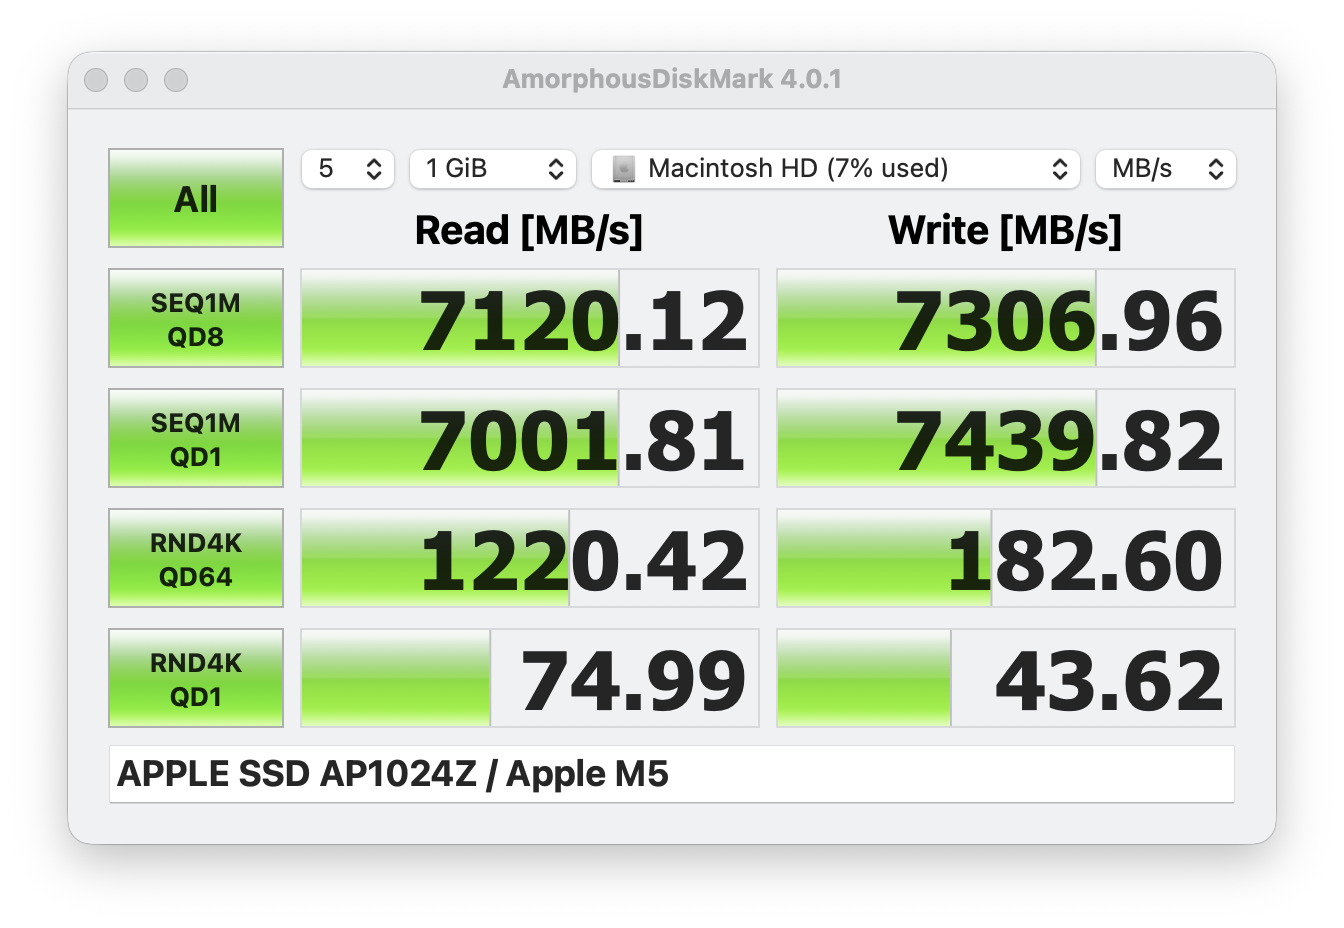
While the M4 MacBook Pro was still limited to PCIe 3.0 speeds, that's no longer the case with the new MacBook Pro M5. It's now on par with the more expensive MBP models, although the next generation could very well feature an upgrade to PCIe 5.0. With transfer rates of up to 7.3 GB/s, its performance is completely fine. When purchasing the 1 TB model, users have 945 GB at their disposal after initial setup. The SSD chips are still soldered in place, with surcharges for upgrades remaining extremely high, as is typical for Apple (jumping from 512 GB to 1 TB costs $200).
GPU performance
The new M5 GPU is significantly faster than the M4 GPU and again requires a maximum of 18-19 watts. We noted advantages of 25-33 percent over the M4 GPU during the benchmarks. This meant that the M5 GPU could also outperform the small M3 Pro GPU with 14 cores and was on par with the old M2 Pro GPU with 19 cores. Further comparisons with other manufacturers are available in our analysis article.
Its gaming performance is similarly impressive, especially when running native games such as Cyberpunk 2077 or Baldur's Gate 3. In addition, its gaming performance remains absolutely consistent. Metal FX upscaling can be used to further increase the device's performance. For example, we were able to increase the frame rates in Cyberpunk 2077 (1080p, Ultra) from 29.3 to 39.6 FPS without noticeably affecting image quality. Cyberpunk is also set to support Apple's own version of Frame Generation in the future.
| 3DMark Steel Nomad Score | 1125 points | |
| 3DMark Steel Nomad Light Score | 5221 points | |
| 3DMark Steel Nomad Light Unlimited Score | 5266 points | |
Help | ||
| Blender / v3.3 Classroom METAL | |
| Average Apple M5 10-Core GPU (68 - 76.3, n=2) | |
| Apple MacBook Pro 14 2025 M5 | |
| Apple MacBook Pro 14 2024 M4 Pro Entry | |
| Average of class Multimedia (17.8 - 68, n=5, last 2 years) | |
| Blender / v3.3 Classroom CPU | |
| Lenovo Yoga Slim 7X 14Q8X9 | |
| Apple MacBook Pro 14 2025 M5 | |
| Average of class Multimedia (134.5 - 1042, n=64, last 2 years) | |
| Average Apple M5 10-Core GPU (344 - 429, n=2) | |
| Dell 14 Premium | |
| Lenovo Yoga Pro 7 14ASP G9 | |
| HP EliteBook X G1a 14 AI | |
| Apple MacBook Pro 14 2024 M4 Pro Entry | |
| Blender / v3.3 Classroom oneAPI/Intel | |
| Average of class Multimedia (105 - 492, n=17, last 2 years) | |
| Dell 14 Premium | |
* ... smaller is better
| Total War Pharaoh - 1920x1080 Ultra Preset | |
| Average of class Multimedia (23.4 - 84.1, n=14, last 2 years) | |
| Apple MacBook Pro 14 2024 M4 Pro Entry | |
| Apple MacBook Pro 14 2024 M4 Pro | |
| Apple MacBook Pro 14 2025 M5 | |
| Apple MacBook Pro 14 2024 M4 | |
| Shadow of the Tomb Raider - 1920x1080 Highest Preset AA:T | |
| Apple MacBook Pro 14 2024 M4 Pro | |
| Apple MacBook Pro 14 2024 M4 Pro Entry | |
| Average of class Multimedia (23 - 129, n=8, last 2 years) | |
| Apple MacBook Pro 14 2025 M5 | |
| Apple MacBook Pro 14 2024 M4 | |
| low | med. | high | ultra | QHD | |
|---|---|---|---|---|---|
| Shadow of the Tomb Raider (2018) | 145 | 72 | 66 | 59 | 41 |
| Baldur's Gate 3 (2023) | 65 | 57 | 49 | 47 | |
| Cyberpunk 2077 (2023) | 52.4 | 40.9 | 34.1 | 29.3 | 16.9 |
| Total War Pharaoh (2023) | 68.6 | 55.5 | 51.6 | 49 | 35.3 |
| Assassin's Creed Shadows (2025) | 32 | 30 | 26 | 16 |
Emissions & energy
Noise emissions
Apple has again equipped the base model of its MacBook Pro 14 with only a single fan. To be fair, it's worth noting that you can hardly hear it unless you're running the processor at full capacity or using emulated programs/games, for example. The first fan level of 2,500 rpm was practically inaudible during our test(25 dB(A)). When playing Cyberpunk 2077, it reached a maximum of just 30 dB(A) at ~3,800 rpm. In the stress test, on the other hand, it got loud and the fan reached its maximum speed (6,550 rpm), hitting 48 dB(A). There were no other electronic noises on our test device.
Noise level
| Idle |
| 24.5 / 24.5 / 24.5 dB(A) |
| Load |
| 25.2 / 48 dB(A) |
 | ||
30 dB silent 40 dB(A) audible 50 dB(A) loud |
||
min: | ||
| Apple MacBook Pro 14 2025 M5 M5 10-Core GPU, M5 10-Core, Apple SSD AP1024Z | Apple MacBook Pro 14 2024 M4 M4 10-Core GPU, M4 10-Core, Apple SSD AP0512Z | Apple MacBook Pro 14 2024 M4 Pro M4 Pro 20-Core GPU, M4 Pro 14-Core, Apple SSD AP2048Z | Dell 14 Premium Arc 140T, Ultra 7 255H, Kioxia BG6 KBG6AZNV1T02 | HP EliteBook X G1a 14 AI Radeon 890M, Ryzen AI 9 HX PRO 375, Kioxia XG8 KXG80ZNV1T02 | Lenovo Yoga Pro 7 14ASP G9 Radeon 880M, Ryzen AI 9 365, Micron 2550 1TB MTFDKCD1T0TGE | Lenovo Yoga Slim 7X 14Q8X9 Adreno X1-85 3.8 TFLOPS, SD X Elite X1E-78-100, Samsung PM9C1a MZAL81T0HDLB | |
|---|---|---|---|---|---|---|---|
| Noise | -8% | -8% | -11% | -3% | -11% | -1% | |
| off / environment * (dB) | 24.5 | 25.4 -4% | 23.9 2% | 23 6% | 24 2% | 23.8 3% | 24.1 2% |
| Idle Minimum * (dB) | 24.5 | 25.4 -4% | 23.9 2% | 23.2 5% | 24.4 -0% | 23.8 3% | 24.1 2% |
| Idle Average * (dB) | 24.5 | 25.4 -4% | 23.9 2% | 24 2% | 24.4 -0% | 23.8 3% | 24.1 2% |
| Idle Maximum * (dB) | 24.5 | 25.4 -4% | 23.9 2% | 24.7 -1% | 24.5 -0% | 23.8 3% | 24.1 2% |
| Load Average * (dB) | 25.2 | 26.6 -6% | 30.2 -20% | 39 -55% | 25.4 -1% | 44.6 -77% | 25.3 -0% |
| Cyberpunk 2077 ultra * (dB) | 30 | 40.1 -34% | 44.5 -48% | 43 -43% | 39.3 -31% | 35.9 -20% | 38.6 -29% |
| Load Maximum * (dB) | 48 | 48.9 -2% | 44.5 7% | 44.9 6% | 43.1 10% | 44.6 7% | 40.5 16% |
* ... smaller is better
Temperature
The surface temperatures of the MacBook Pro M5 stay super low during simple tasks and generally don't become critical even under high load. Incidentally, we measured the highest temperatures (maximum 45 °C) when gaming, as the fan held back quite a bit in this scenario. Thankfully, however, this didn't cause any limitations.
During the stress test, the M5 SoC briefly consumed up to 44 watts, but the value then dropped quickly and finally settled at 30 watts. As a result, the base model of the MacBook Pro can't exploit the full potential of the M5 under combined CPU/GPU load.
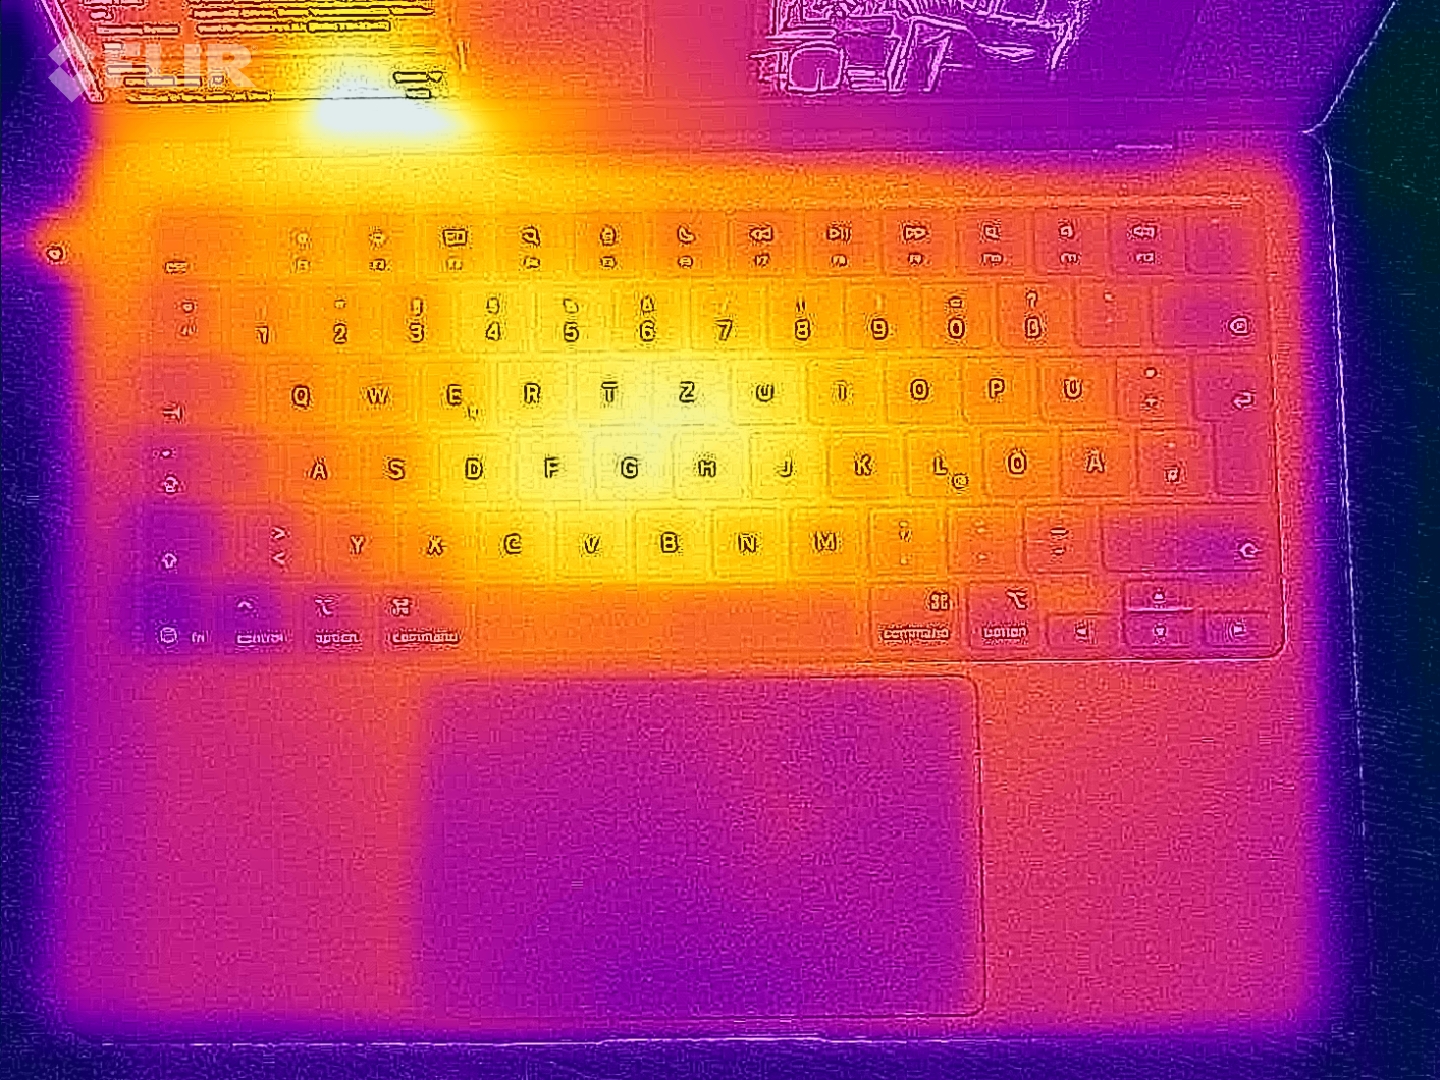
(±) The maximum temperature on the upper side is 43.8 °C / 111 F, compared to the average of 36.8 °C / 98 F, ranging from 21 to 71 °C for the class Multimedia.
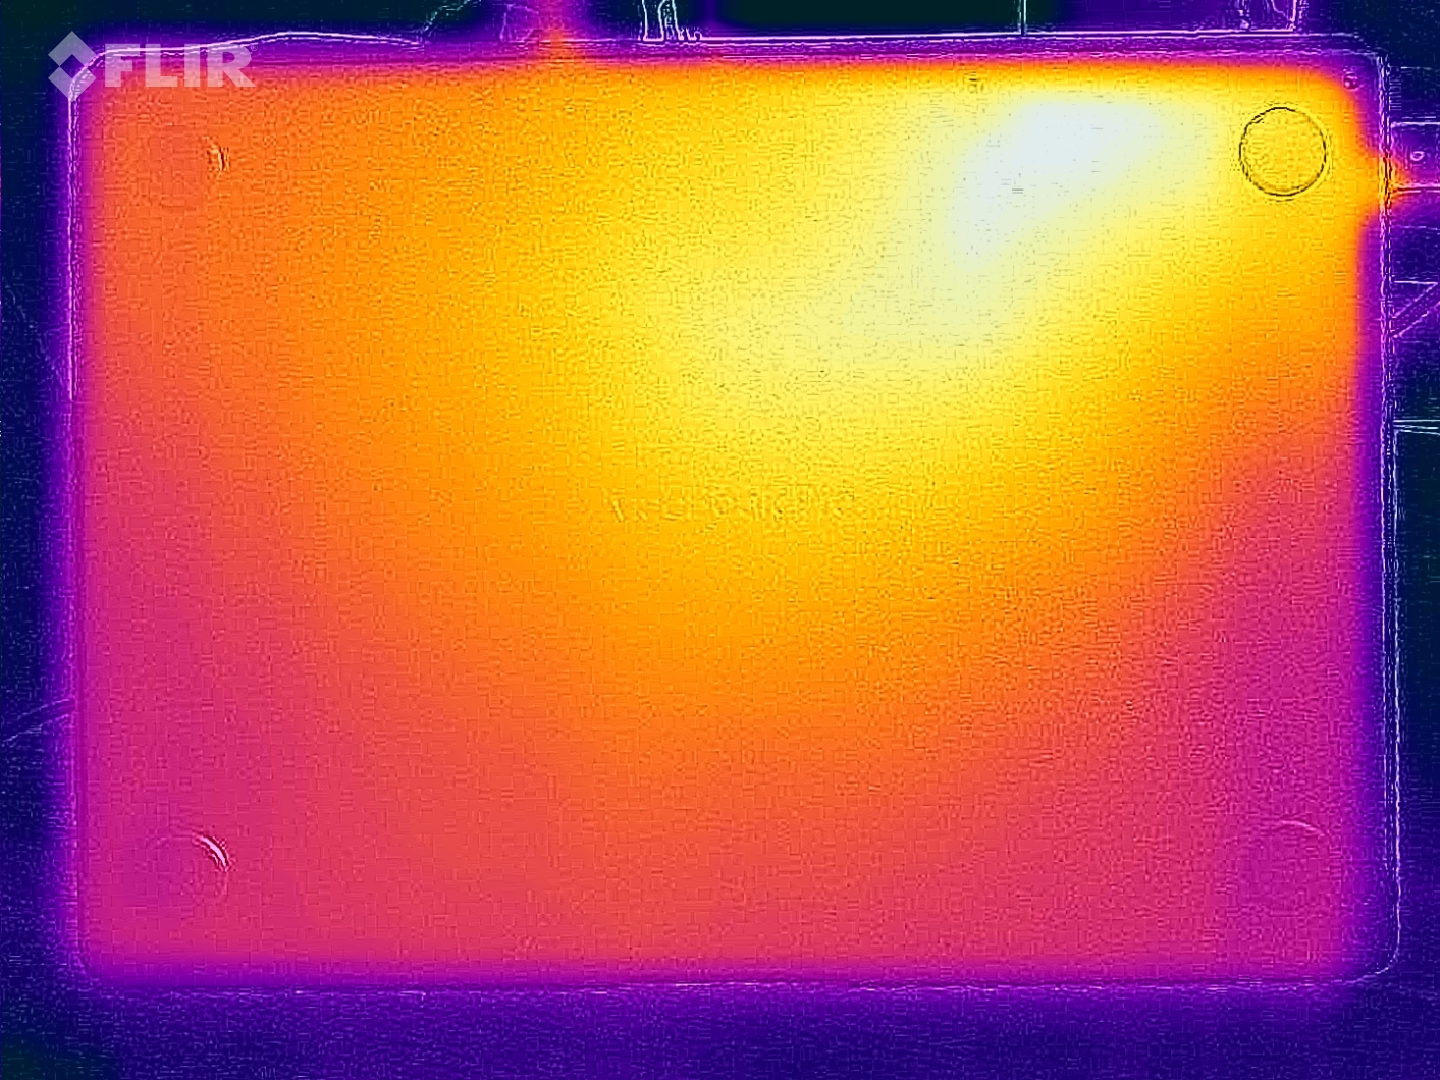
(±) The bottom heats up to a maximum of 40.6 °C / 105 F, compared to the average of 39.1 °C / 102 F
(+) In idle usage, the average temperature for the upper side is 22.5 °C / 73 F, compared to the device average of 31.3 °C / 88 F.
(-) 3: The average temperature for the upper side is 39 °C / 102 F, compared to the average of 31.3 °C / 88 F for the class Multimedia.
(+) The palmrests and touchpad are reaching skin temperature as a maximum (34.5 °C / 94.1 F) and are therefore not hot.
(-) The average temperature of the palmrest area of similar devices was 28.7 °C / 83.7 F (-5.8 °C / -10.4 F).
| Apple MacBook Pro 14 2025 M5 Apple M5 10-Core, Apple M5 10-Core GPU | Apple MacBook Pro 14 2024 M4 Apple M4 10-Core, Apple M4 10-core GPU | Apple MacBook Pro 14 2024 M4 Pro Apple M4 Pro 14-Core, Apple M4 Pro 20-Core GPU | Dell 14 Premium Intel Core Ultra 7 255H, Intel Arc Graphics 140T | HP EliteBook X G1a 14 AI AMD Ryzen AI 9 HX PRO 375, AMD Radeon 890M | Lenovo Yoga Pro 7 14ASP G9 AMD Ryzen AI 9 365, AMD Radeon 880M | Lenovo Yoga Slim 7X 14Q8X9 Qualcomm Snapdragon X Elite X1E-78-100, Qualcomm SD X Adreno X1-85 3.8 TFLOPS | |
|---|---|---|---|---|---|---|---|
| Heat | 2% | -3% | 3% | 3% | -12% | -22% | |
| Maximum Upper Side * (°C) | 43.8 | 41.5 5% | 47.3 -8% | 33 25% | 36 18% | 42 4% | 44.9 -3% |
| Maximum Bottom * (°C) | 40.6 | 40 1% | 44.2 -9% | 33.6 17% | 34.2 16% | 40.6 -0% | 51.5 -27% |
| Idle Upper Side * (°C) | 22.9 | 22.3 3% | 22.1 3% | 26.4 -15% | 25 -9% | 28.2 -23% | 28.9 -26% |
| Idle Bottom * (°C) | 22.5 | 22.5 -0% | 22.1 2% | 25.6 -14% | 25.6 -14% | 28.9 -28% | 29.4 -31% |
* ... smaller is better
Speakers
Apple MacBook Pro 14 2025 M5 audio analysis
(+) | speakers can play relatively loud (84.8 dB)
Bass 100 - 315 Hz
(+) | good bass - only 4.2% away from median
(+) | bass is linear (6.5% delta to prev. frequency)
Mids 400 - 2000 Hz
(+) | balanced mids - only 2% away from median
(+) | mids are linear (3.2% delta to prev. frequency)
Highs 2 - 16 kHz
(+) | balanced highs - only 3.3% away from median
(+) | highs are linear (3.7% delta to prev. frequency)
Overall 100 - 16.000 Hz
(+) | overall sound is linear (6.4% difference to median)
Compared to same class
» 4% of all tested devices in this class were better, 1% similar, 95% worse
» The best had a delta of 5%, average was 17%, worst was 45%
Compared to all devices tested
» 1% of all tested devices were better, 0% similar, 99% worse
» The best had a delta of 4%, average was 23%, worst was 134%
Dell 14 Premium audio analysis
(±) | speaker loudness is average but good (80.7 dB)
Bass 100 - 315 Hz
(±) | reduced bass - on average 11.4% lower than median
(±) | linearity of bass is average (10.1% delta to prev. frequency)
Mids 400 - 2000 Hz
(+) | balanced mids - only 1.4% away from median
(+) | mids are linear (2.6% delta to prev. frequency)
Highs 2 - 16 kHz
(+) | balanced highs - only 1% away from median
(+) | highs are linear (3.4% delta to prev. frequency)
Overall 100 - 16.000 Hz
(+) | overall sound is linear (9.2% difference to median)
Compared to same class
» 13% of all tested devices in this class were better, 0% similar, 87% worse
» The best had a delta of 5%, average was 17%, worst was 45%
Compared to all devices tested
» 3% of all tested devices were better, 1% similar, 96% worse
» The best had a delta of 4%, average was 23%, worst was 134%
Apple MacBook Pro 14 2024 M4 Pro audio analysis
(+) | speakers can play relatively loud (84.9 dB)
Bass 100 - 315 Hz
(+) | good bass - only 4.6% away from median
(±) | linearity of bass is average (7.3% delta to prev. frequency)
Mids 400 - 2000 Hz
(+) | balanced mids - only 1.5% away from median
(+) | mids are linear (2.1% delta to prev. frequency)
Highs 2 - 16 kHz
(+) | balanced highs - only 2.6% away from median
(+) | highs are linear (3.9% delta to prev. frequency)
Overall 100 - 16.000 Hz
(+) | overall sound is linear (5.9% difference to median)
Compared to same class
» 3% of all tested devices in this class were better, 0% similar, 97% worse
» The best had a delta of 5%, average was 17%, worst was 45%
Compared to all devices tested
» 0% of all tested devices were better, 0% similar, 100% worse
» The best had a delta of 4%, average was 23%, worst was 134%
HP EliteBook X G1a 14 AI audio analysis
(+) | speakers can play relatively loud (89.1 dB)
Bass 100 - 315 Hz
(±) | reduced bass - on average 12.5% lower than median
(±) | linearity of bass is average (10.8% delta to prev. frequency)
Mids 400 - 2000 Hz
(±) | higher mids - on average 6% higher than median
(+) | mids are linear (3.9% delta to prev. frequency)
Highs 2 - 16 kHz
(+) | balanced highs - only 3.3% away from median
(+) | highs are linear (5.1% delta to prev. frequency)
Overall 100 - 16.000 Hz
(+) | overall sound is linear (11.5% difference to median)
Compared to same class
» 3% of all tested devices in this class were better, 2% similar, 95% worse
» The best had a delta of 7%, average was 21%, worst was 53%
Compared to all devices tested
» 8% of all tested devices were better, 2% similar, 90% worse
» The best had a delta of 4%, average was 23%, worst was 134%
Lenovo Yoga Pro 7 14ASP G9 audio analysis
(±) | speaker loudness is average but good (75.3 dB)
Bass 100 - 315 Hz
(±) | reduced bass - on average 11.4% lower than median
(±) | linearity of bass is average (10.3% delta to prev. frequency)
Mids 400 - 2000 Hz
(+) | balanced mids - only 3% away from median
(+) | mids are linear (6.9% delta to prev. frequency)
Highs 2 - 16 kHz
(+) | balanced highs - only 3.9% away from median
(+) | highs are linear (4.5% delta to prev. frequency)
Overall 100 - 16.000 Hz
(+) | overall sound is linear (14.2% difference to median)
Compared to same class
» 27% of all tested devices in this class were better, 6% similar, 67% worse
» The best had a delta of 5%, average was 18%, worst was 53%
Compared to all devices tested
» 17% of all tested devices were better, 4% similar, 79% worse
» The best had a delta of 4%, average was 23%, worst was 134%
Lenovo Yoga Slim 7X 14Q8X9 audio analysis
(±) | speaker loudness is average but good (81.3 dB)
Bass 100 - 315 Hz
(-) | nearly no bass - on average 17.1% lower than median
(±) | linearity of bass is average (10.1% delta to prev. frequency)
Mids 400 - 2000 Hz
(+) | balanced mids - only 2.6% away from median
(+) | mids are linear (2.8% delta to prev. frequency)
Highs 2 - 16 kHz
(+) | balanced highs - only 2.3% away from median
(+) | highs are linear (4.5% delta to prev. frequency)
Overall 100 - 16.000 Hz
(+) | overall sound is linear (12.6% difference to median)
Compared to same class
» 18% of all tested devices in this class were better, 4% similar, 77% worse
» The best had a delta of 5%, average was 18%, worst was 53%
Compared to all devices tested
» 11% of all tested devices were better, 3% similar, 86% worse
» The best had a delta of 4%, average was 23%, worst was 134%
Power consumption
The laptop's idle power consumption has been reduced slightly compared to its predecessor, and ~11 watts is a good value considering its high brightness. We noted no surprises under load either. We tested the MacBook with the 70-watt power adapter, which was ultimately sufficient. However, buyers of the new MacBook Pro M5 should note that Apple now sells the device without a power adapter; only a MagSafe cable is included in its scope of delivery.
| Off / Standby | |
| Idle | |
| Load |
|
Key:
min: | |
| Apple MacBook Pro 14 2025 M5 M5 10-Core, M5 10-Core GPU, Apple SSD AP1024Z, Mini-LED, 3024x1964, 14.2" | Apple MacBook Pro 14 2024 M4 M4 10-Core, M4 10-Core GPU, Apple SSD AP0512Z, MiniLED, 3024x1964, 14.2" | Apple MacBook Pro 14 2024 M4 Pro M4 Pro 14-Core, M4 Pro 20-Core GPU, Apple SSD AP2048Z, MiniLED, 3024x1964, 14.2" | Dell 14 Premium Ultra 7 255H, Arc 140T, Kioxia BG6 KBG6AZNV1T02, OLED, 3200x2000, 14.5" | HP EliteBook X G1a 14 AI Ryzen AI 9 HX PRO 375, Radeon 890M, Kioxia XG8 KXG80ZNV1T02, IPS, 1920x1200, 14" | Lenovo Yoga Pro 7 14ASP G9 Ryzen AI 9 365, Radeon 880M, Micron 2550 1TB MTFDKCD1T0TGE, OLED, 3072x1920, 14.5" | Lenovo Yoga Slim 7X 14Q8X9 SD X Elite X1E-78-100, Adreno X1-85 3.8 TFLOPS, Samsung PM9C1a MZAL81T0HDLB, OLED, 2944x1840, 14.5" | Average Apple M5 10-Core GPU | Average of class Multimedia | |
|---|---|---|---|---|---|---|---|---|---|
| Power Consumption | 3% | -27% | -14% | -58% | -39% | -0% | 25% | -50% | |
| Idle Minimum * (Watt) | 2.1 | 2.1 -0% | 2.17 -3% | 4.4 -110% | 6.5 -210% | 5.5 -162% | 5.1 -143% | 2.09 ? -0% | 5.68 ? -170% |
| Idle Average * (Watt) | 11.6 | 12.5 -8% | 10.9 6% | 6.1 47% | 8.7 25% | 7.6 34% | 8.4 28% | 8.77 ? 24% | 10.2 ? 12% |
| Idle Maximum * (Watt) | 11.7 | 12.6 -8% | 11 6% | 13.7 -17% | 10.3 12% | 7.9 32% | 8.6 26% | 8.85 ? 24% | 12.4 ? -6% |
| Load Average * (Watt) | 51.1 | 37.8 26% | 74.3 -45% | 53.8 -5% | 75.7 -48% | 77.9 -52% | 26.1 49% | 31.1 ? 39% | 65.4 ? -28% |
| Cyberpunk 2077 ultra external monitor * (Watt) | 42.4 | 40.2 5% | 80.5 -90% | 46.5 -10% | 73.1 -72% | 61.5 -45% | 35.3 17% | ||
| Cyberpunk 2077 ultra * (Watt) | 43.6 | 42.8 2% | 50.7 -16% | 76.2 -75% | 63 -44% | 37.2 15% | |||
| Load Maximum * (Watt) | 71.5 | 69 3% | 98.1 -37% | 62.7 12% | 100.7 -41% | 94.8 -33% | 67.1 6% | 43.5 ? 39% | 113.3 ? -58% |
* ... smaller is better
Power consumption Cyberpunk / stress test
Power consumption with external monitor
Runtimes
The device's runtimes aren't quite as good as those of the predecessor model, although 16:42 hours we measured during our Wi-Fi test at 150 cd/m² is still a very good result. We also observed a reduction in battery life with the iPad Pro M5, which is likely due to its slight increase in power consumption in single-core operation. At full brightness, the Wi-Fi test still ran for just under 5.5 hours. The laptop's display remains its the biggest power consumer.
Notebookcheck total rating
Apple MacBook Pro 14 2025 M5
- 10/21/2025 v8
Andreas Osthoff
 Total Sustainability Score:
 Possible alternatives compared
Image | Model / Review | Price | Weight | Height | Display |
|---|---|---|---|---|---|
1. 90.9%  | Apple MacBook Pro 14 2025 M5 Apple M5 10-Core ⎘ Apple M5 10-Core GPU ⎘ 32 GB Memory, 1024 GB SSD | Amazon: List Price: 2739€ | 1.5 kg | 15.5 mm | 14.20" 3024x1964 254 PPI Mini-LED |
2. 82.5%  | Dell 14 Premium Intel Core Ultra 7 255H ⎘ Intel Arc Graphics 140T ⎘ 32 GB Memory, 1024 GB SSD | Amazon: List Price: 1950 USD | 1.7 kg | 18 mm | 14.50" 3200x2000 260 PPI OLED |
3. 88.7%  | HP EliteBook X G1a 14 AI AMD Ryzen AI 9 HX PRO 375 ⎘ AMD Radeon 890M ⎘ 32 GB Memory, 1024 GB SSD | Amazon: List Price: 2200 USD | 1.5 kg | 13.2 mm | 14.00" 1920x1200 162 PPI IPS |
4. 89.3%  | Apple MacBook Pro 14 2024 M4 Apple M4 10-Core ⎘ Apple M4 10-core GPU ⎘ 16 GB Memory, 512 GB SSD | Amazon: List Price: 1899€ | 1.5 kg | 15.5 mm | 14.20" 3024x1964 254 PPI MiniLED |
5. 85.1%  | Lenovo Yoga Pro 7 14ASP G9 AMD Ryzen AI 9 365 ⎘ AMD Radeon 880M ⎘ 32 GB Memory, 1024 GB SSD | Amazon: List Price: 1599€ | 1.5 kg | 18 mm | 14.50" 3072x1920 250 PPI OLED |
6. 86.4%  | Lenovo Yoga Slim 7X 14Q8X9 Qualcomm Snapdragon X Elite X1E-78-100 ⎘ Qualcomm SD X Adreno X1-85 3.8 TFLOPS ⎘ 32 GB Memory, 1024 GB SSD | Amazon: 1. $1,339.00 Lenovo Yoga Slim 7 Laptop 14... 2. $1,179.00 Lenovo Yoga Slim 7 14Q8X9 La... 3. $1,169.00 Lenovo Yoga Slim 7 14Q8X9 La... List Price: 1599€ | 1.3 kg | 15 mm | 14.50" 2944x1840 239 PPI OLED |
Transparency
The selection of devices to be reviewed is made by our editorial team. The test sample was provided to the author as a loan by the manufacturer or retailer for the purpose of this review. The lender had no influence on this review, nor did the manufacturer receive a copy of this review before publication. There was no obligation to publish this review. As an independent media company, Notebookcheck is not subjected to the authority of manufacturers, retailers or publishers.
This is how Notebookcheck is testing
Every year, Notebookcheck independently reviews hundreds of laptops and smartphones using standardized procedures to ensure that all results are comparable. We have continuously developed our test methods for around 20 years and set industry standards in the process. In our test labs, high-quality measuring equipment is utilized by experienced technicians and editors. These tests involve a multi-stage validation process. Our complex rating system is based on hundreds of well-founded measurements and benchmarks, which maintains objectivity. Further information on our test methods can be found here.

