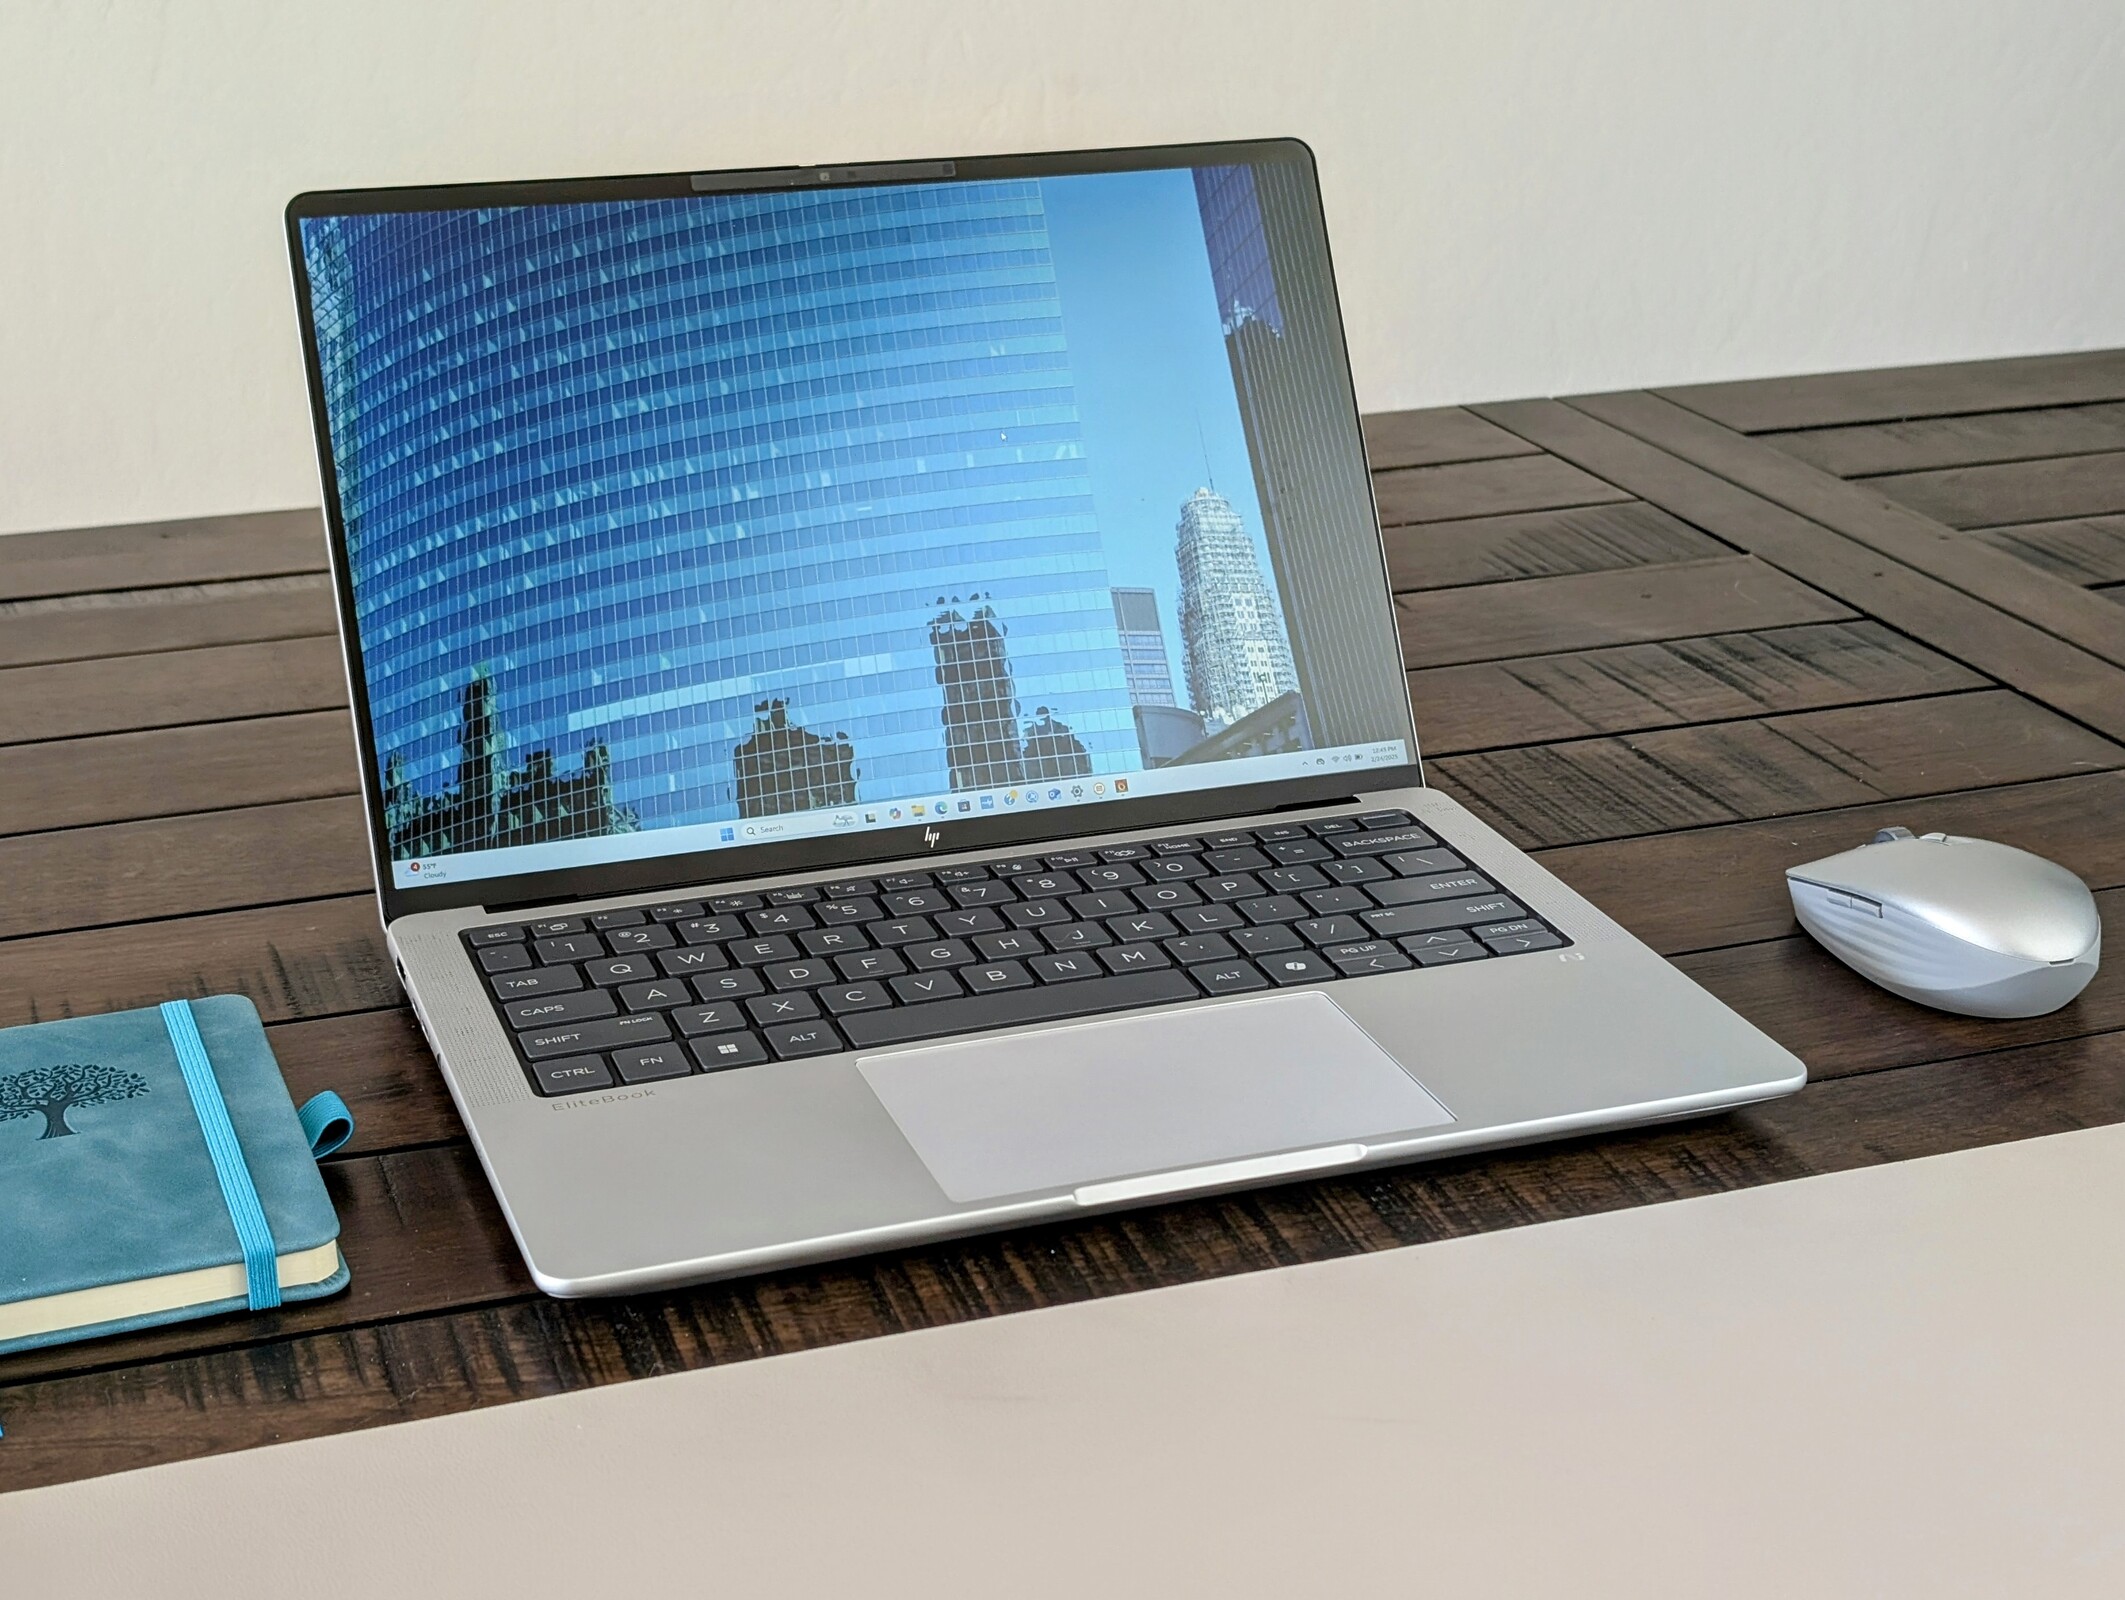
HP EliteBook X G1a 14 AI review: Supercharged business laptop with AMD Ryzen AI 9 HX
Ryzen AI 9 HX PRO 375 debut.
The AMD Zen 5 CPU makes the EliteBook X G1a 14 AI a powerhouse of a laptop especially for a business subnotebook without needing to sacrifice battery life or ergonomics. However, weight can be a bit heavy for a 14-inch machine while display options are limited to sRGB and 60 Hz.Allen Ngo 👁 Published 🇫🇷 🇪🇸 ...
Verdict — Prioritizes Performance Over Other Features
The AMD Ryzen AI 9 HX PRO 375 CPU helps to distinguish the EliteBook X G1a 14 AI from other 14-inch business laptops. Performance is very fast for the size and category to be a worthwhile investment for users or content creators who want more power than what the typical U-series subnotebook can provide. The comfortable keys and respectable battery life make the system better than expected for travelers as well when considering its speedy HX-series processor.
While the system is faster than it looks, it's also a bit heavier than it looks as well. Most U-series alternatives like the Lenovo ThinkPad X1 Carbon Gen 13 or Asus ExpertBook P5 are noticeably lighter and with more display options than the EliteBook X G1a 14 AI. The lack of WAN might detract certain users who rely on the feature while content creators may want to consider the OLED panel for P3 colors and the higher refresh rate. It's also a bummer that the standard limited warranty is just one year instead of three years despite the starting price of over $2000 and the fact that the EliteBook X is a higher-end business machine.
Pros
Cons
Price and Availability
HP is now shipping the EliteBook X G1a 14 starting at $2100 for the Ryzen AI 7 1200p IPS configuration up to $2750 for the Ryzen AI 9 HX 1880p OLED configuration. Alternatively, Amazon has select SKUs starting at $2100.
Potential Competitors in Comparison
Image | Model / Review | Price | Weight | Height | Display |
|---|---|---|---|---|---|
1. 88.7%  | HP EliteBook X G1a 14 AI AMD Ryzen AI 9 HX PRO 375 ⎘ AMD Radeon 890M ⎘ 32 GB Memory, 1024 GB SSD | Amazon: List Price: 2200 USD | 1.5 kg | 13.2 mm | 14.00" 1920x1200 162 PPI IPS |
2. 88.4% v7 (old)  | HP EliteBook 1040 G10 818N7EA Intel Core i5-1335U ⎘ Intel Iris Xe Graphics G7 80EUs ⎘ 16 GB Memory, 512 GB SSD | Amazon: 1. $939.99 HP EliteBook 1040 G11 Busine... 2. $378.89 HP EliteBook 840 G10 (Latest... 3. $340.00 HP EliteBook x360 1040 G8 14... List Price: 1669€ | 1.3 kg | 17.9 mm | 14.00" 1920x1200 162 PPI IPS |
3. 89.9%  | Lenovo ThinkPad X1 Carbon Gen 13 21NS0010GE Intel Core Ultra 7 258V ⎘ Intel Arc Graphics 140V ⎘ 32 GB Memory, 1024 GB SSD | Amazon: 1. $1,499.00 Lenovo Gen 13 ThinkPad X1 Ca... 2. $1,649.99 Lenovo ThinkPad X1 Carbon Ge... 3. $2,099.99 Lenovo ThinkPad X1 Carbon Ge... List Price: 2700 Euro | 982 g | 16 mm | 14.00" 2880x1800 243 PPI OLED |
4. 87.7%  | Dell Latitude 7450 2-in-1 Intel Core Ultra 7 165U ⎘ Intel Graphics 4-Core iGPU (Meteor / Arrow Lake) ⎘ 32 GB Memory, 512 GB SSD | Amazon: $1,019.95 List Price: 2279 USD | 1.5 kg | 17.1 mm | 14.00" 1920x1200 162 PPI IPS |
5. 85.9% 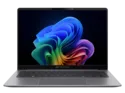 | Asus ExpertBook P5 P5405-NZ0102X Intel Core Ultra 7 258V ⎘ Intel Arc Graphics 140V ⎘ 32 GB Memory, 1024 GB SSD | Amazon: 1. $138.75 GENTERUN Compatible for Asus... 2. $1,299.00 [2024] ASUS ExpertBook P5 P5... 3. $1,329.41 EXCaliberPC [2024] ASUS Expe... List Price: 1500€ | 1.3 kg | 16.5 mm | 14.00" 2560x1600 216 PPI IPS LED |
6. 83.5%  | Acer Swift 14 AI SF14-51-58TU Intel Core Ultra 5 226V ⎘ Intel Arc Graphics 130V ⎘ 16 GB Memory, 512 GB SSD | Amazon: List Price: 1200 EUR | 1.3 kg | 16 mm | 14.00" 2880x1800 243 PPI OLED |
Table of Contents
The high-end EliteBook X G1a 14 is a direct successor to the EliteBook 1040 series as HP is changing up the naming convention moving forward to be easier for users to understand. In this case, the 'X' replaces the '1000', the '14' replaces the '40' to represent inches, the 'a' represents AMD, and the 'G1' represents the first generation with the new name.
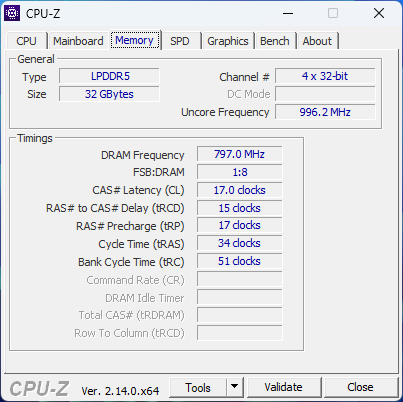
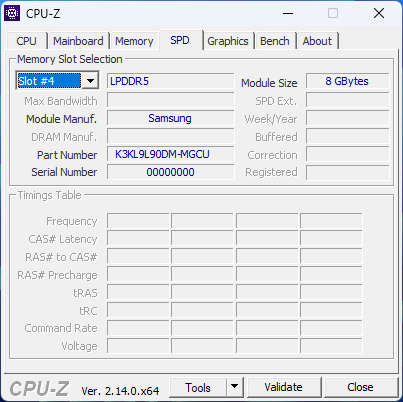
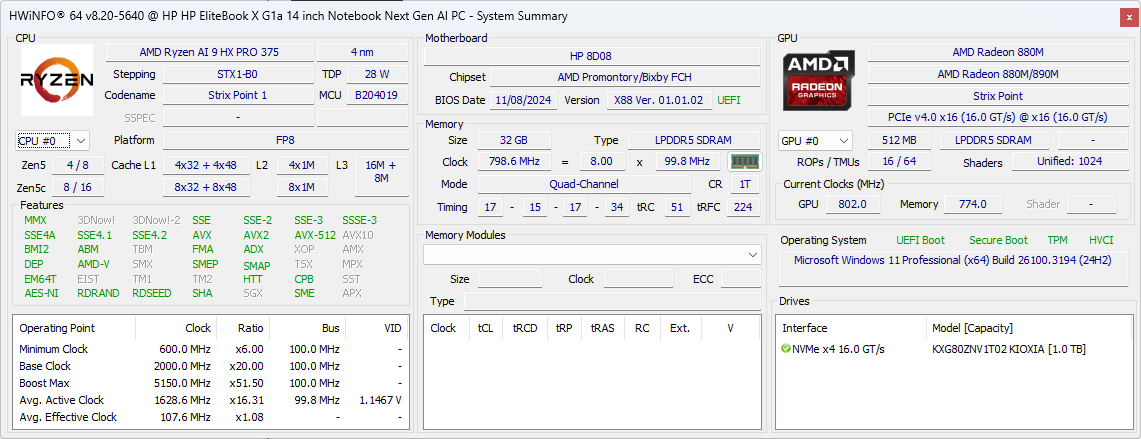
Our test unit is a middle configuration with the Ryzen AI 9 HX PRO 375, 32 GB LPDDR5x RAM, and 1200p IPS display for approximately $2200 USD. Other configurations are available with the lesser Ryzen AI 7 PRO 360 or pricier 1800p OLED touchscreen. The model is notable for being one of the few 14-inch business laptops with Zen 5 HX-series PRO processor options.
Alternatives in this space include other high-end 14-inch office laptops like the Lenovo ThinkPad X1 Carbon, Dell Latitude 7450 2-in-1, or Asus ExpertBook P5.
(February 25, 2025 update: The OLED panel features 120 Hz and P3 colors while the IPS panel is limited to 60 Hz and sRGB.)
More HP reviews:
Specifications
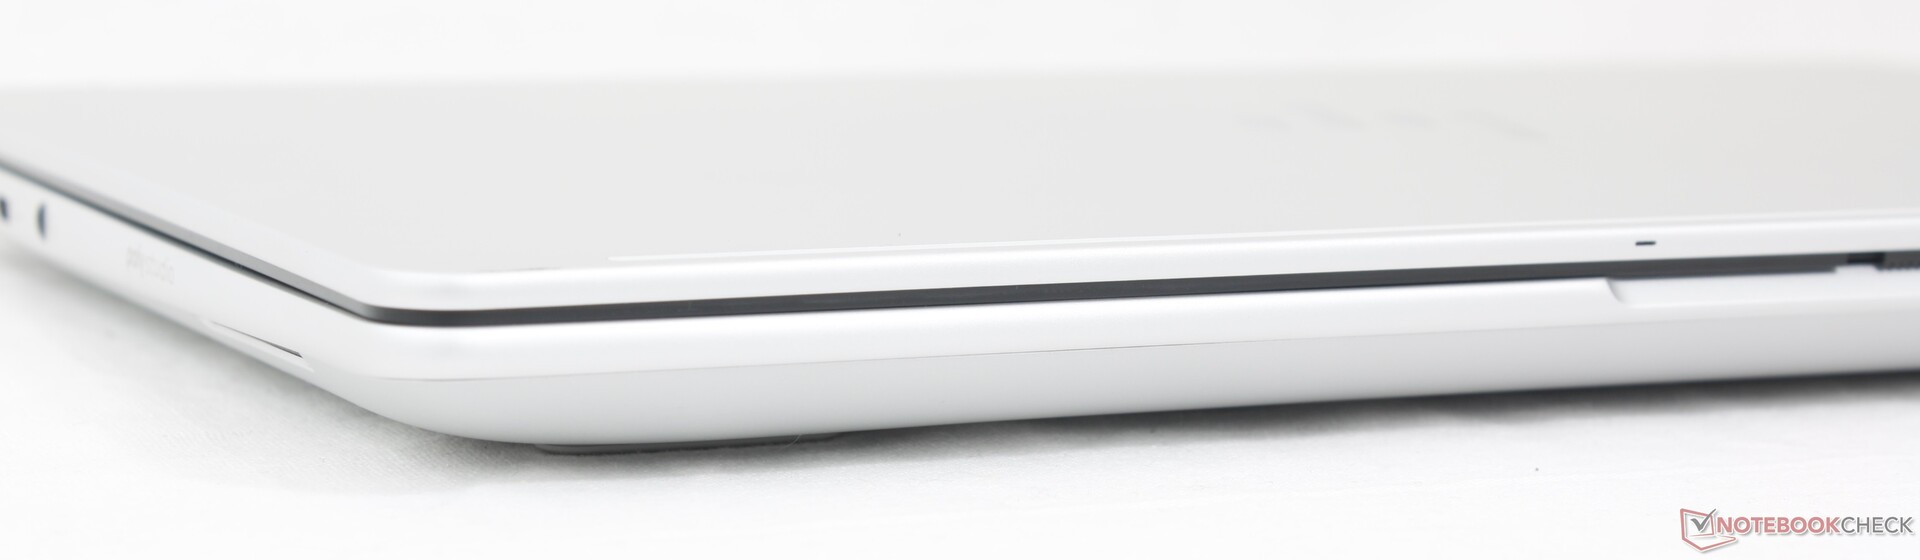
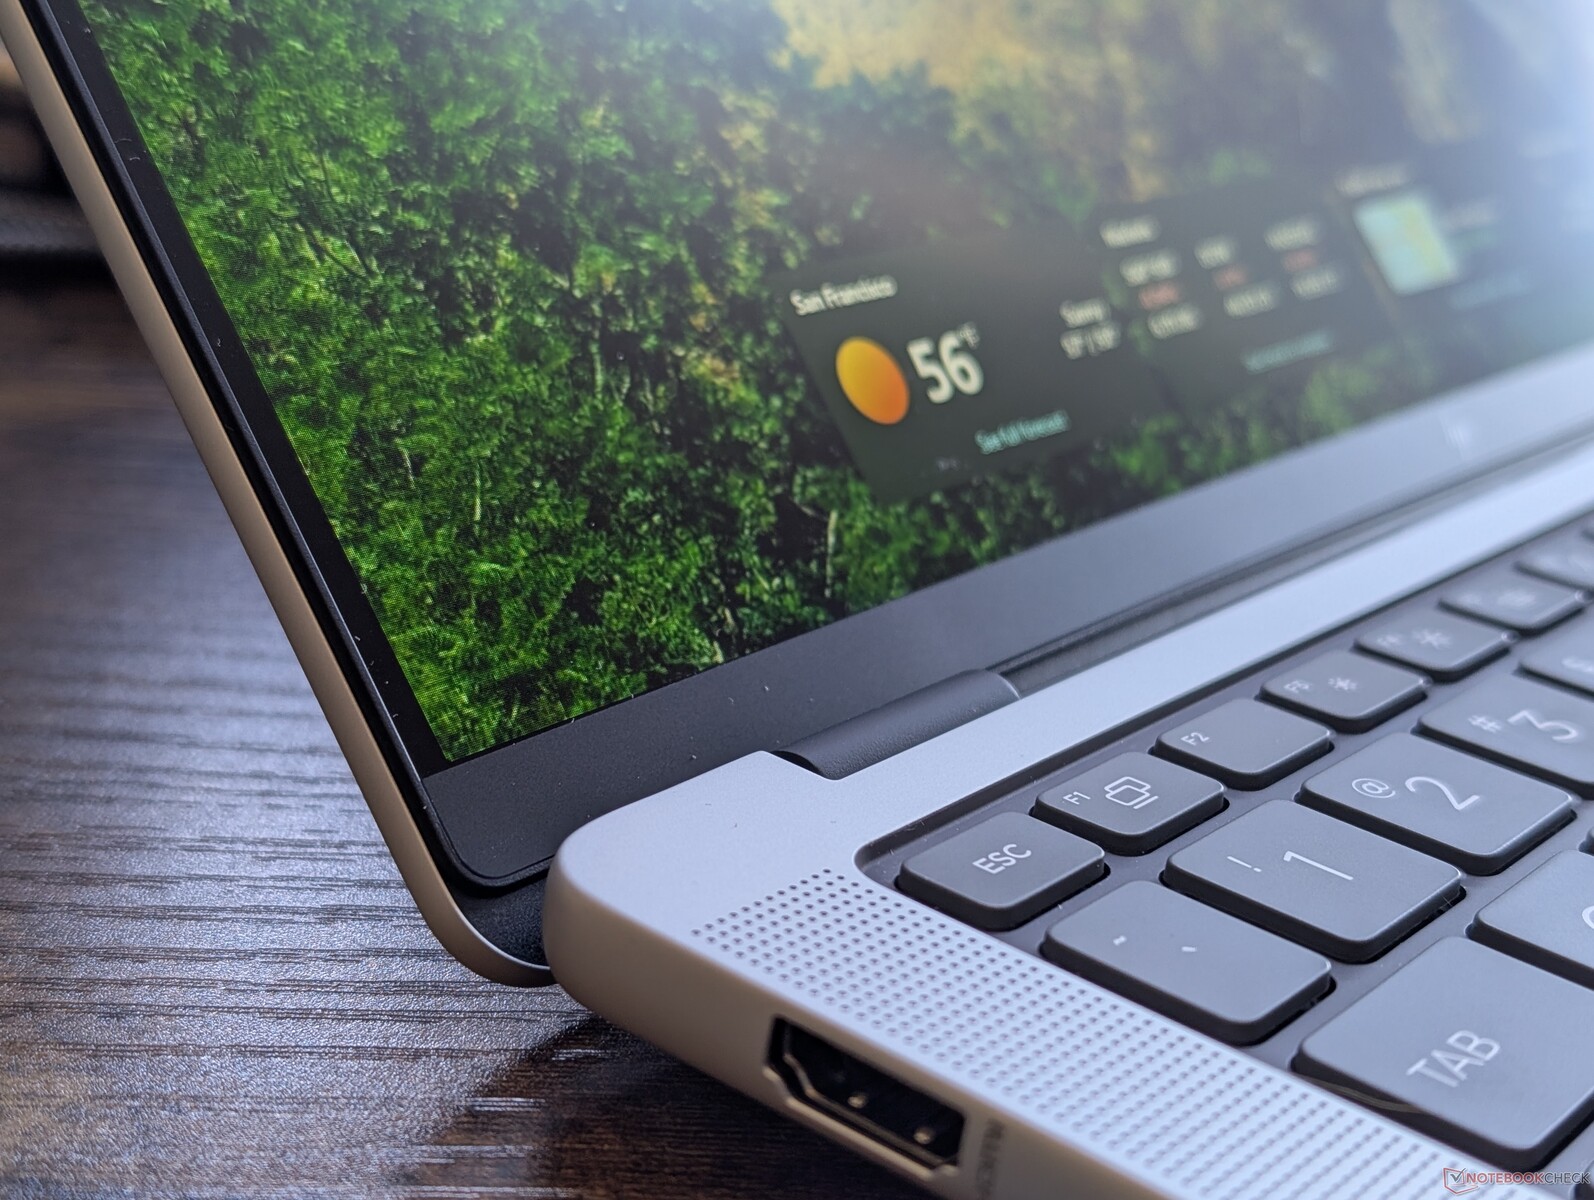
Case — New Name With A Familiar Feel
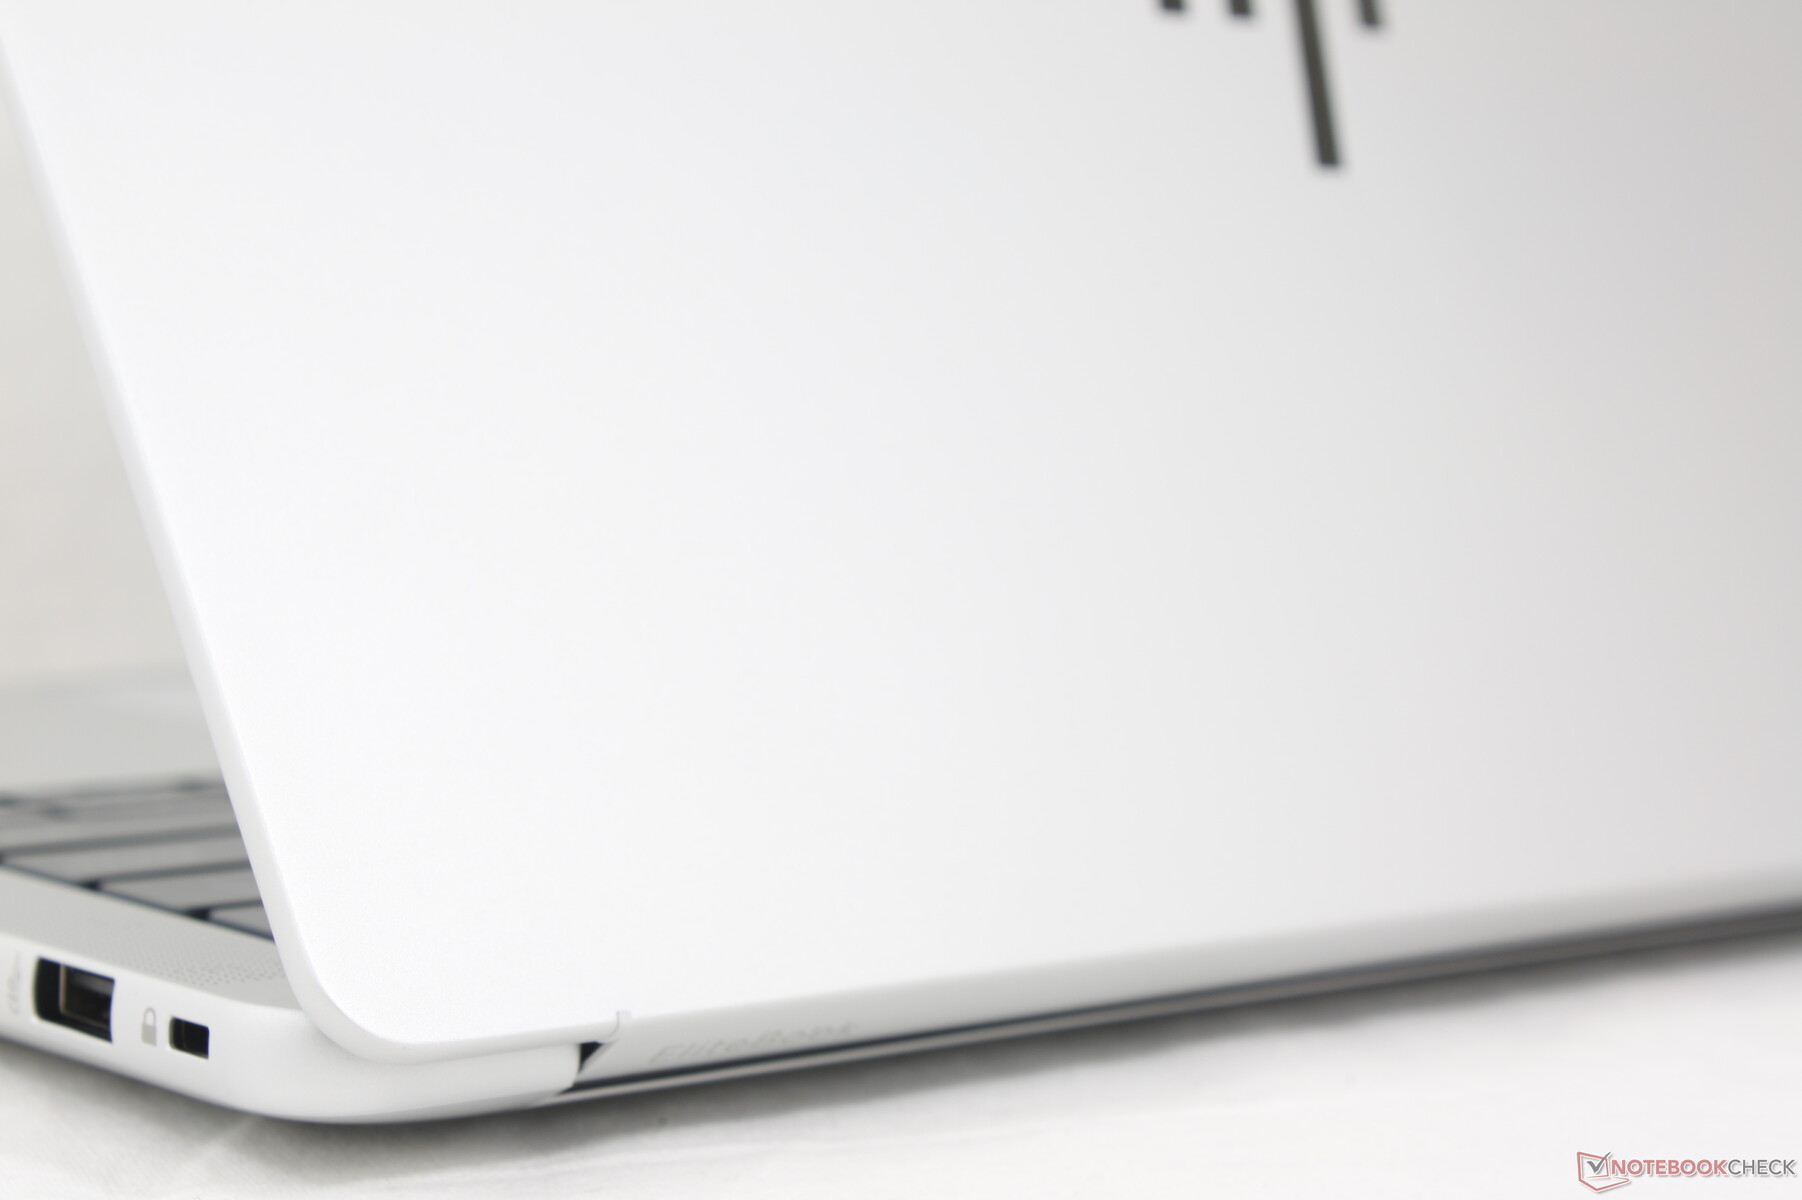
The bright gray aluminum alloy chassis should look recognizable to existing EliteBook owners. It's resistant to twisting and bending even around the display for strong first impressions, but there is still some warping when pressing down the center of the outer lid.
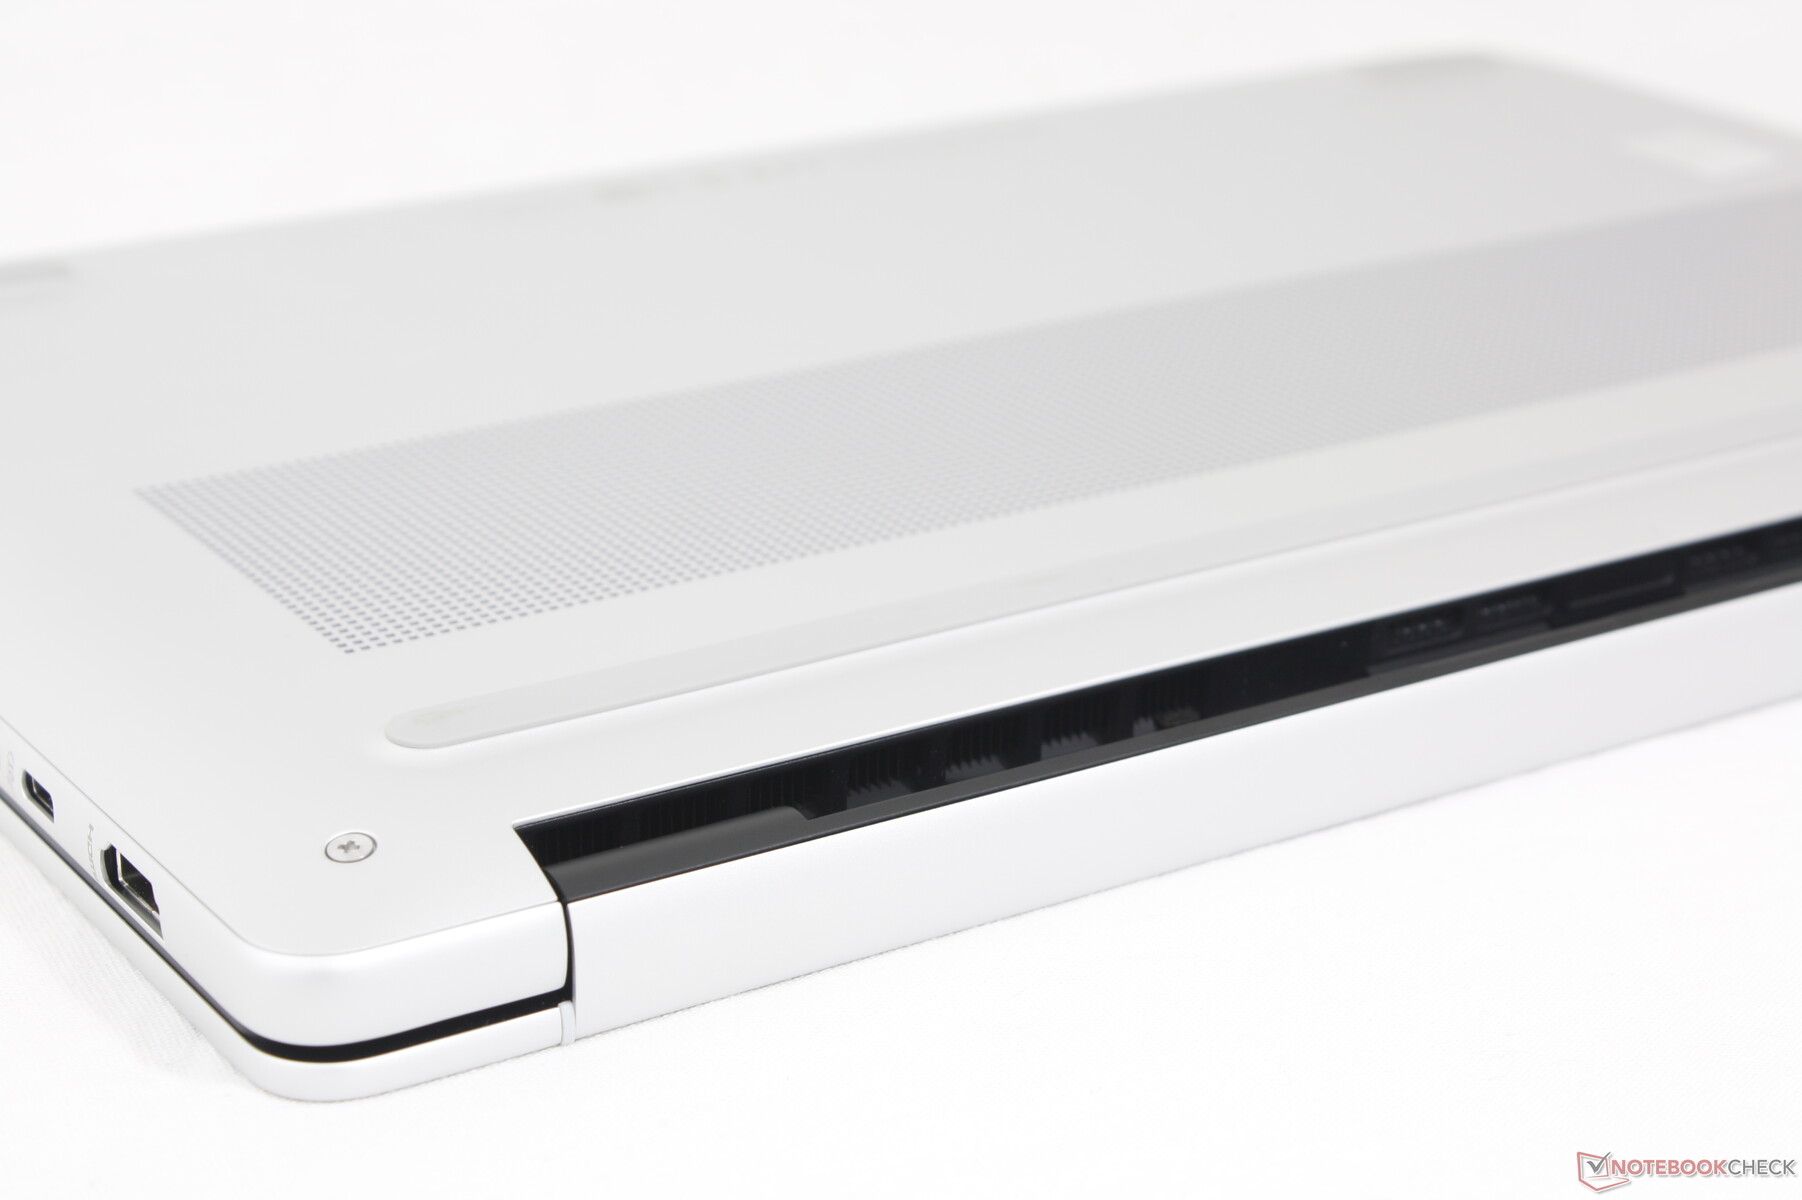
There are several visual differences when compared to the outgoing EliteBook 1040 including the sharper and flatter edges and corners, larger ventilation grilles along the bottom cover, redesigned speaker grilles, and the use of fewer screws for even easier servicing. The small changes add up for a slightly sleeker machine.
The model is smaller and heavier than the outgoing EliteBook 1040 G10 for a denser feel. In fact, this is one of the heavier 14-inch clamshells at over 500 g greater than the competing ThinkPad X1 Carbon Gen 13.
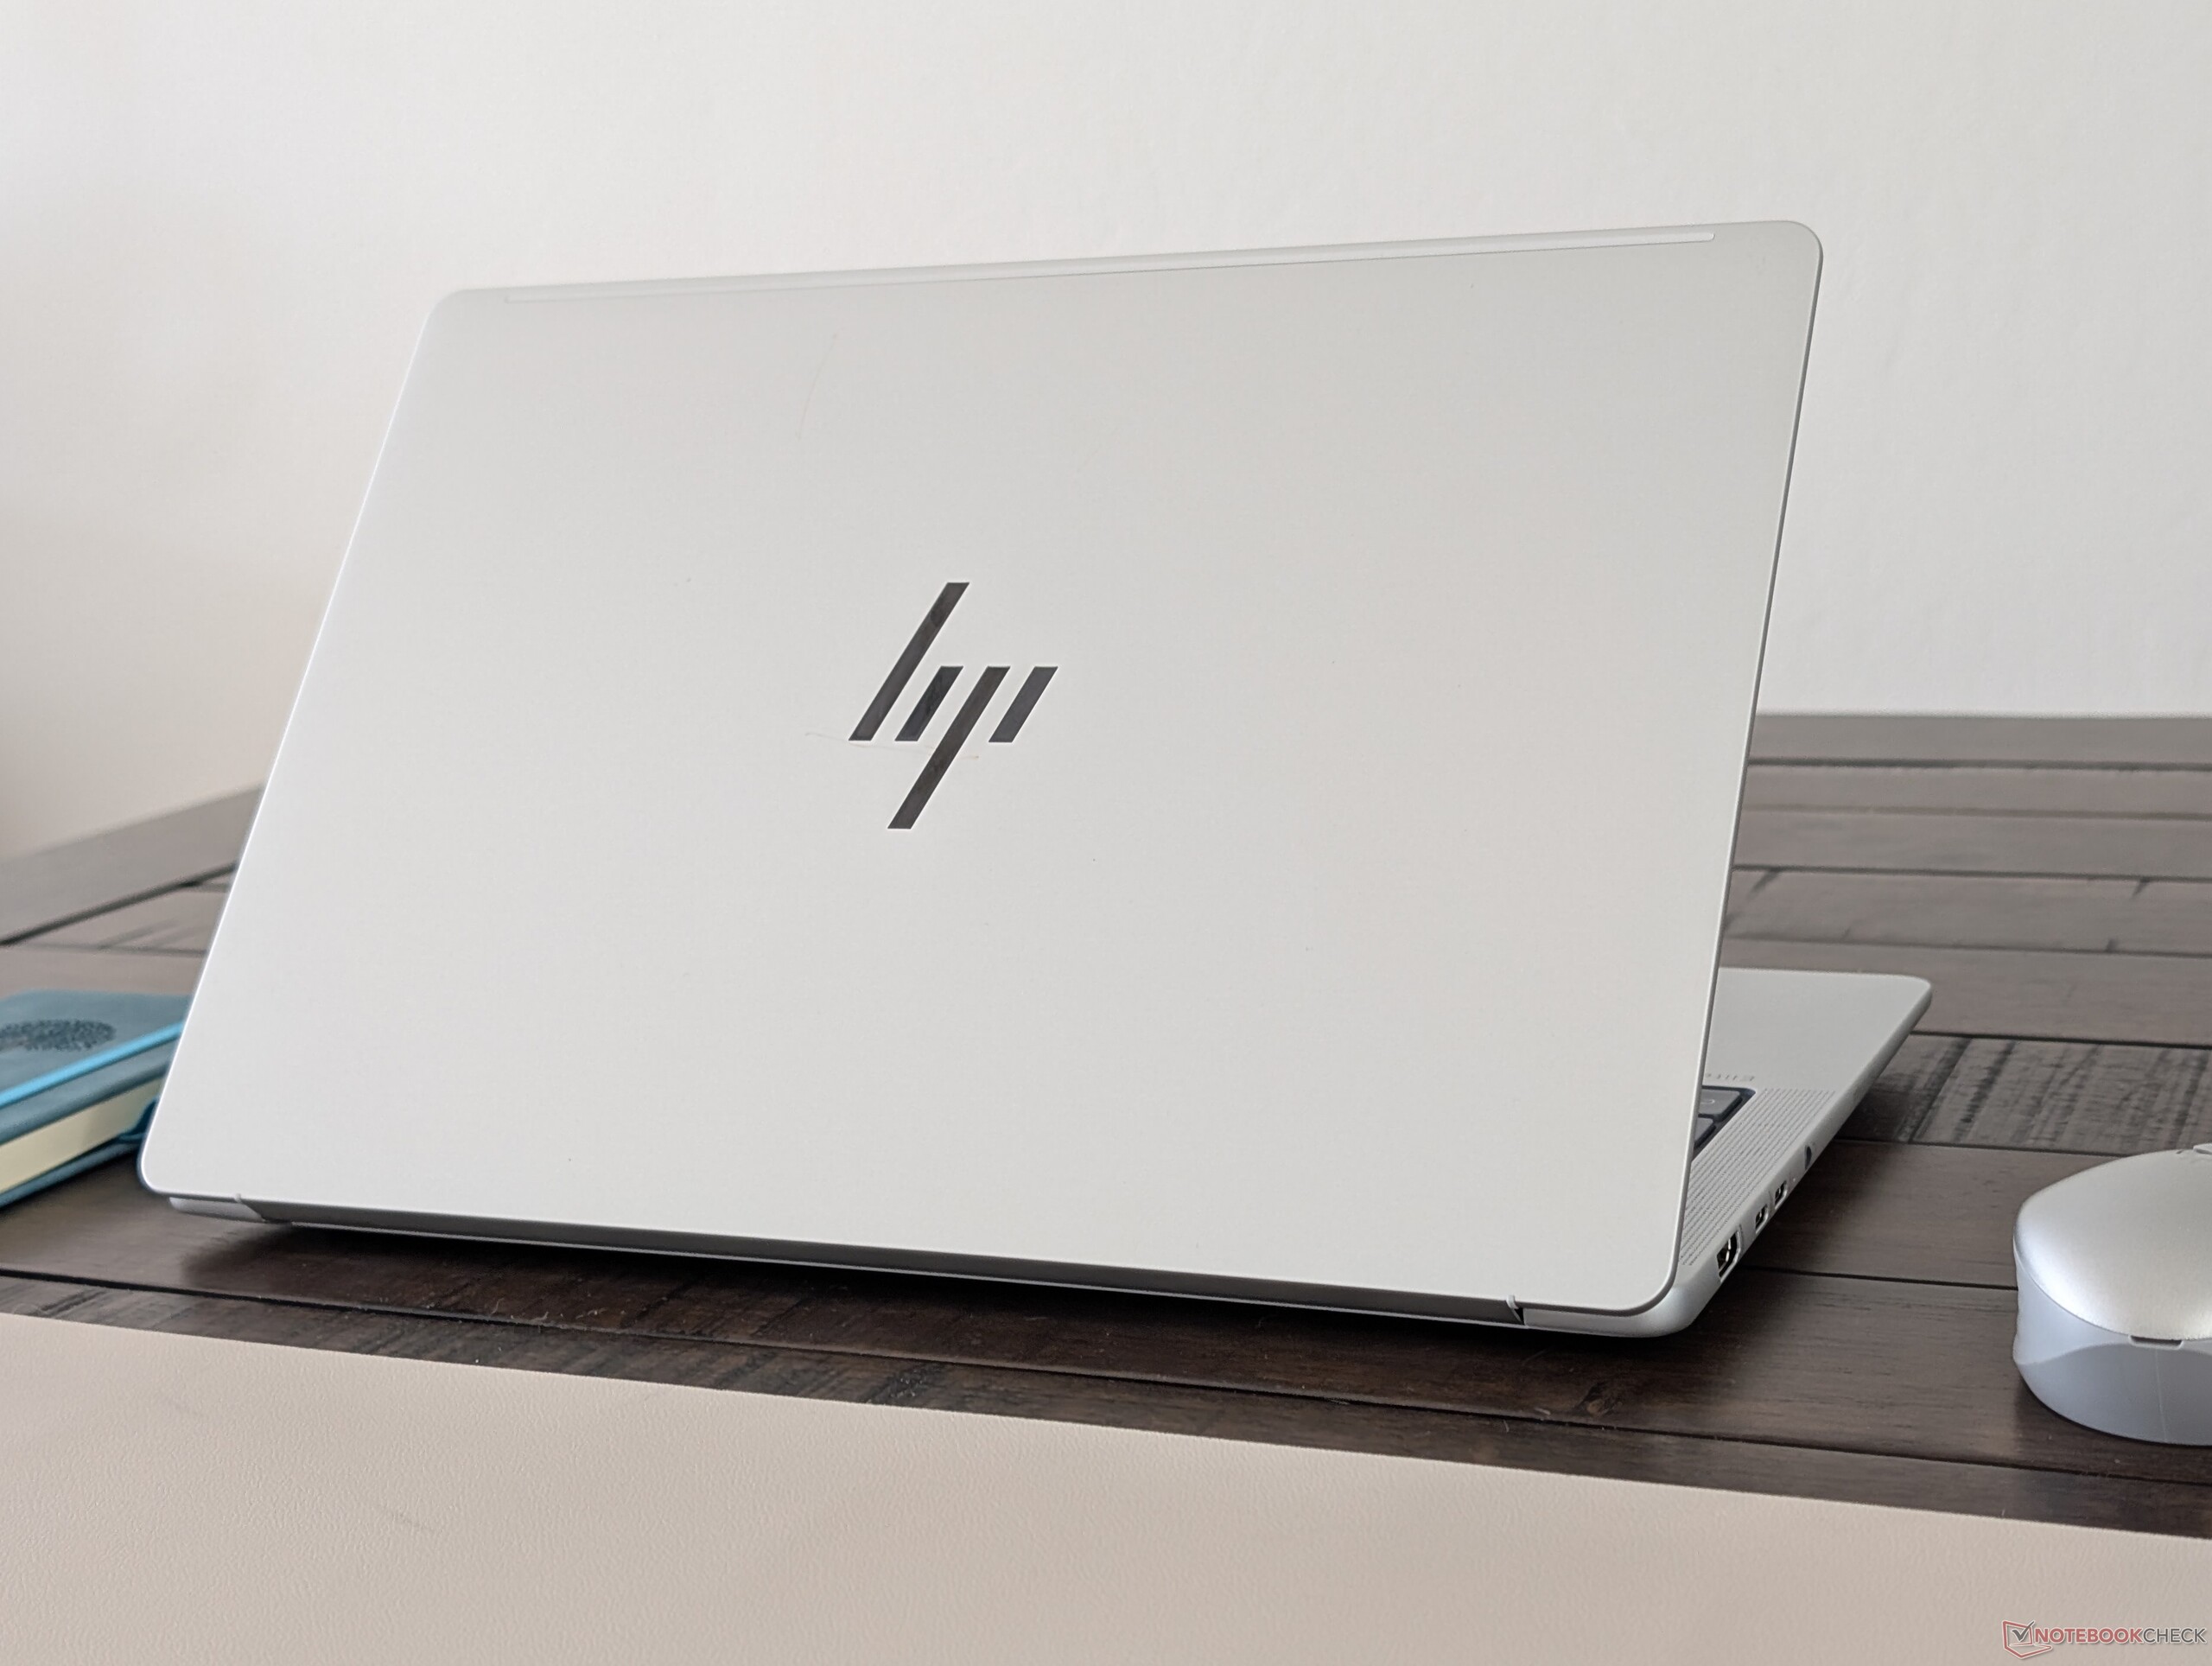
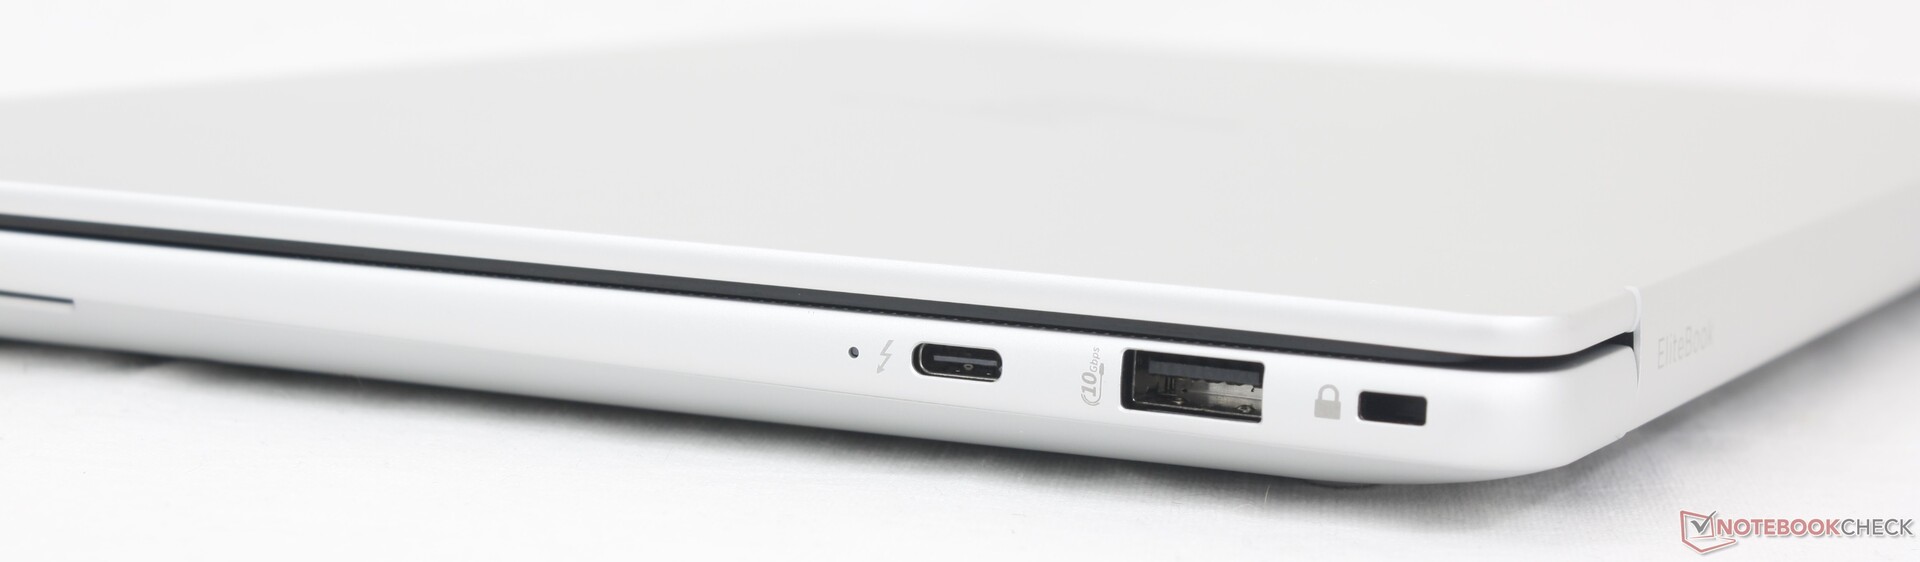
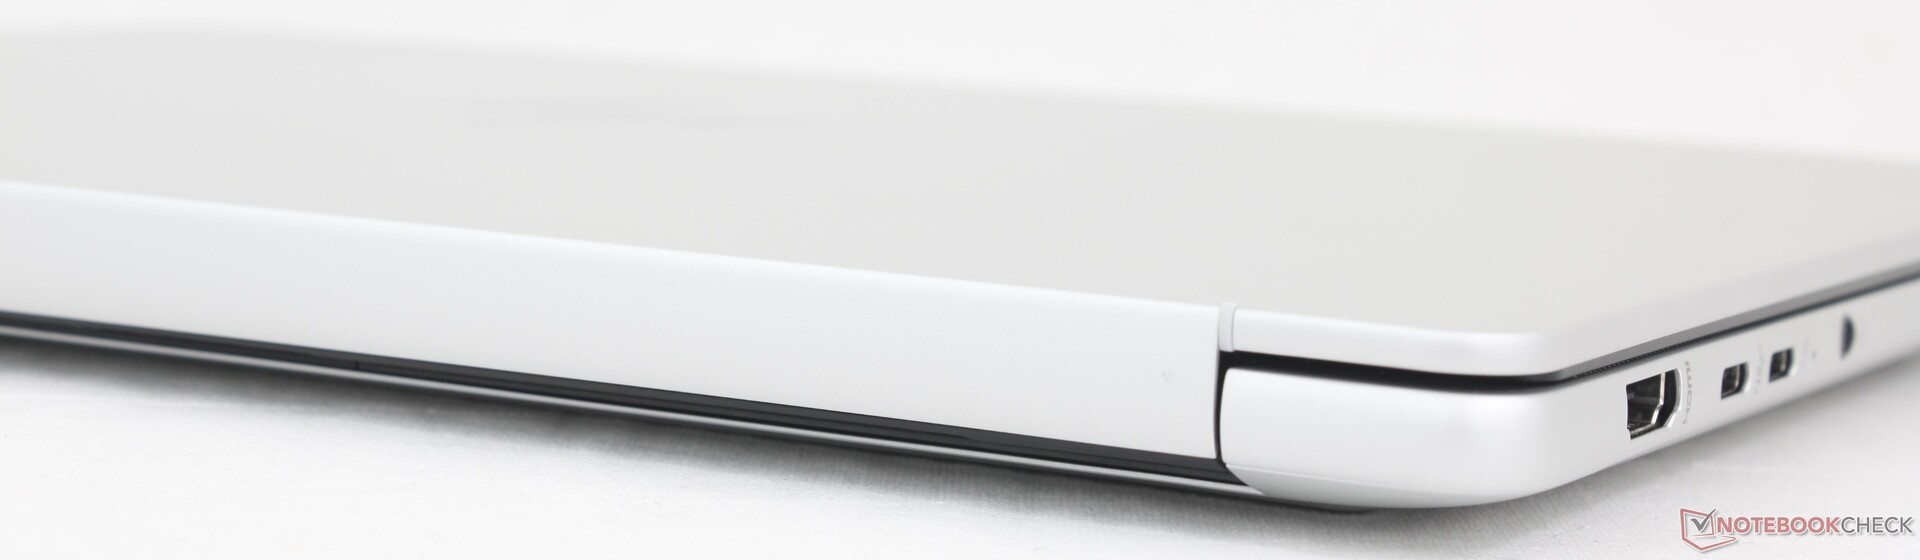
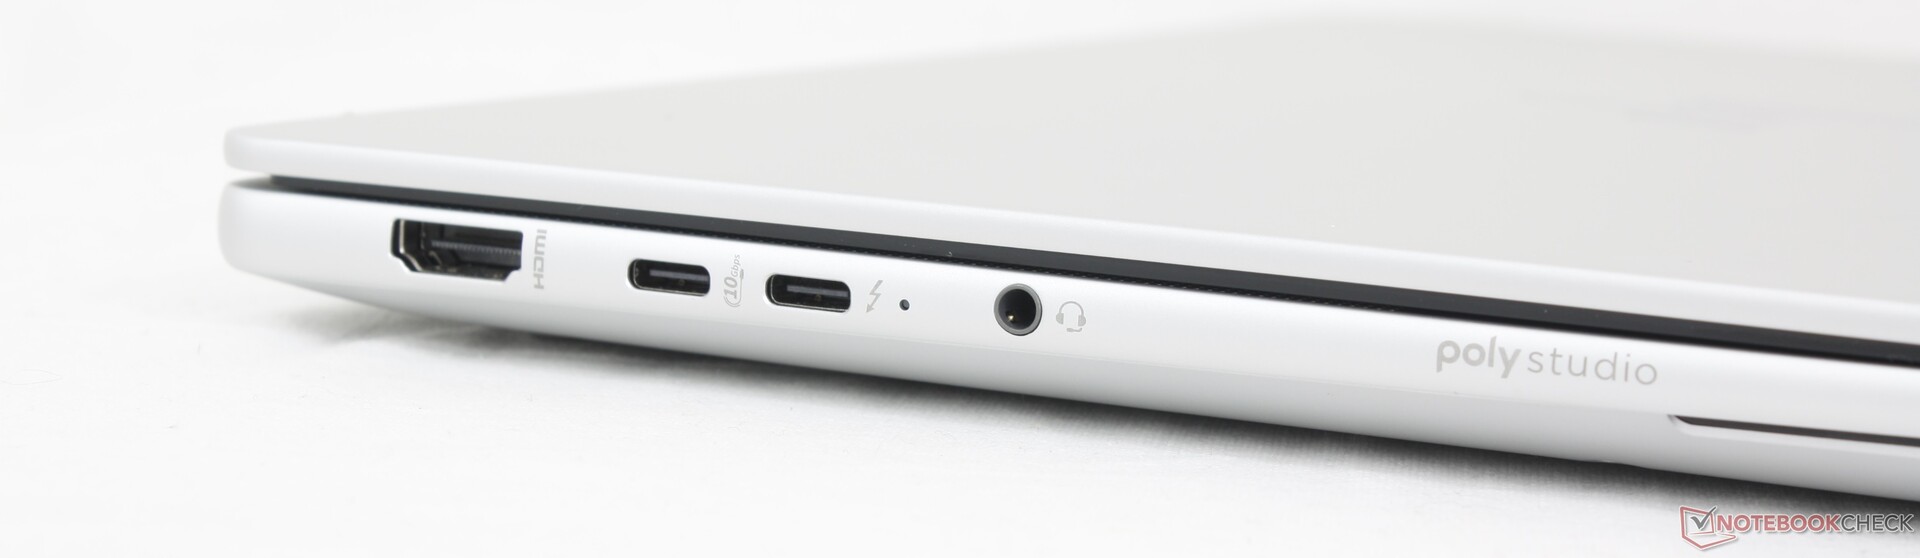
Connectivity
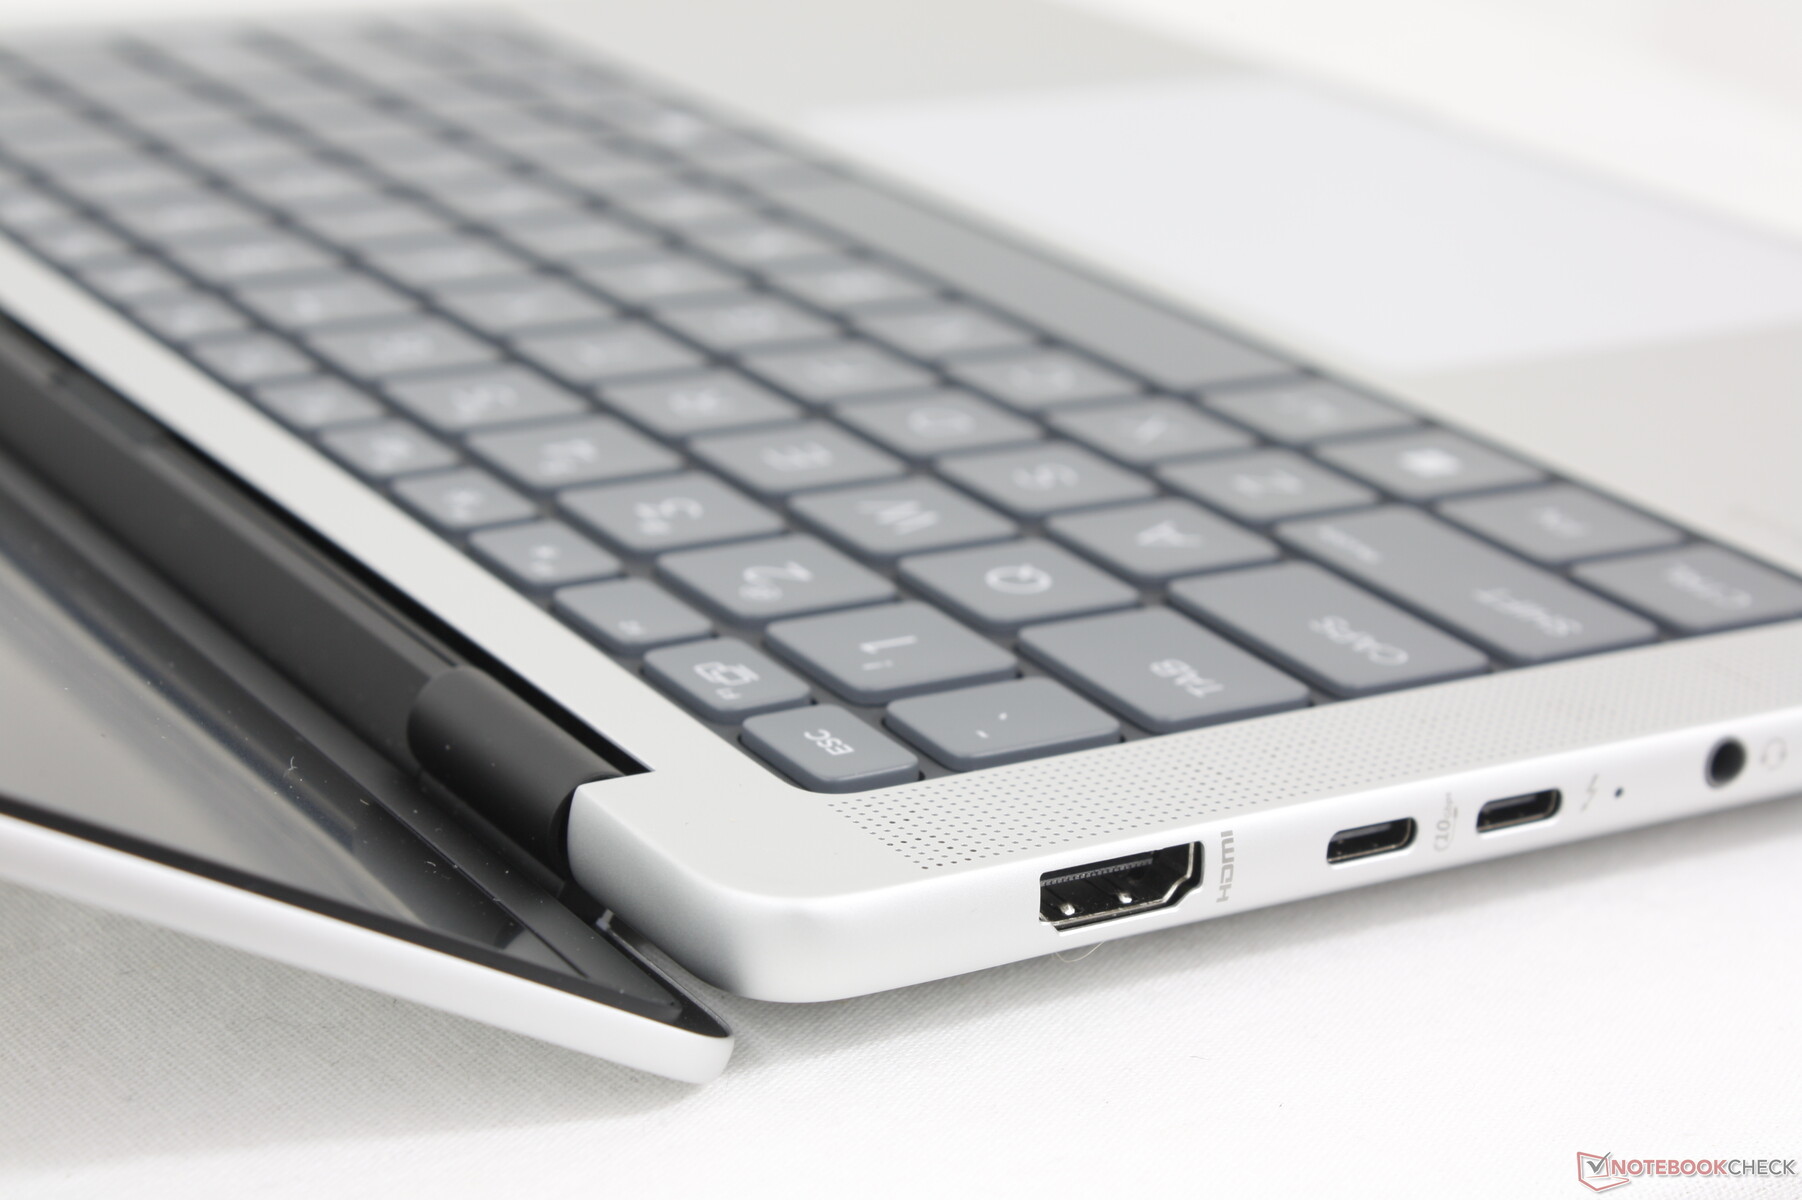
The model swaps out a USB-A port for a USB-C port when compared to the outgoing model. The change allows for charging on either side of the unit whereas the EliteBook 1040 G10 can only be charged along the left edge.
Note that only two of the three USB-C ports support Thunderbolt 4 or 40 Gbps speeds.
Communication
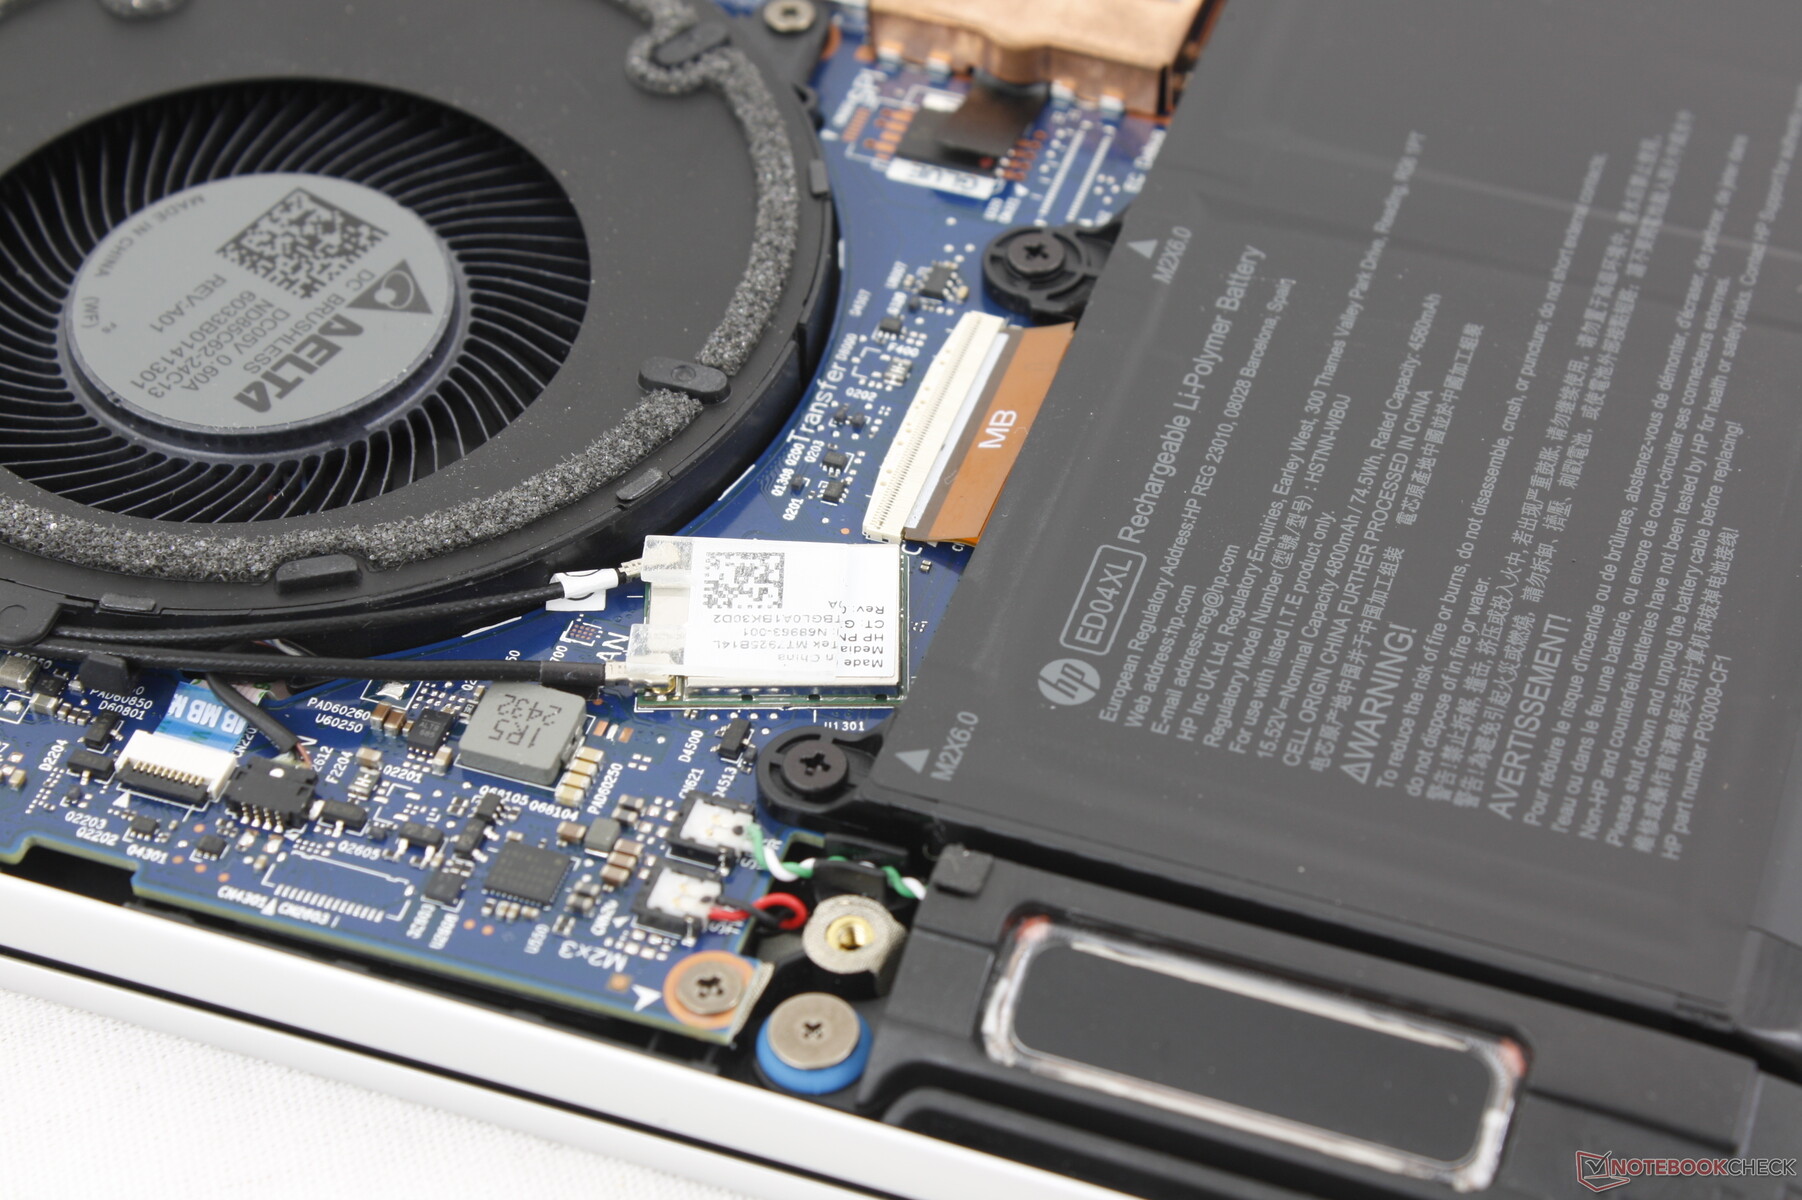
The Mediatek MT7925 comes standard for Wi-Fi 6E, Wi-Fi 7, and Bluetooth 5.4 connectivity.
Webcam
The 5 MP webcam is of lower resolution than the 9 MP sensor on the OmniBook Ultra 14. Image quality is otherwise satisfactory for meetings or video streams. Both IR and a physical shutter come standard.


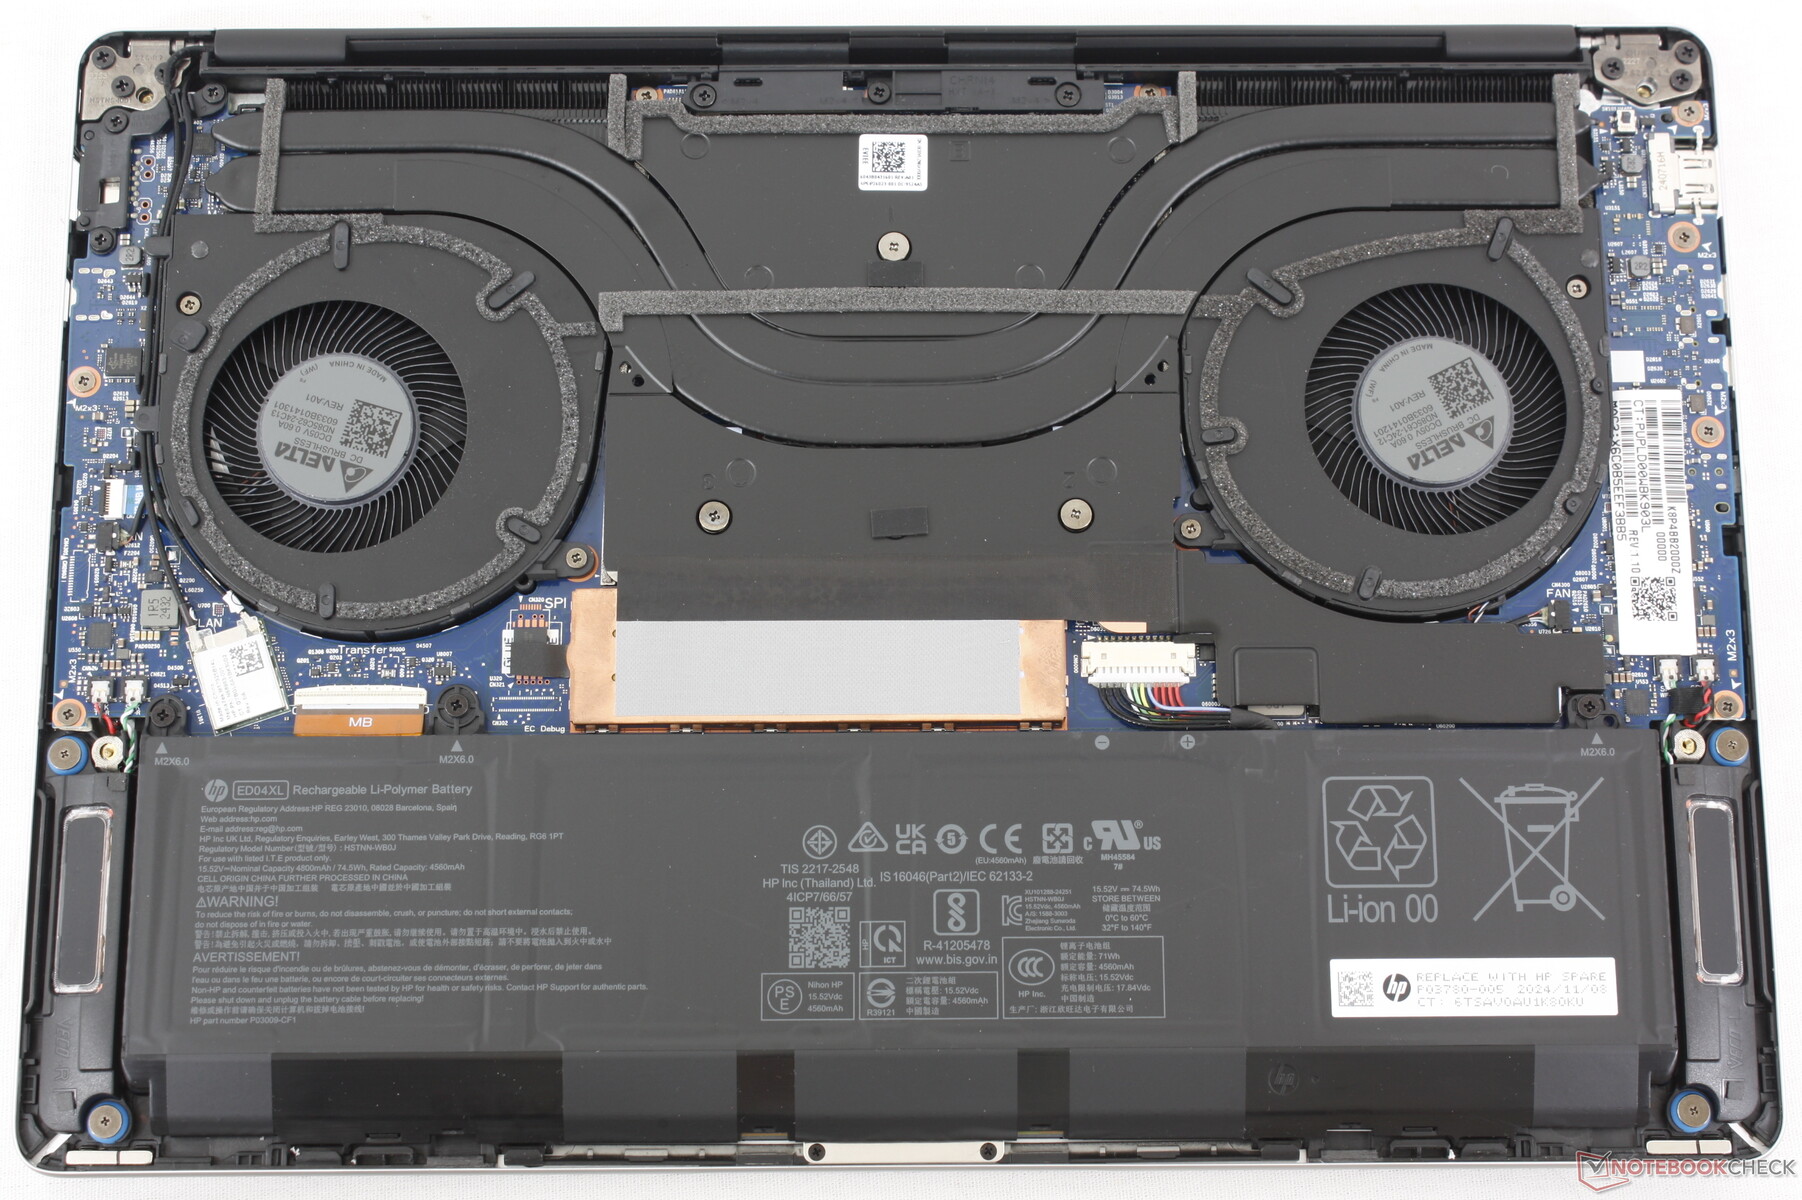
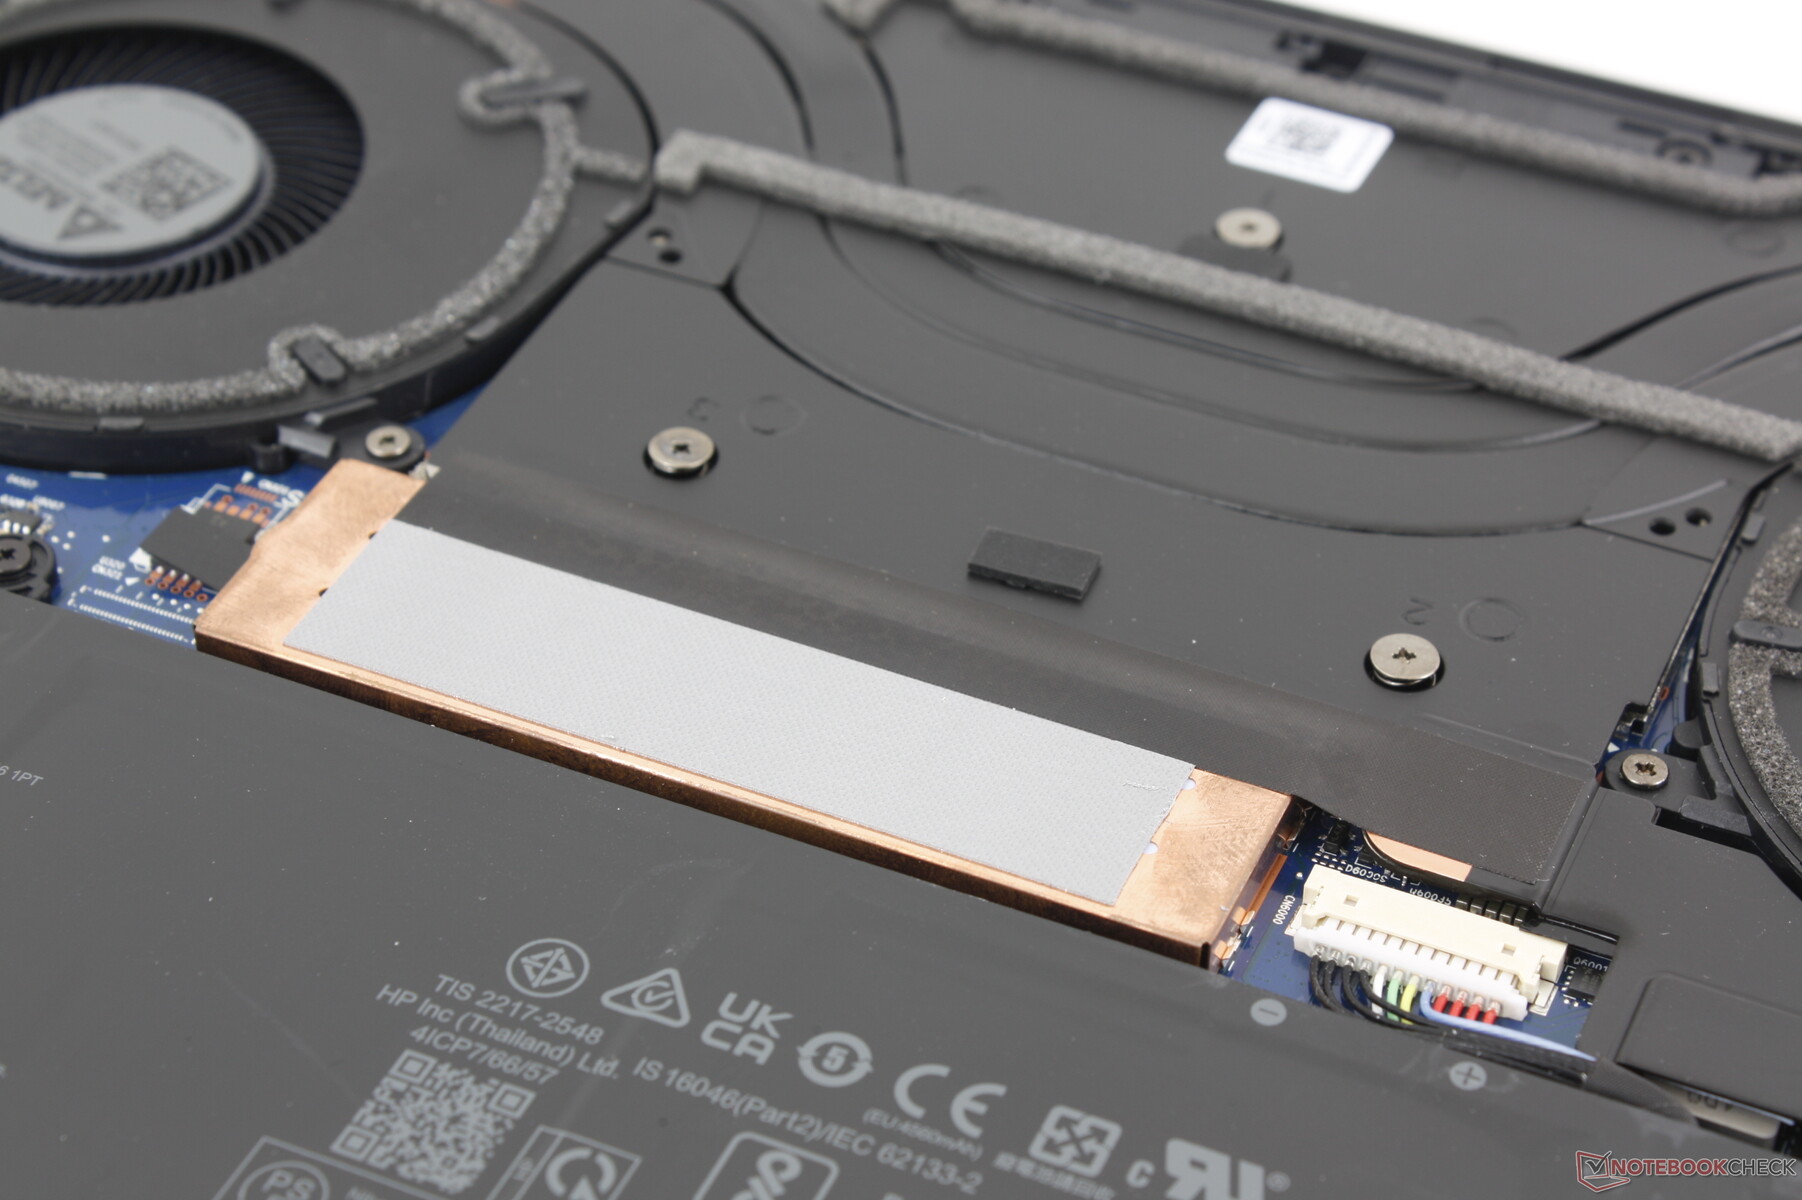
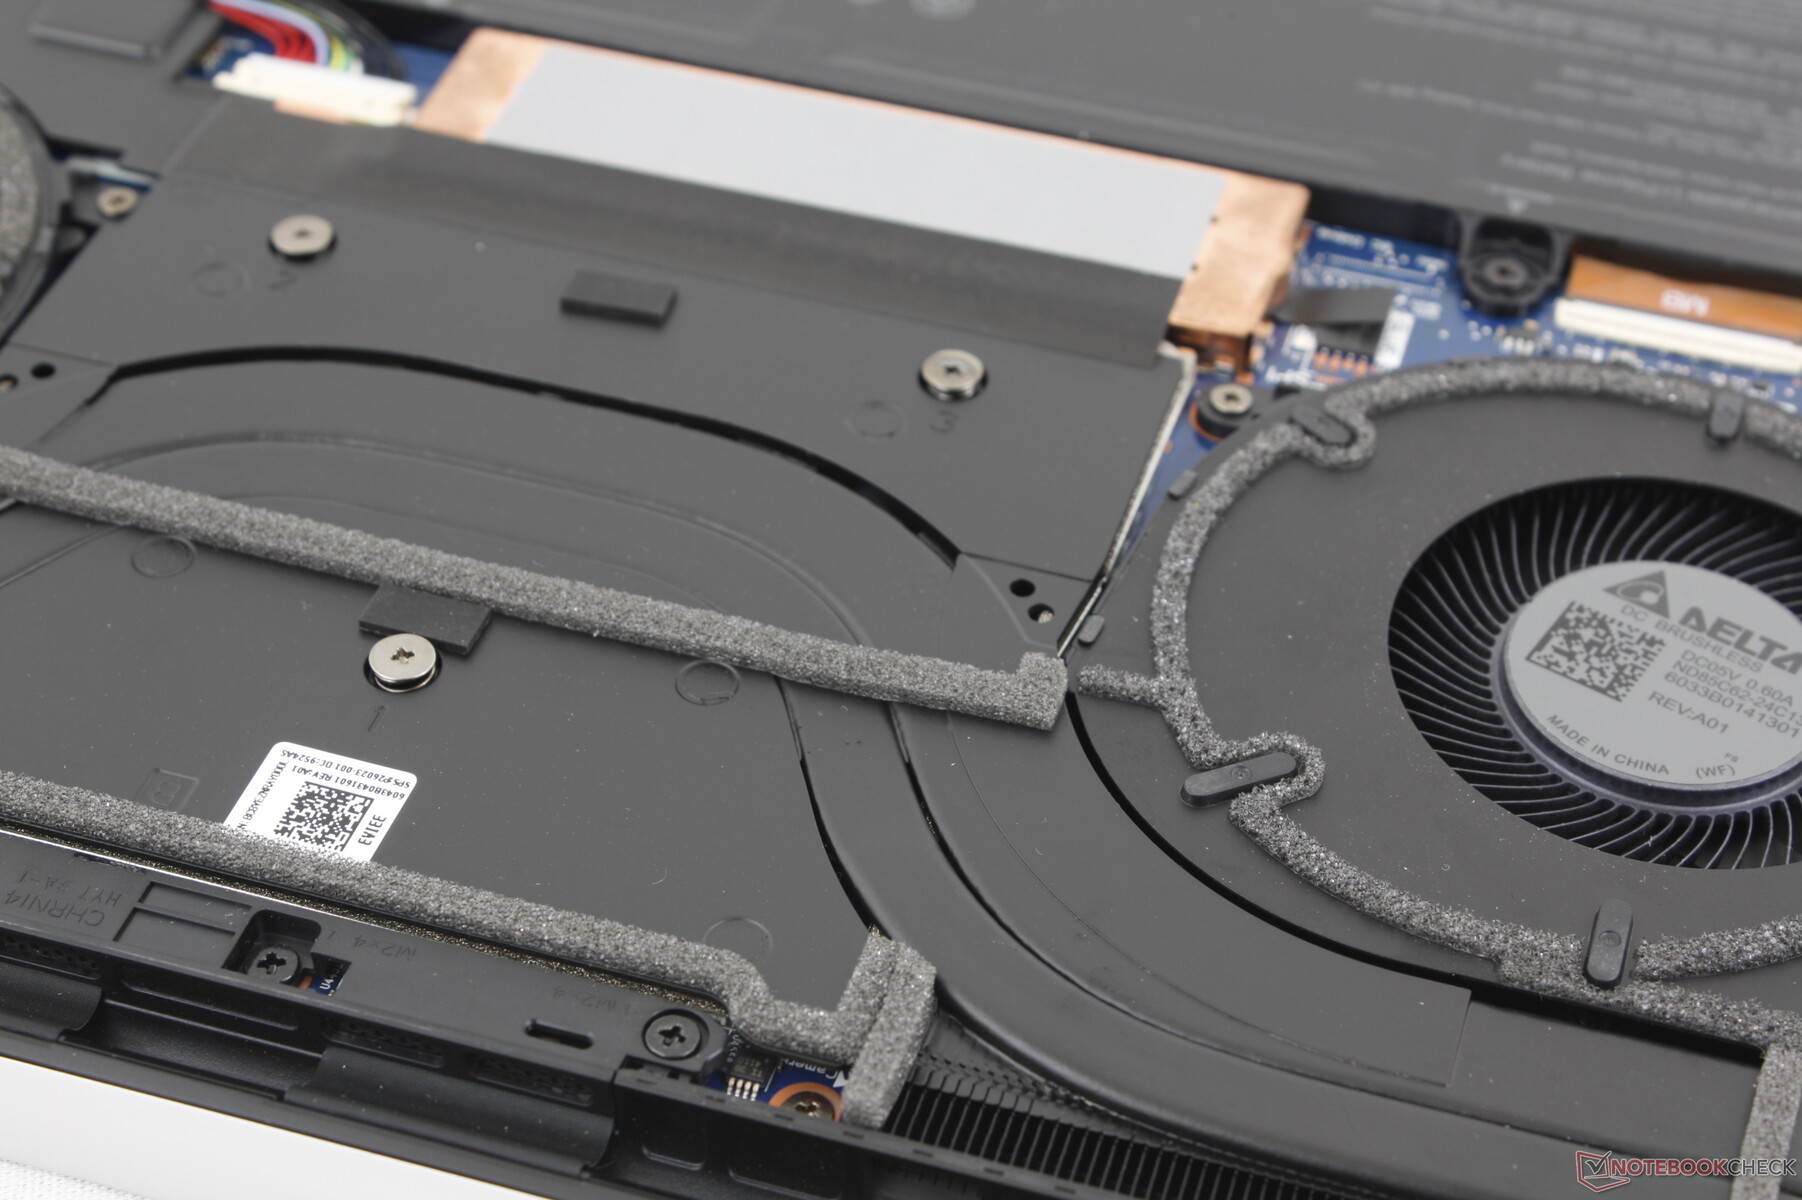
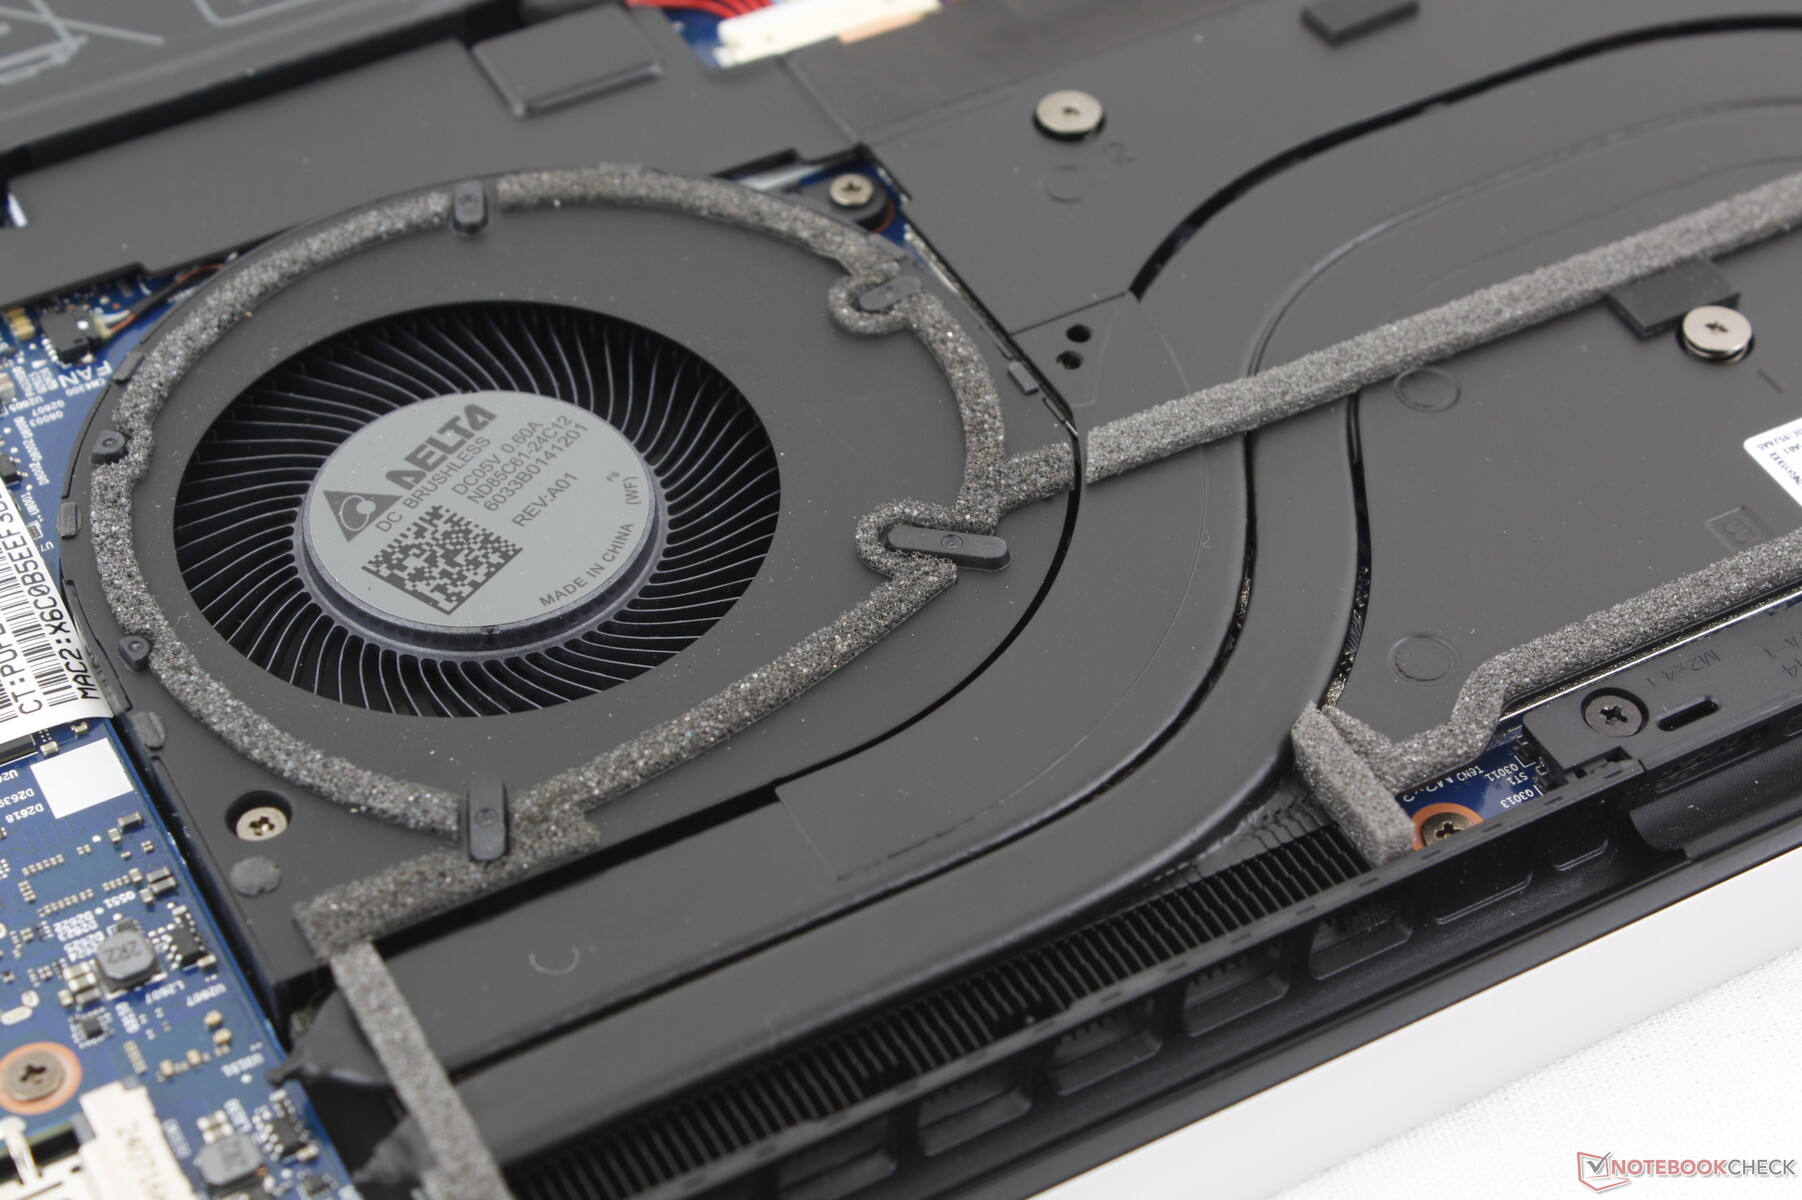
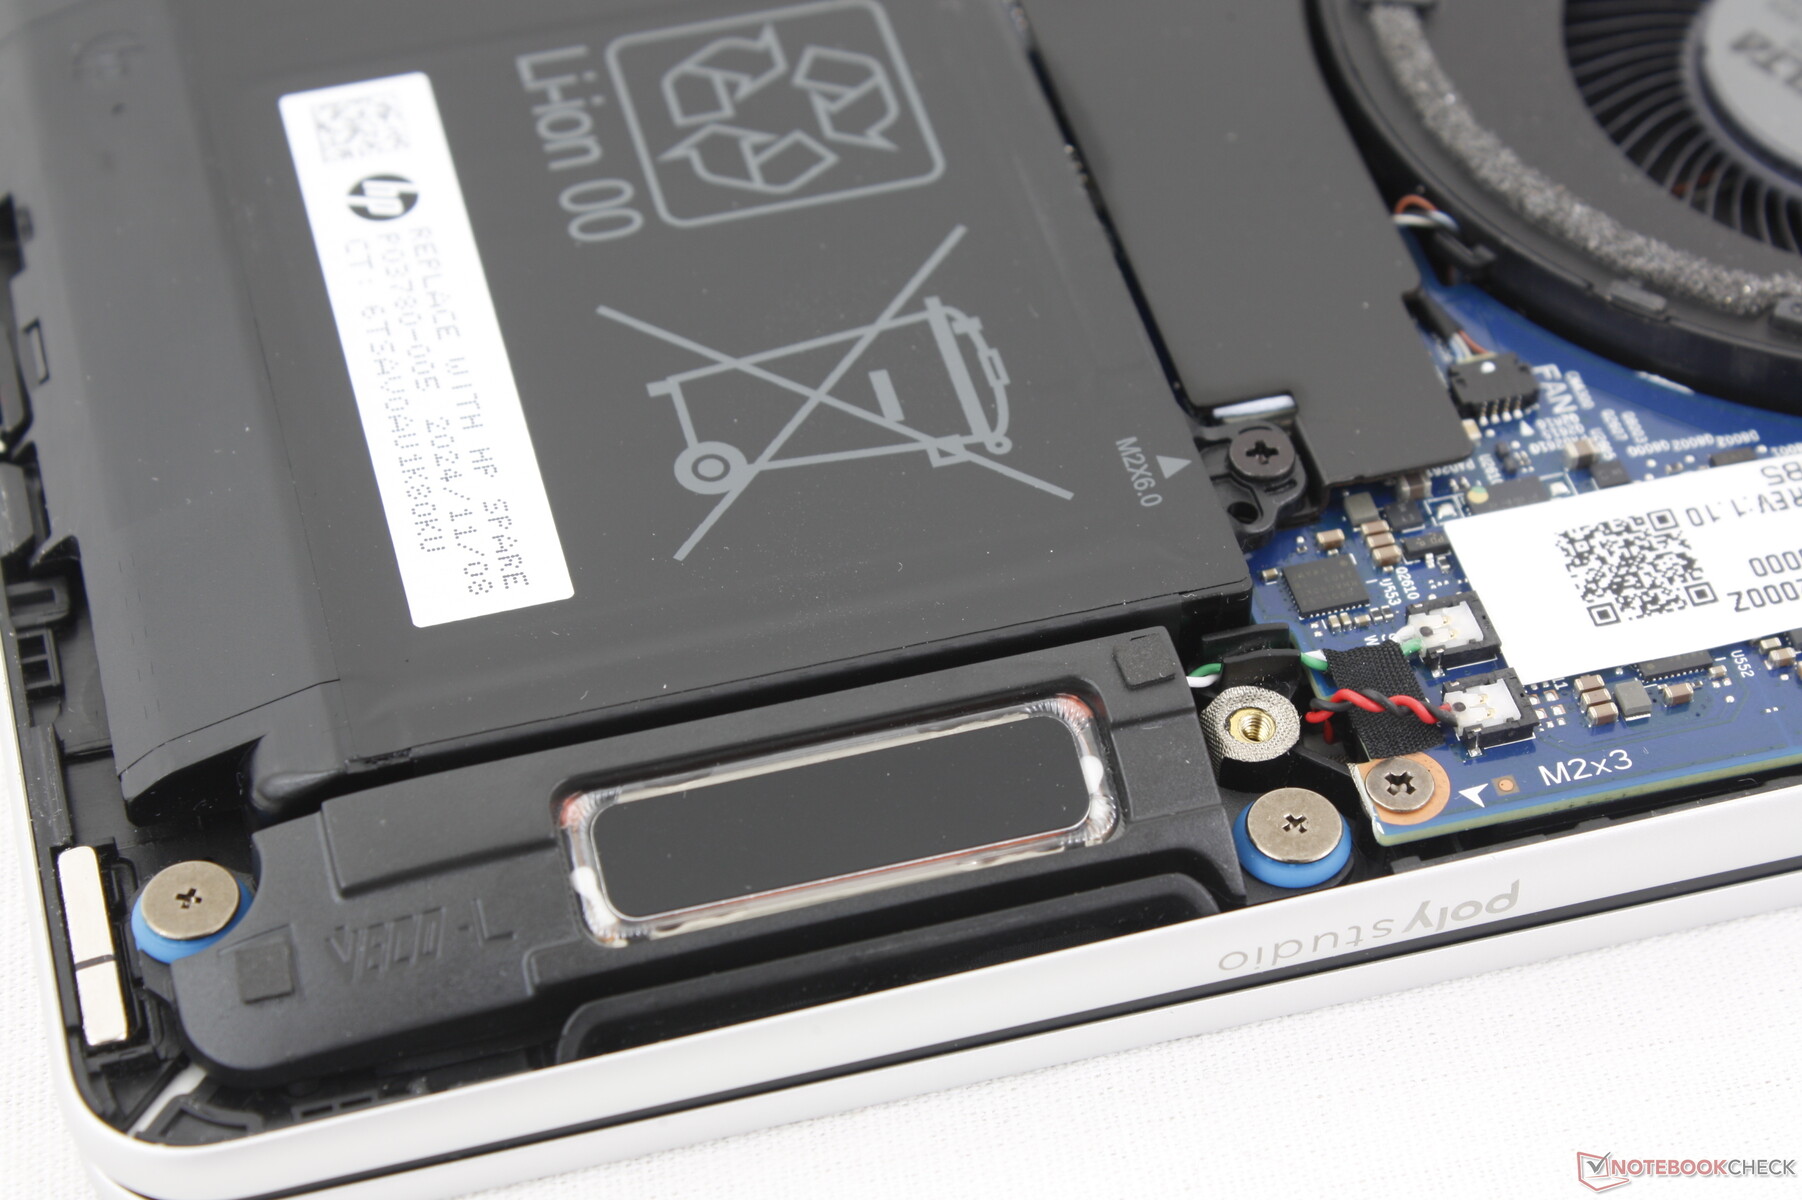
Maintenance
The bottom panel is secured by just four Phillips screws for easy servicing. There isn't much to upgrade once inside as the RAM and WLAN modules are soldered.
Sustainability
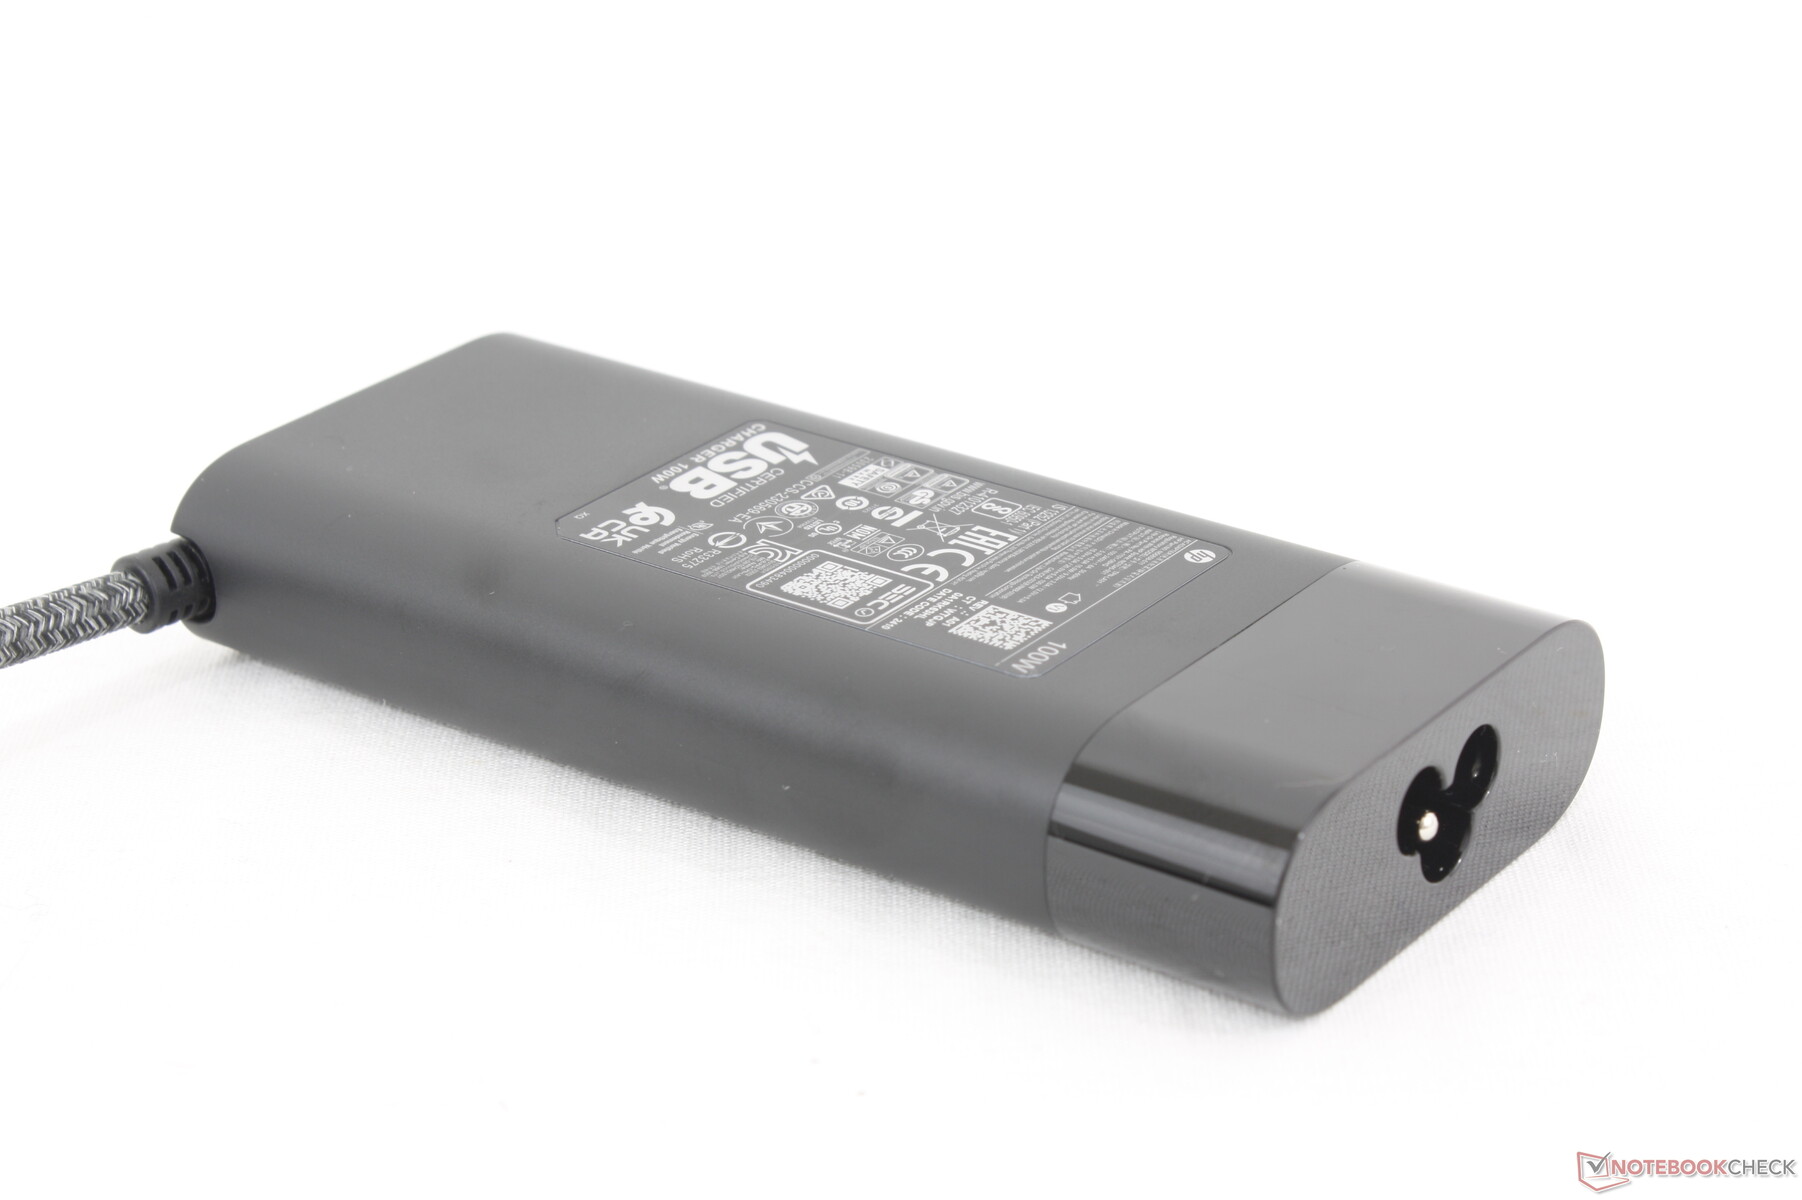
HP boasts 80 percent recycled aluminum for the outer cover, 50 percent recycled plastic for the keycaps, 30 percent recycled ocean-bound plastic for the speakers, 20 percent recycled cooking oil for the plastic bezels, and 50 percent recycled copper for the cooling solution. The packaging is also paper and cardboard with only a bit of plastic around the AC adapter.
Accessories And Warranty
The retail box includes no extras outside of the usual paperwork and AC adapter.
Unfortunately, the standard warranty in the US is only one year instead of the three years that we've come to expect from flagship Elite series models.
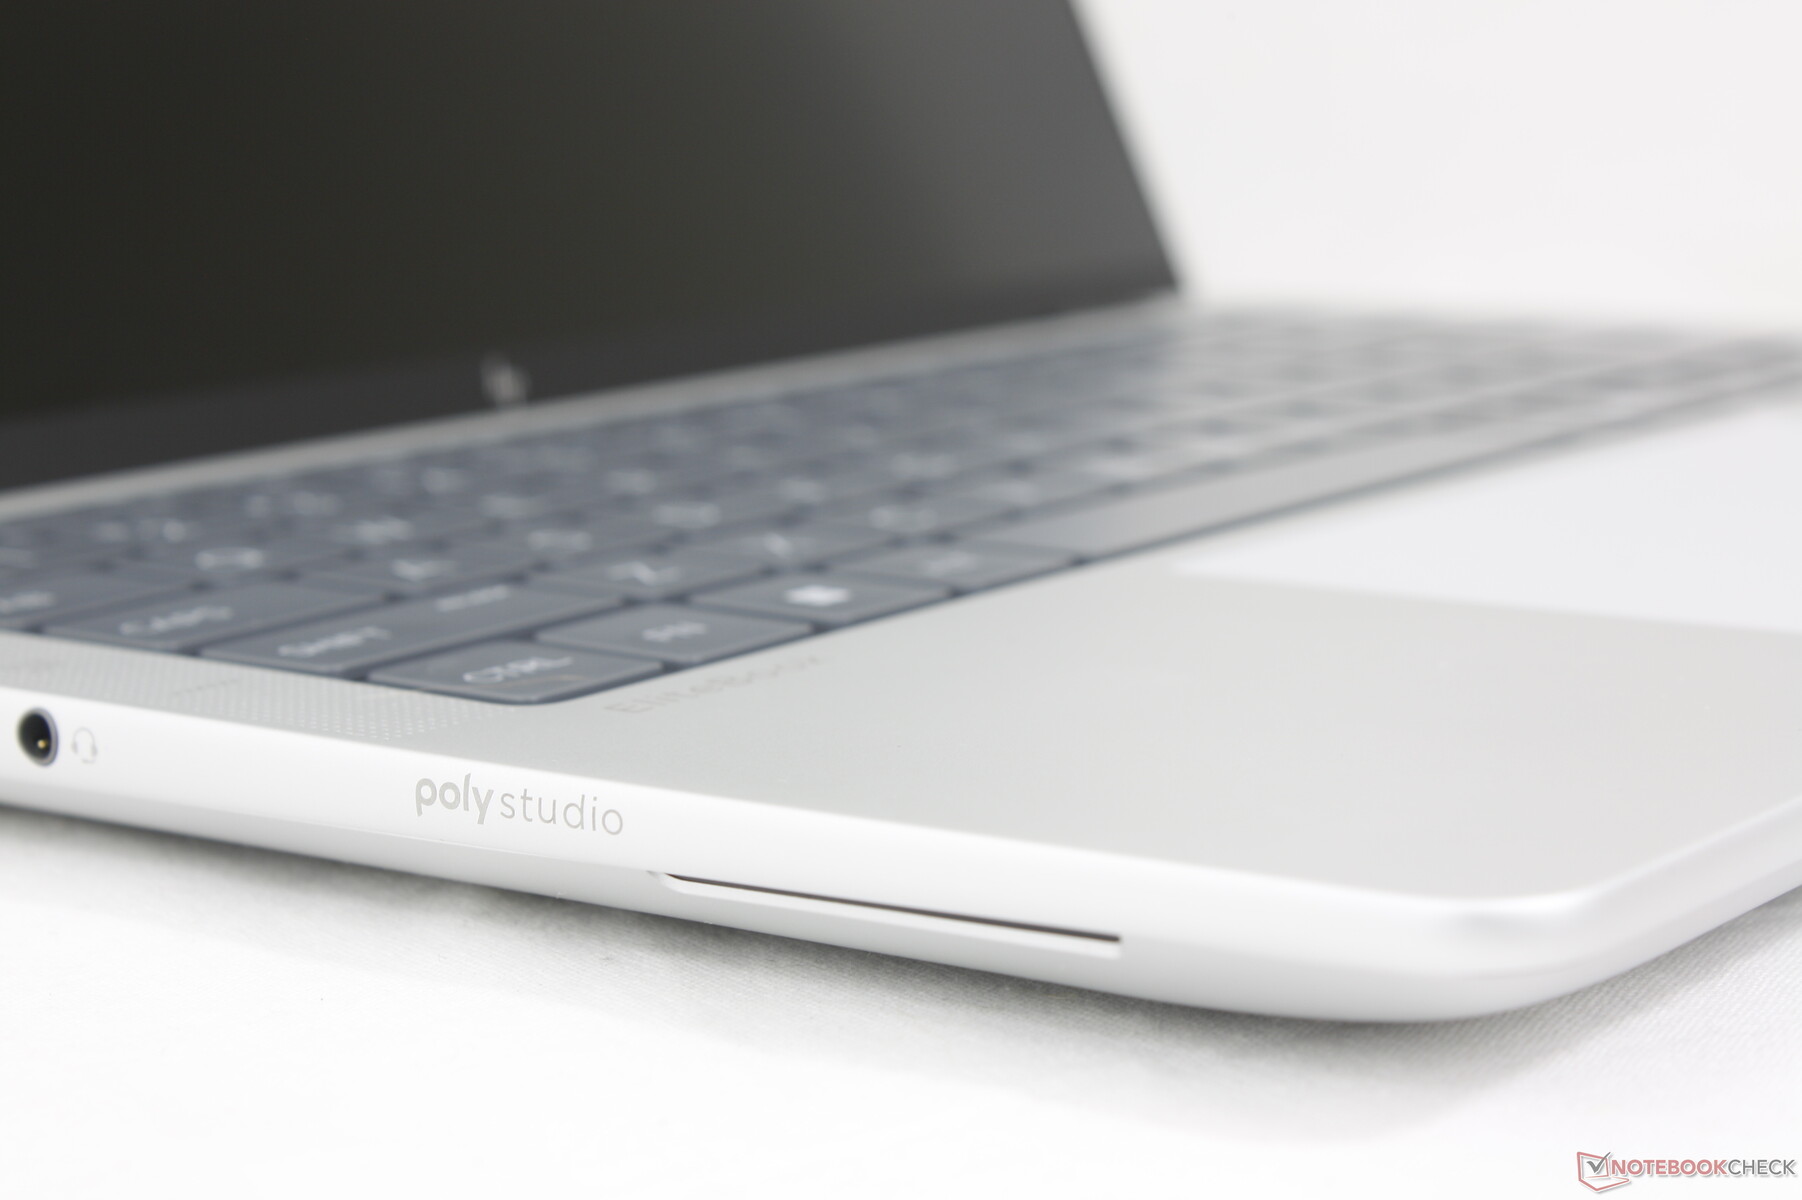
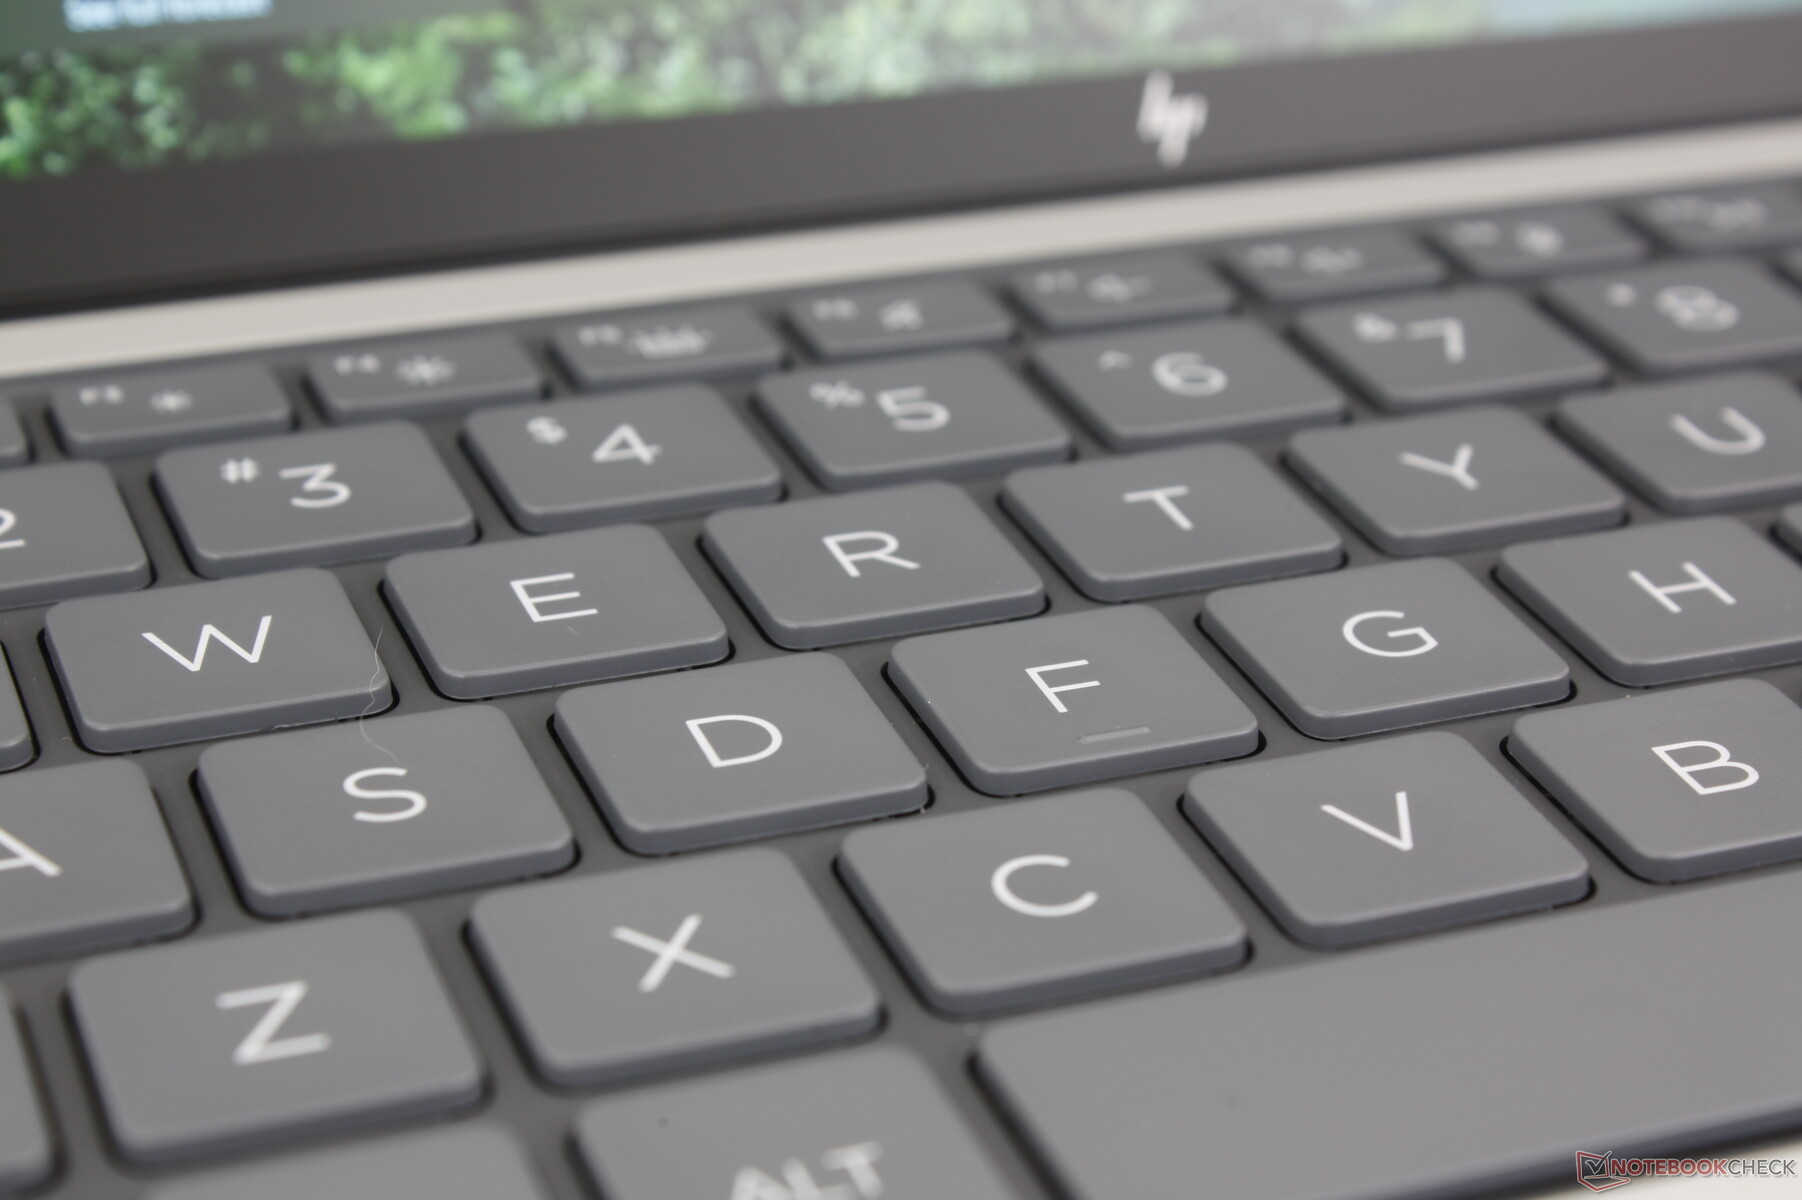
Input Devices — One Of The Most Comfortable For The Size
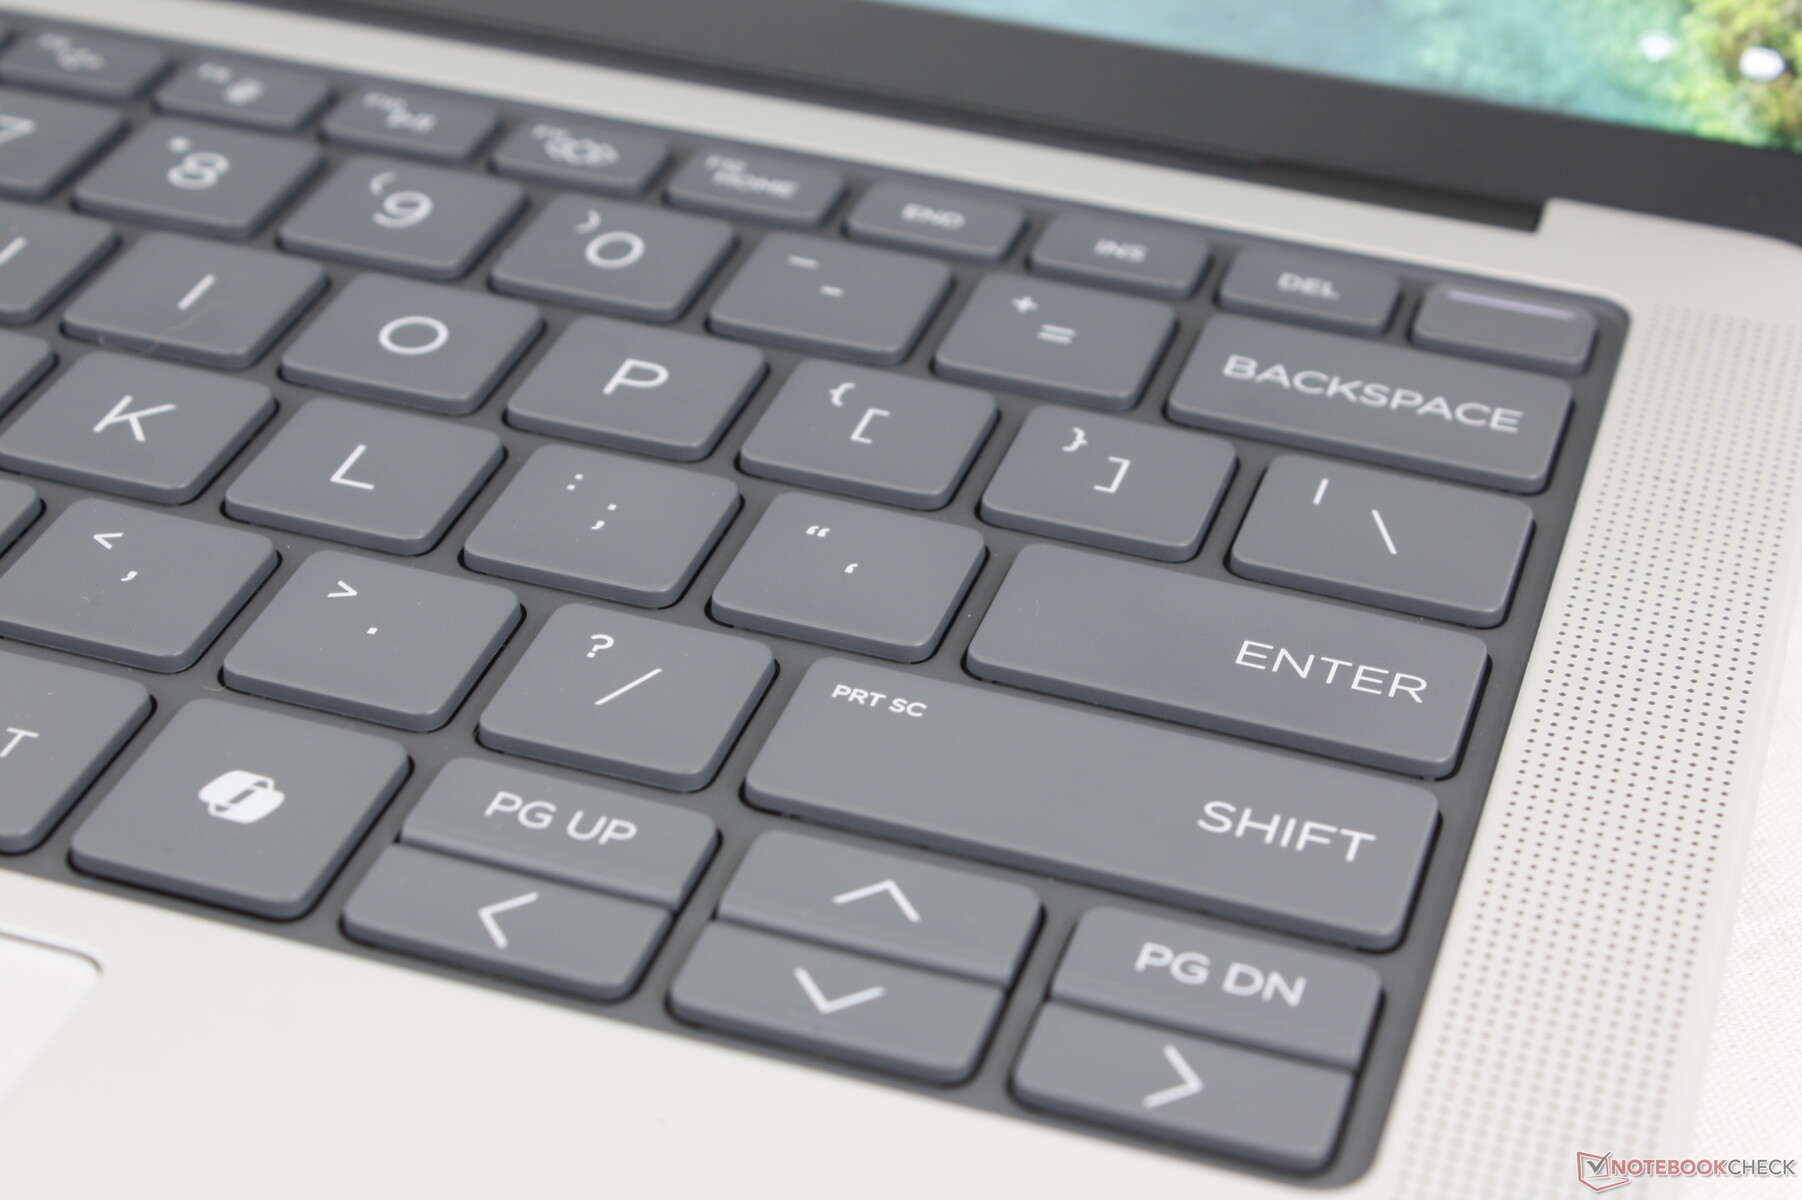
Keyboard
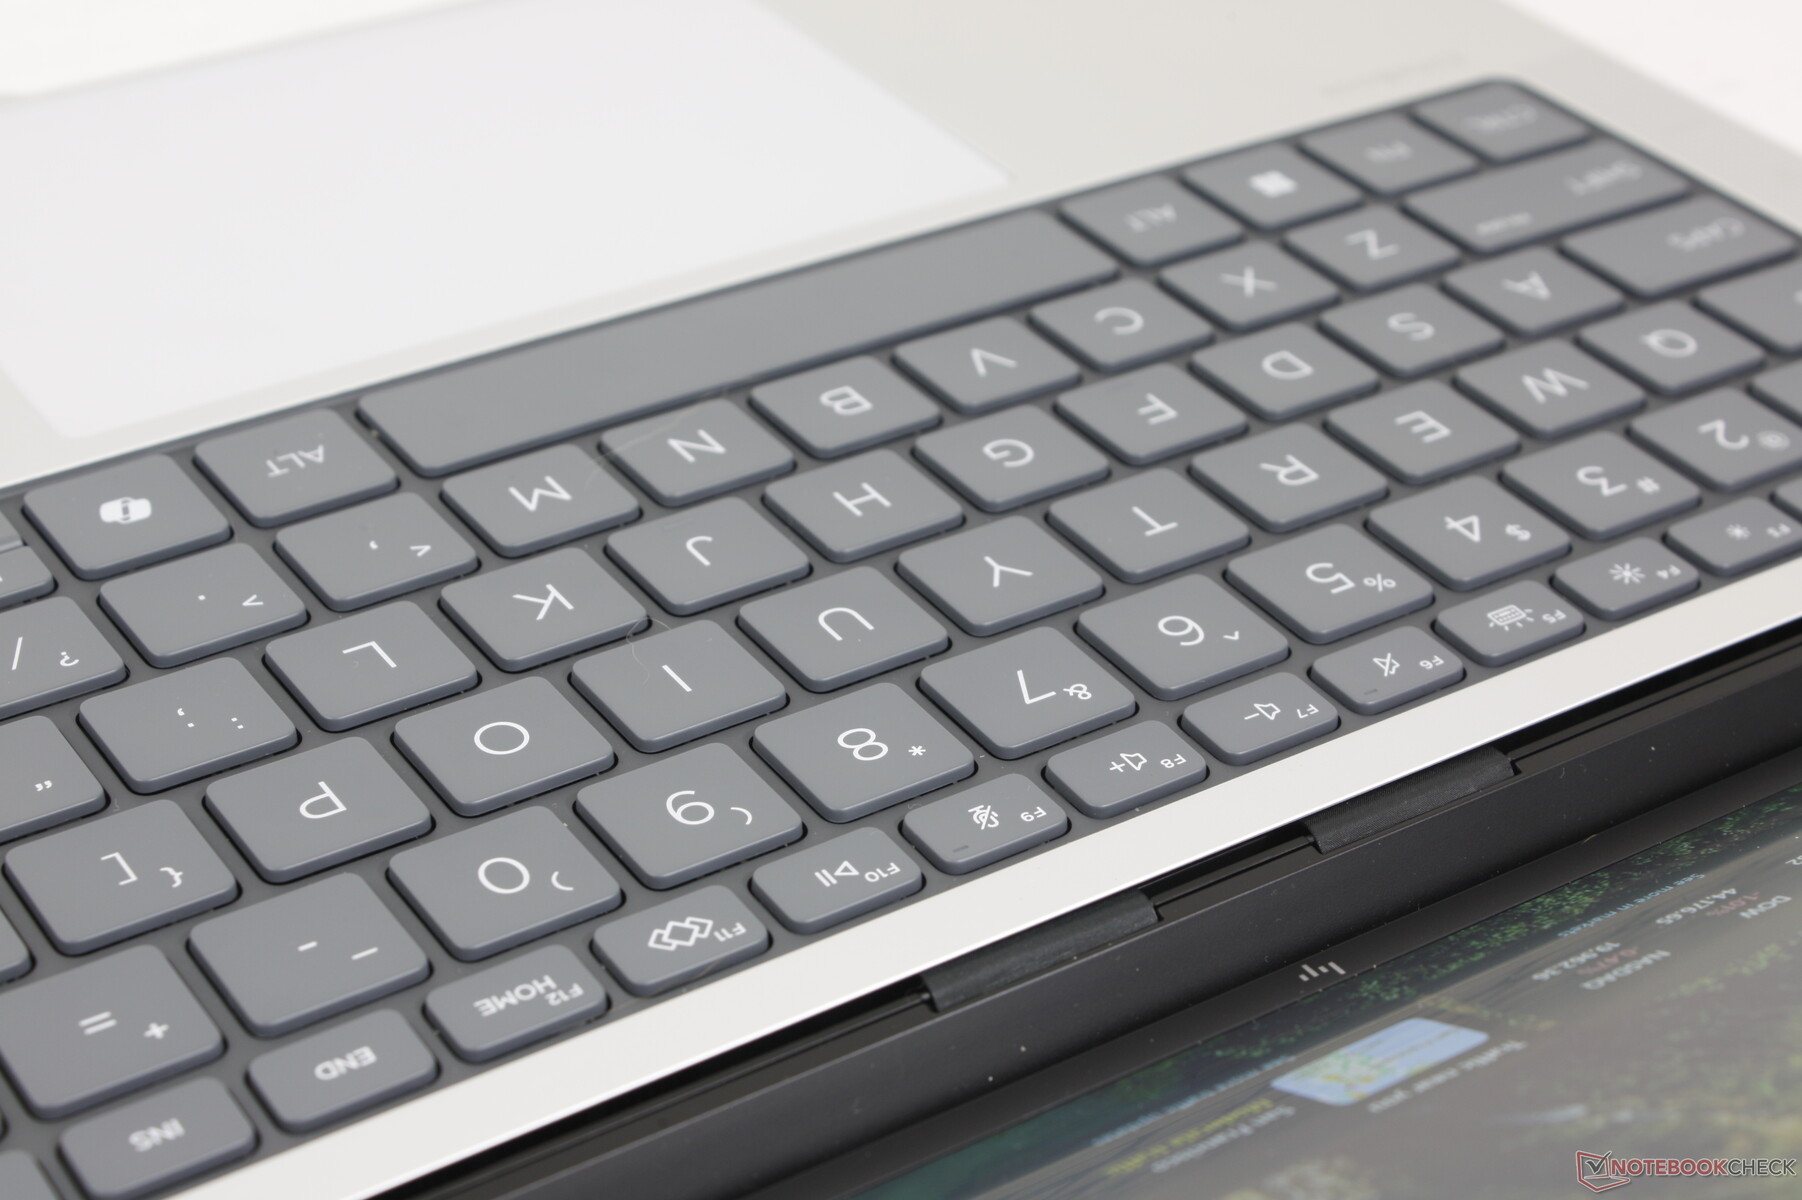
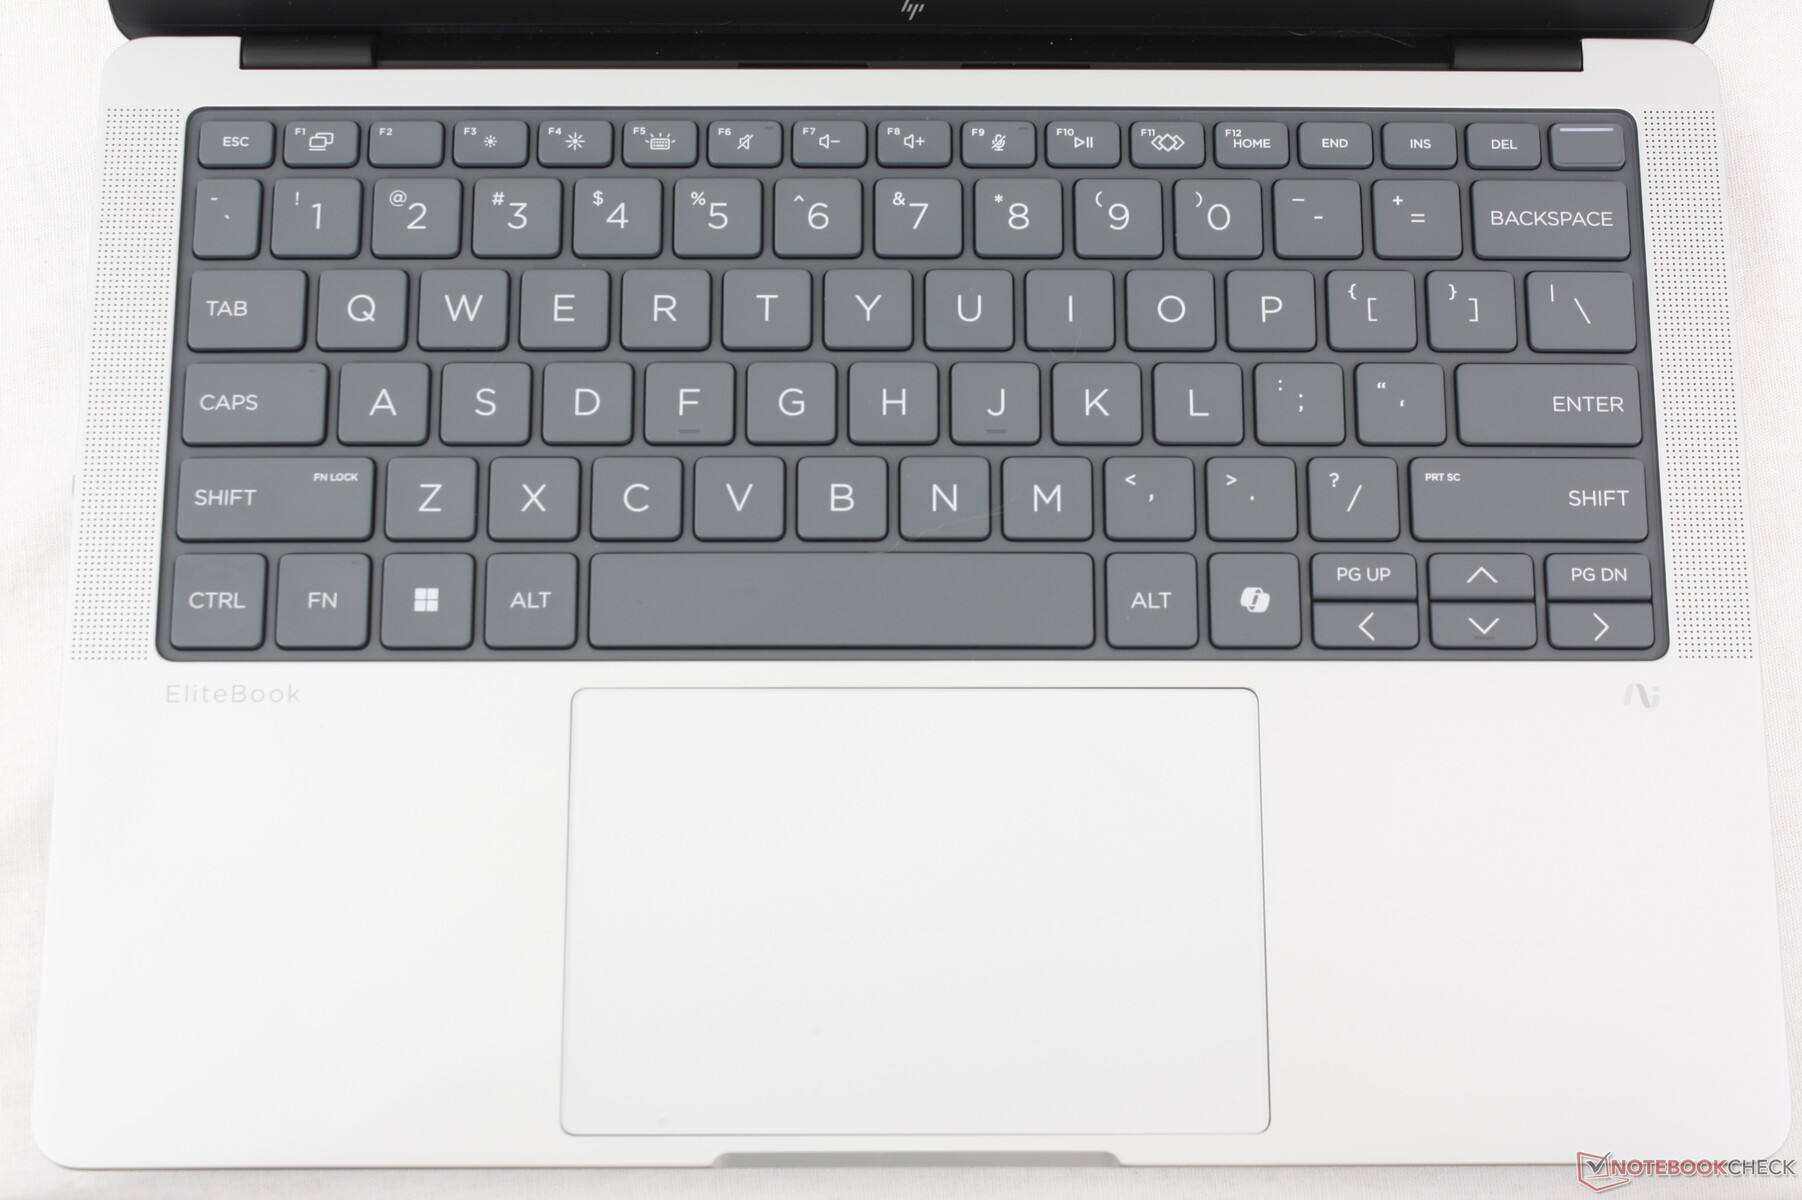
The keyboard is GS Mark compliant for an optimal ergonomic typing experience. Key travel is relatively deep at 1.5 mm while feedback is uniform and sharper than a Lenovo IdeaPad or Dell XPS. Clatter is average and not overly high-pitched, either.
Touchpad
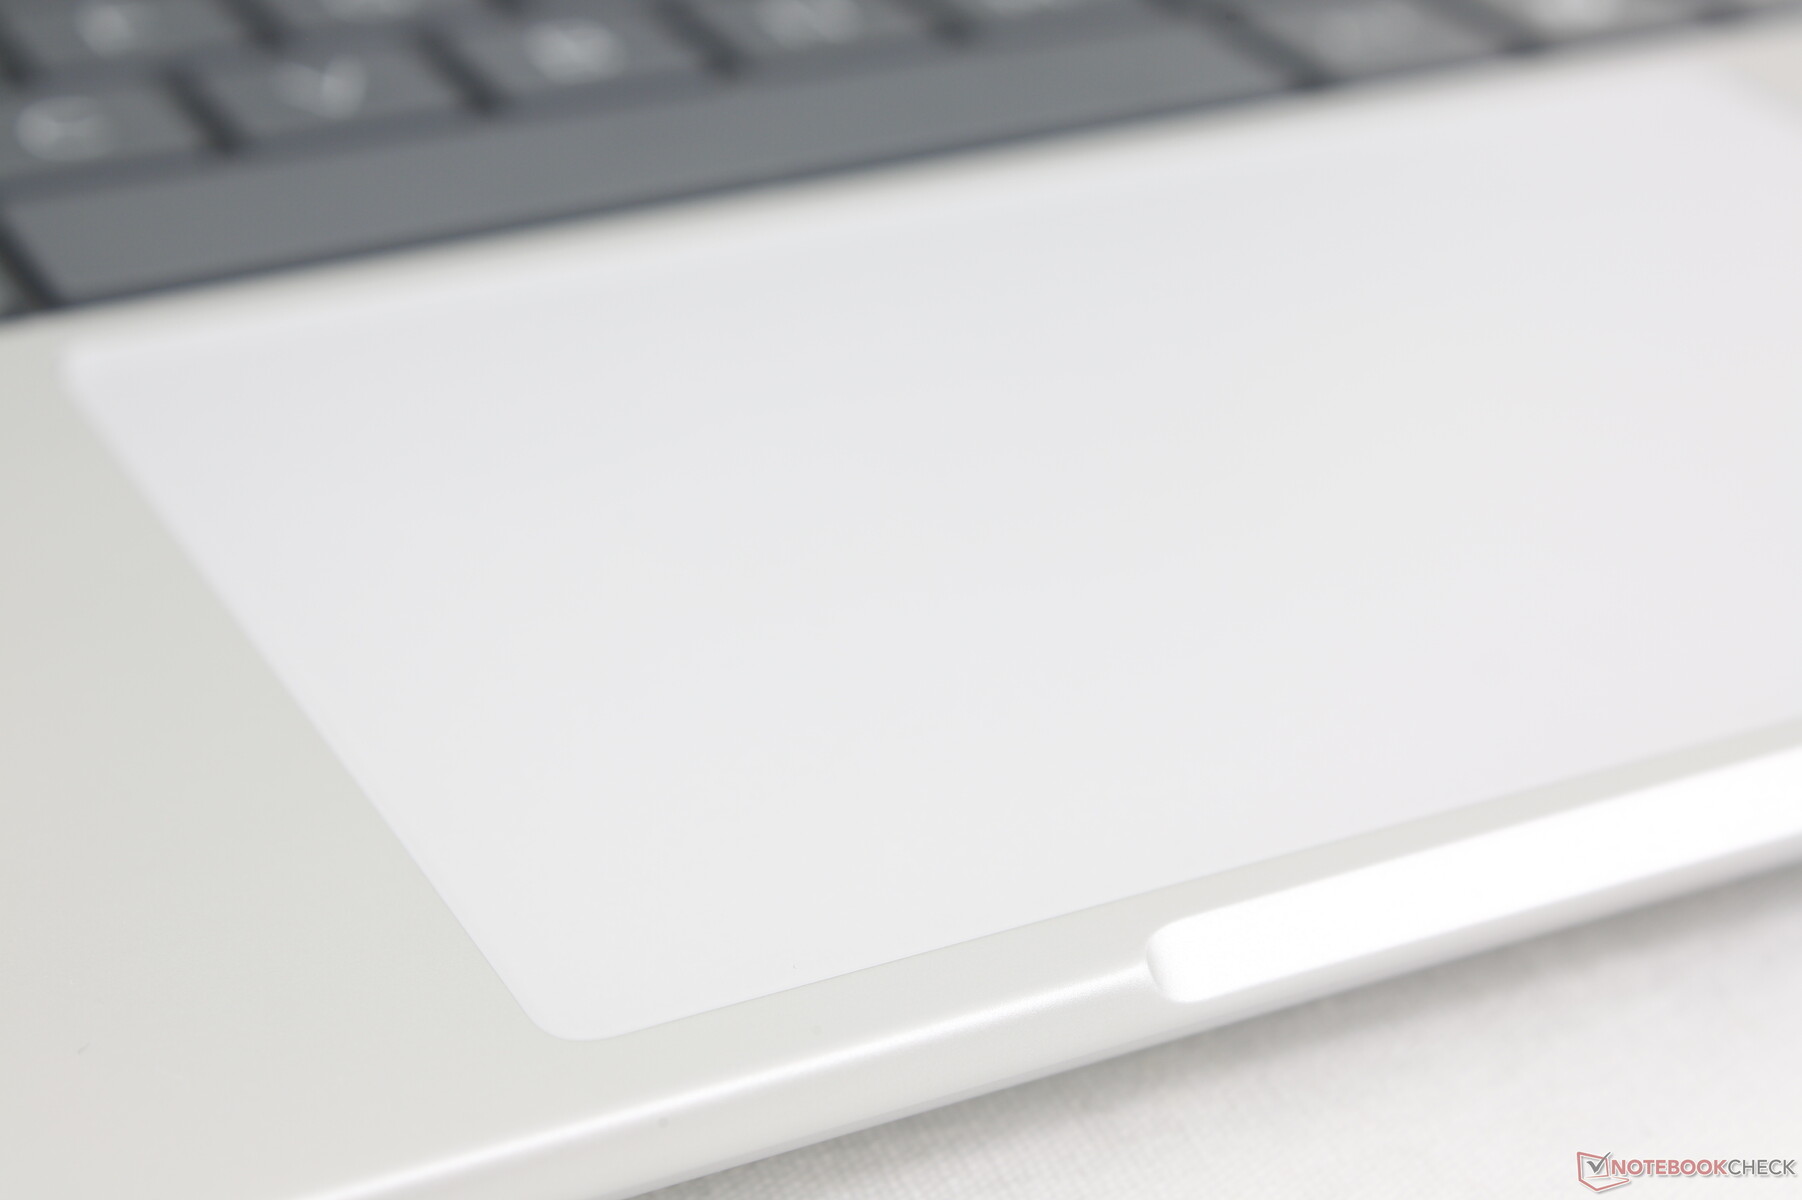
The clickpad is slightly wider when compared to last year's design (12.5 x 8 cm vs. 12 x 8 cm) for a spacious feel despite the small 14-inch form factor. Feedback when inputting clicks is sharp yet quiet for one of the better clickpad experiences on a laptop. Nonetheless, some users may still prefer the old-school TrackPoint and dedicated mouse keys on models like the ThinkPad T14s Gen 6 instead.
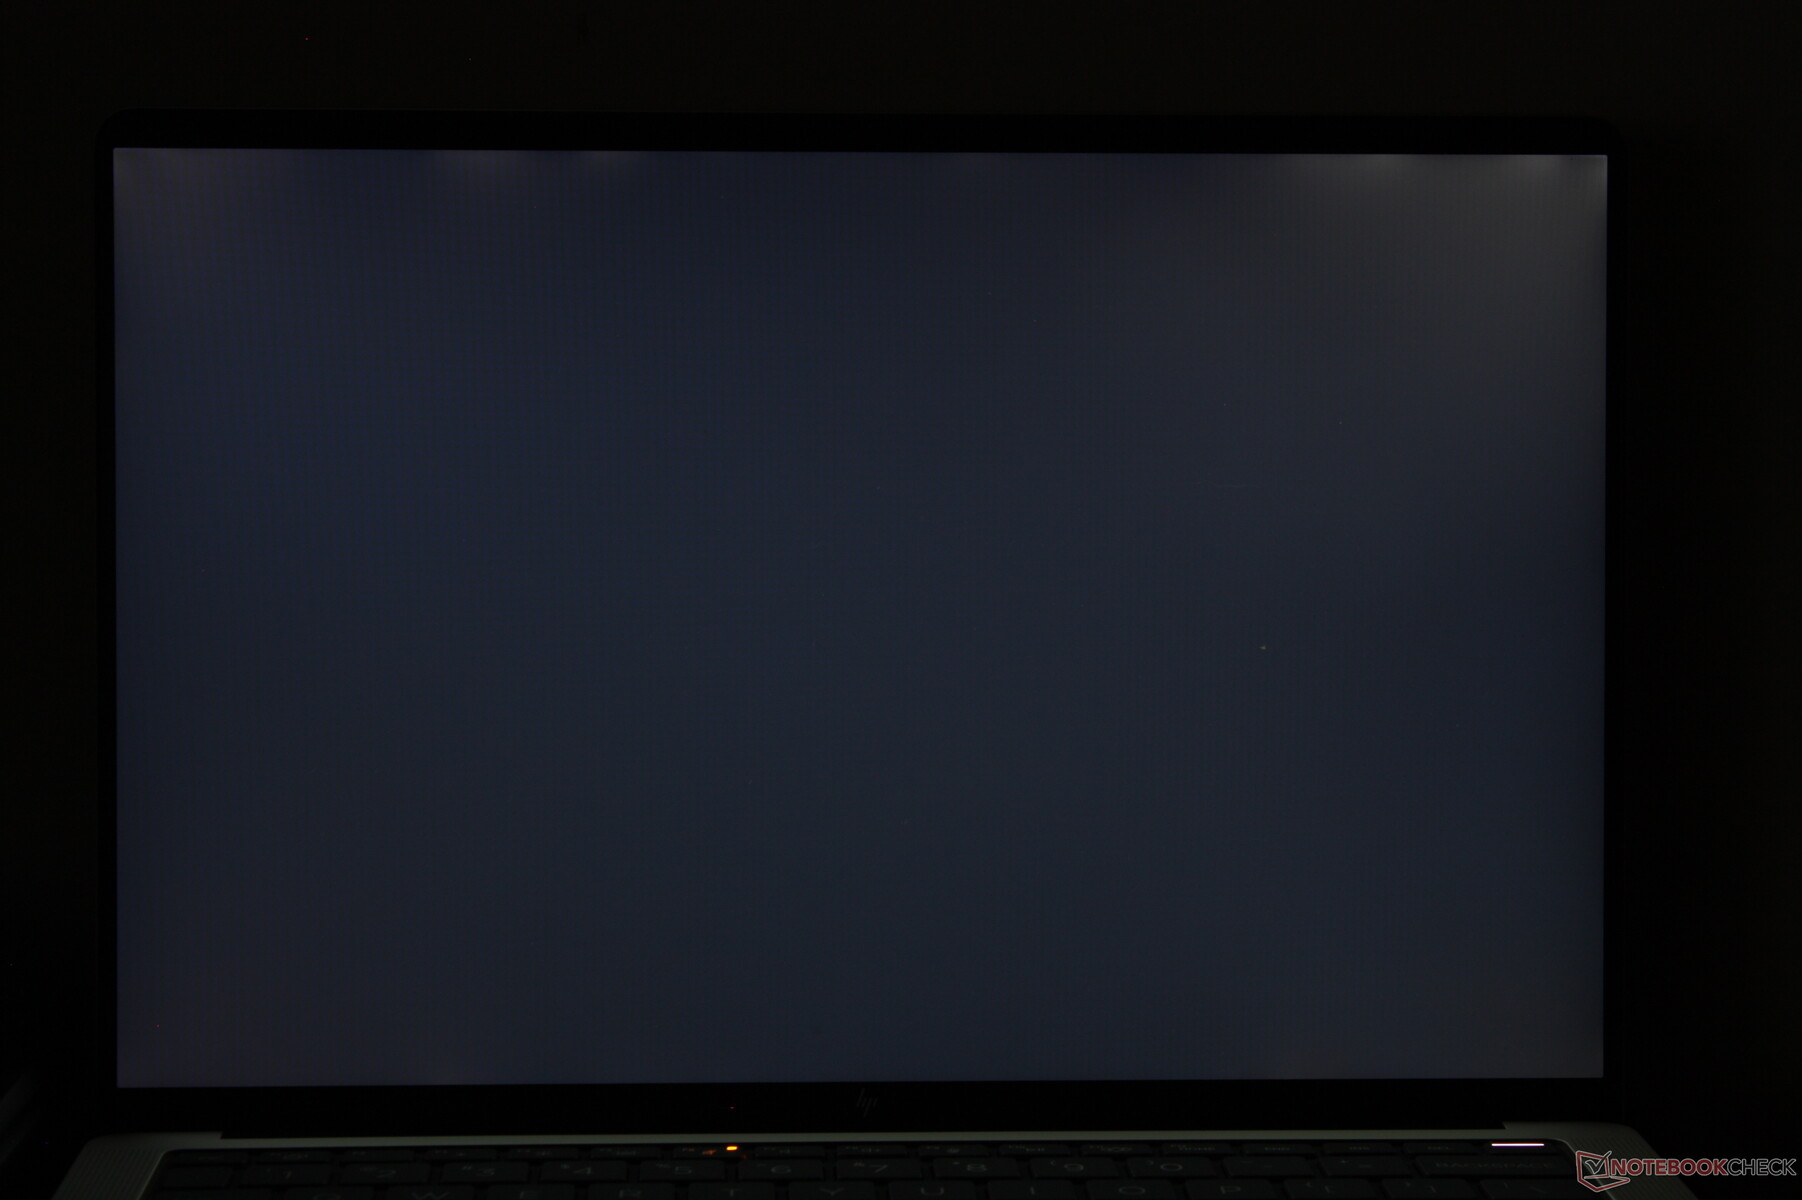
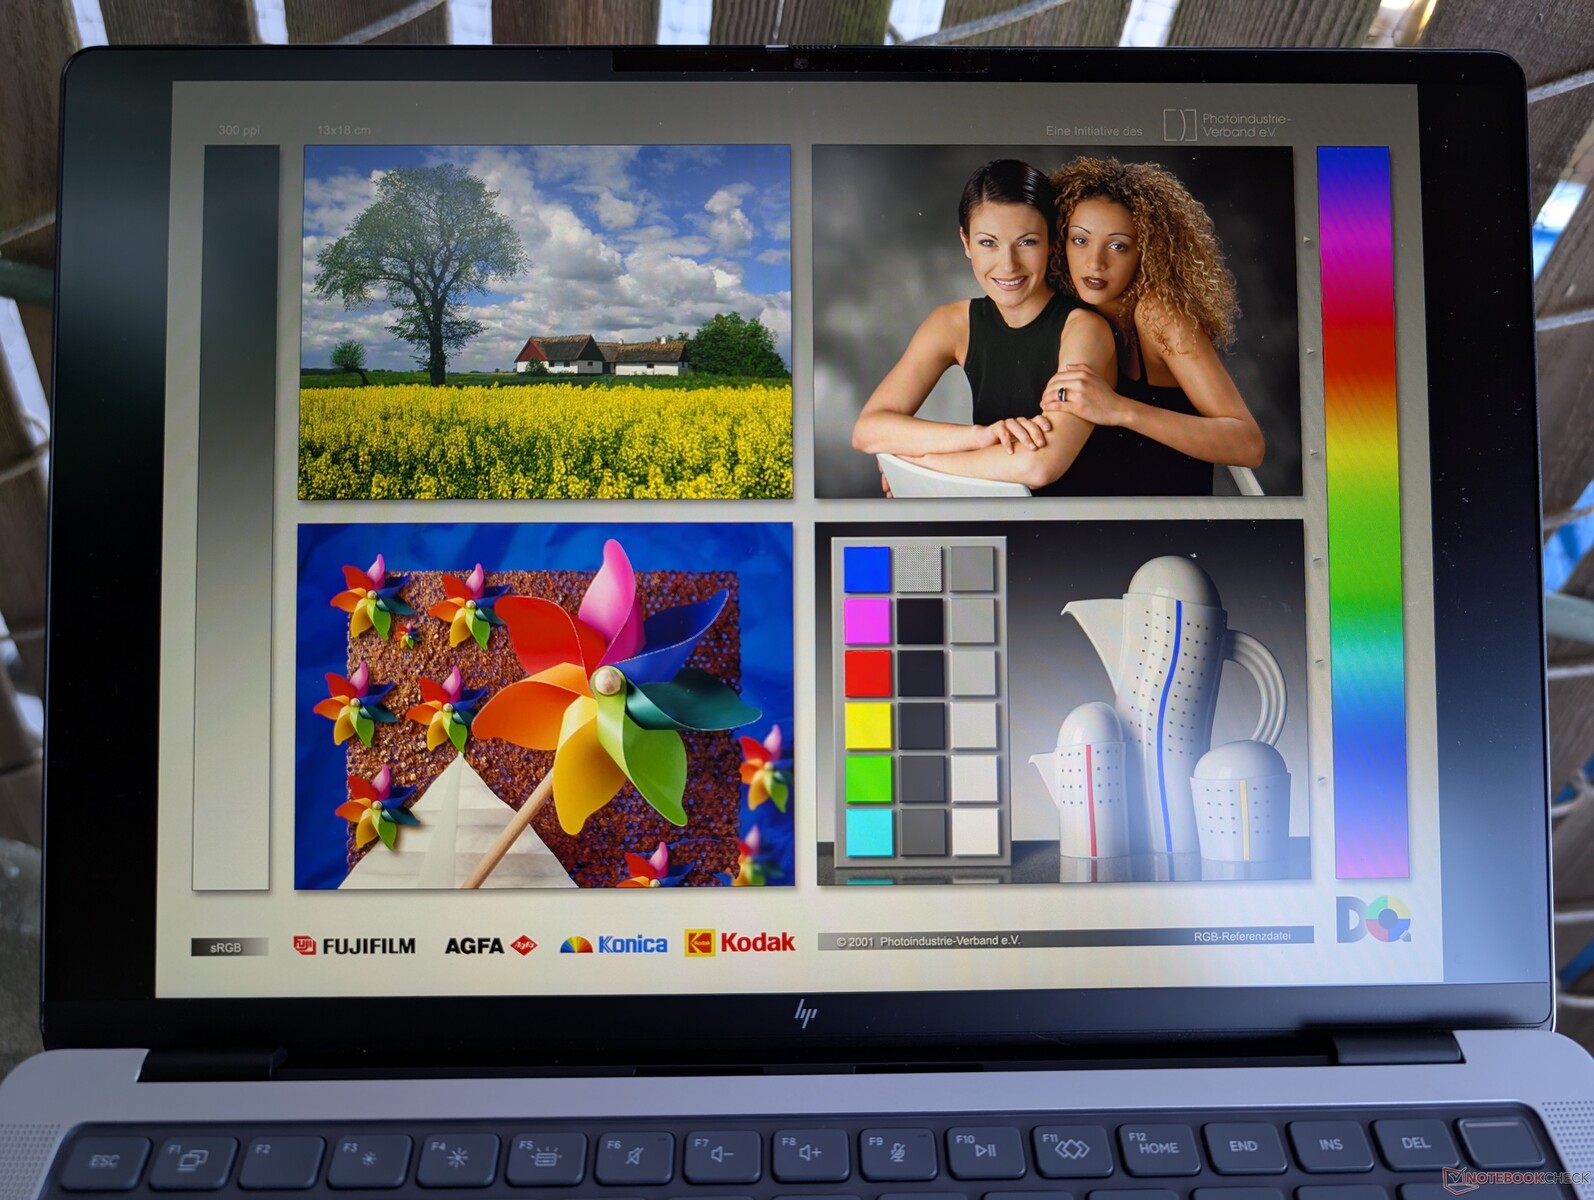
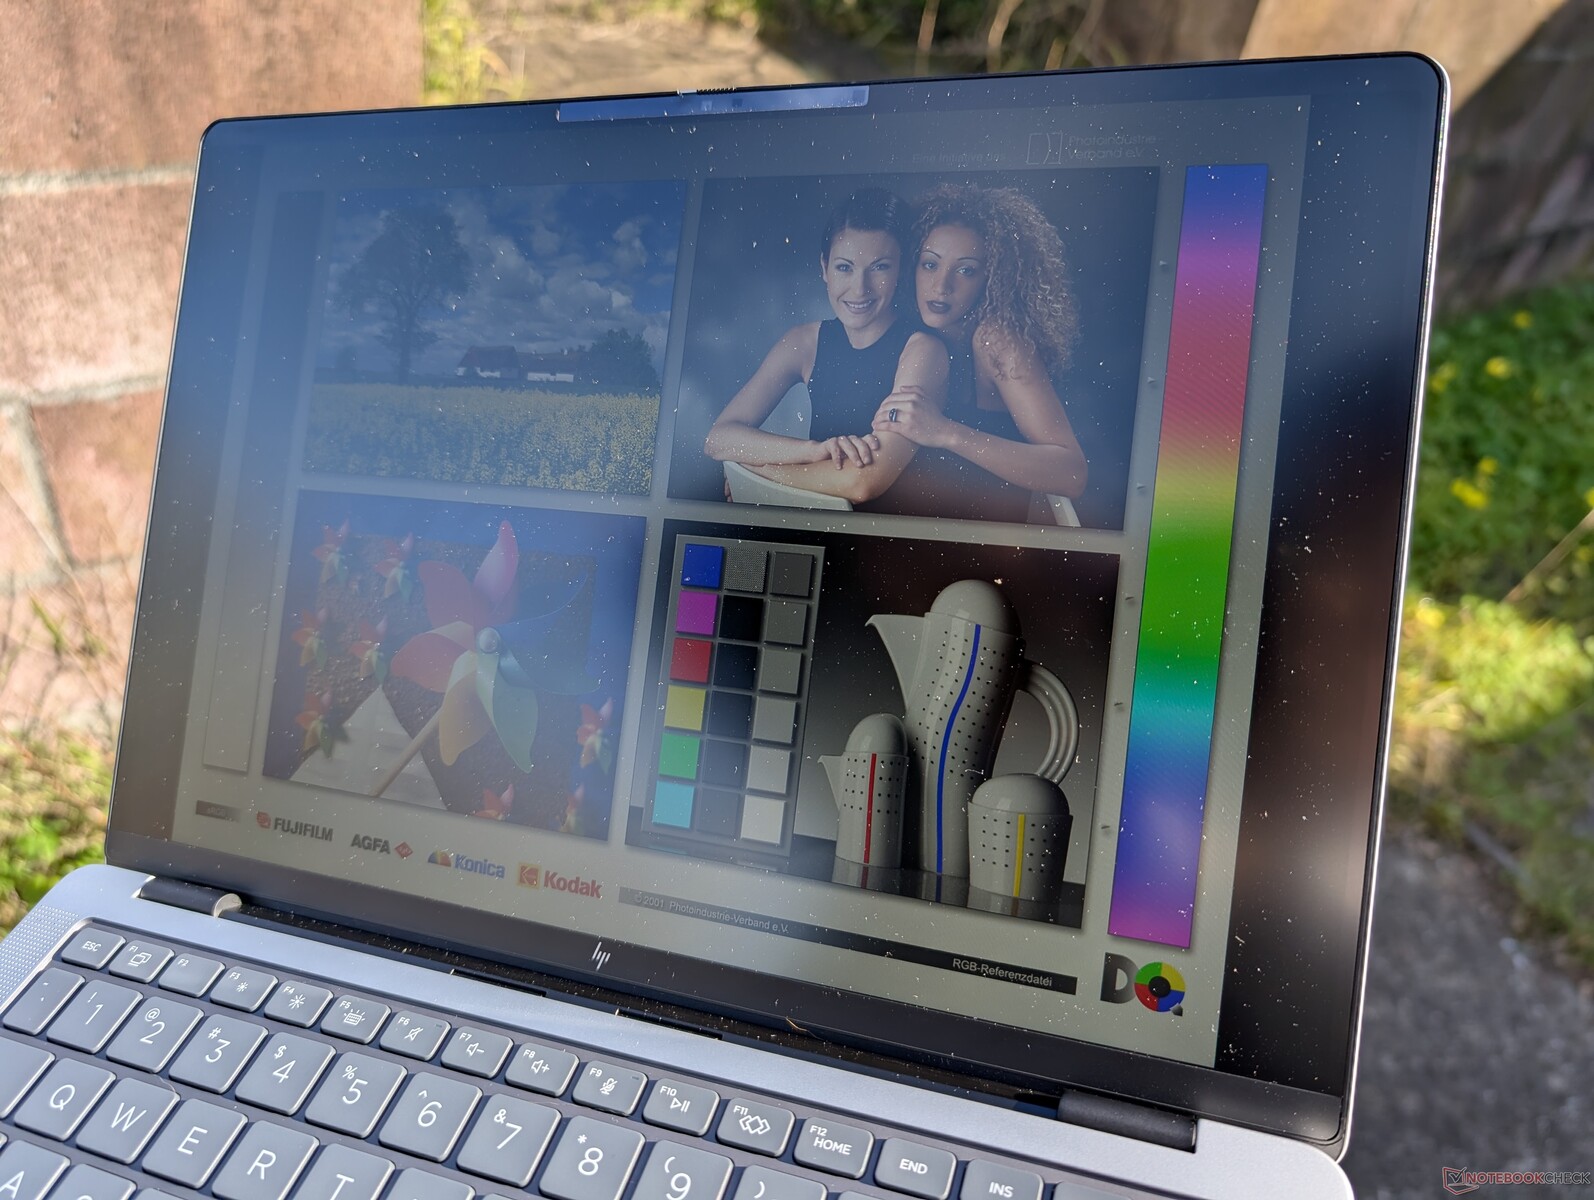
Display — Could Be Stronger For The Price
Two display options are available as follows:
- 1920 x 1200, matte, IPS, 400 nits, 100% sRGB, 60 Hz, non-touch
- 2880 x 1800, glossy, OLED, 400 nits, 100% P3, 120 Hz, touchscreen
The 1200p panel on our unit is a midrange offering with its meager 60 Hz refresh rate and slow black-white and gray-gray response times. Ghosting is thus especially noticeable and the experience isn't as smooth as the 144 Hz IPS panel on the ExpertBook P5. Users may want to consider the ThinkPad X1 Carbon Gen 13 for wider display features.
Brightness and image quality are otherwise decent for indoor users who are satisfied with sRGB colors. Buyers should not expect HDR compatibility or the best multimedia playback experience from this model.


| |||||||||||||||||||||||||
Brightness Distribution: 87 %
Center on Battery: 442.8 cd/m²
Contrast: 2013:1 (Black: 0.22 cd/m²)
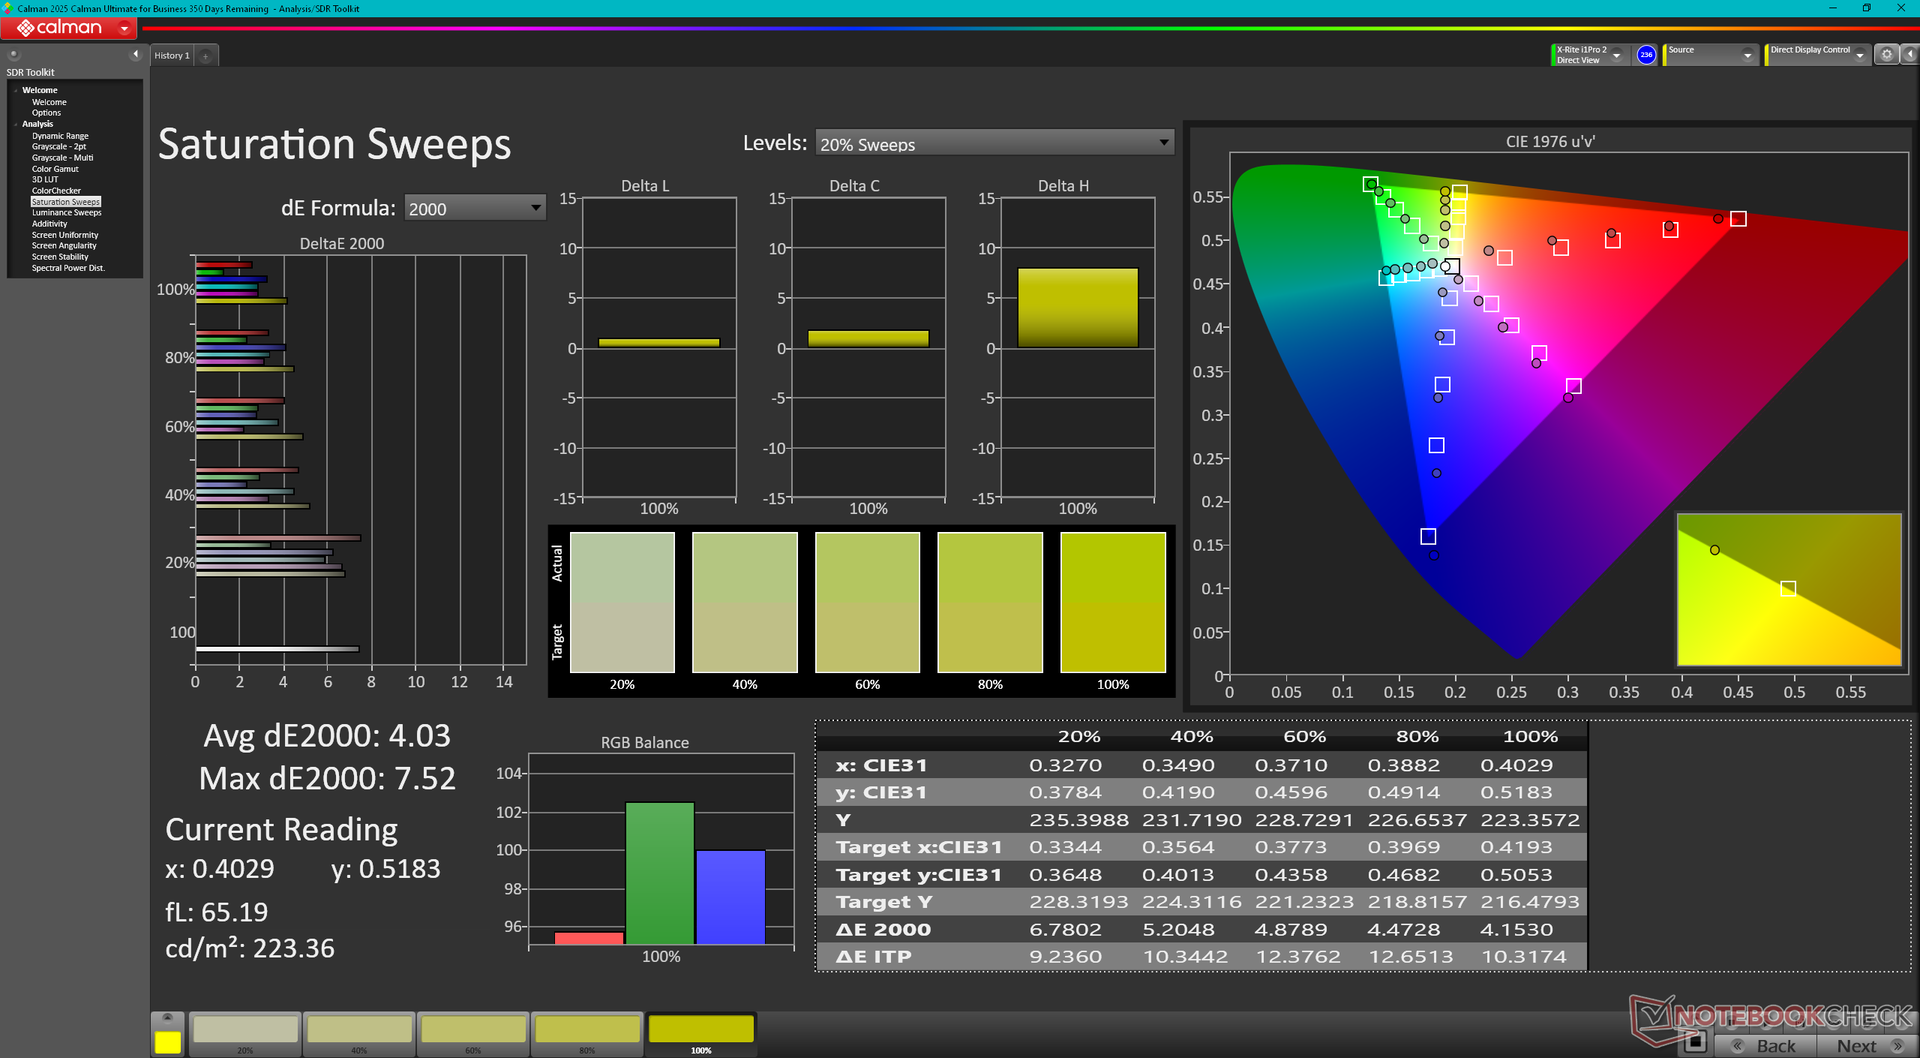
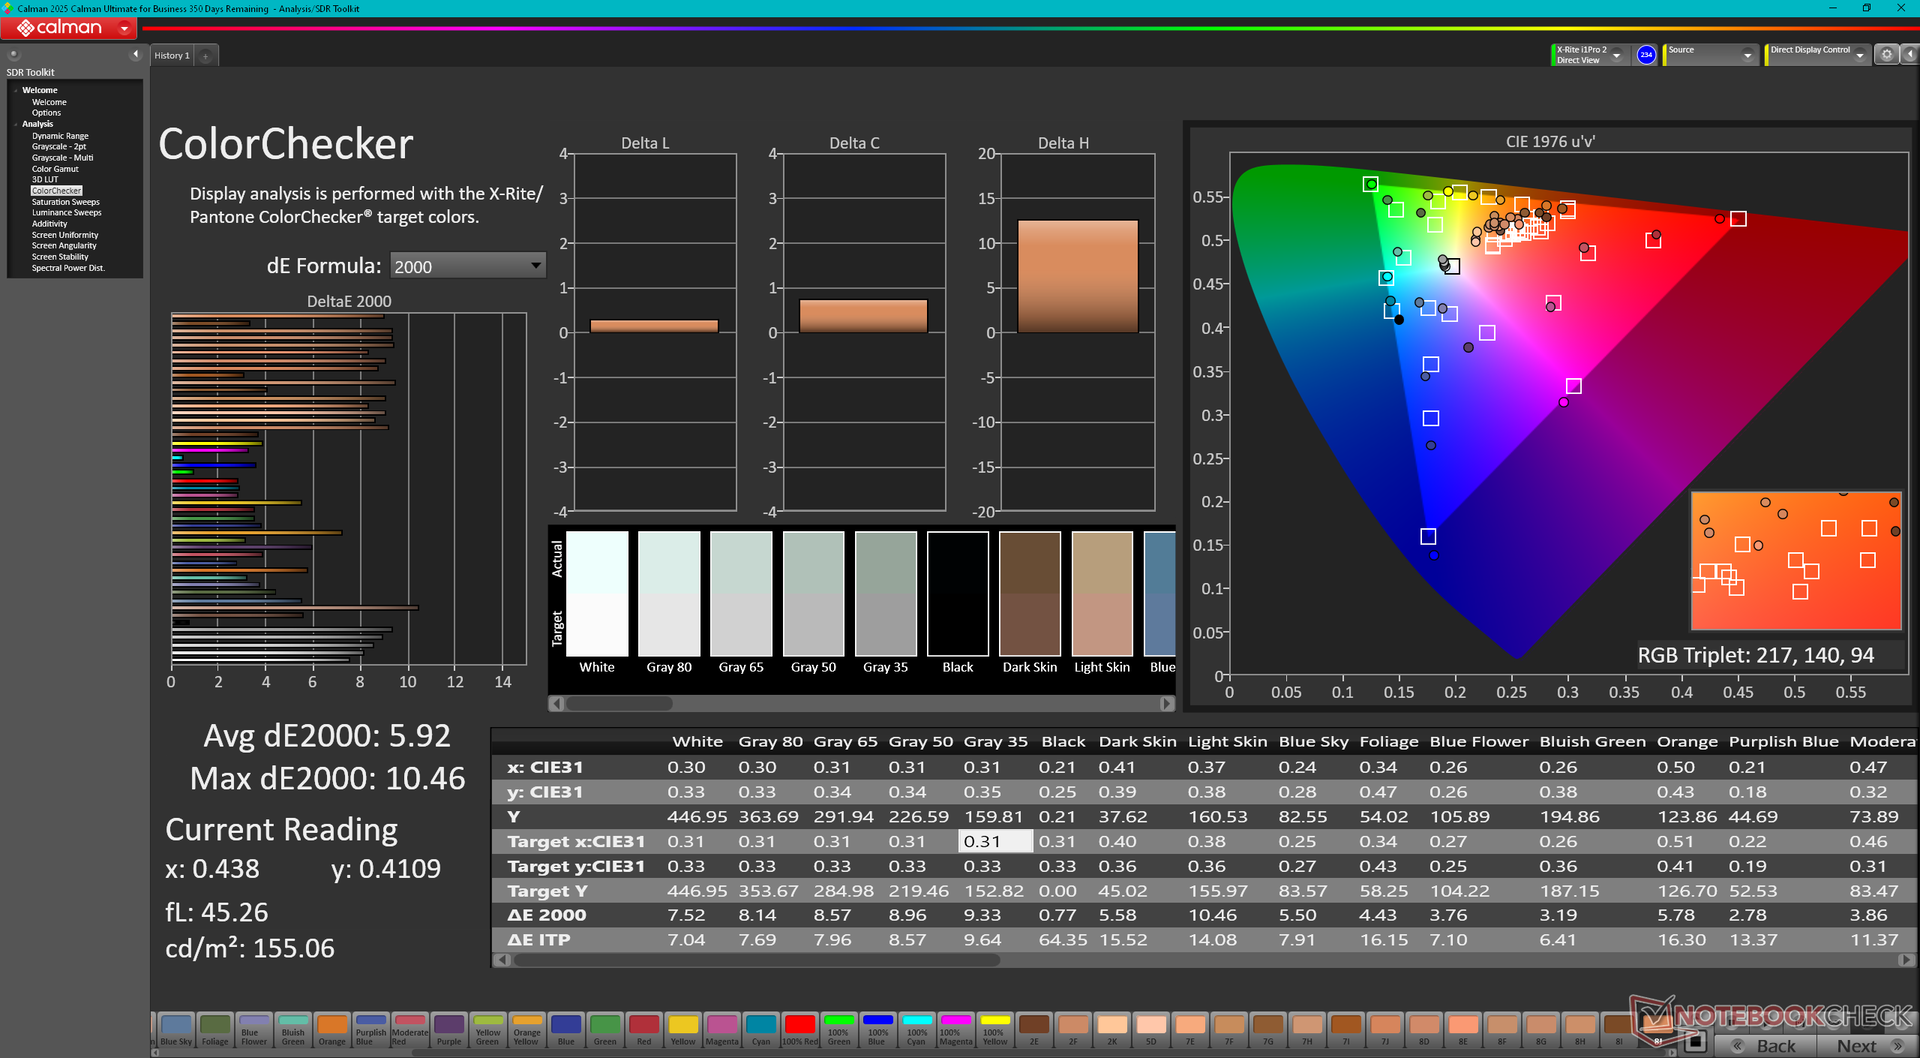
ΔE ColorChecker Calman: 5.92 | ∀{0.5-29.43 Ø4.73}
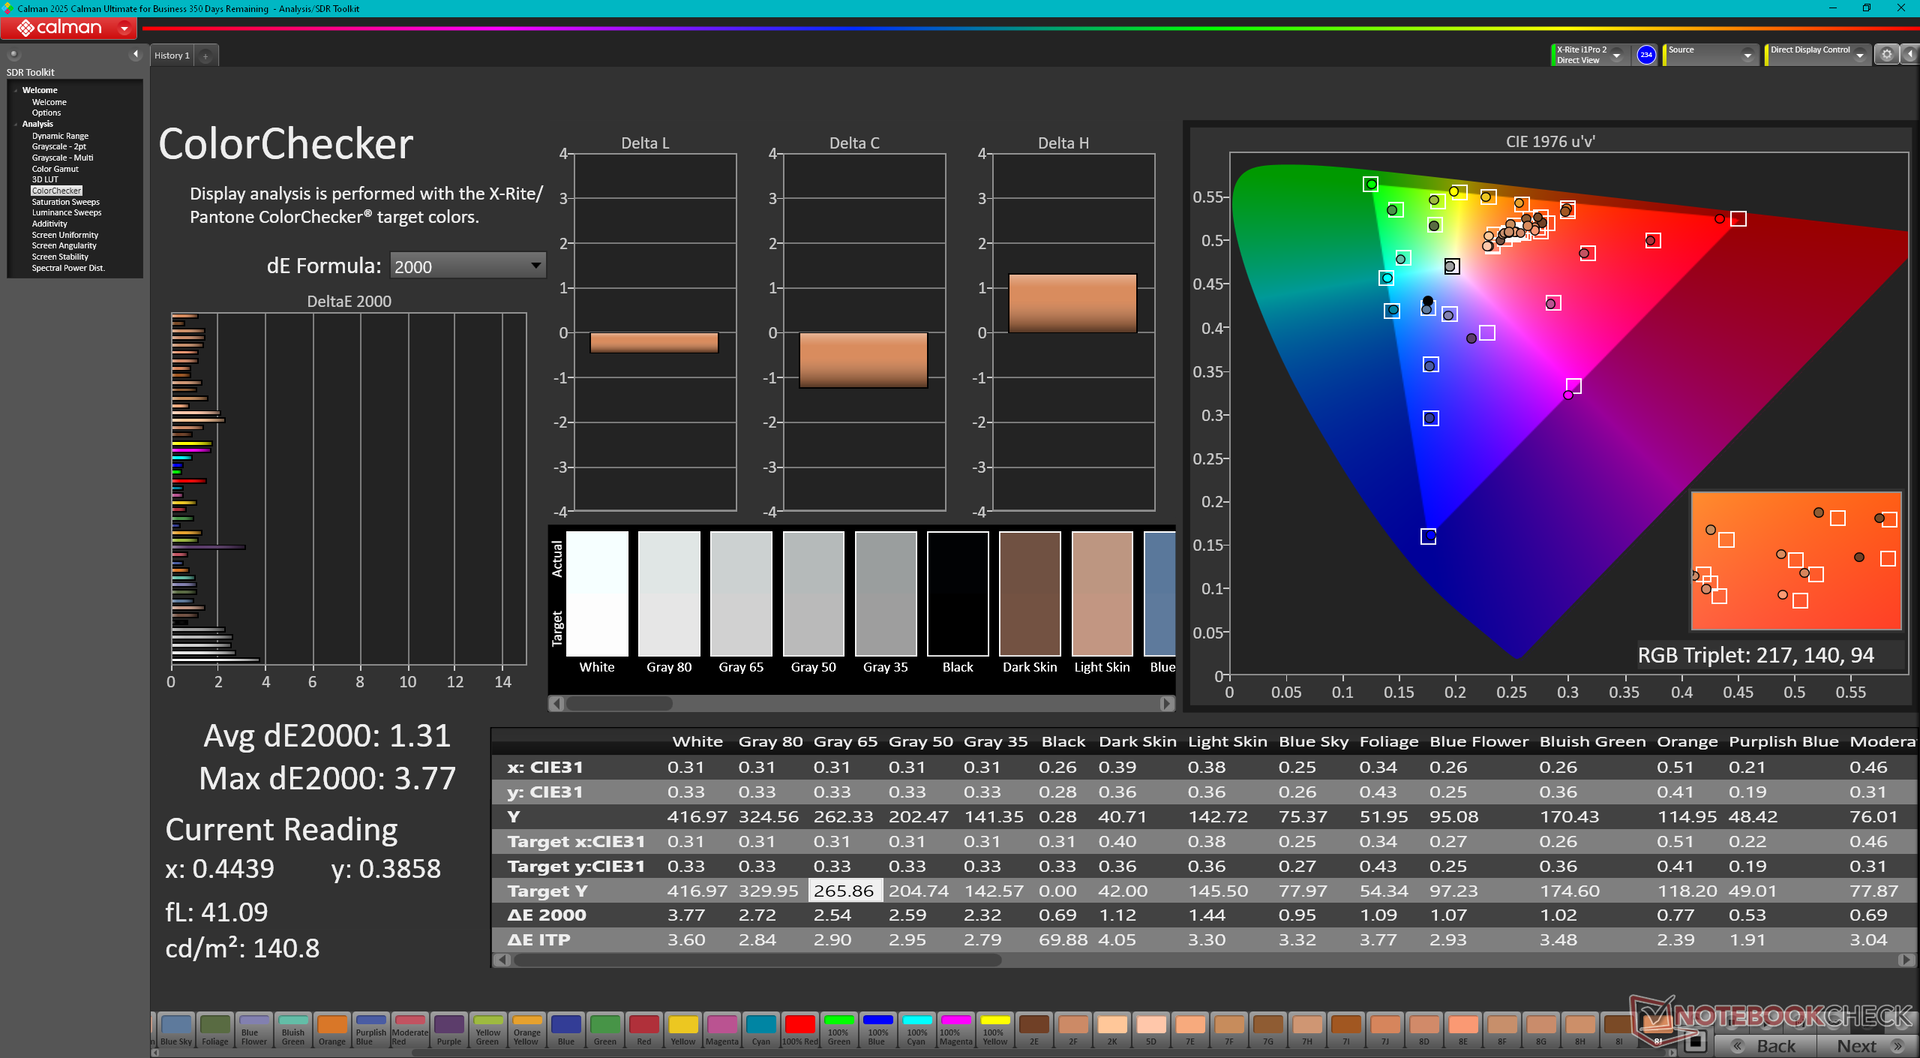
calibrated: 1.31
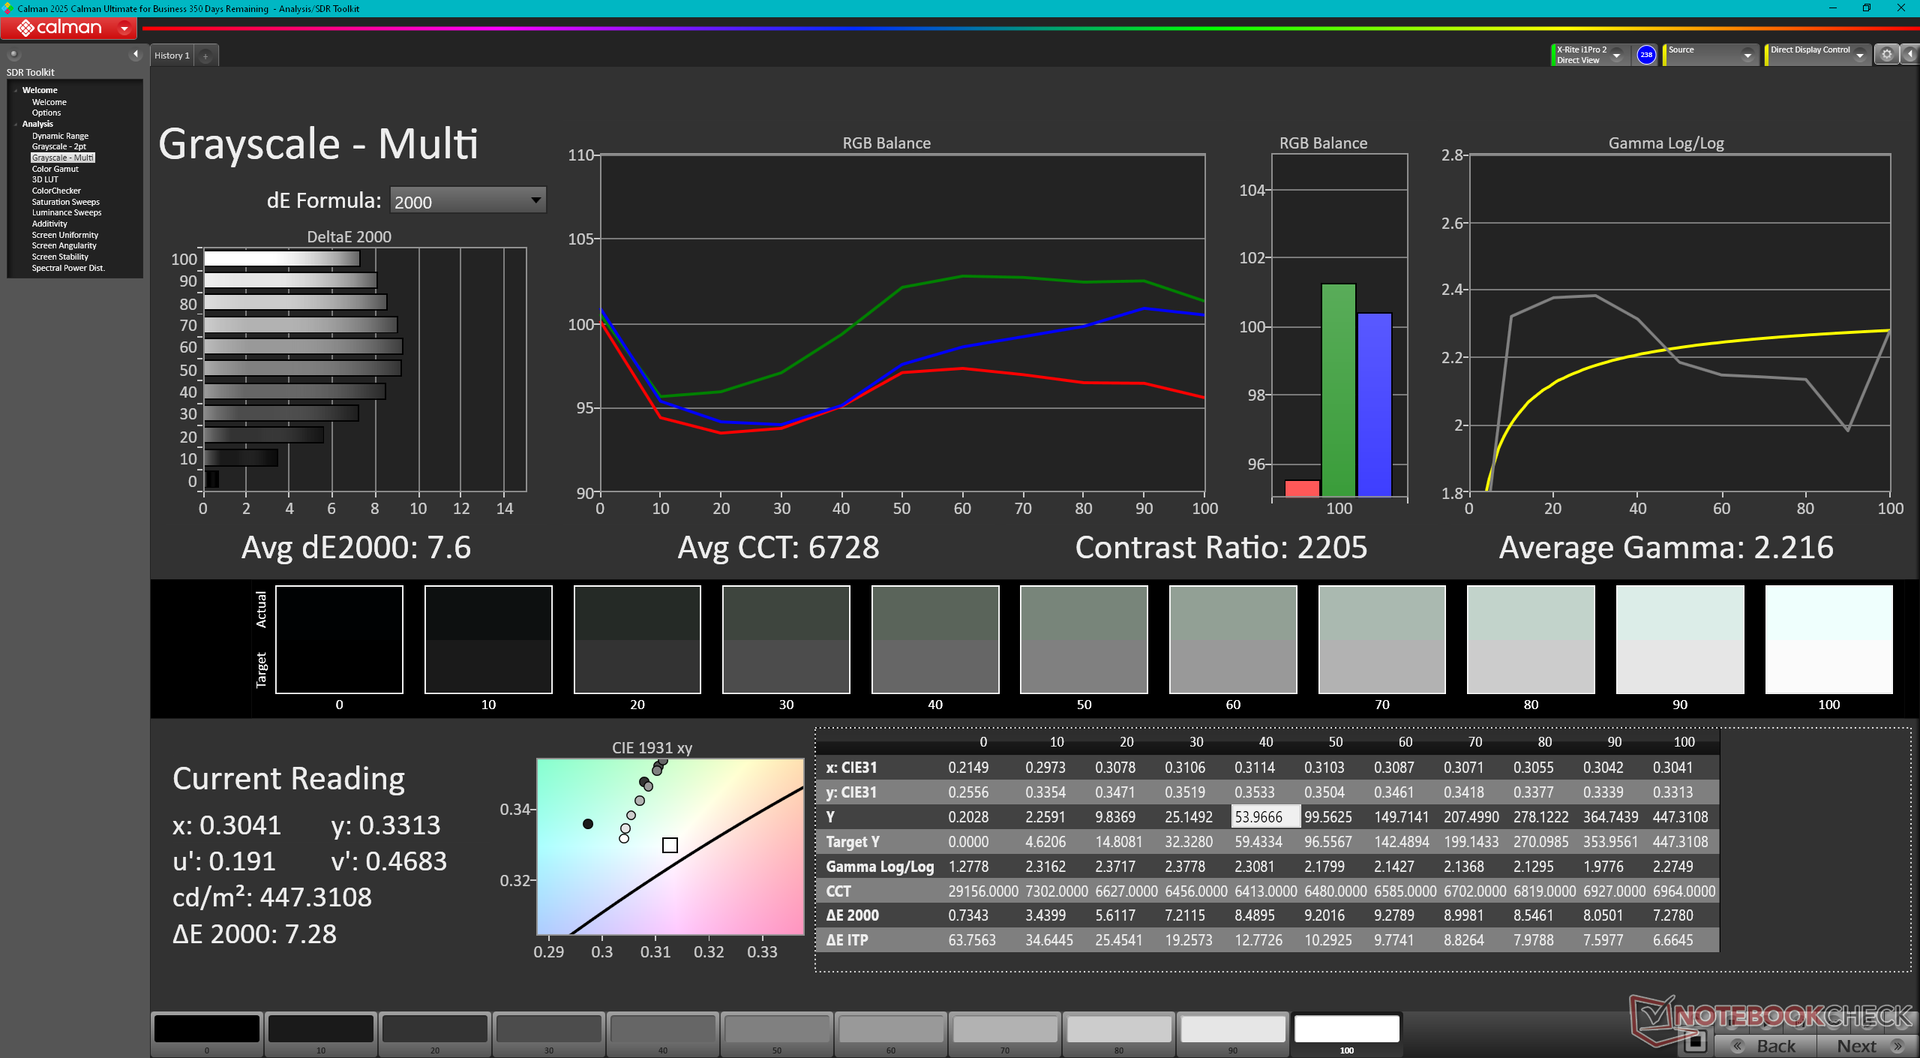
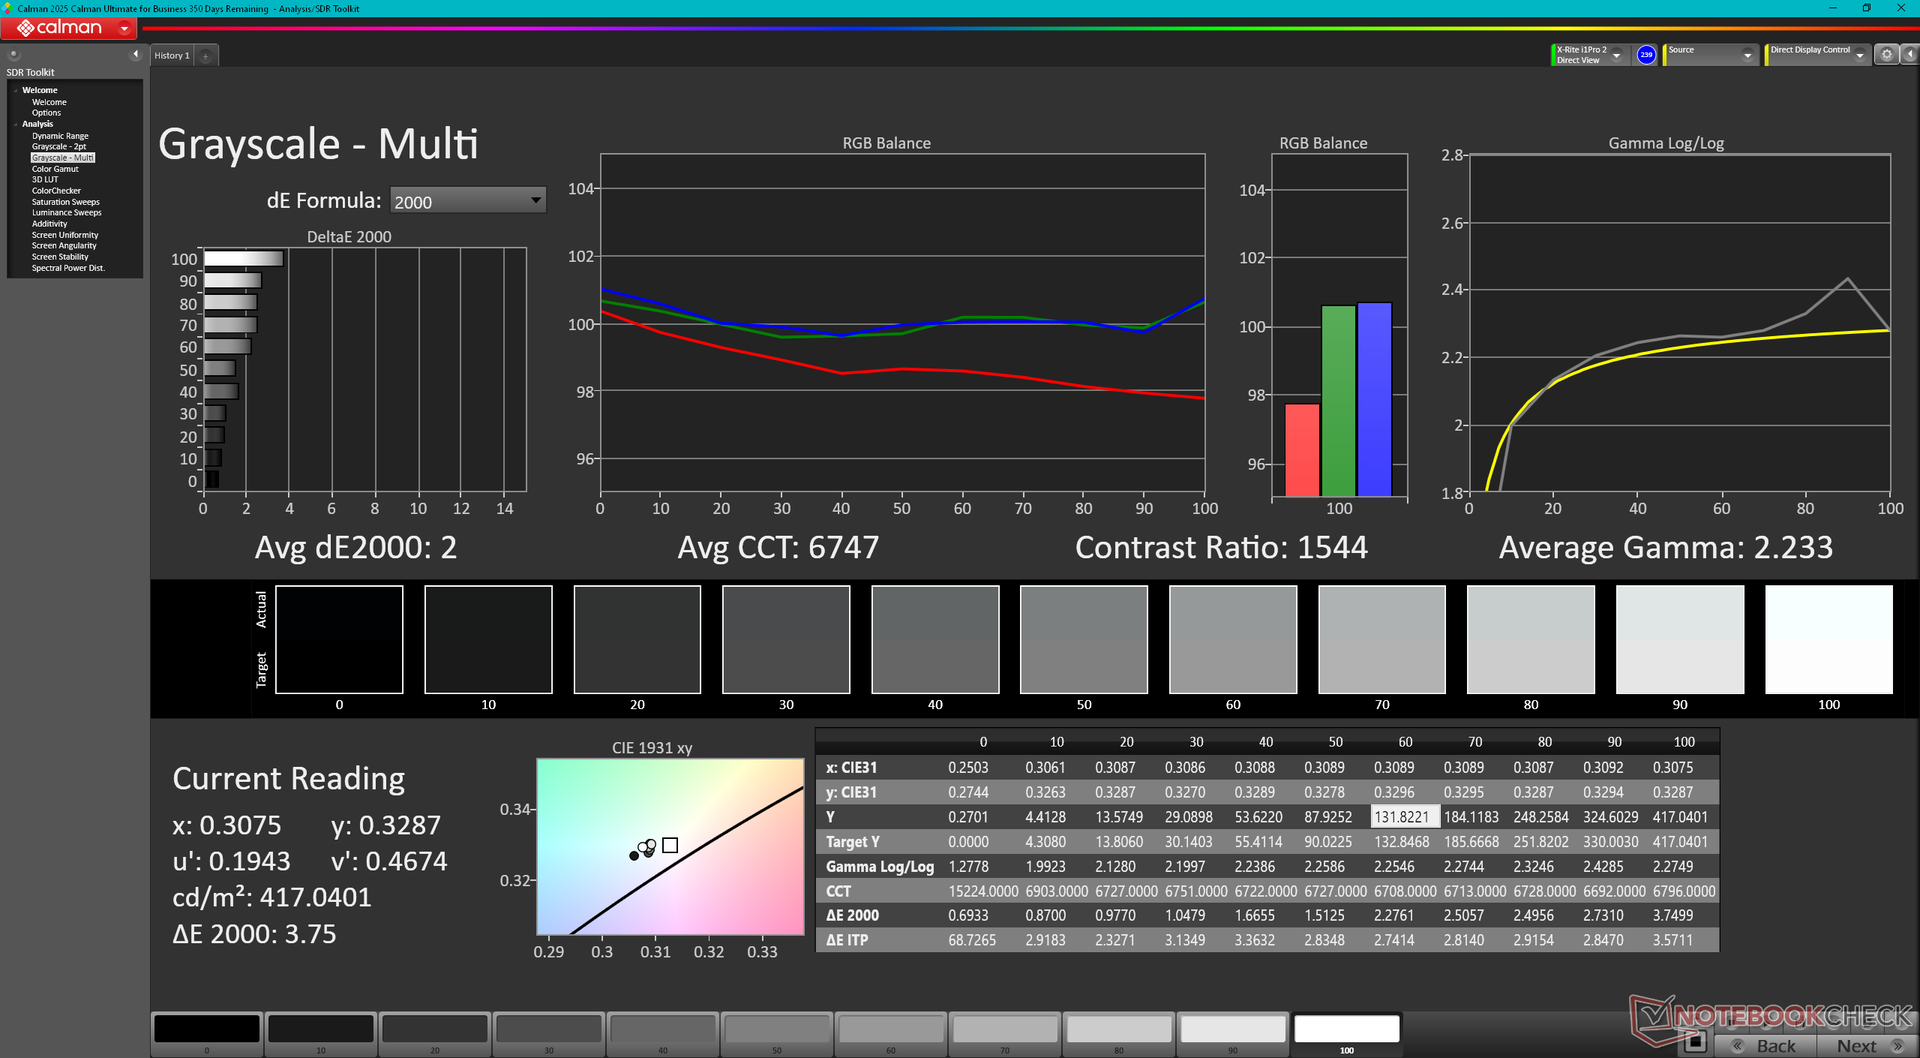
ΔE Greyscale Calman: 7.6 | ∀{0.09-98 Ø4.97}
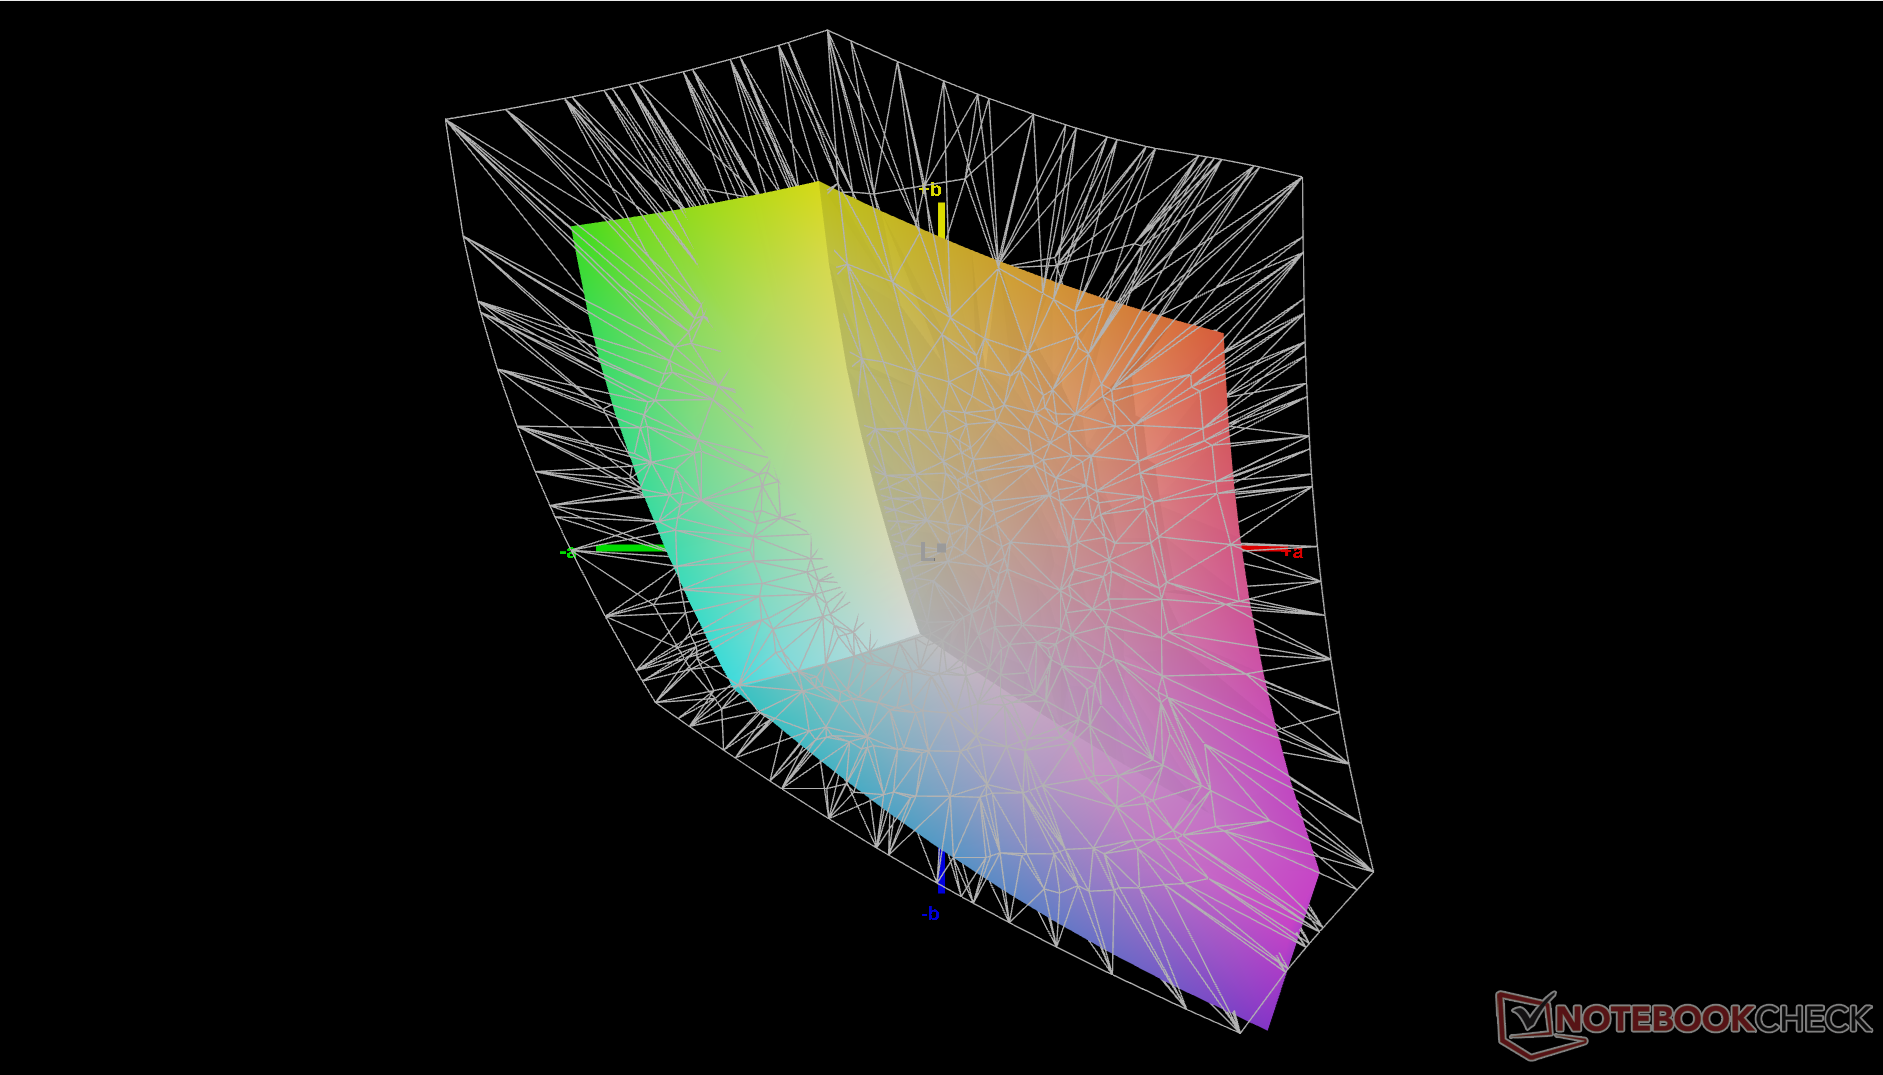
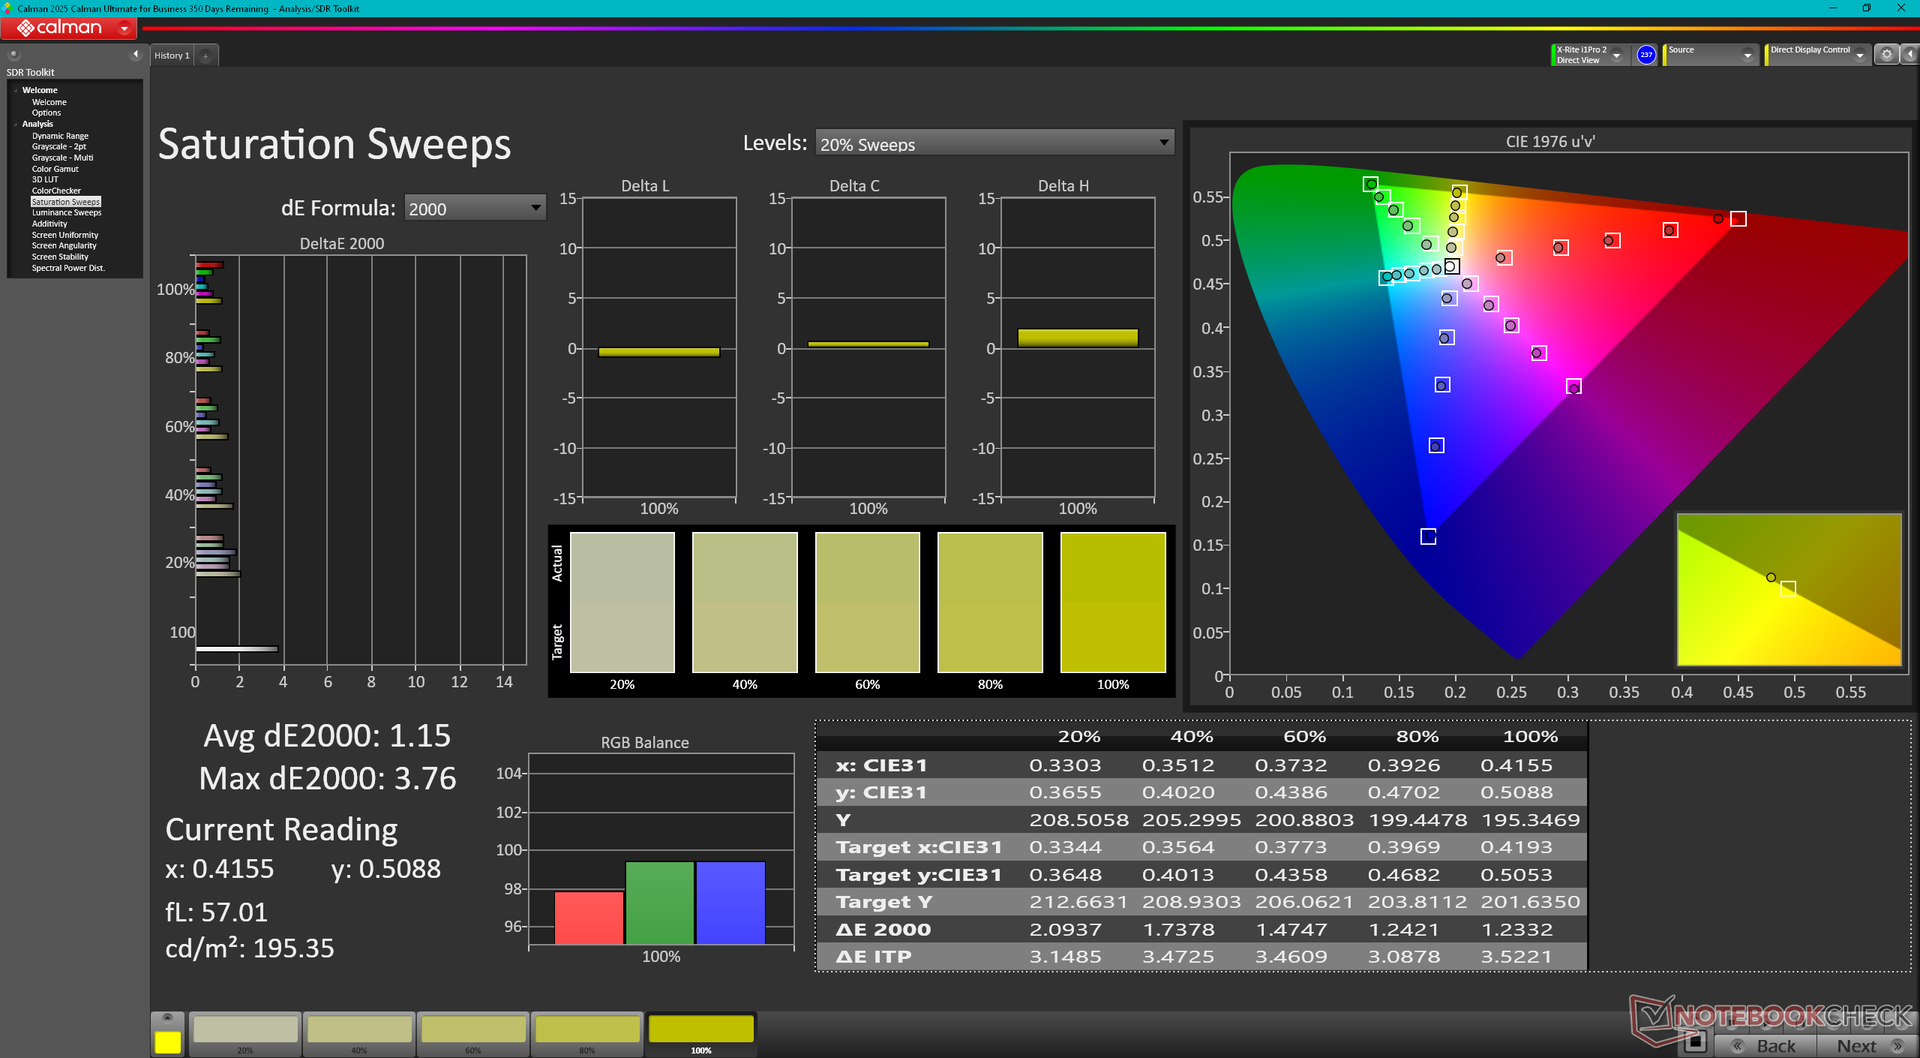
64% AdobeRGB 1998 (Argyll 3D)
93.2% sRGB (Argyll 3D)
62.6% Display P3 (Argyll 3D)
Gamma: 2.22
CCT: 6728 K
| HP EliteBook X G1a 14 AI LG Philips LGD07A1, IPS, 1920x1200, 14", 60 Hz | HP EliteBook 1040 G10 818N7EA CMN1435, IPS, 1920x1200, 14", 60 Hz | Lenovo ThinkPad X1 Carbon Gen 13 21NS0010GE ATNA40YK20-0, OLED, 2880x1800, 14", 120 Hz | Dell Latitude 7450 2-in-1 BOE NV140WU, IPS, 1920x1200, 14", 60 Hz | Asus ExpertBook P5 P5405-NZ0102X NE140QDM-NX4, IPS LED, 2560x1600, 14", 144 Hz | Acer Swift 14 AI SF14-51-58TU Samsung ATNA40YK11-0 (SDC4181), OLED, 2880x1800, 14", 90 Hz | |
|---|---|---|---|---|---|---|
| Display | 4% | 39% | 16% | 10% | 40% | |
| Display P3 Coverage (%) | 62.6 | 67.7 8% | 99.5 59% | 76.5 22% | 70.8 13% | 99.9 60% |
| sRGB Coverage (%) | 93.2 | 88.1 -5% | 100 7% | 100 7% | 98 5% | 100 7% |
| AdobeRGB 1998 Coverage (%) | 64 | 69.8 9% | 97.1 52% | 76 19% | 71.6 12% | 97.6 53% |
| Response Times | 5% | 95% | 30% | 29% | 98% | |
| Response Time Grey 50% / Grey 80% * (ms) | 55.8 ? | 54.8 ? 2% | 2.4 ? 96% | 35.65 ? 36% | 36.3 ? 35% | 0.8 ? 99% |
| Response Time Black / White * (ms) | 30.5 ? | 28.3 ? 7% | 1.9 ? 94% | 23.35 ? 23% | 23.4 ? 23% | 0.8 ? 97% |
| PWM Frequency (Hz) | 240 ? | 60 ? | ||||
| PWM Amplitude * (%) | 33 | |||||
| Screen | 14% | -22% | 8% | 21% | 287% | |
| Brightness middle (cd/m²) | 442.8 | 343 -23% | 407 -8% | 333 -25% | 457 3% | 500 13% |
| Brightness (cd/m²) | 412 | 330 -20% | 410 0% | 326 -21% | 457 11% | 499 21% |
| Brightness Distribution (%) | 87 | 92 6% | 99 14% | 85 -2% | 95 9% | 97 11% |
| Black Level * (cd/m²) | 0.22 | 0.19 14% | 0.27 -23% | 0.12 45% | 0.01 95% | |
| Contrast (:1) | 2013 | 1805 -10% | 1233 -39% | 3808 89% | 50000 2384% | |
| Colorchecker dE 2000 * | 5.92 | 3 49% | 4.9 17% | 2.46 58% | 4.9 17% | 3.55 40% |
| Colorchecker dE 2000 max. * | 10.46 | 7 33% | 9.1 13% | 4.58 56% | 8.5 19% | 6.38 39% |
| Colorchecker dE 2000 calibrated * | 1.31 | 0.7 47% | 4.7 -259% | 1.31 -0% | 1.7 -30% | 2.55 -95% |
| Greyscale dE 2000 * | 7.6 | 5.4 29% | 2.3 70% | 2.1 72% | 5.7 25% | 2.2 71% |
| Gamma | 2.22 99% | 2.14 103% | 2.26 97% | 2.2 100% | 2.25 98% | 1.94 113% |
| CCT | 6728 97% | 7079 92% | 6310 103% | 6578 99% | 7647 85% | 6405 101% |
| Total Average (Program / Settings) | 8% /
10% | 37% /
13% | 18% /
13% | 20% /
20% | 142% /
207% |
* ... smaller is better
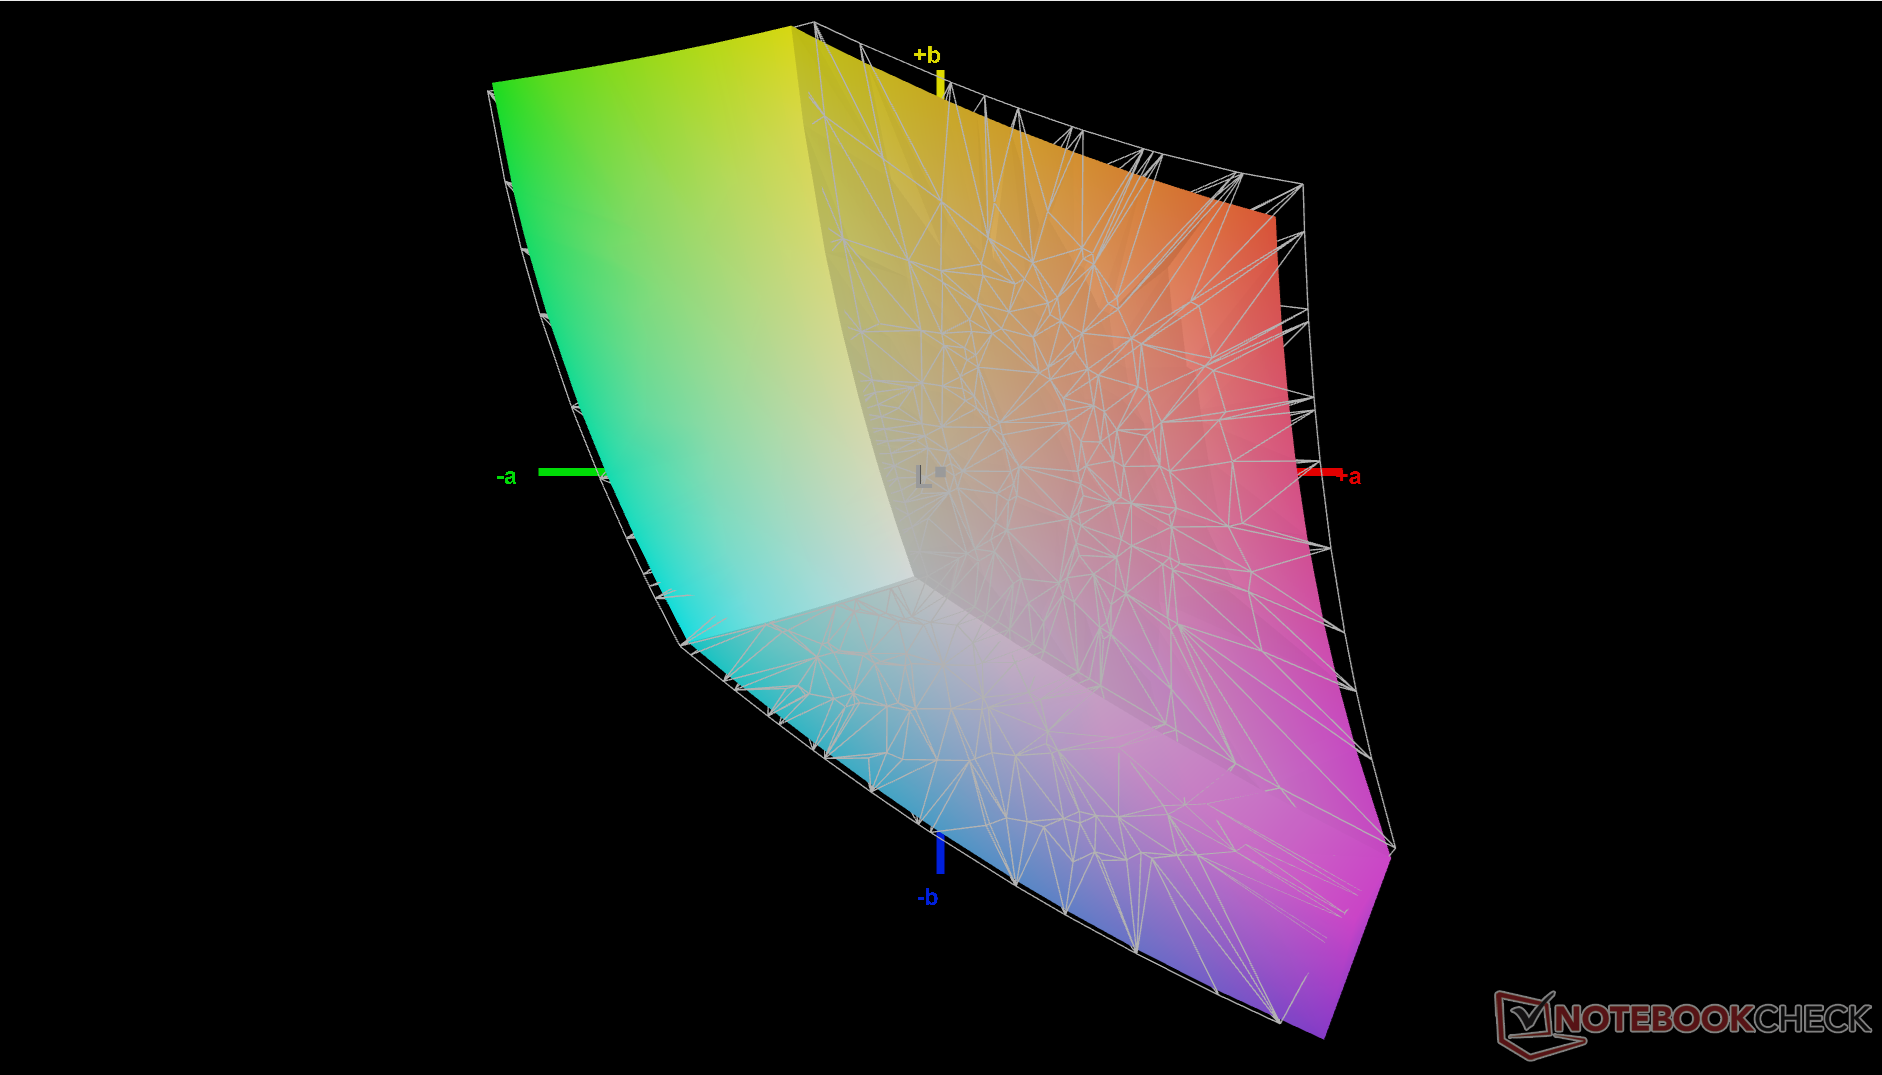
The FHD panel does not come calibrated at factory and so average grayscale and color deltaE values are only average at 7.6 and 5.92, respectively. Calibrating the display ourselves with an X-Rite colorimeter would improve the averages to just 2.0 and 1.31, respectively. We recommend applying our calibrated ICM profile above to get more accurate sRGB colors.
Display Response Times
| ↔ Response Time Black to White | ||
|---|---|---|
| 30.5 ms ... rise ↗ and fall ↘ combined | ↗ 15.3 ms rise | 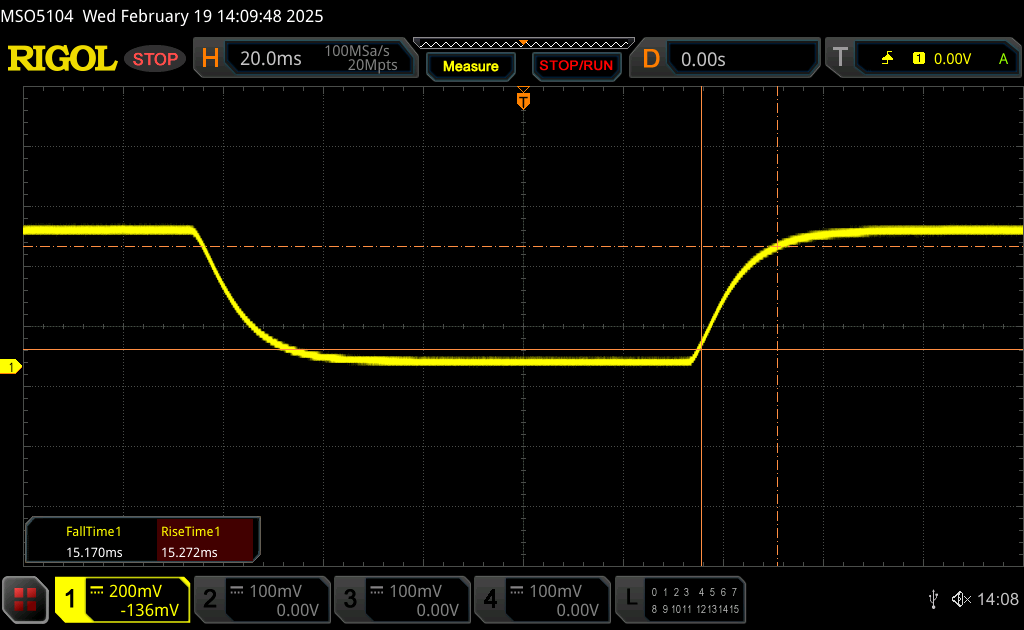 |
| ↘ 15.2 ms fall | ||
| The screen shows slow response rates in our tests and will be unsatisfactory for gamers. In comparison, all tested devices range from 0.1 (minimum) to 240 (maximum) ms. » 83 % of all devices are better. This means that the measured response time is worse than the average of all tested devices (19.9 ms). | ||
| ↔ Response Time 50% Grey to 80% Grey | ||
| 55.8 ms ... rise ↗ and fall ↘ combined | ↗ 25.3 ms rise | 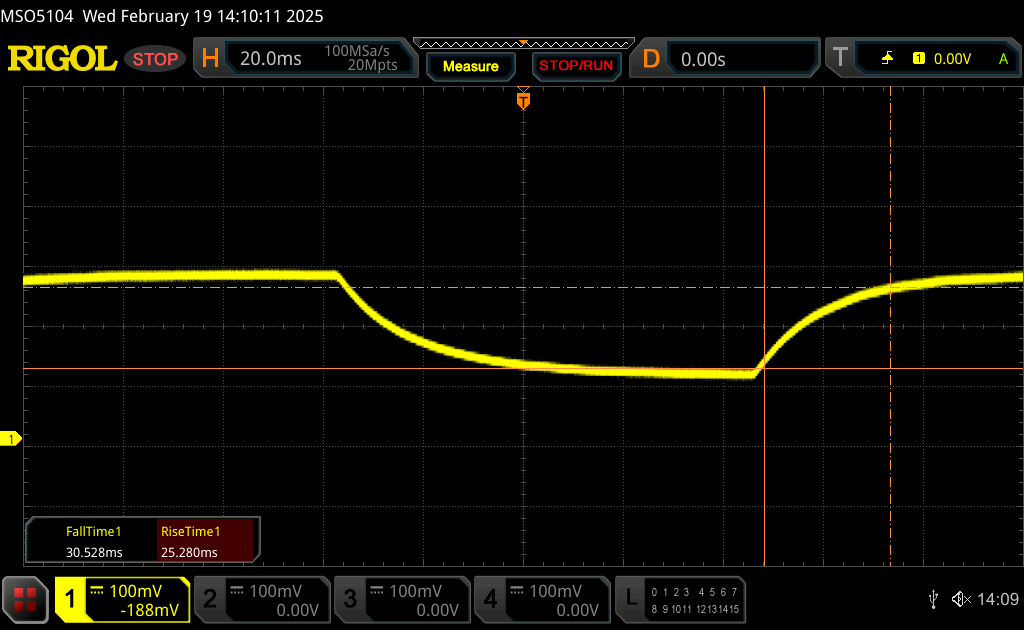 |
| ↘ 30.5 ms fall | ||
| The screen shows slow response rates in our tests and will be unsatisfactory for gamers. In comparison, all tested devices range from 0.165 (minimum) to 636 (maximum) ms. » 93 % of all devices are better. This means that the measured response time is worse than the average of all tested devices (31.1 ms). | ||
Screen Flickering / PWM (Pulse-Width Modulation)
| Screen flickering / PWM not detected | 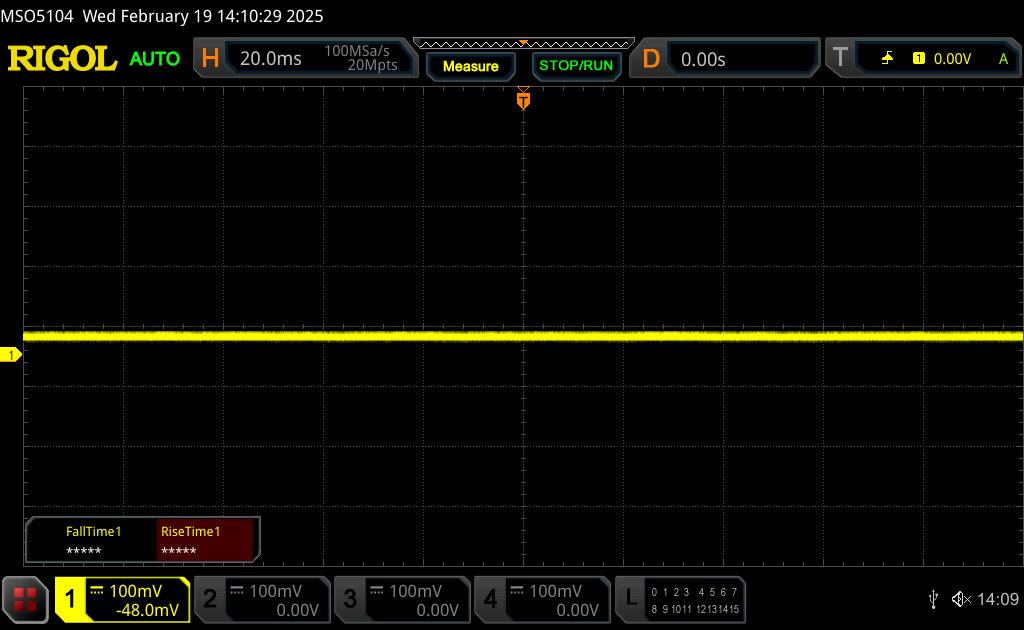 | ||
In comparison: 52 % of all tested devices do not use PWM to dim the display. If PWM was detected, an average of 7798 (minimum: 5 - maximum: 343500) Hz was measured. | |||
Outdoor visibility is average for the category given the ~400 nit backlight. HP does not offer any 1000-nit options with this particular model.

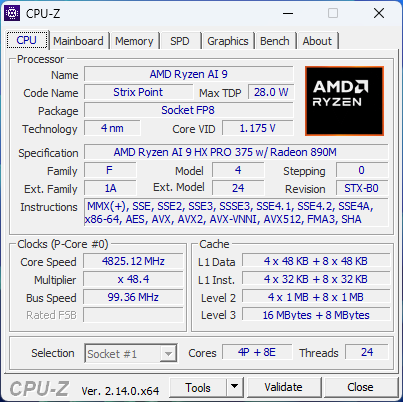
Performance — Zen 5 Dominance
Testing Conditions
We set MyHP to Performance mode prior to running the benchmarks below. The two power profiles in MyHP (Smart Sense and Performance) correlate with the Windows Balanced and Performance profiles, respectively. Changing one setting will automatically change the other unlike on older versions of MyHP.
Processor
CPU performance is a significant boost at ~2x over most other 14-inch business laptops where Intel options are much more common. The Ryzen AI 9 HX PRO 375 runs at a higher power envelope than Intel Lunar Lake or Raptor Lake-U and the advantages really show.
Dropping down from our Ryzen AI 9 HX SKU to the Ryzen AI 7 PRO 360 option is expected to impact performance by as much as 35 percent based on our time with the Lenovo ThinkPad T14s Gen 6. The performance difference is rather significant between the two processor options.
Cinebench R15 Multi Loop
Cinebench R23: Multi Core | Single Core
Cinebench R20: CPU (Multi Core) | CPU (Single Core)
Cinebench R15: CPU Multi 64Bit | CPU Single 64Bit
Blender: v2.79 BMW27 CPU
7-Zip 18.03: 7z b 4 | 7z b 4 -mmt1
Geekbench 6.7: Multi-Core | Single-Core
Geekbench 5.5: Multi-Core | Single-Core
HWBOT x265 Benchmark v2.2: 4k Preset
LibreOffice : 20 Documents To PDF
R Benchmark 2.5: Overall mean
* ... smaller is better
AIDA64: FP32 Ray-Trace | FPU Julia | CPU SHA3 | CPU Queen | FPU SinJulia | FPU Mandel | CPU AES | CPU ZLib | FP64 Ray-Trace | CPU PhotoWorxx
| Performance rating | |
| HP EliteBook X G1a 14 AI | |
| Average AMD Ryzen AI 9 HX PRO 375 | |
| Asus ExpertBook P5 P5405-NZ0102X | |
| Lenovo ThinkPad X1 Carbon Gen 13 21NS0010GE | |
| Acer Swift 14 AI SF14-51-58TU | |
| Dell Latitude 7450 2-in-1 | |
| HP EliteBook 1040 G10 818N7EA | |
| AIDA64 / FP32 Ray-Trace | |
| HP EliteBook X G1a 14 AI | |
| Average AMD Ryzen AI 9 HX PRO 375 (n=1) | |
| Asus ExpertBook P5 P5405-NZ0102X | |
| Acer Swift 14 AI SF14-51-58TU | |
| Dell Latitude 7450 2-in-1 | |
| Lenovo ThinkPad X1 Carbon Gen 13 21NS0010GE | |
| HP EliteBook 1040 G10 818N7EA | |
| AIDA64 / FPU Julia | |
| HP EliteBook X G1a 14 AI | |
| Average AMD Ryzen AI 9 HX PRO 375 (n=1) | |
| Asus ExpertBook P5 P5405-NZ0102X | |
| Acer Swift 14 AI SF14-51-58TU | |
| Lenovo ThinkPad X1 Carbon Gen 13 21NS0010GE | |
| Dell Latitude 7450 2-in-1 | |
| HP EliteBook 1040 G10 818N7EA | |
| AIDA64 / CPU SHA3 | |
| HP EliteBook X G1a 14 AI | |
| Average AMD Ryzen AI 9 HX PRO 375 (n=1) | |
| Asus ExpertBook P5 P5405-NZ0102X | |
| Dell Latitude 7450 2-in-1 | |
| Lenovo ThinkPad X1 Carbon Gen 13 21NS0010GE | |
| Acer Swift 14 AI SF14-51-58TU | |
| HP EliteBook 1040 G10 818N7EA | |
| AIDA64 / CPU Queen | |
| HP EliteBook X G1a 14 AI | |
| Average AMD Ryzen AI 9 HX PRO 375 (n=1) | |
| HP EliteBook 1040 G10 818N7EA | |
| Asus ExpertBook P5 P5405-NZ0102X | |
| Lenovo ThinkPad X1 Carbon Gen 13 21NS0010GE | |
| Dell Latitude 7450 2-in-1 | |
| Acer Swift 14 AI SF14-51-58TU | |
| AIDA64 / FPU SinJulia | |
| HP EliteBook X G1a 14 AI | |
| Average AMD Ryzen AI 9 HX PRO 375 (n=1) | |
| Dell Latitude 7450 2-in-1 | |
| Asus ExpertBook P5 P5405-NZ0102X | |
| HP EliteBook 1040 G10 818N7EA | |
| Lenovo ThinkPad X1 Carbon Gen 13 21NS0010GE | |
| Acer Swift 14 AI SF14-51-58TU | |
| AIDA64 / FPU Mandel | |
| HP EliteBook X G1a 14 AI | |
| Average AMD Ryzen AI 9 HX PRO 375 (n=1) | |
| Asus ExpertBook P5 P5405-NZ0102X | |
| Acer Swift 14 AI SF14-51-58TU | |
| Lenovo ThinkPad X1 Carbon Gen 13 21NS0010GE | |
| Dell Latitude 7450 2-in-1 | |
| HP EliteBook 1040 G10 818N7EA | |
| AIDA64 / CPU AES | |
| HP EliteBook X G1a 14 AI | |
| Average AMD Ryzen AI 9 HX PRO 375 (n=1) | |
| Dell Latitude 7450 2-in-1 | |
| Asus ExpertBook P5 P5405-NZ0102X | |
| Lenovo ThinkPad X1 Carbon Gen 13 21NS0010GE | |
| Acer Swift 14 AI SF14-51-58TU | |
| HP EliteBook 1040 G10 818N7EA | |
| AIDA64 / CPU ZLib | |
| HP EliteBook X G1a 14 AI | |
| Average AMD Ryzen AI 9 HX PRO 375 (n=1) | |
| Dell Latitude 7450 2-in-1 | |
| Asus ExpertBook P5 P5405-NZ0102X | |
| Lenovo ThinkPad X1 Carbon Gen 13 21NS0010GE | |
| Acer Swift 14 AI SF14-51-58TU | |
| HP EliteBook 1040 G10 818N7EA | |
| AIDA64 / FP64 Ray-Trace | |
| HP EliteBook X G1a 14 AI | |
| Average AMD Ryzen AI 9 HX PRO 375 (n=1) | |
| Asus ExpertBook P5 P5405-NZ0102X | |
| Acer Swift 14 AI SF14-51-58TU | |
| Lenovo ThinkPad X1 Carbon Gen 13 21NS0010GE | |
| Dell Latitude 7450 2-in-1 | |
| HP EliteBook 1040 G10 818N7EA | |
| AIDA64 / CPU PhotoWorxx | |
| Asus ExpertBook P5 P5405-NZ0102X | |
| Lenovo ThinkPad X1 Carbon Gen 13 21NS0010GE | |
| HP EliteBook X G1a 14 AI | |
| Average AMD Ryzen AI 9 HX PRO 375 (n=1) | |
| Acer Swift 14 AI SF14-51-58TU | |
| Dell Latitude 7450 2-in-1 | |
| HP EliteBook 1040 G10 818N7EA | |
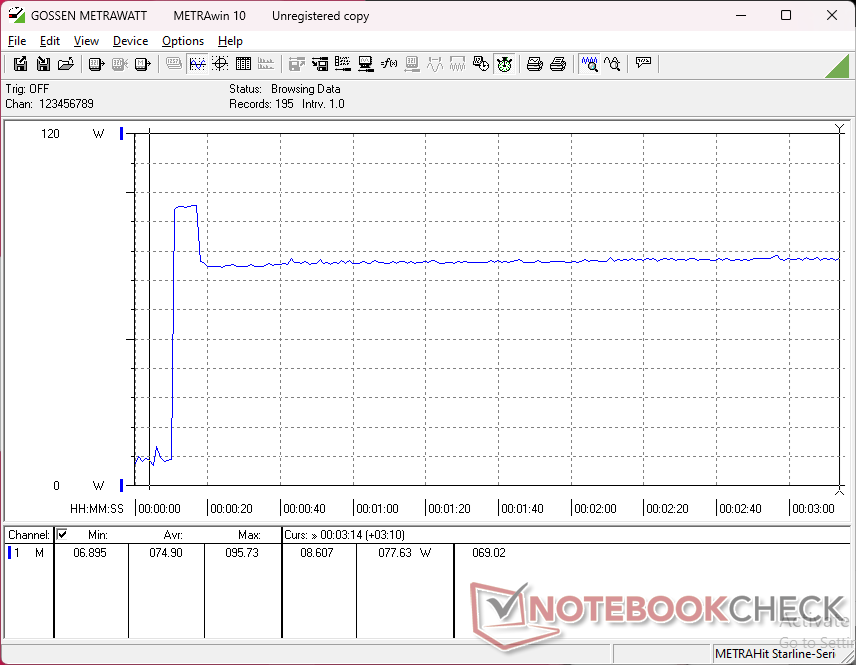
Stress Test
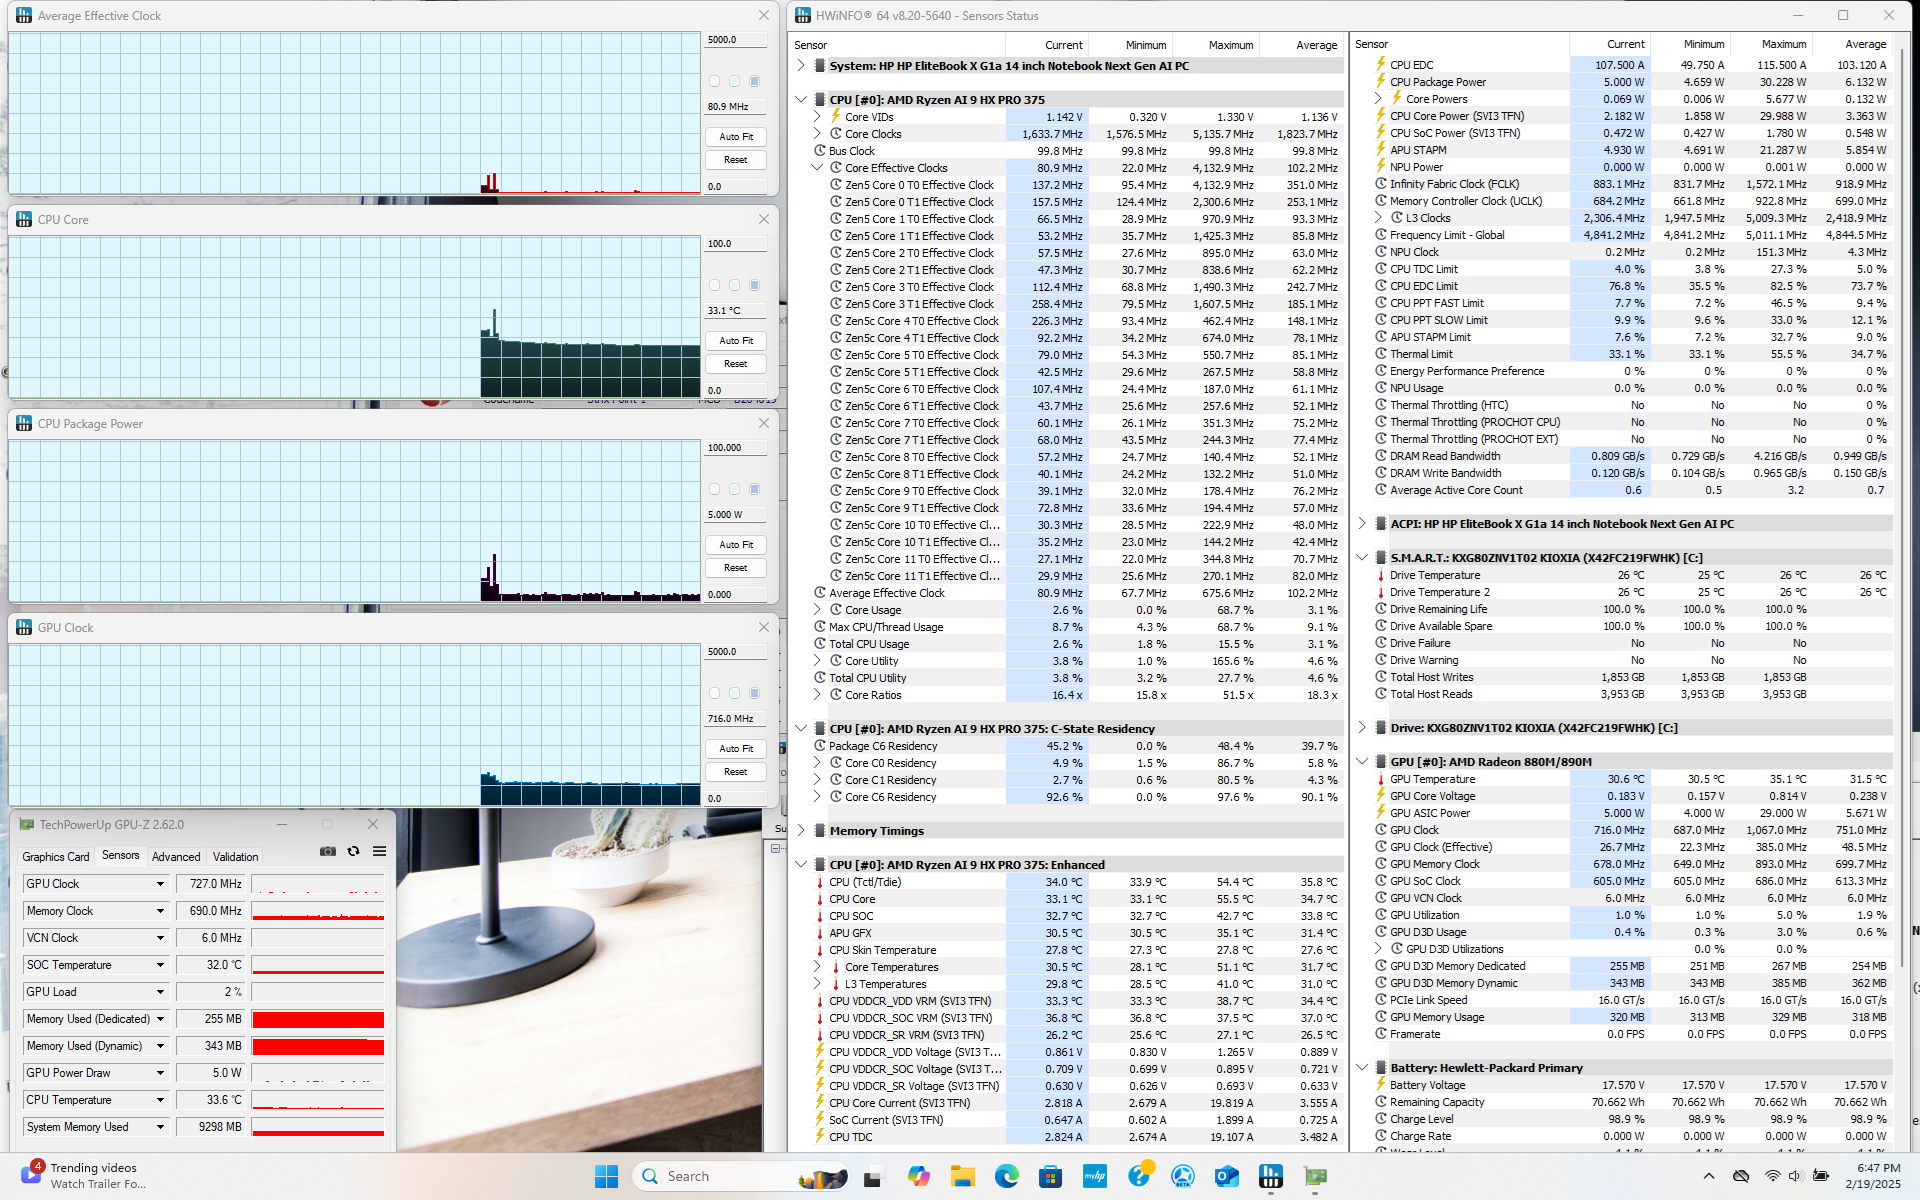
The CPU would boost to 3.6 GHz and 65 W when initiating Prime95 stress before falling to 3.1 GHz and 50 W just a few seconds later due to thermal limitations. The observation aligns with our results in the Power Consumption section below. Maximum CPU Boost performance is thus not sustainable.
Core temperature would stabilize at 67 C when running Cyberpunk 2077 on Performance mode compared to 84 C on the OmniBook Ultra 14 with a similar Zen 5 CPU.
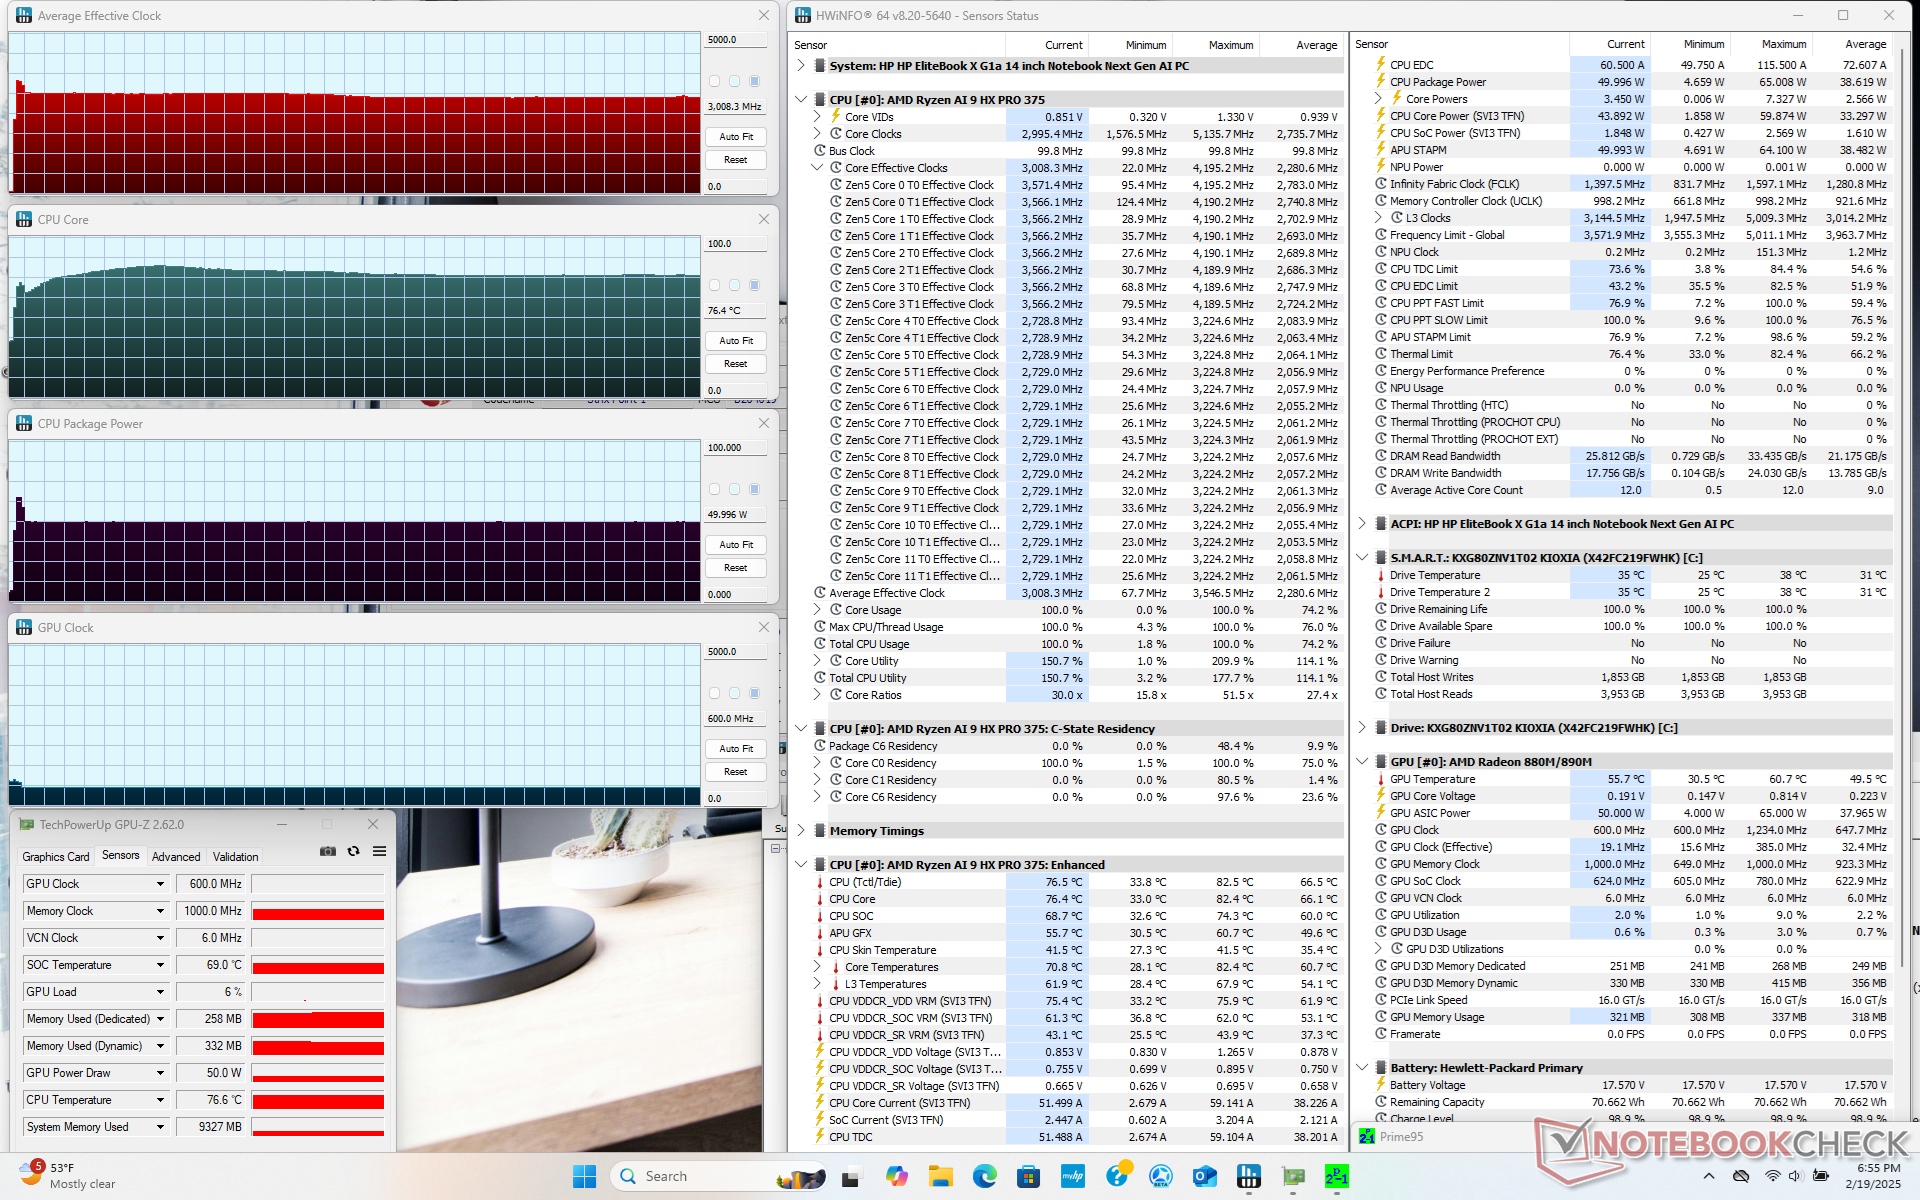
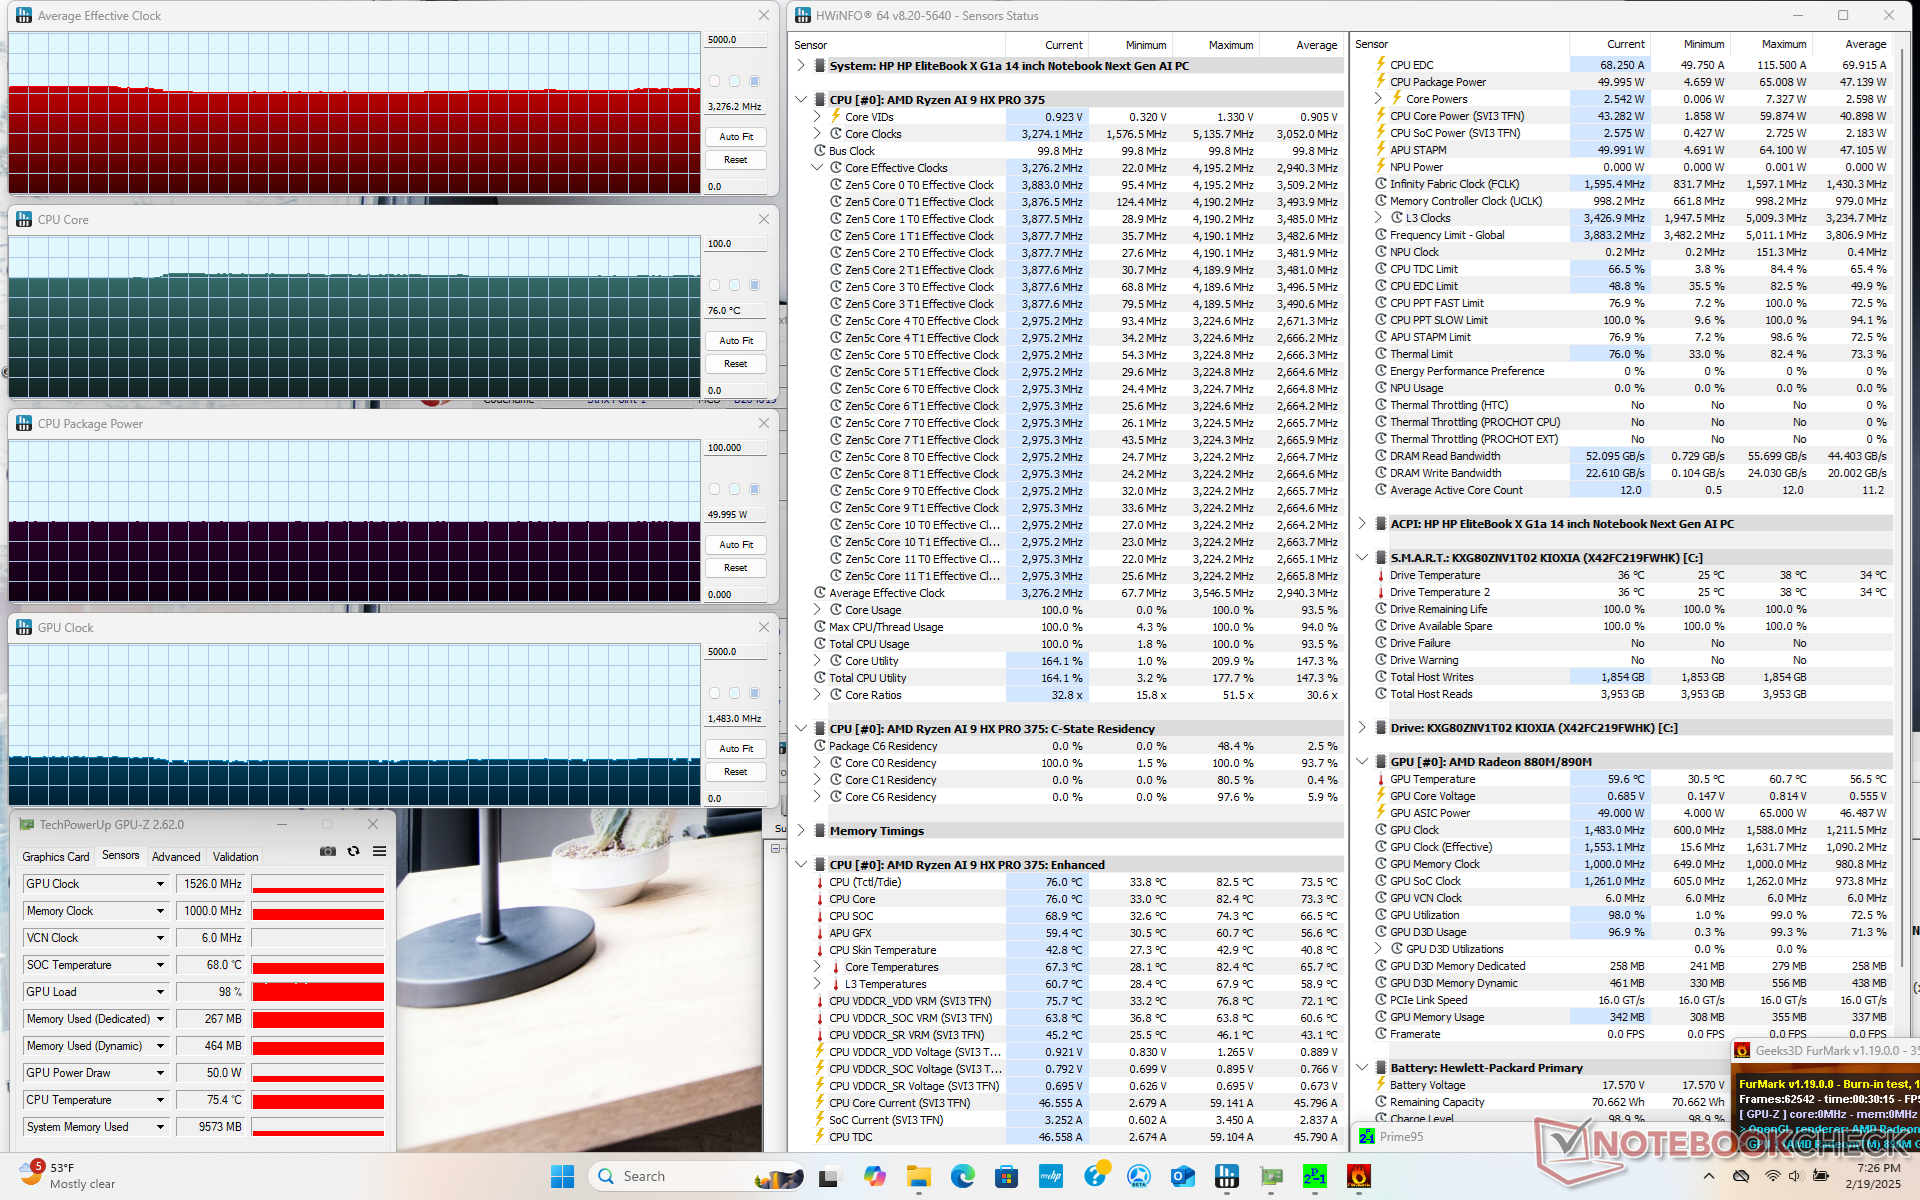
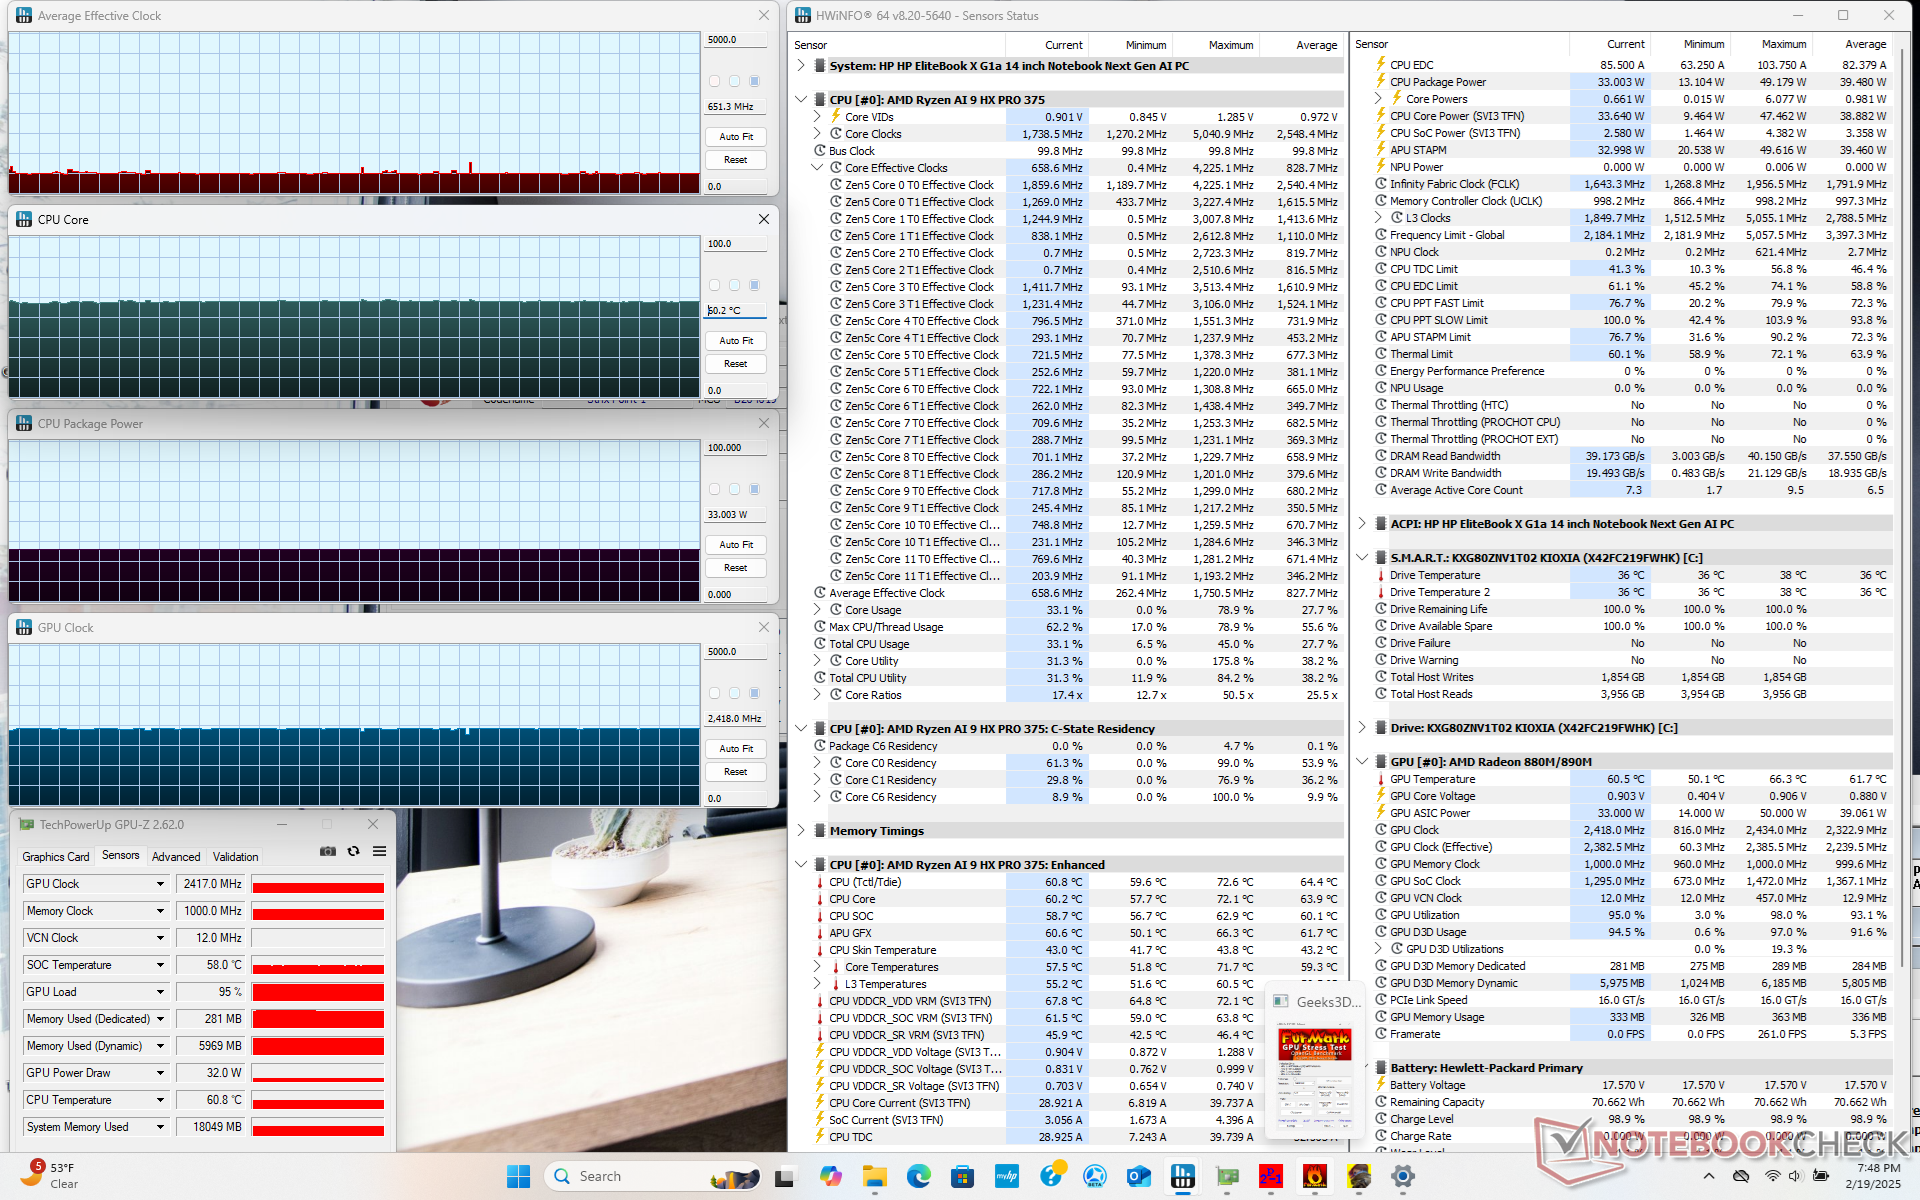
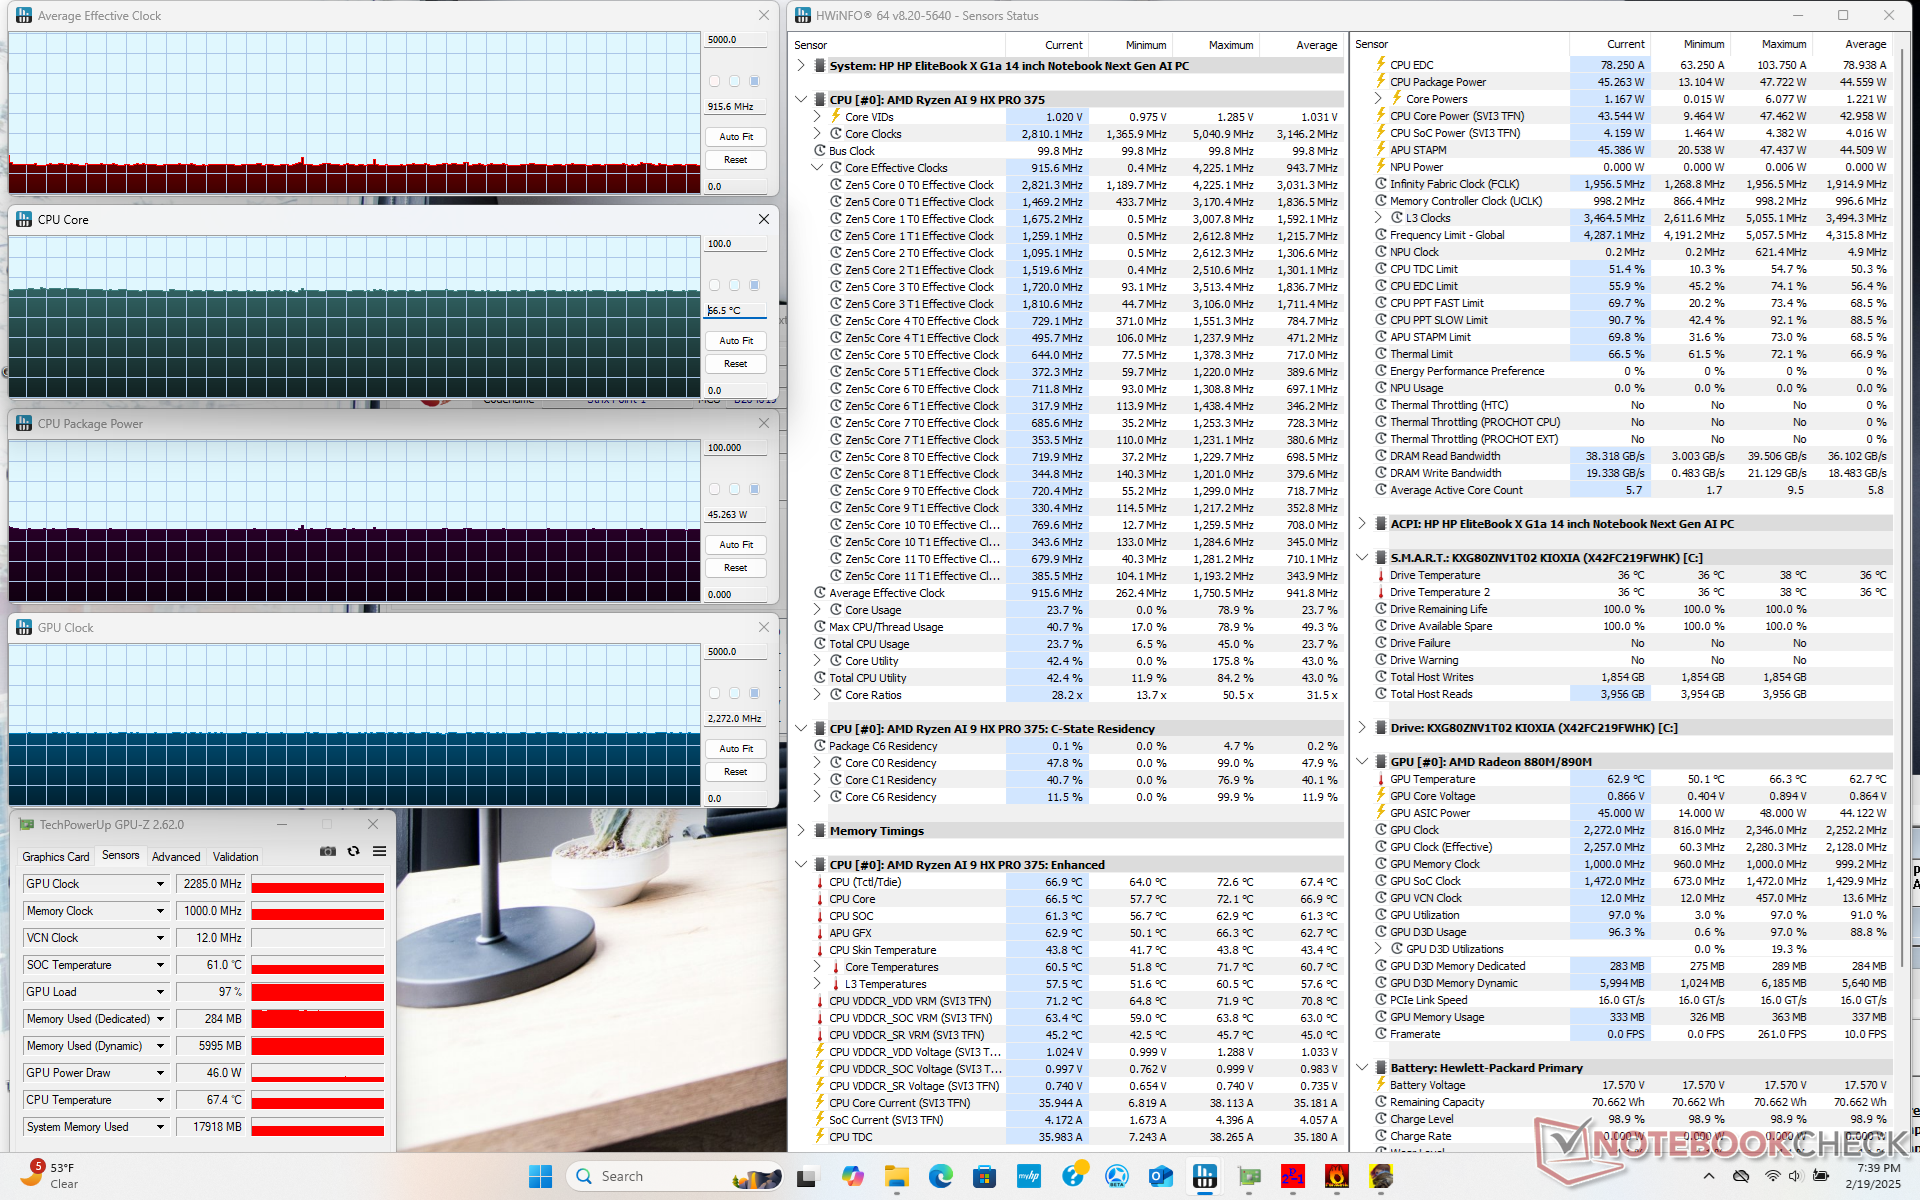
| Average CPU Clock (GHz) | GPU Clock (MHz) | Average CPU Temperature (°C) | |
| System Idle | -- | -- | 33 |
| Prime95 Stress | 3.0 | -- | 76 |
| Prime95 + FurMark Stress | 3.3 | 1483 | 76 |
| Cyberpunk 2077 Stress (Balanced profile) | 0.7 | 2418 | 60 |
| Cyberpunk 2077 Stress (Performance profile) | 0.9 | 2272 | 67 |
System Performance
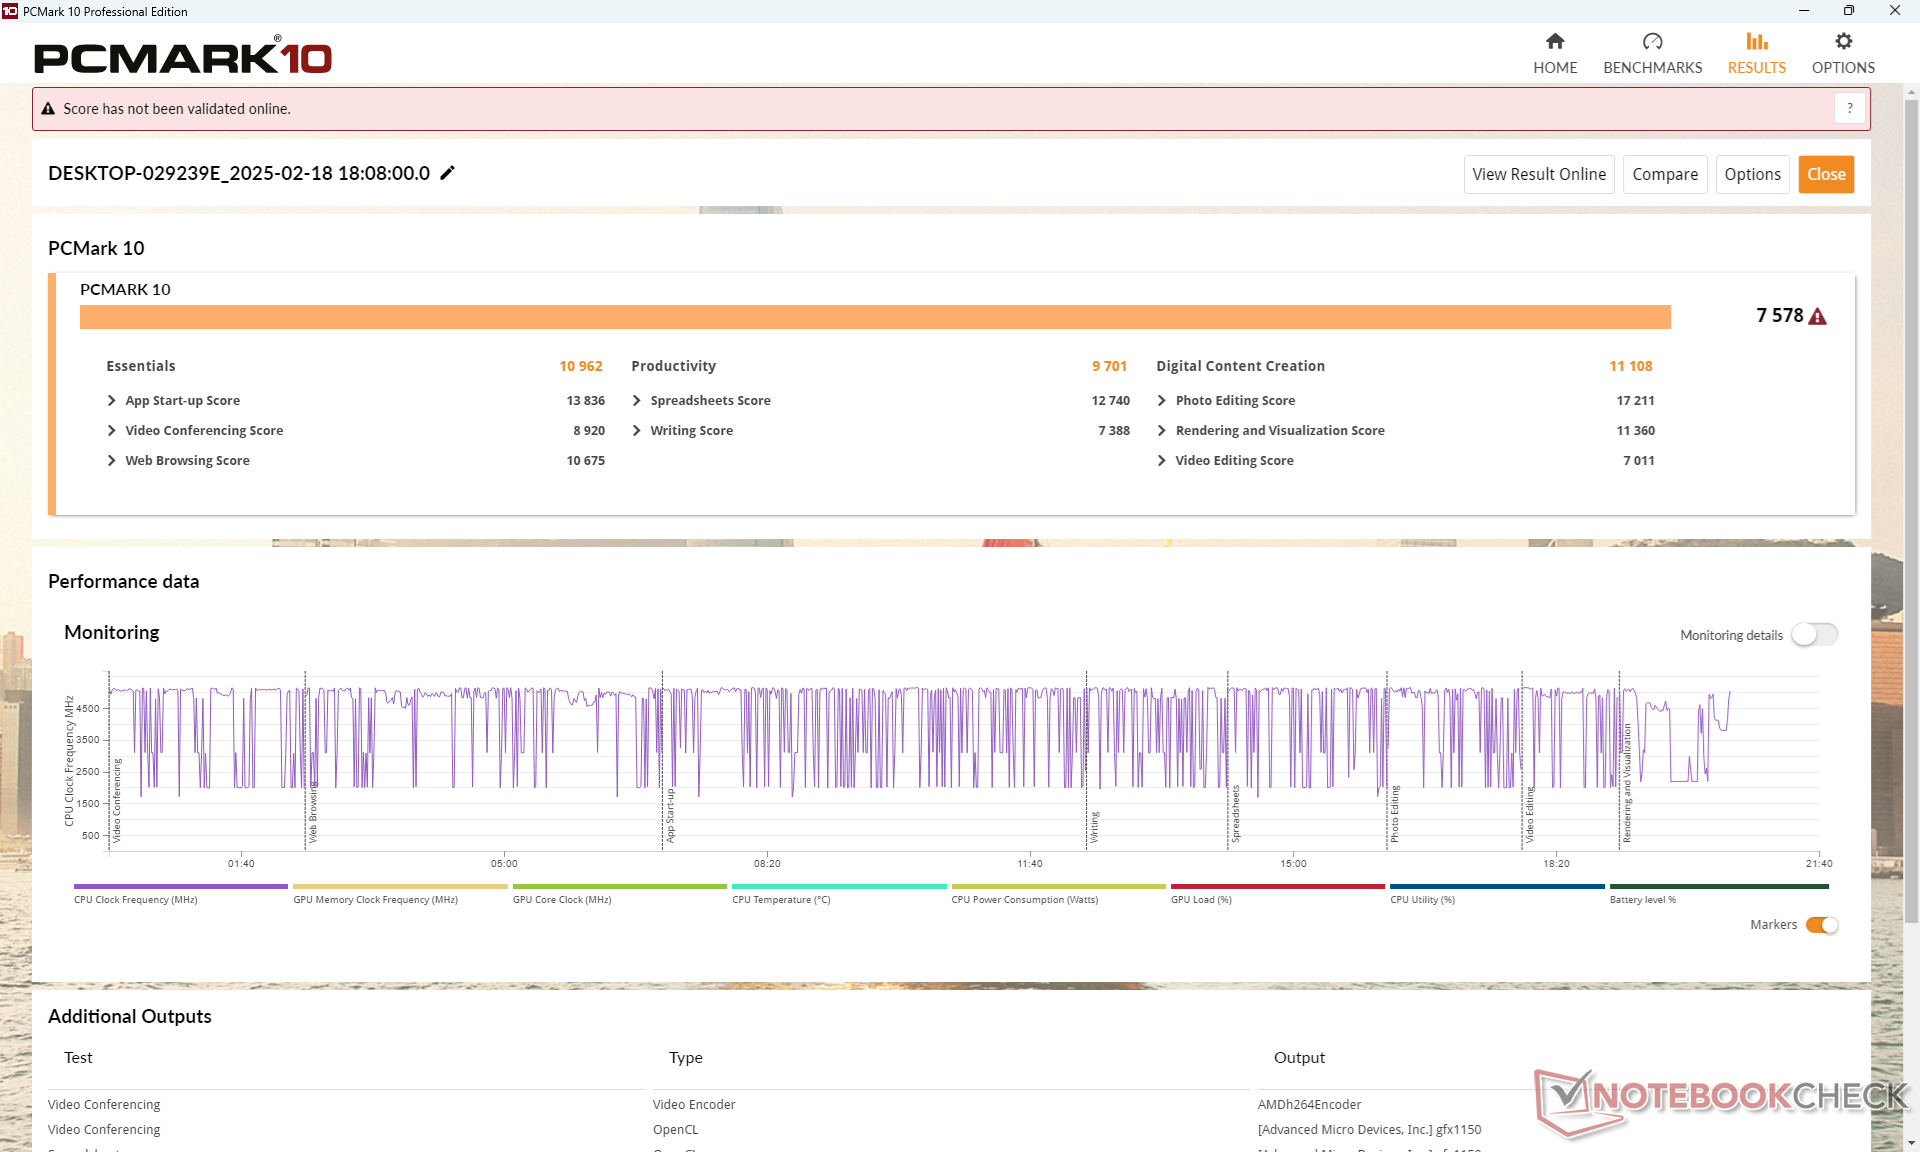
PCMark results are some of the fastest of any 14-inch business laptop due to the Zen 5 CPU. RAM performance is nonetheless slower than the embedded solution on the Intel Lunar Lake series.
CrossMark: Overall | Productivity | Creativity | Responsiveness
WebXPRT 3: Overall
WebXPRT 4: Overall
Mozilla Kraken 1.1: Total
| PCMark 10 / Score | |
| HP EliteBook X G1a 14 AI | |
| Average AMD Ryzen AI 9 HX PRO 375, AMD Radeon 890M (n=1) | |
| Lenovo ThinkPad X1 Carbon Gen 13 21NS0010GE | |
| Asus ExpertBook P5 P5405-NZ0102X | |
| Acer Swift 14 AI SF14-51-58TU | |
| Dell Latitude 7450 2-in-1 | |
| HP EliteBook 1040 G10 818N7EA | |
| PCMark 10 / Essentials | |
| Dell Latitude 7450 2-in-1 | |
| HP EliteBook X G1a 14 AI | |
| Average AMD Ryzen AI 9 HX PRO 375, AMD Radeon 890M (n=1) | |
| Lenovo ThinkPad X1 Carbon Gen 13 21NS0010GE | |
| HP EliteBook 1040 G10 818N7EA | |
| Asus ExpertBook P5 P5405-NZ0102X | |
| Acer Swift 14 AI SF14-51-58TU | |
| PCMark 10 / Productivity | |
| HP EliteBook X G1a 14 AI | |
| Average AMD Ryzen AI 9 HX PRO 375, AMD Radeon 890M (n=1) | |
| Lenovo ThinkPad X1 Carbon Gen 13 21NS0010GE | |
| Asus ExpertBook P5 P5405-NZ0102X | |
| Dell Latitude 7450 2-in-1 | |
| Acer Swift 14 AI SF14-51-58TU | |
| HP EliteBook 1040 G10 818N7EA | |
| PCMark 10 / Digital Content Creation | |
| HP EliteBook X G1a 14 AI | |
| Average AMD Ryzen AI 9 HX PRO 375, AMD Radeon 890M (n=1) | |
| Lenovo ThinkPad X1 Carbon Gen 13 21NS0010GE | |
| Asus ExpertBook P5 P5405-NZ0102X | |
| Acer Swift 14 AI SF14-51-58TU | |
| Dell Latitude 7450 2-in-1 | |
| HP EliteBook 1040 G10 818N7EA | |
| CrossMark / Overall | |
| Lenovo ThinkPad X1 Carbon Gen 13 21NS0010GE | |
| HP EliteBook X G1a 14 AI | |
| Average AMD Ryzen AI 9 HX PRO 375, AMD Radeon 890M (n=1) | |
| Asus ExpertBook P5 P5405-NZ0102X | |
| Dell Latitude 7450 2-in-1 | |
| HP EliteBook 1040 G10 818N7EA | |
| CrossMark / Productivity | |
| Lenovo ThinkPad X1 Carbon Gen 13 21NS0010GE | |
| Asus ExpertBook P5 P5405-NZ0102X | |
| HP EliteBook X G1a 14 AI | |
| Average AMD Ryzen AI 9 HX PRO 375, AMD Radeon 890M (n=1) | |
| Dell Latitude 7450 2-in-1 | |
| HP EliteBook 1040 G10 818N7EA | |
| CrossMark / Creativity | |
| Lenovo ThinkPad X1 Carbon Gen 13 21NS0010GE | |
| HP EliteBook X G1a 14 AI | |
| Average AMD Ryzen AI 9 HX PRO 375, AMD Radeon 890M (n=1) | |
| Asus ExpertBook P5 P5405-NZ0102X | |
| Dell Latitude 7450 2-in-1 | |
| HP EliteBook 1040 G10 818N7EA | |
| CrossMark / Responsiveness | |
| HP EliteBook X G1a 14 AI | |
| Average AMD Ryzen AI 9 HX PRO 375, AMD Radeon 890M (n=1) | |
| Lenovo ThinkPad X1 Carbon Gen 13 21NS0010GE | |
| Dell Latitude 7450 2-in-1 | |
| Asus ExpertBook P5 P5405-NZ0102X | |
| HP EliteBook 1040 G10 818N7EA | |
| WebXPRT 3 / Overall | |
| Dell Latitude 7450 2-in-1 | |
| HP EliteBook X G1a 14 AI | |
| Average AMD Ryzen AI 9 HX PRO 375, AMD Radeon 890M (n=1) | |
| Asus ExpertBook P5 P5405-NZ0102X | |
| HP EliteBook 1040 G10 818N7EA | |
| WebXPRT 4 / Overall | |
| Dell Latitude 7450 2-in-1 | |
| Lenovo ThinkPad X1 Carbon Gen 13 21NS0010GE | |
| Asus ExpertBook P5 P5405-NZ0102X | |
| HP EliteBook X G1a 14 AI | |
| Average AMD Ryzen AI 9 HX PRO 375, AMD Radeon 890M (n=1) | |
| Acer Swift 14 AI SF14-51-58TU | |
| Acer Swift 14 AI SF14-51-58TU | |
| HP EliteBook 1040 G10 818N7EA | |
| Mozilla Kraken 1.1 / Total | |
| HP EliteBook 1040 G10 818N7EA | |
| Acer Swift 14 AI SF14-51-58TU | |
| Acer Swift 14 AI SF14-51-58TU | |
| Asus ExpertBook P5 P5405-NZ0102X | |
| Lenovo ThinkPad X1 Carbon Gen 13 21NS0010GE | |
| HP EliteBook X G1a 14 AI | |
| Average AMD Ryzen AI 9 HX PRO 375, AMD Radeon 890M (n=1) | |
| Dell Latitude 7450 2-in-1 | |
* ... smaller is better
| PCMark 10 Score | 7578 points | |
Help | ||
| AIDA64 / Memory Copy | |
| Asus ExpertBook P5 P5405-NZ0102X | |
| Lenovo ThinkPad X1 Carbon Gen 13 21NS0010GE | |
| Acer Swift 14 AI SF14-51-58TU | |
| HP EliteBook X G1a 14 AI | |
| Average AMD Ryzen AI 9 HX PRO 375 (n=1) | |
| Dell Latitude 7450 2-in-1 | |
| HP EliteBook 1040 G10 818N7EA | |
| AIDA64 / Memory Read | |
| HP EliteBook X G1a 14 AI | |
| Average AMD Ryzen AI 9 HX PRO 375 (n=1) | |
| Asus ExpertBook P5 P5405-NZ0102X | |
| Lenovo ThinkPad X1 Carbon Gen 13 21NS0010GE | |
| Acer Swift 14 AI SF14-51-58TU | |
| HP EliteBook 1040 G10 818N7EA | |
| Dell Latitude 7450 2-in-1 | |
| AIDA64 / Memory Write | |
| Asus ExpertBook P5 P5405-NZ0102X | |
| Lenovo ThinkPad X1 Carbon Gen 13 21NS0010GE | |
| Acer Swift 14 AI SF14-51-58TU | |
| HP EliteBook X G1a 14 AI | |
| Average AMD Ryzen AI 9 HX PRO 375 (n=1) | |
| HP EliteBook 1040 G10 818N7EA | |
| Dell Latitude 7450 2-in-1 | |
| AIDA64 / Memory Latency | |
| Dell Latitude 7450 2-in-1 | |
| HP EliteBook X G1a 14 AI | |
| Average AMD Ryzen AI 9 HX PRO 375 (n=1) | |
| Lenovo ThinkPad X1 Carbon Gen 13 21NS0010GE | |
| Asus ExpertBook P5 P5405-NZ0102X | |
| Acer Swift 14 AI SF14-51-58TU | |
| HP EliteBook 1040 G10 818N7EA | |
* ... smaller is better
DPC Latency
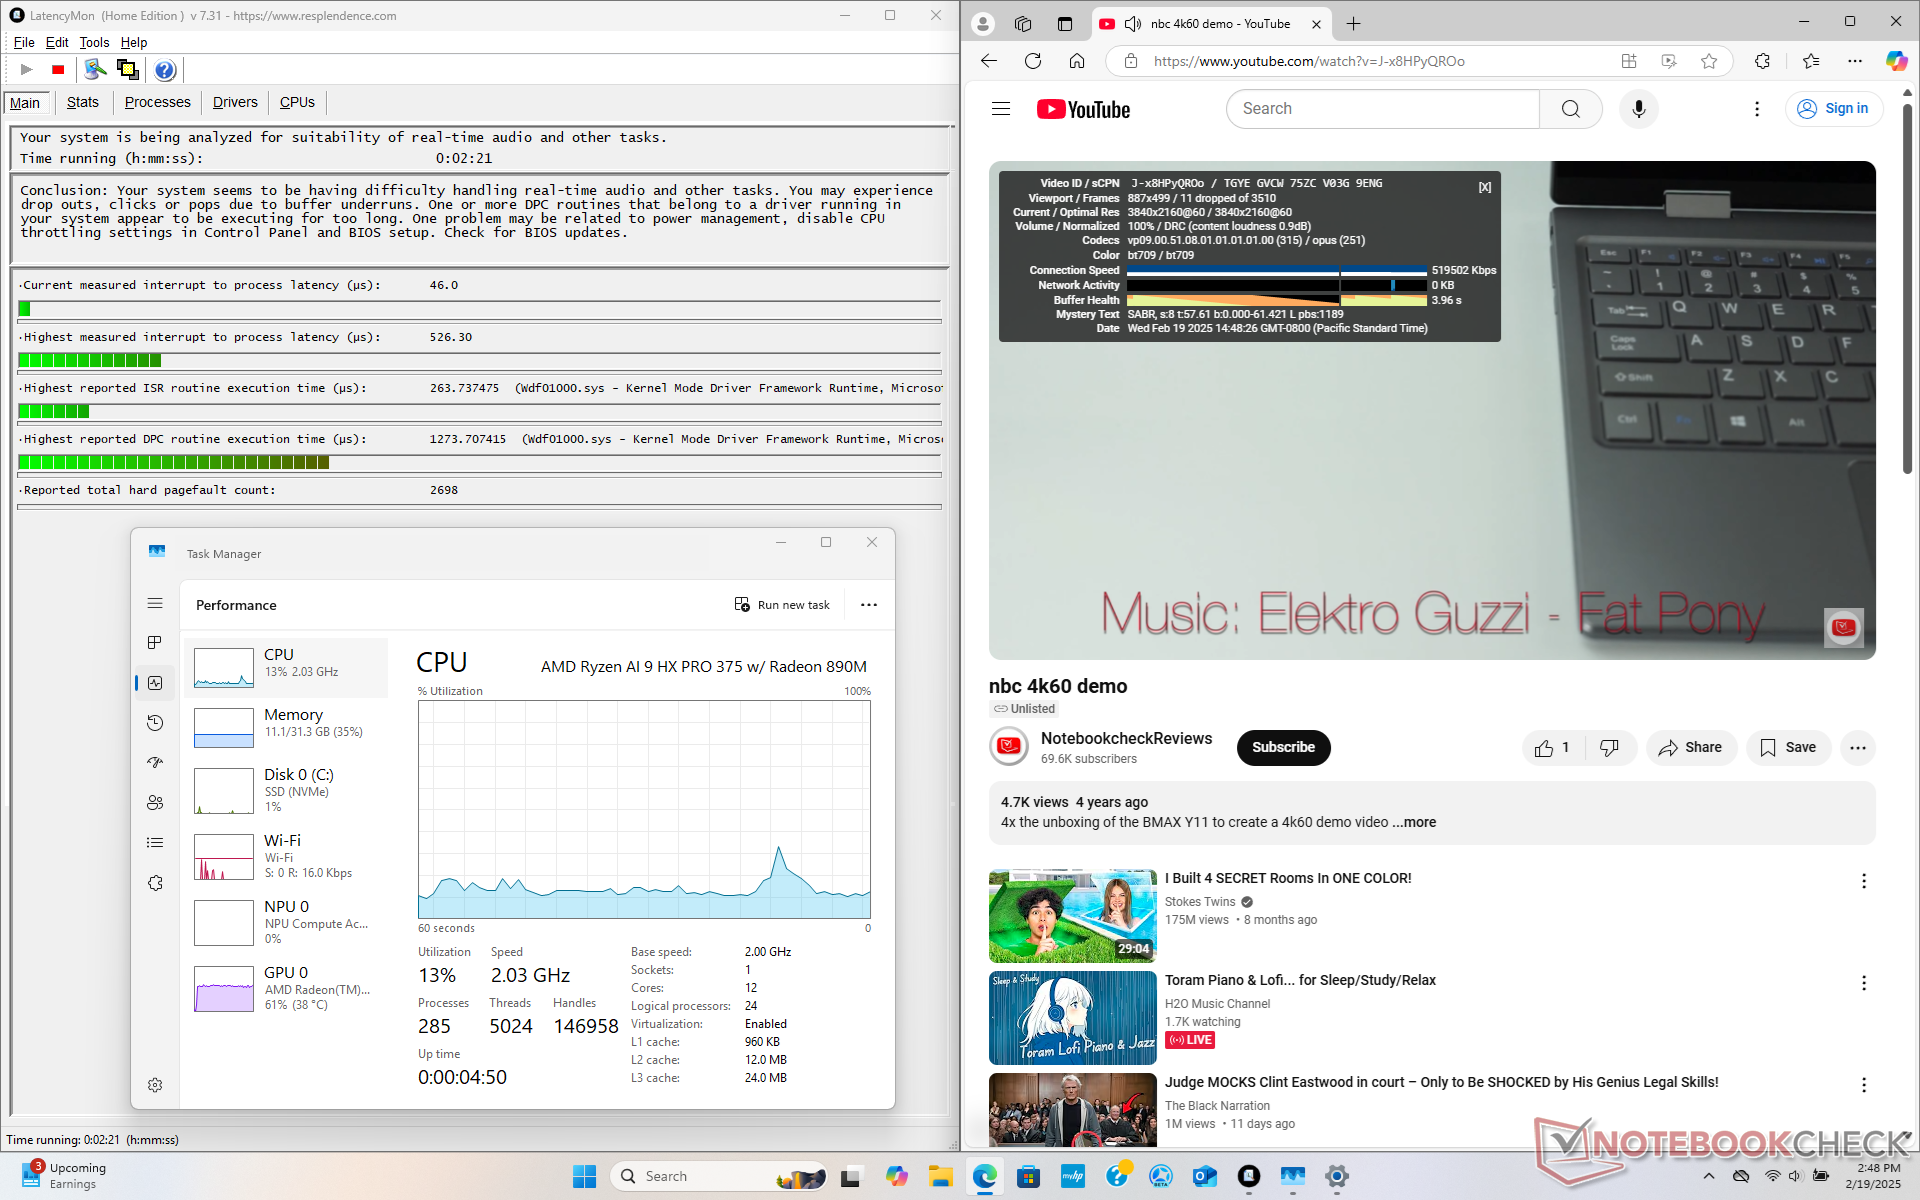
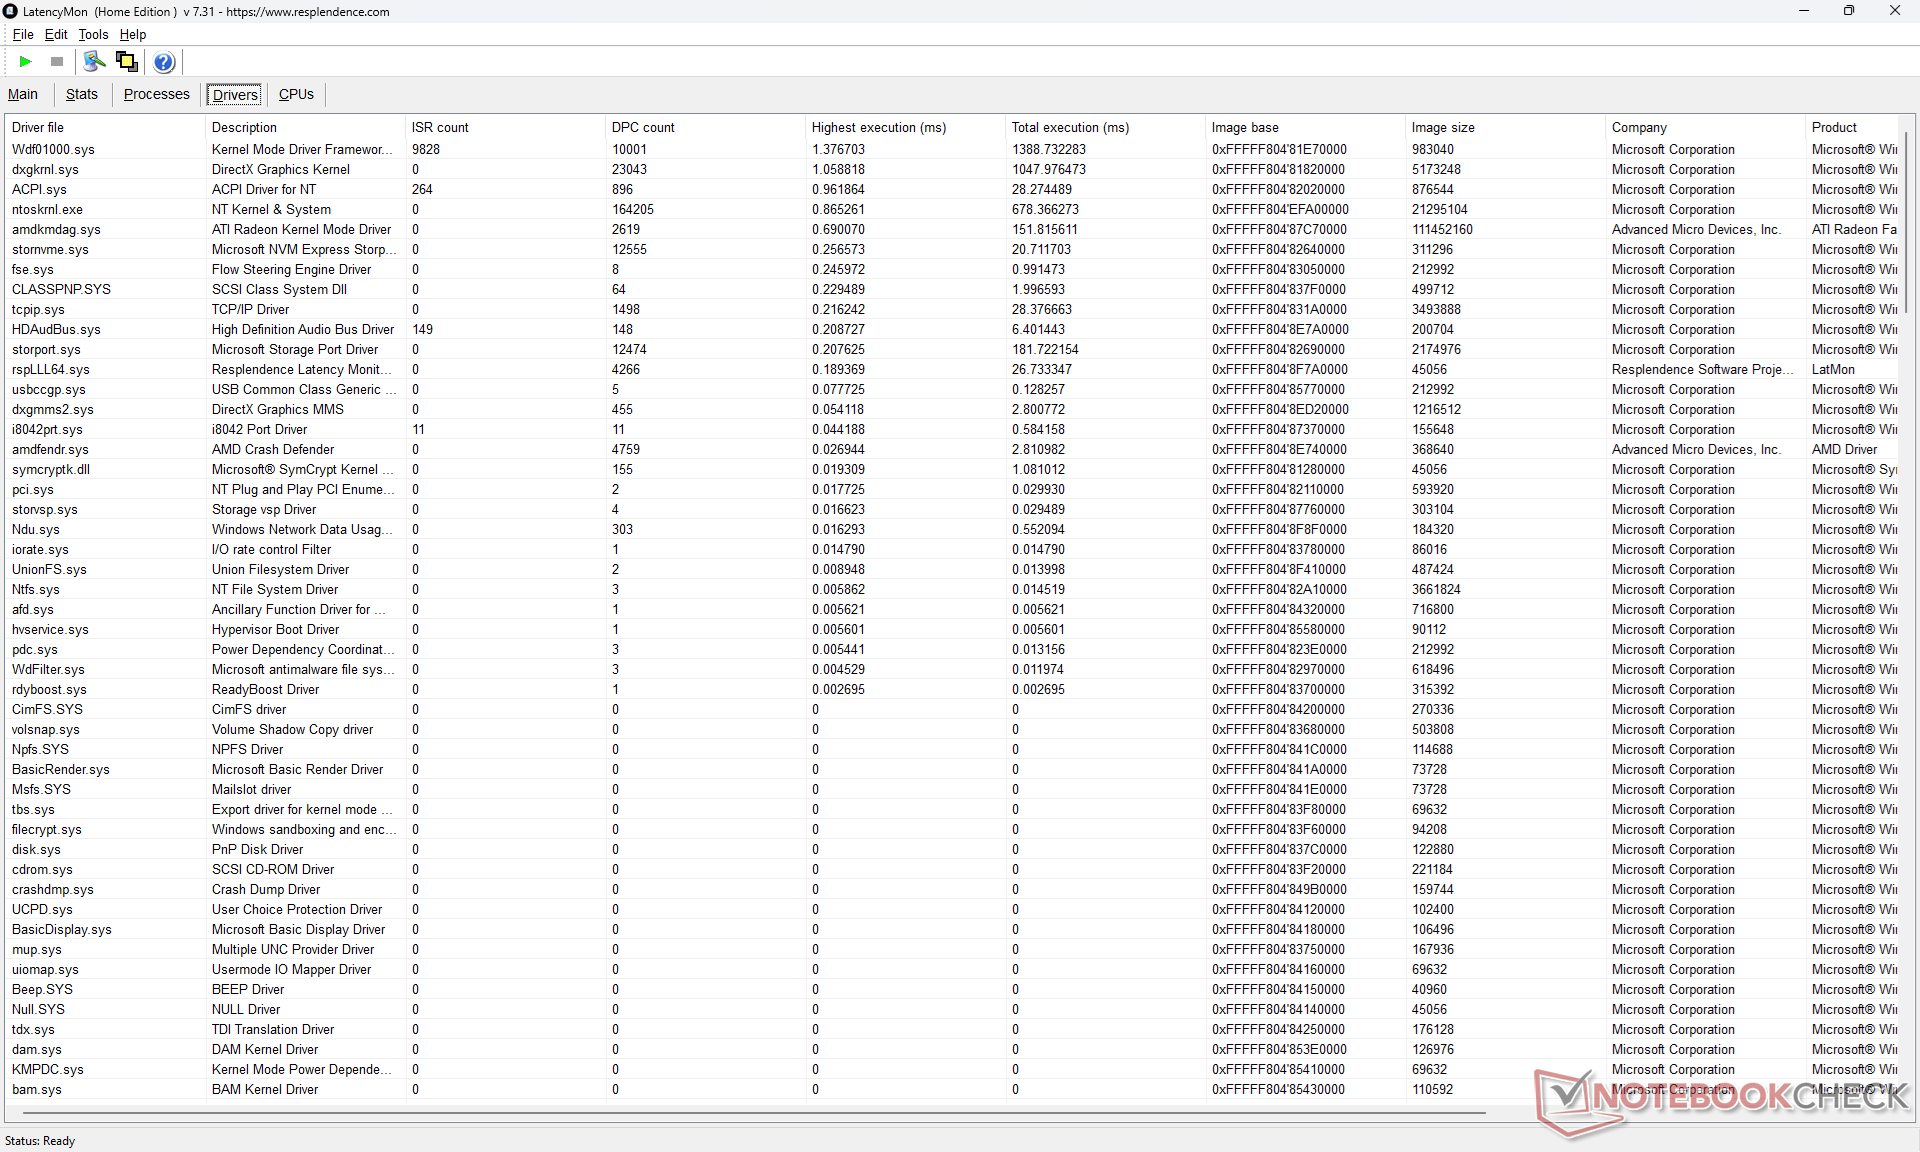
LatencyMon shows just minor DPC issues when opening multiple browser tabs of our homepage. However, 4K60 video playback is imperfect with 11 dropped frames recorded over a 60-second period even after multiple retries. This appears to be more common on AMD-powered machines when compared to Intel options.
| DPC Latencies / LatencyMon - interrupt to process latency (max), Web, Youtube, Prime95 | |
| HP EliteBook 1040 G10 818N7EA | |
| Acer Swift 14 AI SF14-51-58TU | |
| Lenovo ThinkPad X1 Carbon Gen 13 21NS0010GE | |
| Dell Latitude 7450 2-in-1 | |
| HP EliteBook X G1a 14 AI | |
* ... smaller is better
Storage Devices
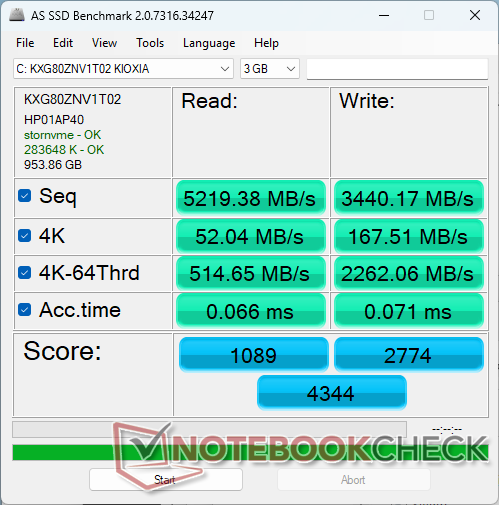
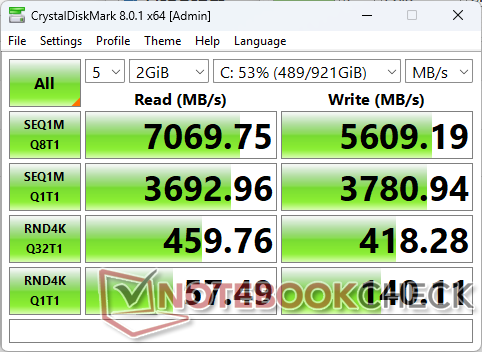
Our unit ships with the Kioxia XG8 instead of the Samsung MZ9L4512HBLU on last year's EliteBook 1040 G10 for significantly faster transfer rates. Performance is steady up to ~6900 MB/s compared to almost half that on the Samsung.

* ... smaller is better
Disk Throttling: DiskSpd Read Loop, Queue Depth 8
GPU Performance
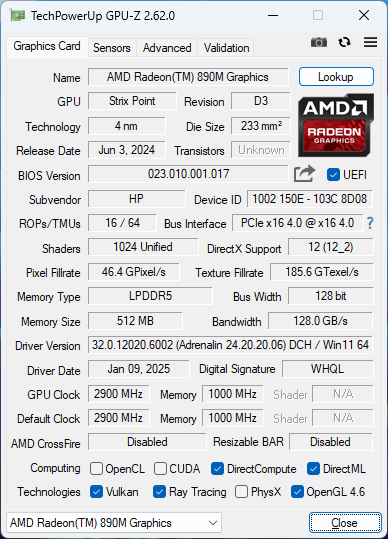
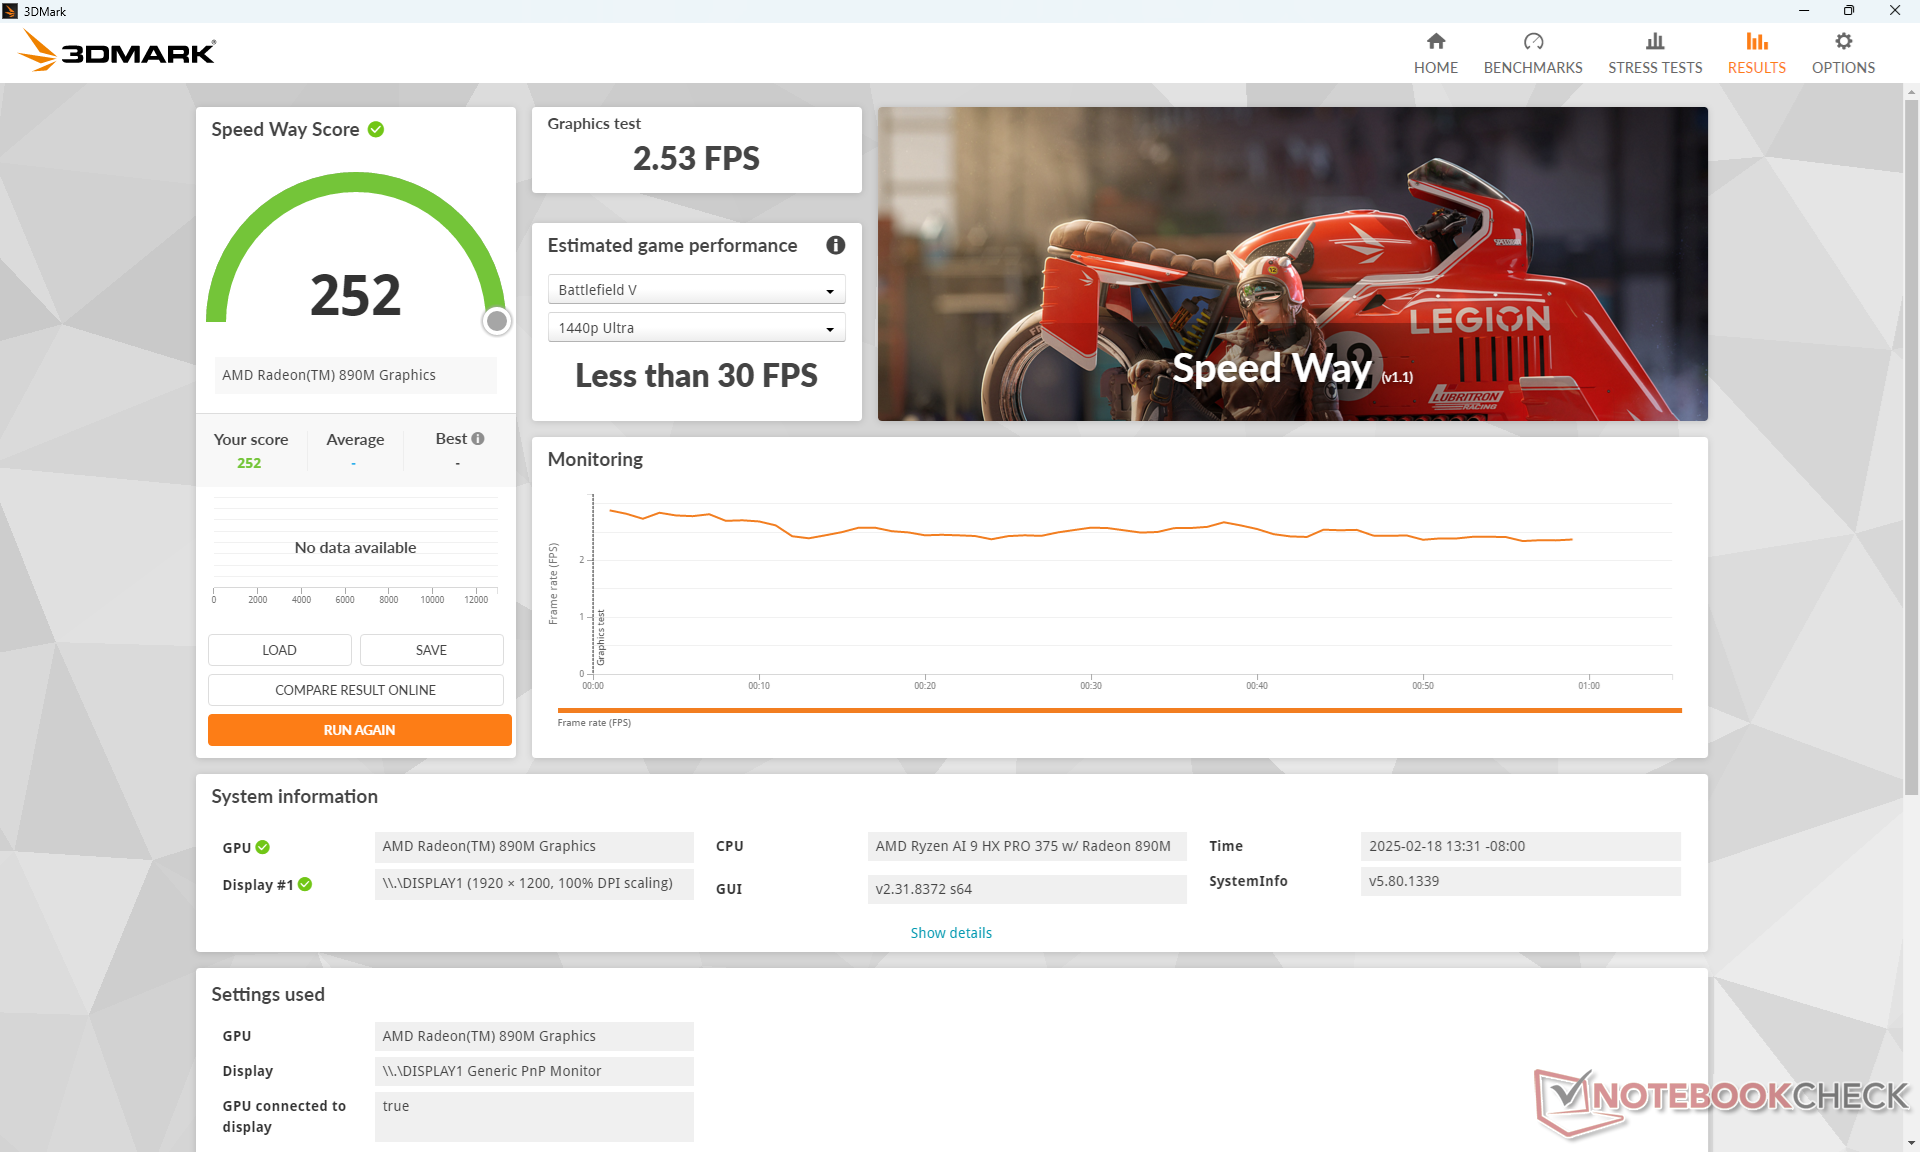
The Radeon 890M is one of the fastest integrated solutions currently available on laptops providing a 15 to 30 percent boost over the outgoing Radeon 780M or 680M, respectively. It outperforms last year's Arc 8 as well although the latest Arc 140V series is much more competitive.
Dropping down to the Ryzen AI 7 PRO 360 configuration instead of our Ryzen AI 9 option entails a slightly slower Radeon 880M.
Modern titles are playable at the native 1080p resolution with most settings on low to medium, but gaming is nonetheless not ideal on this business laptop due to the aforementioned slow black-white response times.
| Power Profile | Graphics Score | Physics Score | Combined Score |
| Performance Mode | 9810 | 27793 | 3389 |
| Balanced Mode | 9411 (-4%) | 26051 (-6%) | 3208 (-5%) |
| Battery Power | 8239 (-16%) | 24569 (-12%) | 3013 (-11%) |
Dropping down to Balanced mode (aka Smart Sense mode) impacts performance just slightly as shown by our Fire Strike results table below.
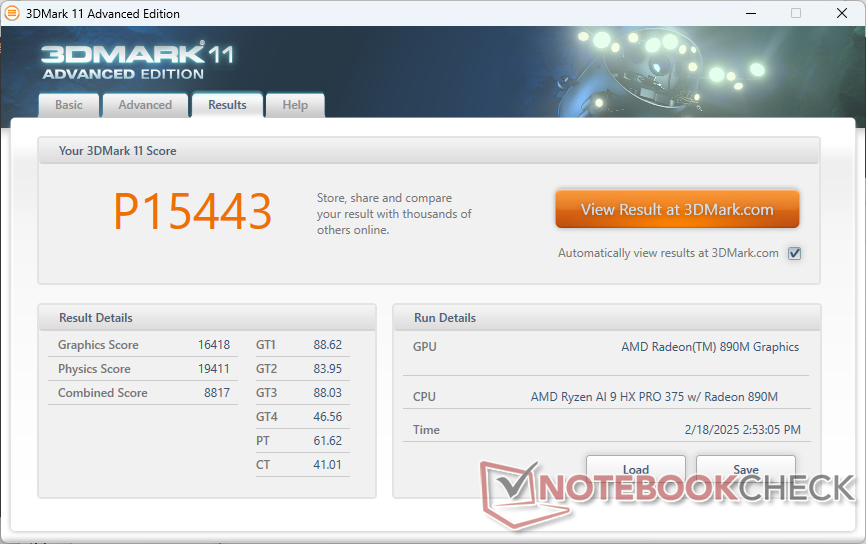
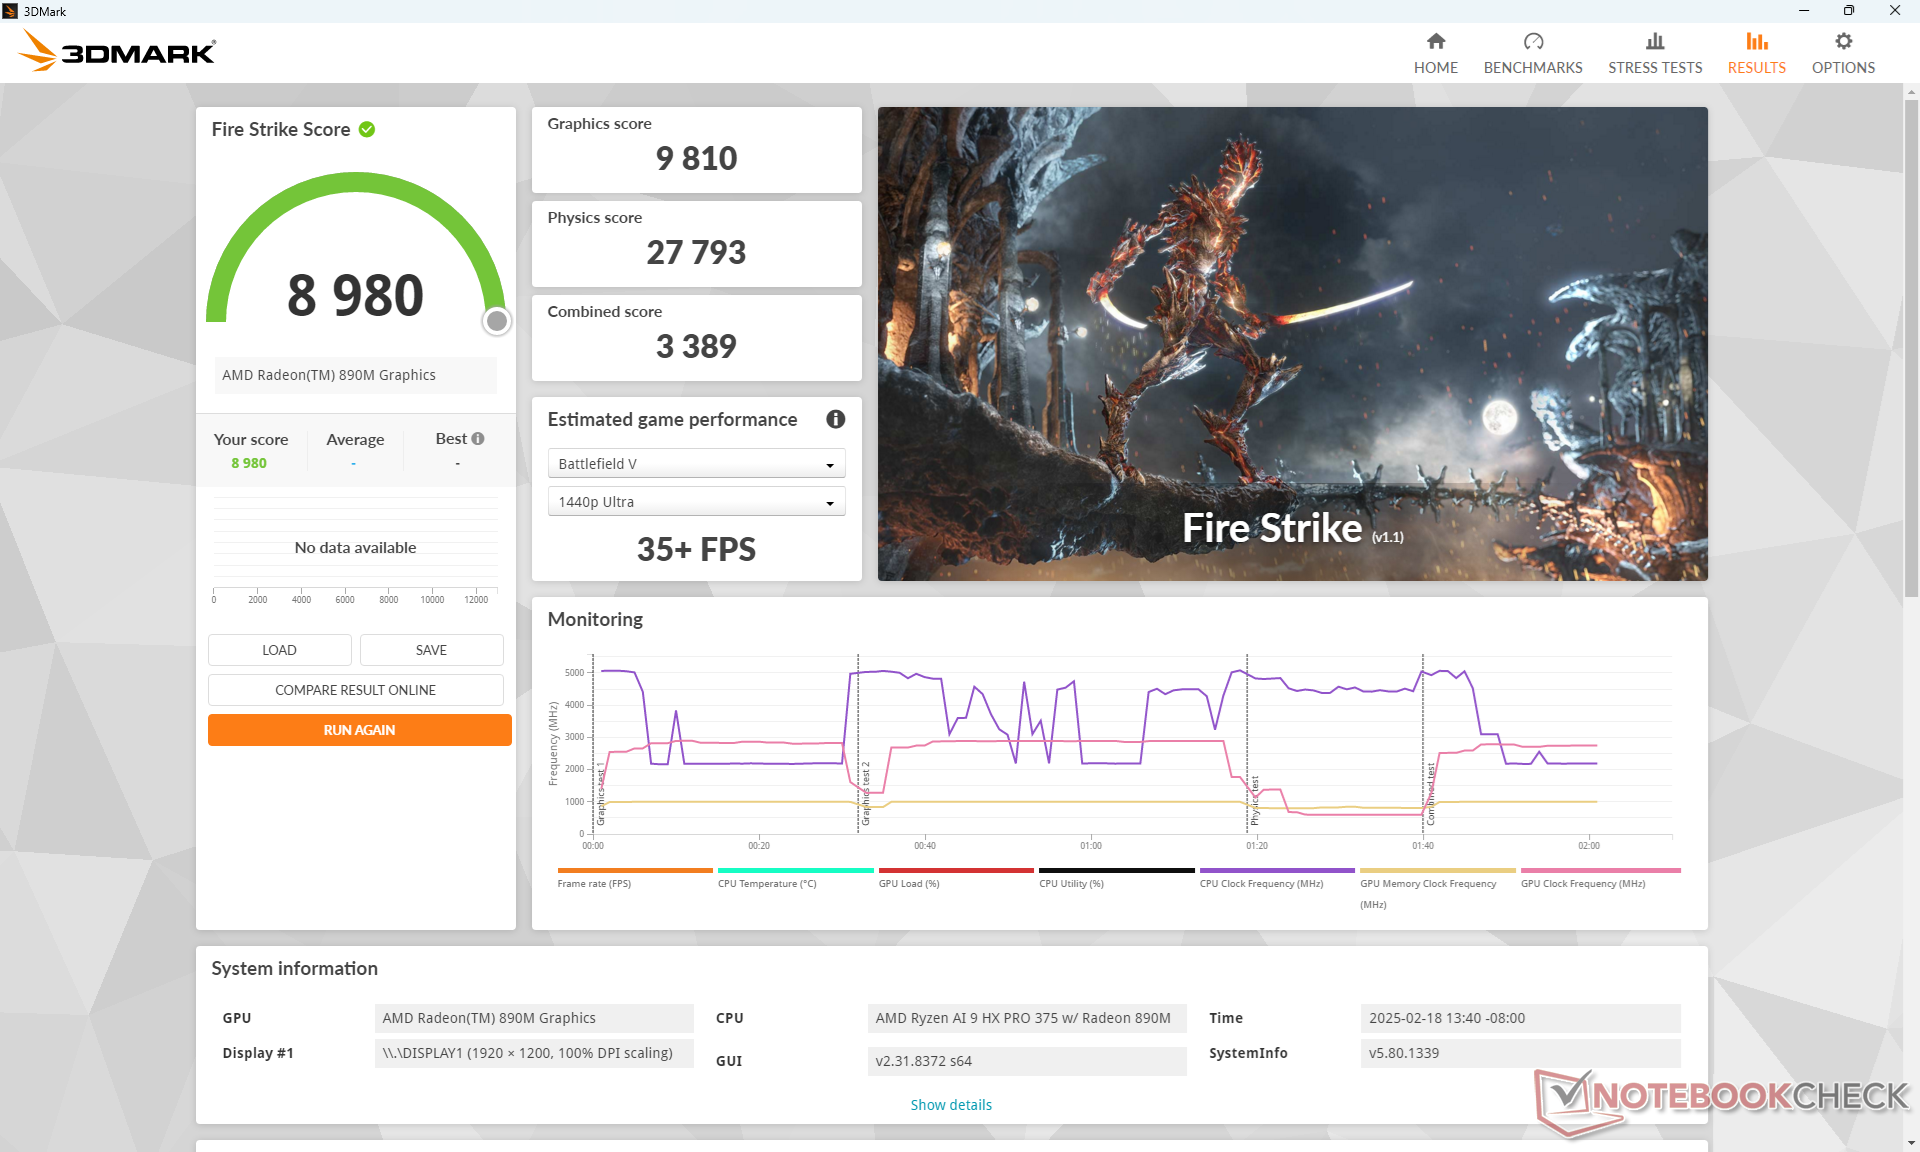
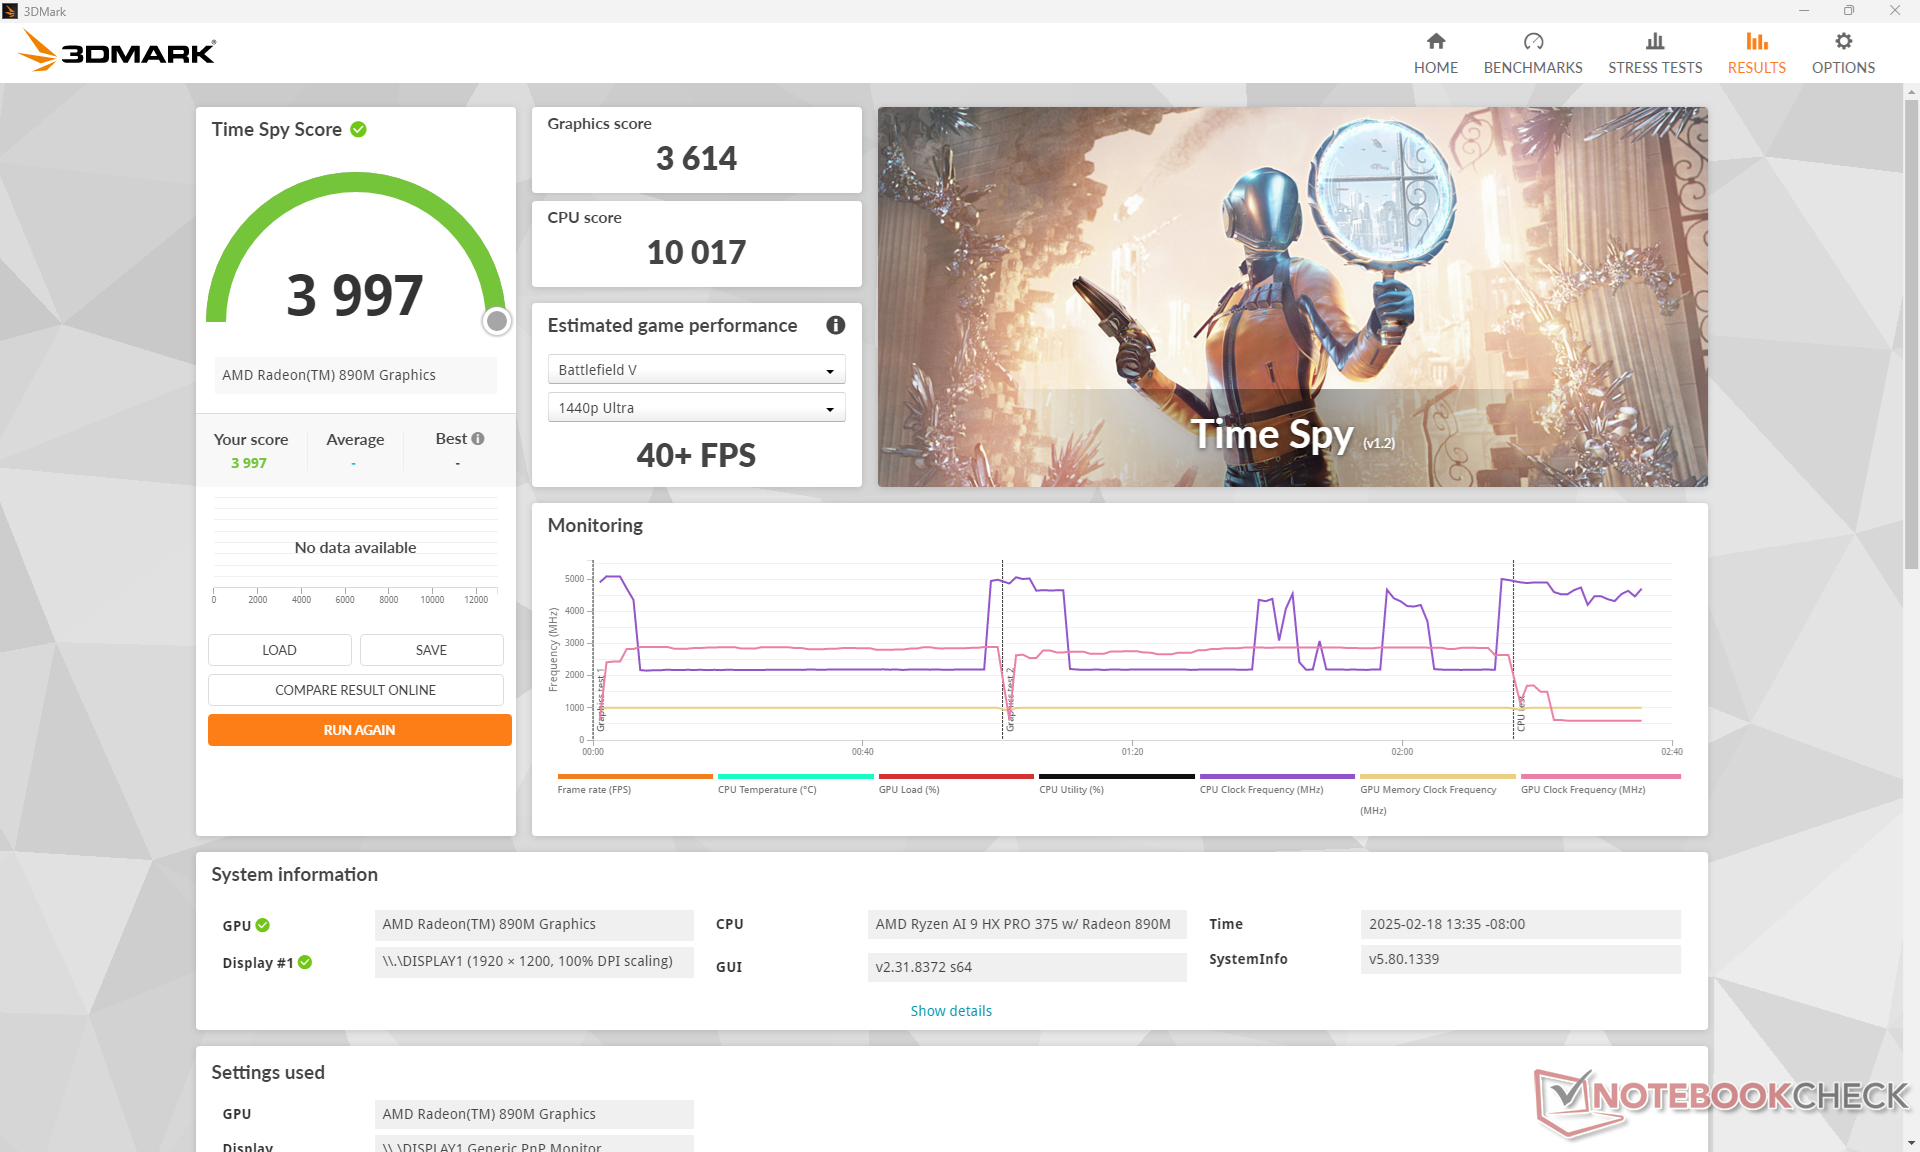
| 3DMark 11 Performance | 15443 points | |
| 3DMark Cloud Gate Standard Score | 38099 points | |
| 3DMark Fire Strike Score | 8980 points | |
| 3DMark Time Spy Score | 3997 points | |
Help | ||
* ... smaller is better
| Tiny Tina's Wonderlands | |
| 1280x720 Lowest Preset (DX12) | |
| HP OmniBook Ultra 14 | |
| Average AMD Radeon 890M (104.3 - 172.1, n=6) | |
| HP EliteBook X G1a 14 AI | |
| Lenovo ThinkPad E14 G6 | |
| Dell Latitude 9440 2-in-1 | |
| 1920x1080 Low Preset (DX12) | |
| HP OmniBook Ultra 14 | |
| Average AMD Radeon 890M (68.1 - 88.3, n=6) | |
| HP EliteBook X G1a 14 AI | |
| Lenovo ThinkPad E14 G6 | |
| Dell Latitude 9440 2-in-1 | |
| 1920x1080 Medium Preset (DX12) | |
| HP OmniBook Ultra 14 | |
| Average AMD Radeon 890M (52.2 - 62.4, n=6) | |
| HP EliteBook X G1a 14 AI | |
| Lenovo ThinkPad E14 G6 | |
| Dell Latitude 9440 2-in-1 | |
| 1920x1080 High Preset (DX12) | |
| HP OmniBook Ultra 14 | |
| Average AMD Radeon 890M (35.9 - 41.8, n=6) | |
| HP EliteBook X G1a 14 AI | |
| Lenovo ThinkPad E14 G6 | |
| Dell Latitude 9440 2-in-1 | |
| 1920x1080 Badass Preset (DX12) | |
| HP OmniBook Ultra 14 | |
| Average AMD Radeon 890M (28.1 - 34.1, n=6) | |
| HP EliteBook X G1a 14 AI | |
| Lenovo ThinkPad E14 G6 | |
| Dell Latitude 9440 2-in-1 | |
Cyberpunk 2077 ultra FPS Chart
| low | med. | high | ultra | |
|---|---|---|---|---|
| GTA V (2015) | 164.5 | 154.1 | 79.5 | 33.3 |
| Dota 2 Reborn (2015) | 153.6 | 127.7 | 46.6 | 44.8 |
| Final Fantasy XV Benchmark (2018) | 85.5 | 45.2 | 32.9 | |
| X-Plane 11.11 (2018) | 65.1 | 54.9 | 42.2 | |
| Far Cry 5 (2018) | 98 | 59 | 54 | 52 |
| Strange Brigade (2018) | 195.7 | 79.5 | 67.8 | 56.5 |
| Tiny Tina's Wonderlands (2022) | 80 | 53.8 | 35.9 | 28.1 |
| F1 22 (2022) | 101.6 | 94.5 | 71.6 | 19 |
| Baldur's Gate 3 (2023) | 41.1 | 33.6 | 28.5 | 27.9 |
| Cyberpunk 2077 (2023) | 50.5 | 39.6 | 30.9 | 26.8 |
Emissions
System Noise
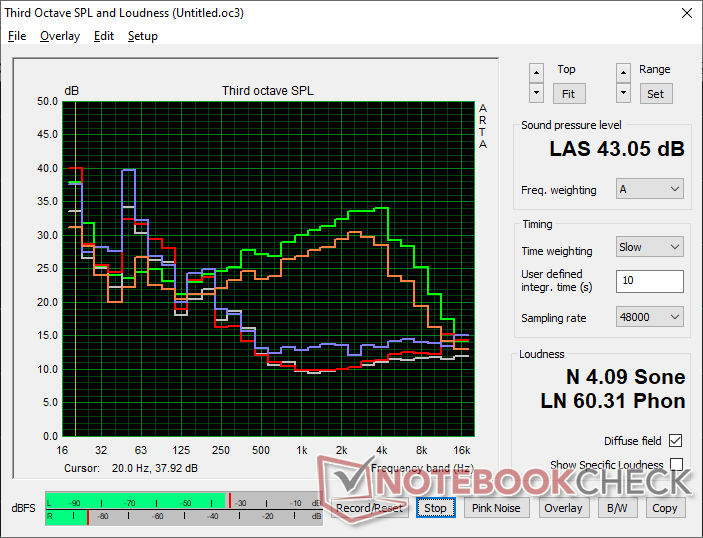
The fans are able to remain quieter for longer when demanding loads are introduced and so any RPM changes are generally gradual. Maximum fan noise level is otherwise one of the louder 14-inch laptops at the low 40 dB(A) range.
Note that the system runs much quieter at just 27 dB(A) on Smart Sense mode when compared to 39 dB(A) on Performance mode during our Cyberpunk 2077 test.
Noise level
| Idle |
| 24.4 / 24.4 / 24.5 dB(A) |
| Load |
| 25.4 / 43.1 dB(A) |
 | ||
30 dB silent 40 dB(A) audible 50 dB(A) loud |
||
min: | ||
| HP EliteBook X G1a 14 AI Radeon 890M, Ryzen AI 9 HX PRO 375, Kioxia XG8 KXG80ZNV1T02 | HP EliteBook 1040 G10 818N7EA Iris Xe G7 80EUs, i5-1335U, Samsung MZ9L4512HBLU-00BMV | Lenovo ThinkPad X1 Carbon Gen 13 21NS0010GE Arc 140V, Core Ultra 7 258V, SK hynix PCB01 HFS001TFM9X179N GL | Dell Latitude 7450 2-in-1 Graphics 4-Core iGPU (Arrow Lake), Ultra 7 165U, Micron 2550 512GB | Asus ExpertBook P5 P5405-NZ0102X Arc 140V, Core Ultra 7 258V, Western Digital PC SN5000S SDEQNSJ-1T00 | Acer Swift 14 AI SF14-51-58TU Arc 130V, Core Ultra 5 226V, Micron 2550 512GB | |
|---|---|---|---|---|---|---|
| Noise | -2% | -1% | -3% | 4% | -12% | |
| off / environment * (dB) | 24 | 23.1 4% | 23.2 3% | 23.03 4% | 24.1 -0% | 25 -4% |
| Idle Minimum * (dB) | 24.4 | 23.1 5% | 23.2 5% | 23.53 4% | 24.1 1% | 25 -2% |
| Idle Average * (dB) | 24.4 | 23.1 5% | 23.2 5% | 23.53 4% | 24.1 1% | 26 -7% |
| Idle Maximum * (dB) | 24.5 | 23.1 6% | 23.2 5% | 23.53 4% | 24.1 2% | 29 -18% |
| Load Average * (dB) | 25.4 | 35.3 -39% | 29.9 -18% | 38.54 -52% | 31.2 -23% | 40 -57% |
| Cyberpunk 2077 ultra * (dB) | 39.3 | 43.3 -10% | 38.2 3% | 31.7 19% | 40 -2% | |
| Load Maximum * (dB) | 43.1 | 41.1 5% | 40.5 6% | 38.21 11% | 31.2 28% | 41 5% |
| Witcher 3 ultra * (dB) | 37.3 |
* ... smaller is better
Temperature
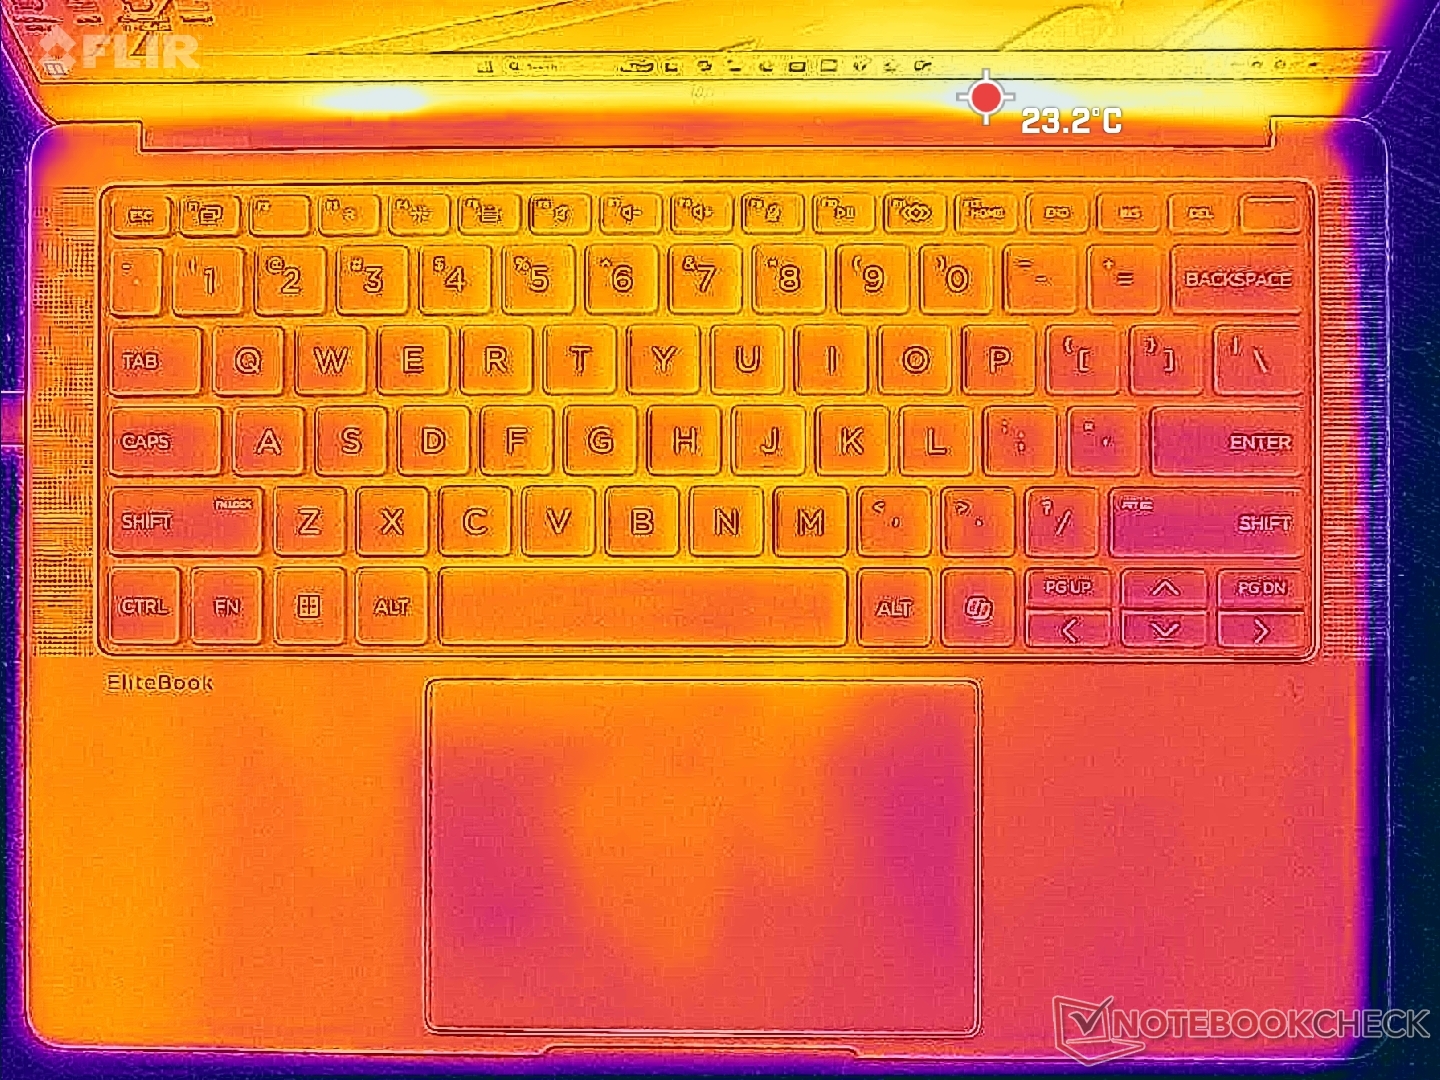
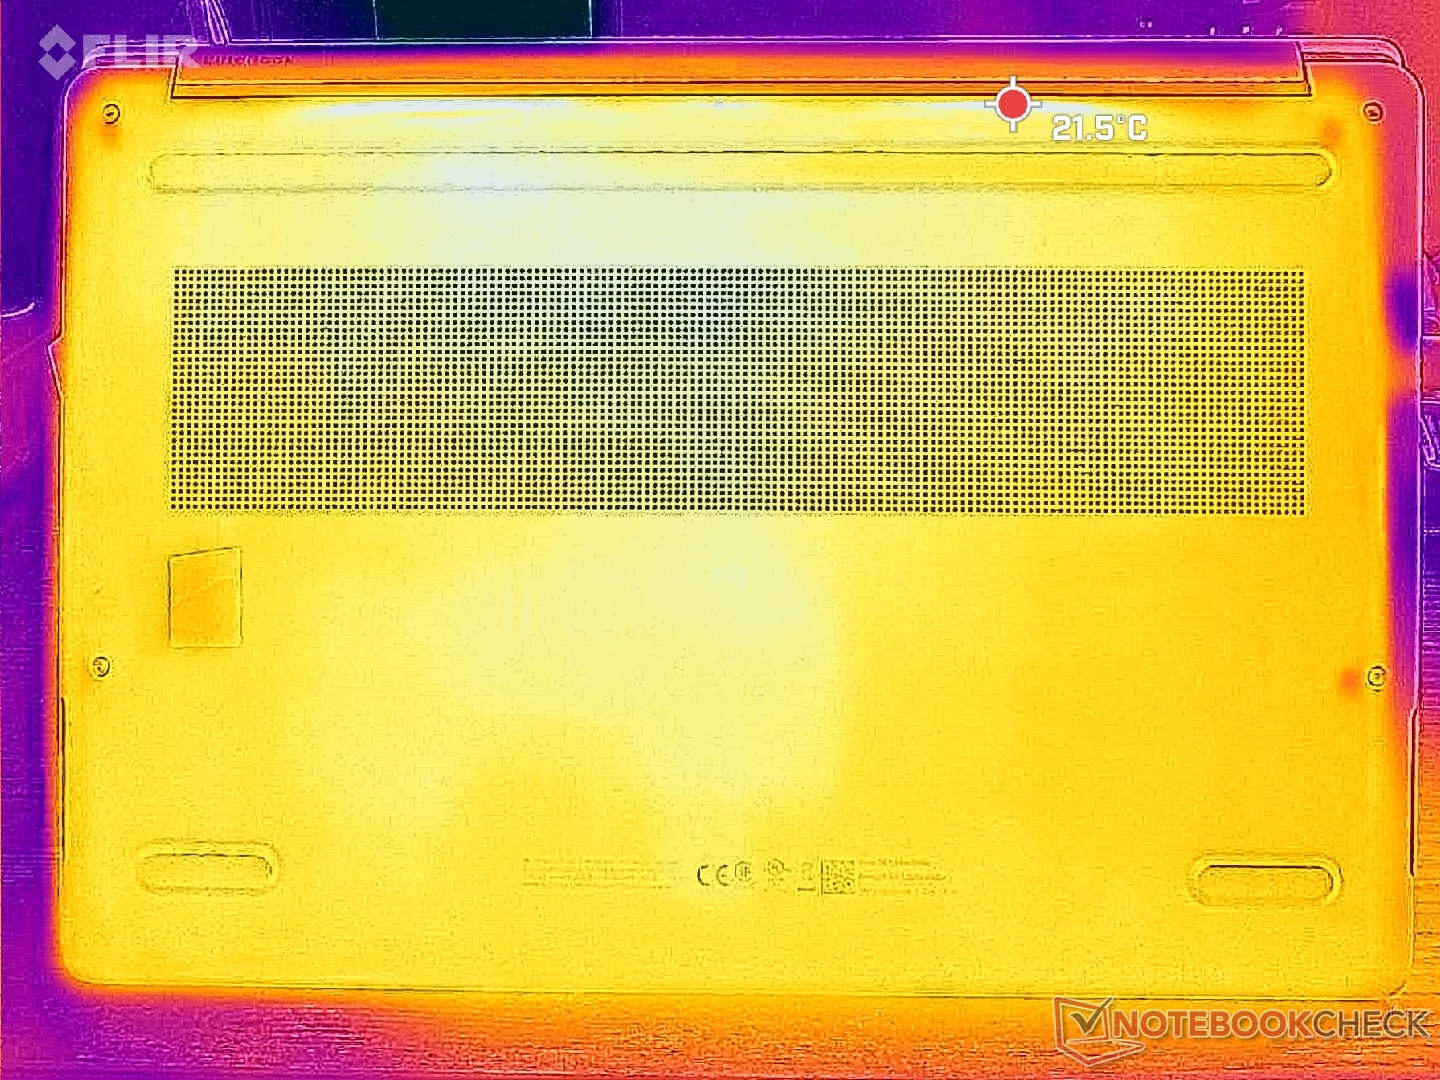
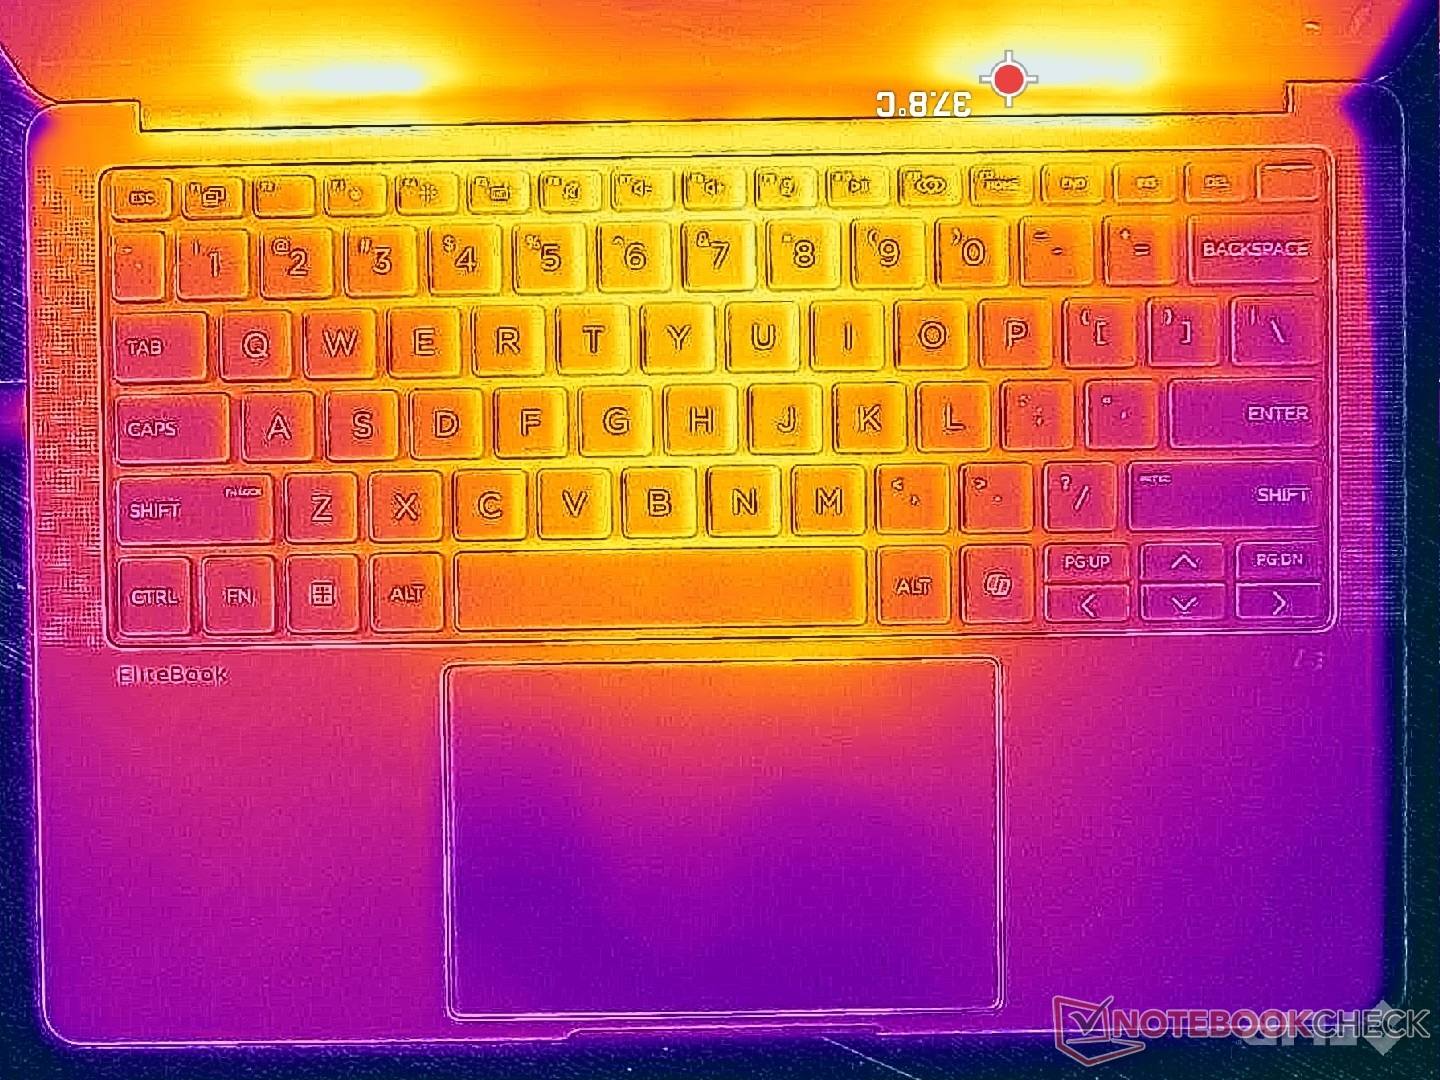
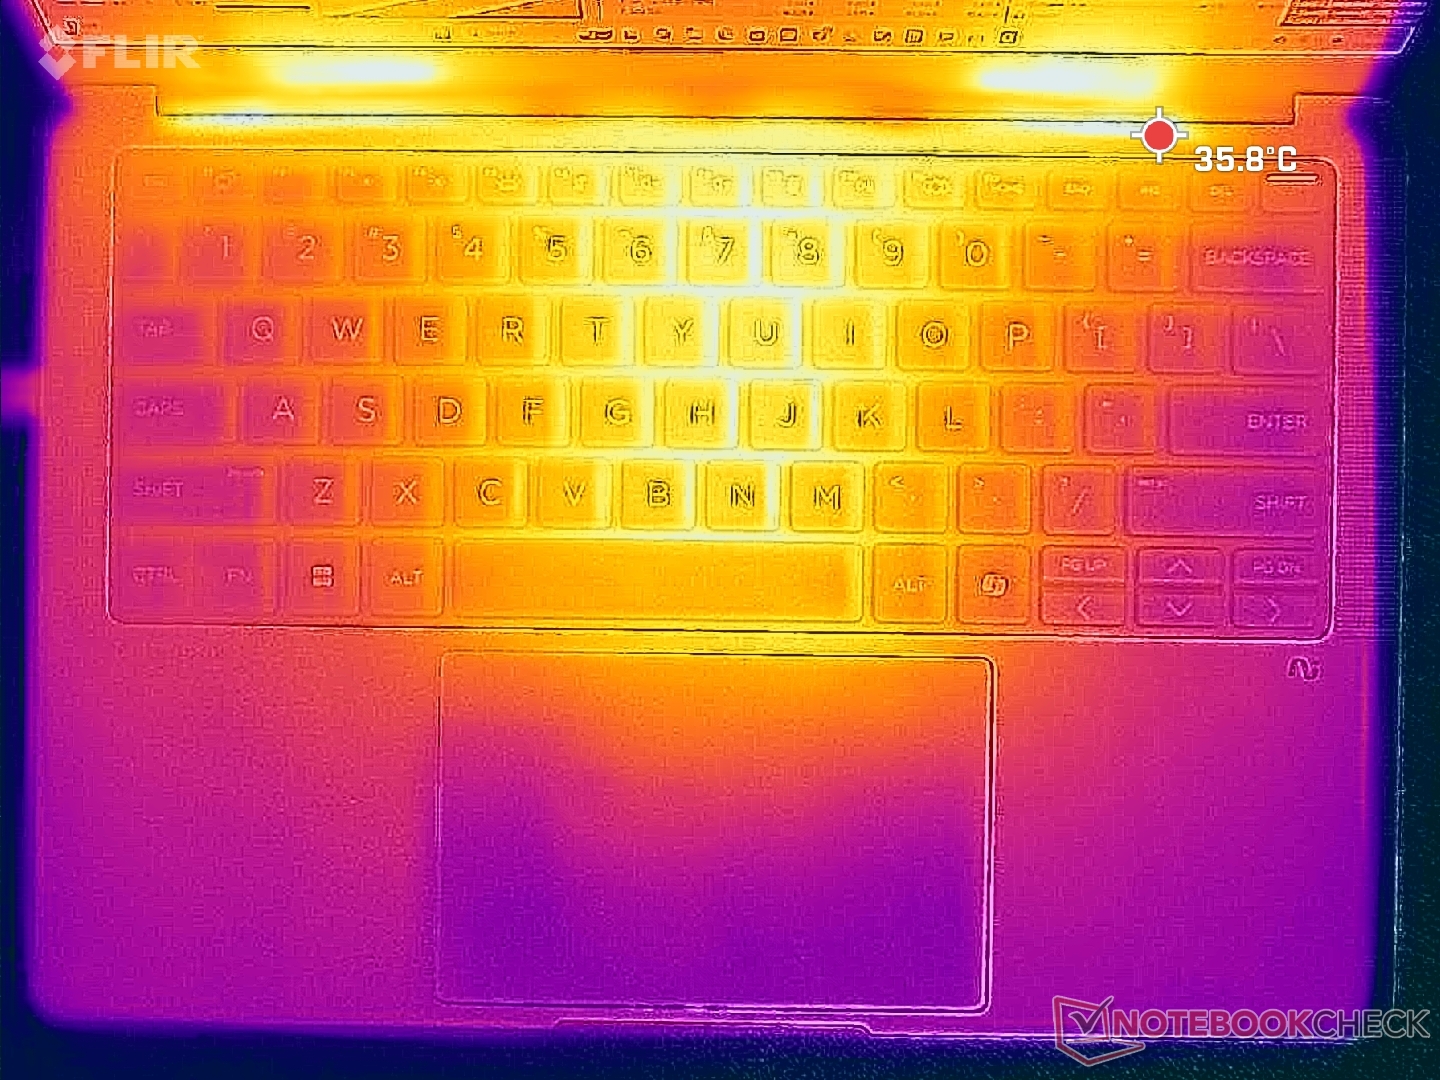
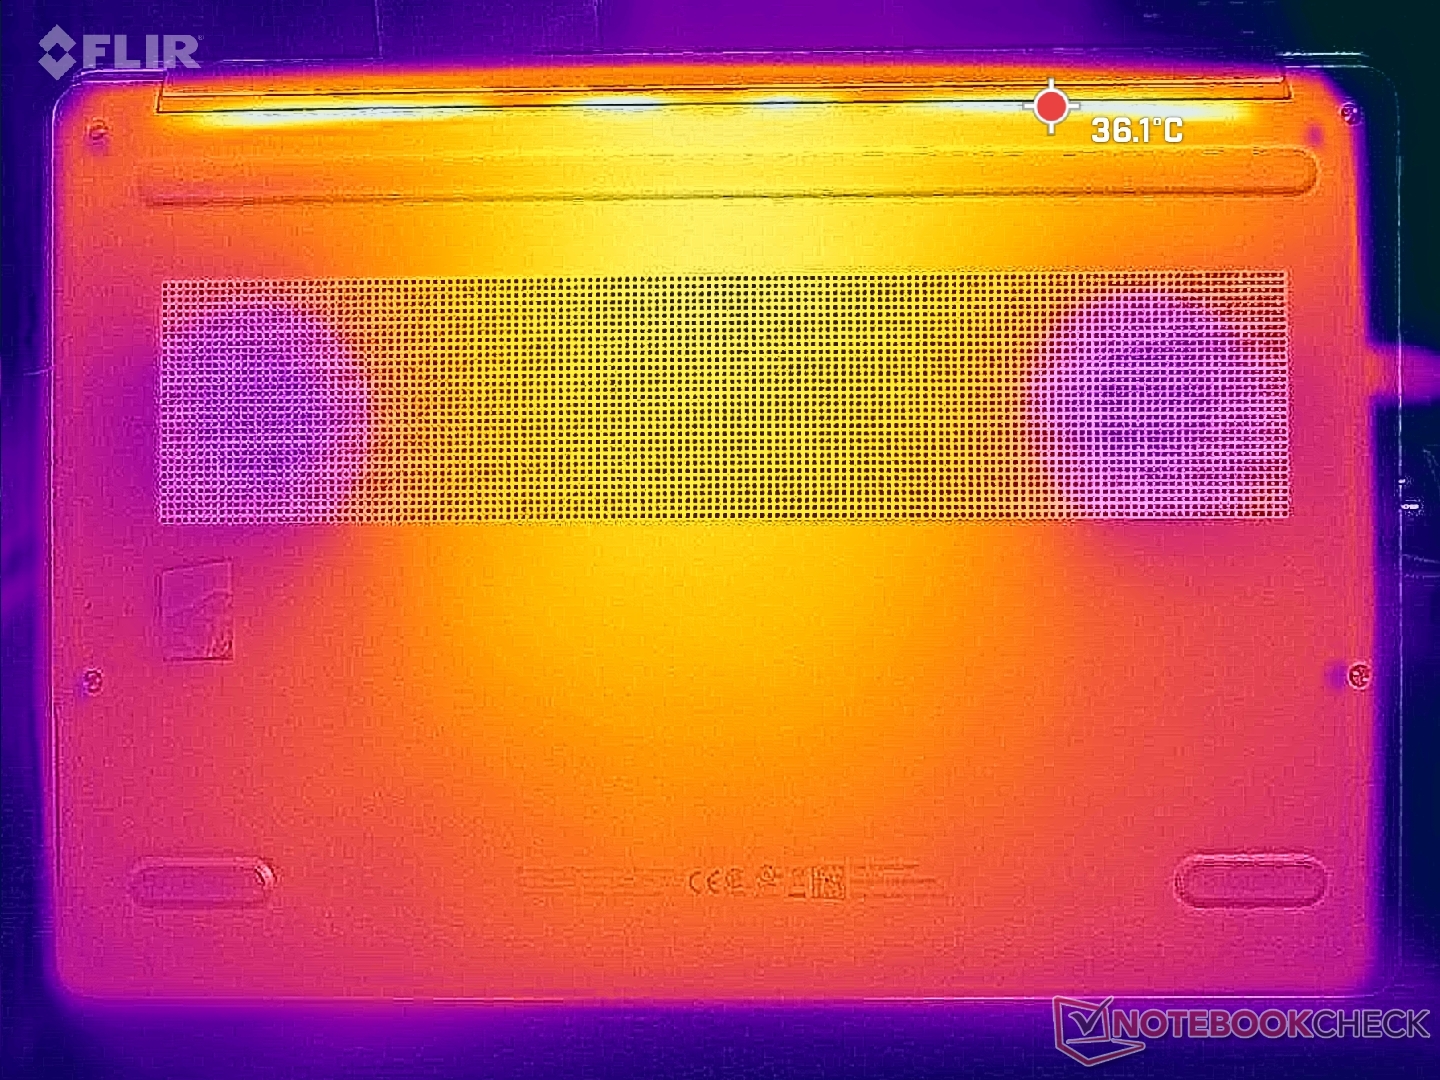
Surface temperatures are warmest down the center where hot spots can reach 36 C when running demanding loads. This is noticeably cooler than on the outgoing EliteBook 1040 G10 by almost 10 C when under similar conditions despite their wide performance differences.
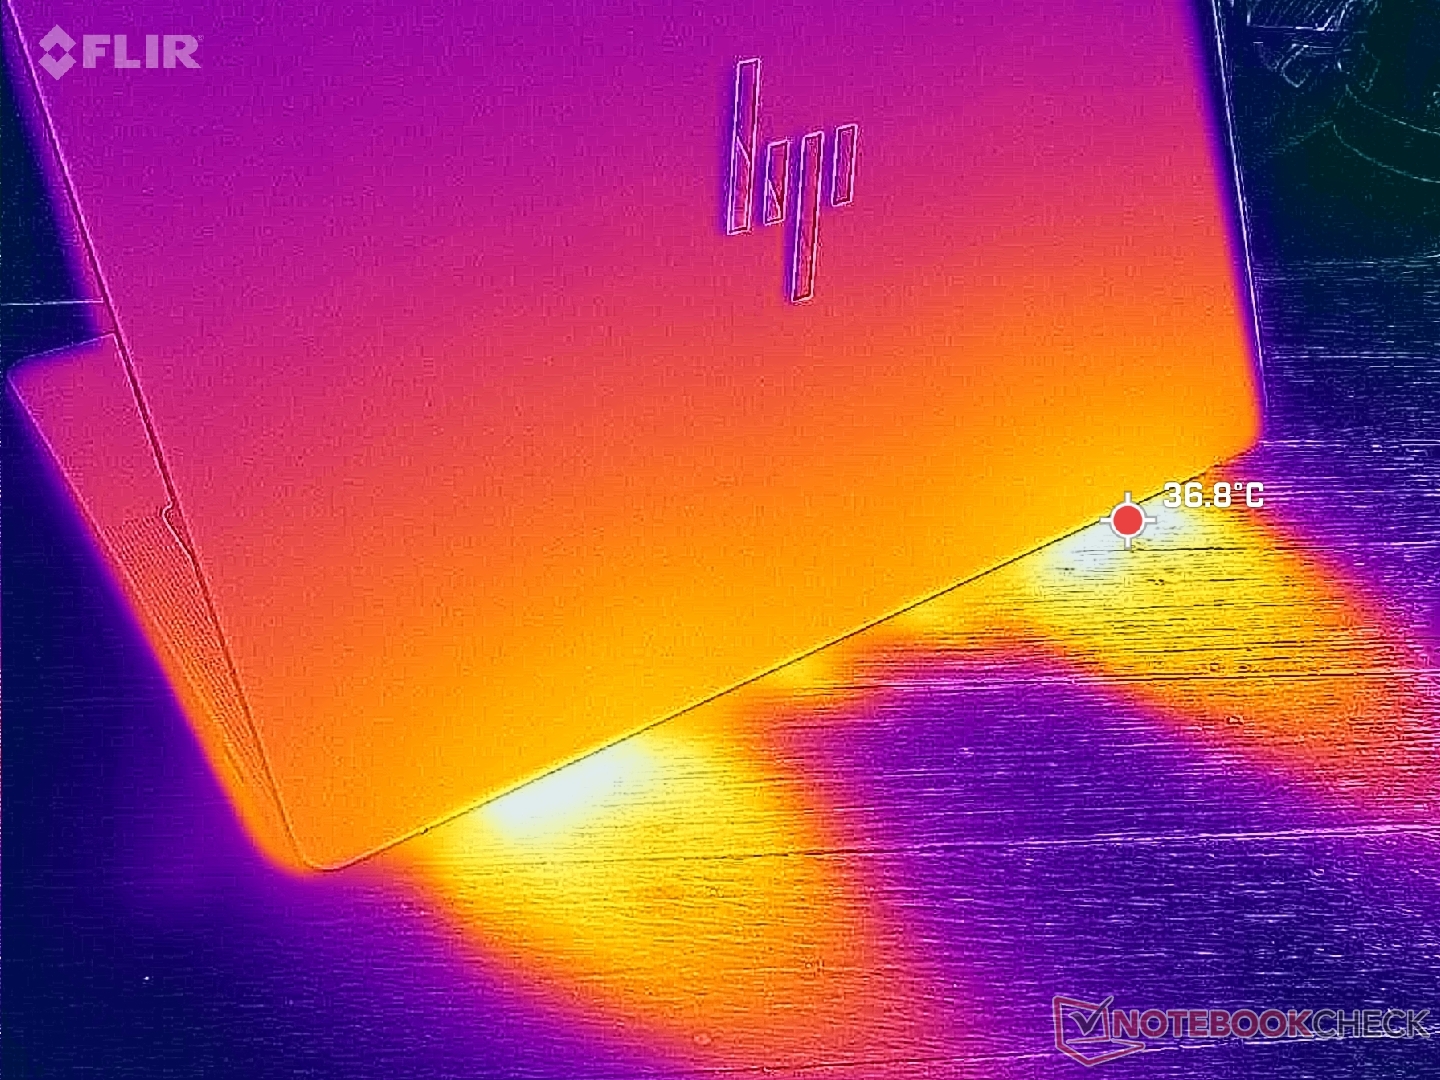
(+) The maximum temperature on the upper side is 36 °C / 97 F, compared to the average of 34.3 °C / 94 F, ranging from 21.2 to 62.5 °C for the class Office.
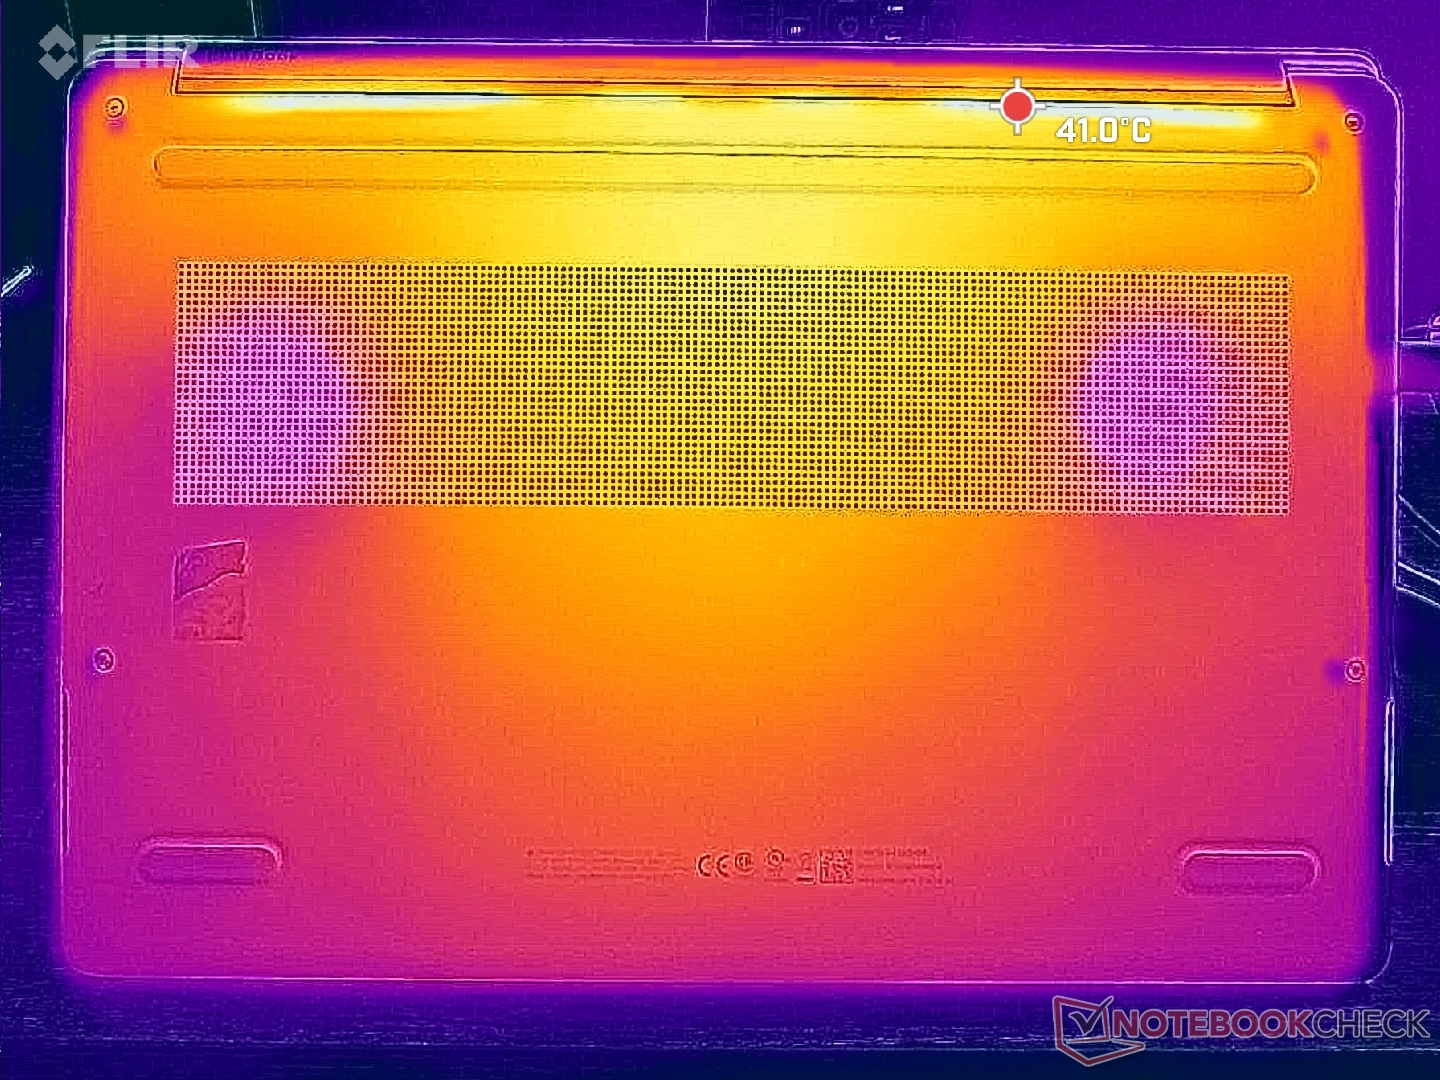
(+) The bottom heats up to a maximum of 34.2 °C / 94 F, compared to the average of 36.8 °C / 98 F
(+) In idle usage, the average temperature for the upper side is 24.3 °C / 76 F, compared to the device average of 29.5 °C / 85 F.
(+) 3: The average temperature for the upper side is 30.9 °C / 88 F, compared to the average of 29.5 °C / 85 F for the class Office.
(+) The palmrests and touchpad are cooler than skin temperature with a maximum of 27.6 °C / 81.7 F and are therefore cool to the touch.
(±) The average temperature of the palmrest area of similar devices was 27.5 °C / 81.5 F (-0.1 °C / -0.2 F).
| HP EliteBook X G1a 14 AI AMD Ryzen AI 9 HX PRO 375, AMD Radeon 890M | HP EliteBook 1040 G10 818N7EA Intel Core i5-1335U, Intel Iris Xe Graphics G7 80EUs | Lenovo ThinkPad X1 Carbon Gen 13 21NS0010GE Intel Core Ultra 7 258V, Intel Arc Graphics 140V | Dell Latitude 7450 2-in-1 Intel Core Ultra 7 165U, Intel Graphics 4-Core iGPU (Meteor / Arrow Lake) | Asus ExpertBook P5 P5405-NZ0102X Intel Core Ultra 7 258V, Intel Arc Graphics 140V | Acer Swift 14 AI SF14-51-58TU Intel Core Ultra 5 226V, Intel Arc Graphics 130V | |
|---|---|---|---|---|---|---|
| Heat | -13% | -14% | -14% | -11% | -15% | |
| Maximum Upper Side * (°C) | 36 | 40.5 -13% | 42.3 -17% | 41.2 -14% | 41.6 -16% | 41 -14% |
| Maximum Bottom * (°C) | 34.2 | 45.8 -34% | 40.1 -17% | 45 -32% | 43.2 -26% | 45 -32% |
| Idle Upper Side * (°C) | 25 | 25.5 -2% | 27.3 -9% | 27.2 -9% | 25.7 -3% | 26 -4% |
| Idle Bottom * (°C) | 25.6 | 26.1 -2% | 28.3 -11% | 26.2 -2% | 25.3 1% | 28 -9% |
* ... smaller is better
Speakers
HP EliteBook X G1a 14 AI audio analysis
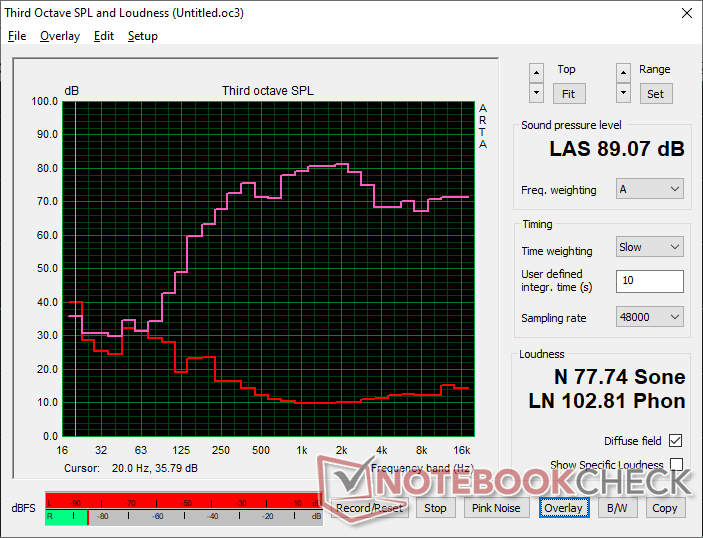
(+) | speakers can play relatively loud (89.1 dB)
Bass 100 - 315 Hz
(±) | reduced bass - on average 12.5% lower than median
(±) | linearity of bass is average (10.8% delta to prev. frequency)
Mids 400 - 2000 Hz
(±) | higher mids - on average 6% higher than median
(+) | mids are linear (3.9% delta to prev. frequency)
Highs 2 - 16 kHz
(+) | balanced highs - only 3.3% away from median
(+) | highs are linear (5.1% delta to prev. frequency)
Overall 100 - 16.000 Hz
(+) | overall sound is linear (11.5% difference to median)
Compared to same class
» 3% of all tested devices in this class were better, 2% similar, 95% worse
» The best had a delta of 7%, average was 21%, worst was 53%
Compared to all devices tested
» 8% of all tested devices were better, 2% similar, 90% worse
» The best had a delta of 4%, average was 24%, worst was 134%
Apple MacBook Pro 16 2021 M1 Pro audio analysis
(+) | speakers can play relatively loud (84.7 dB)
Bass 100 - 315 Hz
(+) | good bass - only 3.8% away from median
(+) | bass is linear (5.2% delta to prev. frequency)
Mids 400 - 2000 Hz
(+) | balanced mids - only 1.3% away from median
(+) | mids are linear (2.1% delta to prev. frequency)
Highs 2 - 16 kHz
(+) | balanced highs - only 1.9% away from median
(+) | highs are linear (2.7% delta to prev. frequency)
Overall 100 - 16.000 Hz
(+) | overall sound is linear (4.6% difference to median)
Compared to same class
» 0% of all tested devices in this class were better, 0% similar, 100% worse
» The best had a delta of 5%, average was 17%, worst was 45%
Compared to all devices tested
» 0% of all tested devices were better, 0% similar, 100% worse
» The best had a delta of 4%, average was 24%, worst was 134%
Energy Management
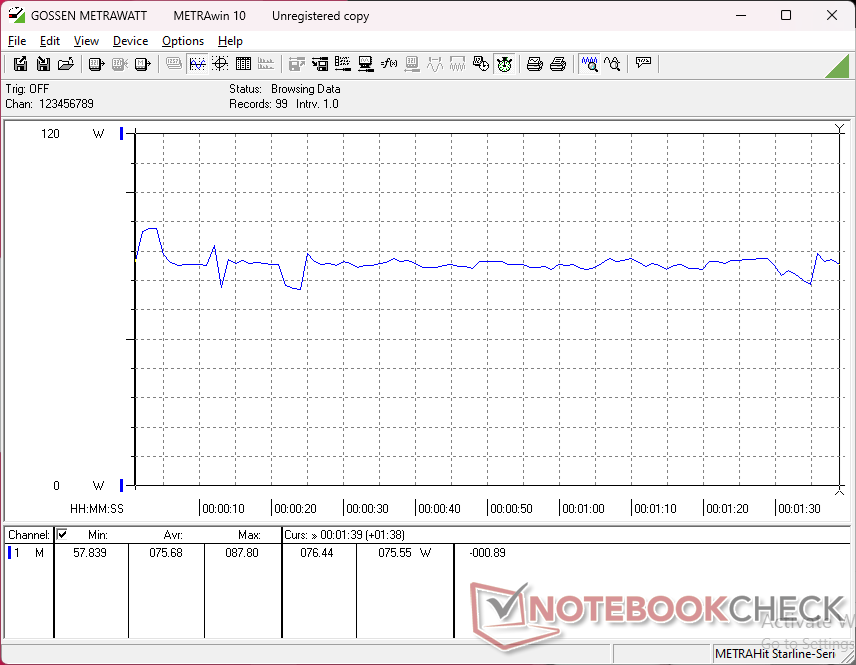
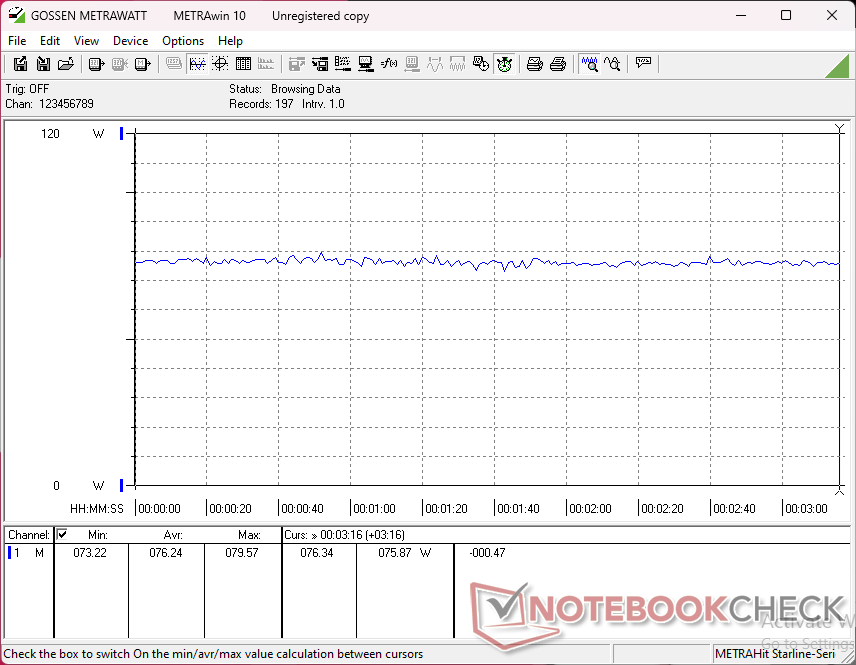
Power Consumption
Consumption is generally higher than most other 14-inch business laptops which is to be expected due to the more demanding processor. Idling demands between 6 W and 11 W compared to just 7 W on the Lunar Lake-powered ThinkPad X1 Carbon Gen 13. The delta grows even wider when running demanding loads like games where consumption can be as high as 76 W compared to just ~35 W on the aforementioned Lenovo.

| Off / Standby | |
| Idle | |
| Load |
|
Key:
min: | |
| HP EliteBook X G1a 14 AI Ryzen AI 9 HX PRO 375, Radeon 890M, Kioxia XG8 KXG80ZNV1T02, IPS, 1920x1200, 14" | HP EliteBook 1040 G10 818N7EA i5-1335U, Iris Xe G7 80EUs, Samsung MZ9L4512HBLU-00BMV, IPS, 1920x1200, 14" | Lenovo ThinkPad X1 Carbon Gen 13 21NS0010GE Core Ultra 7 258V, Arc 140V, SK hynix PCB01 HFS001TFM9X179N GL, OLED, 2880x1800, 14" | Dell Latitude 7450 2-in-1 Ultra 7 165U, Graphics 4-Core iGPU (Arrow Lake), Micron 2550 512GB, IPS, 1920x1200, 14" | Asus ExpertBook P5 P5405-NZ0102X Core Ultra 7 258V, Arc 140V, Western Digital PC SN5000S SDEQNSJ-1T00, IPS LED, 2560x1600, 14" | Acer Swift 14 AI SF14-51-58TU Core Ultra 5 226V, Arc 130V, Micron 2550 512GB, OLED, 2880x1800, 14" | |
|---|---|---|---|---|---|---|
| Power Consumption | 39% | 44% | 45% | 30% | 35% | |
| Idle Minimum * (Watt) | 6.5 | 2.8 57% | 4.7 28% | 2.23 66% | 3.9 40% | 5 23% |
| Idle Average * (Watt) | 8.7 | 6.1 30% | 5.7 34% | 5.36 38% | 8.9 -2% | 6 31% |
| Idle Maximum * (Watt) | 10.3 | 6.3 39% | 6.1 41% | 6.8 34% | 9.6 7% | 10 3% |
| Load Average * (Watt) | 75.7 | 48.9 35% | 29.8 61% | 51.2 32% | 43.4 43% | 36 52% |
| Cyberpunk 2077 ultra external monitor * (Watt) | 73.1 | 34.1 53% | 34.6 53% | 41.8 43% | 38.2 48% | |
| Cyberpunk 2077 ultra * (Watt) | 76.2 | 35.3 54% | 29.5 61% | 42.8 44% | 41.6 45% | |
| Load Maximum * (Watt) | 100.7 | 65.9 35% | 60.1 40% | 69.9 31% | 64.1 36% | 60 40% |
| Witcher 3 ultra * (Watt) | 38.2 |
* ... smaller is better
Power Consumption Cyberpunk / Stress Test
Power Consumption external Monitor
Battery Life
Battery capacity is larger than before from 51 Wh on the EliteBook 1040 G10 to 75 Wh on our EliteBook X G1a 14. Consequently, WLAN runtime has increased by several hours to just over 14 hours. Expect the more demanding OLED configuration to clock in a few hours shorter.
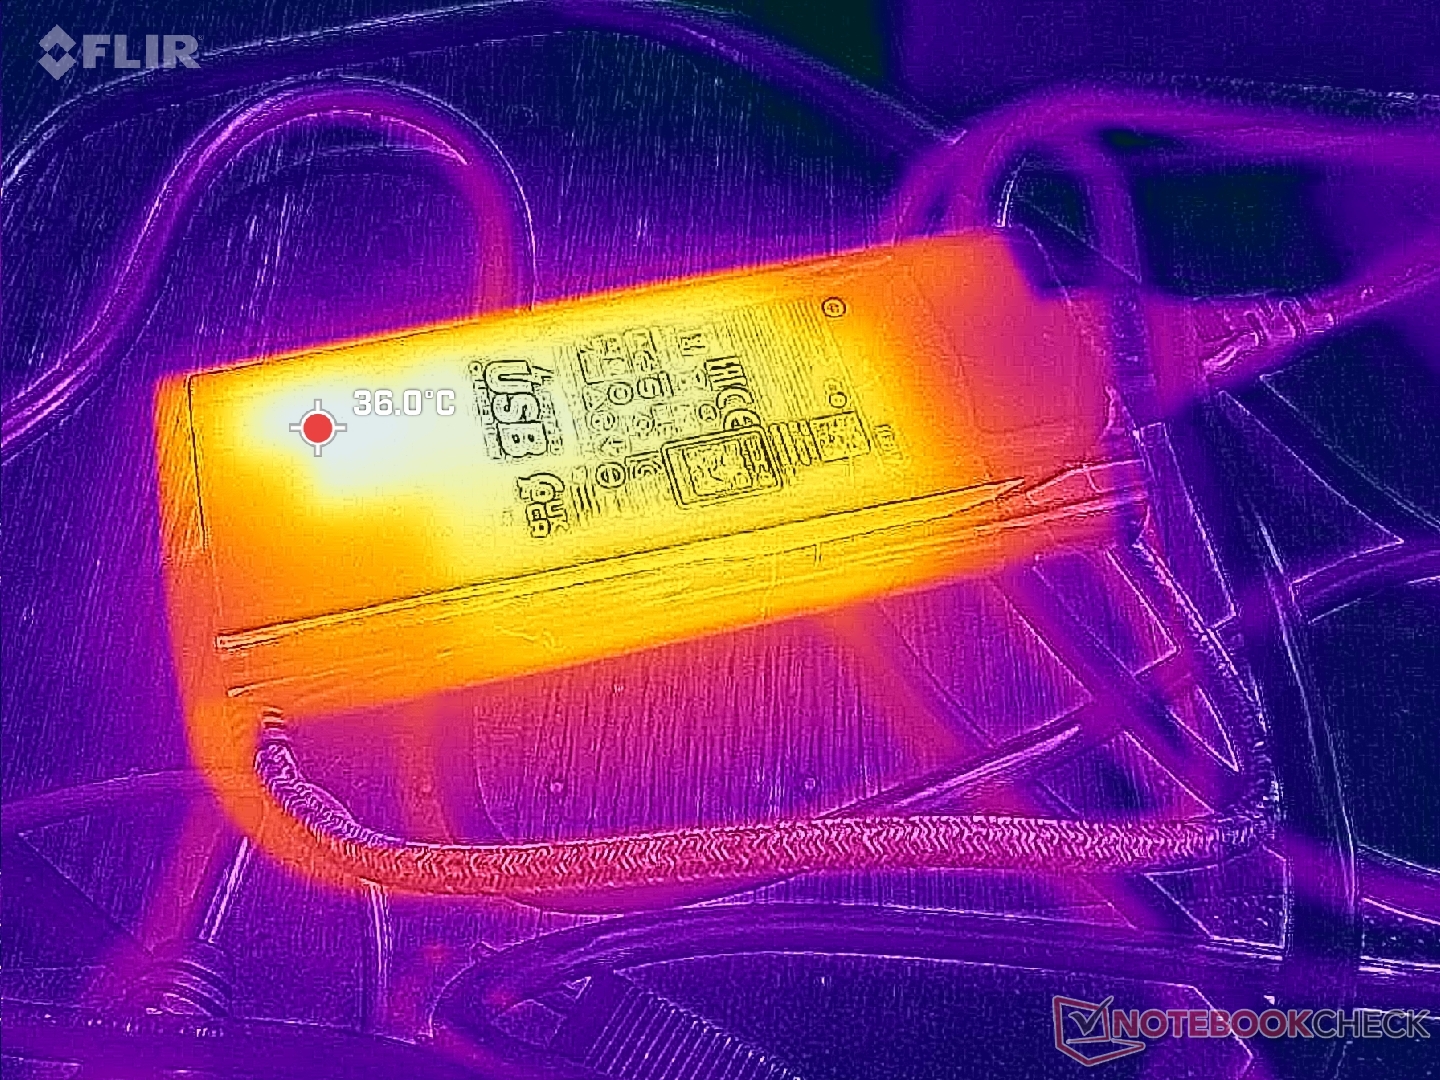
Charging from empty to full capacity is still relatively fast at around 90 minutes despite the larger battery.
| HP EliteBook X G1a 14 AI Ryzen AI 9 HX PRO 375, Radeon 890M, 74.5 Wh | HP EliteBook 1040 G10 818N7EA i5-1335U, Iris Xe G7 80EUs, 51 Wh | Lenovo ThinkPad X1 Carbon Gen 13 21NS0010GE Core Ultra 7 258V, Arc 140V, 57 Wh | Dell Latitude 7450 2-in-1 Ultra 7 165U, Graphics 4-Core iGPU (Arrow Lake), 57 Wh | Asus ExpertBook P5 P5405-NZ0102X Core Ultra 7 258V, Arc 140V, 63 Wh | Acer Swift 14 AI SF14-51-58TU Core Ultra 5 226V, Arc 130V, 65 Wh | |
|---|---|---|---|---|---|---|
| Battery runtime | -31% | -23% | -23% | 14% | -11% | |
| Reader / Idle (h) | 21.2 | |||||
| WiFi v1.3 (h) | 14.2 | 9.8 -31% | 11 -23% | 11 -23% | 16.2 14% | 12.6 -11% |
| H.264 (h) | 12.7 | 12.4 | ||||
| Load (h) | 2.2 | 1.4 | 2.9 | |||
| Cyberpunk 2077 ultra 150cd (h) | 1.6 |
Notebookcheck Rating
HP EliteBook X G1a 14 AI
- 02/25/2025 v8
Allen Ngo
 Total Sustainability Score:
 Transparency
The selection of devices to be reviewed is made by our editorial team. The test sample was provided to the author as a loan by the manufacturer or retailer for the purpose of this review. The lender had no influence on this review, nor did the manufacturer receive a copy of this review before publication. There was no obligation to publish this review. As an independent media company, Notebookcheck is not subjected to the authority of manufacturers, retailers or publishers.
This is how Notebookcheck is testing
Every year, Notebookcheck independently reviews hundreds of laptops and smartphones using standardized procedures to ensure that all results are comparable. We have continuously developed our test methods for around 20 years and set industry standards in the process. In our test labs, high-quality measuring equipment is utilized by experienced technicians and editors. These tests involve a multi-stage validation process. Our complex rating system is based on hundreds of well-founded measurements and benchmarks, which maintains objectivity. Further information on our test methods can be found here.
