Notebookcheck Logo
Teaser

Slim OLED gamer with RTX 5070 and Lunar Lake - Acer Predator Triton 14 AI review

Problems with the OLED.

Acer's Predator Triton 14 is a slim 14-inch gamer with an OLED touchscreen aimed at creative users and gamers. It combines an efficient Lunar Lake processor with the 110-watt GeForce RTX 5070. However, the test apparently shows weaknesses in the OLED and the fan noise.
Andreas Osthoff, 👁 Andreas Osthoff, Brian Burriston (translated by DeepL / Ninh Duy) Published 🇩🇪
AI Blackwell RTX 5000 Gaming Intel Laptop Lunar Lake Thunderbolt Touchscreen Wi-Fi 7 Windows

Verdict - Predator Triton 14 AI is not convincing

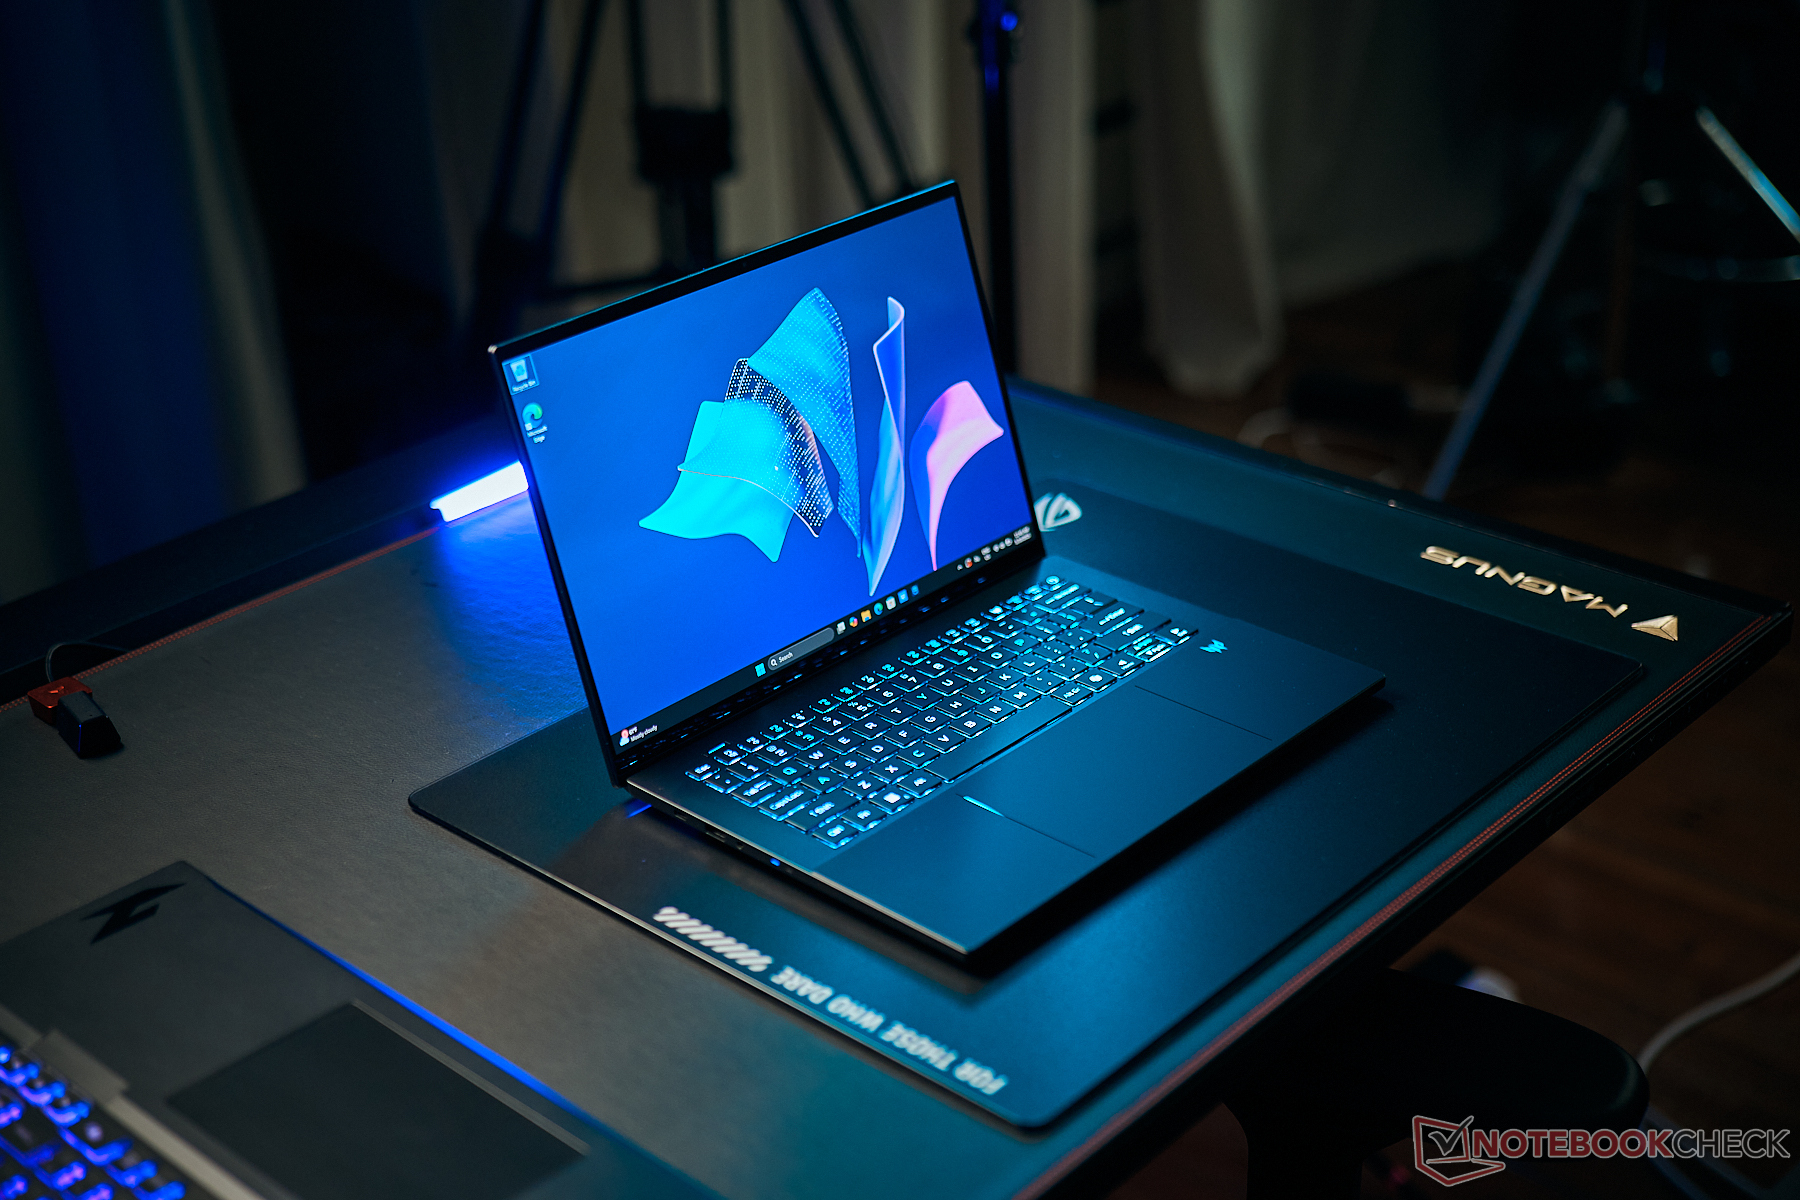
With the Predator Triton 14 AI, Acer has a compact gamer on offer that impresses above all with its high-quality casing and comfortable input devices. The combination of the efficient Lunar Lake processor and the fast GeForce RTX 5070 is not ideal, as the processor slows down the graphics card somewhat when gaming and the multi-core performance is simply significantly weaker than that of the competition. In addition, the cooling becomes unpleasantly loud if you really want to call up the full performance.

The OLED touchscreen was also not convincing. The biggest problem is the clearly visible raster effect, which significantly impairs the subjective image quality. There is also PWM with a very low frequency and the color deviations are not ideal for image processing.

In a competitive comparison with the Asus ROG Zephyrus G14 and the Razer Blade the Predator Triton is not really competitive. In addition to the problems with the image quality, the Acer is also noticeably more expensive at 2,999 Euros(~$3529).

Pros

+ high quality housing
+ Thunderbolt 4 & Wi-Fi 7
+ comfortable keyboard
+ haptic touchpad with stylus support
+ decent battery life

Cons

- visible raster effect of the OLED panel
- very loud fan
- slow card reader
- comparatively slow CPU
- RAM cannot be upgraded
- high standby consumption

Price and availability

The Acer Predator Triton 14 AI is available from online retailers for an RRP of 2,999 Euros(~$3529).

Amazon Logo
$2,599.99
acer Predator Triton 14 AI PT14-52T-96T3 Copilot+ PC – 14.5″ WQXGA+ OLED 120 Hz Touch | Intel Core Ultra 9 288V | NVIDIA GeForce RTX 5070 | 32 GB LPDDR5X | 2 TB PCIe
  • $69.99
    PowerPortnerLink 330W 280W Charger Compatible with Acer Predator Helios Neo 18 16 14 16S Helios/Triton 18 16 300 500 700 3D 17 X Nitro 5 17 18 16 14 Series PHN18 PHN16 PH18-71 Laptop

With the Predator Triton 14 AI, Acer offers a compact gaming laptop with a Lunar Lake processor, GeForce RTX 5070 laptop and OLED touchscreen. Only one model with 32 GB RAM and 2 TB SSD is currently available in stores for an RRP of €2,999 (~$3529).

Specifications

Acer Predator Triton 14 AI PT14-52
Processor
Intel Core Ultra 9 288V 8 x 3.3 - 5.1 GHz, 37 W PL2 / Short Burst, 37 W PL1 / Sustained, Lunar Lake
Graphics adapter
NVIDIA GeForce RTX 5070 Laptop - 8 GB VRAM, Core: 2535 MHz, RAM: 1481 MHz, 110 W TDP ( including 25 W Dynamic Boost), GDDR7, 591.59, Optimus, MUX-Switch
Memory
32 GB 
, LPDDR5x-8533, Dual-Channel, onboard
Display
14.50 inch 16:10, 2880 x 1800 pixel 234 PPI, capacitive, ATNA45AF03-0, OLED, glossy: yes, HDR, 120 Hz
Storage
Micron 3400 1TB MTFDKBA1T0TFH, 1024 GB 
, M.2 PCIe, 870 GB free
Soundcard
Intel Lunar Lake SOC - cAVS (Audio, Voice, Speech)
Connections
2 USB 3.0 / 3.1 Gen1, 1 USB 3.1 Gen2, 1 USB4 40 Gbps, 1 Thunderbolt 4, USB-C Power Delivery (PD), 1 HDMI, 2 DisplayPort, Audio Connections: 3.5mm, Card Reader: microSD, Brightness Sensor
Networking
Intel Killer AX1775s 320MHz (a/b/g/h/n = Wi-Fi 4/ac = Wi-Fi 5/ax = Wi-Fi 6/ Wi-Fi 6E 6 GHz), Bluetooth 5.4
Size
height x width x depth (in mm): 17.31 x 320 x 221 ( = 0.68 x 12.6 x 8.7 in)
Battery
76 Wh, 4930 mAh Lithium-Polymer
Operating System
Microsoft Windows 11 Home
Camera
Webcam: 1080p + IR
Additional features
Speakers: Stereo, Keyboard: Chiclet, Keyboard Light: yes, 140W PSU, 24 Months Warranty
Weight
1.587 kg ( = 55.98 oz / 3.5 pounds), Power Supply: 496 g ( = 17.5 oz / 1.09 pounds)
Price
2999 Euro
Note: The manufacturer may use components from different suppliers including display panels, drives or memory sticks with similar specifications.


Case & equipment

Illuminated logos
Illuminated logos

Acer uses a black CNC-milled metal casing, which is of very high quality overall. The workmanship is excellent and the stability is very good (both base unit and lid), only the hinges (max. opening angle 135 degrees) could be a little tighter, as there is a slight bounce. In addition to the illuminated keyboard, the two logos (lid and base unit) can also be illuminated in any desired color. When the lighting is deactivated, the compact gamer looks very simple and is not particularly noticeable. The surfaces are quite susceptible to fingerprints, but are also easy to clean.

The connections are located on both sides and all the important standards are available here. The microSD card reader on the right-hand side is very slow and the 1080p webcam (including IR for face recognition) doesn't take particularly good pictures either. The Wi-Fi module supports the current Wi-Fi 7 standard and achieves very good and stable transfer rates.

Size comparison

344.9 mm / 13.6 in 255.4 mm / 10.1 in 21.5 mm / 0.846 in 1.9 kg4.18 lbs324.12 mm / 12.8 in 255.4 mm / 10.1 in 20.9 mm / 0.823 in 1.9 kg4.29 lbs320 mm / 12.6 in 221 mm / 8.7 in 17.31 mm / 0.681 in 1.6 kg3.5 lbs313 mm / 12.3 in 233 mm / 9.17 in 18 mm / 0.709 in 1.6 kg3.64 lbs311 mm / 12.2 in 227 mm / 8.94 in 19.9 mm / 0.783 in 1.5 kg3.22 lbs311 mm / 12.2 in 220 mm / 8.66 in 18.3 mm / 0.72 in 1.6 kg3.48 lbs310.7 mm / 12.2 in 224.3 mm / 8.83 in 16.2 mm / 0.638 in 1.6 kg3.56 lbs297 mm / 11.7 in 210 mm / 8.27 in 1 mm / 0.03937 in 5.7 g0.01257 lbs
Left: USB-C 3.2 Gen.2 (10 Gbit/s, DisplayPort ALT mode, Power Delivery), USB-A 3.2 Gen.1 (5 Gbit/s), 3.5 mm audio
Right: microSD card reader, USB-C 4.0 with Thunderbolt 4 (40 Gbit/s, DisplayPort ALT mode, Power Delivery), USB-A 3.2 Gen.1 (5 Gbit/s), HDMI 2.1
SD Card Reader
average JPG Copy Test (av. of 3 runs)
Razer Blade 14 2025
AMD Ryzen AI 9 365 (Angelbird AV Pro V60)
202 MB/s +767%
Asus ROG Zephyrus G14 2025 GA403WW
AMD Ryzen AI 9 HX 370 (Angelbird AV Pro V60)
187 MB/s +703%
Average of class Gaming
  (20 - 210, n=68, last 2 years)
112.7 MB/s +384%
Asus TUF Gaming A14 FA401WV-WB94
AMD Ryzen AI 9 HX 370 (Angelbird AV Pro V60)
58.1 MB/s +149%
Acer Predator Helios Neo 14 (2024)
Intel Core Ultra 9 185H (AV PRO microSD 128 GB V60)
26 MB/s +12%
Acer Predator Triton 14 AI PT14-52
Intel Core Ultra 9 288V (Angelbird AV Pro V60)
23.3 MB/s
maximum AS SSD Seq Read Test (1GB)
Asus TUF Gaming A14 FA401WV-WB94
AMD Ryzen AI 9 HX 370 (Angelbird AV Pro V60)
226.1 MB/s +787%
Razer Blade 14 2025
AMD Ryzen AI 9 365 (Angelbird AV Pro V60)
211.3 MB/s +729%
Asus ROG Zephyrus G14 2025 GA403WW
AMD Ryzen AI 9 HX 370 (Angelbird AV Pro V60)
210.6 MB/s +726%
Average of class Gaming
  (25.5 - 261, n=65, last 2 years)
144.5 MB/s +467%
Acer Predator Helios Neo 14 (2024)
Intel Core Ultra 9 185H (AV PRO microSD 128 GB V60)
27 MB/s +6%
Acer Predator Triton 14 AI PT14-52
Intel Core Ultra 9 288V (Angelbird AV Pro V60)
25.5 MB/s
Networking
Acer Predator Triton 14 AI PT14-52
Intel Killer AX1775s 320MHz
iperf3 transmit AXE11000
1563 (min: 1384) MBit/s ∼84%
iperf3 receive AXE11000
1656 (min: 1589) MBit/s ∼95%
Razer Blade 14 2025
Mediatek Wi-Fi 7 MT7925 Wireless LAN Card
iperf3 transmit AXE11000
1842 (min: 1618) MBit/s ∼99%
iperf3 receive AXE11000
1719 (min: 1648) MBit/s ∼99%
Asus ROG Zephyrus G14 2025 GA403WW
Mediatek Wi-Fi 7 MT7925 Wireless LAN Card
iperf3 transmit AXE11000
1862 (min: 1777) MBit/s ∼100%
iperf3 receive AXE11000
1741 (min: 1698) MBit/s ∼100%
Acer Predator Helios Neo 14 (2024)
Killer Wi-Fi 6E AX1675i 160MHz Wireless Network Adapter
iperf3 transmit AXE11000
1222 (min: 552) MBit/s ∼66%
iperf3 receive AXE11000
1691 (min: 1653) MBit/s ∼97%
Asus TUF Gaming A14 FA401WV-WB94
MediaTek Wi-Fi 6E MT7922 160MHz Wireless LAN Card
iperf3 transmit AXE11000
746 (min: 470) MBit/s ∼40%
iperf3 receive AXE11000
857 (min: 706) MBit/s ∼49%
iperf3 transmit AXE11000 6GHz
1102 (min: 1056) MBit/s ∼85%
iperf3 receive AXE11000 6GHz
1187 (min: 1171) MBit/s ∼85%
HP Omen Transcend 14-fb0014
Intel Wi-Fi 7 BE200 320MHz
iperf3 transmit AXE11000
1200 (min: 623) MBit/s ∼64%
iperf3 receive AXE11000
1418 (min: 1323) MBit/s ∼81%
iperf3 transmit AXE11000 6GHz
1298 (min: 1188) MBit/s ∼100%
iperf3 receive AXE11000 6GHz
1402 (min: 1366) MBit/s ∼100%
0501001502002503003504004505005506006507007508008509009501000105011001150120012501300135014001450150015501600165017001750Tooltip
Acer Predator Triton 14 AI PT14-52; iperf3 transmit AXE11000; iperf 3.1.3: Ø1563 (1384-1792)
Acer Predator Triton 14 AI PT14-52; iperf3 receive AXE11000; iperf 3.1.3: Ø1656 (1589-1704)
ColorChecker
7.6 ∆E
9.2 ∆E
16.2 ∆E
13 ∆E
14.5 ∆E
12 ∆E
4.8 ∆E
15.8 ∆E
4.3 ∆E
5.8 ∆E
8.9 ∆E
7.1 ∆E
10.3 ∆E
12.8 ∆E
4.6 ∆E
7 ∆E
8.3 ∆E
18.7 ∆E
2.7 ∆E
10 ∆E
11.4 ∆E
11.3 ∆E
8.9 ∆E
3.4 ∆E
ColorChecker Acer Predator Triton 14 AI PT14-52: 9.53 ∆E min: 2.75 - max: 18.69 ∆E

Maintenance

The lower casing cover is secured with several Torx screws (T6) and can be easily removed. The RAM is integrated in the processor, so maintenance work is limited to the fans, the battery, the M.2 SSD and the WLAN module.

Internal structure
Internal structure
WLAN module
WLAN module
M.2-2280 SSD
M.2-2280 SSD

Sustainability

Acer does not provide any information on the CO2 footprint or the use of recycled materials. The packaging can be fully recycled.

Input devices - Comfortable RGB keyboard

The RGB keyboard offers a very comfortable typing experience and even long texts can be written without any problems. Compared to the base unit, the housing around the keyboard is slightly lowered, which is why a fairly generous stroke can be realized here. In direct comparison, the keyboard of the ROG Zephyrus G14 is a little more comfortable, but you really can't complain here. Only the arrow keys are too small, especially for a gamer.

Input devices (test device with US layout)
Keyboard illumination

Acer installs a large haptic trackpad that is practically seamlessly integrated into the base unit. There are two LED strips on the side edges that briefly light up white when in use to indicate the edge. Operation is excellent and input with the active stylus (included) is also supported. However, the stylus cannot be used on the capacitive touchscreen, which only supports input with the fingers.

Haptic touchpad with LED limiting strips...
...and support for stylus.

Display - Problematic OLED

Subpixel arrangement
Clearly visible raster effect (slightly amplified by the camera)

Acer uses a 14.5-inch OLED touchscreen (2,880 x 1,800 pixels, 16:10) with 120 Hz from Samsung. The basic OLED strengths (vivid colors, high contrasts, fast response times) are present, but the touchscreen layer results in a clearly visible raster effect, which greatly impairs the subjective image quality, especially with bright content. We tried to capture this in the picture on the right, but the camera exacerbates the problem minimally. There is also PWM flickering at 240 Hz at every brightness level. Both the brightness and the color temperature can be controlled by a sensor. The touchscreen is very reflective, which limits its use, especially outdoors.

The brightness in SDR mode is just under 380 cd/m² and the black level is 0, which results in very high contrasts. In HDR mode, the maximum brightness is 558 cd/m² for image sections and 478 cd/m² for a full screen. The panel fully covers both the sRGB and P3 color spaces and Acer offers corresponding color profiles. In our analysis with the professional CalMAN software, the color temperature is slightly too warm, but there is no color cast. However, the color deviations are partly above the target value of 3, which we could not improve with our own calibration. The panel is therefore not ideal for image editing.

378
cd/m²
375
cd/m²
376
cd/m²
378
cd/m²
376
cd/m²
377
cd/m²
377
cd/m²
378
cd/m²
376
cd/m²
Distribution of brightness
ATNA45AF03-0 tested with X-Rite i1Pro 3
Maximum: 378 cd/m² (Nits) Average: 376.8 cd/m² Minimum: 21.1 cd/m²
Brightness Distribution: 99 %
Center on Battery: 376 cd/m²
Contrast: ∞:1 (Black: 0 cd/m²)
ΔE ColorChecker Calman: 2.7 | ∀{0.5-29.43 Ø4.78}
ΔE Greyscale Calman: 2.7 | ∀{0.09-98 Ø5}
95.1% AdobeRGB 1998 (Argyll 3D)
99.9% sRGB (Argyll 3D)
99.6% Display P3 (Argyll 3D)
Gamma: 2.23
CCT: 6138 K
Acer Predator Triton 14 AI PT14-52
ATNA45AF03-0, OLED, 2880x1800, 14.5", 120 Hz
Razer Blade 14 2025
ATNA40CU05-0, OLED, 2880x1800, 14", 120 Hz
Asus ROG Zephyrus G14 2025 GA403WW
ATNA40CU05-0, OLED, 2880x1800, 14", 120 Hz
Acer Predator Helios Neo 14 (2024)
BOE CQ NE145F8M-NY1, IPS, 3072x1920, 14.5", 165 Hz
Asus TUF Gaming A14 FA401WV-WB94
BOE NE140QDM-NX7, IPS, 2560x1600, 14", 165 Hz
HP Omen Transcend 14-fb0014
Samsung SDC4197, OLED, 2880x1800, 14", 120 Hz
Lenovo Legion 5 15IRX10 5070
LEN151WQXGA, OLED, 2560x1600, 15.1", 165 Hz
Display
-2%
-2%
-23%
-24%
0%
Display P3 Coverage (%)
99.6
99.5
0%
99.6
0%
65
-35%
65.1
-35%
99.6
0%
sRGB Coverage (%)
99.9
100
0%
100
0%
95.3
-5%
94
-6%
100
0%
AdobeRGB 1998 Coverage (%)
95.1
89.2
-6%
89.9
-5%
66.8
-30%
65.6
-31%
96.1
1%
Response Times
6%
-19%
-917%
-1561%
-66%
Response Time Grey 50% / Grey 80% * (ms)
0.48 ?(0.24, 0.24)
0.59 ?(0.32, 0.27)
-23%
0.62 ?(0.33, 0.29)
-29%
5.4 ?(2.5, 2.9)
-1025%
10.7 ?(5, 5.7)
-2129%
0.86 ?(0.45, 0.41)
-79%
Response Time Black / White * (ms)
0.65 ?(0.35, 0.3)
0.63 ?(0.35, 0.28)
3%
0.68 ?(0.36, 0.32)
-5%
5.9 ?(1.9, 4)
-808%
7.1 ?(3.9, 3.2)
-992%
0.99 ?(0.46, 0.53)
-52%
PWM Frequency (Hz)
240 ?(100)
960 ?(90)
960 ?(60)
479 ?(100)
PWM Amplitude * (%)
41
26
37%
50
-22%
Screen
11%
39%
-4%
-13%
-2%
Brightness middle (cd/m²)
376
361
-4%
423
13%
450
20%
455.8
21%
386.3
3%
Brightness (cd/m²)
377
363
-4%
424
12%
433
15%
436
16%
389
3%
Brightness Distribution (%)
99
98
-1%
98
-1%
87
-12%
93
-6%
98
-1%
Black Level * (cd/m²)
0.01
0.45
0.38
Colorchecker dE 2000 *
2.7
1.7
37%
0.7
74%
2.26
16%
3.39
-26%
4.03
-49%
Colorchecker dE 2000 max. *
5.3
3.9
26%
1.8
66%
7.5
-42%
7.3
-38%
6.69
-26%
Greyscale dE 2000 *
2.7
2.4
11%
0.8
70%
3.2
-19%
3.9
-44%
1.2
56%
Gamma
2.23 99%
2.14 103%
2.18 101%
2.214 99%
2.17 101%
2.25 98%
CCT
6138 106%
6571 99%
6505 100%
6121 106%
7340 89%
6280 104%
Contrast (:1)
42300
1000
1199
Colorchecker dE 2000 calibrated *
1.21
1.67
1.07
Total Average (Program / Settings)
5% / 6%
6% / 14%
-315% / -175%
-533% / -297%
-23% / -13%

* ... smaller is better

CalMAN Grayscale (Profile: P3)
CalMAN saturation (profile: P3)
CalMAN ColorChecker (Profile: P3)
CalMAN Grayscale (Profile: sRGB)
CalMAN saturation (profile: sRGB)
CalMAN ColorChecker (Profile: sRGB)
vs. sRGB
vs. sRGB
vs. P3
vs. P3
vs. AdobeRGB
vs. AdobeRGB

Display Response Times

Display response times show how fast the screen is able to change from one color to the next. Slow response times can lead to afterimages and can cause moving objects to appear blurry (ghosting). Gamers of fast-paced 3D titles should pay special attention to fast response times.
       Response Time Black to White
0.65 ms ... rise ↗ and fall ↘ combined↗ 0.35 ms rise
↘ 0.3 ms fall
The screen shows very fast response rates in our tests and should be very well suited for fast-paced gaming.
In comparison, all tested devices range from 0.1 (minimum) to 240 (maximum) ms. » 1 % of all devices are better.
This means that the measured response time is better than the average of all tested devices (20.2 ms).
       Response Time 50% Grey to 80% Grey
0.48 ms ... rise ↗ and fall ↘ combined↗ 0.24 ms rise
↘ 0.24 ms fall
The screen shows very fast response rates in our tests and should be very well suited for fast-paced gaming.
In comparison, all tested devices range from 0.165 (minimum) to 636 (maximum) ms. » 1 % of all devices are better.
This means that the measured response time is better than the average of all tested devices (31.6 ms).

Screen Flickering / PWM (Pulse-Width Modulation)

To dim the screen, some notebooks will simply cycle the backlight on and off in rapid succession - a method called Pulse Width Modulation (PWM) . This cycling frequency should ideally be undetectable to the human eye. If said frequency is too low, users with sensitive eyes may experience strain or headaches or even notice the flickering altogether.
Screen flickering / PWM detected 240 Hz
Amplitude: 41 %
≤ 100 % brightness setting

The display backlight flickers at 240 Hz (worst case, e.g., utilizing PWM) Flickering detected at a brightness setting of 100 % and below. There should be no flickering or PWM above this brightness setting.

The frequency of 240 Hz is relatively low, so sensitive users will likely notice flickering and experience eyestrain at the stated brightness setting and below.

In comparison: 53 % of all tested devices do not use PWM to dim the display. If PWM was detected, an average of 8098 (minimum: 5 - maximum: 343500) Hz was measured.

PWM (0 % brightness)
PWM (20 % brightness)
PWM (40 % brightness)
PWM (60 % brightness)
PWM (80 % brightness)
PWM (100 % brightness)
In the sun
In the sun
Viewing angle stability

Performance - Lunar Lake & Blackwell

Test conditions

Predator Sense
Predator Sense

Acer offers various energy profiles that can be switched either via the Predator Sense software or the corresponding button. The CPU performance is practically identical in all profiles, but the full GPU performance is only available in Turbo mode, which we also used for the benchmarks. In battery mode, the Balanced mode is the maximum available.

Energy profile TDP CB24 Multi TGP Time Spy Graphics CP2077 QHD Ultra max. Fan volume
Quiet 37 watts 664 points 65 watts 9,820 points 46.5 FPS 40 dB(A)
Balanced 37 watts 667 points 65 watts 9,974 points 47.3 FPS 47.6 dB(A)
Performance 37 watts 668 points 85 watts 11,375 points 54.3 FPS 53.3 dB(A)
Turbo 37 watts 670 points 110 watts 12,401 points 59 FPS 57.9 dB(A)
battery (Balanced) 35/17 watts 480 points 65 watts 9,839 points 46.7 FPS 40 dB(A)

Processor

The Lunar Lake Core Ultra 9 288V is allowed to consume a maximum of 37 watts and does so in the Predator Triton. The performance is also okay in everyday use due to the high single-core performance, but the 8-core simply doesn't stand a chance against the competition, especially when it comes to multi-core performance.

Cinebench R15 Multi endurance test

018036054072090010801260144016201800198021602340252027002880306032403420Tooltip
Acer Predator Triton 14 AI PT14-52 Intel Core Ultra 9 288V: Ø1625 (1583.03-1639.81)
Razer Blade 14 2025 AMD Ryzen AI 9 365: Ø2928 (2910.57-2975.97)
Asus ROG Zephyrus G14 2025 GA403WW AMD Ryzen AI 9 HX 370: Ø3508 (3409.77-3551.38)
Acer Predator Helios Neo 14 (2024) Intel Core Ultra 9 185H: Ø2619 (2486.48-2745.37)
Asus TUF Gaming A14 FA401WV-WB94 AMD Ryzen AI 9 HX 370: Ø3426 (3408.61-3447.98)
HP Omen Transcend 14-fb0014 Intel Core Ultra 7 155H: Ø2510 (2462.6-2628.12)
Lenovo Legion 5 15IRX10 5070 Intel Core i7-13650HX: Ø2889 (2835.47-3073.14)
CPU Performance rating: Percent
Cinebench R23: Multi Core | Single Core
Cinebench R20: CPU (Multi Core) | CPU (Single Core)
Cinebench R15: CPU Multi 64Bit | CPU Single 64Bit
Blender: v2.79 BMW27 CPU
7-Zip 18.03: 7z b 4 | 7z b 4 -mmt1
Geekbench 6.5: Multi-Core | Single-Core
Geekbench 5.5: Multi-Core | Single-Core
HWBOT x265 Benchmark v2.2: 4k Preset
LibreOffice : 20 Documents To PDF
R Benchmark 2.5: Overall mean
CPU Performance rating
Average of class Gaming
 
84.5 pt
Asus ROG Zephyrus G14 2025 GA403WW
AMD Ryzen AI 9 HX 370
84 pt
Asus TUF Gaming A14 FA401WV-WB94
AMD Ryzen AI 9 HX 370
80.2 pt
Lenovo Legion 5 15IRX10 5070
Intel Core i7-13650HX
74.8 pt
Razer Blade 14 2025
AMD Ryzen AI 9 365
74.5 pt
Acer Predator Helios Neo 14 (2024)
Intel Core Ultra 9 185H
72.1 pt
HP Omen Transcend 14-fb0014
Intel Core Ultra 7 155H
65.8 pt
Acer Predator Triton 14 AI PT14-52
Intel Core Ultra 9 288V
61.1 pt
Average Intel Core Ultra 9 288V
 
58 pt
Cinebench R23 / Multi Core
Average of class Gaming
  (5668 - 40970, n=147, last 2 years)
25160 Points +130%
Asus ROG Zephyrus G14 2025 GA403WW
AMD Ryzen AI 9 HX 370
23902 Points +118%
Asus TUF Gaming A14 FA401WV-WB94
AMD Ryzen AI 9 HX 370
23456 (23201.9min - 23456.3max) Points +114%
Lenovo Legion 5 15IRX10 5070
Intel Core i7-13650HX
20325 Points +86%
Razer Blade 14 2025
AMD Ryzen AI 9 365
19449 Points +78%
Acer Predator Helios Neo 14 (2024)
Intel Core Ultra 9 185H
17787 Points +63%
HP Omen Transcend 14-fb0014
Intel Core Ultra 7 155H
16758 (15790min - 16758.1max) Points +53%
Acer Predator Triton 14 AI PT14-52
Intel Core Ultra 9 288V
10941 Points
Average Intel Core Ultra 9 288V
  (9091 - 10941, n=4)
10097 Points -8%
Cinebench R23 / Single Core
Acer Predator Triton 14 AI PT14-52
Intel Core Ultra 9 288V
2013 Points
Asus ROG Zephyrus G14 2025 GA403WW
AMD Ryzen AI 9 HX 370
1997 Points -1%
Razer Blade 14 2025
AMD Ryzen AI 9 365
1987 Points -1%
Average of class Gaming
  (1136 - 2267, n=147, last 2 years)
1984 Points -1%
Asus TUF Gaming A14 FA401WV-WB94
AMD Ryzen AI 9 HX 370
1979 Points -2%
Average Intel Core Ultra 9 288V
  (1794 - 2013, n=5)
1929 Points -4%
Acer Predator Helios Neo 14 (2024)
Intel Core Ultra 9 185H
1883 Points -6%
Lenovo Legion 5 15IRX10 5070
Intel Core i7-13650HX
1858 Points -8%
HP Omen Transcend 14-fb0014
Intel Core Ultra 7 155H
1666 Points -17%
Cinebench R20 / CPU (Multi Core)
Average of class Gaming
  (2179 - 16108, n=146, last 2 years)
9701 Points +129%
Asus ROG Zephyrus G14 2025 GA403WW
AMD Ryzen AI 9 HX 370
9280 Points +119%
Asus TUF Gaming A14 FA401WV-WB94
AMD Ryzen AI 9 HX 370
9151 Points +116%
Lenovo Legion 5 15IRX10 5070
Intel Core i7-13650HX
7811 Points +85%
Razer Blade 14 2025
AMD Ryzen AI 9 365
7576 Points +79%
Acer Predator Helios Neo 14 (2024)
Intel Core Ultra 9 185H
6910 Points +63%
HP Omen Transcend 14-fb0014
Intel Core Ultra 7 155H
6529 Points +54%
Acer Predator Triton 14 AI PT14-52
Intel Core Ultra 9 288V
4230 Points
Average Intel Core Ultra 9 288V
  (4091 - 4230, n=3)
4162 Points -2%
Cinebench R20 / CPU (Single Core)
Asus ROG Zephyrus G14 2025 GA403WW
AMD Ryzen AI 9 HX 370
791 Points +2%
Asus TUF Gaming A14 FA401WV-WB94
AMD Ryzen AI 9 HX 370
782 Points +1%
Razer Blade 14 2025
AMD Ryzen AI 9 365
779 Points 0%
Acer Predator Triton 14 AI PT14-52
Intel Core Ultra 9 288V
777 Points
Average of class Gaming
  (439 - 870, n=146, last 2 years)
767 Points -1%
Average Intel Core Ultra 9 288V
  (703 - 777, n=3)
743 Points -4%
Acer Predator Helios Neo 14 (2024)
Intel Core Ultra 9 185H
733 Points -6%
Lenovo Legion 5 15IRX10 5070
Intel Core i7-13650HX
719 Points -7%
HP Omen Transcend 14-fb0014
Intel Core Ultra 7 155H
644 Points -17%
Cinebench R15 / CPU Multi 64Bit
Average of class Gaming
  (1537 - 6271, n=146, last 2 years)
3895 Points +138%
Asus ROG Zephyrus G14 2025 GA403WW
AMD Ryzen AI 9 HX 370
3551 Points +117%
Asus TUF Gaming A14 FA401WV-WB94
AMD Ryzen AI 9 HX 370
3448 (3408.61min - 3447.98max) Points +110%
Lenovo Legion 5 15IRX10 5070
Intel Core i7-13650HX
3073 (2835.47min - 3073.14max) Points +87%
Razer Blade 14 2025
AMD Ryzen AI 9 365
2976 (2910.57min - 2975.97max) Points +81%
Acer Predator Helios Neo 14 (2024)
Intel Core Ultra 9 185H
2745 Points +67%
HP Omen Transcend 14-fb0014
Intel Core Ultra 7 155H
2628 (2462.6min - 2628.12max) Points +60%
Acer Predator Triton 14 AI PT14-52
Intel Core Ultra 9 288V
1640 (1583.03min - 1639.81max) Points
Average Intel Core Ultra 9 288V
  (1500 - 1640, n=3)
1574 Points -4%
Cinebench R15 / CPU Single 64Bit
Acer Predator Triton 14 AI PT14-52
Intel Core Ultra 9 288V
309 Points
Asus ROG Zephyrus G14 2025 GA403WW
AMD Ryzen AI 9 HX 370
307 Points -1%
Average Intel Core Ultra 9 288V
  (294 - 309, n=2)
302 Points -2%
Asus TUF Gaming A14 FA401WV-WB94
AMD Ryzen AI 9 HX 370
301 Points -3%
Average of class Gaming
  (188.8 - 343, n=145, last 2 years)
293 Points -5%
Acer Predator Helios Neo 14 (2024)
Intel Core Ultra 9 185H
281 Points -9%
Lenovo Legion 5 15IRX10 5070
Intel Core i7-13650HX
268 Points -13%
HP Omen Transcend 14-fb0014
Intel Core Ultra 7 155H
253 Points -18%
Razer Blade 14 2025
AMD Ryzen AI 9 365
195.7 Points -37%
Blender / v2.79 BMW27 CPU
Average Intel Core Ultra 9 288V
  (310 - 441, n=4)
381 Seconds * -23%
Acer Predator Triton 14 AI PT14-52
Intel Core Ultra 9 288V
310 Seconds *
HP Omen Transcend 14-fb0014
Intel Core Ultra 7 155H
195 Seconds * +37%
Acer Predator Helios Neo 14 (2024)
Intel Core Ultra 9 185H
177 Seconds * +43%
Razer Blade 14 2025
AMD Ryzen AI 9 365
169 Seconds * +45%
Lenovo Legion 5 15IRX10 5070
Intel Core i7-13650HX
168 Seconds * +46%
Average of class Gaming
  (80 - 517, n=142, last 2 years)
154.8 Seconds * +50%
Asus TUF Gaming A14 FA401WV-WB94
AMD Ryzen AI 9 HX 370
143 Seconds * +54%
Asus ROG Zephyrus G14 2025 GA403WW
AMD Ryzen AI 9 HX 370
139 Seconds * +55%
7-Zip 18.03 / 7z b 4
Average of class Gaming
  (23795 - 148086, n=144, last 2 years)
91043 MIPS +148%
Asus ROG Zephyrus G14 2025 GA403WW
AMD Ryzen AI 9 HX 370
83139 MIPS +127%
Asus TUF Gaming A14 FA401WV-WB94
AMD Ryzen AI 9 HX 370
80277 MIPS +119%
Lenovo Legion 5 15IRX10 5070
Intel Core i7-13650HX
78404 MIPS +114%
Acer Predator Helios Neo 14 (2024)
Intel Core Ultra 9 185H
71752 MIPS +96%
Razer Blade 14 2025
AMD Ryzen AI 9 365
71550 MIPS +95%
HP Omen Transcend 14-fb0014
Intel Core Ultra 7 155H
63817 MIPS +74%
Acer Predator Triton 14 AI PT14-52
Intel Core Ultra 9 288V
36683 MIPS
Average Intel Core Ultra 9 288V
  (32105 - 36683, n=5)
34617 MIPS -6%
7-Zip 18.03 / 7z b 4 -mmt1
Average of class Gaming
  (4199 - 7508, n=144, last 2 years)
6412 MIPS +8%
Asus ROG Zephyrus G14 2025 GA403WW
AMD Ryzen AI 9 HX 370
6183 MIPS +4%
Asus TUF Gaming A14 FA401WV-WB94
AMD Ryzen AI 9 HX 370
6106 MIPS +3%
Razer Blade 14 2025
AMD Ryzen AI 9 365
6017 MIPS +1%
Lenovo Legion 5 15IRX10 5070
Intel Core i7-13650HX
5992 MIPS +1%
Acer Predator Triton 14 AI PT14-52
Intel Core Ultra 9 288V
5929 MIPS
Average Intel Core Ultra 9 288V
  (5734 - 5993, n=5)
5919 MIPS 0%
Acer Predator Helios Neo 14 (2024)
Intel Core Ultra 9 185H
5519 MIPS -7%
HP Omen Transcend 14-fb0014
Intel Core Ultra 7 155H
5054 MIPS -15%
Geekbench 6.5 / Multi-Core
Asus ROG Zephyrus G14 2025 GA403WW
AMD Ryzen AI 9 HX 370
15994 Points +43%
Average of class Gaming
  (5340 - 22104, n=144, last 2 years)
15651 Points +40%
Razer Blade 14 2025
AMD Ryzen AI 9 365
15137 Points +35%
Lenovo Legion 5 15IRX10 5070
Intel Core i7-13650HX
14378 Points +28%
Acer Predator Helios Neo 14 (2024)
Intel Core Ultra 9 185H
14039 Points +25%
Asus TUF Gaming A14 FA401WV-WB94
AMD Ryzen AI 9 HX 370
13799 Points +23%
HP Omen Transcend 14-fb0014
Intel Core Ultra 7 155H
13313 Points +19%
Acer Predator Triton 14 AI PT14-52
Intel Core Ultra 9 288V
11190 Points
Average Intel Core Ultra 9 288V
  (10969 - 11190, n=5)
11050 Points -1%
Geekbench 6.5 / Single-Core
Asus ROG Zephyrus G14 2025 GA403WW
AMD Ryzen AI 9 HX 370
2929 Points +1%
Razer Blade 14 2025
AMD Ryzen AI 9 365
2888 Points 0%
Acer Predator Triton 14 AI PT14-52
Intel Core Ultra 9 288V
2887 Points
Asus TUF Gaming A14 FA401WV-WB94
AMD Ryzen AI 9 HX 370
2846 Points -1%
Average Intel Core Ultra 9 288V
  (2797 - 2887, n=4)
2843 Points -2%
Average of class Gaming
  (1490 - 3253, n=144, last 2 years)
2791 Points -3%
Lenovo Legion 5 15IRX10 5070
Intel Core i7-13650HX
2595 Points -10%
Acer Predator Helios Neo 14 (2024)
Intel Core Ultra 9 185H
2490 Points -14%
HP Omen Transcend 14-fb0014
Intel Core Ultra 7 155H
2386 Points -17%
Geekbench 5.5 / Multi-Core
Average of class Gaming
  (4557 - 27010, n=143, last 2 years)
16810 Points +72%
Asus ROG Zephyrus G14 2025 GA403WW
AMD Ryzen AI 9 HX 370
15759 Points +62%
Lenovo Legion 5 15IRX10 5070
Intel Core i7-13650HX
14778 Points +52%
Asus TUF Gaming A14 FA401WV-WB94
AMD Ryzen AI 9 HX 370
14068 Points +44%
Razer Blade 14 2025
AMD Ryzen AI 9 365
13981 Points +43%
Acer Predator Helios Neo 14 (2024)
Intel Core Ultra 9 185H
13613 Points +40%
HP Omen Transcend 14-fb0014
Intel Core Ultra 7 155H
13119 Points +35%
Acer Predator Triton 14 AI PT14-52
Intel Core Ultra 9 288V
9745 Points
Average Intel Core Ultra 9 288V
  (9588 - 9745, n=3)
9655 Points -1%
Geekbench 5.5 / Single-Core
Asus ROG Zephyrus G14 2025 GA403WW
AMD Ryzen AI 9 HX 370
2160 Points +3%
Razer Blade 14 2025
AMD Ryzen AI 9 365
2104 Points 0%
Acer Predator Triton 14 AI PT14-52
Intel Core Ultra 9 288V
2094 Points
Average Intel Core Ultra 9 288V
  (2024 - 2114, n=3)
2077 Points -1%
Asus TUF Gaming A14 FA401WV-WB94
AMD Ryzen AI 9 HX 370
2030 Points -3%
Average of class Gaming
  (986 - 2423, n=143, last 2 years)
2011 Points -4%
Acer Predator Helios Neo 14 (2024)
Intel Core Ultra 9 185H
1873 Points -11%
Lenovo Legion 5 15IRX10 5070
Intel Core i7-13650HX
1856 Points -11%
HP Omen Transcend 14-fb0014
Intel Core Ultra 7 155H
1741 Points -17%
HWBOT x265 Benchmark v2.2 / 4k Preset
Asus ROG Zephyrus G14 2025 GA403WW
AMD Ryzen AI 9 HX 370
28.4 fps +99%
Average of class Gaming
  (7.7 - 44.3, n=144, last 2 years)
27.2 fps +90%
Asus TUF Gaming A14 FA401WV-WB94
AMD Ryzen AI 9 HX 370
26 fps +82%
Razer Blade 14 2025
AMD Ryzen AI 9 365
24.2 fps +69%
Lenovo Legion 5 15IRX10 5070
Intel Core i7-13650HX
21.9 fps +53%
Acer Predator Helios Neo 14 (2024)
Intel Core Ultra 9 185H
20.1 fps +41%
HP Omen Transcend 14-fb0014
Intel Core Ultra 7 155H
19.3 fps +35%
Acer Predator Triton 14 AI PT14-52
Intel Core Ultra 9 288V
14.3 fps
Average Intel Core Ultra 9 288V
  (11.2 - 14.3, n=3)
12.9 fps -10%
LibreOffice / 20 Documents To PDF
Razer Blade 14 2025
AMD Ryzen AI 9 365
54.3 s * -19%
Asus TUF Gaming A14 FA401WV-WB94
AMD Ryzen AI 9 HX 370
51.7 s * -13%
Asus ROG Zephyrus G14 2025 GA403WW
AMD Ryzen AI 9 HX 370
50.7 s * -11%
Average of class Gaming
  (19 - 88.8, n=143, last 2 years)
47.6 s * -4%
Average Intel Core Ultra 9 288V
  (39.9 - 56.9, n=4)
46.4 s * -1%
Acer Predator Triton 14 AI PT14-52
Intel Core Ultra 9 288V
45.8 s *
HP Omen Transcend 14-fb0014
Intel Core Ultra 7 155H
45.1 s * +2%
Lenovo Legion 5 15IRX10 5070
Intel Core i7-13650HX
44.3 s * +3%
Acer Predator Helios Neo 14 (2024)
Intel Core Ultra 9 185H
38.4 s * +16%
R Benchmark 2.5 / Overall mean
HP Omen Transcend 14-fb0014
Intel Core Ultra 7 155H
0.4637 sec * -10%
Lenovo Legion 5 15IRX10 5070
Intel Core i7-13650HX
0.4461 sec * -5%
Acer Predator Helios Neo 14 (2024)
Intel Core Ultra 9 185H
0.4424 sec * -5%
Average Intel Core Ultra 9 288V
  (0.4218 - 0.4503, n=4)
0.4318 sec * -2%
Average of class Gaming
  (0.3551 - 0.759, n=145, last 2 years)
0.428 sec * -1%
Acer Predator Triton 14 AI PT14-52
Intel Core Ultra 9 288V
0.4229 sec *
Asus TUF Gaming A14 FA401WV-WB94
AMD Ryzen AI 9 HX 370
0.419 sec * +1%
Razer Blade 14 2025
AMD Ryzen AI 9 365
0.4091 sec * +3%
Asus ROG Zephyrus G14 2025 GA403WW
AMD Ryzen AI 9 HX 370
0.4077 sec * +4%

* ... smaller is better

Cinebench R15 CPU Multi 64Bit
1640 Points
Cinebench R15 OpenGL 64Bit
196.3 fps
Cinebench R15 Ref. Match 64Bit
99.6 %
Cinebench R15 CPU Single 64Bit
309 Points
Cinebench R20 CPU (Multi Core)
4230 Points
Cinebench R20 CPU (Single Core)
777 Points
Cinebench R23 Single Core
2013 Points
Cinebench R23 Multi Core
10941 Points
Cinebench 2024 CPU Single Core
127.7 Points
Cinebench 2024 CPU Multi Core
670 Points
Help
Performance rating
Asus ROG Zephyrus G14 2025 GA403WW
AMD Ryzen AI 9 HX 370, GeForce RTX 5080 Laptop
96.7 pt
Asus TUF Gaming A14 FA401WV-WB94
AMD Ryzen AI 9 HX 370, GeForce RTX 4060 Laptop GPU
89.1 pt
Average of class Gaming
 
84.6 pt
Razer Blade 14 2025
AMD Ryzen AI 9 365, GeForce RTX 5070 Laptop
82.2 pt
Lenovo Legion 5 15IRX10 5070
Intel Core i7-13650HX, GeForce RTX 5070 Laptop
67.4 pt
Acer Predator Helios Neo 14 (2024)
Intel Core Ultra 9 185H, GeForce RTX 4070 Laptop GPU
63.2 pt
HP Omen Transcend 14-fb0014
Intel Core Ultra 7 155H, GeForce RTX 4060 Laptop GPU
59.8 pt
Acer Predator Triton 14 AI PT14-52
Intel Core Ultra 9 288V, GeForce RTX 5070 Laptop
43.8 pt
Average Intel Core Ultra 9 288V
 
41.3 pt
AIDA64 / FP32 Ray-Trace
Asus ROG Zephyrus G14 2025 GA403WW
AMD Ryzen AI 9 HX 370, GeForce RTX 5080 Laptop
37804 KRay/s +189%
Asus TUF Gaming A14 FA401WV-WB94
AMD Ryzen AI 9 HX 370, GeForce RTX 4060 Laptop GPU
37654 KRay/s +188%
Razer Blade 14 2025
AMD Ryzen AI 9 365, GeForce RTX 5070 Laptop
30940 KRay/s +137%
Average of class Gaming
  (7192 - 85542, n=143, last 2 years)
28130 KRay/s +115%
Lenovo Legion 5 15IRX10 5070
Intel Core i7-13650HX, GeForce RTX 5070 Laptop
19427 KRay/s +49%
Acer Predator Helios Neo 14 (2024)
Intel Core Ultra 9 185H, GeForce RTX 4070 Laptop GPU
17300 KRay/s +32%
HP Omen Transcend 14-fb0014
Intel Core Ultra 7 155H, GeForce RTX 4060 Laptop GPU
15430 KRay/s +18%
Acer Predator Triton 14 AI PT14-52
Intel Core Ultra 9 288V, GeForce RTX 5070 Laptop
13061 KRay/s
Average Intel Core Ultra 9 288V
  (9953 - 13061, n=3)
11987 KRay/s -8%
AIDA64 / FPU Julia
Asus TUF Gaming A14 FA401WV-WB94
AMD Ryzen AI 9 HX 370, GeForce RTX 4060 Laptop GPU
147937 Points +128%
Asus ROG Zephyrus G14 2025 GA403WW
AMD Ryzen AI 9 HX 370, GeForce RTX 5080 Laptop
142843 Points +120%
Average of class Gaming
  (35040 - 238426, n=143, last 2 years)
127134 Points +96%
Razer Blade 14 2025
AMD Ryzen AI 9 365, GeForce RTX 5070 Laptop
119210 Points +84%
Lenovo Legion 5 15IRX10 5070
Intel Core i7-13650HX, GeForce RTX 5070 Laptop
96081 Points +48%
Acer Predator Helios Neo 14 (2024)
Intel Core Ultra 9 185H, GeForce RTX 4070 Laptop GPU
88782 Points +37%
HP Omen Transcend 14-fb0014
Intel Core Ultra 7 155H, GeForce RTX 4060 Laptop GPU
80482 Points +24%
Acer Predator Triton 14 AI PT14-52
Intel Core Ultra 9 288V, GeForce RTX 5070 Laptop
64847 Points
Average Intel Core Ultra 9 288V
  (49602 - 64847, n=3)
59589 Points -8%
AIDA64 / CPU SHA3
Asus ROG Zephyrus G14 2025 GA403WW
AMD Ryzen AI 9 HX 370, GeForce RTX 5080 Laptop
5926 MB/s +108%
Average of class Gaming
  (1728 - 9817, n=143, last 2 years)
5852 MB/s +105%
Asus TUF Gaming A14 FA401WV-WB94
AMD Ryzen AI 9 HX 370, GeForce RTX 4060 Laptop GPU
5816 MB/s +104%
Razer Blade 14 2025
AMD Ryzen AI 9 365, GeForce RTX 5070 Laptop
4971 MB/s +74%
Lenovo Legion 5 15IRX10 5070
Intel Core i7-13650HX, GeForce RTX 5070 Laptop
4381 MB/s +53%
Acer Predator Helios Neo 14 (2024)
Intel Core Ultra 9 185H, GeForce RTX 4070 Laptop GPU
4087 MB/s +43%
HP Omen Transcend 14-fb0014
Intel Core Ultra 7 155H, GeForce RTX 4060 Laptop GPU
3698 MB/s +30%
Acer Predator Triton 14 AI PT14-52
Intel Core Ultra 9 288V, GeForce RTX 5070 Laptop
2855 MB/s
Average Intel Core Ultra 9 288V
  (2285 - 2855, n=3)
2665 MB/s -7%
AIDA64 / CPU Queen
Average of class Gaming
  (49785 - 173351, n=143, last 2 years)
118874 Points +139%
Lenovo Legion 5 15IRX10 5070
Intel Core i7-13650HX, GeForce RTX 5070 Laptop
109639 Points +120%
Asus TUF Gaming A14 FA401WV-WB94
AMD Ryzen AI 9 HX 370, GeForce RTX 4060 Laptop GPU
95053 Points +91%
Asus ROG Zephyrus G14 2025 GA403WW
AMD Ryzen AI 9 HX 370, GeForce RTX 5080 Laptop
94986 Points +91%
Razer Blade 14 2025
AMD Ryzen AI 9 365, GeForce RTX 5070 Laptop
92790 Points +86%
HP Omen Transcend 14-fb0014
Intel Core Ultra 7 155H, GeForce RTX 4060 Laptop GPU
87166 Points +75%
Acer Predator Helios Neo 14 (2024)
Intel Core Ultra 9 185H, GeForce RTX 4070 Laptop GPU
86970 Points +75%
Acer Predator Triton 14 AI PT14-52
Intel Core Ultra 9 288V, GeForce RTX 5070 Laptop
49785 Points
Average Intel Core Ultra 9 288V
  (49647 - 49785, n=3)
49725 Points 0%
AIDA64 / FPU SinJulia
Asus TUF Gaming A14 FA401WV-WB94
AMD Ryzen AI 9 HX 370, GeForce RTX 4060 Laptop GPU
18943 Points +328%
Asus ROG Zephyrus G14 2025 GA403WW
AMD Ryzen AI 9 HX 370, GeForce RTX 5080 Laptop
18778 Points +324%
Razer Blade 14 2025
AMD Ryzen AI 9 365, GeForce RTX 5070 Laptop
16240 Points +267%
Average of class Gaming
  (4424 - 33636, n=143, last 2 years)
14220 Points +221%
Acer Predator Helios Neo 14 (2024)
Intel Core Ultra 9 185H, GeForce RTX 4070 Laptop GPU
11336 Points +156%
Lenovo Legion 5 15IRX10 5070
Intel Core i7-13650HX, GeForce RTX 5070 Laptop
10887 Points +146%
HP Omen Transcend 14-fb0014
Intel Core Ultra 7 155H, GeForce RTX 4060 Laptop GPU
10200 Points +131%
Acer Predator Triton 14 AI PT14-52
Intel Core Ultra 9 288V, GeForce RTX 5070 Laptop
4424 Points
Average Intel Core Ultra 9 288V
  (4421 - 4424, n=3)
4422 Points 0%
AIDA64 / FPU Mandel
Asus ROG Zephyrus G14 2025 GA403WW
AMD Ryzen AI 9 HX 370, GeForce RTX 5080 Laptop
93798 Points +172%
Asus TUF Gaming A14 FA401WV-WB94
AMD Ryzen AI 9 HX 370, GeForce RTX 4060 Laptop GPU
79251 Points +130%
Average of class Gaming
  (17585 - 128721, n=143, last 2 years)
65632 Points +90%
Razer Blade 14 2025
AMD Ryzen AI 9 365, GeForce RTX 5070 Laptop
63459 Points +84%
Lenovo Legion 5 15IRX10 5070
Intel Core i7-13650HX, GeForce RTX 5070 Laptop
47256 Points +37%
Acer Predator Helios Neo 14 (2024)
Intel Core Ultra 9 185H, GeForce RTX 4070 Laptop GPU
43997 Points +28%
HP Omen Transcend 14-fb0014
Intel Core Ultra 7 155H, GeForce RTX 4060 Laptop GPU
39208 Points +14%
Acer Predator Triton 14 AI PT14-52
Intel Core Ultra 9 288V, GeForce RTX 5070 Laptop
34507 Points
Average Intel Core Ultra 9 288V
  (26344 - 34507, n=3)
31164 Points -10%
AIDA64 / CPU AES
Asus ROG Zephyrus G14 2025 GA403WW
AMD Ryzen AI 9 HX 370, GeForce RTX 5080 Laptop
118806 MB/s +203%
Average of class Gaming
  (19065 - 247074, n=143, last 2 years)
108581 MB/s +177%
Razer Blade 14 2025
AMD Ryzen AI 9 365, GeForce RTX 5070 Laptop
99502 MB/s +153%
Acer Predator Helios Neo 14 (2024)
Intel Core Ultra 9 185H, GeForce RTX 4070 Laptop GPU
87147 MB/s +122%
Lenovo Legion 5 15IRX10 5070
Intel Core i7-13650HX, GeForce RTX 5070 Laptop
82705 MB/s +111%
Asus TUF Gaming A14 FA401WV-WB94
AMD Ryzen AI 9 HX 370, GeForce RTX 4060 Laptop GPU
81059 MB/s +106%
HP Omen Transcend 14-fb0014
Intel Core Ultra 7 155H, GeForce RTX 4060 Laptop GPU
76827 MB/s +96%
Acer Predator Triton 14 AI PT14-52
Intel Core Ultra 9 288V, GeForce RTX 5070 Laptop
39258 MB/s
Average Intel Core Ultra 9 288V
  (35250 - 39258, n=3)
37879 MB/s -4%
AIDA64 / CPU ZLib
Average of class Gaming
  (373 - 2531, n=143, last 2 years)
1524 MB/s +142%
Asus ROG Zephyrus G14 2025 GA403WW
AMD Ryzen AI 9 HX 370, GeForce RTX 5080 Laptop
1516 MB/s +141%
Asus TUF Gaming A14 FA401WV-WB94
AMD Ryzen AI 9 HX 370, GeForce RTX 4060 Laptop GPU
1514 MB/s +141%
Lenovo Legion 5 15IRX10 5070
Intel Core i7-13650HX, GeForce RTX 5070 Laptop
1285 MB/s +104%
Razer Blade 14 2025
AMD Ryzen AI 9 365, GeForce RTX 5070 Laptop
1271 MB/s +102%
Acer Predator Helios Neo 14 (2024)
Intel Core Ultra 9 185H, GeForce RTX 4070 Laptop GPU
1197 MB/s +90%
HP Omen Transcend 14-fb0014
Intel Core Ultra 7 155H, GeForce RTX 4060 Laptop GPU
1064 MB/s +69%
Acer Predator Triton 14 AI PT14-52
Intel Core Ultra 9 288V, GeForce RTX 5070 Laptop
629 MB/s
Average Intel Core Ultra 9 288V
  (527 - 629, n=3)
582 MB/s -7%
AIDA64 / FP64 Ray-Trace
Asus ROG Zephyrus G14 2025 GA403WW
AMD Ryzen AI 9 HX 370, GeForce RTX 5080 Laptop
20648 KRay/s +188%
Asus TUF Gaming A14 FA401WV-WB94
AMD Ryzen AI 9 HX 370, GeForce RTX 4060 Laptop GPU
19238 KRay/s +169%
Razer Blade 14 2025
AMD Ryzen AI 9 365, GeForce RTX 5070 Laptop
16696 KRay/s +133%
Average of class Gaming
  (3856 - 45446, n=143, last 2 years)
15068 KRay/s +110%
Lenovo Legion 5 15IRX10 5070
Intel Core i7-13650HX, GeForce RTX 5070 Laptop
10597 KRay/s +48%
Acer Predator Helios Neo 14 (2024)
Intel Core Ultra 9 185H, GeForce RTX 4070 Laptop GPU
8976 KRay/s +25%
HP Omen Transcend 14-fb0014
Intel Core Ultra 7 155H, GeForce RTX 4060 Laptop GPU
8056 KRay/s +12%
Acer Predator Triton 14 AI PT14-52
Intel Core Ultra 9 288V, GeForce RTX 5070 Laptop
7164 KRay/s
Average Intel Core Ultra 9 288V
  (4862 - 7164, n=3)
6352 KRay/s -11%
AIDA64 / CPU PhotoWorxx
Acer Predator Triton 14 AI PT14-52
Intel Core Ultra 9 288V, GeForce RTX 5070 Laptop
55531 MPixel/s
HP Omen Transcend 14-fb0014
Intel Core Ultra 7 155H, GeForce RTX 4060 Laptop GPU
54223 MPixel/s -2%
Average Intel Core Ultra 9 288V
  (50790 - 55531, n=3)
53893 MPixel/s -3%
Razer Blade 14 2025
AMD Ryzen AI 9 365, GeForce RTX 5070 Laptop
53550 MPixel/s -4%
Asus ROG Zephyrus G14 2025 GA403WW
AMD Ryzen AI 9 HX 370, GeForce RTX 5080 Laptop
51050 MPixel/s -8%
Acer Predator Helios Neo 14 (2024)
Intel Core Ultra 9 185H, GeForce RTX 4070 Laptop GPU
45768 MPixel/s -18%
Lenovo Legion 5 15IRX10 5070
Intel Core i7-13650HX, GeForce RTX 5070 Laptop
43289 MPixel/s -22%
Average of class Gaming
  (10805 - 62916, n=143, last 2 years)
43281 MPixel/s -22%
Asus TUF Gaming A14 FA401WV-WB94
AMD Ryzen AI 9 HX 370, GeForce RTX 4060 Laptop GPU
37747 MPixel/s -32%

System performance

The general performance impression is good and there are no problems in everyday use. There were also no stability problems during the test.

Performance rating: Percent
PCMark 10: Score | Essentials | Productivity | Digital Content Creation
CrossMark: Overall | Productivity | Creativity | Responsiveness
WebXPRT 3: Overall
WebXPRT 4: Overall
Mozilla Kraken 1.1: Total
Performance rating
Asus ROG Zephyrus G14 2025 GA403WW
GeForce RTX 5080 Laptop, Ryzen AI 9 HX 370, WD PC SN740 SDDPNQE-2T00
89.1 pt
Average of class Gaming
 
88.8 pt
Razer Blade 14 2025
GeForce RTX 5070 Laptop, Ryzen AI 9 365, Samsung PM9A1 MZVL21T0HCLR
86.8 pt
Acer Predator Helios Neo 14 (2024)
GeForce RTX 4070 Laptop GPU, Ultra 9 185H, SK Hynix PC801 HFS001TEJ9X125N
83.8 pt
Acer Predator Triton 14 AI PT14-52
GeForce RTX 5070 Laptop, Core Ultra 9 288V, Micron 3400 1TB MTFDKBA1T0TFH
80.8 pt
Asus TUF Gaming A14 FA401WV-WB94
GeForce RTX 4060 Laptop GPU, Ryzen AI 9 HX 370, WD PC SN560 SDDPNQE-1T00
80.8 pt
Average Intel Core Ultra 9 288V, NVIDIA GeForce RTX 5070 Laptop
 
80.8 pt
Lenovo Legion 5 15IRX10 5070
GeForce RTX 5070 Laptop, i7-13650HX, WD PC SN7100S SDFPMSL-1T00-1101
80.5 pt
HP Omen Transcend 14-fb0014
GeForce RTX 4060 Laptop GPU, Ultra 7 155H, WDC PC SN810 1TB
71.3 pt
PCMark 10 / Score
Average of class Gaming
  (5776 - 9667, n=122, last 2 years)
8066 Points +7%
Asus ROG Zephyrus G14 2025 GA403WW
GeForce RTX 5080 Laptop, Ryzen AI 9 HX 370, WD PC SN740 SDDPNQE-2T00
8012 Points +7%
Razer Blade 14 2025
GeForce RTX 5070 Laptop, Ryzen AI 9 365, Samsung PM9A1 MZVL21T0HCLR
7866 Points +5%
Asus TUF Gaming A14 FA401WV-WB94
GeForce RTX 4060 Laptop GPU, Ryzen AI 9 HX 370, WD PC SN560 SDDPNQE-1T00
7645 Points +2%
Acer Predator Triton 14 AI PT14-52
GeForce RTX 5070 Laptop, Core Ultra 9 288V, Micron 3400 1TB MTFDKBA1T0TFH
7517 Points
Average Intel Core Ultra 9 288V, NVIDIA GeForce RTX 5070 Laptop
  (n=1)
7517 Points 0%
Acer Predator Helios Neo 14 (2024)
GeForce RTX 4070 Laptop GPU, Ultra 9 185H, SK Hynix PC801 HFS001TEJ9X125N
7490 Points 0%
Lenovo Legion 5 15IRX10 5070
GeForce RTX 5070 Laptop, i7-13650HX, WD PC SN7100S SDFPMSL-1T00-1101
7187 Points -4%
HP Omen Transcend 14-fb0014
GeForce RTX 4060 Laptop GPU, Ultra 7 155H, WDC PC SN810 1TB
6962 Points -7%
PCMark 10 / Essentials
Acer Predator Helios Neo 14 (2024)
GeForce RTX 4070 Laptop GPU, Ultra 9 185H, SK Hynix PC801 HFS001TEJ9X125N
10752 Points +22%
Average of class Gaming
  (8810 - 12600, n=126, last 2 years)
10719 Points +22%
Razer Blade 14 2025
GeForce RTX 5070 Laptop, Ryzen AI 9 365, Samsung PM9A1 MZVL21T0HCLR
10647 Points +21%
Asus ROG Zephyrus G14 2025 GA403WW
GeForce RTX 5080 Laptop, Ryzen AI 9 HX 370, WD PC SN740 SDDPNQE-2T00
10582 Points +20%
Lenovo Legion 5 15IRX10 5070
GeForce RTX 5070 Laptop, i7-13650HX, WD PC SN7100S SDFPMSL-1T00-1101
10363 Points +18%
Asus TUF Gaming A14 FA401WV-WB94
GeForce RTX 4060 Laptop GPU, Ryzen AI 9 HX 370, WD PC SN560 SDDPNQE-1T00
10236 Points +16%
HP Omen Transcend 14-fb0014
GeForce RTX 4060 Laptop GPU, Ultra 7 155H, WDC PC SN810 1TB
9850 Points +12%
Acer Predator Triton 14 AI PT14-52
GeForce RTX 5070 Laptop, Core Ultra 9 288V, Micron 3400 1TB MTFDKBA1T0TFH
8810 Points
Average Intel Core Ultra 9 288V, NVIDIA GeForce RTX 5070 Laptop
  (n=1)
8810 Points 0%
PCMark 10 / Productivity
Acer Predator Triton 14 AI PT14-52
GeForce RTX 5070 Laptop, Core Ultra 9 288V, Micron 3400 1TB MTFDKBA1T0TFH
12095 Points
Average Intel Core Ultra 9 288V, NVIDIA GeForce RTX 5070 Laptop
  (n=1)
12095 Points 0%
Asus ROG Zephyrus G14 2025 GA403WW
GeForce RTX 5080 Laptop, Ryzen AI 9 HX 370, WD PC SN740 SDDPNQE-2T00
10039 Points -17%
Asus TUF Gaming A14 FA401WV-WB94
GeForce RTX 4060 Laptop GPU, Ryzen AI 9 HX 370, WD PC SN560 SDDPNQE-1T00
9925 Points -18%
Razer Blade 14 2025
GeForce RTX 5070 Laptop, Ryzen AI 9 365, Samsung PM9A1 MZVL21T0HCLR
9890 Points -18%
Average of class Gaming
  (6662 - 16716, n=122, last 2 years)
9880 Points -18%
HP Omen Transcend 14-fb0014
GeForce RTX 4060 Laptop GPU, Ultra 7 155H, WDC PC SN810 1TB
9477 Points -22%
Acer Predator Helios Neo 14 (2024)
GeForce RTX 4070 Laptop GPU, Ultra 9 185H, SK Hynix PC801 HFS001TEJ9X125N
9330 Points -23%
Lenovo Legion 5 15IRX10 5070
GeForce RTX 5070 Laptop, i7-13650HX, WD PC SN7100S SDFPMSL-1T00-1101
7600 Points -37%
PCMark 10 / Digital Content Creation
Average of class Gaming
  (7440 - 19351, n=122, last 2 years)
13639 Points +26%
Asus TUF Gaming A14 FA401WV-WB94
GeForce RTX 4060 Laptop GPU, Ryzen AI 9 HX 370, WD PC SN560 SDDPNQE-1T00
13395 Points +24%
Asus ROG Zephyrus G14 2025 GA403WW
GeForce RTX 5080 Laptop, Ryzen AI 9 HX 370, WD PC SN740 SDDPNQE-2T00
13138 Points +21%
Lenovo Legion 5 15IRX10 5070
GeForce RTX 5070 Laptop, i7-13650HX, WD PC SN7100S SDFPMSL-1T00-1101
12795 Points +18%
Razer Blade 14 2025
GeForce RTX 5070 Laptop, Ryzen AI 9 365, Samsung PM9A1 MZVL21T0HCLR
12547 Points +16%
Acer Predator Helios Neo 14 (2024)
GeForce RTX 4070 Laptop GPU, Ultra 9 185H, SK Hynix PC801 HFS001TEJ9X125N
11369 Points +5%
Acer Predator Triton 14 AI PT14-52
GeForce RTX 5070 Laptop, Core Ultra 9 288V, Micron 3400 1TB MTFDKBA1T0TFH
10816 Points
Average Intel Core Ultra 9 288V, NVIDIA GeForce RTX 5070 Laptop
  (n=1)
10816 Points 0%
HP Omen Transcend 14-fb0014
GeForce RTX 4060 Laptop GPU, Ultra 7 155H, WDC PC SN810 1TB
9811 Points -9%
CrossMark / Overall
Average of class Gaming
  (1247 - 2344, n=117, last 2 years)
1982 Points +15%
Asus ROG Zephyrus G14 2025 GA403WW
GeForce RTX 5080 Laptop, Ryzen AI 9 HX 370, WD PC SN740 SDDPNQE-2T00
1981 Points +15%
Razer Blade 14 2025
GeForce RTX 5070 Laptop, Ryzen AI 9 365, Samsung PM9A1 MZVL21T0HCLR
1964 Points +14%
Acer Predator Helios Neo 14 (2024)
GeForce RTX 4070 Laptop GPU, Ultra 9 185H, SK Hynix PC801 HFS001TEJ9X125N
1917 Points +11%
Lenovo Legion 5 15IRX10 5070
GeForce RTX 5070 Laptop, i7-13650HX, WD PC SN7100S SDFPMSL-1T00-1101
1839 Points +6%
Acer Predator Triton 14 AI PT14-52
GeForce RTX 5070 Laptop, Core Ultra 9 288V, Micron 3400 1TB MTFDKBA1T0TFH
1728 Points
Average Intel Core Ultra 9 288V, NVIDIA GeForce RTX 5070 Laptop
  (n=1)
1728 Points 0%
Asus TUF Gaming A14 FA401WV-WB94
GeForce RTX 4060 Laptop GPU, Ryzen AI 9 HX 370, WD PC SN560 SDDPNQE-1T00
1710 Points -1%
HP Omen Transcend 14-fb0014
GeForce RTX 4060 Laptop GPU, Ultra 7 155H, WDC PC SN810 1TB
1540 Points -11%
CrossMark / Productivity
Average of class Gaming
  (1299 - 2211, n=117, last 2 years)
1861 Points +11%
Acer Predator Helios Neo 14 (2024)
GeForce RTX 4070 Laptop GPU, Ultra 9 185H, SK Hynix PC801 HFS001TEJ9X125N
1849 Points +11%
Razer Blade 14 2025
GeForce RTX 5070 Laptop, Ryzen AI 9 365, Samsung PM9A1 MZVL21T0HCLR
1808 Points +8%
Asus ROG Zephyrus G14 2025 GA403WW
GeForce RTX 5080 Laptop, Ryzen AI 9 HX 370, WD PC SN740 SDDPNQE-2T00
1795 Points +7%
Lenovo Legion 5 15IRX10 5070
GeForce RTX 5070 Laptop, i7-13650HX, WD PC SN7100S SDFPMSL-1T00-1101
1719 Points +3%
Acer Predator Triton 14 AI PT14-52
GeForce RTX 5070 Laptop, Core Ultra 9 288V, Micron 3400 1TB MTFDKBA1T0TFH
1670 Points
Average Intel Core Ultra 9 288V, NVIDIA GeForce RTX 5070 Laptop
  (n=1)
1670 Points 0%
Asus TUF Gaming A14 FA401WV-WB94
GeForce RTX 4060 Laptop GPU, Ryzen AI 9 HX 370, WD PC SN560 SDDPNQE-1T00
1574 Points -6%
HP Omen Transcend 14-fb0014
GeForce RTX 4060 Laptop GPU, Ultra 7 155H, WDC PC SN810 1TB
1436 Points -14%
CrossMark / Creativity
Asus ROG Zephyrus G14 2025 GA403WW
GeForce RTX 5080 Laptop, Ryzen AI 9 HX 370, WD PC SN740 SDDPNQE-2T00
2377 Points +20%
Razer Blade 14 2025
GeForce RTX 5070 Laptop, Ryzen AI 9 365, Samsung PM9A1 MZVL21T0HCLR
2253 Points +13%
Average of class Gaming
  (1275 - 2729, n=117, last 2 years)
2218 Points +12%
Asus TUF Gaming A14 FA401WV-WB94
GeForce RTX 4060 Laptop GPU, Ryzen AI 9 HX 370, WD PC SN560 SDDPNQE-1T00
2077 Points +4%
Lenovo Legion 5 15IRX10 5070
GeForce RTX 5070 Laptop, i7-13650HX, WD PC SN7100S SDFPMSL-1T00-1101
2047 Points +3%
Acer Predator Helios Neo 14 (2024)
GeForce RTX 4070 Laptop GPU, Ultra 9 185H, SK Hynix PC801 HFS001TEJ9X125N
2008 Points +1%
Acer Predator Triton 14 AI PT14-52
GeForce RTX 5070 Laptop, Core Ultra 9 288V, Micron 3400 1TB MTFDKBA1T0TFH
1989 Points
Average Intel Core Ultra 9 288V, NVIDIA GeForce RTX 5070 Laptop
  (n=1)
1989 Points 0%
HP Omen Transcend 14-fb0014
GeForce RTX 4060 Laptop GPU, Ultra 7 155H, WDC PC SN810 1TB
1813 Points -9%
CrossMark / Responsiveness
Acer Predator Helios Neo 14 (2024)
GeForce RTX 4070 Laptop GPU, Ultra 9 185H, SK Hynix PC801 HFS001TEJ9X125N
1856 Points +47%
Average of class Gaming
  (1030 - 2330, n=117, last 2 years)
1724 Points +37%
Razer Blade 14 2025
GeForce RTX 5070 Laptop, Ryzen AI 9 365, Samsung PM9A1 MZVL21T0HCLR
1666 Points +32%
Lenovo Legion 5 15IRX10 5070
GeForce RTX 5070 Laptop, i7-13650HX, WD PC SN7100S SDFPMSL-1T00-1101
1629 Points +29%
Asus ROG Zephyrus G14 2025 GA403WW
GeForce RTX 5080 Laptop, Ryzen AI 9 HX 370, WD PC SN740 SDDPNQE-2T00
1540 Points +22%
Acer Predator Triton 14 AI PT14-52
GeForce RTX 5070 Laptop, Core Ultra 9 288V, Micron 3400 1TB MTFDKBA1T0TFH
1259 Points
Average Intel Core Ultra 9 288V, NVIDIA GeForce RTX 5070 Laptop
  (n=1)
1259 Points 0%
Asus TUF Gaming A14 FA401WV-WB94
GeForce RTX 4060 Laptop GPU, Ryzen AI 9 HX 370, WD PC SN560 SDDPNQE-1T00
1226 Points -3%
HP Omen Transcend 14-fb0014
GeForce RTX 4060 Laptop GPU, Ultra 7 155H, WDC PC SN810 1TB
1165 Points -7%
WebXPRT 3 / Overall
Asus ROG Zephyrus G14 2025 GA403WW
GeForce RTX 5080 Laptop, Ryzen AI 9 HX 370, WD PC SN740 SDDPNQE-2T00
347 Points +16%
Average of class Gaming
  (237 - 532, n=122, last 2 years)
315 Points +5%
Acer Predator Triton 14 AI PT14-52
GeForce RTX 5070 Laptop, Core Ultra 9 288V, Micron 3400 1TB MTFDKBA1T0TFH
300 Points
Average Intel Core Ultra 9 288V, NVIDIA GeForce RTX 5070 Laptop
  (n=1)
300 Points 0%
Razer Blade 14 2025
GeForce RTX 5070 Laptop, Ryzen AI 9 365, Samsung PM9A1 MZVL21T0HCLR
289 Points -4%
Asus TUF Gaming A14 FA401WV-WB94
GeForce RTX 4060 Laptop GPU, Ryzen AI 9 HX 370, WD PC SN560 SDDPNQE-1T00
288 Points -4%
Acer Predator Helios Neo 14 (2024)
GeForce RTX 4070 Laptop GPU, Ultra 9 185H, SK Hynix PC801 HFS001TEJ9X125N
287 Points -4%
Lenovo Legion 5 15IRX10 5070
GeForce RTX 5070 Laptop, i7-13650HX, WD PC SN7100S SDFPMSL-1T00-1101
277 Points -8%
HP Omen Transcend 14-fb0014
GeForce RTX 4060 Laptop GPU, Ultra 7 155H, WDC PC SN810 1TB
274 Points -9%
WebXPRT 4 / Overall
Acer Predator Triton 14 AI PT14-52
GeForce RTX 5070 Laptop, Core Ultra 9 288V, Micron 3400 1TB MTFDKBA1T0TFH
284 Points
Average Intel Core Ultra 9 288V, NVIDIA GeForce RTX 5070 Laptop
  (n=1)
284 Points 0%
Average of class Gaming
  (176.4 - 345, n=117, last 2 years)
283 Points 0%
Asus ROG Zephyrus G14 2025 GA403WW
GeForce RTX 5080 Laptop, Ryzen AI 9 HX 370, WD PC SN740 SDDPNQE-2T00
275 Points -3%
Razer Blade 14 2025
GeForce RTX 5070 Laptop, Ryzen AI 9 365, Samsung PM9A1 MZVL21T0HCLR
271 Points -5%
Lenovo Legion 5 15IRX10 5070
GeForce RTX 5070 Laptop, i7-13650HX, WD PC SN7100S SDFPMSL-1T00-1101
266 Points -6%
Acer Predator Helios Neo 14 (2024)
GeForce RTX 4070 Laptop GPU, Ultra 9 185H, SK Hynix PC801 HFS001TEJ9X125N
260 Points -8%
Asus TUF Gaming A14 FA401WV-WB94
GeForce RTX 4060 Laptop GPU, Ryzen AI 9 HX 370, WD PC SN560 SDDPNQE-1T00
252 Points -11%
HP Omen Transcend 14-fb0014
GeForce RTX 4060 Laptop GPU, Ultra 7 155H, WDC PC SN810 1TB
236 Points -17%
Mozilla Kraken 1.1 / Total
HP Omen Transcend 14-fb0014
GeForce RTX 4060 Laptop GPU, Ultra 7 155H, WDC PC SN810 1TB
585 ms * -24%
Lenovo Legion 5 15IRX10 5070
GeForce RTX 5070 Laptop, i7-13650HX, WD PC SN7100S SDFPMSL-1T00-1101
521 ms * -10%
Acer Predator Helios Neo 14 (2024)
GeForce RTX 4070 Laptop GPU, Ultra 9 185H, SK Hynix PC801 HFS001TEJ9X125N
508 ms * -8%
Acer Predator Triton 14 AI PT14-52
GeForce RTX 5070 Laptop, Core Ultra 9 288V, Micron 3400 1TB MTFDKBA1T0TFH
472 ms *
Average Intel Core Ultra 9 288V, NVIDIA GeForce RTX 5070 Laptop
  (n=1)
472 ms * -0%
Average of class Gaming
  (397 - 674, n=131, last 2 years)
472 ms * -0%
Asus TUF Gaming A14 FA401WV-WB94
GeForce RTX 4060 Laptop GPU, Ryzen AI 9 HX 370, WD PC SN560 SDDPNQE-1T00
450 ms * +5%
Razer Blade 14 2025
GeForce RTX 5070 Laptop, Ryzen AI 9 365, Samsung PM9A1 MZVL21T0HCLR
437 ms * +7%
Asus ROG Zephyrus G14 2025 GA403WW
GeForce RTX 5080 Laptop, Ryzen AI 9 HX 370, WD PC SN740 SDDPNQE-2T00
425 ms * +10%

* ... smaller is better

PCMark 10 Score
7517 points
Help
AIDA64 / Memory Copy
Average Intel Core Ultra 9 288V
  (108104 - 108894, n=3)
108471 MB/s 0%
Acer Predator Triton 14 AI PT14-52
Intel Core Ultra 9 288V, GeForce RTX 5070 Laptop
108104 MB/s
Razer Blade 14 2025
AMD Ryzen AI 9 365, GeForce RTX 5070 Laptop
94015 MB/s -13%
HP Omen Transcend 14-fb0014
Intel Core Ultra 7 155H, GeForce RTX 4060 Laptop GPU
92565 MB/s -14%
Asus ROG Zephyrus G14 2025 GA403WW
AMD Ryzen AI 9 HX 370, GeForce RTX 5080 Laptop
92291 MB/s -15%
Asus TUF Gaming A14 FA401WV-WB94
AMD Ryzen AI 9 HX 370, GeForce RTX 4060 Laptop GPU
92030 MB/s -15%
Acer Predator Helios Neo 14 (2024)
Intel Core Ultra 9 185H, GeForce RTX 4070 Laptop GPU
84317 MB/s -22%
Average of class Gaming
  (21750 - 108104, n=143, last 2 years)
71638 MB/s -34%
Lenovo Legion 5 15IRX10 5070
Intel Core i7-13650HX, GeForce RTX 5070 Laptop
66372 MB/s -39%
AIDA64 / Memory Read
Razer Blade 14 2025
AMD Ryzen AI 9 365, GeForce RTX 5070 Laptop
104349 MB/s +20%
Asus ROG Zephyrus G14 2025 GA403WW
AMD Ryzen AI 9 HX 370, GeForce RTX 5080 Laptop
100437 MB/s +15%
Asus TUF Gaming A14 FA401WV-WB94
AMD Ryzen AI 9 HX 370, GeForce RTX 4060 Laptop GPU
99673 MB/s +14%
HP Omen Transcend 14-fb0014
Intel Core Ultra 7 155H, GeForce RTX 4060 Laptop GPU
90647 MB/s +4%
Average Intel Core Ultra 9 288V
  (86694 - 87810, n=3)
87193 MB/s 0%
Acer Predator Triton 14 AI PT14-52
Intel Core Ultra 9 288V, GeForce RTX 5070 Laptop
87076 MB/s
Acer Predator Helios Neo 14 (2024)
Intel Core Ultra 9 185H, GeForce RTX 4070 Laptop GPU
76163 MB/s -13%
Average of class Gaming
  (22956 - 104349, n=143, last 2 years)
74367 MB/s -15%
Lenovo Legion 5 15IRX10 5070
Intel Core i7-13650HX, GeForce RTX 5070 Laptop
71022 MB/s -18%
AIDA64 / Memory Write
Acer Predator Triton 14 AI PT14-52
Intel Core Ultra 9 288V, GeForce RTX 5070 Laptop
117889 MB/s
Average Intel Core Ultra 9 288V
  (113427 - 117889, n=3)
116380 MB/s -1%
Asus TUF Gaming A14 FA401WV-WB94
AMD Ryzen AI 9 HX 370, GeForce RTX 4060 Laptop GPU
108954 MB/s -8%
Asus ROG Zephyrus G14 2025 GA403WW
AMD Ryzen AI 9 HX 370, GeForce RTX 5080 Laptop
105190 MB/s -11%
Razer Blade 14 2025
AMD Ryzen AI 9 365, GeForce RTX 5070 Laptop
105106 MB/s -11%
HP Omen Transcend 14-fb0014
Intel Core Ultra 7 155H, GeForce RTX 4060 Laptop GPU
75414 MB/s -36%
Average of class Gaming
  (22297 - 133486, n=143, last 2 years)
73349 MB/s -38%
Lenovo Legion 5 15IRX10 5070
Intel Core i7-13650HX, GeForce RTX 5070 Laptop
68225 MB/s -42%
Acer Predator Helios Neo 14 (2024)
Intel Core Ultra 9 185H, GeForce RTX 4070 Laptop GPU
51880 MB/s -56%
AIDA64 / Memory Latency
HP Omen Transcend 14-fb0014
Intel Core Ultra 7 155H, GeForce RTX 4060 Laptop GPU
152.5 ns * -55%
Acer Predator Helios Neo 14 (2024)
Intel Core Ultra 9 185H, GeForce RTX 4070 Laptop GPU
144.3 ns * -46%
Asus TUF Gaming A14 FA401WV-WB94
AMD Ryzen AI 9 HX 370, GeForce RTX 4060 Laptop GPU
119.4 ns * -21%
Asus ROG Zephyrus G14 2025 GA403WW
AMD Ryzen AI 9 HX 370, GeForce RTX 5080 Laptop
106.6 ns * -8%
Razer Blade 14 2025
AMD Ryzen AI 9 365, GeForce RTX 5070 Laptop
103.6 ns * -5%
Average of class Gaming
  (59.5 - 259, n=143, last 2 years)
101.9 ns * -3%
Acer Predator Triton 14 AI PT14-52
Intel Core Ultra 9 288V, GeForce RTX 5070 Laptop
98.5 ns *
Average Intel Core Ultra 9 288V
  (97.9 - 98.5, n=3)
98.2 ns * -0%
Lenovo Legion 5 15IRX10 5070
Intel Core i7-13650HX, GeForce RTX 5070 Laptop
88.4 ns * +10%

* ... smaller is better

DPC latencies

In our standardized latency test (surfing the Internet, 4K YouTube playback, CPU load), the test device with the current BIOS version shows no restrictions when using real-time audio applications.

LatencyMon - Overview
LatencyMon - Driver
LatencyMon - Driver
DPC Latencies / LatencyMon - interrupt to process latency (max), Web, Youtube, Prime95
Razer Blade 14 2025
GeForce RTX 5070 Laptop, Ryzen AI 9 365, Samsung PM9A1 MZVL21T0HCLR
8940.3 μs * -1167%
Lenovo Legion 5 15IRX10 5070
GeForce RTX 5070 Laptop, i7-13650HX, WD PC SN7100S SDFPMSL-1T00-1101
1010.7 μs * -43%
Acer Predator Helios Neo 14 (2024)
GeForce RTX 4070 Laptop GPU, Ultra 9 185H, SK Hynix PC801 HFS001TEJ9X125N
864.8 μs * -23%
Acer Predator Triton 14 AI PT14-52
GeForce RTX 5070 Laptop, Core Ultra 9 288V, Micron 3400 1TB MTFDKBA1T0TFH
705.4 μs *
HP Omen Transcend 14-fb0014
GeForce RTX 4060 Laptop GPU, Ultra 7 155H, WDC PC SN810 1TB
638.9 μs * +9%
Asus ROG Zephyrus G14 2025 GA403WW
GeForce RTX 5080 Laptop, Ryzen AI 9 HX 370, WD PC SN740 SDDPNQE-2T00
543.3 μs * +23%

* ... smaller is better

Mass storage

A 1 TB SSD (870 GB free) from Micron is installed in the test device, but the sales model is equipped with a 2 TB SSD. The performance of the PCIe 4.0 SSD is average and remains stable overall under prolonged load.

Micron 3400 1TB MTFDKBA1T0TFH
CDM 5/6 Read Seq Q32T1: 6546 MB/s
CDM 5/6 Write Seq Q32T1: 4796 MB/s
CDM 5/6 Read 4K Q32T1: 463 MB/s
CDM 5/6 Write 4K Q32T1: 422 MB/s
CDM 5/6 Read 4K: 56.3 MB/s
CDM 5/6 Write 4K: 119.5 MB/s
CDM 6 Write 4K Q8T8: 405 MB/s
CDM 6 Read 4K Q8T8: 683 MB/s
Drive Performance rating - Percent
Acer Predator Helios Neo 14 (2024)
SK Hynix PC801 HFS001TEJ9X125N
93.4 pt
Razer Blade 14 2025
Samsung PM9A1 MZVL21T0HCLR
80.6 pt
Lenovo Legion 5 15IRX10 5070
WD PC SN7100S SDFPMSL-1T00-1101
76.9 pt
Average of class Gaming
 
73.6 pt
Average Micron 3400 1TB MTFDKBA1T0TFH
 
66.1 pt
Asus ROG Zephyrus G14 2025 GA403WW
WD PC SN740 SDDPNQE-2T00
56.1 pt
HP Omen Transcend 14-fb0014
WDC PC SN810 1TB
49.3 pt
Acer Predator Triton 14 AI PT14-52
Micron 3400 1TB MTFDKBA1T0TFH
48.3 pt
Asus TUF Gaming A14 FA401WV-WB94
WD PC SN560 SDDPNQE-1T00
38 pt
DiskSpd
seq read
Acer Predator Helios Neo 14 (2024)
SK Hynix PC801 HFS001TEJ9X125N
5314 (5307.13min - 5313.55max) MB/s +115%
Razer Blade 14 2025
Samsung PM9A1 MZVL21T0HCLR
3813 (3801.51min - 3813.46max) MB/s +54%
Lenovo Legion 5 15IRX10 5070
WD PC SN7100S SDFPMSL-1T00-1101
3569 (3518.49min - 3569.14max) MB/s +44%
Average of class Gaming
  (281 - 8300, n=127, last 2 years)
3496 MB/s +41%
HP Omen Transcend 14-fb0014
WDC PC SN810 1TB
3464 (3425.98min - 3464.29max) MB/s +40%
Average Micron 3400 1TB MTFDKBA1T0TFH
  (1306 - 4343, n=24)
3249 MB/s +31%
Asus TUF Gaming A14 FA401WV-WB94
WD PC SN560 SDDPNQE-1T00
2972 (2943.76min - 2971.8max) MB/s +20%
Asus ROG Zephyrus G14 2025 GA403WW
WD PC SN740 SDDPNQE-2T00
2934 (2919.69min - 2934.34max) MB/s +19%
Acer Predator Triton 14 AI PT14-52
Micron 3400 1TB MTFDKBA1T0TFH
2472 (2385.56min - 2471.79max) MB/s
seq write
Acer Predator Helios Neo 14 (2024)
SK Hynix PC801 HFS001TEJ9X125N
5300 (5260.88min - 5299.6max) MB/s +126%
Lenovo Legion 5 15IRX10 5070
WD PC SN7100S SDFPMSL-1T00-1101
4107 (1382.44min - 4106.61max) MB/s +75%
Average of class Gaming
  (1454 - 9699, n=127, last 2 years)
3958 MB/s +69%
Average Micron 3400 1TB MTFDKBA1T0TFH
  (2345 - 4954, n=24)
3793 MB/s +62%
Razer Blade 14 2025
Samsung PM9A1 MZVL21T0HCLR
3469 (2223.57min - 3469.11max) MB/s +48%
Asus ROG Zephyrus G14 2025 GA403WW
WD PC SN740 SDDPNQE-2T00
3237 (3157.45min - 3236.98max) MB/s +38%
HP Omen Transcend 14-fb0014
WDC PC SN810 1TB
2767 (2730.91min - 2767.11max) MB/s +18%
Asus TUF Gaming A14 FA401WV-WB94
WD PC SN560 SDDPNQE-1T00
2552 (2410.68min - 2552.16max) MB/s +9%
Acer Predator Triton 14 AI PT14-52
Micron 3400 1TB MTFDKBA1T0TFH
2345 (2113.3min - 2344.75max) MB/s
seq q8 t1 read
Acer Predator Helios Neo 14 (2024)
SK Hynix PC801 HFS001TEJ9X125N
7150 (6584.05min - 7150.03max) MB/s +9%
Average of class Gaming
  (3193 - 15056, n=127, last 2 years)
6986 MB/s +7%
HP Omen Transcend 14-fb0014
WDC PC SN810 1TB
6984 (6240.18min - 6983.73max) MB/s +7%
Razer Blade 14 2025
Samsung PM9A1 MZVL21T0HCLR
6691 (5876.63min - 6691.17max) MB/s +2%
Lenovo Legion 5 15IRX10 5070
WD PC SN7100S SDFPMSL-1T00-1101
6624 (5414.29min - 6624.48max) MB/s +1%
Average Micron 3400 1TB MTFDKBA1T0TFH
  (6207 - 6734, n=24)
6570 MB/s 0%
Acer Predator Triton 14 AI PT14-52
Micron 3400 1TB MTFDKBA1T0TFH
6550 (5807.77min - 6549.94max) MB/s
Asus ROG Zephyrus G14 2025 GA403WW
WD PC SN740 SDDPNQE-2T00
5041 (4233.02min - 5040.5max) MB/s -23%
Asus TUF Gaming A14 FA401WV-WB94
WD PC SN560 SDDPNQE-1T00
5011 (4175.89min - 5010.98max) MB/s -23%
seq q8 t1 write
Lenovo Legion 5 15IRX10 5070
WD PC SN7100S SDFPMSL-1T00-1101
6650 (3228.82min - 6649.56max) MB/s +48%
Acer Predator Helios Neo 14 (2024)
SK Hynix PC801 HFS001TEJ9X125N
6519 (6480.83min - 6519.17max) MB/s +45%
Average of class Gaming
  (1699 - 13519, n=127, last 2 years)
5620 MB/s +25%
Average Micron 3400 1TB MTFDKBA1T0TFH
  (4259 - 4991, n=24)
4794 MB/s +7%
Acer Predator Triton 14 AI PT14-52
Micron 3400 1TB MTFDKBA1T0TFH
4493 (4216.07min - 4492.76max) MB/s
HP Omen Transcend 14-fb0014
WDC PC SN810 1TB
4454 (4349.91min - 4453.83max) MB/s -1%
Razer Blade 14 2025
Samsung PM9A1 MZVL21T0HCLR
4123 (2408.79min - 4122.72max) MB/s -8%
Asus ROG Zephyrus G14 2025 GA403WW
WD PC SN740 SDDPNQE-2T00
4034 (3884.75min - 4033.56max) MB/s -10%
Asus TUF Gaming A14 FA401WV-WB94
WD PC SN560 SDDPNQE-1T00
3464 (3397.72min - 3464.49max) MB/s -23%
4k q1 t1 read
Lenovo Legion 5 15IRX10 5070
WD PC SN7100S SDFPMSL-1T00-1101
89.3 (87.63min - 89.25max) MB/s +94%
Acer Predator Helios Neo 14 (2024)
SK Hynix PC801 HFS001TEJ9X125N
78.3 (78.02min - 78.33max) MB/s +70%
Average of class Gaming
  (32.2 - 110.2, n=127, last 2 years)
68.9 MB/s +49%
HP Omen Transcend 14-fb0014
WDC PC SN810 1TB
63.8 (62.98min - 63.76max) MB/s +38%
Average Micron 3400 1TB MTFDKBA1T0TFH
  (39.2 - 74.3, n=24)
58.9 MB/s +28%
Asus ROG Zephyrus G14 2025 GA403WW
WD PC SN740 SDDPNQE-2T00
57.7 (56.74min - 57.73max) MB/s +25%
Razer Blade 14 2025
Samsung PM9A1 MZVL21T0HCLR
55.9 (55.71min - 55.9max) MB/s +21%
Acer Predator Triton 14 AI PT14-52
Micron 3400 1TB MTFDKBA1T0TFH
46.1 (45.76min - 46.14max) MB/s
Asus TUF Gaming A14 FA401WV-WB94
WD PC SN560 SDDPNQE-1T00
41.9 (41.34min - 41.93max) MB/s -9%
4k q1 t1 write
Acer Predator Helios Neo 14 (2024)
SK Hynix PC801 HFS001TEJ9X125N
268 (265.39min - 267.72max) MB/s +156%
Average of class Gaming
  (78 - 397, n=127, last 2 years)
205 MB/s +96%
Razer Blade 14 2025
Samsung PM9A1 MZVL21T0HCLR
203 (200.63min - 203.18max) MB/s +94%
Average Micron 3400 1TB MTFDKBA1T0TFH
  (104.8 - 273, n=24)
185.9 MB/s +77%
Lenovo Legion 5 15IRX10 5070
WD PC SN7100S SDFPMSL-1T00-1101
166.3 (162.99min - 166.26max) MB/s +59%
Asus ROG Zephyrus G14 2025 GA403WW
WD PC SN740 SDDPNQE-2T00
160.1 (157.11min - 160.13max) MB/s +53%
Acer Predator Triton 14 AI PT14-52
Micron 3400 1TB MTFDKBA1T0TFH
104.8 (102.33min - 104.81max) MB/s
HP Omen Transcend 14-fb0014
WDC PC SN810 1TB
85 (82.48min - 84.96max) MB/s -19%
Asus TUF Gaming A14 FA401WV-WB94
WD PC SN560 SDDPNQE-1T00
78 (75.5min - 77.97max) MB/s -26%
4k q32 t16 read
Acer Predator Helios Neo 14 (2024)
SK Hynix PC801 HFS001TEJ9X125N
4820 (4785.11min - 4819.55max) MB/s +537%
Razer Blade 14 2025
Samsung PM9A1 MZVL21T0HCLR
3222 (3205.72min - 3221.76max) MB/s +326%
Average of class Gaming
  (417 - 8067, n=127, last 2 years)
2478 MB/s +227%
Average Micron 3400 1TB MTFDKBA1T0TFH
  (636 - 2868, n=24)
2021 MB/s +167%
Lenovo Legion 5 15IRX10 5070
WD PC SN7100S SDFPMSL-1T00-1101
1477 (1412.34min - 1477.22max) MB/s +95%
Asus ROG Zephyrus G14 2025 GA403WW
WD PC SN740 SDDPNQE-2T00
859 (798.15min - 859.48max) MB/s +13%
Acer Predator Triton 14 AI PT14-52
Micron 3400 1TB MTFDKBA1T0TFH
757 (675.71min - 757.36max) MB/s
Asus TUF Gaming A14 FA401WV-WB94
WD PC SN560 SDDPNQE-1T00
620 (586.37min - 620.02max) MB/s -18%
HP Omen Transcend 14-fb0014
WDC PC SN810 1TB
417 (370.38min - 417.19max) MB/s -45%
4k q32 t16 write
Acer Predator Helios Neo 14 (2024)
SK Hynix PC801 HFS001TEJ9X125N
3091 (3068.4min - 3091.44max) MB/s +705%
Lenovo Legion 5 15IRX10 5070
WD PC SN7100S SDFPMSL-1T00-1101
2770 (2736.74min - 2770.31max) MB/s +621%
Razer Blade 14 2025
Samsung PM9A1 MZVL21T0HCLR
2479 (2210.04min - 2479.14max) MB/s +546%
Average of class Gaming
  (162.3 - 5653, n=127, last 2 years)
2036 MB/s +430%
Average Micron 3400 1TB MTFDKBA1T0TFH
  (328 - 2786, n=24)
1707 MB/s +345%
Asus ROG Zephyrus G14 2025 GA403WW
WD PC SN740 SDDPNQE-2T00
577 (533.21min - 577.37max) MB/s +50%
Acer Predator Triton 14 AI PT14-52
Micron 3400 1TB MTFDKBA1T0TFH
384 (275.96min - 384.29max) MB/s
Asus TUF Gaming A14 FA401WV-WB94
WD PC SN560 SDDPNQE-1T00
227 (189.21min - 227.15max) MB/s -41%
HP Omen Transcend 14-fb0014
WDC PC SN810 1TB
162.3 (149.98min - 162.25max) MB/s -58%
AS SSD
Score Total
Razer Blade 14 2025
Samsung PM9A1 MZVL21T0HCLR
8561 Points +155%
Acer Predator Helios Neo 14 (2024)
SK Hynix PC801 HFS001TEJ9X125N
8486 Points +153%
Average of class Gaming
  (2912 - 13854, n=124, last 2 years)
6836 Points +104%
Lenovo Legion 5 15IRX10 5070
WD PC SN7100S SDFPMSL-1T00-1101
6187 Points +84%
Average Micron 3400 1TB MTFDKBA1T0TFH
  (3356 - 7575, n=22)
6169 Points +84%
Asus ROG Zephyrus G14 2025 GA403WW
WD PC SN740 SDDPNQE-2T00
4276 Points +27%
HP Omen Transcend 14-fb0014
WDC PC SN810 1TB
4112 Points +23%
Asus TUF Gaming A14 FA401WV-WB94
WD PC SN560 SDDPNQE-1T00
3357 Points 0%
Acer Predator Triton 14 AI PT14-52
Micron 3400 1TB MTFDKBA1T0TFH
3356 Points
Score Read
Razer Blade 14 2025
Samsung PM9A1 MZVL21T0HCLR
3165 Points +179%
Acer Predator Helios Neo 14 (2024)
SK Hynix PC801 HFS001TEJ9X125N
2908 Points +157%
Lenovo Legion 5 15IRX10 5070
WD PC SN7100S SDFPMSL-1T00-1101
2434 Points +115%
Average of class Gaming
  (953 - 4418, n=124, last 2 years)
2322 Points +105%
Average Micron 3400 1TB MTFDKBA1T0TFH
  (1123 - 2855, n=22)
2208 Points +95%
HP Omen Transcend 14-fb0014
WDC PC SN810 1TB
1211 Points +7%
Asus ROG Zephyrus G14 2025 GA403WW
WD PC SN740 SDDPNQE-2T00
1171 Points +3%
Acer Predator Triton 14 AI PT14-52
Micron 3400 1TB MTFDKBA1T0TFH
1133 Points
Asus TUF Gaming A14 FA401WV-WB94
WD PC SN560 SDDPNQE-1T00
962 Points -15%
Score Write
Acer Predator Helios Neo 14 (2024)
SK Hynix PC801 HFS001TEJ9X125N
4106 Points +140%
Razer Blade 14 2025
Samsung PM9A1 MZVL21T0HCLR
3851 Points +125%
Average of class Gaming
  (1136 - 7208, n=124, last 2 years)
3390 Points +98%
Average Micron 3400 1TB MTFDKBA1T0TFH
  (1714 - 3304, n=22)
2887 Points +68%
Lenovo Legion 5 15IRX10 5070
WD PC SN7100S SDFPMSL-1T00-1101
2582 Points +51%
Asus ROG Zephyrus G14 2025 GA403WW
WD PC SN740 SDDPNQE-2T00
2543 Points +48%
HP Omen Transcend 14-fb0014
WDC PC SN810 1TB
2416 Points +41%
Asus TUF Gaming A14 FA401WV-WB94
WD PC SN560 SDDPNQE-1T00
1980 Points +16%
Acer Predator Triton 14 AI PT14-52
Micron 3400 1TB MTFDKBA1T0TFH
1714 Points
Seq Read
Acer Predator Helios Neo 14 (2024)
SK Hynix PC801 HFS001TEJ9X125N
5686.51 MB/s +22%
Lenovo Legion 5 15IRX10 5070
WD PC SN7100S SDFPMSL-1T00-1101
5561 MB/s +19%
Average of class Gaming
  (2272 - 9890, n=124, last 2 years)
5301 MB/s +14%
Razer Blade 14 2025
Samsung PM9A1 MZVL21T0HCLR
5295 MB/s +13%
HP Omen Transcend 14-fb0014
WDC PC SN810 1TB
5251.35 MB/s +12%
Acer Predator Triton 14 AI PT14-52
Micron 3400 1TB MTFDKBA1T0TFH
4670 MB/s
Average Micron 3400 1TB MTFDKBA1T0TFH
  (2201 - 5348, n=22)
4477 MB/s -4%
Asus ROG Zephyrus G14 2025 GA403WW
WD PC SN740 SDDPNQE-2T00
4236 MB/s -9%
Asus TUF Gaming A14 FA401WV-WB94
WD PC SN560 SDDPNQE-1T00
3746.58 MB/s -20%
Seq Write
Acer Predator Helios Neo 14 (2024)
SK Hynix PC801 HFS001TEJ9X125N
5335.07 MB/s +80%
Average of class Gaming
  (114.5 - 9926, n=124, last 2 years)
3894 MB/s +31%
Razer Blade 14 2025
Samsung PM9A1 MZVL21T0HCLR
3815 MB/s +28%
Lenovo Legion 5 15IRX10 5070
WD PC SN7100S SDFPMSL-1T00-1101
3716 MB/s +25%
Average Micron 3400 1TB MTFDKBA1T0TFH
  (1876 - 4539, n=22)
3296 MB/s +11%
Asus ROG Zephyrus G14 2025 GA403WW
WD PC SN740 SDDPNQE-2T00
3245 MB/s +9%
Acer Predator Triton 14 AI PT14-52
Micron 3400 1TB MTFDKBA1T0TFH
2972 MB/s
HP Omen Transcend 14-fb0014
WDC PC SN810 1TB
2228.73 MB/s -25%
Asus TUF Gaming A14 FA401WV-WB94
WD PC SN560 SDDPNQE-1T00
2070.14 MB/s -30%
4K Read
Lenovo Legion 5 15IRX10 5070
WD PC SN7100S SDFPMSL-1T00-1101
94.3 MB/s +70%
Razer Blade 14 2025
Samsung PM9A1 MZVL21T0HCLR
71.8 MB/s +30%
Acer Predator Helios Neo 14 (2024)
SK Hynix PC801 HFS001TEJ9X125N
70.28 MB/s +27%
Average of class Gaming
  (27.8 - 108.4, n=124, last 2 years)
68.3 MB/s +23%
HP Omen Transcend 14-fb0014
WDC PC SN810 1TB
61.7 MB/s +11%
Average Micron 3400 1TB MTFDKBA1T0TFH
  (40.6 - 67.7, n=22)
58.5 MB/s +6%
Acer Predator Triton 14 AI PT14-52
Micron 3400 1TB MTFDKBA1T0TFH
55.4 MB/s
Asus ROG Zephyrus G14 2025 GA403WW
WD PC SN740 SDDPNQE-2T00
50.9 MB/s -8%
Asus TUF Gaming A14 FA401WV-WB94
WD PC SN560 SDDPNQE-1T00
36.63 MB/s -34%
4K Write
Acer Predator Helios Neo 14 (2024)
SK Hynix PC801 HFS001TEJ9X125N
231.27 MB/s +68%
Lenovo Legion 5 15IRX10 5070
WD PC SN7100S SDFPMSL-1T00-1101
227 MB/s +65%
Average of class Gaming
  (75.6 - 512, n=124, last 2 years)
216 MB/s +57%
Asus ROG Zephyrus G14 2025 GA403WW
WD PC SN740 SDDPNQE-2T00
201 MB/s +46%
Razer Blade 14 2025
Samsung PM9A1 MZVL21T0HCLR
183.2 MB/s +33%
HP Omen Transcend 14-fb0014
WDC PC SN810 1TB
176.41 MB/s +28%
Average Micron 3400 1TB MTFDKBA1T0TFH
  (97.9 - 242, n=22)
176.1 MB/s +28%
Asus TUF Gaming A14 FA401WV-WB94
WD PC SN560 SDDPNQE-1T00
157.35 MB/s +14%
Acer Predator Triton 14 AI PT14-52
Micron 3400 1TB MTFDKBA1T0TFH
137.7 MB/s
4K-64 Read
Razer Blade 14 2025
Samsung PM9A1 MZVL21T0HCLR
2564 MB/s +320%
Acer Predator Helios Neo 14 (2024)
SK Hynix PC801 HFS001TEJ9X125N
2268.99 MB/s +271%
Lenovo Legion 5 15IRX10 5070
WD PC SN7100S SDFPMSL-1T00-1101
1783 MB/s +192%
Average of class Gaming
  (517 - 3630, n=124, last 2 years)
1725 MB/s +182%
Average Micron 3400 1TB MTFDKBA1T0TFH
  (603 - 2264, n=22)
1702 MB/s +179%
Asus ROG Zephyrus G14 2025 GA403WW
WD PC SN740 SDDPNQE-2T00
696 MB/s +14%
HP Omen Transcend 14-fb0014
WDC PC SN810 1TB
623.99 MB/s +2%
Acer Predator Triton 14 AI PT14-52
Micron 3400 1TB MTFDKBA1T0TFH
611 MB/s
Asus TUF Gaming A14 FA401WV-WB94
WD PC SN560 SDDPNQE-1T00
550.75 MB/s -10%
4K-64 Write
Acer Predator Helios Neo 14 (2024)
SK Hynix PC801 HFS001TEJ9X125N
3341.31 MB/s +161%
Razer Blade 14 2025
Samsung PM9A1 MZVL21T0HCLR
3286 MB/s +157%
Average of class Gaming
  (850 - 5909, n=124, last 2 years)
2788 MB/s +118%
Average Micron 3400 1TB MTFDKBA1T0TFH
  (1279 - 2807, n=22)
2381 MB/s +86%
Asus ROG Zephyrus G14 2025 GA403WW
WD PC SN740 SDDPNQE-2T00
2018 MB/s +58%
HP Omen Transcend 14-fb0014
WDC PC SN810 1TB
2016.6 MB/s +58%
Lenovo Legion 5 15IRX10 5070
WD PC SN7100S SDFPMSL-1T00-1101
1983 MB/s +55%
Asus TUF Gaming A14 FA401WV-WB94
WD PC SN560 SDDPNQE-1T00
1615.58 MB/s +26%
Acer Predator Triton 14 AI PT14-52
Micron 3400 1TB MTFDKBA1T0TFH
1279 MB/s
Access Time Read
Asus TUF Gaming A14 FA401WV-WB94
WD PC SN560 SDDPNQE-1T00
0.093 ms * -166%
HP Omen Transcend 14-fb0014
WDC PC SN810 1TB
0.077 ms * -120%
Average of class Gaming
  (0.016 - 0.17, n=124, last 2 years)
0.05486 ms * -57%
Average Micron 3400 1TB MTFDKBA1T0TFH
  (0.023 - 0.089, n=21)
0.04619 ms * -32%
Acer Predator Helios Neo 14 (2024)
SK Hynix PC801 HFS001TEJ9X125N
0.038 ms * -9%
Acer Predator Triton 14 AI PT14-52
Micron 3400 1TB MTFDKBA1T0TFH
0.035 ms *
Asus ROG Zephyrus G14 2025 GA403WW
WD PC SN740 SDDPNQE-2T00
0.026 ms * +26%
Lenovo Legion 5 15IRX10 5070
WD PC SN7100S SDFPMSL-1T00-1101
0.026 ms * +26%
Razer Blade 14 2025
Samsung PM9A1 MZVL21T0HCLR
0.025 ms * +29%
Access Time Write
Asus TUF Gaming A14 FA401WV-WB94
WD PC SN560 SDDPNQE-1T00
0.072 ms * -106%
HP Omen Transcend 14-fb0014
WDC PC SN810 1TB
0.061 ms * -74%
Average of class Gaming
  (0.012 - 0.277, n=124, last 2 years)
0.03878 ms * -11%
Average Micron 3400 1TB MTFDKBA1T0TFH
  (0.019 - 0.092, n=22)
0.03682 ms * -5%
Acer Predator Triton 14 AI PT14-52
Micron 3400 1TB MTFDKBA1T0TFH
0.035 ms *
Lenovo Legion 5 15IRX10 5070
WD PC SN7100S SDFPMSL-1T00-1101
0.027 ms * +23%
Razer Blade 14 2025
Samsung PM9A1 MZVL21T0HCLR
0.023 ms * +34%
Asus ROG Zephyrus G14 2025 GA403WW
WD PC SN740 SDDPNQE-2T00
0.019 ms * +46%
Acer Predator Helios Neo 14 (2024)
SK Hynix PC801 HFS001TEJ9X125N
0.018 ms * +49%

* ... smaller is better

Read continuous performance: DiskSpd Read Loop, Queue Depth 8

03306609901320165019802310264029703300363039604290462049505280561059406270Tooltip
Acer Predator Triton 14 AI PT14-52; diskspd 2.0.17 f: Ø6458 (5557.24-6577.15)

GPU performance

The dedicated GPU is the GeForce RTX 5070 with a TGP of 110 watts, i.e. a very fast variant. The 5070 offers 8 GB of VRAM, which can lead to limitations in current games, especially in high resolutions, which we will discuss in a special article already looked at in more detail. The graphics switching is done via the regular Optimus technology, but a MUX switch is installed and you can switch completely to the dGPU, but this requires a restart.

The pure graphics performance is basically okay, but the rather weak Lunar Lake processor is noticeable when gaming and you can't exploit the full potential of the RTX 5070. Here the Razer Blade 14 with an AMD CPU, for example, is 10% faster. Nevertheless, all modern titles can be played (especially in Full HD), even if not always with maximum details.

3DMark Performance rating - Percent
Asus ROG Zephyrus G14 2025 GA403WW
NVIDIA GeForce RTX 5080 Laptop, AMD Ryzen AI 9 HX 370
100 pt
Asus ROG Zephyrus G14 2025 5070 Ti
NVIDIA GeForce RTX 5070 Ti Laptop, AMD Ryzen AI 9 HX 370
94 pt
Lenovo Legion 5 15IRX10 5070
NVIDIA GeForce RTX 5070 Laptop, Intel Core i7-13650HX
89.9 pt
Average of class Gaming
 
89 pt
Razer Blade 14 2025
NVIDIA GeForce RTX 5070 Laptop, AMD Ryzen AI 9 365
82.6 pt
Average NVIDIA GeForce RTX 5070 Laptop
 
82.6 pt
Acer Predator Triton 14 AI PT14-52
NVIDIA GeForce RTX 5070 Laptop, Intel Core Ultra 9 288V
76.8 pt
Asus TUF Gaming A14 FA401WV-WB94
NVIDIA GeForce RTX 4060 Laptop GPU, AMD Ryzen AI 9 HX 370
64.7 pt
Acer Predator Helios Neo 14 (2024)
NVIDIA GeForce RTX 4070 Laptop GPU, Intel Core Ultra 9 185H
64.1 pt
HP Omen Transcend 14-fb0014
NVIDIA GeForce RTX 4060 Laptop GPU, Intel Core Ultra 7 155H
50.3 pt
3DMark 11 - 1280x720 Performance GPU
Asus ROG Zephyrus G14 2025 GA403WW
NVIDIA GeForce RTX 5080 Laptop, AMD Ryzen AI 9 HX 370
54868 Points +31%
Asus ROG Zephyrus G14 2025 5070 Ti
NVIDIA GeForce RTX 5070 Ti Laptop, AMD Ryzen AI 9 HX 370
50966 Points +22%
Lenovo Legion 5 15IRX10 5070
NVIDIA GeForce RTX 5070 Laptop, Intel Core i7-13650HX
49568 Points +18%
Average of class Gaming
  (13523 - 80022, n=139, last 2 years)
48476 Points +16%
Razer Blade 14 2025
NVIDIA GeForce RTX 5070 Laptop, AMD Ryzen AI 9 365
45246 Points +8%
Average NVIDIA GeForce RTX 5070 Laptop
  (36721 - 49568, n=23)
44424 Points +6%
Acer Predator Triton 14 AI PT14-52
NVIDIA GeForce RTX 5070 Laptop, Intel Core Ultra 9 288V
41871 Points
Asus TUF Gaming A14 FA401WV-WB94
NVIDIA GeForce RTX 4060 Laptop GPU, AMD Ryzen AI 9 HX 370
36372 Points -13%
Acer Predator Helios Neo 14 (2024)
NVIDIA GeForce RTX 4070 Laptop GPU, Intel Core Ultra 9 185H
36209 Points -14%
HP Omen Transcend 14-fb0014
NVIDIA GeForce RTX 4060 Laptop GPU, Intel Core Ultra 7 155H
29246 Points -30%
3DMark
1920x1080 Fire Strike Graphics
Asus ROG Zephyrus G14 2025 GA403WW
NVIDIA GeForce RTX 5080 Laptop, AMD Ryzen AI 9 HX 370
40859 Points +26%
Asus ROG Zephyrus G14 2025 5070 Ti
NVIDIA GeForce RTX 5070 Ti Laptop, AMD Ryzen AI 9 HX 370
40606 Points +25%
Lenovo Legion 5 15IRX10 5070
NVIDIA GeForce RTX 5070 Laptop, Intel Core i7-13650HX
38323 Points +18%
Average of class Gaming
  (6487 - 62849, n=152, last 2 years)
36203 Points +12%
Average NVIDIA GeForce RTX 5070 Laptop
  (28759 - 38680, n=25)
35363 Points +9%
Razer Blade 14 2025
NVIDIA GeForce RTX 5070 Laptop, AMD Ryzen AI 9 365
33878 Points +4%
Acer Predator Triton 14 AI PT14-52
NVIDIA GeForce RTX 5070 Laptop, Intel Core Ultra 9 288V
32456 Points
Asus TUF Gaming A14 FA401WV-WB94
NVIDIA GeForce RTX 4060 Laptop GPU, AMD Ryzen AI 9 HX 370
26679 Points -18%
Acer Predator Helios Neo 14 (2024)
NVIDIA GeForce RTX 4070 Laptop GPU, Intel Core Ultra 9 185H
26653 Points -18%
HP Omen Transcend 14-fb0014
NVIDIA GeForce RTX 4060 Laptop GPU, Intel Core Ultra 7 155H
20867 Points -36%
2560x1440 Time Spy Graphics
Asus ROG Zephyrus G14 2025 GA403WW
NVIDIA GeForce RTX 5080 Laptop, AMD Ryzen AI 9 HX 370
16644 Points +34%
Average of class Gaming
  (2295 - 25984, n=149, last 2 years)
15001 Points +21%
Asus ROG Zephyrus G14 2025 5070 Ti
NVIDIA GeForce RTX 5070 Ti Laptop, AMD Ryzen AI 9 HX 370
14945 Points +21%
Lenovo Legion 5 15IRX10 5070
NVIDIA GeForce RTX 5070 Laptop, Intel Core i7-13650HX
14258 Points +15%
Razer Blade 14 2025
NVIDIA GeForce RTX 5070 Laptop, AMD Ryzen AI 9 365
13734 Points +11%
Average NVIDIA GeForce RTX 5070 Laptop
  (10851 - 14771, n=25)
13342 Points +8%
Acer Predator Triton 14 AI PT14-52
NVIDIA GeForce RTX 5070 Laptop, Intel Core Ultra 9 288V
12401 Points
Asus TUF Gaming A14 FA401WV-WB94
NVIDIA GeForce RTX 4060 Laptop GPU, AMD Ryzen AI 9 HX 370
10397 Points -16%
Acer Predator Helios Neo 14 (2024)
NVIDIA GeForce RTX 4070 Laptop GPU, Intel Core Ultra 9 185H
10182 Points -18%
HP Omen Transcend 14-fb0014
NVIDIA GeForce RTX 4060 Laptop GPU, Intel Core Ultra 7 155H
7758 Points -37%
3DMark 11 Performance
29568 points
3DMark Fire Strike Score
24366 points
3DMark Time Spy Score
11572 points
3DMark Steel Nomad Score
2884 points
3DMark Steel Nomad Light Score
12857 points
Help
Blender / v3.3 Classroom OPTIX/RTX
HP Omen Transcend 14-fb0014
NVIDIA GeForce RTX 4060 Laptop GPU, Intel Core Ultra 7 155H
24 Seconds * -4%
Acer Predator Triton 14 AI PT14-52
NVIDIA GeForce RTX 5070 Laptop, Intel Core Ultra 9 288V
23 Seconds *
Asus TUF Gaming A14 FA401WV-WB94
NVIDIA GeForce RTX 4060 Laptop GPU, AMD Ryzen AI 9 HX 370
22 Seconds * +4%
Acer Predator Helios Neo 14 (2024)
NVIDIA GeForce RTX 4070 Laptop GPU, Intel Core Ultra 9 185H
21 Seconds * +9%
Average NVIDIA GeForce RTX 5070 Laptop
  (17 - 24, n=23)
19.7 Seconds * +14%
Average of class Gaming
  (9 - 95, n=140, last 2 years)
19.1 Seconds * +17%
Razer Blade 14 2025
NVIDIA GeForce RTX 5070 Laptop, AMD Ryzen AI 9 365
19 Seconds * +17%
Lenovo Legion 5 15IRX10 5070
NVIDIA GeForce RTX 5070 Laptop, Intel Core i7-13650HX
18 Seconds * +22%
Asus ROG Zephyrus G14 2025 GA403WW
NVIDIA GeForce RTX 5080 Laptop, AMD Ryzen AI 9 HX 370
17 Seconds * +26%
Asus ROG Zephyrus G14 2025 5070 Ti
NVIDIA GeForce RTX 5070 Ti Laptop, AMD Ryzen AI 9 HX 370
16 Seconds * +30%
Blender / v3.3 Classroom CUDA
HP Omen Transcend 14-fb0014
NVIDIA GeForce RTX 4060 Laptop GPU, Intel Core Ultra 7 155H
48 Seconds * -41%
Average NVIDIA GeForce RTX 5070 Laptop
  (29 - 228, n=24)
40.4 Seconds * -19%
Asus TUF Gaming A14 FA401WV-WB94
NVIDIA GeForce RTX 4060 Laptop GPU, AMD Ryzen AI 9 HX 370
40 Seconds * -18%
Acer Predator Helios Neo 14 (2024)
NVIDIA GeForce RTX 4070 Laptop GPU, Intel Core Ultra 9 185H
34 Seconds * -0%
Acer Predator Triton 14 AI PT14-52
NVIDIA GeForce RTX 5070 Laptop, Intel Core Ultra 9 288V
34 Seconds *
Average of class Gaming
  (15 - 228, n=144, last 2 years)
33.1 Seconds * +3%
Razer Blade 14 2025
NVIDIA GeForce RTX 5070 Laptop, AMD Ryzen AI 9 365
31 Seconds * +9%
Lenovo Legion 5 15IRX10 5070
NVIDIA GeForce RTX 5070 Laptop, Intel Core i7-13650HX
29 Seconds * +15%
Asus ROG Zephyrus G14 2025 5070 Ti
NVIDIA GeForce RTX 5070 Ti Laptop, AMD Ryzen AI 9 HX 370
26 Seconds * +24%
Asus ROG Zephyrus G14 2025 GA403WW
NVIDIA GeForce RTX 5080 Laptop, AMD Ryzen AI 9 HX 370
23 Seconds * +32%
Blender / v3.3 Classroom CPU
Acer Predator Triton 14 AI PT14-52
NVIDIA GeForce RTX 5070 Laptop, Intel Core Ultra 9 288V
507 Seconds *
HP Omen Transcend 14-fb0014
NVIDIA GeForce RTX 4060 Laptop GPU, Intel Core Ultra 7 155H
338 Seconds * +33%
Acer Predator Helios Neo 14 (2024)
NVIDIA GeForce RTX 4070 Laptop GPU, Intel Core Ultra 9 185H
306 Seconds * +40%
Lenovo Legion 5 15IRX10 5070
NVIDIA GeForce RTX 5070 Laptop, Intel Core i7-13650HX
294 Seconds * +42%
Razer Blade 14 2025
NVIDIA GeForce RTX 5070 Laptop, AMD Ryzen AI 9 365
261 Seconds * +49%
Average of class Gaming
  (122 - 962, n=141, last 2 years)
261 Seconds * +49%
Average NVIDIA GeForce RTX 5070 Laptop
  (137 - 507, n=21)
257 Seconds * +49%
Asus ROG Zephyrus G14 2025 5070 Ti
NVIDIA GeForce RTX 5070 Ti Laptop, AMD Ryzen AI 9 HX 370
217 Seconds * +57%
Asus TUF Gaming A14 FA401WV-WB94
NVIDIA GeForce RTX 4060 Laptop GPU, AMD Ryzen AI 9 HX 370
215 Seconds * +58%
Asus ROG Zephyrus G14 2025 GA403WW
NVIDIA GeForce RTX 5080 Laptop, AMD Ryzen AI 9 HX 370
208 Seconds * +59%

* ... smaller is better

Performance rating - Percent
Average of class Gaming
 
93.4 pt
Asus ROG Zephyrus G14 2025 GA403WW
AMD Ryzen AI 9 HX 370, NVIDIA GeForce RTX 5080 Laptop
92.6 pt
Lenovo Legion 5 15IRX10 5070
Intel Core i7-13650HX, NVIDIA GeForce RTX 5070 Laptop
91.4 pt
Asus ROG Zephyrus G14 2025 5070 Ti
AMD Ryzen AI 9 HX 370, NVIDIA GeForce RTX 5070 Ti Laptop
89.1 pt
Razer Blade 14 2025
AMD Ryzen AI 9 365, NVIDIA GeForce RTX 5070 Laptop
88.3 pt
Acer Predator Triton 14 AI PT14-52
Intel Core Ultra 9 288V, NVIDIA GeForce RTX 5070 Laptop
80.6 pt
Acer Predator Helios Neo 14 (2024)
Intel Core Ultra 9 185H, NVIDIA GeForce RTX 4070 Laptop GPU
72.4 pt
Asus TUF Gaming A14 FA401WV-WB94
AMD Ryzen AI 9 HX 370, NVIDIA GeForce RTX 4060 Laptop GPU
70.3 pt
HP Omen Transcend 14-fb0014
Intel Core Ultra 7 155H, NVIDIA GeForce RTX 4060 Laptop GPU
61.8 pt
Cyberpunk 2077 - 1920x1080 Ultra Preset (FSR off)
Asus ROG Zephyrus G14 2025 GA403WW
AMD Ryzen AI 9 HX 370, NVIDIA GeForce RTX 5080 Laptop
109.9 (79.8min) fps +24%
Asus ROG Zephyrus G14 2025 5070 Ti
AMD Ryzen AI 9 HX 370, NVIDIA GeForce RTX 5070 Ti Laptop
104.9 (79.7min) fps +18%
Lenovo Legion 5 15IRX10 5070
Intel Core i7-13650HX, NVIDIA GeForce RTX 5070 Laptop
101.5 (81.8min) fps +15%
Average of class Gaming
  (17.7 - 169.9, n=146, last 2 years)
101.1 fps +14%
Razer Blade 14 2025
AMD Ryzen AI 9 365, NVIDIA GeForce RTX 5070 Laptop
98.9 (73.1min) fps +12%
Acer Predator Triton 14 AI PT14-52
Intel Core Ultra 9 288V, NVIDIA GeForce RTX 5070 Laptop
88.6 (68.6min) fps
Asus TUF Gaming A14 FA401WV-WB94
AMD Ryzen AI 9 HX 370, NVIDIA GeForce RTX 4060 Laptop GPU
73.3 (60min) fps -17%
Acer Predator Helios Neo 14 (2024)
Intel Core Ultra 9 185H, NVIDIA GeForce RTX 4070 Laptop GPU
72.4 (59.8min) fps -18%
HP Omen Transcend 14-fb0014
Intel Core Ultra 7 155H, NVIDIA GeForce RTX 4060 Laptop GPU
56.7 (31.1min) fps -36%
Baldur's Gate 3 - 1920x1080 Ultra Preset AA:T
Asus ROG Zephyrus G14 2025 GA403WW
AMD Ryzen AI 9 HX 370, NVIDIA GeForce RTX 5080 Laptop
144 fps +34%
Average of class Gaming
  (37.2 - 246, n=113, last 2 years)
134.2 fps +25%
Asus ROG Zephyrus G14 2025 5070 Ti
AMD Ryzen AI 9 HX 370, NVIDIA GeForce RTX 5070 Ti Laptop
131.7 fps +23%
Razer Blade 14 2025
AMD Ryzen AI 9 365, NVIDIA GeForce RTX 5070 Laptop
128.4 fps +20%
Lenovo Legion 5 15IRX10 5070
Intel Core i7-13650HX, NVIDIA GeForce RTX 5070 Laptop
127.2 fps +19%
Acer Predator Helios Neo 14 (2024)
Intel Core Ultra 9 185H, NVIDIA GeForce RTX 4070 Laptop GPU
107.9 (57.2min, 71.4P0.1, 87.3P1) fps +1%
Acer Predator Triton 14 AI PT14-52
Intel Core Ultra 9 288V, NVIDIA GeForce RTX 5070 Laptop
107.2 (87.9min, 90.3P0.1, 95.7P1) fps
Asus TUF Gaming A14 FA401WV-WB94
AMD Ryzen AI 9 HX 370, NVIDIA GeForce RTX 4060 Laptop GPU
90.1 fps -16%
HP Omen Transcend 14-fb0014
Intel Core Ultra 7 155H, NVIDIA GeForce RTX 4060 Laptop GPU
73.2 fps -32%
GTA V - 1920x1080 Highest AA:4xMSAA + FX AF:16x
Lenovo Legion 5 15IRX10 5070
Intel Core i7-13650HX, NVIDIA GeForce RTX 5070 Laptop
143.7 (2.97min, 111.1P1) fps +23%
Razer Blade 14 2025
AMD Ryzen AI 9 365, NVIDIA GeForce RTX 5070 Laptop
127.2 (4.9min, 90.9P1) fps +9%
Average of class Gaming
  (12.1 - 186.9, n=130, last 2 years)
125.1 fps +7%
Asus ROG Zephyrus G14 2025 GA403WW
AMD Ryzen AI 9 HX 370, NVIDIA GeForce RTX 5080 Laptop
124.8 (4.45min, 83.3P1) fps +7%
Asus ROG Zephyrus G14 2025 5070 Ti
AMD Ryzen AI 9 HX 370, NVIDIA GeForce RTX 5070 Ti Laptop
124.7 fps +7%
Acer Predator Triton 14 AI PT14-52
Intel Core Ultra 9 288V, NVIDIA GeForce RTX 5070 Laptop
116.4 (1.933min, 83.3P1) fps
Asus TUF Gaming A14 FA401WV-WB94
AMD Ryzen AI 9 HX 370, NVIDIA GeForce RTX 4060 Laptop GPU
110.8 (3.47min, 71.4P1) fps -5%
Acer Predator Helios Neo 14 (2024)
Intel Core Ultra 9 185H, NVIDIA GeForce RTX 4070 Laptop GPU
104.8 (4.53min, 71.4P1) fps -10%
HP Omen Transcend 14-fb0014
Intel Core Ultra 7 155H, NVIDIA GeForce RTX 4060 Laptop GPU
96.7 (4.16min, 62.5P1) fps -17%
Final Fantasy XV Benchmark - 1920x1080 High Quality
Asus ROG Zephyrus G14 2025 GA403WW
AMD Ryzen AI 9 HX 370, NVIDIA GeForce RTX 5080 Laptop
146 fps +20%
Lenovo Legion 5 15IRX10 5070
Intel Core i7-13650HX, NVIDIA GeForce RTX 5070 Laptop
139.7 fps +15%
Razer Blade 14 2025
AMD Ryzen AI 9 365, NVIDIA GeForce RTX 5070 Laptop
138.3 fps +14%
Average of class Gaming
  (19.2 - 215, n=142, last 2 years)
137 fps +12%
Asus ROG Zephyrus G14 2025 5070 Ti
AMD Ryzen AI 9 HX 370, NVIDIA GeForce RTX 5070 Ti Laptop
135.8 fps +11%
Acer Predator Triton 14 AI PT14-52
Intel Core Ultra 9 288V, NVIDIA GeForce RTX 5070 Laptop
121.8 fps
Acer Predator Helios Neo 14 (2024)
Intel Core Ultra 9 185H, NVIDIA GeForce RTX 4070 Laptop GPU
104.6 fps -14%
Asus TUF Gaming A14 FA401WV-WB94
AMD Ryzen AI 9 HX 370, NVIDIA GeForce RTX 4060 Laptop GPU
100.6 fps -17%
HP Omen Transcend 14-fb0014
Intel Core Ultra 7 155H, NVIDIA GeForce RTX 4060 Laptop GPU
83.2 fps -32%
Strange Brigade - 1920x1080 ultra AA:ultra AF:16
Asus ROG Zephyrus G14 2025 GA403WW
AMD Ryzen AI 9 HX 370, NVIDIA GeForce RTX 5080 Laptop
299 (10.8min, 213P1) fps +32%
Asus ROG Zephyrus G14 2025 5070 Ti
AMD Ryzen AI 9 HX 370, NVIDIA GeForce RTX 5070 Ti Laptop
276 (7.8min, 203P1) fps +22%
Average of class Gaming
  (38.9 - 456, n=130, last 2 years)
262 fps +16%
Razer Blade 14 2025
AMD Ryzen AI 9 365, NVIDIA GeForce RTX 5070 Laptop
258 (53.6min, 127.9P1) fps +14%
Acer Predator Triton 14 AI PT14-52
Intel Core Ultra 9 288V, NVIDIA GeForce RTX 5070 Laptop
226 (130.1min, 164.9P1) fps
Lenovo Legion 5 15IRX10 5070
Intel Core i7-13650HX, NVIDIA GeForce RTX 5070 Laptop
208 fps -8%
Asus TUF Gaming A14 FA401WV-WB94
AMD Ryzen AI 9 HX 370, NVIDIA GeForce RTX 4060 Laptop GPU
193.5 (45.4min, 142.5P1) fps -14%
Acer Predator Helios Neo 14 (2024)
Intel Core Ultra 9 185H, NVIDIA GeForce RTX 4070 Laptop GPU
183 (33.8min, 138.5P1) fps -19%
HP Omen Transcend 14-fb0014
Intel Core Ultra 7 155H, NVIDIA GeForce RTX 4060 Laptop GPU
151.1 (81.6min, 109.2P1) fps -33%
Dota 2 Reborn - 1920x1080 ultra (3/3) best looking
Average of class Gaming
  (65.1 - 248, n=145, last 2 years)
154.4 fps +21%
Lenovo Legion 5 15IRX10 5070
Intel Core i7-13650HX, NVIDIA GeForce RTX 5070 Laptop
150.2 (129min) fps +18%
Razer Blade 14 2025
AMD Ryzen AI 9 365, NVIDIA GeForce RTX 5070 Laptop
137.6 (116.8min) fps +8%
Asus TUF Gaming A14 FA401WV-WB94
AMD Ryzen AI 9 HX 370, NVIDIA GeForce RTX 4060 Laptop GPU
135 (117.6min) fps +6%
Asus ROG Zephyrus G14 2025 GA403WW
AMD Ryzen AI 9 HX 370, NVIDIA GeForce RTX 5080 Laptop
134.2 (114.4min) fps +5%
Asus ROG Zephyrus G14 2025 5070 Ti
AMD Ryzen AI 9 HX 370, NVIDIA GeForce RTX 5070 Ti Laptop
134.2 (115.1min) fps +5%
Acer Predator Helios Neo 14 (2024)
Intel Core Ultra 9 185H, NVIDIA GeForce RTX 4070 Laptop GPU
130.8 (114.6min) fps +3%
Acer Predator Triton 14 AI PT14-52
Intel Core Ultra 9 288V, NVIDIA GeForce RTX 5070 Laptop
127.5 (109.9min) fps
HP Omen Transcend 14-fb0014
Intel Core Ultra 7 155H, NVIDIA GeForce RTX 4060 Laptop GPU
121.1 (104.5min) fps -5%
X-Plane 11.11 - 1920x1080 high (fps_test=3)
Average of class Gaming
  (33.4 - 150.2, n=148, last 2 years)
103.6 fps +15%
Lenovo Legion 5 15IRX10 5070
Intel Core i7-13650HX, NVIDIA GeForce RTX 5070 Laptop
100.2 fps +12%
Acer Predator Triton 14 AI PT14-52
Intel Core Ultra 9 288V, NVIDIA GeForce RTX 5070 Laptop
89.7 fps
Razer Blade 14 2025
AMD Ryzen AI 9 365, NVIDIA GeForce RTX 5070 Laptop
83.1 fps -7%
Asus ROG Zephyrus G14 2025 5070 Ti
AMD Ryzen AI 9 HX 370, NVIDIA GeForce RTX 5070 Ti Laptop
80.7 fps -10%
HP Omen Transcend 14-fb0014
Intel Core Ultra 7 155H, NVIDIA GeForce RTX 4060 Laptop GPU
79.5 fps -11%
Acer Predator Helios Neo 14 (2024)
Intel Core Ultra 9 185H, NVIDIA GeForce RTX 4070 Laptop GPU
78 fps -13%
Asus ROG Zephyrus G14 2025 GA403WW
AMD Ryzen AI 9 HX 370, NVIDIA GeForce RTX 5080 Laptop
76.9 fps -14%
Asus TUF Gaming A14 FA401WV-WB94
AMD Ryzen AI 9 HX 370, NVIDIA GeForce RTX 4060 Laptop GPU
67.3 fps -25%

Cyberpunk 2077 ultra FPS chart

05101520253035404550556065707580Tooltip
Acer Predator Triton 14 AI PT14-52 Core Ultra 9 288V, GeForce RTX 5070 Laptop: Ø82.5 (79.3-84.5)
CPU/GPU data Cyberpunk 2077 (1080p, Ultra)
lowmed.highultraQHD DLSSQHD
GTA V (2015) 116.4
Dota 2 Reborn (2015) 160 142 137.6 127.5
Final Fantasy XV Benchmark (2018) 161.8 157.8 121.8 88.8
X-Plane 11.11 (2018) 97.7 87.9 89.7
Strange Brigade (2018) 374 294 251 226 157.2
Baldur's Gate 3 (2023) 148.6 124 108 107.2 75.2
Cyberpunk 2077 (2023) 122.5 117.3 100 88.6 65 59
F1 24 (2024) 197.8 195.5 190.6 78.5 78 51

Emissions & Energy

Noise emissions

Vapor-chamber cooling

There are two sides to the cooling. On the one hand, the efficient Lunar Lake processor with its low maximum consumption means that notebooks are generally very quiet during everyday tasks without using the dGPU, even in Turbo mode. However, as soon as the RTX 5070 is used, the fans become really loud, although Acer already uses a vapor chamber here. In Turbo mode it is a very loud and annoying 57.9 dB(A) and in performance mode still more than 53 dB(A). This also makes it by far the loudest device in our comparison group. There were no other electronic noises.

Noise level

Idle
24.9 / 24.9 / 30.5 dB(A)
Load
36.1 / 57.9 dB(A)
  red to green bar
 
 
30 dB
silent
40 dB(A)
audible
50 dB(A)
loud
 
min: dark, med: mid, max: light   Earthworks M23R, Arta (15 cm distance)   environment noise: 24.9 dB(A)
dB(A) 0102030405060708090Deep BassMiddle BassHigh BassLower RangeMidsHigher MidsLower HighsMid HighsUpper HighsSuper Highs2041.341.141.241.543.42531.431.530.630.828.93129.726.828.426.926.6402927.7282527502828.426.828.327.86328.624.127.227.126.18026.821.221.119.631.610032.722.419.621.624.512527.219.218.818.524.816027.919.616.917.425.720031.521.11815.72825032.922.920.919.131.131534.222.419.516.832.340037.122.219.314.334.750039.423.220.812.336.963040.223.219.311.437.180043.325.720.211.338.8100044.126.320.410.540.3125043.925.520.710.740.5160047.426.921.310.943200048.426.920.111.443.7250047.723.617.412.443315048.124.516.814.543.4400047.222.115.512.842.5500046.119.413.812.640.563004518.713.813.639.4800043.518.613.512.737.91000042.320.413.313.333.51250038.620.913.913.530.11600034.421.313.613.226.4SPL57.936.130.524.953.2N11.72.31.30.68.6median 42.3median 22.4median 18.8median 13.2median 37.1Delta6.12.42.52.65.5hearing rangehide median Fan NoiseAcer Predator Triton 14 AI PT14-52
Acer Predator Triton 14 AI PT14-52
Core Ultra 9 288V, GeForce RTX 5070 Laptop
Razer Blade 14 2025
Ryzen AI 9 365, GeForce RTX 5070 Laptop
Asus ROG Zephyrus G14 2025 GA403WW
Ryzen AI 9 HX 370, GeForce RTX 5080 Laptop
Acer Predator Helios Neo 14 (2024)
Ultra 9 185H, GeForce RTX 4070 Laptop GPU
Asus TUF Gaming A14 FA401WV-WB94
Ryzen AI 9 HX 370, GeForce RTX 4060 Laptop GPU
HP Omen Transcend 14-fb0014
Ultra 7 155H, GeForce RTX 4060 Laptop GPU
Lenovo Legion 5 15IRX10 5070
i7-13650HX, GeForce RTX 5070 Laptop
Noise
2%
-9%
-9%
4%
11%
5%
off / environment * (dB)
24.9
23.7
5%
23.3
6%
24
4%
22.9
8%
24.5
2%
24
4%
Idle Minimum * (dB)
24.9
23.7
5%
29.1
-17%
29
-16%
22.9
8%
24.7
1%
24
4%
Idle Average * (dB)
24.9
23.7
5%
29.1
-17%
31
-24%
28.3
-14%
24.7
1%
24
4%
Idle Maximum * (dB)
30.5
27
11%
29.1
5%
36
-18%
28.8
6%
24.7
19%
28.3
7%
Load Average * (dB)
36.1
44.9
-24%
54.4
-51%
47
-30%
37.3
-3%
25.2
30%
39.6
-10%
Cyberpunk 2077 ultra * (dB)
57.9
54.6
6%
54.4
6%
50
14%
50.6
13%
50.1
13%
Load Maximum * (dB)
57.9
54.6
6%
54.4
6%
52
10%
50.6
13%
52
10%
50.1
13%
Witcher 3 ultra * (dB)
47

* ... smaller is better

Temperature

The metal casing remains pleasantly cool in everyday use, but it heats up considerably under load. However, it does not become critical with a maximum of 47 °C (116.6 °F) on the underside. In the stress test, the CPU operates at the full 37 watts (~80 °C/176 °F) and the GPU at around 87 watts (~81 °C/177.8 °F).

CPU/GPU data stress test
Max. Load
 41.9 °C
107 F
42.9 °C
109 F
41.5 °C
107 F
 
 37.9 °C
100 F
42.7 °C
109 F
37.5 °C
100 F
 
 33.3 °C
92 F
38 °C
100 F
35 °C
95 F
 
Maximum: 42.9 °C = 109 F
Average: 39 °C = 102 F
44.5 °C
112 F
47.4 °C
117 F
43 °C
109 F
41.1 °C
106 F
43.9 °C
111 F
38.2 °C
101 F
37.6 °C
100 F
39.4 °C
103 F
34.7 °C
94 F
Maximum: 47.4 °C = 117 F
Average: 41.1 °C = 106 F
Power Supply (max.)  44.7 °C = 112 F | Room Temperature 20.8 °C = 69 F | Fluke t3000FC (calibrated), Voltcraft IR-900
(-) The average temperature for the upper side under maximal load is 39 °C / 102 F, compared to the average of 33.9 °C / 93 F for the devices in the class Gaming.
(±) The maximum temperature on the upper side is 42.9 °C / 109 F, compared to the average of 40.4 °C / 105 F, ranging from 21.2 to 68.8 °C for the class Gaming.
(-) The bottom heats up to a maximum of 47.4 °C / 117 F, compared to the average of 43.2 °C / 110 F
(+) In idle usage, the average temperature for the upper side is 26.2 °C / 79 F, compared to the device average of 33.9 °C / 93 F.
(±) 3: The average temperature for the upper side is 35.8 °C / 96 F, compared to the average of 33.9 °C / 93 F for the class Gaming.
(±) The palmrests and touchpad can get very hot to the touch with a maximum of 38 °C / 100.4 F.
(-) The average temperature of the palmrest area of similar devices was 28.9 °C / 84 F (-9.1 °C / -16.4 F).
Surface temperatures stress test (top side)
Surface temperatures stress test (underside)
Acer Predator Triton 14 AI PT14-52
Core Ultra 9 288V, GeForce RTX 5070 Laptop
Razer Blade 14 2025
Ryzen AI 9 365, GeForce RTX 5070 Laptop
Asus ROG Zephyrus G14 2025 GA403WW
Ryzen AI 9 HX 370, GeForce RTX 5080 Laptop
Acer Predator Helios Neo 14 (2024)
Ultra 9 185H, GeForce RTX 4070 Laptop GPU
Asus TUF Gaming A14 FA401WV-WB94
Ryzen AI 9 HX 370, GeForce RTX 4060 Laptop GPU
HP Omen Transcend 14-fb0014
Ultra 7 155H, GeForce RTX 4060 Laptop GPU
Lenovo Legion 5 15IRX10 5070
i7-13650HX, GeForce RTX 5070 Laptop
Heat
-8%
-12%
-21%
-8%
9%
-12%
Maximum Upper Side * (°C)
42.9
47
-10%
51.2
-19%
57
-33%
49.8
-16%
41.2
4%
41.6
3%
Maximum Bottom * (°C)
47.4
49.6
-5%
50.3
-6%
55
-16%
46
3%
39
18%
52.7
-11%
Idle Upper Side * (°C)
27.3
29.8
-9%
30.2
-11%
32
-17%
30.2
-11%
26.2
4%
32.6
-19%
Idle Bottom * (°C)
28.1
30.7
-9%
30.9
-10%
33
-17%
29.8
-6%
25.4
10%
33.9
-21%

* ... smaller is better

Speaker

The sound system consists of 6 modules and the maximum volume is very high, but the speakers are not really convincing. Even at around 50% of the volume, the sound is quite boomy and playing music or movies is no longer really pleasant.

dB(A) 0102030405060708090Deep BassMiddle BassHigh BassLower RangeMidsHigher MidsLower HighsMid HighsUpper HighsSuper Highs2041.540.92530.833.23126.930.3402529.55028.331.46327.133.18019.63610021.644.312518.548.716017.45420015.764.225019.164.531516.870.540014.372.150012.376.163011.483.180011.388.2100010.583.4125010.779.8160010.975.4200011.475.7250012.472.8315014.569.1400012.867.1500012.665.5630013.663.4800012.758.61000013.358.31250013.553.41600013.251.4SPL24.990.7N0.675.7median 13.2median 69.1Delta2.68.137.236.432.130.529.429.928.53225.231.6263421.338.618.843.118.848.317.347.718.554.42056.116.159.21463.312.169.410.472.210.470.81069.110.3689.770.910.571.910.964.611.164.411.263.611.457.511.757.51256.811.758.911.560.51158.323.779.60.544.8median 11.5median 60.52.66.634.839.129.433.126.634.426.733.525.23722.142.318.449.118.16216.866.91664.716.16915.169.714.571.811.569.810.968.610.271.310.274.610.171.39.973.410.16710.67110.869.211.365.611.665.811.760.411.859.911.956.311.954.711.855.11151.723.381.20.553.1median 11.6median 671.85.3hearing rangehide median Pink NoiseAcer Predator Triton 14 AI PT14-52Razer Blade 14 2025Asus ROG Zephyrus G14 2025 GA403WW
Frequency diagram (checkboxes can be checked and unchecked to compare devices)
Acer Predator Triton 14 AI PT14-52 audio analysis

(+) | speakers can play relatively loud (90.7 dB)
Bass 100 - 315 Hz
(±) | reduced bass - on average 11.9% lower than median
(±) | linearity of bass is average (10.3% delta to prev. frequency)
Mids 400 - 2000 Hz
(±) | higher mids - on average 10.1% higher than median
(+) | mids are linear (6.9% delta to prev. frequency)
Highs 2 - 16 kHz
(±) | reduced highs - on average 5.2% lower than median
(+) | highs are linear (4.4% delta to prev. frequency)
Overall 100 - 16.000 Hz
(±) | linearity of overall sound is average (17.9% difference to median)
Compared to same class
» 54% of all tested devices in this class were better, 9% similar, 37% worse
» The best had a delta of 6%, average was 18%, worst was 132%
Compared to all devices tested
» 36% of all tested devices were better, 8% similar, 56% worse
» The best had a delta of 4%, average was 24%, worst was 134%

Razer Blade 14 2025 audio analysis

(±) | speaker loudness is average but good (79.6 dB)
Bass 100 - 315 Hz
(±) | reduced bass - on average 9% lower than median
(±) | linearity of bass is average (7.4% delta to prev. frequency)
Mids 400 - 2000 Hz
(±) | higher mids - on average 9% higher than median
(+) | mids are linear (5.4% delta to prev. frequency)
Highs 2 - 16 kHz
(+) | balanced highs - only 3.2% away from median
(+) | highs are linear (5% delta to prev. frequency)
Overall 100 - 16.000 Hz
(±) | linearity of overall sound is average (15.1% difference to median)
Compared to same class
» 32% of all tested devices in this class were better, 6% similar, 62% worse
» The best had a delta of 6%, average was 18%, worst was 132%
Compared to all devices tested
» 20% of all tested devices were better, 4% similar, 76% worse
» The best had a delta of 4%, average was 24%, worst was 134%

Asus ROG Zephyrus G14 2025 GA403WW audio analysis

(±) | speaker loudness is average but good (81.2 dB)
Bass 100 - 315 Hz
(+) | good bass - only 2.8% away from median
(±) | linearity of bass is average (8.1% delta to prev. frequency)
Mids 400 - 2000 Hz
(+) | balanced mids - only 3.9% away from median
(+) | mids are linear (5.6% delta to prev. frequency)
Highs 2 - 16 kHz
(±) | reduced highs - on average 5.9% lower than median
(+) | highs are linear (4.3% delta to prev. frequency)
Overall 100 - 16.000 Hz
(+) | overall sound is linear (10.4% difference to median)
Compared to same class
» 6% of all tested devices in this class were better, 2% similar, 92% worse
» The best had a delta of 6%, average was 18%, worst was 132%
Compared to all devices tested
» 5% of all tested devices were better, 1% similar, 94% worse
» The best had a delta of 4%, average was 24%, worst was 134%

Energy consumption

When idle, the device requires quite a lot of power and has no efficiency advantages here either. This is only noticeable under load, which is around 135 watts when gaming. The included 140 watt power supply unit is therefore just sufficient, but offers no scope for charging the battery, for example. The standby consumption of 2.6 watts is far too high.

Power Consumption
Off / Standbydarklight 0.54 / 2.6 Watt
Idledarkmidlight 9.3 / 12.2 / 12.5 Watt
Load midlight 68.4 / 145.4 Watt
 color bar
Key: min: dark, med: mid, max: light        Metrahit Energy
Acer Predator Triton 14 AI PT14-52
Core Ultra 9 288V, GeForce RTX 5070 Laptop, Micron 3400 1TB MTFDKBA1T0TFH, OLED, 2880x1800, 14.5"
Razer Blade 14 2025
Ryzen AI 9 365, GeForce RTX 5070 Laptop, Samsung PM9A1 MZVL21T0HCLR, OLED, 2880x1800, 14"
Asus ROG Zephyrus G14 2025 GA403WW
Ryzen AI 9 HX 370, GeForce RTX 5080 Laptop, WD PC SN740 SDDPNQE-2T00, OLED, 2880x1800, 14"
Acer Predator Helios Neo 14 (2024)
Ultra 9 185H, GeForce RTX 4070 Laptop GPU, SK Hynix PC801 HFS001TEJ9X125N, IPS, 3072x1920, 14.5"
Asus TUF Gaming A14 FA401WV-WB94
Ryzen AI 9 HX 370, GeForce RTX 4060 Laptop GPU, WD PC SN560 SDDPNQE-1T00, IPS, 2560x1600, 14"
HP Omen Transcend 14-fb0014
Ultra 7 155H, GeForce RTX 4060 Laptop GPU, WDC PC SN810 1TB, OLED, 2880x1800, 14"
Lenovo Legion 5 15IRX10 5070
i7-13650HX, GeForce RTX 5070 Laptop, WD PC SN7100S SDFPMSL-1T00-1101, OLED, 2560x1600, 15.1"
Average NVIDIA GeForce RTX 5070 Laptop
 
Average of class Gaming
 
Power Consumption
-15%
-12%
-22%
-23%
-21%
-31%
-47%
-71%
Idle Minimum * (Watt)
9.3
9.3
-0%
6.7
28%
6
35%
9.1
2%
9.1
2%
11.4
-23%
11.5 ?(4.6 - 32, n=22)
-24%
Idle Average * (Watt)
12.2
11.1
9%
8.8
28%
11
10%
15.3
-25%
12.6
-3%
12.8
-5%
16.3 ?(8.1 - 36, n=22)
-34%
Idle Maximum * (Watt)
12.5
11.2
10%
9.3
26%
21
-68%
22.6
-81%
27.4
-119%
13.4
-7%
21.6 ?(10.2 - 47, n=22)
-73%
Load Average * (Watt)
68.4
91.9
-34%
121.5
-78%
93
-36%
72.1
-5%
63.5
7%
103.7
-52%
Cyberpunk 2077 ultra external monitor * (Watt)
132.2
168.6
-28%
155.5
-18%
146.3
-11%
141.7
-7%
171.5
-30%
Cyberpunk 2077 ultra * (Watt)
134
171.5
-28%
157.4
-17%
147.9
-10%
144.7
-8%
171.5
-28%
Load Maximum * (Watt)
145.4
195
-34%
218.1
-50%
252
-73%
198
-36%
135.3
7%
246.8
-70%
Witcher 3 ultra * (Watt)
118.9

* ... smaller is better

Energy consumption Cyberpunk / Stress test

0102030405060708090100110120130140Tooltip
Acer Predator Triton 14 AI PT14-52; 1280x720 Prime95 28.10 and Furmark 1.25: Ø140.5 (131.9-145.4)
Acer Predator Triton 14 AI PT14-52; Idle 150cd/m2: Ø12.9 (11.9-14.4)
Acer Predator Triton 14 AI PT14-52; Cyberpunk 2077 FHD ultra no FSR 150cd: Ø134 (131.9-137.7)

Energy consumption with external monitor

0102030405060708090100110120130Tooltip
Acer Predator Triton 14 AI PT14-52; Prime95 V2810 Stress (external Monitor): Ø63.4 (62.1-66.1)
Acer Predator Triton 14 AI PT14-52; Cinebench R15 Multi (external Monitor): Ø61.8 (61.1-64.3)
Acer Predator Triton 14 AI PT14-52; Cinebench R23 Single (external Monitor): Ø27.6 (25.7-43.8)
Acer Predator Triton 14 AI PT14-52; Cinebench R23 Multi (external Monitor): Ø60.3 (57.8-62.4)
Acer Predator Triton 14 AI PT14-52; 1280x720 FurMark 1.19 GPU Stress Test (external Monitor): Ø135.5 (131.9-139.7)
Acer Predator Triton 14 AI PT14-52; Idle 1min (external Monitor): Ø8.56 (7.93-10.4)
Acer Predator Triton 14 AI PT14-52; Cyberpunk 2077 FHD ultra no FSR (external Monitor): Ø132.2 (130.4-134.2)

Battery life

The 76 Wh-battery enables reasonable runtimes, but the Lunar Lake processor does not really provide an advantage here. With 9 hours in the WLAN test at 150 cd/m² and 6:45 hours at full brightness, the Acer is just ahead of the Razer Blade 14 (72 Wh), but also clearly behind the ROG Zephyrus G14 (73 Wh).

battery-Information on
Charging process
Charging process
Battery Runtime
WiFi Websurfing
9h 01min
WiFi Websurfing max. Brightness
6h 45min
Battery Runtime
WiFi Websurfing
Asus ROG Zephyrus G14 2025 GA403WW
Ryzen AI 9 HX 370, GeForce RTX 5080 Laptop, 73 Wh
10.5 h +17%
Acer Predator Triton 14 AI PT14-52
Core Ultra 9 288V, GeForce RTX 5070 Laptop, 76 Wh
9 h
Razer Blade 14 2025
Ryzen AI 9 365, GeForce RTX 5070 Laptop, 72 Wh
8.9 h -1%
Acer Predator Helios Neo 14 (2024)
Ultra 9 185H, GeForce RTX 4070 Laptop GPU, 76 Wh
8.7 h -3%
HP Omen Transcend 14-fb0014
Ultra 7 155H, GeForce RTX 4060 Laptop GPU, 71 Wh
8.6 h -4%
Asus TUF Gaming A14 FA401WV-WB94
Ryzen AI 9 HX 370, GeForce RTX 4060 Laptop GPU, 73 Wh
7 h -22%
Average of class Gaming
  (1.967 - 14.8, n=126, last 2 years)
6.81 h -24%
Lenovo Legion 5 15IRX10 5070
i7-13650HX, GeForce RTX 5070 Laptop, 80 Wh
4.9 h -46%
WiFi Websurfing max. Brightness
Asus ROG Zephyrus G14 2025 GA403WW
Ryzen AI 9 HX 370, GeForce RTX 5080 Laptop, 73 Wh
7.7 h +13%
Acer Predator Triton 14 AI PT14-52
Core Ultra 9 288V, GeForce RTX 5070 Laptop, 76 Wh
6.8 h
Razer Blade 14 2025
Ryzen AI 9 365, GeForce RTX 5070 Laptop, 72 Wh
6 h -12%
Average of class Gaming
  (2.35 - 8.93, n=37, last 2 years)
5.3 h -22%

Notebookcheck overall rating

Acer Predator Triton 14 AI PT14-52 - 12/28/2025 v8
Andreas Osthoff

Chassis
87 / 98 → 88%
Keyboard
87%
Pointing Device
100%
Connectivity
68 / 80 → 85%
Weight
68 / 10-68 → 100%
Battery
83 / 95 → 88%
Display
71%
Games Performance
87%
Application Performance
86%
Temperature
87 / 95 → 91%
Noise
59 / 90 → 66%
Audio
78%
Camera
32 / 75 → 43%
Average
60%
82%
Gaming - Weighted Average
CO2 Emissions
No Data
Materials
0%
Packaging
50%
Power Use
68.7%
Repairability
40%
Software Updates
22.3%
Recycle Logo Total Sustainability Score: 30.2%

Possible alternatives in comparison

Image
Model / Review
Price
Weight
Height
Display
1.
82.3%
Acer Predator Triton 14 AI PT14-52
Intel Core Ultra 9 288V ⎘
NVIDIA GeForce RTX 5070 Laptop ⎘
32 GB Memory, 1024 GB SSD
Amazon:
1. $2,599.99
acer Predator Triton 14 AI P...
2. $69.99
PowerPortnerLink 330W 280W C...
List Price: 2999€
1.6 kg17.31 mm14.50"
2880x1800
234 PPI
OLED
2.
87.2%
Razer Blade 14 2025
Razer Blade 14 2025
AMD Ryzen AI 9 365 ⎘
NVIDIA GeForce RTX 5070 Laptop ⎘
32 GB Memory, 1024 GB SSD
Amazon:
1. $2,067.90
Razer Blade 14 (2025) Gaming...
2. $2,099.99
Razer Blade 14 (2025) Gaming...
3. $1,799.99
Razer Blade 14 (2025) Gaming...
List Price: 2399€
1.6 kg16.2 mm14.00"
2880x1800
243 PPI
OLED
3.
88.9%
Asus ROG Zephyrus G14 2025 GA403WW
AMD Ryzen AI 9 HX 370 ⎘
NVIDIA GeForce RTX 5080 Laptop ⎘
64 GB Memory, 2048 GB SSD
Amazon:
1. 
JUYOON 240W Laptop Charger C...
2. $52.99
180W AC Charger for Asus ROG...
3. $10.99
KEANBOLL 3 Pack Designed for...
List Price: 3899€
1.6 kg18.3 mm14.00"
2880x1800
243 PPI
OLED
4.
80.5%
Acer Predator Helios Neo 14 (2024)
Intel Core Ultra 9 185H ⎘
NVIDIA GeForce RTX 4070 Laptop GPU ⎘
32 GB Memory, 1024 GB SSD
Amazon: $1,699.00
List Price: 2100 Euro
1.9 kg20.9 mm14.50"
3072x1920
250 PPI
IPS
5.
80.3%
Asus TUF Gaming A14 FA401WV-WB94
AMD Ryzen AI 9 HX 370 ⎘
NVIDIA GeForce RTX 4060 Laptop GPU ⎘
16 GB Memory, 1024 GB SSD
Amazon:
List Price: 1500 USD
1.5 kg19.9 mm14.00"
2560x1600
216 PPI
IPS
6.
88.5% v7 (old)
HP Omen Transcend 14-fb0014
Intel Core Ultra 7 155H ⎘
NVIDIA GeForce RTX 4060 Laptop GPU ⎘
16 GB Memory, 1024 GB SSD
Amazon:
1. $1,549.00
HP OMEN Transcend 14-fb0761n...
2. $1,649.00
HP Omen Transcend 14 Gaming ...
3. $38.99
Replacement Backlit Keyboard...
List Price: 1700 USD
1.6 kg18 mm14.00"
2880x1800
243 PPI
OLED
7.
86.5%
Lenovo Legion 5 15IRX10 5070
Intel Core i7-13650HX ⎘
NVIDIA GeForce RTX 5070 Laptop ⎘
32 GB Memory, 1024 GB SSD
Amazon:
1. $1,668.00
Lenovo Legion 5 15IRX10 15.1...
2. $1,429.99
Lenovo Legion 5 15IAX10 15.1...
3. $1,919.00
Lenovo Legion 5 15IRX10 Gami...
List Price: 1499€
1.9 kg21.5 mm15.10"
2560x1600
200 PPI
OLED

Transparency

The selection of devices to be reviewed is made by our editorial team. The test sample was provided to the author as a loan by the manufacturer or retailer for the purpose of this review. The lender had no influence on this review, nor did the manufacturer receive a copy of this review before publication. There was no obligation to publish this review. As an independent media company, Notebookcheck is not subjected to the authority of manufacturers, retailers or publishers.

This is how Notebookcheck is testing

Every year, Notebookcheck independently reviews hundreds of laptops and smartphones using standardized procedures to ensure that all results are comparable. We have continuously developed our test methods for around 20 years and set industry standards in the process. In our test labs, high-quality measuring equipment is utilized by experienced technicians and editors. These tests involve a multi-stage validation process. Our complex rating system is based on hundreds of well-founded measurements and benchmarks, which maintains objectivity. Further information on our test methods can be found here.

No comments for this article

Got questions or something to add to our article? Even without registering you can post in the comments!
No comments for this article / reply

static version load dynamic
Loading Comments
Comment on this article
Please share our article, every link counts!
Mail Logo
Google Logo Add as a preferred
source on Google
> Expert Reviews and News on Laptops, Smartphones and Tech Innovations > Reviews > Slim OLED gamer with RTX 5070 and Lunar Lake - Acer Predator Triton 14 AI review
Andreas Osthoff, 2025-12-30 (Update: 2025-12-30)