
Verdict - Legion 5 15 with an excellent price-to-performance ratio
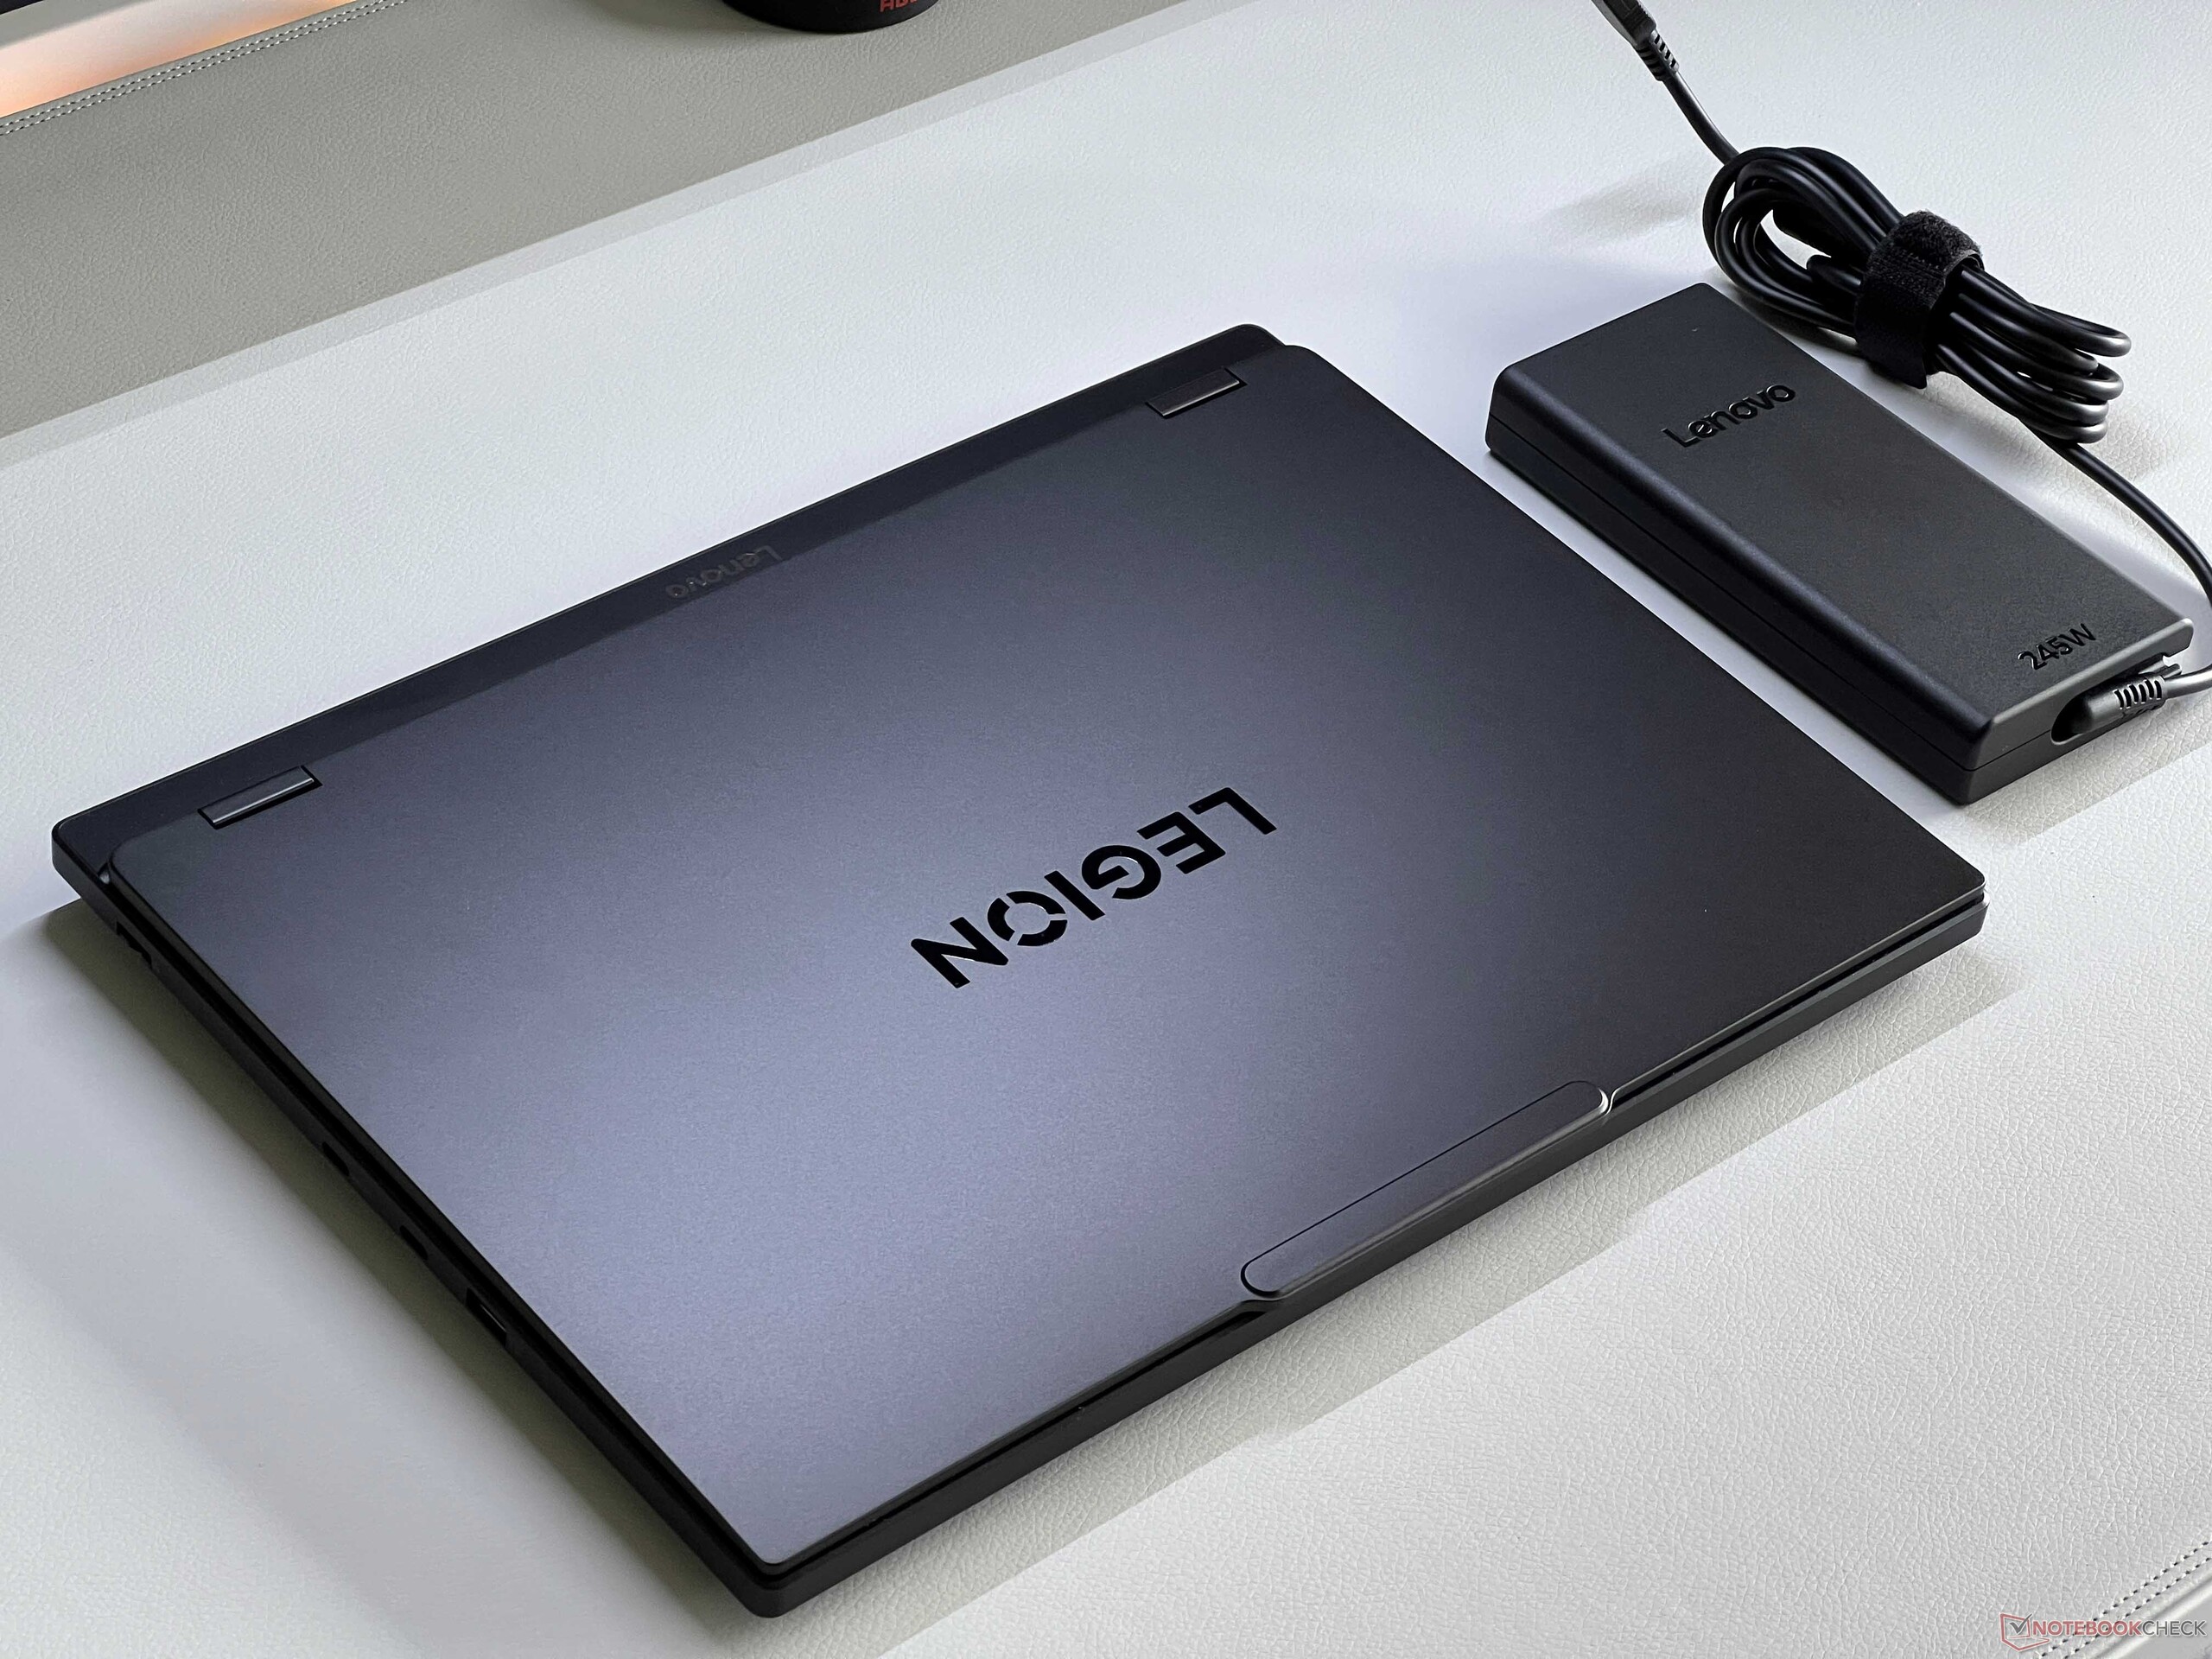
The Lenovo Legion 5 15, featuring the Intel Core i7-13650HX and GeForce RTX 5070, once again delivers an outstanding all-around package and stands as one of the most affordable RTX 5070 gaming laptops at €1,499. Its gaming performance is on par with the more expensive Legion 5 Pro 16. Combined with an excellent OLED display boasting a 165 Hz refresh rate and impressive brightness, gaming becomes an absolute pleasure. Thanks to the pre-installed color profiles, even demanding photo and video editing can be done with highly accurate colors.
The Intel Core i7-13650HX draws significantly more power than the Ryzen 7 260 but doesn’t deliver much additional performance. This also leads to noticeably shorter battery life. The Intel model lacks USB 4.0 support, and Advanced Optimus isn’t available, though that’s not a major drawback since a MUX switch is included.
Naturally, there are a few smaller drawbacks, such as the loud fans during gaming sessions - although competitors often perform even worse in this area. Overall, though, there’s little to complain about. The Legion 5 15 remains an excellent gaming laptop through and through.
Pros
Cons
Price and availability
At the time of writing, the Lenovo Legion 5 15IRX10, featuring the RTX 5070 and Core i9-14900HX, is available on Amazon for $1,849.
- $1,996.00Lenovo Legion 5 15IRX10 15.1" WQXGA OLED, Gaming Laptop, Intel Core i9 14th Gen 14900HX 1.6GHz; NVIDIA GeForce RTX 5070 8GB GDDR7; 32GB DDR5 RAM; 1TB NVMe M.2 SSD; Gigabit LAN, 2x2 WiFi 7
- $1,999.99Lenovo Legion 5i Gen 10 Gaming Laptop, Intel Ultra 7-255HX, 16 GB DDR5 RAM, 1 TB PCIe SSD, 15.1" WQXGA (2560x1600) Display, Nvidia G-Force RTX 5070, 24-Zone RGB Keyboard, W11 Home, Eclipse Black
- $2,499.00Lenovo Legion 5 15IRX10 Gaming Laptop 2025 15.1” WQXGA 2560x1600 Display165 Hertz Intel Core i9-14900HX GeForce RTX 5070 8G GDDR7 32GB DDR5 4TB SSD 24-Zone RGB Backlit KB Wi-Fi 7 Windows 11 Pro
We have already conducted an extensive review of the Lenovo Legion 5 15 with the AMD Ryzen 7 260 and the RTX 5060 Laptop GPU. Now, let’s take a look at the variant featuring the Intel Core i7-13650HX paired with the mobile RTX 5070. In this article, we focus primarily on performance; for all other details about the chassis and OLED display, please refer to our review of the AMD model.
Specifications
Differences from the AMD model
Compared to the identical AMD model, from which the following images are also taken, there is only one difference in terms of features: the Intel model does not have USB 4.0.


Performance - Raptor Lake & RTX 5070
Test conditions
We conducted the following benchmarks and measurements in Performance mode. When running on battery power, the highest available setting is Auto mode.
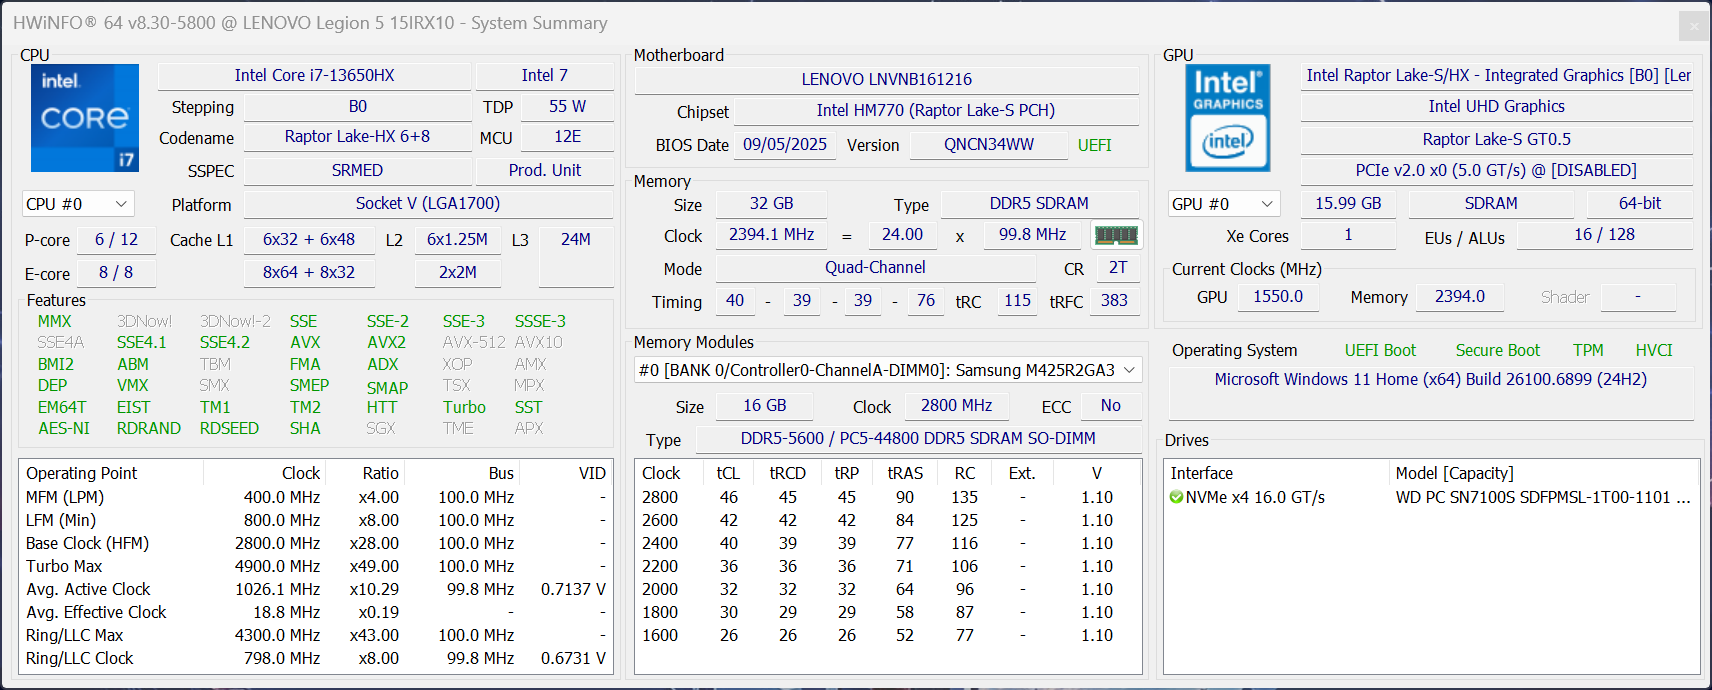
Processor
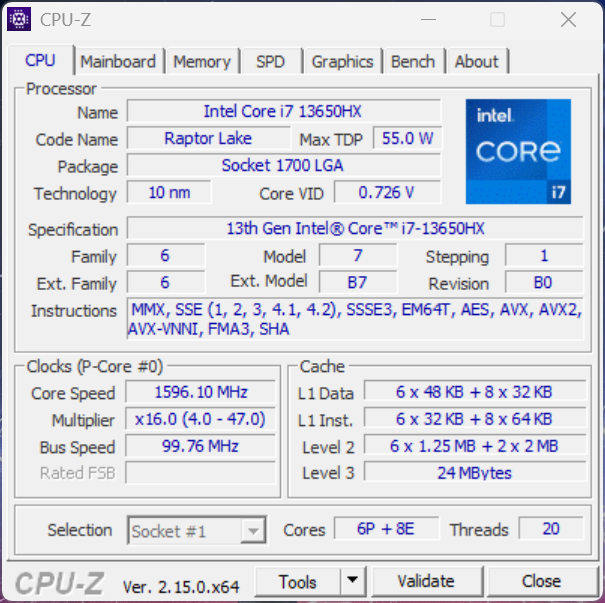
The Intel Core i7-13650HX (Raptor Lake) serves as the processor, with power limits of 140 and 95 watts - significantly higher than those of the AMD version. Overall, however, CPU performance is only slightly better than the Zen 4 chip. In battery mode, CPU performance drops by about 40%.
Cinebench R15 Multi endurance test
Cinebench R23: Multi Core | Single Core
Cinebench R20: CPU (Multi Core) | CPU (Single Core)
Cinebench R15: CPU Multi 64Bit | CPU Single 64Bit
Blender: v2.79 BMW27 CPU
7-Zip 18.03: 7z b 4 | 7z b 4 -mmt1
Geekbench 6.7: Multi-Core | Single-Core
Geekbench 5.5: Multi-Core | Single-Core
HWBOT x265 Benchmark v2.2: 4k Preset
LibreOffice : 20 Documents To PDF
R Benchmark 2.5: Overall mean
| CPU Performance rating | |
| Lenovo Legion Pro 5 16IAX10, RTX 5070 | |
| Average of class Gaming | |
| Lenovo Legion 5 15IRX10 5070 | |
| Average Intel Core i7-13650HX | |
| Lenovo Legion 5 15AHP G10 | |
| Schenker XMG Core 15 (M25) | |
| Asus TUF Gaming A16 FA608UP | |
| MSI Katana A15 AI B8VG | |
| Cinebench R23 / Multi Core | |
| Lenovo Legion Pro 5 16IAX10, RTX 5070 | |
| Average of class Gaming (10488 - 42661, n=107, last 2 years) | |
| Lenovo Legion 5 15IRX10 5070 | |
| Average Intel Core i7-13650HX (18744 - 21006, n=6) | |
| Lenovo Legion 5 15AHP G10 | |
| Asus TUF Gaming A16 FA608UP | |
| MSI Katana A15 AI B8VG | |
| Schenker XMG Core 15 (M25) | |
| Cinebench R23 / Single Core | |
| Lenovo Legion Pro 5 16IAX10, RTX 5070 | |
| Average of class Gaming (1166 - 2415, n=107, last 2 years) | |
| Schenker XMG Core 15 (M25) | |
| Lenovo Legion 5 15IRX10 5070 | |
| Average Intel Core i7-13650HX (1693 - 1903, n=6) | |
| Lenovo Legion 5 15AHP G10 | |
| Asus TUF Gaming A16 FA608UP | |
| MSI Katana A15 AI B8VG | |
| Cinebench R20 / CPU (Multi Core) | |
| Lenovo Legion Pro 5 16IAX10, RTX 5070 | |
| Average of class Gaming (4029 - 16433, n=106, last 2 years) | |
| Lenovo Legion 5 15IRX10 5070 | |
| Average Intel Core i7-13650HX (7197 - 8021, n=5) | |
| Lenovo Legion 5 15AHP G10 | |
| Asus TUF Gaming A16 FA608UP | |
| MSI Katana A15 AI B8VG | |
| Schenker XMG Core 15 (M25) | |
| Cinebench R20 / CPU (Single Core) | |
| Lenovo Legion Pro 5 16IAX10, RTX 5070 | |
| Average of class Gaming (442 - 913, n=106, last 2 years) | |
| Schenker XMG Core 15 (M25) | |
| Lenovo Legion 5 15IRX10 5070 | |
| Average Intel Core i7-13650HX (700 - 728, n=5) | |
| Lenovo Legion 5 15AHP G10 | |
| Asus TUF Gaming A16 FA608UP | |
| MSI Katana A15 AI B8VG | |
| Cinebench R15 / CPU Multi 64Bit | |
| Lenovo Legion Pro 5 16IAX10, RTX 5070 | |
| Average of class Gaming (1578 - 6330, n=105, last 2 years) | |
| Lenovo Legion 5 15IRX10 5070 | |
| Average Intel Core i7-13650HX (2864 - 3147, n=5) | |
| Lenovo Legion 5 15AHP G10 | |
| Asus TUF Gaming A16 FA608UP | |
| Schenker XMG Core 15 (M25) | |
| MSI Katana A15 AI B8VG | |
| Cinebench R15 / CPU Single 64Bit | |
| Lenovo Legion Pro 5 16IAX10, RTX 5070 | |
| Schenker XMG Core 15 (M25) | |
| Average of class Gaming (188.8 - 350, n=106, last 2 years) | |
| Lenovo Legion 5 15AHP G10 | |
| Asus TUF Gaming A16 FA608UP | |
| Lenovo Legion 5 15IRX10 5070 | |
| Average Intel Core i7-13650HX (256 - 275, n=5) | |
| MSI Katana A15 AI B8VG | |
| Blender / v2.79 BMW27 CPU | |
| MSI Katana A15 AI B8VG | |
| Lenovo Legion 5 15AHP G10 | |
| Asus TUF Gaming A16 FA608UP | |
| Schenker XMG Core 15 (M25) | |
| Average Intel Core i7-13650HX (158 - 226, n=5) | |
| Lenovo Legion 5 15IRX10 5070 | |
| Average of class Gaming (79 - 330, n=104, last 2 years) | |
| Lenovo Legion Pro 5 16IAX10, RTX 5070 | |
| 7-Zip 18.03 / 7z b 4 | |
| Lenovo Legion Pro 5 16IAX10, RTX 5070 | |
| Average of class Gaming (33491 - 148086, n=105, last 2 years) | |
| Lenovo Legion 5 15IRX10 5070 | |
| Average Intel Core i7-13650HX (73927 - 80057, n=5) | |
| Lenovo Legion 5 15AHP G10 | |
| Asus TUF Gaming A16 FA608UP | |
| MSI Katana A15 AI B8VG | |
| Schenker XMG Core 15 (M25) | |
| 7-Zip 18.03 / 7z b 4 -mmt1 | |
| Lenovo Legion Pro 5 16IAX10, RTX 5070 | |
| MSI Katana A15 AI B8VG | |
| Lenovo Legion 5 15AHP G10 | |
| Average of class Gaming (4199 - 7436, n=105, last 2 years) | |
| Schenker XMG Core 15 (M25) | |
| Asus TUF Gaming A16 FA608UP | |
| Lenovo Legion 5 15IRX10 5070 | |
| Average Intel Core i7-13650HX (5828 - 6125, n=5) | |
| Geekbench 6.7 / Multi-Core | |
| Lenovo Legion Pro 5 16IAX10, RTX 5070 | |
| Average of class Gaming (6625 - 22850, n=106, last 2 years) | |
| Lenovo Legion 5 15IRX10 5070 | |
| Schenker XMG Core 15 (M25) | |
| Average Intel Core i7-13650HX (13554 - 14378, n=3) | |
| Lenovo Legion 5 15AHP G10 | |
| Asus TUF Gaming A16 FA608UP | |
| MSI Katana A15 AI B8VG | |
| Geekbench 6.7 / Single-Core | |
| Lenovo Legion Pro 5 16IAX10, RTX 5070 | |
| Schenker XMG Core 15 (M25) | |
| Average of class Gaming (1490 - 3259, n=106, last 2 years) | |
| Lenovo Legion 5 15AHP G10 | |
| Asus TUF Gaming A16 FA608UP | |
| Lenovo Legion 5 15IRX10 5070 | |
| Average Intel Core i7-13650HX (2505 - 2595, n=3) | |
| MSI Katana A15 AI B8VG | |
| Geekbench 5.5 / Multi-Core | |
| Lenovo Legion Pro 5 16IAX10, RTX 5070 | |
| Average of class Gaming (6460 - 28263, n=105, last 2 years) | |
| Lenovo Legion 5 15IRX10 5070 | |
| Average Intel Core i7-13650HX (12509 - 14778, n=5) | |
| Schenker XMG Core 15 (M25) | |
| Lenovo Legion 5 15AHP G10 | |
| Asus TUF Gaming A16 FA608UP | |
| MSI Katana A15 AI B8VG | |
| Geekbench 5.5 / Single-Core | |
| Lenovo Legion Pro 5 16IAX10, RTX 5070 | |
| Schenker XMG Core 15 (M25) | |
| Average of class Gaming (986 - 2474, n=105, last 2 years) | |
| Lenovo Legion 5 15AHP G10 | |
| Asus TUF Gaming A16 FA608UP | |
| MSI Katana A15 AI B8VG | |
| Lenovo Legion 5 15IRX10 5070 | |
| Average Intel Core i7-13650HX (1810 - 1866, n=5) | |
| HWBOT x265 Benchmark v2.2 / 4k Preset | |
| Lenovo Legion Pro 5 16IAX10, RTX 5070 | |
| Average of class Gaming (11.5 - 44.4, n=105, last 2 years) | |
| Schenker XMG Core 15 (M25) | |
| Lenovo Legion 5 15AHP G10 | |
| Lenovo Legion 5 15IRX10 5070 | |
| Asus TUF Gaming A16 FA608UP | |
| Average Intel Core i7-13650HX (18.9 - 23.6, n=5) | |
| MSI Katana A15 AI B8VG | |
| LibreOffice / 20 Documents To PDF | |
| Schenker XMG Core 15 (M25) | |
| Asus TUF Gaming A16 FA608UP | |
| MSI Katana A15 AI B8VG | |
| Average of class Gaming (33.2 - 88.8, n=105, last 2 years) | |
| Lenovo Legion 5 15AHP G10 | |
| Average Intel Core i7-13650HX (38.9 - 58.8, n=5) | |
| Lenovo Legion Pro 5 16IAX10, RTX 5070 | |
| Lenovo Legion 5 15IRX10 5070 | |
| R Benchmark 2.5 / Overall mean | |
| Asus TUF Gaming A16 FA608UP | |
| Lenovo Legion 5 15IRX10 5070 | |
| Lenovo Legion 5 15AHP G10 | |
| MSI Katana A15 AI B8VG | |
| Average Intel Core i7-13650HX (0.4217 - 0.4461, n=6) | |
| Average of class Gaming (0.3439 - 0.759, n=106, last 2 years) | |
| Lenovo Legion Pro 5 16IAX10, RTX 5070 | |
| Schenker XMG Core 15 (M25) | |
* ... smaller is better
AIDA64: FP32 Ray-Trace | FPU Julia | CPU SHA3 | CPU Queen | FPU SinJulia | FPU Mandel | CPU AES | CPU ZLib | FP64 Ray-Trace | CPU PhotoWorxx
| Performance rating | |
| Lenovo Legion Pro 5 16IAX10, RTX 5070 | |
| Average of class Gaming | |
| Lenovo Legion 5 15AHP G10 | |
| Asus TUF Gaming A16 FA608UP | |
| MSI Katana A15 AI B8VG | |
| Schenker XMG Core 15 (M25) | |
| Lenovo Legion 5 15IRX10 5070 | |
| Average Intel Core i7-13650HX | |
| AIDA64 / FP32 Ray-Trace | |
| Lenovo Legion Pro 5 16IAX10, RTX 5070 | |
| Average of class Gaming (10227 - 85542, n=105, last 2 years) | |
| Lenovo Legion 5 15AHP G10 | |
| Asus TUF Gaming A16 FA608UP | |
| Schenker XMG Core 15 (M25) | |
| MSI Katana A15 AI B8VG | |
| Lenovo Legion 5 15IRX10 5070 | |
| Average Intel Core i7-13650HX (13404 - 20012, n=5) | |
| AIDA64 / FPU Julia | |
| Lenovo Legion Pro 5 16IAX10, RTX 5070 | |
| Average of class Gaming (51376 - 238426, n=105, last 2 years) | |
| Lenovo Legion 5 15AHP G10 | |
| Asus TUF Gaming A16 FA608UP | |
| MSI Katana A15 AI B8VG | |
| Schenker XMG Core 15 (M25) | |
| Lenovo Legion 5 15IRX10 5070 | |
| Average Intel Core i7-13650HX (68241 - 97317, n=5) | |
| AIDA64 / CPU SHA3 | |
| Lenovo Legion Pro 5 16IAX10, RTX 5070 | |
| Average of class Gaming (2180 - 10115, n=105, last 2 years) | |
| Asus TUF Gaming A16 FA608UP | |
| Lenovo Legion 5 15AHP G10 | |
| MSI Katana A15 AI B8VG | |
| Schenker XMG Core 15 (M25) | |
| Lenovo Legion 5 15IRX10 5070 | |
| Average Intel Core i7-13650HX (3127 - 4487, n=5) | |
| AIDA64 / CPU Queen | |
| Lenovo Legion Pro 5 16IAX10, RTX 5070 | |
| Lenovo Legion 5 15AHP G10 | |
| MSI Katana A15 AI B8VG | |
| Asus TUF Gaming A16 FA608UP | |
| Average of class Gaming (49785 - 173351, n=90, last 2 years) | |
| Lenovo Legion 5 15IRX10 5070 | |
| Average Intel Core i7-13650HX (108627 - 110589, n=5) | |
| Schenker XMG Core 15 (M25) | |
| AIDA64 / FPU SinJulia | |
| Lenovo Legion 5 15AHP G10 | |
| MSI Katana A15 AI B8VG | |
| Asus TUF Gaming A16 FA608UP | |
| Average of class Gaming (4424 - 33636, n=105, last 2 years) | |
| Schenker XMG Core 15 (M25) | |
| Lenovo Legion Pro 5 16IAX10, RTX 5070 | |
| Lenovo Legion 5 15IRX10 5070 | |
| Average Intel Core i7-13650HX (9134 - 10887, n=5) | |
| AIDA64 / FPU Mandel | |
| Lenovo Legion Pro 5 16IAX10, RTX 5070 | |
| Average of class Gaming (25115 - 128721, n=105, last 2 years) | |
| Lenovo Legion 5 15AHP G10 | |
| Asus TUF Gaming A16 FA608UP | |
| MSI Katana A15 AI B8VG | |
| Schenker XMG Core 15 (M25) | |
| Lenovo Legion 5 15IRX10 5070 | |
| Average Intel Core i7-13650HX (33391 - 48323, n=5) | |
| AIDA64 / CPU AES | |
| Lenovo Legion Pro 5 16IAX10, RTX 5070 | |
| Average of class Gaming (39258 - 247074, n=105, last 2 years) | |
| Asus TUF Gaming A16 FA608UP | |
| Schenker XMG Core 15 (M25) | |
| MSI Katana A15 AI B8VG | |
| Lenovo Legion 5 15IRX10 5070 | |
| Average Intel Core i7-13650HX (64436 - 85343, n=5) | |
| Lenovo Legion 5 15AHP G10 | |
| AIDA64 / CPU ZLib | |
| Lenovo Legion Pro 5 16IAX10, RTX 5070 | |
| Average of class Gaming (574 - 2531, n=105, last 2 years) | |
| Lenovo Legion 5 15IRX10 5070 | |
| Average Intel Core i7-13650HX (1136 - 1285, n=5) | |
| Schenker XMG Core 15 (M25) | |
| Lenovo Legion 5 15AHP G10 | |
| MSI Katana A15 AI B8VG | |
| Asus TUF Gaming A16 FA608UP | |
| AIDA64 / FP64 Ray-Trace | |
| Lenovo Legion Pro 5 16IAX10, RTX 5070 | |
| Average of class Gaming (5509 - 45446, n=105, last 2 years) | |
| Lenovo Legion 5 15AHP G10 | |
| Asus TUF Gaming A16 FA608UP | |
| Schenker XMG Core 15 (M25) | |
| MSI Katana A15 AI B8VG | |
| Lenovo Legion 5 15IRX10 5070 | |
| Average Intel Core i7-13650HX (7270 - 10900, n=5) | |
| AIDA64 / CPU PhotoWorxx | |
| Lenovo Legion Pro 5 16IAX10, RTX 5070 | |
| Schenker XMG Core 15 (M25) | |
| Average of class Gaming (12271 - 89891, n=105, last 2 years) | |
| Lenovo Legion 5 15IRX10 5070 | |
| Lenovo Legion 5 15AHP G10 | |
| Asus TUF Gaming A16 FA608UP | |
| Average Intel Core i7-13650HX (36170 - 43289, n=5) | |
| MSI Katana A15 AI B8VG | |
System performance
The Legion is a very fast machine, and we encountered no stability issues during testing.
PCMark 10: Score | Essentials | Productivity | Digital Content Creation
CrossMark: Overall | Productivity | Creativity | Responsiveness
WebXPRT 3: Overall
WebXPRT 4: Overall
Mozilla Kraken 1.1: Total
| Performance rating | |
| Lenovo Legion Pro 5 16IAX10, RTX 5070 | |
| Average of class Gaming | |
| Lenovo Legion 5 15AHP G10 | |
| Lenovo Legion 5 15IRX10 5070 | |
| Average Intel Core i7-13650HX, NVIDIA GeForce RTX 5070 Laptop | |
| Schenker XMG Core 15 (M25) -3! | |
| Asus TUF Gaming A16 FA608UP -4! | |
| MSI Katana A15 AI B8VG -4! | |
| PCMark 10 / Score | |
| Lenovo Legion Pro 5 16IAX10, RTX 5070 | |
| Average of class Gaming (5828 - 12414, n=93, last 2 years) | |
| Lenovo Legion 5 15AHP G10 | |
| MSI Katana A15 AI B8VG | |
| Lenovo Legion 5 15IRX10 5070 | |
| Average Intel Core i7-13650HX, NVIDIA GeForce RTX 5070 Laptop (n=1) | |
| PCMark 10 / Essentials | |
| Lenovo Legion Pro 5 16IAX10, RTX 5070 | |
| Lenovo Legion 5 15AHP G10 | |
| Schenker XMG Core 15 (M25) | |
| Average of class Gaming (8810 - 11935, n=97, last 2 years) | |
| Lenovo Legion 5 15IRX10 5070 | |
| Average Intel Core i7-13650HX, NVIDIA GeForce RTX 5070 Laptop (n=1) | |
| MSI Katana A15 AI B8VG | |
| PCMark 10 / Productivity | |
| Average of class Gaming (6845 - 25323, n=95, last 2 years) | |
| Lenovo Legion 5 15AHP G10 | |
| Lenovo Legion Pro 5 16IAX10, RTX 5070 | |
| MSI Katana A15 AI B8VG | |
| Lenovo Legion 5 15IRX10 5070 | |
| Average Intel Core i7-13650HX, NVIDIA GeForce RTX 5070 Laptop (n=1) | |
| PCMark 10 / Digital Content Creation | |
| Lenovo Legion Pro 5 16IAX10, RTX 5070 | |
| Average of class Gaming (7602 - 19954, n=95, last 2 years) | |
| Lenovo Legion 5 15AHP G10 | |
| Lenovo Legion 5 15IRX10 5070 | |
| Average Intel Core i7-13650HX, NVIDIA GeForce RTX 5070 Laptop (n=1) | |
| MSI Katana A15 AI B8VG | |
| CrossMark / Overall | |
| Lenovo Legion Pro 5 16IAX10, RTX 5070 | |
| Average of class Gaming (1366 - 2409, n=94, last 2 years) | |
| Lenovo Legion 5 15IRX10 5070 | |
| Average Intel Core i7-13650HX, NVIDIA GeForce RTX 5070 Laptop (n=1) | |
| Lenovo Legion 5 15AHP G10 | |
| Schenker XMG Core 15 (M25) | |
| Asus TUF Gaming A16 FA608UP | |
| CrossMark / Productivity | |
| Lenovo Legion Pro 5 16IAX10, RTX 5070 | |
| Average of class Gaming (1386 - 2254, n=94, last 2 years) | |
| Lenovo Legion 5 15IRX10 5070 | |
| Average Intel Core i7-13650HX, NVIDIA GeForce RTX 5070 Laptop (n=1) | |
| Lenovo Legion 5 15AHP G10 | |
| Asus TUF Gaming A16 FA608UP | |
| Schenker XMG Core 15 (M25) | |
| CrossMark / Creativity | |
| Lenovo Legion Pro 5 16IAX10, RTX 5070 | |
| Average of class Gaming (1343 - 2786, n=94, last 2 years) | |
| Lenovo Legion 5 15IRX10 5070 | |
| Average Intel Core i7-13650HX, NVIDIA GeForce RTX 5070 Laptop (n=1) | |
| Lenovo Legion 5 15AHP G10 | |
| Schenker XMG Core 15 (M25) | |
| Asus TUF Gaming A16 FA608UP | |
| CrossMark / Responsiveness | |
| Lenovo Legion Pro 5 16IAX10, RTX 5070 | |
| Average of class Gaming (1226 - 2334, n=94, last 2 years) | |
| Lenovo Legion 5 15IRX10 5070 | |
| Average Intel Core i7-13650HX, NVIDIA GeForce RTX 5070 Laptop (n=1) | |
| Lenovo Legion 5 15AHP G10 | |
| Schenker XMG Core 15 (M25) | |
| Asus TUF Gaming A16 FA608UP | |
| WebXPRT 3 / Overall | |
| Lenovo Legion Pro 5 16IAX10, RTX 5070 | |
| Average of class Gaming (220 - 532, n=98, last 2 years) | |
| Lenovo Legion 5 15AHP G10 | |
| Asus TUF Gaming A16 FA608UP | |
| Lenovo Legion 5 15IRX10 5070 | |
| Average Intel Core i7-13650HX, NVIDIA GeForce RTX 5070 Laptop (n=1) | |
| MSI Katana A15 AI B8VG | |
| Schenker XMG Core 15 (M25) | |
| WebXPRT 4 / Overall | |
| Lenovo Legion Pro 5 16IAX10, RTX 5070 | |
| Average of class Gaming (165 - 354, n=98, last 2 years) | |
| Lenovo Legion 5 15IRX10 5070 | |
| Average Intel Core i7-13650HX, NVIDIA GeForce RTX 5070 Laptop (n=1) | |
| Lenovo Legion 5 15AHP G10 | |
| Asus TUF Gaming A16 FA608UP | |
| MSI Katana A15 AI B8VG | |
| Schenker XMG Core 15 (M25) | |
| Mozilla Kraken 1.1 / Total | |
| MSI Katana A15 AI B8VG | |
| MSI Katana A15 AI B8VG | |
| Asus TUF Gaming A16 FA608UP | |
| Lenovo Legion 5 15IRX10 5070 | |
| Average Intel Core i7-13650HX, NVIDIA GeForce RTX 5070 Laptop (n=1) | |
| Lenovo Legion 5 15AHP G10 | |
| Average of class Gaming (391 - 590, n=100, last 2 years) | |
| Schenker XMG Core 15 (M25) | |
| Lenovo Legion Pro 5 16IAX10, RTX 5070 | |
* ... smaller is better
| PCMark 10 Score | 7187 points | |
Help | ||
| AIDA64 / Memory Copy | |
| Lenovo Legion Pro 5 16IAX10, RTX 5070 | |
| Schenker XMG Core 15 (M25) | |
| Average of class Gaming (21750 - 129946, n=105, last 2 years) | |
| Lenovo Legion 5 15AHP G10 | |
| Asus TUF Gaming A16 FA608UP | |
| Lenovo Legion 5 15IRX10 5070 | |
| MSI Katana A15 AI B8VG | |
| Average Intel Core i7-13650HX (59266 - 66372, n=5) | |
| AIDA64 / Memory Read | |
| Lenovo Legion Pro 5 16IAX10, RTX 5070 | |
| Average of class Gaming (22956 - 118858, n=105, last 2 years) | |
| Lenovo Legion 5 15IRX10 5070 | |
| Average Intel Core i7-13650HX (67305 - 71022, n=5) | |
| Schenker XMG Core 15 (M25) | |
| MSI Katana A15 AI B8VG | |
| Asus TUF Gaming A16 FA608UP | |
| Lenovo Legion 5 15AHP G10 | |
| AIDA64 / Memory Write | |
| Lenovo Legion 5 15AHP G10 | |
| Asus TUF Gaming A16 FA608UP | |
| Lenovo Legion Pro 5 16IAX10, RTX 5070 | |
| Schenker XMG Core 15 (M25) | |
| MSI Katana A15 AI B8VG | |
| Average of class Gaming (22297 - 135096, n=105, last 2 years) | |
| Lenovo Legion 5 15IRX10 5070 | |
| Average Intel Core i7-13650HX (58028 - 68225, n=5) | |
| AIDA64 / Memory Latency | |
| Average of class Gaming (75.3 - 259, n=105, last 2 years) | |
| Lenovo Legion Pro 5 16IAX10, RTX 5070 | |
| Asus TUF Gaming A16 FA608UP | |
| Lenovo Legion 5 15AHP G10 | |
| MSI Katana A15 AI B8VG | |
| Schenker XMG Core 15 (M25) | |
| Average Intel Core i7-13650HX (83.7 - 90.8, n=5) | |
| Lenovo Legion 5 15IRX10 5070 | |
* ... smaller is better
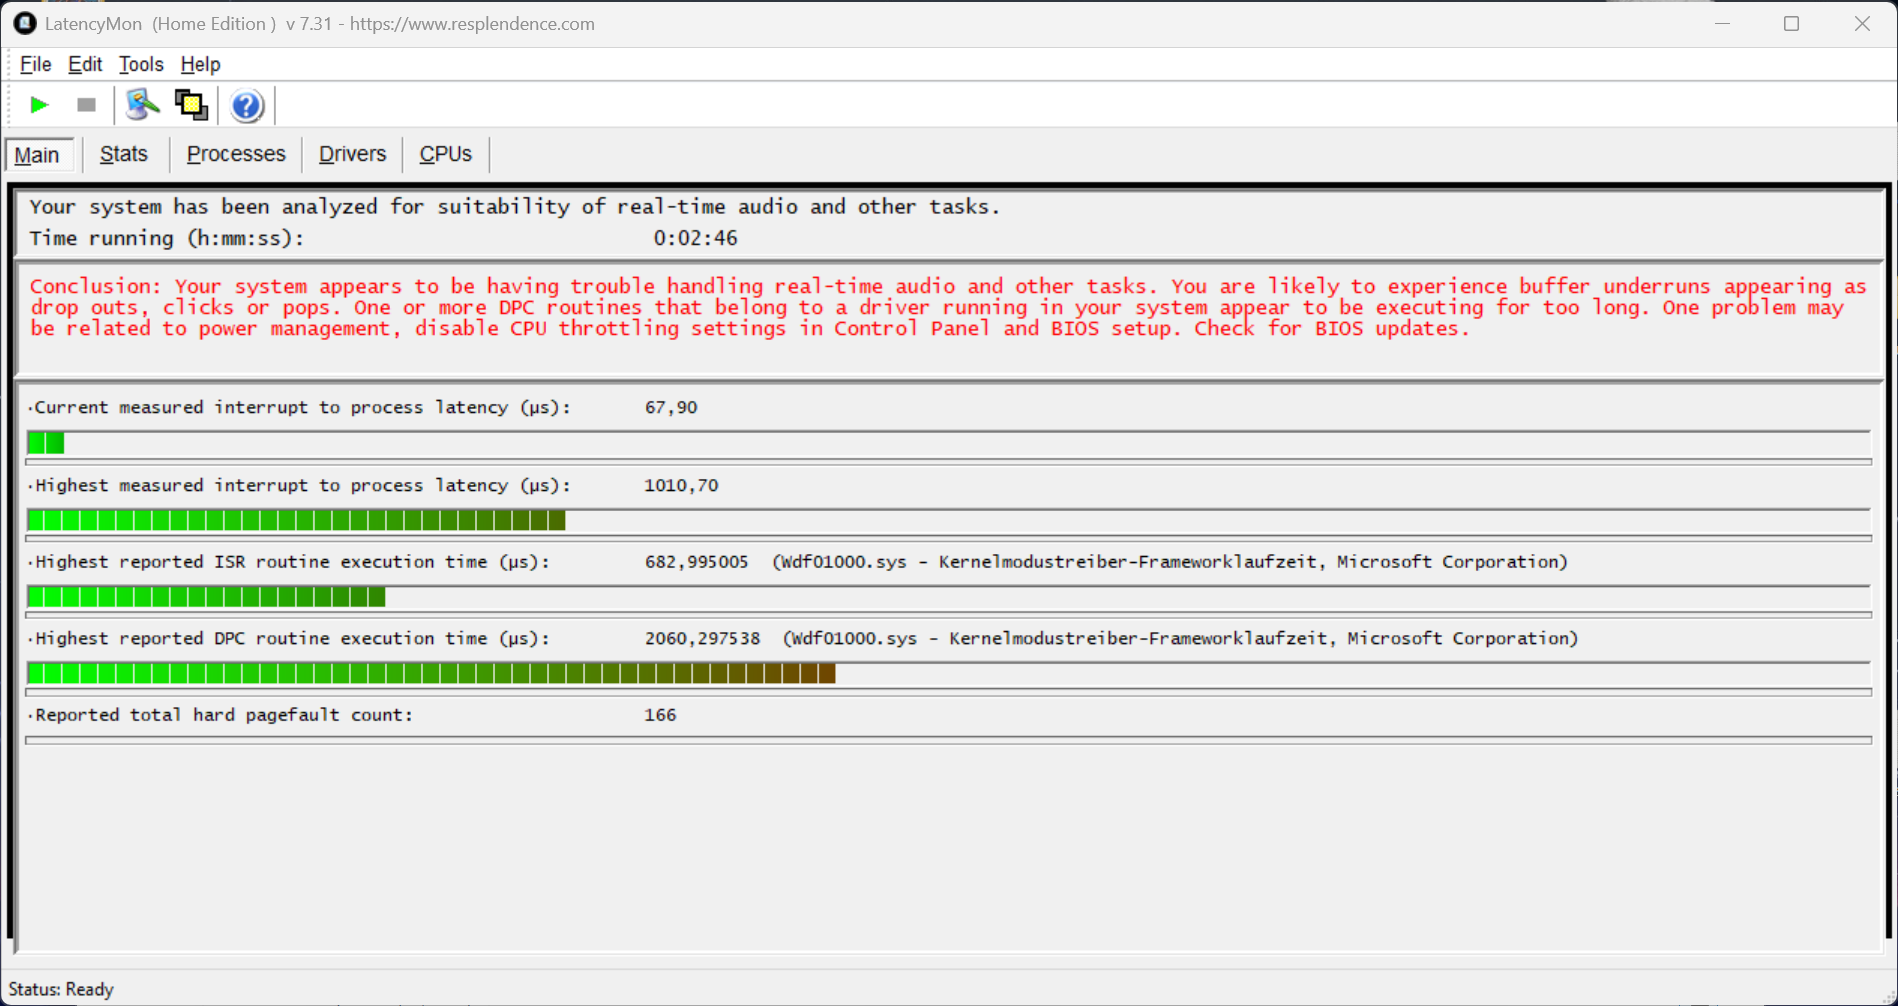
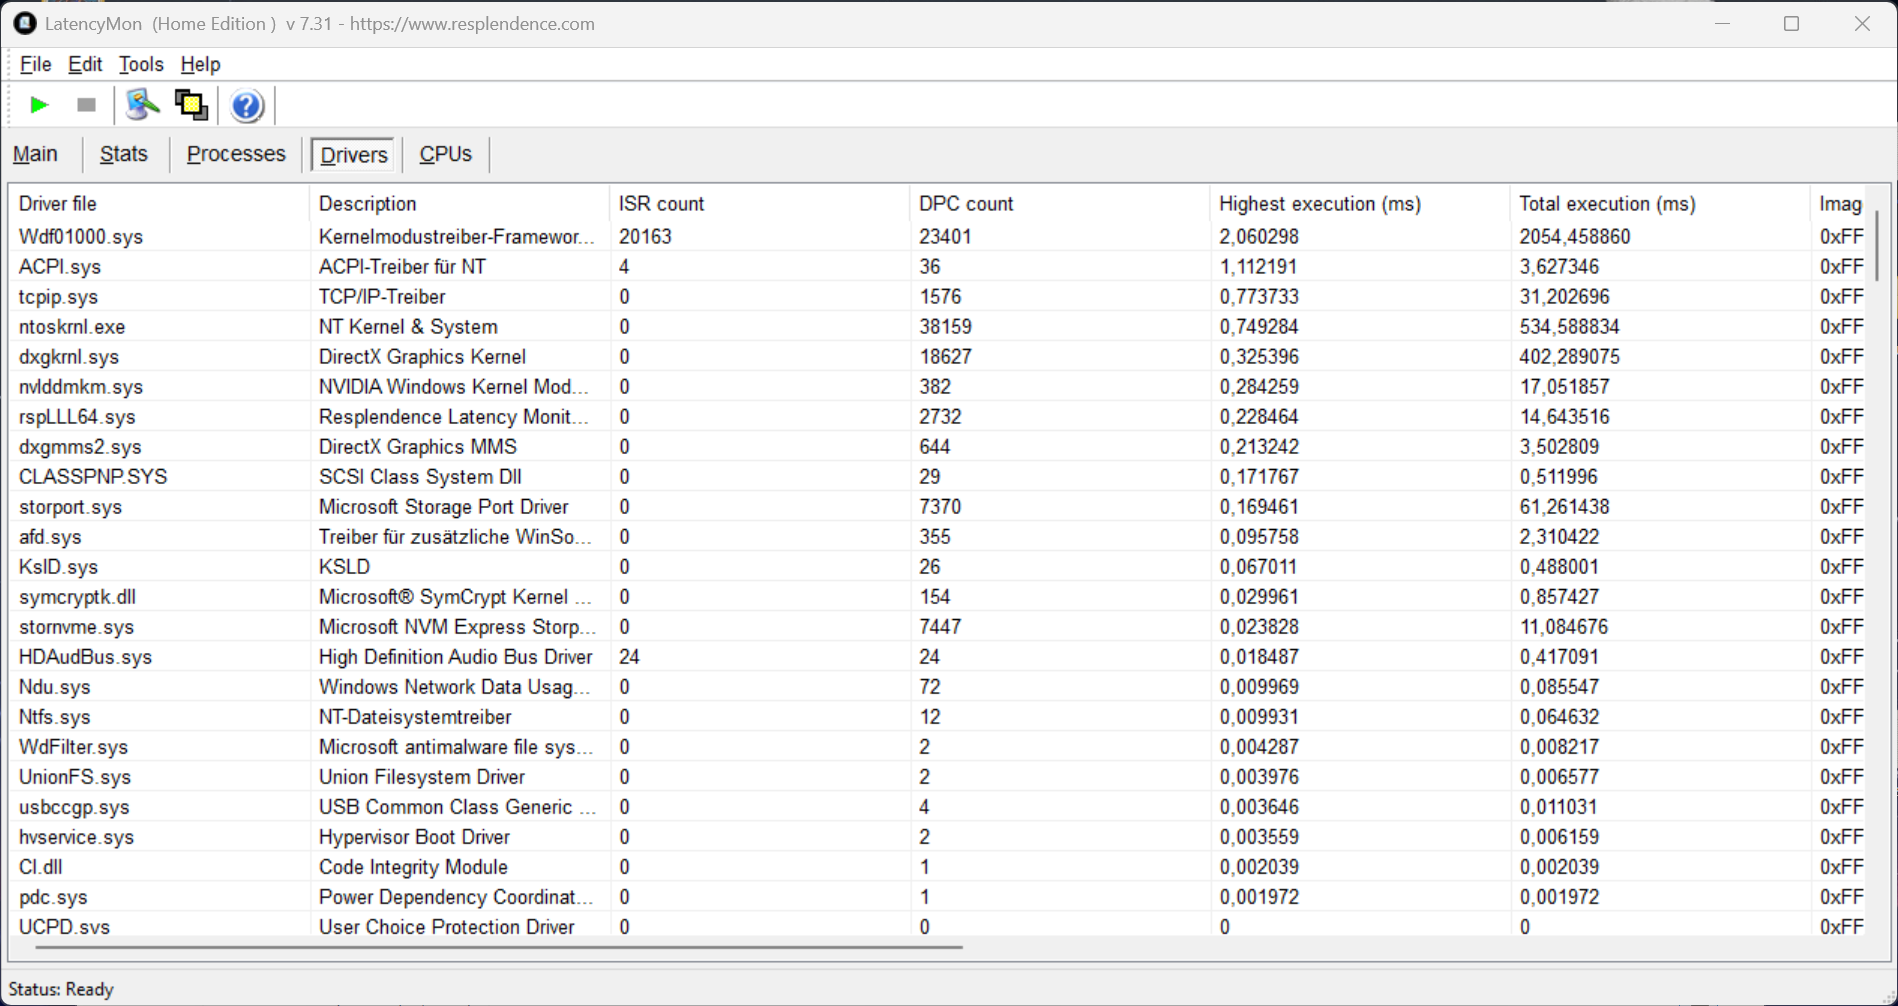
DPC latencies
In our standardized latency test, the Intel model with the current BIOS version shows minor limitations when running real-time audio applications.
| DPC Latencies / LatencyMon - interrupt to process latency (max), Web, Youtube, Prime95 | |
| MSI Katana A15 AI B8VG | |
| Lenovo Legion 5 15AHP G10 | |
| Lenovo Legion 5 15IRX10 5070 | |
| Schenker XMG Core 15 (M25) | |
| Lenovo Legion Pro 5 16IAX10, RTX 5070 | |
| Asus TUF Gaming A16 FA608UP | |
* ... smaller is better
Mass storage
The 1 TB M.2-2242 SSD from Western Digital (with 873 GB available) delivers good, consistent transfer speeds. A full-size M.2-2280 slot is also available for storage expansion.

* ... smaller is better
Read continuous performance: DiskSpd Read Loop, Queue Depth 8
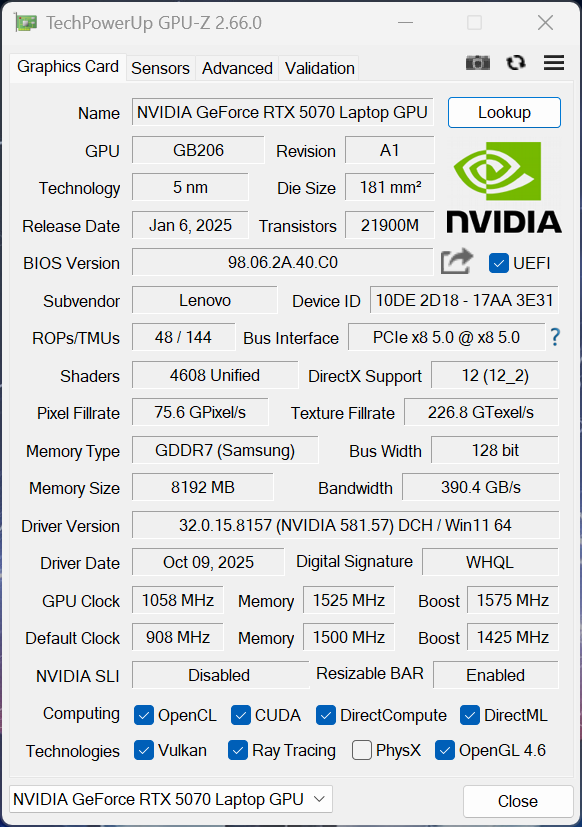
GPU performance
Lenovo equips the laptop with the highest-power configuration of the Nvidia GeForce RTX 5070 laptop GPU, rated at 115 watts. Graphics switching is handled through Optimus technology, though a MUX switch is also available. In synthetic benchmarks, the Legion generally outperforms its competitors, and even the Legion Pro 5 16 holds its own. GPU performance remains completely stable under sustained load but drops by about 30% when running on battery power (maximum 55 watts).
| 3DMark 11 Performance | 39444 points | |
| 3DMark Fire Strike Score | 31655 points | |
| 3DMark Time Spy Score | 14448 points | |
| 3DMark Steel Nomad Score | 3178 points | |
| 3DMark Steel Nomad Light Score | 14880 points | |
Help | ||
| Blender / v3.3 Classroom OPTIX/RTX | |
| Schenker XMG Core 15 (M25) | |
| MSI Katana A15 AI B8VG | |
| Lenovo Legion 5 15AHP G10 | |
| Asus TUF Gaming A16 FA608UP | |
| Average NVIDIA GeForce RTX 5070 Laptop (17 - 24, n=28) | |
| Average of class Gaming (9 - 32, n=106, last 2 years) | |
| Lenovo Legion Pro 5 16IAX10, RTX 5070 | |
| Lenovo Legion 5 15IRX10 5070 | |
| Blender / v3.3 Classroom CUDA | |
| Schenker XMG Core 15 (M25) | |
| Average NVIDIA GeForce RTX 5070 Laptop (29 - 228, n=29) | |
| Lenovo Legion 5 15AHP G10 | |
| MSI Katana A15 AI B8VG | |
| Asus TUF Gaming A16 FA608UP | |
| Average of class Gaming (15 - 228, n=106, last 2 years) | |
| Lenovo Legion Pro 5 16IAX10, RTX 5070 | |
| Lenovo Legion 5 15IRX10 5070 | |
| Blender / v3.3 Classroom CPU | |
| MSI Katana A15 AI B8VG | |
| Lenovo Legion 5 15IRX10 5070 | |
| Asus TUF Gaming A16 FA608UP | |
| Lenovo Legion 5 15AHP G10 | |
| Schenker XMG Core 15 (M25) | |
| Average NVIDIA GeForce RTX 5070 Laptop (137 - 507, n=26) | |
| Average of class Gaming (122 - 565, n=102, last 2 years) | |
| Lenovo Legion Pro 5 16IAX10, RTX 5070 | |
* ... smaller is better
Gaming performance
Gaming performance is also excellent, although the Legion Pro 5 16 is slightly faster in some titles. However, the difference is hardly noticeable, and most games still run smoothly even at QHD resolution. Only extremely memory-intensive titles may struggle due to the limited 8 GB of video memory.
| Final Fantasy XV Benchmark - 1920x1080 High Quality | |
| Average of class Gaming (41 - 215, n=95, last 2 years) | |
| Lenovo Legion Pro 5 16IAX10, RTX 5070 | |
| Asus TUF Gaming A16 FA608UP | |
| Lenovo Legion 5 15IRX10 5070 | |
| Lenovo Legion 5 15AHP G10 | |
| MSI Katana A15 AI B8VG | |
| Strange Brigade - 1920x1080 ultra AA:ultra AF:16 | |
| Average of class Gaming (76.3 - 456, n=86, last 2 years) | |
| Lenovo Legion Pro 5 16IAX10, RTX 5070 | |
| Lenovo Legion 5 15AHP G10 | |
| Asus TUF Gaming A16 FA608UP | |
| Lenovo Legion 5 15IRX10 5070 | |
| Assassin's Creed Shadows - 2560x1440 Ultra High | |
| Average of class Gaming (22 - 65, n=49, last 2 years) | |
| Lenovo Legion 5 15IRX10 5070 | |
| Lenovo Legion Pro 5 16IAX10, RTX 5070 | |
| Average NVIDIA GeForce RTX 5070 Laptop (22 - 40, n=12) | |
| Lenovo Legion 5 15AHP G10 | |
| F1 24 - 2560x1440 Ultra High Preset AA:T AF:16x | |
| Average of class Gaming (36.7 - 109.4, n=58, last 2 years) | |
| Asus TUF Gaming A16 FA608UP | |
| Lenovo Legion 5 15IRX10 5070 | |
| Average NVIDIA GeForce RTX 5070 Laptop (40.3 - 59.3, n=18) | |
| Lenovo Legion 5 15AHP G10 | |
Cyberpunk 2077 ultra FPS chart
| low | med. | high | ultra | QHD | |
|---|---|---|---|---|---|
| GTA V (2015) | 143.7 | 120.1 | |||
| Dota 2 Reborn (2015) | 178 | 166.2 | 161.5 | 150.2 | |
| Final Fantasy XV Benchmark (2018) | 207 | 180.5 | 139.7 | 108.7 | |
| X-Plane 11.11 (2018) | 132.4 | 121.5 | 100.2 | ||
| Strange Brigade (2018) | 470 | 281 | 240 | 208 | 137 |
| Baldur's Gate 3 (2023) | 176.7 | 146.5 | 130.8 | 127.2 | 90.1 |
| Cyberpunk 2077 (2023) | 157.8 | 132.5 | 112.8 | 101.5 | 66 |
| F1 24 (2024) | 244 | 90.2 | 55.3 | ||
| Assassin's Creed Shadows (2025) | 83 | 77 | 66 | 45 | 39 |
Emissions
System noise
The fan behavior is identical to that of the AMD model. In Performance mode, noise levels reach up to 50.1 dB(A) during gaming, which is clearly audible (Auto mode: ~44.5 dB(A); Battery Saver mode: ~40.5 dB(A)). We recommend using Battery Saver mode for light tasks, as the fans are often inactive in this setting. No additional electronic noises were detected.
Noise level
| Idle |
| 24 / 24 / 28.3 dB(A) |
| Load |
| 39.6 / 50.1 dB(A) |
 | ||
30 dB silent 40 dB(A) audible 50 dB(A) loud |
||
min: | ||
| Lenovo Legion 5 15IRX10 5070 i7-13650HX, GeForce RTX 5070 Laptop | Lenovo Legion Pro 5 16IAX10, RTX 5070 Ultra 7 255HX, GeForce RTX 5070 Laptop | Lenovo Legion 5 15AHP G10 R7 260, GeForce RTX 5060 Laptop | Schenker XMG Core 15 (M25) Ryzen AI 7 350, GeForce RTX 5060 Laptop | MSI Katana A15 AI B8VG R9 8945HS, GeForce RTX 4070 Laptop GPU | no name | Asus TUF Gaming A16 FA608UP R7 260, GeForce RTX 5070 Laptop | |
|---|---|---|---|---|---|---|---|
| Noise | 2% | 0% | -5% | -2% | -3% | -15% | |
| off / environment * (dB) | 24 | 23 4% | 25.5 -6% | 24 -0% | 25 -4% | 22.9 5% | 25.1 -5% |
| Idle Minimum * (dB) | 24 | 23 4% | 25.5 -6% | 25 -4% | 25 -4% | 24 -0% | 32.2 -34% |
| Idle Average * (dB) | 24 | 23 4% | 25.5 -6% | 27 -13% | 26 -8% | 25.6 -7% | 32.2 -34% |
| Idle Maximum * (dB) | 28.3 | 23 19% | 26.9 5% | 29 -2% | 27 5% | 25.6 10% | 32.2 -14% |
| Load Average * (dB) | 39.6 | 43.85 -11% | 34.6 13% | 48 -21% | 40 -1% | 46.8 -18% | 38.1 4% |
| Cyberpunk 2077 ultra * (dB) | 50.1 | 50.27 -0% | 50.1 -0% | 49 2% | 52 -4% | 49.9 -0% | 53.9 -8% |
| Load Maximum * (dB) | 50.1 | 52.9 -6% | 50.1 -0% | 50 -0% | 50 -0% | 55.6 -11% | 57.1 -14% |
* ... smaller is better
Temperature
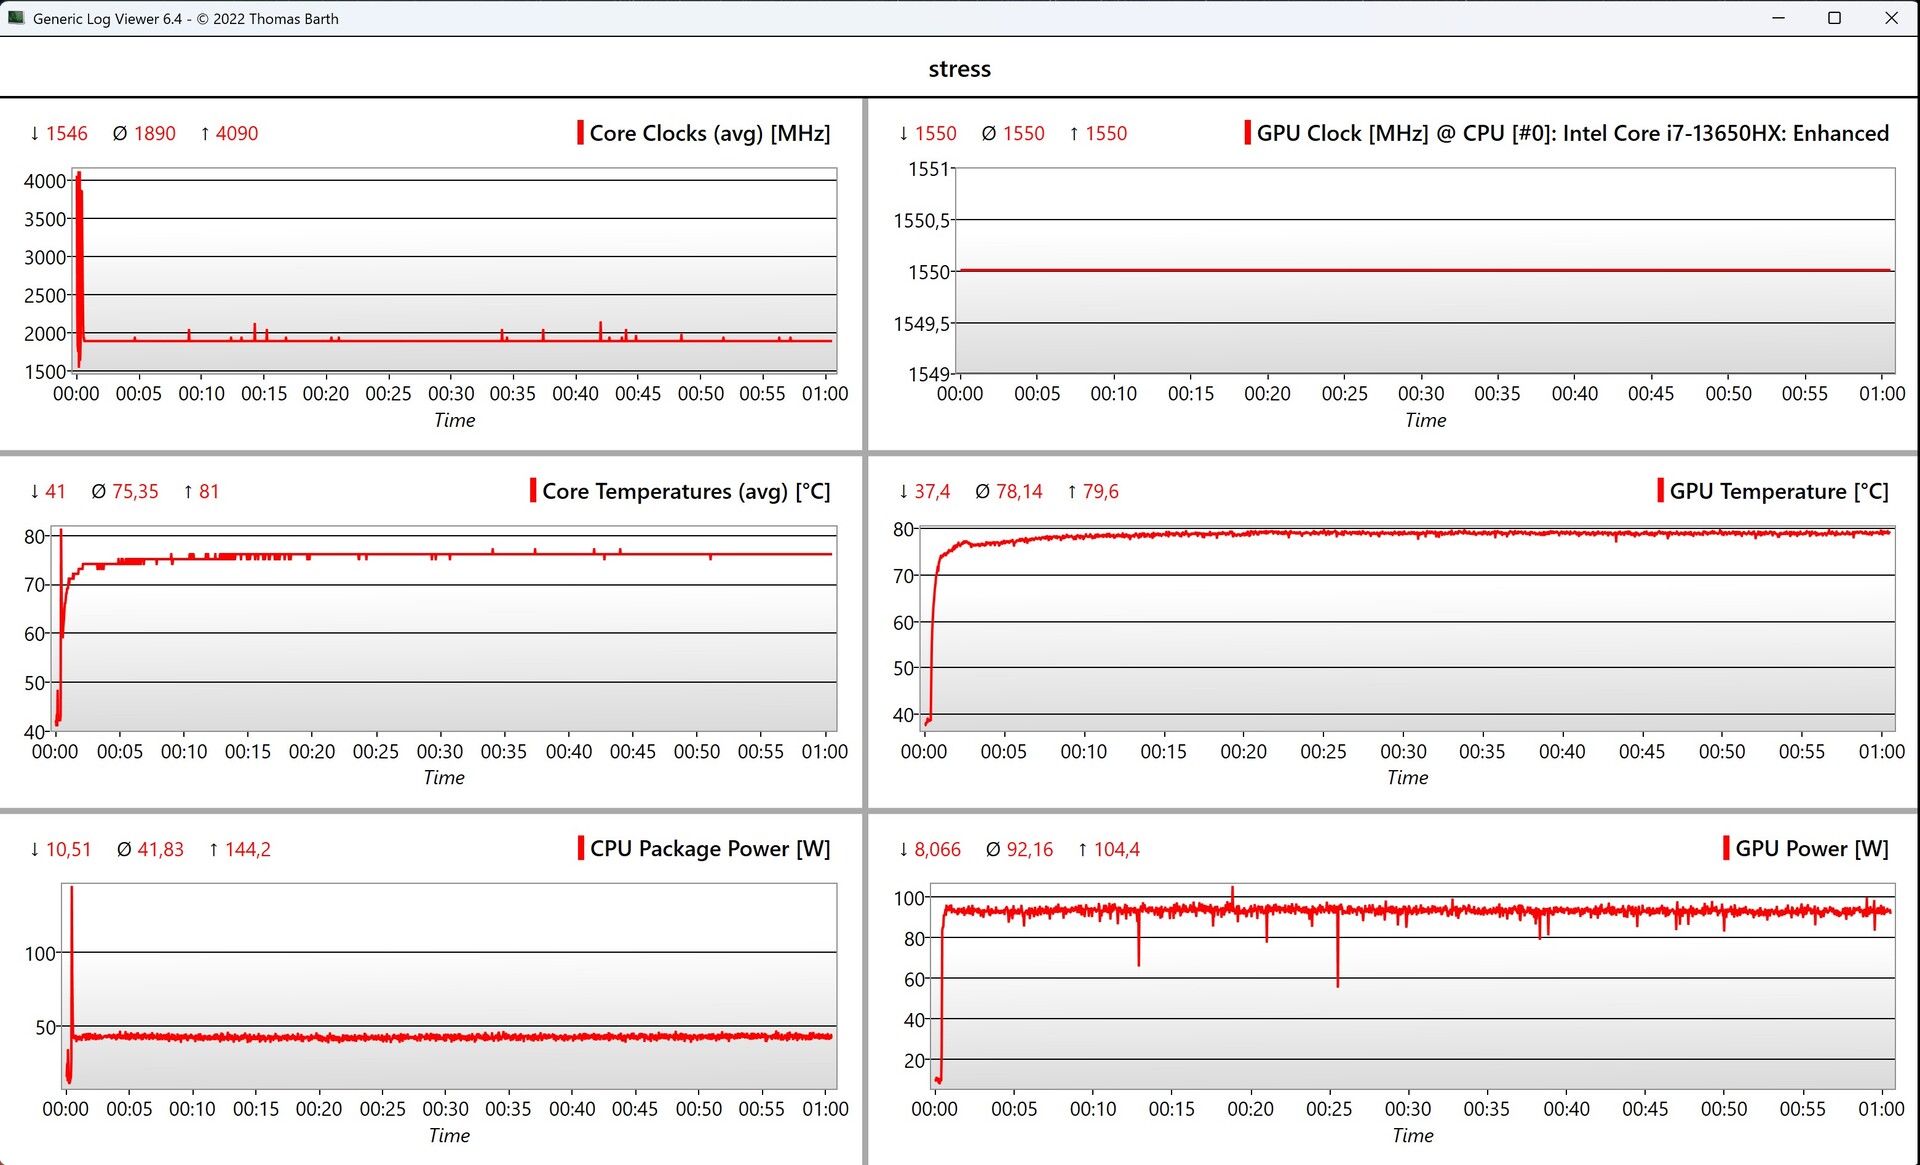
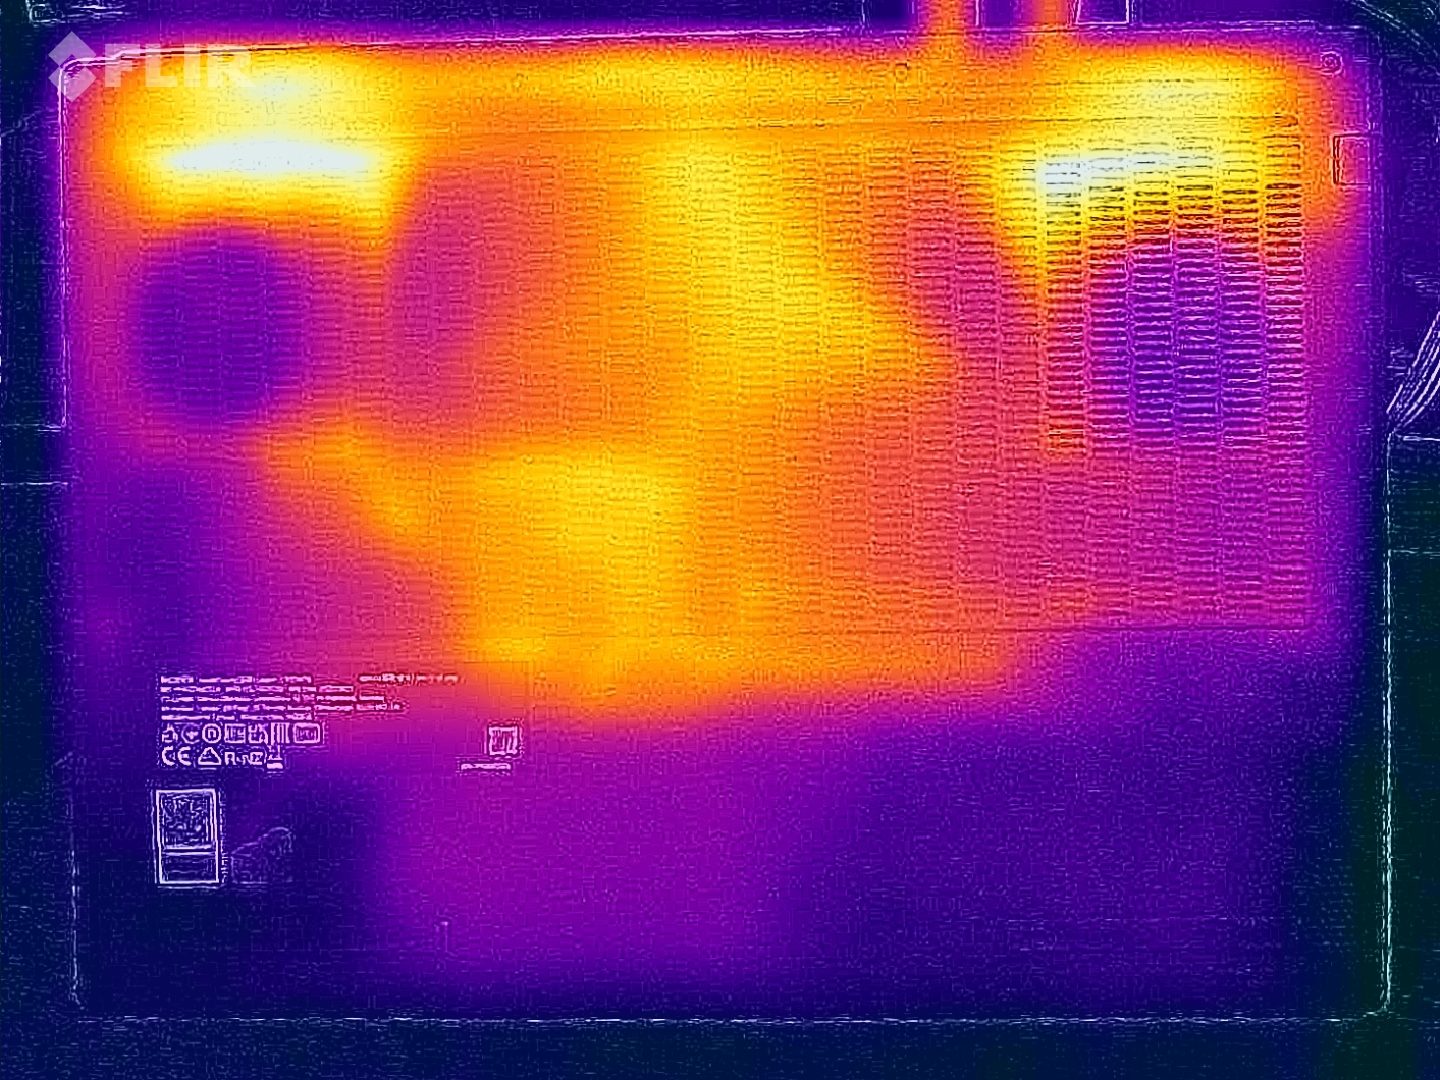
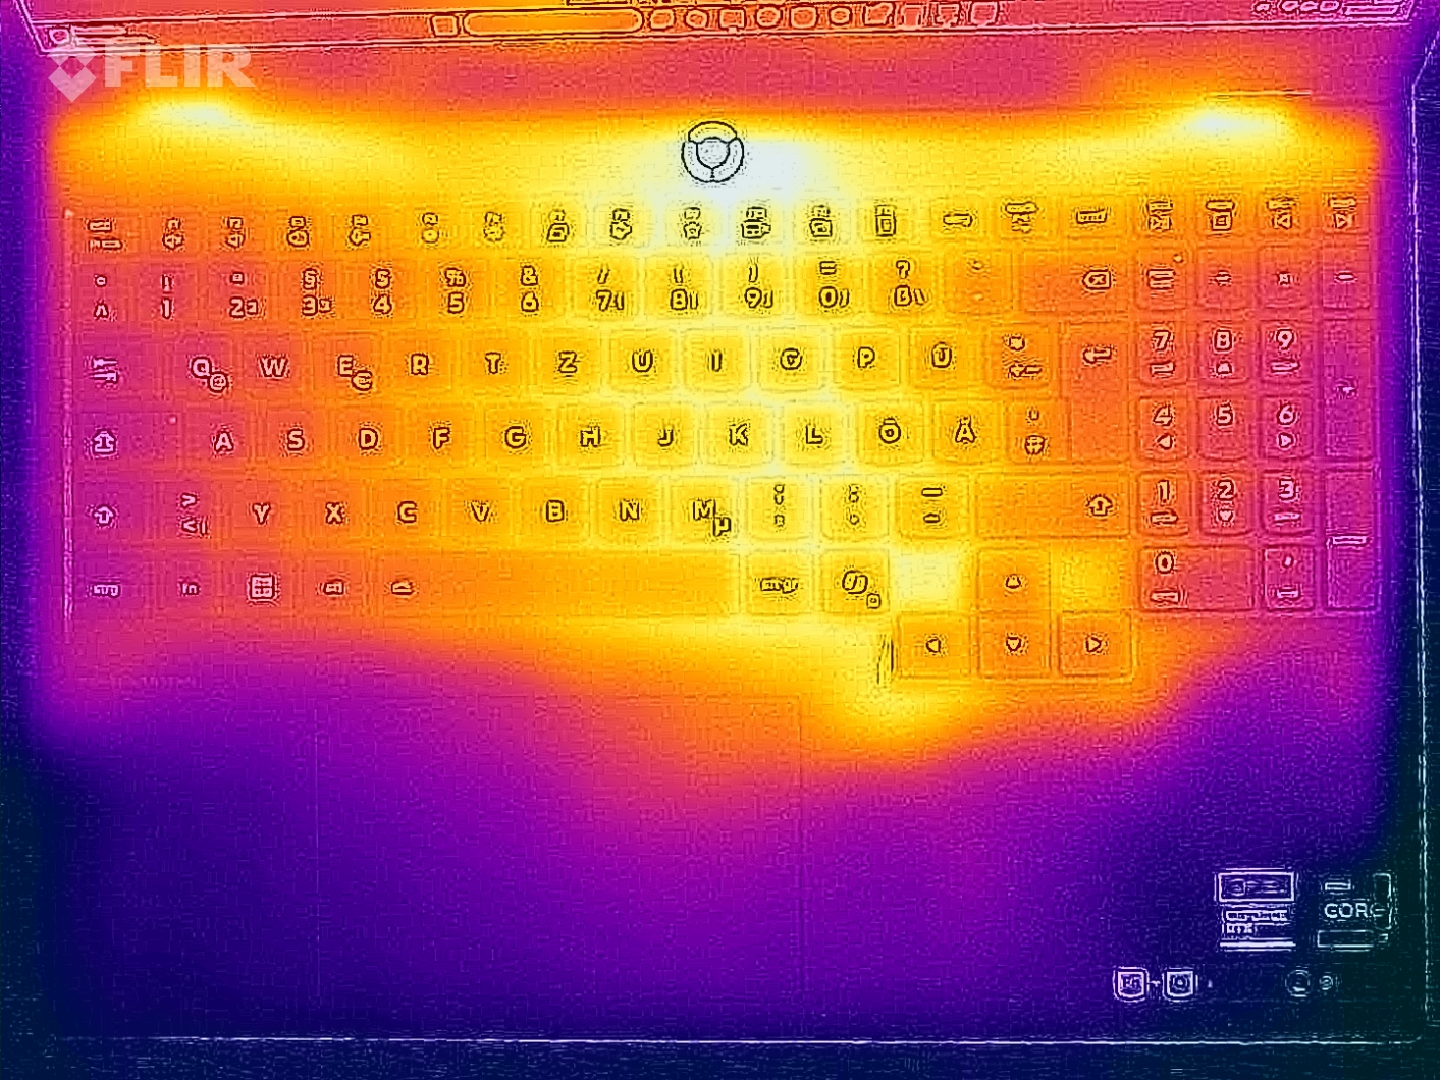
Surface temperatures remain very low during everyday use, but we recorded spots exceeding 50 °C during gaming, so the device shouldn’t be used on your lap. In the stress test, the GPU stabilized at 92 watts and the CPU at around 42 watts.
(±) The maximum temperature on the upper side is 41.6 °C / 107 F, compared to the average of 40.4 °C / 105 F, ranging from 21.2 to 68.8 °C for the class Gaming.
(-) The bottom heats up to a maximum of 52.7 °C / 127 F, compared to the average of 43.2 °C / 110 F
(+) In idle usage, the average temperature for the upper side is 29.4 °C / 85 F, compared to the device average of 33.9 °C / 93 F.
(±) 3: The average temperature for the upper side is 35.9 °C / 97 F, compared to the average of 33.9 °C / 93 F for the class Gaming.
(+) The palmrests and touchpad are reaching skin temperature as a maximum (33.3 °C / 91.9 F) and are therefore not hot.
(-) The average temperature of the palmrest area of similar devices was 28.8 °C / 83.8 F (-4.5 °C / -8.1 F).
| Lenovo Legion 5 15IRX10 5070 i7-13650HX, GeForce RTX 5070 Laptop | Lenovo Legion Pro 5 16IAX10, RTX 5070 Ultra 7 255HX, GeForce RTX 5070 Laptop | Lenovo Legion 5 15AHP G10 R7 260, GeForce RTX 5060 Laptop | Schenker XMG Core 15 (M25) Ryzen AI 7 350, GeForce RTX 5060 Laptop | MSI Katana A15 AI B8VG R9 8945HS, GeForce RTX 4070 Laptop GPU | no name | Asus TUF Gaming A16 FA608UP R7 260, GeForce RTX 5070 Laptop | |
|---|---|---|---|---|---|---|---|
| Heat | 4% | 7% | -2% | -2% | 16% | ||
| Maximum Upper Side * (°C) | 41.6 | 42 -1% | 42.2 -1% | 49 -18% | 48 -15% | 39.5 5% | |
| Maximum Bottom * (°C) | 52.7 | 44 17% | 51.7 2% | 59 -12% | 46 13% | 45.1 14% | |
| Idle Upper Side * (°C) | 32.6 | 33 -1% | 28.5 13% | 28 14% | 34 -4% | 25.7 21% | |
| Idle Bottom * (°C) | 33.9 | 34 -0% | 29.2 14% | 31 9% | 34 -0% | 25.5 25% |
* ... smaller is better
Speakers
Lenovo Legion 5 15IRX10 5070 audio analysis
(±) | speaker loudness is average but good (81.5 dB)
Bass 100 - 315 Hz
(-) | nearly no bass - on average 21% lower than median
(±) | linearity of bass is average (8.2% delta to prev. frequency)
Mids 400 - 2000 Hz
(+) | balanced mids - only 4.7% away from median
(+) | mids are linear (5.4% delta to prev. frequency)
Highs 2 - 16 kHz
(+) | balanced highs - only 3.1% away from median
(+) | highs are linear (6.4% delta to prev. frequency)
Overall 100 - 16.000 Hz
(±) | linearity of overall sound is average (16.7% difference to median)
Compared to same class
» 43% of all tested devices in this class were better, 10% similar, 47% worse
» The best had a delta of 6%, average was 18%, worst was 132%
Compared to all devices tested
» 29% of all tested devices were better, 7% similar, 64% worse
» The best had a delta of 4%, average was 23%, worst was 134%
Lenovo Legion Pro 5 16IAX10, RTX 5070 audio analysis
(±) | speaker loudness is average but good (75.73 dB)
Bass 100 - 315 Hz
(-) | nearly no bass - on average 20% lower than median
(±) | linearity of bass is average (9.3% delta to prev. frequency)
Mids 400 - 2000 Hz
(±) | higher mids - on average 6.1% higher than median
(±) | linearity of mids is average (7.9% delta to prev. frequency)
Highs 2 - 16 kHz
(+) | balanced highs - only 2.2% away from median
(+) | highs are linear (6.3% delta to prev. frequency)
Overall 100 - 16.000 Hz
(±) | linearity of overall sound is average (19.4% difference to median)
Compared to same class
» 67% of all tested devices in this class were better, 7% similar, 26% worse
» The best had a delta of 6%, average was 18%, worst was 132%
Compared to all devices tested
» 48% of all tested devices were better, 7% similar, 45% worse
» The best had a delta of 4%, average was 23%, worst was 134%
Lenovo Legion 5 15AHP G10 audio analysis
(±) | speaker loudness is average but good (81.5 dB)
Bass 100 - 315 Hz
(-) | nearly no bass - on average 21% lower than median
(±) | linearity of bass is average (8.2% delta to prev. frequency)
Mids 400 - 2000 Hz
(+) | balanced mids - only 4.7% away from median
(+) | mids are linear (5.4% delta to prev. frequency)
Highs 2 - 16 kHz
(+) | balanced highs - only 3.1% away from median
(+) | highs are linear (6.4% delta to prev. frequency)
Overall 100 - 16.000 Hz
(±) | linearity of overall sound is average (16.7% difference to median)
Compared to same class
» 43% of all tested devices in this class were better, 10% similar, 47% worse
» The best had a delta of 6%, average was 18%, worst was 132%
Compared to all devices tested
» 29% of all tested devices were better, 7% similar, 64% worse
» The best had a delta of 4%, average was 23%, worst was 134%
Schenker XMG Core 15 (M25) audio analysis
(+) | speakers can play relatively loud (82 dB)
Bass 100 - 315 Hz
(-) | nearly no bass - on average 18.3% lower than median
(±) | linearity of bass is average (9.8% delta to prev. frequency)
Mids 400 - 2000 Hz
(+) | balanced mids - only 3.4% away from median
(+) | mids are linear (5.9% delta to prev. frequency)
Highs 2 - 16 kHz
(+) | balanced highs - only 3.2% away from median
(+) | highs are linear (4.1% delta to prev. frequency)
Overall 100 - 16.000 Hz
(+) | overall sound is linear (14.3% difference to median)
Compared to same class
» 26% of all tested devices in this class were better, 7% similar, 67% worse
» The best had a delta of 6%, average was 18%, worst was 132%
Compared to all devices tested
» 18% of all tested devices were better, 4% similar, 78% worse
» The best had a delta of 4%, average was 23%, worst was 134%
MSI Katana A15 AI B8VG audio analysis
(±) | speaker loudness is average but good (81 dB)
Bass 100 - 315 Hz
(-) | nearly no bass - on average 21.6% lower than median
(±) | linearity of bass is average (10% delta to prev. frequency)
Mids 400 - 2000 Hz
(±) | higher mids - on average 6.2% higher than median
(±) | linearity of mids is average (8.6% delta to prev. frequency)
Highs 2 - 16 kHz
(+) | balanced highs - only 2.8% away from median
(+) | highs are linear (6% delta to prev. frequency)
Overall 100 - 16.000 Hz
(±) | linearity of overall sound is average (19.2% difference to median)
Compared to same class
» 65% of all tested devices in this class were better, 7% similar, 28% worse
» The best had a delta of 6%, average was 18%, worst was 132%
Compared to all devices tested
» 46% of all tested devices were better, 7% similar, 46% worse
» The best had a delta of 4%, average was 23%, worst was 134%
Asus TUF Gaming A16 FA608UP audio analysis
(±) | speaker loudness is average but good (80.2 dB)
Bass 100 - 315 Hz
(±) | reduced bass - on average 11.8% lower than median
(±) | linearity of bass is average (8.7% delta to prev. frequency)
Mids 400 - 2000 Hz
(+) | balanced mids - only 3% away from median
(+) | mids are linear (3% delta to prev. frequency)
Highs 2 - 16 kHz
(+) | balanced highs - only 4.4% away from median
(±) | linearity of highs is average (7.4% delta to prev. frequency)
Overall 100 - 16.000 Hz
(+) | overall sound is linear (12.6% difference to median)
Compared to same class
» 16% of all tested devices in this class were better, 4% similar, 81% worse
» The best had a delta of 6%, average was 18%, worst was 132%
Compared to all devices tested
» 11% of all tested devices were better, 3% similar, 86% worse
» The best had a delta of 4%, average was 23%, worst was 134%
Energy Management
At idle, the Intel model’s power consumption is slightly higher than that of the AMD variant. The difference becomes more pronounced under moderate load, at just under 30 watts, where the HX processor’s impact is noticeable. During the stress test, we measured a peak consumption of 247 watts, which quickly stabilized at around 175 watts. The included 245-watt power adapter is therefore adequately sized.
| Off / Standby | |
| Idle | |
| Load |
|
Key:
min: | |
| Lenovo Legion 5 15IRX10 5070 i7-13650HX, GeForce RTX 5070 Laptop, WD PC SN7100S SDFPMSL-1T00-1101, OLED, 2560x1600, 15.1" | Lenovo Legion Pro 5 16IAX10, RTX 5070 Ultra 7 255HX, GeForce RTX 5070 Laptop, SK Hynix HFS001TEJ9X115N, OLED, 2650x1600, 16" | Lenovo Legion 5 15AHP G10 R7 260, GeForce RTX 5060 Laptop, SK hynix PVC10 HFS001TEM4X182N, OLED, 2560x1600, 15.1" | Schenker XMG Core 15 (M25) Ryzen AI 7 350, GeForce RTX 5060 Laptop, Samsung 990 Pro 2 TB MZVL72T0HDLB, IPS, 2560x1600, 15.3" | MSI Katana A15 AI B8VG R9 8945HS, GeForce RTX 4070 Laptop GPU, WD PC SN560 SDDPNQE-1T00, IPS, 1920x1080, 15.6" | no name | Asus TUF Gaming A16 FA608UP R7 260, GeForce RTX 5070 Laptop, Western Digital PC SN5000S SDEQNSJ-1T00, IPS, 2560x1600, 16" | Average NVIDIA GeForce RTX 5070 Laptop | Average of class Gaming | |
|---|---|---|---|---|---|---|---|---|---|
| Power Consumption | -14% | 17% | 4% | -5% | 12% | 15% | -11% | -30% | |
| Idle Minimum * (Watt) | 11.4 | 10.6 7% | 6.9 39% | 10.6 7% | 13 -14% | 4.4 61% | 4.6 60% | 10.8 ? 5% | 13 ? -14% |
| Idle Average * (Watt) | 12.8 | 12.3 4% | 10.7 16% | 12.1 5% | 18 -41% | 18 -41% | 9.8 23% | 15.4 ? -20% | 18.7 ? -46% |
| Idle Maximum * (Watt) | 13.4 | 18.6 -39% | 11.3 16% | 15.9 -19% | 23 -72% | 18.2 -36% | 10.2 24% | 21 ? -57% | 24.3 ? -81% |
| Load Average * (Watt) | 103.7 | 104 -0% | 69.7 33% | 95 8% | 63 39% | 87.1 16% | 76.1 27% | 98.7 ? 5% | 110.2 ? -6% |
| Cyberpunk 2077 ultra external monitor * (Watt) | 171.5 | 227 -32% | 165 4% | 165 4% | 156 9% | 120.6 30% | 198.1 -16% | ||
| Cyberpunk 2077 ultra * (Watt) | 171.5 | 231 -35% | 162.6 5% | 169 1% | 156.8 9% | 123 28% | 198.9 -16% | ||
| Load Maximum * (Watt) | 246.8 | 248 -0% | 233.6 5% | 192 22% | 159 36% | 183 26% | 235.2 5% | 218 ? 12% | 258 ? -5% |
* ... smaller is better
energy consumption Cyberpunk / Stress test
energy consumption with external monitor
Battery life
Battery life is noticeably shorter than that of the AMD model. At a brightness of 150 cd/m² and a 60 Hz refresh rate, we measured just under five hours.
| Lenovo Legion 5 15IRX10 5070 i7-13650HX, GeForce RTX 5070 Laptop, 80 Wh | Lenovo Legion Pro 5 16IAX10, RTX 5070 Ultra 7 255HX, GeForce RTX 5070 Laptop, 80 Wh | Lenovo Legion 5 15AHP G10 R7 260, GeForce RTX 5060 Laptop, 80 Wh | Schenker XMG Core 15 (M25) Ryzen AI 7 350, GeForce RTX 5060 Laptop, 99.8 Wh | MSI Katana A15 AI B8VG R9 8945HS, GeForce RTX 4070 Laptop GPU, 53.5 Wh | no name Wh | Asus TUF Gaming A16 FA608UP R7 260, GeForce RTX 5070 Laptop, 90 Wh | Average of class Gaming | |
|---|---|---|---|---|---|---|---|---|
| Battery Runtime | ||||||||
| WiFi Websurfing (h) | 4.9 | 6.2 27% | 9.7 98% | 9.9 102% | 4 -18% | 13 165% | 7.11 ? 45% |
Notebookcheck overall rating
Lenovo Legion 5 15IRX10 5070
- 10/26/2025 v8
Andreas Osthoff
 Total Sustainability Score:
 Possible alternatives in comparison
Image | Model / Review | Price | Weight | Height | Display |
|---|---|---|---|---|---|
1. 86.5%  | Lenovo Legion 5 15IRX10 5070 Intel Core i7-13650HX ⎘ NVIDIA GeForce RTX 5070 Laptop ⎘ 32 GB Memory, 1024 GB SSD | Amazon: List Price: 1499€ | 1.9 kg | 21.5 mm | 15.10" 2560x1600 200 PPI OLED |
2. 86.2%  | Lenovo Legion Pro 5 16IAX10, RTX 5070 Intel Core Ultra 7 255HX ⎘ NVIDIA GeForce RTX 5070 Laptop ⎘ 32 GB Memory, 1024 GB SSD | Amazon: List Price: 1800 Euro | 2.3 kg | 25.95 mm | 16.00" 2650x1600 189 PPI OLED |
3. 87.2%  | Lenovo Legion 5 15AHP G10 AMD Ryzen 7 260 ⎘ NVIDIA GeForce RTX 5060 Laptop ⎘ 32 GB Memory, 1024 GB SSD | Amazon: List Price: 1449€ | 1.9 kg | 21.5 mm | 15.10" 2560x1600 200 PPI OLED |
4. 84.7%  | Schenker XMG Core 15 (M25) AMD Ryzen AI 7 350 ⎘ NVIDIA GeForce RTX 5060 Laptop ⎘ 64 GB Memory, 2048 GB SSD | Amazon: List Price: 1840 EUR | 1.9 kg | 22 mm | 15.30" 2560x1600 197 PPI IPS |
5. 76.4%  | MSI Katana A15 AI B8VG AMD Ryzen 9 8945HS ⎘ NVIDIA GeForce RTX 4070 Laptop GPU ⎘ 16 GB Memory, 1024 GB SSD | Amazon: List Price: 1500 EUR | 2.3 kg | 24.9 mm | 15.60" 1920x1080 141 PPI IPS |
| no name ⎘ ⎘ | Amazon: 1. $23.19 No Name 2. $12.99 The Paper with No Name! 3. No Name | ||||
7. 83.8%  | Asus TUF Gaming A16 FA608UP AMD Ryzen 7 260 ⎘ NVIDIA GeForce RTX 5070 Laptop ⎘ 32 GB Memory, 1024 GB SSD | Amazon: List Price: 2199€ | 2.2 kg | 25.7 mm | 16.00" 2560x1600 189 PPI IPS |
Transparency
The selection of devices to be reviewed is made by our editorial team. The test sample was provided to the author as a loan by the manufacturer or retailer for the purpose of this review. The lender had no influence on this review, nor did the manufacturer receive a copy of this review before publication. There was no obligation to publish this review. As an independent media company, Notebookcheck is not subjected to the authority of manufacturers, retailers or publishers.
This is how Notebookcheck is testing
Every year, Notebookcheck independently reviews hundreds of laptops and smartphones using standardized procedures to ensure that all results are comparable. We have continuously developed our test methods for around 20 years and set industry standards in the process. In our test labs, high-quality measuring equipment is utilized by experienced technicians and editors. These tests involve a multi-stage validation process. Our complex rating system is based on hundreds of well-founded measurements and benchmarks, which maintains objectivity. Further information on our test methods can be found here.

