
Verdict - A successful RTX 5060 contender
After all the testing, the XMG Core 15 proves to be a strong RTX 5060 gaming laptop, earning good to very good marks in most areas—including build quality, ports, keyboard and touchpad, display, battery life, and audio. There is room for improvement, especially in terms of thermal performance, which is relatively high under load. The overall score of 85% is nearly equal to that of its competitor, Lenovo Legion 5, which scored 87% in the review.
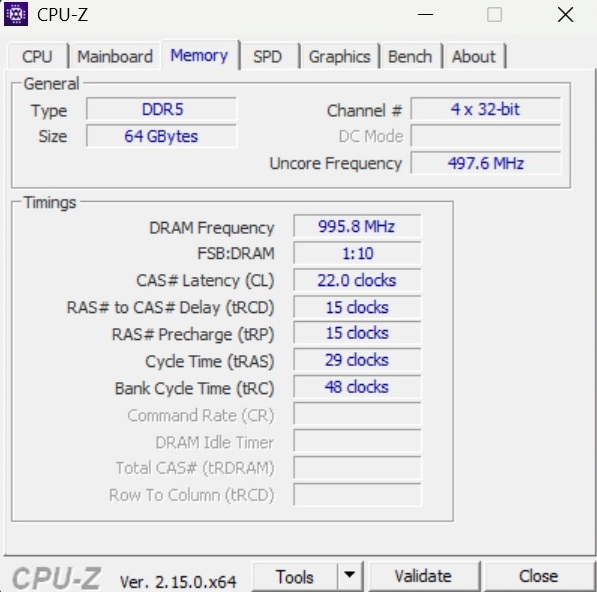
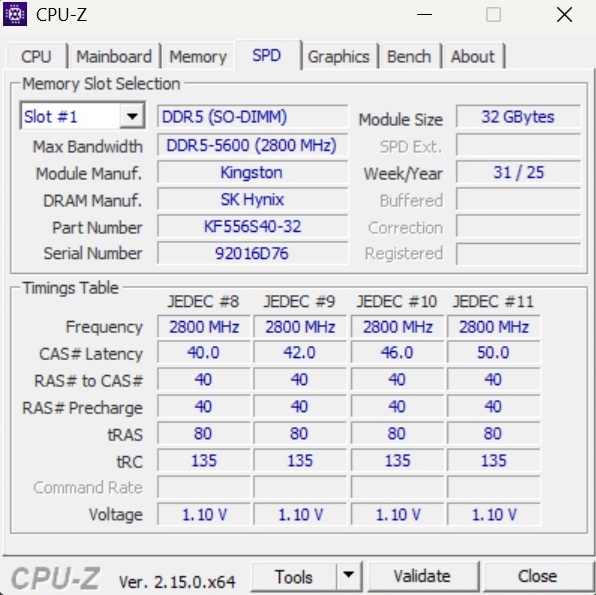
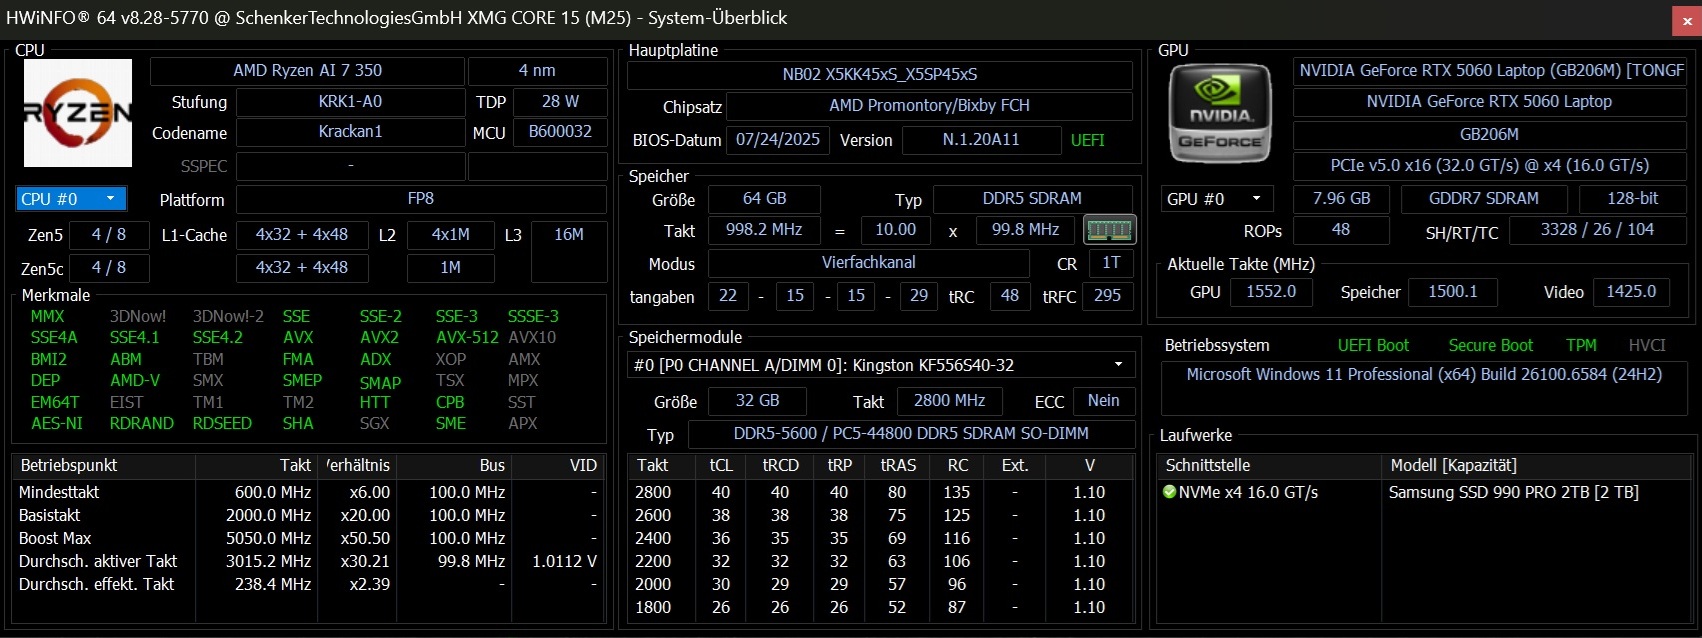
While last year’s XMG Core 15 M24 came with a Ryzen 7 8845HS and a GeForce RTX 4060, the 2025 version moves to more modern hardware. Buyers can choose a Ryzen AI 7 350, Ryzen AI 9 365, or Ryzen AI 9 HX 370 processor, paired with either a GeForce RTX 5060 or RTX 5070, each with 8 GB of GDDR7 VRAM. Every model features a bright 300 Hz IPS display in a 16:10 format with a 2,560 × 1,600 resolution. Memory ranges from 8 GB to 128 GB (two SO-DIMM slots), and there are two M.2 SSD slots inside.
The 15-inch model starts at €1,549. Our test unit—with a Ryzen 7 350, RTX 5060, 64 GB of RAM, a 2 TB SSD, and Windows 11 Pro—costs about €1,850, which is steep considering the GPU performance on tap.
Pros
Cons
Price and availability
Translator’s note: Schenker’s devices are not officially available in North America.
The Schenker XMG Core 15 M25 can be individually configured on the bestware.com homepage.
Competitors include other Blackwell-based gaming laptops such as the Lenovo LOQ 15, the aforementioned Legion 5 15, the Medion Erazer Scout 17 E1 and the MSI Katana 17 HX, all of which appear in the comparison tables.
Specifications
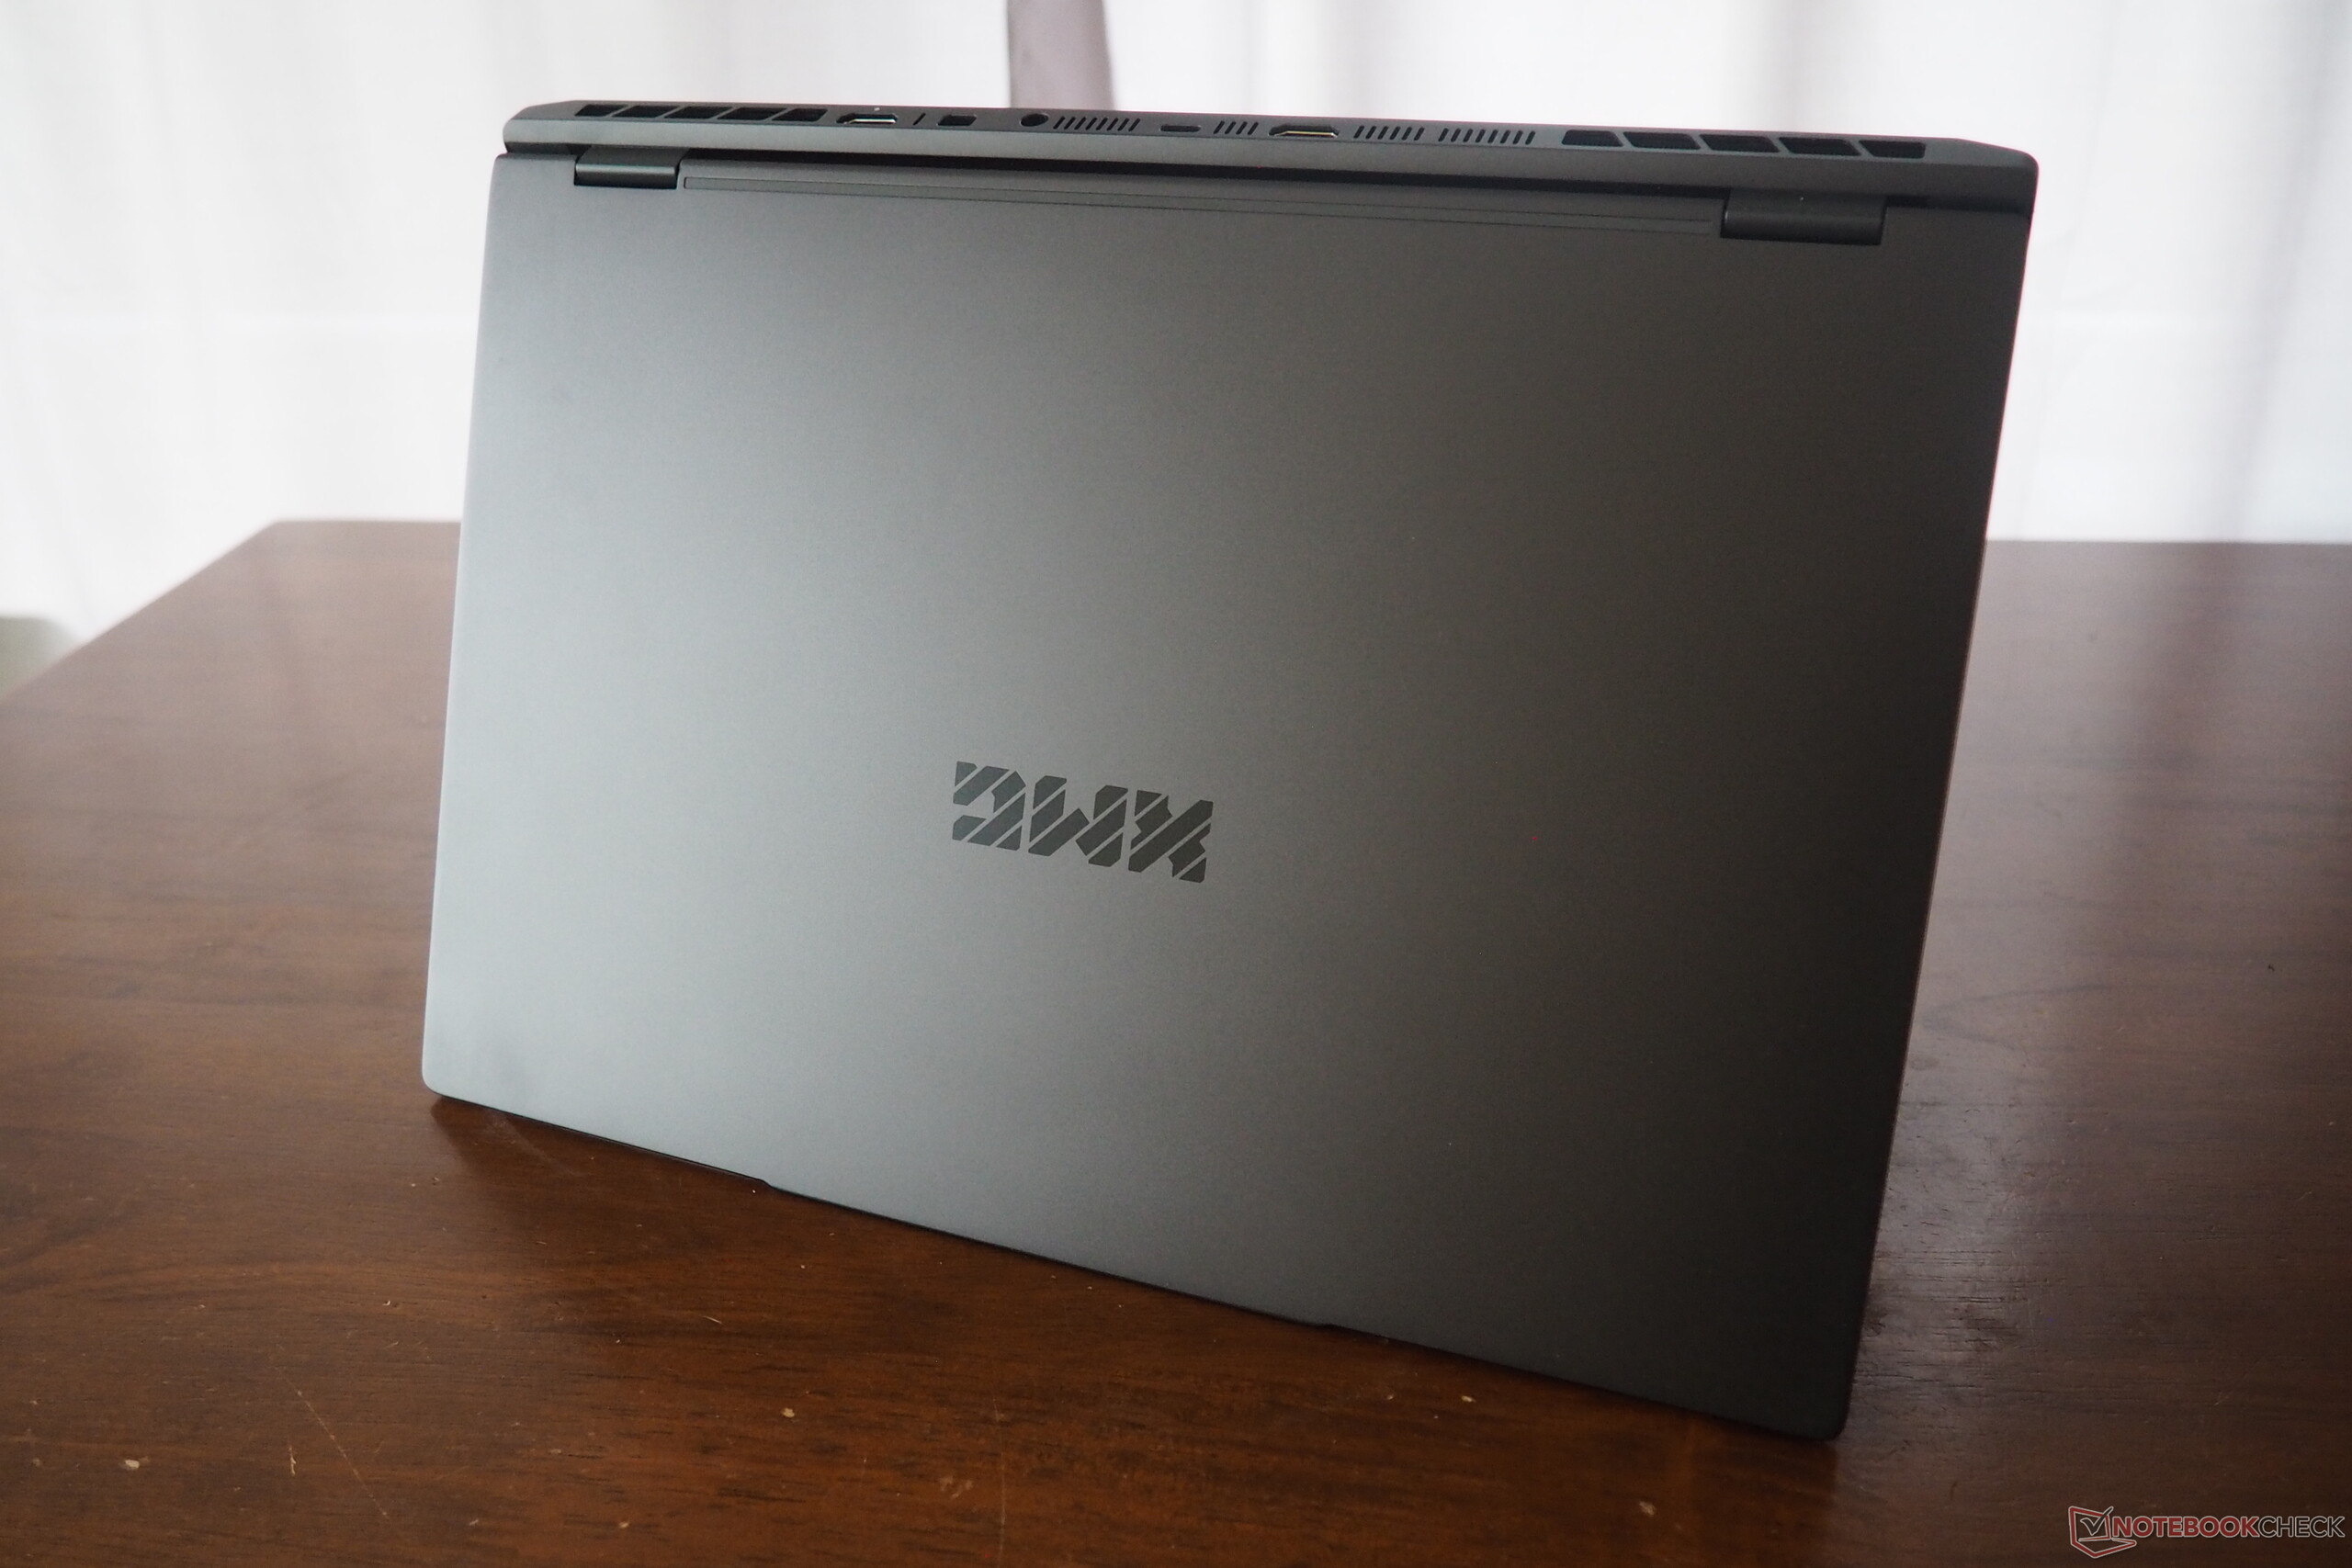
Case
Aside from the keyboard backlighting, the case is fairly plain but solid. It comes from barebone producer Uniwill and feels sturdy and high quality thanks to a large metal insert (on the Legion 5, for example, only the lid is metal). The display can open a full 180 degrees, which isn’t common. Build quality and hinge strength are also impressive, leaving no real complaints. At 1.9 kg, the chassis is relatively light and roughly matches the Legion 5.
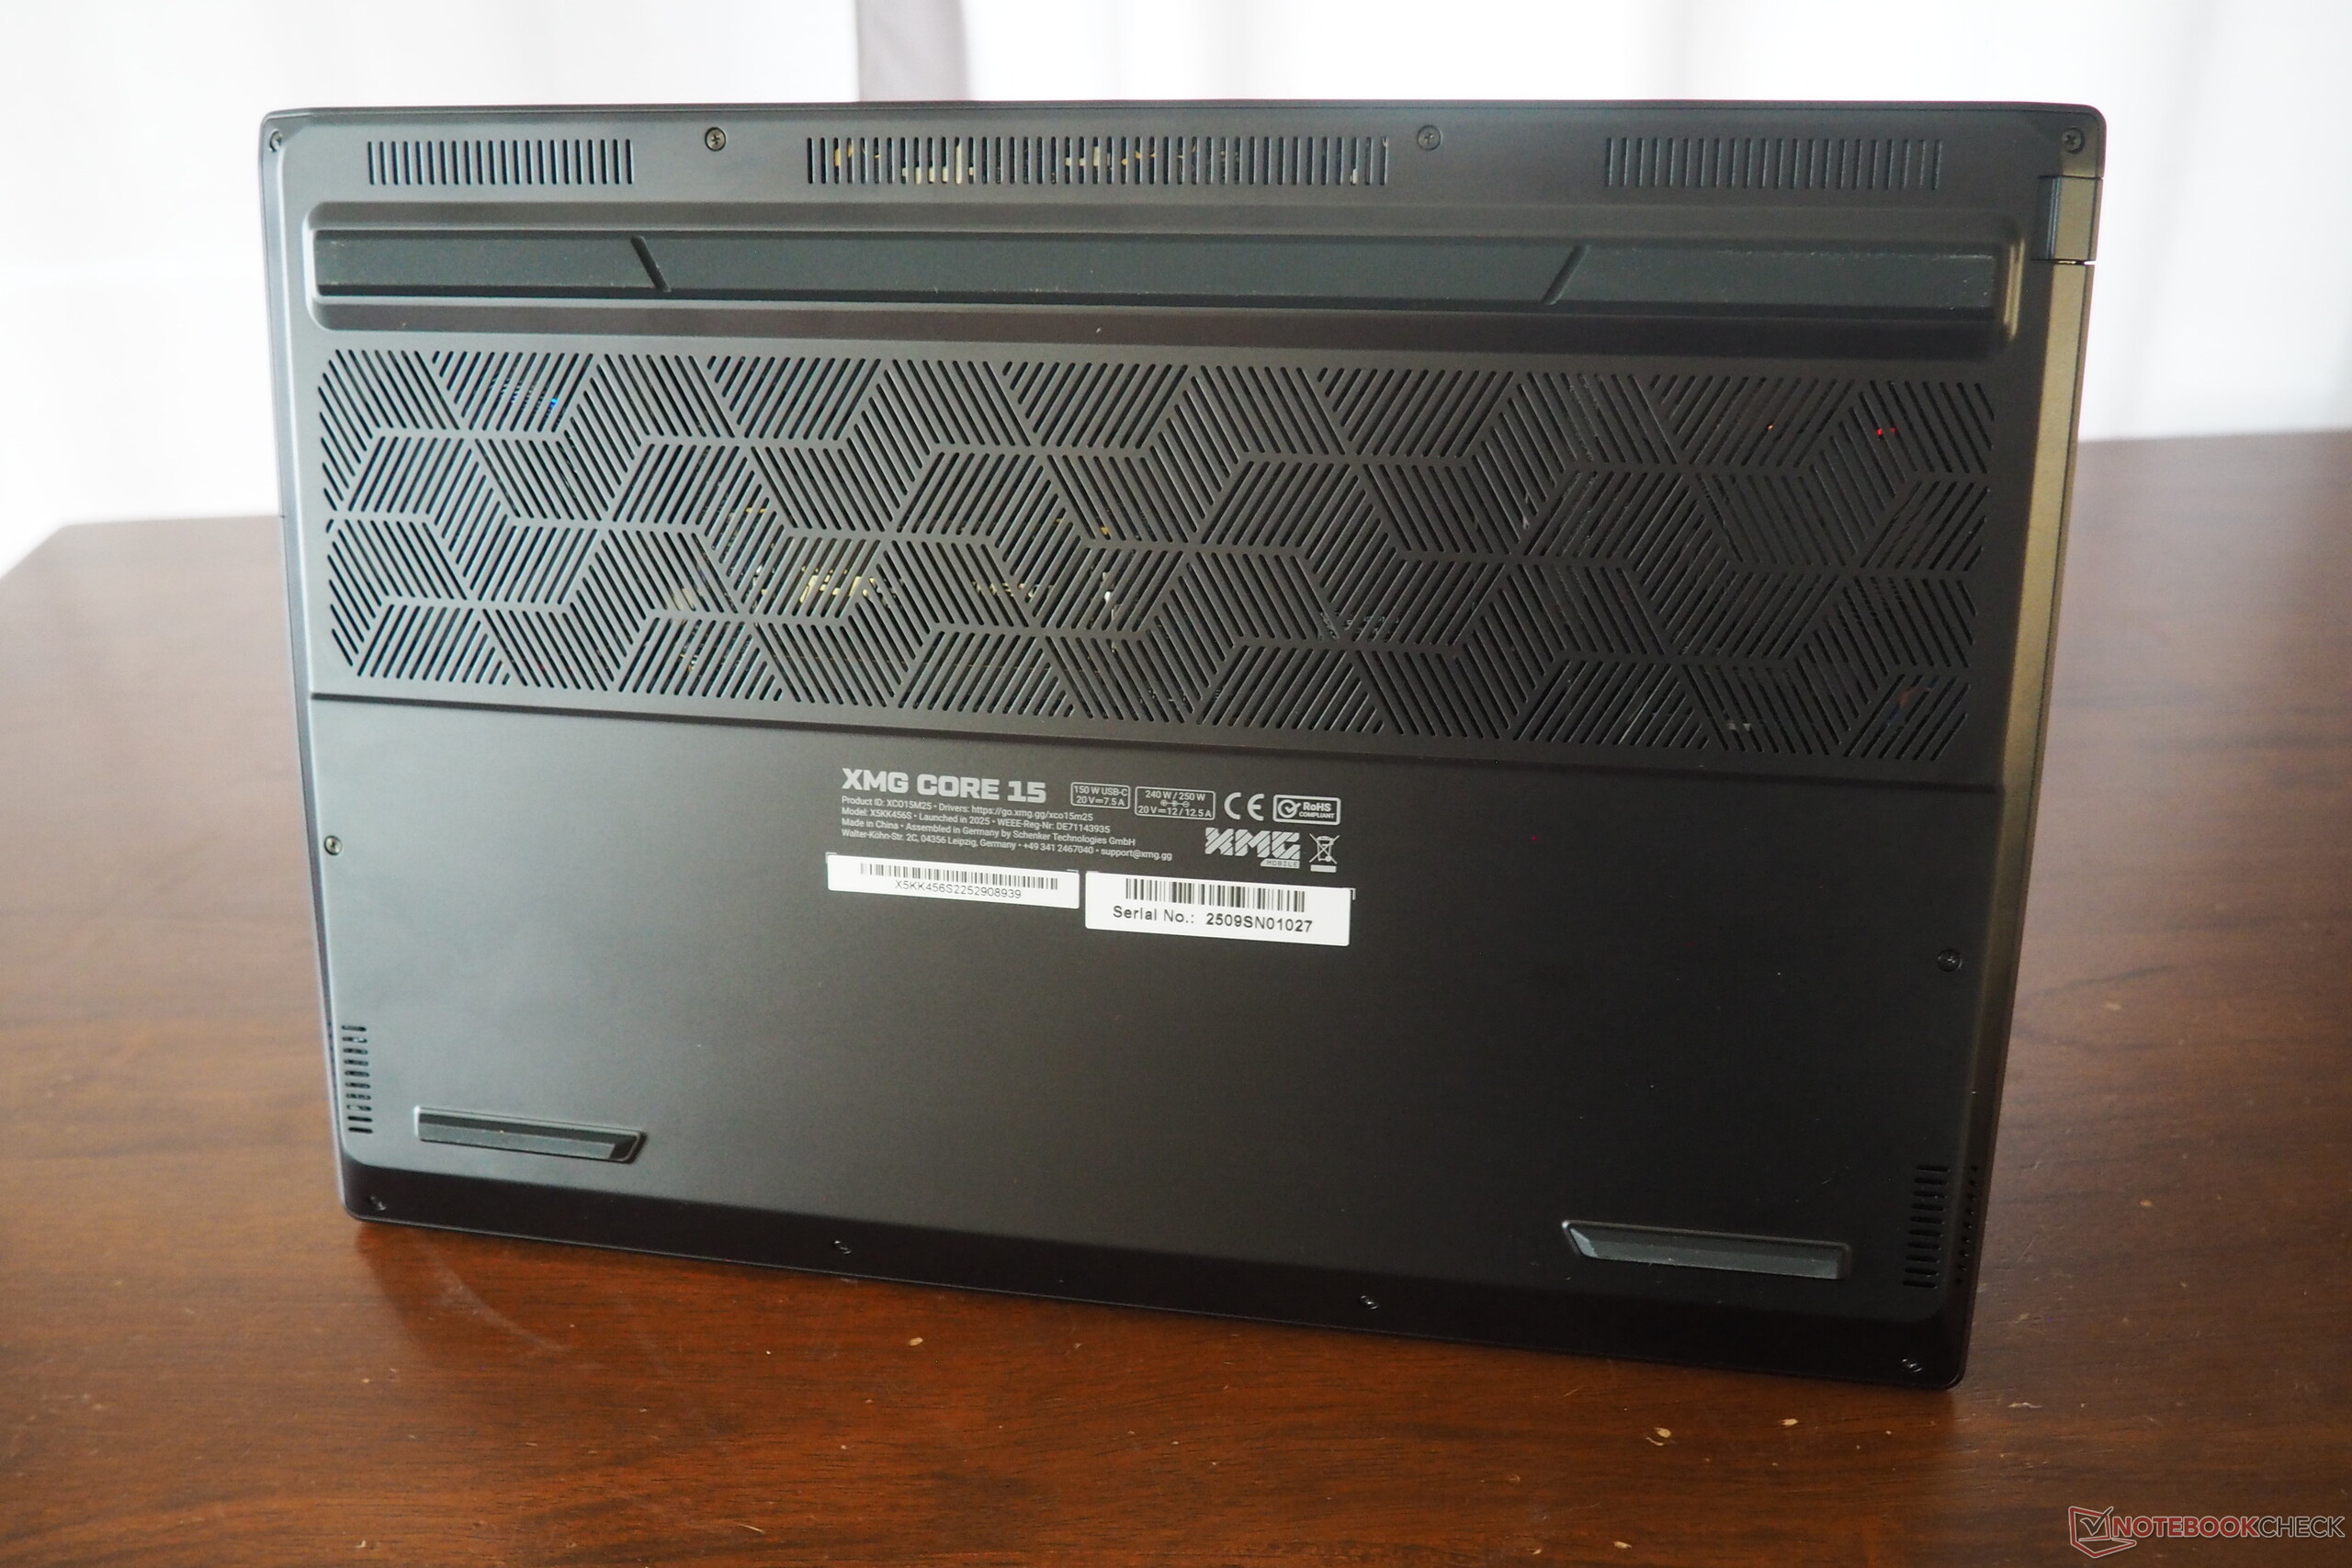
Equipment
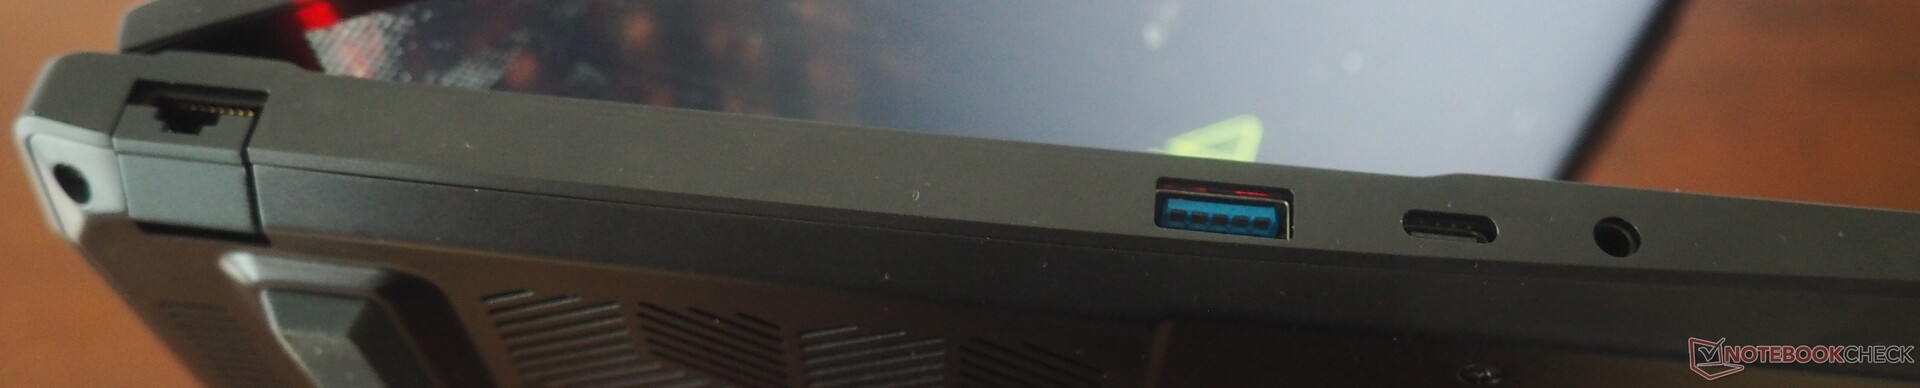
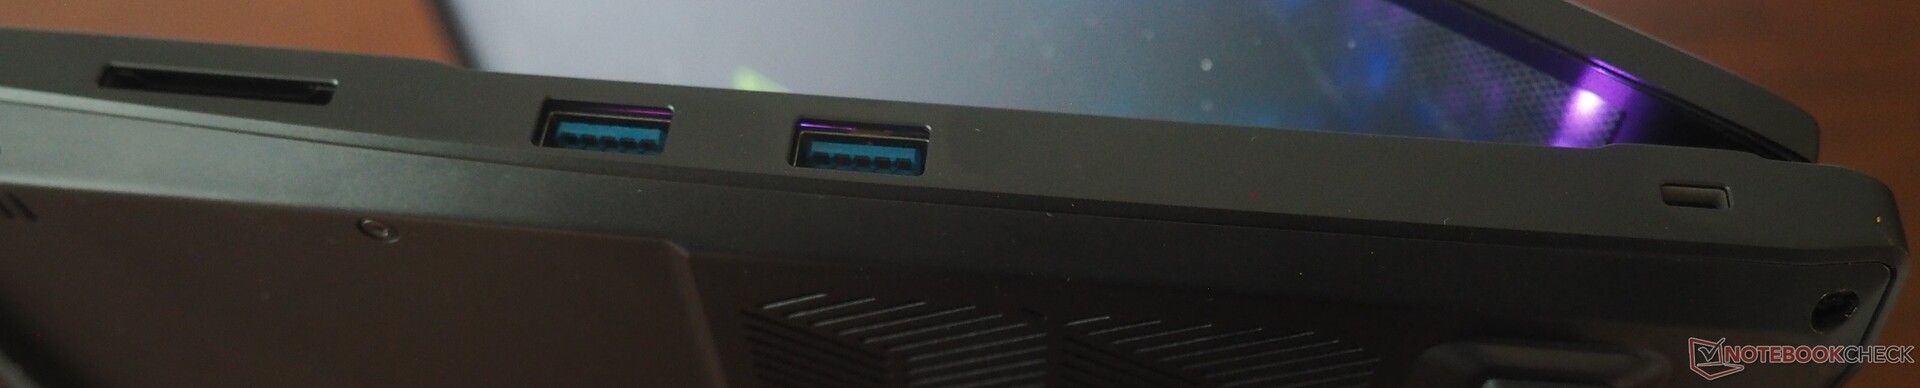
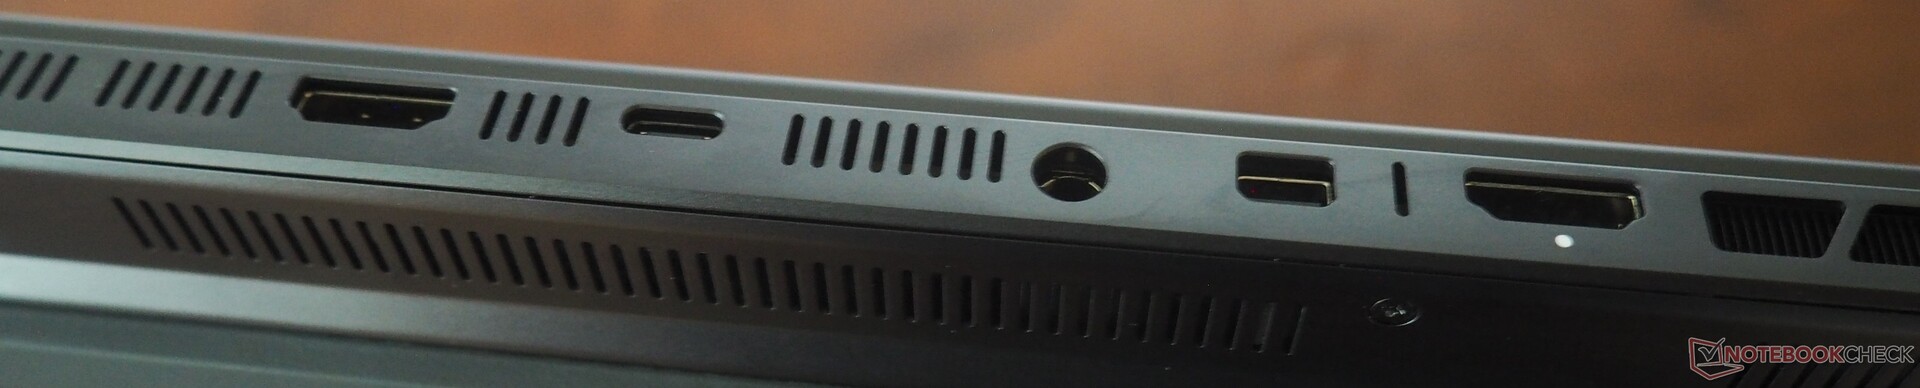
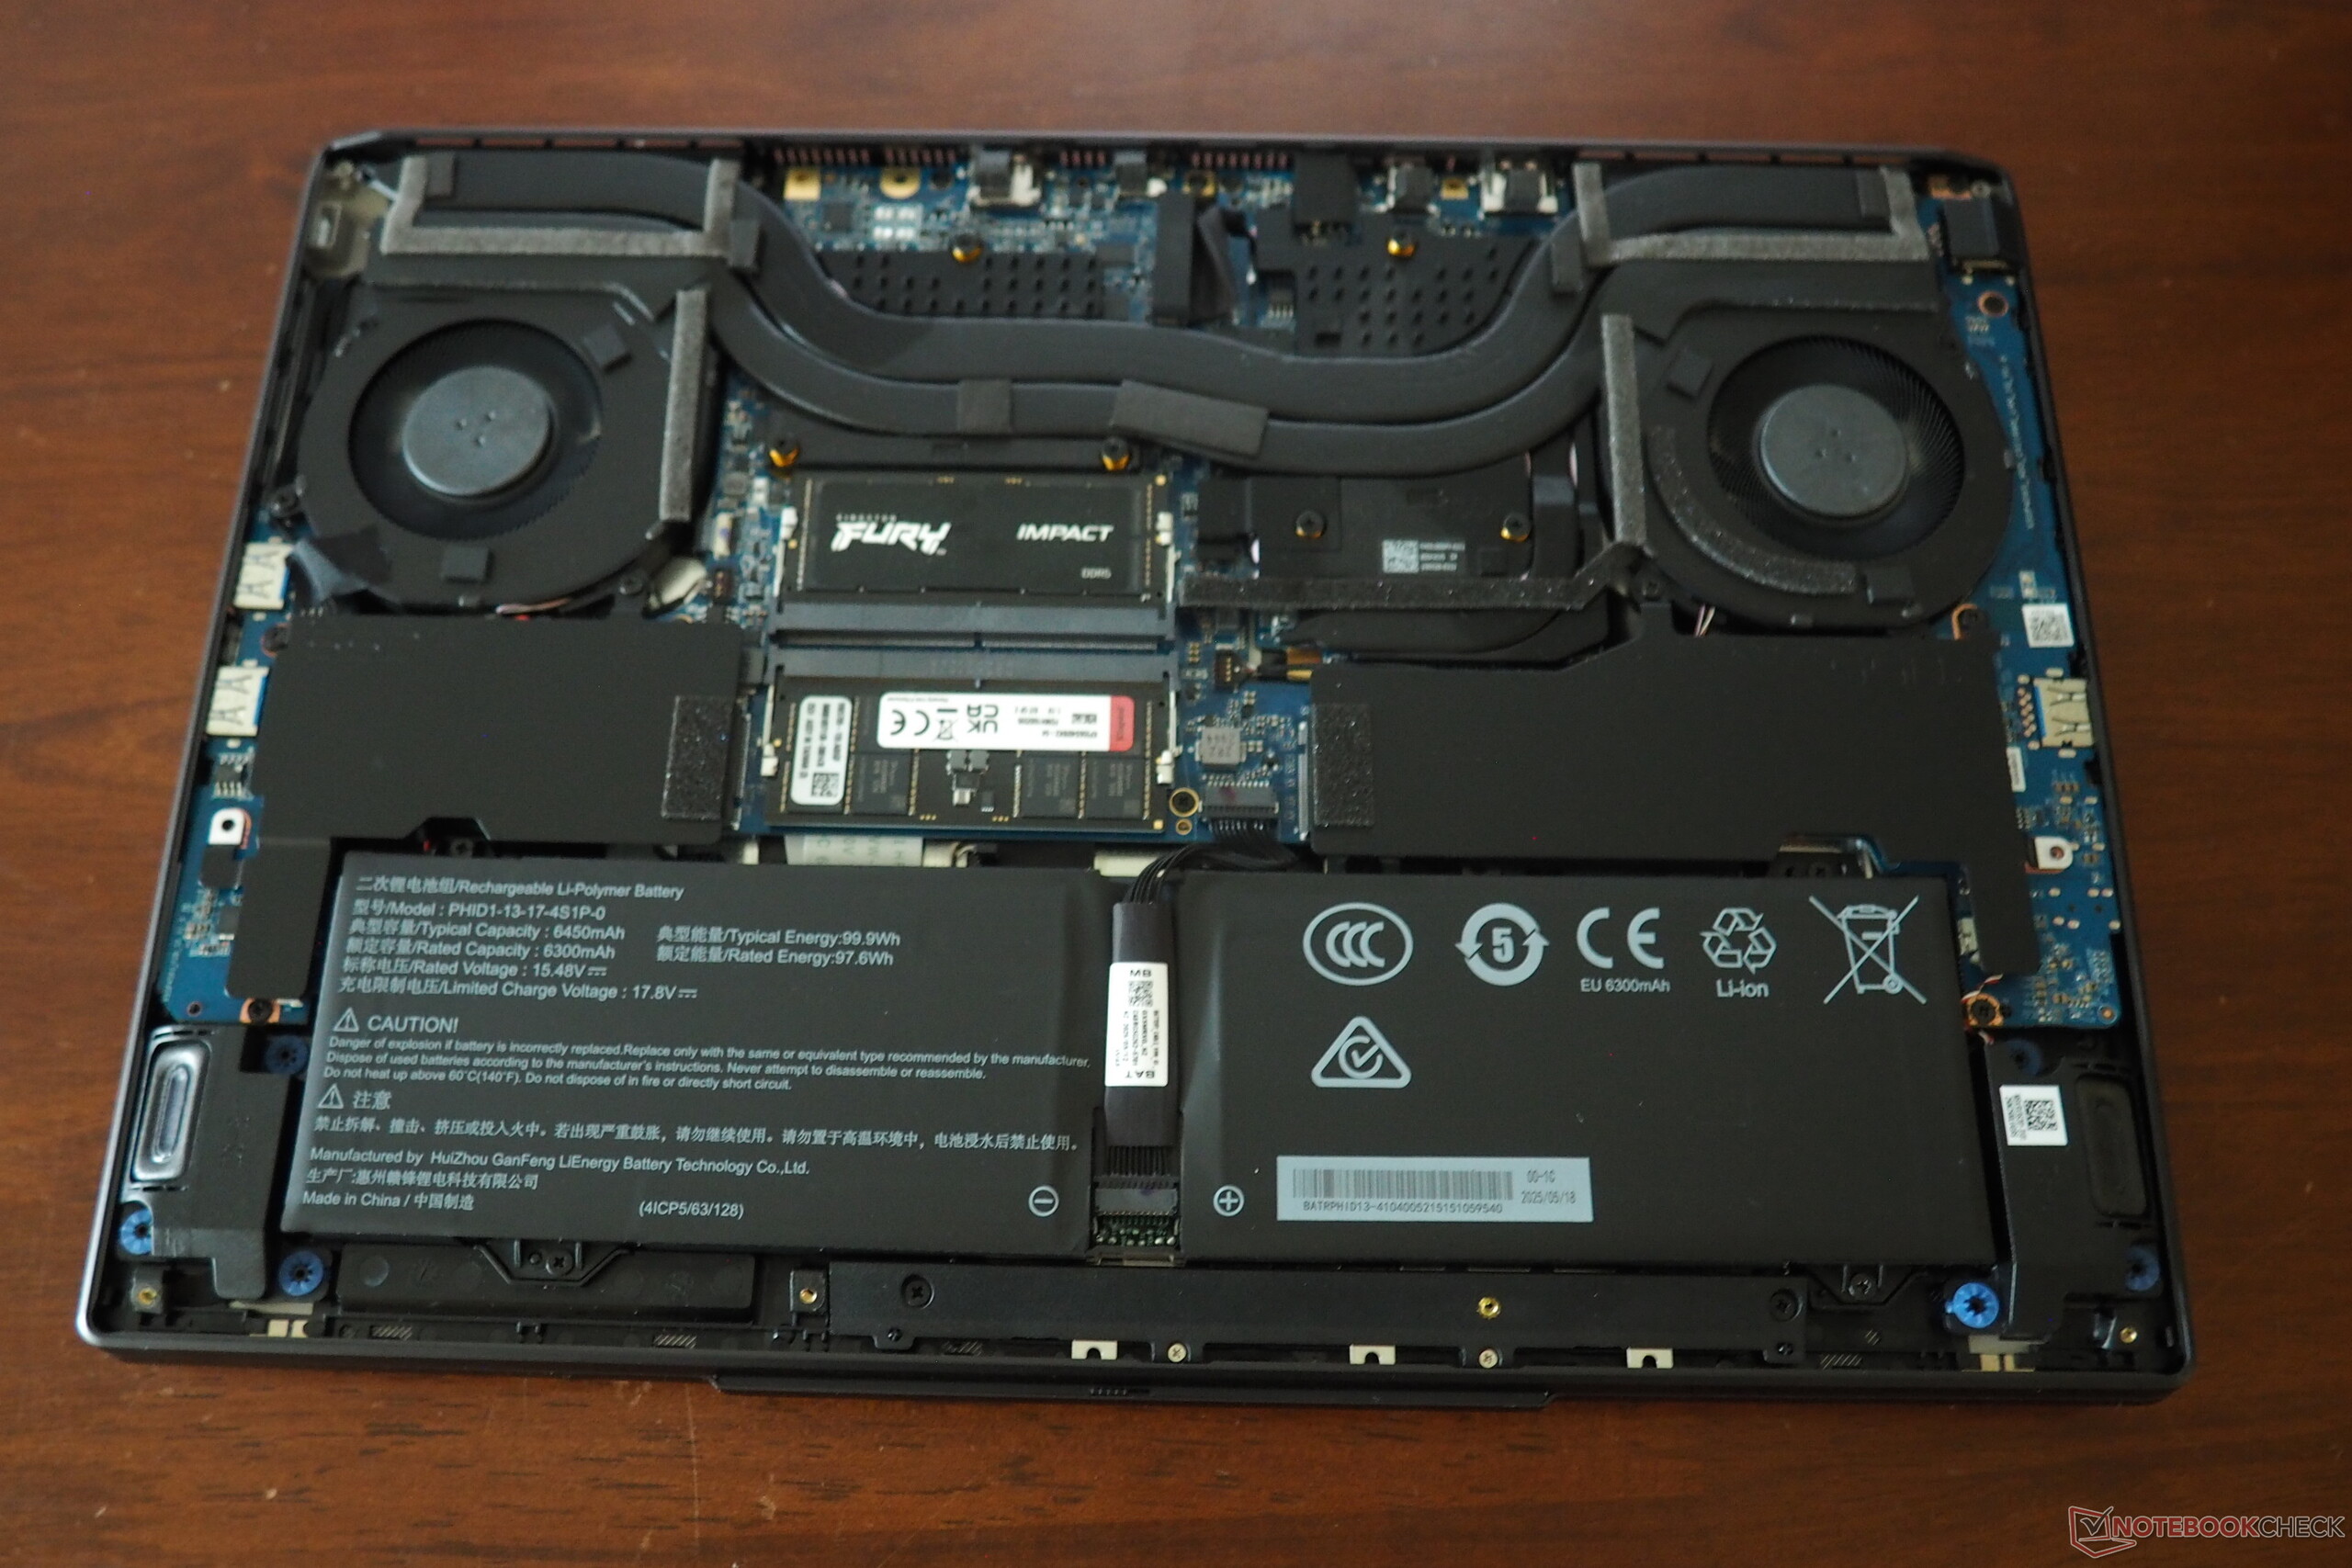
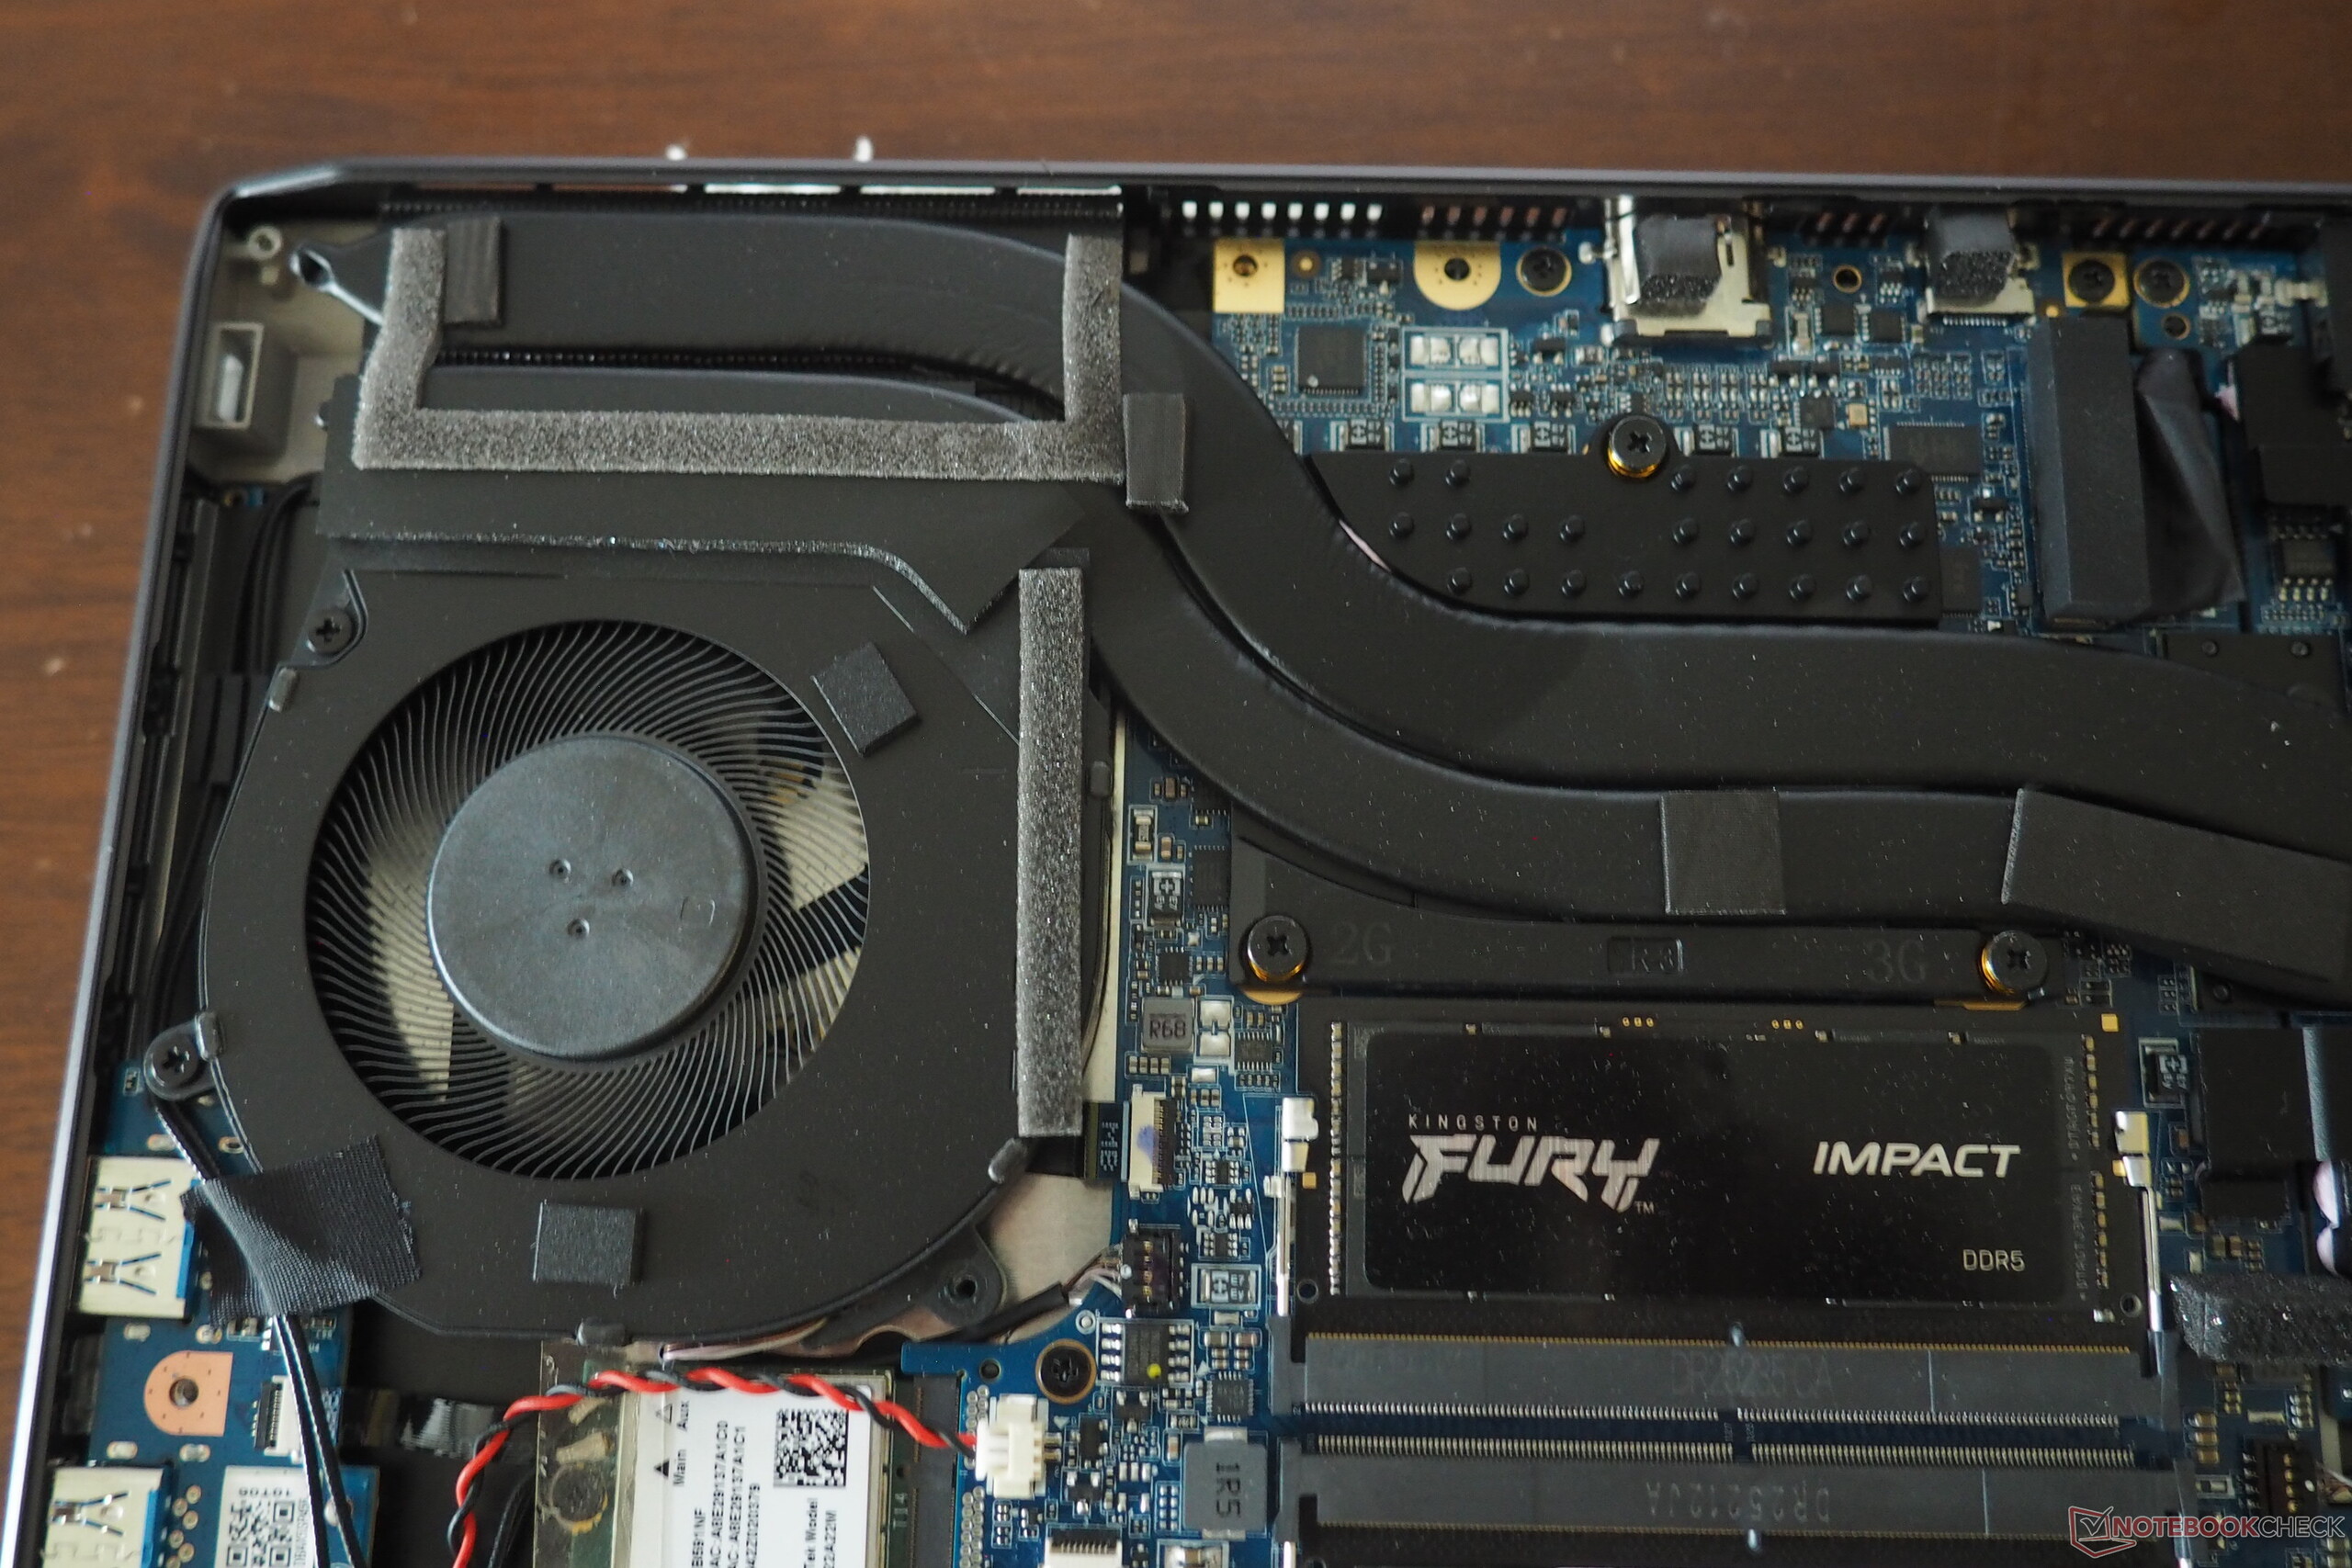
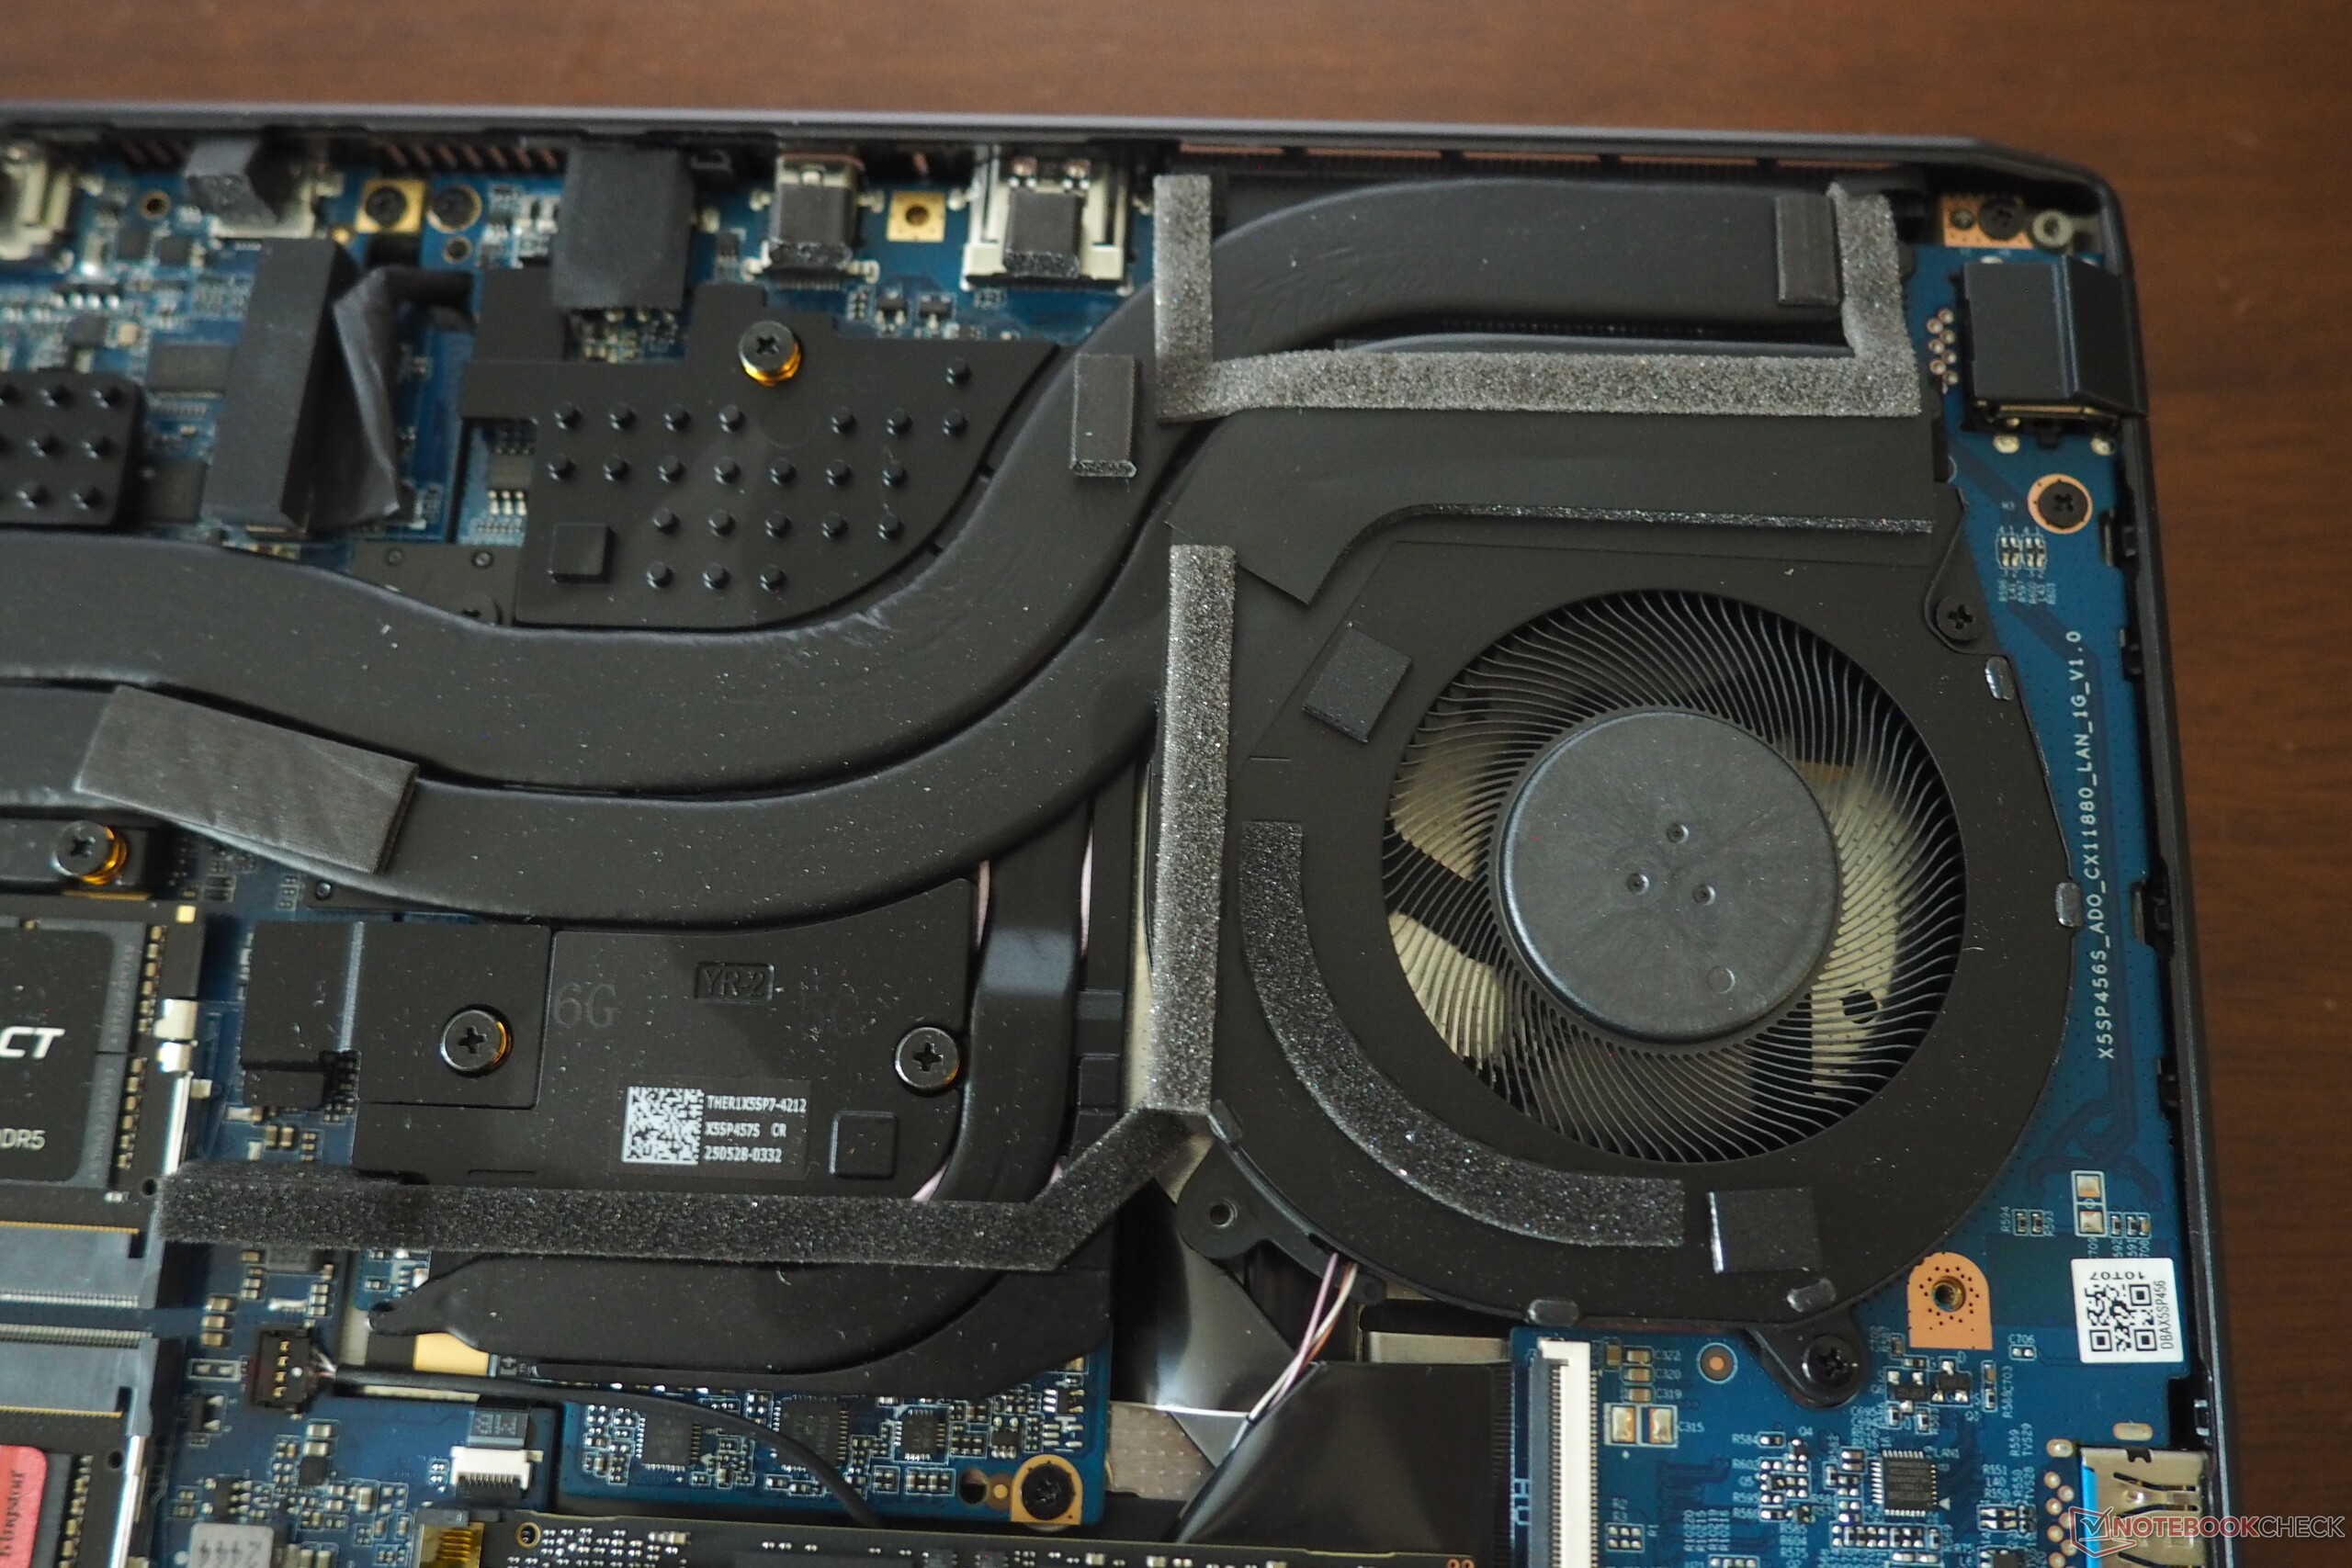
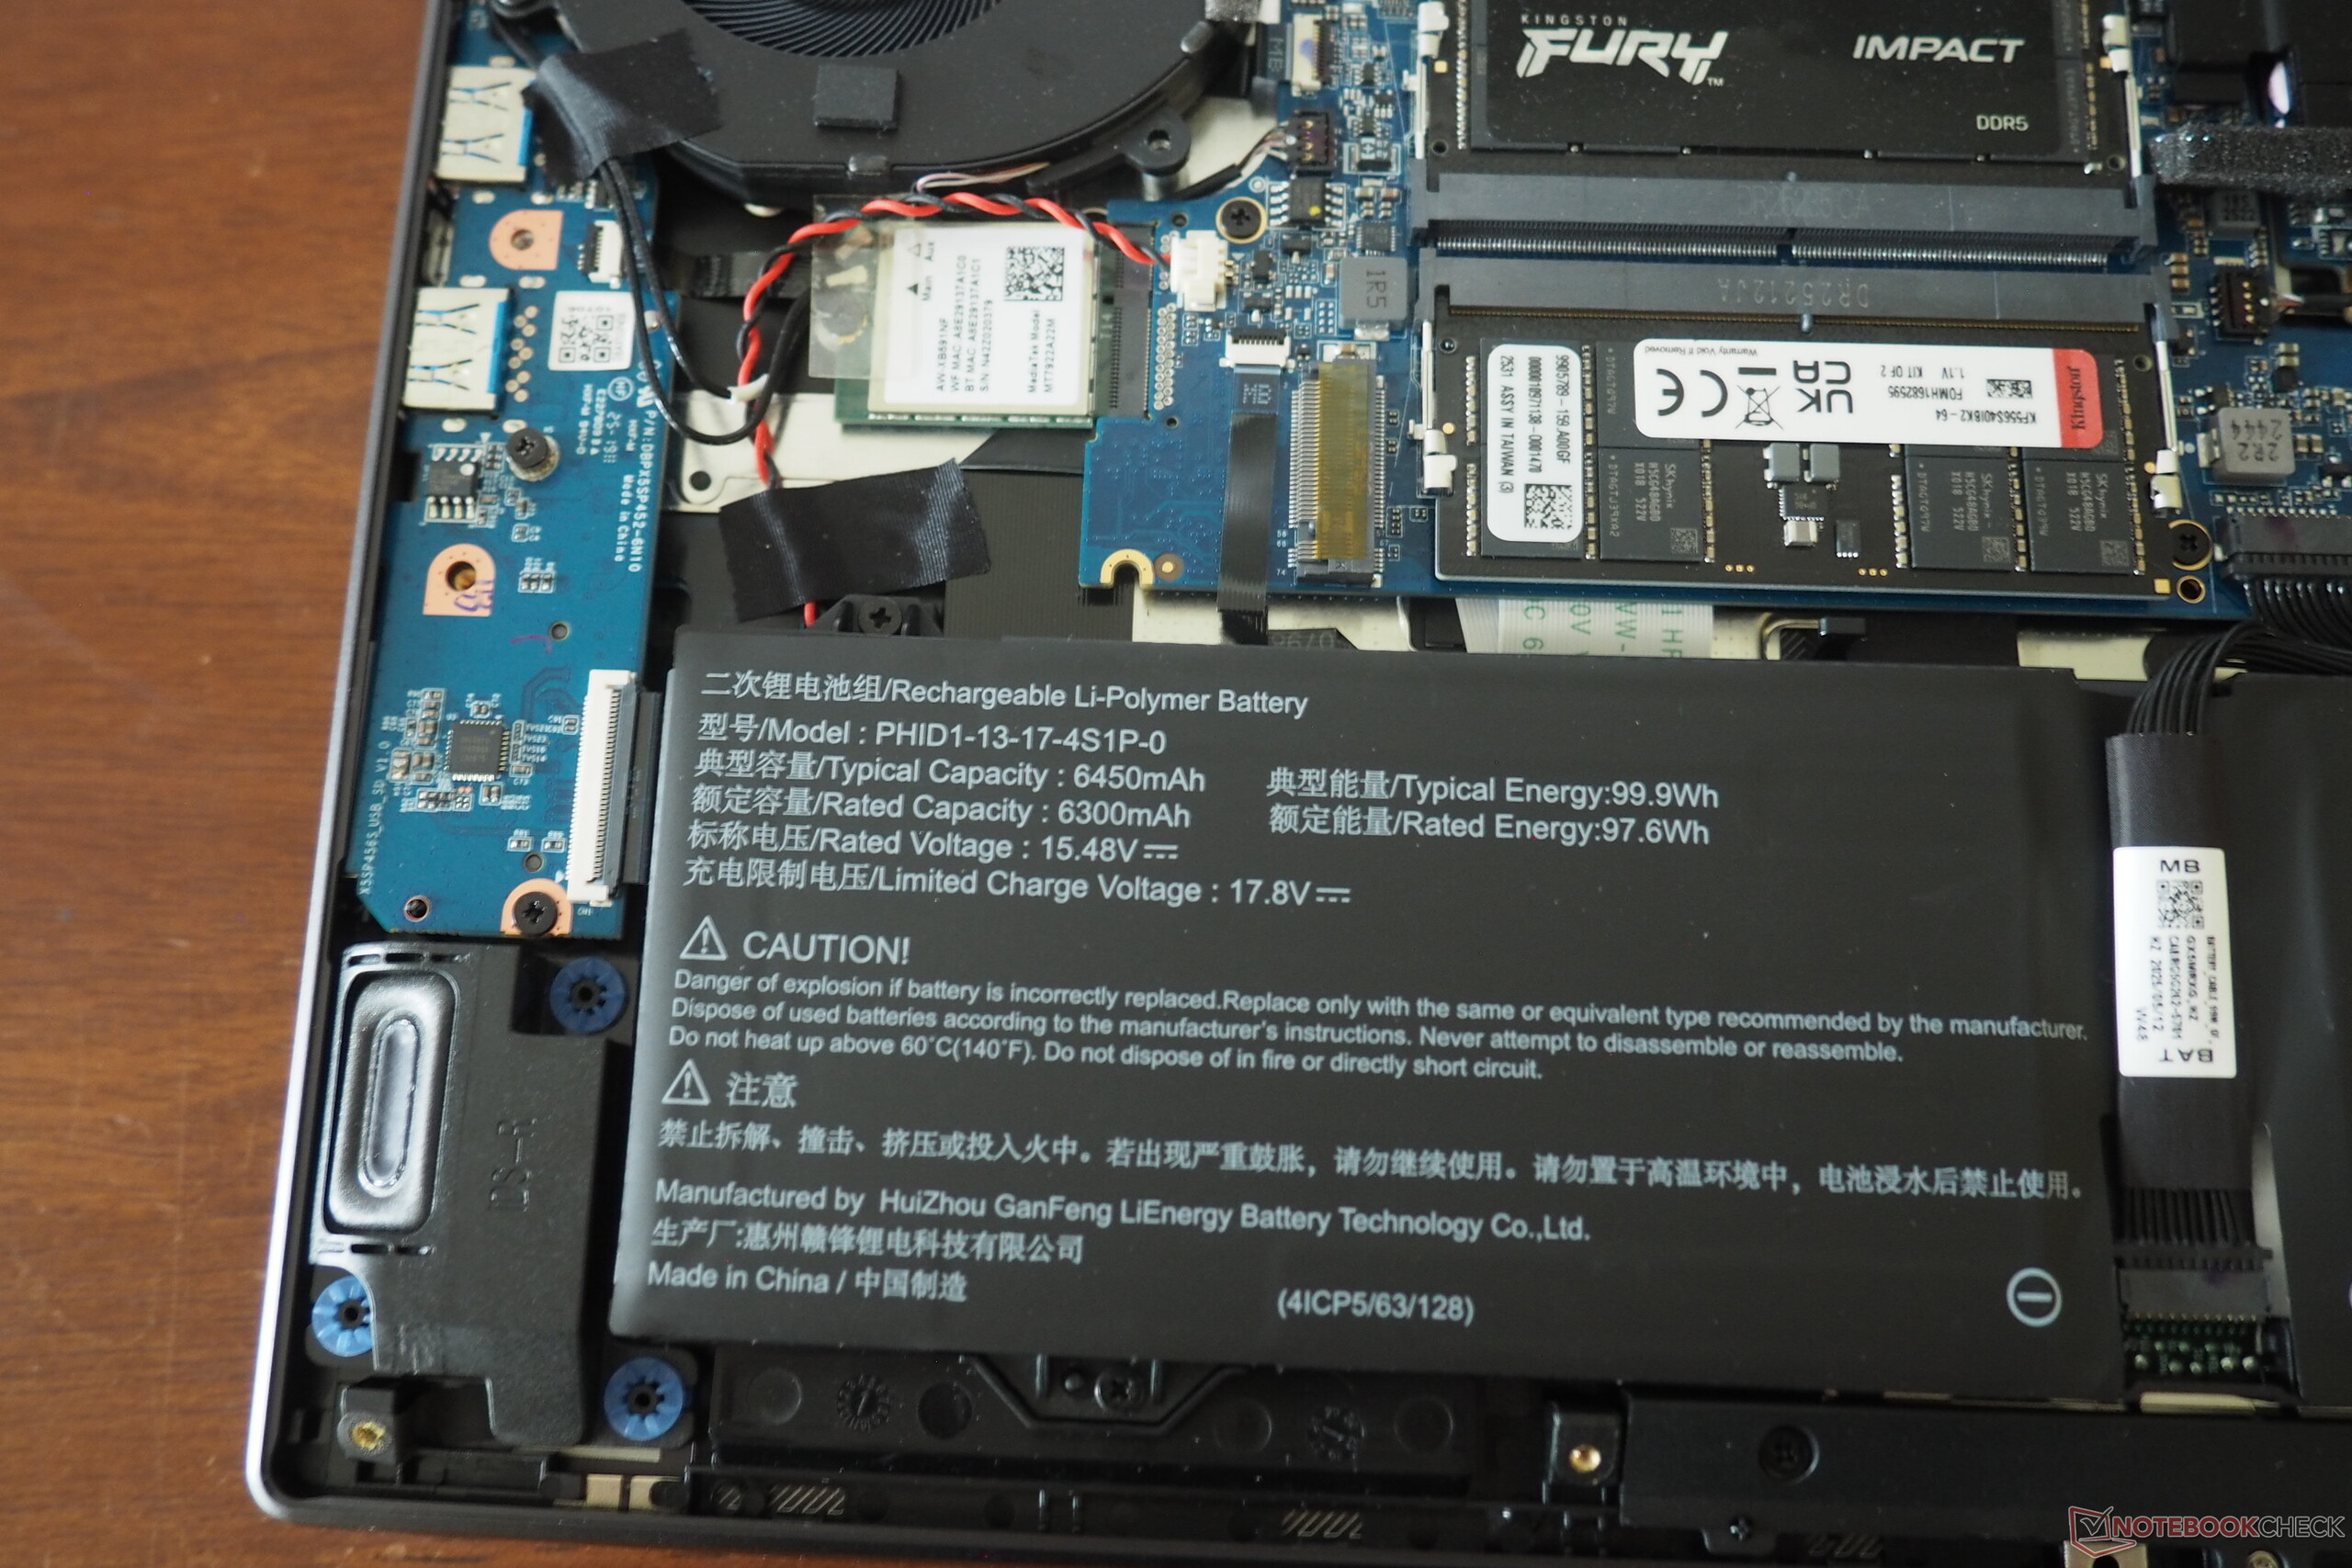
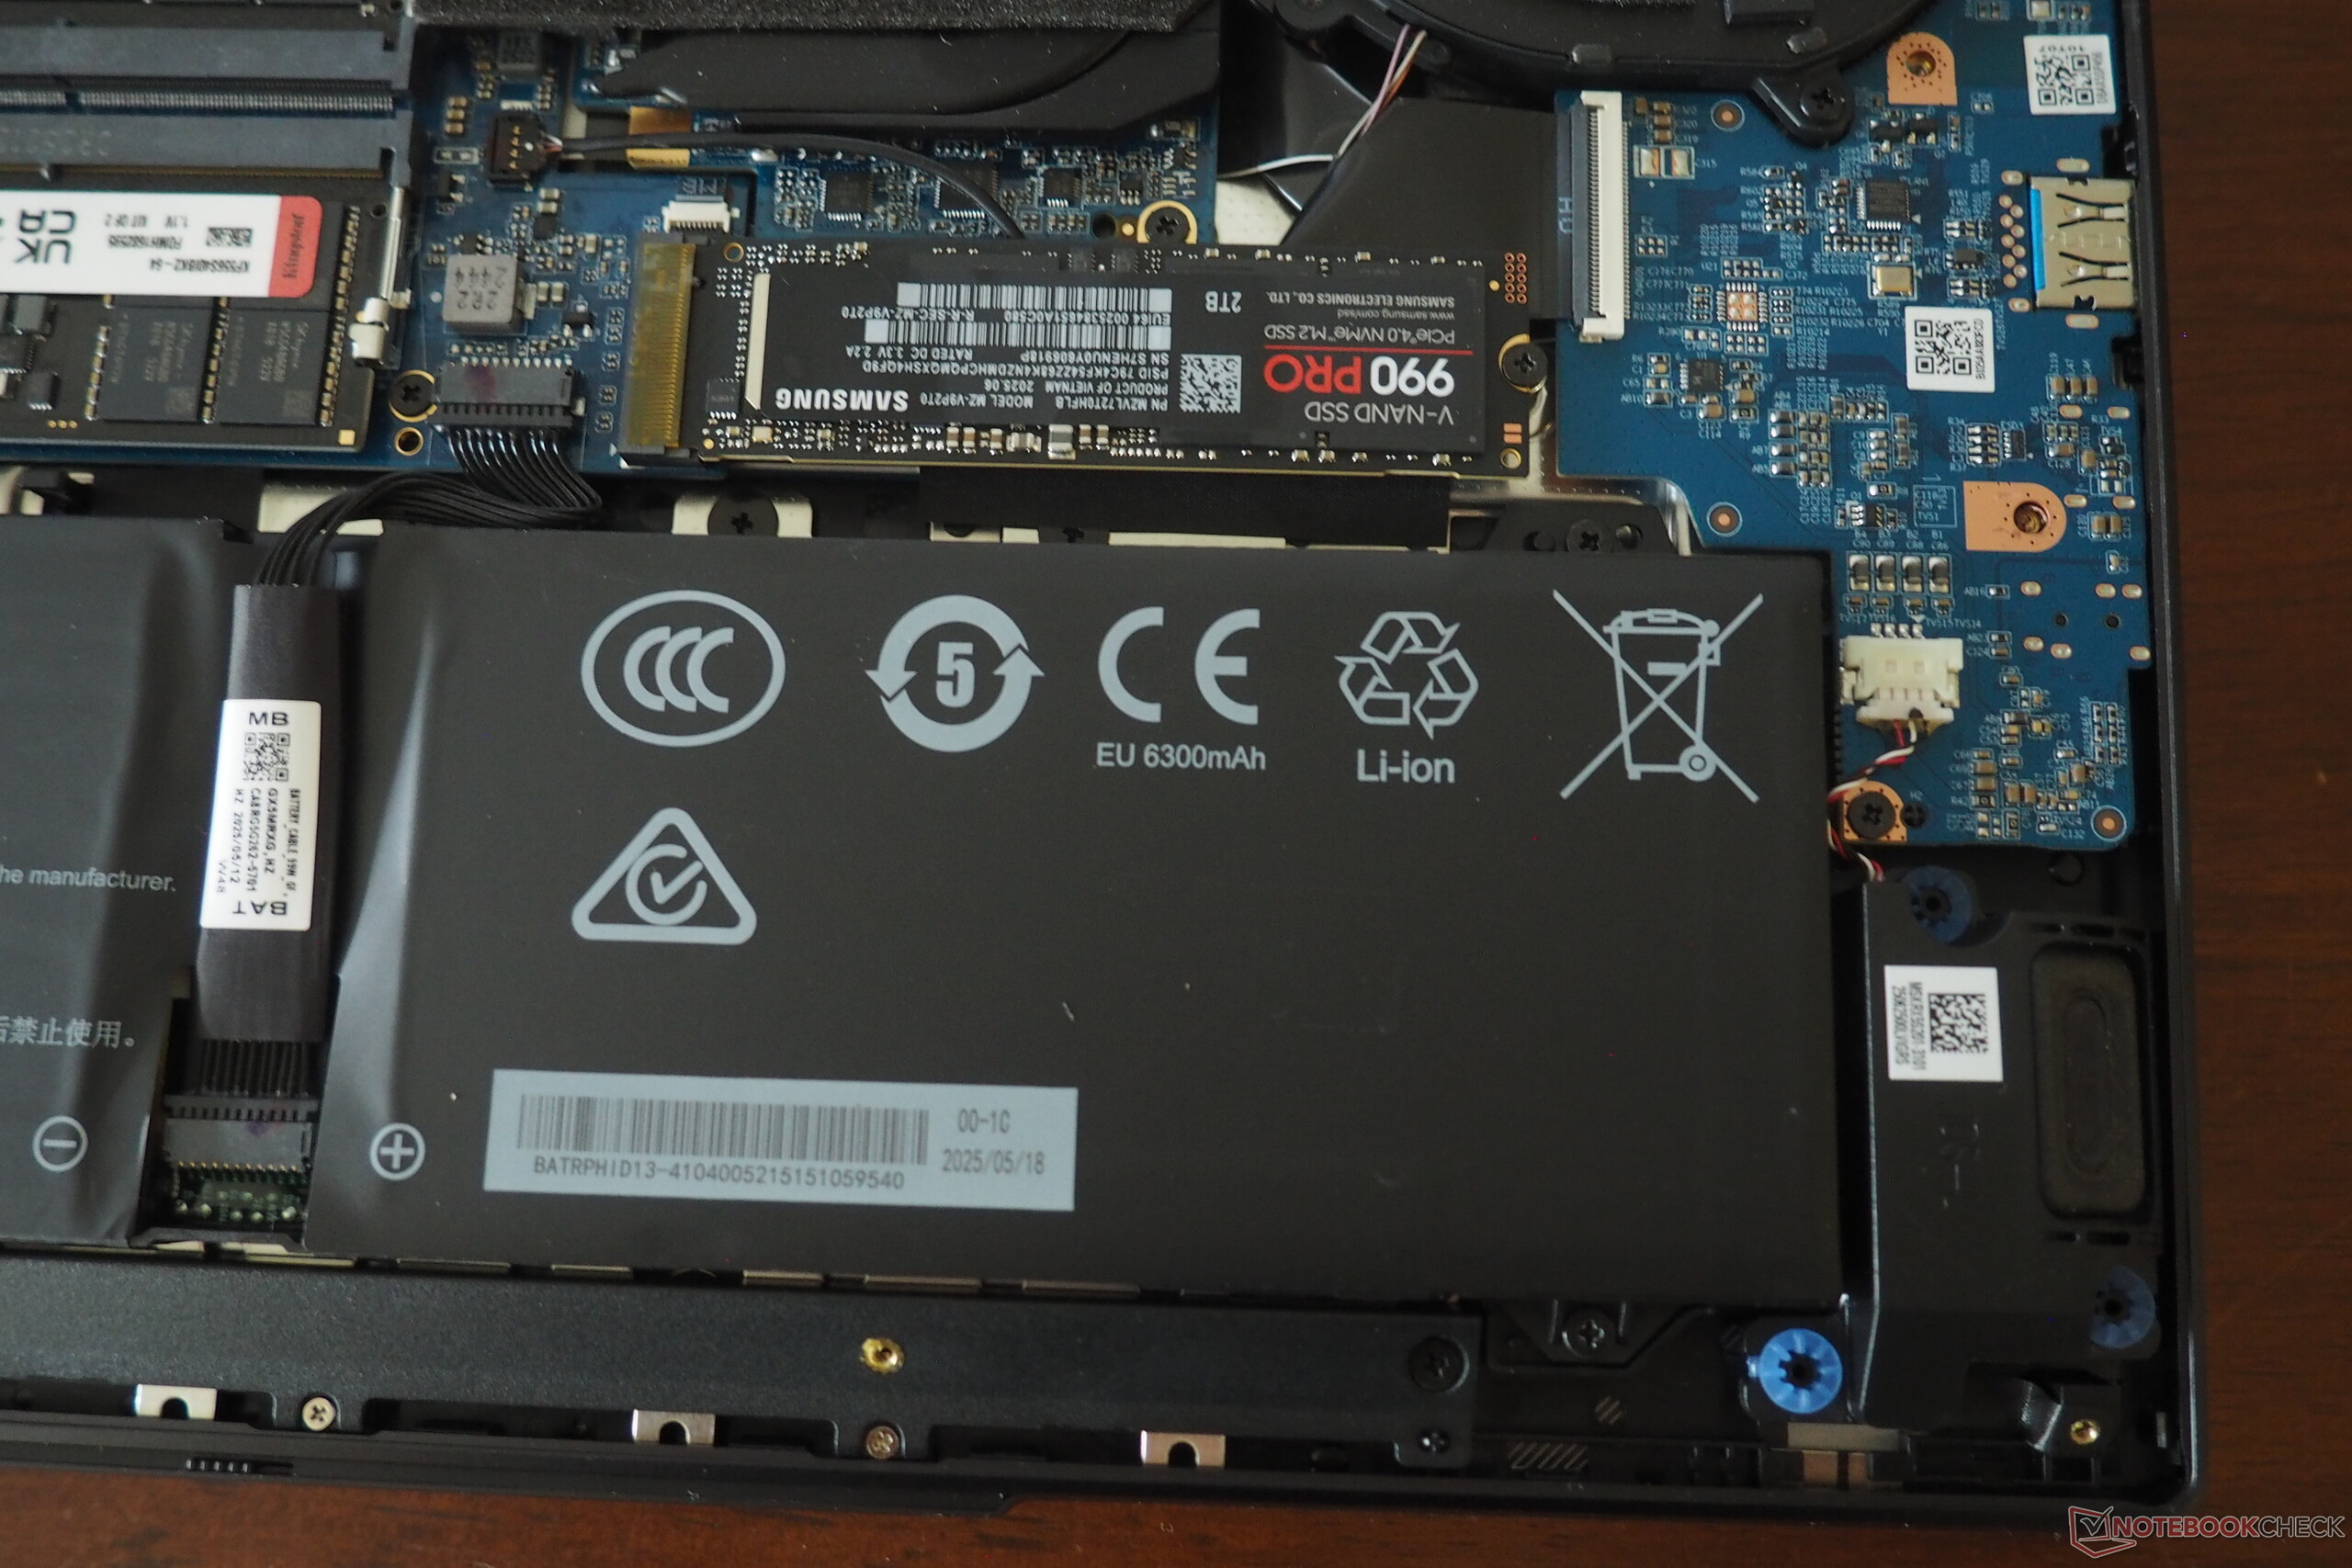
As the photos show, the connectivity is both extensive and up to date. The built-in wireless module (Wi-Fi 6E) and especially the card reader are impressively fast. The webcam (including privacy shutter) is decent and offers sharper images than some competitors thanks to its Full HD resolution. The bottom panel can be removed after loosening ten Phillips screws.
SD Card Reader
| SD Card Reader - average JPG Copy Test (av. of 3 runs) | |
| Schenker XMG Core 15 (M25) (AV PRO microSD 128 GB V60) | |
| Average of class Gaming (20.9 - 210, n=54, last 2 years) | |
| Lenovo Yoga Pro 9 16IAH G10 RTX 5060 (Angelbird AV Pro V60) | |
| Schenker XMG Core 15 (M24) | |
Communication
Webcam

 GeForce RTX 5060 Laptop, Ryzen AI 7 350, Samsung 990 Pro 2 TB MZVL72T0HDLB")
 GeForce RTX 5060 Laptop, Ryzen AI 7 350, Samsung 990 Pro 2 TB MZVL72T0HDLB")
Maintenance
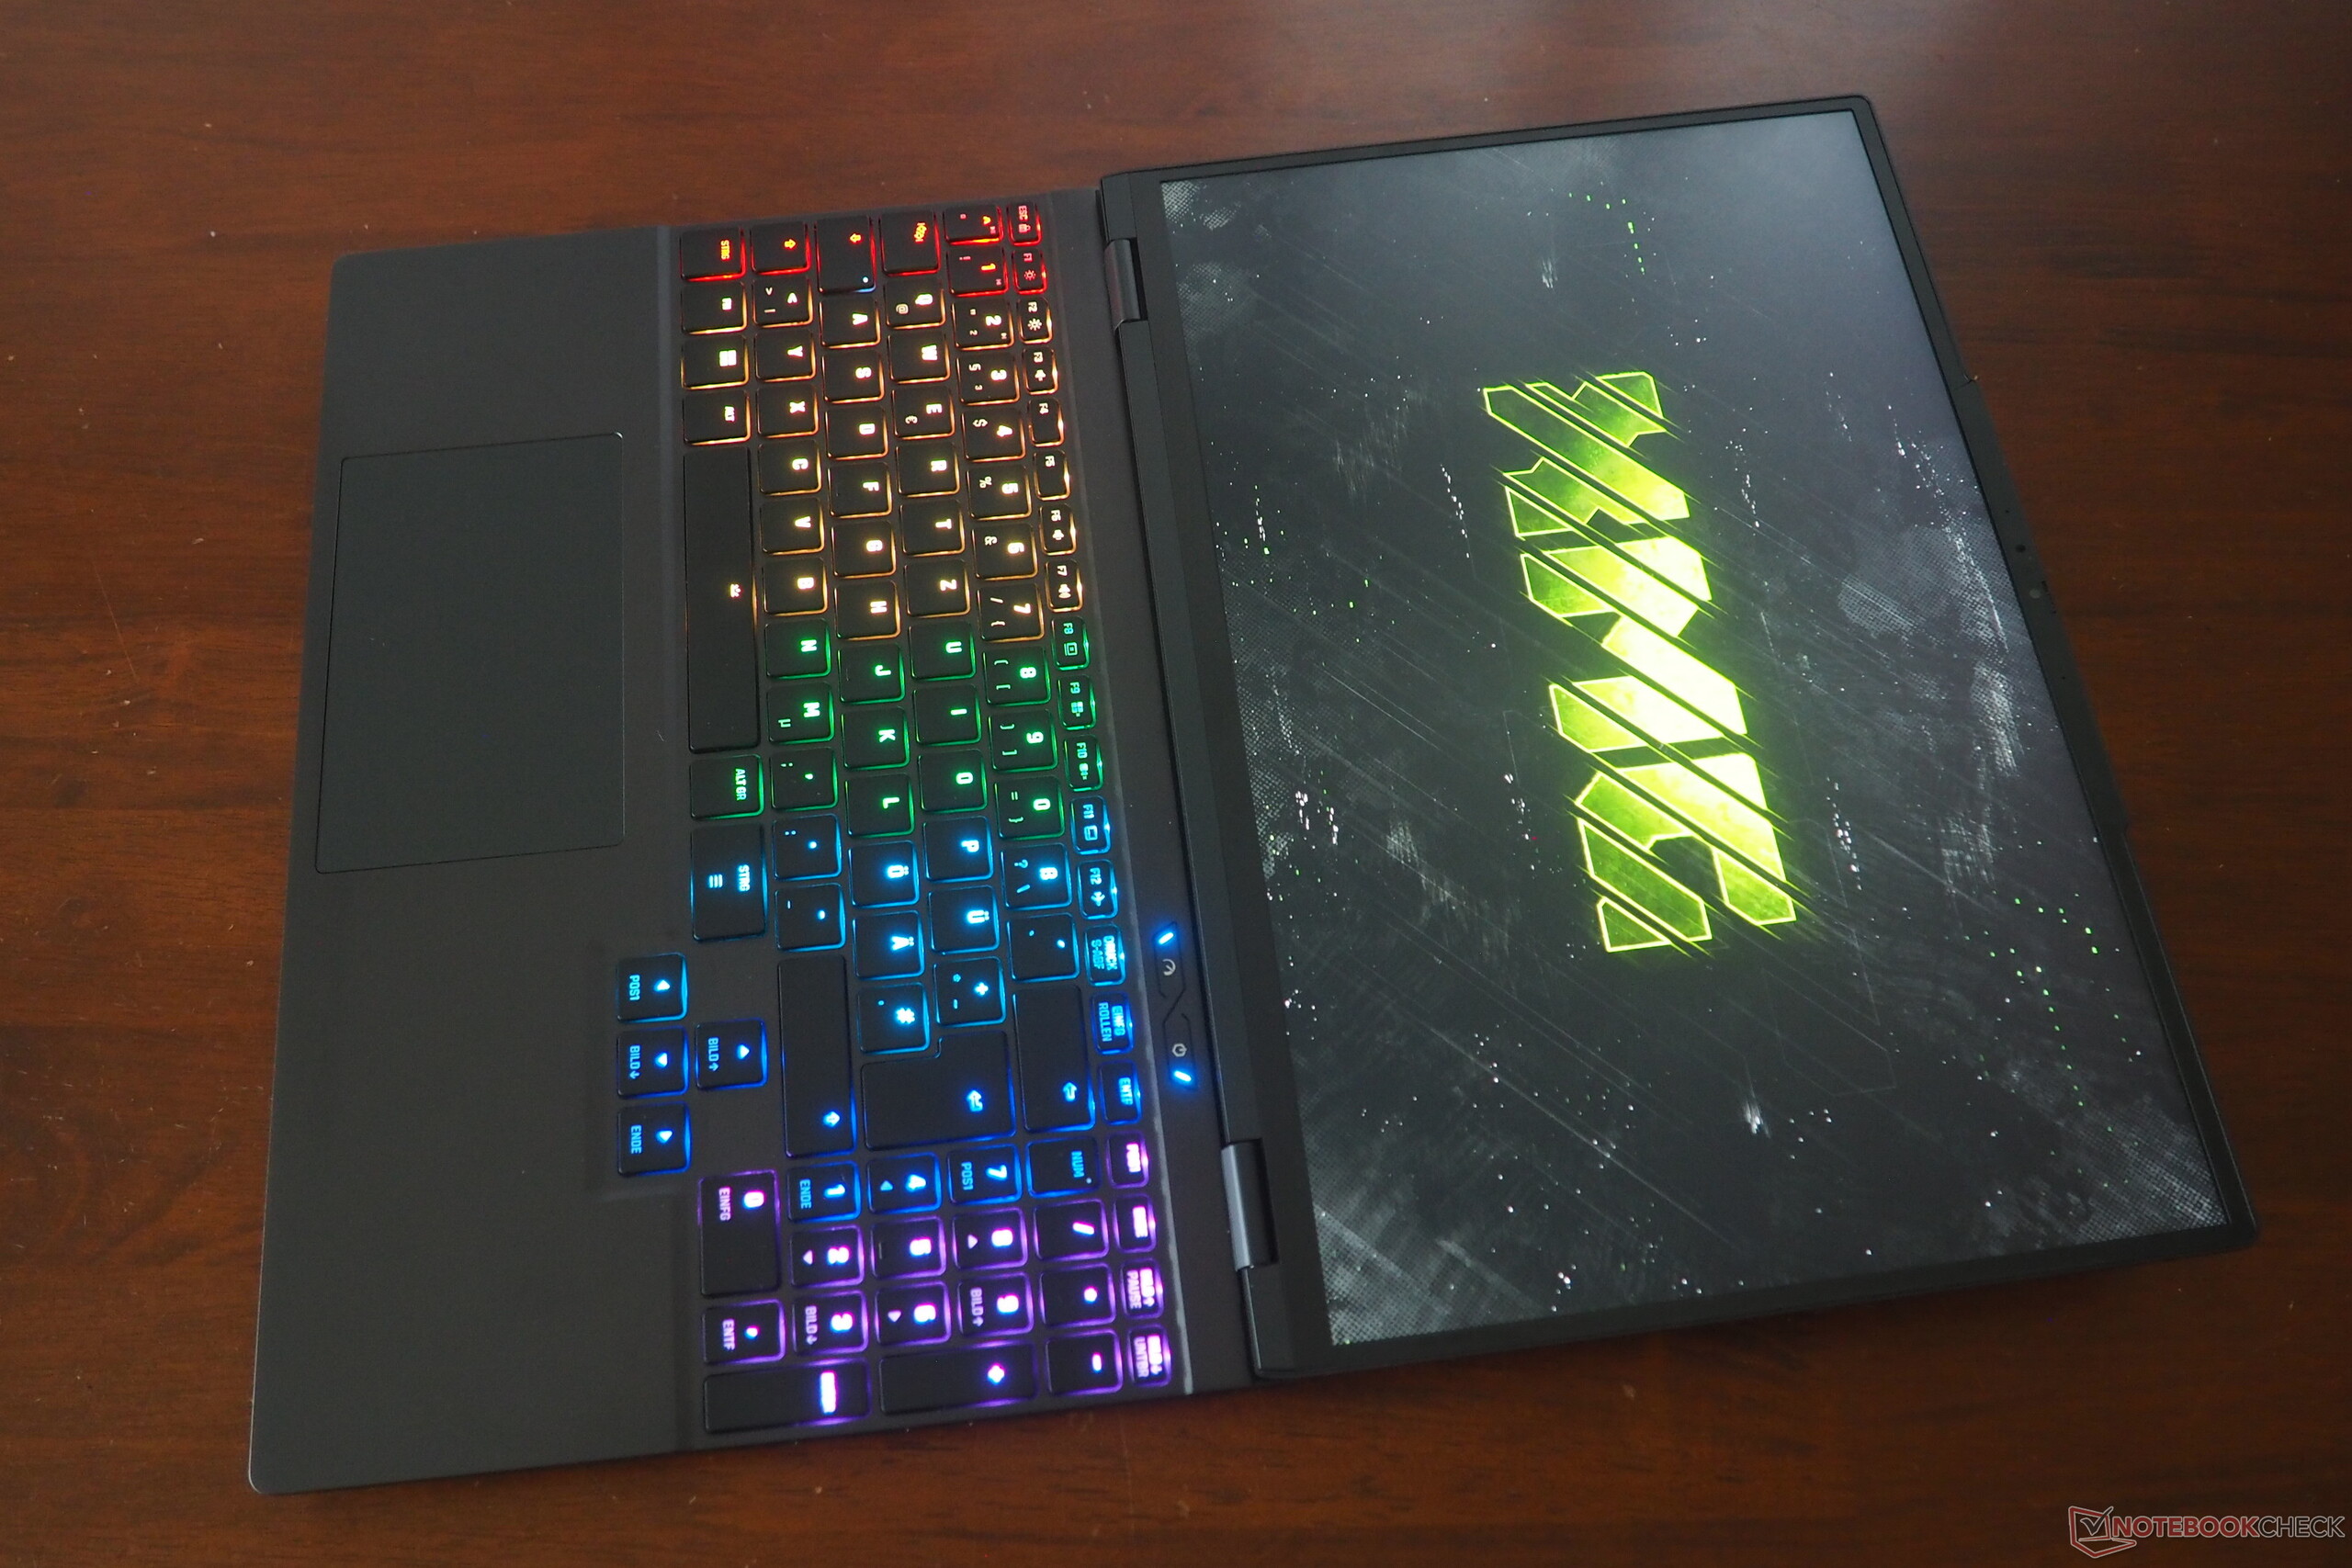
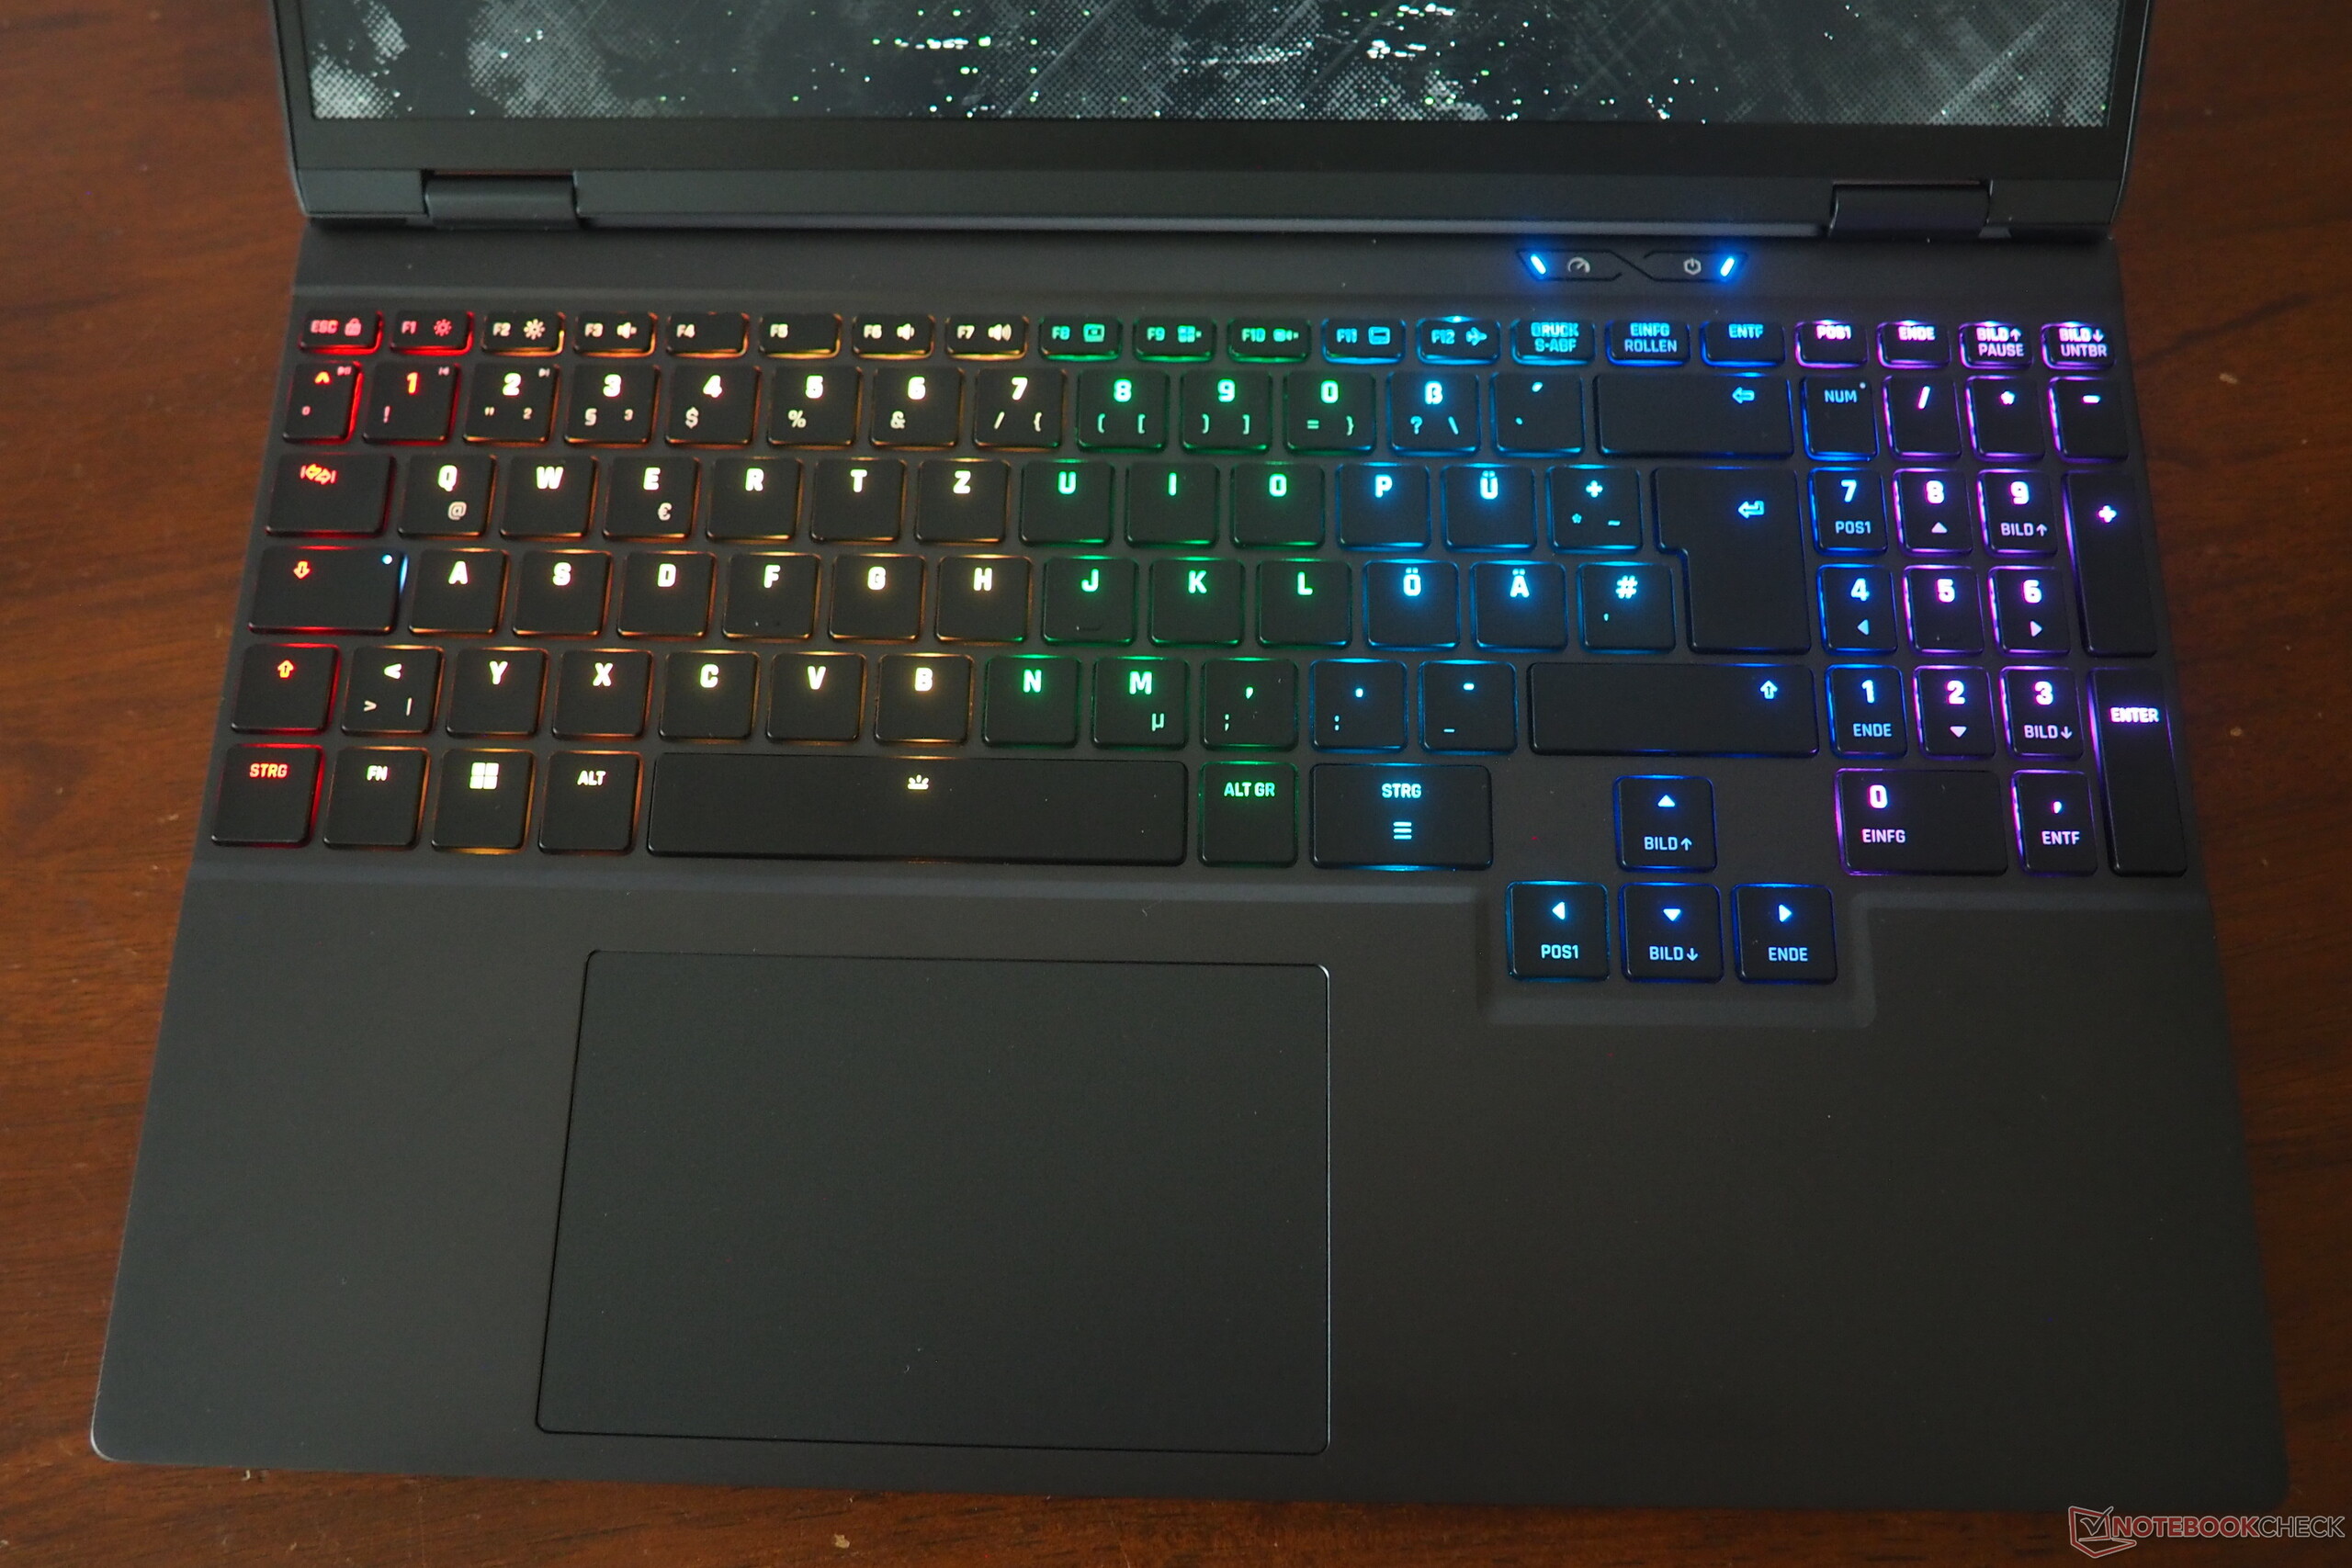
Input devices
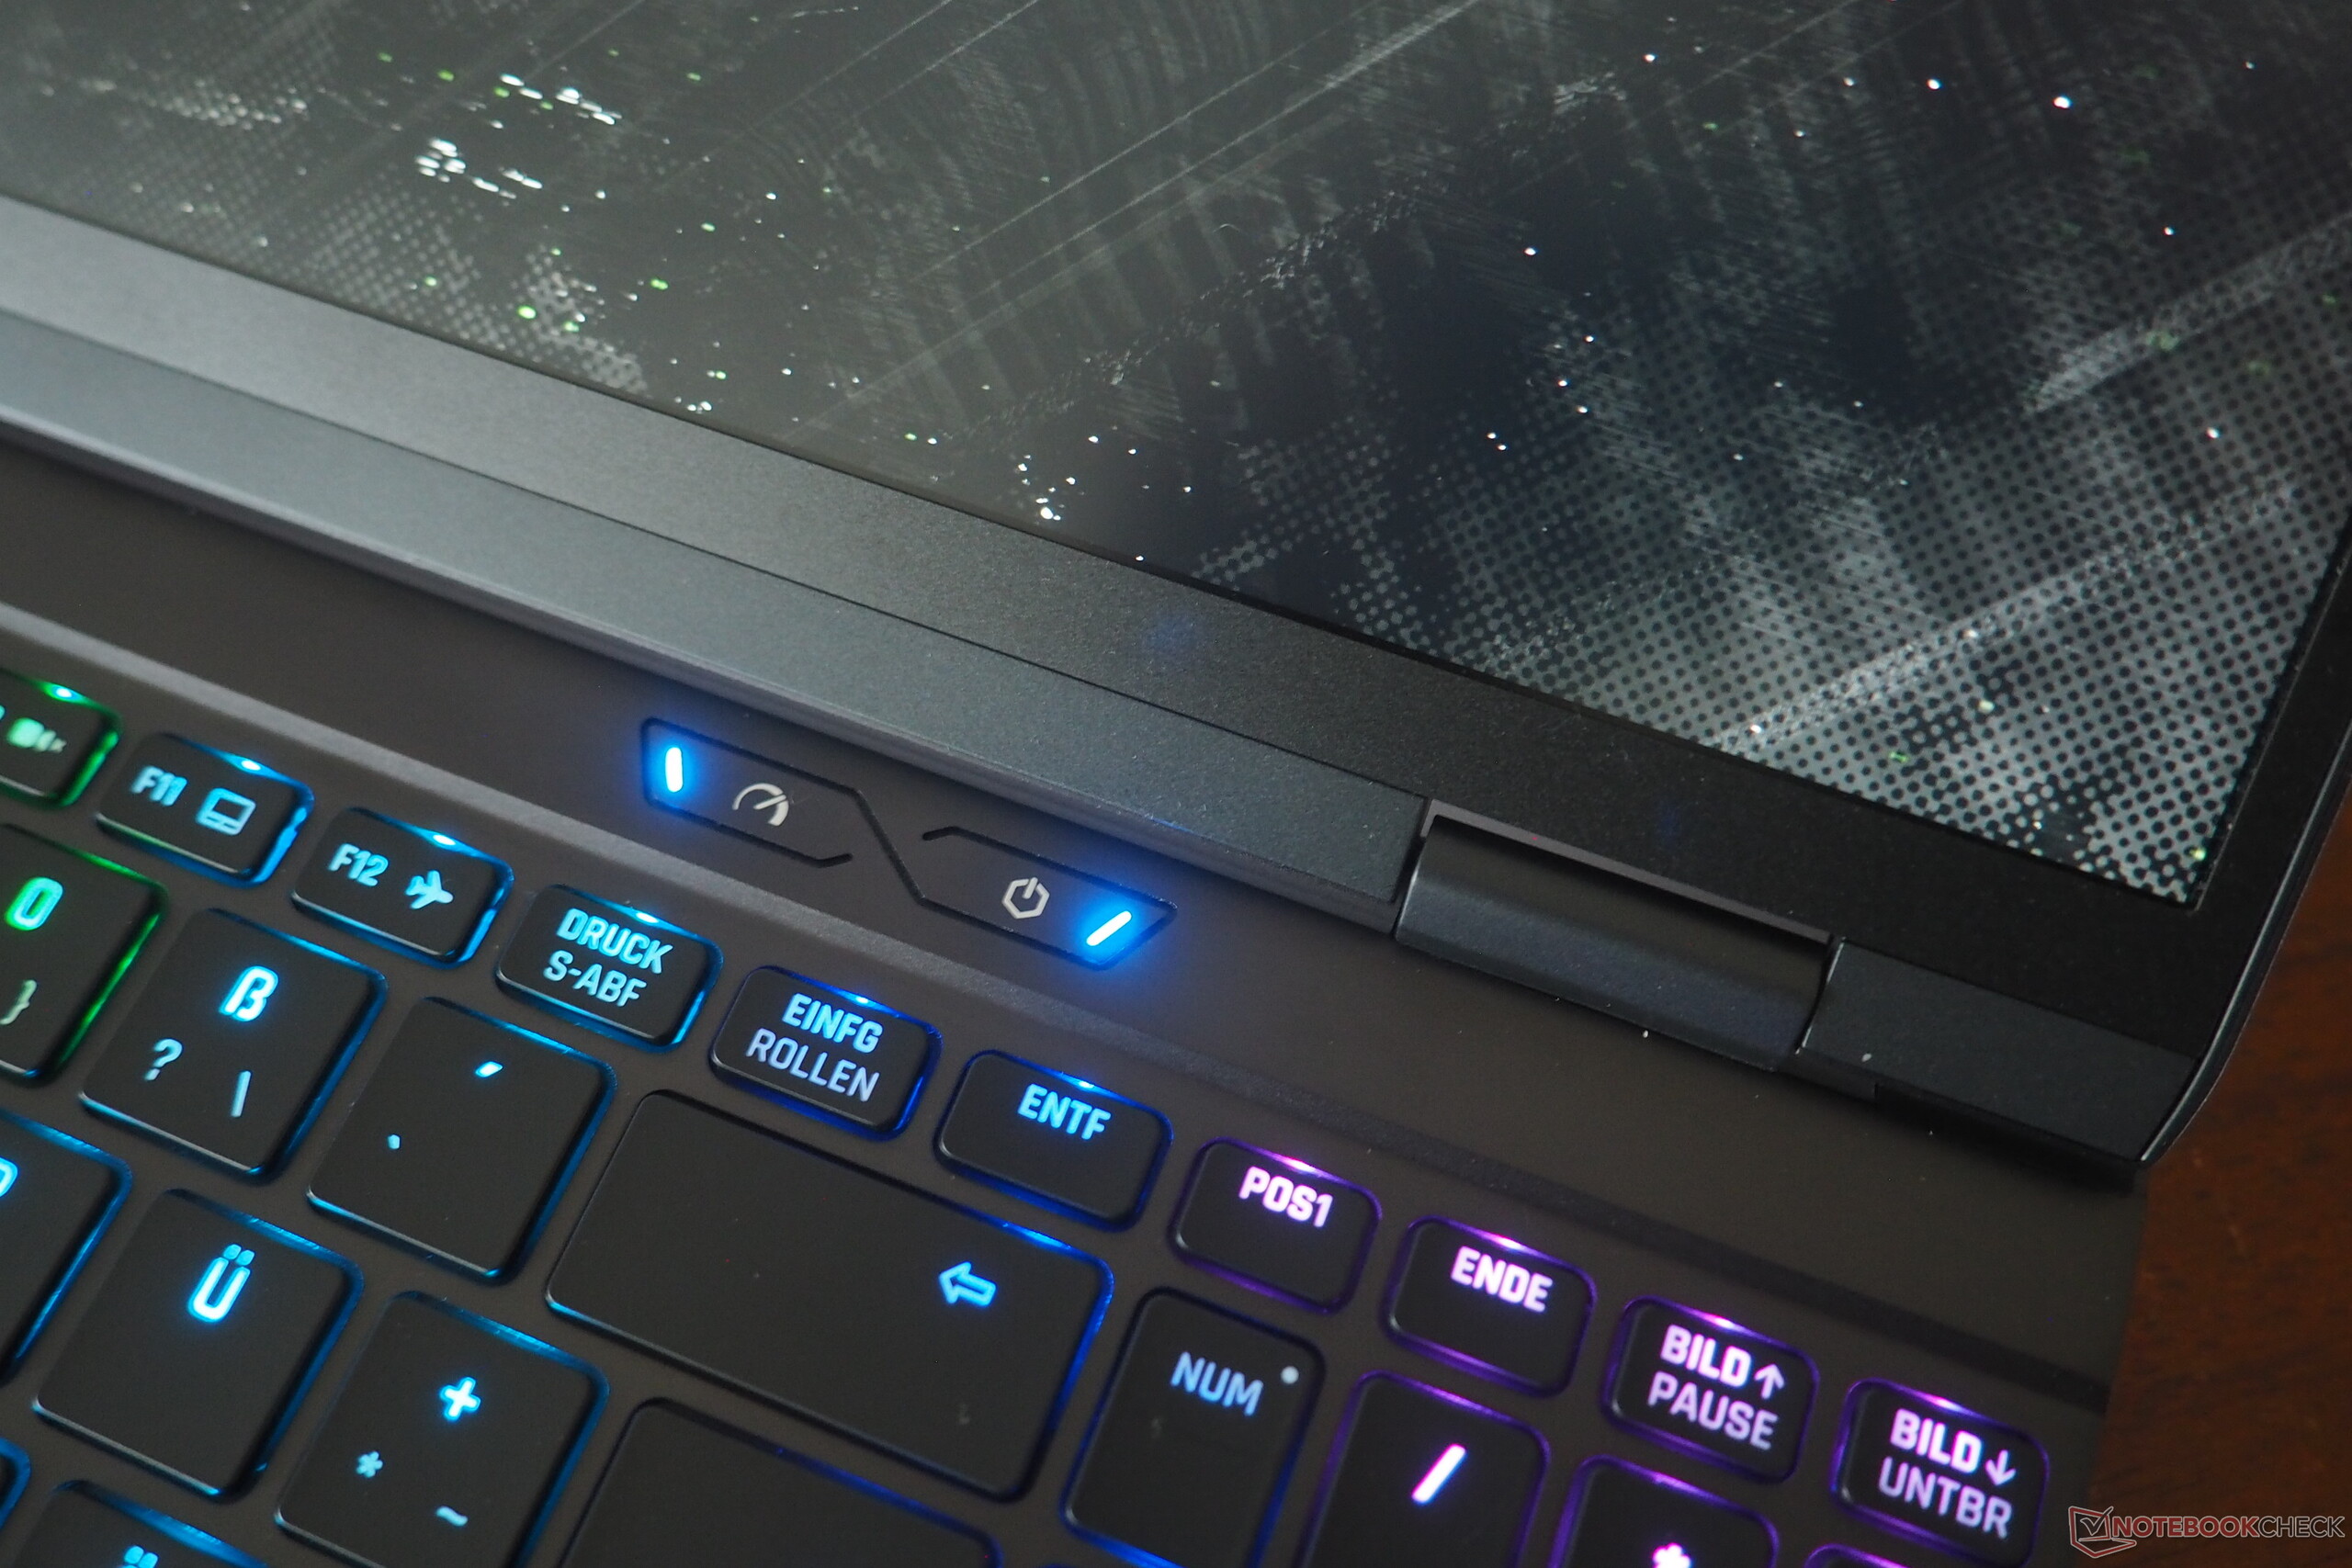
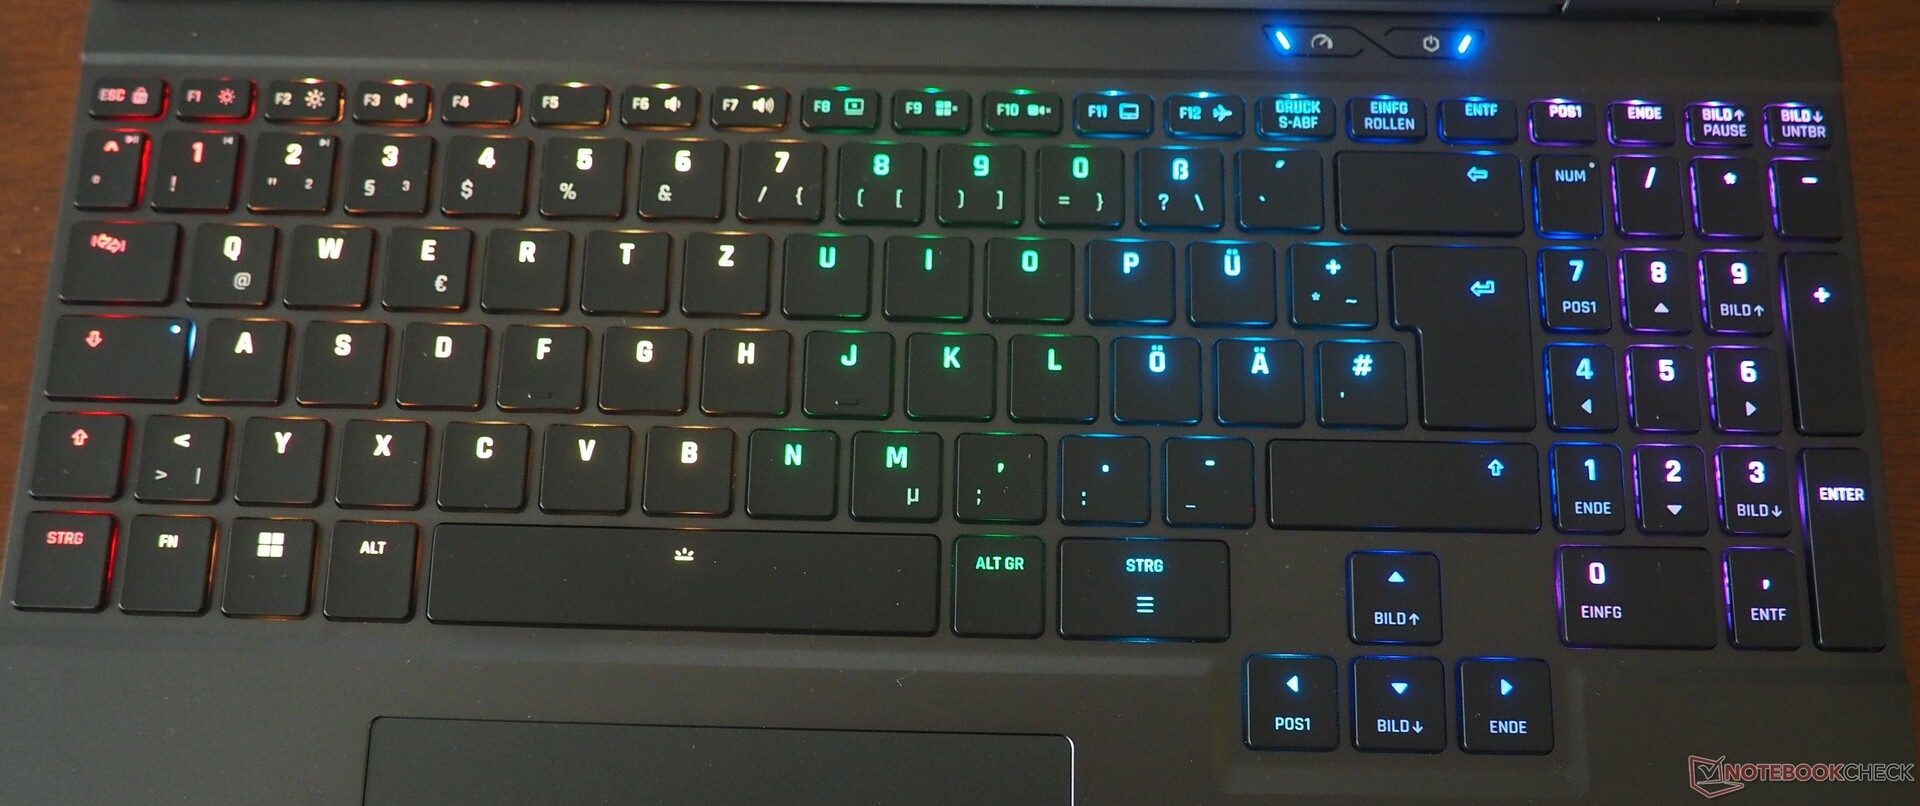
The input devices perform well. The keyboard impresses with its bright, adjustable RGB lighting, well-designed layout, and generously sized arrow keys. The touchpad is pleasantly smooth and precise, measuring a sizable 12.3 by 7.6 cm.
Display
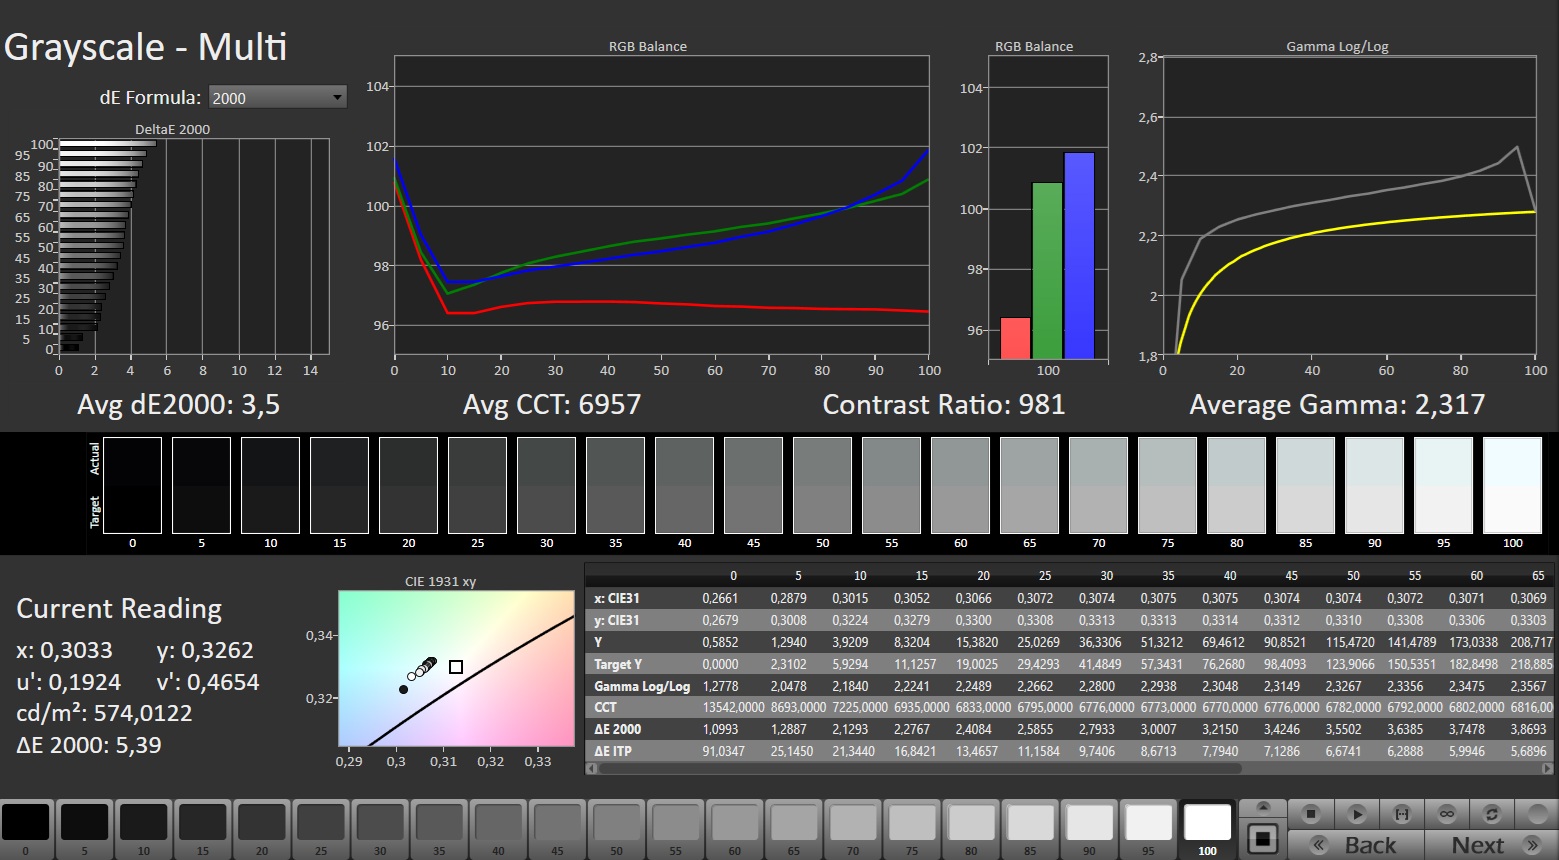
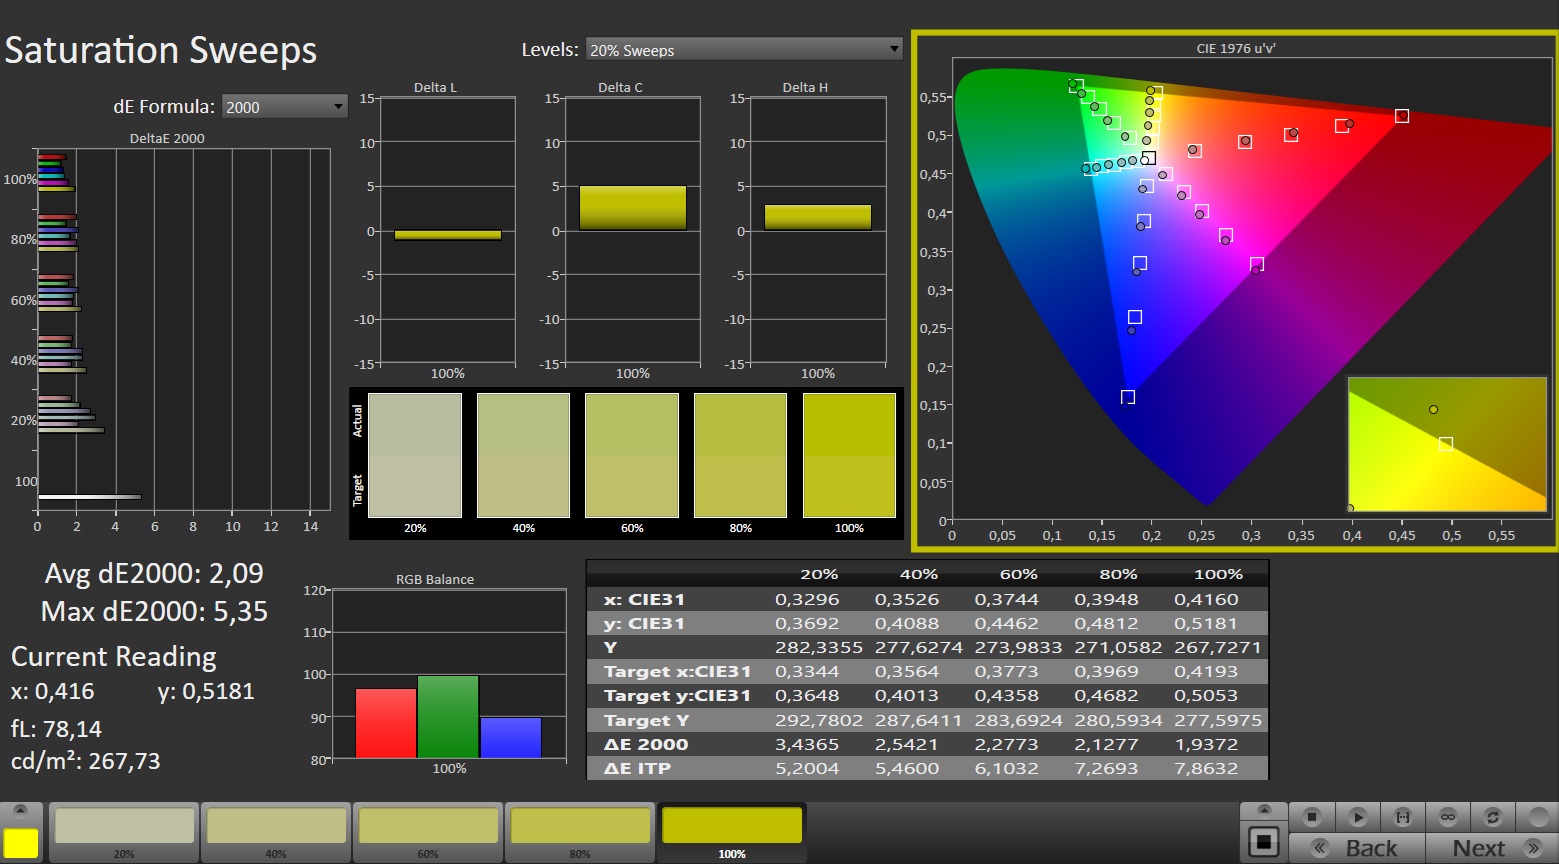
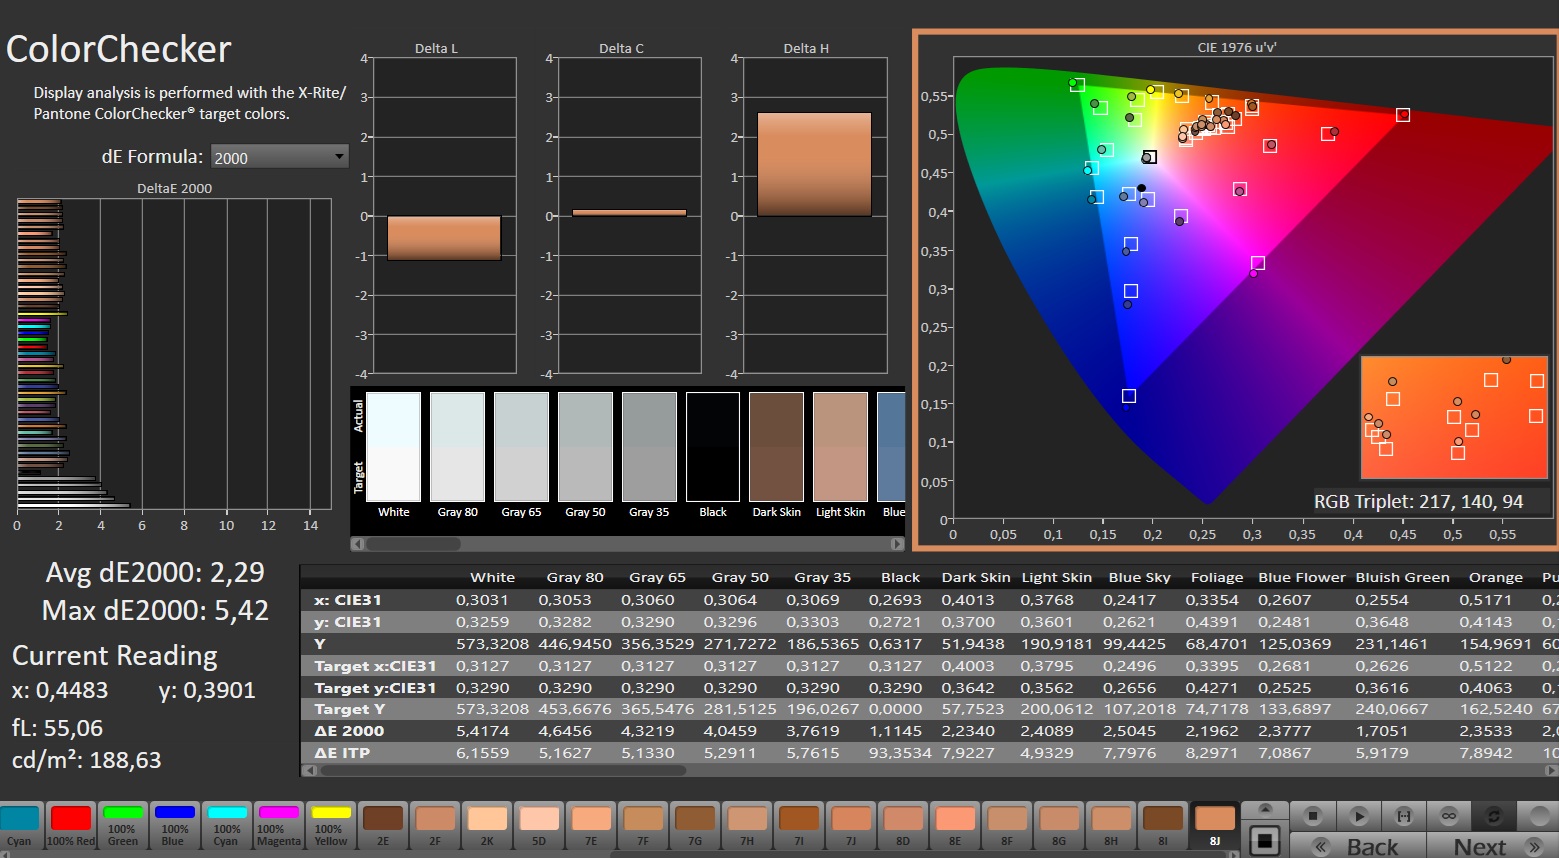
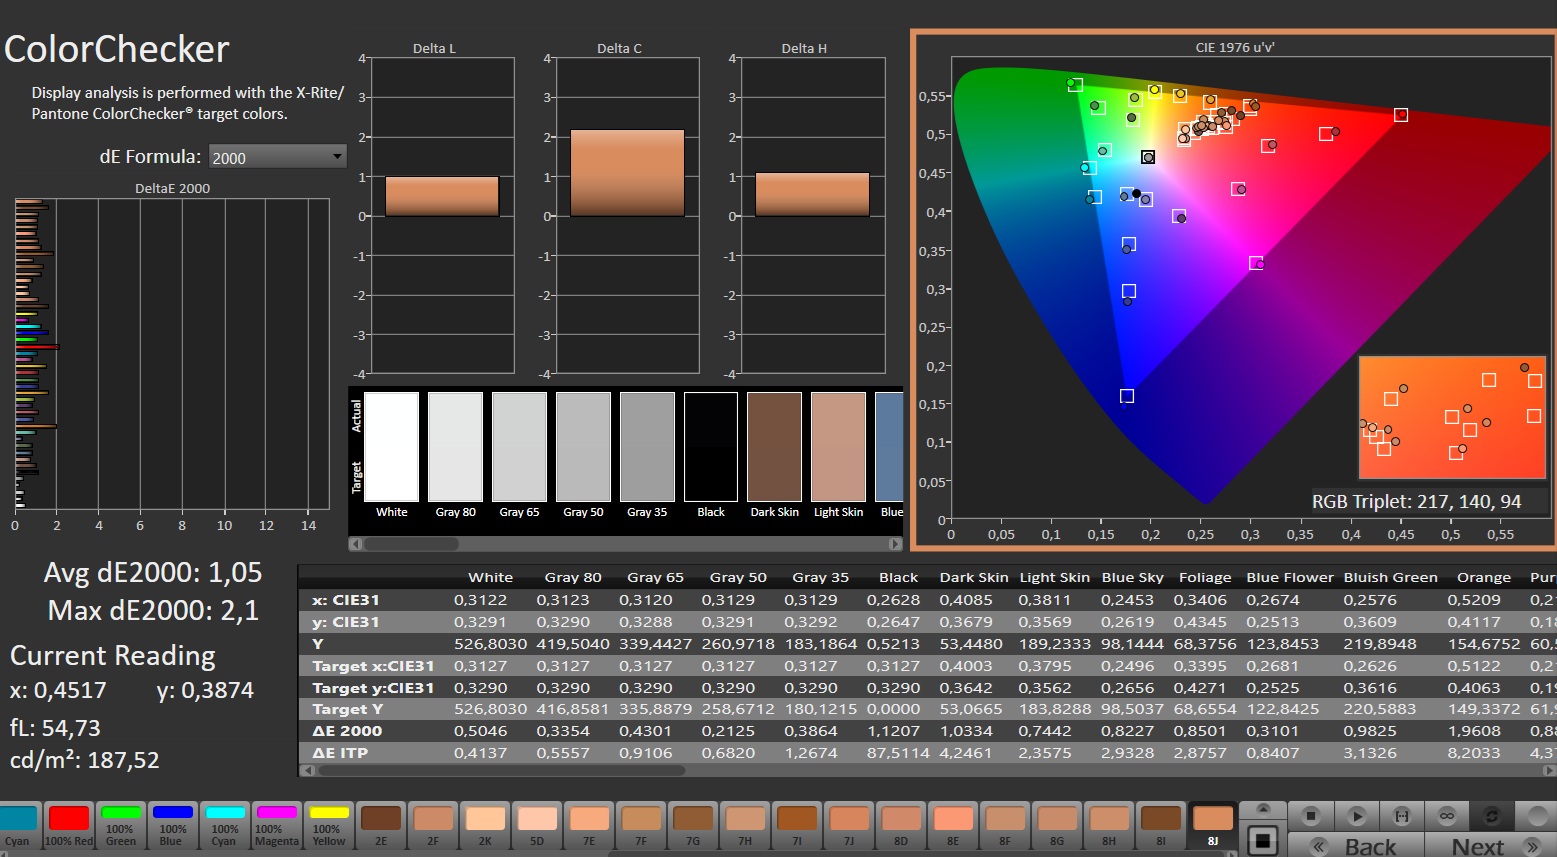
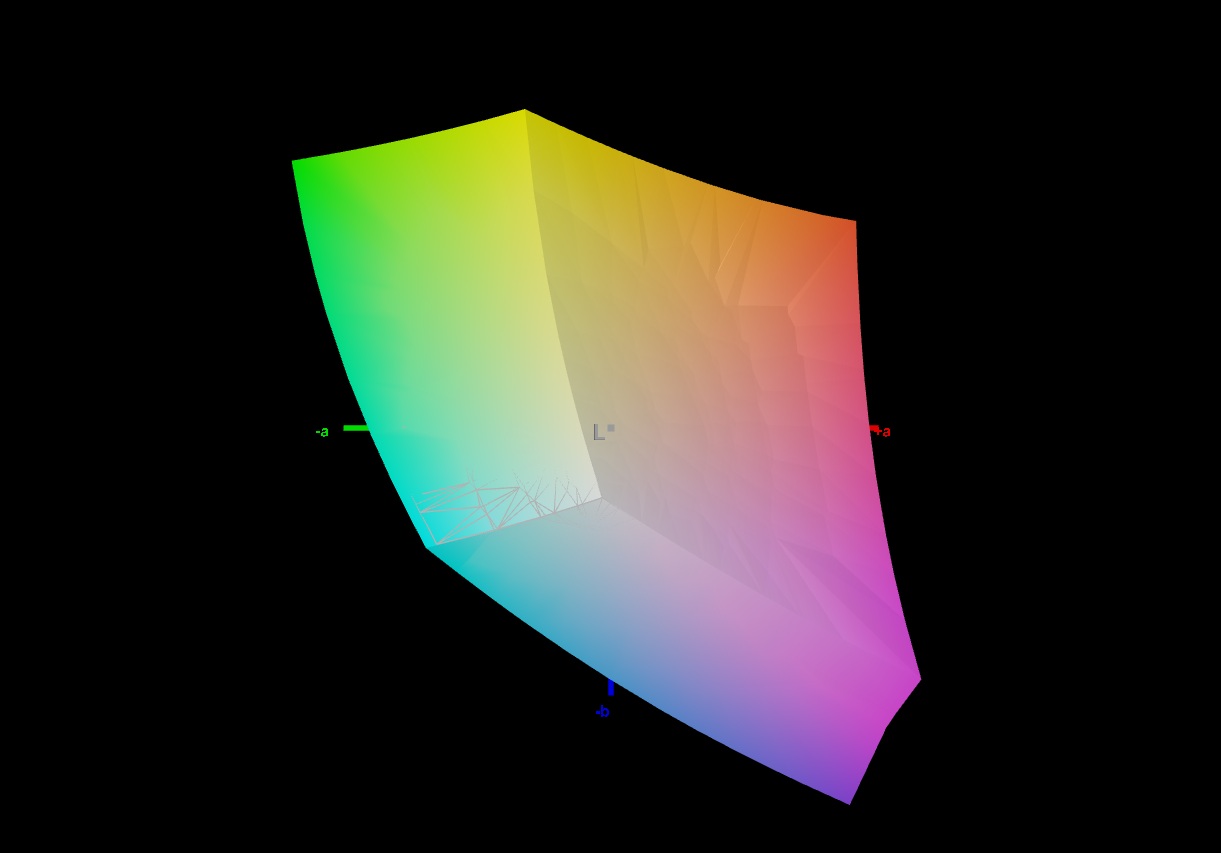
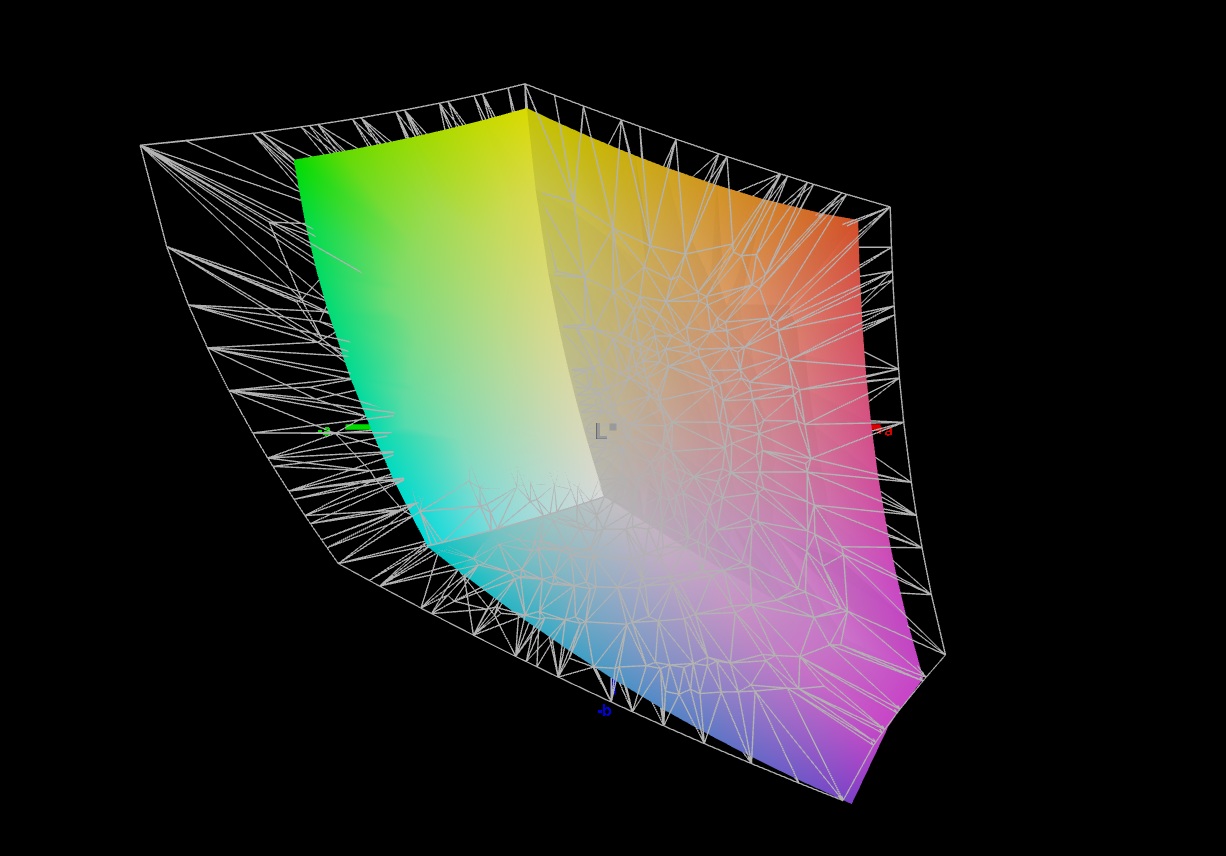
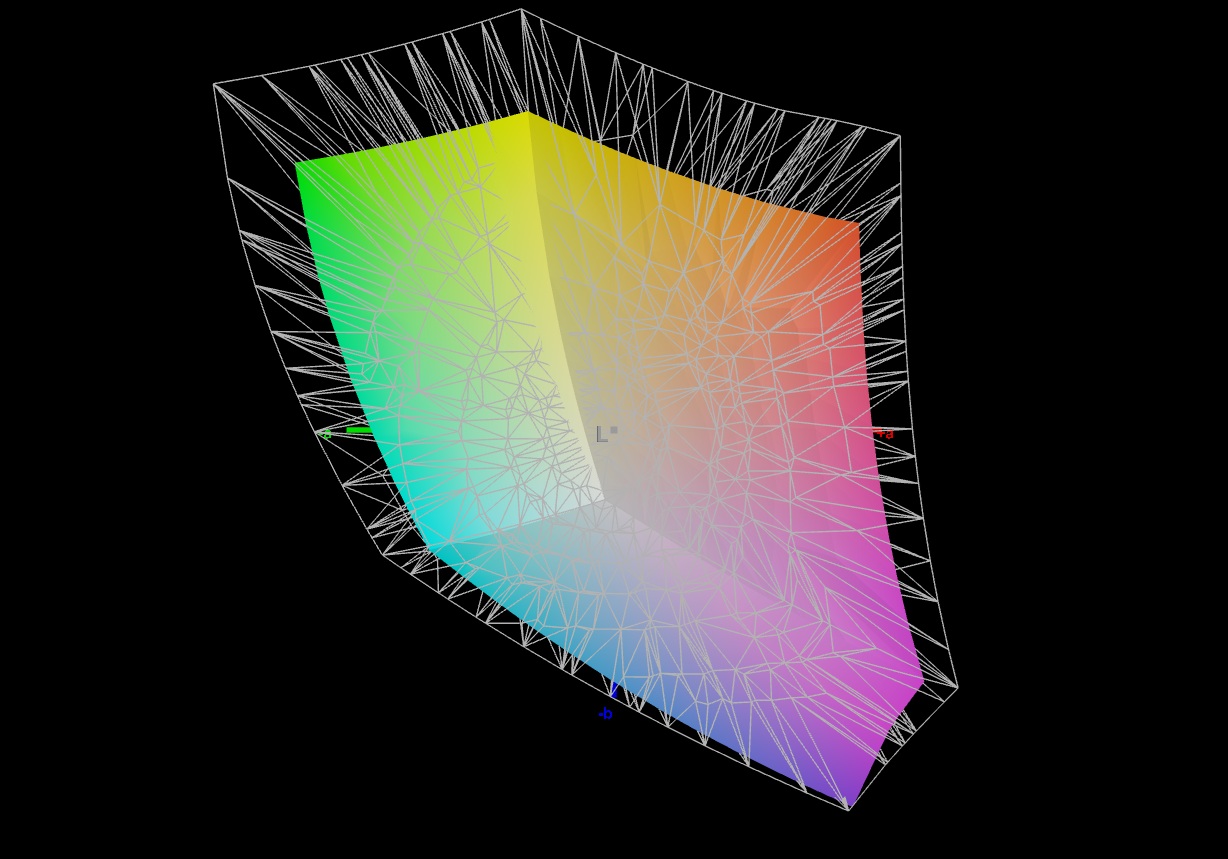
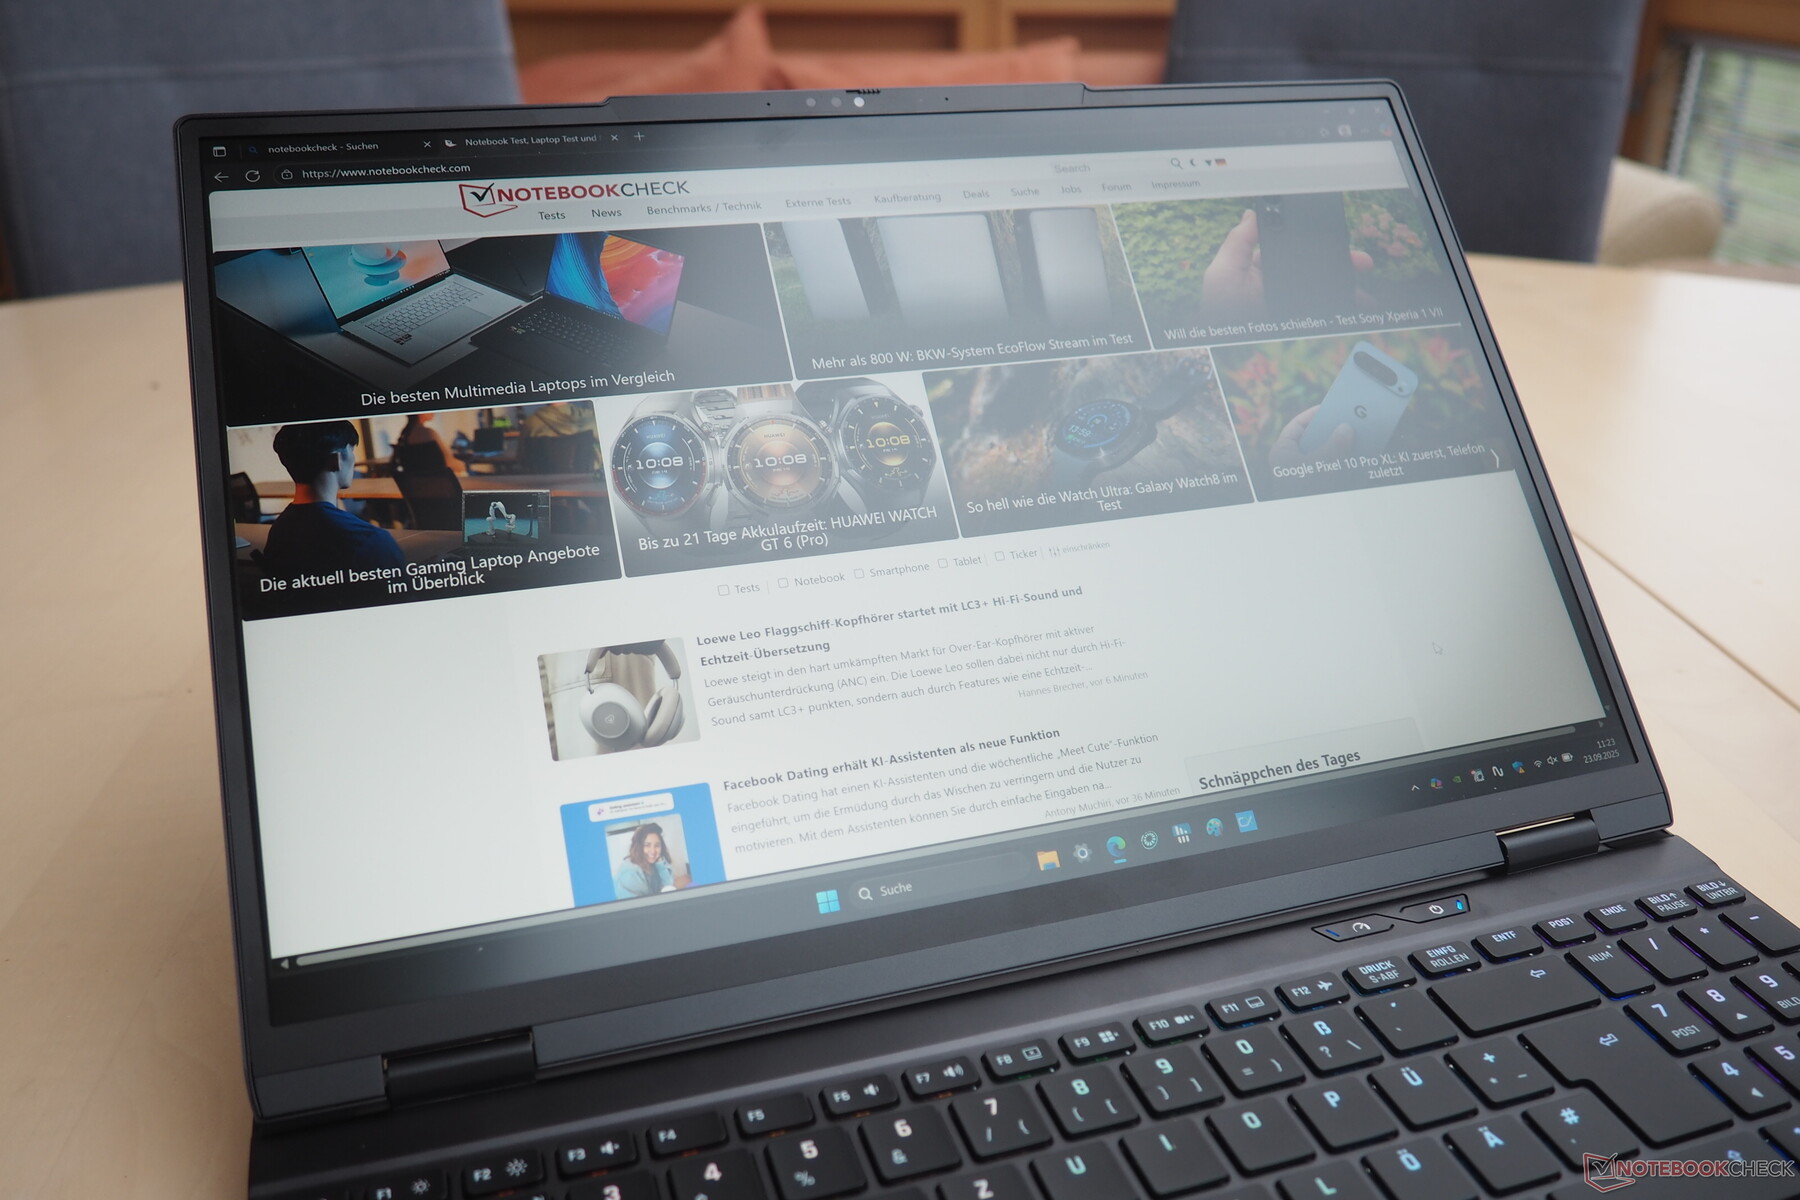
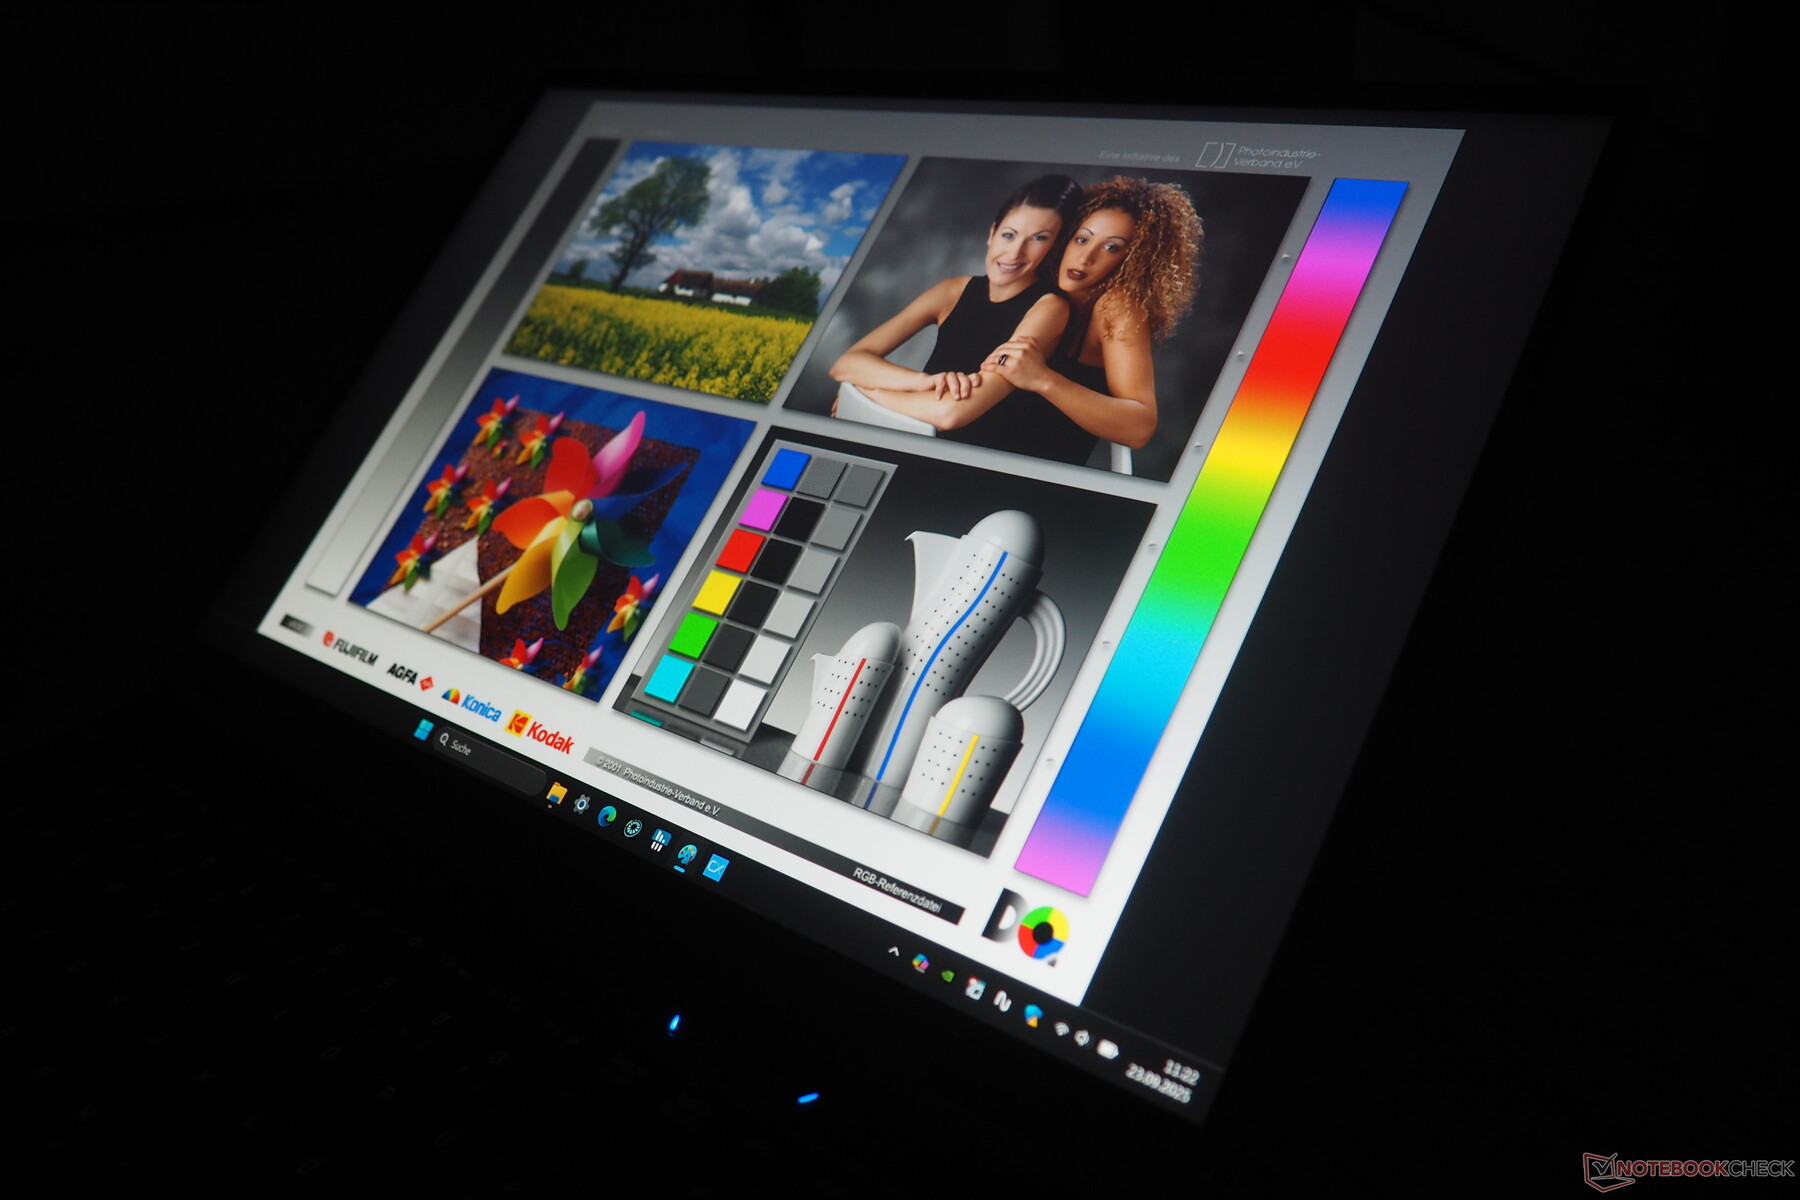
The manufacturer chose an IPS panel for the display, which is suitable for brighter rooms and occasional outdoor use with an average of 530 cd/m². Since the black level isn't quite as perfect (0.54 cd/m²), the contrast only reaches around 1,000:1. The Legion 5’s OLED panel manages this much better, but it has to contend with strong reflections. Buyers will have to be satisfied with sRGB for the color space, as DCI-P3 and AdobeRGB are not fully covered. However, the color accuracy is already good out of the box.
| |||||||||||||||||||||||||
Brightness Distribution: 94 %
Center on Battery: 545 cd/m²
Contrast: 1009:1 (Black: 0.54 cd/m²)
ΔE ColorChecker Calman: 2.29 | ∀{0.5-29.43 Ø4.73}
calibrated: 1.05
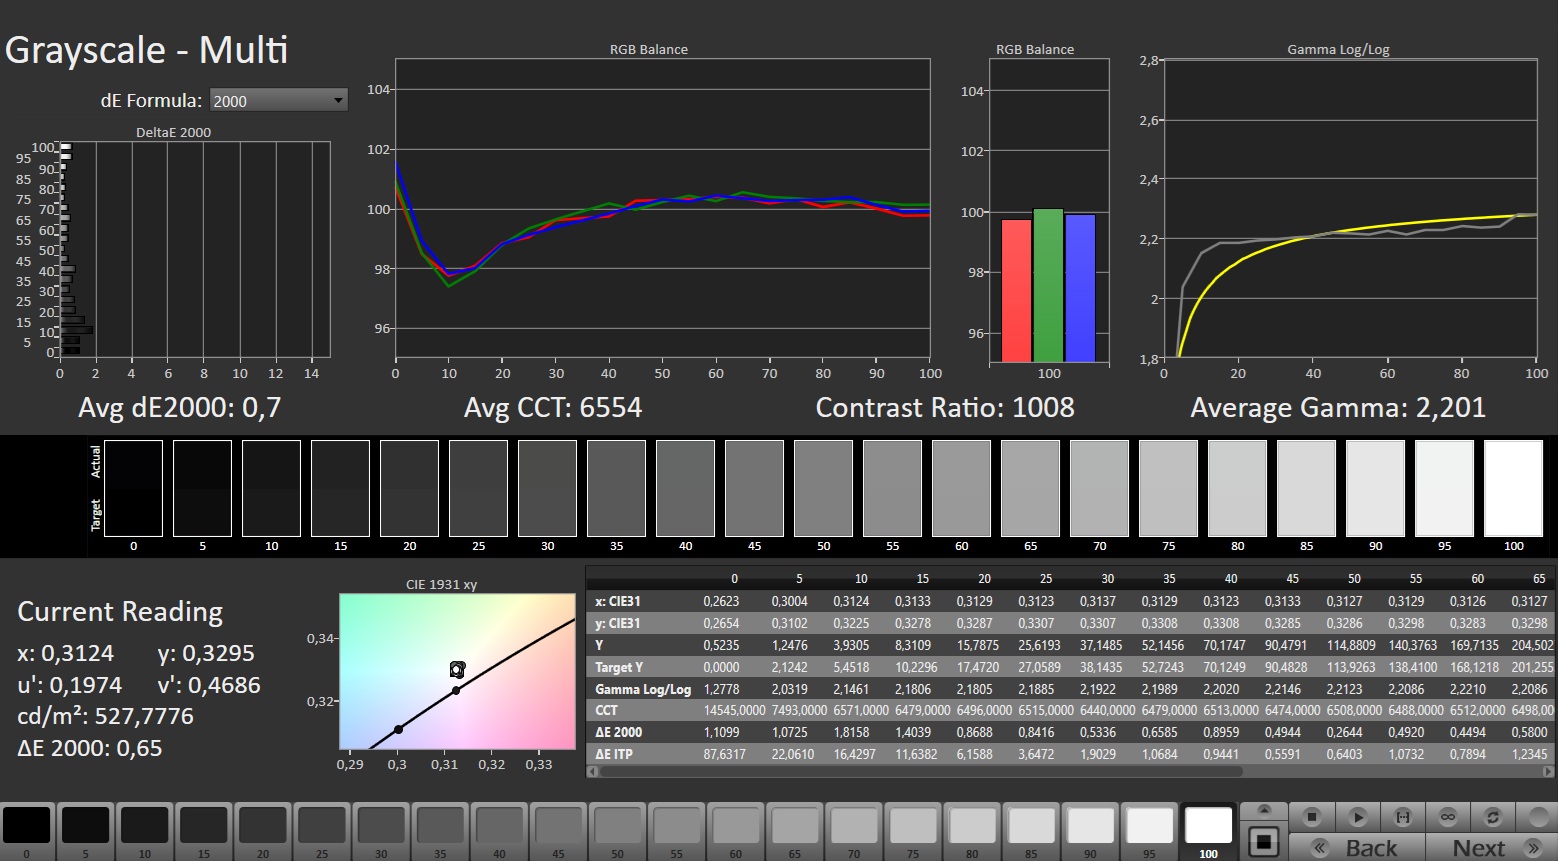
ΔE Greyscale Calman: 3.5 | ∀{0.09-98 Ø4.97}
73.6% AdobeRGB 1998 (Argyll 3D)
99.9% sRGB (Argyll 3D)
71.7% Display P3 (Argyll 3D)
Gamma: 2.317
CCT: 6957 K
| Schenker XMG Core 15 (M25) NE153QDM-NZ2 (BOE0D5F), IPS, 2560x1600, 15.3", 300 Hz | Lenovo LOQ 15AHP10 CSOT MNF601BA1-4, IPS, 1920x1080, 15.6", 144 Hz | Lenovo Legion 5 15AHP G10 LEN151WQXGA, OLED, 2560x1600, 15.1", 165 Hz | Medion Erazer Scout 17 E1 MD62758 BOEhydis NV173FHM-NX4, IPS, 1920x1080, 17.3", 144 Hz | MSI Katana 17 HX B14WGK CSOT MNH301CA3-1, IPS, 2560x1440, 17.3", 240 Hz | Schenker XMG Core 15 (M24) BOE NJ NE153QDM-NZ1 (BOE0C8E), IPS, 2560x1600, 15.3", 240 Hz | |
|---|---|---|---|---|---|---|
| Display | -4% | 24% | -46% | 19% | 1% | |
| Display P3 Coverage (%) | 71.7 | 67.3 -6% | 99.9 39% | 37.7 -47% | 97.3 36% | 73.2 2% |
| sRGB Coverage (%) | 99.9 | 99.2 -1% | 100 0% | 56.3 -44% | 99.6 0% | 100 0% |
| AdobeRGB 1998 Coverage (%) | 73.6 | 69.1 -6% | 98.3 34% | 39 -47% | 89 21% | 74.6 1% |
| Response Times | -249% | 95% | -137% | -13% | -31% | |
| Response Time Grey 50% / Grey 80% * (ms) | 12.4 ? | 33.9 ? -173% | 0.42 ? 97% | 21.4 ? -73% | 5.2 ? 58% | 9.6 ? 23% |
| Response Time Black / White * (ms) | 5 ? | 21.2 ? -324% | 0.4 ? 92% | 15 ? -200% | 9.2 ? -84% | 9.2 ? -84% |
| PWM Frequency (Hz) | 1152 ? | |||||
| PWM Amplitude * (%) | 11 | |||||
| Screen | 16% | 29% | -79% | 7% | 9% | |
| Brightness middle (cd/m²) | 545 | 318 -42% | 492 -10% | 279 -49% | 296 -46% | 635 17% |
| Brightness (cd/m²) | 530 | 300 -43% | 495 -7% | 260 -51% | 272 -49% | 604 14% |
| Brightness Distribution (%) | 94 | 89 -5% | 92 -2% | 90 -4% | 87 -7% | 91 -3% |
| Black Level * (cd/m²) | 0.54 | 0.2 63% | 0.24 56% | 0.27 50% | 0.64 -19% | |
| Contrast (:1) | 1009 | 1590 58% | 1163 15% | 1096 9% | 992 -2% | |
| Colorchecker dE 2000 * | 2.29 | 1.33 42% | 0.9 61% | 4.97 -117% | 1.35 41% | 1.89 17% |
| Colorchecker dE 2000 max. * | 5.42 | 4.42 18% | 1.8 67% | 20.52 -279% | 4.76 12% | 3.14 42% |
| Colorchecker dE 2000 calibrated * | 1.05 | 0.94 10% | 4.58 -336% | 0.78 26% | 1.14 -9% | |
| Greyscale dE 2000 * | 3.5 | 1.9 46% | 1.2 66% | 1.7 51% | 2.7 23% | 2.53 28% |
| Gamma | 2.317 95% | 2.187 101% | 2.16 102% | 2.201 100% | 2.201 100% | 2.36 93% |
| CCT | 6957 93% | 6678 97% | 6291 103% | 6937 94% | 6770 96% | 6434 101% |
| Total Average (Program / Settings) | -79% /
-26% | 49% /
40% | -87% /
-80% | 4% /
6% | -7% /
2% |
* ... smaller is better

Display Response Times
| ↔ Response Time Black to White | ||
|---|---|---|
| 5 ms ... rise ↗ and fall ↘ combined | ↗ 1.4 ms rise | 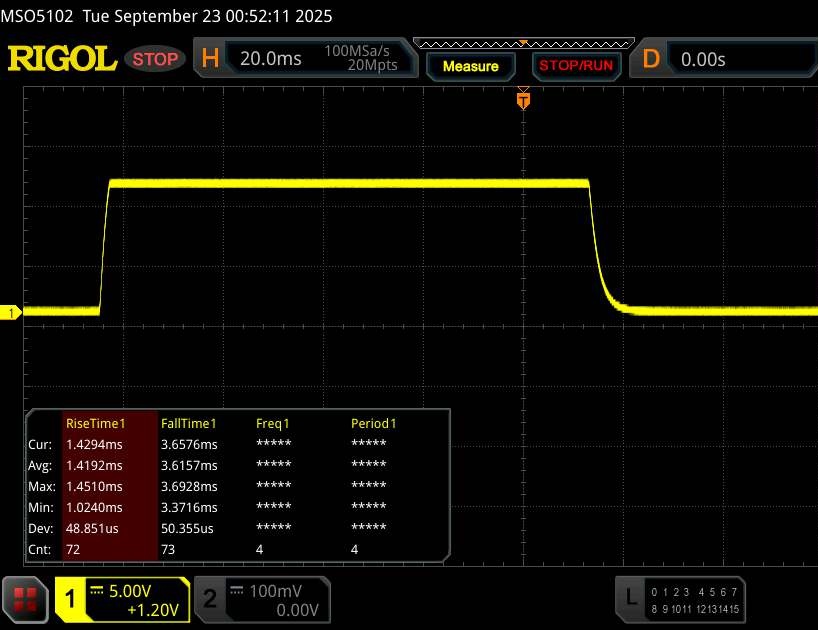 |
| ↘ 3.6 ms fall | ||
| The screen shows very fast response rates in our tests and should be very well suited for fast-paced gaming. In comparison, all tested devices range from 0.1 (minimum) to 240 (maximum) ms. » 17 % of all devices are better. This means that the measured response time is better than the average of all tested devices (19.9 ms). | ||
| ↔ Response Time 50% Grey to 80% Grey | ||
| 12.4 ms ... rise ↗ and fall ↘ combined | ↗ 5.8 ms rise | 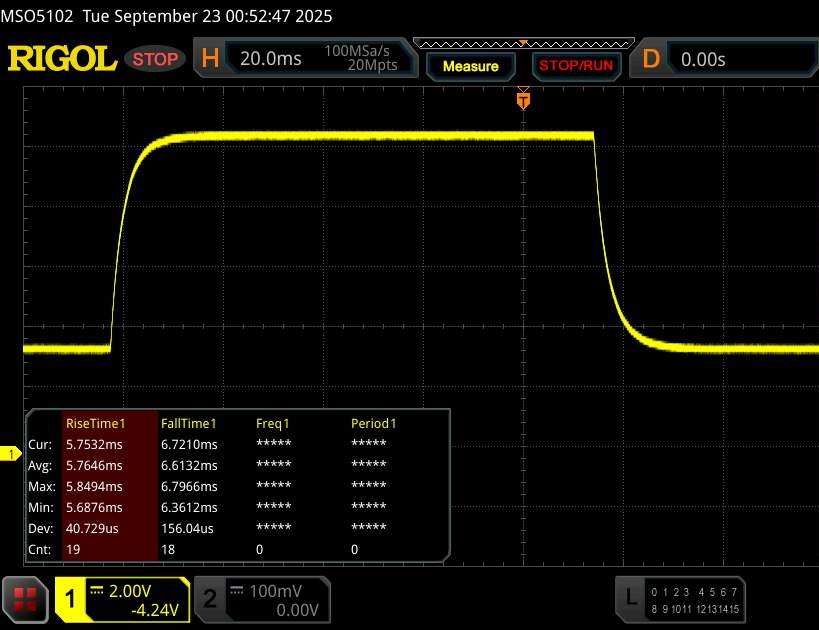 |
| ↘ 6.6 ms fall | ||
| The screen shows good response rates in our tests, but may be too slow for competitive gamers. In comparison, all tested devices range from 0.165 (minimum) to 636 (maximum) ms. » 26 % of all devices are better. This means that the measured response time is better than the average of all tested devices (31.1 ms). | ||
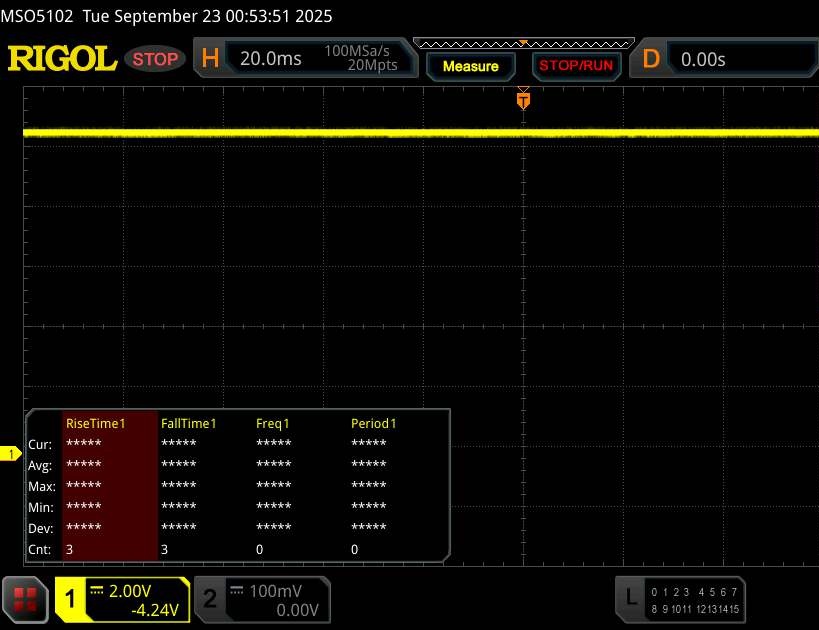
Screen Flickering / PWM (Pulse-Width Modulation)
| Screen flickering / PWM not detected | 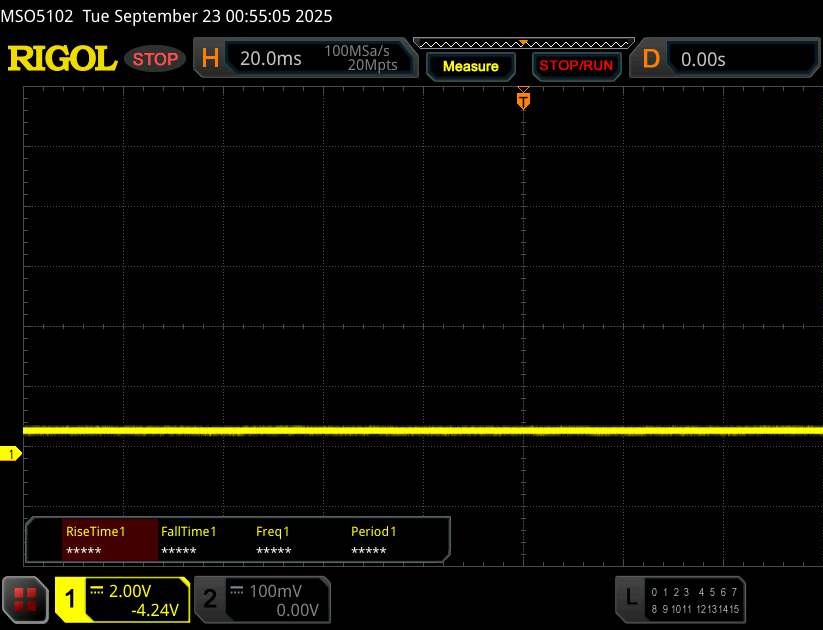 | ||
In comparison: 52 % of all tested devices do not use PWM to dim the display. If PWM was detected, an average of 7784 (minimum: 5 - maximum: 343500) Hz was measured. | |||

Performance


Test conditions
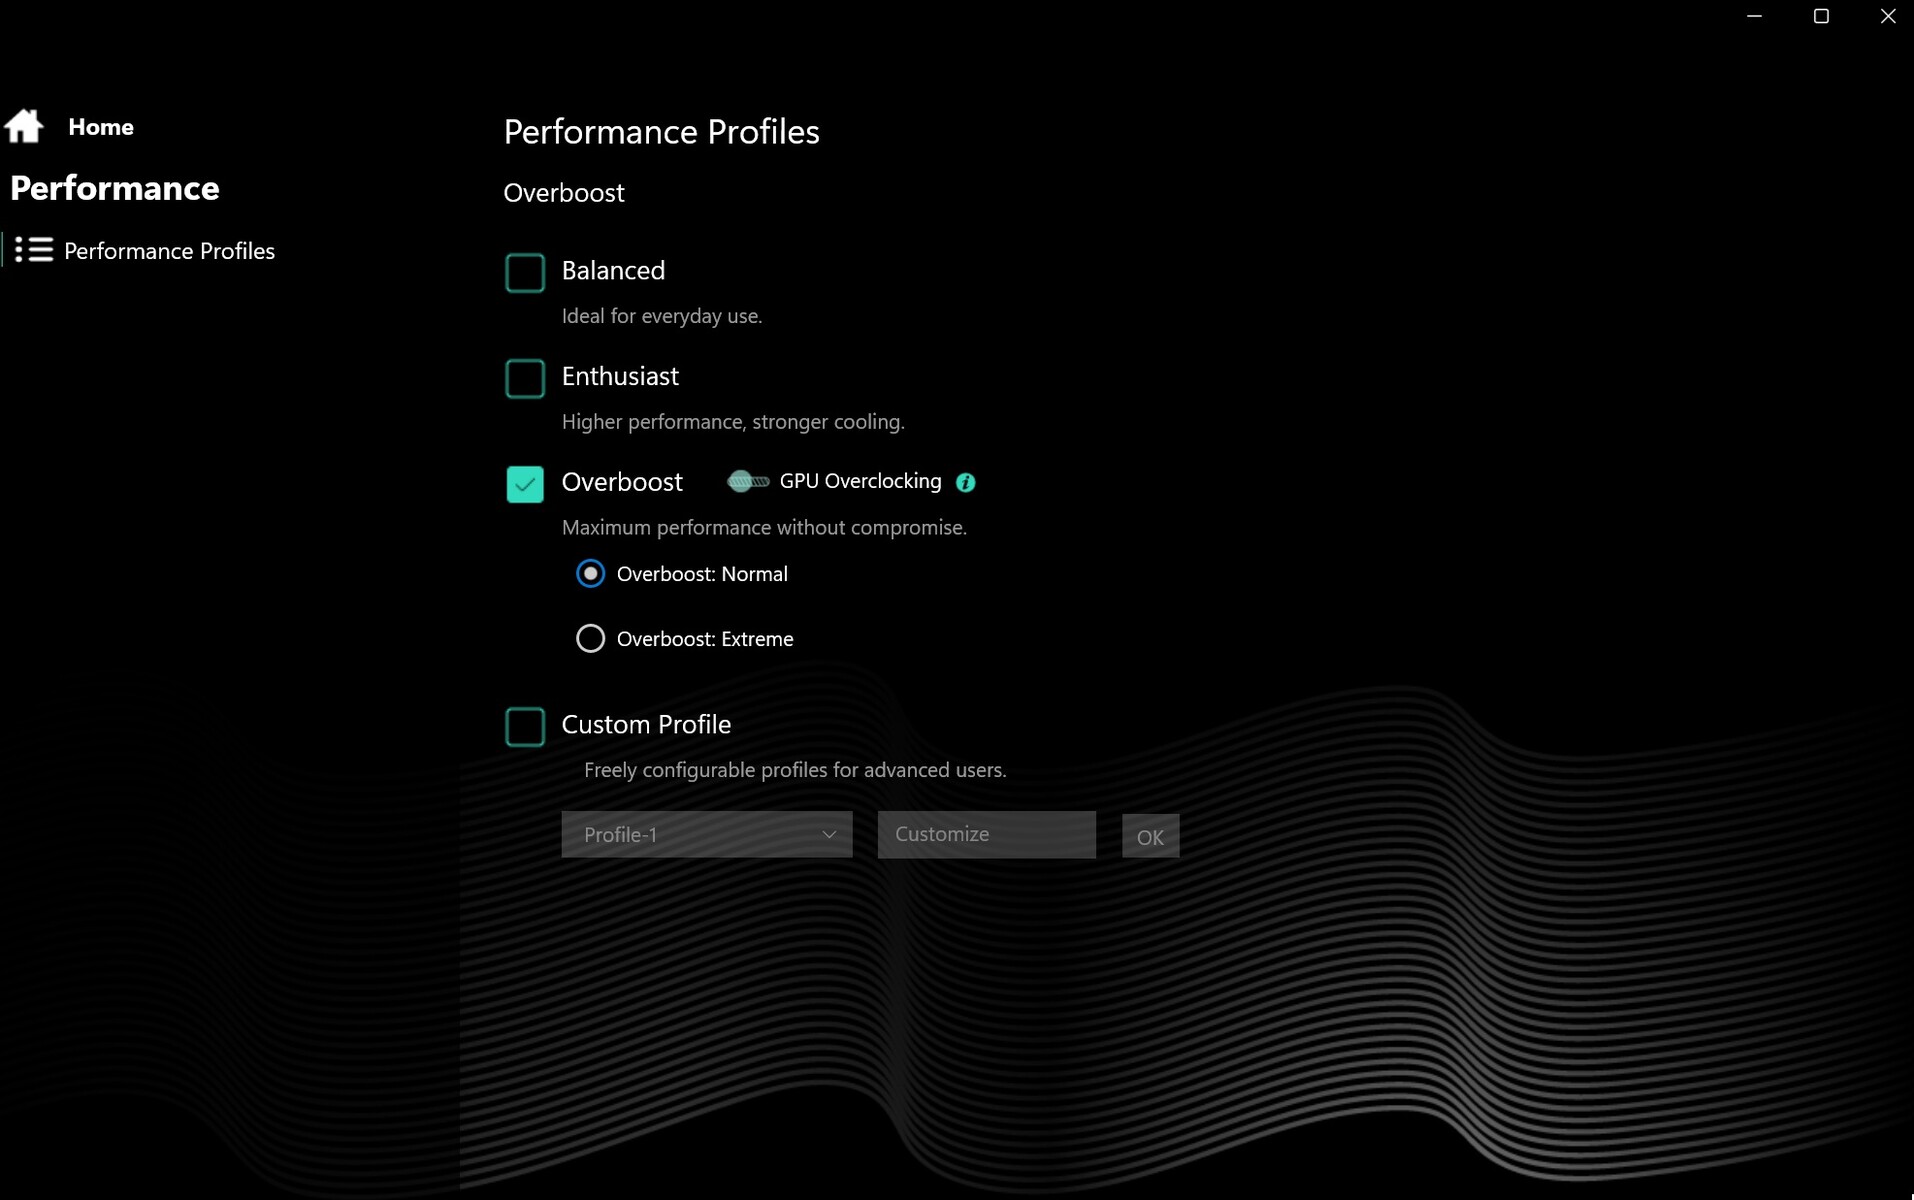
The pre-installed Control Center offers a variety of functions and settings. Gamers will be most interested in the performance menu, which provides three profiles (see table). Except for the battery test, all measurements were taken in Overboost mode with GPU overclocking disabled. A custom profile can also be created if desired.


| Mode | Balanced | Enthusiast | Overboost |
| Cyberpunk 2077 Noise | 34 dB(A) | 46 dB(A) | 49 dB(A) |
| Cyberpunk 2077 Performance (FHD/Ultra) | 30 fps locked | 79.1 fps | 84.3 fps |
| Cyberpunk 2077 GPU Power Draw | ~25 W | ~80 W | ~105 W |
| Cinebench R15 Multi Score | 2204 Points | 2570 Points | 2753 Points |
| CPU PL1 | 45 W | 54 W | 70 W |
| CPU PL2 | 65 W | 65 W | 105 W |
Processor
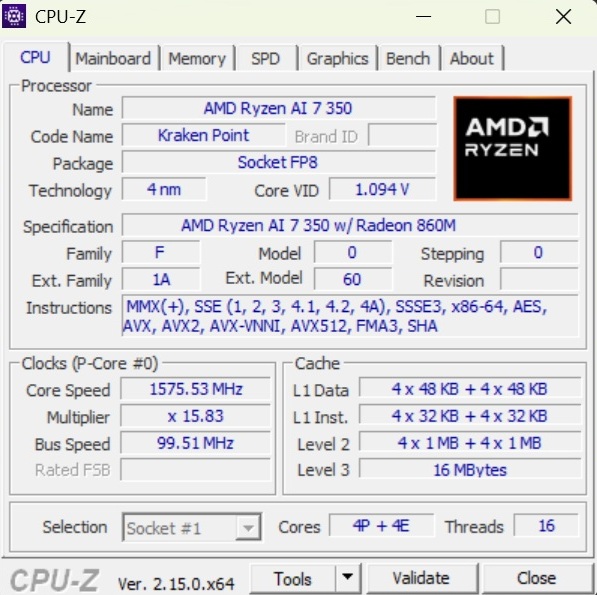
The Ryzen AI 7 350 is an eight-core processor capable of handling up to 16 threads simultaneously via SMT. In the Cinebench loop, the 4 nm chip delivered fairly consistent performance. Across all benchmarks, the older XMG Core 15’s Ryzen 7 8845HS was slightly faster, while the Legion 5’s Ryzen 7 260 performed about the same.
Cinebench R15 Multi endurance test
* ... smaller is better
AIDA64: FP32 Ray-Trace | FPU Julia | CPU SHA3 | CPU Queen | FPU SinJulia | FPU Mandel | CPU AES | CPU ZLib | FP64 Ray-Trace | CPU PhotoWorxx
| Performance rating | |
| Average of class Gaming | |
| Schenker XMG Core 15 (M24) | |
| Lenovo Legion 5 15AHP G10 | |
| Schenker XMG Core 15 (M25) | |
| Lenovo LOQ 15AHP10 | |
| Average AMD Ryzen AI 7 350 | |
| MSI Katana 17 HX B14WGK | |
| Medion Erazer Scout 17 E1 MD62758 | |
| AIDA64 / FP32 Ray-Trace | |
| Average of class Gaming (10227 - 85542, n=107, last 2 years) | |
| Schenker XMG Core 15 (M24) | |
| Lenovo Legion 5 15AHP G10 | |
| Schenker XMG Core 15 (M25) | |
| Average AMD Ryzen AI 7 350 (20203 - 28112, n=16) | |
| Lenovo LOQ 15AHP10 | |
| MSI Katana 17 HX B14WGK | |
| Medion Erazer Scout 17 E1 MD62758 | |
| AIDA64 / FPU Julia | |
| Average of class Gaming (51376 - 238426, n=107, last 2 years) | |
| Schenker XMG Core 15 (M24) | |
| Lenovo Legion 5 15AHP G10 | |
| Schenker XMG Core 15 (M25) | |
| Lenovo LOQ 15AHP10 | |
| Average AMD Ryzen AI 7 350 (75098 - 110301, n=16) | |
| MSI Katana 17 HX B14WGK | |
| Medion Erazer Scout 17 E1 MD62758 | |
| AIDA64 / CPU SHA3 | |
| Average of class Gaming (2180 - 9817, n=107, last 2 years) | |
| Schenker XMG Core 15 (M24) | |
| Lenovo Legion 5 15AHP G10 | |
| Lenovo LOQ 15AHP10 | |
| Schenker XMG Core 15 (M25) | |
| Average AMD Ryzen AI 7 350 (3395 - 4399, n=16) | |
| MSI Katana 17 HX B14WGK | |
| Medion Erazer Scout 17 E1 MD62758 | |
| AIDA64 / CPU Queen | |
| Schenker XMG Core 15 (M24) | |
| Lenovo Legion 5 15AHP G10 | |
| Average of class Gaming (49785 - 173351, n=98, last 2 years) | |
| Lenovo LOQ 15AHP10 | |
| MSI Katana 17 HX B14WGK | |
| Medion Erazer Scout 17 E1 MD62758 | |
| Schenker XMG Core 15 (M25) | |
| Average AMD Ryzen AI 7 350 (67317 - 77400, n=16) | |
| AIDA64 / FPU SinJulia | |
| Schenker XMG Core 15 (M24) | |
| Lenovo Legion 5 15AHP G10 | |
| Lenovo LOQ 15AHP10 | |
| Average of class Gaming (4424 - 33636, n=107, last 2 years) | |
| Schenker XMG Core 15 (M25) | |
| Average AMD Ryzen AI 7 350 (11916 - 13856, n=16) | |
| MSI Katana 17 HX B14WGK | |
| Medion Erazer Scout 17 E1 MD62758 | |
| AIDA64 / FPU Mandel | |
| Average of class Gaming (25115 - 128721, n=107, last 2 years) | |
| Schenker XMG Core 15 (M24) | |
| Lenovo Legion 5 15AHP G10 | |
| Schenker XMG Core 15 (M25) | |
| Lenovo LOQ 15AHP10 | |
| Average AMD Ryzen AI 7 350 (39456 - 59540, n=15) | |
| MSI Katana 17 HX B14WGK | |
| Medion Erazer Scout 17 E1 MD62758 | |
| AIDA64 / CPU AES | |
| Average of class Gaming (39258 - 247074, n=107, last 2 years) | |
| Schenker XMG Core 15 (M24) | |
| Schenker XMG Core 15 (M25) | |
| Average AMD Ryzen AI 7 350 (56915 - 87670, n=16) | |
| Lenovo Legion 5 15AHP G10 | |
| Lenovo LOQ 15AHP10 | |
| MSI Katana 17 HX B14WGK | |
| Medion Erazer Scout 17 E1 MD62758 | |
| AIDA64 / CPU ZLib | |
| Average of class Gaming (574 - 2531, n=107, last 2 years) | |
| Schenker XMG Core 15 (M25) | |
| Lenovo Legion 5 15AHP G10 | |
| Lenovo LOQ 15AHP10 | |
| Average AMD Ryzen AI 7 350 (663 - 1140, n=16) | |
| MSI Katana 17 HX B14WGK | |
| Schenker XMG Core 15 (M24) | |
| Medion Erazer Scout 17 E1 MD62758 | |
| AIDA64 / FP64 Ray-Trace | |
| Average of class Gaming (5509 - 45446, n=107, last 2 years) | |
| Schenker XMG Core 15 (M24) | |
| Lenovo Legion 5 15AHP G10 | |
| Schenker XMG Core 15 (M25) | |
| Average AMD Ryzen AI 7 350 (10707 - 15222, n=15) | |
| Lenovo LOQ 15AHP10 | |
| MSI Katana 17 HX B14WGK | |
| Medion Erazer Scout 17 E1 MD62758 | |
| AIDA64 / CPU PhotoWorxx | |
| Schenker XMG Core 15 (M25) | |
| Average of class Gaming (12271 - 89891, n=107, last 2 years) | |
| Schenker XMG Core 15 (M24) | |
| Lenovo Legion 5 15AHP G10 | |
| Average AMD Ryzen AI 7 350 (25170 - 47405, n=16) | |
| Medion Erazer Scout 17 E1 MD62758 | |
| MSI Katana 17 HX B14WGK | |
| Lenovo LOQ 15AHP10 | |
System performance
In the system tests, the new Core 15 ranks near the top of the comparison field, edged out only by the Katana 17. In the memory benchmarks, however, the Schenker notebook takes first place.
PCMark 10: Essentials
CrossMark: Overall | Productivity | Creativity | Responsiveness
WebXPRT 3: Overall
WebXPRT 4: Overall
Mozilla Kraken 1.1: Total
| Performance rating | |
| Average of class Gaming | |
| MSI Katana 17 HX B14WGK | |
| Schenker XMG Core 15 (M24) | |
| Lenovo Legion 5 15AHP G10 | |
| Schenker XMG Core 15 (M25) | |
| Average AMD Ryzen AI 7 350, NVIDIA GeForce RTX 5060 Laptop | |
| Lenovo LOQ 15AHP10 -2! | |
| Medion Erazer Scout 17 E1 MD62758 -1! | |
| PCMark 10 / Essentials | |
| Lenovo Legion 5 15AHP G10 | |
| Schenker XMG Core 15 (M25) | |
| Average AMD Ryzen AI 7 350, NVIDIA GeForce RTX 5060 Laptop (n=1) | |
| Average of class Gaming (8810 - 12600, n=98, last 2 years) | |
| Lenovo LOQ 15AHP10 | |
| MSI Katana 17 HX B14WGK | |
| Schenker XMG Core 15 (M24) | |
| Medion Erazer Scout 17 E1 MD62758 | |
| CrossMark / Overall | |
| Average of class Gaming (1366 - 2409, n=96, last 2 years) | |
| MSI Katana 17 HX B14WGK | |
| Schenker XMG Core 15 (M24) | |
| Lenovo Legion 5 15AHP G10 | |
| Lenovo LOQ 15AHP10 | |
| Schenker XMG Core 15 (M25) | |
| Average AMD Ryzen AI 7 350, NVIDIA GeForce RTX 5060 Laptop (n=1) | |
| Medion Erazer Scout 17 E1 MD62758 | |
| CrossMark / Productivity | |
| MSI Katana 17 HX B14WGK | |
| Average of class Gaming (1386 - 2254, n=96, last 2 years) | |
| Schenker XMG Core 15 (M24) | |
| Lenovo LOQ 15AHP10 | |
| Lenovo Legion 5 15AHP G10 | |
| Schenker XMG Core 15 (M25) | |
| Average AMD Ryzen AI 7 350, NVIDIA GeForce RTX 5060 Laptop (n=1) | |
| Medion Erazer Scout 17 E1 MD62758 | |
| CrossMark / Creativity | |
| Average of class Gaming (1343 - 2729, n=96, last 2 years) | |
| Schenker XMG Core 15 (M24) | |
| MSI Katana 17 HX B14WGK | |
| Lenovo Legion 5 15AHP G10 | |
| Schenker XMG Core 15 (M25) | |
| Average AMD Ryzen AI 7 350, NVIDIA GeForce RTX 5060 Laptop (n=1) | |
| Lenovo LOQ 15AHP10 | |
| Medion Erazer Scout 17 E1 MD62758 | |
| CrossMark / Responsiveness | |
| MSI Katana 17 HX B14WGK | |
| Average of class Gaming (1226 - 2334, n=96, last 2 years) | |
| Lenovo LOQ 15AHP10 | |
| Schenker XMG Core 15 (M24) | |
| Lenovo Legion 5 15AHP G10 | |
| Schenker XMG Core 15 (M25) | |
| Average AMD Ryzen AI 7 350, NVIDIA GeForce RTX 5060 Laptop (n=1) | |
| Medion Erazer Scout 17 E1 MD62758 | |
| WebXPRT 3 / Overall | |
| Average of class Gaming (242 - 532, n=99, last 2 years) | |
| Lenovo Legion 5 15AHP G10 | |
| Schenker XMG Core 15 (M24) | |
| MSI Katana 17 HX B14WGK | |
| Schenker XMG Core 15 (M25) | |
| Average AMD Ryzen AI 7 350, NVIDIA GeForce RTX 5060 Laptop (n=1) | |
| WebXPRT 4 / Overall | |
| Average of class Gaming (176.4 - 354, n=99, last 2 years) | |
| MSI Katana 17 HX B14WGK | |
| Schenker XMG Core 15 (M24) | |
| Lenovo Legion 5 15AHP G10 | |
| Medion Erazer Scout 17 E1 MD62758 | |
| Schenker XMG Core 15 (M25) | |
| Average AMD Ryzen AI 7 350, NVIDIA GeForce RTX 5060 Laptop (n=1) | |
| Mozilla Kraken 1.1 / Total | |
| Medion Erazer Scout 17 E1 MD62758 | |
| Lenovo LOQ 15AHP10 | |
| Schenker XMG Core 15 (M24) | |
| Lenovo Legion 5 15AHP G10 | |
| MSI Katana 17 HX B14WGK | |
| Average of class Gaming (391 - 590, n=104, last 2 years) | |
| Schenker XMG Core 15 (M25) | |
| Average AMD Ryzen AI 7 350, NVIDIA GeForce RTX 5060 Laptop (n=1) | |
* ... smaller is better
| AIDA64 / Memory Copy | |
| Average AMD Ryzen AI 7 350 (37823 - 106997, n=16) | |
| Schenker XMG Core 15 (M25) | |
| Average of class Gaming (21750 - 129946, n=107, last 2 years) | |
| Schenker XMG Core 15 (M24) | |
| Lenovo Legion 5 15AHP G10 | |
| MSI Katana 17 HX B14WGK | |
| Medion Erazer Scout 17 E1 MD62758 | |
| Lenovo LOQ 15AHP10 | |
| AIDA64 / Memory Read | |
| Average of class Gaming (22956 - 118858, n=107, last 2 years) | |
| MSI Katana 17 HX B14WGK | |
| Schenker XMG Core 15 (M25) | |
| Schenker XMG Core 15 (M24) | |
| Lenovo Legion 5 15AHP G10 | |
| Average AMD Ryzen AI 7 350 (43921 - 63650, n=16) | |
| Medion Erazer Scout 17 E1 MD62758 | |
| Lenovo LOQ 15AHP10 | |
| AIDA64 / Memory Write | |
| Average AMD Ryzen AI 7 350 (42576 - 110817, n=16) | |
| Schenker XMG Core 15 (M24) | |
| Lenovo Legion 5 15AHP G10 | |
| Schenker XMG Core 15 (M25) | |
| Average of class Gaming (22297 - 135096, n=107, last 2 years) | |
| Medion Erazer Scout 17 E1 MD62758 | |
| MSI Katana 17 HX B14WGK | |
| Lenovo LOQ 15AHP10 | |
| AIDA64 / Memory Latency | |
| Average of class Gaming (75.3 - 259, n=107, last 2 years) | |
| Medion Erazer Scout 17 E1 MD62758 | |
| Average AMD Ryzen AI 7 350 (87.7 - 109.8, n=16) | |
| Lenovo LOQ 15AHP10 | |
| MSI Katana 17 HX B14WGK | |
| Lenovo Legion 5 15AHP G10 | |
| Schenker XMG Core 15 (M25) | |
| Schenker XMG Core 15 (M24) | |
* ... smaller is better
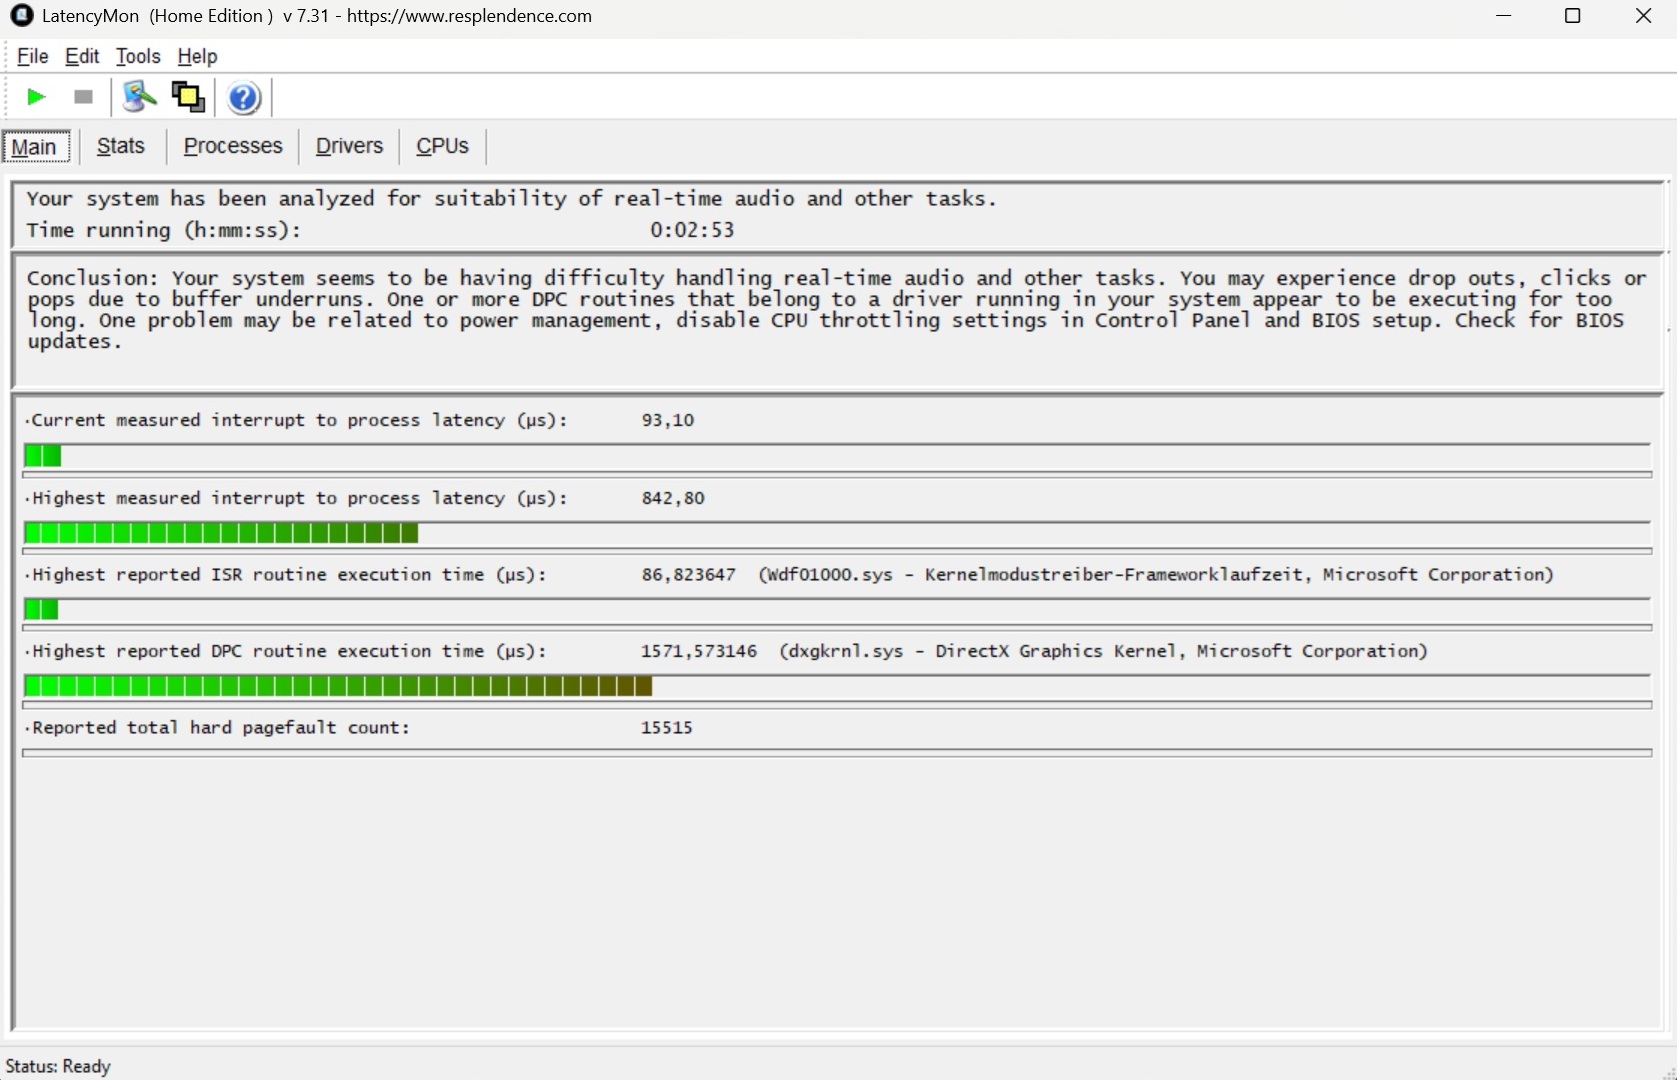
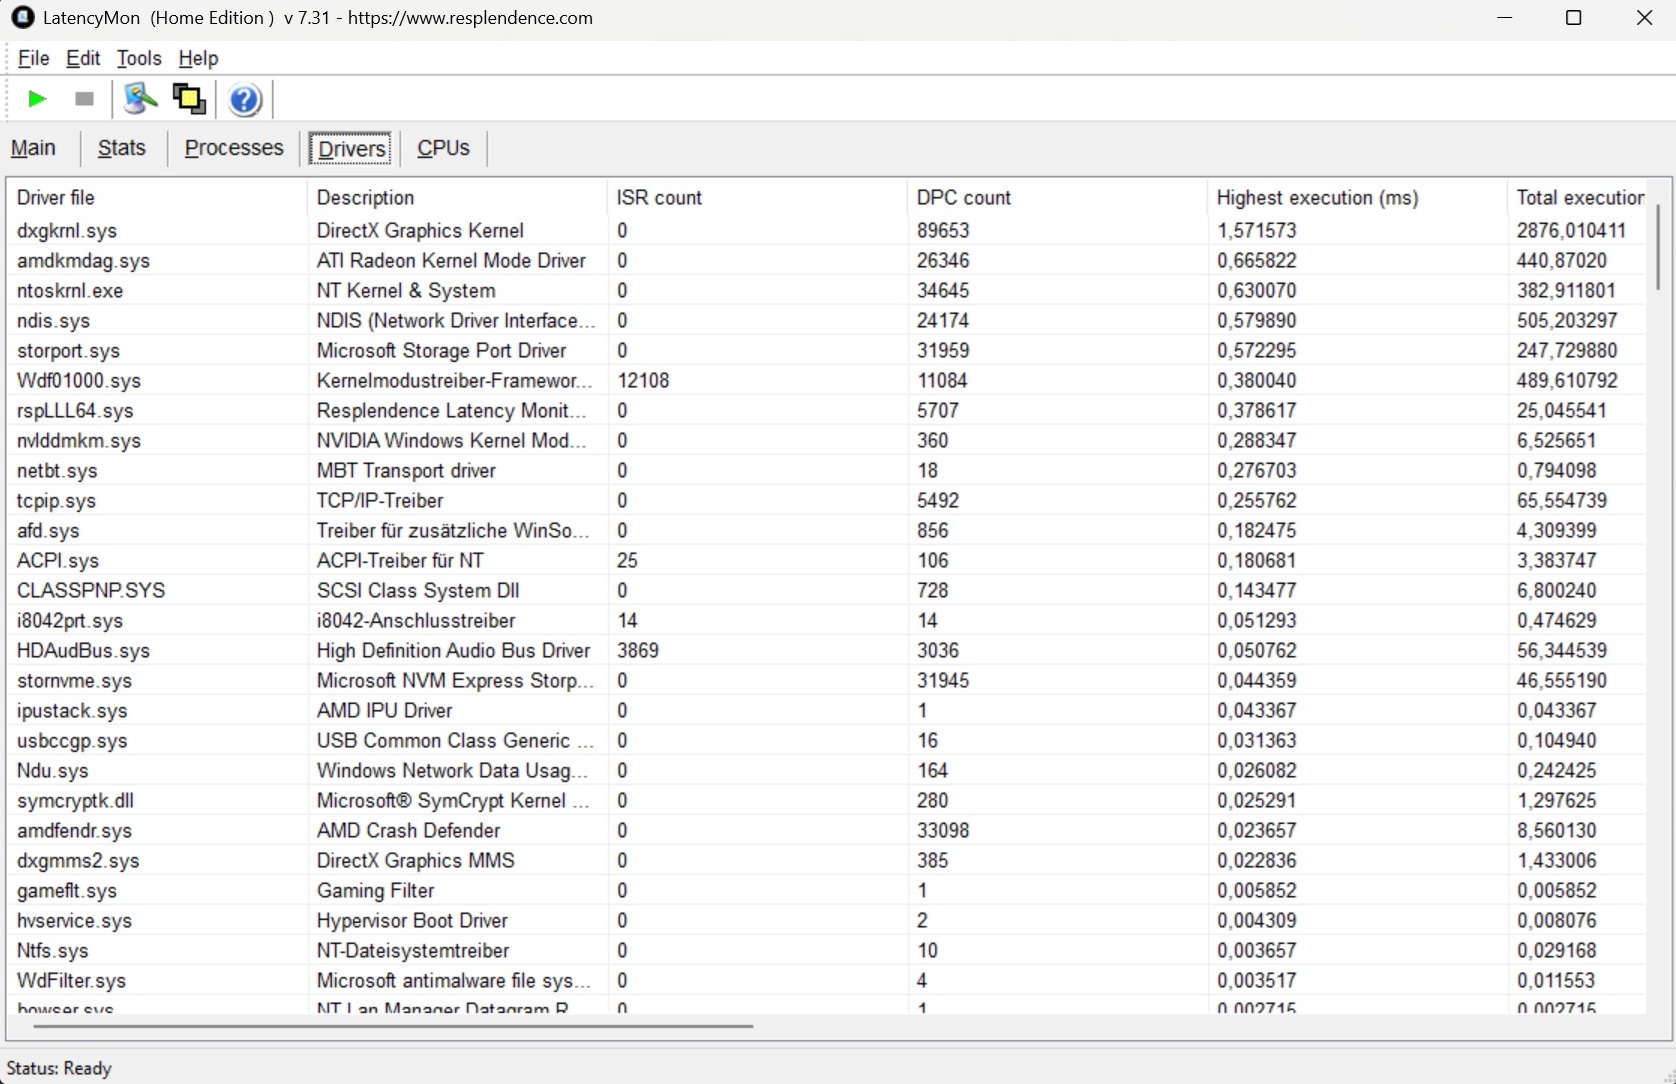
DPC latencies
Latency results are also strong. Although the LatencyMon tool flags potential issues, the measured value is still the best—and lowest—in the test group.
| DPC Latencies / LatencyMon - interrupt to process latency (max), Web, Youtube, Prime95 | |
| MSI Katana 17 HX B14WGK | |
| Medion Erazer Scout 17 E1 MD62758 | |
| Lenovo Legion 5 15AHP G10 | |
| Lenovo LOQ 15AHP10 | |
| Schenker XMG Core 15 (M24) | |
| Schenker XMG Core 15 (M25) | |
* ... smaller is better
Storage devices
Our test configuration was powered by a very fast 2 TB SSD from Samsung. The 990 Pro model delivers high and consistent values for both writing and reading, but this also applies to the competition if we exclude the Lenovo LOQ 15 (sometimes massive drops in performance in the Loop benchmark).

* ... smaller is better
Read continuous performance: DiskSpd Read Loop, Queue Depth 8
GPU performance
As seen in previous tests, the mobile RTX 5060 has both strengths and weaknesses. While 8 GB of VRAM is only partially appropriate or sufficient in 2025 (the best example is Indiana Jones; see Benchmark article), its other features—such as DLSS 4 and Multi-Frame Generation—remain impressive. In synthetic graphics benchmarks, the XMG Core 15 performs roughly on par with Lenovo’s RTX 5060 models, and the predecessor’s RTX 4060 still holds its own.
| 3DMark 11 Performance | 33080 points | |
| 3DMark Cloud Gate Standard Score | 50015 points | |
| 3DMark Fire Strike Score | 29119 points | |
| 3DMark Time Spy Score | 11779 points | |
Help | ||
* ... smaller is better
Gaming performance
Based on the Full HD tests, the Core 15 is between the LOQ15 (-6%) and the Legion 5 (+5%) in the gaming benchmarks. The QHD range is more interesting for most users, and here the results match the expected averages for this GPU. At 2,560 × 1,440/1,600 pixels, the system struggles at times, so enabling DLSS and Multi-Frame Generation is recommended when needed. For example, Hellblade 2 which only runs at a jerky 28 FPS in QHD without additional features. Including DLSS 4, it is a solid 43 FPS. Quadruple frame generation even ensures 137 FPS, although the frametimes are not optimal.
| low | med. | high | ultra | QHD DLSS | QHD | |
|---|---|---|---|---|---|---|
| GTA V (2015) | 183.6 | 176.9 | 170.1 | 120.6 | ||
| Dota 2 Reborn (2015) | 184.5 | 163.4 | 154.4 | 144.6 | ||
| X-Plane 11.11 (2018) | 107.5 | 98.3 | 83.4 | |||
| Baldur's Gate 3 (2023) | 115.7 | 94.1 | 93.3 | 62.6 | ||
| Cyberpunk 2077 (2023) | 107.3 | 93.5 | 84.3 | 53.5 | ||
| Horizon Forbidden West (2024) | 78.3 | 60.6 | 60 | 60.6 | 47 | |
| Ghost of Tsushima (2024) | 87.1 | 76.7 | 60.9 | 61.9 | 46.1 | |
| Senua's Saga Hellblade 2 (2024) | 53.7 | 38.6 | 42.8 | 28.4 | ||
| Star Wars Outlaws (2024) | 51.7 | 46.8 | 37.8 | 37.9 | 27.2 | |
| Space Marine 2 (2024) | 78.7 | 77.4 | 76.7 | 70.3 | 54 | |
| Until Dawn (2024) | 84.9 | 62.5 | 47.9 | 43.5 | 33.2 | |
| Stalker 2 (2024) | 58.8 | 52.3 | 44 | 70.1 | 32.4 | |
| Kingdom Come Deliverance 2 (2025) | 106.3 | 86 | 60.4 | 57.4 | 43.6 | |
| The Elder Scrolls IV Oblivion Remastered (2025) | 61 | 54.9 | 29.2 | 30 | 13.8 | |
| Doom: The Dark Ages (2025) | 64.4 | 57.5 | 56.4 | 52.8 | 38.2 | |
| Borderlands 4 (2025) | 42.8 | 34.7 | 28.7 | 21.2 | 21.9 | 11.5 |
| Performance rating - Percent | |
| Average of class Gaming | |
| MSI Katana 17 HX B14WGK | |
| Schenker XMG Core 15 (M25) | |
| Average NVIDIA GeForce RTX 5060 Laptop | |
| Lenovo LOQ 15AHP10 | |
| Medion Erazer Scout 17 E1 MD62758 | |
| Horizon Forbidden West | |
| 2560x1440 Very High Preset AA:T | |
| Average of class Gaming (39.6 - 100.9, n=10, last 2 years) | |
| MSI Katana 17 HX B14WGK | |
| Lenovo LOQ 15AHP10 | |
| Average NVIDIA GeForce RTX 5060 Laptop (47 - 48.1, n=2) | |
| Schenker XMG Core 15 (M25) | |
| Medion Erazer Scout 17 E1 MD62758 | |
| 2560x1440 Very High Preset + DLSS Quality | |
| Average of class Gaming (58.4 - 116.6, n=8, last 2 years) | |
| MSI Katana 17 HX B14WGK | |
| Schenker XMG Core 15 (M25) | |
| Average NVIDIA GeForce RTX 5060 Laptop (59.9 - 60.6, n=2) | |
| Lenovo LOQ 15AHP10 | |
| Medion Erazer Scout 17 E1 MD62758 | |
| The Elder Scrolls IV Oblivion Remastered | |
| 2560x1440 Ultra Preset AA:T | |
| Average of class Gaming (12.7 - 45.9, n=14, last 2 years) | |
| MSI Katana 17 HX B14WGK | |
| Schenker XMG Core 15 (M25) | |
| Medion Erazer Scout 17 E1 MD62758 | |
| Average NVIDIA GeForce RTX 5060 Laptop (12.7 - 13.8, n=2) | |
| Lenovo LOQ 15AHP10 | |
| 2560x1440 Ultra Preset + Quality DLSS | |
| Average of class Gaming (25.3 - 59.7, n=12, last 2 years) | |
| MSI Katana 17 HX B14WGK | |
| Schenker XMG Core 15 (M25) | |
| Average NVIDIA GeForce RTX 5060 Laptop (25.3 - 30, n=2) | |
| Medion Erazer Scout 17 E1 MD62758 | |
| Lenovo LOQ 15AHP10 | |
As usual, we tested long-term 3D performance with Cyberpunk 2077. The XMG Core 15 performed steadily, showing no noticeable drops.
Cyberpunk 2077 ultra FPS chart
Emissions
Noise
In Overboost mode, the noise level in 3D mode is neither low nor particularly high. 49 dB(A) in Cyberpunk 2077 is based on Legion 5, which reaches 50 dB(A). The fans remain partially off when idle, and when they do spin, noise stays modest at around 27 to 29 dB.
Noise level
| Idle |
| 25 / 27 / 29 dB(A) |
| Load |
| 48 / 50 dB(A) |
 | ||
30 dB silent 40 dB(A) audible 50 dB(A) loud |
||
min: | ||
| Schenker XMG Core 15 (M25) Ryzen AI 7 350, GeForce RTX 5060 Laptop | Lenovo LOQ 15AHP10 R7 250, GeForce RTX 5060 Laptop | Lenovo Legion 5 15AHP G10 R7 260, GeForce RTX 5060 Laptop | Medion Erazer Scout 17 E1 MD62758 Core 5 210H, GeForce RTX 5050 Laptop | MSI Katana 17 HX B14WGK i7-14650HX, GeForce RTX 5070 Laptop | Schenker XMG Core 15 (M24) R7 8845HS, GeForce RTX 4060 Laptop GPU | |
|---|---|---|---|---|---|---|
| Noise | -33% | 4% | -7% | -15% | 8% | |
| off / environment * (dB) | 24 | 25 -4% | 25.5 -6% | 24 -0% | 25 -4% | 23 4% |
| Idle Minimum * (dB) | 25 | 43 -72% | 25.5 -2% | 27 -8% | 31 -24% | 23 8% |
| Idle Average * (dB) | 27 | 45 -67% | 25.5 6% | 29 -7% | 32 -19% | 23 15% |
| Idle Maximum * (dB) | 29 | 48 -66% | 26.9 7% | 32 -10% | 34 -17% | 23 21% |
| Load Average * (dB) | 48 | 53 -10% | 34.6 28% | 47 2% | 50 -4% | 38.92 19% |
| Cyberpunk 2077 ultra * (dB) | 49 | 51 -4% | 50.1 -2% | 55 -12% | 58 -18% | 52.06 -6% |
| Load Maximum * (dB) | 50 | 53 -6% | 50.1 -0% | 58 -16% | 59 -18% | 52.09 -4% |
| Witcher 3 ultra * (dB) | 50.96 |
* ... smaller is better
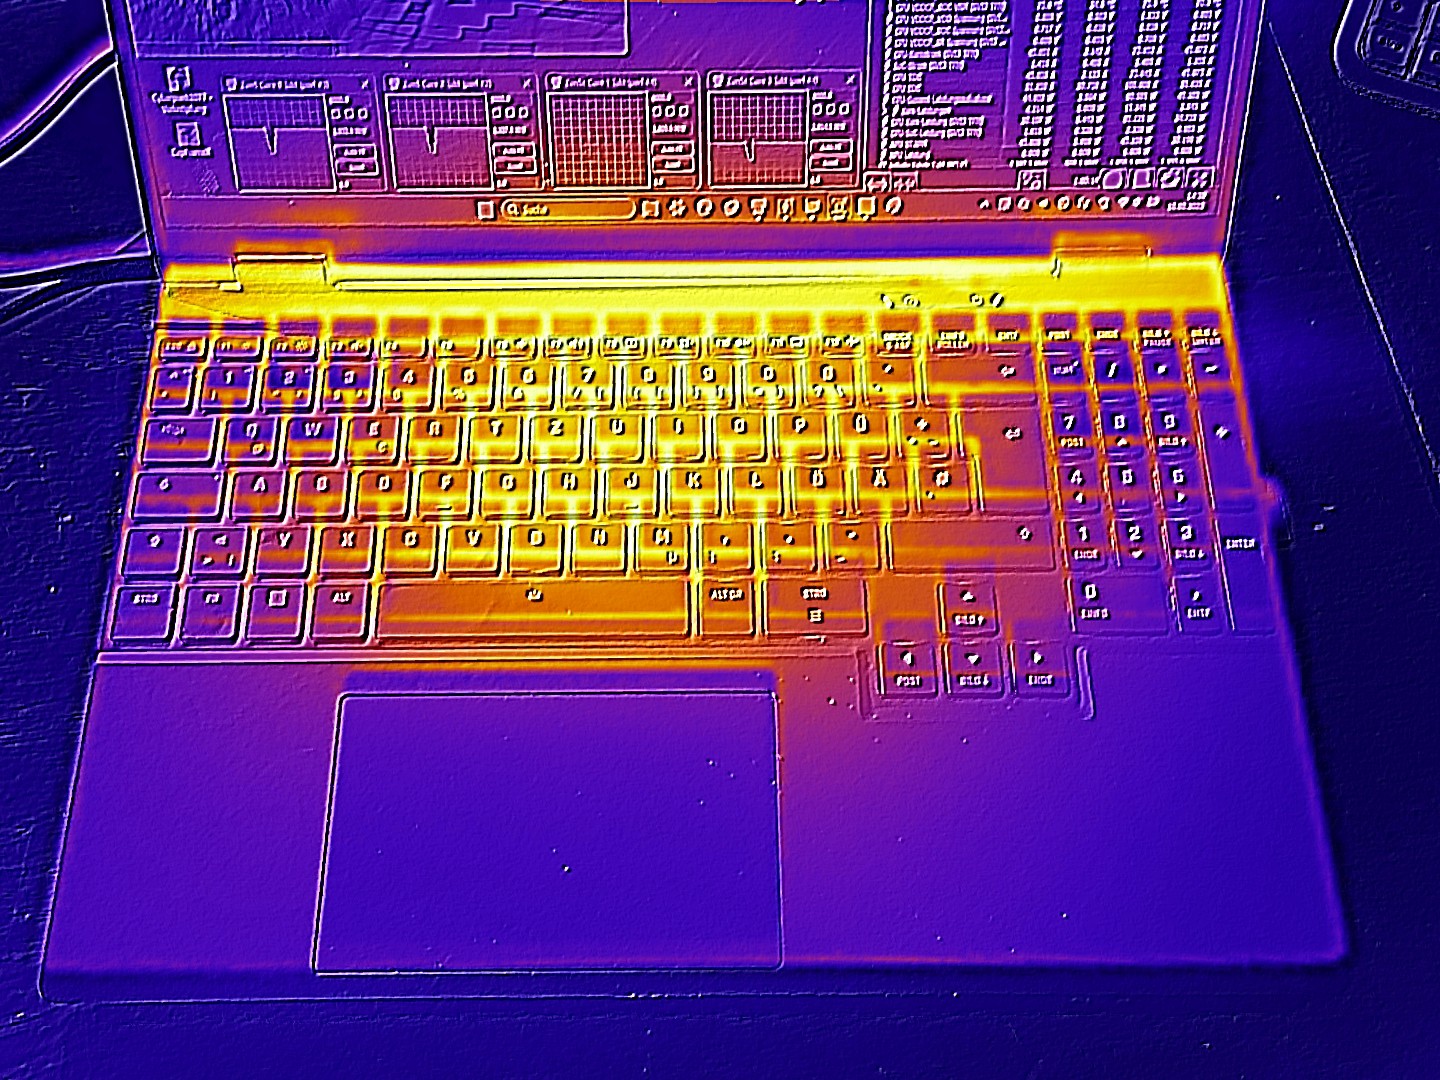
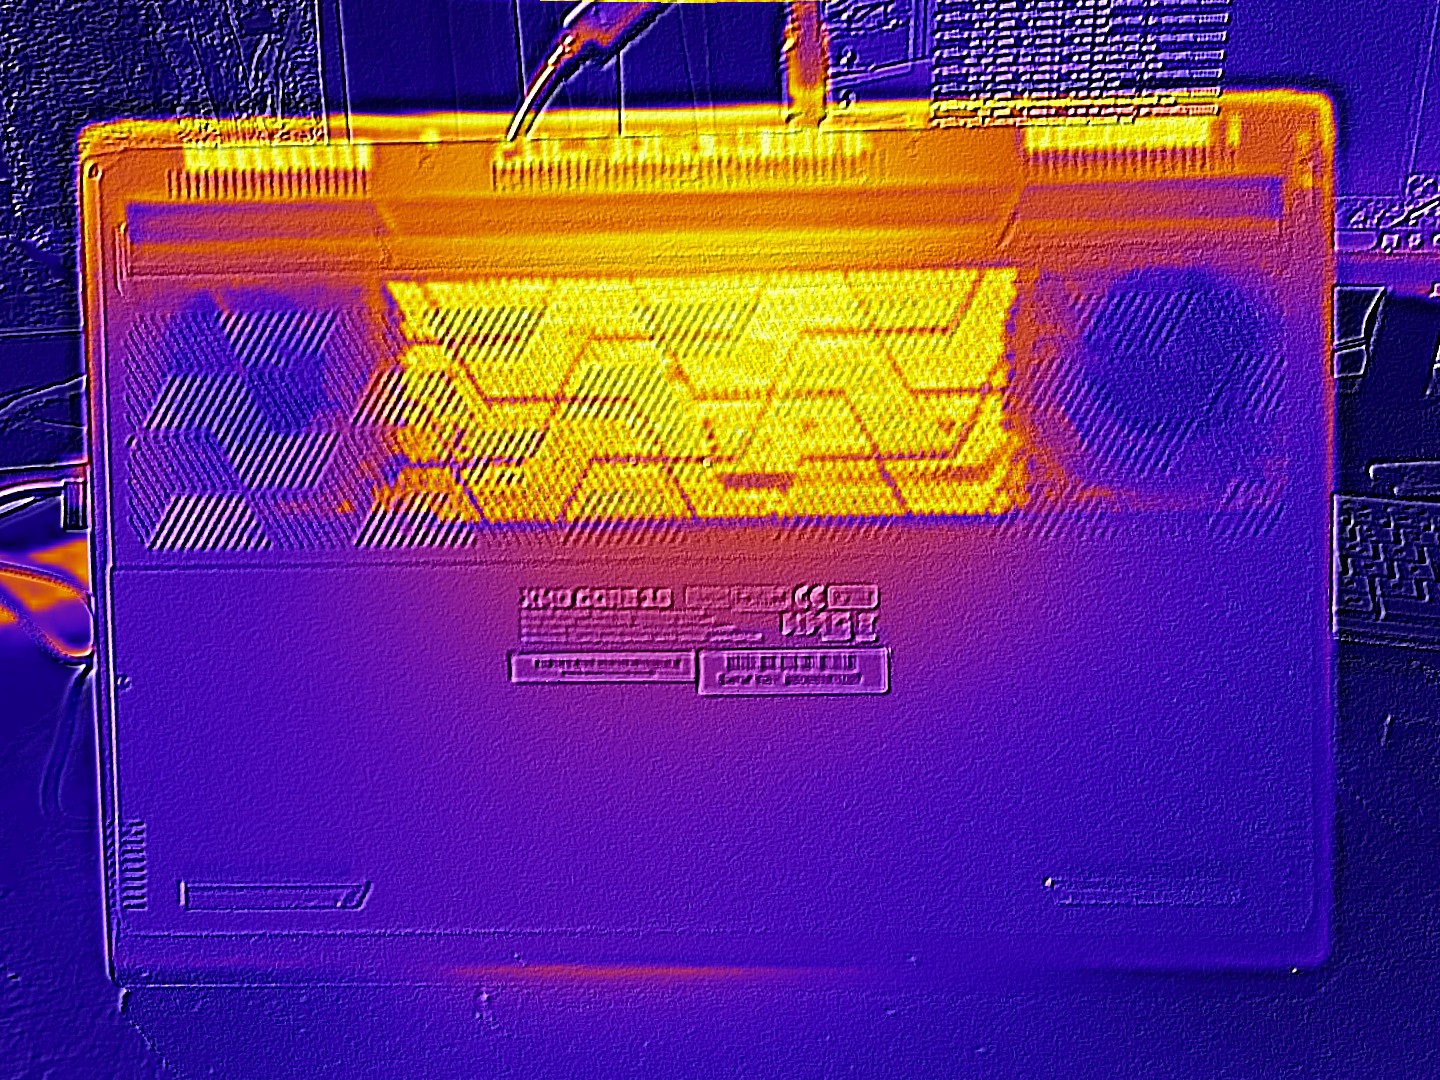
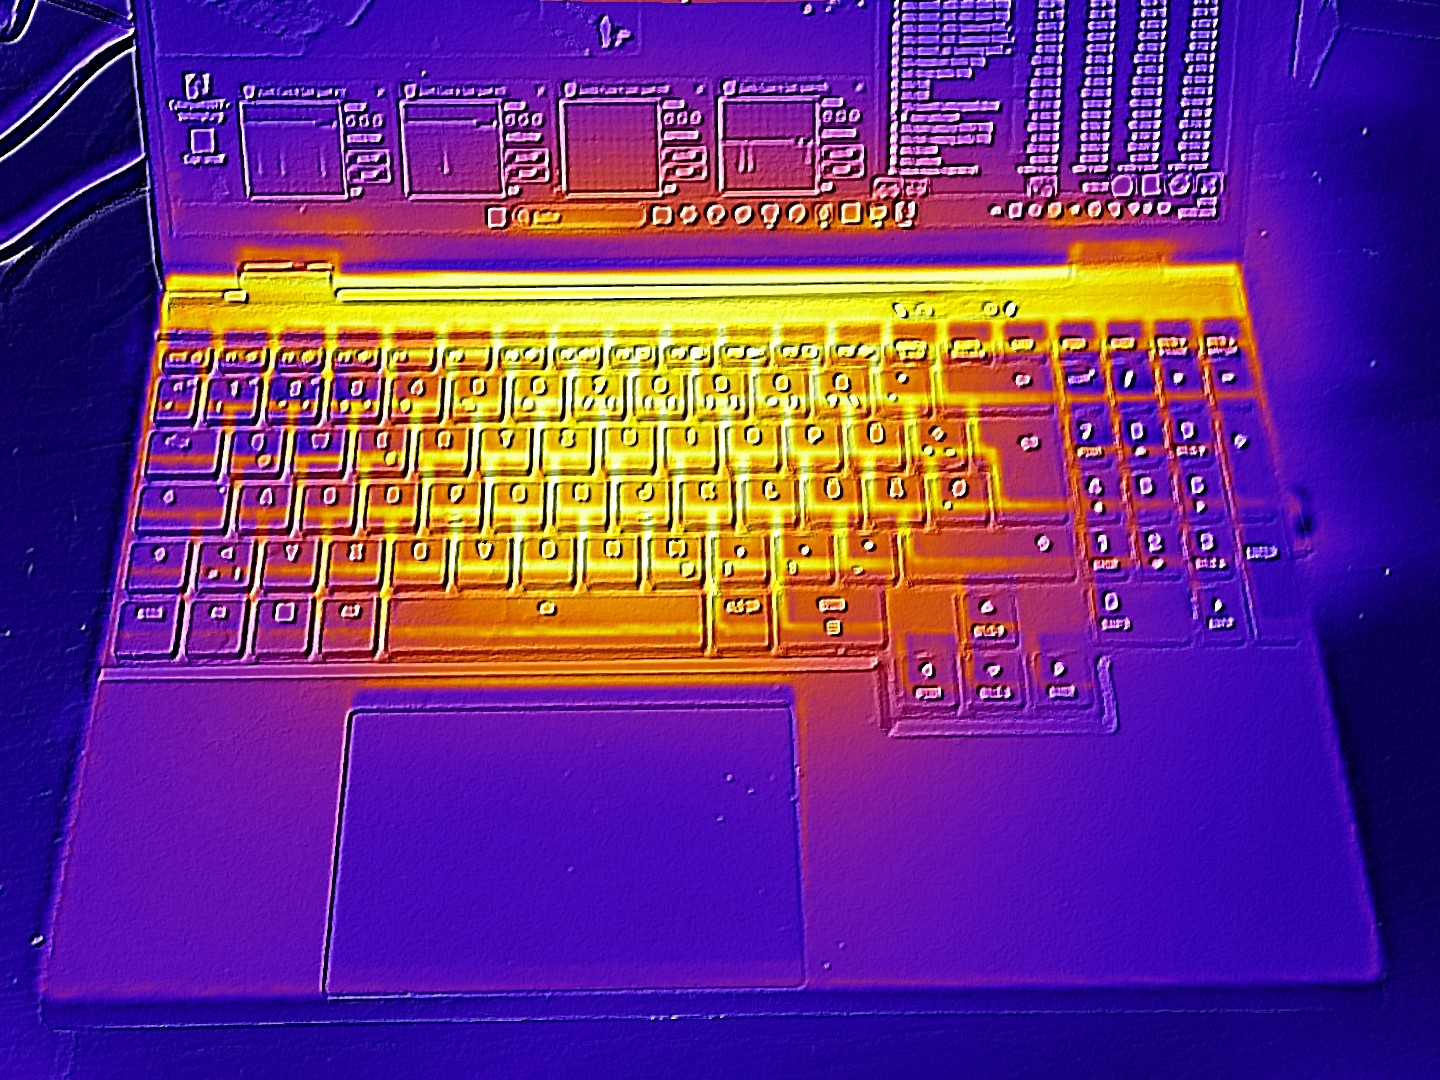
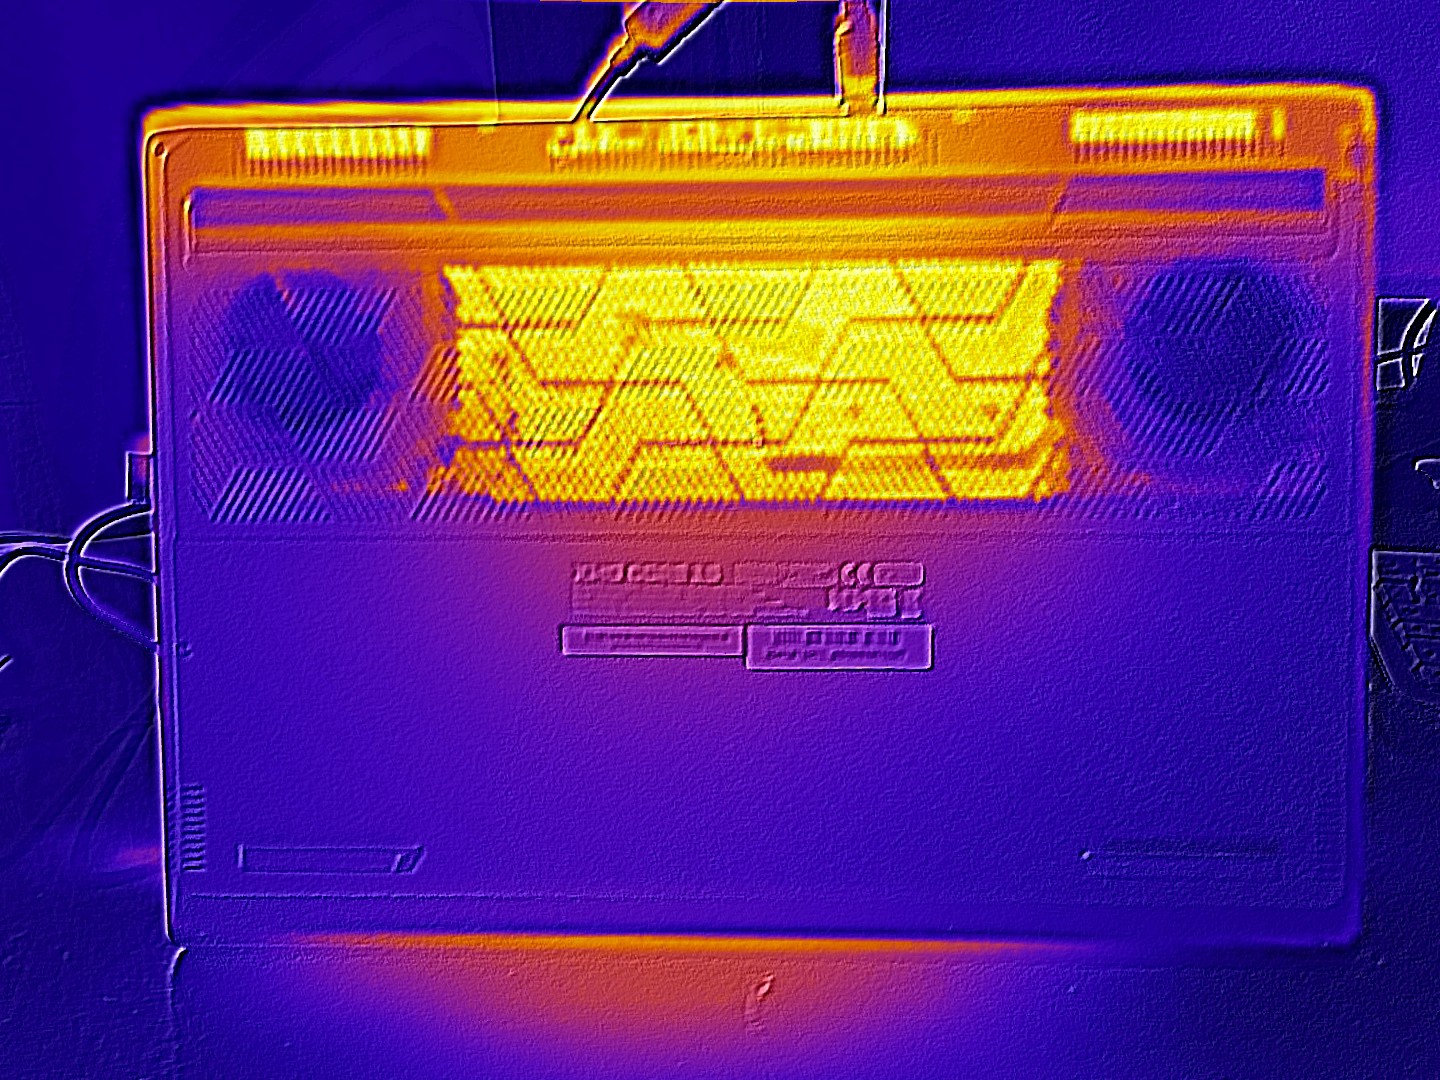
Temperature
The temperature results are mixed. While the chassis stays mostly below 30 °C at idle, surface temperatures climb to nearly 50 °C on top and 60 °C on the bottom under load. These readings are similar to the Lenovo LOQ 15, whereas the Legion 5 runs cooler.
(-) The maximum temperature on the upper side is 49 °C / 120 F, compared to the average of 40.4 °C / 105 F, ranging from 21.2 to 68.8 °C for the class Gaming.
(-) The bottom heats up to a maximum of 59 °C / 138 F, compared to the average of 43.2 °C / 110 F
(+) In idle usage, the average temperature for the upper side is 27.4 °C / 81 F, compared to the device average of 33.9 °C / 93 F.
(-) 3: The average temperature for the upper side is 41.2 °C / 106 F, compared to the average of 33.9 °C / 93 F for the class Gaming.
(+) The palmrests and touchpad are reaching skin temperature as a maximum (35 °C / 95 F) and are therefore not hot.
(-) The average temperature of the palmrest area of similar devices was 28.8 °C / 83.8 F (-6.2 °C / -11.2 F).
| Schenker XMG Core 15 (M25) Ryzen AI 7 350, GeForce RTX 5060 Laptop | Lenovo LOQ 15AHP10 R7 250, GeForce RTX 5060 Laptop | Lenovo Legion 5 15AHP G10 R7 260, GeForce RTX 5060 Laptop | Medion Erazer Scout 17 E1 MD62758 Core 5 210H, GeForce RTX 5050 Laptop | MSI Katana 17 HX B14WGK i7-14650HX, GeForce RTX 5070 Laptop | Schenker XMG Core 15 (M24) R7 8845HS, GeForce RTX 4060 Laptop GPU | |
|---|---|---|---|---|---|---|
| Heat | -2% | 8% | 5% | -6% | -15% | |
| Maximum Upper Side * (°C) | 49 | 49 -0% | 42.2 14% | 42 14% | 52 -6% | 52 -6% |
| Maximum Bottom * (°C) | 59 | 58 2% | 51.7 12% | 45 24% | 56 5% | 61 -3% |
| Idle Upper Side * (°C) | 28 | 32 -14% | 28.5 -2% | 30 -7% | 33 -18% | 35 -25% |
| Idle Bottom * (°C) | 31 | 29 6% | 29.2 6% | 35 -13% | 32 -3% | 39 -26% |
* ... smaller is better
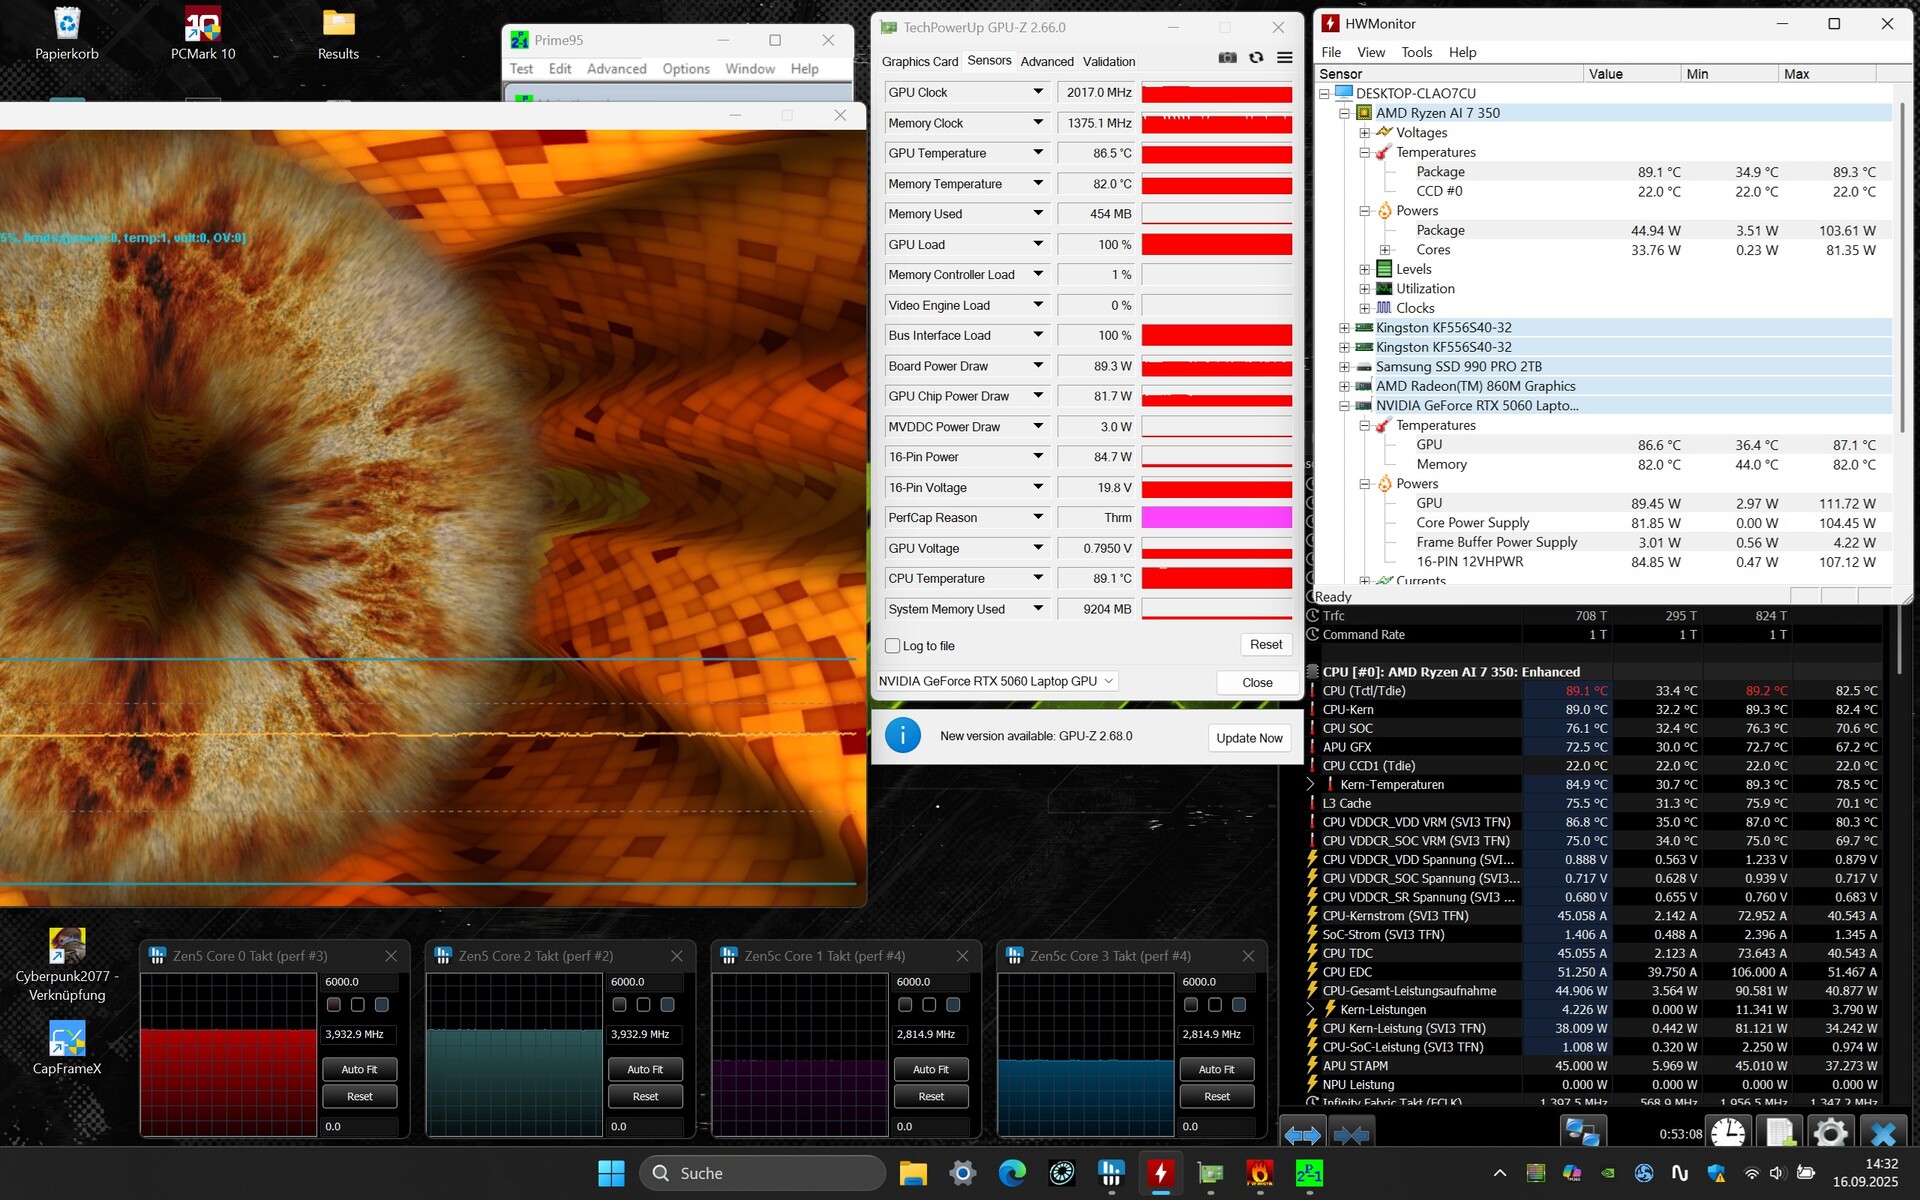
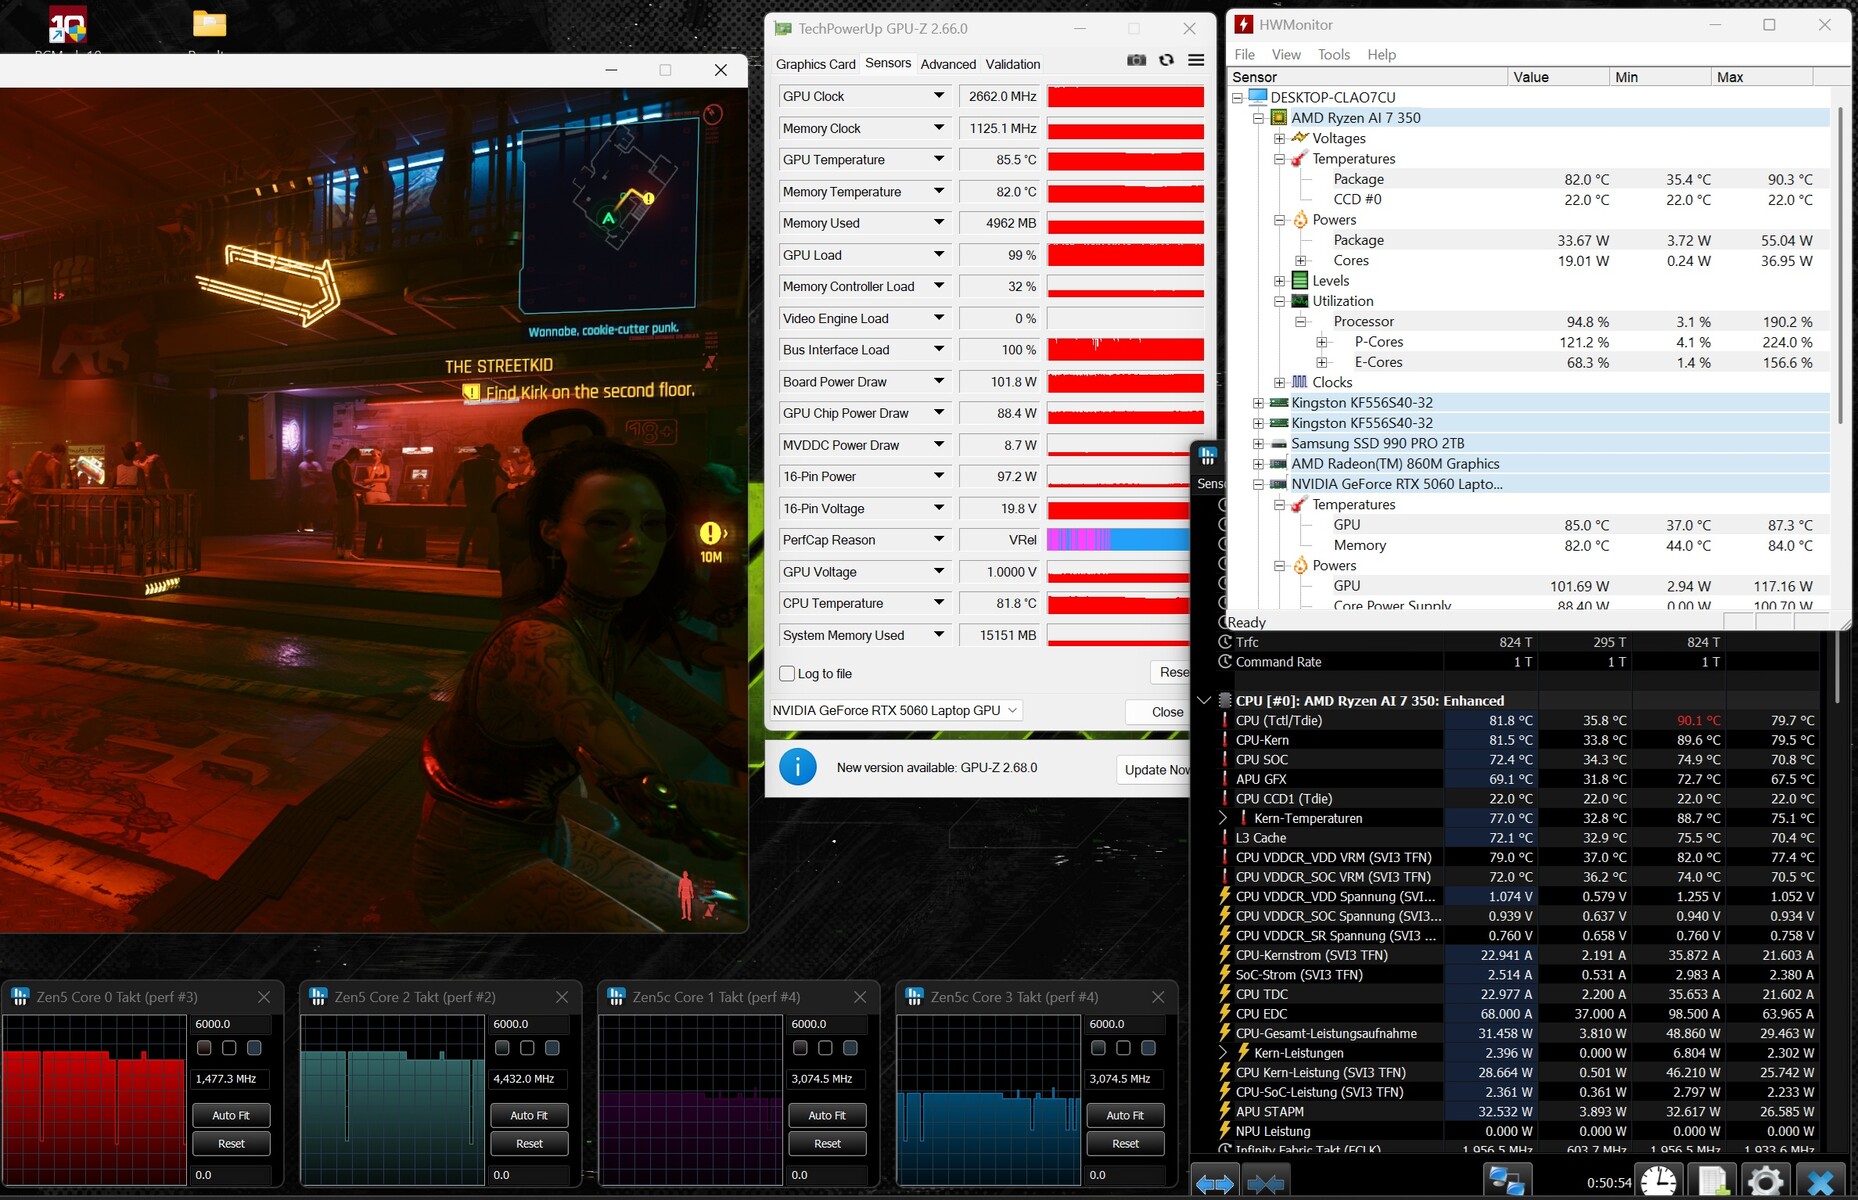
Stress test
In the stress test with the Furmark and Prime95 tools, the CPU heated up to almost 89 °C, whereas the GPU leveled off at around 86 °C.
Speakers
The sound quality is above average. As usual, the bass could be stronger, but overall the Core 15 performs well and, according to our audio analysis, delivers slightly better sound than the Legion 5.
Schenker XMG Core 15 (M25) audio analysis
(+) | speakers can play relatively loud (82 dB)
Bass 100 - 315 Hz
(-) | nearly no bass - on average 18.3% lower than median
(±) | linearity of bass is average (9.8% delta to prev. frequency)
Mids 400 - 2000 Hz
(+) | balanced mids - only 3.4% away from median
(+) | mids are linear (5.9% delta to prev. frequency)
Highs 2 - 16 kHz
(+) | balanced highs - only 3.2% away from median
(+) | highs are linear (4.1% delta to prev. frequency)
Overall 100 - 16.000 Hz
(+) | overall sound is linear (14.3% difference to median)
Compared to same class
» 26% of all tested devices in this class were better, 7% similar, 67% worse
» The best had a delta of 6%, average was 18%, worst was 132%
Compared to all devices tested
» 17% of all tested devices were better, 4% similar, 79% worse
» The best had a delta of 4%, average was 24%, worst was 134%
Lenovo Legion 5 15AHP G10 audio analysis
(±) | speaker loudness is average but good (81.5 dB)
Bass 100 - 315 Hz
(-) | nearly no bass - on average 21% lower than median
(±) | linearity of bass is average (8.2% delta to prev. frequency)
Mids 400 - 2000 Hz
(+) | balanced mids - only 4.7% away from median
(+) | mids are linear (5.4% delta to prev. frequency)
Highs 2 - 16 kHz
(+) | balanced highs - only 3.1% away from median
(+) | highs are linear (6.4% delta to prev. frequency)
Overall 100 - 16.000 Hz
(±) | linearity of overall sound is average (16.7% difference to median)
Compared to same class
» 43% of all tested devices in this class were better, 10% similar, 47% worse
» The best had a delta of 6%, average was 18%, worst was 132%
Compared to all devices tested
» 29% of all tested devices were better, 7% similar, 64% worse
» The best had a delta of 4%, average was 24%, worst was 134%
Power consumption
energy consumption
The Schenker notebook consumes less power than many competitors, especially when idle. Power usage for external displays depends on the output used: the Mini DisplayPort and one of the two HDMI ports run through the dGPU, while the others use the iGPU.
| Off / Standby | |
| Idle | |
| Load |
|
Key:
min: | |
| Schenker XMG Core 15 (M25) Ryzen AI 7 350, GeForce RTX 5060 Laptop | Lenovo LOQ 15AHP10 R7 250, GeForce RTX 5060 Laptop | Lenovo Legion 5 15AHP G10 R7 260, GeForce RTX 5060 Laptop | Medion Erazer Scout 17 E1 MD62758 Core 5 210H, GeForce RTX 5050 Laptop | MSI Katana 17 HX B14WGK i7-14650HX, GeForce RTX 5070 Laptop | Schenker XMG Core 15 (M24) R7 8845HS, GeForce RTX 4060 Laptop GPU | Average of class Gaming | |
|---|---|---|---|---|---|---|---|
| Power Consumption | -22% | 12% | -13% | -23% | -6% | -36% | |
| Idle Minimum * (Watt) | 10.6 | 20 -89% | 6.9 35% | 13.5 -27% | 9.7 8% | 9.3 12% | 13.2 ? -25% |
| Idle Average * (Watt) | 12.1 | 20.7 -71% | 10.7 12% | 14.8 -22% | 15 -24% | 12.9 -7% | 18.9 ? -56% |
| Idle Maximum * (Watt) | 15.9 | 22.7 -43% | 11.3 29% | 22.9 -44% | 23.7 -49% | 12.8 19% | 24.3 ? -53% |
| Load Average * (Watt) | 95 | 71 25% | 69.7 27% | 87 8% | 126 -33% | 108.3 ? -14% | |
| Cyberpunk 2077 ultra external monitor * (Watt) | 165 | 151.1 8% | 165 -0% | 171.9 -4% | 202 -22% | ||
| Cyberpunk 2077 ultra * (Watt) | 169 | 153.1 9% | 162.6 4% | 173.4 -3% | 205 -21% | ||
| Load Maximum * (Watt) | 192 | 172 10% | 233.6 -22% | 195 -2% | 227 -18% | 286 -49% | 254 ? -32% |
| Witcher 3 ultra * (Watt) | 167 |
* ... smaller is better
energy consumption Cyberpunk / Stress test
energy consumption with external monitor
Battery life
Although battery life trails the previous Core 15, roughly 10 hours in the browser test at 150 cd/m² brightness is still impressive and matches the Legion 5’s comparable result.
| Schenker XMG Core 15 (M25) Ryzen AI 7 350, GeForce RTX 5060 Laptop, 99.8 Wh | Lenovo LOQ 15AHP10 R7 250, GeForce RTX 5060 Laptop, 60 Wh | Lenovo Legion 5 15AHP G10 R7 260, GeForce RTX 5060 Laptop, 80 Wh | Medion Erazer Scout 17 E1 MD62758 Core 5 210H, GeForce RTX 5050 Laptop, 53 Wh | MSI Katana 17 HX B14WGK i7-14650HX, GeForce RTX 5070 Laptop, 75 Wh | Schenker XMG Core 15 (M24) R7 8845HS, GeForce RTX 4060 Laptop GPU, 99.8 Wh | Average of class Gaming | |
|---|---|---|---|---|---|---|---|
| Battery runtime | -55% | -2% | -61% | -48% | 49% | -29% | |
| WiFi v1.3 (h) | 9.9 | 4.5 -55% | 9.7 -2% | 3.9 -61% | 5.1 -48% | 14.8 49% | 7.04 ? -29% |
| Reader / Idle (h) | 6.9 | 8.71 ? | |||||
| Load (h) | 1.3 | 1.2 | 2.5 | 1.47 ? | |||
| H.264 (h) | 11.5 | 10.1 | 8.26 ? | ||||
| Cyberpunk 2077 ultra 150cd (h) | 0.9 |
Notebookcheck overall rating
The 2025 XMG Core 15 carries over the high-quality metal chassis and good input devices of its predecessor while adding updated ports and newer hardware. Aside from its fairly steep price, there’s little to criticize. The main competitor, the Legion 5 , will have to keep up. Lenovo’s key advantage is its OLED panel—assuming you can live with the reflections.
Schenker XMG Core 15 (M25)
- 09/25/2025 v8
Florian Glaser
 Total Sustainability Score:
 Possible alternatives in comparison
Image | Model / Review | Price | Weight | Height | Display |
|---|---|---|---|---|---|
1. 84.7%  | Schenker XMG Core 15 (M25) AMD Ryzen AI 7 350 ⎘ NVIDIA GeForce RTX 5060 Laptop ⎘ 64 GB Memory, 2048 GB SSD | Amazon: List Price: 1840 EUR | 1.9 kg | 22 mm | 15.30" 2560x1600 197 PPI IPS |
2. 77.5%  | Lenovo LOQ 15AHP10 AMD Ryzen 7 250 ⎘ NVIDIA GeForce RTX 5060 Laptop ⎘ 16 GB Memory, 1024 GB SSD | Amazon: | 2.4 kg | 24 mm | 15.60" 1920x1080 141 PPI IPS |
3. 87.2%  | Lenovo Legion 5 15AHP G10 AMD Ryzen 7 260 ⎘ NVIDIA GeForce RTX 5060 Laptop ⎘ 32 GB Memory, 1024 GB SSD | Amazon: List Price: 1449€ | 1.9 kg | 21.5 mm | 15.10" 2560x1600 200 PPI OLED |
4. 76.8%  | Medion Erazer Scout 17 E1 MD62758 Intel Core 5 210H ⎘ NVIDIA GeForce RTX 5050 Laptop ⎘ 16 GB Memory, 1024 GB | Amazon: List Price: 1250 EUR | 2.7 kg | 26 mm | 17.30" 1920x1080 127 PPI IPS |
5. 77.3%  | MSI Katana 17 HX B14WGK Intel Core i7-14650HX ⎘ NVIDIA GeForce RTX 5070 Laptop ⎘ 16 GB Memory, 1024 GB SSD | Amazon: List Price: 1800 EUR | 2.7 kg | 28 mm | 17.30" 2560x1440 170 PPI IPS |
6. 83.7%  | Schenker XMG Core 15 (M24) AMD Ryzen 7 8845HS ⎘ NVIDIA GeForce RTX 4060 Laptop GPU ⎘ 32 GB Memory, 1024 GB SSD | Amazon: List Price: 1650 Euro | 2.1 kg | 21.9 mm | 15.30" 2560x1600 197 PPI IPS |
Transparency
The selection of devices to be reviewed is made by our editorial team. The test sample was provided to the author as a loan by the manufacturer or retailer for the purpose of this review. The lender had no influence on this review, nor did the manufacturer receive a copy of this review before publication. There was no obligation to publish this review. As an independent media company, Notebookcheck is not subjected to the authority of manufacturers, retailers or publishers.
This is how Notebookcheck is testing
Every year, Notebookcheck independently reviews hundreds of laptops and smartphones using standardized procedures to ensure that all results are comparable. We have continuously developed our test methods for around 20 years and set industry standards in the process. In our test labs, high-quality measuring equipment is utilized by experienced technicians and editors. These tests involve a multi-stage validation process. Our complex rating system is based on hundreds of well-founded measurements and benchmarks, which maintains objectivity. Further information on our test methods can be found here.

