Verdict - MacBook Neo is a surprisingly good laptop for $599
The new MacBook Neo feels like a typical MacBook, which means you do not have to make any compromises in terms of chassis quality, typing experience and also the display. Yes, the screen is not as good as on the MacBook Air, but it is also not that far off and considering the low price, the quality is really good. The panel does not support P3 color gamut (which is not really a big deal) or True Tone, even though a brightness sensor is included. The screen is very sharp and accurate in return, so even picture editing is possible. There is no PWM flickering, but the screen uses temporal dithering. The brightness is good at more than 500 nits, even though it is more reflective compared to the MacBook Air.
In terms of performance, the A18 Pro smartphone processor is surprisingly powerful and offers more single-core as well as graphics performance compared to the entry-level Snapdragon-X-CPUs from Qualcomm, only the multi-core performance is lower. However, it is still sufficient for everyday tasks and the overall experience feels snappy. Sure, heavy multitasking will be an issue and also fill the 8 GB RAM very quickly, but this is not the target scenario for the MacBook Neo anyway. And if you keep it light and primarily use Apple's native apps, it will be a very snappy and silent daily companion. While neither the memory, nor the SSD can be upgraded, the repairability of the components is actually pretty good (no glue, all parts accessible).
There are additional drawbacks: You only get two USB-C ports and one of them is limited the old 2.0 standard, but it can at least be used for charging. Only the more expensive model with 512 GB SSD storage gets Touch-ID, but the biggest issue in our opinion is definitely the lack of a keyboard backlight. The battery runtime also drops significantly when you use a higher display brightness.
Sure, the MacBook Air M4 is a better device overall if you find a good deal, it might be an alternative if you want the $699 MacBook Neo, but we think the base model for $599 (or $499 for education customers) will be very successful and to be honest, Windows does not really offer an alternative. Yes, you could get a refurbished or used device, but this is not the target audience for the new MacBook Neo. The Neo could also be better right now (A19 Pro with 12 GB RAM, backlit keyboard), but we are pretty sure it would have been more expensive, and Apple probably wants to keep some things for an improved second generation of the MacBook Neo.
Pros
Cons
Table of Contents
- Verdict - MacBook Neo is a surprisingly good laptop for $599
- Specifications
- Case - MacBook Neo feels like a regular MacBook
- Connectivity - Neo with USB 3.0 & 2.0
- Input Devices - Familiar typing experience, good mechanical trackpad
- Display - IPS with 500 nits
- Performance - A18 Pro with 8 GB RAM
- Emissions - MacBook Neo is always silent
- Energy Management
- Notebookcheck Rating
- Potential Competitors in Comparison
Apple is entering uncharted territory with the new 13-inch MacBook Neo, which starts at just $599 (or $499 for education customers) powered by the smartphone chip A18 Pro, 8 GB RAM and 256 GB SSD storage. We bought our base model at a local Apple store on launch day. The optional SKU for $699 offers a larger 512 GB SSD as well as a Touch-ID fingerprint scanner.
Specifications
Case - MacBook Neo feels like a regular MacBook

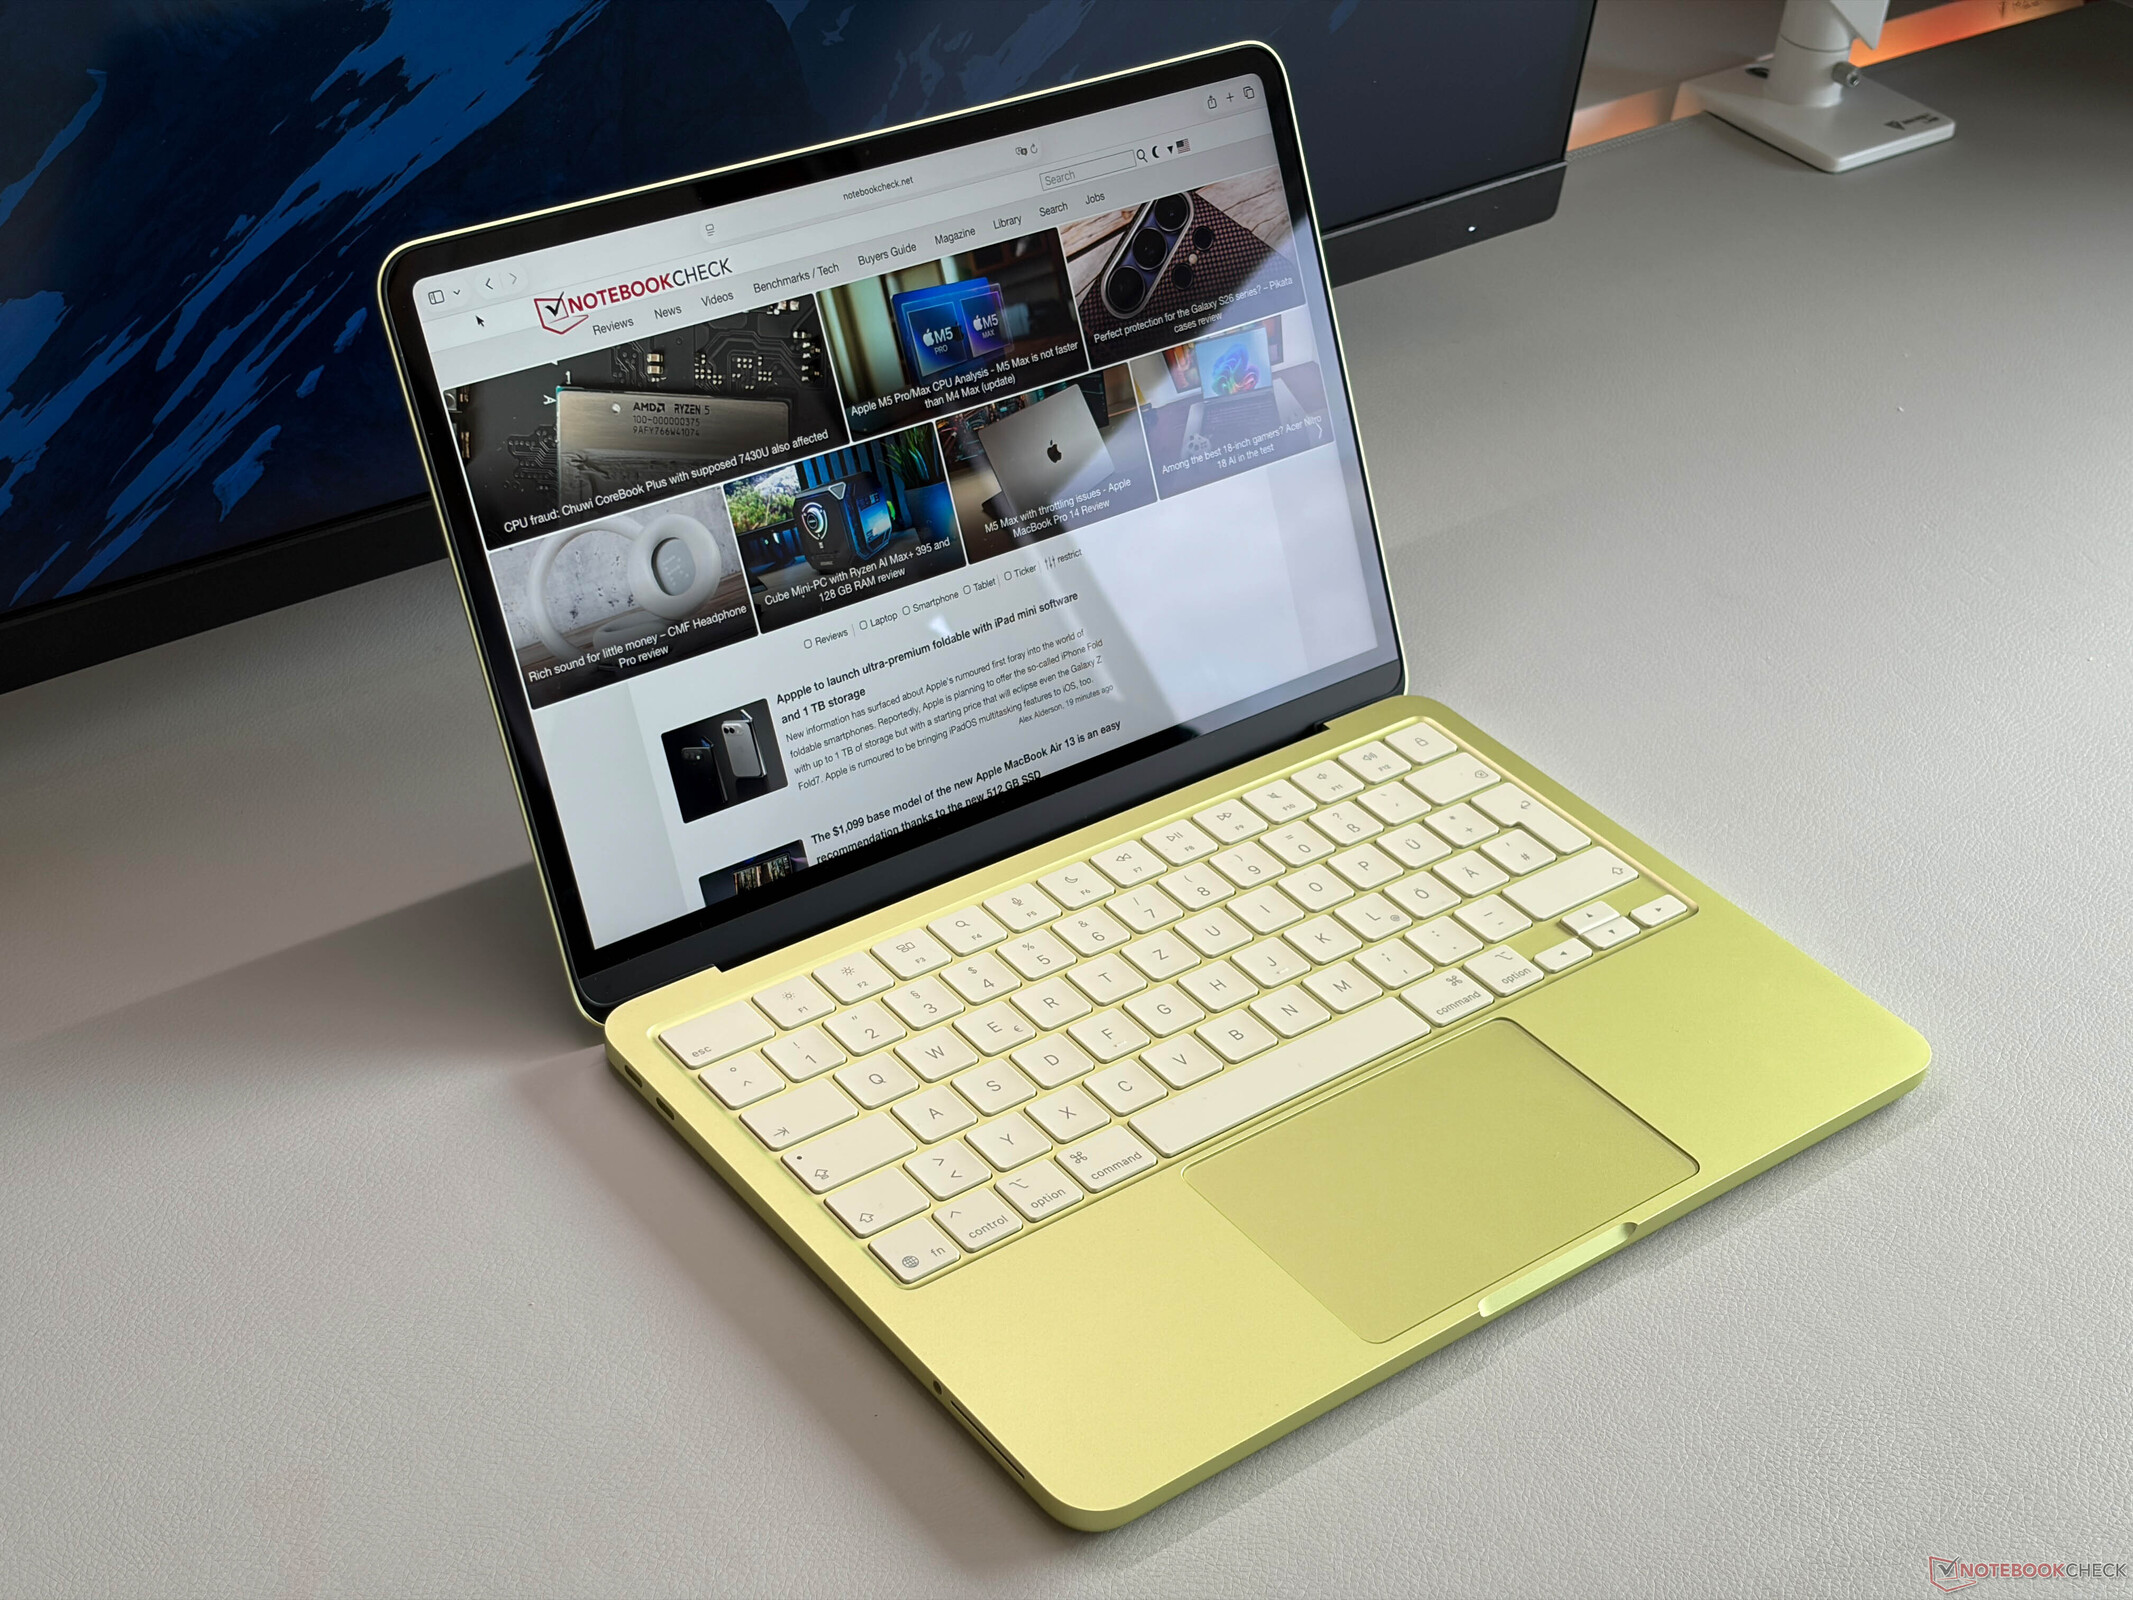
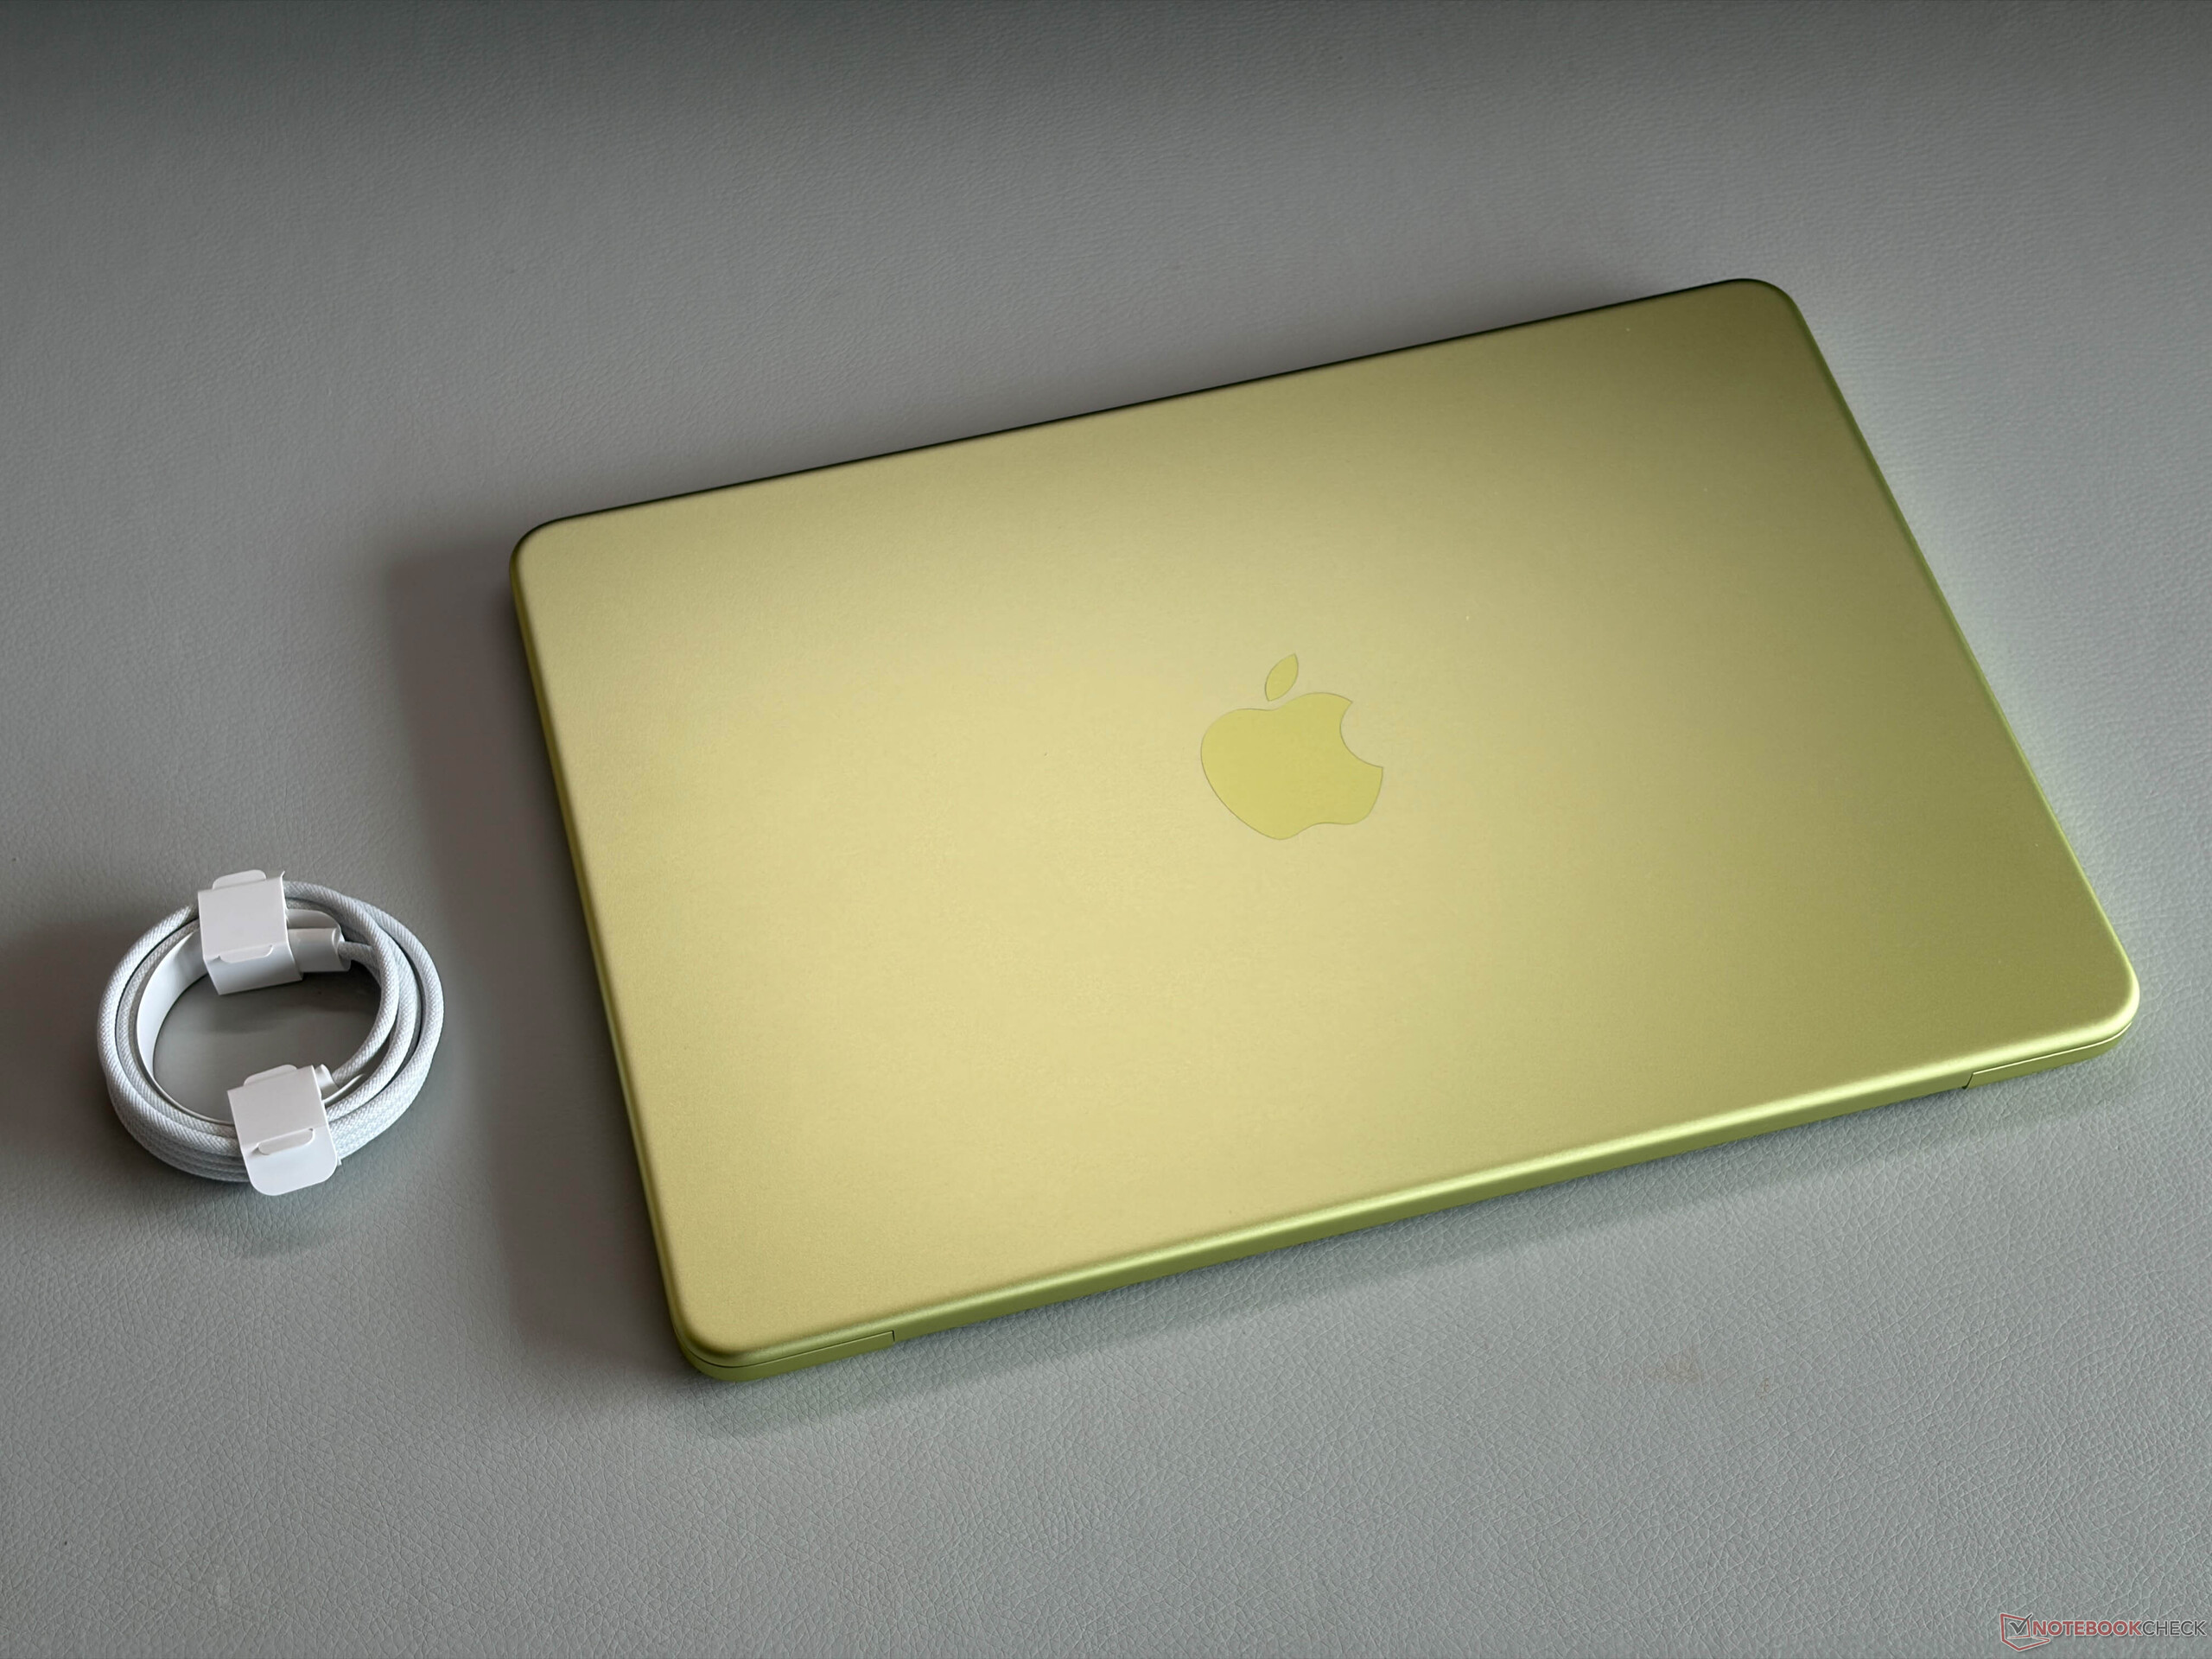
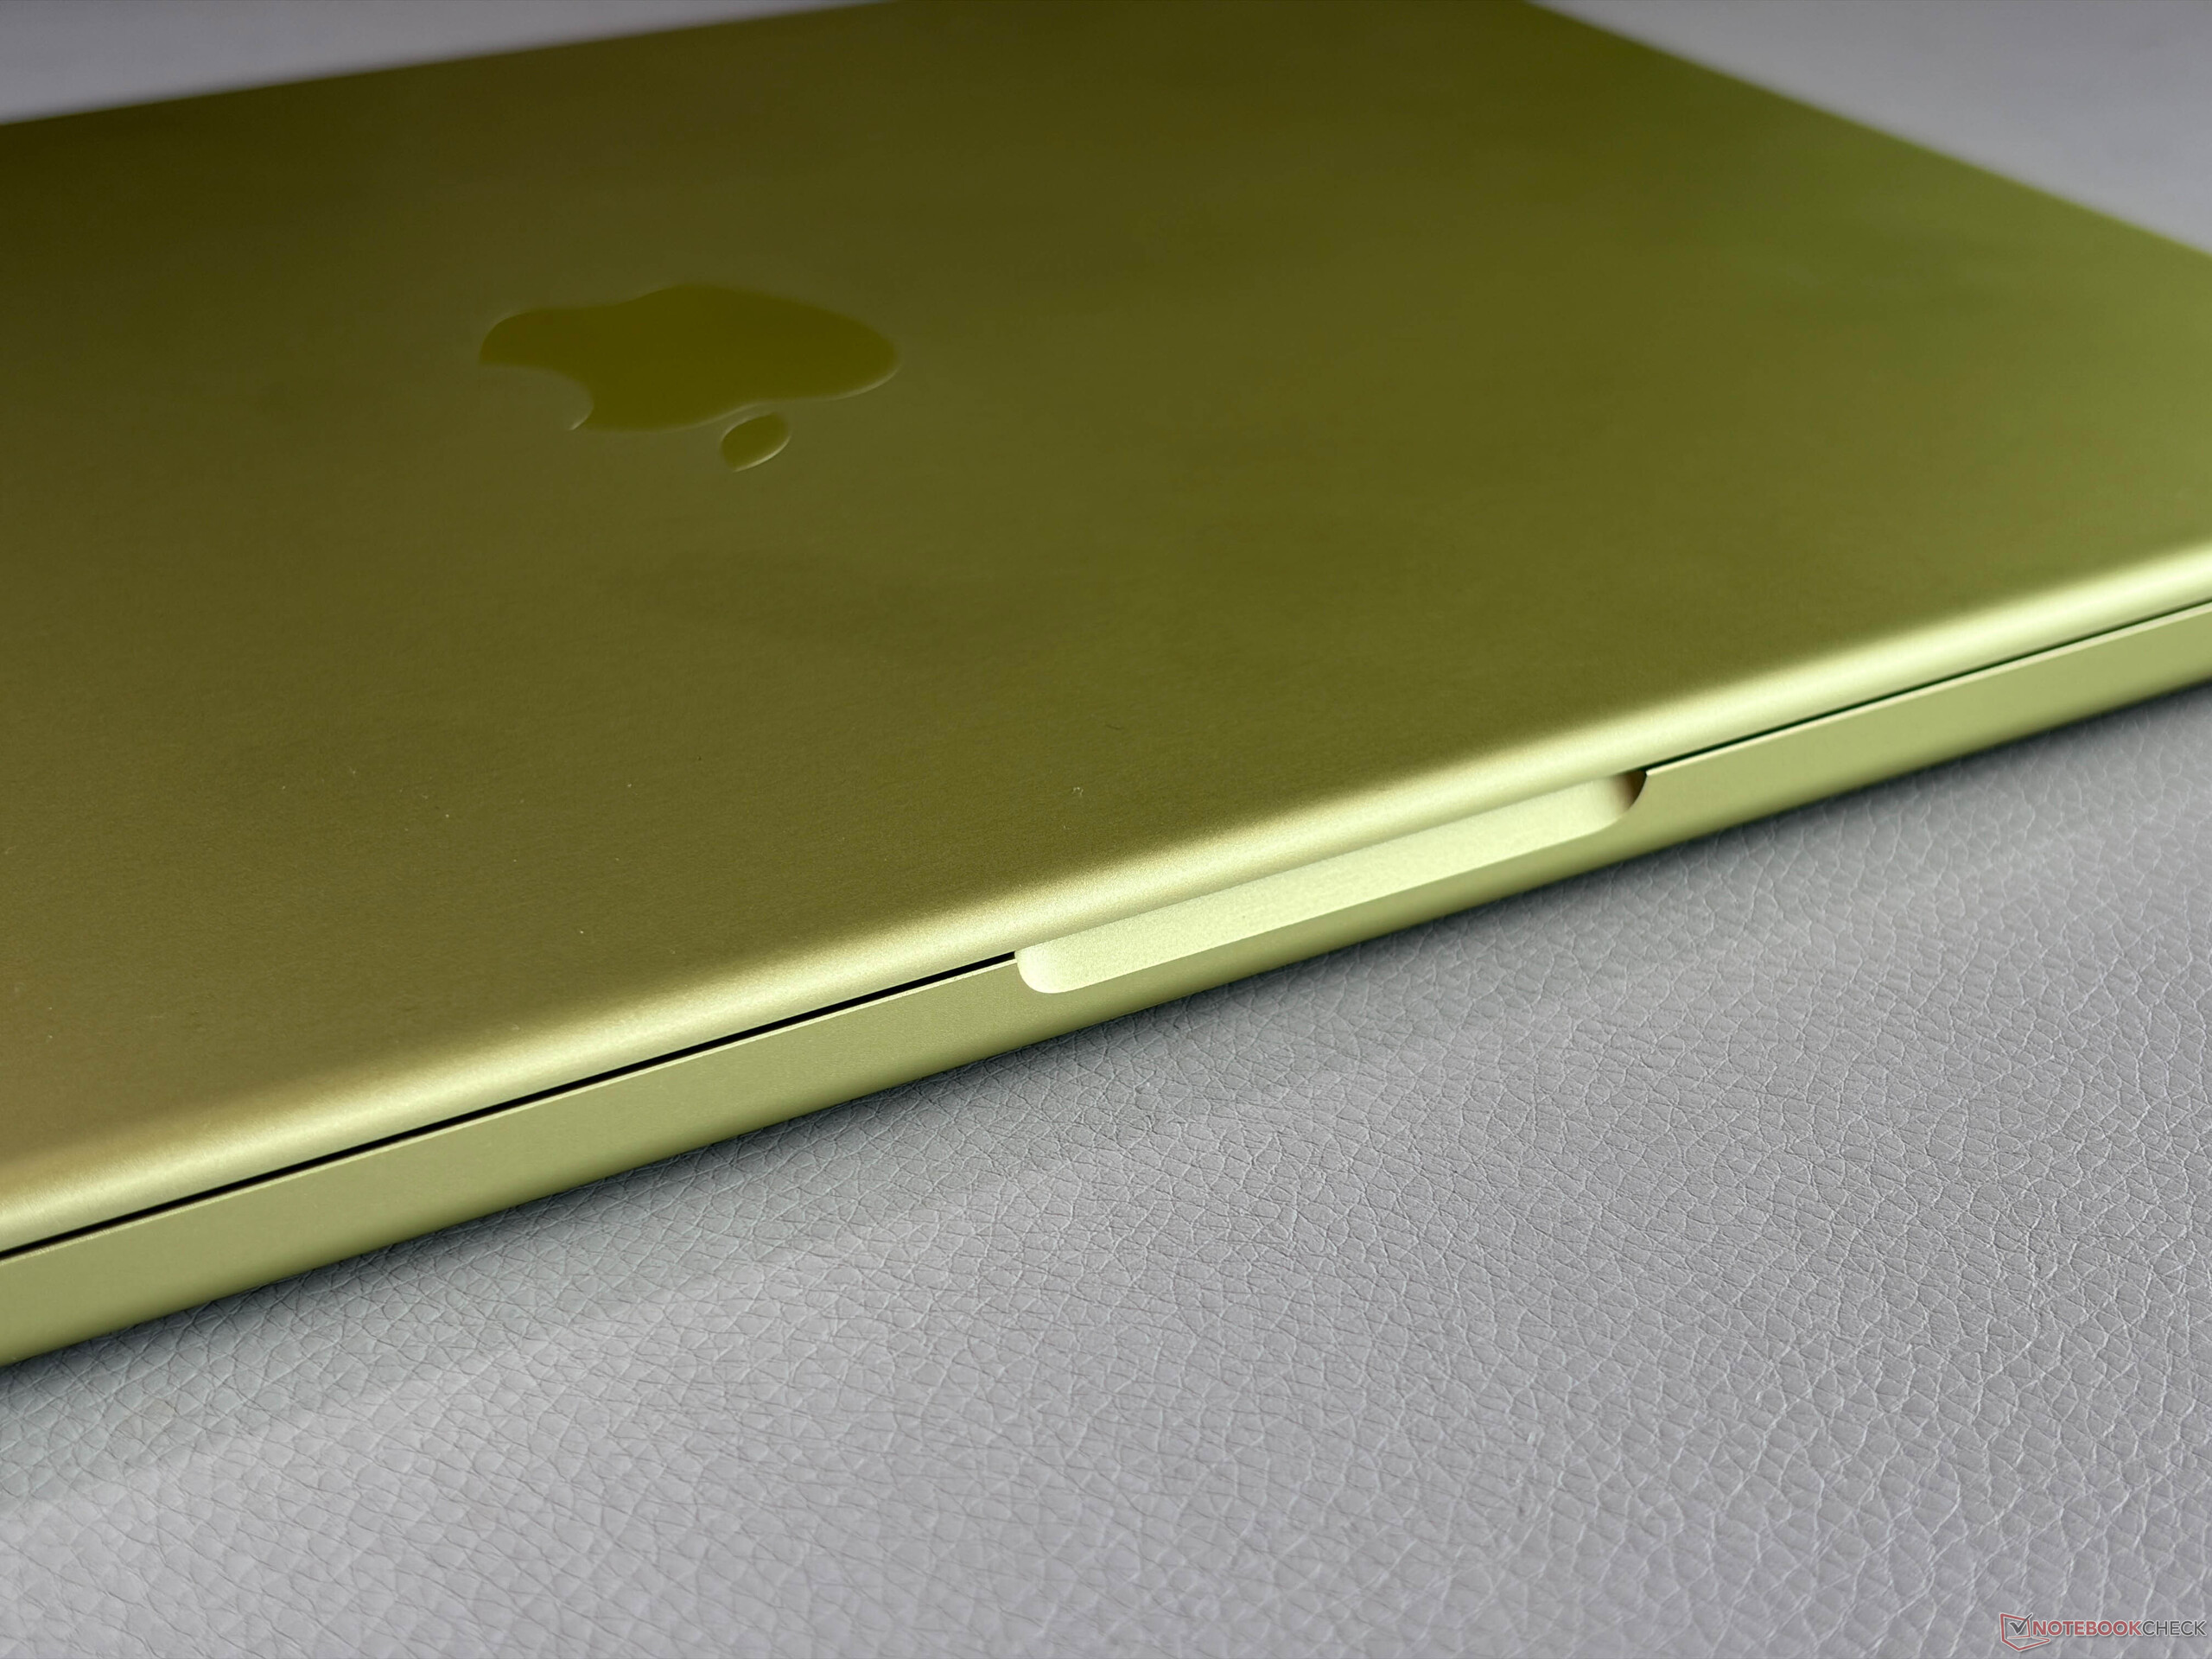
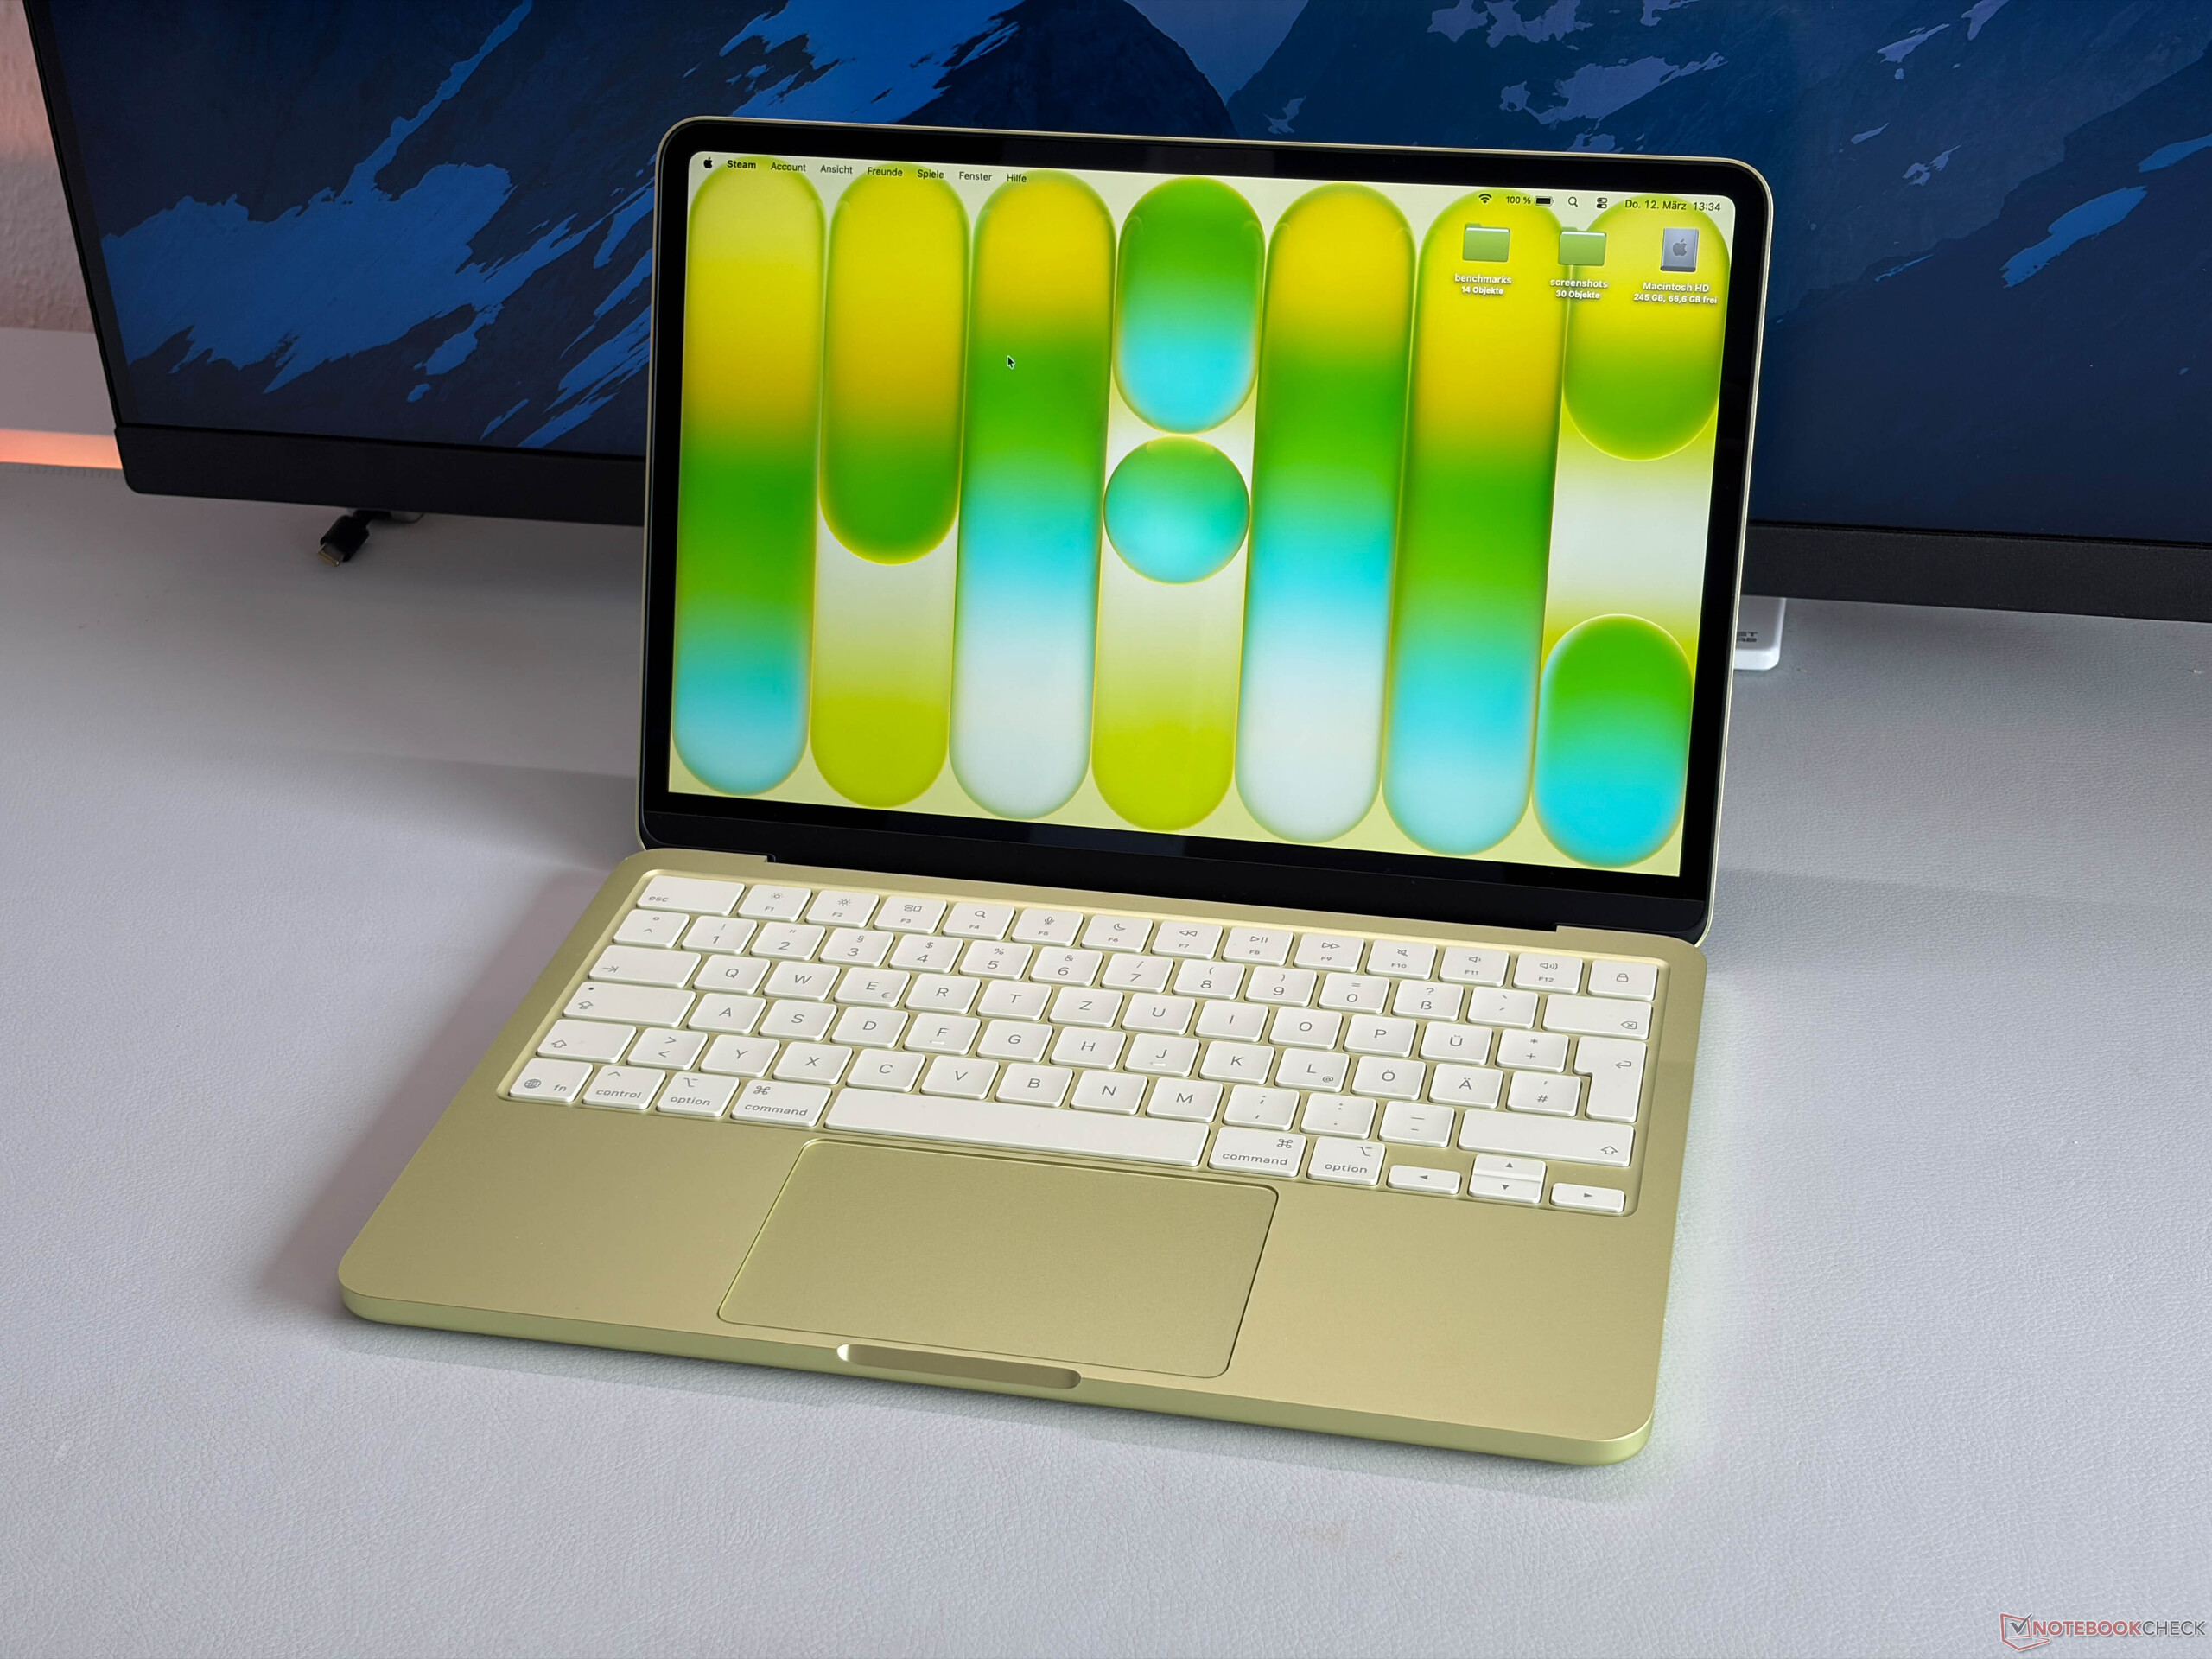
Apple offers the new MacBook Neo in four different colors, and we got the Citrus version. It is definitely pretty fresh, but this is obviously a matter of taste. If you prefer a lower profile, there is also the silver version. Apple also colored the rubber feet and also the macOS colors, even though this can be changed. The keyboard on our model also has a slight color hue towards yellow, but it is subtle.
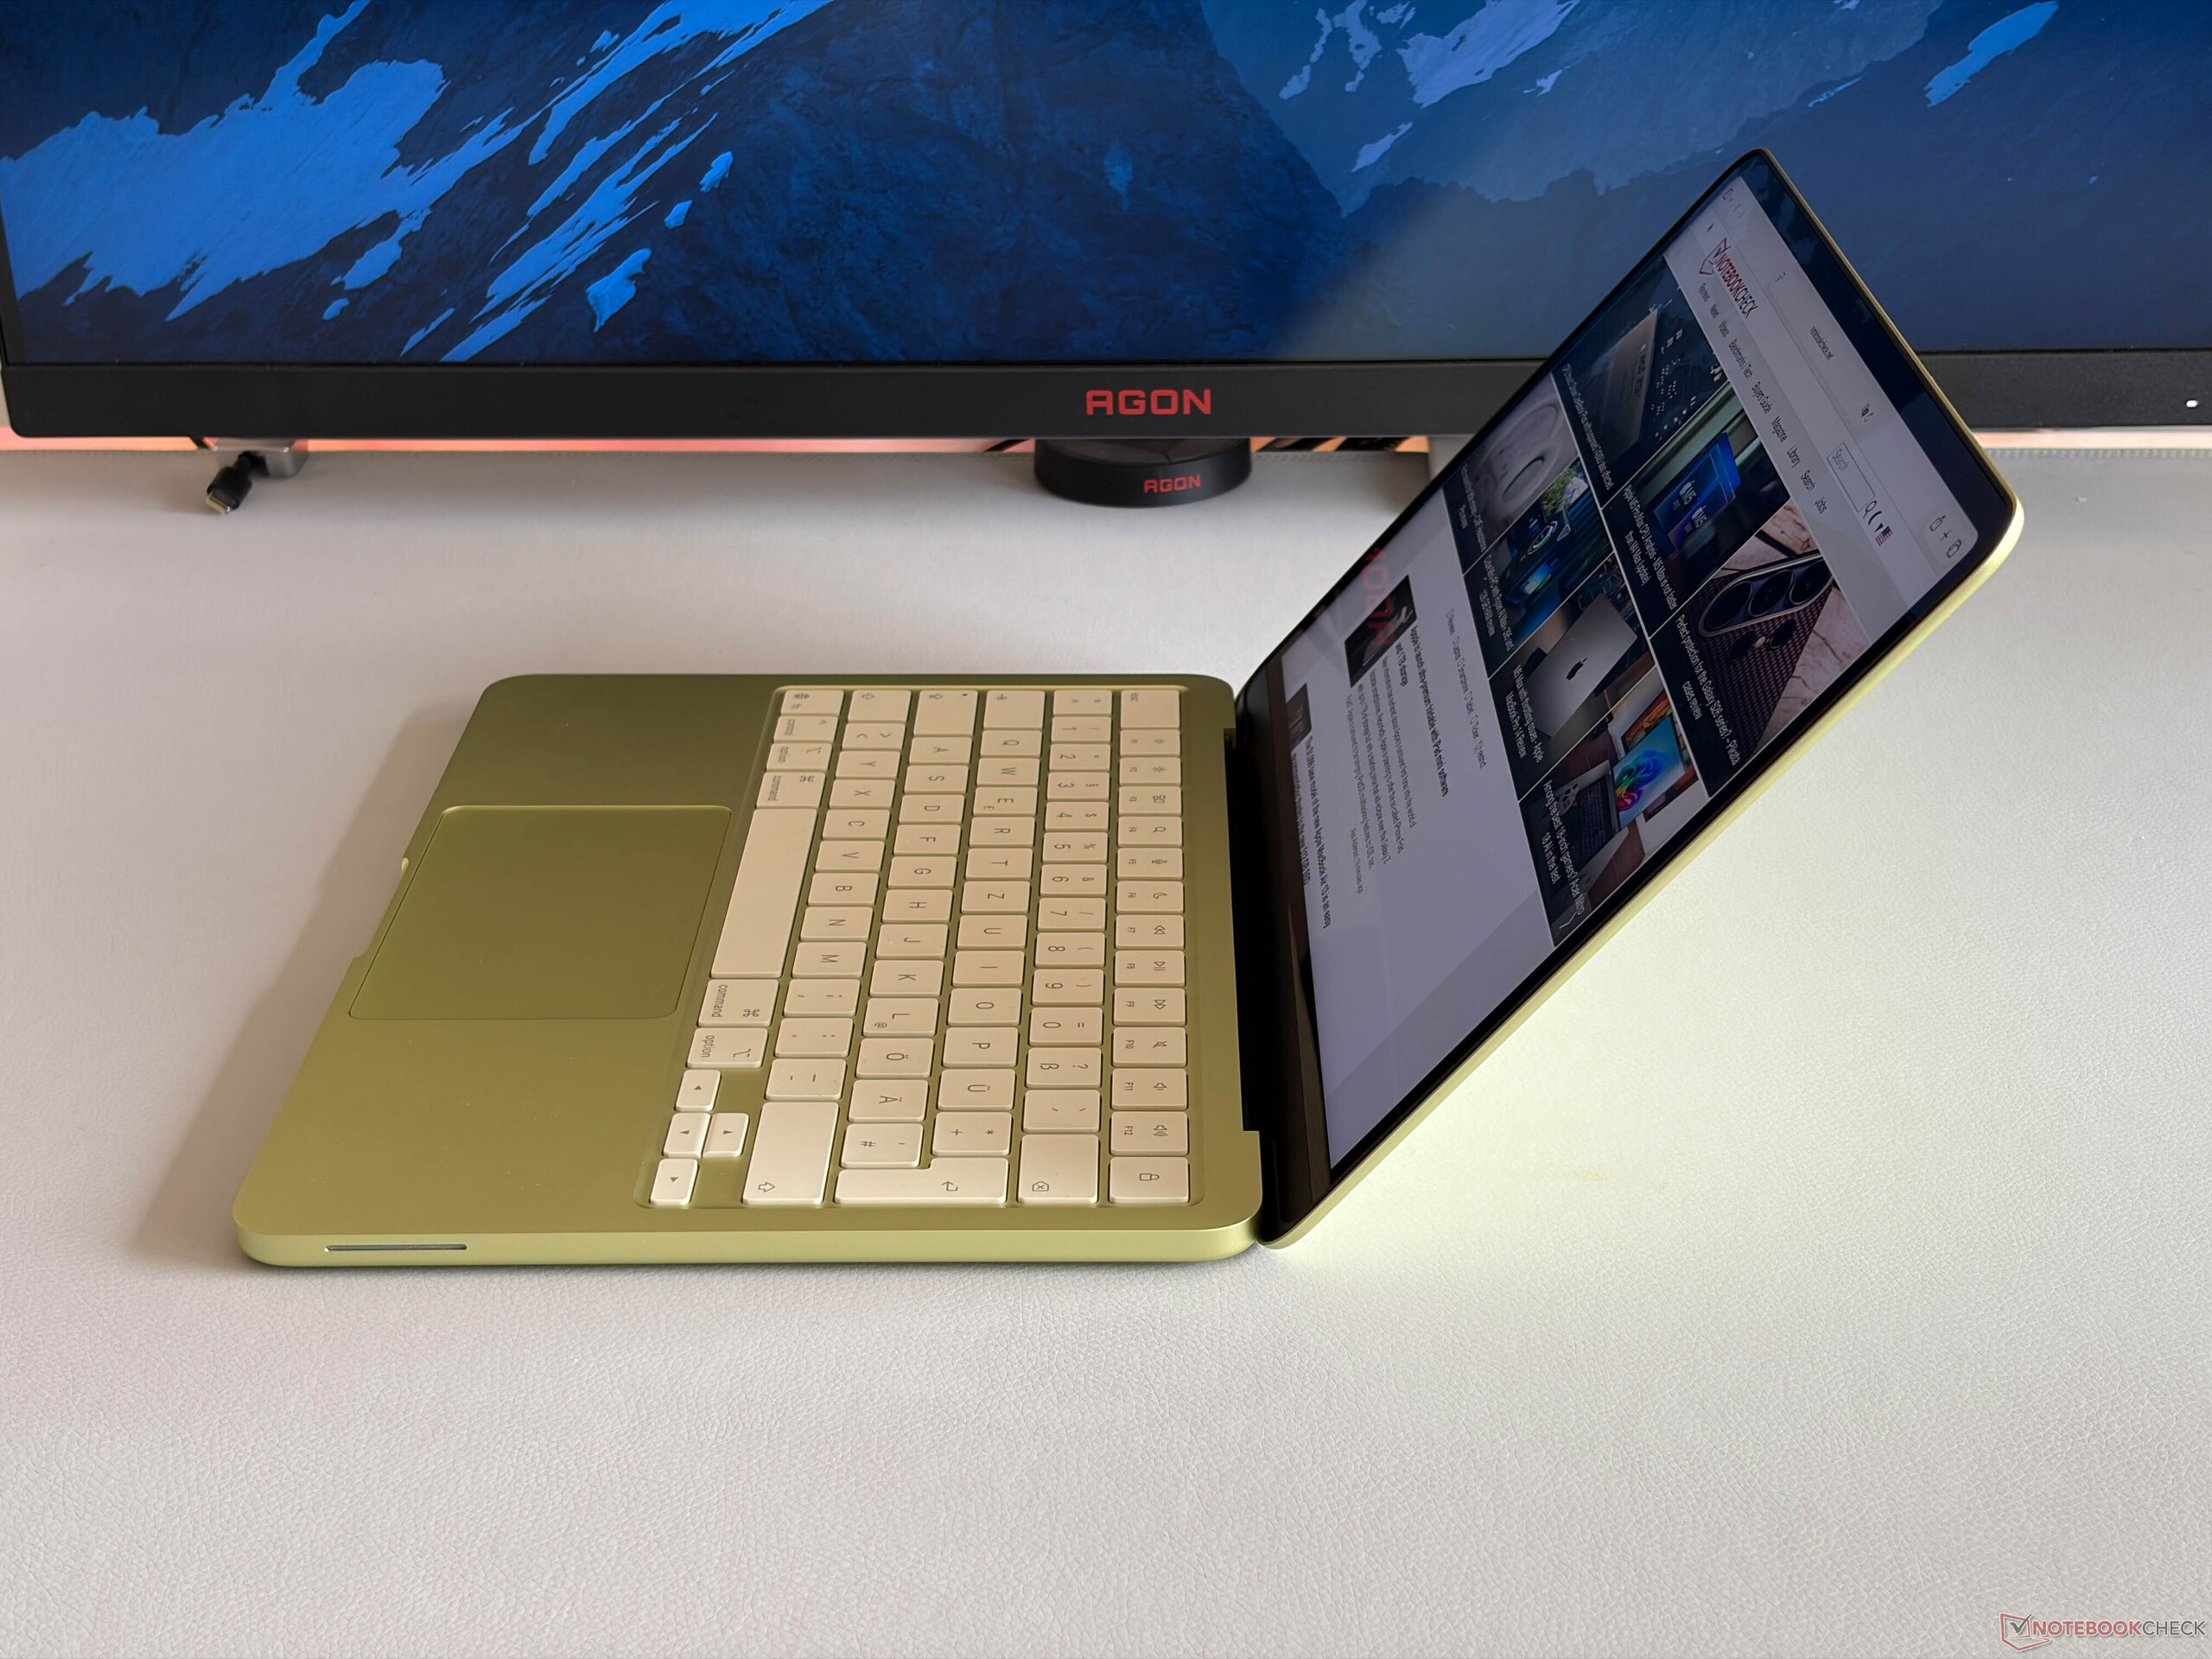
Apple uses an aluminum chassis and the quality is better than what you expect for $599 and pretty much like on all the other and more expensive MacBooks. It also feels like a regular MacBook when you use it and both the build quality as well as the stability are very good. This is also the case for the lid, and we cannot provoke picture distortions with pressure from the back. The hinges are well adjusted and there is no significant wobble, but at the same time you can easily open the lid with one hand (max. opening angle 135 degrees). There is no display notch, which improves the design in our opinion, even though the bezels are very thick.
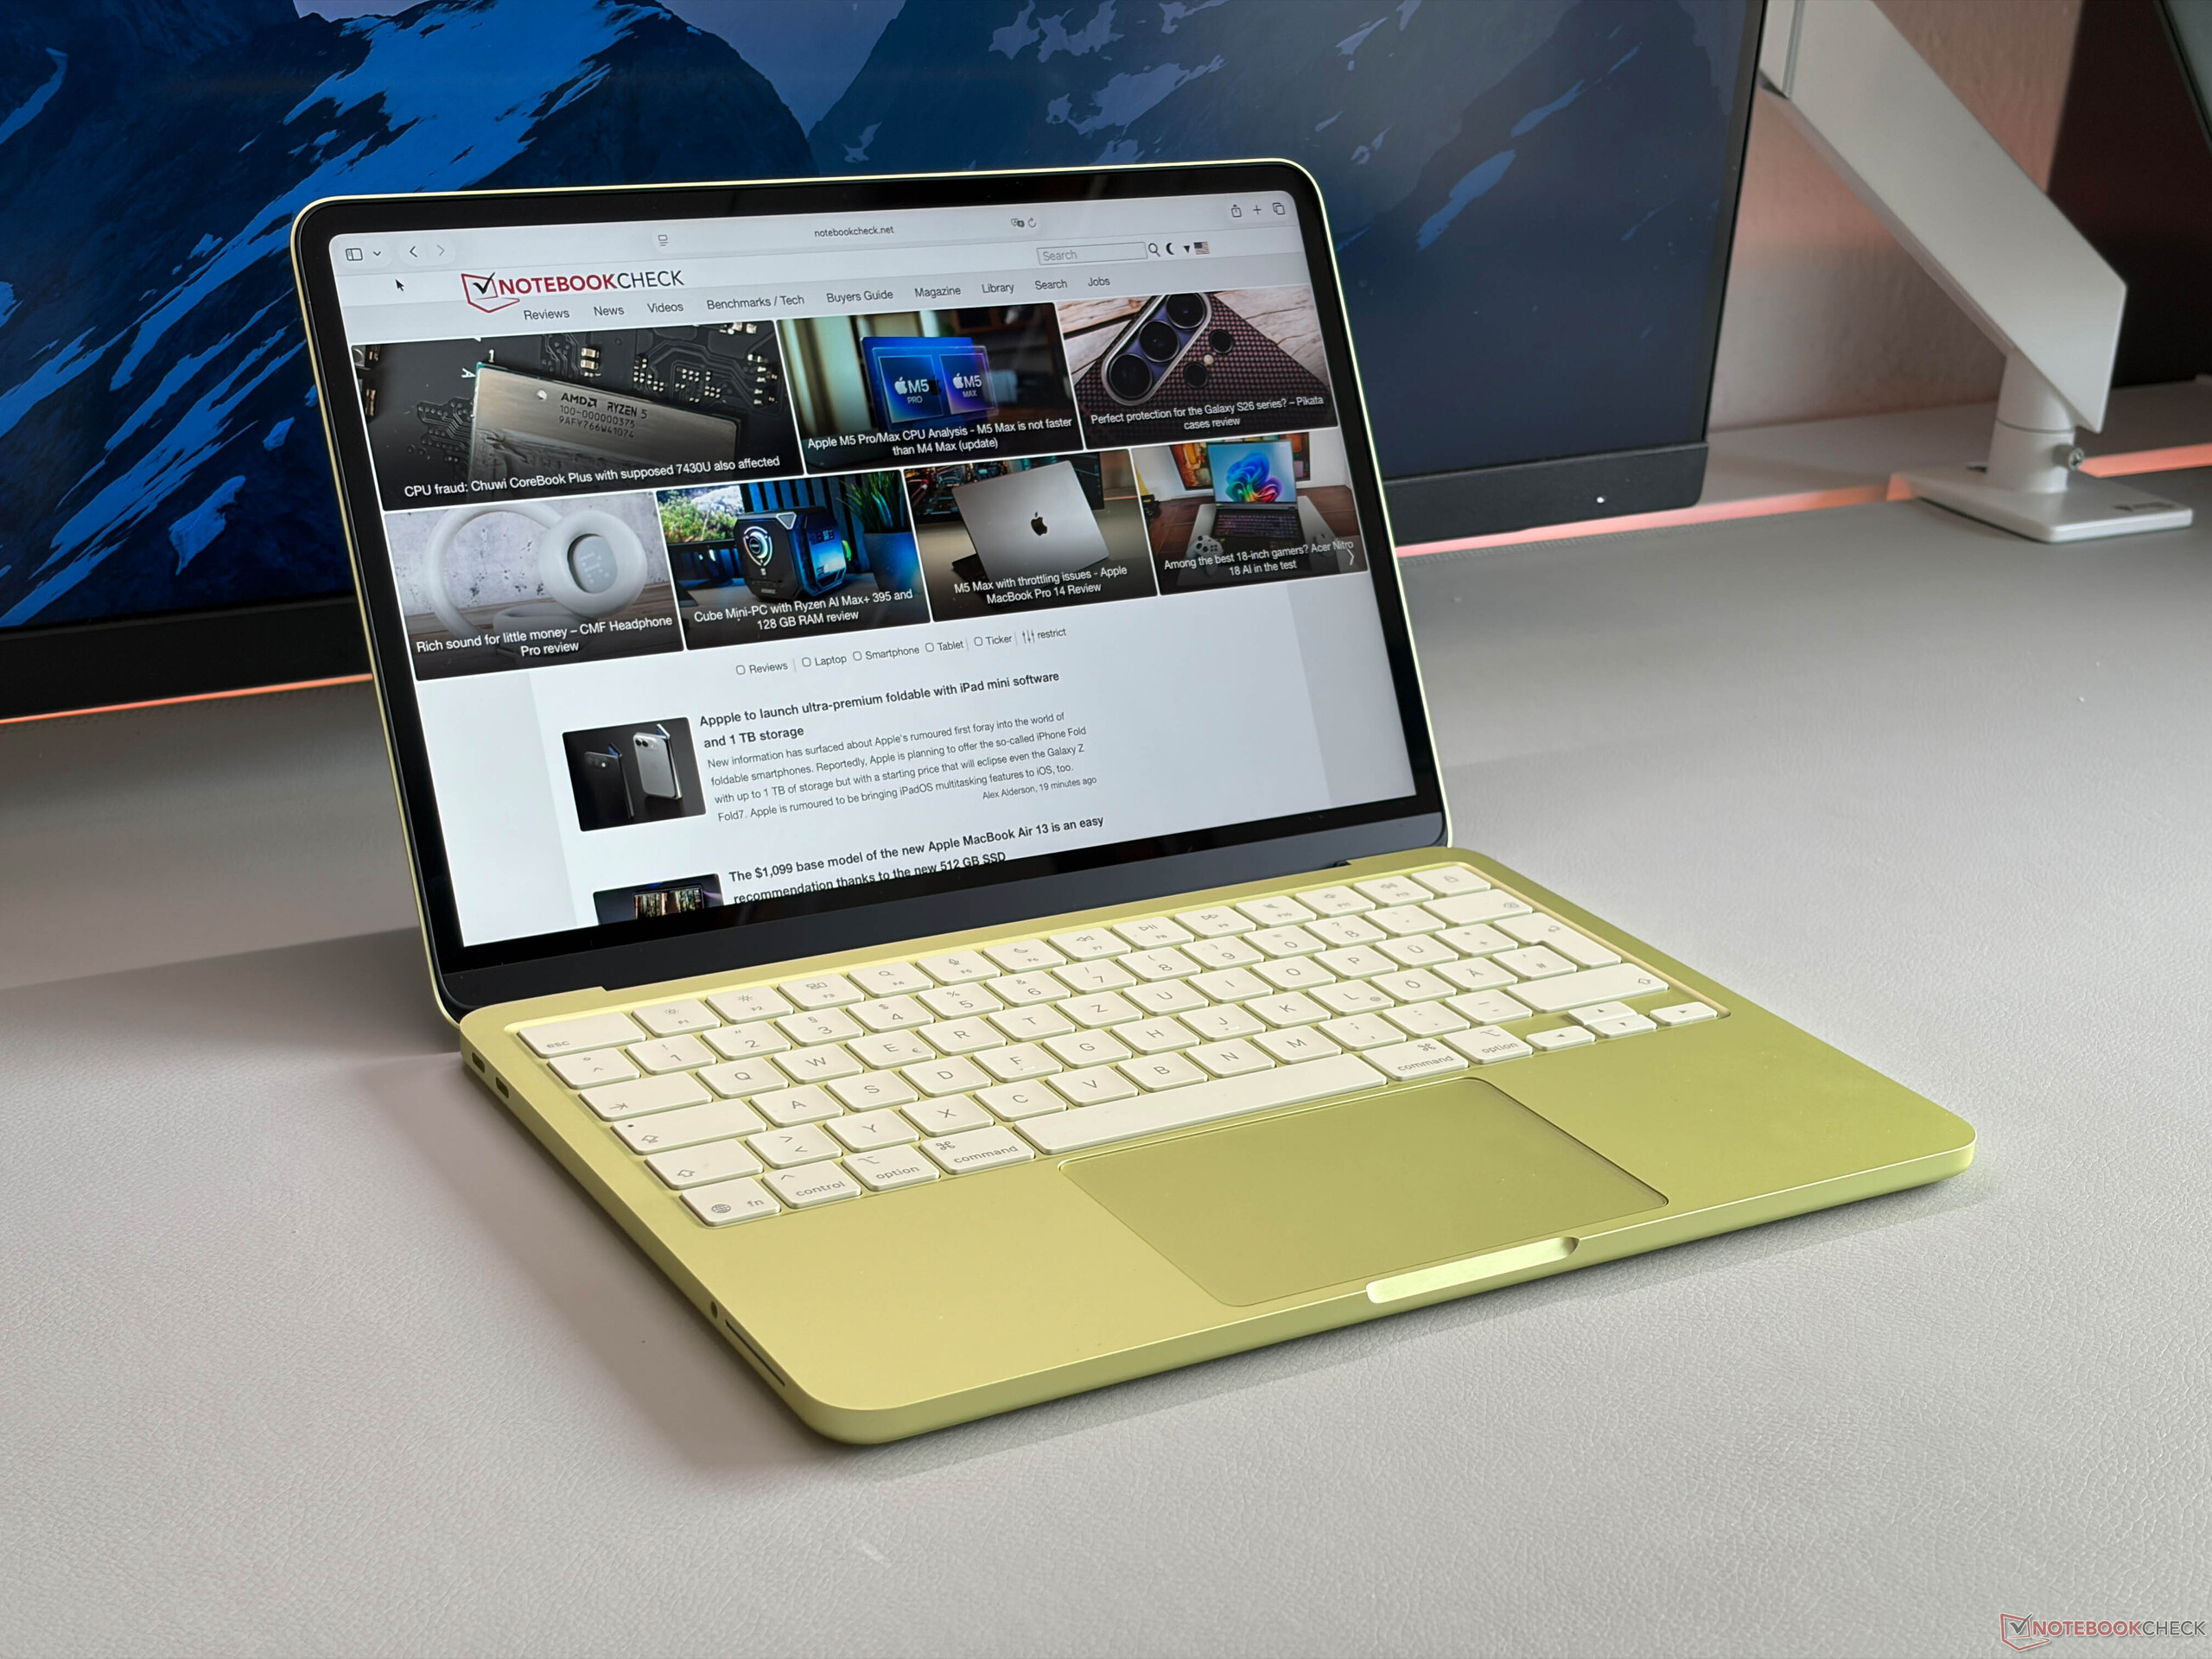

The MacBook Neo (12.7 mm) is a bit thicker compared to the current MacBook Air (11.3 mm). It weighs pretty much the same as the current MacBook Air at 1.235 kg, so it is very compact overall. We also took some pictures with our own MacBook Air M1 for comparison, which has a slightly larger footprint.


Connectivity - Neo with USB 3.0 & 2.0

The connectivity is one area where you notice the low price. Apple only includes two USB-C ports, and one of them is limited to the old USB 2.0 standard. It can at least be used for charging as well, so it is not completely useless. The rear USB-C port (3.2 Gen. 2) can be used to attach an external screen, and the Neo supports one external screen at up to 4K resolution (60 Hz) in addition to the internal screen. We tried it with our regular desk setup, and it worked fine with our screen via USB-C (charging and using the speakers as well as input devices that are directly connected to the screen). The two USB-C ports are located at the left rear, while the 3.5 mm stereo jack is positioned more towards the front.
The Wi-Fi module supports Wi-Fi 6E and the results in our standardized test were okay. The receiving performance was pretty solid at around 1.1-1.3 Gbps, but while sending data, there were bigger fluctuations. Still, we did not experience any issues while downloading games, files or simply watching YouTube videos. The 1080p FaceTime HD webcam takes decent pictures and the microphones also work well, but it does not support Center Stage.


| Networking | |
| Apple MacBook Neo 256 GB | |
| iperf3 transmit AXE11000 | |
| iperf3 receive AXE11000 | |
| Microsoft Surface Laptop 13 | |
| iperf3 transmit AXE11000 | |
| iperf3 receive AXE11000 | |
| HP Omnibook 5 14 | |
| iperf3 transmit AXE11000 | |
| iperf3 receive AXE11000 | |
| iperf3 transmit AXE11000 6GHz | |
| iperf3 receive AXE11000 6GHz | |
| Lenovo IdeaPad Slim 3 14 AHP G10 | |
| iperf3 transmit AXE11000 | |
| iperf3 receive AXE11000 | |


Maintenance
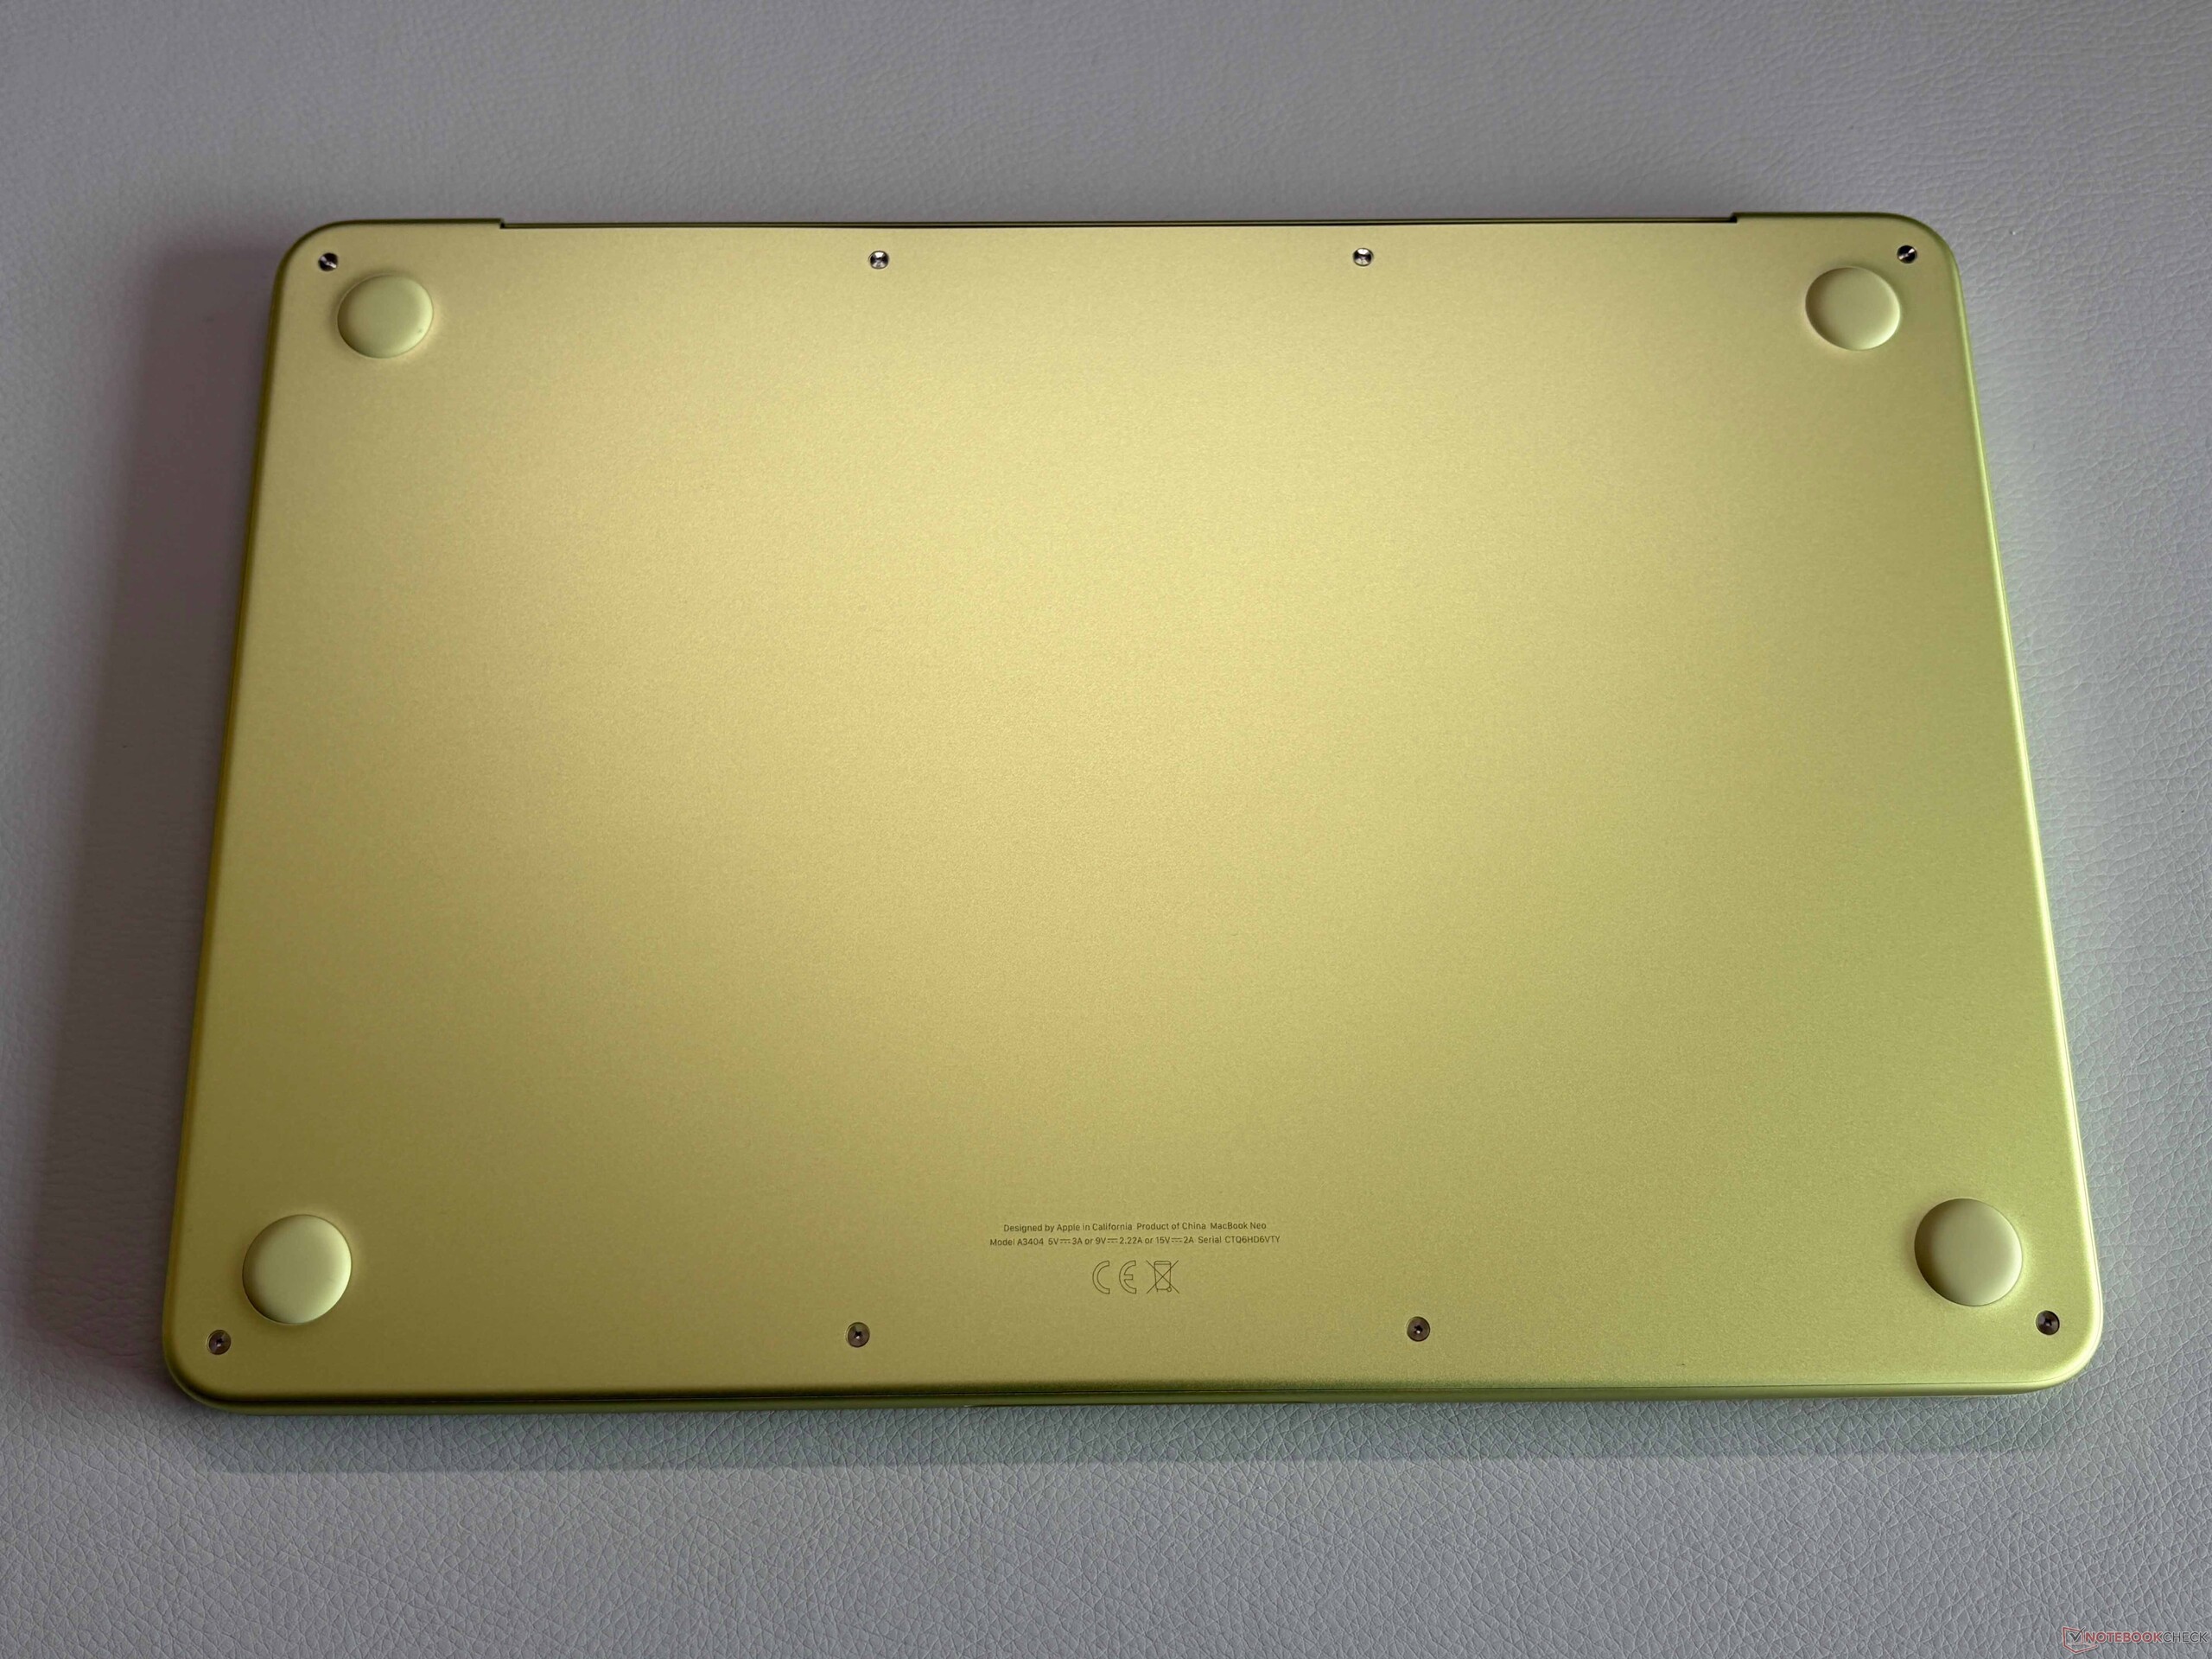
The bottom panel is secured by pentalobe screws and can be easily removed. While neither the RAM nor the storage can be upgraded, the MacBook Neo is actually pretty easy to repair and all components like the battery, the speaker modules, the ports etc. are fixed with screws and Apple uses no adhesives. This is definitely a step in the right direction.


Sustainability
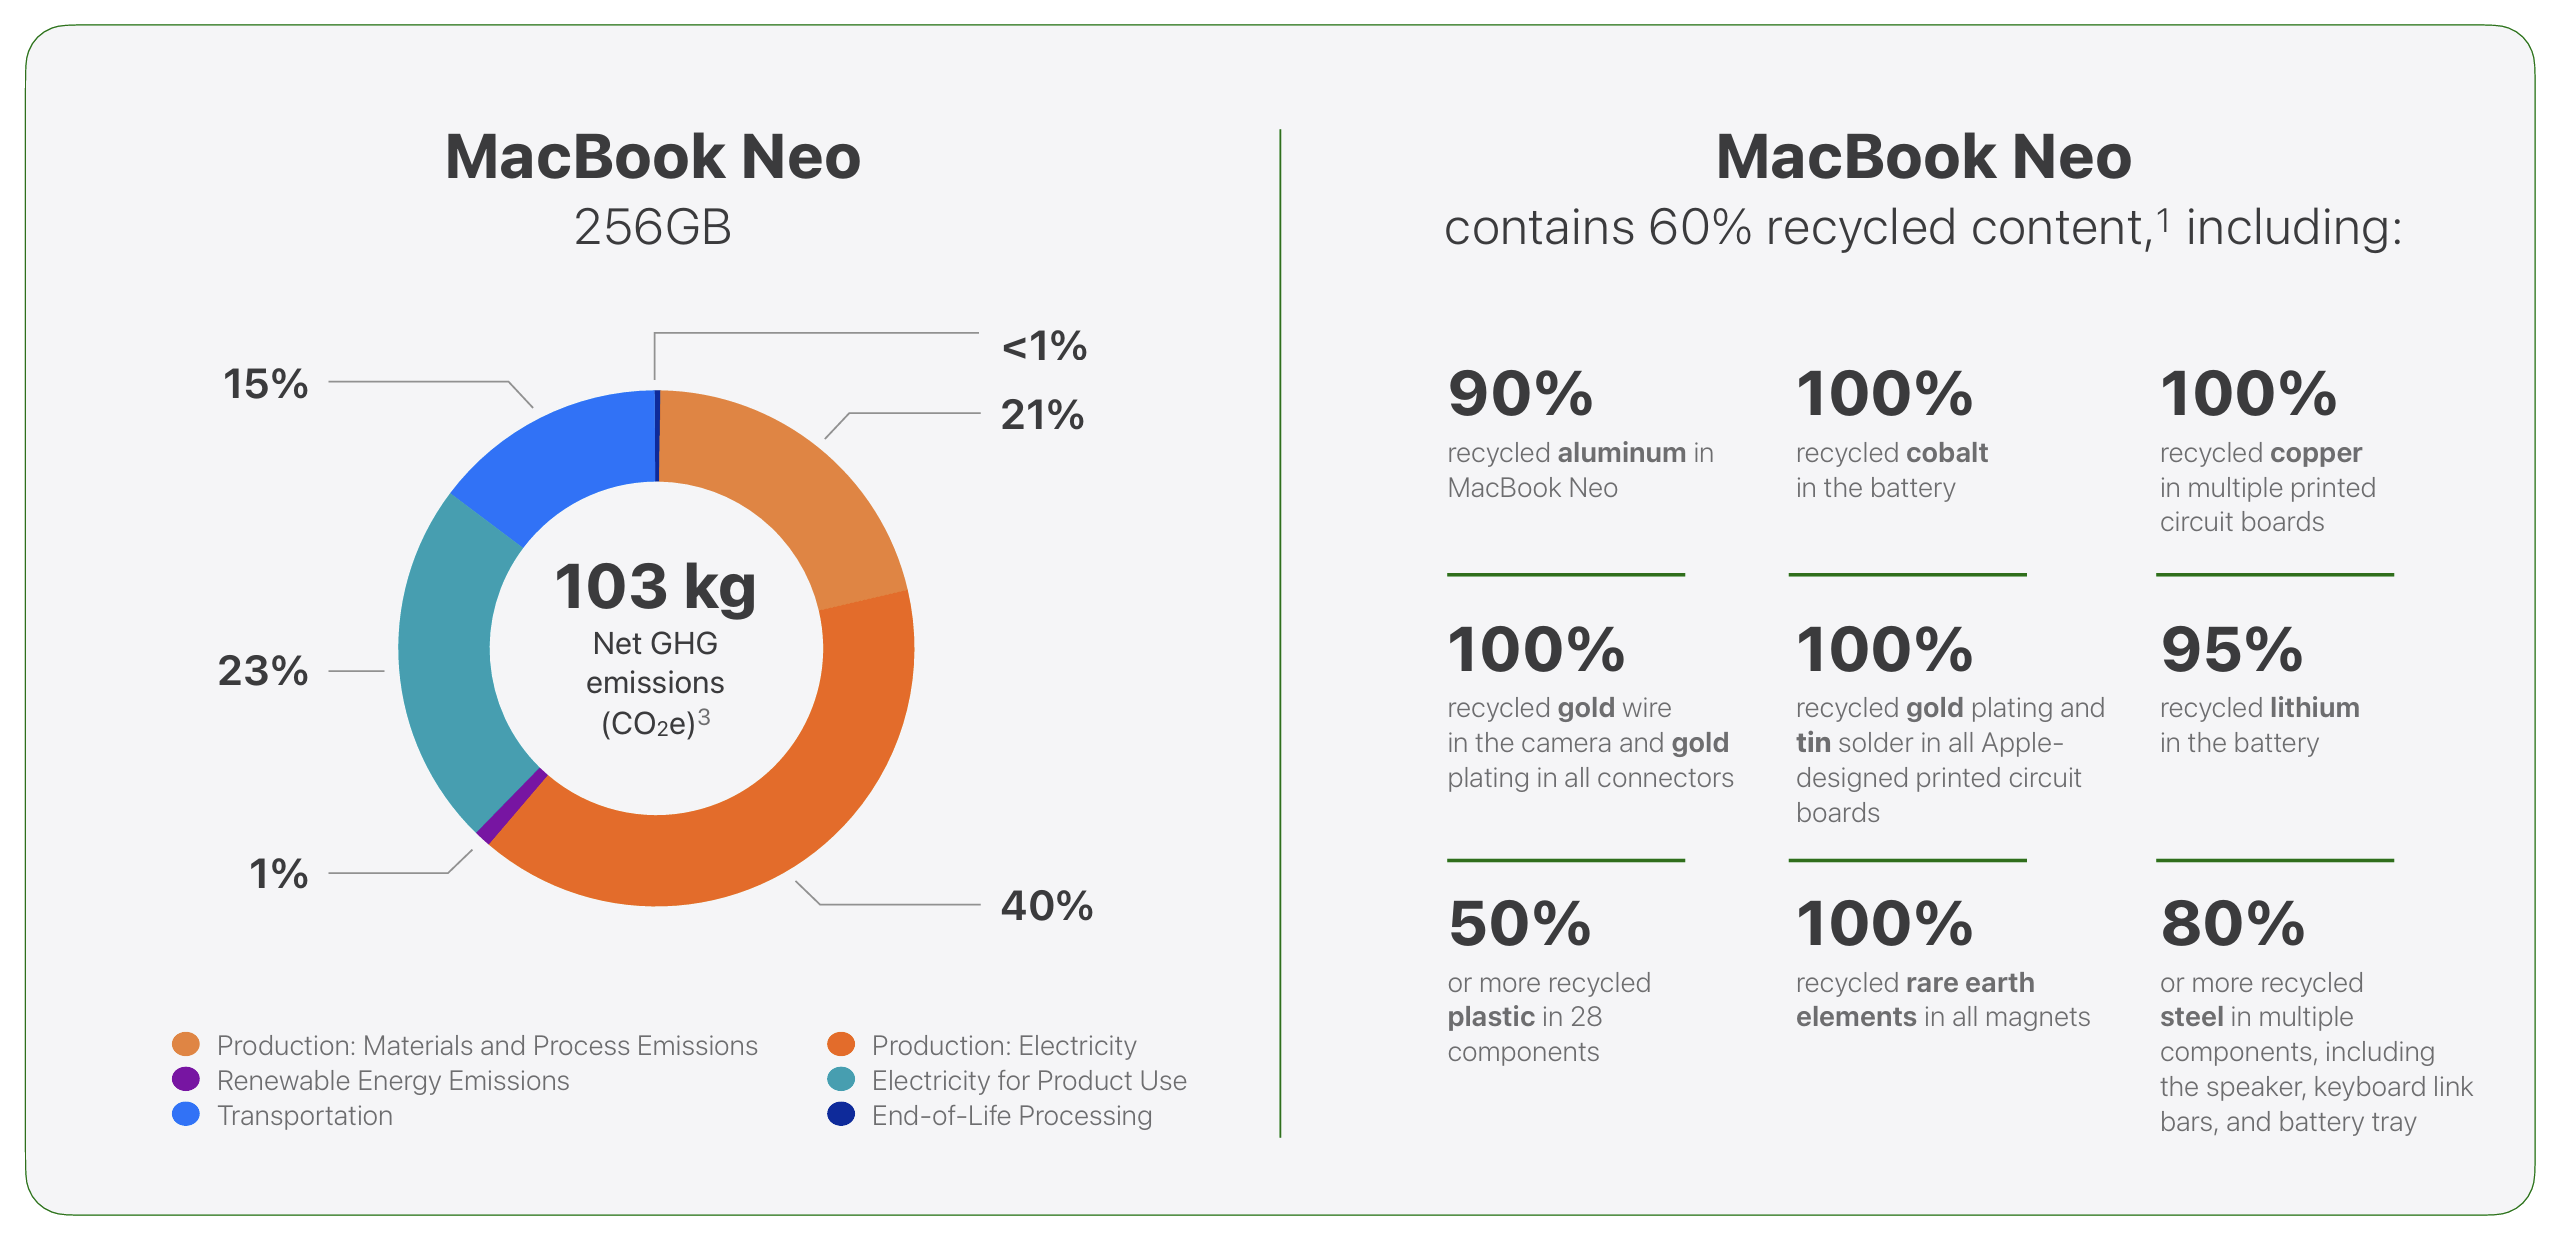
Apple offers a comprehensive environmental report for the MacBook Neo with data about CO2 emissions as well as the use of recycled materials for the device as well as packaging. The projected carbon footprint for our base model is 103 kg CO2e.
Input Devices - Familiar typing experience, good mechanical trackpad
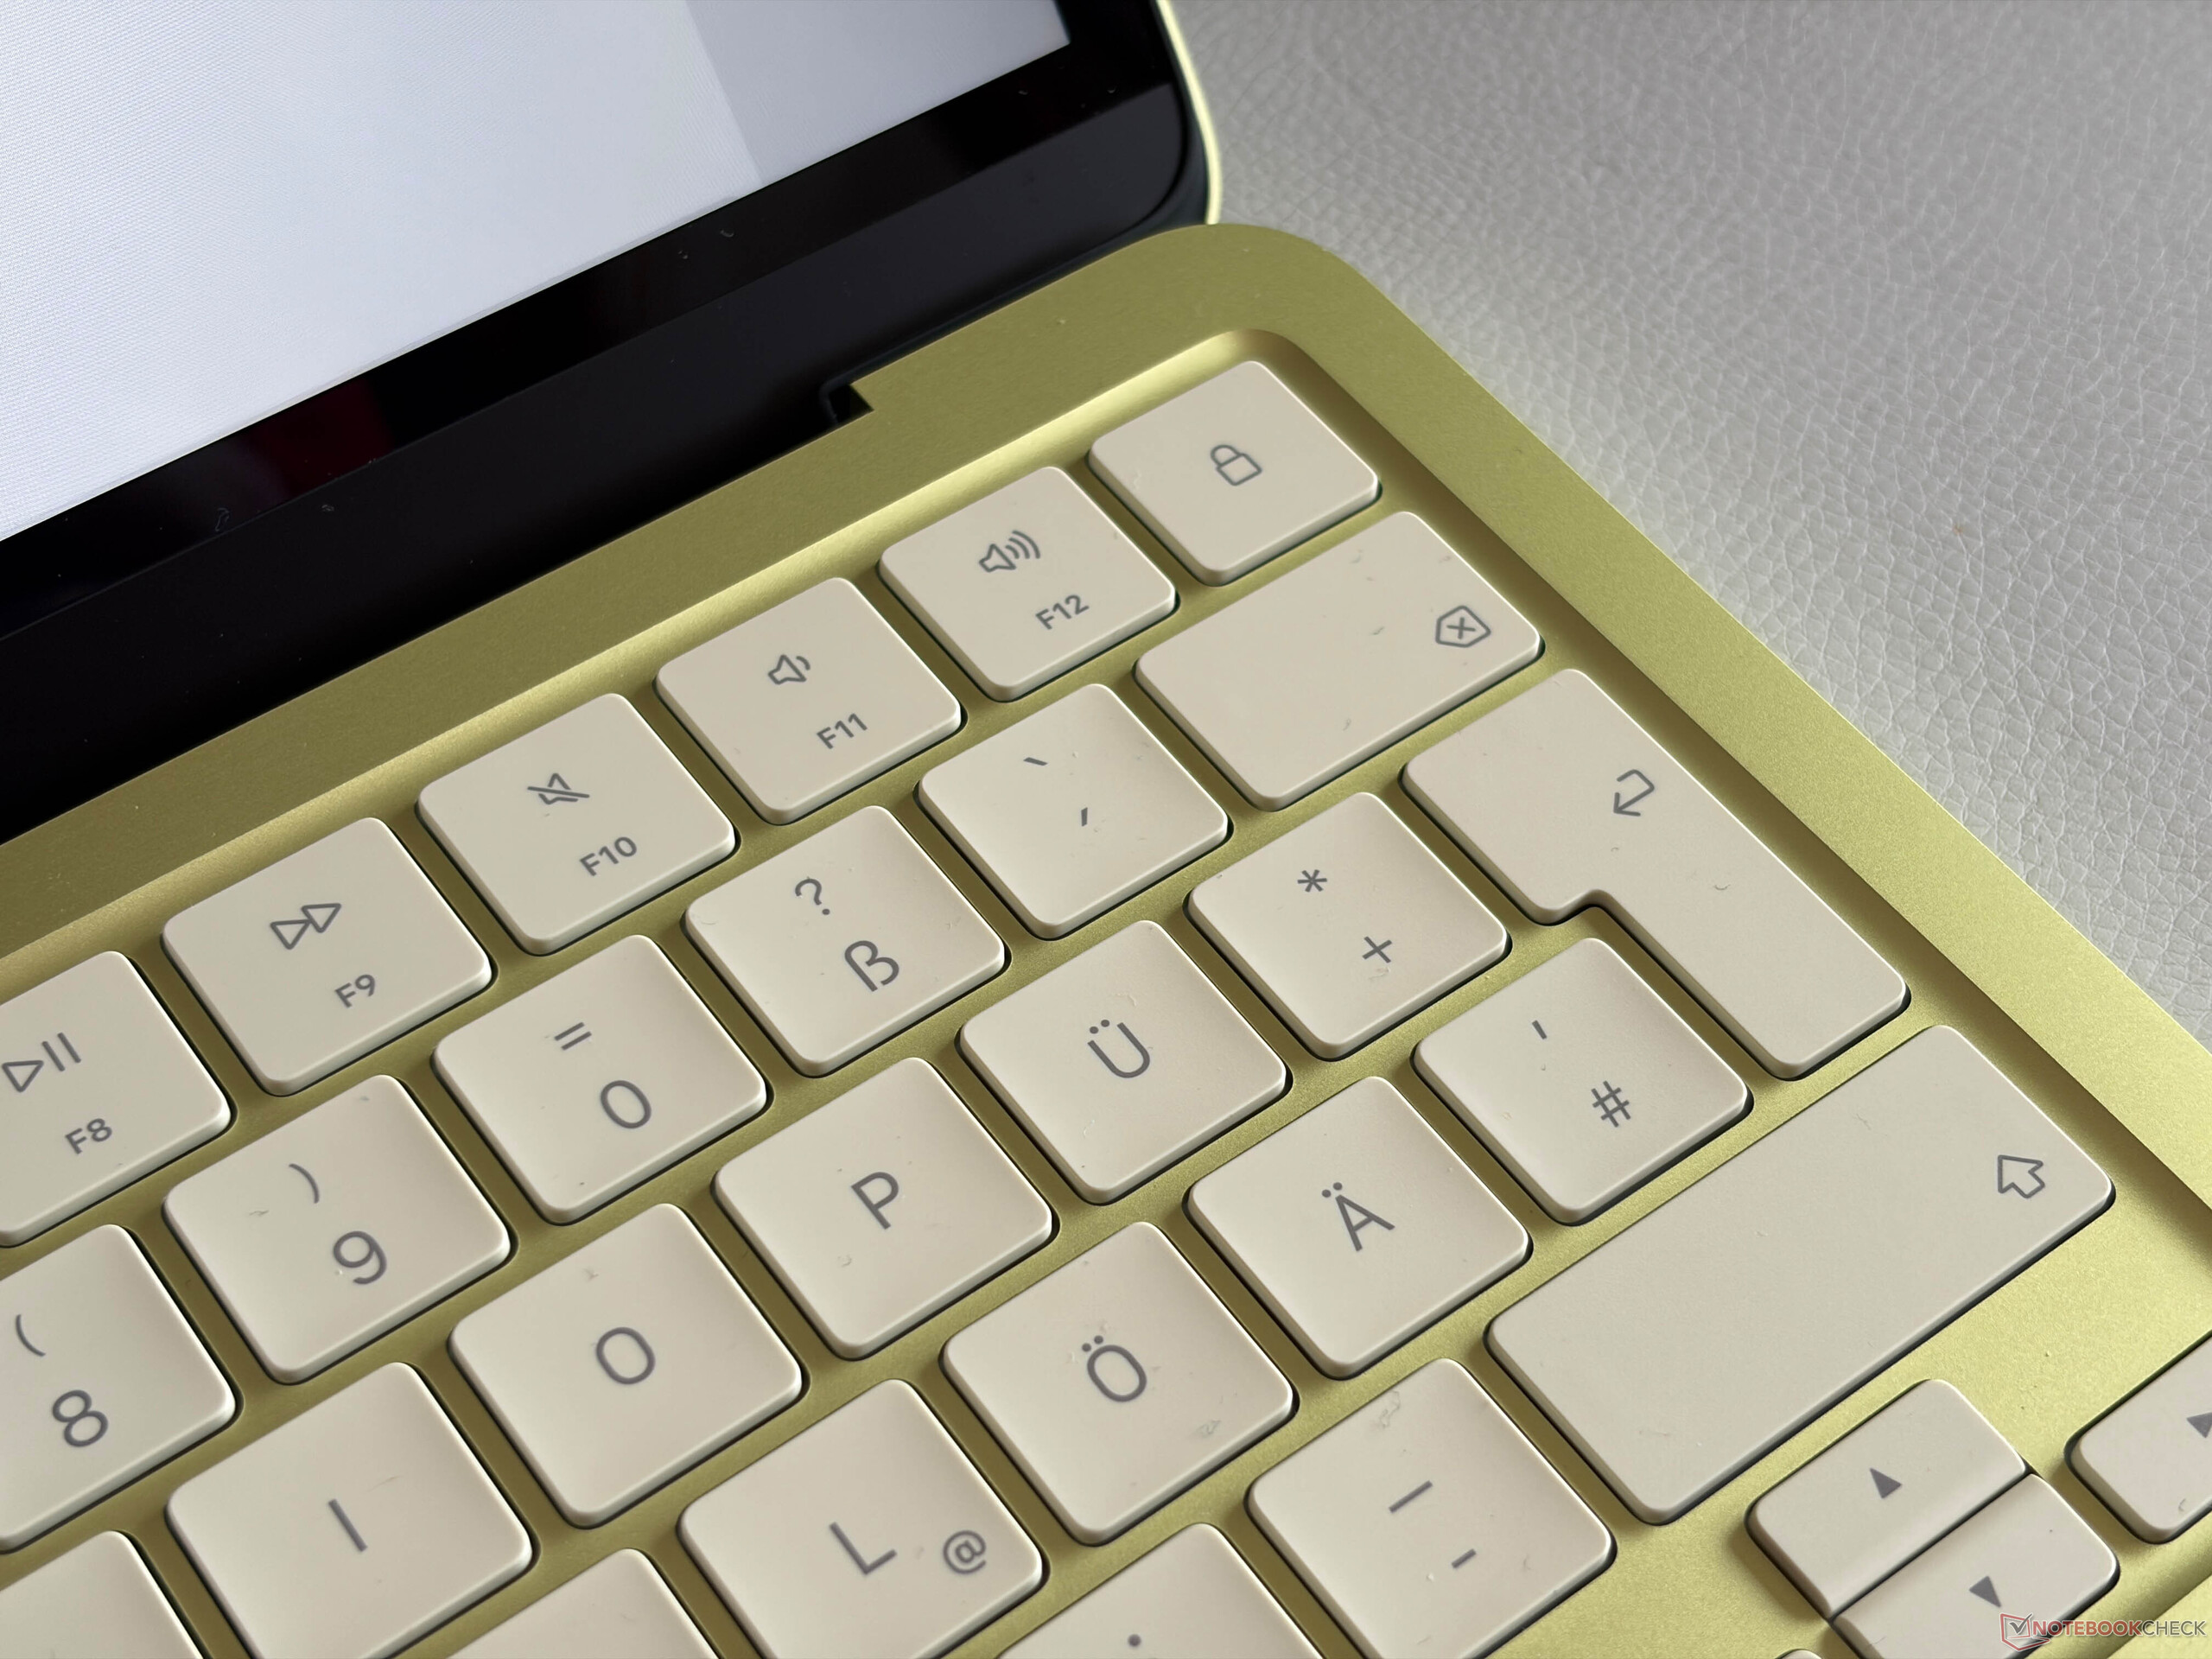
The keyboard offers a familiar typing experience for anyone who has used a MacBook over the last couple of years. Key travel is rather shallow, but the feedback is precise and it is comfortable overall. Our base model does not feature the Touch-ID fingerprint scanner and just has a regular power button with lock feature. The biggest issue we have with the keyboard is the lack of background illumination.

Apple drops the haptic trackpad from the MacBook Air and uses a mechanical version instead. Contrary to clickpads on Windows laptops (which can only be clicked in the lower half), however, Apple's version can be clicked everywhere, because the mechanism uses a button in the center. This results in a very even feedback and we had no issues with the pad, even though it is pretty small for a modern laptop at 11.5 x 7.2 cm.
Display - IPS with 500 nits

Apple uses a 13-inch IPS-screen with the resolution of 2408 x 1506 pixels (16:10) and 60 Hz, which provides sharp as well as crisp colors. One thing you will immediately notice is the lack of the notch, but to be honest, the menu bar now eats into the vertical space of the regular 16:10 display, which is not the case on the MacBook Air (where the menu bar is sitting next to the notch and on top of the regular 16:10 screen). Overall, the image quality is really good for this price. The brightness can be adjusted automatically, but there is no True Tone. Compared to other glossy MacBook screens, the panel of the MacBook Neo is noticeably more reflective and that can quickly be an issue outdoors.
The brightness is very good at more than 500 nits, but the black value is pretty high at 0.48, so the maximum contrast ratio is just ~1150:1 and black contents look more like dark gray. There is also some backlight bleeding around the corners at high brightness values.
| |||||||||||||||||||||||||
Brightness Distribution: 91 %
Center on Battery: 548 cd/m²
Contrast: 1142:1 (Black: 0.48 cd/m²)
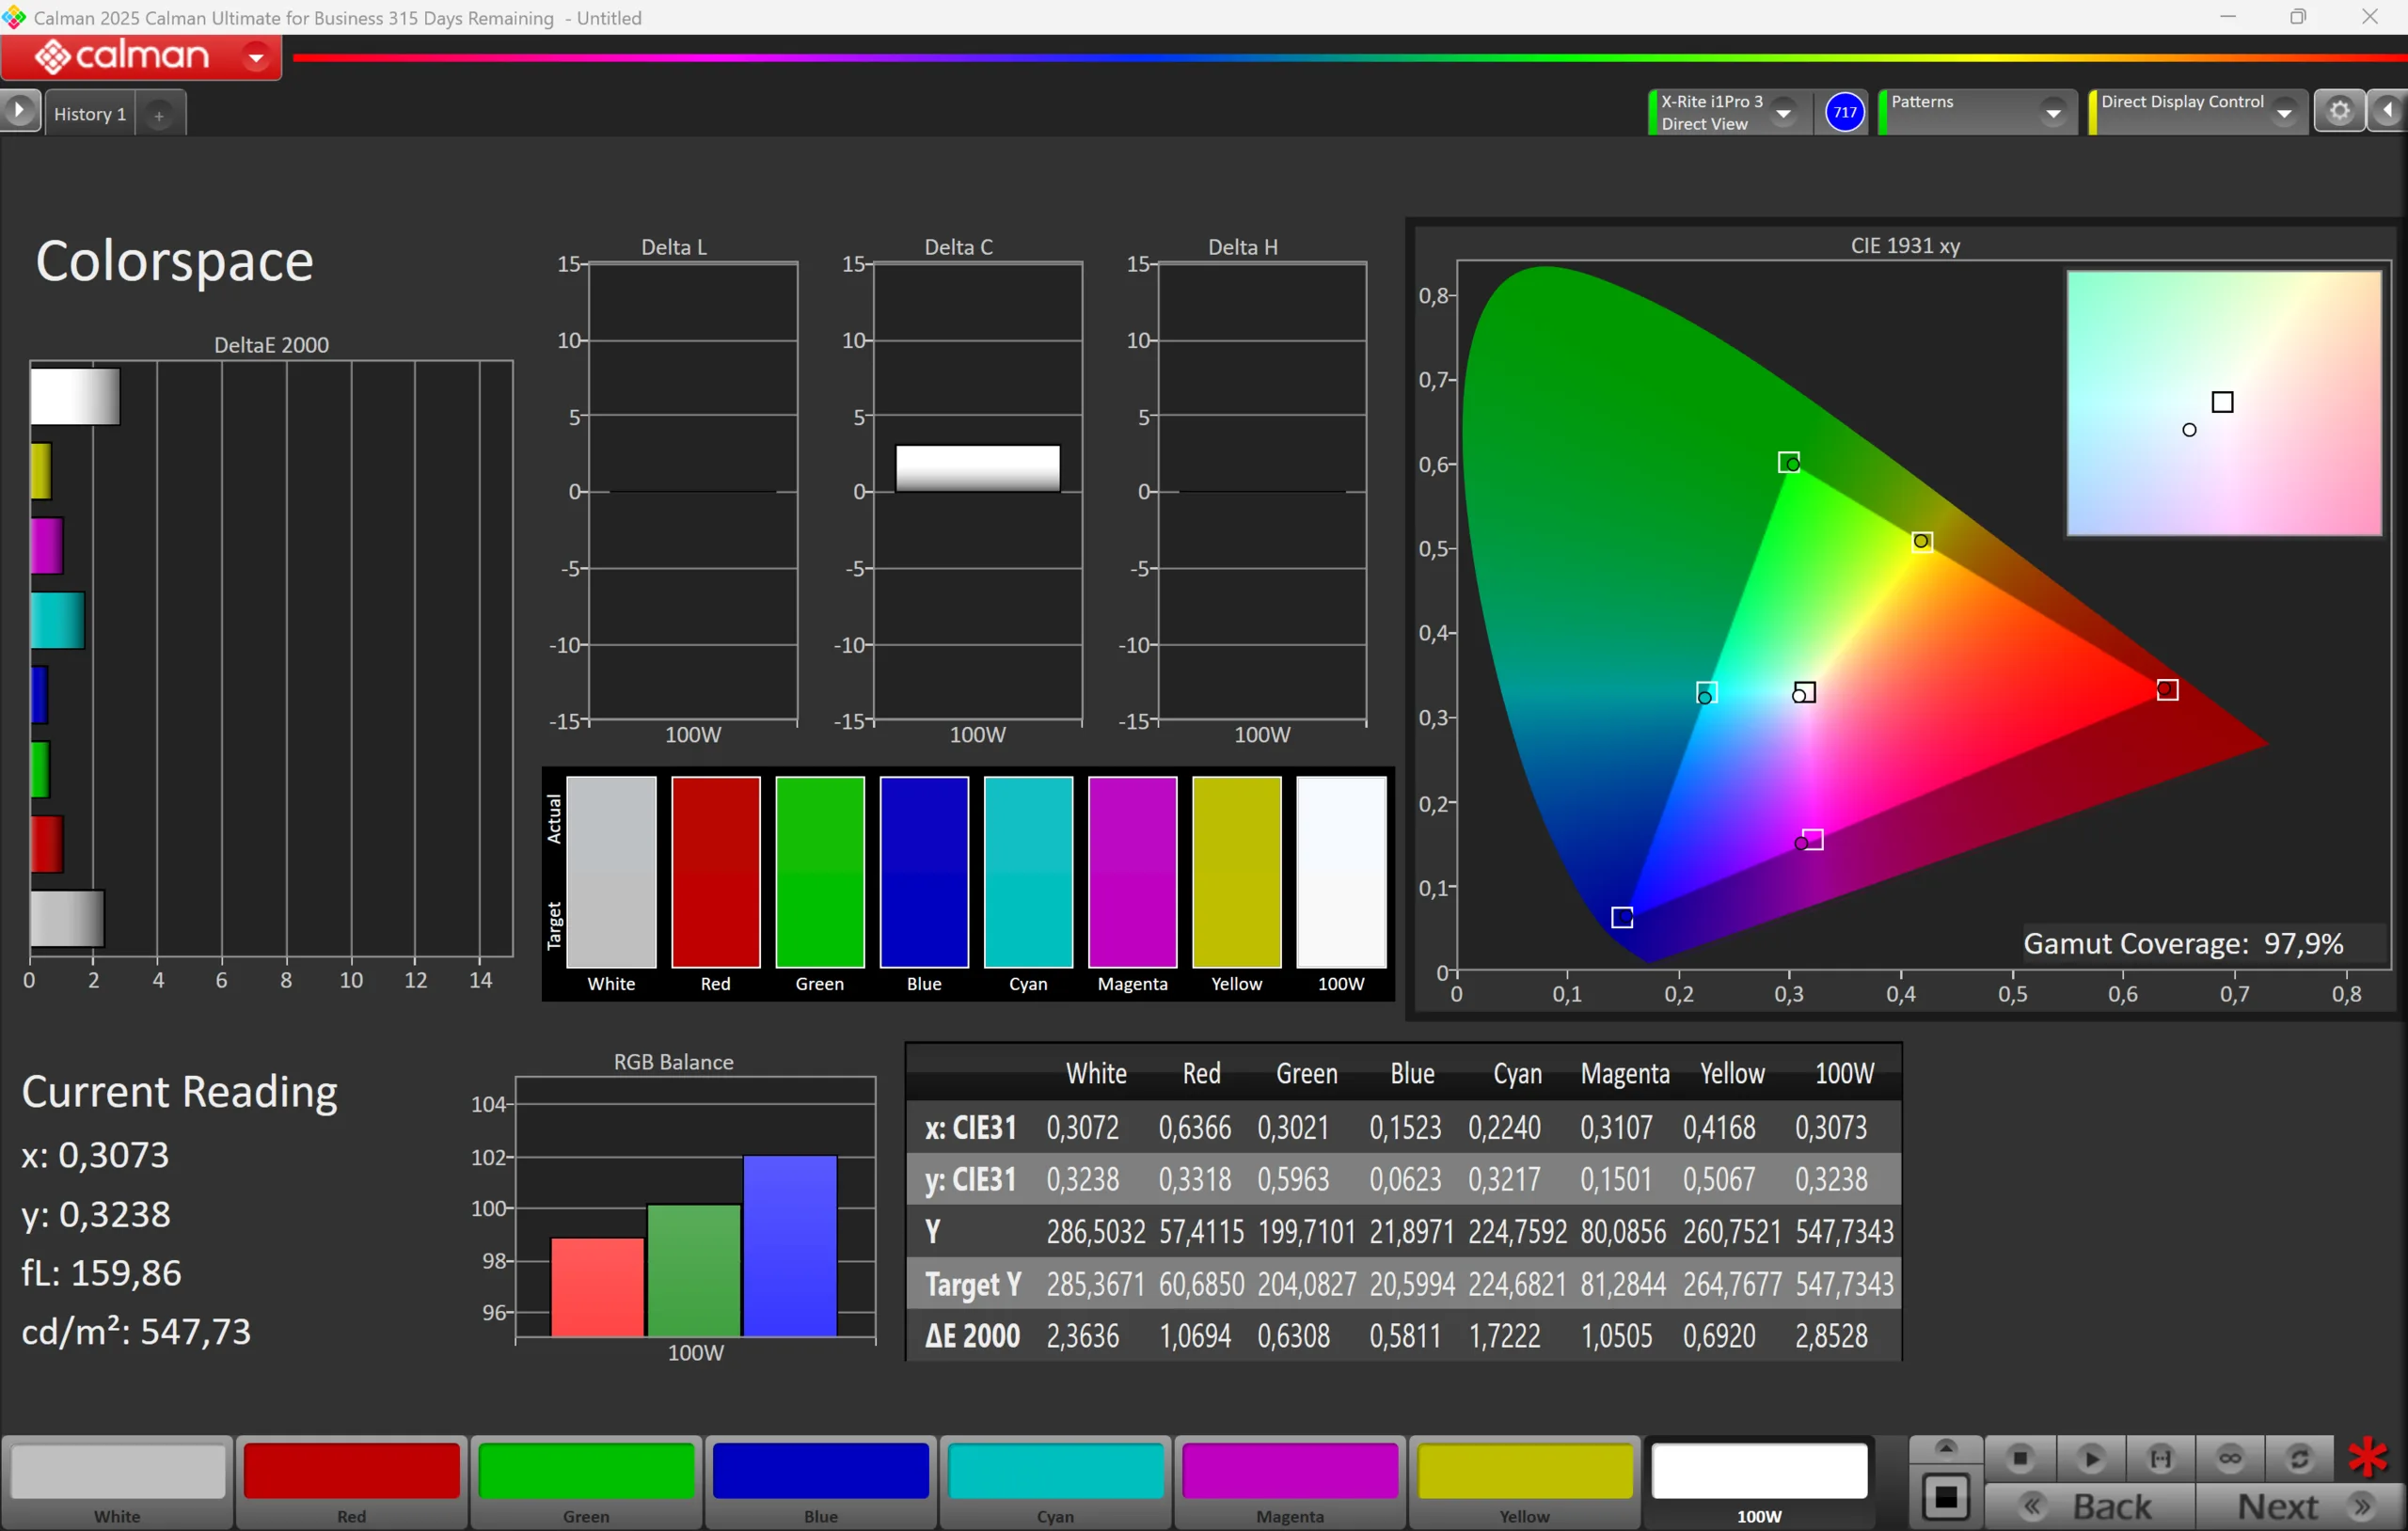
ΔE ColorChecker Calman: 1.4 | ∀{0.5-29.43 Ø4.75}
calibrated: 0.4
ΔE Greyscale Calman: 2.1 | ∀{0.09-98 Ø5}
72.6% AdobeRGB 1998 (Argyll 3D)
72.2% sRGB (Argyll 3D)
97.9% Display P3 (Argyll 3D)
Gamma: 2.24
CCT: 6870 K
| Apple MacBook Neo 256 GB IPS, 2408x1506, 13", 60 Hz | Microsoft Surface Laptop 13 LP130WU112413, IPS, 1920x1280, 13", 60 Hz | HP Omnibook 5 14 Samsung SDC4213, OLED, 1920x1200, 14", 60 Hz | Lenovo IdeaPad Slim 3 14 AHP G10 LEN140WUXGA, IPS, 1920x1200, 14", 60 Hz | Apple MacBook Air 13 M4 Entry IPS, 2560x1664, 13.6", 60 Hz | |
|---|---|---|---|---|---|
| Display | 3% | -3% | -41% | 20% | |
| Display P3 Coverage (%) | 97.9 | 72.4 -26% | 95 -3% | 39.1 -60% | 98.4 1% |
| sRGB Coverage (%) | 72.2 | 97.6 35% | 58.4 -19% | 99.9 38% | |
| AdobeRGB 1998 Coverage (%) | 72.6 | 72.6 0% | 40.4 -44% | 87.9 21% | |
| Response Times | -104% | 90% | -49% | -76% | |
| Response Time Grey 50% / Grey 80% * (ms) | 20.8 ? | 48.7 ? -134% | 1.67 ? 92% | 31.4 ? -51% | 34.5 ? -66% |
| Response Time Black / White * (ms) | 14.6 ? | 25.3 ? -73% | 1.84 ? 87% | 21.3 ? -46% | 27.2 ? -86% |
| PWM Frequency (Hz) | 480 | ||||
| PWM Amplitude * (%) | 13.5 | ||||
| Screen | 19% | -53% | -227% | 4% | |
| Brightness middle (cd/m²) | 548 | 417 -24% | 288.7 -47% | 304 -45% | 525 -4% |
| Brightness (cd/m²) | 519 | 409 -21% | 289 -44% | 281 -46% | 506 -3% |
| Brightness Distribution (%) | 91 | 92 1% | 98 8% | 89 -2% | 92 1% |
| Black Level * (cd/m²) | 0.48 | 0.17 65% | 0.22 54% | 0.42 12% | |
| Contrast (:1) | 1142 | 2453 115% | 1382 21% | 1250 9% | |
| Colorchecker dE 2000 * | 1.4 | 1.3 7% | 3.43 -145% | 5.9 -321% | 1.4 -0% |
| Colorchecker dE 2000 max. * | 3.1 | 2.9 6% | 7.04 -127% | 19.2 -519% | 2.8 10% |
| Colorchecker dE 2000 calibrated * | 0.4 | 4.7 -1075% | |||
| Greyscale dE 2000 * | 2.1 | 2 5% | 1.3 38% | 4.5 -114% | 2 5% |
| Gamma | 2.24 98% | 2.18 101% | 2.2 100% | 2.21 100% | 2.2 100% |
| CCT | 6870 95% | 6890 94% | 6336 103% | 6098 107% | 6876 95% |
| Total Average (Program / Settings) | -27% /
-3% | 11% /
-16% | -106% /
-162% | -17% /
-5% |
* ... smaller is better
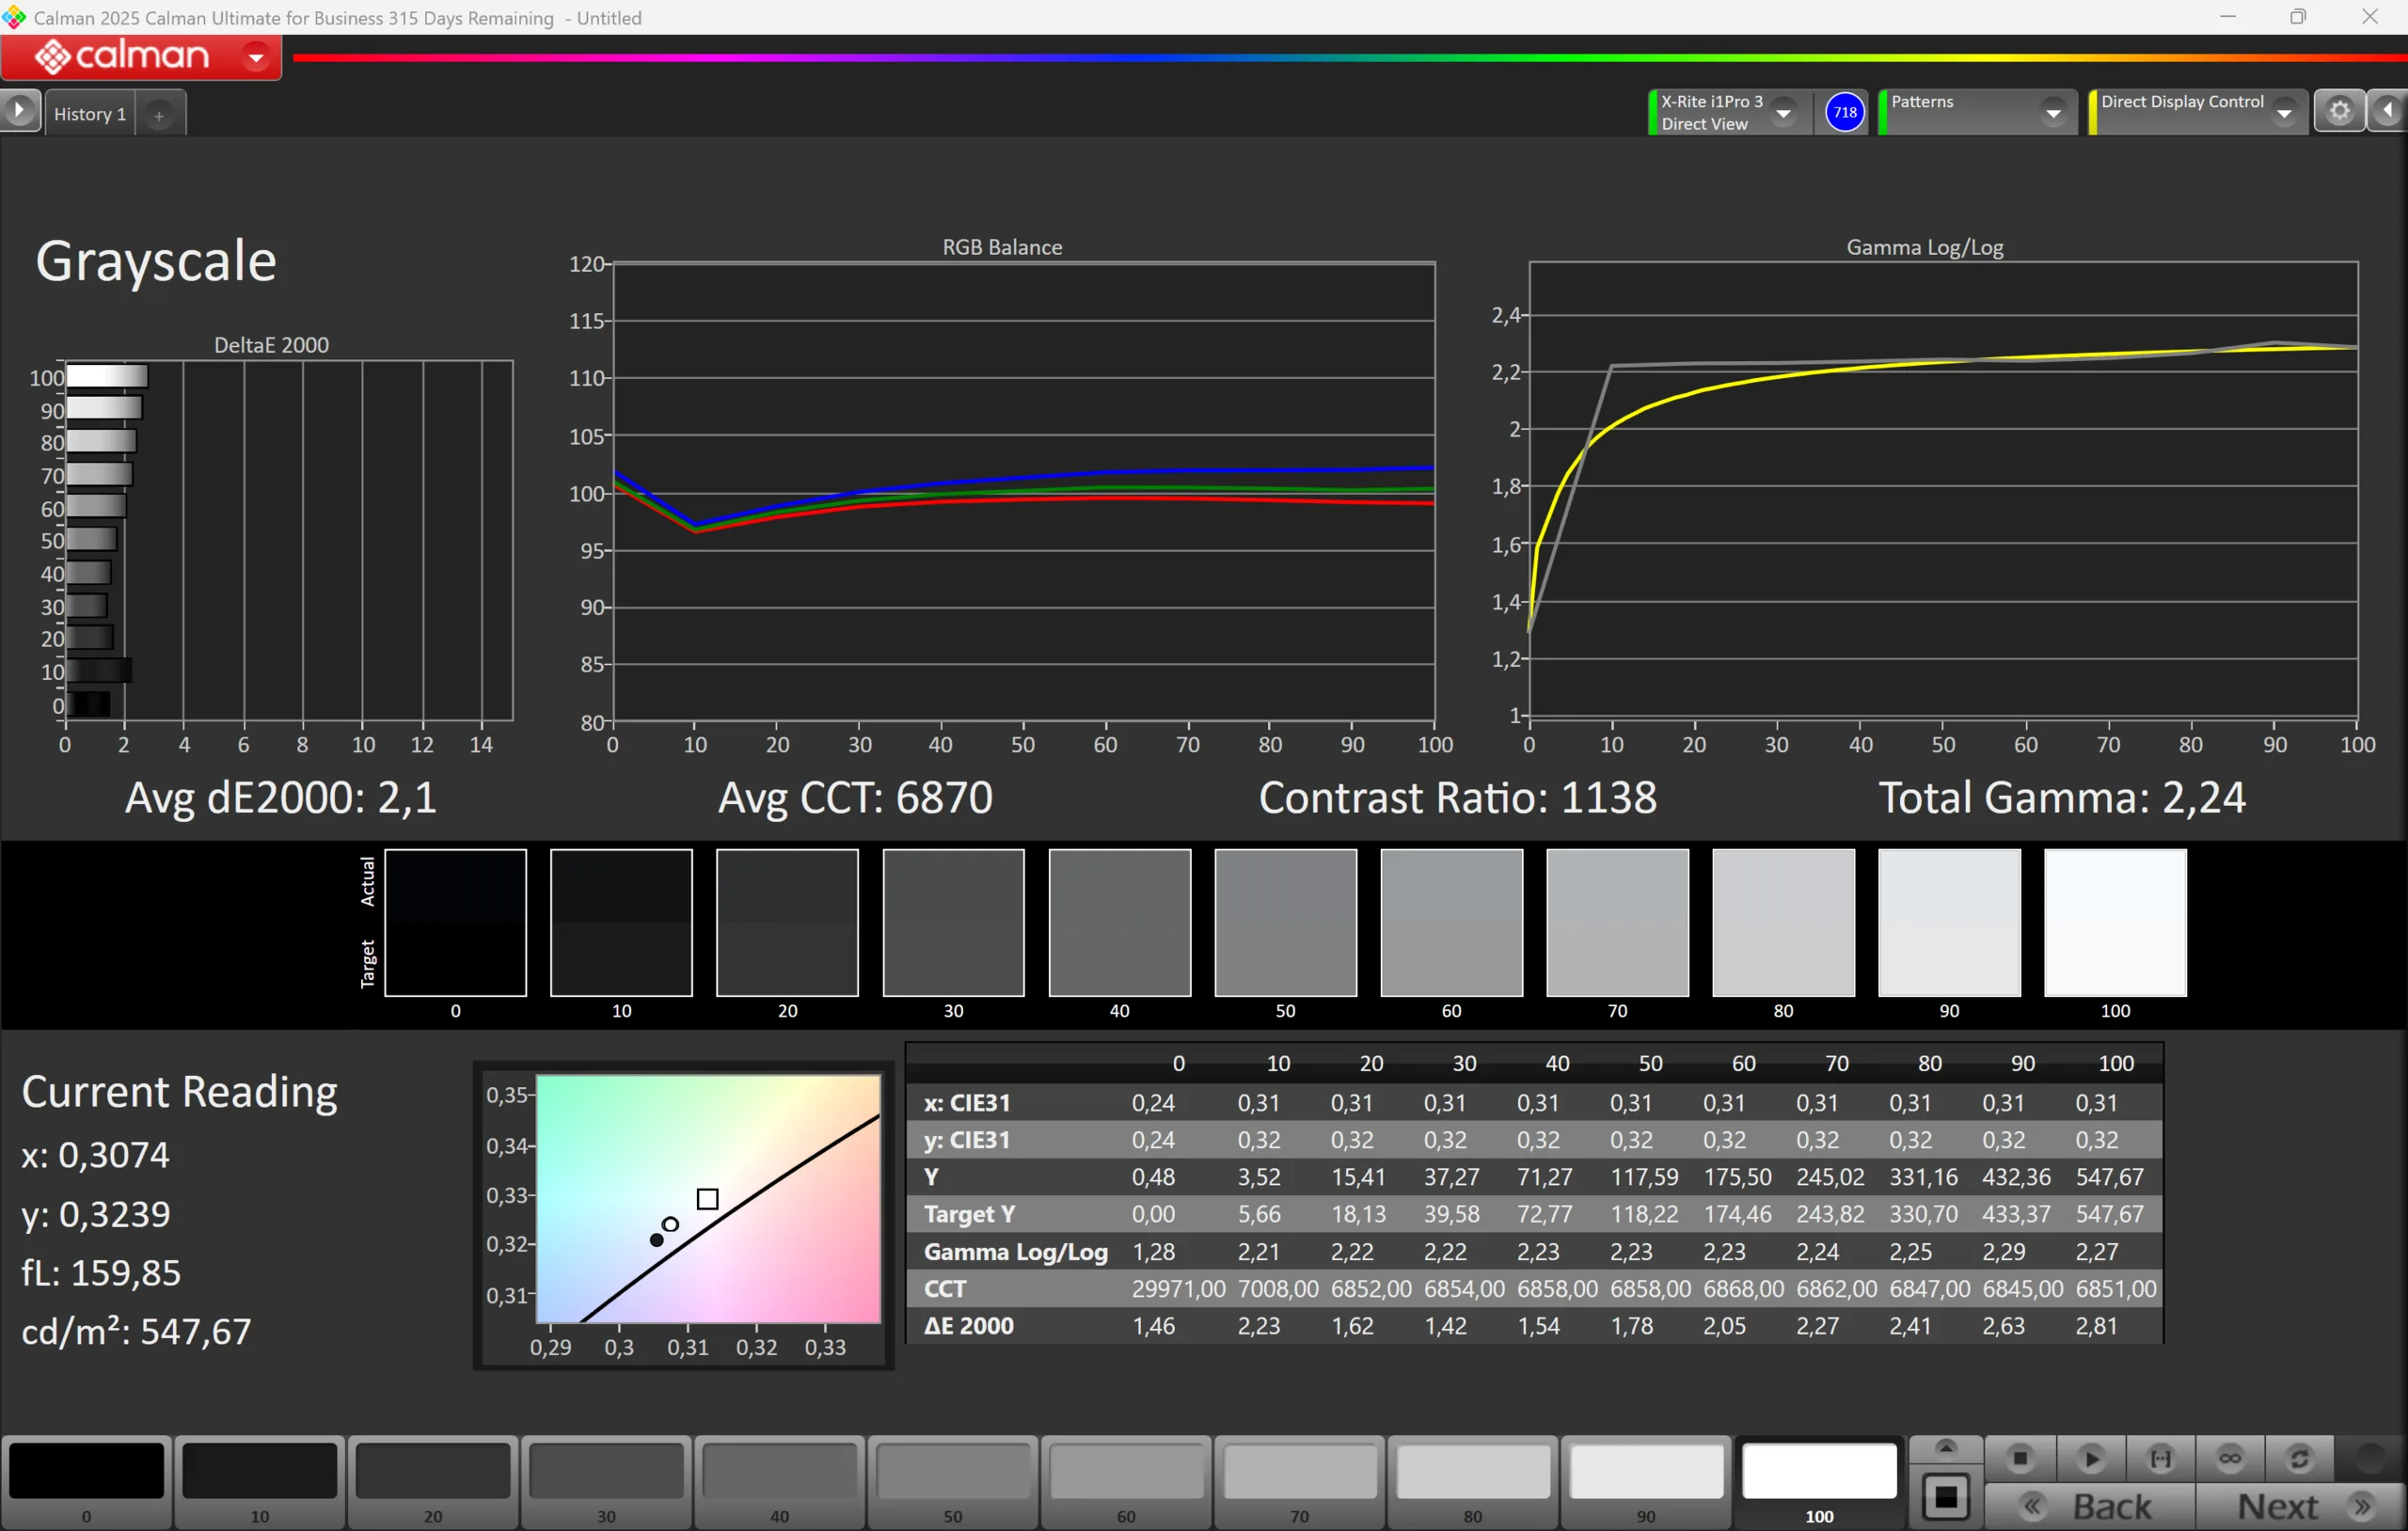
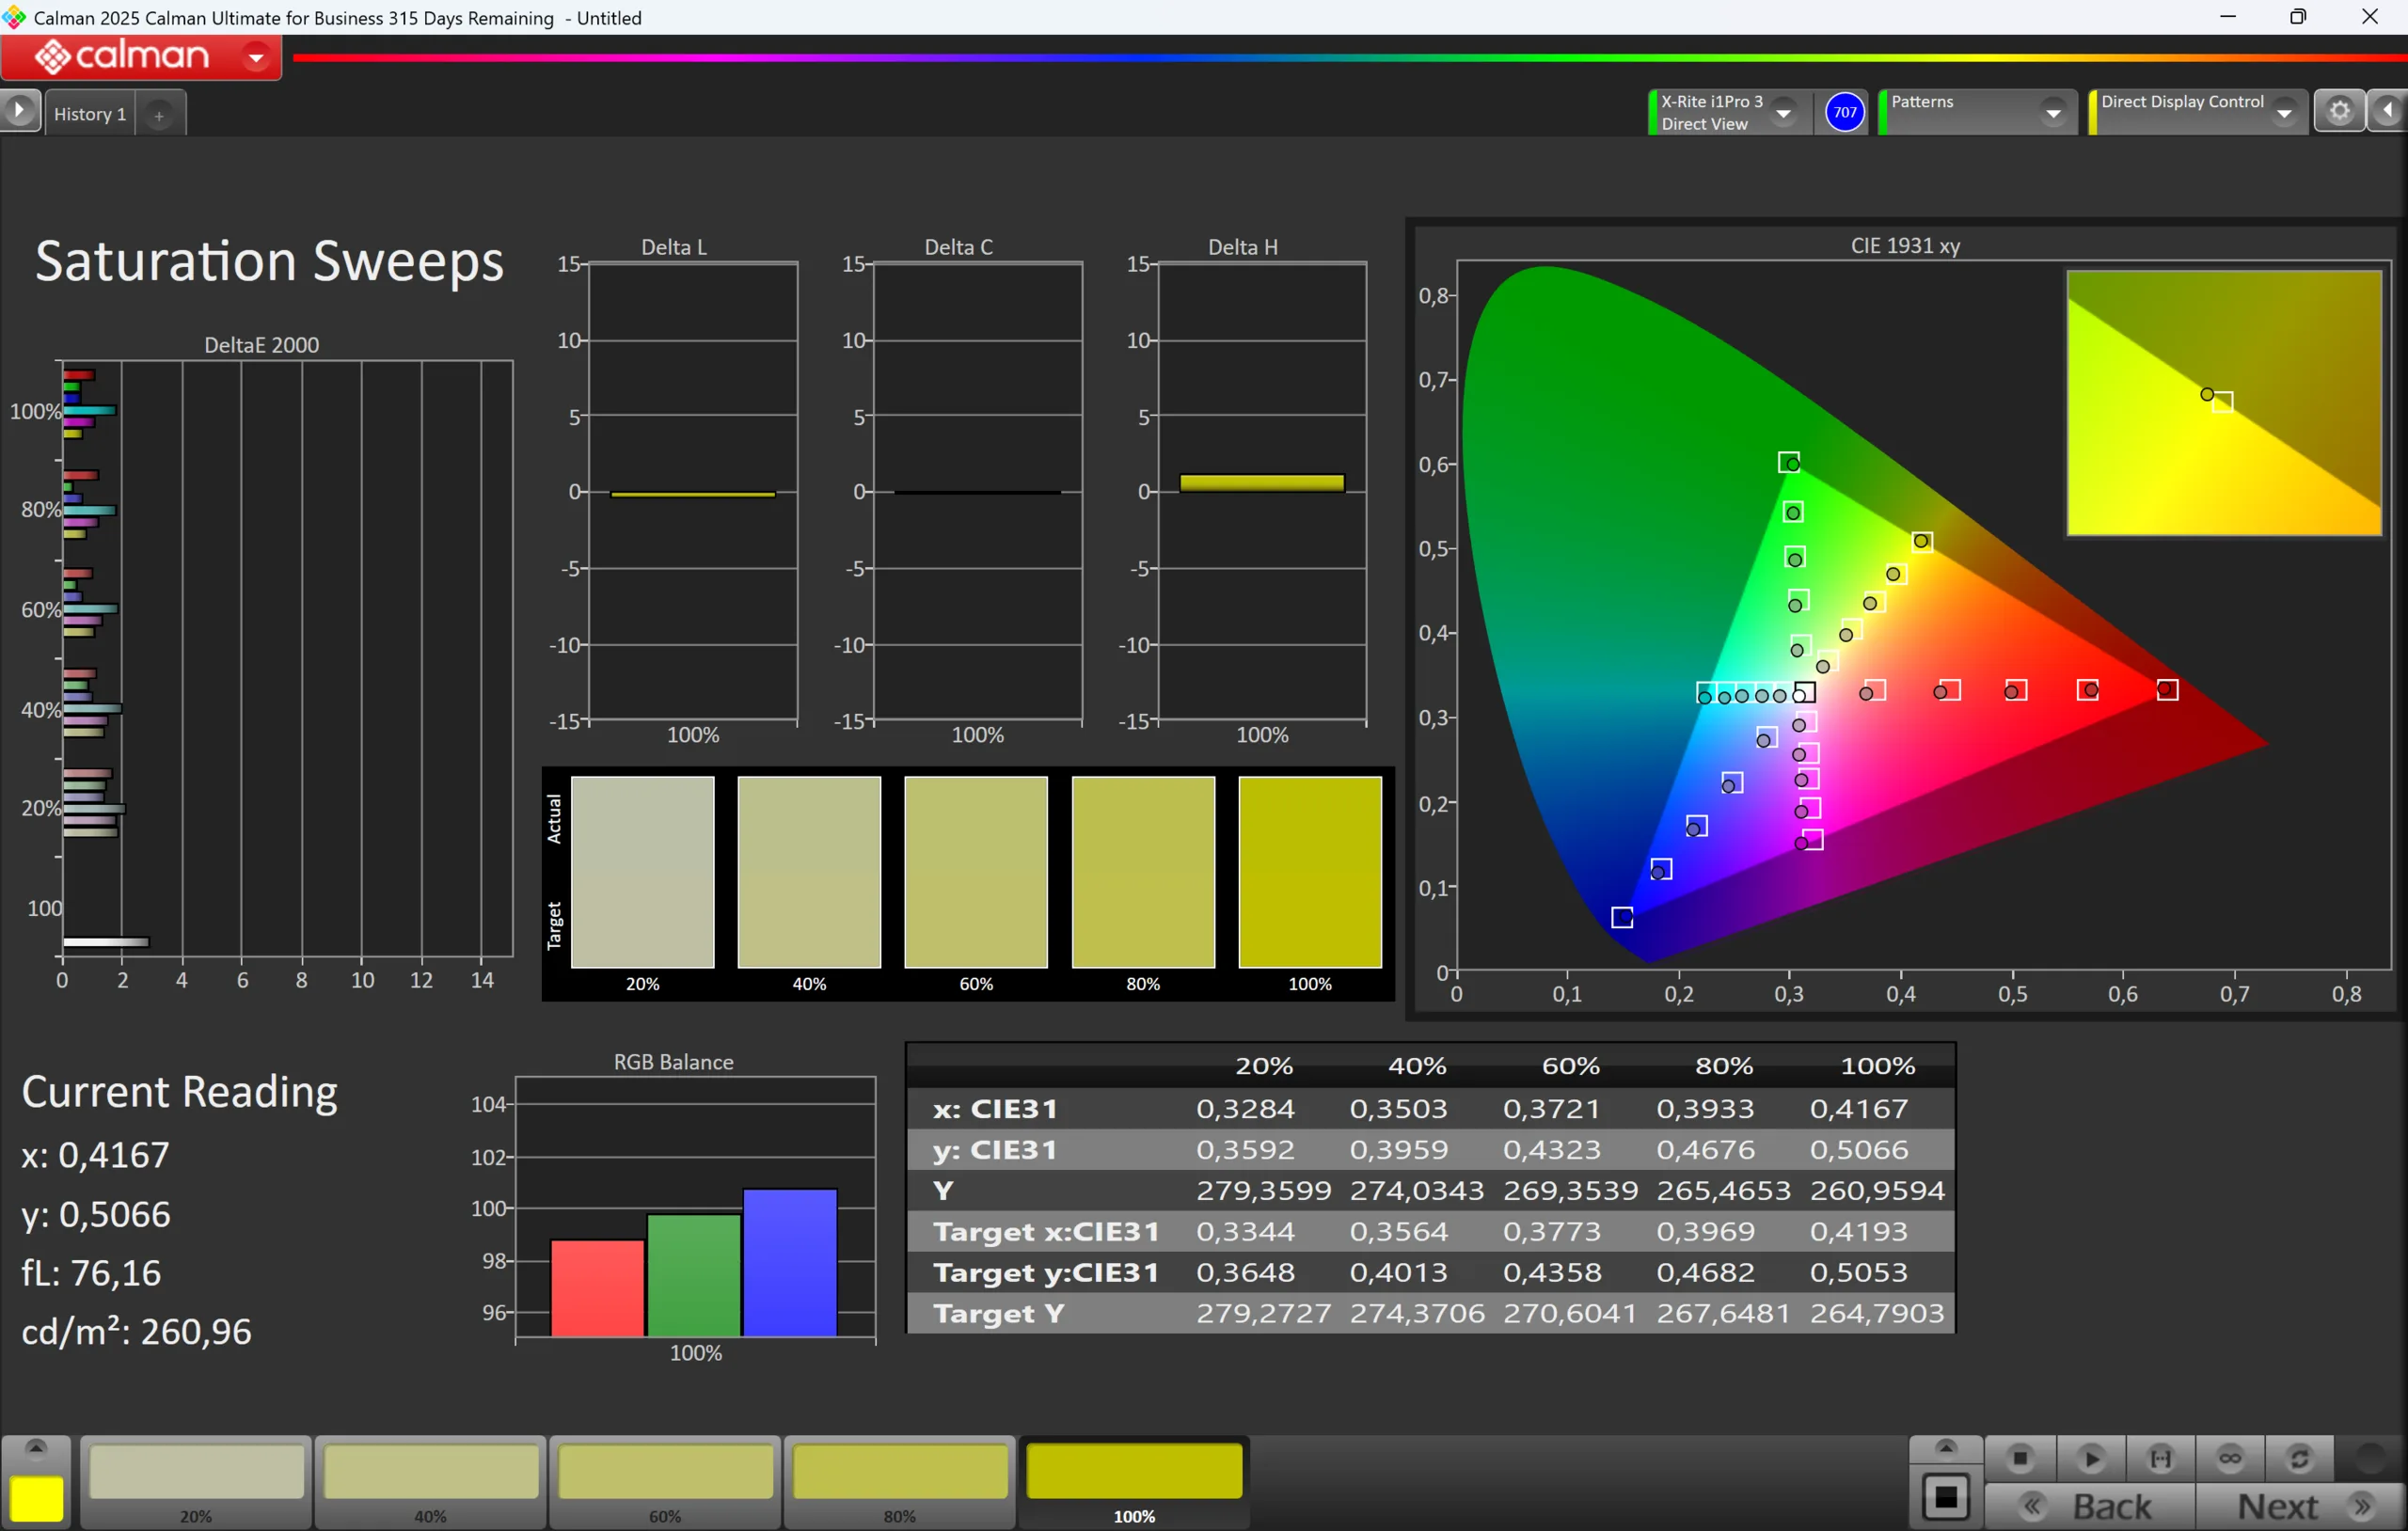


We analyzed the panel with the professional CalMAN software (X-Rite i1 Pro 3) and the picture is already very good out of the box. There is a small blue cast and the color temperature is a bit cool, but you wouldn't really notice it unless you have it right next to a calibrated screen. The panel has even more potential though, because we managed to improve the grayscale performance as well as the color accuracy noticeably with our own calibration. The corresponding color profile can be downloaded for free in the box above. Thanks to full sRGB color gamut, you can also use the MacBook Neo for picture/video editing.
Display Response Times
| ↔ Response Time Black to White | ||
|---|---|---|
| 14.6 ms ... rise ↗ and fall ↘ combined | ↗ 4.3 ms rise | 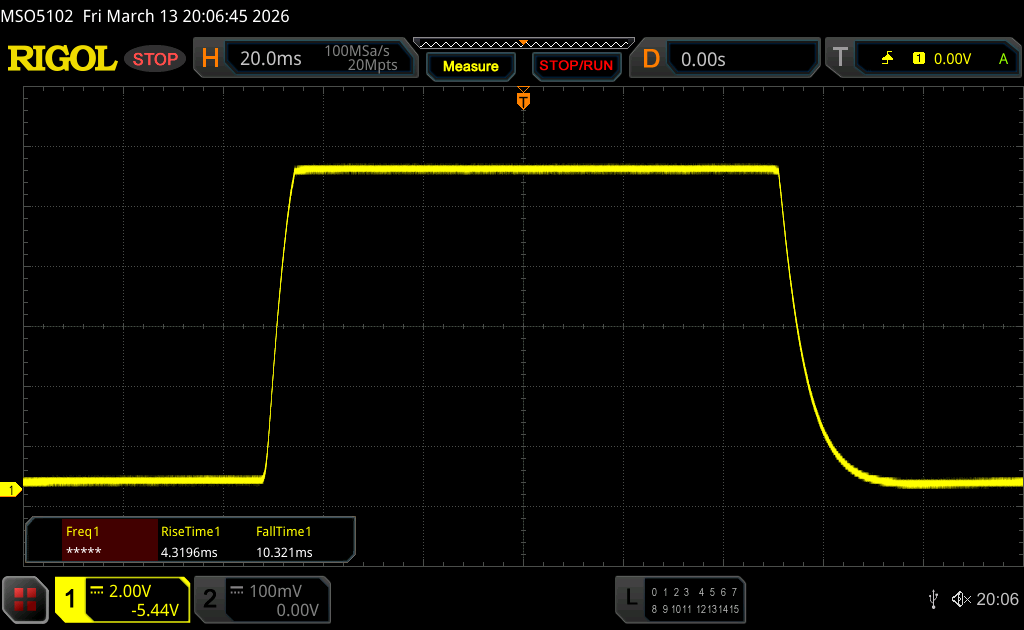 |
| ↘ 10.3 ms fall | ||
| The screen shows good response rates in our tests, but may be too slow for competitive gamers. In comparison, all tested devices range from 0.1 (minimum) to 240 (maximum) ms. » 35 % of all devices are better. This means that the measured response time is better than the average of all tested devices (20.1 ms). | ||
| ↔ Response Time 50% Grey to 80% Grey | ||
| 20.8 ms ... rise ↗ and fall ↘ combined | ↗ 9.2 ms rise | 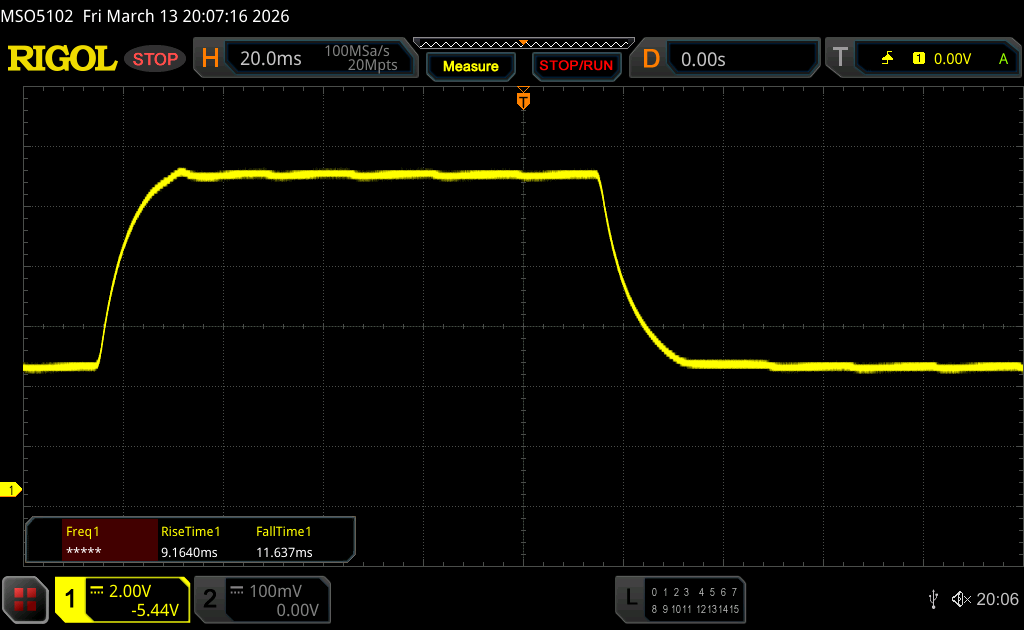 |
| ↘ 11.6 ms fall | ||
| The screen shows good response rates in our tests, but may be too slow for competitive gamers. In comparison, all tested devices range from 0.165 (minimum) to 636 (maximum) ms. » 32 % of all devices are better. This means that the measured response time is better than the average of all tested devices (31.4 ms). | ||
Screen Flickering / PWM (Pulse-Width Modulation)
| Screen flickering / PWM not detected |  | ||
In comparison: 53 % of all tested devices do not use PWM to dim the display. If PWM was detected, an average of 7996 (minimum: 5 - maximum: 343500) Hz was measured. | |||
We did not determine PWM flickering and the response times are completely okay for an IPS screen, but there is temporal dithering. We captured it with a slow-motion video (240 Hz) and went through different levels of gray as you can see in the video below. You can start seeing the flicker at 74 % gray, but it is really noticeable at 60 % and lower. If you are sensitive to temporal dithering, you will not be happy with the MacBook Neo.


Performance - A18 Pro with 8 GB RAM
Processor
Apple uses the A18 Pro SoC, which is the processor from the old iPhone 16 Pro. It offers 6 cores (2x Performance at up to 4.0 GHz, 4x Efficiency at up to 2.4 GHz) and consumes up to 6 Watts in multi-core scenarios (settles at 3.8 to 4W under sustained workloads) and 3.5-4 Watt under single-core load. Considering these values, the performance here is exceptional. We have already reported on the excellent single-core performance, which easily surpasses every other mobile processor from AMD, Intel, or Qualcomm and is only beaten by Apple's M4 and M5 generation.
The multi-core performance is lower, but keep in mind that the Cinebench 20204 Multi test takes a couple of minutes and it is a passively cooled device. It is still not far off from Intel's Lunar Lake Core Ultra 5 chips. The performance is also completely stable on battery power.
Cinebench 2024: CPU Multi Core | CPU Single Core
Geekbench 6.5: Multi-Core | Single-Core
Cinebench 2024: CPU Multi Core | CPU Single Core
Geekbench 6.5: Multi-Core | Single-Core
System Performance
The MacBook Neo is a snappy system and the benchmark scores are also very good. It easily beats the Snapdragon competition in CrossMark as well as the browser benchmarks. 8 GB RAM is obviously not very generous, but if you primarily use Apple's native apps anyway, you should be fine. We are still using an entry-level MacBook Air M1 with 8 GB RAM every day and it still works very well.
CrossMark: Overall | Productivity | Creativity | Responsiveness
WebXPRT 3: Overall
WebXPRT 4: Overall
Mozilla Kraken 1.1: Total
CrossMark: Overall | Productivity | Creativity | Responsiveness
WebXPRT 3: Overall
WebXPRT 4: Overall
Mozilla Kraken 1.1: Total
* ... smaller is better
Storage Devices
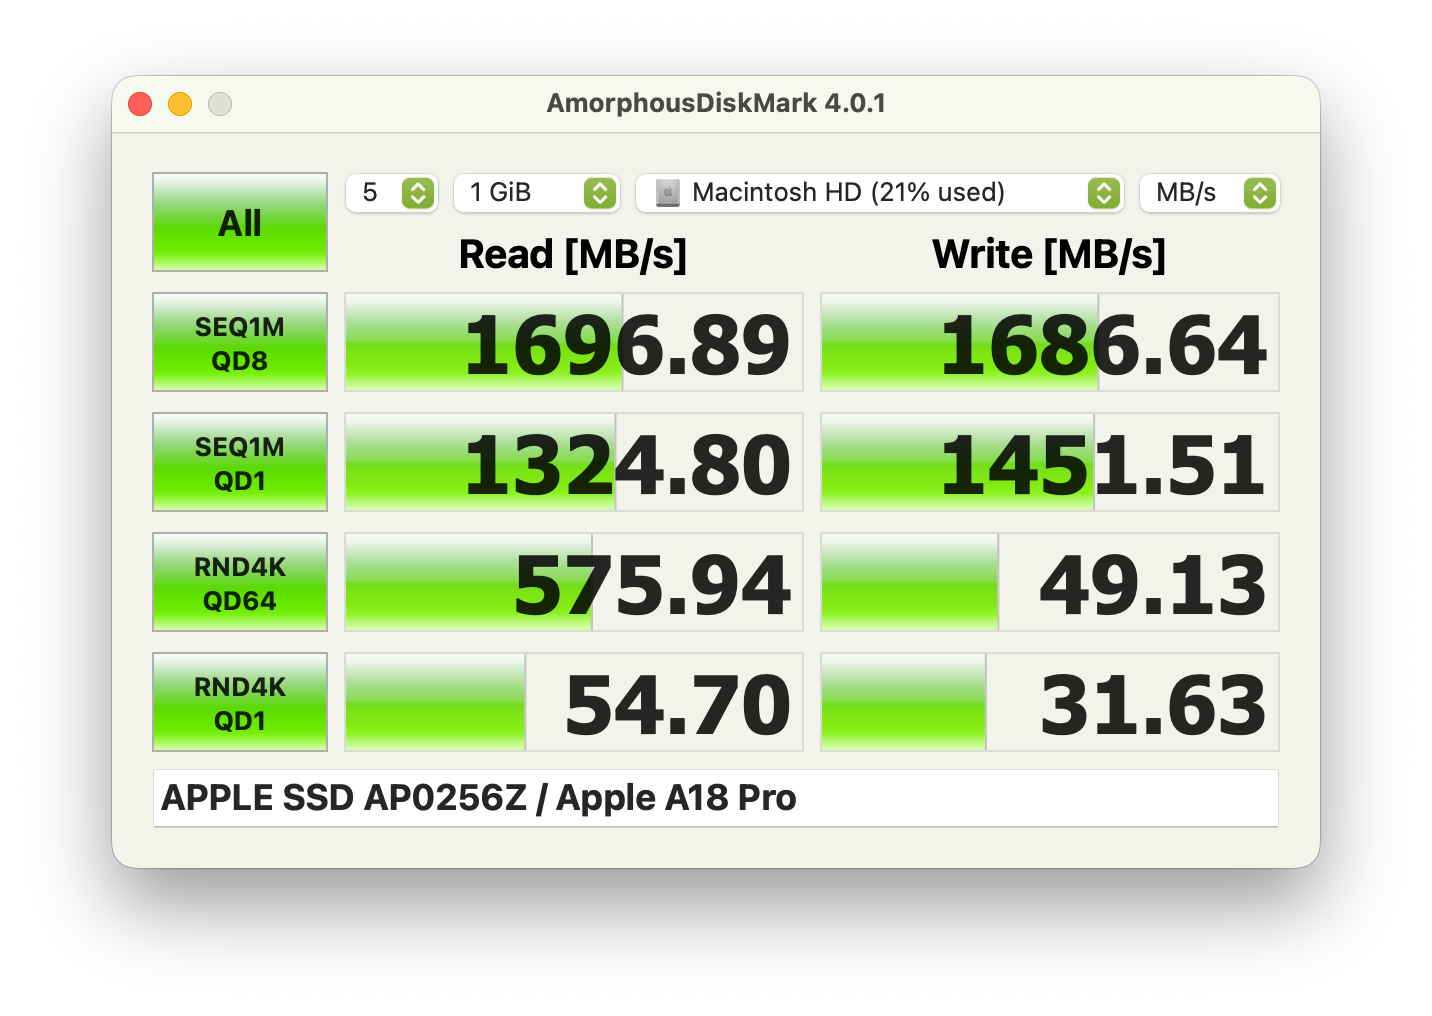
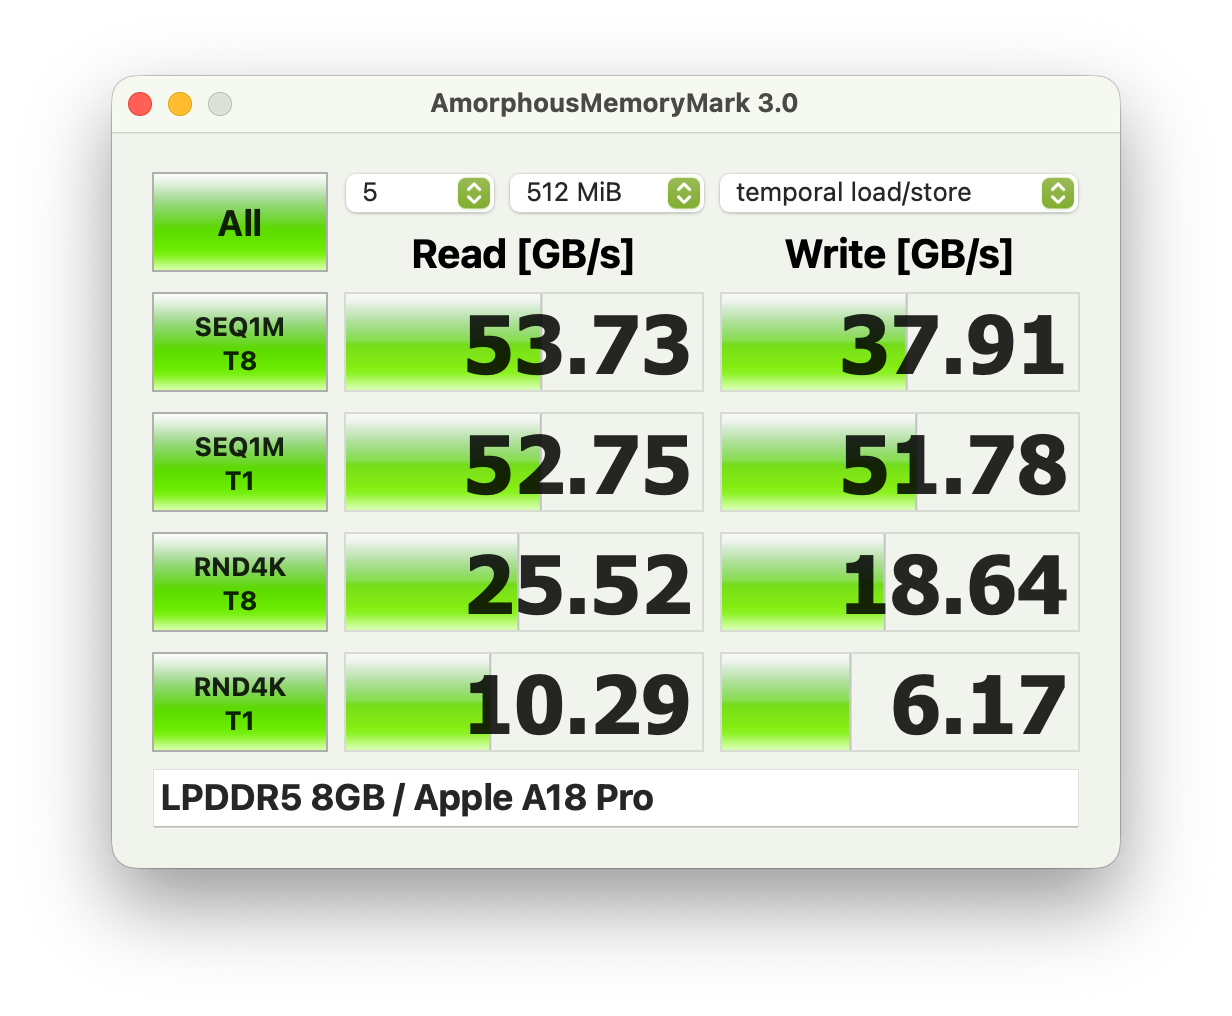
The SSD performance is around 1,5 GB/s and therefore like the MacBook Air M1, so it is fast enough for everyday stuff as well as swap cache. You can use 194 GB for your own files.
GPU Performance

The A18 Pro features a 6-core GPU and the maximum power consumption is 6 Watts, which will eventually drop to 4.4 Watts. The sustained performance is still pretty good and you only lose around 10 % in the Steel Nomad Light stress test. The graphics performance is actually pretty decent and easily beats the Adreno X1-45 GPU and it is also not much slower than the X1-85 model in the Surface Laptop 7 13.8. Compared to Intel's iGPUs, it is faster than the Iris Xe Graphics G7, for example. All in all, it is a capable iGPU for everyday tasks including high-resolution video playback or some light video editing.
Geekbench 6.5: GPU Metal | GPU OpenCL
| 3DMark / Wild Life Extreme | |
| Apple MacBook Air 13 M4 Entry | |
| Average of class Subnotebook (659 - 11498, n=32, last 2 years) | |
| Lenovo IdeaPad Slim 3 14 AHP G10 | |
| Apple MacBook Air 2020 M1 Entry | |
| Apple MacBook Air 2020 M1 Entry | |
| Apple MacBook Neo 256 GB | |
| Xiaomi RedmiBook 14 2025 | |
| Average Apple A18 GPU (3330 - 4255, n=4) | |
| Lenovo ThinkPad L13 2in1 G5 21LNS4AM00 | |
| Microsoft Surface Laptop 13 | |
| 3DMark / Steel Nomad Light Score | |
| Apple MacBook Air 13 M4 Entry | |
| Average of class Subnotebook (1034 - 5084, n=29, last 2 years) | |
| Lenovo IdeaPad Slim 3 14 AHP G10 | |
| Microsoft Surface Laptop 7 13.8 Copilot+ | |
| Apple MacBook Air 2020 M1 Entry | |
| Apple MacBook Neo 256 GB | |
| Average Apple A18 GPU (1517 - 1803, n=4) | |
| Lenovo ThinkPad L13 2in1 G5 21LNS4AM00 | |
| Xiaomi RedmiBook 14 2025 | |
| Microsoft Surface Laptop 13 | |
| 3DMark / Steel Nomad Score | |
| Apple MacBook Air 13 M4 Entry | |
| Average of class Subnotebook (184 - 1070, n=32, last 2 years) | |
| Microsoft Surface Laptop 7 13.8 Copilot+ | |
| Lenovo IdeaPad Slim 3 14 AHP G10 | |
| Apple MacBook Air 2020 M1 Entry | |
| Apple MacBook Neo 256 GB | |
| Average Apple A18 GPU (n=1) | |
| Microsoft Surface Laptop 13 | |
| Alliwava GH9, i9-12900HK | |
| Alliwava GH9, i9-12900HK | |
| Geekbench 6.5 / GPU Metal | |
| Average of class Subnotebook (31469 - 76530, n=5, last 2 years) | |
| Apple MacBook Air 13 M4 Entry | |
| Apple MacBook Air 13 M3 10C GPU | |
| Apple MacBook Neo 256 GB | |
| Apple MacBook Air 2020 M1 Entry | |
| Average Apple A18 GPU (28031 - 31469, n=2) | |
Geekbench 6.5: GPU Metal | GPU OpenCL
| 3DMark Steel Nomad Score | 385 points | |
| 3DMark Steel Nomad Light Score | 1786 points | |
Help | ||
| Blender / v3.3 Classroom METAL | |
| Apple MacBook Air 2020 M1 Entry | |
| Apple MacBook Neo 256 GB | |
| Average Apple A18 GPU (n=1) | |
| Apple MacBook Air 13 M3 10C GPU | |
| Average of class Subnotebook (76.3 - 227, n=5, last 2 years) | |
| Apple MacBook Air 13 M4 Entry | |
| Blender / v3.3 Classroom oneAPI/Intel | |
| HP EliteBook 8 Flip G1i 13 | |
| Average of class Subnotebook (195 - 396, n=12, last 2 years) | |
* ... smaller is better
Gaming Performance
The gaming performance is very limited and you should focus on older titles. Modern games like Cyberpunk 2077 are only barely playable in the lowest settings and resolutions with MetalFX upscaling, but to be honest, the game does not look very pretty and we still experienced frame drops below 30 fps in crowded areas. You should therefore focus on the Apple Arcade games or use streaming services. We also performed some tests with the internal display resolution, but the situation is not much better for demanding titles, as you can see below. We will add more gaming tests over the next couple of days.
| Low | Medium | High | Ultra | |
|---|---|---|---|---|
| Cyberpunk 2077 | 24.2 fps | 19.3 fps | 13.8 fps | 11.3 fps |
| Cyberpunk 2077 MetalFX Auto | 33.1 fps | 28.5 fps | 17 fps | 15.4 fps |
| Baldur's Gate 3 | 26.3 fps | 21.5 fps | 18.1 fps | 17.7 fps |
| Shadow of the Tomb Raider - 1280x720 Lowest Preset | |
| Apple MacBook Air 13 M3 10C GPU | |
| Apple MacBook Air 13 M4 Entry | |
| Average of class Subnotebook (41 - 106, n=7, last 2 years) | |
| Apple MacBook Air 2020 M1 Entry | |
| Microsoft Surface Laptop 7 13.8 Copilot+ | |
| Apple MacBook Neo 256 GB | |
| low | med. | high | ultra | |
|---|---|---|---|---|
| Shadow of the Tomb Raider (2018) | 43 | 20 | 18 | 17 |
| Baldur's Gate 3 (2023) | 19.1 | 15.5 | 13.9 | 13.6 |
| Cyberpunk 2077 (2023) | 12.4 | 9.2 | 7 | 5.6 |
| Total War Pharaoh (2023) | 54.9 | 36.4 | 19.9 | 14.9 |
Emissions - MacBook Neo is always silent
System Noise
The MacBook Neo does not use fans and is therefore always silent, which is a huge advantage over its Windows rivals. We did not experience any other electronic noises, either.
| Apple MacBook Neo 256 GB A18 Pro, A18 GPU | Microsoft Surface Laptop 13 SD X Plus X1P-42-100, Adreno X1-45 1.7 TFLOPS | HP Omnibook 5 14 SD X Plus X1P-42-100, Adreno X1-45 1.7 TFLOPS | Lenovo IdeaPad Slim 3 14 AHP G10 R7 8840HS, Radeon 780M | Apple MacBook Air 13 M4 Entry M4 10-Core, M4 8-Core GPU | |
|---|---|---|---|---|---|
| Noise | |||||
| off / environment * (dB) | 23.5 | 25.8 | 24.2 | ||
| Idle Minimum * (dB) | 23.5 | 25.8 | 24.2 | ||
| Idle Average * (dB) | 23.5 | 25.8 | 24.2 | ||
| Idle Maximum * (dB) | 23.5 | 25.8 | 26.8 | ||
| Load Average * (dB) | 23.5 | 29 | 40.8 | ||
| Cyberpunk 2077 ultra * (dB) | 29.9 | 29.2 | 38 | ||
| Load Maximum * (dB) | 43.6 | 37.8 | 40.8 |
* ... smaller is better
Temperature
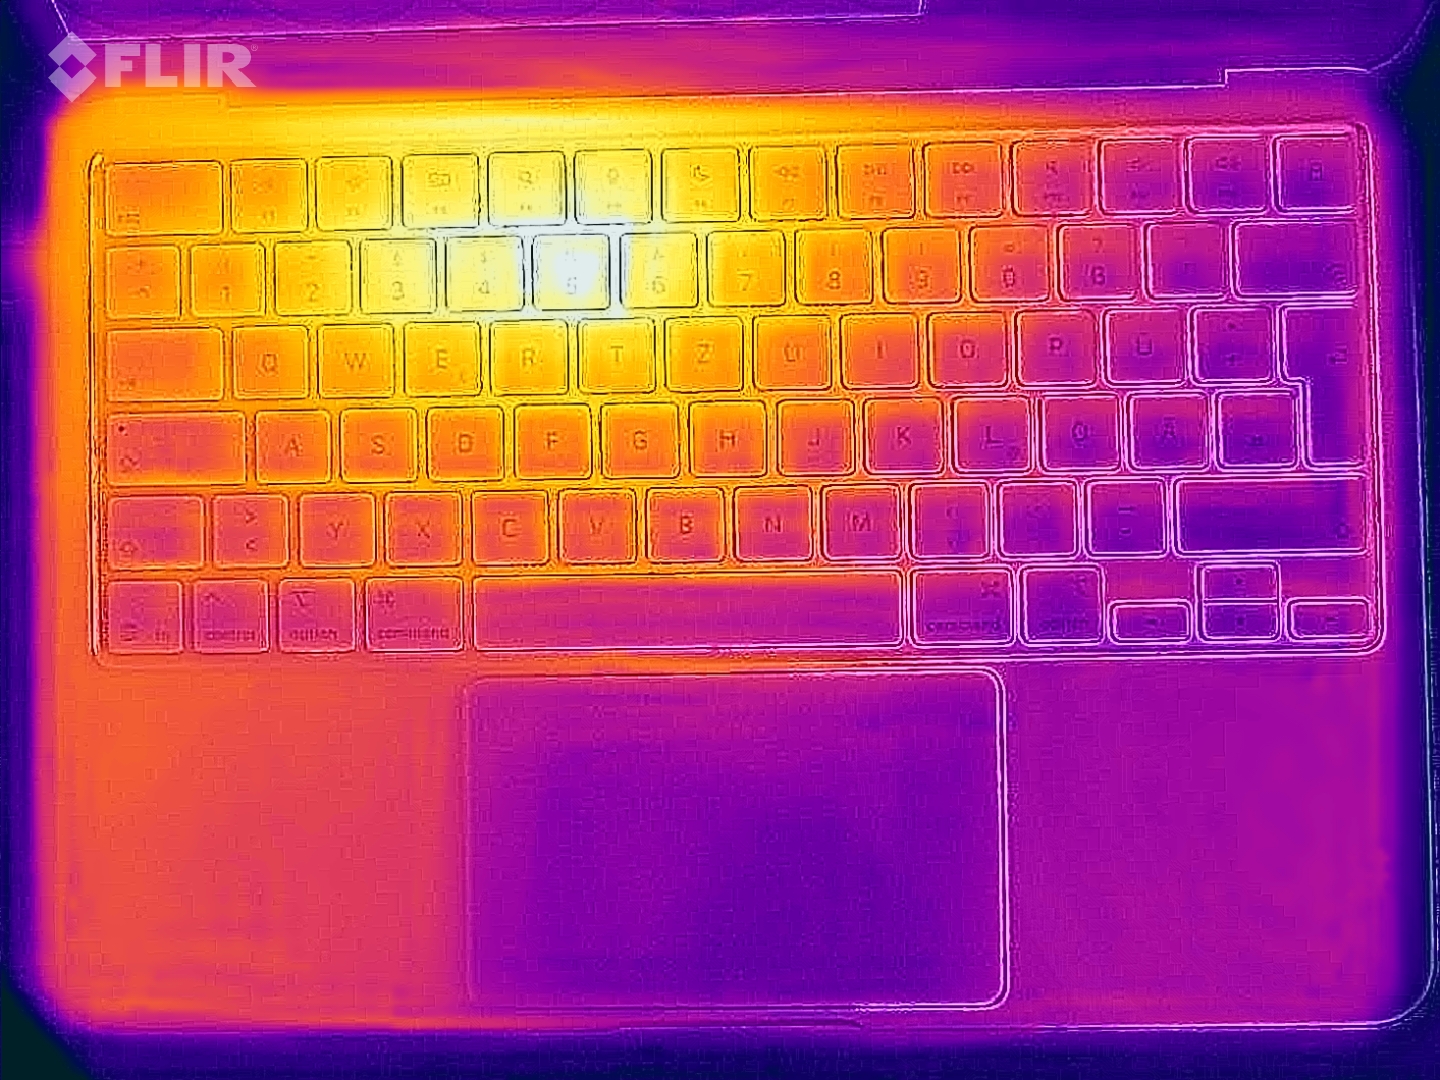
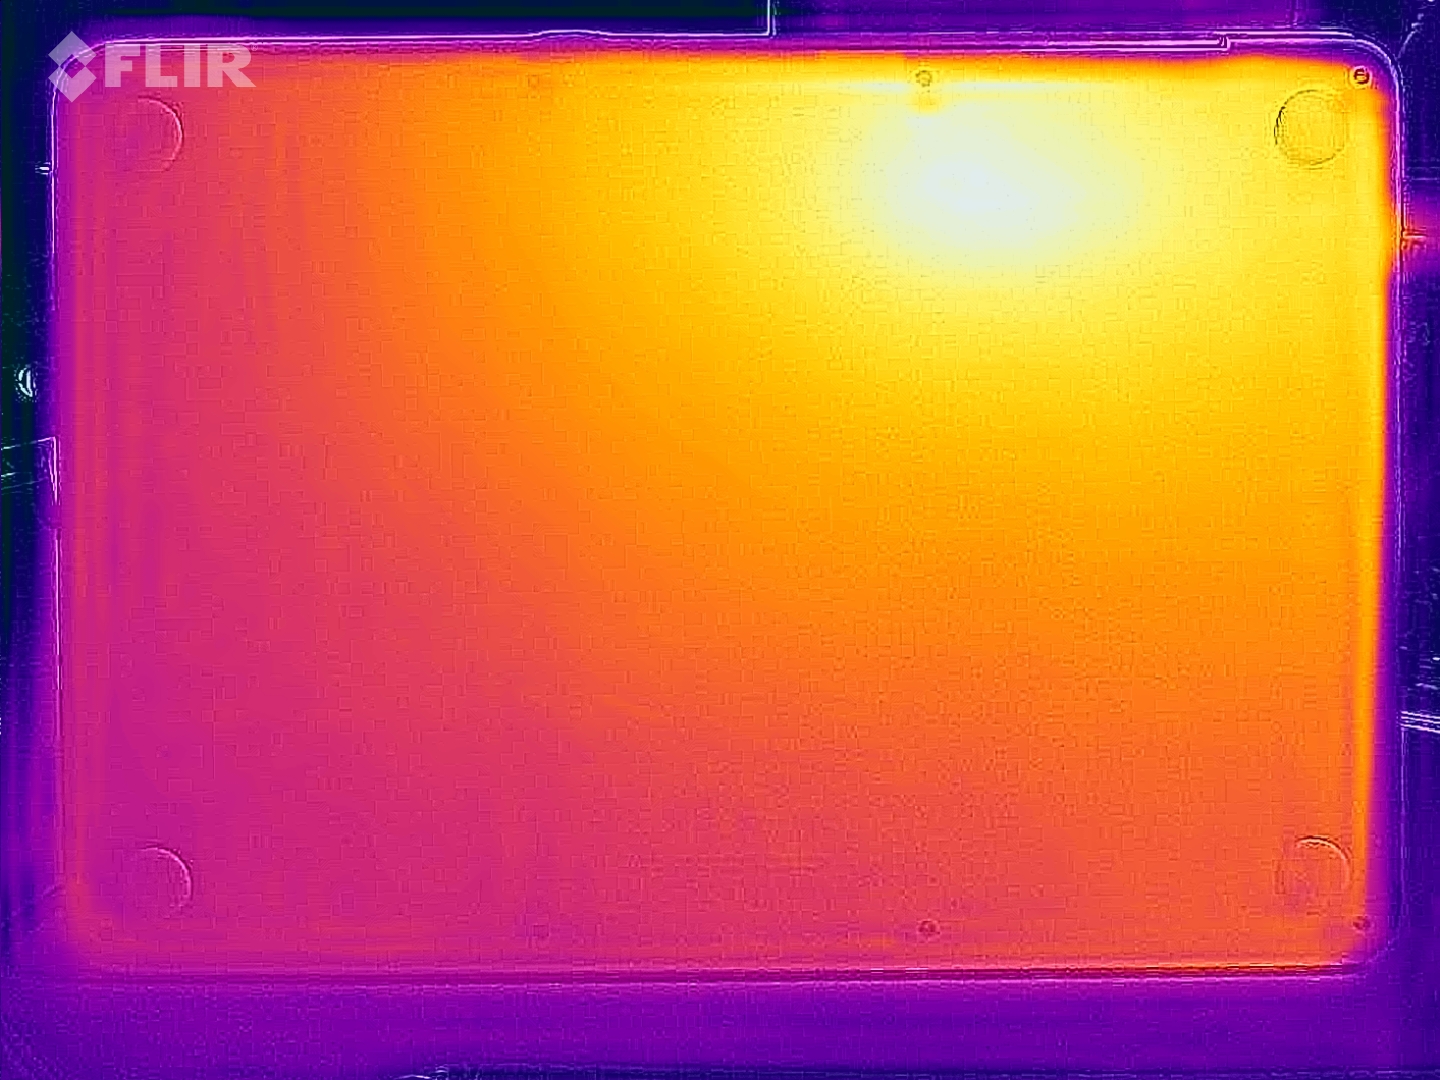
The surface temperatures of the aluminum chassis are always pretty cool, even when you stress the system. We only measured 40 °C at two spots, all the other areas remained much cooler, so there are absolutely no limitations here. During the stress test, the A18 Pro consumes up to 8.8 Watts, but quickly levels off at around 5 Watts.
(±) The maximum temperature on the upper side is 40.8 °C / 105 F, compared to the average of 35.9 °C / 97 F, ranging from 21.4 to 59 °C for the class Subnotebook.
(+) The bottom heats up to a maximum of 38 °C / 100 F, compared to the average of 39.2 °C / 103 F
(+) In idle usage, the average temperature for the upper side is 23.1 °C / 74 F, compared to the device average of 30.8 °C / 87 F.
(+) 3: The average temperature for the upper side is 31 °C / 88 F, compared to the average of 30.8 °C / 87 F for the class Subnotebook.
(+) The palmrests and touchpad are cooler than skin temperature with a maximum of 30.3 °C / 86.5 F and are therefore cool to the touch.
(-) The average temperature of the palmrest area of similar devices was 28.2 °C / 82.8 F (-2.1 °C / -3.7 F).
| Apple MacBook Neo 256 GB A18 Pro, A18 GPU | Microsoft Surface Laptop 13 SD X Plus X1P-42-100, Adreno X1-45 1.7 TFLOPS | HP Omnibook 5 14 SD X Plus X1P-42-100, Adreno X1-45 1.7 TFLOPS | Lenovo IdeaPad Slim 3 14 AHP G10 R7 8840HS, Radeon 780M | Apple MacBook Air 13 M4 Entry M4 10-Core, M4 8-Core GPU | |
|---|---|---|---|---|---|
| Heat | -3% | -9% | -17% | -7% | |
| Maximum Upper Side * (°C) | 40.8 | 39 4% | 32.4 21% | 38.3 6% | 44.9 -10% |
| Maximum Bottom * (°C) | 38 | 42.2 -11% | 33.6 12% | 51.5 -36% | 42.6 -12% |
| Idle Upper Side * (°C) | 23.8 | 23.9 -0% | 30.2 -27% | 25.8 -8% | 23.9 -0% |
| Idle Bottom * (°C) | 22.8 | 24 -5% | 32 -40% | 29.5 -29% | 24 -5% |
* ... smaller is better
Speakers

The two speaker modules inside the chassis are very large and the resulting sound is very good. They lack a bit of punch compared to the MacBook Air, for example, but considering the price range, the result is excellent.
Apple MacBook Neo 256 GB audio analysis
(+) | speakers can play relatively loud (83 dB)
Bass 100 - 315 Hz
(±) | reduced bass - on average 7.7% lower than median
(±) | linearity of bass is average (7% delta to prev. frequency)
Mids 400 - 2000 Hz
(+) | balanced mids - only 1.3% away from median
(+) | mids are linear (3.3% delta to prev. frequency)
Highs 2 - 16 kHz
(+) | balanced highs - only 4.4% away from median
(+) | highs are linear (4.3% delta to prev. frequency)
Overall 100 - 16.000 Hz
(+) | overall sound is linear (9% difference to median)
Compared to same class
» 4% of all tested devices in this class were better, 1% similar, 95% worse
» The best had a delta of 5%, average was 18%, worst was 53%
Compared to all devices tested
» 3% of all tested devices were better, 1% similar, 96% worse
» The best had a delta of 4%, average was 24%, worst was 134%
Microsoft Surface Laptop 13 audio analysis
(+) | speakers can play relatively loud (83.5 dB)
Bass 100 - 315 Hz
(-) | nearly no bass - on average 15.5% lower than median
(±) | linearity of bass is average (10.7% delta to prev. frequency)
Mids 400 - 2000 Hz
(+) | balanced mids - only 3.3% away from median
(+) | mids are linear (4.3% delta to prev. frequency)
Highs 2 - 16 kHz
(+) | balanced highs - only 1.5% away from median
(+) | highs are linear (4.7% delta to prev. frequency)
Overall 100 - 16.000 Hz
(+) | overall sound is linear (11.1% difference to median)
Compared to same class
» 11% of all tested devices in this class were better, 2% similar, 87% worse
» The best had a delta of 5%, average was 18%, worst was 53%
Compared to all devices tested
» 6% of all tested devices were better, 2% similar, 92% worse
» The best had a delta of 4%, average was 24%, worst was 134%
HP Omnibook 5 14 audio analysis
(+) | speakers can play relatively loud (92.7 dB)
Bass 100 - 315 Hz
(-) | nearly no bass - on average 19.3% lower than median
(+) | bass is linear (5.5% delta to prev. frequency)
Mids 400 - 2000 Hz
(+) | balanced mids - only 3% away from median
(+) | mids are linear (4% delta to prev. frequency)
Highs 2 - 16 kHz
(+) | balanced highs - only 1.3% away from median
(+) | highs are linear (2% delta to prev. frequency)
Overall 100 - 16.000 Hz
(+) | overall sound is linear (12.8% difference to median)
Compared to same class
» 19% of all tested devices in this class were better, 5% similar, 77% worse
» The best had a delta of 5%, average was 18%, worst was 53%
Compared to all devices tested
» 12% of all tested devices were better, 3% similar, 86% worse
» The best had a delta of 4%, average was 24%, worst was 134%
Lenovo IdeaPad Slim 3 14 AHP G10 audio analysis
(+) | speakers can play relatively loud (82.6 dB)
Bass 100 - 315 Hz
(-) | nearly no bass - on average 29.7% lower than median
(±) | linearity of bass is average (9.5% delta to prev. frequency)
Mids 400 - 2000 Hz
(±) | higher mids - on average 6.8% higher than median
(±) | linearity of mids is average (7% delta to prev. frequency)
Highs 2 - 16 kHz
(+) | balanced highs - only 3.8% away from median
(+) | highs are linear (4.9% delta to prev. frequency)
Overall 100 - 16.000 Hz
(±) | linearity of overall sound is average (24.3% difference to median)
Compared to same class
» 82% of all tested devices in this class were better, 4% similar, 14% worse
» The best had a delta of 5%, average was 18%, worst was 53%
Compared to all devices tested
» 73% of all tested devices were better, 6% similar, 21% worse
» The best had a delta of 4%, average was 24%, worst was 134%
Energy Management
Power Consumption

During our consumption measurements, the idle values at maximum brightness are pretty high at up to 9 Watts, which is a result of the bright IPS screen. Under load, we measure up to 24 Watts, which stabilizes at ~18.5 Watts. Apple does not include a power adapter in Europe; we recommend a 30W model to be on the safe side.
| Off / Standby | |
| Idle | |
| Load |
|
Key:
min: | |
| Apple MacBook Neo 256 GB A18 Pro, A18 GPU, Apple SSD AP0256Z, IPS, 2408x1506, 13" | Microsoft Surface Laptop 13 SD X Plus X1P-42-100, Adreno X1-45 1.7 TFLOPS, , IPS, 1920x1280, 13" | HP Omnibook 5 14 SD X Plus X1P-42-100, Adreno X1-45 1.7 TFLOPS, Samsung PM9C1 MZVL81T0HELB-00BTW, OLED, 1920x1200, 14" | Lenovo IdeaPad Slim 3 14 AHP G10 R7 8840HS, Radeon 780M, Micron 2500 MTFDKBA512QGN, IPS, 1920x1200, 14" | Apple MacBook Air 13 M4 Entry M4 10-Core, M4 8-Core GPU, Apple SSD AP0256Z, IPS, 2560x1664, 13.6" | Average Apple A18 GPU | Average of class Subnotebook | |
|---|---|---|---|---|---|---|---|
| Power Consumption | -31% | -38% | -112% | -38% | 52% | -81% | |
| Idle Minimum * (Watt) | 1.5 | 1.8 -20% | 1.9 -27% | 3.3 -120% | 1.9 -27% | 0.873 ? 42% | 3.92 ? -161% |
| Idle Average * (Watt) | 8.9 | 5.1 43% | 2.5 72% | 6.3 29% | 8.7 2% | 3.3 ? 63% | 6.93 ? 22% |
| Idle Maximum * (Watt) | 9 | 5.6 38% | 8.1 10% | 6.8 24% | 8.8 2% | 3.39 ? 62% | 8.23 ? 9% |
| Load Average * (Watt) | 18.9 | 13.8 27% | 17.8 6% | 45.7 -142% | 29.9 -58% | 9.09 ? 52% | 42.9 ? -127% |
| Cyberpunk 2077 ultra external monitor * (Watt) | 10.3 | 19.4 -88% | 19.1 -85% | 35.8 -248% | 21.5 -109% | ||
| Cyberpunk 2077 ultra * (Watt) | 11.5 | 21.8 -90% | 19.9 -73% | 38.2 -232% | 18.5 -61% | ||
| Load Maximum * (Watt) | 26.3 | 60.2 -129% | 70.3 -167% | 51.7 -97% | 30.8 -17% | 15 ? 43% | 65.3 ? -148% |
* ... smaller is better
Power Consumption Cyberpunk / Stress Test
Power Consumption external Monitor
Battery Life

The battery capacity of 36.5 Watts is pretty small, but the runtime in our Wi-Fi test at 150 nits is still good at almost 13 hours. However, the situation changes drastically when you increase the brightness and the Wi-Fi runtime drops to just under 5 hours. This can be an issue, especially in brighter environments, where you simply need a higher panel brightness. We will add more battery runtime tests soon.
The charging speed is slow, and it took exactly two hours with a 65W power adapter before the battery was back to 100 % (50 % after 45 minutes, 80 % after 76 minutes).
Notebookcheck Rating
Apple MacBook Neo 256 GB
- 03/13/2026 v8
Andreas Osthoff
 Total Sustainability Score:
 Potential Competitors in Comparison
Image | Model / Review | Price | Weight | Height | Display |
|---|---|---|---|---|---|
1. 86%  | Apple MacBook Neo 256 GB Apple A18 Pro ⎘ Apple A18 GPU ⎘ 8 GB Memory, 256 GB SSD | List Price: 699€ | 1.2 kg | 12.7 mm | 13.00" 2408x1506 218 PPI IPS |
2. 84.3%  | Microsoft Surface Laptop 13 Qualcomm Snapdragon X Plus X1P-42-100 ⎘ Qualcomm SD X Adreno X1-45 1.7 TFLOPS ⎘ 16 GB Memory | List Price: 1219€ | 1.2 kg | 15.6 mm | 13.00" 1920x1280 178 PPI IPS |
3. 85.5% 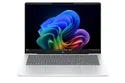 | HP Omnibook 5 14 Qualcomm Snapdragon X Plus X1P-42-100 ⎘ Qualcomm SD X Adreno X1-45 1.7 TFLOPS ⎘ 16 GB Memory, 1024 GB SSD | List Price: 550 USD | 1.3 kg | 12.7 mm | 14.00" 1920x1200 162 PPI OLED |
4. 81.1% 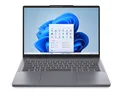 | Lenovo IdeaPad Slim 3 14 AHP G10 AMD Ryzen 7 8840HS ⎘ AMD Radeon 780M ⎘ 16 GB Memory, 512 GB SSD | List Price: 649€ | 1.5 kg | 17.9 mm | 14.00" 1920x1200 162 PPI IPS |
5. 91.2% 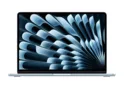 | Apple MacBook Air 13 M4 Entry Apple M4 10-Core ⎘ Apple M4 8-Core GPU ⎘ 16 GB Memory, 256 GB SSD | List Price: 1039€ | 1.2 kg | 11.3 mm | 13.60" 2560x1664 225 PPI IPS |
Transparency
The selection of devices to be reviewed is made by our editorial team. The test sample was provided to the author as a loan by the manufacturer or retailer for the purpose of this review. The lender had no influence on this review, nor did the manufacturer receive a copy of this review before publication. There was no obligation to publish this review. As an independent media company, Notebookcheck is not subjected to the authority of manufacturers, retailers or publishers.
This is how Notebookcheck is testing
Every year, Notebookcheck independently reviews hundreds of laptops and smartphones using standardized procedures to ensure that all results are comparable. We have continuously developed our test methods for around 20 years and set industry standards in the process. In our test labs, high-quality measuring equipment is utilized by experienced technicians and editors. These tests involve a multi-stage validation process. Our complex rating system is based on hundreds of well-founded measurements and benchmarks, which maintains objectivity. Further information on our test methods can be found here.
