
Verdict - The new MacBook Air 13 M5 is an excellent laptop for a lot of people
The old MacBook Air 13 was already a great everyday laptop, but the new M5 model raises the bar even further. Apple's M5 SoC is the fastest single core processor you can buy and the multi-core performance is also very good, even when the consumption is throttled due to the thermal limitations after a couple of minutes. It is amazing that you can get this amount of performance in a completely silent laptop and the base M5 with the 8-core GPU is also crazy efficient while gaming, where the laptop does not throttle even during extensive gaming sessions.
Considering that Apple also now includes Wi-Fi 7 and doubled the storage of the base model to 512 GB with faster PCIe 4.0 drives, the new base model for $1,099 is the most interesting version for the majority of users and it is almost impossible to beat the price-performance ratio of the new MacBook Air 13 M5. Considering the price development of the previous M4 version, it will not be long before you can get this machine for under $1,000.
There are still drawbacks, of course, including the limited number of ports, the lack of Face-ID, soldered RAM and SSDs as well as the 60 Hz screen. We don't mind the IPS panel since it is not affected by PWM flickering, but a higher refresh rate would be nice. Looking at the MacBook Pro 14 M5, however, we do not think Apple is really interested in selling a MacBook Air with a better screen, since it would probably cannibalize the sales figures of the entry-level MacBook Pro.
Pros
Cons
Price and Availability
The new MacBook Air 13 M5 launches on March 11th for $1,099.
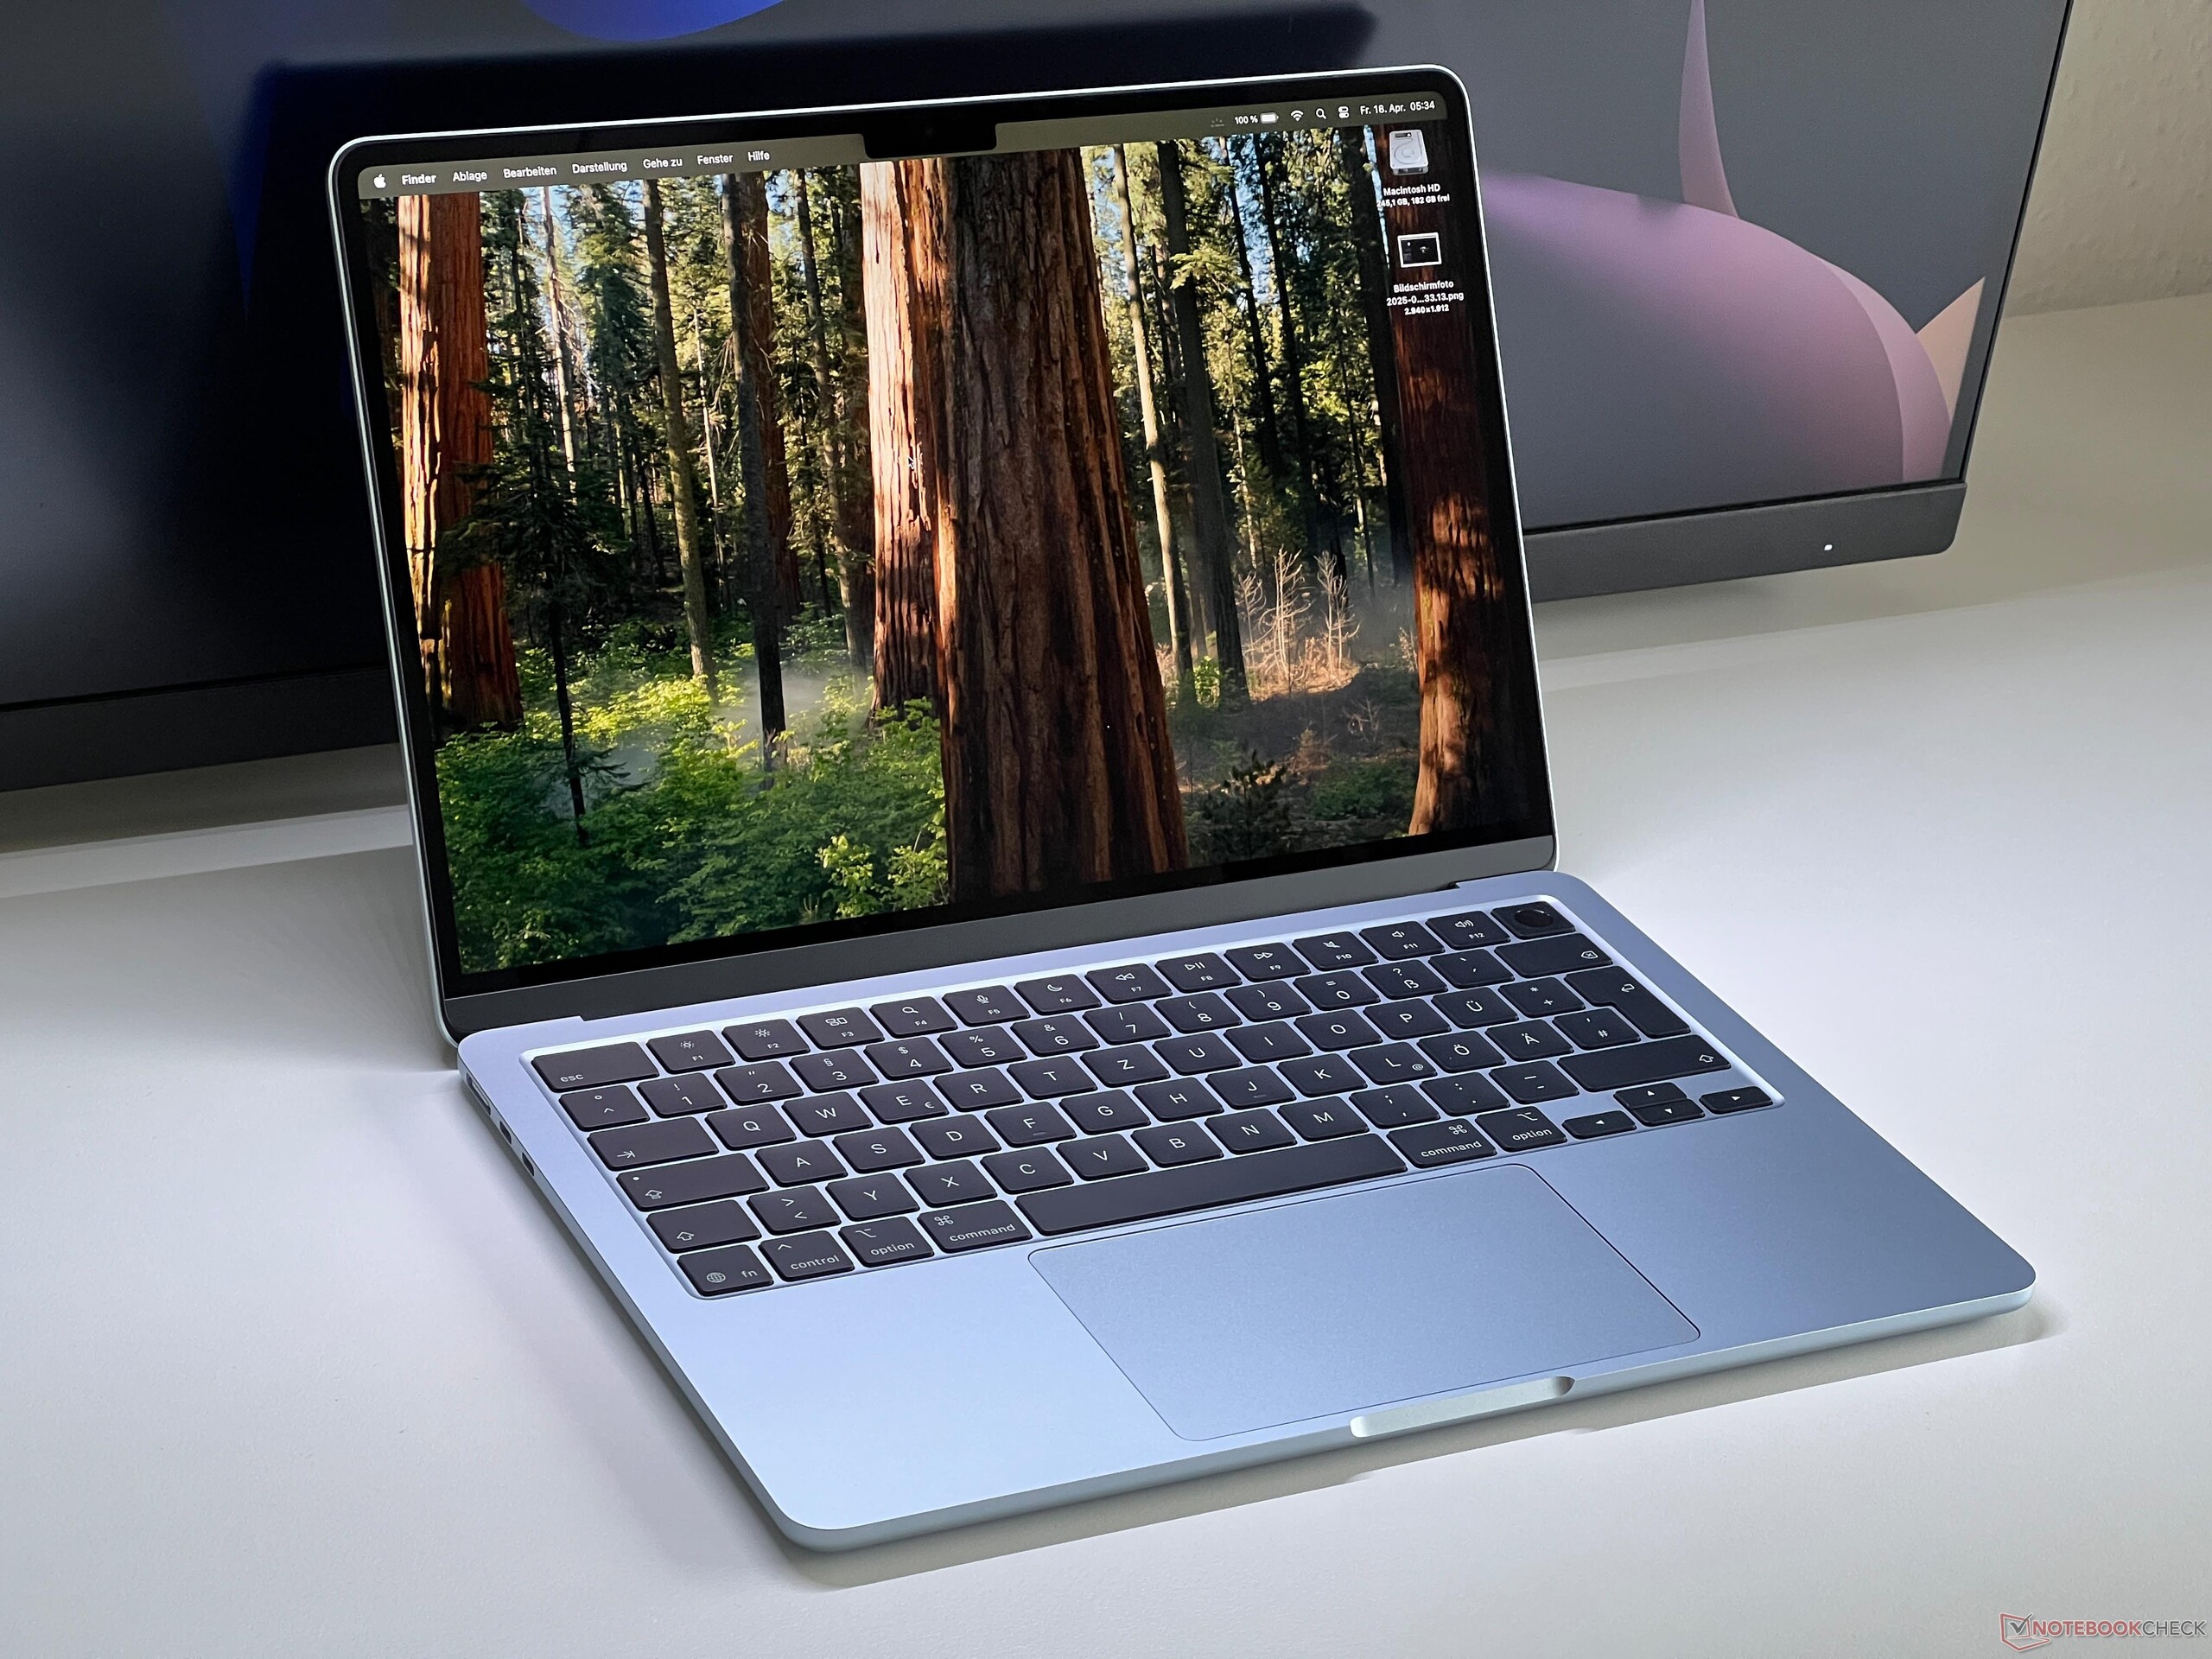
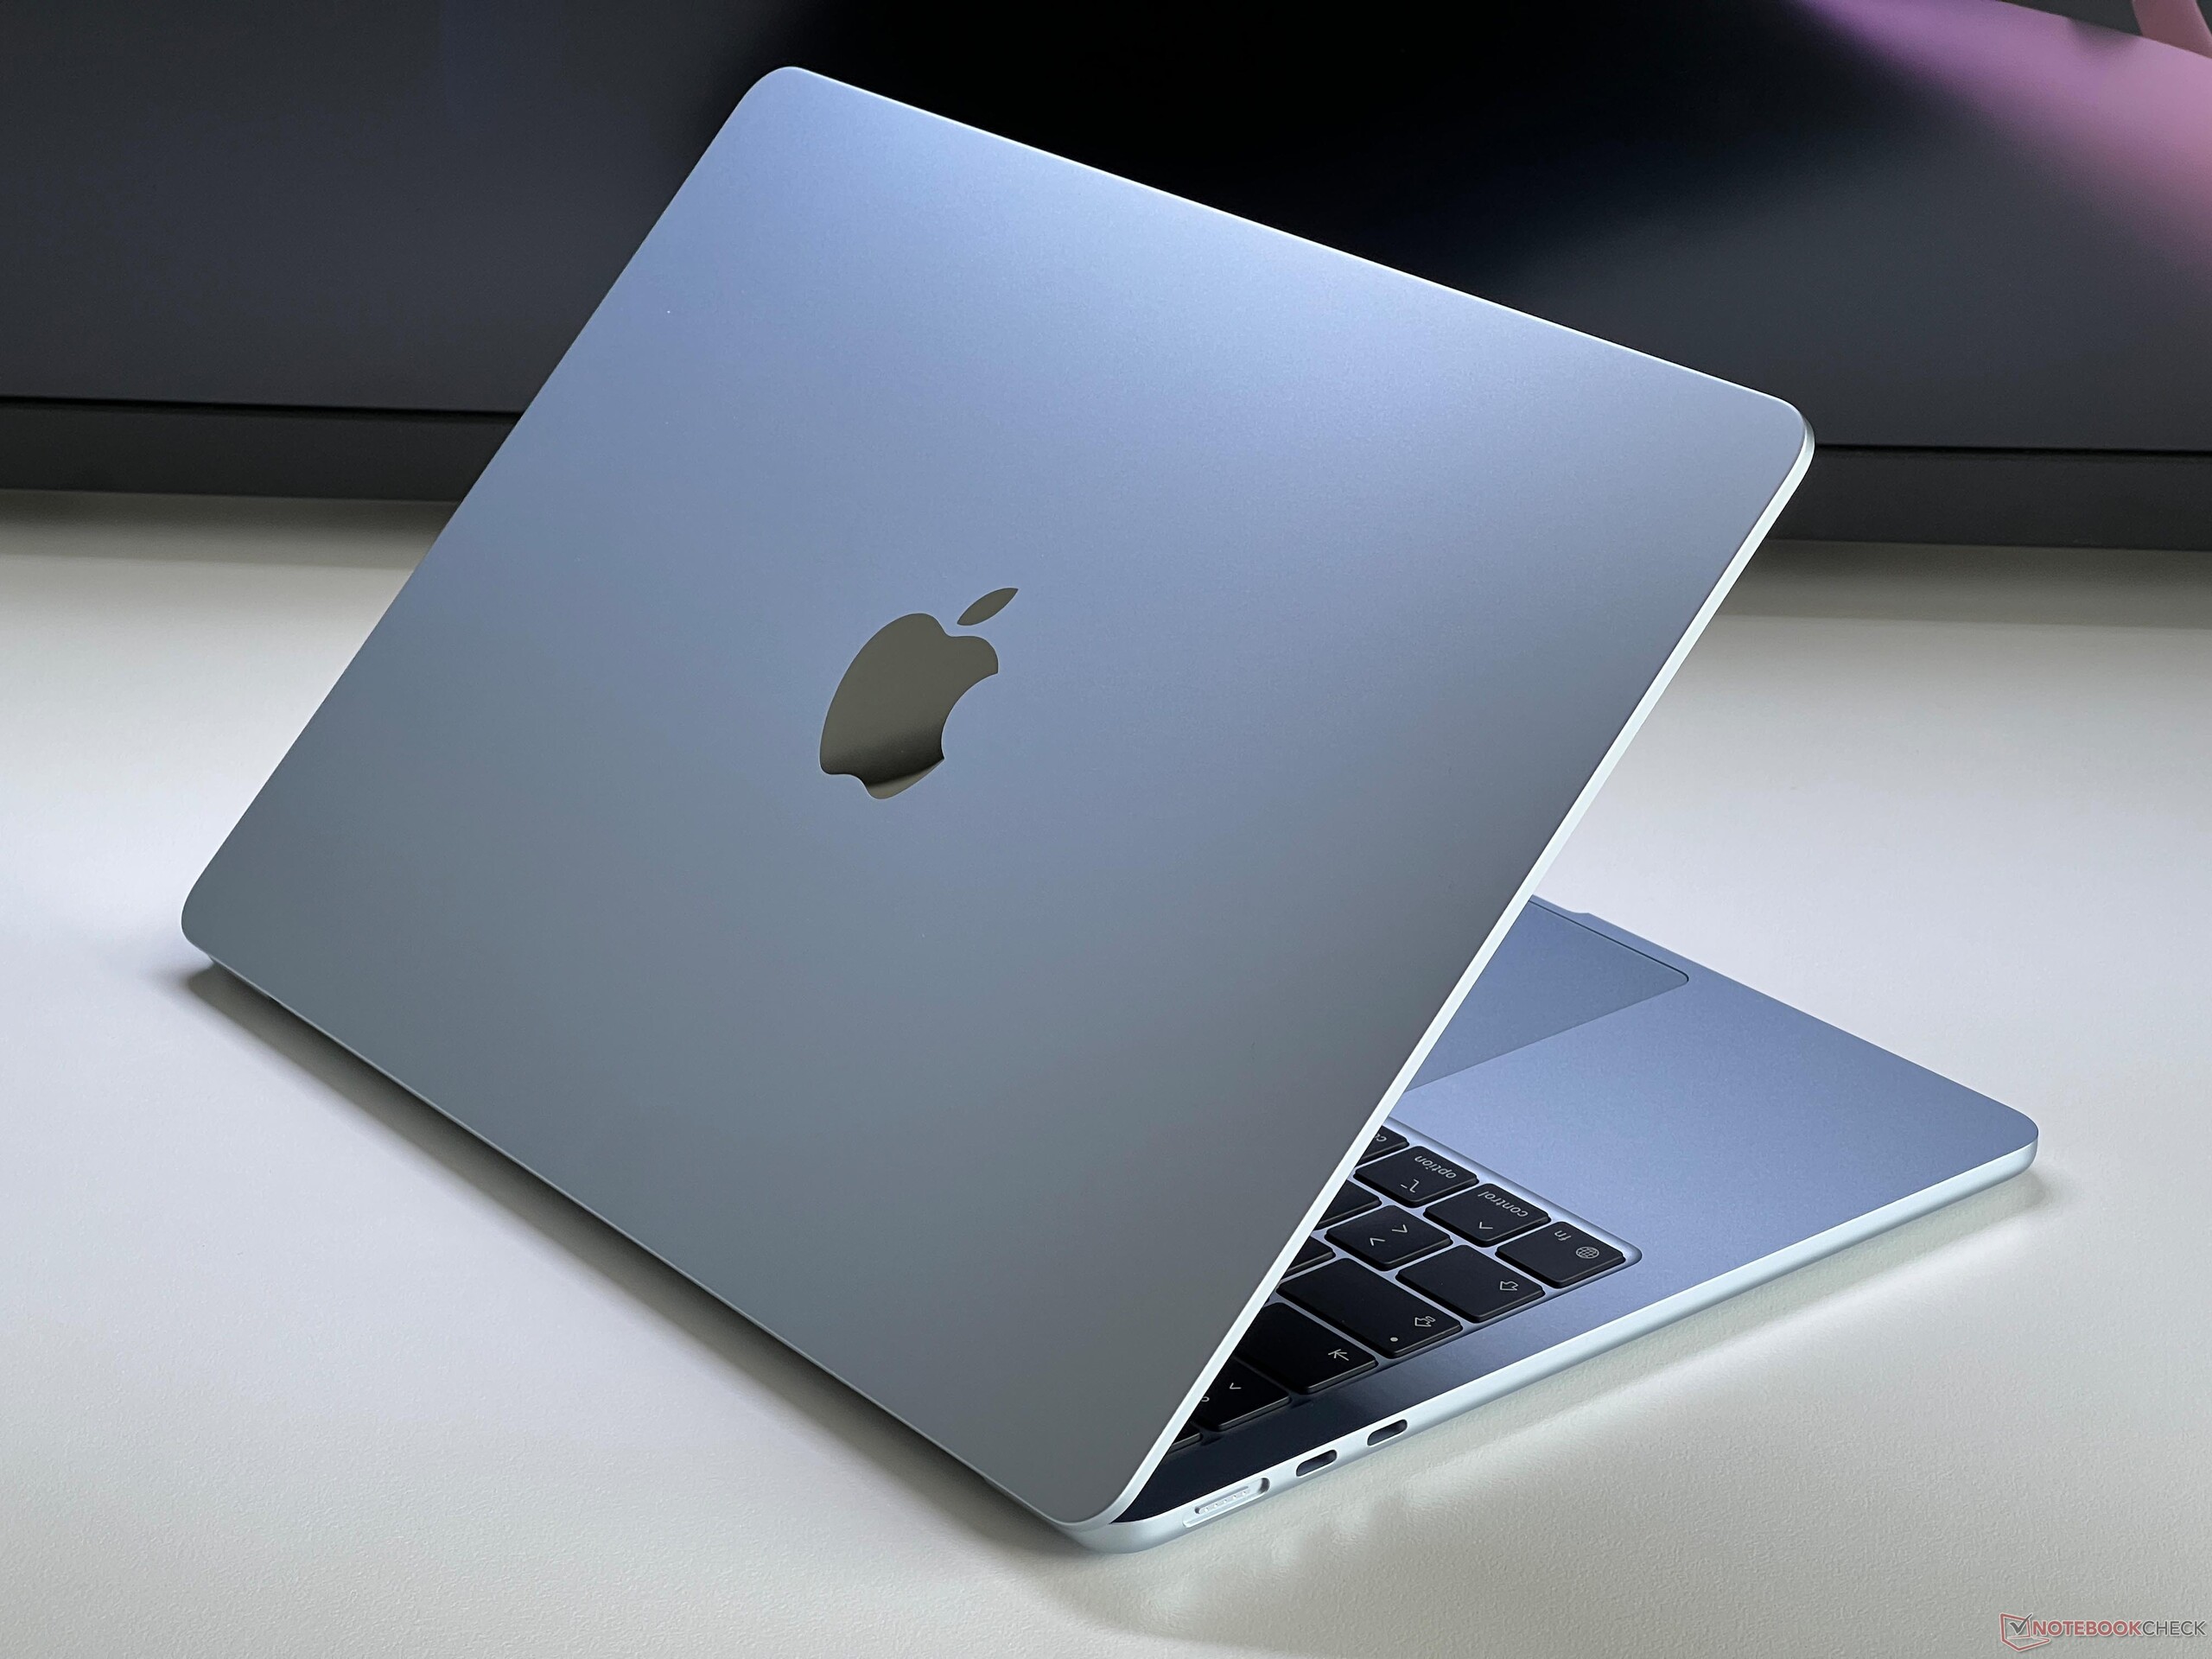
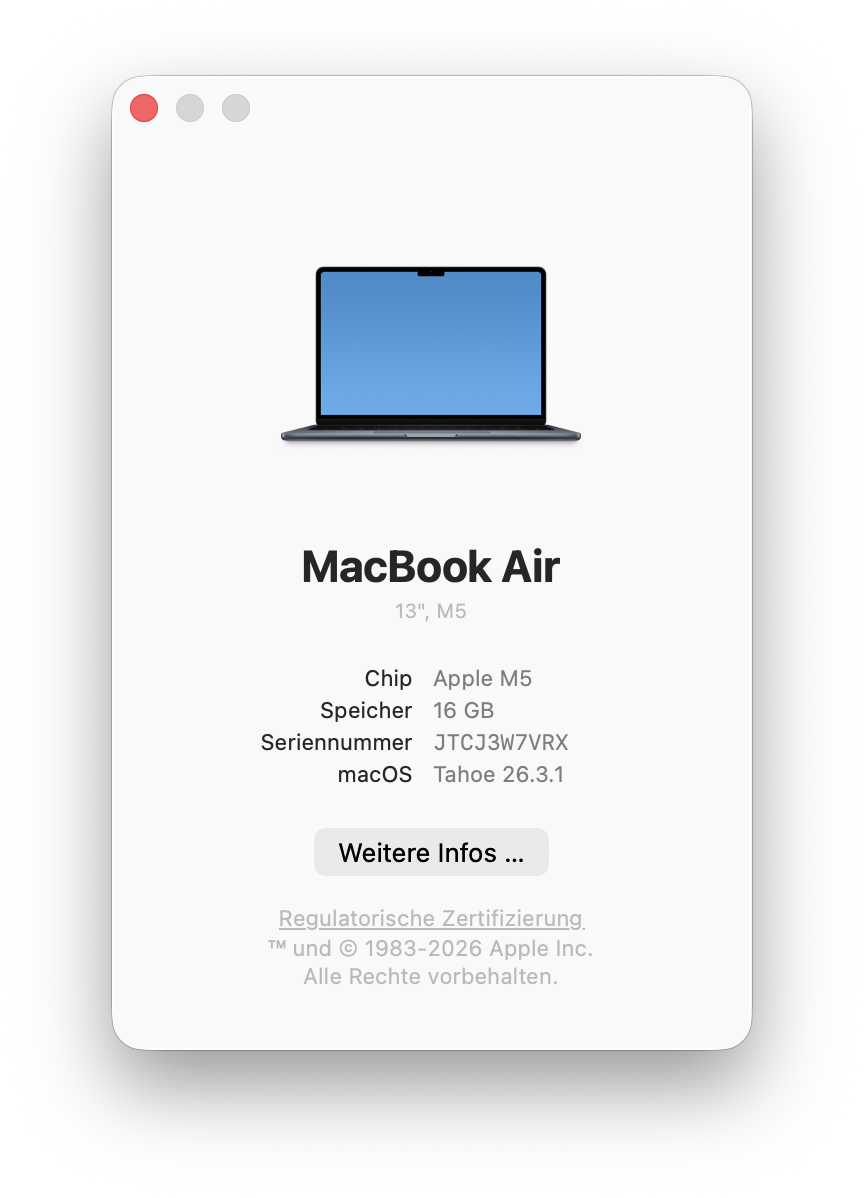
Apple updates its MacBook Air lineup with new M5 SoCs, Wi-Fi 7 chips and twice the storage for $1,099. We review the new entry-level model with 16 GB RAM and faster 512 GB SSD (PCIe 4.0).
Specifications
Case and Connectivity
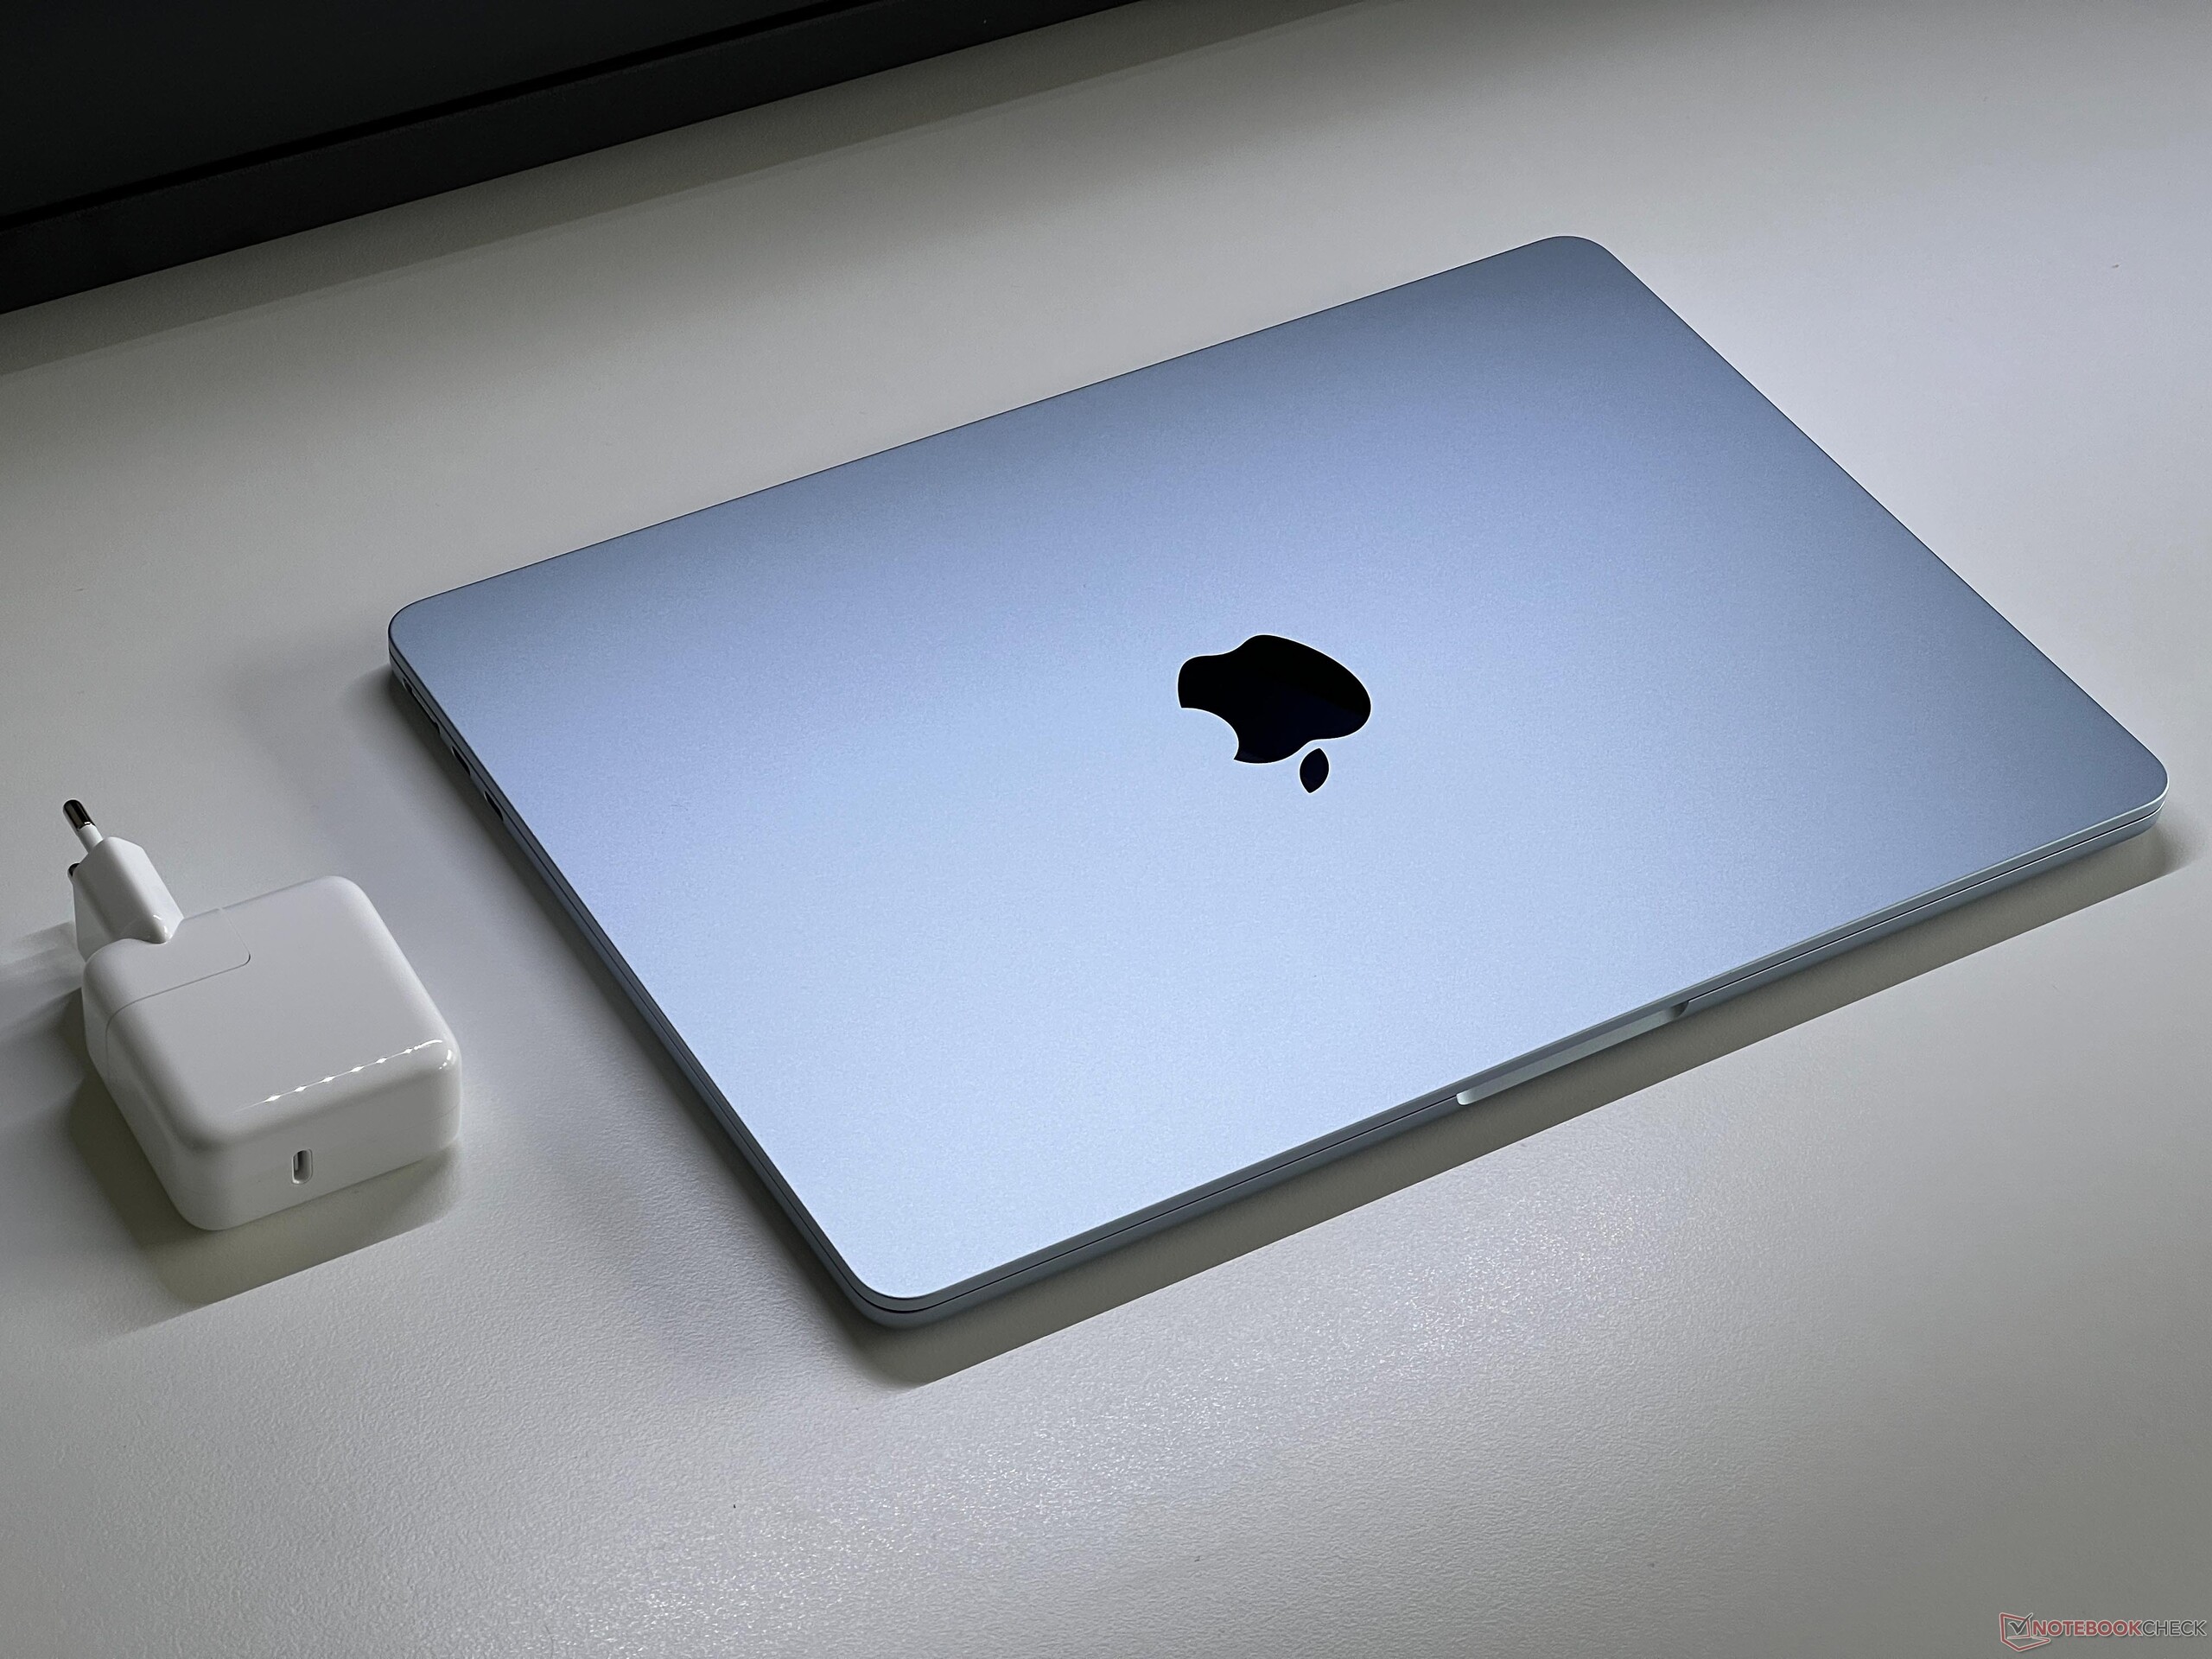
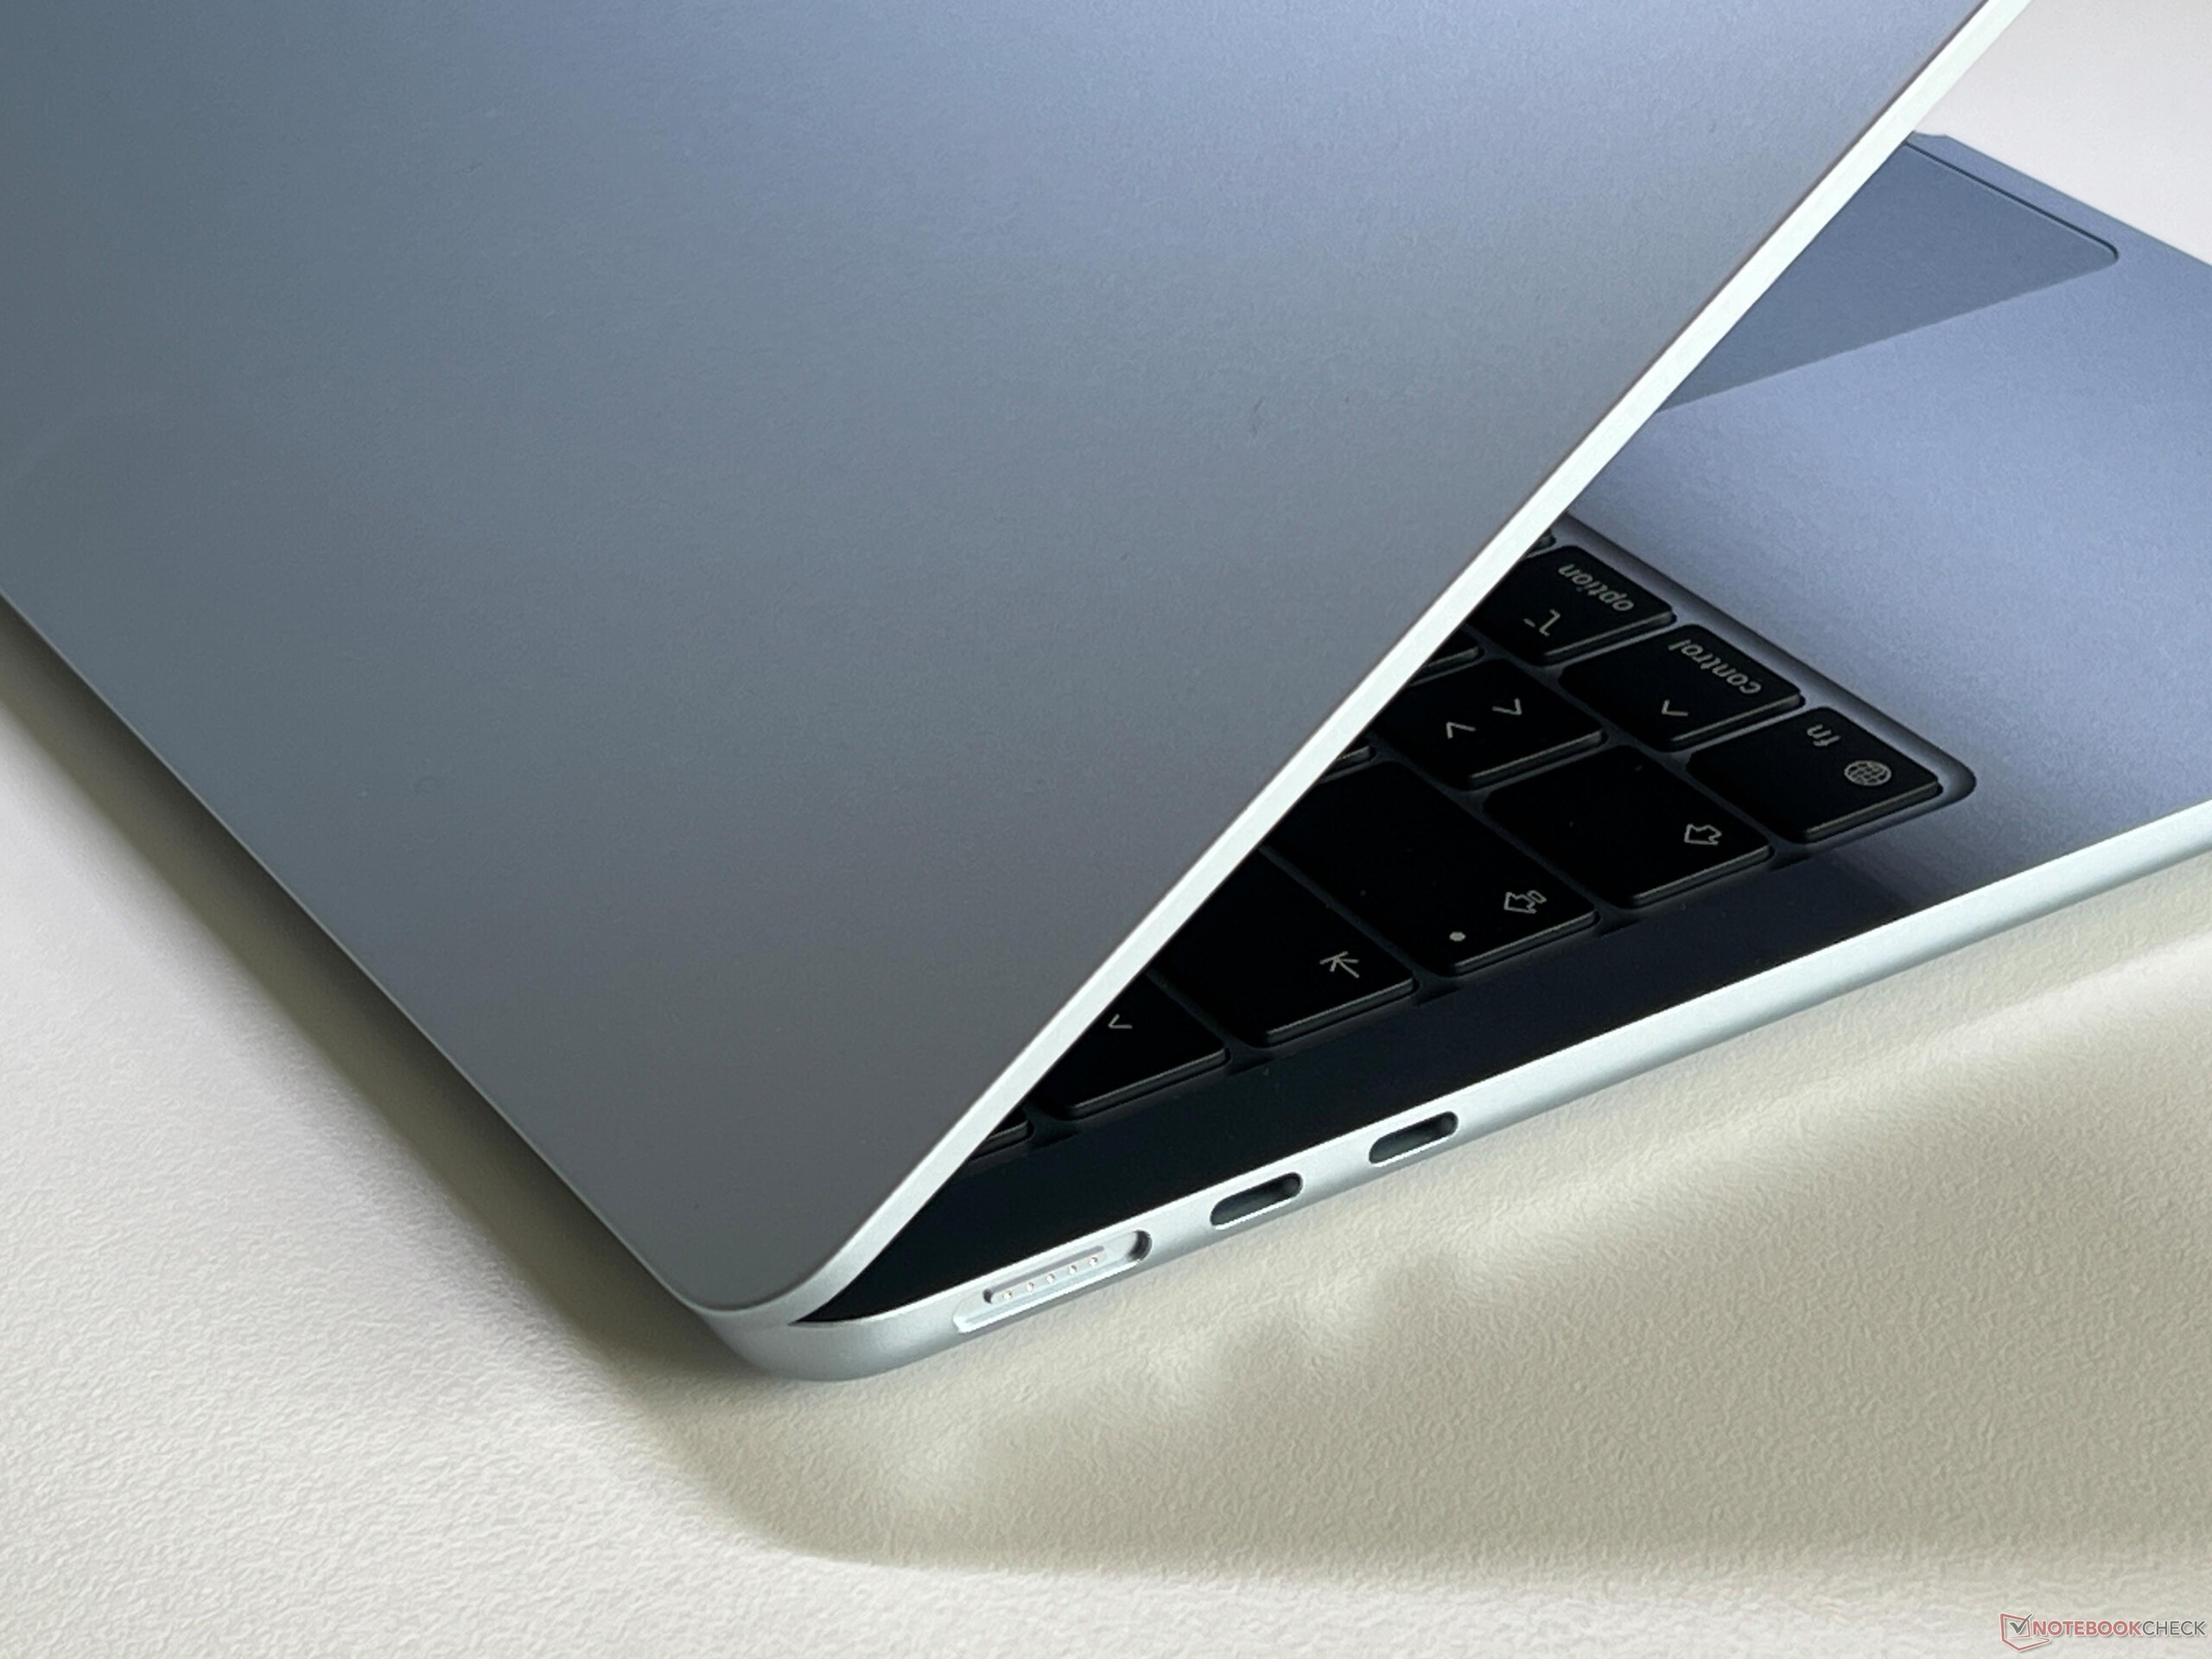
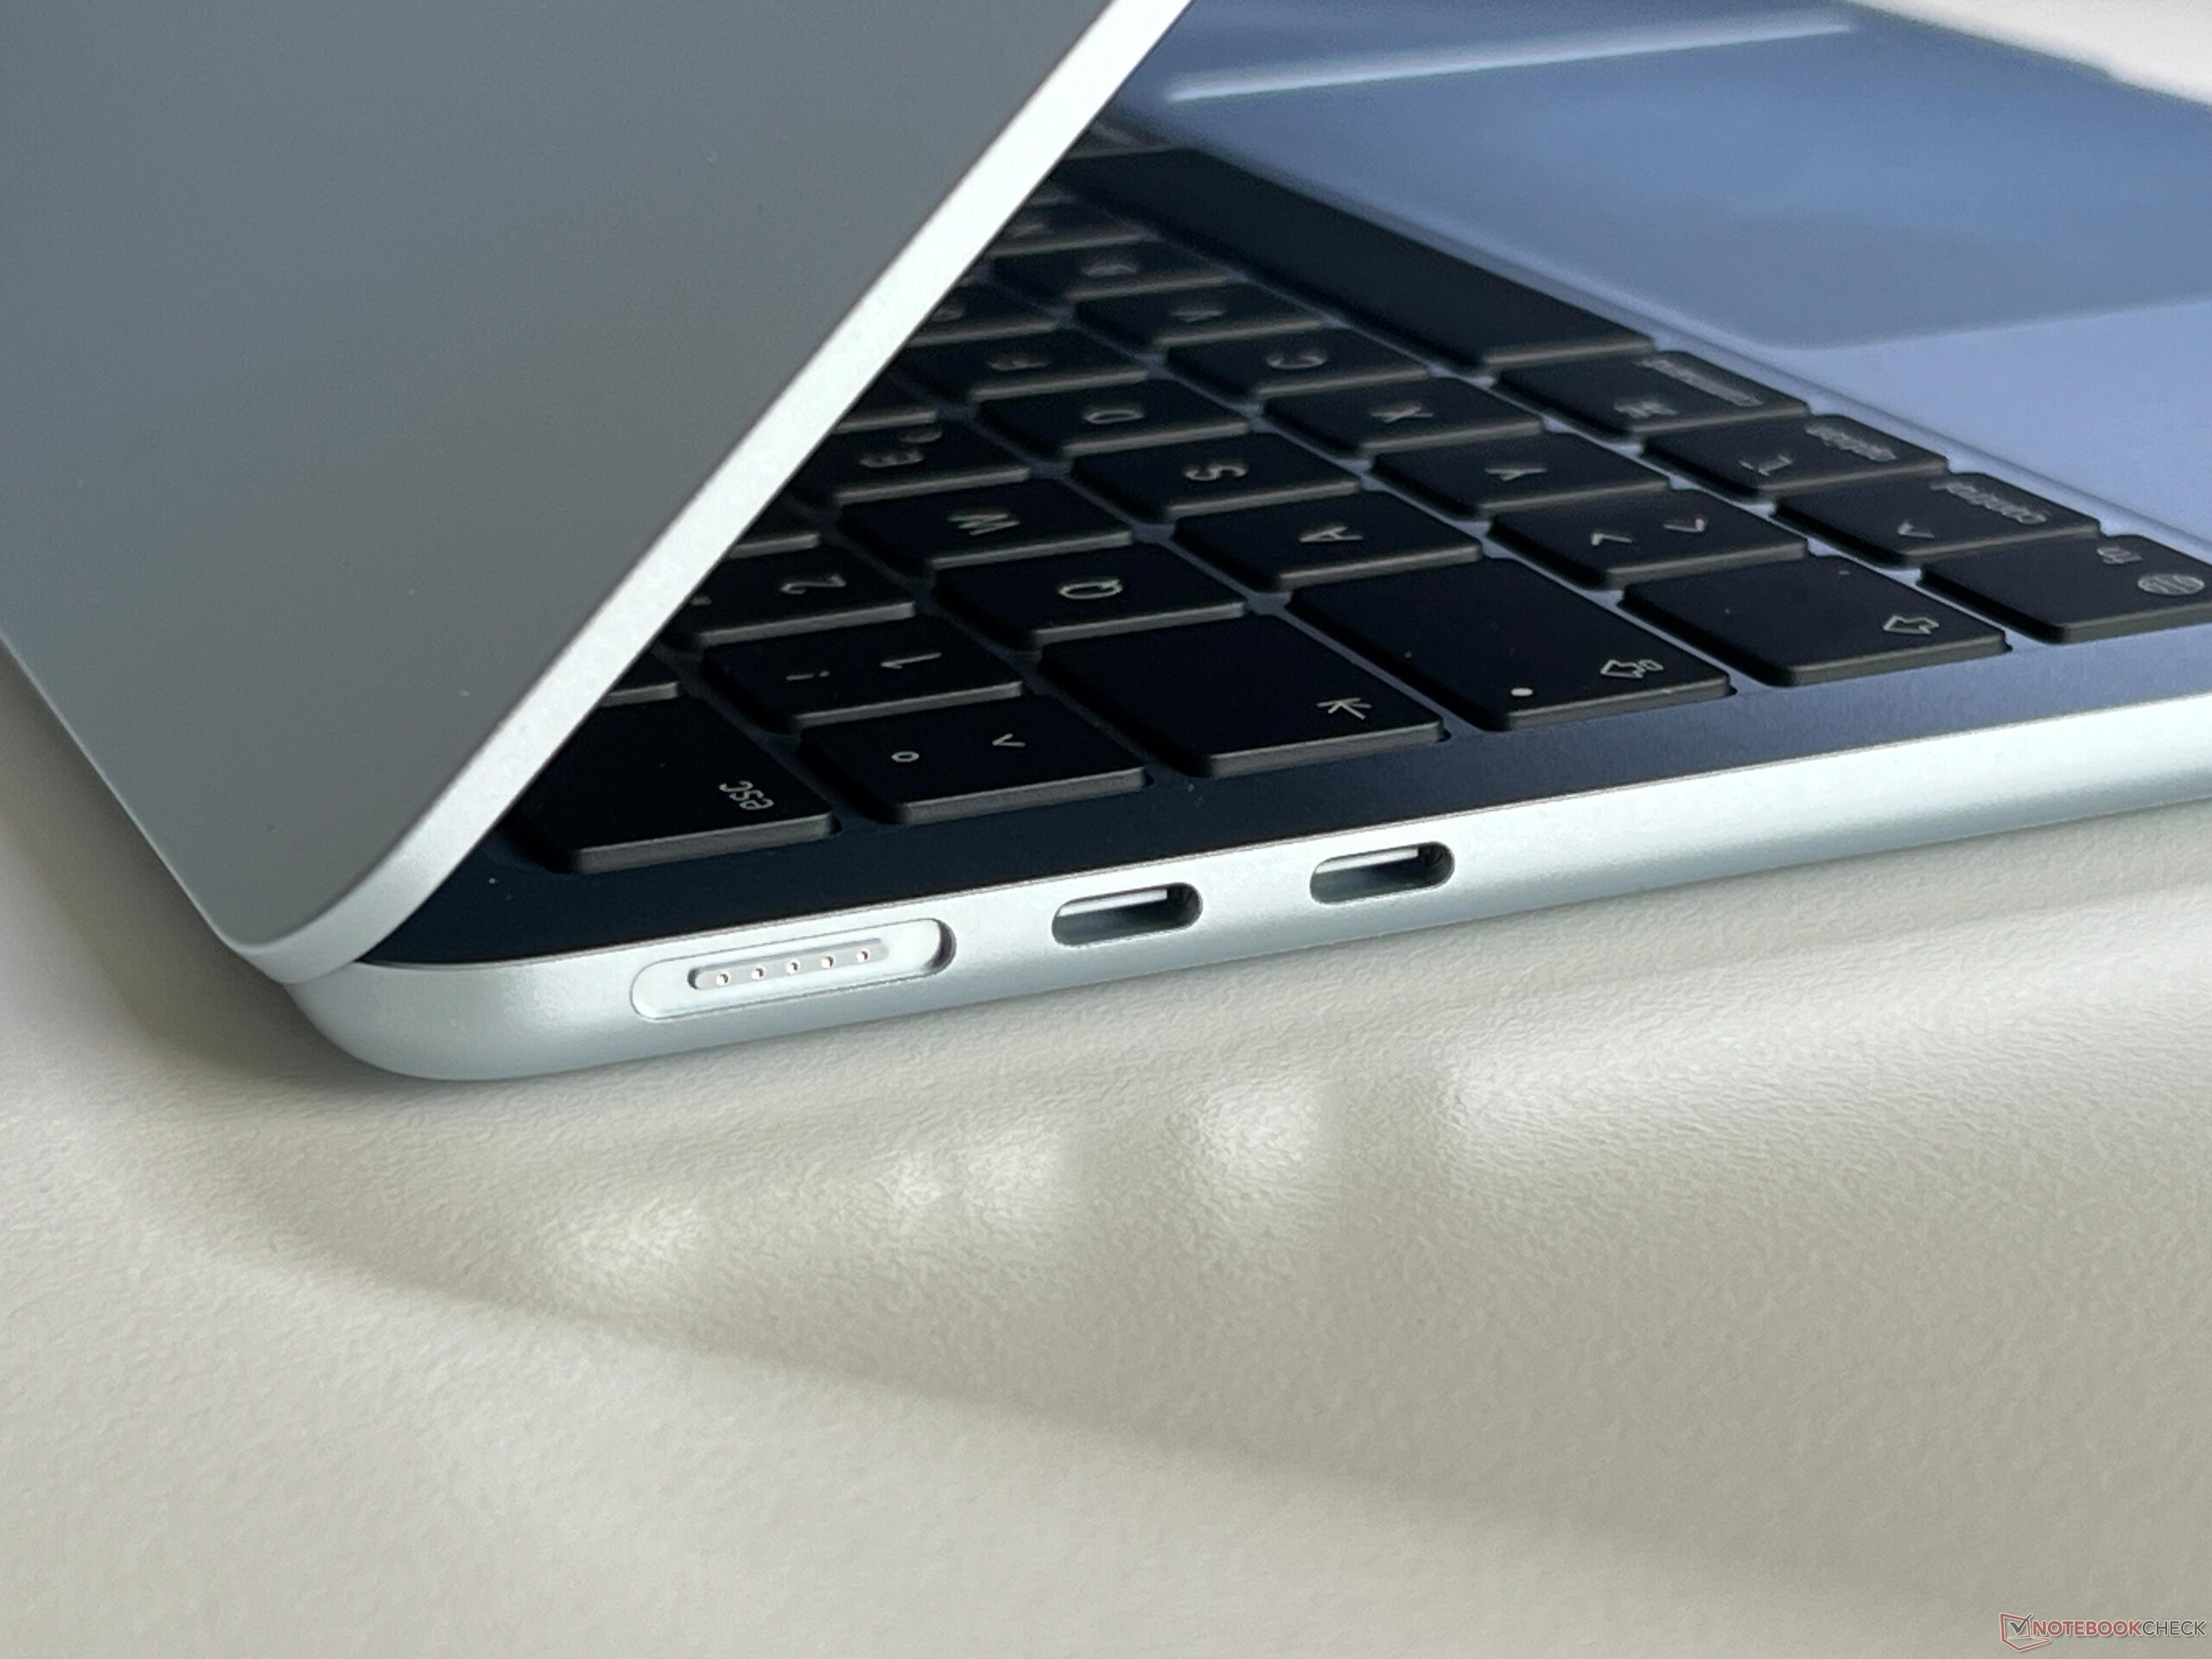
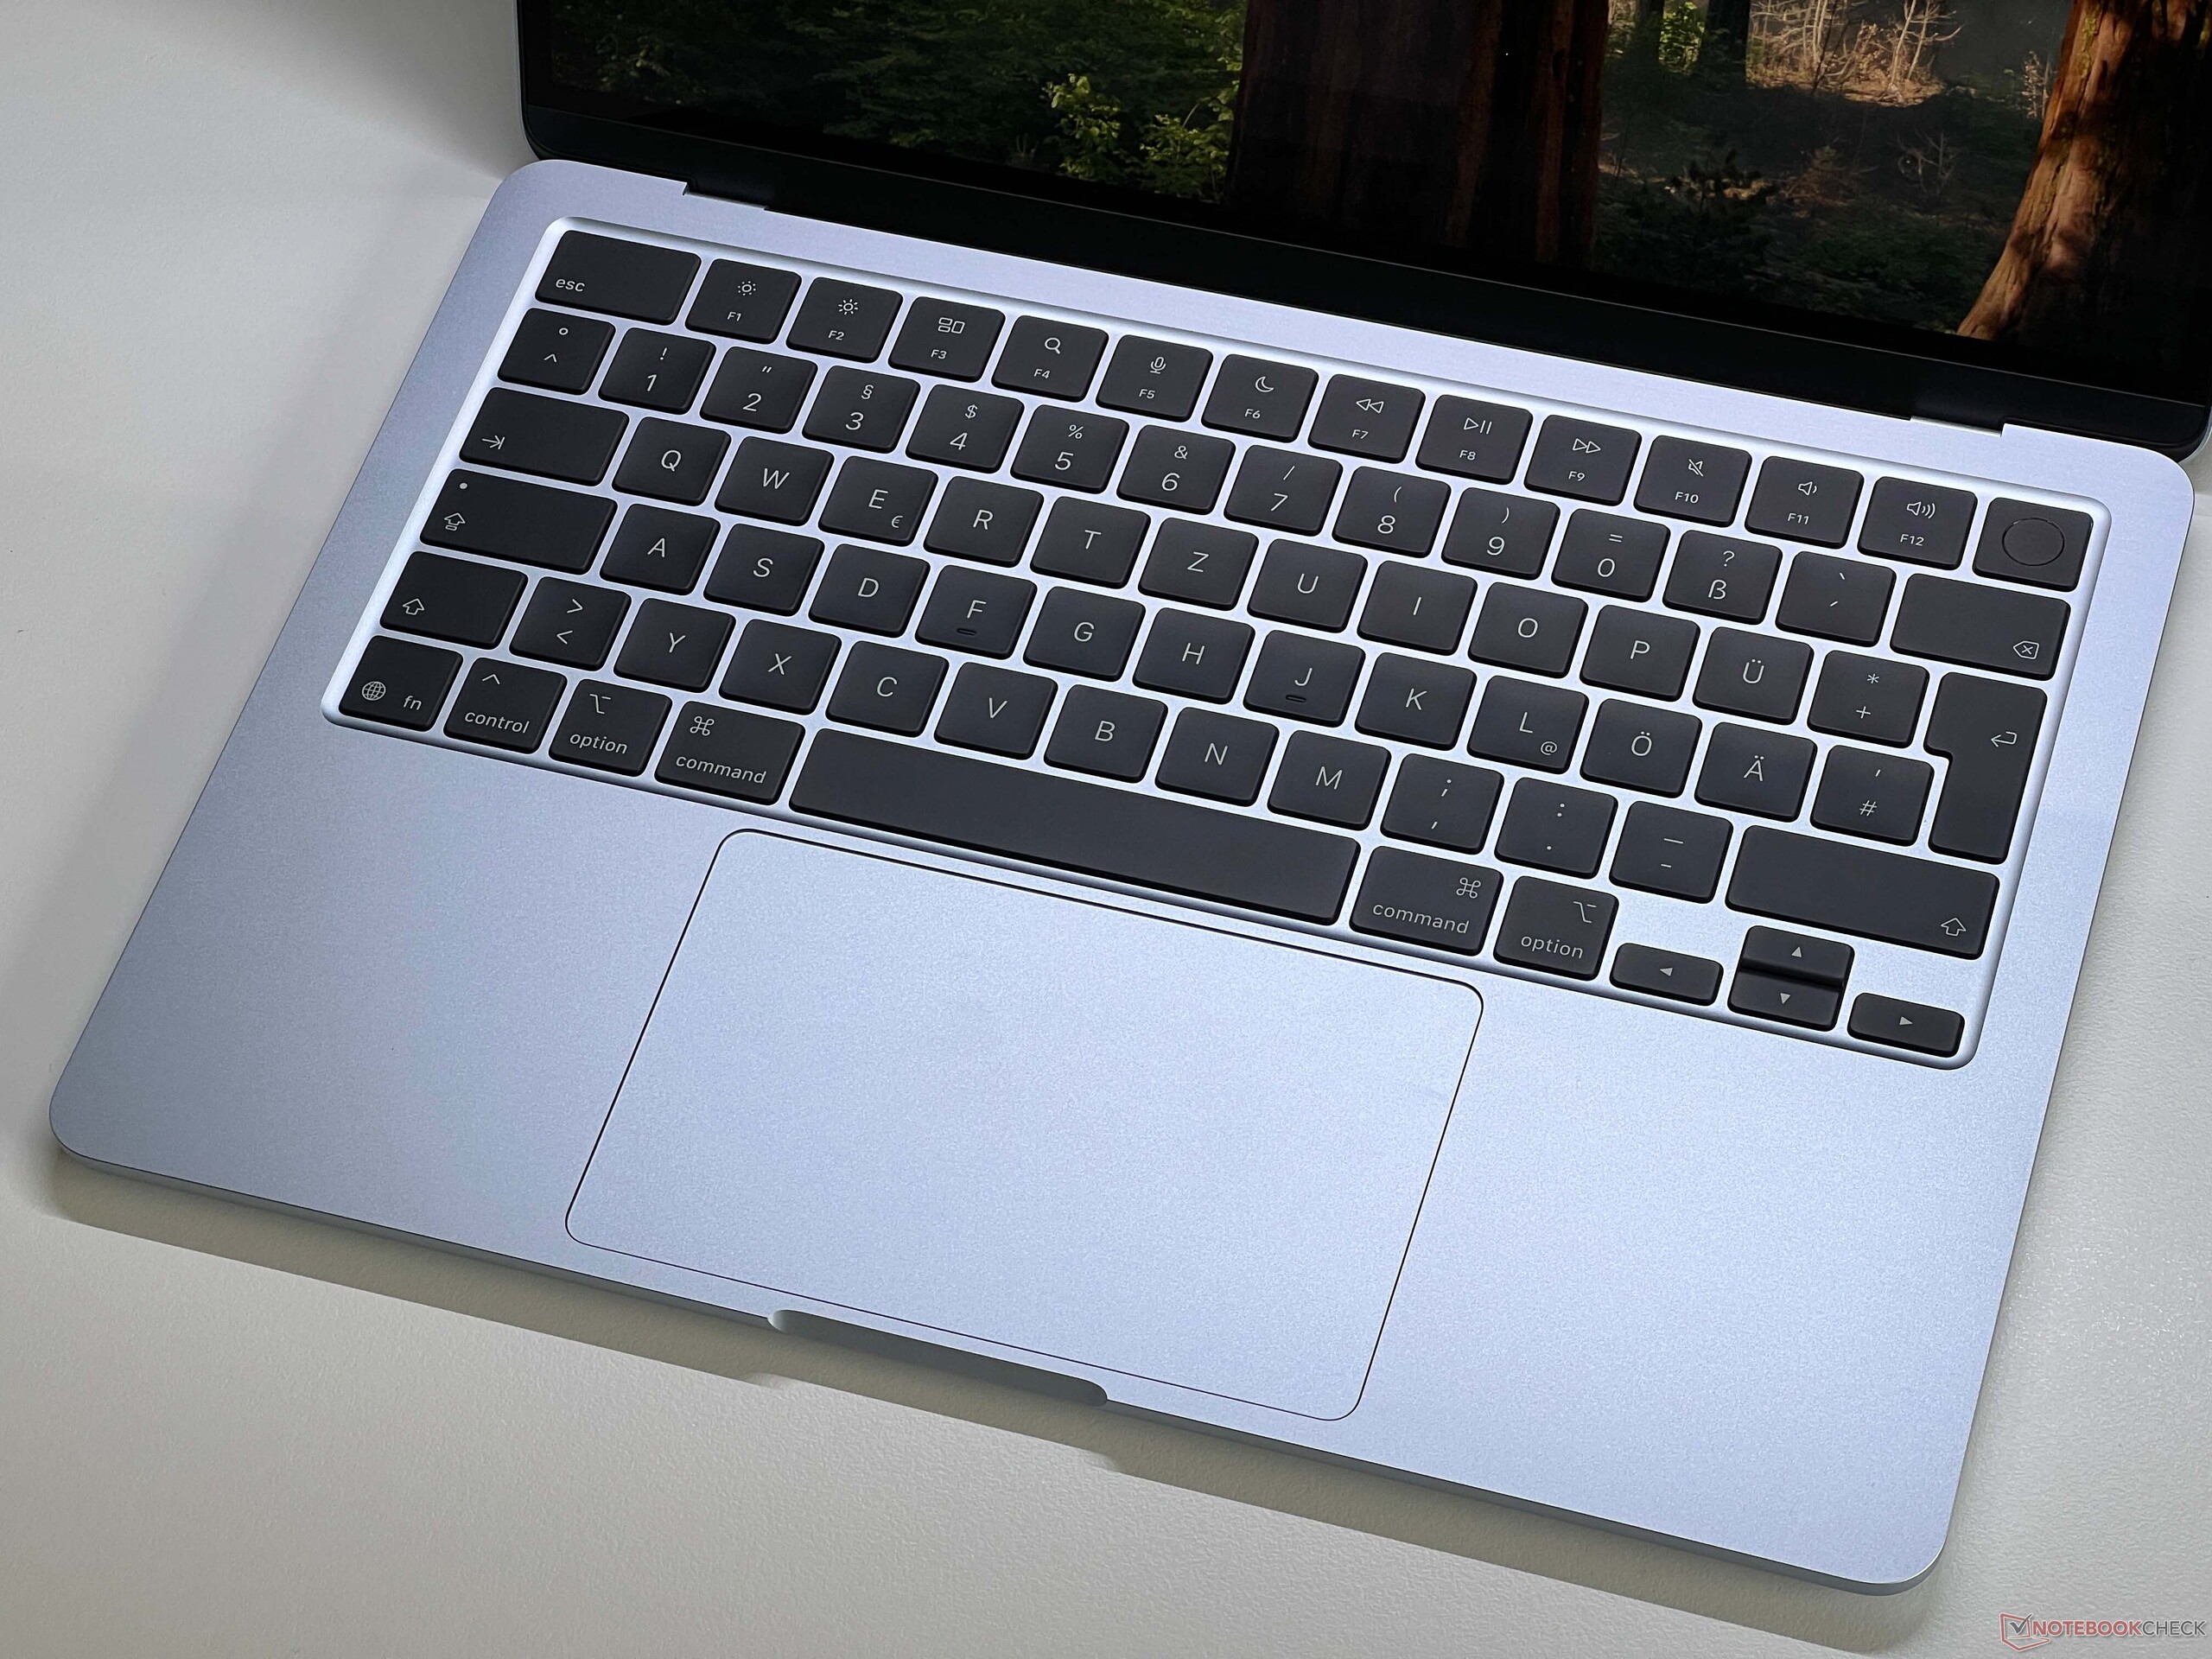
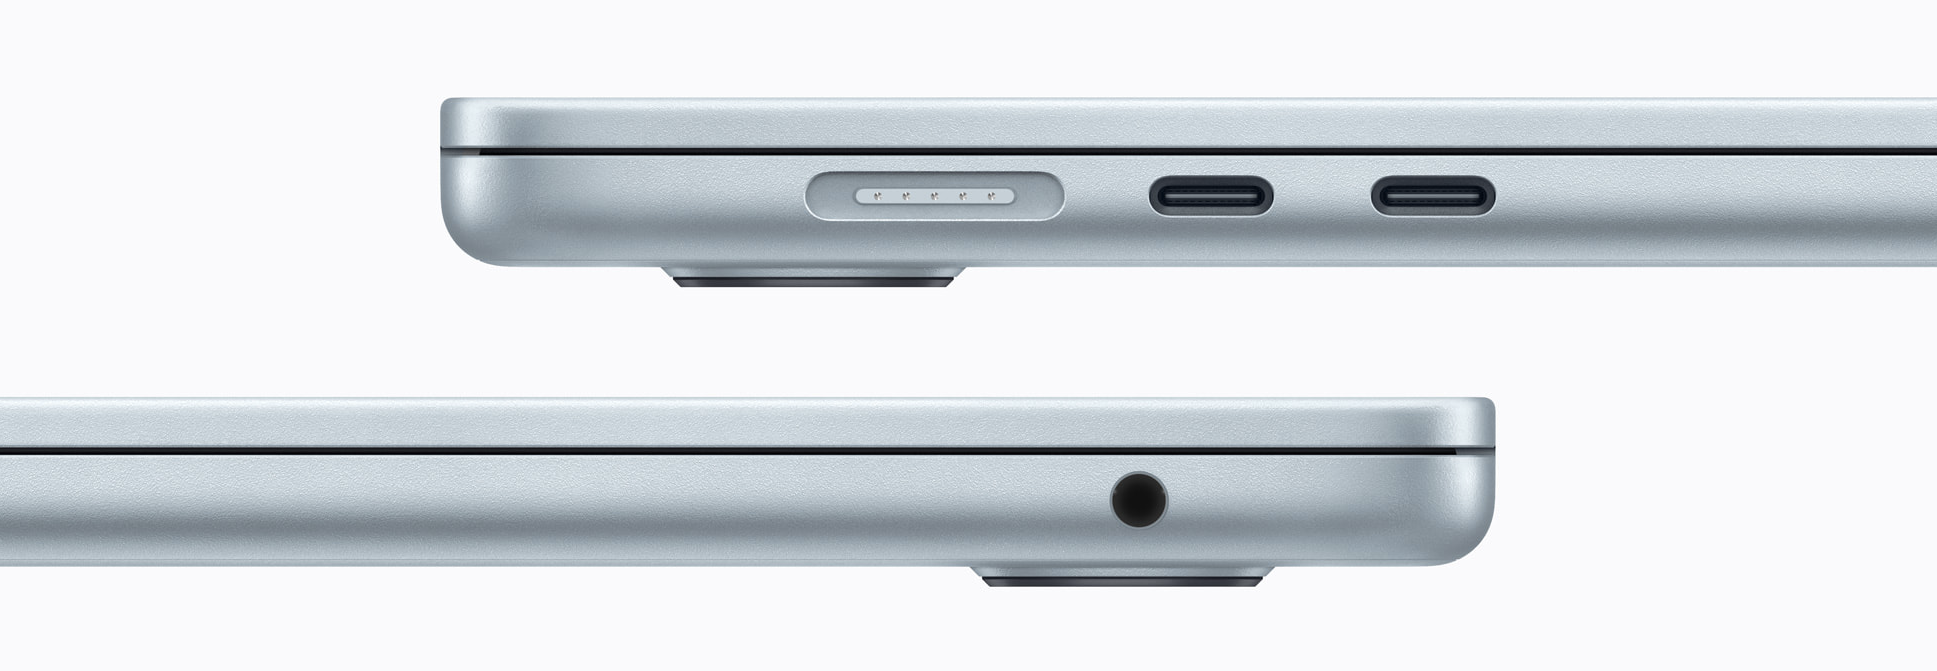
The chassis design including the input devices is identical to the previous model and you still get a very slim aluminum unibody, even though the Air remains a bit heavier than some of its rivals at 1.23 kg. The connectivity is still rather limited with MagSafe, 3.5 mm audio as well as two USB-C ports with Thunderbolt 4. Apple fixed our Wi-Fi criticism though and the Air now supports the latest Wi-Fi 7 including Bluetooth 6.0 via Apple's own N1 chip. The performance in our standardized Wi-Fi test was not perfectly consistent though and the results could be better, but the effects for everyday use are negligible. The following images are from the previous model.
| Networking | |
| Apple MacBook Air 13 M5 | |
| iperf3 transmit AXE11000 | |
| iperf3 receive AXE11000 | |
| MSI Prestige 13 AI Plus Evo A2VMG | |
| iperf3 transmit AXE11000 | |
| iperf3 receive AXE11000 | |
| iperf3 transmit AXE11000 6GHz | |
| iperf3 receive AXE11000 6GHz | |
| Dell XPS 13 9350 | |
| iperf3 transmit AXE11000 | |
| iperf3 receive AXE11000 | |
| iperf3 transmit AXE11000 6GHz | |
| iperf3 receive AXE11000 6GHz | |
| Microsoft Surface Laptop 7 13.8 Copilot+ | |
| iperf3 transmit AXE11000 | |
| iperf3 receive AXE11000 | |
| iperf3 transmit AXE11000 6GHz | |
| iperf3 receive AXE11000 6GHz | |


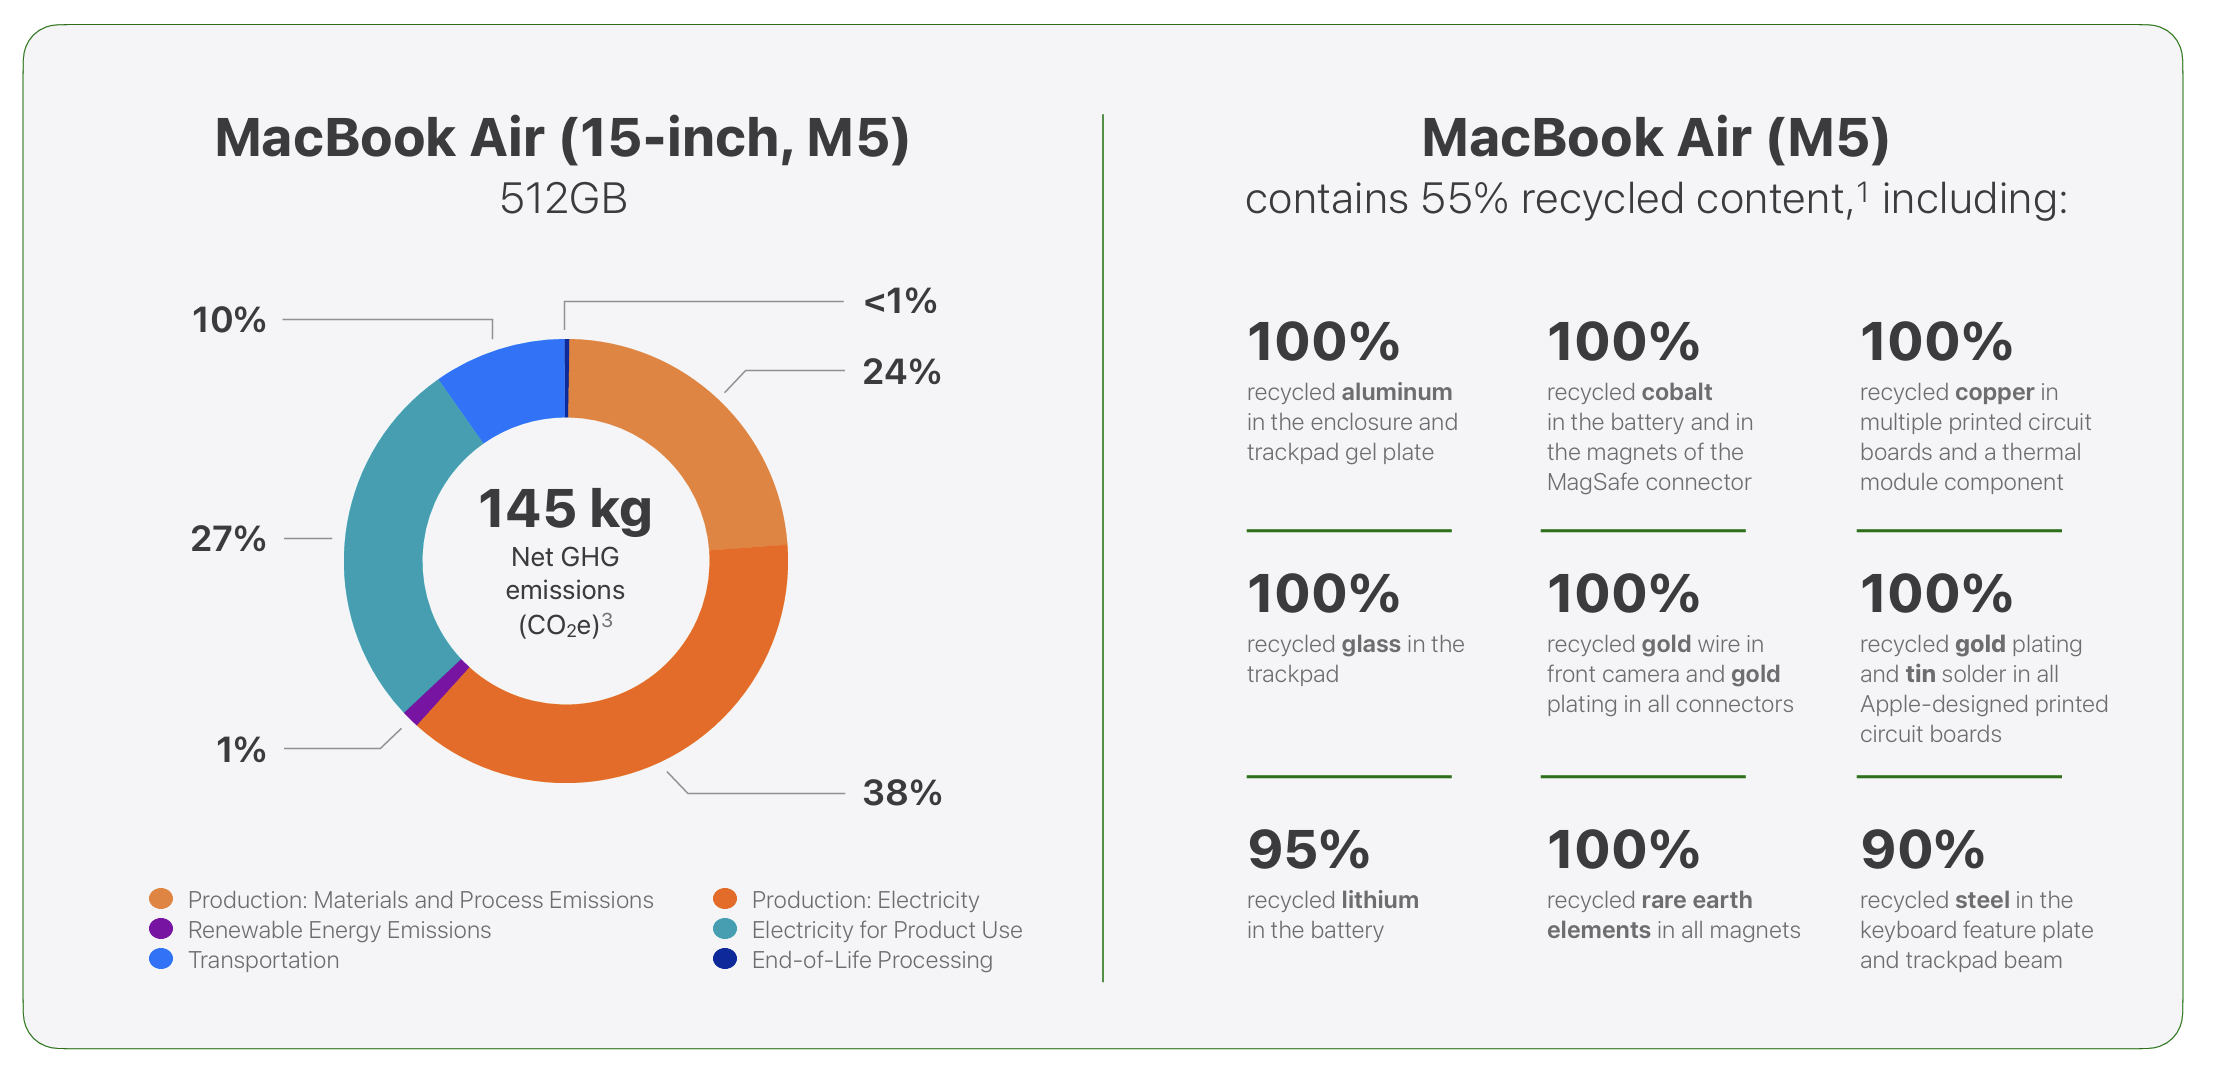
Sustainability
Apple offers a comprehensive environmental report including data about the CO2 emissions as well as recycled contents. The following image shows exemplary data for the MacBook Air 15; the base model of the MBA 13 M5 has a carbon footprint of 119 kg CO2e.
Display - Still 60 Hz IPS
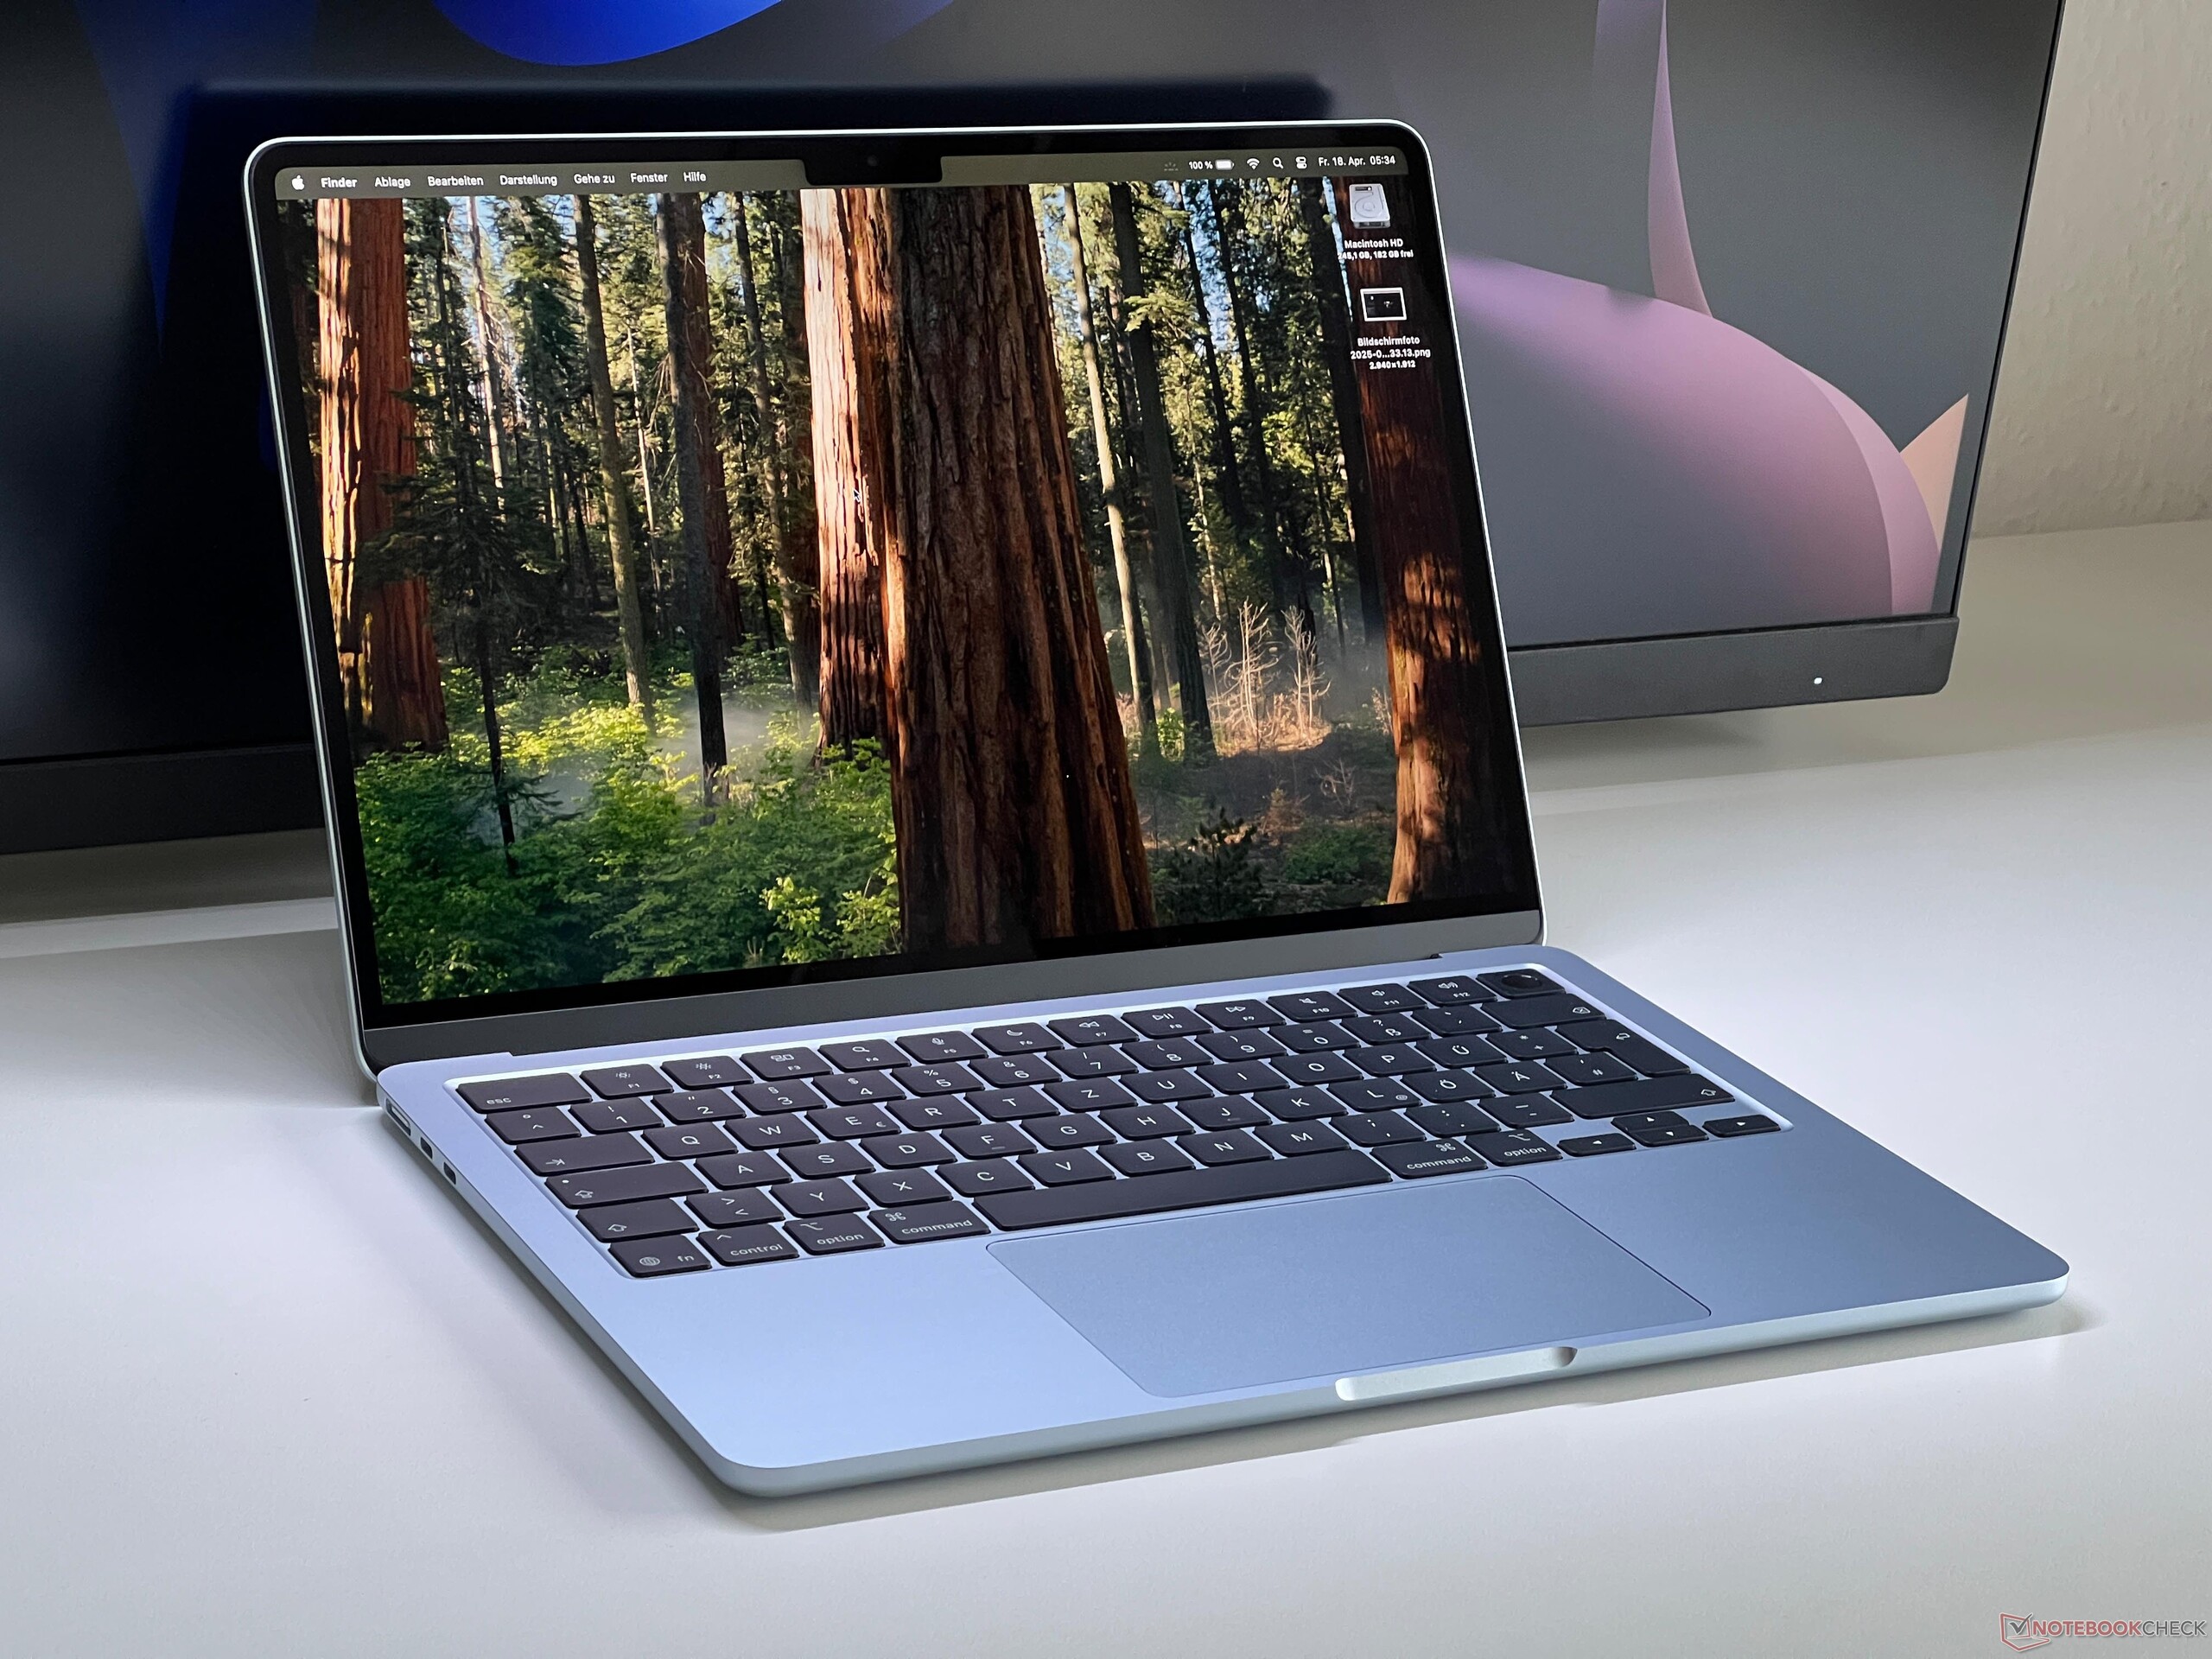
Apple did not change the display, so we still get a 60 Hz IPS screen (2560 x 1664 pixels, 16:10) and offers good image quality, but the low frequency is an issue. The surface is anti-reflective and there is a visible advantage compared to most other glossy screens, which is also noticeable in our outdoor shots below. There is hardly any backlight bleeding and there is no PWM flickering, either, while the response times are inconspicuous. Both the brightness as well as the color temperature can be adjusted automatically.
The brightness is still north of 500 nits, but the black value is a bit high at 0.38, which still results in a good maximum contrast ratio of ~1300:1. Our analysis with the professional CalMAN software shows that the factory calibration is not that great and there is a distinct blue case in combination with a cool color temperature. This boosts the maximum brightness and is not noticeable when you use True Tone, but it is not ideal for picture editing. We calibrated the panel and managed to improve the accuracy noticeably (the corresponding profile can be downloaded for free in the box below), so picture editing is no problem (P3 & sRGB).
| |||||||||||||||||||||||||
Brightness Distribution: 90 %
Center on Battery: 546 cd/m²
Contrast: 1437:1 (Black: 0.38 cd/m²)
ΔE ColorChecker Calman: 2.1 | ∀{0.5-29.43 Ø4.72}
calibrated: 0.9
ΔE Greyscale Calman: 3.3 | ∀{0.09-98 Ø4.97}
86.8% AdobeRGB 1998 (Argyll 3D)
98.6% sRGB (Argyll 3D)
98.1% Display P3 (Argyll 3D)
Gamma: 2.22
CCT: 7127 K
| Apple MacBook Air 13 M5 IPS, 2560x1664, 13.6", 60 Hz | Apple MacBook Air 13 M4 Entry IPS, 2560x1664, 13.6", 60 Hz | MSI Prestige 13 AI Plus Evo A2VMG ATNA33AA07-0, OLED, 2880x1800, 13.3", 60 Hz | Dell XPS 13 9350 LG Philips 134WU2, IPS, 1920x1200, 13.4", 120 Hz | Microsoft Surface Laptop 7 13.8 Copilot+ LQ138P1JX61, IPS, 2304x1536, 13.8", 120 Hz | |
|---|---|---|---|---|---|
| Display | 1% | 4% | -17% | 0% | |
| Display P3 Coverage (%) | 98.1 | 98.4 0% | 99.9 2% | 67.3 -31% | 97.8 0% |
| sRGB Coverage (%) | 98.6 | 99.9 1% | 100 1% | 99 0% | 98.2 0% |
| AdobeRGB 1998 Coverage (%) | 86.8 | 87.9 1% | 95.8 10% | 68.6 -21% | 87.3 1% |
| Response Times | -64% | 89% | -65% | -39% | |
| Response Time Grey 50% / Grey 80% * (ms) | 24.3 ? | 34.5 ? -42% | 1.94 ? 92% | 37.3 ? -53% | 38.9 ? -60% |
| Response Time Black / White * (ms) | 14.7 ? | 27.2 ? -85% | 2.02 ? 86% | 25.9 ? -76% | 17.4 ? -18% |
| PWM Frequency (Hz) | 60 ? | ||||
| PWM Amplitude * (%) | 21.9 | ||||
| Screen | 9% | -9% | 26% | 17% | |
| Brightness middle (cd/m²) | 546 | 525 -4% | 382.4 -30% | 462.8 -15% | 606 11% |
| Brightness (cd/m²) | 519 | 506 -3% | 383 -26% | 435 -16% | 592 14% |
| Brightness Distribution (%) | 90 | 92 2% | 99 10% | 87 -3% | 94 4% |
| Black Level * (cd/m²) | 0.38 | 0.42 -11% | 0.19 50% | 0.43 -13% | |
| Contrast (:1) | 1437 | 1250 -13% | 2436 70% | 1409 -2% | |
| Colorchecker dE 2000 * | 2.1 | 1.4 33% | 3.84 -83% | 1.92 9% | 1.3 38% |
| Colorchecker dE 2000 max. * | 4 | 2.8 30% | 6.66 -67% | 3.45 14% | 2.1 47% |
| Colorchecker dE 2000 calibrated * | 0.9 | 0.41 54% | 0.48 47% | ||
| Greyscale dE 2000 * | 3.3 | 2 39% | 0.7 79% | 0.6 82% | 2.1 36% |
| Gamma | 2.22 99% | 2.2 100% | 2.23 99% | 2.19 100% | 2.16 102% |
| CCT | 7127 91% | 6876 95% | 6475 100% | 6539 99% | 6842 95% |
| Total Average (Program / Settings) | -18% /
-4% | 28% /
11% | -19% /
4% | -7% /
4% |
* ... smaller is better


Display Response Times
| ↔ Response Time Black to White | ||
|---|---|---|
| 14.7 ms ... rise ↗ and fall ↘ combined | ↗ 5.1 ms rise | 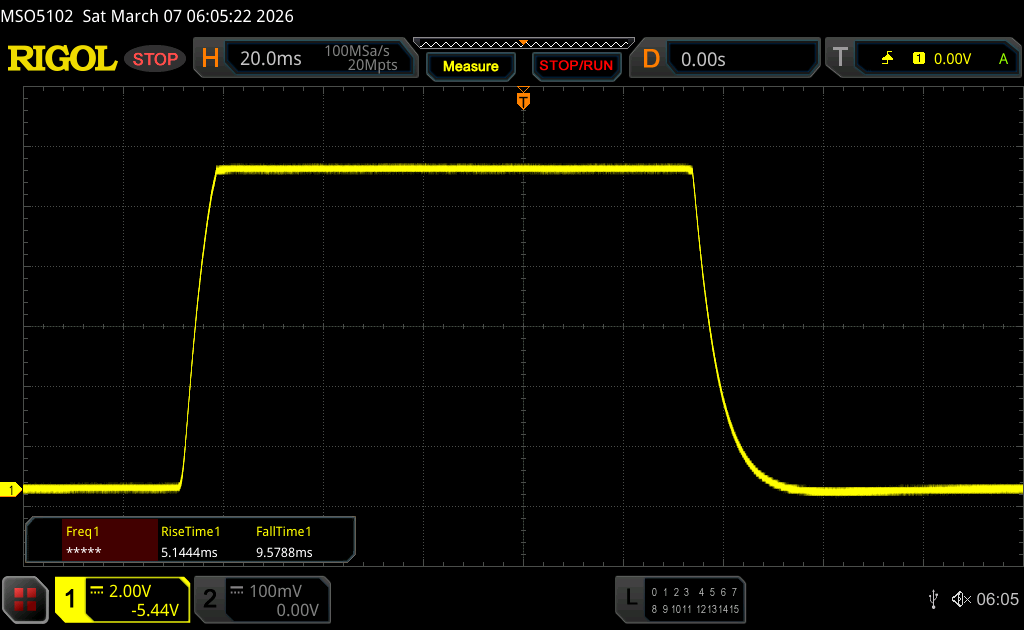 |
| ↘ 9.6 ms fall | ||
| The screen shows good response rates in our tests, but may be too slow for competitive gamers. In comparison, all tested devices range from 0.1 (minimum) to 240 (maximum) ms. » 36 % of all devices are better. This means that the measured response time is better than the average of all tested devices (19.8 ms). | ||
| ↔ Response Time 50% Grey to 80% Grey | ||
| 24.3 ms ... rise ↗ and fall ↘ combined | ↗ 11.5 ms rise | 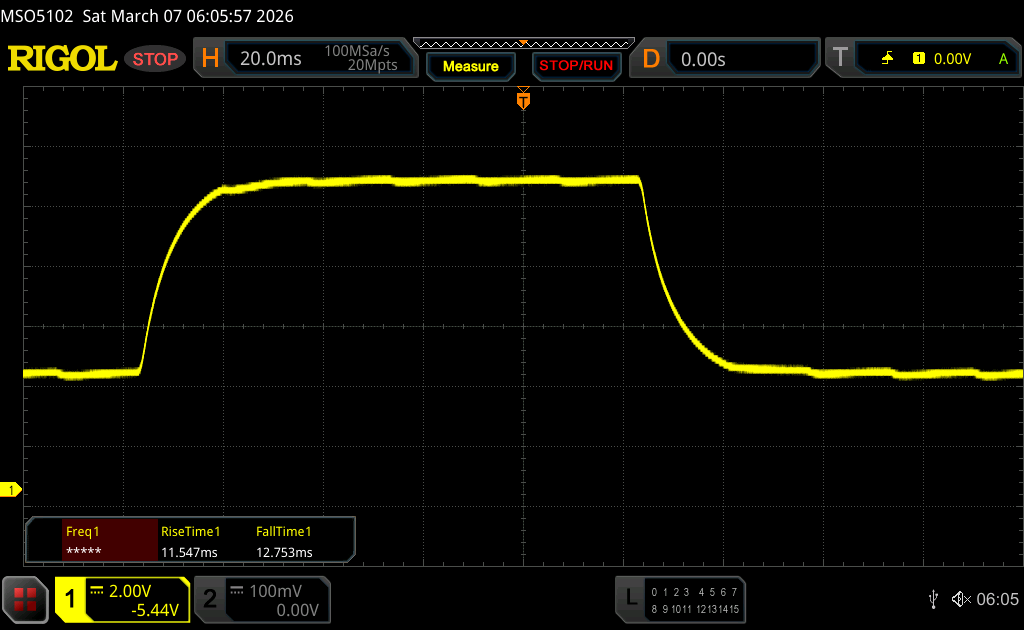 |
| ↘ 12.8 ms fall | ||
| The screen shows good response rates in our tests, but may be too slow for competitive gamers. In comparison, all tested devices range from 0.165 (minimum) to 636 (maximum) ms. » 35 % of all devices are better. This means that the measured response time is better than the average of all tested devices (31 ms). | ||
Screen Flickering / PWM (Pulse-Width Modulation)
| Screen flickering / PWM not detected | 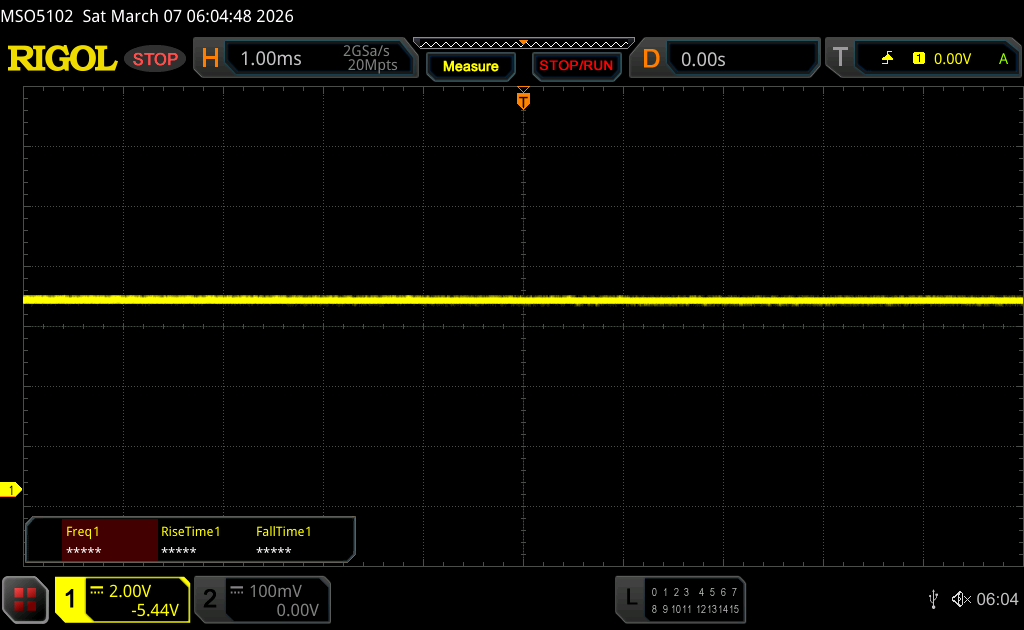 | ||
In comparison: 52 % of all tested devices do not use PWM to dim the display. If PWM was detected, an average of 7750 (minimum: 5 - maximum: 343500) Hz was measured. | |||


Performance - M5 is crazy efficient
The base model of the new MacBook Air 13 M5 gets 10 CPU cores, 8 GPU cores, 16 GB RAM and 512 GB SSD storage. You can upgrade to the faster 10-core GPU version, up to 32 GB RAM and up to 4 TB SSD storage.
Processor
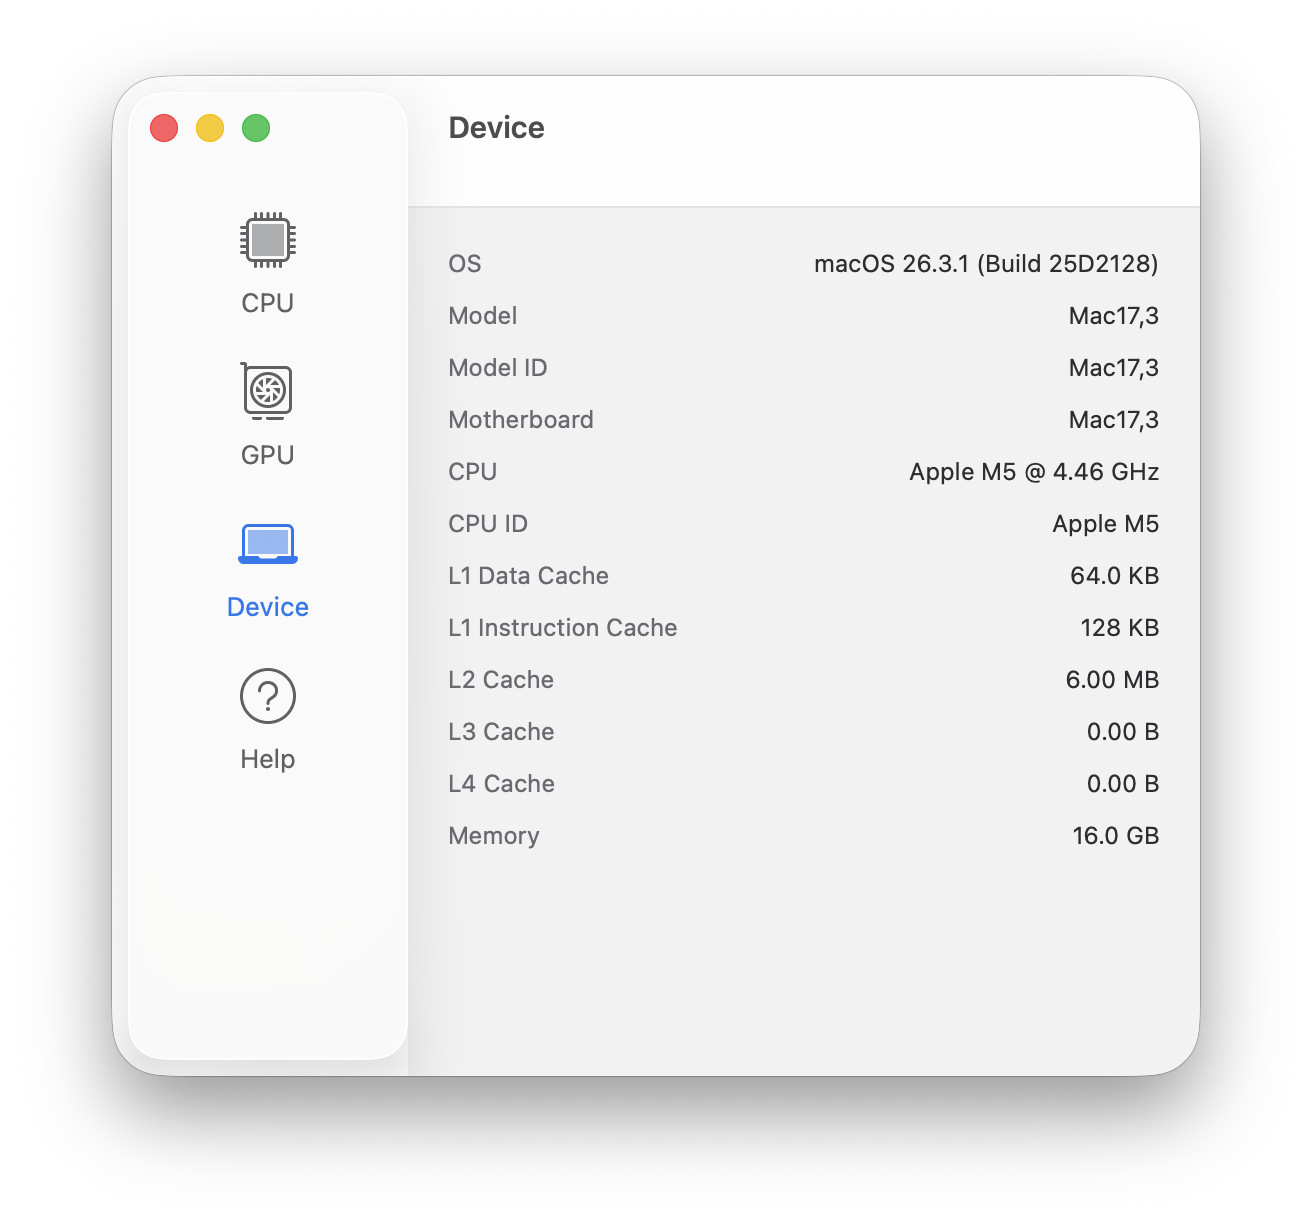
The CPU performance of the new Apple M5 (4 super cores, 6 efficiency cores) is very impressive and it is the fastest single-core processor you can buy with quite a margin. The multi-core performance is also very good, even though the system has to reduce the power limit quite quickly. The deficit compared to the MacBook Pro 14 M5 with active cooling is still only 18 % during the Cinebench 2024 Multi test, which takes a couple of minutes and where the power consumption drops to ~13W. After the stress test of CB24 Multi (30 minutes), the result is still 820 points at 9 Watts. The CPU performance is not reduced on battery power.
Cinebench 2024: CPU Multi Core | CPU Single Core
Geekbench 6.7: Multi-Core | Single-Core
| CPU Performance rating | |
| Apple MacBook Pro 14 2025 M5 | |
| Average Apple M5 10-Core | |
| Apple MacBook Air 13 M5 | |
| Apple MacBook Air 13 M4 Entry | |
| Microsoft Surface Laptop 7 13.8 Copilot+ | |
| Apple MacBook Air 13 M3 8C GPU | |
| Average of class Subnotebook | |
| MSI Prestige 13 AI Plus Evo A2VMG | |
| Dell XPS 13 9350 | |
| Cinebench 2024 / CPU Multi Core | |
| Apple MacBook Pro 14 2025 M5 | |
| Average Apple M5 10-Core (957 - 1172, n=3) | |
| Apple MacBook Air 13 M5 | |
| Microsoft Surface Laptop 7 13.8 Copilot+ | |
| Apple MacBook Air 13 M4 Entry | |
| Average of class Subnotebook (148 - 1471, n=65, last 2 years) | |
| MSI Prestige 13 AI Plus Evo A2VMG | |
| Apple MacBook Air 13 M3 8C GPU | |
| Dell XPS 13 9350 | |
| Cinebench 2024 / CPU Single Core | |
| Apple MacBook Pro 14 2025 M5 | |
| Apple MacBook Air 13 M5 | |
| Average Apple M5 10-Core (199 - 200, n=3) | |
| Apple MacBook Air 13 M4 Entry | |
| Apple MacBook Air 13 M3 8C GPU | |
| Microsoft Surface Laptop 7 13.8 Copilot+ | |
| Average of class Subnotebook (35 - 200, n=54, last 2 years) | |
| Dell XPS 13 9350 | |
| MSI Prestige 13 AI Plus Evo A2VMG | |
| Geekbench 6.7 / Multi-Core | |
| Apple MacBook Pro 14 2025 M5 | |
| Average Apple M5 10-Core (16544 - 18054, n=5) | |
| Apple MacBook Air 13 M5 | |
| Apple MacBook Air 13 M4 Entry | |
| Microsoft Surface Laptop 7 13.8 Copilot+ | |
| Average of class Subnotebook (2244 - 20325, n=62, last 2 years) | |
| Apple MacBook Air 13 M3 8C GPU | |
| MSI Prestige 13 AI Plus Evo A2VMG | |
| Dell XPS 13 9350 | |
| Geekbench 6.7 / Single-Core | |
| Apple MacBook Pro 14 2025 M5 | |
| Average Apple M5 10-Core (4128 - 4326, n=5) | |
| Apple MacBook Air 13 M5 | |
| Apple MacBook Air 13 M4 Entry | |
| Apple MacBook Air 13 M3 8C GPU | |
| Microsoft Surface Laptop 7 13.8 Copilot+ | |
| Average of class Subnotebook (960 - 4195, n=61, last 2 years) | |
| Dell XPS 13 9350 | |
| MSI Prestige 13 AI Plus Evo A2VMG | |
System Performance
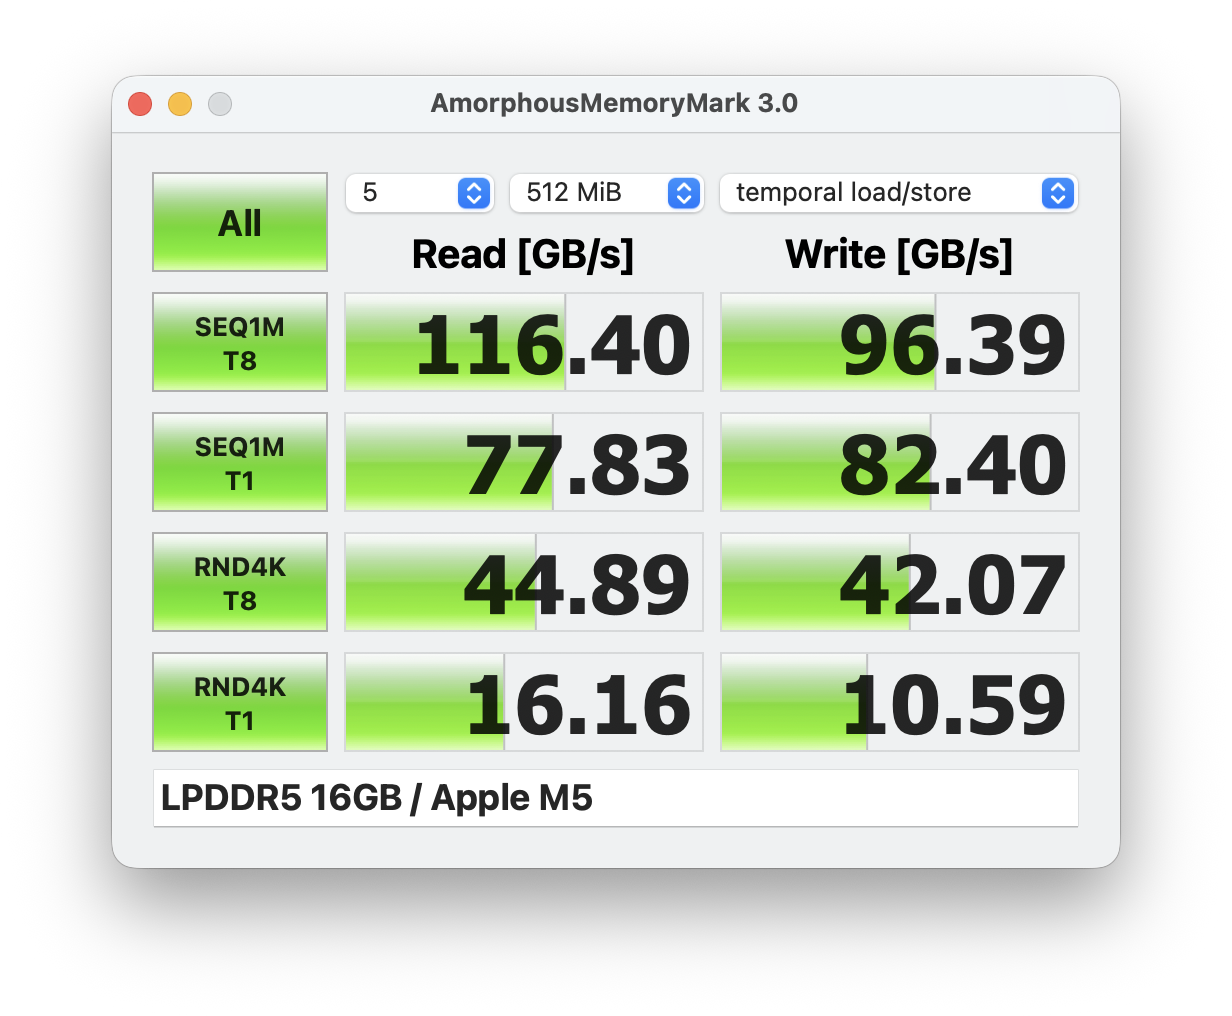
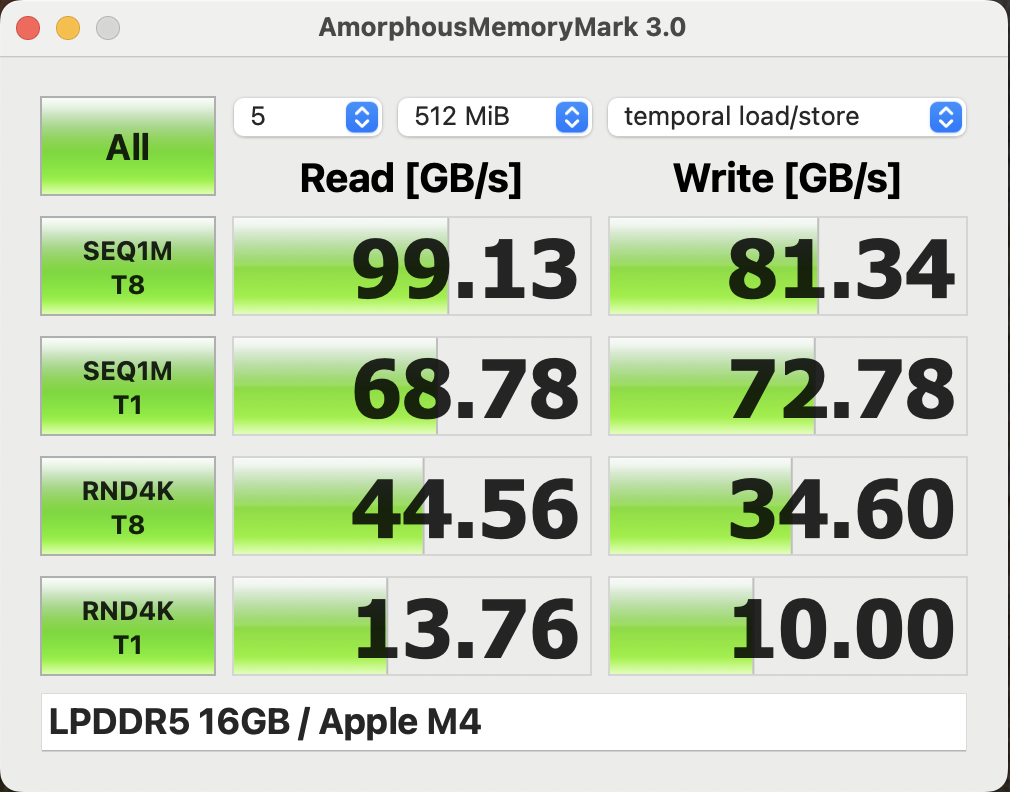
The subjective system performance is excellent and the benchmark results support this impression. Apple also increased the memory bandwidth compared to the M4. Overall, you will not notice a difference compared to the more expensive MacBook Pro models in everyday scenarios.
CrossMark: Overall | Productivity | Creativity | Responsiveness
WebXPRT 3: Overall
WebXPRT 4: Overall
Mozilla Kraken 1.1: Total
| Performance rating | |
| Apple MacBook Pro 14 2025 M5 | |
| Apple MacBook Air 13 M5 | |
| Average Apple M5 10-Core, Apple M5 8-Core GPU | |
| Apple MacBook Air 13 M4 Entry | |
| Microsoft Surface Laptop 7 13.8 Copilot+ | |
| Dell XPS 13 9350 | |
| MSI Prestige 13 AI Plus Evo A2VMG | |
| Average of class Subnotebook | |
| CrossMark / Overall | |
| Apple MacBook Pro 14 2025 M5 | |
| Apple MacBook Air 13 M5 | |
| Average Apple M5 10-Core, Apple M5 8-Core GPU (n=1) | |
| Apple MacBook Air 13 M4 Entry | |
| Dell XPS 13 9350 | |
| MSI Prestige 13 AI Plus Evo A2VMG | |
| Average of class Subnotebook (365 - 2356, n=59, last 2 years) | |
| Microsoft Surface Laptop 7 13.8 Copilot+ | |
| CrossMark / Productivity | |
| Apple MacBook Pro 14 2025 M5 | |
| Apple MacBook Air 13 M5 | |
| Average Apple M5 10-Core, Apple M5 8-Core GPU (n=1) | |
| Apple MacBook Air 13 M4 Entry | |
| Dell XPS 13 9350 | |
| MSI Prestige 13 AI Plus Evo A2VMG | |
| Average of class Subnotebook (364 - 2277, n=59, last 2 years) | |
| Microsoft Surface Laptop 7 13.8 Copilot+ | |
| CrossMark / Creativity | |
| Apple MacBook Pro 14 2025 M5 | |
| Apple MacBook Air 13 M5 | |
| Average Apple M5 10-Core, Apple M5 8-Core GPU (n=1) | |
| Apple MacBook Air 13 M4 Entry | |
| MSI Prestige 13 AI Plus Evo A2VMG | |
| Dell XPS 13 9350 | |
| Average of class Subnotebook (372 - 2743, n=59, last 2 years) | |
| Microsoft Surface Laptop 7 13.8 Copilot+ | |
| CrossMark / Responsiveness | |
| Apple MacBook Pro 14 2025 M5 | |
| Apple MacBook Air 13 M5 | |
| Average Apple M5 10-Core, Apple M5 8-Core GPU (n=1) | |
| Apple MacBook Air 13 M4 Entry | |
| Average of class Subnotebook (312 - 1854, n=59, last 2 years) | |
| Dell XPS 13 9350 | |
| Microsoft Surface Laptop 7 13.8 Copilot+ | |
| MSI Prestige 13 AI Plus Evo A2VMG | |
| WebXPRT 3 / Overall | |
| Apple MacBook Pro 14 2025 M5 | |
| Apple MacBook Air 13 M5 | |
| Average Apple M5 10-Core, Apple M5 8-Core GPU (n=1) | |
| Apple MacBook Air 13 M4 Entry | |
| Microsoft Surface Laptop 7 13.8 Copilot+ | |
| Average of class Subnotebook (156 - 530, n=55, last 2 years) | |
| Dell XPS 13 9350 | |
| MSI Prestige 13 AI Plus Evo A2VMG | |
| WebXPRT 4 / Overall | |
| Apple MacBook Pro 14 2025 M5 | |
| Apple MacBook Air 13 M5 | |
| Average Apple M5 10-Core, Apple M5 8-Core GPU (n=1) | |
| Apple MacBook Air 13 M4 Entry | |
| Microsoft Surface Laptop 7 13.8 Copilot+ | |
| MSI Prestige 13 AI Plus Evo A2VMG | |
| Dell XPS 13 9350 | |
| Average of class Subnotebook (132 - 378, n=60, last 2 years) | |
| Mozilla Kraken 1.1 / Total | |
| Average of class Subnotebook (234 - 1104, n=60, last 2 years) | |
| MSI Prestige 13 AI Plus Evo A2VMG | |
| Dell XPS 13 9350 | |
| Microsoft Surface Laptop 7 13.8 Copilot+ | |
| Apple MacBook Air 13 M4 Entry | |
| Apple MacBook Air 13 M5 | |
| Average Apple M5 10-Core, Apple M5 8-Core GPU (n=1) | |
| Apple MacBook Pro 14 2025 M5 | |
* ... smaller is better
Storage Devices
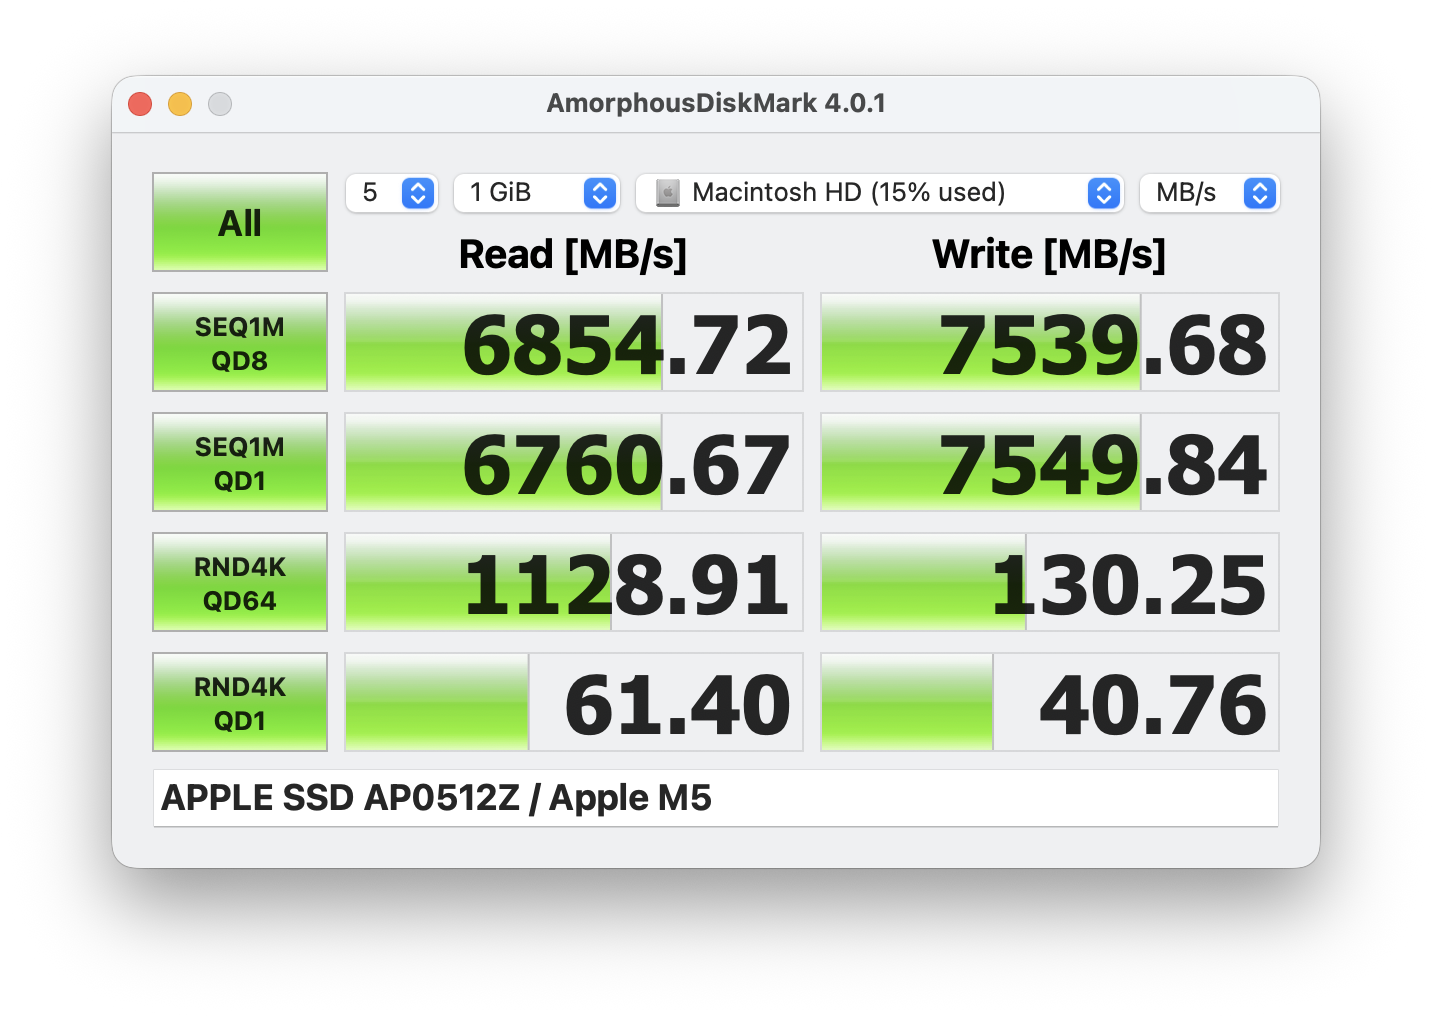
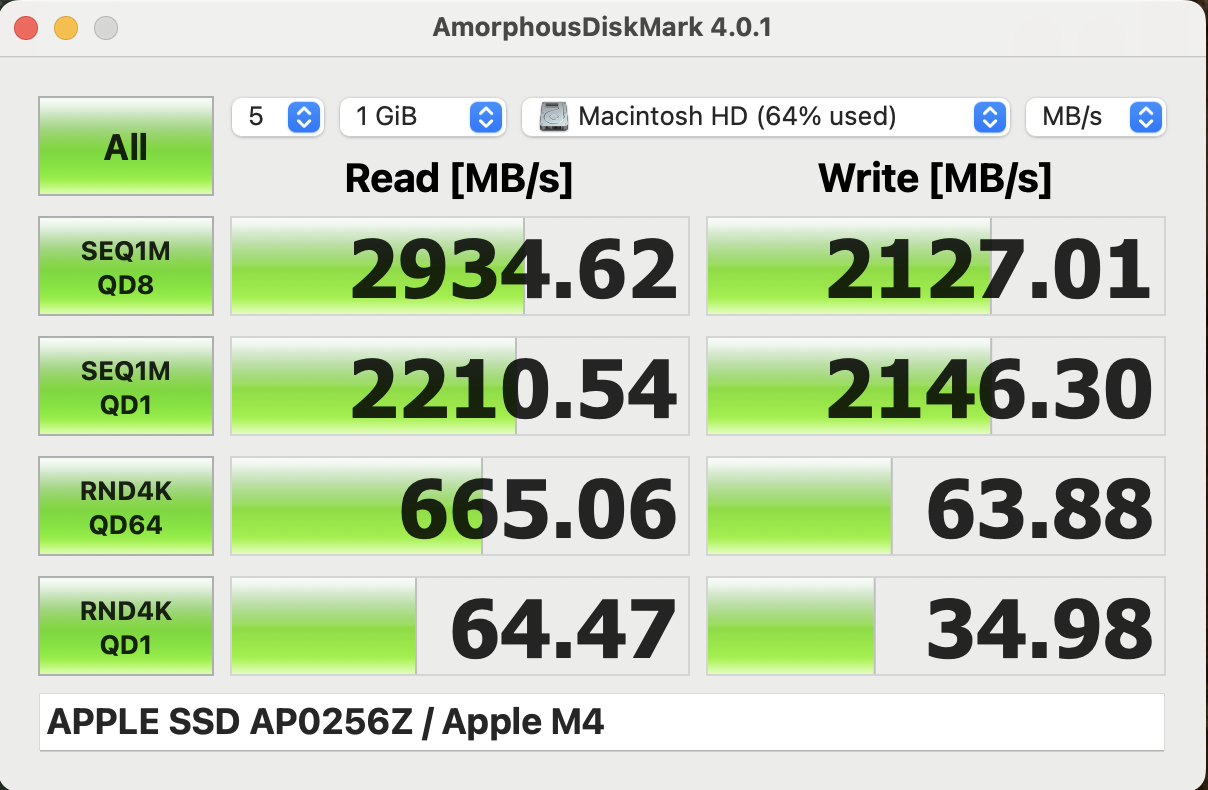
The base model now gets 512 GB SSD storage by default, and the speed was improved to PCIe 4.0, so the transfer rates are on par with the MacBook Pro models at around 7 GB/s. The SSD is once again onboard, but the maximum capacity was increased from 2 to 4 TB.
GPU Performance
The base model of the M5-SoC is equipped with 8 GPU cores with a maximum consumption of 16.5 Watts and the performance is very good overall. The deficit compared to the 10-core GPU in the MBP 14 M5 is between 12-20 % and the advantage over the old M4 8-core GPU is between 30-50 % depending on the benchmark.
The performance drops by around 18 percent in the synthetic 3DMark stress test (Steel Nomad Light), but the situation is completely different while playing games. During all the games we tested, the SoC consumption was sitting between 7-8 Watts, which is insanely efficient and this also means there is no throttling. We tested Cyberpunk 2077 for one hour and the frame rate at 1080p/Ultra was rock solid at 19.6 fps.
| Cinebench 2024 - GPU | |
| Apple MacBook Pro 14 2025 M5 | |
| Apple MacBook Air 13 M5 | |
| Average Apple M5 8-Core GPU (n=1) | |
| Average of class Subnotebook (3574 - 6071, n=4, last 2 years) | |
| Apple MacBook Air 13 M4 Entry | |
| 3DMark Steel Nomad Score | 941 points | |
| 3DMark Steel Nomad Light Score | 4405 points | |
Help | ||
| Blender / v3.3 Classroom METAL | |
| Average of class Subnotebook (76.3 - 227, n=5, last 2 years) | |
| Apple MacBook Air 13 M4 Entry | |
| Apple MacBook Air 13 M5 | |
| Average Apple M5 8-Core GPU (n=1) | |
| Apple MacBook Pro 14 2025 M5 | |
| Blender / v3.3 Classroom CPU | |
| Microsoft Surface Laptop 7 13.8 Copilot+ | |
| Dell XPS 13 9350 | |
| MSI Prestige 13 AI Plus Evo A2VMG | |
| Average of class Subnotebook (241 - 861, n=59, last 2 years) | |
| Apple MacBook Pro 14 2025 M5 | |
| Apple MacBook Air 13 M4 Entry | |
| Apple MacBook Air 13 M5 | |
| Average Apple M5 8-Core GPU (n=1) | |
| Blender / v3.3 Classroom oneAPI/Intel | |
| Average of class Subnotebook (105 - 396, n=11, last 2 years) | |
| Dell XPS 13 9350 | |
| MSI Prestige 13 AI Plus Evo A2VMG | |
* ... smaller is better
| Cyberpunk 2077 - 1920x1080 Ultra Preset (FSR off) | |
| Apple MacBook Pro 14 2025 M5 | |
| MSI Prestige 13 AI Plus Evo A2VMG | |
| Apple MacBook Air 13 M5 | |
| Dell XPS 13 9350 | |
| Microsoft Surface Laptop 7 13.8 Copilot+ | |
| Apple MacBook Air 13 M4 Entry | |
| Baldur's Gate 3 - 1920x1080 Ultra Preset AA:T | |
| Apple MacBook Pro 14 2025 M5 | |
| MSI Prestige 13 AI Plus Evo A2VMG | |
| Apple MacBook Air 13 M5 | |
| Dell XPS 13 9350 | |
| Apple MacBook Air 13 M4 Entry | |
| Microsoft Surface Laptop 7 13.8 Copilot+ | |
| Assassin's Creed Shadows - 1920x1080 Low | |
| Apple MacBook Pro 14 2025 M5 | |
| Apple MacBook Air 13 M5 | |
| Total War Pharaoh - 1920x1080 Ultra Preset | |
| Apple MacBook Pro 14 2025 M5 | |
| Apple MacBook Air 13 M5 | |
| Apple MacBook Air 13 M4 Entry | |
| Shadow of the Tomb Raider - 1920x1080 Highest Preset AA:T | |
| Apple MacBook Pro 14 2025 M5 | |
| Apple MacBook Air 13 M5 | |
| Apple MacBook Air 13 M4 Entry | |
Cyberpunk 2077 ultra FPS Chart
| low | med. | high | ultra | |
|---|---|---|---|---|
| Shadow of the Tomb Raider (2018) | 87 | 45 | 42 | 38 |
| Baldur's Gate 3 (2023) | 46 | 35.1 | 29.2 | 28.5 |
| Cyberpunk 2077 (2023) | 35.8 | 27.3 | 22.8 | 19.5 |
| Total War Pharaoh (2023) | 58.8 | 54.9 | 51 | 38.1 |
| Assassin's Creed Shadows (2025) | 22 | 20 | 17 | 11 |
Emissions & Power Consumption
System Noise
The MacBook Air still uses a fanless cooling unit, so the laptop is always silent and we did not experience any other electronic noises, either. This is a huge advantage over Windows competitors.
| Apple MacBook Air 13 M5 M5 10-Core, M5 8-Core GPU | MSI Prestige 13 AI Plus Evo A2VMG Core Ultra 7 258V, Arc 140V | Dell XPS 13 9350 Core Ultra 7 256V, Arc 140V | Microsoft Surface Laptop 7 13.8 Copilot+ SD X Elite X1E-80-100, Adreno X1-85 3.8 TFLOPS | Apple MacBook Pro 14 2025 M5 M5 10-Core, M5 10-Core GPU | |
|---|---|---|---|---|---|
| Noise | |||||
| off / environment * (dB) | 24.1 | 24.1 | 23.8 | 24.5 | |
| Idle Minimum * (dB) | 24.8 | 24.4 | 23.8 | 24.5 | |
| Idle Average * (dB) | 24.8 | 24.4 | 23.8 | 24.5 | |
| Idle Maximum * (dB) | 26.7 | 24.4 | 23.8 | 24.5 | |
| Load Average * (dB) | 36.8 | 26.2 | 26 | 25.2 | |
| Cyberpunk 2077 ultra * (dB) | 44.5 | 34.2 | 31.5 | 30 | |
| Load Maximum * (dB) | 50.8 | 45.2 | 40.3 | 48 |
* ... smaller is better
Temperature
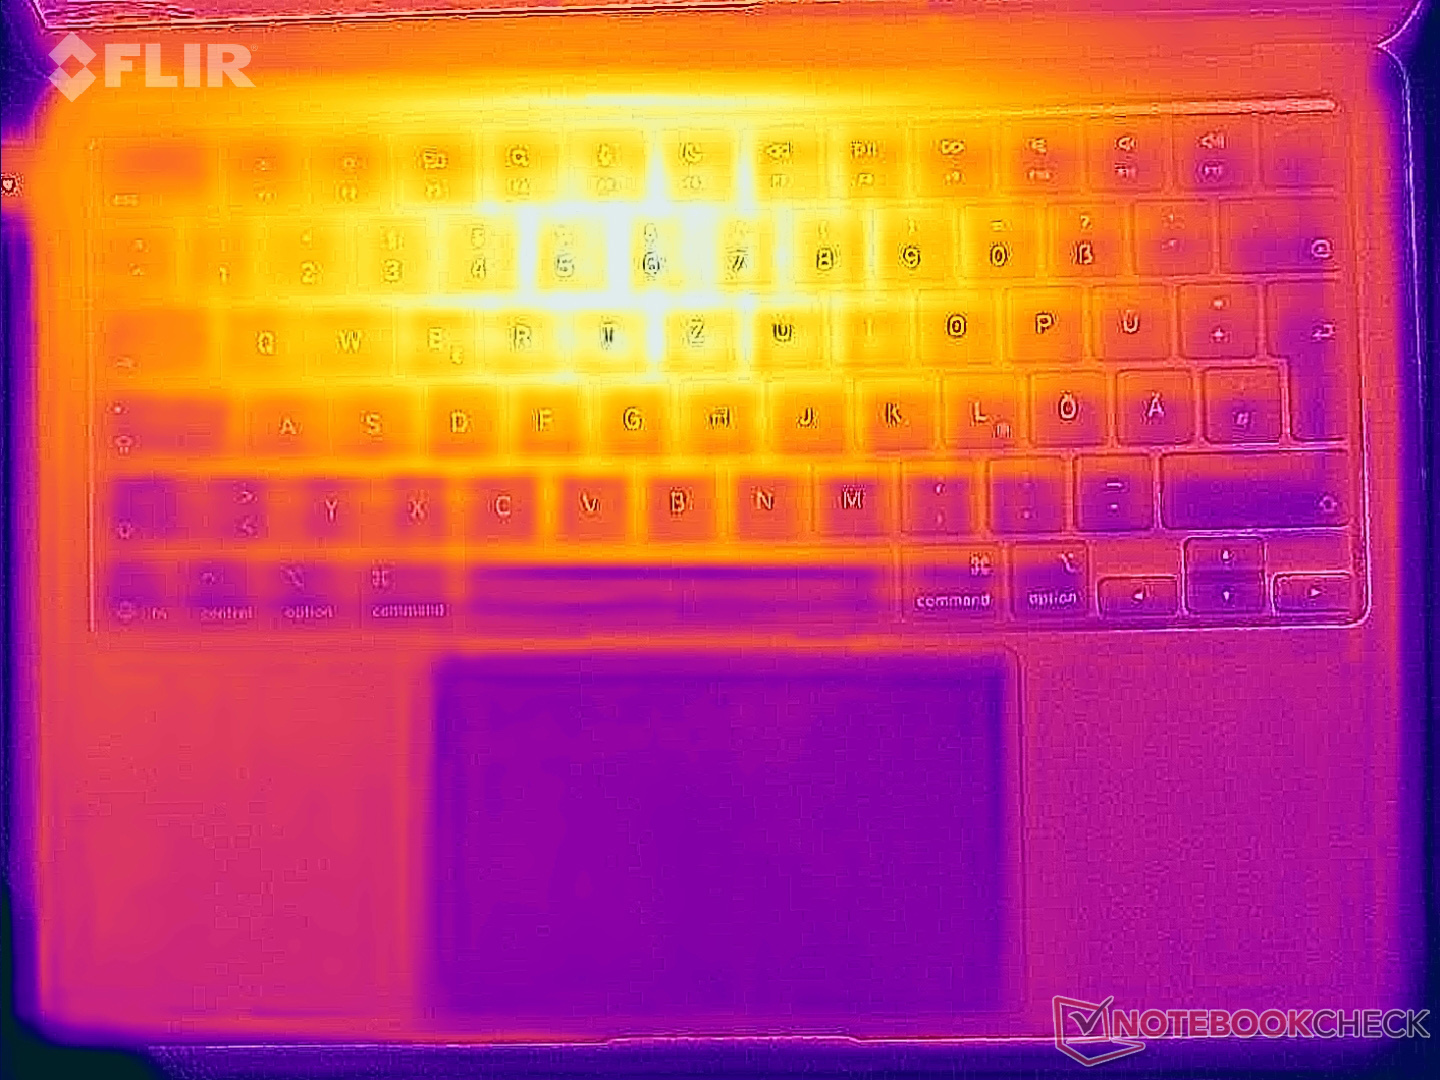
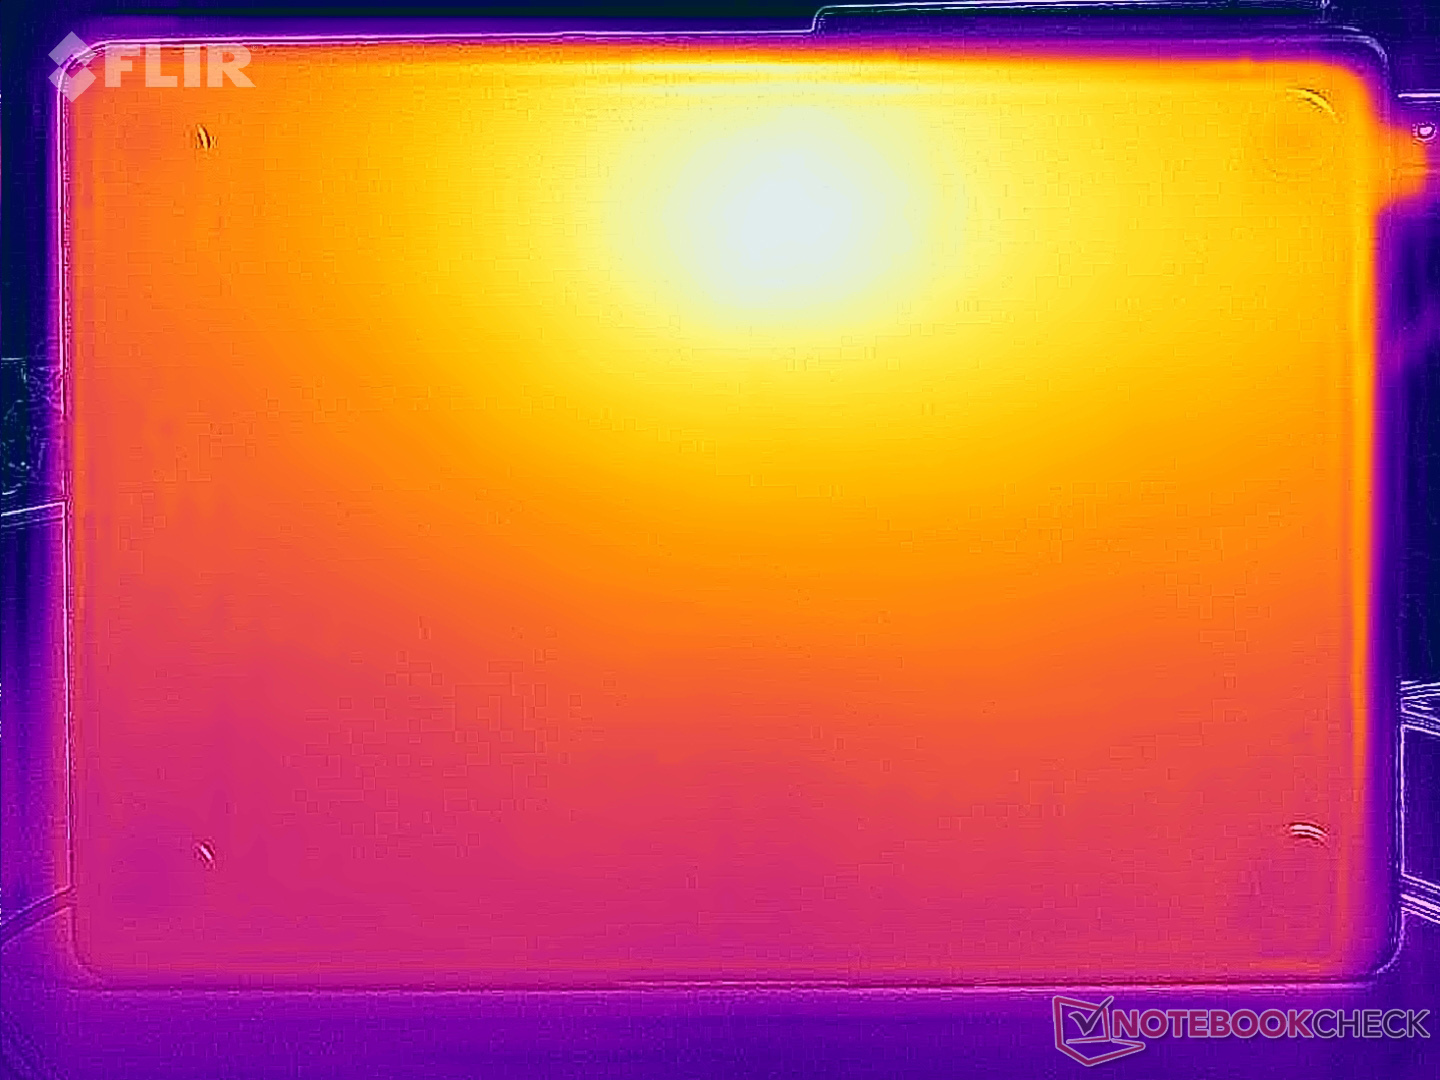
Surface temperatures are absolutely no problem and the MacBook Air usually stays very cool. If you really stress it, it will warm up to slightly more than 40 °C, but that is no problem. During our stress test with combined CPU/GPU load, the M5 SoC consumes up to 26 Watts and then quickly levels off at around 8 Watts.
(±) The maximum temperature on the upper side is 44.1 °C / 111 F, compared to the average of 35.9 °C / 97 F, ranging from 21.4 to 59 °C for the class Subnotebook.
(±) The bottom heats up to a maximum of 42.4 °C / 108 F, compared to the average of 39.2 °C / 103 F
(+) In idle usage, the average temperature for the upper side is 23.3 °C / 74 F, compared to the device average of 30.8 °C / 87 F.
(±) 3: The average temperature for the upper side is 36.4 °C / 98 F, compared to the average of 30.8 °C / 87 F for the class Subnotebook.
(+) The palmrests and touchpad are reaching skin temperature as a maximum (32.9 °C / 91.2 F) and are therefore not hot.
(-) The average temperature of the palmrest area of similar devices was 28.2 °C / 82.8 F (-4.7 °C / -8.4 F).
| Apple MacBook Air 13 M5 M5 10-Core, M5 8-Core GPU | Apple MacBook Air 13 M4 Entry M4 10-Core, M4 8-Core GPU | MSI Prestige 13 AI Plus Evo A2VMG Core Ultra 7 258V, Arc 140V | Dell XPS 13 9350 Core Ultra 7 256V, Arc 140V | Microsoft Surface Laptop 7 13.8 Copilot+ SD X Elite X1E-80-100, Adreno X1-85 3.8 TFLOPS | |
|---|---|---|---|---|---|
| Heat | -1% | -3% | 4% | -5% | |
| Maximum Upper Side * (°C) | 44.1 | 44.9 -2% | 43.4 2% | 34.8 21% | 47.1 -7% |
| Maximum Bottom * (°C) | 42.4 | 42.6 -0% | 42.4 -0% | 37.4 12% | 44.6 -5% |
| Idle Upper Side * (°C) | 23.7 | 23.9 -1% | 25.4 -7% | 25.4 -7% | 24.7 -4% |
| Idle Bottom * (°C) | 23.8 | 24 -1% | 25.6 -8% | 26.2 -10% | 24.5 -3% |
* ... smaller is better
Speakers
The speaker system of the small MBA 13 offers good sound quality and you will rarely miss external speakers.
Apple MacBook Air 13 M5 audio analysis
(+) | speakers can play relatively loud (82.1 dB)
Bass 100 - 315 Hz
(±) | reduced bass - on average 10.5% lower than median
(±) | linearity of bass is average (10.2% delta to prev. frequency)
Mids 400 - 2000 Hz
(+) | balanced mids - only 2% away from median
(+) | mids are linear (2.7% delta to prev. frequency)
Highs 2 - 16 kHz
(±) | higher highs - on average 5.1% higher than median
(+) | highs are linear (3% delta to prev. frequency)
Overall 100 - 16.000 Hz
(+) | overall sound is linear (11.7% difference to median)
Compared to same class
» 13% of all tested devices in this class were better, 3% similar, 84% worse
» The best had a delta of 5%, average was 18%, worst was 53%
Compared to all devices tested
» 8% of all tested devices were better, 3% similar, 89% worse
» The best had a delta of 4%, average was 23%, worst was 134%
MSI Prestige 13 AI Plus Evo A2VMG audio analysis
(+) | speakers can play relatively loud (84.5 dB)
Bass 100 - 315 Hz
(-) | nearly no bass - on average 19.4% lower than median
(±) | linearity of bass is average (9.6% delta to prev. frequency)
Mids 400 - 2000 Hz
(±) | higher mids - on average 6.4% higher than median
(+) | mids are linear (5.1% delta to prev. frequency)
Highs 2 - 16 kHz
(±) | higher highs - on average 6.1% higher than median
(+) | highs are linear (4.6% delta to prev. frequency)
Overall 100 - 16.000 Hz
(±) | linearity of overall sound is average (18.2% difference to median)
Compared to same class
» 52% of all tested devices in this class were better, 7% similar, 40% worse
» The best had a delta of 5%, average was 18%, worst was 53%
Compared to all devices tested
» 39% of all tested devices were better, 8% similar, 53% worse
» The best had a delta of 4%, average was 23%, worst was 134%
Dell XPS 13 9350 audio analysis
(+) | speakers can play relatively loud (82.6 dB)
Bass 100 - 315 Hz
(±) | reduced bass - on average 8.5% lower than median
(±) | linearity of bass is average (8.3% delta to prev. frequency)
Mids 400 - 2000 Hz
(±) | higher mids - on average 6.2% higher than median
(+) | mids are linear (5.9% delta to prev. frequency)
Highs 2 - 16 kHz
(±) | higher highs - on average 5.3% higher than median
(+) | highs are linear (5.1% delta to prev. frequency)
Overall 100 - 16.000 Hz
(+) | overall sound is linear (13% difference to median)
Compared to same class
» 21% of all tested devices in this class were better, 4% similar, 75% worse
» The best had a delta of 5%, average was 18%, worst was 53%
Compared to all devices tested
» 13% of all tested devices were better, 2% similar, 85% worse
» The best had a delta of 4%, average was 23%, worst was 134%
Microsoft Surface Laptop 7 13.8 Copilot+ audio analysis
(±) | speaker loudness is average but good (81.8 dB)
Bass 100 - 315 Hz
(±) | reduced bass - on average 12.7% lower than median
(±) | linearity of bass is average (9.8% delta to prev. frequency)
Mids 400 - 2000 Hz
(+) | balanced mids - only 4.1% away from median
(+) | mids are linear (2.4% delta to prev. frequency)
Highs 2 - 16 kHz
(+) | balanced highs - only 2.1% away from median
(+) | highs are linear (2.5% delta to prev. frequency)
Overall 100 - 16.000 Hz
(+) | overall sound is linear (12.1% difference to median)
Compared to same class
» 14% of all tested devices in this class were better, 5% similar, 81% worse
» The best had a delta of 5%, average was 18%, worst was 53%
Compared to all devices tested
» 10% of all tested devices were better, 2% similar, 88% worse
» The best had a delta of 4%, average was 23%, worst was 134%
Power Consumption
The power consumption figures did not really change compared to the previous model and there are no surprises here. The 30W PSU is a limiting factor for a couple of seconds during our stress test, but the consumption quickly levels off at around 24W.
| Off / Standby | |
| Idle | |
| Load |
|
Key:
min: | |
| Apple MacBook Air 13 M5 M5 10-Core, M5 8-Core GPU, Apple SSD AP0512Z, IPS, 2560x1664, 13.6" | Apple MacBook Air 13 M4 Entry M4 10-Core, M4 8-Core GPU, Apple SSD AP0256Z, IPS, 2560x1664, 13.6" | MSI Prestige 13 AI Plus Evo A2VMG Core Ultra 7 258V, Arc 140V, , OLED, 2880x1800, 13.3" | Dell XPS 13 9350 Core Ultra 7 256V, Arc 140V, Micron 2550 512GB, IPS, 1920x1200, 13.4" | Microsoft Surface Laptop 7 13.8 Copilot+ SD X Elite X1E-80-100, Adreno X1-85 3.8 TFLOPS, Samsung MZ9L4512HBLU-00BMV, IPS, 2304x1536, 13.8" | Average Apple M5 8-Core GPU | Average of class Subnotebook | |
|---|---|---|---|---|---|---|---|
| Power Consumption | -2% | -71% | -36% | -9% | 0% | -44% | |
| Idle Minimum * (Watt) | 1.8 | 1.9 -6% | 3.5 -94% | 1.3 28% | 1.4 22% | 1.8 ? -0% | 3.78 ? -110% |
| Idle Average * (Watt) | 9.3 | 8.7 6% | 5.9 37% | 2.5 73% | 6.3 32% | 9.3 ? -0% | 6.57 ? 29% |
| Idle Maximum * (Watt) | 9.4 | 8.8 6% | 10 -6% | 4.1 56% | 7.6 19% | 9.4 ? -0% | 7.94 ? 16% |
| Load Average * (Watt) | 29.4 | 29.9 -2% | 38.7 -32% | 40.1 -36% | 26.9 9% | 29.4 ? -0% | 41.9 ? -43% |
| Cyberpunk 2077 ultra * (Watt) | 18.9 | 18.5 2% | 46.3 -145% | 46.1 -144% | 38.5 -104% | ||
| Cyberpunk 2077 ultra external monitor * (Watt) | 17.7 | 21.5 -21% | 45.6 -158% | 43.1 -144% | |||
| Load Maximum * (Watt) | 30.4 | 30.8 -1% | 61.5 -102% | 57.3 -88% | 40.7 -34% | 30.4 ? -0% | 64.4 ? -112% |
* ... smaller is better
Power Consumption Cyberpunk / Stress Test
Power Consumption external Monitor
Battery Life
The battery life in our Wi-Fi test at 150 nits is little more than 16 hours and therefor identical to the previous model. The Lunar Lake Dell XPS 13 9350 offers 4 hours more, but also has a lower display resolution.
Update: The battery life in our Wi-Fi test at max. brightness is a bit shorter than before with 6:39 hours.
Notebookcheck Rating
Apple MacBook Air 13 M5
- 03/07/2026 v8
Andreas Osthoff
 Total Sustainability Score:
 Potential Competitors in Comparison
Image | Model / Review | Price | Weight | Height | Display |
|---|---|---|---|---|---|
1. 91.6% 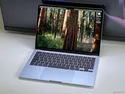 | Apple MacBook Air 13 M5 Apple M5 10-Core ⎘ Apple M5 8-Core GPU ⎘ 16 GB Memory, 512 GB SSD | Amazon: List Price: 1199€ | 1.2 kg | 11.3 mm | 13.60" 2560x1664 225 PPI IPS |
2. 91.2%  | Apple MacBook Air 13 M4 Entry Apple M4 10-Core ⎘ Apple M4 8-Core GPU ⎘ 16 GB Memory, 256 GB SSD | Amazon: List Price: 1039€ | 1.2 kg | 11.3 mm | 13.60" 2560x1664 225 PPI IPS |
3. 85%  | MSI Prestige 13 AI Plus Evo A2VMG Intel Core Ultra 7 258V ⎘ Intel Arc Graphics 140V ⎘ 32 GB Memory | Amazon: 1. $1,149.49 msi Prestige 13 AI Evo Lapto... 2. $31.99 CPU Cooling Fan Replacement ... 3. $1,349.00 HIDevolution [2024] MSI Pres... List Price: 1400 USD | 970 g | 16.9 mm | 13.30" 2880x1800 255 PPI OLED |
4. 85.3%  | Dell XPS 13 9350 Intel Core Ultra 7 256V ⎘ Intel Arc Graphics 140V ⎘ 16 GB Memory, 512 GB SSD | Amazon: List Price: 1400 USD | 1.2 kg | 15.3 mm | 13.40" 1920x1200 169 PPI IPS |
5. 86.2%  | Microsoft Surface Laptop 7 13.8 Copilot+ Qualcomm Snapdragon X Elite X1E-80-100 ⎘ Qualcomm SD X Adreno X1-85 3.8 TFLOPS ⎘ 16 GB Memory, 512 GB SSD | Amazon: List Price: 1649€ | 1.3 kg | 17.5 mm | 13.80" 2304x1536 201 PPI IPS |
Transparency
The selection of devices to be reviewed is made by our editorial team. The test sample was provided to the author as a loan by the manufacturer or retailer for the purpose of this review. The lender had no influence on this review, nor did the manufacturer receive a copy of this review before publication. There was no obligation to publish this review. As an independent media company, Notebookcheck is not subjected to the authority of manufacturers, retailers or publishers.
This is how Notebookcheck is testing
Every year, Notebookcheck independently reviews hundreds of laptops and smartphones using standardized procedures to ensure that all results are comparable. We have continuously developed our test methods for around 20 years and set industry standards in the process. In our test labs, high-quality measuring equipment is utilized by experienced technicians and editors. These tests involve a multi-stage validation process. Our complex rating system is based on hundreds of well-founded measurements and benchmarks, which maintains objectivity. Further information on our test methods can be found here.
