
Verdict - The new Surface Laptop 13 is simply too expensive
In itself, the new Surface Laptop 13 is a quiet and fast enough everyday companion with long battery runtimes. Its IPS touchscreen delivers decent image quality, but its frequency is only 60 Hz.
In terms of performance, the smallest Snapdragon X Plus is sufficient and, as a Copilot+ laptop, it also supports all of Windows' AI functions, but its slimmed-down GPU in particular is very weak and limits the laptop's already limited gaming performance even further. The Surface Laptop can only dream of the performance of the passively cooled MacBook Air M4. At least the device almost always remains silent as long as the processor isn't overloaded.
The biggest problem is the Surface Laptop 13.8 which, although its runtimes are shorter, already comes with the slightly faster Snapdragon X Plus with 10 cores in its base configuration. Plus, it features a haptic trackpad and, above all, a much better 120 Hz display. At the same time, the Surface Laptop 13.8's current price online is comparable or sometimes even a little cheaper—and it comes with a power supply, which we unfortunately can't say about the new Surface Laptop 13.
If you look at the new Surface Laptop 13 as a direct successor to the Surface Laptop Go 3, then the new model is slightly bigger, but better in almost every respect. That being said, it simply makes no sense not to go for the much better Surface Laptop 13.8 with the current prices being taken into account.
Pros
Cons
Price and availability
You can order the Surface Laptop 13 directly from Microsoft, with prices starting at $899.99.
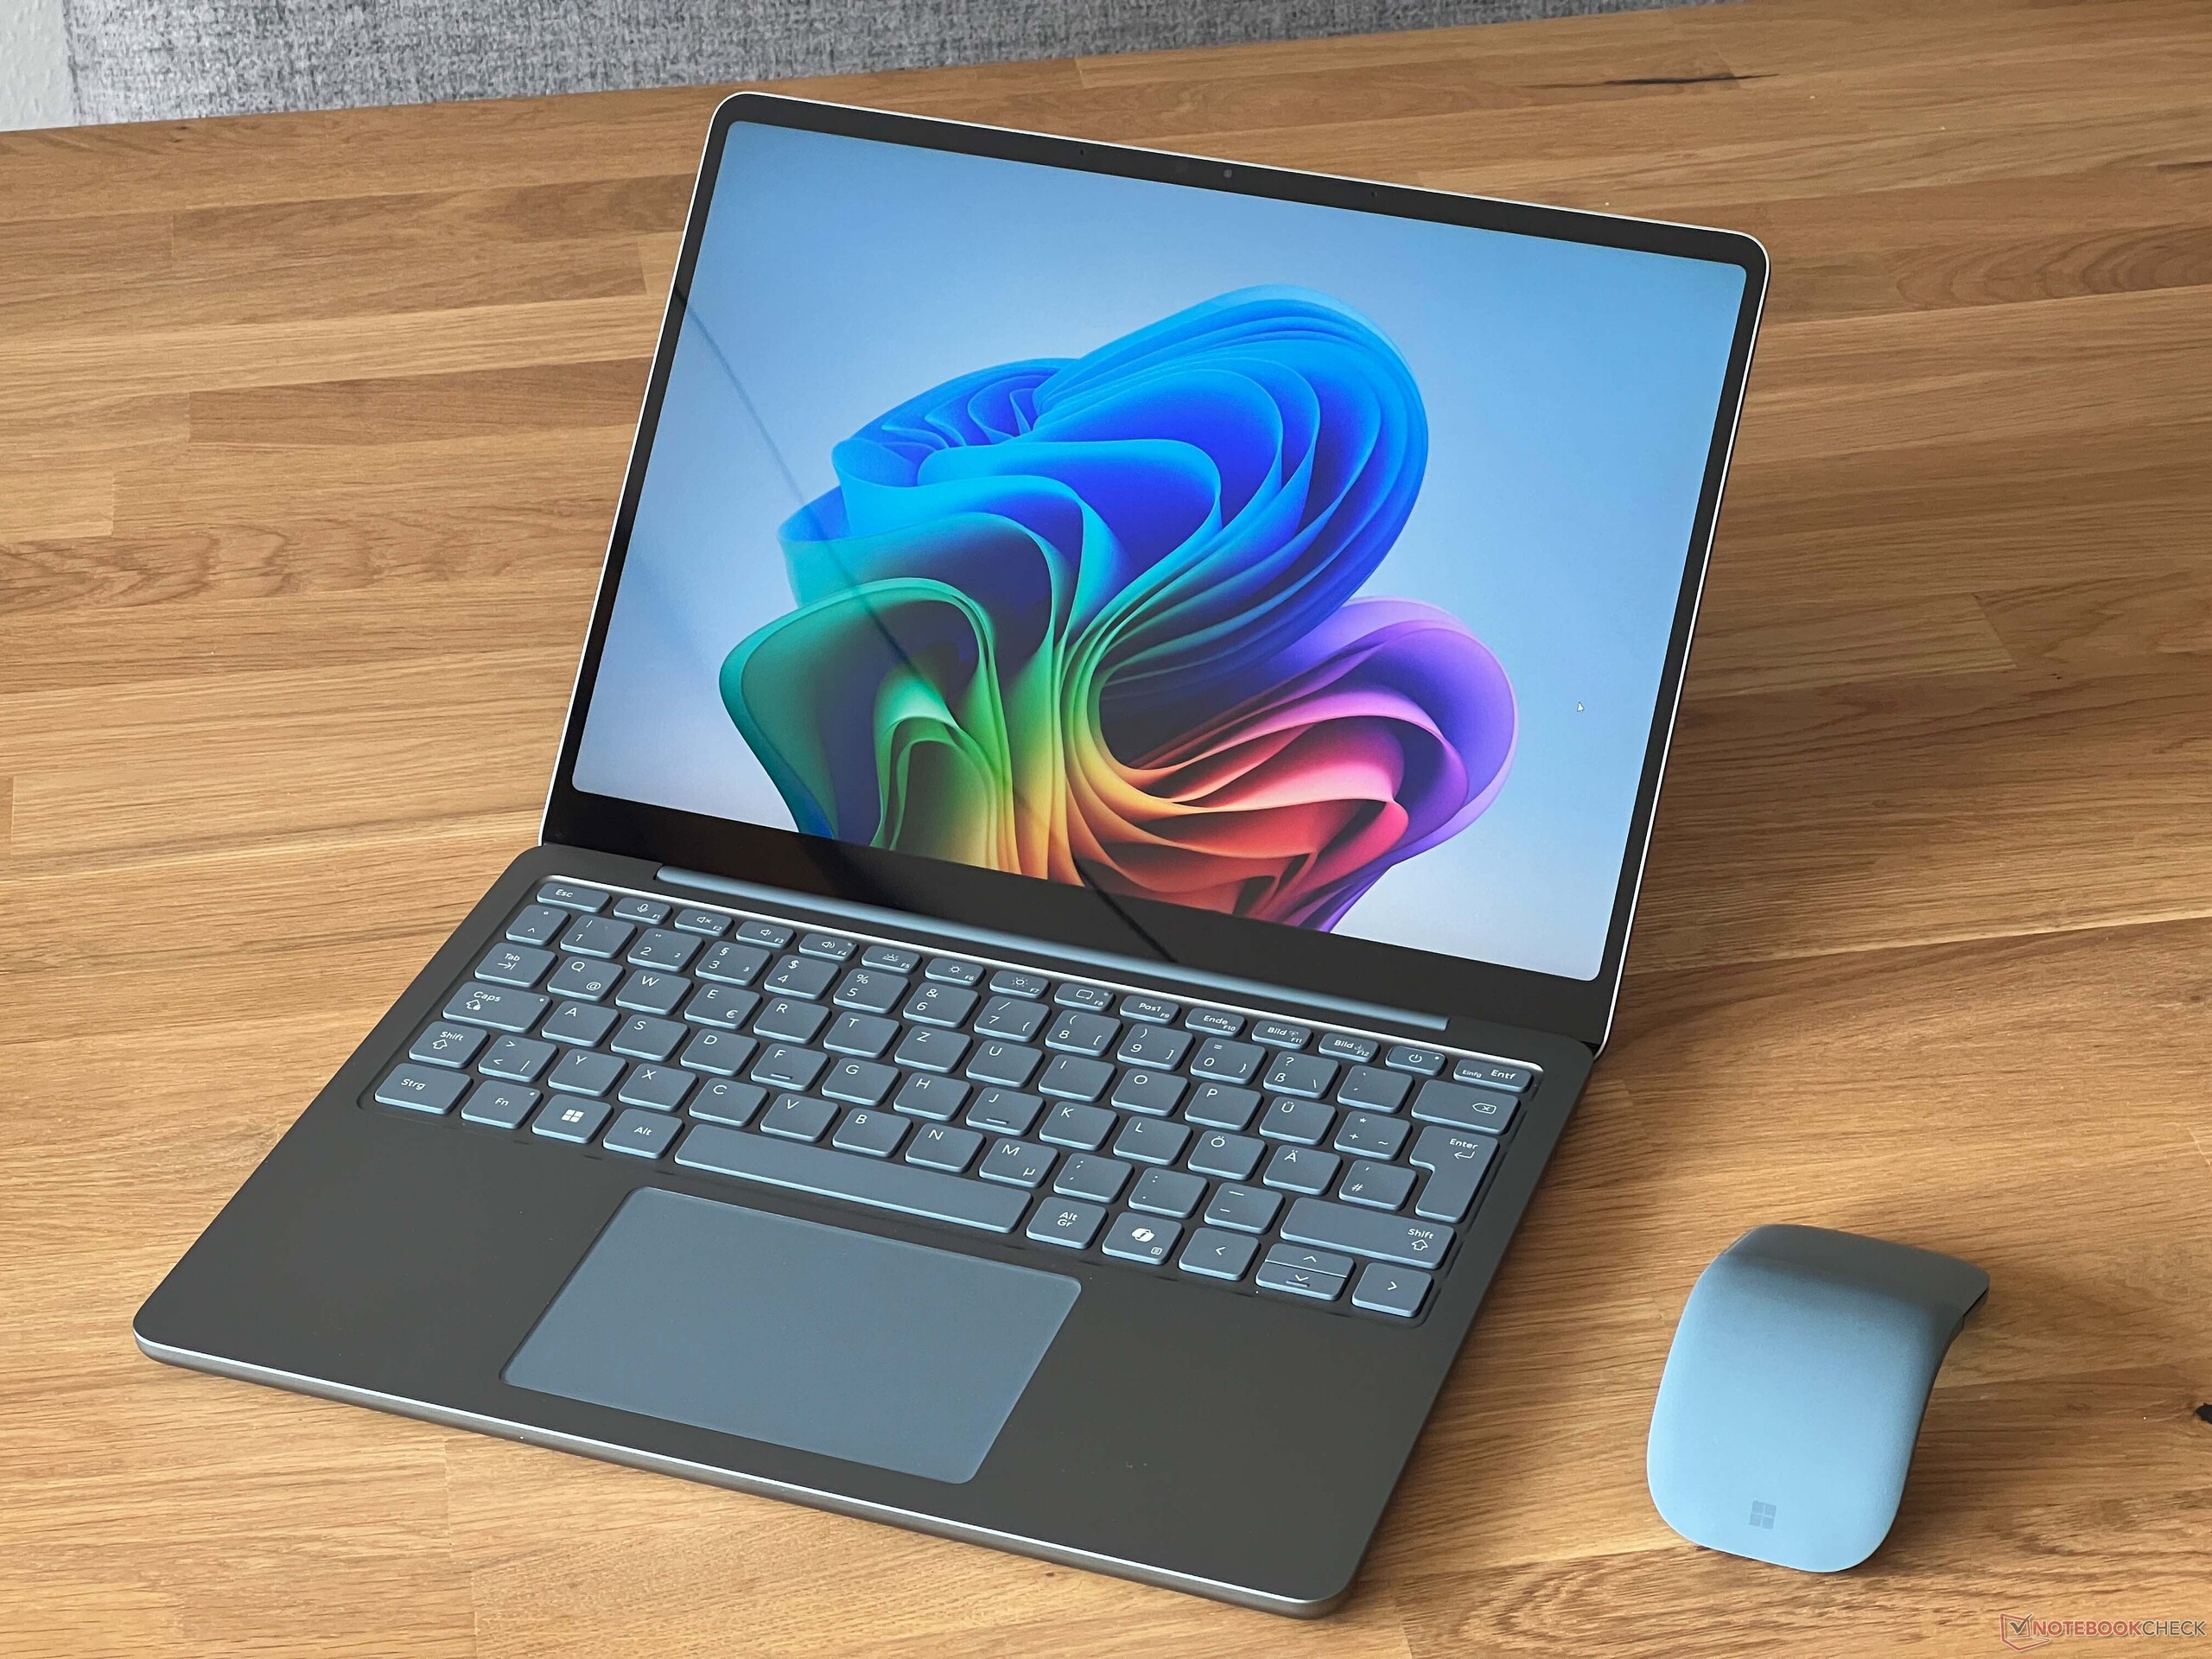
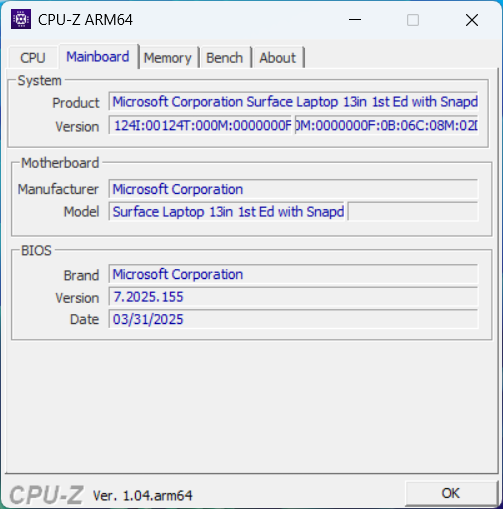
Microsoft is expanding its Surface Laptop lineup and has introduced a new 13-inch model, which is just a tiny bit smaller than the familiar 13.8-inch model. It comes equipped with the small Snapdragon X Plus, 16 GB RAM and a Full HD touchscreen with a refresh rate of 60 Hz—so no real highlights. The MRSP for the version with 256 GB of SSD storage is $899.99; we are testing the variant with 512 GB of storage for $999.99.
Specifications
Case & connectivity
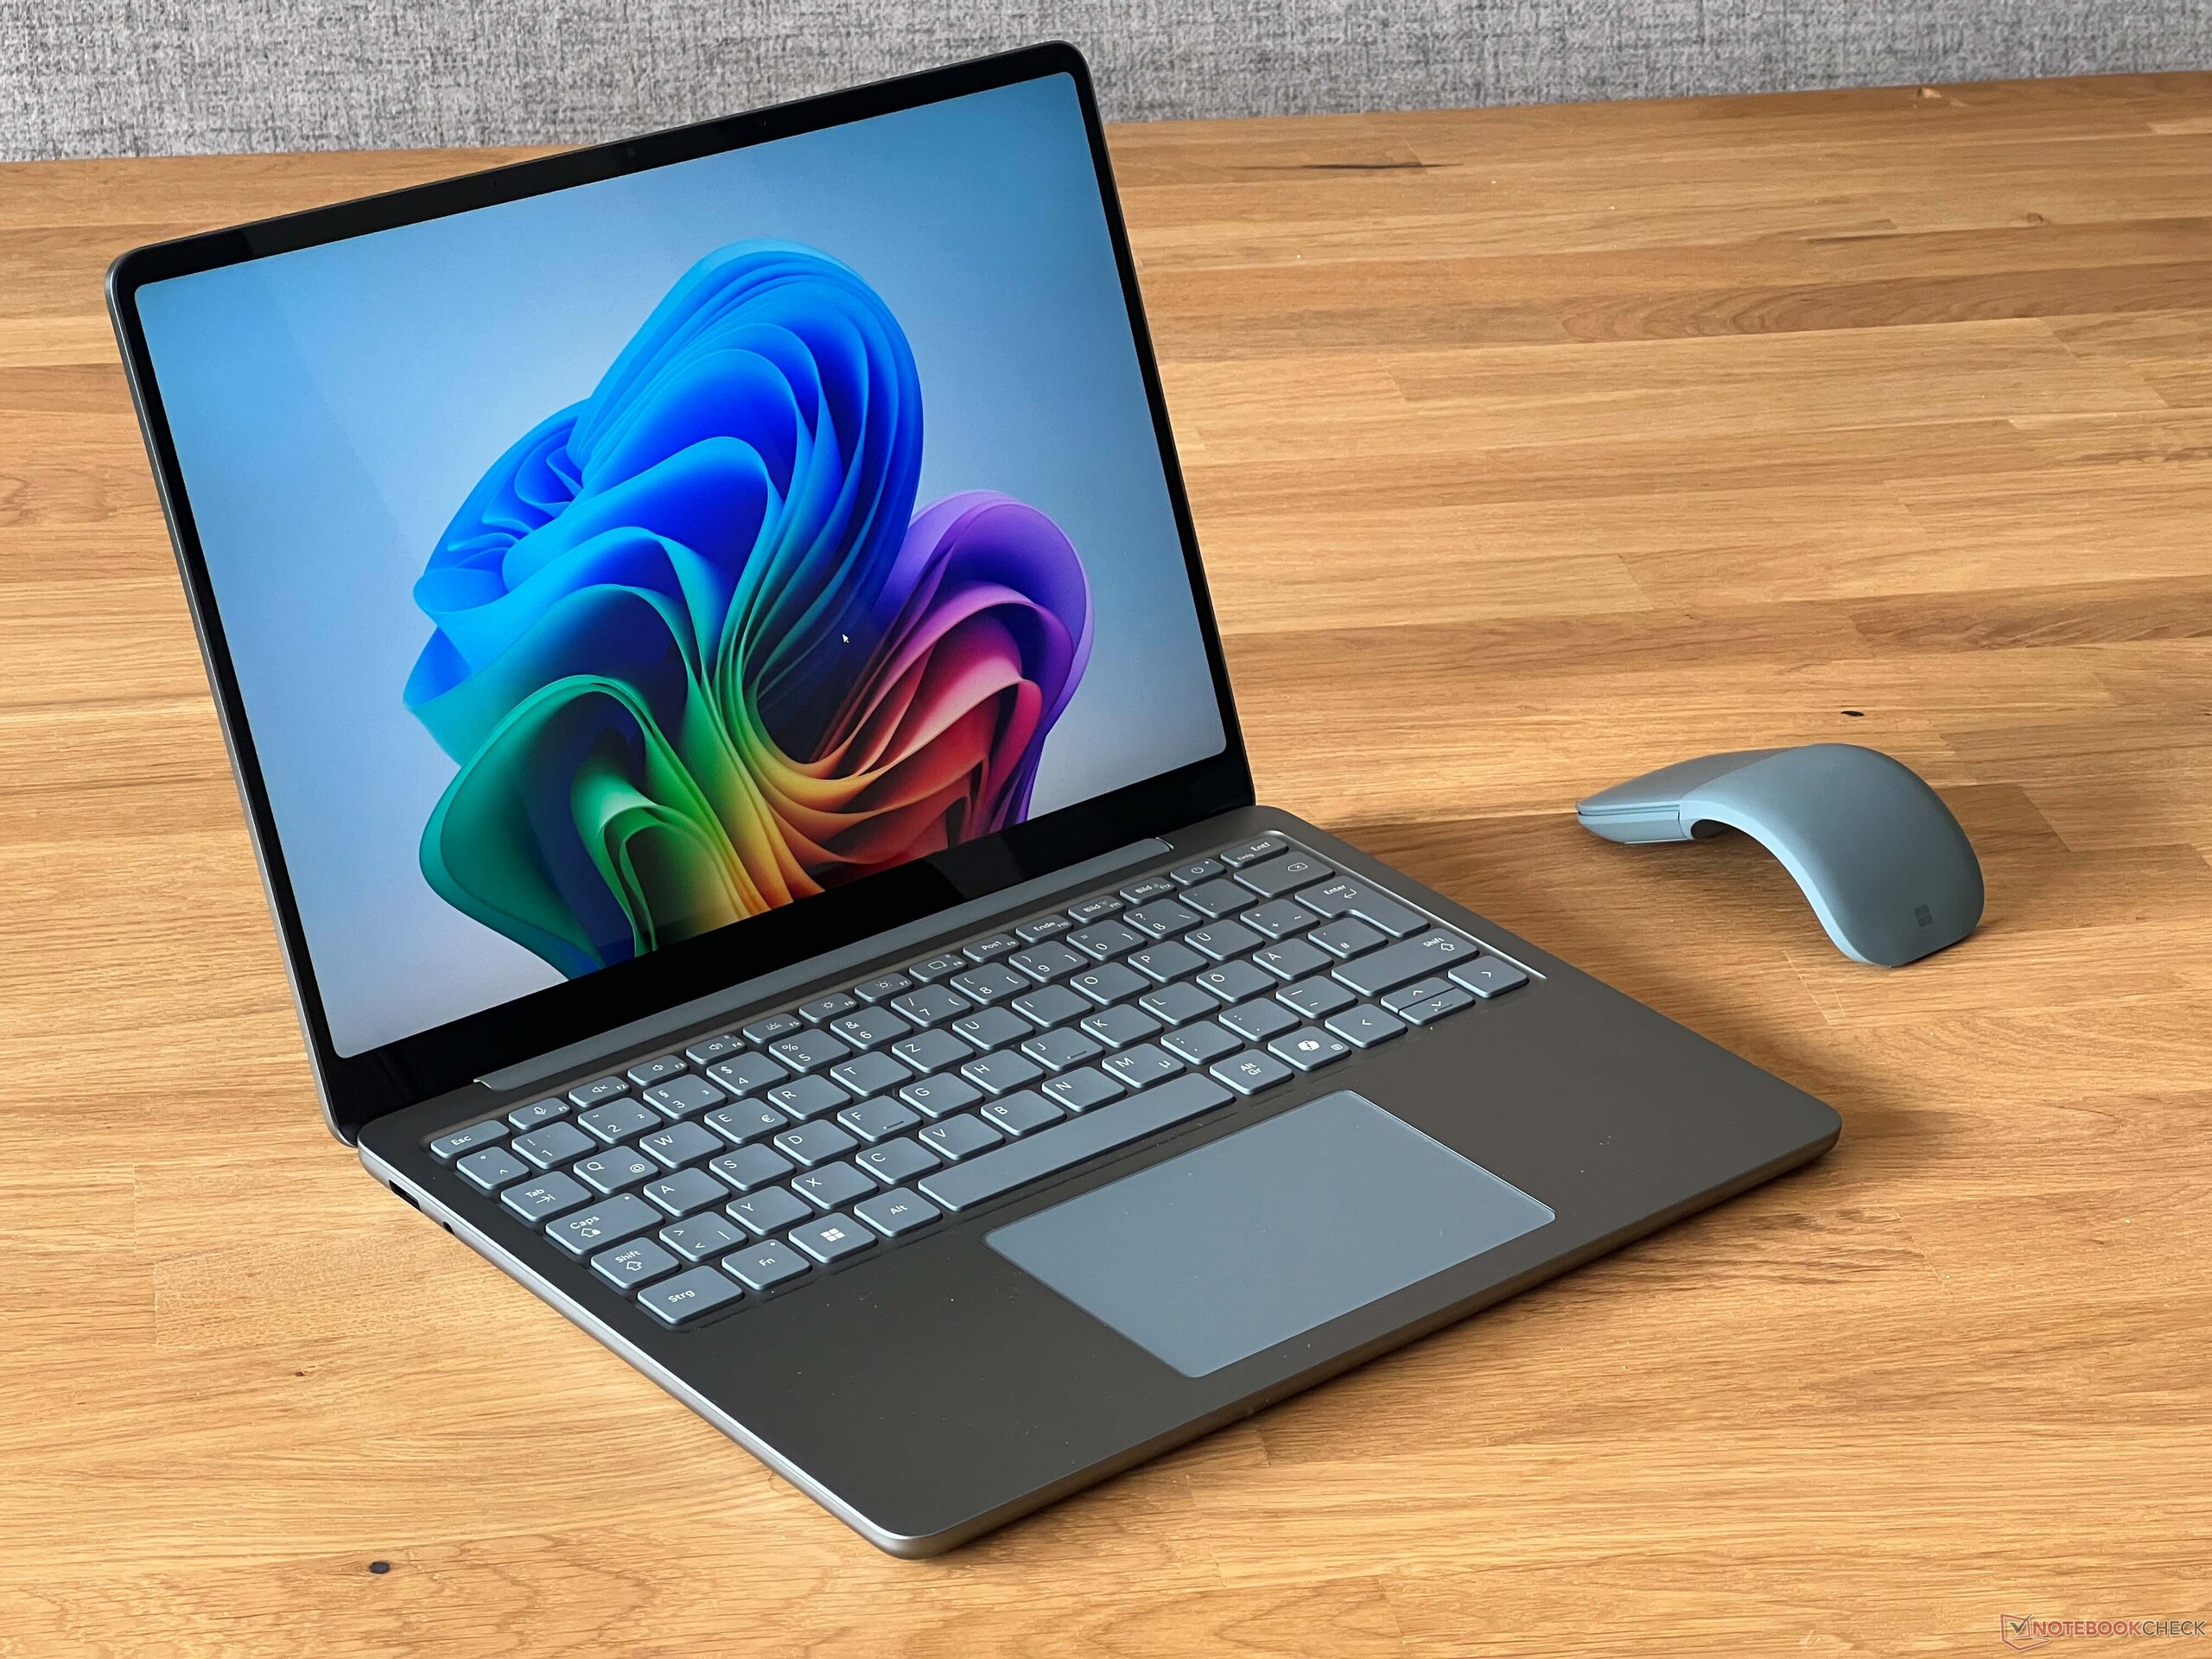
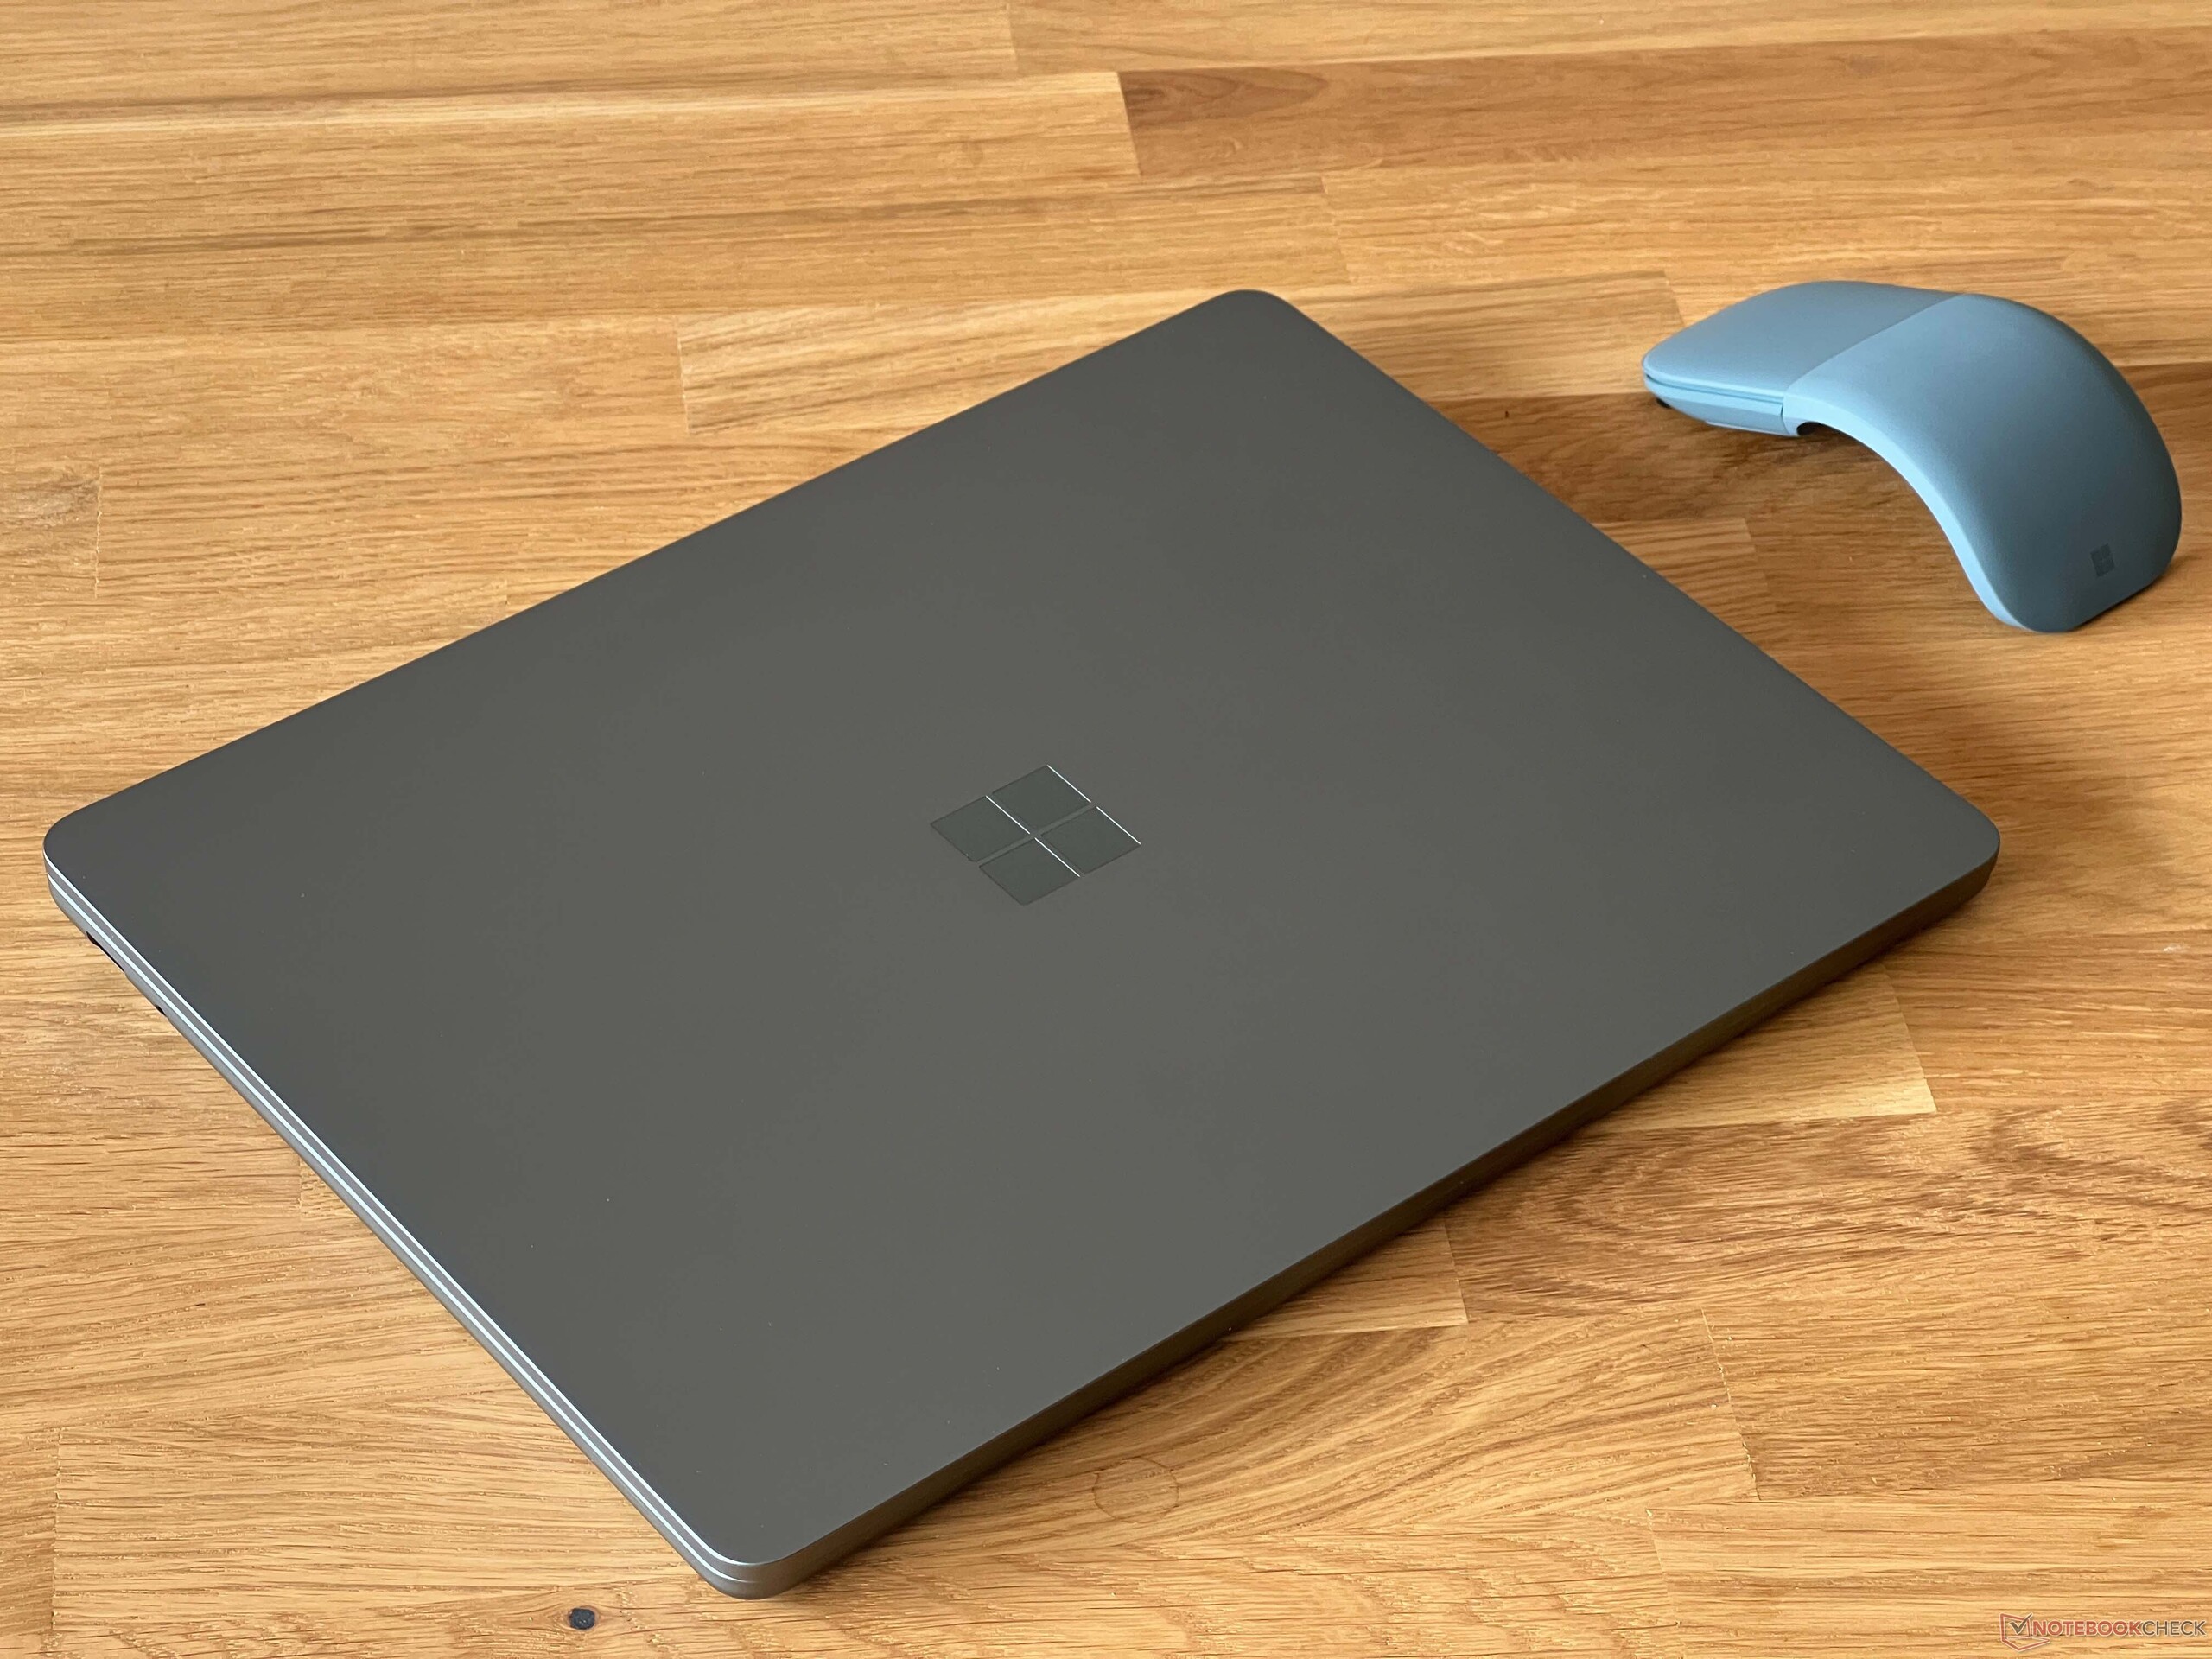
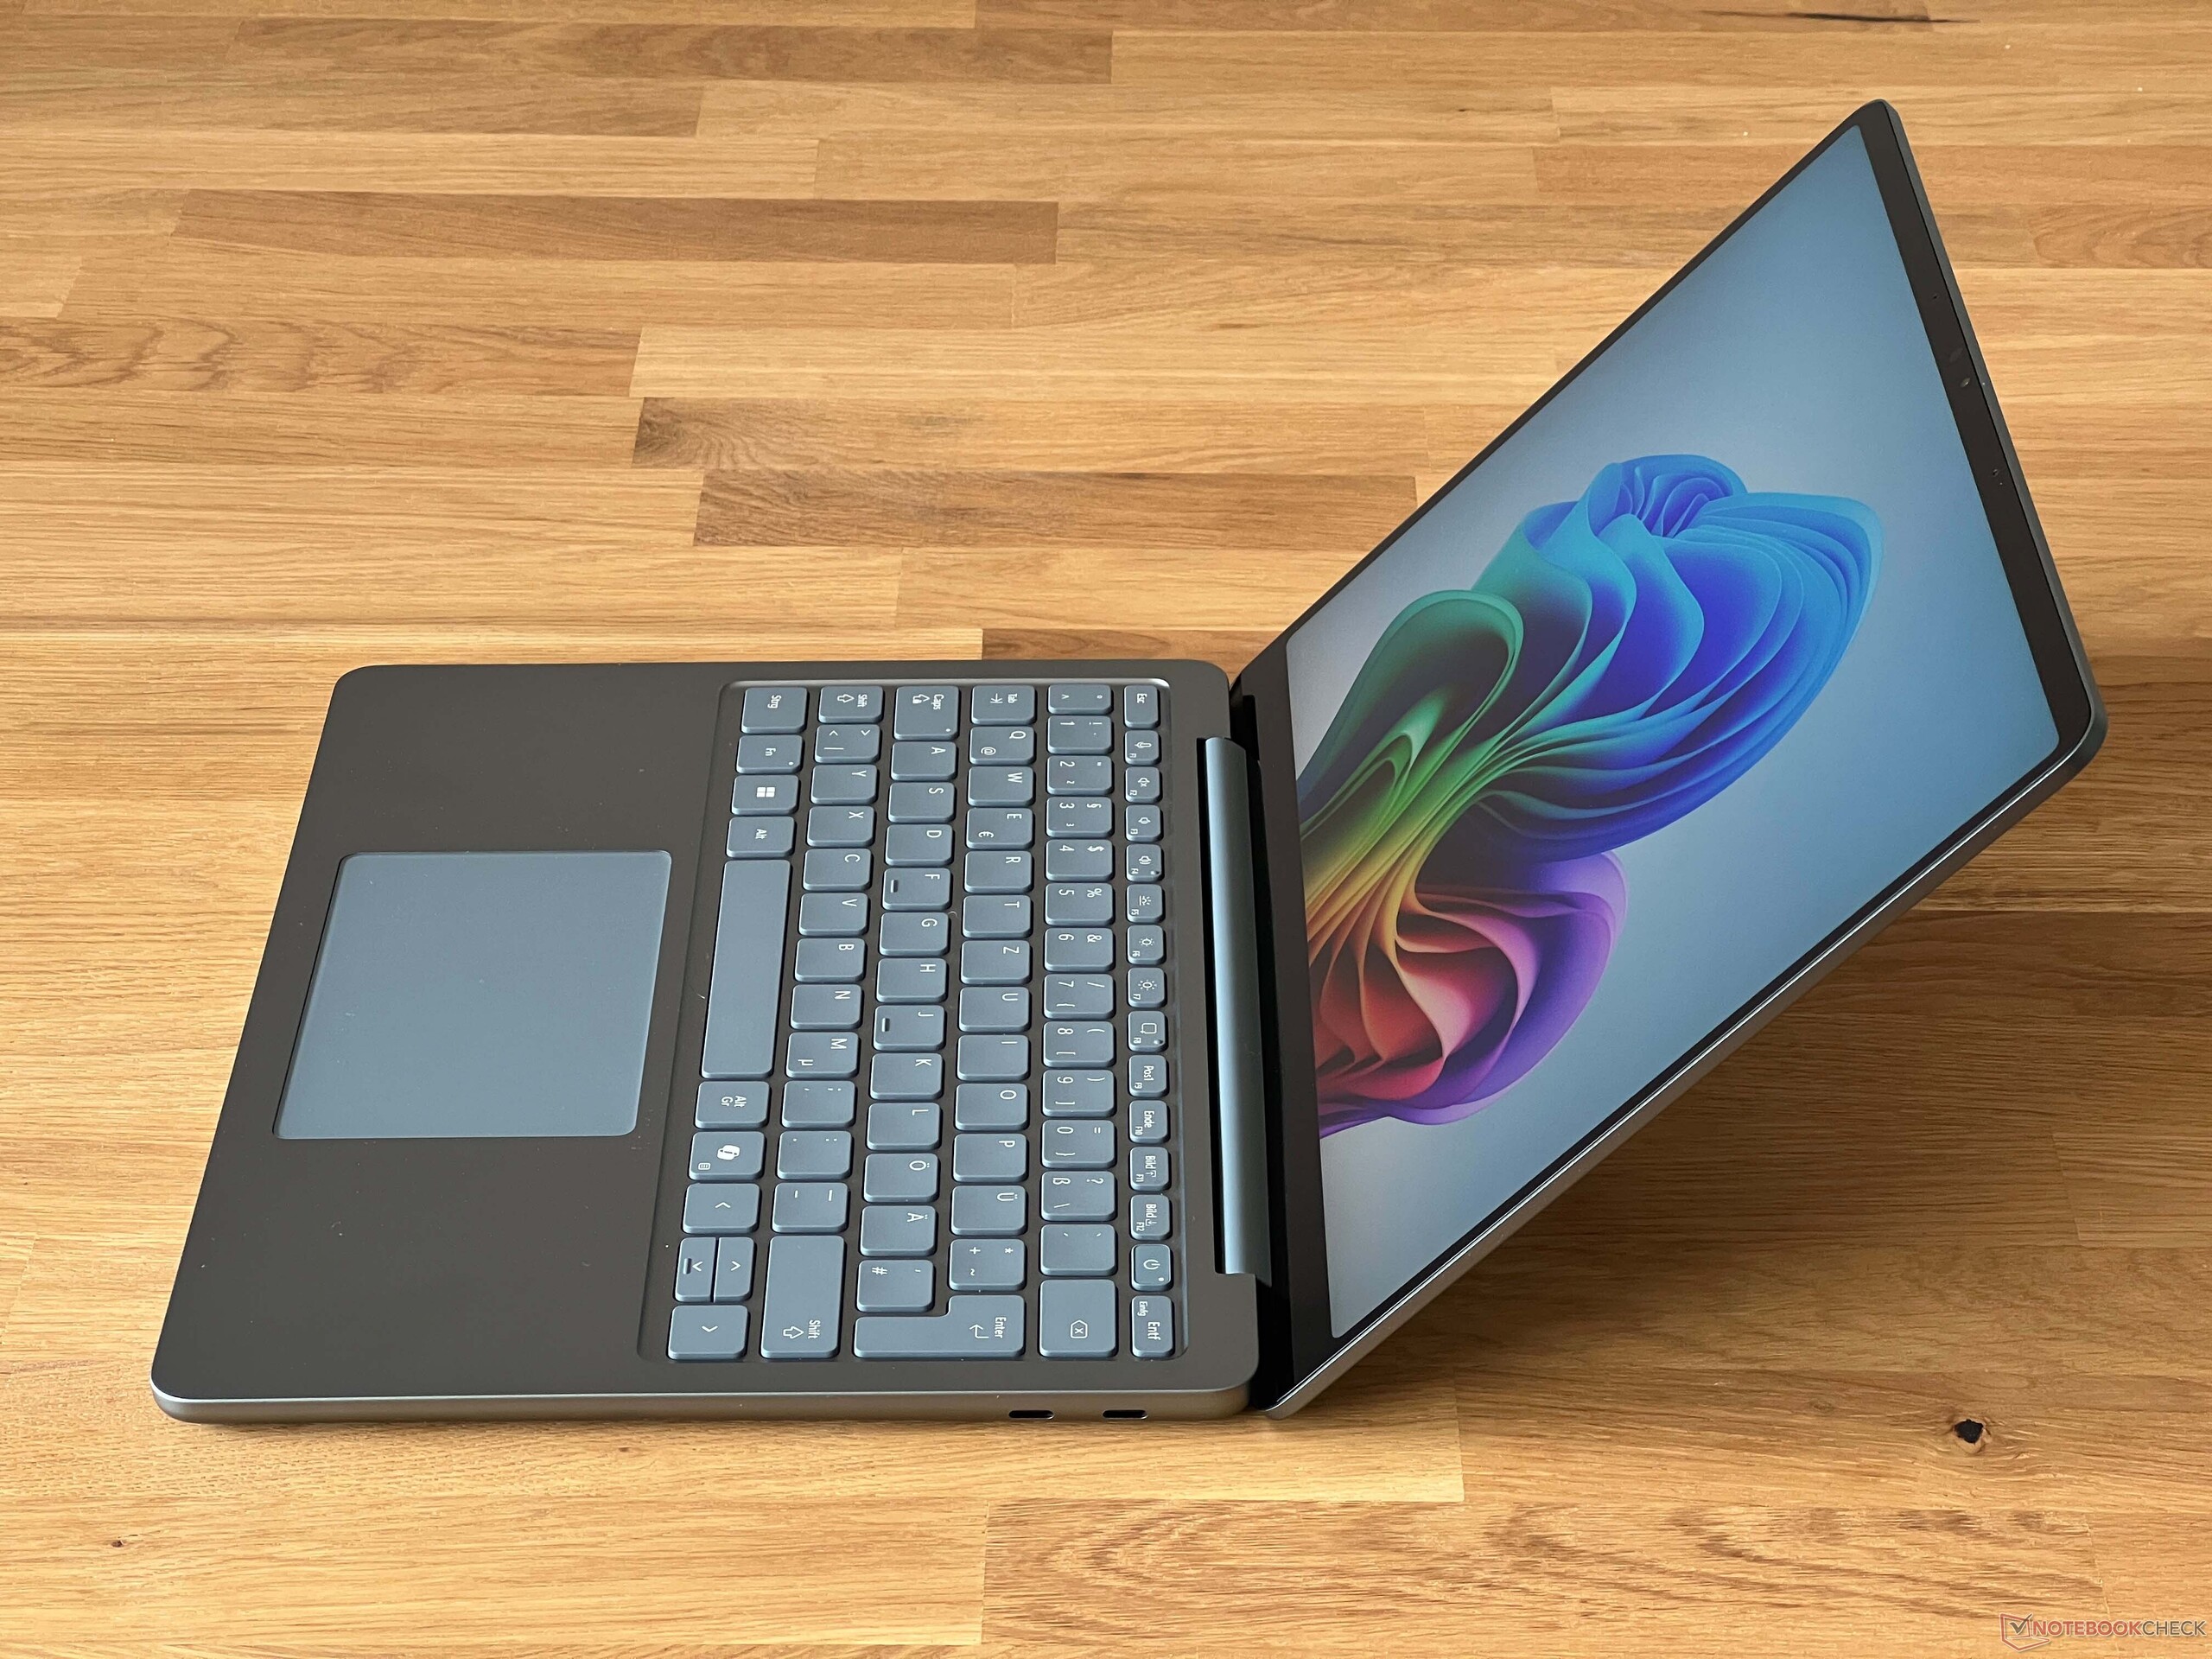
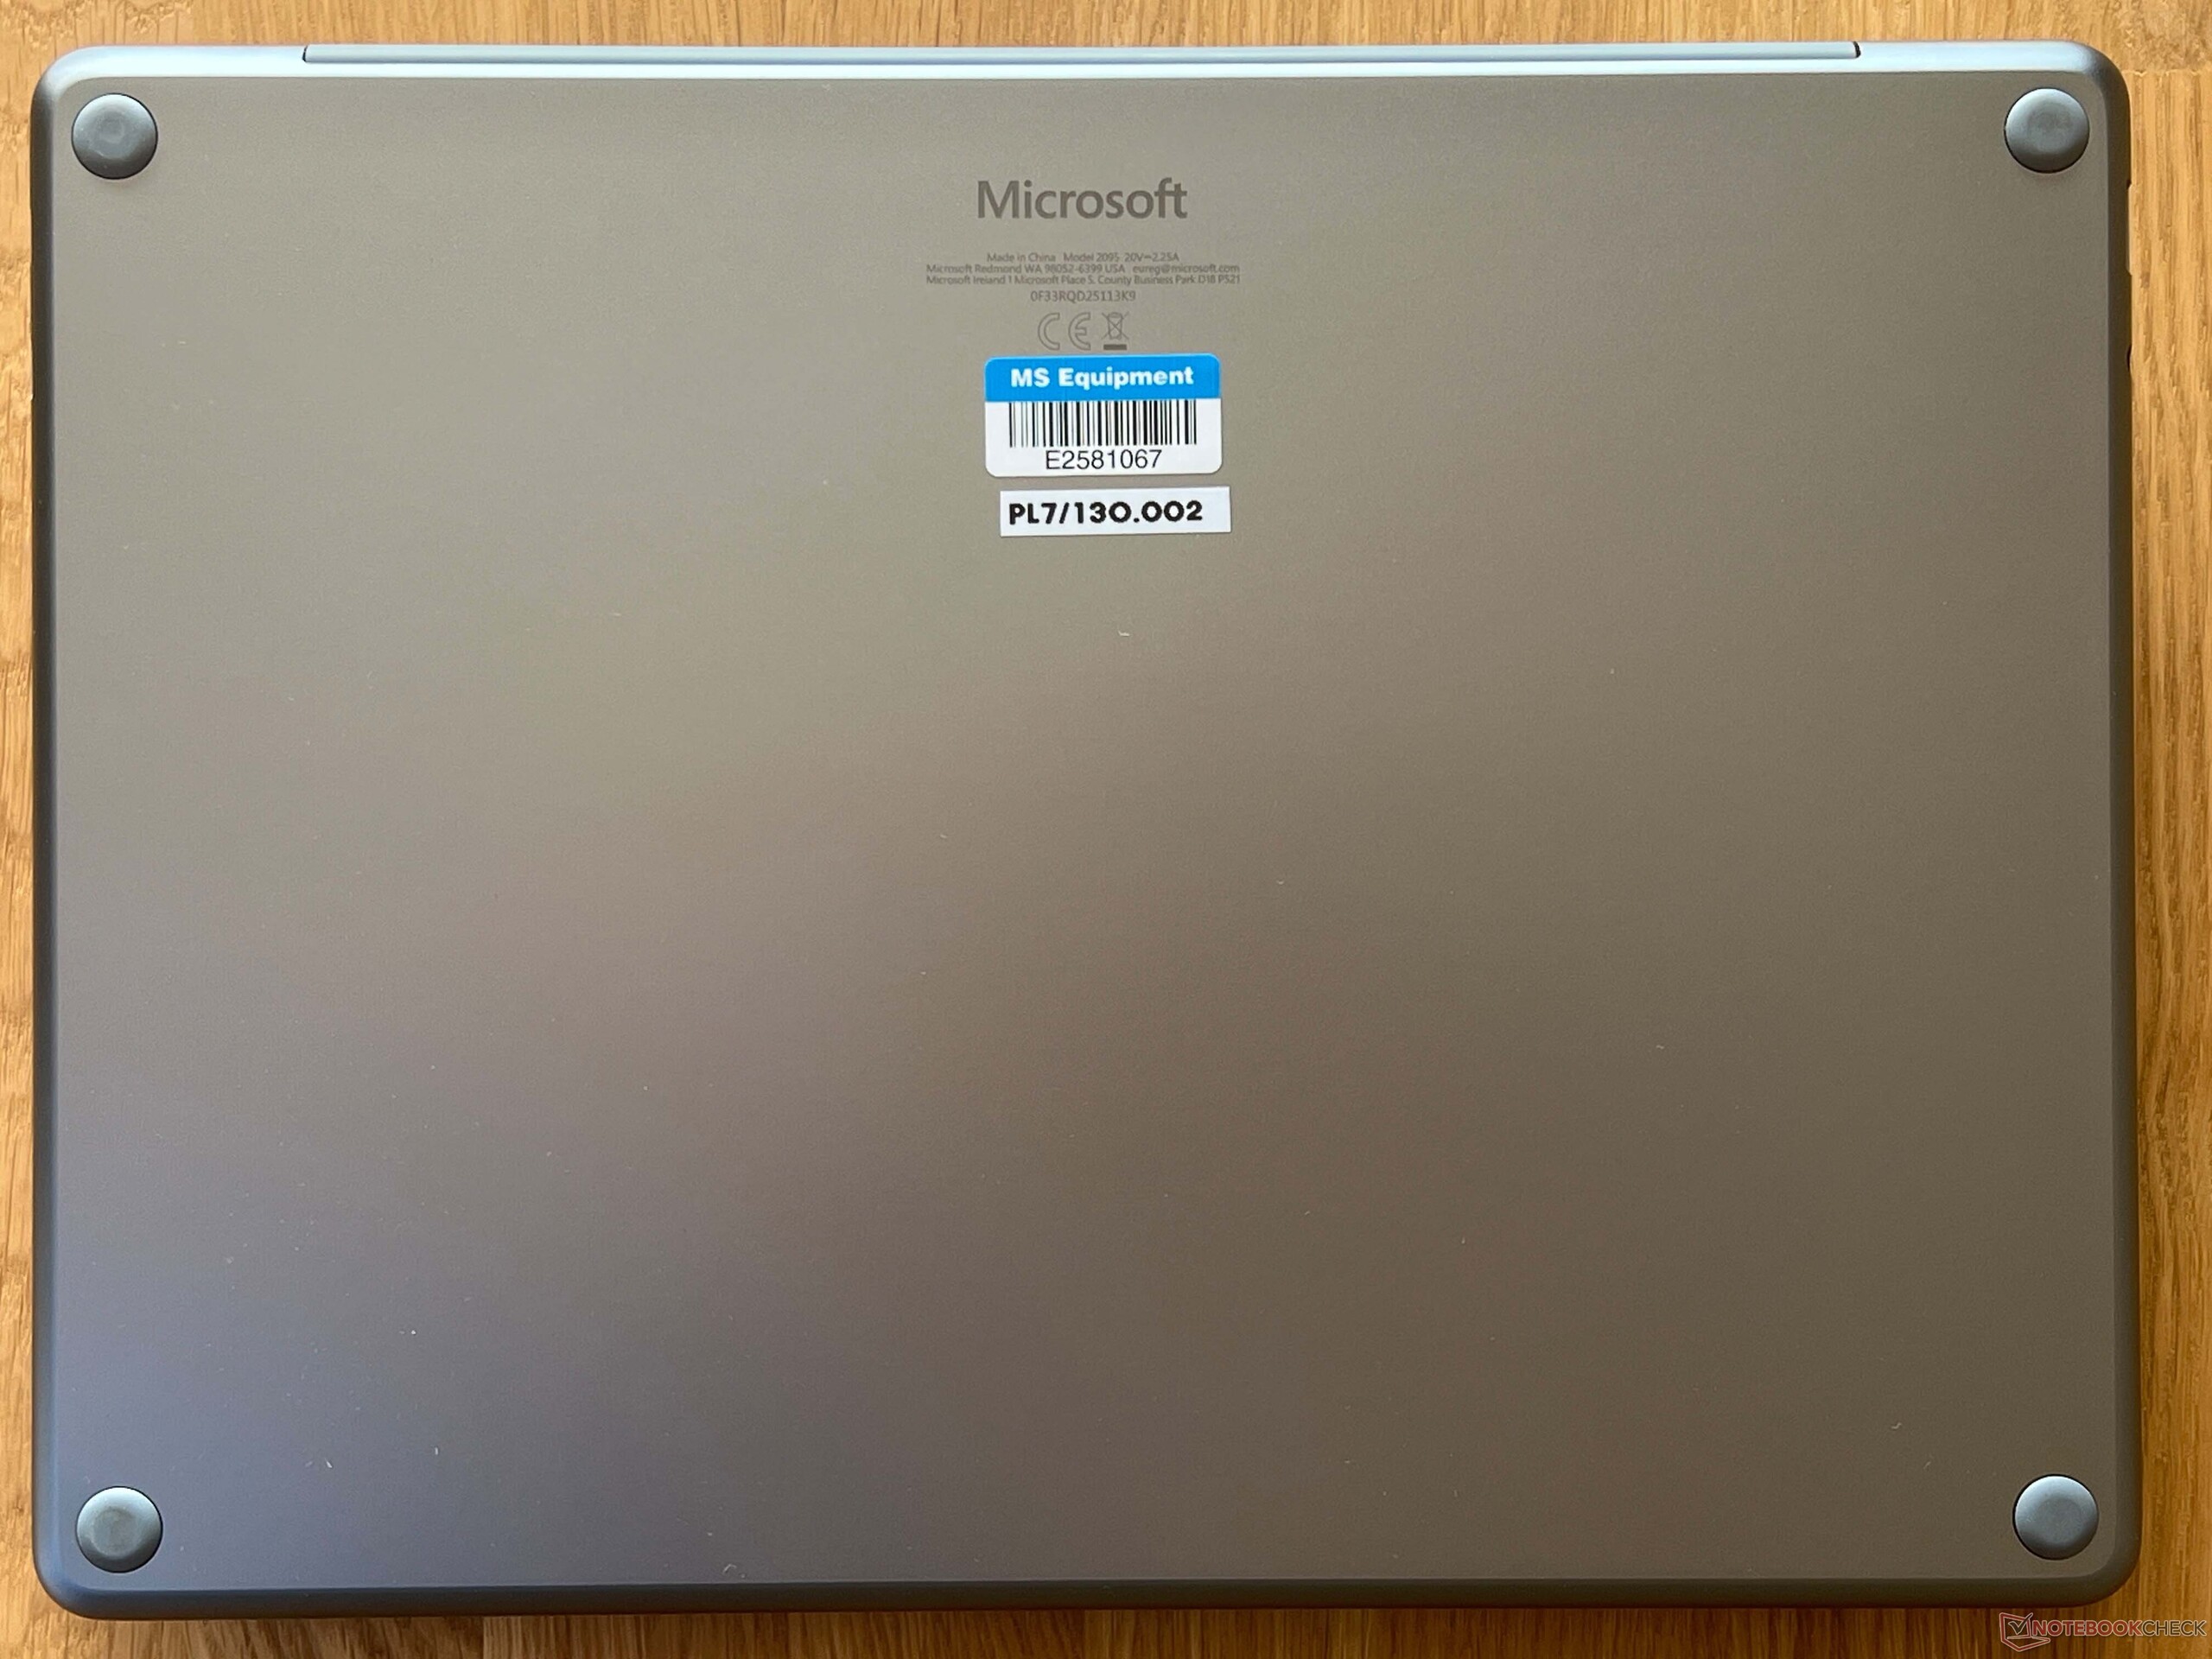
In terms of its design, the new Surface Laptop differs a little compared to the larger models, as its base unit is slightly more rounded. Weighing in at 1.2 kilograms, the device isn't particularly heavy, however, the back part (15.9 millimeters) in particular feels quite bulky. Its build quality is great and its metal case doesn't disappoint when it comes to stability either. Still, we noted some creaking noises when opening the lid (max. ~135 degrees), and you can hardly do so with one hand. Screws are hidden beneath the four glued-on rubber feet but even after removing these, the cover was extremely tight on our test device and we couldn't remove it. [June 12, 2025 update: We did it. Please scroll down to the Maintenance section for more.] The case is available in Silver, Violet, or Ocean, with the latter being our test device's colorway.
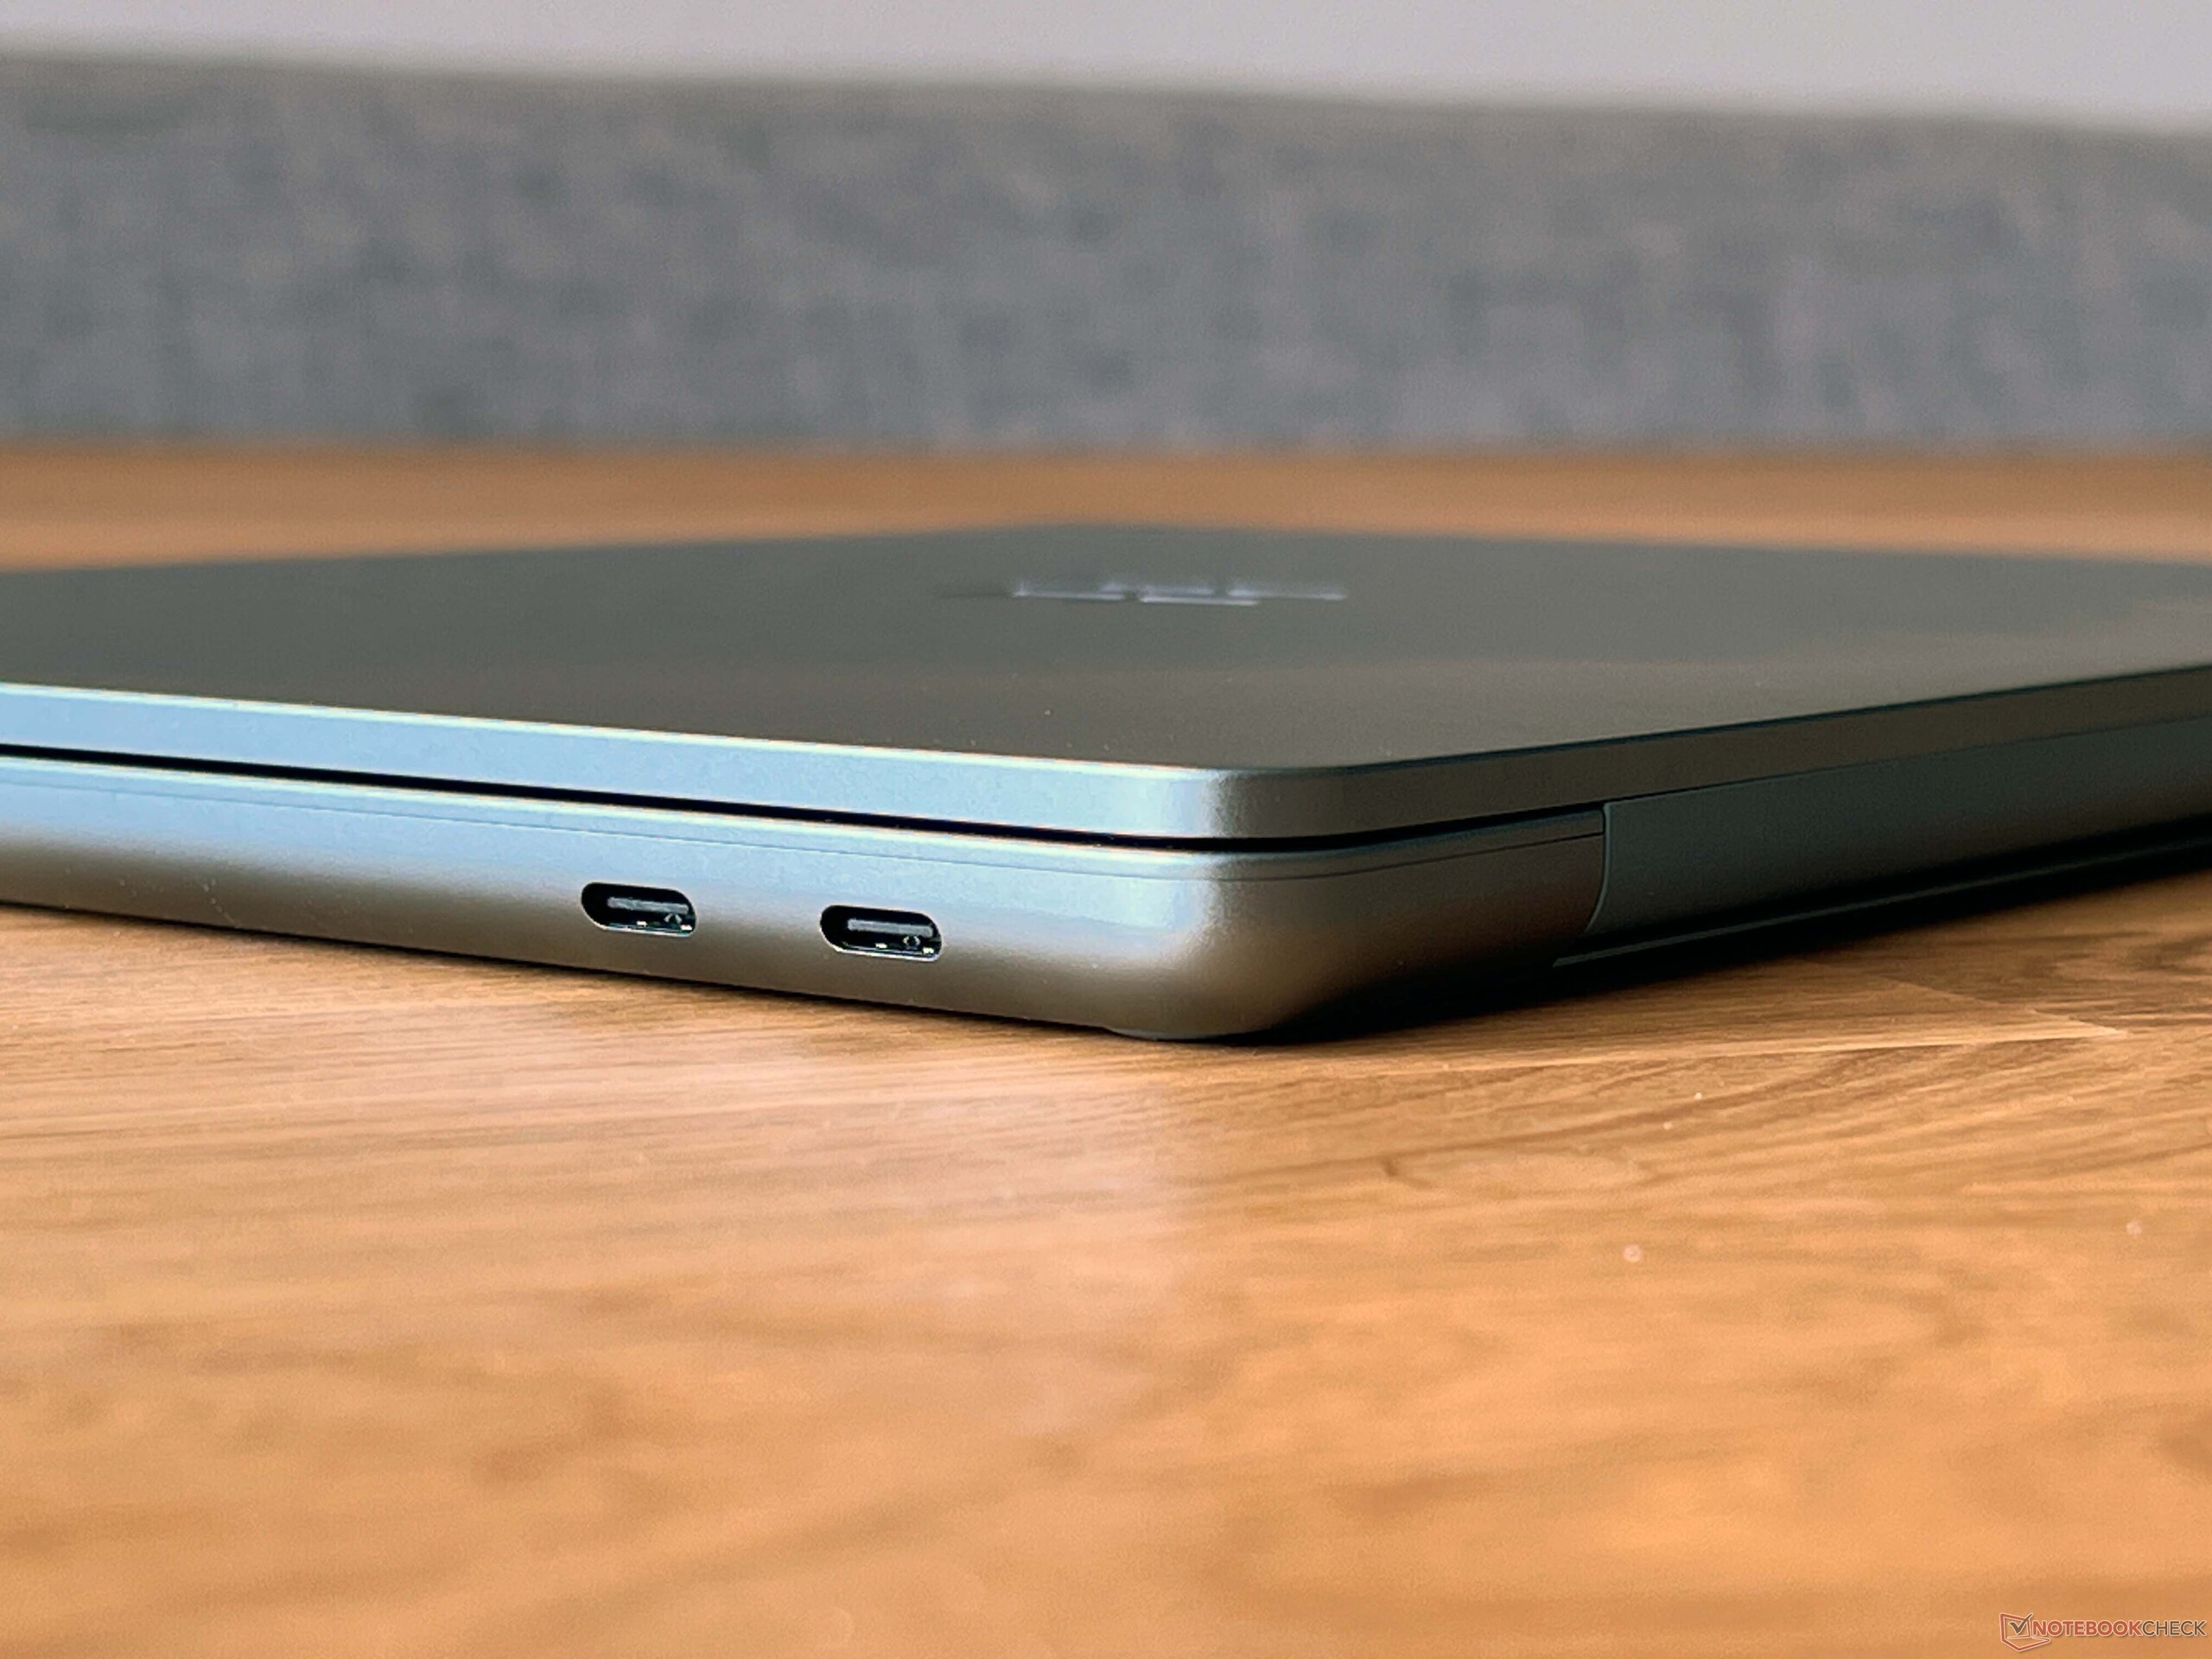
When it comes to its connectivity, Microsoft has axed the Surface connector, which may become an issue if you still have corresponding accessories. The two USB-C ports only support the 3.2 standard. Nevertheless, the laptop supports Wi-Fi 7 and its transfer rates were excellent during our test. Its 1080p webcam takes decent photos, and the device is a Copilot+ laptop.


| Networking | |
| Microsoft Surface Laptop 13 | |
| iperf3 transmit AXE11000 | |
| iperf3 receive AXE11000 | |
| Microsoft Surface Laptop 7 13.8 Copilot+ | |
| iperf3 transmit AXE11000 | |
| iperf3 receive AXE11000 | |
| iperf3 transmit AXE11000 6GHz | |
| iperf3 receive AXE11000 6GHz | |
| Apple MacBook Air 13 M3 10C GPU | |
| iperf3 transmit AXE11000 | |
| iperf3 receive AXE11000 | |
| Dell XPS 13 9345 | |
| iperf3 transmit AXE11000 | |
| iperf3 receive AXE11000 | |
| iperf3 transmit AXE11000 6GHz | |
| iperf3 receive AXE11000 6GHz | |
| Framework Laptop 13.5 Core Ultra 7 155H | |
| iperf3 transmit AXE11000 | |
| iperf3 receive AXE11000 | |
| iperf3 transmit AXE11000 6GHz | |
| iperf3 receive AXE11000 6GHz | |
| Microsoft Surface Laptop Go 3 | |
| iperf3 transmit AXE11000 | |
| iperf3 receive AXE11000 | |


Maintenance
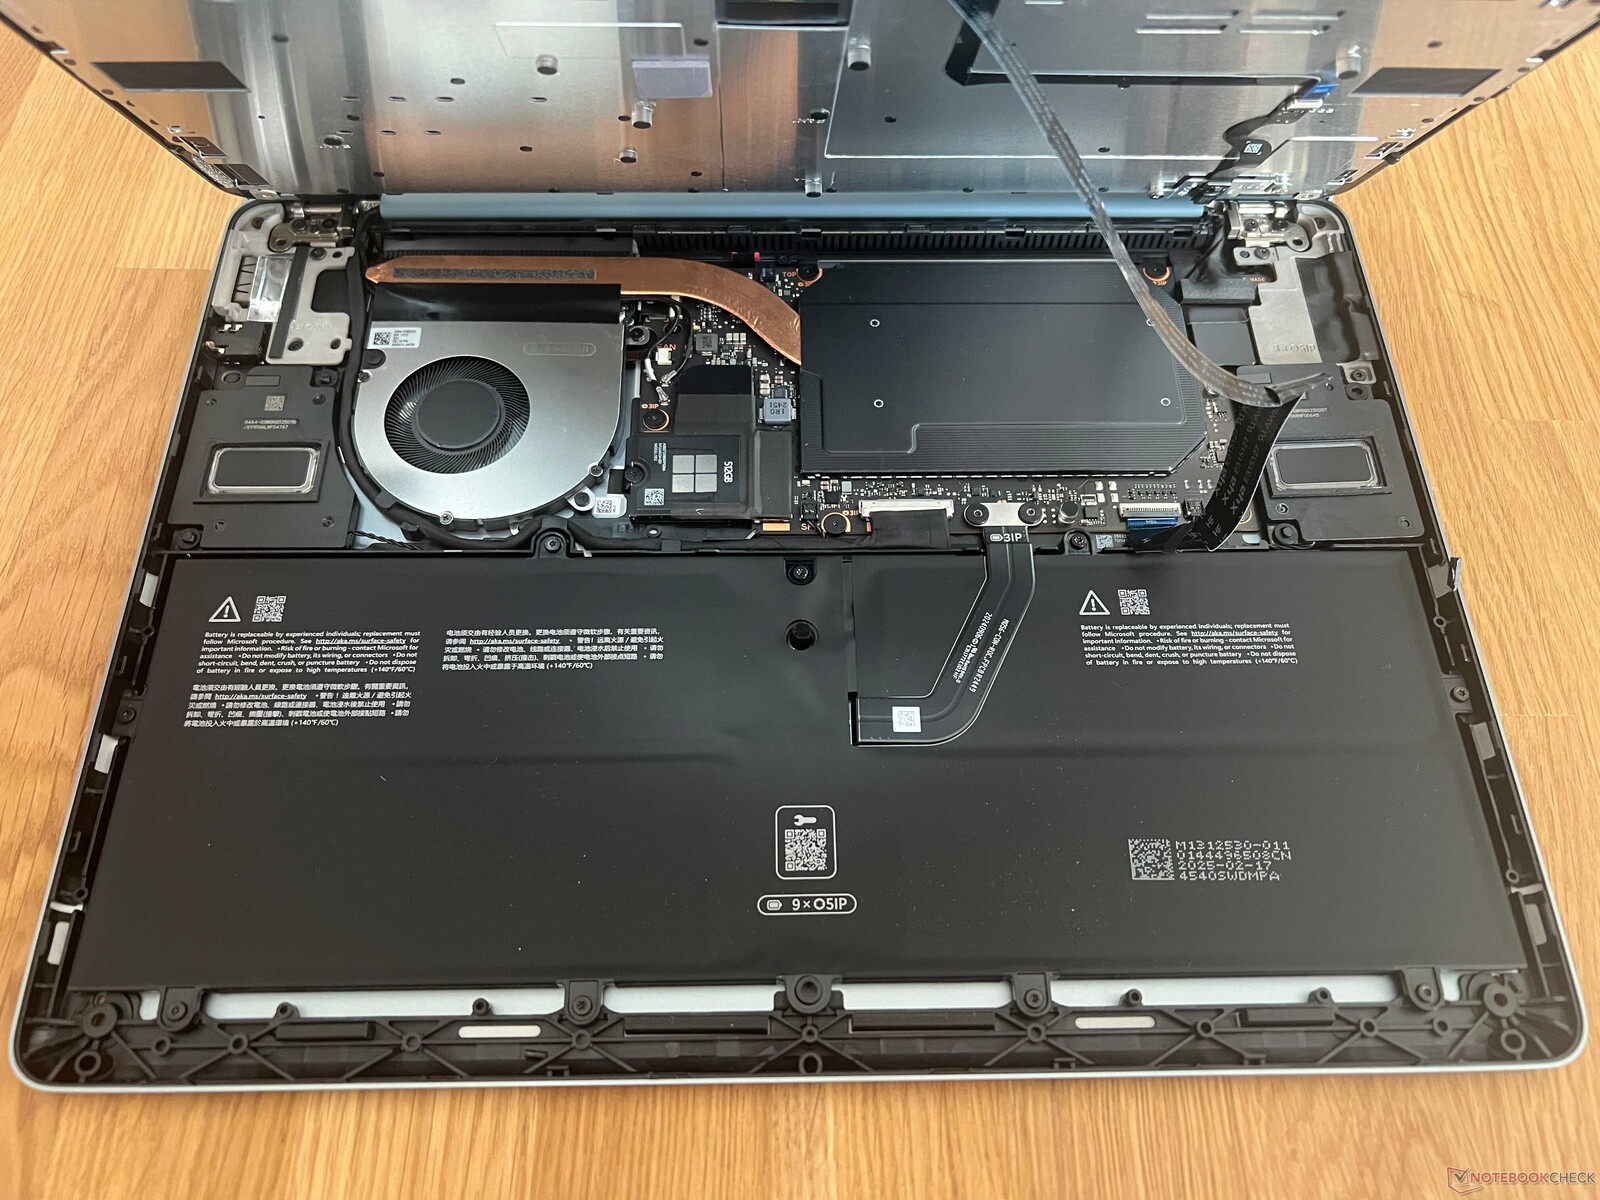
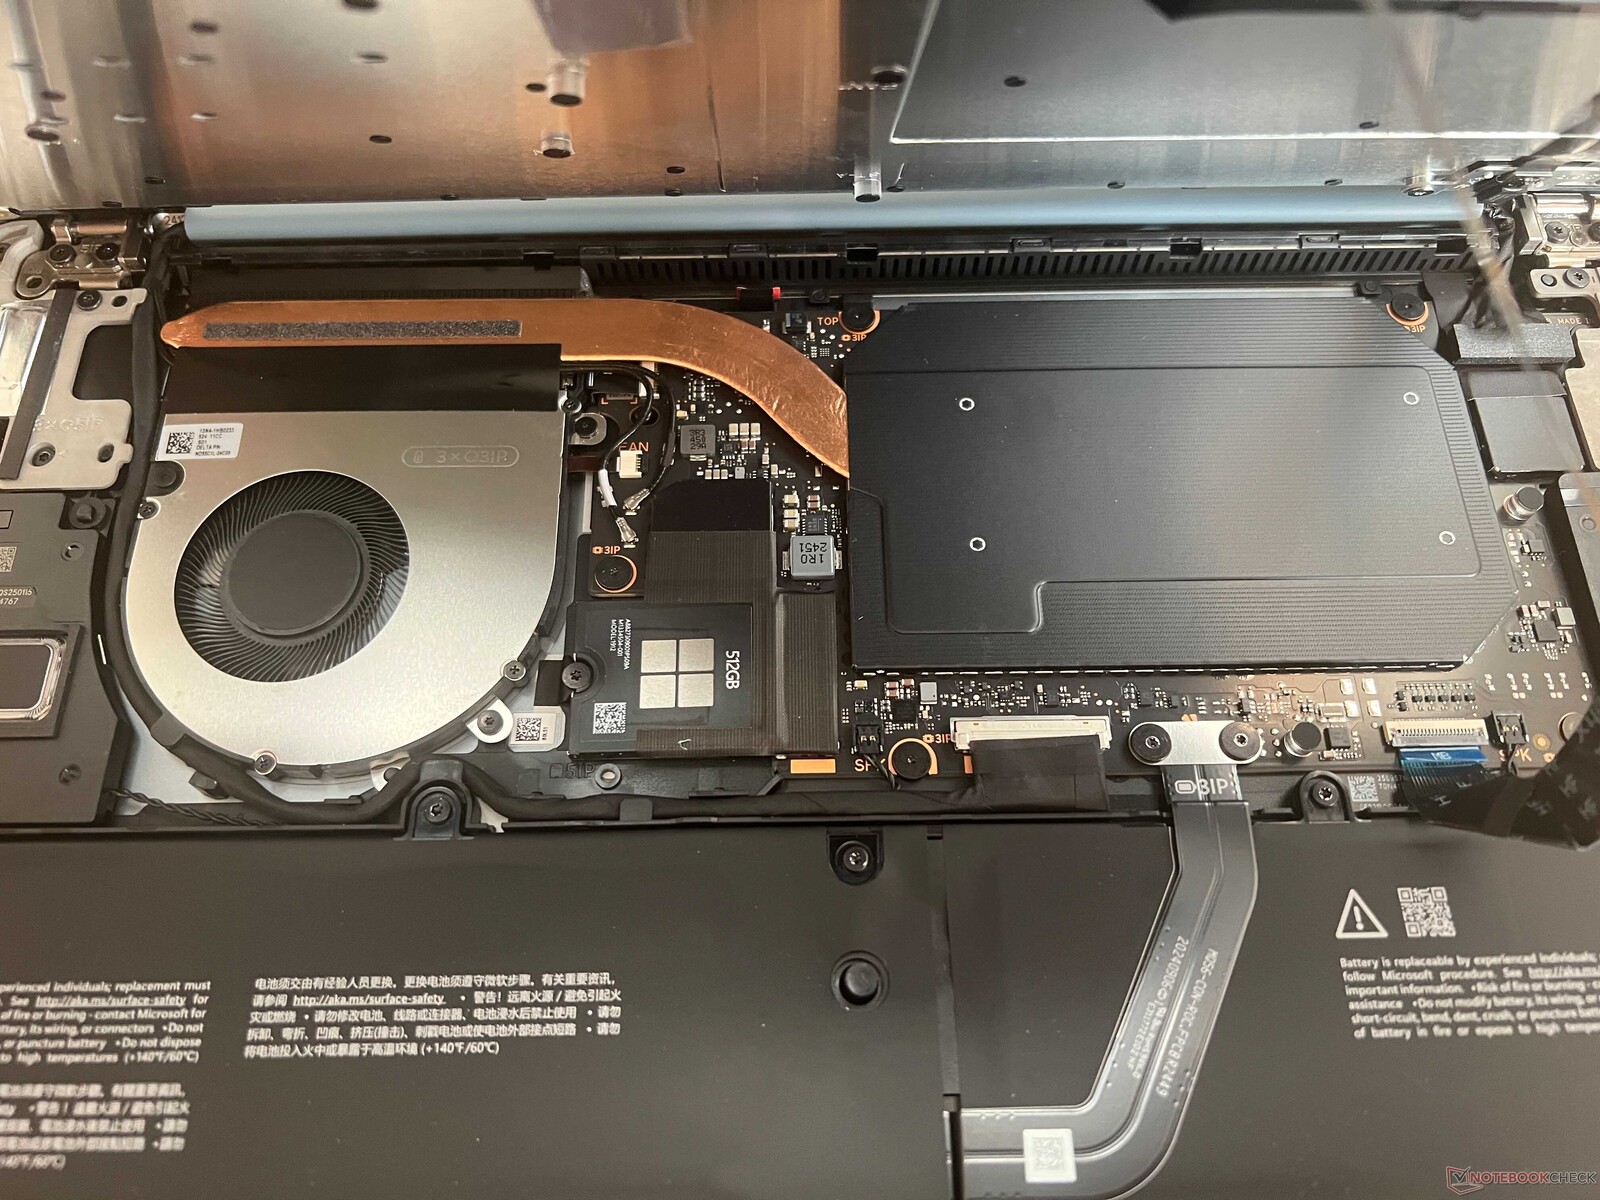
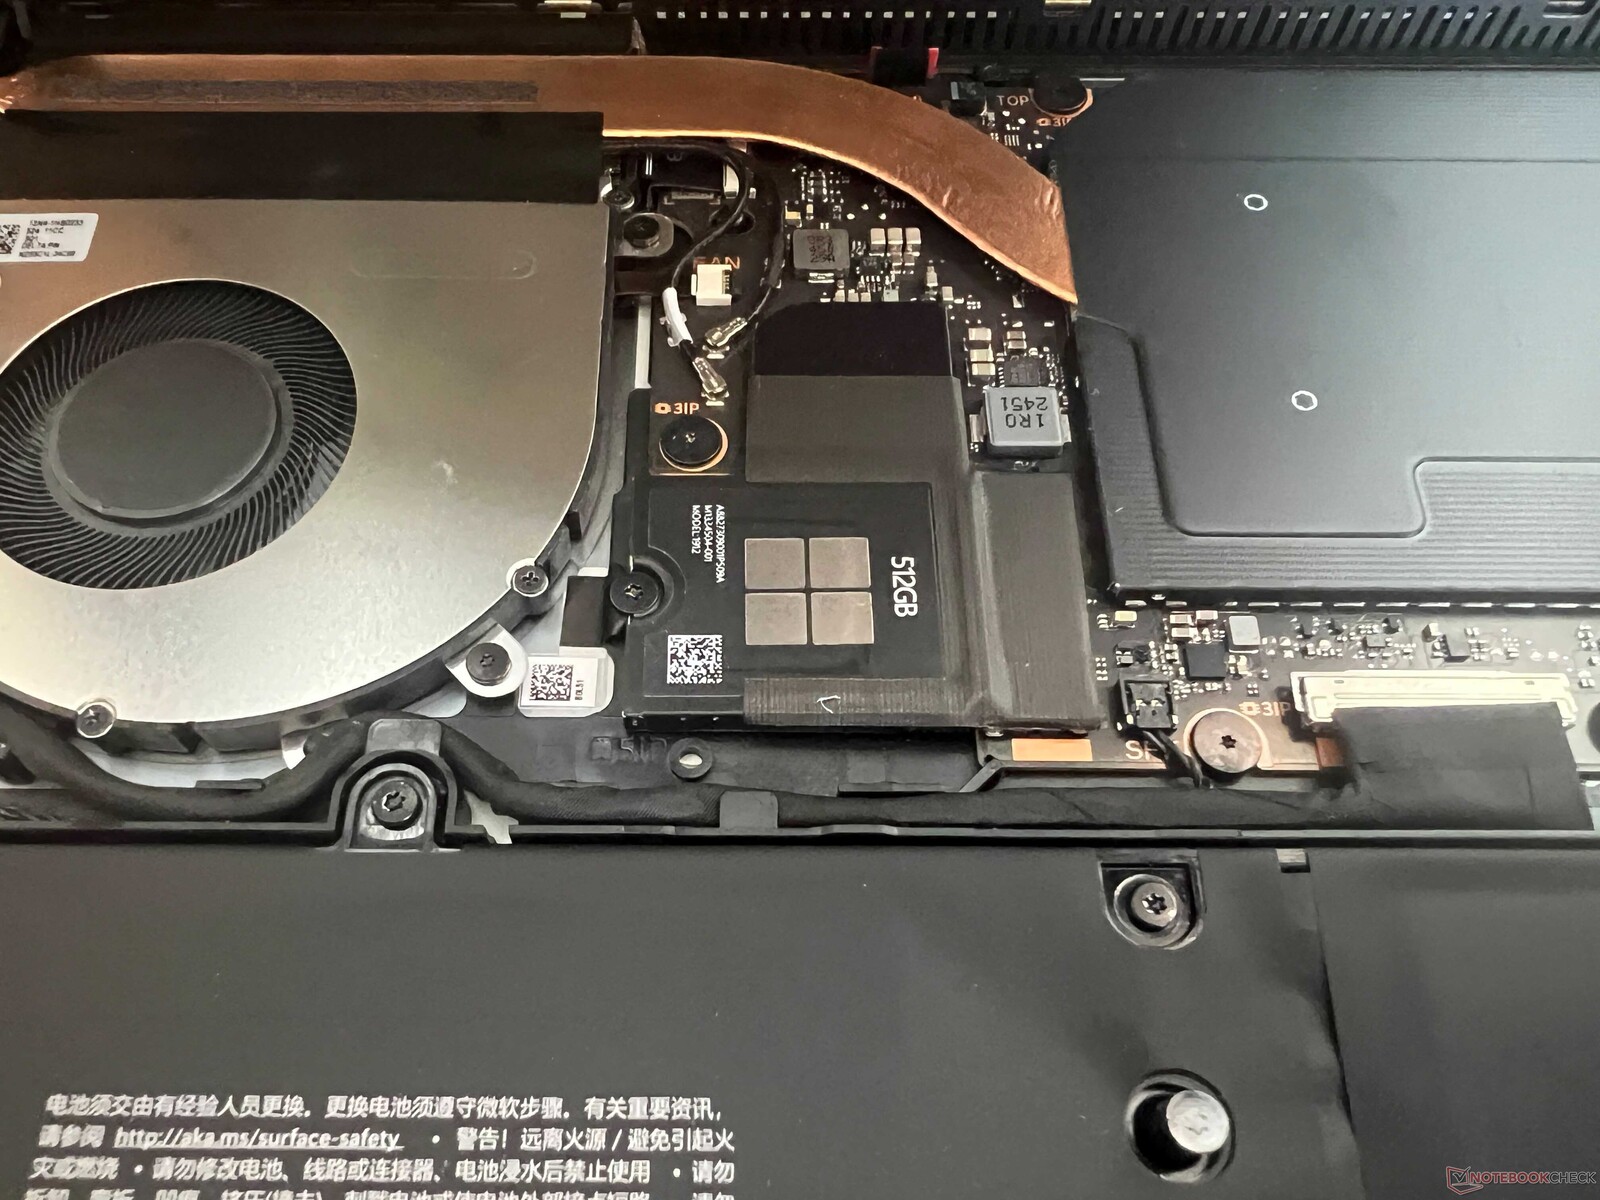
We tried following the official repair guide (in German) and ultimately succeeded. After removing the screws holding the bottom plate in place, one should carefully try to lift the plate up using plastic spudgers and similar tools. Careful; a cable has to be disconnected before removing the bottom plate. Once done, the system's internals are revealed. A single fan is employed for cooling and the socketed UFS data storage module really is user-replaceable. Some kind of an adhesive is used on the data storage medium which is not particularly user-friendly and represents a step back for Surface products as a series, in our opinion.
Sustainability
The Surface Laptop 13 is Energy Star certified and Microsoft states on its website which components are made from recycled materials. In contrast to the Surface Laptop 13.8, however, no details are given about the case itself. Its packaging can be fully recycled.
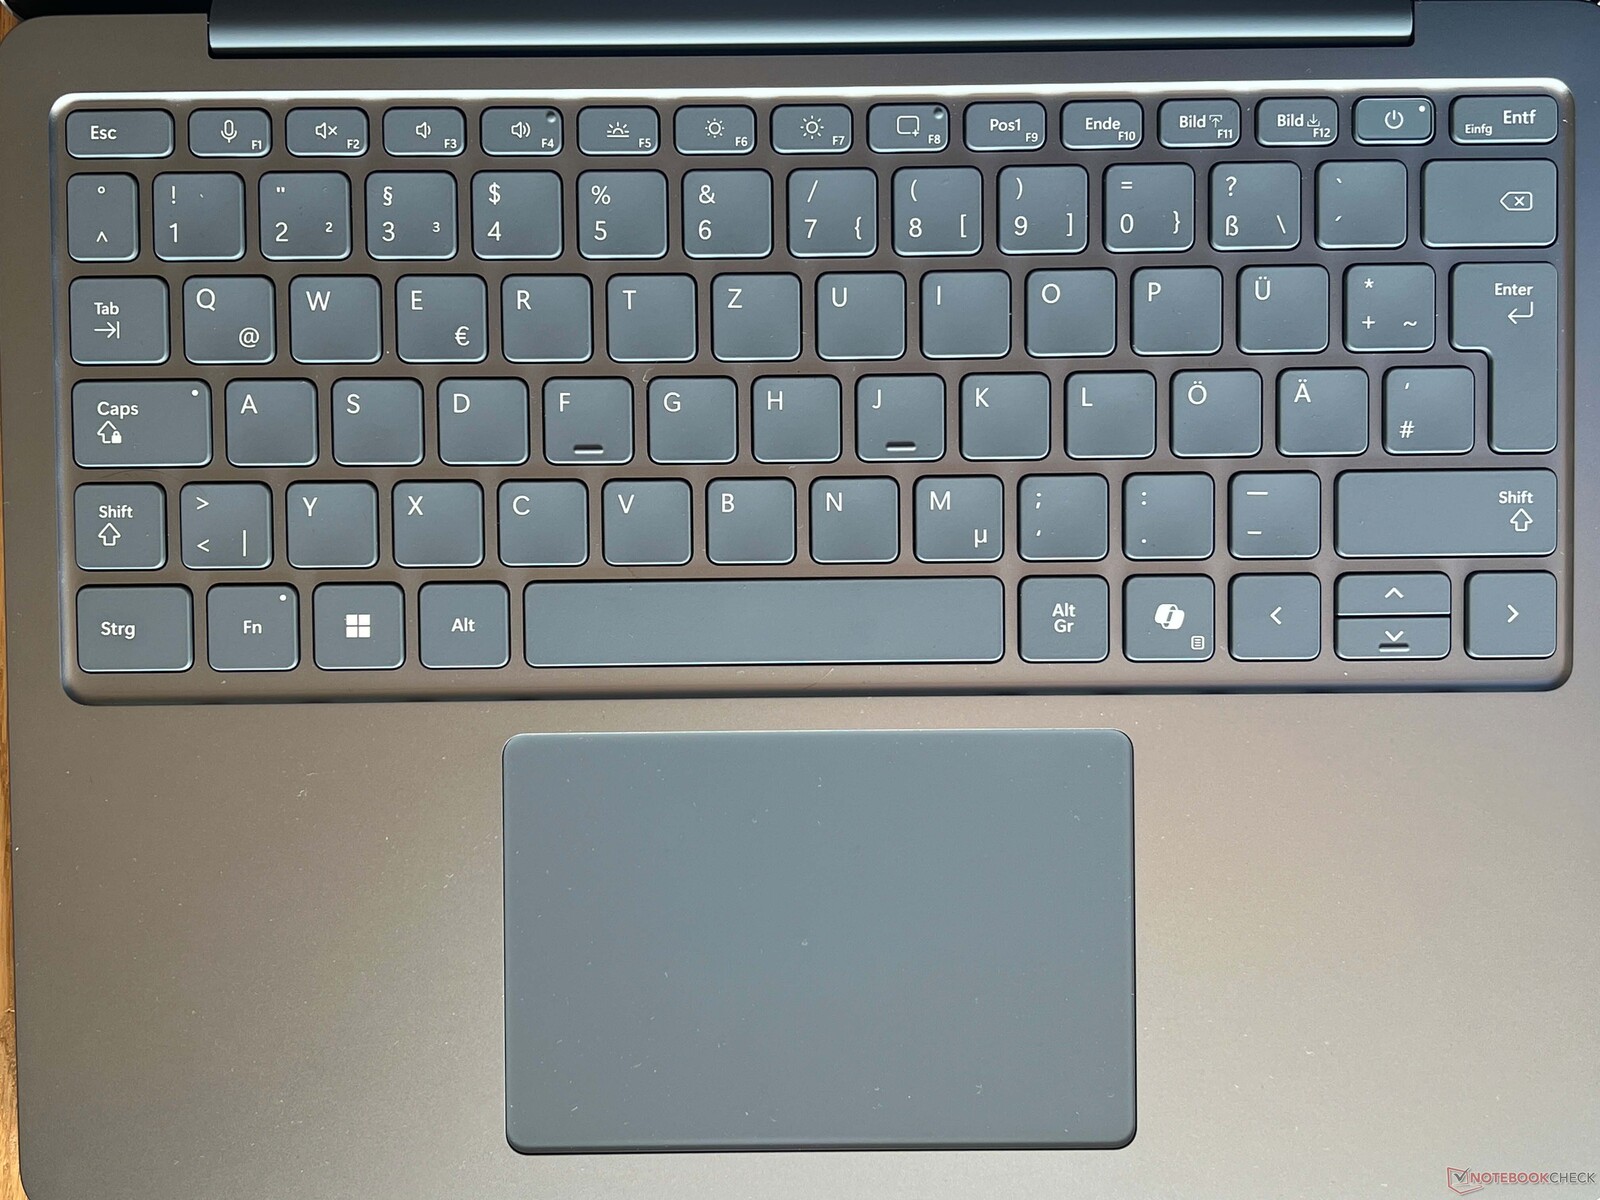
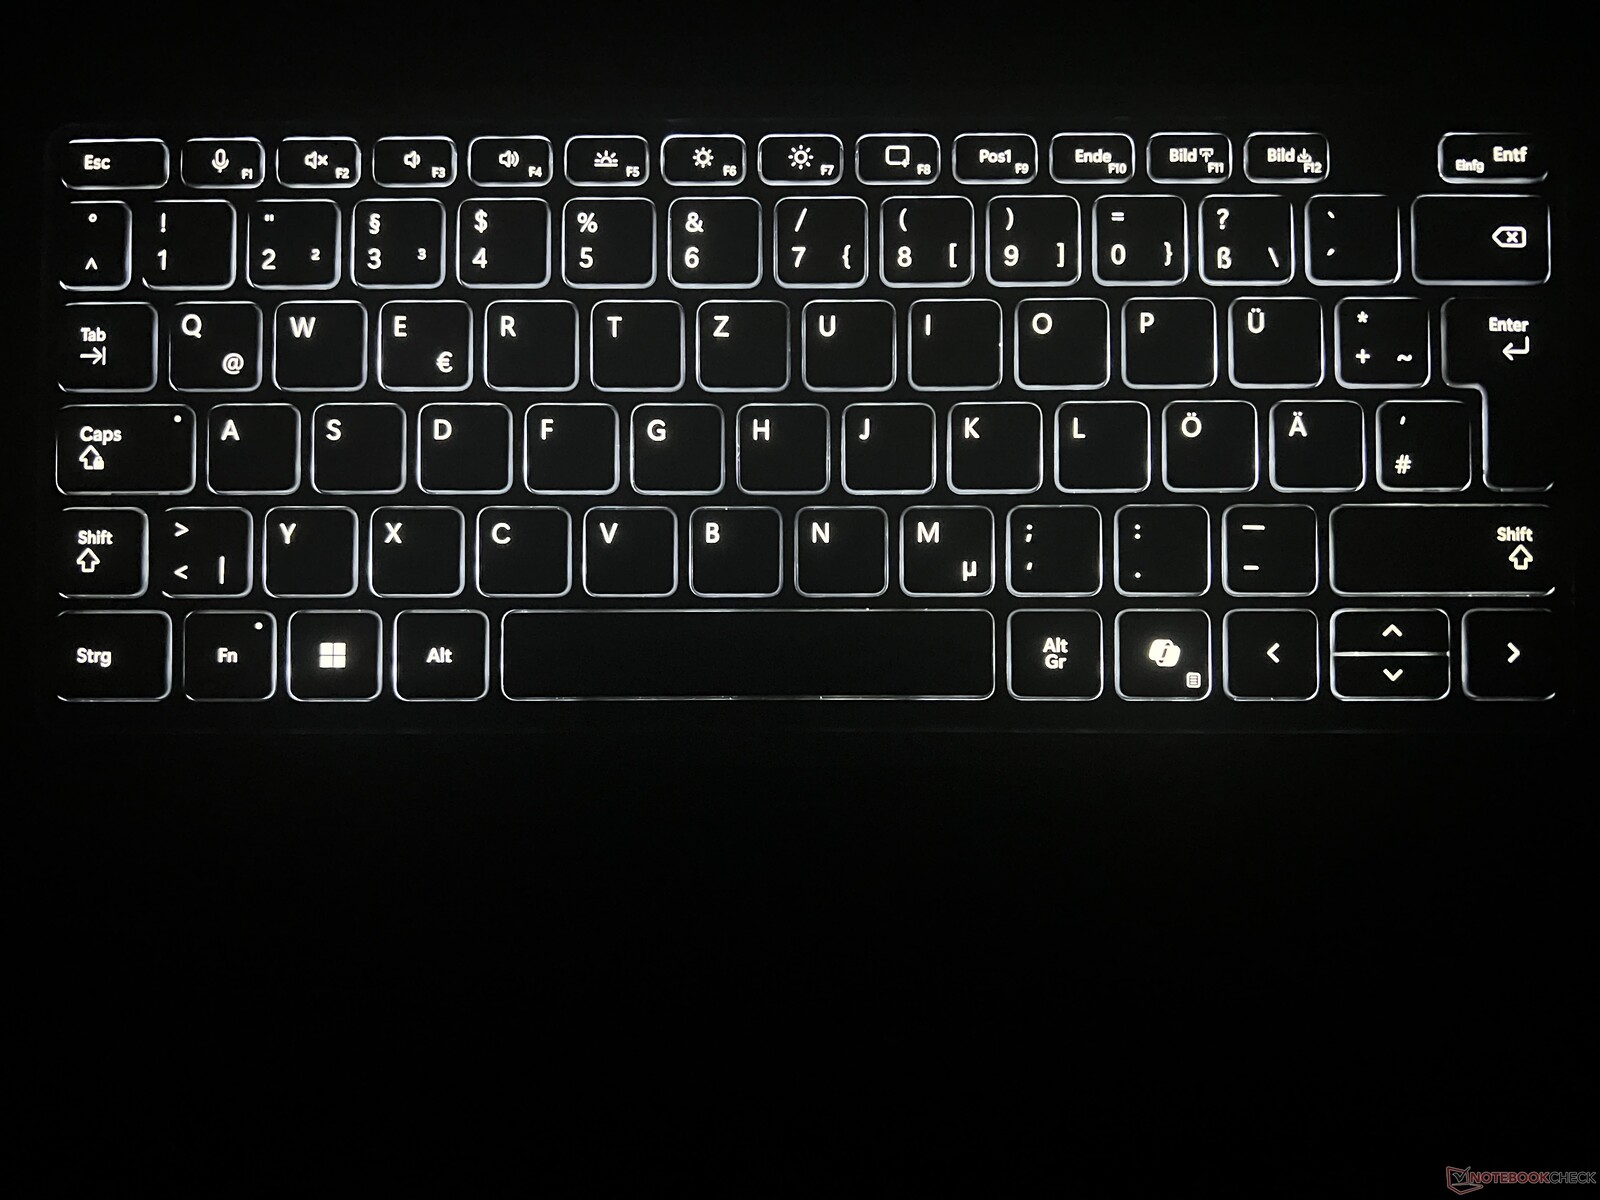
Input devices - Backlit keyboard
The laptop's backlit keyboard feels comfortable to type on, and a fingerprint sensor is integrated into the power button at the top right. In contrast to the Surface Laptop 13.8, this model doesn't feature a haptic trackpad, but the normal clickpad does its job well. It feels nice and smooth and gives off quiet mechanical clicks.
Microsoft additionally sent us its new Surface Arc mouse, which can be made flat for transportation. However, it only works when curved and it only supports one position. In terms of its ergonomics, the mouse really doesn't feel great, as its thin design means that your ring finger and little finger pretty much always hang in the air. The mechanical button is a small ClickPad on which you can also scroll. This works fine, but is somewhat cumbersome and overall, we simply cannot recommend the Surface Arc mouse.
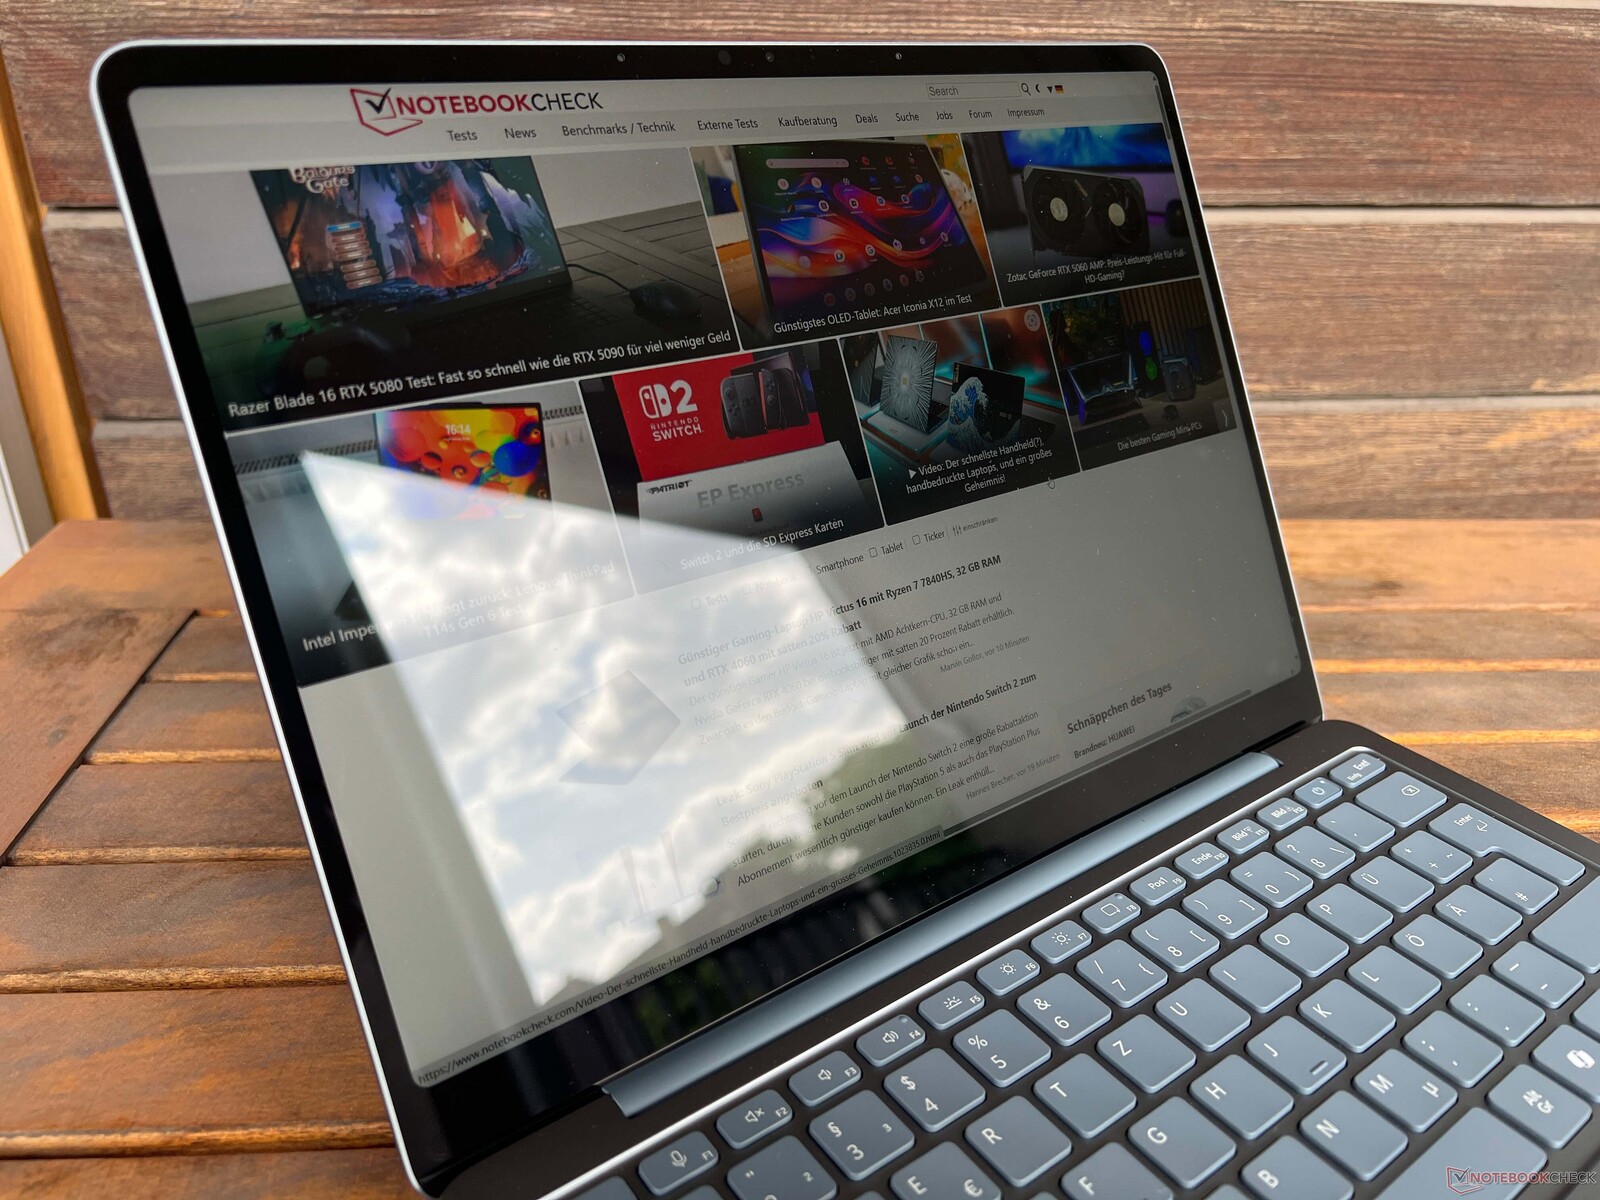
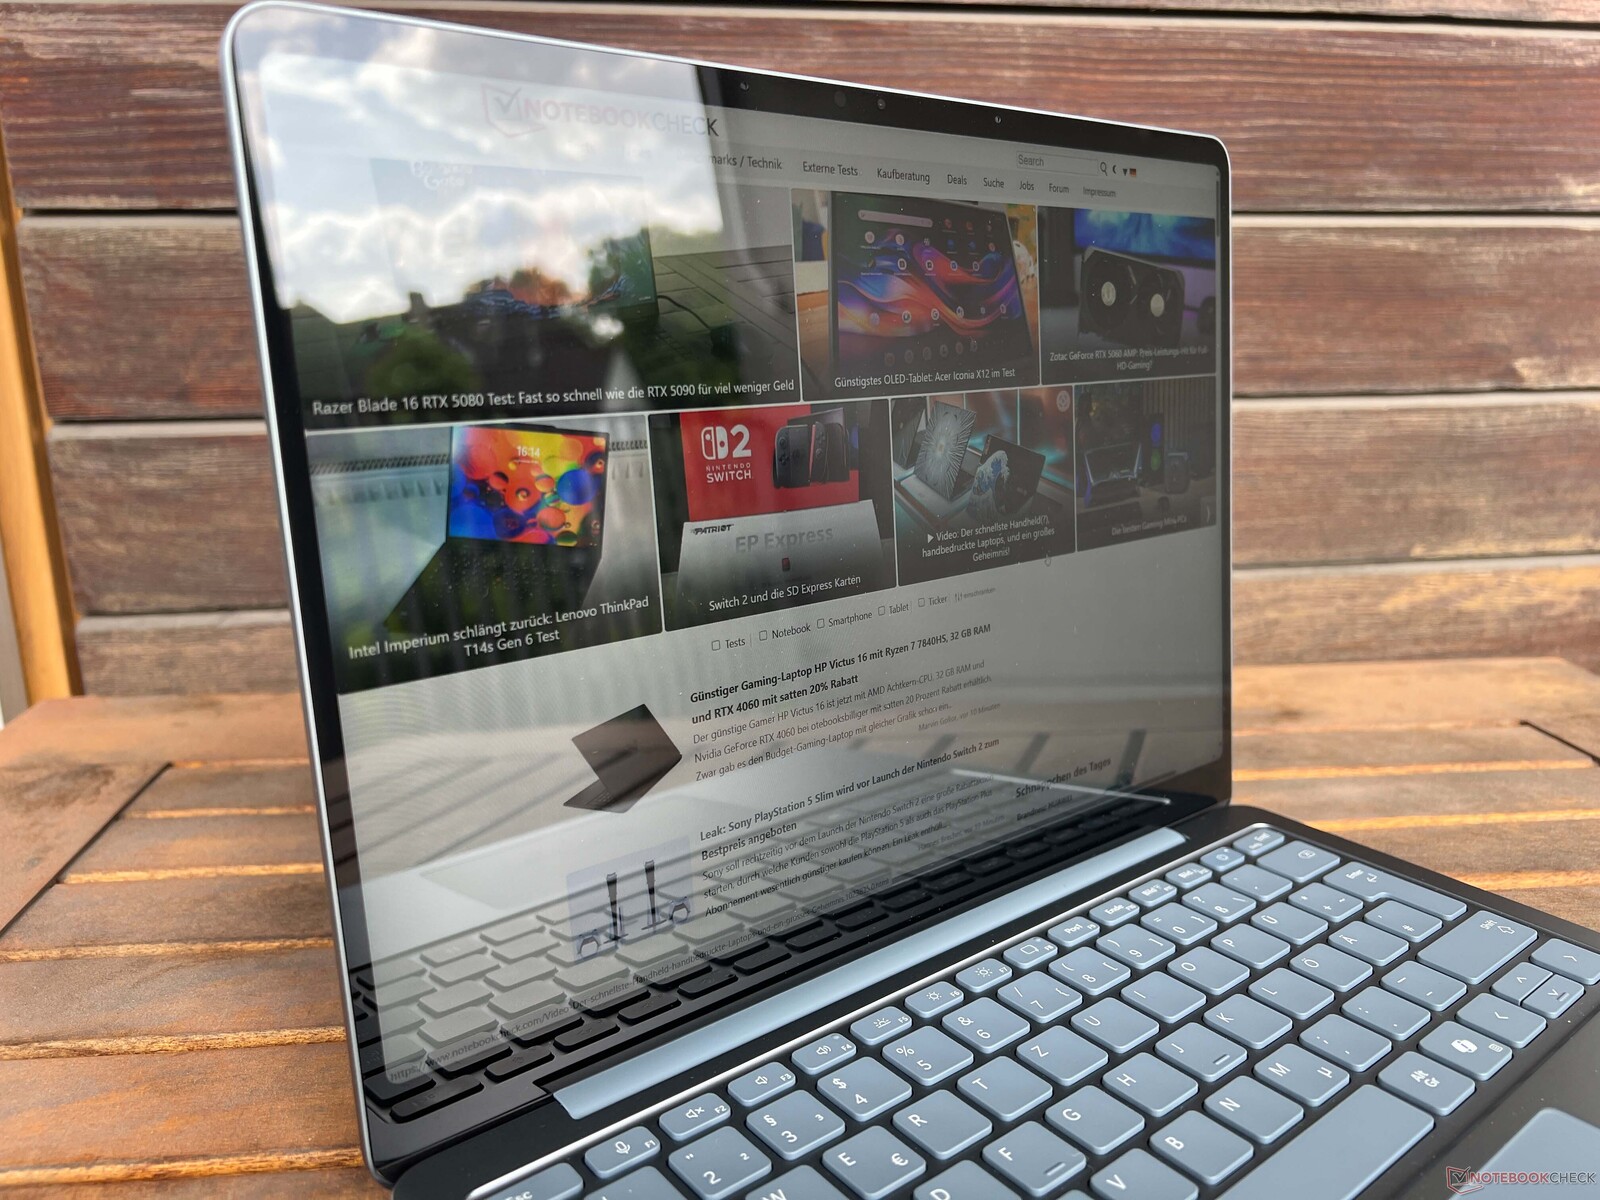
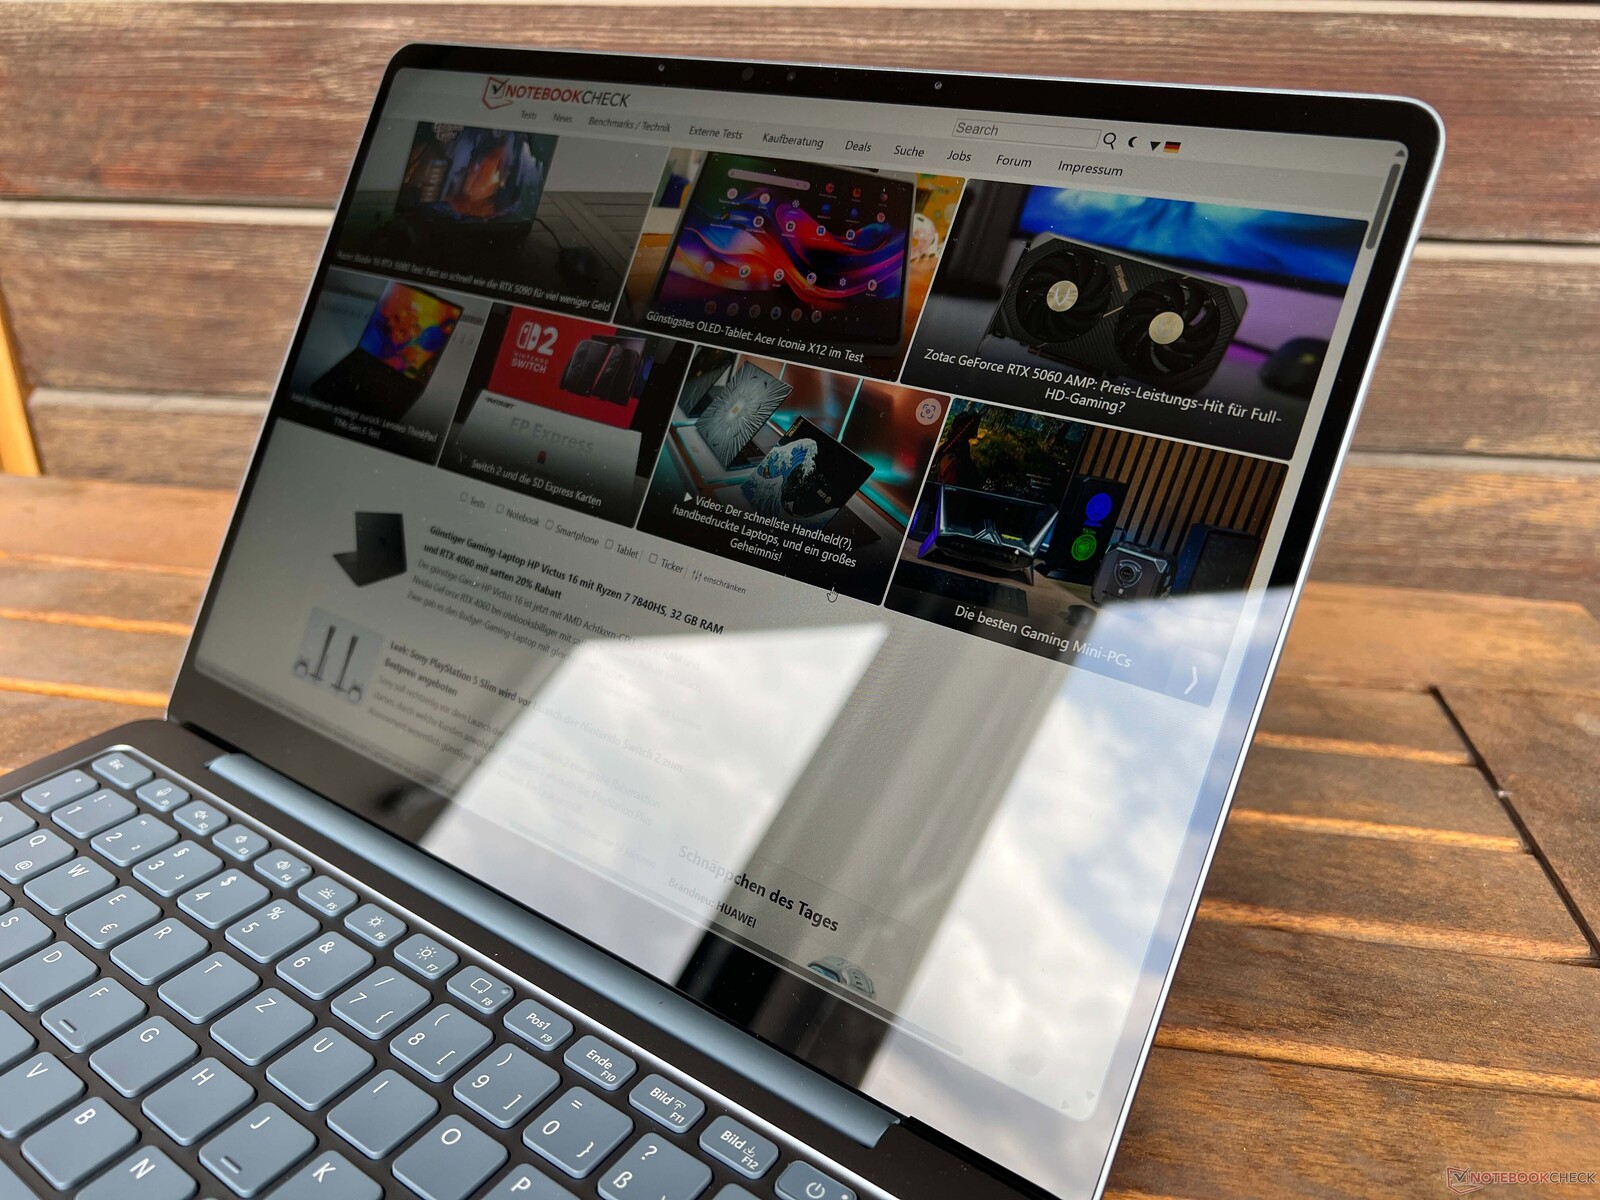
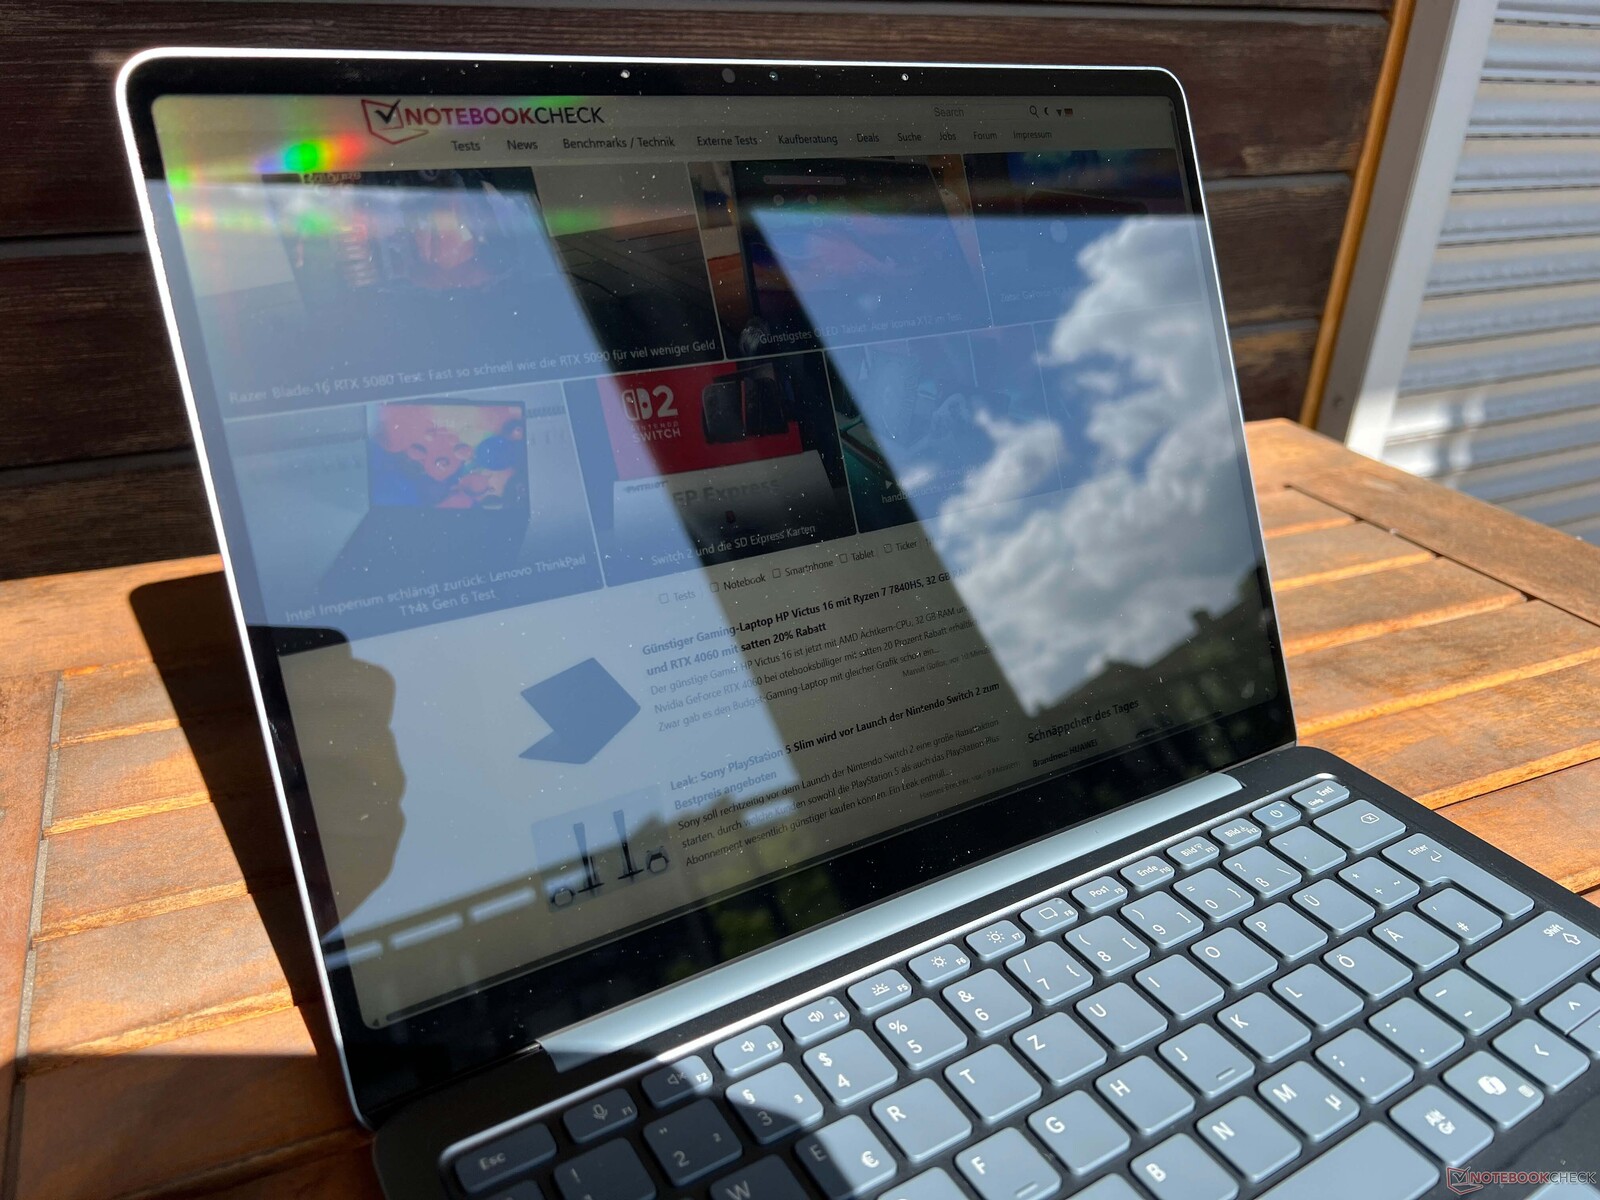
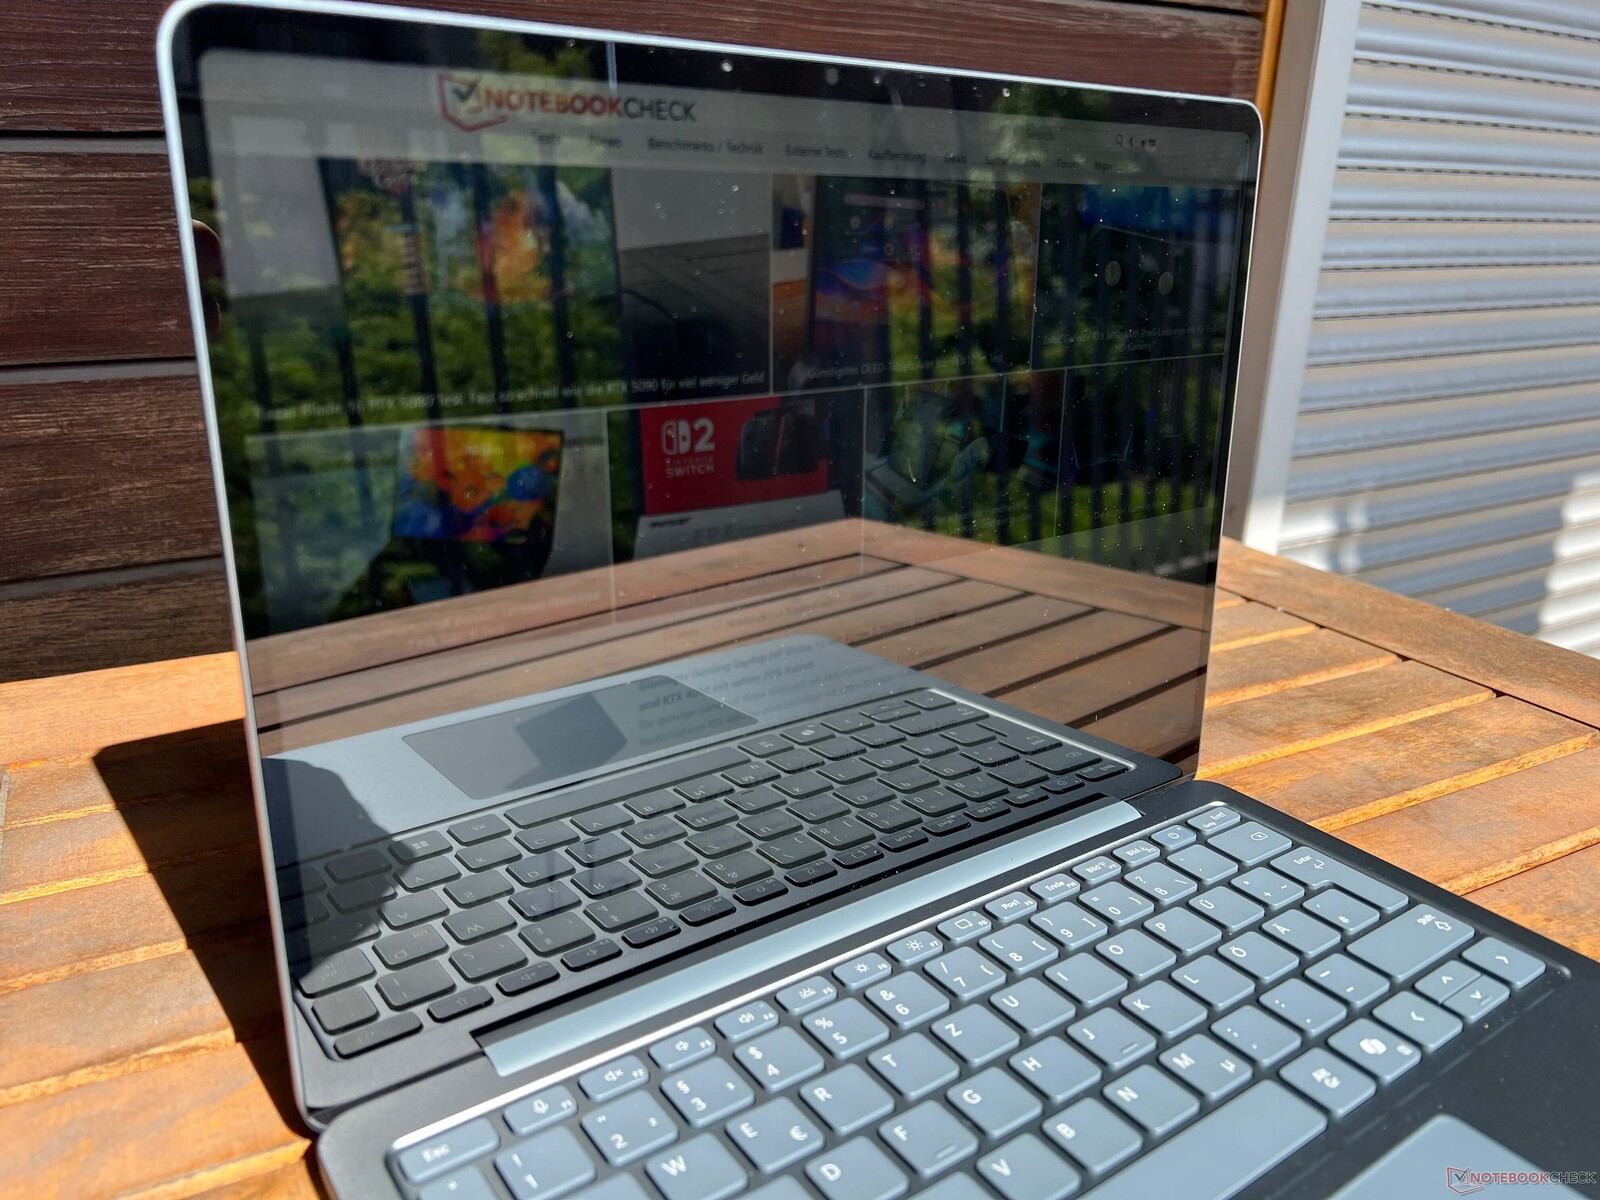
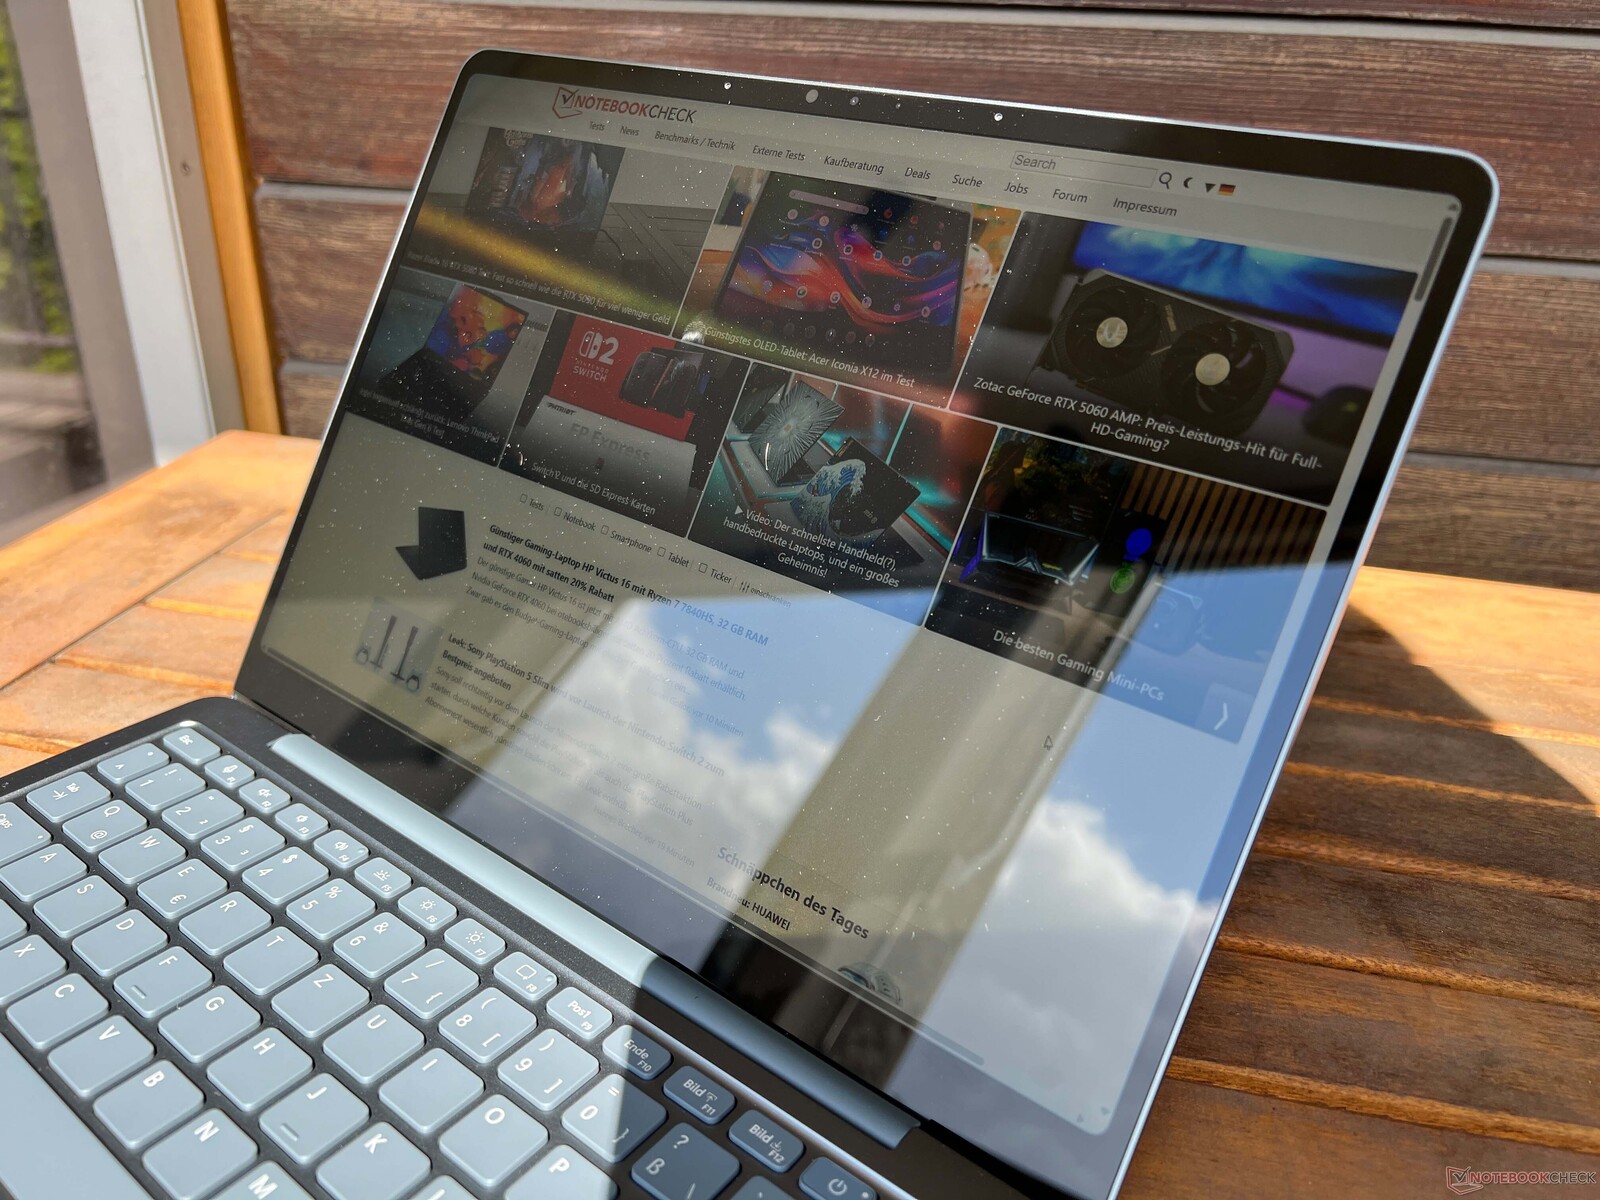
Display - IPS at 60 Hz
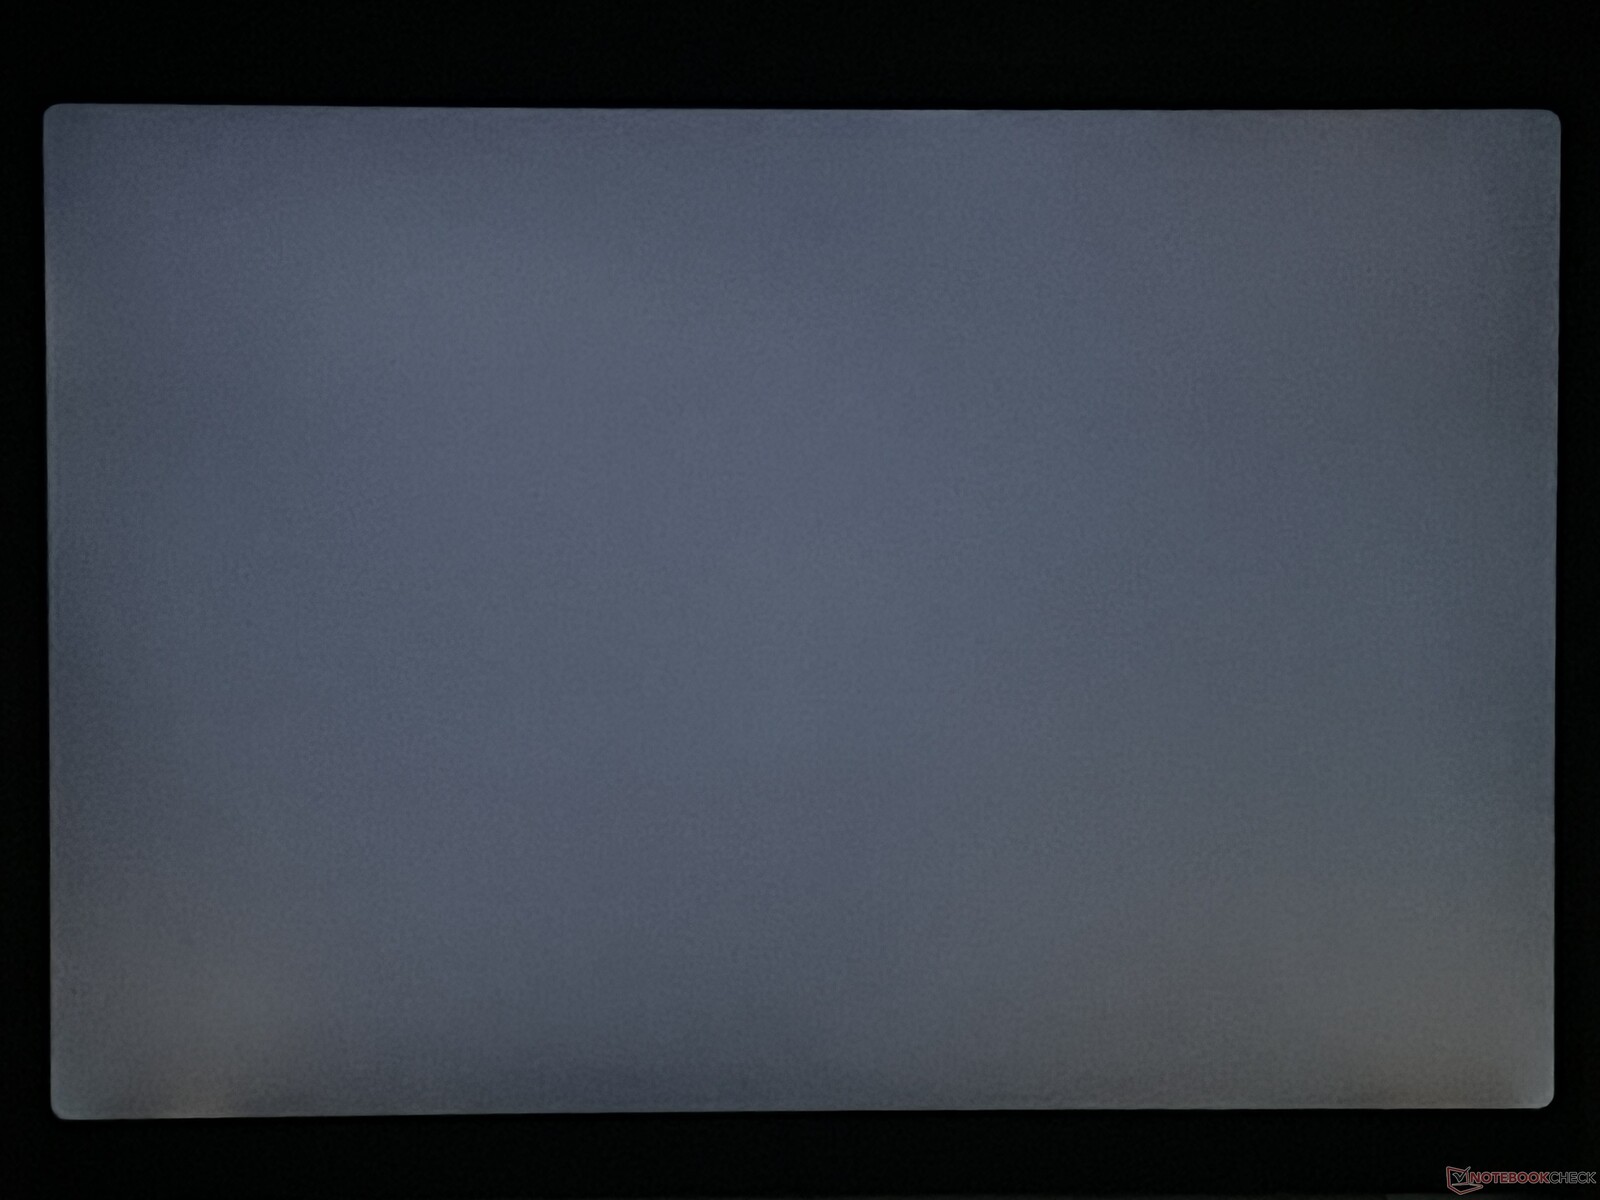
The laptop's 13-inch IPS screen has a resolution of 1,920 x 1,280 pixels (3:2) and subjectively, its picture quality is good and even bright surfaces don't appear grainy. The colors are vivid (sRGB) and content is sharp enough, although its refresh rate is unfortunately only 60 Hz. We didn't note any PWM flickering and though its response times aren't the quickest, you shouldn't notice this during everyday use. You can adjust its brightness and color temperature via a sensor. Outdoor use becomes a bit of an issue due to how reflective the panel is.
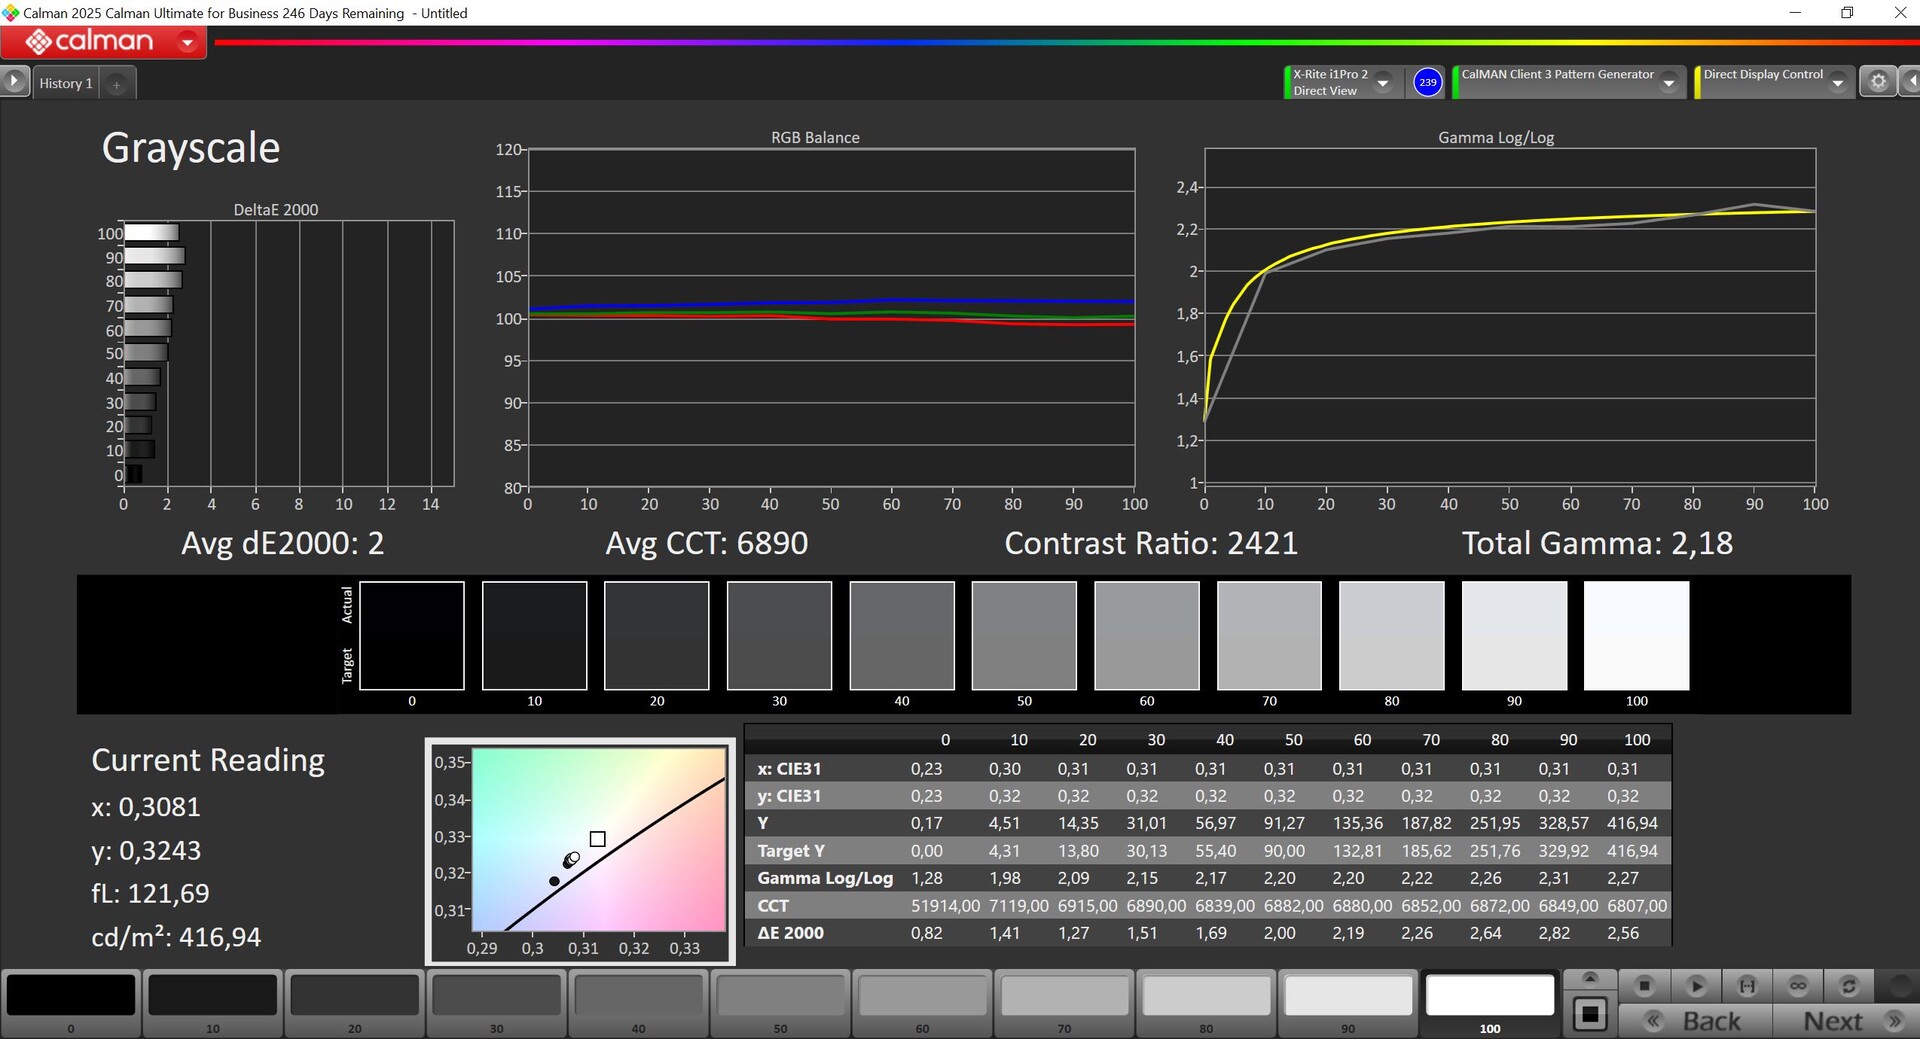
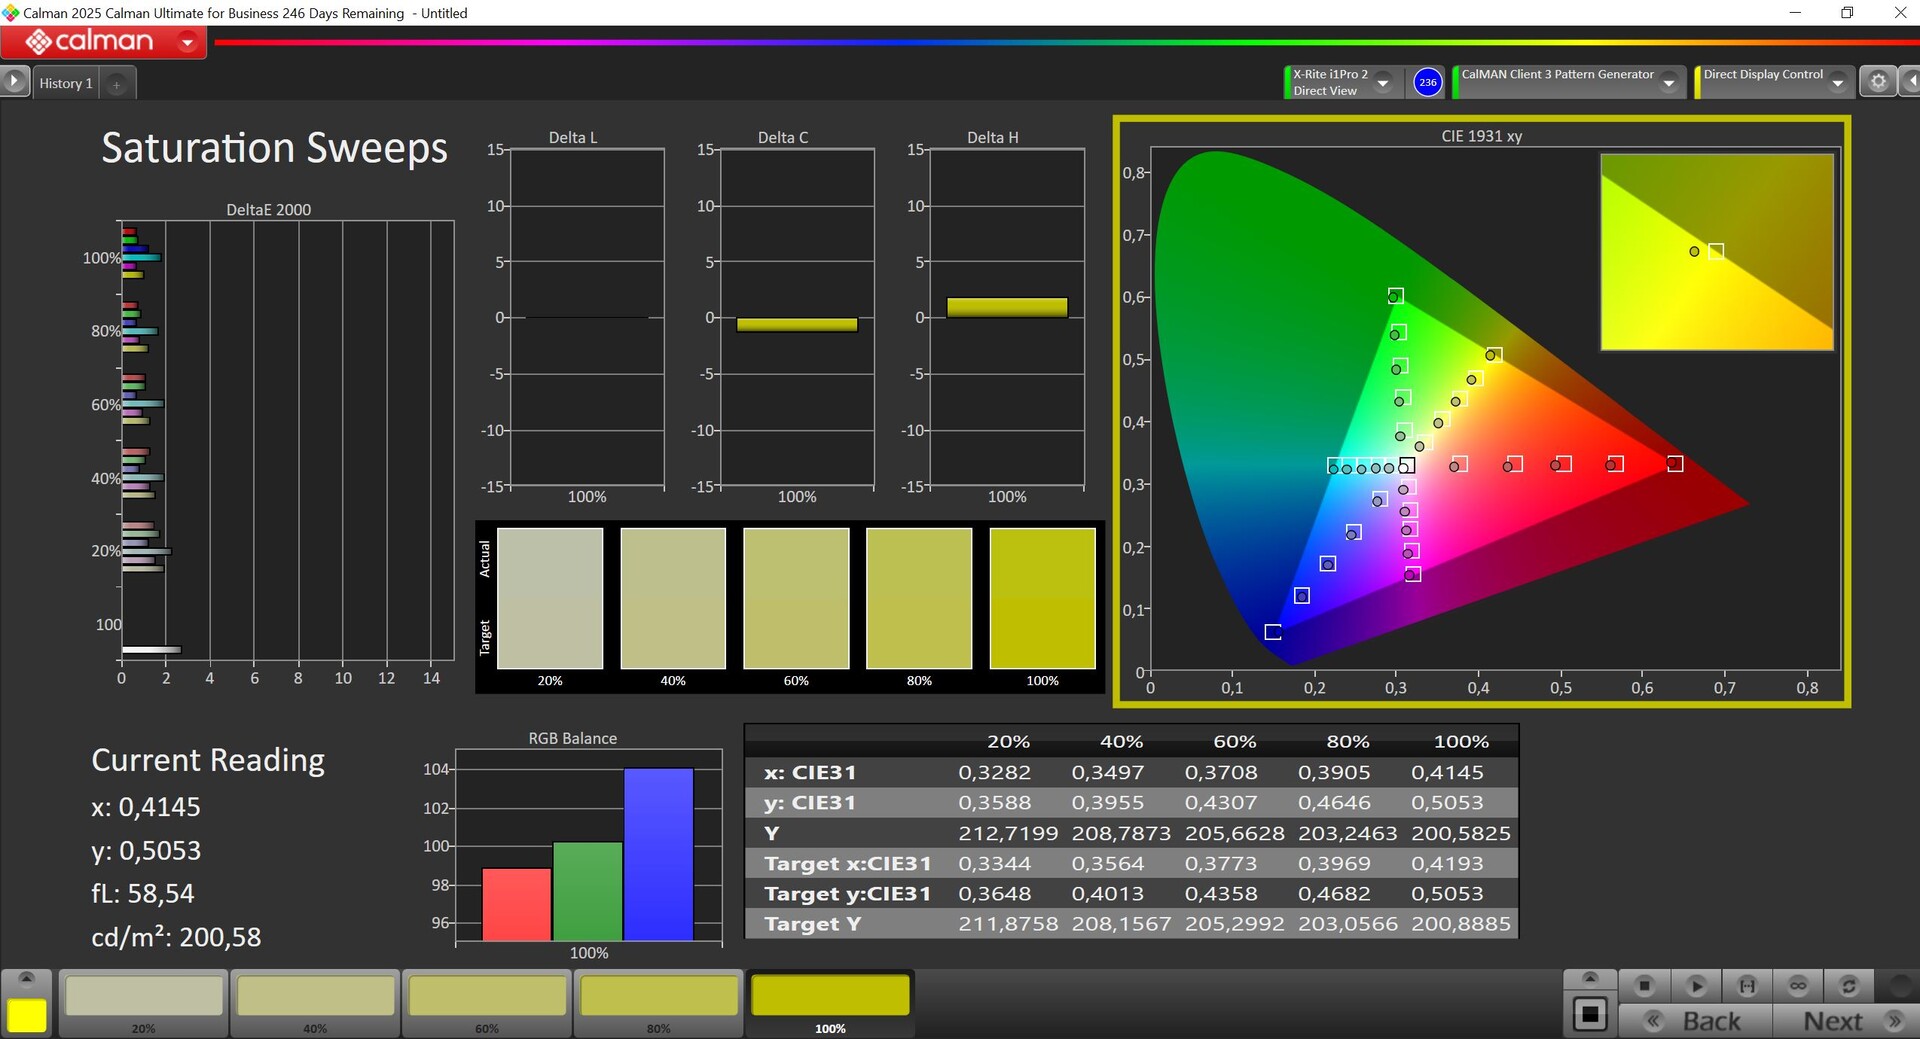
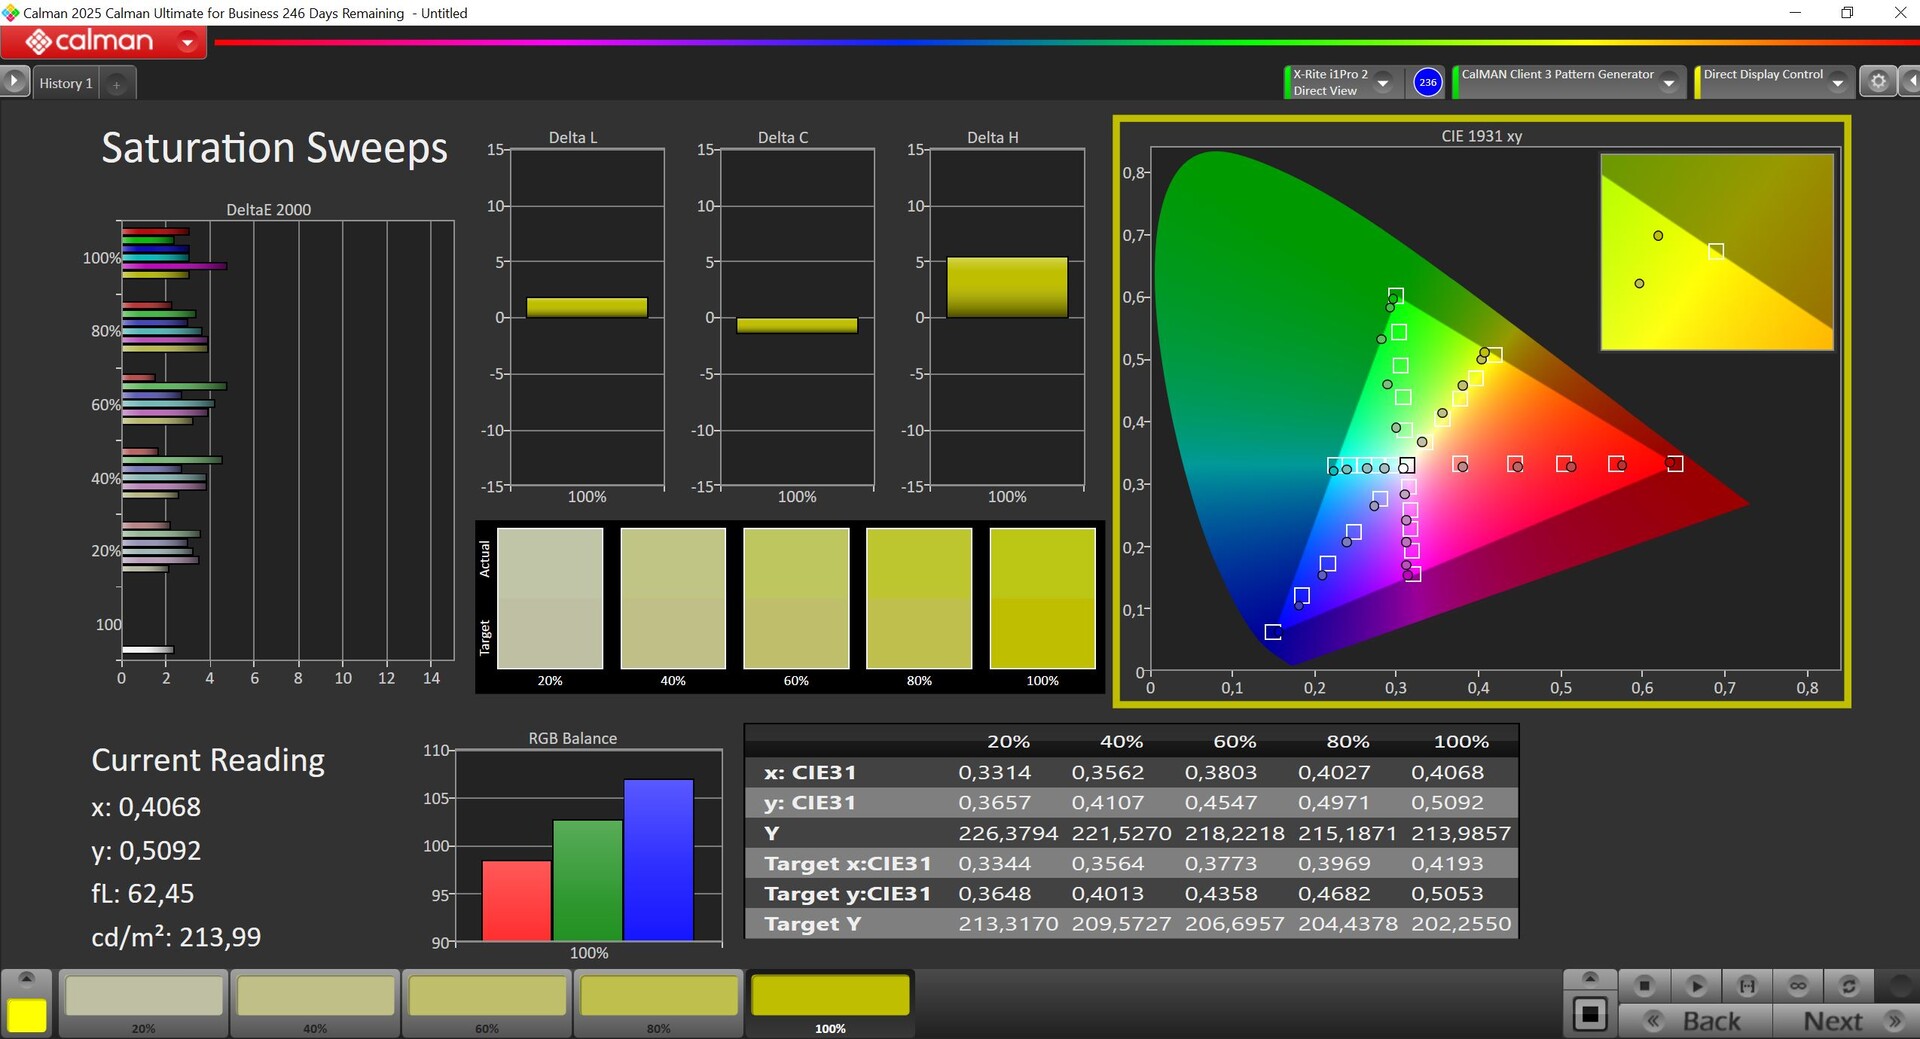
Its brightness is just over 400 cd/m2 and, together with its low black level (0.17), this results in a very high maximum contrast ratio. There are two pre-installed color profiles, which we analyzed using the professional CalMAN software. The profile Enhanced displays colors a little oversaturated, but the sRGB profile is very accurate, so you can edit images without any problems. Nevertheless, the screen of the Surface Laptop 13.8 (brighter, 120 Hz, P3) is clearly better.
| |||||||||||||||||||||||||
Brightness Distribution: 92 %
Center on Battery: 417 cd/m²
Contrast: 2453:1 (Black: 0.17 cd/m²)
ΔE ColorChecker Calman: 1.3 | ∀{0.5-29.43 Ø4.71}
ΔE Greyscale Calman: 2 | ∀{0.09-98 Ø4.96}
72.6% AdobeRGB 1998 (Argyll 3D)
97.6% sRGB (Argyll 3D)
72.4% Display P3 (Argyll 3D)
Gamma: 2.18
CCT: 6890 K
| Microsoft Surface Laptop 13 LP130WU112413, IPS, 1920x1280, 13", 60 Hz | Microsoft Surface Laptop 7 13.8 Copilot+ LQ138P1JX61, IPS, 2304x1536, 13.8", 120 Hz | Apple MacBook Air 13 M4 Entry IPS, 2560x1664, 13.6", 60 Hz | Apple MacBook Air 13 M3 10C GPU IPS, 2560x1664, 13.6", 60 Hz | Dell XPS 13 9345 IPS, 1920x1200, 13.4", 120 Hz | Framework Laptop 13.5 Core Ultra 7 155H BOE NE135A1M-NY1, IPS, 2880x1920, 13.5", 120 Hz | Microsoft Surface Laptop Go 3 LP125WX172403, IPS, 1536x1024, 12.4", 60 Hz | |
|---|---|---|---|---|---|---|---|
| Display | 19% | 20% | 20% | -2% | 1% | -7% | |
| Display P3 Coverage (%) | 72.4 | 97.8 35% | 98.4 36% | 98.4 36% | 69.4 -4% | 72.8 1% | 64.5 -11% |
| sRGB Coverage (%) | 97.6 | 98.2 1% | 99.9 2% | 99.9 2% | 97.8 0% | 98.6 1% | 96.9 -1% |
| AdobeRGB 1998 Coverage (%) | 72.6 | 87.3 20% | 87.9 21% | 87.9 21% | 71.7 -1% | 72.9 0% | 66.6 -8% |
| Response Times | 26% | 11% | 11% | 21% | 10% | 9% | |
| Response Time Grey 50% / Grey 80% * (ms) | 48.7 ? | 38.9 ? 20% | 34.5 ? 29% | 34.5 ? 29% | 35.2 ? 28% | 41.9 ? 14% | 36.7 ? 25% |
| Response Time Black / White * (ms) | 25.3 ? | 17.4 ? 31% | 27.2 ? -8% | 27.2 ? -8% | 21.8 ? 14% | 23.7 ? 6% | 27.1 ? -7% |
| PWM Frequency (Hz) | 60000 ? | ||||||
| Screen | -10% | -19% | -19% | -51% | -80% | -15% | |
| Brightness middle (cd/m²) | 417 | 606 45% | 525 26% | 525 26% | 518.3 24% | 498.5 20% | 339 -19% |
| Brightness (cd/m²) | 409 | 592 45% | 506 24% | 506 24% | 487 19% | 464 13% | 337 -18% |
| Brightness Distribution (%) | 92 | 94 2% | 92 0% | 92 0% | 86 -7% | 86 -7% | 96 4% |
| Black Level * (cd/m²) | 0.17 | 0.43 -153% | 0.42 -147% | 0.42 -147% | 0.26 -53% | 0.36 -112% | 0.34 -100% |
| Contrast (:1) | 2453 | 1409 -43% | 1250 -49% | 1250 -49% | 1993 -19% | 1385 -44% | 997 -59% |
| Colorchecker dE 2000 * | 1.3 | 1.3 -0% | 1.4 -8% | 1.4 -8% | 3.4 -162% | 4.27 -228% | 0.9 31% |
| Colorchecker dE 2000 max. * | 2.9 | 2.1 28% | 2.8 3% | 2.8 3% | 5.68 -96% | 7.08 -144% | 2.4 17% |
| Greyscale dE 2000 * | 2 | 2.1 -5% | 2 -0% | 2 -0% | 4.2 -110% | 4.7 -135% | 1.5 25% |
| Gamma | 2.18 101% | 2.16 102% | 2.2 100% | 2.2 100% | 2.29 96% | 2.09 105% | 2.23 99% |
| CCT | 6890 94% | 6842 95% | 6876 95% | 6876 95% | 7235 90% | 7417 88% | 6523 100% |
| Colorchecker dE 2000 calibrated * | 1.26 | ||||||
| Total Average (Program / Settings) | 12% /
2% | 4% /
-5% | 4% /
-5% | -11% /
-28% | -23% /
-47% | -4% /
-9% |
* ... smaller is better


Display Response Times
| ↔ Response Time Black to White | ||
|---|---|---|
| 25.3 ms ... rise ↗ and fall ↘ combined | ↗ 12.4 ms rise | 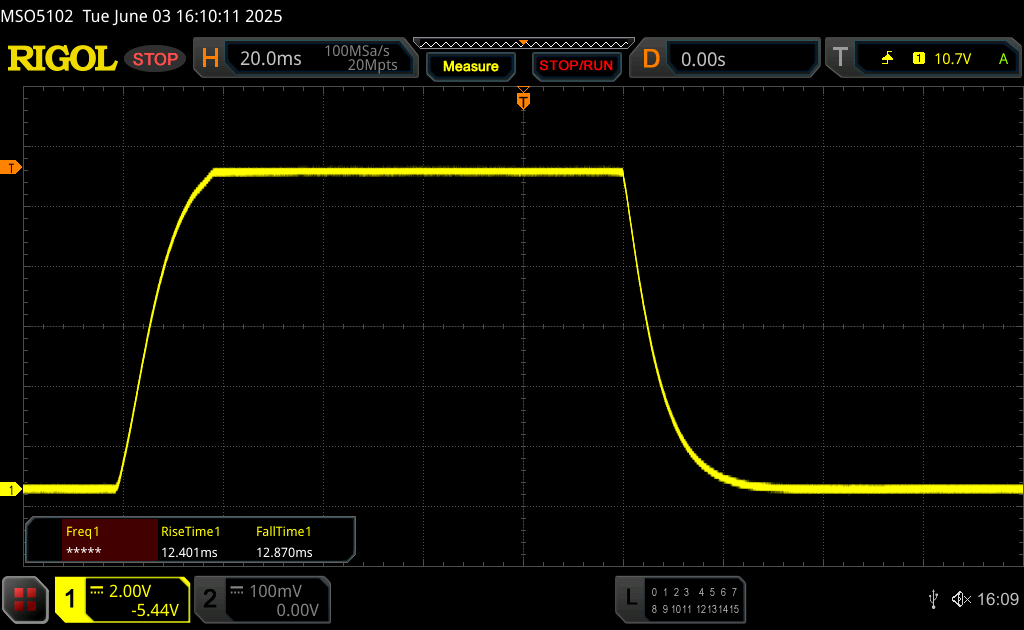 |
| ↘ 12.9 ms fall | ||
| The screen shows relatively slow response rates in our tests and may be too slow for gamers. In comparison, all tested devices range from 0.1 (minimum) to 240 (maximum) ms. » 61 % of all devices are better. This means that the measured response time is worse than the average of all tested devices (19.8 ms). | ||
| ↔ Response Time 50% Grey to 80% Grey | ||
| 48.7 ms ... rise ↗ and fall ↘ combined | ↗ 22.5 ms rise |  |
| ↘ 26.2 ms fall | ||
| The screen shows slow response rates in our tests and will be unsatisfactory for gamers. In comparison, all tested devices range from 0.165 (minimum) to 636 (maximum) ms. » 84 % of all devices are better. This means that the measured response time is worse than the average of all tested devices (31 ms). | ||
Screen Flickering / PWM (Pulse-Width Modulation)
| Screen flickering / PWM not detected |  | ||
In comparison: 52 % of all tested devices do not use PWM to dim the display. If PWM was detected, an average of 7747 (minimum: 5 - maximum: 343500) Hz was measured. | |||

Performance - Snapdragon X Plus & 16 GB RAM
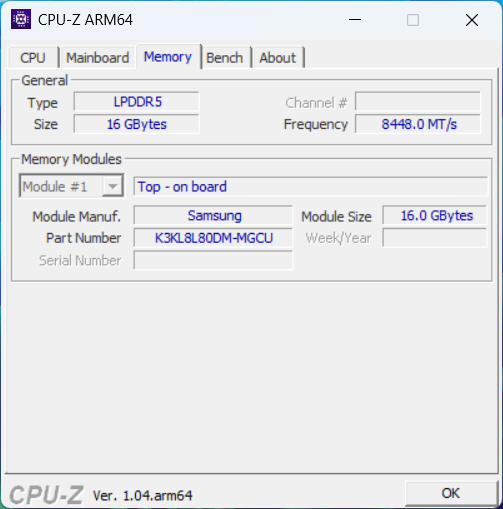
The Surface Laptop 13 is only available with the smallest Snapdragon X Plus processor (X1P-42-100) and 16 GB RAM.
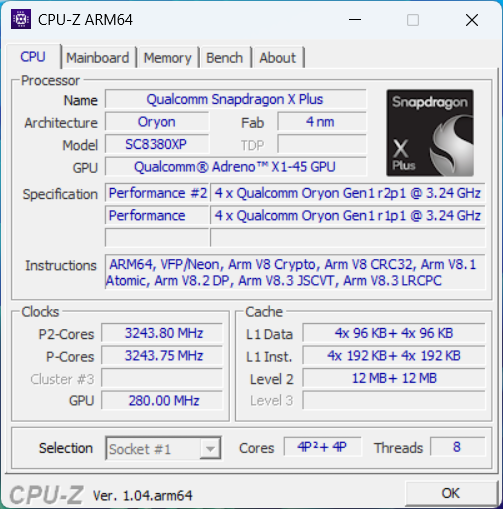

Processor - Snapdragon X1P-42-100
The Snapdragon X1P-42-100 features 8 cores at up to 3.4 GHz and, based on our energy measurements, it can consume up to 45 watts for a short time and then 35 watts permanently. The two benchmarks Cinebench 2024 and Geekbench 6.4 run natively, but the Surface Laptop always came in last place during our tests. In the emulated tests, it even had to admit defeat to the old Surface Laptop Go 3. However, its performance, which remains stable even on battery power, is still enough for simple everyday tasks.
Cinebench 2024: CPU Multi Core | CPU Single Core
Geekbench 6.7: Multi-Core | Single-Core
| CPU Performance rating | |
| Apple MacBook Air 13 M4 Entry | |
| Dell XPS 13 9345 | |
| Microsoft Surface Laptop 7 13.8 Copilot+ | |
| Average of class Subnotebook | |
| Apple MacBook Air 13 M3 10C GPU | |
| Framework Laptop 13.5 Core Ultra 7 155H | |
| Average Qualcomm Snapdragon X Plus X1P-42-100 | |
| Microsoft Surface Laptop 13 | |
| Cinebench 2024 / CPU Multi Core | |
| Dell XPS 13 9345 | |
| Microsoft Surface Laptop 7 13.8 Copilot+ | |
| Apple MacBook Air 13 M4 Entry | |
| Average of class Subnotebook (148 - 1471, n=66, last 2 years) | |
| Microsoft Surface Laptop 13 | |
| Average Qualcomm Snapdragon X Plus X1P-42-100 (554 - 763, n=11) | |
| Framework Laptop 13.5 Core Ultra 7 155H | |
| Apple MacBook Air 13 M3 10C GPU | |
| Cinebench 2024 / CPU Single Core | |
| Apple MacBook Air 13 M4 Entry | |
| Apple MacBook Air 13 M3 10C GPU | |
| Microsoft Surface Laptop 7 13.8 Copilot+ | |
| Dell XPS 13 9345 | |
| Average of class Subnotebook (35 - 200, n=55, last 2 years) | |
| Microsoft Surface Laptop 13 | |
| Average Qualcomm Snapdragon X Plus X1P-42-100 (107 - 109, n=10) | |
| Framework Laptop 13.5 Core Ultra 7 155H | |
| Geekbench 6.7 / Multi-Core | |
| Apple MacBook Air 13 M4 Entry | |
| Dell XPS 13 9345 | |
| Microsoft Surface Laptop 7 13.8 Copilot+ | |
| Average of class Subnotebook (2244 - 20325, n=63, last 2 years) | |
| Apple MacBook Air 13 M3 10C GPU | |
| Framework Laptop 13.5 Core Ultra 7 155H | |
| Average Qualcomm Snapdragon X Plus X1P-42-100 (7609 - 14998, n=10) | |
| Microsoft Surface Laptop 13 | |
| Geekbench 6.7 / Single-Core | |
| Apple MacBook Air 13 M4 Entry | |
| Apple MacBook Air 13 M3 10C GPU | |
| Dell XPS 13 9345 | |
| Microsoft Surface Laptop 7 13.8 Copilot+ | |
| Average of class Subnotebook (960 - 4195, n=62, last 2 years) | |
| Framework Laptop 13.5 Core Ultra 7 155H | |
| Average Qualcomm Snapdragon X Plus X1P-42-100 (2271 - 2675, n=9) | |
| Microsoft Surface Laptop 13 | |
Cinebench R15 Multi continuous test
Cinebench R23: Multi Core | Single Core
Cinebench R20: CPU (Multi Core) | CPU (Single Core)
Cinebench R15: CPU Multi 64Bit | CPU Single 64Bit
Blender: v2.79 BMW27 CPU
7-Zip 18.03: 7z b 4 | 7z b 4 -mmt1
HWBOT x265 Benchmark v2.2: 4k Preset
LibreOffice : 20 Documents To PDF
R Benchmark 2.5: Overall mean
| CPU Performance rating | |
| Framework Laptop 13.5 Core Ultra 7 155H | |
| Average of class Subnotebook | |
| Microsoft Surface Laptop 7 13.8 Copilot+ | |
| Dell XPS 13 9345 | |
| Apple MacBook Air 13 M3 10C GPU -9! | |
| Microsoft Surface Laptop Go 3 | |
| Average Qualcomm Snapdragon X Plus X1P-42-100 | |
| Microsoft Surface Laptop 13 | |
| Cinebench R23 / Multi Core | |
| Framework Laptop 13.5 Core Ultra 7 155H | |
| Average of class Subnotebook (1555 - 21812, n=60, last 2 years) | |
| Apple MacBook Air 13 M3 10C GPU | |
| Microsoft Surface Laptop 7 13.8 Copilot+ | |
| Dell XPS 13 9345 | |
| Average Qualcomm Snapdragon X Plus X1P-42-100 (6062 - 8284, n=10) | |
| Microsoft Surface Laptop 13 | |
| Microsoft Surface Laptop Go 3 | |
| Cinebench R23 / Single Core | |
| Apple MacBook Air 13 M3 10C GPU | |
| Framework Laptop 13.5 Core Ultra 7 155H | |
| Average of class Subnotebook (358 - 2213, n=61, last 2 years) | |
| Microsoft Surface Laptop Go 3 | |
| Microsoft Surface Laptop 7 13.8 Copilot+ | |
| Dell XPS 13 9345 | |
| Average Qualcomm Snapdragon X Plus X1P-42-100 (1065 - 1134, n=10) | |
| Microsoft Surface Laptop 13 | |
| Cinebench R20 / CPU (Multi Core) | |
| Framework Laptop 13.5 Core Ultra 7 155H | |
| Average of class Subnotebook (579 - 8541, n=57, last 2 years) | |
| Microsoft Surface Laptop 7 13.8 Copilot+ | |
| Dell XPS 13 9345 | |
| Average Qualcomm Snapdragon X Plus X1P-42-100 (2361 - 3125, n=10) | |
| Microsoft Surface Laptop 13 | |
| Microsoft Surface Laptop Go 3 | |
| Cinebench R20 / CPU (Single Core) | |
| Framework Laptop 13.5 Core Ultra 7 155H | |
| Average of class Subnotebook (128 - 832, n=57, last 2 years) | |
| Microsoft Surface Laptop Go 3 | |
| Microsoft Surface Laptop 7 13.8 Copilot+ | |
| Dell XPS 13 9345 | |
| Microsoft Surface Laptop 13 | |
| Average Qualcomm Snapdragon X Plus X1P-42-100 (406 - 427, n=10) | |
| Cinebench R15 / CPU Multi 64Bit | |
| Framework Laptop 13.5 Core Ultra 7 155H | |
| Microsoft Surface Laptop 7 13.8 Copilot+ | |
| Average of class Subnotebook (327 - 3345, n=57, last 2 years) | |
| Dell XPS 13 9345 | |
| Average Qualcomm Snapdragon X Plus X1P-42-100 (1191 - 1560, n=10) | |
| Microsoft Surface Laptop 13 | |
| Microsoft Surface Laptop Go 3 | |
| Cinebench R15 / CPU Single 64Bit | |
| Average of class Subnotebook (72.4 - 322, n=57, last 2 years) | |
| Framework Laptop 13.5 Core Ultra 7 155H | |
| Microsoft Surface Laptop 7 13.8 Copilot+ | |
| Dell XPS 13 9345 | |
| Microsoft Surface Laptop Go 3 | |
| Microsoft Surface Laptop 13 | |
| Average Qualcomm Snapdragon X Plus X1P-42-100 (206 - 215, n=10) | |
| Blender / v2.79 BMW27 CPU | |
| Microsoft Surface Laptop Go 3 | |
| Apple MacBook Air 13 M3 10C GPU | |
| Average Qualcomm Snapdragon X Plus X1P-42-100 (398 - 683, n=10) | |
| Microsoft Surface Laptop 13 | |
| Average of class Subnotebook (159 - 2271, n=58, last 2 years) | |
| Dell XPS 13 9345 | |
| Microsoft Surface Laptop 7 13.8 Copilot+ | |
| Framework Laptop 13.5 Core Ultra 7 155H | |
| 7-Zip 18.03 / 7z b 4 | |
| Framework Laptop 13.5 Core Ultra 7 155H | |
| Microsoft Surface Laptop 7 13.8 Copilot+ | |
| Average of class Subnotebook (11668 - 77867, n=57, last 2 years) | |
| Dell XPS 13 9345 | |
| Microsoft Surface Laptop 13 | |
| Average Qualcomm Snapdragon X Plus X1P-42-100 (29238 - 32811, n=10) | |
| Microsoft Surface Laptop Go 3 | |
| 7-Zip 18.03 / 7z b 4 -mmt1 | |
| Average of class Subnotebook (2643 - 6699, n=59, last 2 years) | |
| Framework Laptop 13.5 Core Ultra 7 155H | |
| Microsoft Surface Laptop 7 13.8 Copilot+ | |
| Dell XPS 13 9345 | |
| Microsoft Surface Laptop Go 3 | |
| Microsoft Surface Laptop 13 | |
| Average Qualcomm Snapdragon X Plus X1P-42-100 (4087 - 4675, n=10) | |
| HWBOT x265 Benchmark v2.2 / 4k Preset | |
| Framework Laptop 13.5 Core Ultra 7 155H | |
| Average of class Subnotebook (0.97 - 25.1, n=57, last 2 years) | |
| Microsoft Surface Laptop 7 13.8 Copilot+ | |
| Dell XPS 13 9345 | |
| Microsoft Surface Laptop Go 3 | |
| Average Qualcomm Snapdragon X Plus X1P-42-100 (3.16 - 6.18, n=10) | |
| Microsoft Surface Laptop 13 | |
| LibreOffice / 20 Documents To PDF | |
| Microsoft Surface Laptop 7 13.8 Copilot+ | |
| Microsoft Surface Laptop 13 | |
| Average Qualcomm Snapdragon X Plus X1P-42-100 (49.8 - 62.7, n=10) | |
| Average of class Subnotebook (39.9 - 220, n=56, last 2 years) | |
| Microsoft Surface Laptop Go 3 | |
| Dell XPS 13 9345 | |
| Framework Laptop 13.5 Core Ultra 7 155H | |
| R Benchmark 2.5 / Overall mean | |
| Microsoft Surface Laptop 13 | |
| Average Qualcomm Snapdragon X Plus X1P-42-100 (0.728 - 0.777, n=10) | |
| Dell XPS 13 9345 | |
| Microsoft Surface Laptop 7 13.8 Copilot+ | |
| Microsoft Surface Laptop Go 3 | |
| Average of class Subnotebook (0.4024 - 1.456, n=58, last 2 years) | |
| Framework Laptop 13.5 Core Ultra 7 155H | |
* ... smaller is better
AIDA64: FP32 Ray-Trace | FPU Julia | CPU SHA3 | CPU Queen | FPU SinJulia | FPU Mandel | CPU AES | CPU ZLib | FP64 Ray-Trace | CPU PhotoWorxx
| Performance rating | |
| Framework Laptop 13.5 Core Ultra 7 155H | |
| Average of class Subnotebook | |
| Microsoft Surface Laptop 7 13.8 Copilot+ | |
| Dell XPS 13 9345 | |
| Average Qualcomm Snapdragon X Plus X1P-42-100 | |
| Microsoft Surface Laptop 13 | |
| Microsoft Surface Laptop Go 3 | |
| AIDA64 / FP32 Ray-Trace | |
| Average of class Subnotebook (1135 - 32888, n=58, last 2 years) | |
| Framework Laptop 13.5 Core Ultra 7 155H | |
| Microsoft Surface Laptop 7 13.8 Copilot+ | |
| Dell XPS 13 9345 | |
| Microsoft Surface Laptop 13 | |
| Average Qualcomm Snapdragon X Plus X1P-42-100 (1480 - 6208, n=9) | |
| Microsoft Surface Laptop Go 3 | |
| AIDA64 / FPU Julia | |
| Average of class Subnotebook (5218 - 123315, n=58, last 2 years) | |
| Framework Laptop 13.5 Core Ultra 7 155H | |
| Microsoft Surface Laptop 7 13.8 Copilot+ | |
| Dell XPS 13 9345 | |
| Microsoft Surface Laptop Go 3 | |
| Microsoft Surface Laptop 13 | |
| Average Qualcomm Snapdragon X Plus X1P-42-100 (14234 - 17629, n=9) | |
| AIDA64 / CPU SHA3 | |
| Average of class Subnotebook (444 - 5287, n=58, last 2 years) | |
| Microsoft Surface Laptop 7 13.8 Copilot+ | |
| Dell XPS 13 9345 | |
| Framework Laptop 13.5 Core Ultra 7 155H | |
| Average Qualcomm Snapdragon X Plus X1P-42-100 (2036 - 2642, n=9) | |
| Microsoft Surface Laptop 13 | |
| Microsoft Surface Laptop Go 3 | |
| AIDA64 / CPU Queen | |
| Framework Laptop 13.5 Core Ultra 7 155H | |
| Microsoft Surface Laptop 7 13.8 Copilot+ | |
| Dell XPS 13 9345 | |
| Average of class Subnotebook (10579 - 95002, n=49, last 2 years) | |
| Microsoft Surface Laptop Go 3 | |
| Microsoft Surface Laptop 13 | |
| Average Qualcomm Snapdragon X Plus X1P-42-100 (44346 - 48641, n=9) | |
| AIDA64 / FPU SinJulia | |
| Framework Laptop 13.5 Core Ultra 7 155H | |
| Average of class Subnotebook (744 - 18418, n=58, last 2 years) | |
| Microsoft Surface Laptop Go 3 | |
| Microsoft Surface Laptop 7 13.8 Copilot+ | |
| Dell XPS 13 9345 | |
| Microsoft Surface Laptop 13 | |
| Average Qualcomm Snapdragon X Plus X1P-42-100 (1240 - 1502, n=9) | |
| AIDA64 / FPU Mandel | |
| Average of class Subnotebook (3341 - 65433, n=58, last 2 years) | |
| Framework Laptop 13.5 Core Ultra 7 155H | |
| Microsoft Surface Laptop 7 13.8 Copilot+ | |
| Dell XPS 13 9345 | |
| Microsoft Surface Laptop Go 3 | |
| Microsoft Surface Laptop 13 | |
| Average Qualcomm Snapdragon X Plus X1P-42-100 (4929 - 9953, n=9) | |
| AIDA64 / CPU AES | |
| Microsoft Surface Laptop 7 13.8 Copilot+ | |
| Dell XPS 13 9345 | |
| Framework Laptop 13.5 Core Ultra 7 155H | |
| Average of class Subnotebook (638 - 96917, n=58, last 2 years) | |
| Microsoft Surface Laptop 13 | |
| Average Qualcomm Snapdragon X Plus X1P-42-100 (37646 - 45232, n=9) | |
| Microsoft Surface Laptop Go 3 | |
| AIDA64 / CPU ZLib | |
| Framework Laptop 13.5 Core Ultra 7 155H | |
| Average of class Subnotebook (164.9 - 1379, n=58, last 2 years) | |
| Microsoft Surface Laptop 7 13.8 Copilot+ | |
| Dell XPS 13 9345 | |
| Microsoft Surface Laptop 13 | |
| Average Qualcomm Snapdragon X Plus X1P-42-100 (473 - 524, n=9) | |
| Microsoft Surface Laptop Go 3 | |
| AIDA64 / FP64 Ray-Trace | |
| Average of class Subnotebook (610 - 17495, n=58, last 2 years) | |
| Framework Laptop 13.5 Core Ultra 7 155H | |
| Microsoft Surface Laptop 7 13.8 Copilot+ | |
| Dell XPS 13 9345 | |
| Average Qualcomm Snapdragon X Plus X1P-42-100 (2262 - 3430, n=9) | |
| Microsoft Surface Laptop 13 | |
| Microsoft Surface Laptop Go 3 | |
| AIDA64 / CPU PhotoWorxx | |
| Average of class Subnotebook (6569 - 85600, n=58, last 2 years) | |
| Framework Laptop 13.5 Core Ultra 7 155H | |
| Microsoft Surface Laptop 7 13.8 Copilot+ | |
| Dell XPS 13 9345 | |
| Microsoft Surface Laptop Go 3 | |
| Microsoft Surface Laptop 13 | |
| Average Qualcomm Snapdragon X Plus X1P-42-100 (31088 - 32478, n=9) | |
System performance
The Surface Laptop 13 is responsive during everyday use and most users shouldn't have any compatibility problems, although you should do some research beforehand when using older software. Overall, there were no stability problems in our test, only during gaming benchmarks did our test device hang twice.
CrossMark: Overall | Productivity | Creativity | Responsiveness
WebXPRT 3: Overall
WebXPRT 4: Overall
Mozilla Kraken 1.1: Total
| Performance rating | |
| Apple MacBook Air 13 M4 Entry | |
| Apple MacBook Air 13 M3 10C GPU | |
| Microsoft Surface Laptop 7 13.8 Copilot+ | |
| Average of class Subnotebook | |
| Dell XPS 13 9345 | |
| Framework Laptop 13.5 Core Ultra 7 155H | |
| Microsoft Surface Laptop 13 | |
| Average Qualcomm Snapdragon X Plus X1P-42-100, Qualcomm SD X Adreno X1-45 1.7 TFLOPS | |
| Microsoft Surface Laptop Go 3 | |
| CrossMark / Overall | |
| Apple MacBook Air 13 M4 Entry | |
| Apple MacBook Air 13 M3 10C GPU | |
| Framework Laptop 13.5 Core Ultra 7 155H | |
| Average of class Subnotebook (365 - 2356, n=60, last 2 years) | |
| Microsoft Surface Laptop 7 13.8 Copilot+ | |
| Dell XPS 13 9345 | |
| Microsoft Surface Laptop Go 3 | |
| Average Qualcomm Snapdragon X Plus X1P-42-100, Qualcomm SD X Adreno X1-45 1.7 TFLOPS (1061 - 1463, n=10) | |
| Microsoft Surface Laptop 13 | |
| CrossMark / Productivity | |
| Apple MacBook Air 13 M4 Entry | |
| Apple MacBook Air 13 M3 10C GPU | |
| Framework Laptop 13.5 Core Ultra 7 155H | |
| Average of class Subnotebook (364 - 2277, n=60, last 2 years) | |
| Microsoft Surface Laptop 7 13.8 Copilot+ | |
| Microsoft Surface Laptop Go 3 | |
| Dell XPS 13 9345 | |
| Average Qualcomm Snapdragon X Plus X1P-42-100, Qualcomm SD X Adreno X1-45 1.7 TFLOPS (1059 - 1284, n=10) | |
| Microsoft Surface Laptop 13 | |
| CrossMark / Creativity | |
| Apple MacBook Air 13 M4 Entry | |
| Apple MacBook Air 13 M3 10C GPU | |
| Framework Laptop 13.5 Core Ultra 7 155H | |
| Average of class Subnotebook (372 - 2743, n=60, last 2 years) | |
| Microsoft Surface Laptop 7 13.8 Copilot+ | |
| Dell XPS 13 9345 | |
| Microsoft Surface Laptop Go 3 | |
| Average Qualcomm Snapdragon X Plus X1P-42-100, Qualcomm SD X Adreno X1-45 1.7 TFLOPS (1070 - 1660, n=10) | |
| Microsoft Surface Laptop 13 | |
| CrossMark / Responsiveness | |
| Apple MacBook Air 13 M4 Entry | |
| Apple MacBook Air 13 M3 10C GPU | |
| Average of class Subnotebook (312 - 1854, n=60, last 2 years) | |
| Framework Laptop 13.5 Core Ultra 7 155H | |
| Microsoft Surface Laptop 7 13.8 Copilot+ | |
| Dell XPS 13 9345 | |
| Average Qualcomm Snapdragon X Plus X1P-42-100, Qualcomm SD X Adreno X1-45 1.7 TFLOPS (989 - 1563, n=10) | |
| Microsoft Surface Laptop Go 3 | |
| Microsoft Surface Laptop 13 | |
| WebXPRT 3 / Overall | |
| Apple MacBook Air 13 M4 Entry | |
| Apple MacBook Air 13 M3 10C GPU | |
| Microsoft Surface Laptop 7 13.8 Copilot+ | |
| Dell XPS 13 9345 | |
| Average Qualcomm Snapdragon X Plus X1P-42-100, Qualcomm SD X Adreno X1-45 1.7 TFLOPS (129.9 - 426, n=10) | |
| Microsoft Surface Laptop 13 | |
| Average of class Subnotebook (156 - 530, n=56, last 2 years) | |
| Framework Laptop 13.5 Core Ultra 7 155H | |
| Microsoft Surface Laptop Go 3 | |
| WebXPRT 4 / Overall | |
| Apple MacBook Air 13 M4 Entry | |
| Dell XPS 13 9345 | |
| Apple MacBook Air 13 M3 10C GPU | |
| Microsoft Surface Laptop 7 13.8 Copilot+ | |
| Average of class Subnotebook (132 - 378, n=61, last 2 years) | |
| Microsoft Surface Laptop 13 | |
| Average Qualcomm Snapdragon X Plus X1P-42-100, Qualcomm SD X Adreno X1-45 1.7 TFLOPS (130.3 - 289, n=10) | |
| Framework Laptop 13.5 Core Ultra 7 155H | |
| Microsoft Surface Laptop Go 3 | |
| Mozilla Kraken 1.1 / Total | |
| Microsoft Surface Laptop Go 3 | |
| Average Qualcomm Snapdragon X Plus X1P-42-100, Qualcomm SD X Adreno X1-45 1.7 TFLOPS (396 - 1145, n=10) | |
| Framework Laptop 13.5 Core Ultra 7 155H | |
| Average of class Subnotebook (234 - 1104, n=61, last 2 years) | |
| Dell XPS 13 9345 | |
| Microsoft Surface Laptop 13 | |
| Microsoft Surface Laptop 7 13.8 Copilot+ | |
| Apple MacBook Air 13 M3 10C GPU | |
| Apple MacBook Air 13 M4 Entry | |
* ... smaller is better
| AIDA64 / Memory Copy | |
| Average of class Subnotebook (14554 - 131023, n=58, last 2 years) | |
| Framework Laptop 13.5 Core Ultra 7 155H | |
| Dell XPS 13 9345 | |
| Microsoft Surface Laptop 13 | |
| Microsoft Surface Laptop 7 13.8 Copilot+ | |
| Average Qualcomm Snapdragon X Plus X1P-42-100 (61258 - 63933, n=9) | |
| Microsoft Surface Laptop Go 3 | |
| AIDA64 / Memory Read | |
| Microsoft Surface Laptop 13 | |
| Average Qualcomm Snapdragon X Plus X1P-42-100 (112408 - 128030, n=9) | |
| Dell XPS 13 9345 | |
| Microsoft Surface Laptop 7 13.8 Copilot+ | |
| Average of class Subnotebook (15948 - 127174, n=58, last 2 years) | |
| Framework Laptop 13.5 Core Ultra 7 155H | |
| Microsoft Surface Laptop Go 3 | |
| AIDA64 / Memory Write | |
| Average of class Subnotebook (15709 - 135141, n=58, last 2 years) | |
| Microsoft Surface Laptop Go 3 | |
| Framework Laptop 13.5 Core Ultra 7 155H | |
| Microsoft Surface Laptop 13 | |
| Average Qualcomm Snapdragon X Plus X1P-42-100 (45782 - 49288, n=9) | |
| Dell XPS 13 9345 | |
| Microsoft Surface Laptop 7 13.8 Copilot+ | |
| AIDA64 / Memory Latency | |
| Framework Laptop 13.5 Core Ultra 7 155H | |
| Microsoft Surface Laptop Go 3 | |
| Average of class Subnotebook (6.1 - 159.9, n=56, last 2 years) | |
| Dell XPS 13 9345 | |
| Average Qualcomm Snapdragon X Plus X1P-42-100 (6.8 - 8.7, n=5) | |
| Microsoft Surface Laptop 7 13.8 Copilot+ | |
| Microsoft Surface Laptop 13 | |
* ... smaller is better
Storage device
The Surface Laptop 13 is fitted with removable UFS 4.0 storage, whereby our test device is the 512 GB variant (411 GB free for the user). Its maximum transfer rates of just under 4 GB/s are perfectly fine for everyday use and these speeds remain stable even under constant load.

* ... smaller is better
Reading continuous performance: DiskSpd Read Loop, Queue Depth 8
GPU performance
The Adreno X1-45's graphics performance is very low, and also lower than the old Surface Laptop Go 3. Everyday tasks such as playing high-resolution videos are not a problem for the device, but this is hardly enough for gaming. It must be said, though, that compatibility issues also play a role here. If you want to play games, you should rely on streaming services such as Xbox Game Pass.
| 3DMark 11 Performance | 4568 points | |
| 3DMark Fire Strike Score | 3653 points | |
| 3DMark Time Spy Score | 1069 points | |
| 3DMark Steel Nomad Score | 228 points | |
| 3DMark Steel Nomad Light Score | 1096 points | |
| 3DMark Steel Nomad Light Unlimited Score | 1085 points | |
Help | ||
| Blender / v3.3 Classroom CPU | |
| Microsoft Surface Laptop Go 3 | |
| Microsoft Surface Laptop 13 | |
| Average Qualcomm SD X Adreno X1-45 1.7 TFLOPS (711 - 1226, n=13) | |
| Microsoft Surface Laptop 7 13.8 Copilot+ | |
| Dell XPS 13 9345 | |
| Average of class Subnotebook (241 - 861, n=60, last 2 years) | |
| Apple MacBook Air 13 M3 10C GPU | |
| Framework Laptop 13.5 Core Ultra 7 155H | |
| Apple MacBook Air 13 M4 Entry | |
| Blender / v3.3 Classroom METAL | |
| Apple MacBook Air 13 M3 10C GPU | |
| Average of class Subnotebook (76.3 - 227, n=5, last 2 years) | |
| Apple MacBook Air 13 M4 Entry | |
| Blender / v3.3 Classroom oneAPI/Intel | |
| Framework Laptop 13.5 Core Ultra 7 155H | |
| Average of class Subnotebook (105 - 396, n=11, last 2 years) | |
* ... smaller is better
| Cyberpunk 2077 - 1920x1080 Ultra Preset (FSR off) | |
| Framework Laptop 13.5 Core Ultra 7 155H | |
| Average of class Subnotebook (5.6 - 44.9, n=63, last 2 years) | |
| Dell XPS 13 9345 | |
| Microsoft Surface Laptop 7 13.8 Copilot+ | |
| Apple MacBook Air 13 M4 Entry | |
| Microsoft Surface Laptop 13 | |
| GTA V - 1920x1080 Highest AA:4xMSAA + FX AF:16x | |
| Average of class Subnotebook (10.7 - 43.7, n=56, last 2 years) | |
| Microsoft Surface Laptop 7 13.8 Copilot+ | |
| Dell XPS 13 9345 | |
| Framework Laptop 13.5 Core Ultra 7 155H | |
| Microsoft Surface Laptop 13 | |
| Final Fantasy XV Benchmark - 1280x720 Lite Quality | |
| Average of class Subnotebook (21.4 - 129.8, n=55, last 2 years) | |
| Framework Laptop 13.5 Core Ultra 7 155H | |
| Microsoft Surface Laptop 7 13.8 Copilot+ | |
| Dell XPS 13 9345 | |
| Microsoft Surface Laptop 13 | |
| Strange Brigade - 1920x1080 ultra AA:ultra AF:16 | |
| Average of class Subnotebook (19 - 101.3, n=50, last 2 years) | |
| Framework Laptop 13.5 Core Ultra 7 155H | |
| Microsoft Surface Laptop 7 13.8 Copilot+ | |
| Dell XPS 13 9345 | |
| Microsoft Surface Laptop 13 | |
| Dota 2 Reborn - 1920x1080 ultra (3/3) best looking | |
| Average of class Subnotebook (13 - 97, n=61, last 2 years) | |
| Framework Laptop 13.5 Core Ultra 7 155H | |
| Microsoft Surface Laptop 7 13.8 Copilot+ | |
| Dell XPS 13 9345 | |
| Microsoft Surface Laptop 13 | |
Cyberpunk 2077 ultra FPS diagram
| low | med. | high | ultra | |
|---|---|---|---|---|
| GTA V (2015) | 98.3 | 88.7 | 34 | 15.3 |
| Dota 2 Reborn (2015) | 80.4 | 64.1 | 37 | 29.9 |
| Final Fantasy XV Benchmark (2018) | 21.4 | |||
| X-Plane 11.11 (2018) | 33.3 | |||
| Strange Brigade (2018) | 86.7 | 29.8 | 23 | 20 |
| Baldur's Gate 3 (2023) | 13.4 | 11.1 | ||
| Cyberpunk 2077 (2023) | 15.3 | 11.7 | 9.96 | 8.55 |
Emissions & energy
Noise emissions
During everyday use, the Surface Laptop 13 is almost always silent and you usually only hear the fan when you're playing games or placing the processor under load. Then, things can get pretty loud indeed—we measured 43.6 dB(A). No additional electronic noises came from our test device during our test.
Noise level
| Idle |
| 23.5 / 23.5 / 23.5 dB(A) |
| Load |
| 23.5 / 43.6 dB(A) |
 | ||
30 dB silent 40 dB(A) audible 50 dB(A) loud |
||
min: | ||
| Microsoft Surface Laptop 13 Adreno X1-45 1.7 TFLOPS, SD X Plus X1P-42-100 | Microsoft Surface Laptop 7 13.8 Copilot+ Adreno X1-85 3.8 TFLOPS, SD X Elite X1E-80-100, Samsung MZ9L4512HBLU-00BMV | Apple MacBook Air 13 M4 Entry M4 8-Core GPU, M4 10-Core, Apple SSD AP0256Z | Apple MacBook Air 13 M3 10C GPU M3 10-Core GPU, M3, Apple SSD AP0512Z | Dell XPS 13 9345 Adreno X1-85 3.8 TFLOPS, SD X Elite X1E-80-100 | Framework Laptop 13.5 Core Ultra 7 155H Arc 8-Core, Ultra 7 155H | Microsoft Surface Laptop Go 3 Iris Xe G7 80EUs, i5-1235U, Kioxia BG5 KBG50ZNS256G | |
|---|---|---|---|---|---|---|---|
| Noise | -2% | -8% | -20% | -1% | |||
| off / environment * (dB) | 23.5 | 23.8 -1% | 22.9 3% | 24 -2% | 22.5 4% | ||
| Idle Minimum * (dB) | 23.5 | 23.8 -1% | 22.9 3% | 24.1 -3% | 22.5 4% | ||
| Idle Average * (dB) | 23.5 | 23.8 -1% | 22.9 3% | 25.1 -7% | 22.5 4% | ||
| Idle Maximum * (dB) | 23.5 | 23.8 -1% | 22.9 3% | 27 -15% | 22.5 4% | ||
| Load Average * (dB) | 23.5 | 26 -11% | 32.8 -40% | 38.4 -63% | 31.3 -33% | ||
| Cyberpunk 2077 ultra * (dB) | 29.9 | 31.5 -5% | 40.6 -36% | 43.7 -46% | |||
| Load Maximum * (dB) | 43.6 | 40.3 8% | 40.6 7% | 45.8 -5% | 39.1 10% | ||
| Witcher 3 ultra * (dB) | 37.8 |
* ... smaller is better
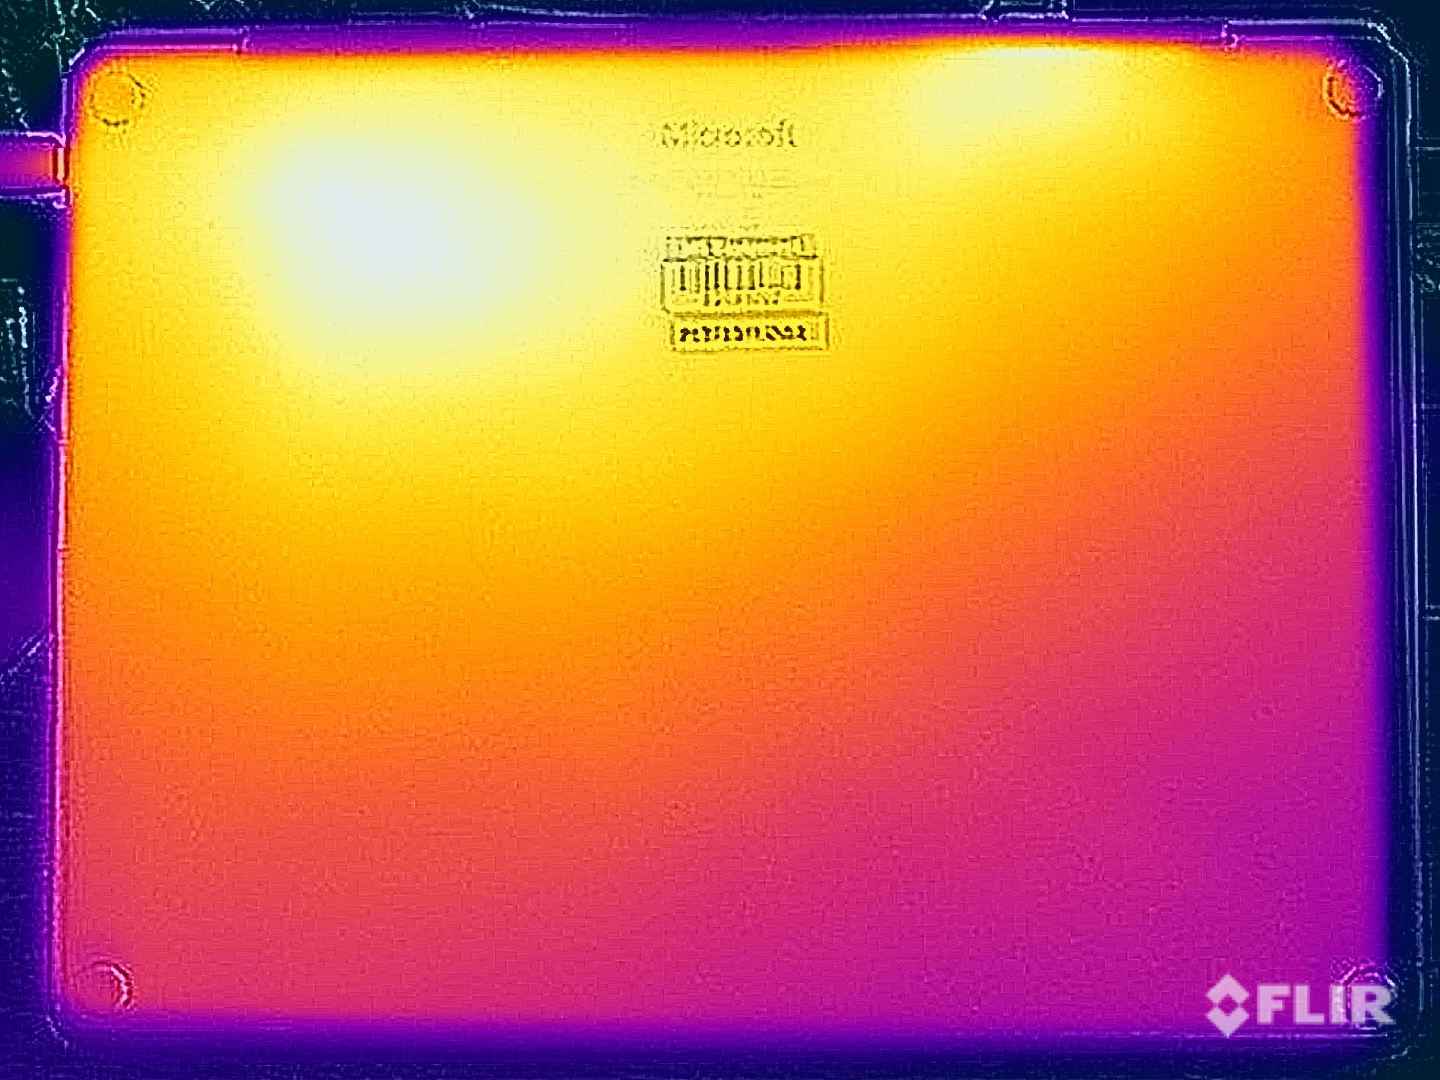
Temperature
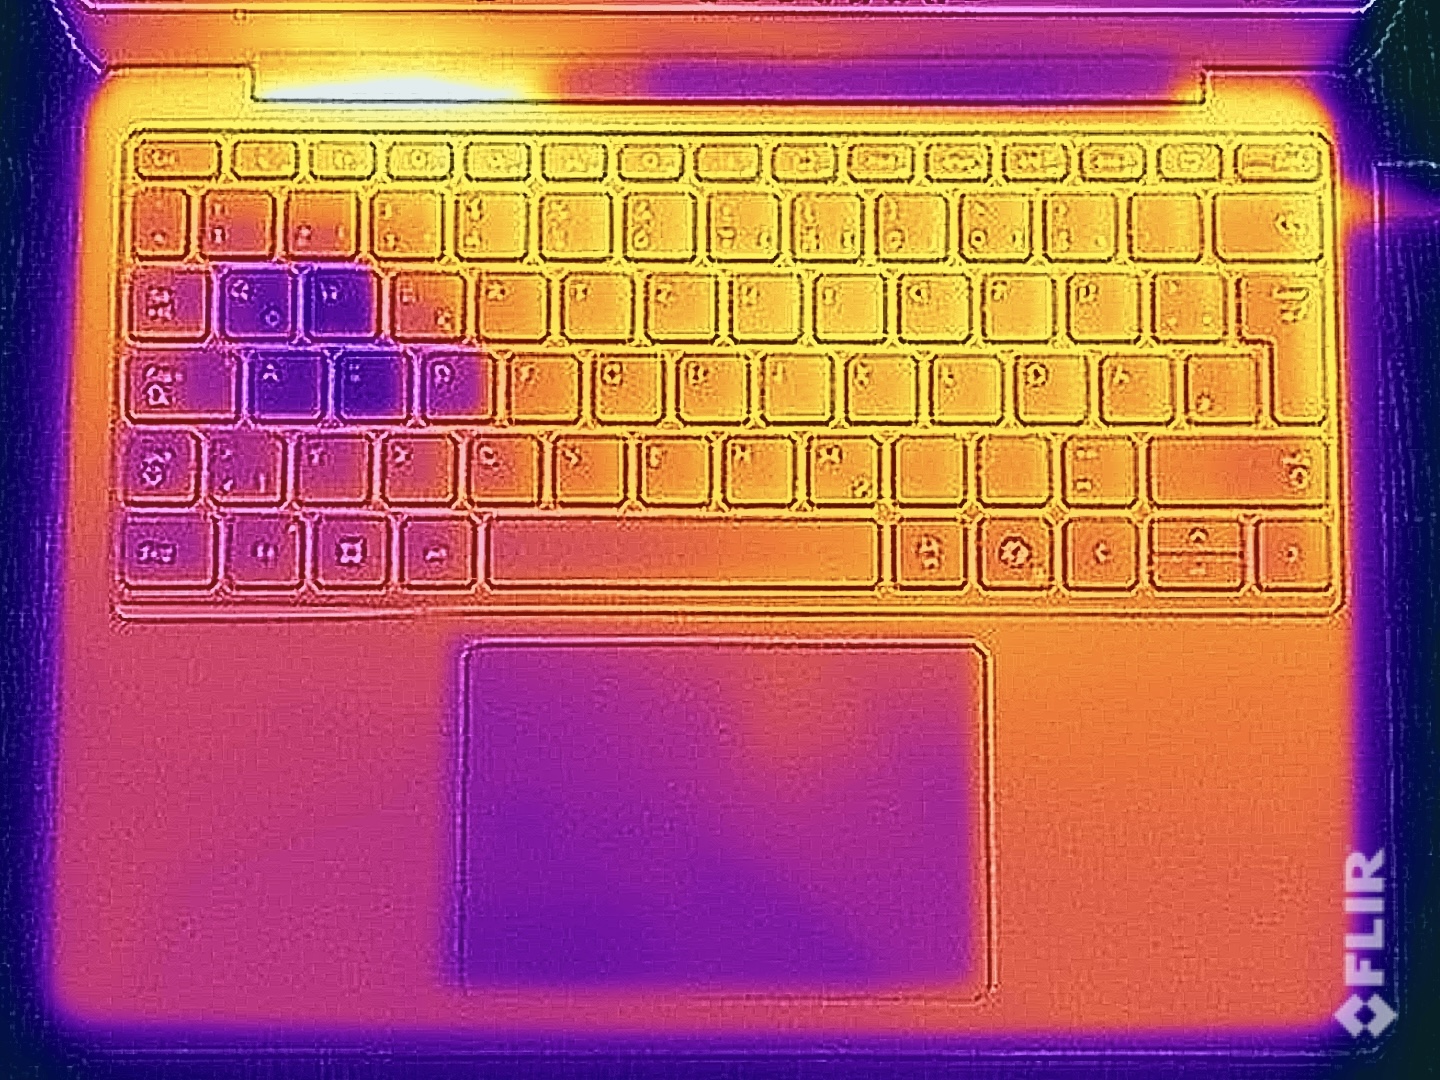
The Surface Laptop 13 stays super cool during everyday use and there are no temperature issues even under full load, so you can rest the device on your thighs without any problems.
(+) The maximum temperature on the upper side is 39 °C / 102 F, compared to the average of 35.9 °C / 97 F, ranging from 21.4 to 59 °C for the class Subnotebook.
(±) The bottom heats up to a maximum of 42.2 °C / 108 F, compared to the average of 39.2 °C / 103 F
(+) In idle usage, the average temperature for the upper side is 23.7 °C / 75 F, compared to the device average of 30.8 °C / 87 F.
(+) 3: The average temperature for the upper side is 31.7 °C / 89 F, compared to the average of 30.8 °C / 87 F for the class Subnotebook.
(+) The palmrests and touchpad are reaching skin temperature as a maximum (34.3 °C / 93.7 F) and are therefore not hot.
(-) The average temperature of the palmrest area of similar devices was 28.2 °C / 82.8 F (-6.1 °C / -10.9 F).
| Microsoft Surface Laptop 13 Qualcomm Snapdragon X Plus X1P-42-100, Qualcomm SD X Adreno X1-45 1.7 TFLOPS | Microsoft Surface Laptop 7 13.8 Copilot+ Qualcomm Snapdragon X Elite X1E-80-100, Qualcomm SD X Adreno X1-85 3.8 TFLOPS | Apple MacBook Air 13 M4 Entry Apple M4 10-Core, Apple M4 8-Core GPU | Apple MacBook Air 13 M3 10C GPU Apple M3, Apple M3 10-Core GPU | Dell XPS 13 9345 Qualcomm Snapdragon X Elite X1E-80-100, Qualcomm SD X Adreno X1-85 3.8 TFLOPS | Framework Laptop 13.5 Core Ultra 7 155H Intel Core Ultra 7 155H, Intel Arc 8-Core iGPU | Microsoft Surface Laptop Go 3 Intel Core i5-1235U, Intel Iris Xe Graphics G7 80EUs | |
|---|---|---|---|---|---|---|---|
| Heat | -8% | -4% | -1% | -20% | -13% | -7% | |
| Maximum Upper Side * (°C) | 39 | 47.1 -21% | 44.9 -15% | 44.3 -14% | 45.2 -16% | 42.8 -10% | 40.9 -5% |
| Maximum Bottom * (°C) | 42.2 | 44.6 -6% | 42.6 -1% | 43.4 -3% | 44.2 -5% | 45.2 -7% | 47.2 -12% |
| Idle Upper Side * (°C) | 23.9 | 24.7 -3% | 23.9 -0% | 22.3 7% | 30.4 -27% | 27.2 -14% | 24.9 -4% |
| Idle Bottom * (°C) | 24 | 24.5 -2% | 24 -0% | 22.1 8% | 31.6 -32% | 28.6 -19% | 25.9 -8% |
* ... smaller is better
Speakers
Although the speakers lack bass a bit, the laptop's overall sound quality is good.
Microsoft Surface Laptop 13 audio analysis
(+) | speakers can play relatively loud (83.5 dB)
Bass 100 - 315 Hz
(-) | nearly no bass - on average 15.5% lower than median
(±) | linearity of bass is average (10.7% delta to prev. frequency)
Mids 400 - 2000 Hz
(+) | balanced mids - only 3.3% away from median
(+) | mids are linear (4.3% delta to prev. frequency)
Highs 2 - 16 kHz
(+) | balanced highs - only 1.5% away from median
(+) | highs are linear (4.7% delta to prev. frequency)
Overall 100 - 16.000 Hz
(+) | overall sound is linear (11.1% difference to median)
Compared to same class
» 11% of all tested devices in this class were better, 2% similar, 87% worse
» The best had a delta of 5%, average was 18%, worst was 53%
Compared to all devices tested
» 7% of all tested devices were better, 2% similar, 92% worse
» The best had a delta of 4%, average was 23%, worst was 134%
Microsoft Surface Laptop 7 13.8 Copilot+ audio analysis
(±) | speaker loudness is average but good (81.8 dB)
Bass 100 - 315 Hz
(±) | reduced bass - on average 12.7% lower than median
(±) | linearity of bass is average (9.8% delta to prev. frequency)
Mids 400 - 2000 Hz
(+) | balanced mids - only 4.1% away from median
(+) | mids are linear (2.4% delta to prev. frequency)
Highs 2 - 16 kHz
(+) | balanced highs - only 2.1% away from median
(+) | highs are linear (2.5% delta to prev. frequency)
Overall 100 - 16.000 Hz
(+) | overall sound is linear (12.1% difference to median)
Compared to same class
» 15% of all tested devices in this class were better, 5% similar, 81% worse
» The best had a delta of 5%, average was 18%, worst was 53%
Compared to all devices tested
» 10% of all tested devices were better, 2% similar, 88% worse
» The best had a delta of 4%, average was 23%, worst was 134%
Dell XPS 13 9345 audio analysis
(+) | speakers can play relatively loud (82.3 dB)
Bass 100 - 315 Hz
(±) | reduced bass - on average 9.9% lower than median
(±) | linearity of bass is average (12.4% delta to prev. frequency)
Mids 400 - 2000 Hz
(+) | balanced mids - only 1.9% away from median
(+) | mids are linear (3.2% delta to prev. frequency)
Highs 2 - 16 kHz
(+) | balanced highs - only 1.5% away from median
(+) | highs are linear (3% delta to prev. frequency)
Overall 100 - 16.000 Hz
(+) | overall sound is linear (8.2% difference to median)
Compared to same class
» 2% of all tested devices in this class were better, 1% similar, 97% worse
» The best had a delta of 5%, average was 18%, worst was 53%
Compared to all devices tested
» 2% of all tested devices were better, 1% similar, 97% worse
» The best had a delta of 4%, average was 23%, worst was 134%
Framework Laptop 13.5 Core Ultra 7 155H audio analysis
(±) | speaker loudness is average but good (79.8 dB)
Bass 100 - 315 Hz
(±) | reduced bass - on average 14.5% lower than median
(±) | linearity of bass is average (8.2% delta to prev. frequency)
Mids 400 - 2000 Hz
(+) | balanced mids - only 3.6% away from median
(+) | mids are linear (3.5% delta to prev. frequency)
Highs 2 - 16 kHz
(+) | balanced highs - only 2.5% away from median
(+) | highs are linear (4.1% delta to prev. frequency)
Overall 100 - 16.000 Hz
(+) | overall sound is linear (14.7% difference to median)
Compared to same class
» 13% of all tested devices in this class were better, 4% similar, 84% worse
» The best had a delta of 7%, average was 21%, worst was 53%
Compared to all devices tested
» 19% of all tested devices were better, 4% similar, 77% worse
» The best had a delta of 4%, average was 23%, worst was 134%
Microsoft Surface Laptop Go 3 audio analysis
(±) | speaker loudness is average but good (79 dB)
Bass 100 - 315 Hz
(-) | nearly no bass - on average 18.7% lower than median
(±) | linearity of bass is average (9.8% delta to prev. frequency)
Mids 400 - 2000 Hz
(+) | balanced mids - only 4.8% away from median
(+) | mids are linear (5.2% delta to prev. frequency)
Highs 2 - 16 kHz
(+) | balanced highs - only 1.1% away from median
(+) | highs are linear (2.7% delta to prev. frequency)
Overall 100 - 16.000 Hz
(±) | linearity of overall sound is average (15.4% difference to median)
Compared to same class
» 35% of all tested devices in this class were better, 6% similar, 59% worse
» The best had a delta of 5%, average was 18%, worst was 53%
Compared to all devices tested
» 23% of all tested devices were better, 4% similar, 73% worse
» The best had a delta of 4%, average was 23%, worst was 134%
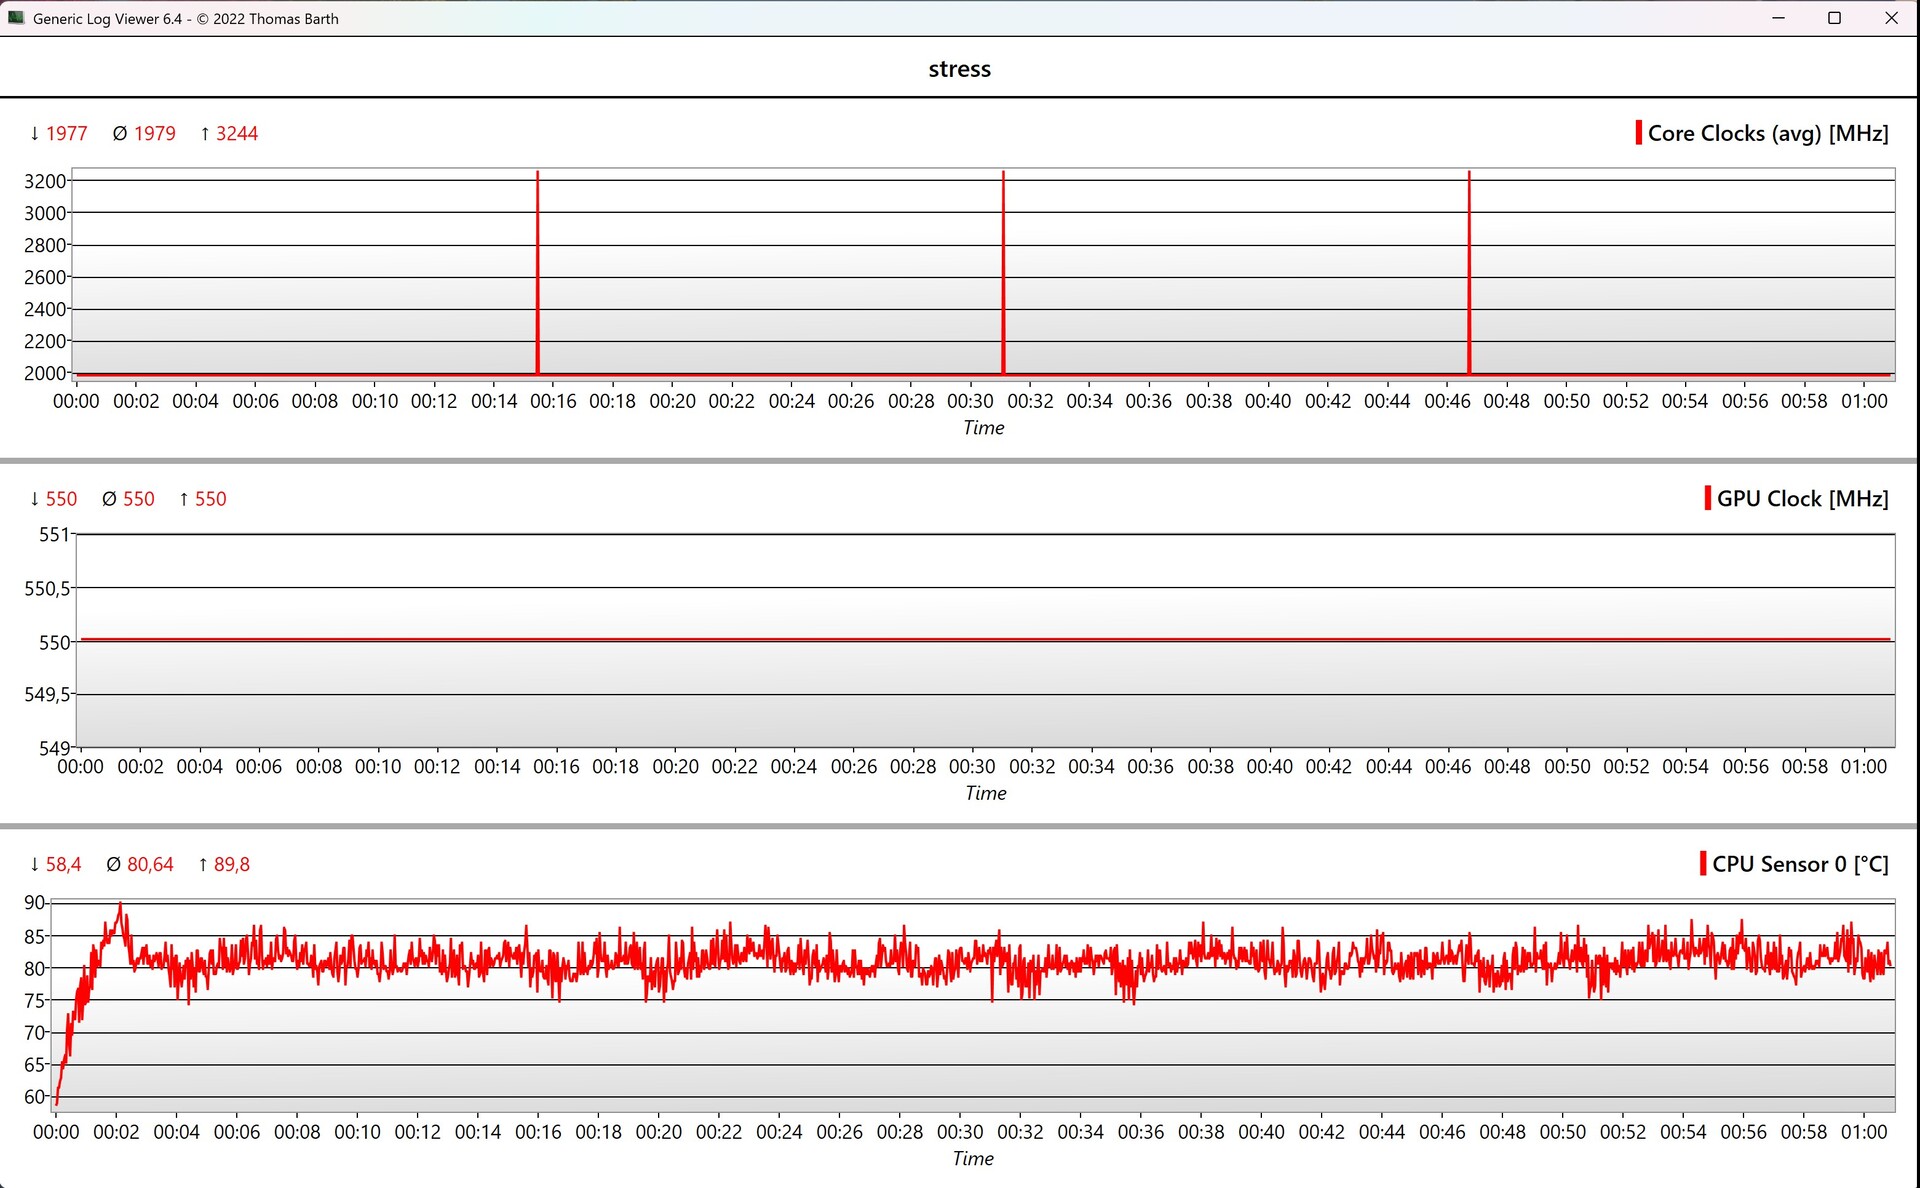
Power consumption
The new Surface Laptop 13 is very frugal and requires just over 5 watts when idling. Under load, it can require up to 60 watts, which then levels off at around 40 watts. Microsoft recommends a 45-watt power supply unit, but we would recommend going for a 65-watt module.
| Off / Standby | |
| Idle | |
| Load |
|
Key:
min: | |
| Microsoft Surface Laptop 13 Adreno X1-45 1.7 TFLOPS, SD X Plus X1P-42-100 | Microsoft Surface Laptop 7 13.8 Copilot+ Adreno X1-85 3.8 TFLOPS, SD X Elite X1E-80-100, Samsung MZ9L4512HBLU-00BMV | Apple MacBook Air 13 M4 Entry M4 8-Core GPU, M4 10-Core, Apple SSD AP0256Z | Apple MacBook Air 13 M3 10C GPU M3 10-Core GPU, M3, Apple SSD AP0512Z | Dell XPS 13 9345 Adreno X1-85 3.8 TFLOPS, SD X Elite X1E-80-100 | Framework Laptop 13.5 Core Ultra 7 155H Arc 8-Core, Ultra 7 155H | Microsoft Surface Laptop Go 3 Iris Xe G7 80EUs, i5-1235U, Kioxia BG5 KBG50ZNS256G | |
|---|---|---|---|---|---|---|---|
| Power Consumption | -30% | -28% | -49% | -63% | -87% | -81% | |
| Idle Minimum * (Watt) | 1.8 | 1.4 22% | 1.9 -6% | 1.95 -8% | 2.8 -56% | 2.5 -39% | 4.8 -167% |
| Idle Average * (Watt) | 5.1 | 6.3 -24% | 8.7 -71% | 8.7 -71% | 4.9 4% | 5.2 -2% | 8.3 -63% |
| Idle Maximum * (Watt) | 5.6 | 7.6 -36% | 8.8 -57% | 8.9 -59% | 5.7 -2% | 5.8 -4% | 8.9 -59% |
| Load Average * (Watt) | 13.8 | 26.9 -95% | 29.9 -117% | 34.3 -149% | 40.6 -194% | 47.5 -244% | 34.7 -151% |
| Cyberpunk 2077 ultra * (Watt) | 21.8 | 38.5 -77% | 18.5 15% | 40.7 -87% | 54.5 -150% | ||
| Cyberpunk 2077 ultra external monitor * (Watt) | 19.4 | 21.5 -11% | 39.4 -103% | 52.4 -170% | |||
| Load Maximum * (Watt) | 60.2 | 40.7 32% | 30.8 49% | 35.4 41% | 64 -6% | 61.5 -2% | 38.6 36% |
| Witcher 3 ultra * (Watt) | 28.6 | 32.9 |
* ... smaller is better
Power consumption Cyberpunk / stress test
Power consumption with external monitor
Runtimes
The Surface Laptop 13'S runtimes are very good, especially considering its comparatively small 50 Wh battery. During the WLAN test at 150 cd/m² (63% of our test device's maximum brightness), we measured a very good 16:41 hours, and it still managed 11:22 hours at full brightness. Charging takes 131 minutes using a 65-watt power supply (80% after 63 minutes).
Notebookcheck total rating
Microsoft Surface Laptop 13
- 06/05/2025 v8
Andreas Osthoff
 Total Sustainability Score:
 Possible alternatives compared
Image | Model / Review | Price | Weight | Height | Display |
|---|---|---|---|---|---|
1. 84.3%  | Microsoft Surface Laptop 13 Qualcomm Snapdragon X Plus X1P-42-100 ⎘ Qualcomm SD X Adreno X1-45 1.7 TFLOPS ⎘ 16 GB Memory | Amazon: List Price: 1219€ | 1.2 kg | 15.6 mm | 13.00" 1920x1280 178 PPI IPS |
2. 86.2%  | Microsoft Surface Laptop 7 13.8 Copilot+ Qualcomm Snapdragon X Elite X1E-80-100 ⎘ Qualcomm SD X Adreno X1-85 3.8 TFLOPS ⎘ 16 GB Memory, 512 GB SSD | Amazon: List Price: 1649€ | 1.3 kg | 17.5 mm | 13.80" 2304x1536 201 PPI IPS |
3. 91.2%  | Apple MacBook Air 13 M4 Entry Apple M4 10-Core ⎘ Apple M4 8-Core GPU ⎘ 16 GB Memory, 256 GB SSD | Amazon: List Price: 1039€ | 1.2 kg | 11.3 mm | 13.60" 2560x1664 225 PPI IPS |
4. 92.4% v7 (old)  | Apple MacBook Air 13 M3 10C GPU Apple M3 ⎘ Apple M3 10-Core GPU ⎘ 16 GB Memory, 512 GB SSD | Amazon: List Price: 1759€ | 1.2 kg | 11.3 mm | 13.60" 2560x1664 225 PPI IPS |
5. 84.5%  | Dell XPS 13 9345 Qualcomm Snapdragon X Elite X1E-80-100 ⎘ Qualcomm SD X Adreno X1-85 3.8 TFLOPS ⎘ 16 GB Memory | Amazon: List Price: 1300 USD | 1.2 kg | 15.3 mm | 13.40" 1920x1200 169 PPI IPS |
6. 84%  | Framework Laptop 13.5 Core Ultra 7 155H Intel Core Ultra 7 155H ⎘ Intel Arc 8-Core iGPU ⎘ 32 GB Memory | Amazon: 1. $815.00 MSI Modern 13 inch Ultrabook... List Price: 1500 USD | 1.4 kg | 15.85 mm | 13.50" 2880x1920 256 PPI IPS |
7. 83.3% v7 (old)  | Microsoft Surface Laptop Go 3 Intel Core i5-1235U ⎘ Intel Iris Xe Graphics G7 80EUs ⎘ 16 GB Memory, 512 GB SSD | Amazon: List Price: 1149€ | 1.1 kg | 15.7 mm | 12.40" 1536x1024 149 PPI IPS |
Transparency
The selection of devices to be reviewed is made by our editorial team. The test sample was provided to the author as a loan by the manufacturer or retailer for the purpose of this review. The lender had no influence on this review, nor did the manufacturer receive a copy of this review before publication. There was no obligation to publish this review. As an independent media company, Notebookcheck is not subjected to the authority of manufacturers, retailers or publishers.
This is how Notebookcheck is testing
Every year, Notebookcheck independently reviews hundreds of laptops and smartphones using standardized procedures to ensure that all results are comparable. We have continuously developed our test methods for around 20 years and set industry standards in the process. In our test labs, high-quality measuring equipment is utilized by experienced technicians and editors. These tests involve a multi-stage validation process. Our complex rating system is based on hundreds of well-founded measurements and benchmarks, which maintains objectivity. Further information on our test methods can be found here.

