Verdict - Yoga Pro 9i 16 with excellent display
With the new 3.2K tandem OLED display, Lenovo can raise the bar for multimedia laptops once again, although the 2.8K OLED was already very good. With a maximum brightness of 1,600 cd/m², it matches the mini LED panel of the Apple MacBook Pro 16 and there are advantages in terms of response times and color space coverage. The tandem OLED panel is also available as an optional touchscreen.
The optional Core Ultra 9 285H is not really worthwhile compared to the Core Ultra 7 255H, as there is only a very slight advantage in single-core scenarios. The mobile GeForce RTX 5070 is around 10-15% faster than the RTX 5060 and can pay off if you want the highest GPU performance. However, we also see a missed opportunity here to install even faster GPUs. Asus will soon be launching the ProArt P16 in a faster version (maximum RTX 5090 laptop, also tandem OLED) and will probably easily take the performance crown in the multimedia laptop segment.
All in all, the Yoga Pro 9i 16 remains a great multimedia laptop that has become even better thanks to the new OLED screen.
Pros
Cons
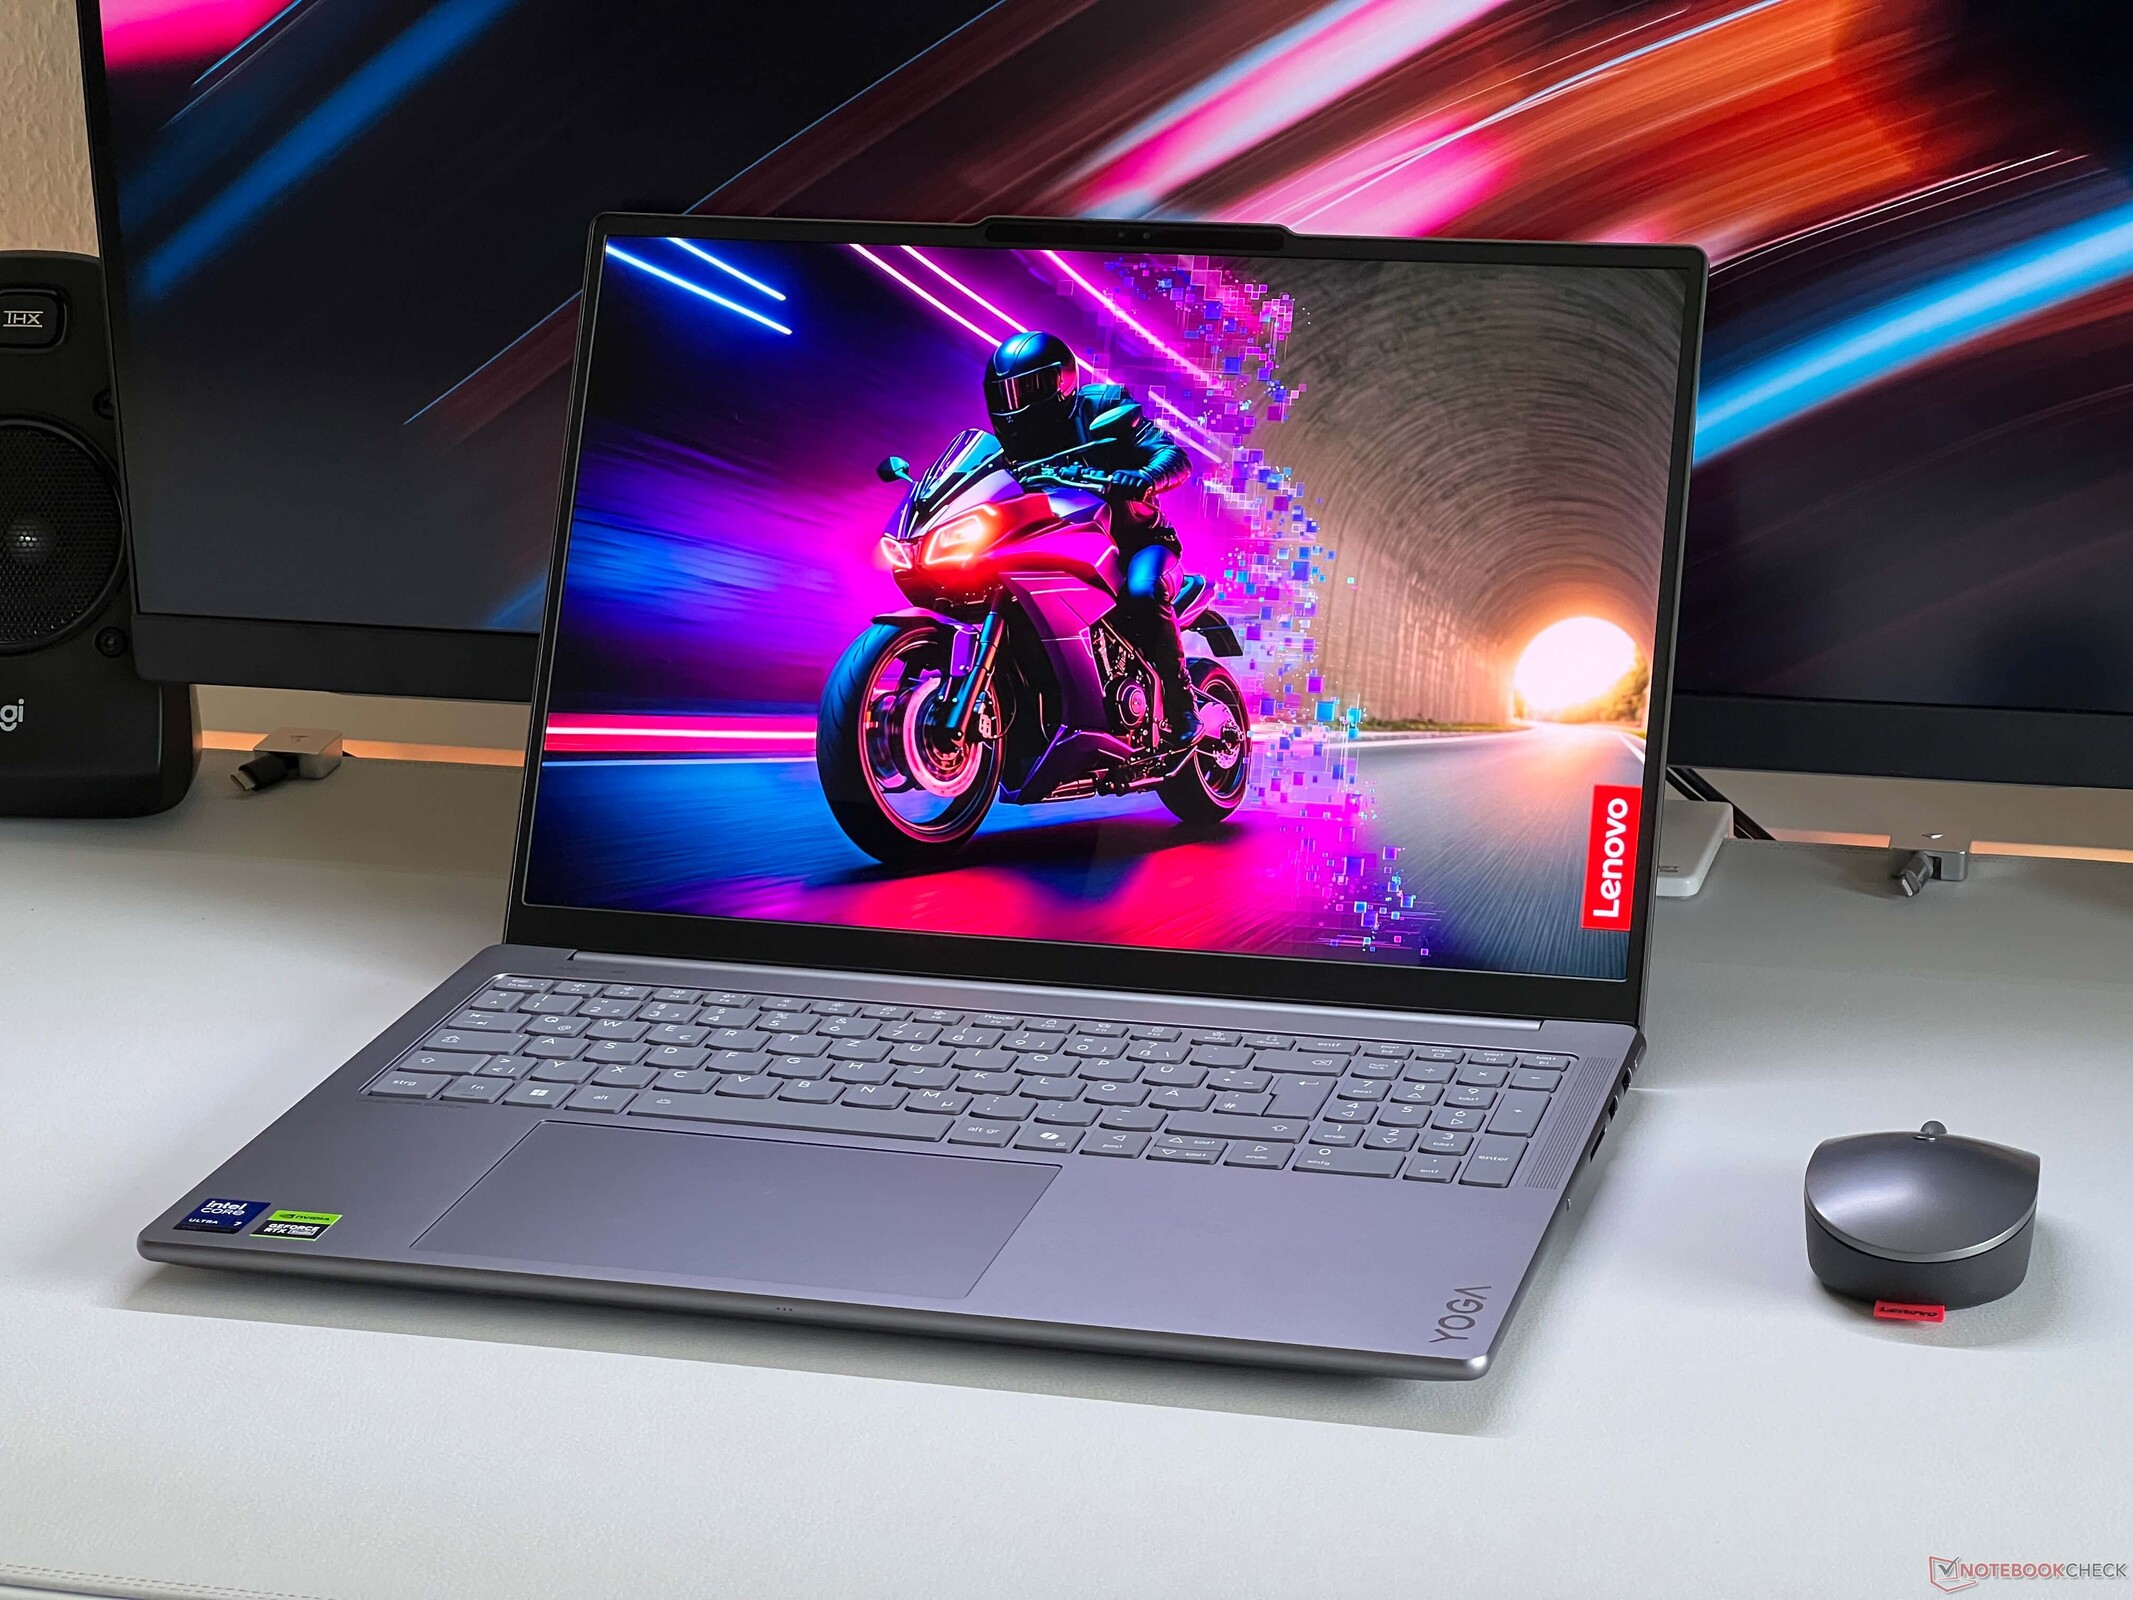
The Yoga Pro 9i 16 is Lenovo's high-end multimedia laptop and we were able to test the current current G10 model extensively with the 2.8K OLED and the Nvidia GeForce RTX 5060 laptop. Now the new top model is also available, which combines Intel's Core Ultra 9 285H with the GeForce RTX 5070 laptop and 64 GB of RAM. The new Tandem OLED panel with a higher 3.2K resolution is also used, which delivers even better brightness values. The RRP for our test device with 2 TB SSD storage is 2,799 Euros (~$3253).
There are no differences to the previously tested Yoga Pro 9i 16 with the RTX 5060 laptop in terms of the casing, features, input devices and speakers. In this review, we will focus on the new display as well as the performance, emissions and battery life.
Specifications


Display - Tandem OLED with 1,600 cd/m²

The new tandem OLED panel offers a resolution of 3,200 x 2,000 (16:10) and a frequency of 120 Hz and is optionally available with touch functionality. The subjective picture quality is excellent and even bright surfaces do not appear grainy. The response times are extremely fast and measurable PWM flickering only occurs at a brightness of 60% or less, with a very high frequency of 1.2 kHz and a low amplitude of 22%. So there should be no problems here.
The big difference from the already very good 2.8K OLED is the brightness, as it is almost 1,000 nits in SDR mode and up to 1,600 nits in HDR mode with small image sections (with an almost completely white image still ~1,180 cd/m²). The brightness values are therefore on par with the mini LED panel from the MacBook Pro 16, but the Lenovo has advantages in terms of response times and color space coverage. On the other hand, the MacBook is also available with an optional matte panel.
| |||||||||||||||||||||||||
Brightness Distribution: 98 %
Center on Battery: 984 cd/m²
Contrast: ∞:1 (Black: 0 cd/m²)
ΔE ColorChecker Calman: 0.9 | ∀{0.5-29.43 Ø4.72}
ΔE Greyscale Calman: 1.3 | ∀{0.09-98 Ø4.97}
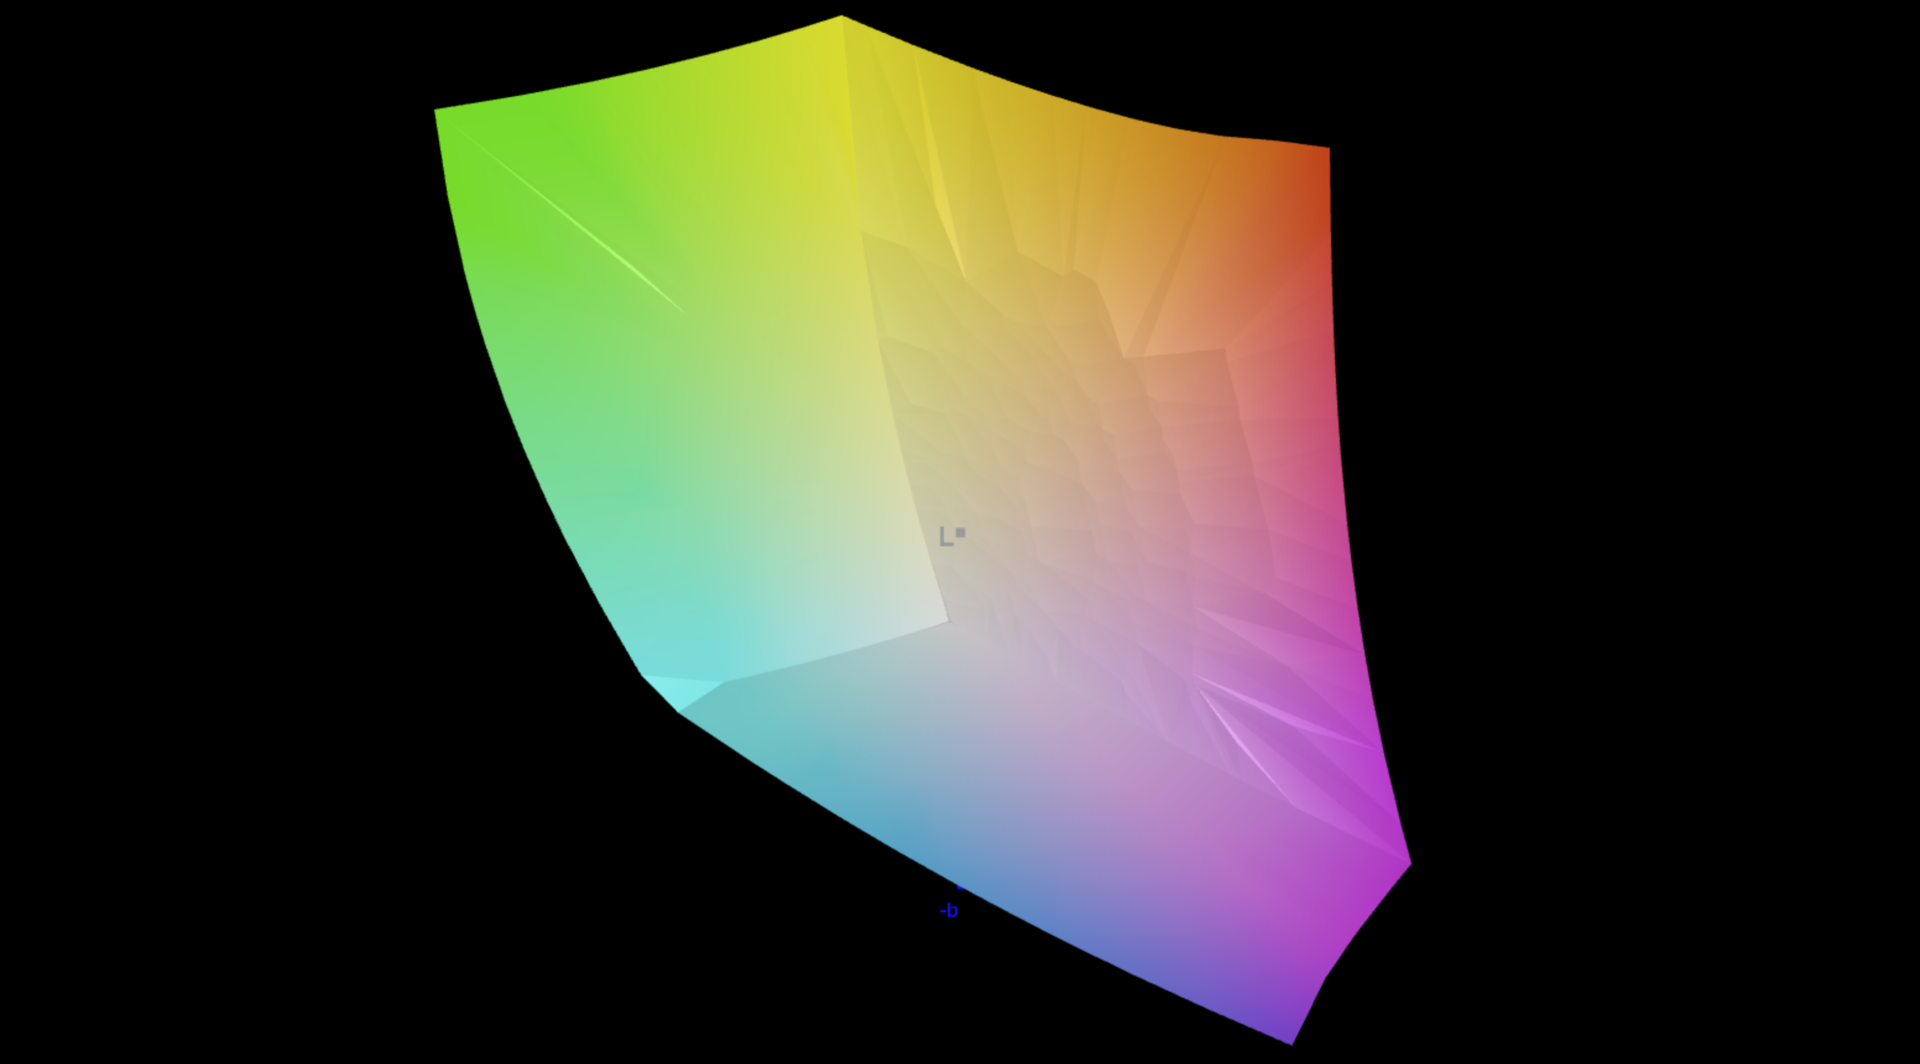
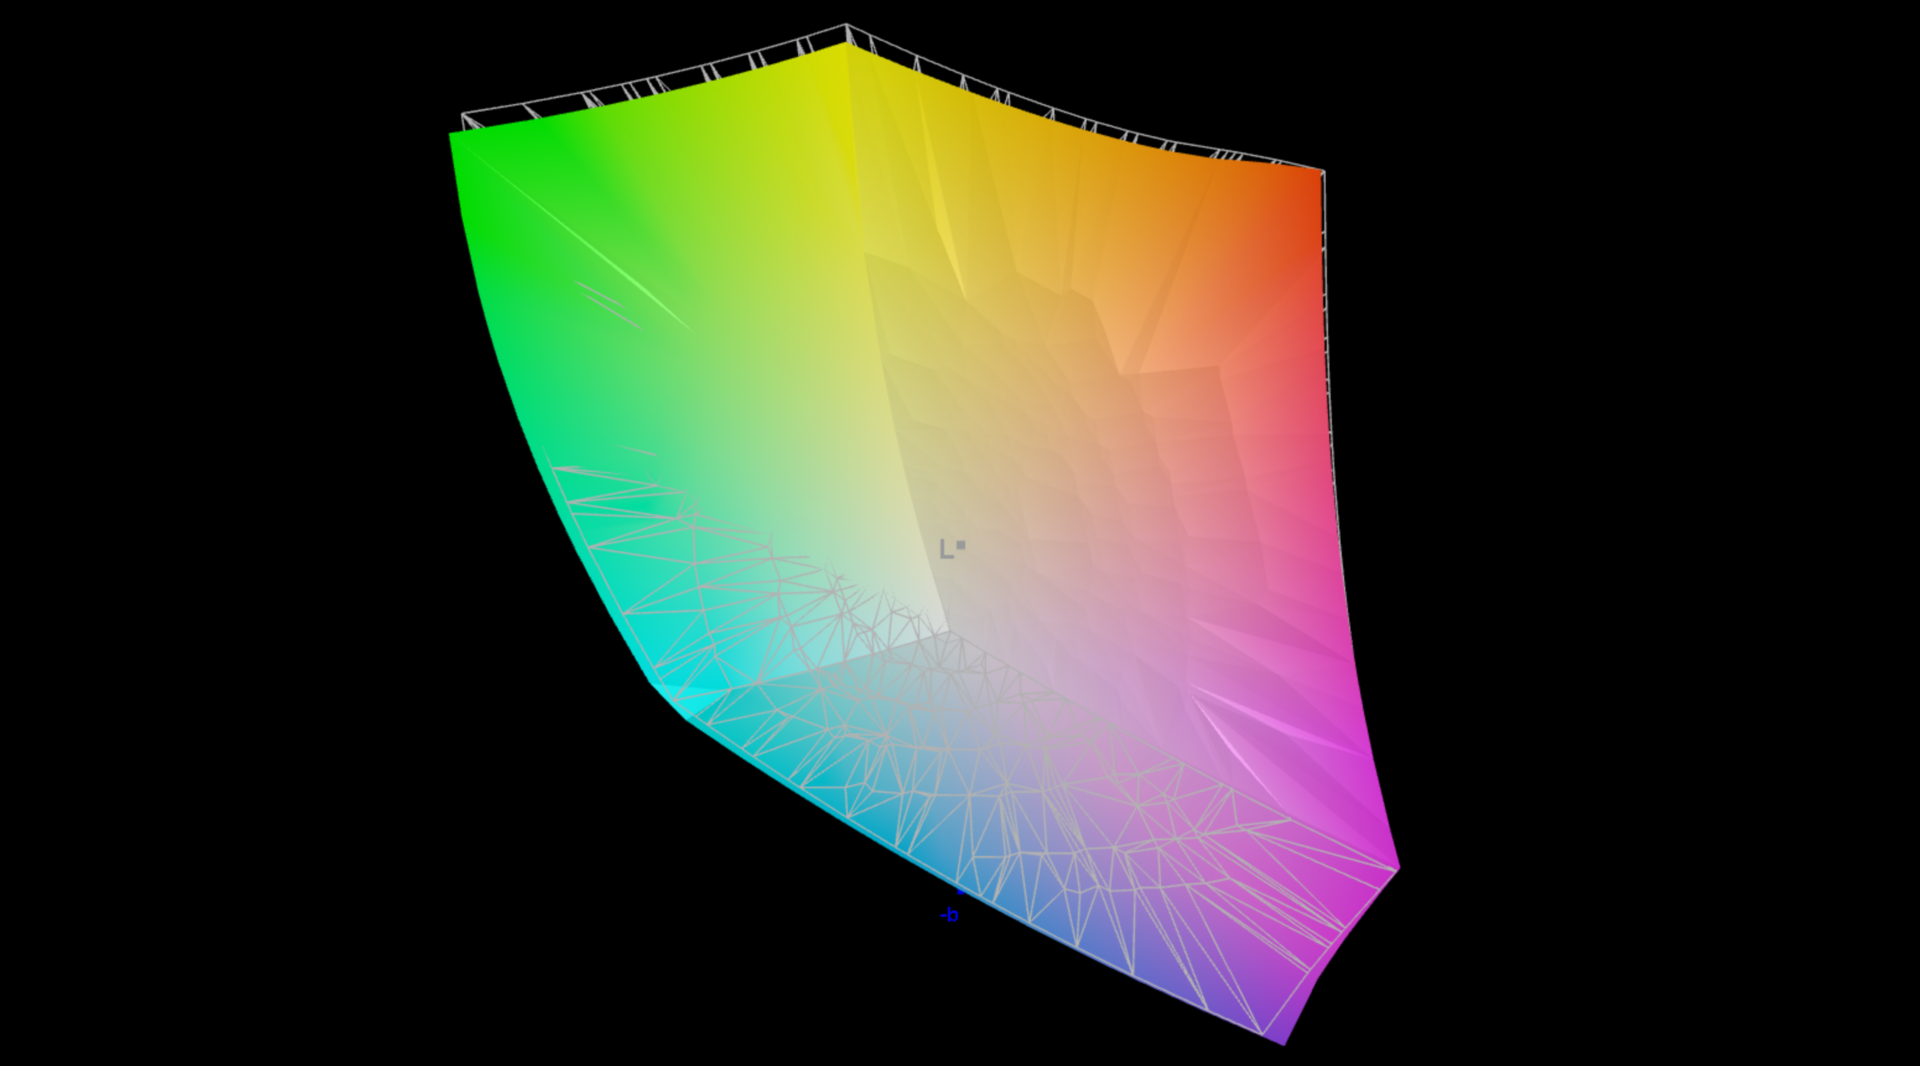
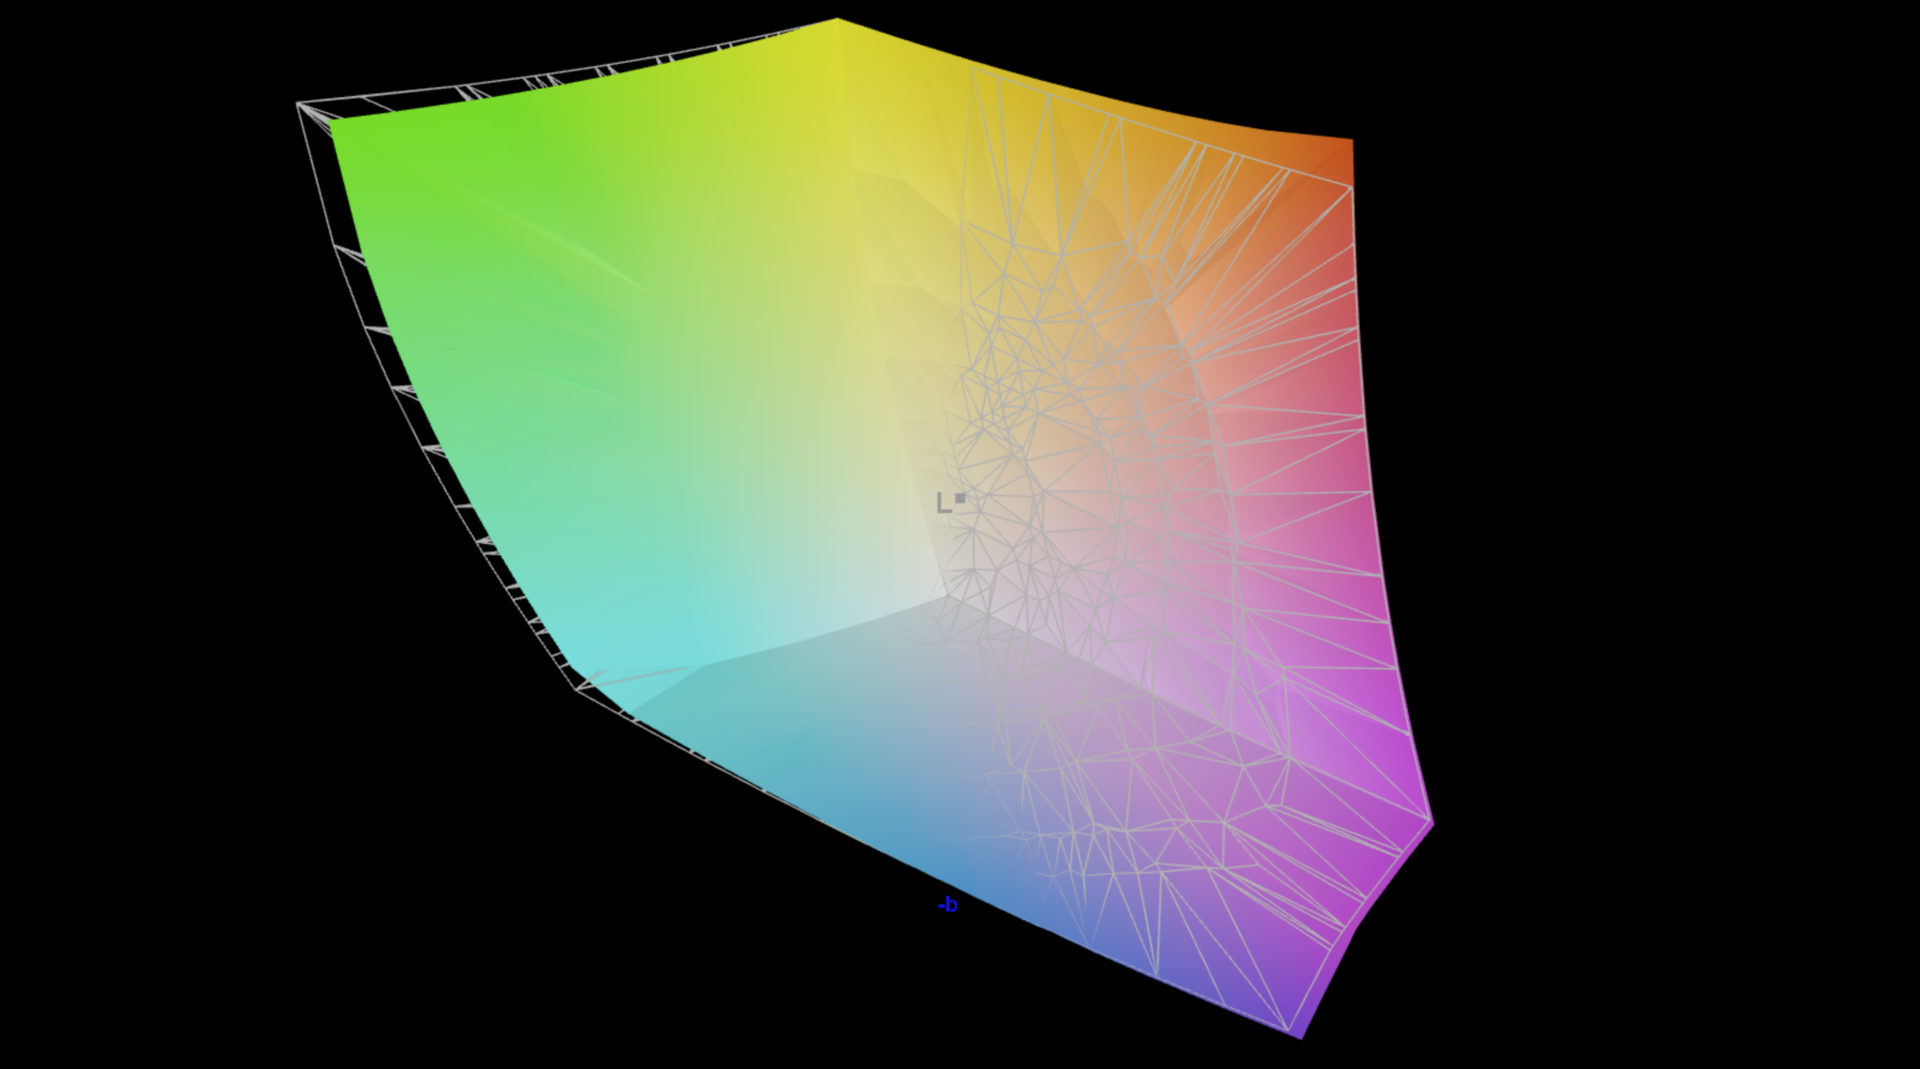
96.8% AdobeRGB 1998 (Argyll 3D)
100% sRGB (Argyll 3D)
97.4% Display P3 (Argyll 3D)
Gamma: 2.21
CCT: 6751 K
| Lenovo Yoga Pro 9i 16 RTX 5070 ATNA60KA01-0, OLED, 3200x2000, 16", 120 Hz | Asus ProArt P16 H7606WP ATNA60CL10-0, OLED, 2880x1800, 16", 120 Hz | Lenovo Yoga Pro 9 16IAH G10 RTX 5060 ATNA60HR04-0, OLED, 2880x1800, 16", 120 Hz | Apple MacBook Pro 16 2024 M4 Pro Mini-LED, 3456x2234, 16.2", 120 Hz | Schenker XMG Core 16 M25 MNG007DA6-4, IPS, 2560x1600, 16", 300 Hz | |
|---|---|---|---|---|---|
| Display | -2% | -2% | -2% | -3% | |
| Display P3 Coverage (%) | 97.4 | 99.5 2% | 99 2% | 99.7 2% | 98.8 1% |
| sRGB Coverage (%) | 100 | 100 0% | 100 0% | 100 0% | 100 0% |
| AdobeRGB 1998 Coverage (%) | 96.8 | 89.5 -8% | 89.6 -7% | 88.8 -8% | 88.4 -9% |
| Response Times | -74% | -175% | -9057% | -2544% | |
| Response Time Grey 50% / Grey 80% * (ms) | 0.27 ? | 0.63 ? -133% | 1.47 ? -444% | 43 ? -15826% | 10.7 ? -3863% |
| Response Time Black / White * (ms) | 0.37 ? | 0.63 ? -70% | 0.42 ? -14% | 41.2 ? -11035% | 4.9 ? -1224% |
| PWM Frequency (Hz) | 1200 | 480 ? | 1200 ? | 14880 | |
| PWM Amplitude * (%) | 22 | 26 -18% | 37 -68% | 90 -309% | |
| Screen | -20% | -22% | 4% | -89% | |
| Brightness middle (cd/m²) | 974 | 362 -63% | 475 -51% | 632 -35% | 512 -47% |
| Brightness (cd/m²) | 979 | 363 -63% | 474 -52% | 616 -37% | 483 -51% |
| Brightness Distribution (%) | 98 | 99 1% | 97 -1% | 95 -3% | 91 -7% |
| Black Level * (cd/m²) | 0.43 | ||||
| Colorchecker dE 2000 * | 0.9 | 0.8 11% | 1 -11% | 0.6 33% | 2.4 -167% |
| Colorchecker dE 2000 max. * | 1.7 | 1.8 -6% | 2 -18% | 1.2 29% | 3.8 -124% |
| Greyscale dE 2000 * | 1.3 | 1.3 -0% | 1.3 -0% | 0.8 38% | 3.1 -138% |
| Gamma | 2.21 100% | 2.2 100% | 2.24 98% | 2.21 100% | 2.41 91% |
| CCT | 6751 96% | 6741 96% | 6672 97% | 6450 101% | 6534 99% |
| Contrast (:1) | 1191 | ||||
| Colorchecker dE 2000 calibrated * | 0.9 | ||||
| Total Average (Program / Settings) | -32% /
-29% | -66% /
-55% | -3018% /
-2263% | -879% /
-512% |
* ... smaller is better
In our analysis with the professional CalMAN software, we checked the various color profiles and the colors are already very accurate in the respective profiles. The only outlier is 100% red in AdobeRGB, but otherwise there are no complaints and we were unable to improve the display any further with our own calibration.


Display Response Times
| ↔ Response Time Black to White | ||
|---|---|---|
| 0.37 ms ... rise ↗ and fall ↘ combined | ↗ 0.2 ms rise |  |
| ↘ 0.17 ms fall | ||
| The screen shows very fast response rates in our tests and should be very well suited for fast-paced gaming. In comparison, all tested devices range from 0.1 (minimum) to 240 (maximum) ms. » 0 % of all devices are better. This means that the measured response time is better than the average of all tested devices (19.8 ms). | ||
| ↔ Response Time 50% Grey to 80% Grey | ||
| 0.27 ms ... rise ↗ and fall ↘ combined | ↗ 0.13 ms rise |  |
| ↘ 0.14 ms fall | ||
| The screen shows very fast response rates in our tests and should be very well suited for fast-paced gaming. In comparison, all tested devices range from 0.165 (minimum) to 636 (maximum) ms. » 0 % of all devices are better. This means that the measured response time is better than the average of all tested devices (31 ms). | ||
Screen Flickering / PWM (Pulse-Width Modulation)
| Screen flickering / PWM detected | 1200 Hz Amplitude: 22 % |  | |
The display backlight flickers at 1200 Hz (worst case, e.g., utilizing PWM) . The frequency of 1200 Hz is quite high, so most users sensitive to PWM should not notice any flickering. In comparison: 52 % of all tested devices do not use PWM to dim the display. If PWM was detected, an average of 7763 (minimum: 5 - maximum: 343500) Hz was measured. | |||


Performance - Core Ultra 9 & RTX 5070


Test conditions
We used the performance mode for the test, but you should also try out the auto mode when gaming due to the lower fan volume.
| Energy profile | CPU TDP | CB24 Multi | GPU TGP | Time Spy Graphics | CP2077 QHD Ultra | max. Fan volume |
|---|---|---|---|---|---|---|
| Battery saving mode | 40 watts | 838 points | 28 watts | 3,079 points | 14.2 FPS | 30.6 dB(A) |
| Auto | 80/65 watts | 1,114 points | 75 watts | 12,025 points | 62.1 FPS | 44.2 dB(A) |
| Power | 115/80 watts | 1,189 points | 100 watts | 13,187 points | 62.8 FPS | 52.7 dB(A) |
| battery | 80 watts | 1,185 points | 65 watts | 10,912 points | 53.1 FPS | 44.2 dB(A) |
Processor - Core Ultra 9 285H
The power limits are identical to the previously tested Yoga Pro and overall the Core Ultra 9 285H only has a slight advantage in the single-core tests over the Core Ultra 7 255H. The CPU upgrade is therefore not really worthwhile. The two M4 chips in the MacBook Pro 16 offer significantly more CPU performance, both in single and multi-core tests.
Cinebench R15 Multi endurance test
Cinebench 2024: CPU Multi Core | CPU Single Core
Cinebench R23: Multi Core | Single Core
Cinebench R20: CPU (Multi Core) | CPU (Single Core)
Cinebench R15: CPU Multi 64Bit | CPU Single 64Bit
Blender: v2.79 BMW27 CPU
7-Zip 18.03: 7z b 4 | 7z b 4 -mmt1
Geekbench 6.7: Multi-Core | Single-Core
Geekbench 5.5: Multi-Core | Single-Core
HWBOT x265 Benchmark v2.2: 4k Preset
LibreOffice : 20 Documents To PDF
R Benchmark 2.5: Overall mean
| CPU Performance rating | |
| Apple MacBook Pro 16 M4 Max -8! | |
| Apple MacBook Pro 16 2024 M4 Pro -12! | |
| Lenovo Yoga Pro 9i 16 RTX 5070 | |
| Lenovo Yoga Pro 9 16IAH G10 RTX 5060 | |
| Asus ProArt P16 H7606WP | |
| Average Intel Core Ultra 9 285H | |
| Dell XPS 16 9640 | |
| Average of class Multimedia | |
| Cinebench 2024 / CPU Multi Core | |
| Apple MacBook Pro 16 M4 Max | |
| Apple MacBook Pro 16 M4 Max | |
| Apple MacBook Pro 16 2024 M4 Pro | |
| Asus ProArt P16 H7606WP | |
| Lenovo Yoga Pro 9 16IAH G10 RTX 5060 | |
| Lenovo Yoga Pro 9i 16 RTX 5070 | |
| Average Intel Core Ultra 9 285H (740 - 1194, n=11) | |
| Average of class Multimedia (327 - 2437, n=78, last 2 years) | |
| Dell XPS 16 9640 | |
| Cinebench 2024 / CPU Single Core | |
| Apple MacBook Pro 16 2024 M4 Pro | |
| Apple MacBook Pro 16 M4 Max | |
| Lenovo Yoga Pro 9i 16 RTX 5070 | |
| Average Intel Core Ultra 9 285H (124.8 - 130, n=11) | |
| Average of class Multimedia (72.5 - 201, n=62, last 2 years) | |
| Lenovo Yoga Pro 9 16IAH G10 RTX 5060 | |
| Asus ProArt P16 H7606WP | |
| Dell XPS 16 9640 | |
| Cinebench R23 / Multi Core | |
| Apple MacBook Pro 16 M4 Max | |
| Asus ProArt P16 H7606WP | |
| Lenovo Yoga Pro 9i 16 RTX 5070 | |
| Apple MacBook Pro 16 2024 M4 Pro | |
| Lenovo Yoga Pro 9 16IAH G10 RTX 5060 | |
| Average Intel Core Ultra 9 285H (15070 - 23576, n=12) | |
| Dell XPS 16 9640 | |
| Average of class Multimedia (4861 - 33362, n=80, last 2 years) | |
| Cinebench R23 / Single Core | |
| Apple MacBook Pro 16 2024 M4 Pro | |
| Apple MacBook Pro 16 M4 Max | |
| Lenovo Yoga Pro 9i 16 RTX 5070 | |
| Average Intel Core Ultra 9 285H (1979 - 2166, n=12) | |
| Lenovo Yoga Pro 9 16IAH G10 RTX 5060 | |
| Asus ProArt P16 H7606WP | |
| Average of class Multimedia (1128 - 2459, n=72, last 2 years) | |
| Dell XPS 16 9640 | |
| Cinebench R20 / CPU (Multi Core) | |
| Asus ProArt P16 H7606WP | |
| Lenovo Yoga Pro 9i 16 RTX 5070 | |
| Lenovo Yoga Pro 9 16IAH G10 RTX 5060 | |
| Average Intel Core Ultra 9 285H (5861 - 9208, n=12) | |
| Dell XPS 16 9640 | |
| Apple MacBook Pro 16 M4 Max | |
| Average of class Multimedia (1887 - 12912, n=63, last 2 years) | |
| Cinebench R20 / CPU (Single Core) | |
| Lenovo Yoga Pro 9i 16 RTX 5070 | |
| Average Intel Core Ultra 9 285H (761 - 837, n=12) | |
| Asus ProArt P16 H7606WP | |
| Lenovo Yoga Pro 9 16IAH G10 RTX 5060 | |
| Average of class Multimedia (425 - 853, n=63, last 2 years) | |
| Dell XPS 16 9640 | |
| Apple MacBook Pro 16 M4 Max | |
| Cinebench R15 / CPU Multi 64Bit | |
| Apple MacBook Pro 16 M4 Max | |
| Lenovo Yoga Pro 9i 16 RTX 5070 | |
| Asus ProArt P16 H7606WP | |
| Lenovo Yoga Pro 9 16IAH G10 RTX 5060 | |
| Average Intel Core Ultra 9 285H (2280 - 3496, n=12) | |
| Dell XPS 16 9640 | |
| Average of class Multimedia (856 - 5224, n=67, last 2 years) | |
| Cinebench R15 / CPU Single 64Bit | |
| Lenovo Yoga Pro 9i 16 RTX 5070 | |
| Average Intel Core Ultra 9 285H (288 - 322, n=12) | |
| Lenovo Yoga Pro 9 16IAH G10 RTX 5060 | |
| Apple MacBook Pro 16 M4 Max | |
| Average of class Multimedia (184.8 - 326, n=65, last 2 years) | |
| Dell XPS 16 9640 | |
| Asus ProArt P16 H7606WP | |
| Blender / v2.79 BMW27 CPU | |
| Average of class Multimedia (100 - 557, n=64, last 2 years) | |
| Average Intel Core Ultra 9 285H (151 - 235, n=12) | |
| Dell XPS 16 9640 | |
| Lenovo Yoga Pro 9 16IAH G10 RTX 5060 | |
| Lenovo Yoga Pro 9i 16 RTX 5070 | |
| Asus ProArt P16 H7606WP | |
| 7-Zip 18.03 / 7z b 4 | |
| Asus ProArt P16 H7606WP | |
| Lenovo Yoga Pro 9i 16 RTX 5070 | |
| Dell XPS 16 9640 | |
| Lenovo Yoga Pro 9 16IAH G10 RTX 5060 | |
| Average Intel Core Ultra 9 285H (50116 - 71959, n=12) | |
| Average of class Multimedia (26062 - 130368, n=61, last 2 years) | |
| 7-Zip 18.03 / 7z b 4 -mmt1 | |
| Lenovo Yoga Pro 9i 16 RTX 5070 | |
| Average Intel Core Ultra 9 285H (5403 - 6419, n=12) | |
| Asus ProArt P16 H7606WP | |
| Lenovo Yoga Pro 9 16IAH G10 RTX 5060 | |
| Average of class Multimedia (3666 - 7545, n=62, last 2 years) | |
| Dell XPS 16 9640 | |
| Geekbench 6.7 / Multi-Core | |
| Apple MacBook Pro 16 M4 Max | |
| Apple MacBook Pro 16 2024 M4 Pro | |
| Lenovo Yoga Pro 9i 16 RTX 5070 | |
| Lenovo Yoga Pro 9 16IAH G10 RTX 5060 | |
| Average Intel Core Ultra 9 285H (15284 - 17992, n=15) | |
| Asus ProArt P16 H7606WP | |
| Average of class Multimedia (4983 - 29415, n=75, last 2 years) | |
| Dell XPS 16 9640 | |
| Geekbench 6.7 / Single-Core | |
| Apple MacBook Pro 16 M4 Max | |
| Apple MacBook Pro 16 2024 M4 Pro | |
| Lenovo Yoga Pro 9i 16 RTX 5070 | |
| Asus ProArt P16 H7606WP | |
| Average of class Multimedia (1534 - 4335, n=74, last 2 years) | |
| Average Intel Core Ultra 9 285H (2665 - 3110, n=15) | |
| Lenovo Yoga Pro 9 16IAH G10 RTX 5060 | |
| Dell XPS 16 9640 | |
| Geekbench 5.5 / Multi-Core | |
| Lenovo Yoga Pro 9i 16 RTX 5070 | |
| Lenovo Yoga Pro 9 16IAH G10 RTX 5060 | |
| Average Intel Core Ultra 9 285H (13140 - 17487, n=13) | |
| Asus ProArt P16 H7606WP | |
| Dell XPS 16 9640 | |
| Average of class Multimedia (4652 - 20422, n=61, last 2 years) | |
| Geekbench 5.5 / Single-Core | |
| Asus ProArt P16 H7606WP | |
| Lenovo Yoga Pro 9i 16 RTX 5070 | |
| Average Intel Core Ultra 9 285H (1689 - 2256, n=13) | |
| Lenovo Yoga Pro 9 16IAH G10 RTX 5060 | |
| Average of class Multimedia (805 - 2974, n=61, last 2 years) | |
| Dell XPS 16 9640 | |
| HWBOT x265 Benchmark v2.2 / 4k Preset | |
| Asus ProArt P16 H7606WP | |
| Lenovo Yoga Pro 9i 16 RTX 5070 | |
| Lenovo Yoga Pro 9 16IAH G10 RTX 5060 | |
| Average Intel Core Ultra 9 285H (17.9 - 27.2, n=12) | |
| Dell XPS 16 9640 | |
| Average of class Multimedia (5.26 - 36.1, n=62, last 2 years) | |
| LibreOffice / 20 Documents To PDF | |
| Asus ProArt P16 H7606WP | |
| Average of class Multimedia (23.9 - 146.7, n=63, last 2 years) | |
| Average Intel Core Ultra 9 285H (39.4 - 56.1, n=12) | |
| Dell XPS 16 9640 | |
| Lenovo Yoga Pro 9i 16 RTX 5070 | |
| Lenovo Yoga Pro 9 16IAH G10 RTX 5060 | |
| R Benchmark 2.5 / Overall mean | |
| Dell XPS 16 9640 | |
| Average of class Multimedia (0.3604 - 0.947, n=62, last 2 years) | |
| Lenovo Yoga Pro 9 16IAH G10 RTX 5060 | |
| Average Intel Core Ultra 9 285H (0.4079 - 0.4794, n=12) | |
| Lenovo Yoga Pro 9i 16 RTX 5070 | |
| Asus ProArt P16 H7606WP | |
* ... smaller is better
AIDA64: FP32 Ray-Trace | FPU Julia | CPU SHA3 | CPU Queen | FPU SinJulia | FPU Mandel | CPU AES | CPU ZLib | FP64 Ray-Trace | CPU PhotoWorxx
| Performance rating | |
| Schenker XMG Core 16 M25 | |
| Asus ProArt P16 H7606WP | |
| Lenovo Yoga Pro 9i 16 RTX 5070 | |
| Lenovo Yoga Pro 9 16IAH G10 RTX 5060 | |
| Average Intel Core Ultra 9 285H | |
| Average of class Multimedia | |
| AIDA64 / FP32 Ray-Trace | |
| Asus ProArt P16 H7606WP | |
| Schenker XMG Core 16 M25 | |
| Lenovo Yoga Pro 9 16IAH G10 RTX 5060 | |
| Lenovo Yoga Pro 9i 16 RTX 5070 | |
| Average Intel Core Ultra 9 285H (13687 - 24612, n=14) | |
| Average of class Multimedia (2214 - 50388, n=59, last 2 years) | |
| AIDA64 / FPU Julia | |
| Asus ProArt P16 H7606WP | |
| Schenker XMG Core 16 M25 | |
| Lenovo Yoga Pro 9i 16 RTX 5070 | |
| Lenovo Yoga Pro 9 16IAH G10 RTX 5060 | |
| Average Intel Core Ultra 9 285H (54365 - 129641, n=14) | |
| Average of class Multimedia (12867 - 201874, n=60, last 2 years) | |
| AIDA64 / CPU SHA3 | |
| Schenker XMG Core 16 M25 | |
| Asus ProArt P16 H7606WP | |
| Lenovo Yoga Pro 9i 16 RTX 5070 | |
| Lenovo Yoga Pro 9 16IAH G10 RTX 5060 | |
| Average Intel Core Ultra 9 285H (3473 - 5879, n=14) | |
| Average of class Multimedia (626 - 8623, n=60, last 2 years) | |
| AIDA64 / CPU Queen | |
| Asus ProArt P16 H7606WP | |
| Schenker XMG Core 16 M25 | |
| Average of class Multimedia (13483 - 181505, n=47, last 2 years) | |
| Lenovo Yoga Pro 9i 16 RTX 5070 | |
| Lenovo Yoga Pro 9 16IAH G10 RTX 5060 | |
| Average Intel Core Ultra 9 285H (53557 - 67363, n=12) | |
| AIDA64 / FPU SinJulia | |
| Schenker XMG Core 16 M25 | |
| Asus ProArt P16 H7606WP | |
| Lenovo Yoga Pro 9i 16 RTX 5070 | |
| Lenovo Yoga Pro 9 16IAH G10 RTX 5060 | |
| Average of class Multimedia (886 - 28794, n=60, last 2 years) | |
| Average Intel Core Ultra 9 285H (6921 - 9378, n=14) | |
| AIDA64 / FPU Mandel | |
| Asus ProArt P16 H7606WP | |
| Schenker XMG Core 16 M25 | |
| Lenovo Yoga Pro 9i 16 RTX 5070 | |
| Lenovo Yoga Pro 9 16IAH G10 RTX 5060 | |
| Average Intel Core Ultra 9 285H (38174 - 64632, n=14) | |
| Average of class Multimedia (6395 - 105740, n=59, last 2 years) | |
| AIDA64 / CPU AES | |
| Schenker XMG Core 16 M25 | |
| Asus ProArt P16 H7606WP | |
| Lenovo Yoga Pro 9i 16 RTX 5070 | |
| Lenovo Yoga Pro 9 16IAH G10 RTX 5060 | |
| Average Intel Core Ultra 9 285H (58110 - 117613, n=14) | |
| Average of class Multimedia (8171 - 126790, n=60, last 2 years) | |
| AIDA64 / CPU ZLib | |
| Schenker XMG Core 16 M25 | |
| Asus ProArt P16 H7606WP | |
| Lenovo Yoga Pro 9i 16 RTX 5070 | |
| Lenovo Yoga Pro 9 16IAH G10 RTX 5060 | |
| Average Intel Core Ultra 9 285H (574 - 1366, n=14) | |
| Average of class Multimedia (143.8 - 2022, n=60, last 2 years) | |
| AIDA64 / FP64 Ray-Trace | |
| Asus ProArt P16 H7606WP | |
| Schenker XMG Core 16 M25 | |
| Lenovo Yoga Pro 9i 16 RTX 5070 | |
| Lenovo Yoga Pro 9 16IAH G10 RTX 5060 | |
| Average Intel Core Ultra 9 285H (5509 - 13527, n=14) | |
| Average of class Multimedia (1014 - 26875, n=60, last 2 years) | |
| AIDA64 / CPU PhotoWorxx | |
| Lenovo Yoga Pro 9 16IAH G10 RTX 5060 | |
| Lenovo Yoga Pro 9i 16 RTX 5070 | |
| Average Intel Core Ultra 9 285H (49874 - 65392, n=14) | |
| Schenker XMG Core 16 M25 | |
| Average of class Multimedia (8187 - 88154, n=60, last 2 years) | |
| Asus ProArt P16 H7606WP | |
System performance
The system performance is very good and there were no stability problems during the test. Due to the Advanced Optimus graphics switching, there is a brief hang when the Nvidia GPU is activated (for example when starting a game), but this is normal.
PCMark 10: Score | Essentials | Productivity | Digital Content Creation
CrossMark: Overall | Productivity | Creativity | Responsiveness
WebXPRT 3: Overall
WebXPRT 4: Overall
Mozilla Kraken 1.1: Total
| Performance rating | |
| Apple MacBook Pro 16 M4 Max -4! | |
| Apple MacBook Pro 16 2024 M4 Pro -4! | |
| Average Intel Core Ultra 9 285H, NVIDIA GeForce RTX 5070 Laptop | |
| Lenovo Yoga Pro 9i 16 RTX 5070 | |
| Dell XPS 16 9640 -1! | |
| Lenovo Yoga Pro 9 16IAH G10 RTX 5060 | |
| Asus ProArt P16 H7606WP | |
| Average of class Multimedia | |
| PCMark 10 / Score | |
| Average Intel Core Ultra 9 285H, NVIDIA GeForce RTX 5070 Laptop (8267 - 9691, n=2) | |
| Lenovo Yoga Pro 9i 16 RTX 5070 | |
| Asus ProArt P16 H7606WP | |
| Lenovo Yoga Pro 9 16IAH G10 RTX 5060 | |
| Average of class Multimedia (4325 - 10386, n=57, last 2 years) | |
| Dell XPS 16 9640 | |
| PCMark 10 / Essentials | |
| Asus ProArt P16 H7606WP | |
| Lenovo Yoga Pro 9i 16 RTX 5070 | |
| Lenovo Yoga Pro 9 16IAH G10 RTX 5060 | |
| Average of class Multimedia (8025 - 11664, n=56, last 2 years) | |
| Average Intel Core Ultra 9 285H, NVIDIA GeForce RTX 5070 Laptop (10345 - 10564, n=2) | |
| Dell XPS 16 9640 | |
| PCMark 10 / Productivity | |
| Average Intel Core Ultra 9 285H, NVIDIA GeForce RTX 5070 Laptop (9402 - 18233, n=2) | |
| Average of class Multimedia (7323 - 18233, n=56, last 2 years) | |
| Lenovo Yoga Pro 9i 16 RTX 5070 | |
| Lenovo Yoga Pro 9 16IAH G10 RTX 5060 | |
| Dell XPS 16 9640 | |
| Asus ProArt P16 H7606WP | |
| PCMark 10 / Digital Content Creation | |
| Lenovo Yoga Pro 9i 16 RTX 5070 | |
| Asus ProArt P16 H7606WP | |
| Average Intel Core Ultra 9 285H, NVIDIA GeForce RTX 5070 Laptop (13096 - 15438, n=2) | |
| Lenovo Yoga Pro 9 16IAH G10 RTX 5060 | |
| Average of class Multimedia (3651 - 16240, n=56, last 2 years) | |
| Dell XPS 16 9640 | |
| CrossMark / Overall | |
| Apple MacBook Pro 16 M4 Max | |
| Average Intel Core Ultra 9 285H, NVIDIA GeForce RTX 5070 Laptop (2077 - 2236, n=2) | |
| Apple MacBook Pro 16 2024 M4 Pro | |
| Lenovo Yoga Pro 9i 16 RTX 5070 | |
| Lenovo Yoga Pro 9 16IAH G10 RTX 5060 | |
| Asus ProArt P16 H7606WP | |
| Average of class Multimedia (866 - 2728, n=66, last 2 years) | |
| Dell XPS 16 9640 | |
| CrossMark / Productivity | |
| Apple MacBook Pro 16 M4 Max | |
| Average Intel Core Ultra 9 285H, NVIDIA GeForce RTX 5070 Laptop (1920 - 2092, n=2) | |
| Apple MacBook Pro 16 2024 M4 Pro | |
| Lenovo Yoga Pro 9i 16 RTX 5070 | |
| Lenovo Yoga Pro 9 16IAH G10 RTX 5060 | |
| Dell XPS 16 9640 | |
| Average of class Multimedia (931 - 2489, n=66, last 2 years) | |
| Asus ProArt P16 H7606WP | |
| CrossMark / Creativity | |
| Apple MacBook Pro 16 M4 Max | |
| Apple MacBook Pro 16 2024 M4 Pro | |
| Average Intel Core Ultra 9 285H, NVIDIA GeForce RTX 5070 Laptop (2438 - 2470, n=2) | |
| Lenovo Yoga Pro 9i 16 RTX 5070 | |
| Lenovo Yoga Pro 9 16IAH G10 RTX 5060 | |
| Asus ProArt P16 H7606WP | |
| Average of class Multimedia (907 - 3465, n=66, last 2 years) | |
| Dell XPS 16 9640 | |
| CrossMark / Responsiveness | |
| Average Intel Core Ultra 9 285H, NVIDIA GeForce RTX 5070 Laptop (1629 - 2024, n=2) | |
| Dell XPS 16 9640 | |
| Lenovo Yoga Pro 9i 16 RTX 5070 | |
| Lenovo Yoga Pro 9 16IAH G10 RTX 5060 | |
| Apple MacBook Pro 16 M4 Max | |
| Apple MacBook Pro 16 2024 M4 Pro | |
| Asus ProArt P16 H7606WP | |
| Average of class Multimedia (605 - 2024, n=66, last 2 years) | |
| WebXPRT 3 / Overall | |
| Apple MacBook Pro 16 M4 Max | |
| Apple MacBook Pro 16 2024 M4 Pro | |
| Lenovo Yoga Pro 9i 16 RTX 5070 | |
| Average of class Multimedia (136.4 - 596, n=69, last 2 years) | |
| Average Intel Core Ultra 9 285H, NVIDIA GeForce RTX 5070 Laptop (326 - 345, n=2) | |
| Asus ProArt P16 H7606WP | |
| Lenovo Yoga Pro 9 16IAH G10 RTX 5060 | |
| Dell XPS 16 9640 | |
| WebXPRT 4 / Overall | |
| Apple MacBook Pro 16 M4 Max | |
| Apple MacBook Pro 16 2024 M4 Pro | |
| Lenovo Yoga Pro 9i 16 RTX 5070 | |
| Average Intel Core Ultra 9 285H, NVIDIA GeForce RTX 5070 Laptop (303 - 311, n=2) | |
| Lenovo Yoga Pro 9 16IAH G10 RTX 5060 | |
| Average of class Multimedia (167.3 - 402, n=70, last 2 years) | |
| Asus ProArt P16 H7606WP | |
| Dell XPS 16 9640 | |
| Mozilla Kraken 1.1 / Total | |
| Average of class Multimedia (228 - 835, n=72, last 2 years) | |
| Lenovo Yoga Pro 9 16IAH G10 RTX 5060 | |
| Asus ProArt P16 H7606WP | |
| Average Intel Core Ultra 9 285H, NVIDIA GeForce RTX 5070 Laptop (433 - 444, n=2) | |
| Lenovo Yoga Pro 9i 16 RTX 5070 | |
| Apple MacBook Pro 16 M4 Max | |
| Apple MacBook Pro 16 2024 M4 Pro | |
* ... smaller is better
| PCMark 10 Score | 8267 points | |
Help | ||
| AIDA64 / Memory Copy | |
| Lenovo Yoga Pro 9i 16 RTX 5070 | |
| Lenovo Yoga Pro 9 16IAH G10 RTX 5060 | |
| Dell XPS 16 9640 | |
| Average Intel Core Ultra 9 285H (76179 - 109252, n=14) | |
| Asus ProArt P16 H7606WP | |
| Average of class Multimedia (11299 - 132135, n=60, last 2 years) | |
| AIDA64 / Memory Read | |
| Asus ProArt P16 H7606WP | |
| Lenovo Yoga Pro 9 16IAH G10 RTX 5060 | |
| Lenovo Yoga Pro 9i 16 RTX 5070 | |
| Dell XPS 16 9640 | |
| Average of class Multimedia (11624 - 174586, n=60, last 2 years) | |
| Average Intel Core Ultra 9 285H (74572 - 89837, n=14) | |
| AIDA64 / Memory Write | |
| Asus ProArt P16 H7606WP | |
| Lenovo Yoga Pro 9 16IAH G10 RTX 5060 | |
| Average of class Multimedia (11755 - 134998, n=60, last 2 years) | |
| Average Intel Core Ultra 9 285H (62446 - 107584, n=14) | |
| Dell XPS 16 9640 | |
| Lenovo Yoga Pro 9i 16 RTX 5070 | |
| AIDA64 / Memory Latency | |
| Dell XPS 16 9640 | |
| Lenovo Yoga Pro 9 16IAH G10 RTX 5060 | |
| Average Intel Core Ultra 9 285H (106.2 - 136.7, n=14) | |
| Lenovo Yoga Pro 9i 16 RTX 5070 | |
| Average of class Multimedia (7 - 535, n=59, last 2 years) | |
| Asus ProArt P16 H7606WP | |
* ... smaller is better
DPC latencies


| DPC Latencies / LatencyMon - interrupt to process latency (max), Web, Youtube, Prime95 | |
| Lenovo Yoga Pro 9i 16 RTX 5070 | |
| Dell XPS 16 9640 | |
| Asus ProArt P16 H7606WP | |
| Lenovo Yoga Pro 9 16IAH G10 RTX 5060 | |
* ... smaller is better
Mass storage
Our test device is equipped with two 1 TB SSDs from Western Digital (864 + 949 GB free). The performance of the PCIe 4.0 SSDs is very good and remains stable even under prolonged load.

* ... smaller is better
Read continuous performance: DiskSpd Read Loop, Queue Depth 8
GPU performance
The Yoga is equipped with the mobile Nvidia GeForce RTX 5070 (Advanced Optimus) and Lenovo does not offer a faster GPU. The performance of the 100-watt variant meets expectations and we see an advantage of around 10-15% over the mobile RTX 5060 in the benchmarks. When gaming, it is best to limit yourself to the 1080p resolution, as the 5070 feels most comfortable here. At higher resolutions, the rather low VRAM (8 GB) can also become problematic in some current titles.
| 3DMark 11 Performance | 36611 points | |
| 3DMark Fire Strike Score | 30655 points | |
| 3DMark Time Spy Score | 13315 points | |
| 3DMark Steel Nomad Score | 2906 points | |
| 3DMark Steel Nomad Light Score | 13721 points | |
Help | ||
| Blender / v3.3 Classroom OPTIX/RTX | |
| Average of class Multimedia (12 - 105, n=24, last 2 years) | |
| Lenovo Yoga Pro 9i 16 RTX 5070 | |
| Lenovo Yoga Pro 9 16IAH G10 RTX 5060 | |
| Dell XPS 16 9640 | |
| Average NVIDIA GeForce RTX 5070 Laptop (17 - 24, n=28) | |
| Asus ProArt P16 H7606WP | |
| Blender / v3.3 Classroom CUDA | |
| Average of class Multimedia (20 - 186, n=24, last 2 years) | |
| Lenovo Yoga Pro 9 16IAH G10 RTX 5060 | |
| Average NVIDIA GeForce RTX 5070 Laptop (29 - 228, n=29) | |
| Dell XPS 16 9640 | |
| Lenovo Yoga Pro 9i 16 RTX 5070 | |
| Asus ProArt P16 H7606WP | |
| Blender / v3.3 Classroom METAL | |
| Average of class Multimedia (17.8 - 68, n=5, last 2 years) | |
| Apple MacBook Pro 16 M4 Max | |
| Blender / v3.3 Classroom CPU | |
| Average of class Multimedia (134.5 - 1042, n=66, last 2 years) | |
| Dell XPS 16 9640 | |
| Lenovo Yoga Pro 9 16IAH G10 RTX 5060 | |
| Average NVIDIA GeForce RTX 5070 Laptop (137 - 507, n=26) | |
| Lenovo Yoga Pro 9i 16 RTX 5070 | |
| Asus ProArt P16 H7606WP | |
| Apple MacBook Pro 16 M4 Max | |
* ... smaller is better
| GTA V - 1920x1080 Highest AA:4xMSAA + FX AF:16x | |
| Lenovo Yoga Pro 9i 16 RTX 5070 | |
| Lenovo Yoga Pro 9 16IAH G10 RTX 5060 | |
| Asus ProArt P16 H7606WP | |
| Dell XPS 16 9640 | |
| Average of class Multimedia (7.92 - 141.6, n=61, last 2 years) | |
| Final Fantasy XV Benchmark - 1920x1080 High Quality | |
| Lenovo Yoga Pro 9i 16 RTX 5070 | |
| Asus ProArt P16 H7606WP | |
| Lenovo Yoga Pro 9 16IAH G10 RTX 5060 | |
| Dell XPS 16 9640 | |
| Average of class Multimedia (7.61 - 144.4, n=64, last 2 years) | |
| Strange Brigade - 1920x1080 ultra AA:ultra AF:16 | |
| Asus ProArt P16 H7606WP | |
| Lenovo Yoga Pro 9i 16 RTX 5070 | |
| Lenovo Yoga Pro 9 16IAH G10 RTX 5060 | |
| Dell XPS 16 9640 | |
| Average of class Multimedia (13.3 - 303, n=64, last 2 years) | |
| Dota 2 Reborn - 1920x1080 ultra (3/3) best looking | |
| Lenovo Yoga Pro 9i 16 RTX 5070 | |
| Lenovo Yoga Pro 9 16IAH G10 RTX 5060 | |
| Asus ProArt P16 H7606WP | |
| Average of class Multimedia (29 - 179.9, n=66, last 2 years) | |
| Dell XPS 16 9640 | |
| X-Plane 11.11 - 1920x1080 high (fps_test=3) | |
| Lenovo Yoga Pro 9i 16 RTX 5070 | |
| Lenovo Yoga Pro 9 16IAH G10 RTX 5060 | |
| Dell XPS 16 9640 | |
| Dell XPS 16 9640 | |
| Asus ProArt P16 H7606WP | |
| Average of class Multimedia (16.9 - 141.1, n=60, last 2 years) | |
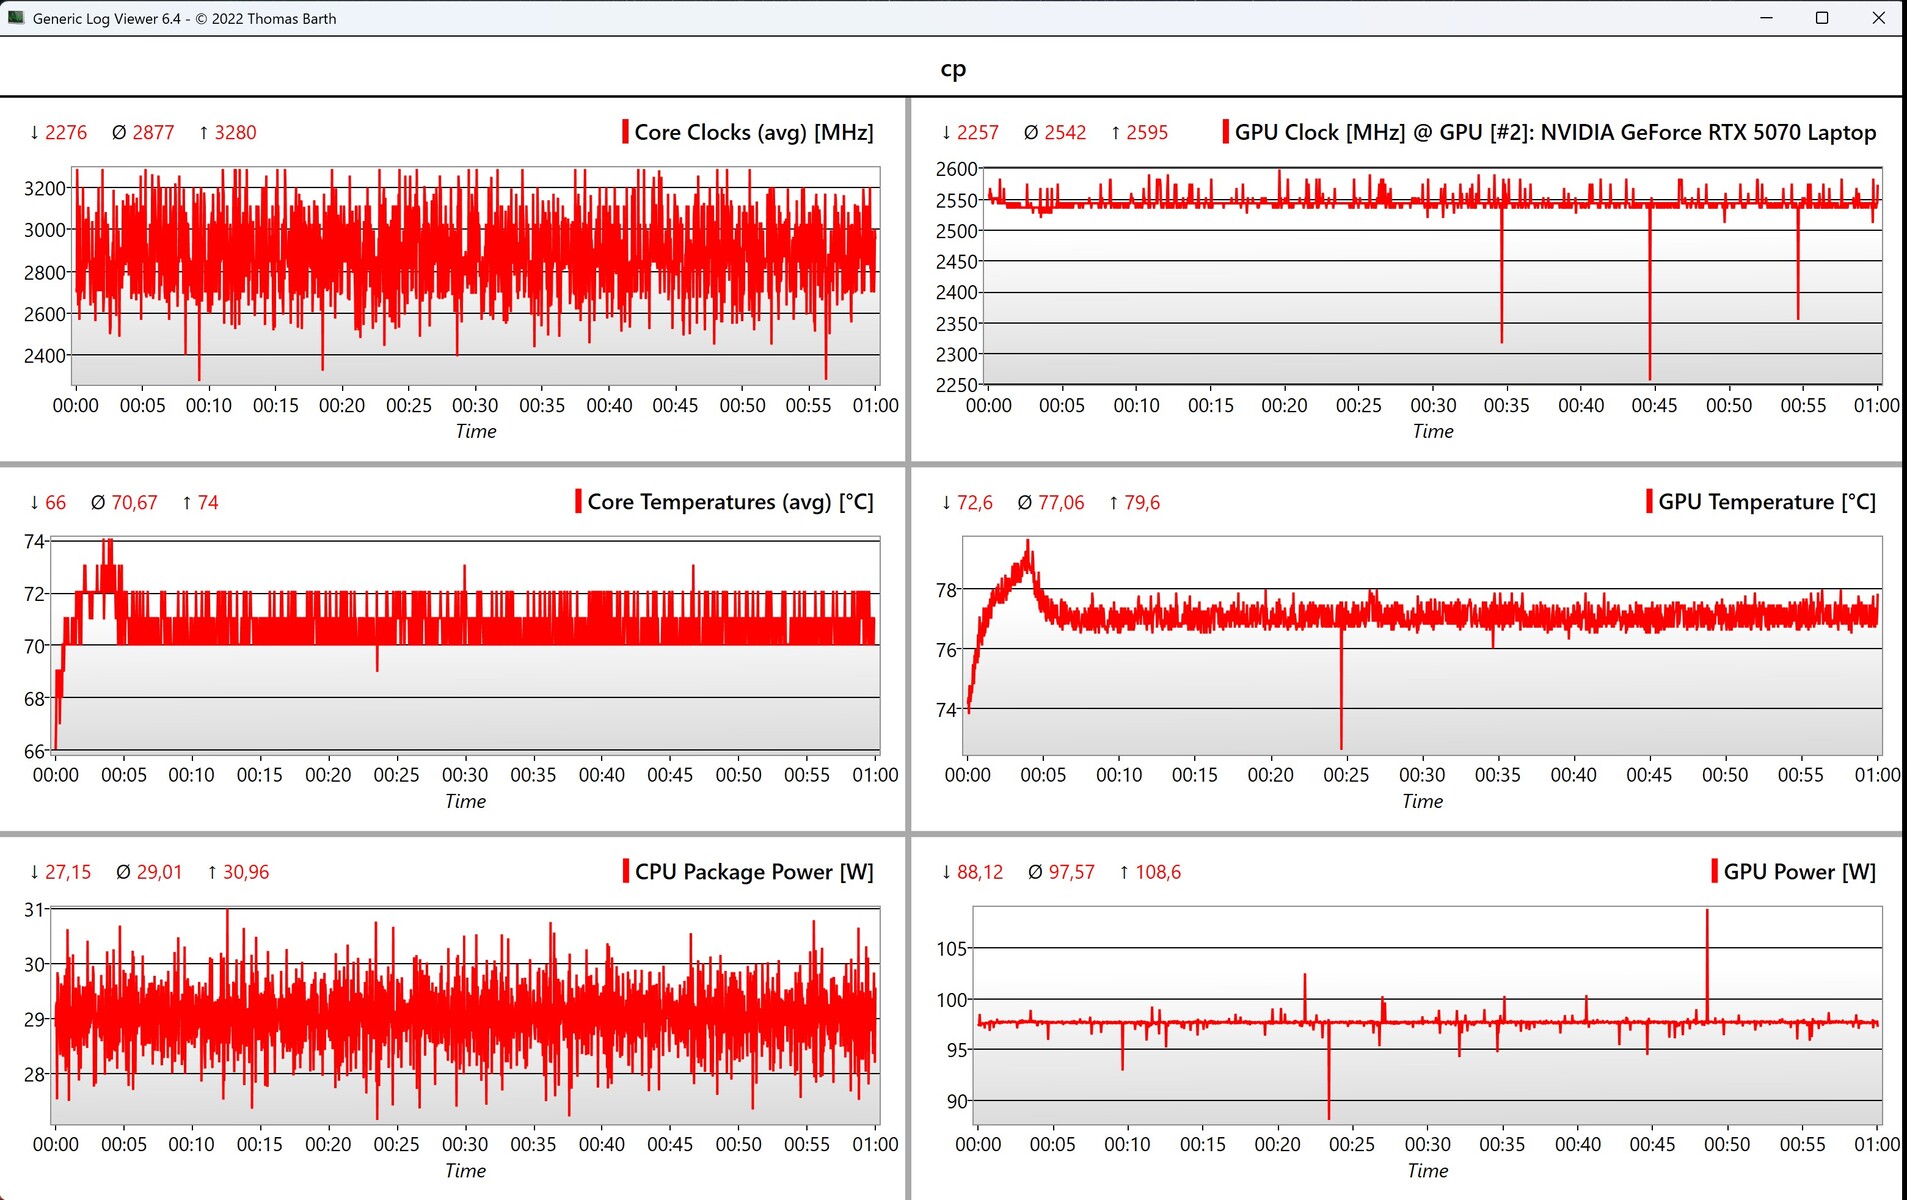
Cyberpunk 2077 ultra FPS chart
| low | med. | high | ultra | QHD DLSS | QHD | |
|---|---|---|---|---|---|---|
| GTA V (2015) | 138.9 | 118.7 | ||||
| Dota 2 Reborn (2015) | 172.5 | 163.3 | 153.1 | 143.6 | ||
| Final Fantasy XV Benchmark (2018) | 222 | 181.1 | 140.3 | 101.2 | ||
| X-Plane 11.11 (2018) | 125.1 | 113.5 | 95.2 | |||
| Strange Brigade (2018) | 520 | 346 | 285 | 246 | 165.8 | |
| Baldur's Gate 3 (2023) | 173.6 | 139.4 | 87.5 | 87.3 | 63.1 | |
| Cyberpunk 2077 (2023) | 149.5 | 129 | 109.4 | 98.3 | 73.4 | 62.8 |
| F1 24 (2024) | 271 | 241 | 83.3 | 82.4 | 51.9 | |
| Assassin's Creed Shadows (2025) | 73 | 68 | 59 | 44 | 33 | |
| F1 25 (2025) | 214 | 204 | 177.8 | 27.1 | 27.1 | 11.2 |
Emissions & Energy
Noise emissions
The noise emissions are practically identical to the already tested model with the RTX 5060 laptop GPU, which is not surprising given the same power limits. The battery-saving mode is easily sufficient for everyday use and you should try the auto mode when gaming, which remains noticeably quieter than the performance mode. There were no other electronic noises on the test device.
Noise level
| Idle |
| 24.1 / 24.1 / 25.1 dB(A) |
| Load |
| 44.2 / 52.7 dB(A) |
 | ||
30 dB silent 40 dB(A) audible 50 dB(A) loud |
||
min: | ||
| Lenovo Yoga Pro 9i 16 RTX 5070 GeForce RTX 5070 Laptop, Ultra 9 285H, WD PC SN7100S SDFPMSL-1T00-1101 | Asus ProArt P16 H7606WP GeForce RTX 5070 Laptop, Ryzen AI 9 HX 370, WD PC SN740 SDDPNQE-2T00 | Lenovo Yoga Pro 9 16IAH G10 RTX 5060 GeForce RTX 5060 Laptop, Ultra 7 255H, WD PC SN7100S SDFPMSL-1T00-1101 | Apple MacBook Pro 16 2024 M4 Pro M4 Pro 20-Core GPU, M4 Pro 14-Core, Apple SSD AP2048Z | Dell XPS 16 9640 GeForce RTX 4070 Laptop GPU, Ultra 7 155H, Kioxia XG8 KXG80ZNV1T02 | Apple MacBook Pro 16 M4 Max M4 Max 40-Core GPU, M4 Max 16-Core, Apple SSD AP1024Z | |
|---|---|---|---|---|---|---|
| Noise | -7% | -3% | 15% | 0% | 7% | |
| off / environment * (dB) | 24.1 | 23.5 2% | 25.2 -5% | 24 -0% | 24.5 -2% | 24.1 -0% |
| Idle Minimum * (dB) | 24.1 | 26.7 -11% | 25.2 -5% | 24 -0% | 24.5 -2% | 24.1 -0% |
| Idle Average * (dB) | 24.1 | 26.7 -11% | 25.2 -5% | 24 -0% | 24.5 -2% | 24.1 -0% |
| Idle Maximum * (dB) | 25.1 | 31.1 -24% | 26.9 -7% | 24 4% | 27.5 -10% | 24.1 4% |
| Load Average * (dB) | 44.2 | 44.8 -1% | 44.5 -1% | 25.3 43% | 39.6 10% | 42.2 5% |
| Cyberpunk 2077 ultra * (dB) | 52.7 | 53.7 -2% | 50.2 5% | 33.9 36% | 42.2 20% | |
| Load Maximum * (dB) | 52.7 | 53.7 -2% | 52.7 -0% | 42.3 20% | 49.7 6% | 42.2 20% |
| Witcher 3 ultra * (dB) | 49.7 |
* ... smaller is better
Temperature
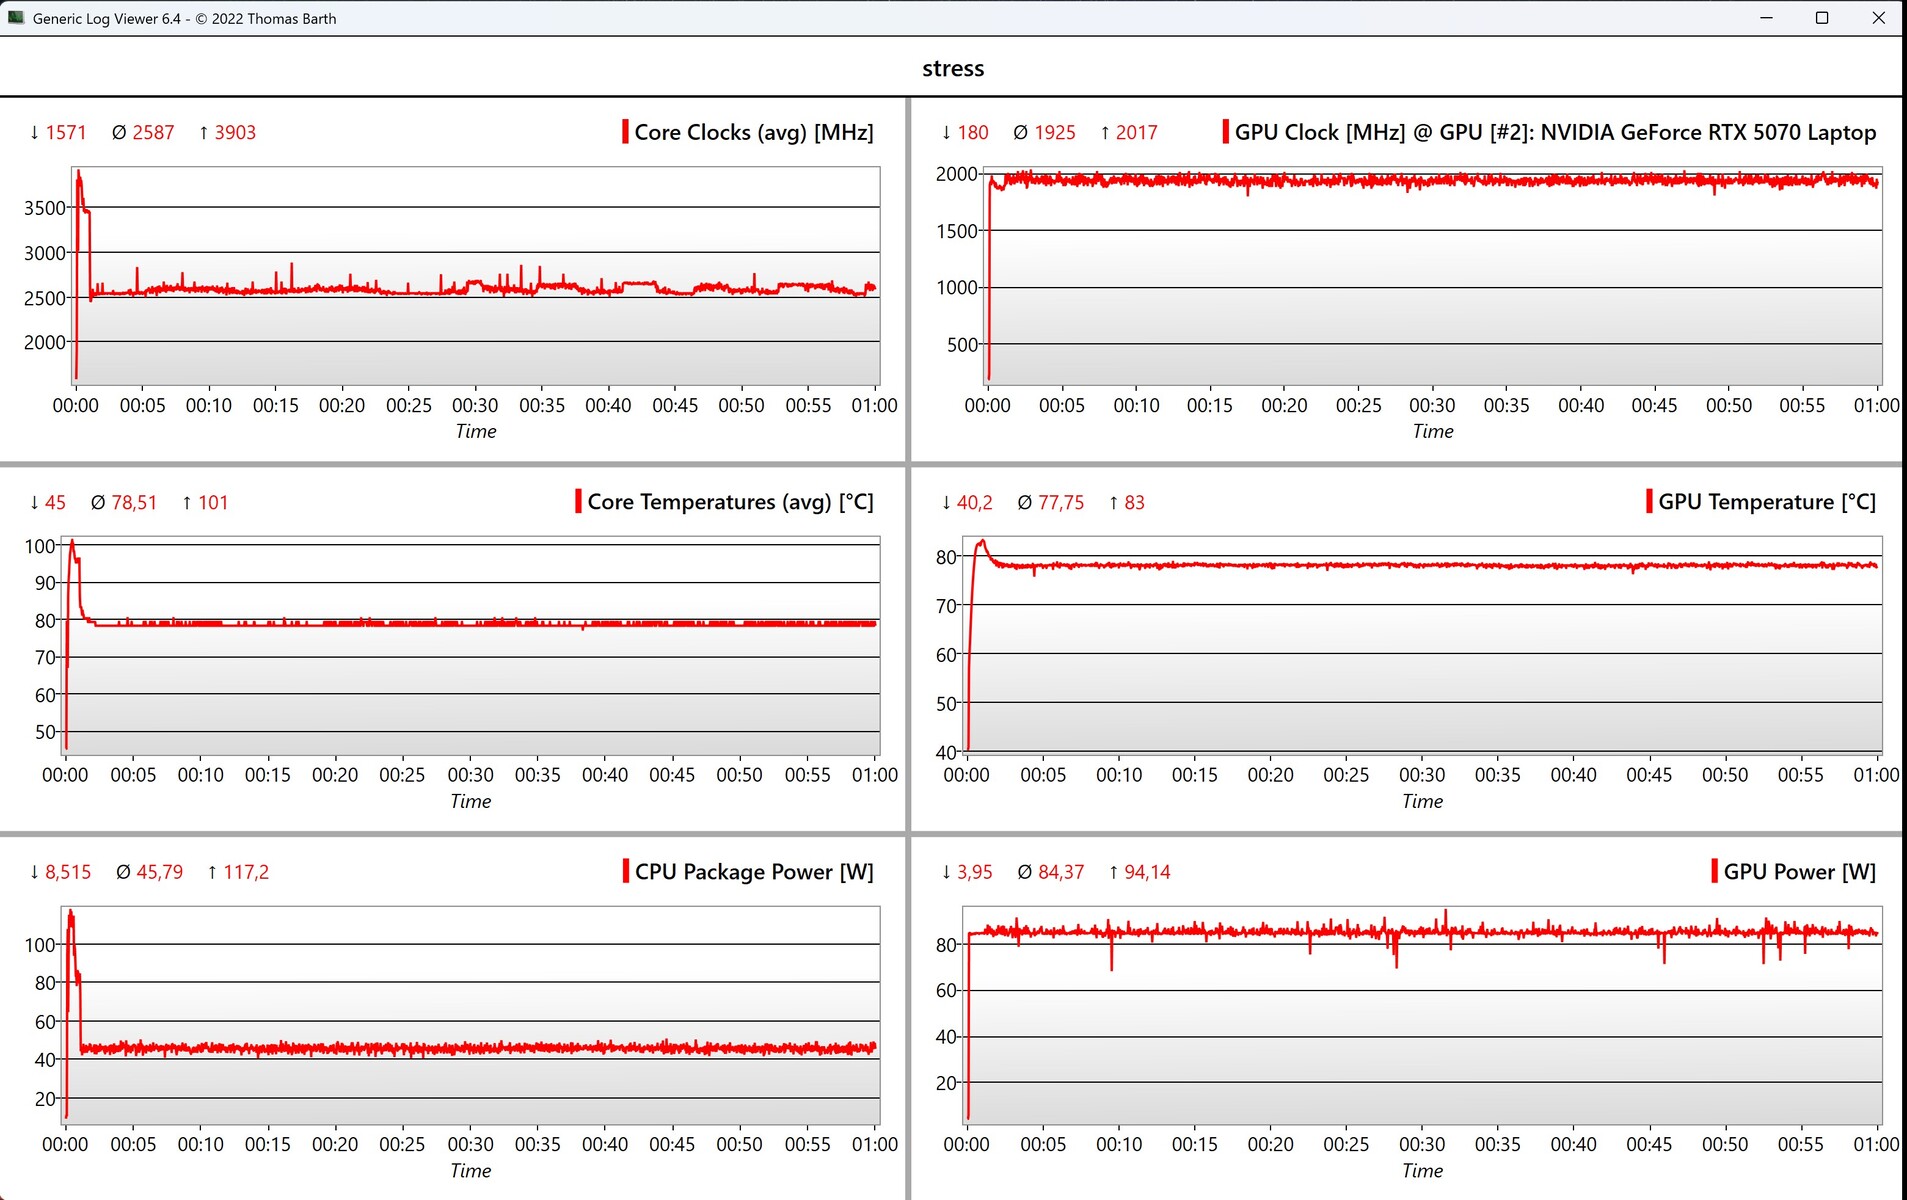
There are also no significant differences in the surface temperatures compared to the previously tested version and there are no critical hotspots. In the stress test, the processor operates at 45 watts (~78 °C/172.4 °F) and the graphics card at 85 watts (~78 °C/172.4 °F).
(±) The maximum temperature on the upper side is 41.8 °C / 107 F, compared to the average of 36.8 °C / 98 F, ranging from 21 to 71 °C for the class Multimedia.
(-) The bottom heats up to a maximum of 47.9 °C / 118 F, compared to the average of 39.1 °C / 102 F
(+) In idle usage, the average temperature for the upper side is 25.9 °C / 79 F, compared to the device average of 31.3 °C / 88 F.
(±) 3: The average temperature for the upper side is 36.6 °C / 98 F, compared to the average of 31.3 °C / 88 F for the class Multimedia.
(+) The palmrests and touchpad are reaching skin temperature as a maximum (33.2 °C / 91.8 F) and are therefore not hot.
(-) The average temperature of the palmrest area of similar devices was 28.7 °C / 83.7 F (-4.5 °C / -8.1 F).


| Lenovo Yoga Pro 9i 16 RTX 5070 Intel Core Ultra 9 285H, NVIDIA GeForce RTX 5070 Laptop | Asus ProArt P16 H7606WP AMD Ryzen AI 9 HX 370, NVIDIA GeForce RTX 5070 Laptop | Lenovo Yoga Pro 9 16IAH G10 RTX 5060 Intel Core Ultra 7 255H, NVIDIA GeForce RTX 5060 Laptop | Apple MacBook Pro 16 2024 M4 Pro Apple M4 Pro 14-Core, Apple M4 Pro 20-Core GPU | Dell XPS 16 9640 Intel Core Ultra 7 155H, NVIDIA GeForce RTX 4070 Laptop GPU | Apple MacBook Pro 16 M4 Max Apple M4 Max 16-Core, Apple M4 Max 40-Core GPU | |
|---|---|---|---|---|---|---|
| Heat | -2% | -3% | 12% | 6% | 9% | |
| Maximum Upper Side * (°C) | 41.8 | 47 -12% | 42.9 -3% | 42.7 -2% | 39.4 6% | 42.8 -2% |
| Maximum Bottom * (°C) | 47.9 | 47.4 1% | 47.4 1% | 43.1 10% | 36.9 23% | 42.3 12% |
| Idle Upper Side * (°C) | 26.3 | 26.1 1% | 27.6 -5% | 21.5 18% | 28.2 -7% | 23.6 10% |
| Idle Bottom * (°C) | 27.6 | 26.4 4% | 29 -5% | 21.5 22% | 27.4 1% | 23.5 15% |
* ... smaller is better
Speaker
Lenovo Yoga Pro 9i 16 RTX 5070 audio analysis
(±) | speaker loudness is average but good (81.4 dB)
Bass 100 - 315 Hz
(±) | reduced bass - on average 5.5% lower than median
(±) | linearity of bass is average (7.5% delta to prev. frequency)
Mids 400 - 2000 Hz
(+) | balanced mids - only 1.7% away from median
(+) | mids are linear (3.1% delta to prev. frequency)
Highs 2 - 16 kHz
(±) | reduced highs - on average 6.2% lower than median
(+) | highs are linear (3.9% delta to prev. frequency)
Overall 100 - 16.000 Hz
(+) | overall sound is linear (9.7% difference to median)
Compared to same class
» 13% of all tested devices in this class were better, 1% similar, 85% worse
» The best had a delta of 5%, average was 17%, worst was 45%
Compared to all devices tested
» 4% of all tested devices were better, 1% similar, 95% worse
» The best had a delta of 4%, average was 24%, worst was 134%
Asus ProArt P16 H7606WP audio analysis
(+) | speakers can play relatively loud (82 dB)
Bass 100 - 315 Hz
(+) | good bass - only 4.2% away from median
(±) | linearity of bass is average (8.8% delta to prev. frequency)
Mids 400 - 2000 Hz
(+) | balanced mids - only 4.4% away from median
(+) | mids are linear (3.2% delta to prev. frequency)
Highs 2 - 16 kHz
(+) | balanced highs - only 1.3% away from median
(+) | highs are linear (3.3% delta to prev. frequency)
Overall 100 - 16.000 Hz
(+) | overall sound is linear (7.8% difference to median)
Compared to same class
» 6% of all tested devices in this class were better, 3% similar, 91% worse
» The best had a delta of 5%, average was 17%, worst was 45%
Compared to all devices tested
» 1% of all tested devices were better, 0% similar, 98% worse
» The best had a delta of 4%, average was 24%, worst was 134%
Apple MacBook Pro 16 2024 M4 Pro audio analysis
(+) | speakers can play relatively loud (84.6 dB)
Bass 100 - 315 Hz
(±) | reduced bass - on average 5.1% lower than median
(+) | bass is linear (5.6% delta to prev. frequency)
Mids 400 - 2000 Hz
(+) | balanced mids - only 1.4% away from median
(+) | mids are linear (2.4% delta to prev. frequency)
Highs 2 - 16 kHz
(+) | balanced highs - only 1.6% away from median
(+) | highs are linear (3% delta to prev. frequency)
Overall 100 - 16.000 Hz
(+) | overall sound is linear (4.8% difference to median)
Compared to same class
» 0% of all tested devices in this class were better, 0% similar, 99% worse
» The best had a delta of 5%, average was 17%, worst was 45%
Compared to all devices tested
» 0% of all tested devices were better, 0% similar, 100% worse
» The best had a delta of 4%, average was 24%, worst was 134%
Energy consumption
| Off / Standby | |
| Idle | |
| Load |
|
Key:
min: | |
| Lenovo Yoga Pro 9i 16 RTX 5070 Ultra 9 285H, GeForce RTX 5070 Laptop, WD PC SN7100S SDFPMSL-1T00-1101, OLED, 3200x2000, 16" | Asus ProArt P16 H7606WP Ryzen AI 9 HX 370, GeForce RTX 5070 Laptop, WD PC SN740 SDDPNQE-2T00, OLED, 2880x1800, 16" | Lenovo Yoga Pro 9 16IAH G10 RTX 5060 Ultra 7 255H, GeForce RTX 5060 Laptop, WD PC SN7100S SDFPMSL-1T00-1101, OLED, 2880x1800, 16" | Apple MacBook Pro 16 2024 M4 Pro M4 Pro 14-Core, M4 Pro 20-Core GPU, Apple SSD AP2048Z, Mini-LED, 3456x2234, 16.2" | Dell XPS 16 9640 Ultra 7 155H, GeForce RTX 4070 Laptop GPU, Kioxia XG8 KXG80ZNV1T02, OLED, 3840x2400, 16.3" | Apple MacBook Pro 16 M4 Max M4 Max 16-Core, M4 Max 40-Core GPU, Apple SSD AP1024Z, Mini-LED, 3456x2234, 16.2" | Average NVIDIA GeForce RTX 5070 Laptop | Average of class Multimedia | |
|---|---|---|---|---|---|---|---|---|
| Power Consumption | -2% | 16% | 25% | 24% | 14% | -16% | 33% | |
| Idle Minimum * (Watt) | 8.8 | 9.9 -13% | 4.9 44% | 4.6 48% | 7.7 12% | 4.7 47% | 10.8 ? -23% | 5.65 ? 36% |
| Idle Average * (Watt) | 16.1 | 13.6 16% | 10.9 32% | 16.8 -4% | 10.3 36% | 15.5 4% | 15.4 ? 4% | 10 ? 38% |
| Idle Maximum * (Watt) | 16.5 | 14 15% | 11.3 32% | 17.1 -4% | 10.6 36% | 15.6 5% | 21 ? -27% | 12.3 ? 25% |
| Load Average * (Watt) | 89.3 | 93.8 -5% | 88.7 1% | 76.4 14% | 76.5 14% | 125 -40% | 98.7 ? -11% | 65.1 ? 27% |
| Cyberpunk 2077 ultra external monitor * (Watt) | 157.9 | 158.3 -0% | 155.7 1% | 79.3 50% | 107.2 32% | |||
| Cyberpunk 2077 ultra * (Watt) | 160.6 | 162.1 -1% | 157.1 2% | 83.4 48% | 116.2 28% | |||
| Load Maximum * (Watt) | 177.4 | 229 -29% | 175.5 1% | 138.1 22% | 138.5 22% | 143.7 19% | 218 ? -23% | 112.5 ? 37% |
| Witcher 3 ultra * (Watt) | 126.4 |
* ... smaller is better
Energy consumption Cyberpunk / Stress test
Energy consumption with external monitor
Battery life
At a brightness of 150 cd/m² (46%) and 60 Hz, the battery life of 11 hours is even slightly better than the Yoga with the RTX 5060. However, at full SDR brightness, it is already over after 4.5 hours. Video playback at 150 cd/m² is even possible for almost 14.5 hours.
| Lenovo Yoga Pro 9i 16 RTX 5070 Ultra 9 285H, GeForce RTX 5070 Laptop, 84 Wh | Asus ProArt P16 H7606WP Ryzen AI 9 HX 370, GeForce RTX 5070 Laptop, 90 Wh | Lenovo Yoga Pro 9 16IAH G10 RTX 5060 Ultra 7 255H, GeForce RTX 5060 Laptop, 84 Wh | Apple MacBook Pro 16 2024 M4 Pro M4 Pro 14-Core, M4 Pro 20-Core GPU, 99.6 Wh | Dell XPS 16 9640 Ultra 7 155H, GeForce RTX 4070 Laptop GPU, 99.5 Wh | Apple MacBook Pro 16 M4 Max M4 Max 16-Core, M4 Max 40-Core GPU, 99.6 Wh | Average of class Multimedia | |
|---|---|---|---|---|---|---|---|
| Battery runtime | -17% | -11% | 74% | 5% | 57% | 11% | |
| H.264 (h) | 14.4 | 24.6 71% | 16.5 15% | 21.8 51% | 16.2 ? 13% | ||
| WiFi v1.3 (h) | 11.1 | 9.2 -17% | 9.9 -11% | 19.6 77% | 10.5 -5% | 18 62% | 12 ? 8% |
| Load (h) | 1.5 | 1.1 | 1.669 ? |
Notebookcheck overall rating
Lenovo Yoga Pro 9i 16 RTX 5070
- 10/09/2025 v8
Andreas Osthoff
 Total Sustainability Score:
 Possible alternatives in comparison
Image | Model / Review | Price | Weight | Height | Display |
|---|---|---|---|---|---|
1. 90.4%  | Lenovo Yoga Pro 9i 16 RTX 5070 Intel Core Ultra 9 285H ⎘ NVIDIA GeForce RTX 5070 Laptop ⎘ 64 GB Memory, 1024 GB SSD | Amazon: List Price: 2800€ | 1.9 kg | 17.9 mm | 16.00" 3200x2000 236 PPI OLED |
2. 89.1%  | Asus ProArt P16 H7606WP AMD Ryzen AI 9 HX 370 ⎘ NVIDIA GeForce RTX 5070 Laptop ⎘ 64 GB Memory, 2048 GB SSD | Amazon: 1. $4,599.00 HIDevolution [2025] ASUS Pro... 2. $4,924.00 HIDevolution [2025] ASUS Pro... 3. $5,649.00 HIDevolution [2025] ASUS Pro... List Price: 3399€ | 1.8 kg | 17.3 mm | 16.00" 2880x1800 212 PPI OLED |
3. 89.1%  | Lenovo Yoga Pro 9 16IAH G10 RTX 5060 Intel Core Ultra 7 255H ⎘ NVIDIA GeForce RTX 5060 Laptop ⎘ 32 GB Memory, 1024 GB SSD | Amazon: List Price: 2199€ | 1.9 kg | 17.9 mm | 16.00" 2880x1800 212 PPI OLED |
4. 93%  | Apple MacBook Pro 16 2024 M4 Pro Apple M4 Pro 14-Core ⎘ Apple M4 Pro 20-Core GPU ⎘ 48 GB Memory, 2048 GB SSD | Amazon: List Price: 4219€ | 2.1 kg | 16.8 mm | 16.20" 3456x2234 254 PPI Mini-LED |
5. 88.6% v7 (old)  | Dell XPS 16 9640 Intel Core Ultra 7 155H ⎘ NVIDIA GeForce RTX 4070 Laptop GPU ⎘ 32 GB Memory, 1024 GB SSD | Amazon: 1. $2,799.99 Dell XPS 16 9640 Laptop | In... 2. $2,199.00 New XPS 16 9640 Business Lap... 3. $2,499.00 Dell XPS 16 9640 16.3" Touch... | 2.3 kg | 18.7 mm | 16.30" 3840x2400 139 PPI OLED |
Transparency
The selection of devices to be reviewed is made by our editorial team. The test sample was provided to the author as a loan by the manufacturer or retailer for the purpose of this review. The lender had no influence on this review, nor did the manufacturer receive a copy of this review before publication. There was no obligation to publish this review. As an independent media company, Notebookcheck is not subjected to the authority of manufacturers, retailers or publishers.
This is how Notebookcheck is testing
Every year, Notebookcheck independently reviews hundreds of laptops and smartphones using standardized procedures to ensure that all results are comparable. We have continuously developed our test methods for around 20 years and set industry standards in the process. In our test labs, high-quality measuring equipment is utilized by experienced technicians and editors. These tests involve a multi-stage validation process. Our complex rating system is based on hundreds of well-founded measurements and benchmarks, which maintains objectivity. Further information on our test methods can be found here.

