
Verdict - Galaxy Book6 Ultra is very good multimedia laptop
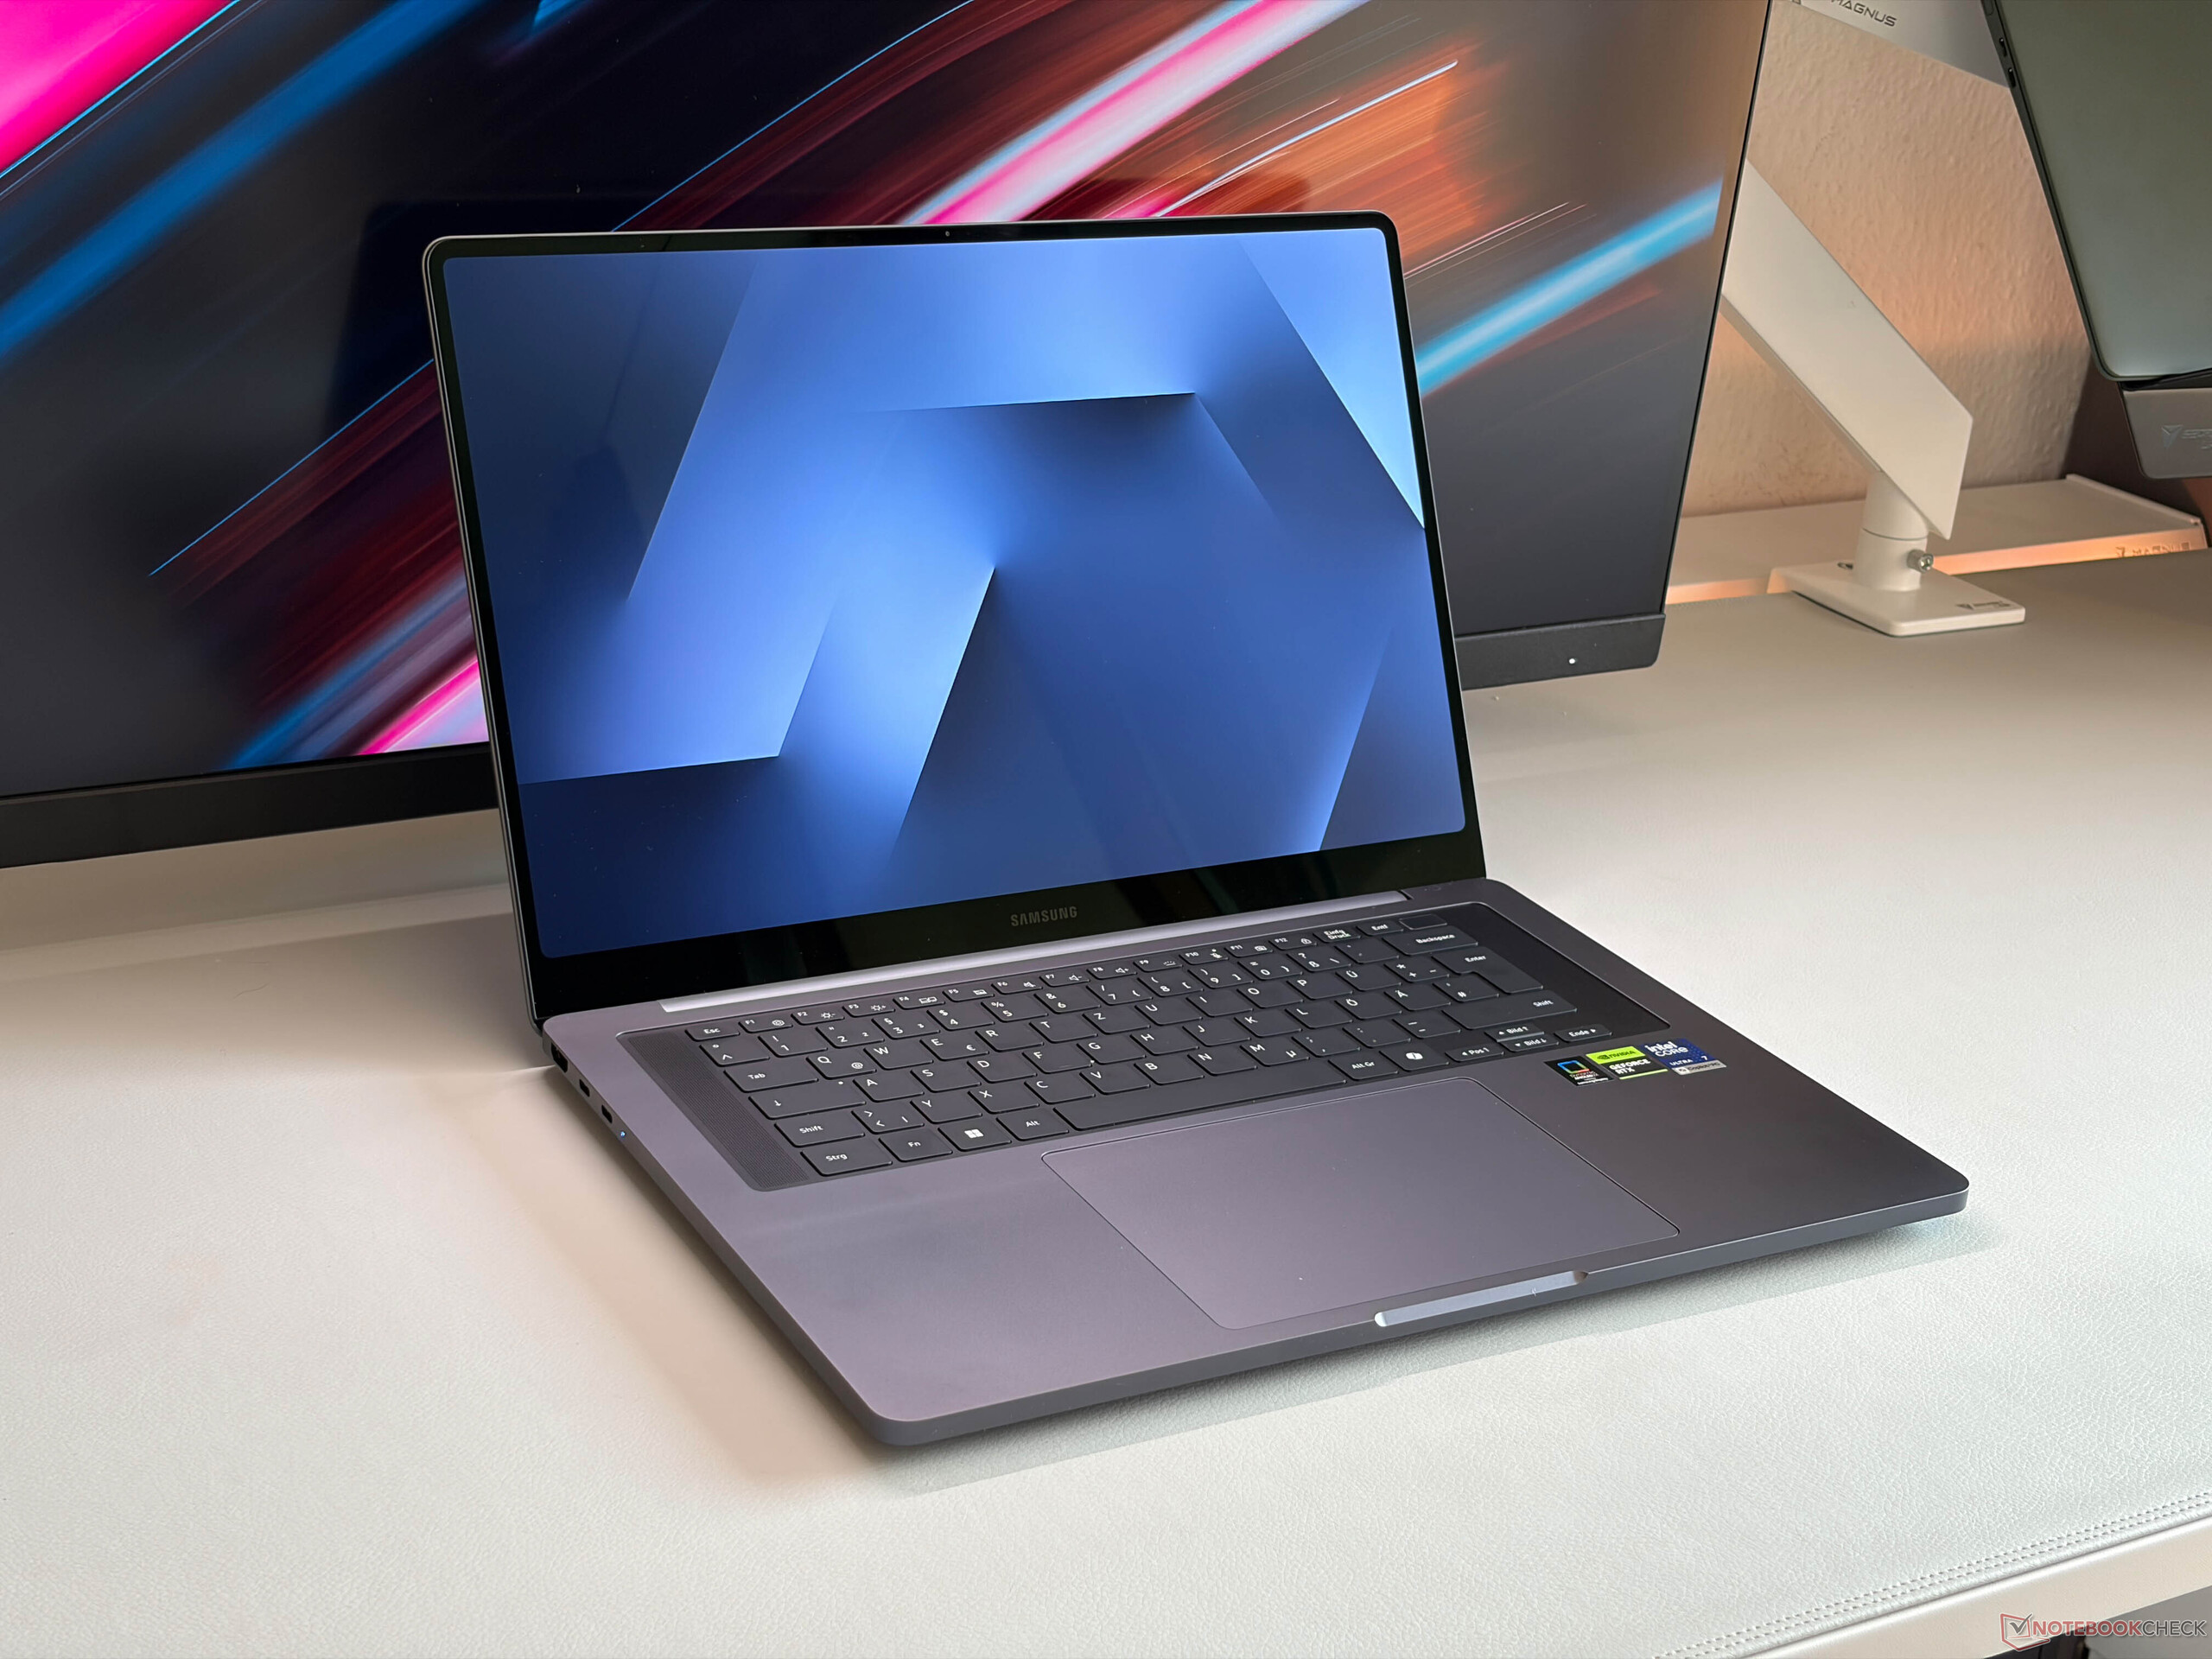
Samsung's new Galaxy Book6 Ultra is a very good multimedia laptop with a gorgeous OLED screen, sufficient performance with the Panther Lake processor as well as Nvidia Blackwell GPU and an excellent speaker system. The new chassis design is very similar to Apple's MacBook Pro though and we would not be surprised if many users confused the two systems. This also means Samsung ditched the numeric keypad, which can be an issue for some users.
The performance of the components is very good for a multimedia laptop and the cooling unit works well. The fans will be quite audible if you really stress the laptop in High Performance mode, but it is still quieter than many rivals. We were particularly impressed by the new OLED touchscreen with its amazing picture quality and accurate color profiles, but PWM flickering with the high amplitude is a problem.
The OLED screen with the variable refresh rate between 30-120 Hz is also very efficient and results in excellent battery runtimes that clearly beat all Windows alternatives, despite the smallest battery capacity. However, if you want more performance, even better screens (tandem OLED panels) and superior keyboards, you should have a look at the Asus ProArt P16 or Lenovo's Yoga Pro 9i 16. Apple's MacBook Pro is obviously a rival as well and also offers a brighter screen, more ports and quieter fans. The performance of the M4 Pro or M4 Max is also better and the upcoming M5 Pro/M5 Max models should increase the gap even further.
Pros
Cons
Price and Availability
We have no information about the U.S. pricing or availability yet.
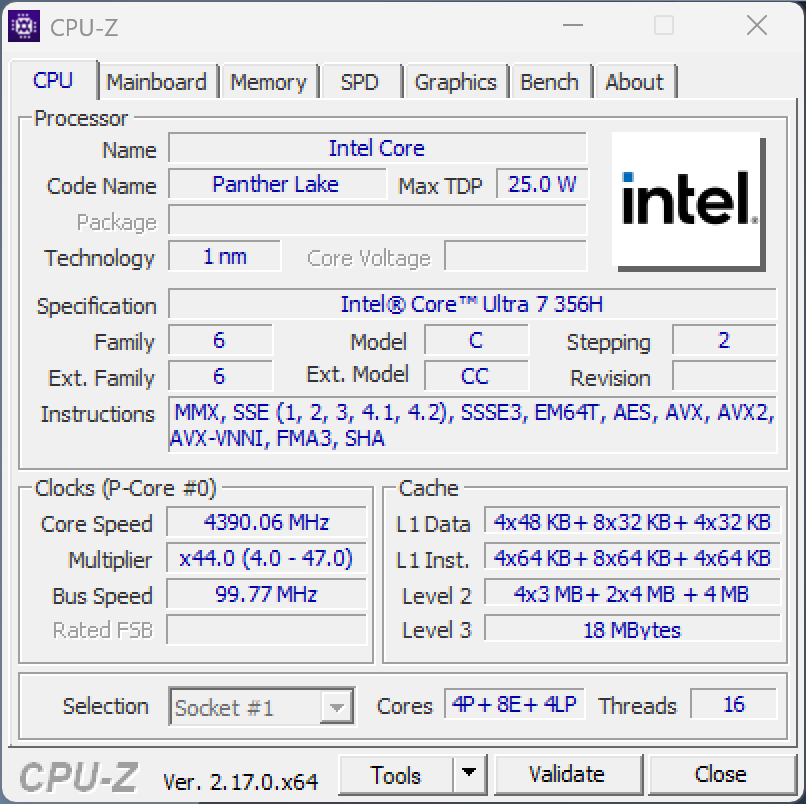
Samsung refreshes its most powerful laptop, the Galaxy Book6 Ultra. The 16-inch multimedia device now features new Intel Panther Lake chips, optional Nvidia Blackwell GPUs as well as a new OLED touchscreen inside a revised chassis. We review the model with the Core Ultra 7 356H, GeForce RTX 5070, 32 GB RAM and 1 TB SSD storage.
Specifications
Case and Connectivity
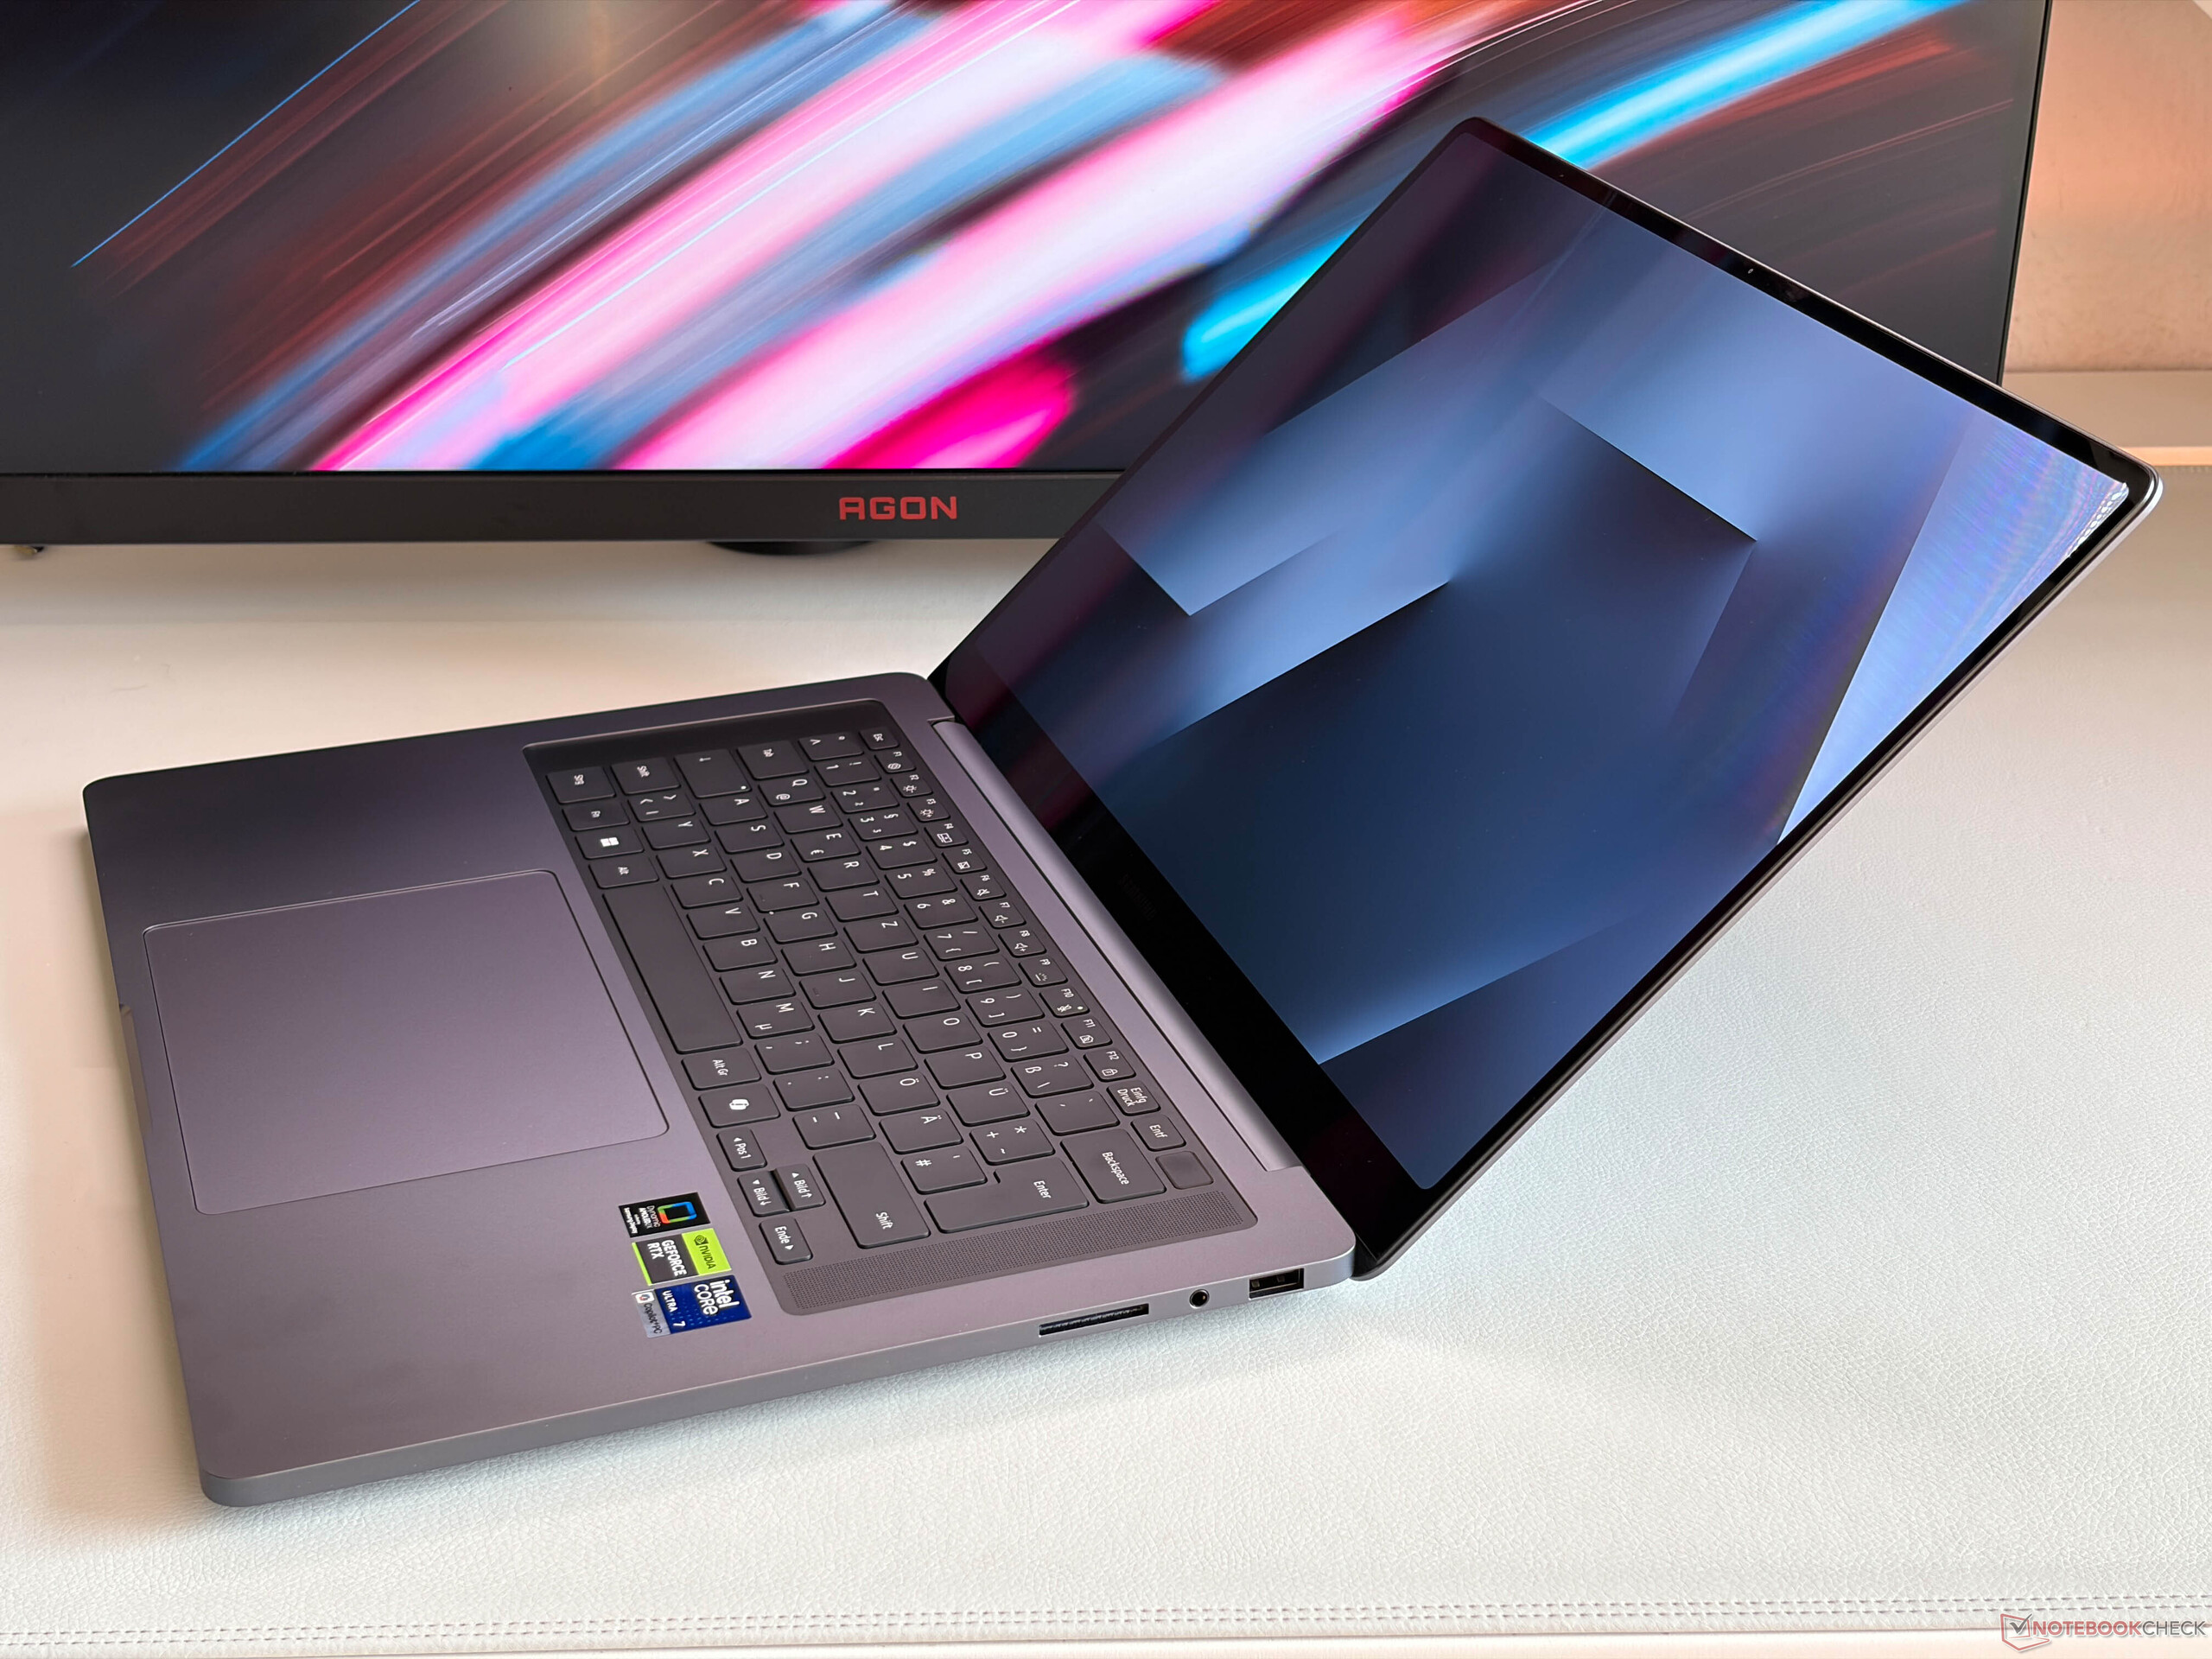
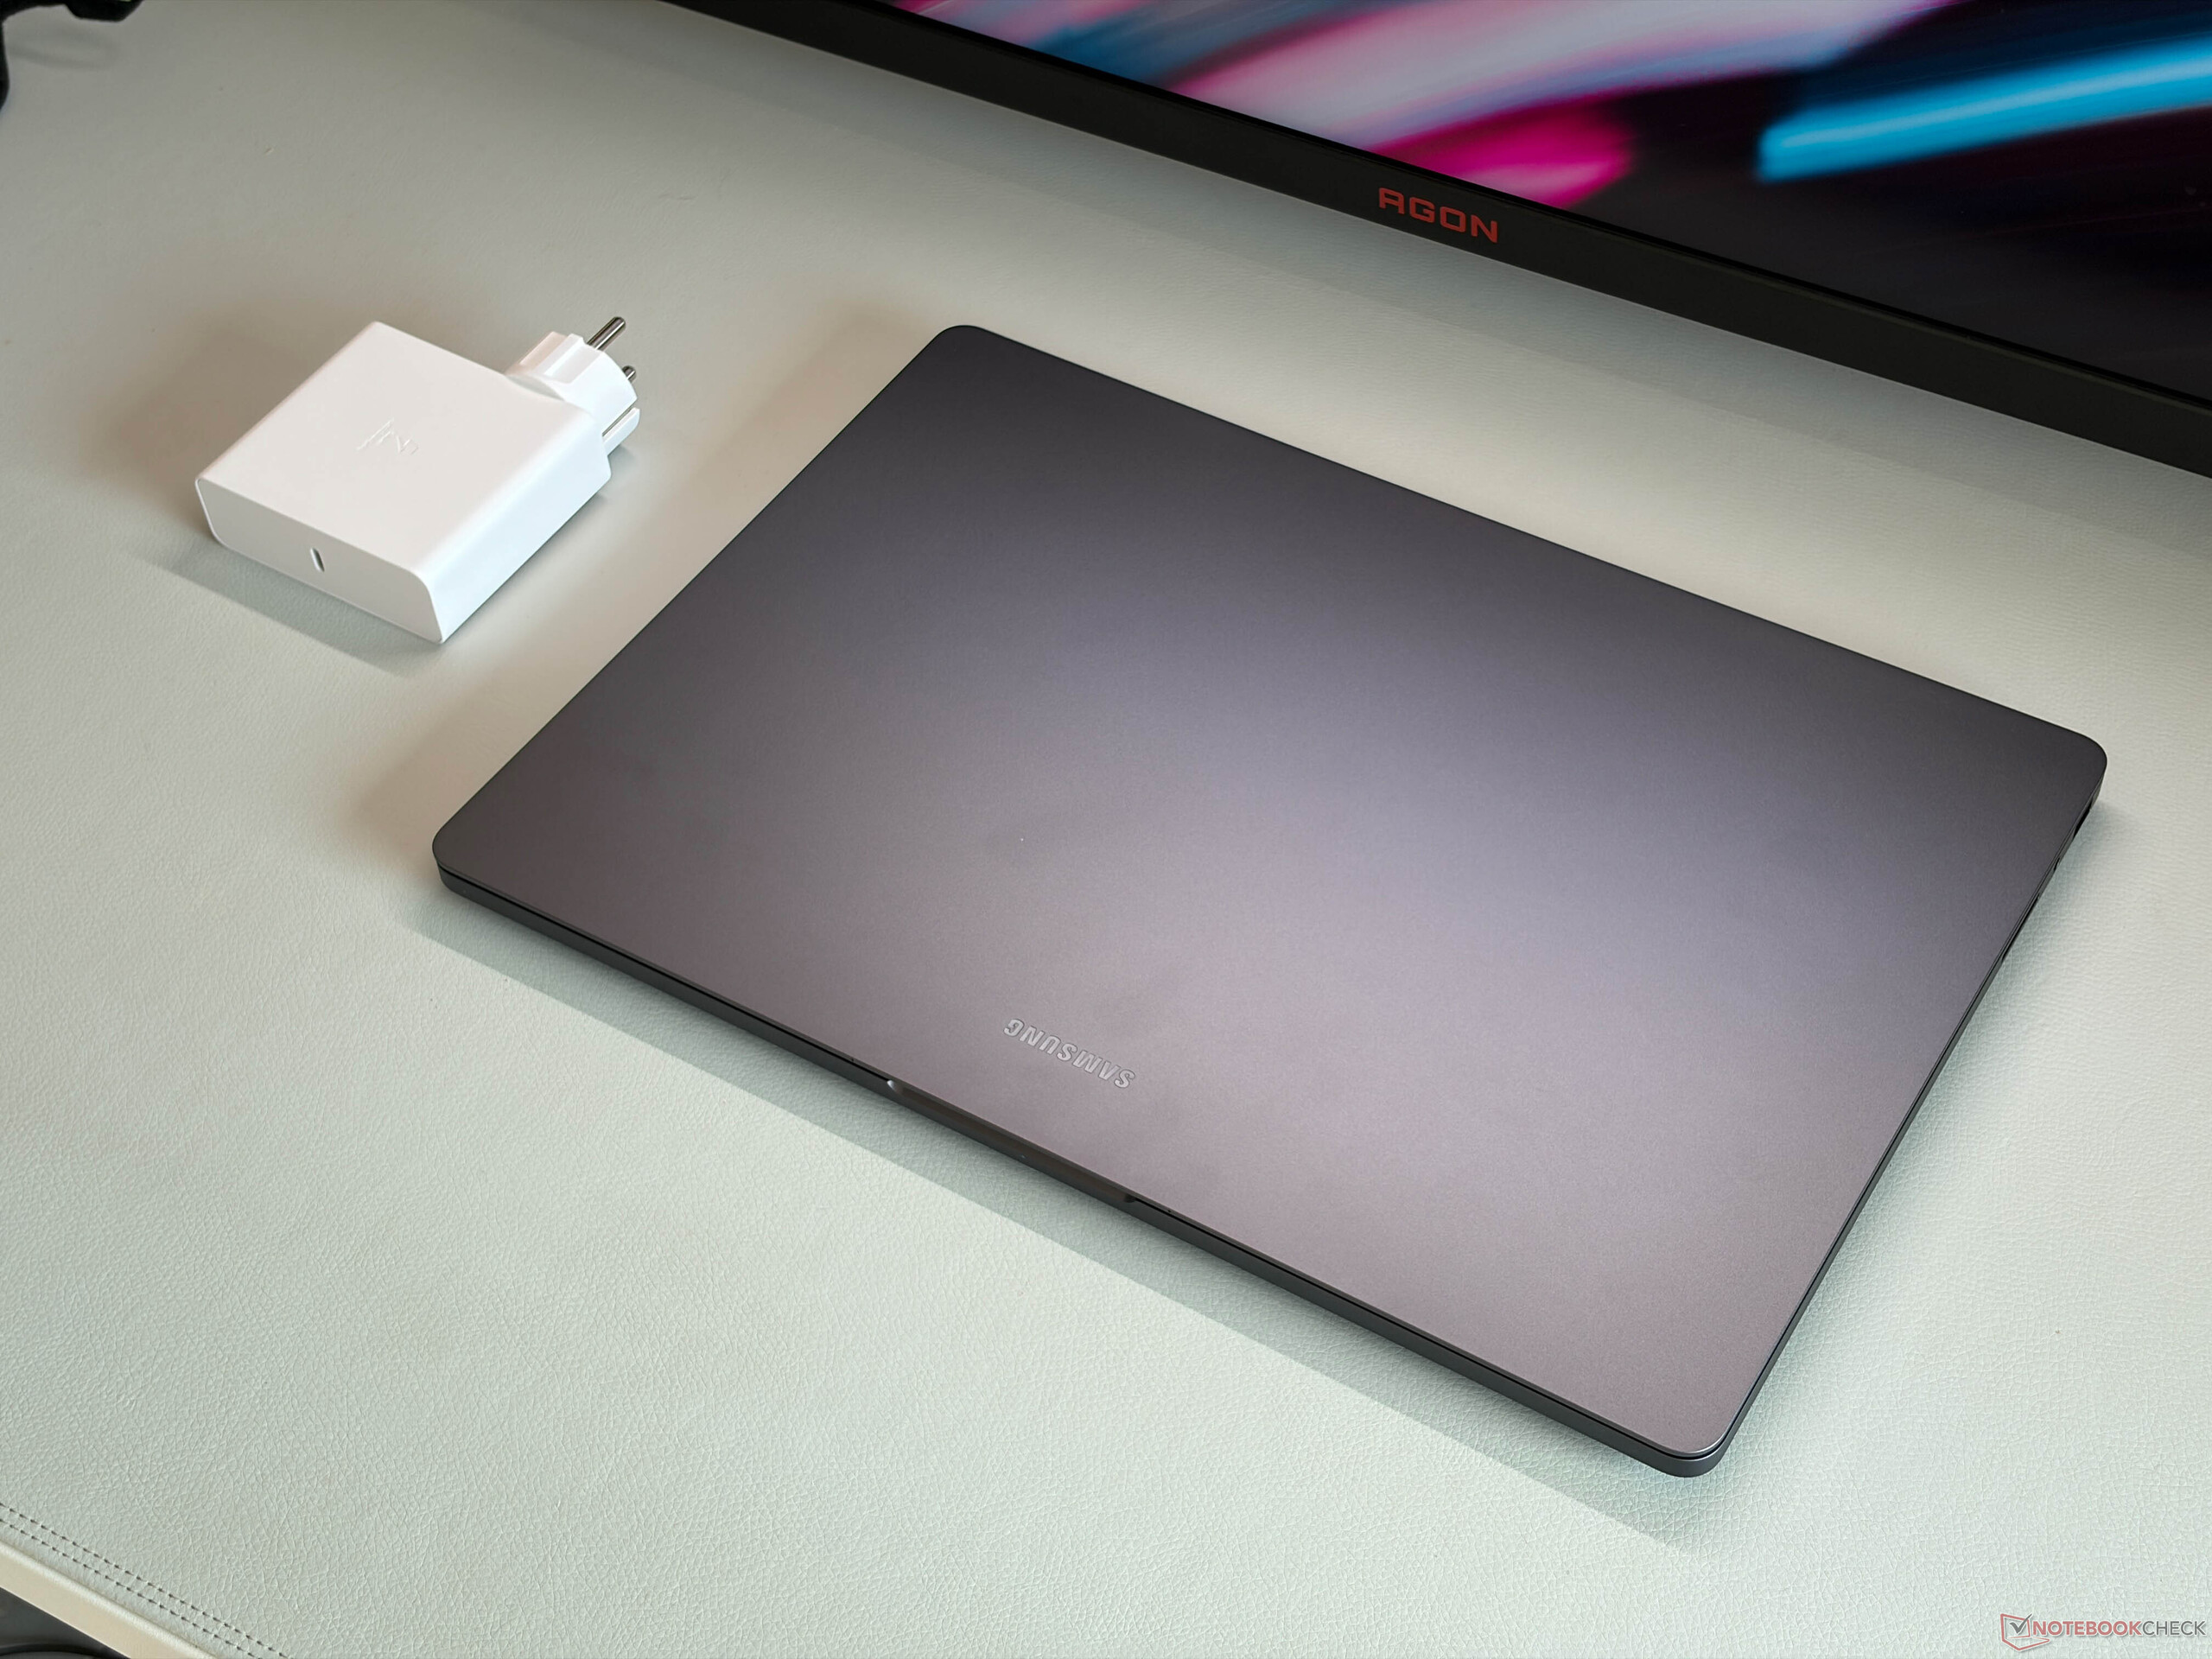
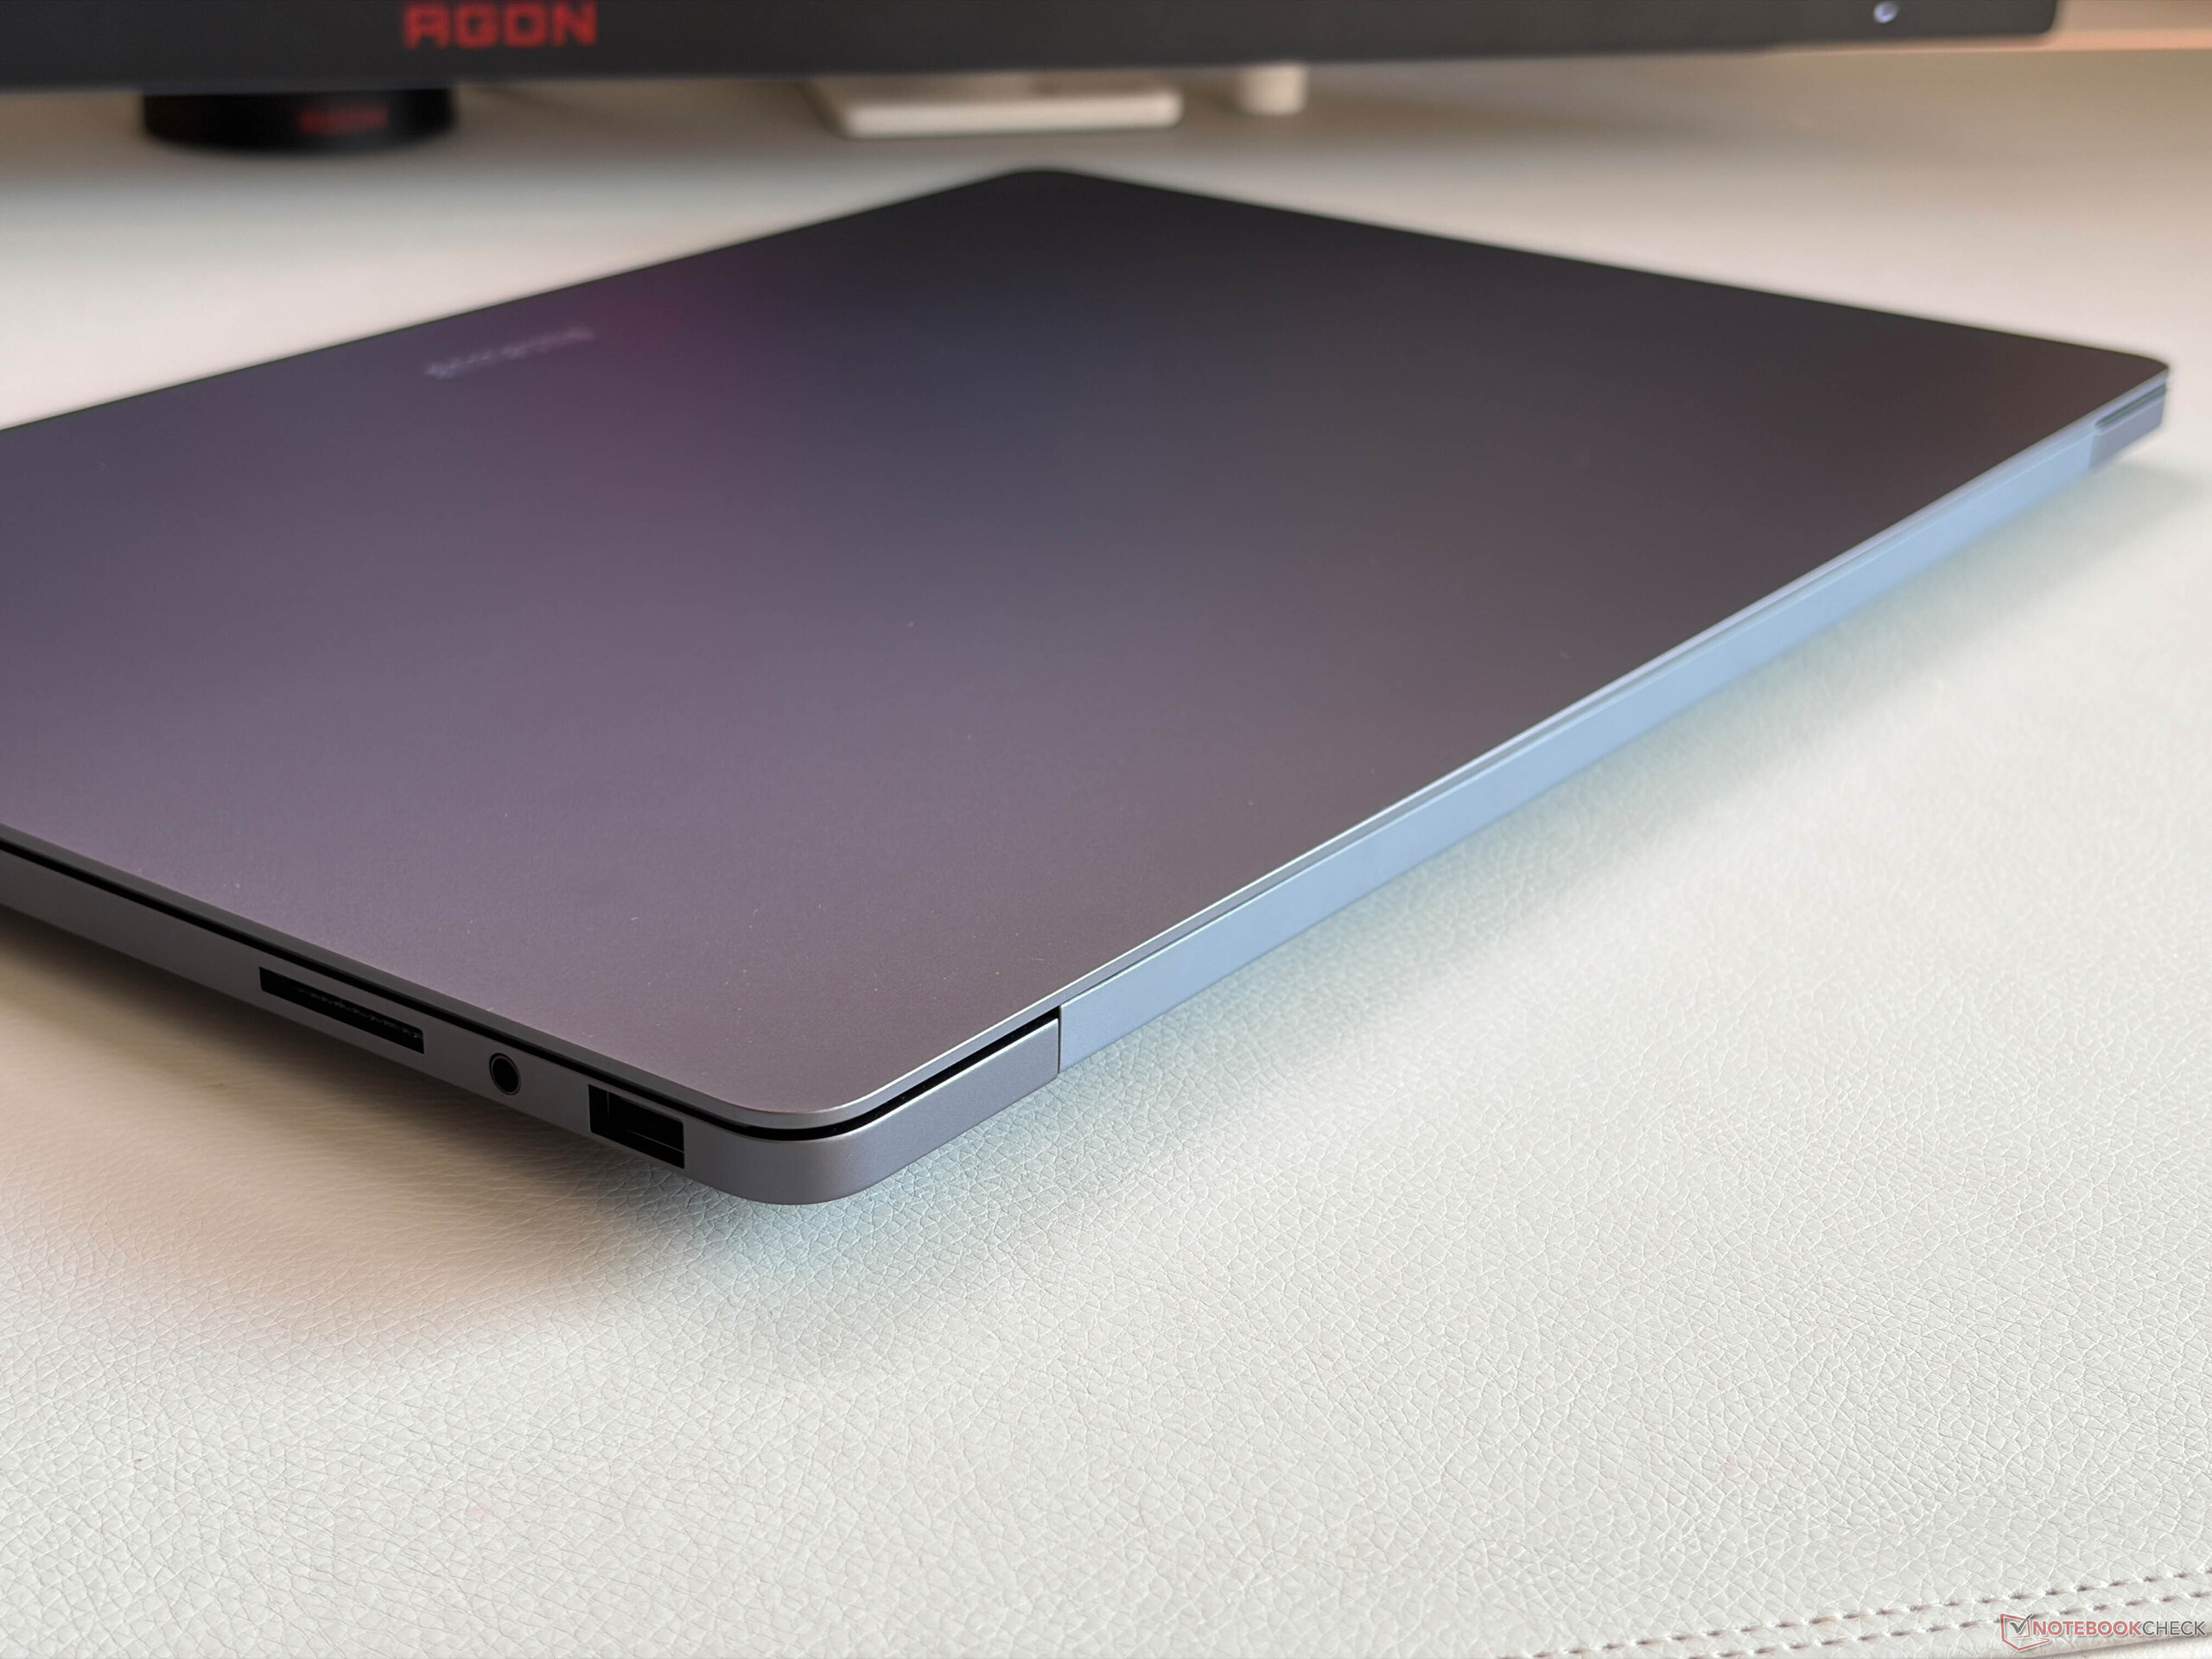
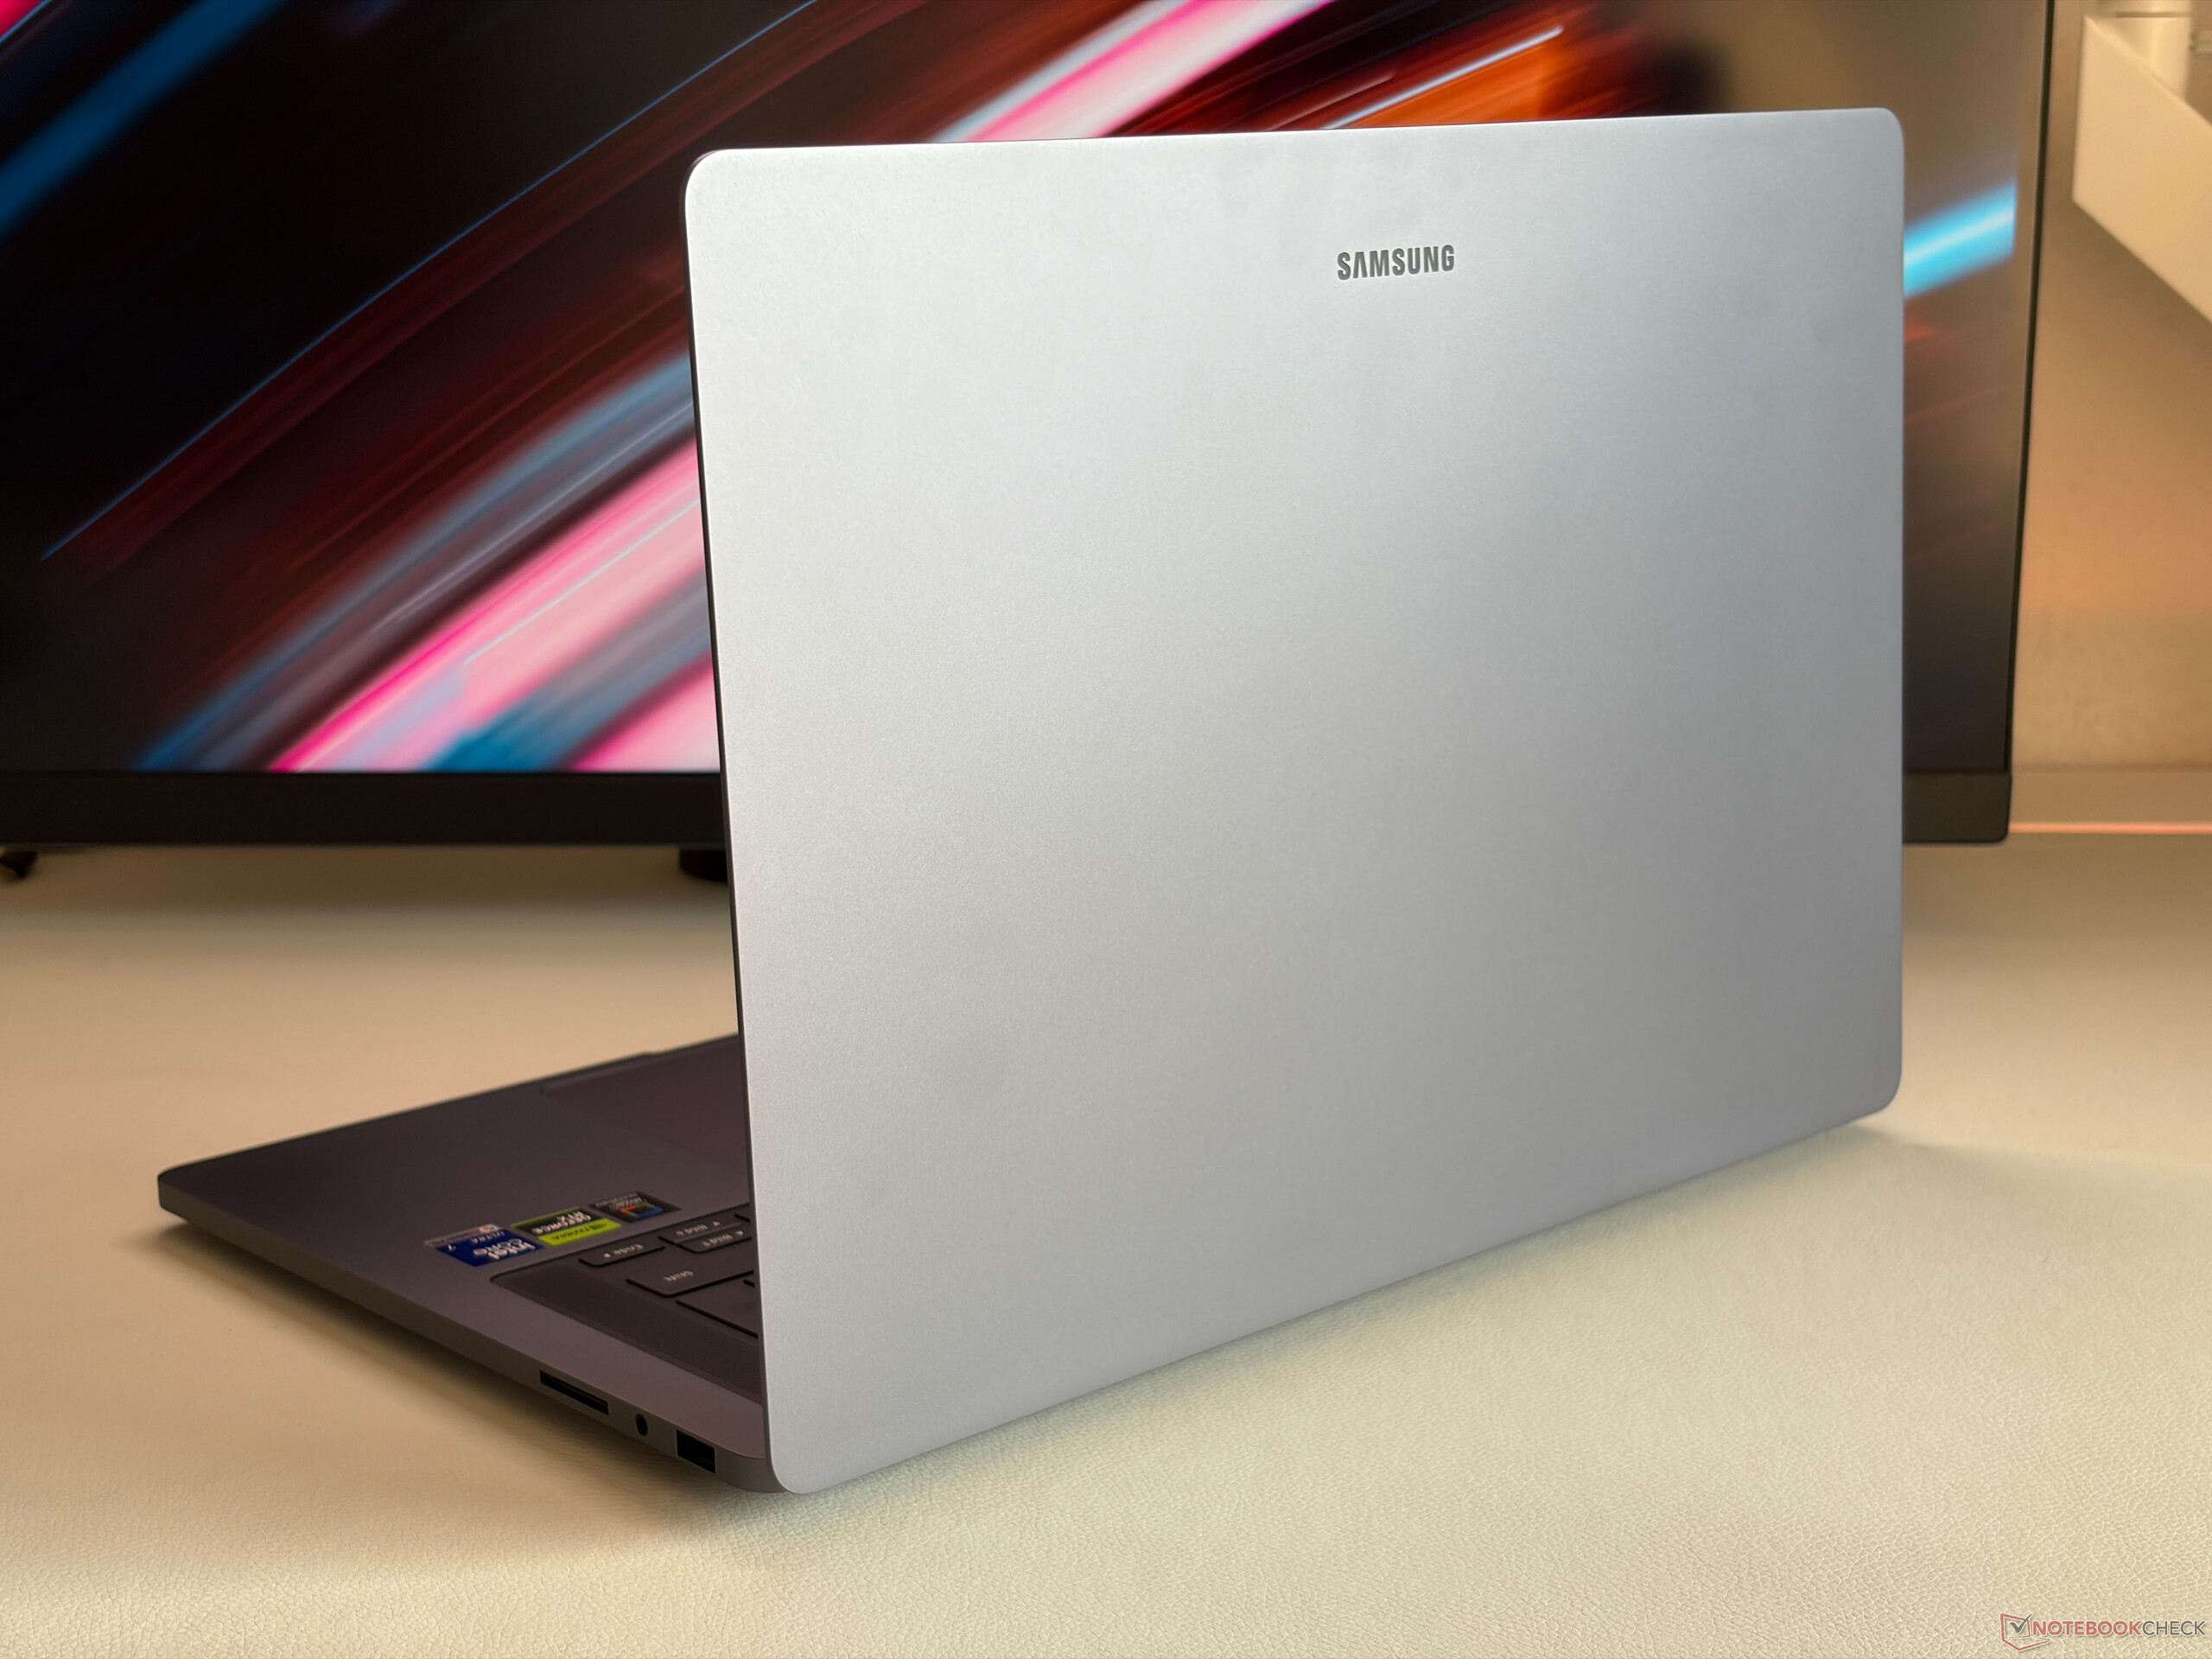
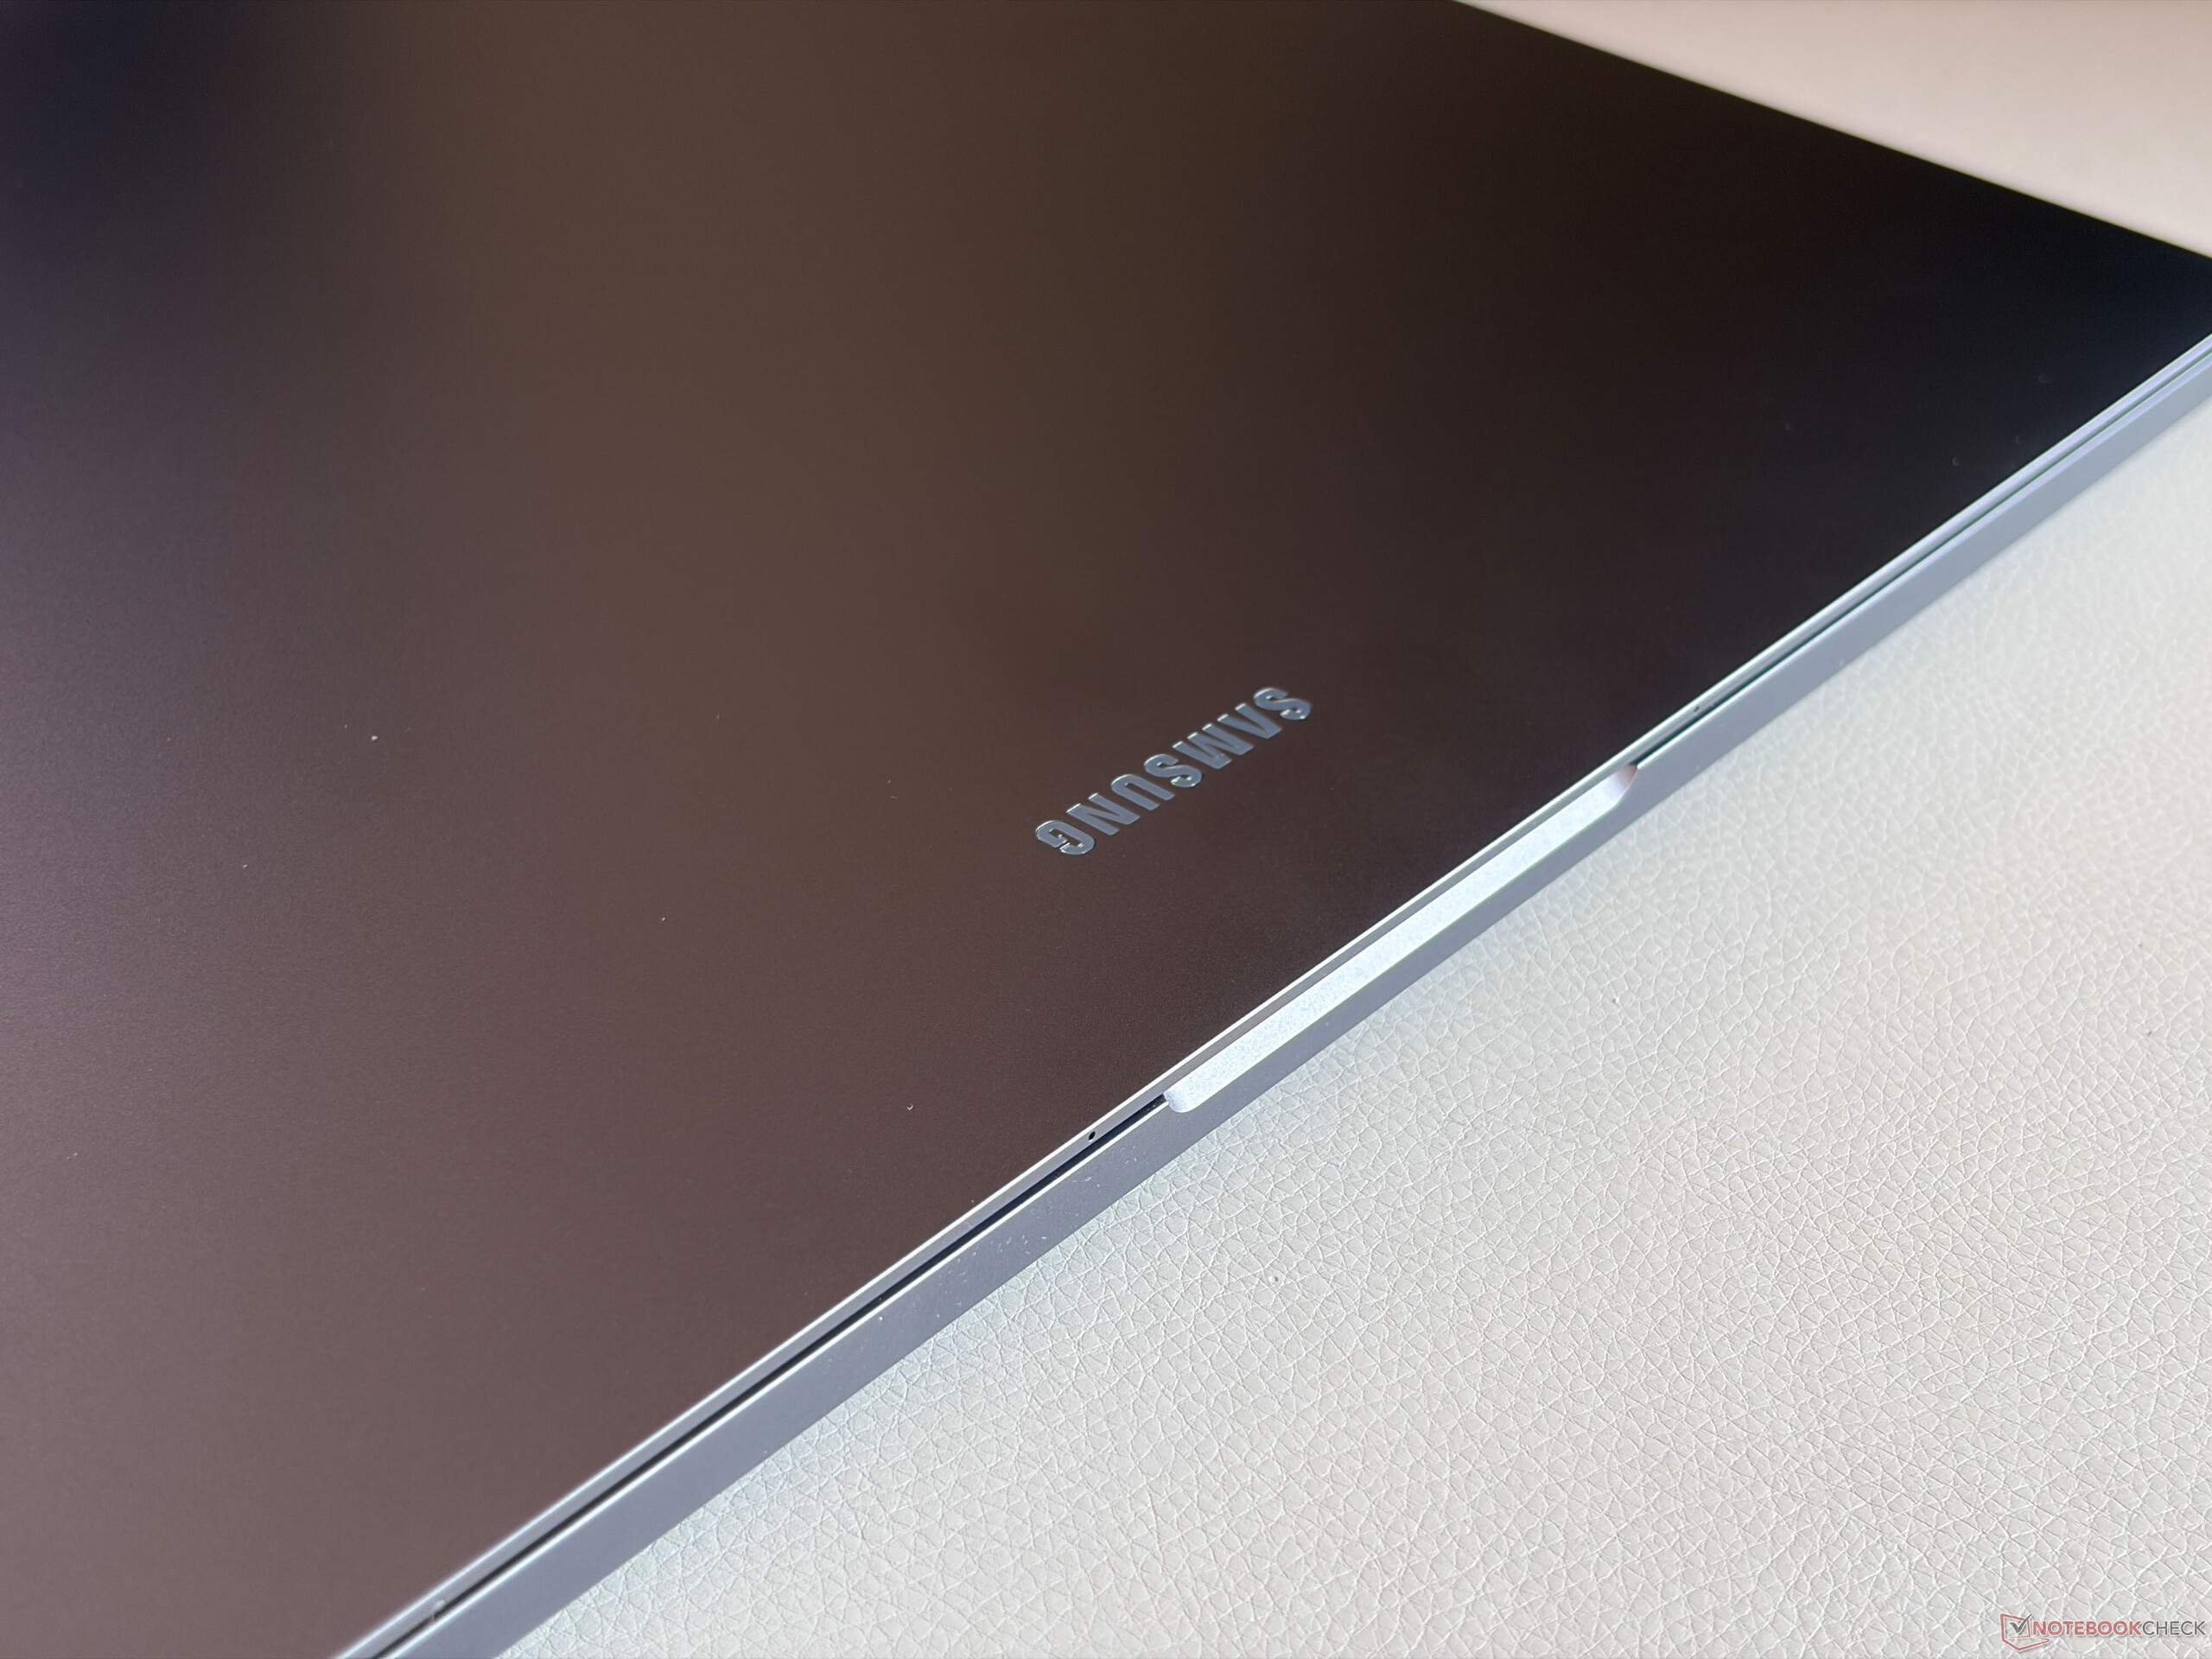
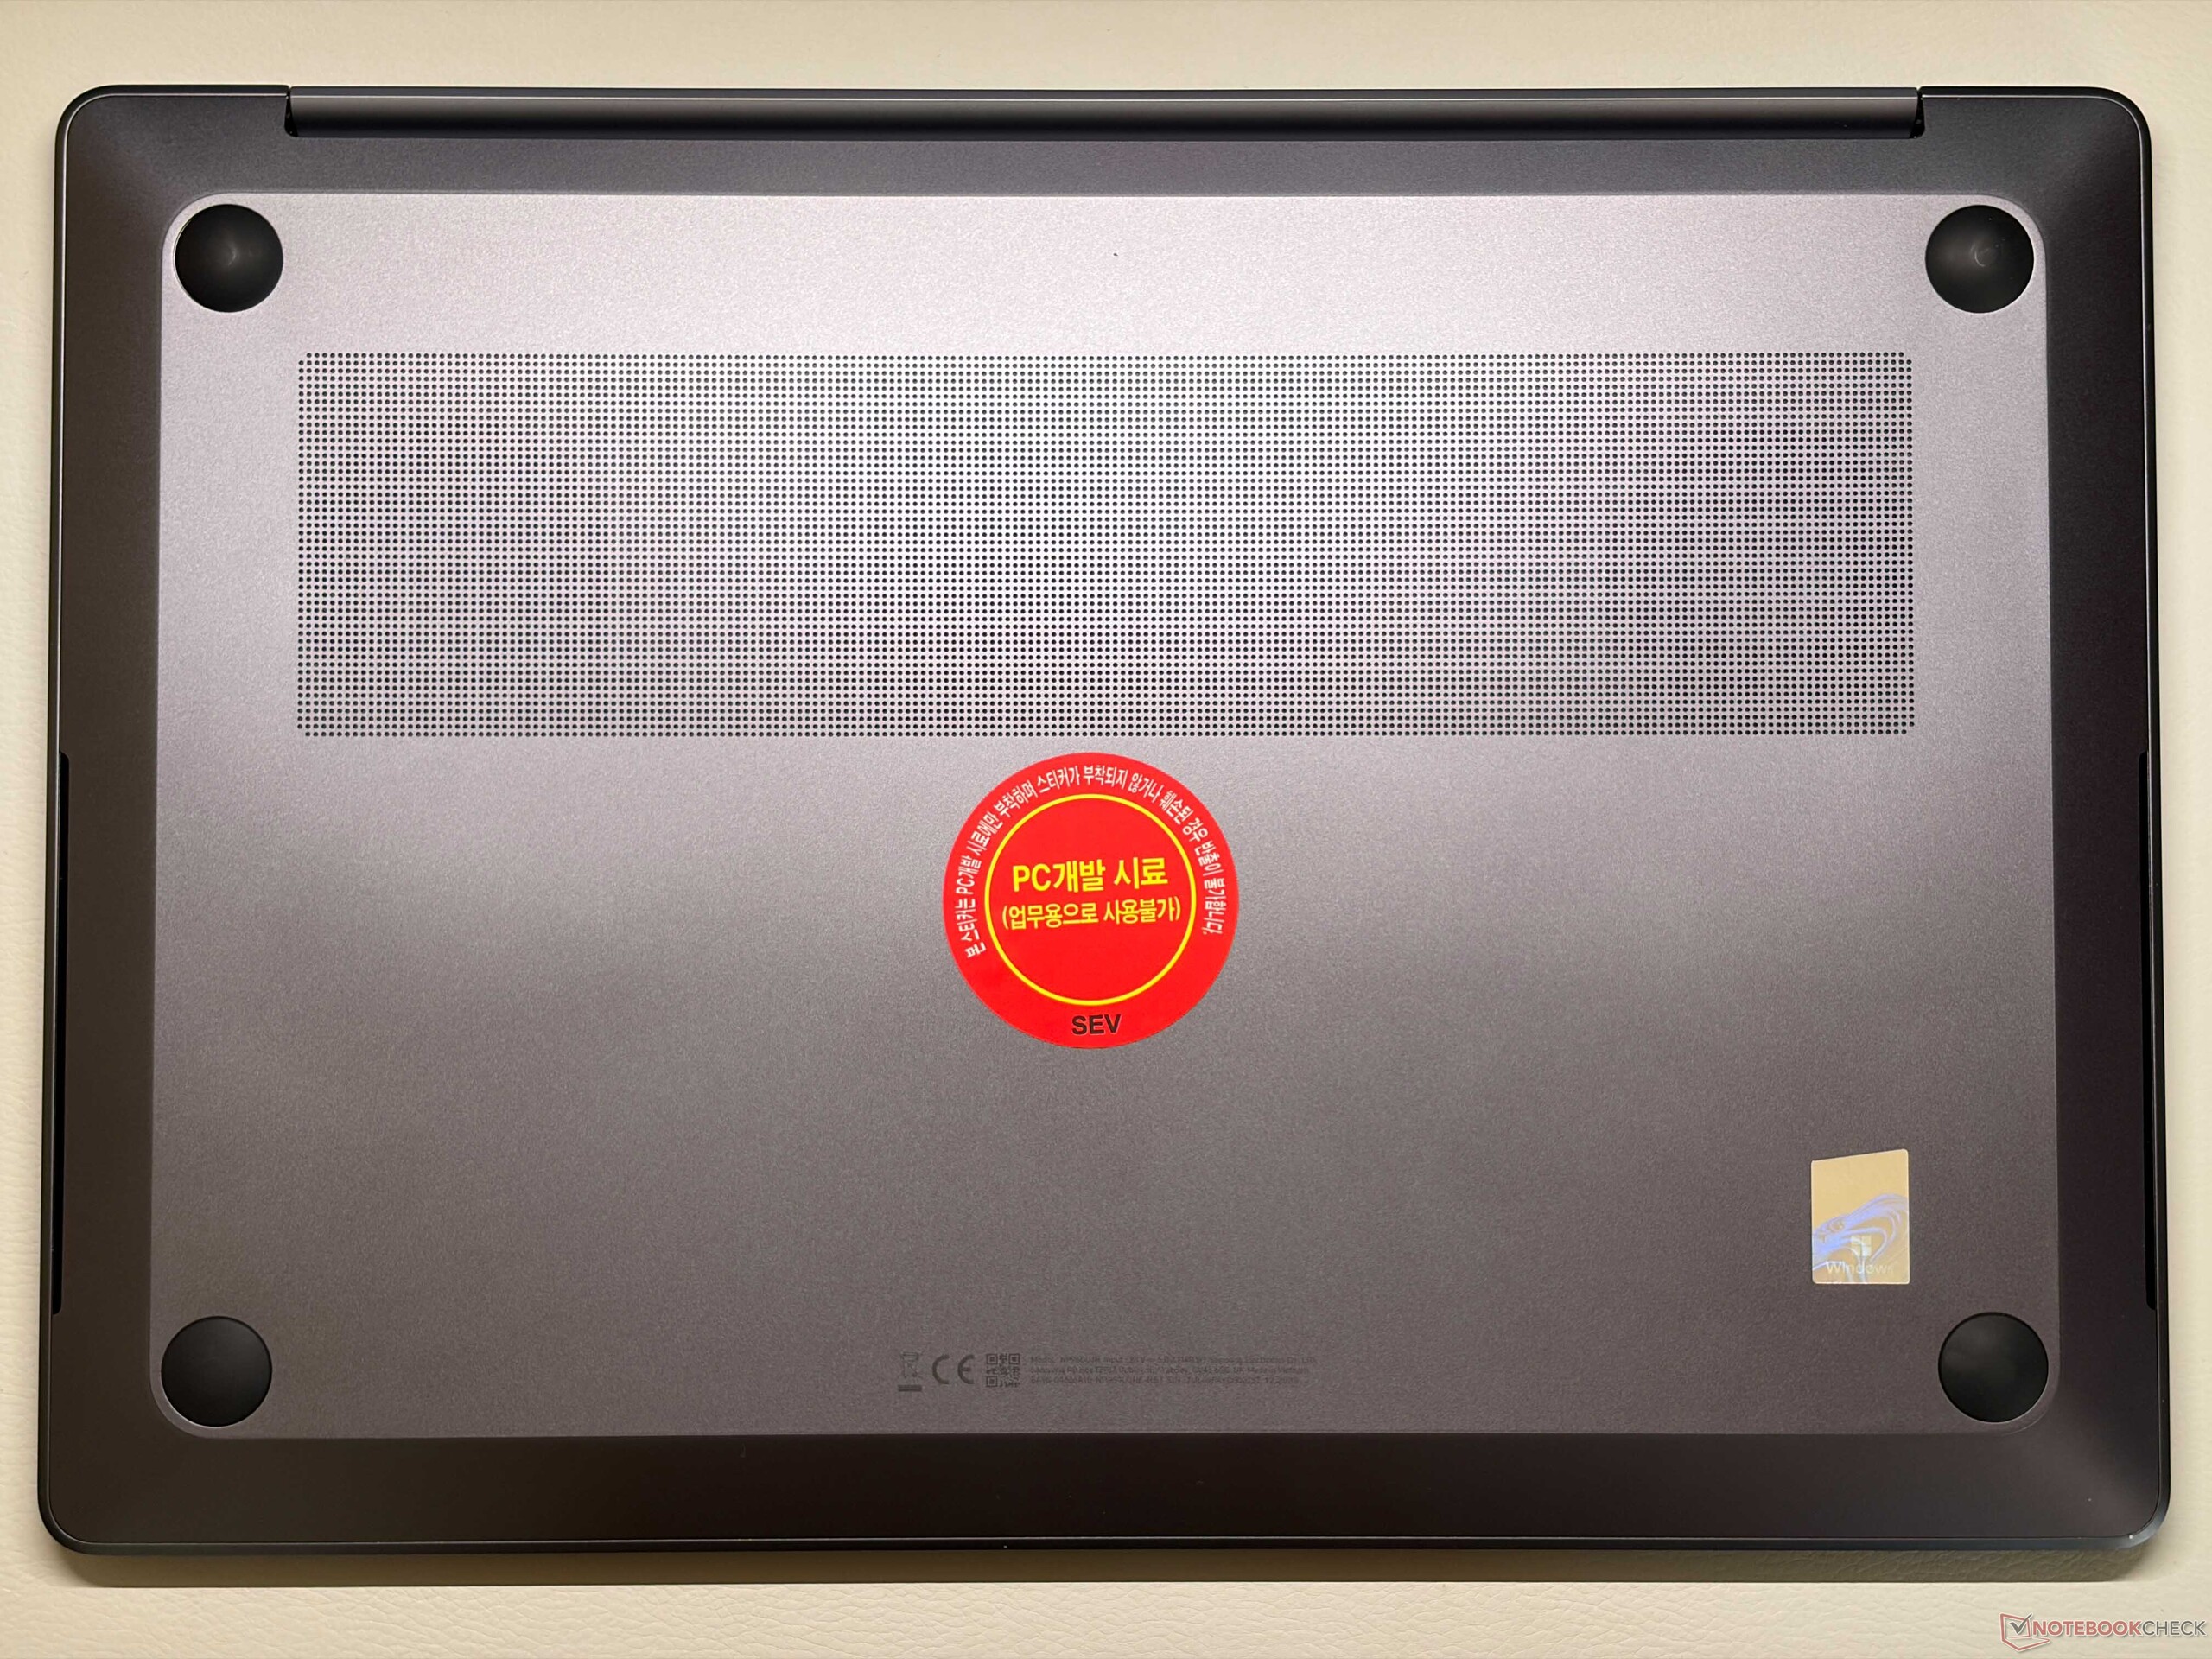
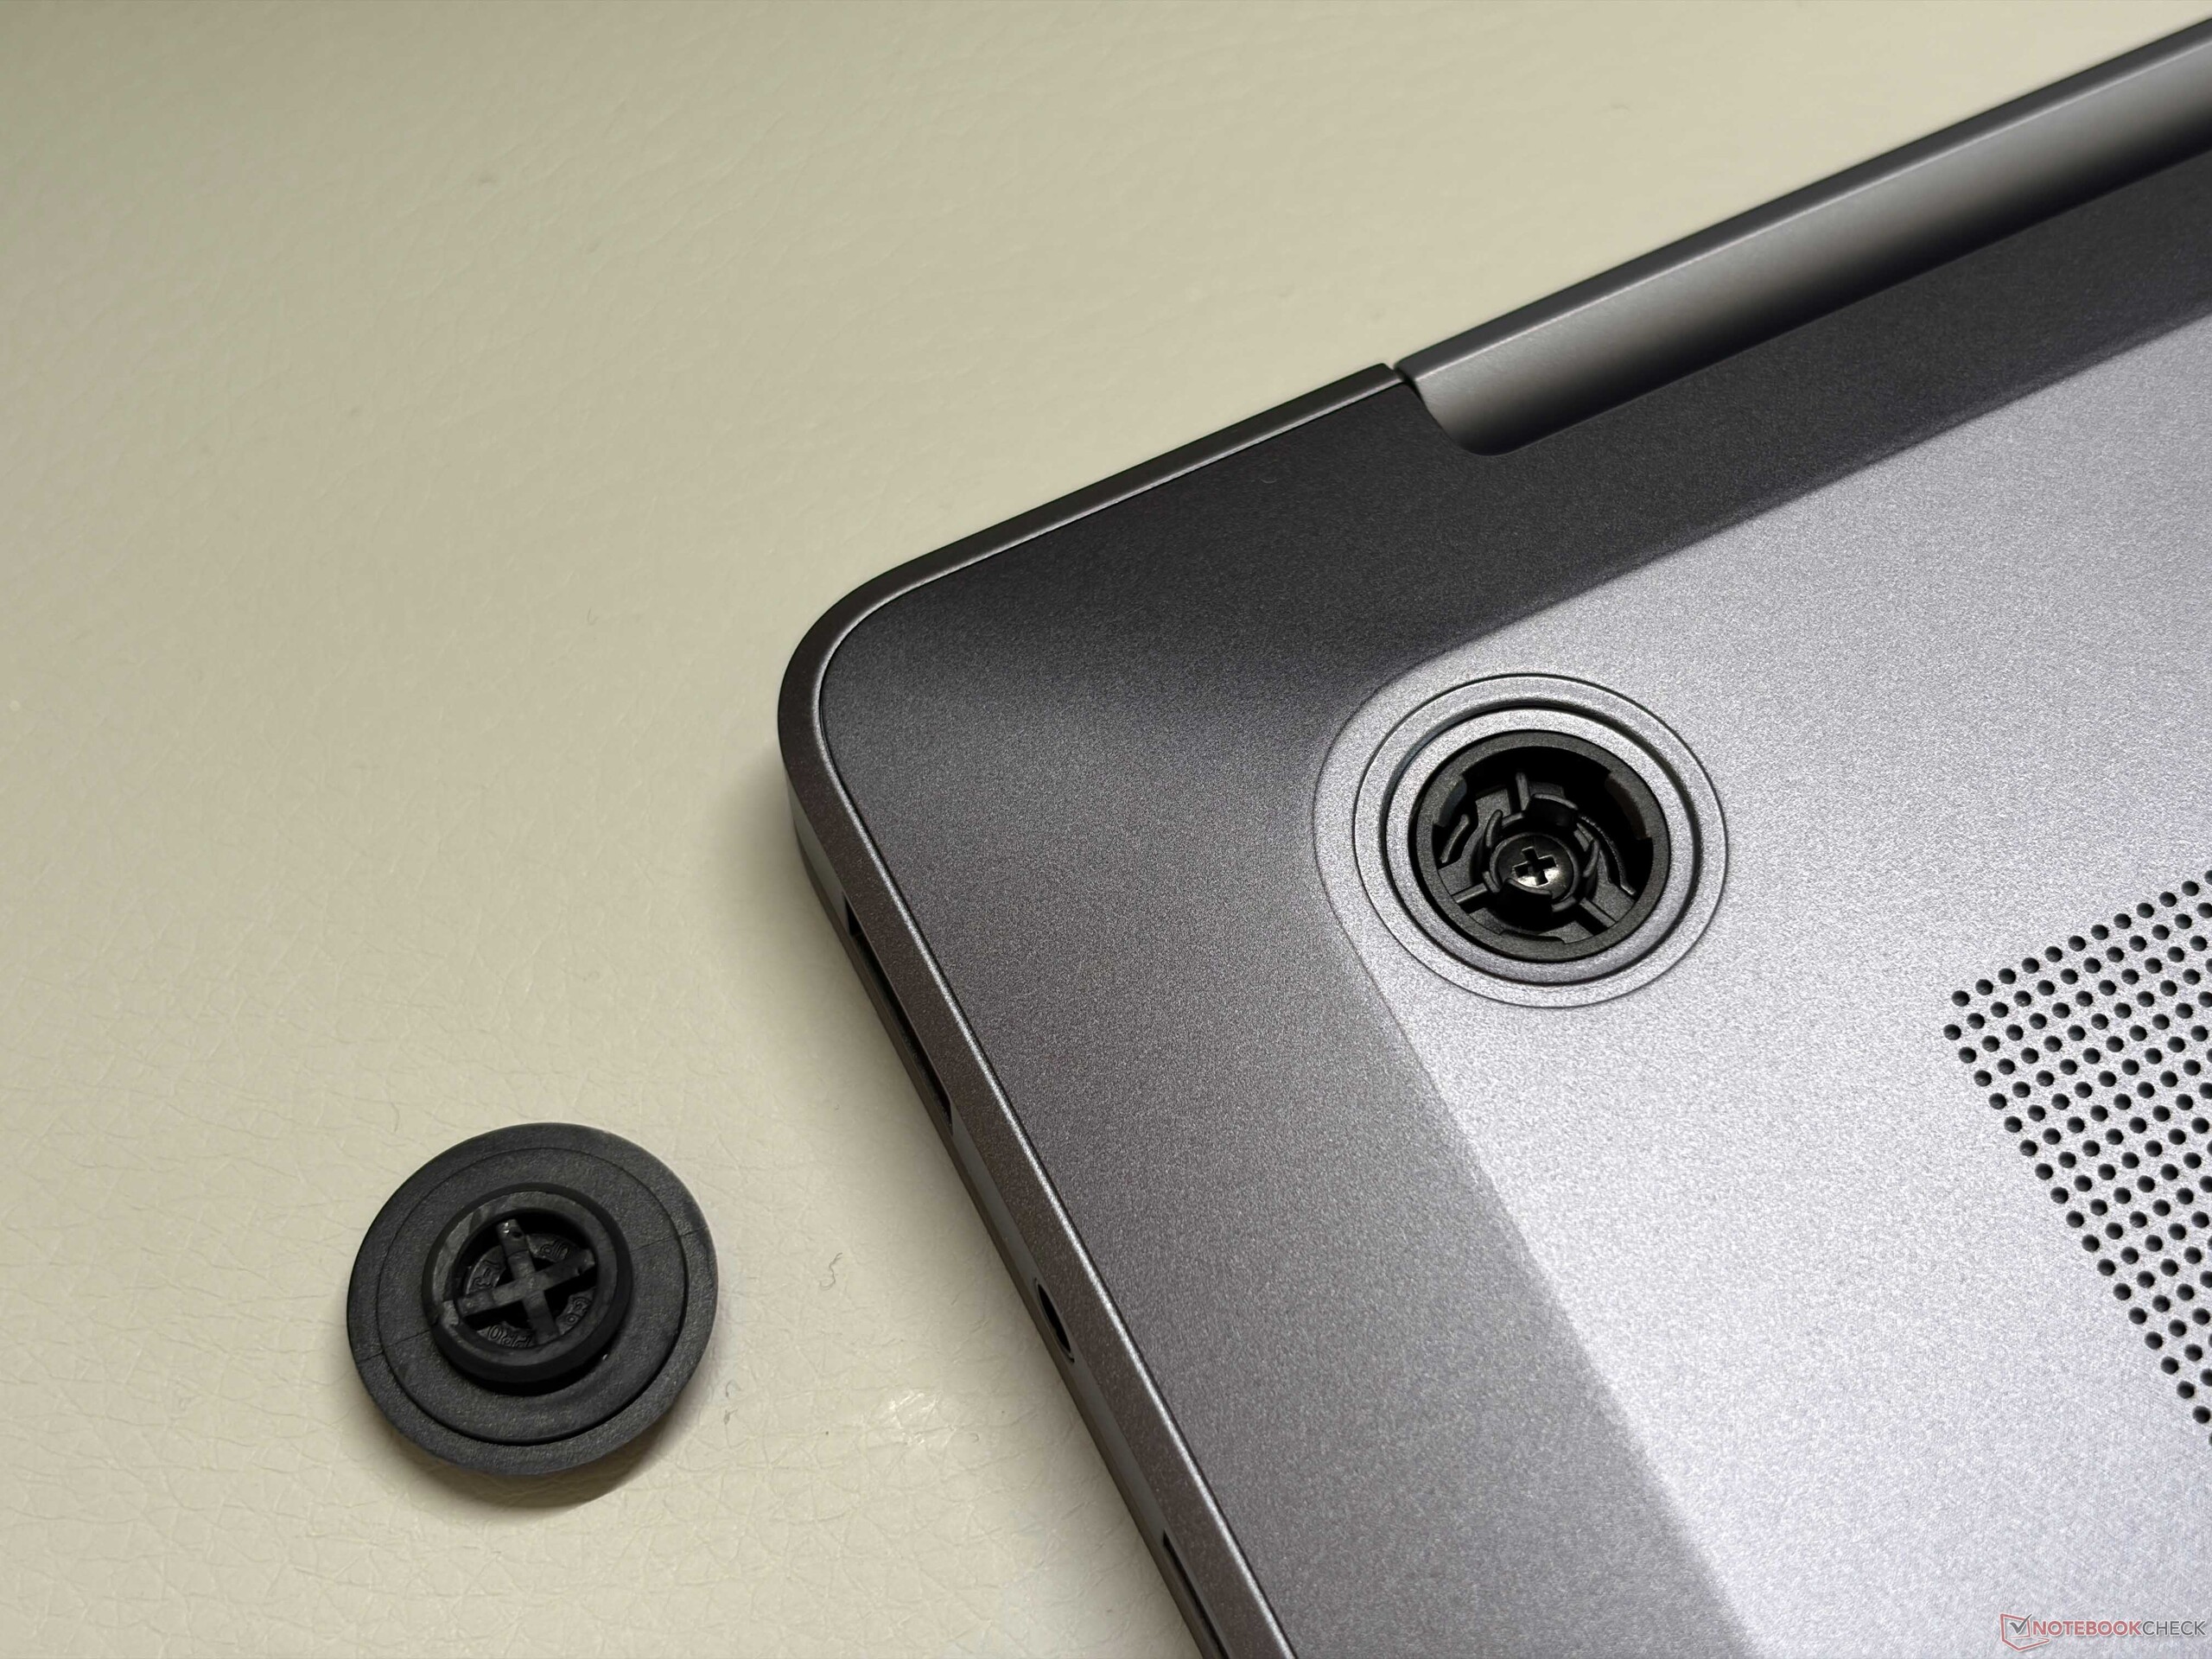
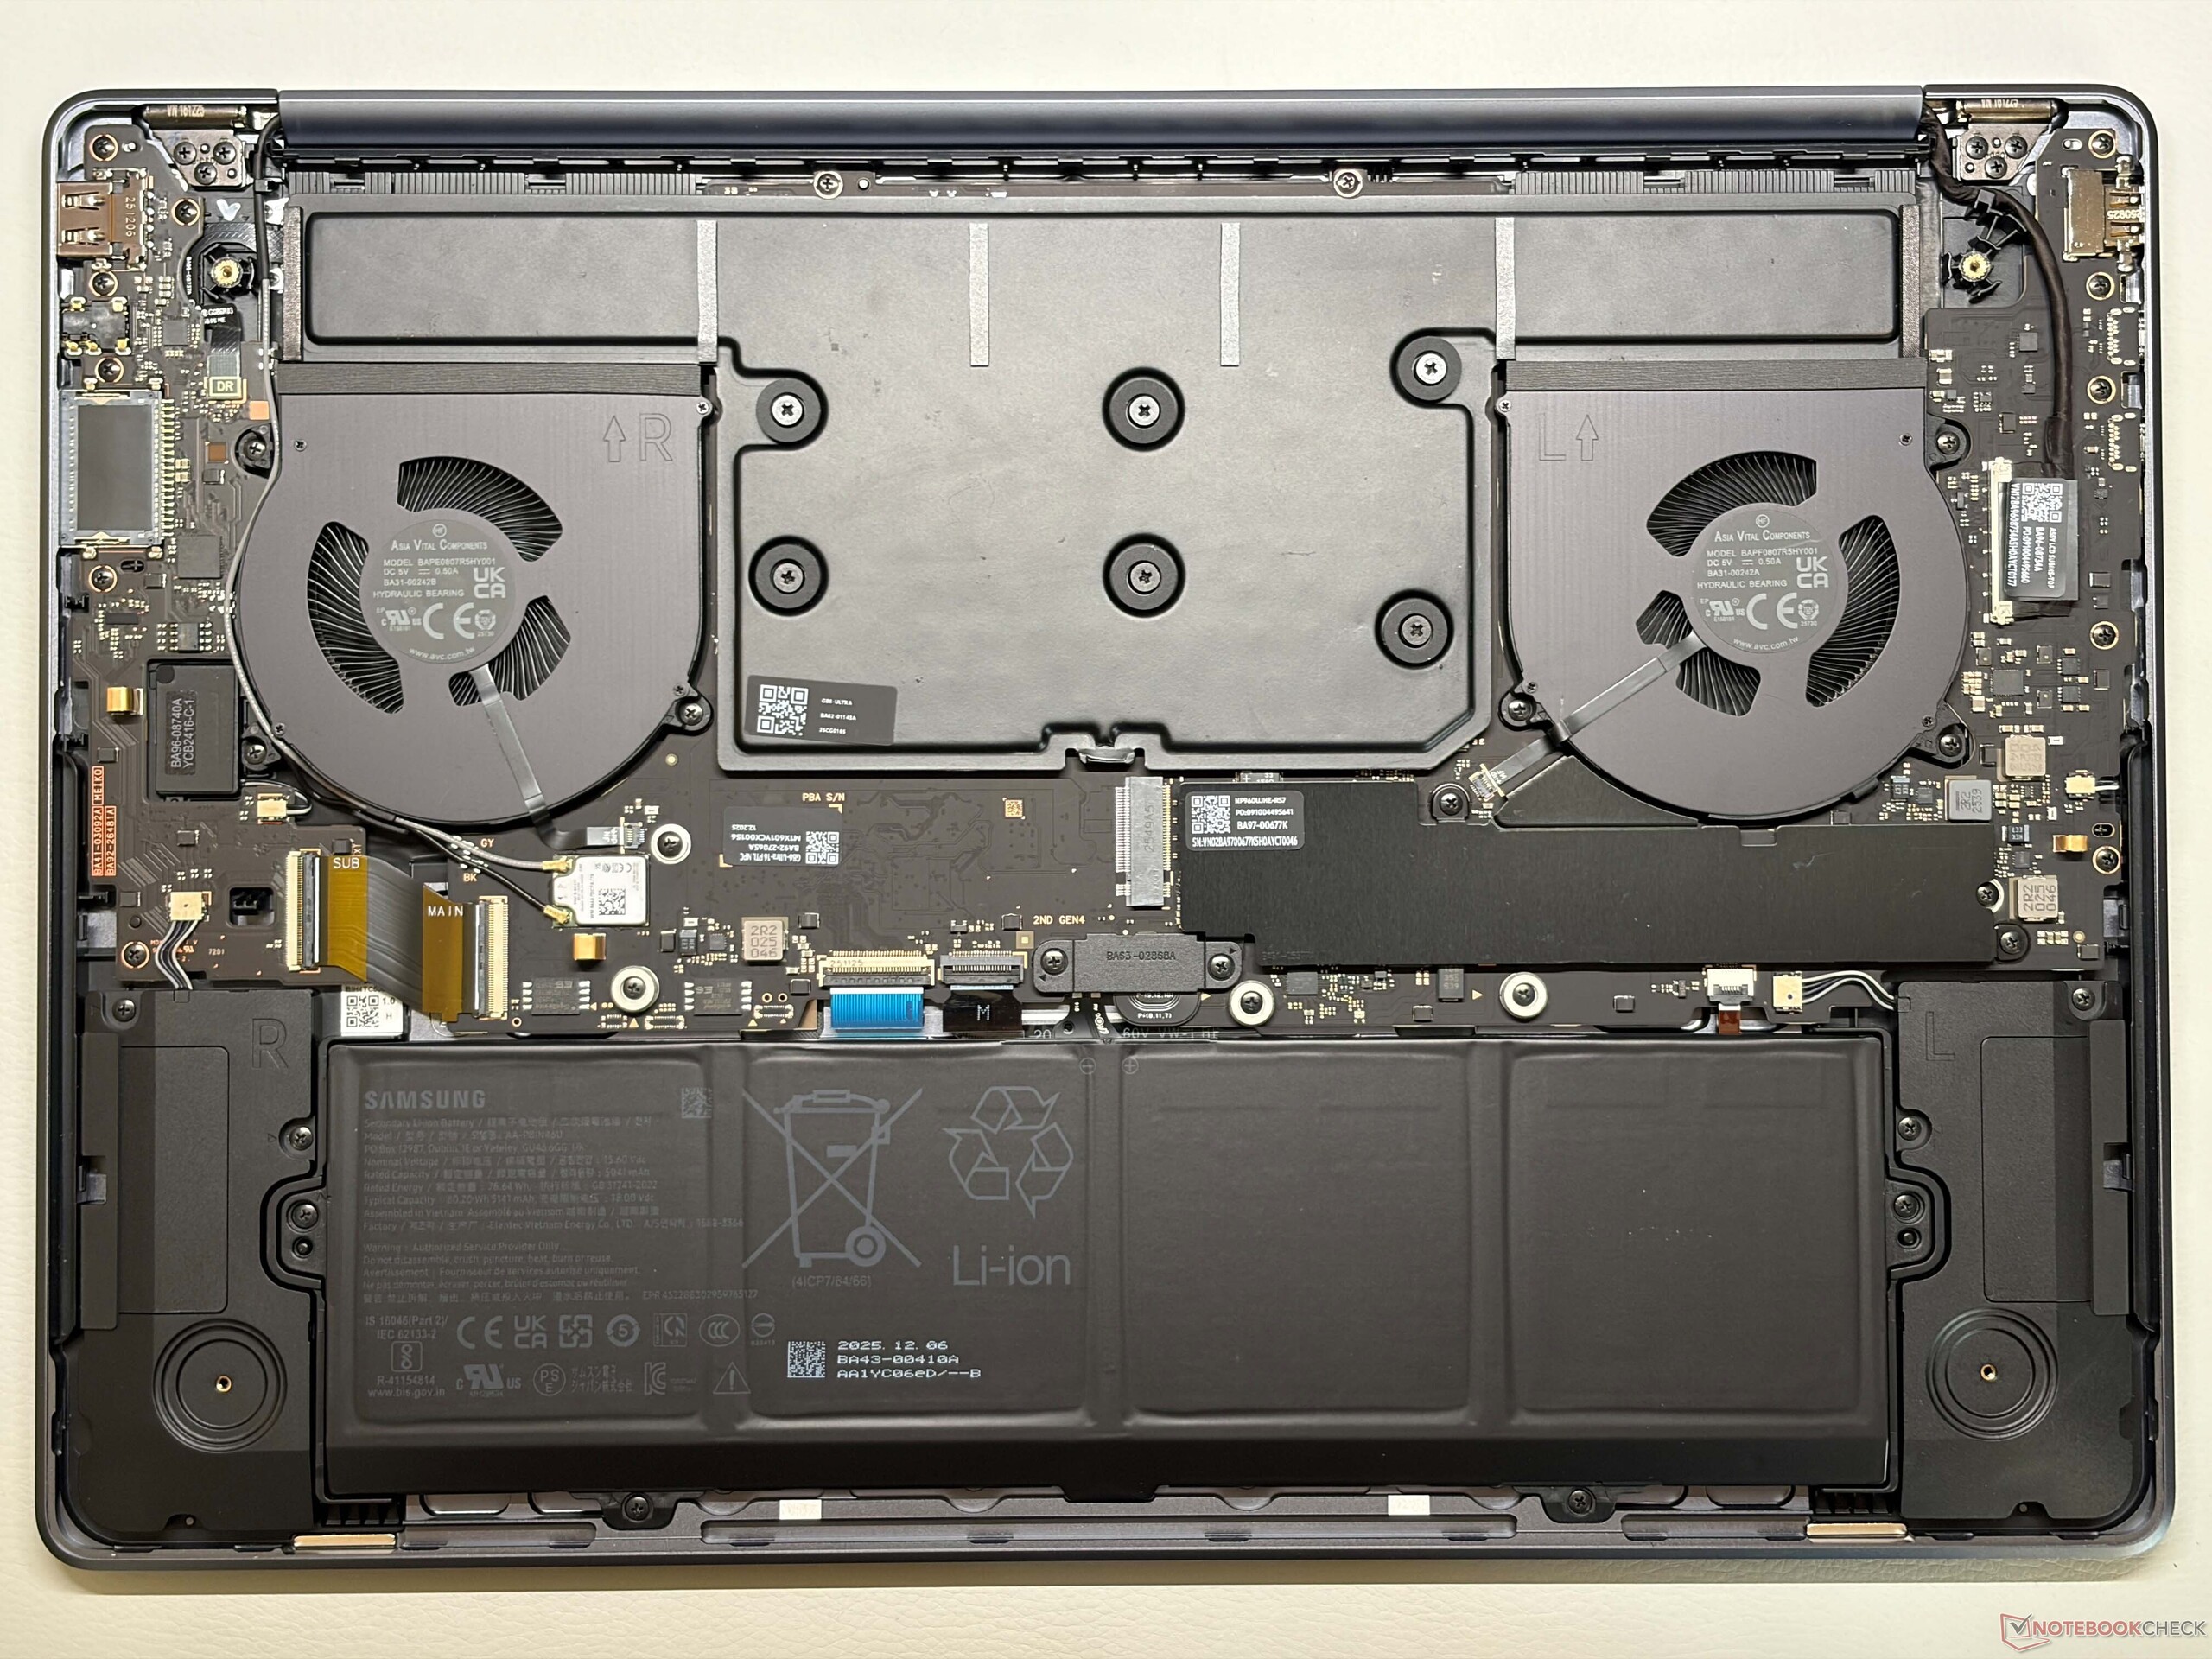
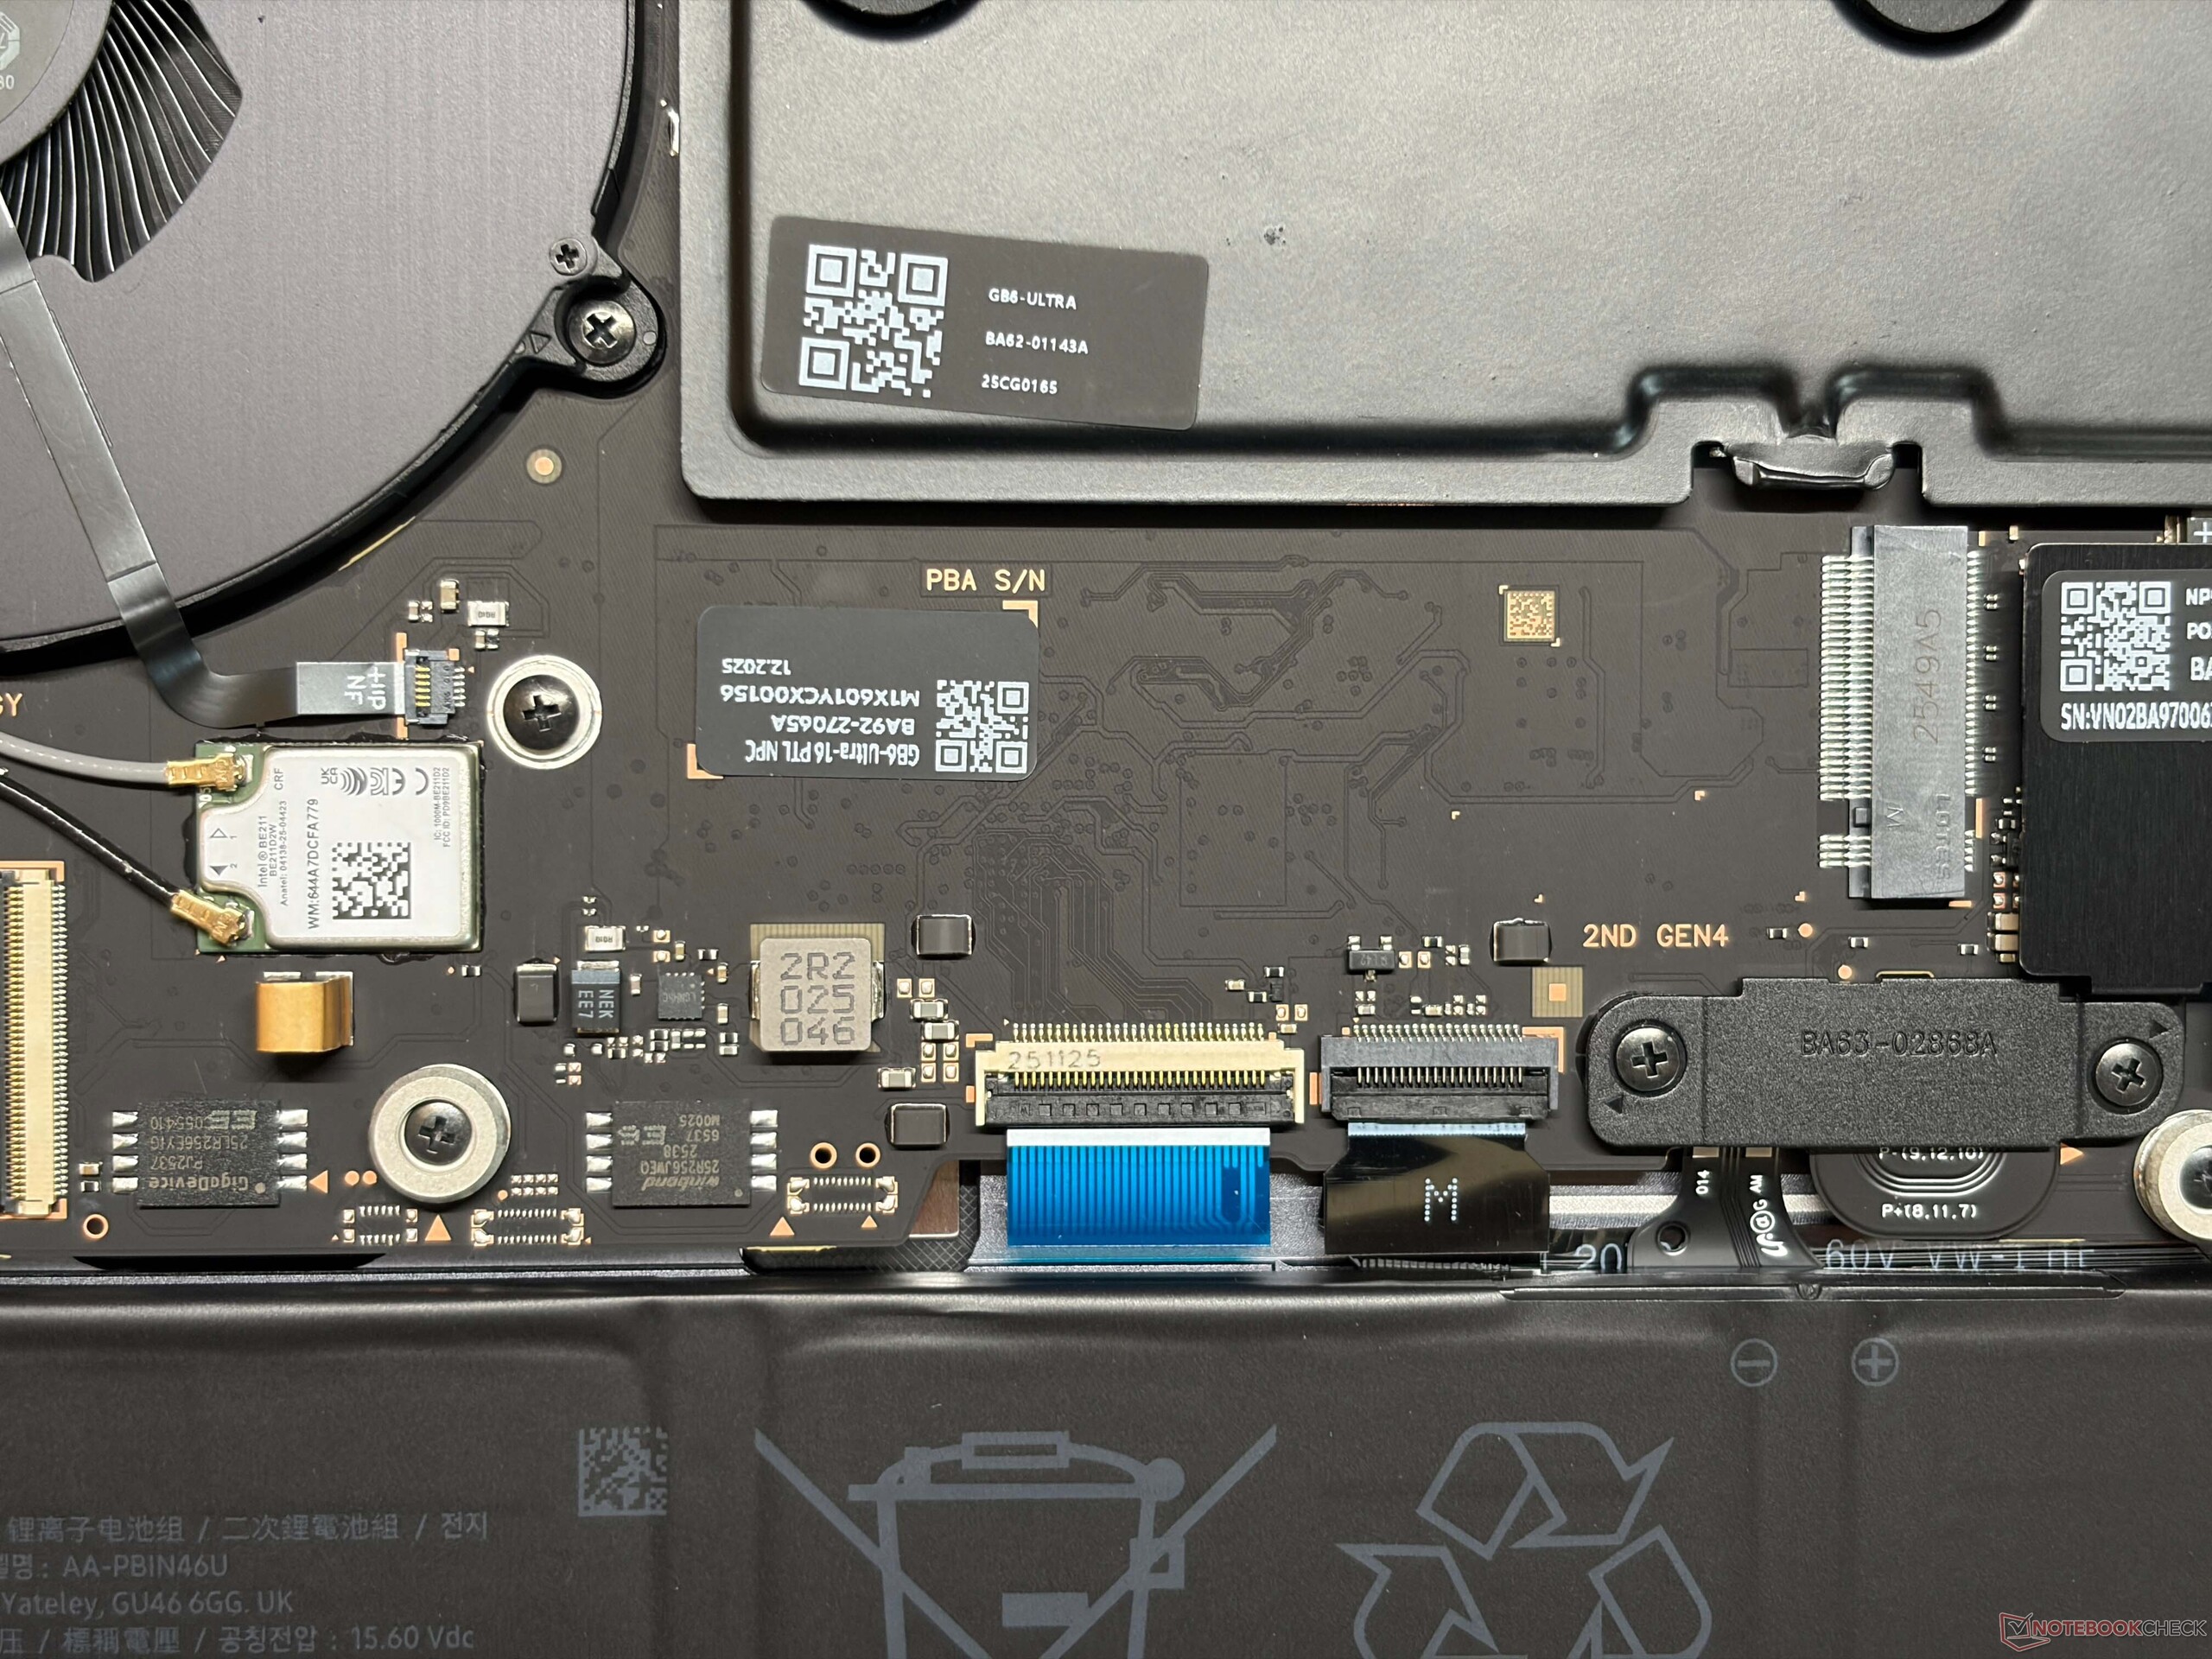
Samsung ditched the previous design with the wedge-shaped base unit (which is still being used for the other Galaxy Book6 models) and the new Galaxy Book6 Ultra looks and feels much more like a MacBook Pro 16. We are pretty sure that many users would have a hard time differentiating between the two models if you remove the logos. The overall quality of the Galaxy Book6 Ultra with the aluminum chassis is excellent, both in terms of stability as well as build quality. Fingerprints are an issue though and the surfaces are not easy to clean. We are not happy with the hinges (maximum opening angle ~135 degrees), because the screen wobbles quite a bit. The lower bezel is also very thick. You can remove the bottom panel and access bot SSD slots, the battery as well as the fans, but the memory and the Wi-Fi module cannot be replaced.
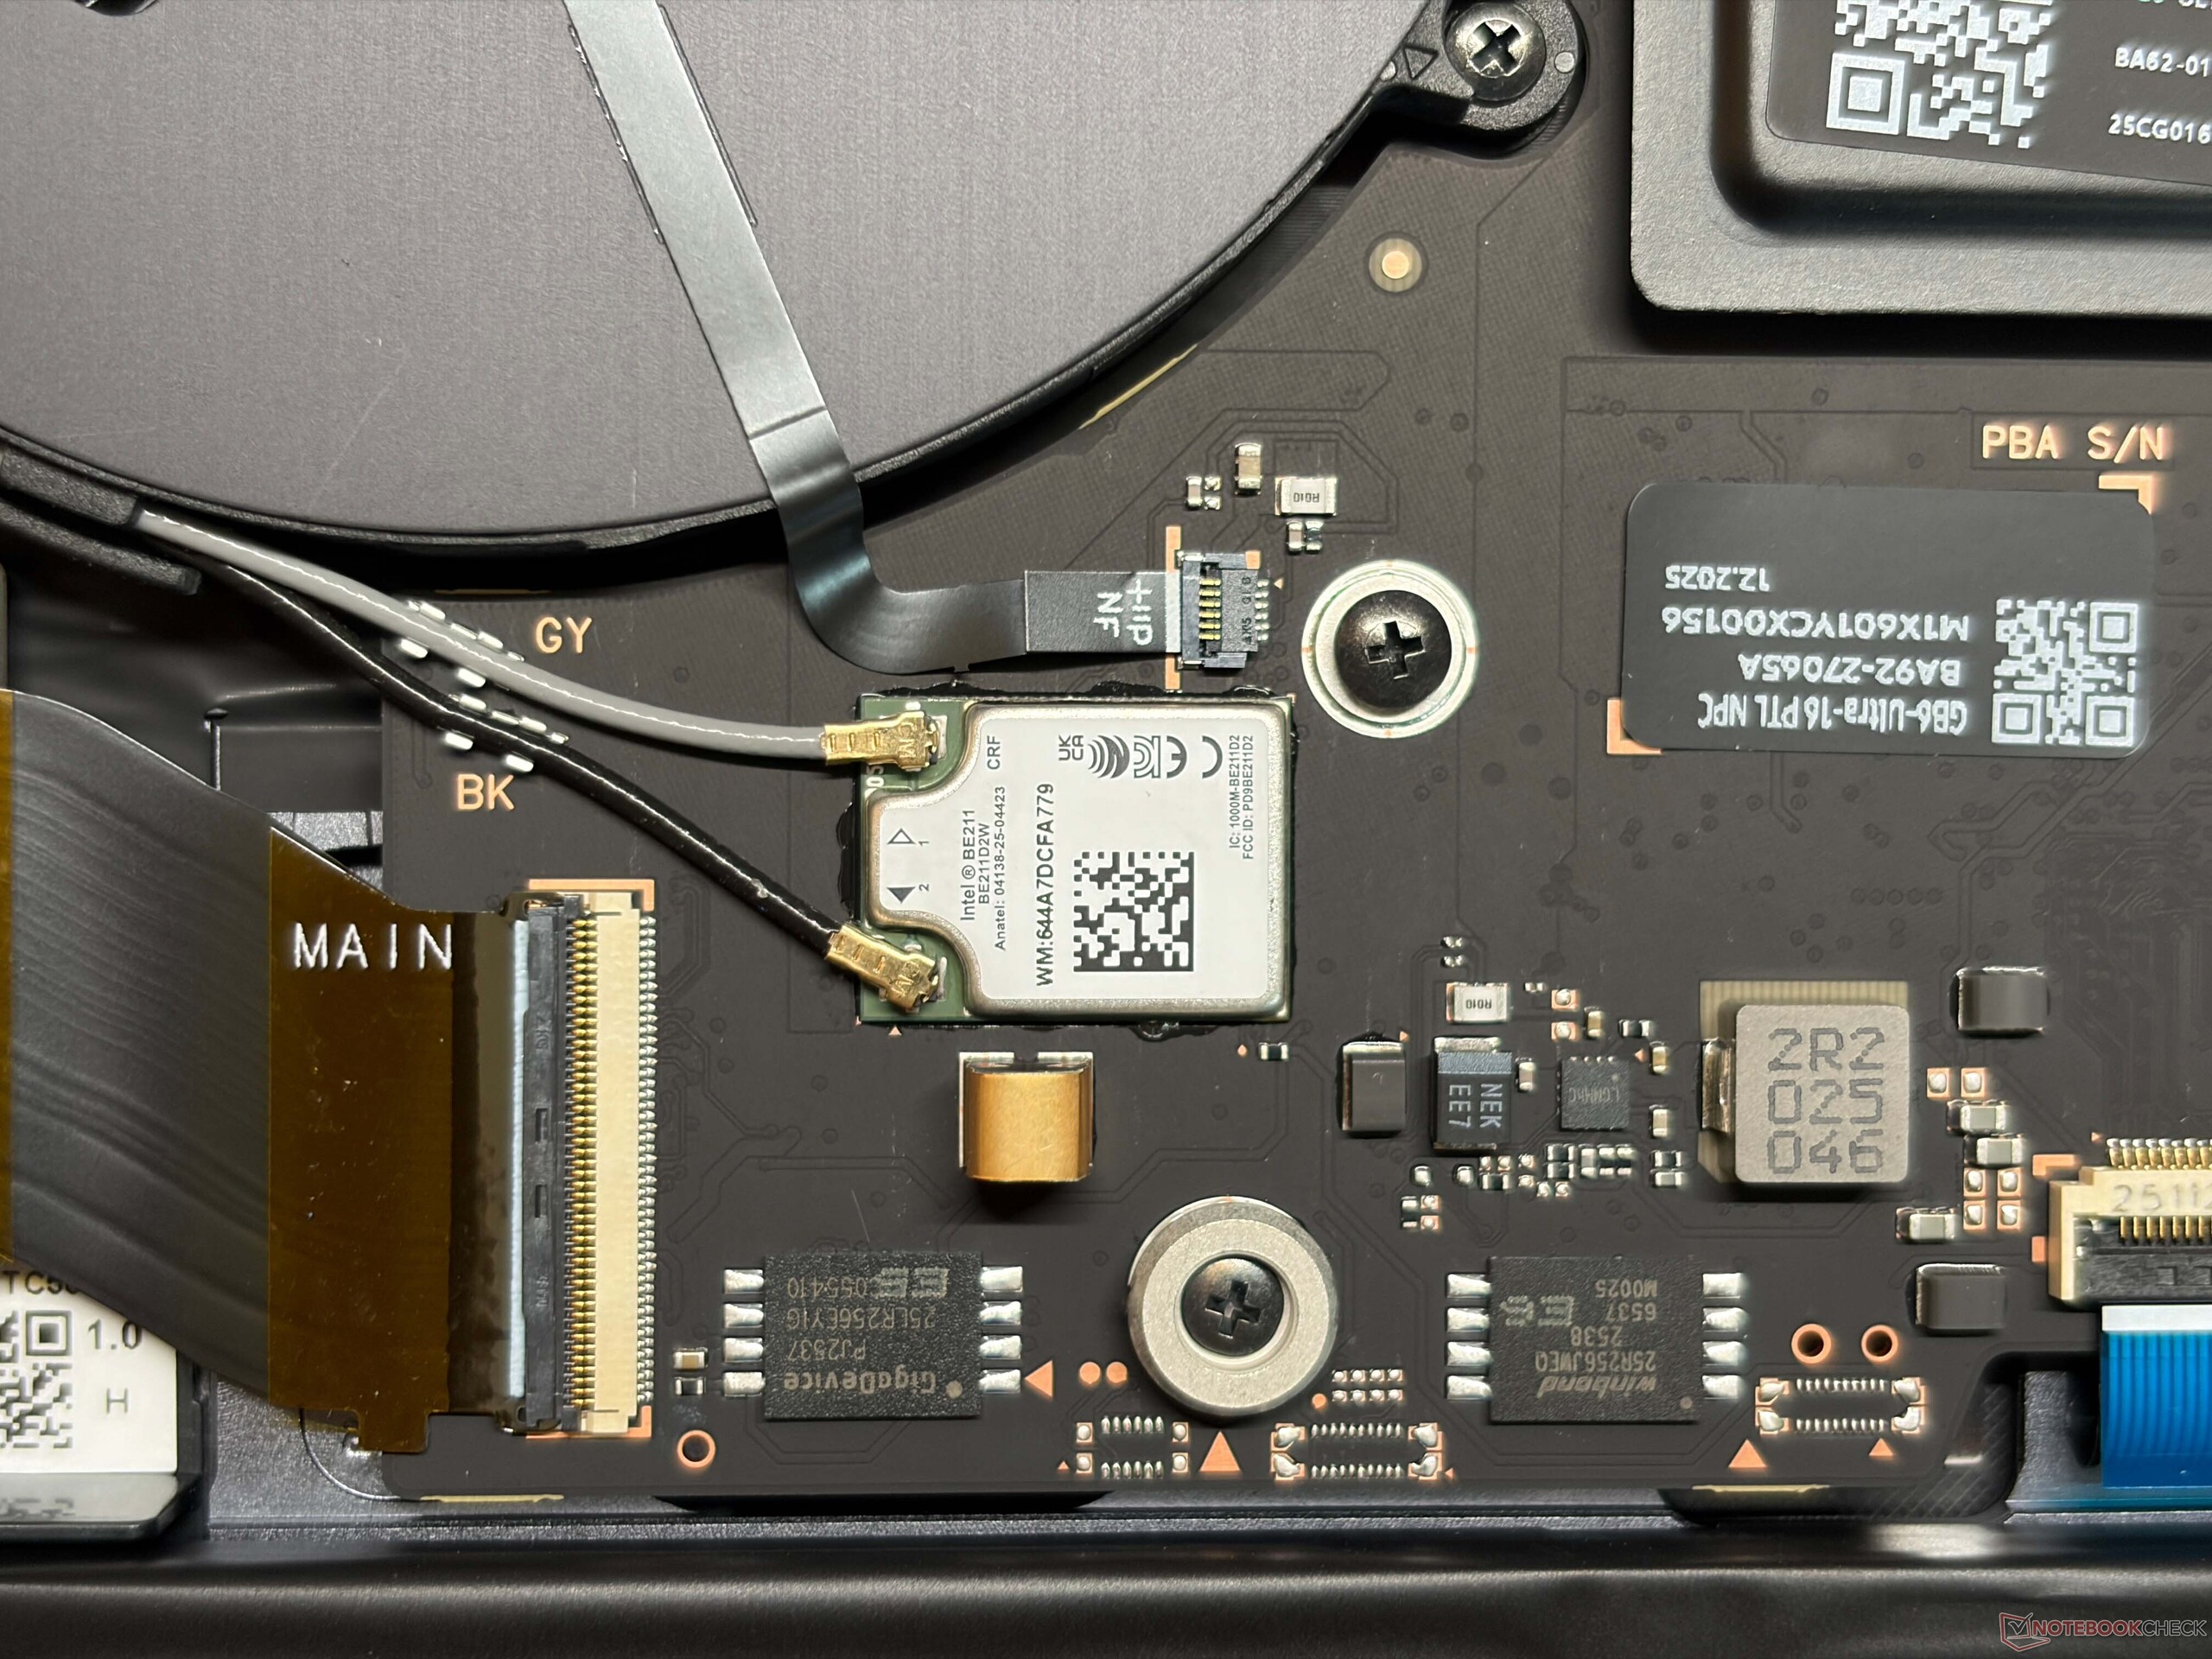
The port situation is limited with two USB-C ports and one USB-A port. One of the USB-C ports is also occupied by the power adapter, so the number of usable ports is limited. The SD-card reader is pretty slow at around 80-90 MB/s and does not support the SD-Express. You get a modern Wi-Fi 7 module with Bluetooth 5.4 and the transfer rates are good. The 1080p cam takes average pictures and also supports facial recognition, but there is no shutter.


| SD Card Reader | |
| average JPG Copy Test (av. of 3 runs) | |
| Lenovo ThinkPad T1g Gen 8 21TD003GE (ADATA SD8.0 Express 512 GBAV Pro V60) | |
| Lenovo ThinkPad T1g Gen 8 21TD003GE (Angelbird AV Pro V60) | |
| Asus ProArt P16 H7606WP (Angelbird AV Pro V60) | |
| Apple MacBook Pro 16 2024 M4 Pro (Angelbird AV Pro V60) | |
| Average of class Multimedia (23 - 531, n=41, last 2 years) | |
| Lenovo Yoga Pro 9i 16 RTX 5070 (Angelbird AV Pro V60) | |
| Samsung Galaxy Book6 Ultra (Angelbird AV Pro V60) | |
| maximum AS SSD Seq Read Test (1GB) | |
| Lenovo ThinkPad T1g Gen 8 21TD003GE (ADATA SD8.0 Express 512 GB) | |
| Lenovo ThinkPad T1g Gen 8 21TD003GE (Angelbird AV Pro V60) | |
| Asus ProArt P16 H7606WP (Angelbird AV Pro V60) | |
| Apple MacBook Pro 16 2024 M4 Pro (Angelbird AV Pro V60) | |
| Average of class Multimedia (37.3 - 1455, n=40, last 2 years) | |
| Lenovo Yoga Pro 9i 16 RTX 5070 (Angelbird AV Pro V60) | |
| Samsung Galaxy Book6 Ultra (Angelbird AV Pro V60) | |
| Networking | |
| Samsung Galaxy Book6 Ultra | |
| iperf3 transmit AXE11000 | |
| iperf3 receive AXE11000 | |
| Apple MacBook Pro 16 2024 M4 Pro | |
| iperf3 transmit AXE11000 | |
| iperf3 receive AXE11000 | |
| Lenovo Yoga Pro 9i 16 RTX 5070 | |
| iperf3 transmit AXE11000 | |
| iperf3 receive AXE11000 | |
| Dell 16 Premium DA16250 | |
| iperf3 transmit AXE11000 | |
| iperf3 receive AXE11000 | |
| iperf3 transmit AXE11000 6GHz | |
| iperf3 receive AXE11000 6GHz | |
| Lenovo ThinkPad T1g Gen 8 21TD003GE | |
| iperf3 transmit AXE11000 | |
| iperf3 receive AXE11000 | |
| Asus ProArt P16 H7606WP | |
| iperf3 transmit AXE11000 | |
| iperf3 receive AXE11000 | |


Input Devices
Samsung also tried to copy the keyboard of the MacBook Pro and got rid of the numpad from the previous model. The key travel is quite shallow and the typing experience between Samsung and Apple is actually very similar and good overall, but there are more comfortable keyboards out there like on the Asus ProArt P16 or the Lenovo Yoga Pro 9i 16. The haptic touchpad works very well and you can also use the capacitive touchscreen for inputs.


Display - New OLED touchscreen

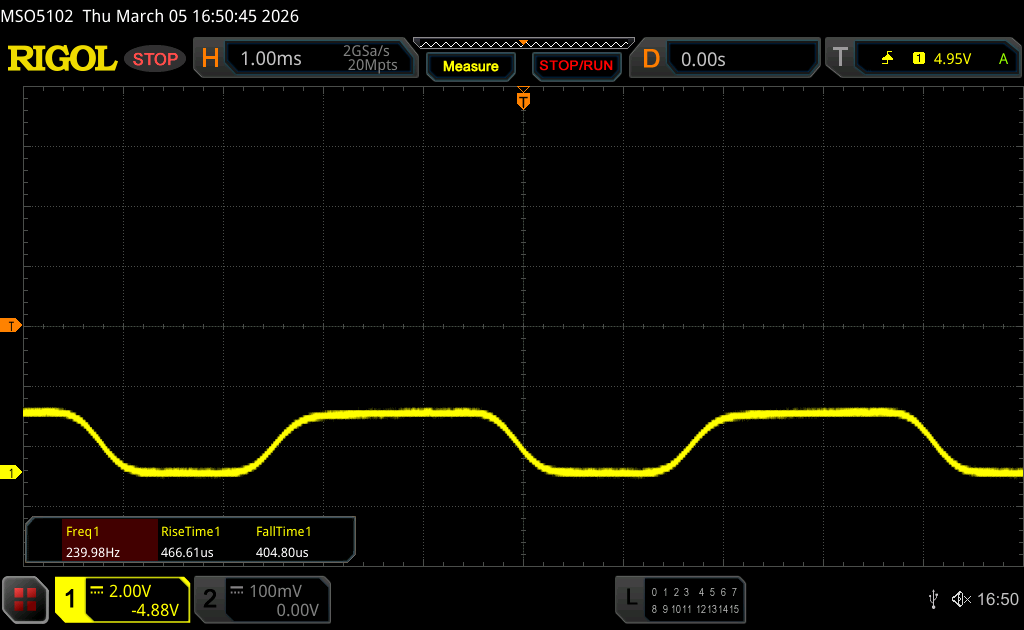
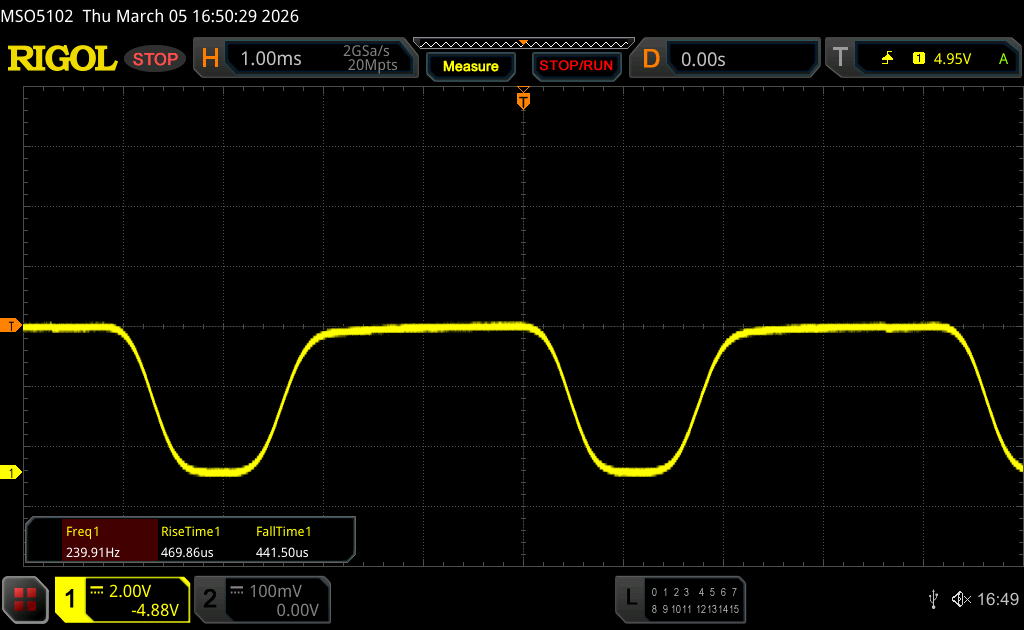
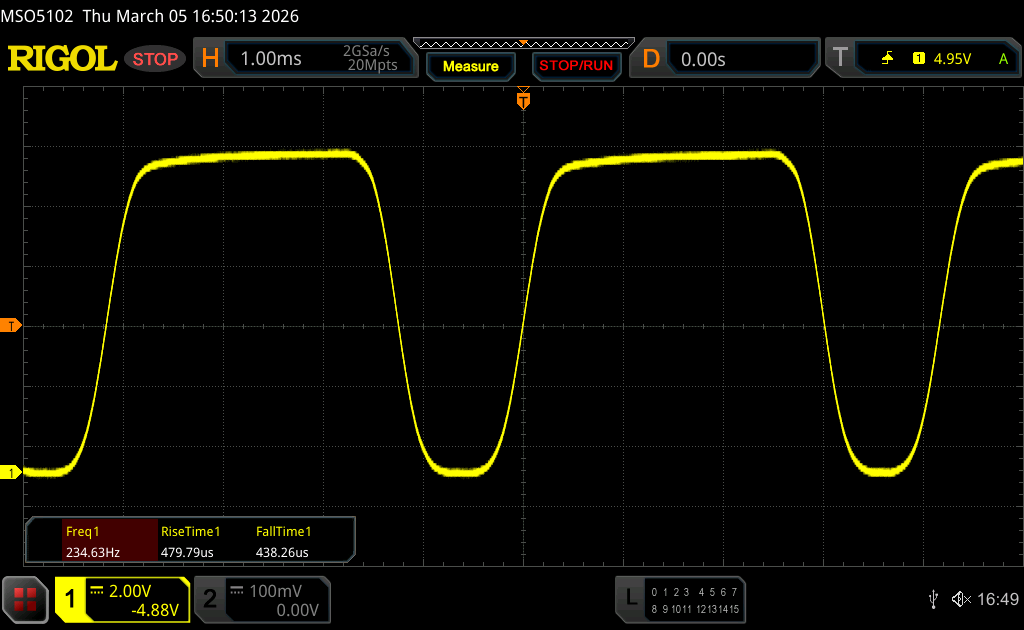
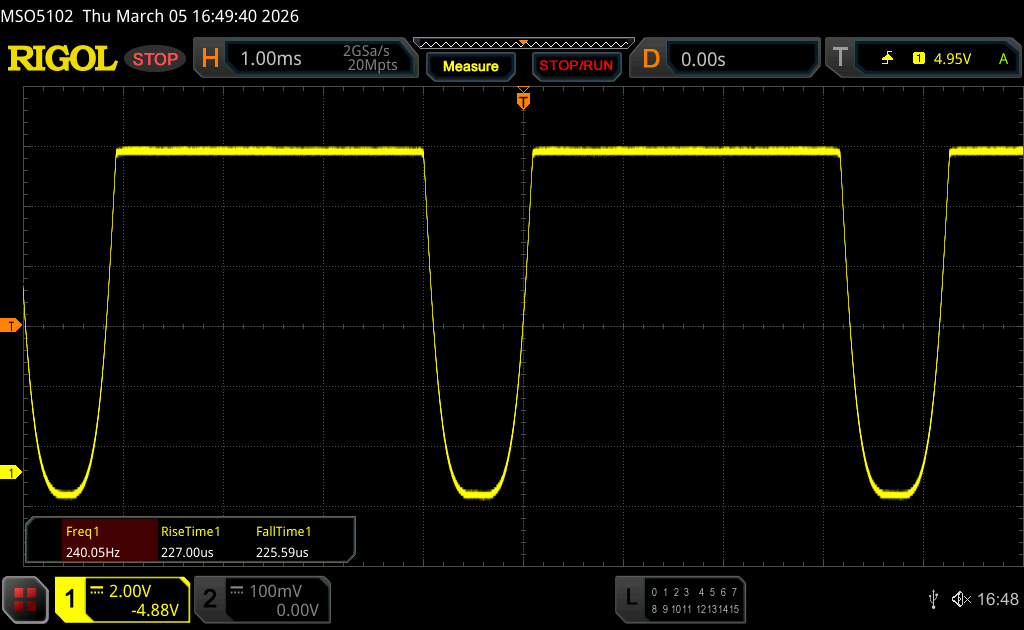
Samsung uses a new OLED touchscreen (2880 x 1800 pixels) for the Galaxy Book6 Ultra and the subjective image quality is excellent with deep blacks, rich colors, smooth movements thanks to 120 Hz (adaptive between 30-120 Hz) and bright contents are not affected by the touch layer, either. Response times are quick, but we can measure PWM flickering at 240 Hz for every brightness level with a pretty big amplitude, so sensitive users should try the panel first.
The brightness was improved as well and we now measure around 500 nits for SDR and up to 1182 nits for HDR contents (645 nits for a completely white image). This is an improvement, but not quite up there with tandem OLED screens or the Mini-LED screen of the MacBook. Samsung includes multiple color profiles including P3 as well as sRGB. Our analysis with the professional CalMAN software shows that the color accuracy is very good and our own calibration did not improve the image quality further. The Galaxy Book6 Ultra is therefore very well-suited for picture editing.
| |||||||||||||||||||||||||
Brightness Distribution: 97 %
Center on Battery: 499 cd/m²
Contrast: ∞:1 (Black: 0 cd/m²)
ΔE ColorChecker Calman: 0.9 | ∀{0.5-29.43 Ø4.71}
ΔE Greyscale Calman: 1.6 | ∀{0.09-98 Ø4.96}
85.3% AdobeRGB 1998 (Argyll 3D)
99.9% sRGB (Argyll 3D)
97% Display P3 (Argyll 3D)
Gamma: 2.22
CCT: 6445 K
| Samsung Galaxy Book6 Ultra ATNA60HR05-0, OLED, 2880x1800, 16", 120 Hz | Apple MacBook Pro 16 2024 M4 Pro Mini-LED, 3456x2234, 16.2", 120 Hz | Lenovo Yoga Pro 9i 16 RTX 5070 ATNA60KA01-0, OLED, 3200x2000, 16", 120 Hz | Asus ProArt P16 RTX 5090 ATNA60HC03-0, OLED, 3840x2400, 16", 120 Hz | Dell 16 Premium DA16250 Samsung 163DU02, OLED, 3840x2400, 16.3", 120 Hz | Lenovo ThinkPad T1g Gen 8 21TD003GE ATNA60KA02-0, Tandem-OLED, 3200x2000, 16", 120 Hz | |
|---|---|---|---|---|---|---|
| Display | 2% | 4% | 2% | 2% | 2% | |
| Display P3 Coverage (%) | 97 | 99.7 3% | 97.4 0% | 98.9 2% | 99.7 3% | 98.8 2% |
| sRGB Coverage (%) | 99.9 | 100 0% | 100 0% | 100 0% | 100 0% | 100 0% |
| AdobeRGB 1998 Coverage (%) | 85.3 | 88.8 4% | 96.8 13% | 88.6 4% | 88.1 3% | 88.9 4% |
| Response Times | -6230% | 44% | 30% | -26% | 40% | |
| Response Time Grey 50% / Grey 80% * (ms) | 0.5 ? | 43 ? -8500% | 0.27 ? 46% | 0.3 ? 40% | 0.61 ? -22% | 0.26 ? 48% |
| Response Time Black / White * (ms) | 0.4 ? | 41.2 ? -10200% | 0.37 ? 7% | 0.45 ? -13% | 0.88 ? -120% | 0.42 ? -5% |
| PWM Frequency (Hz) | 240 ? | 14880 | 1200 | 480 ? | 490.8 ? | 1200 ? |
| PWM Amplitude * (%) | 100 | 90 10% | 22 78% | 38 62% | 35 65% | 22 78% |
| Screen | 29% | 38% | 34% | -19% | -37% | |
| Brightness middle (cd/m²) | 499 | 632 27% | 974 95% | 661 32% | 385.7 -23% | 578 16% |
| Brightness (cd/m²) | 505 | 616 22% | 979 94% | 663 31% | 387 -23% | 583 15% |
| Brightness Distribution (%) | 97 | 95 -2% | 98 1% | 99 2% | 98 1% | 98 1% |
| Black Level * (cd/m²) | ||||||
| Colorchecker dE 2000 * | 0.9 | 0.6 33% | 0.9 -0% | 0.5 44% | 1.36 -51% | 1.6 -78% |
| Colorchecker dE 2000 max. * | 2.1 | 1.2 43% | 1.7 19% | 1.4 33% | 2.85 -36% | 4.5 -114% |
| Greyscale dE 2000 * | 1.6 | 0.8 50% | 1.3 19% | 0.6 63% | 1.3 19% | 2.6 -63% |
| Gamma | 2.22 99% | 2.21 100% | 2.21 100% | 2.19 100% | 2.2 100% | 2.19 100% |
| CCT | 6445 101% | 6450 101% | 6751 96% | 6565 99% | 6282 103% | 6527 100% |
| Colorchecker dE 2000 calibrated * | 0.65 | |||||
| Total Average (Program / Settings) | -2066% /
-1543% | 29% /
31% | 22% /
25% | -14% /
-15% | 2% /
-8% |
* ... smaller is better


Display Response Times
| ↔ Response Time Black to White | ||
|---|---|---|
| 0.4 ms ... rise ↗ and fall ↘ combined | ↗ 0.2 ms rise | 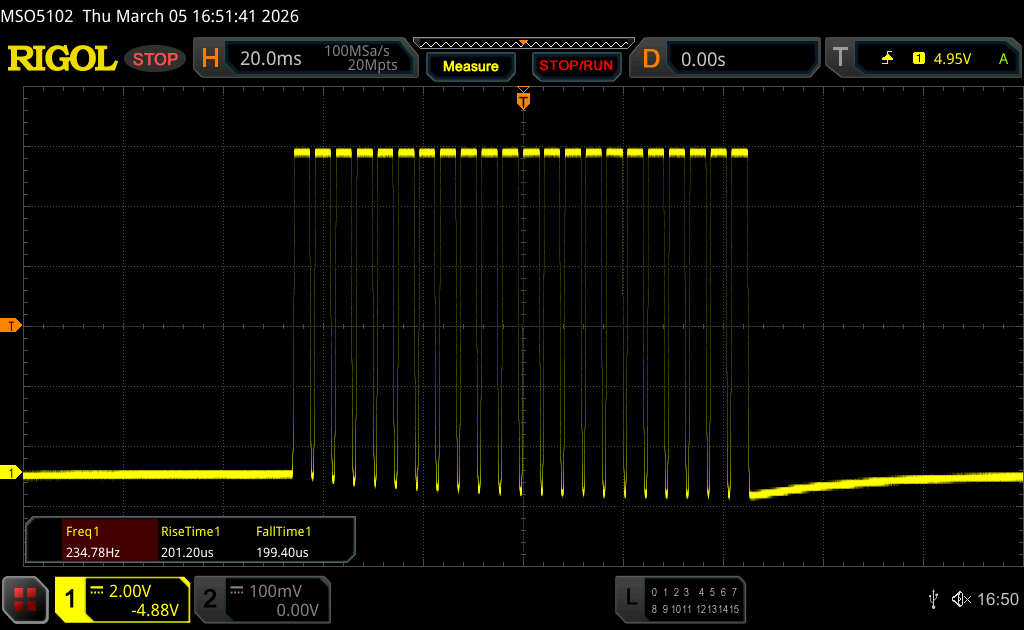 |
| ↘ 0.2 ms fall | ||
| The screen shows very fast response rates in our tests and should be very well suited for fast-paced gaming. In comparison, all tested devices range from 0.1 (minimum) to 240 (maximum) ms. » 0 % of all devices are better. This means that the measured response time is better than the average of all tested devices (19.8 ms). | ||
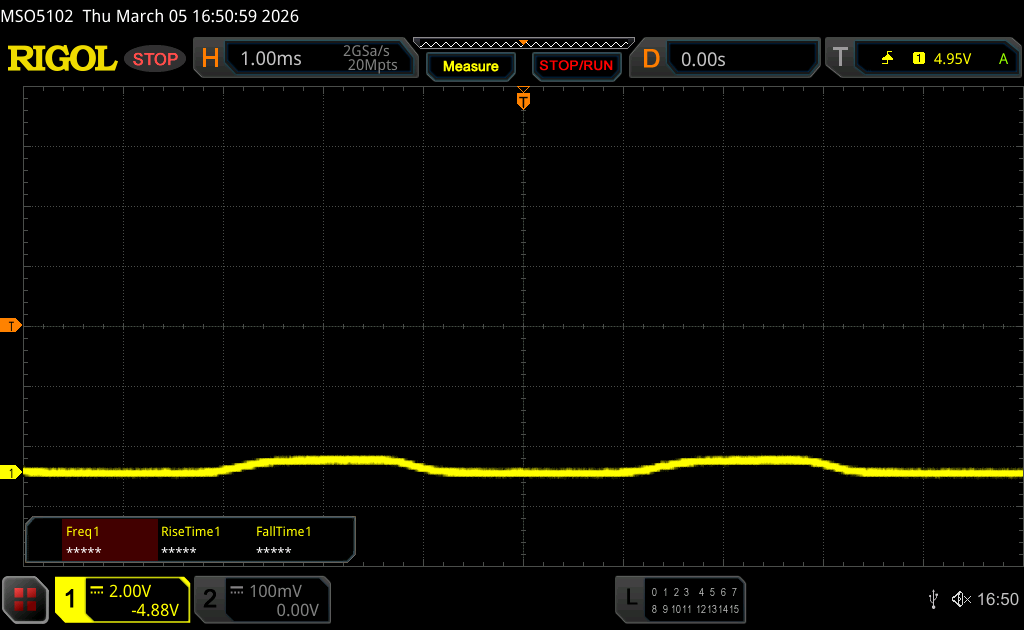
| ↔ Response Time 50% Grey to 80% Grey | ||
| 0.5 ms ... rise ↗ and fall ↘ combined | ↗ 0.25 ms rise | 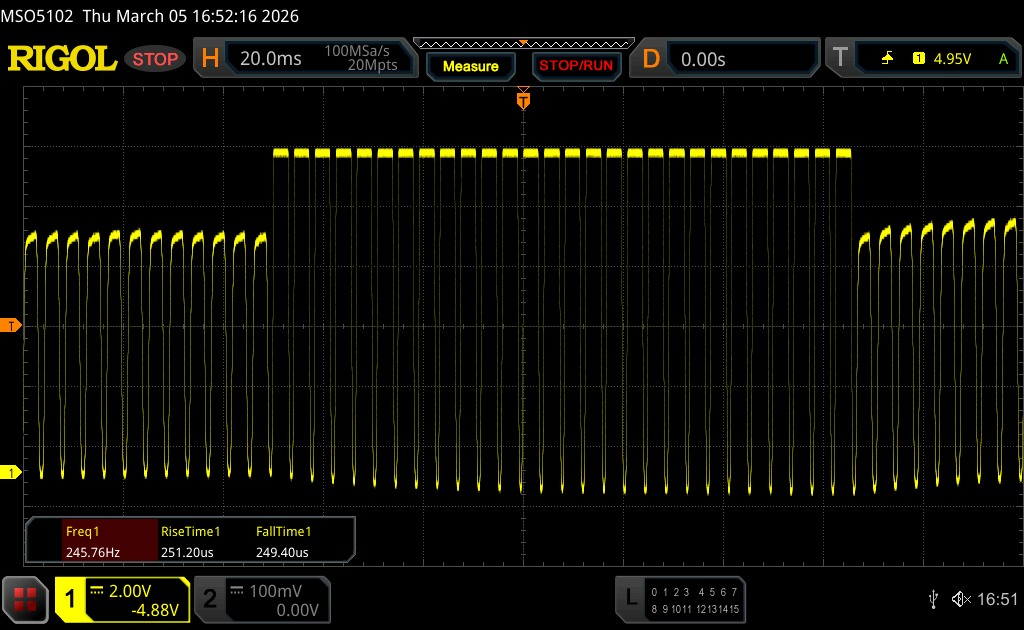 |
| ↘ 0.25 ms fall | ||
| The screen shows very fast response rates in our tests and should be very well suited for fast-paced gaming. In comparison, all tested devices range from 0.165 (minimum) to 636 (maximum) ms. » 1 % of all devices are better. This means that the measured response time is better than the average of all tested devices (31 ms). | ||
Screen Flickering / PWM (Pulse-Width Modulation)
| Screen flickering / PWM detected | 240 Hz Amplitude: 100 % | ≤ 100 % brightness setting | 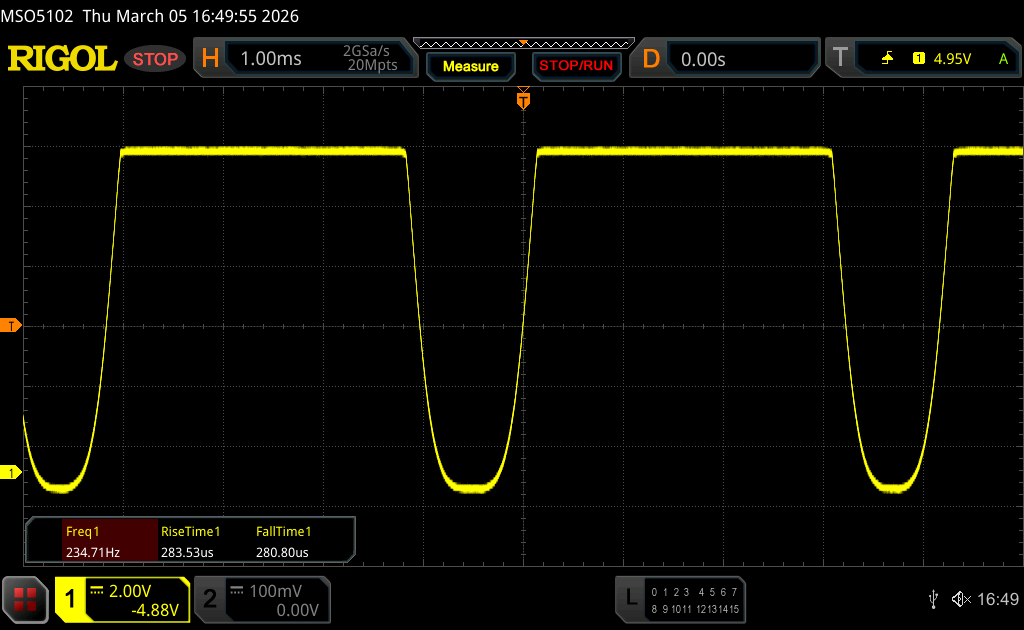 |
The display backlight flickers at 240 Hz (worst case, e.g., utilizing PWM) Flickering detected at a brightness setting of 100 % and below. There should be no flickering or PWM above this brightness setting. The frequency of 240 Hz is relatively low, so sensitive users will likely notice flickering and experience eyestrain at the stated brightness setting and below. In comparison: 52 % of all tested devices do not use PWM to dim the display. If PWM was detected, an average of 7747 (minimum: 5 - maximum: 343500) Hz was measured. | |||


Performance - Panther Lake meets Blackwell
Testing Conditions
Samsung includes multiple power profiles and they are synced with the Windows settings. We performed our benchmarks in the High Performance mode.
| Profile | TDP (Watts) | CB R24 Multi (points) | TGP (Watts) | Time Sy Graphics (Points) | Cyberpunk 2077 QHD Ultra (FPS) | max. fan noise(dB(A)) |
|---|---|---|---|---|---|---|
| Quiet | 45/30 | 916 | 22 | 3054 | 14.4 | 33.7 |
| Optimized | 65/45/35 | 1002 | 60 | 9149 | 47.2 | 40.3 |
| High Performance | 65 | 1232 | 90 | 12027 | 57.4 | 48.5 |
| Battery | 65/50 | 1173 | 70 | 10258 | 49.7 | 48.2 |
Processor
Our review unit is equipped with the Core Ultra 7 356H (Panther Lake), which offers 16 cores and a maximum clock of 4.7 GHz. It is almost identical to the Core Ultra X7 (up to 4.8 GHz), but does not include the fast Arc B390 GPU. The CPU performance with the power limit of 65 Watts is good and stable. All the Windows devices are pretty close here, only the MacBook Pro with the M4 Pro is clearly superior both in multi-core as and especially single-core scenarios and the upcoming M5 Pro model will most likely increase the gap even further.
Cinebench R15 Multi Loop
Cinebench 2024: CPU Multi Core | CPU Single Core
Cinebench R23: Multi Core | Single Core
Cinebench R20: CPU (Multi Core) | CPU (Single Core)
Cinebench R15: CPU Multi 64Bit | CPU Single 64Bit
Blender: v2.79 BMW27 CPU
7-Zip 18.03: 7z b 4 | 7z b 4 -mmt1
Geekbench 6.7: Multi-Core | Single-Core
Geekbench 5.5: Multi-Core | Single-Core
HWBOT x265 Benchmark v2.2: 4k Preset
LibreOffice : 20 Documents To PDF
R Benchmark 2.5: Overall mean
| CPU Performance rating | |
| Apple MacBook Pro 16 M4 Max -8! | |
| Apple MacBook Pro 16 2024 M4 Pro -12! | |
| Lenovo Yoga Pro 9i 16 RTX 5070 | |
| Lenovo ThinkPad T1g Gen 8 21TD003GE | |
| Asus ProArt P16 RTX 5090 | |
| Samsung Galaxy Book6 Ultra | |
| Dell 16 Premium DA16250 | |
| Average Intel Core Ultra 7 356H | |
| Average of class Multimedia | |
| Cinebench 2024 / CPU Multi Core | |
| Apple MacBook Pro 16 M4 Max | |
| Apple MacBook Pro 16 M4 Max | |
| Apple MacBook Pro 16 2024 M4 Pro | |
| Asus ProArt P16 RTX 5090 | |
| Samsung Galaxy Book6 Ultra | |
| Lenovo Yoga Pro 9i 16 RTX 5070 | |
| Average Intel Core Ultra 7 356H (1006 - 1232, n=3) | |
| Lenovo ThinkPad T1g Gen 8 21TD003GE | |
| Dell 16 Premium DA16250 | |
| Average of class Multimedia (327 - 2437, n=76, last 2 years) | |
| Cinebench 2024 / CPU Single Core | |
| Apple MacBook Pro 16 2024 M4 Pro | |
| Apple MacBook Pro 16 M4 Max | |
| Average of class Multimedia (72.5 - 201, n=60, last 2 years) | |
| Lenovo Yoga Pro 9i 16 RTX 5070 | |
| Lenovo ThinkPad T1g Gen 8 21TD003GE | |
| Samsung Galaxy Book6 Ultra | |
| Dell 16 Premium DA16250 | |
| Average Intel Core Ultra 7 356H (116 - 122.4, n=3) | |
| Asus ProArt P16 RTX 5090 | |
| Cinebench R23 / Multi Core | |
| Apple MacBook Pro 16 M4 Max | |
| Asus ProArt P16 RTX 5090 | |
| Lenovo Yoga Pro 9i 16 RTX 5070 | |
| Apple MacBook Pro 16 2024 M4 Pro | |
| Lenovo ThinkPad T1g Gen 8 21TD003GE | |
| Dell 16 Premium DA16250 | |
| Samsung Galaxy Book6 Ultra | |
| Average Intel Core Ultra 7 356H (18395 - 20650, n=2) | |
| Average of class Multimedia (4861 - 33362, n=77, last 2 years) | |
| Cinebench R23 / Single Core | |
| Apple MacBook Pro 16 2024 M4 Pro | |
| Apple MacBook Pro 16 M4 Max | |
| Lenovo Yoga Pro 9i 16 RTX 5070 | |
| Lenovo ThinkPad T1g Gen 8 21TD003GE | |
| Samsung Galaxy Book6 Ultra | |
| Average Intel Core Ultra 7 356H (2040 - 2045, n=2) | |
| Asus ProArt P16 RTX 5090 | |
| Average of class Multimedia (1128 - 2459, n=69, last 2 years) | |
| Dell 16 Premium DA16250 | |
| Cinebench R20 / CPU (Multi Core) | |
| Asus ProArt P16 RTX 5090 | |
| Lenovo Yoga Pro 9i 16 RTX 5070 | |
| Lenovo ThinkPad T1g Gen 8 21TD003GE | |
| Dell 16 Premium DA16250 | |
| Samsung Galaxy Book6 Ultra | |
| Average Intel Core Ultra 7 356H (7180 - 8074, n=2) | |
| Apple MacBook Pro 16 M4 Max | |
| Average of class Multimedia (1887 - 12912, n=60, last 2 years) | |
| Cinebench R20 / CPU (Single Core) | |
| Lenovo Yoga Pro 9i 16 RTX 5070 | |
| Lenovo ThinkPad T1g Gen 8 21TD003GE | |
| Asus ProArt P16 RTX 5090 | |
| Average Intel Core Ultra 7 356H (773 - 774, n=2) | |
| Samsung Galaxy Book6 Ultra | |
| Dell 16 Premium DA16250 | |
| Average of class Multimedia (425 - 853, n=60, last 2 years) | |
| Apple MacBook Pro 16 M4 Max | |
| Cinebench R15 / CPU Multi 64Bit | |
| Apple MacBook Pro 16 M4 Max | |
| Asus ProArt P16 RTX 5090 | |
| Lenovo Yoga Pro 9i 16 RTX 5070 | |
| Lenovo ThinkPad T1g Gen 8 21TD003GE | |
| Dell 16 Premium DA16250 | |
| Samsung Galaxy Book6 Ultra | |
| Average Intel Core Ultra 7 356H (2937 - 3201, n=2) | |
| Average of class Multimedia (856 - 5224, n=64, last 2 years) | |
| Cinebench R15 / CPU Single 64Bit | |
| Lenovo Yoga Pro 9i 16 RTX 5070 | |
| Lenovo ThinkPad T1g Gen 8 21TD003GE | |
| Apple MacBook Pro 16 M4 Max | |
| Samsung Galaxy Book6 Ultra | |
| Average Intel Core Ultra 7 356H (303 - 306, n=2) | |
| Dell 16 Premium DA16250 | |
| Average of class Multimedia (184.8 - 326, n=62, last 2 years) | |
| Asus ProArt P16 RTX 5090 | |
| Blender / v2.79 BMW27 CPU | |
| Average of class Multimedia (100 - 557, n=61, last 2 years) | |
| Average Intel Core Ultra 7 356H (163 - 196, n=2) | |
| Dell 16 Premium DA16250 | |
| Samsung Galaxy Book6 Ultra | |
| Lenovo ThinkPad T1g Gen 8 21TD003GE | |
| Lenovo Yoga Pro 9i 16 RTX 5070 | |
| Asus ProArt P16 RTX 5090 | |
| 7-Zip 18.03 / 7z b 4 | |
| Asus ProArt P16 RTX 5090 | |
| Lenovo Yoga Pro 9i 16 RTX 5070 | |
| Samsung Galaxy Book6 Ultra | |
| Lenovo ThinkPad T1g Gen 8 21TD003GE | |
| Dell 16 Premium DA16250 | |
| Average Intel Core Ultra 7 356H (65579 - 69785, n=2) | |
| Average of class Multimedia (26062 - 130368, n=58, last 2 years) | |
| 7-Zip 18.03 / 7z b 4 -mmt1 | |
| Average Intel Core Ultra 7 356H (6305 - 6375, n=2) | |
| Samsung Galaxy Book6 Ultra | |
| Lenovo Yoga Pro 9i 16 RTX 5070 | |
| Asus ProArt P16 RTX 5090 | |
| Lenovo ThinkPad T1g Gen 8 21TD003GE | |
| Average of class Multimedia (3666 - 7545, n=59, last 2 years) | |
| Dell 16 Premium DA16250 | |
| Geekbench 6.7 / Multi-Core | |
| Apple MacBook Pro 16 M4 Max | |
| Apple MacBook Pro 16 2024 M4 Pro | |
| Lenovo Yoga Pro 9i 16 RTX 5070 | |
| Lenovo ThinkPad T1g Gen 8 21TD003GE | |
| Dell 16 Premium DA16250 | |
| Samsung Galaxy Book6 Ultra | |
| Average Intel Core Ultra 7 356H (15578 - 16676, n=3) | |
| Asus ProArt P16 RTX 5090 | |
| Average of class Multimedia (4983 - 29415, n=72, last 2 years) | |
| Geekbench 6.7 / Single-Core | |
| Apple MacBook Pro 16 M4 Max | |
| Apple MacBook Pro 16 2024 M4 Pro | |
| Lenovo Yoga Pro 9i 16 RTX 5070 | |
| Lenovo ThinkPad T1g Gen 8 21TD003GE | |
| Asus ProArt P16 RTX 5090 | |
| Average of class Multimedia (1534 - 4335, n=71, last 2 years) | |
| Samsung Galaxy Book6 Ultra | |
| Dell 16 Premium DA16250 | |
| Average Intel Core Ultra 7 356H (2532 - 2851, n=3) | |
| Geekbench 5.5 / Multi-Core | |
| Lenovo Yoga Pro 9i 16 RTX 5070 | |
| Lenovo ThinkPad T1g Gen 8 21TD003GE | |
| Samsung Galaxy Book6 Ultra | |
| Average Intel Core Ultra 7 356H (16721 - 16761, n=2) | |
| Dell 16 Premium DA16250 | |
| Asus ProArt P16 RTX 5090 | |
| Average of class Multimedia (4652 - 20422, n=59, last 2 years) | |
| Geekbench 5.5 / Single-Core | |
| Asus ProArt P16 RTX 5090 | |
| Lenovo Yoga Pro 9i 16 RTX 5070 | |
| Lenovo ThinkPad T1g Gen 8 21TD003GE | |
| Average Intel Core Ultra 7 356H (2086 - 2098, n=2) | |
| Samsung Galaxy Book6 Ultra | |
| Average of class Multimedia (805 - 2974, n=59, last 2 years) | |
| Dell 16 Premium DA16250 | |
| HWBOT x265 Benchmark v2.2 / 4k Preset | |
| Asus ProArt P16 RTX 5090 | |
| Lenovo Yoga Pro 9i 16 RTX 5070 | |
| Lenovo ThinkPad T1g Gen 8 21TD003GE | |
| Samsung Galaxy Book6 Ultra | |
| Dell 16 Premium DA16250 | |
| Average Intel Core Ultra 7 356H (20 - 25.1, n=2) | |
| Average of class Multimedia (5.26 - 36.1, n=59, last 2 years) | |
| LibreOffice / 20 Documents To PDF | |
| Average Intel Core Ultra 7 356H (47.3 - 57.8, n=2) | |
| Average of class Multimedia (23.9 - 146.7, n=60, last 2 years) | |
| Asus ProArt P16 RTX 5090 | |
| Samsung Galaxy Book6 Ultra | |
| Lenovo Yoga Pro 9i 16 RTX 5070 | |
| Dell 16 Premium DA16250 | |
| Lenovo ThinkPad T1g Gen 8 21TD003GE | |
| R Benchmark 2.5 / Overall mean | |
| Average of class Multimedia (0.3604 - 0.947, n=59, last 2 years) | |
| Dell 16 Premium DA16250 | |
| Average Intel Core Ultra 7 356H (0.4268 - 0.459, n=2) | |
| Samsung Galaxy Book6 Ultra | |
| Lenovo ThinkPad T1g Gen 8 21TD003GE | |
| Asus ProArt P16 RTX 5090 | |
| Lenovo Yoga Pro 9i 16 RTX 5070 | |
* ... smaller is better
AIDA64: FP32 Ray-Trace | FPU Julia | CPU SHA3 | CPU Queen | FPU SinJulia | FPU Mandel | CPU AES | CPU ZLib | FP64 Ray-Trace | CPU PhotoWorxx | CPU CheckMate
| Performance rating | |
| Asus ProArt P16 RTX 5090 -1! | |
| Lenovo Yoga Pro 9i 16 RTX 5070 -1! | |
| Lenovo ThinkPad T1g Gen 8 21TD003GE -1! | |
| Samsung Galaxy Book6 Ultra -1! | |
| Average Intel Core Ultra 7 356H -1! | |
| Average of class Multimedia | |
| AIDA64 / FP32 Ray-Trace | |
| Asus ProArt P16 RTX 5090 (v6.92.6600) | |
| Lenovo Yoga Pro 9i 16 RTX 5070 (v6.92.6600) | |
| Lenovo ThinkPad T1g Gen 8 21TD003GE (v6.92.6600) | |
| Samsung Galaxy Book6 Ultra (v8.20.8100) | |
| Average Intel Core Ultra 7 356H (16303 - 20528, n=2) | |
| Average of class Multimedia (2214 - 50388, n=56, last 2 years) | |
| AIDA64 / FPU Julia | |
| Asus ProArt P16 RTX 5090 (v6.92.6600) | |
| Lenovo Yoga Pro 9i 16 RTX 5070 (v6.92.6600) | |
| Lenovo ThinkPad T1g Gen 8 21TD003GE (v6.92.6600) | |
| Samsung Galaxy Book6 Ultra (v8.20.8100) | |
| Average Intel Core Ultra 7 356H (81236 - 108092, n=2) | |
| Average of class Multimedia (12867 - 201874, n=57, last 2 years) | |
| AIDA64 / CPU SHA3 | |
| Lenovo Yoga Pro 9i 16 RTX 5070 (v6.92.6600) | |
| Lenovo ThinkPad T1g Gen 8 21TD003GE (v6.92.6600) | |
| Samsung Galaxy Book6 Ultra (v8.20.8100) | |
| Asus ProArt P16 RTX 5090 (v6.92.6600) | |
| Average Intel Core Ultra 7 356H (4141 - 5284, n=2) | |
| Average of class Multimedia (626 - 8623, n=57, last 2 years) | |
| AIDA64 / CPU Queen | |
| Asus ProArt P16 RTX 5090 (v6.92.6600) | |
| Average of class Multimedia (13483 - 181505, n=44, last 2 years) | |
| Lenovo ThinkPad T1g Gen 8 21TD003GE (v6.92.6600) | |
| Lenovo Yoga Pro 9i 16 RTX 5070 (v6.92.6600) | |
| AIDA64 / FPU SinJulia | |
| Asus ProArt P16 RTX 5090 (v6.92.6600) | |
| Lenovo Yoga Pro 9i 16 RTX 5070 (v6.92.6600) | |
| Lenovo ThinkPad T1g Gen 8 21TD003GE (v6.92.6600) | |
| Average of class Multimedia (886 - 28794, n=57, last 2 years) | |
| Average Intel Core Ultra 7 356H (6960 - 6965, n=2) | |
| Samsung Galaxy Book6 Ultra (v8.20.8100) | |
| AIDA64 / FPU Mandel | |
| Asus ProArt P16 RTX 5090 (v6.92.6600) | |
| Lenovo Yoga Pro 9i 16 RTX 5070 (v6.92.6600) | |
| Lenovo ThinkPad T1g Gen 8 21TD003GE (v6.92.6600) | |
| Samsung Galaxy Book6 Ultra (v8.20.8100) | |
| Average Intel Core Ultra 7 356H (44538 - 58505, n=2) | |
| Average of class Multimedia (6395 - 105740, n=56, last 2 years) | |
| AIDA64 / CPU AES | |
| Asus ProArt P16 RTX 5090 (v6.92.6600) | |
| Lenovo Yoga Pro 9i 16 RTX 5070 (v6.92.6600) | |
| Lenovo ThinkPad T1g Gen 8 21TD003GE (v6.92.6600) | |
| Samsung Galaxy Book6 Ultra (v8.20.8100) | |
| Average Intel Core Ultra 7 356H (64920 - 67037, n=2) | |
| Average of class Multimedia (8171 - 126790, n=57, last 2 years) | |
| AIDA64 / CPU ZLib | |
| Asus ProArt P16 RTX 5090 (v6.92.6600) | |
| Lenovo Yoga Pro 9i 16 RTX 5070 (v6.92.6600) | |
| Lenovo ThinkPad T1g Gen 8 21TD003GE (v6.92.6600) | |
| Samsung Galaxy Book6 Ultra (v8.20.8100) | |
| Average Intel Core Ultra 7 356H (1086 - 1199, n=2) | |
| Average of class Multimedia (143.8 - 2022, n=57, last 2 years) | |
| AIDA64 / FP64 Ray-Trace | |
| Asus ProArt P16 RTX 5090 (v6.92.6600) | |
| Lenovo Yoga Pro 9i 16 RTX 5070 (v6.92.6600) | |
| Lenovo ThinkPad T1g Gen 8 21TD003GE (v6.92.6600) | |
| Samsung Galaxy Book6 Ultra (v8.20.8100) | |
| Average Intel Core Ultra 7 356H (8201 - 11057, n=2) | |
| Average of class Multimedia (1014 - 26875, n=57, last 2 years) | |
| AIDA64 / CPU PhotoWorxx | |
| Average Intel Core Ultra 7 356H (83099 - 83163, n=2) | |
| Samsung Galaxy Book6 Ultra (v8.20.8100) | |
| Lenovo Yoga Pro 9i 16 RTX 5070 (v6.92.6600) | |
| Lenovo ThinkPad T1g Gen 8 21TD003GE (v6.92.6600) | |
| Average of class Multimedia (8187 - 88154, n=57, last 2 years) | |
| Asus ProArt P16 RTX 5090 (v6.92.6600) | |
| AIDA64 / CPU CheckMate | |
| Samsung Galaxy Book6 Ultra (v8.20.8100) | |
| Average Intel Core Ultra 7 356H (4196 - 4629, n=2) | |
| Average of class Multimedia (569 - 4742, n=16, last 2 years) | |
System Performance
The subjective performance impression is excellent and the benchmark scores are very high. We did not encounter any stability issues during our review period.
PCMark 10: Score | Essentials | Productivity | Digital Content Creation
CrossMark: Overall | Productivity | Creativity | Responsiveness
WebXPRT 3: Overall
WebXPRT 4: Overall
Mozilla Kraken 1.1: Total
| Performance rating | |
| Apple MacBook Pro 16 2024 M4 Pro -4! | |
| Lenovo ThinkPad T1g Gen 8 21TD003GE | |
| Lenovo Yoga Pro 9i 16 RTX 5070 | |
| Samsung Galaxy Book6 Ultra | |
| Average Intel Core Ultra 7 356H, NVIDIA GeForce RTX 5070 Laptop | |
| Dell 16 Premium DA16250 -4! | |
| Average of class Multimedia | |
| Asus ProArt P16 RTX 5090 -4! | |
| PCMark 10 / Score | |
| Lenovo ThinkPad T1g Gen 8 21TD003GE | |
| Samsung Galaxy Book6 Ultra | |
| Average Intel Core Ultra 7 356H, NVIDIA GeForce RTX 5070 Laptop (n=1) | |
| Lenovo Yoga Pro 9i 16 RTX 5070 | |
| Average of class Multimedia (4325 - 10386, n=55, last 2 years) | |
| PCMark 10 / Essentials | |
| Lenovo Yoga Pro 9i 16 RTX 5070 | |
| Average of class Multimedia (8025 - 11664, n=54, last 2 years) | |
| Lenovo ThinkPad T1g Gen 8 21TD003GE | |
| Samsung Galaxy Book6 Ultra | |
| Average Intel Core Ultra 7 356H, NVIDIA GeForce RTX 5070 Laptop (n=1) | |
| PCMark 10 / Productivity | |
| Lenovo ThinkPad T1g Gen 8 21TD003GE | |
| Samsung Galaxy Book6 Ultra | |
| Average Intel Core Ultra 7 356H, NVIDIA GeForce RTX 5070 Laptop (n=1) | |
| Average of class Multimedia (7323 - 18233, n=54, last 2 years) | |
| Lenovo Yoga Pro 9i 16 RTX 5070 | |
| PCMark 10 / Digital Content Creation | |
| Lenovo Yoga Pro 9i 16 RTX 5070 | |
| Lenovo ThinkPad T1g Gen 8 21TD003GE | |
| Samsung Galaxy Book6 Ultra | |
| Average Intel Core Ultra 7 356H, NVIDIA GeForce RTX 5070 Laptop (n=1) | |
| Average of class Multimedia (3651 - 16240, n=54, last 2 years) | |
| CrossMark / Overall | |
| Lenovo ThinkPad T1g Gen 8 21TD003GE | |
| Apple MacBook Pro 16 2024 M4 Pro | |
| Lenovo Yoga Pro 9i 16 RTX 5070 | |
| Dell 16 Premium DA16250 | |
| Asus ProArt P16 RTX 5090 | |
| Samsung Galaxy Book6 Ultra | |
| Average Intel Core Ultra 7 356H, NVIDIA GeForce RTX 5070 Laptop (n=1) | |
| Average of class Multimedia (866 - 2728, n=63, last 2 years) | |
| CrossMark / Productivity | |
| Lenovo ThinkPad T1g Gen 8 21TD003GE | |
| Apple MacBook Pro 16 2024 M4 Pro | |
| Lenovo Yoga Pro 9i 16 RTX 5070 | |
| Dell 16 Premium DA16250 | |
| Asus ProArt P16 RTX 5090 | |
| Average of class Multimedia (931 - 2489, n=63, last 2 years) | |
| Samsung Galaxy Book6 Ultra | |
| Average Intel Core Ultra 7 356H, NVIDIA GeForce RTX 5070 Laptop (n=1) | |
| CrossMark / Creativity | |
| Apple MacBook Pro 16 2024 M4 Pro | |
| Lenovo ThinkPad T1g Gen 8 21TD003GE | |
| Lenovo Yoga Pro 9i 16 RTX 5070 | |
| Asus ProArt P16 RTX 5090 | |
| Samsung Galaxy Book6 Ultra | |
| Average Intel Core Ultra 7 356H, NVIDIA GeForce RTX 5070 Laptop (n=1) | |
| Dell 16 Premium DA16250 | |
| Average of class Multimedia (907 - 3465, n=63, last 2 years) | |
| CrossMark / Responsiveness | |
| Lenovo ThinkPad T1g Gen 8 21TD003GE | |
| Dell 16 Premium DA16250 | |
| Lenovo Yoga Pro 9i 16 RTX 5070 | |
| Apple MacBook Pro 16 2024 M4 Pro | |
| Samsung Galaxy Book6 Ultra | |
| Average Intel Core Ultra 7 356H, NVIDIA GeForce RTX 5070 Laptop (n=1) | |
| Average of class Multimedia (605 - 2024, n=63, last 2 years) | |
| Asus ProArt P16 RTX 5090 | |
| WebXPRT 3 / Overall | |
| Apple MacBook Pro 16 2024 M4 Pro | |
| Lenovo Yoga Pro 9i 16 RTX 5070 | |
| Average of class Multimedia (136.4 - 596, n=66, last 2 years) | |
| Dell 16 Premium DA16250 | |
| Lenovo ThinkPad T1g Gen 8 21TD003GE | |
| Samsung Galaxy Book6 Ultra | |
| Average Intel Core Ultra 7 356H, NVIDIA GeForce RTX 5070 Laptop (n=1) | |
| Asus ProArt P16 RTX 5090 | |
| WebXPRT 4 / Overall | |
| Apple MacBook Pro 16 2024 M4 Pro | |
| Lenovo Yoga Pro 9i 16 RTX 5070 | |
| Lenovo ThinkPad T1g Gen 8 21TD003GE | |
| Dell 16 Premium DA16250 | |
| Samsung Galaxy Book6 Ultra | |
| Average Intel Core Ultra 7 356H, NVIDIA GeForce RTX 5070 Laptop (n=1) | |
| Average of class Multimedia (167.3 - 402, n=68, last 2 years) | |
| Asus ProArt P16 RTX 5090 | |
| Mozilla Kraken 1.1 / Total | |
| Dell 16 Premium DA16250 | |
| Samsung Galaxy Book6 Ultra | |
| Average Intel Core Ultra 7 356H, NVIDIA GeForce RTX 5070 Laptop (n=1) | |
| Average of class Multimedia (228 - 835, n=69, last 2 years) | |
| Lenovo ThinkPad T1g Gen 8 21TD003GE | |
| Lenovo Yoga Pro 9i 16 RTX 5070 | |
| Asus ProArt P16 RTX 5090 | |
| Apple MacBook Pro 16 2024 M4 Pro | |
* ... smaller is better
| PCMark 10 Score | 9383 points | |
Help | ||
| AIDA64 / Memory Copy | |
| Average Intel Core Ultra 7 356H (116043 - 121055, n=2) | |
| Samsung Galaxy Book6 Ultra | |
| Lenovo Yoga Pro 9i 16 RTX 5070 | |
| Lenovo ThinkPad T1g Gen 8 21TD003GE | |
| Asus ProArt P16 RTX 5090 | |
| Average of class Multimedia (11299 - 132135, n=57, last 2 years) | |
| AIDA64 / Memory Read | |
| Average Intel Core Ultra 7 356H (107881 - 112376, n=2) | |
| Samsung Galaxy Book6 Ultra | |
| Asus ProArt P16 RTX 5090 | |
| Lenovo Yoga Pro 9i 16 RTX 5070 | |
| Average of class Multimedia (11624 - 174586, n=57, last 2 years) | |
| Lenovo ThinkPad T1g Gen 8 21TD003GE | |
| AIDA64 / Memory Write | |
| Average Intel Core Ultra 7 356H (120431 - 120449, n=2) | |
| Samsung Galaxy Book6 Ultra | |
| Asus ProArt P16 RTX 5090 | |
| Average of class Multimedia (11755 - 134998, n=57, last 2 years) | |
| Lenovo ThinkPad T1g Gen 8 21TD003GE | |
| Lenovo Yoga Pro 9i 16 RTX 5070 | |
| AIDA64 / Memory Latency | |
| Lenovo ThinkPad T1g Gen 8 21TD003GE | |
| Average of class Multimedia (7 - 535, n=56, last 2 years) | |
| Lenovo Yoga Pro 9i 16 RTX 5070 | |
| Asus ProArt P16 RTX 5090 | |
| Samsung Galaxy Book6 Ultra | |
| Average Intel Core Ultra 7 356H (88.6 - 90, n=2) | |
* ... smaller is better
DPC Latency
The review unit did not show any problems with real-time audio applications during our standardized latency test (web browsing, 4K YouTube playback, CPU load).
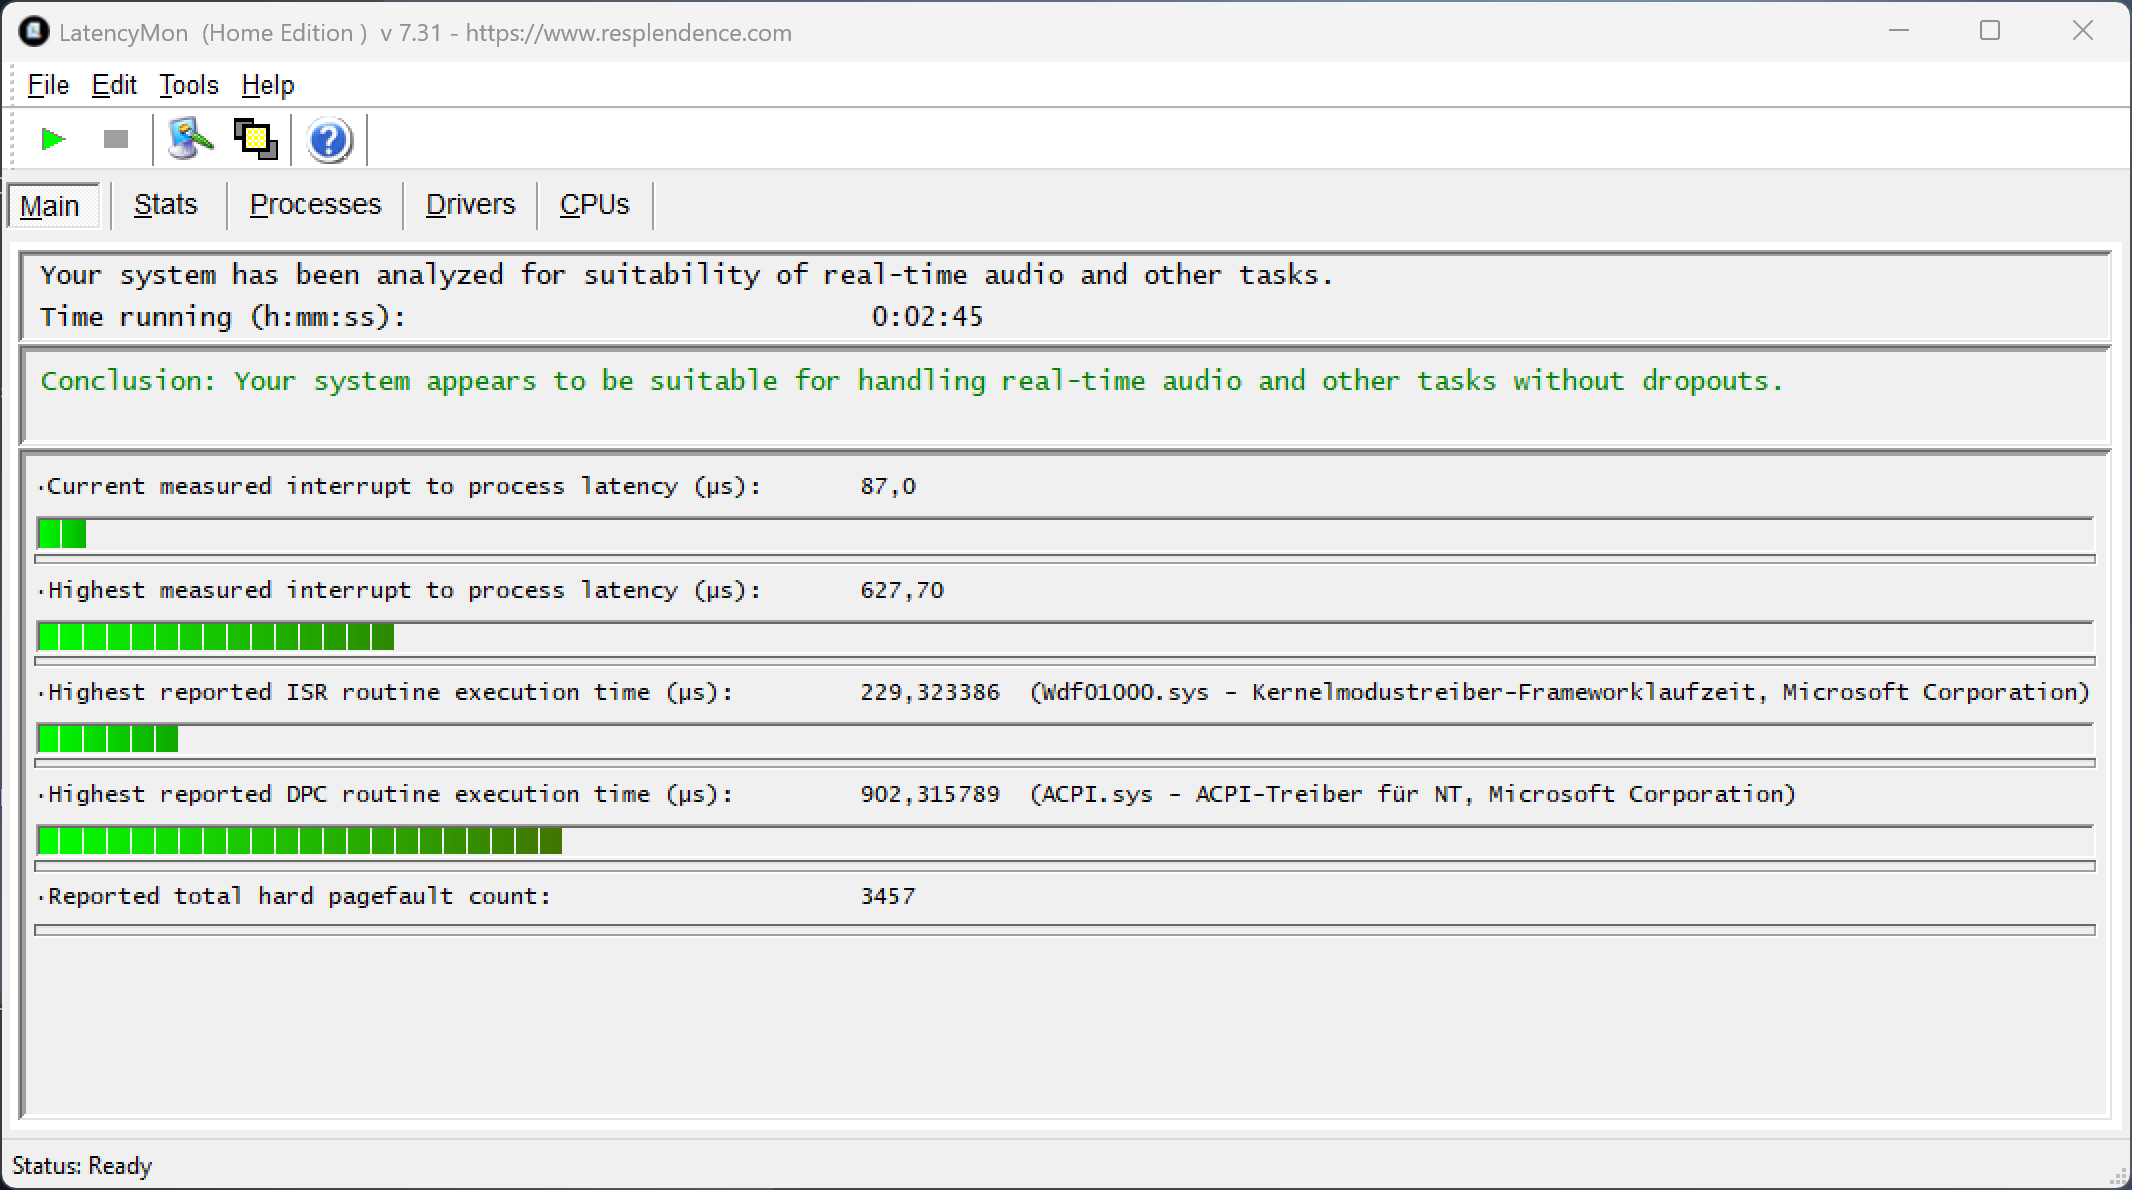
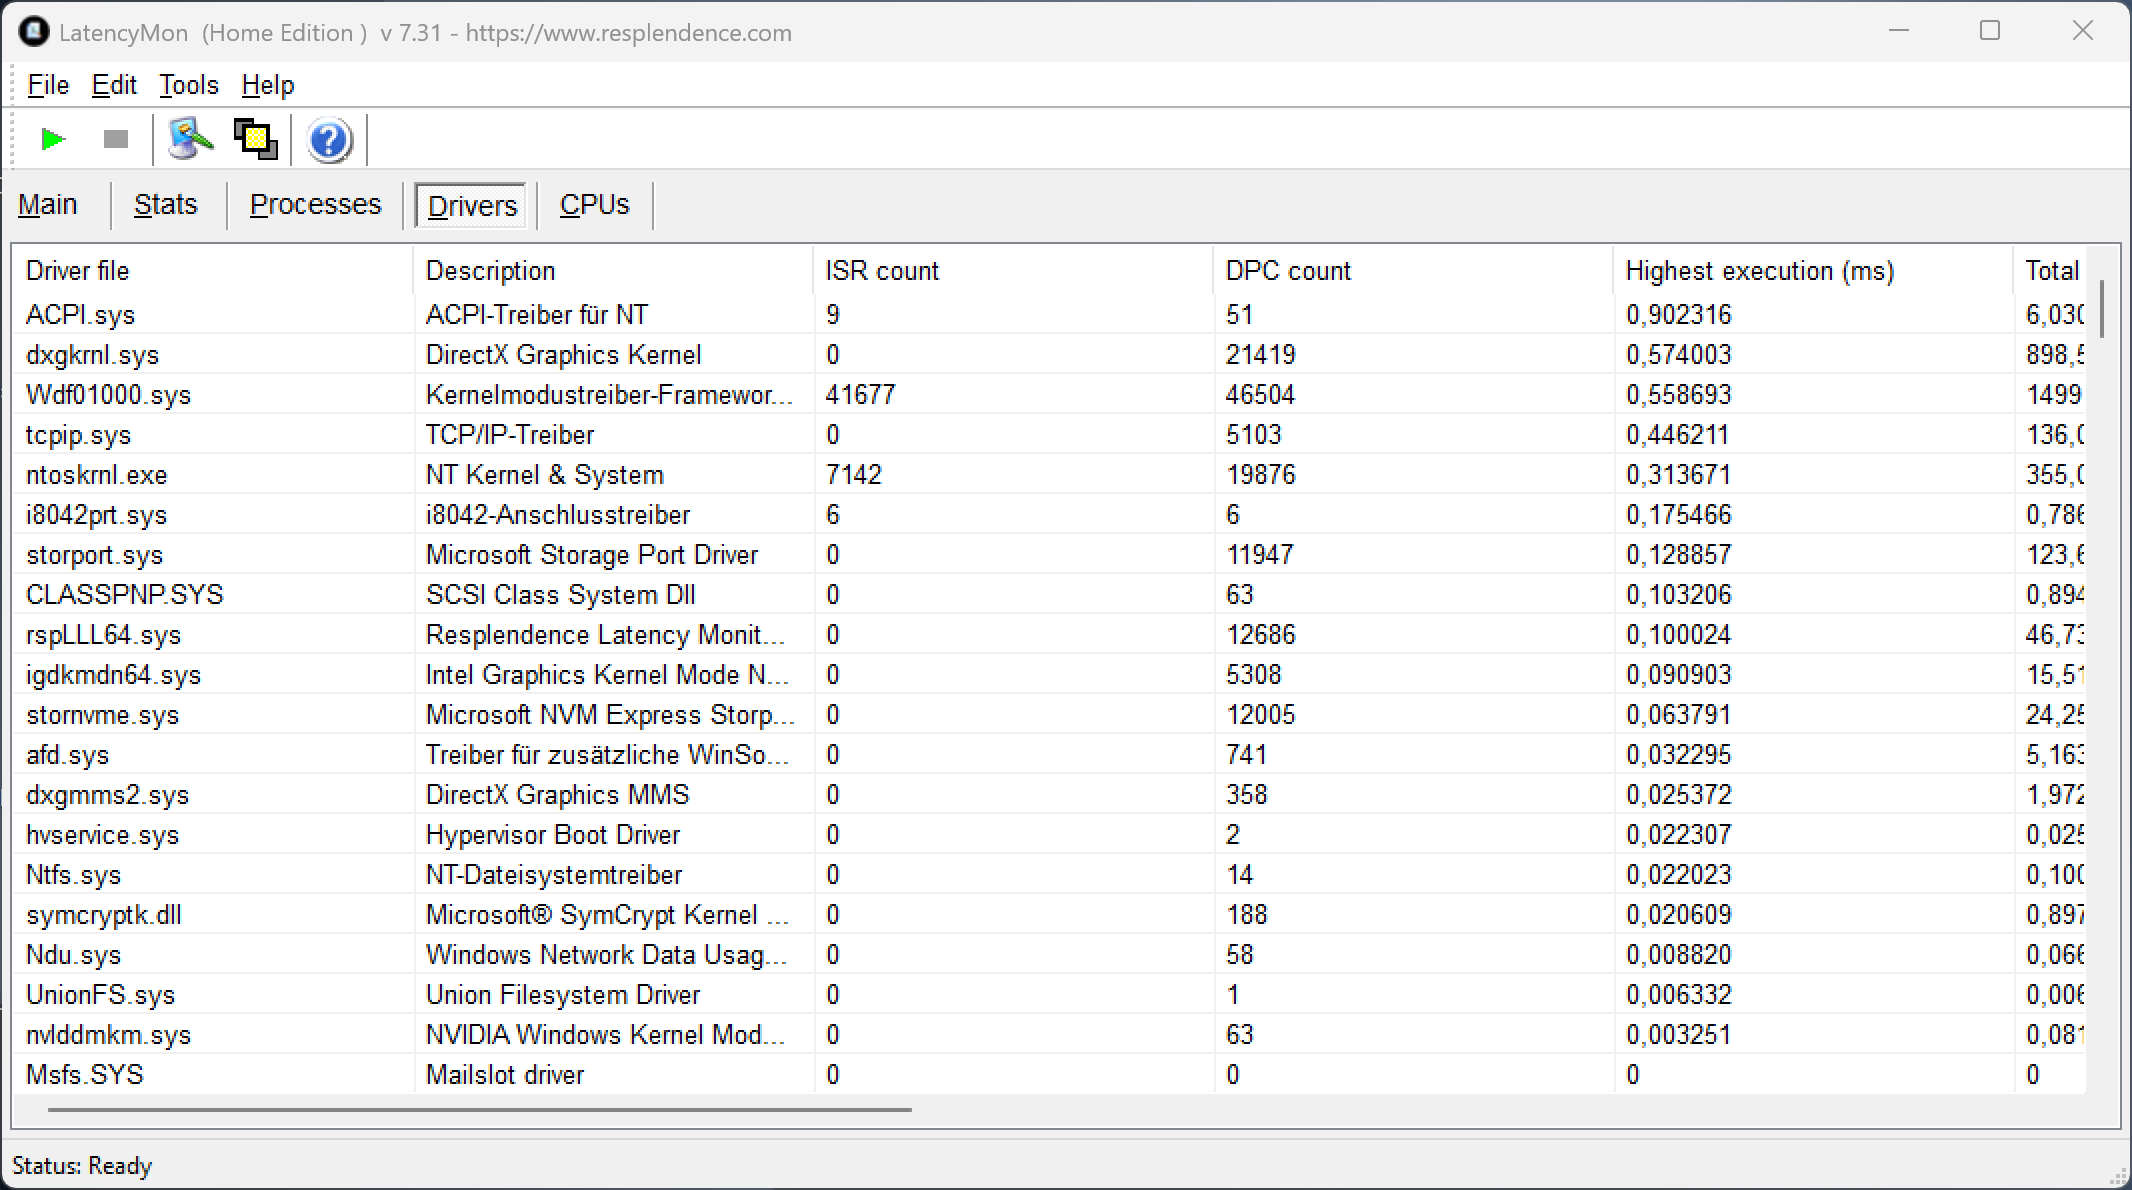
| DPC Latencies / LatencyMon - interrupt to process latency (max), Web, Youtube, Prime95 | |
| Asus ProArt P16 RTX 5090 | |
| Lenovo ThinkPad T1g Gen 8 21TD003GE | |
| Lenovo Yoga Pro 9i 16 RTX 5070 | |
| Samsung Galaxy Book6 Ultra | |
| Dell 16 Premium DA16250 | |
* ... smaller is better
Storage Devices
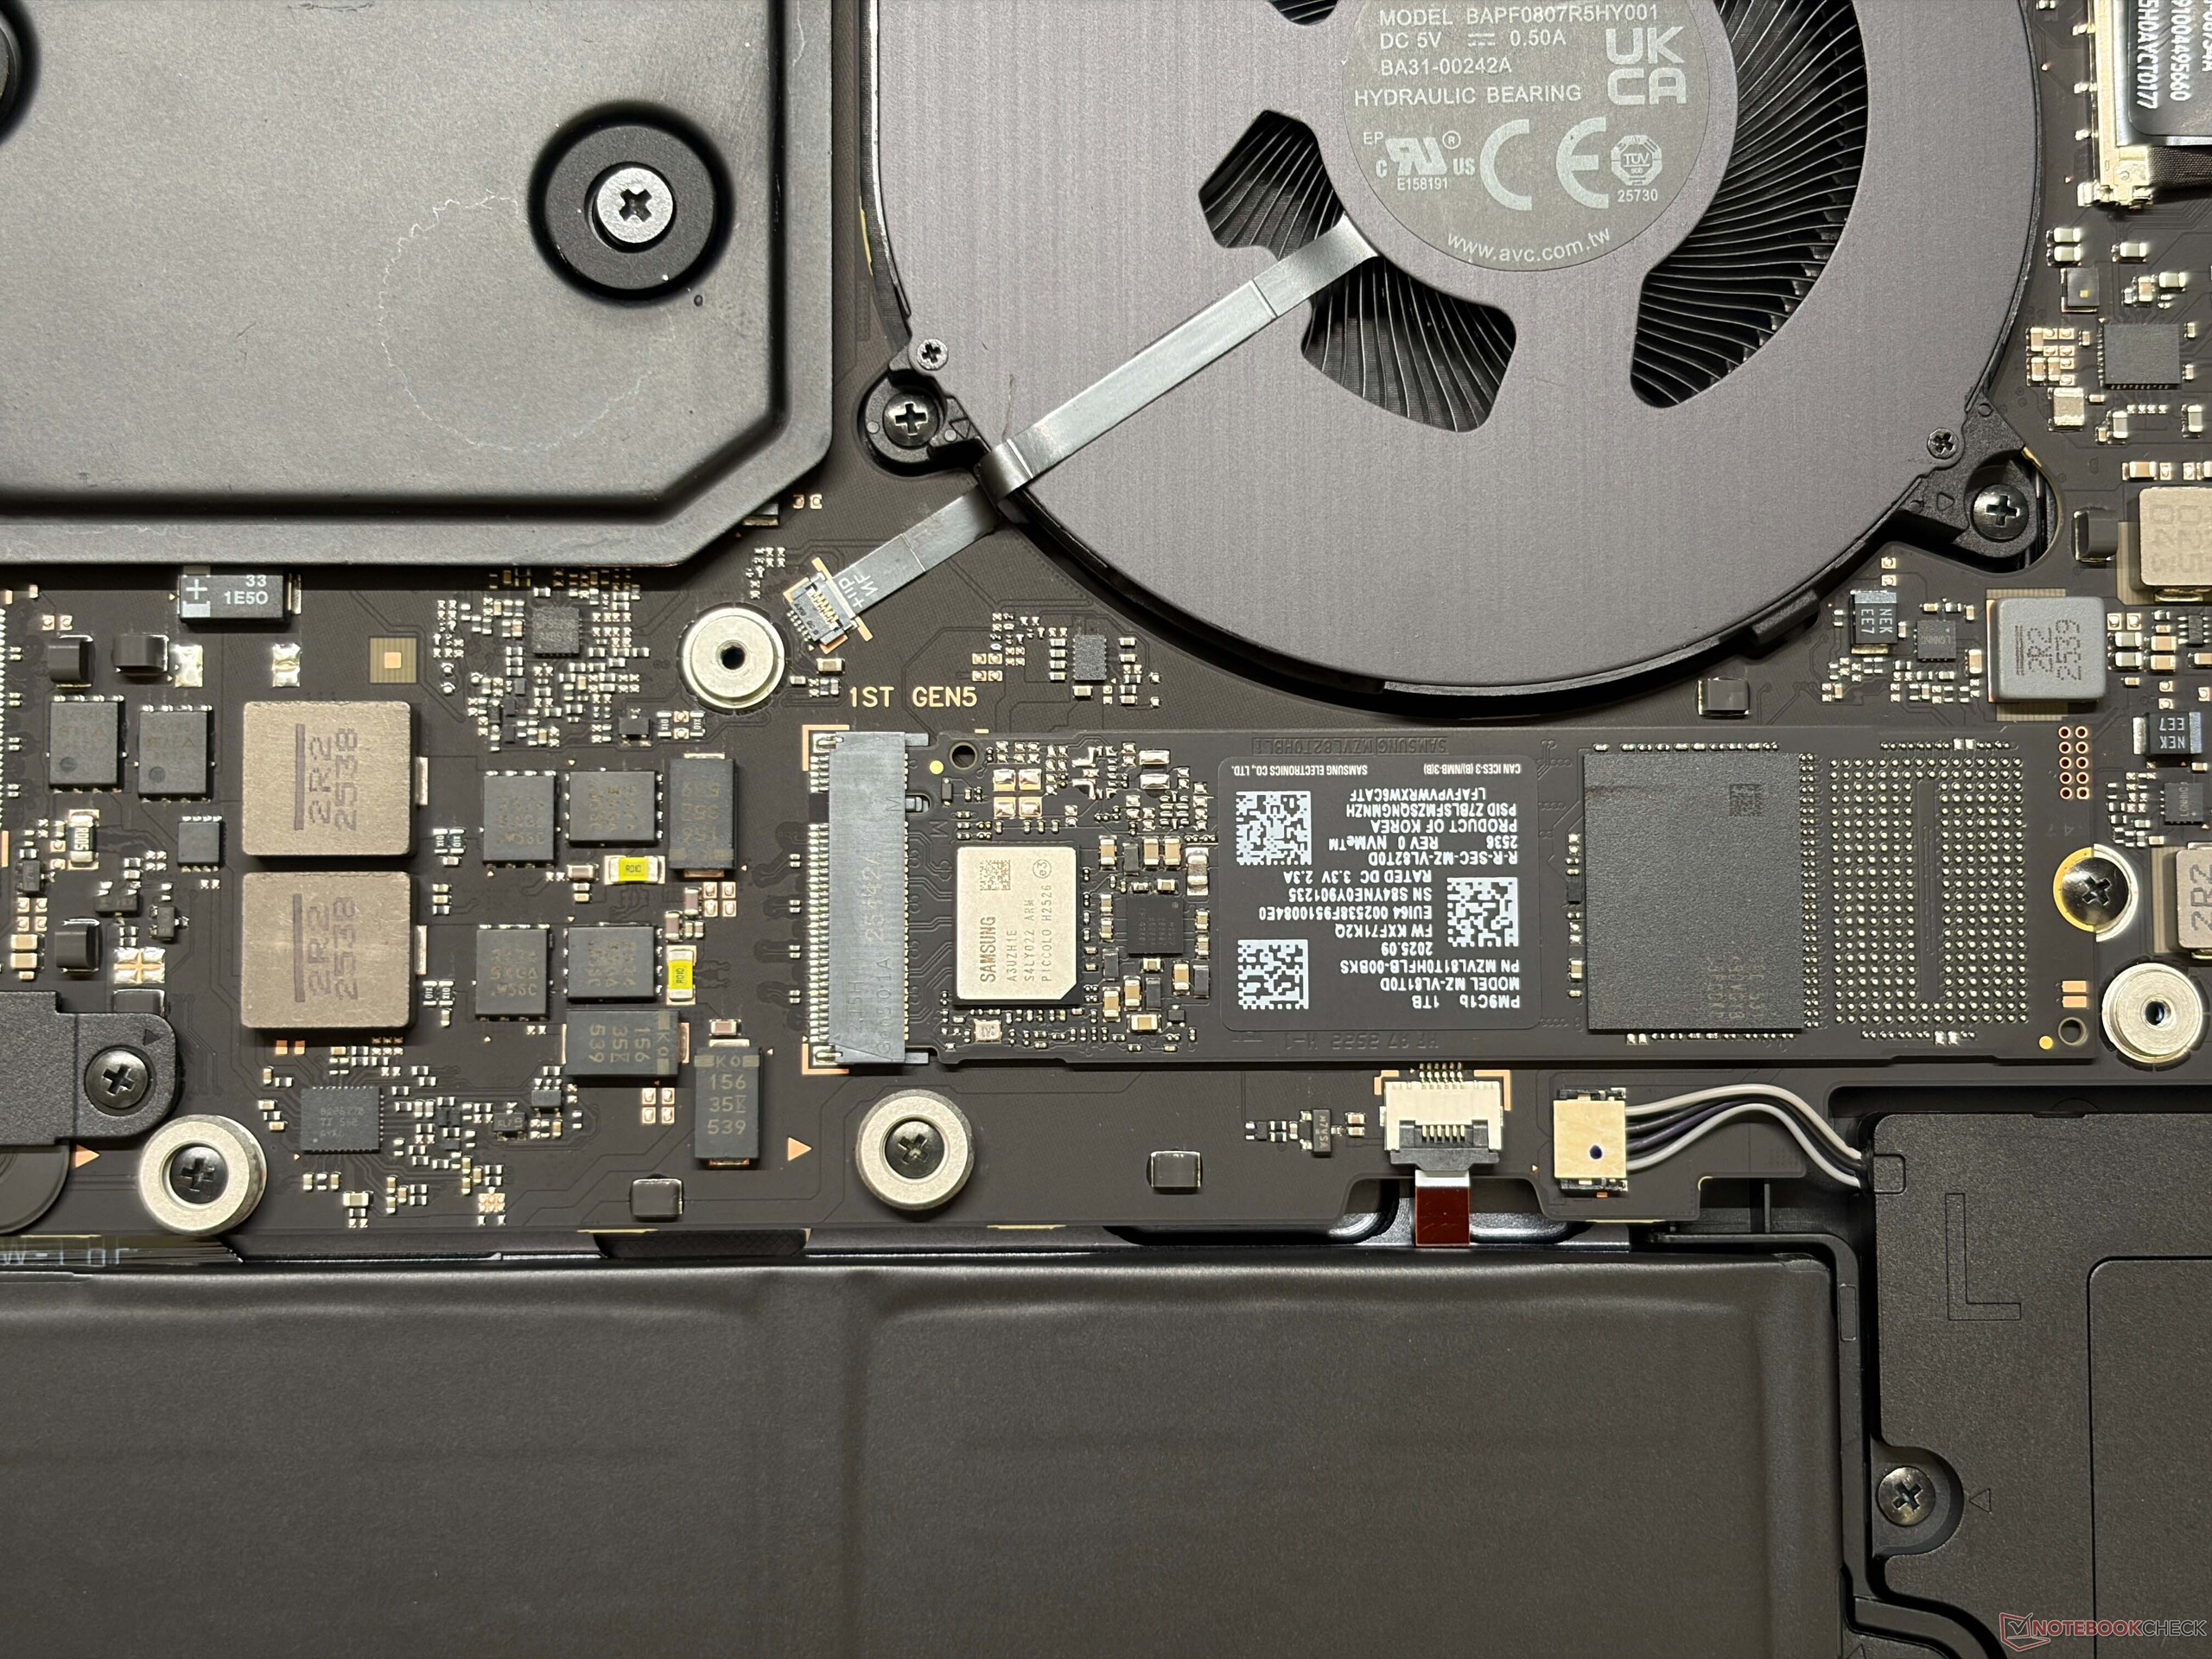
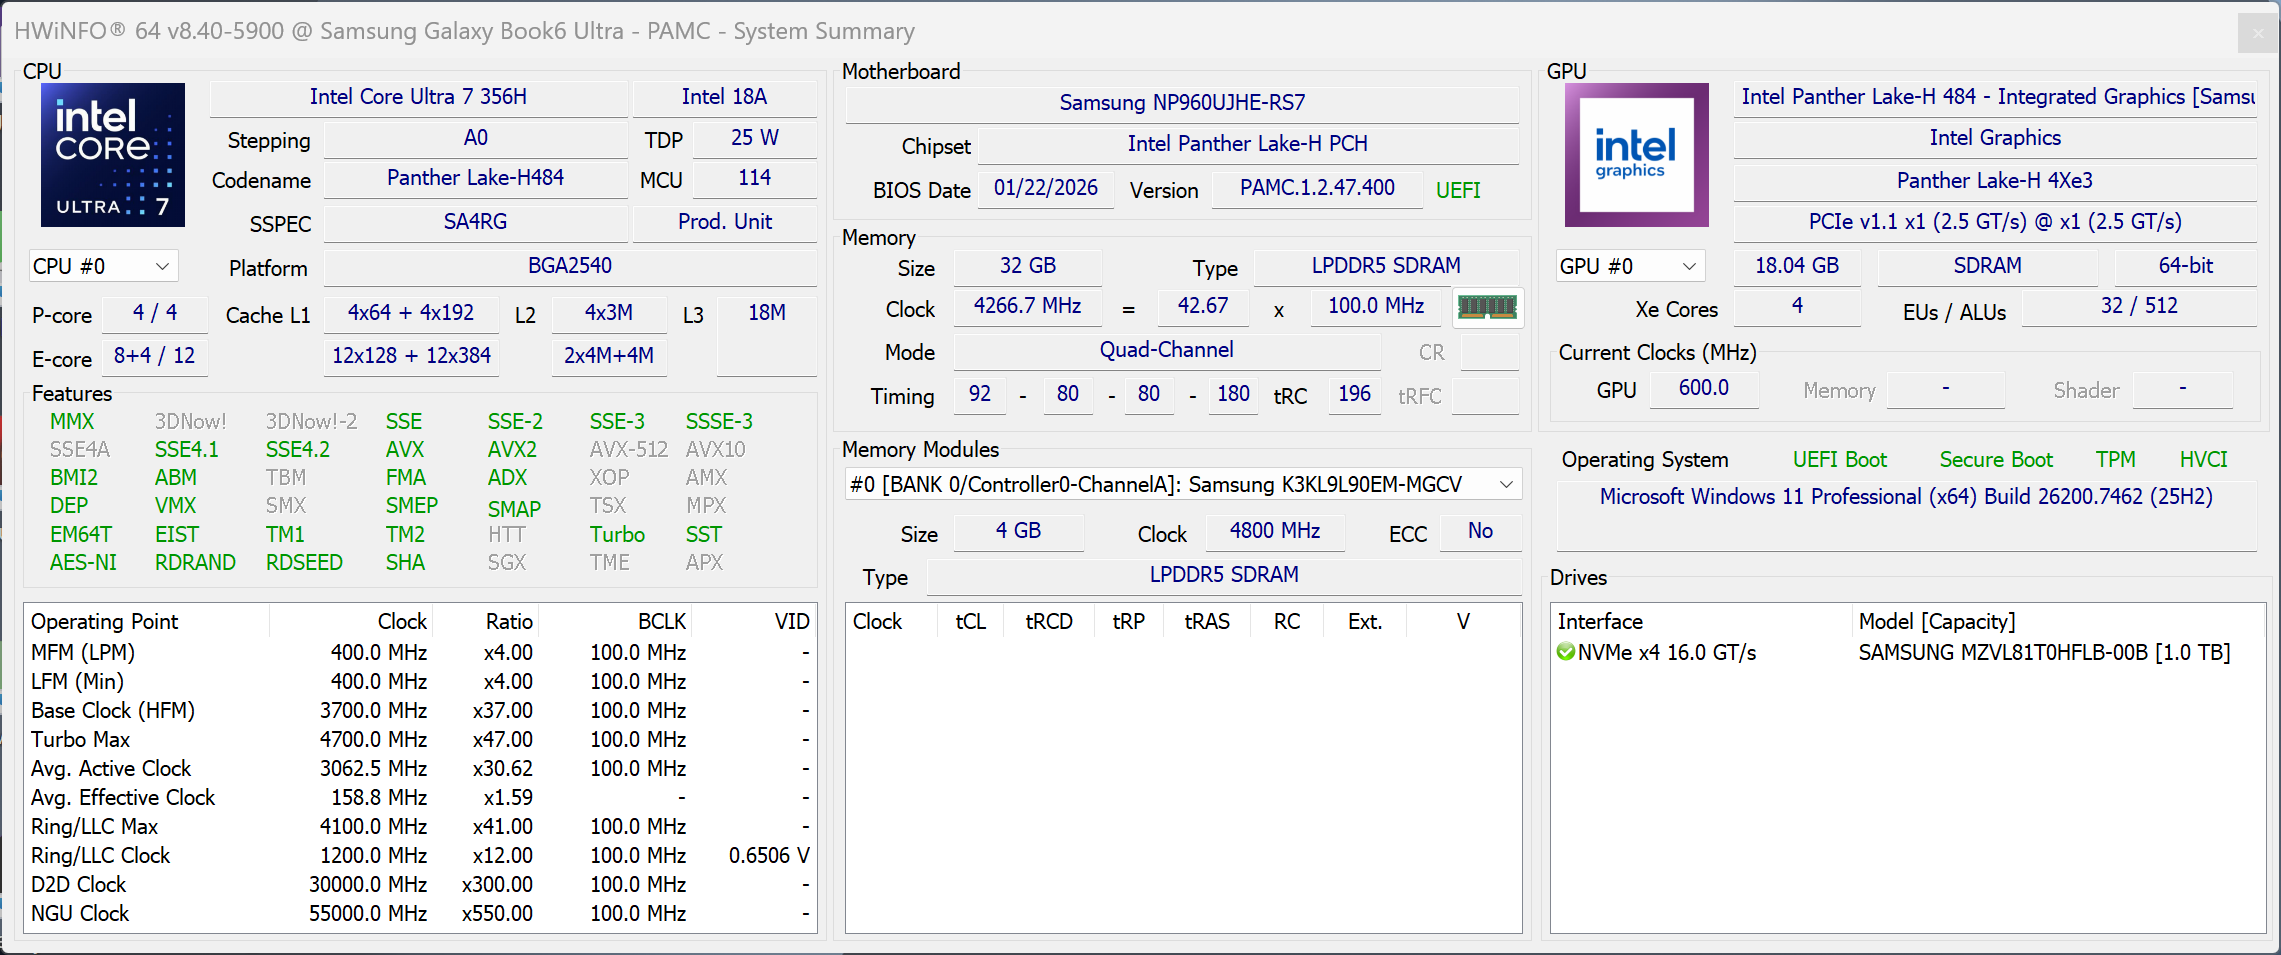
Our review unit is equipped with a 1 TB drive from Samsung (PM9C1b, 846 GB free) with decent and stable transfer rates. There is also a secondary M.2-2280 slot if you want to add more storage, but both slots are limited to PCIe 4.0.

* ... smaller is better
Disk Throttling: DiskSpd Read Loop, Queue Depth 8
GPU Performance
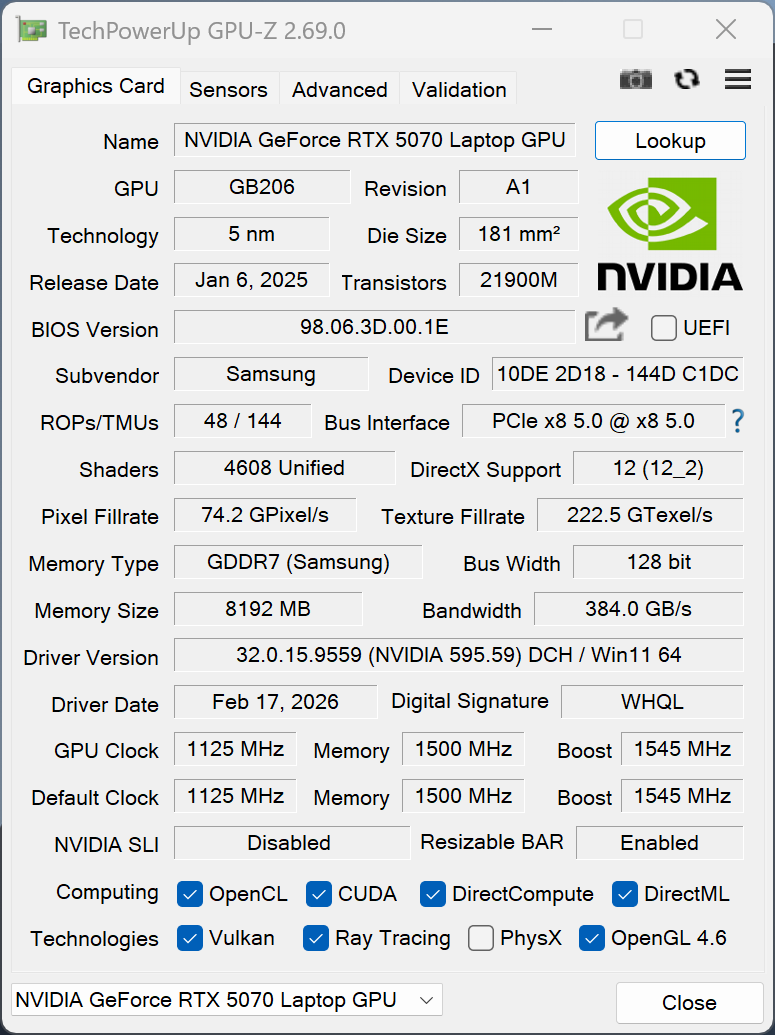
The GeForce RTX 5070 can consume up to 90 Watts and offers good performance figures for a multimedia laptop. The gaming performance is also good and stable, but the limited amount of VRAM (8 GB) can be a limitation in demanding games. Please see our dedicated article for more information.
| 3DMark 11 Performance | 33399 points | |
| 3DMark Fire Strike Score | 27336 points | |
| 3DMark Time Spy Score | 11467 points | |
| 3DMark Steel Nomad Score | 2784 points | |
| 3DMark Steel Nomad Light Score | 12271 points | |
Help | ||
| Blender / v3.3 Classroom OPTIX/RTX | |
| Average of class Multimedia (12 - 105, n=23, last 2 years) | |
| Lenovo Yoga Pro 9i 16 RTX 5070 | |
| Lenovo ThinkPad T1g Gen 8 21TD003GE | |
| Dell 16 Premium DA16250 | |
| Samsung Galaxy Book6 Ultra | |
| Average NVIDIA GeForce RTX 5070 Laptop (17 - 24, n=28) | |
| Asus ProArt P16 RTX 5090 | |
| Blender / v3.3 Classroom CUDA | |
| Average of class Multimedia (20 - 186, n=23, last 2 years) | |
| Average NVIDIA GeForce RTX 5070 Laptop (29 - 228, n=29) | |
| Lenovo ThinkPad T1g Gen 8 21TD003GE | |
| Dell 16 Premium DA16250 | |
| Lenovo Yoga Pro 9i 16 RTX 5070 | |
| Samsung Galaxy Book6 Ultra | |
| Asus ProArt P16 RTX 5090 | |
| Blender / v3.3 Classroom CPU | |
| Average of class Multimedia (134.5 - 1042, n=64, last 2 years) | |
| Dell 16 Premium DA16250 | |
| Samsung Galaxy Book6 Ultra | |
| Lenovo ThinkPad T1g Gen 8 21TD003GE | |
| Average NVIDIA GeForce RTX 5070 Laptop (137 - 507, n=26) | |
| Lenovo Yoga Pro 9i 16 RTX 5070 | |
| Asus ProArt P16 RTX 5090 | |
* ... smaller is better
| GTA V - 1920x1080 Highest AA:4xMSAA + FX AF:16x | |
| Lenovo Yoga Pro 9i 16 RTX 5070 | |
| Samsung Galaxy Book6 Ultra | |
| Lenovo ThinkPad T1g Gen 8 21TD003GE | |
| Dell 16 Premium DA16250 | |
| Asus ProArt P16 RTX 5090 | |
| Average of class Multimedia (7.92 - 141.6, n=59, last 2 years) | |
| Final Fantasy XV Benchmark - 1920x1080 High Quality | |
| Asus ProArt P16 RTX 5090 | |
| Lenovo Yoga Pro 9i 16 RTX 5070 | |
| Lenovo ThinkPad T1g Gen 8 21TD003GE | |
| Samsung Galaxy Book6 Ultra | |
| Dell 16 Premium DA16250 | |
| Average of class Multimedia (7.61 - 144.4, n=61, last 2 years) | |
| Strange Brigade - 1920x1080 ultra AA:ultra AF:16 | |
| Asus ProArt P16 RTX 5090 | |
| Lenovo Yoga Pro 9i 16 RTX 5070 | |
| Samsung Galaxy Book6 Ultra | |
| Lenovo ThinkPad T1g Gen 8 21TD003GE | |
| Dell 16 Premium DA16250 | |
| Average of class Multimedia (13.3 - 303, n=61, last 2 years) | |
| Dota 2 Reborn - 1920x1080 ultra (3/3) best looking | |
| Lenovo Yoga Pro 9i 16 RTX 5070 | |
| Dell 16 Premium DA16250 | |
| Samsung Galaxy Book6 Ultra | |
| Lenovo ThinkPad T1g Gen 8 21TD003GE | |
| Asus ProArt P16 RTX 5090 | |
| Average of class Multimedia (29 - 179.9, n=63, last 2 years) | |
Cyberpunk 2077 ultra FPS Chart
| low | med. | high | ultra | QHD DLSS | QHD | 4K | |
|---|---|---|---|---|---|---|---|
| GTA V (2015) | 137.1 | 111.9 | |||||
| Dota 2 Reborn (2015) | 173.3 | 155.4 | 149.3 | 139.7 | |||
| Final Fantasy XV Benchmark (2018) | 178.8 | 137.3 | 116.6 | 88.8 | 48.7 | ||
| X-Plane 11.11 (2018) | 109.6 | 102.4 | 76 | ||||
| Strange Brigade (2018) | 479 | 315 | 257 | 220 | 151.8 | ||
| Baldur's Gate 3 (2023) | 149.1 | 129.7 | 111.1 | 109.2 | 76.2 | ||
| Cyberpunk 2077 (2023) | 114.1 | 104 | 92.5 | 84.6 | 67.5 | 57.4 | |
| F1 24 (2024) | 257 | 217 | 77.5 | 77.2 | 49.5 |
Emissions & Power Consumption
System Noise

Samsung uses a vapor chamber cooling unit with two fans and the Galaxy Book6 Ultra is a very quiet device in everyday scenarios, even in the High Performance power profile. When you start to stress the components, the fans will get audible and we measured a maximum fan noise of 48.5 dB(A). The other power profiles are quieter (33-40 dB(A)), but you will also sacrifice some performance. Our test unit had no issues with other electronic noises.
Noise level
| Idle |
| 25.1 / 25.1 / 25.1 dB(A) |
| Load |
| 36.9 / 48.5 dB(A) |
 | ||
30 dB silent 40 dB(A) audible 50 dB(A) loud |
||
min: | ||
| Samsung Galaxy Book6 Ultra Ultra 7 356H, GeForce RTX 5070 Laptop | Apple MacBook Pro 16 2024 M4 Pro M4 Pro 14-Core, M4 Pro 20-Core GPU | Lenovo Yoga Pro 9i 16 RTX 5070 Ultra 9 285H, GeForce RTX 5070 Laptop | Asus ProArt P16 RTX 5090 Ryzen AI 9 HX 370, GeForce RTX 5090 Laptop | Dell 16 Premium DA16250 Ultra 7 255H, GeForce RTX 5070 Laptop | Lenovo ThinkPad T1g Gen 8 21TD003GE Ultra 9 285H, GeForce RTX 5070 Laptop | |
|---|---|---|---|---|---|---|
| Noise | 13% | -4% | -9% | 2% | -1% | |
| off / environment * (dB) | 25.1 | 24 4% | 24.1 4% | 24.2 4% | 23.2 8% | 25 -0% |
| Idle Minimum * (dB) | 25.1 | 24 4% | 24.1 4% | 24.2 4% | 23.2 8% | 25 -0% |
| Idle Average * (dB) | 25.1 | 24 4% | 24.1 4% | 27.6 -10% | 23.2 8% | 25 -0% |
| Idle Maximum * (dB) | 25.1 | 24 4% | 25.1 -0% | 32.6 -30% | 26.6 -6% | 27.3 -9% |
| Load Average * (dB) | 36.9 | 25.3 31% | 44.2 -20% | 42.6 -15% | 39.4 -7% | 37.3 -1% |
| Cyberpunk 2077 ultra * (dB) | 48.5 | 33.9 30% | 52.7 -9% | 51.2 -6% | 47.3 2% | 47.8 1% |
| Load Maximum * (dB) | 48.5 | 42.3 13% | 52.7 -9% | 53.2 -10% | 48.9 -1% | 47.8 1% |
* ... smaller is better
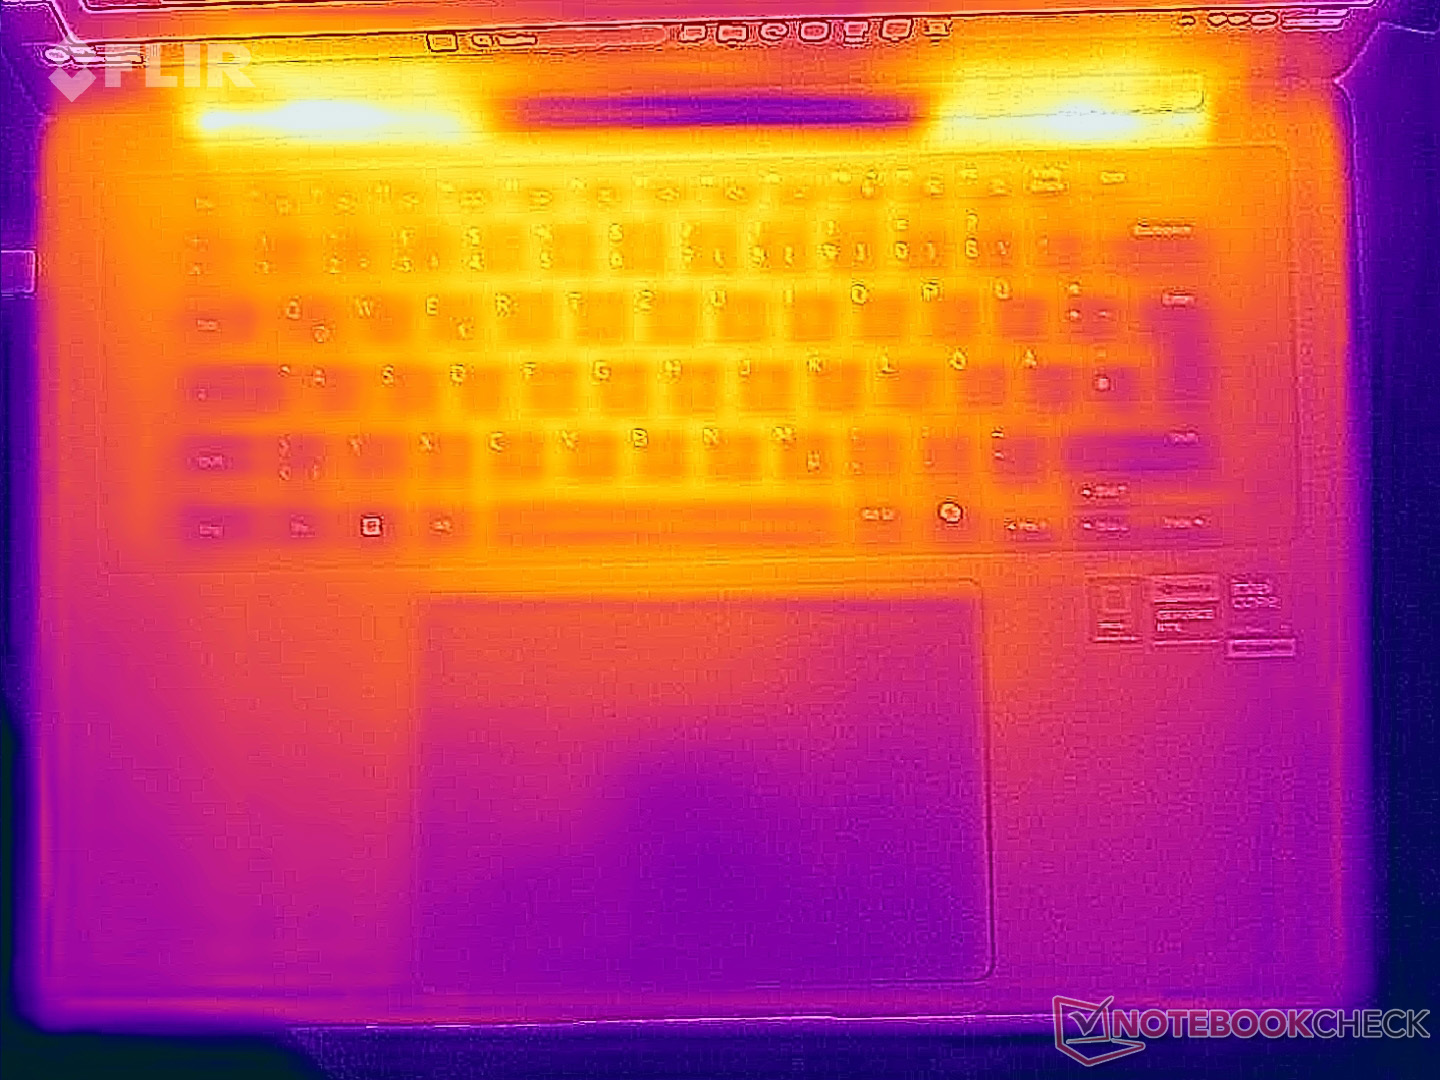
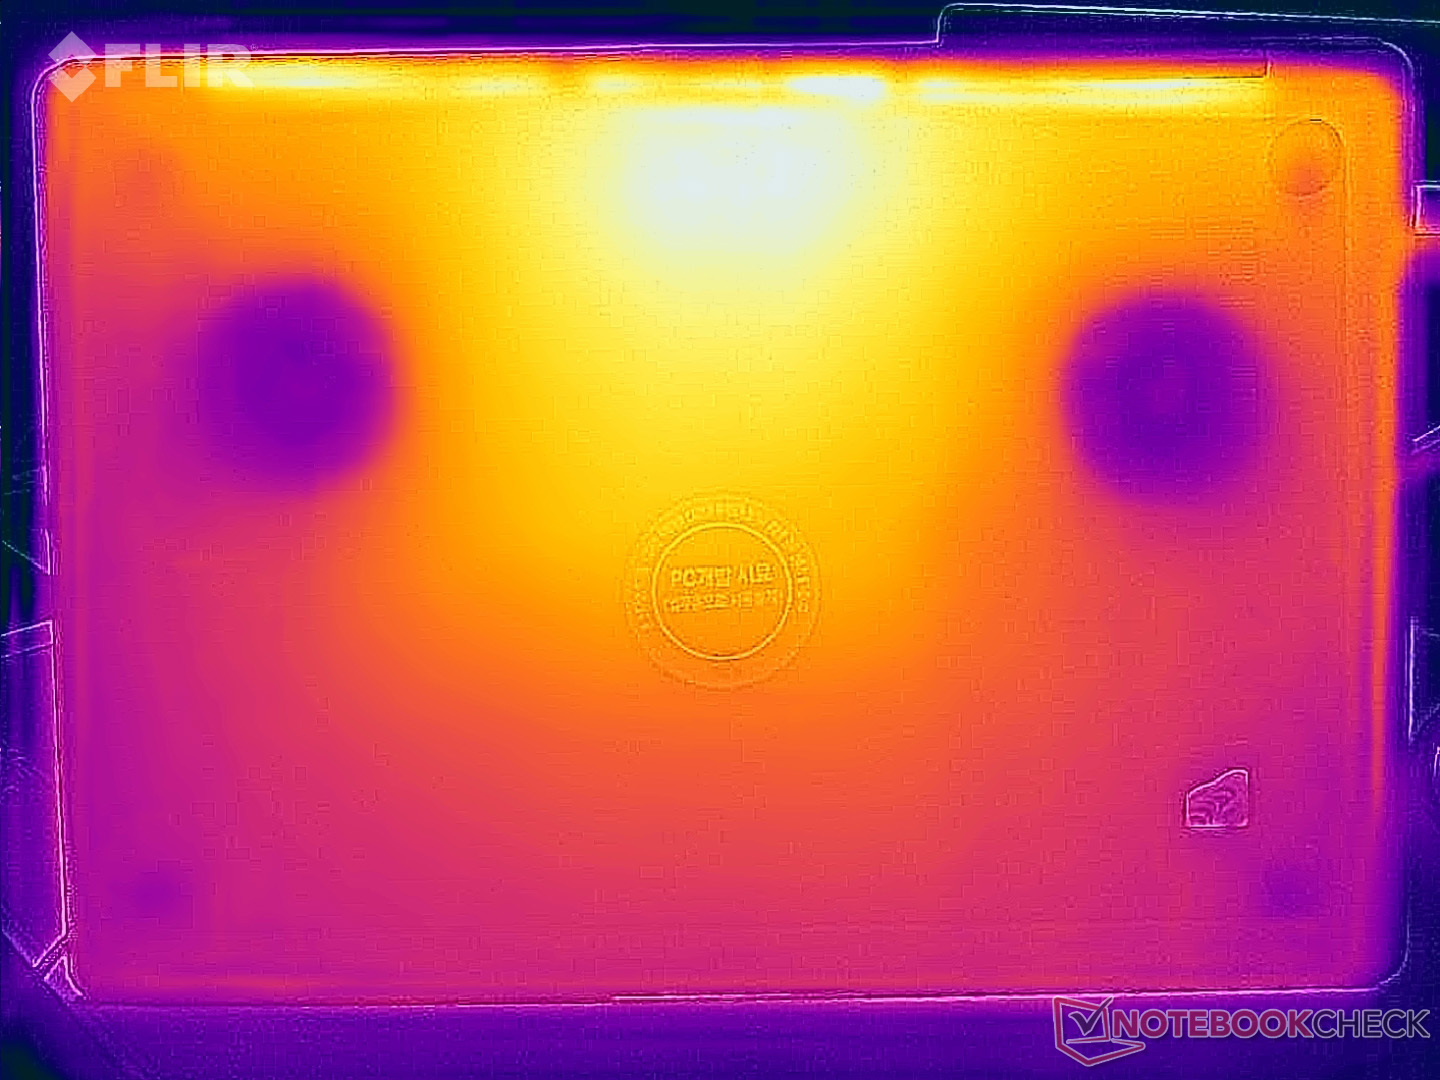
Temperature
The aluminum surfaces are very cool during everyday situations, but some spots get pretty warm under load. We measure almost 50 °C at the upper center section of the bottom panel, so you should avoid skin contact. Otherwise, there are no limitations and the keyboard only warms up to ~40 °C, so typing is not affected. During the stress test, the CPU will level off at just 20 Watts, while the GPU maintains 80 Watts.

(±) The maximum temperature on the upper side is 42.7 °C / 109 F, compared to the average of 36.8 °C / 98 F, ranging from 21 to 71 °C for the class Multimedia.
(-) The bottom heats up to a maximum of 49.1 °C / 120 F, compared to the average of 39.1 °C / 102 F
(+) In idle usage, the average temperature for the upper side is 24.9 °C / 77 F, compared to the device average of 31.3 °C / 88 F.
(-) 3: The average temperature for the upper side is 38.5 °C / 101 F, compared to the average of 31.3 °C / 88 F for the class Multimedia.
(+) The palmrests and touchpad are reaching skin temperature as a maximum (34.7 °C / 94.5 F) and are therefore not hot.
(-) The average temperature of the palmrest area of similar devices was 28.7 °C / 83.7 F (-6 °C / -10.8 F).
| Samsung Galaxy Book6 Ultra Ultra 7 356H, GeForce RTX 5070 Laptop | Apple MacBook Pro 16 2024 M4 Pro M4 Pro 14-Core, M4 Pro 20-Core GPU | Lenovo Yoga Pro 9i 16 RTX 5070 Ultra 9 285H, GeForce RTX 5070 Laptop | Asus ProArt P16 RTX 5090 Ryzen AI 9 HX 370, GeForce RTX 5090 Laptop | Dell 16 Premium DA16250 Ultra 7 255H, GeForce RTX 5070 Laptop | Lenovo ThinkPad T1g Gen 8 21TD003GE Ultra 9 285H, GeForce RTX 5070 Laptop | |
|---|---|---|---|---|---|---|
| Heat | 11% | -2% | -3% | -0% | -1% | |
| Maximum Upper Side * (°C) | 42.7 | 42.7 -0% | 41.8 2% | 47 -10% | 36.8 14% | 44.7 -5% |
| Maximum Bottom * (°C) | 49.1 | 43.1 12% | 47.9 2% | 51.6 -5% | 34.8 29% | 42.8 13% |
| Idle Upper Side * (°C) | 25.4 | 21.5 15% | 26.3 -4% | 24.9 2% | 31.2 -23% | 26.9 -6% |
| Idle Bottom * (°C) | 25.5 | 21.5 16% | 27.6 -8% | 25.5 -0% | 30.8 -21% | 27.3 -7% |
* ... smaller is better
Speakers
The six-speaker audio system offers impressive sound performance and does not have to hide behind the competition. To be fair though, all the comparison devices offer great sound quality and it will be tough to hear the difference.
Samsung Galaxy Book6 Ultra audio analysis
(+) | speakers can play relatively loud (85.6 dB)
Bass 100 - 315 Hz
(±) | reduced bass - on average 5.9% lower than median
(±) | linearity of bass is average (7.9% delta to prev. frequency)
Mids 400 - 2000 Hz
(+) | balanced mids - only 3.7% away from median
(+) | mids are linear (4.3% delta to prev. frequency)
Highs 2 - 16 kHz
(+) | balanced highs - only 2.2% away from median
(+) | highs are linear (3.4% delta to prev. frequency)
Overall 100 - 16.000 Hz
(+) | overall sound is linear (7.3% difference to median)
Compared to same class
» 6% of all tested devices in this class were better, 1% similar, 94% worse
» The best had a delta of 5%, average was 17%, worst was 45%
Compared to all devices tested
» 1% of all tested devices were better, 0% similar, 99% worse
» The best had a delta of 4%, average was 23%, worst was 134%
Apple MacBook Pro 16 2024 M4 Pro audio analysis
(+) | speakers can play relatively loud (84.6 dB)
Bass 100 - 315 Hz
(±) | reduced bass - on average 5.1% lower than median
(+) | bass is linear (5.6% delta to prev. frequency)
Mids 400 - 2000 Hz
(+) | balanced mids - only 1.4% away from median
(+) | mids are linear (2.4% delta to prev. frequency)
Highs 2 - 16 kHz
(+) | balanced highs - only 1.6% away from median
(+) | highs are linear (3% delta to prev. frequency)
Overall 100 - 16.000 Hz
(+) | overall sound is linear (4.8% difference to median)
Compared to same class
» 0% of all tested devices in this class were better, 0% similar, 99% worse
» The best had a delta of 5%, average was 17%, worst was 45%
Compared to all devices tested
» 0% of all tested devices were better, 0% similar, 100% worse
» The best had a delta of 4%, average was 23%, worst was 134%
Lenovo Yoga Pro 9i 16 RTX 5070 audio analysis
(±) | speaker loudness is average but good (81.4 dB)
Bass 100 - 315 Hz
(±) | reduced bass - on average 5.5% lower than median
(±) | linearity of bass is average (7.5% delta to prev. frequency)
Mids 400 - 2000 Hz
(+) | balanced mids - only 1.7% away from median
(+) | mids are linear (3.1% delta to prev. frequency)
Highs 2 - 16 kHz
(±) | reduced highs - on average 6.2% lower than median
(+) | highs are linear (3.9% delta to prev. frequency)
Overall 100 - 16.000 Hz
(+) | overall sound is linear (9.7% difference to median)
Compared to same class
» 13% of all tested devices in this class were better, 1% similar, 85% worse
» The best had a delta of 5%, average was 17%, worst was 45%
Compared to all devices tested
» 4% of all tested devices were better, 1% similar, 95% worse
» The best had a delta of 4%, average was 23%, worst was 134%
Asus ProArt P16 RTX 5090 audio analysis
(±) | speaker loudness is average but good (80.8 dB)
Bass 100 - 315 Hz
(+) | good bass - only 3.3% away from median
(±) | linearity of bass is average (7.7% delta to prev. frequency)
Mids 400 - 2000 Hz
(+) | balanced mids - only 2.9% away from median
(+) | mids are linear (1.9% delta to prev. frequency)
Highs 2 - 16 kHz
(+) | balanced highs - only 4.1% away from median
(+) | highs are linear (5.5% delta to prev. frequency)
Overall 100 - 16.000 Hz
(+) | overall sound is linear (8.3% difference to median)
Compared to same class
» 9% of all tested devices in this class were better, 2% similar, 89% worse
» The best had a delta of 5%, average was 17%, worst was 45%
Compared to all devices tested
» 2% of all tested devices were better, 1% similar, 97% worse
» The best had a delta of 4%, average was 23%, worst was 134%
Dell 16 Premium DA16250 audio analysis
(+) | speakers can play relatively loud (84.2 dB)
Bass 100 - 315 Hz
(±) | reduced bass - on average 6.1% lower than median
(+) | bass is linear (4.2% delta to prev. frequency)
Mids 400 - 2000 Hz
(+) | balanced mids - only 1.4% away from median
(+) | mids are linear (3.6% delta to prev. frequency)
Highs 2 - 16 kHz
(+) | balanced highs - only 1.5% away from median
(+) | highs are linear (2.2% delta to prev. frequency)
Overall 100 - 16.000 Hz
(+) | overall sound is linear (5.1% difference to median)
Compared to same class
» 1% of all tested devices in this class were better, 0% similar, 99% worse
» The best had a delta of 5%, average was 17%, worst was 45%
Compared to all devices tested
» 0% of all tested devices were better, 0% similar, 100% worse
» The best had a delta of 4%, average was 23%, worst was 134%
Lenovo ThinkPad T1g Gen 8 21TD003GE audio analysis
(+) | speakers can play relatively loud (85.6 dB)
Bass 100 - 315 Hz
(±) | reduced bass - on average 9.3% lower than median
(±) | linearity of bass is average (11.9% delta to prev. frequency)
Mids 400 - 2000 Hz
(+) | balanced mids - only 2.5% away from median
(+) | mids are linear (4% delta to prev. frequency)
Highs 2 - 16 kHz
(+) | balanced highs - only 3.4% away from median
(±) | linearity of highs is average (7.5% delta to prev. frequency)
Overall 100 - 16.000 Hz
(+) | overall sound is linear (8.7% difference to median)
Compared to same class
» 11% of all tested devices in this class were better, 2% similar, 87% worse
» The best had a delta of 5%, average was 17%, worst was 45%
Compared to all devices tested
» 3% of all tested devices were better, 1% similar, 97% worse
» The best had a delta of 4%, average was 23%, worst was 134%
Power Consumption

The Galaxy Book6 Ultra is surprisingly efficient while idling with a maximum consumption of just 7.1 Watts at full SDR brightness. During the stress test, we measure around 140-144 Watts for the first 40 seconds, but the consumption then levels off at around 124 Watts and the battery is not drained, so the 140W power adapter is sufficient.
| Off / Standby | |
| Idle | |
| Load |
|
Key:
min: | |
| Samsung Galaxy Book6 Ultra Ultra 7 356H, GeForce RTX 5070 Laptop, Samsung PM9C1b MZVL81T0HFLB-00BH1, OLED, 2880x1800, 16" | Apple MacBook Pro 16 2024 M4 Pro M4 Pro 14-Core, M4 Pro 20-Core GPU, Apple SSD AP2048Z, Mini-LED, 3456x2234, 16.2" | Lenovo Yoga Pro 9i 16 RTX 5070 Ultra 9 285H, GeForce RTX 5070 Laptop, WD PC SN7100S SDFPMSL-1T00-1101, OLED, 3200x2000, 16" | Asus ProArt P16 RTX 5090 Ryzen AI 9 HX 370, GeForce RTX 5090 Laptop, Micron 2500 2TB MTFDKBA2T0QGN-1BN1AABGA, OLED, 3840x2400, 16" | Dell 16 Premium DA16250 Ultra 7 255H, GeForce RTX 5070 Laptop, Kioxia BG6 KBG6AZNV1T02, OLED, 3840x2400, 16.3" | Lenovo ThinkPad T1g Gen 8 21TD003GE Ultra 9 285H, GeForce RTX 5070 Laptop, Samsung PM9E1 MZVLC2T0HBLD, Tandem-OLED, 3200x2000, 16" | Average NVIDIA GeForce RTX 5070 Laptop | Average of class Multimedia | |
|---|---|---|---|---|---|---|---|---|
| Power Consumption | -38% | -73% | -82% | -66% | -48% | -122% | -32% | |
| Idle Minimum * (Watt) | 4.4 | 4.6 -5% | 8.8 -100% | 10.9 -148% | 6.5 -48% | 8.5 -93% | 10.8 ? -145% | 5.68 ? -29% |
| Idle Average * (Watt) | 6.4 | 16.8 -163% | 16.1 -152% | 12.1 -89% | 8.1 -27% | 13.6 -113% | 15.4 ? -141% | 10.2 ? -59% |
| Idle Maximum * (Watt) | 7.1 | 17.1 -141% | 16.5 -132% | 12.5 -76% | 33 -365% | 14.1 -99% | 21 ? -196% | 12.4 ? -75% |
| Load Average * (Watt) | 55.1 | 76.4 -39% | 89.3 -62% | 129.3 -135% | 88.9 -61% | 84.5 -53% | 98.7 ? -79% | 65.4 ? -19% |
| Cyberpunk 2077 ultra external monitor * (Watt) | 133 | 79.3 40% | 157.9 -19% | 172.8 -30% | 108.9 18% | 118.1 11% | ||
| Cyberpunk 2077 ultra * (Watt) | 134.3 | 83.4 38% | 160.6 -20% | 176.6 -31% | 108.7 19% | 120.3 10% | ||
| Load Maximum * (Watt) | 143.9 | 138.1 4% | 177.4 -23% | 233.9 -63% | 138.3 4% | 143 1% | 218 ? -51% | 113.3 ? 21% |
* ... smaller is better
Power Consumption Cyberpunk / Stress Test
Power Consumption external Monitor
Battery Life
Even though the Galaxy Book6 Ultra has the smallest battery capacity in our comparison group at just 80.2 Wh, it manages impressive battery runtimes even getting close to the MacBook Pro. At 150 nits, our Wi-Fi test runs for almost 17 hours and therefore much longer compared to any other Windows rival. At full brightness, we still record almost 8.5 hours, which even beats the MacBook Pro (which is a bit brighter) by around one hour.

Notebookcheck Rating
Samsung Galaxy Book6 Ultra
- 03/06/2026 v8
Andreas Osthoff
 Total Sustainability Score:
 Potential Competitors in Comparison
Image | Model / Review | Price | Weight | Height | Display |
|---|---|---|---|---|---|
1. 90.7%  | Samsung Galaxy Book6 Ultra Intel Core Ultra 7 356H ⎘ NVIDIA GeForce RTX 5070 Laptop ⎘ 32 GB Memory, 1000 GB SSD | Amazon: List Price: 3599€ | 1.9 kg | 15.4 mm | 16.00" 2880x1800 212 PPI OLED |
2. 93%  | Apple MacBook Pro 16 2024 M4 Pro Apple M4 Pro 14-Core ⎘ Apple M4 Pro 20-Core GPU ⎘ 48 GB Memory, 2048 GB SSD | Amazon: List Price: 4219€ | 2.1 kg | 16.8 mm | 16.20" 3456x2234 254 PPI Mini-LED |
3. 90.4%  | Lenovo Yoga Pro 9i 16 RTX 5070 Intel Core Ultra 9 285H ⎘ NVIDIA GeForce RTX 5070 Laptop ⎘ 64 GB Memory, 1024 GB SSD | Amazon: List Price: 2800€ | 1.9 kg | 17.9 mm | 16.00" 3200x2000 236 PPI OLED |
4. 89.7% 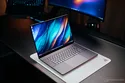 | Asus ProArt P16 RTX 5090 AMD Ryzen AI 9 HX 370 ⎘ NVIDIA GeForce RTX 5090 Laptop ⎘ 64 GB Memory, 2048 GB SSD | Amazon: List Price: 4799€ | 2 kg | 18.3 mm | 16.00" 3840x2400 283 PPI OLED |
5. 87.9%  | Dell 16 Premium DA16250 Intel Core Ultra 7 255H ⎘ NVIDIA GeForce RTX 5070 Laptop ⎘ 32 GB Memory, 1024 GB SSD | Amazon: List Price: 3300 USD | 2.3 kg | 18.7 mm | 16.30" 3840x2400 278 PPI OLED |
6. 92.4%  | Lenovo ThinkPad T1g Gen 8 21TD003GE Intel Core Ultra 9 285H ⎘ NVIDIA GeForce RTX 5070 Laptop ⎘ 64 GB Memory, 2048 GB SSD | Amazon: List Price: 4500€ | 1.9 kg | 15.8 mm | 16.00" 3200x2000 236 PPI Tandem-OLED |
Transparency
The selection of devices to be reviewed is made by our editorial team. The test sample was provided to the author as a loan by the manufacturer or retailer for the purpose of this review. The lender had no influence on this review, nor did the manufacturer receive a copy of this review before publication. There was no obligation to publish this review. As an independent media company, Notebookcheck is not subjected to the authority of manufacturers, retailers or publishers.
This is how Notebookcheck is testing
Every year, Notebookcheck independently reviews hundreds of laptops and smartphones using standardized procedures to ensure that all results are comparable. We have continuously developed our test methods for around 20 years and set industry standards in the process. In our test labs, high-quality measuring equipment is utilized by experienced technicians and editors. These tests involve a multi-stage validation process. Our complex rating system is based on hundreds of well-founded measurements and benchmarks, which maintains objectivity. Further information on our test methods can be found here.
