Verdict - Galaxy Book6 Pro is a good, but also expensive laptop
Samsung finally uses brighter OLED screens for the new Galaxy Book6 Pro and the new 120 Hz touchscreen with up to 1200 nits peak brightness offers superb image quality. The only downside is the constant PWM flickering, so sensitive users should try it first. You also get new Panther Lake processors from Intel, but our test unit only uses the Core Ultra 7 356H with the slow iGPU, which is pretty slow. It is sufficient for everyday tasks including video streaming, but if you want to play some games, we recommend the SKU with the Core Ultra X7.
The aluminum chassis is once again very sleek and stable and ports selection is sufficient, but Samsung removed the card reader. The fans are quiet, temperatures are low and battery runtimes are very good, even though some rivals with inferior screens like the Dell XPS 16 we tested offer more stamina. We also like the new input devices with the haptic trackpad, but Samsung removed the dedicated numpad.
The big issue here is the price, because our unit retails for $2099 and this does not even include the faster Core Ultra X7 processor with the Arc B390 iGPU. All in all, the new Galaxy Book6 Pro is a good, but expensive overall package for everyday use.
Pros
Cons
Price and Availability
You can order the new Galaxy Book6 Pro directly from Samsung starting from $2099.
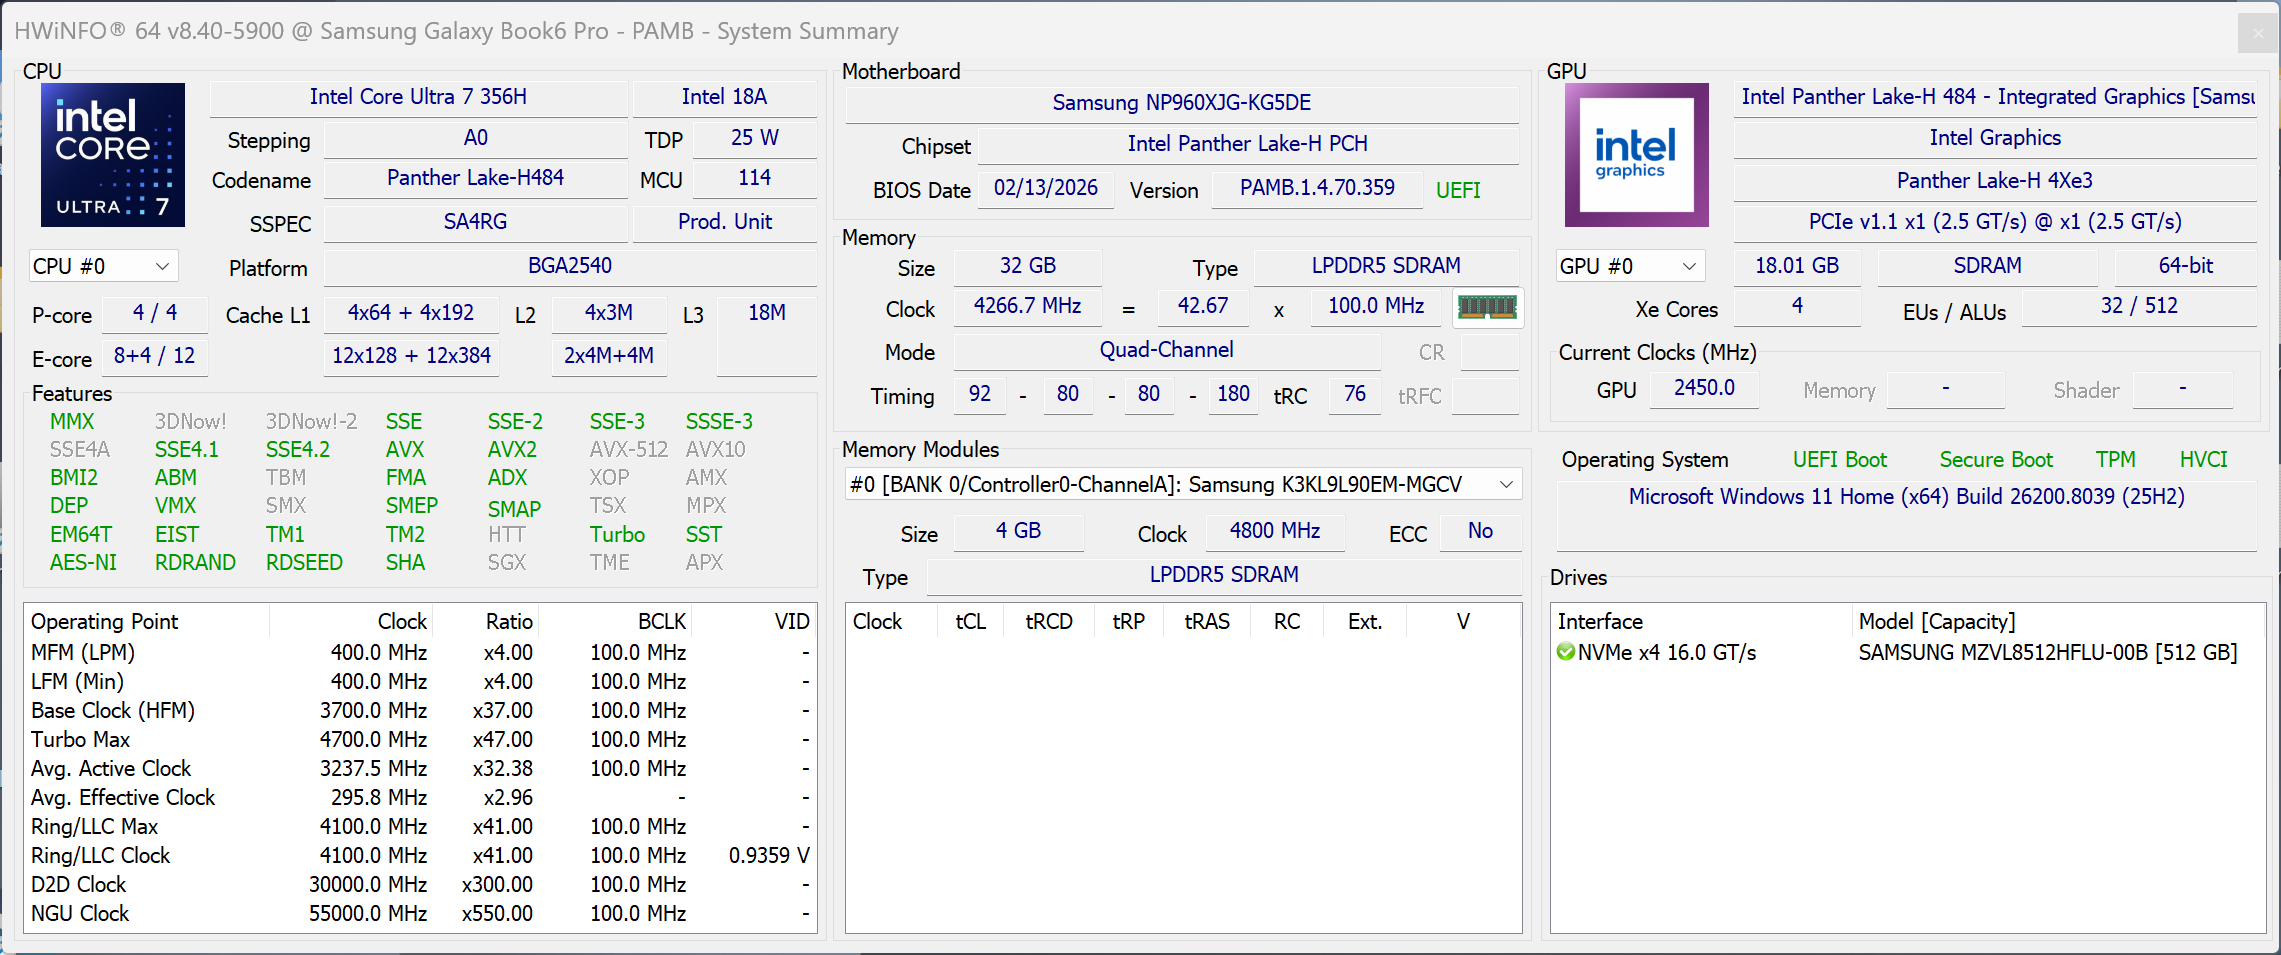
Samsung refreshed its Galaxy Book6 Pro models and now uses Intel's latest Panther Lake processor generation as well as updated OLED screens. We review the new 16-inch model with the Core Ultra 7 356H in combination with the standard Intel Graphics iGPU (4 Xe cores), 32 GB RAM as well as a 512 GB SSD. The retail model for $2049 gets a larger 1 TB SSD, the other specs are identical to our review unit.
Specifications
Case and Connectivity
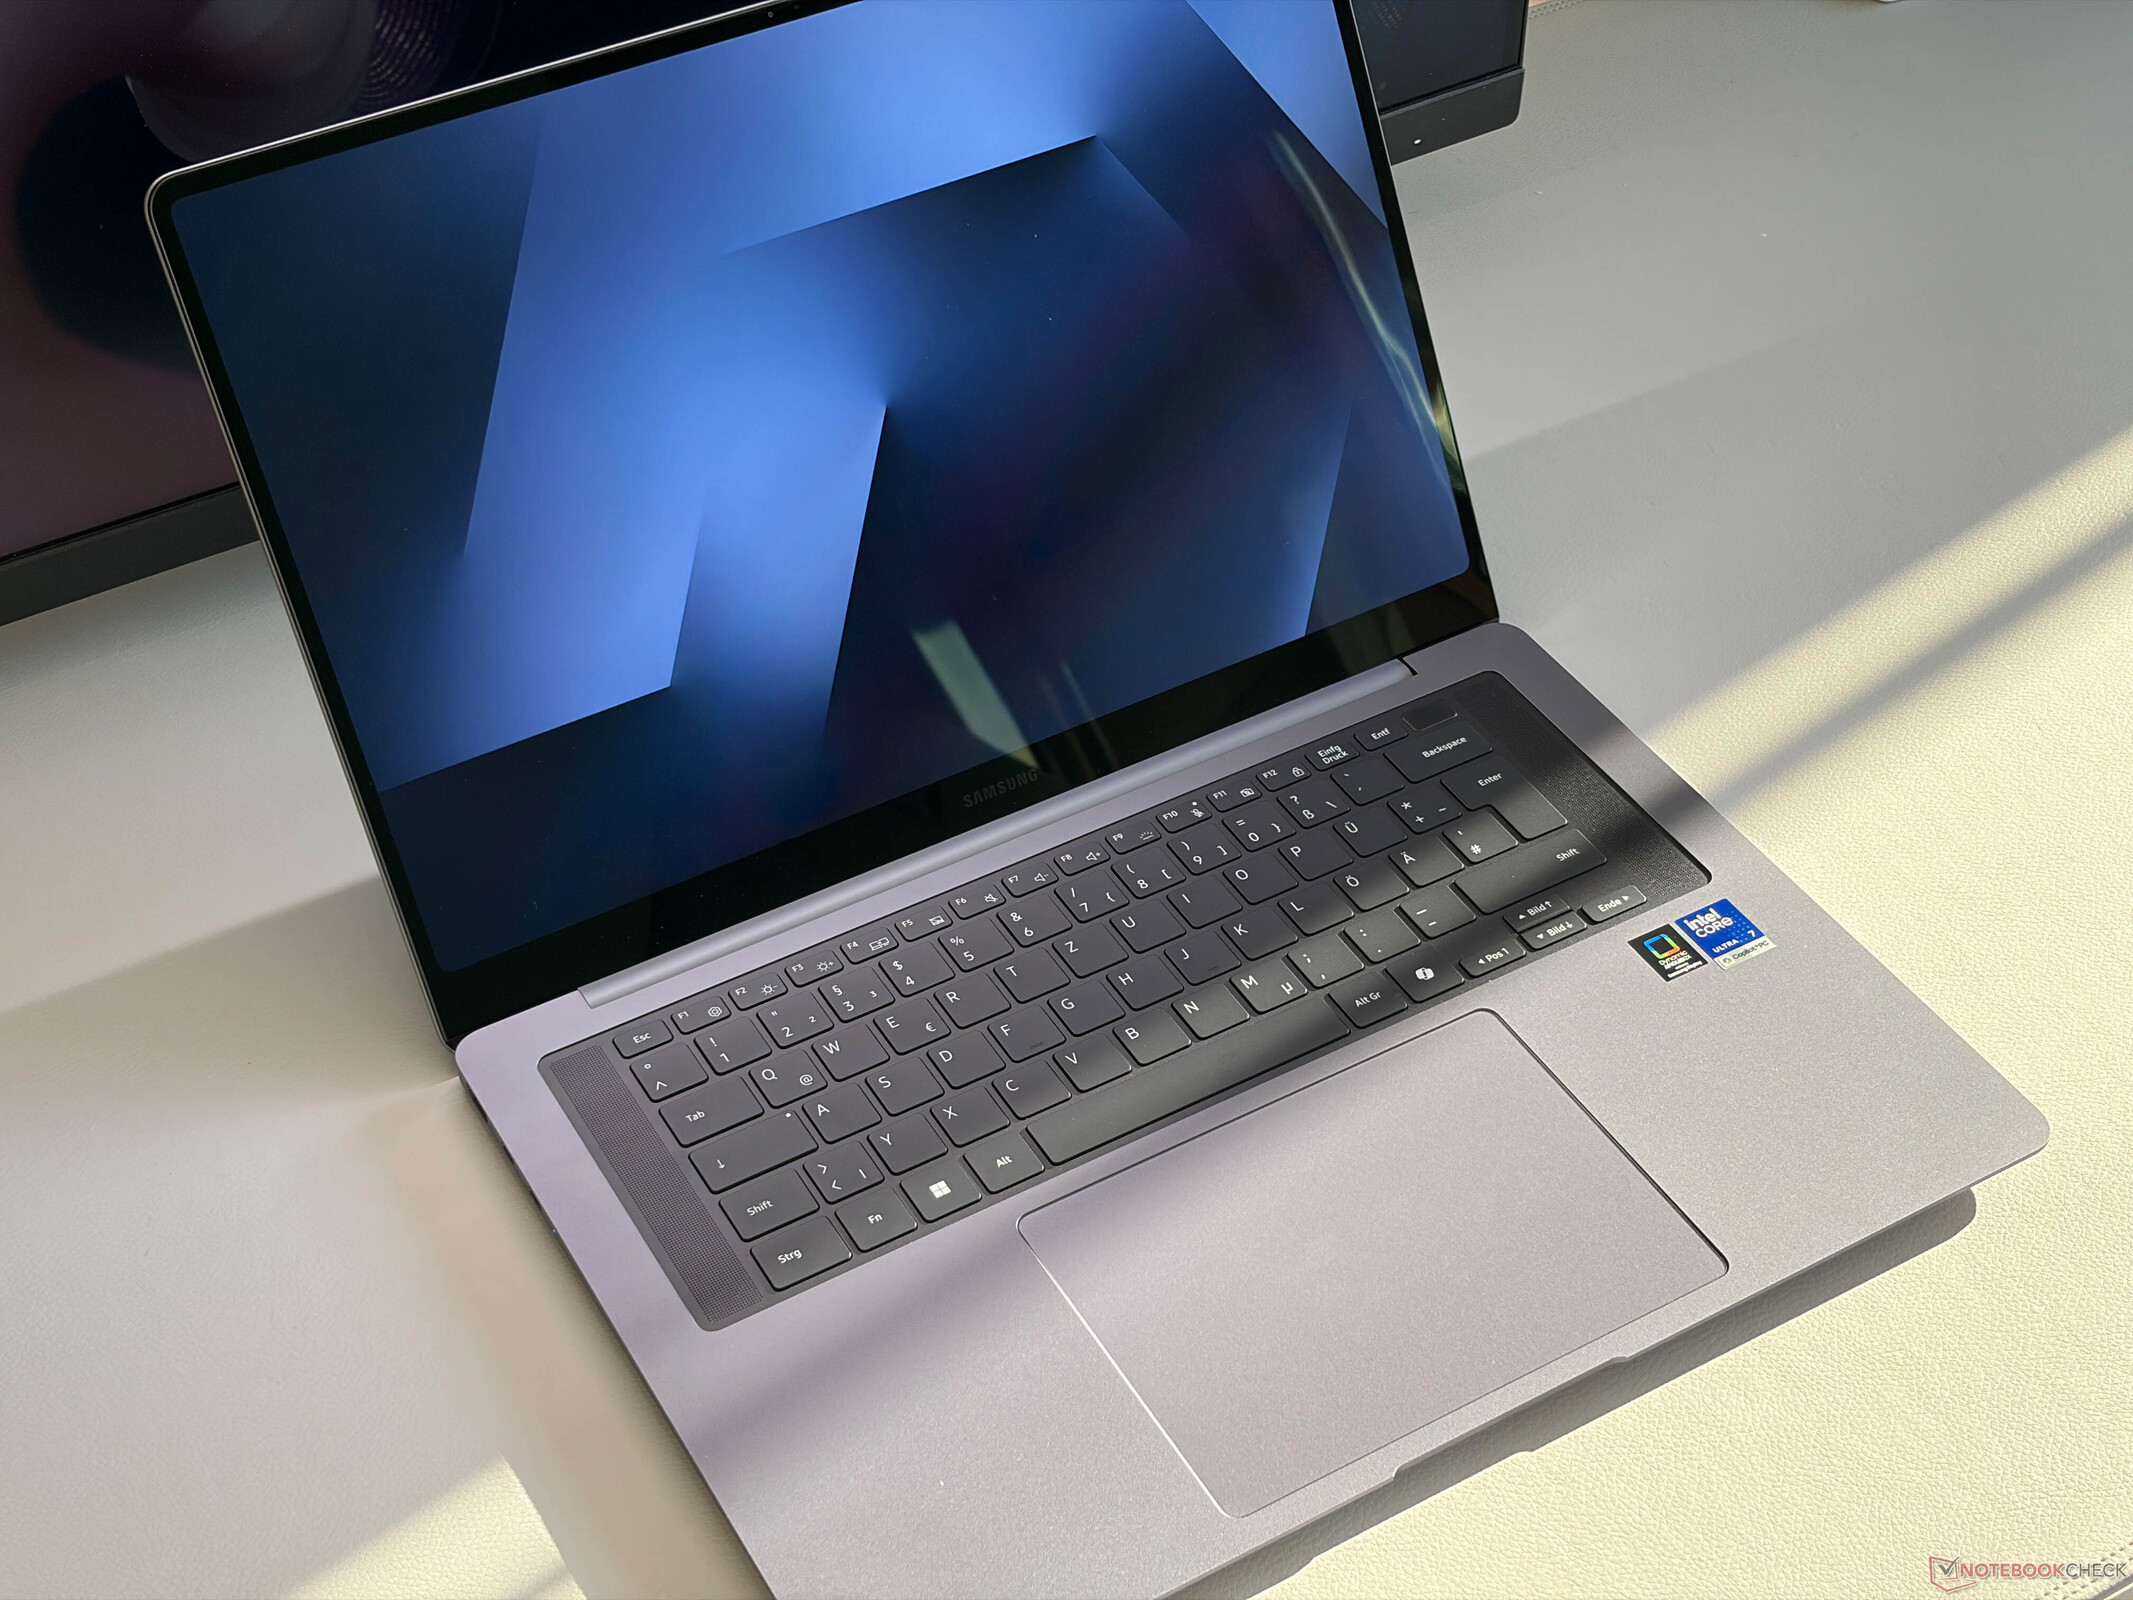
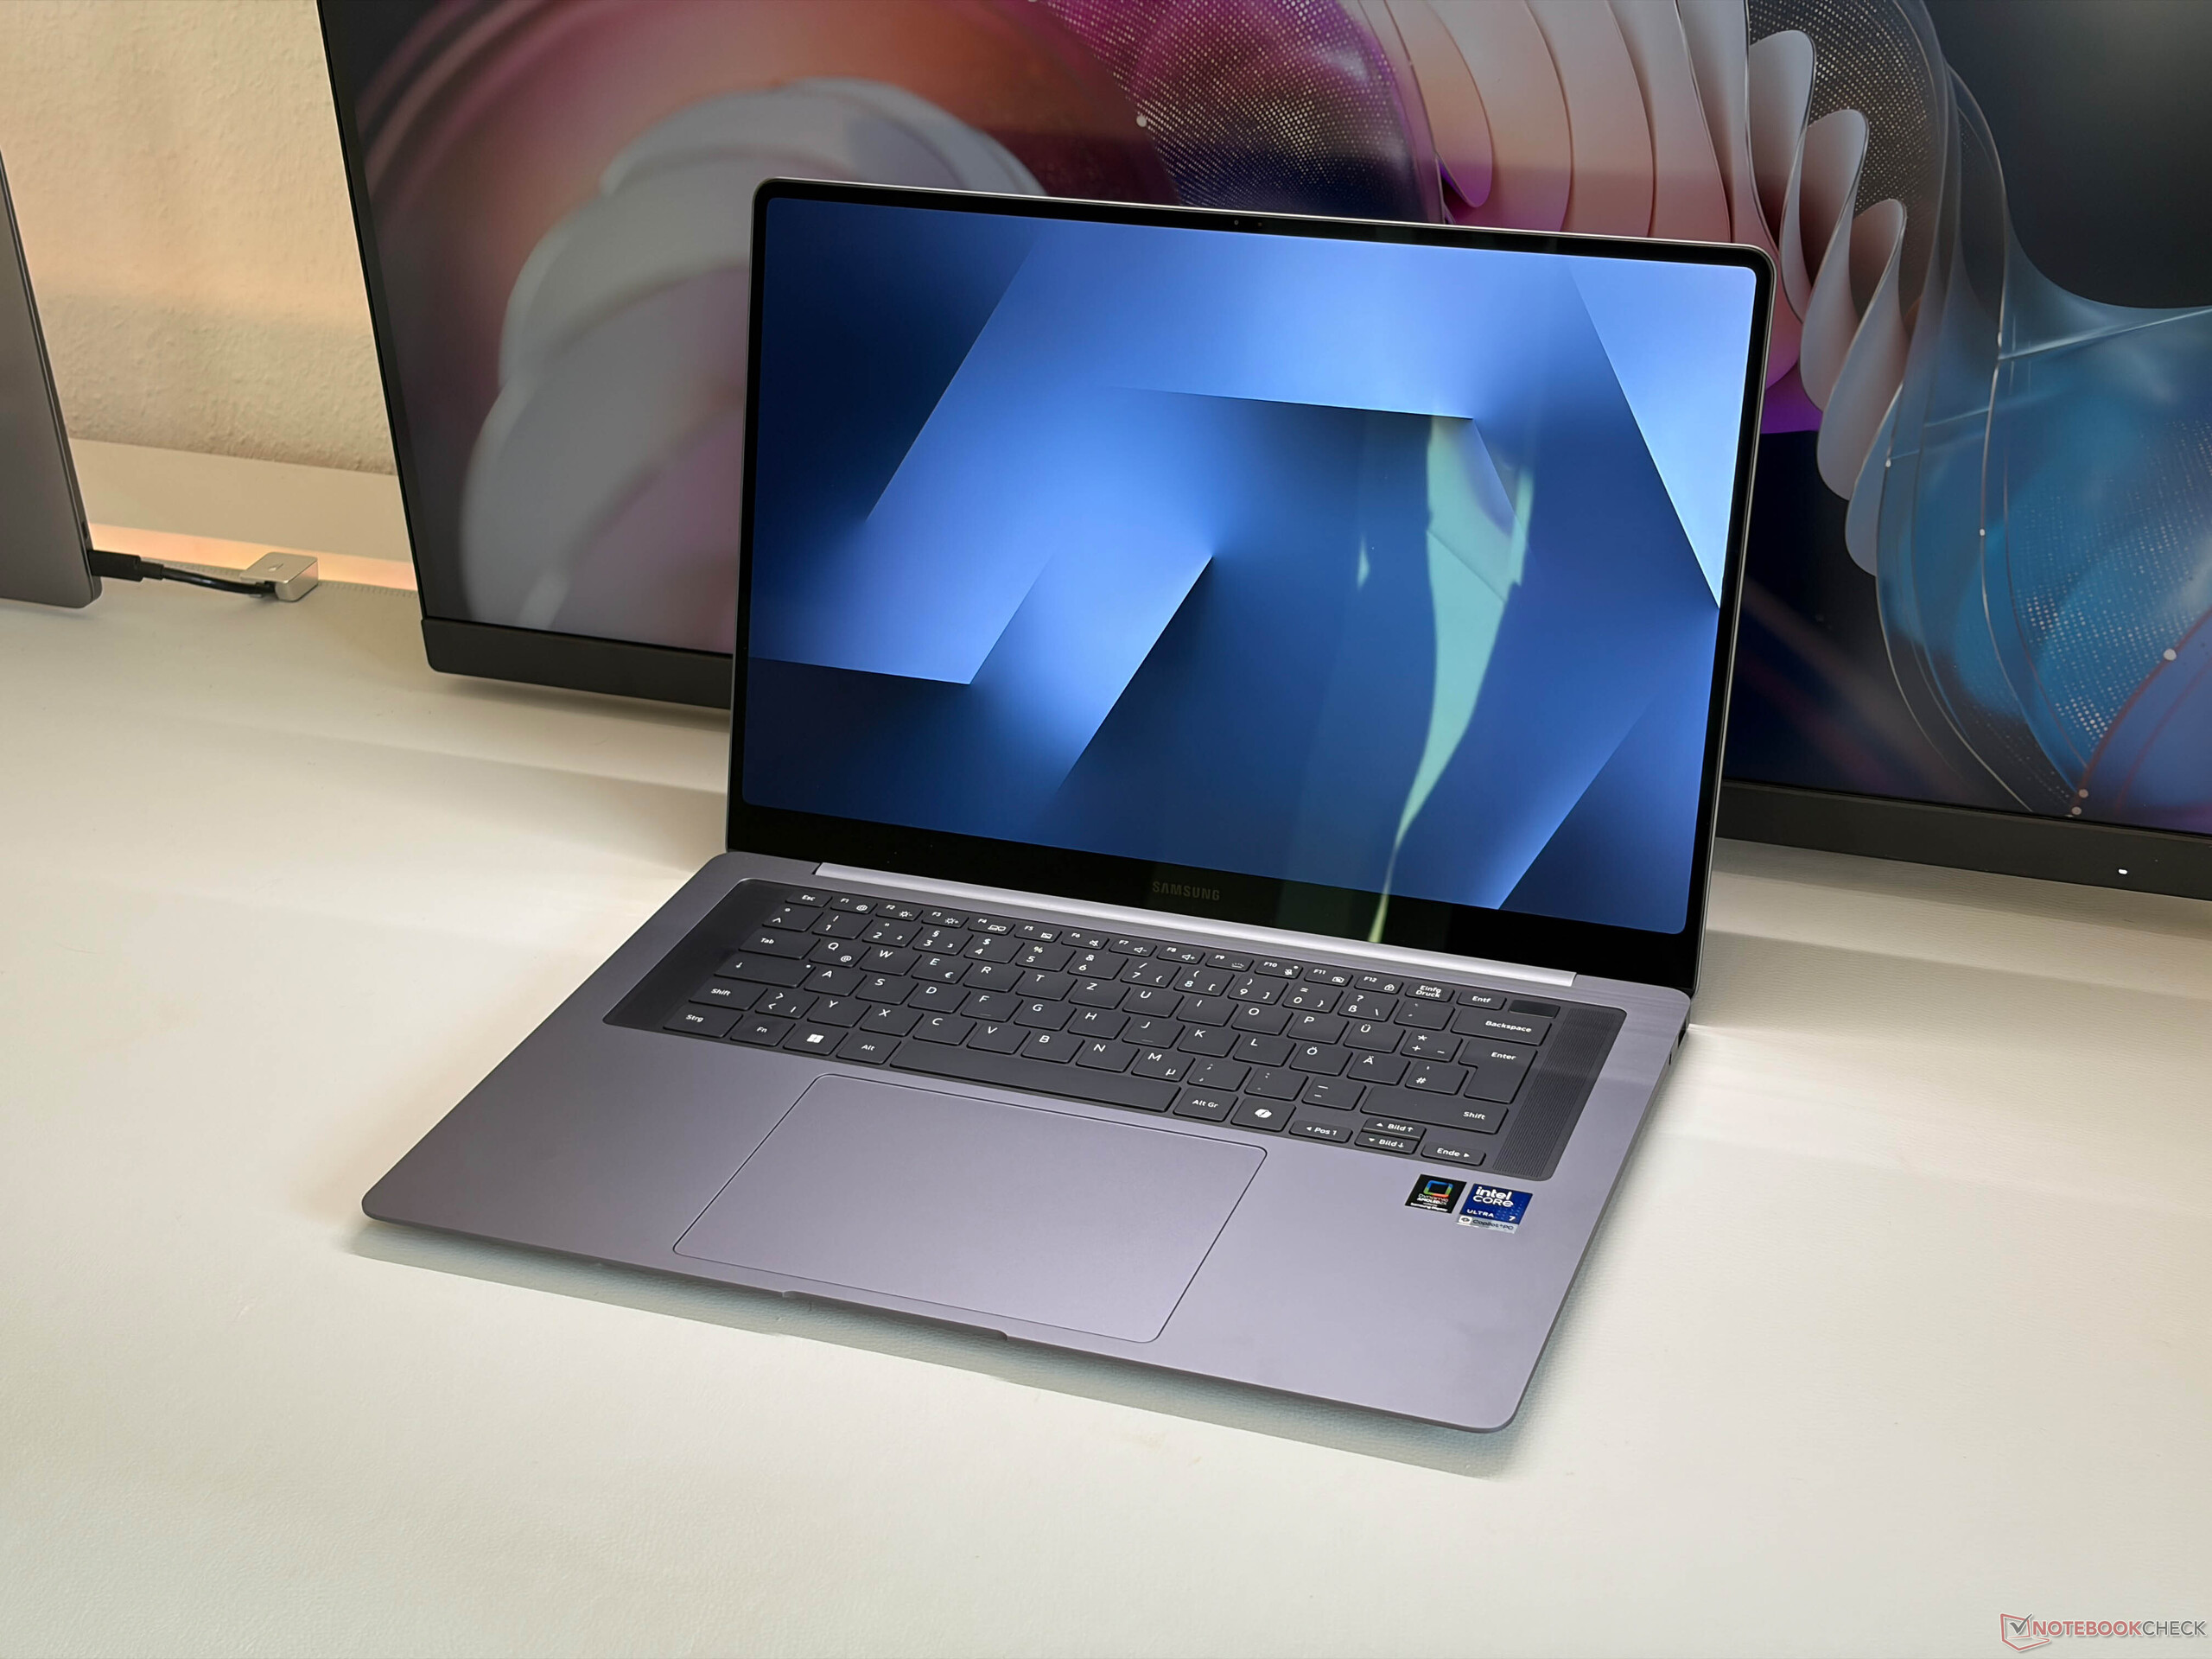
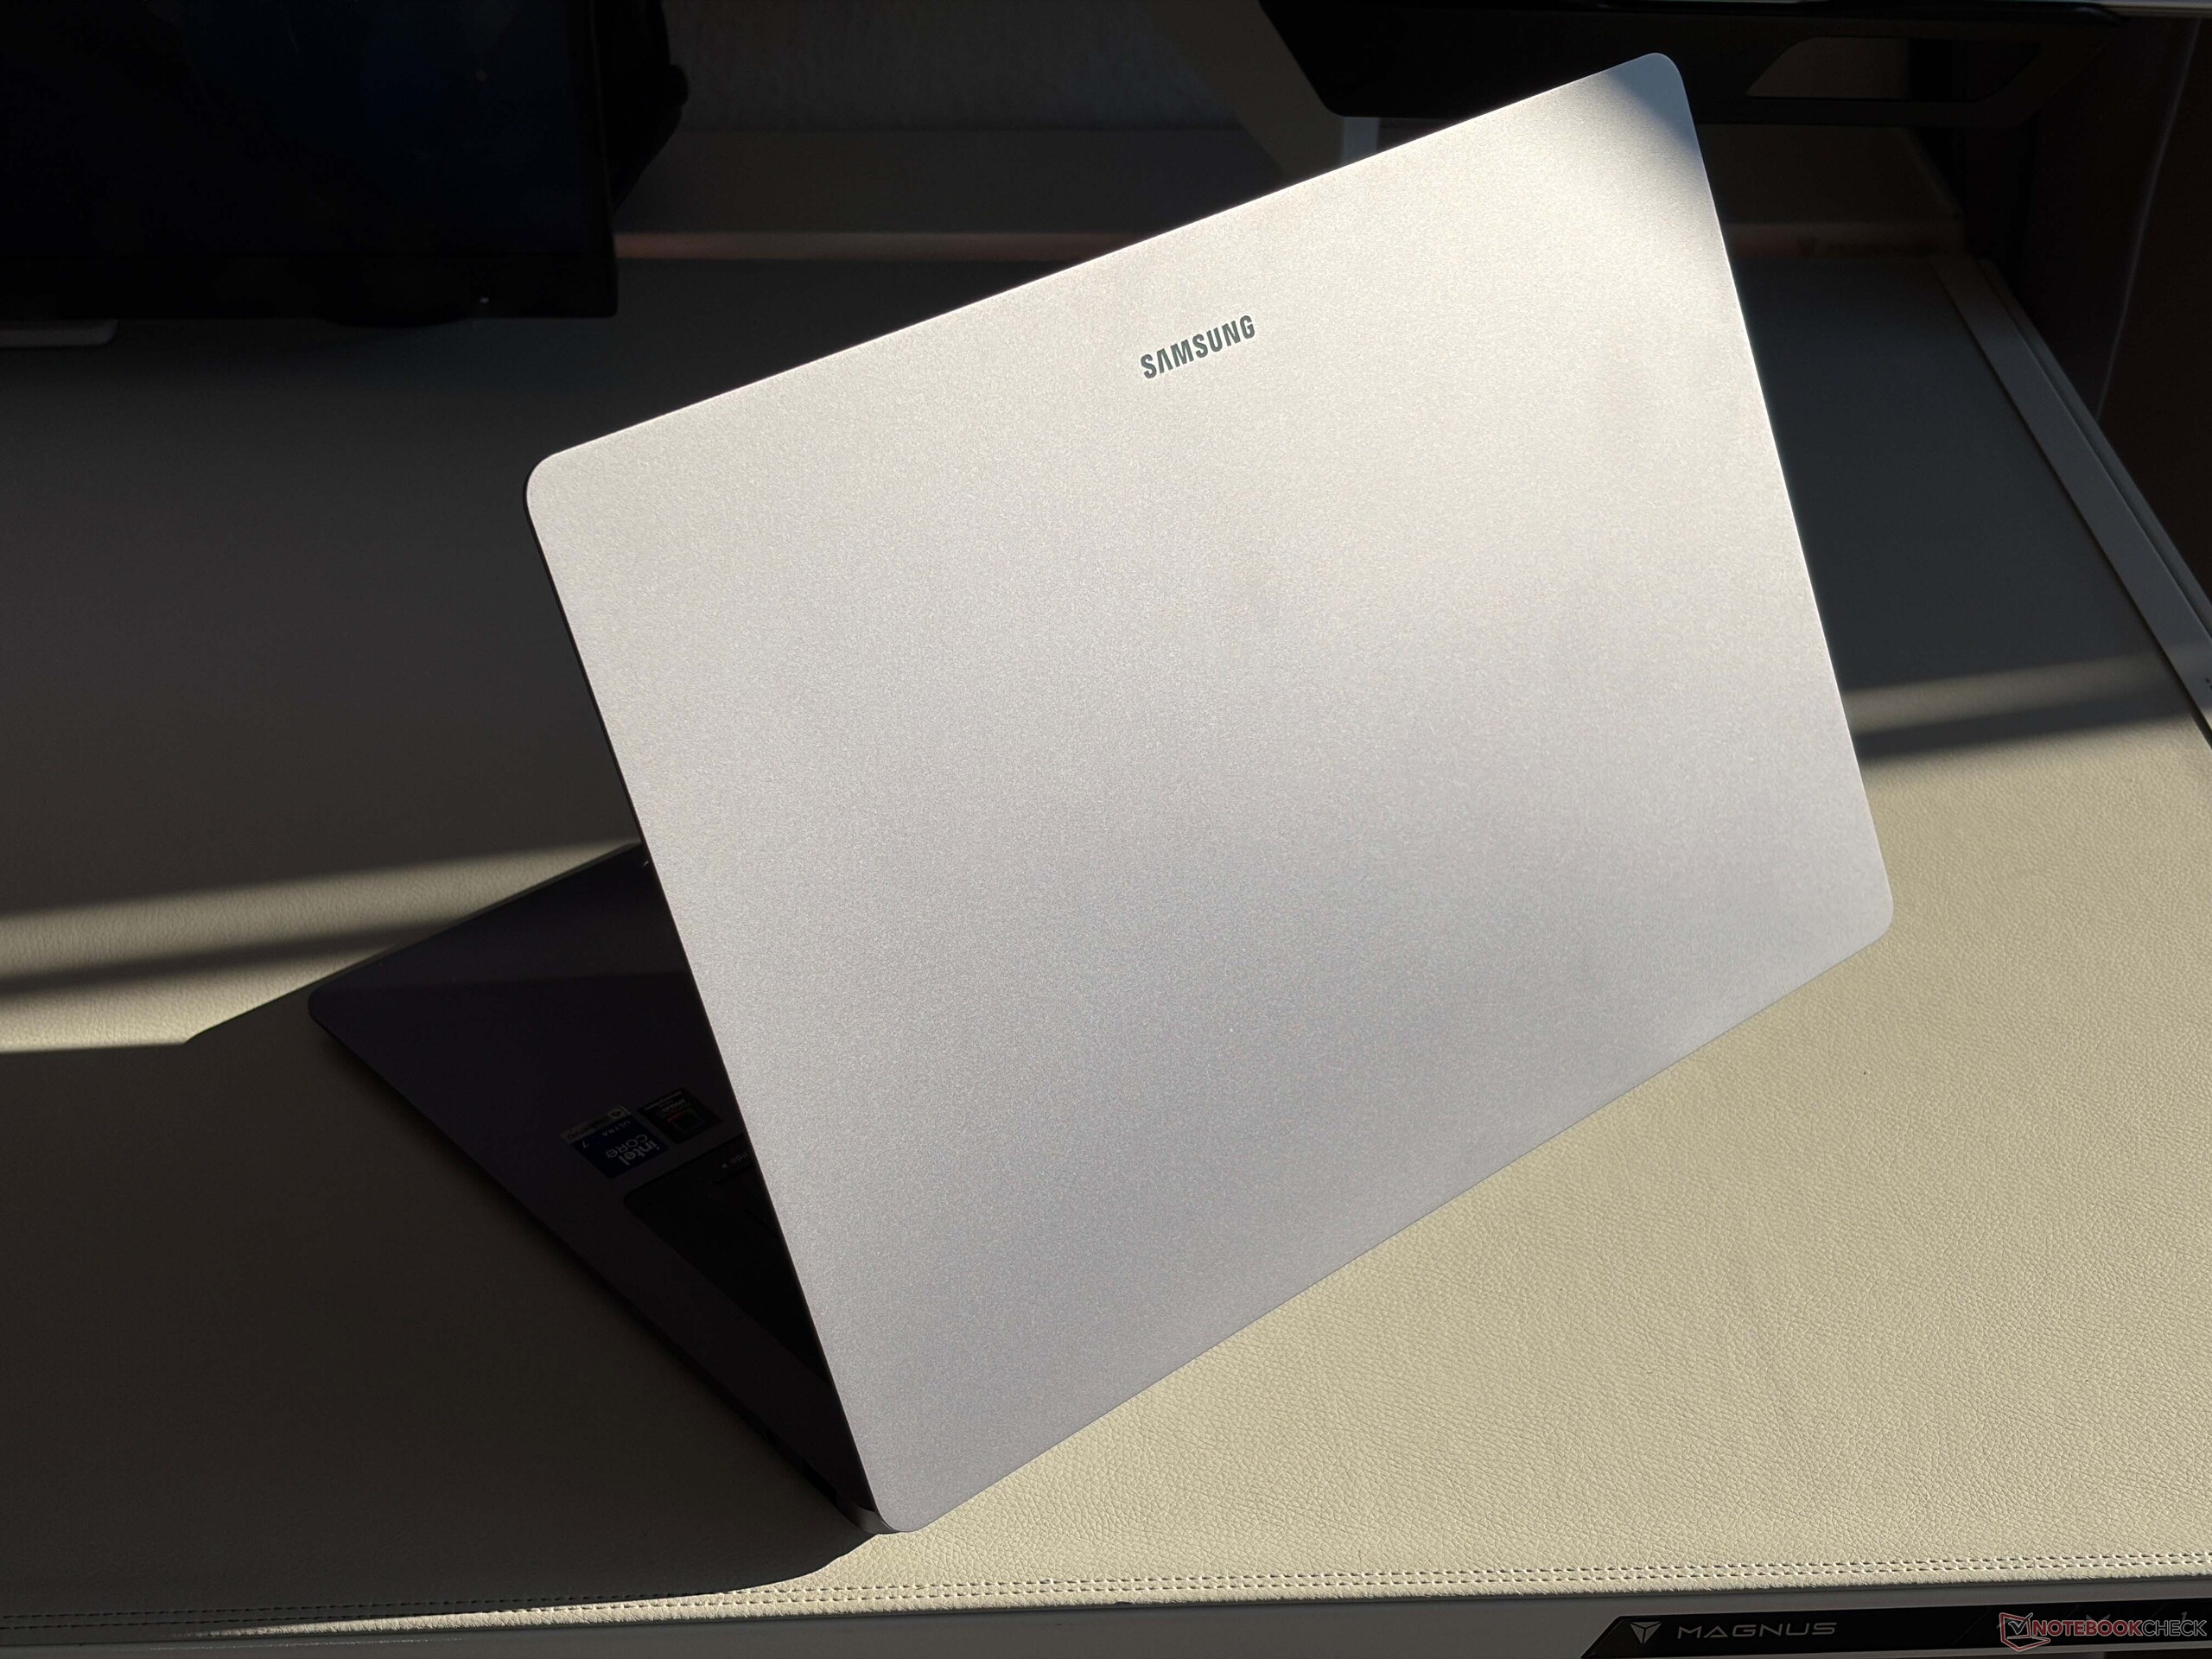
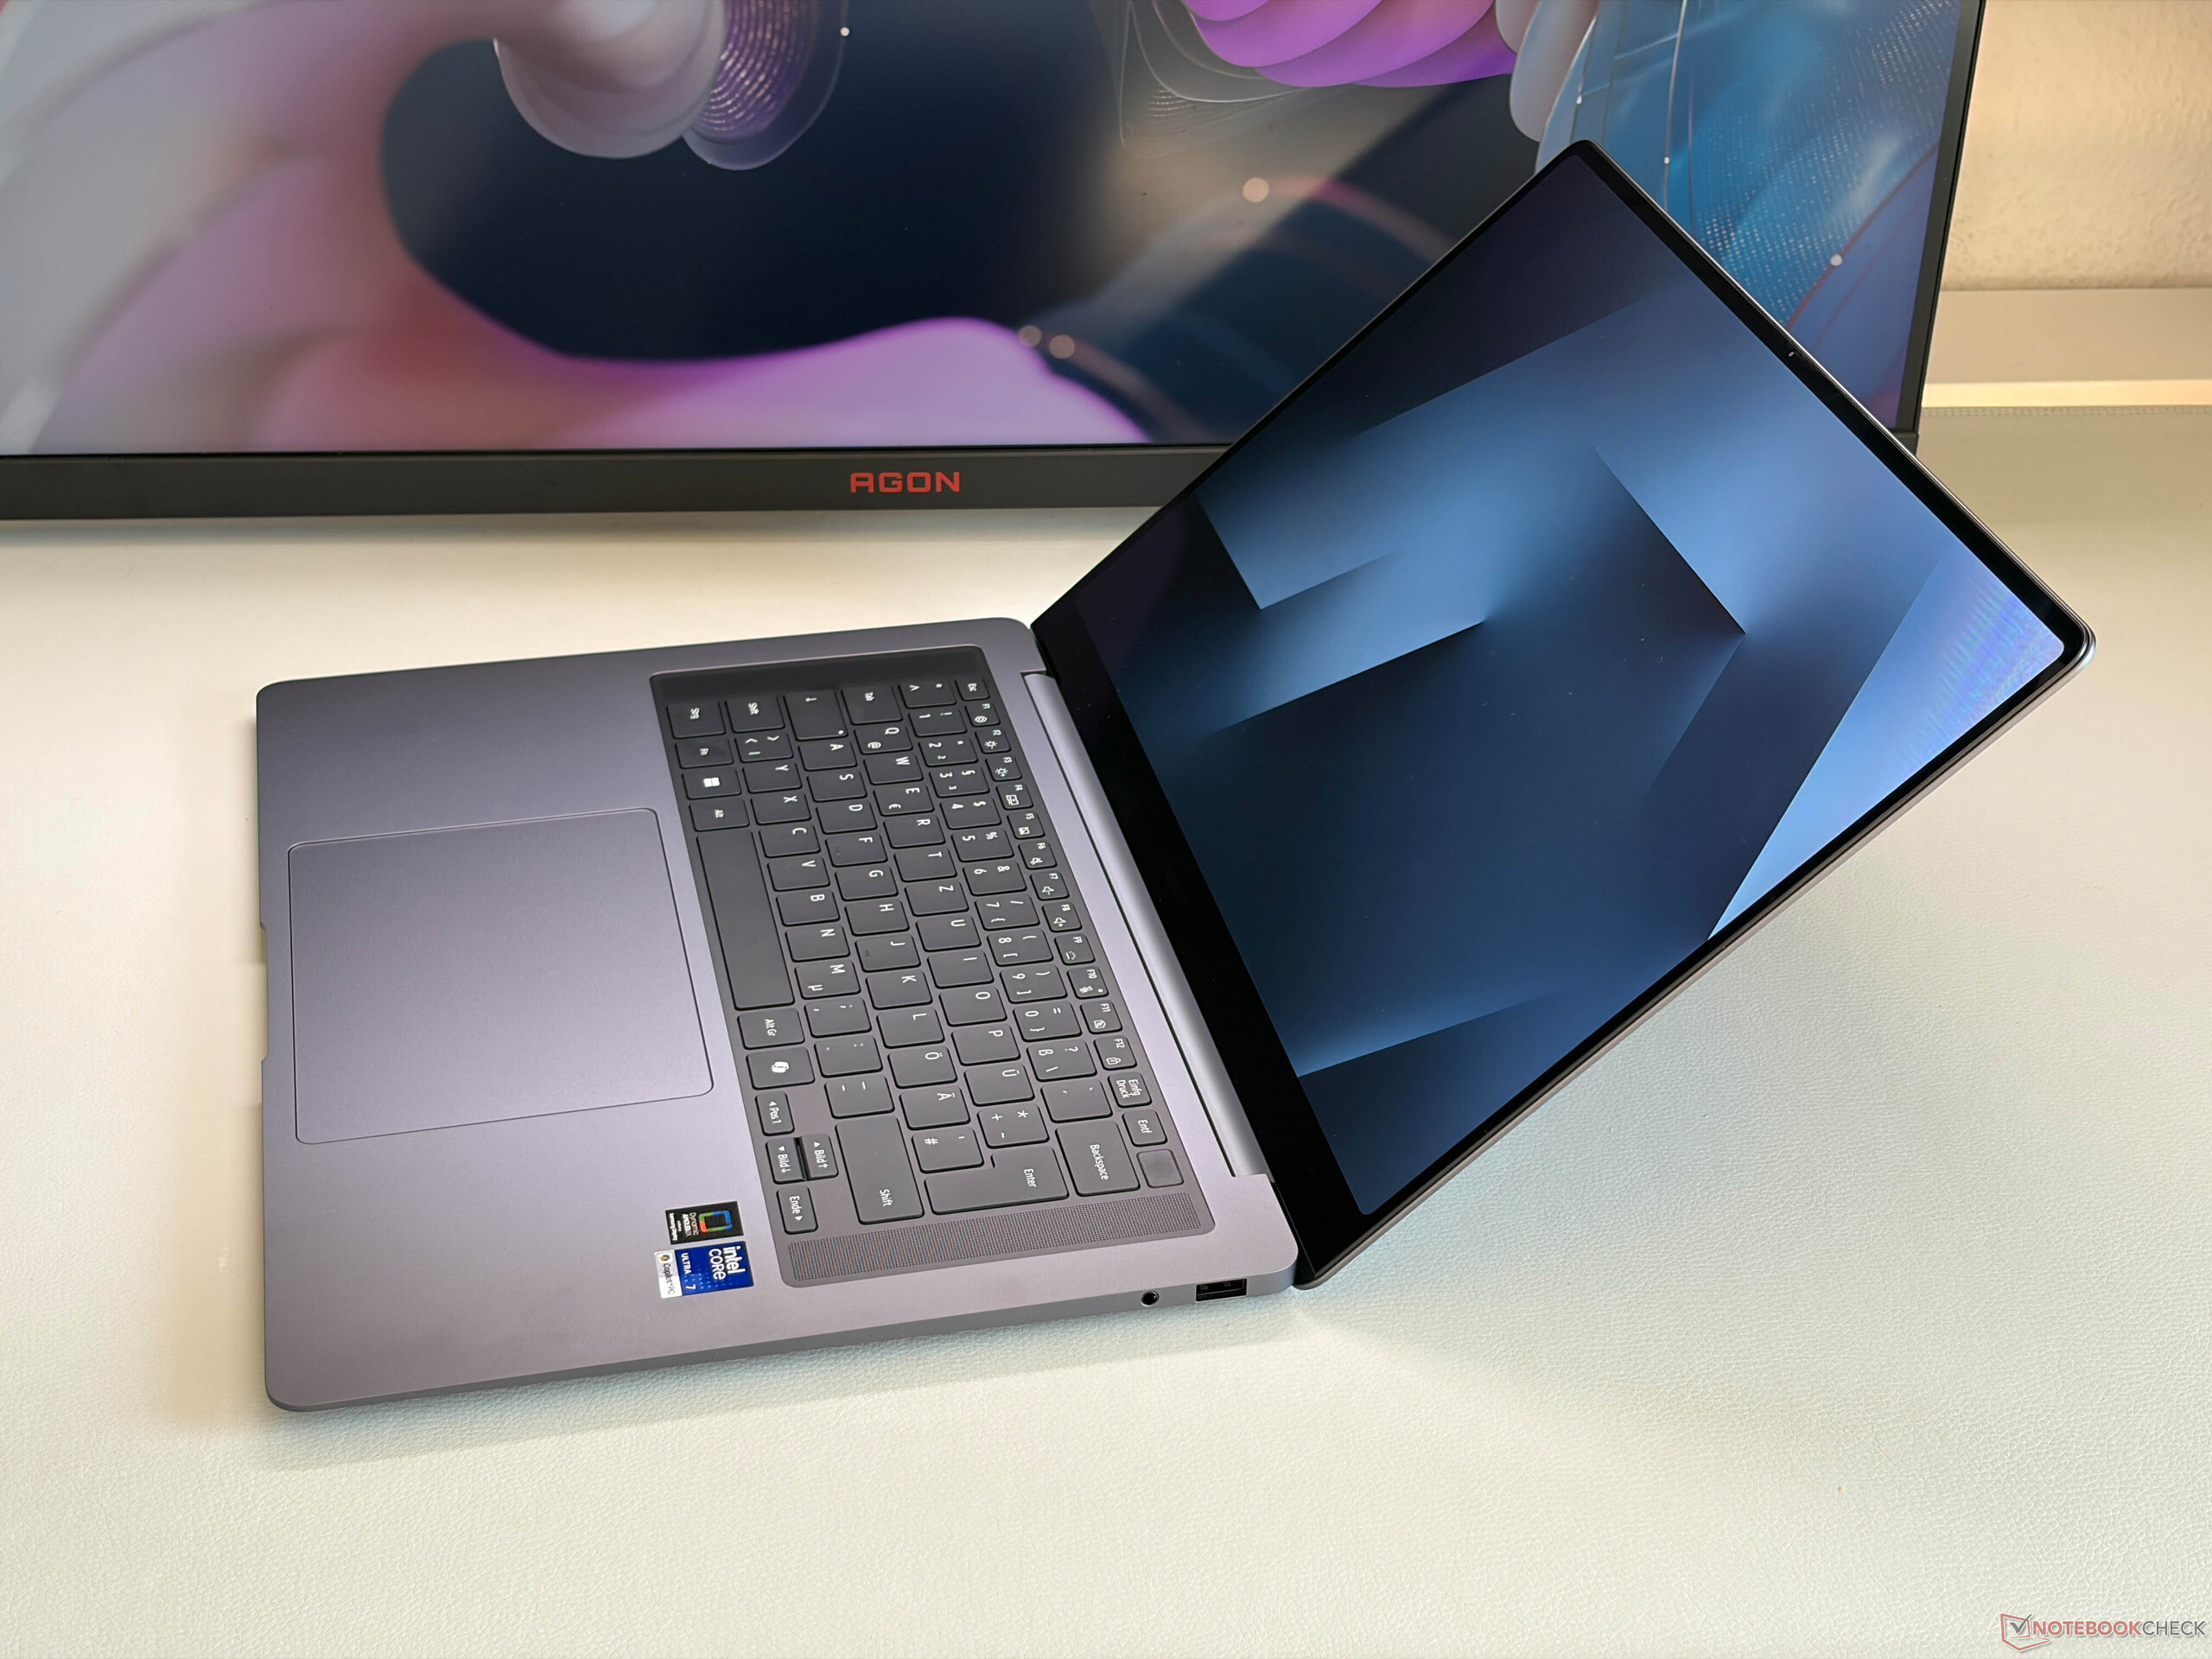
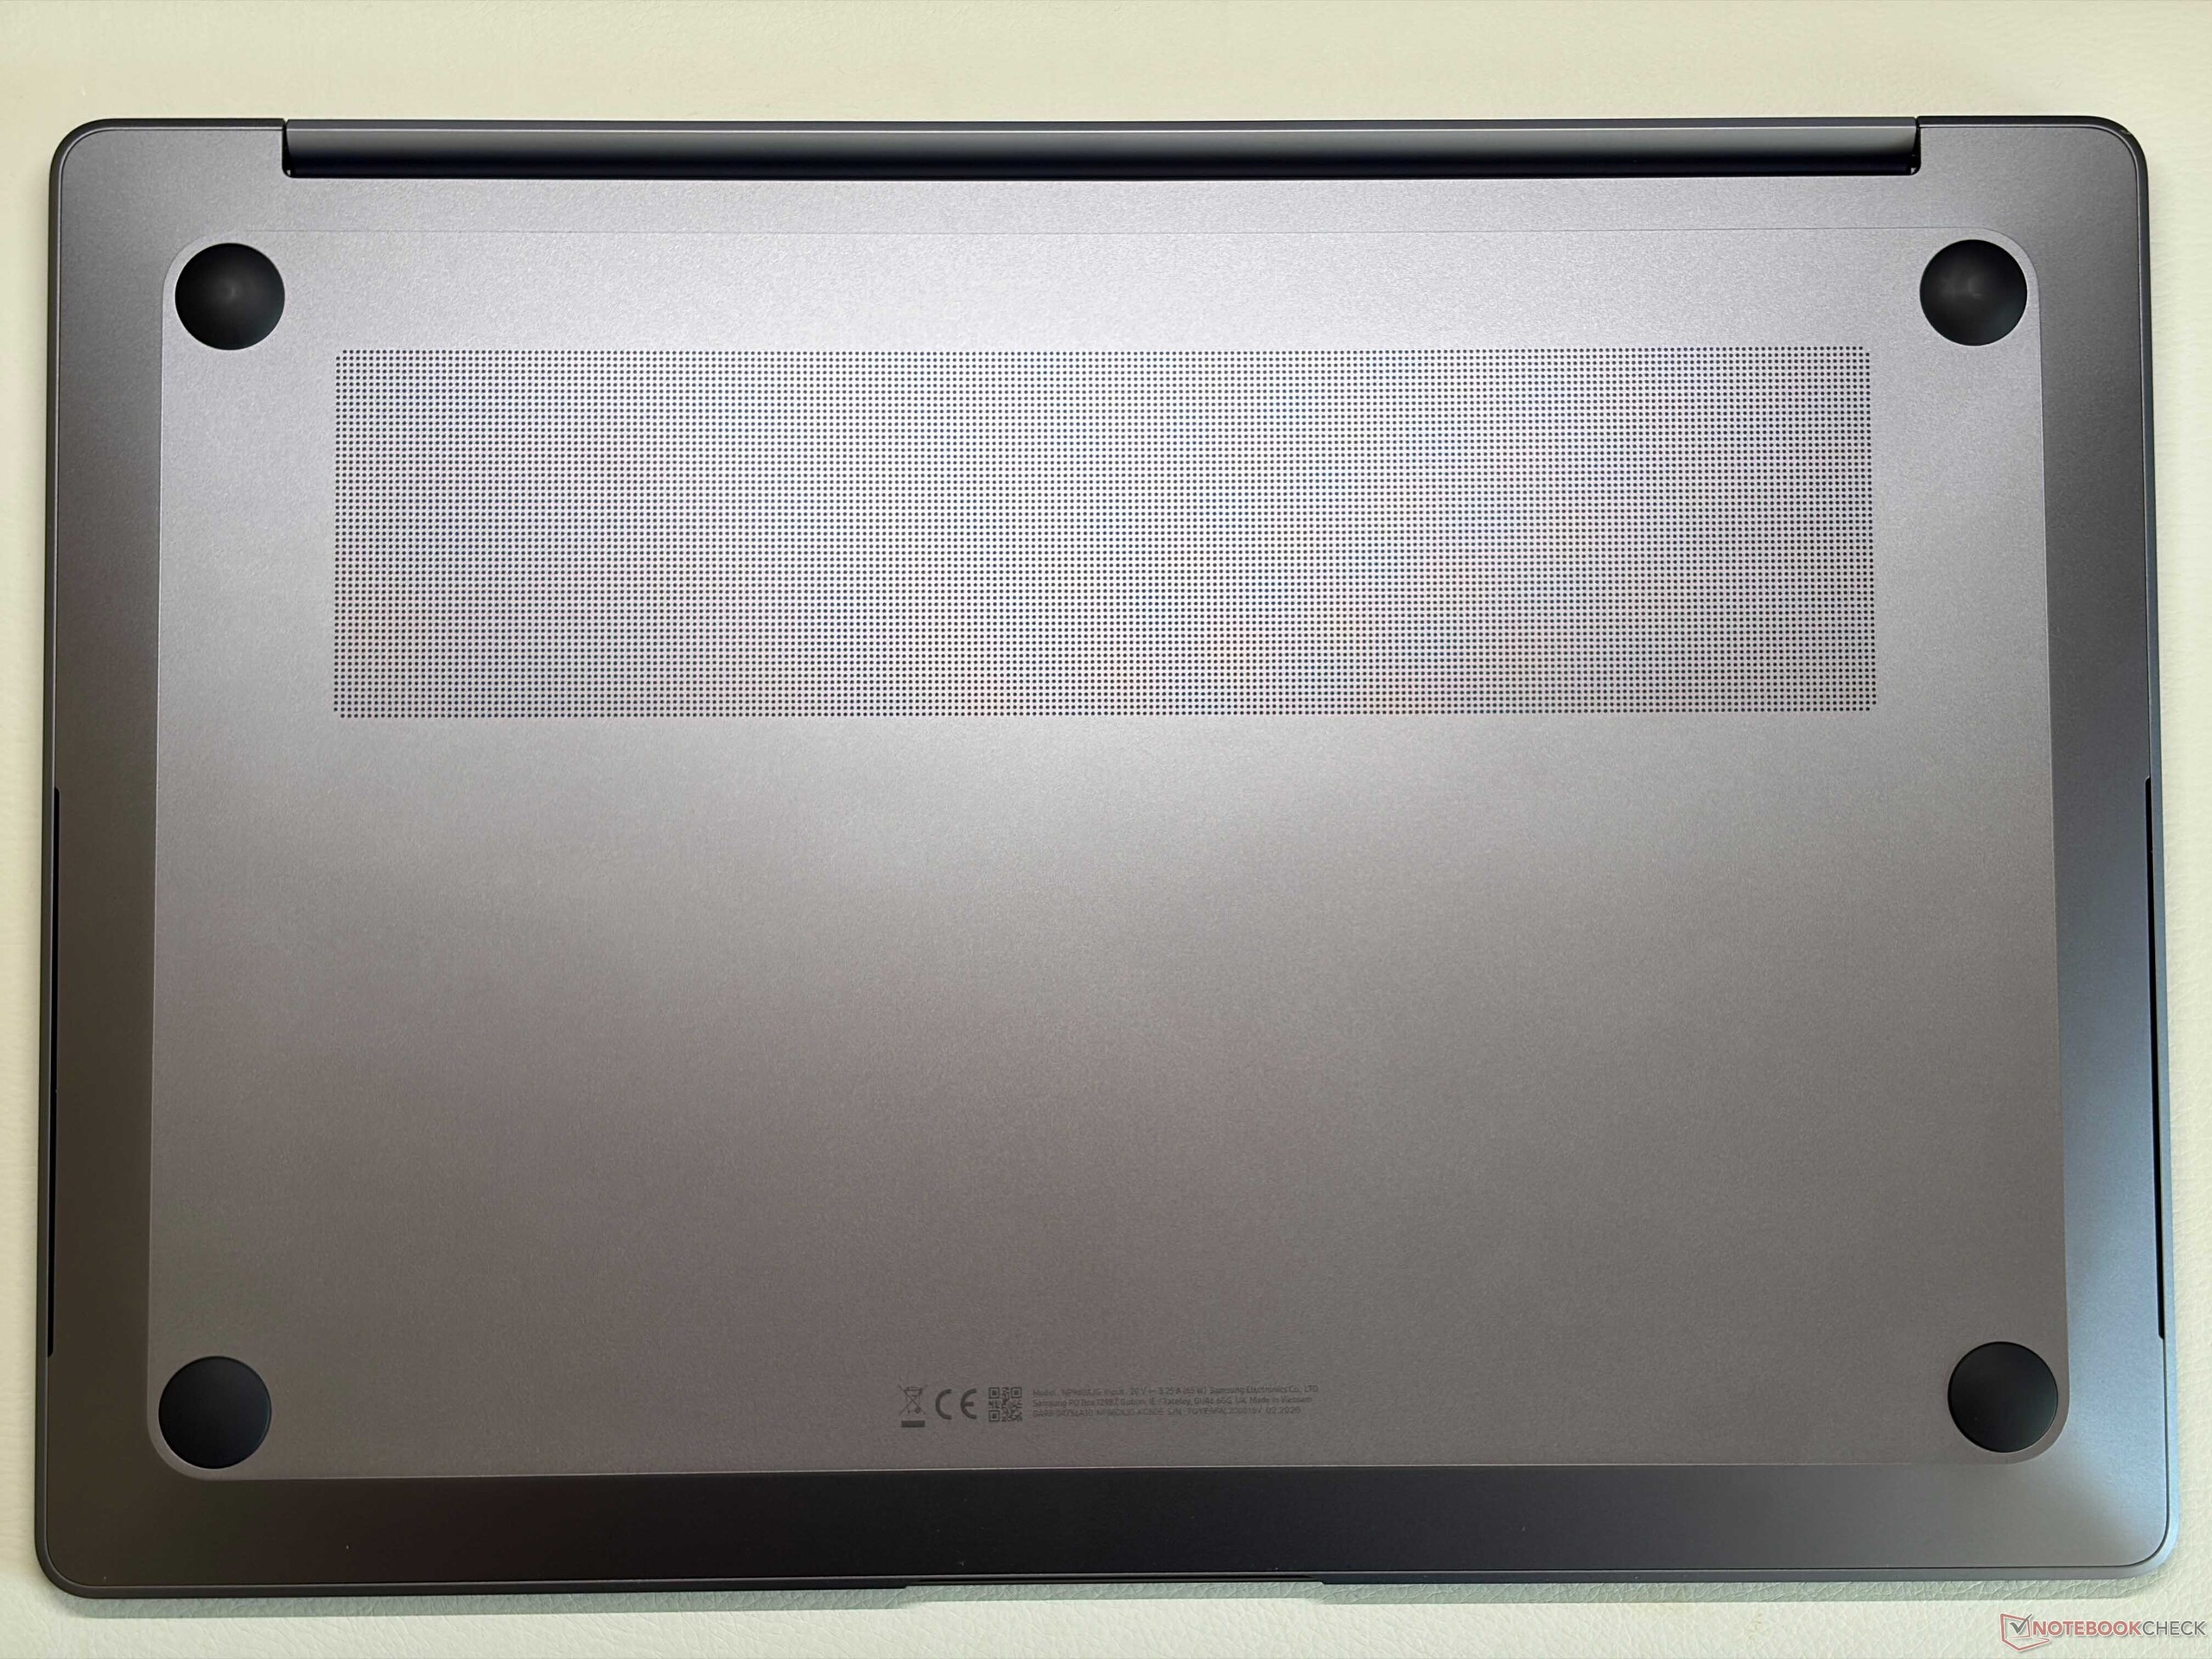
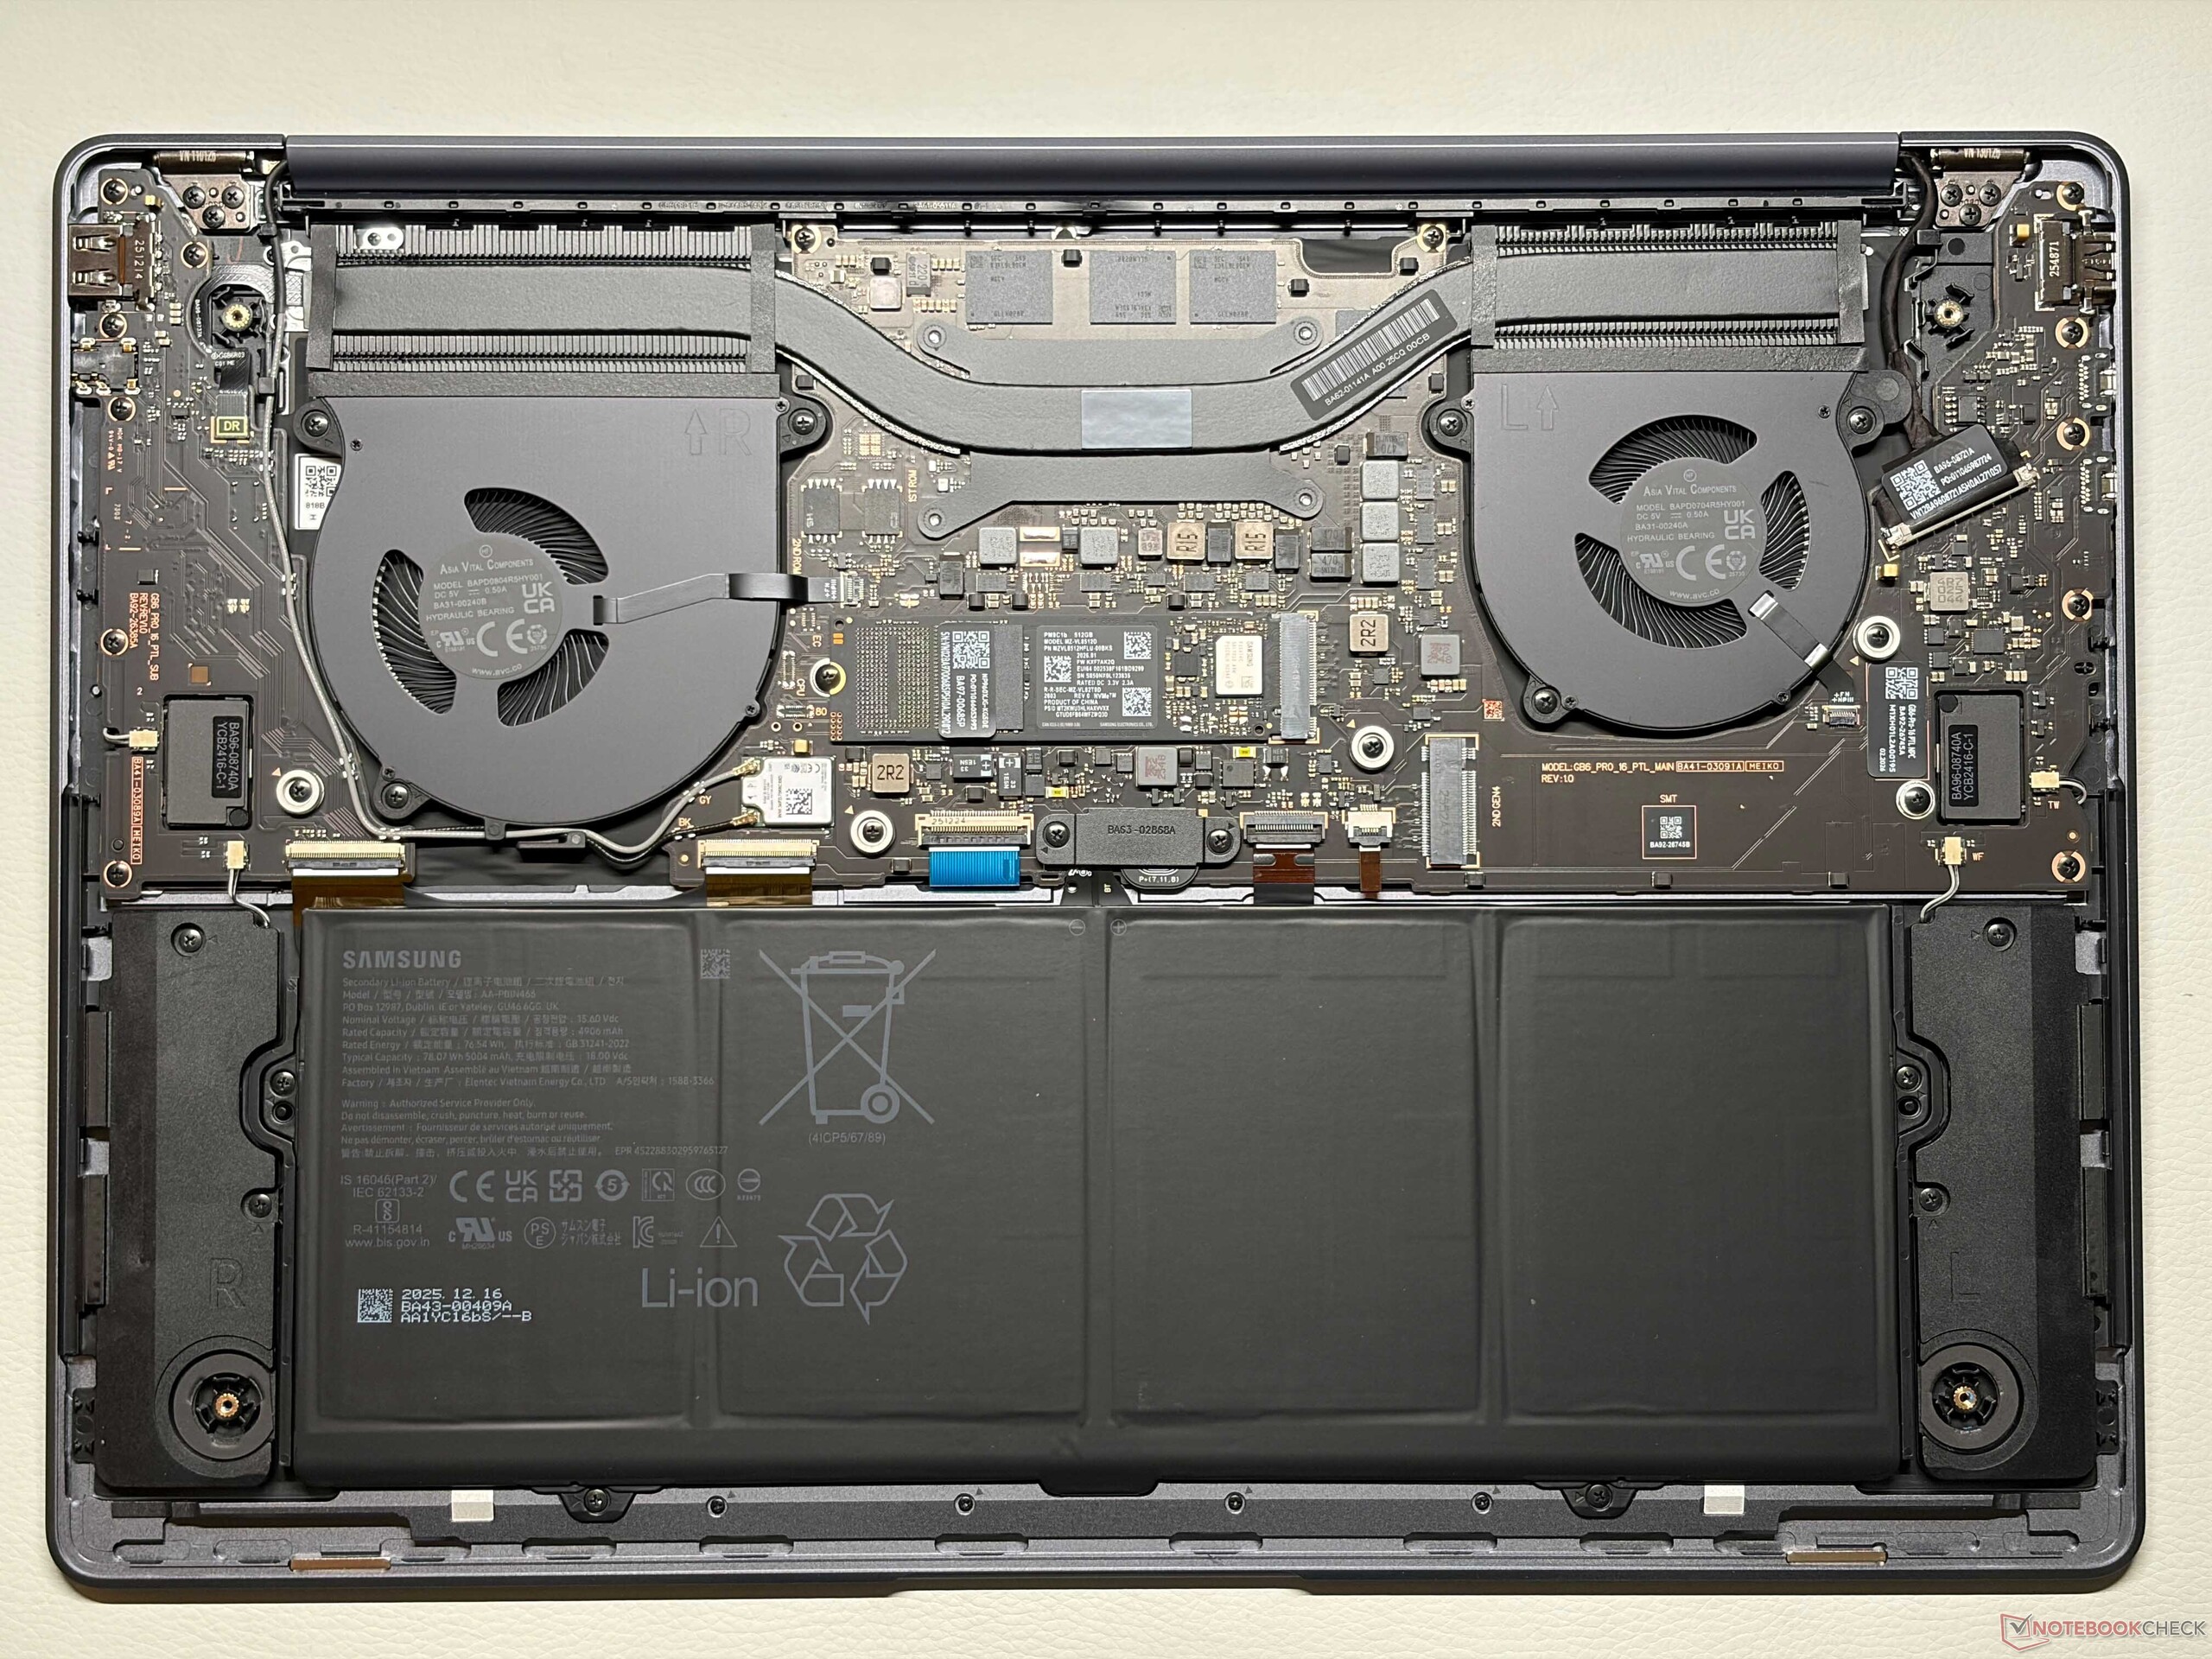
The chassis design looks pretty much identical to the previous model, which means you once again get a sleek 16-inch laptop with a high-quality aluminum chassis. The silver color does not really attract fingerprints and the stability is excellent. Especially the lower bezel is once again very thick and the new keyboard design as well as the re-arranged Samsung logo on the lid are basically the only two visible changes. The internal layout was slightly changed as well, but you still get two full-size M.2-2280 SSD slots, all the other components are onboard.
In terms of connectivity you still get Thunderbolt 4 as well as a regular USB-A port, but the microSD-card reader is gone. The Wi-Fi module now supports the new Wi-Fi 7 standard and we determine transfer rates of up to 4.5 Gbps. The 1080p webcam did not change.


| Networking | |
| Samsung Galaxy Book6 Pro | |
| iperf3 transmit AXE11000 | |
| iperf3 receive AXE11000 | |
| iperf3 transmit RT-BE96U WiFi7 | |
| iperf3 receive RT-BE96U WiFi7 | |
| Dell XPS 16 Core Ultra 5 325 | |
| iperf3 transmit AXE11000 | |
| iperf3 receive AXE11000 | |
| iperf3 transmit AXE11000 6GHz | |
| iperf3 receive AXE11000 6GHz | |
| Asus ZenBook S16 UM5606GA | |
| iperf3 transmit AXE11000 | |
| iperf3 receive AXE11000 | |
| Apple MacBook Air 15 M5 | |
| iperf3 transmit AXE11000 | |
| iperf3 receive AXE11000 | |
| Microsoft Surface Laptop 7 15 Lunar Lake | |
| iperf3 transmit AXE11000 | |
| iperf3 receive AXE11000 | |
| Lenovo ThinkPad X9-15 Aura Edition | |
| iperf3 transmit AXE11000 | |
| iperf3 receive AXE11000 | |


Input Devices
Samsung changed the input devices and we already experienced the new keyboard on the Galaxy Book6 Ultra. The dedicated numpad is gone and there are now speakers next to the keyboard. The typing experience is okay and benefits from precise feedback, but the key travel is pretty shallow. Both the Zenbook S16 as well as the ThinkPad X9 15 offer more comfortable keyboards. The huge haptic trackpad (15 x 10.5 cm) on the other hand is excellent and you can also use the capacitive touchscreen for inputs.


Display - Brighter 120 Hz OLED
Samsung uses a brighter OLED touchscreen for the Galaxy Book6 Pro and it is the exact same panel from the Galaxy Book6 Ultra. The subjective image quality is excellent with rich colors and sharp images and even bright contents do not look grainy. Movements are smooth thanks to 120 Hz (adaptive between 30-120 Hz) and response times are very fast, but there is PWM flickering at 240 Hz at every brightness level with a large amplitude, so sensitive users should try the panel first.
Samsung finally improved the brightness and we measure 500 nits for SDR contents and up to 1200 nits for HDR contents (648 nits for a completely white image). Samsung also implements accurate color profiles for P3 as well as sRGB out of the box and our analysis with the professional CalMAN software shows excellent color accuracy out of the box, so pitcure editing is no problem. We could not improve the accuracy even further with our own calibration.
| |||||||||||||||||||||||||
Brightness Distribution: 97 %
Center on Battery: 502 cd/m²
Contrast: ∞:1 (Black: 0 cd/m²)
ΔE ColorChecker Calman: 1 | ∀{0.5-29.43 Ø4.73}
ΔE Greyscale Calman: 1.8 | ∀{0.09-98 Ø4.97}
85.9% AdobeRGB 1998 (Argyll 3D)
99.9% sRGB (Argyll 3D)
98.3% Display P3 (Argyll 3D)
Gamma: 2.24
CCT: 6435 K
| Samsung Galaxy Book6 Pro ATNA60HR05-0, OLED, 2880x1800, 16", 120 Hz | Dell XPS 16 Core Ultra 5 325 LG Philips 160WUX, IPS, 1920x1200, 16", 120 Hz | Asus ZenBook S16 UM5606GA ATNA60HR07-0, OLED, 2880x1800, 16", 120 Hz | Apple MacBook Air 15 M5 IPS, 2880x1864, 15.3", 60 Hz | Microsoft Surface Laptop 7 15 Lunar Lake LQ150P1JX61, IPS, 2496x1664, 15", 120 Hz | Lenovo ThinkPad X9-15 Aura Edition ATNA53JB01-0, OLED, 2880x1800, 15.3", 120 Hz | Samsung Galaxy Book4 Pro 16 ATNA60CL07-0, OLED, 2880x1800, 16", 120 Hz | |
|---|---|---|---|---|---|---|---|
| Display | -19% | 4% | -1% | 1% | 4% | 5% | |
| Display P3 Coverage (%) | 98.3 | 66.2 -33% | 99.8 2% | 97.5 -1% | 98.1 0% | 100 2% | 99.5 1% |
| sRGB Coverage (%) | 99.9 | 97.4 -3% | 100 0% | 98.3 -2% | 100 0% | 100 0% | 100 0% |
| AdobeRGB 1998 Coverage (%) | 85.9 | 67.7 -21% | 94 9% | 86.3 0% | 87.2 2% | 94.6 10% | 97.5 14% |
| Response Times | -6924% | -37% | -4477% | -4967% | -38% | -46% | |
| Response Time Grey 50% / Grey 80% * (ms) | 0.51 ? | 39.3 ? -7606% | 1.27 ? -149% | 26.9 ? -5175% | 33.4 ? -6449% | 1.46 ? -186% | 0.64 ? -25% |
| Response Time Black / White * (ms) | 0.41 ? | 26 ? -6241% | 0.43 ? -5% | 15.9 ? -3778% | 14.7 ? -3485% | 0.44 ? -7% | 0.68 ? -66% |
| PWM Frequency (Hz) | 240 ? | 960 ? | 1200 ? | 240 ? | |||
| PWM Amplitude * (%) | 100 | 56 44% | 22 78% | ||||
| Screen | -48% | -7% | -42% | 35% | 1% | -2% | |
| Brightness middle (cd/m²) | 502 | 534.6 6% | 465 -7% | 538 7% | 599 19% | 509 1% | 385 -23% |
| Brightness (cd/m²) | 507 | 515 2% | 466 -8% | 521 3% | 590 16% | 508 0% | 391 -23% |
| Brightness Distribution (%) | 97 | 92 -5% | 99 2% | 90 -7% | 93 -4% | 97 0% | 97 0% |
| Black Level * (cd/m²) | 0.26 | 0.44 | 0.4 | 0.01 | |||
| Colorchecker dE 2000 * | 1 | 2.53 -153% | 1 -0% | 2.1 -110% | 0.5 50% | 1.1 -10% | 1.1 -10% |
| Colorchecker dE 2000 max. * | 2.4 | 4.57 -90% | 3 -25% | 4.1 -71% | 0.9 62% | 2.5 -4% | 1.8 25% |
| Greyscale dE 2000 * | 1.8 | 2.7 -50% | 1.9 -6% | 3.1 -72% | 0.6 67% | 1.5 17% | 1.4 22% |
| Gamma | 2.24 98% | 2.32 95% | 2.19 100% | 2.19 100% | 2.16 102% | 2.28 96% | 2.24 98% |
| CCT | 6435 101% | 6860 95% | 6458 101% | 7075 92% | 6543 99% | 6294 103% | 6444 101% |
| Contrast (:1) | 2056 | 1223 | 1498 | 50900 | |||
| Colorchecker dE 2000 calibrated * | 1.26 | 0.7 | |||||
| Total Average (Program / Settings) | -2330% /
-1290% | -13% /
-12% | -1507% /
-837% | -1644% /
-884% | -11% /
-8% | -14% /
-8% |
* ... smaller is better


Display Response Times
| ↔ Response Time Black to White | ||
|---|---|---|
| 0.41 ms ... rise ↗ and fall ↘ combined | ↗ 0.2 ms rise | 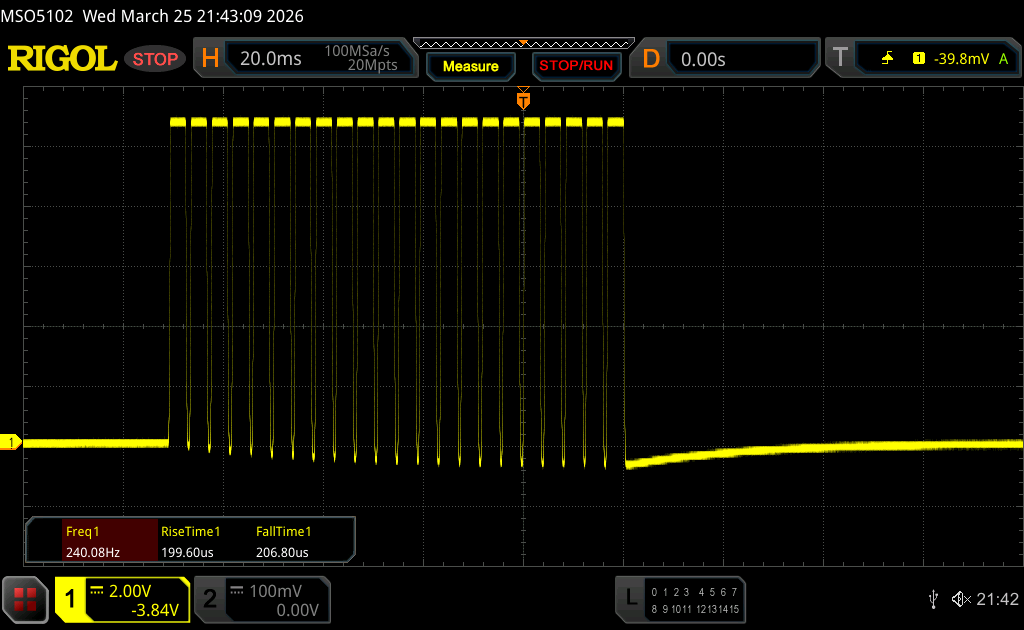 |
| ↘ 0.21 ms fall | ||
| The screen shows very fast response rates in our tests and should be very well suited for fast-paced gaming. In comparison, all tested devices range from 0.1 (minimum) to 240 (maximum) ms. » 0 % of all devices are better. This means that the measured response time is better than the average of all tested devices (19.9 ms). | ||
| ↔ Response Time 50% Grey to 80% Grey | ||
| 0.51 ms ... rise ↗ and fall ↘ combined | ↗ 0.25 ms rise | 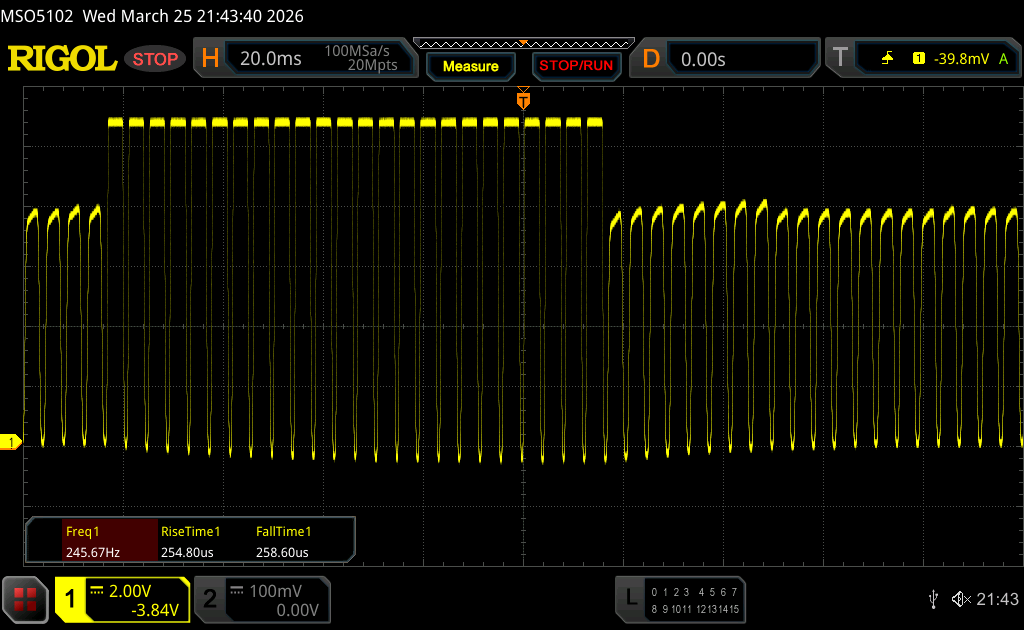 |
| ↘ 0.26 ms fall | ||
| The screen shows very fast response rates in our tests and should be very well suited for fast-paced gaming. In comparison, all tested devices range from 0.165 (minimum) to 636 (maximum) ms. » 1 % of all devices are better. This means that the measured response time is better than the average of all tested devices (31.1 ms). | ||
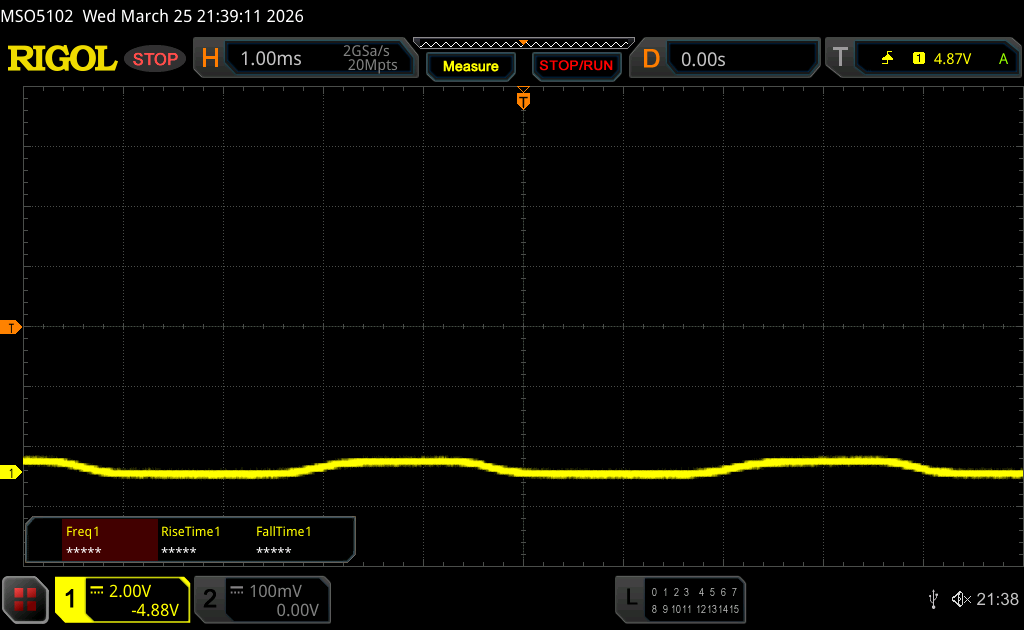
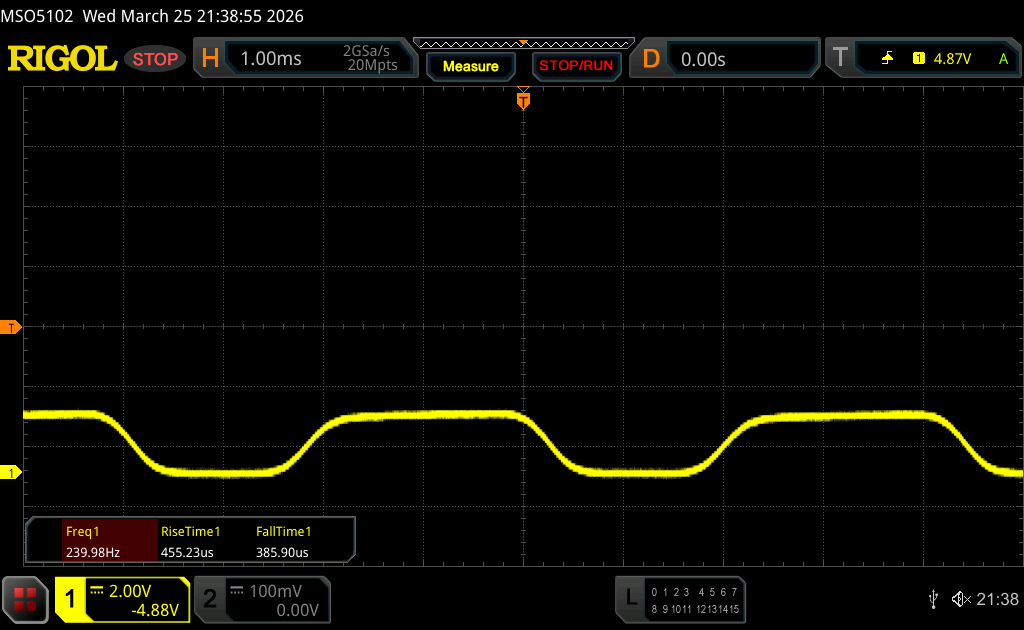
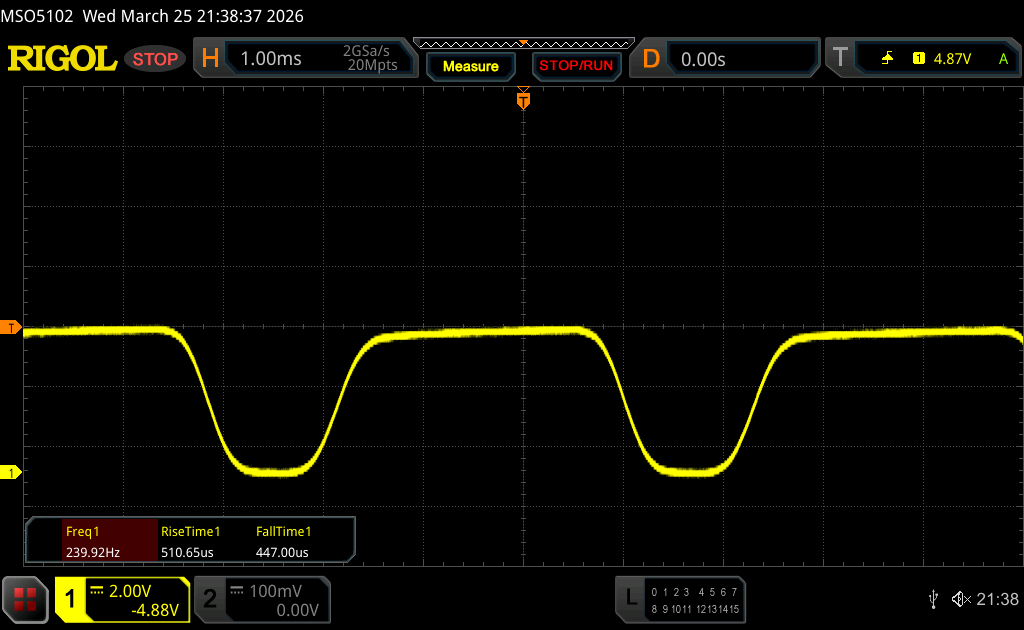
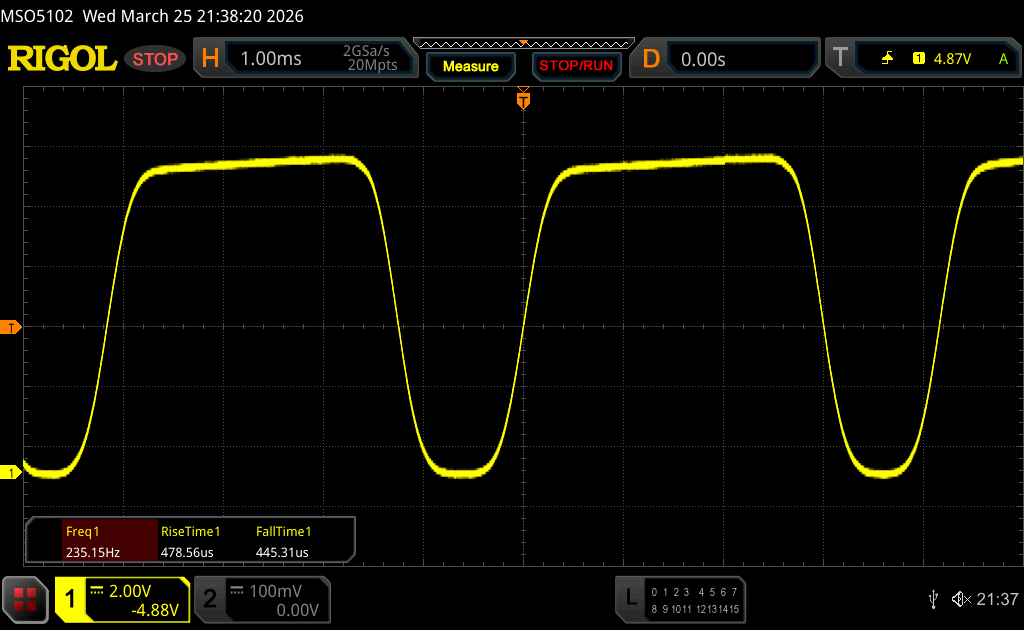
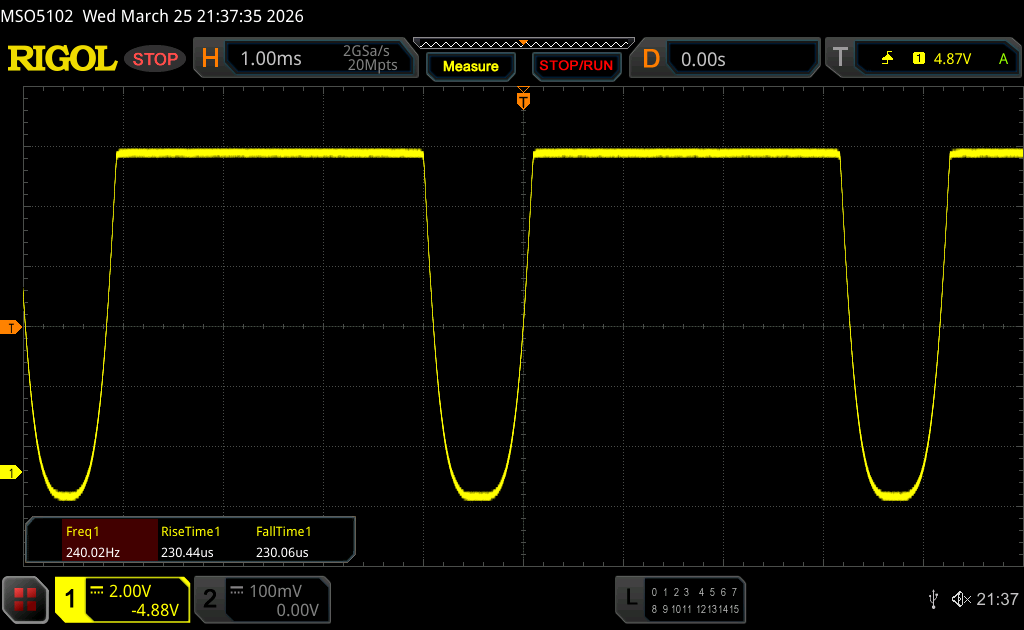
Screen Flickering / PWM (Pulse-Width Modulation)
| Screen flickering / PWM detected | 240 Hz Amplitude: 100 % | ≤ 100 % brightness setting | 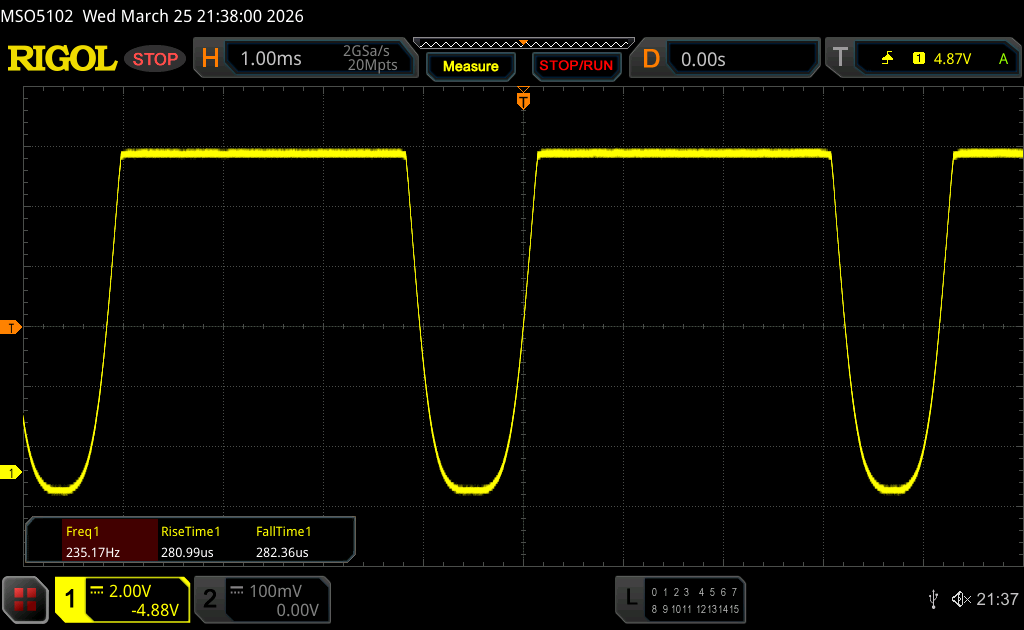 |
The display backlight flickers at 240 Hz (worst case, e.g., utilizing PWM) Flickering detected at a brightness setting of 100 % and below. There should be no flickering or PWM above this brightness setting. The frequency of 240 Hz is relatively low, so sensitive users will likely notice flickering and experience eyestrain at the stated brightness setting and below. In comparison: 52 % of all tested devices do not use PWM to dim the display. If PWM was detected, an average of 7794 (minimum: 5 - maximum: 343500) Hz was measured. | |||


Performance - Panther Lake
Samsung currently only offers the new Galaxy Book6 Pro with the Core Ultra 7 356H in combination with soldered RAM and the slow iGPU with 4 Xe cores. Samsung also announced one SKU with the Core Ultra X7 358H and the faster Arc B390 iGPU.
Testing Conditions
Samsung includes multiple power profiles and they sync with the Windows settings. For our test unit, it does not make sense to use the High Performance mode, since the performance gains are almost non-existent and limited to the CPU, but fans will be much louder. We used the Optimized mode for our benchmarks.
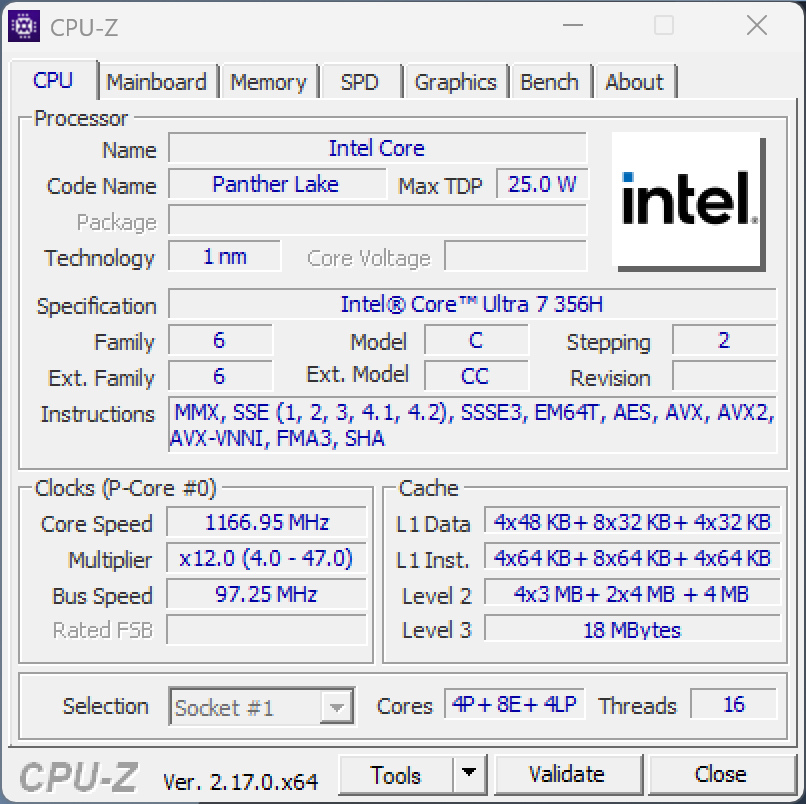
Processor
Samsung uses the new Core Ultra 7 356H (Panther Lake) with a total of 16 cores. The short-term power limit is very high at 80 Watts, but quickly drops to just 30 Watts. This means the performance in short peak load scenarios is good, but drops by around 25 % under sustained workloads. The CPU performance only drops marginally on battery power (- 5%, 60/30W).
Cinebench R15 Multi Loop
Cinebench 2024: CPU Multi Core | CPU Single Core
Cinebench R23: Multi Core | Single Core
Cinebench R20: CPU (Multi Core) | CPU (Single Core)
Cinebench R15: CPU Multi 64Bit | CPU Single 64Bit
Blender: v2.79 BMW27 CPU
7-Zip 18.03: 7z b 4 | 7z b 4 -mmt1
Geekbench 6.7: Multi-Core | Single-Core
Geekbench 5.5: Multi-Core | Single-Core
HWBOT x265 Benchmark v2.2: 4k Preset
LibreOffice : 20 Documents To PDF
R Benchmark 2.5: Overall mean
| CPU Performance rating | |
| Apple MacBook Air 15 M5 -14! | |
| Average Intel Core Ultra 7 356H | |
| Samsung Galaxy Book6 Pro | |
| Asus ZenBook S16 UM5606GA | |
| Average of class Multimedia | |
| Samsung Galaxy Book4 Pro 16 -2! | |
| Microsoft Surface Laptop 7 15 Lunar Lake | |
| Dell XPS 16 Core Ultra 5 325 | |
| Lenovo ThinkPad X9-15 Aura Edition | |
| Cinebench 2024 / CPU Multi Core | |
| Average Intel Core Ultra 7 356H (1006 - 1232, n=3) | |
| Average of class Multimedia (327 - 2437, n=81, last 2 years) | |
| Samsung Galaxy Book6 Pro | |
| Apple MacBook Air 15 M5 | |
| Asus ZenBook S16 UM5606GA | |
| Dell XPS 16 Core Ultra 5 325 | |
| Microsoft Surface Laptop 7 15 Lunar Lake | |
| Lenovo ThinkPad X9-15 Aura Edition | |
| Cinebench 2024 / CPU Single Core | |
| Apple MacBook Air 15 M5 | |
| Average of class Multimedia (72.5 - 201, n=62, last 2 years) | |
| Microsoft Surface Laptop 7 15 Lunar Lake | |
| Samsung Galaxy Book6 Pro | |
| Average Intel Core Ultra 7 356H (116 - 122.4, n=3) | |
| Lenovo ThinkPad X9-15 Aura Edition | |
| Asus ZenBook S16 UM5606GA | |
| Dell XPS 16 Core Ultra 5 325 | |
| Cinebench R23 / Multi Core | |
| Average Intel Core Ultra 7 356H (18395 - 20650, n=2) | |
| Samsung Galaxy Book6 Pro | |
| Asus ZenBook S16 UM5606GA | |
| Average of class Multimedia (4861 - 33362, n=81, last 2 years) | |
| Samsung Galaxy Book4 Pro 16 | |
| Dell XPS 16 Core Ultra 5 325 | |
| Microsoft Surface Laptop 7 15 Lunar Lake | |
| Lenovo ThinkPad X9-15 Aura Edition | |
| Cinebench R23 / Single Core | |
| Average Intel Core Ultra 7 356H (2040 - 2045, n=2) | |
| Samsung Galaxy Book6 Pro | |
| Asus ZenBook S16 UM5606GA | |
| Average of class Multimedia (1128 - 2459, n=73, last 2 years) | |
| Microsoft Surface Laptop 7 15 Lunar Lake | |
| Lenovo ThinkPad X9-15 Aura Edition | |
| Dell XPS 16 Core Ultra 5 325 | |
| Samsung Galaxy Book4 Pro 16 | |
| Cinebench R20 / CPU (Multi Core) | |
| Average Intel Core Ultra 7 356H (7180 - 8074, n=2) | |
| Samsung Galaxy Book6 Pro | |
| Asus ZenBook S16 UM5606GA | |
| Average of class Multimedia (1887 - 12912, n=64, last 2 years) | |
| Samsung Galaxy Book4 Pro 16 | |
| Dell XPS 16 Core Ultra 5 325 | |
| Microsoft Surface Laptop 7 15 Lunar Lake | |
| Lenovo ThinkPad X9-15 Aura Edition | |
| Cinebench R20 / CPU (Single Core) | |
| Asus ZenBook S16 UM5606GA | |
| Samsung Galaxy Book6 Pro | |
| Average Intel Core Ultra 7 356H (773 - 774, n=2) | |
| Microsoft Surface Laptop 7 15 Lunar Lake | |
| Average of class Multimedia (425 - 853, n=64, last 2 years) | |
| Lenovo ThinkPad X9-15 Aura Edition | |
| Dell XPS 16 Core Ultra 5 325 | |
| Samsung Galaxy Book4 Pro 16 | |
| Cinebench R15 / CPU Multi 64Bit | |
| Average Intel Core Ultra 7 356H (2937 - 3201, n=2) | |
| Samsung Galaxy Book6 Pro | |
| Asus ZenBook S16 UM5606GA | |
| Average of class Multimedia (856 - 5224, n=68, last 2 years) | |
| Samsung Galaxy Book4 Pro 16 | |
| Dell XPS 16 Core Ultra 5 325 | |
| Microsoft Surface Laptop 7 15 Lunar Lake | |
| Lenovo ThinkPad X9-15 Aura Edition | |
| Cinebench R15 / CPU Single 64Bit | |
| Average Intel Core Ultra 7 356H (303 - 306, n=2) | |
| Samsung Galaxy Book6 Pro | |
| Lenovo ThinkPad X9-15 Aura Edition | |
| Microsoft Surface Laptop 7 15 Lunar Lake | |
| Average of class Multimedia (184.8 - 326, n=66, last 2 years) | |
| Dell XPS 16 Core Ultra 5 325 | |
| Samsung Galaxy Book4 Pro 16 | |
| Asus ZenBook S16 UM5606GA | |
| Blender / v2.79 BMW27 CPU | |
| Lenovo ThinkPad X9-15 Aura Edition | |
| Microsoft Surface Laptop 7 15 Lunar Lake | |
| Dell XPS 16 Core Ultra 5 325 | |
| Average of class Multimedia (100 - 557, n=65, last 2 years) | |
| Samsung Galaxy Book4 Pro 16 | |
| Samsung Galaxy Book6 Pro | |
| Asus ZenBook S16 UM5606GA | |
| Average Intel Core Ultra 7 356H (163 - 196, n=2) | |
| 7-Zip 18.03 / 7z b 4 | |
| Average Intel Core Ultra 7 356H (65579 - 69785, n=2) | |
| Asus ZenBook S16 UM5606GA | |
| Samsung Galaxy Book6 Pro | |
| Samsung Galaxy Book4 Pro 16 | |
| Average of class Multimedia (29095 - 130368, n=62, last 2 years) | |
| Dell XPS 16 Core Ultra 5 325 | |
| Microsoft Surface Laptop 7 15 Lunar Lake | |
| Lenovo ThinkPad X9-15 Aura Edition | |
| 7-Zip 18.03 / 7z b 4 -mmt1 | |
| Samsung Galaxy Book6 Pro | |
| Average Intel Core Ultra 7 356H (6305 - 6375, n=2) | |
| Asus ZenBook S16 UM5606GA | |
| Microsoft Surface Laptop 7 15 Lunar Lake | |
| Average of class Multimedia (3666 - 7545, n=63, last 2 years) | |
| Lenovo ThinkPad X9-15 Aura Edition | |
| Dell XPS 16 Core Ultra 5 325 | |
| Samsung Galaxy Book4 Pro 16 | |
| Geekbench 6.7 / Multi-Core | |
| Apple MacBook Air 15 M5 | |
| Samsung Galaxy Book6 Pro | |
| Average Intel Core Ultra 7 356H (15578 - 16676, n=3) | |
| Average of class Multimedia (4983 - 29415, n=76, last 2 years) | |
| Asus ZenBook S16 UM5606GA | |
| Samsung Galaxy Book4 Pro 16 | |
| Microsoft Surface Laptop 7 15 Lunar Lake | |
| Dell XPS 16 Core Ultra 5 325 | |
| Lenovo ThinkPad X9-15 Aura Edition | |
| Geekbench 6.7 / Single-Core | |
| Apple MacBook Air 15 M5 | |
| Average of class Multimedia (1534 - 4335, n=75, last 2 years) | |
| Microsoft Surface Laptop 7 15 Lunar Lake | |
| Samsung Galaxy Book6 Pro | |
| Asus ZenBook S16 UM5606GA | |
| Lenovo ThinkPad X9-15 Aura Edition | |
| Average Intel Core Ultra 7 356H (2532 - 2851, n=3) | |
| Dell XPS 16 Core Ultra 5 325 | |
| Samsung Galaxy Book4 Pro 16 | |
| Geekbench 5.5 / Multi-Core | |
| Average Intel Core Ultra 7 356H (16721 - 16761, n=2) | |
| Samsung Galaxy Book6 Pro | |
| Asus ZenBook S16 UM5606GA | |
| Average of class Multimedia (4652 - 20422, n=62, last 2 years) | |
| Samsung Galaxy Book4 Pro 16 | |
| Dell XPS 16 Core Ultra 5 325 | |
| Microsoft Surface Laptop 7 15 Lunar Lake | |
| Lenovo ThinkPad X9-15 Aura Edition | |
| Geekbench 5.5 / Single-Core | |
| Asus ZenBook S16 UM5606GA | |
| Samsung Galaxy Book6 Pro | |
| Average Intel Core Ultra 7 356H (2086 - 2098, n=2) | |
| Microsoft Surface Laptop 7 15 Lunar Lake | |
| Lenovo ThinkPad X9-15 Aura Edition | |
| Average of class Multimedia (805 - 2974, n=62, last 2 years) | |
| Dell XPS 16 Core Ultra 5 325 | |
| Samsung Galaxy Book4 Pro 16 | |
| HWBOT x265 Benchmark v2.2 / 4k Preset | |
| Average Intel Core Ultra 7 356H (20 - 25.1, n=2) | |
| Asus ZenBook S16 UM5606GA | |
| Samsung Galaxy Book6 Pro | |
| Average of class Multimedia (5.26 - 36.1, n=63, last 2 years) | |
| Samsung Galaxy Book4 Pro 16 | |
| Dell XPS 16 Core Ultra 5 325 | |
| Microsoft Surface Laptop 7 15 Lunar Lake | |
| Lenovo ThinkPad X9-15 Aura Edition | |
| LibreOffice / 20 Documents To PDF | |
| Samsung Galaxy Book6 Pro | |
| Asus ZenBook S16 UM5606GA | |
| Average Intel Core Ultra 7 356H (47.3 - 57.8, n=2) | |
| Average of class Multimedia (23.9 - 146.7, n=64, last 2 years) | |
| Dell XPS 16 Core Ultra 5 325 | |
| Microsoft Surface Laptop 7 15 Lunar Lake | |
| Lenovo ThinkPad X9-15 Aura Edition | |
| Samsung Galaxy Book4 Pro 16 | |
| R Benchmark 2.5 / Overall mean | |
| Lenovo ThinkPad X9-15 Aura Edition | |
| Samsung Galaxy Book4 Pro 16 | |
| Average of class Multimedia (0.3604 - 0.947, n=63, last 2 years) | |
| Samsung Galaxy Book6 Pro | |
| Dell XPS 16 Core Ultra 5 325 | |
| Microsoft Surface Laptop 7 15 Lunar Lake | |
| Average Intel Core Ultra 7 356H (0.4268 - 0.459, n=2) | |
| Asus ZenBook S16 UM5606GA | |
* ... smaller is better
AIDA64: FP32 Ray-Trace | FPU Julia | CPU SHA3 | CPU Queen | FPU SinJulia | FPU Mandel | CPU AES | CPU ZLib | FP64 Ray-Trace | CPU PhotoWorxx | CPU CheckMate
| Performance rating | |
| Asus ZenBook S16 UM5606GA -1! | |
| Average Intel Core Ultra 7 356H -1! | |
| Samsung Galaxy Book6 Pro -1! | |
| Average of class Multimedia | |
| Samsung Galaxy Book4 Pro 16 -1! | |
| Dell XPS 16 Core Ultra 5 325 -1! | |
| Lenovo ThinkPad X9-15 Aura Edition | |
| Microsoft Surface Laptop 7 15 Lunar Lake -1! | |
| AIDA64 / FP32 Ray-Trace | |
| Asus ZenBook S16 UM5606GA (v6.92.6600) | |
| Average Intel Core Ultra 7 356H (16303 - 20528, n=2) | |
| Average of class Multimedia (2214 - 50388, n=60, last 2 years) | |
| Samsung Galaxy Book6 Pro (v8.20.8100) | |
| Samsung Galaxy Book4 Pro 16 (v6.92.6600) | |
| Lenovo ThinkPad X9-15 Aura Edition (v6.92.6600) | |
| Lenovo ThinkPad X9-15 Aura Edition (v6.92.6600) | |
| Lenovo ThinkPad X9-15 Aura Edition (v8.20.8100) | |
| Dell XPS 16 Core Ultra 5 325 (v8.20.8100) | |
| Microsoft Surface Laptop 7 15 Lunar Lake (v6.92.6600) | |
| AIDA64 / FPU Julia | |
| Asus ZenBook S16 UM5606GA (v6.92.6600) | |
| Average Intel Core Ultra 7 356H (81236 - 108092, n=2) | |
| Average of class Multimedia (12867 - 201874, n=61, last 2 years) | |
| Samsung Galaxy Book6 Pro (v8.20.8100) | |
| Samsung Galaxy Book4 Pro 16 (v6.92.6600) | |
| Dell XPS 16 Core Ultra 5 325 (v8.20.8100) | |
| Lenovo ThinkPad X9-15 Aura Edition (v6.92.6600) | |
| Lenovo ThinkPad X9-15 Aura Edition (v8.20.8100) | |
| Lenovo ThinkPad X9-15 Aura Edition (v6.92.6600) | |
| Microsoft Surface Laptop 7 15 Lunar Lake (v6.92.6600) | |
| AIDA64 / CPU SHA3 | |
| Average Intel Core Ultra 7 356H (4141 - 5284, n=2) | |
| Asus ZenBook S16 UM5606GA (v6.92.6600) | |
| Samsung Galaxy Book6 Pro (v8.20.8100) | |
| Average of class Multimedia (653 - 8623, n=61, last 2 years) | |
| Samsung Galaxy Book4 Pro 16 (v6.92.6600) | |
| Dell XPS 16 Core Ultra 5 325 (v8.20.8100) | |
| Lenovo ThinkPad X9-15 Aura Edition (v6.92.6600) | |
| Lenovo ThinkPad X9-15 Aura Edition (v8.20.8100) | |
| Lenovo ThinkPad X9-15 Aura Edition (v6.92.6600) | |
| Microsoft Surface Laptop 7 15 Lunar Lake (v6.92.6600) | |
| AIDA64 / CPU Queen | |
| Asus ZenBook S16 UM5606GA (v6.92.6600) | |
| Samsung Galaxy Book4 Pro 16 (v6.92.6600) | |
| Average of class Multimedia (13483 - 181505, n=49, last 2 years) | |
| Lenovo ThinkPad X9-15 Aura Edition (v6.92.6600) | |
| Lenovo ThinkPad X9-15 Aura Edition (v6.92.6600) | |
| Microsoft Surface Laptop 7 15 Lunar Lake (v6.92.6600) | |
| AIDA64 / FPU SinJulia | |
| Asus ZenBook S16 UM5606GA (v6.92.6600) | |
| Samsung Galaxy Book4 Pro 16 (v6.92.6600) | |
| Average of class Multimedia (1240 - 28794, n=61, last 2 years) | |
| Samsung Galaxy Book6 Pro (v8.20.8100) | |
| Average Intel Core Ultra 7 356H (6960 - 6965, n=2) | |
| Lenovo ThinkPad X9-15 Aura Edition (v8.20.8100) | |
| Lenovo ThinkPad X9-15 Aura Edition (v6.92.6600) | |
| Lenovo ThinkPad X9-15 Aura Edition (v6.92.6600) | |
| Microsoft Surface Laptop 7 15 Lunar Lake (v6.92.6600) | |
| Dell XPS 16 Core Ultra 5 325 (v8.20.8100) | |
| AIDA64 / FPU Mandel | |
| Asus ZenBook S16 UM5606GA (v6.92.6600) | |
| Average Intel Core Ultra 7 356H (44538 - 58505, n=2) | |
| Samsung Galaxy Book6 Pro (v8.20.8100) | |
| Average of class Multimedia (6395 - 105740, n=60, last 2 years) | |
| Samsung Galaxy Book4 Pro 16 (v6.92.6600) | |
| Dell XPS 16 Core Ultra 5 325 (v8.20.8100) | |
| Lenovo ThinkPad X9-15 Aura Edition (v6.92.6600) | |
| Lenovo ThinkPad X9-15 Aura Edition (v6.92.6600) | |
| Lenovo ThinkPad X9-15 Aura Edition (v8.20.8100) | |
| Microsoft Surface Laptop 7 15 Lunar Lake (v6.92.6600) | |
| AIDA64 / CPU AES | |
| Asus ZenBook S16 UM5606GA (v6.92.6600) | |
| Samsung Galaxy Book4 Pro 16 (v6.92.6600) | |
| Average of class Multimedia (13243 - 126790, n=61, last 2 years) | |
| Average Intel Core Ultra 7 356H (64920 - 67037, n=2) | |
| Samsung Galaxy Book6 Pro (v8.20.8100) | |
| Lenovo ThinkPad X9-15 Aura Edition (v8.20.8100) | |
| Lenovo ThinkPad X9-15 Aura Edition (v6.92.6600) | |
| Lenovo ThinkPad X9-15 Aura Edition (v6.92.6600) | |
| Microsoft Surface Laptop 7 15 Lunar Lake (v6.92.6600) | |
| Dell XPS 16 Core Ultra 5 325 (v8.20.8100) | |
| AIDA64 / CPU ZLib | |
| Asus ZenBook S16 UM5606GA (v6.92.6600) | |
| Average Intel Core Ultra 7 356H (1086 - 1199, n=2) | |
| Samsung Galaxy Book6 Pro (v8.20.8100) | |
| Average of class Multimedia (167.2 - 2022, n=61, last 2 years) | |
| Samsung Galaxy Book4 Pro 16 (v6.92.6600) | |
| Dell XPS 16 Core Ultra 5 325 (v8.20.8100) | |
| Lenovo ThinkPad X9-15 Aura Edition (v6.92.6600) | |
| Lenovo ThinkPad X9-15 Aura Edition (v8.20.8100) | |
| Lenovo ThinkPad X9-15 Aura Edition (v6.92.6600) | |
| Microsoft Surface Laptop 7 15 Lunar Lake (v6.92.6600) | |
| AIDA64 / FP64 Ray-Trace | |
| Asus ZenBook S16 UM5606GA (v6.92.6600) | |
| Average of class Multimedia (1014 - 26875, n=61, last 2 years) | |
| Average Intel Core Ultra 7 356H (8201 - 11057, n=2) | |
| Samsung Galaxy Book6 Pro (v8.20.8100) | |
| Samsung Galaxy Book4 Pro 16 (v6.92.6600) | |
| Lenovo ThinkPad X9-15 Aura Edition (v6.92.6600) | |
| Lenovo ThinkPad X9-15 Aura Edition (v6.92.6600) | |
| Lenovo ThinkPad X9-15 Aura Edition (v8.20.8100) | |
| Dell XPS 16 Core Ultra 5 325 (v8.20.8100) | |
| Microsoft Surface Laptop 7 15 Lunar Lake (v6.92.6600) | |
| AIDA64 / CPU PhotoWorxx | |
| Samsung Galaxy Book6 Pro (v8.20.8100) | |
| Average Intel Core Ultra 7 356H (83099 - 83163, n=2) | |
| Lenovo ThinkPad X9-15 Aura Edition (v8.20.8100) | |
| Lenovo ThinkPad X9-15 Aura Edition (v6.92.6600) | |
| Lenovo ThinkPad X9-15 Aura Edition (v6.92.6600) | |
| Dell XPS 16 Core Ultra 5 325 (v8.20.8100) | |
| Microsoft Surface Laptop 7 15 Lunar Lake (v6.92.6600) | |
| Asus ZenBook S16 UM5606GA (v6.92.6600) | |
| Samsung Galaxy Book4 Pro 16 (v6.92.6600) | |
| Average of class Multimedia (12860 - 88154, n=61, last 2 years) | |
| AIDA64 / CPU CheckMate | |
| Average Intel Core Ultra 7 356H (4196 - 4629, n=2) | |
| Samsung Galaxy Book6 Pro (v8.20.8100) | |
| Average of class Multimedia (1570 - 4742, n=15, last 2 years) | |
| Dell XPS 16 Core Ultra 5 325 (v8.20.8100) | |
| Lenovo ThinkPad X9-15 Aura Edition (v8.20.8100) | |
System Performance
The subjective performance impression is excellent and we did not notice any stutters or stability issues.
PCMark 10: Score | Essentials | Productivity | Digital Content Creation
CrossMark: Overall | Productivity | Creativity | Responsiveness
WebXPRT 3: Overall
WebXPRT 4: Overall
Mozilla Kraken 1.1: Total
| Performance rating | |
| Apple MacBook Air 15 M5 -4! | |
| Samsung Galaxy Book6 Pro | |
| Average Intel Core Ultra 7 356H, Intel Graphics 4 Xe3 Panther Lake iGPU | |
| Average of class Multimedia | |
| Asus ZenBook S16 UM5606GA | |
| Microsoft Surface Laptop 7 15 Lunar Lake | |
| Dell XPS 16 Core Ultra 5 325 | |
| Lenovo ThinkPad X9-15 Aura Edition | |
| Samsung Galaxy Book4 Pro 16 | |
| PCMark 10 / Score | |
| Samsung Galaxy Book6 Pro | |
| Average Intel Core Ultra 7 356H, Intel Graphics 4 Xe3 Panther Lake iGPU (n=1) | |
| Asus ZenBook S16 UM5606GA | |
| Dell XPS 16 Core Ultra 5 325 | |
| Average of class Multimedia (4325 - 10386, n=58, last 2 years) | |
| Microsoft Surface Laptop 7 15 Lunar Lake | |
| Lenovo ThinkPad X9-15 Aura Edition | |
| Samsung Galaxy Book4 Pro 16 | |
| PCMark 10 / Essentials | |
| Samsung Galaxy Book4 Pro 16 | |
| Microsoft Surface Laptop 7 15 Lunar Lake | |
| Lenovo ThinkPad X9-15 Aura Edition | |
| Asus ZenBook S16 UM5606GA | |
| Average of class Multimedia (8025 - 11664, n=57, last 2 years) | |
| Samsung Galaxy Book6 Pro | |
| Average Intel Core Ultra 7 356H, Intel Graphics 4 Xe3 Panther Lake iGPU (n=1) | |
| Dell XPS 16 Core Ultra 5 325 | |
| PCMark 10 / Productivity | |
| Samsung Galaxy Book6 Pro | |
| Average Intel Core Ultra 7 356H, Intel Graphics 4 Xe3 Panther Lake iGPU (n=1) | |
| Asus ZenBook S16 UM5606GA | |
| Dell XPS 16 Core Ultra 5 325 | |
| Average of class Multimedia (7323 - 18233, n=57, last 2 years) | |
| Microsoft Surface Laptop 7 15 Lunar Lake | |
| Lenovo ThinkPad X9-15 Aura Edition | |
| Samsung Galaxy Book4 Pro 16 | |
| PCMark 10 / Digital Content Creation | |
| Average of class Multimedia (3651 - 16240, n=57, last 2 years) | |
| Microsoft Surface Laptop 7 15 Lunar Lake | |
| Samsung Galaxy Book6 Pro | |
| Average Intel Core Ultra 7 356H, Intel Graphics 4 Xe3 Panther Lake iGPU (n=1) | |
| Asus ZenBook S16 UM5606GA | |
| Lenovo ThinkPad X9-15 Aura Edition | |
| Dell XPS 16 Core Ultra 5 325 | |
| Samsung Galaxy Book4 Pro 16 | |
| CrossMark / Overall | |
| Apple MacBook Air 15 M5 | |
| Samsung Galaxy Book6 Pro | |
| Average Intel Core Ultra 7 356H, Intel Graphics 4 Xe3 Panther Lake iGPU (n=1) | |
| Average of class Multimedia (866 - 2728, n=67, last 2 years) | |
| Samsung Galaxy Book4 Pro 16 | |
| Lenovo ThinkPad X9-15 Aura Edition | |
| Microsoft Surface Laptop 7 15 Lunar Lake | |
| Dell XPS 16 Core Ultra 5 325 | |
| Asus ZenBook S16 UM5606GA | |
| CrossMark / Productivity | |
| Apple MacBook Air 15 M5 | |
| Samsung Galaxy Book6 Pro | |
| Average Intel Core Ultra 7 356H, Intel Graphics 4 Xe3 Panther Lake iGPU (n=1) | |
| Average of class Multimedia (931 - 2489, n=67, last 2 years) | |
| Samsung Galaxy Book4 Pro 16 | |
| Lenovo ThinkPad X9-15 Aura Edition | |
| Microsoft Surface Laptop 7 15 Lunar Lake | |
| Asus ZenBook S16 UM5606GA | |
| Dell XPS 16 Core Ultra 5 325 | |
| CrossMark / Creativity | |
| Apple MacBook Air 15 M5 | |
| Samsung Galaxy Book6 Pro | |
| Average Intel Core Ultra 7 356H, Intel Graphics 4 Xe3 Panther Lake iGPU (n=1) | |
| Average of class Multimedia (907 - 3465, n=67, last 2 years) | |
| Lenovo ThinkPad X9-15 Aura Edition | |
| Microsoft Surface Laptop 7 15 Lunar Lake | |
| Samsung Galaxy Book4 Pro 16 | |
| Asus ZenBook S16 UM5606GA | |
| Dell XPS 16 Core Ultra 5 325 | |
| CrossMark / Responsiveness | |
| Apple MacBook Air 15 M5 | |
| Samsung Galaxy Book6 Pro | |
| Average Intel Core Ultra 7 356H, Intel Graphics 4 Xe3 Panther Lake iGPU (n=1) | |
| Samsung Galaxy Book4 Pro 16 | |
| Average of class Multimedia (605 - 2024, n=67, last 2 years) | |
| Asus ZenBook S16 UM5606GA | |
| Dell XPS 16 Core Ultra 5 325 | |
| Lenovo ThinkPad X9-15 Aura Edition | |
| Microsoft Surface Laptop 7 15 Lunar Lake | |
| WebXPRT 3 / Overall | |
| Apple MacBook Air 15 M5 | |
| Average of class Multimedia (136.4 - 596, n=70, last 2 years) | |
| Microsoft Surface Laptop 7 15 Lunar Lake | |
| Asus ZenBook S16 UM5606GA | |
| Lenovo ThinkPad X9-15 Aura Edition | |
| Samsung Galaxy Book6 Pro | |
| Average Intel Core Ultra 7 356H, Intel Graphics 4 Xe3 Panther Lake iGPU (n=1) | |
| Dell XPS 16 Core Ultra 5 325 | |
| Samsung Galaxy Book4 Pro 16 | |
| WebXPRT 4 / Overall | |
| Apple MacBook Air 15 M5 | |
| Average of class Multimedia (167.3 - 402, n=71, last 2 years) | |
| Microsoft Surface Laptop 7 15 Lunar Lake | |
| Lenovo ThinkPad X9-15 Aura Edition | |
| Samsung Galaxy Book6 Pro | |
| Average Intel Core Ultra 7 356H, Intel Graphics 4 Xe3 Panther Lake iGPU (n=1) | |
| Dell XPS 16 Core Ultra 5 325 | |
| Samsung Galaxy Book4 Pro 16 | |
| Asus ZenBook S16 UM5606GA | |
| Mozilla Kraken 1.1 / Total | |
| Samsung Galaxy Book4 Pro 16 | |
| Dell XPS 16 Core Ultra 5 325 | |
| Asus ZenBook S16 UM5606GA | |
| Microsoft Surface Laptop 7 15 Lunar Lake | |
| Lenovo ThinkPad X9-15 Aura Edition | |
| Samsung Galaxy Book6 Pro | |
| Average Intel Core Ultra 7 356H, Intel Graphics 4 Xe3 Panther Lake iGPU (n=1) | |
| Average of class Multimedia (228 - 835, n=74, last 2 years) | |
| Apple MacBook Air 15 M5 | |
* ... smaller is better
| PCMark 10 Score | 8644 points | |
Help | ||
| AIDA64 / Memory Copy | |
| Samsung Galaxy Book6 Pro | |
| Average Intel Core Ultra 7 356H (116043 - 121055, n=2) | |
| Lenovo ThinkPad X9-15 Aura Edition | |
| Microsoft Surface Laptop 7 15 Lunar Lake | |
| Dell XPS 16 Core Ultra 5 325 | |
| Asus ZenBook S16 UM5606GA | |
| Samsung Galaxy Book4 Pro 16 | |
| Average of class Multimedia (21158 - 132135, n=61, last 2 years) | |
| AIDA64 / Memory Read | |
| Samsung Galaxy Book6 Pro | |
| Average Intel Core Ultra 7 356H (107881 - 112376, n=2) | |
| Asus ZenBook S16 UM5606GA | |
| Samsung Galaxy Book4 Pro 16 | |
| Microsoft Surface Laptop 7 15 Lunar Lake | |
| Lenovo ThinkPad X9-15 Aura Edition | |
| Dell XPS 16 Core Ultra 5 325 | |
| Average of class Multimedia (19699 - 174586, n=61, last 2 years) | |
| AIDA64 / Memory Write | |
| Samsung Galaxy Book6 Pro | |
| Average Intel Core Ultra 7 356H (120431 - 120449, n=2) | |
| Microsoft Surface Laptop 7 15 Lunar Lake | |
| Lenovo ThinkPad X9-15 Aura Edition | |
| Asus ZenBook S16 UM5606GA | |
| Dell XPS 16 Core Ultra 5 325 | |
| Average of class Multimedia (17733 - 134998, n=61, last 2 years) | |
| Samsung Galaxy Book4 Pro 16 | |
| AIDA64 / Memory Latency | |
| Samsung Galaxy Book4 Pro 16 | |
| Average of class Multimedia (7 - 535, n=60, last 2 years) | |
| Asus ZenBook S16 UM5606GA | |
| Dell XPS 16 Core Ultra 5 325 | |
| Microsoft Surface Laptop 7 15 Lunar Lake | |
| Lenovo ThinkPad X9-15 Aura Edition | |
| Average Intel Core Ultra 7 356H (88.6 - 90, n=2) | |
| Samsung Galaxy Book6 Pro | |
* ... smaller is better
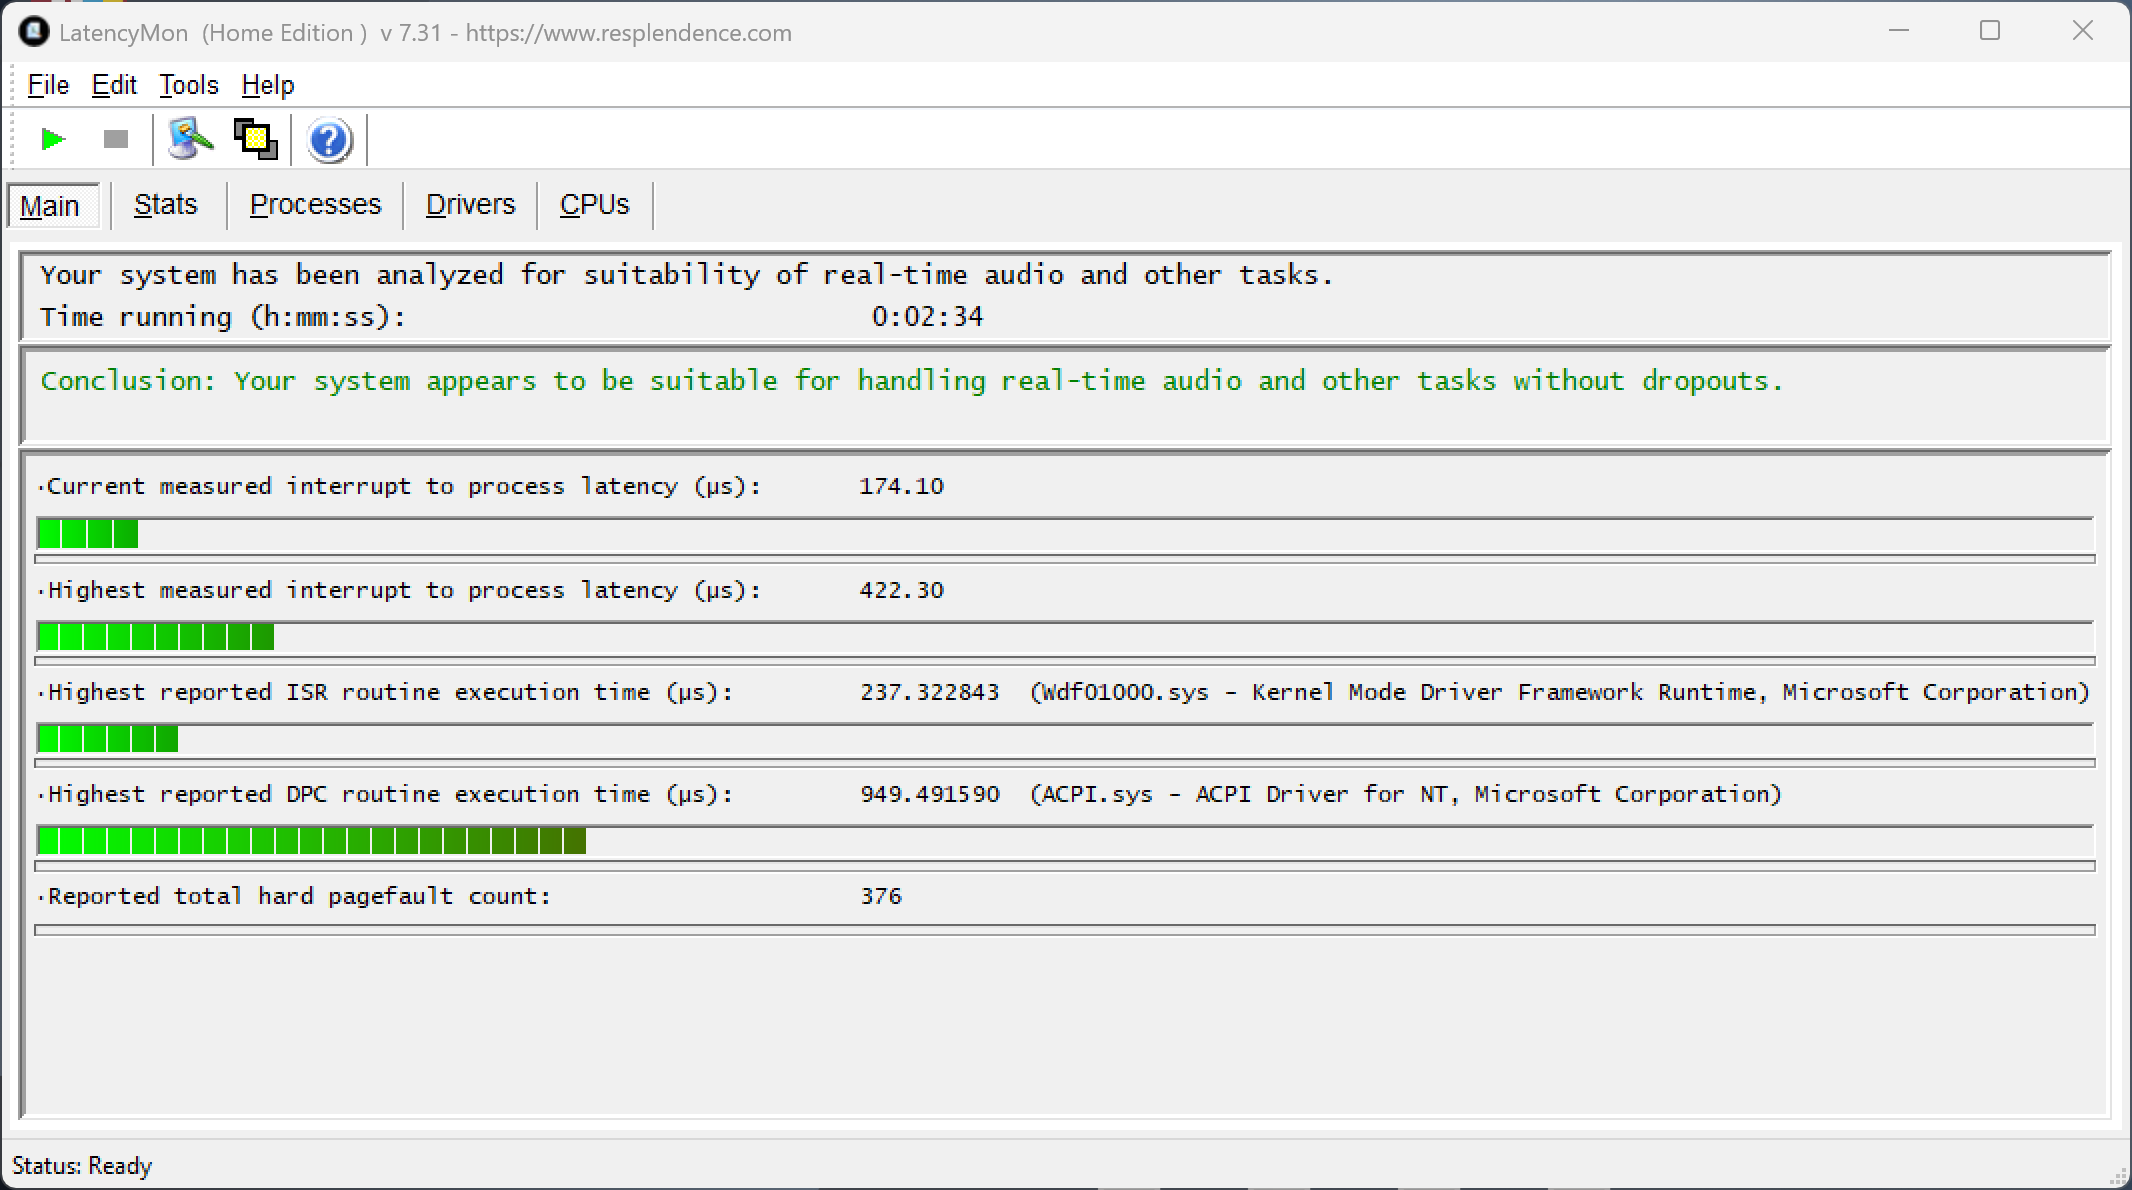
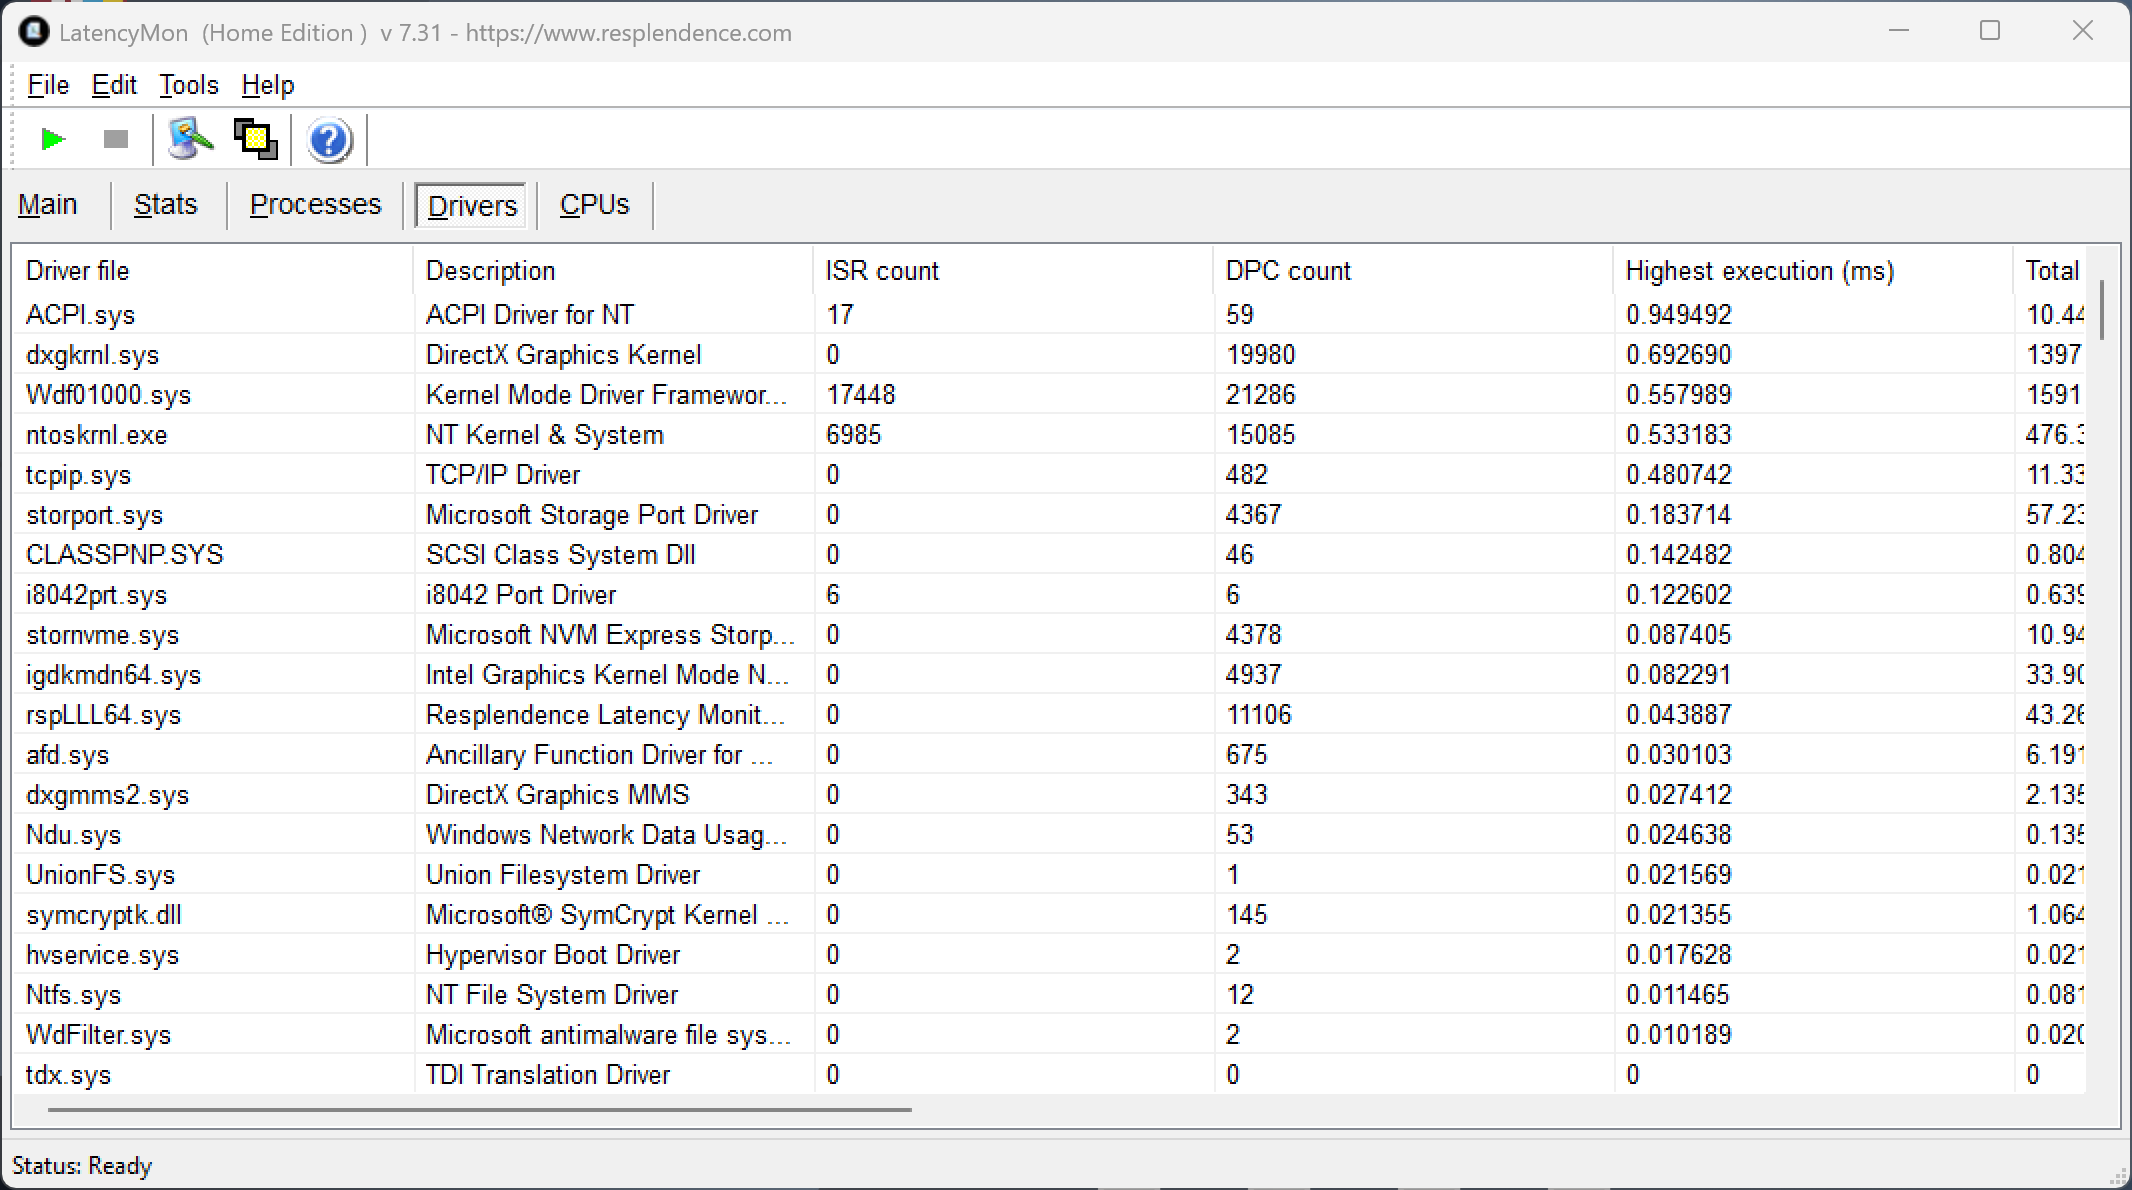
DPC Latency
Our standardized latency test does not show any limitations for the Galaxy Book6 Pro.
| DPC Latencies / LatencyMon - interrupt to process latency (max), Web, Youtube, Prime95 | |
| Dell XPS 16 Core Ultra 5 325 | |
| Samsung Galaxy Book4 Pro 16 | |
| Lenovo ThinkPad X9-15 Aura Edition | |
| Microsoft Surface Laptop 7 15 Lunar Lake | |
| Asus ZenBook S16 UM5606GA | |
| Samsung Galaxy Book6 Pro | |
* ... smaller is better
Storage Devices
Our unit is equipped with a 512 GB drive (369 GB free, Samsung PM9C1b) and the transfer rates of the PCIe 4.0 SSD are good and stable. Thanks to the additional M.2-2280 slot, it is no problem to add more storage capacity.

* ... smaller is better
Disk Throttling: DiskSpd Read Loop, Queue Depth 8
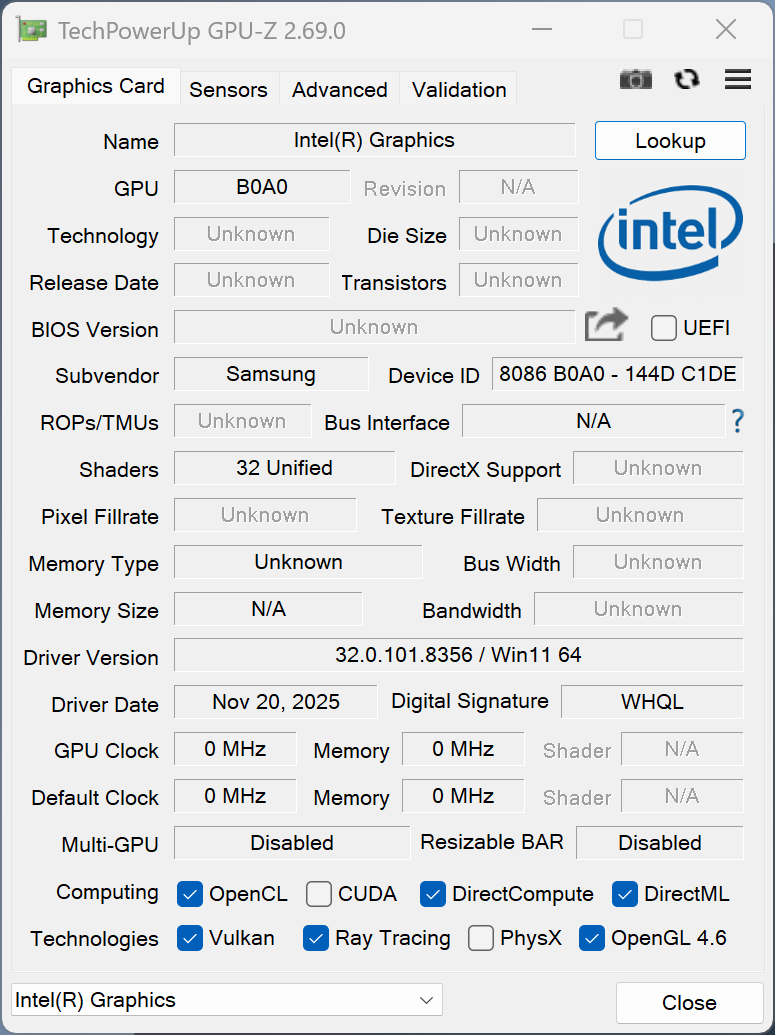
GPU Performance
Some of the Panther Lake chips are equipped with powerful iGPUs called Arc B370/B390, but the Core Ultra 7 356H only gets the slower Arc Graphics with 4 Xe cores. The GPU can handle everyday tasks including streaming of high-definition videos with ease, but the raw performance is even worse compared to the old 8-core Arc iGPU from the Meteor Lake generation in the old Galaxy Book4 Pro. If you want to play some games, we definitely recommend the Galaxy Book6 Pro with the Core Ultra X7 358H and the Arc B390 GPU.
| 3DMark 11 Performance | 8078 points | |
| 3DMark Fire Strike Score | 6513 points | |
| 3DMark Time Spy Score | 3395 points | |
| 3DMark Steel Nomad Score | 622 points | |
| 3DMark Steel Nomad Light Score | 2501 points | |
Help | ||
| Blender / v3.3 Classroom CPU | |
| Lenovo ThinkPad X9-15 Aura Edition | |
| Microsoft Surface Laptop 7 15 Lunar Lake | |
| Dell XPS 16 Core Ultra 5 325 | |
| Average Intel Graphics 4 Xe3 Panther Lake iGPU (332 - 569, n=8) | |
| Samsung Galaxy Book4 Pro 16 | |
| Average of class Multimedia (134.5 - 1042, n=68, last 2 years) | |
| Apple MacBook Air 15 M5 | |
| Samsung Galaxy Book6 Pro | |
| Asus ZenBook S16 UM5606GA | |
| Blender / v3.3 Classroom oneAPI/Intel | |
| Average Intel Graphics 4 Xe3 Panther Lake iGPU (235 - 257, n=5) | |
| Dell XPS 16 Core Ultra 5 325 | |
| Average of class Multimedia (105 - 401, n=17, last 2 years) | |
| Blender / v3.3 Classroom METAL | |
| Apple MacBook Air 15 M5 | |
| Average of class Multimedia (17.8 - 68, n=5, last 2 years) | |
* ... smaller is better
Cyberpunk 2077 ultra FPS Chart
| low | med. | high | ultra | |
|---|---|---|---|---|
| GTA V (2015) | 180.8 | 174.7 | 58.2 | 23.8 |
| Dota 2 Reborn (2015) | 109.6 | 91.5 | 81.8 | 77.4 |
| Final Fantasy XV Benchmark (2018) | 72.3 | 36.7 | 26.1 | |
| X-Plane 11.11 (2018) | 45.1 | 33 | 32.4 | |
| Strange Brigade (2018) | 197 | 70.5 | 59.1 | 51.1 |
| Baldur's Gate 3 (2023) | 31.5 | 23.9 | 21 | 20.3 |
| Cyberpunk 2077 (2023) | 36.8 | 28.2 | 24.4 | 20.5 |
| F1 24 (2024) | 66.8 | 64.3 | 46.5 | 14.8 |
Emissions & Power Consumption
System Noise

The Galaxy Book6 Pro is usually a very quiet or silent companion in everyday scenarios with light workloads. The first fan levels are also pretty quiet at around 27-32 dB(A) and only maximum load or gaming will result in up to 38.4 dB(A), so it is one of the quietest models in our comparison group (except for the silent MacBook Air). In High Performance mode, we measure up to 43.9 dB(A) and only up to 29.1 dB(A) in Quiet mode. We did not notice any electronic noises on our unit.
Noise level
| Idle |
| 25.3 / 25.3 / 25.3 dB(A) |
| Load |
| 31.8 / 38.4 dB(A) |
 | ||
30 dB silent 40 dB(A) audible 50 dB(A) loud |
||
min: | ||
| Samsung Galaxy Book6 Pro Ultra 7 356H, Intel Graphics 4 Xe3 PTL | Dell XPS 16 Core Ultra 5 325 Ultra 5 325, Intel Graphics 4 Xe3 PTL | Asus ZenBook S16 UM5606GA Ryzen AI 9 465, Radeon 880M | Apple MacBook Air 15 M5 M5 10-Core, M5 10-Core GPU | Microsoft Surface Laptop 7 15 Lunar Lake Core Ultra 7 268V, Arc 140V | Lenovo ThinkPad X9-15 Aura Edition Core Ultra 7 258V, Arc 140V | Samsung Galaxy Book4 Pro 16 Ultra 7 155H, Arc 8-Core | |
|---|---|---|---|---|---|---|---|
| Noise | 2% | -14% | 2% | -2% | -4% | ||
| off / environment * (dB) | 25.3 | 22.8 10% | 24.9 2% | 23.9 6% | 24.4 4% | 24.6 3% | |
| Idle Minimum * (dB) | 25.3 | 22.9 9% | 24.9 2% | 23.9 6% | 24.4 4% | 24.6 3% | |
| Idle Average * (dB) | 25.3 | 22.9 9% | 24.9 2% | 23.9 6% | 24.4 4% | 24.6 3% | |
| Idle Maximum * (dB) | 25.3 | 23.9 6% | 24.9 2% | 23.9 6% | 24.4 4% | 26.4 -4% | |
| Load Average * (dB) | 31.8 | 34.8 -9% | 45.7 -44% | 31.8 -0% | 35.8 -13% | 40 -26% | |
| Cyberpunk 2077 ultra * (dB) | 38.4 | 38 1% | 49 -28% | 38 1% | 39.4 -3% | ||
| Load Maximum * (dB) | 38.4 | 43.3 -13% | 50.4 -31% | 41.9 -9% | 45 -17% | 40 -4% | |
| Witcher 3 ultra * (dB) | 40 |
* ... smaller is better
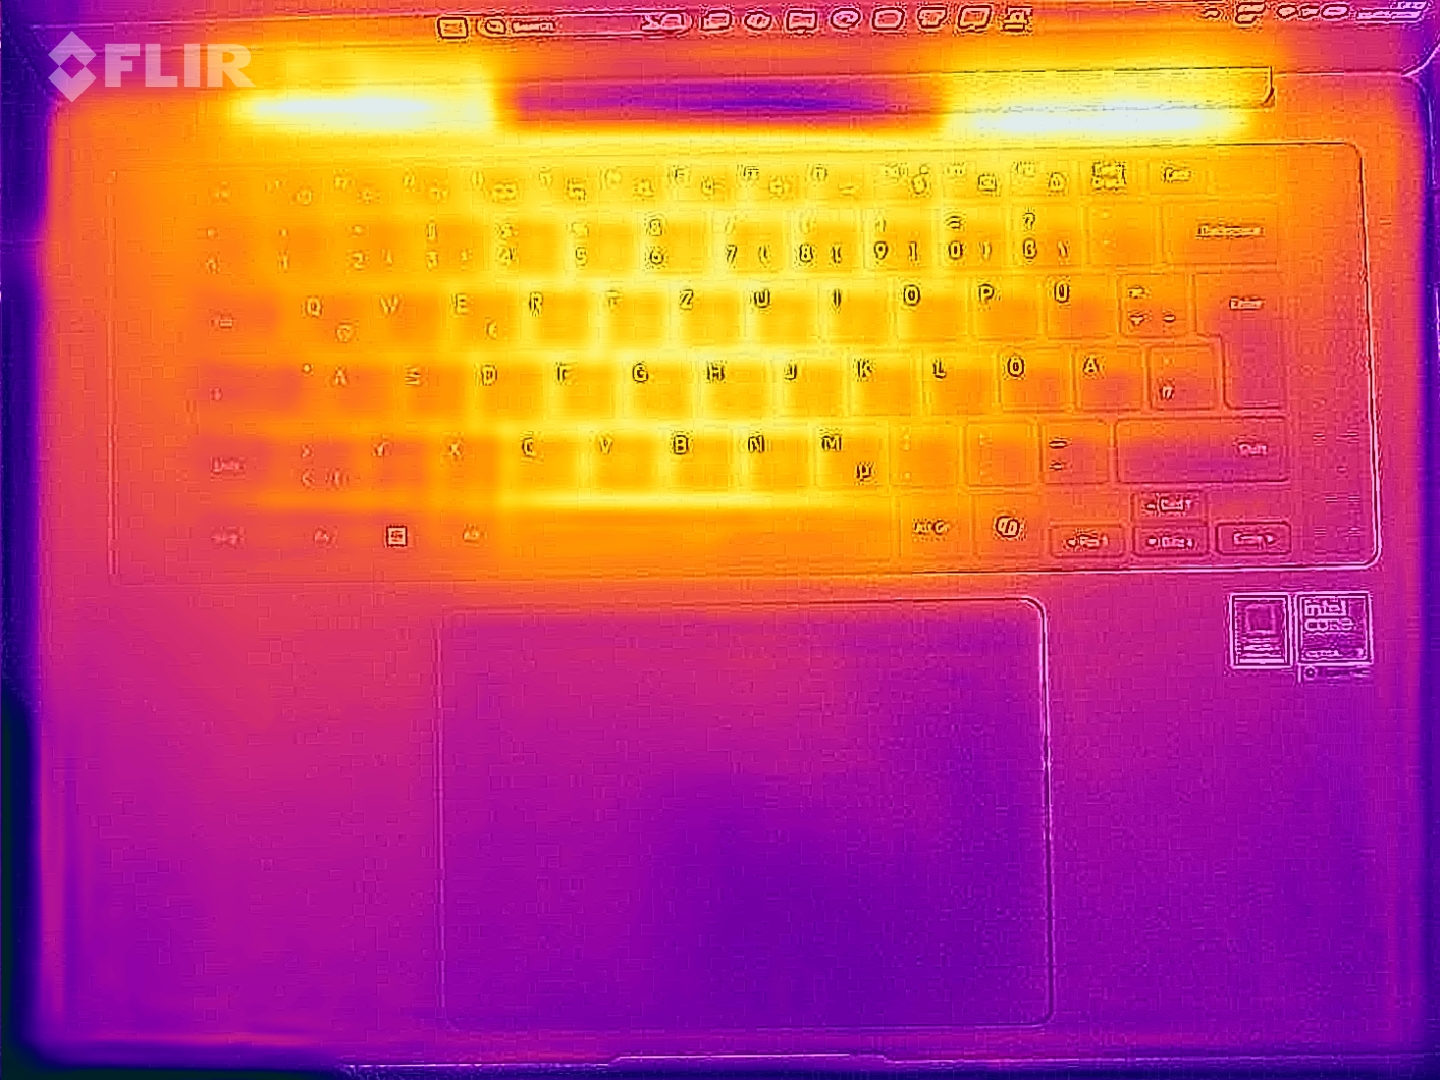
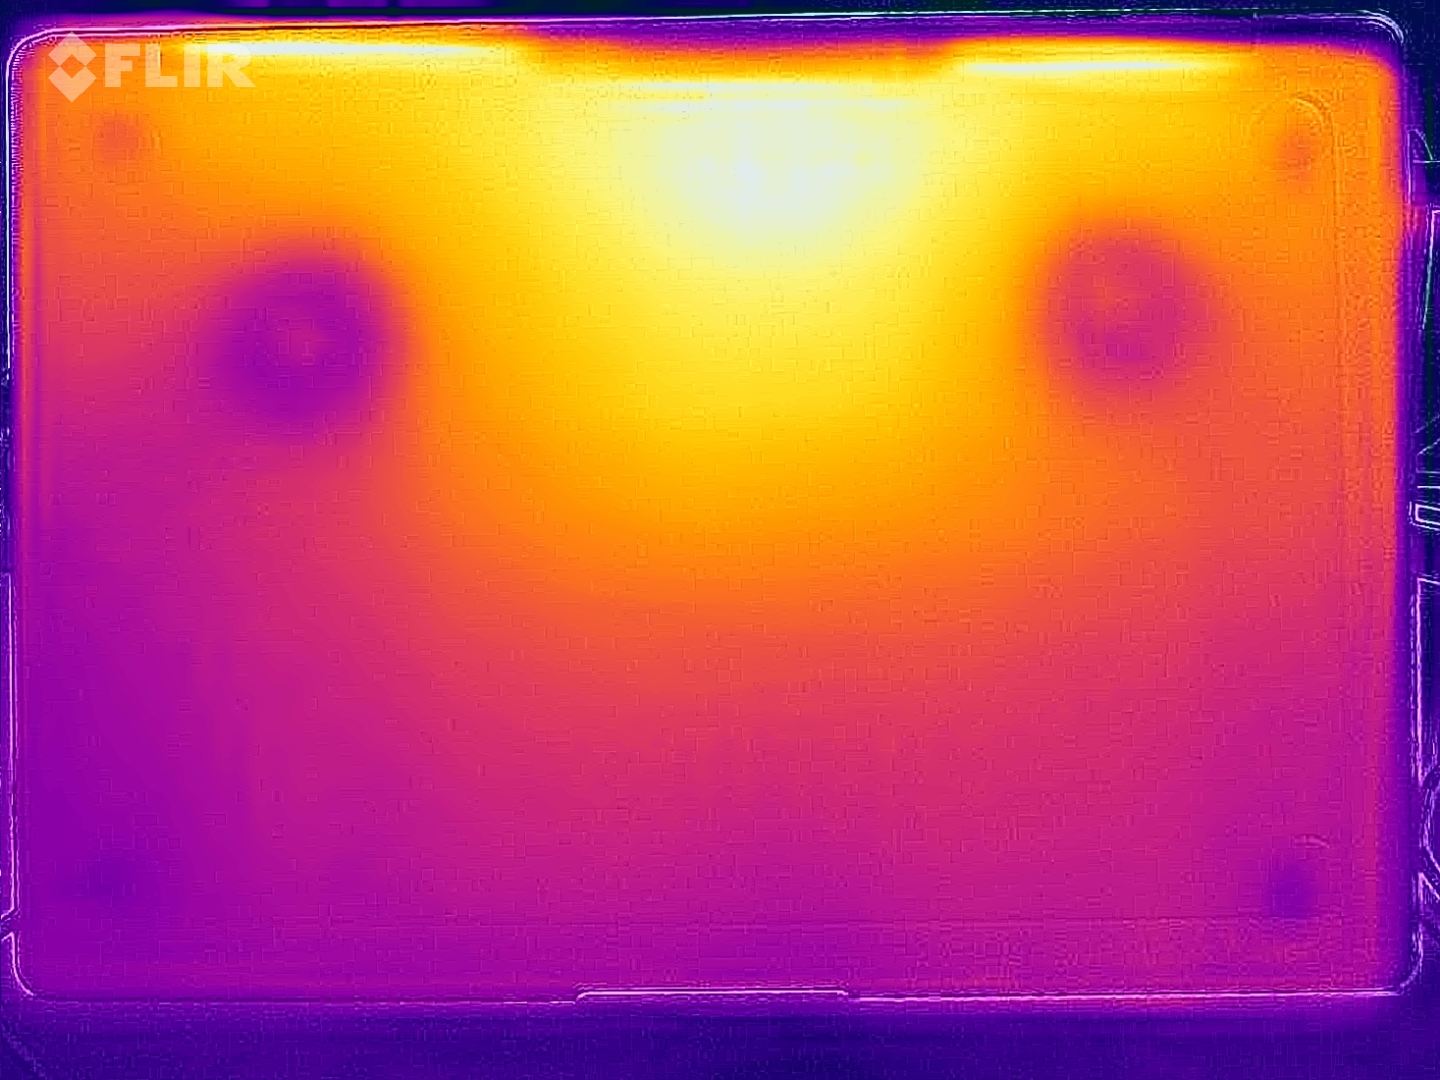
Temperature
The surfaces stay very cool in everyday scenarios and we can only measure more than 40 °C under load at one spot, so there are absolutely no limitations. During our stress test, the CPU consumption levels off at ~27 Watts.

(+) The maximum temperature on the upper side is 37.8 °C / 100 F, compared to the average of 36.8 °C / 98 F, ranging from 21 to 71 °C for the class Multimedia.
(±) The bottom heats up to a maximum of 40.1 °C / 104 F, compared to the average of 39.1 °C / 102 F
(+) In idle usage, the average temperature for the upper side is 22.4 °C / 72 F, compared to the device average of 31.3 °C / 88 F.
(±) 3: The average temperature for the upper side is 32.8 °C / 91 F, compared to the average of 31.3 °C / 88 F for the class Multimedia.
(+) The palmrests and touchpad are cooler than skin temperature with a maximum of 28.4 °C / 83.1 F and are therefore cool to the touch.
(±) The average temperature of the palmrest area of similar devices was 28.7 °C / 83.7 F (+0.3 °C / 0.6 F).
| Samsung Galaxy Book6 Pro Ultra 7 356H, Intel Graphics 4 Xe3 PTL | Dell XPS 16 Core Ultra 5 325 Ultra 5 325, Intel Graphics 4 Xe3 PTL | Asus ZenBook S16 UM5606GA Ryzen AI 9 465, Radeon 880M | Apple MacBook Air 15 M5 M5 10-Core, M5 10-Core GPU | Microsoft Surface Laptop 7 15 Lunar Lake Core Ultra 7 268V, Arc 140V | Lenovo ThinkPad X9-15 Aura Edition Core Ultra 7 258V, Arc 140V | |
|---|---|---|---|---|---|---|
| Heat | -7% | -16% | -9% | -8% | -6% | |
| Maximum Upper Side * (°C) | 37.8 | 43.8 -16% | 43.4 -15% | 44.1 -17% | 45.7 -21% | 42.1 -11% |
| Maximum Bottom * (°C) | 40.1 | 42 -5% | 46.2 -15% | 43.1 -7% | 42.9 -7% | 39.5 1% |
| Idle Upper Side * (°C) | 22.6 | 23.2 -3% | 26.5 -17% | 24 -6% | 23.6 -4% | 24.5 -8% |
| Idle Bottom * (°C) | 22.8 | 23.6 -4% | 27 -18% | 23.9 -5% | 23.1 -1% | 24.4 -7% |
* ... smaller is better
Speakers
The four speaker system offers decent sound quality, but the competition offers better even better sound systems. The modules of the Galaxy Book6 Pro simply lack some punch, which is noticeable.
Samsung Galaxy Book6 Pro audio analysis
(±) | speaker loudness is average but good (81.1 dB)
Bass 100 - 315 Hz
(±) | reduced bass - on average 13.7% lower than median
(±) | linearity of bass is average (8.9% delta to prev. frequency)
Mids 400 - 2000 Hz
(+) | balanced mids - only 3.1% away from median
(+) | mids are linear (3.5% delta to prev. frequency)
Highs 2 - 16 kHz
(+) | balanced highs - only 1.3% away from median
(+) | highs are linear (2.7% delta to prev. frequency)
Overall 100 - 16.000 Hz
(+) | overall sound is linear (11% difference to median)
Compared to same class
» 16% of all tested devices in this class were better, 3% similar, 81% worse
» The best had a delta of 5%, average was 17%, worst was 45%
Compared to all devices tested
» 6% of all tested devices were better, 2% similar, 92% worse
» The best had a delta of 4%, average was 24%, worst was 134%
Dell XPS 16 Core Ultra 5 325 audio analysis
(+) | speakers can play relatively loud (85.3 dB)
Bass 100 - 315 Hz
(±) | reduced bass - on average 6.1% lower than median
(+) | bass is linear (5.6% delta to prev. frequency)
Mids 400 - 2000 Hz
(+) | balanced mids - only 3.2% away from median
(+) | mids are linear (4.6% delta to prev. frequency)
Highs 2 - 16 kHz
(+) | balanced highs - only 2.4% away from median
(+) | highs are linear (3.3% delta to prev. frequency)
Overall 100 - 16.000 Hz
(+) | overall sound is linear (7% difference to median)
Compared to same class
» 5% of all tested devices in this class were better, 1% similar, 94% worse
» The best had a delta of 5%, average was 17%, worst was 45%
Compared to all devices tested
» 1% of all tested devices were better, 0% similar, 99% worse
» The best had a delta of 4%, average was 24%, worst was 134%
Asus ZenBook S16 UM5606GA audio analysis
(±) | speaker loudness is average but good (78.2 dB)
Bass 100 - 315 Hz
(+) | good bass - only 4.6% away from median
(+) | bass is linear (6.2% delta to prev. frequency)
Mids 400 - 2000 Hz
(+) | balanced mids - only 1.9% away from median
(+) | mids are linear (5% delta to prev. frequency)
Highs 2 - 16 kHz
(+) | balanced highs - only 2.1% away from median
(+) | highs are linear (4.9% delta to prev. frequency)
Overall 100 - 16.000 Hz
(+) | overall sound is linear (7.6% difference to median)
Compared to same class
» 6% of all tested devices in this class were better, 2% similar, 92% worse
» The best had a delta of 5%, average was 17%, worst was 45%
Compared to all devices tested
» 1% of all tested devices were better, 0% similar, 98% worse
» The best had a delta of 4%, average was 24%, worst was 134%
Apple MacBook Air 15 M5 audio analysis
(+) | speakers can play relatively loud (84.8 dB)
Bass 100 - 315 Hz
(±) | reduced bass - on average 6.8% lower than median
(+) | bass is linear (6.6% delta to prev. frequency)
Mids 400 - 2000 Hz
(+) | balanced mids - only 2% away from median
(+) | mids are linear (3.3% delta to prev. frequency)
Highs 2 - 16 kHz
(+) | balanced highs - only 3.6% away from median
(+) | highs are linear (3.2% delta to prev. frequency)
Overall 100 - 16.000 Hz
(+) | overall sound is linear (7.7% difference to median)
Compared to same class
» 2% of all tested devices in this class were better, 0% similar, 98% worse
» The best had a delta of 5%, average was 18%, worst was 53%
Compared to all devices tested
» 1% of all tested devices were better, 0% similar, 98% worse
» The best had a delta of 4%, average was 24%, worst was 134%
Microsoft Surface Laptop 7 15 Lunar Lake audio analysis
(±) | speaker loudness is average but good (78.8 dB)
Bass 100 - 315 Hz
(±) | reduced bass - on average 9.3% lower than median
(±) | linearity of bass is average (8.4% delta to prev. frequency)
Mids 400 - 2000 Hz
(+) | balanced mids - only 4.4% away from median
(+) | mids are linear (3% delta to prev. frequency)
Highs 2 - 16 kHz
(+) | balanced highs - only 2.4% away from median
(+) | highs are linear (4.1% delta to prev. frequency)
Overall 100 - 16.000 Hz
(+) | overall sound is linear (11.4% difference to median)
Compared to same class
» 3% of all tested devices in this class were better, 2% similar, 95% worse
» The best had a delta of 7%, average was 21%, worst was 53%
Compared to all devices tested
» 7% of all tested devices were better, 2% similar, 91% worse
» The best had a delta of 4%, average was 24%, worst was 134%
Lenovo ThinkPad X9-15 Aura Edition audio analysis
(+) | speakers can play relatively loud (87.5 dB)
Bass 100 - 315 Hz
(±) | reduced bass - on average 12.5% lower than median
(+) | bass is linear (6.8% delta to prev. frequency)
Mids 400 - 2000 Hz
(+) | balanced mids - only 3.1% away from median
(+) | mids are linear (5.3% delta to prev. frequency)
Highs 2 - 16 kHz
(+) | balanced highs - only 2.4% away from median
(+) | highs are linear (3.3% delta to prev. frequency)
Overall 100 - 16.000 Hz
(+) | overall sound is linear (9.5% difference to median)
Compared to same class
» 1% of all tested devices in this class were better, 0% similar, 99% worse
» The best had a delta of 7%, average was 21%, worst was 53%
Compared to all devices tested
» 4% of all tested devices were better, 1% similar, 95% worse
» The best had a delta of 4%, average was 24%, worst was 134%
Power Consumption
The new OLED screen (2.8K, 120 Hz) is extremely efficient and the maximum idle consumption is just 4.6 Watts, which is identical to the new XPS 16 with the inferior FHD panel with 60 Hz. Under load, we can measure up to 71 Watts, even though we used a 180W PSU since our unit was shipped without a PSU. It seems that there is a limitation, because the short-term consumption should be higher considering the short-term CPU consumption of 80 Watts. The consumption quickly levels off at ~54W.
| Off / Standby | |
| Idle | |
| Load |
|
Key:
min: | |
| Samsung Galaxy Book6 Pro Ultra 7 356H, Intel Graphics 4 Xe3 PTL, Samsung PM9C1b MZVL8512HFLU-00BLL, OLED, 2880x1800, 16" | Dell XPS 16 Core Ultra 5 325 Ultra 5 325, Intel Graphics 4 Xe3 PTL, SK hynix PVC10 HFS512GEM4X182N, IPS, 1920x1200, 16" | Asus ZenBook S16 UM5606GA Ryzen AI 9 465, Radeon 880M, SanDisk PC SN5100S, OLED, 2880x1800, 16" | Apple MacBook Air 15 M5 M5 10-Core, M5 10-Core GPU, Apple SSD AP2048Z, IPS, 2880x1864, 15.3" | Microsoft Surface Laptop 7 15 Lunar Lake Core Ultra 7 268V, Arc 140V, Samsung PM9C1a MZ9L81T0HDLB, IPS, 2496x1664, 15" | Lenovo ThinkPad X9-15 Aura Edition Core Ultra 7 258V, Arc 140V, WD PC SN740 SDDQMQD-1T00, OLED, 2880x1800, 15.3" | Samsung Galaxy Book4 Pro 16 Ultra 7 155H, Arc 8-Core, Samsung PM9B1 512GB MZVL4512HBLU, OLED, 2880x1800, 16" | Average Intel Graphics 4 Xe3 Panther Lake iGPU | Average of class Multimedia | |
|---|---|---|---|---|---|---|---|---|---|
| Power Consumption | 5% | -47% | -23% | -35% | 4% | -26% | -15% | -110% | |
| Idle Minimum * (Watt) | 2.5 | 1.3 48% | 3.7 -48% | 2.2 12% | 3.2 -28% | 2.4 4% | 3.6 -44% | 2.8 ? -12% | 5.71 ? -128% |
| Idle Average * (Watt) | 4.2 | 4.5 -7% | 7.4 -76% | 11.7 -179% | 8.7 -107% | 3.9 7% | 5.7 -36% | 5.08 ? -21% | 10.1 ? -140% |
| Idle Maximum * (Watt) | 4.6 | 4.6 -0% | 9.5 -107% | 11.8 -157% | 9 -96% | 5.1 -11% | 6.1 -33% | 6.68 ? -45% | 12.4 ? -170% |
| Load Average * (Watt) | 42.2 | 36.5 14% | 57.9 -37% | 36.2 14% | 44.7 -6% | 42.5 -1% | 52.5 -24% | 40.1 ? 5% | 65 ? -54% |
| Cyberpunk 2077 ultra external monitor * (Watt) | 40.6 | 45.4 -12% | 57 -40% | 21.7 47% | 49.3 -21% | 40.2 1% | |||
| Cyberpunk 2077 ultra * (Watt) | 52.7 | 47.9 9% | 58.5 -11% | 23.5 55% | 51.1 3% | 43.5 17% | |||
| Load Maximum * (Watt) | 70.8 | 82.8 -17% | 76.9 -9% | 37.4 47% | 64.6 9% | 64.4 9% | 64.7 9% | 72.3 ? -2% | 112.2 ? -58% |
| Witcher 3 ultra * (Watt) | 46.6 |
* ... smaller is better
Power Consumption Cyberpunk / Stress Test
Power Consumption external Monitor
Battery Life
The 80 Wh battery manages good battery runtimes, but keep in mind that our Wi-Fi test mainly uses bright websites, wo OLED screens are at a disadvantage compared to IPS panels. We determine more than 16 hours in our Wi-Fi test and still almost 9 hours at full brightness. The rivals manage even longer runtimes, but usually use inferior screens as well. The exception is the ThinkPad X9 15, while the Zenbook S16 does not last as long.

| Samsung Galaxy Book6 Pro Ultra 7 356H, Intel Graphics 4 Xe3 PTL, 78 Wh | Dell XPS 16 Core Ultra 5 325 Ultra 5 325, Intel Graphics 4 Xe3 PTL, 70 Wh | Asus ZenBook S16 UM5606GA Ryzen AI 9 465, Radeon 880M, 83 Wh | Apple MacBook Air 15 M5 M5 10-Core, M5 10-Core GPU, 66.5 Wh | Microsoft Surface Laptop 7 15 Lunar Lake Core Ultra 7 268V, Arc 140V, 64 Wh | Lenovo ThinkPad X9-15 Aura Edition Core Ultra 7 258V, Arc 140V, 80 Wh | Samsung Galaxy Book4 Pro 16 Ultra 7 155H, Arc 8-Core, 76 Wh | Average of class Multimedia | |
|---|---|---|---|---|---|---|---|---|
| Battery Runtime | 63% | -16% | -9% | 5% | 8% | -25% | -24% | |
| WiFi Websurfing (h) | 16.3 | 26.6 63% | 13.1 -20% | 17.2 6% | 17.7 9% | 17.5 7% | 10.7 -34% | 12 ? -26% |
| WiFi Websurfing max. Brightness (h) | 8.8 | 7.8 -11% | 6.7 -24% | 8.8 0% | 9.5 8% | 7.5 -15% | 6.95 ? -21% |
Notebookcheck Rating
Samsung Galaxy Book6 Pro
- 03/31/2026 v8
Andreas Osthoff
 Total Sustainability Score:
 Potential Competitors in Comparison
Image | Model / Review | Price | Weight | Height | Display |
|---|---|---|---|---|---|
1. 86.3% 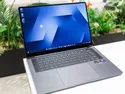 | Samsung Galaxy Book6 Pro Intel Core Ultra 7 356H ⎘ Intel Graphics 4 Xe3 Panther Lake iGPU ⎘ 32 GB Memory, 512 GB SSD | Amazon: List Price: 2199€ | 1.6 kg | 11.9 mm | 16.00" 2880x1800 212 PPI OLED |
2. 84.2%  | Dell XPS 16 Core Ultra 5 325 Intel Core Ultra 5 325 ⎘ Intel Graphics 4 Xe3 Panther Lake iGPU ⎘ 16 GB Memory, 512 GB SSD | Amazon: 1. $2,592.78 Dell Premium 16 (XPS 16 2025... 2. $1,977.99 Dell Premium 16 (Previously ... 3. $2,599.00 Dell Premium 16 (XPS 16 2025... List Price: 1600 USD | 1.7 kg | 15.4 mm | 16.00" 1920x1200 142 PPI IPS |
3. 86.6%  | Asus ZenBook S16 UM5606GA AMD Ryzen AI 9 465 ⎘ AMD Radeon 880M ⎘ 32 GB Memory, 1024 GB SSD | Amazon: List Price: 1799€ | 1.5 kg | 12.9 mm | 16.00" 2880x1800 212 PPI OLED |
4. 91.6%  | Apple MacBook Air 15 M5 Apple M5 10-Core ⎘ Apple M5 10-Core GPU ⎘ 32 GB Memory, 2048 GB SSD | Amazon: | 1.5 kg | 11.5 mm | 15.30" 2880x1864 224 PPI IPS |
5. 87.4%  | Microsoft Surface Laptop 7 15 Lunar Lake Intel Core Ultra 7 268V ⎘ Intel Arc Graphics 140V ⎘ 32 GB Memory, 1024 GB SSD | Amazon: List Price: 2760€ | 1.7 kg | 18.3 mm | 15.00" 2496x1664 200 PPI IPS |
6. 90.1%  | Lenovo ThinkPad X9-15 Aura Edition Intel Core Ultra 7 258V ⎘ Intel Arc Graphics 140V ⎘ 32 GB Memory, 1024 GB SSD | Amazon: List Price: 1989€ | 1.4 kg | 17.7 mm | 15.30" 2880x1800 222 PPI OLED |
Transparency
The selection of devices to be reviewed is made by our editorial team. The test sample was provided to the author as a loan by the manufacturer or retailer for the purpose of this review. The lender had no influence on this review, nor did the manufacturer receive a copy of this review before publication. There was no obligation to publish this review. As an independent media company, Notebookcheck is not subjected to the authority of manufacturers, retailers or publishers.
This is how Notebookcheck is testing
Every year, Notebookcheck independently reviews hundreds of laptops and smartphones using standardized procedures to ensure that all results are comparable. We have continuously developed our test methods for around 20 years and set industry standards in the process. In our test labs, high-quality measuring equipment is utilized by experienced technicians and editors. These tests involve a multi-stage validation process. Our complex rating system is based on hundreds of well-founded measurements and benchmarks, which maintains objectivity. Further information on our test methods can be found here.
