Verdict — Greener And Leaner Than Ever Before
The Core Ultra X7 CPU and Arc B390 GPU are up to 70 percent and 150 percent faster than the admittedly disappointing Core Ultra 5 or Ultra 7 options, respectively, without needing to run any warmer. This higher-end configuration may cost $400 more at the time of writing, but it also doubles both the RAM (16 GB to 32 GB) and storage capacity (512 GB to 1 TB) to be a worthwhile consideration especially for graphic editors or content creators.
For even more power but lower efficiency, users may want to consider last year's Arrow Lake-powered Dell 16 Premium which can offer 20 percent faster multi-thread performance and 60 percent faster graphics performance than even the top-of-the-line 2026 XPS 16 configuration. Just keep in mind that the older Dell 16 Premium design entails a thicker and heavier build to accommodate the Nvidia GPU.
Observed throttling behavior suggests that the CPU could have likely benefited from a stronger cooling solution. Core temperature would reach 100 C when stressed before dialing back clock rates to keep temperatures in check. The competing Asus ExpertBook Ultra is able to sustain higher clock rates with the same Panther Lake X7 processor for faster performance than our Dell.
Meanwhile, the luxurious OLED panel is an additional $150 on top of the $400 mentioned above. The display upgrade is less recommended over the Core Ultra X7 CPU upgrade as the base IPS panel is already quite strong in terms of colors, contrast ratio, and refresh rate. For the level of editing and multimedia that the CPU and GPU are targeting, the IPS panel should be sufficient for most users on a tighter budget.
Pros
Cons
Price and Availability
The configuration as reviewed with the Core Ultra X7 and 3.2K OLED touchscreen is retailing for $2350 directly from Dell.
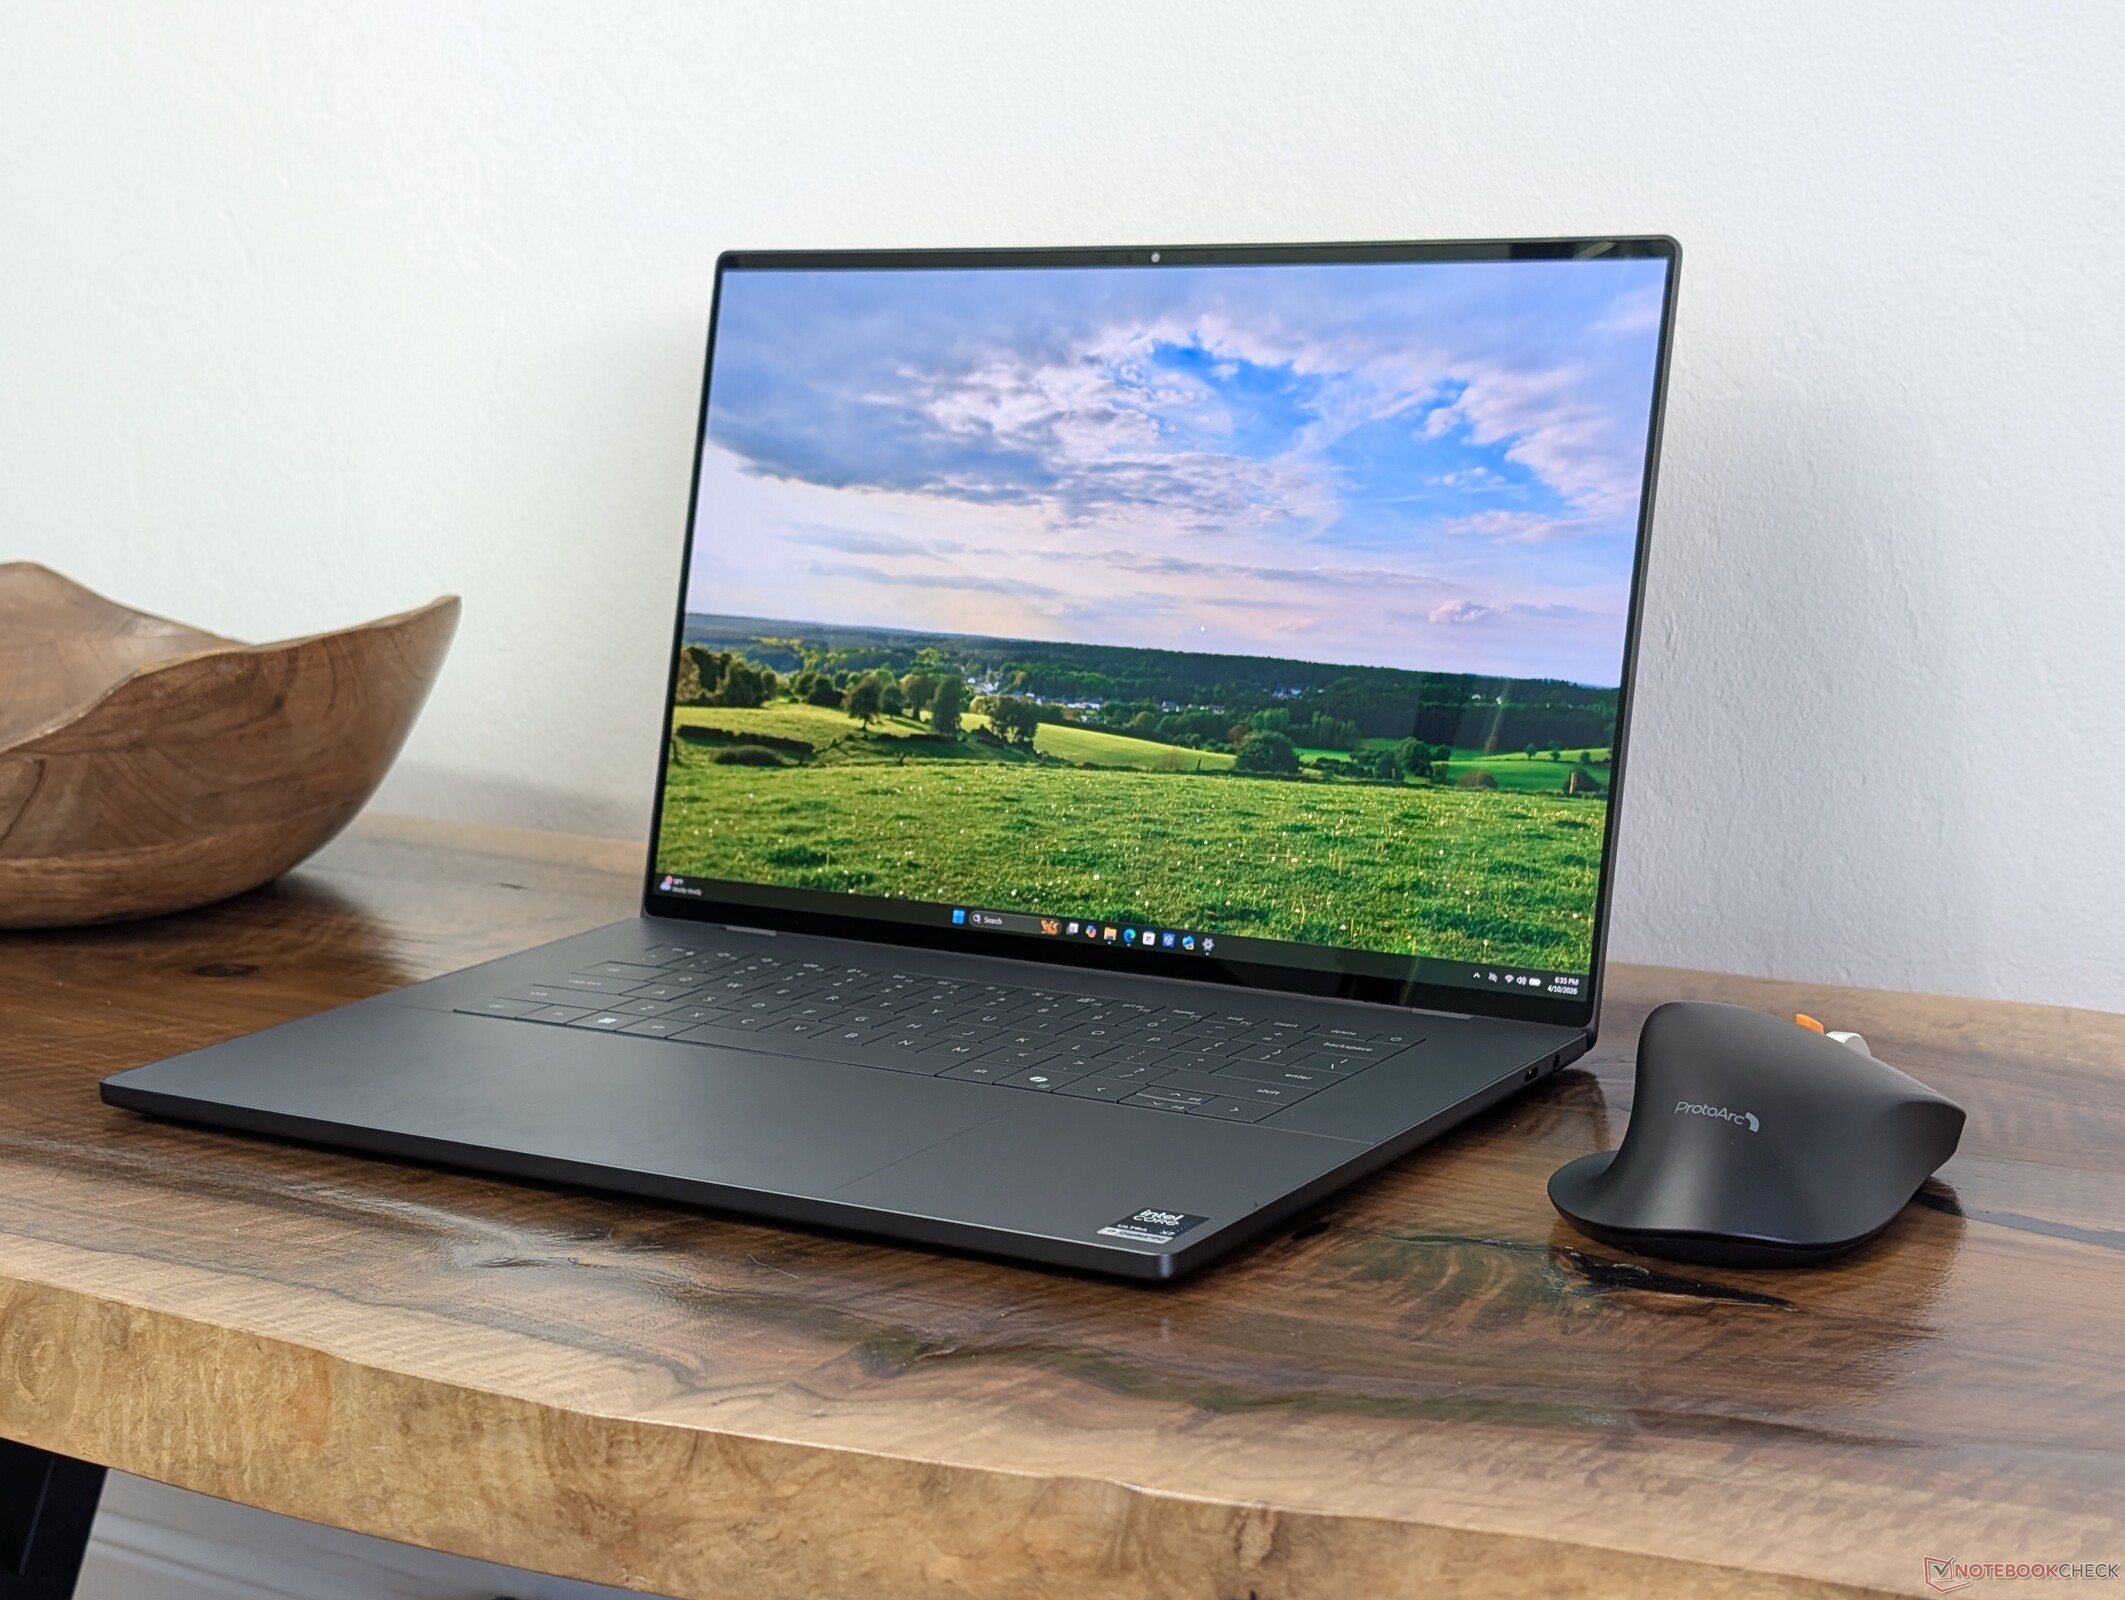
After having recently tested the base Core Ultra 5 325 IPS configuration of the newest XPS 16, we're now ready to tackle the Core Ultra X7 358H OLED configuration to see what kinds of upgrades and benefits the costlier option brings to the table. Is the higher-end SKU worth the extra $500 to $600?
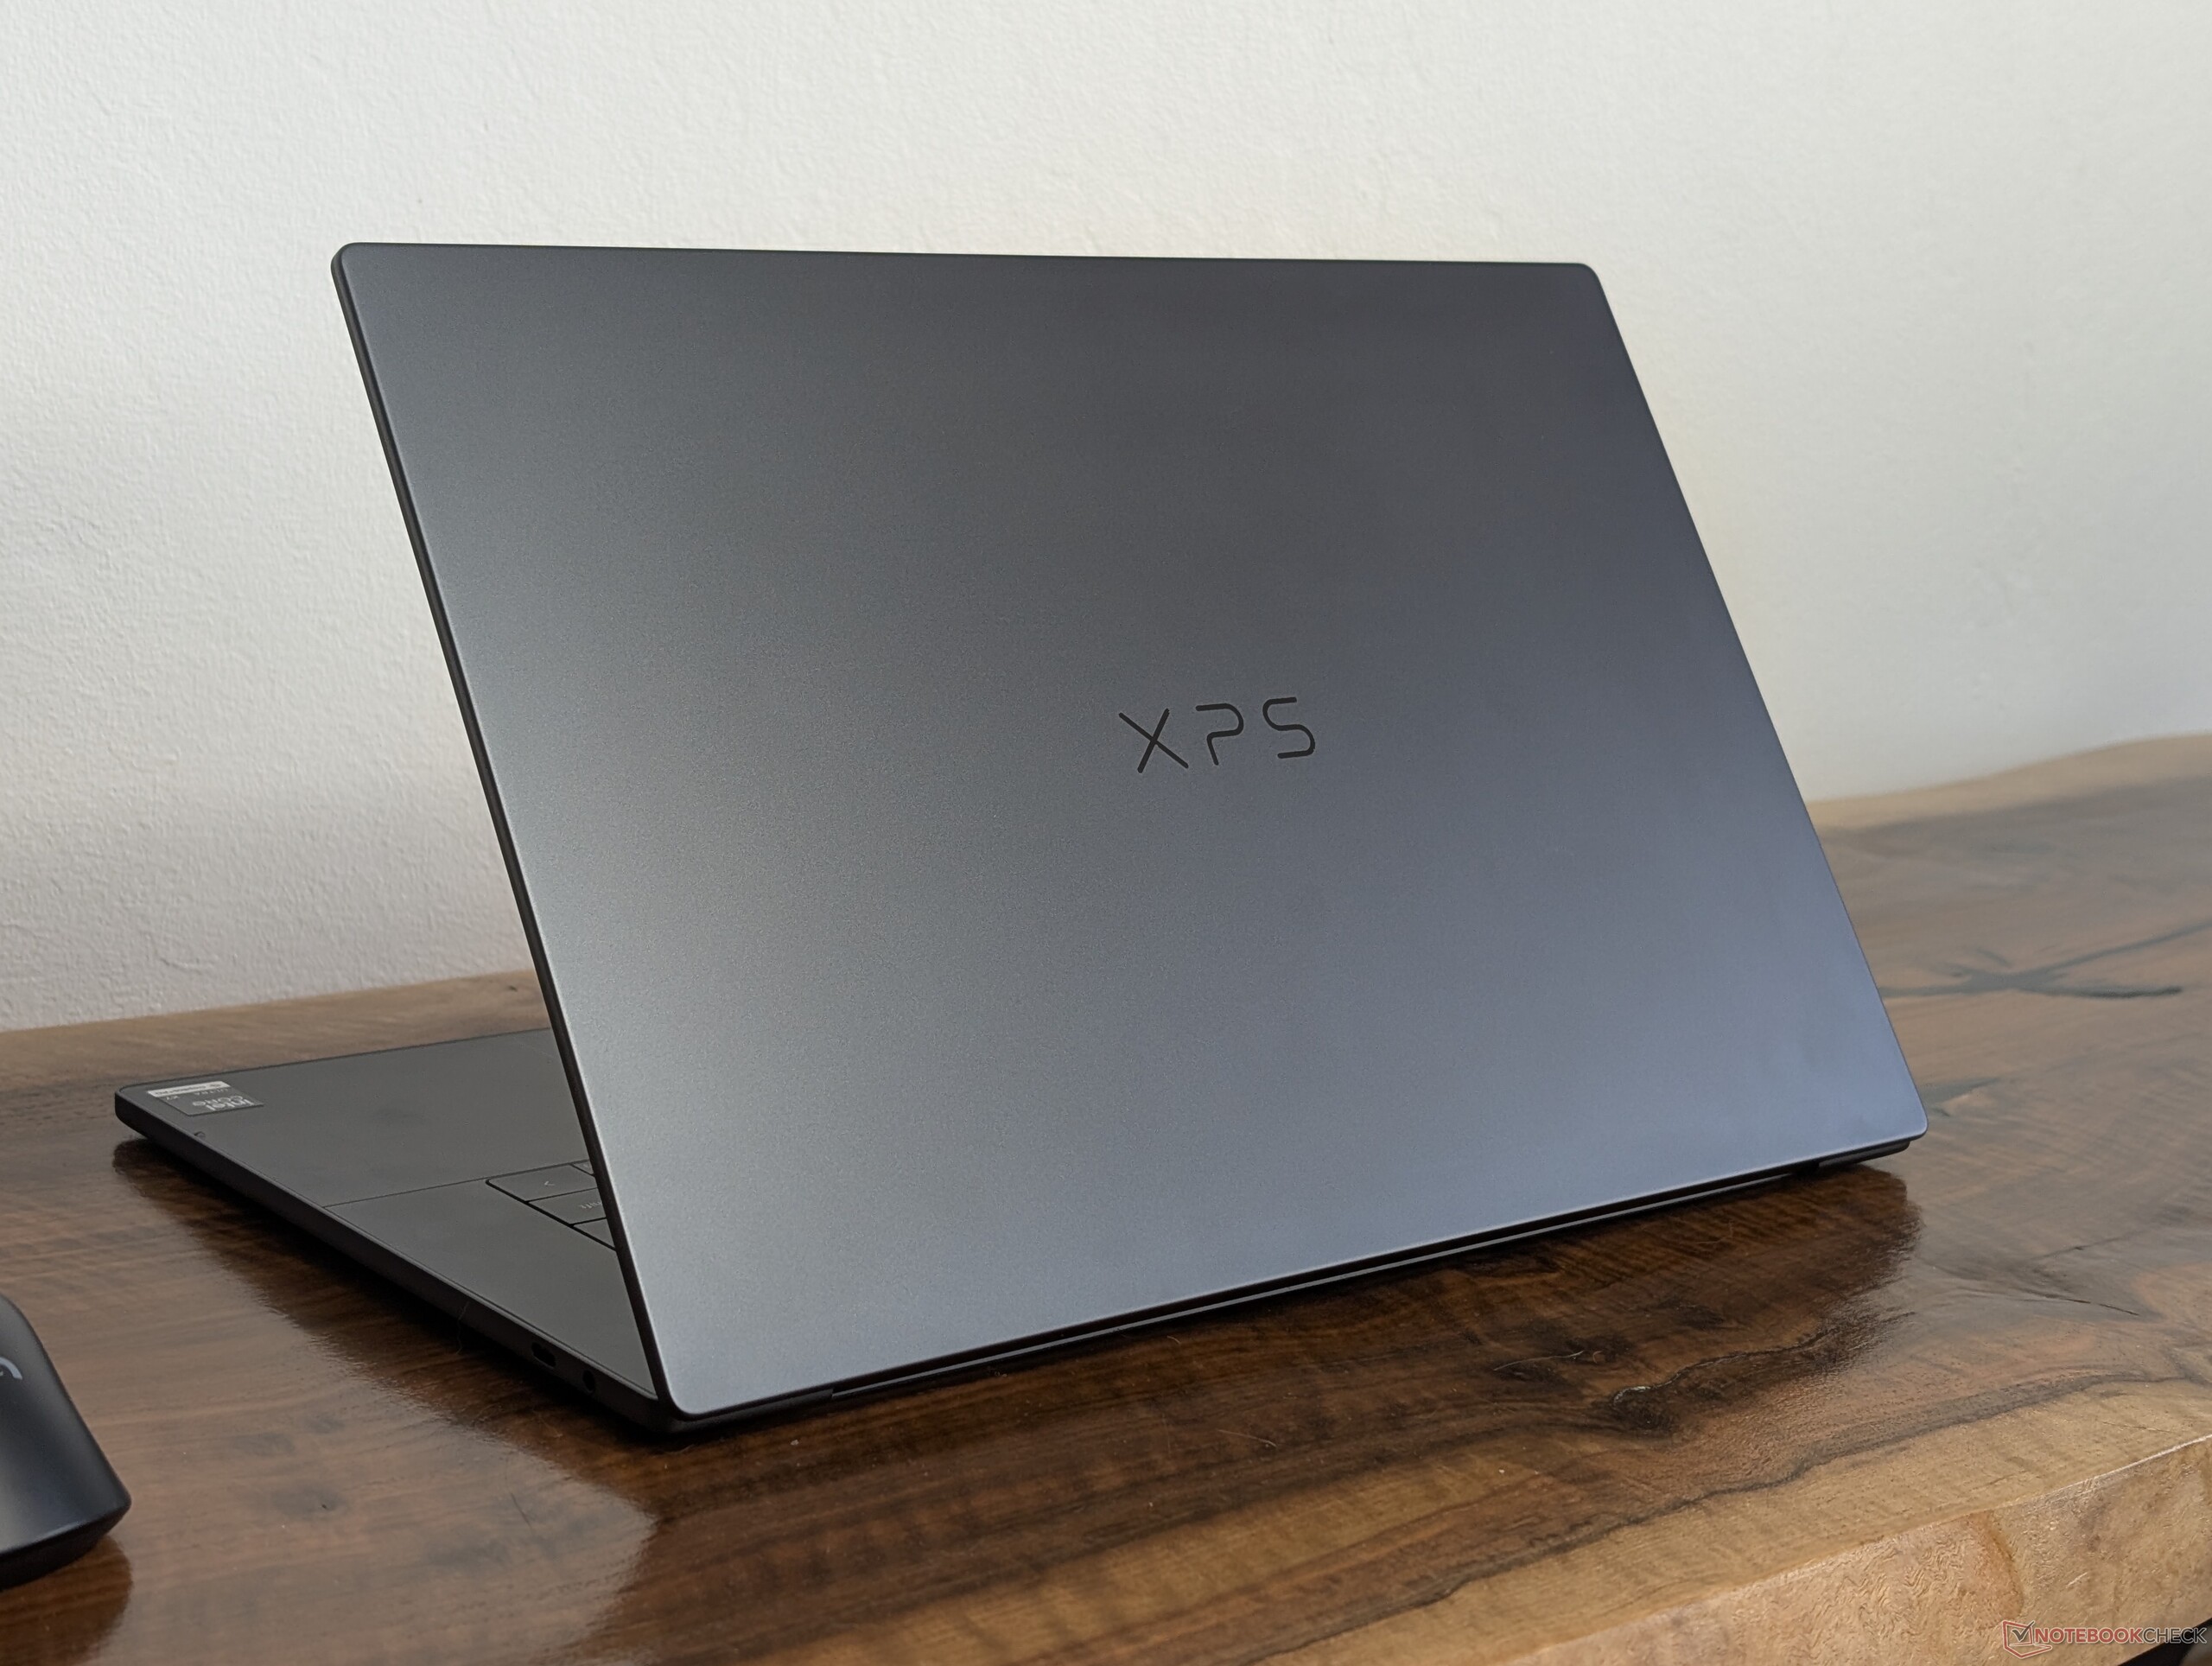
All of our comments about the physical features of the new 2026 XPS 16 design can be found here. This page instead focuses on the differences users can expect when choosing between the Core Ultra 5 or Core Ultra X7 configurations of the model.
More Dell reviews:
Specifications
Case
The OLED configuration is slightly thinner and lighter than the IPS configuration by almost 1 mm and 100 g, respectively. Both options are otherwise identical.
Connectivity


Communication
Webcam


Maintenance

Sustainability
The new XPS 16 uses more recycled materials than most other models in Dell's current portfolio. The chassis consists of 25 to 75 percent recycled aluminum alongside 10 percent recycled glass for the OLED touchscreen, 50 percent cobalt for the battery, 90 percent recycled steel for the keycaps, and 100 percent recycled materials for the packaging.
Display
Two display options are available:
- 1920 x 1200, 100% sRGB, IPS, non-touch, 1 - 120 Hz, matte
- 3200 x 2000, 100% DCI-P3, OLED, touchscreen, 20 - 120 Hz, DisplayHDR 500, glossy
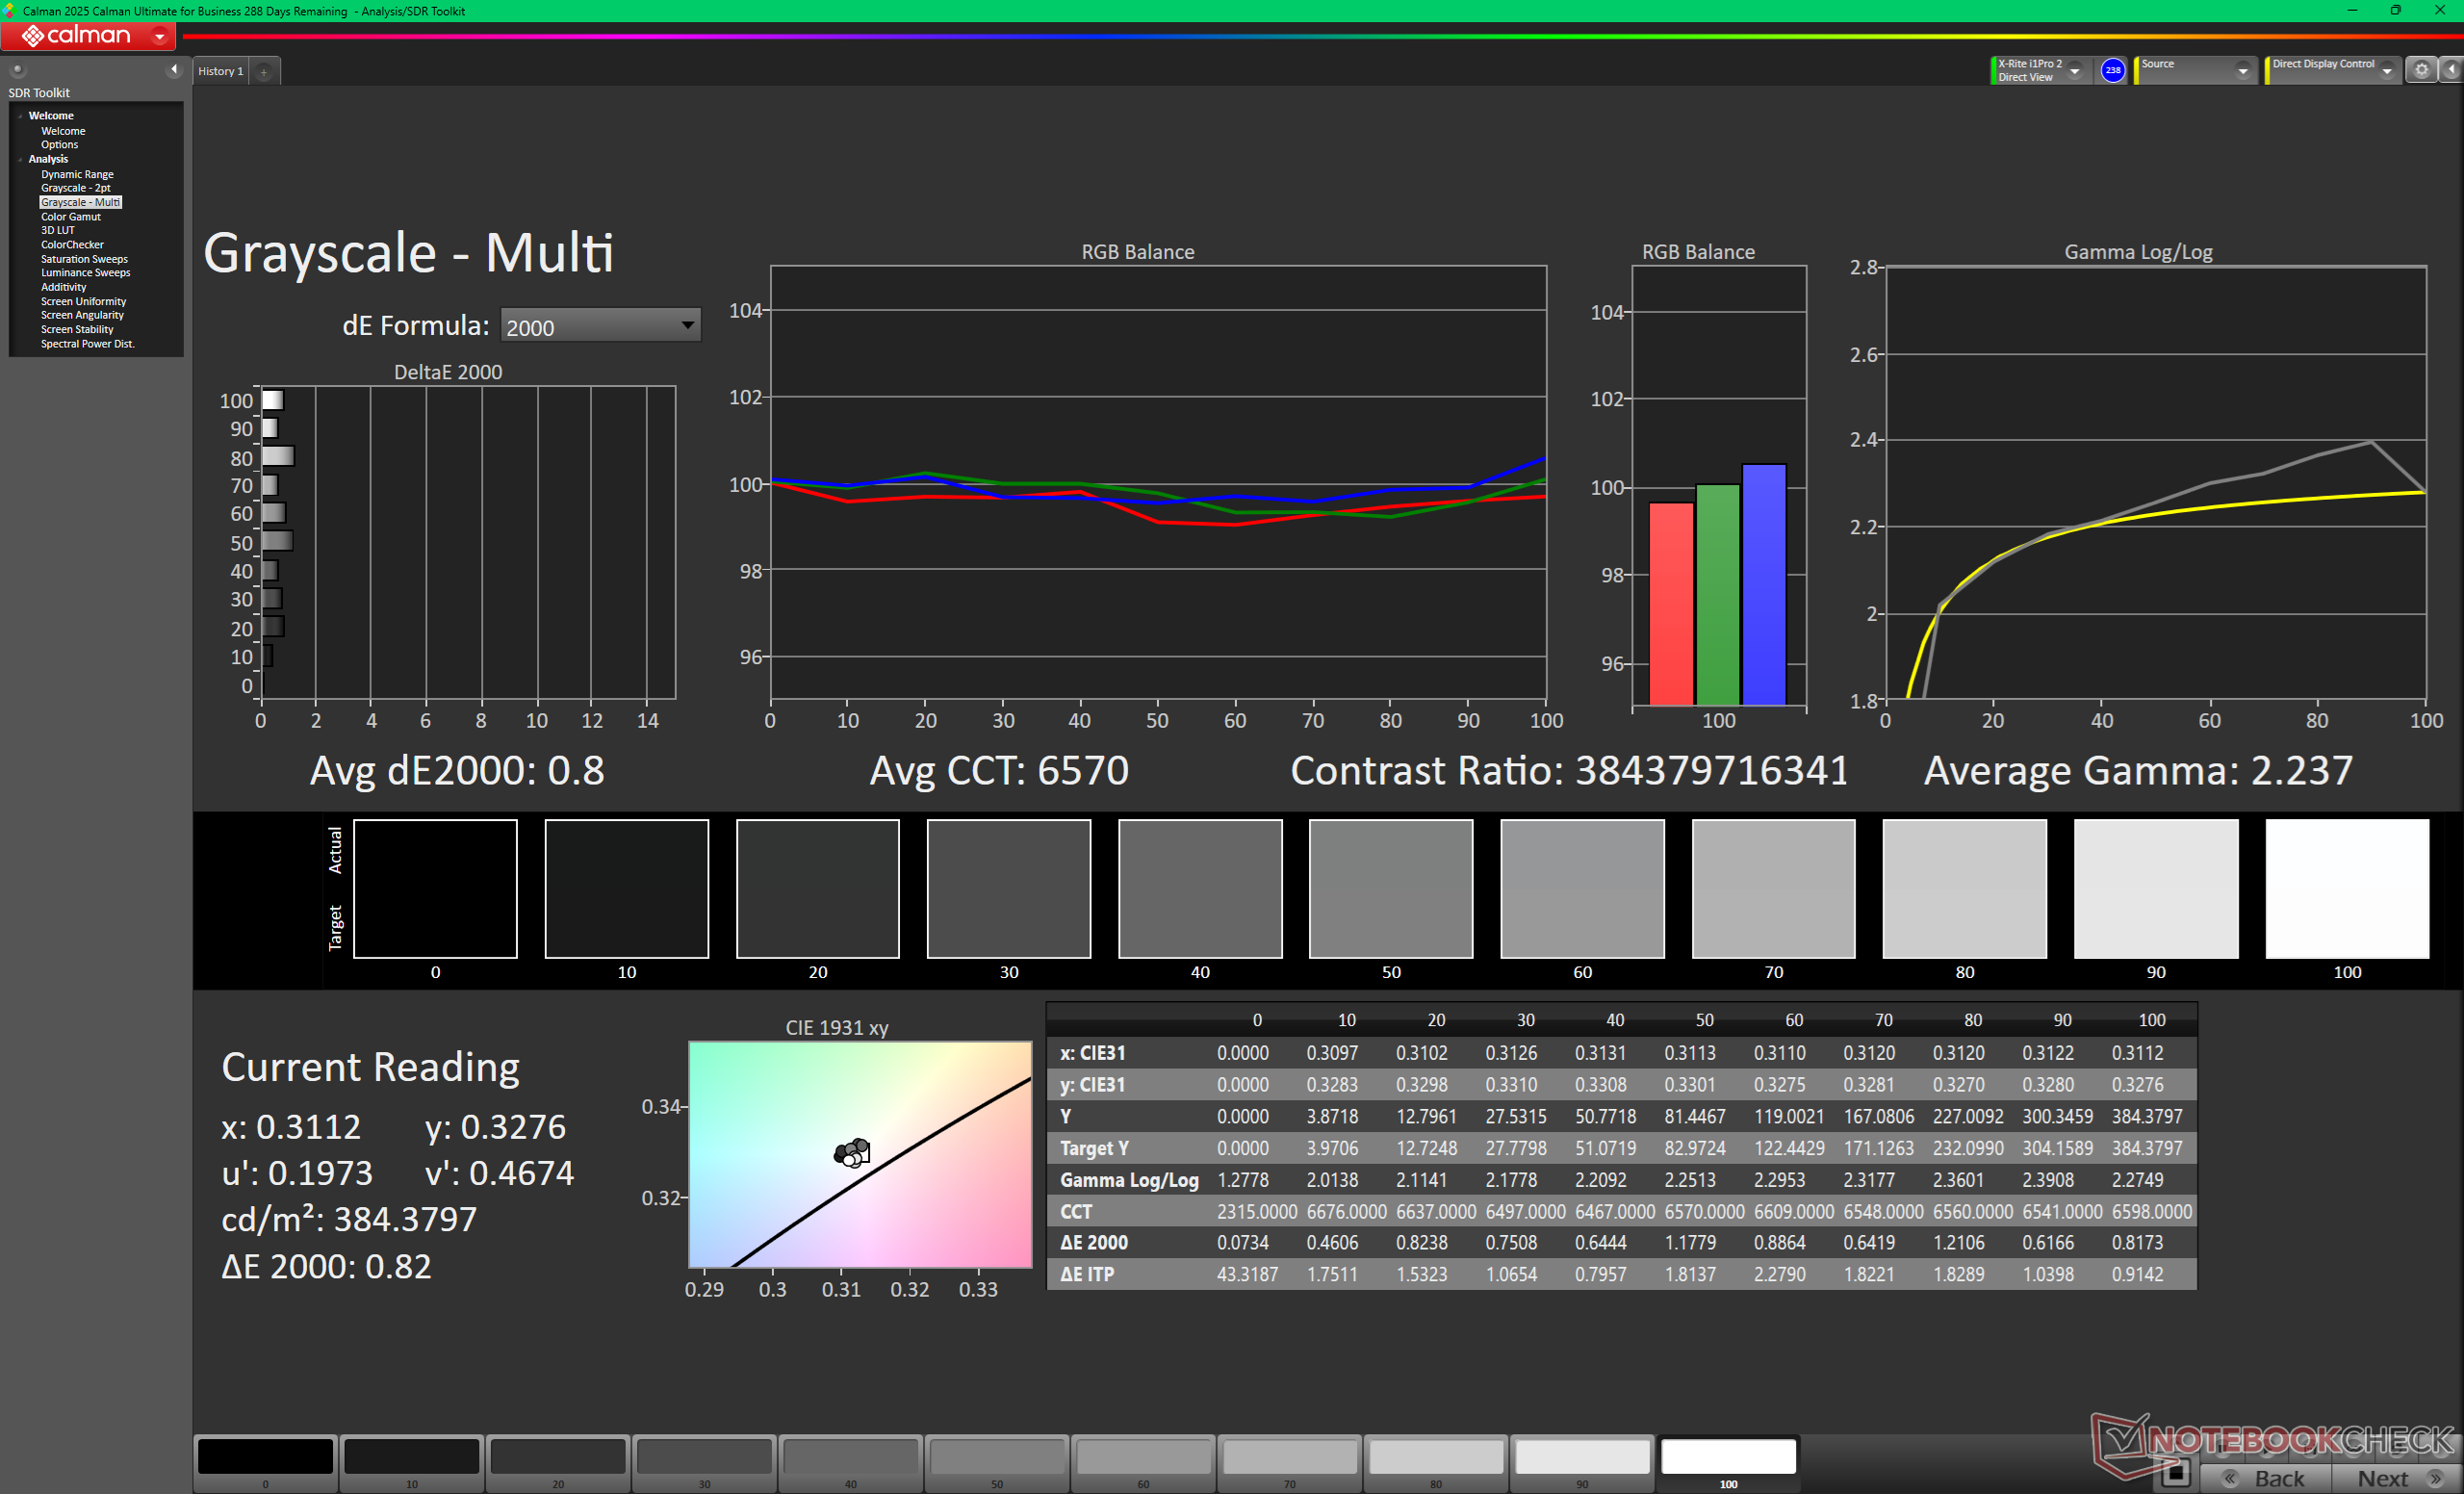
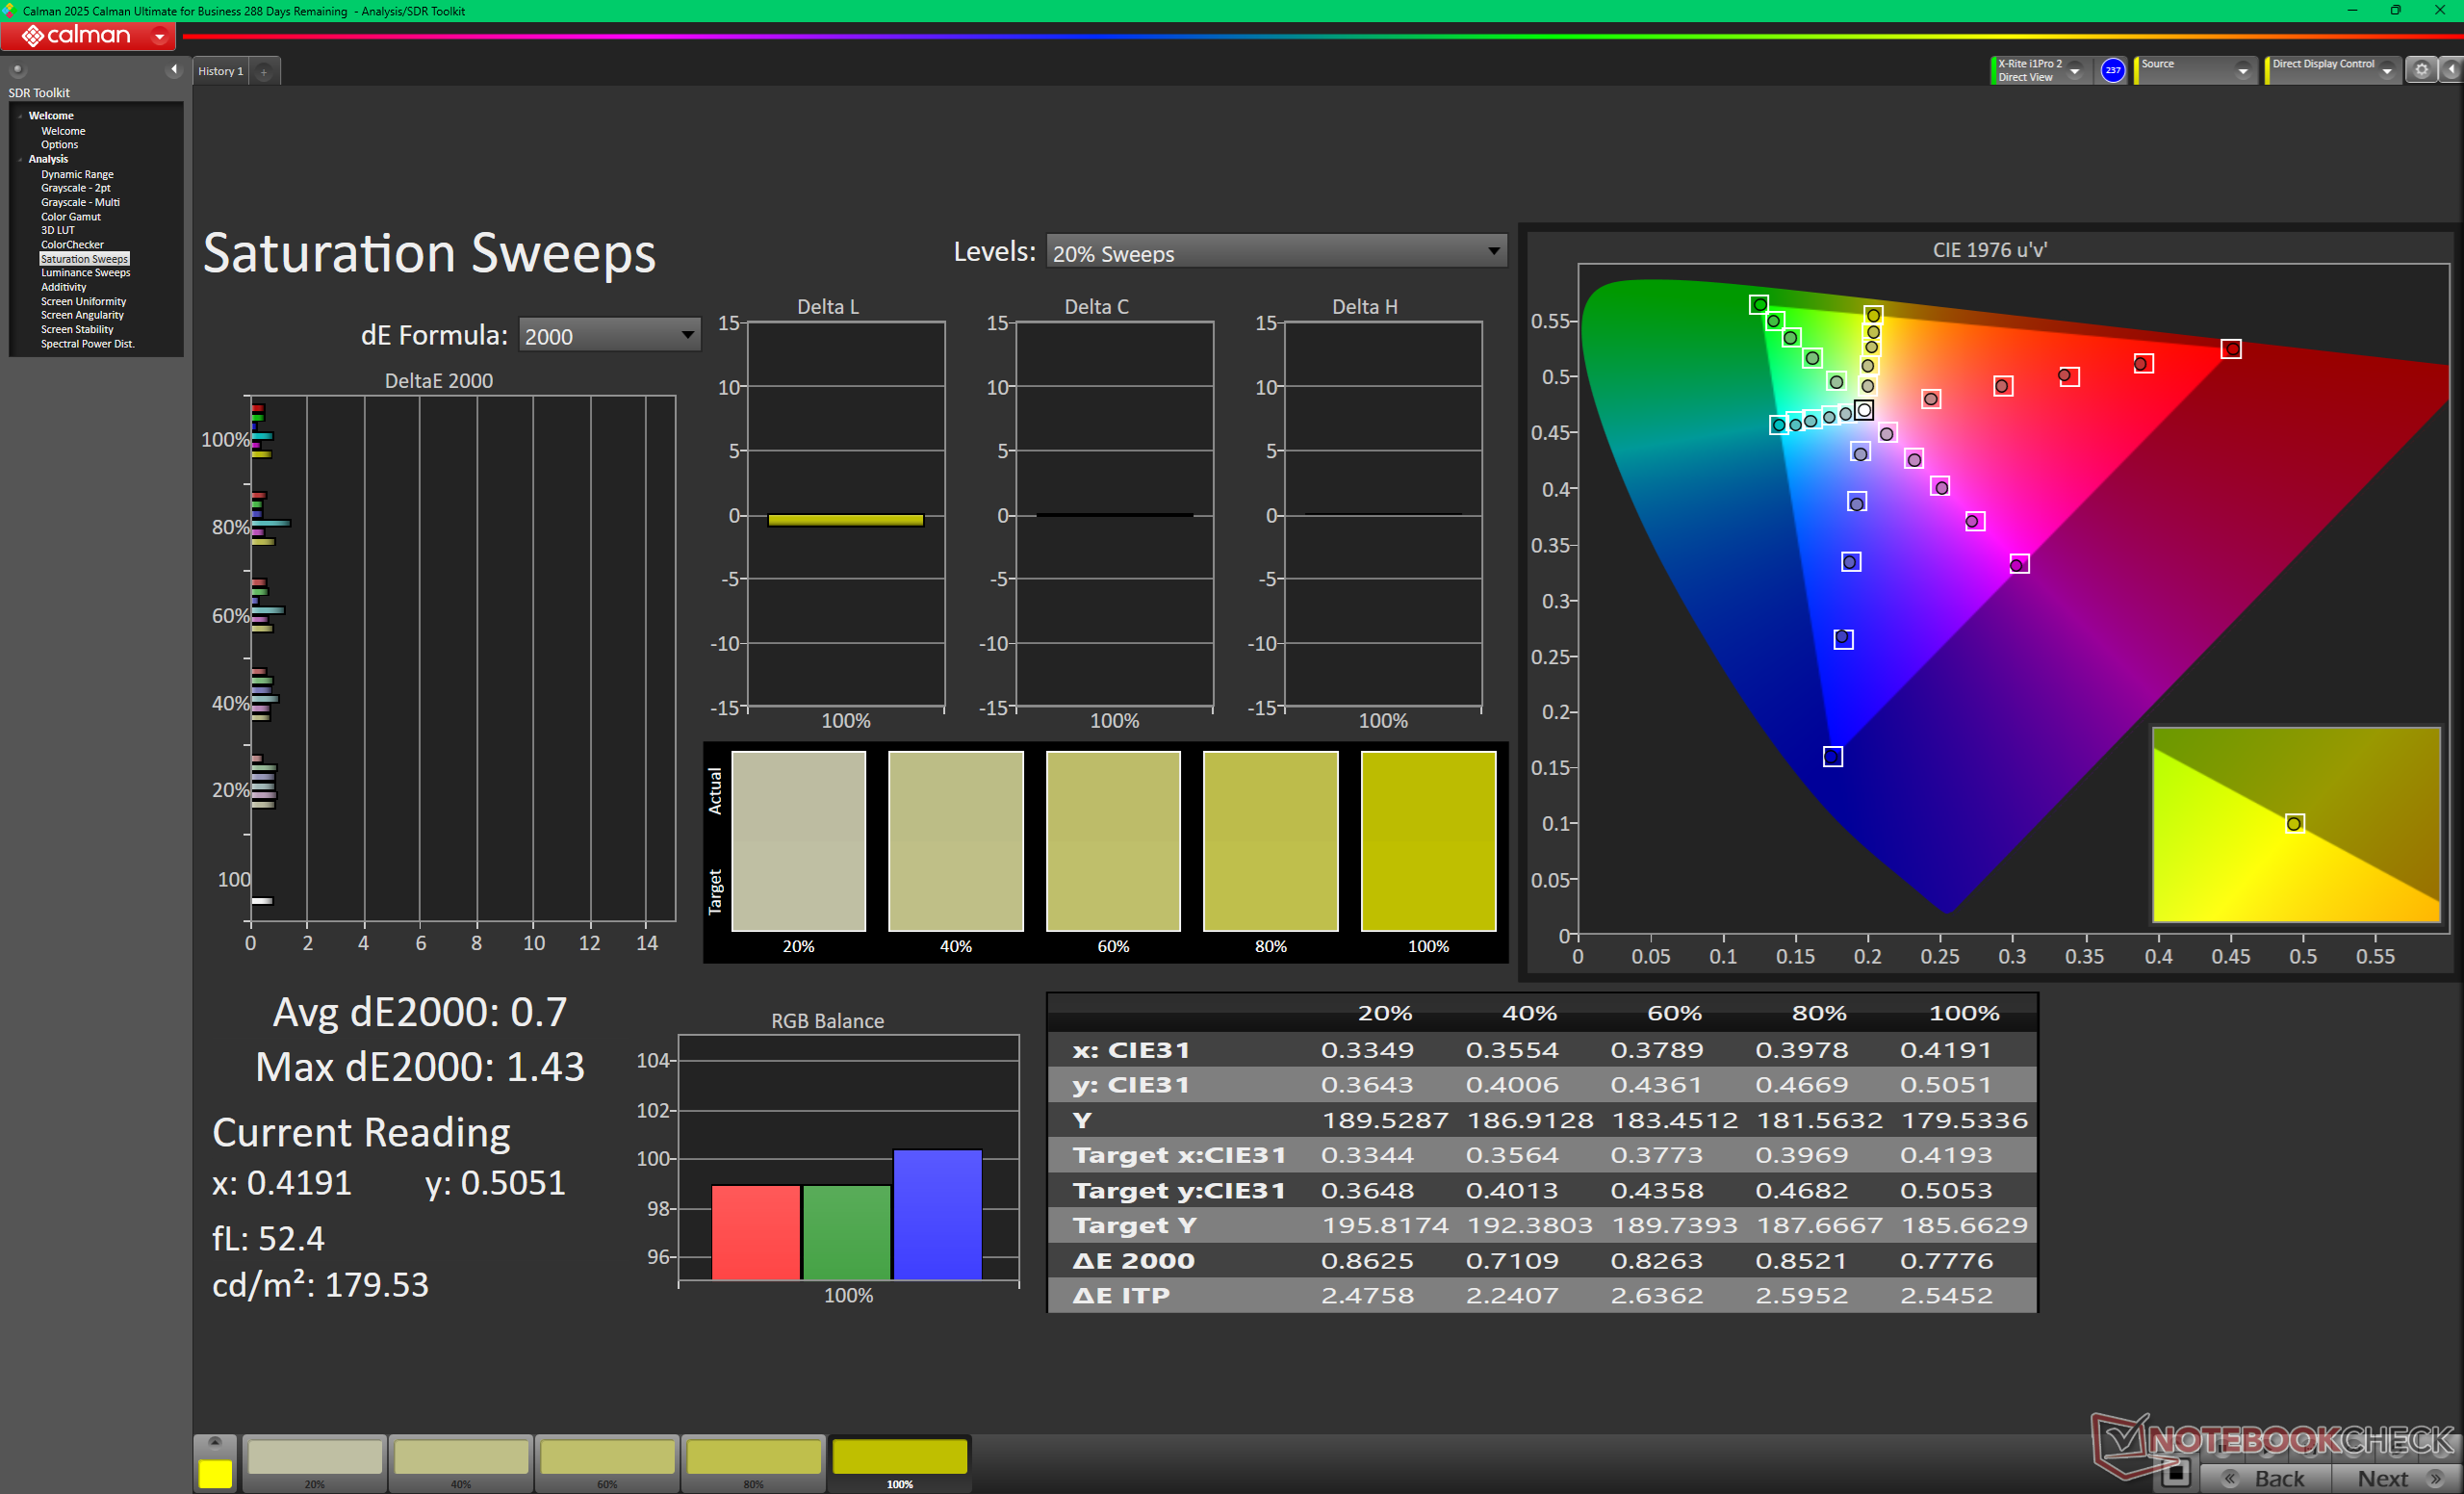
The OLED option offers multiple improvements over the base IPS panel including a higher native resolution, deeper P3 colors, touchscreen functionality, HDR500 support, and pitch black contrast levels. It also natively addresses the relatively slow black-white response times of the base IPS panel for a cleaner user experience.
Selecting OLED nevertheless introduces a few minor setbacks such as higher power consumption, pulse-width modulation, and a glare-heavy glossy screen. Its native 3.2K resolution is also notably lower than the 4K OLED panel on the older XPS 16 design (3200 x 2000 vs. 3840 x 2400).
Maximum brightness on the OLED panel tops out at 395 nits on SDR mode or 518 nits if on HDR mode according to our own in-house measurements. Thus, the cheaper IPS configuration is actually slightly brighter than the OLED configuration when displaying SDR content. Outdoor viewability is therefoire not necessarily better with the glossier OLED option.
| |||||||||||||||||||||||||
Brightness Distribution: 95 %
Center on Battery: 395.4 cd/m²
Contrast: ∞:1 (Black: 0 cd/m²)
ΔE ColorChecker Calman: 3.69 | ∀{0.5-29.43 Ø4.72}
calibrated: 0.68
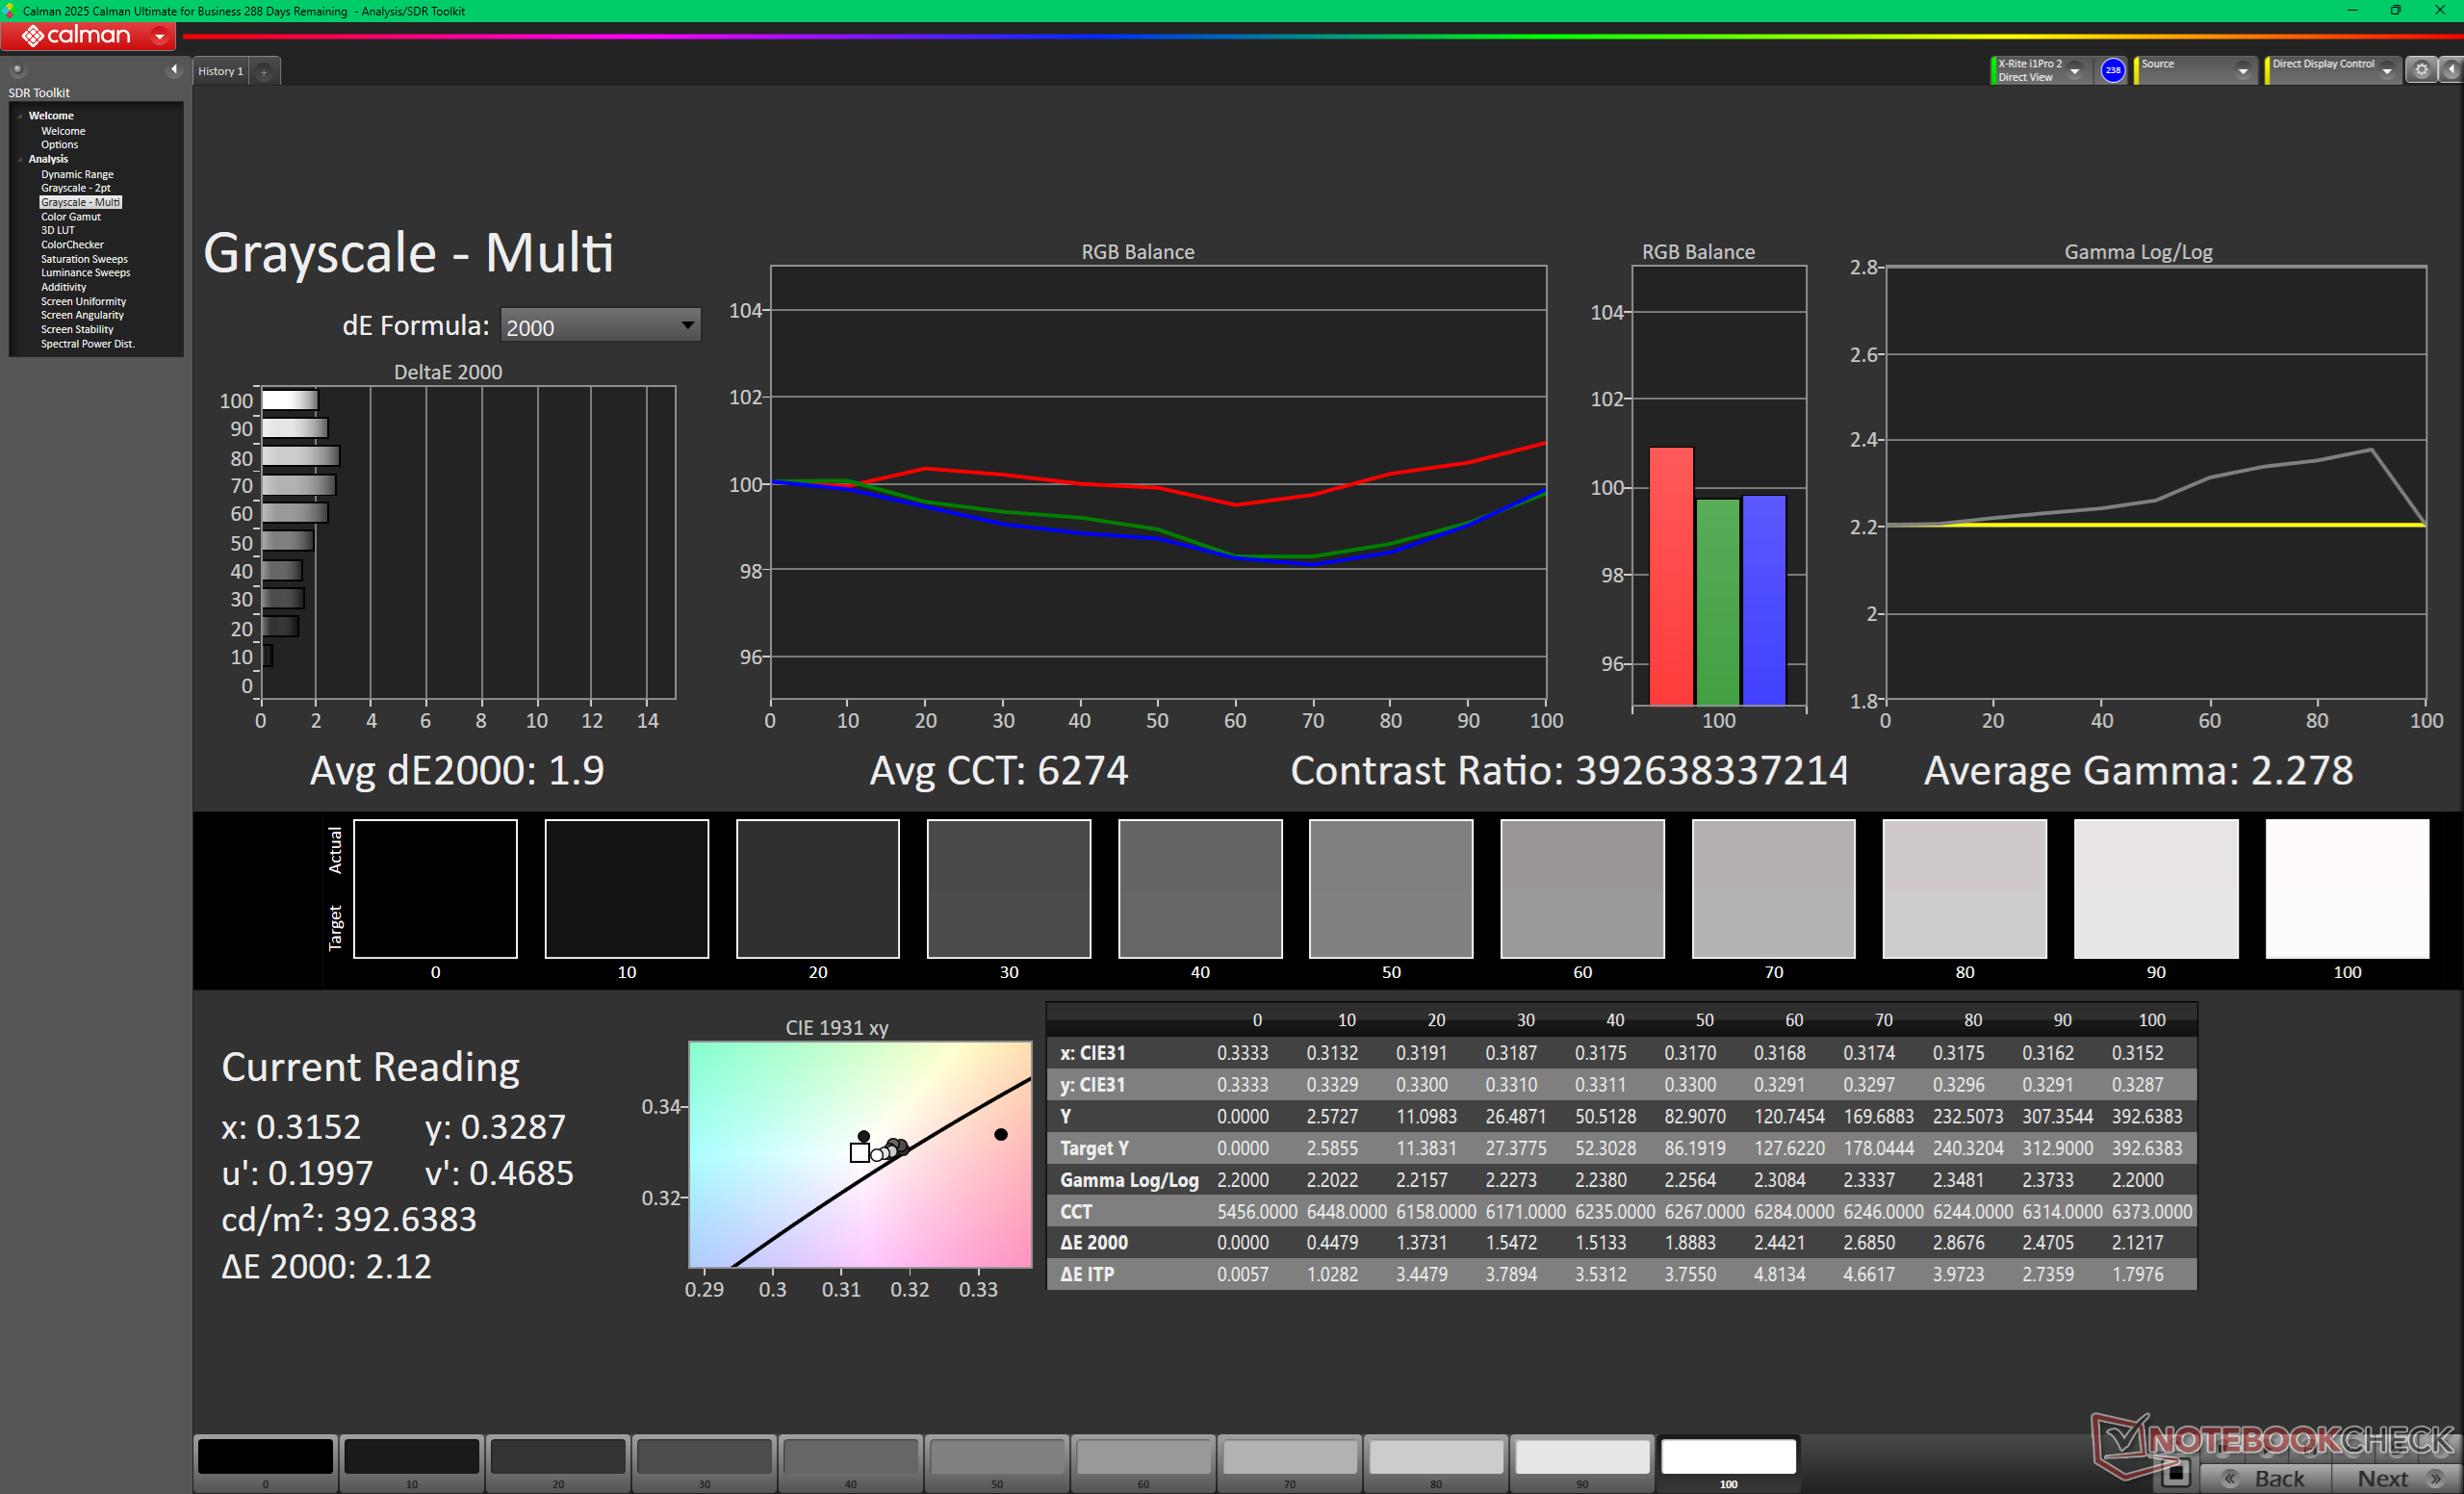
ΔE Greyscale Calman: 1.9 | ∀{0.09-98 Ø4.97}
96.5% AdobeRGB 1998 (Argyll 3D)
100% sRGB (Argyll 3D)
99.5% Display P3 (Argyll 3D)
Gamma: 2.28
CCT: 6274 K
| Dell XPS 16 Core Ultra X7 358H LG Philips 160WV1, OLED, 3200x2000, 16", 120 Hz | Dell XPS 16 Core Ultra 5 325 LG Philips 160WUX, IPS, 1920x1200, 16", 120 Hz | Dell XPS 16 9640 SDC4196, OLED, 3840x2400, 16.3", 90 Hz | Samsung Galaxy Book6 Pro ATNA60HR05-0, OLED, 2880x1800, 16", 120 Hz | Lenovo Yoga Pro 9 16IAH10 RTX 5050 ATNA60HR04-0, OLED, 2880x1800, 16", 120 Hz | HP Omnibook 5 16-af1037nr BOE0C46, IPS, 1920x1200, 16", 60 Hz | |
|---|---|---|---|---|---|---|
| Display | -22% | -3% | -4% | -54% | ||
| Display P3 Coverage (%) | 99.5 | 66.2 -33% | 98.3 -1% | 98.3 -1% | 39.2 -61% | |
| sRGB Coverage (%) | 100 | 97.4 -3% | 100 0% | 99.9 0% | 57.7 -42% | |
| AdobeRGB 1998 Coverage (%) | 96.5 | 67.7 -30% | 87.8 -9% | 85.9 -11% | 40.5 -58% | |
| Response Times | -4418% | -12% | -49% | -19% | -3791% | |
| Response Time Grey 50% / Grey 80% * (ms) | 0.65 ? | 39.3 ? -5946% | 0.82 ? -26% | 0.51 ? 22% | 32.5 ? -4900% | |
| Response Time Black / White * (ms) | 0.87 ? | 26 ? -2889% | 0.85 ? 2% | 0.41 ? 53% | 24.2 ? -2682% | |
| PWM Frequency (Hz) | 240.2 ? | 360 ? | 240 ? | 1200 | ||
| PWM Amplitude * (%) | 31 | 100 -223% | 37 -19% | |||
| Screen | 1% | 6% | 34% | 5% | -91% | |
| Brightness middle (cd/m²) | 395.4 | 534.6 35% | 366 -7% | 502 27% | 471.7 19% | 349.2 -12% |
| Brightness (cd/m²) | 392 | 515 31% | 367 -6% | 507 29% | 474 21% | 326 -17% |
| Brightness Distribution (%) | 95 | 92 -3% | 96 1% | 97 2% | 98 3% | 86 -9% |
| Black Level * (cd/m²) | 0.26 | 0.33 | ||||
| Colorchecker dE 2000 * | 3.69 | 2.53 31% | 1.3 65% | 1 73% | 3.53 4% | 5.87 -59% |
| Colorchecker dE 2000 max. * | 7.94 | 4.57 42% | 3.6 55% | 2.4 70% | 6.31 21% | 20.58 -159% |
| Colorchecker dE 2000 calibrated * | 0.68 | 1.26 -85% | 1 -47% | 3.04 -347% | ||
| Greyscale dE 2000 * | 1.9 | 2.7 -42% | 2.2 -16% | 1.8 5% | 2.6 -37% | 2.6 -37% |
| Gamma | 2.28 96% | 2.32 95% | 2.14 103% | 2.24 98% | 2.24 98% | 2.14 103% |
| CCT | 6274 104% | 6860 95% | 6680 97% | 6435 101% | 6292 103% | 6411 101% |
| Contrast (:1) | 2056 | 1058 | ||||
| Total Average (Program / Settings) | -1480% /
-741% | -3% /
1% | -6% /
4% | -7% /
2% | -1312% /
-699% |
* ... smaller is better


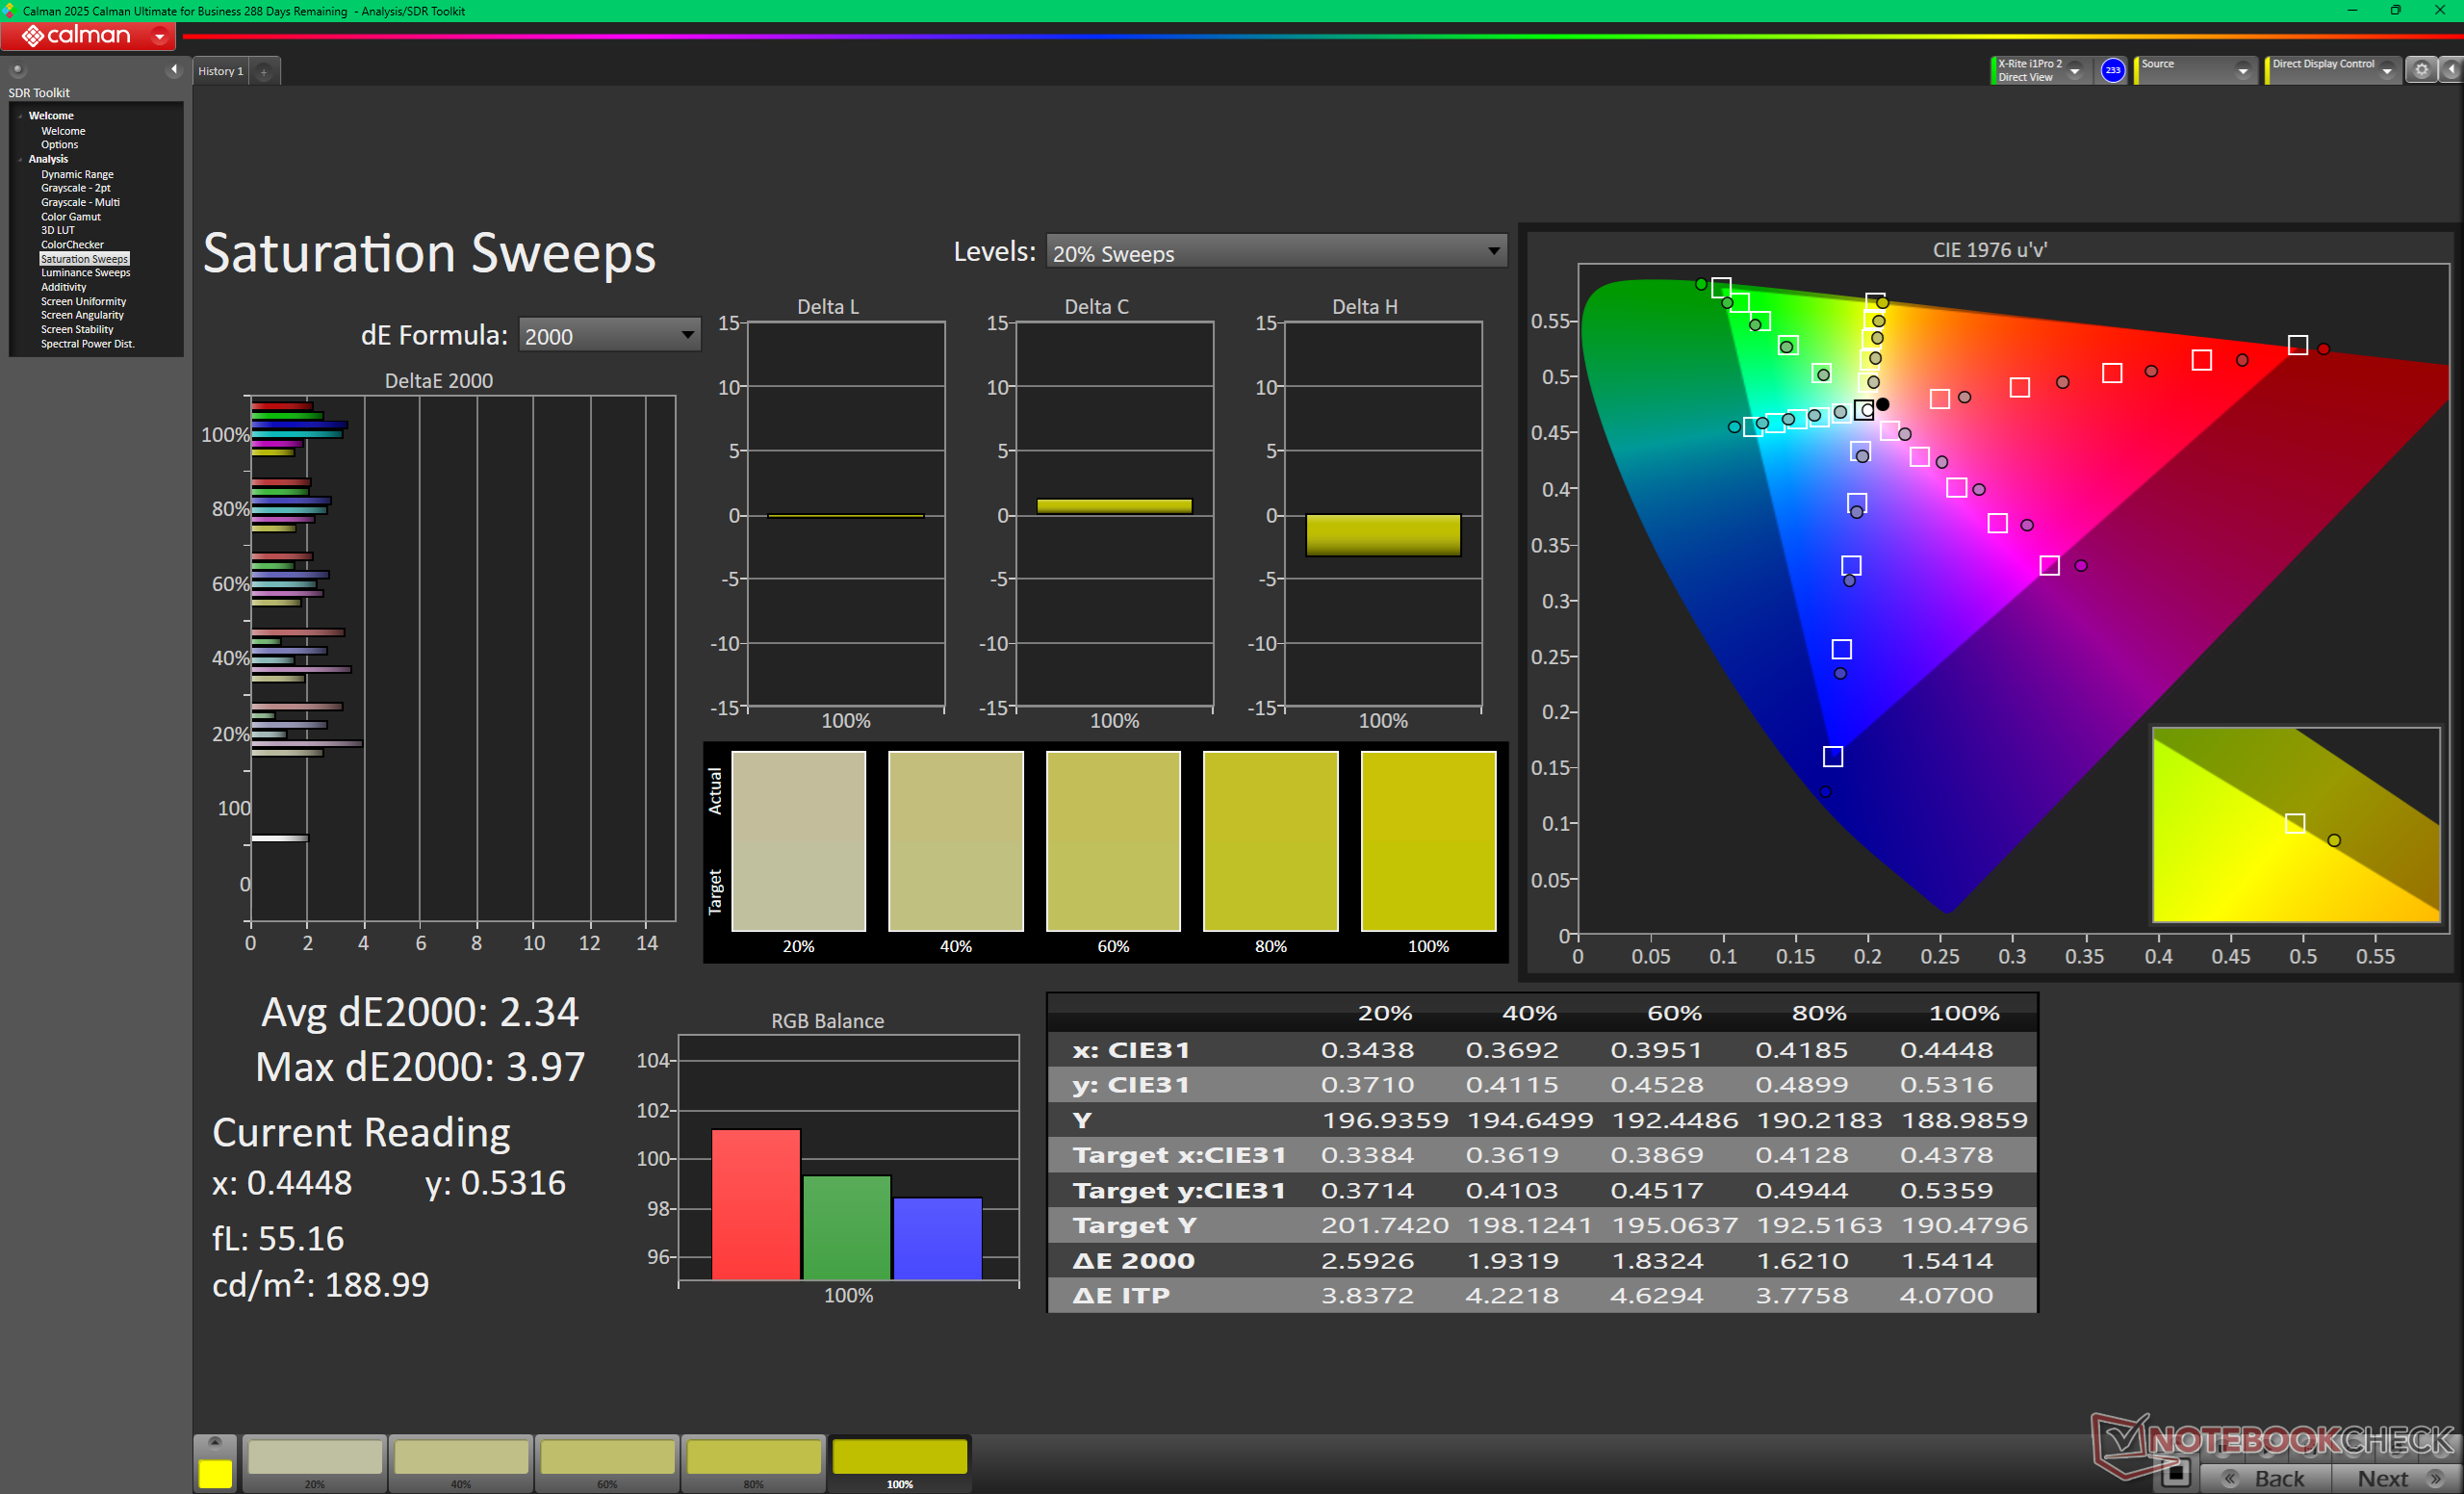
The panel comes decently calibrated against the P3 standard with average grayscale and color DeltaE values reaching 1.9 and 3.69, respectively. Additional calibration is therefore not necessary for most end users.


Display Response Times
| ↔ Response Time Black to White | ||
|---|---|---|
| 0.87 ms ... rise ↗ and fall ↘ combined | ↗ 0.43 ms rise | 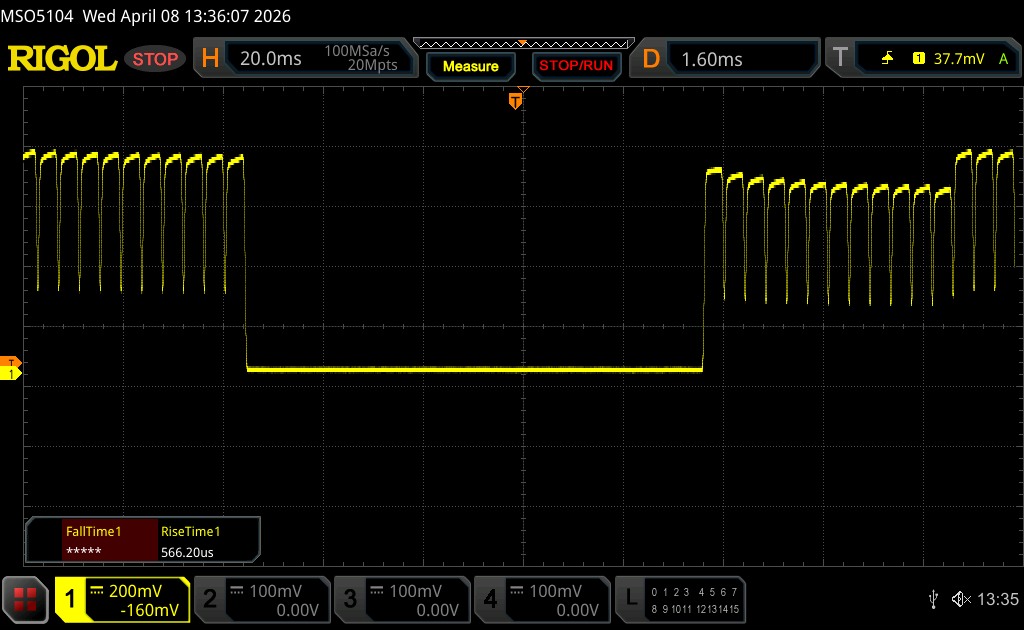 |
| ↘ 0.44 ms fall | ||
| The screen shows very fast response rates in our tests and should be very well suited for fast-paced gaming. In comparison, all tested devices range from 0.1 (minimum) to 240 (maximum) ms. » 3 % of all devices are better. This means that the measured response time is better than the average of all tested devices (19.8 ms). | ||
| ↔ Response Time 50% Grey to 80% Grey | ||
| 0.65 ms ... rise ↗ and fall ↘ combined | ↗ 0.36 ms rise | 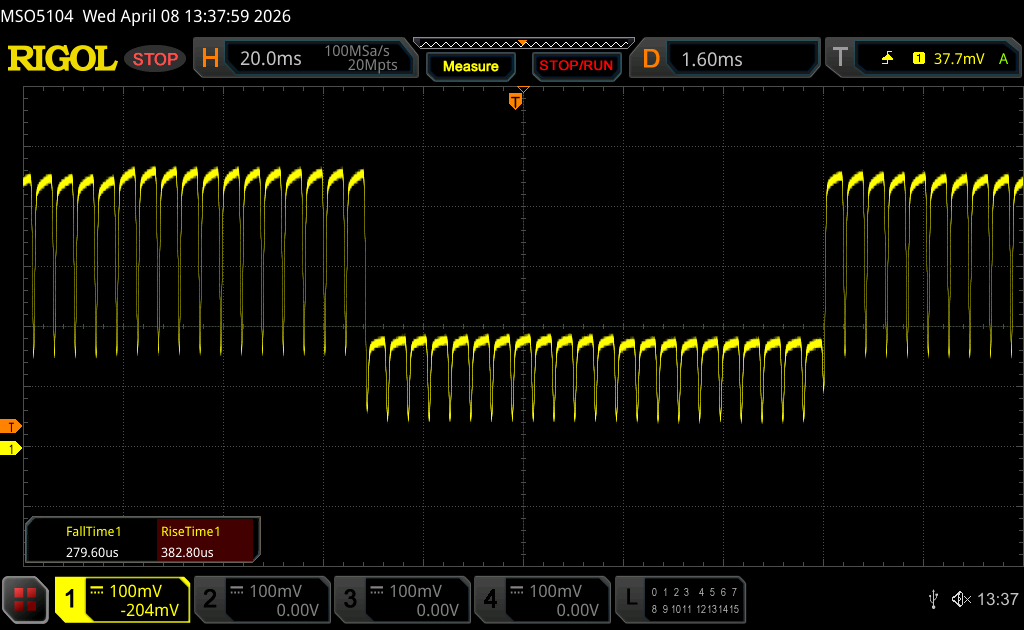 |
| ↘ 0.29 ms fall | ||
| The screen shows very fast response rates in our tests and should be very well suited for fast-paced gaming. In comparison, all tested devices range from 0.165 (minimum) to 636 (maximum) ms. » 2 % of all devices are better. This means that the measured response time is better than the average of all tested devices (31 ms). | ||
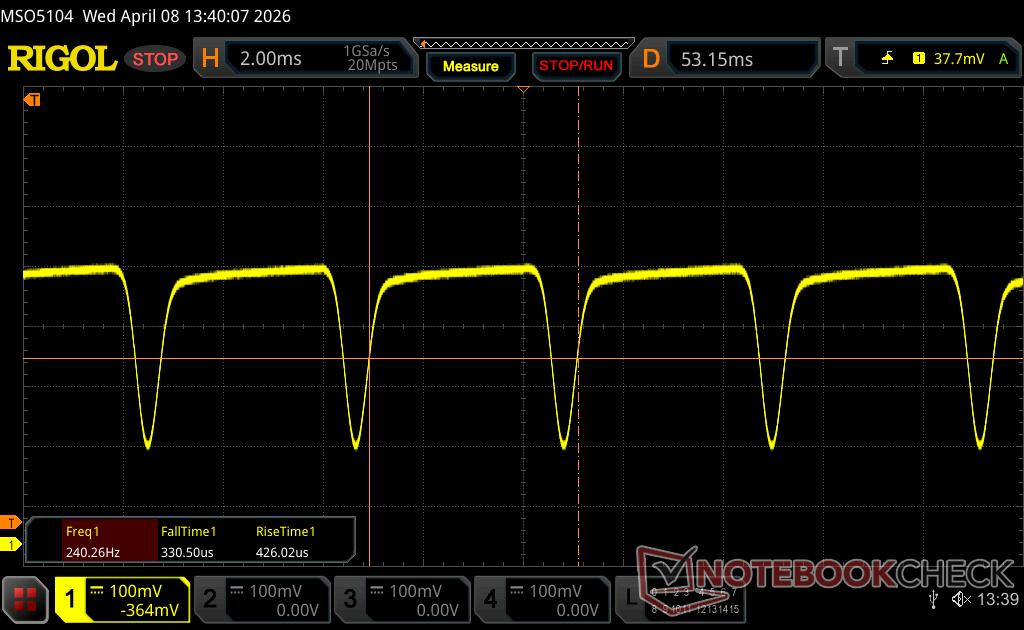
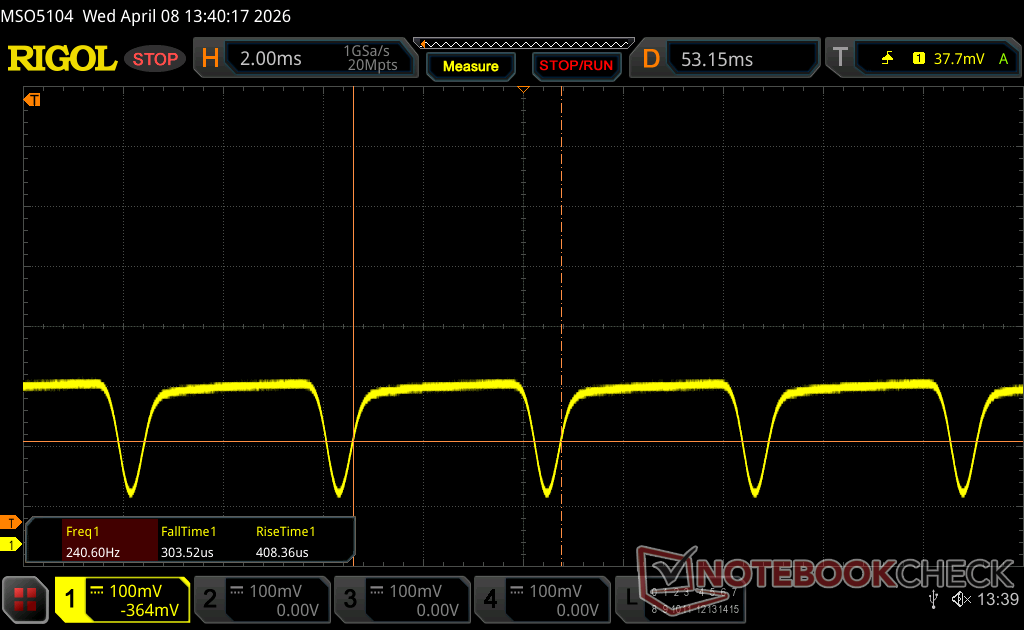
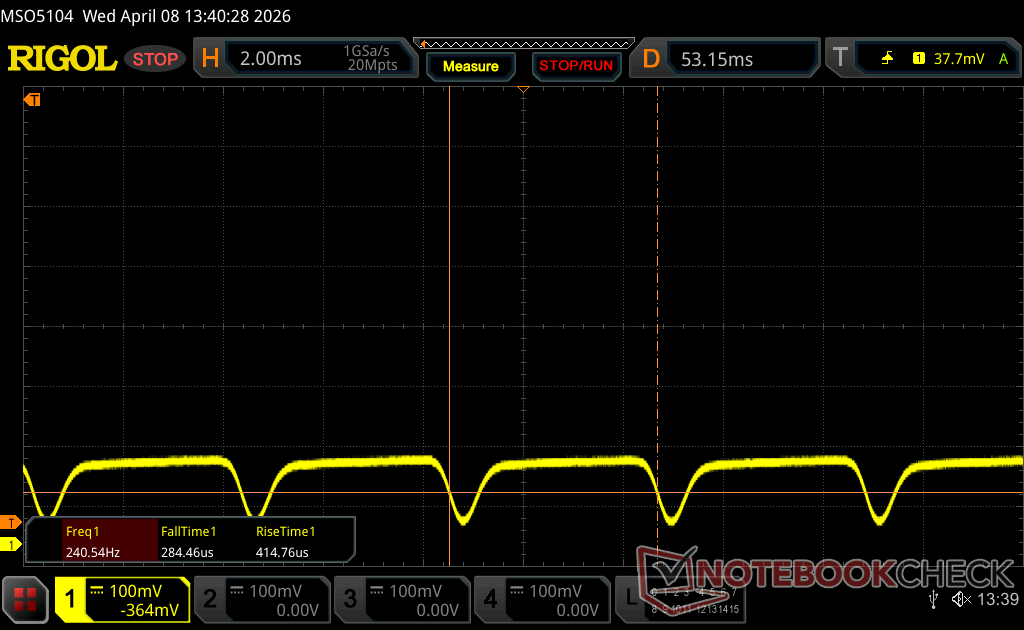
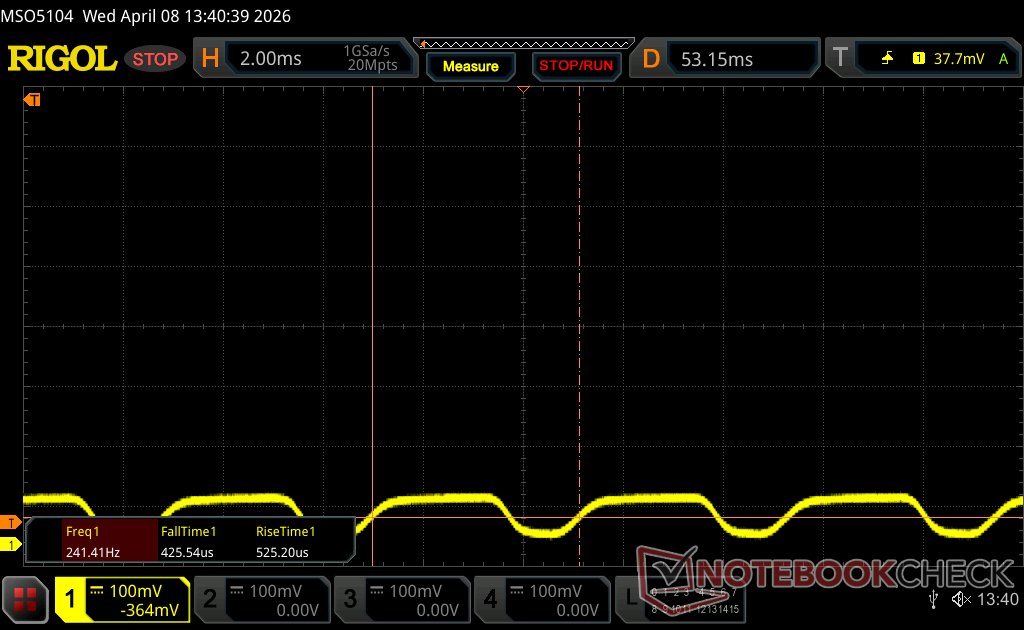
Screen Flickering / PWM (Pulse-Width Modulation)
| Screen flickering / PWM detected | 240.2 Hz Amplitude: 31 % | ≤ 100 % brightness setting | 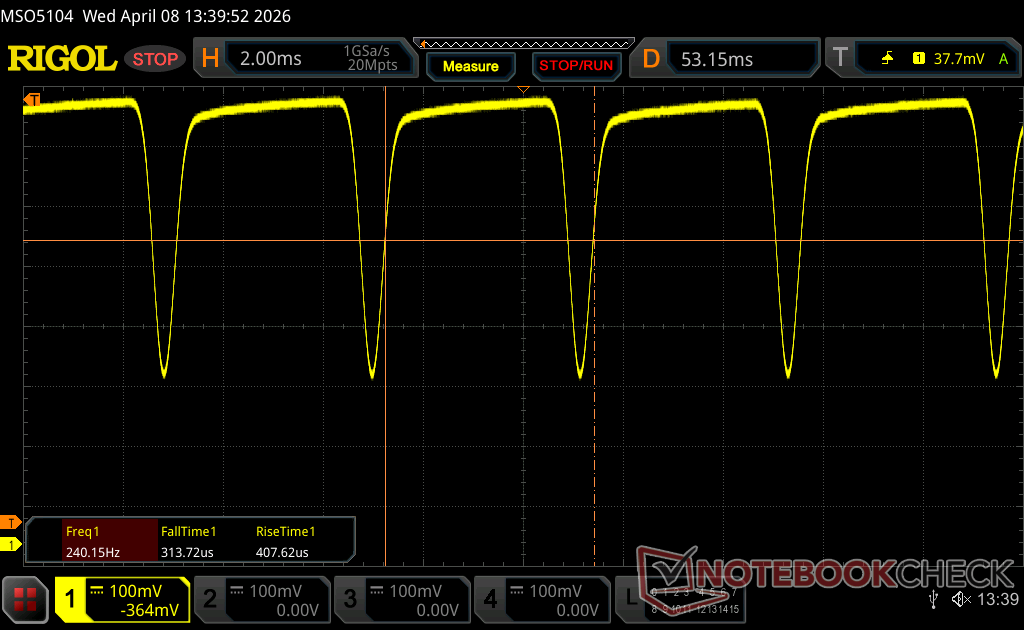 |
The display backlight flickers at 240.2 Hz (worst case, e.g., utilizing PWM) Flickering detected at a brightness setting of 100 % and below. There should be no flickering or PWM above this brightness setting. The frequency of 240.2 Hz is relatively low, so sensitive users will likely notice flickering and experience eyestrain at the stated brightness setting and below. In comparison: 52 % of all tested devices do not use PWM to dim the display. If PWM was detected, an average of 7763 (minimum: 5 - maximum: 343500) Hz was measured. | |||


Performance
Testing Conditions
We set Windows and Dell Optimizer to Performance mode prior to running the benchmarks below.
Processor
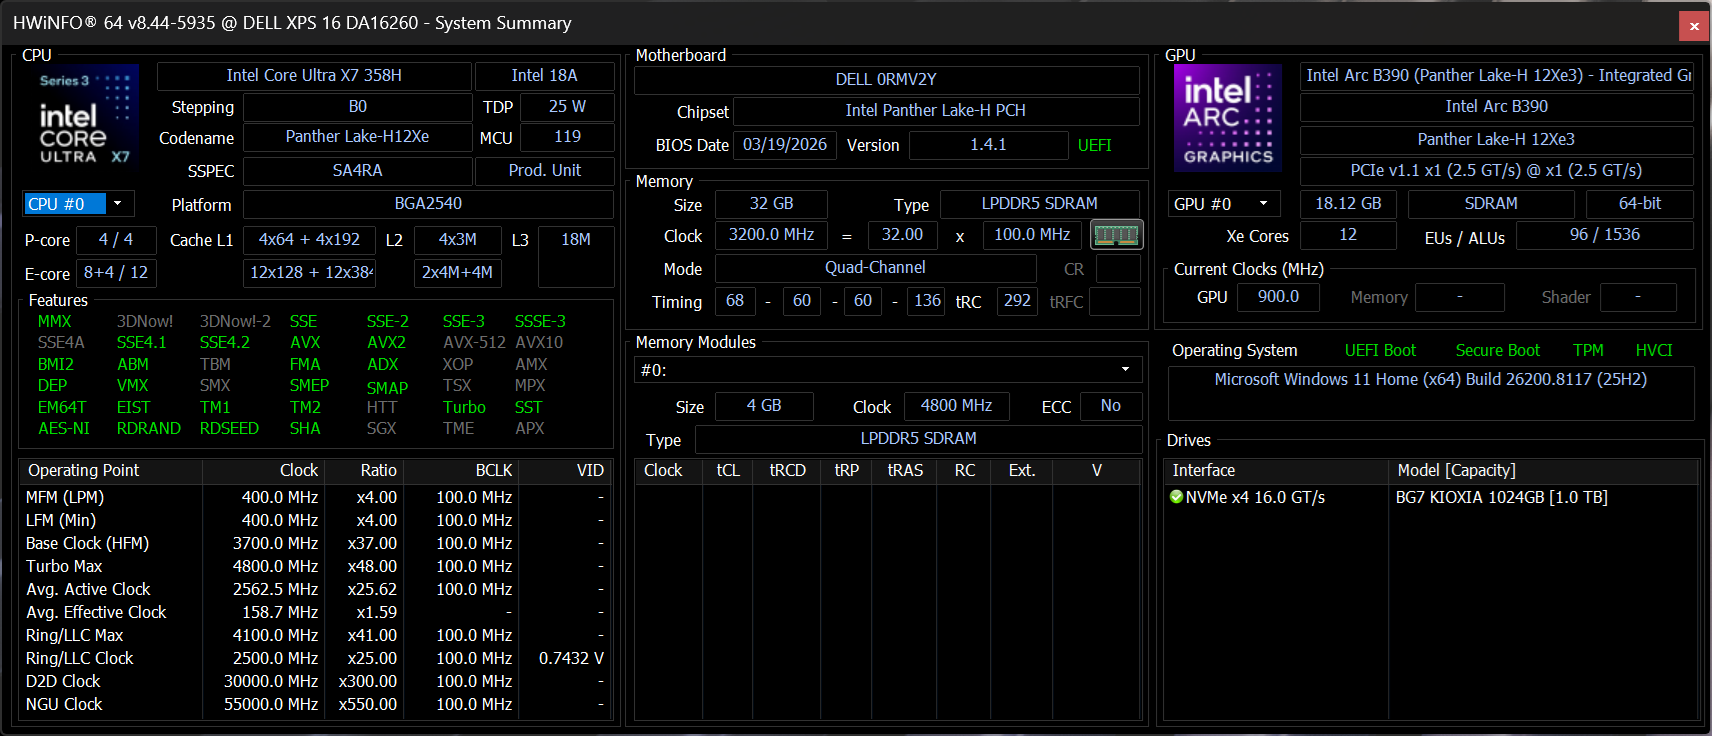
The Core Ultra X7 358H offers a 60 to 70 percent boost in multi-thread performance over the base Core Ultra 5 325 or Core Ultra 7 355 configurations. Unfortunately, Turbo Boost sustainability is imperfect as shown by our CineBench R15 xT stress graph below where performance would dip by about 15 percent after the first few loops. The competing Asus ExpertBook Ultra can sustain faster clock rates and performance with the same Core Ultra X7 CPU in comparison.
The Core Ultra 7 255H in the older Dell 16 Premium is notably faster the Core Ultra X7 358H in the newer XPS 16 when it comes to multi-threaded loads.
Cinebench R15 Multi Loop
Cinebench R23: Multi Core | Single Core
Cinebench R20: CPU (Multi Core) | CPU (Single Core)
Cinebench R15: CPU Multi 64Bit | CPU Single 64Bit
Blender: v2.79 BMW27 CPU
7-Zip 18.03: 7z b 4 | 7z b 4 -mmt1
Geekbench 6.7: Multi-Core | Single-Core
Geekbench 5.5: Multi-Core | Single-Core
HWBOT x265 Benchmark v2.2: 4k Preset
LibreOffice : 20 Documents To PDF
R Benchmark 2.5: Overall mean
* ... smaller is better
AIDA64: FP32 Ray-Trace | FPU Julia | CPU SHA3 | CPU Queen | FPU SinJulia | FPU Mandel | CPU AES | CPU ZLib | FP64 Ray-Trace | CPU PhotoWorxx | CPU CheckMate
| Performance rating | |
| Lenovo Yoga Pro 9 16IAH10 RTX 5050 -1! | |
| Dell XPS 16 9640 -1! | |
| Samsung Galaxy Book6 Pro -1! | |
| Dell XPS 16 Core Ultra X7 358H -1! | |
| Average Intel Core Ultra X7 358H | |
| Dell XPS 16 Core Ultra 5 325 -1! | |
| HP Omnibook 5 16-af1037nr -1! | |
| AIDA64 / FP32 Ray-Trace | |
| Lenovo Yoga Pro 9 16IAH10 RTX 5050 (v6.92.6600) | |
| Dell XPS 16 9640 (v6.92.6600) | |
| Samsung Galaxy Book6 Pro (v8.20.8100) | |
| Dell XPS 16 Core Ultra X7 358H (v8.20.8100) | |
| Average Intel Core Ultra X7 358H (12221 - 17932, n=8) | |
| Dell XPS 16 Core Ultra 5 325 (v8.20.8100) | |
| HP Omnibook 5 16-af1037nr (v6.92.6600) | |
| AIDA64 / FPU Julia | |
| Lenovo Yoga Pro 9 16IAH10 RTX 5050 (v6.92.6600) | |
| Dell XPS 16 9640 (v6.92.6600) | |
| Dell XPS 16 Core Ultra X7 358H (v8.20.8100) | |
| Samsung Galaxy Book6 Pro (v8.20.8100) | |
| Average Intel Core Ultra X7 358H (29930 - 95525, n=8) | |
| Dell XPS 16 Core Ultra 5 325 (v8.20.8100) | |
| HP Omnibook 5 16-af1037nr (v6.92.6600) | |
| AIDA64 / CPU SHA3 | |
| Lenovo Yoga Pro 9 16IAH10 RTX 5050 (v6.92.6600) | |
| Average Intel Core Ultra X7 358H (3910 - 4911, n=8) | |
| Dell XPS 16 Core Ultra X7 358H (v8.20.8100) | |
| Samsung Galaxy Book6 Pro (v8.20.8100) | |
| Dell XPS 16 9640 (v6.92.6600) | |
| Dell XPS 16 Core Ultra 5 325 (v8.20.8100) | |
| HP Omnibook 5 16-af1037nr (v6.92.6600) | |
| AIDA64 / CPU Queen | |
| Dell XPS 16 9640 (v6.92.6600) | |
| Lenovo Yoga Pro 9 16IAH10 RTX 5050 (v6.92.6600) | |
| Average Intel Core Ultra X7 358H (63425 - 63827, n=2) | |
| HP Omnibook 5 16-af1037nr (v6.92.6600) | |
| AIDA64 / FPU SinJulia | |
| Dell XPS 16 9640 (v6.92.6600) | |
| Lenovo Yoga Pro 9 16IAH10 RTX 5050 (v6.92.6600) | |
| Samsung Galaxy Book6 Pro (v8.20.8100) | |
| Dell XPS 16 Core Ultra X7 358H (v8.20.8100) | |
| Average Intel Core Ultra X7 358H (4735 - 7038, n=8) | |
| Dell XPS 16 Core Ultra 5 325 (v8.20.8100) | |
| HP Omnibook 5 16-af1037nr (v6.92.6600) | |
| AIDA64 / FPU Mandel | |
| Lenovo Yoga Pro 9 16IAH10 RTX 5050 (v6.92.6600) | |
| Dell XPS 16 Core Ultra X7 358H (v8.20.8100) | |
| Samsung Galaxy Book6 Pro (v8.20.8100) | |
| Dell XPS 16 9640 (v6.92.6600) | |
| Average Intel Core Ultra X7 358H (14716 - 50734, n=8) | |
| Dell XPS 16 Core Ultra 5 325 (v8.20.8100) | |
| HP Omnibook 5 16-af1037nr (v6.92.6600) | |
| AIDA64 / CPU AES | |
| Dell XPS 16 9640 (v6.92.6600) | |
| Lenovo Yoga Pro 9 16IAH10 RTX 5050 (v6.92.6600) | |
| Samsung Galaxy Book6 Pro (v8.20.8100) | |
| Dell XPS 16 Core Ultra X7 358H (v8.20.8100) | |
| Average Intel Core Ultra X7 358H (5127 - 67510, n=8) | |
| Dell XPS 16 Core Ultra 5 325 (v8.20.8100) | |
| HP Omnibook 5 16-af1037nr (v6.92.6600) | |
| AIDA64 / CPU ZLib | |
| Lenovo Yoga Pro 9 16IAH10 RTX 5050 (v6.92.6600) | |
| Dell XPS 16 9640 (v6.92.6600) | |
| Samsung Galaxy Book6 Pro (v8.20.8100) | |
| Average Intel Core Ultra X7 358H (932 - 1179, n=8) | |
| Dell XPS 16 Core Ultra X7 358H (v8.20.8100) | |
| Dell XPS 16 Core Ultra 5 325 (v8.20.8100) | |
| HP Omnibook 5 16-af1037nr (v6.92.6600) | |
| AIDA64 / FP64 Ray-Trace | |
| Lenovo Yoga Pro 9 16IAH10 RTX 5050 (v6.92.6600) | |
| Dell XPS 16 9640 (v6.92.6600) | |
| Dell XPS 16 Core Ultra X7 358H (v8.20.8100) | |
| Samsung Galaxy Book6 Pro (v8.20.8100) | |
| Average Intel Core Ultra X7 358H (6506 - 9447, n=8) | |
| Dell XPS 16 Core Ultra 5 325 (v8.20.8100) | |
| HP Omnibook 5 16-af1037nr (v6.92.6600) | |
| AIDA64 / CPU PhotoWorxx | |
| Dell XPS 16 Core Ultra X7 358H (v8.20.8100) | |
| Samsung Galaxy Book6 Pro (v8.20.8100) | |
| Average Intel Core Ultra X7 358H (30538 - 88154, n=8) | |
| Lenovo Yoga Pro 9 16IAH10 RTX 5050 (v6.92.6600) | |
| Dell XPS 16 Core Ultra 5 325 (v8.20.8100) | |
| Dell XPS 16 9640 (v6.92.6600) | |
| HP Omnibook 5 16-af1037nr (v6.92.6600) | |
| AIDA64 / CPU CheckMate | |
| Average Intel Core Ultra X7 358H (4187 - 4475, n=7) | |
| Dell XPS 16 Core Ultra X7 358H (v8.20.8100) | |
| Samsung Galaxy Book6 Pro (v8.20.8100) | |
| Dell XPS 16 Core Ultra 5 325 (v8.20.8100) | |
System Performance
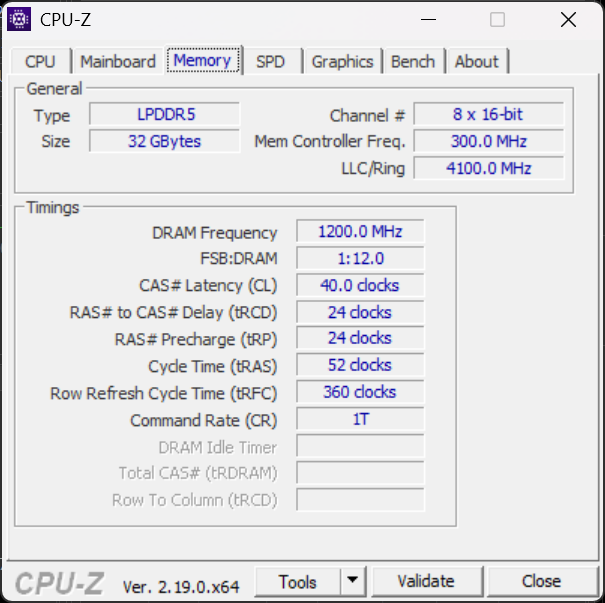
PCMark results are notably higher than the base Core Ultra 5 configuration especially when it comes to the GPU-heavy Digital Content Creation subtest due to the much faster integrated graphics for the Core Ultra X7 configuration. RAM performance is also 25 to 40 percent faster when configuring with 32 GB instead of 16 GB according to AIDA64.

PCMark 10: Score | Essentials | Productivity | Digital Content Creation
CrossMark: Overall | Productivity | Creativity | Responsiveness
WebXPRT 3: Overall
WebXPRT 4: Overall
Mozilla Kraken 1.1: Total
| Performance rating | |
| Dell XPS 16 Core Ultra X7 358H | |
| Lenovo Yoga Pro 9 16IAH10 RTX 5050 | |
| Average Intel Core Ultra X7 358H, Intel Arc B390 12 Xe3 Panther Lake iGPU | |
| Samsung Galaxy Book6 Pro | |
| Dell XPS 16 9640 -1! | |
| Dell XPS 16 Core Ultra 5 325 | |
| HP Omnibook 5 16-af1037nr | |
| PCMark 10 / Score | |
| Dell XPS 16 Core Ultra X7 358H | |
| Lenovo Yoga Pro 9 16IAH10 RTX 5050 | |
| Average Intel Core Ultra X7 358H, Intel Arc B390 12 Xe3 Panther Lake iGPU (8834 - 9880, n=8) | |
| Samsung Galaxy Book6 Pro | |
| Dell XPS 16 Core Ultra 5 325 | |
| HP Omnibook 5 16-af1037nr | |
| Dell XPS 16 9640 | |
| PCMark 10 / Essentials | |
| Dell XPS 16 Core Ultra X7 358H | |
| Average Intel Core Ultra X7 358H, Intel Arc B390 12 Xe3 Panther Lake iGPU (10282 - 11263, n=7) | |
| Lenovo Yoga Pro 9 16IAH10 RTX 5050 | |
| Dell XPS 16 9640 | |
| Samsung Galaxy Book6 Pro | |
| Dell XPS 16 Core Ultra 5 325 | |
| HP Omnibook 5 16-af1037nr | |
| PCMark 10 / Productivity | |
| Lenovo Yoga Pro 9 16IAH10 RTX 5050 | |
| Dell XPS 16 Core Ultra X7 358H | |
| Samsung Galaxy Book6 Pro | |
| Average Intel Core Ultra X7 358H, Intel Arc B390 12 Xe3 Panther Lake iGPU (13908 - 16780, n=7) | |
| HP Omnibook 5 16-af1037nr | |
| Dell XPS 16 Core Ultra 5 325 | |
| Dell XPS 16 9640 | |
| PCMark 10 / Digital Content Creation | |
| Dell XPS 16 Core Ultra X7 358H | |
| Average Intel Core Ultra X7 358H, Intel Arc B390 12 Xe3 Panther Lake iGPU (13082 - 13893, n=7) | |
| Lenovo Yoga Pro 9 16IAH10 RTX 5050 | |
| Samsung Galaxy Book6 Pro | |
| Dell XPS 16 9640 | |
| Dell XPS 16 Core Ultra 5 325 | |
| HP Omnibook 5 16-af1037nr | |
| CrossMark / Overall | |
| Dell XPS 16 Core Ultra X7 358H | |
| Average Intel Core Ultra X7 358H, Intel Arc B390 12 Xe3 Panther Lake iGPU (1884 - 2119, n=8) | |
| Lenovo Yoga Pro 9 16IAH10 RTX 5050 | |
| Samsung Galaxy Book6 Pro | |
| Dell XPS 16 9640 | |
| Dell XPS 16 Core Ultra 5 325 | |
| HP Omnibook 5 16-af1037nr | |
| CrossMark / Productivity | |
| Dell XPS 16 Core Ultra X7 358H | |
| Lenovo Yoga Pro 9 16IAH10 RTX 5050 | |
| Average Intel Core Ultra X7 358H, Intel Arc B390 12 Xe3 Panther Lake iGPU (1678 - 1928, n=8) | |
| Samsung Galaxy Book6 Pro | |
| Dell XPS 16 9640 | |
| Dell XPS 16 Core Ultra 5 325 | |
| HP Omnibook 5 16-af1037nr | |
| CrossMark / Creativity | |
| Dell XPS 16 Core Ultra X7 358H | |
| Average Intel Core Ultra X7 358H, Intel Arc B390 12 Xe3 Panther Lake iGPU (2241 - 2529, n=8) | |
| Samsung Galaxy Book6 Pro | |
| Lenovo Yoga Pro 9 16IAH10 RTX 5050 | |
| Dell XPS 16 9640 | |
| Dell XPS 16 Core Ultra 5 325 | |
| HP Omnibook 5 16-af1037nr | |
| CrossMark / Responsiveness | |
| Dell XPS 16 Core Ultra X7 358H | |
| Dell XPS 16 9640 | |
| Average Intel Core Ultra X7 358H, Intel Arc B390 12 Xe3 Panther Lake iGPU (1560 - 1837, n=8) | |
| Lenovo Yoga Pro 9 16IAH10 RTX 5050 | |
| Samsung Galaxy Book6 Pro | |
| Dell XPS 16 Core Ultra 5 325 | |
| HP Omnibook 5 16-af1037nr | |
| WebXPRT 3 / Overall | |
| Lenovo Yoga Pro 9 16IAH10 RTX 5050 | |
| Average Intel Core Ultra X7 358H, Intel Arc B390 12 Xe3 Panther Lake iGPU (293 - 338, n=8) | |
| Dell XPS 16 Core Ultra X7 358H | |
| HP Omnibook 5 16-af1037nr | |
| Samsung Galaxy Book6 Pro | |
| Dell XPS 16 9640 | |
| Dell XPS 16 Core Ultra 5 325 | |
| WebXPRT 4 / Overall | |
| Lenovo Yoga Pro 9 16IAH10 RTX 5050 | |
| Dell XPS 16 Core Ultra X7 358H | |
| Average Intel Core Ultra X7 358H, Intel Arc B390 12 Xe3 Panther Lake iGPU (278 - 305, n=7) | |
| HP Omnibook 5 16-af1037nr | |
| Samsung Galaxy Book6 Pro | |
| Dell XPS 16 Core Ultra 5 325 | |
| Dell XPS 16 9640 | |
| Mozilla Kraken 1.1 / Total | |
| HP Omnibook 5 16-af1037nr | |
| Dell XPS 16 Core Ultra 5 325 | |
| Samsung Galaxy Book6 Pro | |
| Average Intel Core Ultra X7 358H, Intel Arc B390 12 Xe3 Panther Lake iGPU (445 - 460, n=8) | |
| Dell XPS 16 Core Ultra X7 358H | |
| Lenovo Yoga Pro 9 16IAH10 RTX 5050 | |
* ... smaller is better
| PCMark 10 Score | 9717 points | |
Help | ||
| AIDA64 / Memory Copy | |
| Dell XPS 16 Core Ultra X7 358H | |
| Samsung Galaxy Book6 Pro | |
| Average Intel Core Ultra X7 358H (102745 - 132135, n=7) | |
| Dell XPS 16 Core Ultra 5 325 | |
| Lenovo Yoga Pro 9 16IAH10 RTX 5050 | |
| Dell XPS 16 9640 | |
| HP Omnibook 5 16-af1037nr | |
| AIDA64 / Memory Read | |
| Dell XPS 16 Core Ultra X7 358H | |
| Samsung Galaxy Book6 Pro | |
| Average Intel Core Ultra X7 358H (97755 - 118888, n=8) | |
| Lenovo Yoga Pro 9 16IAH10 RTX 5050 | |
| Dell XPS 16 Core Ultra 5 325 | |
| Dell XPS 16 9640 | |
| HP Omnibook 5 16-af1037nr | |
| AIDA64 / Memory Write | |
| Dell XPS 16 Core Ultra X7 358H | |
| Average Intel Core Ultra X7 358H (105984 - 134998, n=8) | |
| Samsung Galaxy Book6 Pro | |
| Dell XPS 16 Core Ultra 5 325 | |
| Lenovo Yoga Pro 9 16IAH10 RTX 5050 | |
| Dell XPS 16 9640 | |
| HP Omnibook 5 16-af1037nr | |
| AIDA64 / Memory Latency | |
| HP Omnibook 5 16-af1037nr | |
| Dell XPS 16 9640 | |
| Lenovo Yoga Pro 9 16IAH10 RTX 5050 | |
| Dell XPS 16 Core Ultra 5 325 | |
| Samsung Galaxy Book6 Pro | |
| Dell XPS 16 Core Ultra X7 358H | |
| Average Intel Core Ultra X7 358H (84.6 - 101.9, n=8) | |
* ... smaller is better
DPC Latency


| DPC Latencies / LatencyMon - interrupt to process latency (max), Web, Youtube, Prime95 | |
| Lenovo Yoga Pro 9 16IAH10 RTX 5050 | |
| Dell XPS 16 Core Ultra 5 325 | |
| HP Omnibook 5 16-af1037nr | |
| Dell XPS 16 9640 | |
| Dell XPS 16 Core Ultra X7 358H | |
| Samsung Galaxy Book6 Pro | |
* ... smaller is better
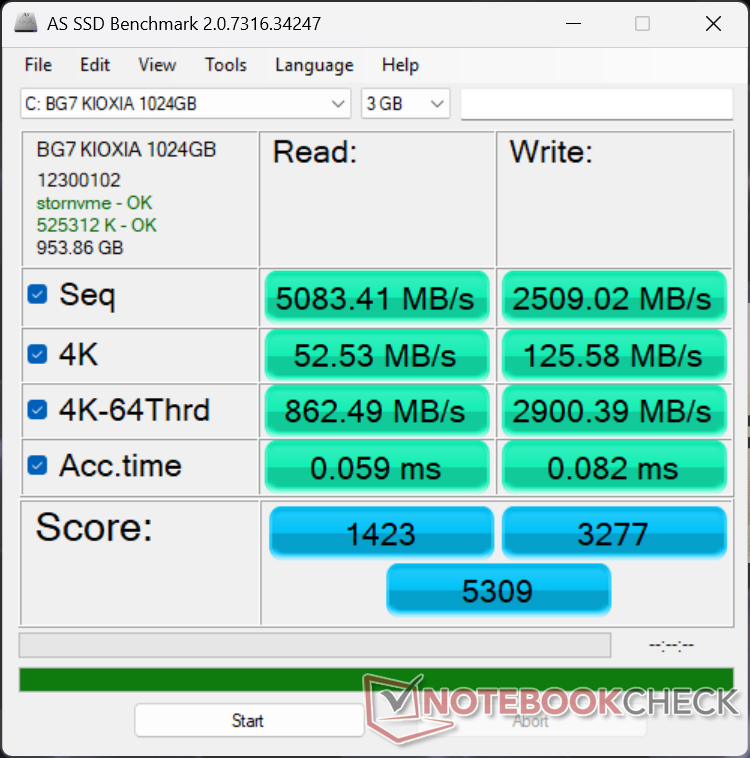
Storage Devices
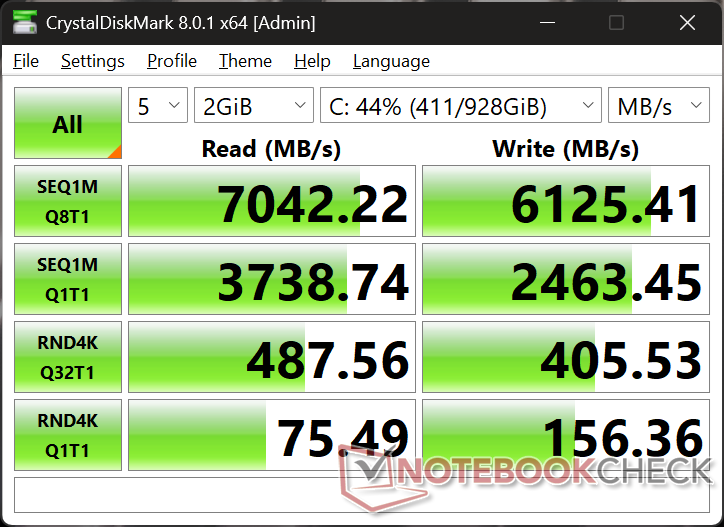
Our test unit ships with a Kioxia BG7 instead of the BG8 or BG6 as found on our Core Ultra 5 configuration or 2025 Dell 16 Premium, respectively. Performance is otherwise nearly the same between them with maximum sustainable transfer rates of around 7000 MB/s.


| Drive Performance rating - Percent | |
| Dell XPS 16 9640 | |
| Lenovo Yoga Pro 9 16IAH10 RTX 5050 | |
| Dell XPS 16 Core Ultra X7 358H | |
| Samsung Galaxy Book6 Pro | |
| Dell XPS 16 Core Ultra 5 325 | |
| HP Omnibook 5 16-af1037nr | |
* ... smaller is better
Disk Throttling: DiskSpd Read Loop, Queue Depth 8
GPU Performance
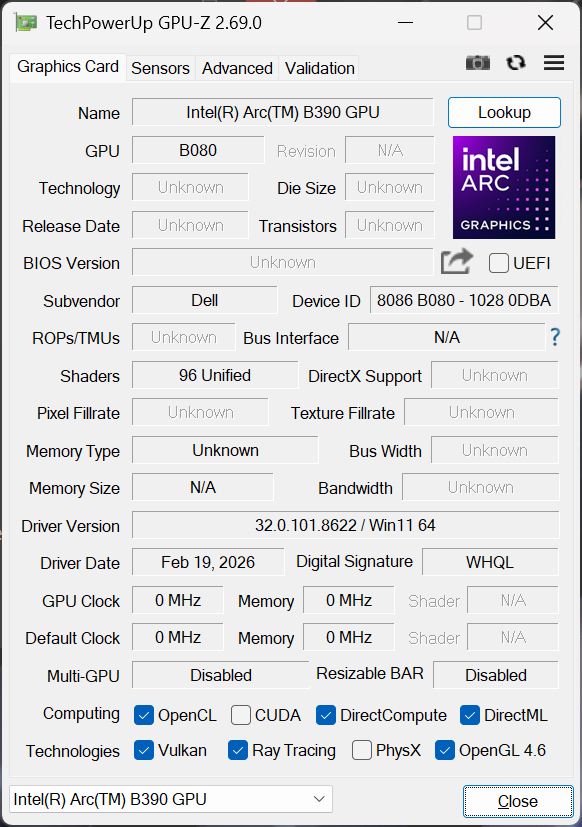
The integrated Arc B390 is significantly faster than the base Graphics 4 Xe3 option in the Core Ultra 5 configuration. It is the fastest GPU available for the 2026 XPS 16 as discrete Nvidia options are no longer configurable. Users can expect a 2.5x increase in raw performance over the Graphics 4 Xe3 or a 30 percent raw performance deficit when compared to the older XPS 16 with RTX 4070 graphics. It is nonetheless powerful enough to run most modern titles at 1080p on Medium settings including Black Myth: Wukong.
Running on Balanced mode instead of Performance mode does not significantly impact performance. Meanwhile, running on battery power reduces performance just slightly by up to 10 percent as shown by our Fire Strike results table below.
| Power Profile | Graphics Score | Physics Score | Combined Score |
| Performance Mode | 17018 | 22086 | 4859 |
| Balanced Mode | 16785 (-1%) | 22887 (+4%) | 4467 (-8%) |
| Battery Power | 15685 (-8%) | 20760 (-6%) | 4269 (-12%) |
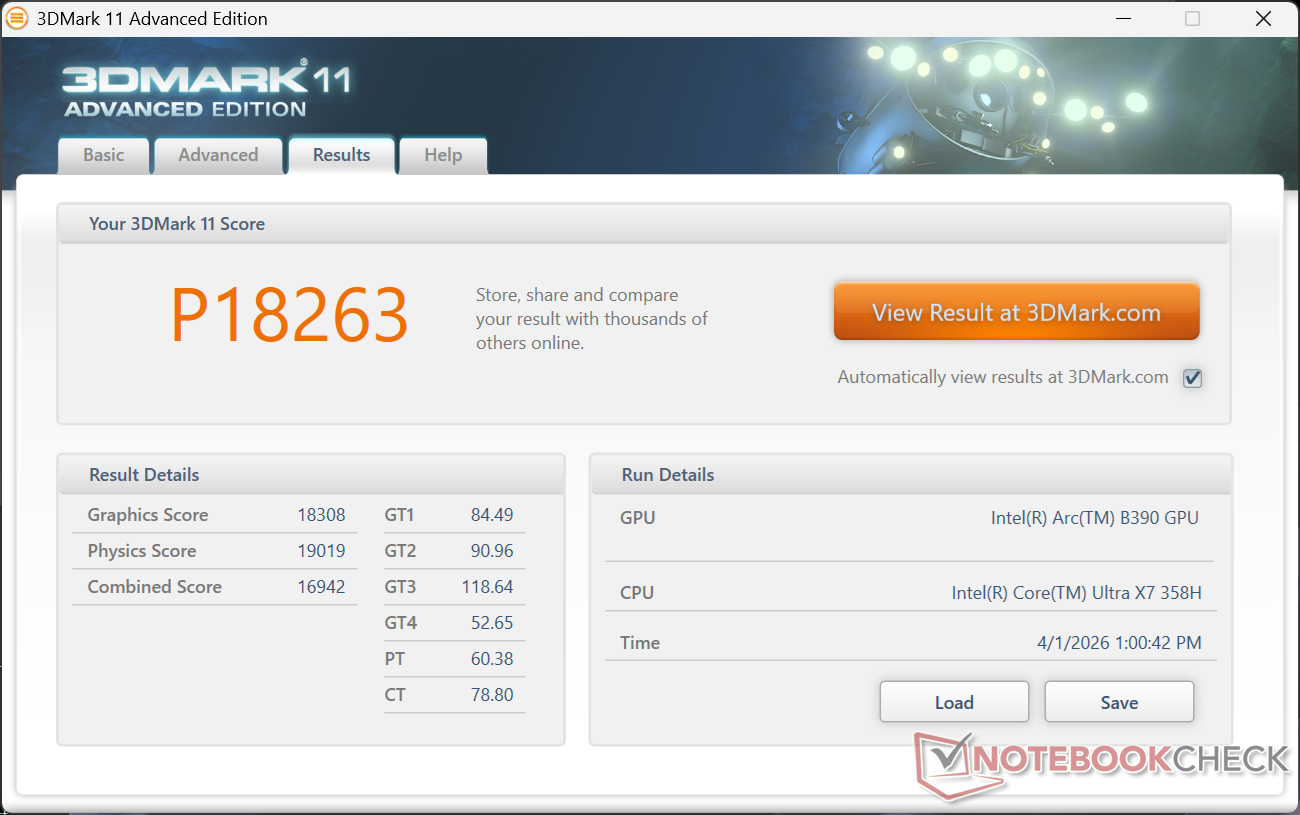


| 3DMark 11 Performance | 18263 points | |
| 3DMark Cloud Gate Standard Score | 39015 points | |
| 3DMark Fire Strike Score | 13997 points | |
| 3DMark Time Spy Score | 7436 points | |
Help | ||
* ... smaller is better
| Performance rating - Percent | |
| Lenovo Yoga Pro 9 16IAH10 RTX 5050 | |
| Dell XPS 16 9640 | |
| Dell XPS 16 Core Ultra X7 358H | |
| Samsung Galaxy Book6 Pro | |
| Dell XPS 16 Core Ultra 5 325 | |
| HP Omnibook 5 16-af1037nr | |
| Cyberpunk 2077 - 1920x1080 Ultra Preset (FSR off) | |
| Lenovo Yoga Pro 9 16IAH10 RTX 5050 | |
| Dell XPS 16 9640 | |
| Dell XPS 16 Core Ultra X7 358H | |
| Samsung Galaxy Book6 Pro | |
| Dell XPS 16 Core Ultra 5 325 | |
| HP Omnibook 5 16-af1037nr | |
| Baldur's Gate 3 - 1920x1080 Ultra Preset AA:T | |
| Lenovo Yoga Pro 9 16IAH10 RTX 5050 | |
| Dell XPS 16 9640 | |
| Dell XPS 16 Core Ultra X7 358H | |
| Samsung Galaxy Book6 Pro | |
| Dell XPS 16 Core Ultra 5 325 | |
| HP Omnibook 5 16-af1037nr | |
| GTA V - 1920x1080 Highest AA:4xMSAA + FX AF:16x | |
| Lenovo Yoga Pro 9 16IAH10 RTX 5050 | |
| Dell XPS 16 9640 | |
| Dell XPS 16 Core Ultra X7 358H | |
| Samsung Galaxy Book6 Pro | |
| Dell XPS 16 Core Ultra 5 325 | |
| HP Omnibook 5 16-af1037nr | |
| Final Fantasy XV Benchmark - 1920x1080 High Quality | |
| Lenovo Yoga Pro 9 16IAH10 RTX 5050 | |
| Dell XPS 16 9640 | |
| Dell XPS 16 Core Ultra X7 358H | |
| Samsung Galaxy Book6 Pro | |
| Dell XPS 16 Core Ultra 5 325 | |
| HP Omnibook 5 16-af1037nr | |
| Strange Brigade - 1920x1080 ultra AA:ultra AF:16 | |
| Lenovo Yoga Pro 9 16IAH10 RTX 5050 | |
| Dell XPS 16 9640 | |
| Dell XPS 16 Core Ultra X7 358H | |
| Samsung Galaxy Book6 Pro | |
| Dell XPS 16 Core Ultra 5 325 | |
| HP Omnibook 5 16-af1037nr | |
| Dota 2 Reborn - 1920x1080 ultra (3/3) best looking | |
| Lenovo Yoga Pro 9 16IAH10 RTX 5050 | |
| Dell XPS 16 Core Ultra X7 358H | |
| Dell XPS 16 9640 | |
| Samsung Galaxy Book6 Pro | |
| Dell XPS 16 Core Ultra 5 325 | |
| HP Omnibook 5 16-af1037nr | |
| X-Plane 11.11 - 1920x1080 high (fps_test=3) | |
| Lenovo Yoga Pro 9 16IAH10 RTX 5050 | |
| Dell XPS 16 9640 | |
| Dell XPS 16 9640 | |
| Dell XPS 16 Core Ultra X7 358H | |
| Samsung Galaxy Book6 Pro | |
| HP Omnibook 5 16-af1037nr | |
| Dell XPS 16 Core Ultra 5 325 | |
Cyberpunk 2077 ultra FPS Chart
| low | med. | high | ultra | |
|---|---|---|---|---|
| GTA V (2015) | 182 | 176.1 | 103.3 | 45.2 |
| Dota 2 Reborn (2015) | 112.9 | 91.6 | 100.2 | 96.9 |
| Final Fantasy XV Benchmark (2018) | 131.1 | 79.7 | 56.2 | |
| X-Plane 11.11 (2018) | 55.9 | 47.6 | 38.8 | |
| Strange Brigade (2018) | 359 | 130.5 | 104 | 90.6 |
| Baldur's Gate 3 (2023) | 72.3 | 62.3 | 55.6 | 54.3 |
| Cyberpunk 2077 (2023) | 80.4 | 65.4 | 56 | 48.7 |
| F1 24 (2024) | 142.7 | 135.3 | 103.4 | 36.8 |
| Black Myth: Wukong (2024) | 47 | 37 | 29 | 16 |
Emissions
System Noise
Fan RPM would increase more readily when compared to the base Core Ultra 5 configuration which aligns with the generally higher power consumption of the Core Ultra X7 system. When running 3DMark 06, for example, fan noise would top out at 38 dB(A) compared to 34 dB(A) on the Core Ultra 5 SKU.
Noise level
| Idle |
| 23.4 / 23.4 / 25.8 dB(A) |
| Load |
| 38 / 48.6 dB(A) |
 | ||
30 dB silent 40 dB(A) audible 50 dB(A) loud |
||
min: | ||
| Dell XPS 16 Core Ultra X7 358H Ultra X7 358H, Arc B390 Panther Lake iGPU | Dell XPS 16 Core Ultra 5 325 Ultra 5 325, Intel Graphics 4 Xe3 PTL | Dell XPS 16 9640 Ultra 7 155H, GeForce RTX 4070 Laptop GPU | Samsung Galaxy Book6 Pro Ultra 7 356H, Intel Graphics 4 Xe3 PTL | Lenovo Yoga Pro 9 16IAH10 RTX 5050 Ultra 9 285H, GeForce RTX 5050 Laptop | HP Omnibook 5 16-af1037nr Ultra 7 255U, Graphics 4-Core iGPU (Arrow Lake) | |
|---|---|---|---|---|---|---|
| Noise | 5% | -5% | 2% | -7% | 13% | |
| off / environment * (dB) | 23.3 | 22.8 2% | 24.5 -5% | 25.3 -9% | 24.6 -6% | 23.3 -0% |
| Idle Minimum * (dB) | 23.4 | 22.9 2% | 24.5 -5% | 25.3 -8% | 24.6 -5% | 23.5 -0% |
| Idle Average * (dB) | 23.4 | 22.9 2% | 24.5 -5% | 25.3 -8% | 24.6 -5% | 23.5 -0% |
| Idle Maximum * (dB) | 25.8 | 23.9 7% | 27.5 -7% | 25.3 2% | 26.8 -4% | 24.4 5% |
| Load Average * (dB) | 38 | 34.8 8% | 39.6 -4% | 31.8 16% | 32.8 14% | 25.8 32% |
| Cyberpunk 2077 ultra * (dB) | 38.1 | 38 -0% | 38.4 -1% | 51.8 -36% | 26.2 31% | |
| Load Maximum * (dB) | 48.6 | 43.3 11% | 49.7 -2% | 38.4 21% | 51.8 -7% | 39 20% |
| Witcher 3 ultra * (dB) | 49.7 |
* ... smaller is better
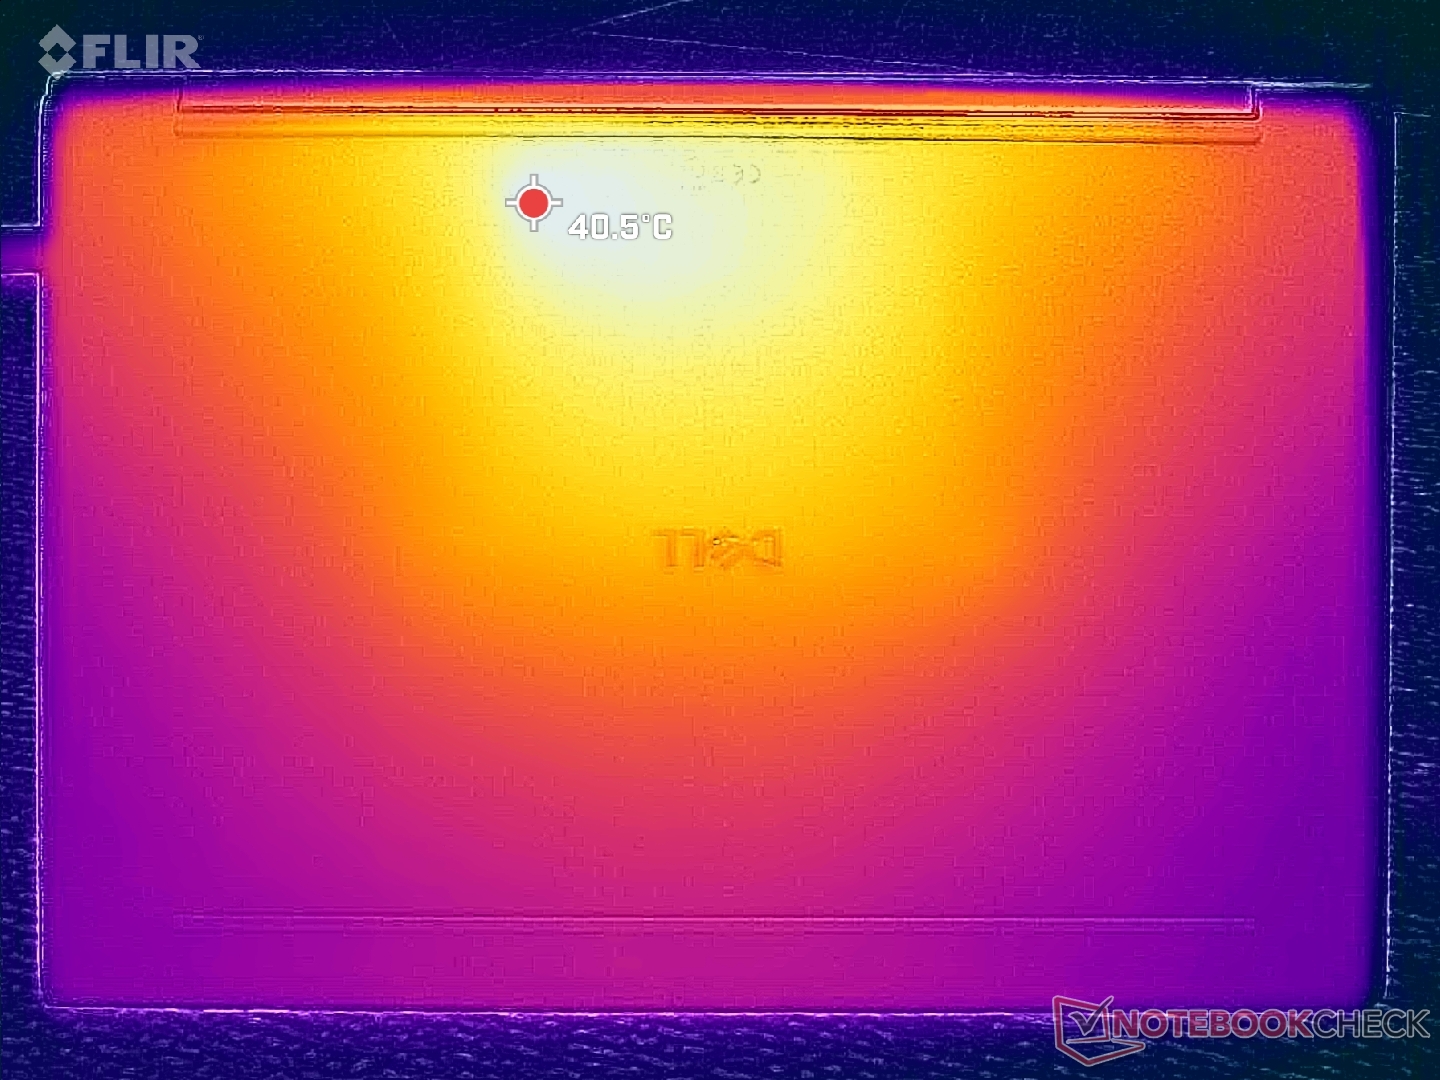
Temperature
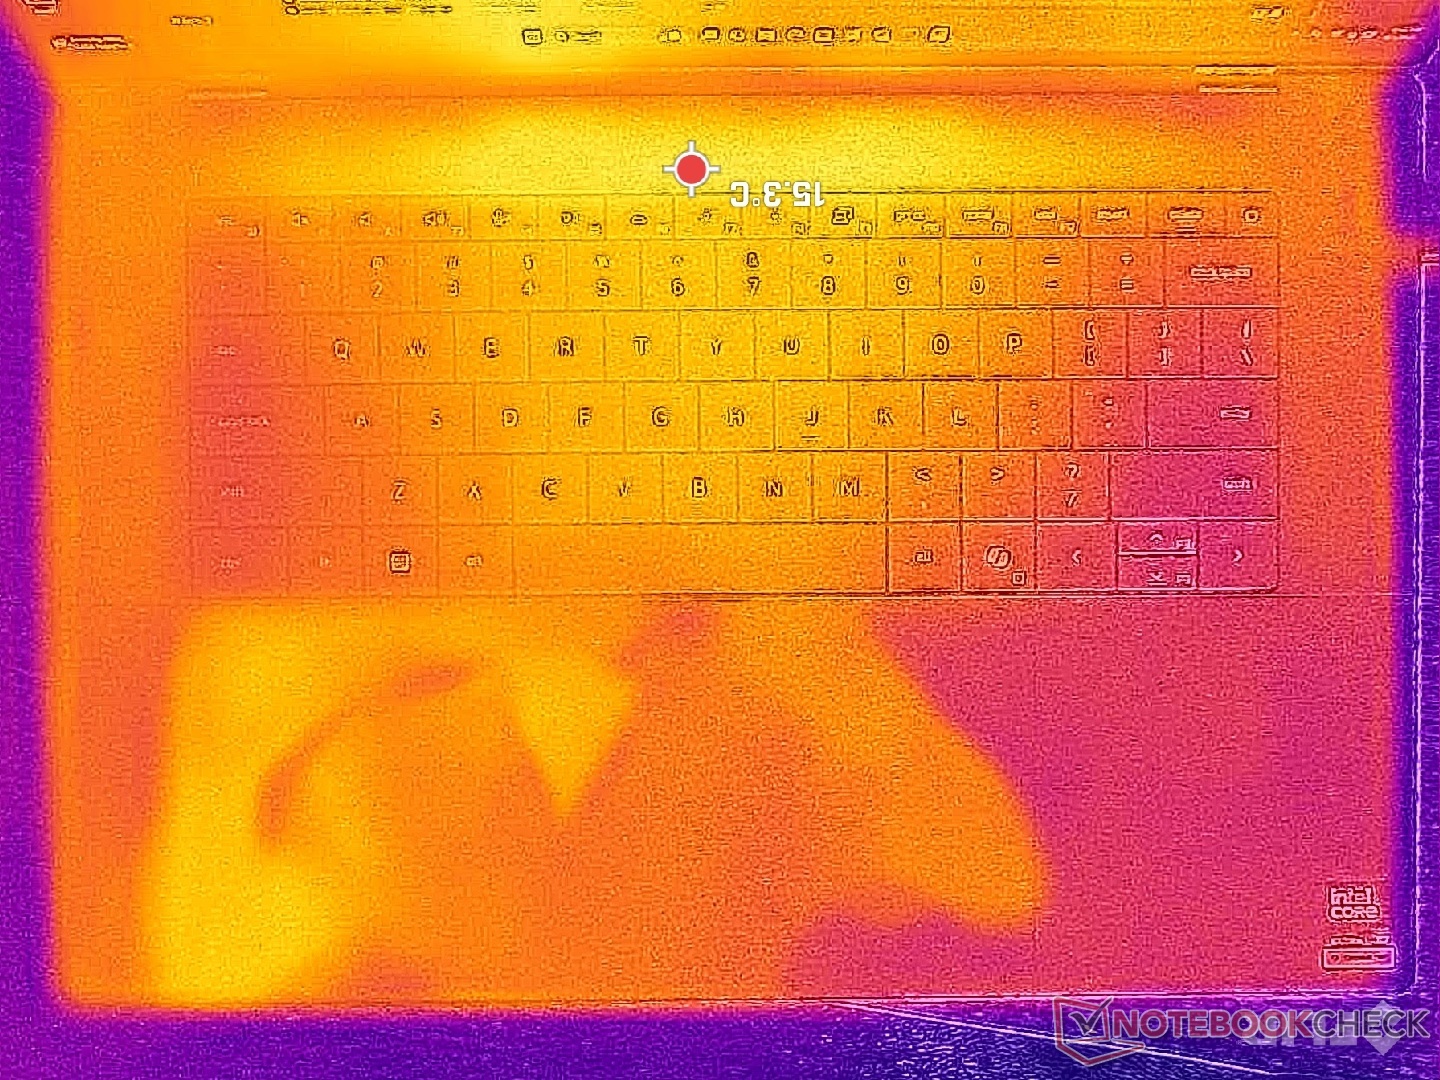
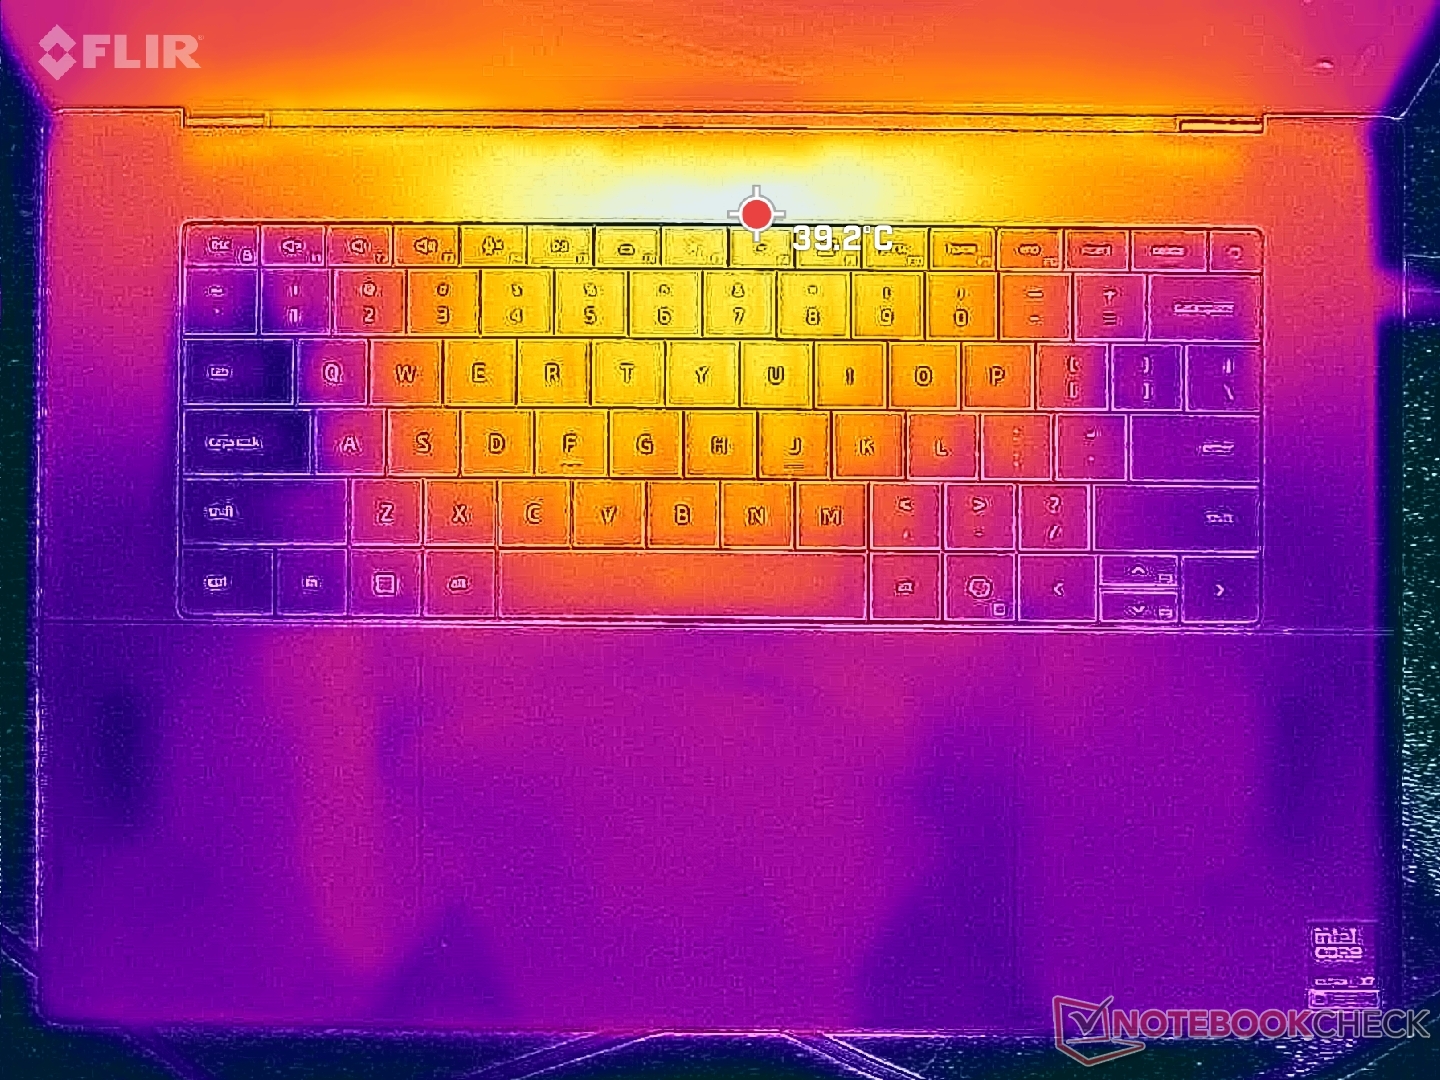
Surface temperatures are cooler on average when compared to the older but thicker XPS 16 9640 with faster RTX 4070 graphics. Hot spots nevertheless top out at the similar 40 C range near the keyboard center.
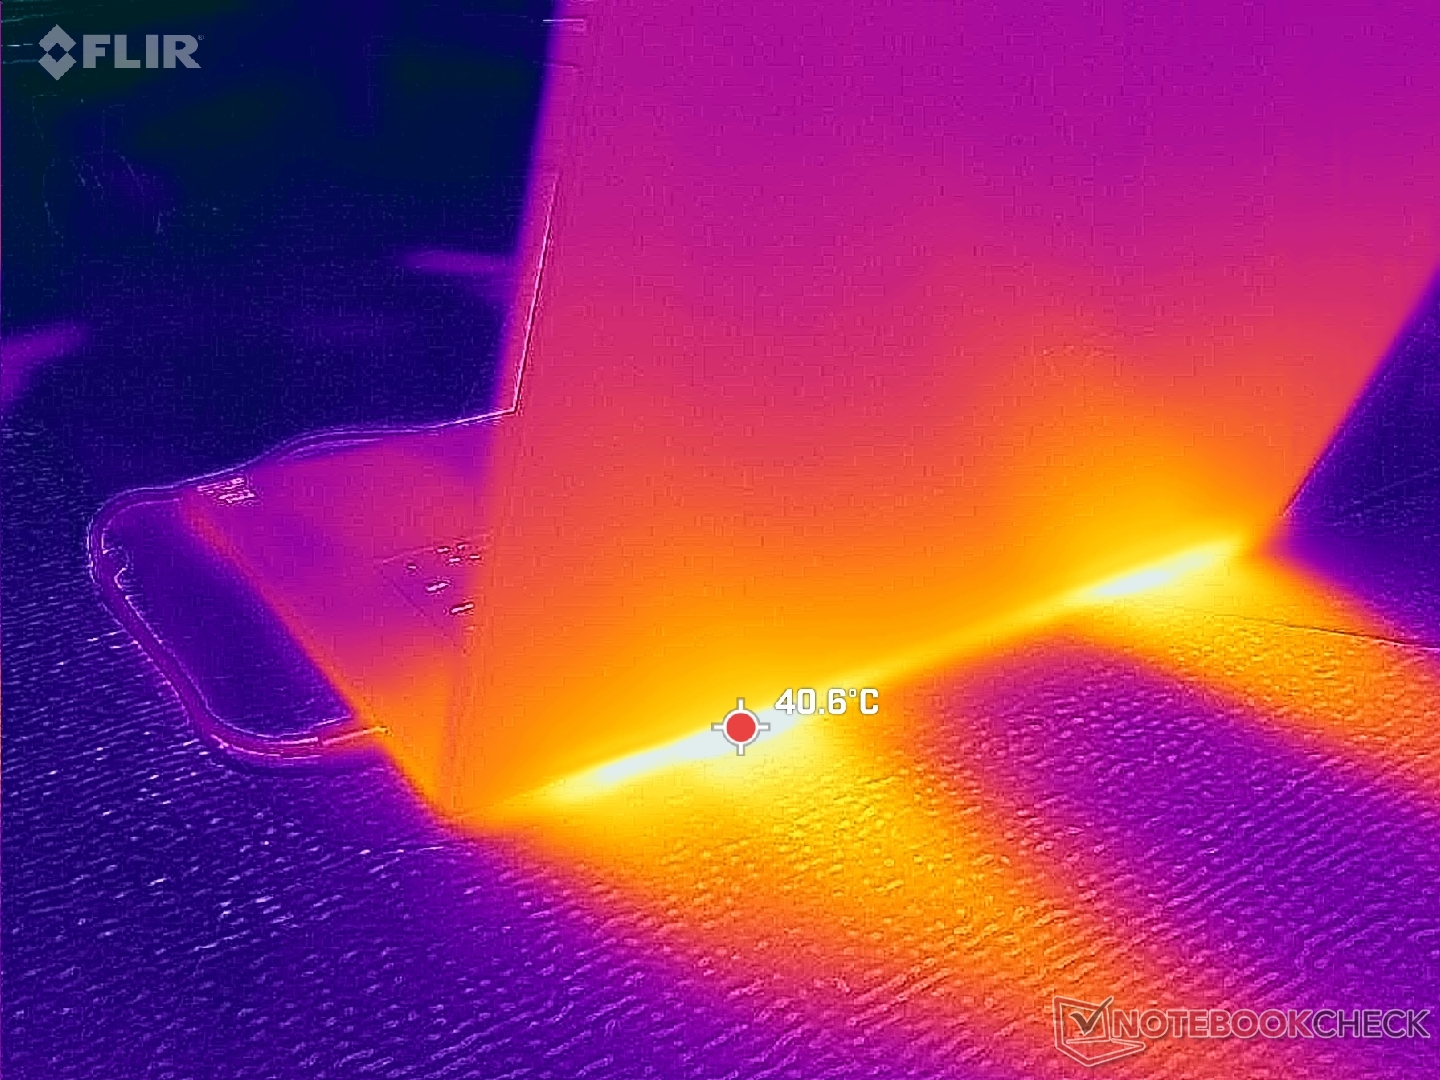
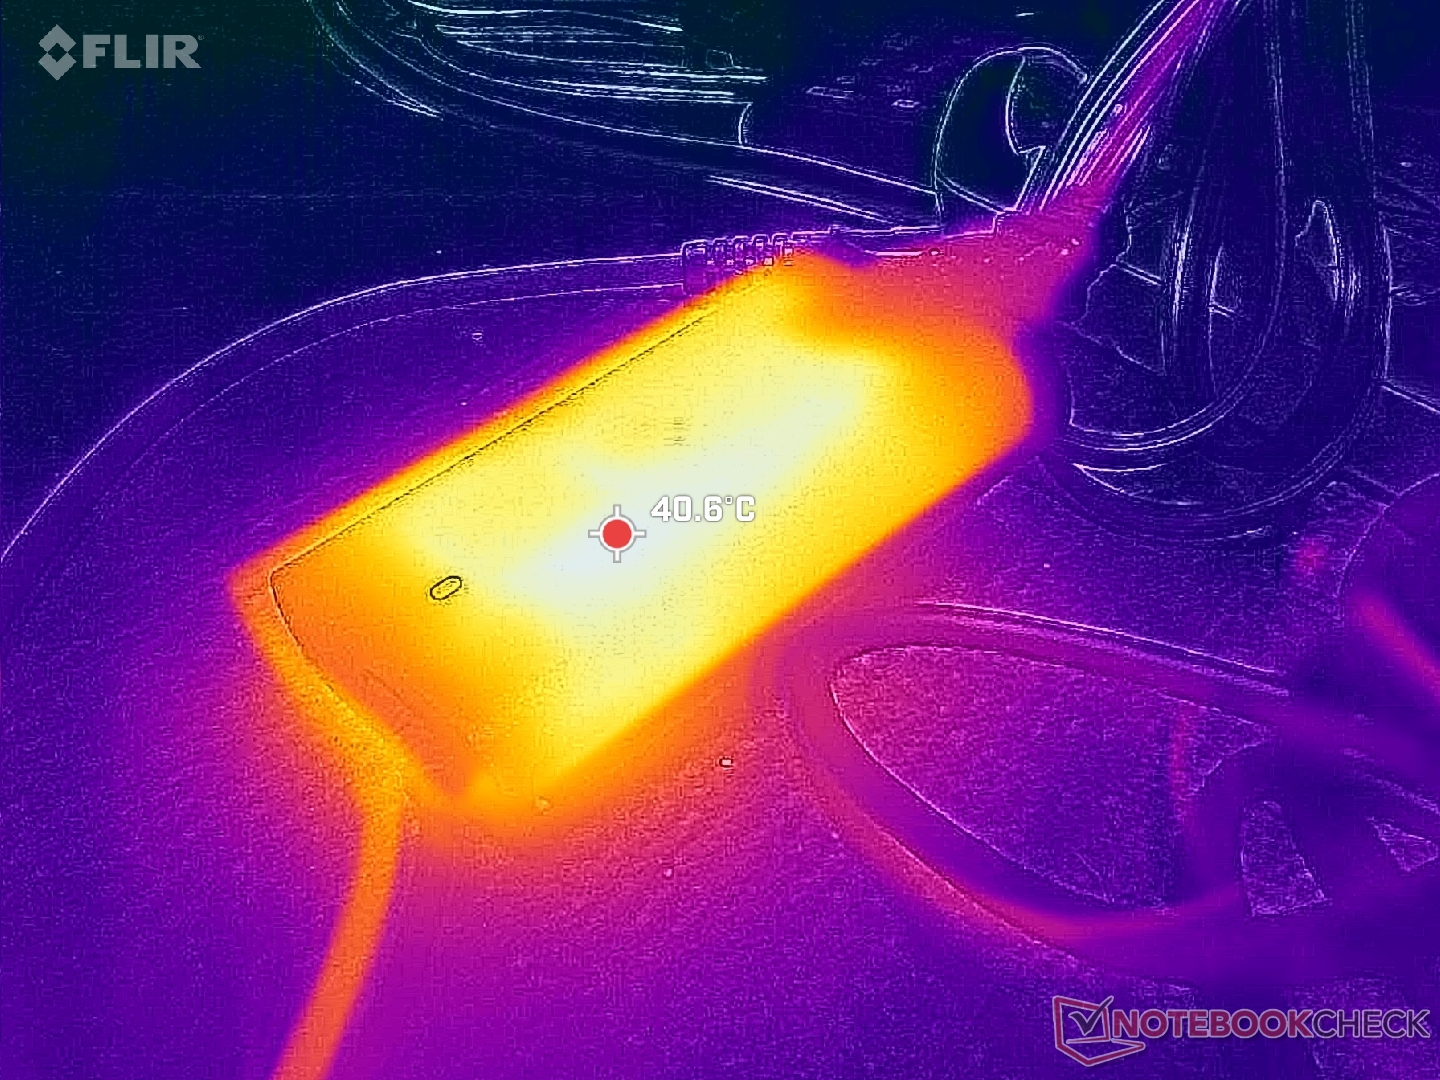
(±) The maximum temperature on the upper side is 40.6 °C / 105 F, compared to the average of 36.8 °C / 98 F, ranging from 21 to 71 °C for the class Multimedia.
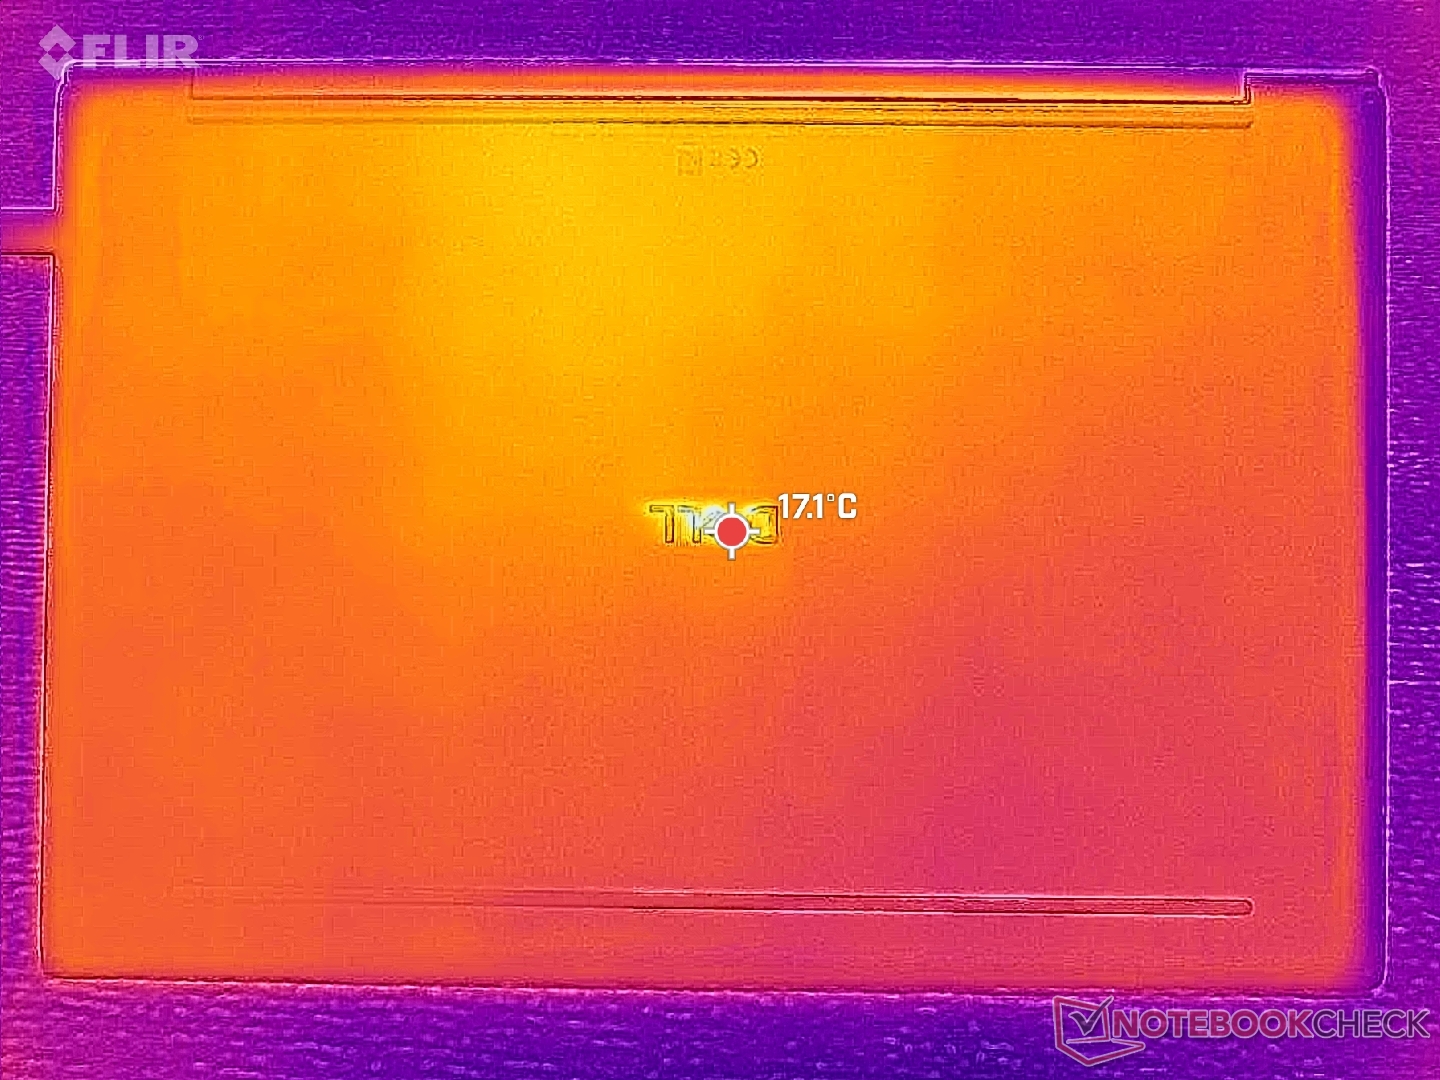
(+) The bottom heats up to a maximum of 39.8 °C / 104 F, compared to the average of 39.1 °C / 102 F
(+) In idle usage, the average temperature for the upper side is 22.3 °C / 72 F, compared to the device average of 31.3 °C / 88 F.
(+) The palmrests and touchpad are cooler than skin temperature with a maximum of 25.6 °C / 78.1 F and are therefore cool to the touch.
(+) The average temperature of the palmrest area of similar devices was 28.7 °C / 83.7 F (+3.1 °C / 5.6 F).
| Dell XPS 16 Core Ultra X7 358H Ultra X7 358H, Arc B390 Panther Lake iGPU | Dell XPS 16 Core Ultra 5 325 Ultra 5 325, Intel Graphics 4 Xe3 PTL | Dell XPS 16 9640 Ultra 7 155H, GeForce RTX 4070 Laptop GPU | Samsung Galaxy Book6 Pro Ultra 7 356H, Intel Graphics 4 Xe3 PTL | Lenovo Yoga Pro 9 16IAH10 RTX 5050 Ultra 9 285H, GeForce RTX 5050 Laptop | HP Omnibook 5 16-af1037nr Ultra 7 255U, Graphics 4-Core iGPU (Arrow Lake) | |
|---|---|---|---|---|---|---|
| Heat | -3% | -7% | 3% | -12% | 6% | |
| Maximum Upper Side * (°C) | 40.6 | 43.8 -8% | 39.4 3% | 37.8 7% | 34.4 15% | 28 31% |
| Maximum Bottom * (°C) | 39.8 | 42 -6% | 36.9 7% | 40.1 -1% | 41.4 -4% | 33.2 17% |
| Idle Upper Side * (°C) | 23.2 | 23.2 -0% | 28.2 -22% | 22.6 3% | 28.6 -23% | 24.6 -6% |
| Idle Bottom * (°C) | 23.8 | 23.6 1% | 27.4 -15% | 22.8 4% | 31.8 -34% | 27.8 -17% |
* ... smaller is better
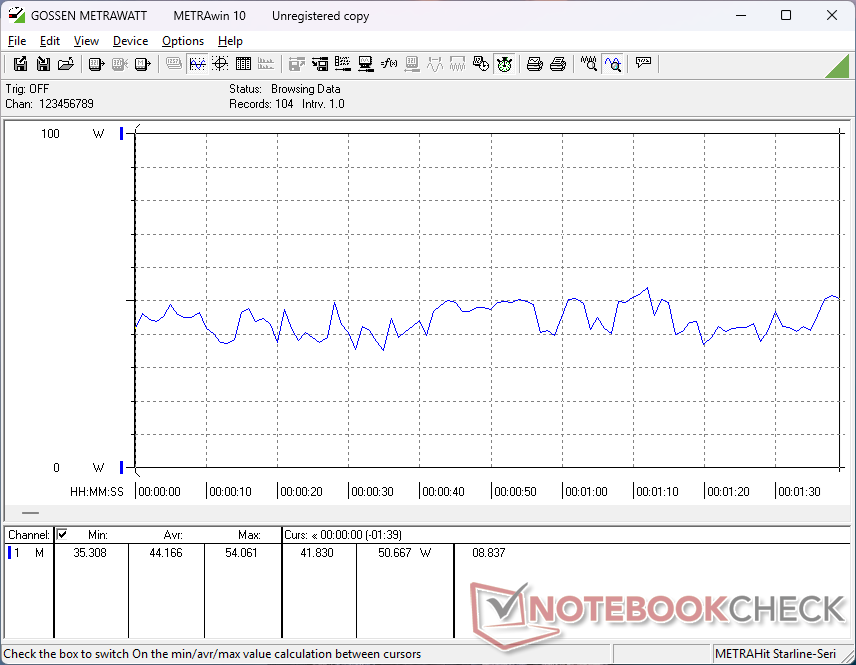
Stress Test
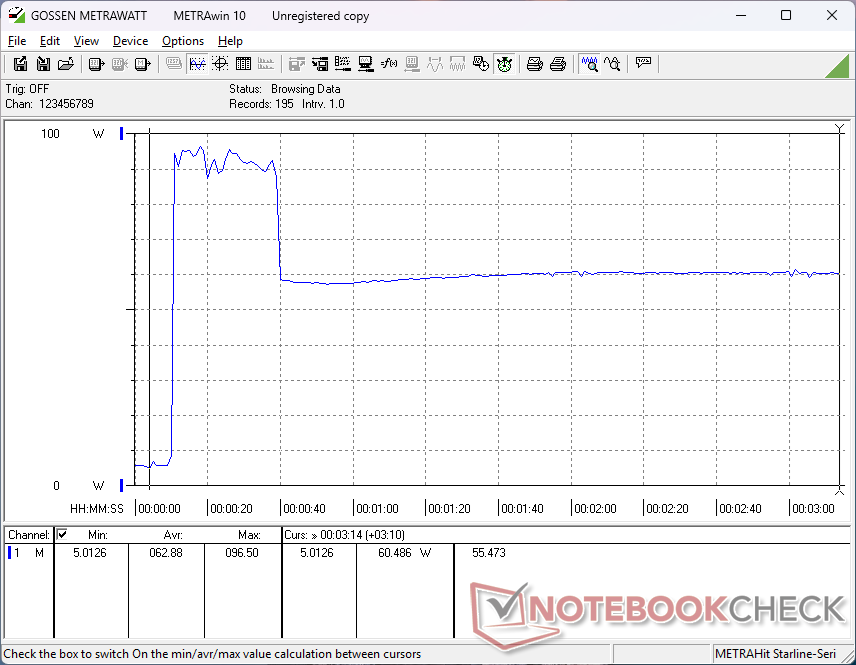
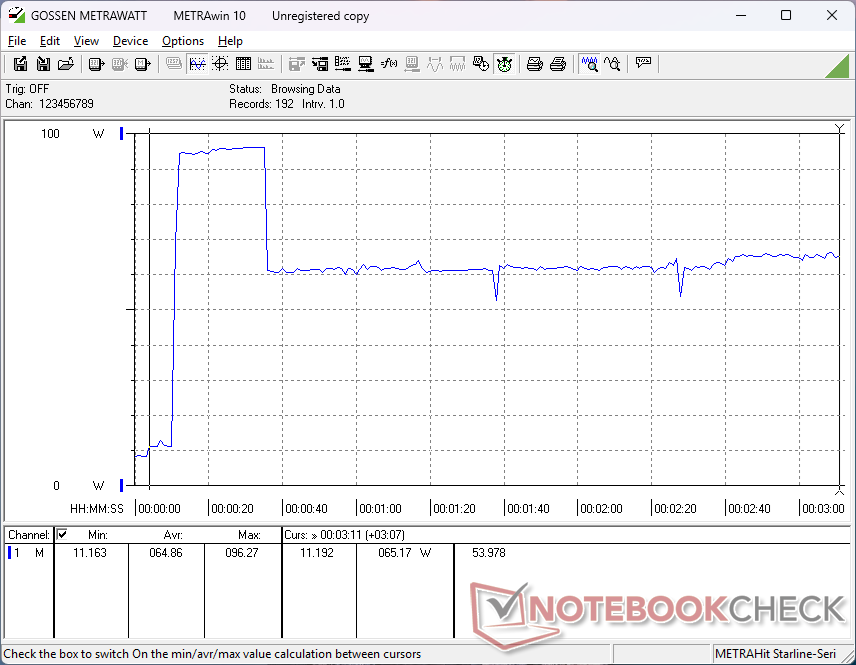
The CPU would boost to 2.9 GHz, 69 W, and 100 C when running Prime95 stress before dropping to 2.2 GHz, 40 W, and 78 C a few seconds later to represent limited Turbo Boost sustainability. The throttling complements our CineBench R15 xT loop results above and power consumption behavior below.
Perhaps more notably, core temperature under load is cooler than the slower Core Ultra 5 configuration of the XPS 16. The CPU would stabilize at 78 C and 68 C when running Prime95 and Cyberpunk 2077, respectively, compared to 86 C and 89 C on the Core Ultra 5 XPS 16.


| CPU Clock (GHz) | GPU Clock (MHz) | Average CPU Temperature (°C) | |
| System Idle | -- | -- | 44 |
| Prime95 Stress | 2.1 | 900 | 78 |
| Prime95 + FurMark Stress | 1.7 | 1350 | 71 |
| Cyberpunk 2077 Stress | 0.87 | 2150 | 68 |
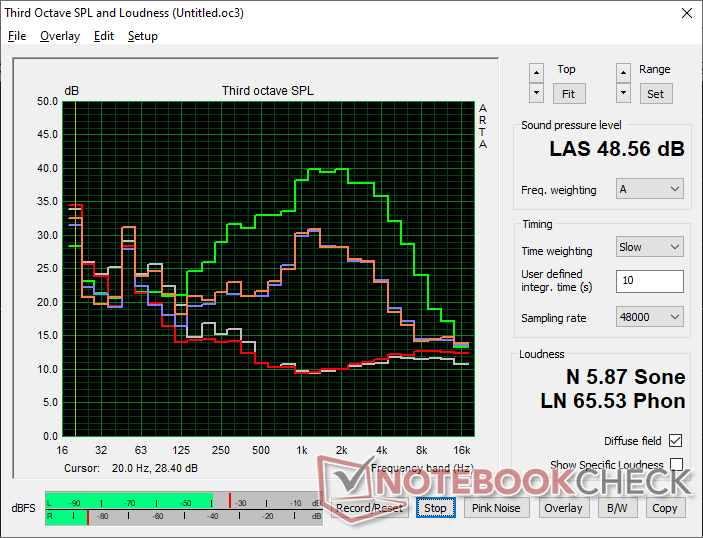
Speakers
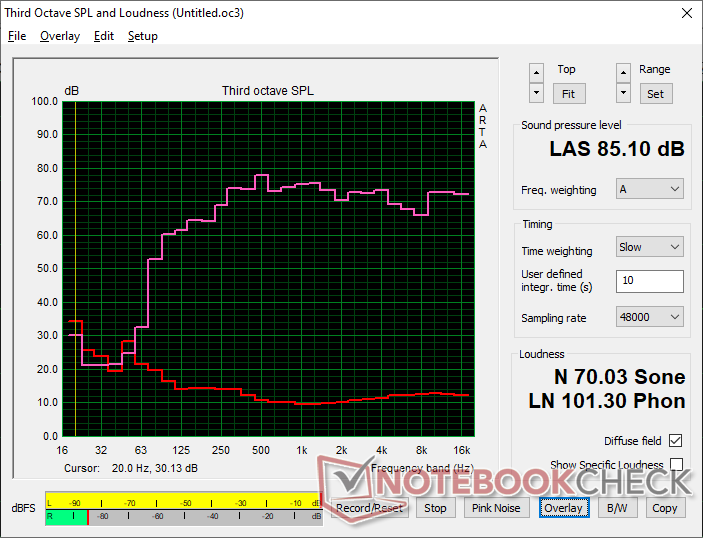
Dell XPS 16 Core Ultra X7 358H audio analysis
(+) | speakers can play relatively loud (85.1 dB)
Bass 100 - 315 Hz
(±) | reduced bass - on average 7.6% lower than median
(+) | bass is linear (6.1% delta to prev. frequency)
Mids 400 - 2000 Hz
(+) | balanced mids - only 2.1% away from median
(+) | mids are linear (3.4% delta to prev. frequency)
Highs 2 - 16 kHz
(+) | balanced highs - only 2.3% away from median
(+) | highs are linear (4.1% delta to prev. frequency)
Overall 100 - 16.000 Hz
(+) | overall sound is linear (6.2% difference to median)
Compared to same class
» 3% of all tested devices in this class were better, 0% similar, 96% worse
» The best had a delta of 5%, average was 17%, worst was 45%
Compared to all devices tested
» 0% of all tested devices were better, 0% similar, 99% worse
» The best had a delta of 4%, average was 24%, worst was 134%
Apple MacBook Pro 16 2021 M1 Pro audio analysis
(+) | speakers can play relatively loud (84.7 dB)
Bass 100 - 315 Hz
(+) | good bass - only 3.8% away from median
(+) | bass is linear (5.2% delta to prev. frequency)
Mids 400 - 2000 Hz
(+) | balanced mids - only 1.3% away from median
(+) | mids are linear (2.1% delta to prev. frequency)
Highs 2 - 16 kHz
(+) | balanced highs - only 1.9% away from median
(+) | highs are linear (2.7% delta to prev. frequency)
Overall 100 - 16.000 Hz
(+) | overall sound is linear (4.6% difference to median)
Compared to same class
» 0% of all tested devices in this class were better, 0% similar, 100% worse
» The best had a delta of 5%, average was 17%, worst was 45%
Compared to all devices tested
» 0% of all tested devices were better, 0% similar, 100% worse
» The best had a delta of 4%, average was 24%, worst was 134%
Energy Management
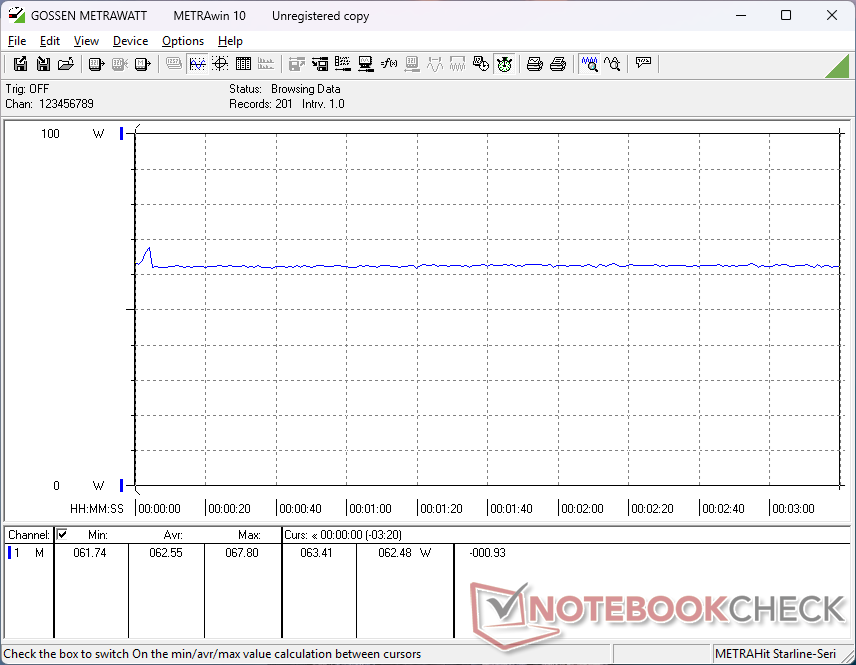
Power Consumption
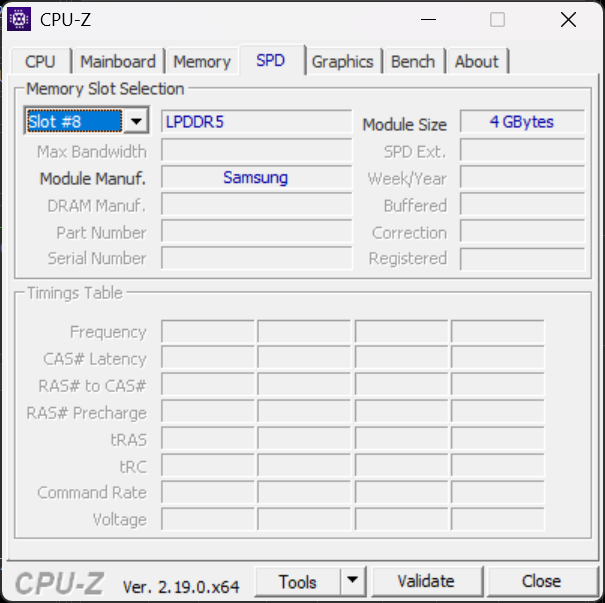
The Core Ultra X7 OLED configuration is generally more demanding than the base Core Ultra 5 IPS configuration even when idling due to the OLED panel. Running Cyberpunk 2077 and Prime95 draws about 38 percent and 35 percent more power, respectively. However, the performance increase far outweighs the higher power demand and so performance-per-watt is still higher with the Core Ultra X7 option.
| Off / Standby | |
| Idle | |
| Load |
|
Key:
min: | |
| Dell XPS 16 Core Ultra X7 358H Ultra X7 358H, Arc B390 Panther Lake iGPU, , OLED, 3200x2000, 16" | Dell XPS 16 Core Ultra 5 325 Ultra 5 325, Intel Graphics 4 Xe3 PTL, SK hynix PVC10 HFS512GEM4X182N, IPS, 1920x1200, 16" | Dell XPS 16 9640 Ultra 7 155H, GeForce RTX 4070 Laptop GPU, Kioxia XG8 KXG80ZNV1T02, OLED, 3840x2400, 16.3" | Samsung Galaxy Book6 Pro Ultra 7 356H, Intel Graphics 4 Xe3 PTL, Samsung PM9C1b MZVL8512HFLU-00BLL, OLED, 2880x1800, 16" | Lenovo Yoga Pro 9 16IAH10 RTX 5050 Ultra 9 285H, GeForce RTX 5050 Laptop, WD PC SN7100S SDFPMSL-1T00-1101, OLED, 2880x1800, 16" | HP Omnibook 5 16-af1037nr Ultra 7 255U, Graphics 4-Core iGPU (Arrow Lake), , IPS, 1920x1200, 16" | |
|---|---|---|---|---|---|---|
| Power Consumption | 28% | -70% | 25% | -142% | -2% | |
| Idle Minimum * (Watt) | 4 | 1.3 67% | 7.7 -93% | 2.5 37% | 6.8 -70% | 4.8 -20% |
| Idle Average * (Watt) | 4.4 | 4.5 -2% | 10.3 -134% | 4.2 5% | 20.1 -357% | 9.4 -114% |
| Idle Maximum * (Watt) | 10.2 | 4.6 55% | 10.6 -4% | 4.6 55% | 21.6 -112% | 9.7 5% |
| Load Average * (Watt) | 44.2 | 36.5 17% | 76.5 -73% | 42.2 5% | 87.6 -98% | 41.8 5% |
| Cyberpunk 2077 ultra * (Watt) | 62.6 | 47.9 23% | 52.7 16% | 148.2 -137% | 39.5 37% | |
| Cyberpunk 2077 ultra external monitor * (Watt) | 62.4 | 45.4 27% | 40.6 35% | 147.9 -137% | 35.9 42% | |
| Load Maximum * (Watt) | 94.6 | 82.8 12% | 138.5 -46% | 70.8 25% | 173.5 -83% | 66.1 30% |
| Witcher 3 ultra * (Watt) | 126.4 |
* ... smaller is better
Power Consumption Cyberpunk / Stress Test
Power Consumption external Monitor
Battery Life
Runtimes are significantly shorter with our Core Ultra X7 3.2K OLED SKU versus the Core Ultra 5 FHD IPS SKU by over half even with Windows VRR enabled. While 10+ hours is still more than enough for most, the difference is notable.
| Dell XPS 16 Core Ultra X7 358H Ultra X7 358H, Arc B390 Panther Lake iGPU, 70 Wh | Dell XPS 16 Core Ultra 5 325 Ultra 5 325, Intel Graphics 4 Xe3 PTL, 70 Wh | Dell XPS 16 9640 Ultra 7 155H, GeForce RTX 4070 Laptop GPU, 99.5 Wh | Samsung Galaxy Book6 Pro Ultra 7 356H, Intel Graphics 4 Xe3 PTL, 78 Wh | Lenovo Yoga Pro 9 16IAH10 RTX 5050 Ultra 9 285H, GeForce RTX 5050 Laptop, 84 Wh | HP Omnibook 5 16-af1037nr Ultra 7 255U, Graphics 4-Core iGPU (Arrow Lake), 59 Wh | |
|---|---|---|---|---|---|---|
| Battery runtime | 158% | 2% | 58% | 4% | -8% | |
| WiFi v1.3 (h) | 10.3 | 26.6 158% | 10.5 2% | 16.3 58% | 10.7 4% | 9.5 -8% |
| H.264 (h) | 16.5 | |||||
| Load (h) | 1.5 |
Notebookcheck Rating
The Core Ultra X7 XPS 16 configuration is significantly more compelling than the lesser Core Ultra 5 or Ultra 7 options. The model gives up performance when compared to last year's Dell 16 Premium for a much thinner, leaner, and more efficient look.
Dell XPS 16 Core Ultra X7 358H
- 04/11/2026 v8
Allen Ngo
 Total Sustainability Score:
 Potential Competitors in Comparison
Image | Model / Review | Price | Weight | Height | Display |
|---|---|---|---|---|---|
1. 87.2%  | Dell XPS 16 Core Ultra X7 358H Intel Core Ultra X7 358H ⎘ Intel Arc B390 12 Xe3 Panther Lake iGPU ⎘ 32 GB Memory | Amazon: 1. $2,499.00 Dell Premium 16 (XPS 16 2025... 2. $2,599.00 Dell Premium 16 (XPS 16 2025... 3. $1,977.99 Dell Premium 16 (Previously ... List Price: 2350 USD | 1.7 kg | 14.62 mm | 16.00" 3200x2000 236 PPI OLED |
2. 84.2%  | Dell XPS 16 Core Ultra 5 325 Intel Core Ultra 5 325 ⎘ Intel Graphics 4 Xe3 Panther Lake iGPU ⎘ 16 GB Memory, 512 GB SSD | Amazon: 1. $2,599.00 Dell Premium 16 (XPS 16 2025... 2. $2,499.00 Dell Premium 16 (XPS 16 2025... 3. $1,977.99 Dell Premium 16 (Previously ... List Price: 1600 USD | 1.7 kg | 15.4 mm | 16.00" 1920x1200 142 PPI IPS |
3. 88.6% v7 (old)  | Dell XPS 16 9640 Intel Core Ultra 7 155H ⎘ NVIDIA GeForce RTX 4070 Laptop GPU ⎘ 32 GB Memory, 1024 GB SSD | Amazon: 1. $2,799.99 Dell XPS 16 9640 Laptop | In... 2. $2,199.00 New XPS 16 9640 Business Lap... 3. $2,499.00 Dell XPS 16 9640 16.3" Touch... | 2.3 kg | 18.7 mm | 16.30" 3840x2400 139 PPI OLED |
4. 86.3%  | Samsung Galaxy Book6 Pro Intel Core Ultra 7 356H ⎘ Intel Graphics 4 Xe3 Panther Lake iGPU ⎘ 32 GB Memory, 512 GB SSD | Amazon: List Price: 2199€ | 1.6 kg | 11.9 mm | 16.00" 2880x1800 212 PPI OLED |
5. 88.8%  | Lenovo Yoga Pro 9 16IAH10 RTX 5050 Intel Core Ultra 9 285H ⎘ NVIDIA GeForce RTX 5050 Laptop ⎘ 32 GB Memory, 1024 GB SSD | Amazon: List Price: 1800 USD | 2 kg | 17.9 mm | 16.00" 2880x1800 212 PPI OLED |
6. 77.8%  | HP Omnibook 5 16-af1037nr Intel Core Ultra 7 255U ⎘ Intel Graphics 4-Core iGPU (Meteor / Arrow Lake) ⎘ 16 GB Memory | Amazon: List Price: 660 USD | 1.7 kg | 18.6 mm | 16.00" 1920x1200 142 PPI IPS |
Transparency
The selection of devices to be reviewed is made by our editorial team. The test sample was provided to the author as a loan by the manufacturer or retailer for the purpose of this review. The lender had no influence on this review, nor did the manufacturer receive a copy of this review before publication. There was no obligation to publish this review. As an independent media company, Notebookcheck is not subjected to the authority of manufacturers, retailers or publishers.
This is how Notebookcheck is testing
Every year, Notebookcheck independently reviews hundreds of laptops and smartphones using standardized procedures to ensure that all results are comparable. We have continuously developed our test methods for around 20 years and set industry standards in the process. In our test labs, high-quality measuring equipment is utilized by experienced technicians and editors. These tests involve a multi-stage validation process. Our complex rating system is based on hundreds of well-founded measurements and benchmarks, which maintains objectivity. Further information on our test methods can be found here.
