





Verdict - Surface Laptop 13.8 is a very good everyday laptop
Microsoft did not really change anything in two years and simply equips the Surface Laptop 13.8 with a new Snapdragon X2 Plus processor, but the additional performance is good to have and the overall package is still good. The performance deficit compared to the Snapdragon X2 Elite is also very small and the upgrade does not make much sense unless you need more RAM or storage. You get a high-quality metal chassis, very comfortable input devices and a bright as well as color accurate IPS screen. Yes, it is glossy and the image quality is just not as good as on OLED screens, but in return there are no issues with PWM flickering.
You also get good speakers, the fan is often silent or very quiet and the battery runtime is improved. Negative aspects include the soldered memory and the lack of a card reader. Microsoft still uses the proprietary Surface Connect port, but most users would probably prefer a third USB-C port on the right side.
However, we have two major issues with the Surface Laptop. The first one is the price and $1599 for the smallest config with the Snapdragon X2 Plus, 16 GB RAM and the 512 GB SSD is not cheap. The bigger problem is that Microsoft forces private customers to buy the Snapdragon version. The Intel model is available with the latest Core Ultra X processors including the Arc B390 iGPU, which offers much more graphics and gaming performance. We are pretty sure private customers would benefit more from the faster GPU, but this does not seem to fit into Microsoft's ARM strategy. Business users can also get an anti-reflective screen with an integrated privacy filter. Our experiences with privacy filters are not great though, so we are not sure if that is really a big deal.
Pros
Cons

Specifications
Case, Connectivity and Input Devices
Microsoft did not change the chassis compared to the previous model, but now offers a new color for the 13.8-inch version: Jade. Our review unit features the new green color and we like it a lot, but you can also get it in Platinum, Dune or Black. The metal chassis still offers excellent build quality, but it is also on the heavy side with more than 1.3 kg. There is still some wobbling from the hinges, but it is not too distracting. You can easily access the internals and clean the fan or replace the compact M.2-2230 SSD.
Connectivity is still okay with two USB-C 4.0 ports as well as a regular USB-A port and you also get Microsoft's proprietary Surface Connect port on the right side. There are some accessories (like a docking station), but we would have preferred an additional USB-C port. You do not get HDMI or a card reader, though. The Wi-Fi 7 module manages very fast transfer rates with a corresponding router and we had no issues with the signal quality during our review period. The 1080p webcam (with IR) takes decent images. We are still big fans of the input devices. The illuminated keyboard is super comfortable to type on and the haptic trackpad also works really well. You can obviously use the capacitive touchscreen for inputs as well.


| Networking | |
| Microsoft Surface Laptop 8 13.8 | |
| iperf3 transmit Wi-Fi6/7 RT-BE96U | |
| iperf3 receive Wi-Fi6/7 RT-BE96U | |
| Microsoft Surface Laptop 7 13.8 Copilot+ | |
| iperf3 receive AXE11000 6GHz | |
| iperf3 transmit AXE11000 6GHz | |
| iperf3 receive AXE11000 | |
| iperf3 transmit AXE11000 | |
| Apple MacBook Air 13 M5 | |
| iperf3 receive AXE11000 | |
| iperf3 transmit AXE11000 | |
| MSI Prestige 13 AI+ A3MG | |
| iperf3 transmit Wi-Fi6/7 RT-BE96U | |
| iperf3 receive Wi-Fi6/7 RT-BE96U | |
| HP OmniBook 7 Aero 13-bg1077nr | |
| iperf3 receive AXE11000 | |
| iperf3 transmit AXE11000 | |
| Samsung Galaxy Book5 Pro 14 940XHA | |
| iperf3 receive AXE11000 | |
| iperf3 transmit AXE11000 | |


Display


While business customers can also get the Intel SKU with an anti-glare screen including an integrated privacy filter, private customers only get the ARM version with the familiar glossy IPS touchscreen, which is still supplied by Sharp. The 3:2 screen with 2304 x 1536 pixels and 120 Hz offers good image quality without any PWM flickering, which is an advantage over OLED competitors. Response times are pretty slow though, even though it is not a huge issue in practice.
The brightness is still very good at more than 600 nits. This slightly affects the black value (0.44), so the maximum contrast ratio is "only" 1400:1 and black contents appear a bit gray. Our analysis with the professional CalMAN software shows that the pre-installed color profiles for sRGB and P3 are very accurate and do not require additional calibration for picture editing. Both the brightness as well as the color temperature can be adjusted automatically via sensor.
| |||||||||||||||||||||||||
Brightness Distribution: 91 %
Center on Battery: 617 cd/m²
Contrast: 1402:1 (Black: 0.44 cd/m²)
ΔE ColorChecker Calman: 0.9 | ∀{0.5-29.43 Ø4.69}
ΔE Greyscale Calman: 2 | ∀{0.09-98 Ø4.94}
86.5% AdobeRGB 1998 (Argyll 3D)
97.8% sRGB (Argyll 3D)
96.5% Display P3 (Argyll 3D)
Gamma: 2.19
CCT: 6810 K
| Microsoft Surface Laptop 8 13.8 LQ138P1JX61, IPS, 2304x1536, 13.8", 120 Hz | Microsoft Surface Laptop 7 13.8 Copilot+ LQ138P1JX61, IPS, 2304x1536, 13.8", 120 Hz | Apple MacBook Air 13 M5 IPS, 2560x1664, 13.6", 60 Hz | MSI Prestige 13 AI+ A3MG ATNA33AA07-0, OLED, 2880x1800, 13.3", 60 Hz | HP OmniBook 7 Aero 13-bg1077nr LG Philips LGD0746, IPS, 1920x1200, 13.3", 60 Hz | Asus Zenbook A14 UX3704NA ATNA40CT06-0, OLED, 1920x1200, 14", 60 Hz | Samsung Galaxy Book5 Pro 14 940XHA ATNA40CU07-0, OLED, 2880x1800, 14", 120 Hz | |
|---|---|---|---|---|---|---|---|
| Display | 1% | 1% | 6% | -18% | 2% | 6% | |
| Display P3 Coverage (%) | 96.5 | 97.8 1% | 98.1 2% | 99.9 4% | 66.5 -31% | 99.5 3% | 99.9 4% |
| sRGB Coverage (%) | 97.8 | 98.2 0% | 98.6 1% | 100 2% | 96.8 -1% | 98.8 1% | 100 2% |
| AdobeRGB 1998 Coverage (%) | 86.5 | 87.3 1% | 86.8 0% | 95.7 11% | 67.3 -22% | 88.9 3% | 95.7 11% |
| Response Times | 3% | 29% | 94% | -39% | 95% | 97% | |
| Response Time Grey 50% / Grey 80% * (ms) | 38.8 ? | 38.9 ? -0% | 24.3 ? 37% | 1.8 ? 95% | 44.7 ? -15% | 1.22 ? 97% | 0.83 ? 98% |
| Response Time Black / White * (ms) | 18.3 ? | 17.4 ? 5% | 14.7 ? 20% | 1.5 ? 92% | 29.7 ? -62% | 1.26 ? 93% | 0.69 ? 96% |
| PWM Frequency (Hz) | 60 ? | 480 ? | 240 ? | ||||
| PWM Amplitude * (%) | 33 | 15 | 66 | ||||
| Screen | -6% | -37% | 679% | -122% | -22% | -43% | |
| Brightness middle (cd/m²) | 617 | 606 -2% | 546 -12% | 394 -36% | 442 -28% | 404 -35% | 400 -35% |
| Brightness (cd/m²) | 623 | 592 -5% | 519 -17% | 395 -37% | 420 -33% | 408 -35% | 402 -35% |
| Brightness Distribution (%) | 91 | 94 3% | 90 -1% | 98 8% | 88 -3% | 98 8% | 99 9% |
| Black Level * (cd/m²) | 0.44 | 0.43 2% | 0.38 14% | 0.005 99% | 0.3 32% | ||
| Contrast (:1) | 1402 | 1409 0% | 1437 2% | 78800 5521% | 1473 5% | ||
| Colorchecker dE 2000 * | 0.9 | 1.3 -44% | 2.1 -133% | 1.67 -86% | 4.34 -382% | 1.1 -22% | 2.1 -133% |
| Colorchecker dE 2000 max. * | 2.2 | 2.1 5% | 4 -82% | 3.9 -77% | 9.71 -341% | 3.3 -50% | 3.3 -50% |
| Greyscale dE 2000 * | 2 | 2.1 -5% | 3.3 -65% | 1.2 40% | 6.5 -225% | 1.9 5% | 2.3 -15% |
| Gamma | 2.19 100% | 2.16 102% | 2.22 99% | 2.212 99% | 2.13 103% | 2.17 101% | 2.26 97% |
| CCT | 6810 95% | 6842 95% | 7127 91% | 6470 100% | 7466 87% | 6547 99% | 6795 96% |
| Colorchecker dE 2000 calibrated * | 0.9 | 0.58 | 1.6 | ||||
| Total Average (Program / Settings) | -1% /
-3% | -2% /
-18% | 260% /
434% | -60% /
-85% | 25% /
6% | 20% /
-4% |
* ... smaller is better


Display Response Times
| ↔ Response Time Black to White | ||
|---|---|---|
| 18.3 ms ... rise ↗ and fall ↘ combined | ↗ 5.8 ms rise |  |
| ↘ 12.5 ms fall | ||
| The screen shows good response rates in our tests, but may be too slow for competitive gamers. In comparison, all tested devices range from 0.1 (minimum) to 240 (maximum) ms. » 42 % of all devices are better. This means that the measured response time is similar to the average of all tested devices (19.7 ms). | ||
| ↔ Response Time 50% Grey to 80% Grey | ||
| 38.8 ms ... rise ↗ and fall ↘ combined | ↗ 14.1 ms rise |  |
| ↘ 24.7 ms fall | ||
| The screen shows slow response rates in our tests and will be unsatisfactory for gamers. In comparison, all tested devices range from 0.13 (minimum) to 636 (maximum) ms. » 59 % of all devices are better. This means that the measured response time is worse than the average of all tested devices (30.7 ms). | ||
Screen Flickering / PWM (Pulse-Width Modulation)
| Screen flickering / PWM not detected |  | ||
In comparison: 52 % of all tested devices do not use PWM to dim the display. If PWM was detected, an average of 7611 (minimum: 5 - maximum: 343500) Hz was measured. | |||


Performance


Testing Conditions
We performed our benchmarks and measurements in Best Performance mode.
Processor Performance
The base model is equipped with the new Snapdragon X2 Plus (X2P-64-100), which offers 10 cores (6 prime cores running at 4.0 GHz & 4x performance cores at 3.4 GHz) and it can consume up to 28 Watts and eventually levels off at 18 Watts (both on mains and battery). The overall performance is actually very close to the Snapdragon X2 Elite with 12 cores we just reviewed in the new Surface Pro OLED and the X2 Plus is also slightly faster than the old X1E-80-100 in the previous generation Surface Laptop. The overall performance level is very good and very similar to Intel's new Panther Lake models in this TDP range.
The small performance difference to the small Snapdragon X2 Elite means that the switch only makes sense when you need more than 16 GB RAM and 512 GB SSD storage. In addition to the native CPU benchmarks (Cinebench 2024 & Geekbench) we also included emulated benchmarks below.
Cinebench 2024: CPU Multi Core | CPU Single Core
Geekbench 6.7: Multi-Core | Single-Core
| CPU Performance rating | |
| Asus Zenbook A14 UX3704NA | |
| Apple MacBook Air 13 M5 | |
| Microsoft Surface Pro 13 OLED | |
| Microsoft Surface Laptop 8 13.8 | |
| Average Qualcomm Snapdragon X2 Plus X2P-64-100 | |
| Microsoft Surface Laptop 7 13.8 Copilot+ | |
| MSI Prestige 13 AI+ A3MG | |
| HP OmniBook 7 Aero 13-bg1077nr | |
| Average of class Subnotebook | |
| Samsung Galaxy Book5 Pro 14 940XHA | |
| Cinebench 2024 / CPU Multi Core | |
| Asus Zenbook A14 UX3704NA | |
| Microsoft Surface Pro 13 OLED | |
| Apple MacBook Air 13 M5 | |
| Microsoft Surface Laptop 7 13.8 Copilot+ | |
| MSI Prestige 13 AI+ A3MG | |
| Microsoft Surface Laptop 8 13.8 | |
| Average Qualcomm Snapdragon X2 Plus X2P-64-100 (n=1) | |
| HP OmniBook 7 Aero 13-bg1077nr | |
| Average of class Subnotebook (416 - 1471, n=52, last 2 years) | |
| Samsung Galaxy Book5 Pro 14 940XHA | |
| Cinebench 2024 / CPU Single Core | |
| Apple MacBook Air 13 M5 | |
| Asus Zenbook A14 UX3704NA | |
| Microsoft Surface Laptop 8 13.8 | |
| Average Qualcomm Snapdragon X2 Plus X2P-64-100 (n=1) | |
| Microsoft Surface Pro 13 OLED | |
| Microsoft Surface Laptop 7 13.8 Copilot+ | |
| Average of class Subnotebook (83 - 200, n=50, last 2 years) | |
| MSI Prestige 13 AI+ A3MG | |
| HP OmniBook 7 Aero 13-bg1077nr | |
| Samsung Galaxy Book5 Pro 14 940XHA | |
| Geekbench 6.7 / Multi-Core | |
| Asus Zenbook A14 UX3704NA | |
| Apple MacBook Air 13 M5 | |
| Microsoft Surface Pro 13 OLED | |
| Microsoft Surface Laptop 8 13.8 | |
| Microsoft Surface Laptop 7 13.8 Copilot+ | |
| MSI Prestige 13 AI+ A3MG | |
| Average Qualcomm Snapdragon X2 Plus X2P-64-100 (12923 - 14277, n=2) | |
| HP OmniBook 7 Aero 13-bg1077nr | |
| Average of class Subnotebook (5987 - 20325, n=60, last 2 years) | |
| Samsung Galaxy Book5 Pro 14 940XHA | |
| Geekbench 6.7 / Single-Core | |
| Apple MacBook Air 13 M5 | |
| Asus Zenbook A14 UX3704NA | |
| Microsoft Surface Pro 13 OLED | |
| Microsoft Surface Laptop 8 13.8 | |
| Average Qualcomm Snapdragon X2 Plus X2P-64-100 (2878 - 3265, n=2) | |
| HP OmniBook 7 Aero 13-bg1077nr | |
| MSI Prestige 13 AI+ A3MG | |
| Microsoft Surface Laptop 7 13.8 Copilot+ | |
| Average of class Subnotebook (1922 - 4195, n=60, last 2 years) | |
| Samsung Galaxy Book5 Pro 14 940XHA | |
Cinebench R15 Multi Loop
Cinebench R23: Multi Core | Single Core
Cinebench R20: CPU (Multi Core) | CPU (Single Core)
Cinebench R15: CPU Multi 64Bit | CPU Single 64Bit
Blender: v2.79 BMW27 CPU
7-Zip 18.03: 7z b 4 | 7z b 4 -mmt1
HWBOT x265 Benchmark v2.2: 4k Preset
LibreOffice : 20 Documents To PDF
R Benchmark 2.5: Overall mean
| CPU Performance rating | |
| HP OmniBook 7 Aero 13-bg1077nr | |
| Asus Zenbook A14 UX3704NA -1! | |
| MSI Prestige 13 AI+ A3MG | |
| Average of class Subnotebook | |
| Samsung Galaxy Book5 Pro 14 940XHA | |
| Microsoft Surface Laptop 8 13.8 | |
| Average Qualcomm Snapdragon X2 Plus X2P-64-100 | |
| Microsoft Surface Laptop 7 13.8 Copilot+ | |
| Cinebench R23 / Multi Core | |
| Asus Zenbook A14 UX3704NA | |
| HP OmniBook 7 Aero 13-bg1077nr | |
| Average of class Subnotebook (5263 - 20022, n=57, last 2 years) | |
| MSI Prestige 13 AI+ A3MG | |
| Microsoft Surface Laptop 7 13.8 Copilot+ | |
| Samsung Galaxy Book5 Pro 14 940XHA | |
| Microsoft Surface Laptop 8 13.8 | |
| Average Qualcomm Snapdragon X2 Plus X2P-64-100 (n=1) | |
| Cinebench R23 / Single Core | |
| MSI Prestige 13 AI+ A3MG | |
| HP OmniBook 7 Aero 13-bg1077nr | |
| Samsung Galaxy Book5 Pro 14 940XHA | |
| Average of class Subnotebook (975 - 2213, n=57, last 2 years) | |
| Asus Zenbook A14 UX3704NA | |
| Microsoft Surface Laptop 8 13.8 | |
| Average Qualcomm Snapdragon X2 Plus X2P-64-100 (n=1) | |
| Microsoft Surface Laptop 7 13.8 Copilot+ | |
| Cinebench R20 / CPU (Multi Core) | |
| Asus Zenbook A14 UX3704NA | |
| HP OmniBook 7 Aero 13-bg1077nr | |
| MSI Prestige 13 AI+ A3MG | |
| Average of class Subnotebook (2072 - 7884, n=55, last 2 years) | |
| Samsung Galaxy Book5 Pro 14 940XHA | |
| Microsoft Surface Laptop 7 13.8 Copilot+ | |
| Microsoft Surface Laptop 8 13.8 | |
| Average Qualcomm Snapdragon X2 Plus X2P-64-100 (n=1) | |
| Cinebench R20 / CPU (Single Core) | |
| MSI Prestige 13 AI+ A3MG | |
| HP OmniBook 7 Aero 13-bg1077nr | |
| Samsung Galaxy Book5 Pro 14 940XHA | |
| Average of class Subnotebook (366 - 832, n=55, last 2 years) | |
| Asus Zenbook A14 UX3704NA | |
| Microsoft Surface Laptop 8 13.8 | |
| Average Qualcomm Snapdragon X2 Plus X2P-64-100 (n=1) | |
| Microsoft Surface Laptop 7 13.8 Copilot+ | |
| Cinebench R15 / CPU Multi 64Bit | |
| Asus Zenbook A14 UX3704NA | |
| MSI Prestige 13 AI+ A3MG | |
| Microsoft Surface Laptop 7 13.8 Copilot+ | |
| HP OmniBook 7 Aero 13-bg1077nr | |
| Microsoft Surface Laptop 8 13.8 | |
| Average Qualcomm Snapdragon X2 Plus X2P-64-100 (n=1) | |
| Average of class Subnotebook (849 - 3291, n=55, last 2 years) | |
| Samsung Galaxy Book5 Pro 14 940XHA | |
| Cinebench R15 / CPU Single 64Bit | |
| HP OmniBook 7 Aero 13-bg1077nr | |
| Asus Zenbook A14 UX3704NA | |
| MSI Prestige 13 AI+ A3MG | |
| Samsung Galaxy Book5 Pro 14 940XHA | |
| Average of class Subnotebook (184 - 322, n=56, last 2 years) | |
| Microsoft Surface Laptop 8 13.8 | |
| Average Qualcomm Snapdragon X2 Plus X2P-64-100 (n=1) | |
| Microsoft Surface Laptop 7 13.8 Copilot+ | |
| Blender / v2.79 BMW27 CPU | |
| Microsoft Surface Laptop 8 13.8 | |
| Average Qualcomm Snapdragon X2 Plus X2P-64-100 (n=1) | |
| Samsung Galaxy Book5 Pro 14 940XHA | |
| Microsoft Surface Laptop 7 13.8 Copilot+ | |
| Average of class Subnotebook (178 - 633, n=54, last 2 years) | |
| MSI Prestige 13 AI+ A3MG | |
| HP OmniBook 7 Aero 13-bg1077nr | |
| Asus Zenbook A14 UX3704NA | |
| 7-Zip 18.03 / 7z b 4 | |
| HP OmniBook 7 Aero 13-bg1077nr | |
| Microsoft Surface Laptop 7 13.8 Copilot+ | |
| MSI Prestige 13 AI+ A3MG | |
| Microsoft Surface Laptop 8 13.8 | |
| Average Qualcomm Snapdragon X2 Plus X2P-64-100 (n=1) | |
| Average of class Subnotebook (16455 - 66177, n=53, last 2 years) | |
| Samsung Galaxy Book5 Pro 14 940XHA | |
| 7-Zip 18.03 / 7z b 4 -mmt1 | |
| Asus Zenbook A14 UX3704NA | |
| HP OmniBook 7 Aero 13-bg1077nr | |
| MSI Prestige 13 AI+ A3MG | |
| Microsoft Surface Laptop 8 13.8 | |
| Average Qualcomm Snapdragon X2 Plus X2P-64-100 (n=1) | |
| Average of class Subnotebook (4088 - 6699, n=55, last 2 years) | |
| Samsung Galaxy Book5 Pro 14 940XHA | |
| Microsoft Surface Laptop 7 13.8 Copilot+ | |
| HWBOT x265 Benchmark v2.2 / 4k Preset | |
| HP OmniBook 7 Aero 13-bg1077nr | |
| Average of class Subnotebook (3.16 - 23.3, n=55, last 2 years) | |
| MSI Prestige 13 AI+ A3MG | |
| Samsung Galaxy Book5 Pro 14 940XHA | |
| Asus Zenbook A14 UX3704NA | |
| Microsoft Surface Laptop 7 13.8 Copilot+ | |
| Microsoft Surface Laptop 8 13.8 | |
| Average Qualcomm Snapdragon X2 Plus X2P-64-100 (n=1) | |
| LibreOffice / 20 Documents To PDF | |
| Microsoft Surface Laptop 7 13.8 Copilot+ | |
| MSI Prestige 13 AI+ A3MG | |
| Average of class Subnotebook (41.4 - 78.8, n=54, last 2 years) | |
| HP OmniBook 7 Aero 13-bg1077nr | |
| Samsung Galaxy Book5 Pro 14 940XHA | |
| Microsoft Surface Laptop 8 13.8 | |
| Average Qualcomm Snapdragon X2 Plus X2P-64-100 (n=1) | |
| Asus Zenbook A14 UX3704NA | |
| R Benchmark 2.5 / Overall mean | |
| Microsoft Surface Laptop 7 13.8 Copilot+ | |
| Microsoft Surface Laptop 8 13.8 | |
| Average Qualcomm Snapdragon X2 Plus X2P-64-100 (n=1) | |
| Asus Zenbook A14 UX3704NA | |
| Average of class Subnotebook (0.4024 - 0.861, n=55, last 2 years) | |
| Samsung Galaxy Book5 Pro 14 940XHA | |
| HP OmniBook 7 Aero 13-bg1077nr | |
| MSI Prestige 13 AI+ A3MG | |
* ... smaller is better
AIDA64: FP32 Ray-Trace | FPU Julia | CPU SHA3 | CPU Queen | FPU SinJulia | FPU Mandel | CPU AES | CPU ZLib | FP64 Ray-Trace | CPU PhotoWorxx | CPU CheckMate
| Performance rating | |
| HP OmniBook 7 Aero 13-bg1077nr -1! | |
| Average of class Subnotebook | |
| Asus Zenbook A14 UX3704NA -1! | |
| MSI Prestige 13 AI+ A3MG -2! | |
| Samsung Galaxy Book5 Pro 14 940XHA -1! | |
| Microsoft Surface Laptop 7 13.8 Copilot+ -1! | |
| Microsoft Surface Laptop 8 13.8 -1! | |
| Average Qualcomm Snapdragon X2 Plus X2P-64-100 -1! | |
| AIDA64 / FP32 Ray-Trace | |
| HP OmniBook 7 Aero 13-bg1077nr (v6.92.6600) | |
| Average of class Subnotebook (2069 - 28231, n=55, last 2 years) | |
| Samsung Galaxy Book5 Pro 14 940XHA (v6.92.6600) | |
| MSI Prestige 13 AI+ A3MG (v8.20.8100) | |
| Asus Zenbook A14 UX3704NA (v8.20.8100) | |
| Microsoft Surface Laptop 7 13.8 Copilot+ (v6.92.6600) | |
| Microsoft Surface Laptop 8 13.8 (v8.20.8100) | |
| Average Qualcomm Snapdragon X2 Plus X2P-64-100 (n=1) | |
| AIDA64 / FPU Julia | |
| HP OmniBook 7 Aero 13-bg1077nr (v6.92.6600) | |
| Average of class Subnotebook (11041 - 114866, n=55, last 2 years) | |
| Samsung Galaxy Book5 Pro 14 940XHA (v6.92.6600) | |
| MSI Prestige 13 AI+ A3MG (v8.20.8100) | |
| Asus Zenbook A14 UX3704NA (v8.20.8100) | |
| Microsoft Surface Laptop 7 13.8 Copilot+ (v6.92.6600) | |
| Microsoft Surface Laptop 8 13.8 (v8.20.8100) | |
| Average Qualcomm Snapdragon X2 Plus X2P-64-100 (n=1) | |
| AIDA64 / CPU SHA3 | |
| Asus Zenbook A14 UX3704NA (v8.20.8100) | |
| HP OmniBook 7 Aero 13-bg1077nr (v6.92.6600) | |
| Average of class Subnotebook (561 - 4973, n=55, last 2 years) | |
| Microsoft Surface Laptop 7 13.8 Copilot+ (v6.92.6600) | |
| MSI Prestige 13 AI+ A3MG (v8.20.8100) | |
| Microsoft Surface Laptop 8 13.8 (v8.20.8100) | |
| Average Qualcomm Snapdragon X2 Plus X2P-64-100 (n=1) | |
| Samsung Galaxy Book5 Pro 14 940XHA (v6.92.6600) | |
| AIDA64 / CPU Queen | |
| HP OmniBook 7 Aero 13-bg1077nr (v6.92.6600) | |
| Microsoft Surface Laptop 7 13.8 Copilot+ (v6.92.6600) | |
| Average of class Subnotebook (44593 - 90515, n=39, last 2 years) | |
| Samsung Galaxy Book5 Pro 14 940XHA (v6.92.6600) | |
| AIDA64 / FPU SinJulia | |
| HP OmniBook 7 Aero 13-bg1077nr (v6.92.6600) | |
| Average of class Subnotebook (692 - 14208, n=55, last 2 years) | |
| MSI Prestige 13 AI+ A3MG (v8.20.8100) | |
| Samsung Galaxy Book5 Pro 14 940XHA (v6.92.6600) | |
| Asus Zenbook A14 UX3704NA (v8.20.8100) | |
| Microsoft Surface Laptop 7 13.8 Copilot+ (v6.92.6600) | |
| Microsoft Surface Laptop 8 13.8 (v8.20.8100) | |
| Average Qualcomm Snapdragon X2 Plus X2P-64-100 (n=1) | |
| AIDA64 / FPU Mandel | |
| HP OmniBook 7 Aero 13-bg1077nr (v6.92.6600) | |
| Average of class Subnotebook (5978 - 57729, n=55, last 2 years) | |
| Samsung Galaxy Book5 Pro 14 940XHA (v6.92.6600) | |
| MSI Prestige 13 AI+ A3MG (v8.20.8100) | |
| Asus Zenbook A14 UX3704NA (v8.20.8100) | |
| Microsoft Surface Laptop 7 13.8 Copilot+ (v6.92.6600) | |
| Microsoft Surface Laptop 8 13.8 (v8.20.8100) | |
| Average Qualcomm Snapdragon X2 Plus X2P-64-100 (n=1) | |
| AIDA64 / CPU AES | |
| Asus Zenbook A14 UX3704NA (v8.20.8100) | |
| HP OmniBook 7 Aero 13-bg1077nr (v6.92.6600) | |
| Microsoft Surface Laptop 7 13.8 Copilot+ (v6.92.6600) | |
| Microsoft Surface Laptop 8 13.8 (v8.20.8100) | |
| Average Qualcomm Snapdragon X2 Plus X2P-64-100 (n=1) | |
| Average of class Subnotebook (6815 - 96917, n=55, last 2 years) | |
| MSI Prestige 13 AI+ A3MG (v8.20.8100) | |
| Samsung Galaxy Book5 Pro 14 940XHA (v6.92.6600) | |
| AIDA64 / CPU ZLib | |
| Asus Zenbook A14 UX3704NA (v8.20.8100) | |
| Average of class Subnotebook (127.2 - 1217, n=55, last 2 years) | |
| Microsoft Surface Laptop 7 13.8 Copilot+ (v6.92.6600) | |
| MSI Prestige 13 AI+ A3MG (v8.20.8100) | |
| HP OmniBook 7 Aero 13-bg1077nr (v6.92.6600) | |
| Microsoft Surface Laptop 8 13.8 (v8.20.8100) | |
| Average Qualcomm Snapdragon X2 Plus X2P-64-100 (n=1) | |
| Samsung Galaxy Book5 Pro 14 940XHA (v6.92.6600) | |
| AIDA64 / FP64 Ray-Trace | |
| HP OmniBook 7 Aero 13-bg1077nr (v6.92.6600) | |
| Average of class Subnotebook (953 - 15342, n=55, last 2 years) | |
| Samsung Galaxy Book5 Pro 14 940XHA (v6.92.6600) | |
| Asus Zenbook A14 UX3704NA (v8.20.8100) | |
| MSI Prestige 13 AI+ A3MG (v8.20.8100) | |
| Microsoft Surface Laptop 7 13.8 Copilot+ (v6.92.6600) | |
| Microsoft Surface Laptop 8 13.8 (v8.20.8100) | |
| Average Qualcomm Snapdragon X2 Plus X2P-64-100 (n=1) | |
| AIDA64 / CPU PhotoWorxx | |
| MSI Prestige 13 AI+ A3MG (v8.20.8100) | |
| Asus Zenbook A14 UX3704NA (v8.20.8100) | |
| Samsung Galaxy Book5 Pro 14 940XHA (v6.92.6600) | |
| Average of class Subnotebook (10193 - 85600, n=55, last 2 years) | |
| HP OmniBook 7 Aero 13-bg1077nr (v6.92.6600) | |
| Microsoft Surface Laptop 7 13.8 Copilot+ (v6.92.6600) | |
| Microsoft Surface Laptop 8 13.8 (v8.20.8100) | |
| Average Qualcomm Snapdragon X2 Plus X2P-64-100 (n=1) | |
| AIDA64 / CPU CheckMate | |
| Average of class Subnotebook (471 - 5939, n=15, last 2 years) | |
| Asus Zenbook A14 UX3704NA (v8.20.8100) | |
| Microsoft Surface Laptop 8 13.8 (v8.20.8100) | |
| Average Qualcomm Snapdragon X2 Plus X2P-64-100 (n=1) | |
System and Storage Devices

System performance is very good and the Surface Laptop is a very responsive device. The compatibility with apps has been improved noticeably since the launch of the first generation of Snapdragon CPUs, but we would still recommend you check whether your favorite software is supported before you buy a Windows on ARM device.
Microsoft uses compact M.2-2230 SSDs (PCIe 4.0) for the Surface Laptop and the base model uses a 512 GB drive (421 GB free) and the drive from SK hynix offers good and stable transfer rates.
CrossMark: Overall | Productivity | Creativity | Responsiveness
WebXPRT 3: Overall
WebXPRT 4: Overall
Mozilla Kraken 1.1: Total
| Performance rating | |
| Apple MacBook Air 13 M5 | |
| Asus Zenbook A14 UX3704NA | |
| MSI Prestige 13 AI+ A3MG | |
| Microsoft Surface Laptop 8 13.8 | |
| Average Qualcomm Snapdragon X2 Plus X2P-64-100, Qualcomm SD X2 Adreno X2-45 | |
| Average of class Subnotebook | |
| Microsoft Surface Laptop 7 13.8 Copilot+ | |
| Samsung Galaxy Book5 Pro 14 940XHA | |
| HP OmniBook 7 Aero 13-bg1077nr | |
| CrossMark / Overall | |
| Apple MacBook Air 13 M5 | |
| MSI Prestige 13 AI+ A3MG | |
| Asus Zenbook A14 UX3704NA | |
| Average of class Subnotebook (1061 - 2356, n=57, last 2 years) | |
| Samsung Galaxy Book5 Pro 14 940XHA | |
| Microsoft Surface Laptop 8 13.8 | |
| Average Qualcomm Snapdragon X2 Plus X2P-64-100, Qualcomm SD X2 Adreno X2-45 (n=1) | |
| HP OmniBook 7 Aero 13-bg1077nr | |
| Microsoft Surface Laptop 7 13.8 Copilot+ | |
| CrossMark / Productivity | |
| Apple MacBook Air 13 M5 | |
| MSI Prestige 13 AI+ A3MG | |
| Asus Zenbook A14 UX3704NA | |
| Average of class Subnotebook (1022 - 2277, n=57, last 2 years) | |
| Samsung Galaxy Book5 Pro 14 940XHA | |
| Microsoft Surface Laptop 8 13.8 | |
| Average Qualcomm Snapdragon X2 Plus X2P-64-100, Qualcomm SD X2 Adreno X2-45 (n=1) | |
| Microsoft Surface Laptop 7 13.8 Copilot+ | |
| HP OmniBook 7 Aero 13-bg1077nr | |
| CrossMark / Creativity | |
| Apple MacBook Air 13 M5 | |
| MSI Prestige 13 AI+ A3MG | |
| Asus Zenbook A14 UX3704NA | |
| Average of class Subnotebook (1070 - 2743, n=57, last 2 years) | |
| Microsoft Surface Laptop 8 13.8 | |
| Average Qualcomm Snapdragon X2 Plus X2P-64-100, Qualcomm SD X2 Adreno X2-45 (n=1) | |
| Samsung Galaxy Book5 Pro 14 940XHA | |
| HP OmniBook 7 Aero 13-bg1077nr | |
| Microsoft Surface Laptop 7 13.8 Copilot+ | |
| CrossMark / Responsiveness | |
| Asus Zenbook A14 UX3704NA | |
| MSI Prestige 13 AI+ A3MG | |
| Apple MacBook Air 13 M5 | |
| Microsoft Surface Laptop 8 13.8 | |
| Average Qualcomm Snapdragon X2 Plus X2P-64-100, Qualcomm SD X2 Adreno X2-45 (n=1) | |
| Average of class Subnotebook (1010 - 1873, n=57, last 2 years) | |
| Samsung Galaxy Book5 Pro 14 940XHA | |
| Microsoft Surface Laptop 7 13.8 Copilot+ | |
| HP OmniBook 7 Aero 13-bg1077nr | |
| WebXPRT 3 / Overall | |
| Apple MacBook Air 13 M5 | |
| Asus Zenbook A14 UX3704NA | |
| Microsoft Surface Laptop 8 13.8 | |
| Average Qualcomm Snapdragon X2 Plus X2P-64-100, Qualcomm SD X2 Adreno X2-45 (n=1) | |
| Microsoft Surface Laptop 7 13.8 Copilot+ | |
| Average of class Subnotebook (203 - 530, n=55, last 2 years) | |
| MSI Prestige 13 AI+ A3MG | |
| Samsung Galaxy Book5 Pro 14 940XHA | |
| HP OmniBook 7 Aero 13-bg1077nr | |
| WebXPRT 4 / Overall | |
| Asus Zenbook A14 UX3704NA | |
| Apple MacBook Air 13 M5 | |
| Microsoft Surface Laptop 8 13.8 | |
| Average Qualcomm Snapdragon X2 Plus X2P-64-100, Qualcomm SD X2 Adreno X2-45 (n=1) | |
| Microsoft Surface Laptop 7 13.8 Copilot+ | |
| MSI Prestige 13 AI+ A3MG | |
| Average of class Subnotebook (167.3 - 378, n=59, last 2 years) | |
| HP OmniBook 7 Aero 13-bg1077nr | |
| Samsung Galaxy Book5 Pro 14 940XHA | |
| Mozilla Kraken 1.1 / Total | |
| HP OmniBook 7 Aero 13-bg1077nr | |
| Samsung Galaxy Book5 Pro 14 940XHA | |
| Average of class Subnotebook (234 - 709, n=60, last 2 years) | |
| MSI Prestige 13 AI+ A3MG | |
| Microsoft Surface Laptop 7 13.8 Copilot+ | |
| Average Qualcomm Snapdragon X2 Plus X2P-64-100, Qualcomm SD X2 Adreno X2-45 (n=1) | |
| Microsoft Surface Laptop 8 13.8 | |
| Asus Zenbook A14 UX3704NA | |
| Apple MacBook Air 13 M5 | |
* ... smaller is better
» No benchmarks for this notebook found!
| AIDA64 / Memory Copy | |
| MSI Prestige 13 AI+ A3MG | |
| Samsung Galaxy Book5 Pro 14 940XHA | |
| Average of class Subnotebook (15233 - 131023, n=55, last 2 years) | |
| HP OmniBook 7 Aero 13-bg1077nr | |
| Asus Zenbook A14 UX3704NA | |
| Microsoft Surface Laptop 7 13.8 Copilot+ | |
| Microsoft Surface Laptop 8 13.8 | |
| Average Qualcomm Snapdragon X2 Plus X2P-64-100 (n=1) | |
| AIDA64 / Memory Read | |
| Asus Zenbook A14 UX3704NA | |
| Microsoft Surface Laptop 7 13.8 Copilot+ | |
| Microsoft Surface Laptop 8 13.8 | |
| Average Qualcomm Snapdragon X2 Plus X2P-64-100 (n=1) | |
| MSI Prestige 13 AI+ A3MG | |
| Samsung Galaxy Book5 Pro 14 940XHA | |
| Average of class Subnotebook (13982 - 127174, n=55, last 2 years) | |
| HP OmniBook 7 Aero 13-bg1077nr | |
| AIDA64 / Memory Write | |
| Samsung Galaxy Book5 Pro 14 940XHA | |
| MSI Prestige 13 AI+ A3MG | |
| HP OmniBook 7 Aero 13-bg1077nr | |
| Average of class Subnotebook (17404 - 135141, n=55, last 2 years) | |
| Asus Zenbook A14 UX3704NA | |
| Microsoft Surface Laptop 7 13.8 Copilot+ | |
| Microsoft Surface Laptop 8 13.8 | |
| Average Qualcomm Snapdragon X2 Plus X2P-64-100 (n=1) | |
| AIDA64 / Memory Latency | |
| MSI Prestige 13 AI+ A3MG | |
| HP OmniBook 7 Aero 13-bg1077nr | |
| Average of class Subnotebook (6.1 - 317, n=53, last 2 years) | |
| Samsung Galaxy Book5 Pro 14 940XHA | |
| Microsoft Surface Laptop 7 13.8 Copilot+ | |
| Microsoft Surface Laptop 8 13.8 | |
| Average Qualcomm Snapdragon X2 Plus X2P-64-100 (n=1) | |
* ... smaller is better

* ... smaller is better
Disk Throttling: DiskSpd Read Loop, Queue Depth 8
GPU and Gaming Performance
The Snapdragon X2 Plus features the Adreno X2-45 GPU with a maximum clock of 1.7 GHz. This is interesting, because the GPU performance is not only much better compared to the old Adreno X1-45, but it is actually pretty close to the Adreno X2-85 clocked at 1.35 GHz in the new Surface Pro OLED. It is also a bit faster than the Panther Lake Intel Graphics with 4 Xe cores. Gaming is also possible and we did not experience any compatibility issues.
| 3DMark 06 Standard Score | 23244 points | |
| 3DMark Vantage P Result | 31418 points | |
| 3DMark 11 Performance | 8099 points | |
| 3DMark Fire Strike Score | 6284 points | |
| 3DMark Time Spy Score | 2538 points | |
| 3DMark Steel Nomad Score | 622 points | |
| 3DMark Steel Nomad Light Score | 2935 points | |
Help | ||
| Blender / v3.3 Classroom METAL | |
| Average of class Subnotebook (76.3 - 227, n=5, last 2 years) | |
| Apple MacBook Air 13 M5 | |
| Blender / v3.3 Classroom CPU | |
| Microsoft Surface Laptop 8 13.8 | |
| Average Qualcomm SD X2 Adreno X2-45 (n=1) | |
| Microsoft Surface Laptop 7 13.8 Copilot+ | |
| Samsung Galaxy Book5 Pro 14 940XHA | |
| Average of class Subnotebook (280 - 1117, n=60, last 2 years) | |
| MSI Prestige 13 AI+ A3MG | |
| Asus Zenbook A14 UX3704NA | |
| HP OmniBook 7 Aero 13-bg1077nr | |
| Apple MacBook Air 13 M5 | |
* ... smaller is better
| Final Fantasy XV Benchmark - 1920x1080 High Quality | |
| Asus Zenbook A14 UX3704NA | |
| Samsung Galaxy Book5 Pro 14 940XHA | |
| Average of class Subnotebook (8.37 - 54.5, n=50, last 2 years) | |
| HP OmniBook 7 Aero 13-bg1077nr | |
| Microsoft Surface Laptop 8 13.8 | |
| Microsoft Surface Laptop 7 13.8 Copilot+ | |
Cyberpunk 2077 ultra FPS Chart
| low | med. | high | ultra | |
|---|---|---|---|---|
| GTA V (2015) | 138.3 | 126.3 | 57.9 | 23 |
| Dota 2 Reborn (2015) | 91.3 | 75.4 | 67.6 | 60.7 |
| Final Fantasy XV Benchmark (2018) | 71.9 | 37.2 | 21.1 | |
| X-Plane 11.11 (2018) | 49.2 | 43 | 38.8 | |
| Strange Brigade (2018) | 174.6 | 63.1 | 52.9 | 44 |
| Baldur's Gate 3 (2023) | 34.2 | 25 | 21.6 | 21.4 |
| Cyberpunk 2077 (2023) | 34.9 | 27.5 | 22.3 | 19.1 |
Emissions & Power Consumption
System Noise

The Surface Laptop is a very quiet device and the single fan is usually turned off during light workloads or short peak load scenarios. Gaming or high CPU loads will result in 37-42 dB(A), which is audible, but not too distracting. Still, considering the low TDP and the height of the chassis, the fan noise is on the loud side. The other two power modes stay a bit quieter udner load (Balanced: 38.6 dB(A), Best power efficiency: 36.2 dB(A)). We did not notice any other electronic noises.
Noise level
| Idle |
| 25.1 / 25.1 / 25.1 dB(A) |
| Load |
| 25.1 / 42.4 dB(A) |
 | ||
30 dB silent 40 dB(A) audible 50 dB(A) loud |
||
min:  , med: , med:  , max: , max:  Earthworks M23R, Arta (15 cm distance) environment noise: 25.1 dB(A) Earthworks M23R, Arta (15 cm distance) environment noise: 25.1 dB(A) | ||
| Microsoft Surface Laptop 8 13.8 SD X2 Plus X2P-64-100, Adreno X2-45 | Microsoft Surface Laptop 7 13.8 Copilot+ SD X Elite X1E-80-100, Adreno X1-85 3.8 TFLOPS | Apple MacBook Air 13 M5 M5 10-Core, M5 8-Core GPU | MSI Prestige 13 AI+ A3MG Ultra 9 386H, Intel Graphics 4 Xe3 PTL | HP OmniBook 7 Aero 13-bg1077nr Ryzen AI 7 350, Radeon 860M | Asus Zenbook A14 UX3704NA X2E-88-100, X2-90 | Samsung Galaxy Book5 Pro 14 940XHA Core Ultra 5 226V, Arc 130V | |
|---|---|---|---|---|---|---|---|
| Noise | 5% | -8% | 10% | -12% | 0% | ||
| off / environment * (dB) | 25.1 | 23.8 5% | 25 -0% | 23.2 8% | 24.2 4% | 25.1 -0% | |
| Idle Minimum * (dB) | 25.1 | 23.8 5% | 26 -4% | 23.3 7% | 24.2 4% | 25.1 -0% | |
| Idle Average * (dB) | 25.1 | 23.8 5% | 27 -8% | 23.3 7% | 24.2 4% | 25.1 -0% | |
| Idle Maximum * (dB) | 25.1 | 23.8 5% | 28 -12% | 23.3 7% | 24.2 4% | 25.1 -0% | |
| Load Average * (dB) | 25.1 | 26 -4% | 31 -24% | 24.7 2% | 41.3 -65% | 29.3 -17% | |
| Cyberpunk 2077 ultra * (dB) | 37.4 | 31.5 16% | 41 -10% | 23.5 37% | 41.3 -10% | 33.1 11% | |
| Load Maximum * (dB) | 42.4 | 40.3 5% | 42 1% | 42 1% | 51.7 -22% | 38.7 9% |
* ... smaller is better
Temperature
The surface temperatures are no problem and we only measure more than 40 °C in extreme load scenarios or while gaming. You can still use it on your lap and also type without any limitations. During the stress test, the SoC consumes up to 46 Watts, but quickly drops to 17-18 Watts.

(±) The maximum temperature on the upper side is 44.4 °C / 112 F, compared to the average of 35.9 °C / 97 F, ranging from 21.4 to 59 °C for the class Subnotebook.
(±) The bottom heats up to a maximum of 42.5 °C / 109 F, compared to the average of 39.2 °C / 103 F
(+) In idle usage, the average temperature for the upper side is 25.6 °C / 78 F, compared to the device average of 30.8 °C / 87 F.
(-) 3: The average temperature for the upper side is 39.5 °C / 103 F, compared to the average of 30.8 °C / 87 F for the class Subnotebook.
(+) The palmrests and touchpad are reaching skin temperature as a maximum (35 °C / 95 F) and are therefore not hot.
(-) The average temperature of the palmrest area of similar devices was 28.2 °C / 82.8 F (-6.8 °C / -12.2 F).


| Microsoft Surface Laptop 8 13.8 SD X2 Plus X2P-64-100, Adreno X2-45 | Microsoft Surface Laptop 7 13.8 Copilot+ SD X Elite X1E-80-100, Adreno X1-85 3.8 TFLOPS | Apple MacBook Air 13 M5 M5 10-Core, M5 8-Core GPU | MSI Prestige 13 AI+ A3MG Ultra 9 386H, Intel Graphics 4 Xe3 PTL | HP OmniBook 7 Aero 13-bg1077nr Ryzen AI 7 350, Radeon 860M | Asus Zenbook A14 UX3704NA X2E-88-100, X2-90 | Samsung Galaxy Book5 Pro 14 940XHA Core Ultra 5 226V, Arc 130V | |
|---|---|---|---|---|---|---|---|
| Heat | 0% | 4% | 5% | 12% | 3% | 2% | |
| Maximum Upper Side * (°C) | 44.4 | 47.1 -6% | 44.1 1% | 42 5% | 35.8 19% | 40.9 8% | 41.4 7% |
| Maximum Bottom * (°C) | 42.5 | 44.6 -5% | 42.4 -0% | 41 4% | 37.6 12% | 47.2 -11% | 44.6 -5% |
| Idle Upper Side * (°C) | 25.9 | 24.7 5% | 23.7 8% | 24.2 7% | 24.5 5% | 24.9 4% | |
| Idle Bottom * (°C) | 26 | 24.5 6% | 23.8 8% | 24 8% | 24 8% | 25.5 2% |
* ... smaller is better
Speakers
The sound system did not change and still offers good sound quality.
Microsoft Surface Laptop 8 13.8 audio analysis
(+) | speakers can play relatively loud (83.3 dB)
Bass 100 - 315 Hz
(±) | reduced bass - on average 11.9% lower than median
(±) | linearity of bass is average (10.8% delta to prev. frequency)
Mids 400 - 2000 Hz
(+) | balanced mids - only 3.9% away from median
(+) | mids are linear (4.4% delta to prev. frequency)
Highs 2 - 16 kHz
(+) | balanced highs - only 2.5% away from median
(+) | highs are linear (3.1% delta to prev. frequency)
Overall 100 - 16.000 Hz
(+) | overall sound is linear (12% difference to median)
Compared to same class
» 15% of all tested devices in this class were better, 5% similar, 81% worse
» The best had a delta of 5%, average was 18%, worst was 53%
Compared to all devices tested
» 9% of all tested devices were better, 2% similar, 88% worse
» The best had a delta of 4%, average was 23%, worst was 136%
Microsoft Surface Laptop 7 13.8 Copilot+ audio analysis
(±) | speaker loudness is average but good (81.8 dB)
Bass 100 - 315 Hz
(±) | reduced bass - on average 12.7% lower than median
(±) | linearity of bass is average (9.8% delta to prev. frequency)
Mids 400 - 2000 Hz
(+) | balanced mids - only 4.1% away from median
(+) | mids are linear (2.4% delta to prev. frequency)
Highs 2 - 16 kHz
(+) | balanced highs - only 2.1% away from median
(+) | highs are linear (2.5% delta to prev. frequency)
Overall 100 - 16.000 Hz
(+) | overall sound is linear (12.1% difference to median)
Compared to same class
» 15% of all tested devices in this class were better, 5% similar, 80% worse
» The best had a delta of 5%, average was 18%, worst was 53%
Compared to all devices tested
» 10% of all tested devices were better, 2% similar, 88% worse
» The best had a delta of 4%, average was 23%, worst was 136%
Apple MacBook Air 13 M5 audio analysis
(+) | speakers can play relatively loud (82.1 dB)
Bass 100 - 315 Hz
(±) | reduced bass - on average 10.5% lower than median
(±) | linearity of bass is average (10.2% delta to prev. frequency)
Mids 400 - 2000 Hz
(+) | balanced mids - only 2% away from median
(+) | mids are linear (2.7% delta to prev. frequency)
Highs 2 - 16 kHz
(±) | higher highs - on average 5.1% higher than median
(+) | highs are linear (3% delta to prev. frequency)
Overall 100 - 16.000 Hz
(+) | overall sound is linear (11.7% difference to median)
Compared to same class
» 14% of all tested devices in this class were better, 3% similar, 83% worse
» The best had a delta of 5%, average was 18%, worst was 53%
Compared to all devices tested
» 8% of all tested devices were better, 3% similar, 89% worse
» The best had a delta of 4%, average was 23%, worst was 136%
MSI Prestige 13 AI+ A3MG audio analysis
(±) | speaker loudness is average but good (79 dB)
Bass 100 - 315 Hz
(±) | reduced bass - on average 14.9% lower than median
(±) | linearity of bass is average (13.9% delta to prev. frequency)
Mids 400 - 2000 Hz
(±) | higher mids - on average 7.1% higher than median
(+) | mids are linear (6% delta to prev. frequency)
Highs 2 - 16 kHz
(±) | higher highs - on average 5.1% higher than median
(+) | highs are linear (6.2% delta to prev. frequency)
Overall 100 - 16.000 Hz
(±) | linearity of overall sound is average (19.8% difference to median)
Compared to same class
» 63% of all tested devices in this class were better, 7% similar, 31% worse
» The best had a delta of 5%, average was 18%, worst was 53%
Compared to all devices tested
» 51% of all tested devices were better, 7% similar, 42% worse
» The best had a delta of 4%, average was 23%, worst was 136%
HP OmniBook 7 Aero 13-bg1077nr audio analysis
(+) | speakers can play relatively loud (82.3 dB)
Bass 100 - 315 Hz
(-) | nearly no bass - on average 15.9% lower than median
(±) | linearity of bass is average (10.5% delta to prev. frequency)
Mids 400 - 2000 Hz
(±) | higher mids - on average 5.8% higher than median
(+) | mids are linear (6.4% delta to prev. frequency)
Highs 2 - 16 kHz
(+) | balanced highs - only 3% away from median
(±) | linearity of highs is average (7% delta to prev. frequency)
Overall 100 - 16.000 Hz
(±) | linearity of overall sound is average (15.7% difference to median)
Compared to same class
» 38% of all tested devices in this class were better, 5% similar, 57% worse
» The best had a delta of 5%, average was 18%, worst was 53%
Compared to all devices tested
» 24% of all tested devices were better, 5% similar, 71% worse
» The best had a delta of 4%, average was 23%, worst was 136%
Asus Zenbook A14 UX3704NA audio analysis
(+) | speakers can play relatively loud (84.5 dB)
Bass 100 - 315 Hz
(±) | reduced bass - on average 14.8% lower than median
(±) | linearity of bass is average (9.1% delta to prev. frequency)
Mids 400 - 2000 Hz
(+) | balanced mids - only 2.9% away from median
(+) | mids are linear (4.7% delta to prev. frequency)
Highs 2 - 16 kHz
(+) | balanced highs - only 3.2% away from median
(+) | highs are linear (3.9% delta to prev. frequency)
Overall 100 - 16.000 Hz
(+) | overall sound is linear (12.2% difference to median)
Compared to same class
» 16% of all tested devices in this class were better, 5% similar, 80% worse
» The best had a delta of 5%, average was 18%, worst was 53%
Compared to all devices tested
» 10% of all tested devices were better, 3% similar, 87% worse
» The best had a delta of 4%, average was 23%, worst was 136%
Samsung Galaxy Book5 Pro 14 940XHA audio analysis
(±) | speaker loudness is average but good (80.7 dB)
Bass 100 - 315 Hz
(±) | reduced bass - on average 14.6% lower than median
(±) | linearity of bass is average (11.5% delta to prev. frequency)
Mids 400 - 2000 Hz
(±) | higher mids - on average 6.5% higher than median
(+) | mids are linear (4% delta to prev. frequency)
Highs 2 - 16 kHz
(+) | balanced highs - only 2.8% away from median
(+) | highs are linear (5.5% delta to prev. frequency)
Overall 100 - 16.000 Hz
(±) | linearity of overall sound is average (15.8% difference to median)
Compared to same class
» 38% of all tested devices in this class were better, 6% similar, 56% worse
» The best had a delta of 5%, average was 18%, worst was 53%
Compared to all devices tested
» 25% of all tested devices were better, 5% similar, 70% worse
» The best had a delta of 4%, average was 23%, worst was 136%
Power Consumption and Battery Life

The idle consumption is almost identical to the previous generation and we can measure up to 61 Watts during the stress test, which eventually levels off at around 40 Watts. A 65W power adapter is therefore sufficient (EU models are shipped without a PSU). The battery runtime was still improved, because we determined almost 19 hours in our Wi-Fi test at 150 nits (~4.5 hours more than before) and slightly more than 8.5 hours at full brightness, so it even beats the MacBook Air 13 M5.
| Off / Standby | 0.16 / 0.43 Watt |
| Idle | 1.7 / 6.8 / 7.5 Watt |
| Load |
28 / 61.3 Watt |
   
| |
Key:
min: ,
med: ,
max: Metrahit Energy | |
| Microsoft Surface Laptop 8 13.8 Adreno X2-45, SD X2 Plus X2P-64-100, SK hynix PVC10 HFS512GEM4X182N | Microsoft Surface Laptop 7 13.8 Copilot+ Adreno X1-85 3.8 TFLOPS, SD X Elite X1E-80-100, Samsung MZ9L4512HBLU-00BMV | Apple MacBook Air 13 M5 M5 8-Core GPU, M5 10-Core, Apple SSD AP0512Z | MSI Prestige 13 AI+ A3MG Intel Graphics 4 Xe3 PTL, Ultra 9 386H, Micron 2500 1TB MTFDKBA1T0QGN | HP OmniBook 7 Aero 13-bg1077nr Radeon 860M, Ryzen AI 7 350, SK hynix PC801 HFS001TEJ9X101N | Asus Zenbook A14 UX3704NA X2-90, X2E-88-100, Micron 2600 1TB MTFDKBA1T0QHK | Samsung Galaxy Book5 Pro 14 940XHA Arc 130V, Core Ultra 5 226V, Samsung PM9C1 MZVL8512HELU | |
|---|---|---|---|---|---|---|---|
| Power Consumption | 10% | 12% | -17% | -30% | -49% | -14% | |
| Idle Minimum * (Watt) | 1.7 | 1.4 18% | 1.8 -6% | 3.5 -106% | 3.2 -88% | 4.7 -176% | 3.7 -118% |
| Idle Average * (Watt) | 6.8 | 6.3 7% | 9.3 -37% | 4 41% | 6.8 -0% | 7.1 -4% | 5.2 24% |
| Idle Maximum * (Watt) | 7.5 | 7.6 -1% | 9.4 -25% | 6.4 15% | 7 7% | 7.4 1% | 5.4 28% |
| Load Average * (Watt) | 28 | 26.9 4% | 29.4 -5% | 44 -57% | 50.3 -80% | 39.6 -41% | 26.2 6% |
| Cyberpunk 2077 ultra external monitor * (Watt) | 38.1 | 17.7 54% | 41.6 -9% | 31.4 18% | 42.7 -12% | ||
| Cyberpunk 2077 ultra * (Watt) | 37.9 | 38.5 -2% | 18.9 50% | 41 -8% | 52.8 -39% | 65.3 -72% | 47.4 -25% |
| Load Maximum * (Watt) | 61.3 | 40.7 34% | 30.4 50% | 54 12% | 59.9 2% | 101.8 -66% | 63.5 -4% |
* ... smaller is better
Power Consumption Cyberpunk / Stress Test
Power Consumption external Monitor
Battery Life
Notebookcheck Rating
Microsoft Surface Laptop 8 13.8
- 07/08/2026 v8
Andreas Osthoff
 Total Sustainability Score:
 Potential Competitors in Comparison
Image | Model / Review | Price | Weight | Height | Display |
|---|---|---|---|---|---|
1. 88.4% 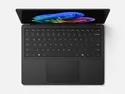 | Microsoft Surface Laptop 8 13.8 Qualcomm Snapdragon X2 Plus X2P-64-100 ⎘ Qualcomm SD X2 Adreno X2-45 ⎘ 16 GB Memory, 512 GB SSD | List Price: 1699€ | 1.3 kg | 17.5 mm | 13.80" 2304x1536 201 PPI IPS |
2. 86.2% 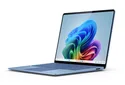 | Microsoft Surface Laptop 7 13.8 Copilot+ Qualcomm Snapdragon X Elite X1E-80-100 ⎘ Qualcomm SD X Adreno X1-85 3.8 TFLOPS ⎘ 16 GB Memory, 512 GB SSD | List Price: 1649€ | 1.3 kg | 17.5 mm | 13.80" 2304x1536 201 PPI IPS |
3. 91.6%  | Apple MacBook Air 13 M5 Apple M5 10-Core ⎘ Apple M5 8-Core GPU ⎘ 16 GB Memory, 512 GB SSD | List Price: 1199€ | 1.2 kg | 11.3 mm | 13.60" 2560x1664 225 PPI IPS |
4. 84%  | MSI Prestige 13 AI+ A3MG Intel Core Ultra 9 386H ⎘ Intel Graphics 4 Xe3 Panther Lake iGPU ⎘ 32 GB Memory, 1024 GB SSD | List Price: 1600 EUR | 888 g | 15.9 mm | 13.30" 2880x1800 255 PPI OLED |
5. 86.9% 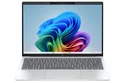 | HP OmniBook 7 Aero 13-bg1077nr AMD Ryzen AI 7 350 ⎘ AMD Radeon 860M ⎘ 32 GB Memory, 1024 GB SSD | List Price: 1250 USD | 1 kg | 17.6 mm | 13.30" 1920x1200 170 PPI IPS |
6. 87.5%  | Asus Zenbook A14 UX3704NA Qualcomm Snapdragon X2 Elite X2E-88-100 ⎘ Qualcomm Adreno X2-90 ⎘ 32 GB Memory, 1024 GB SSD | Amazon: 1. $869.99 ASUS Zenbook A14 Copilot+ PC... 2. $769.00 iCarp ASUS Zenbook AI-Powere... 3. $988.00 ASUS Zenbook A14 14" FHD+ OL... | 992 g | 15.9 mm | 14.00" 1920x1200 162 PPI OLED |
7. 86.9% 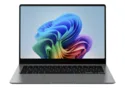 | Samsung Galaxy Book5 Pro 14 940XHA Intel Core Ultra 5 226V ⎘ Intel Arc Graphics 130V ⎘ 16 GB Memory, 512 GB SSD | List Price: 1699€ | 1.2 kg | 11.6 mm | 14.00" 2880x1800 243 PPI OLED |
Transparency
The selection of devices to be reviewed is made by our editorial team. The test sample was freely purchased by the author at his/her own expense. The lender had no influence on this review, nor did the manufacturer receive a copy of this review before publication. There was no obligation to publish this review. As an independent media company, Notebookcheck is not subjected to the authority of manufacturers, retailers or publishers.
This is how Notebookcheck is testing
Every year, Notebookcheck independently reviews hundreds of laptops and smartphones using standardized procedures to ensure that all results are comparable. We have continuously developed our test methods for around 20 years and set industry standards in the process. In our test labs, high-quality measuring equipment is utilized by experienced technicians and editors. These tests involve a multi-stage validation process. Our complex rating system is based on hundreds of well-founded measurements and benchmarks, which maintains objectivity. Further information on our test methods can be found here.
 Add as a preferred source on Google


