
Visually, the Geekom AX8 Pro is certainly an eye-catcher. Geekom draws on its own portfolio and installs an AMD Ryzen 9 8945HS. The AMD SoC should bring a significant increase in performance in terms of 3D performance, as Geekom has not yet used Meteor Lake processors. In the top configuration, 32 GB DDR5 RAM and a 2 TB SSD are installed. We have already seen several times in the past that Geekom does not necessarily market inexpensive devices. This is also the case with the Geekom AX8 Pro, which costs 999 euros in the best configuration. This is already an offer, as the manufacturer's RRP is 1,099 euros - a proud price that Geekom is charging for this device. At 879 euros, the Geekom AX8 Pro with AMD Ryzen 7 8845HS, 32 GB RAM, and 1 TB SSD is slightly cheaper, but still no bargain.
Geekom itself is probably its biggest competitor, as there are often attractive offers among slightly older devices that are technically on par with the Geekom AX8 Pro. The Geekom AX8 Pro also has to prove itself against devices from other manufacturers in this review.
Possible competitors in comparison
Rating | Version | Date | Model | Weight | Height | Price |
|---|---|---|---|---|---|---|
| 78.4 % | v8 | 08 / 2024 | Geekom AX8 Pro R9 8945HS, Radeon 780M | 548 g | 37 mm | |
| 80.8 % | v8 | 06 / 2024 | Aoostar GEM12 R7 8845HS, Radeon 780M | 653 g | 60 mm | |
| 78 % | v8 | 07 / 2024 | Geekom AE7 R9 7940HS, Radeon 780M | 578 g | 49.2 mm | |
| 72.8 % | v8 | 08 / 2024 | Geekom XT13 Pro i9-13900H, Iris Xe G7 96EUs | 555 g | 37 mm | |
| 87.5 % v7 (old) | v7 (old) | 05 / 2024 | Minisforum AtomMan X7 Ti Ultra 9 185H, Arc 8-Core | 863 g | 48.6 mm | |
| 83.4 % v7 (old) | v7 (old) | 04 / 2024 | Acemagic F2A Ultra 7 155H, Arc 8-Core | 768 g | 57 mm |
Note: We have updated our rating system and the results of version 8 are not comparable with the results of version 7 available here.


Case - Sturdy chassis with new color top processing
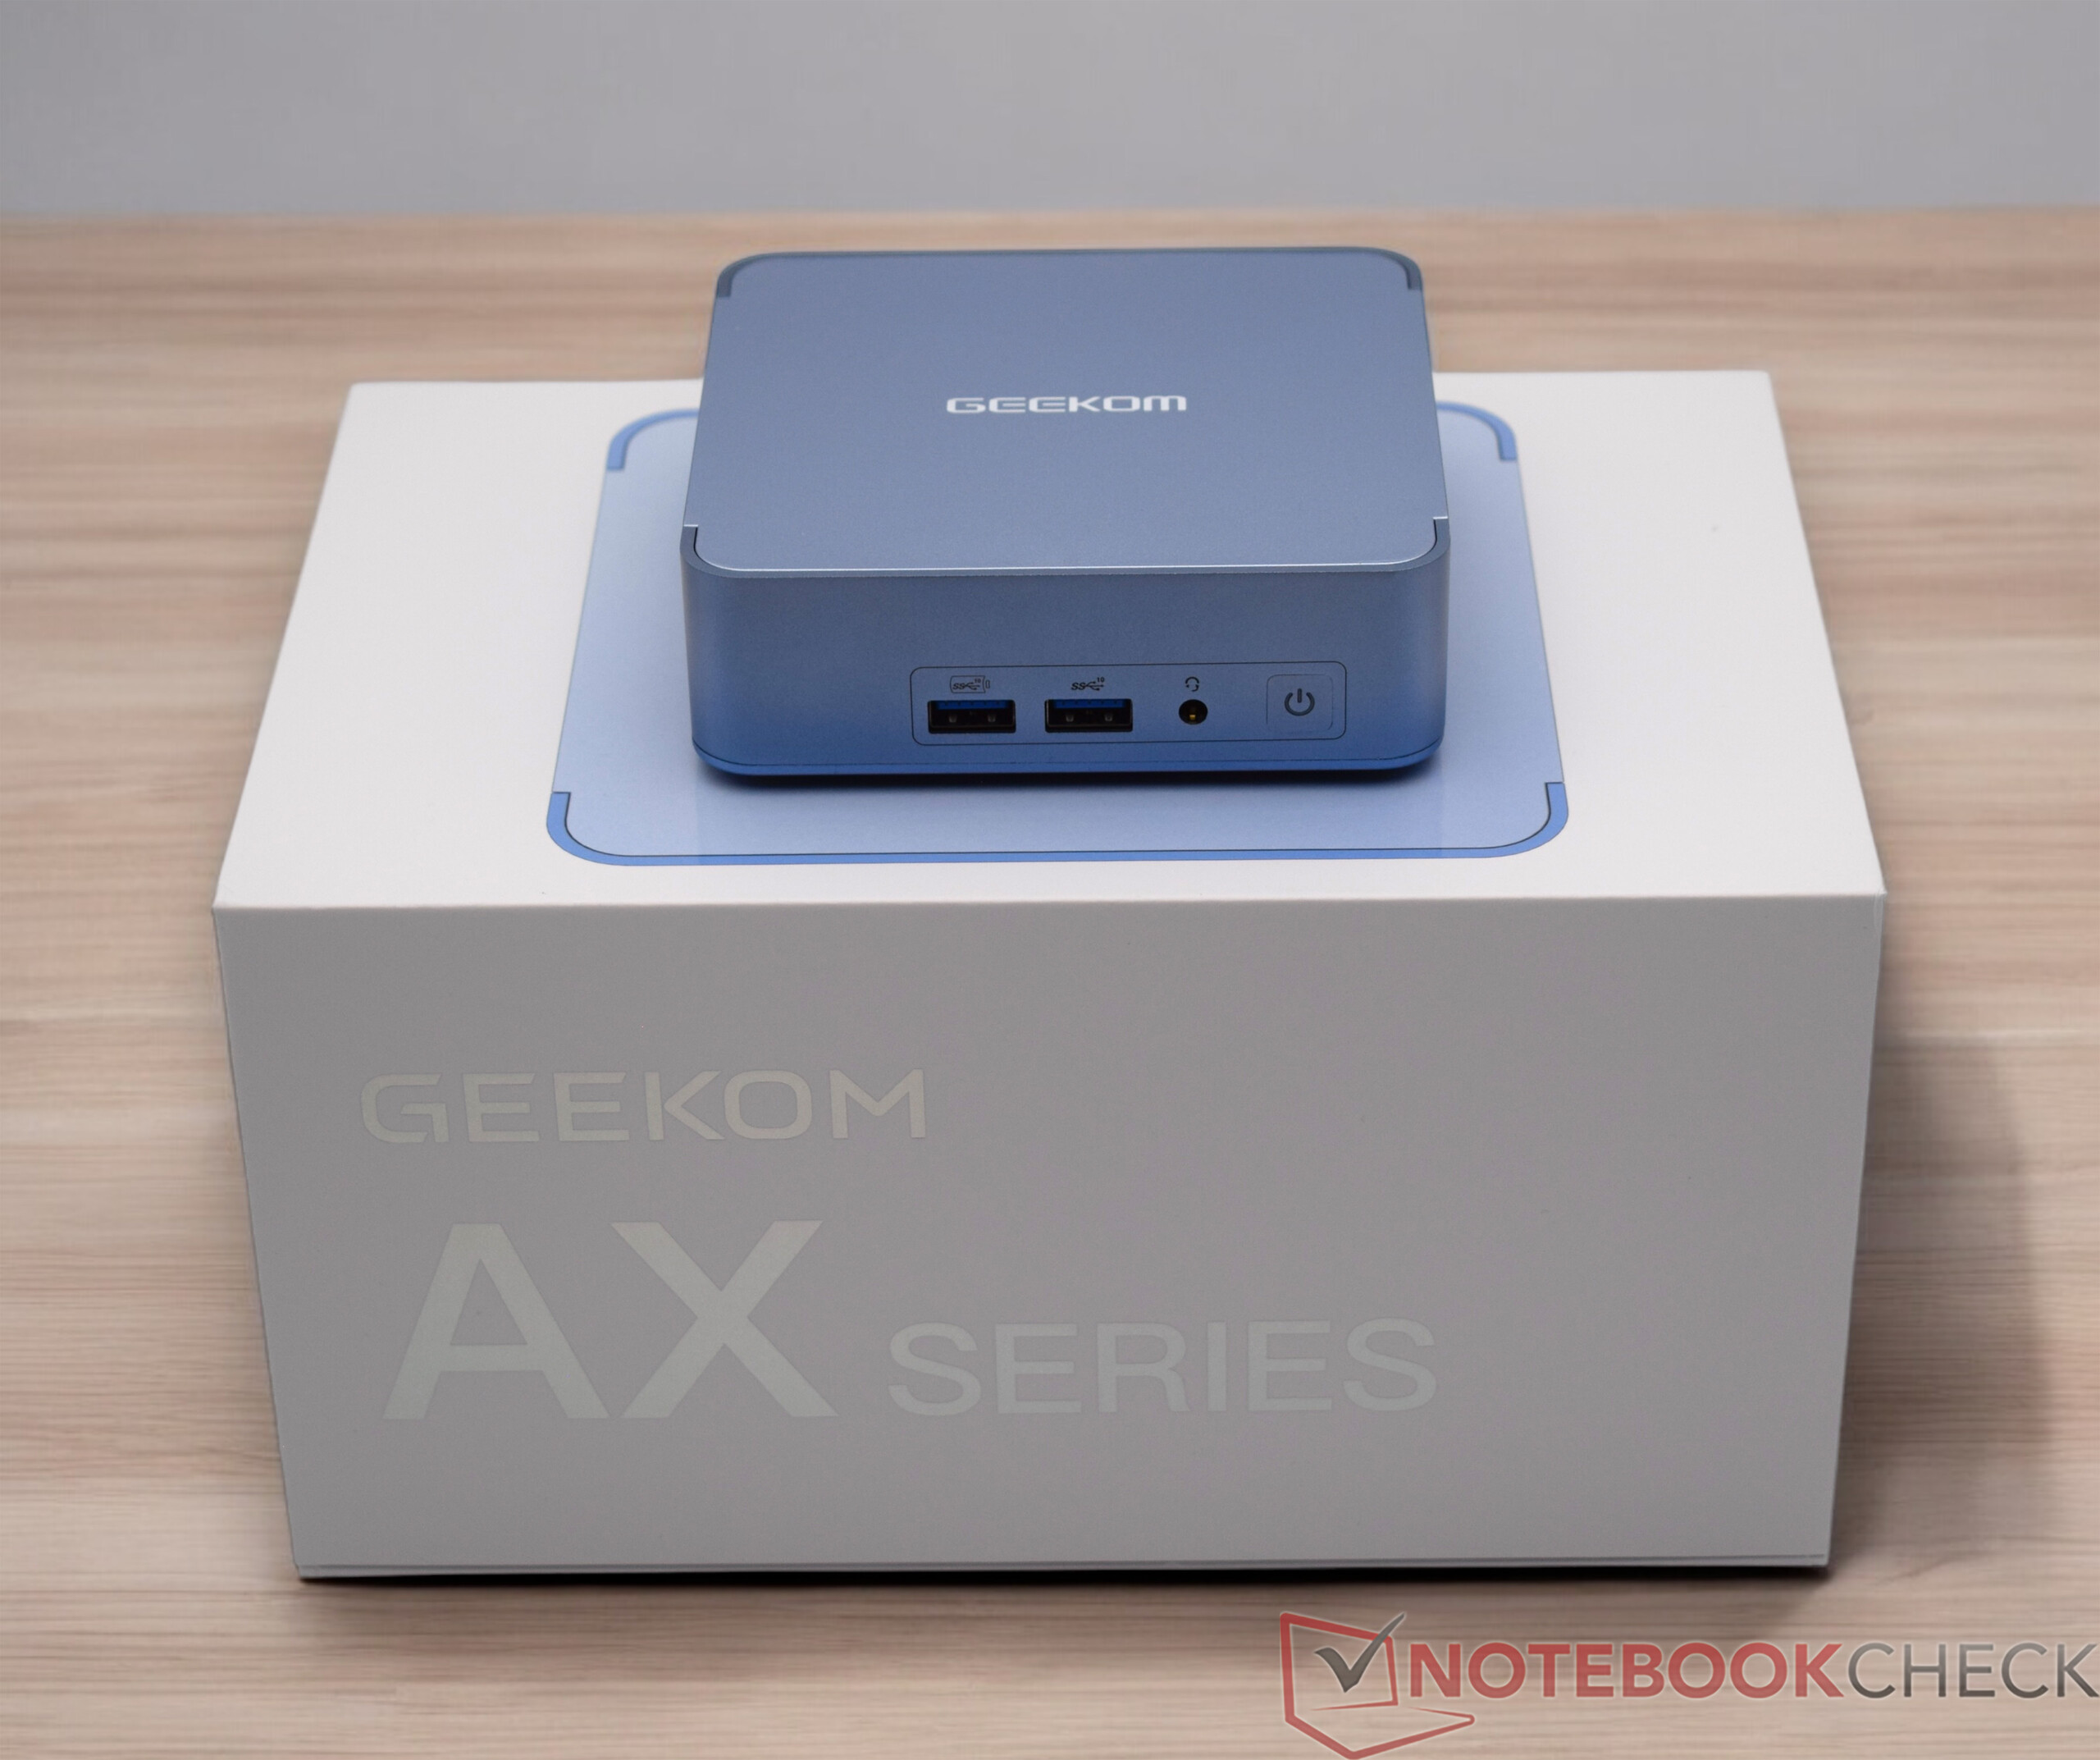
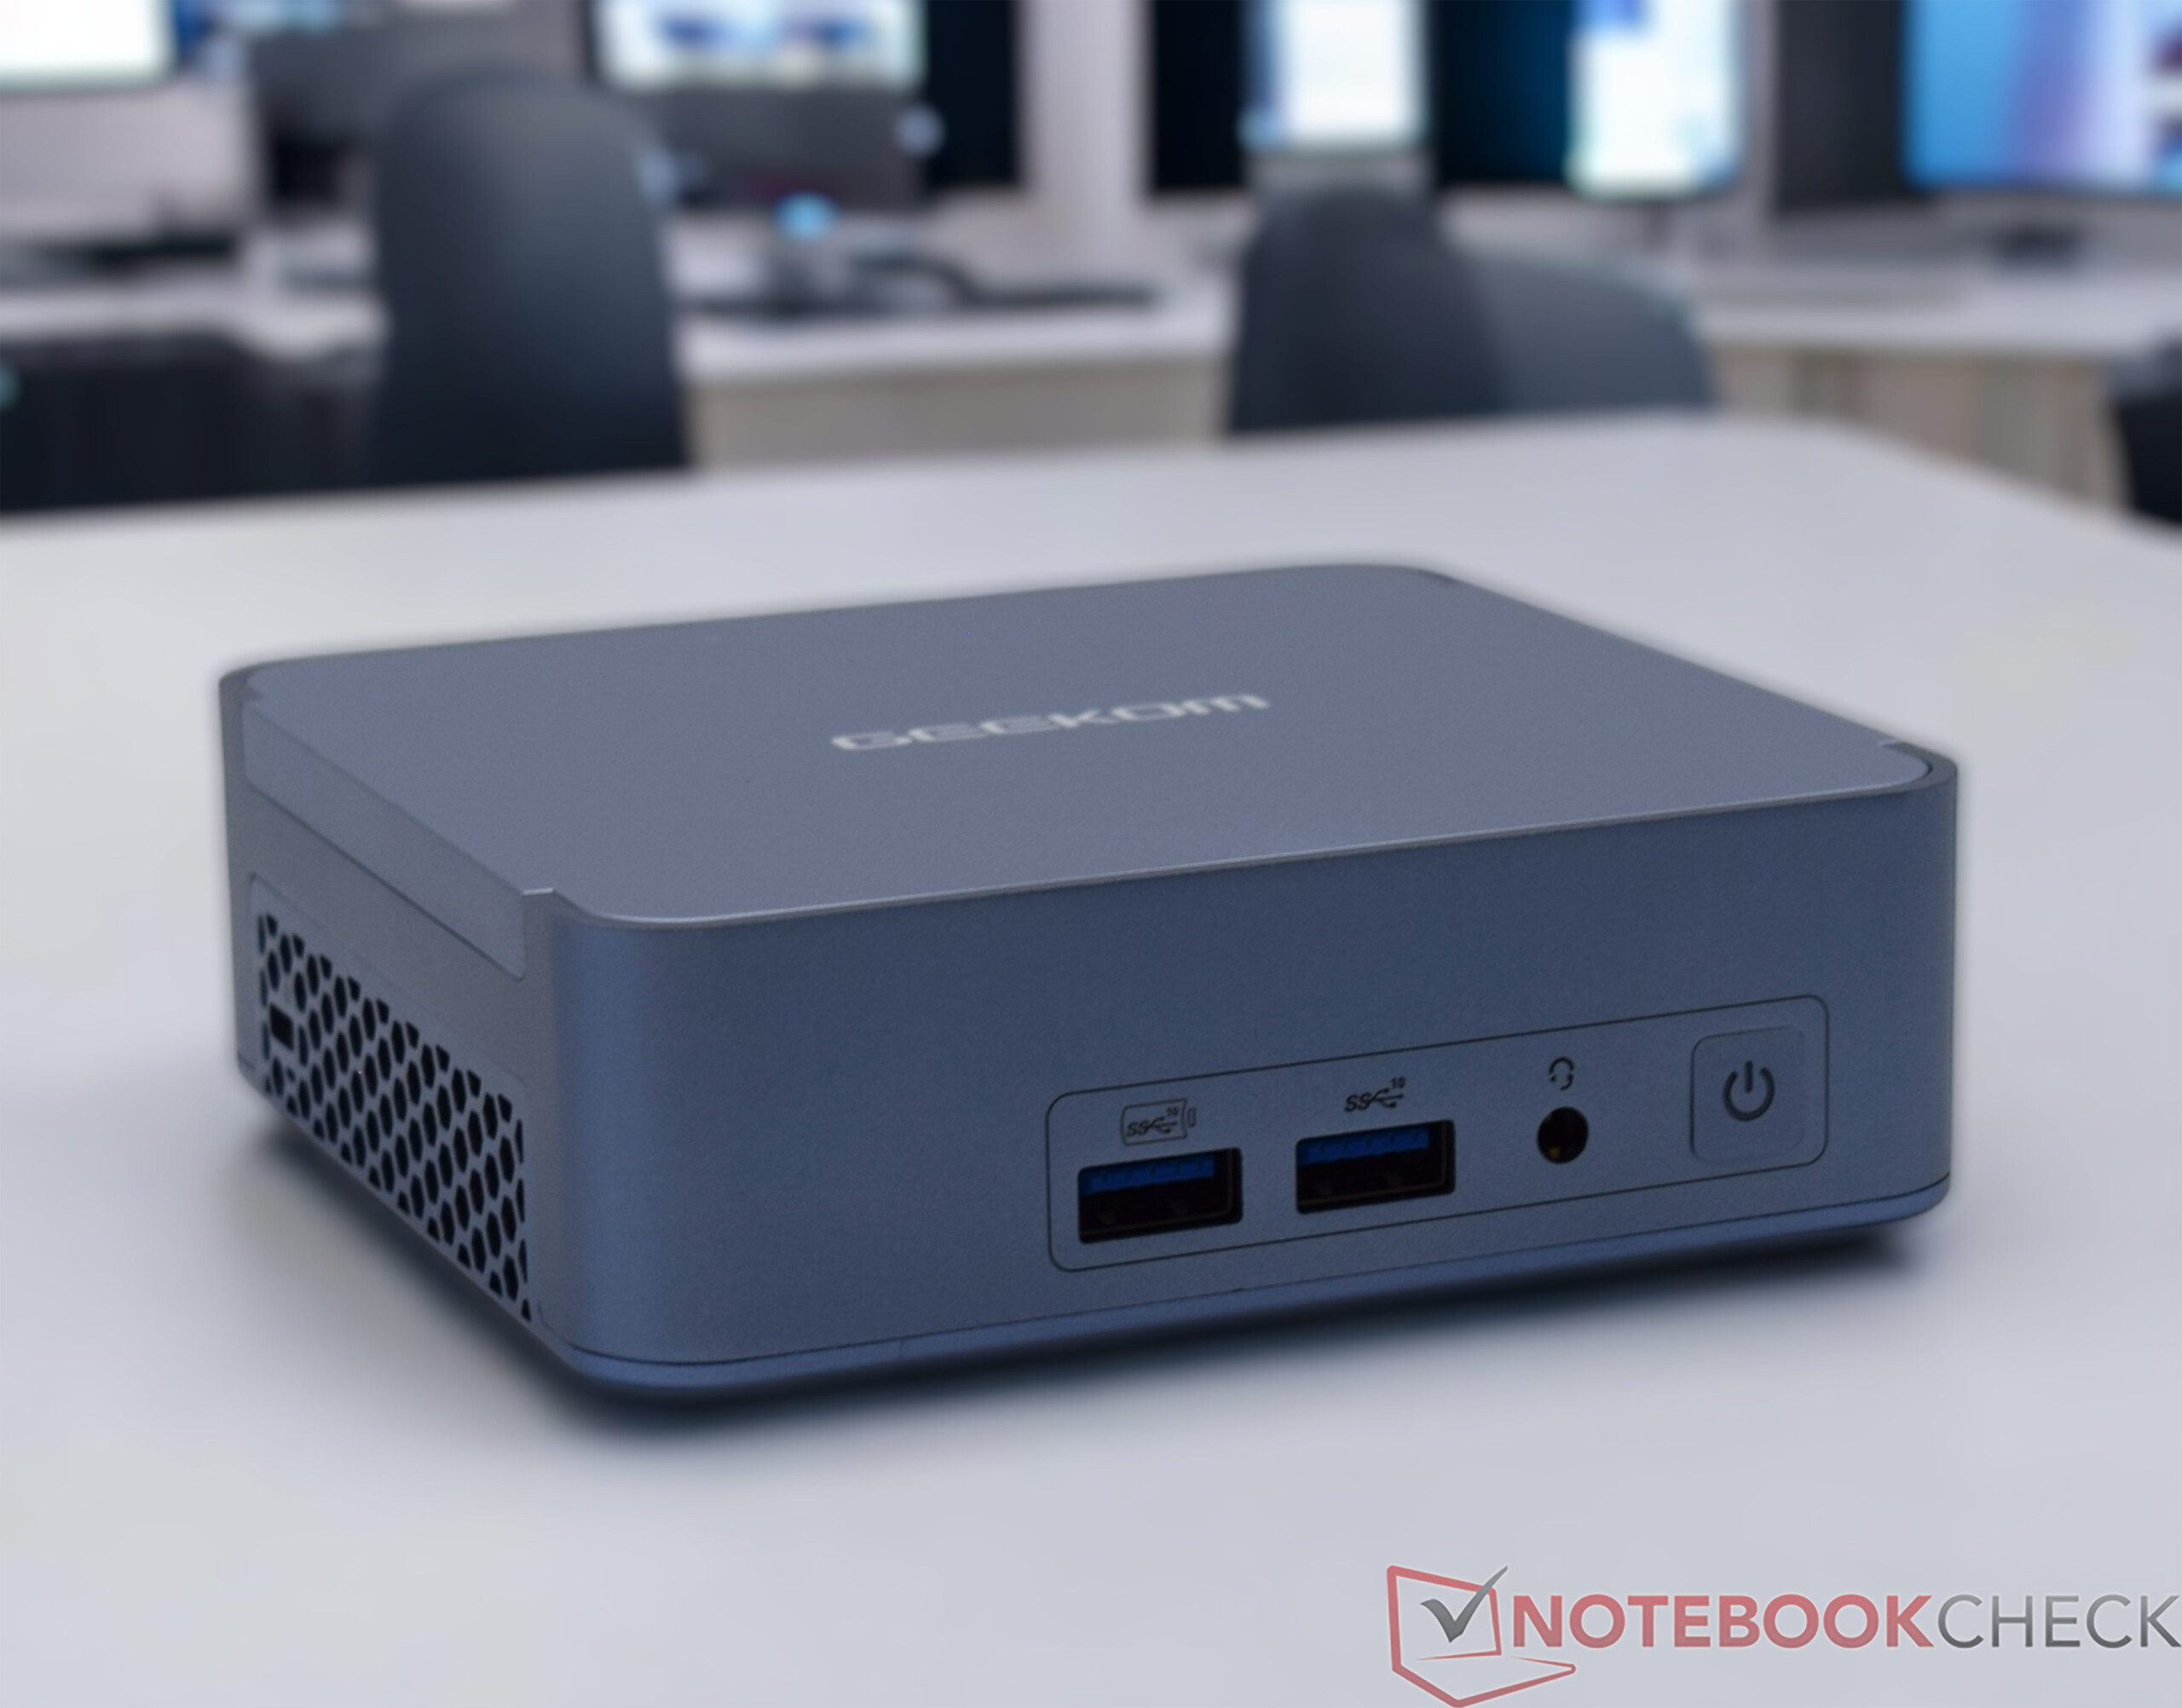
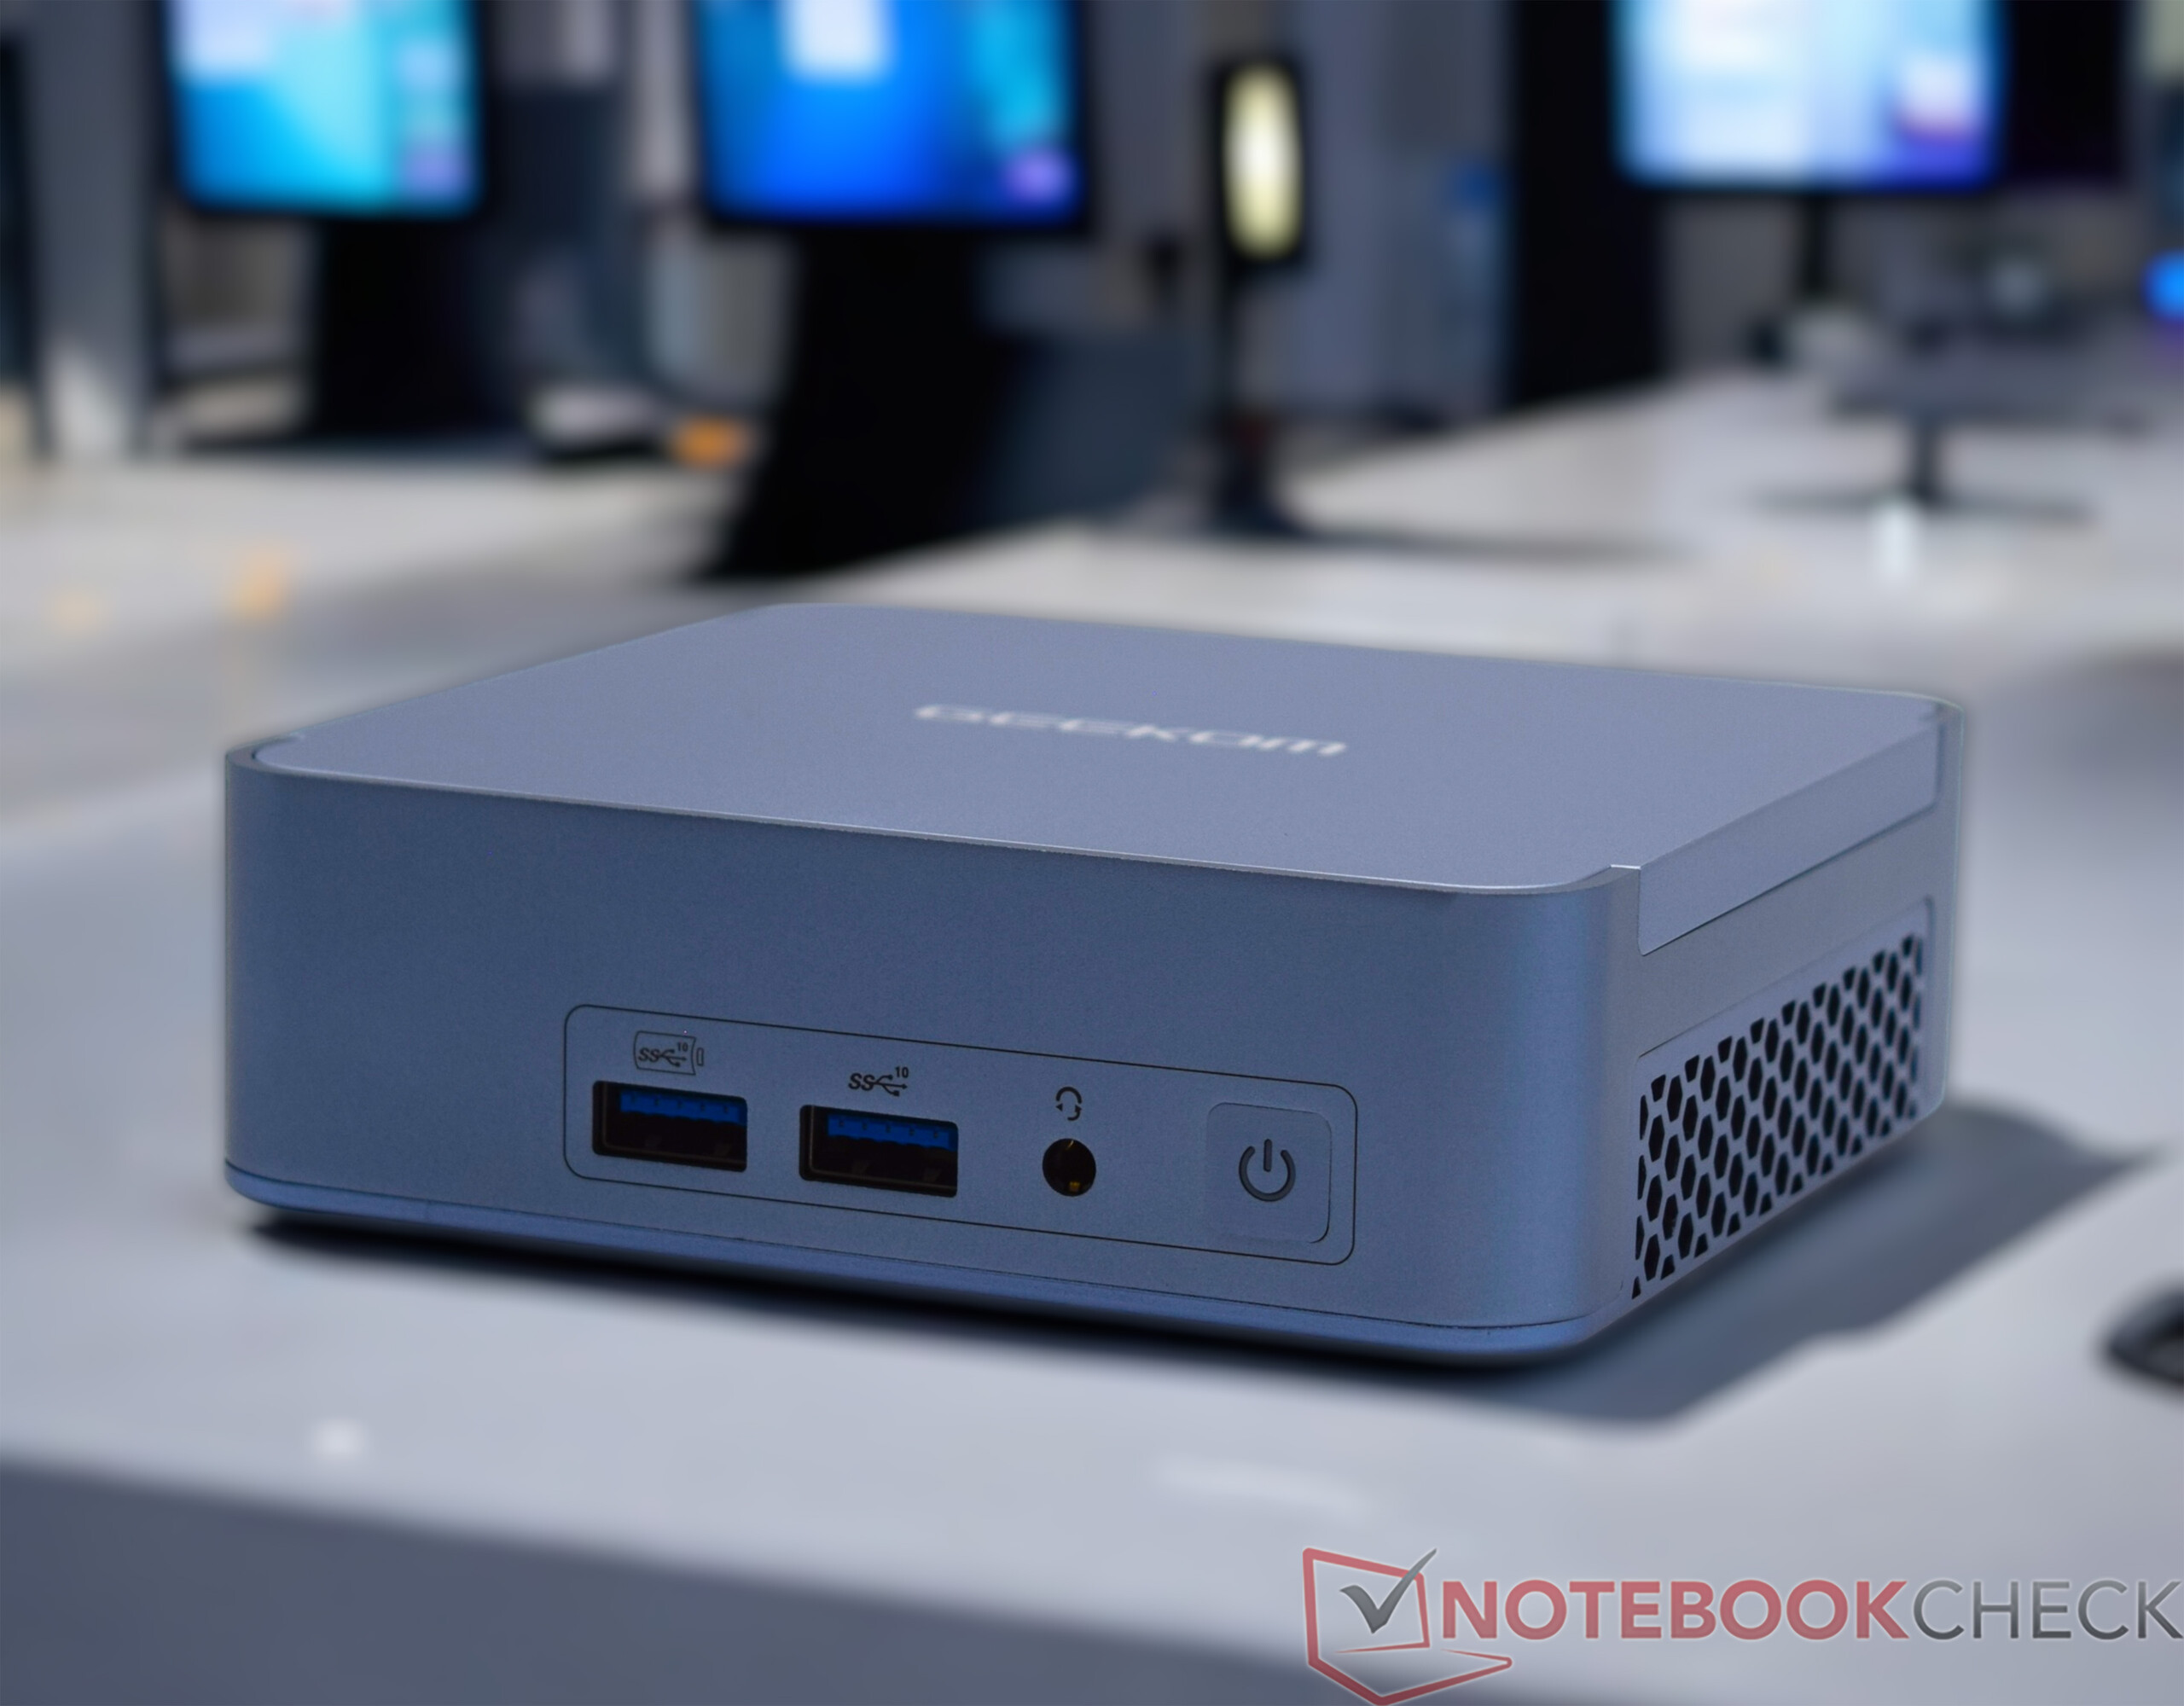
The basis of the Geekom AX8 Pro is identical to the Geekom XT13 Pro which in turn shares the housing with the Geekom XT12 Pro. As an AMD counterpart, the Geekom AX8 Pro gets the chance to prove its performance with the same compact base. The devices only differ visually, as the housing of the Geekom AX8 Pro is painted blue. The silver and white components of the in-house counterparts are, as usual, of excellent quality and fit together perfectly. However, there are differences in color due to the different materials. The casing is predominantly made of metal, although the lid and underside are made of plastic. At just 548 grams, our test device is lightweight, and the Geekom is also very space-saving in terms of its footprint (11.7 x 11.2 centimeters). The Geekom AX8 Pro can be attached directly to a monitor using the VESA bracket supplied.
Equipment
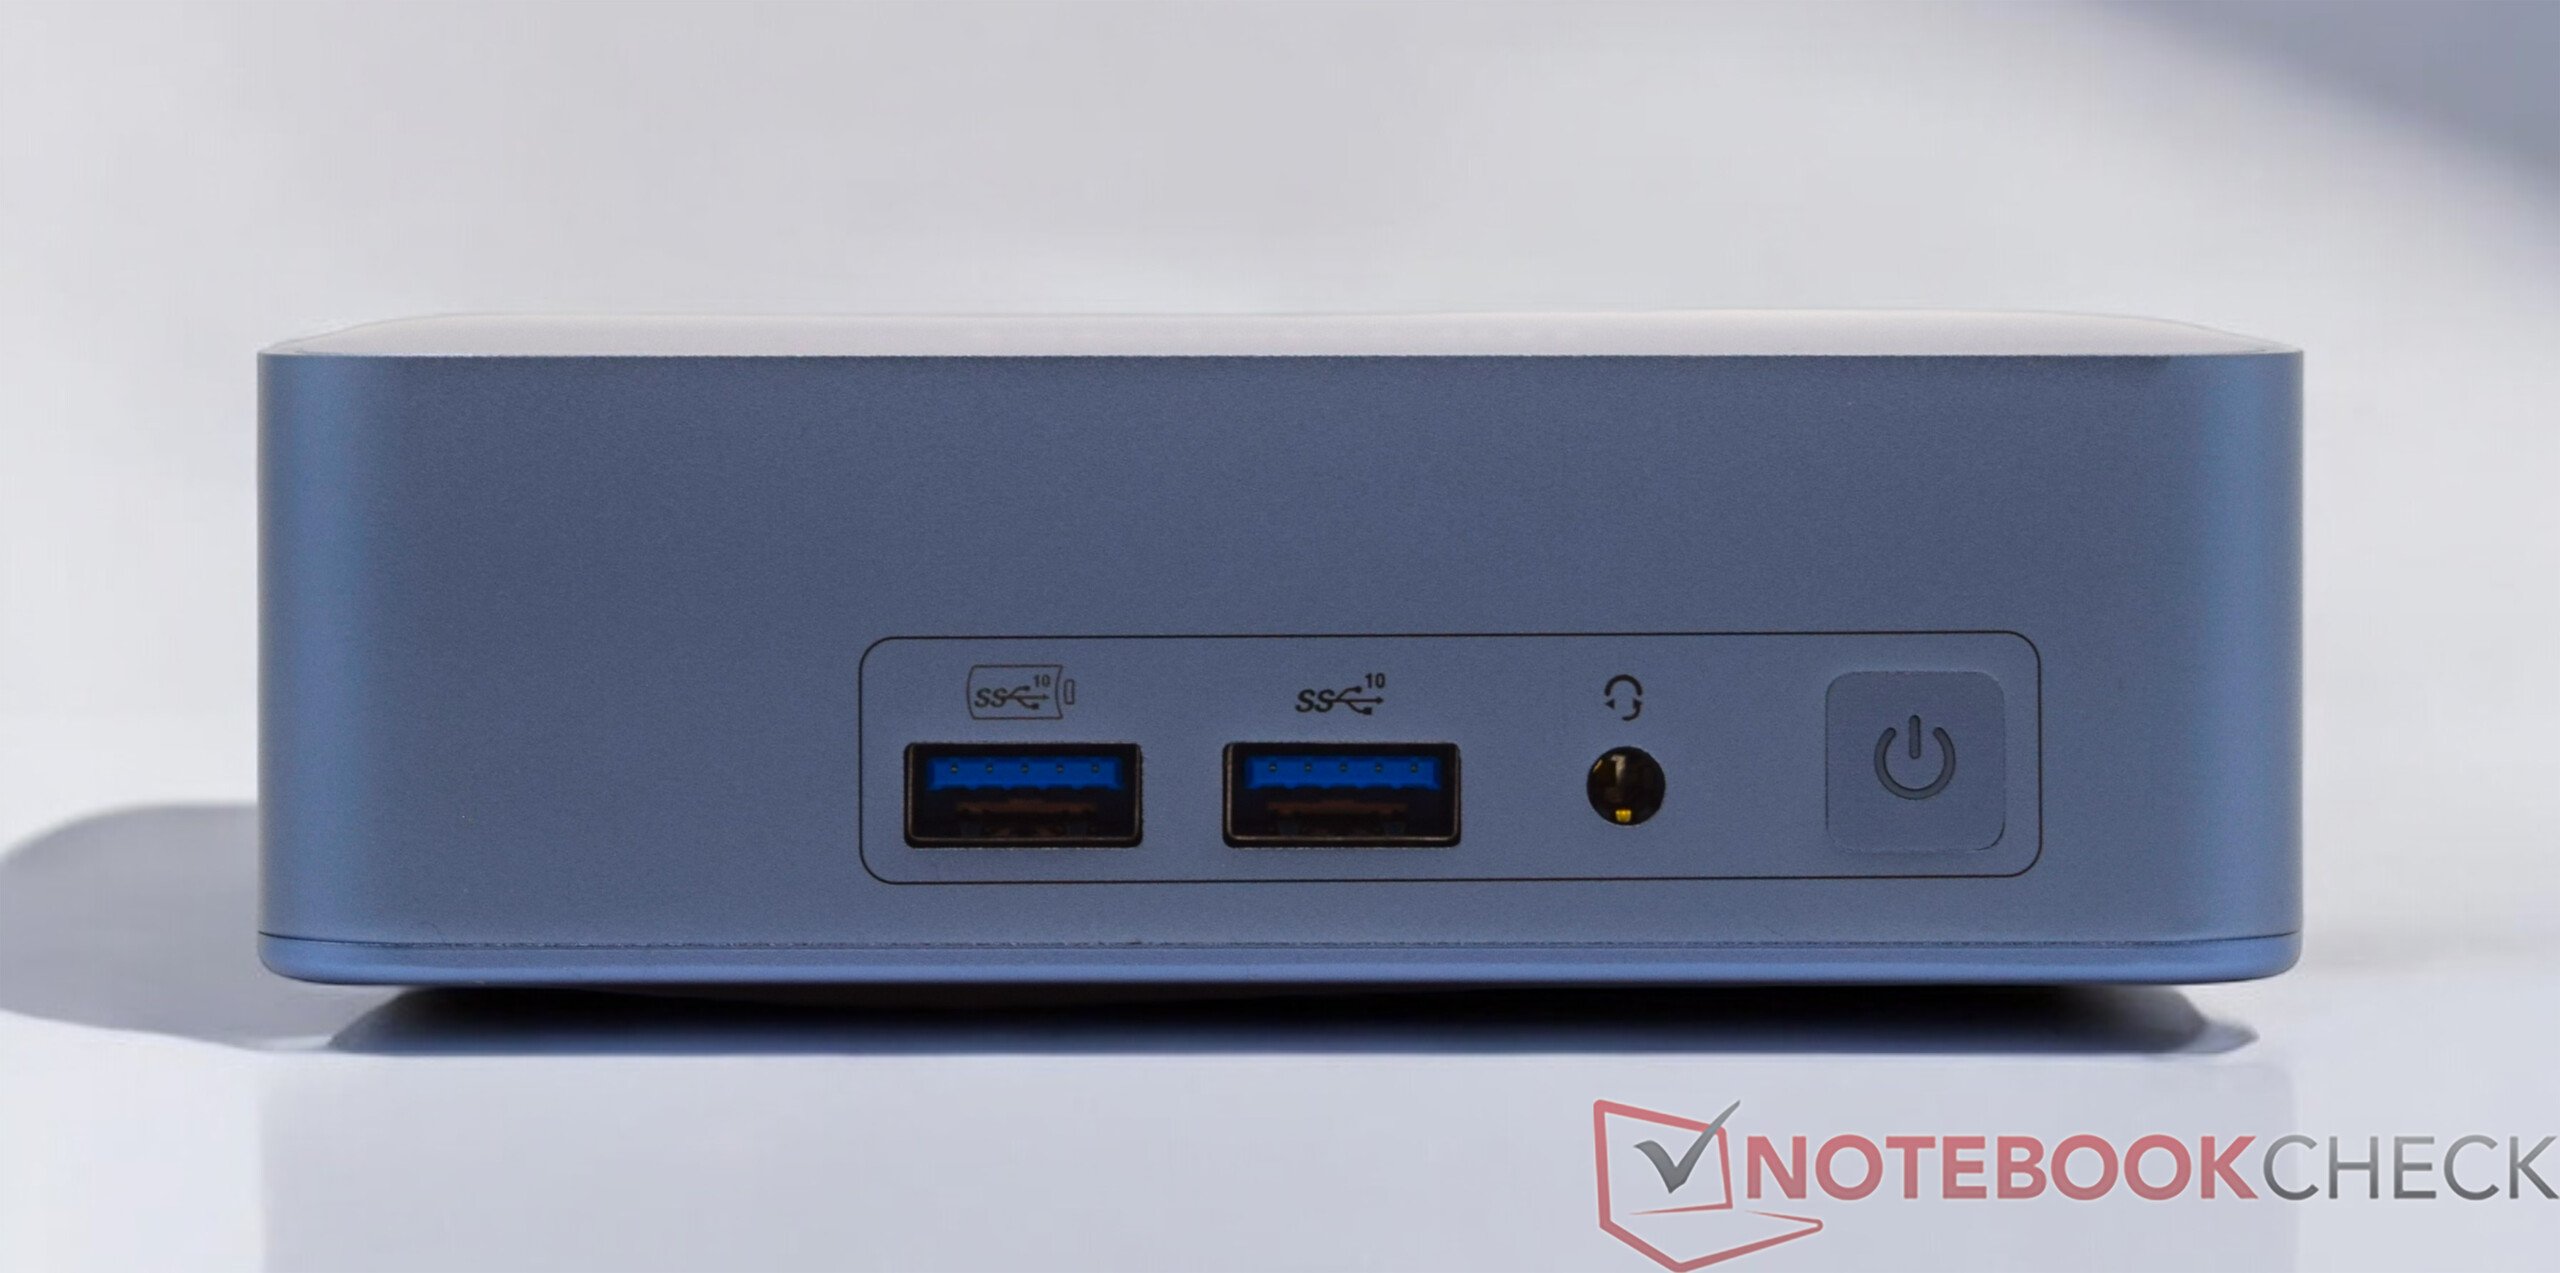
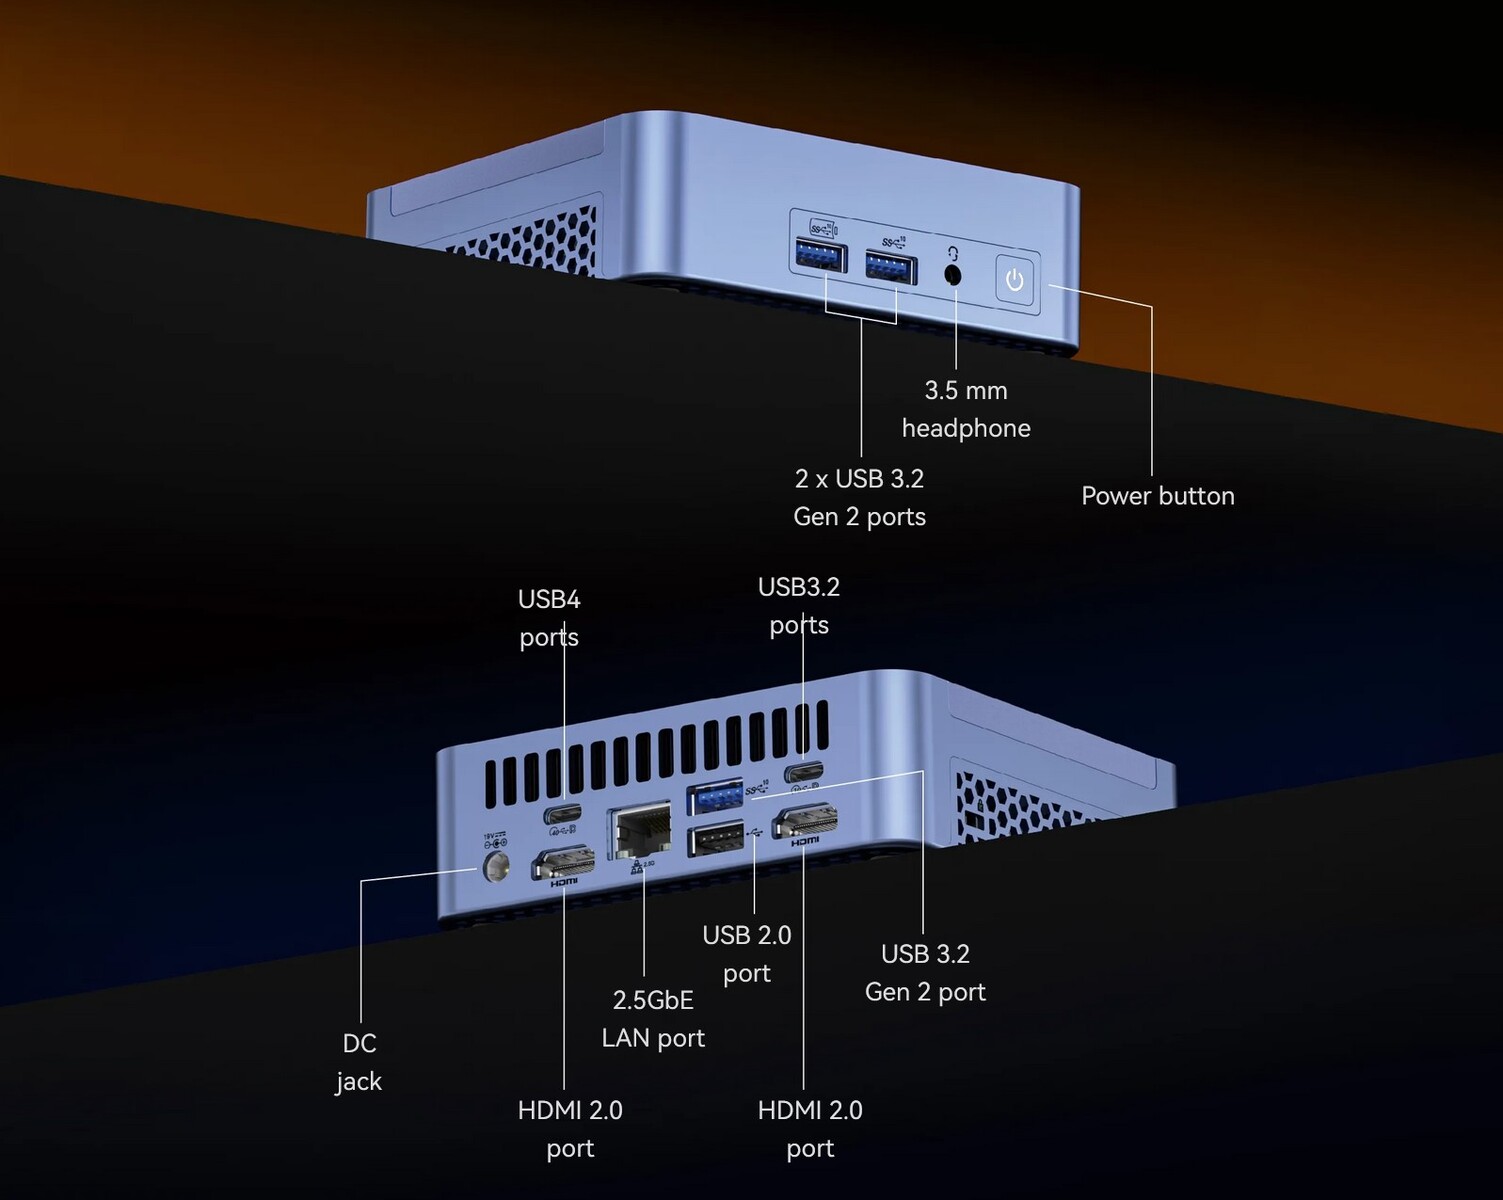
When it comes to external interfaces, the Geekom AX8 Pro can't quite compete with its Intel counterpart aka Geekom XT13 Pro. At first glance, there are hardly any differences, but on closer inspection, it becomes apparent that the Geekom AX8 Pro only has a USB4 interface. This is not too bad, as the expansion options are still there. Thunderbolt functionality is also omitted. The Intel models (e.g. Intel NUC 13 Pro Desk Edition Kit), which was once launched as the NUC series and is now marketed by Asus, does however offer Thunderbolt support. The interface layout is identical, and the Geekom AX8 Pro also scores points in terms of numbers despite its compact design.
Communication

The Geekom AX8 Pro gets a familiar wireless module that we have already found in other Geekom mini PCs. The MediaTek Wi-Fi 6E MT7922 WLAN module can also handle the newer 6 GHz frequency range if the router offers this option. According to our test results, this is also recommended, as the transfer rates are noticeably better than with a connection in the 5 GHz frequency range. We used the Asus ROG Rapture GT-AXE11000 router for the test. Alternatively, an RJ45 socket with 2.5 Gbit/s is also available to the user.
Accessories
The Geekom AX8 Pro comes with a 120-watt power supply unit and a VESA mount including mounting material. The manufacturer does not include any other accessories such as a keyboard or mouse.

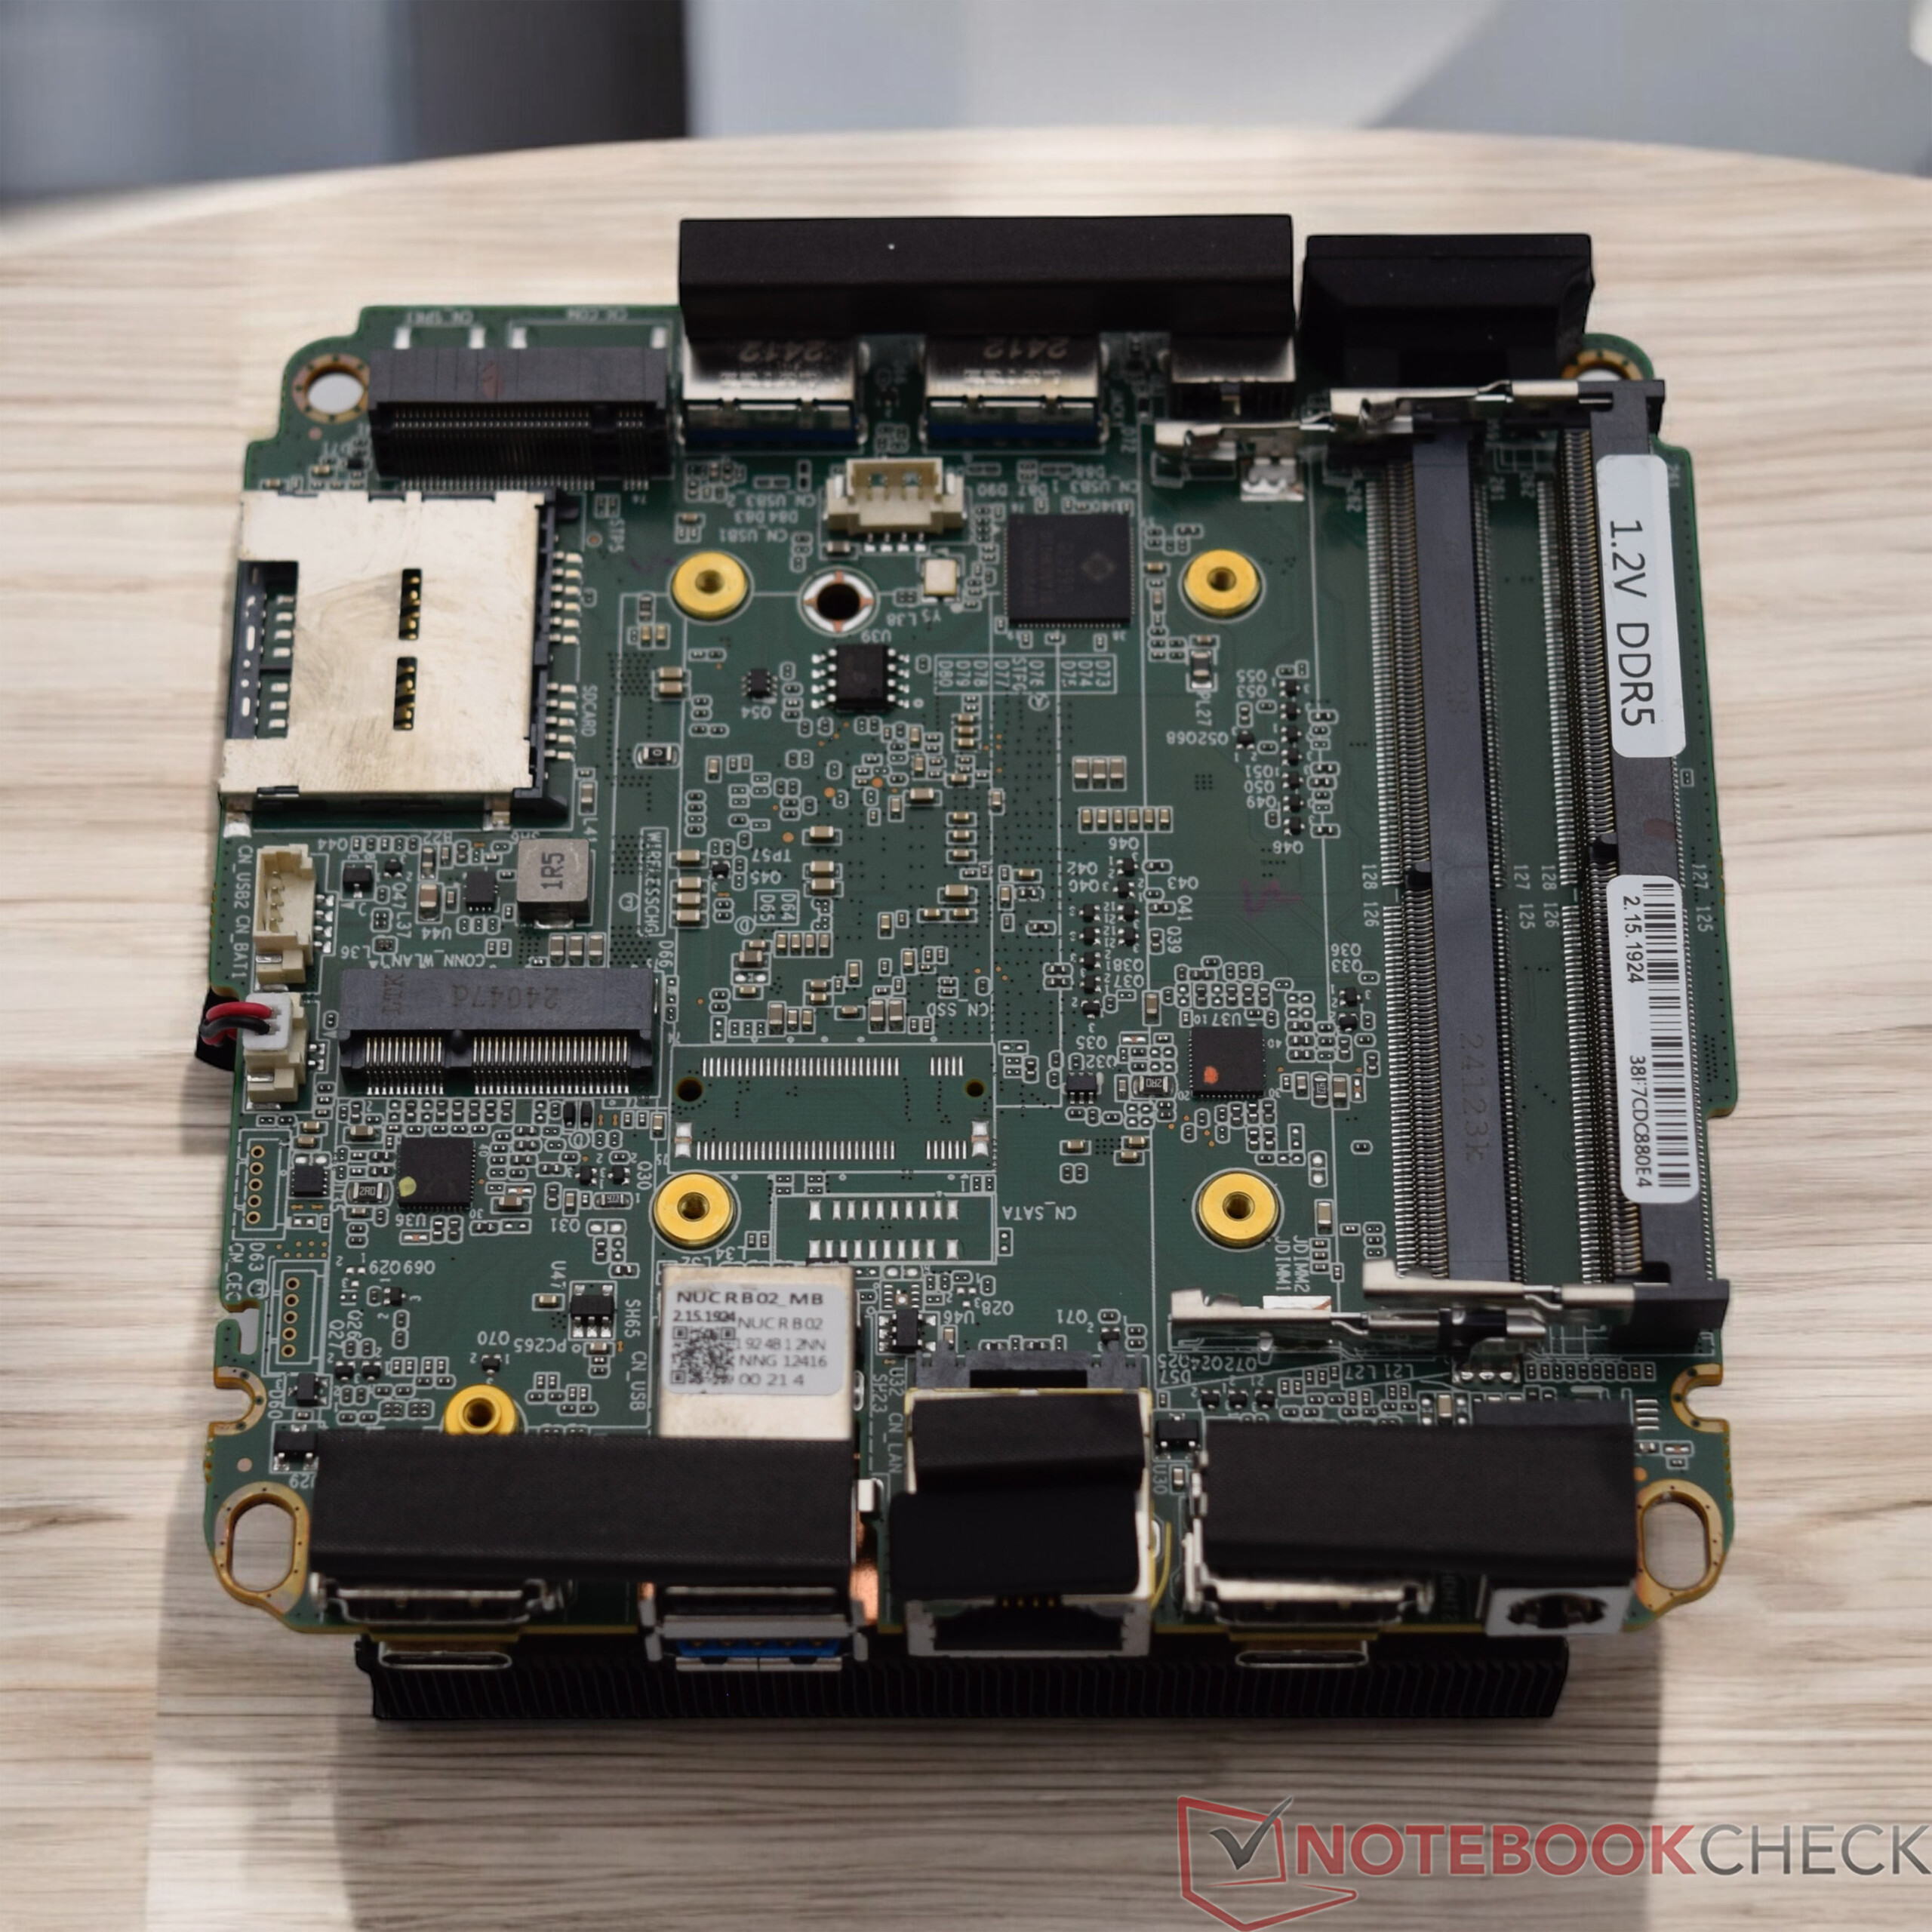
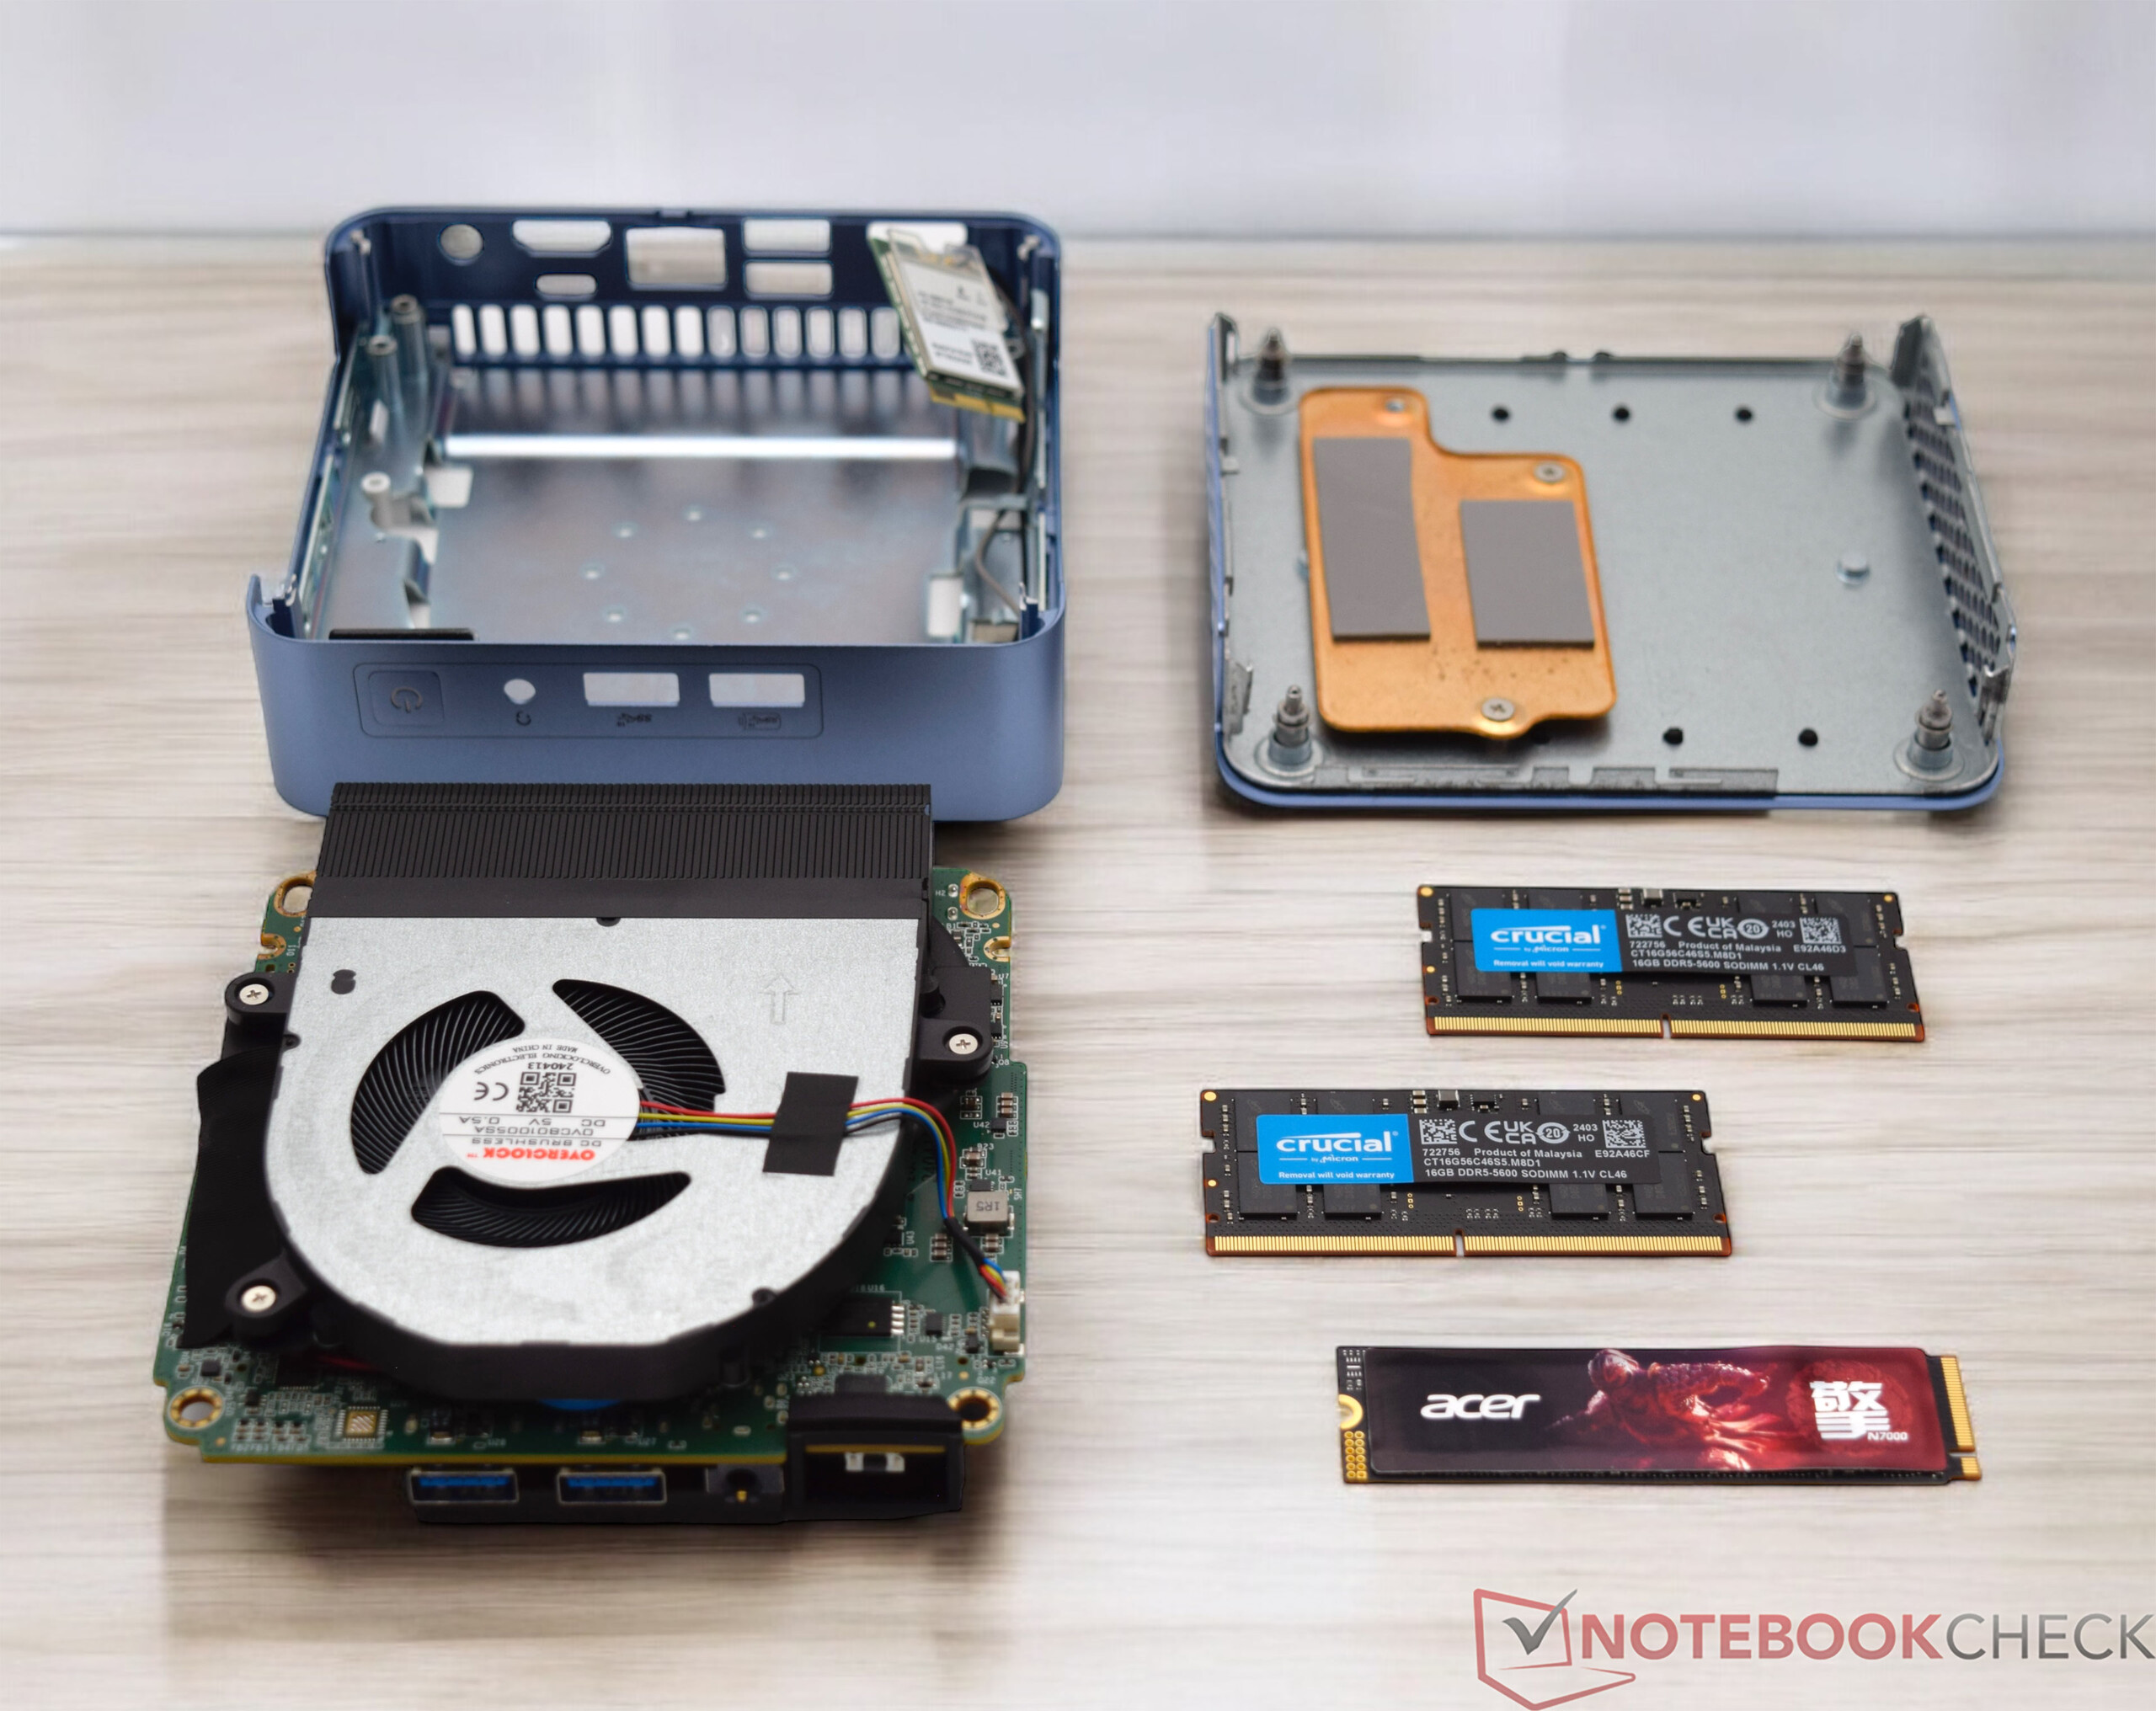
Maintenance
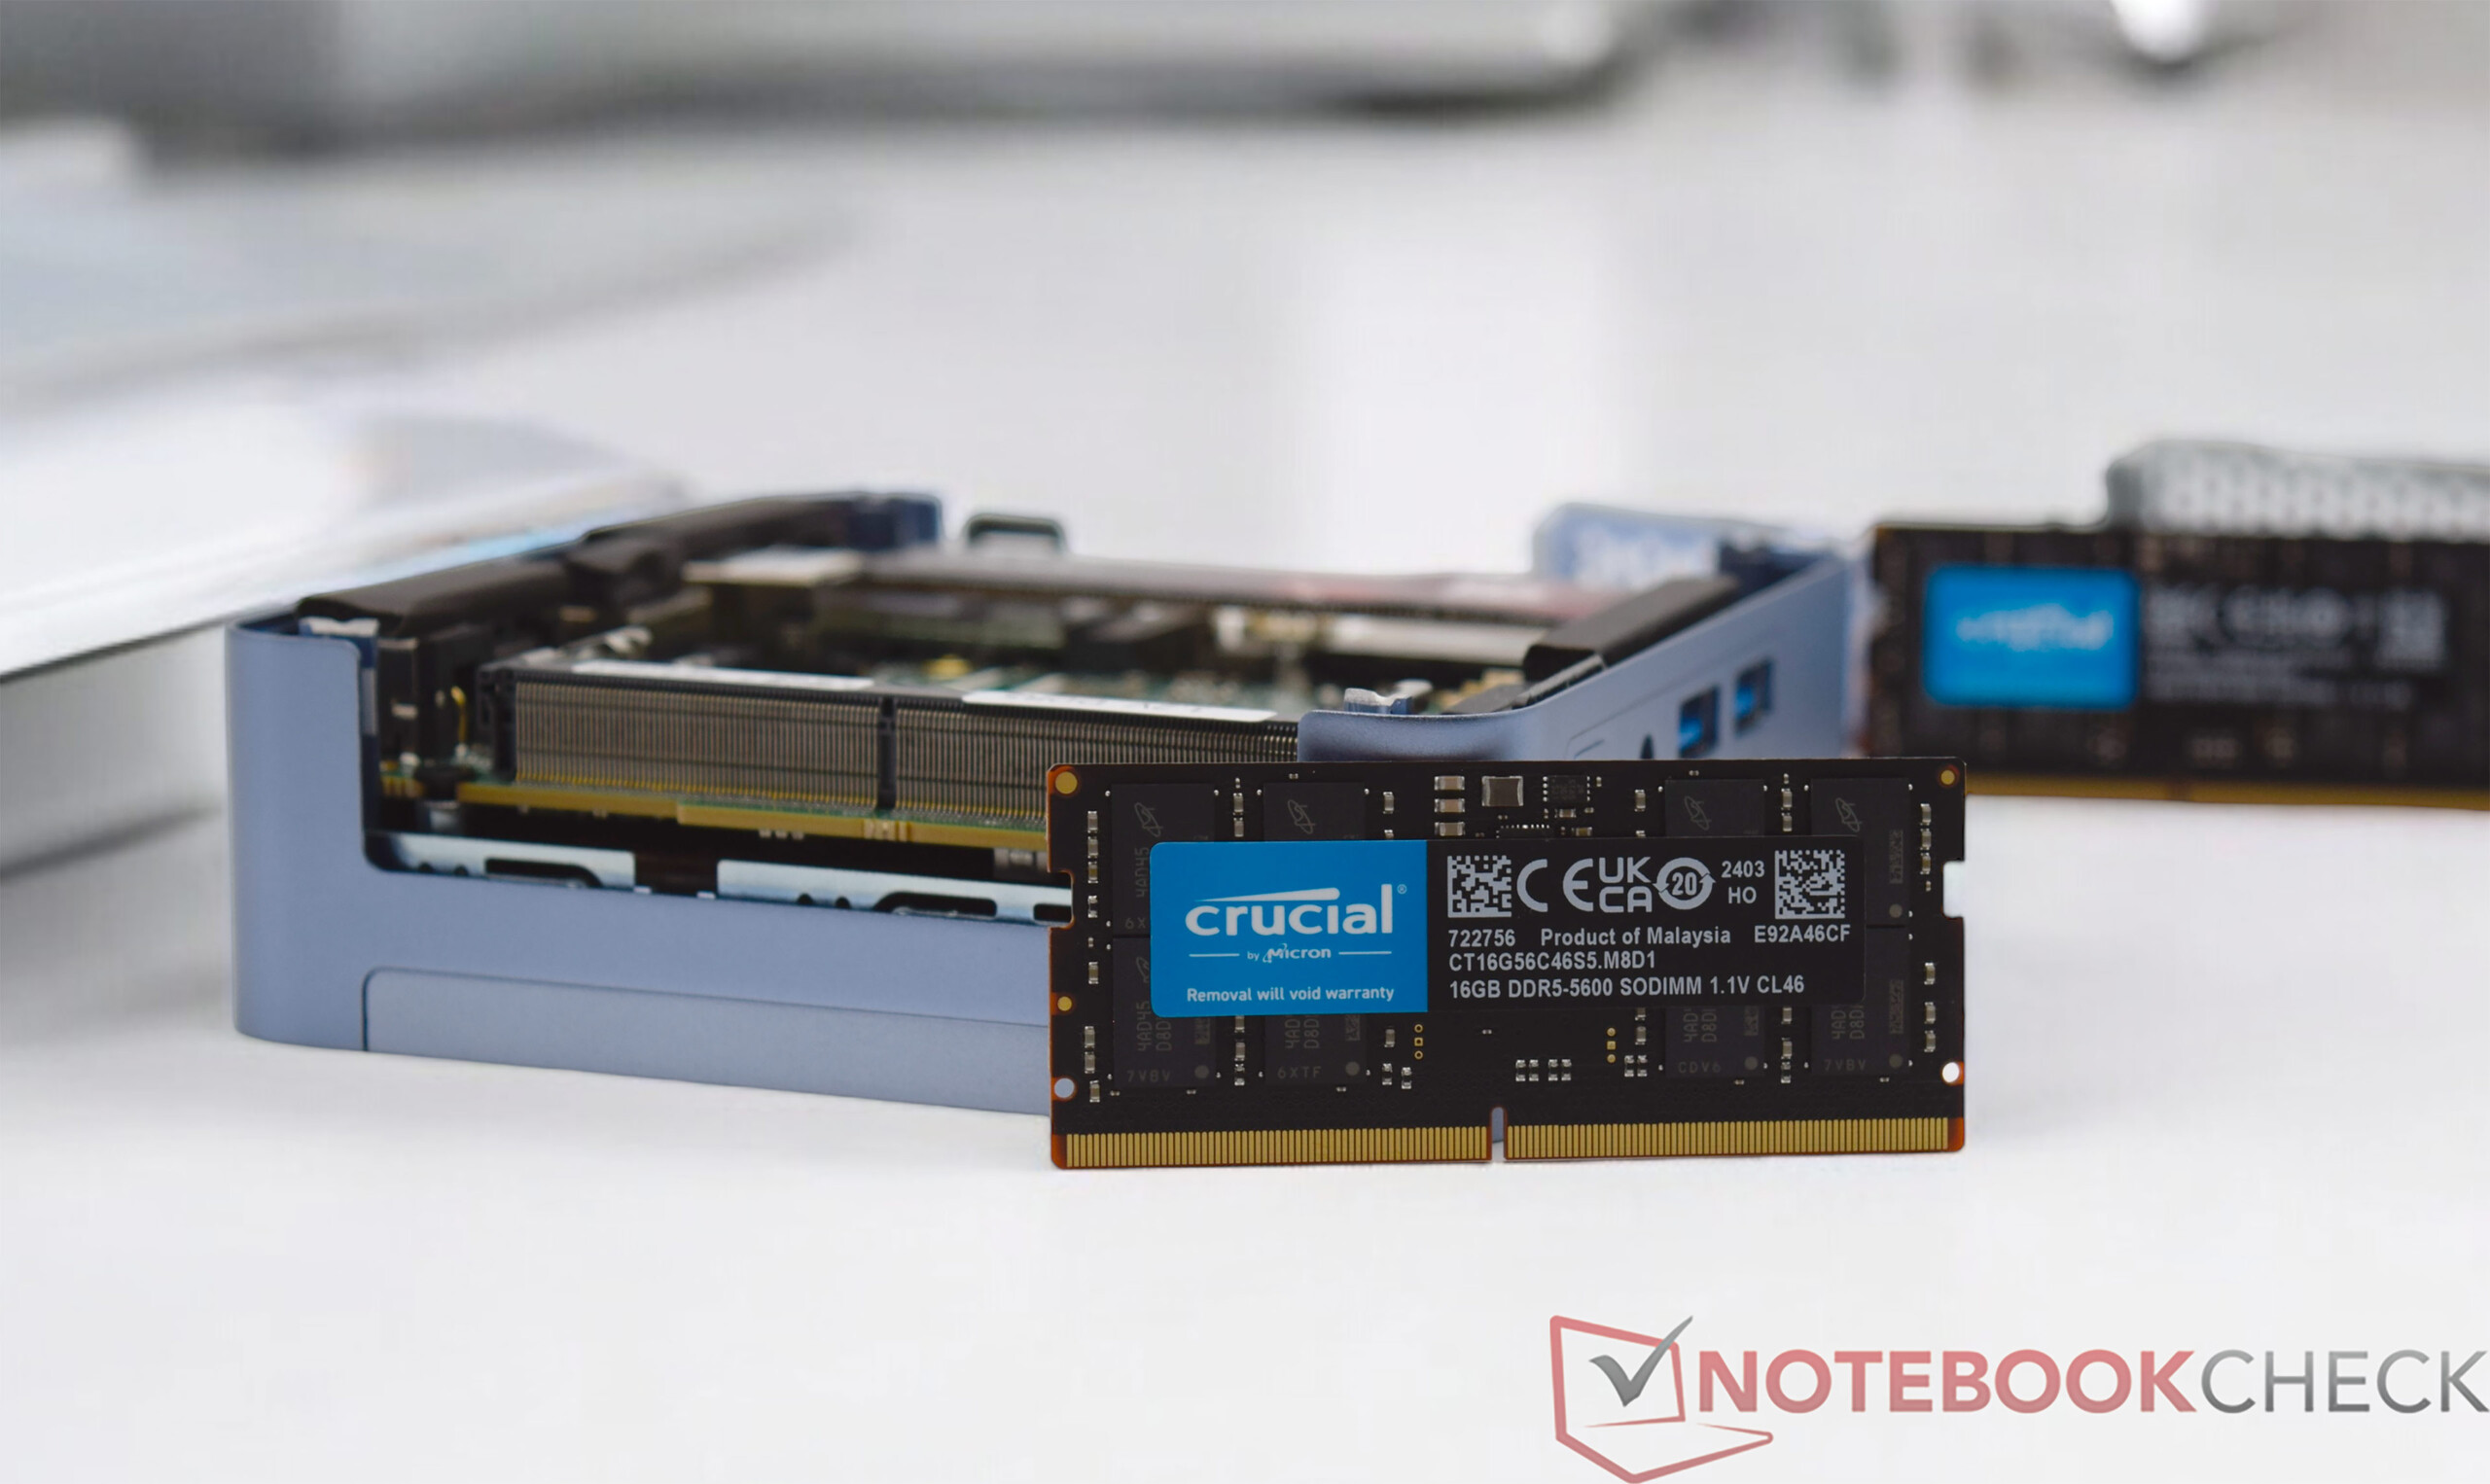
The Geekom AX8 Pro can be opened from the underside without any major obstacles: Only four small screws need to be loosened. The base plate also serves as a passive cooling element for the SSD. The RAM and mass storage can be replaced if necessary. However, the Geekom AX8 Pro no longer offers any upgrade options. If you want to clean the CPU fan, you have to remove the board and cooling unit. With a little dexterity, however, this is not a problem.


Sustainability
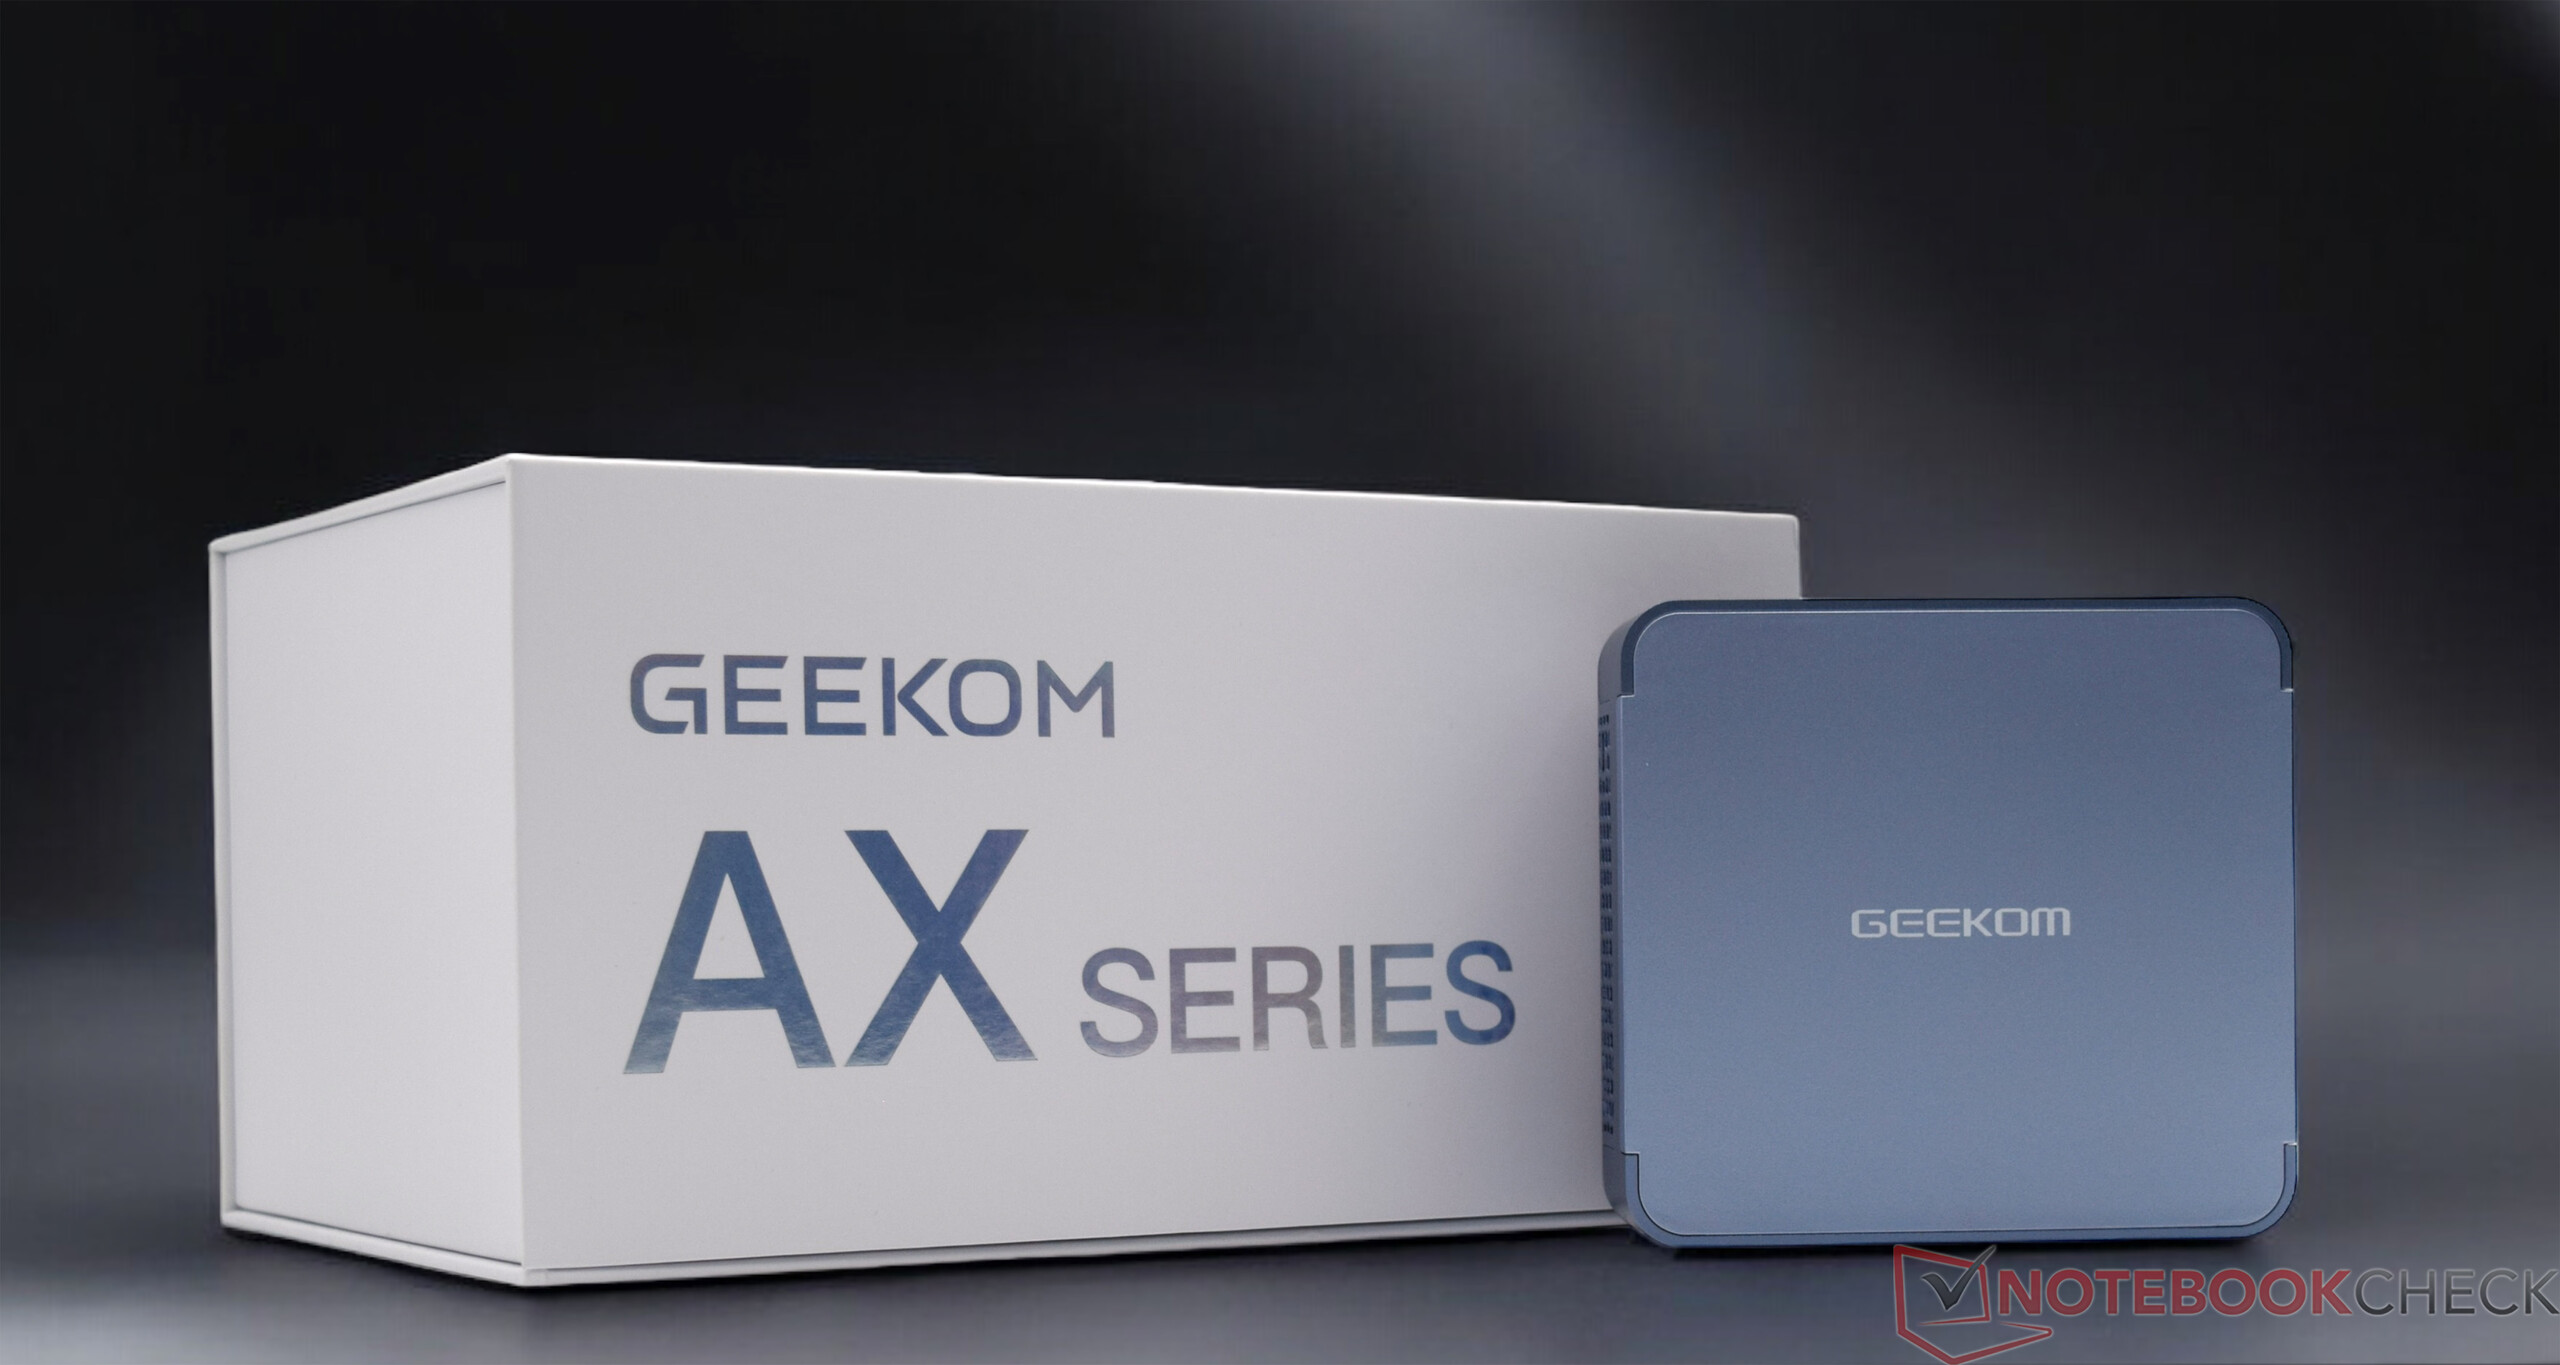
The Geekom AX8 Pro is a very compact mini PC. Nevertheless, the manufacturer packs the device with manageable accessories in a comparatively large box. The dimensions are very similar to the packaging of the Geekom XT13 Pro. The Geekom XT12 Pro, on the other hand, was delivered in much smaller packaging. The approach taken by Geekom with our test model is not in line with sensible sustainability in terms of the space required for shipping. The device itself is predominantly made of metal and plastic. However, we do not know whether the manufacturer uses specially recycled materials for its production. Geekom receives praise for the 36-month warranty period.
Performance - Plenty of power thanks to AMD Ryzen 9 8945HS
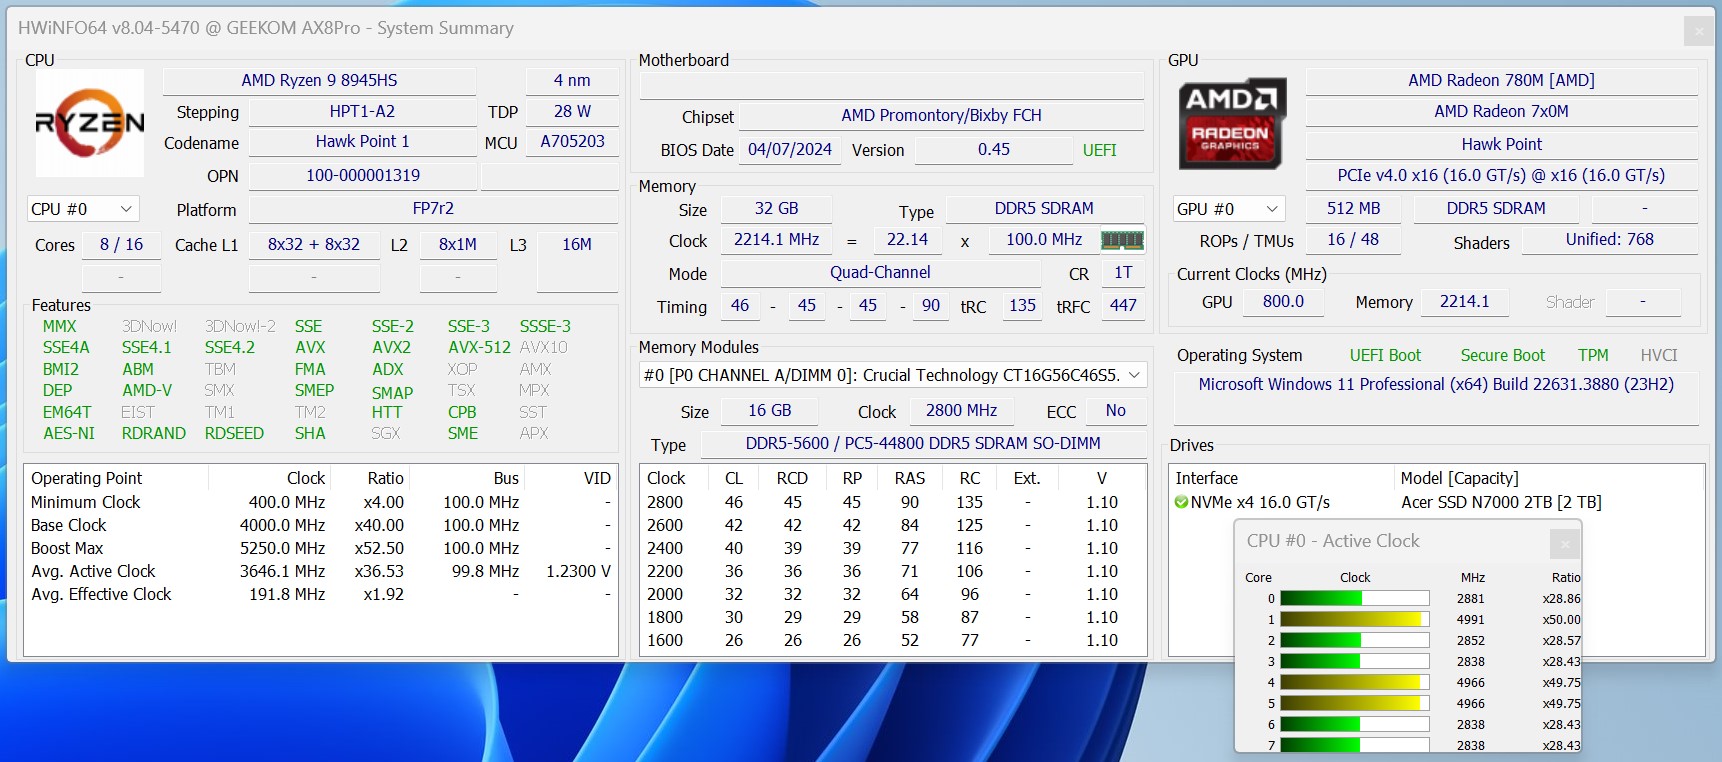
The AMD Ryzen 9 8945HS is a high-end processor and offers more than enough power for most applications. If you only have rudimentary office tasks to complete, you can also opt for a less powerful device. Alternatively, the Geekom AX8 Pro can also be equipped with the slightly weaker AMD Ryzen 7 8845HS is also available. Both SoCs are native 8-cores and offer 16 logical computing units. When it comes to RAM, 32 GB DDR5 RAM is always a good choice, although at least 1 TB is installed for mass storage.


Test conditions
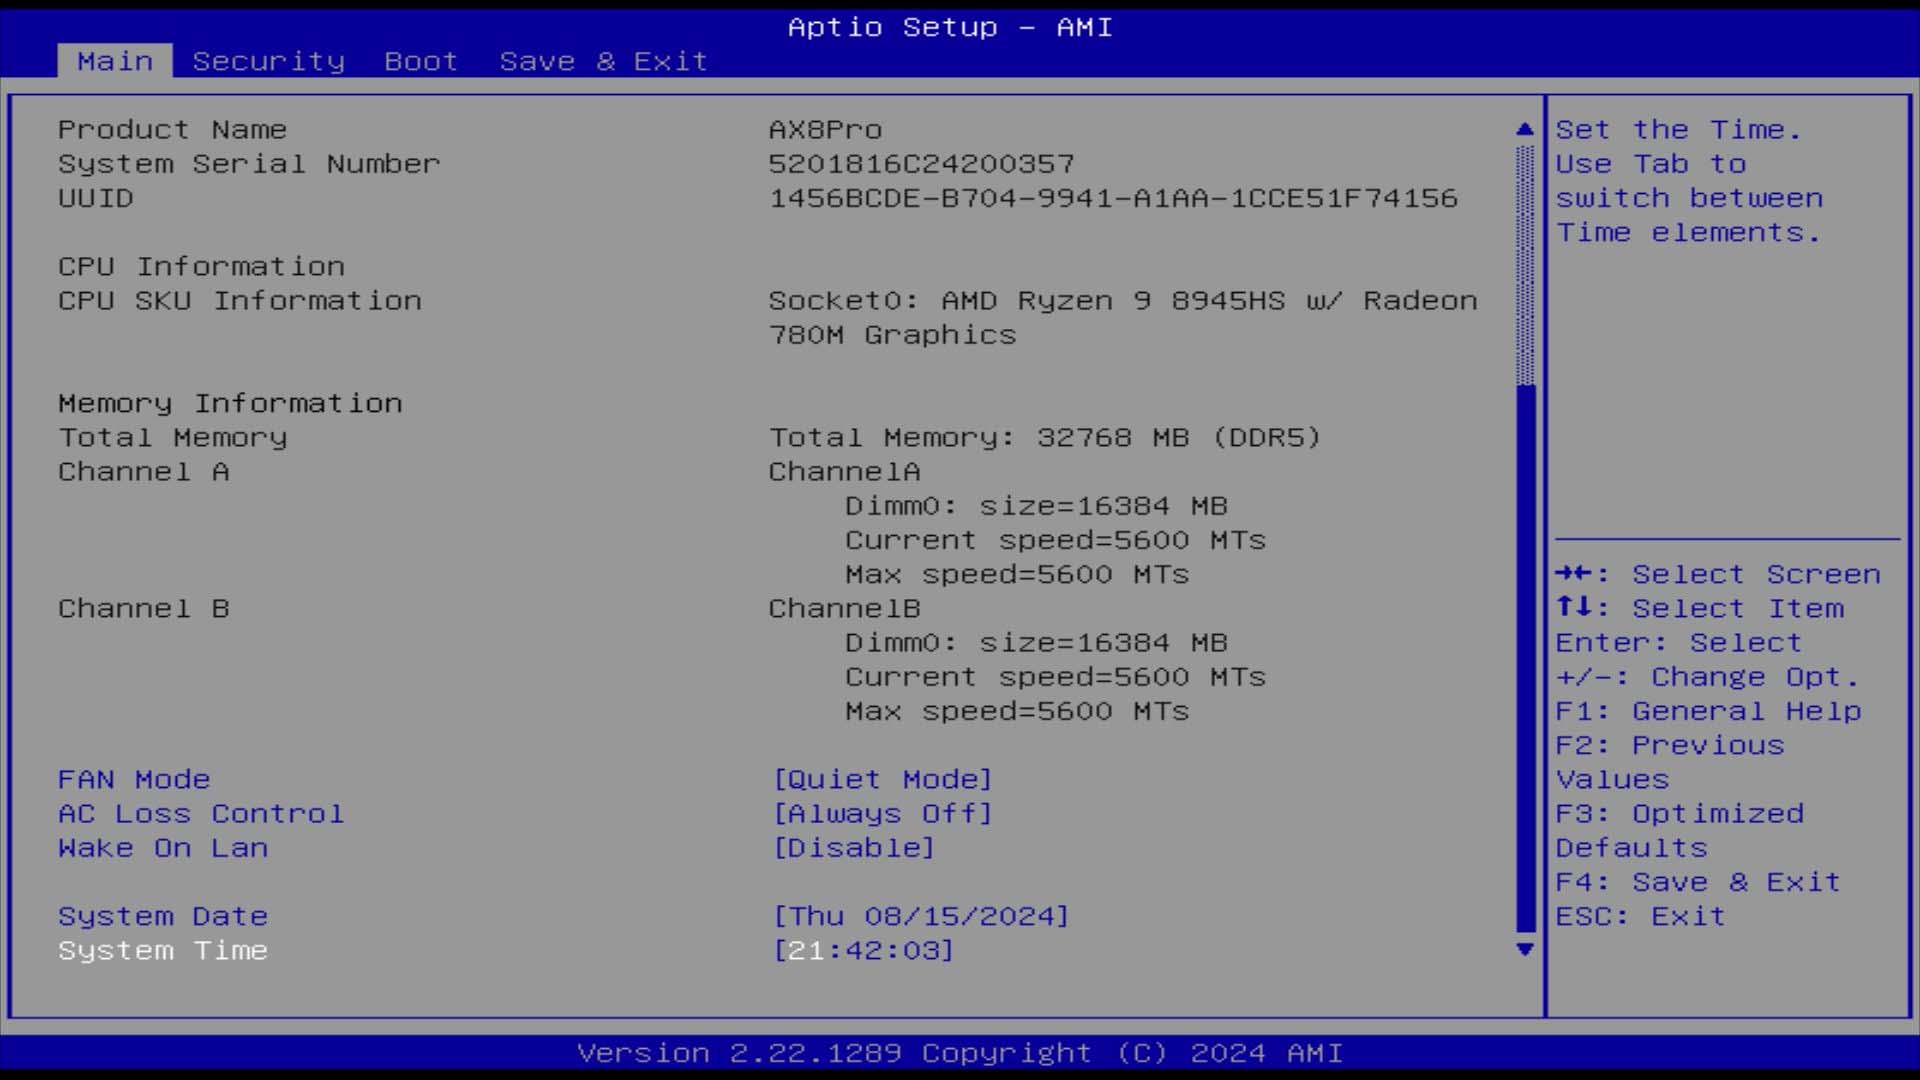
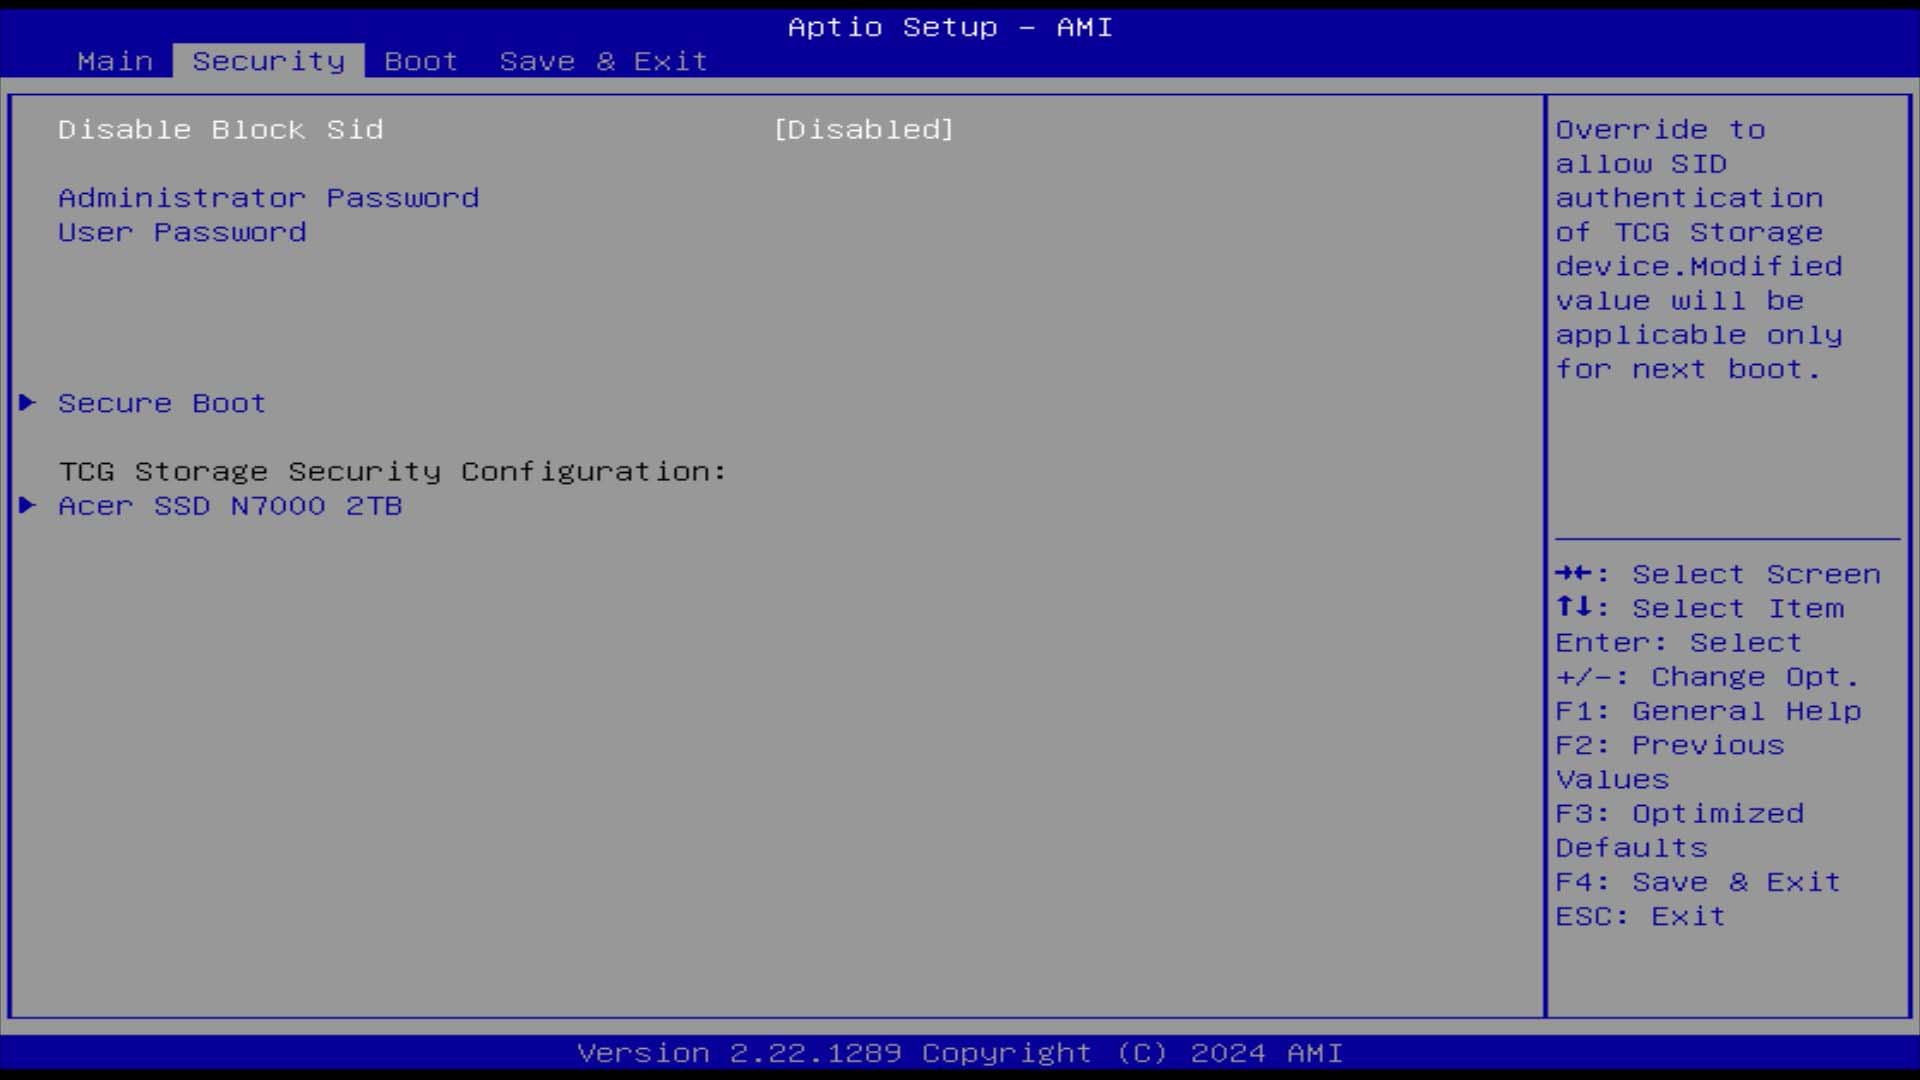
We use the "Balanced" energy profile for all performance tests with the Geekom AX8 Pro. There were only deviations from this in the power consumption and noise measurements according to our Test criteria. In accordance with the manufacturer's specifications, Geekom allows the SoC to operate at the lowest power consumption. In figures, this means a power limit of 45 watts under continuous load, although up to 60 watts are allowed for short periods. The BIOS itself is very simple and allows practically no changes. Changes to the power limits of the SoC and the allocation of RAM for the iGPU are not possible. Only the fan presets can be changed. Performance mode
is activated here by default.

Processor

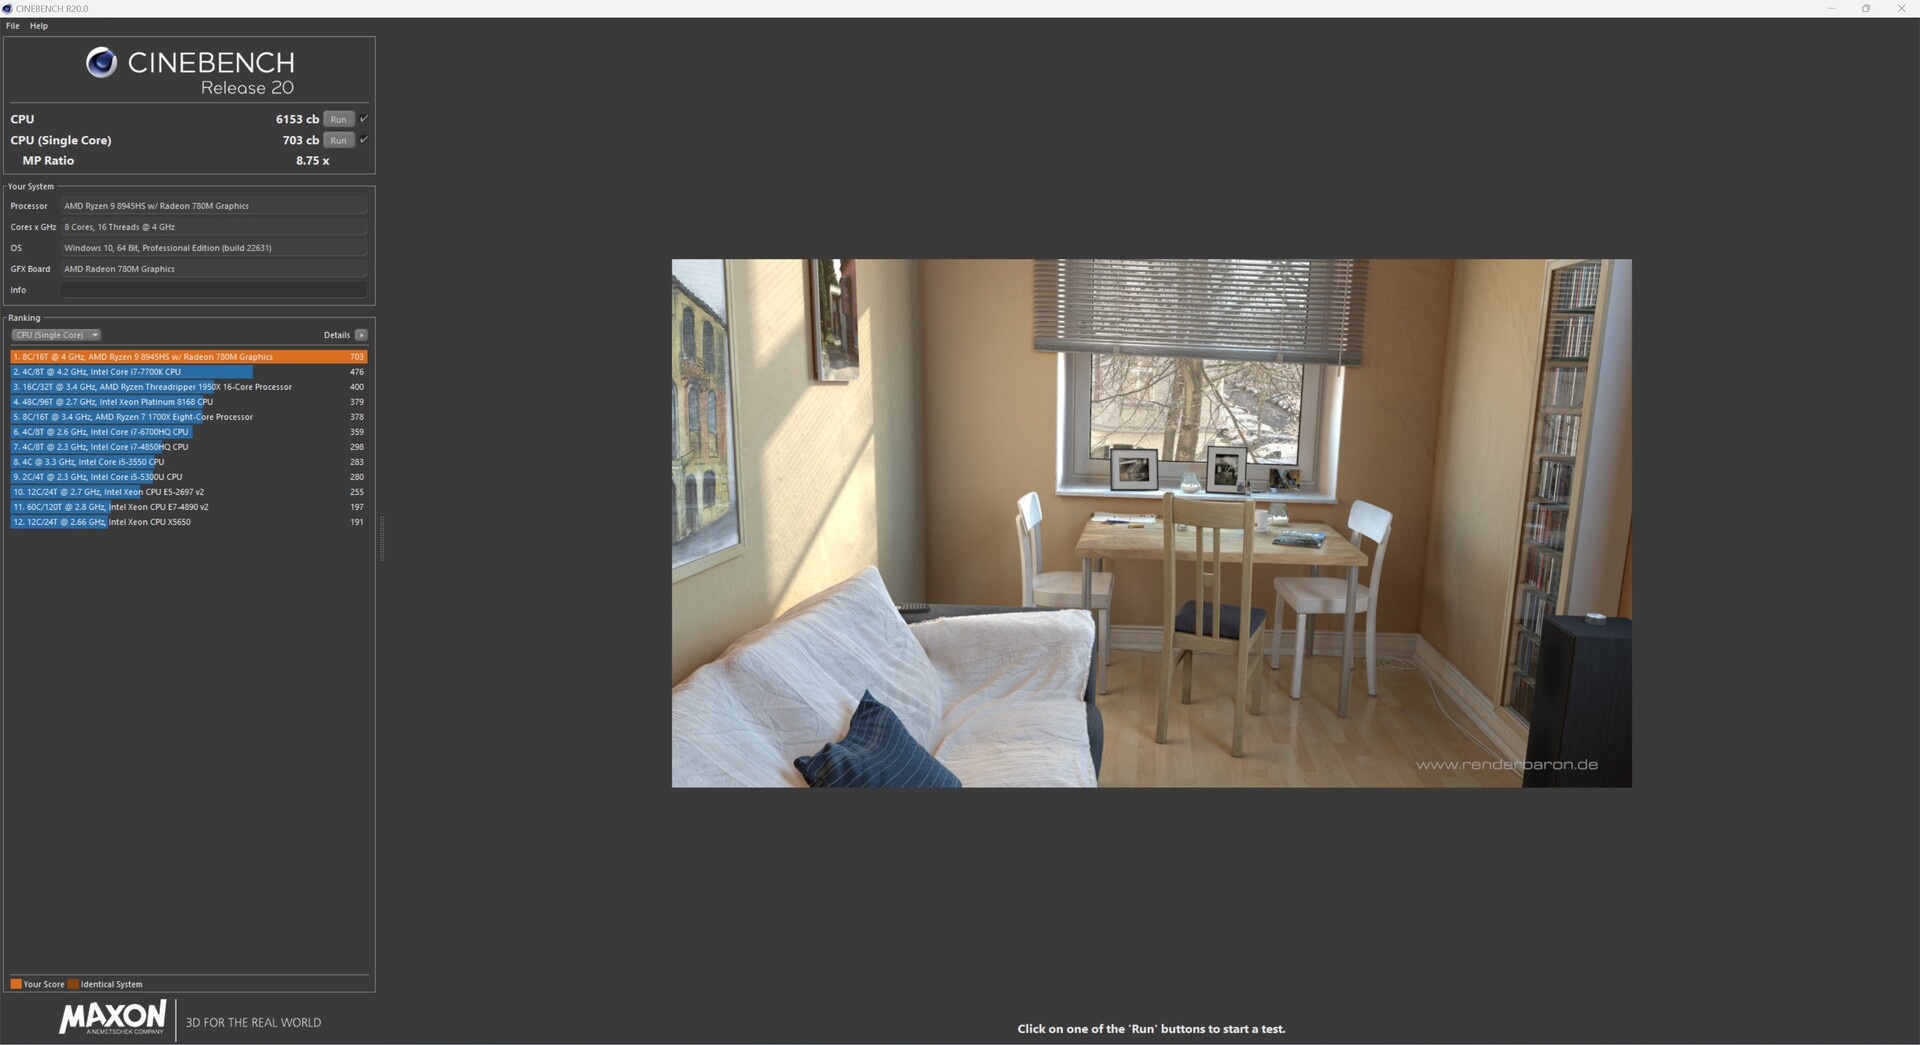
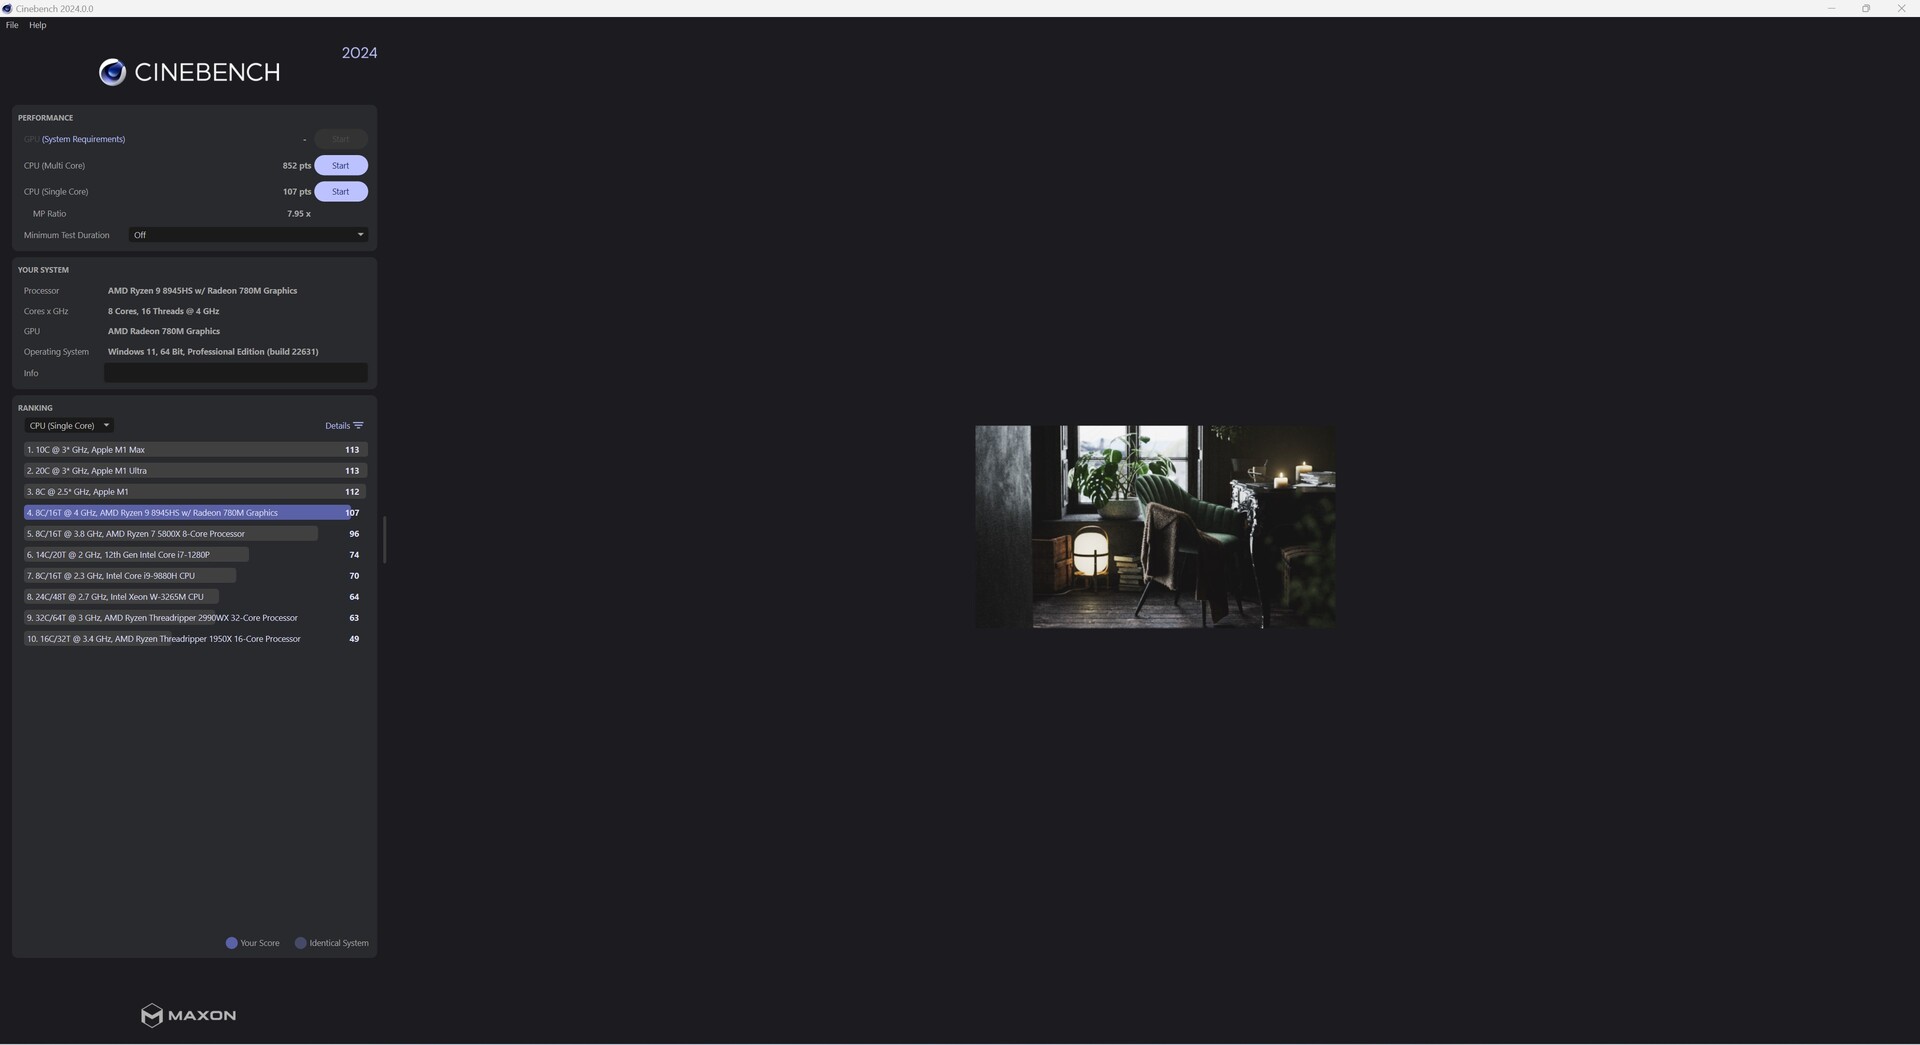
The Geekom AX8 Pro is equipped with a AMD Ryzen 9 8945HS, which is also found in the Geekom A8. In a direct duel, however, the AX8 Pro has to admit defeat to the A8. However, with a performance difference of only two percentage points in the performance rating, we can state that both devices offer almost identical performance. In the individual tests, the Geekom AX8 Pro cannot always prevail against its competitors. The Meteor Lake-powered devices in particular (Minisforum AtomMan X7 Ti and Acemagic F2A) can clearly set themselves apart in the multi-core tests due to the higher number of physical cores. In terms of single-core performance, however, the AMD Ryzen 9 8945HS is on par with an Intel Core Ultra 9 185H.
For further comparisons and benchmarks, please refer to our CPU comparison table.


| Performance rating - Percent | |
| Geekom A8, R9 8945HS | |
| Geekom AE7 | |
| Geekom AX8 Pro | |
| Aoostar GEM12 | |
| Minisforum AtomMan X7 Ti | |
| Acemagic F2A | |
| Geekom XT13 Pro | |
| Cinebench R10 | |
| Rendering Single CPUs 64Bit | |
| Geekom A8, R9 8945HS | |
| Geekom AX8 Pro | |
| Minisforum AtomMan X7 Ti | |
| Geekom AE7 | |
| Aoostar GEM12 | |
| Acemagic F2A | |
| Geekom XT13 Pro | |
| Rendering Multiple CPUs 64Bit | |
| Acemagic F2A | |
| Geekom A8, R9 8945HS | |
| Minisforum AtomMan X7 Ti | |
| Geekom AE7 | |
| Aoostar GEM12 | |
| Geekom AX8 Pro | |
| Geekom XT13 Pro | |
| Blender - v2.79 BMW27 CPU | |
| Geekom XT13 Pro | |
| Geekom AX8 Pro | |
| Aoostar GEM12 | |
| Geekom AE7 | |
| Geekom A8, R9 8945HS | |
| Acemagic F2A | |
| Minisforum AtomMan X7 Ti | |
| WinRAR - Result | |
| Minisforum AtomMan X7 Ti | |
| Geekom A8, R9 8945HS | |
| Geekom AX8 Pro | |
| Acemagic F2A | |
| Geekom AE7 | |
| Aoostar GEM12 | |
| Geekom XT13 Pro | |
| Geekbench 4.4 | |
| 64 Bit Single-Core Score | |
| Geekom A8, R9 8945HS | |
| Geekom AX8 Pro | |
| Geekom AE7 | |
| Aoostar GEM12 | |
| Minisforum AtomMan X7 Ti | |
| Geekom XT13 Pro | |
| Acemagic F2A | |
| 64 Bit Multi-Core Score | |
| Geekom AE7 | |
| Geekom A8, R9 8945HS | |
| Minisforum AtomMan X7 Ti | |
| Geekom AX8 Pro | |
| Aoostar GEM12 | |
| Acemagic F2A | |
| Geekom XT13 Pro | |
| 3DMark 11 - 1280x720 Performance Physics | |
| Geekom A8, R9 8945HS | |
| Geekom AX8 Pro | |
| Geekom AE7 | |
| Minisforum AtomMan X7 Ti | |
| Aoostar GEM12 | |
| Acemagic F2A | |
| Geekom XT13 Pro | |
| HWBOT x265 Benchmark v2.2 - 4k Preset | |
| Minisforum AtomMan X7 Ti | |
| Geekom A8, R9 8945HS | |
| Geekom AE7 | |
| Geekom AX8 Pro | |
| Aoostar GEM12 | |
| Acemagic F2A | |
| Geekom XT13 Pro | |
| R Benchmark 2.5 - Overall mean | |
| Geekom XT13 Pro | |
| Acemagic F2A | |
| Minisforum AtomMan X7 Ti | |
| Geekom AX8 Pro | |
| Aoostar GEM12 | |
| Geekom A8, R9 8945HS | |
| Geekom AE7 | |
| LibreOffice - 20 Documents To PDF | |
| Geekom AE7 | |
| Geekom A8, R9 8945HS | |
| Geekom AX8 Pro | |
| Minisforum AtomMan X7 Ti | |
| Aoostar GEM12 | |
| Geekom XT13 Pro | |
| Acemagic F2A | |
| WebXPRT 3 - Overall | |
| Geekom AE7 | |
| Geekom A8, R9 8945HS | |
| Geekom AX8 Pro | |
| Aoostar GEM12 | |
| Acemagic F2A | |
| Geekom XT13 Pro | |
| Minisforum AtomMan X7 Ti | |
| Mozilla Kraken 1.1 - Total | |
| Geekom XT13 Pro | |
| Acemagic F2A | |
| Minisforum AtomMan X7 Ti | |
| Aoostar GEM12 | |
| Geekom AE7 | |
| Geekom AX8 Pro | |
| Geekom A8, R9 8945HS | |
| 3DMark | |
| 1920x1080 Fire Strike Physics | |
| Geekom A8, R9 8945HS | |
| Geekom AX8 Pro | |
| Geekom AE7 | |
| Aoostar GEM12 | |
| Minisforum AtomMan X7 Ti | |
| Acemagic F2A | |
| Geekom XT13 Pro | |
| 2560x1440 Time Spy CPU | |
| Minisforum AtomMan X7 Ti | |
| Geekom A8, R9 8945HS | |
| Geekom AE7 | |
| Geekom AX8 Pro | |
| Aoostar GEM12 | |
| Acemagic F2A | |
| Geekom XT13 Pro | |
| Super Pi mod 1.5 XS 1M - 1M | |
| Geekom XT13 Pro | |
| Aoostar GEM12 | |
| Acemagic F2A | |
| Geekom AE7 | |
| Geekom A8, R9 8945HS | |
| Geekom AX8 Pro | |
| Minisforum AtomMan X7 Ti | |
| Super Pi mod 1.5 XS 2M - 2M | |
| Aoostar GEM12 | |
| Geekom AE7 | |
| Geekom A8, R9 8945HS | |
| Geekom AX8 Pro | |
| Geekom XT13 Pro | |
| Acemagic F2A | |
| Minisforum AtomMan X7 Ti | |
| Super Pi Mod 1.5 XS 32M - 32M | |
| Aoostar GEM12 | |
| Geekom AE7 | |
| Geekom AX8 Pro | |
| Geekom A8, R9 8945HS | |
| Geekom XT13 Pro | |
| Acemagic F2A | |
| Minisforum AtomMan X7 Ti | |
| Affinity Photo 2 - Combined (Multi CPU) | |
| Minisforum AtomMan X7 Ti | |
| Acemagic F2A | |
| Geekom A8, R9 8945HS | |
| Aoostar GEM12 | |
| Geekom AE7 | |
| Geekom AX8 Pro | |
| Geekom XT13 Pro | |
* ... smaller is better
AIDA64: FP32 Ray-Trace | FPU Julia | CPU SHA3 | CPU Queen | FPU SinJulia | FPU Mandel | CPU AES | CPU ZLib | FP64 Ray-Trace | CPU PhotoWorxx
| Performance rating | |
| Geekom AE7 | |
| Geekom AX8 Pro | |
| Aoostar GEM12 | |
| Average of class Mini PC | |
| Minisforum AtomMan X7 Ti | |
| Acemagic F2A | |
| Geekom XT13 Pro | |
| AIDA64 / FP32 Ray-Trace | |
| Geekom AE7 | |
| Aoostar GEM12 | |
| Average of class Mini PC (974 - 82725, n=97, last 2 years) | |
| Geekom AX8 Pro | |
| Acemagic F2A | |
| Minisforum AtomMan X7 Ti | |
| Geekom XT13 Pro | |
| AIDA64 / FPU Julia | |
| Geekom AE7 | |
| Aoostar GEM12 | |
| Geekom AX8 Pro | |
| Average of class Mini PC (6115 - 363782, n=97, last 2 years) | |
| Minisforum AtomMan X7 Ti | |
| Acemagic F2A | |
| Geekom XT13 Pro | |
| AIDA64 / CPU SHA3 | |
| Geekom AE7 | |
| Aoostar GEM12 | |
| Geekom AX8 Pro | |
| Minisforum AtomMan X7 Ti | |
| Average of class Mini PC (385 - 9475, n=97, last 2 years) | |
| Acemagic F2A | |
| Geekom XT13 Pro | |
| AIDA64 / CPU Queen | |
| Geekom AE7 | |
| Aoostar GEM12 | |
| Geekom AX8 Pro | |
| Geekom XT13 Pro | |
| Average of class Mini PC (20501 - 154404, n=80, last 2 years) | |
| Acemagic F2A | |
| Minisforum AtomMan X7 Ti | |
| AIDA64 / FPU SinJulia | |
| Geekom AE7 | |
| Aoostar GEM12 | |
| Geekom AX8 Pro | |
| Average of class Mini PC (1116 - 31931, n=97, last 2 years) | |
| Minisforum AtomMan X7 Ti | |
| Acemagic F2A | |
| Geekom XT13 Pro | |
| AIDA64 / FPU Mandel | |
| Geekom AE7 | |
| Aoostar GEM12 | |
| Geekom AX8 Pro | |
| Average of class Mini PC (3322 - 192994, n=97, last 2 years) | |
| Acemagic F2A | |
| Minisforum AtomMan X7 Ti | |
| Geekom XT13 Pro | |
| AIDA64 / CPU AES | |
| Geekom AE7 | |
| Geekom AX8 Pro | |
| Minisforum AtomMan X7 Ti | |
| Acemagic F2A | |
| Geekom XT13 Pro | |
| Aoostar GEM12 | |
| Average of class Mini PC (9915 - 204742, n=96, last 2 years) | |
| AIDA64 / CPU ZLib | |
| Minisforum AtomMan X7 Ti | |
| Acemagic F2A | |
| Average of class Mini PC (127.2 - 2431, n=97, last 2 years) | |
| Aoostar GEM12 | |
| Geekom AE7 | |
| Geekom AX8 Pro | |
| Geekom XT13 Pro | |
| AIDA64 / FP64 Ray-Trace | |
| Geekom AE7 | |
| Aoostar GEM12 | |
| Geekom AX8 Pro | |
| Average of class Mini PC (537 - 43587, n=97, last 2 years) | |
| Acemagic F2A | |
| Minisforum AtomMan X7 Ti | |
| Geekom XT13 Pro | |
| AIDA64 / CPU PhotoWorxx | |
| Minisforum AtomMan X7 Ti | |
| Average of class Mini PC (8069 - 96843, n=97, last 2 years) | |
| Geekom AE7 | |
| Aoostar GEM12 | |
| Geekom AX8 Pro | |
| Acemagic F2A | |
| Geekom XT13 Pro | |
Cinebench R15 Multi loop
The Cinebench R15 endurance loop is an extreme scenario and stresses the processor with recurring endurance tests to determine how well the cooling system works. Geekom itself specifies a TDP of 45 watts. This can only be achieved at the beginning and drops from the second run onwards. The continuous load reduces the performance of the AMD Ryzen 9 8945HS is reduced even further. Compared to the competitors, the final result is very sobering.

System performance
The system performance of the Geekom AX8 Pro is excellent and is slightly better than that of the comparison devices. However, no device makes a significant mistake. Even the Geekom XT13 Pro which brings up the rear in the comparison, also delivered adequate performance in everyday use in our test.
| AIDA64 / Memory Copy | |
| Minisforum AtomMan X7 Ti | |
| Geekom AX8 Pro | |
| Geekom AE7 | |
| Aoostar GEM12 | |
| Acemagic F2A | |
| Geekom XT13 Pro | |
| AIDA64 / Memory Read | |
| Minisforum AtomMan X7 Ti | |
| Acemagic F2A | |
| Geekom AE7 | |
| Geekom AX8 Pro | |
| Aoostar GEM12 | |
| Geekom XT13 Pro | |
| AIDA64 / Memory Write | |
| Geekom AX8 Pro | |
| Geekom AE7 | |
| Aoostar GEM12 | |
| Minisforum AtomMan X7 Ti | |
| Acemagic F2A | |
| Geekom XT13 Pro | |
| AIDA64 / Memory Latency | |
| Acemagic F2A | |
| Minisforum AtomMan X7 Ti | |
| Geekom AX8 Pro | |
| Geekom AE7 | |
| Aoostar GEM12 | |
| Geekom XT13 Pro | |
* ... smaller is better
| UL Procyon for Windows | |
| Overall Score Integer NPU | |
| Acemagic F2A | |
| Minisforum AtomMan X7 Ti | |
| Overall Score Integer GPU | |
| Acemagic F2A | |
| Aoostar GEM12 | |
| Minisforum AtomMan X7 Ti | |
| Geekom AX8 Pro | |
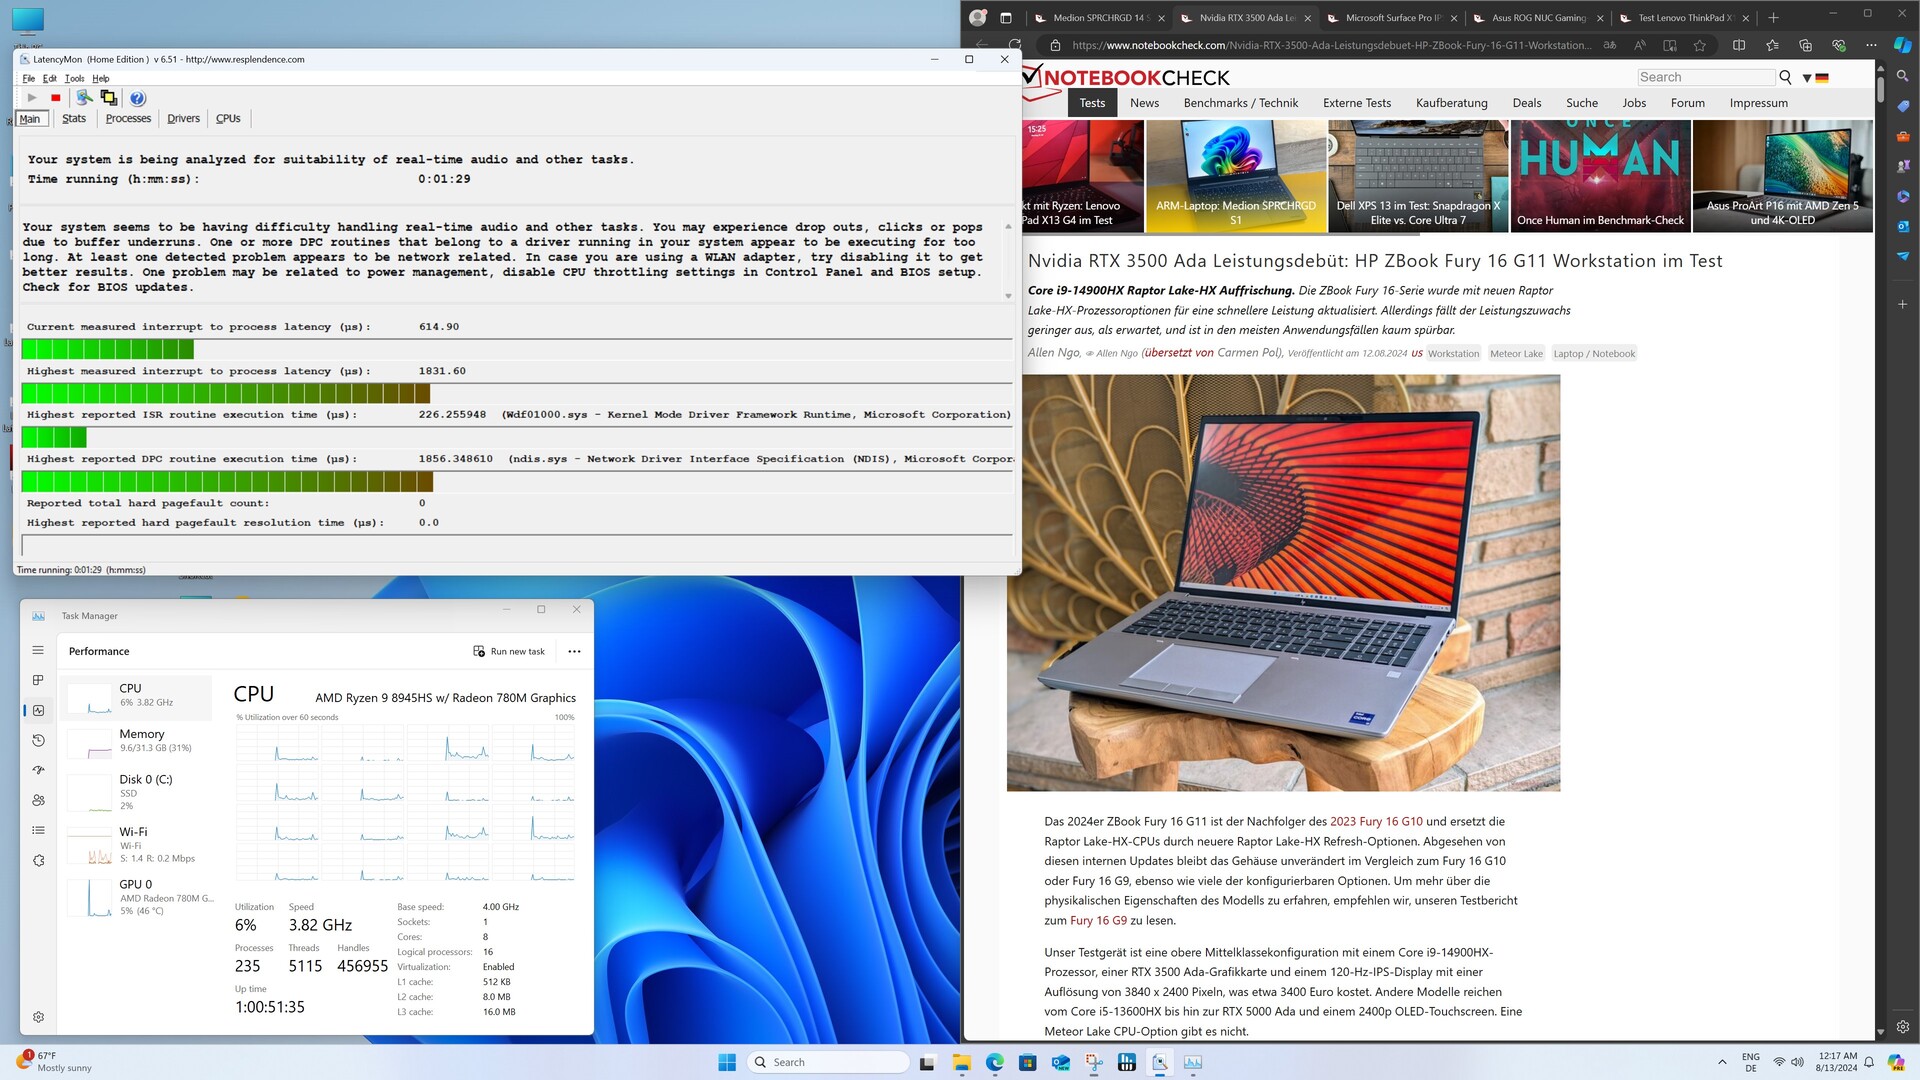
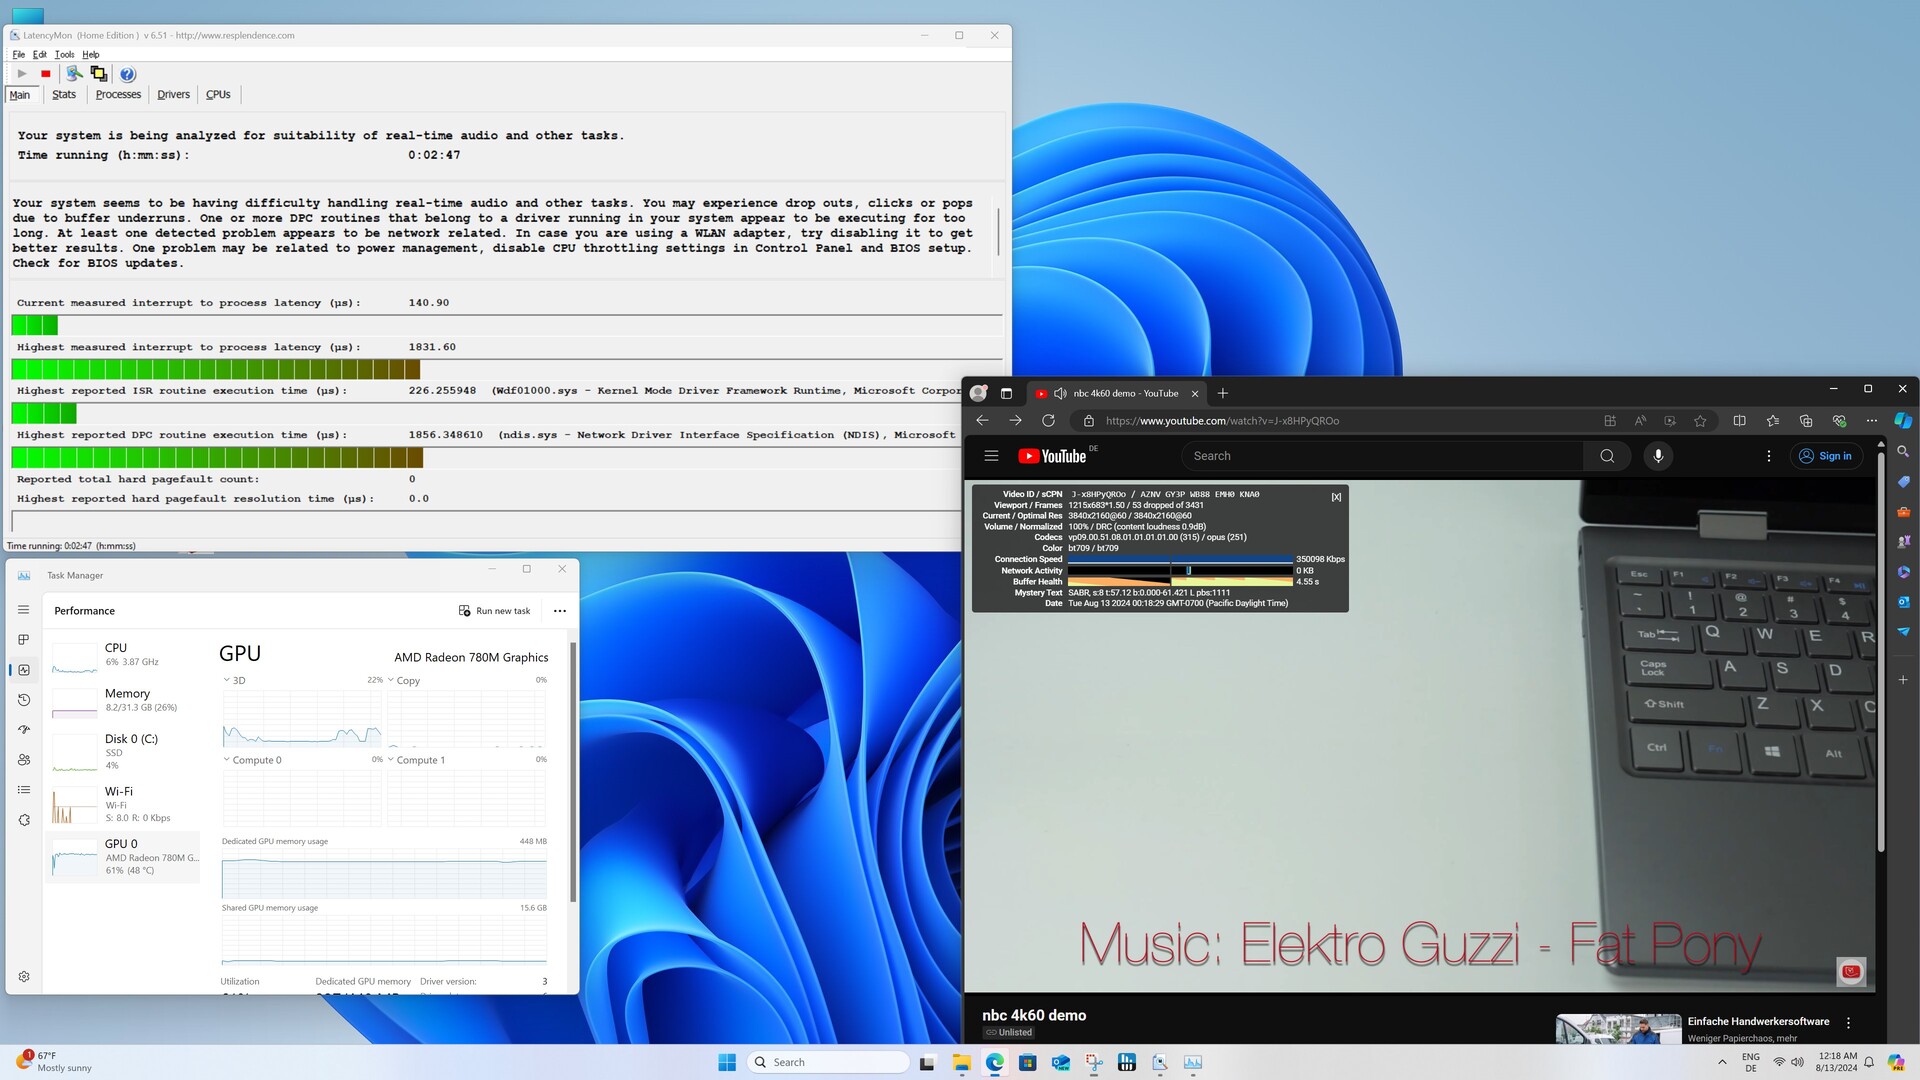
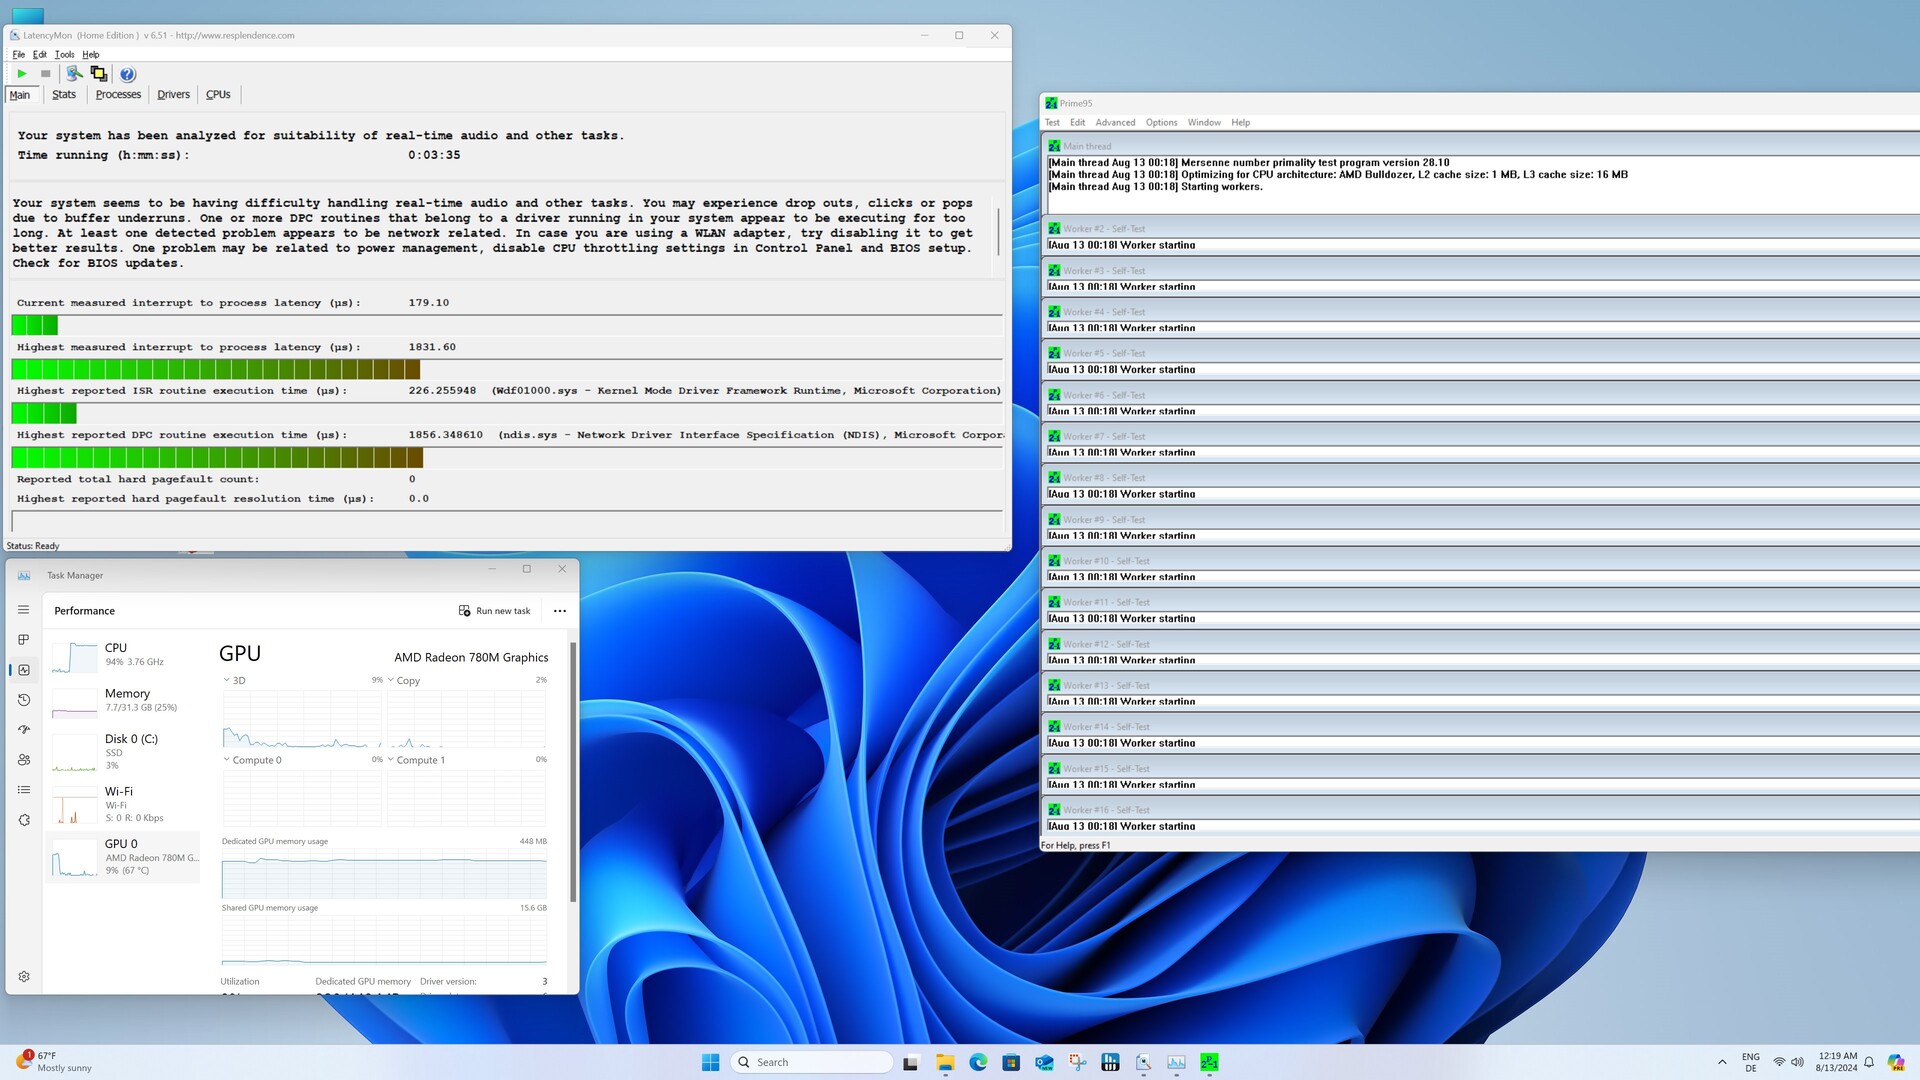
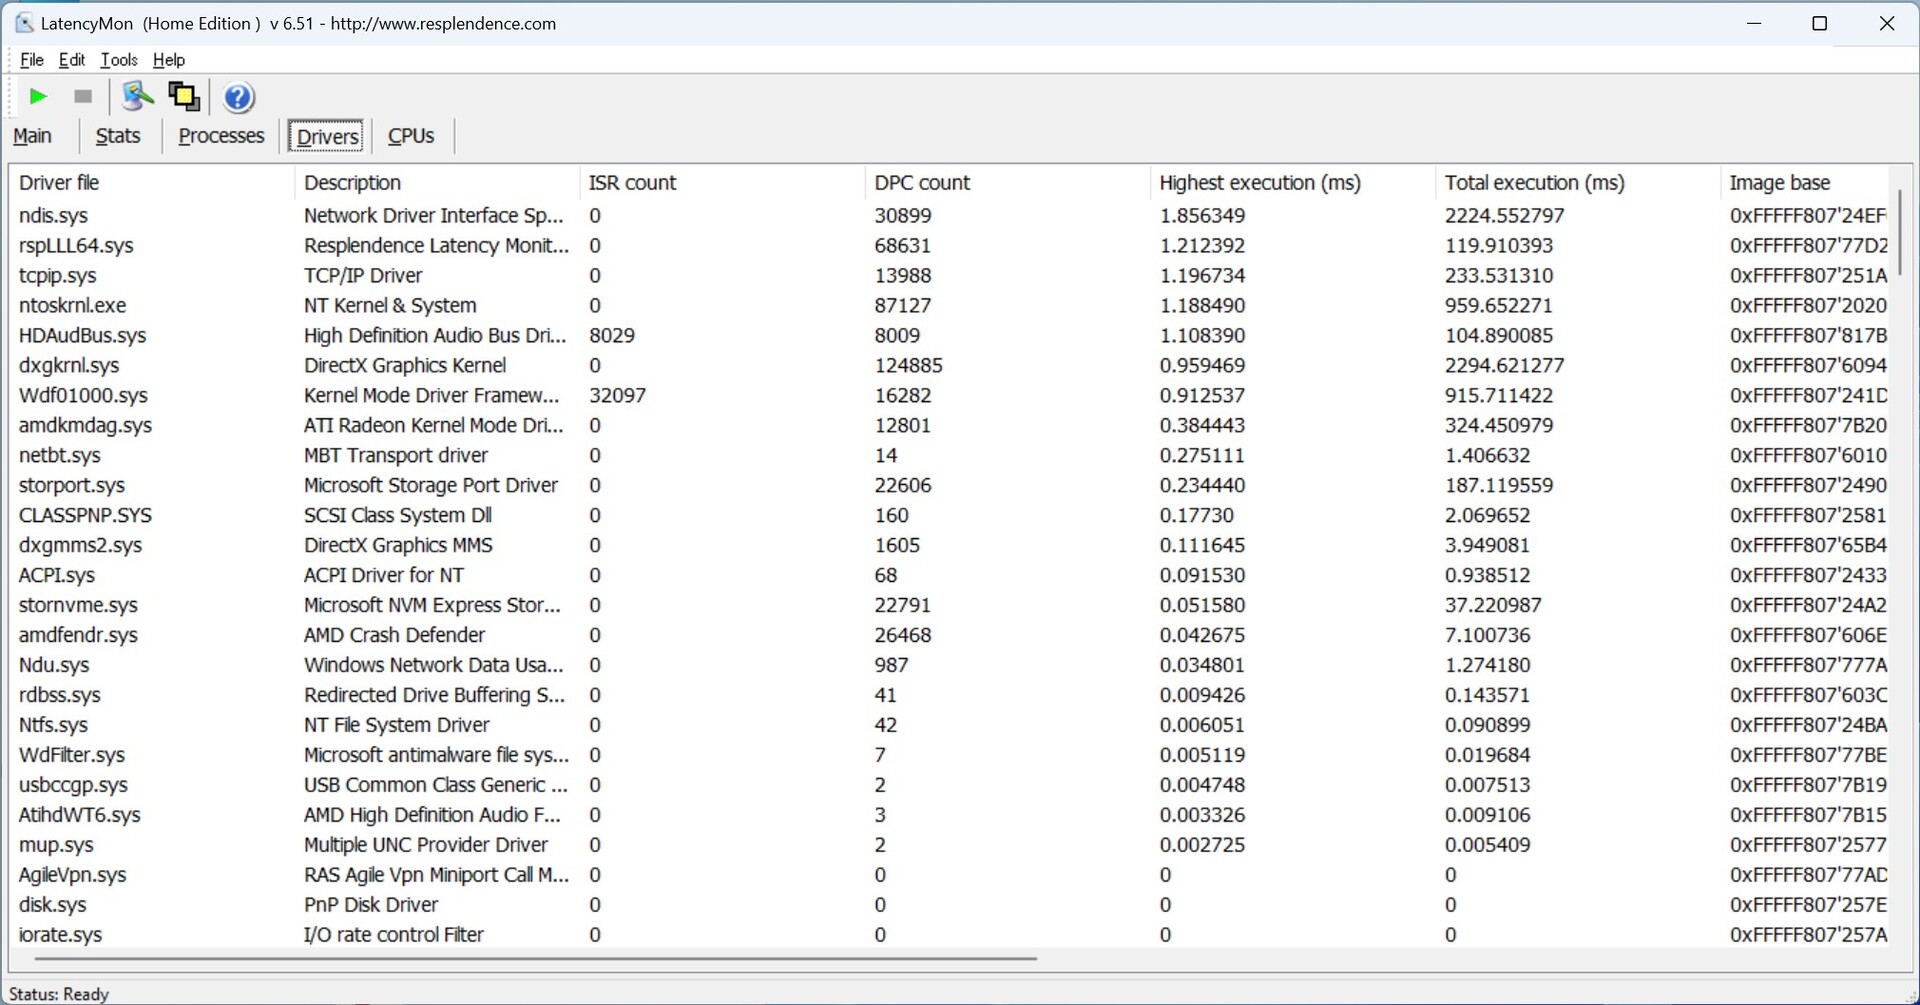
DPC latencies
The Geekom AX8 Pro is not convincing in terms of latency. We document similarly high values to the Geekom XT13 Pro. Even simply surfing the Internet results in high DPC values. The playback of the 4K test video and the short stress test have no negative influence on the DPC values. The utilization of the iGPU is noticeably high at over 60 percent during video playback. The iGPU of the Geekom A7 was only utilized to 30 percent in the same test. A similar result to the Geekom AX8 Pro was already delivered by the Geekom A8, which we also tested in the configuration with the AMD Ryzen 9 8945HS.
| DPC Latencies / LatencyMon - interrupt to process latency (max), Web, Youtube, Prime95 | |
| Acemagic F2A | |
| Geekom AE7 | |
| Minisforum AtomMan X7 Ti | |
| Geekom AX8 Pro | |
| Geekom XT13 Pro | |
| Aoostar GEM12 | |
* ... smaller is better
Mass storage

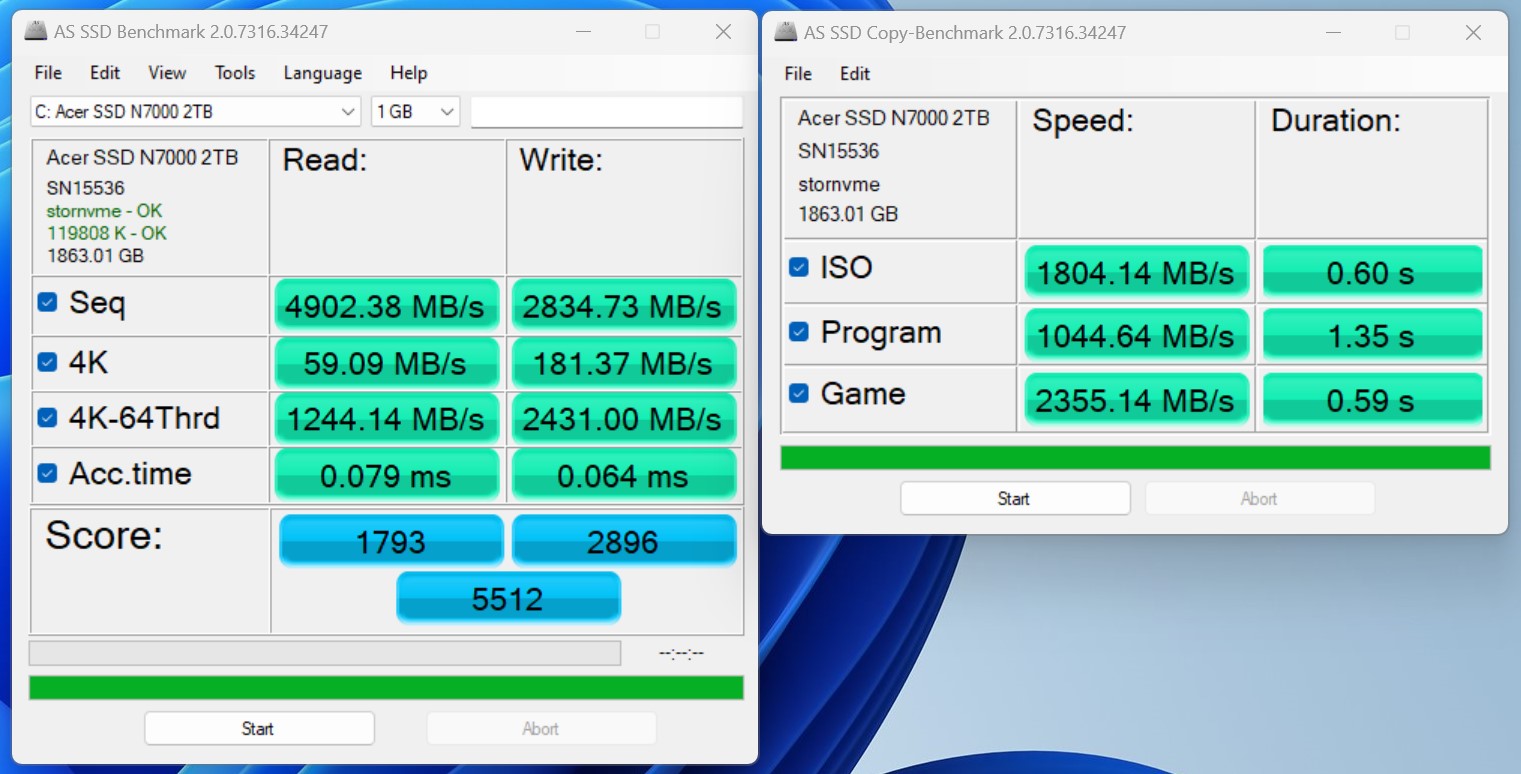
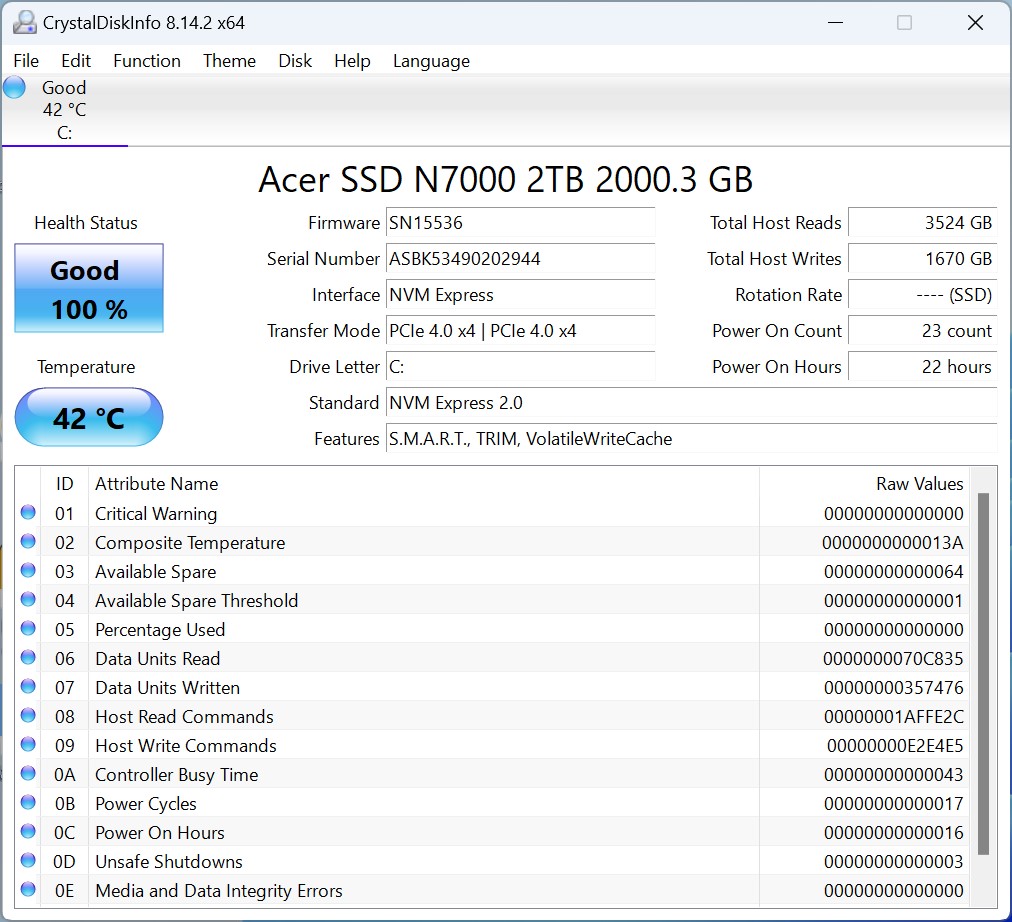
The Geekom AX8 Pro gets an SSD with 2 TB of storage space in the top configuration. More precisely, Geekom has installed an Acer N7000 here. Physically, the mass storage is optimally connected, resulting in high transfer rates in the test. Nevertheless, the SSD in the Geekom AX8 Pro cannot deliver the performance that we achieved with the Geekom XT13 Pro. There is no noticeable difference in performance during normal use. The stress test shows excellent performance. With one small exception, we documented a stable read performance. The passive cooling unit is sufficient to dissipate the heat quickly enough. Only one mass storage device can be installed in the Geekom AX8 Pro. This distinguishes our test sample from the Intel-based Geekom XT13 Pro, which can be equipped with a total of two mass storage devices.
For further comparisons and benchmarks, please take a look at our Comparison table.


| Drive Performance rating - Percent | |
| Aoostar GEM12 | |
| Geekom XT13 Pro | |
| Geekom AX8 Pro | |
| Geekom AE7 | |
| Minisforum AtomMan X7 Ti | |
| Average of class Mini PC | |
| Acemagic F2A | |
* ... smaller is better
Continuous read: DiskSpd Read Loop, Queue Depth 8
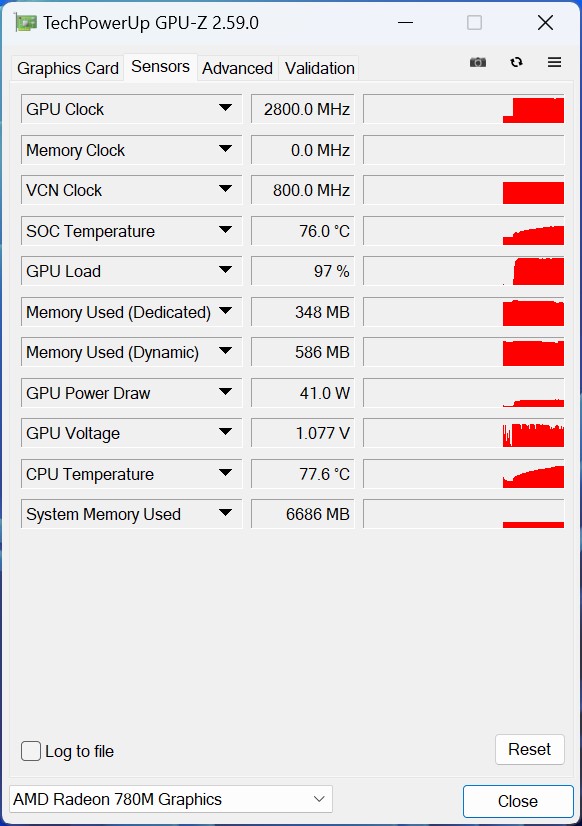
Graphics card
The AMD Ryzen 9 8945HS offers the AMD Radeon 780M - a very powerful iGPU, which was already used in the Ryzen 7000 SoCs. However, the performance has not changed significantly. Rather, it depends on what power limit the manufacturer grants the SoC and how powerful the built-in cooling unit is. Although the Geekom AX8 Pro does not necessarily offer a very powerful cooling unit, the results in terms of 3D performance are comparatively good. Our test sample can often outperform the Aoostar GEM12 which has a significantly more powerful cooling unit. However, we also see that a newer SoC does not guarantee better performance, as the Geekom AE7 can sometimes deliver better results. In the performance comparison, we also see, among other things, that AMD with the Radeon 780M outperforms the Intel Arc 8 with the Radeon 780M.
Further comparisons and benchmarks can be found in our GPU comparison table.
| 3DMark Performance rating - Percent | |
| Geekom AE7 | |
| Geekom AX8 Pro | |
| Aoostar GEM12 | |
| Acemagic F2A | |
| Minisforum AtomMan X7 Ti | |
| Geekom XT13 Pro | |
| 3DMark 11 - 1280x720 Performance GPU | |
| Geekom AE7 | |
| Aoostar GEM12 | |
| Geekom AX8 Pro | |
| Acemagic F2A | |
| Minisforum AtomMan X7 Ti | |
| Geekom XT13 Pro | |
| 3DMark | |
| 2560x1440 Time Spy Graphics | |
| Acemagic F2A | |
| Minisforum AtomMan X7 Ti | |
| Geekom AE7 | |
| Geekom AX8 Pro | |
| Aoostar GEM12 | |
| Geekom XT13 Pro | |
| 1920x1080 Fire Strike Graphics | |
| Geekom AE7 | |
| Geekom AX8 Pro | |
| Aoostar GEM12 | |
| Acemagic F2A | |
| Minisforum AtomMan X7 Ti | |
| Geekom XT13 Pro | |
| Performance rating - Percent | |
| Geekom AE7 | |
| Aoostar GEM12 | |
| Geekom AX8 Pro | |
| Minisforum AtomMan X7 Ti | |
| Acemagic F2A | |
| Geekom XT13 Pro | |
| Unigine Heaven 4.0 | |
| Extreme Preset OpenGL | |
| Aoostar GEM12 | |
| Geekom AE7 | |
| Acemagic F2A | |
| Geekom AX8 Pro | |
| Minisforum AtomMan X7 Ti | |
| Geekom XT13 Pro | |
| Extreme Preset DX11 | |
| Geekom AX8 Pro | |
| Aoostar GEM12 | |
| Geekom AE7 | |
| Minisforum AtomMan X7 Ti | |
| Acemagic F2A | |
| Geekom XT13 Pro | |
| Unigine Valley 1.0 | |
| 1920x1080 Extreme HD DirectX AA:x8 | |
| Aoostar GEM12 | |
| Geekom AE7 | |
| Geekom AX8 Pro | |
| Minisforum AtomMan X7 Ti | |
| Acemagic F2A | |
| Geekom XT13 Pro | |
| 1920x1080 Extreme HD Preset OpenGL AA:x8 | |
| Minisforum AtomMan X7 Ti | |
| Aoostar GEM12 | |
| Geekom AX8 Pro | |
| Geekom AE7 | |
| Acemagic F2A | |
| Geekom XT13 Pro | |
| Unigine Superposition | |
| 1280x720 720p Low | |
| Geekom AX8 Pro | |
| Aoostar GEM12 | |
| Geekom AE7 | |
| Acemagic F2A | |
| Minisforum AtomMan X7 Ti | |
| Geekom XT13 Pro | |
| 1920x1080 1080p High | |
| Geekom AE7 | |
| Aoostar GEM12 | |
| Geekom AX8 Pro | |
| Acemagic F2A | |
| Minisforum AtomMan X7 Ti | |
| Geekom XT13 Pro | |
| 1920x1080 1080p Extreme | |
| Acemagic F2A | |
| Minisforum AtomMan X7 Ti | |
| Geekom AE7 | |
| Aoostar GEM12 | |
| Geekom AX8 Pro | |
| Geekom XT13 Pro | |
| ComputeMark v2.1 | |
| 1024x600 Normal, Score | |
| Geekom AE7 | |
| Aoostar GEM12 | |
| Geekom AX8 Pro | |
| Acemagic F2A | |
| Minisforum AtomMan X7 Ti | |
| Geekom XT13 Pro | |
| 1024x600 Normal, Fluid 3DTex | |
| Geekom AX8 Pro | |
| Aoostar GEM12 | |
| Geekom AE7 | |
| Minisforum AtomMan X7 Ti | |
| Acemagic F2A | |
| Geekom XT13 Pro | |
| 1024x600 Normal, Fluid 2DTexArr | |
| Geekom AE7 | |
| Aoostar GEM12 | |
| Minisforum AtomMan X7 Ti | |
| Geekom AX8 Pro | |
| Acemagic F2A | |
| Geekom XT13 Pro | |
| 1024x600 Normal, Mandel Vector | |
| Geekom AE7 | |
| Aoostar GEM12 | |
| Geekom AX8 Pro | |
| Acemagic F2A | |
| Minisforum AtomMan X7 Ti | |
| Geekom XT13 Pro | |
| 1024x600 Normal, Mandel Scalar | |
| Geekom AE7 | |
| Aoostar GEM12 | |
| Geekom AX8 Pro | |
| Acemagic F2A | |
| Minisforum AtomMan X7 Ti | |
| Geekom XT13 Pro | |
| 1024x600 Normal, QJuliaRayTrace | |
| Geekom AE7 | |
| Aoostar GEM12 | |
| Acemagic F2A | |
| Geekom AX8 Pro | |
| Minisforum AtomMan X7 Ti | |
| Geekom XT13 Pro | |
| LuxMark v2.0 64Bit | |
| Room GPUs-only | |
| Geekom AX8 Pro | |
| Geekom AE7 | |
| Aoostar GEM12 | |
| Minisforum AtomMan X7 Ti | |
| Geekom XT13 Pro | |
| Acemagic F2A | |
| Sala GPUs-only | |
| Minisforum AtomMan X7 Ti | |
| Acemagic F2A | |
| Geekom AE7 | |
| Geekom AX8 Pro | |
| Geekom XT13 Pro | |
| Aoostar GEM12 | |
| Affinity Photo 2 - Combined (Single / Multi GPU) | |
| Minisforum AtomMan X7 Ti | |
| Acemagic F2A | |
| Geekom XT13 Pro | |
| Geekom AE7 | |
| Geekom AX8 Pro | |
| Aoostar GEM12 | |
| Geekom AX8 Pro, AMD Radeon 780M R9 8945HS | Aoostar GEM12, AMD Radeon 780M R7 8845HS | Geekom AE7, AMD Radeon 780M R9 7940HS | Geekom XT13 Pro, Intel Iris Xe Graphics G7 96EUs i9-13900H | Minisforum AtomMan X7 Ti, Intel Arc 8-Core iGPU Ultra 9 185H | Acemagic F2A, Intel Arc 8-Core iGPU Ultra 7 155H | Average of class Mini PC | |
|---|---|---|---|---|---|---|---|
| SPECviewperf 2020 | 2% | -4% | -66% | -53% | -56% | 102% | |
| 3840x2160 Medical (medical-03) (fps) | 12.8 | 11.2 -13% | 12.7 -1% | 3.63 -72% | 4.23 -67% | 5.05 -61% | 24.2 ? 89% |
| 3840x2160 Energy (energy-03) (fps) | 13.3 | 19.9 50% | 14.4 8% | 3.15 -76% | 6.03 -55% | 4.61 -65% | 36.2 ? 172% |
| 3840x2160 Creo (creo-03) (fps) | 35.3 | 33.4 -5% | 30.2 -14% | 16 -55% | 18.5 -48% | 17.9 -49% | 52 ? 47% |
| 3840x2160 CATIA (catia-06) (fps) | 25.1 | 23.2 -8% | 23.7 -6% | 7.9 -69% | 11.1 -56% | 10 -60% | 36.7 ? 46% |
| 3840x2160 3ds Max (3dsmax-07) (fps) | 21.1 | 20.4 -3% | 20.7 -2% | 10.3 -51% | 14.9 -29% | 12.9 -39% | 58.9 ? 179% |
| 3840x2160 Siemens NX (snx-04) (fps) | 65.7 | 64.1 -2% | 61.3 -7% | 6.13 -91% | 6.24 -91% | 5.7 -91% | 52.5 ? -20% |
| 3840x2160 Maya (maya-06) (fps) | 49.6 | 47.7 -4% | 47.4 -4% | 26.8 -46% | 37.7 -24% | 35.4 -29% | 150.1 ? 203% |
| 3DMark 05 Standard | 62727 points | |
| 3DMark 06 Standard Score | 43083 points | |
| 3DMark Vantage P Result | 39171 points | |
| 3DMark 11 Performance | 13206 points | |
| 3DMark Ice Storm Standard Score | 168337 points | |
| 3DMark Cloud Gate Standard Score | 36962 points | |
| 3DMark Fire Strike Score | 7504 points | |
| 3DMark Fire Strike Extreme Score | 4037 points | |
| 3DMark Time Spy Score | 3206 points | |
| 3DMark Steel Nomad Score | 510 points | |
| 3DMark Steel Nomad Light Score | 2756 points | |
Help | ||
Gaming performance
The good performance of the AMD Radeon 780M which we documented in the synthetic benchmarks, is also evident in the gaming tests. However, it should still be noted that this is an iGPU and cannot keep up with devices with dedicated graphics adapters. In a direct comparison with its competitors, the Geekom AX8 Pro largely confirms the performance of the AMD Radeon 780M. We have a slight performance disadvantage in newer games, which is due to the low power consumption of the SoC.
For a detailed overview of the iGPU's performance compared to other graphics cards, please refer to our GPU game list.
| GTA V | |
| 1024x768 Lowest Settings possible | |
| Geekom AX8 Pro | |
| Geekom AE7 | |
| Aoostar GEM12 | |
| Minisforum AtomMan X7 Ti | |
| Acemagic F2A | |
| Geekom XT13 Pro | |
| 1920x1080 High/On (Advanced Graphics Off) AA:2xMSAA + FX AF:8x | |
| Geekom AX8 Pro | |
| Aoostar GEM12 | |
| Geekom AE7 | |
| Minisforum AtomMan X7 Ti | |
| Acemagic F2A | |
| Geekom XT13 Pro | |
| Dota 2 Reborn | |
| 1280x720 min (0/3) fastest | |
| Geekom AE7 | |
| Geekom AX8 Pro | |
| Aoostar GEM12 | |
| Geekom XT13 Pro | |
| Minisforum AtomMan X7 Ti | |
| Acemagic F2A | |
| 1920x1080 high (2/3) | |
| Geekom AE7 | |
| Geekom AX8 Pro | |
| Aoostar GEM12 | |
| Minisforum AtomMan X7 Ti | |
| Acemagic F2A | |
| Geekom XT13 Pro | |
| Cyberpunk 2077 | |
| 1920x1080 Low Preset (FSR off) | |
| Geekom AE7 | |
| Aoostar GEM12 | |
| Geekom AX8 Pro | |
| Minisforum AtomMan X7 Ti | |
| Acemagic F2A | |
| Geekom XT13 Pro | |
| 1920x1080 High Preset (FSR off) | |
| Geekom AE7 | |
| Aoostar GEM12 | |
| Geekom AX8 Pro | |
| Minisforum AtomMan X7 Ti | |
| Acemagic F2A | |
| Geekom XT13 Pro | |
| Baldur's Gate 3 | |
| 1280x720 Low Preset AA:SM | |
| Geekom AE7 | |
| Geekom AX8 Pro | |
| Aoostar GEM12 | |
| Minisforum AtomMan X7 Ti | |
| Geekom XT13 Pro | |
| 1920x1080 High Preset AA:T | |
| Geekom AE7 | |
| Aoostar GEM12 | |
| Geekom AX8 Pro | |
| Minisforum AtomMan X7 Ti | |
| Geekom XT13 Pro | |
| F1 24 | |
| 1920x1080 Low Preset AA:T AF:16x | |
| Geekom AE7 | |
| Geekom AX8 Pro | |
| Minisforum AtomMan X7 Ti | |
| Acemagic F2A | |
| Geekom XT13 Pro | |
| 1920x1080 High Preset AA:T AF:16x | |
| Geekom AE7 | |
| Minisforum AtomMan X7 Ti | |
| Geekom AX8 Pro | |
| Acemagic F2A | |
| Geekom XT13 Pro | |
FPS chart
| low | med. | high | ultra | |
|---|---|---|---|---|
| GTA V (2015) | 169.4 | 158.3 | 65.9 | 27.7 |
| The Witcher 3 (2015) | 145.5 | 92.2 | 49.4 | 31.5 |
| Dota 2 Reborn (2015) | 157.5 | 116.1 | 88 | 81.2 |
| Final Fantasy XV Benchmark (2018) | 77.9 | 38.8 | 28.5 | |
| X-Plane 11.11 (2018) | 64.2 | 46.8 | 40.1 | |
| Baldur's Gate 3 (2023) | 38.5 | 29.9 | 24.5 | 24.4 |
| Cyberpunk 2077 (2023) | 41.3 | 31.8 | 25.8 | 21.7 |
| F1 24 (2024) | 83.4 | 70.9 | 51.3 |
Geekom AX8 Pro performance check with an Nvidia GeForce RTX 3060 Ti
As already mentioned with the connections, the Geekom AX8 Pro has a USB4 port, which enables the use of external graphics cards. We have conducted some tests in combination with the Razer Core X and an Nvidia GeForce RTX 3060 Ti made. The tests reveal a significant increase in performance compared to the AMD Radeon 780M. The Geekom AX8 Pro delivers almost identical performance to the comparison devices in the synthetic tests. In the gaming tests, the AMD-powered devices have some clear advantages.
In this combination, the mini PC can handle many games that were previously only playable with significant limitations. Sometimes the combination also delivers enough performance to enjoy games in 1,440p without having to sacrifice details.
| Performance rating - Percent | |
| Geekom GT13 Pro (Nvidia GeForce RTX 3060 Ti FE) | |
| Geekom AE7 (Nvidia GeForce RTX 3060 Ti FE) | |
| Geekom AX8 Pro (Nvidia GeForce RTX 3060 Ti FE) | |
| Minisforum UH125 Pro (Nvidia GeForce RTX 3060 Ti FE) | |
| 3DMark 11 - 1280x720 Performance GPU | |
| Geekom AX8 Pro (Nvidia GeForce RTX 3060 Ti FE) | |
| Geekom AE7 (Nvidia GeForce RTX 3060 Ti FE) | |
| Geekom GT13 Pro (Nvidia GeForce RTX 3060 Ti FE) | |
| Minisforum UH125 Pro (Nvidia GeForce RTX 3060 Ti FE) | |
| 3DMark | |
| 2560x1440 Time Spy Graphics | |
| Geekom AX8 Pro (Nvidia GeForce RTX 3060 Ti FE) | |
| Geekom AE7 (Nvidia GeForce RTX 3060 Ti FE) | |
| Geekom GT13 Pro (Nvidia GeForce RTX 3060 Ti FE) | |
| Minisforum UH125 Pro (Nvidia GeForce RTX 3060 Ti FE) | |
| 1920x1080 Fire Strike Graphics | |
| Geekom AE7 (Nvidia GeForce RTX 3060 Ti FE) | |
| Geekom AX8 Pro (Nvidia GeForce RTX 3060 Ti FE) | |
| Geekom GT13 Pro (Nvidia GeForce RTX 3060 Ti FE) | |
| Minisforum UH125 Pro (Nvidia GeForce RTX 3060 Ti FE) | |
| 3840x2160 Fire Strike Ultra Graphics | |
| Geekom GT13 Pro (Nvidia GeForce RTX 3060 Ti FE) | |
| Geekom AX8 Pro (Nvidia GeForce RTX 3060 Ti FE) | |
| Geekom AE7 (Nvidia GeForce RTX 3060 Ti FE) | |
| Minisforum UH125 Pro (Nvidia GeForce RTX 3060 Ti FE) | |
| Unigine Superposition | |
| 1280x720 720p Low | |
| Geekom AE7 (Nvidia GeForce RTX 3060 Ti FE) | |
| Geekom GT13 Pro (Nvidia GeForce RTX 3060 Ti FE) | |
| Geekom AX8 Pro (Nvidia GeForce RTX 3060 Ti FE) | |
| Minisforum UH125 Pro (Nvidia GeForce RTX 3060 Ti FE) | |
| 1920x1080 1080p High | |
| Geekom GT13 Pro (Nvidia GeForce RTX 3060 Ti FE) | |
| Geekom AX8 Pro (Nvidia GeForce RTX 3060 Ti FE) | |
| Geekom AE7 (Nvidia GeForce RTX 3060 Ti FE) | |
| Minisforum UH125 Pro (Nvidia GeForce RTX 3060 Ti FE) | |
| 1920x1080 1080p Extreme | |
| Geekom GT13 Pro (Nvidia GeForce RTX 3060 Ti FE) | |
| Geekom AX8 Pro (Nvidia GeForce RTX 3060 Ti FE) | |
| Minisforum UH125 Pro (Nvidia GeForce RTX 3060 Ti FE) | |
| Geekom AE7 (Nvidia GeForce RTX 3060 Ti FE) | |
| 3840x2160 4k Optimized | |
| Geekom GT13 Pro (Nvidia GeForce RTX 3060 Ti FE) | |
| Geekom AX8 Pro (Nvidia GeForce RTX 3060 Ti FE) | |
| Minisforum UH125 Pro (Nvidia GeForce RTX 3060 Ti FE) | |
| Geekom AE7 (Nvidia GeForce RTX 3060 Ti FE) | |
| 7680x4320 8k Optimized | |
| Geekom GT13 Pro (Nvidia GeForce RTX 3060 Ti FE) | |
| Geekom AX8 Pro (Nvidia GeForce RTX 3060 Ti FE) | |
| Minisforum UH125 Pro (Nvidia GeForce RTX 3060 Ti FE) | |
| Geekom AE7 (Nvidia GeForce RTX 3060 Ti FE) | |
| Unigine Valley 1.0 | |
| 1920x1080 Extreme HD DirectX AA:x8 | |
| Geekom GT13 Pro (Nvidia GeForce RTX 3060 Ti FE) | |
| Geekom AX8 Pro (Nvidia GeForce RTX 3060 Ti FE) | |
| Geekom AE7 (Nvidia GeForce RTX 3060 Ti FE) | |
| Minisforum UH125 Pro (Nvidia GeForce RTX 3060 Ti FE) | |
| 1920x1080 Extreme HD Preset OpenGL AA:x8 | |
| Geekom GT13 Pro (Nvidia GeForce RTX 3060 Ti FE) | |
| Geekom AX8 Pro (Nvidia GeForce RTX 3060 Ti FE) | |
| Geekom AE7 (Nvidia GeForce RTX 3060 Ti FE) | |
| Minisforum UH125 Pro (Nvidia GeForce RTX 3060 Ti FE) | |
| Unigine Heaven 4.0 | |
| Extreme Preset OpenGL | |
| Geekom AX8 Pro (Nvidia GeForce RTX 3060 Ti FE) | |
| Geekom AE7 (Nvidia GeForce RTX 3060 Ti FE) | |
| Geekom GT13 Pro (Nvidia GeForce RTX 3060 Ti FE) | |
| Minisforum UH125 Pro (Nvidia GeForce RTX 3060 Ti FE) | |
| Extreme Preset DX11 | |
| Geekom GT13 Pro (Nvidia GeForce RTX 3060 Ti FE) | |
| Geekom AX8 Pro (Nvidia GeForce RTX 3060 Ti FE) | |
| Geekom AE7 (Nvidia GeForce RTX 3060 Ti FE) | |
| Minisforum UH125 Pro (Nvidia GeForce RTX 3060 Ti FE) | |
| ComputeMark v2.1 | |
| 1024x600 Normal, Score | |
| Geekom GT13 Pro (Nvidia GeForce RTX 3060 Ti FE) | |
| Geekom AE7 (Nvidia GeForce RTX 3060 Ti FE) | |
| Minisforum UH125 Pro (Nvidia GeForce RTX 3060 Ti FE) | |
| Geekom AX8 Pro (Nvidia GeForce RTX 3060 Ti FE) | |
| 1024x600 Normal, Fluid 3DTex | |
| Geekom GT13 Pro (Nvidia GeForce RTX 3060 Ti FE) | |
| Geekom AE7 (Nvidia GeForce RTX 3060 Ti FE) | |
| Minisforum UH125 Pro (Nvidia GeForce RTX 3060 Ti FE) | |
| Geekom AX8 Pro (Nvidia GeForce RTX 3060 Ti FE) | |
| 1024x600 Normal, Fluid 2DTexArr | |
| Geekom GT13 Pro (Nvidia GeForce RTX 3060 Ti FE) | |
| Geekom AE7 (Nvidia GeForce RTX 3060 Ti FE) | |
| Minisforum UH125 Pro (Nvidia GeForce RTX 3060 Ti FE) | |
| Geekom AX8 Pro (Nvidia GeForce RTX 3060 Ti FE) | |
| 1024x600 Normal, Mandel Vector | |
| Geekom GT13 Pro (Nvidia GeForce RTX 3060 Ti FE) | |
| Geekom AE7 (Nvidia GeForce RTX 3060 Ti FE) | |
| Minisforum UH125 Pro (Nvidia GeForce RTX 3060 Ti FE) | |
| Geekom AX8 Pro (Nvidia GeForce RTX 3060 Ti FE) | |
| 1024x600 Normal, Mandel Scalar | |
| Geekom GT13 Pro (Nvidia GeForce RTX 3060 Ti FE) | |
| Geekom AE7 (Nvidia GeForce RTX 3060 Ti FE) | |
| Minisforum UH125 Pro (Nvidia GeForce RTX 3060 Ti FE) | |
| Geekom AX8 Pro (Nvidia GeForce RTX 3060 Ti FE) | |
| 1024x600 Normal, QJuliaRayTrace | |
| Geekom GT13 Pro (Nvidia GeForce RTX 3060 Ti FE) | |
| Geekom AE7 (Nvidia GeForce RTX 3060 Ti FE) | |
| Minisforum UH125 Pro (Nvidia GeForce RTX 3060 Ti FE) | |
| Geekom AX8 Pro (Nvidia GeForce RTX 3060 Ti FE) | |
| Performance rating - Percent | |
| Geekom AE7 (Nvidia GeForce RTX 3060 Ti FE) | |
| Geekom AX8 Pro (Nvidia GeForce RTX 3060 Ti FE) | |
| Geekom GT13 Pro (Nvidia GeForce RTX 3060 Ti FE) | |
| Minisforum UH125 Pro (Nvidia GeForce RTX 3060 Ti FE) | |
| Cyberpunk 2077 | |
| 1280x720 Low Preset (FSR off) | |
| Geekom AE7 (Nvidia GeForce RTX 3060 Ti FE) | |
| Geekom AX8 Pro (Nvidia GeForce RTX 3060 Ti FE) | |
| Geekom GT13 Pro (Nvidia GeForce RTX 3060 Ti FE) | |
| Minisforum UH125 Pro (Nvidia GeForce RTX 3060 Ti FE) | |
| 1920x1080 Medium Preset (FSR off) | |
| Geekom AE7 (Nvidia GeForce RTX 3060 Ti FE) | |
| Geekom AX8 Pro (Nvidia GeForce RTX 3060 Ti FE) | |
| Geekom GT13 Pro (Nvidia GeForce RTX 3060 Ti FE) | |
| Minisforum UH125 Pro (Nvidia GeForce RTX 3060 Ti FE) | |
| 1920x1080 Ultra Preset (FSR off) | |
| Geekom AE7 (Nvidia GeForce RTX 3060 Ti FE) | |
| Geekom AX8 Pro (Nvidia GeForce RTX 3060 Ti FE) | |
| Geekom GT13 Pro (Nvidia GeForce RTX 3060 Ti FE) | |
| Minisforum UH125 Pro (Nvidia GeForce RTX 3060 Ti FE) | |
| Baldur's Gate 3 | |
| 1920x1080 Low Preset AA:SM | |
| Geekom GT13 Pro (Nvidia GeForce RTX 3060 Ti FE) | |
| Geekom AX8 Pro (Nvidia GeForce RTX 3060 Ti FE) | |
| Geekom AE7 (Nvidia GeForce RTX 3060 Ti FE) | |
| Minisforum UH125 Pro (Nvidia GeForce RTX 3060 Ti FE) | |
| 1920x1080 Medium Preset AA:T | |
| Geekom GT13 Pro (Nvidia GeForce RTX 3060 Ti FE) | |
| Geekom AX8 Pro (Nvidia GeForce RTX 3060 Ti FE) | |
| Geekom AE7 (Nvidia GeForce RTX 3060 Ti FE) | |
| Minisforum UH125 Pro (Nvidia GeForce RTX 3060 Ti FE) | |
| 1920x1080 Ultra Preset AA:T | |
| Geekom GT13 Pro (Nvidia GeForce RTX 3060 Ti FE) | |
| Geekom AX8 Pro (Nvidia GeForce RTX 3060 Ti FE) | |
| Geekom AE7 (Nvidia GeForce RTX 3060 Ti FE) | |
| Minisforum UH125 Pro (Nvidia GeForce RTX 3060 Ti FE) | |
| F1 24 | |
| 1920x1080 Low Preset AA:T AF:16x | |
| Geekom AE7 (Nvidia GeForce RTX 3060 Ti FE) | |
| Geekom AX8 Pro (Nvidia GeForce RTX 3060 Ti FE) | |
| Geekom GT13 Pro (Nvidia GeForce RTX 3060 Ti FE) | |
| Minisforum UH125 Pro (Nvidia GeForce RTX 3060 Ti FE) | |
| 1920x1080 Medium Preset AA:T AF:16x | |
| Geekom AX8 Pro (Nvidia GeForce RTX 3060 Ti FE) | |
| Geekom AE7 (Nvidia GeForce RTX 3060 Ti FE) | |
| Geekom GT13 Pro (Nvidia GeForce RTX 3060 Ti FE) | |
| Minisforum UH125 Pro (Nvidia GeForce RTX 3060 Ti FE) | |
| 1920x1080 High Preset AA:T AF:16x | |
| Geekom AX8 Pro (Nvidia GeForce RTX 3060 Ti FE) | |
| Geekom AE7 (Nvidia GeForce RTX 3060 Ti FE) | |
| Geekom GT13 Pro (Nvidia GeForce RTX 3060 Ti FE) | |
| Minisforum UH125 Pro (Nvidia GeForce RTX 3060 Ti FE) | |
| Geekom AX8 Pro, AMD Radeon 780M R9 8945HS | Geekom AX8 Pro (Nvidia GeForce RTX 3060 Ti FE), R9 8945HS | Geekom AE7 (Nvidia GeForce RTX 3060 Ti FE), R9 7940HS | Minisforum UH125 Pro (Nvidia GeForce RTX 3060 Ti FE), Ultra 5 125H | Geekom GT13 Pro (Nvidia GeForce RTX 3060 Ti FE), i9-13900H | Average of class Mini PC | |
|---|---|---|---|---|---|---|
| SPECviewperf 2020 | 82% | 83% | -9% | 80% | 102% | |
| 3840x2160 Medical (medical-03) (fps) | 12.8 | 13 2% | 13 2% | 10.9 -15% | 10.8 -16% | 24.2 ? 89% |
| 3840x2160 Energy (energy-03) (fps) | 13.3 | 21 58% | 20.9 57% | 17.8 34% | 21 58% | 36.2 ? 172% |
| 3840x2160 Creo (creo-03) (fps) | 35.3 | 77.2 119% | 76.8 118% | 26.6 -25% | 76.4 116% | 52 ? 47% |
| 3840x2160 CATIA (catia-06) (fps) | 25.1 | 39.2 56% | 39.2 56% | 23.6 -6% | 40.1 60% | 36.7 ? 46% |
| 3840x2160 3ds Max (3dsmax-07) (fps) | 21.1 | 46.1 118% | 46.5 120% | 28.7 36% | 47.3 124% | 58.9 ? 179% |
| 3840x2160 Siemens NX (snx-04) (fps) | 65.7 | 16.7 -75% | 16.6 -75% | 11.4 -83% | 16.5 -75% | 52.5 ? -20% |
| 3840x2160 Maya (maya-06) (fps) | 49.6 | 198 299% | 199 301% | 47.5 -4% | 196 295% | 150.1 ? 203% |
| low | med. | high | ultra | QHD | 4K | |
|---|---|---|---|---|---|---|
| Dota 2 Reborn (2015) | 179 | 161.1 | 158.7 | 142.1 | 111.4 | |
| Final Fantasy XV Benchmark (2018) | 212 | 144.4 | 99.2 | 78 | 48.4 | |
| X-Plane 11.11 (2018) | 138.2 | 122.2 | 92.4 | 80 | ||
| Baldur's Gate 3 (2023) | 110.9 | 89.4 | 78.7 | 78.2 | 60.5 | 37 |
| Cyberpunk 2077 (2023) | 95.4 | 81.5 | 71.7 | 64.3 | 44.7 | 22.3 |
| F1 24 (2024) | 86.5 | 82.3 | 68.7 | 47.5 | 37 | 15 |
Emissions
Noise emissions
Due to its compact design, the Geekom AX8 Pro is equipped with a small cooling unit. When idling, it operates silently, which is excellent. However, this quickly changes under load, and at 50 dB(A) we measured a sound pressure level that cannot be ignored. The high-frequency fan noise contributes to the fact that the volume is subjectively perceived as even louder. The performance profile for the fan speed is activated by default in the BIOS. Alternatively, there are two other options to choose from. We also carried out a stress test with the quiet fan profile and were only able to measure a slight improvement. At 48 dB(A), the device is still significantly louder than some of its competitors. The design, in combination with the powerful hardware, is a major obstacle when it comes to operating noise.
Noise level
| Idle |
| 24.9 / 24.9 / 24.9 dB(A) |
| Load |
| 50.1 / 50.2 dB(A) |
 | ||
30 dB silent 40 dB(A) audible 50 dB(A) loud |
||
min: | ||
| Geekom AX8 Pro R9 8945HS, Radeon 780M | Aoostar GEM12 R7 8845HS, Radeon 780M | Geekom AE7 R9 7940HS, Radeon 780M | Geekom XT13 Pro i9-13900H, Iris Xe G7 96EUs | Minisforum AtomMan X7 Ti Ultra 9 185H, Arc 8-Core | Acemagic F2A Ultra 7 155H, Arc 8-Core | |
|---|---|---|---|---|---|---|
| Noise | 7% | -1% | -2% | -3% | -0% | |
| off / environment * (dB) | 24.9 | 24.3 2% | 24.4 2% | 25 -0% | 24.1 3% | 24.9 -0% |
| Idle Minimum * (dB) | 24.9 | 27.5 -10% | 24.9 -0% | 27.6 -11% | 29.8 -20% | 25.4 -2% |
| Idle Average * (dB) | 24.9 | 27.6 -11% | 25 -0% | 27.8 -12% | 29.9 -20% | 25.7 -3% |
| Idle Maximum * (dB) | 24.9 | 27.6 -11% | 25 -0% | 27.9 -12% | 30 -20% | 25.7 -3% |
| Load Average * (dB) | 50.1 | 36 28% | 52 -4% | 42.2 16% | 37.3 26% | 47.8 5% |
| Cyberpunk 2077 ultra * (dB) | 50 | 35.4 29% | 52 -4% | 46.6 7% | ||
| Load Maximum * (dB) | 50.2 | 38.2 24% | 51.4 -2% | 49.5 1% | 43.5 13% | 49 2% |
| Witcher 3 ultra * (dB) | 35.4 | 40.2 | 45.23 |
* ... smaller is better
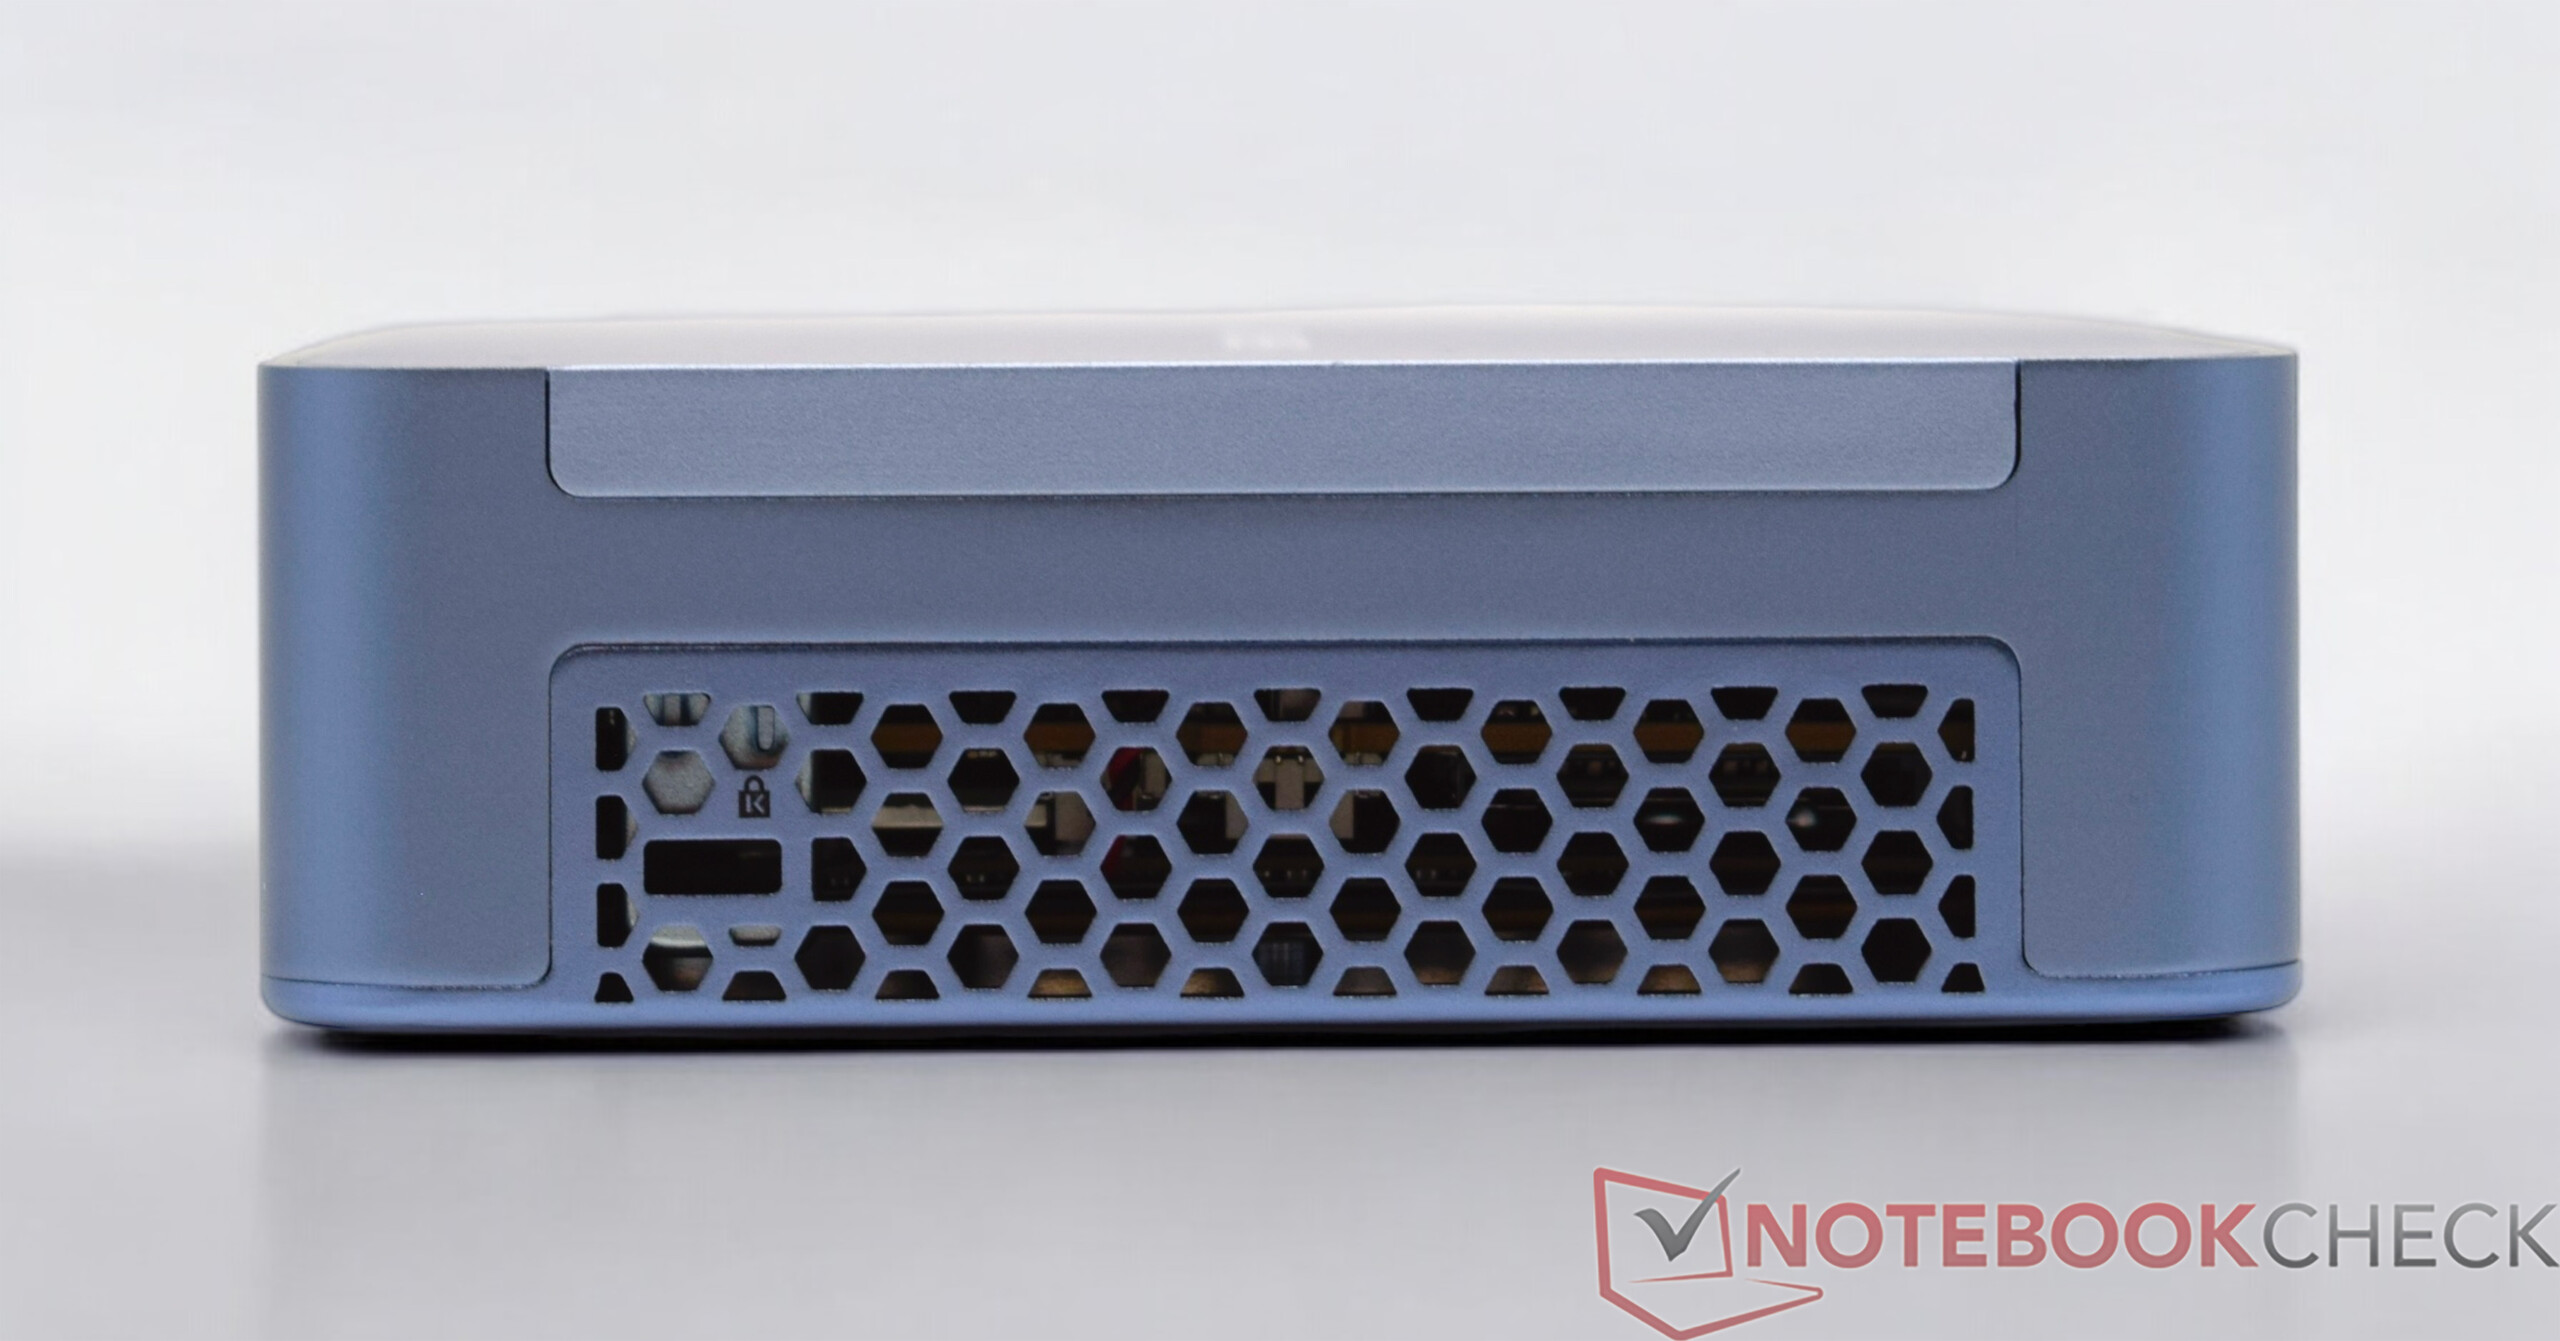
Temperature
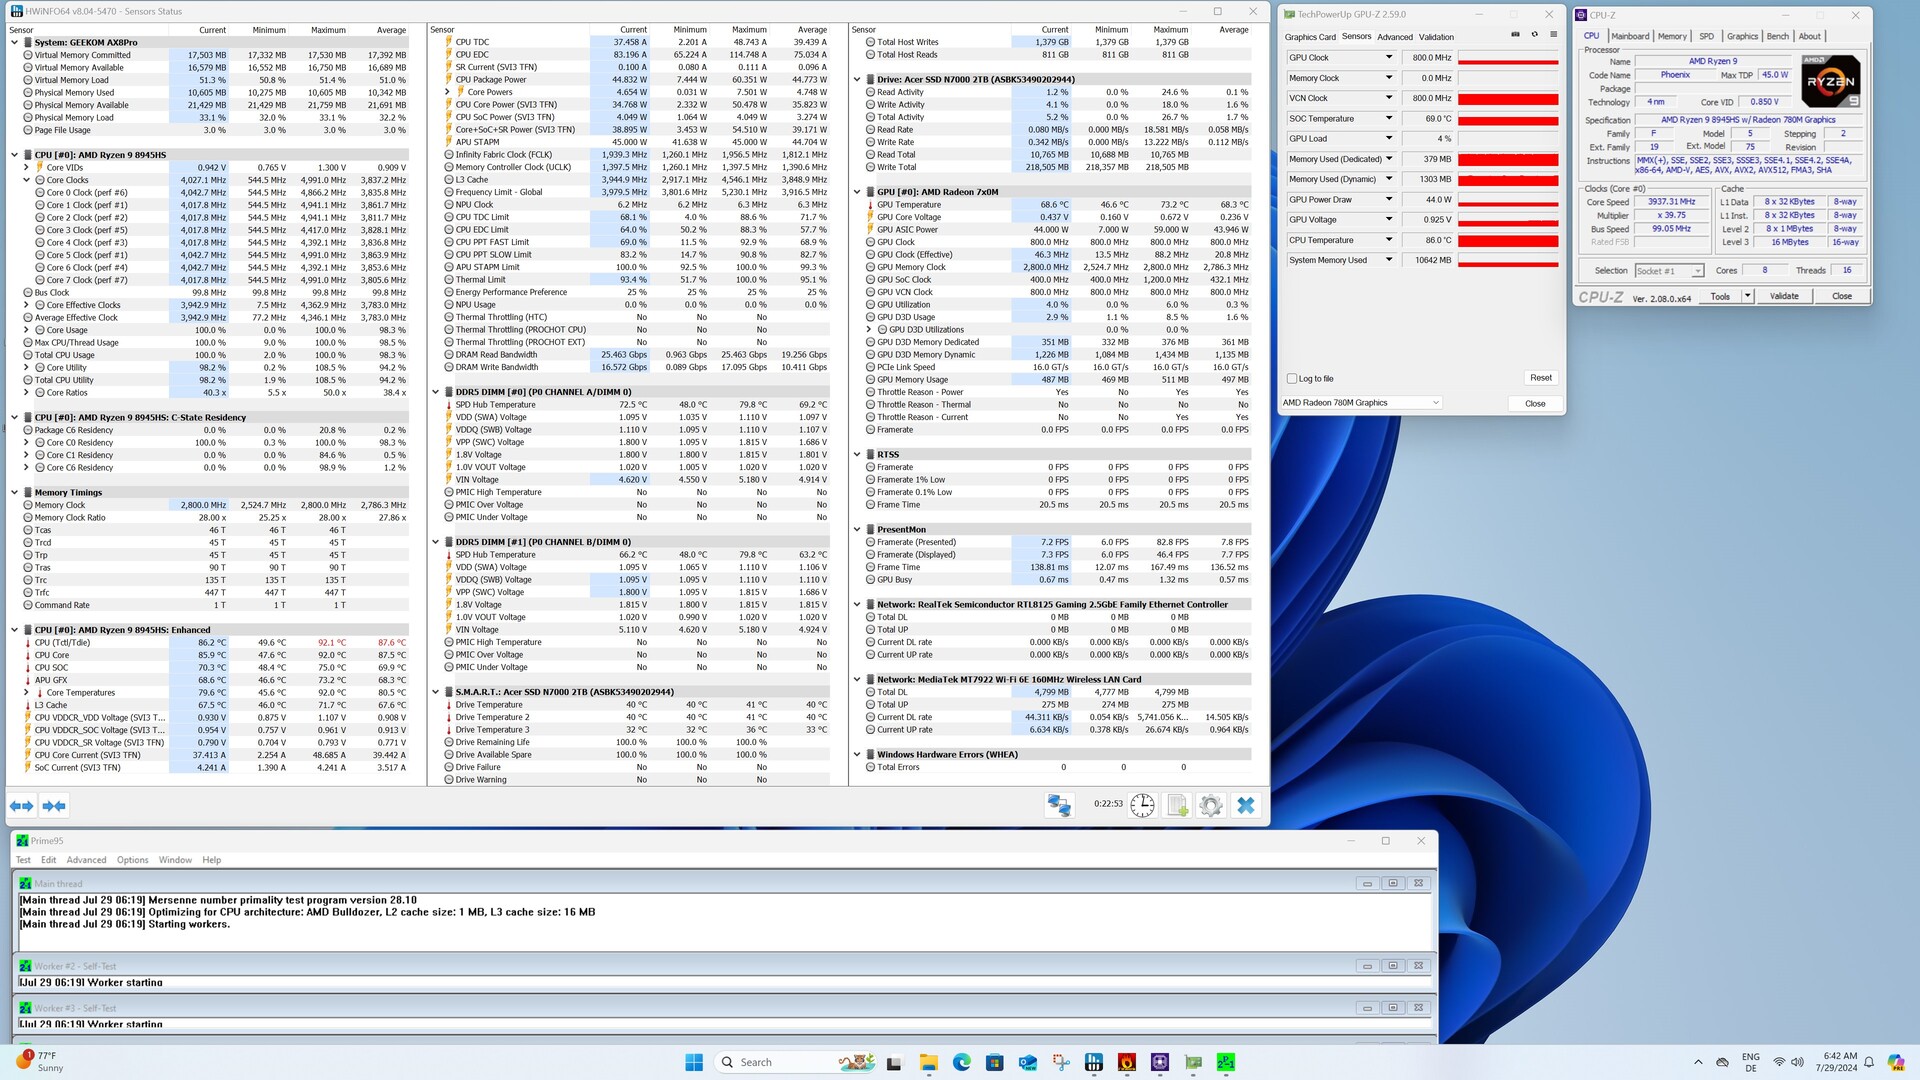
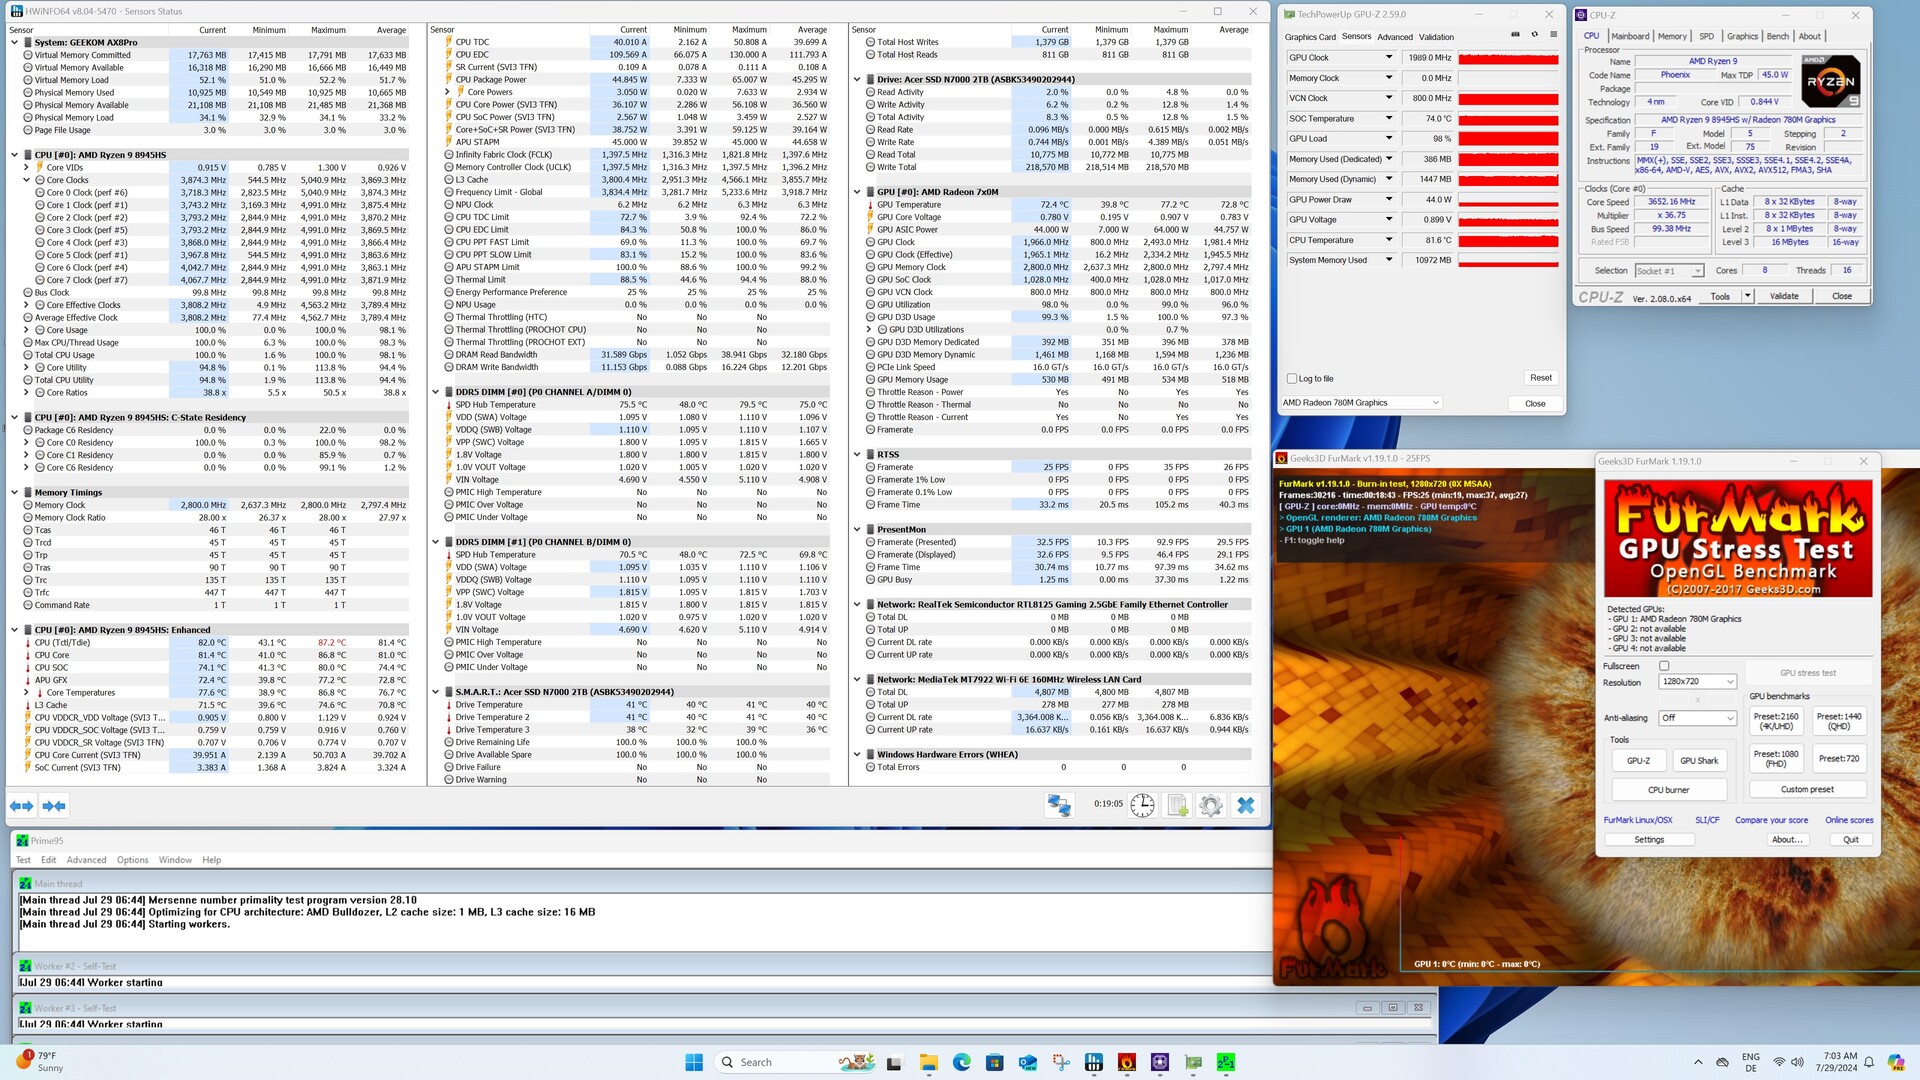
We were unable to document any critical surface temperatures when idling or under load. Fresh air is drawn in at the sides, which is then expelled out of the casing at the rear. The temperatures at the rear are correspondingly slightly higher. With the AMD Ryzen 9 8945HS, we reached just under 93 °C in the stress test, which is not yet a cause for concern. According to AMD, the SoC is specified with a maximum operating temperature of up to 100 °C. The maximum value achieved in our test is only reached for a short time, as the SoC is allowed a maximum of 60 watts. In the Prime95 stress test, the average CPU temperature stabilizes at 87 °C, although a permanent power consumption of 45 watts is achieved.


(±) The maximum temperature on the upper side is 40.8 °C / 105 F, compared to the average of 35.4 °C / 96 F, ranging from 20.6 to 69.5 °C for the class Mini PC.
(+) The bottom heats up to a maximum of 36.8 °C / 98 F, compared to the average of 36.1 °C / 97 F
(+) In idle usage, the average temperature for the upper side is 30.5 °C / 87 F, compared to the device average of 32.1 °C / 90 F.
Power consumption
The Geekom AX8 Pro surprises with good results in terms of energy consumption. However, our test sample is not one of the most economical devices. The Geekom AX8 Pro requires more energy than its competitors, especially when idle. The average power consumption under load settles at 76.4 watts, which is about the same compared to devices that are also equipped with AMD SoCs. A maximum of 99.1 watts is demanded from the 120-watt power supply unit.


| Off / Standby | |
| Idle | |
| Load |
|
Key:
min: | |
| Geekom AX8 Pro R9 8945HS, Radeon 780M | Aoostar GEM12 R7 8845HS, Radeon 780M | Geekom AE7 R9 7940HS, Radeon 780M | Geekom XT13 Pro i9-13900H, Iris Xe G7 96EUs | Minisforum AtomMan X7 Ti Ultra 9 185H, Arc 8-Core | Acemagic F2A Ultra 7 155H, Arc 8-Core | Average AMD Radeon 780M | Average of class Mini PC | |
|---|---|---|---|---|---|---|---|---|
| Power Consumption | 11% | 26% | 34% | 24% | 23% | 40% | 21% | |
| Idle Minimum * (Watt) | 14 | 8.2 41% | 4.5 68% | 6.3 55% | 8.2 41% | 9.1 35% | 6.01 ? 57% | 8.63 ? 38% |
| Idle Average * (Watt) | 15.9 | 10 37% | 4.7 70% | 7.1 55% | 12.1 24% | 10.3 35% | 8.15 ? 49% | 10.8 ? 32% |
| Idle Maximum * (Watt) | 19.5 | 14.6 25% | 8.1 58% | 9 54% | 14 28% | 14.4 26% | 10.3 ? 47% | 13.5 ? 31% |
| Load Average * (Watt) | 76.4 | 73.9 3% | 81.8 -7% | 49.8 35% | 53.1 30% | 54.9 28% | 57.6 ? 25% | 63.6 ? 17% |
| Cyberpunk 2077 ultra external monitor * (Watt) | 54.3 | 79.9 -47% | 71.2 -31% | 54 1% | ||||
| Load Maximum * (Watt) | 99.1 | 95.3 4% | 100.3 -1% | 94.5 5% | 100.4 -1% | 110.4 -11% | 77 ? 22% | 110.9 ? -12% |
* ... smaller is better
Efficiency
| Performance rating - Percent | |
| Geekom AE7 | |
| Geekom AX8 Pro | |
| Minisforum AtomMan X7 Ti | |
| Acemagic F2A | |
| Geekom XT13 Pro | |
| Power Consumption | |
| Cinebench R23 Multi Power Efficiency - external Monitor | |
| Geekom AE7 | |
| Geekom AX8 Pro | |
| Minisforum AtomMan X7 Ti | |
| Geekom XT13 Pro | |
| Acemagic F2A | |
| Cinebench R23 Single Power Efficiency - external Monitor | |
| Geekom AE7 | |
| Geekom AX8 Pro | |
| Minisforum AtomMan X7 Ti | |
| Acemagic F2A | |
| Geekom XT13 Pro | |
| Cinebench R15 Multi Efficiency (external Monitor) | |
| Geekom AX8 Pro | |
| Geekom AE7 | |
| Minisforum AtomMan X7 Ti | |
| Geekom XT13 Pro | |
| Acemagic F2A | |
Power consumption with the external monitor
Power consumption with the external monitor
Pros
Cons
Verdict - Stylish mini PC with good performance

The Geekom AX8 Pro is based on a NUC platform and features the AMD Ryzen 9 8945HS, which offers a lot of performance. However, the compact design prevents better performance development with a lower noise level. The design of the Geekom AX8 Pro is not fundamentally new, as other devices on the same basis have also shown similar weaknesses in terms of emissions. In terms of color, the Geekom AX8 Pro clearly stands out from identical devices with Intel processors. However, whether you like the blue color concept is a matter of opinion. In order to bring a breath of fresh air into the manufacturer's portfolio, Geekom should consider whether they want to continue with the design. A compact mini PC with plenty of power is certainly a good approach. However, the daily background noise on the desk is anything but pleasant. The competitors show that things can be done differently if you don't necessarily focus on the compact design.
The Geekom AX8 Pro is a stylish mini PC with great performance. To keep up with the competition, it needs a little more than just a new coat of paint.
All in all, the Geekom AX8 Pro is a great mini PC that offers too much performance for simple office users. The slightly weaker model based on the AMD Ryzen 7 8845HS could be a good alternative, which is also a little easier on the wallet. Geekom makes a few compromises when it comes to external connections. However, the Geekom AX8 Pro offers all the important connections. Even a USB4 interface is installed. However, the Geekom AX8 Pro is a long way from perfect connectivity. Many mini PCs are already equipped with two USB4 ports and an OCuLink connection. Thunderbolt support is also not available. If you are dependent on this, you should take a closer look at the current Asus NUC 14 Pro devices.
These are certainly all points of criticism at a high level. However, in relation to the current purchase price of 999 euros (RRP: 1,099 euros), the points of criticism are justified. Anyone who spends that much money on a mini PC is unlikely to want to compromise. What's more, its competitors are often cheaper. First and foremost the Minisforum AtomMan X7 Ti should be mentioned.
Note: We have recently updated our rating system and the results of version 8 are not comparable with the results of version 7. Further information can be found here.
Price and availability
At the time of writing, users can order the Geekom AX8 Pro on Geekom's official webstore. Alternatively, Amazon also lists the mini PC with prices starting at $750.
Geekom AX8 Pro
- 08/16/2024 v8
Sebastian Bade
 Total Sustainability Score:
 Transparency
The selection of devices to be reviewed is made by our editorial team. The test sample was provided to the author as a loan by the manufacturer or retailer for the purpose of this review. The lender had no influence on this review, nor did the manufacturer receive a copy of this review before publication. There was no obligation to publish this review. As an independent media company, Notebookcheck is not subjected to the authority of manufacturers, retailers or publishers.
This is how Notebookcheck is testing
Every year, Notebookcheck independently reviews hundreds of laptops and smartphones using standardized procedures to ensure that all results are comparable. We have continuously developed our test methods for around 20 years and set industry standards in the process. In our test labs, high-quality measuring equipment is utilized by experienced technicians and editors. These tests involve a multi-stage validation process. Our complex rating system is based on hundreds of well-founded measurements and benchmarks, which maintains objectivity. Further information on our test methods can be found here.
Price comparison

