Verdict
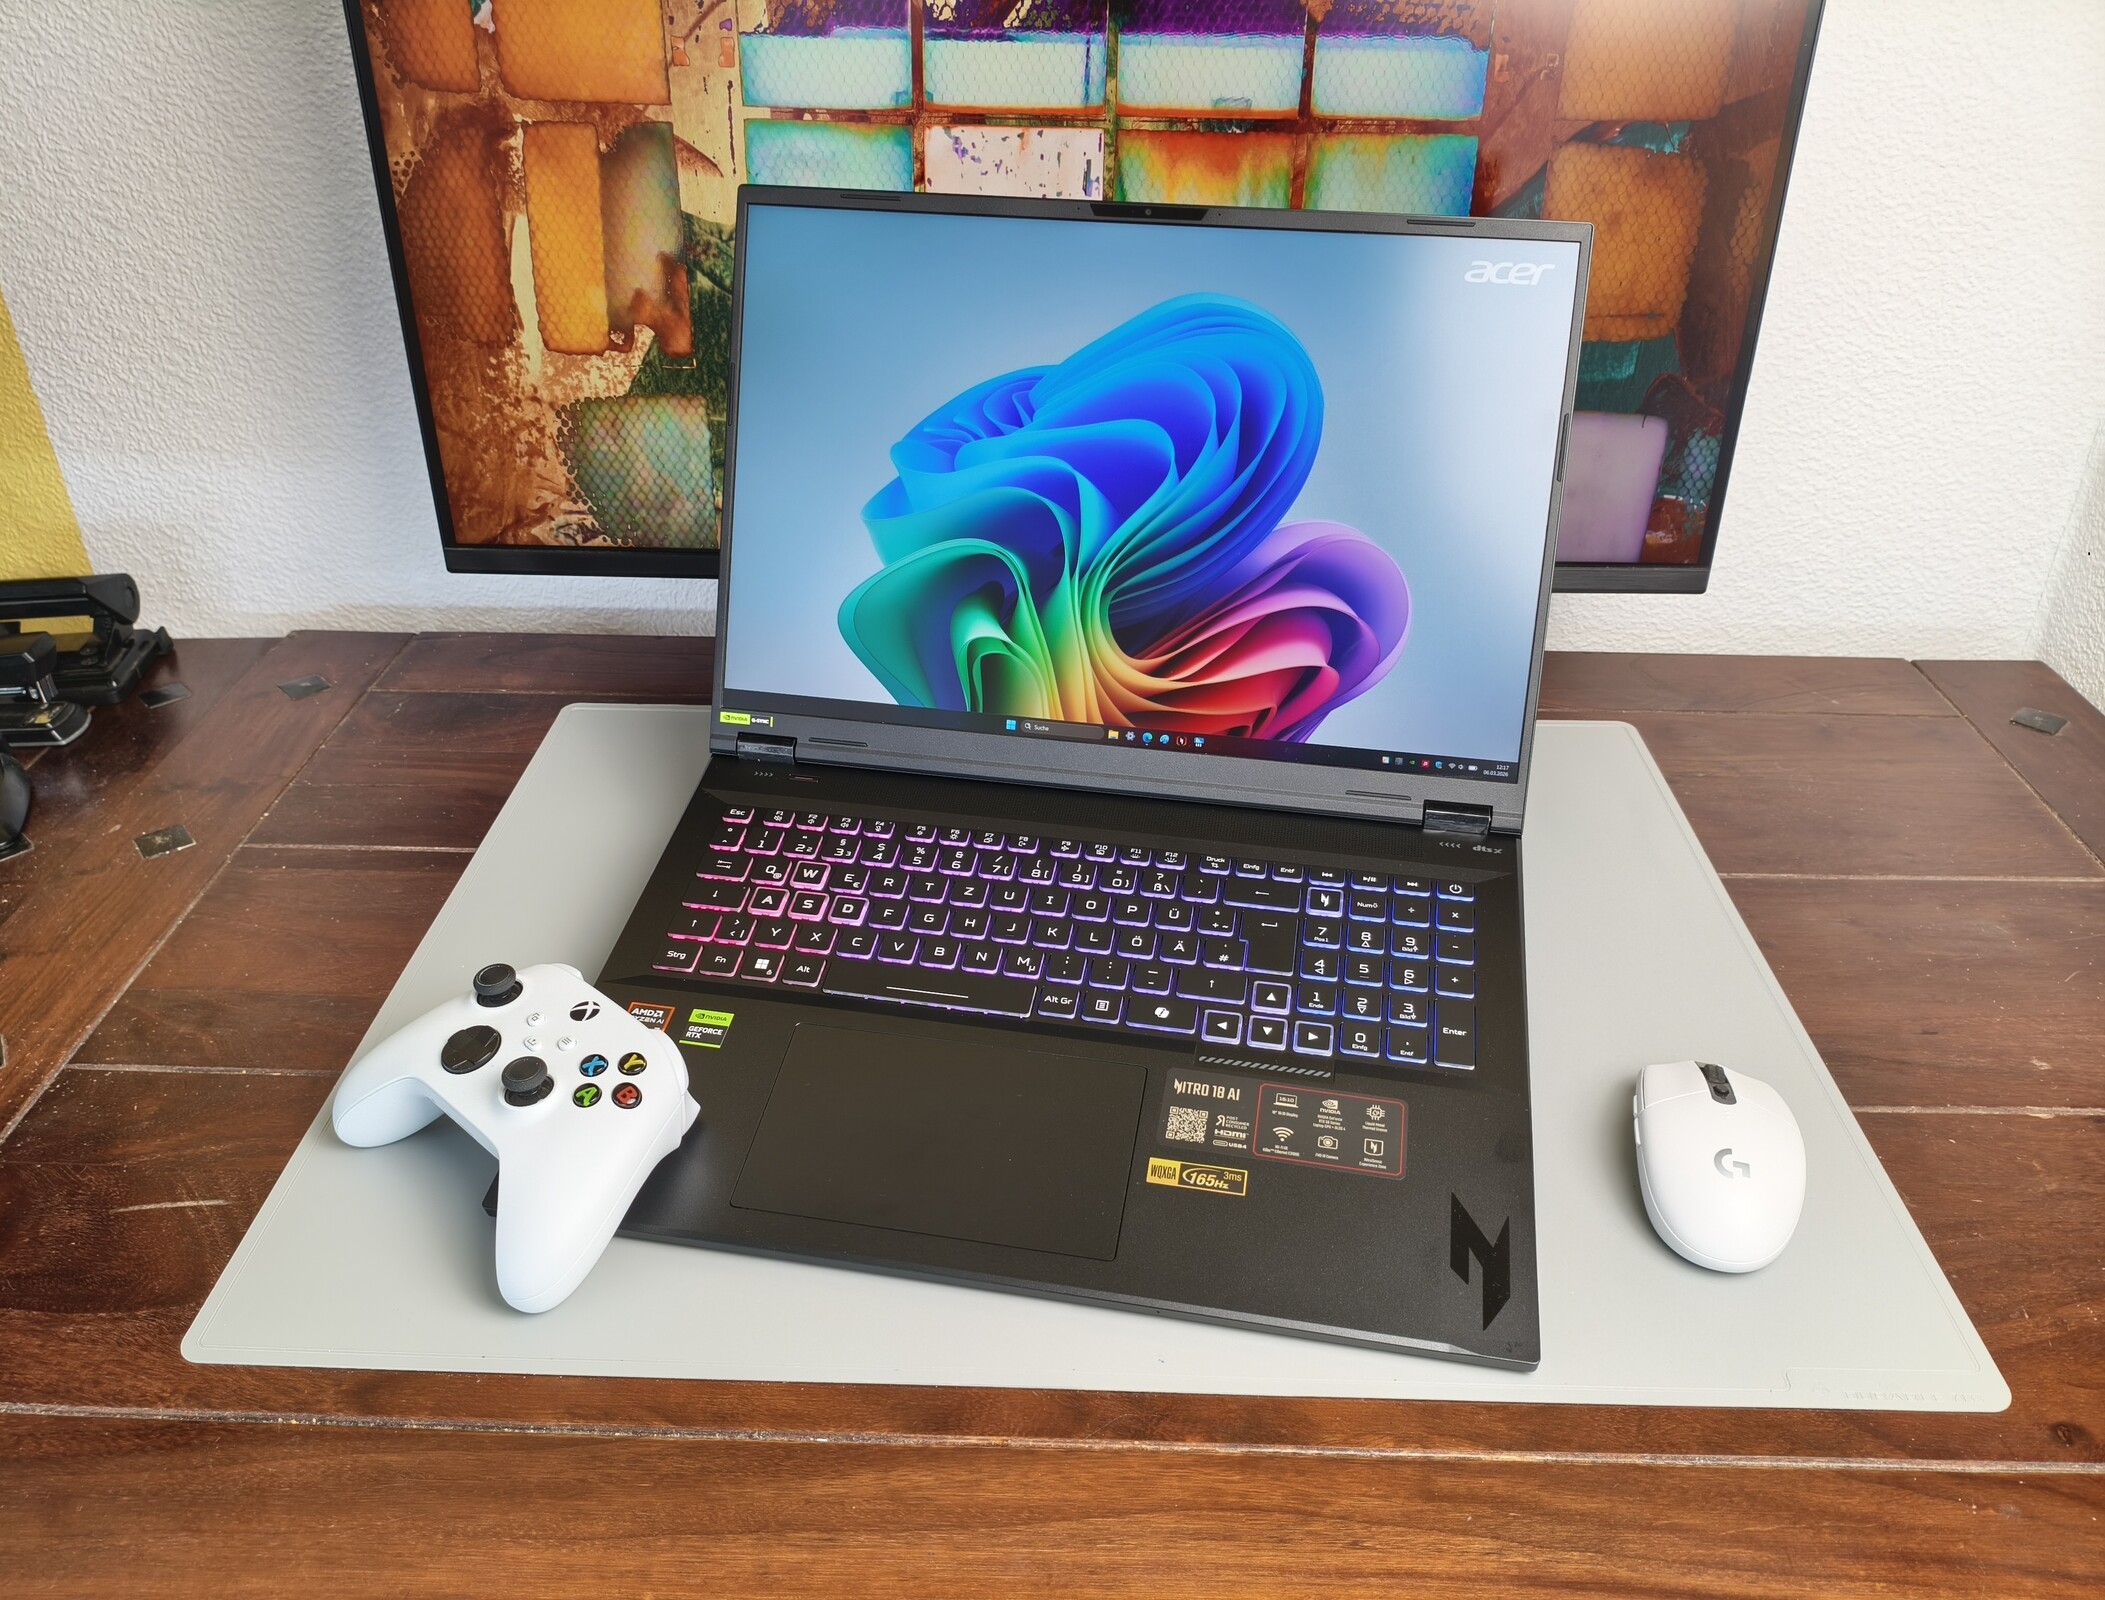
The Nitro 18 AI turns out to be a good gaming laptop in 18-inch format in the tested version with Ryzen AI 7 350 and GeForce RTX 5070, which has almost no significant weaknesses. For example, the slow card reader and high latencies will only affect some users. The fact that the mid-range model is very loud in the Performance and Turbo system modes is also bearable, as the fans remain significantly quieter in Balanced mode, while the CPU and GPU hardly lose any speed.
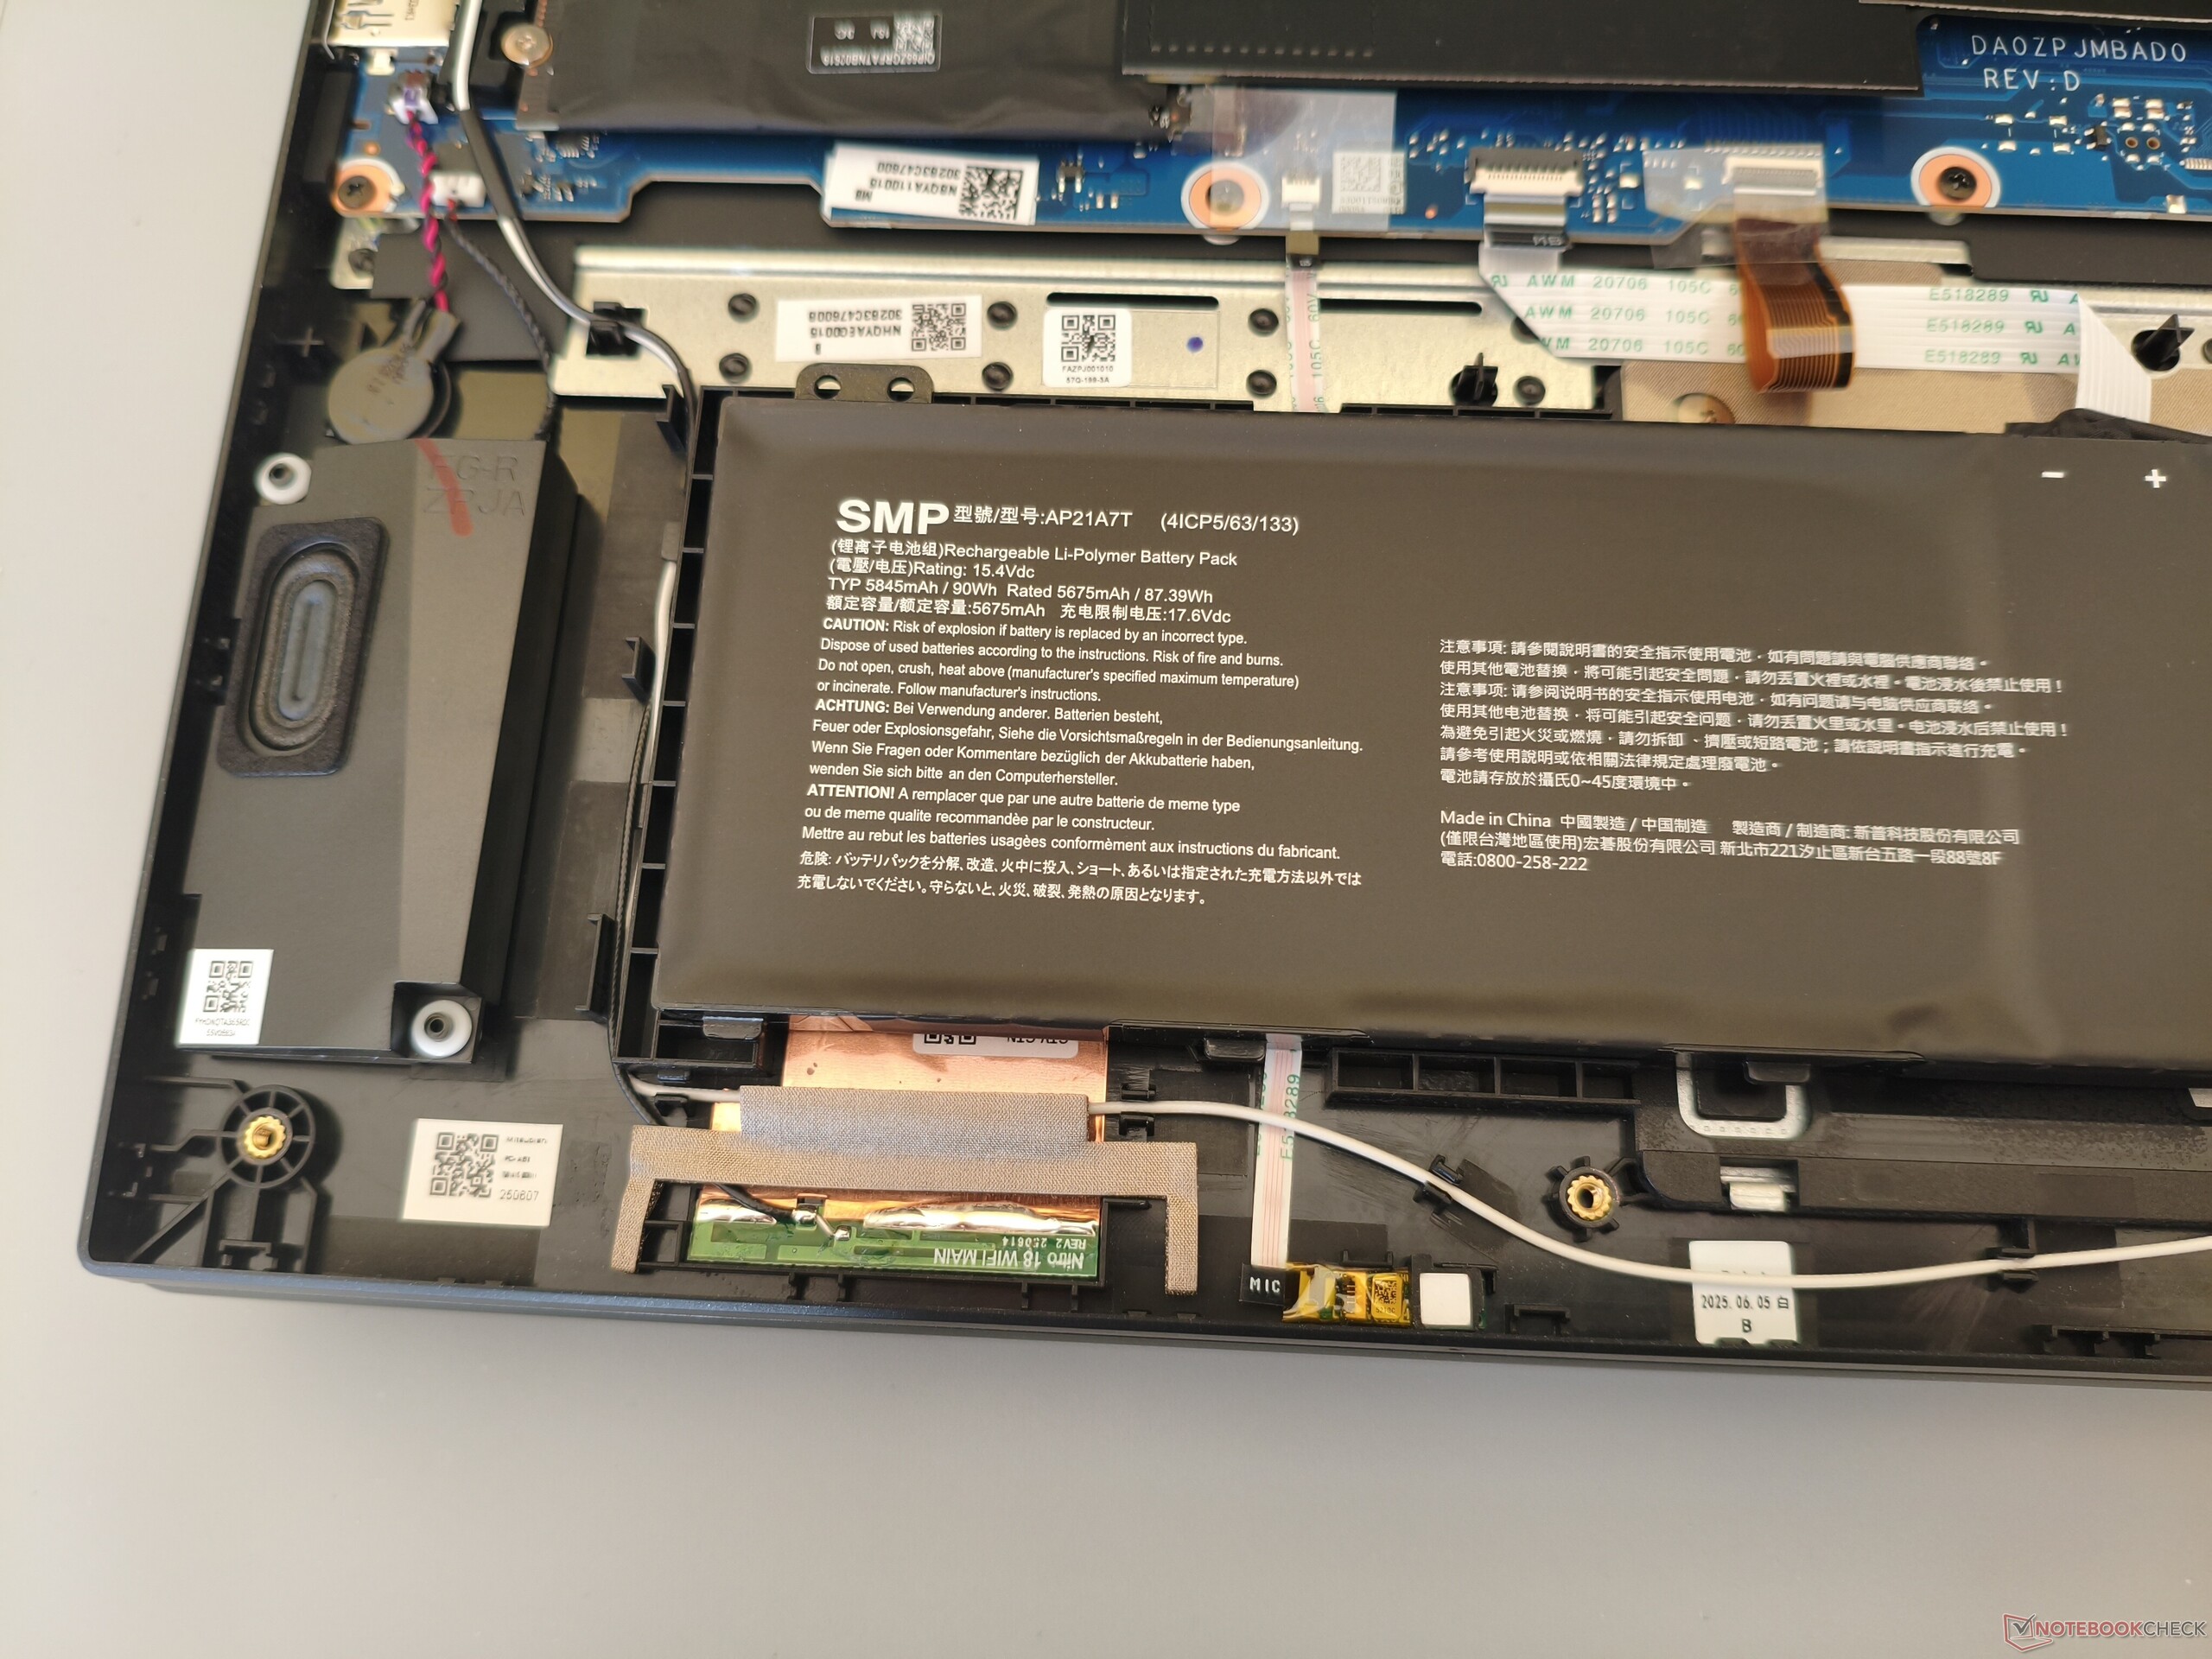
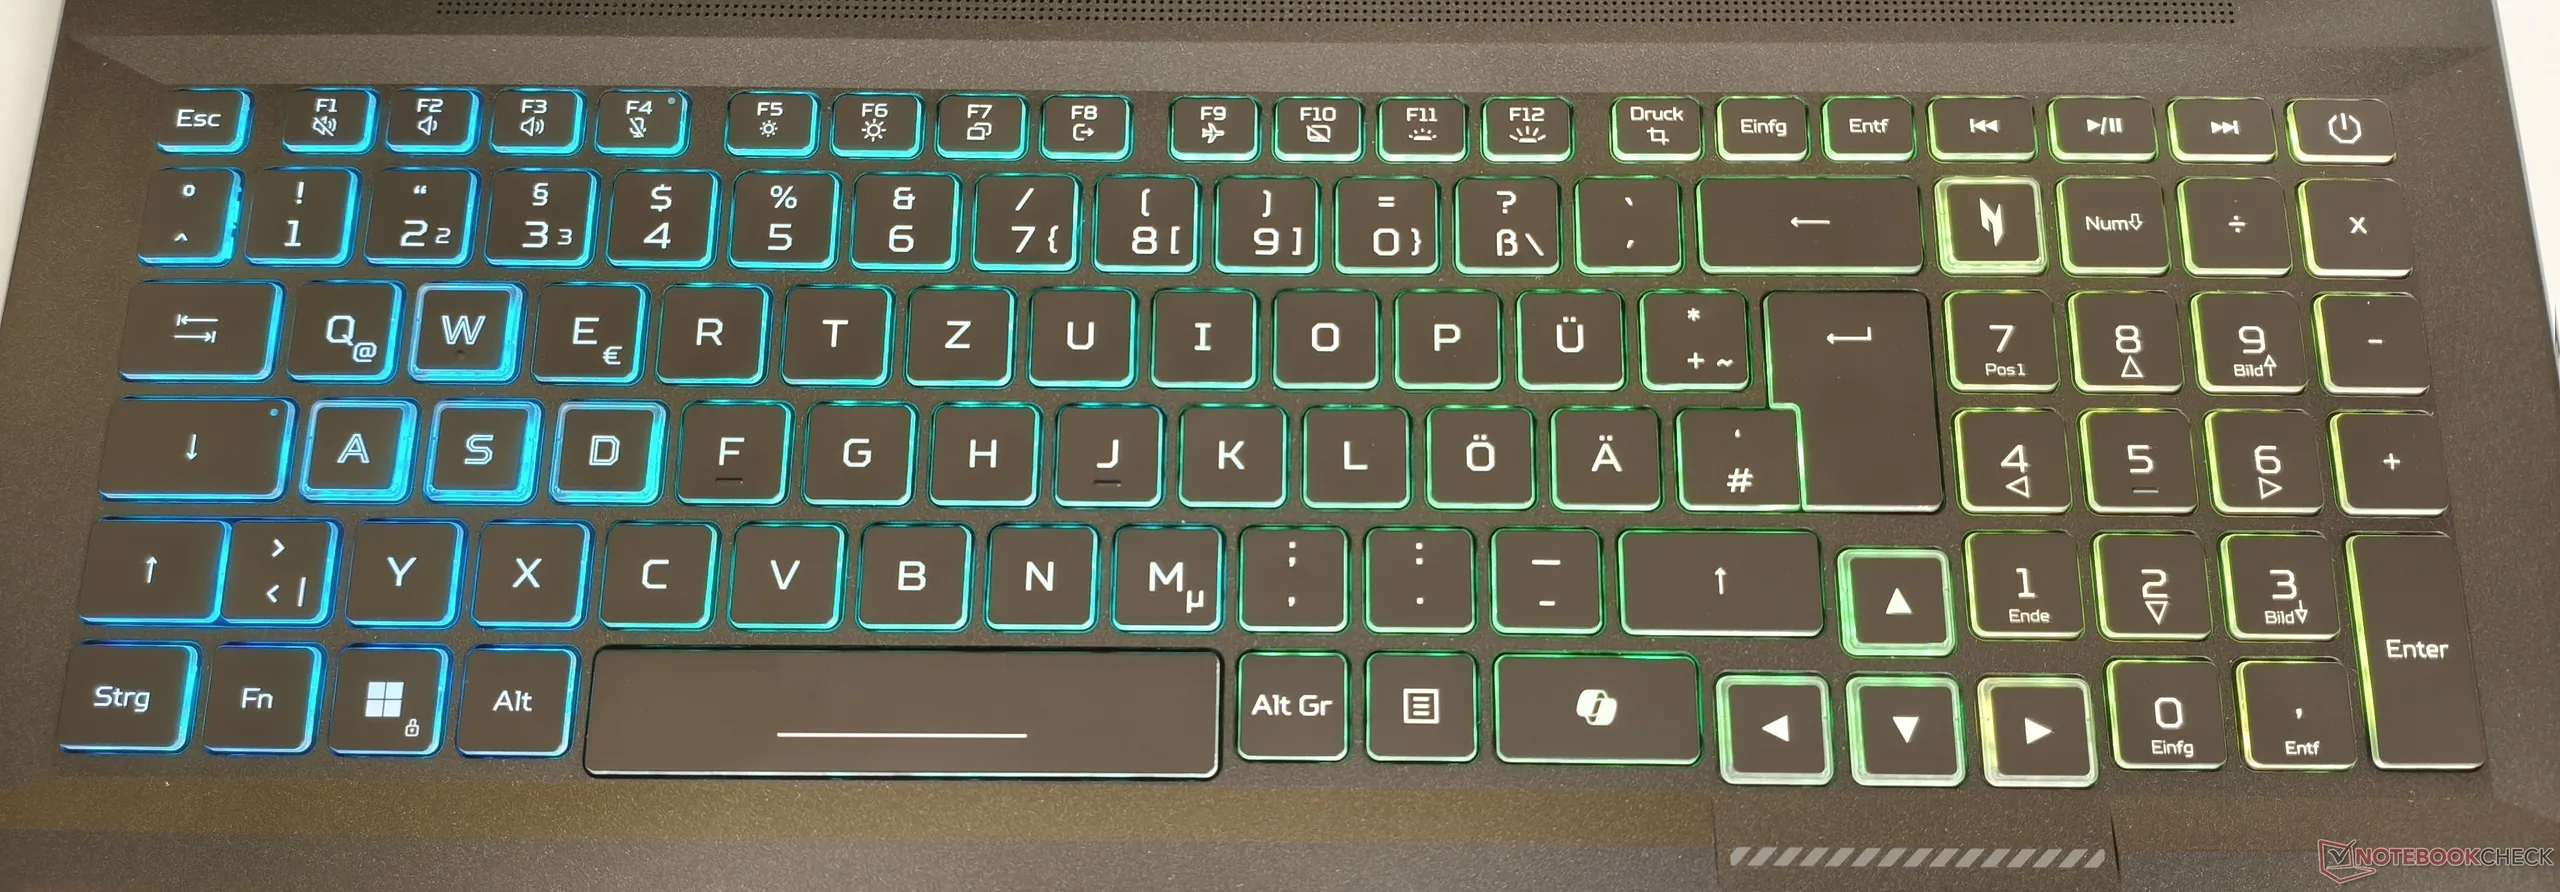
On the positive side, the chic RGB lighting of the keyboard and the rather powerful 90 Wh battery should be mentioned. Meanwhile, upgrade fans will be pleased with the two SO-DIMM and M.2-2280 slots, one of which is still free. In many other categories, the 18-incher lands in the midfield or does not stand out from the crowd, be it the chassis, the sound system, the IPS display, the connections or the input devices, which are all solid.
The Nitro 18 AI's main competitors are the Asus computers TUF Gaming A18 and ROG Strix G18 and the MSI behemoths Crosshair 18 HX and Vector A18 HX.
Pros
Cons
Price and availability
The tested Acer Nitro 18 AI AN18-61-R10V with Ryzen AI 7 350 and GeForce RTX 5070 laptop is available from around 1,800 Euros (~$2092) from various online stores (e.g. Computeruniverse).
Specifications
Housing
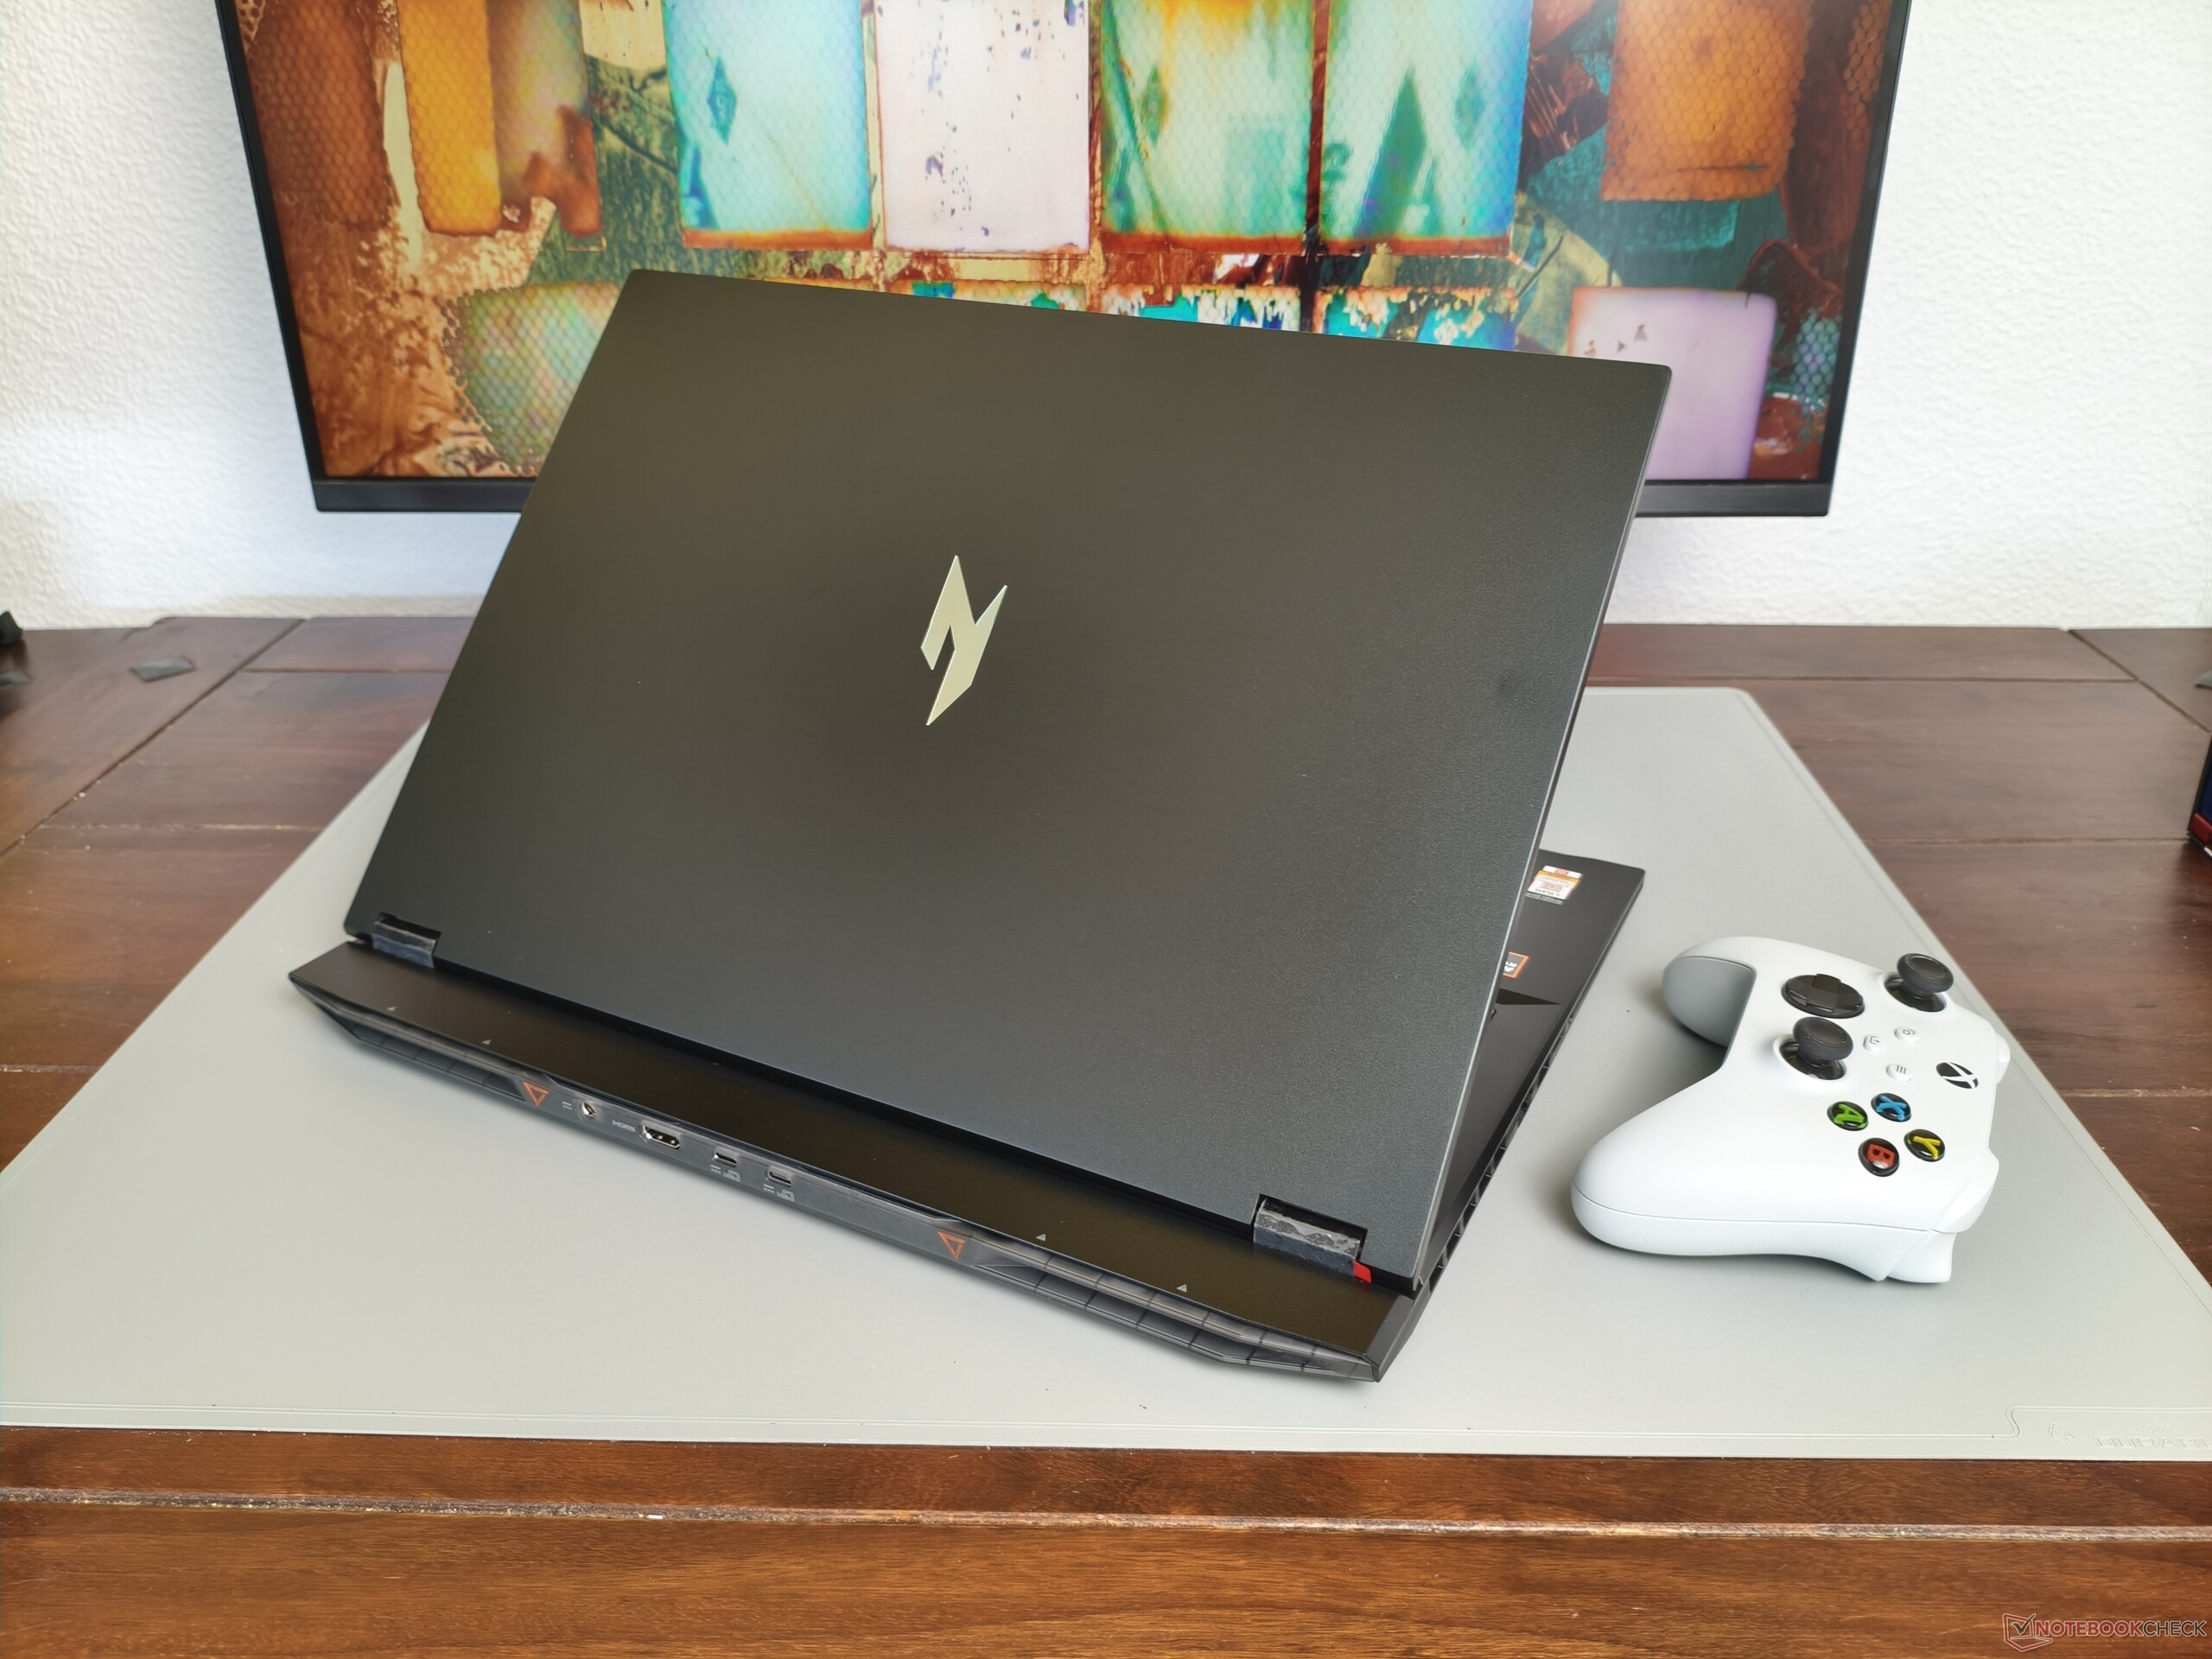
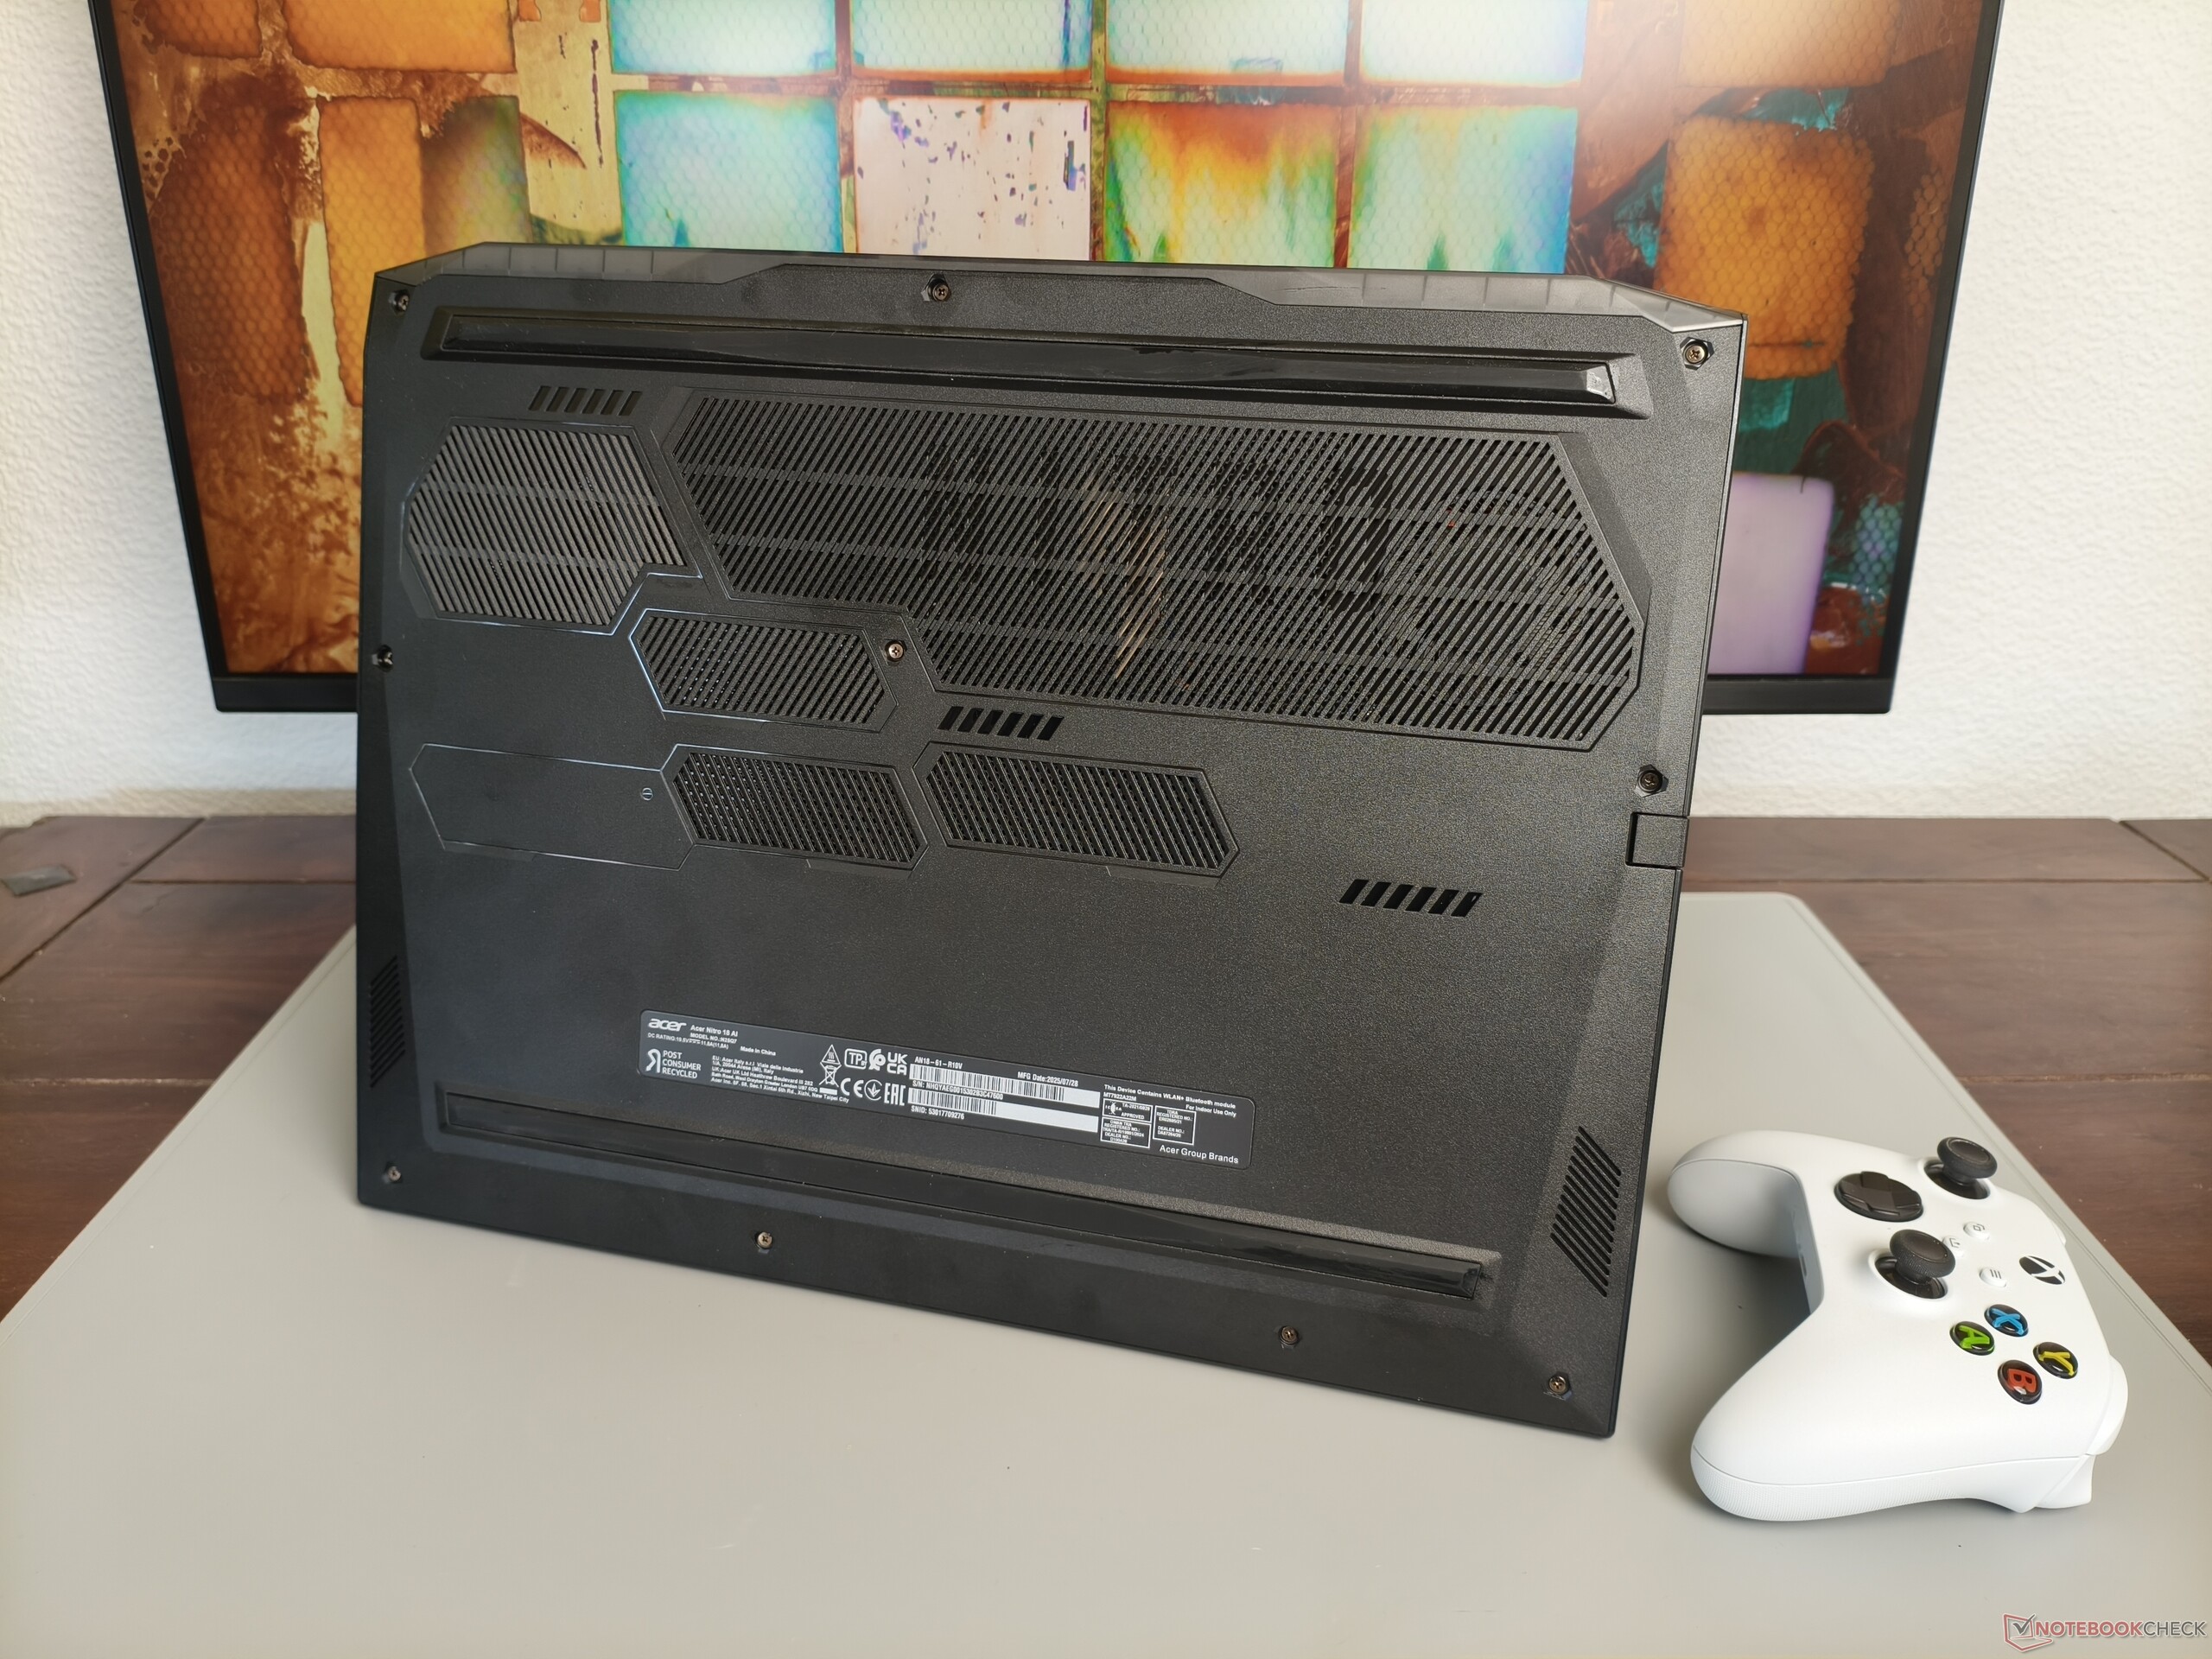
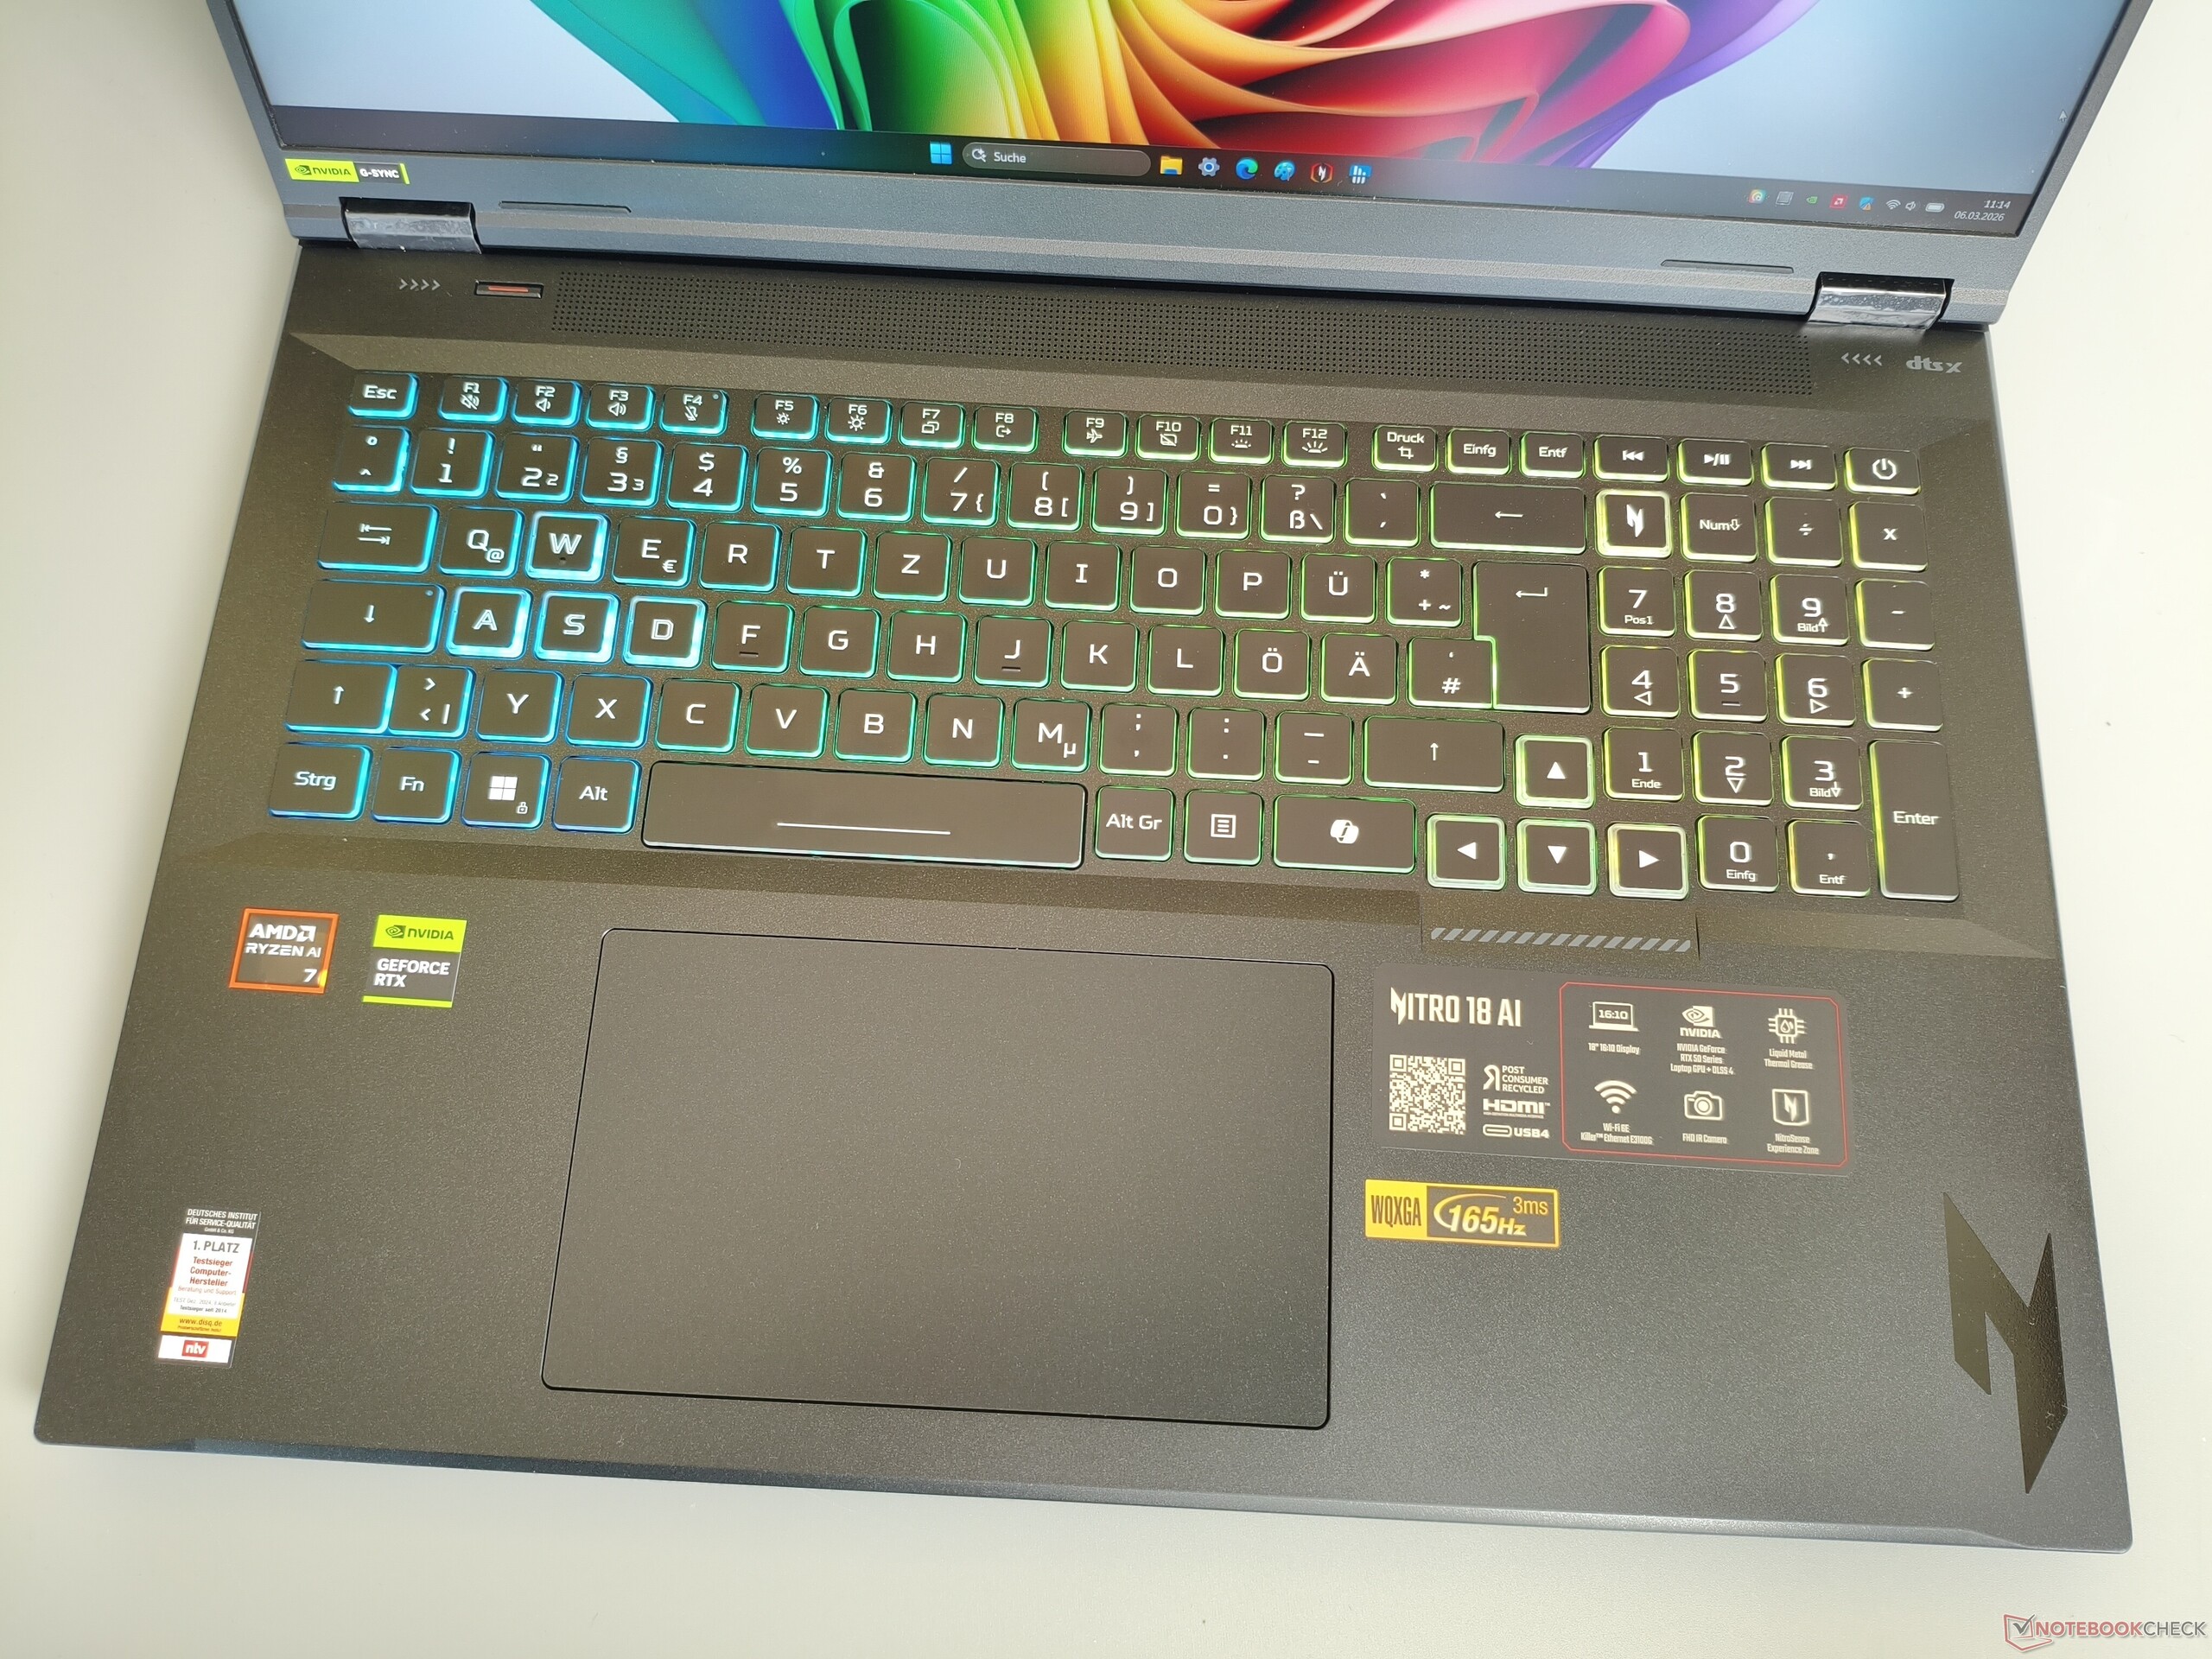
A little more could have been done with the casing. Although the 18-incher offers excellent stability over long stretches, you will look in vain for high-quality metal surfaces. The design proves to be neither simple nor particularly playful, with only a few more striking elements on the underside (see photos). The hinges do a reliable job and the maximum opening angle of just under 150° is fine. With a weight of 3.0 kg (~6.6 lbs), the Nitro 18 AI sits comfortably among the competition, which weighs between 2.6 and 3.5 kg (~5.7 and ~7.7 lbs). The overall height is even slightly lower than that of its competitors.

Equipment
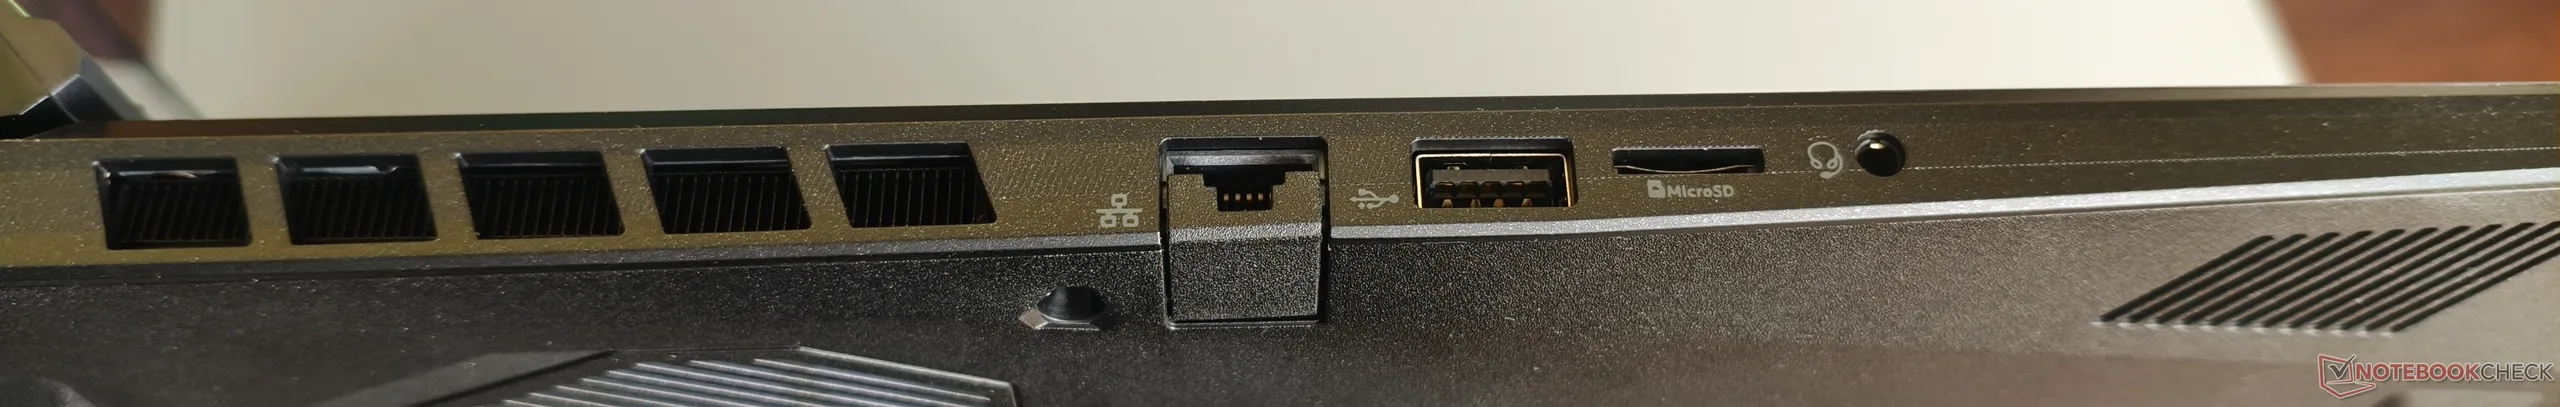
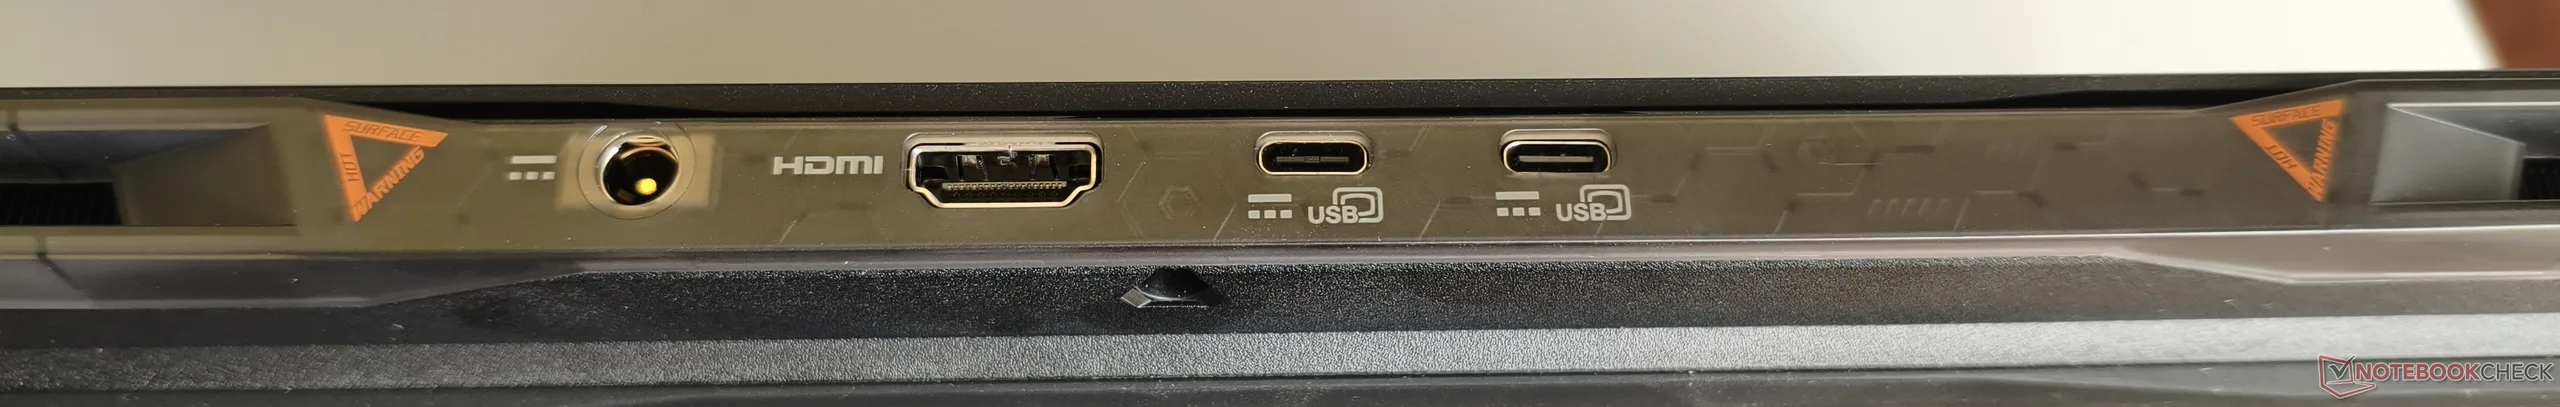
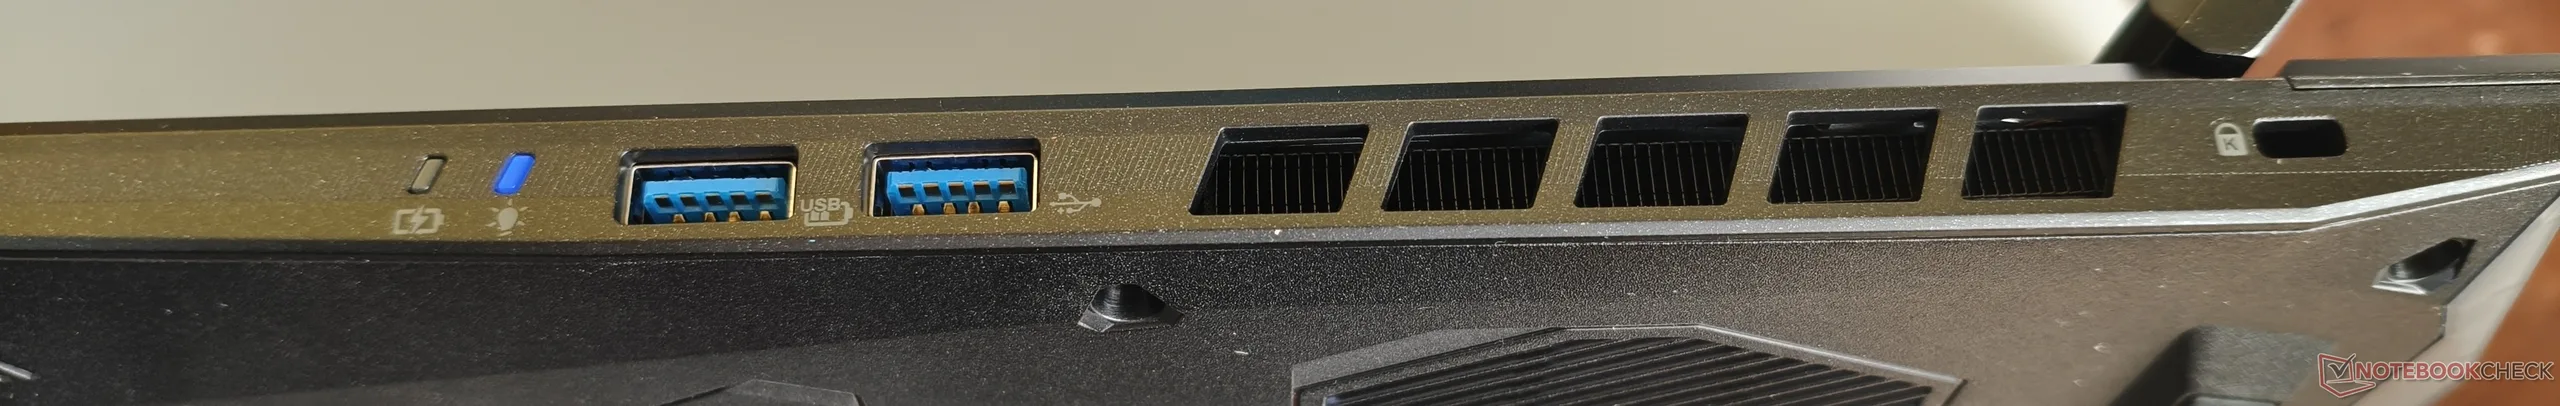
While buyers have to do without Thunderbolt, there is at least a USB 4 port on board. In general, the 18-inch laptop offers two Type-C and three Type-A ports, which is sufficient. There is also an audio socket, an HDMI output, a microSD reader, an RJ45 LAN port and an opening for Kensington locks.
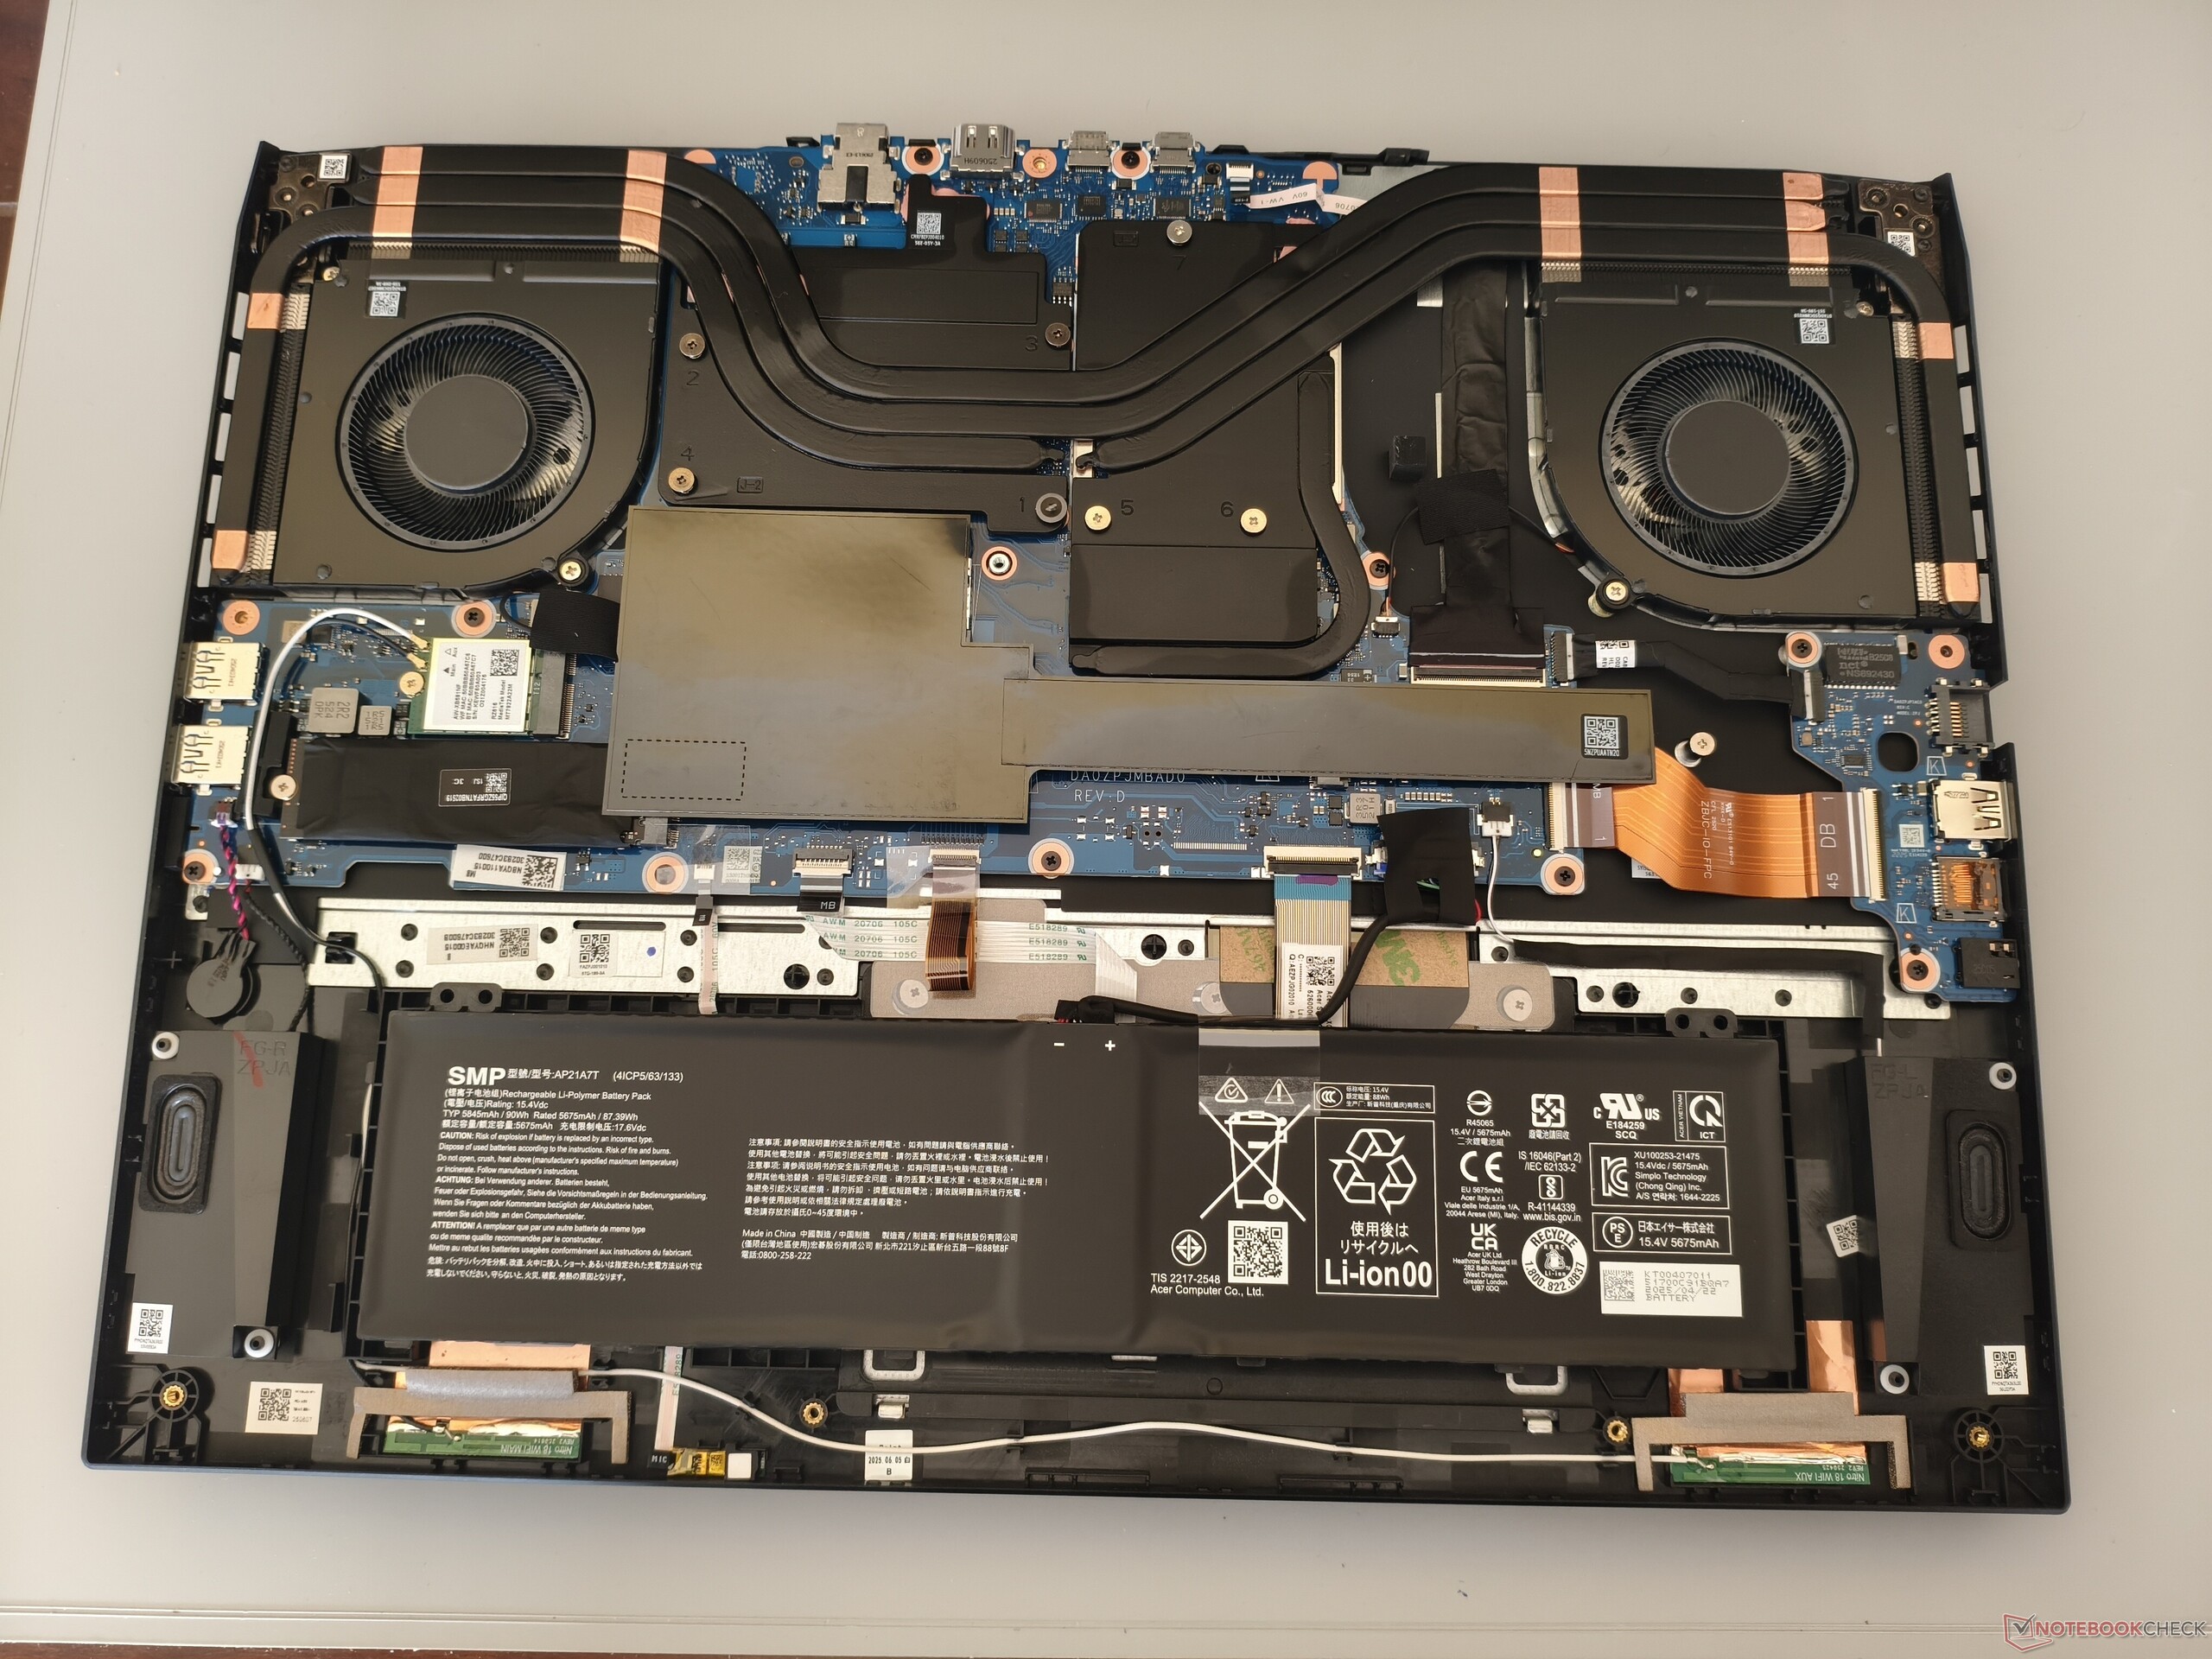
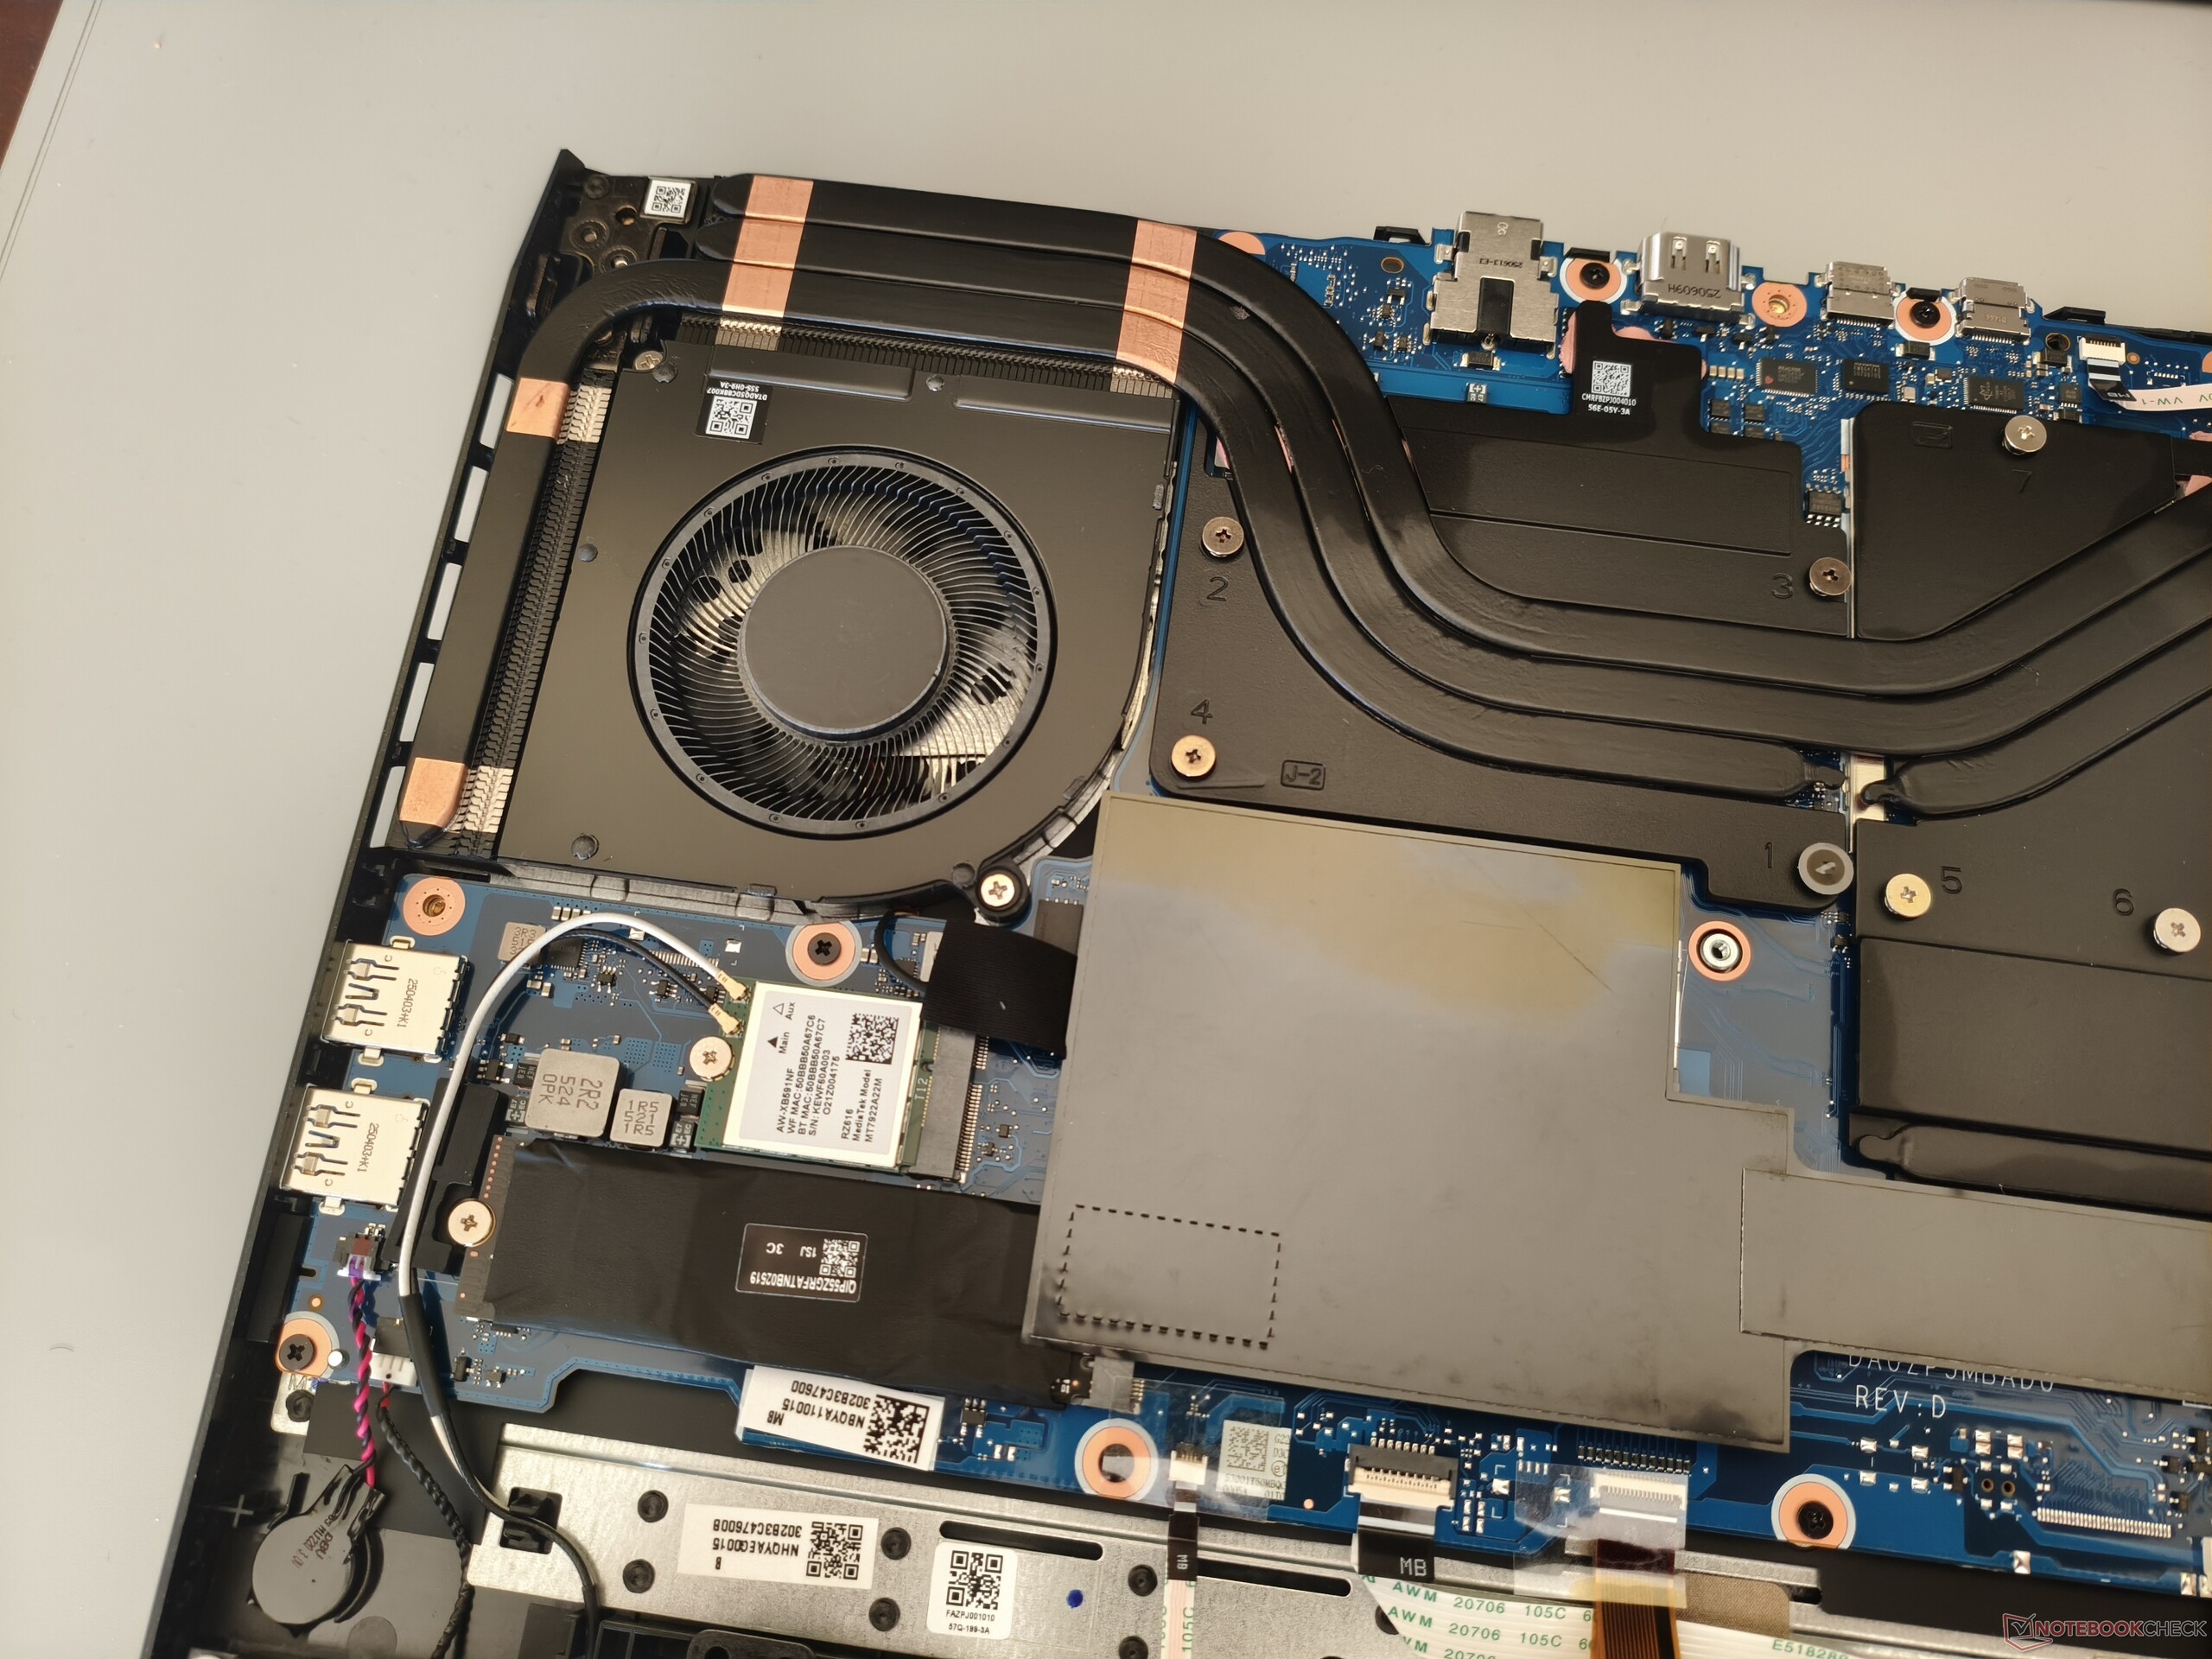
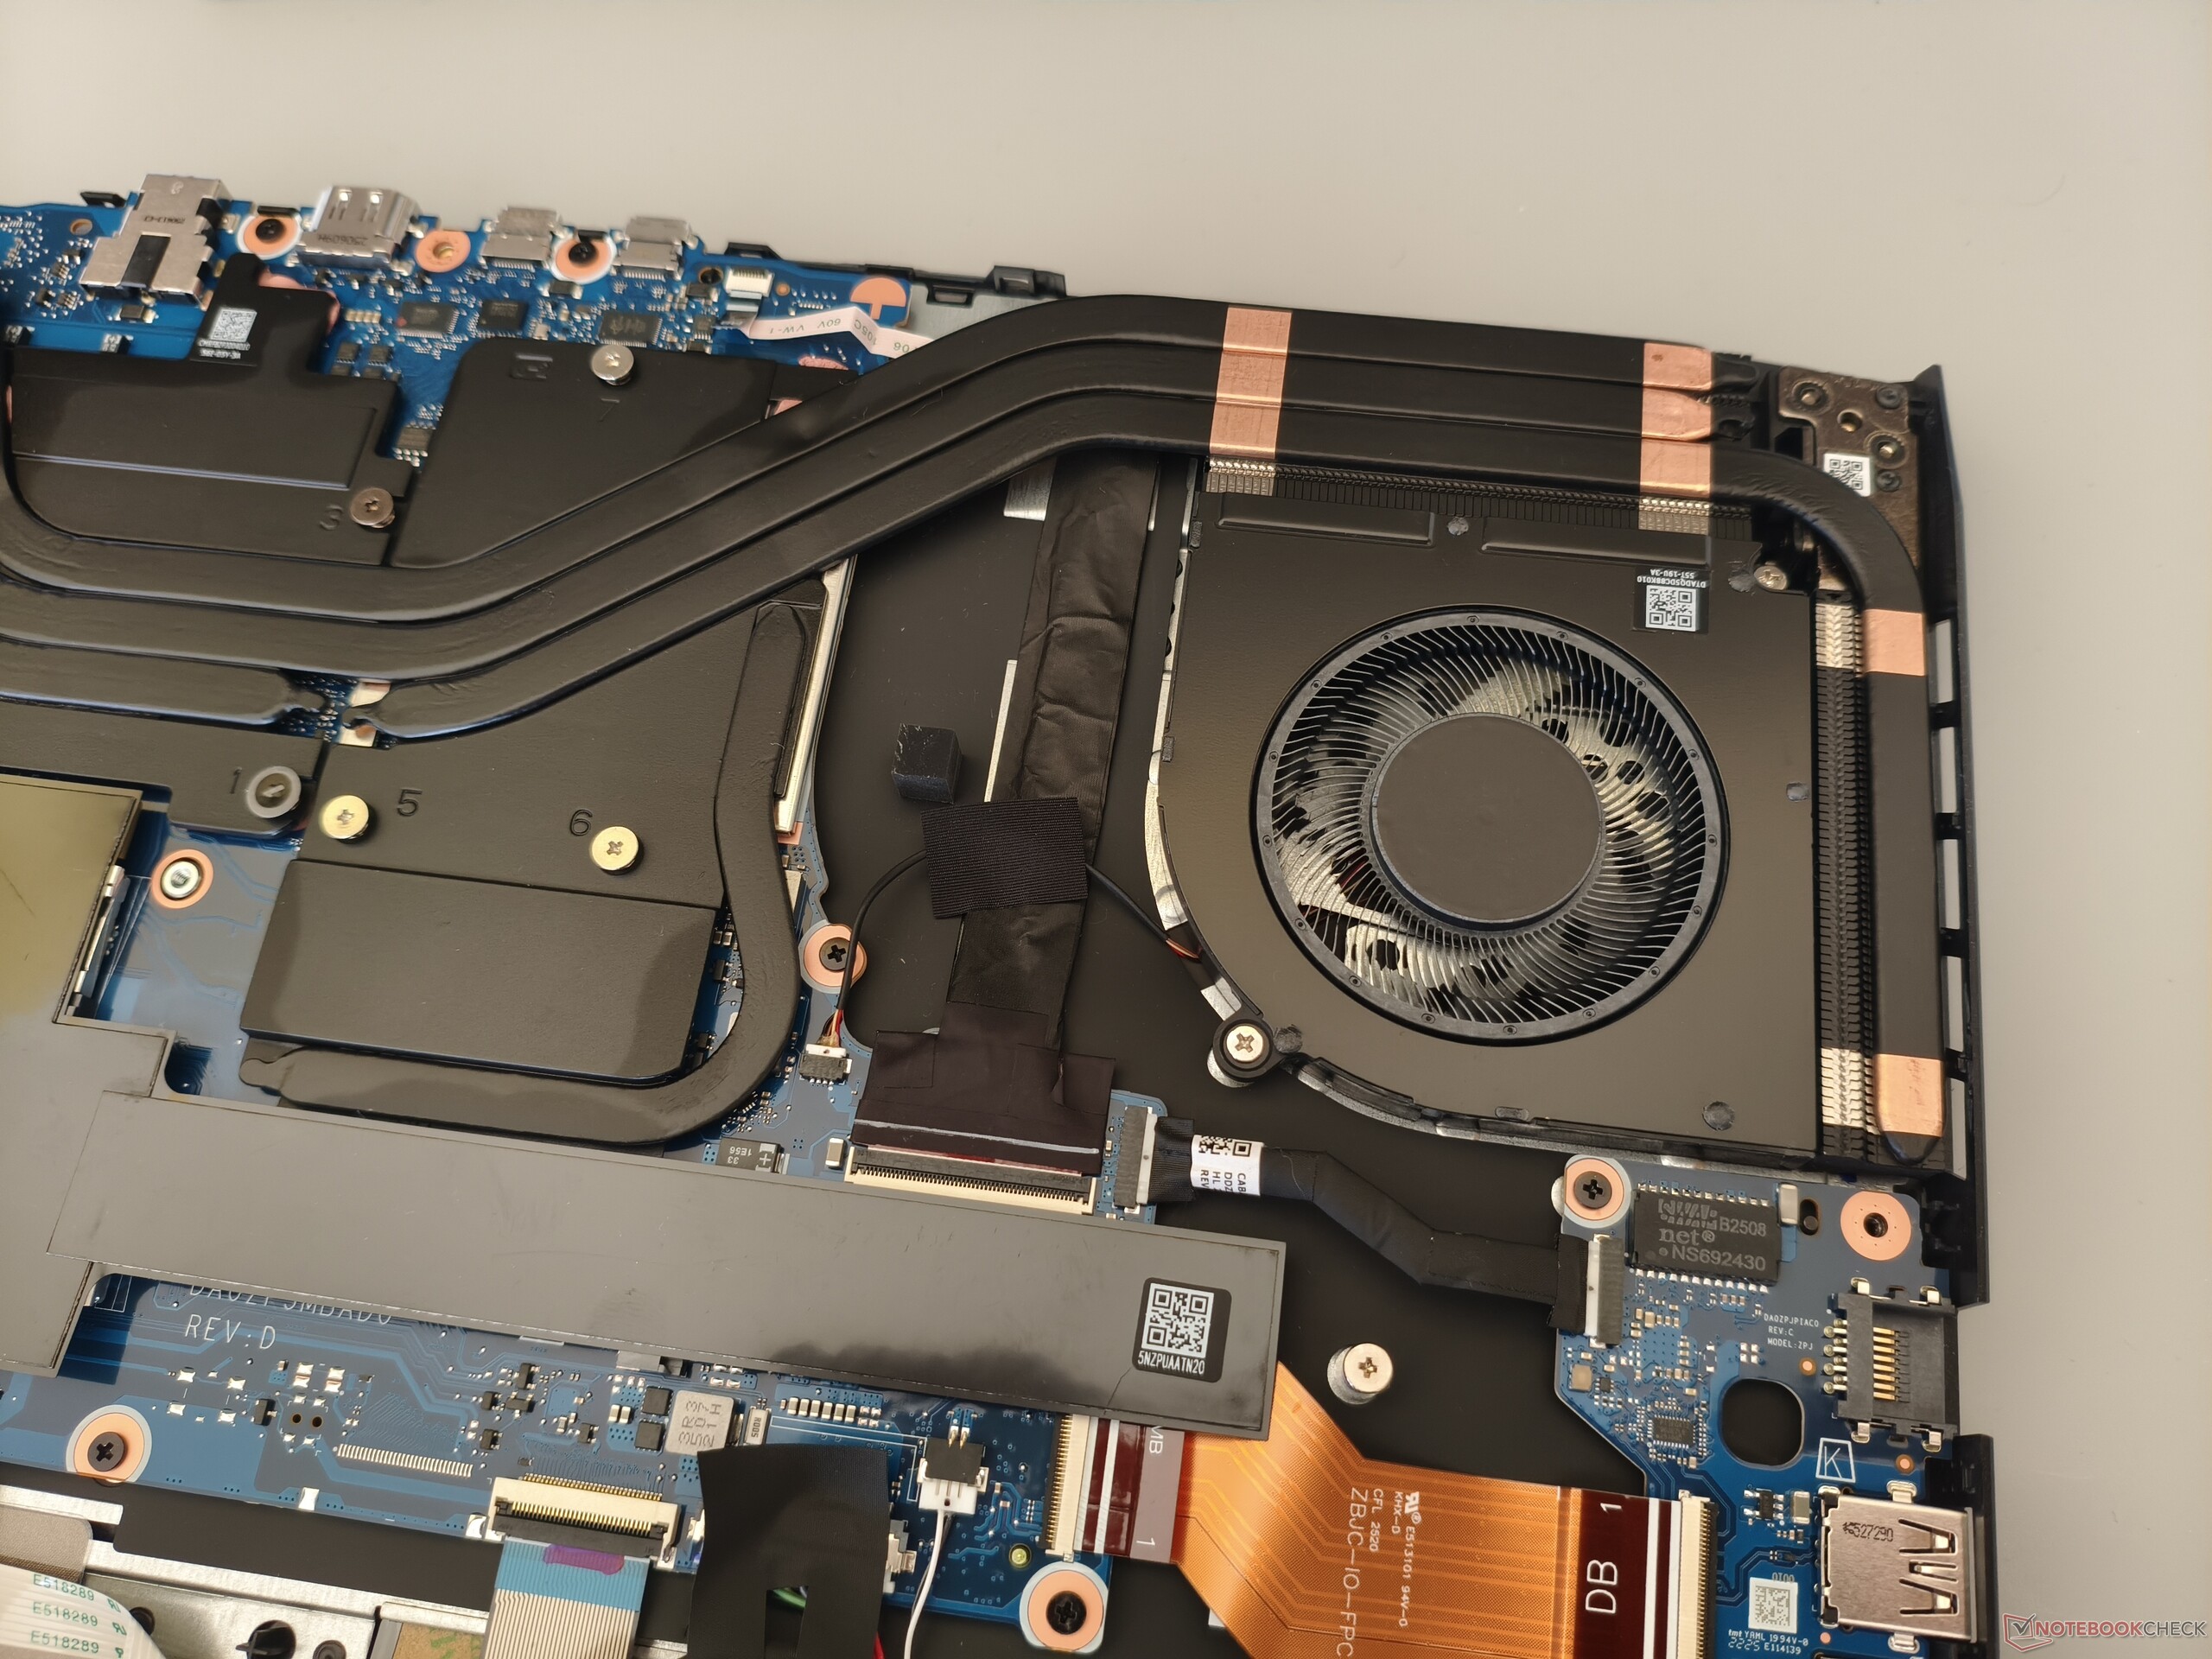
The wireless module from MediaTek (Wi-Fi 6E) performs particularly well in terms of reception. Thanks to its Full HD resolution, the webcam is somewhat sharper than on many other gaming laptops, but it is still not really impressive. To access the inner workings, 10 Phillips screws have to be removed. Our pictures reveal what it looks like under the hood.
SD Card Reader
| SD Card Reader | |
| average JPG Copy Test (av. of 3 runs) | |
| MSI Vector A18 HX A9W (Toshiba Exceria Pro SDXC 64 GB UHS-II) | |
| Average of class Gaming (20.9 - 210, n=54, last 2 years) | |
| Acer Nitro 18 AI AN18-61-R10V (AV PRO microSD 128 GB V60) | |
| maximum AS SSD Seq Read Test (1GB) | |
| MSI Vector A18 HX A9W (Toshiba Exceria Pro SDXC 64 GB UHS-II) | |
| Average of class Gaming (25.5 - 261, n=51, last 2 years) | |
| Acer Nitro 18 AI AN18-61-R10V (AV PRO microSD 128 GB V60) | |
Communication
Webcam


Maintenance
Input devices
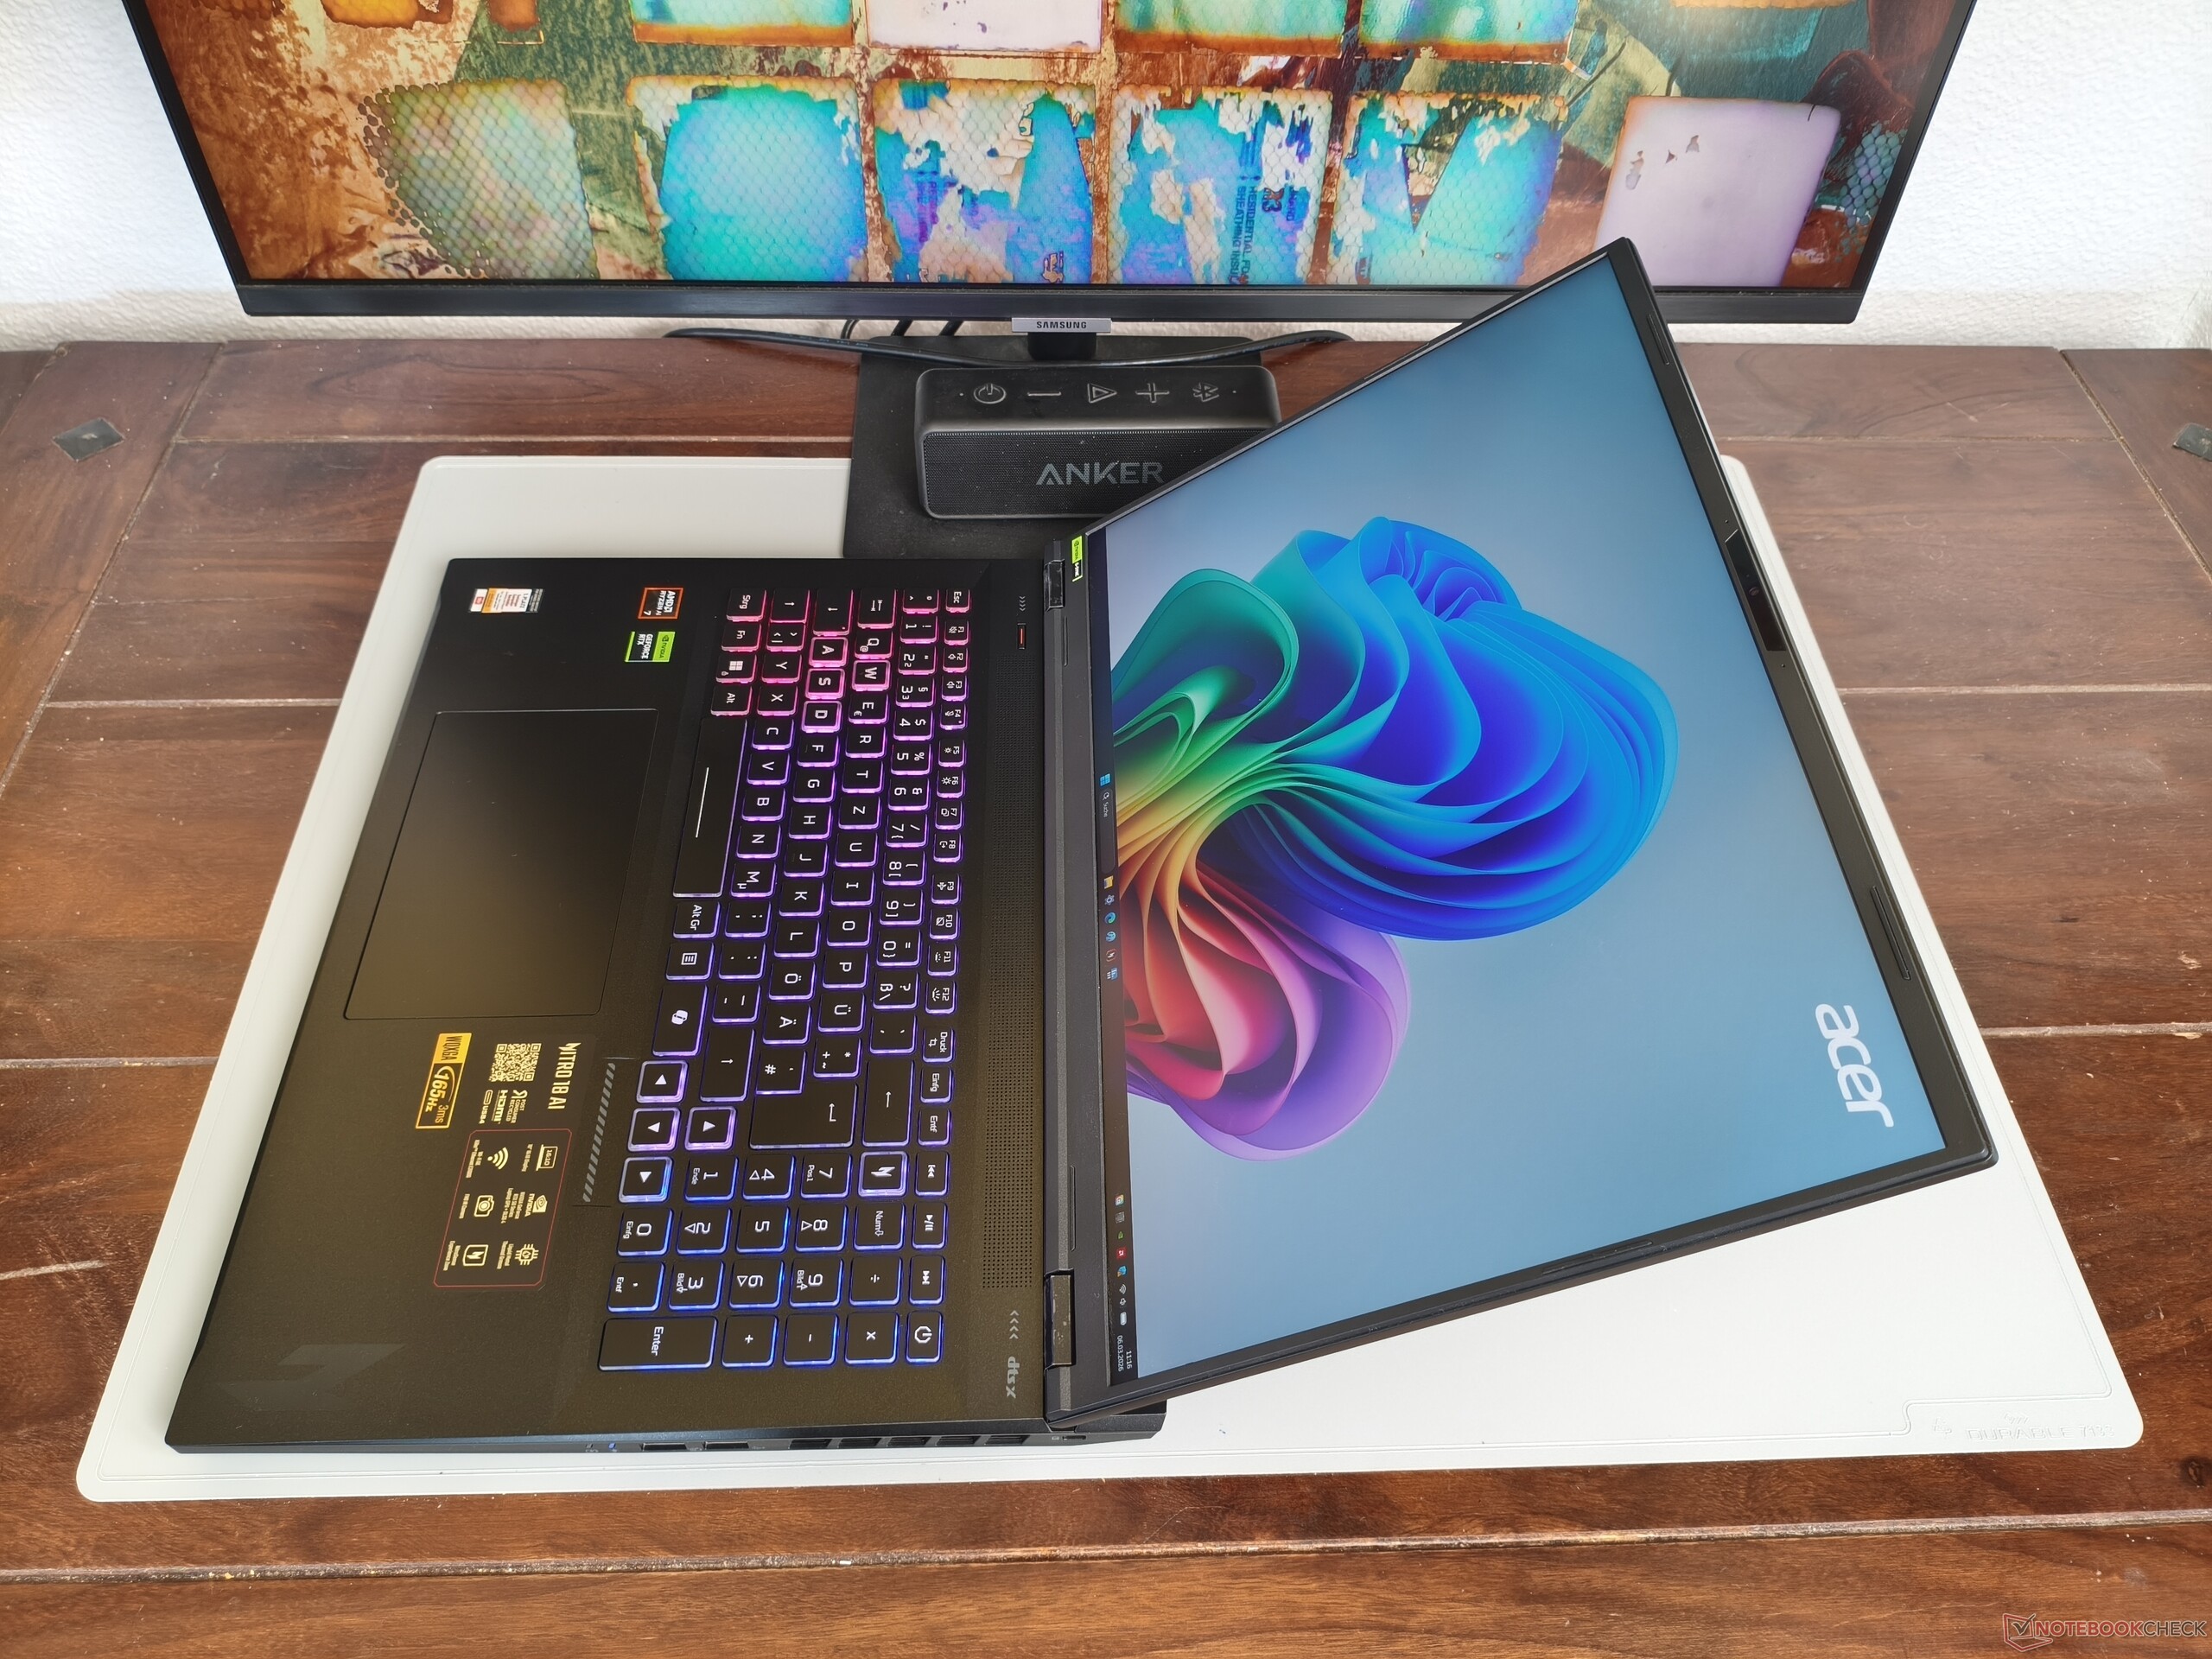
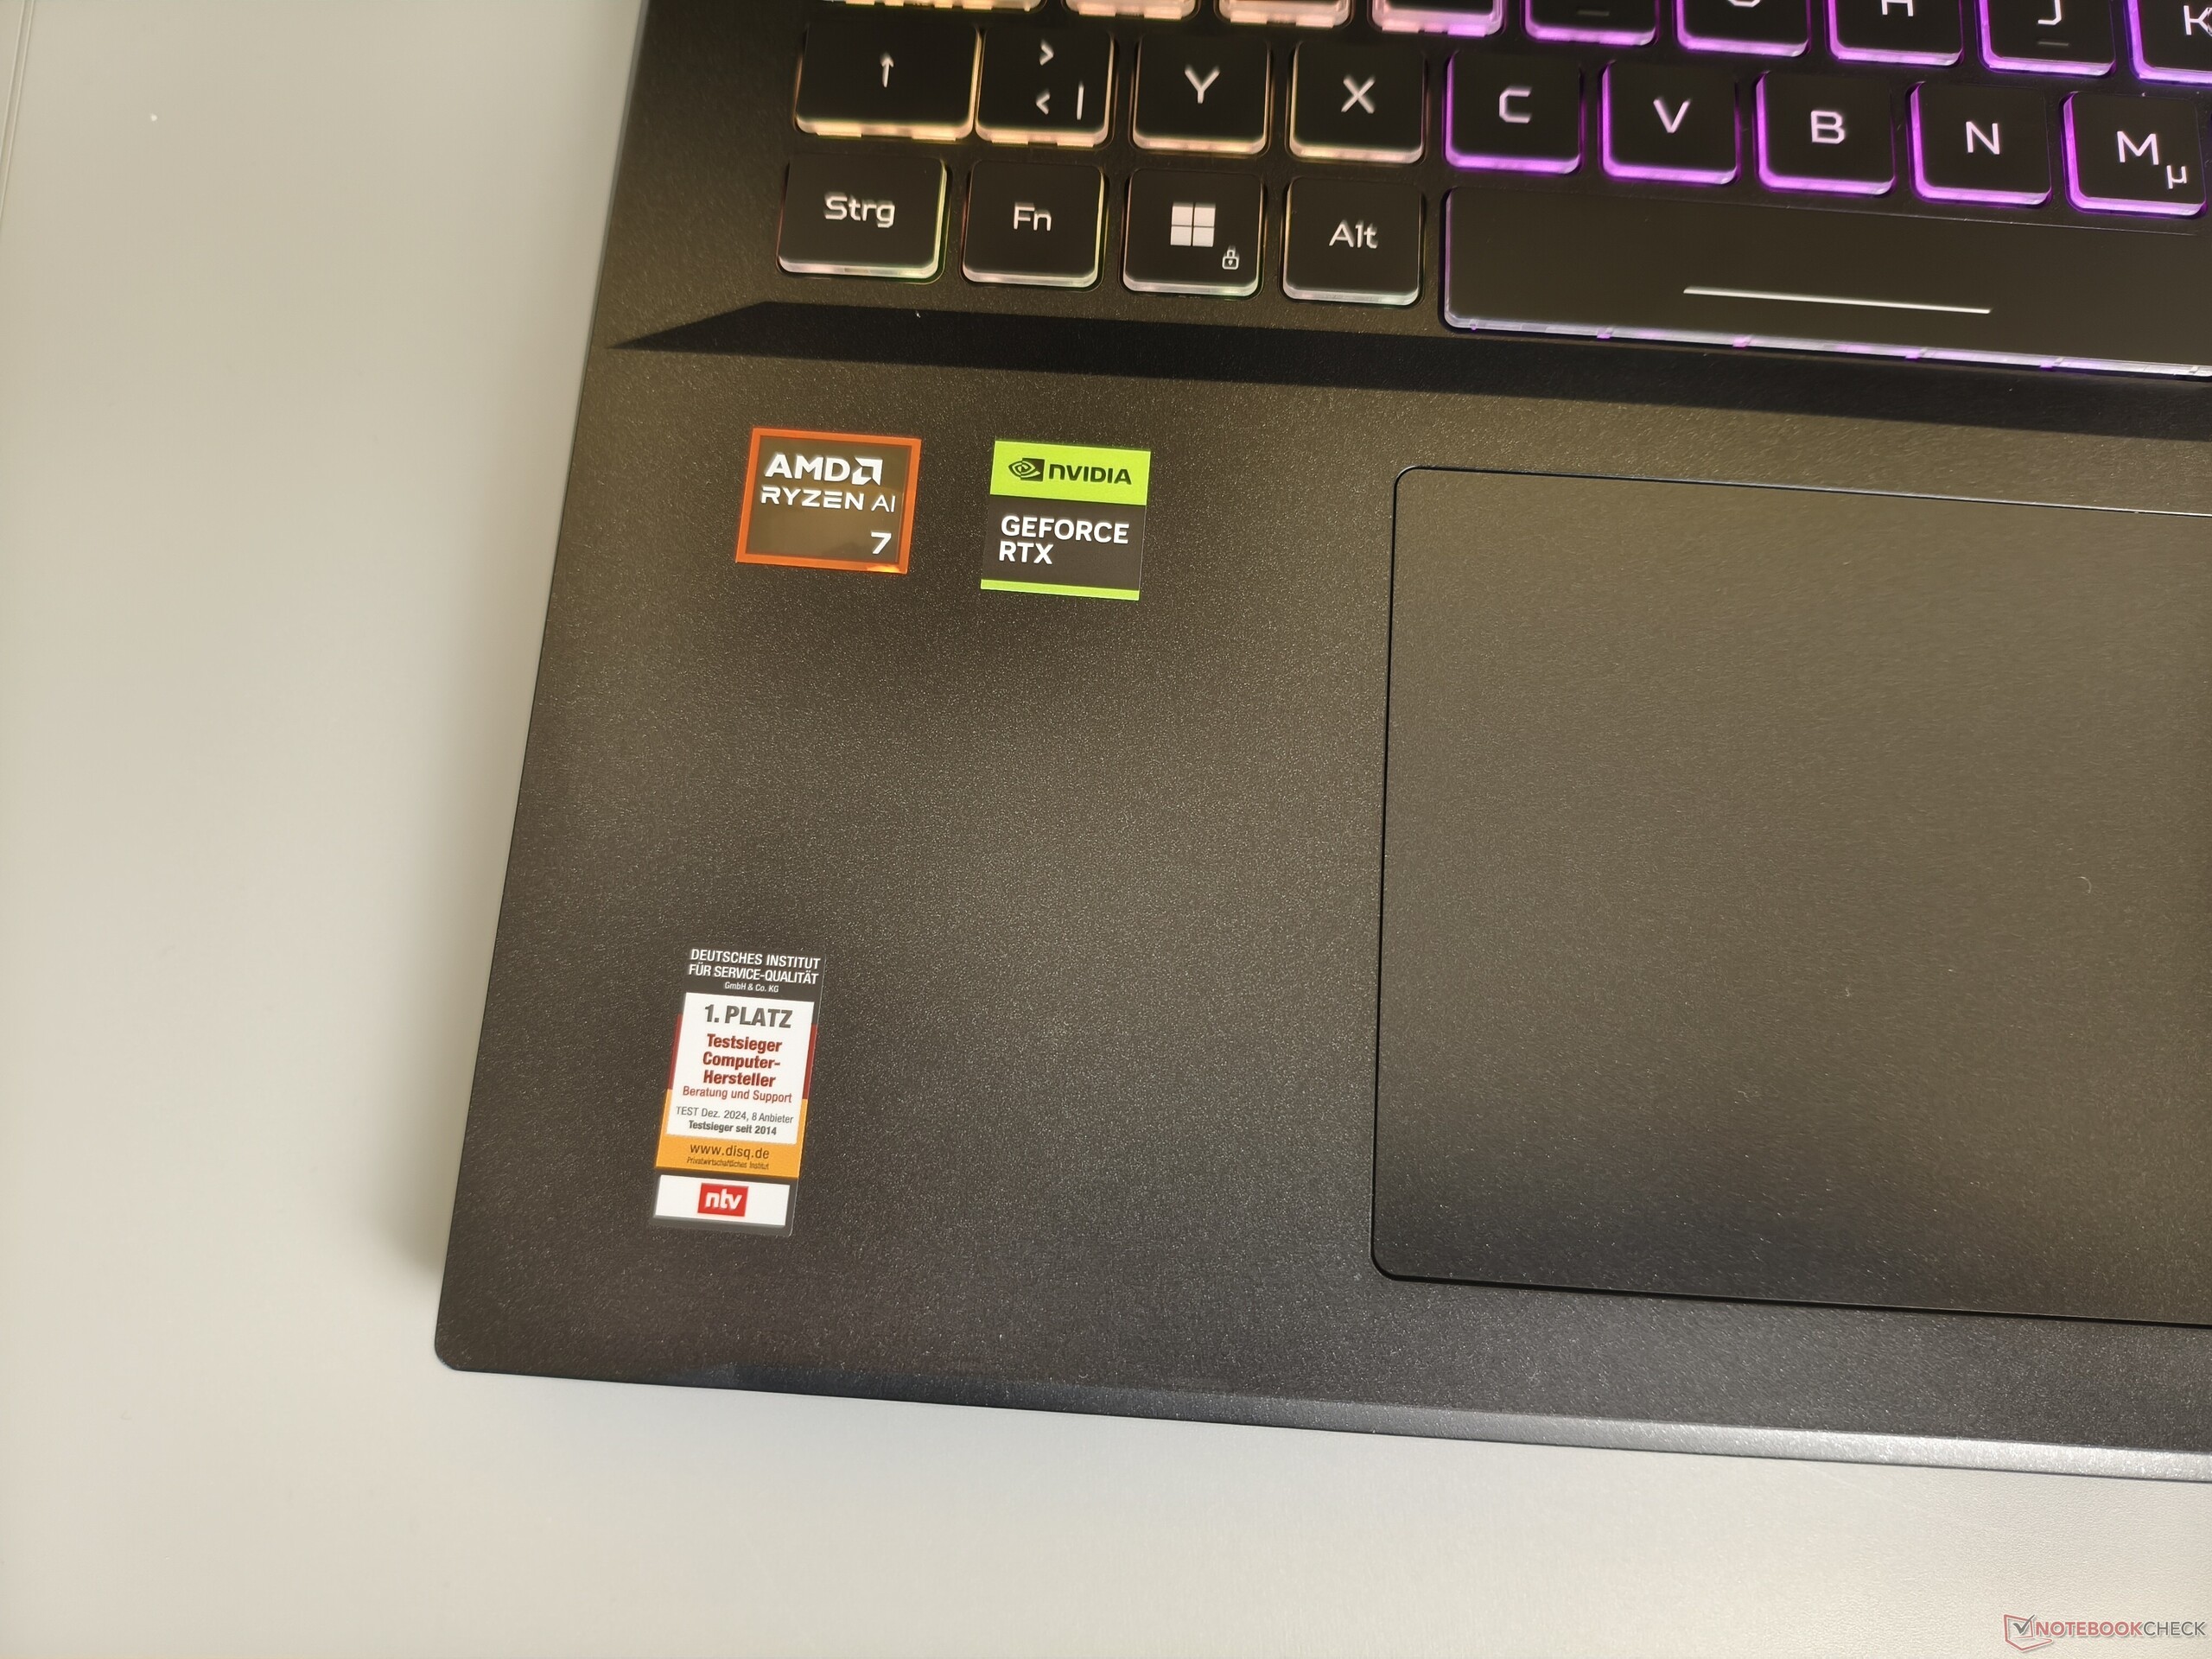
The input devices cut a fine figure. The keyboard scores points not least with a successful layout, well-dimensioned directional arrows and powerful RGB lighting. The feedback is based on the usual rubber dome level, so could be even firmer.
The touchpad is very generously sized at around 15 x 9 cm (~5.9 x 3.5 in) - even for an 18-inch device. The surface is relatively smooth, but we would have liked better or more precise feedback from the click surfaces here and there.
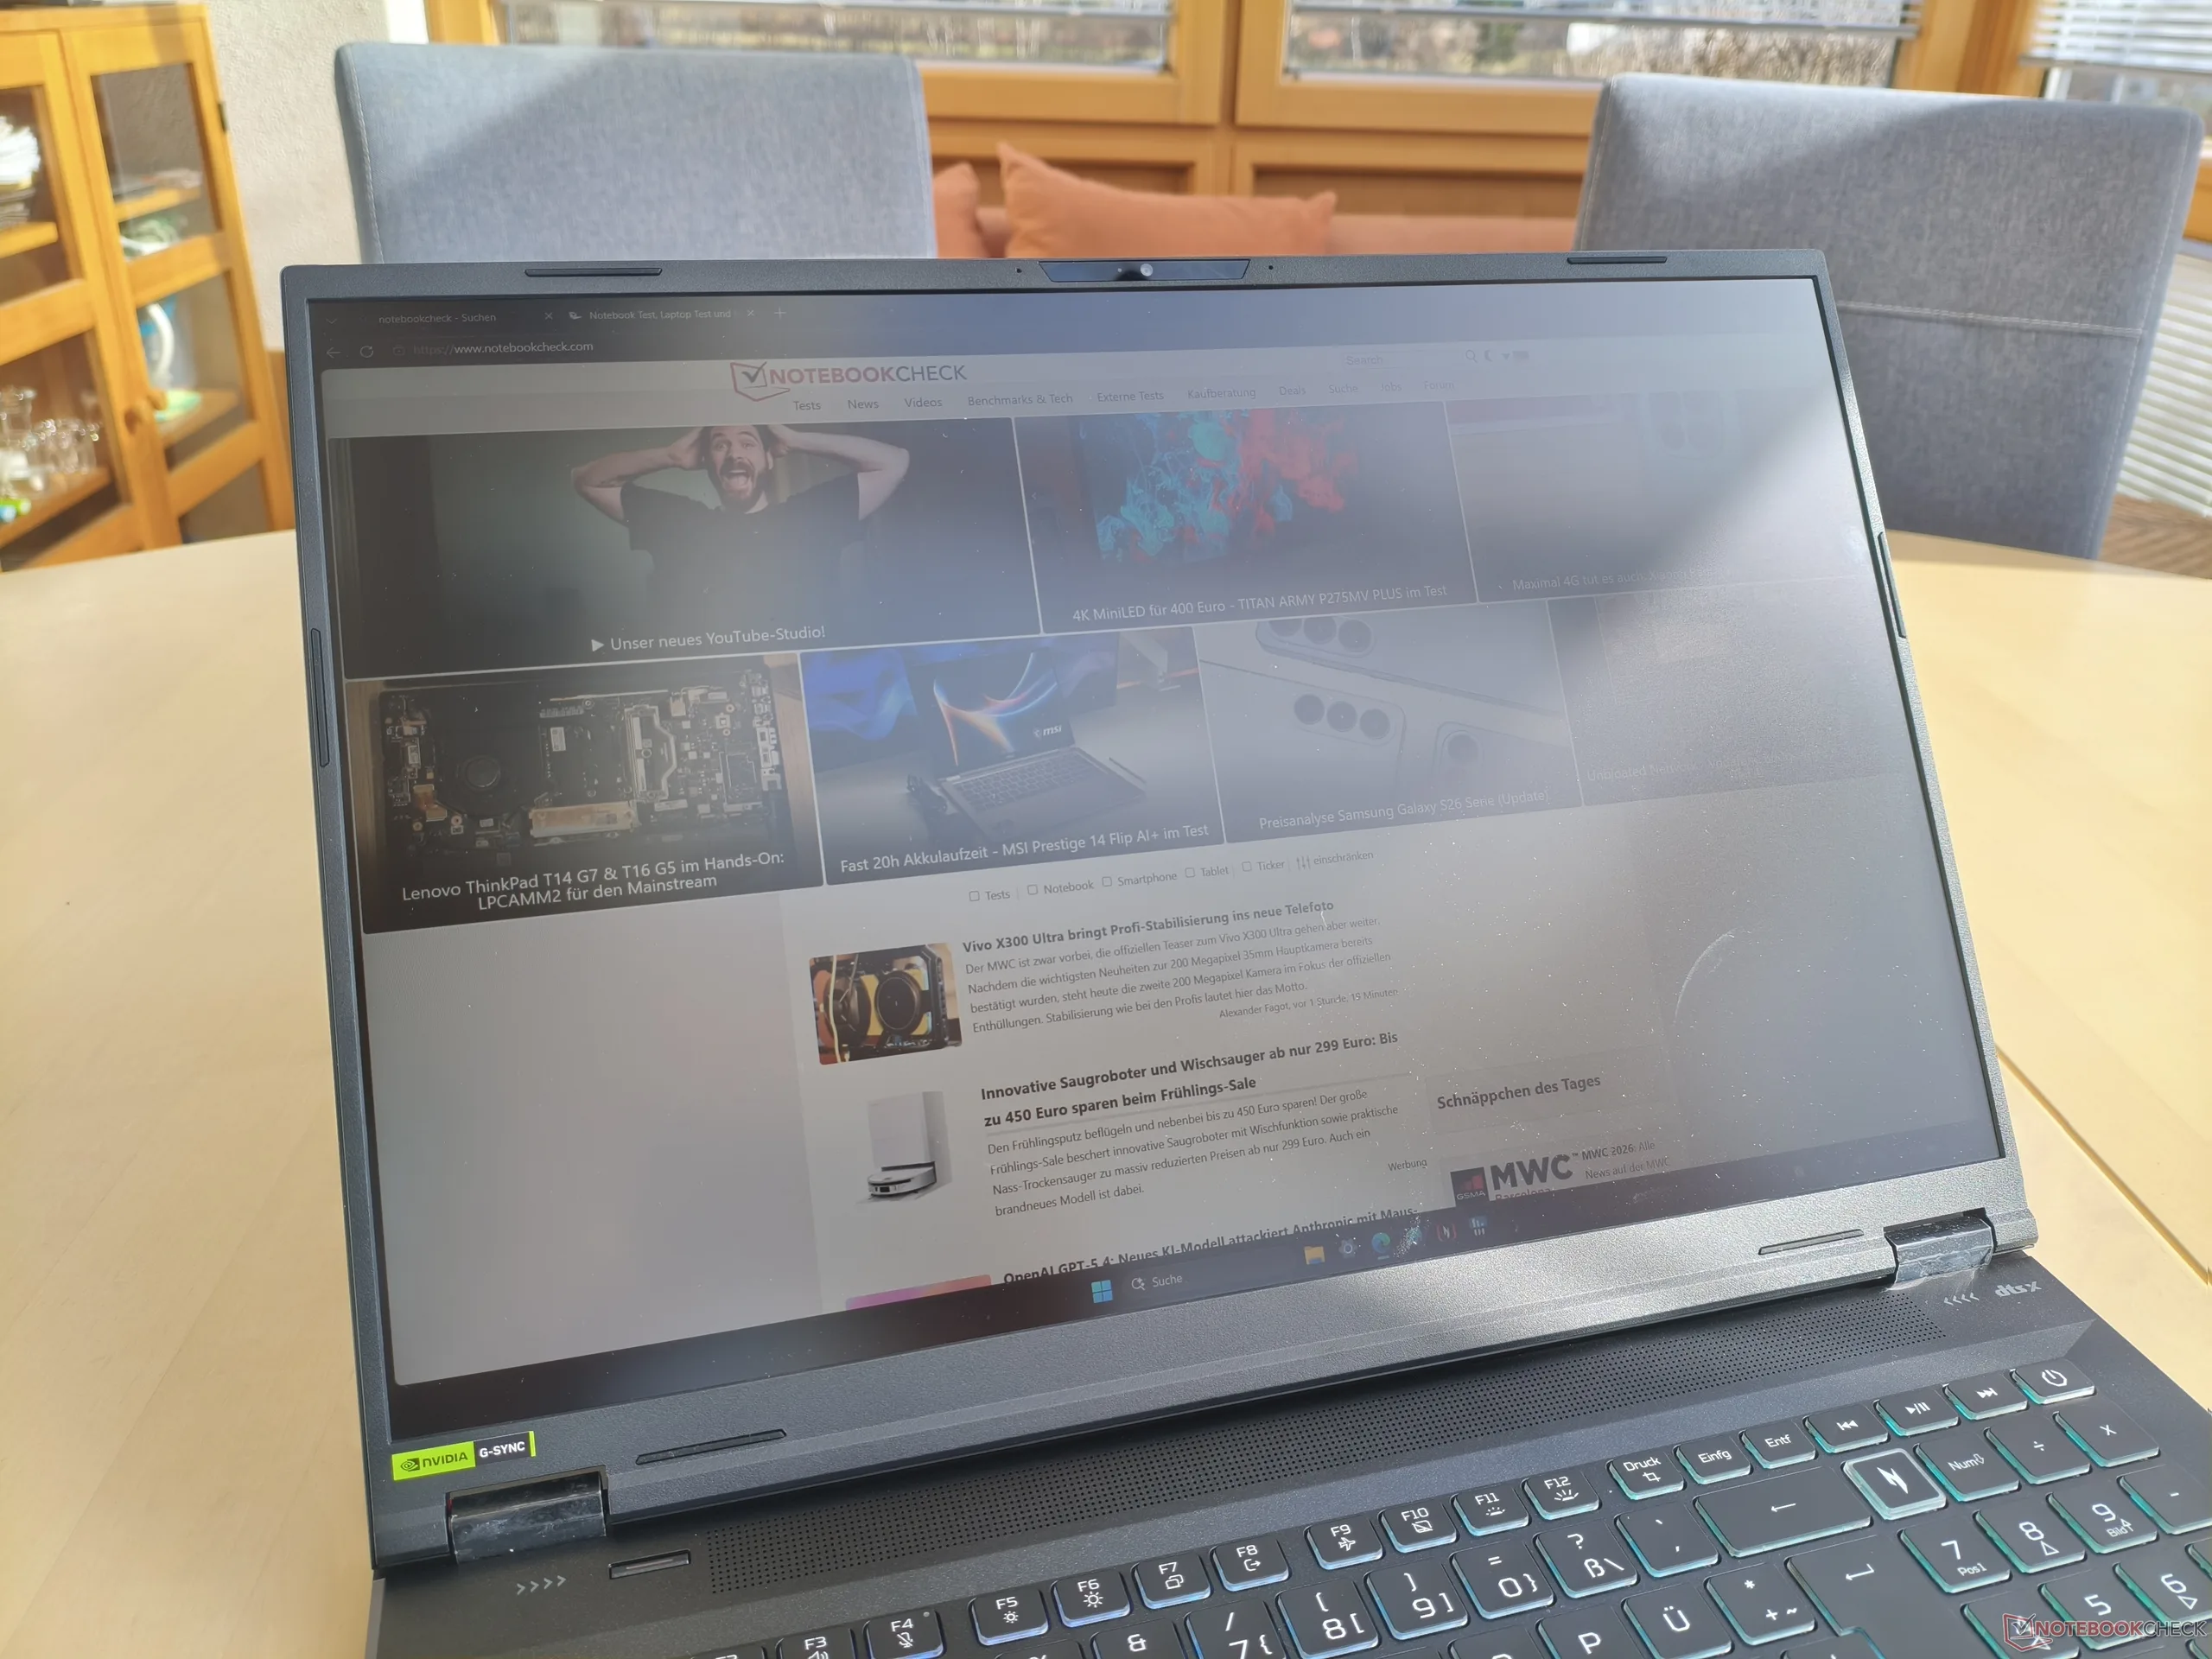
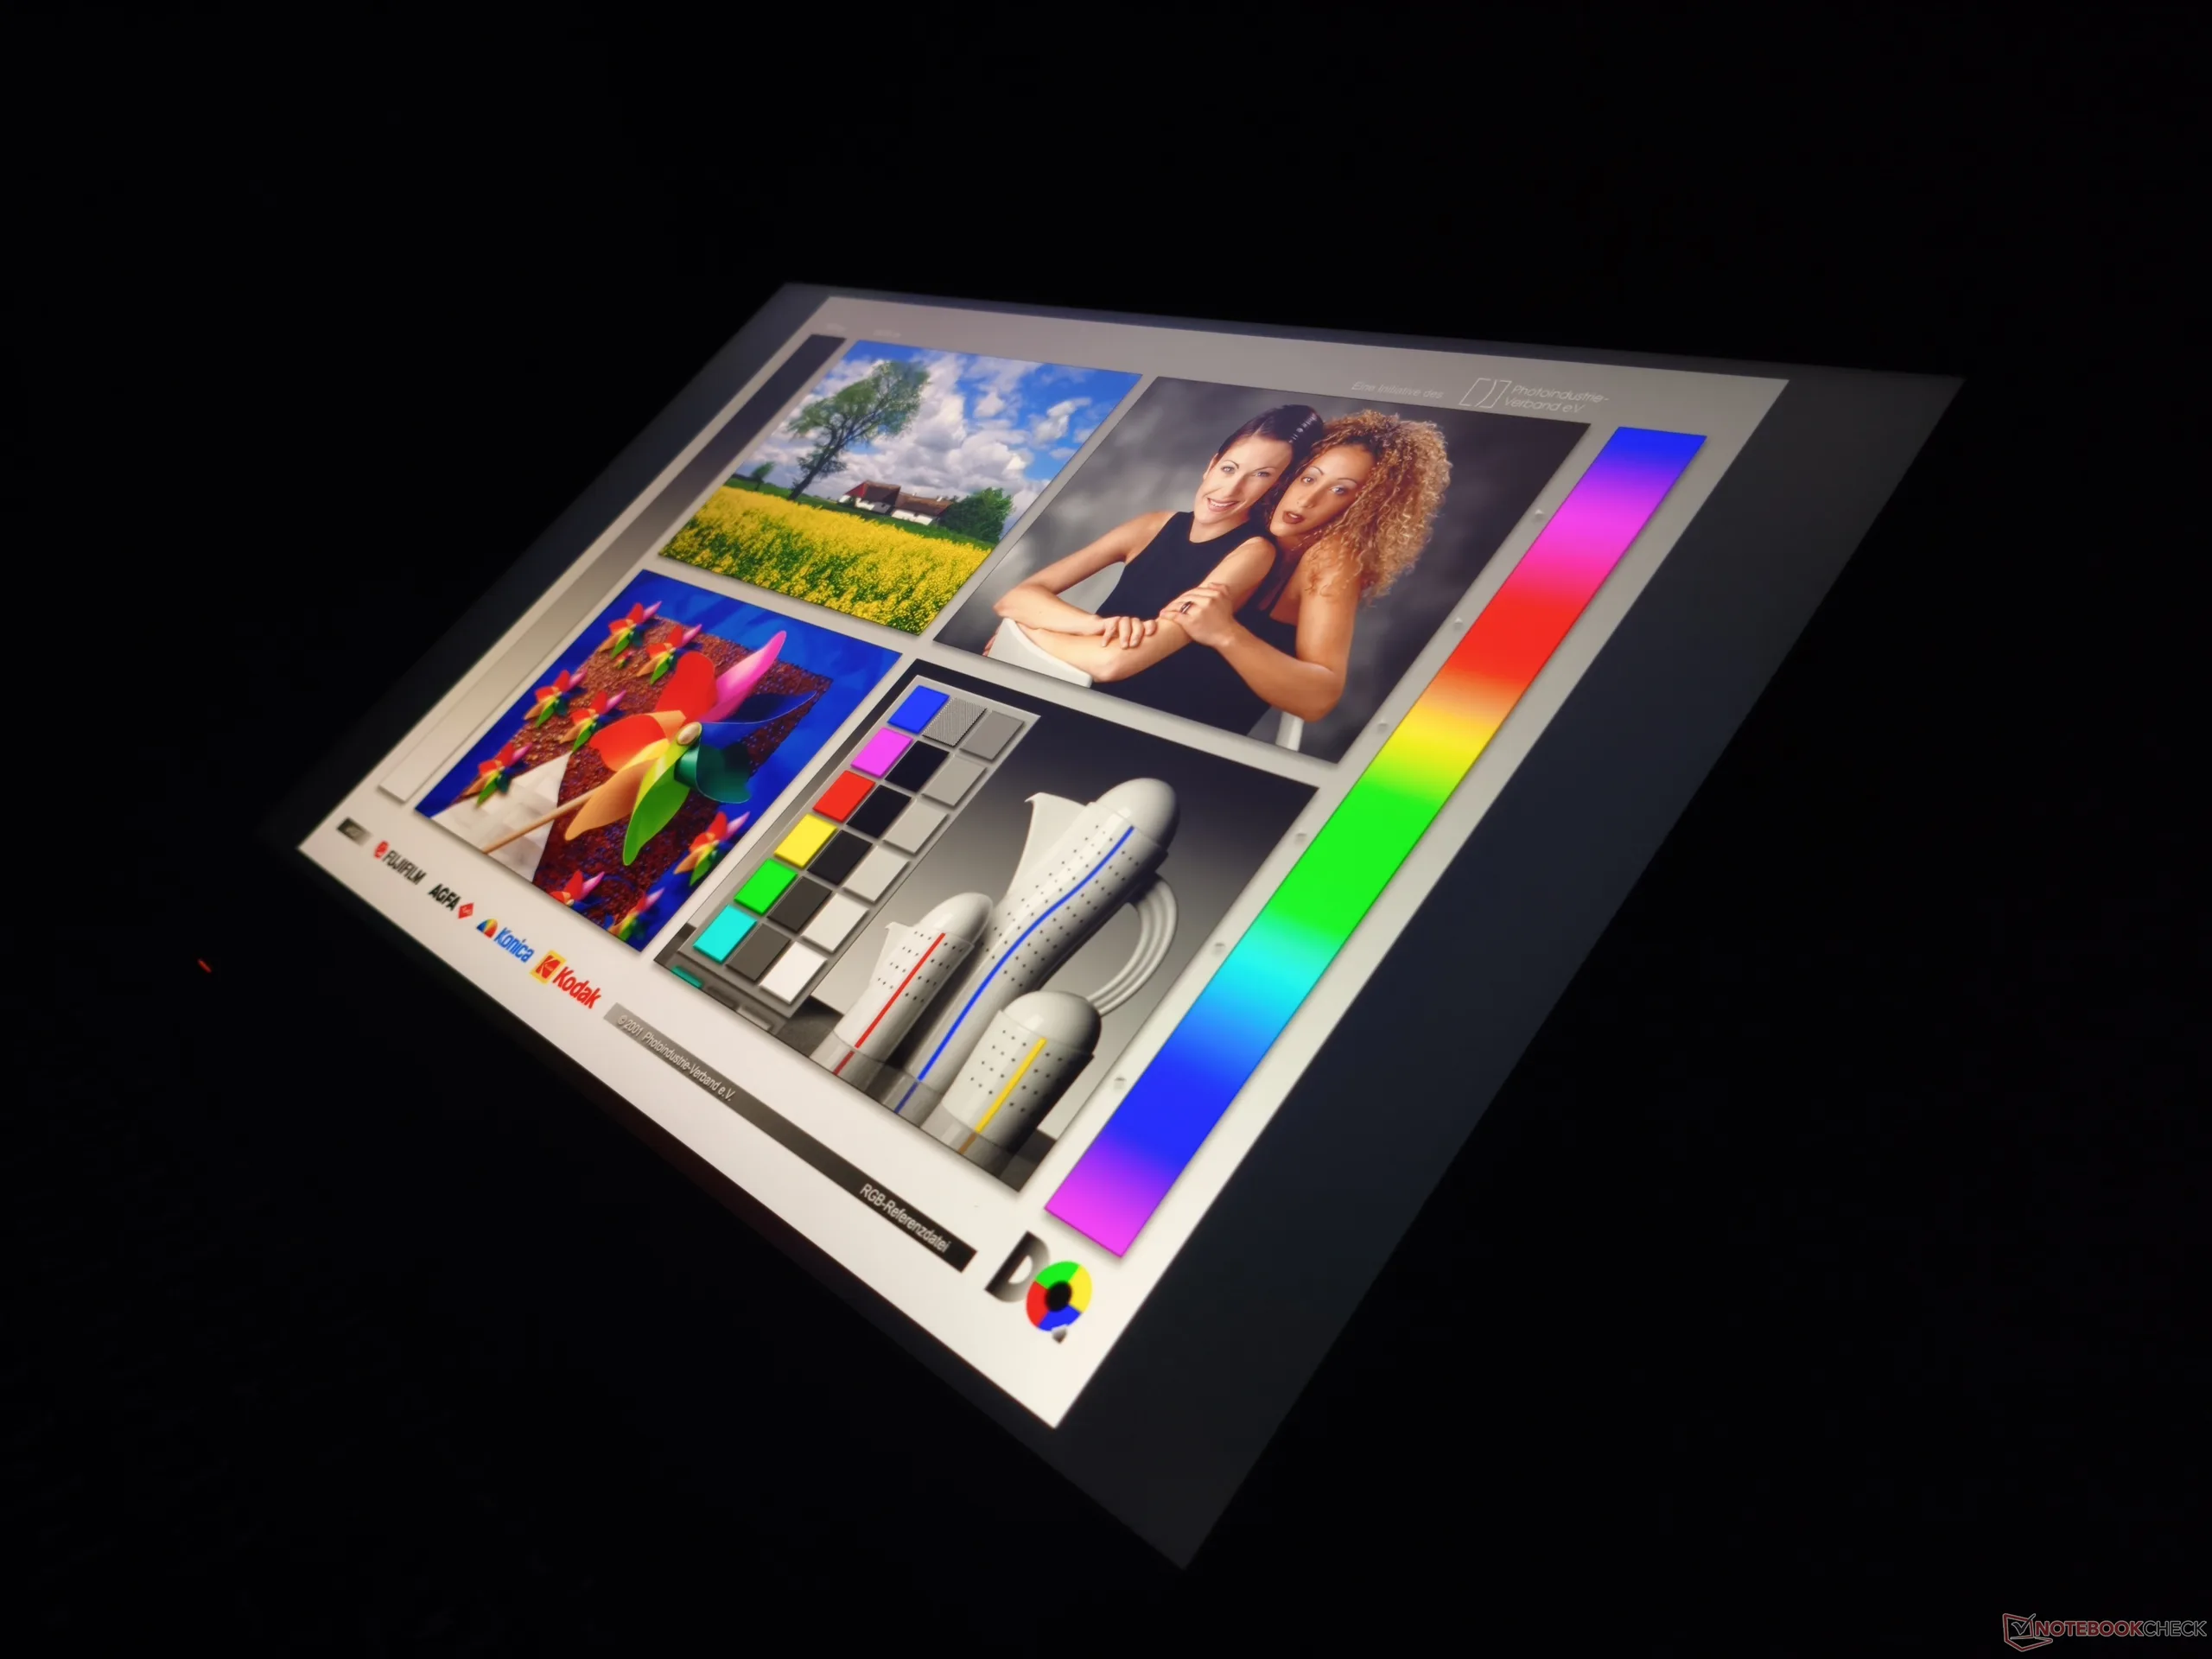
Display
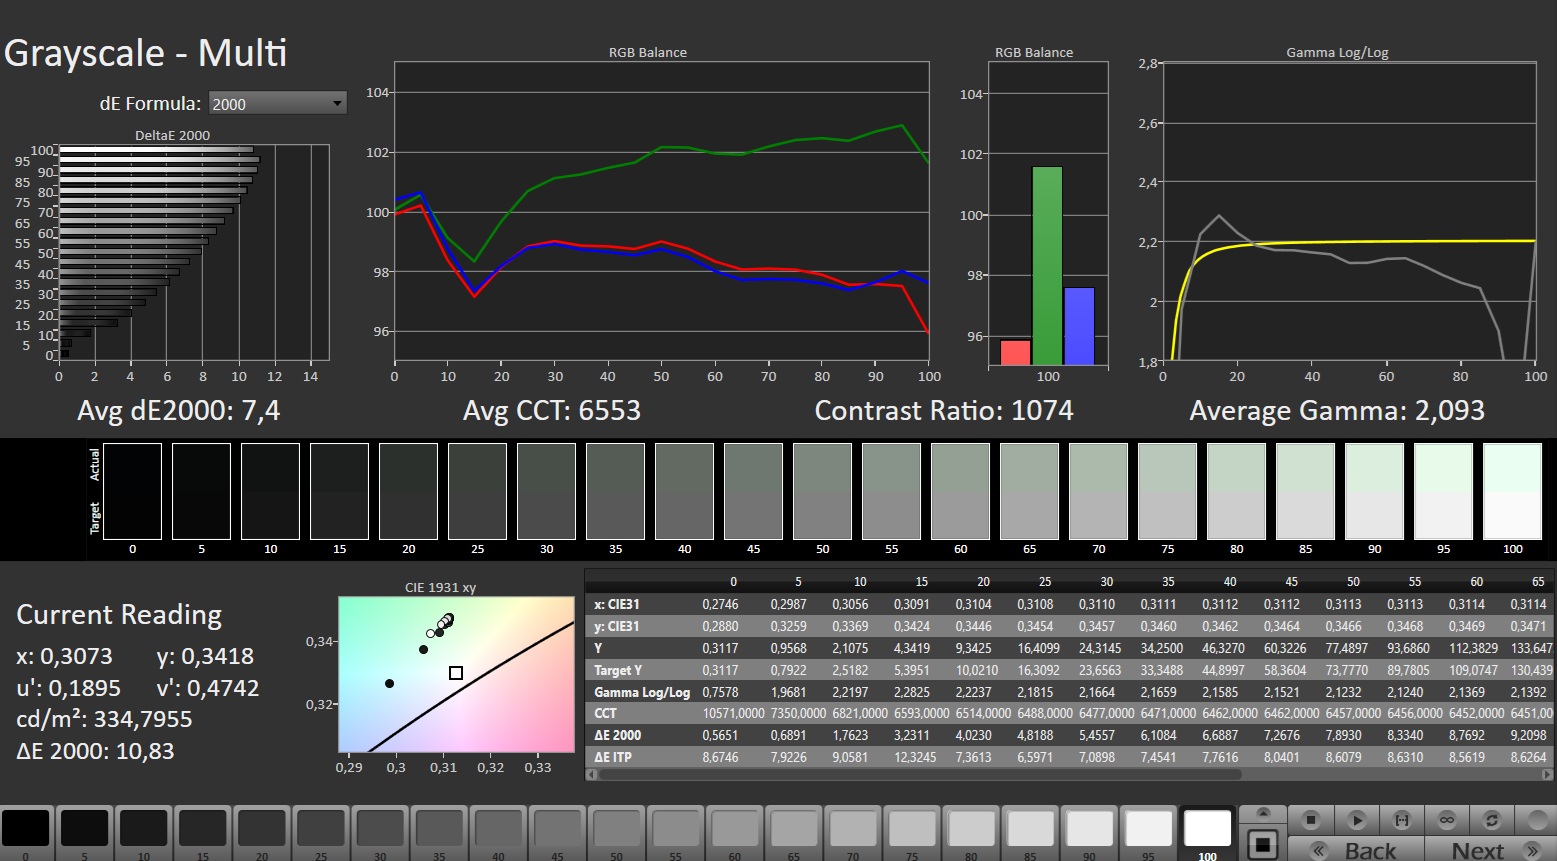
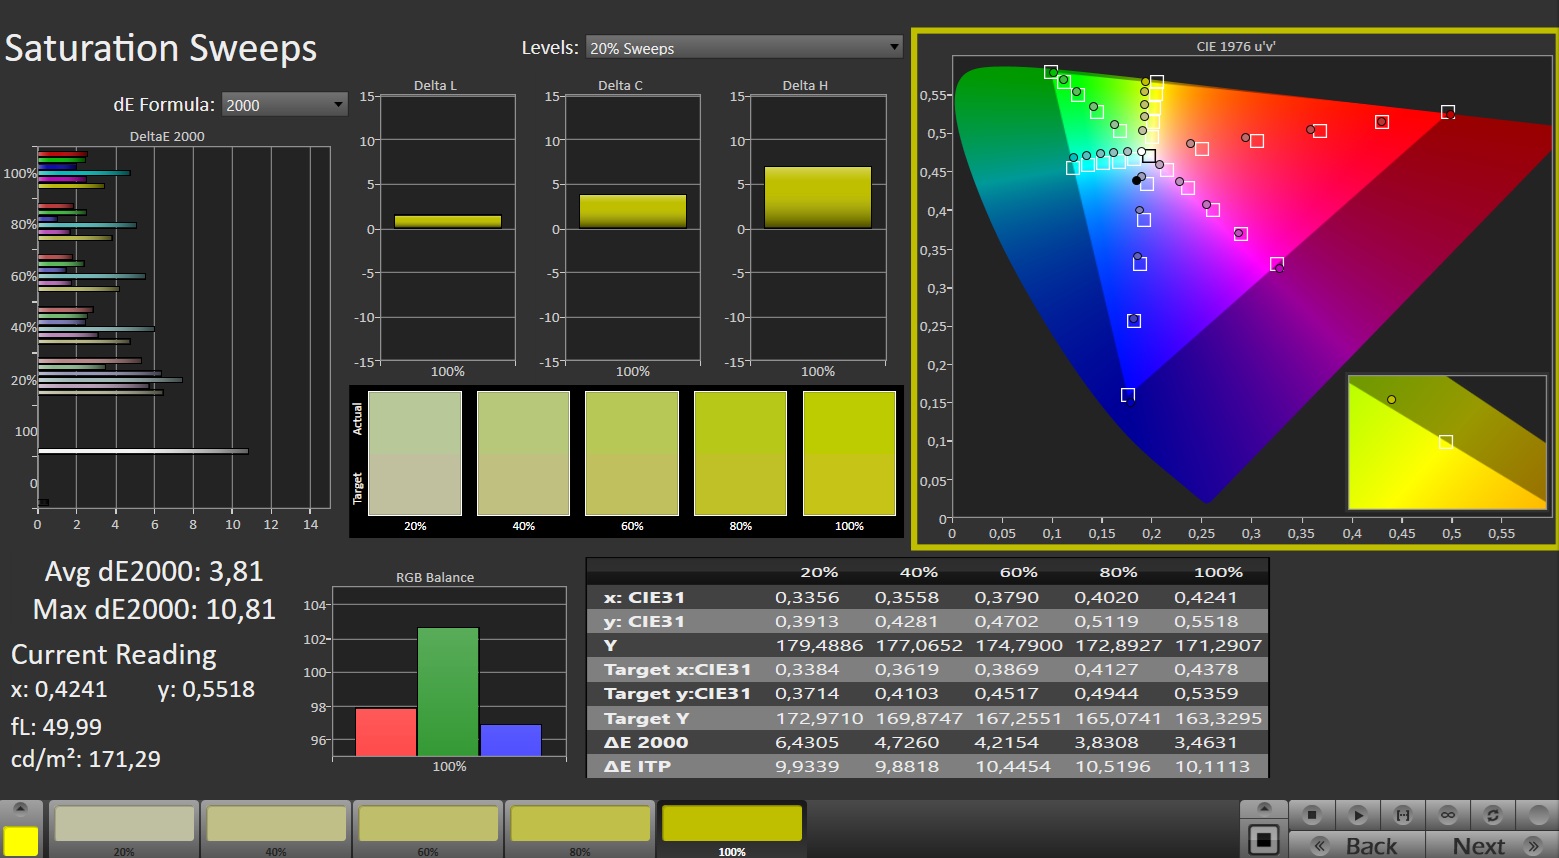
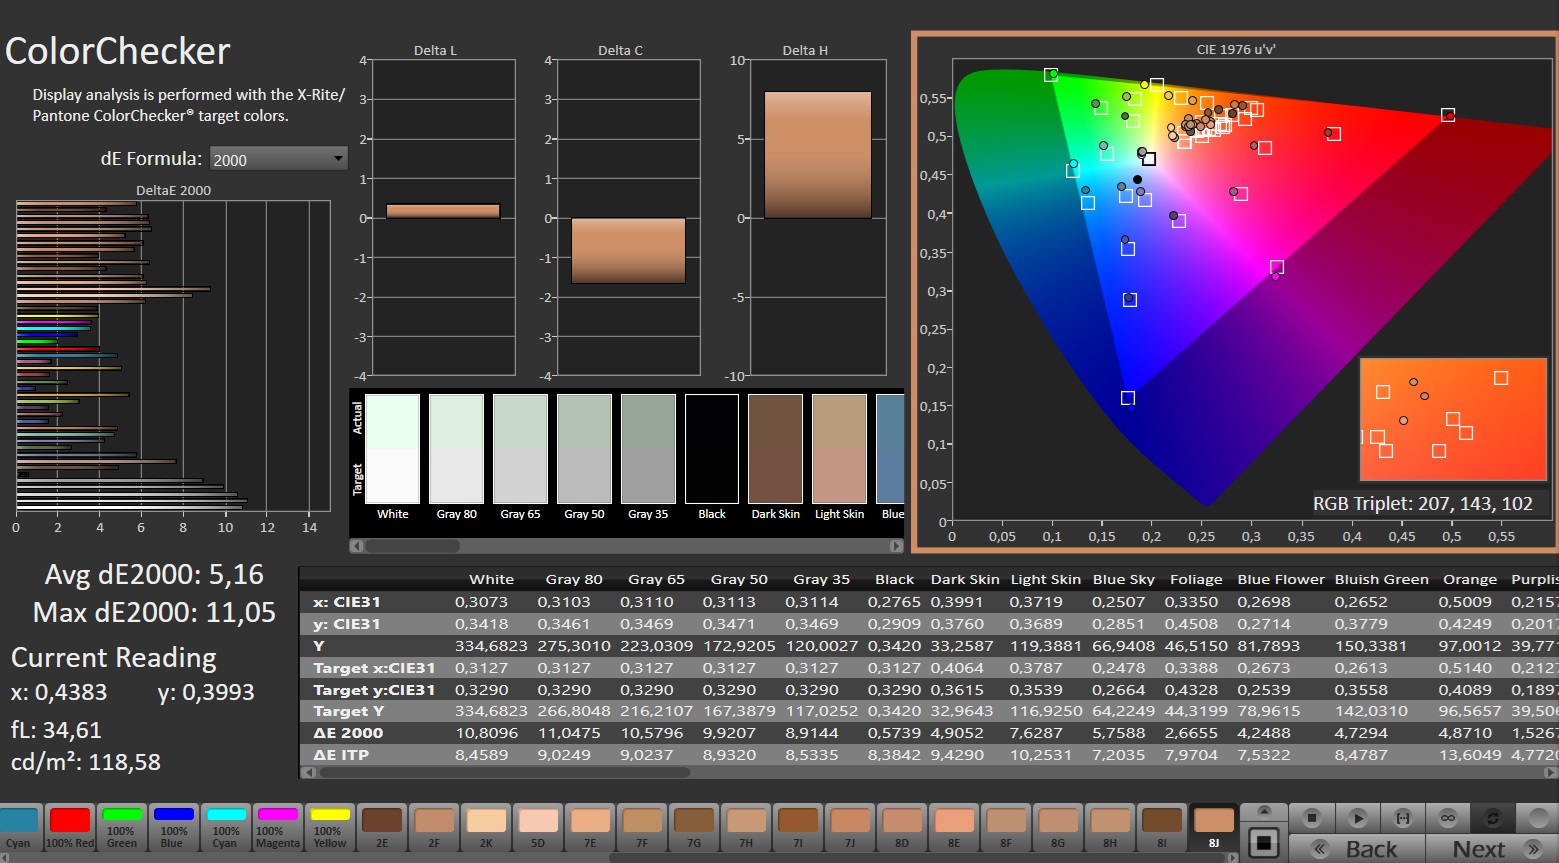
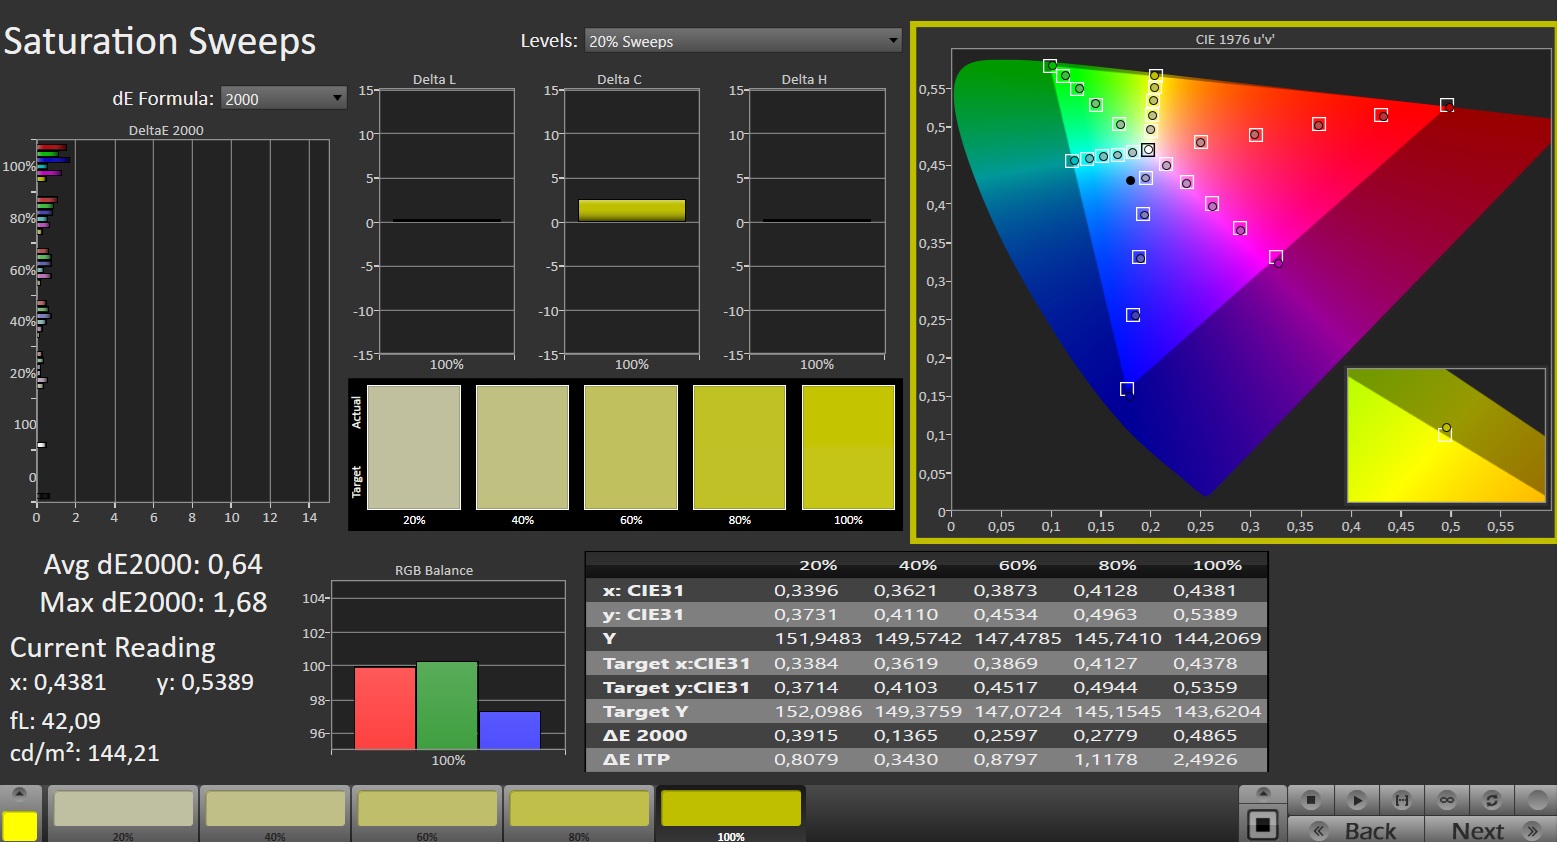
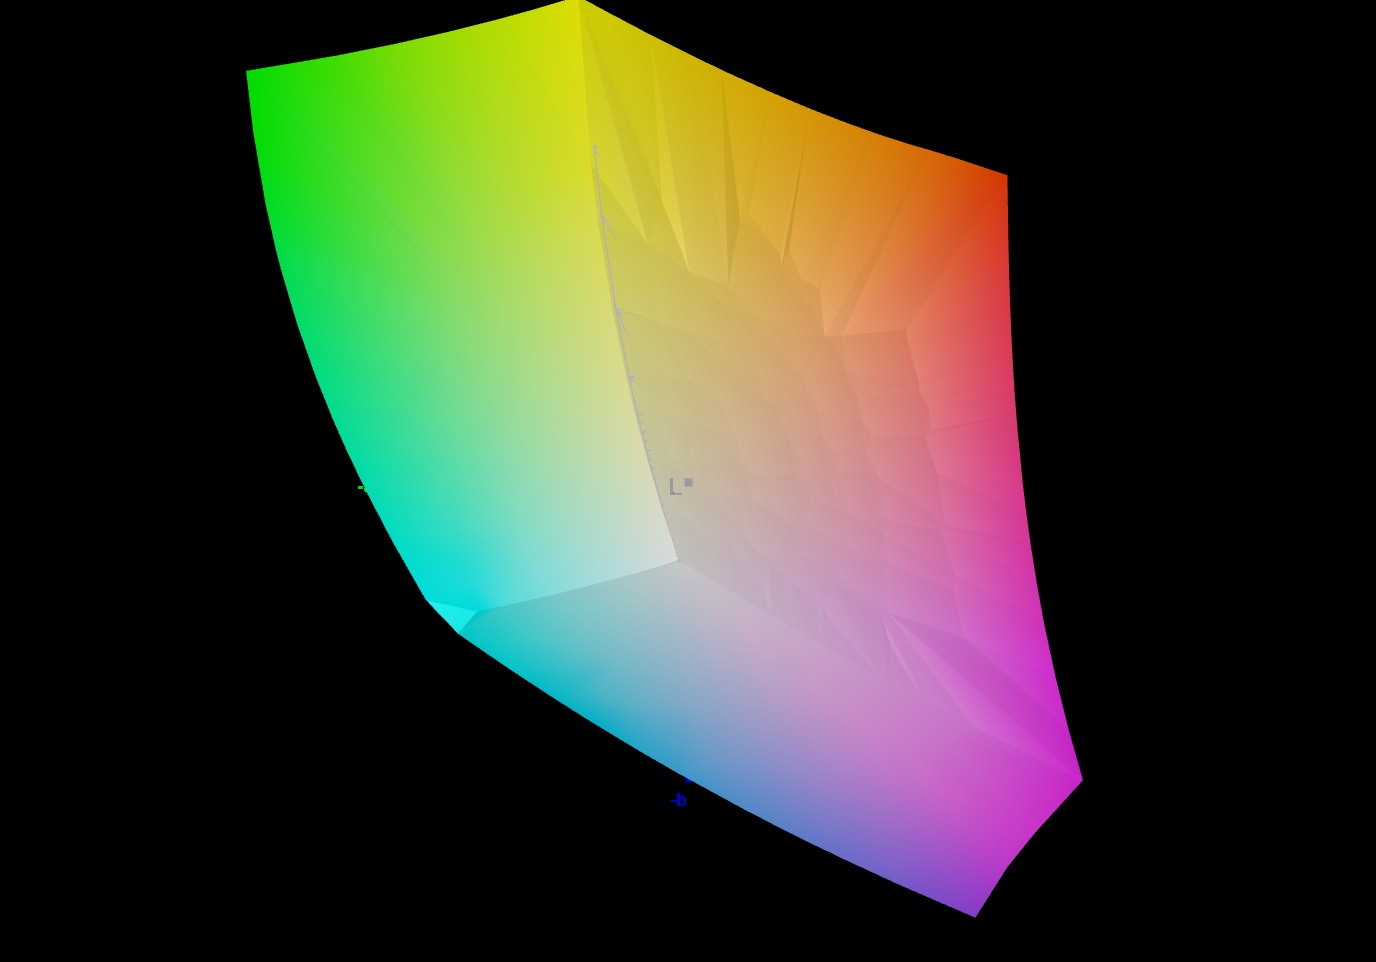
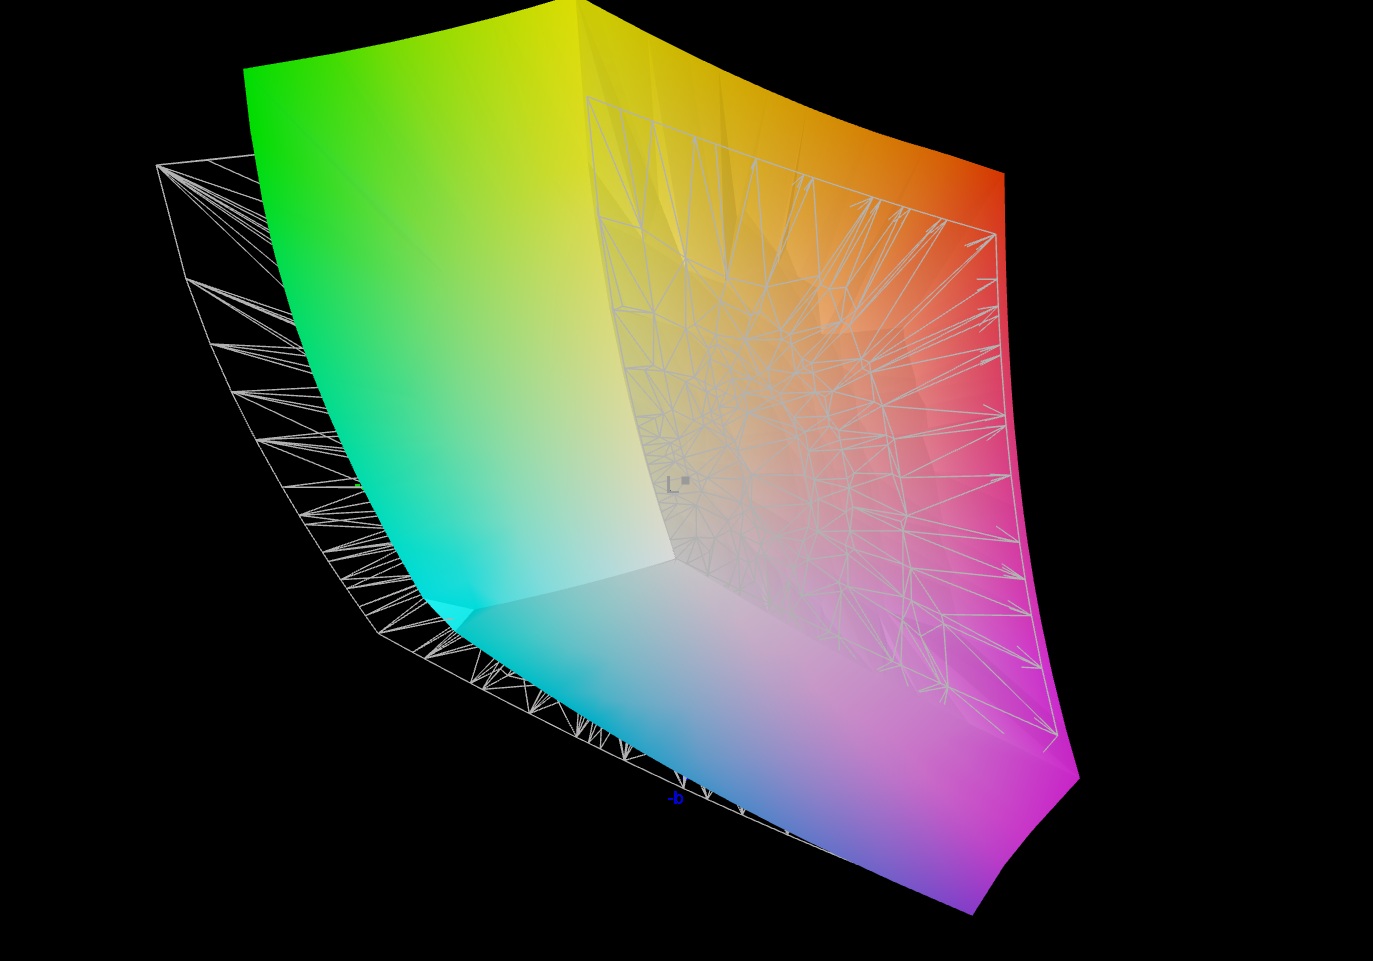
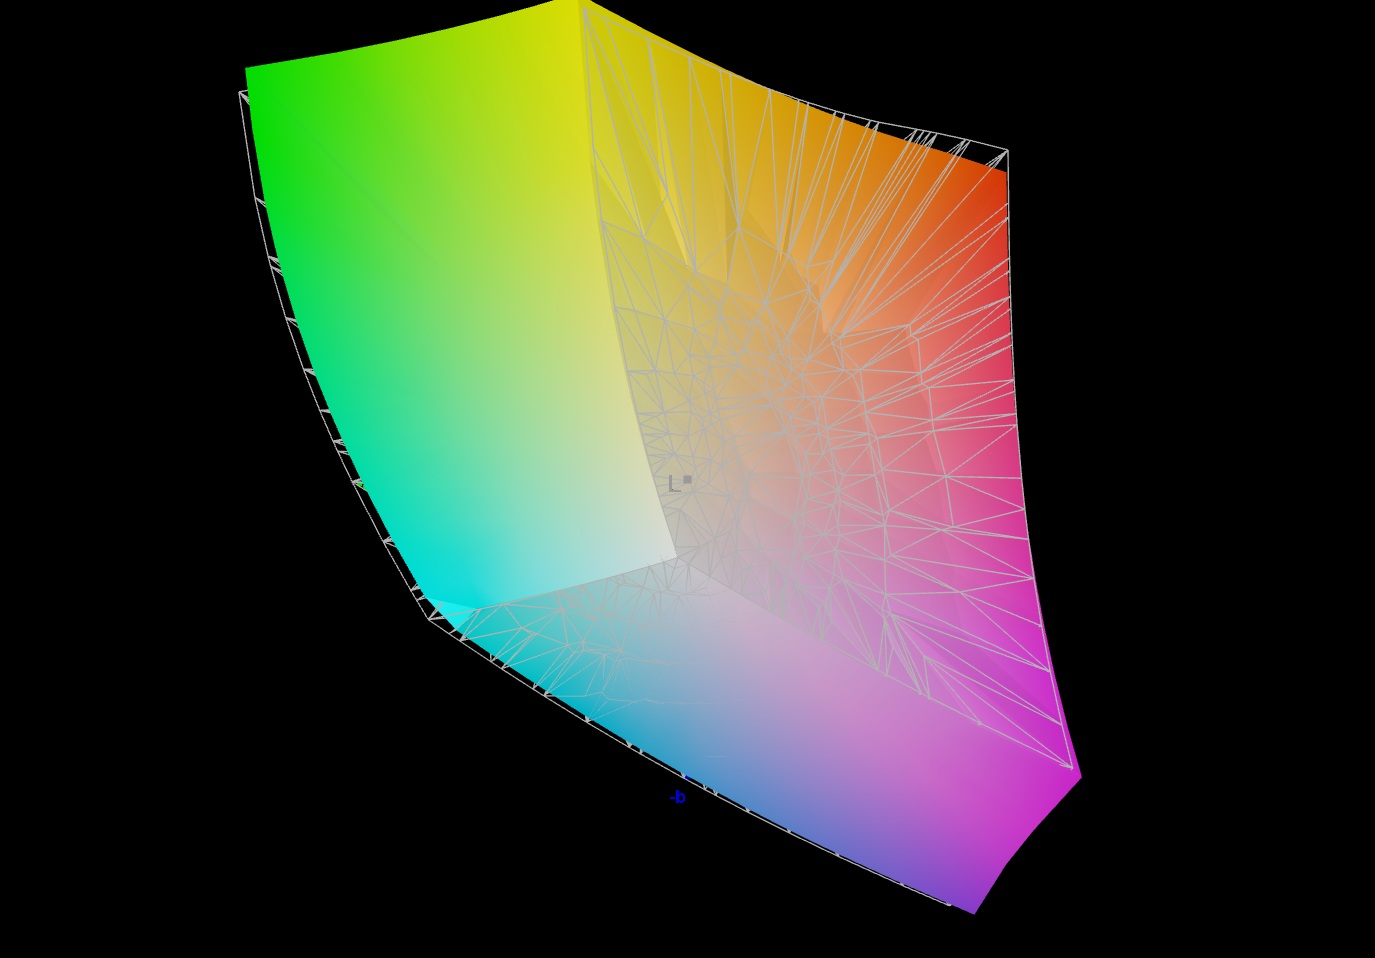
The display leaves a usable impression. An average brightness of 288 cd/m² is a little low for outdoor use, but hardly any user will drag the 18-inch model outside. The competitors still perform better here - in some cases over 500 cd/m² is achieved. The contrast of around 1,130:1, on the other hand, is not out of line. Full sRGB and DCI-P3 coverage are also impressive, although the color accuracy in the delivery state is rather poor. The response times and viewing angles are based on the typical IPS level. Acer specifies a frequency of 165 Hz and the resolution is a crisp 2,560 x 1,600 pixels (16:10 format).
| |||||||||||||||||||||||||
Brightness Distribution: 87 %
Center on Battery: 317 cd/m²
Contrast: 1132:1 (Black: 0.28 cd/m²)
ΔE ColorChecker Calman: 5.16 | ∀{0.5-29.43 Ø4.72}
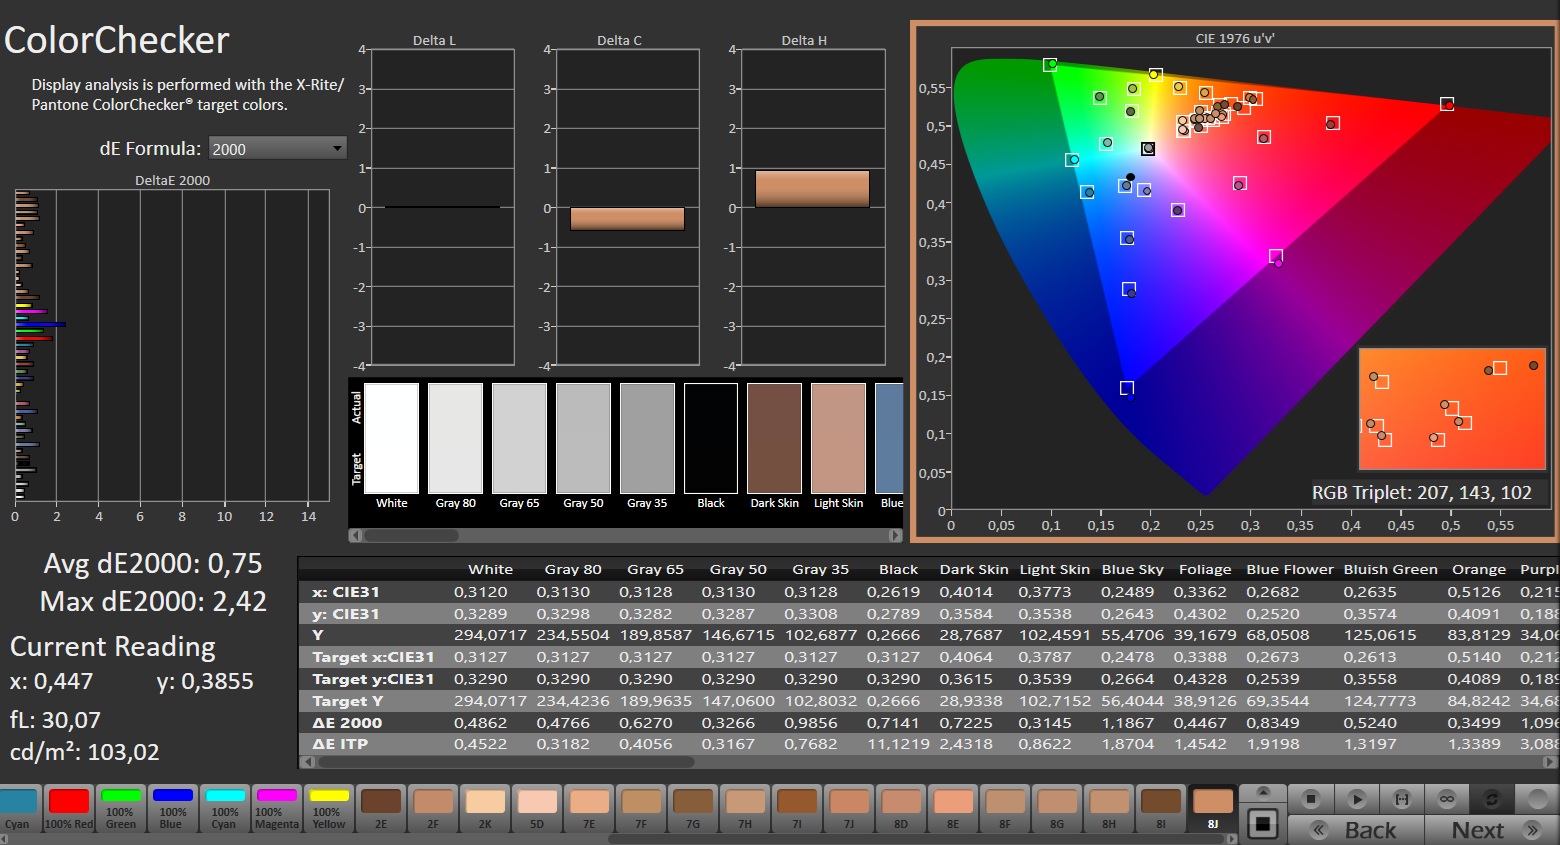
calibrated: 2.42
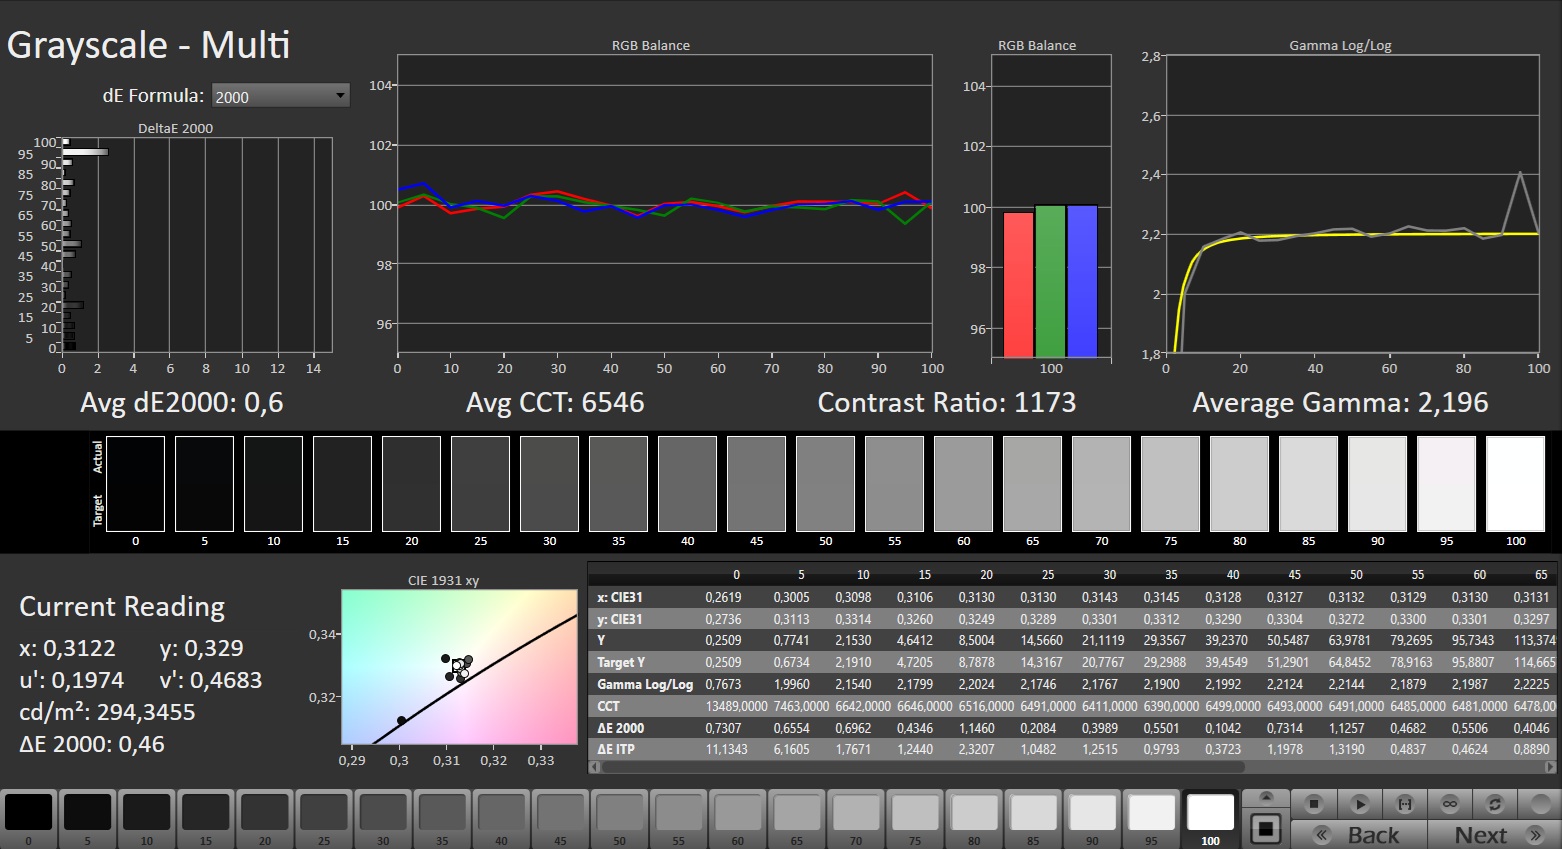
ΔE Greyscale Calman: 7.4 | ∀{0.09-98 Ø4.97}
84.8% AdobeRGB 1998 (Argyll 3D)
99.9% sRGB (Argyll 3D)
97.2% Display P3 (Argyll 3D)
Gamma: 2.093
CCT: 6553 K
| Acer Nitro 18 AI AN18-61-R10V BOEhydis NE180QDM-NY1, IPS, 2560x1600, 18", 165 Hz | Asus TUF Gaming A18 FA808UP-S8022W NE180WUM-NY3 (BOE0CEF), IPS, 1920x1200, 18", 144 Hz | MSI Crosshair 18 HX AI A2XW BOE NE180QDM-NZ4, IPS, 2560x1600, 18", 240 Hz | Asus ROG Strix G18 2025 G814 NE180QDM-NZC, IPS, 2560x1600, 18", 240 Hz | MSI Vector A18 HX A9W AU Optronics B180QAN01.0, IPS, 2560x1600, 18", 240 Hz | |
|---|---|---|---|---|---|
| Display | -17% | 1% | 2% | 1% | |
| Display P3 Coverage (%) | 97.2 | 69.3 -29% | 98 1% | 99.4 2% | 98.1 1% |
| sRGB Coverage (%) | 99.9 | 98.1 -2% | 100 0% | 100 0% | 99.9 0% |
| AdobeRGB 1998 Coverage (%) | 84.8 | 67.9 -20% | 86.1 2% | 87.7 3% | 86.3 2% |
| Response Times | -15% | 11% | 41% | 26% | |
| Response Time Grey 50% / Grey 80% * (ms) | 6.8 ? | 8 ? -18% | 4.7 ? 31% | 3.8 ? 44% | 4.3 ? 37% |
| Response Time Black / White * (ms) | 9.4 ? | 10.4 ? -11% | 10.3 ? -10% | 5.8 ? 38% | 8.1 ? 14% |
| PWM Frequency (Hz) | |||||
| Screen | -84% | -82% | 4% | -62% | |
| Brightness middle (cd/m²) | 317 | 351 11% | 581.4 83% | 582 84% | 543 71% |
| Brightness (cd/m²) | 288 | 332 15% | 534 85% | 557 93% | 502 74% |
| Brightness Distribution (%) | 87 | 89 2% | 84 -3% | 93 7% | 86 -1% |
| Black Level * (cd/m²) | 0.28 | 0.26 7% | 0.46 -64% | 0.4 -43% | 0.56 -100% |
| Contrast (:1) | 1132 | 1350 19% | 1264 12% | 1455 29% | 970 -14% |
| Colorchecker dE 2000 * | 5.16 | 2.89 44% | 3.89 25% | 1.4 73% | 3.41 34% |
| Colorchecker dE 2000 max. * | 0.75 | 7.91 -955% | 7.94 -959% | 3.4 -353% | 6.4 -753% |
| Colorchecker dE 2000 calibrated * | 2.42 | 0.93 62% | 0.97 60% | 0.7 71% | 0.66 73% |
| Greyscale dE 2000 * | 7.4 | 4.46 40% | 5.6 24% | 1.8 76% | 3.4 54% |
| Gamma | 2.093 105% | 2.46 89% | 2.1 105% | 2.24 98% | 2.3 96% |
| CCT | 6553 99% | 7132 91% | 6835 95% | 6633 98% | 6070 107% |
| Total Average (Program / Settings) | -39% /
-60% | -23% /
-51% | 16% /
9% | -12% /
-36% |
* ... smaller is better
Display Response Times
| ↔ Response Time Black to White | ||
|---|---|---|
| 9.4 ms ... rise ↗ and fall ↘ combined | ↗ 4.5 ms rise | 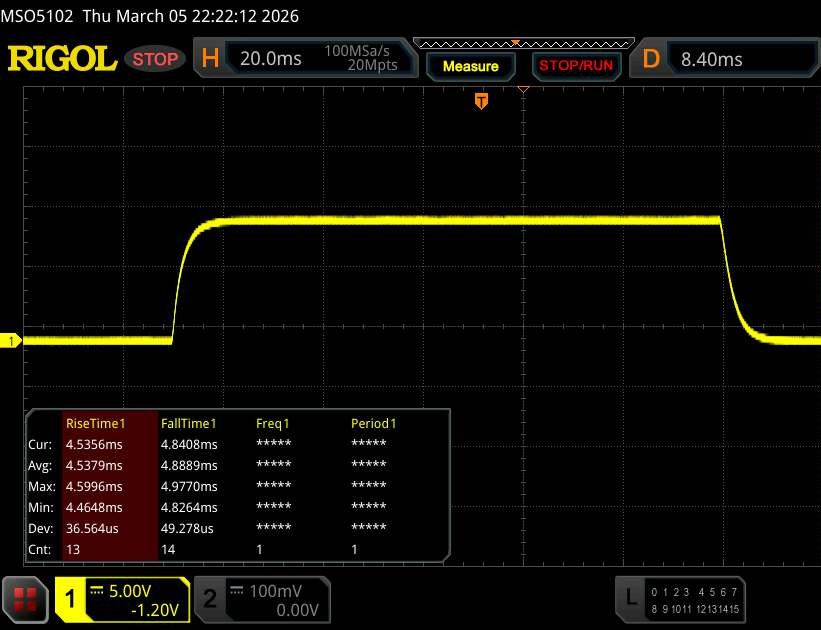 |
| ↘ 4.9 ms fall | ||
| The screen shows fast response rates in our tests and should be suited for gaming. In comparison, all tested devices range from 0.1 (minimum) to 240 (maximum) ms. » 26 % of all devices are better. This means that the measured response time is better than the average of all tested devices (19.8 ms). | ||
| ↔ Response Time 50% Grey to 80% Grey | ||
| 6.8 ms ... rise ↗ and fall ↘ combined | ↗ 3.2 ms rise | 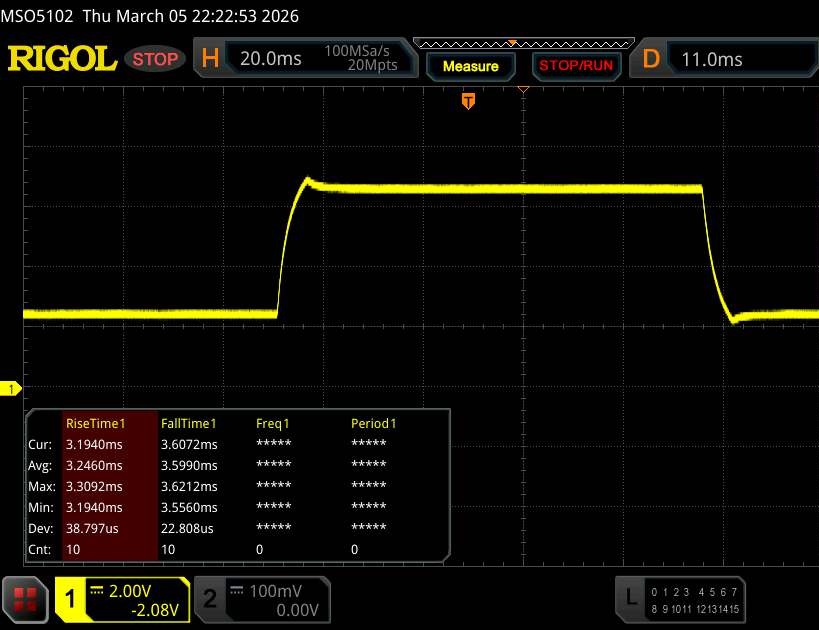 |
| ↘ 3.6 ms fall | ||
| The screen shows very fast response rates in our tests and should be very well suited for fast-paced gaming. In comparison, all tested devices range from 0.165 (minimum) to 636 (maximum) ms. » 20 % of all devices are better. This means that the measured response time is better than the average of all tested devices (31 ms). | ||
Screen Flickering / PWM (Pulse-Width Modulation)
| Screen flickering / PWM not detected | 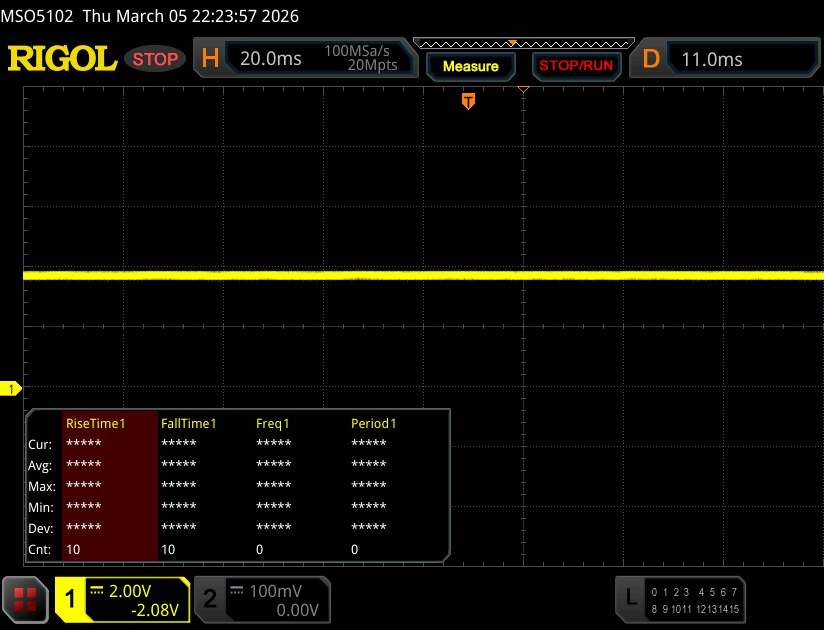 | ||
In comparison: 52 % of all tested devices do not use PWM to dim the display. If PWM was detected, an average of 7747 (minimum: 5 - maximum: 343500) Hz was measured. | |||
Performance
The Nitro 18 AI is available in various configurations, which differ not only in terms of RAM and SSD, but also in terms of the CPU (Ryzen AI 5 340 to Ryzen AI 9 365) and the GPU (RTX 5050 to RTX 5070 Ti) differ. The price varies accordingly.
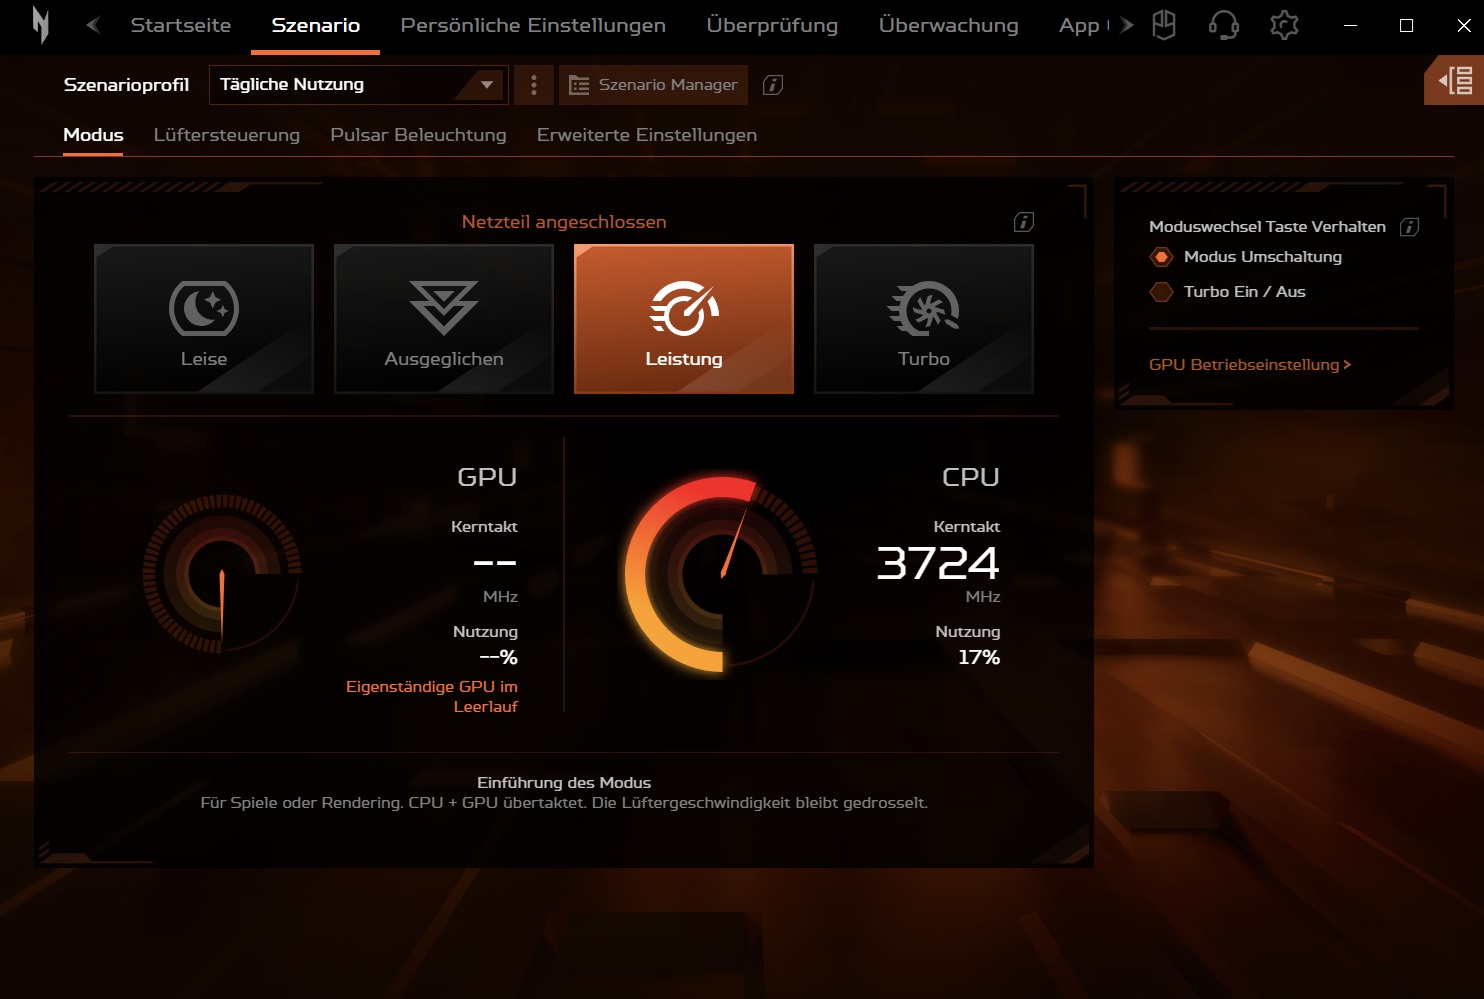
Test conditions
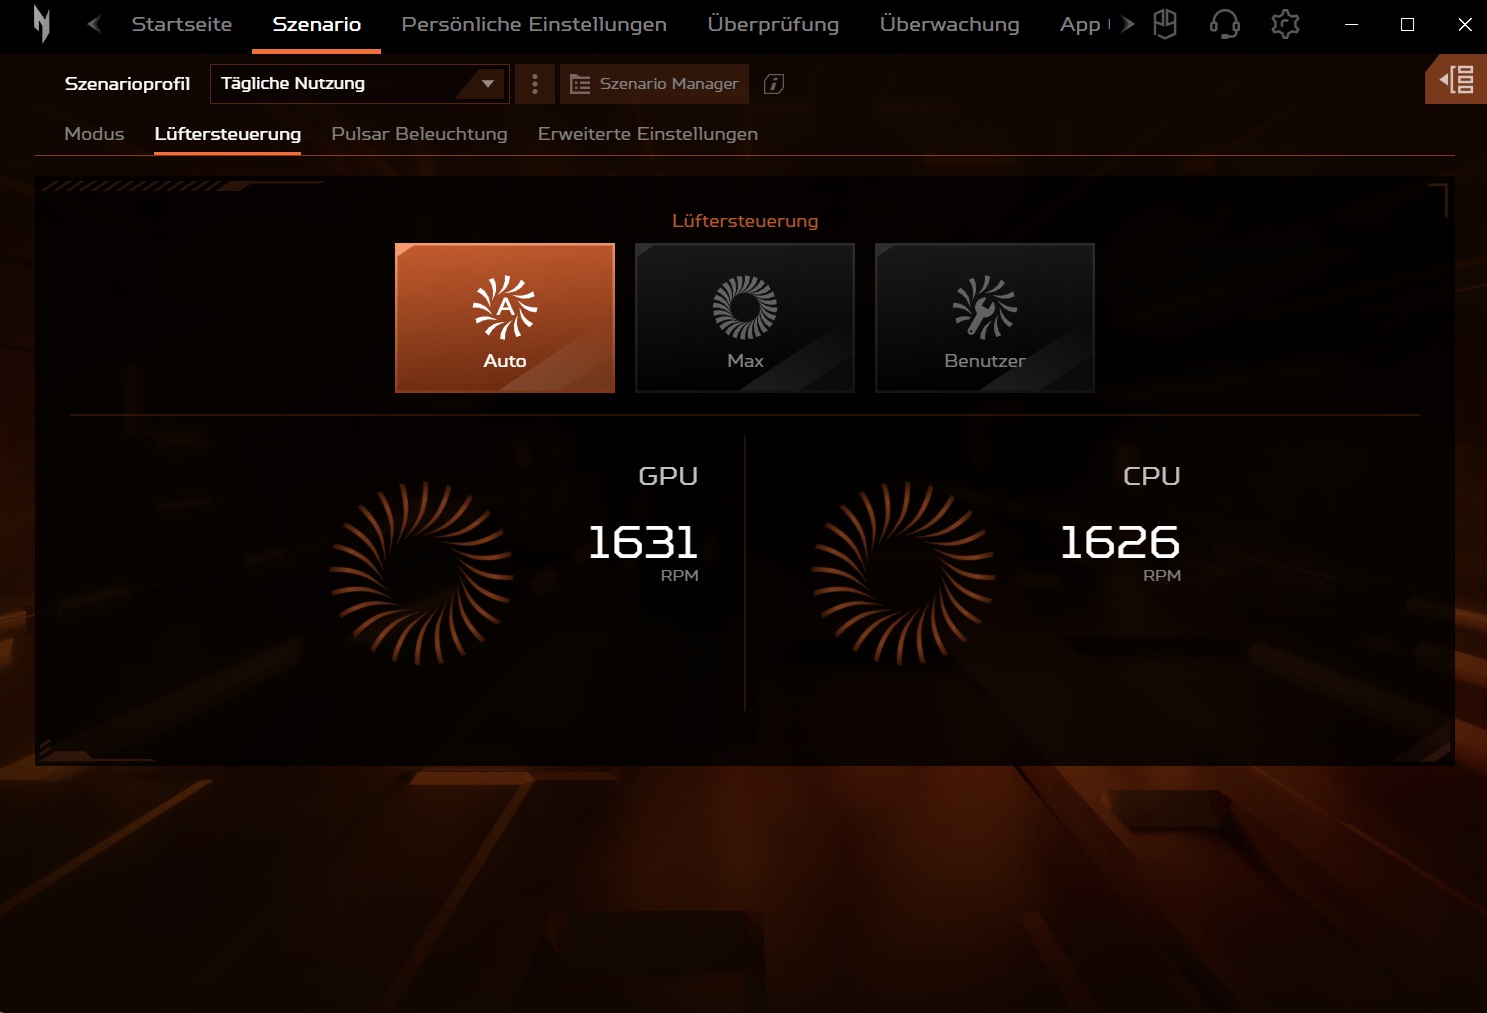
The NitroSense tool contains four different operating modes, ranging from quiet to turbo. Our measurements (apart from the battery test) were carried out with the performance profile.
| Mode | Silent | Balanced | Performance | Turbo |
| Cyberpunk 2077 Noise | 36 dB(A) | 42 dB(A) | 54 dB(A) | 59 dB(A) |
| Cyberpunk 2077 frame rate (FHD/Ultra) | 91.6 fps | 97.1 fps | 101.3 fps | 105.5 fps |
| GPU Power Draw | ~85 W | ~95 W | ~105 W | ~110 W |
| CPU PL1 | 45 W | 65 W | 75 W | 95 W |
| CPU PL2 | 125 W | 125 W | 125 W | 125 W |
| Cinebench R15 Multi Score | 2410 Points | 2615 Points | 2693 Points | 2707 Points |
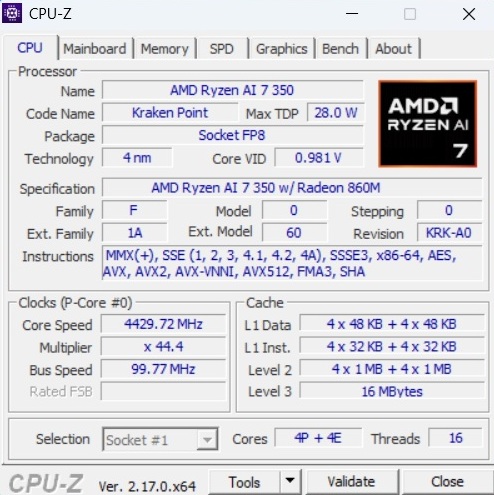
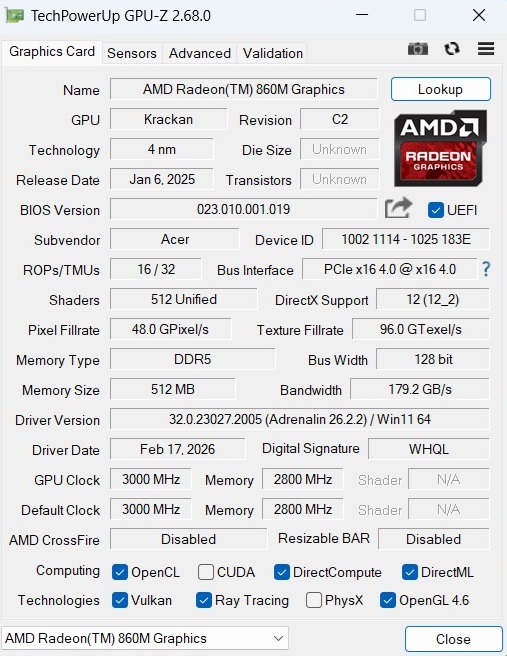
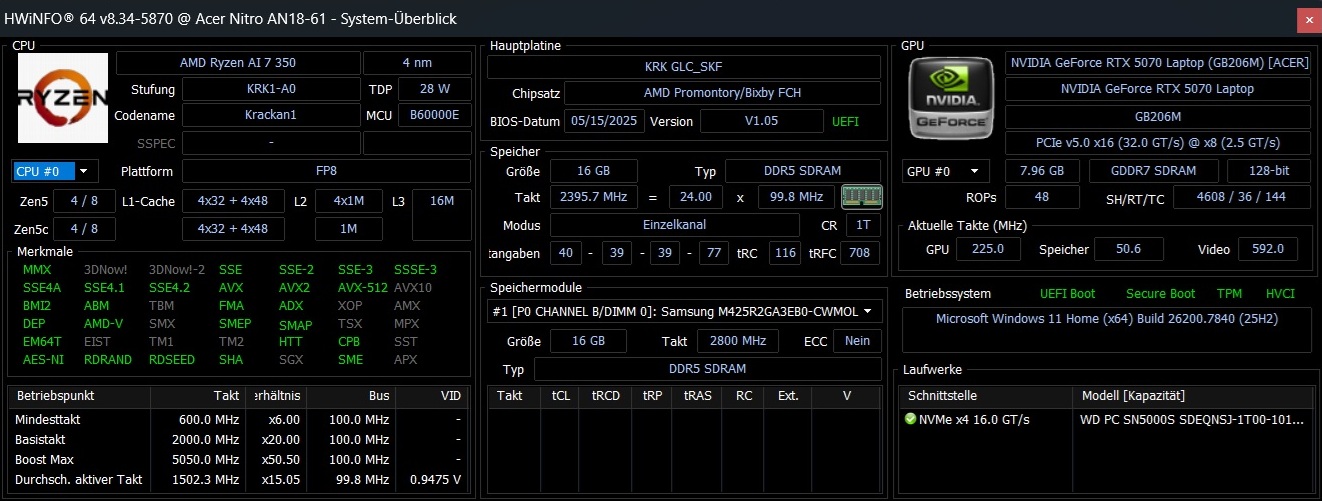
Processor
Although the Ryzen AI 7 350 (8 cores, 16 threads) cannot compete with the more expensive models Core Ultra 9 275HX and Ryzen 9 9955HX of the competition and is roughly on a par with the old Ryzen 7 260 the Zen 5 chip is still a solid processor with good performance that should be more than enough for most users.
Cinebench R15 Multi endurance test
* ... smaller is better
AIDA64: FP32 Ray-Trace | FPU Julia | CPU SHA3 | CPU Queen | FPU SinJulia | FPU Mandel | CPU AES | CPU ZLib | FP64 Ray-Trace | CPU PhotoWorxx
| Performance rating | |
| MSI Vector A18 HX A9W | |
| Asus ROG Strix G18 2025 G814 | |
| MSI Crosshair 18 HX AI A2XW | |
| Average of class Gaming | |
| Asus TUF Gaming A18 FA808UP-S8022W | |
| Acer Nitro 18 AI AN18-61-R10V | |
| Average AMD Ryzen AI 7 350 | |
| AIDA64 / FP32 Ray-Trace | |
| MSI Vector A18 HX A9W (v6.92.6600) | |
| Asus ROG Strix G18 2025 G814 (v6.92.6600) | |
| MSI Crosshair 18 HX AI A2XW (v6.92.6600) | |
| Average of class Gaming (10227 - 85542, n=103, last 2 years) | |
| Acer Nitro 18 AI AN18-61-R10V (v6.92.6600) | |
| Asus TUF Gaming A18 FA808UP-S8022W (v6.92.6600) | |
| Average AMD Ryzen AI 7 350 (20203 - 28112, n=16) | |
| AIDA64 / FPU Julia | |
| MSI Vector A18 HX A9W (v6.92.6600) | |
| Asus ROG Strix G18 2025 G814 (v6.92.6600) | |
| MSI Crosshair 18 HX AI A2XW (v6.92.6600) | |
| Average of class Gaming (51376 - 238426, n=103, last 2 years) | |
| Asus TUF Gaming A18 FA808UP-S8022W (v6.92.6600) | |
| Acer Nitro 18 AI AN18-61-R10V (v6.92.6600) | |
| Average AMD Ryzen AI 7 350 (75098 - 110301, n=16) | |
| AIDA64 / CPU SHA3 | |
| MSI Vector A18 HX A9W (v6.92.6600) | |
| Asus ROG Strix G18 2025 G814 (v6.92.6600) | |
| MSI Crosshair 18 HX AI A2XW (v6.92.6600) | |
| Average of class Gaming (2180 - 9817, n=103, last 2 years) | |
| Asus TUF Gaming A18 FA808UP-S8022W (v6.92.6600) | |
| Acer Nitro 18 AI AN18-61-R10V (v6.92.6600) | |
| Average AMD Ryzen AI 7 350 (3395 - 4399, n=16) | |
| AIDA64 / CPU Queen | |
| Asus ROG Strix G18 2025 G814 (v6.92.6600) | |
| MSI Vector A18 HX A9W (v6.92.6600) | |
| MSI Crosshair 18 HX AI A2XW (v6.92.6600) | |
| Asus TUF Gaming A18 FA808UP-S8022W (v6.92.6600) | |
| Average of class Gaming (49785 - 173351, n=89, last 2 years) | |
| Average AMD Ryzen AI 7 350 (67317 - 77400, n=16) | |
| Acer Nitro 18 AI AN18-61-R10V (v6.92.6600) | |
| AIDA64 / FPU SinJulia | |
| MSI Vector A18 HX A9W (v6.92.6600) | |
| Asus ROG Strix G18 2025 G814 (v6.92.6600) | |
| Asus TUF Gaming A18 FA808UP-S8022W (v6.92.6600) | |
| Average of class Gaming (4424 - 33636, n=103, last 2 years) | |
| Acer Nitro 18 AI AN18-61-R10V (v6.92.6600) | |
| Average AMD Ryzen AI 7 350 (11916 - 13856, n=16) | |
| MSI Crosshair 18 HX AI A2XW (v6.92.6600) | |
| AIDA64 / FPU Mandel | |
| MSI Vector A18 HX A9W (v6.92.6600) | |
| Asus ROG Strix G18 2025 G814 (v6.92.6600) | |
| MSI Crosshair 18 HX AI A2XW (v6.92.6600) | |
| Average of class Gaming (25115 - 128721, n=103, last 2 years) | |
| Asus TUF Gaming A18 FA808UP-S8022W (v6.92.6600) | |
| Acer Nitro 18 AI AN18-61-R10V (v6.92.6600) | |
| Average AMD Ryzen AI 7 350 (39456 - 59540, n=15) | |
| AIDA64 / CPU AES | |
| Asus ROG Strix G18 2025 G814 (v6.92.6600) | |
| MSI Vector A18 HX A9W (v6.92.6600) | |
| MSI Crosshair 18 HX AI A2XW (v6.92.6600) | |
| Average of class Gaming (39258 - 247074, n=103, last 2 years) | |
| Asus TUF Gaming A18 FA808UP-S8022W (v6.92.6600) | |
| Acer Nitro 18 AI AN18-61-R10V (v6.92.6600) | |
| Average AMD Ryzen AI 7 350 (56915 - 87670, n=16) | |
| AIDA64 / CPU ZLib | |
| MSI Vector A18 HX A9W (v6.92.6600) | |
| Asus ROG Strix G18 2025 G814 (v6.92.6600) | |
| MSI Crosshair 18 HX AI A2XW (v6.92.6600) | |
| Average of class Gaming (574 - 2531, n=103, last 2 years) | |
| Acer Nitro 18 AI AN18-61-R10V (v6.92.6600) | |
| Asus TUF Gaming A18 FA808UP-S8022W (v6.92.6600) | |
| Average AMD Ryzen AI 7 350 (663 - 1140, n=16) | |
| AIDA64 / FP64 Ray-Trace | |
| MSI Vector A18 HX A9W (v6.92.6600) | |
| Asus ROG Strix G18 2025 G814 (v6.92.6600) | |
| MSI Crosshair 18 HX AI A2XW (v6.92.6600) | |
| Average of class Gaming (5509 - 45446, n=103, last 2 years) | |
| Asus TUF Gaming A18 FA808UP-S8022W (v6.92.6600) | |
| Acer Nitro 18 AI AN18-61-R10V (v6.92.6600) | |
| Average AMD Ryzen AI 7 350 (10707 - 15222, n=15) | |
| AIDA64 / CPU PhotoWorxx | |
| MSI Crosshair 18 HX AI A2XW (v6.92.6600) | |
| Average of class Gaming (12271 - 89891, n=103, last 2 years) | |
| Asus ROG Strix G18 2025 G814 (v6.92.6600) | |
| MSI Vector A18 HX A9W (v6.92.6600) | |
| Asus TUF Gaming A18 FA808UP-S8022W (v6.92.6600) | |
| Average AMD Ryzen AI 7 350 (25170 - 47405, n=16) | |
| Acer Nitro 18 AI AN18-61-R10V (v6.92.6600) | |
System performance
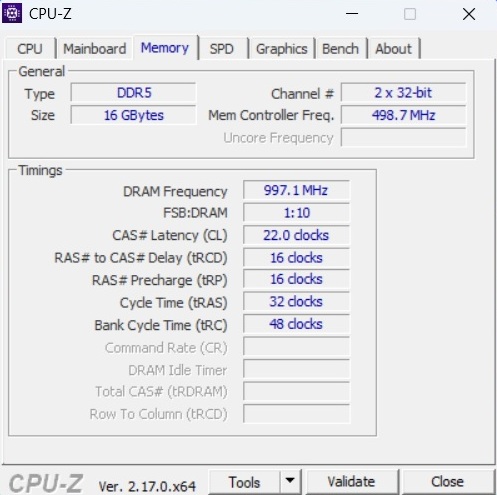
Despite the fact that the CPU performance is not quite at the top, the Nitro 18 AI offers a high system performance that does not have to hide behind its 18-inch counterparts. Only the RAM performs relatively poorly.
PCMark 10: Score | Essentials | Productivity | Digital Content Creation
CrossMark: Overall | Productivity | Creativity | Responsiveness
WebXPRT 3: Overall
WebXPRT 4: Overall
Mozilla Kraken 1.1: Total
| Performance rating | |
| MSI Vector A18 HX A9W | |
| Asus ROG Strix G18 2025 G814 | |
| Acer Nitro 18 AI AN18-61-R10V -1! | |
| MSI Crosshair 18 HX AI A2XW | |
| Average of class Gaming | |
| Average AMD Ryzen AI 7 350, NVIDIA GeForce RTX 5070 Laptop | |
| Asus TUF Gaming A18 FA808UP-S8022W | |
| PCMark 10 / Score | |
| MSI Vector A18 HX A9W | |
| Acer Nitro 18 AI AN18-61-R10V | |
| Asus ROG Strix G18 2025 G814 | |
| Average of class Gaming (5828 - 11730, n=92, last 2 years) | |
| Average AMD Ryzen AI 7 350, NVIDIA GeForce RTX 5070 Laptop (7717 - 8986, n=3) | |
| MSI Crosshair 18 HX AI A2XW | |
| Asus TUF Gaming A18 FA808UP-S8022W | |
| PCMark 10 / Essentials | |
| Asus ROG Strix G18 2025 G814 | |
| MSI Vector A18 HX A9W | |
| MSI Crosshair 18 HX AI A2XW | |
| Average AMD Ryzen AI 7 350, NVIDIA GeForce RTX 5070 Laptop (10496 - 11793, n=3) | |
| Average of class Gaming (8810 - 11935, n=96, last 2 years) | |
| Acer Nitro 18 AI AN18-61-R10V | |
| Asus TUF Gaming A18 FA808UP-S8022W | |
| PCMark 10 / Productivity | |
| Acer Nitro 18 AI AN18-61-R10V | |
| Average AMD Ryzen AI 7 350, NVIDIA GeForce RTX 5070 Laptop (10416 - 15127, n=3) | |
| Asus ROG Strix G18 2025 G814 | |
| Average of class Gaming (6845 - 21327, n=94, last 2 years) | |
| MSI Vector A18 HX A9W | |
| MSI Crosshair 18 HX AI A2XW | |
| Asus TUF Gaming A18 FA808UP-S8022W | |
| PCMark 10 / Digital Content Creation | |
| MSI Vector A18 HX A9W | |
| Asus ROG Strix G18 2025 G814 | |
| Average of class Gaming (7602 - 19954, n=94, last 2 years) | |
| MSI Crosshair 18 HX AI A2XW | |
| Asus TUF Gaming A18 FA808UP-S8022W | |
| Acer Nitro 18 AI AN18-61-R10V | |
| Average AMD Ryzen AI 7 350, NVIDIA GeForce RTX 5070 Laptop (9858 - 12404, n=3) | |
| CrossMark / Overall | |
| Asus ROG Strix G18 2025 G814 | |
| MSI Vector A18 HX A9W | |
| MSI Crosshair 18 HX AI A2XW | |
| Average of class Gaming (1366 - 2409, n=93, last 2 years) | |
| Average AMD Ryzen AI 7 350, NVIDIA GeForce RTX 5070 Laptop (1719 - 1858, n=3) | |
| Asus TUF Gaming A18 FA808UP-S8022W | |
| Acer Nitro 18 AI AN18-61-R10V | |
| CrossMark / Productivity | |
| Asus ROG Strix G18 2025 G814 | |
| MSI Vector A18 HX A9W | |
| MSI Crosshair 18 HX AI A2XW | |
| Average of class Gaming (1386 - 2254, n=93, last 2 years) | |
| Average AMD Ryzen AI 7 350, NVIDIA GeForce RTX 5070 Laptop (1635 - 1732, n=3) | |
| Asus TUF Gaming A18 FA808UP-S8022W | |
| Acer Nitro 18 AI AN18-61-R10V | |
| CrossMark / Creativity | |
| Asus ROG Strix G18 2025 G814 | |
| MSI Vector A18 HX A9W | |
| MSI Crosshair 18 HX AI A2XW | |
| Average of class Gaming (1343 - 2729, n=93, last 2 years) | |
| Average AMD Ryzen AI 7 350, NVIDIA GeForce RTX 5070 Laptop (1956 - 2077, n=3) | |
| Asus TUF Gaming A18 FA808UP-S8022W | |
| Acer Nitro 18 AI AN18-61-R10V | |
| CrossMark / Responsiveness | |
| MSI Crosshair 18 HX AI A2XW | |
| Asus ROG Strix G18 2025 G814 | |
| Average of class Gaming (1226 - 2334, n=93, last 2 years) | |
| MSI Vector A18 HX A9W | |
| Average AMD Ryzen AI 7 350, NVIDIA GeForce RTX 5070 Laptop (1357 - 1642, n=3) | |
| Asus TUF Gaming A18 FA808UP-S8022W | |
| Acer Nitro 18 AI AN18-61-R10V | |
| WebXPRT 3 / Overall | |
| MSI Vector A18 HX A9W | |
| Asus ROG Strix G18 2025 G814 | |
| MSI Crosshair 18 HX AI A2XW | |
| Average of class Gaming (220 - 532, n=97, last 2 years) | |
| Average AMD Ryzen AI 7 350, NVIDIA GeForce RTX 5070 Laptop (288 - 336, n=3) | |
| Acer Nitro 18 AI AN18-61-R10V | |
| Asus TUF Gaming A18 FA808UP-S8022W | |
| WebXPRT 4 / Overall | |
| MSI Vector A18 HX A9W | |
| MSI Crosshair 18 HX AI A2XW | |
| Asus ROG Strix G18 2025 G814 | |
| Average of class Gaming (165 - 354, n=97, last 2 years) | |
| Average AMD Ryzen AI 7 350, NVIDIA GeForce RTX 5070 Laptop (246 - 277, n=3) | |
| Acer Nitro 18 AI AN18-61-R10V | |
| Asus TUF Gaming A18 FA808UP-S8022W | |
| Mozilla Kraken 1.1 / Total | |
| Asus TUF Gaming A18 FA808UP-S8022W | |
| Average of class Gaming (391 - 590, n=99, last 2 years) | |
| Average AMD Ryzen AI 7 350, NVIDIA GeForce RTX 5070 Laptop (431 - 470, n=2) | |
| MSI Crosshair 18 HX AI A2XW | |
| Asus ROG Strix G18 2025 G814 | |
| MSI Vector A18 HX A9W | |
* ... smaller is better
| PCMark 10 Score | 8986 points | |
Help | ||
| AIDA64 / Memory Copy | |
| MSI Crosshair 18 HX AI A2XW | |
| Average AMD Ryzen AI 7 350 (37823 - 106997, n=16) | |
| Average of class Gaming (21750 - 129946, n=103, last 2 years) | |
| Asus TUF Gaming A18 FA808UP-S8022W | |
| Asus ROG Strix G18 2025 G814 | |
| MSI Vector A18 HX A9W | |
| Acer Nitro 18 AI AN18-61-R10V | |
| AIDA64 / Memory Read | |
| MSI Crosshair 18 HX AI A2XW | |
| Average of class Gaming (22956 - 118858, n=103, last 2 years) | |
| Asus ROG Strix G18 2025 G814 | |
| MSI Vector A18 HX A9W | |
| Asus TUF Gaming A18 FA808UP-S8022W | |
| Average AMD Ryzen AI 7 350 (43921 - 63650, n=16) | |
| Acer Nitro 18 AI AN18-61-R10V | |
| AIDA64 / Memory Write | |
| Average AMD Ryzen AI 7 350 (42576 - 110817, n=16) | |
| Asus TUF Gaming A18 FA808UP-S8022W | |
| MSI Crosshair 18 HX AI A2XW | |
| Average of class Gaming (22297 - 135096, n=103, last 2 years) | |
| MSI Vector A18 HX A9W | |
| Asus ROG Strix G18 2025 G814 | |
| Acer Nitro 18 AI AN18-61-R10V | |
| AIDA64 / Memory Latency | |
| Average of class Gaming (75.3 - 259, n=103, last 2 years) | |
| MSI Crosshair 18 HX AI A2XW | |
| MSI Vector A18 HX A9W | |
| Asus ROG Strix G18 2025 G814 | |
| Average AMD Ryzen AI 7 350 (87.7 - 109.8, n=16) | |
| Asus TUF Gaming A18 FA808UP-S8022W | |
| Acer Nitro 18 AI AN18-61-R10V | |
* ... smaller is better
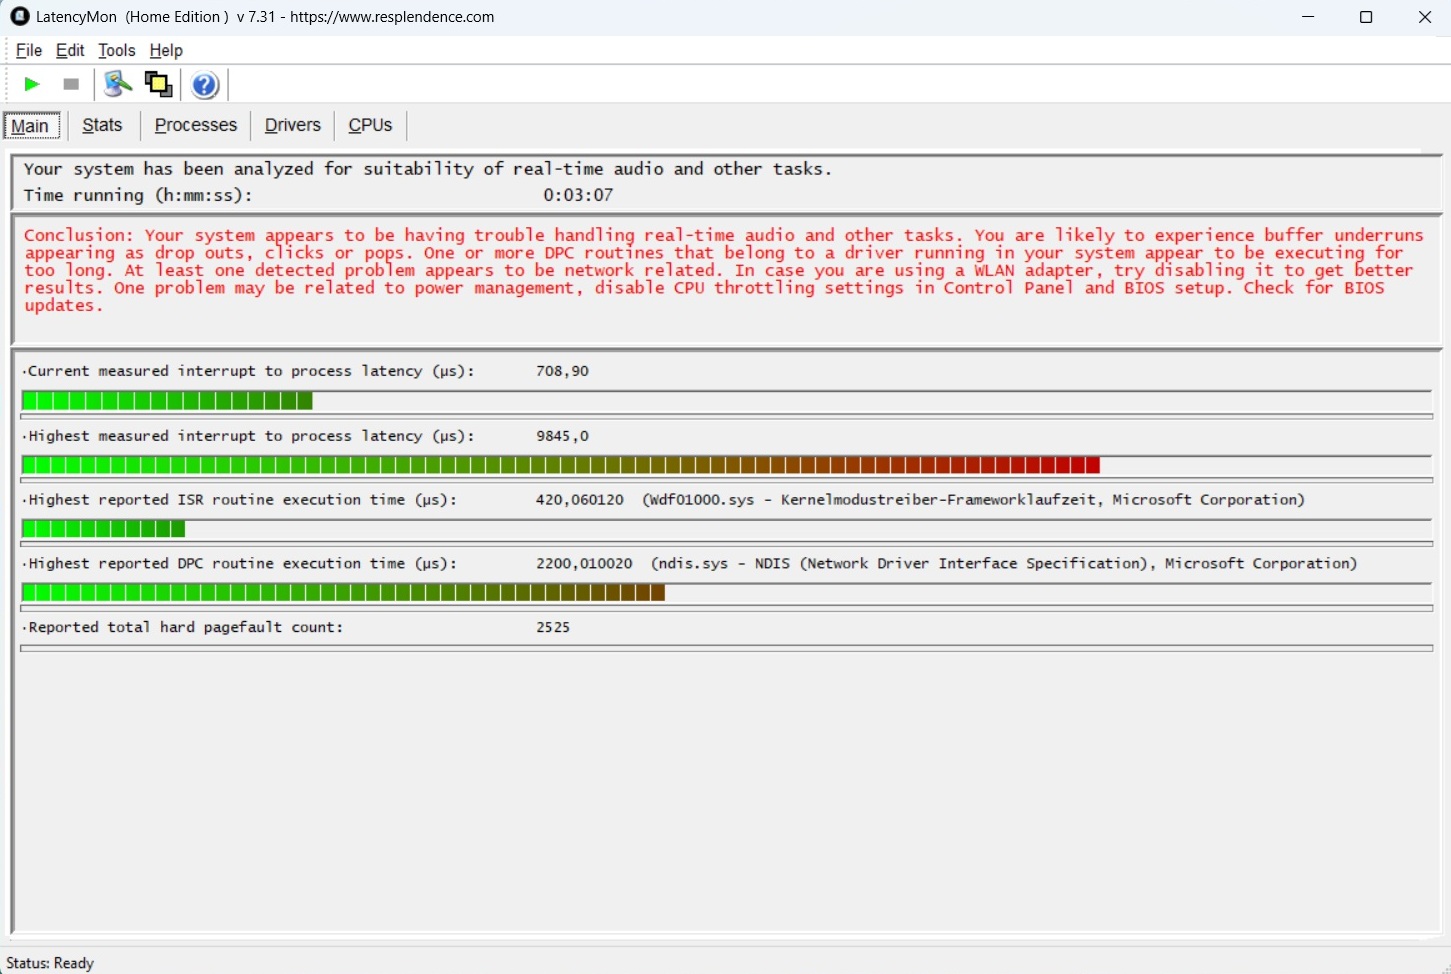
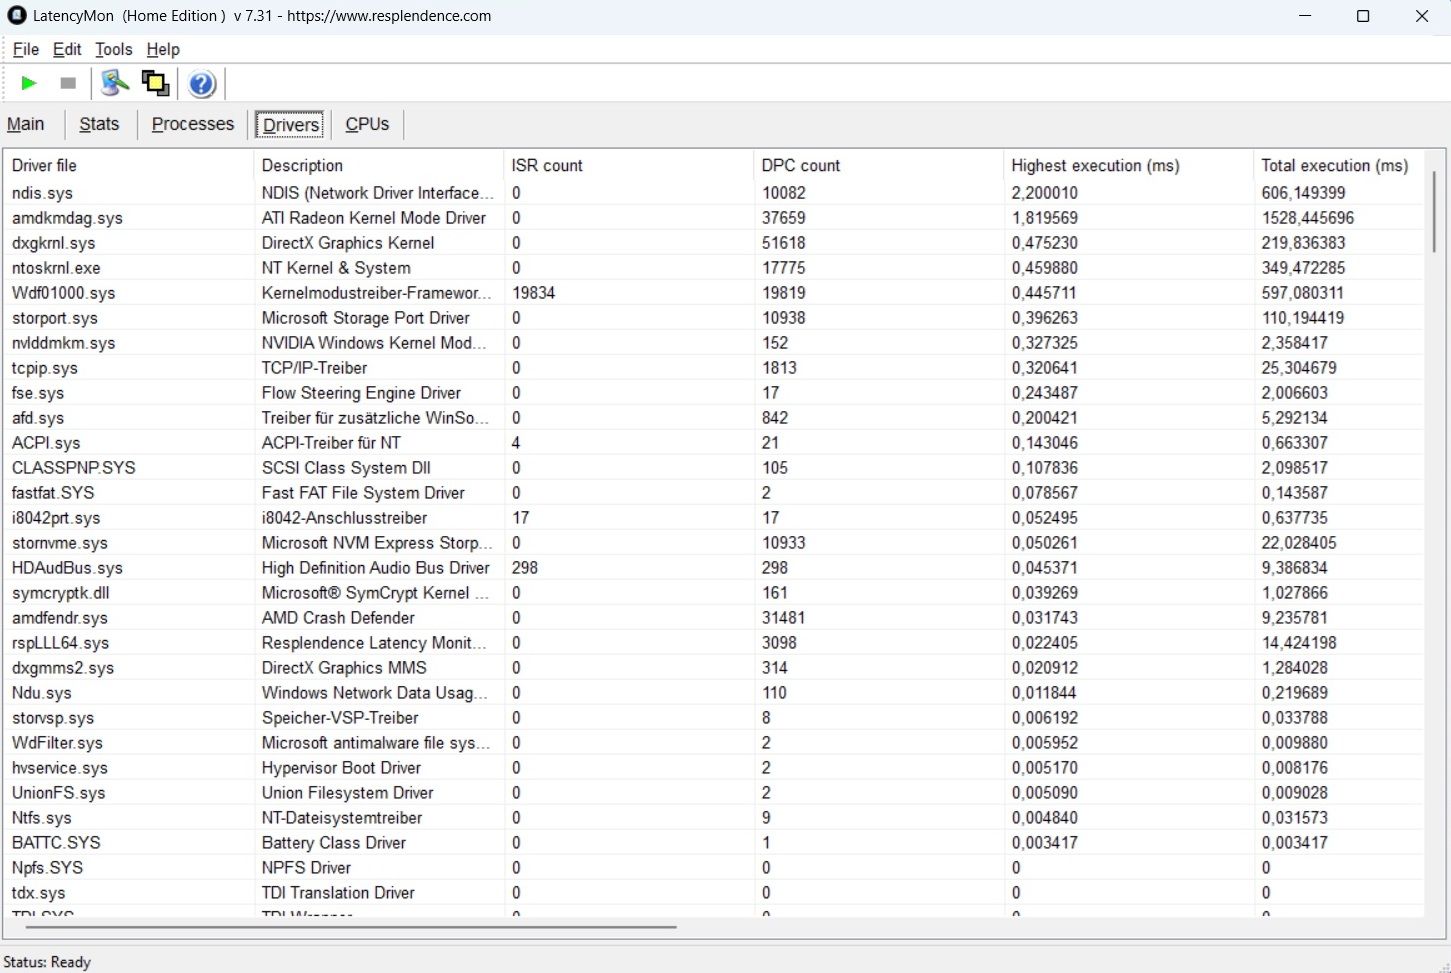
DPC latencies
We were somewhat surprised by the steep latencies in which the Nitro 18 AI comes out on top - in a negative sense.
| DPC Latencies / LatencyMon - interrupt to process latency (max), Web, Youtube, Prime95 | |
| Acer Nitro 18 AI AN18-61-R10V | |
| Asus TUF Gaming A18 FA808UP-S8022W | |
| MSI Crosshair 18 HX AI A2XW | |
| Asus ROG Strix G18 2025 G814 | |
| MSI Vector A18 HX A9W | |
* ... smaller is better
Mass storage
The built-in 1 TB SSD from Western Digital proves to be quite unspectacular, both in terms of speed and long-term performance.

* ... smaller is better
Read continuous performance: DiskSpd Read Loop, Queue Depth 8
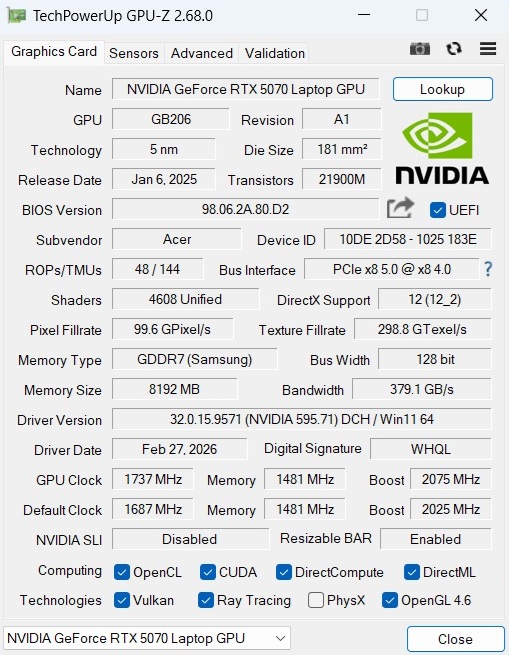
GPU performance
Since the GeForce RTX 5070, which is used in the test device, has to make do with 8 GB of VRAM, it belongs more to the mid-range than the high-end range. In the benchmark course, the Blackwell chip delivered the expected performance level, the maximum TGP of 115 watts is almost exhausted.
| 3DMark 11 Performance | 34028 points | |
| 3DMark Cloud Gate Standard Score | 63527 points | |
| 3DMark Fire Strike Score | 30468 points | |
| 3DMark Time Spy Score | 12923 points | |
Help | ||
* ... smaller is better
Gaming performance
There were also no surprises in terms of gaming performance; the results are within the usual range for the RTX 5070 when using higher resolutions and settings. Although the GPU does not always have enough power for maximum details in the native QHD range, high settings are usually possible (even if not always at 60+ fps).
If you want to get a higher frame rate, you can still use features such as upscaling. Including DLSS Balanced, the performance in Black Ops 7 for example, increased from 24 to 45 fps (QHD, Extreme Preset, Ray Tracing). With quadruple frame generation, it was even 121 fps. How smooth these values feel in practice depends from player to player.
| low | med. | high | ultra | QHD | |
|---|---|---|---|---|---|
| GTA V (2015) | 174.8 | 168.8 | 117.3 | ||
| Dota 2 Reborn (2015) | 149.9 | 129.3 | 122.1 | ||
| X-Plane 11.11 (2018) | 99.5 | 82.5 | |||
| Baldur's Gate 3 (2023) | 133 | 117.1 | 115.4 | ||
| Cyberpunk 2077 (2023) | 128.9 | 115.1 | 101.3 | ||
| Borderlands 4 (2025) | 57.9 | 51.1 | 27.8 | 7.97 | |
| The Outer Worlds 2 (2025) | 87.3 | 79.4 | 47.1 | 30.4 | |
| ARC Raiders (2025) | 151.8 | 121.8 | 83.4 | 59.5 | |
| Anno 117: Pax Romana (2025) | 99 | 76.6 | 39.3 | 27.5 | |
| Call of Duty Black Ops 7 (2025) | 150 | 119 | 40 | 24 | |
| Resident Evil Requiem (2026) | 103.5 | 98.4 | 52.5 | 26.6 |
| Resident Evil Requiem | |
| 1920x1080 Max Settings + High Ray Tracing (no upscaling) | |
| Average of class Gaming (46.7 - 65.4, n=5, last 2 years) | |
| Acer Nitro 18 AI AN18-61-R10V | |
| Average NVIDIA GeForce RTX 5070 Laptop (n=1) | |
| 2560x1440 Max Settings + High Ray Tracing (no upscaling) | |
| Average of class Gaming (26.6 - 42.1, n=3, last 2 years) | |
| Acer Nitro 18 AI AN18-61-R10V | |
| Average NVIDIA GeForce RTX 5070 Laptop (n=1) | |
| Call of Duty Black Ops 7 | |
| 1920x1080 Extreme Preset + Raytracing | |
| Average NVIDIA GeForce RTX 5070 Laptop (40 - 44, n=2) | |
| Average of class Gaming (24 - 60, n=11, last 2 years) | |
| Acer Nitro 18 AI AN18-61-R10V | |
| 2560x1440 Extreme Preset + Raytracing | |
| Average of class Gaming (18 - 39, n=7, last 2 years) | |
| Average NVIDIA GeForce RTX 5070 Laptop (24 - 28, n=2) | |
| Acer Nitro 18 AI AN18-61-R10V | |
| ARC Raiders | |
| 1920x1080 Epic Preset + Epic Raytracing AA:TSR | |
| Acer Nitro 18 AI AN18-61-R10V | |
| Average NVIDIA GeForce RTX 5070 Laptop (n=1) | |
| Average of class Gaming (43.5 - 98.6, n=11, last 2 years) | |
| 2560x1440 Epic Preset + Epic Raytracing AA:TSR | |
| Acer Nitro 18 AI AN18-61-R10V | |
| Average NVIDIA GeForce RTX 5070 Laptop (n=1) | |
| Average of class Gaming (47.8 - 68.3, n=5, last 2 years) | |
| The Outer Worlds 2 | |
| 1920x1080 Very High Preset AA:T | |
| Acer Nitro 18 AI AN18-61-R10V | |
| Average NVIDIA GeForce RTX 5070 Laptop (n=1) | |
| Average of class Gaming (26.4 - 58.4, n=11, last 2 years) | |
| 2560x1440 Very High Preset AA:T | |
| Average of class Gaming (21.5 - 37.8, n=6, last 2 years) | |
| Acer Nitro 18 AI AN18-61-R10V | |
| Average NVIDIA GeForce RTX 5070 Laptop (n=1) | |
| Borderlands 4 | |
| 1920x1080 Badass Preset AA:FX | |
| Acer Nitro 18 AI AN18-61-R10V | |
| Average NVIDIA GeForce RTX 5070 Laptop (27.4 - 27.8, n=2) | |
| Average of class Gaming (16 - 54, n=13, last 2 years) | |
| 2560x1440 Badass Preset AA:FX | |
| Average of class Gaming (7.97 - 37.1, n=6, last 2 years) | |
| Acer Nitro 18 AI AN18-61-R10V | |
| Average NVIDIA GeForce RTX 5070 Laptop (n=1) | |
Cyberpunk 2077 ultra FPS chart
Emissions
Noise emissions
When using the performance mode, the Acer Nitro 18 AI gets quite loud (despite liquid metal). 54 dB(A) in Cyberpunk 2077 is the highest value in the test field together with the MSI Crosshair 18 HX. The fans usually remain active in idle situations, but 28 to 31 dB(A) is still acceptable.
Noise level
| Idle |
| 28 / 29 / 31 dB(A) |
| Load |
| 49 / 56 dB(A) |
 | ||
30 dB silent 40 dB(A) audible 50 dB(A) loud |
||
min: | ||
| Acer Nitro 18 AI AN18-61-R10V Ryzen AI 7 350, GeForce RTX 5070 Laptop | Asus TUF Gaming A18 FA808UP-S8022W R7 260, GeForce RTX 5070 Laptop | MSI Crosshair 18 HX AI A2XW Ultra 9 275HX, GeForce RTX 5070 Laptop | Asus ROG Strix G18 2025 G814 R9 9955HX, GeForce RTX 5070 Laptop | MSI Vector A18 HX A9W R9 9955HX, GeForce RTX 5070 Ti Laptop | |
|---|---|---|---|---|---|
| Noise | 20% | 8% | 8% | 4% | |
| off / environment * (dB) | 24 | 23 4% | 23.1 4% | 24.6 -3% | 22.5 6% |
| Idle Minimum * (dB) | 28 | 23 18% | 27.3 2% | 24.6 12% | 26 7% |
| Idle Average * (dB) | 29 | 23 21% | 27.3 6% | 30 -3% | 26 10% |
| Idle Maximum * (dB) | 31 | 23 26% | 27.6 11% | 30 3% | 32 -3% |
| Load Average * (dB) | 49 | 32.58 34% | 30.1 39% | 34.4 30% | 44.4 9% |
| Cyberpunk 2077 ultra * (dB) | 54 | 45.13 16% | 54.4 -1% | 49.7 8% | 49.8 8% |
| Load Maximum * (dB) | 56 | 58.6 -5% | 49.7 11% | 61.6 -10% |
* ... smaller is better
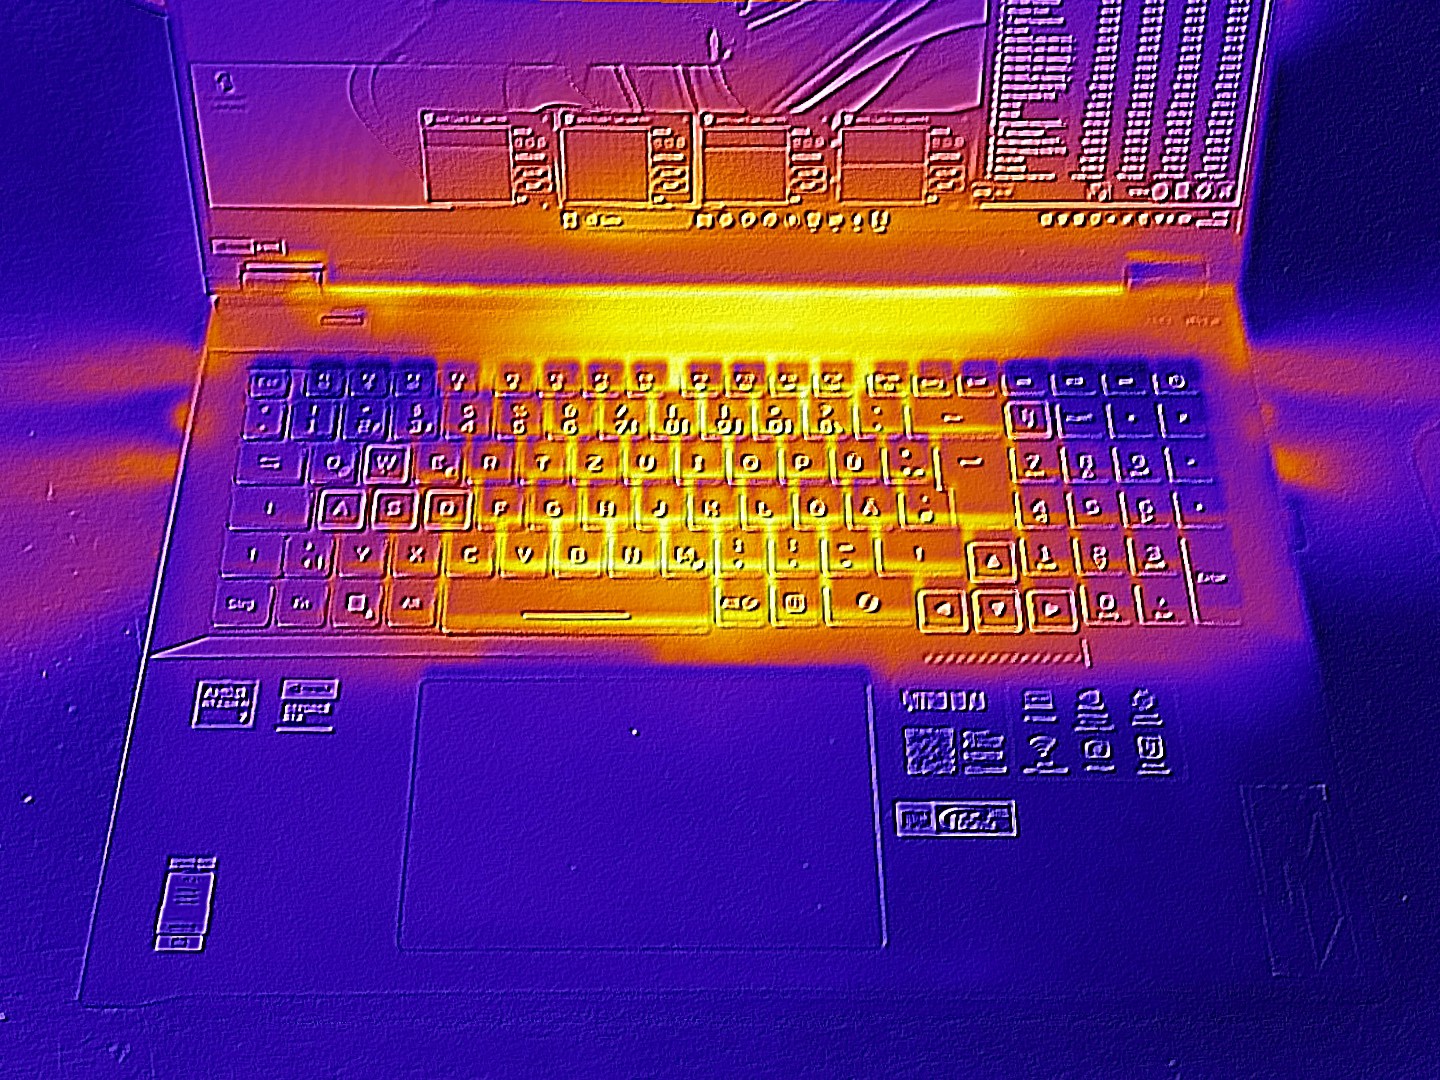
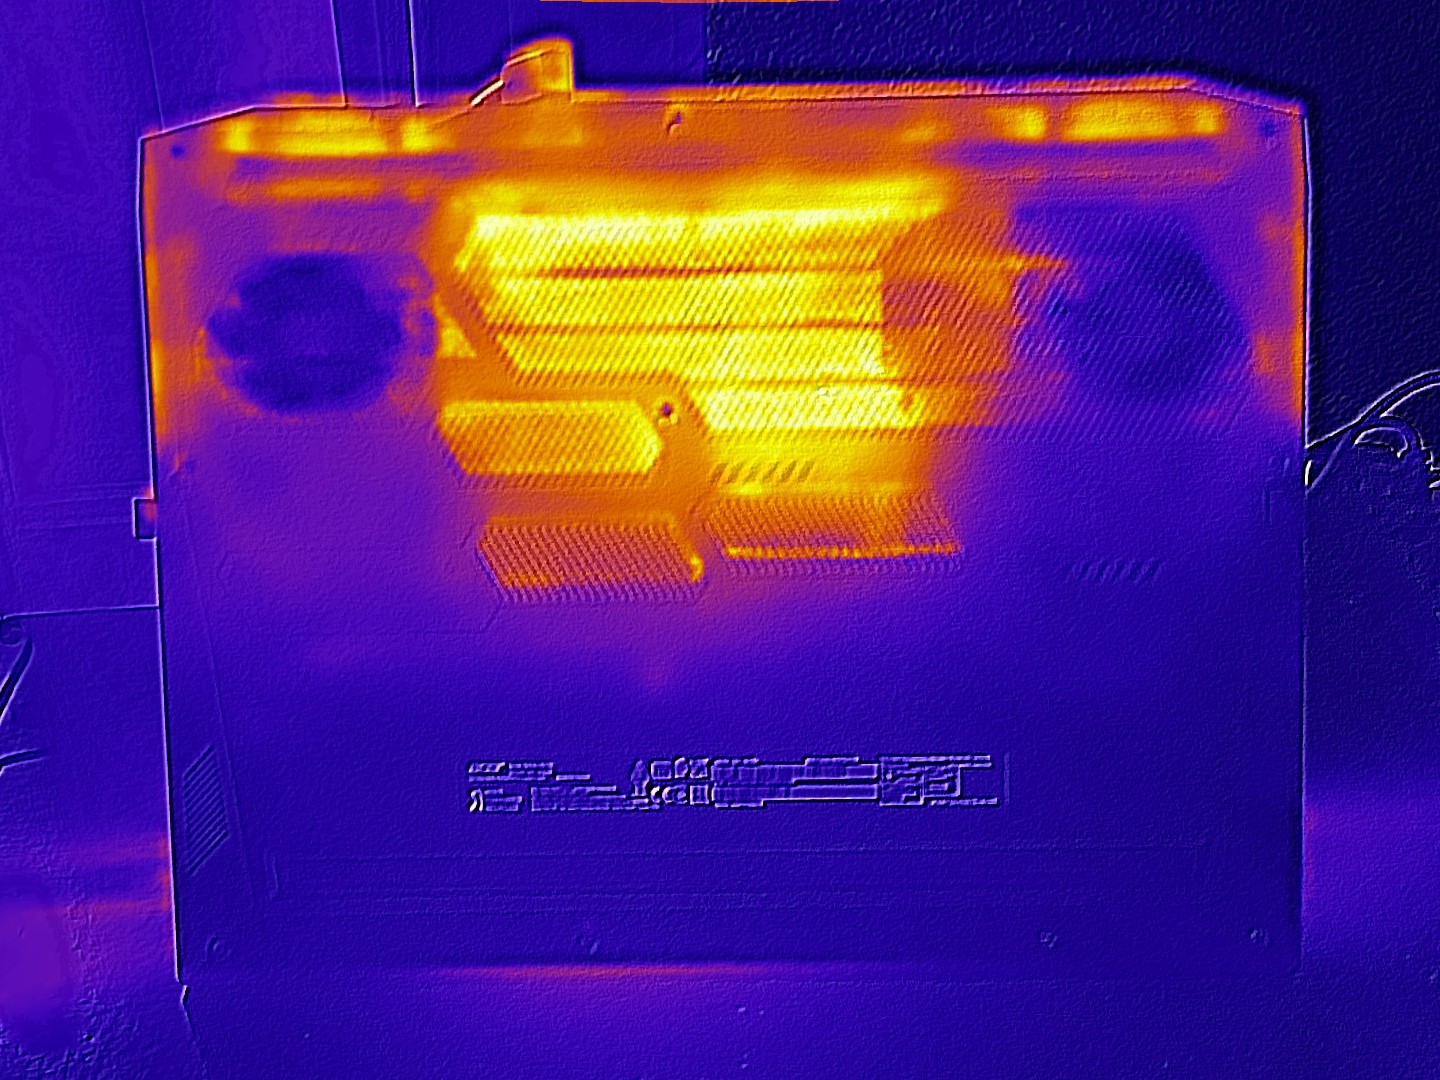
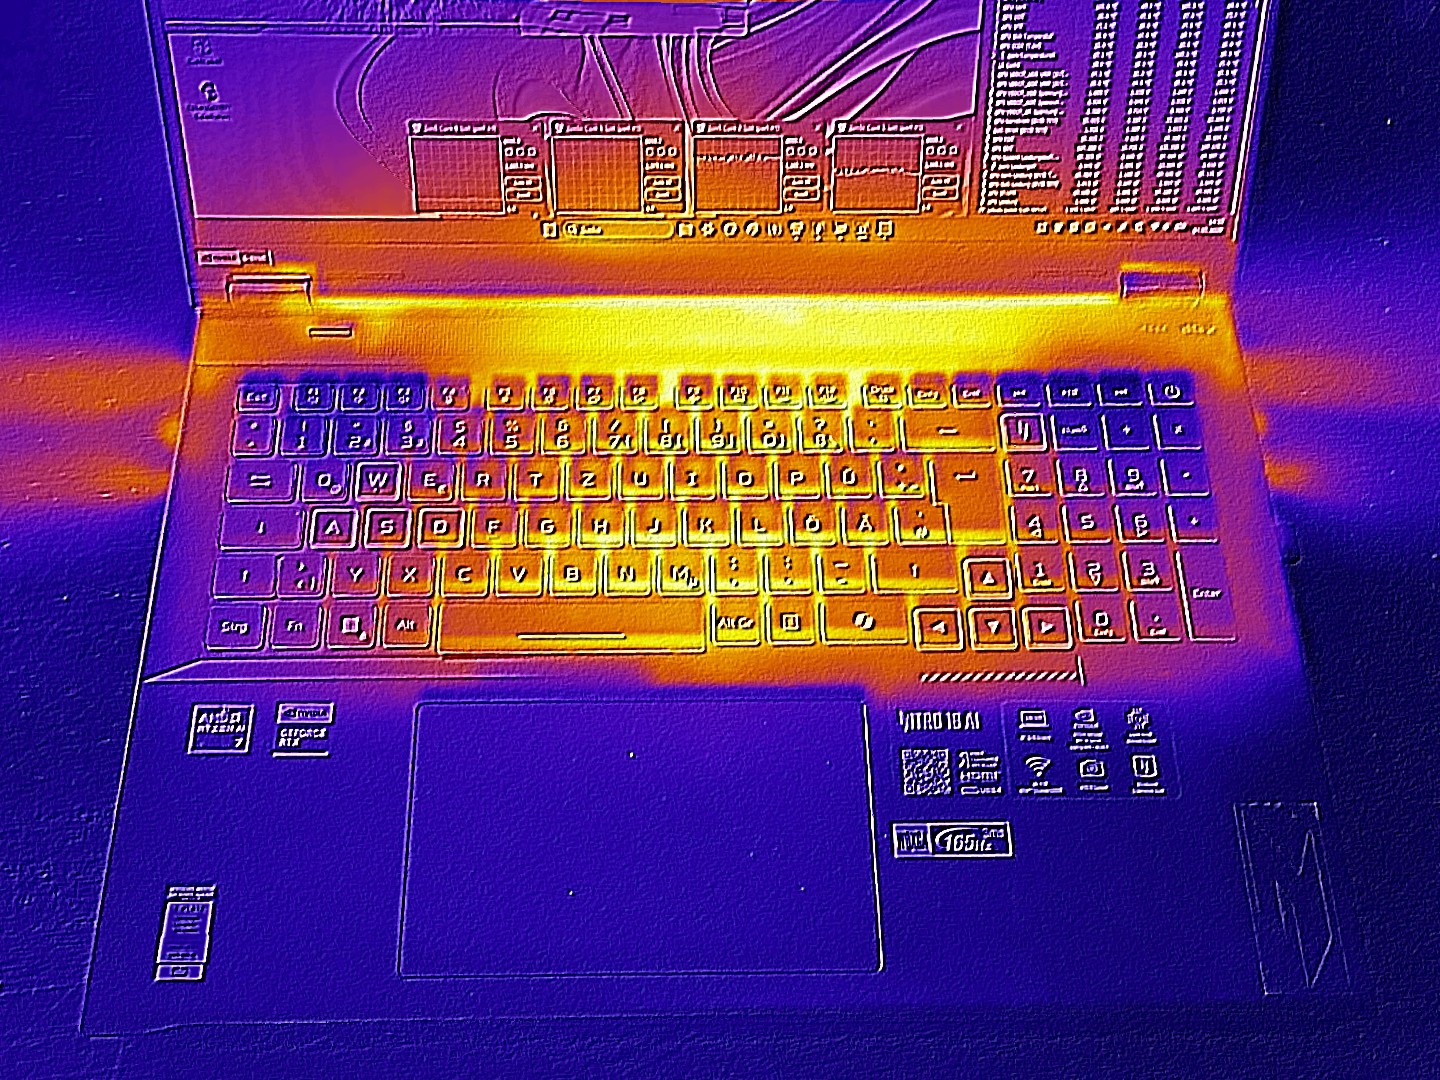
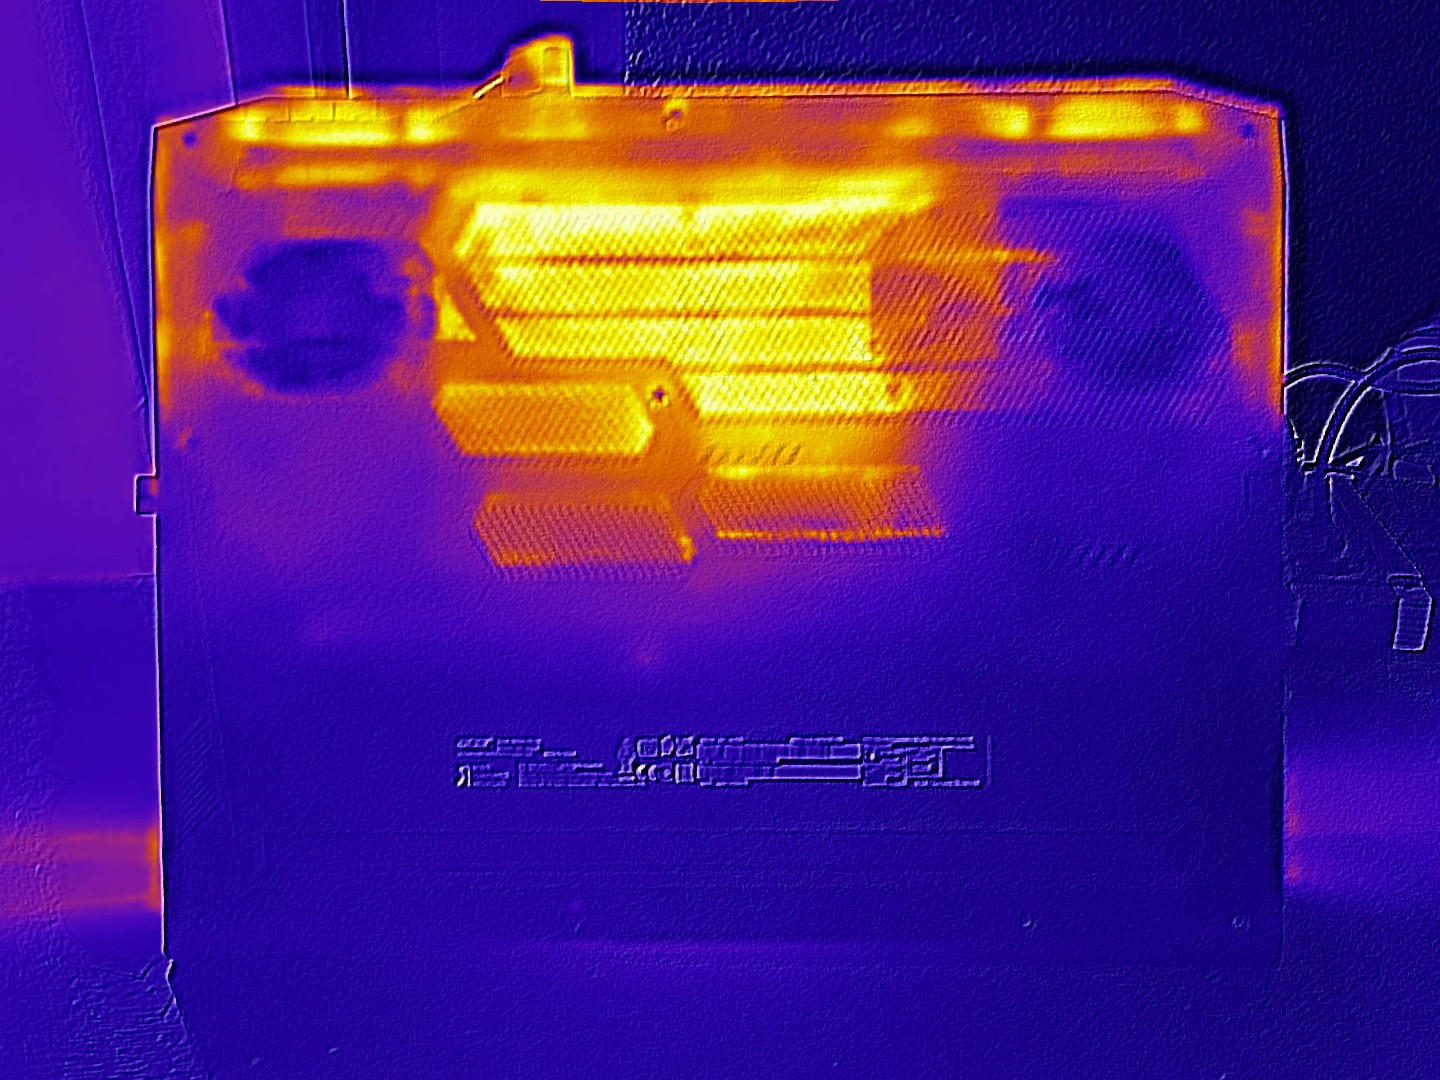
Temperature
Under load, the top in particular heats up. A maximum of 44 °C (111.2 °F) contrasts with a maximum of 57 °C (134.6 °F) on the bottom of the casing. With these values, the 18-incher is ahead of the competition. Meanwhile, there are hardly any differences between the competitors in idle mode.
(±) The maximum temperature on the upper side is 44 °C / 111 F, compared to the average of 40.4 °C / 105 F, ranging from 21.2 to 68.8 °C for the class Gaming.
(-) The bottom heats up to a maximum of 57 °C / 135 F, compared to the average of 43.2 °C / 110 F
(+) In idle usage, the average temperature for the upper side is 23.7 °C / 75 F, compared to the device average of 33.9 °C / 93 F.
(±) 3: The average temperature for the upper side is 33.8 °C / 93 F, compared to the average of 33.9 °C / 93 F for the class Gaming.
(+) The palmrests and touchpad are cooler than skin temperature with a maximum of 26 °C / 78.8 F and are therefore cool to the touch.
(+) The average temperature of the palmrest area of similar devices was 28.8 °C / 83.8 F (+2.8 °C / 5 F).
| Acer Nitro 18 AI AN18-61-R10V Ryzen AI 7 350, GeForce RTX 5070 Laptop | Asus TUF Gaming A18 FA808UP-S8022W R7 260, GeForce RTX 5070 Laptop | MSI Crosshair 18 HX AI A2XW Ultra 9 275HX, GeForce RTX 5070 Laptop | Asus ROG Strix G18 2025 G814 R9 9955HX, GeForce RTX 5070 Laptop | MSI Vector A18 HX A9W R9 9955HX, GeForce RTX 5070 Ti Laptop | |
|---|---|---|---|---|---|
| Heat | 7% | 9% | 6% | -3% | |
| Maximum Upper Side * (°C) | 44 | 39 11% | 40.2 9% | 42.8 3% | 46.6 -6% |
| Maximum Bottom * (°C) | 57 | 41 28% | 44 23% | 43.1 24% | 45.6 20% |
| Idle Upper Side * (°C) | 25 | 27 -8% | 25.6 -2% | 26.8 -7% | 31.2 -25% |
| Idle Bottom * (°C) | 28 | 29 -4% | 26.8 4% | 26.6 5% | 28.6 -2% |
* ... smaller is better
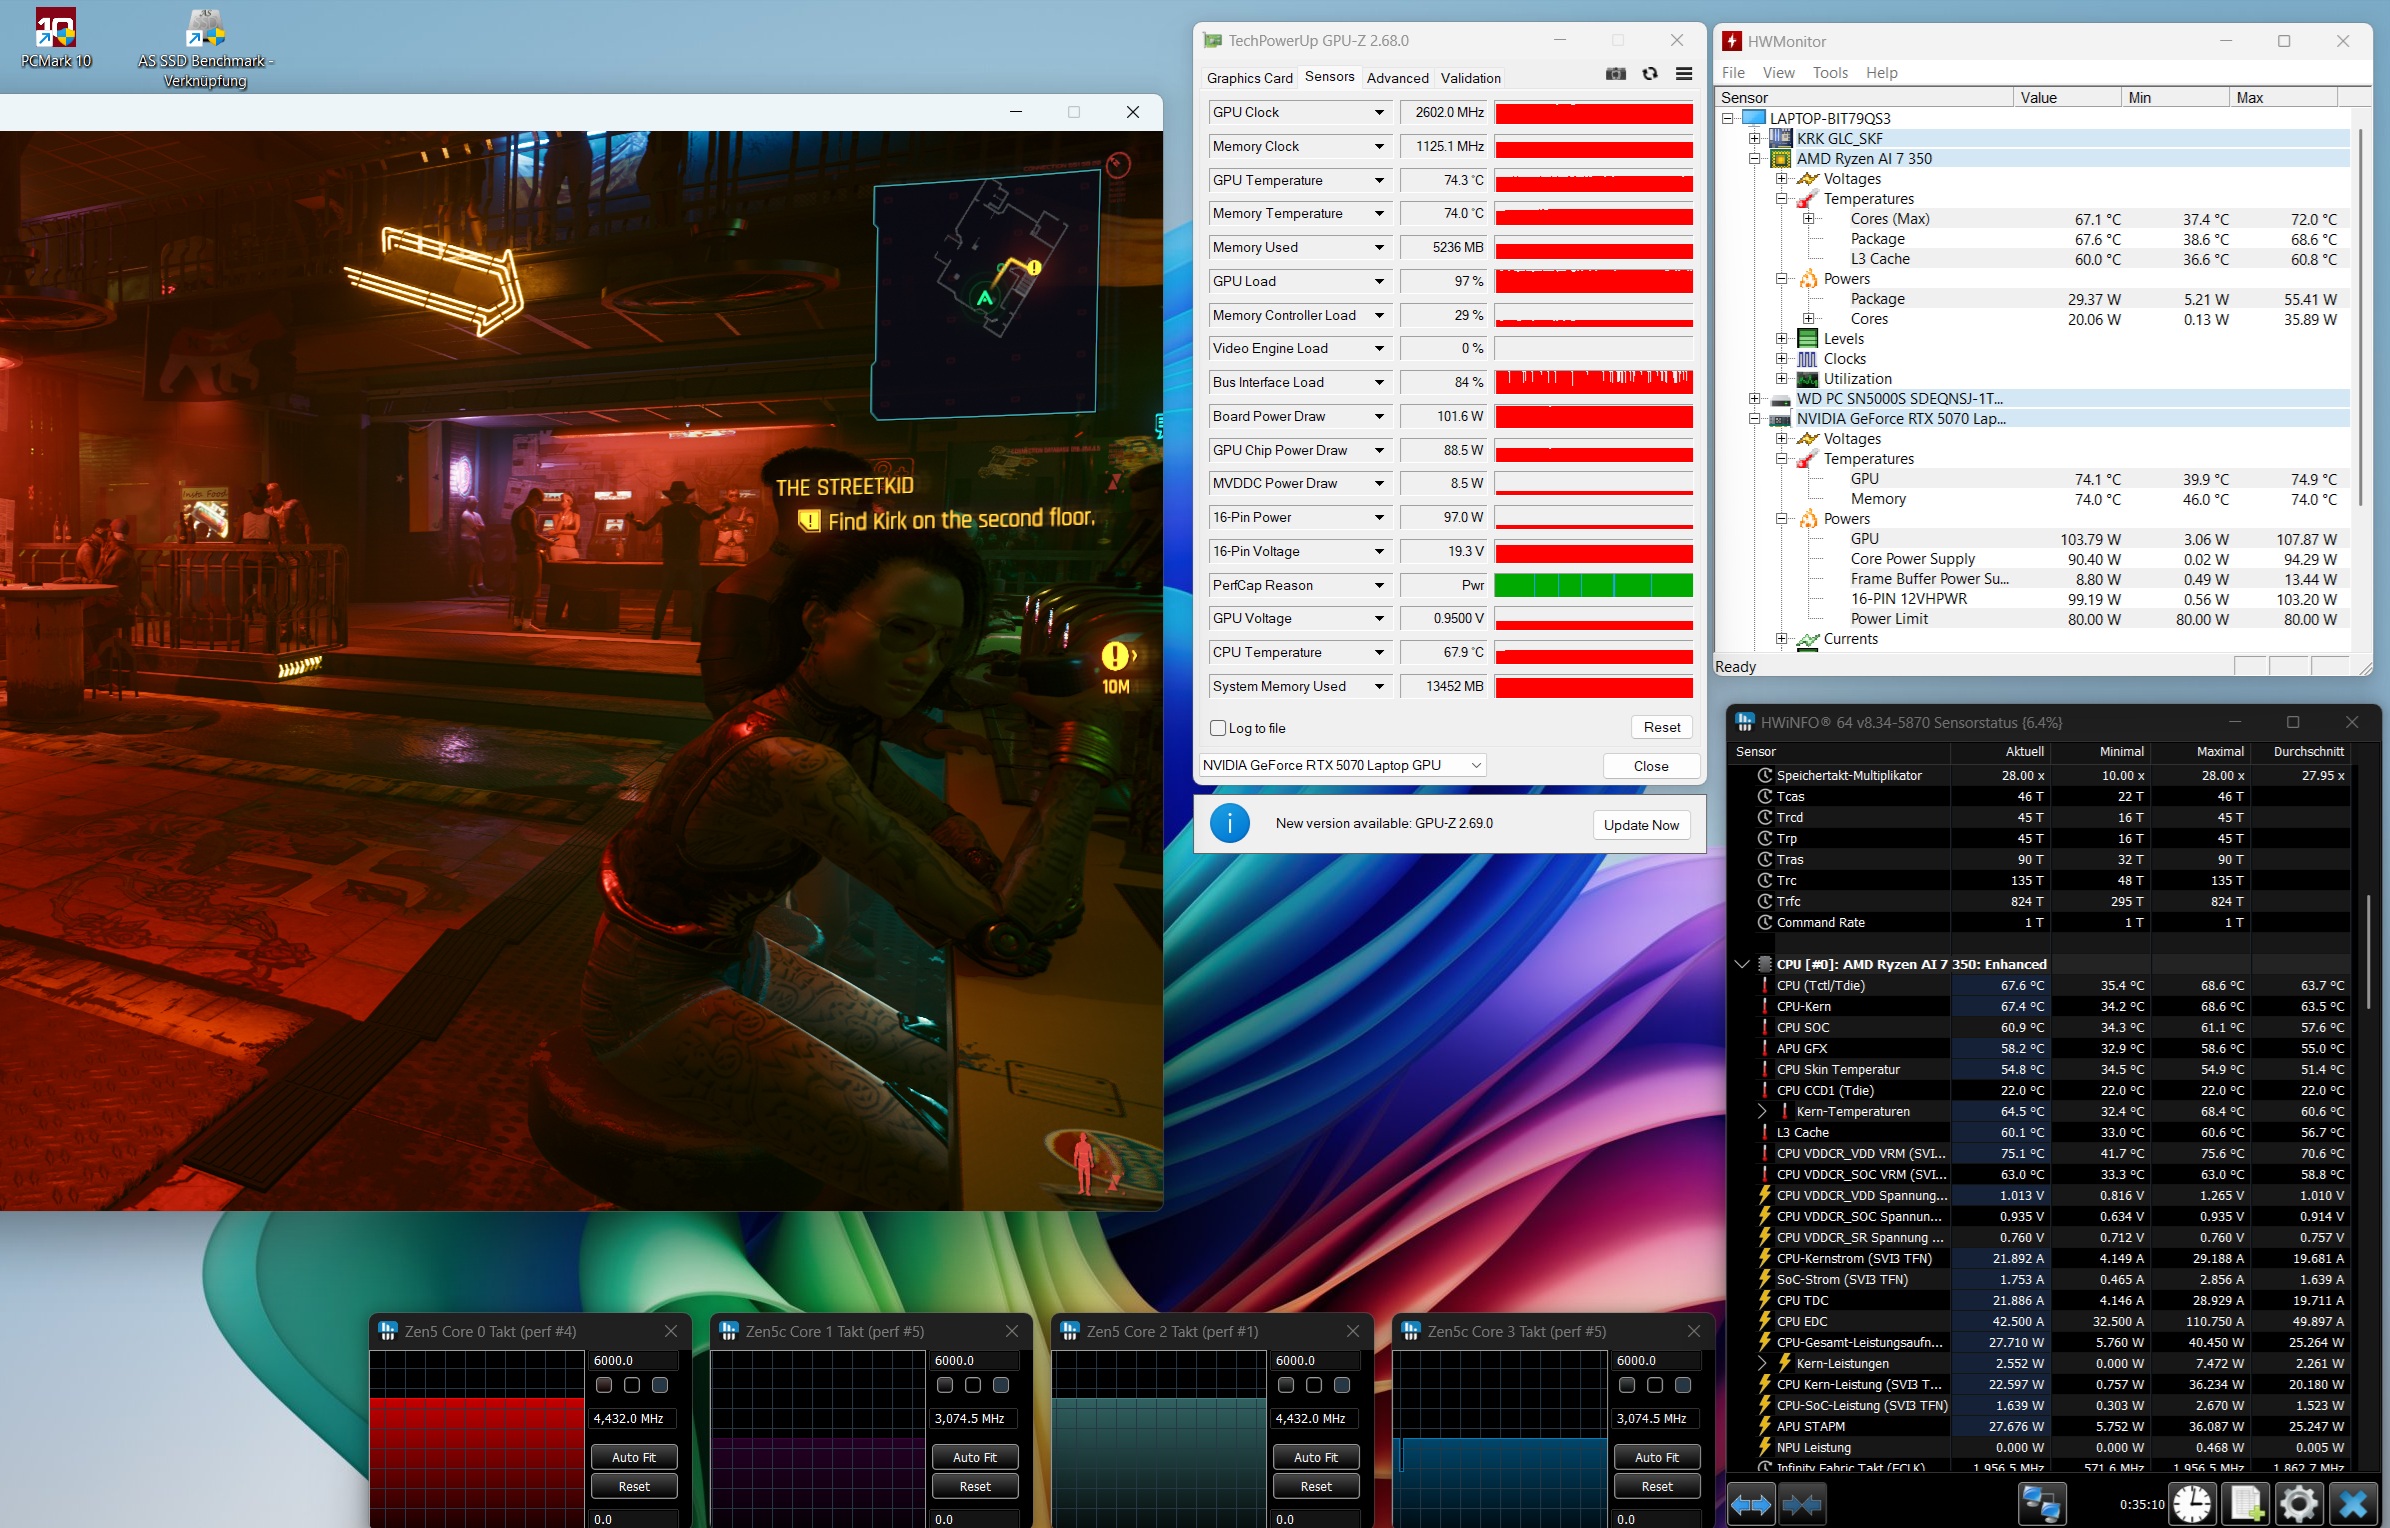
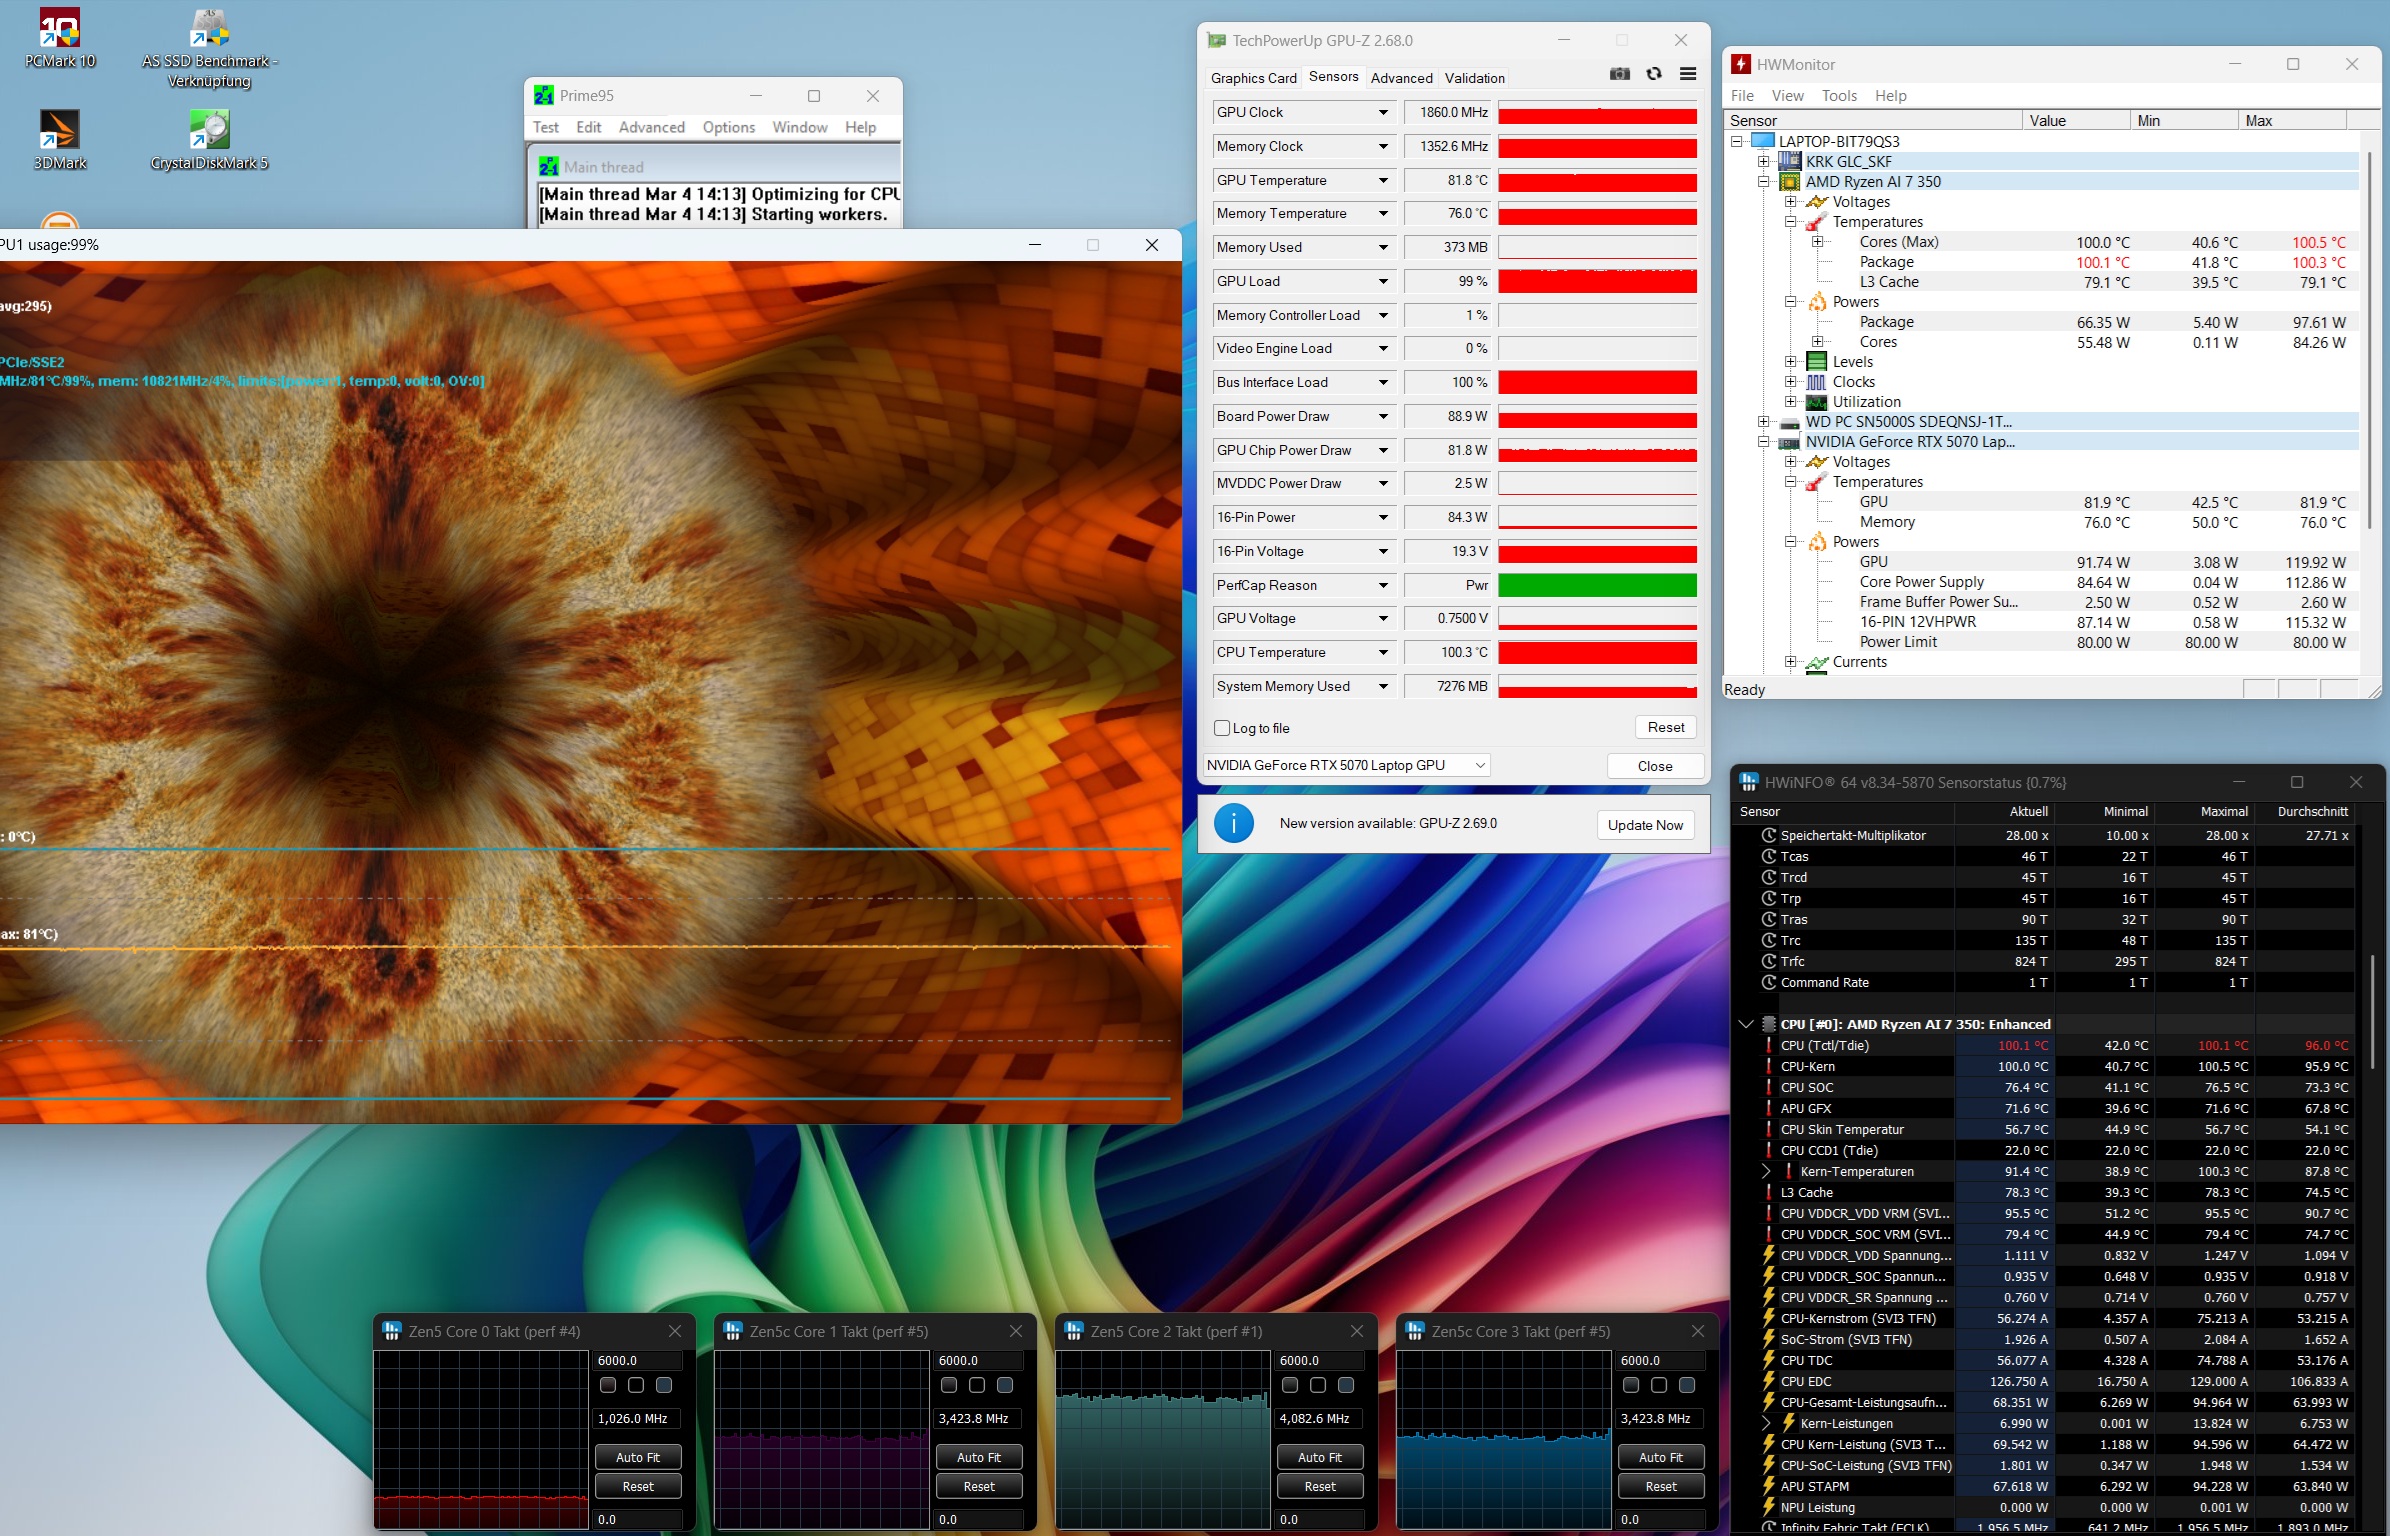
Stress test
The GeForce RTX 5070 completed our stress test with the FurMark and Prime95 tools at around 74 °C (165.2 °F), whereas the Ryzen AI 7 350 only reached an average of around 67 °C (152.6 °F).
Speaker
The sound quality of the built-in 2.0 system is passable, although, as is so often the case, the bass is lacking.
Acer Nitro 18 AI AN18-61-R10V audio analysis
(±) | speaker loudness is average but good (80 dB)
Bass 100 - 315 Hz
(-) | nearly no bass - on average 25% lower than median
(±) | linearity of bass is average (14.4% delta to prev. frequency)
Mids 400 - 2000 Hz
(+) | balanced mids - only 2% away from median
(+) | mids are linear (3.9% delta to prev. frequency)
Highs 2 - 16 kHz
(+) | balanced highs - only 3.1% away from median
(+) | highs are linear (6.6% delta to prev. frequency)
Overall 100 - 16.000 Hz
(±) | linearity of overall sound is average (16.9% difference to median)
Compared to same class
» 44% of all tested devices in this class were better, 11% similar, 45% worse
» The best had a delta of 6%, average was 18%, worst was 132%
Compared to all devices tested
» 30% of all tested devices were better, 8% similar, 62% worse
» The best had a delta of 4%, average was 23%, worst was 134%
Asus TUF Gaming A18 FA808UP-S8022W audio analysis
(±) | speaker loudness is average but good (74.53 dB)
Bass 100 - 315 Hz
(±) | reduced bass - on average 12.9% lower than median
(±) | linearity of bass is average (7.5% delta to prev. frequency)
Mids 400 - 2000 Hz
(±) | higher mids - on average 5.1% higher than median
(+) | mids are linear (5.9% delta to prev. frequency)
Highs 2 - 16 kHz
(+) | balanced highs - only 4.1% away from median
(+) | highs are linear (6.9% delta to prev. frequency)
Overall 100 - 16.000 Hz
(±) | linearity of overall sound is average (16.9% difference to median)
Compared to same class
» 44% of all tested devices in this class were better, 11% similar, 45% worse
» The best had a delta of 6%, average was 18%, worst was 132%
Compared to all devices tested
» 30% of all tested devices were better, 8% similar, 62% worse
» The best had a delta of 4%, average was 23%, worst was 134%
Energy management
Energy consumption
The Nitro 18 AI performs well in terms of power consumption. 6 to 17 watts in idle mode and 89 to 210 watts under load are less than most competitors, which is mainly due to the weaker CPU. Only the TUF Gaming A18 proved to be similarly economical in the test.
| Off / Standby | |
| Idle | |
| Load |
|
Key:
min: | |
| Acer Nitro 18 AI AN18-61-R10V Ryzen AI 7 350, GeForce RTX 5070 Laptop | Asus TUF Gaming A18 FA808UP-S8022W R7 260, GeForce RTX 5070 Laptop | MSI Crosshair 18 HX AI A2XW Ultra 9 275HX, GeForce RTX 5070 Laptop | Asus ROG Strix G18 2025 G814 R9 9955HX, GeForce RTX 5070 Laptop | MSI Vector A18 HX A9W R9 9955HX, GeForce RTX 5070 Ti Laptop | Average NVIDIA GeForce RTX 5070 Laptop | |
|---|---|---|---|---|---|---|
| Power Consumption | -1% | -52% | -53% | -170% | -36% | |
| Idle Minimum * (Watt) | 5.9 | 6.7 -14% | 8.8 -49% | 13.1 -122% | 20.8 -253% | 10.8 ? -83% |
| Idle Average * (Watt) | 9.6 | 11.6 -21% | 14.1 -47% | 20.6 -115% | 52.8 -450% | 15.4 ? -60% |
| Idle Maximum * (Watt) | 17 | 17.7 -4% | 35.4 -108% | 21.1 -24% | 54.5 -221% | 21 ? -24% |
| Load Average * (Watt) | 89 | 85 4% | 106.2 -19% | 123.4 -39% | 146.6 -65% | 98.7 ? -11% |
| Cyberpunk 2077 ultra * (Watt) | 160.4 | 144 10% | 233 -45% | 215 -34% | 285 -78% | |
| Cyberpunk 2077 ultra external monitor * (Watt) | 154.6 | 139 10% | 225 -46% | 179.2 -16% | 278 -80% | |
| Load Maximum * (Watt) | 210 | 187 11% | 322.3 -53% | 249.7 -19% | 297.3 -42% | 218 ? -4% |
* ... smaller is better
Energy consumption Cyberpunk / Stress test
Energy consumption with external monitor
Battery life
The combination of moderate energy consumption and ample battery capacity (90 Wh) ensures respectable runtimes. In our Wi-Fi test with the brightness reduced to 150 cd/m², the 18-incher lasted over 11 hours.
| Acer Nitro 18 AI AN18-61-R10V Ryzen AI 7 350, GeForce RTX 5070 Laptop, 90 Wh | Asus TUF Gaming A18 FA808UP-S8022W R7 260, GeForce RTX 5070 Laptop, 90 Wh | MSI Crosshair 18 HX AI A2XW Ultra 9 275HX, GeForce RTX 5070 Laptop, 90 Wh | Asus ROG Strix G18 2025 G814 R9 9955HX, GeForce RTX 5070 Laptop, 90 Wh | MSI Vector A18 HX A9W R9 9955HX, GeForce RTX 5070 Ti Laptop, 99 Wh | Average of class Gaming | |
|---|---|---|---|---|---|---|
| Battery runtime | 7% | -2% | -36% | -66% | -36% | |
| WiFi v1.3 (h) | 11.1 | 11.9 7% | 10.9 -2% | 7.1 -36% | 3.8 -66% | 7.15 ? -36% |
| Reader / Idle (h) | 7 | 8.71 ? |
Notebookcheck overall rating
Even though the Nitro 18 AI is a good 18-inch gamer, in the end it is not enough to take the crown in this segment. The MSI Vector A18 HX, the Asus TUF Gaming A18 and ROG Strix G18, all performed better overall. Acer's Nitro ends up with a final score more on par with the MSI Crosshair 18 HX.
Acer Nitro 18 AI AN18-61-R10V
- 03/11/2026 v8
Florian Glaser
 Total Sustainability Score:
 Possible alternatives in comparison
Image | Model / Review | Price | Weight | Height | Display |
|---|---|---|---|---|---|
1. 81.2%  | Acer Nitro 18 AI AN18-61-R10V AMD Ryzen AI 7 350 ⎘ NVIDIA GeForce RTX 5070 Laptop ⎘ 16 GB Memory, 1000 GB SSD | Amazon: List Price: 1900 EUR | 3 kg | 25 mm | 18.00" 2560x1600 168 PPI IPS |
2. 83.8%  | Asus TUF Gaming A18 FA808UP-S8022W AMD Ryzen 7 260 ⎘ NVIDIA GeForce RTX 5070 Laptop ⎘ 32 GB Memory, 1024 GB SSD | Amazon: List Price: 2199 Euro | 2.6 kg | 26.7 mm | 18.00" 1920x1200 126 PPI IPS |
3. 81.7%  | MSI Crosshair 18 HX AI A2XW Intel Core Ultra 9 275HX ⎘ NVIDIA GeForce RTX 5070 Laptop ⎘ 32 GB Memory, 1024 GB SSD | Amazon: 1. $1,799.99 msi Crosshair 18 HX AI 18" 2... 2. $1,699.99 msi Crosshair 18 HX AI 18" 2... 3. $1,899.99 msi Crosshair 18 HX AI 18" 2... List Price: 1700 USD | 3.1 kg | 29.9 mm | 18.00" 2560x1600 168 PPI IPS |
4. 86.4%  | Asus ROG Strix G18 2025 G814 AMD Ryzen 9 9955HX ⎘ NVIDIA GeForce RTX 5070 Laptop ⎘ 32 GB Memory, 1024 GB SSD | Amazon: List Price: 2299€ | 2.9 kg | 30.8 mm | 18.00" 2560x1600 168 PPI IPS |
5. 84.8%  | MSI Vector A18 HX A9W AMD Ryzen 9 9955HX ⎘ NVIDIA GeForce RTX 5070 Ti Laptop ⎘ 32 GB Memory | Amazon: List Price: 3200 USD | 3.5 kg | 32.05 mm | 18.00" 2560x1600 189 PPI IPS |
Transparency
The selection of devices to be reviewed is made by our editorial team. The test sample was provided to the author as a loan by the manufacturer or retailer for the purpose of this review. The lender had no influence on this review, nor did the manufacturer receive a copy of this review before publication. There was no obligation to publish this review. As an independent media company, Notebookcheck is not subjected to the authority of manufacturers, retailers or publishers.
This is how Notebookcheck is testing
Every year, Notebookcheck independently reviews hundreds of laptops and smartphones using standardized procedures to ensure that all results are comparable. We have continuously developed our test methods for around 20 years and set industry standards in the process. In our test labs, high-quality measuring equipment is utilized by experienced technicians and editors. These tests involve a multi-stage validation process. Our complex rating system is based on hundreds of well-founded measurements and benchmarks, which maintains objectivity. Further information on our test methods can be found here.

