Verdict - Yoga Pro 7i 15 is a very good, but expensive multimedia laptop
Lenovo's new Yoga Pro 7i 15 Aura Edition offers a very good overall package with good performance figures from the Panther Lake processor and GeForce GPU, solid connectivity options, a gorgeous OLED touchscreen with 165 Hz and accurate color profiles, excellent input devices and a very good sound system. You also get an aluminum chassis with two SSD slots, but the hinges of our unit produced some creaking sounds, which does not really match the high price tag.
The starting price is north of $2600, which is steep for a laptop with the RTX 5060, but unfortunately, it seems we have to get used to that right now following the memory crisis. Other drawbacks include the loud fans when you stress the system, so the Yoga is even louder than some gaming laptops, as well as Lenovo's additional Creator power mode, which simply does not make sense when you already have a High Performance mode, which is now pretty useless.
Pros
Cons
Price and Availability
You can get our review SKU with the RTX 5060 for $2619 directly from Lenovo right now.
- $49.91Original New for Lenovo Yoga Pro 7 15IPH11 (Machine Type : 83SN) Keyboard Backlit 83SN0002US 83SN0003US 83SN0004US
- $2,231.24Lenovo Yoga Pro 9i 16" Laptop - Intel Ultra 9 285H 16-Core, NVIDIA GeForce RTX 5060, 32GB RAM, 1TB NVMe SSD, 16.0" 3.2K Tandem OLED 120Hz 1000-nits, Windows 11 Pro
- $1,069.09Lenovo Yoga 7 2-in-1 Laptop 16" WUXGA IPS Touch (Glossy Anti-Fingerprint) AMD 8-core Ryzen AI 7 350 (Up to 50 AI Tops) 16GB RAM 1TB SSD for Creator Business Professional Win11Pro ICP Hub
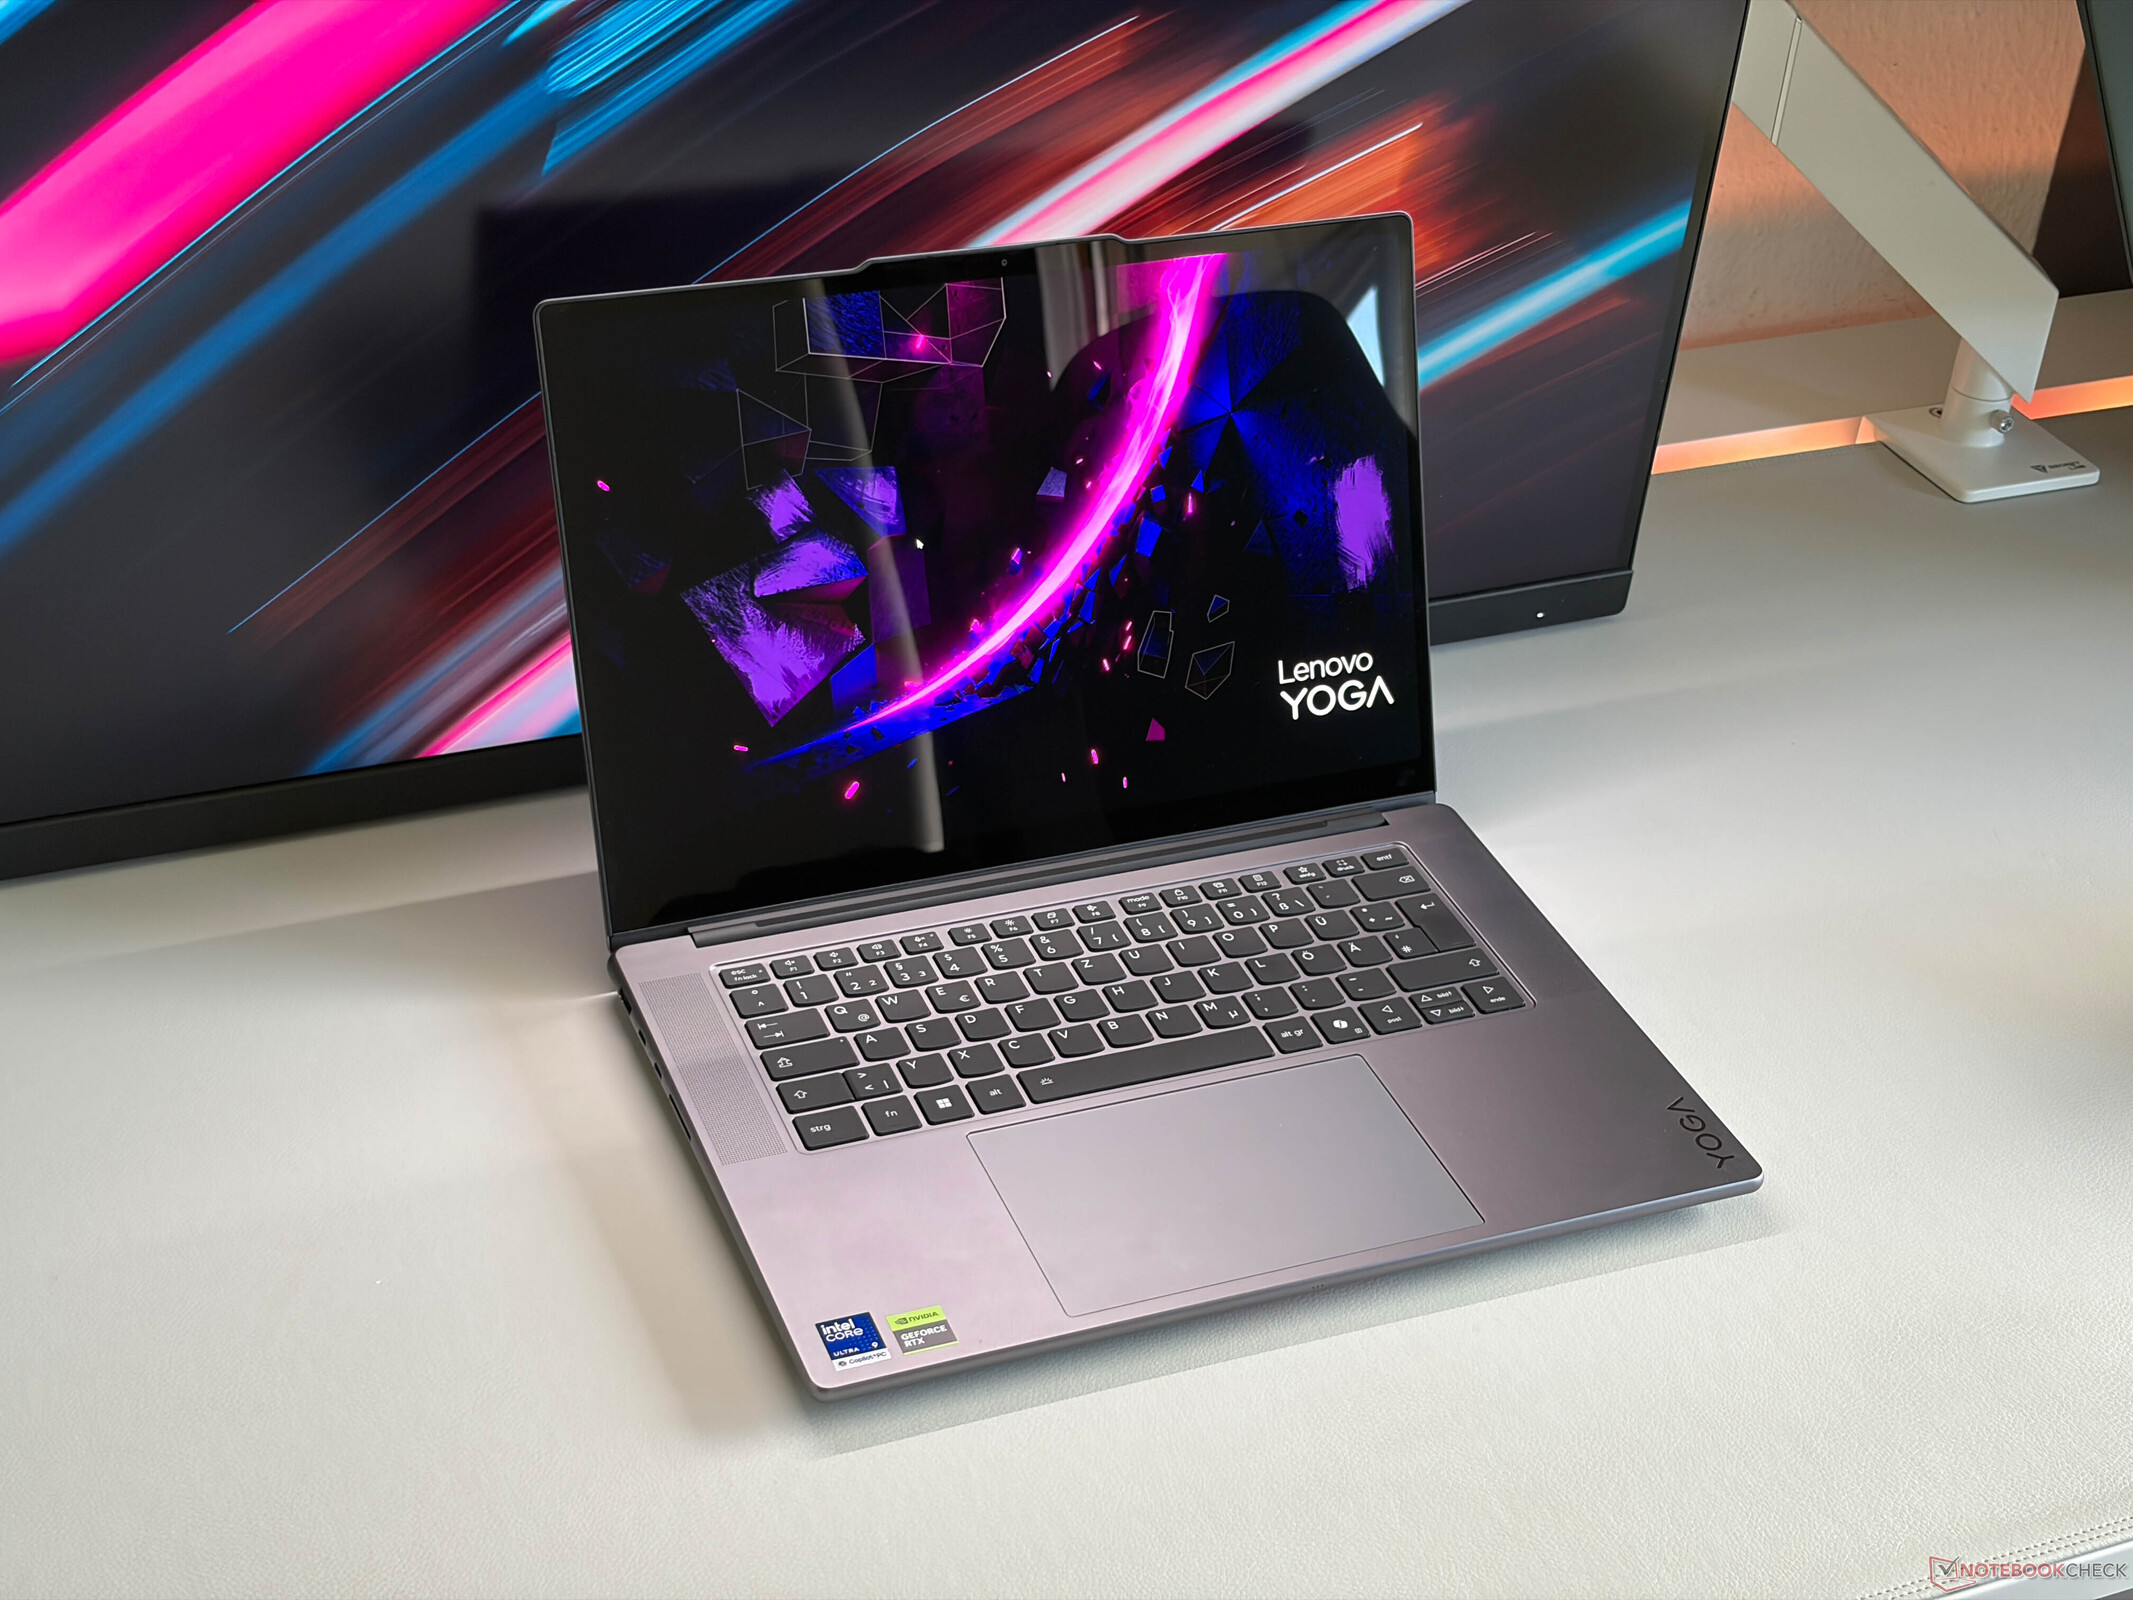
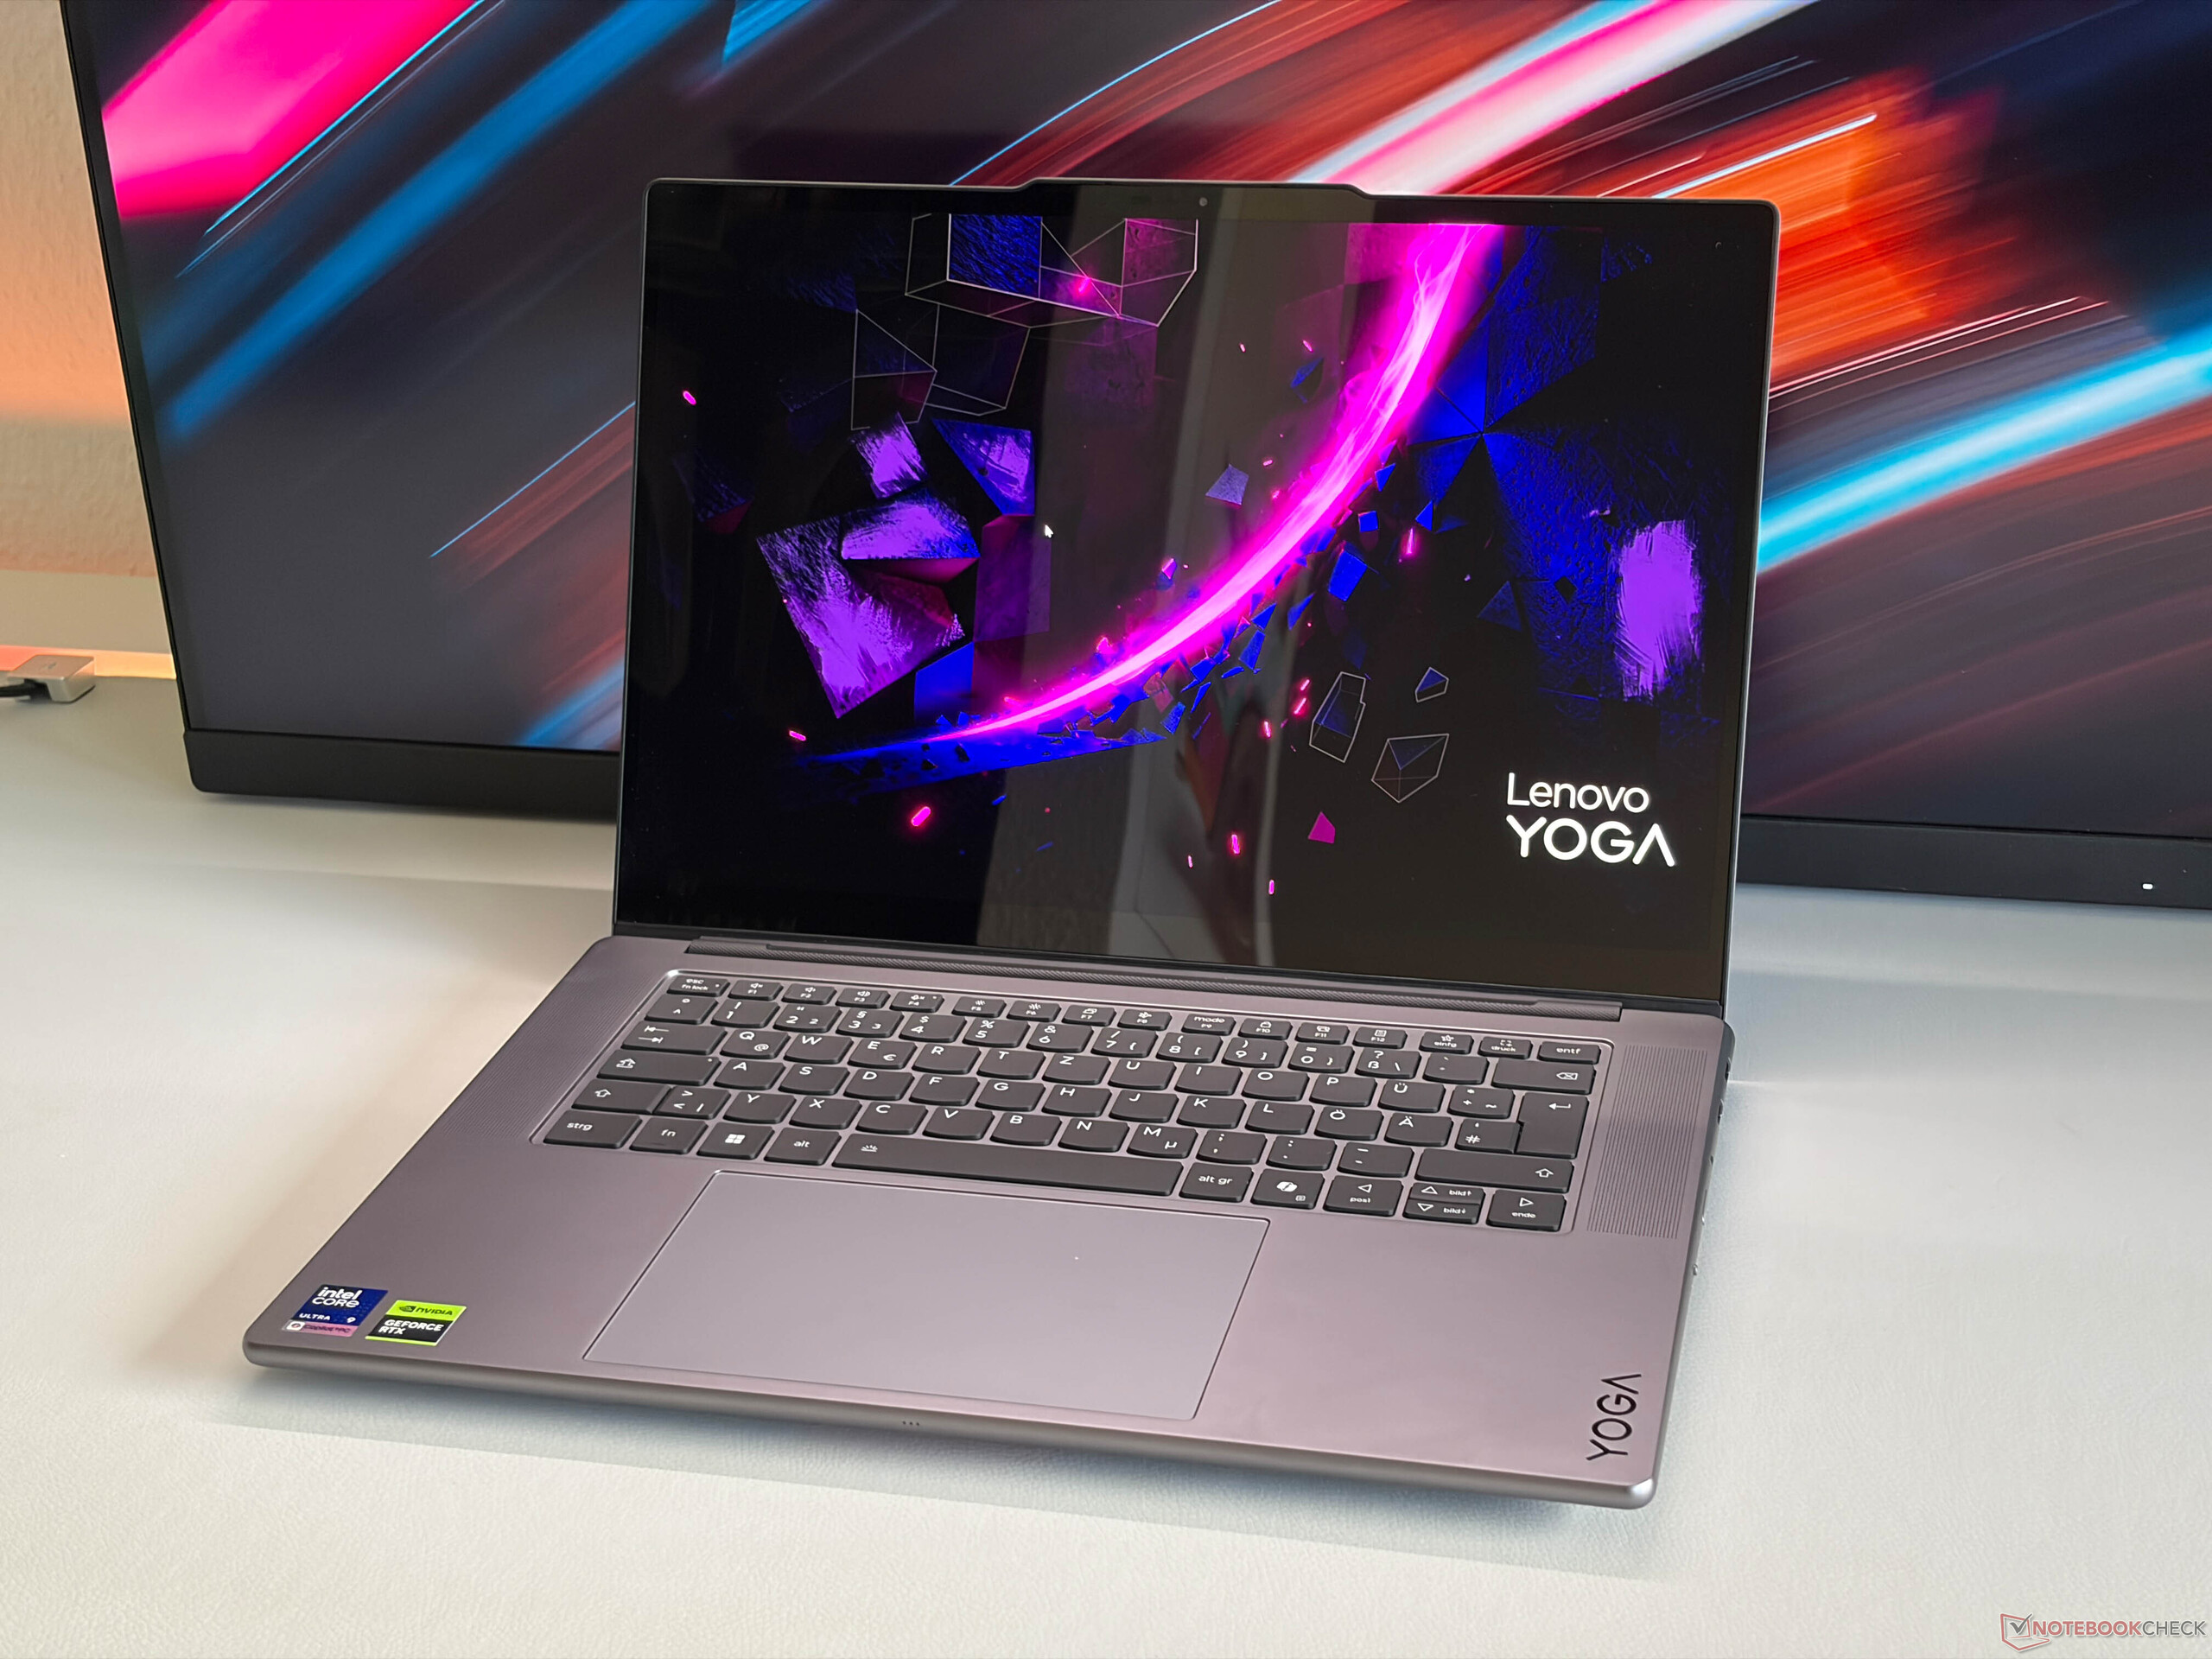
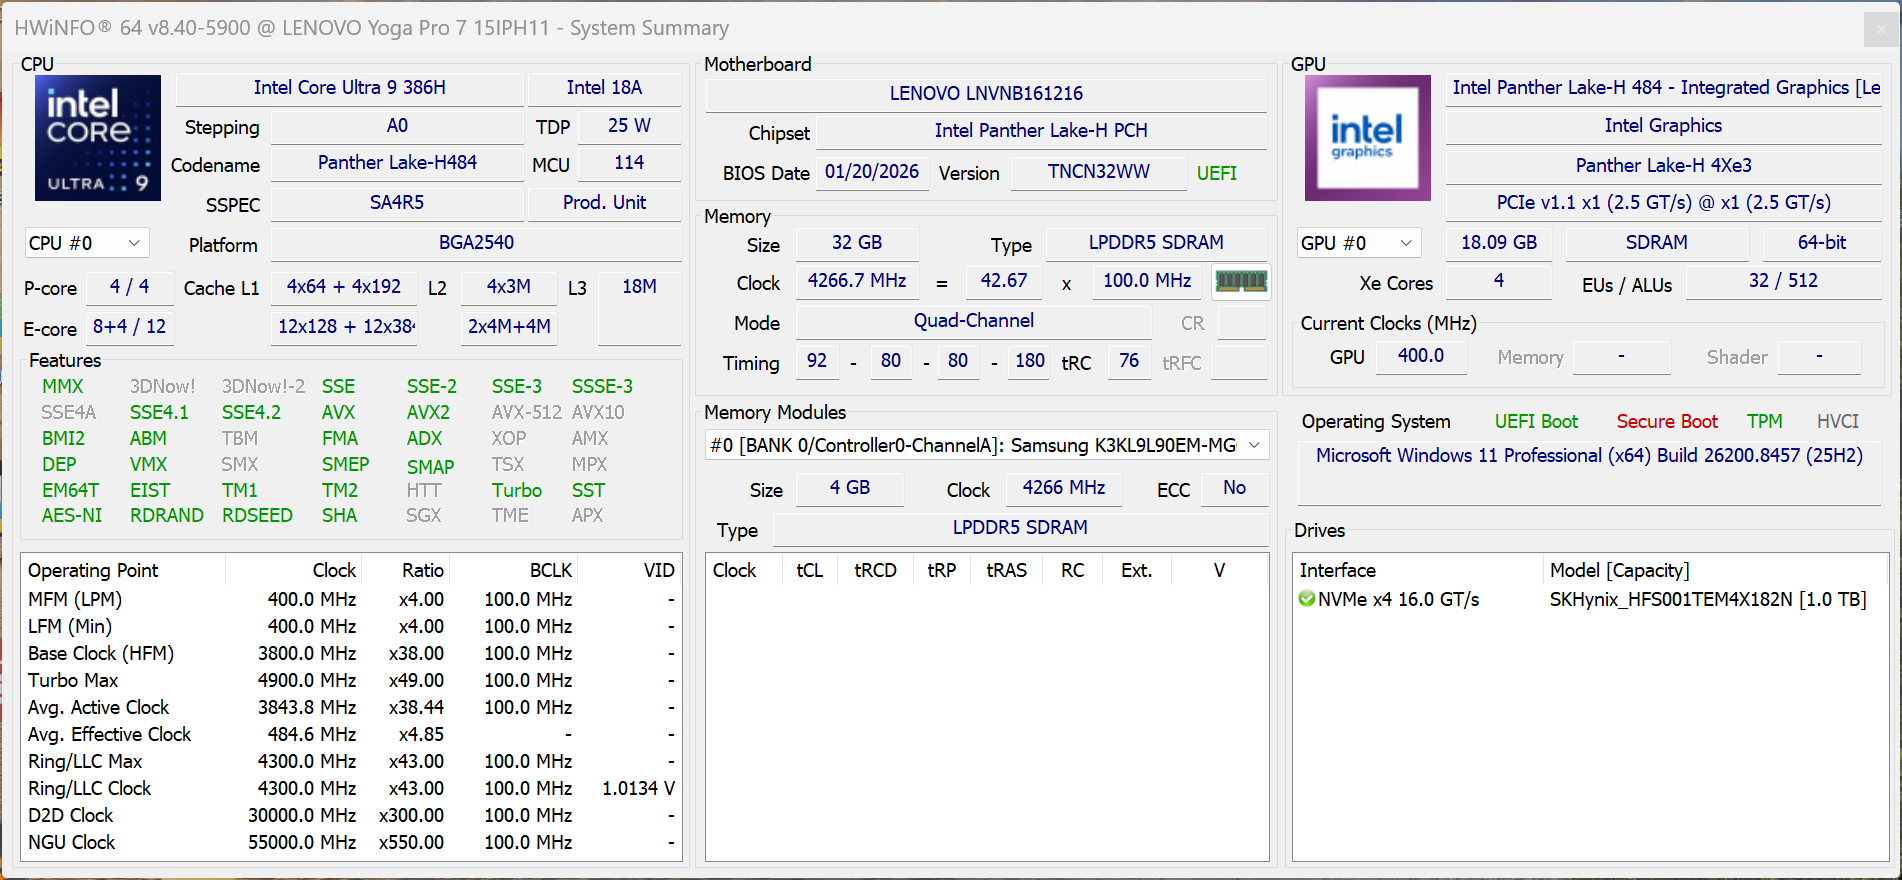
Lenovo's Yoga Pro 7i 15 G11 is a new 15-inch multimedia laptop with a premium price tag and is pretty unique in the current market, because other brands usually only offer 14-inch or 16-inch models right now. Our review spec with the Core Ultra 9 386H, 32 GB RAM, 1 TB SSD storage, GeForce RTX 5060 and the high-resolution OLED touchscreen with 165 Hz currently retails for $2619.
Specifications
Case and Connectivity
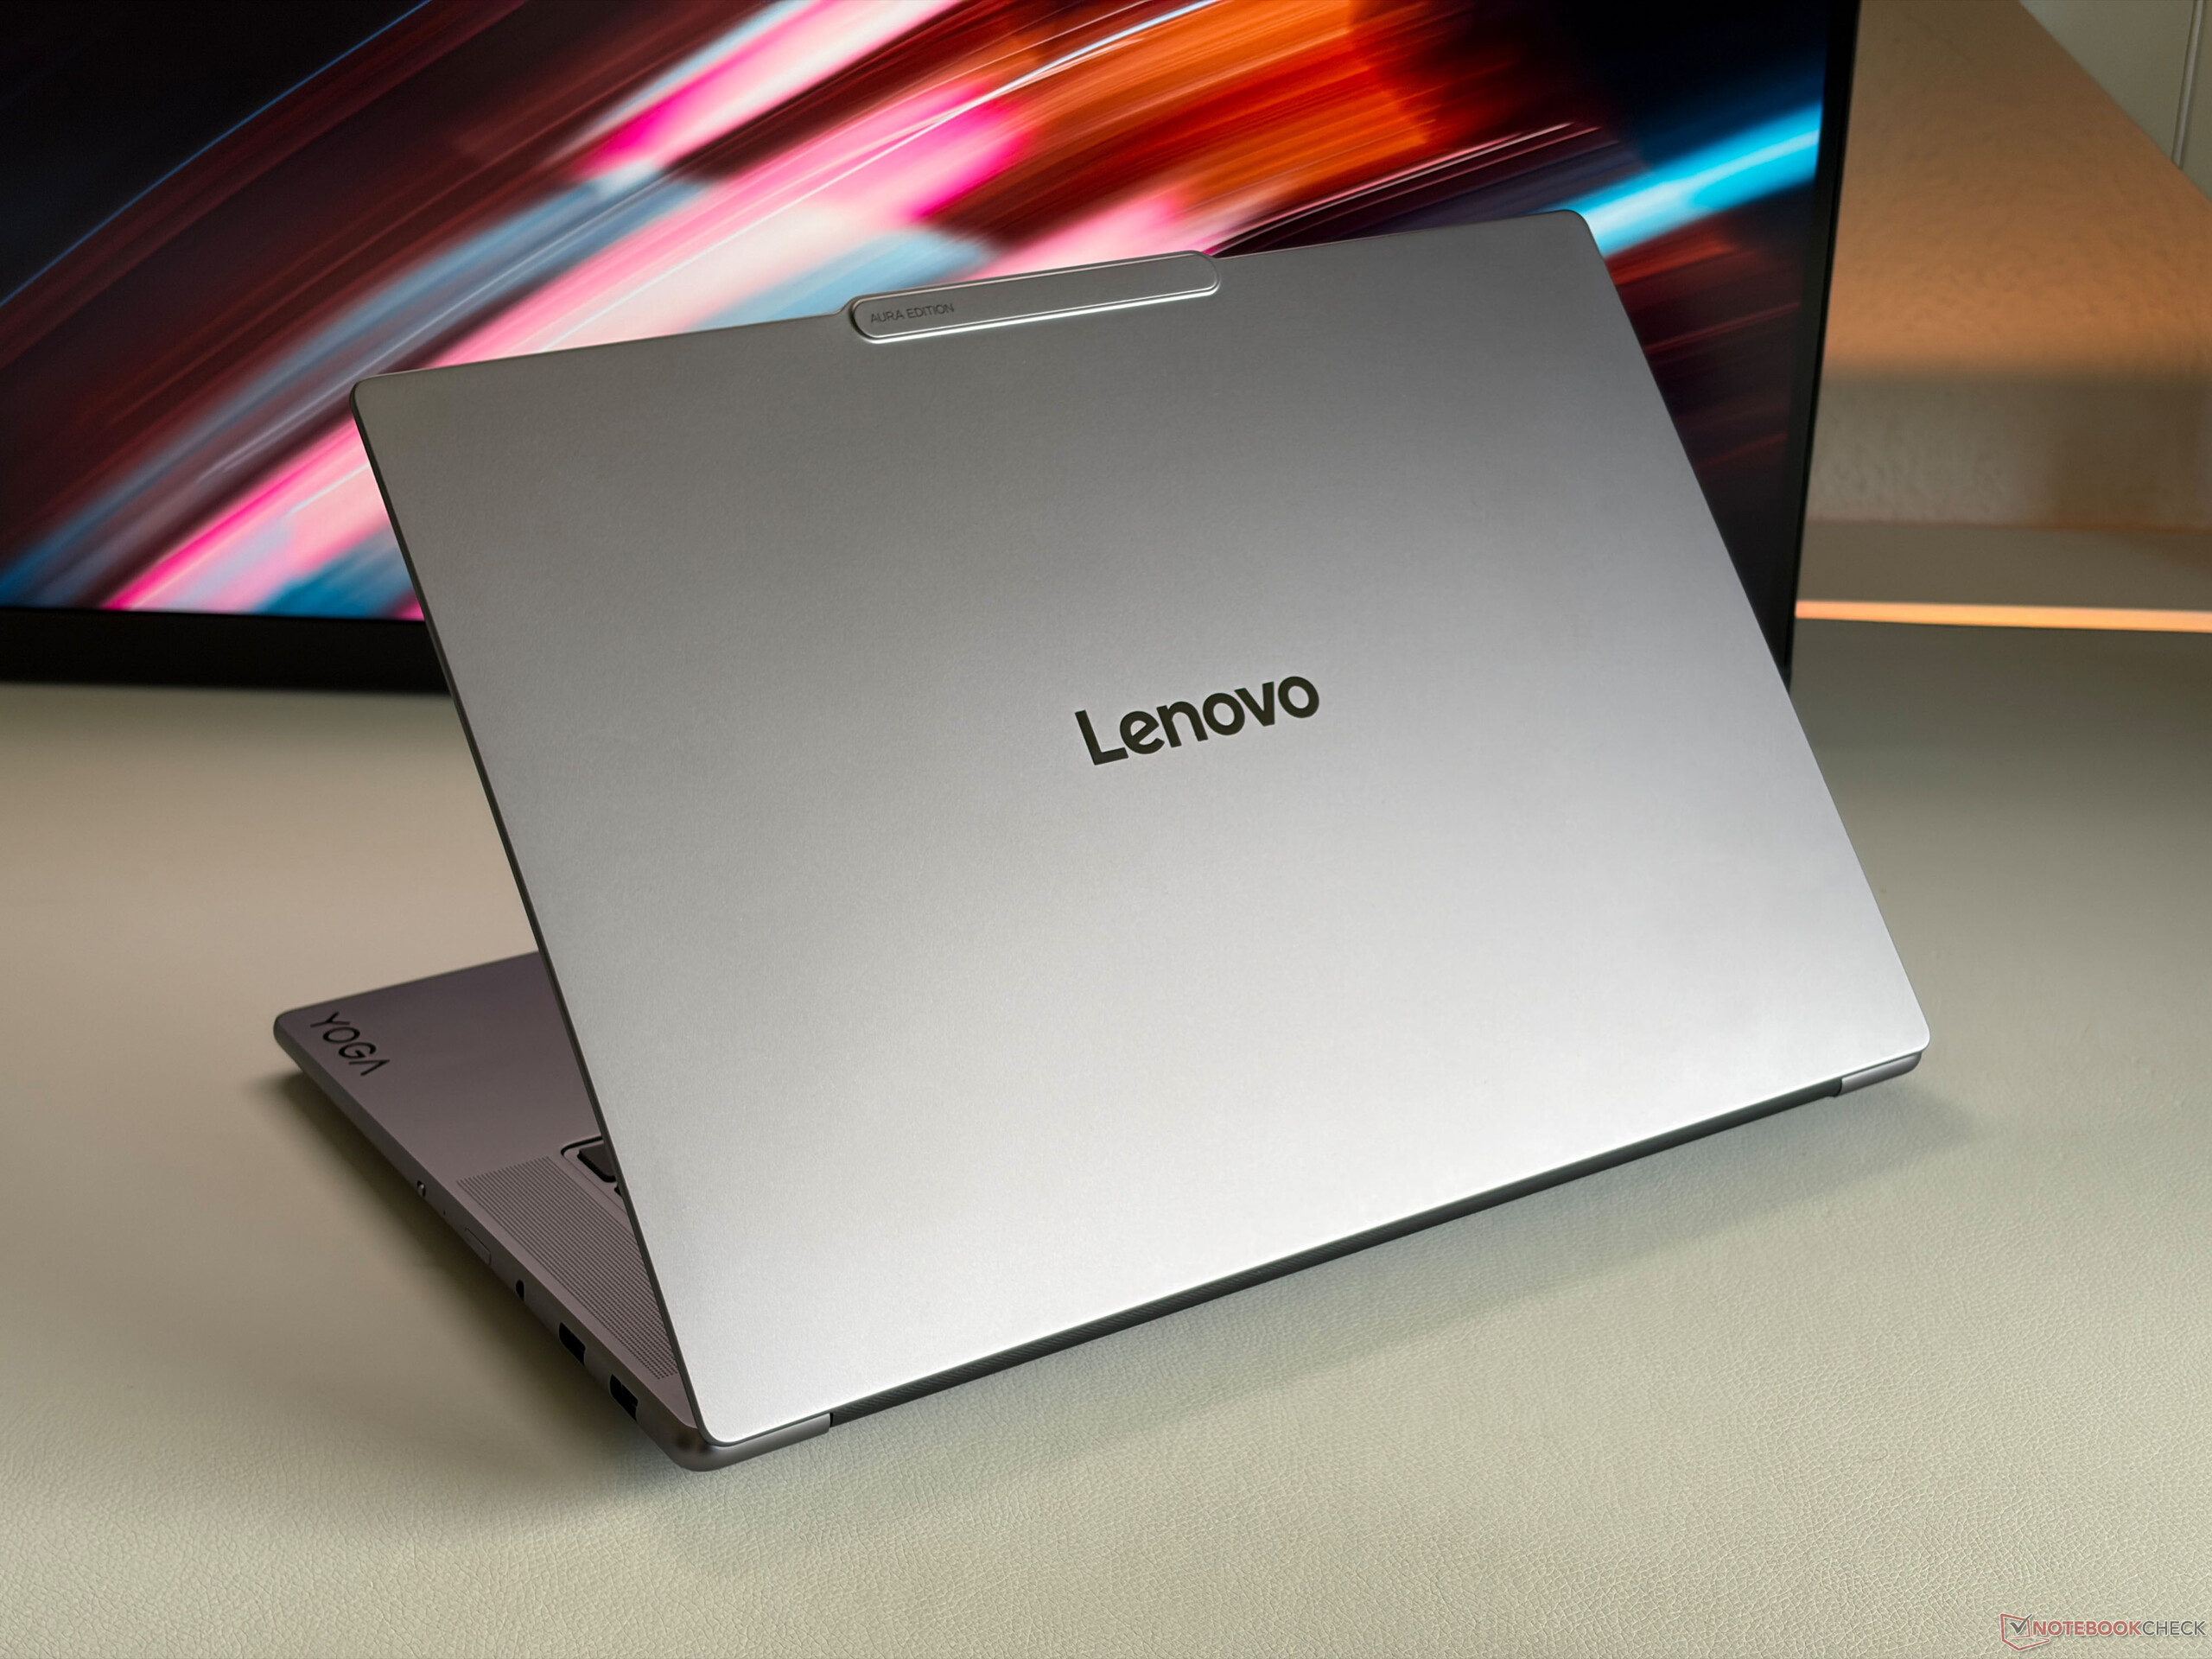
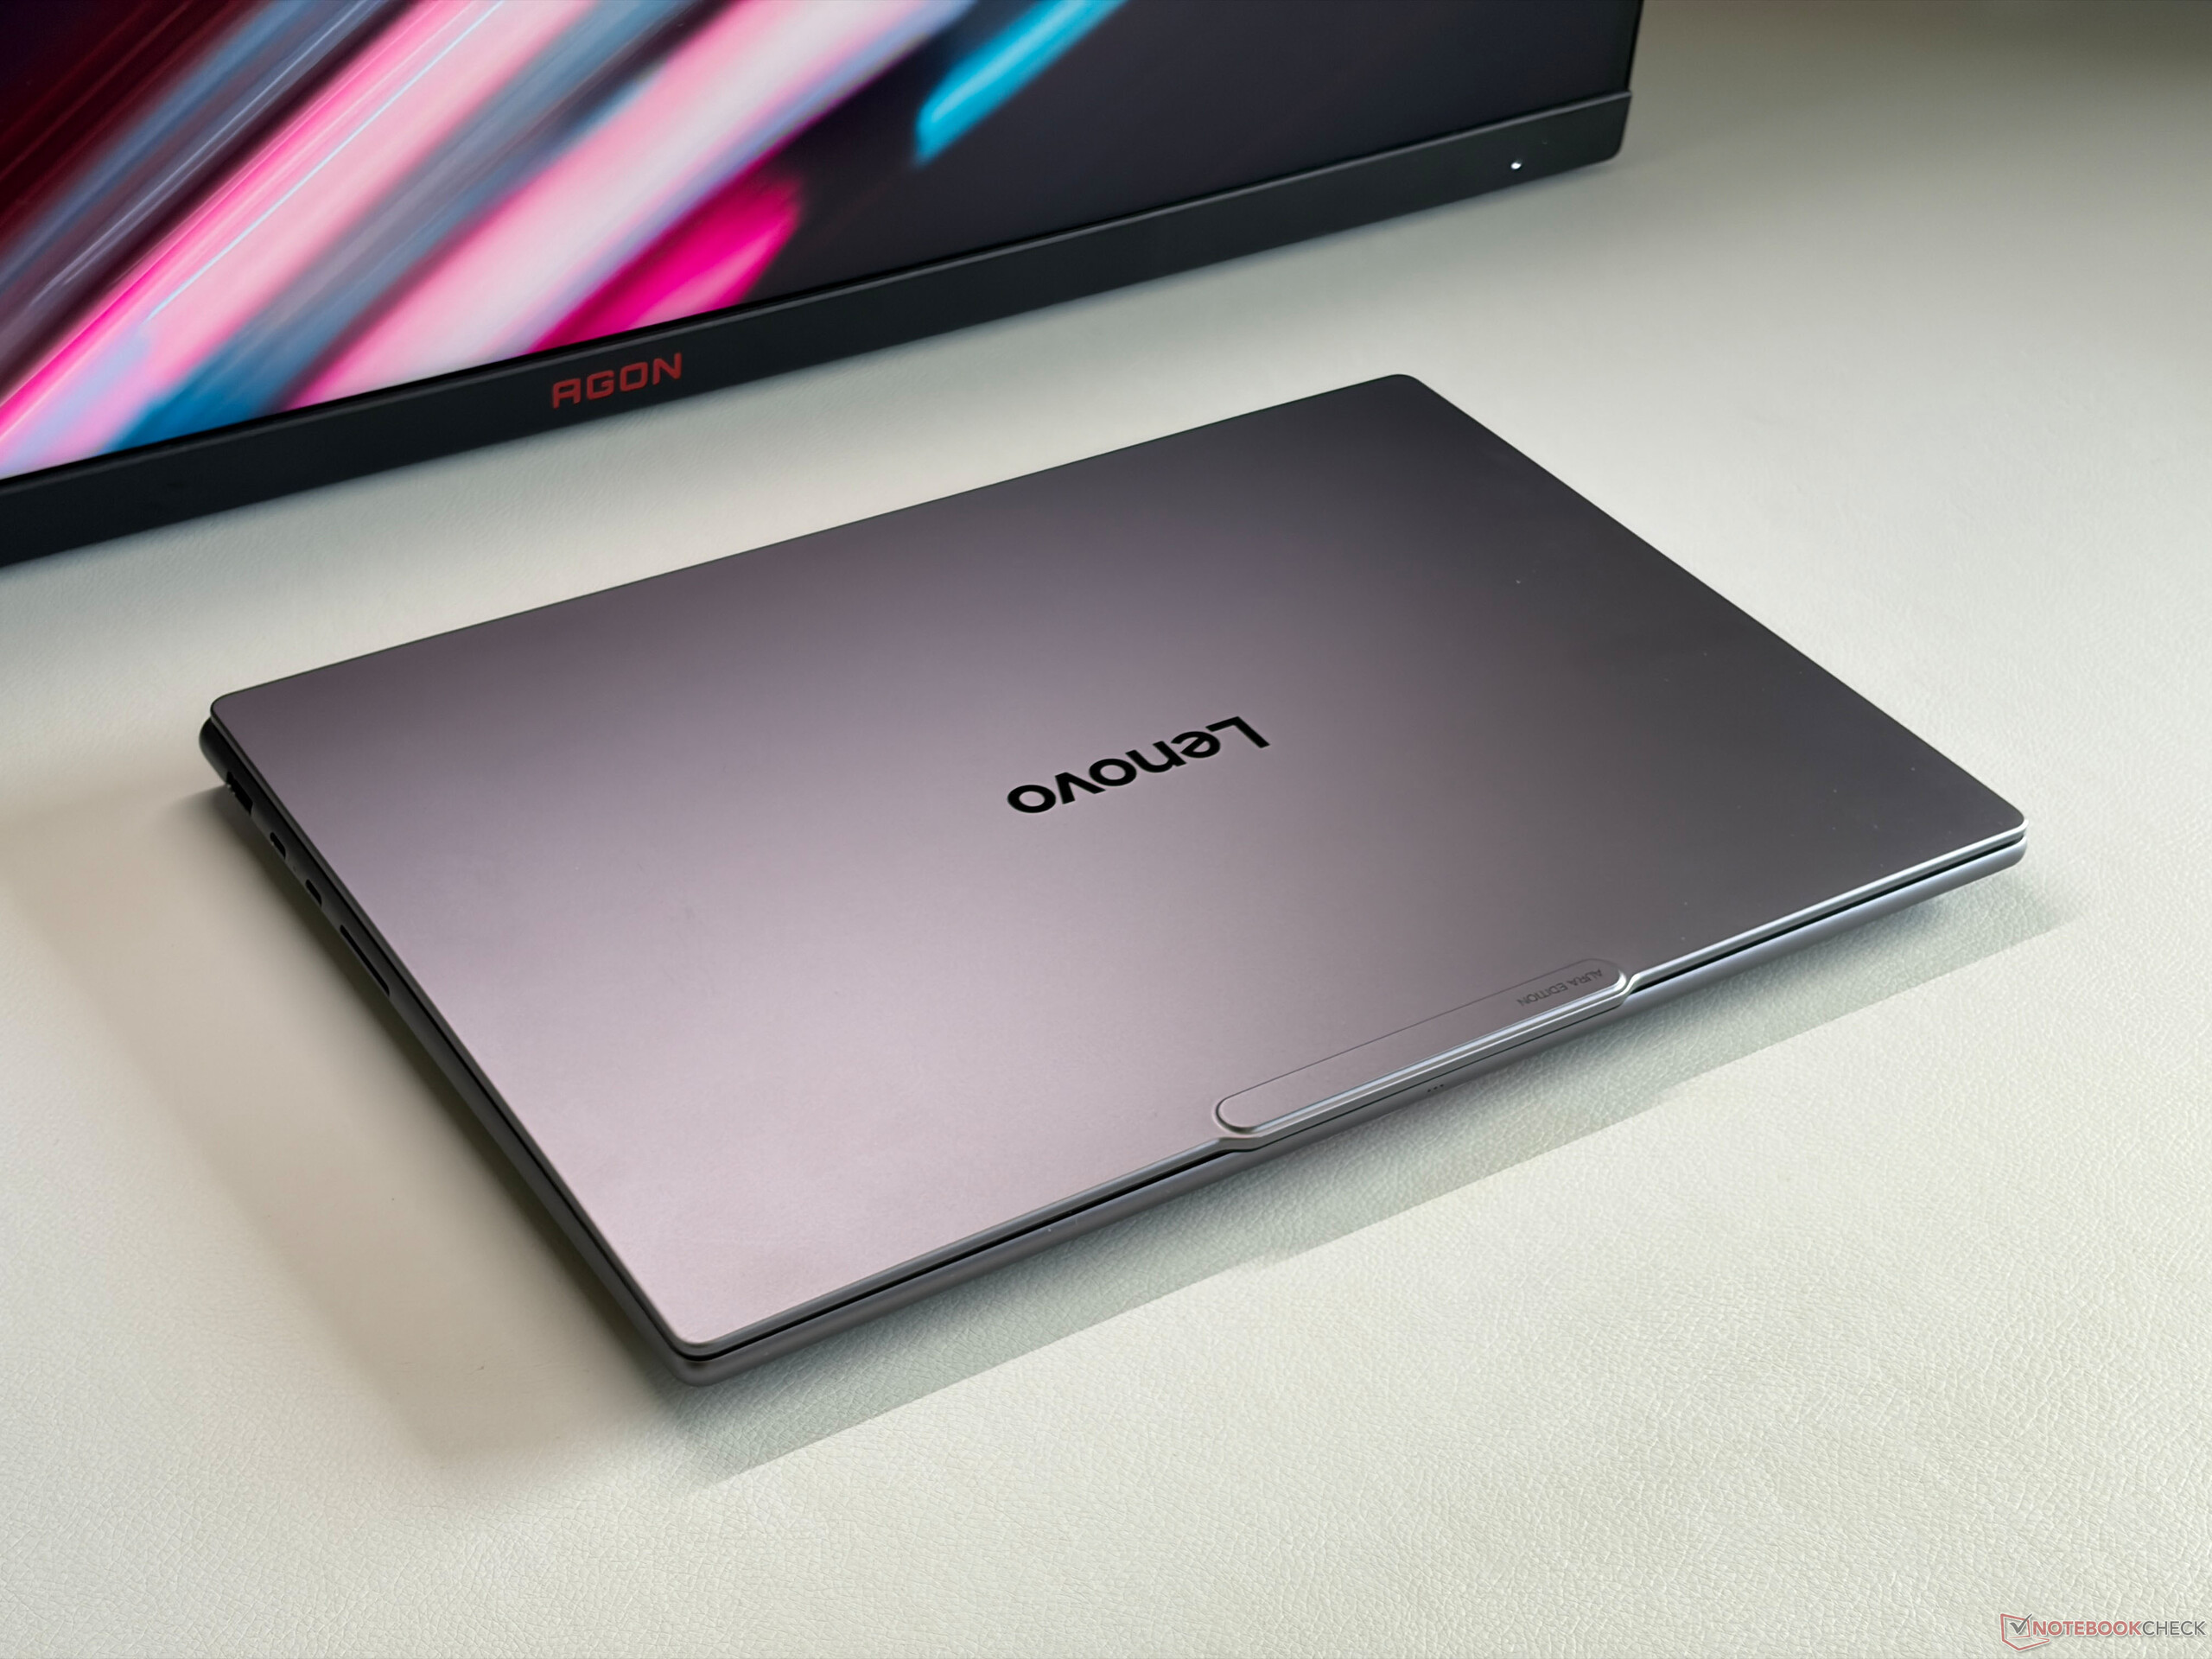
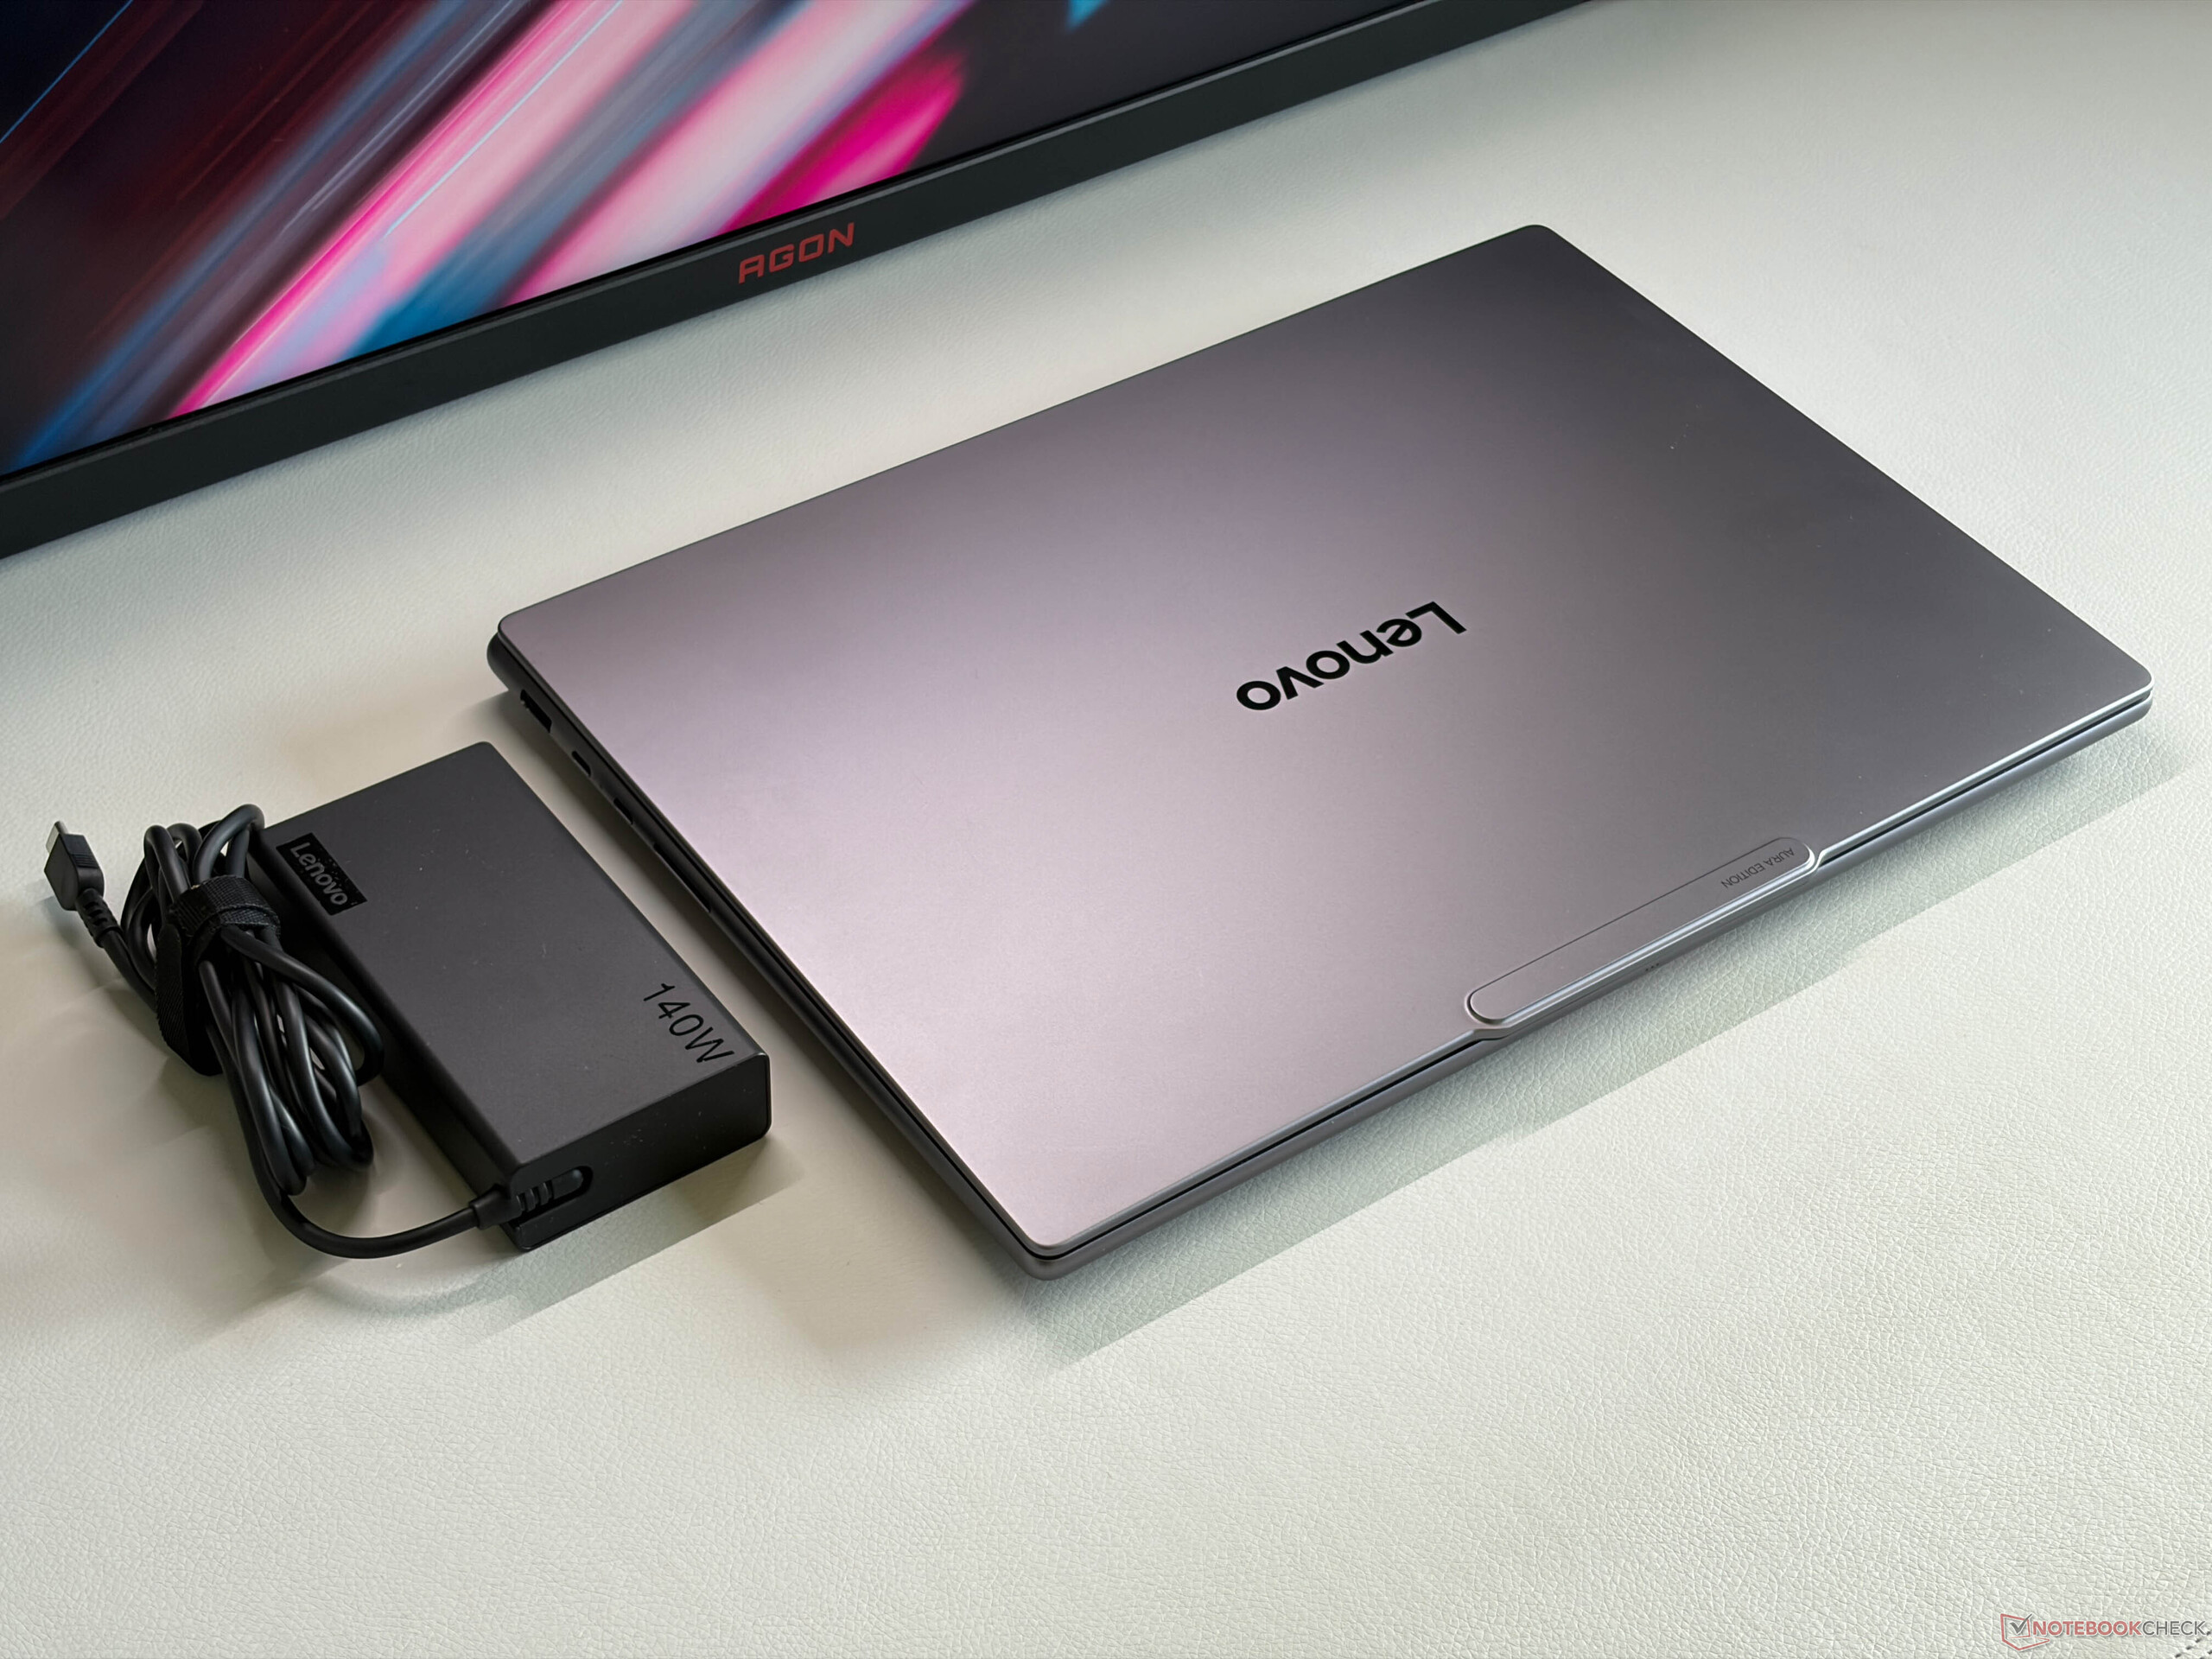
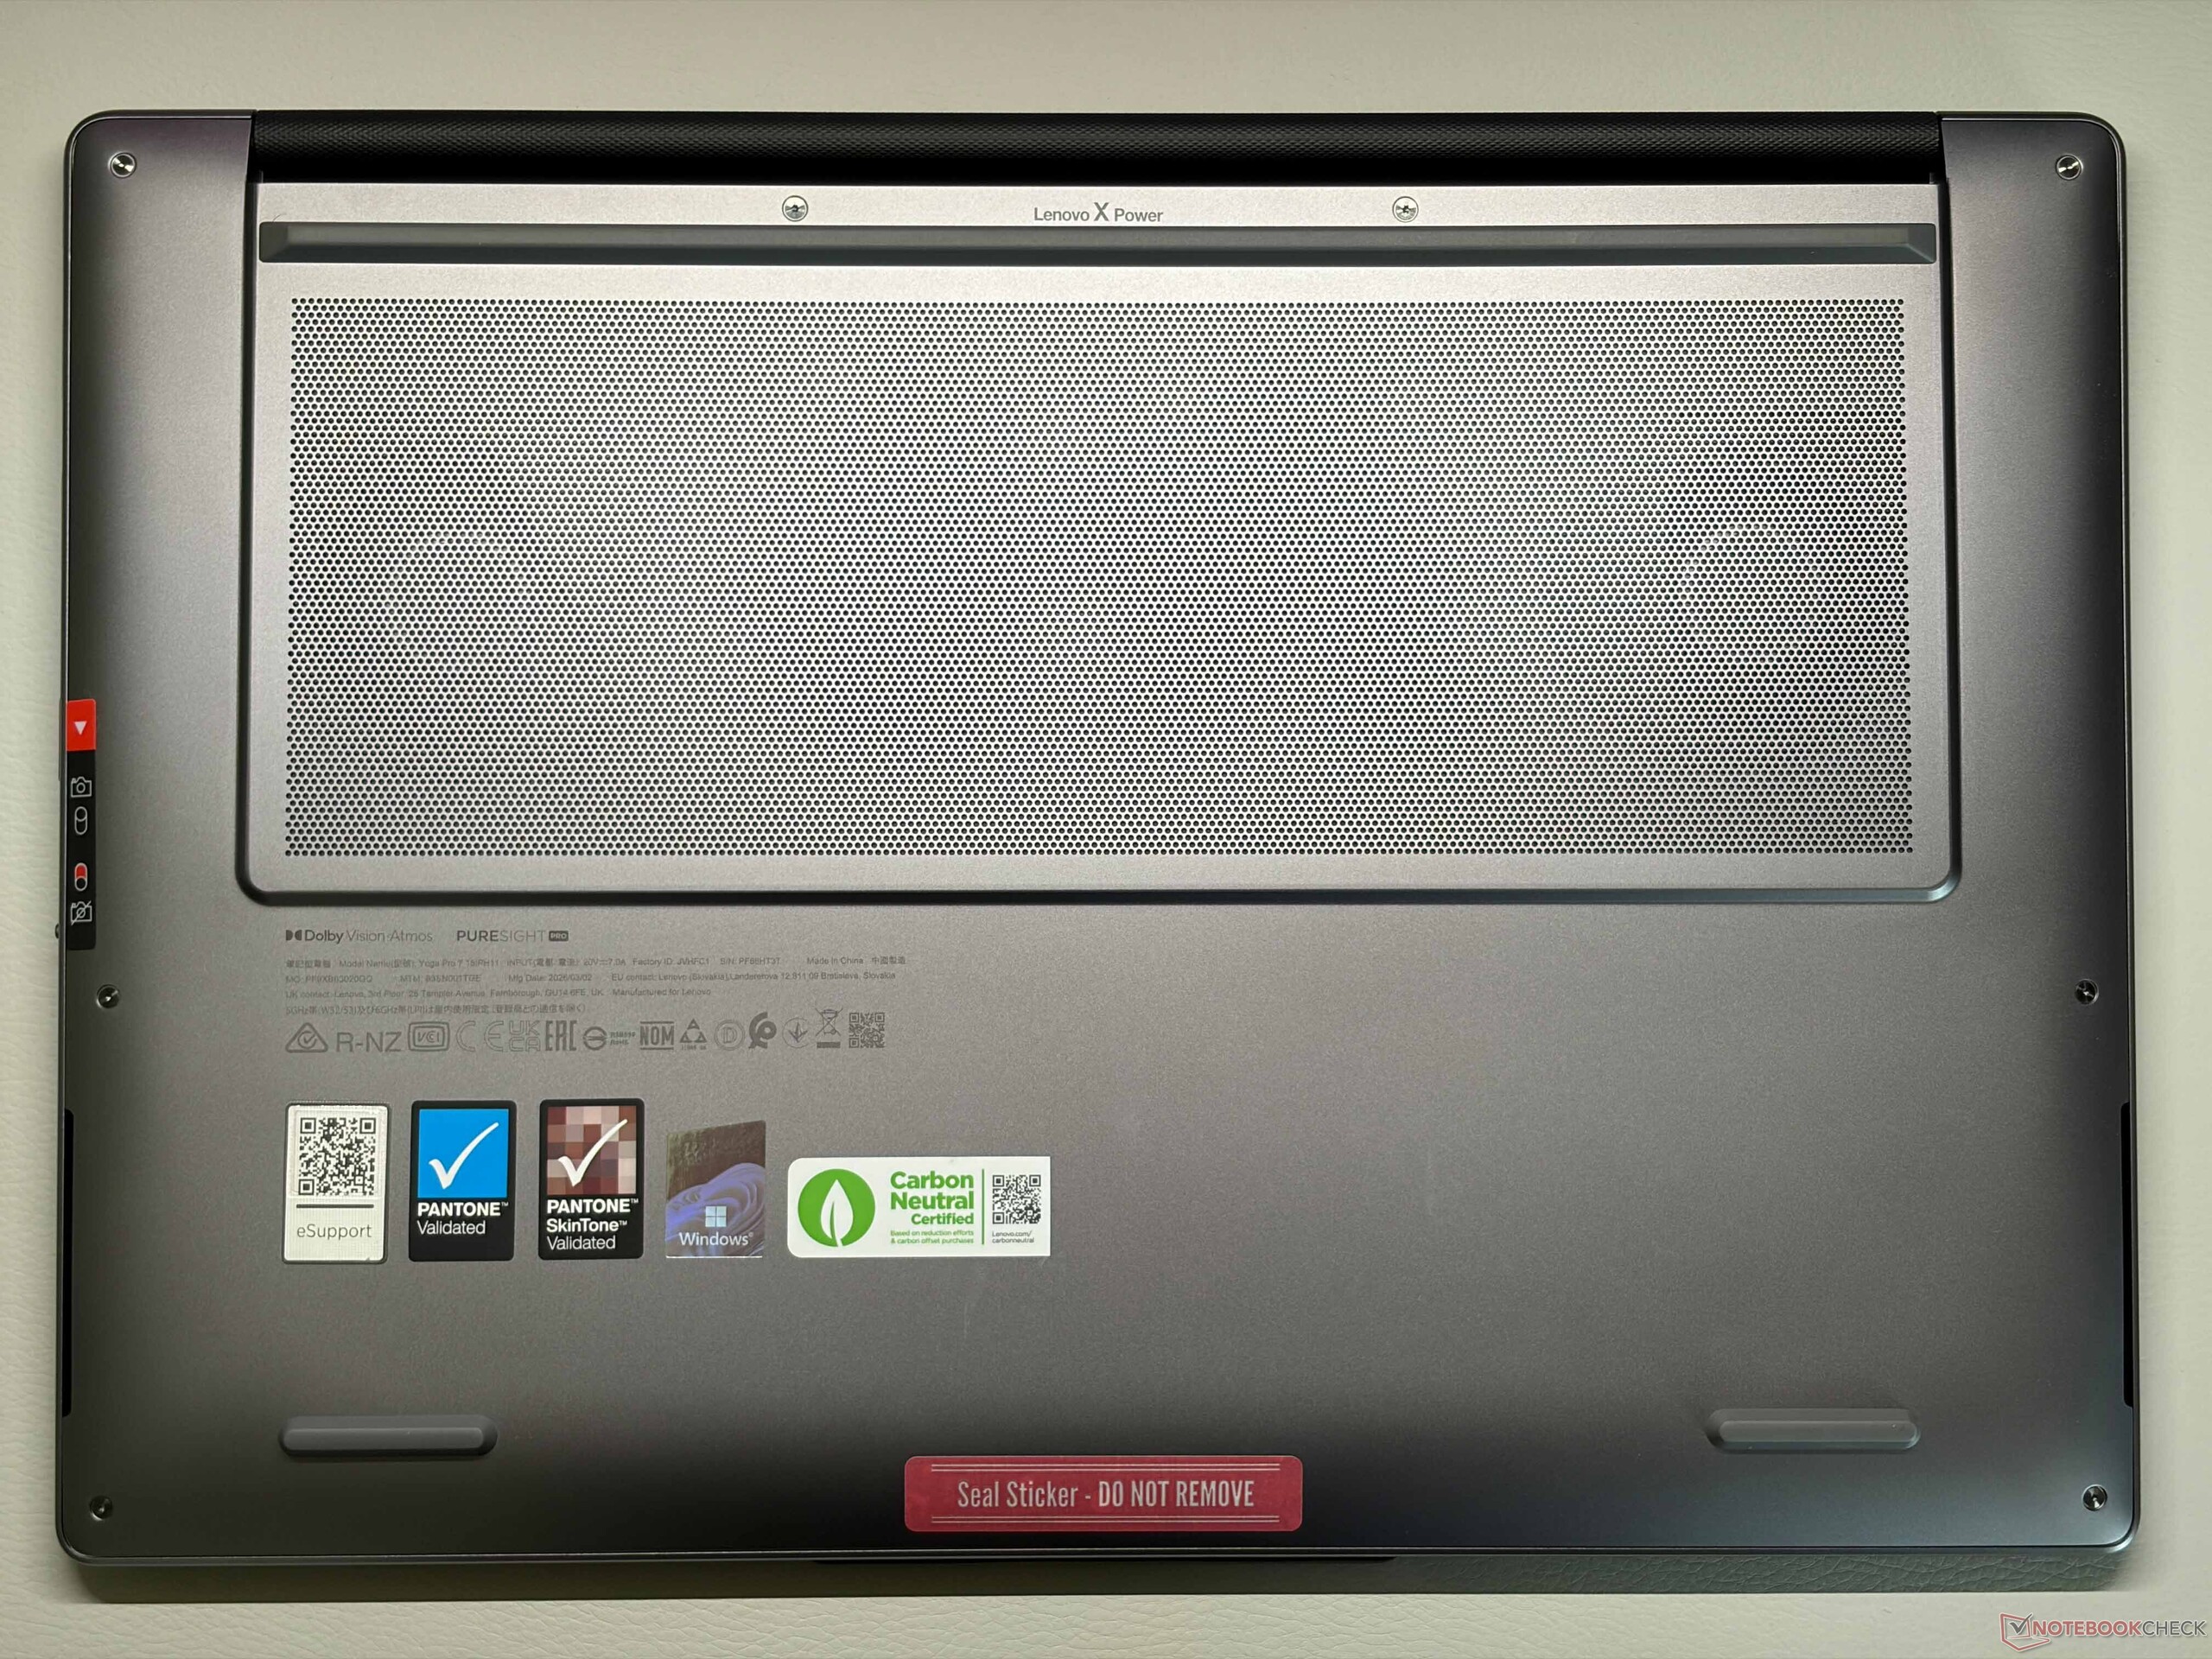
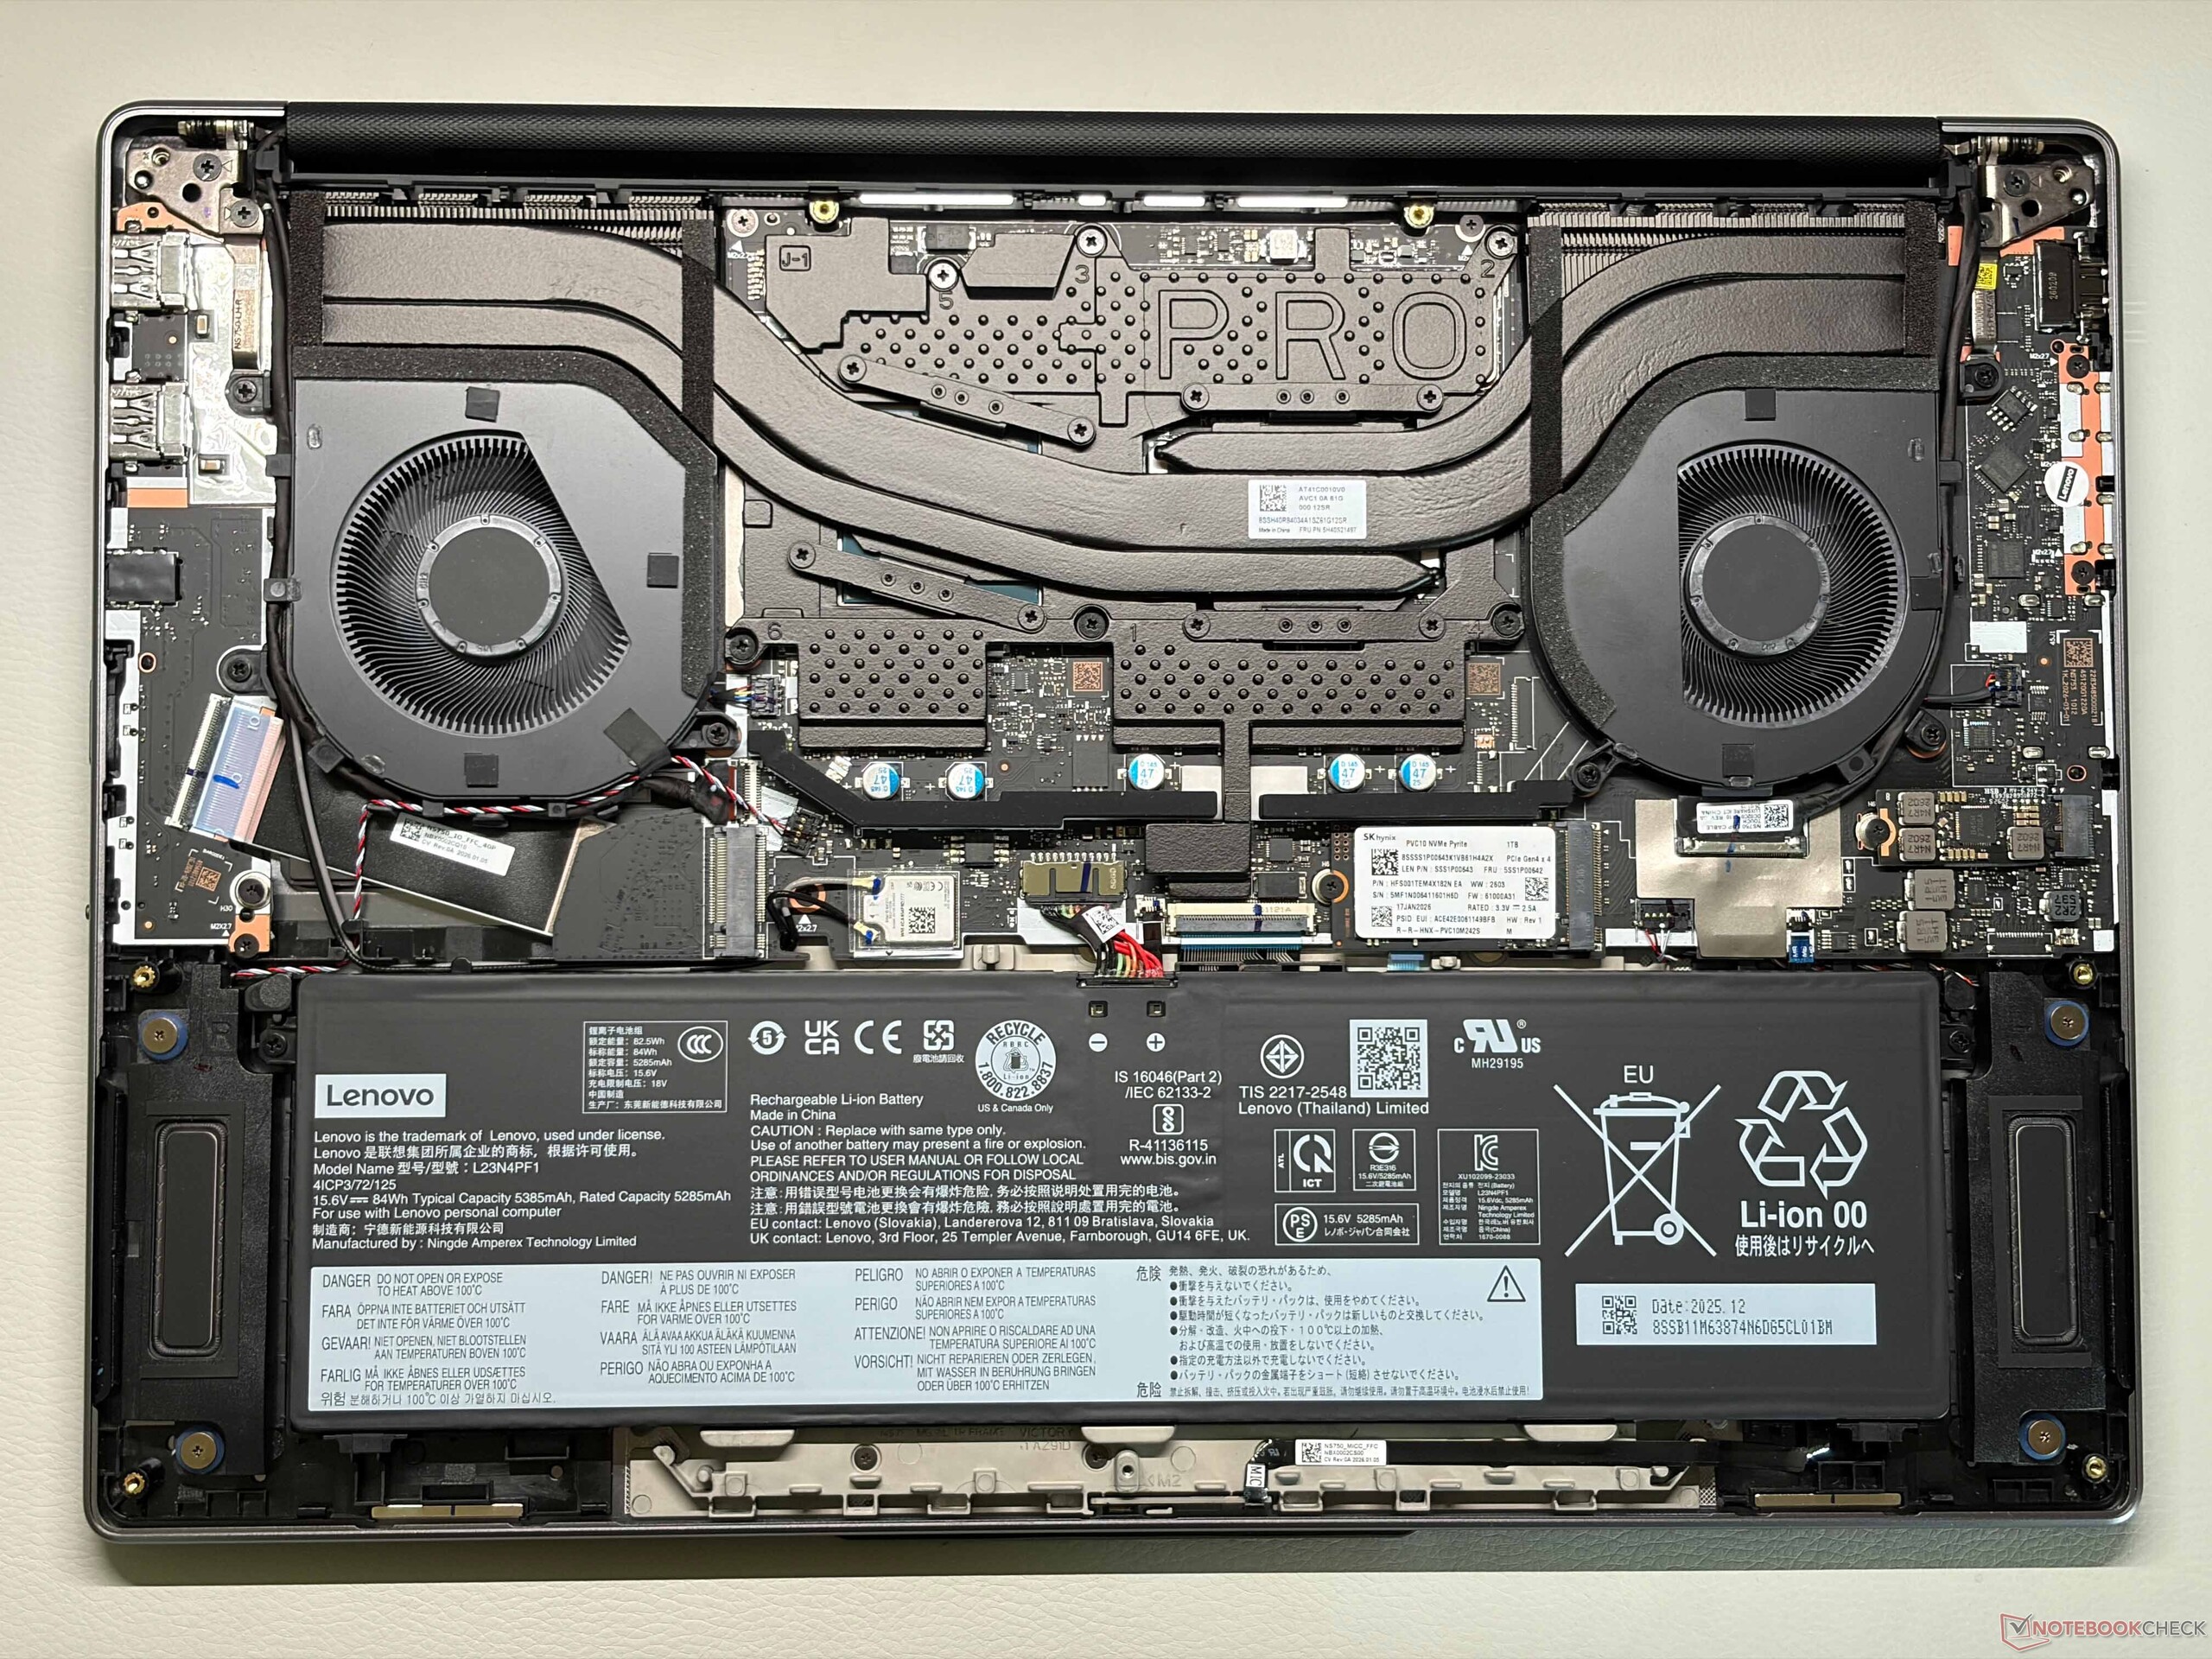
Lenovo uses an aluminum construction for the Yoga Pro 7i 15 and the overall quality is very good, but there are two weak points. It feels solid and the stability of both the base unit as well as the lid is excellent, but we noticed minor creaking sounds from the hinges. The functionality, however, is not affected, and the hinges are well adjusted (max opining angle 170 degrees) and there is only minor bouncing. The other issue is the power button, which is a bit clattery. The dark grey color does not really attract fingerprints, but the camera bump does not look very good. Both the memory and the Wi-Fi module are soldered, but you can implement two SSDs (1x M.2-2242, 1x M.2-2280).
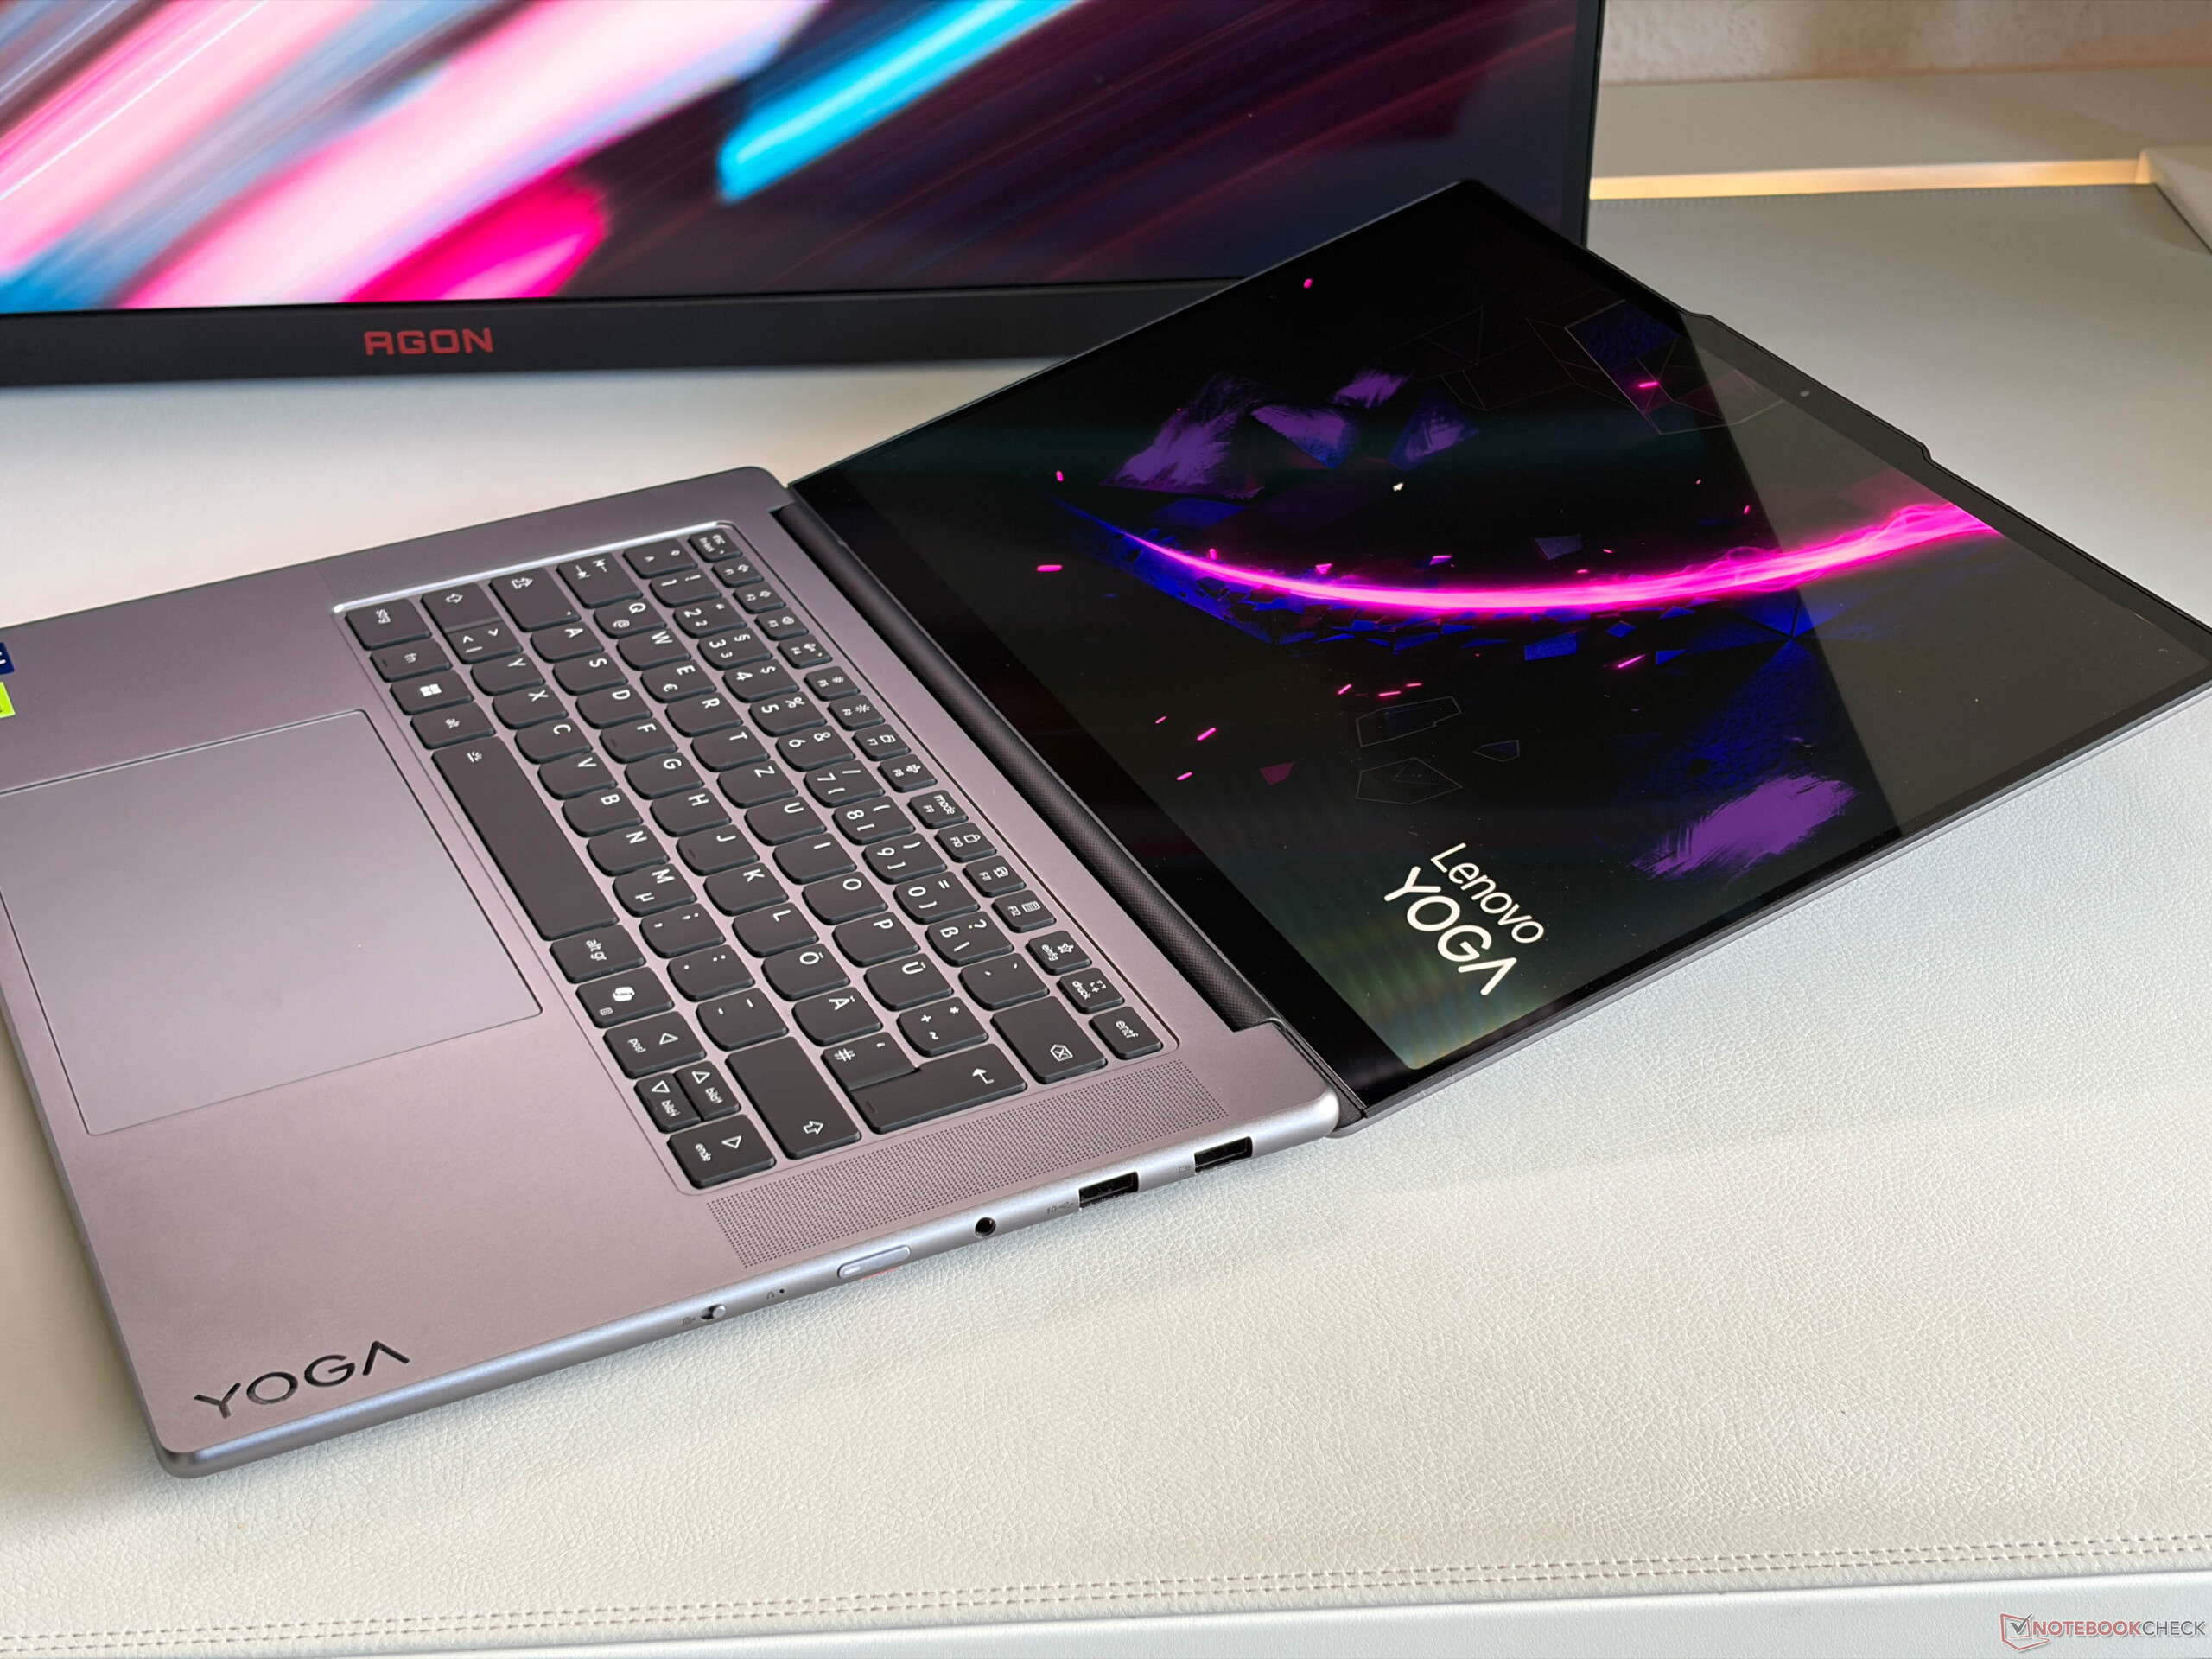
In terms of connectivity, the Yoga offers pretty much anything you could want including Thunderbolt 4, two regular USB-A ports, a fast SD-card reader (even though there is no support for SD-Express) and a modern Wi-Fi 7 module, which manages great transfer rates with a corresponding router. You also get a 5 MP webcam (with eShutter) and it is obviously a Copilot+ certified laptop.


| SD Card Reader | |
| average JPG Copy Test (av. of 3 runs) | |
| Schenker XMG Core 15 (M25) (AV PRO microSD 128 GB V60) | |
| Lenovo Yoga Pro 7 15IPH11 (Angelbird AV Pro V60) | |
| Lenovo Legion 7 16 AGP11 (Angelbird AV Pro V60) | |
| Lenovo Pro 9 16IPH11 (Toshiba Exceria Pro SDXC 64 GB UHS-II) | |
| Average of class Multimedia (23 - 531, n=41, last 2 years) | |
| Samsung Galaxy Book6 Ultra (Angelbird AV Pro V60) | |
| maximum AS SSD Seq Read Test (1GB) | |
| Lenovo Pro 9 16IPH11 (Toshiba Exceria Pro SDXC 64 GB UHS-II) | |
| Lenovo Yoga Pro 7 15IPH11 (Angelbird AV Pro V60) | |
| Lenovo Legion 7 16 AGP11 (Angelbird AV Pro V60) | |
| Average of class Multimedia (37.3 - 1455, n=40, last 2 years) | |
| Samsung Galaxy Book6 Ultra (Angelbird AV Pro V60) | |
| Networking | |
| Lenovo Yoga Pro 7 15IPH11 | |
| iperf3 transmit RT-BE96U WiFi7 | |
| iperf3 receive RT-BE96U WiFi7 | |
| Lenovo Pro 9 16IPH11 | |
| iperf3 transmit AXE11000 | |
| iperf3 receive AXE11000 | |
| iperf3 transmit AXE11000 6GHz | |
| iperf3 receive AXE11000 6GHz | |
| Samsung Galaxy Book6 Ultra | |
| iperf3 transmit AXE11000 | |
| iperf3 receive AXE11000 | |
| Lenovo Legion 7 16 AGP11 | |
| iperf3 transmit RT-BE96U WiFi7 | |
| iperf3 receive RT-BE96U WiFi7 | |
| Schenker XMG Core 15 (M25) | |
| iperf3 transmit AXE11000 | |
| iperf3 receive AXE11000 | |
| Dell XPS 16 Core Ultra X7 358H | |
| iperf3 transmit AXE11000 | |
| iperf3 receive AXE11000 | |
| iperf3 transmit AXE11000 6GHz | |
| iperf3 receive AXE11000 6GHz | |


Input Devices
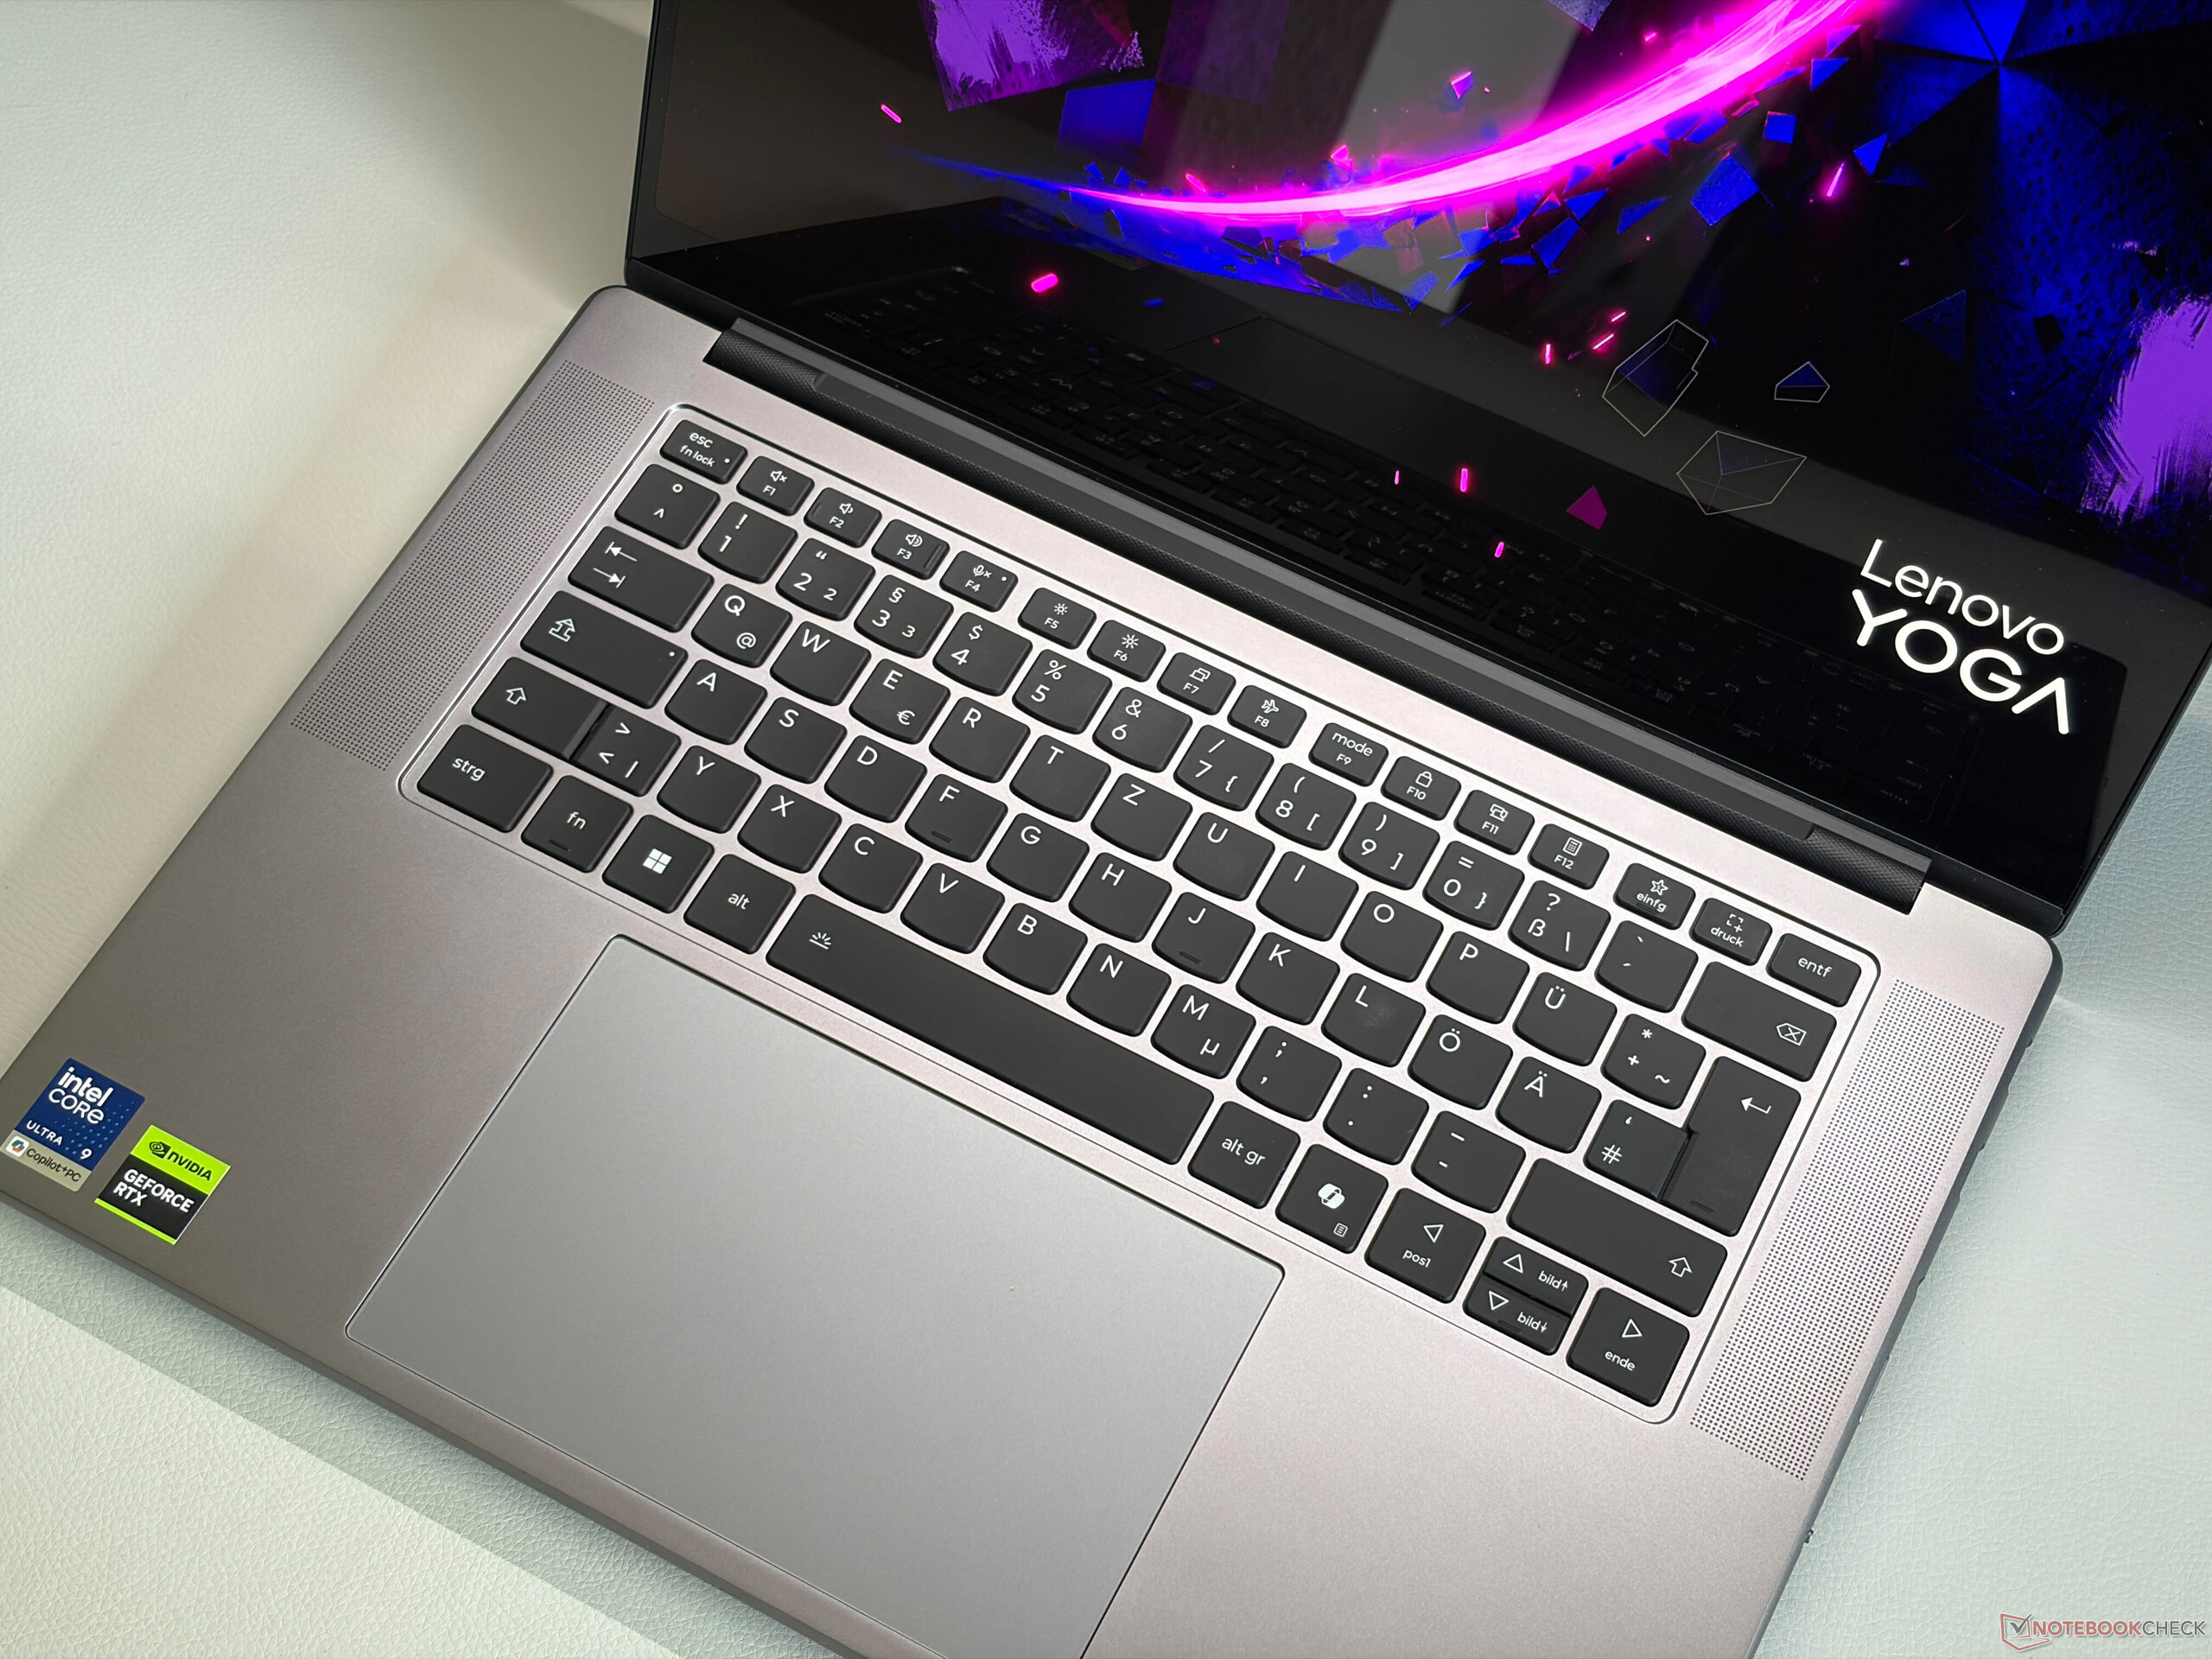
The Yoga offers a very comfortable keyboard (1.5 mm travel) with a two-stage illumination, which can also be activated via sensor. Key strokes are very precise and combined with the rigid base unit, this is one of the best keyboards you can get right now. Lenovo offers two different touchpads (15 x 9.5 cm, glass surface) and our unit is equipped with the regular clickpad, which works extremely well and offers high-quality mechanical clicks in the lower half of the pad. You can also get a force touchpad as an alternative. Our unit also features the capacitive touchscreen.


Display - Gorgeous 165 Hz OLED
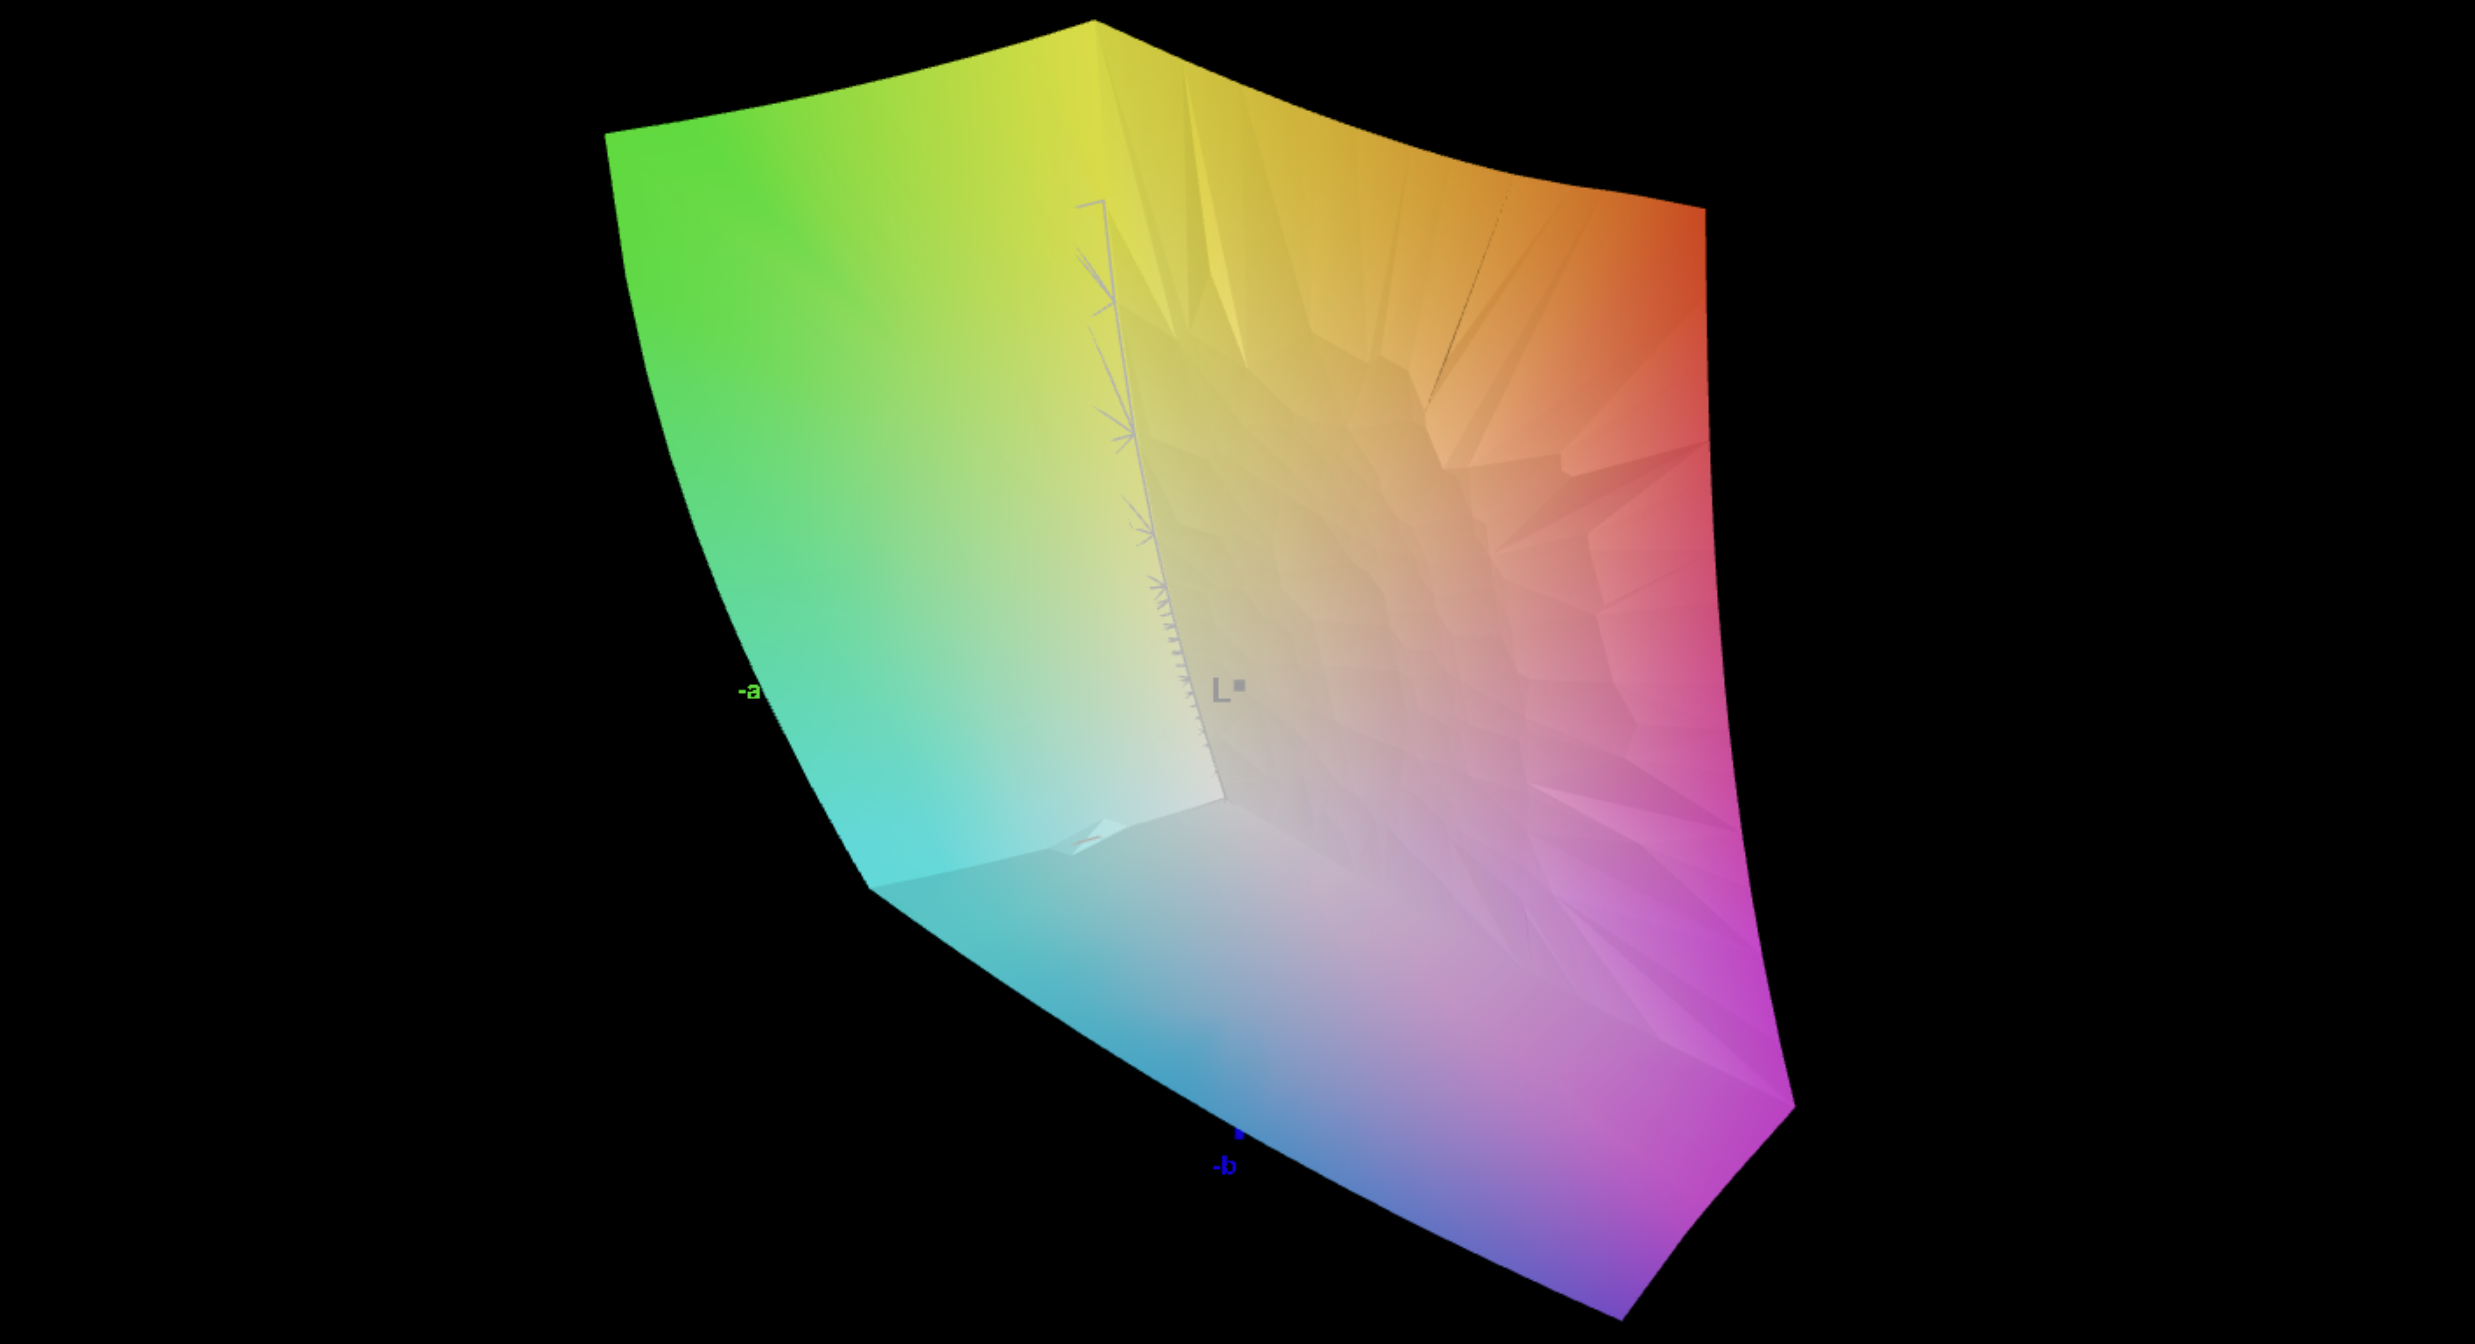
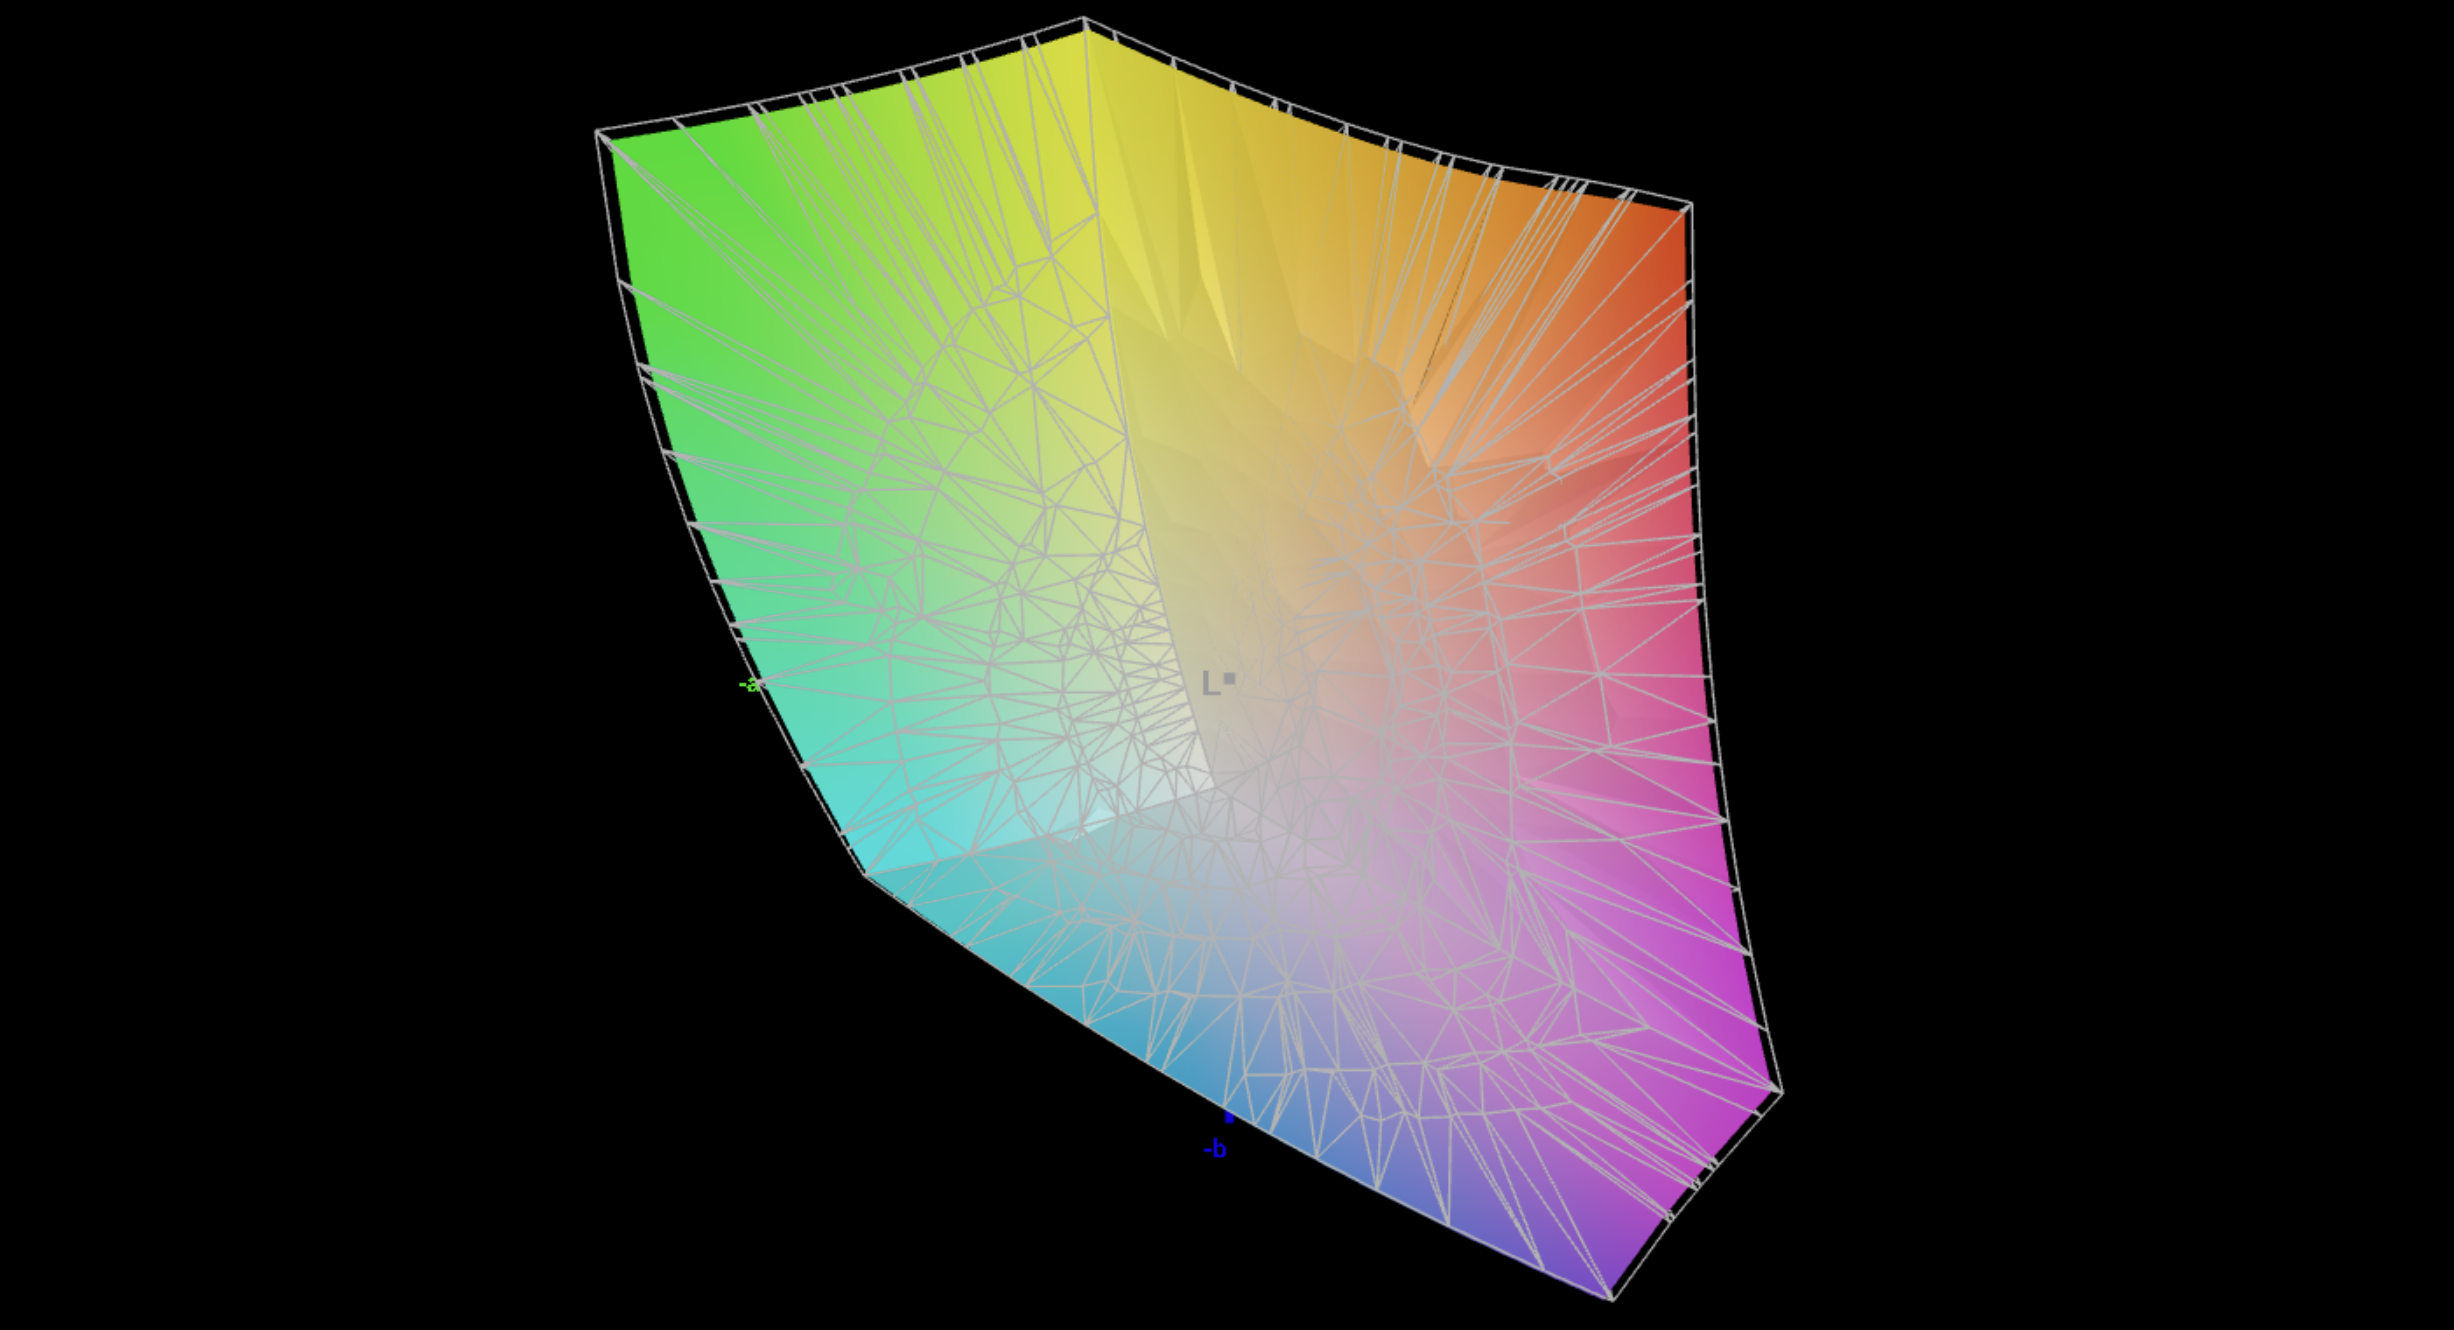
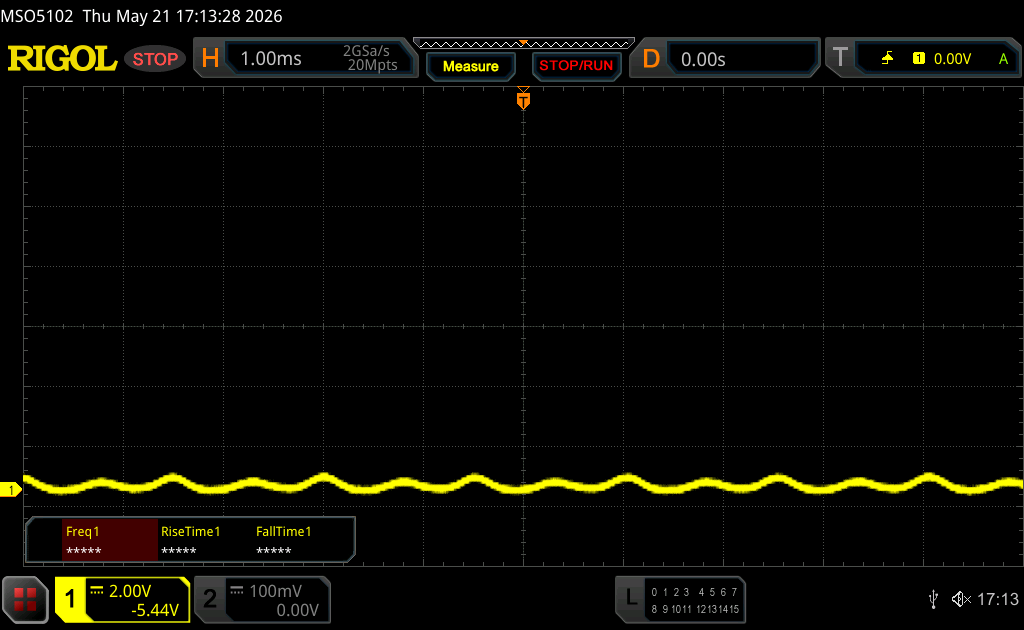
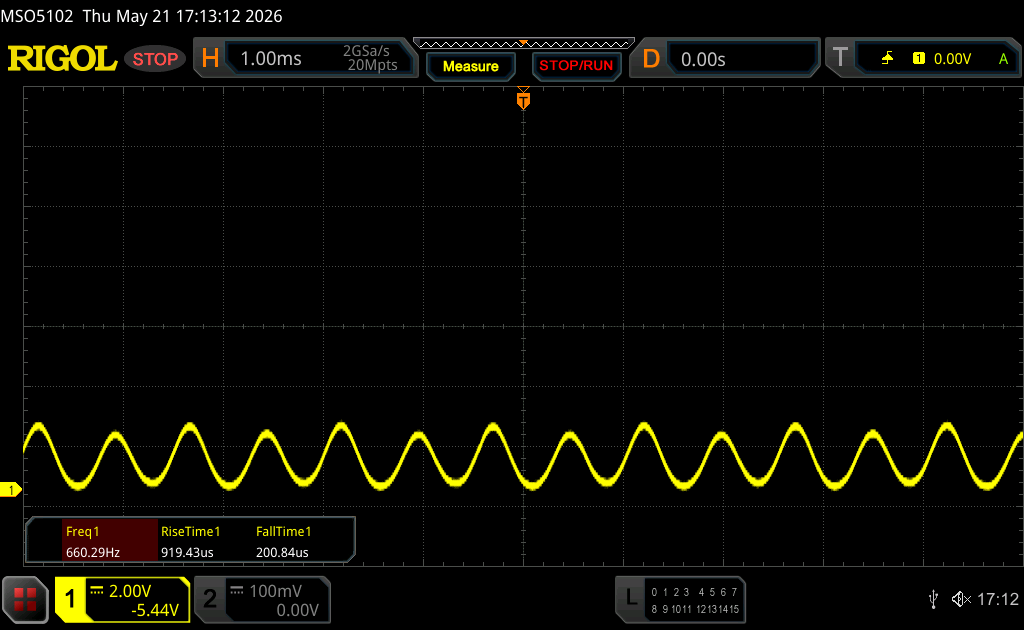
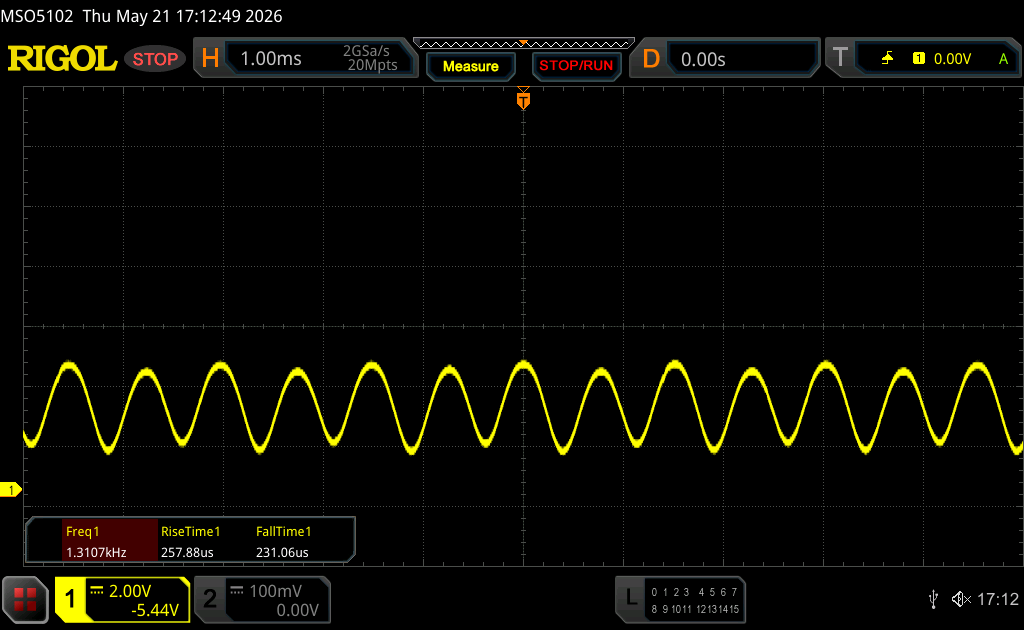
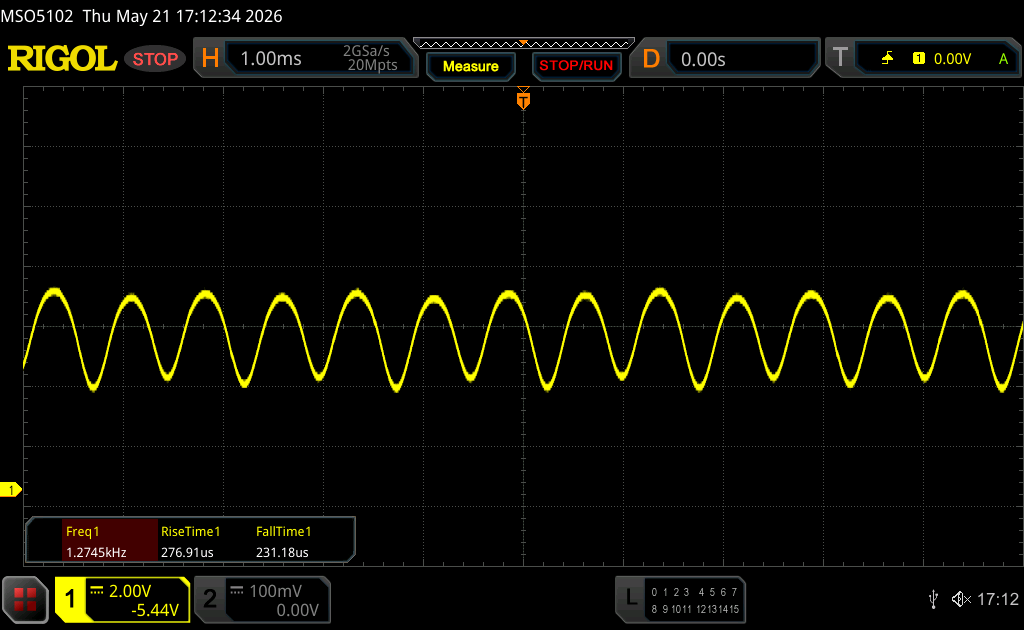
The Yoga Pro 7i 15 Aura Edition only comes with a 2.8K OLED with a frequency of 165 Hz, but you can have a non-touch or a touch version. We are happy to report that the additional touchscreen layer does not affect the image quality, because even white contents do not look grainy (which is often an issue for OLED touchscreens). The overall image quality is just excellent with rich colors, deep blacks and fast response times. We measured PWM flickering, but the frequency is pretty high at 1.3 kHz, so there should not be any issues.
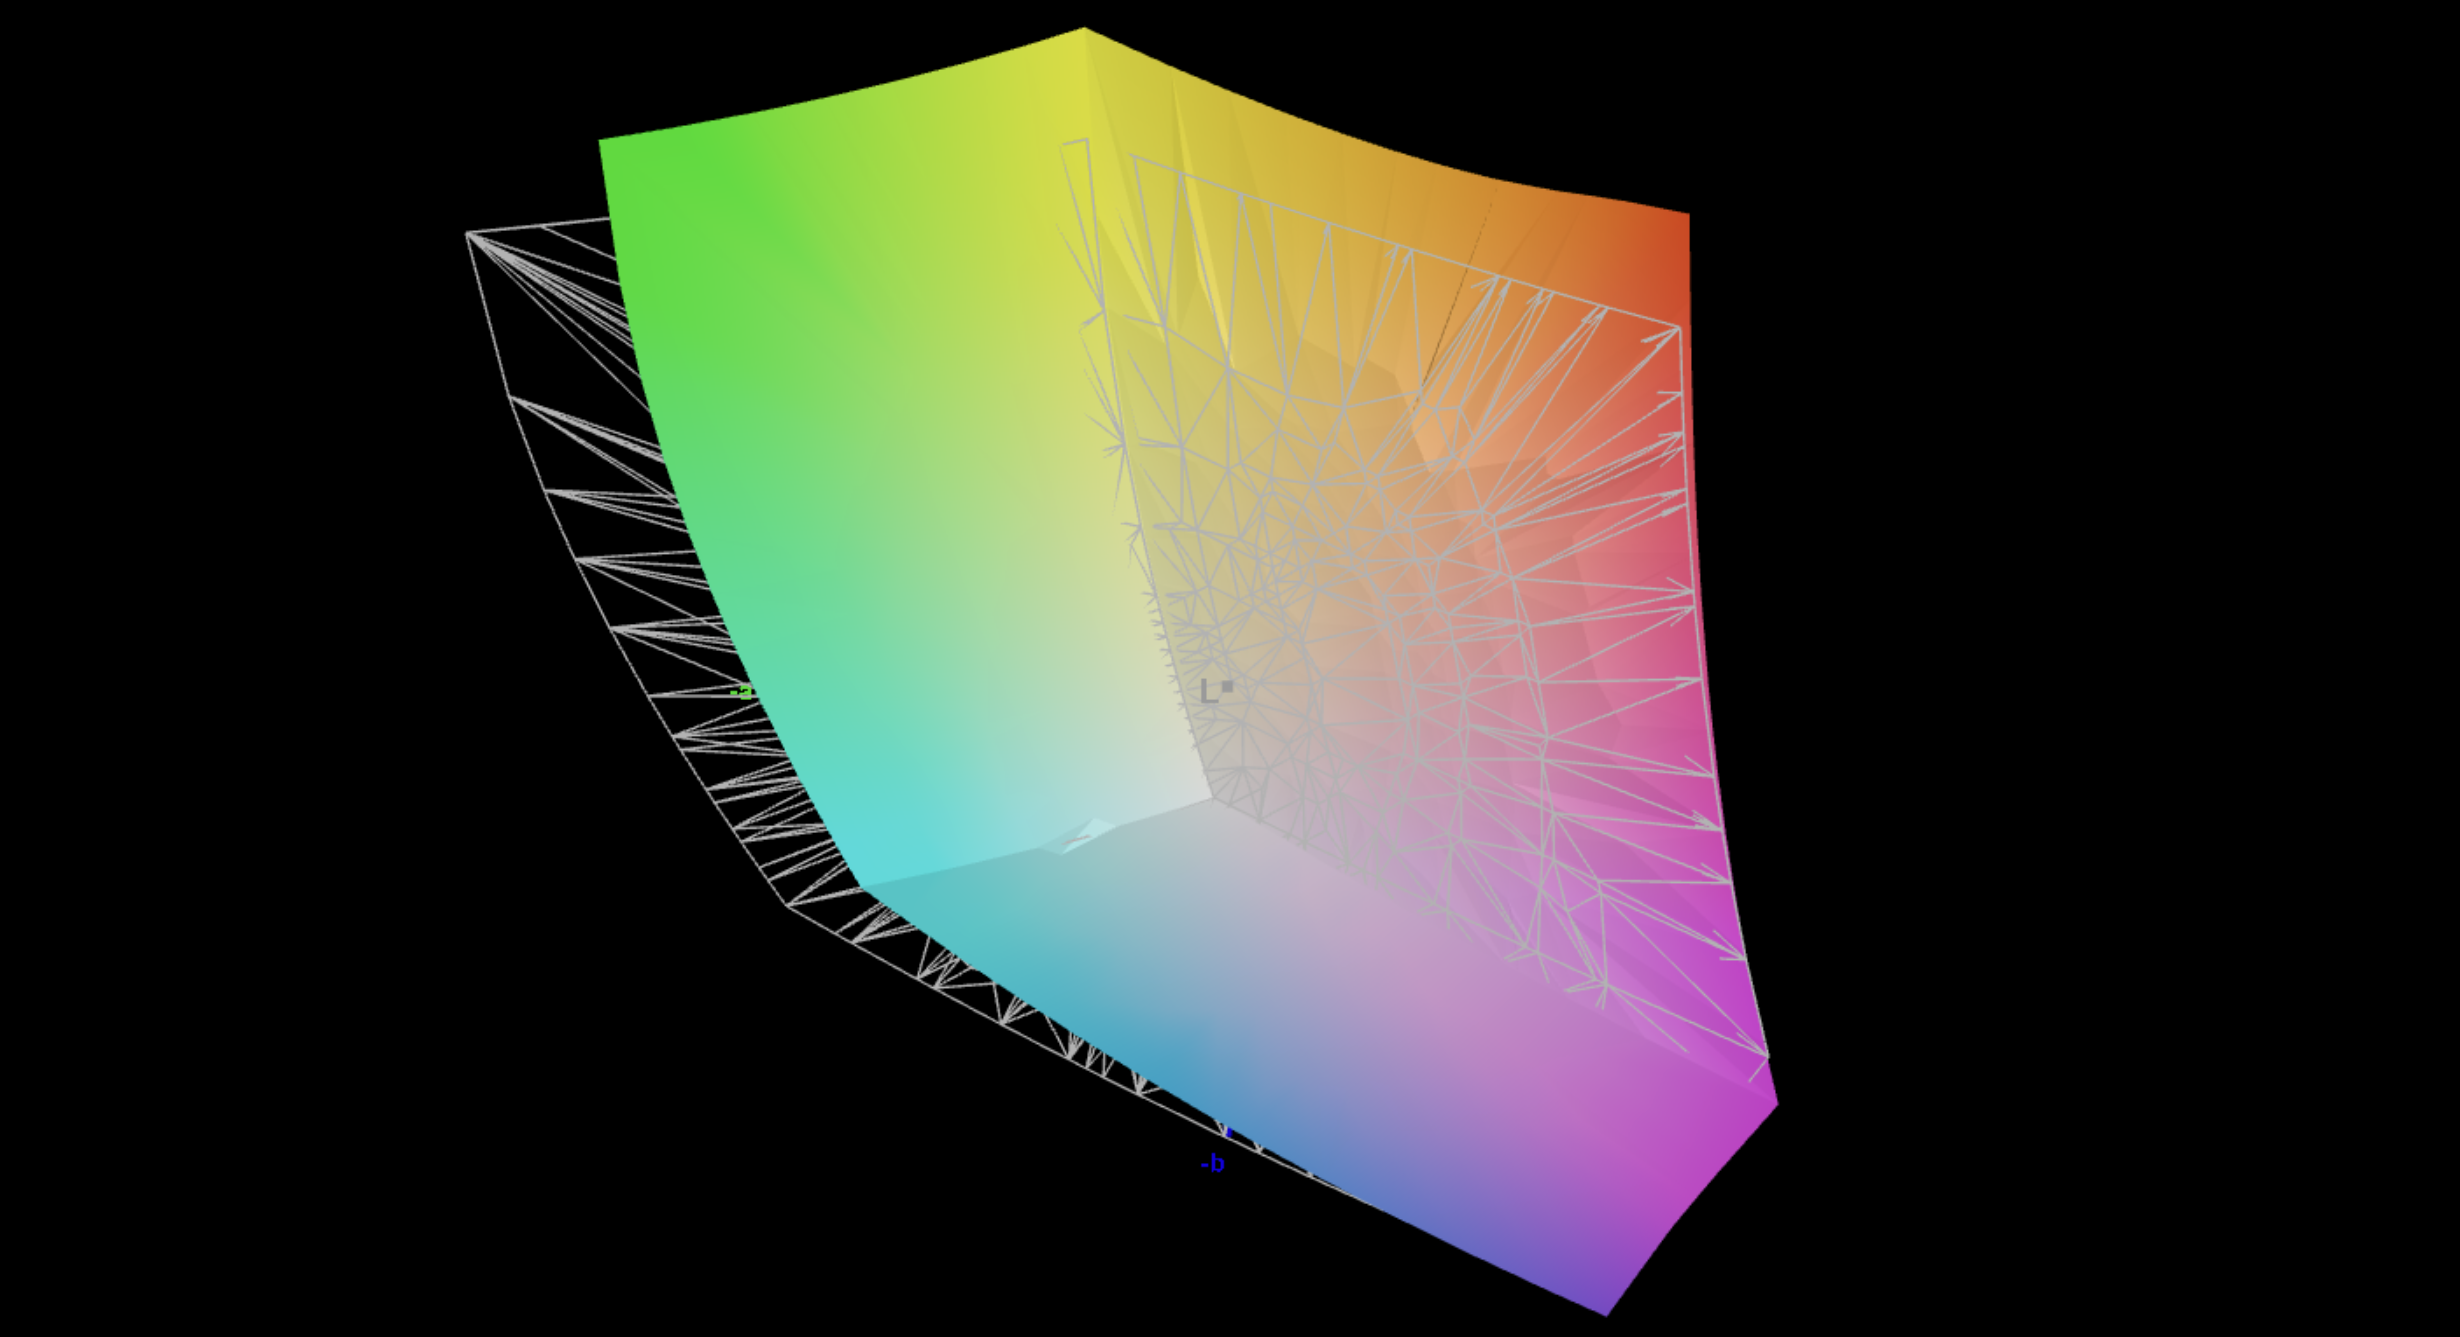
Our analysis with the professional CalMAN software reveals a maximum SDR brightness of almost 500 nits and up to 1107 nits (full-screen 784 nits) for HDR contents. Lenovo offers different color profiles and the P3 profile is already very well-calibrated out of the box with low color deviations. You also get a profile for sRGB contents, so picture editing is no problem. We were not able to improve the color accuracy even further with our own calibration.
| |||||||||||||||||||||||||
Brightness Distribution: 99 %
Center on Battery: 483 cd/m²
Contrast: ∞:1 (Black: 0 cd/m²)
ΔE ColorChecker Calman: 1.3 | ∀{0.5-29.43 Ø4.72}
ΔE Greyscale Calman: 1.7 | ∀{0.09-98 Ø4.97}
86.5% AdobeRGB 1998 (Argyll 3D)
99.9% sRGB (Argyll 3D)
97.1% Display P3 (Argyll 3D)
Gamma: 2.14
CCT: 6338 K
| Lenovo Yoga Pro 7 15IPH11 EF25QBA63.B, OLED, 2560x1600, 15.3", 165 Hz | Lenovo Pro 9 16IPH11 Samsung ATNA60KA04-0, Tandem OLED, 3200x2000, 16", 120 Hz | Samsung Galaxy Book6 Ultra ATNA60HR05-0, OLED, 2880x1800, 16", 120 Hz | Lenovo Legion 7 16 AGP11 ATNA60HU02-0, OLED, 2560x1600, 16", 240 Hz | Schenker XMG Core 15 (M25) NE153QDM-NZ2 (BOE0D5F), IPS, 2560x1600, 15.3", 300 Hz | Dell XPS 16 Core Ultra X7 358H LG Philips 160WV1, OLED, 3200x2000, 16", 120 Hz | |
|---|---|---|---|---|---|---|
| Display | 4% | -0% | 2% | -14% | 5% | |
| Display P3 Coverage (%) | 97.1 | 98.8 2% | 97 0% | 99.2 2% | 71.7 -26% | 99.5 2% |
| sRGB Coverage (%) | 99.9 | 100 0% | 99.9 0% | 100 0% | 99.9 0% | 100 0% |
| AdobeRGB 1998 Coverage (%) | 86.5 | 95.7 11% | 85.3 -1% | 90.2 4% | 73.6 -15% | 96.5 12% |
| Response Times | -67% | -88% | -155% | -3178% | -96% | |
| Response Time Grey 50% / Grey 80% * (ms) | 0.24 ? | 0.58 ? -142% | 0.5 ? -108% | 1.41 ? -488% | 12.4 ? -5067% | 0.65 ? -171% |
| Response Time Black / White * (ms) | 0.36 ? | 0.79 ? -119% | 0.4 ? -11% | 0.25 ? 31% | 5 ? -1289% | 0.87 ? -142% |
| PWM Frequency (Hz) | 1310 ? | 1173.2 | 240 ? | 1440 ? | 240.2 ? | |
| PWM Amplitude * (%) | 41 | 16 61% | 100 -144% | 44 -7% | 31 24% | |
| Screen | -16% | 12% | -70% | -41% | -67% | |
| Brightness middle (cd/m²) | 483 | 930.9 93% | 499 3% | 499 3% | 545 13% | 395.4 -18% |
| Brightness (cd/m²) | 484 | 947 96% | 505 4% | 502 4% | 530 10% | 392 -19% |
| Brightness Distribution (%) | 99 | 94 -5% | 97 -2% | 98 -1% | 94 -5% | 95 -4% |
| Black Level * (cd/m²) | 0.02 | 0.54 | ||||
| Colorchecker dE 2000 * | 1.3 | 3.51 -170% | 0.9 31% | 2.5 -92% | 2.29 -76% | 3.69 -184% |
| Colorchecker dE 2000 max. * | 3 | 6.48 -116% | 2.1 30% | 7.8 -160% | 5.42 -81% | 7.94 -165% |
| Greyscale dE 2000 * | 1.7 | 1.6 6% | 1.6 6% | 4.7 -176% | 3.5 -106% | 1.9 -12% |
| Gamma | 2.14 103% | 2.34 94% | 2.22 99% | 2.21 100% | 2.317 95% | 2.28 96% |
| CCT | 6338 103% | 6398 102% | 6445 101% | 6715 97% | 6957 93% | 6274 104% |
| Colorchecker dE 2000 calibrated * | 1.55 | 1.05 | 0.68 | |||
| Contrast (:1) | 24950 | 1009 | ||||
| Total Average (Program / Settings) | -26% /
-24% | -25% /
-16% | -74% /
-73% | -1078% /
-604% | -53% /
-56% |
* ... smaller is better


Display Response Times
| ↔ Response Time Black to White | ||
|---|---|---|
| 0.36 ms ... rise ↗ and fall ↘ combined | ↗ 0.2 ms rise | 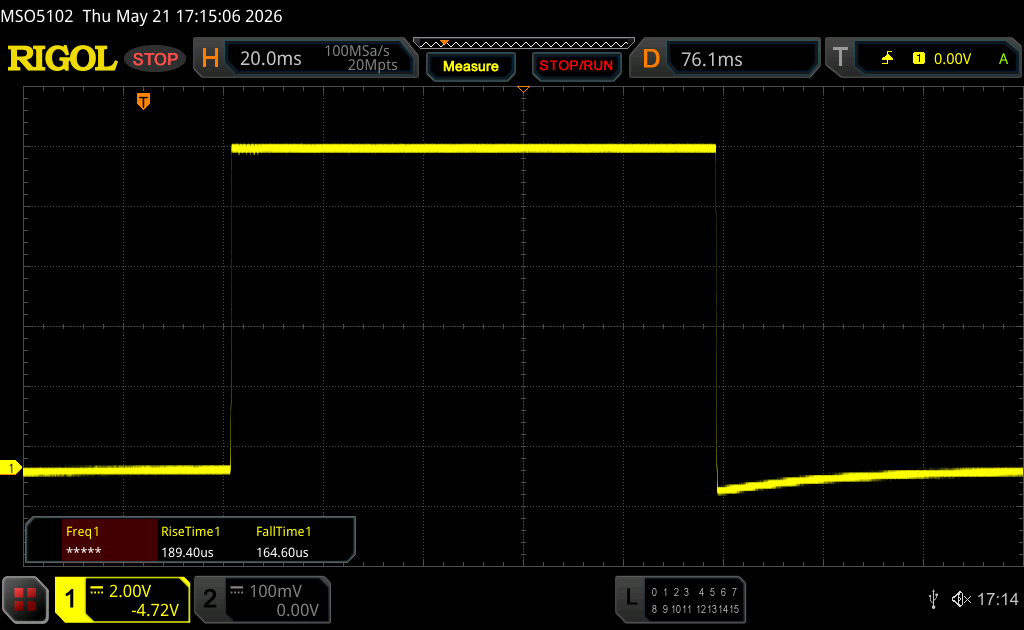 |
| ↘ 0.16 ms fall | ||
| The screen shows very fast response rates in our tests and should be very well suited for fast-paced gaming. In comparison, all tested devices range from 0.1 (minimum) to 240 (maximum) ms. » 0 % of all devices are better. This means that the measured response time is better than the average of all tested devices (19.8 ms). | ||
| ↔ Response Time 50% Grey to 80% Grey | ||
| 0.24 ms ... rise ↗ and fall ↘ combined | ↗ 0.13 ms rise | 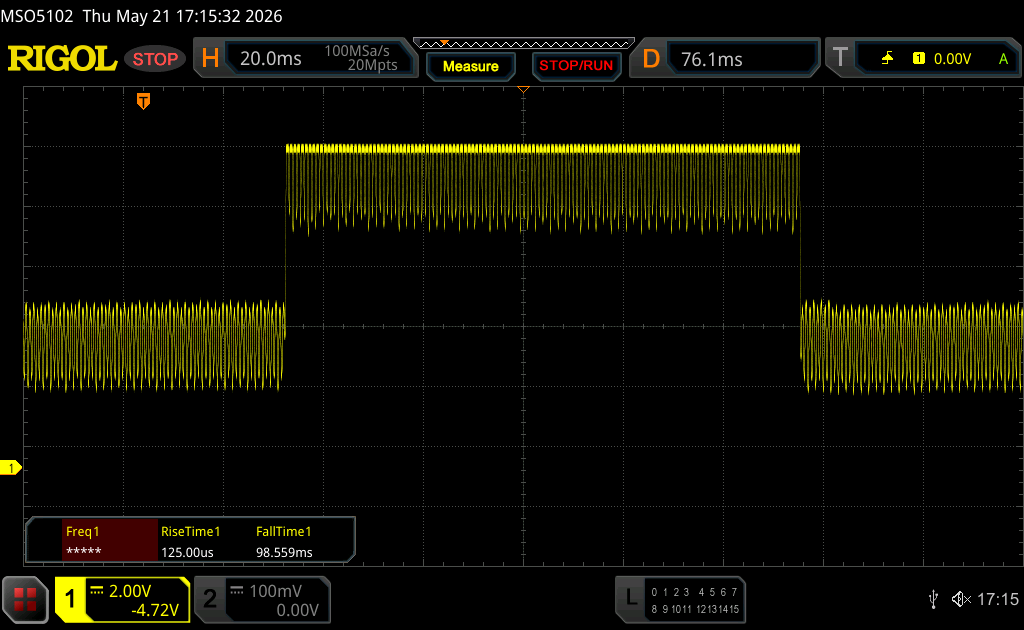 |
| ↘ 0.11 ms fall | ||
| The screen shows very fast response rates in our tests and should be very well suited for fast-paced gaming. In comparison, all tested devices range from 0.165 (minimum) to 636 (maximum) ms. » 0 % of all devices are better. This means that the measured response time is better than the average of all tested devices (31 ms). | ||
Screen Flickering / PWM (Pulse-Width Modulation)
| Screen flickering / PWM detected | 1310 Hz Amplitude: 41 % | ≤ 95 % brightness setting | 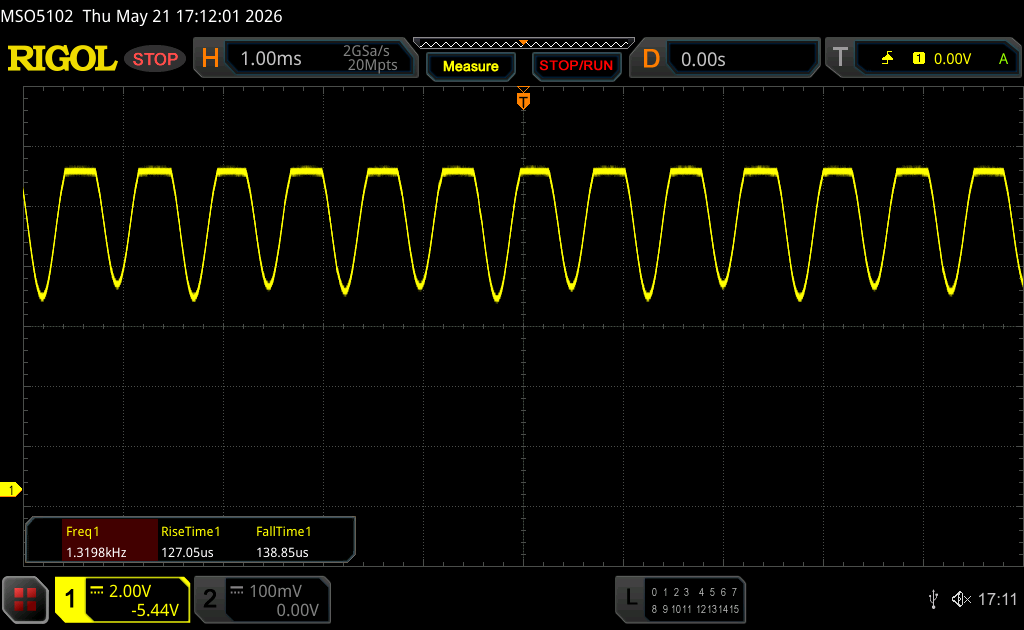 |
The display backlight flickers at 1310 Hz (worst case, e.g., utilizing PWM) Flickering detected at a brightness setting of 95 % and below. There should be no flickering or PWM above this brightness setting. The frequency of 1310 Hz is quite high, so most users sensitive to PWM should not notice any flickering. In comparison: 52 % of all tested devices do not use PWM to dim the display. If PWM was detected, an average of 7750 (minimum: 5 - maximum: 343500) Hz was measured. | |||


Performance - Panther Lake meets Blackwell
Testing Conditions
Lenovo offers its own power modes, which can be synced with the Windows settings. However, in addition to the familiar High Performance mode, you now also get an even faster Creator mode. The problem is that this move does not really make sense, because the High Performance mode is now pretty much identical to the Auto mode as you can see in the table below. It can also not be selected via key combination Fn+Q yet, which is also annoying. The Creator mode is also the only way to get the full GPU performance and we used it for our tests.
| Energy profile | CPU TDP | CB24 Multi | GPU TGP | Time Spy Graphics | Cyberpunk 2077 QHD Ultra | max. fan noise |
|---|---|---|---|---|---|---|
| Battery saver | 40/15 W | 582 points | 24 W | 2458 points | 6.9 fps | 31.7 dB(A) |
| Auto | 60/45 W | 1121 points | 60 W | 9306 points | 41.7 fps | 46 dB(A) |
| High Performance | 70/55 W | 1187 points | 60 W | 9363 points | 43.3 fps | 49.5 dB(A) |
| Creator | 70/60 W | 1219 points | 85 W | 11166 points | 51.5 fps | 54.4 dB(A) |
| Battery | 70/55 W | 1194 points | 55 W | 8747 points | 40.9 fps | 49.5 dB(A) |
Processor
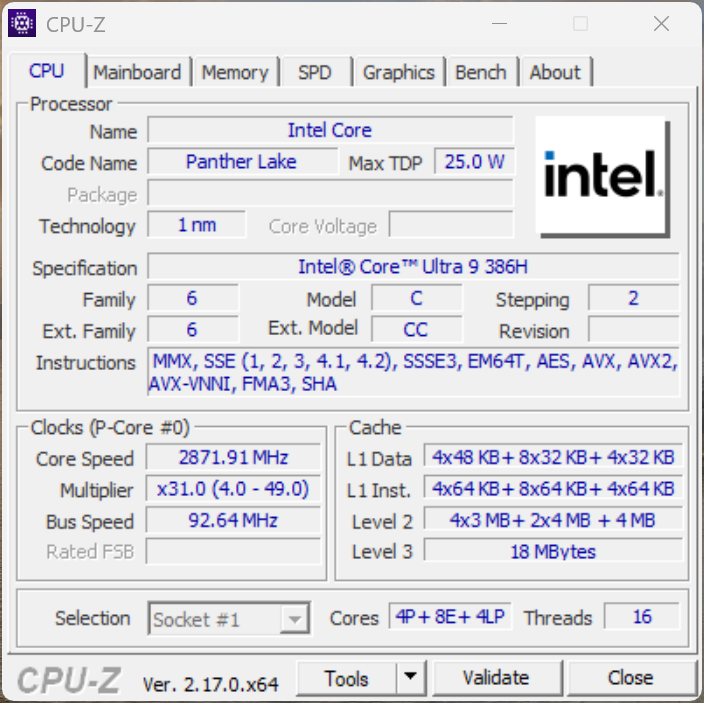
The new Core Ultra 9 386H runs at up to 70 Watts in the Yoga Pro 7i 15 and levels off at 60 Watts, so the multi-core performance is pretty stable. The performance is good overall, even though the CPU cannot keep up with the current ARM chips from Apple or Qualcomm if you require even higher multi-core and single-core performance.
Cinebench R15 Multi Loop
Cinebench R23: Multi Core | Single Core
Cinebench R20: CPU (Multi Core) | CPU (Single Core)
Cinebench R15: CPU Multi 64Bit | CPU Single 64Bit
Blender: v2.79 BMW27 CPU
7-Zip 18.03: 7z b 4 | 7z b 4 -mmt1
Geekbench 6.7: Multi-Core | Single-Core
Geekbench 5.5: Multi-Core | Single-Core
HWBOT x265 Benchmark v2.2: 4k Preset
LibreOffice : 20 Documents To PDF
R Benchmark 2.5: Overall mean
| CPU Performance rating | |
| Lenovo Yoga Pro 7 15IPH11 | |
| Lenovo Legion 7 16 AGP11 | |
| Lenovo Pro 9 16IPH11 | |
| Samsung Galaxy Book6 Ultra | |
| Average Intel Core Ultra 9 386H | |
| Dell XPS 16 Core Ultra X7 358H | |
| Schenker XMG Core 15 (M25) | |
| Average of class Multimedia | |
| Cinebench R23 / Multi Core | |
| Lenovo Legion 7 16 AGP11 | |
| Lenovo Yoga Pro 7 15IPH11 | |
| Lenovo Pro 9 16IPH11 | |
| Samsung Galaxy Book6 Ultra | |
| Average Intel Core Ultra 9 386H (12144 - 21186, n=7) | |
| Dell XPS 16 Core Ultra X7 358H | |
| Average of class Multimedia (4861 - 33362, n=78, last 2 years) | |
| Schenker XMG Core 15 (M25) | |
| Cinebench R23 / Single Core | |
| Dell XPS 16 Core Ultra X7 358H | |
| Lenovo Yoga Pro 7 15IPH11 | |
| Lenovo Legion 7 16 AGP11 | |
| Average Intel Core Ultra 9 386H (2010 - 2101, n=7) | |
| Lenovo Pro 9 16IPH11 | |
| Samsung Galaxy Book6 Ultra | |
| Schenker XMG Core 15 (M25) | |
| Average of class Multimedia (1128 - 2459, n=70, last 2 years) | |
| Cinebench R20 / CPU (Multi Core) | |
| Lenovo Legion 7 16 AGP11 | |
| Lenovo Pro 9 16IPH11 | |
| Lenovo Yoga Pro 7 15IPH11 | |
| Samsung Galaxy Book6 Ultra | |
| Average Intel Core Ultra 9 386H (4757 - 8405, n=7) | |
| Dell XPS 16 Core Ultra X7 358H | |
| Average of class Multimedia (1887 - 12912, n=61, last 2 years) | |
| Schenker XMG Core 15 (M25) | |
| Cinebench R20 / CPU (Single Core) | |
| Lenovo Legion 7 16 AGP11 | |
| Lenovo Yoga Pro 7 15IPH11 | |
| Lenovo Pro 9 16IPH11 | |
| Average Intel Core Ultra 9 386H (762 - 796, n=7) | |
| Dell XPS 16 Core Ultra X7 358H | |
| Samsung Galaxy Book6 Ultra | |
| Schenker XMG Core 15 (M25) | |
| Average of class Multimedia (425 - 853, n=61, last 2 years) | |
| Cinebench R15 / CPU Multi 64Bit | |
| Lenovo Legion 7 16 AGP11 | |
| Lenovo Pro 9 16IPH11 | |
| Lenovo Yoga Pro 7 15IPH11 | |
| Samsung Galaxy Book6 Ultra | |
| Average Intel Core Ultra 9 386H (2197 - 3347, n=7) | |
| Dell XPS 16 Core Ultra X7 358H | |
| Schenker XMG Core 15 (M25) | |
| Average of class Multimedia (856 - 5224, n=65, last 2 years) | |
| Cinebench R15 / CPU Single 64Bit | |
| Lenovo Pro 9 16IPH11 | |
| Lenovo Yoga Pro 7 15IPH11 | |
| Samsung Galaxy Book6 Ultra | |
| Schenker XMG Core 15 (M25) | |
| Dell XPS 16 Core Ultra X7 358H | |
| Average Intel Core Ultra 9 386H (249 - 314, n=7) | |
| Average of class Multimedia (184.8 - 326, n=63, last 2 years) | |
| Lenovo Legion 7 16 AGP11 | |
| Blender / v2.79 BMW27 CPU | |
| Average of class Multimedia (100 - 557, n=62, last 2 years) | |
| Dell XPS 16 Core Ultra X7 358H | |
| Average Intel Core Ultra 9 386H (156 - 299, n=7) | |
| Schenker XMG Core 15 (M25) | |
| Samsung Galaxy Book6 Ultra | |
| Lenovo Yoga Pro 7 15IPH11 | |
| Lenovo Pro 9 16IPH11 | |
| Lenovo Legion 7 16 AGP11 | |
| 7-Zip 18.03 / 7z b 4 | |
| Lenovo Legion 7 16 AGP11 | |
| Lenovo Yoga Pro 7 15IPH11 | |
| Lenovo Pro 9 16IPH11 | |
| Samsung Galaxy Book6 Ultra | |
| Average Intel Core Ultra 9 386H (44980 - 72882, n=7) | |
| Dell XPS 16 Core Ultra X7 358H | |
| Schenker XMG Core 15 (M25) | |
| Average of class Multimedia (26062 - 130368, n=59, last 2 years) | |
| 7-Zip 18.03 / 7z b 4 -mmt1 | |
| Lenovo Yoga Pro 7 15IPH11 | |
| Dell XPS 16 Core Ultra X7 358H | |
| Schenker XMG Core 15 (M25) | |
| Samsung Galaxy Book6 Ultra | |
| Lenovo Legion 7 16 AGP11 | |
| Average Intel Core Ultra 9 386H (5488 - 6493, n=7) | |
| Lenovo Pro 9 16IPH11 | |
| Average of class Multimedia (3666 - 7545, n=60, last 2 years) | |
| Geekbench 6.7 / Multi-Core | |
| Lenovo Yoga Pro 7 15IPH11 | |
| Dell XPS 16 Core Ultra X7 358H | |
| Lenovo Pro 9 16IPH11 | |
| Samsung Galaxy Book6 Ultra | |
| Average Intel Core Ultra 9 386H (13776 - 17405, n=9) | |
| Lenovo Legion 7 16 AGP11 | |
| Average of class Multimedia (4983 - 29415, n=73, last 2 years) | |
| Schenker XMG Core 15 (M25) | |
| Geekbench 6.7 / Single-Core | |
| Lenovo Legion 7 16 AGP11 | |
| Schenker XMG Core 15 (M25) | |
| Lenovo Yoga Pro 7 15IPH11 | |
| Dell XPS 16 Core Ultra X7 358H | |
| Average of class Multimedia (1534 - 4335, n=72, last 2 years) | |
| Lenovo Pro 9 16IPH11 | |
| Average Intel Core Ultra 9 386H (2778 - 2919, n=9) | |
| Samsung Galaxy Book6 Ultra | |
| Geekbench 5.5 / Multi-Core | |
| Lenovo Yoga Pro 7 15IPH11 | |
| Lenovo Pro 9 16IPH11 | |
| Dell XPS 16 Core Ultra X7 358H | |
| Samsung Galaxy Book6 Ultra | |
| Average Intel Core Ultra 9 386H (13098 - 17557, n=7) | |
| Lenovo Legion 7 16 AGP11 | |
| Schenker XMG Core 15 (M25) | |
| Average of class Multimedia (4652 - 20422, n=60, last 2 years) | |
| Geekbench 5.5 / Single-Core | |
| Lenovo Legion 7 16 AGP11 | |
| Lenovo Yoga Pro 7 15IPH11 | |
| Schenker XMG Core 15 (M25) | |
| Lenovo Pro 9 16IPH11 | |
| Dell XPS 16 Core Ultra X7 358H | |
| Average Intel Core Ultra 9 386H (1992 - 2162, n=7) | |
| Samsung Galaxy Book6 Ultra | |
| Average of class Multimedia (805 - 2974, n=60, last 2 years) | |
| HWBOT x265 Benchmark v2.2 / 4k Preset | |
| Lenovo Legion 7 16 AGP11 | |
| Samsung Galaxy Book6 Ultra | |
| Lenovo Pro 9 16IPH11 | |
| Lenovo Yoga Pro 7 15IPH11 | |
| Schenker XMG Core 15 (M25) | |
| Average Intel Core Ultra 9 386H (13.2 - 25.1, n=7) | |
| Dell XPS 16 Core Ultra X7 358H | |
| Average of class Multimedia (5.26 - 36.1, n=60, last 2 years) | |
| LibreOffice / 20 Documents To PDF | |
| Schenker XMG Core 15 (M25) | |
| Lenovo Legion 7 16 AGP11 | |
| Average of class Multimedia (23.9 - 146.7, n=61, last 2 years) | |
| Dell XPS 16 Core Ultra X7 358H | |
| Samsung Galaxy Book6 Ultra | |
| Average Intel Core Ultra 9 386H (38.5 - 56.1, n=7) | |
| Lenovo Yoga Pro 7 15IPH11 | |
| Lenovo Pro 9 16IPH11 | |
| R Benchmark 2.5 / Overall mean | |
| Average of class Multimedia (0.3604 - 0.947, n=60, last 2 years) | |
| Lenovo Pro 9 16IPH11 | |
| Samsung Galaxy Book6 Ultra | |
| Average Intel Core Ultra 9 386H (0.4055 - 0.4384, n=7) | |
| Dell XPS 16 Core Ultra X7 358H | |
| Lenovo Legion 7 16 AGP11 | |
| Lenovo Yoga Pro 7 15IPH11 | |
| Schenker XMG Core 15 (M25) | |
* ... smaller is better
AIDA64: FP32 Ray-Trace | FPU Julia | CPU SHA3 | CPU Queen | FPU SinJulia | FPU Mandel | CPU AES | CPU ZLib | FP64 Ray-Trace | CPU PhotoWorxx | CPU CheckMate
| Performance rating | |
| Lenovo Legion 7 16 AGP11 -1! | |
| Schenker XMG Core 15 (M25) -1! | |
| Lenovo Yoga Pro 7 15IPH11 -1! | |
| Lenovo Pro 9 16IPH11 -1! | |
| Samsung Galaxy Book6 Ultra -1! | |
| Average Intel Core Ultra 9 386H -1! | |
| Average of class Multimedia | |
| Dell XPS 16 Core Ultra X7 358H -1! | |
| AIDA64 / FP32 Ray-Trace | |
| Lenovo Legion 7 16 AGP11 (v8.20.8100) | |
| Schenker XMG Core 15 (M25) (v6.92.6600) | |
| Lenovo Pro 9 16IPH11 (v8.20.8100) | |
| Lenovo Yoga Pro 7 15IPH11 (v8.20.8100) | |
| Samsung Galaxy Book6 Ultra (v8.20.8100) | |
| Average Intel Core Ultra 9 386H (10001 - 21727, n=7) | |
| Average of class Multimedia (2214 - 50388, n=57, last 2 years) | |
| Dell XPS 16 Core Ultra X7 358H (v8.20.8100) | |
| AIDA64 / FPU Julia | |
| Lenovo Legion 7 16 AGP11 (v8.20.8100) | |
| Lenovo Pro 9 16IPH11 (v8.20.8100) | |
| Lenovo Yoga Pro 7 15IPH11 (v8.20.8100) | |
| Schenker XMG Core 15 (M25) (v6.92.6600) | |
| Samsung Galaxy Book6 Ultra (v8.20.8100) | |
| Average Intel Core Ultra 9 386H (53370 - 113595, n=7) | |
| Dell XPS 16 Core Ultra X7 358H (v8.20.8100) | |
| Average of class Multimedia (12867 - 201874, n=58, last 2 years) | |
| AIDA64 / CPU SHA3 | |
| Lenovo Legion 7 16 AGP11 (v8.20.8100) | |
| Lenovo Yoga Pro 7 15IPH11 (v8.20.8100) | |
| Lenovo Pro 9 16IPH11 (v8.20.8100) | |
| Samsung Galaxy Book6 Ultra (v8.20.8100) | |
| Average Intel Core Ultra 9 386H (2776 - 5604, n=7) | |
| Schenker XMG Core 15 (M25) (v6.92.6600) | |
| Dell XPS 16 Core Ultra X7 358H (v8.20.8100) | |
| Average of class Multimedia (626 - 8623, n=58, last 2 years) | |
| AIDA64 / CPU Queen | |
| Schenker XMG Core 15 (M25) (v6.92.6600) | |
| Average of class Multimedia (13483 - 181505, n=45, last 2 years) | |
| AIDA64 / FPU SinJulia | |
| Lenovo Legion 7 16 AGP11 (v8.20.8100) | |
| Schenker XMG Core 15 (M25) (v6.92.6600) | |
| Average of class Multimedia (886 - 28794, n=58, last 2 years) | |
| Lenovo Yoga Pro 7 15IPH11 (v8.20.8100) | |
| Lenovo Pro 9 16IPH11 (v8.20.8100) | |
| Samsung Galaxy Book6 Ultra (v8.20.8100) | |
| Dell XPS 16 Core Ultra X7 358H (v8.20.8100) | |
| Average Intel Core Ultra 9 386H (5314 - 7332, n=7) | |
| AIDA64 / FPU Mandel | |
| Lenovo Legion 7 16 AGP11 (v8.20.8100) | |
| Lenovo Pro 9 16IPH11 (v8.20.8100) | |
| Schenker XMG Core 15 (M25) (v6.92.6600) | |
| Samsung Galaxy Book6 Ultra (v8.20.8100) | |
| Lenovo Yoga Pro 7 15IPH11 (v8.20.8100) | |
| Average Intel Core Ultra 9 386H (28414 - 61578, n=7) | |
| Dell XPS 16 Core Ultra X7 358H (v8.20.8100) | |
| Average of class Multimedia (6395 - 105740, n=57, last 2 years) | |
| AIDA64 / CPU AES | |
| Lenovo Legion 7 16 AGP11 (v8.20.8100) | |
| Schenker XMG Core 15 (M25) (v6.92.6600) | |
| Lenovo Yoga Pro 7 15IPH11 (v8.20.8100) | |
| Lenovo Pro 9 16IPH11 (v8.20.8100) | |
| Samsung Galaxy Book6 Ultra (v8.20.8100) | |
| Average of class Multimedia (8171 - 126790, n=58, last 2 years) | |
| Average Intel Core Ultra 9 386H (46362 - 72112, n=7) | |
| Dell XPS 16 Core Ultra X7 358H (v8.20.8100) | |
| AIDA64 / CPU ZLib | |
| Lenovo Legion 7 16 AGP11 (v8.20.8100) | |
| Lenovo Yoga Pro 7 15IPH11 (v8.20.8100) | |
| Lenovo Pro 9 16IPH11 (v8.20.8100) | |
| Samsung Galaxy Book6 Ultra (v8.20.8100) | |
| Average Intel Core Ultra 9 386H (669 - 1271, n=7) | |
| Schenker XMG Core 15 (M25) (v6.92.6600) | |
| Dell XPS 16 Core Ultra X7 358H (v8.20.8100) | |
| Average of class Multimedia (143.8 - 2022, n=58, last 2 years) | |
| AIDA64 / FP64 Ray-Trace | |
| Lenovo Legion 7 16 AGP11 (v8.20.8100) | |
| Schenker XMG Core 15 (M25) (v6.92.6600) | |
| Lenovo Pro 9 16IPH11 (v8.20.8100) | |
| Samsung Galaxy Book6 Ultra (v8.20.8100) | |
| Lenovo Yoga Pro 7 15IPH11 (v8.20.8100) | |
| Average of class Multimedia (1014 - 26875, n=58, last 2 years) | |
| Average Intel Core Ultra 9 386H (5138 - 11627, n=7) | |
| Dell XPS 16 Core Ultra X7 358H (v8.20.8100) | |
| AIDA64 / CPU PhotoWorxx | |
| Dell XPS 16 Core Ultra X7 358H (v8.20.8100) | |
| Lenovo Yoga Pro 7 15IPH11 (v8.20.8100) | |
| Samsung Galaxy Book6 Ultra (v8.20.8100) | |
| Average Intel Core Ultra 9 386H (54042 - 89891, n=7) | |
| Lenovo Pro 9 16IPH11 (v8.20.8100) | |
| Lenovo Legion 7 16 AGP11 (v8.20.8100) | |
| Average of class Multimedia (8187 - 88154, n=58, last 2 years) | |
| Schenker XMG Core 15 (M25) (v6.92.6600) | |
| AIDA64 / CPU CheckMate | |
| Lenovo Legion 7 16 AGP11 (v8.20.8100) | |
| Lenovo Yoga Pro 7 15IPH11 (v8.20.8100) | |
| Lenovo Pro 9 16IPH11 (v8.20.8100) | |
| Average Intel Core Ultra 9 386H (4051 - 4858, n=6) | |
| Samsung Galaxy Book6 Ultra (v8.20.8100) | |
| Dell XPS 16 Core Ultra X7 358H (v8.20.8100) | |
| Average of class Multimedia (569 - 4742, n=16, last 2 years) | |
System Performance
System performance is excellent, but the Advanced Optimus supports results in short stutters when the dGPU is turned on/off. We did not encounter any stability issues.
PCMark 10: Score | Essentials | Productivity | Digital Content Creation
CrossMark: Overall | Productivity | Creativity | Responsiveness
WebXPRT 3: Overall
WebXPRT 4: Overall
Mozilla Kraken 1.1: Total
| Performance rating | |
| Lenovo Yoga Pro 7 15IPH11 | |
| Average Intel Core Ultra 9 386H, NVIDIA GeForce RTX 5060 Laptop | |
| Dell XPS 16 Core Ultra X7 358H | |
| Lenovo Pro 9 16IPH11 | |
| Samsung Galaxy Book6 Ultra | |
| Lenovo Legion 7 16 AGP11 | |
| Average of class Multimedia | |
| Schenker XMG Core 15 (M25) -3! | |
| PCMark 10 / Score | |
| Dell XPS 16 Core Ultra X7 358H | |
| Lenovo Legion 7 16 AGP11 | |
| Lenovo Pro 9 16IPH11 | |
| Average Intel Core Ultra 9 386H, NVIDIA GeForce RTX 5060 Laptop (9465 - 9484, n=2) | |
| Lenovo Yoga Pro 7 15IPH11 | |
| Samsung Galaxy Book6 Ultra | |
| Average of class Multimedia (4325 - 10386, n=56, last 2 years) | |
| PCMark 10 / Essentials | |
| Dell XPS 16 Core Ultra X7 358H | |
| Lenovo Yoga Pro 7 15IPH11 | |
| Average Intel Core Ultra 9 386H, NVIDIA GeForce RTX 5060 Laptop (10759 - 10841, n=2) | |
| Schenker XMG Core 15 (M25) | |
| Lenovo Pro 9 16IPH11 | |
| Average of class Multimedia (8025 - 11664, n=55, last 2 years) | |
| Lenovo Legion 7 16 AGP11 | |
| Samsung Galaxy Book6 Ultra | |
| PCMark 10 / Productivity | |
| Samsung Galaxy Book6 Ultra | |
| Dell XPS 16 Core Ultra X7 358H | |
| Lenovo Legion 7 16 AGP11 | |
| Lenovo Pro 9 16IPH11 | |
| Average Intel Core Ultra 9 386H, NVIDIA GeForce RTX 5060 Laptop (15199 - 15447, n=2) | |
| Lenovo Yoga Pro 7 15IPH11 | |
| Average of class Multimedia (7323 - 18233, n=55, last 2 years) | |
| PCMark 10 / Digital Content Creation | |
| Lenovo Legion 7 16 AGP11 | |
| Lenovo Yoga Pro 7 15IPH11 | |
| Average Intel Core Ultra 9 386H, NVIDIA GeForce RTX 5060 Laptop (13928 - 13963, n=2) | |
| Lenovo Pro 9 16IPH11 | |
| Dell XPS 16 Core Ultra X7 358H | |
| Samsung Galaxy Book6 Ultra | |
| Average of class Multimedia (3651 - 16240, n=55, last 2 years) | |
| CrossMark / Overall | |
| Lenovo Yoga Pro 7 15IPH11 | |
| Average Intel Core Ultra 9 386H, NVIDIA GeForce RTX 5060 Laptop (2108 - 2164, n=2) | |
| Dell XPS 16 Core Ultra X7 358H | |
| Lenovo Pro 9 16IPH11 | |
| Samsung Galaxy Book6 Ultra | |
| Average of class Multimedia (866 - 2728, n=64, last 2 years) | |
| Schenker XMG Core 15 (M25) | |
| Lenovo Legion 7 16 AGP11 | |
| CrossMark / Productivity | |
| Lenovo Yoga Pro 7 15IPH11 | |
| Average Intel Core Ultra 9 386H, NVIDIA GeForce RTX 5060 Laptop (1917 - 1973, n=2) | |
| Lenovo Pro 9 16IPH11 | |
| Dell XPS 16 Core Ultra X7 358H | |
| Average of class Multimedia (931 - 2489, n=64, last 2 years) | |
| Samsung Galaxy Book6 Ultra | |
| Schenker XMG Core 15 (M25) | |
| Lenovo Legion 7 16 AGP11 | |
| CrossMark / Creativity | |
| Dell XPS 16 Core Ultra X7 358H | |
| Lenovo Pro 9 16IPH11 | |
| Average Intel Core Ultra 9 386H, NVIDIA GeForce RTX 5060 Laptop (2442 - 2500, n=2) | |
| Lenovo Yoga Pro 7 15IPH11 | |
| Samsung Galaxy Book6 Ultra | |
| Average of class Multimedia (907 - 3465, n=64, last 2 years) | |
| Schenker XMG Core 15 (M25) | |
| Lenovo Legion 7 16 AGP11 | |
| CrossMark / Responsiveness | |
| Lenovo Yoga Pro 7 15IPH11 | |
| Average Intel Core Ultra 9 386H, NVIDIA GeForce RTX 5060 Laptop (1682 - 1988, n=2) | |
| Dell XPS 16 Core Ultra X7 358H | |
| Lenovo Pro 9 16IPH11 | |
| Samsung Galaxy Book6 Ultra | |
| Average of class Multimedia (605 - 2024, n=64, last 2 years) | |
| Schenker XMG Core 15 (M25) | |
| Lenovo Legion 7 16 AGP11 | |
| WebXPRT 3 / Overall | |
| Average of class Multimedia (136.4 - 596, n=67, last 2 years) | |
| Lenovo Legion 7 16 AGP11 | |
| Lenovo Pro 9 16IPH11 | |
| Average Intel Core Ultra 9 386H, NVIDIA GeForce RTX 5060 Laptop (310 - 326, n=2) | |
| Lenovo Yoga Pro 7 15IPH11 | |
| Samsung Galaxy Book6 Ultra | |
| Dell XPS 16 Core Ultra X7 358H | |
| Schenker XMG Core 15 (M25) | |
| WebXPRT 4 / Overall | |
| Lenovo Pro 9 16IPH11 | |
| Dell XPS 16 Core Ultra X7 358H | |
| Average Intel Core Ultra 9 386H, NVIDIA GeForce RTX 5060 Laptop (298 - 302, n=2) | |
| Lenovo Yoga Pro 7 15IPH11 | |
| Samsung Galaxy Book6 Ultra | |
| Average of class Multimedia (167.3 - 402, n=69, last 2 years) | |
| Lenovo Legion 7 16 AGP11 | |
| Schenker XMG Core 15 (M25) | |
| Mozilla Kraken 1.1 / Total | |
| Samsung Galaxy Book6 Ultra | |
| Average of class Multimedia (228 - 835, n=70, last 2 years) | |
| Dell XPS 16 Core Ultra X7 358H | |
| Lenovo Yoga Pro 7 15IPH11 | |
| Average Intel Core Ultra 9 386H, NVIDIA GeForce RTX 5060 Laptop (442 - 446, n=2) | |
| Lenovo Pro 9 16IPH11 | |
| Schenker XMG Core 15 (M25) | |
| Lenovo Legion 7 16 AGP11 | |
* ... smaller is better
| PCMark 10 Score | 9465 points | |
Help | ||
| AIDA64 / Memory Copy | |
| Dell XPS 16 Core Ultra X7 358H | |
| Lenovo Yoga Pro 7 15IPH11 | |
| Samsung Galaxy Book6 Ultra | |
| Average Intel Core Ultra 9 386H (75437 - 129946, n=7) | |
| Lenovo Pro 9 16IPH11 | |
| Lenovo Legion 7 16 AGP11 | |
| Average of class Multimedia (11299 - 132135, n=58, last 2 years) | |
| Schenker XMG Core 15 (M25) | |
| AIDA64 / Memory Read | |
| Dell XPS 16 Core Ultra X7 358H | |
| Lenovo Yoga Pro 7 15IPH11 | |
| Samsung Galaxy Book6 Ultra | |
| Average Intel Core Ultra 9 386H (81021 - 118858, n=7) | |
| Lenovo Pro 9 16IPH11 | |
| Lenovo Legion 7 16 AGP11 | |
| Average of class Multimedia (11624 - 174586, n=58, last 2 years) | |
| Schenker XMG Core 15 (M25) | |
| AIDA64 / Memory Write | |
| Dell XPS 16 Core Ultra X7 358H | |
| Lenovo Yoga Pro 7 15IPH11 | |
| Samsung Galaxy Book6 Ultra | |
| Lenovo Legion 7 16 AGP11 | |
| Average Intel Core Ultra 9 386H (75959 - 135096, n=7) | |
| Lenovo Pro 9 16IPH11 | |
| Average of class Multimedia (11755 - 134998, n=58, last 2 years) | |
| Schenker XMG Core 15 (M25) | |
| AIDA64 / Memory Latency | |
| Average of class Multimedia (7 - 535, n=57, last 2 years) | |
| Lenovo Pro 9 16IPH11 | |
| Lenovo Legion 7 16 AGP11 | |
| Average Intel Core Ultra 9 386H (87.2 - 116.9, n=7) | |
| Lenovo Yoga Pro 7 15IPH11 | |
| Schenker XMG Core 15 (M25) | |
| Samsung Galaxy Book6 Ultra | |
| Dell XPS 16 Core Ultra X7 358H | |
* ... smaller is better
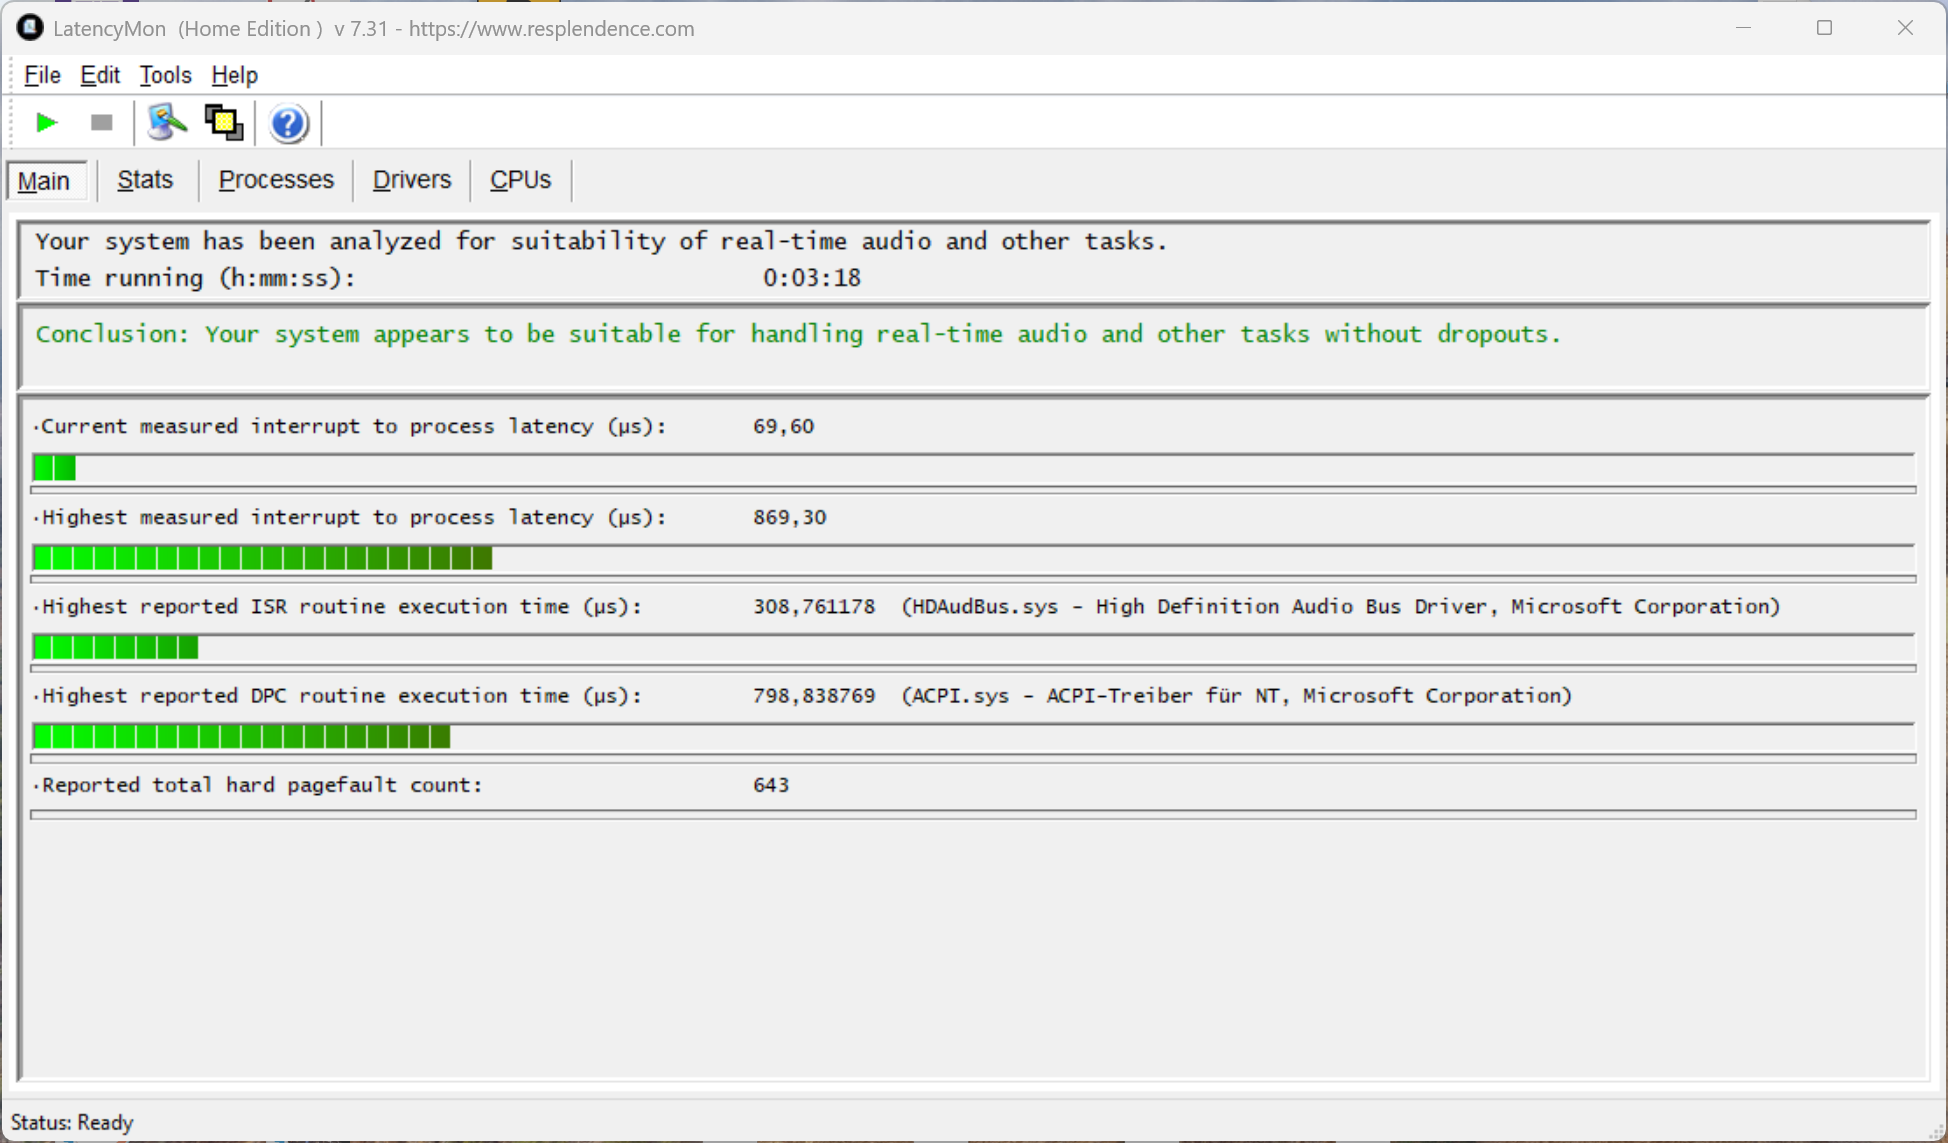
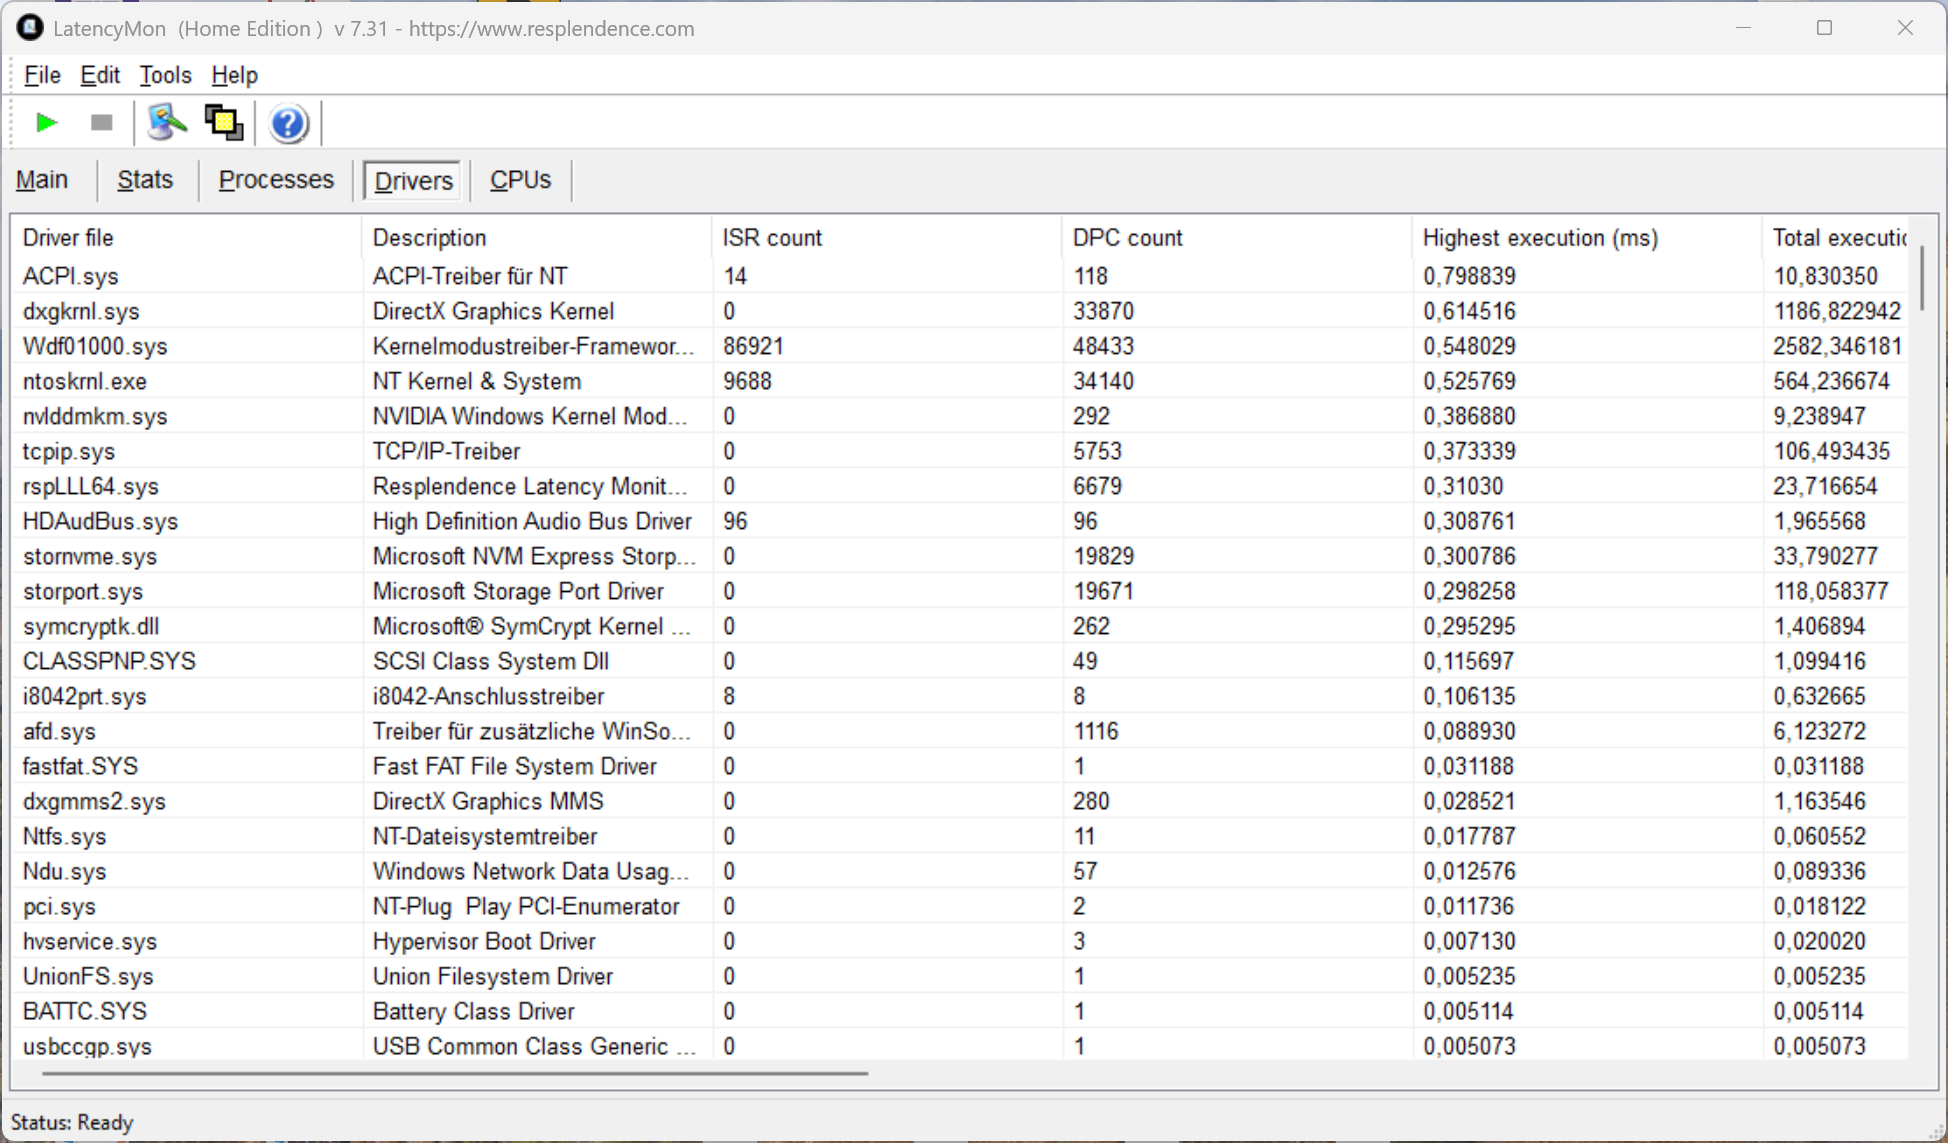
DPC Latency
Our standardized latency test does not reveal any issues for the Yoga Pro 7i 15 for real-time audio applications.
| DPC Latencies / LatencyMon - interrupt to process latency (max), Web, Youtube, Prime95 | |
| Lenovo Legion 7 16 AGP11 | |
| Average of class Multimedia (327 - 7067, n=52, last 2 years) | |
| Lenovo Yoga Pro 7 15IPH11 | |
| Schenker XMG Core 15 (M25) | |
| Lenovo Pro 9 16IPH11 | |
| Samsung Galaxy Book6 Ultra | |
| Dell XPS 16 Core Ultra X7 358H | |
* ... smaller is better
Storage Devices
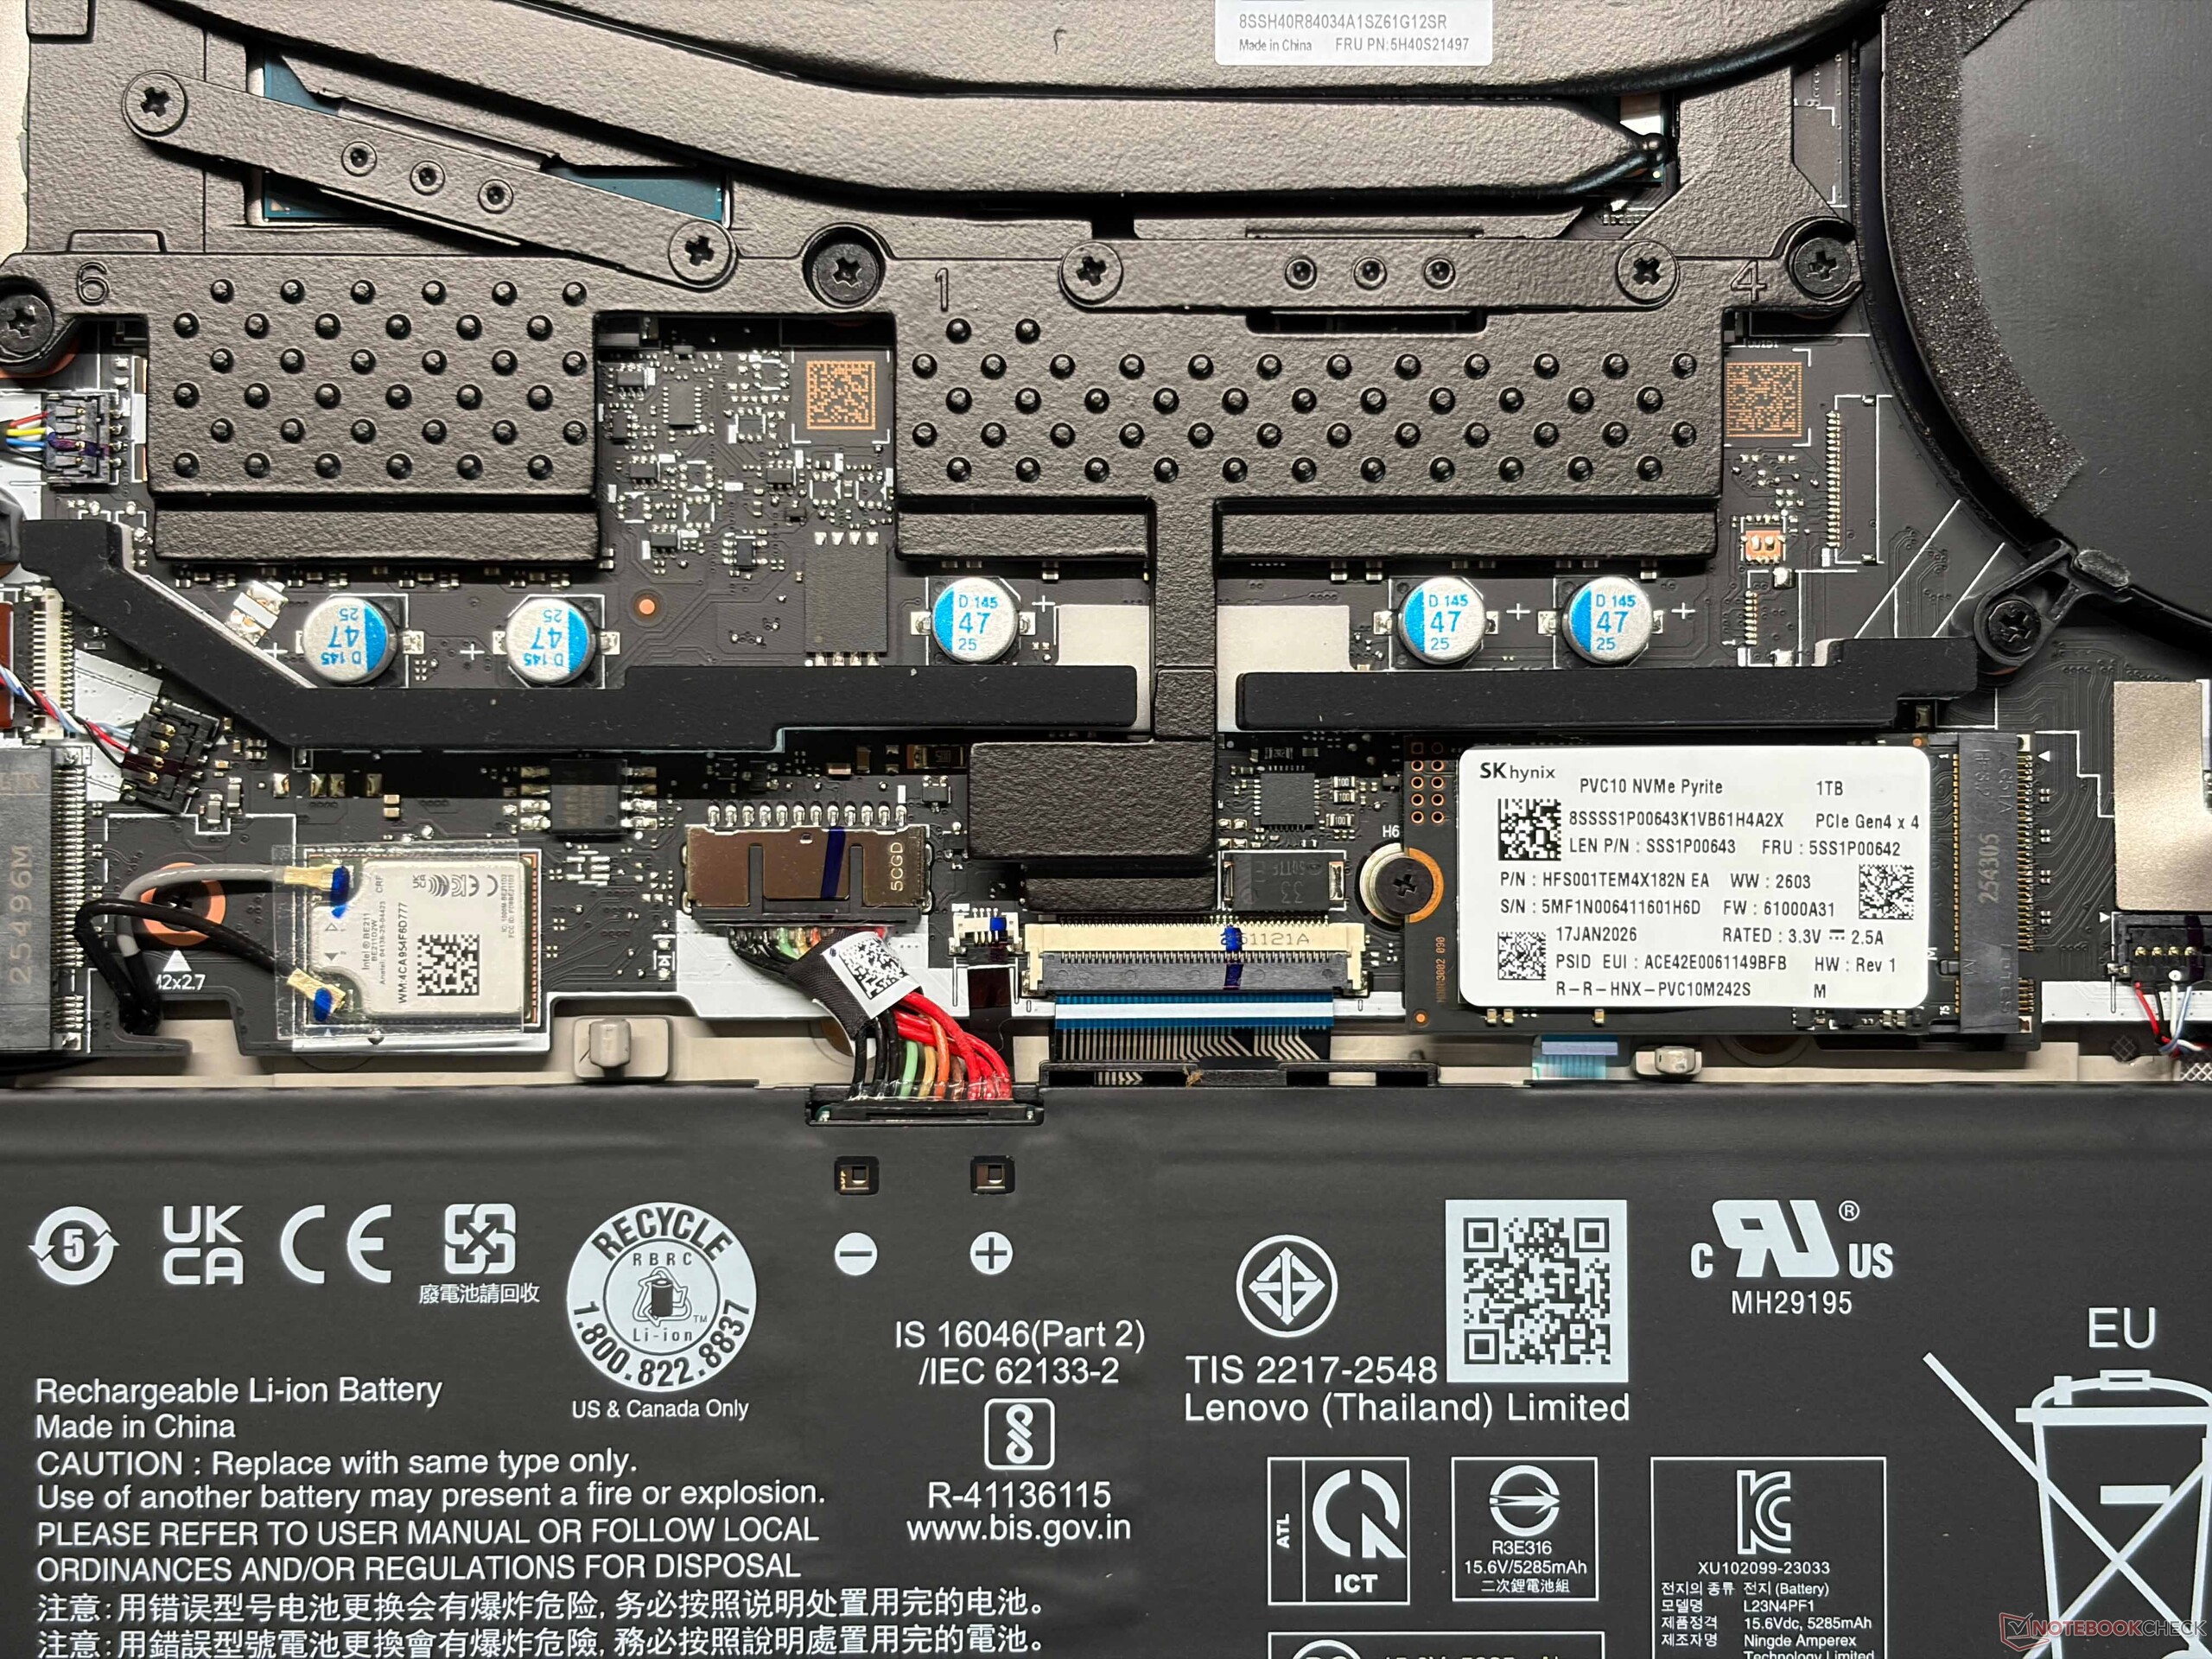
The Yoga comes with a compact M.2-2242 SSD by default, in our case a 1 TB drive from SK hynix (853 GB free). Transfer rates of the PCIe 4.0 SSD are good and stable, but the slot actually supports even faster PCIe 5.0 drives. If you want to expand the storage capacity, you can install a secondary M.2-2280 SSD (PCIe 4.0).

* ... smaller is better
Disk Throttling: DiskSpd Read Loop, Queue Depth 8
GPU Performance
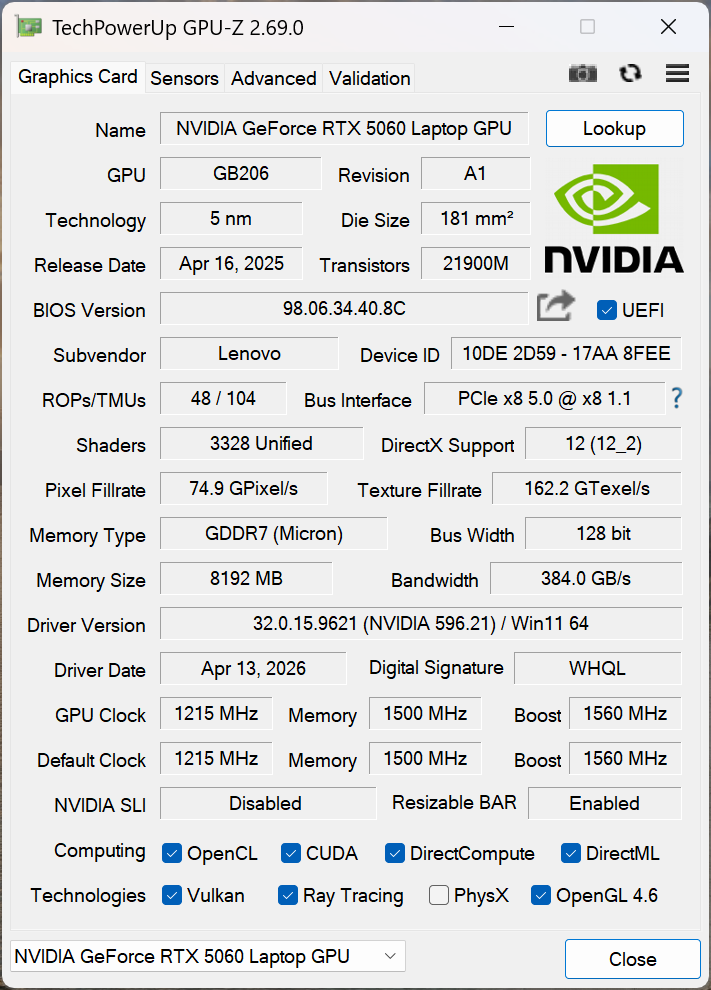
Our Yoga Pro 7i is equipped with the familiar GeForce RTX 5060 with 8 GB VRAM and a maximum TGP of 85 Watts. The performance is on the expected level and significantly better compared to Intel's fastest Arc B390 iGPU in the Dell XPS 16, for example. This means it is also a good solution for gaming, even though the VRAM can cause some issues when you play very demanding games. If you want to be on the safe side, the new Yoga Pro 7i 15 is also available with the updated RTX 5070, which now features 12 GB VRAM.
| 3DMark 11 Performance | 32286 points | |
| 3DMark Fire Strike Score | 26610 points | |
| 3DMark Time Spy Score | 11719 points | |
| 3DMark Steel Nomad Score | 2399 points | |
| 3DMark Steel Nomad Light Score | 11026 points | |
Help | ||
| Blender / v3.3 Classroom OPTIX/RTX | |
| Average of class Multimedia (12 - 105, n=24, last 2 years) | |
| Schenker XMG Core 15 (M25) | |
| Average NVIDIA GeForce RTX 5060 Laptop (20 - 28, n=18) | |
| Lenovo Legion 7 16 AGP11 | |
| Lenovo Yoga Pro 7 15IPH11 | |
| Samsung Galaxy Book6 Ultra | |
| Lenovo Pro 9 16IPH11 | |
| Blender / v3.3 Classroom CUDA | |
| Average of class Multimedia (20 - 186, n=24, last 2 years) | |
| Average NVIDIA GeForce RTX 5060 Laptop (38 - 233, n=20) | |
| Schenker XMG Core 15 (M25) | |
| Lenovo Legion 7 16 AGP11 | |
| Lenovo Pro 9 16IPH11 | |
| Lenovo Yoga Pro 7 15IPH11 | |
| Samsung Galaxy Book6 Ultra | |
| Blender / v3.3 Classroom CPU | |
| Average of class Multimedia (134.5 - 1042, n=65, last 2 years) | |
| Dell XPS 16 Core Ultra X7 358H | |
| Schenker XMG Core 15 (M25) | |
| Average NVIDIA GeForce RTX 5060 Laptop (133 - 511, n=18) | |
| Lenovo Yoga Pro 7 15IPH11 | |
| Samsung Galaxy Book6 Ultra | |
| Lenovo Pro 9 16IPH11 | |
| Lenovo Legion 7 16 AGP11 | |
| Blender / v3.3 Classroom oneAPI/Intel | |
| Average of class Multimedia (105 - 492, n=17, last 2 years) | |
| Dell XPS 16 Core Ultra X7 358H | |
* ... smaller is better
| Cyberpunk 2077 - 1920x1080 Ultra Preset (FSR off) | |
| Lenovo Legion 7 16 AGP11 | |
| Samsung Galaxy Book6 Ultra | |
| Schenker XMG Core 15 (M25) | |
| Lenovo Pro 9 16IPH11 | |
| Lenovo Yoga Pro 7 15IPH11 | |
| Dell XPS 16 Core Ultra X7 358H | |
| Average of class Multimedia (6.41 - 112.3, n=75, last 2 years) | |
| Final Fantasy XV Benchmark - 1920x1080 High Quality | |
| Lenovo Pro 9 16IPH11 | |
| Lenovo Legion 7 16 AGP11 | |
| Samsung Galaxy Book6 Ultra | |
| Lenovo Yoga Pro 7 15IPH11 | |
| Dell XPS 16 Core Ultra X7 358H | |
| Average of class Multimedia (7.61 - 144.4, n=62, last 2 years) | |
| Strange Brigade - 1920x1080 ultra AA:ultra AF:16 | |
| Lenovo Legion 7 16 AGP11 | |
| Samsung Galaxy Book6 Ultra | |
| Lenovo Pro 9 16IPH11 | |
| Lenovo Yoga Pro 7 15IPH11 | |
| Average of class Multimedia (13.3 - 303, n=62, last 2 years) | |
| Dell XPS 16 Core Ultra X7 358H | |
| Dota 2 Reborn - 1920x1080 ultra (3/3) best looking | |
| Lenovo Yoga Pro 7 15IPH11 | |
| Lenovo Legion 7 16 AGP11 | |
| Schenker XMG Core 15 (M25) | |
| Lenovo Pro 9 16IPH11 | |
| Samsung Galaxy Book6 Ultra | |
| Dell XPS 16 Core Ultra X7 358H | |
| Average of class Multimedia (29 - 179.9, n=64, last 2 years) | |
Cyberpunk 2077 ultra FPS Chart
| low | med. | high | ultra | QHD DLSS | QHD | |
|---|---|---|---|---|---|---|
| GTA V (2015) | 133.8 | 105.4 | ||||
| Dota 2 Reborn (2015) | 183.5 | 167.4 | 161.7 | 152.9 | ||
| Final Fantasy XV Benchmark (2018) | 217 | 155.3 | 113.3 | 82.6 | ||
| X-Plane 11.11 (2018) | 138.1 | 110.4 | 93 | |||
| Strange Brigade (2018) | 494 | 296 | 237 | 199 | 142.7 | |
| Baldur's Gate 3 (2023) | 150.5 | 120.4 | 105.5 | 103 | 70.1 | |
| Cyberpunk 2077 (2023) | 129.3 | 107.1 | 90.5 | 82.2 | 61.4 | 51.5 |
| F1 24 (2024) | 257 | 203 | 68.2 | 68.3 | 43.6 | |
| Assassin's Creed Shadows (2025) | 60 | 56 | 48 | 34 | 28 | |
| F1 25 (2025) | 207 | 180.2 | 144.2 | 23.9 | 25.3 | 12.6 |
Emissions & Power Consumption
System Noise

The Yoga is a very quiet device when you only use it for undemanding everyday tasks, but it gets pretty loud if you really stress the system (for example gaming). In the fastest Creator mode, we recorded more than 54 dB(A), which is louder than some gaming laptops. Both the Auto (46 dB(A)) and High Performance mode (49.5 dB(A)) are also pretty loud and we would have preferred a setting at around 40 dB(A). The Battery saver mode is much quieter, but is accompanied by a major performance hit. There were no electronic noises on our unit.
Noise level
| Idle |
| 24.3 / 24.3 / 25.5 dB(A) |
| Load |
| 49.3 / 54.4 dB(A) |
 | ||
30 dB silent 40 dB(A) audible 50 dB(A) loud |
||
min: | ||
| Lenovo Yoga Pro 7 15IPH11 Ultra 9 386H, GeForce RTX 5060 Laptop | Lenovo Pro 9 16IPH11 Ultra 9 386H, GeForce RTX 5060 Laptop | Samsung Galaxy Book6 Ultra Ultra 7 356H, GeForce RTX 5070 Laptop | Lenovo Legion 7 16 AGP11 Ryzen AI 9 HX 470, GeForce RTX 5060 Laptop | Schenker XMG Core 15 (M25) Ryzen AI 7 350, GeForce RTX 5060 Laptop | Dell XPS 16 Core Ultra X7 358H Ultra X7 358H, Arc B390 Panther Lake iGPU | |
|---|---|---|---|---|---|---|
| Noise | 9% | 6% | 4% | -1% | 11% | |
| off / environment * (dB) | 24.3 | 23 5% | 25.1 -3% | 24.5 -1% | 24 1% | 23.3 4% |
| Idle Minimum * (dB) | 24.3 | 23.5 3% | 25.1 -3% | 24.5 -1% | 25 -3% | 23.4 4% |
| Idle Average * (dB) | 24.3 | 24 1% | 25.1 -3% | 24.5 -1% | 27 -11% | 23.4 4% |
| Idle Maximum * (dB) | 25.5 | 24 6% | 25.1 2% | 27.1 -6% | 29 -14% | 25.8 -1% |
| Load Average * (dB) | 49.3 | 32.3 34% | 36.9 25% | 34.6 30% | 48 3% | 38 23% |
| Cyberpunk 2077 ultra * (dB) | 54.4 | 50.1 8% | 48.5 11% | 53 3% | 49 10% | 38.1 30% |
| Load Maximum * (dB) | 54.4 | 50.1 8% | 48.5 11% | 53 3% | 50 8% | 48.6 11% |
* ... smaller is better
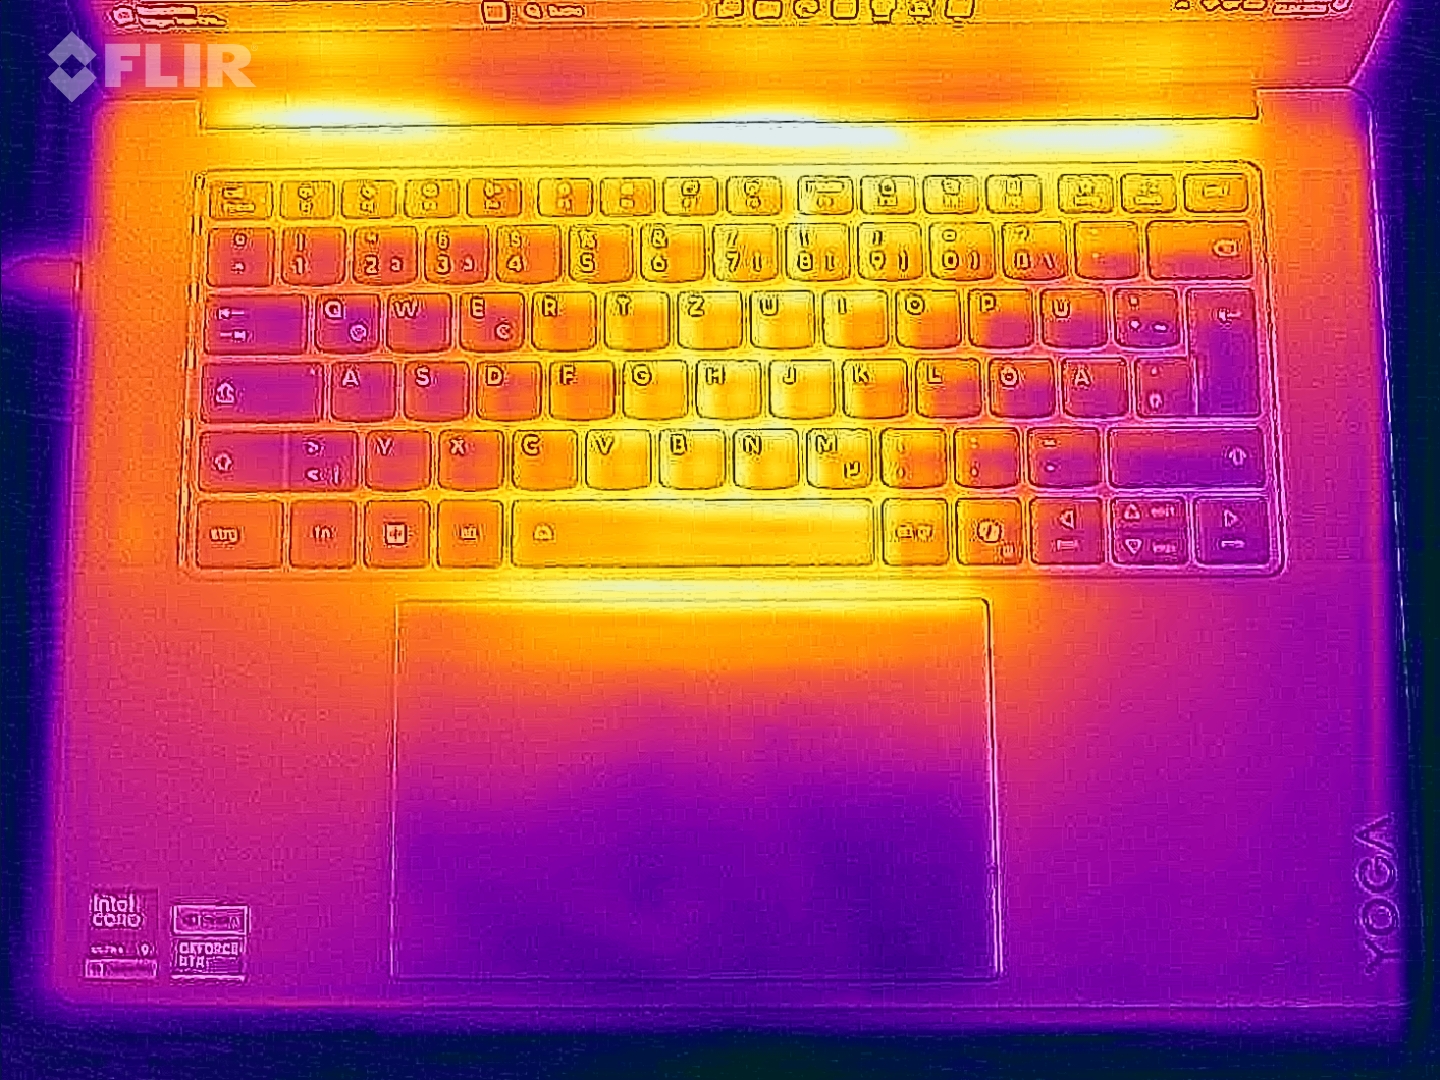
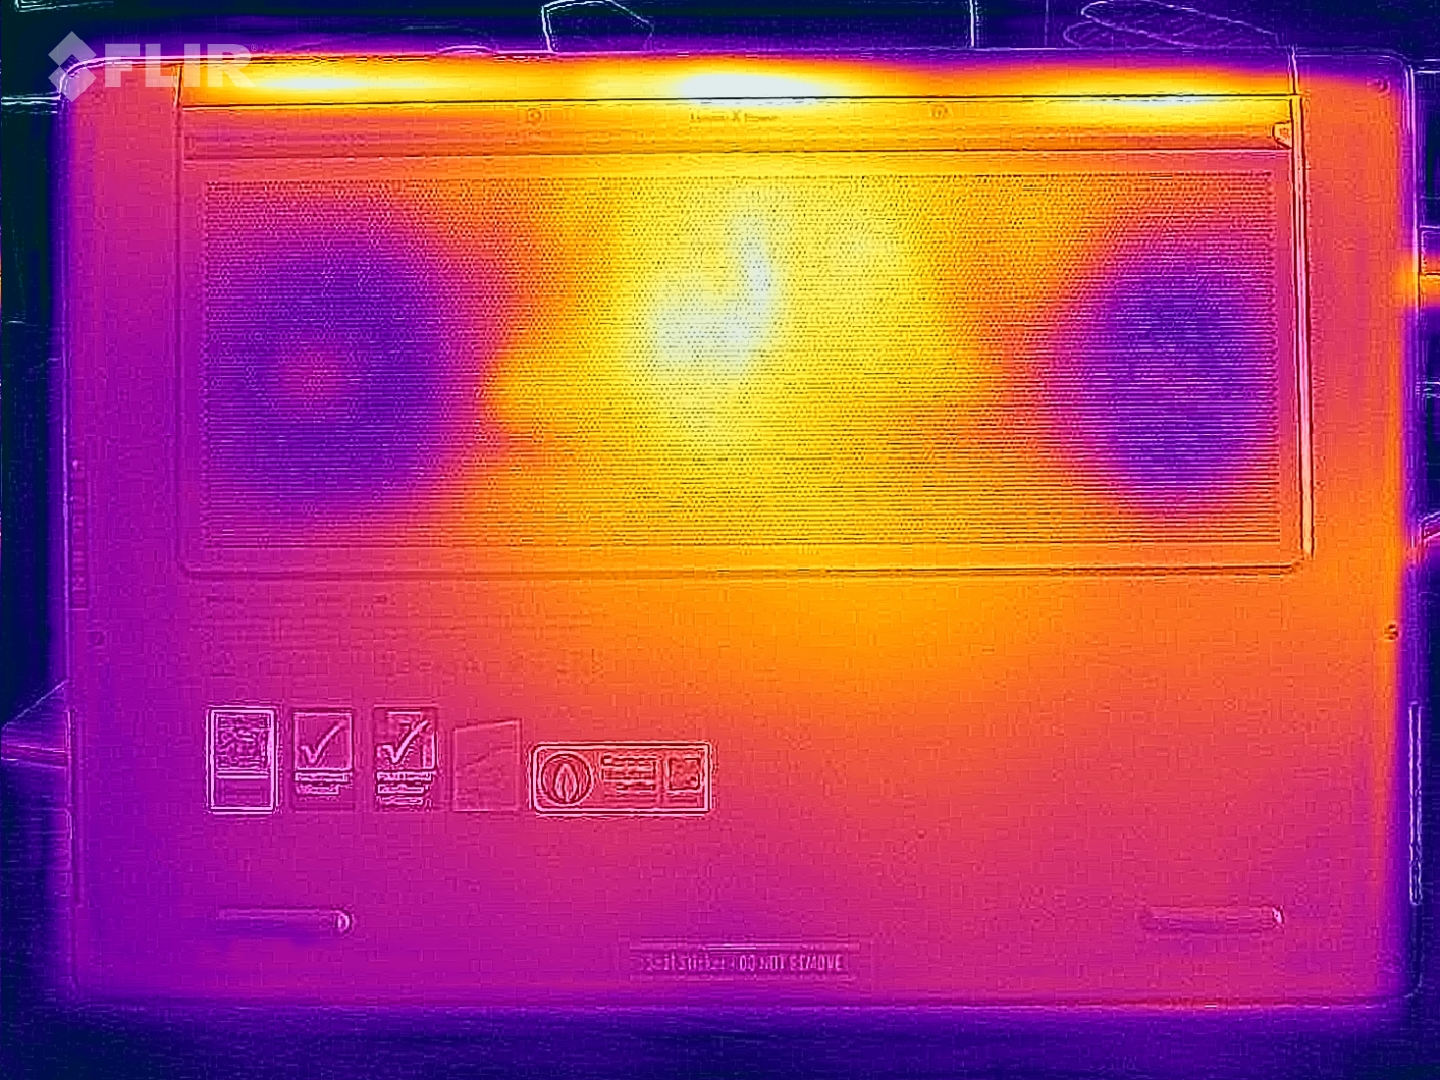
Temperature
The upside of the loud fan noise are the low surface temperatures, because only a few spots surpass 40 °C under load. During the stress test, the CPU levels off at 35 Watts (72 °C), while the GPU maintains 75 Watts (68 °C).

(±) The maximum temperature on the upper side is 40.6 °C / 105 F, compared to the average of 36.8 °C / 98 F, ranging from 21 to 71 °C for the class Multimedia.
(±) The bottom heats up to a maximum of 42.5 °C / 109 F, compared to the average of 39.1 °C / 102 F
(+) In idle usage, the average temperature for the upper side is 25.6 °C / 78 F, compared to the device average of 31.3 °C / 88 F.
(±) 3: The average temperature for the upper side is 35.7 °C / 96 F, compared to the average of 31.3 °C / 88 F for the class Multimedia.
(+) The palmrests and touchpad are cooler than skin temperature with a maximum of 31.5 °C / 88.7 F and are therefore cool to the touch.
(-) The average temperature of the palmrest area of similar devices was 28.7 °C / 83.7 F (-2.8 °C / -5 F).
| Lenovo Yoga Pro 7 15IPH11 Ultra 9 386H, GeForce RTX 5060 Laptop | Lenovo Pro 9 16IPH11 Ultra 9 386H, GeForce RTX 5060 Laptop | Samsung Galaxy Book6 Ultra Ultra 7 356H, GeForce RTX 5070 Laptop | Lenovo Legion 7 16 AGP11 Ryzen AI 9 HX 470, GeForce RTX 5060 Laptop | Schenker XMG Core 15 (M25) Ryzen AI 7 350, GeForce RTX 5060 Laptop | Dell XPS 16 Core Ultra X7 358H Ultra X7 358H, Arc B390 Panther Lake iGPU | |
|---|---|---|---|---|---|---|
| Heat | -4% | -3% | -9% | -21% | 7% | |
| Maximum Upper Side * (°C) | 40.6 | 37.8 7% | 42.7 -5% | 44.9 -11% | 49 -21% | 40.6 -0% |
| Maximum Bottom * (°C) | 42.5 | 38.2 10% | 49.1 -16% | 50.5 -19% | 59 -39% | 39.8 6% |
| Idle Upper Side * (°C) | 26.3 | 30.4 -16% | 25.4 3% | 27.3 -4% | 28 -6% | 23.2 12% |
| Idle Bottom * (°C) | 26.8 | 31 -16% | 25.5 5% | 27.5 -3% | 31 -16% | 23.8 11% |
* ... smaller is better
Speakers
The sound system is excellent and on par with the larger Yoga Pro 9i.
Lenovo Yoga Pro 7 15IPH11 audio analysis
(+) | speakers can play relatively loud (86.1 dB)
Bass 100 - 315 Hz
(±) | reduced bass - on average 8.5% lower than median
(±) | linearity of bass is average (9.8% delta to prev. frequency)
Mids 400 - 2000 Hz
(+) | balanced mids - only 2.5% away from median
(+) | mids are linear (4.8% delta to prev. frequency)
Highs 2 - 16 kHz
(+) | balanced highs - only 2.8% away from median
(+) | highs are linear (2.7% delta to prev. frequency)
Overall 100 - 16.000 Hz
(+) | overall sound is linear (7.6% difference to median)
Compared to same class
» 6% of all tested devices in this class were better, 2% similar, 92% worse
» The best had a delta of 5%, average was 17%, worst was 45%
Compared to all devices tested
» 1% of all tested devices were better, 0% similar, 98% worse
» The best had a delta of 4%, average was 23%, worst was 134%
Lenovo Pro 9 16IPH11 audio analysis
(+) | speakers can play relatively loud (83.1 dB)
Bass 100 - 315 Hz
(±) | reduced bass - on average 5.7% lower than median
(+) | bass is linear (5.1% delta to prev. frequency)
Mids 400 - 2000 Hz
(+) | balanced mids - only 4.2% away from median
(+) | mids are linear (5.4% delta to prev. frequency)
Highs 2 - 16 kHz
(+) | balanced highs - only 1.8% away from median
(+) | highs are linear (4.4% delta to prev. frequency)
Overall 100 - 16.000 Hz
(+) | overall sound is linear (7.7% difference to median)
Compared to same class
» 6% of all tested devices in this class were better, 2% similar, 91% worse
» The best had a delta of 5%, average was 17%, worst was 45%
Compared to all devices tested
» 1% of all tested devices were better, 0% similar, 98% worse
» The best had a delta of 4%, average was 23%, worst was 134%
Samsung Galaxy Book6 Ultra audio analysis
(+) | speakers can play relatively loud (85.6 dB)
Bass 100 - 315 Hz
(±) | reduced bass - on average 5.9% lower than median
(±) | linearity of bass is average (7.9% delta to prev. frequency)
Mids 400 - 2000 Hz
(+) | balanced mids - only 3.7% away from median
(+) | mids are linear (4.3% delta to prev. frequency)
Highs 2 - 16 kHz
(+) | balanced highs - only 2.2% away from median
(+) | highs are linear (3.4% delta to prev. frequency)
Overall 100 - 16.000 Hz
(+) | overall sound is linear (7.3% difference to median)
Compared to same class
» 6% of all tested devices in this class were better, 1% similar, 94% worse
» The best had a delta of 5%, average was 17%, worst was 45%
Compared to all devices tested
» 1% of all tested devices were better, 0% similar, 99% worse
» The best had a delta of 4%, average was 23%, worst was 134%
Lenovo Legion 7 16 AGP11 audio analysis
(±) | speaker loudness is average but good (79 dB)
Bass 100 - 315 Hz
(±) | reduced bass - on average 11.4% lower than median
(±) | linearity of bass is average (8.7% delta to prev. frequency)
Mids 400 - 2000 Hz
(+) | balanced mids - only 3.1% away from median
(+) | mids are linear (2.4% delta to prev. frequency)
Highs 2 - 16 kHz
(+) | balanced highs - only 2.1% away from median
(+) | highs are linear (5% delta to prev. frequency)
Overall 100 - 16.000 Hz
(+) | overall sound is linear (11.7% difference to median)
Compared to same class
» 11% of all tested devices in this class were better, 4% similar, 86% worse
» The best had a delta of 6%, average was 18%, worst was 132%
Compared to all devices tested
» 8% of all tested devices were better, 3% similar, 89% worse
» The best had a delta of 4%, average was 23%, worst was 134%
Schenker XMG Core 15 (M25) audio analysis
(+) | speakers can play relatively loud (82 dB)
Bass 100 - 315 Hz
(-) | nearly no bass - on average 18.3% lower than median
(±) | linearity of bass is average (9.8% delta to prev. frequency)
Mids 400 - 2000 Hz
(+) | balanced mids - only 3.4% away from median
(+) | mids are linear (5.9% delta to prev. frequency)
Highs 2 - 16 kHz
(+) | balanced highs - only 3.2% away from median
(+) | highs are linear (4.1% delta to prev. frequency)
Overall 100 - 16.000 Hz
(+) | overall sound is linear (14.3% difference to median)
Compared to same class
» 26% of all tested devices in this class were better, 7% similar, 67% worse
» The best had a delta of 6%, average was 18%, worst was 132%
Compared to all devices tested
» 17% of all tested devices were better, 4% similar, 78% worse
» The best had a delta of 4%, average was 23%, worst was 134%
Dell XPS 16 Core Ultra X7 358H audio analysis
(+) | speakers can play relatively loud (85.1 dB)
Bass 100 - 315 Hz
(±) | reduced bass - on average 7.6% lower than median
(+) | bass is linear (6.1% delta to prev. frequency)
Mids 400 - 2000 Hz
(+) | balanced mids - only 2.1% away from median
(+) | mids are linear (3.4% delta to prev. frequency)
Highs 2 - 16 kHz
(+) | balanced highs - only 2.3% away from median
(+) | highs are linear (4.1% delta to prev. frequency)
Overall 100 - 16.000 Hz
(+) | overall sound is linear (6.2% difference to median)
Compared to same class
» 3% of all tested devices in this class were better, 0% similar, 96% worse
» The best had a delta of 5%, average was 17%, worst was 45%
Compared to all devices tested
» 0% of all tested devices were better, 0% similar, 99% worse
» The best had a delta of 4%, average was 23%, worst was 134%
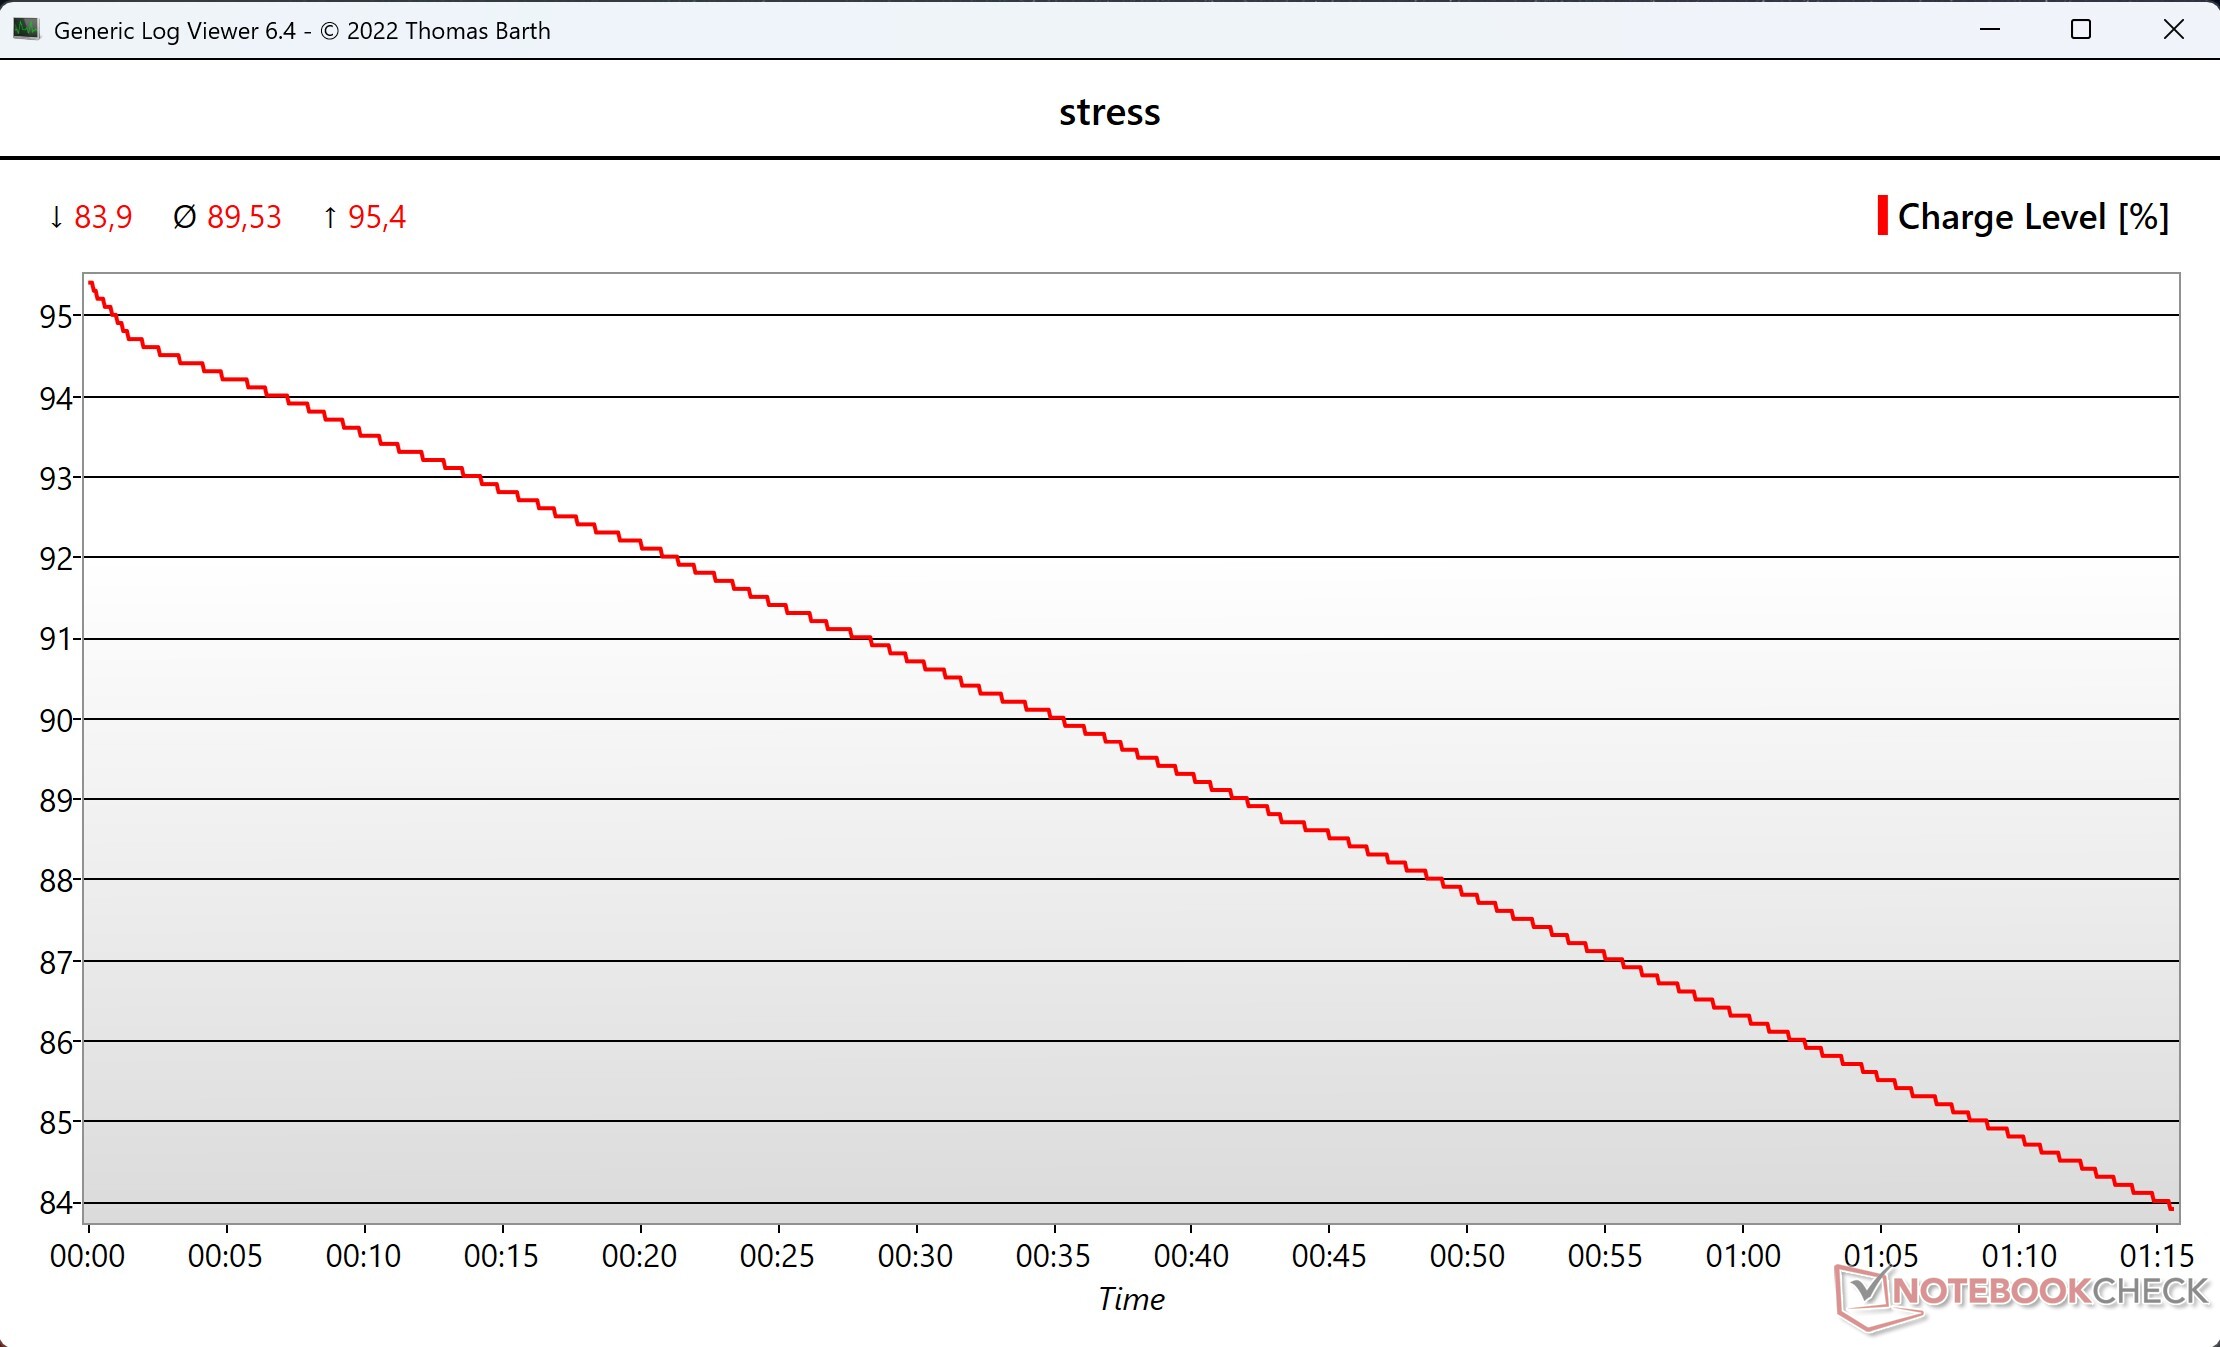
Power Consumption
Lenovo ships the Yoga Pro 7i 15 with a 140W PSU, but it is insufficient under load when you use the Creator mode. During our one-hour stress test, the battery capacity dropped by around 10 %. Sure, this is an extreme scenario, but Lenovo should have shipped a more powerful 180W PSU we know from some ThinkPad models, for example. The idle consumption on the other hand is very low.

| Off / Standby | |
| Idle | |
| Load |
|
Key:
min: | |
| Lenovo Yoga Pro 7 15IPH11 Ultra 9 386H, GeForce RTX 5060 Laptop, SK hynix PVC10 HFS001TEM4X182N, OLED, 2560x1600, 15.3" | Lenovo Pro 9 16IPH11 Ultra 9 386H, GeForce RTX 5060 Laptop, SK hynix PVC10 HFS001TEM4X182N, Tandem OLED, 3200x2000, 16" | Samsung Galaxy Book6 Ultra Ultra 7 356H, GeForce RTX 5070 Laptop, Samsung PM9C1b MZVL81T0HFLB-00BH1, OLED, 2880x1800, 16" | Lenovo Legion 7 16 AGP11 Ryzen AI 9 HX 470, GeForce RTX 5060 Laptop, Lenovo UMIS AM541 1TB, OLED, 2560x1600, 16" | Schenker XMG Core 15 (M25) Ryzen AI 7 350, GeForce RTX 5060 Laptop, Samsung 990 Pro 2 TB MZVL72T0HDLB, IPS, 2560x1600, 15.3" | Dell XPS 16 Core Ultra X7 358H Ultra X7 358H, Arc B390 Panther Lake iGPU, , OLED, 3200x2000, 16" | Average NVIDIA GeForce RTX 5060 Laptop | Average of class Multimedia | |
|---|---|---|---|---|---|---|---|---|
| Power Consumption | -204% | 6% | -31% | -69% | 22% | -82% | -22% | |
| Idle Minimum * (Watt) | 5.2 | 15.1 -190% | 4.4 15% | 5.7 -10% | 10.6 -104% | 4 23% | 8.97 ? -73% | 5.67 ? -9% |
| Idle Average * (Watt) | 6.6 | 30.4 -361% | 6.4 3% | 8.7 -32% | 12.1 -83% | 4.4 33% | 12.9 ? -95% | 10.1 ? -53% |
| Idle Maximum * (Watt) | 6.8 | 46.2 -579% | 7.1 -4% | 9.1 -34% | 15.9 -134% | 10.2 -50% | 18.3 ? -169% | 12.3 ? -81% |
| Load Average * (Watt) | 75.8 | 79.5 -5% | 55.1 27% | 88.7 -17% | 95 -25% | 44.2 42% | 92 ? -21% | 65.6 ? 13% |
| Cyberpunk 2077 ultra * (Watt) | 131.1 | 161.2 -23% | 134.3 -2% | 160.3 -22% | 169 -29% | 62.6 52% | ||
| Load Maximum * (Watt) | 138.8 | 231.4 -67% | 143.9 -4% | 234.9 -69% | 192 -38% | 94.6 32% | 213 ? -53% | 113.2 ? 18% |
| Cyberpunk 2077 ultra external monitor * (Watt) | 160.7 | 133 | 156.9 | 165 | 62.4 |
* ... smaller is better
Power Consumption Cyberpunk / Stress Test
Power Consumption external Monitor
Battery Life
The 84 Wh battery provides good runtimes with 12 hours in our Wi-Fi test at 150 nits and almost 8 hour at maximum brightness. This means the Yoga beats most of its rivals, only the Samsung Galaxy Book6 Ultra is far superior at 150 nits with almost 17 hours (but only 30 minutes more at full brightness).

| Lenovo Yoga Pro 7 15IPH11 Ultra 9 386H, GeForce RTX 5060 Laptop, 84 Wh | Lenovo Pro 9 16IPH11 Ultra 9 386H, GeForce RTX 5060 Laptop, 92.5 Wh | Samsung Galaxy Book6 Ultra Ultra 7 356H, GeForce RTX 5070 Laptop, 80.2 Wh | Lenovo Legion 7 16 AGP11 Ryzen AI 9 HX 470, GeForce RTX 5060 Laptop, 84 Wh | Schenker XMG Core 15 (M25) Ryzen AI 7 350, GeForce RTX 5060 Laptop, 99.8 Wh | Dell XPS 16 Core Ultra X7 358H Ultra X7 358H, Arc B390 Panther Lake iGPU, 70 Wh | Average of class Multimedia | |
|---|---|---|---|---|---|---|---|
| Battery runtime | |||||||
| WiFi v1.3 (h) | 12 | 9.9 -17% | 16.8 40% | 9.2 -23% | 9.9 -17% | 10.3 -14% | 12.1 ? 1% |
Notebookcheck Rating
Lenovo Yoga Pro 7 15IPH11
- 06/04/2026 v8
Andreas Osthoff
 Total Sustainability Score:
 Potential Competitors in Comparison
Image | Model / Review | Price | Weight | Height | Display |
|---|---|---|---|---|---|
1. 90.4%  | Lenovo Yoga Pro 7 15IPH11 Intel Core Ultra 9 386H ⎘ NVIDIA GeForce RTX 5060 Laptop ⎘ 32 GB Memory, 1024 GB SSD | Amazon: 1. $49.91 Original New for Lenovo Yoga... 2. $2,231.24 Lenovo Yoga Pro 9i 16" Lapto... 3. $1,069.09 Lenovo Yoga 7 2-in-1 Laptop ... List Price: 3100€ | 1.7 kg | 16.7 mm | 15.30" 2560x1600 197 PPI OLED |
2. 91%  | Lenovo Pro 9 16IPH11 Intel Core Ultra 9 386H ⎘ NVIDIA GeForce RTX 5060 Laptop ⎘ 32 GB Memory, 1024 GB SSD | Amazon: List Price: 3100 USD | 1.9 kg | 17.3 mm | 16.00" 3200x2000 236 PPI Tandem OLED |
3. 90.7%  | Samsung Galaxy Book6 Ultra Intel Core Ultra 7 356H ⎘ NVIDIA GeForce RTX 5070 Laptop ⎘ 32 GB Memory, 1000 GB SSD | Amazon: List Price: 3599€ | 1.9 kg | 15.4 mm | 16.00" 2880x1800 212 PPI OLED |
4. 86.4%  | Lenovo Legion 7 16 AGP11 AMD Ryzen AI 9 HX 470 ⎘ NVIDIA GeForce RTX 5060 Laptop ⎘ 32 GB Memory, 1024 GB SSD | Amazon: List Price: 2500€ | 1.8 kg | 16.9 mm | 16.00" 2560x1600 189 PPI OLED |
5. 84.7%  | Schenker XMG Core 15 (M25) AMD Ryzen AI 7 350 ⎘ NVIDIA GeForce RTX 5060 Laptop ⎘ 64 GB Memory, 2048 GB SSD | Amazon: List Price: 1840 EUR | 1.9 kg | 22 mm | 15.30" 2560x1600 197 PPI IPS |
6. 87.2%  | Dell XPS 16 Core Ultra X7 358H Intel Core Ultra X7 358H ⎘ Intel Arc B390 12 Xe3 Panther Lake iGPU ⎘ 32 GB Memory | Amazon: 1. $2,199.00 Dell Premium 16 (XPS 16 2025... 2. $2,599.00 Dell Premium 16 (XPS 16 2025... 3. $1,977.99 Dell Premium 16 (Previously ... List Price: 2350 USD | 1.7 kg | 14.62 mm | 16.00" 3200x2000 236 PPI OLED |
Transparency
The selection of devices to be reviewed is made by our editorial team. The test sample was provided to the author as a loan by the manufacturer or retailer for the purpose of this review. The lender had no influence on this review, nor did the manufacturer receive a copy of this review before publication. There was no obligation to publish this review. As an independent media company, Notebookcheck is not subjected to the authority of manufacturers, retailers or publishers.
This is how Notebookcheck is testing
Every year, Notebookcheck independently reviews hundreds of laptops and smartphones using standardized procedures to ensure that all results are comparable. We have continuously developed our test methods for around 20 years and set industry standards in the process. In our test labs, high-quality measuring equipment is utilized by experienced technicians and editors. These tests involve a multi-stage validation process. Our complex rating system is based on hundreds of well-founded measurements and benchmarks, which maintains objectivity. Further information on our test methods can be found here.
