Verdict – the ThinkPad T1g Gen 8 is an excellent multimedia laptop with a minor flaw
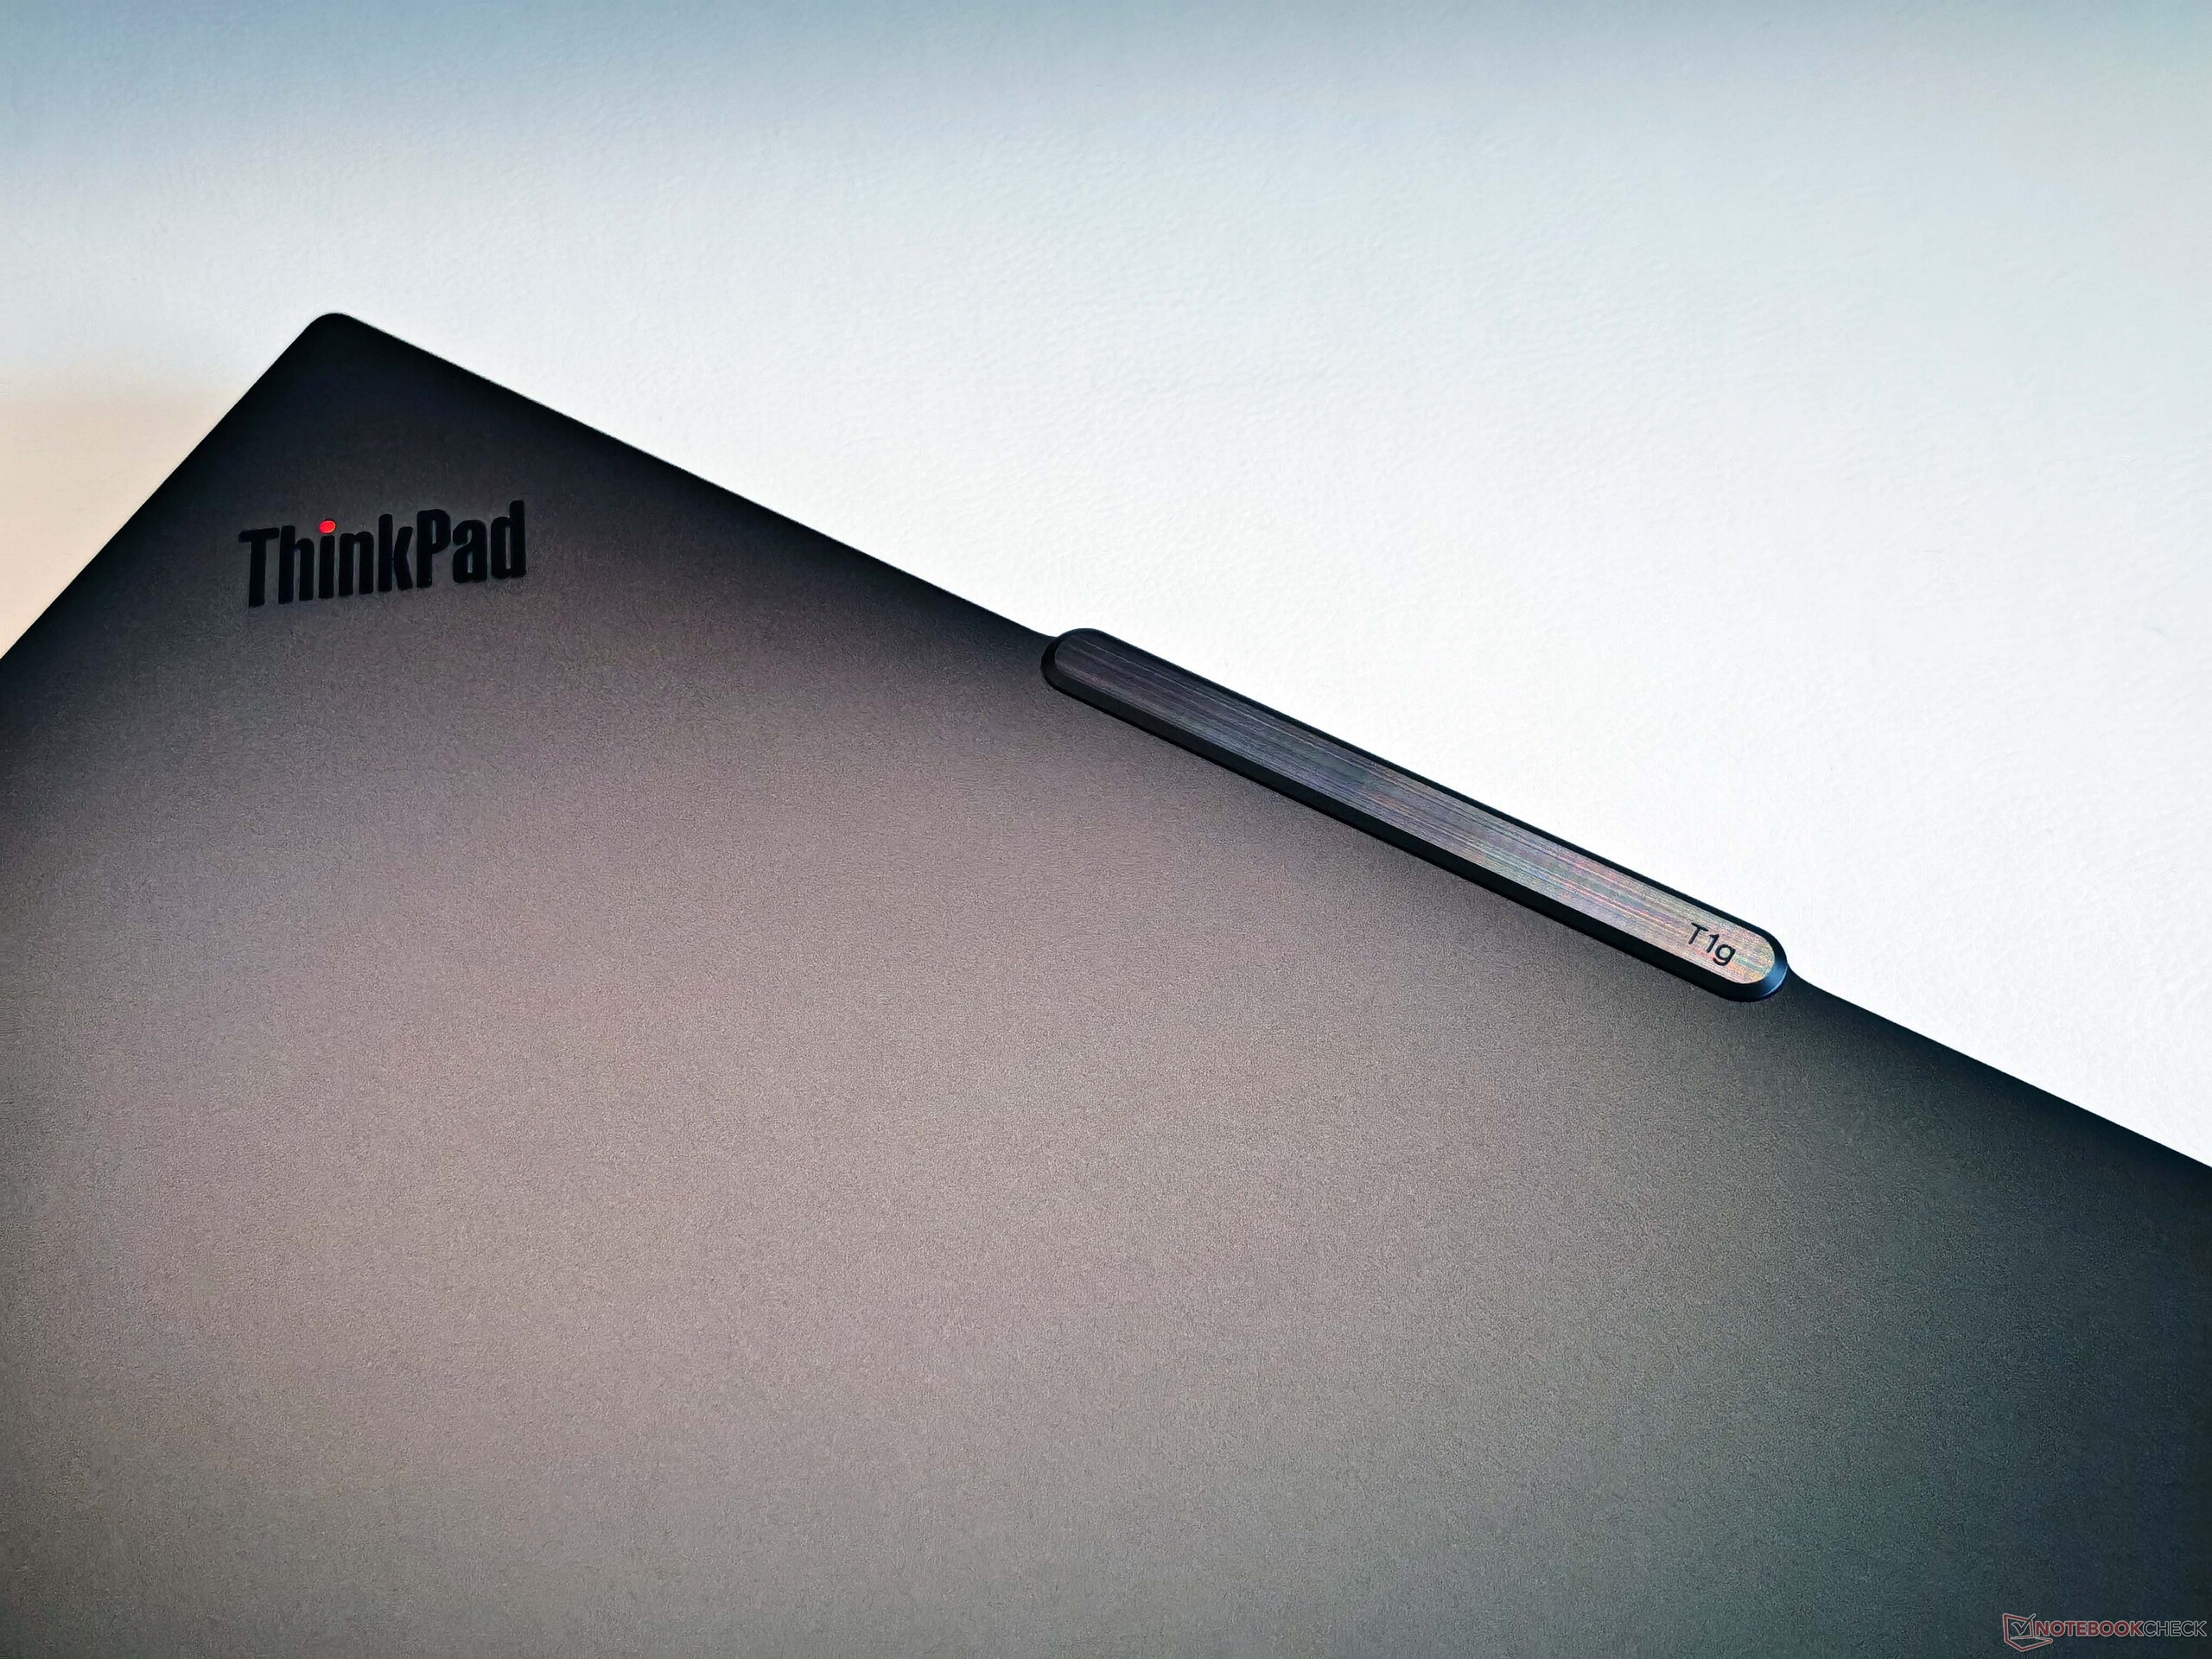
With the ThinkPad T1g Gen 8, Lenovo is aiming to appeal to a broad user base, including professional users, content creators, gamers and prosumers. The result is a very good, albeit expensive, multimedia laptop. Its biggest weakness compared to the competition is the tandem OLED display. Yes, brightness levels are extremely high, especially in HDR mode, and the matte surface helps to reduce reflections, but the image simply appears a little grainier than that of its rivals. In addition, most users are unlikely to know what the "T1g" designation actually stands for. Why Lenovo did not simply revive the well-known ThinkPad X1 Extreme name remains a mystery.
Overall component performance is strong, although the graphics card could have been a little faster. Among its competitors, the ThinkPad T1g Gen 8 stands out by offering user-replaceable RAM, two fast PCIe 5.0 M.2 slots, and Thunderbolt 5 support. On the downside, certain business-focused features such as a SmartCard reader or a 5G modem are missing.
The real sticking point, however, is the price. If you can persuade your employer to spend around €4,500 on a company laptop, the ThinkPad T1g Gen 8 delivers a very compelling overall package. For private users, though, it makes only limited sense. Lenovo's own Yoga Pro 9i 16 offers slightly higher performance and marginally better image quality for almost €2,000 less. And if you are genuinely prepared to spend this much, alternatives such as the MacBook Pro 16 with the faster M4 Max (or soon the M5 Max) or the Asus ProArt P16 with a mobile GeForce RTX 5090 and a tandem OLED panel are simply more attractive options.
Pros
Cons
Price and availability
The ThinkPad T1g Gen 8 can be configured from €2,900 directly from Lenovo. Final pricing varies significantly depending on configuration and region.
Table of Contents
- Verdict – the ThinkPad T1g Gen 8 is an excellent multimedia laptop with a minor flaw
- Specifications
- Case & features
- Input devices – excellent keyboard
- Display – Matte Tandem OLED touchscreen
- Performance – Arrow Lake & Blackwell
- Emissions & power
- Notebookcheck overall rating
- Possible alternatives at a glance
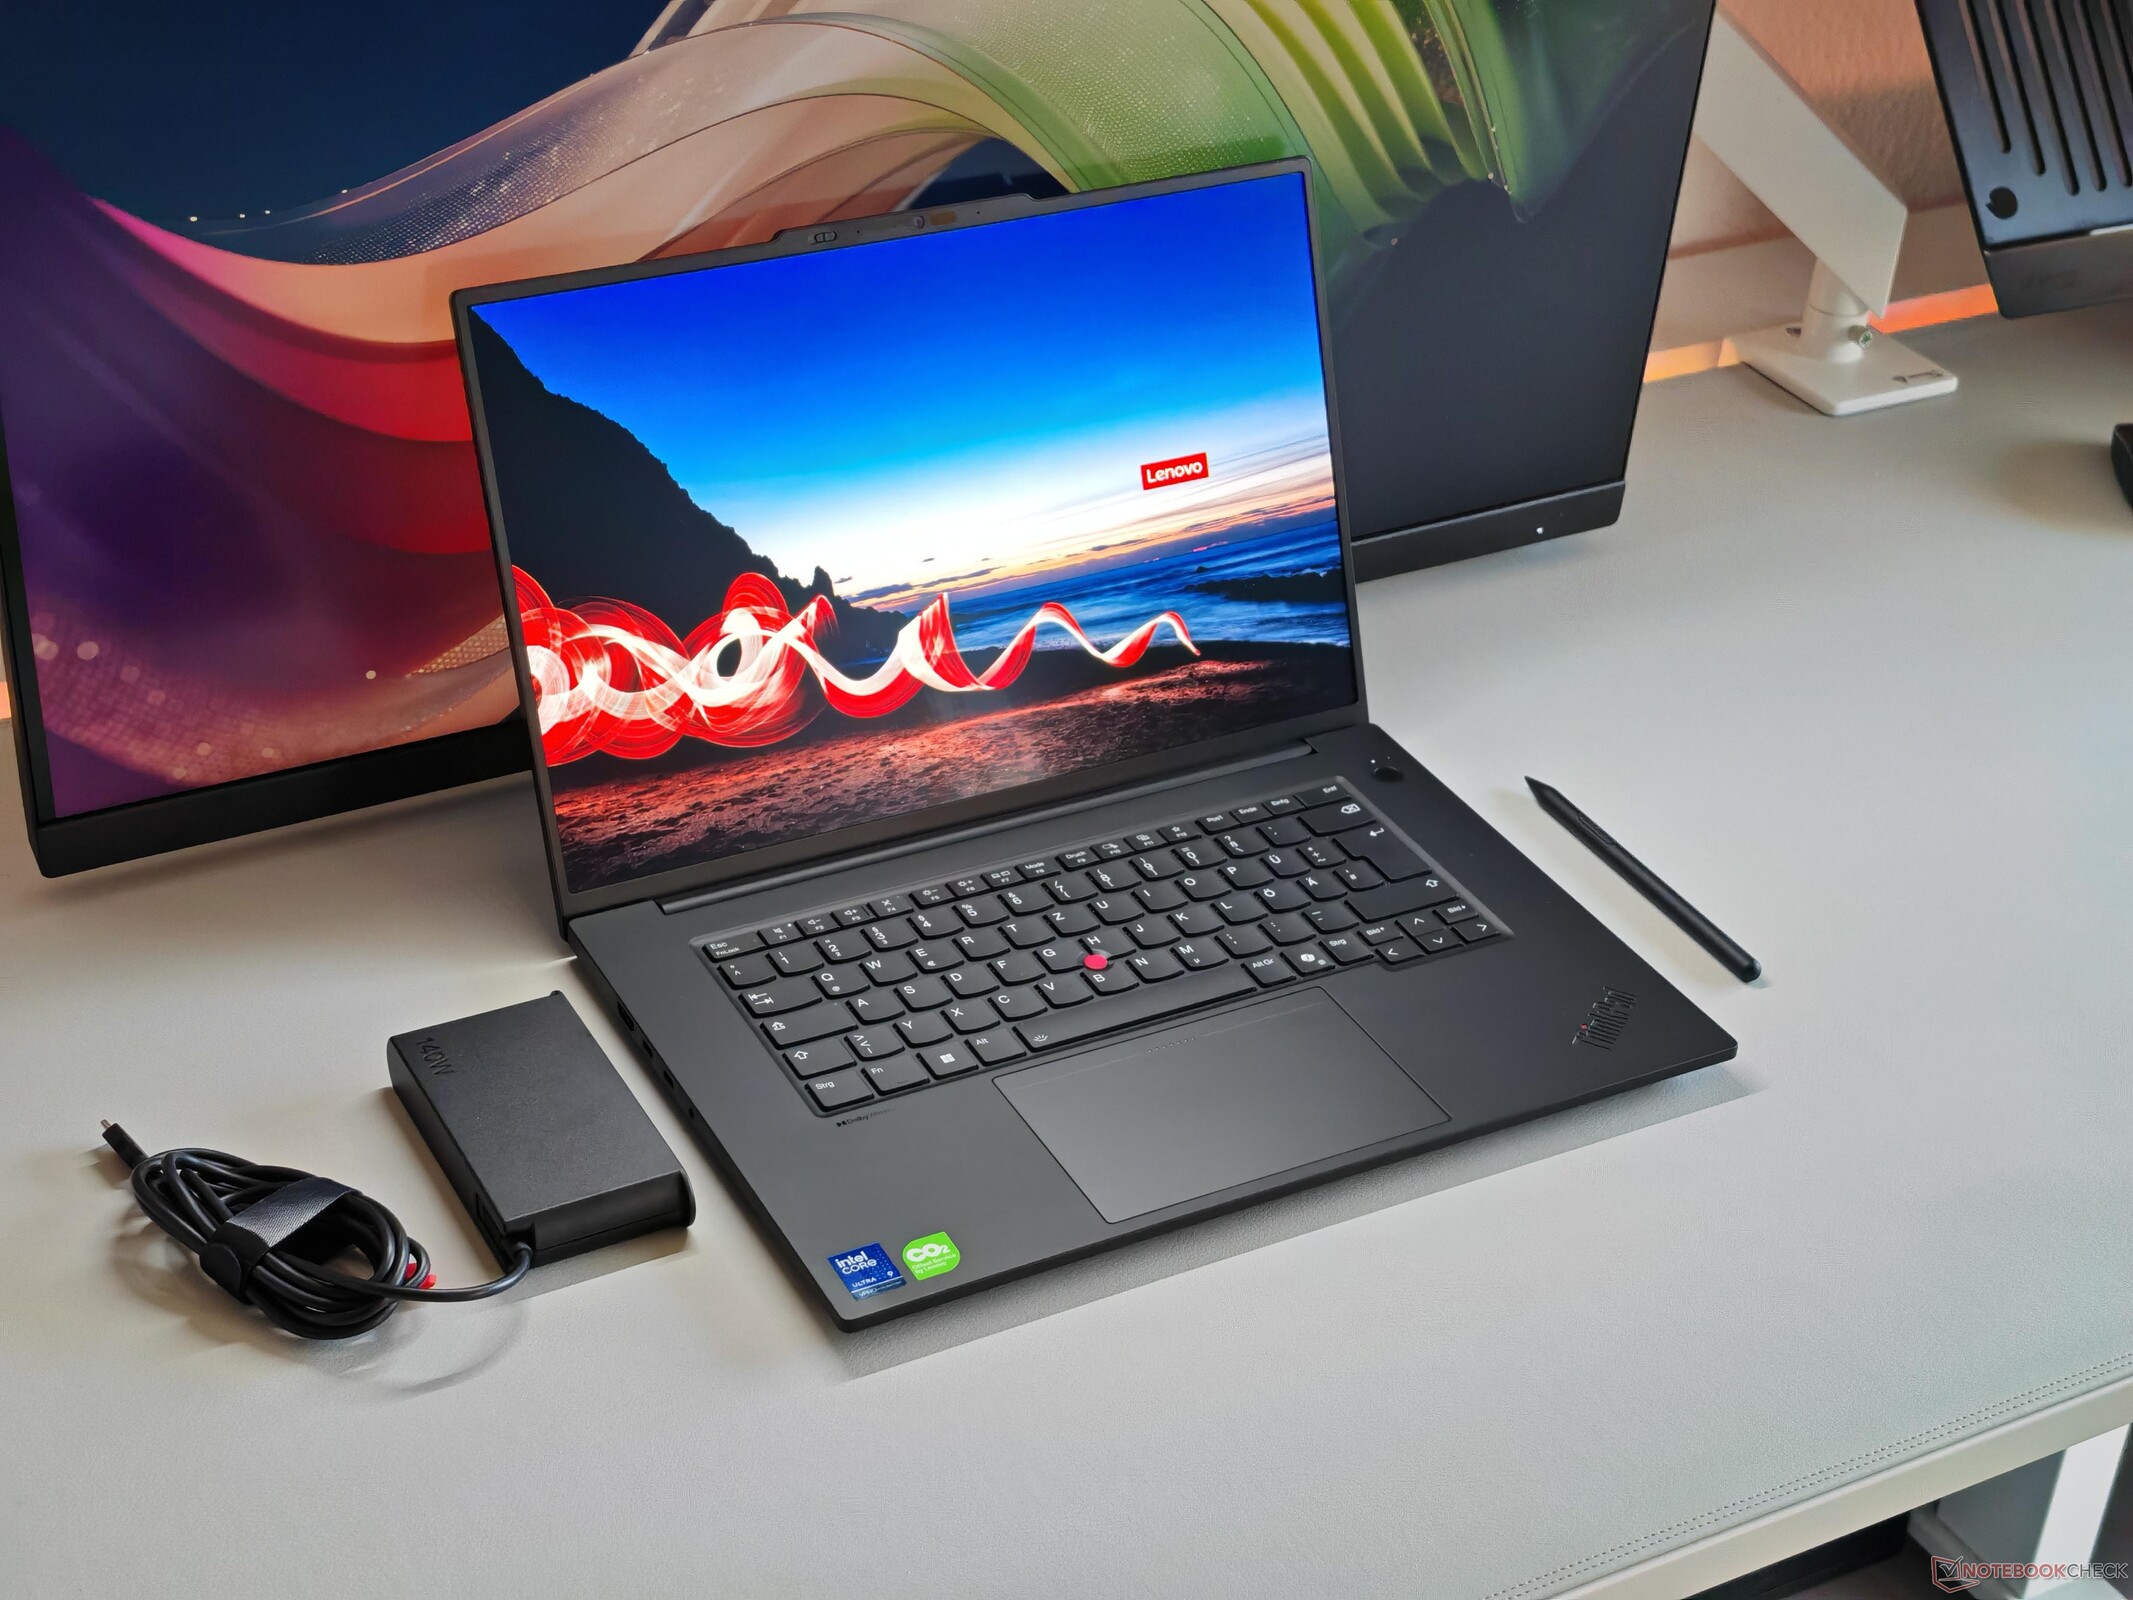
Lenovo had effectively discontinued the ThinkPad X1 Extreme, its multimedia laptop equipped with GeForce GPUs, after the sixth generation and offered only the technically identical workstation counterpart, the ThinkPad P1. With the introduction of the ThinkPad T1g Gen 8, however, the manufacturer is effectively reversing course. In practical terms, the T1g Gen 8 is essentially a ThinkPad P1 Gen 8 with GeForce graphics, repositioned once again as a multimedia-focused model.
Pricing for the ThinkPad T1g Gen 8 starts at around €2,900. Our review unit is the high-end configuration featuring the Intel Core Ultra 9 285H, GeForce RTX 5070, 64 GB of RAM, a 2 TB SSD, and the matte 120-Hz tandem OLED touchscreen, which comes in at approximately €4,500.
Specifications
Case & features
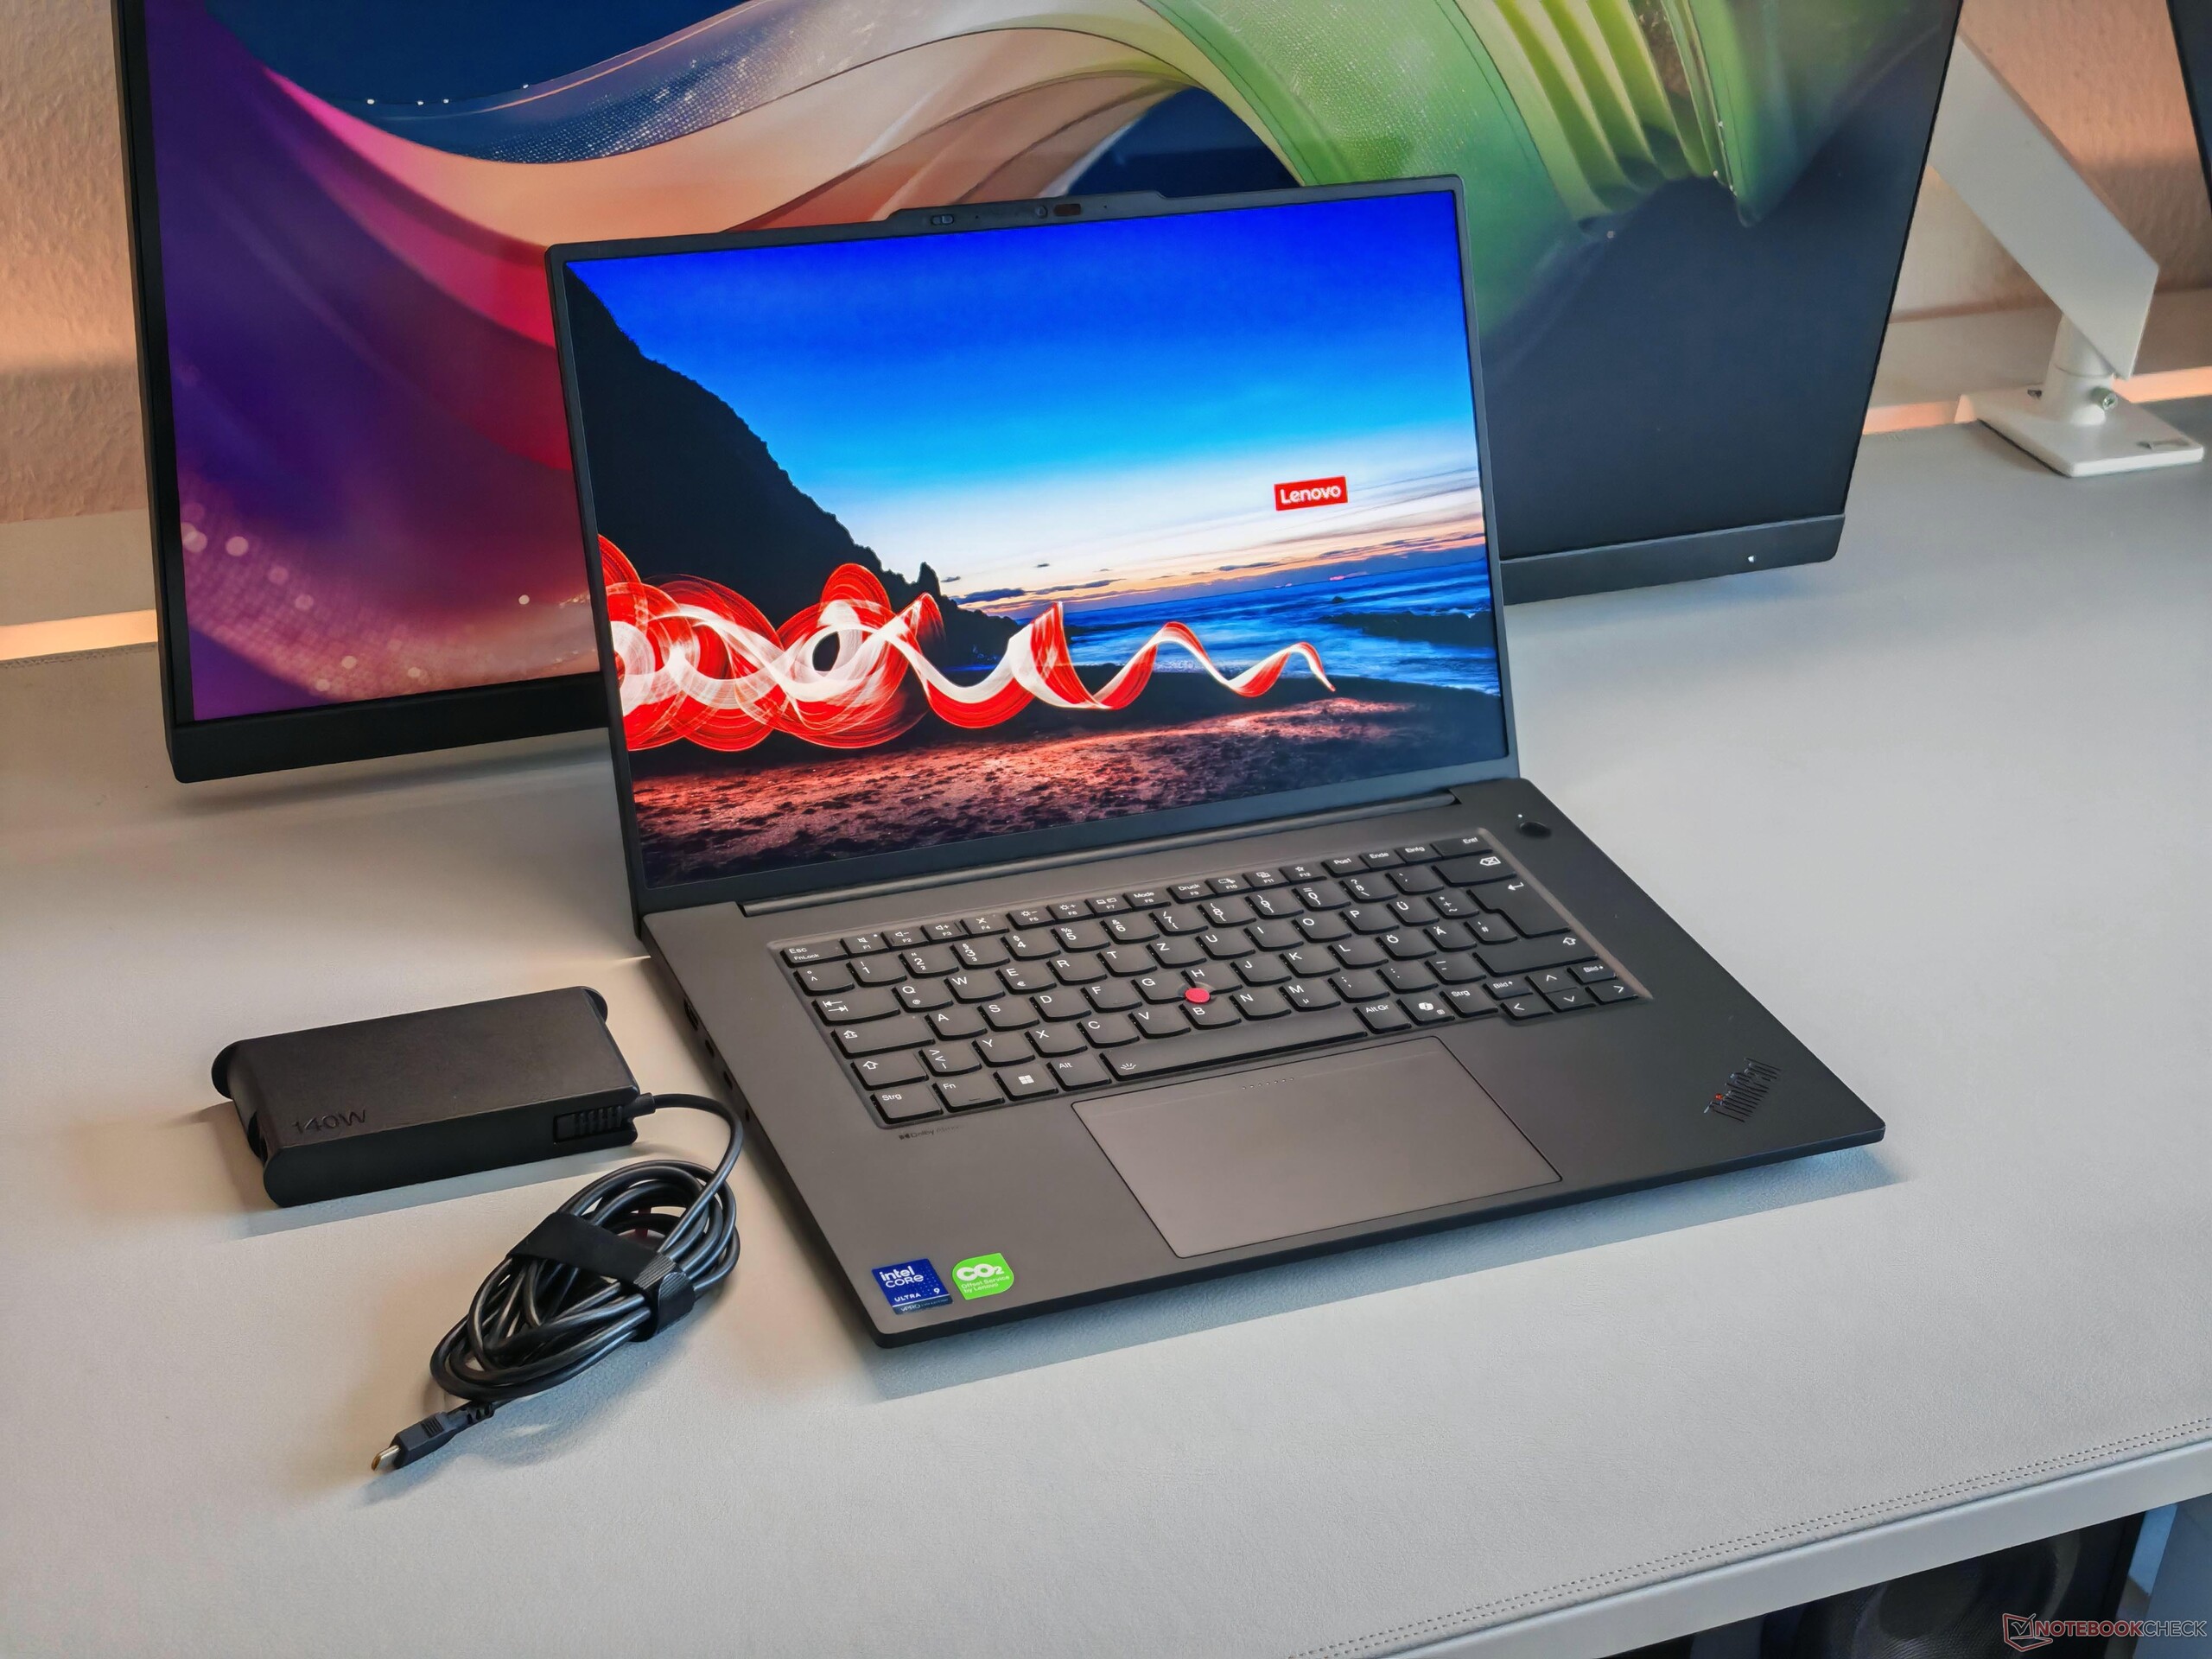
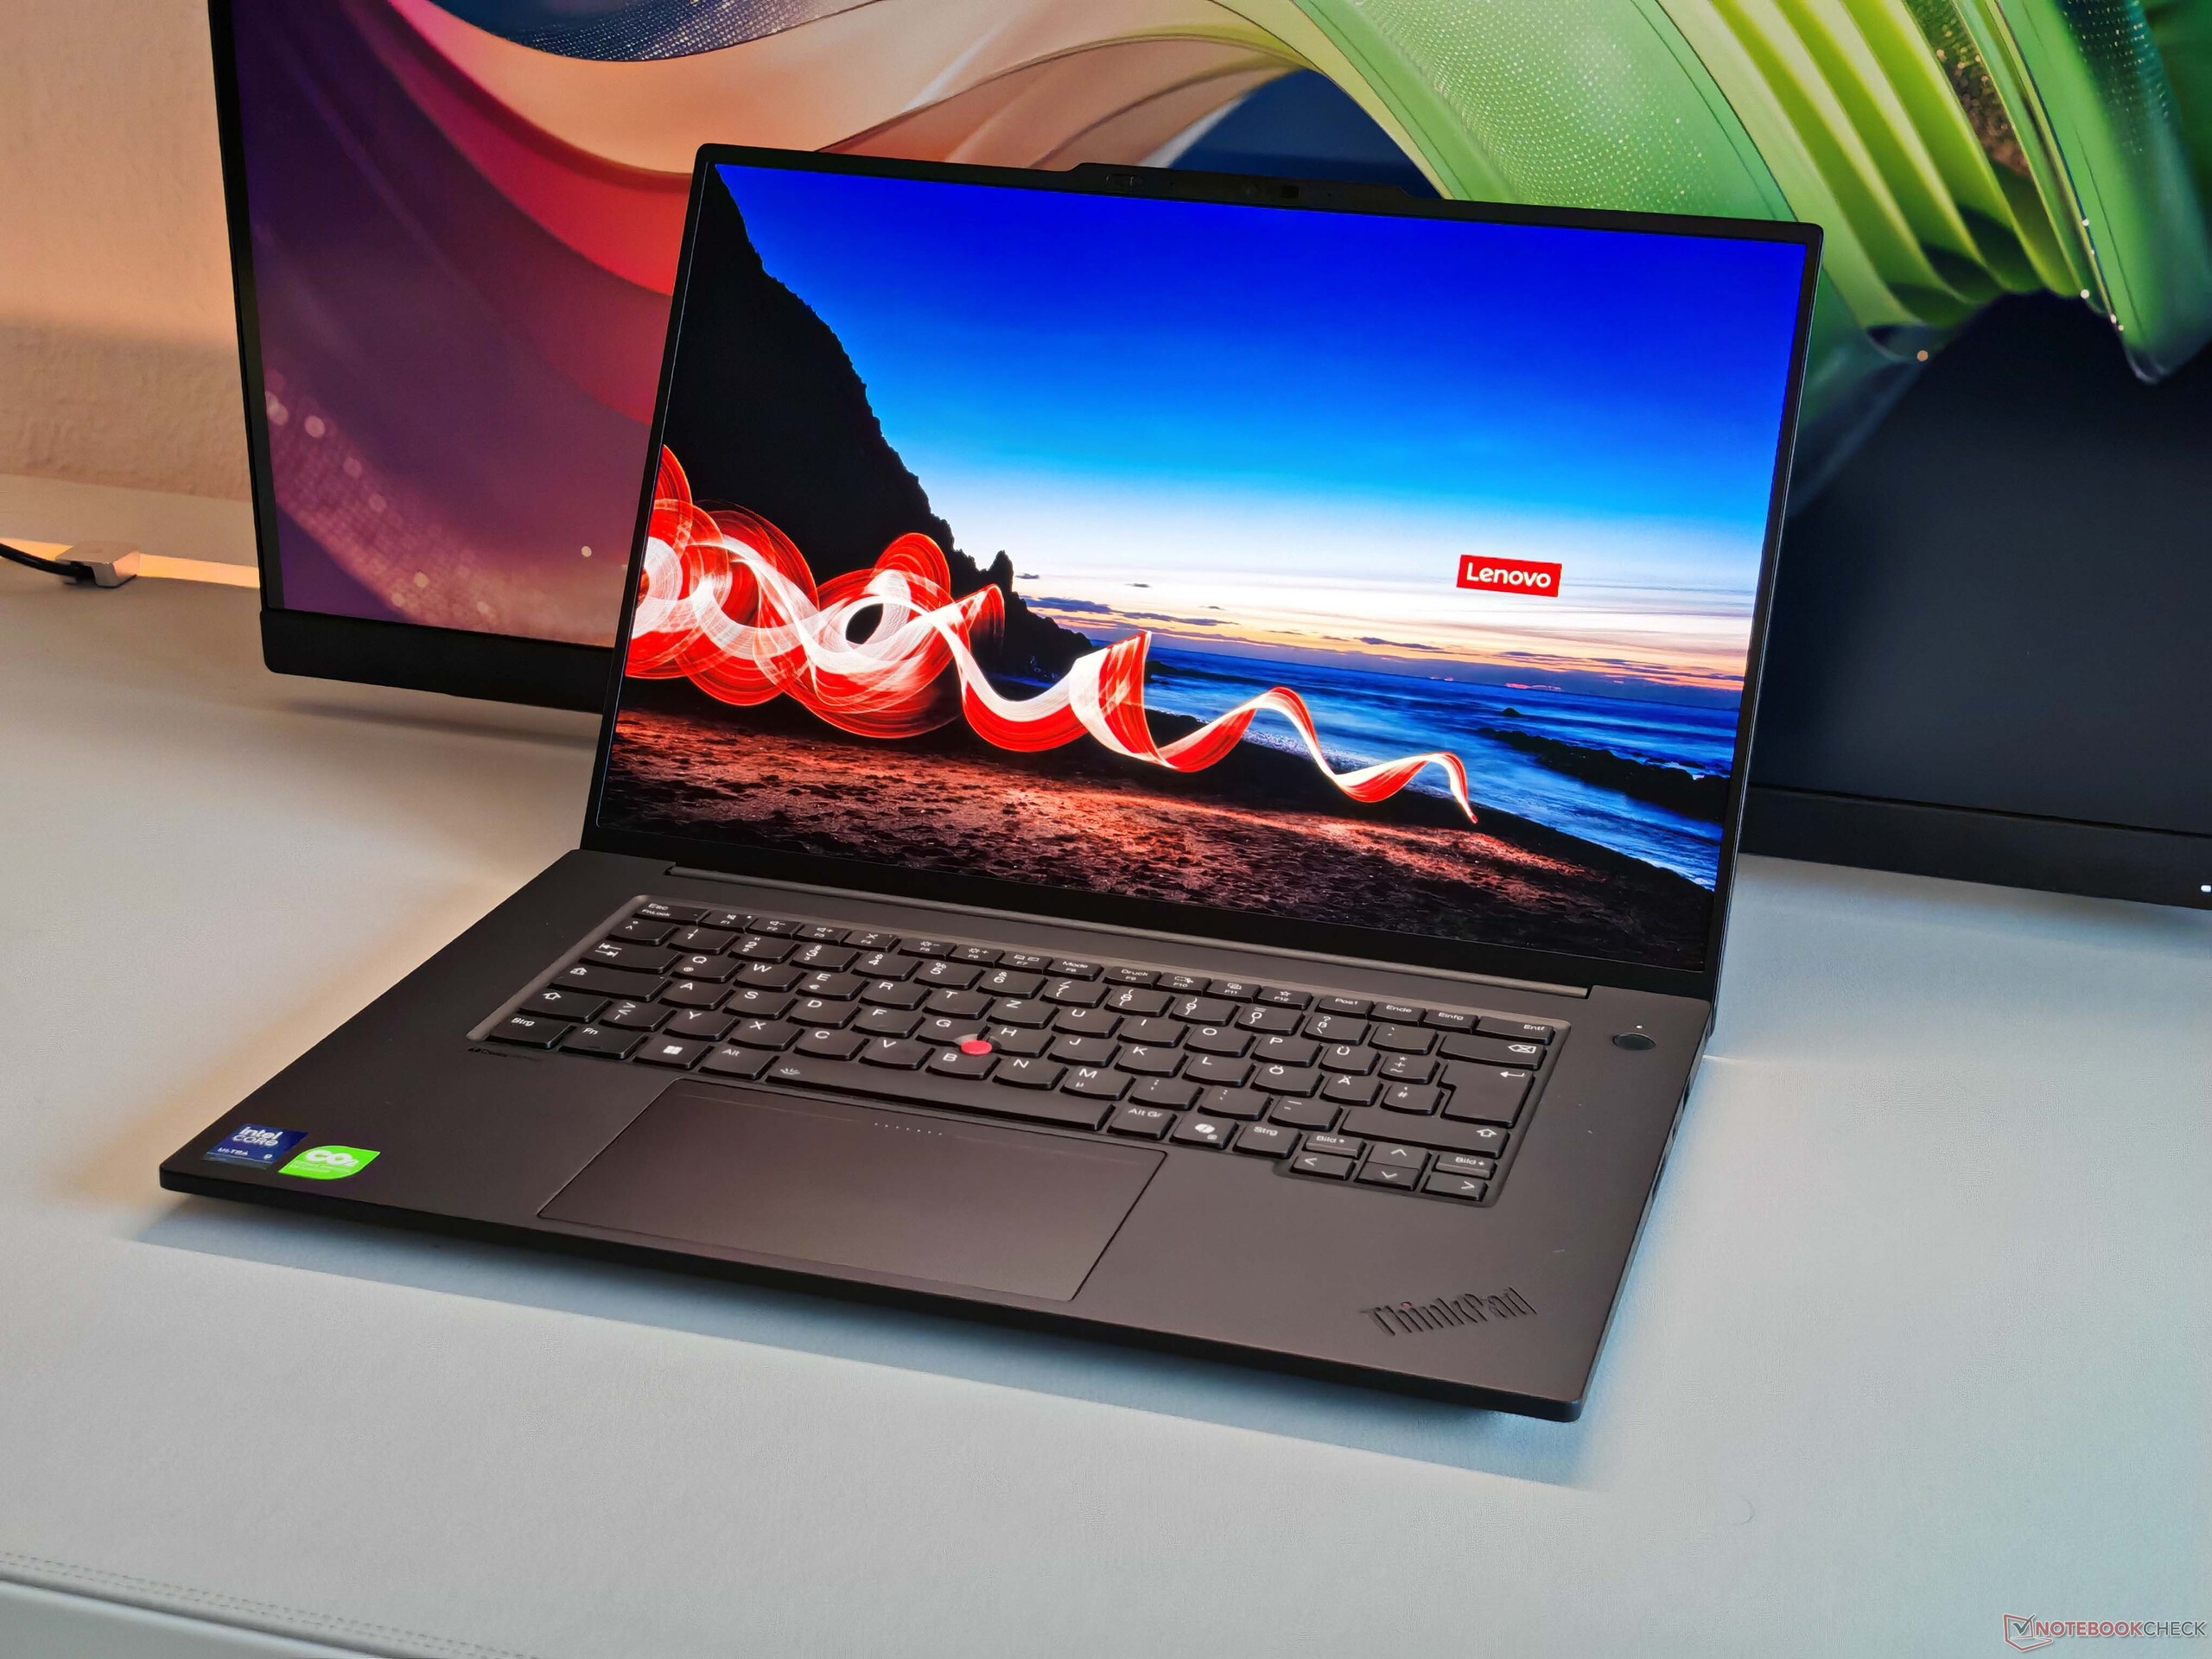
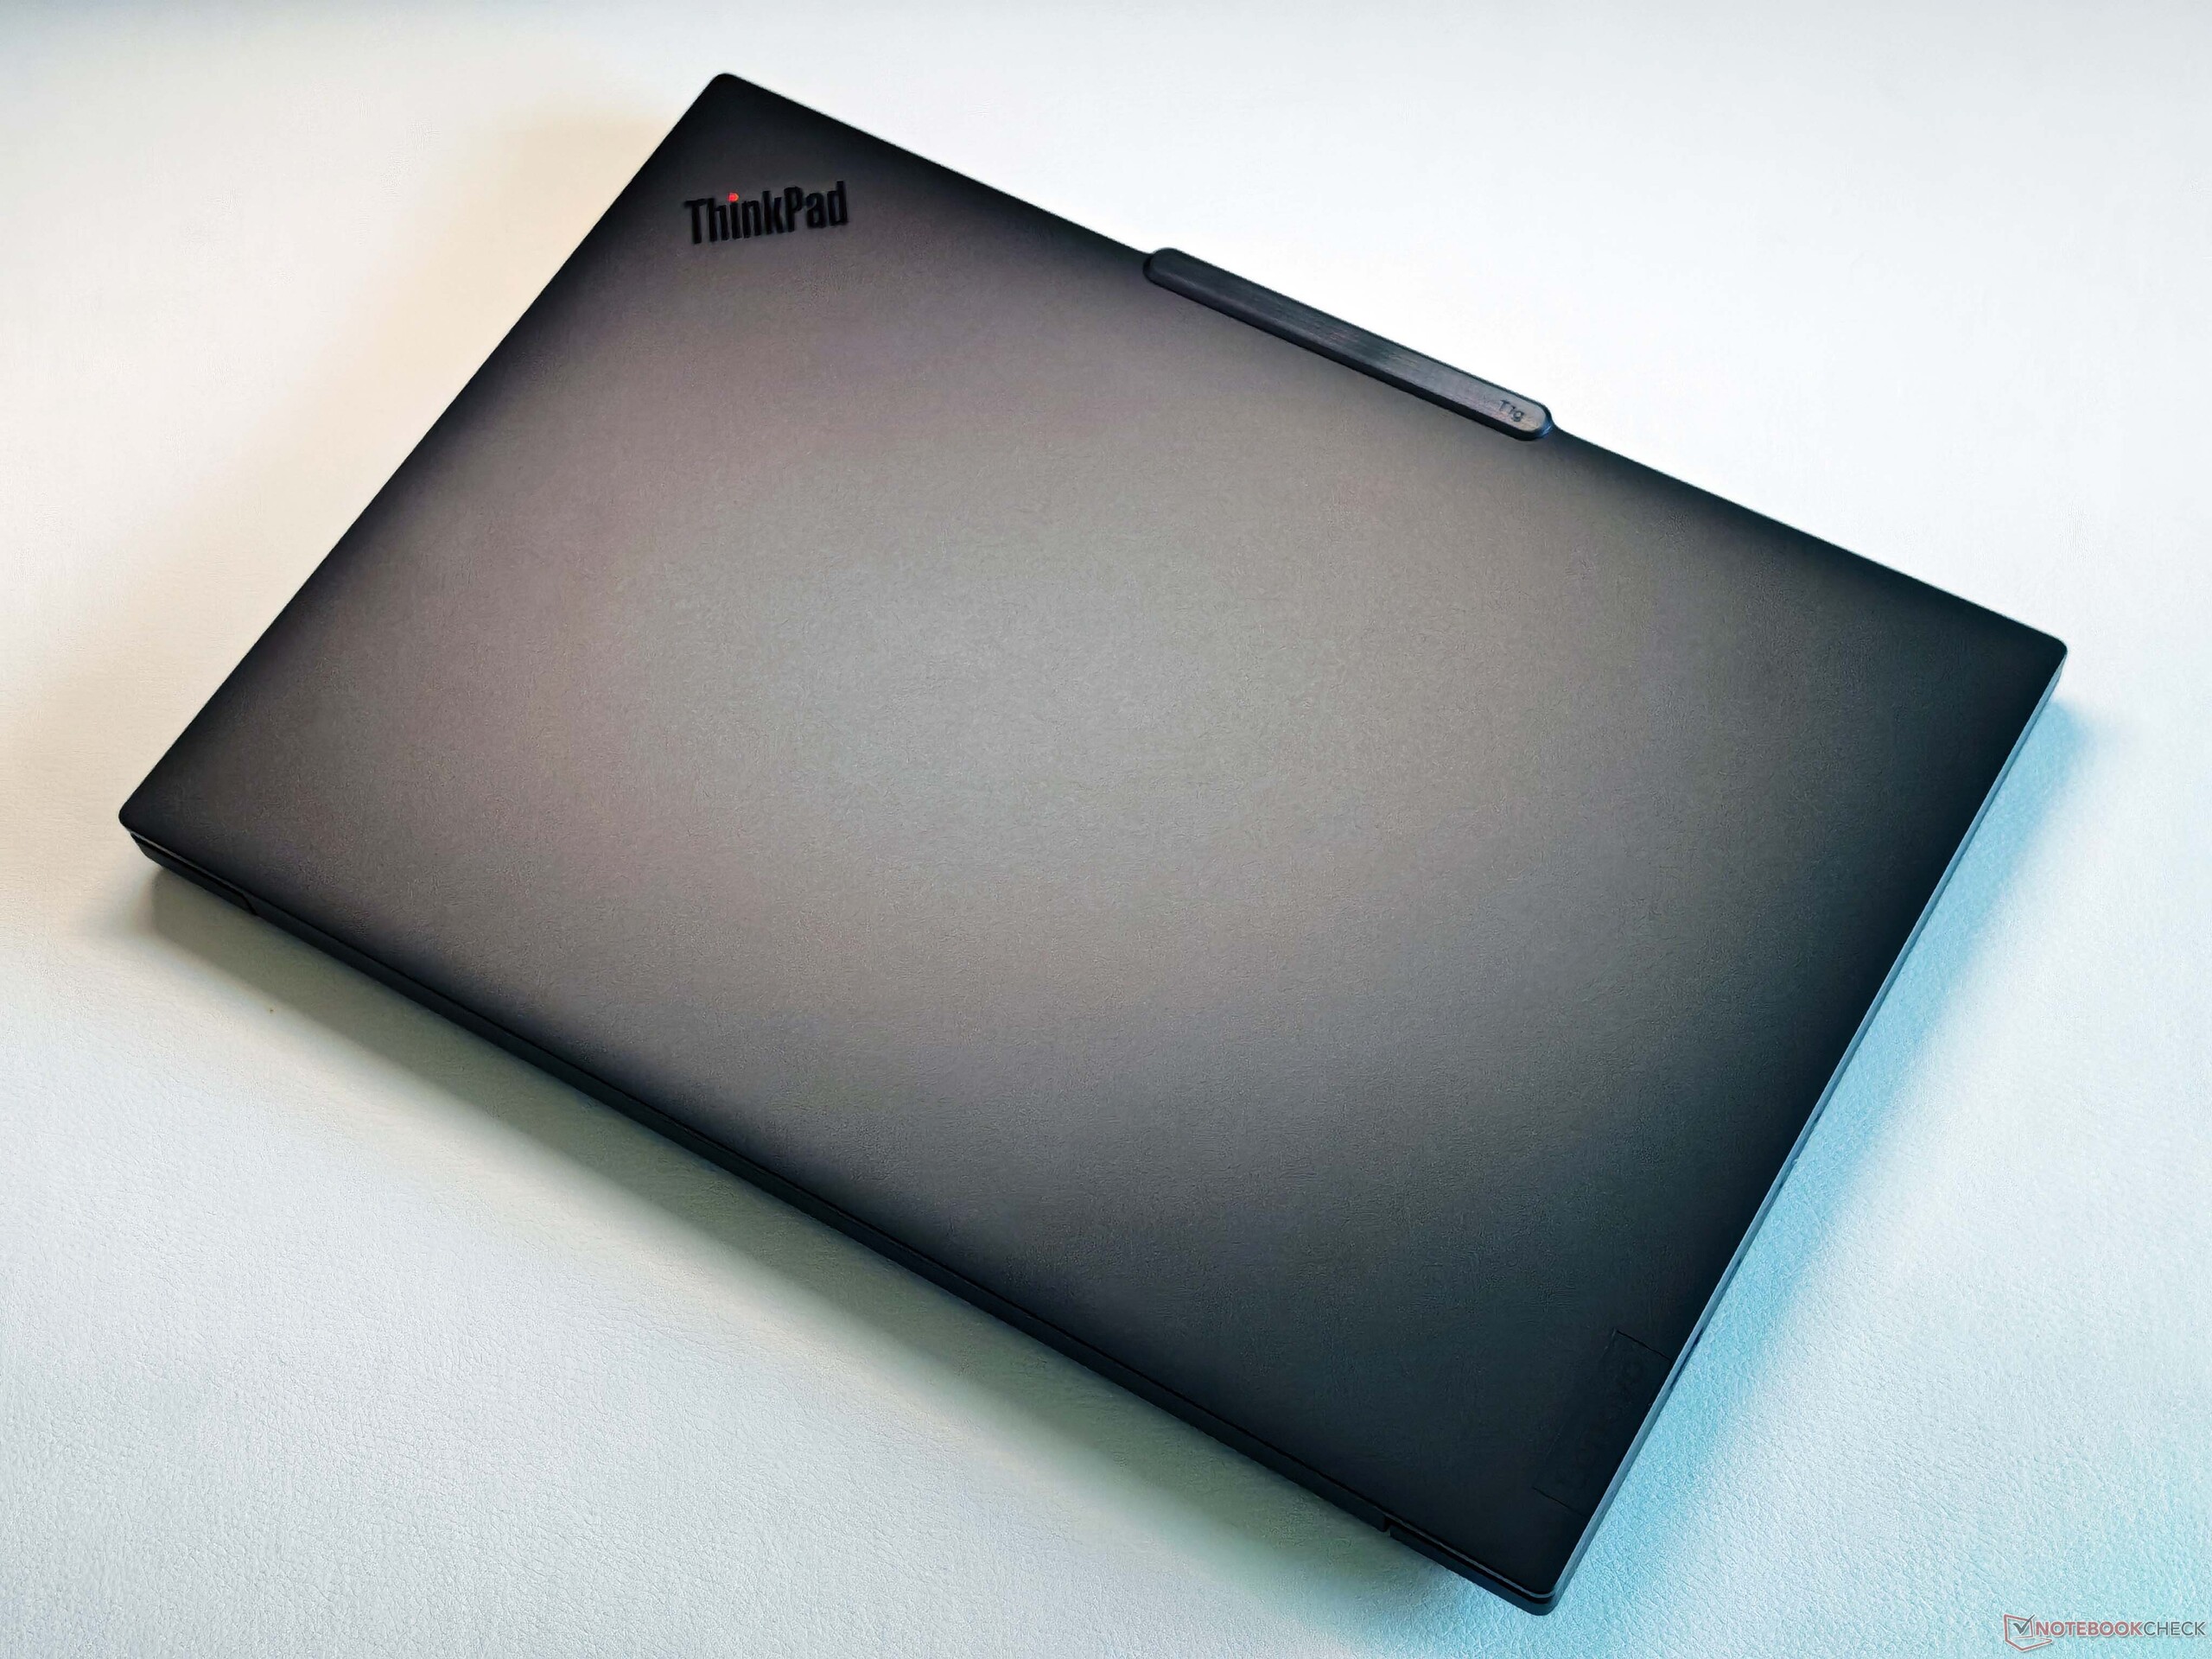
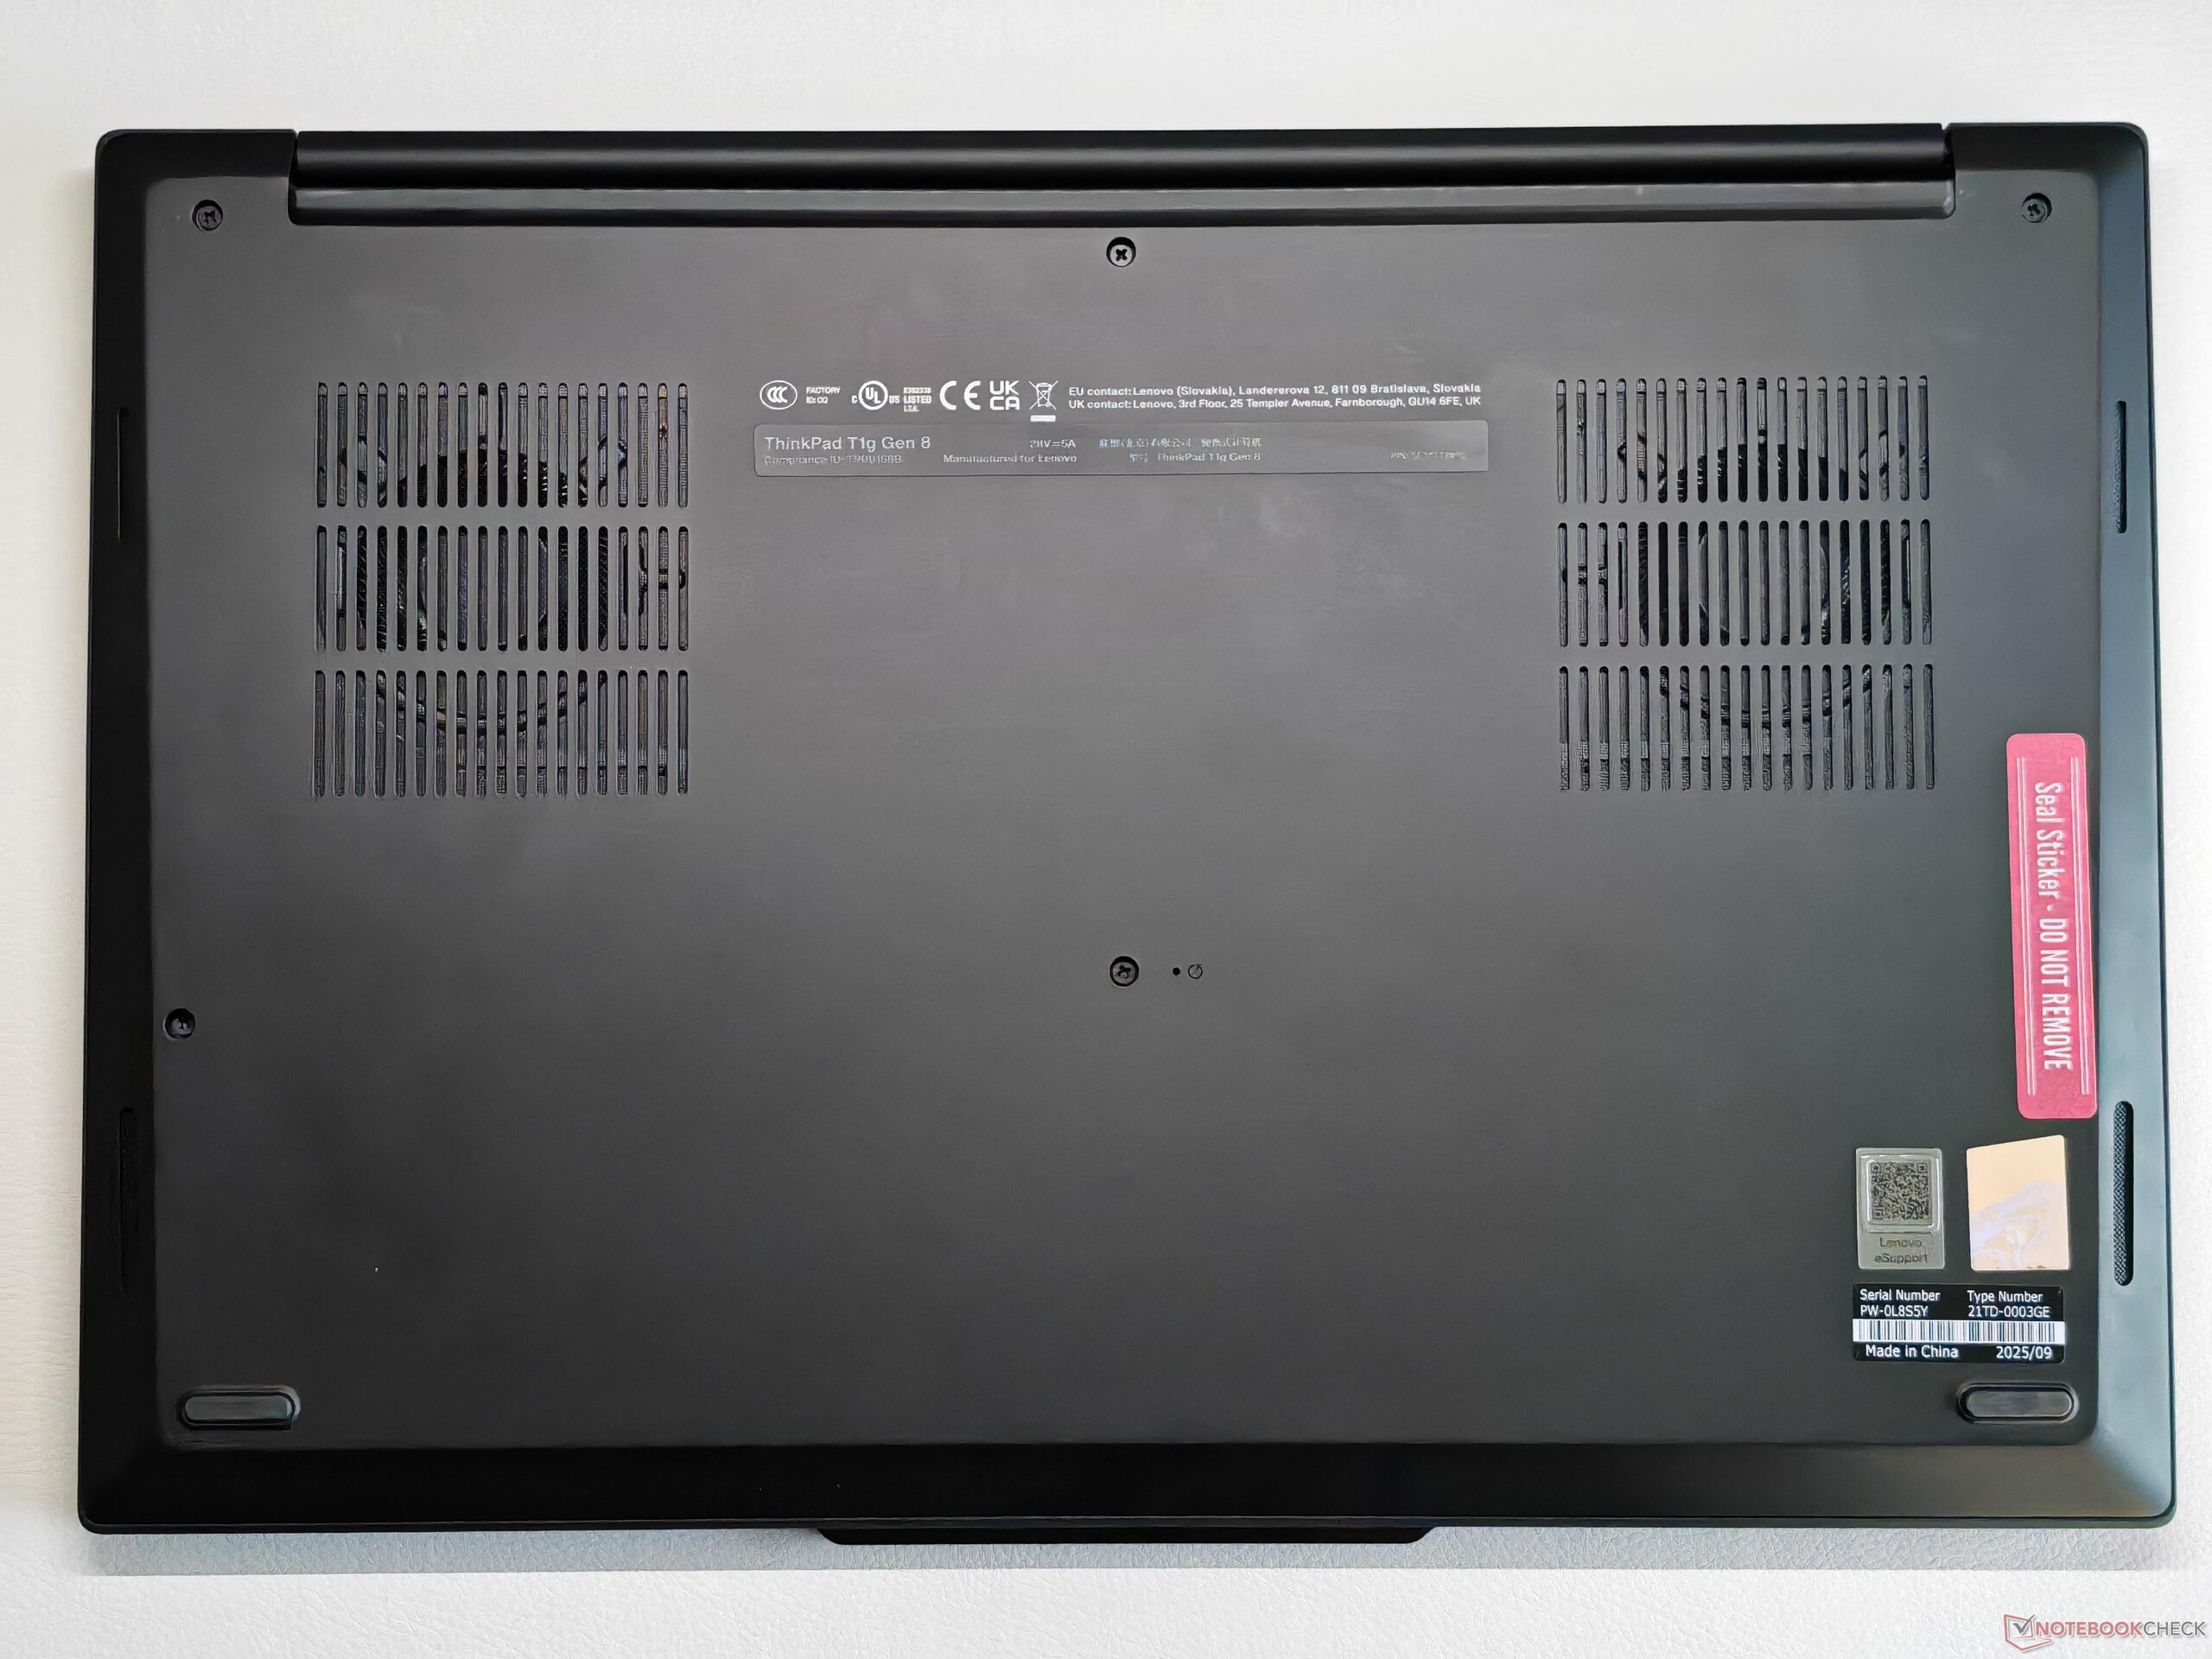
The aluminium chassis of the ThinkPad T1g Gen 8 is already familiar from the ThinkPad P1, and aside from the camera bump, there is very little to criticise here. In terms of build quality, feel and rigidity, the ThinkPad T1g fully lives up to its premium aspirations. The smooth display lid is somewhat prone to fingerprints, but it is easy to clean.
Connectivity is solid, with a sufficient number of USB ports (3x USB-C, 1x USB-A), while Thunderbolt 5 is already available on the left-hand side. The SD card reader accommodates cards fully, although transfer rates are only average. The Wi-Fi module supports Wi-Fi 7 and Bluetooth 5.4 and delivers good transmission speeds in our testing. However, users have to make do without an Ethernet port as well as a 5G modem. The 5 MP webcam (including a privacy shutter and IR module) captures respectable images.


Update: Card reader with SD-Express
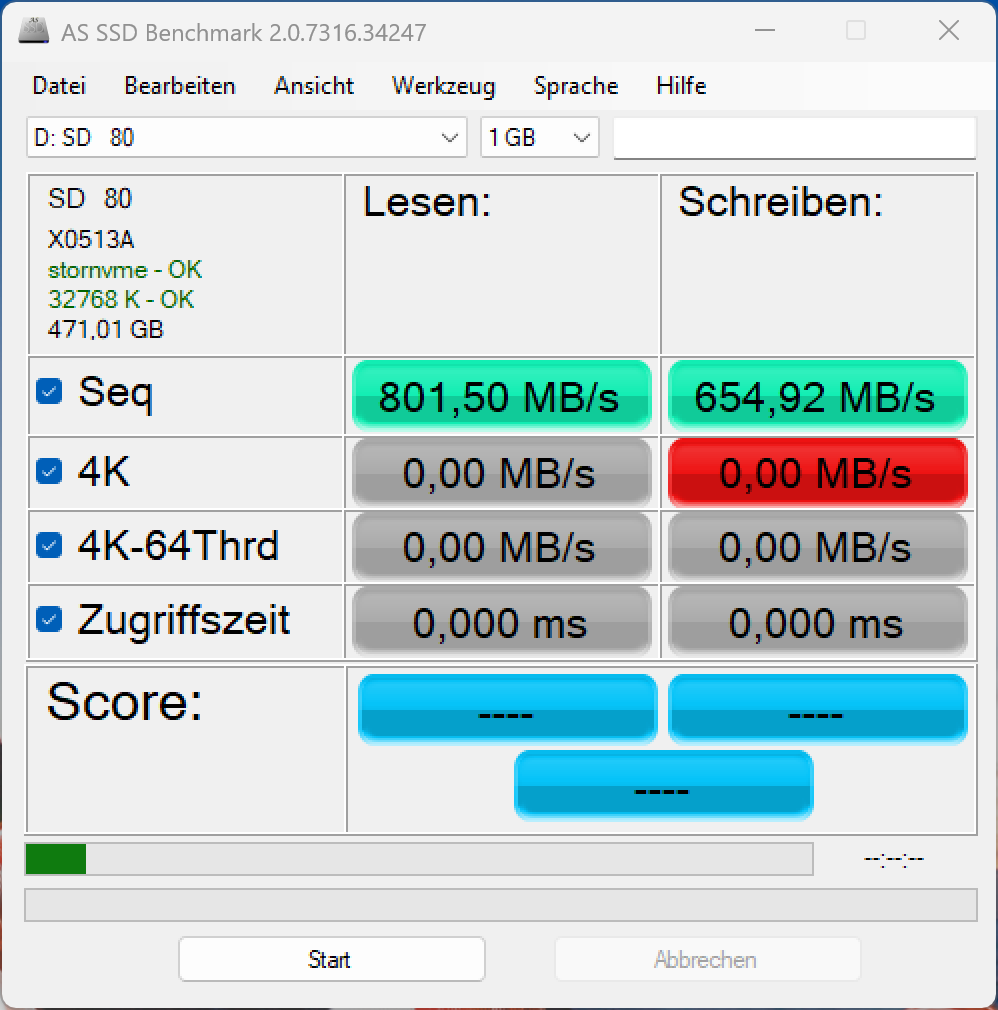
The card reader of the ThinkPad T1g Gen 8 supports SD-Express cards with the 7.0 standard and we tested it with a corresponding memory card from ADATA (SD8.0 Express 512 GB). We determined a maximum transfer rate of more than 800 MB/s and around 530 MB/s when we copied images from the card, which is a big step up from our regular UHS-II card. However, the card reader cannot utilize the full potential of the card. For comparison: The ThinkPad T16g Gen 3 (SD-Express 8.0) manages more than 1.4 GB/s with the same card.
| SD Card Reader | |
| average JPG Copy Test (av. of 3 runs) | |
| Lenovo ThinkPad T1g Gen 8 21TD003GE (ADATA SD8.0 Express 512 GBAV Pro V60) | |
| Lenovo ThinkPad T1g Gen 8 21TD003GE (Angelbird AV Pro V60) | |
| Asus ProArt P16 H7606WP (Angelbird AV Pro V60) | |
| Apple MacBook Pro 16 2024 M4 Pro (Angelbird AV Pro V60) | |
| Average of class Multimedia (23 - 531, n=40, last 2 years) | |
| Lenovo Yoga Pro 9i 16 RTX 5070 (Angelbird AV Pro V60) | |
| maximum AS SSD Seq Read Test (1GB) | |
| Lenovo ThinkPad T1g Gen 8 21TD003GE (ADATA SD8.0 Express 512 GB) | |
| Lenovo ThinkPad T1g Gen 8 21TD003GE (Angelbird AV Pro V60) | |
| Asus ProArt P16 H7606WP (Angelbird AV Pro V60) | |
| Apple MacBook Pro 16 2024 M4 Pro (Angelbird AV Pro V60) | |
| Average of class Multimedia (37.3 - 1455, n=39, last 2 years) | |
| Lenovo Yoga Pro 9i 16 RTX 5070 (Angelbird AV Pro V60) | |
| Networking | |
| Lenovo ThinkPad T1g Gen 8 21TD003GE | |
| iperf3 transmit AXE11000 | |
| iperf3 receive AXE11000 | |
| Lenovo Yoga Pro 9i 16 RTX 5070 | |
| iperf3 transmit AXE11000 | |
| iperf3 receive AXE11000 | |
| Asus ProArt P16 H7606WP | |
| iperf3 transmit AXE11000 | |
| iperf3 receive AXE11000 | |
| Dell 16 Premium DA16250 | |
| iperf3 transmit AXE11000 | |
| iperf3 receive AXE11000 | |
| iperf3 transmit AXE11000 6GHz | |
| iperf3 receive AXE11000 6GHz | |
| Apple MacBook Pro 16 2024 M4 Pro | |
| iperf3 transmit AXE11000 | |
| iperf3 receive AXE11000 | |


Maintenance
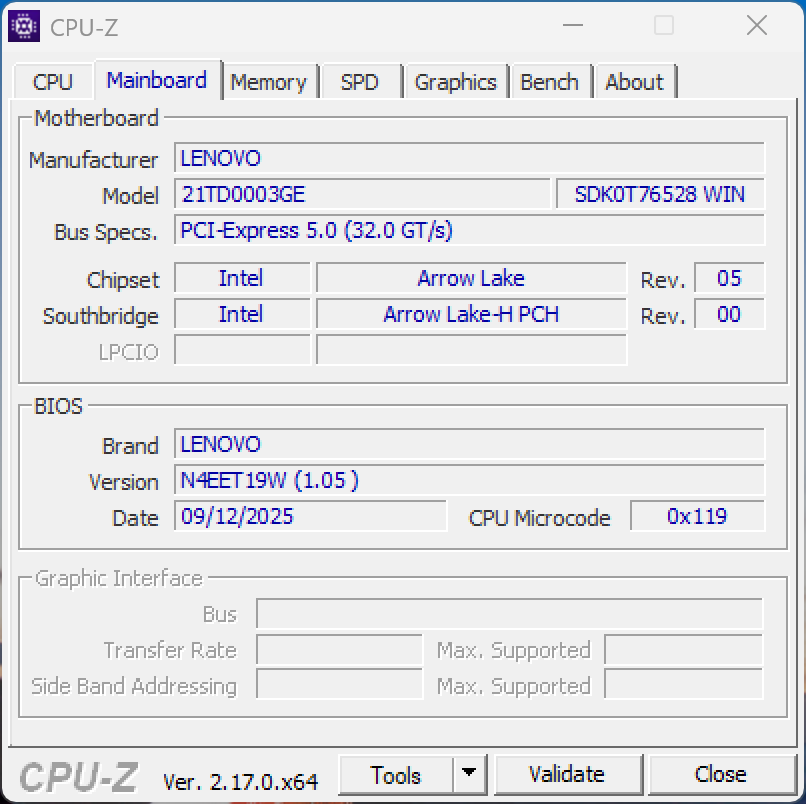
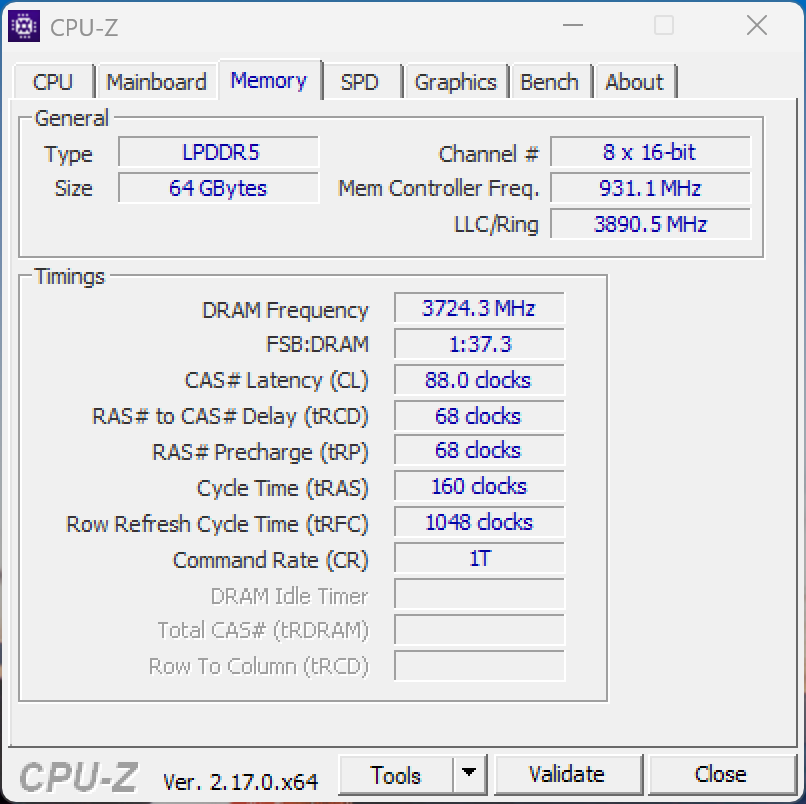
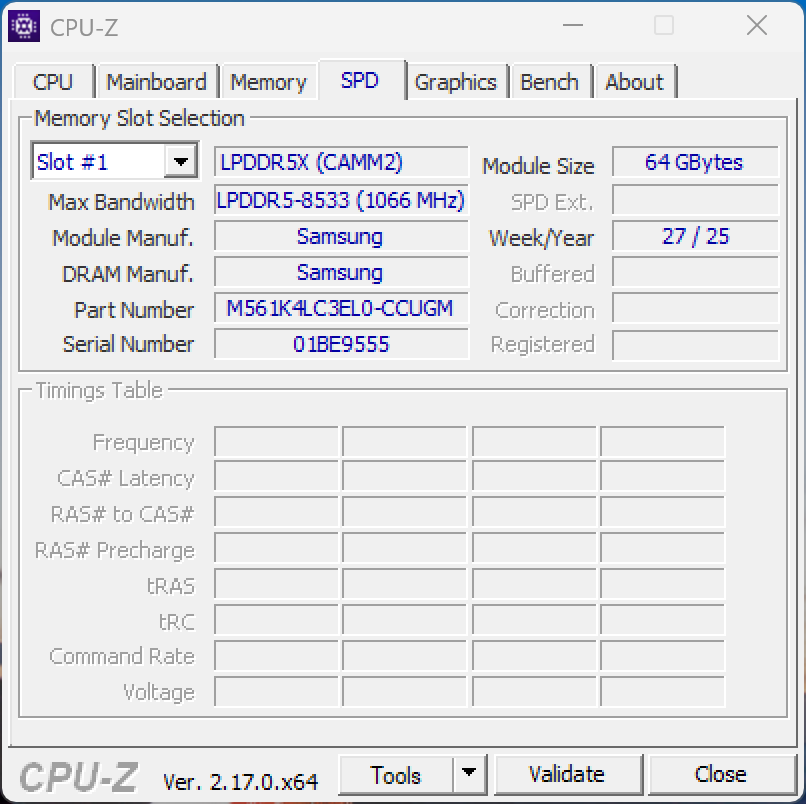
Overall, maintenance options are good, and the RAM can be replaced thanks to a CAMM2 module, although the maximum supported capacity is limited to 64 GB. There are also two M.2-2280 SSD slots (PCIe 5.0), and the battery can be replaced as well. The Wi-Fi module, however, is soldered in place.


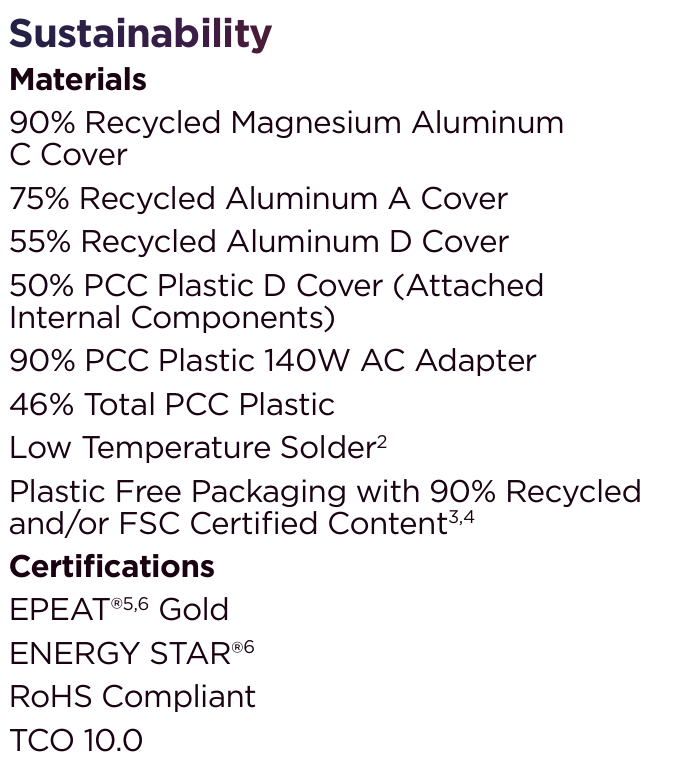
Sustainability
Lenovo offers extensive transparency regarding the device’s CO₂ footprint and the use of recycled materials.

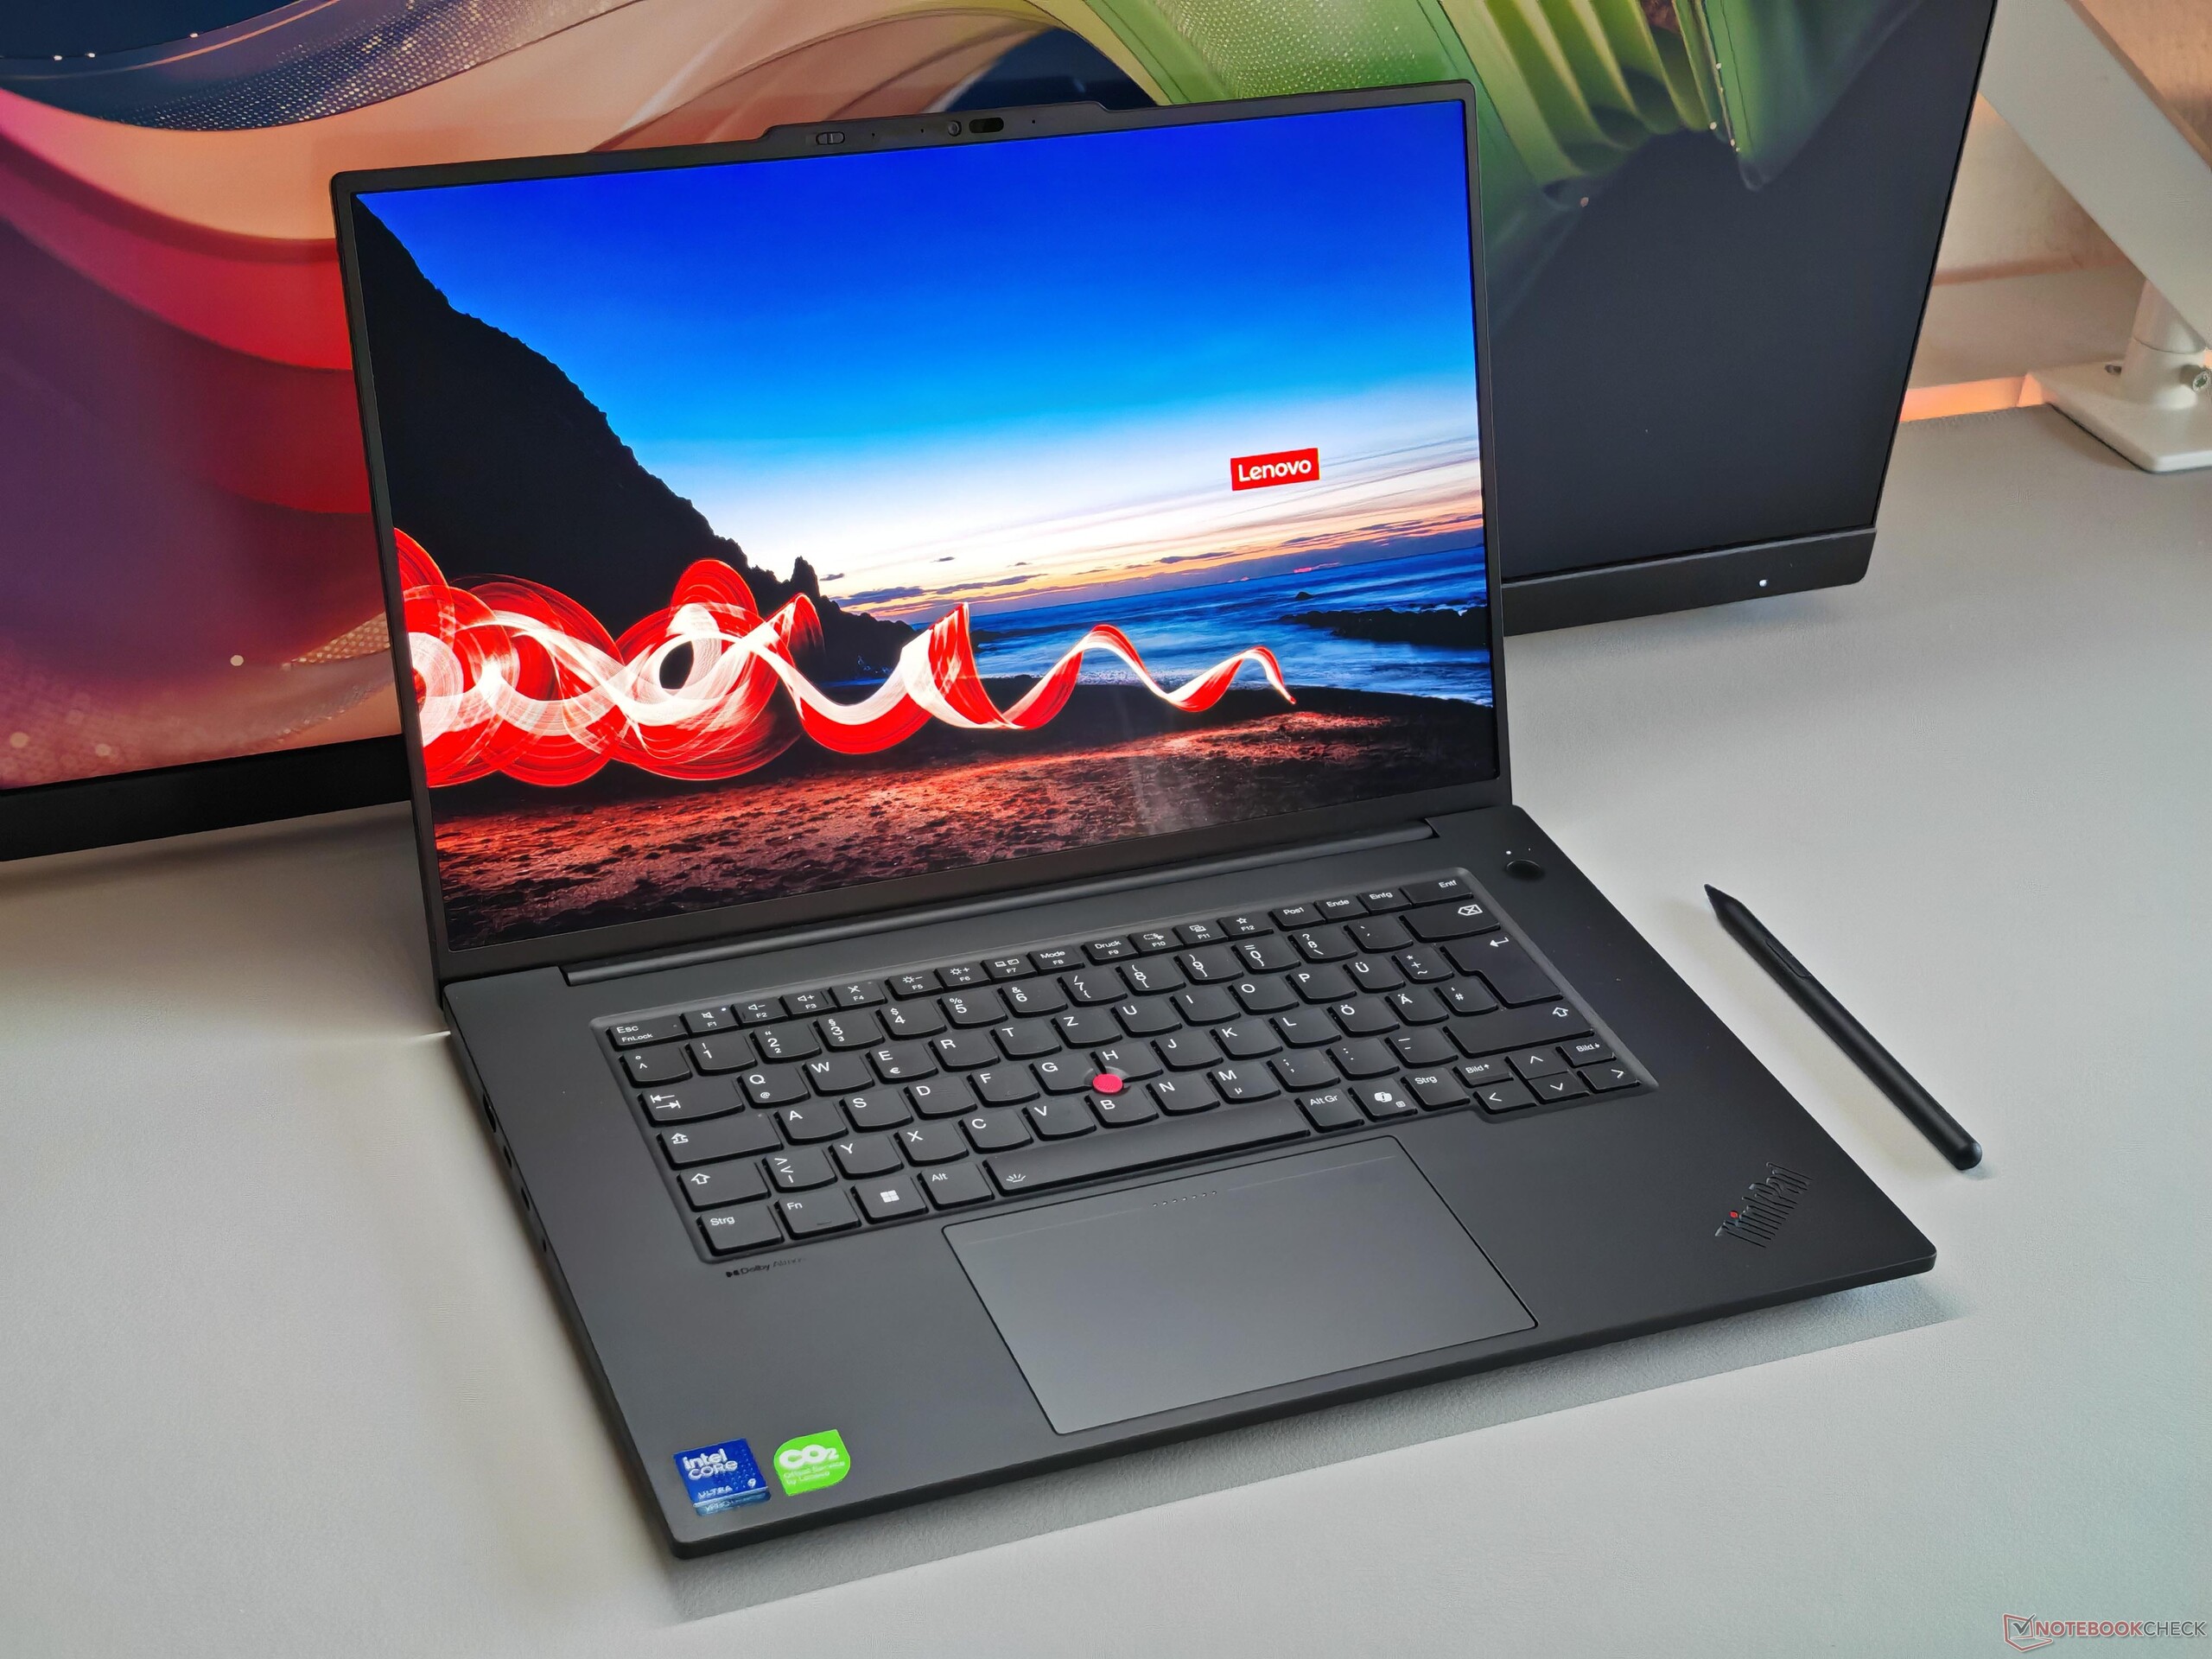
Input devices – excellent keyboard
Even though the layout of the backlit keyboard is not ideal in places (for example, the narrower keys for umlauts), the typing experience is outstanding and it is undoubtedly one of the best mobile keyboards Lenovo currently offers. Subjectively, the key travel feels longer than 1.5 mm, evoking memories of older ThinkPad models.
The haptic touchpad also performs excellently, particularly in combination with the TrackPoint. For more detailed information, we refer readers to our review of the ThinkPad P1 Gen 7. The OLED panel additionally supports touch input, which works reliably, and a stylus is included in the box.


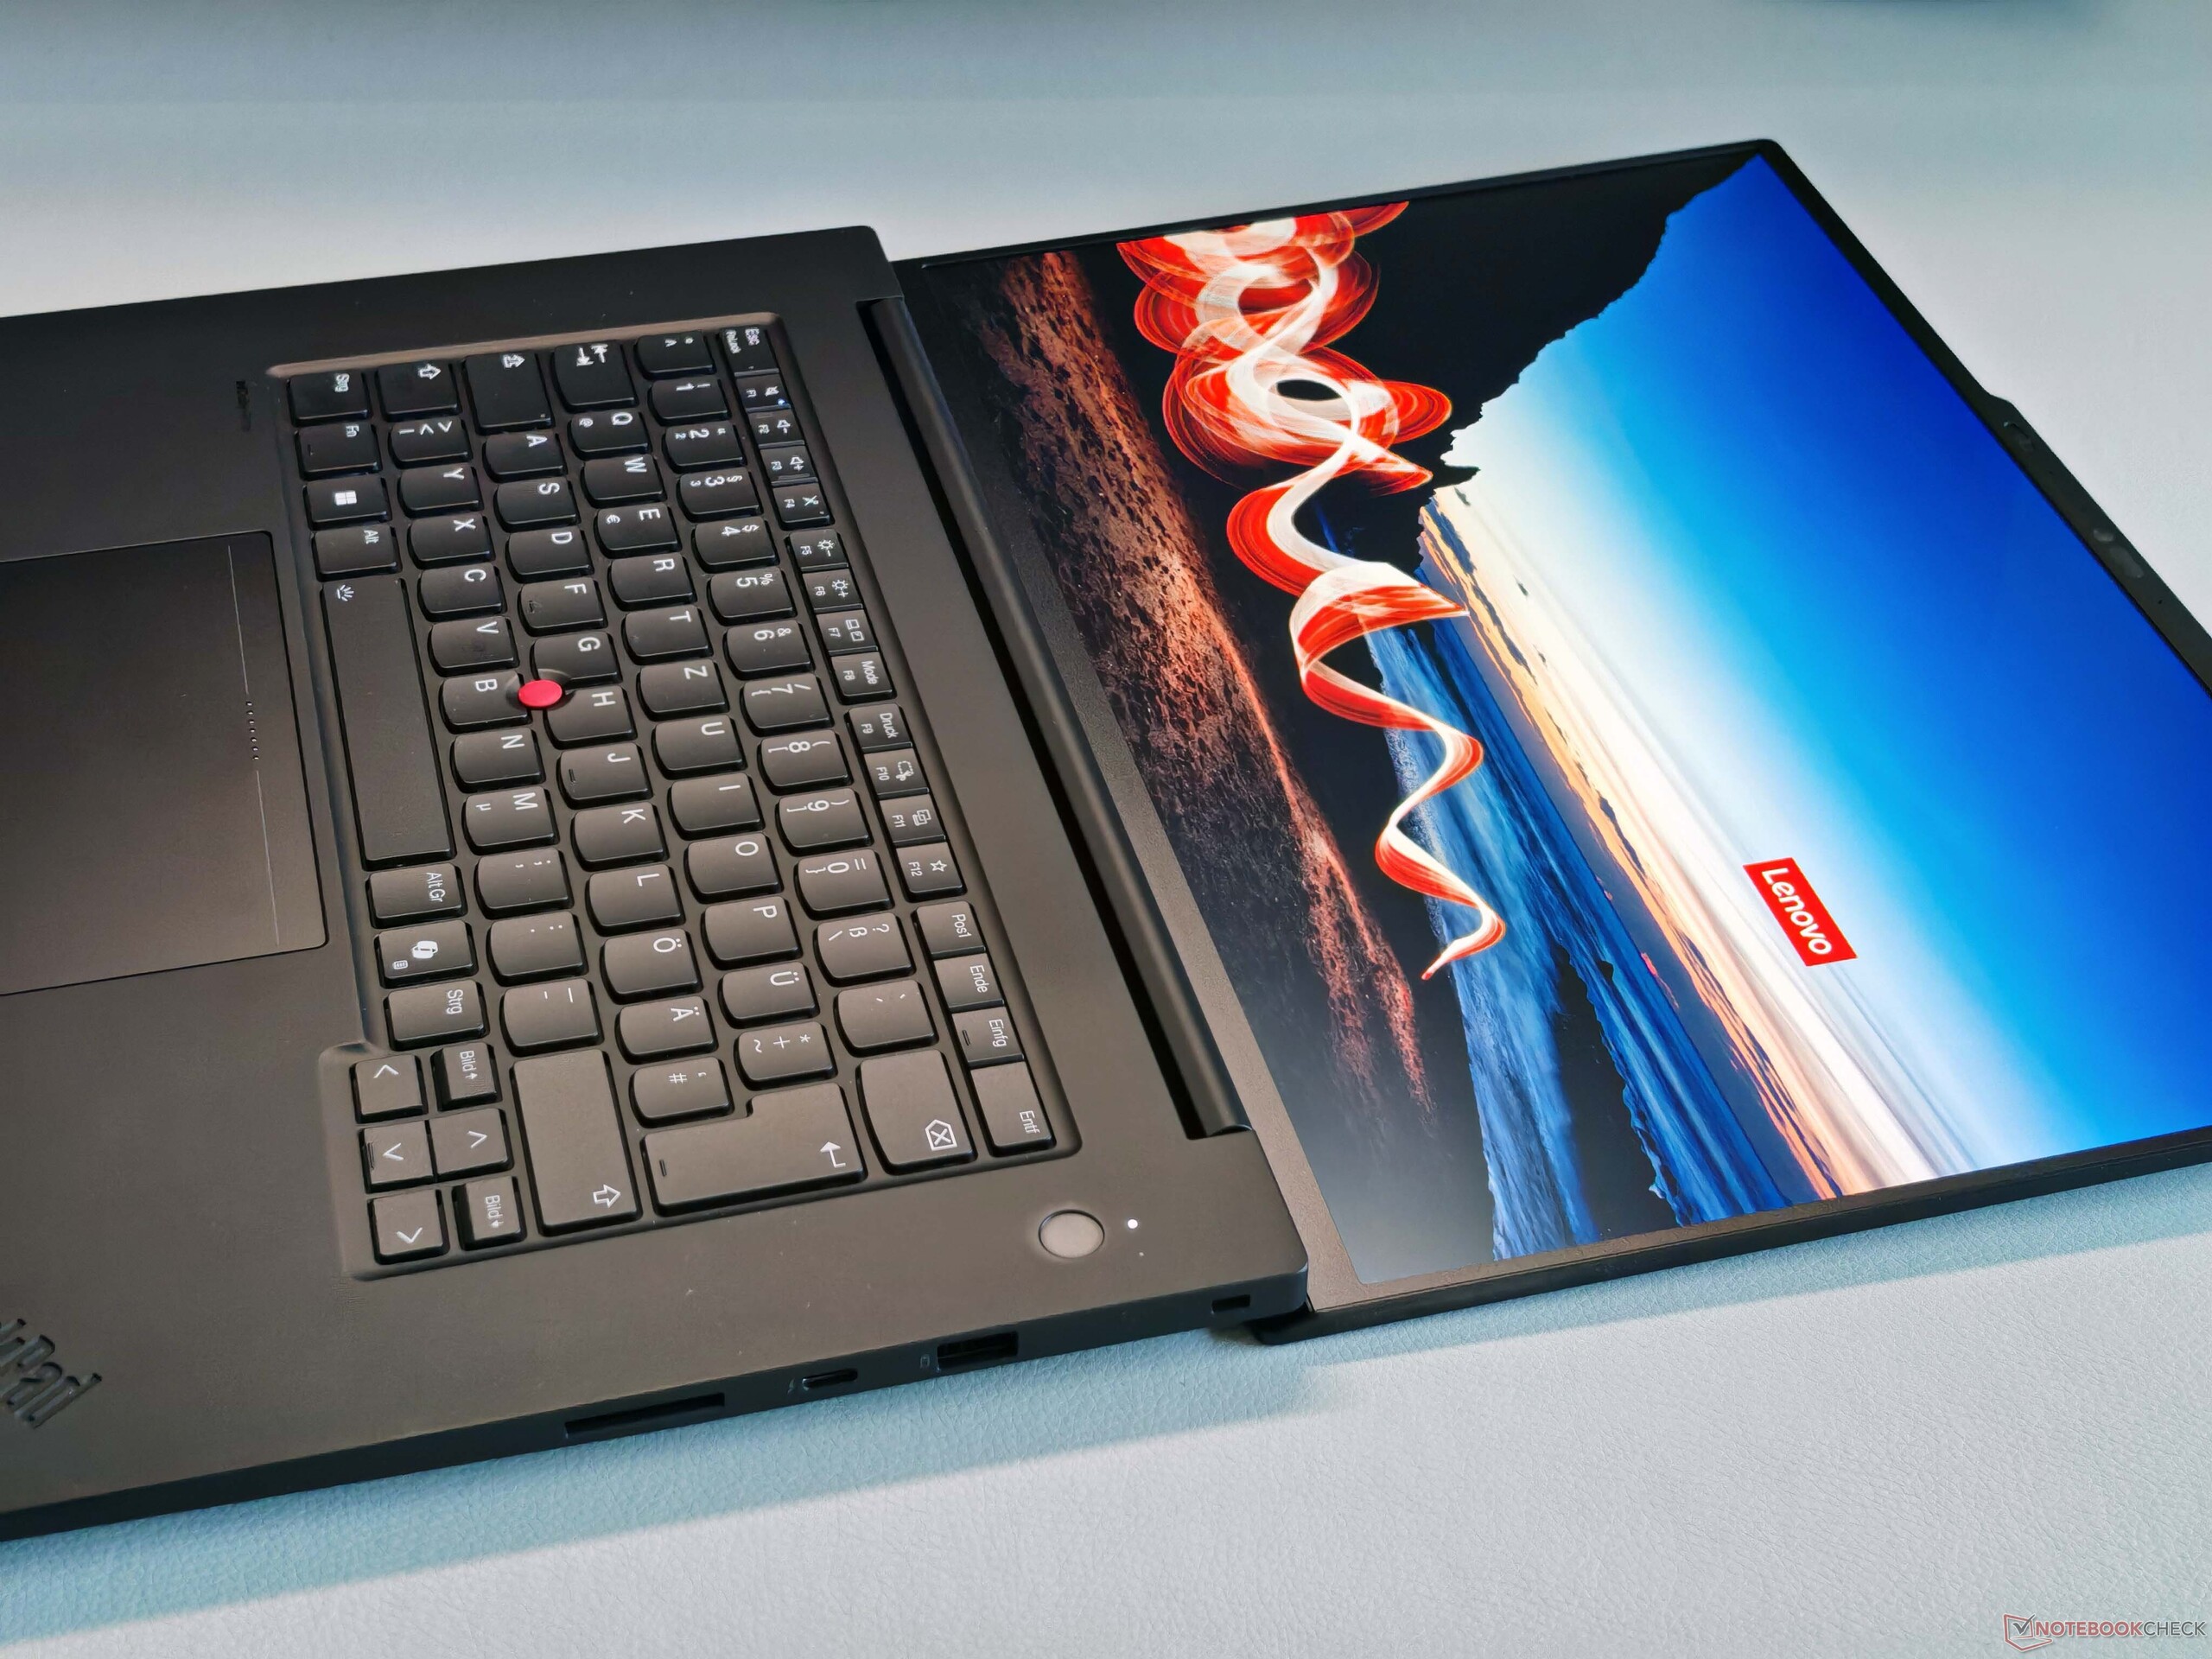
Display – Matte Tandem OLED touchscreen

In addition to two IPS panels (Full HD or 4K, both at 60 Hz), Lenovo also offers a matte Tandem OLED panel with 120 Hz (VRR), which is fitted in our test unit. The main drawback of this option is that the matte surface, combined with the touchscreen layer, results in a slightly grainy image impression, particularly with bright content. As a result, subjective image quality appears somewhat weaker than that of competitors such as the Yoga Pro 9i 16 with its glossy Tandem OLED display. On the plus side, reflections are effectively eliminated.
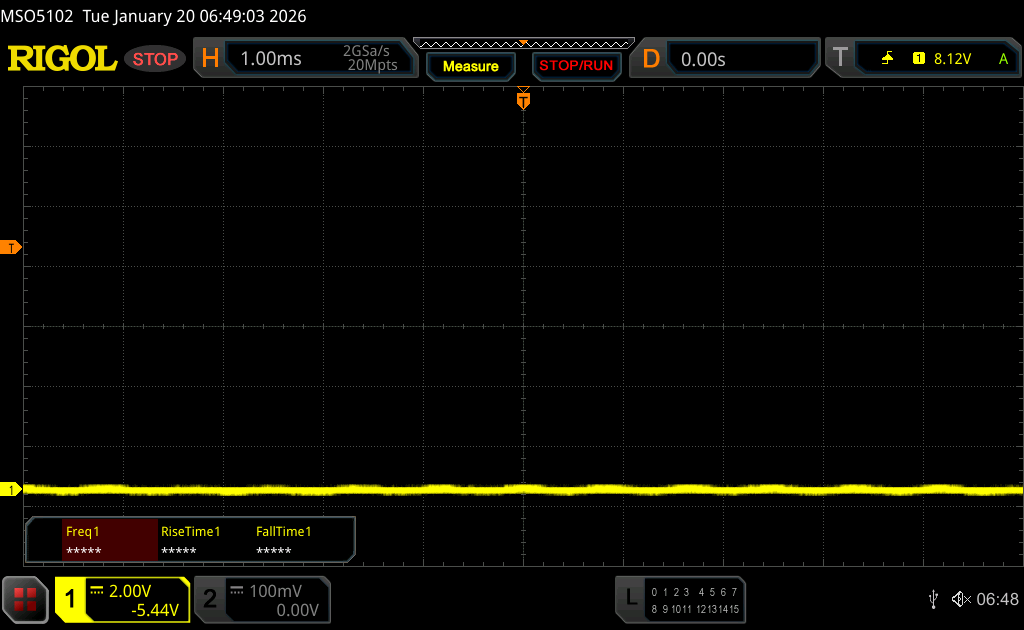
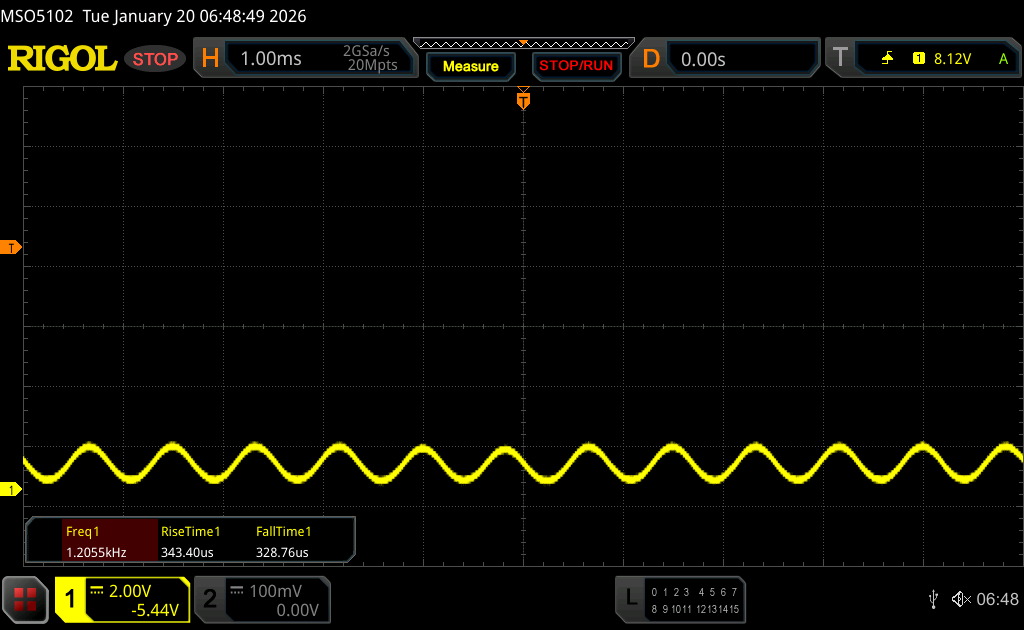
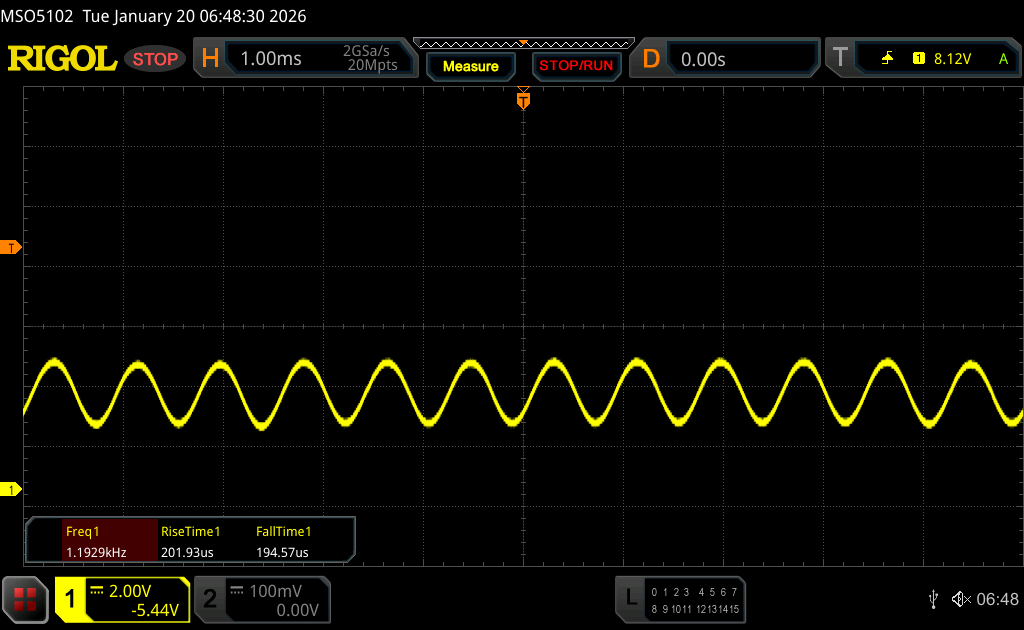
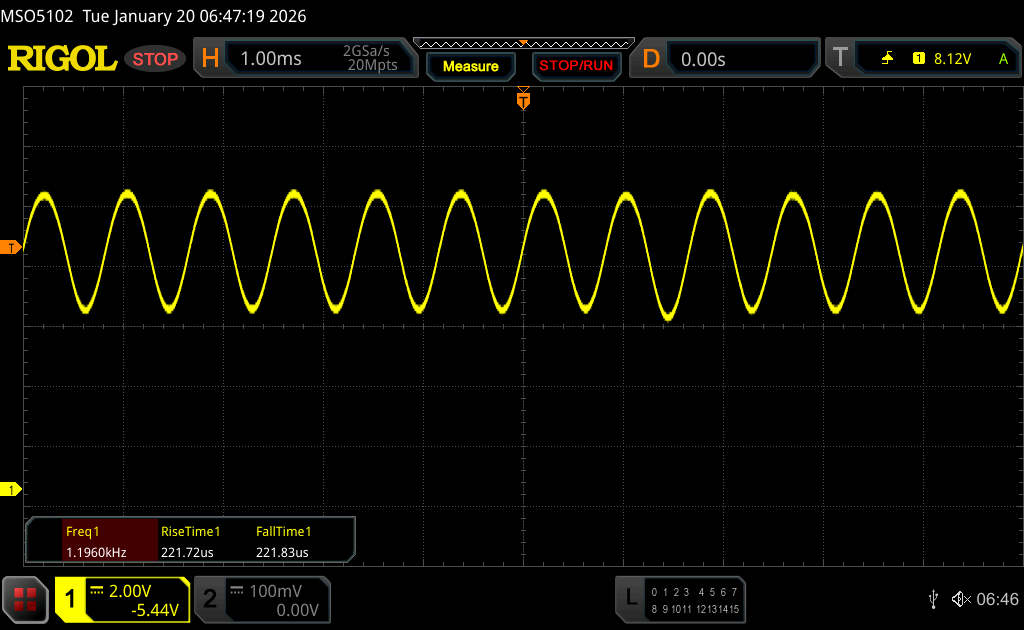
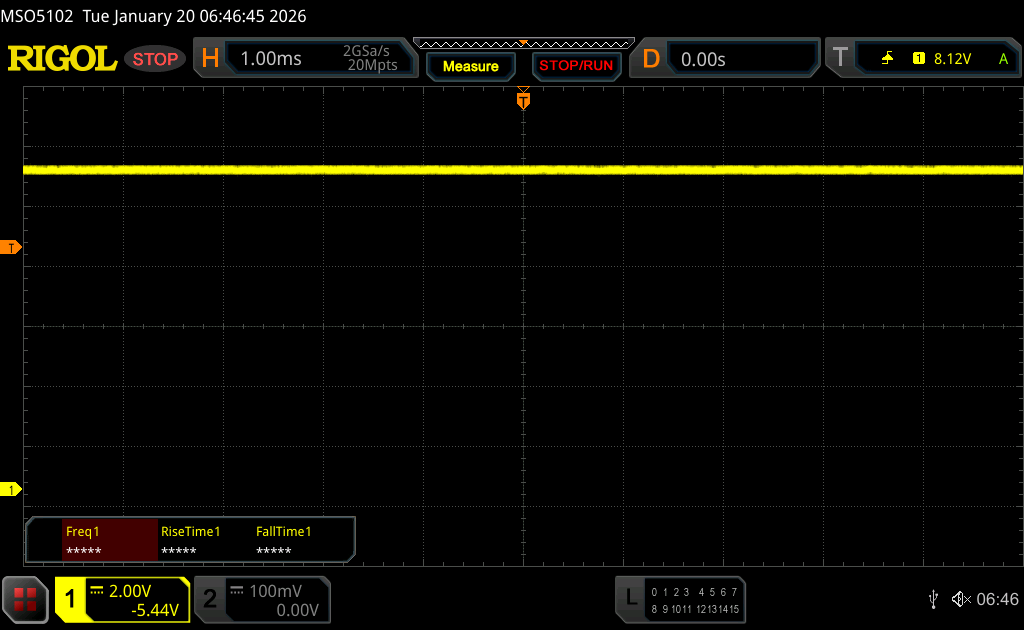
At brightness levels of 70% and below, measurable PWM flickering is present. However, with a high frequency of around 1.2 kHz and low amplitude, this should not pose any significant issues in practice.
SDR brightness reaches a solid ~600 cd/m², while HDR content peaks at up to 1,530 cd/m² (or 753 cd/m² with an almost fully white image). Several colour profiles are available out of the box, and colour accuracy for both sRGB and P3 (each fully covered) is good. Greyscale reproduction could be slightly better, however, and our own calibration did not lead to further improvements.
| |||||||||||||||||||||||||
Brightness Distribution: 98 %
Center on Battery: 578 cd/m²
Contrast: ∞:1 (Black: 0 cd/m²)
ΔE ColorChecker Calman: 1.6 | ∀{0.5-29.43 Ø4.71}
ΔE Greyscale Calman: 2.6 | ∀{0.09-98 Ø4.96}
88.9% AdobeRGB 1998 (Argyll 3D)
100% sRGB (Argyll 3D)
98.8% Display P3 (Argyll 3D)
Gamma: 2.19
CCT: 6527 K
| Lenovo ThinkPad T1g Gen 8 21TD003GE ATNA60KA02-0, Tandem-OLED, 3200x2000, 16", 120 Hz | Lenovo Yoga Pro 9i 16 RTX 5070 ATNA60KA01-0, OLED, 3200x2000, 16", 120 Hz | Asus ProArt P16 RTX 5090 ATNA60HC03-0, OLED, 3840x2400, 16", 120 Hz | Dell 16 Premium DA16250 Samsung 163DU02, OLED, 3840x2400, 16.3", 120 Hz | Apple MacBook Pro 16 2024 M4 Pro Mini-LED, 3456x2234, 16.2", 120 Hz | |
|---|---|---|---|---|---|
| Display | 3% | 0% | 0% | 0% | |
| Display P3 Coverage (%) | 98.8 | 97.4 -1% | 98.9 0% | 99.7 1% | 99.7 1% |
| sRGB Coverage (%) | 100 | 100 0% | 100 0% | 100 0% | 100 0% |
| AdobeRGB 1998 Coverage (%) | 88.9 | 96.8 9% | 88.6 0% | 88.1 -1% | 88.8 0% |
| Response Times | 3% | -32% | -101% | -8819% | |
| Response Time Grey 50% / Grey 80% * (ms) | 0.26 ? | 0.27 ? -4% | 0.3 ? -15% | 0.61 ? -135% | 43 ? -16438% |
| Response Time Black / White * (ms) | 0.42 ? | 0.37 ? 12% | 0.45 ? -7% | 0.88 ? -110% | 41.2 ? -9710% |
| PWM Frequency (Hz) | 1200 ? | 1200 | 480 ? | 490.8 ? | 14880 |
| PWM Amplitude * (%) | 22 | 22 -0% | 38 -73% | 35 -59% | 90 -309% |
| Screen | 49% | 41% | 6% | 36% | |
| Brightness middle (cd/m²) | 578 | 974 69% | 661 14% | 385.7 -33% | 632 9% |
| Brightness (cd/m²) | 583 | 979 68% | 663 14% | 387 -34% | 616 6% |
| Brightness Distribution (%) | 98 | 98 0% | 99 1% | 98 0% | 95 -3% |
| Black Level * (cd/m²) | |||||
| Colorchecker dE 2000 * | 1.6 | 0.9 44% | 0.5 69% | 1.36 15% | 0.6 63% |
| Colorchecker dE 2000 max. * | 4.5 | 1.7 62% | 1.4 69% | 2.85 37% | 1.2 73% |
| Greyscale dE 2000 * | 2.6 | 1.3 50% | 0.6 77% | 1.3 50% | 0.8 69% |
| Gamma | 2.19 100% | 2.21 100% | 2.19 100% | 2.2 100% | 2.21 100% |
| CCT | 6527 100% | 6751 96% | 6565 99% | 6282 103% | 6450 101% |
| Colorchecker dE 2000 calibrated * | 0.65 | ||||
| Total Average (Program / Settings) | 18% /
26% | 3% /
12% | -32% /
-22% | -2928% /
-2187% |
* ... smaller is better


Display Response Times
| ↔ Response Time Black to White | ||
|---|---|---|
| 0.42 ms ... rise ↗ and fall ↘ combined | ↗ 0.23 ms rise | 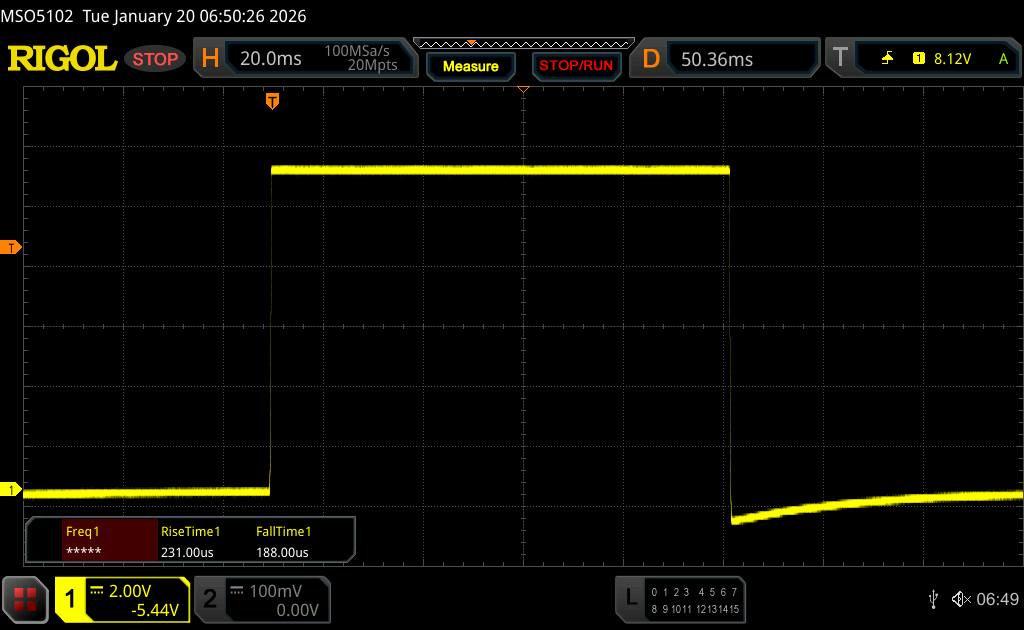 |
| ↘ 0.19 ms fall | ||
| The screen shows very fast response rates in our tests and should be very well suited for fast-paced gaming. In comparison, all tested devices range from 0.1 (minimum) to 240 (maximum) ms. » 1 % of all devices are better. This means that the measured response time is better than the average of all tested devices (19.8 ms). | ||
| ↔ Response Time 50% Grey to 80% Grey | ||
| 0.26 ms ... rise ↗ and fall ↘ combined | ↗ 0.12 ms rise | 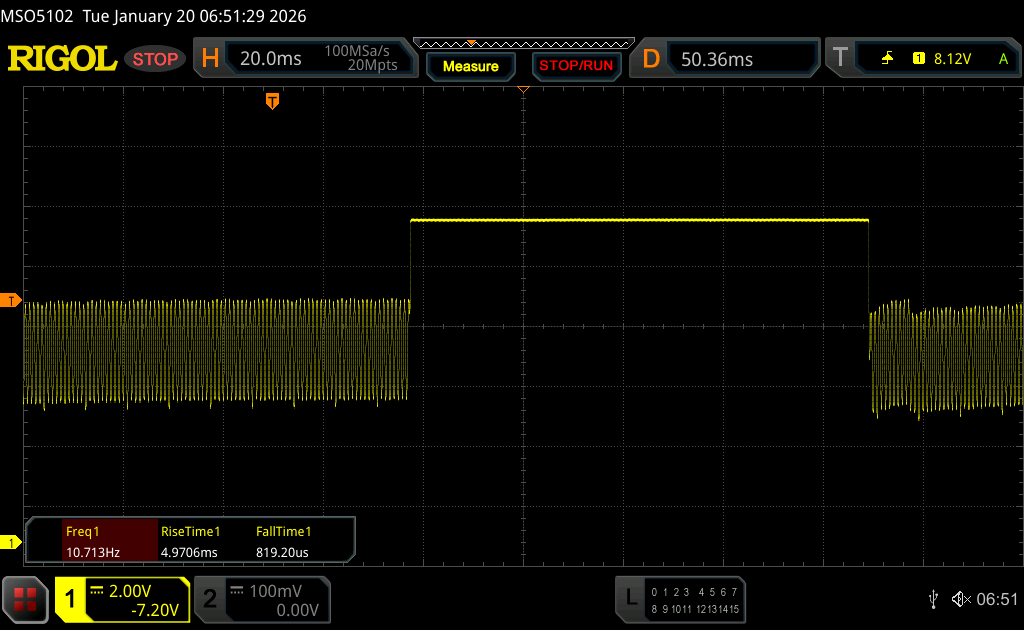 |
| ↘ 0.14 ms fall | ||
| The screen shows very fast response rates in our tests and should be very well suited for fast-paced gaming. In comparison, all tested devices range from 0.165 (minimum) to 636 (maximum) ms. » 0 % of all devices are better. This means that the measured response time is better than the average of all tested devices (31 ms). | ||
Screen Flickering / PWM (Pulse-Width Modulation)
| Screen flickering / PWM detected | 1200 Hz Amplitude: 22 % | ≤ 70 % brightness setting | 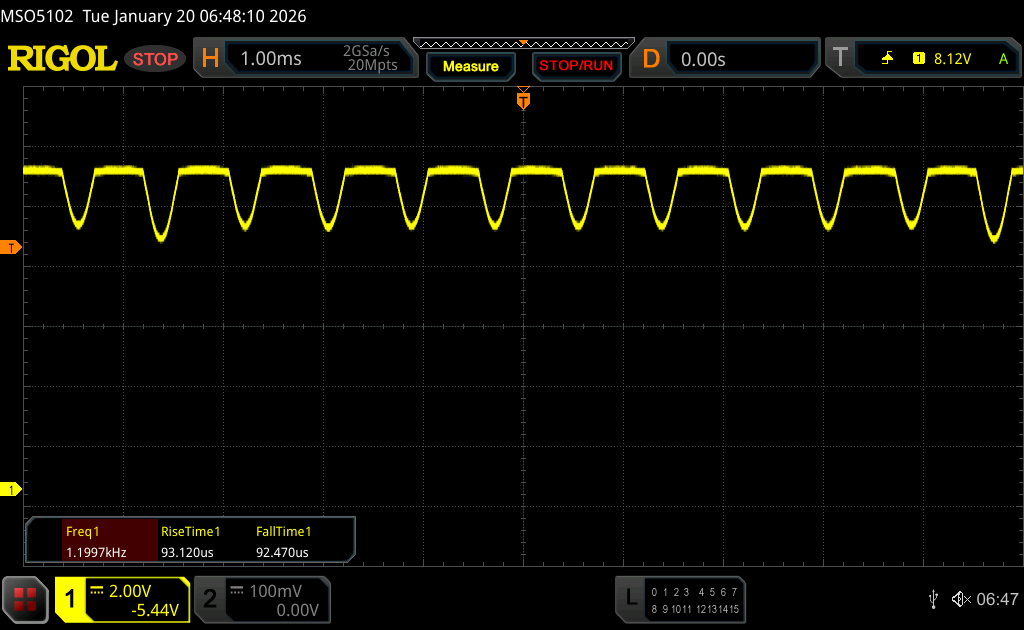 |
The display backlight flickers at 1200 Hz (worst case, e.g., utilizing PWM) Flickering detected at a brightness setting of 70 % and below. There should be no flickering or PWM above this brightness setting. The frequency of 1200 Hz is quite high, so most users sensitive to PWM should not notice any flickering. In comparison: 52 % of all tested devices do not use PWM to dim the display. If PWM was detected, an average of 7747 (minimum: 5 - maximum: 343500) Hz was measured. | |||


Performance – Arrow Lake & Blackwell
Test conditions
As is typical for ThinkPads, Lenovo’s power profiles are directly linked to the Windows power settings. All benchmarks were carried out using the Best performance mode.
Processor
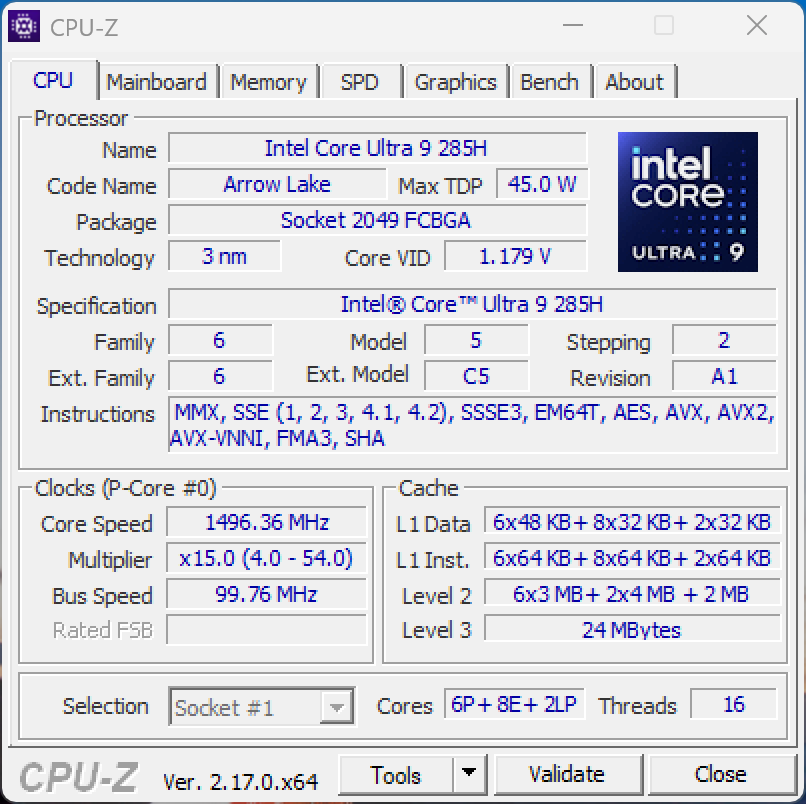
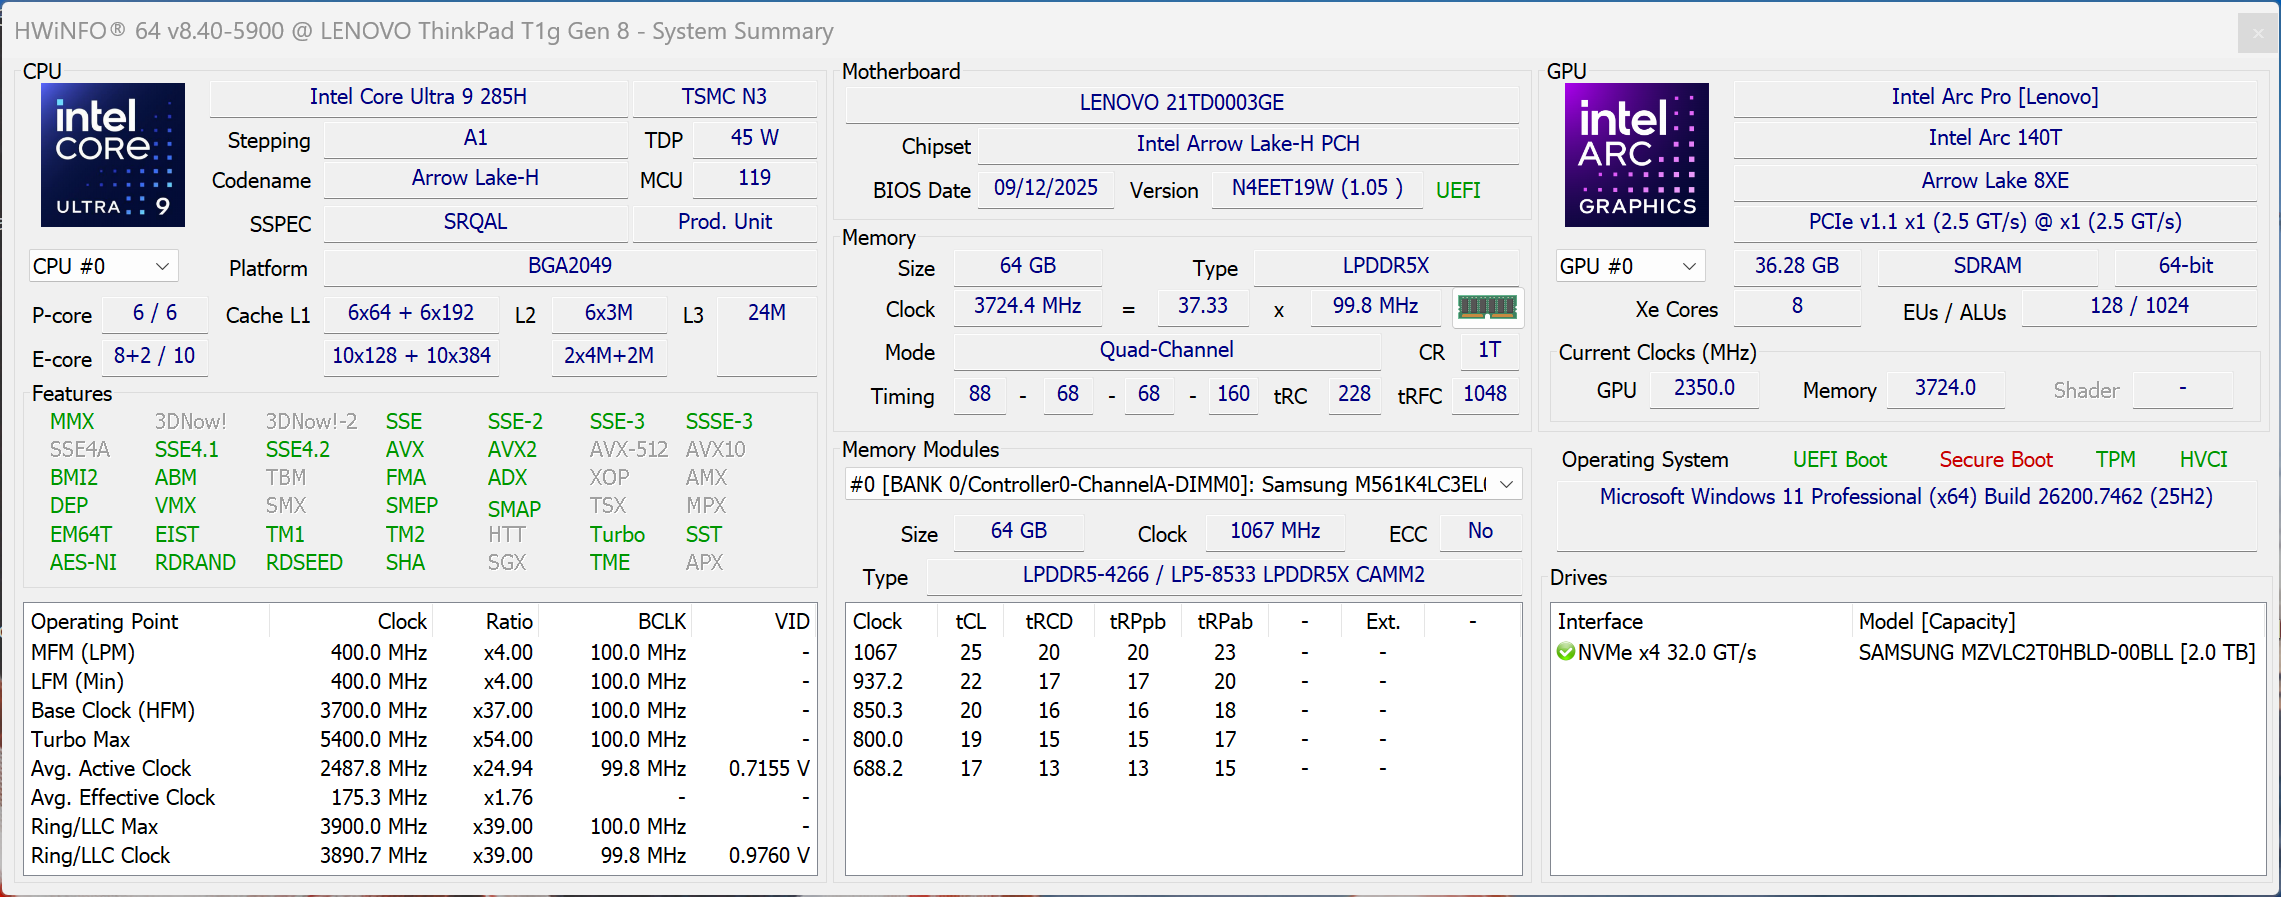
Lenovo equips the ThinkPad T1g Gen 8 with the Intel Core Ultra 9 285H (Arrow Lake), which is allowed to draw up to 105 watts for short bursts before settling at around 74 watts. CPU performance is strong overall, and the Windows-based competitors are largely on a similar level, with only Apple’s M4 Max operating in a clearly different performance class.
When running on battery power, the processor is limited to a maximum of 45 watts, which results in only a modest reduction in multi-core performance of around 11%.
Cinebench R15 Multi sustained test
Cinebench 2024: CPU Multi Core | CPU Single Core
Cinebench R23: Multi Core | Single Core
Cinebench R20: CPU (Multi Core) | CPU (Single Core)
Cinebench R15: CPU Multi 64Bit | CPU Single 64Bit
Blender: v2.79 BMW27 CPU
7-Zip 18.03: 7z b 4 | 7z b 4 -mmt1
Geekbench 6.7: Multi-Core | Single-Core
Geekbench 5.5: Multi-Core | Single-Core
HWBOT x265 Benchmark v2.2: 4k Preset
LibreOffice : 20 Documents To PDF
R Benchmark 2.5: Overall mean
| CPU Performance rating | |
| Apple MacBook Pro 16 M4 Max -8! | |
| Lenovo Yoga Pro 9i 16 RTX 5070 | |
| Lenovo ThinkPad T1g Gen 8 21TD003GE | |
| Asus ProArt P16 RTX 5090 | |
| Lenovo ThinkPad P1 Gen 8 | |
| Dell 16 Premium DA16250 | |
| Average Intel Core Ultra 9 285H | |
| Average of class Multimedia | |
| Cinebench 2024 / CPU Multi Core | |
| Apple MacBook Pro 16 M4 Max | |
| Apple MacBook Pro 16 M4 Max | |
| Asus ProArt P16 RTX 5090 | |
| Lenovo Yoga Pro 9i 16 RTX 5070 | |
| Lenovo ThinkPad P1 Gen 8 | |
| Lenovo ThinkPad T1g Gen 8 21TD003GE | |
| Dell 16 Premium DA16250 | |
| Average Intel Core Ultra 9 285H (740 - 1194, n=11) | |
| Average of class Multimedia (327 - 2437, n=75, last 2 years) | |
| Cinebench 2024 / CPU Single Core | |
| Apple MacBook Pro 16 M4 Max | |
| Average of class Multimedia (72.5 - 201, n=60, last 2 years) | |
| Lenovo Yoga Pro 9i 16 RTX 5070 | |
| Average Intel Core Ultra 9 285H (124.8 - 130, n=11) | |
| Lenovo ThinkPad T1g Gen 8 21TD003GE | |
| Lenovo ThinkPad P1 Gen 8 | |
| Dell 16 Premium DA16250 | |
| Asus ProArt P16 RTX 5090 | |
| Cinebench R23 / Multi Core | |
| Apple MacBook Pro 16 M4 Max | |
| Asus ProArt P16 RTX 5090 | |
| Lenovo Yoga Pro 9i 16 RTX 5070 | |
| Lenovo ThinkPad T1g Gen 8 21TD003GE | |
| Lenovo ThinkPad P1 Gen 8 | |
| Dell 16 Premium DA16250 | |
| Average Intel Core Ultra 9 285H (15070 - 23576, n=12) | |
| Average of class Multimedia (4861 - 33362, n=76, last 2 years) | |
| Cinebench R23 / Single Core | |
| Apple MacBook Pro 16 M4 Max | |
| Lenovo Yoga Pro 9i 16 RTX 5070 | |
| Lenovo ThinkPad T1g Gen 8 21TD003GE | |
| Average Intel Core Ultra 9 285H (1979 - 2166, n=12) | |
| Asus ProArt P16 RTX 5090 | |
| Lenovo ThinkPad P1 Gen 8 | |
| Average of class Multimedia (1128 - 2459, n=68, last 2 years) | |
| Dell 16 Premium DA16250 | |
| Cinebench R20 / CPU (Multi Core) | |
| Asus ProArt P16 RTX 5090 | |
| Lenovo Yoga Pro 9i 16 RTX 5070 | |
| Lenovo ThinkPad T1g Gen 8 21TD003GE | |
| Lenovo ThinkPad P1 Gen 8 | |
| Dell 16 Premium DA16250 | |
| Average Intel Core Ultra 9 285H (5861 - 9208, n=12) | |
| Apple MacBook Pro 16 M4 Max | |
| Average of class Multimedia (1887 - 12912, n=59, last 2 years) | |
| Cinebench R20 / CPU (Single Core) | |
| Lenovo Yoga Pro 9i 16 RTX 5070 | |
| Lenovo ThinkPad T1g Gen 8 21TD003GE | |
| Average Intel Core Ultra 9 285H (761 - 837, n=12) | |
| Asus ProArt P16 RTX 5090 | |
| Lenovo ThinkPad P1 Gen 8 | |
| Dell 16 Premium DA16250 | |
| Average of class Multimedia (425 - 853, n=59, last 2 years) | |
| Apple MacBook Pro 16 M4 Max | |
| Cinebench R15 / CPU Multi 64Bit | |
| Apple MacBook Pro 16 M4 Max | |
| Asus ProArt P16 RTX 5090 | |
| Lenovo Yoga Pro 9i 16 RTX 5070 | |
| Lenovo ThinkPad T1g Gen 8 21TD003GE | |
| Dell 16 Premium DA16250 | |
| Lenovo ThinkPad P1 Gen 8 | |
| Average Intel Core Ultra 9 285H (2280 - 3496, n=12) | |
| Average of class Multimedia (856 - 5224, n=63, last 2 years) | |
| Cinebench R15 / CPU Single 64Bit | |
| Lenovo Yoga Pro 9i 16 RTX 5070 | |
| Lenovo ThinkPad T1g Gen 8 21TD003GE | |
| Average Intel Core Ultra 9 285H (288 - 322, n=12) | |
| Apple MacBook Pro 16 M4 Max | |
| Lenovo ThinkPad P1 Gen 8 | |
| Dell 16 Premium DA16250 | |
| Average of class Multimedia (184.8 - 326, n=61, last 2 years) | |
| Asus ProArt P16 RTX 5090 | |
| Blender / v2.79 BMW27 CPU | |
| Average of class Multimedia (100 - 557, n=60, last 2 years) | |
| Average Intel Core Ultra 9 285H (151 - 235, n=12) | |
| Lenovo ThinkPad P1 Gen 8 | |
| Dell 16 Premium DA16250 | |
| Lenovo ThinkPad T1g Gen 8 21TD003GE | |
| Lenovo Yoga Pro 9i 16 RTX 5070 | |
| Asus ProArt P16 RTX 5090 | |
| 7-Zip 18.03 / 7z b 4 | |
| Asus ProArt P16 RTX 5090 | |
| Lenovo Yoga Pro 9i 16 RTX 5070 | |
| Lenovo ThinkPad T1g Gen 8 21TD003GE | |
| Dell 16 Premium DA16250 | |
| Lenovo ThinkPad P1 Gen 8 | |
| Average Intel Core Ultra 9 285H (50116 - 71959, n=12) | |
| Average of class Multimedia (26062 - 130368, n=57, last 2 years) | |
| 7-Zip 18.03 / 7z b 4 -mmt1 | |
| Lenovo Yoga Pro 9i 16 RTX 5070 | |
| Asus ProArt P16 RTX 5090 | |
| Average Intel Core Ultra 9 285H (5403 - 6419, n=12) | |
| Lenovo ThinkPad T1g Gen 8 21TD003GE | |
| Average of class Multimedia (3666 - 7545, n=58, last 2 years) | |
| Dell 16 Premium DA16250 | |
| Lenovo ThinkPad P1 Gen 8 | |
| Geekbench 6.7 / Multi-Core | |
| Apple MacBook Pro 16 M4 Max | |
| Lenovo Yoga Pro 9i 16 RTX 5070 | |
| Lenovo ThinkPad T1g Gen 8 21TD003GE | |
| Dell 16 Premium DA16250 | |
| Lenovo ThinkPad P1 Gen 8 | |
| Average Intel Core Ultra 9 285H (15284 - 17992, n=15) | |
| Asus ProArt P16 RTX 5090 | |
| Average of class Multimedia (4983 - 29415, n=71, last 2 years) | |
| Geekbench 6.7 / Single-Core | |
| Apple MacBook Pro 16 M4 Max | |
| Lenovo Yoga Pro 9i 16 RTX 5070 | |
| Lenovo ThinkPad T1g Gen 8 21TD003GE | |
| Asus ProArt P16 RTX 5090 | |
| Average of class Multimedia (1534 - 4335, n=70, last 2 years) | |
| Average Intel Core Ultra 9 285H (2665 - 3110, n=15) | |
| Lenovo ThinkPad P1 Gen 8 | |
| Dell 16 Premium DA16250 | |
| Geekbench 5.5 / Multi-Core | |
| Lenovo Yoga Pro 9i 16 RTX 5070 | |
| Lenovo ThinkPad T1g Gen 8 21TD003GE | |
| Dell 16 Premium DA16250 | |
| Lenovo ThinkPad P1 Gen 8 | |
| Average Intel Core Ultra 9 285H (13140 - 17487, n=13) | |
| Asus ProArt P16 RTX 5090 | |
| Average of class Multimedia (4652 - 20422, n=58, last 2 years) | |
| Geekbench 5.5 / Single-Core | |
| Asus ProArt P16 RTX 5090 | |
| Lenovo Yoga Pro 9i 16 RTX 5070 | |
| Lenovo ThinkPad T1g Gen 8 21TD003GE | |
| Average Intel Core Ultra 9 285H (1689 - 2256, n=13) | |
| Lenovo ThinkPad P1 Gen 8 | |
| Average of class Multimedia (805 - 2974, n=58, last 2 years) | |
| Dell 16 Premium DA16250 | |
| HWBOT x265 Benchmark v2.2 / 4k Preset | |
| Asus ProArt P16 RTX 5090 | |
| Lenovo Yoga Pro 9i 16 RTX 5070 | |
| Lenovo ThinkPad P1 Gen 8 | |
| Lenovo ThinkPad T1g Gen 8 21TD003GE | |
| Dell 16 Premium DA16250 | |
| Average Intel Core Ultra 9 285H (17.9 - 27.2, n=12) | |
| Average of class Multimedia (5.26 - 36.1, n=58, last 2 years) | |
| LibreOffice / 20 Documents To PDF | |
| Average of class Multimedia (23.9 - 146.7, n=59, last 2 years) | |
| Asus ProArt P16 RTX 5090 | |
| Average Intel Core Ultra 9 285H (39.4 - 56.1, n=12) | |
| Lenovo Yoga Pro 9i 16 RTX 5070 | |
| Dell 16 Premium DA16250 | |
| Lenovo ThinkPad T1g Gen 8 21TD003GE | |
| Lenovo ThinkPad P1 Gen 8 | |
| R Benchmark 2.5 / Overall mean | |
| Average of class Multimedia (0.3604 - 0.947, n=58, last 2 years) | |
| Dell 16 Premium DA16250 | |
| Lenovo ThinkPad P1 Gen 8 | |
| Average Intel Core Ultra 9 285H (0.4079 - 0.4794, n=12) | |
| Lenovo ThinkPad T1g Gen 8 21TD003GE | |
| Asus ProArt P16 RTX 5090 | |
| Lenovo Yoga Pro 9i 16 RTX 5070 | |
* ... smaller is better
AIDA64: FP32 Ray-Trace | FPU Julia | CPU SHA3 | CPU Queen | FPU SinJulia | FPU Mandel | CPU AES | CPU ZLib | FP64 Ray-Trace | CPU PhotoWorxx
| Performance rating | |
| Asus ProArt P16 RTX 5090 | |
| Lenovo Yoga Pro 9i 16 RTX 5070 | |
| Lenovo ThinkPad P1 Gen 8 | |
| Lenovo ThinkPad T1g Gen 8 21TD003GE | |
| Average Intel Core Ultra 9 285H | |
| Average of class Multimedia | |
| AIDA64 / FP32 Ray-Trace | |
| Asus ProArt P16 RTX 5090 | |
| Lenovo Yoga Pro 9i 16 RTX 5070 | |
| Lenovo ThinkPad T1g Gen 8 21TD003GE | |
| Lenovo ThinkPad P1 Gen 8 | |
| Average Intel Core Ultra 9 285H (13687 - 24612, n=14) | |
| Average of class Multimedia (2214 - 50388, n=55, last 2 years) | |
| AIDA64 / FPU Julia | |
| Asus ProArt P16 RTX 5090 | |
| Lenovo Yoga Pro 9i 16 RTX 5070 | |
| Lenovo ThinkPad P1 Gen 8 | |
| Lenovo ThinkPad T1g Gen 8 21TD003GE | |
| Average Intel Core Ultra 9 285H (54365 - 129641, n=14) | |
| Average of class Multimedia (12867 - 201874, n=56, last 2 years) | |
| AIDA64 / CPU SHA3 | |
| Lenovo Yoga Pro 9i 16 RTX 5070 | |
| Lenovo ThinkPad P1 Gen 8 | |
| Lenovo ThinkPad T1g Gen 8 21TD003GE | |
| Asus ProArt P16 RTX 5090 | |
| Average Intel Core Ultra 9 285H (3473 - 5879, n=14) | |
| Average of class Multimedia (626 - 8623, n=56, last 2 years) | |
| AIDA64 / CPU Queen | |
| Asus ProArt P16 RTX 5090 | |
| Average of class Multimedia (13483 - 181505, n=43, last 2 years) | |
| Lenovo ThinkPad P1 Gen 8 | |
| Lenovo ThinkPad T1g Gen 8 21TD003GE | |
| Lenovo Yoga Pro 9i 16 RTX 5070 | |
| Average Intel Core Ultra 9 285H (53557 - 67363, n=12) | |
| AIDA64 / FPU SinJulia | |
| Asus ProArt P16 RTX 5090 | |
| Lenovo Yoga Pro 9i 16 RTX 5070 | |
| Lenovo ThinkPad T1g Gen 8 21TD003GE | |
| Lenovo ThinkPad P1 Gen 8 | |
| Average of class Multimedia (886 - 28794, n=56, last 2 years) | |
| Average Intel Core Ultra 9 285H (6921 - 9378, n=14) | |
| AIDA64 / FPU Mandel | |
| Asus ProArt P16 RTX 5090 | |
| Lenovo Yoga Pro 9i 16 RTX 5070 | |
| Lenovo ThinkPad P1 Gen 8 | |
| Lenovo ThinkPad T1g Gen 8 21TD003GE | |
| Average Intel Core Ultra 9 285H (38174 - 64632, n=14) | |
| Average of class Multimedia (6395 - 105740, n=55, last 2 years) | |
| AIDA64 / CPU AES | |
| Asus ProArt P16 RTX 5090 | |
| Lenovo Yoga Pro 9i 16 RTX 5070 | |
| Lenovo ThinkPad P1 Gen 8 | |
| Lenovo ThinkPad T1g Gen 8 21TD003GE | |
| Average Intel Core Ultra 9 285H (58110 - 117613, n=14) | |
| Average of class Multimedia (8171 - 126790, n=56, last 2 years) | |
| AIDA64 / CPU ZLib | |
| Asus ProArt P16 RTX 5090 | |
| Lenovo Yoga Pro 9i 16 RTX 5070 | |
| Lenovo ThinkPad P1 Gen 8 | |
| Lenovo ThinkPad T1g Gen 8 21TD003GE | |
| Average Intel Core Ultra 9 285H (574 - 1366, n=14) | |
| Average of class Multimedia (143.8 - 2022, n=56, last 2 years) | |
| AIDA64 / FP64 Ray-Trace | |
| Asus ProArt P16 RTX 5090 | |
| Lenovo Yoga Pro 9i 16 RTX 5070 | |
| Lenovo ThinkPad P1 Gen 8 | |
| Lenovo ThinkPad T1g Gen 8 21TD003GE | |
| Average Intel Core Ultra 9 285H (5509 - 13527, n=14) | |
| Average of class Multimedia (1014 - 26875, n=56, last 2 years) | |
| AIDA64 / CPU PhotoWorxx | |
| Lenovo Yoga Pro 9i 16 RTX 5070 | |
| Lenovo ThinkPad P1 Gen 8 | |
| Lenovo ThinkPad T1g Gen 8 21TD003GE | |
| Average Intel Core Ultra 9 285H (49874 - 65392, n=14) | |
| Average of class Multimedia (8187 - 88154, n=56, last 2 years) | |
| Asus ProArt P16 RTX 5090 | |
System performance
As expected, overall system performance is very good, and no stability issues were encountered during testing.
PCMark 10: Score | Essentials | Productivity | Digital Content Creation
CrossMark: Overall | Productivity | Creativity | Responsiveness
WebXPRT 3: Overall
WebXPRT 4: Overall
Mozilla Kraken 1.1: Total
| Performance rating | |
| Apple MacBook Pro 16 M4 Max -4! | |
| Lenovo ThinkPad T1g Gen 8 21TD003GE | |
| Average Intel Core Ultra 9 285H, NVIDIA GeForce RTX 5070 Laptop | |
| Lenovo ThinkPad P1 Gen 8 | |
| Lenovo Yoga Pro 9i 16 RTX 5070 | |
| Average of class Multimedia | |
| Dell 16 Premium DA16250 -4! | |
| Asus ProArt P16 RTX 5090 -4! | |
| PCMark 10 / Score | |
| Lenovo ThinkPad T1g Gen 8 21TD003GE | |
| Lenovo ThinkPad P1 Gen 8 | |
| Average Intel Core Ultra 9 285H, NVIDIA GeForce RTX 5070 Laptop (8267 - 9691, n=2) | |
| Lenovo Yoga Pro 9i 16 RTX 5070 | |
| Average of class Multimedia (4325 - 10386, n=54, last 2 years) | |
| PCMark 10 / Essentials | |
| Lenovo ThinkPad P1 Gen 8 | |
| Lenovo Yoga Pro 9i 16 RTX 5070 | |
| Average of class Multimedia (8025 - 11664, n=53, last 2 years) | |
| Average Intel Core Ultra 9 285H, NVIDIA GeForce RTX 5070 Laptop (10345 - 10564, n=2) | |
| Lenovo ThinkPad T1g Gen 8 21TD003GE | |
| PCMark 10 / Productivity | |
| Lenovo ThinkPad P1 Gen 8 | |
| Lenovo ThinkPad T1g Gen 8 21TD003GE | |
| Average Intel Core Ultra 9 285H, NVIDIA GeForce RTX 5070 Laptop (9402 - 18233, n=2) | |
| Average of class Multimedia (7323 - 18233, n=53, last 2 years) | |
| Lenovo Yoga Pro 9i 16 RTX 5070 | |
| PCMark 10 / Digital Content Creation | |
| Lenovo Yoga Pro 9i 16 RTX 5070 | |
| Average Intel Core Ultra 9 285H, NVIDIA GeForce RTX 5070 Laptop (13096 - 15438, n=2) | |
| Lenovo ThinkPad T1g Gen 8 21TD003GE | |
| Lenovo ThinkPad P1 Gen 8 | |
| Average of class Multimedia (3651 - 16240, n=53, last 2 years) | |
| CrossMark / Overall | |
| Apple MacBook Pro 16 M4 Max | |
| Lenovo ThinkPad T1g Gen 8 21TD003GE | |
| Average Intel Core Ultra 9 285H, NVIDIA GeForce RTX 5070 Laptop (2077 - 2236, n=2) | |
| Lenovo Yoga Pro 9i 16 RTX 5070 | |
| Dell 16 Premium DA16250 | |
| Asus ProArt P16 RTX 5090 | |
| Lenovo ThinkPad P1 Gen 8 | |
| Average of class Multimedia (866 - 2728, n=62, last 2 years) | |
| CrossMark / Productivity | |
| Lenovo ThinkPad T1g Gen 8 21TD003GE | |
| Apple MacBook Pro 16 M4 Max | |
| Average Intel Core Ultra 9 285H, NVIDIA GeForce RTX 5070 Laptop (1920 - 2092, n=2) | |
| Lenovo Yoga Pro 9i 16 RTX 5070 | |
| Dell 16 Premium DA16250 | |
| Lenovo ThinkPad P1 Gen 8 | |
| Asus ProArt P16 RTX 5090 | |
| Average of class Multimedia (931 - 2489, n=62, last 2 years) | |
| CrossMark / Creativity | |
| Apple MacBook Pro 16 M4 Max | |
| Lenovo ThinkPad T1g Gen 8 21TD003GE | |
| Average Intel Core Ultra 9 285H, NVIDIA GeForce RTX 5070 Laptop (2438 - 2470, n=2) | |
| Lenovo Yoga Pro 9i 16 RTX 5070 | |
| Asus ProArt P16 RTX 5090 | |
| Dell 16 Premium DA16250 | |
| Lenovo ThinkPad P1 Gen 8 | |
| Average of class Multimedia (907 - 3465, n=62, last 2 years) | |
| CrossMark / Responsiveness | |
| Lenovo ThinkPad T1g Gen 8 21TD003GE | |
| Average Intel Core Ultra 9 285H, NVIDIA GeForce RTX 5070 Laptop (1629 - 2024, n=2) | |
| Dell 16 Premium DA16250 | |
| Lenovo Yoga Pro 9i 16 RTX 5070 | |
| Lenovo ThinkPad P1 Gen 8 | |
| Apple MacBook Pro 16 M4 Max | |
| Average of class Multimedia (605 - 2024, n=62, last 2 years) | |
| Asus ProArt P16 RTX 5090 | |
| WebXPRT 3 / Overall | |
| Apple MacBook Pro 16 M4 Max | |
| Lenovo Yoga Pro 9i 16 RTX 5070 | |
| Average of class Multimedia (136.4 - 596, n=65, last 2 years) | |
| Average Intel Core Ultra 9 285H, NVIDIA GeForce RTX 5070 Laptop (326 - 345, n=2) | |
| Dell 16 Premium DA16250 | |
| Lenovo ThinkPad P1 Gen 8 | |
| Lenovo ThinkPad T1g Gen 8 21TD003GE | |
| Asus ProArt P16 RTX 5090 | |
| WebXPRT 4 / Overall | |
| Apple MacBook Pro 16 M4 Max | |
| Lenovo Yoga Pro 9i 16 RTX 5070 | |
| Average Intel Core Ultra 9 285H, NVIDIA GeForce RTX 5070 Laptop (303 - 311, n=2) | |
| Lenovo ThinkPad T1g Gen 8 21TD003GE | |
| Dell 16 Premium DA16250 | |
| Lenovo ThinkPad P1 Gen 8 | |
| Average of class Multimedia (167.3 - 402, n=67, last 2 years) | |
| Asus ProArt P16 RTX 5090 | |
| Mozilla Kraken 1.1 / Total | |
| Dell 16 Premium DA16250 | |
| Lenovo ThinkPad P1 Gen 8 | |
| Average of class Multimedia (228 - 835, n=68, last 2 years) | |
| Lenovo ThinkPad T1g Gen 8 21TD003GE | |
| Average Intel Core Ultra 9 285H, NVIDIA GeForce RTX 5070 Laptop (433 - 444, n=2) | |
| Lenovo Yoga Pro 9i 16 RTX 5070 | |
| Asus ProArt P16 RTX 5090 | |
| Apple MacBook Pro 16 M4 Max | |
* ... smaller is better
| PCMark 10 Score | 9691 points | |
Help | ||
| AIDA64 / Memory Copy | |
| Lenovo Yoga Pro 9i 16 RTX 5070 | |
| Lenovo ThinkPad P1 Gen 8 | |
| Lenovo ThinkPad T1g Gen 8 21TD003GE | |
| Average Intel Core Ultra 9 285H (76179 - 109252, n=14) | |
| Asus ProArt P16 RTX 5090 | |
| Average of class Multimedia (11299 - 132135, n=56, last 2 years) | |
| AIDA64 / Memory Read | |
| Asus ProArt P16 RTX 5090 | |
| Lenovo Yoga Pro 9i 16 RTX 5070 | |
| Average of class Multimedia (11624 - 174586, n=56, last 2 years) | |
| Average Intel Core Ultra 9 285H (74572 - 89837, n=14) | |
| Lenovo ThinkPad T1g Gen 8 21TD003GE | |
| Lenovo ThinkPad P1 Gen 8 | |
| AIDA64 / Memory Write | |
| Asus ProArt P16 RTX 5090 | |
| Average of class Multimedia (11755 - 134998, n=56, last 2 years) | |
| Average Intel Core Ultra 9 285H (62446 - 107584, n=14) | |
| Lenovo ThinkPad T1g Gen 8 21TD003GE | |
| Lenovo Yoga Pro 9i 16 RTX 5070 | |
| Lenovo ThinkPad P1 Gen 8 | |
| AIDA64 / Memory Latency | |
| Lenovo ThinkPad P1 Gen 8 | |
| Lenovo ThinkPad T1g Gen 8 21TD003GE | |
| Average Intel Core Ultra 9 285H (106.2 - 136.7, n=14) | |
| Average of class Multimedia (7 - 535, n=55, last 2 years) | |
| Lenovo Yoga Pro 9i 16 RTX 5070 | |
| Asus ProArt P16 RTX 5090 | |
* ... smaller is better
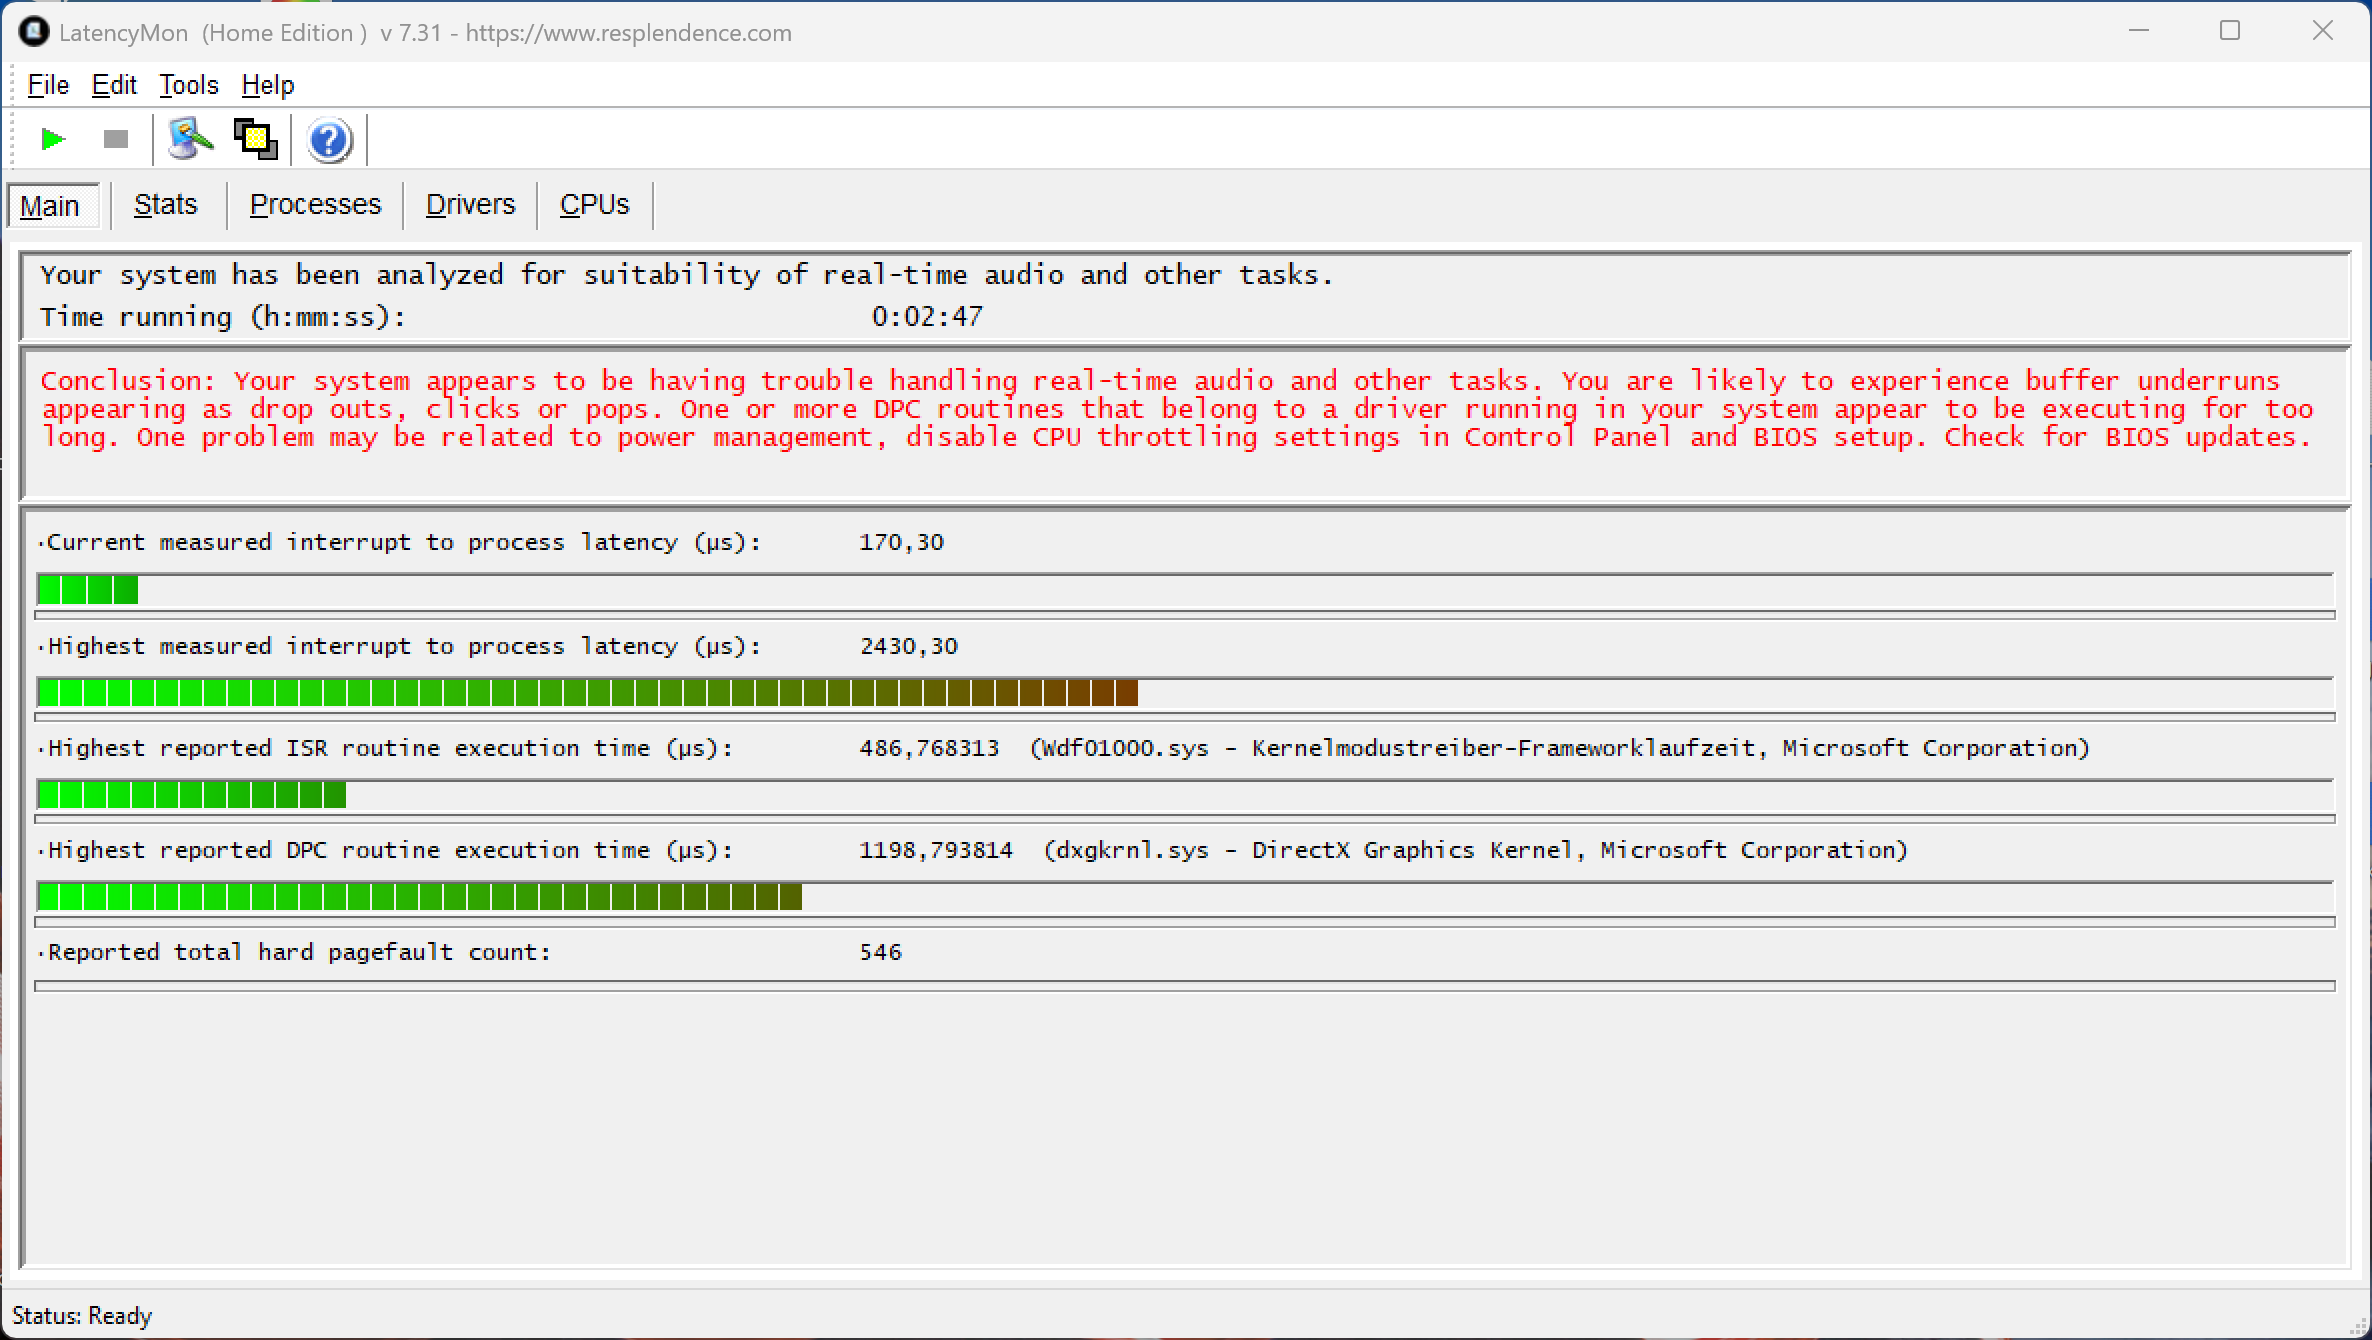
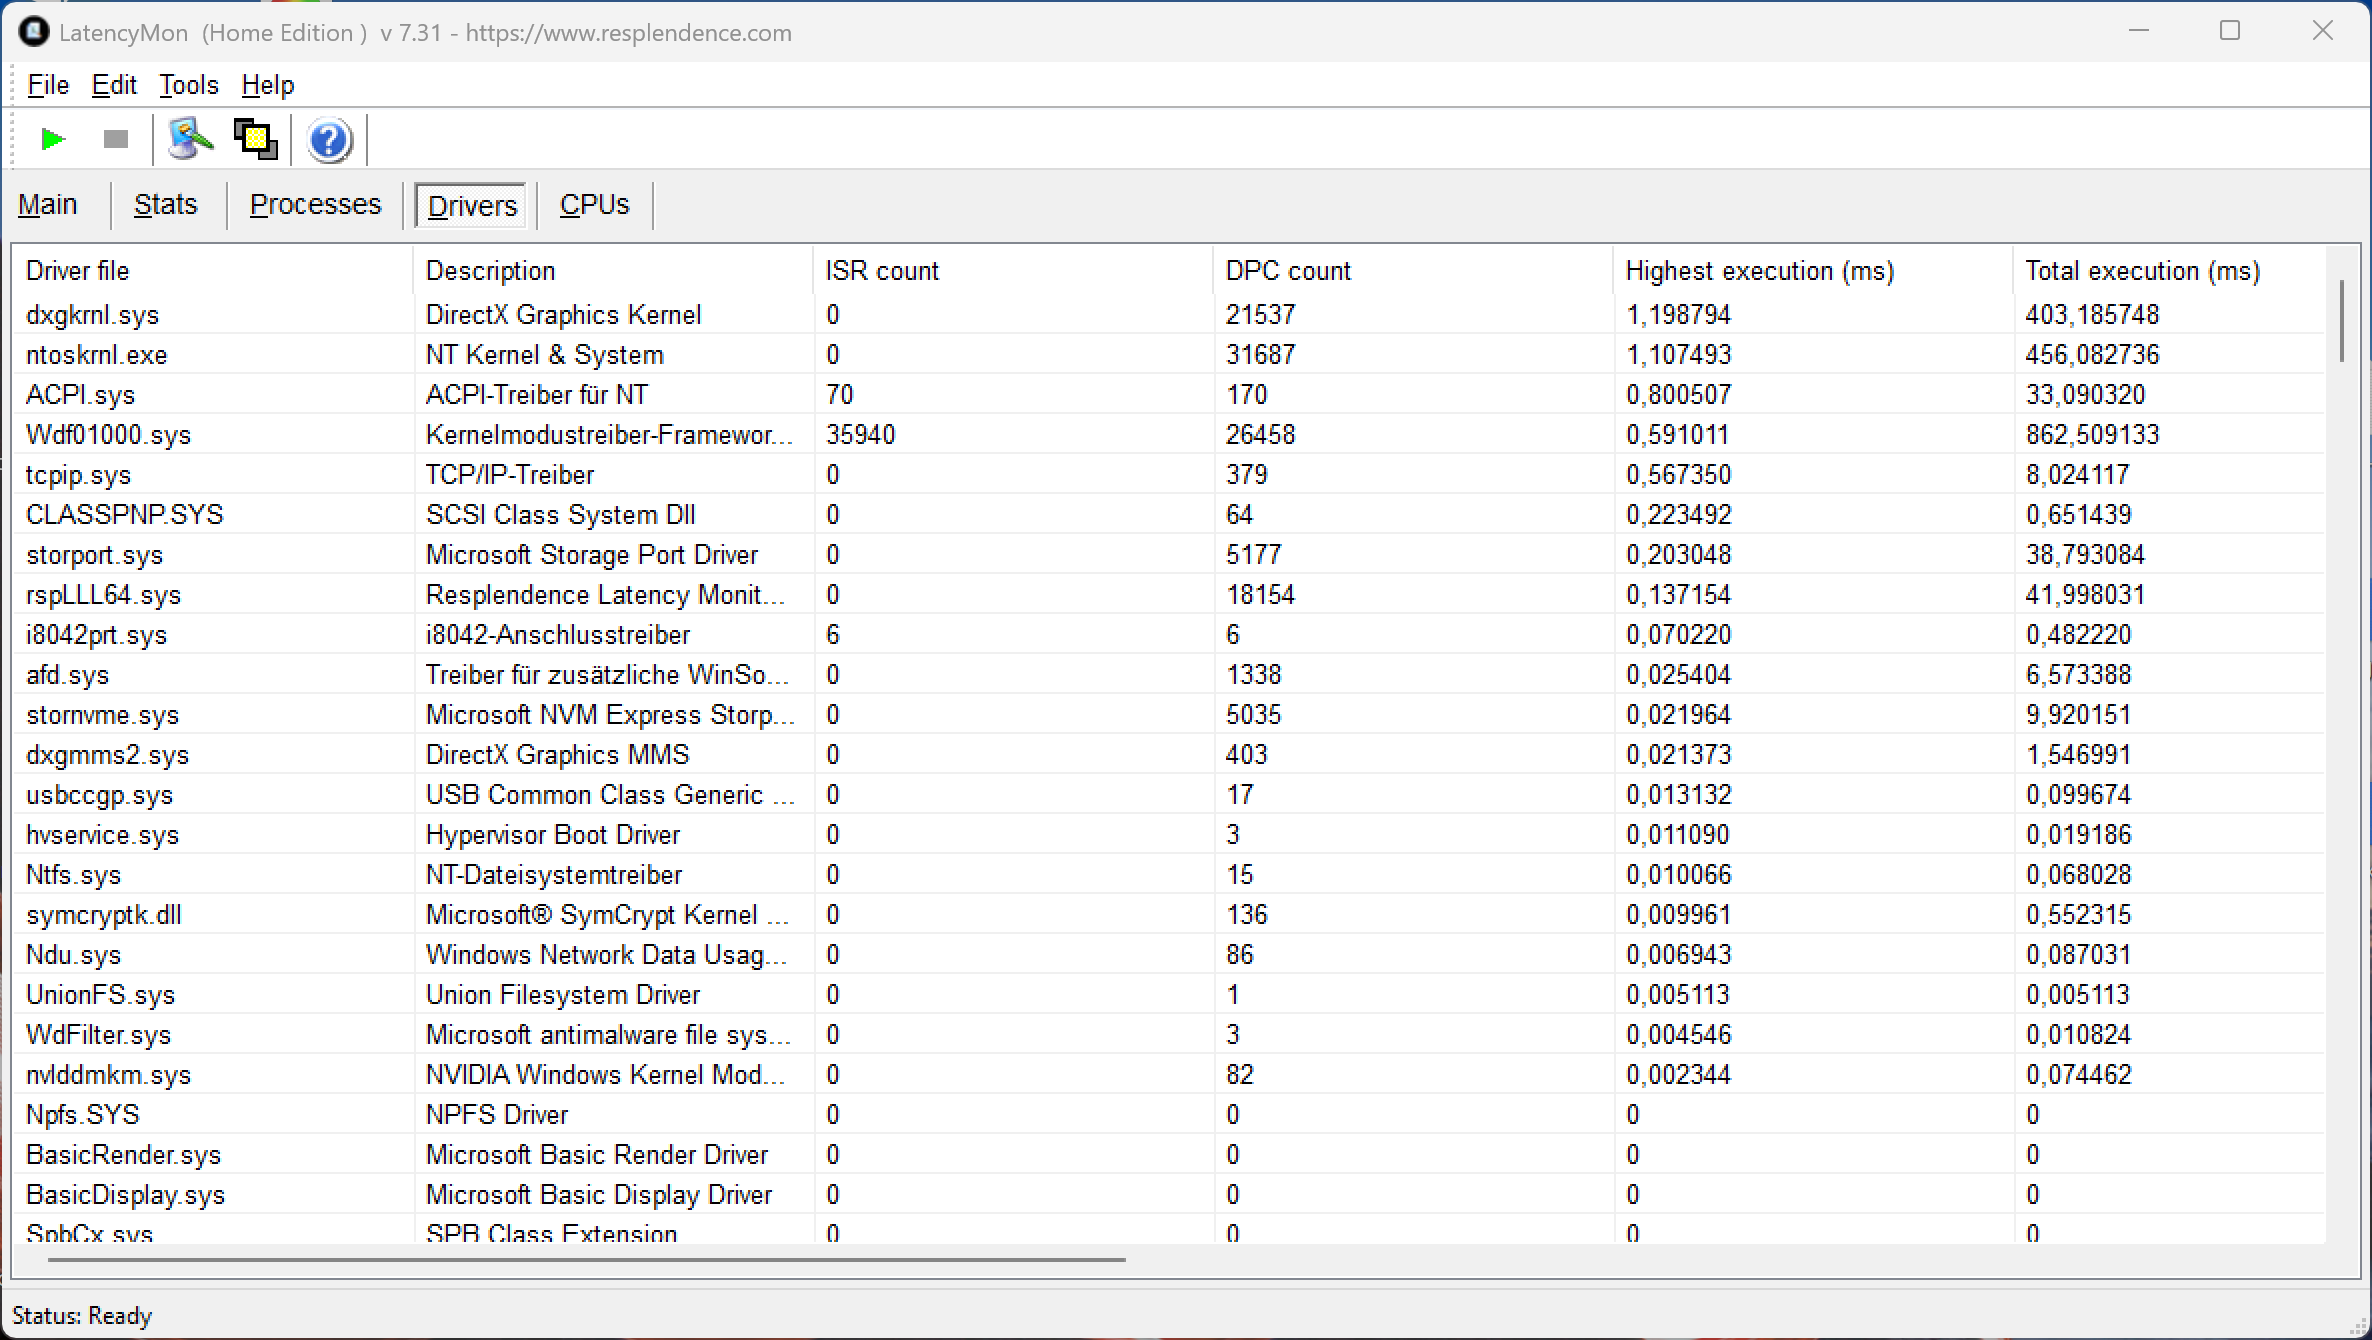
DPC latencies
In our standardised latency test (web browsing, 4K YouTube playback and CPU load), the system shows limitations when it comes to the use of real-time audio applications.
| DPC Latencies / LatencyMon - interrupt to process latency (max), Web, Youtube, Prime95 | |
| Asus ProArt P16 RTX 5090 | |
| Lenovo ThinkPad P1 Gen 8 | |
| Lenovo ThinkPad T1g Gen 8 21TD003GE | |
| Lenovo Yoga Pro 9i 16 RTX 5070 | |
| Dell 16 Premium DA16250 | |
* ... smaller is better
Storage devices
The ThinkPad T1g offers two M.2-2280 slots, both connected via PCIe 5.0. The installed Samsung PM9E1 (2 TB, 1.76 TB free) delivers good and very stable transfer rates, but does not make full use of the available PCIe 5.0 bandwidth.

* ... smaller is better
Read continuous performance: DiskSpd Read Loop, Queue Depth 8
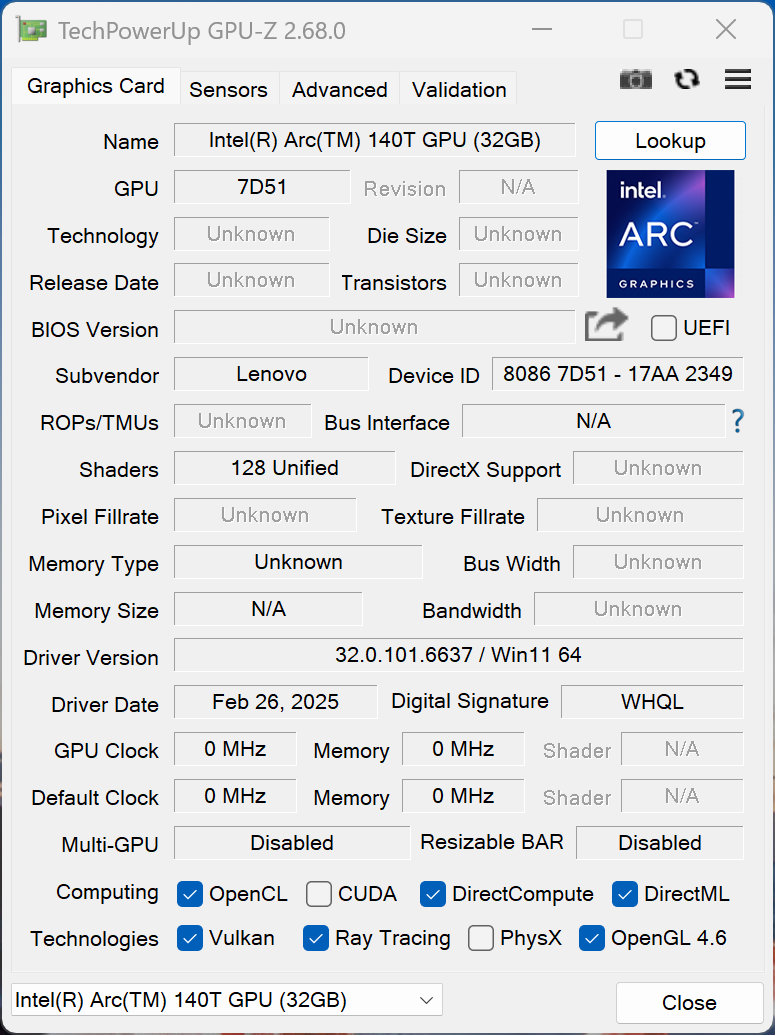
GPU performance
Lenovo uses the 75-watt version of the mobile GeForce RTX 5070 (60 W + 15 W Dynamic Boost) with 8 GB of VRAM. This places it well below the maximum possible 115 watts. As a result, graphics performance is weaker than that of competing RTX 5070 implementations, and it cannot come close to the RTX 5090 found in the Asus ProArt P16. Only the Dell 16 Premium with its 60-watt RTX 5070 is outperformed. Under sustained load, GPU performance remains completely stable, while on battery power the maximum consumption drops to 60 watts (-11%).
Gaming is of course also possible, and many titles still run smoothly at QHD resolution. We have analysed the limitations imposed by the 8 GB of VRAM in a dedicated article.
| 3DMark 11 Performance | 33372 points | |
| 3DMark Fire Strike Score | 27509 points | |
| 3DMark Time Spy Score | 11672 points | |
| 3DMark Steel Nomad Score | 2636 points | |
| 3DMark Steel Nomad Light Score | 11903 points | |
Help | ||
| Blender / v3.3 Classroom OPTIX/RTX | |
| Average of class Multimedia (12 - 105, n=23, last 2 years) | |
| Lenovo Yoga Pro 9i 16 RTX 5070 | |
| Lenovo ThinkPad T1g Gen 8 21TD003GE | |
| Dell 16 Premium DA16250 | |
| Lenovo ThinkPad P1 Gen 8 | |
| Average NVIDIA GeForce RTX 5070 Laptop (17 - 24, n=28) | |
| Asus ProArt P16 H7606WP | |
| Asus ProArt P16 RTX 5090 | |
| Blender / v3.3 Classroom CUDA | |
| Average of class Multimedia (20 - 186, n=23, last 2 years) | |
| Lenovo ThinkPad P1 Gen 8 | |
| Average NVIDIA GeForce RTX 5070 Laptop (29 - 228, n=29) | |
| Lenovo ThinkPad T1g Gen 8 21TD003GE | |
| Dell 16 Premium DA16250 | |
| Lenovo Yoga Pro 9i 16 RTX 5070 | |
| Asus ProArt P16 H7606WP | |
| Asus ProArt P16 RTX 5090 | |
| Blender / v3.3 Classroom METAL | |
| Average of class Multimedia (17.8 - 68, n=5, last 2 years) | |
| Apple MacBook Pro 16 M4 Max | |
| Blender / v3.3 Classroom CPU | |
| Average of class Multimedia (134.5 - 1042, n=63, last 2 years) | |
| Dell 16 Premium DA16250 | |
| Lenovo ThinkPad P1 Gen 8 | |
| Lenovo ThinkPad T1g Gen 8 21TD003GE | |
| Average NVIDIA GeForce RTX 5070 Laptop (137 - 507, n=26) | |
| Lenovo Yoga Pro 9i 16 RTX 5070 | |
| Asus ProArt P16 H7606WP | |
| Asus ProArt P16 RTX 5090 | |
| Apple MacBook Pro 16 M4 Max | |
* ... smaller is better
| Final Fantasy XV Benchmark - 1920x1080 High Quality | |
| Asus ProArt P16 RTX 5090 | |
| Lenovo Yoga Pro 9i 16 RTX 5070 | |
| Asus ProArt P16 H7606WP | |
| Lenovo ThinkPad T1g Gen 8 21TD003GE | |
| Dell 16 Premium DA16250 | |
| Lenovo ThinkPad P1 Gen 8 | |
| Average of class Multimedia (7.61 - 144.4, n=60, last 2 years) | |
| Dota 2 Reborn - 1920x1080 ultra (3/3) best looking | |
| Lenovo Yoga Pro 9i 16 RTX 5070 | |
| Dell 16 Premium DA16250 | |
| Lenovo ThinkPad T1g Gen 8 21TD003GE | |
| Asus ProArt P16 RTX 5090 | |
| Asus ProArt P16 H7606WP | |
| Lenovo ThinkPad P1 Gen 8 | |
| Average of class Multimedia (29 - 179.9, n=62, last 2 years) | |
Cyberpunk 2077 ultra FPS chart
| low | med. | high | ultra | QHD DLSS | QHD | |
|---|---|---|---|---|---|---|
| GTA V (2015) | 128 | 104.1 | ||||
| Dota 2 Reborn (2015) | 165.1 | 152.4 | 144.8 | 134.7 | ||
| Final Fantasy XV Benchmark (2018) | 216 | 156.2 | 119.9 | 88.6 | ||
| X-Plane 11.11 (2018) | 104.2 | 97.9 | 79.9 | |||
| Strange Brigade (2018) | 502 | 300 | 248 | 217 | 146.7 | |
| Baldur's Gate 3 (2023) | 150.4 | 122.1 | 106.8 | 106 | 72.8 | |
| Cyberpunk 2077 (2023) | 137.5 | 112.8 | 98 | 87.3 | 64.4 | 56.1 |
| F1 24 (2024) | 247 | 245 | 197.5 | 66.4 | 67 | 42.1 |
Emissions & power
Noise emissions

The dual-fan cooling system does a good overall job. During light workloads, the system is often barely audible, producing only a soft background noise of around 27 dB(A). Under full load, we measured up to 47.8 dB(A), which still makes the ThinkPad T1g quieter than its Windows-based competitors. Only the MacBook Pro 16 with the M4 Max remains noticeably quieter.
Using the alternative performance profiles allows the maximum fan noise to be reduced further (Best power efficiency: 38.9 dB(A); Balanced: 43.3 dB(A)). These noise levels remain unchanged when running on battery power. No other electronic noises were detected on the test unit.
Noise level
| Idle |
| 25 / 25 / 27.3 dB(A) |
| Load |
| 37.3 / 47.8 dB(A) |
 | ||
30 dB silent 40 dB(A) audible 50 dB(A) loud |
||
min: | ||
| Lenovo ThinkPad T1g Gen 8 21TD003GE Ultra 9 285H, GeForce RTX 5070 Laptop | Lenovo Yoga Pro 9i 16 RTX 5070 Ultra 9 285H, GeForce RTX 5070 Laptop | Asus ProArt P16 RTX 5090 Ryzen AI 9 HX 370, GeForce RTX 5090 Laptop | Dell 16 Premium DA16250 Ultra 7 255H, GeForce RTX 5070 Laptop | Apple MacBook Pro 16 M4 Max M4 Max 16-Core, M4 Max 40-Core GPU | |
|---|---|---|---|---|---|
| Noise | -3% | -8% | 2% | 5% | |
| off / environment * (dB) | 25 | 24.1 4% | 24.2 3% | 23.2 7% | 24.1 4% |
| Idle Minimum * (dB) | 25 | 24.1 4% | 24.2 3% | 23.2 7% | 24.1 4% |
| Idle Average * (dB) | 25 | 24.1 4% | 27.6 -10% | 23.2 7% | 24.1 4% |
| Idle Maximum * (dB) | 27.3 | 25.1 8% | 32.6 -19% | 26.6 3% | 24.1 12% |
| Load Average * (dB) | 37.3 | 44.2 -18% | 42.6 -14% | 39.4 -6% | 42.2 -13% |
| Cyberpunk 2077 ultra * (dB) | 47.8 | 52.7 -10% | 51.2 -7% | 47.3 1% | 42.2 12% |
| Load Maximum * (dB) | 47.8 | 52.7 -10% | 53.2 -11% | 48.9 -2% | 42.2 12% |
* ... smaller is better
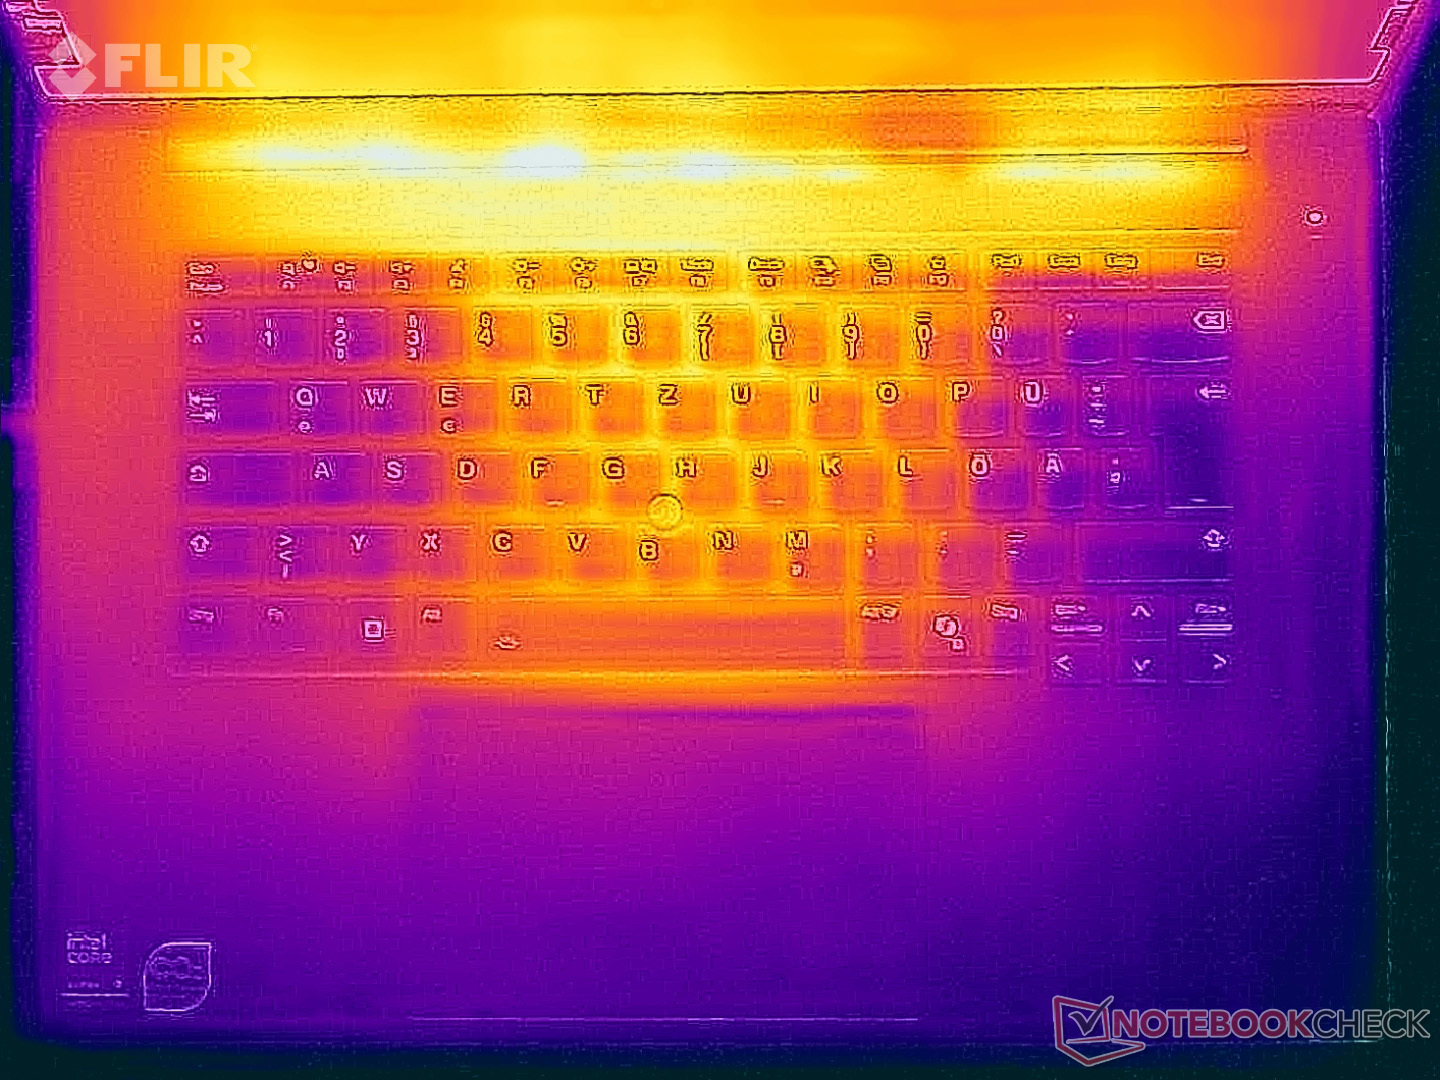
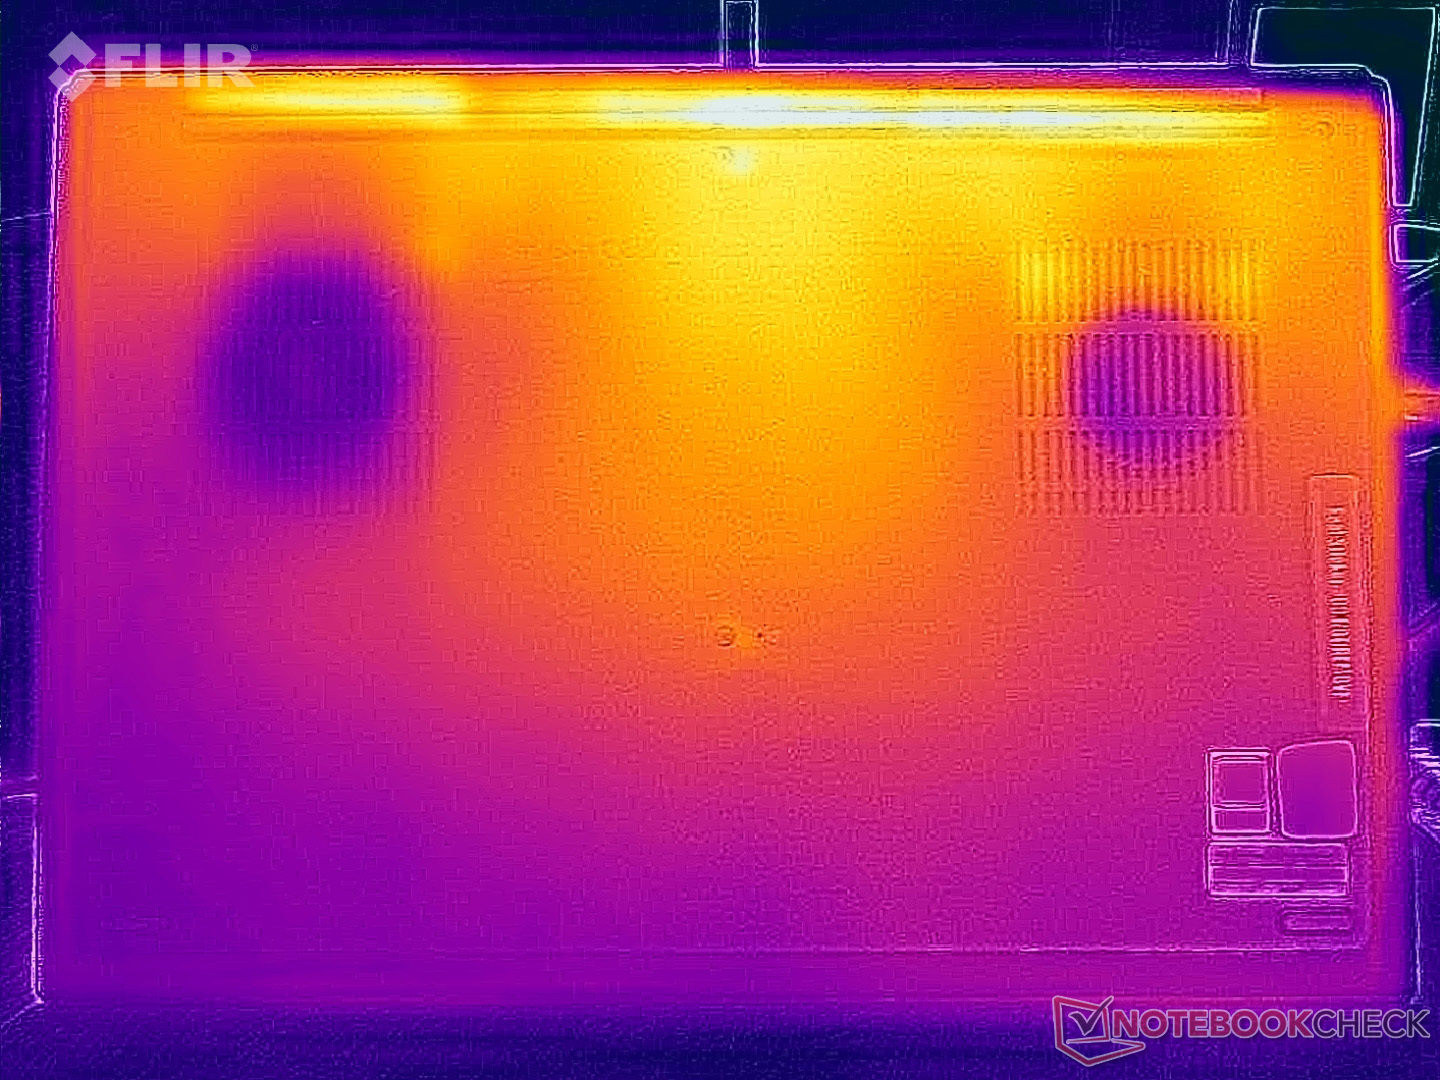
Temperatures
There are no temperature-related issues with the ThinkPad T1g Gen 8. Under light workloads, the aluminium chassis remains very cool, and even during the stress test we measured temperatures above 40 °C only in a few areas, with a maximum of 44.7 °C. As a result, there are no usage limitations.
During the stress test, the CPU operates at 35 watts at around 78 °C, while the GPU runs at 60 watts at approximately 76 °C.

(±) The maximum temperature on the upper side is 44.7 °C / 112 F, compared to the average of 36.8 °C / 98 F, ranging from 21 to 71 °C for the class Multimedia.
(±) The bottom heats up to a maximum of 42.8 °C / 109 F, compared to the average of 39.1 °C / 102 F
(+) In idle usage, the average temperature for the upper side is 25.8 °C / 78 F, compared to the device average of 31.3 °C / 88 F.
(±) 3: The average temperature for the upper side is 37.2 °C / 99 F, compared to the average of 31.3 °C / 88 F for the class Multimedia.
(+) The palmrests and touchpad are reaching skin temperature as a maximum (32 °C / 89.6 F) and are therefore not hot.
(-) The average temperature of the palmrest area of similar devices was 28.7 °C / 83.7 F (-3.3 °C / -5.9 F).
| Lenovo ThinkPad T1g Gen 8 21TD003GE Ultra 9 285H, GeForce RTX 5070 Laptop | Lenovo Yoga Pro 9i 16 RTX 5070 Ultra 9 285H, GeForce RTX 5070 Laptop | Asus ProArt P16 RTX 5090 Ryzen AI 9 HX 370, GeForce RTX 5090 Laptop | Dell 16 Premium DA16250 Ultra 7 255H, GeForce RTX 5070 Laptop | Apple MacBook Pro 16 M4 Max M4 Max 16-Core, M4 Max 40-Core GPU | |
|---|---|---|---|---|---|
| Heat | -1% | -3% | 2% | 8% | |
| Maximum Upper Side * (°C) | 44.7 | 41.8 6% | 47 -5% | 36.8 18% | 42.8 4% |
| Maximum Bottom * (°C) | 42.8 | 47.9 -12% | 51.6 -21% | 34.8 19% | 42.3 1% |
| Idle Upper Side * (°C) | 26.9 | 26.3 2% | 24.9 7% | 31.2 -16% | 23.6 12% |
| Idle Bottom * (°C) | 27.3 | 27.6 -1% | 25.5 7% | 30.8 -13% | 23.5 14% |
* ... smaller is better
Speakers
The stereo speakers offer very good sound quality, but all comparison devices perform at a similarly high level.
Lenovo ThinkPad T1g Gen 8 21TD003GE audio analysis
(+) | speakers can play relatively loud (85.6 dB)
Bass 100 - 315 Hz
(±) | reduced bass - on average 9.3% lower than median
(±) | linearity of bass is average (11.9% delta to prev. frequency)
Mids 400 - 2000 Hz
(+) | balanced mids - only 2.5% away from median
(+) | mids are linear (4% delta to prev. frequency)
Highs 2 - 16 kHz
(+) | balanced highs - only 3.4% away from median
(±) | linearity of highs is average (7.5% delta to prev. frequency)
Overall 100 - 16.000 Hz
(+) | overall sound is linear (8.7% difference to median)
Compared to same class
» 11% of all tested devices in this class were better, 2% similar, 87% worse
» The best had a delta of 5%, average was 17%, worst was 45%
Compared to all devices tested
» 3% of all tested devices were better, 1% similar, 97% worse
» The best had a delta of 4%, average was 23%, worst was 134%
Lenovo Yoga Pro 9i 16 RTX 5070 audio analysis
(±) | speaker loudness is average but good (81.4 dB)
Bass 100 - 315 Hz
(±) | reduced bass - on average 5.5% lower than median
(±) | linearity of bass is average (7.5% delta to prev. frequency)
Mids 400 - 2000 Hz
(+) | balanced mids - only 1.7% away from median
(+) | mids are linear (3.1% delta to prev. frequency)
Highs 2 - 16 kHz
(±) | reduced highs - on average 6.2% lower than median
(+) | highs are linear (3.9% delta to prev. frequency)
Overall 100 - 16.000 Hz
(+) | overall sound is linear (9.7% difference to median)
Compared to same class
» 13% of all tested devices in this class were better, 1% similar, 85% worse
» The best had a delta of 5%, average was 17%, worst was 45%
Compared to all devices tested
» 4% of all tested devices were better, 1% similar, 95% worse
» The best had a delta of 4%, average was 23%, worst was 134%
Asus ProArt P16 RTX 5090 audio analysis
(±) | speaker loudness is average but good (80.8 dB)
Bass 100 - 315 Hz
(+) | good bass - only 3.3% away from median
(±) | linearity of bass is average (7.7% delta to prev. frequency)
Mids 400 - 2000 Hz
(+) | balanced mids - only 2.9% away from median
(+) | mids are linear (1.9% delta to prev. frequency)
Highs 2 - 16 kHz
(+) | balanced highs - only 4.1% away from median
(+) | highs are linear (5.5% delta to prev. frequency)
Overall 100 - 16.000 Hz
(+) | overall sound is linear (8.3% difference to median)
Compared to same class
» 9% of all tested devices in this class were better, 2% similar, 89% worse
» The best had a delta of 5%, average was 17%, worst was 45%
Compared to all devices tested
» 2% of all tested devices were better, 1% similar, 97% worse
» The best had a delta of 4%, average was 23%, worst was 134%
Dell 16 Premium DA16250 audio analysis
(+) | speakers can play relatively loud (84.2 dB)
Bass 100 - 315 Hz
(±) | reduced bass - on average 6.1% lower than median
(+) | bass is linear (4.2% delta to prev. frequency)
Mids 400 - 2000 Hz
(+) | balanced mids - only 1.4% away from median
(+) | mids are linear (3.6% delta to prev. frequency)
Highs 2 - 16 kHz
(+) | balanced highs - only 1.5% away from median
(+) | highs are linear (2.2% delta to prev. frequency)
Overall 100 - 16.000 Hz
(+) | overall sound is linear (5.1% difference to median)
Compared to same class
» 1% of all tested devices in this class were better, 0% similar, 99% worse
» The best had a delta of 5%, average was 17%, worst was 45%
Compared to all devices tested
» 0% of all tested devices were better, 0% similar, 100% worse
» The best had a delta of 4%, average was 23%, worst was 134%
Apple MacBook Pro 16 2024 M4 Pro audio analysis
(+) | speakers can play relatively loud (84.6 dB)
Bass 100 - 315 Hz
(±) | reduced bass - on average 5.1% lower than median
(+) | bass is linear (5.6% delta to prev. frequency)
Mids 400 - 2000 Hz
(+) | balanced mids - only 1.4% away from median
(+) | mids are linear (2.4% delta to prev. frequency)
Highs 2 - 16 kHz
(+) | balanced highs - only 1.6% away from median
(+) | highs are linear (3% delta to prev. frequency)
Overall 100 - 16.000 Hz
(+) | overall sound is linear (4.8% difference to median)
Compared to same class
» 0% of all tested devices in this class were better, 0% similar, 99% worse
» The best had a delta of 5%, average was 17%, worst was 45%
Compared to all devices tested
» 0% of all tested devices were better, 0% similar, 100% worse
» The best had a delta of 4%, average was 23%, worst was 134%
Power consumption

There are no major surprises when it comes to power measurements. The bright OLED panel is noticeable at idle, but this is to be expected. During the stress test, we briefly measured around 143 watts, before consumption quickly settles at approximately 134 watts. The 140-watt power adapter is able to handle this load, but there is little headroom available, for example to charge the battery at the same time.
| Off / Standby | |
| Idle | |
| Load |
|
Key:
min: | |
| Lenovo ThinkPad T1g Gen 8 21TD003GE Ultra 9 285H, GeForce RTX 5070 Laptop, Samsung PM9E1 MZVLC2T0HBLD, Tandem-OLED, 3200x2000, 16" | Lenovo Yoga Pro 9i 16 RTX 5070 Ultra 9 285H, GeForce RTX 5070 Laptop, WD PC SN7100S SDFPMSL-1T00-1101, OLED, 3200x2000, 16" | Asus ProArt P16 RTX 5090 Ryzen AI 9 HX 370, GeForce RTX 5090 Laptop, Micron 2500 2TB MTFDKBA2T0QGN-1BN1AABGA, OLED, 3840x2400, 16" | Dell 16 Premium DA16250 Ultra 7 255H, GeForce RTX 5070 Laptop, Kioxia BG6 KBG6AZNV1T02, OLED, 3840x2400, 16.3" | Apple MacBook Pro 16 M4 Max M4 Max 16-Core, M4 Max 40-Core GPU, Apple SSD AP1024Z, Mini-LED, 3456x2234, 16.2" | Average NVIDIA GeForce RTX 5070 Laptop | Average of class Multimedia | |
|---|---|---|---|---|---|---|---|
| Power Consumption | -19% | -31% | -8% | -2% | -32% | 22% | |
| Idle Minimum * (Watt) | 8.5 | 8.8 -4% | 10.9 -28% | 6.5 24% | 4.7 45% | 10.8 ? -27% | 5.72 ? 33% |
| Idle Average * (Watt) | 13.6 | 16.1 -18% | 12.1 11% | 8.1 40% | 15.5 -14% | 15.4 ? -13% | 10.2 ? 25% |
| Idle Maximum * (Watt) | 14.1 | 16.5 -17% | 12.5 11% | 33 -134% | 15.6 -11% | 21 ? -49% | 12.4 ? 12% |
| Load Average * (Watt) | 84.5 | 89.3 -6% | 129.3 -53% | 88.9 -5% | 125 -48% | 98.7 ? -17% | 65.5 ? 22% |
| Cyberpunk 2077 ultra external monitor * (Watt) | 118.1 | 157.9 -34% | 172.8 -46% | 108.9 8% | 107.2 9% | ||
| Cyberpunk 2077 ultra * (Watt) | 120.3 | 160.6 -33% | 176.6 -47% | 108.7 10% | 116.2 3% | ||
| Load Maximum * (Watt) | 143 | 177.4 -24% | 233.9 -64% | 138.3 3% | 143.7 -0% | 218 ? -52% | 114 ? 20% |
* ... smaller is better
Power consumption – Cyberpunk/stress test
Power consumption with external monitor
Battery life
Using the 90 Wh battery, our Wi-Fi test at 150 cd/m² yields just under 11 hours of runtime, which is a very competitive result among Windows-based rivals. Only the MacBook Pro lasts significantly longer, reaching around 18 hours. At maximum brightness, we measured just under six hours, putting the ThinkPad ahead of the other Windows models, while the MacBook Pro lasts only around one hour longer.

Notebookcheck overall rating
Lenovo ThinkPad T1g Gen 8 21TD003GE
- 01/21/2026 v8
Andreas Osthoff
 Total Sustainability Score:
 Possible alternatives at a glance
Image | Model / Review | Price | Weight | Height | Display |
|---|---|---|---|---|---|
1. 92.4%  | Lenovo ThinkPad T1g Gen 8 21TD003GE Intel Core Ultra 9 285H ⎘ NVIDIA GeForce RTX 5070 Laptop ⎘ 64 GB Memory, 2048 GB SSD | Amazon: List Price: 4500€ | 1.9 kg | 15.8 mm | 16.00" 3200x2000 236 PPI Tandem-OLED |
2. 90.4%  | Lenovo Yoga Pro 9i 16 RTX 5070 Intel Core Ultra 9 285H ⎘ NVIDIA GeForce RTX 5070 Laptop ⎘ 64 GB Memory, 1024 GB SSD | Amazon: List Price: 2800€ | 1.9 kg | 17.9 mm | 16.00" 3200x2000 236 PPI OLED |
3. 89.7%  | Asus ProArt P16 RTX 5090 AMD Ryzen AI 9 HX 370 ⎘ NVIDIA GeForce RTX 5090 Laptop ⎘ 64 GB Memory, 2048 GB SSD | Amazon: List Price: 4799€ | 2 kg | 18.3 mm | 16.00" 3840x2400 283 PPI OLED |
4. 87.9%  | Dell 16 Premium DA16250 Intel Core Ultra 7 255H ⎘ NVIDIA GeForce RTX 5070 Laptop ⎘ 32 GB Memory, 1024 GB SSD | Amazon: List Price: 3300 USD | 2.3 kg | 18.7 mm | 16.30" 3840x2400 278 PPI OLED |
5. 91.7%  | Apple MacBook Pro 16 M4 Max Apple M4 Max 16-Core ⎘ Apple M4 Max 40-Core GPU ⎘ 48 GB Memory, 1024 GB SSD | Amazon: List Price: 4699€ | 2.1 kg | 16.8 mm | 16.20" 3456x2234 254 PPI Mini-LED |
Transparency
The selection of devices to be reviewed is made by our editorial team. The test sample was provided to the author as a loan by the manufacturer or retailer for the purpose of this review. The lender had no influence on this review, nor did the manufacturer receive a copy of this review before publication. There was no obligation to publish this review. As an independent media company, Notebookcheck is not subjected to the authority of manufacturers, retailers or publishers.
This is how Notebookcheck is testing
Every year, Notebookcheck independently reviews hundreds of laptops and smartphones using standardized procedures to ensure that all results are comparable. We have continuously developed our test methods for around 20 years and set industry standards in the process. In our test labs, high-quality measuring equipment is utilized by experienced technicians and editors. These tests involve a multi-stage validation process. Our complex rating system is based on hundreds of well-founded measurements and benchmarks, which maintains objectivity. Further information on our test methods can be found here.

