Verdict — Ultrathin Workstation With Balanced Features
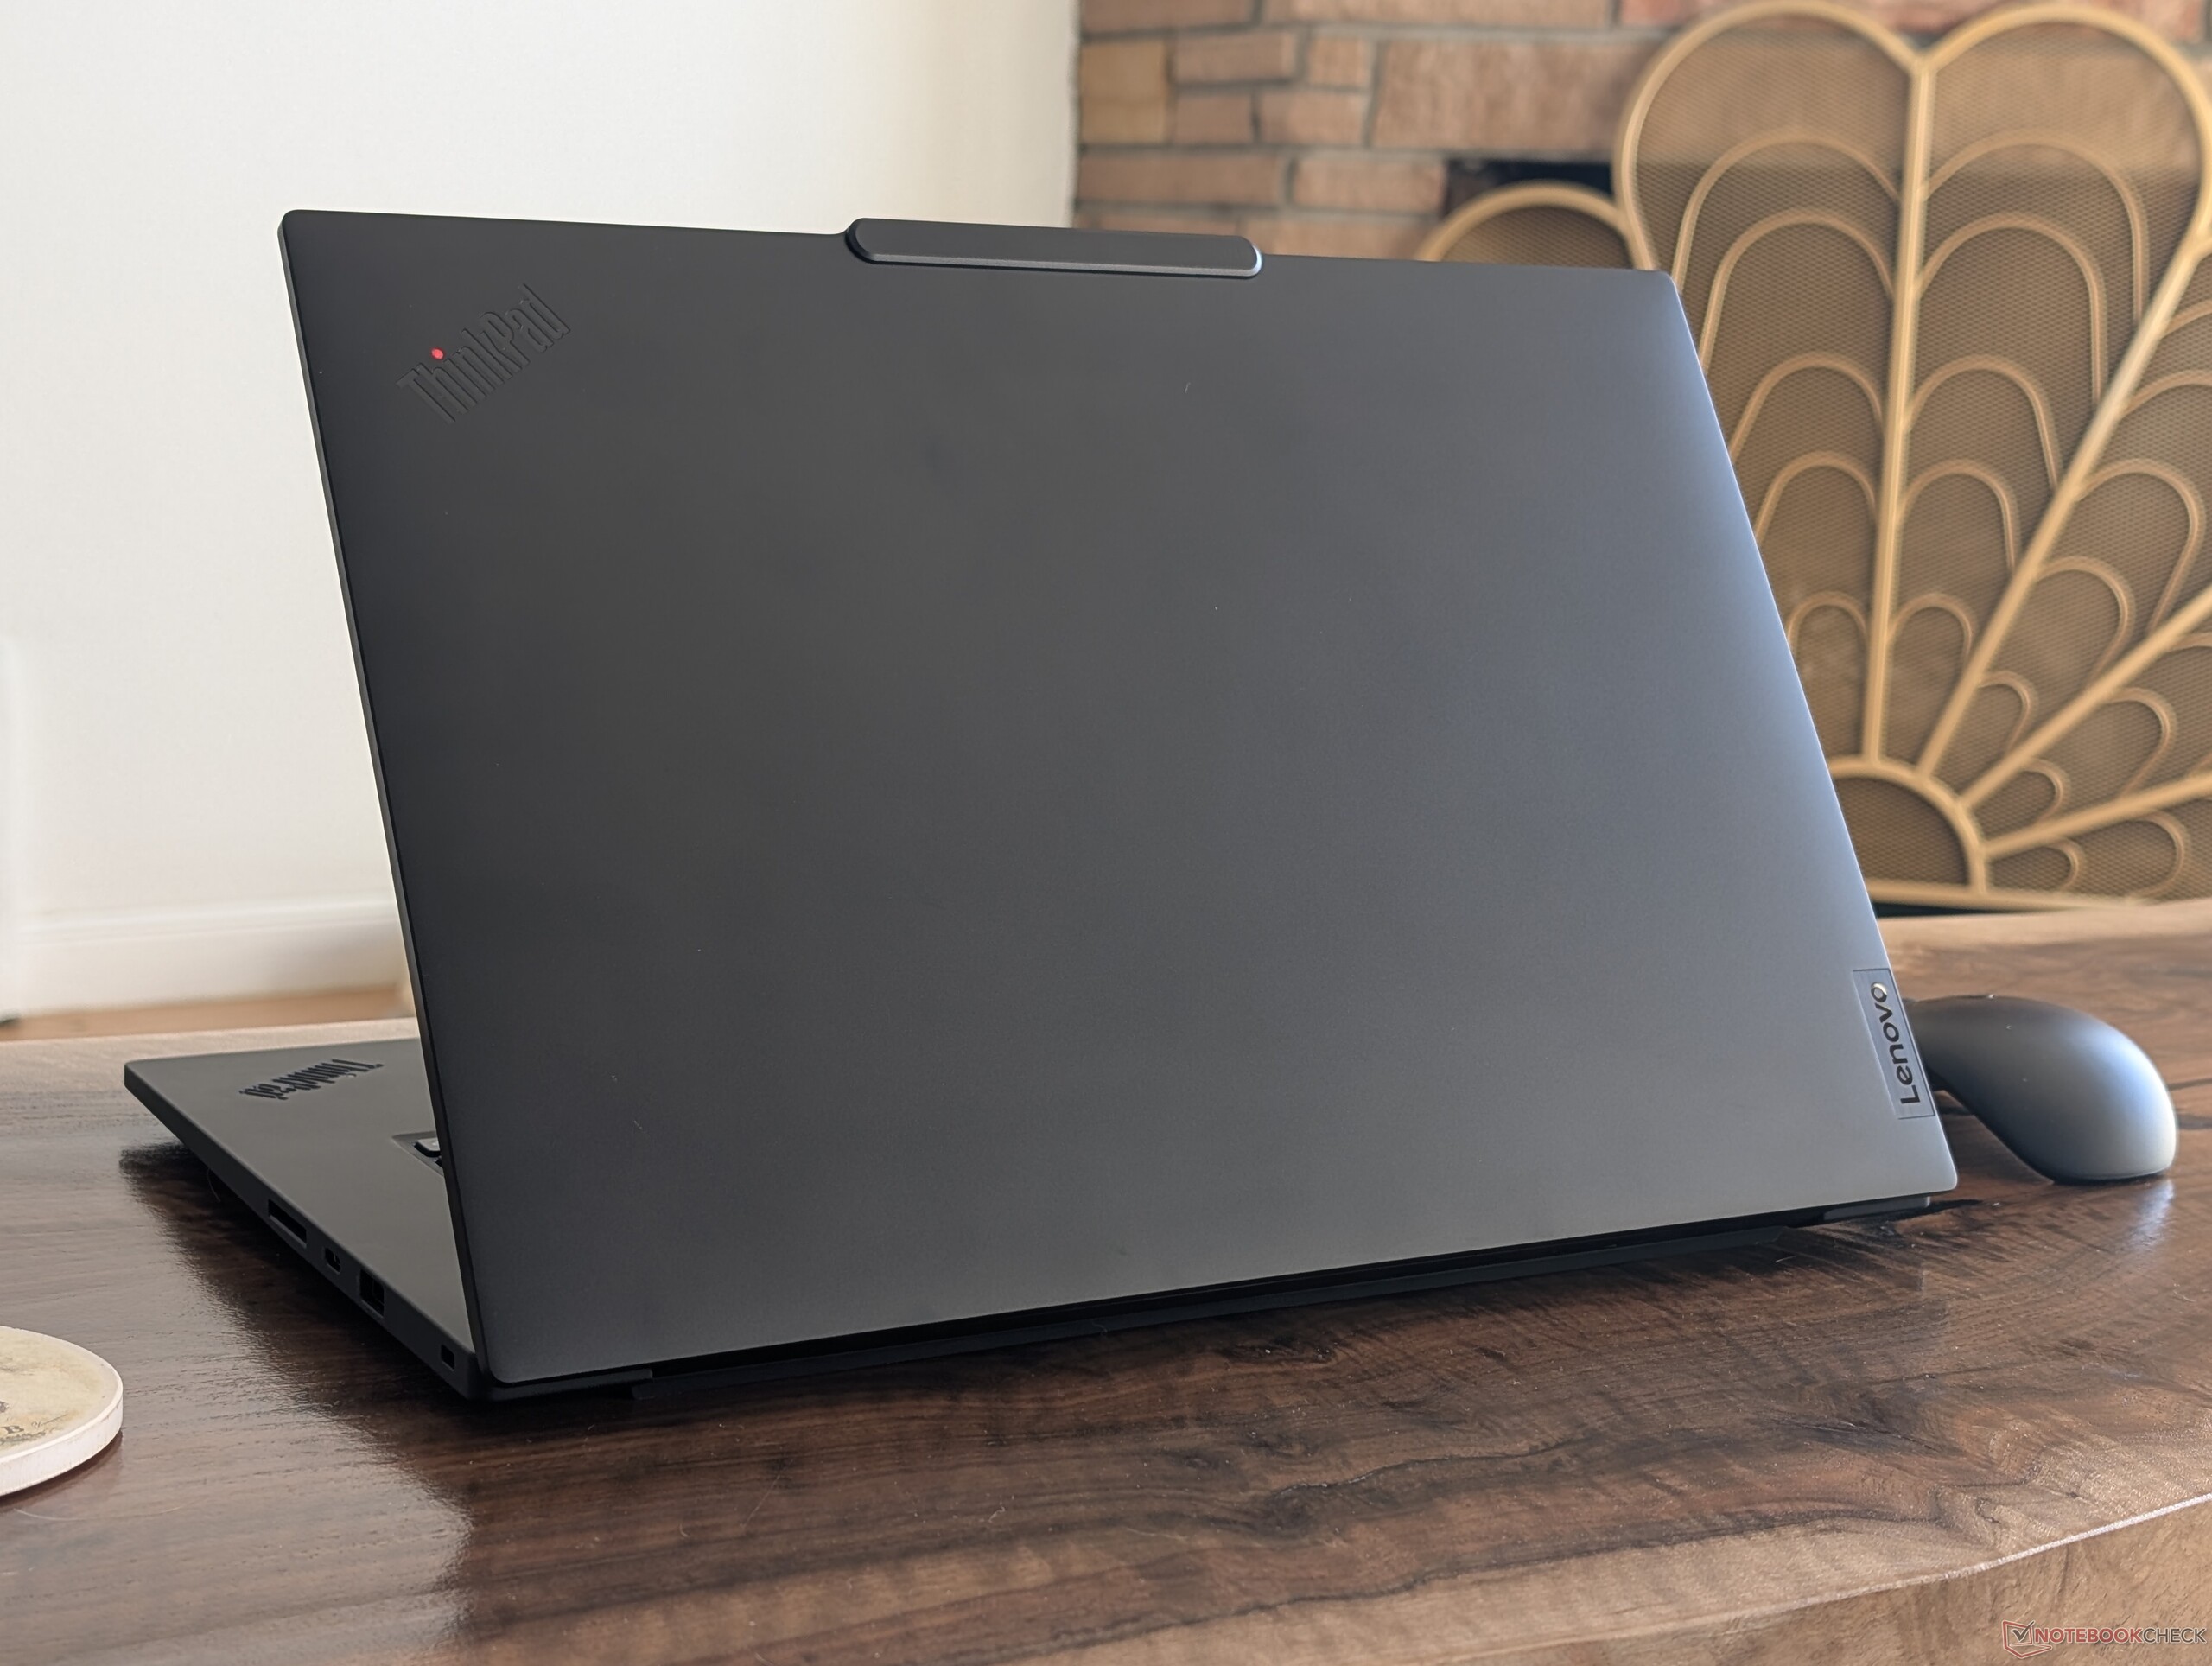
The ThinkPad P1 Gen 8 is a step faster than the ThinkPad P1 Gen 7 while adding support for Thunderbolt 5 connectivity and a new, smaller USB-C AC adapter. The series is known for offering discrete Nvidia graphics options despite the ultrathin profile for high performance-per-volume and so this latest model continues the trend. There are otherwise no external changes for this year's revision.
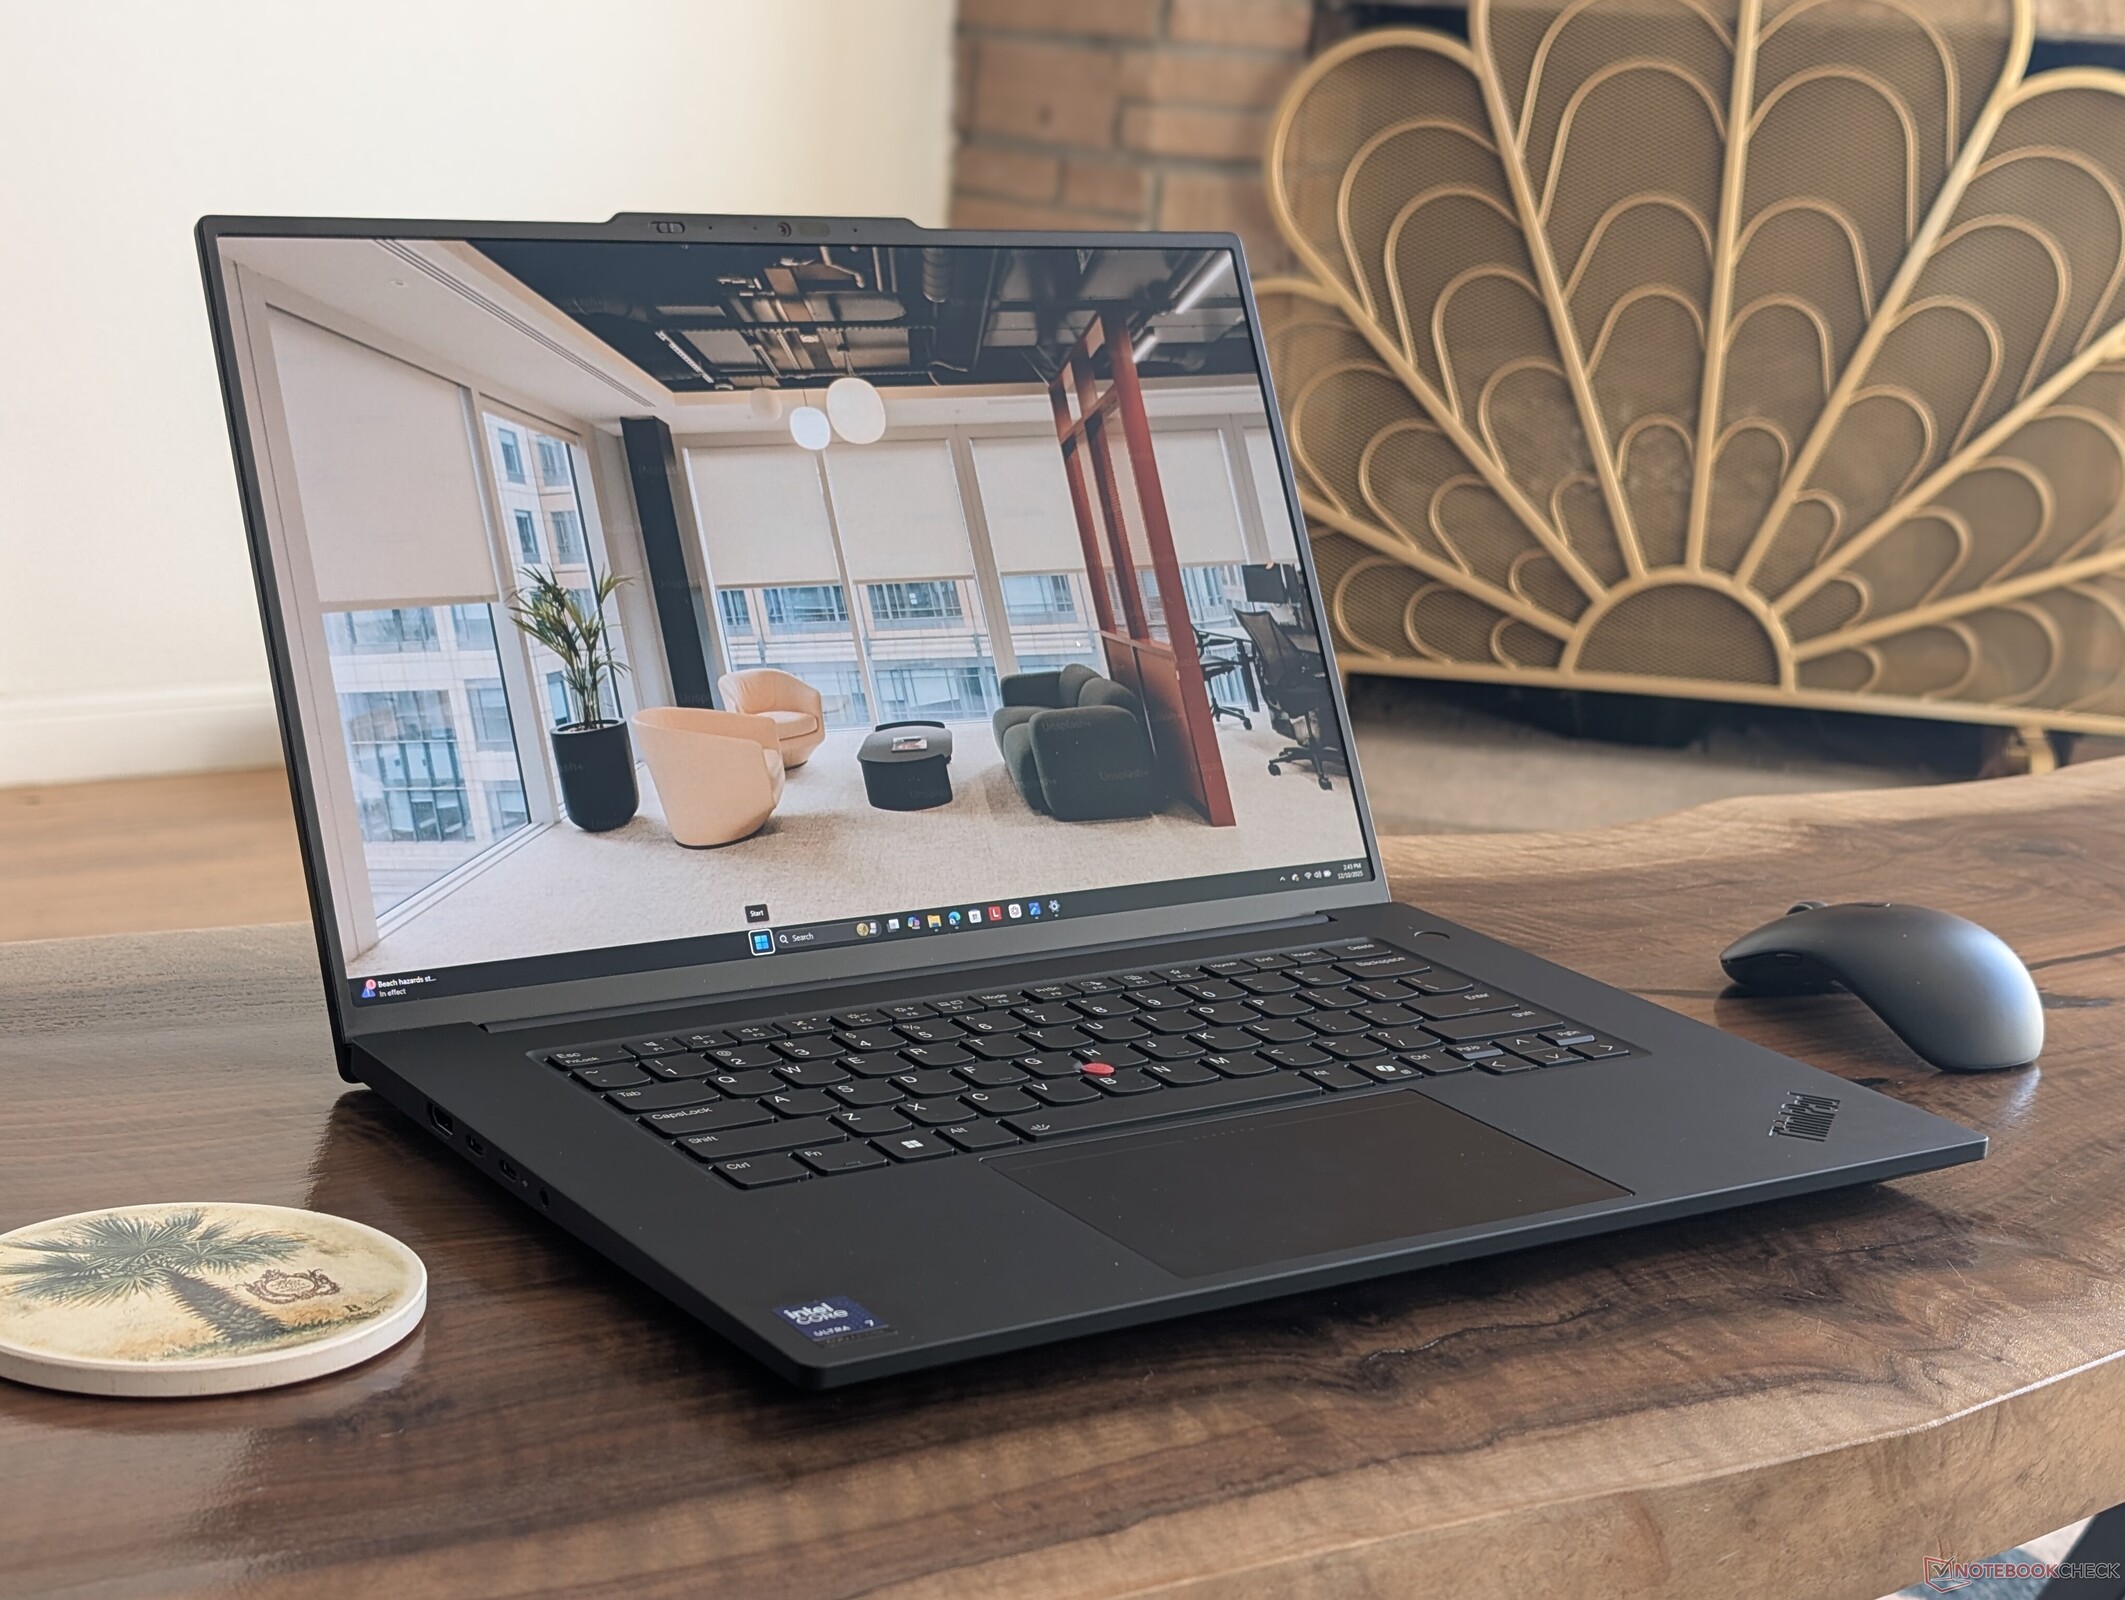
The more exciting feature of the ThinkPad P1 Gen 8, however, is arguably its new tandem OLED touchscreen option. At 1500 nits maximum, this is one of the brightest 16-inch mobile workstations available by far for better HDR playback than the vast majority of laptops out there. It's strange, then, to see such an option on a workstation as the target audience of professionals are unlikely to require super-bright HDR touchscreens for their daily workloads. In fact, battery life is shorter with this configuration and so users may want to configure with the regular 4K IPS panel which offers similar colors and a higher native resolution. Tandem OLED may be better fit for gaming or multimedia-centric laptops like those from the Yoga or Legion series instead.
Power users demanding more horsepower may want to consider the thicker P16 series which offers graphics options beyond the RTX Pro 2000 Blackwell.
Pros
Cons
Price and Availability
The Lenovo ThinkPad P1 16 Gen 8 is now shipping directly from the manufacturer for $2220 as configured. Similar configurations are also available on Amazon.
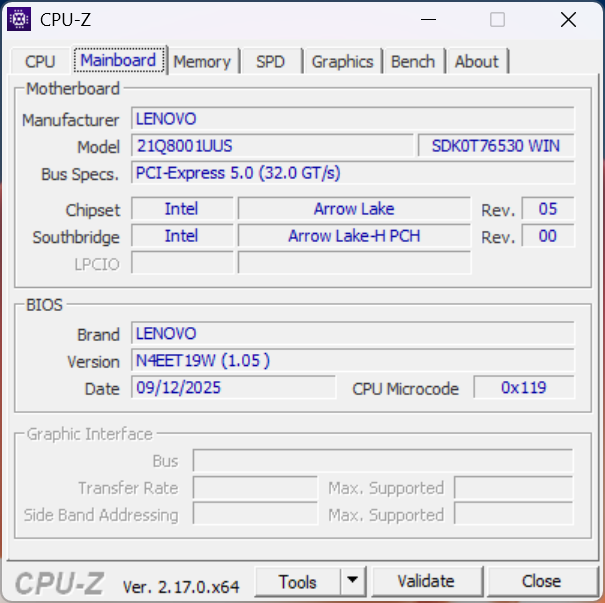
The ThinkPad P1 Gen 8 succeeds last year's ThinkPad P1 Gen 7 by introducing Intel Arrow Lake-H and Nvidia Blackwell options to replace the older Meteor Lake-H and Ada Lovelace options, respectively. It also ships with new display options including 4K IPS or tandem OLED. The chassis is otherwise unchanged and so we recommend checking out our review on the ThinkPad P1 Gen 7 to learn more about the physical features of the system.
Our test unit is a middle configuration with the Core Ultra 7 255H CPU, 75 W RTX Pro 2000 Blackwell GPU, and 3.2K tandem OLED touchscreen for approximately $2220. Lower-end SKUs start with the Core Ultra 5 235H and only integrated Arc 140T graphics with a standard 1200p60 IPS display while higher-end SKUs come with the Core Ultra 9 285H and 4K IPS display. There are no graphics options above the RTX Pro 2000 Blackwell.
Alternatives to the ThinkPad P1 Gen 8 include other 16-inch ultrathin workstations like the HP ZBook X G1i 16, Dell Pro 16 Plus, or the Asus ExpertBook series.
More Lenovo reviews:
Specifications
Case
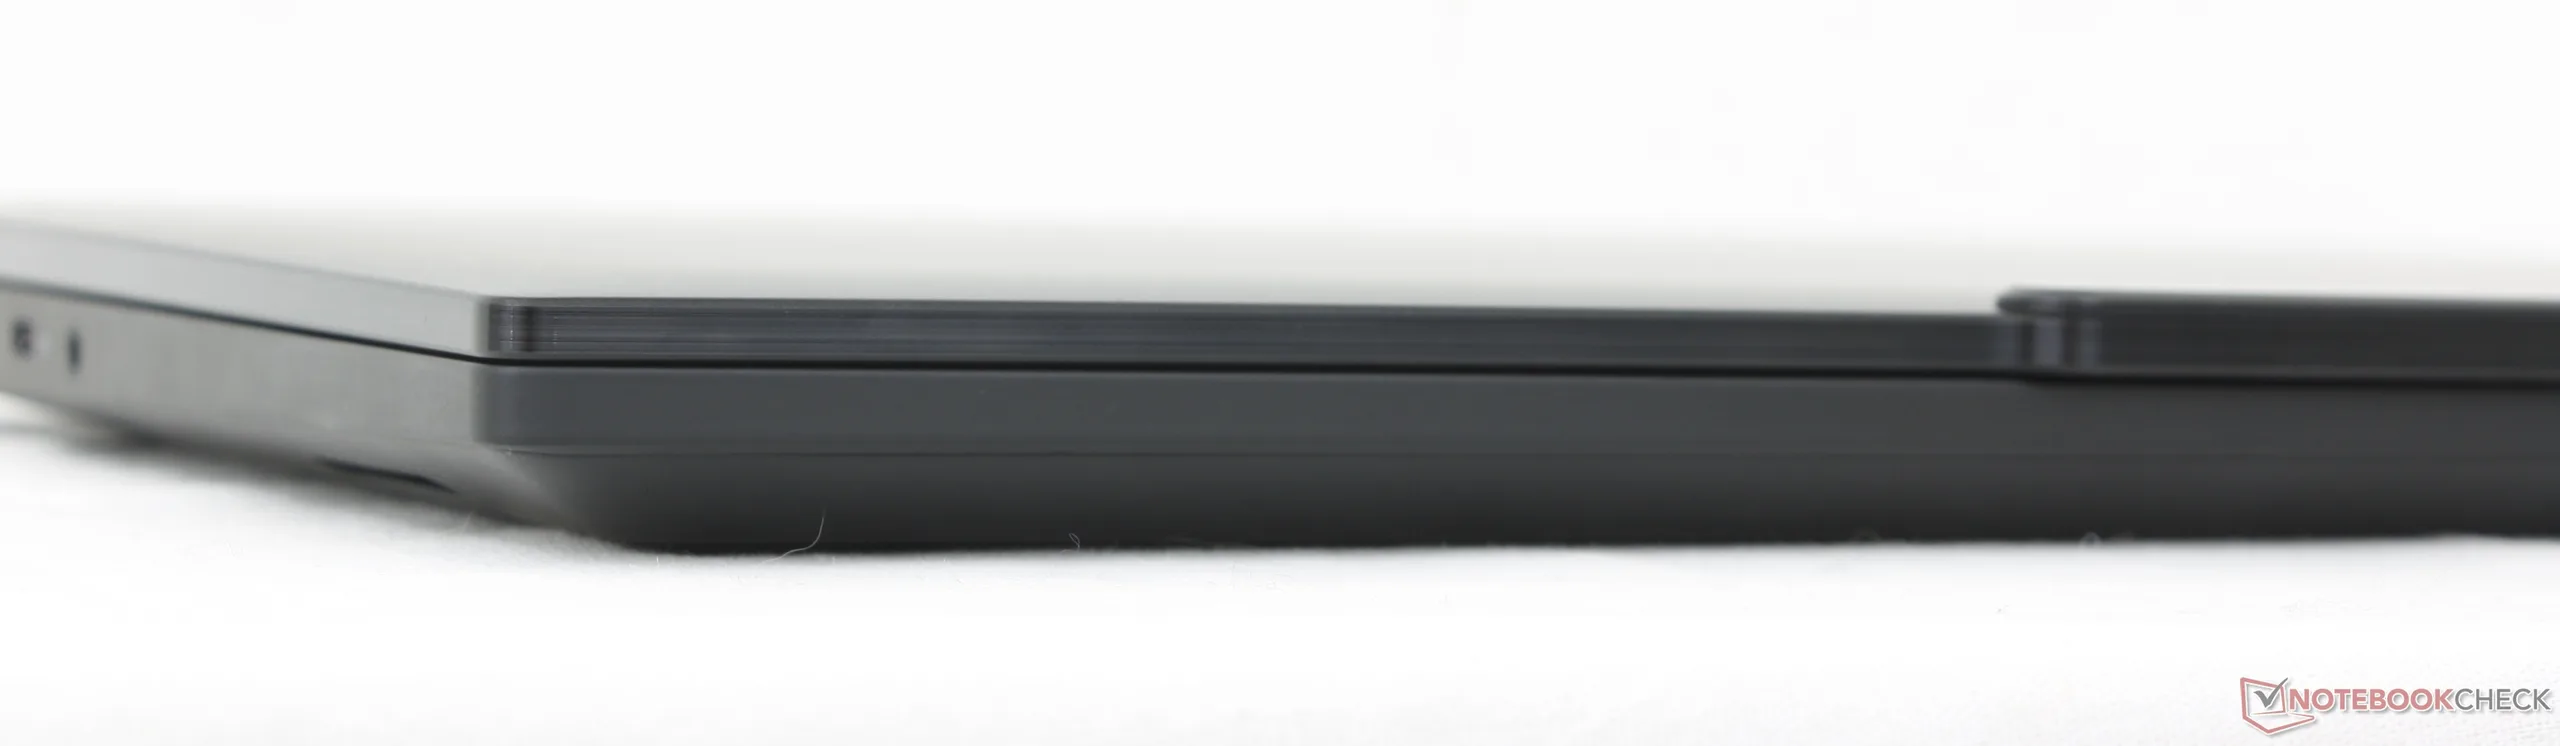
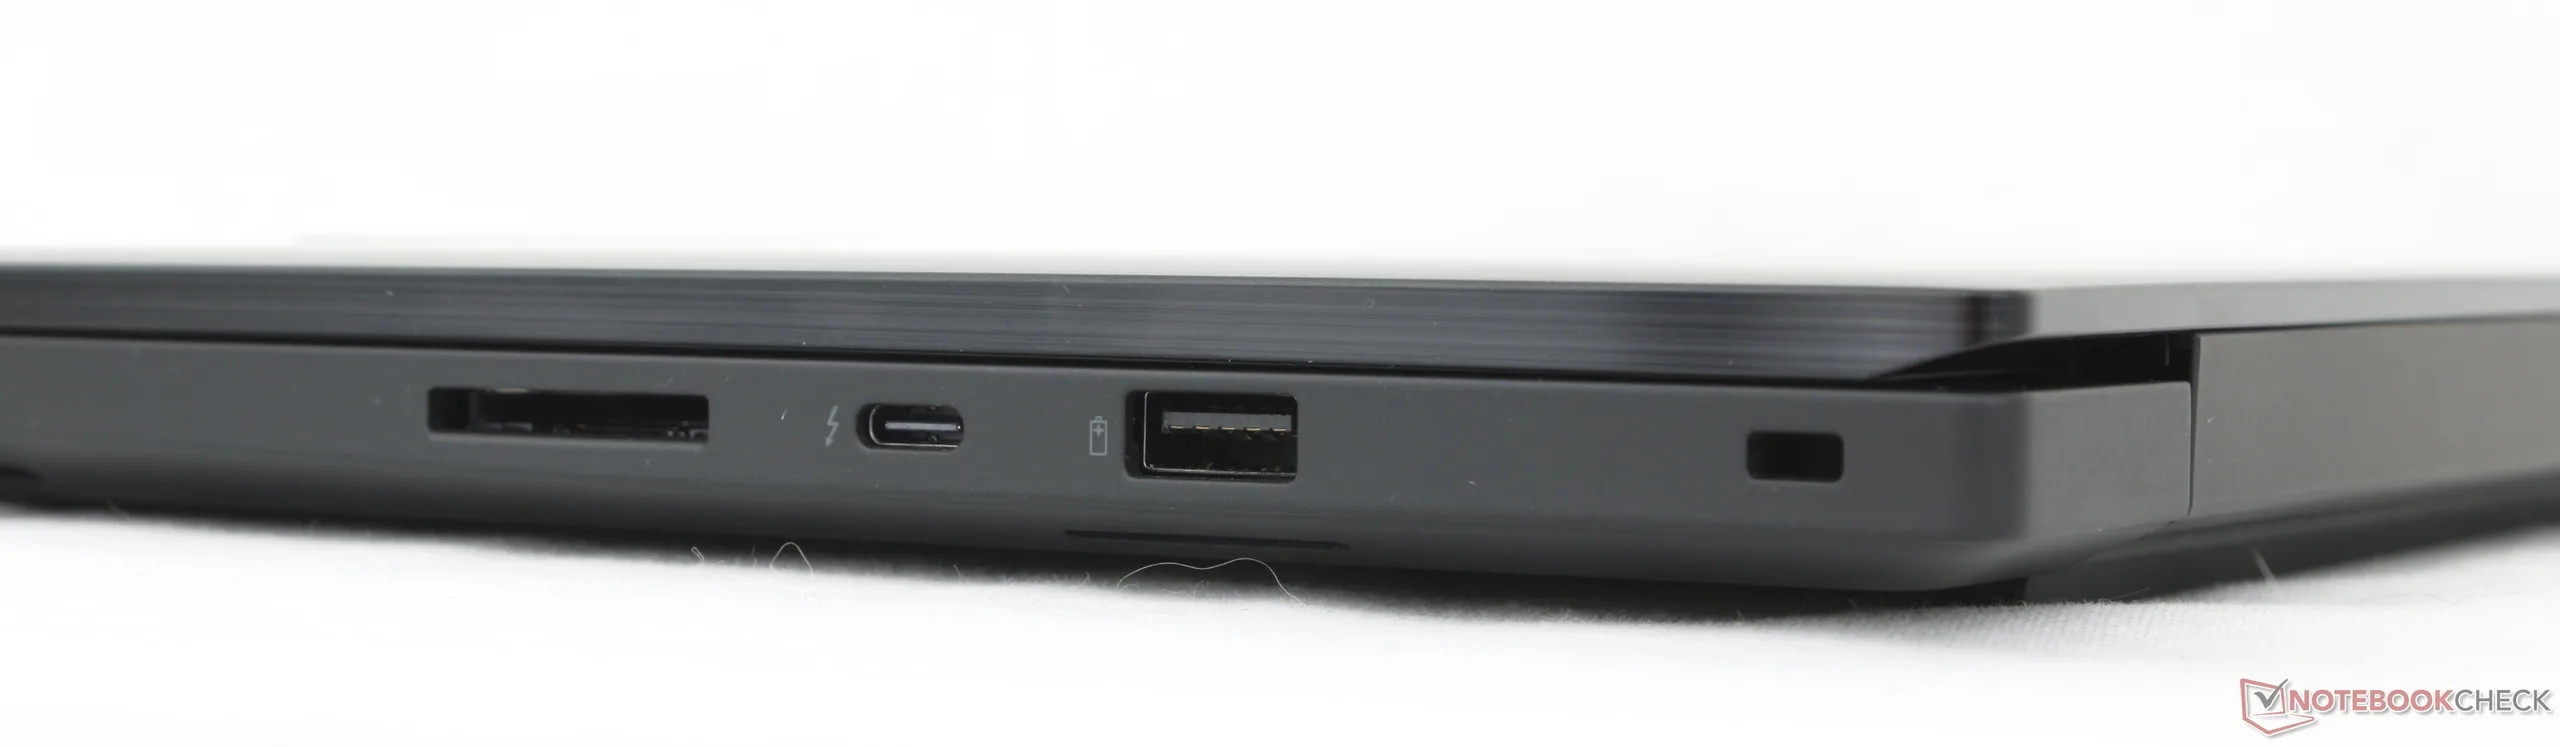
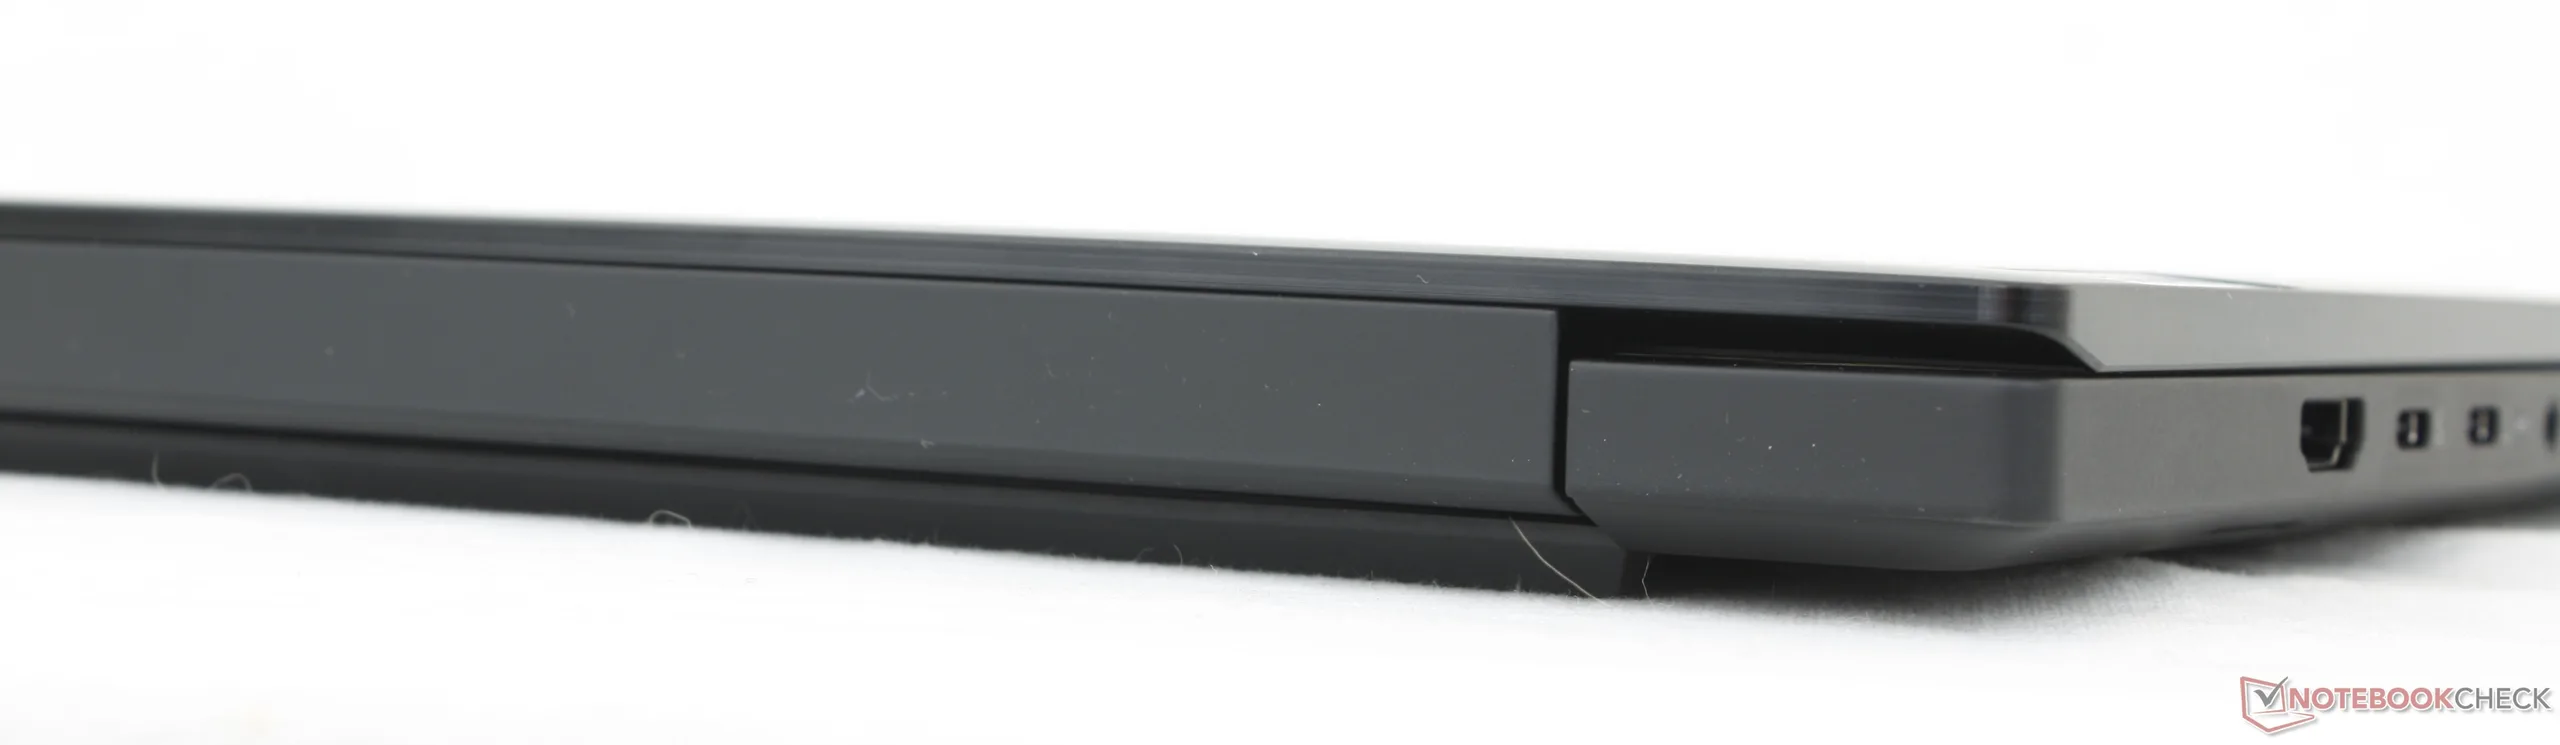
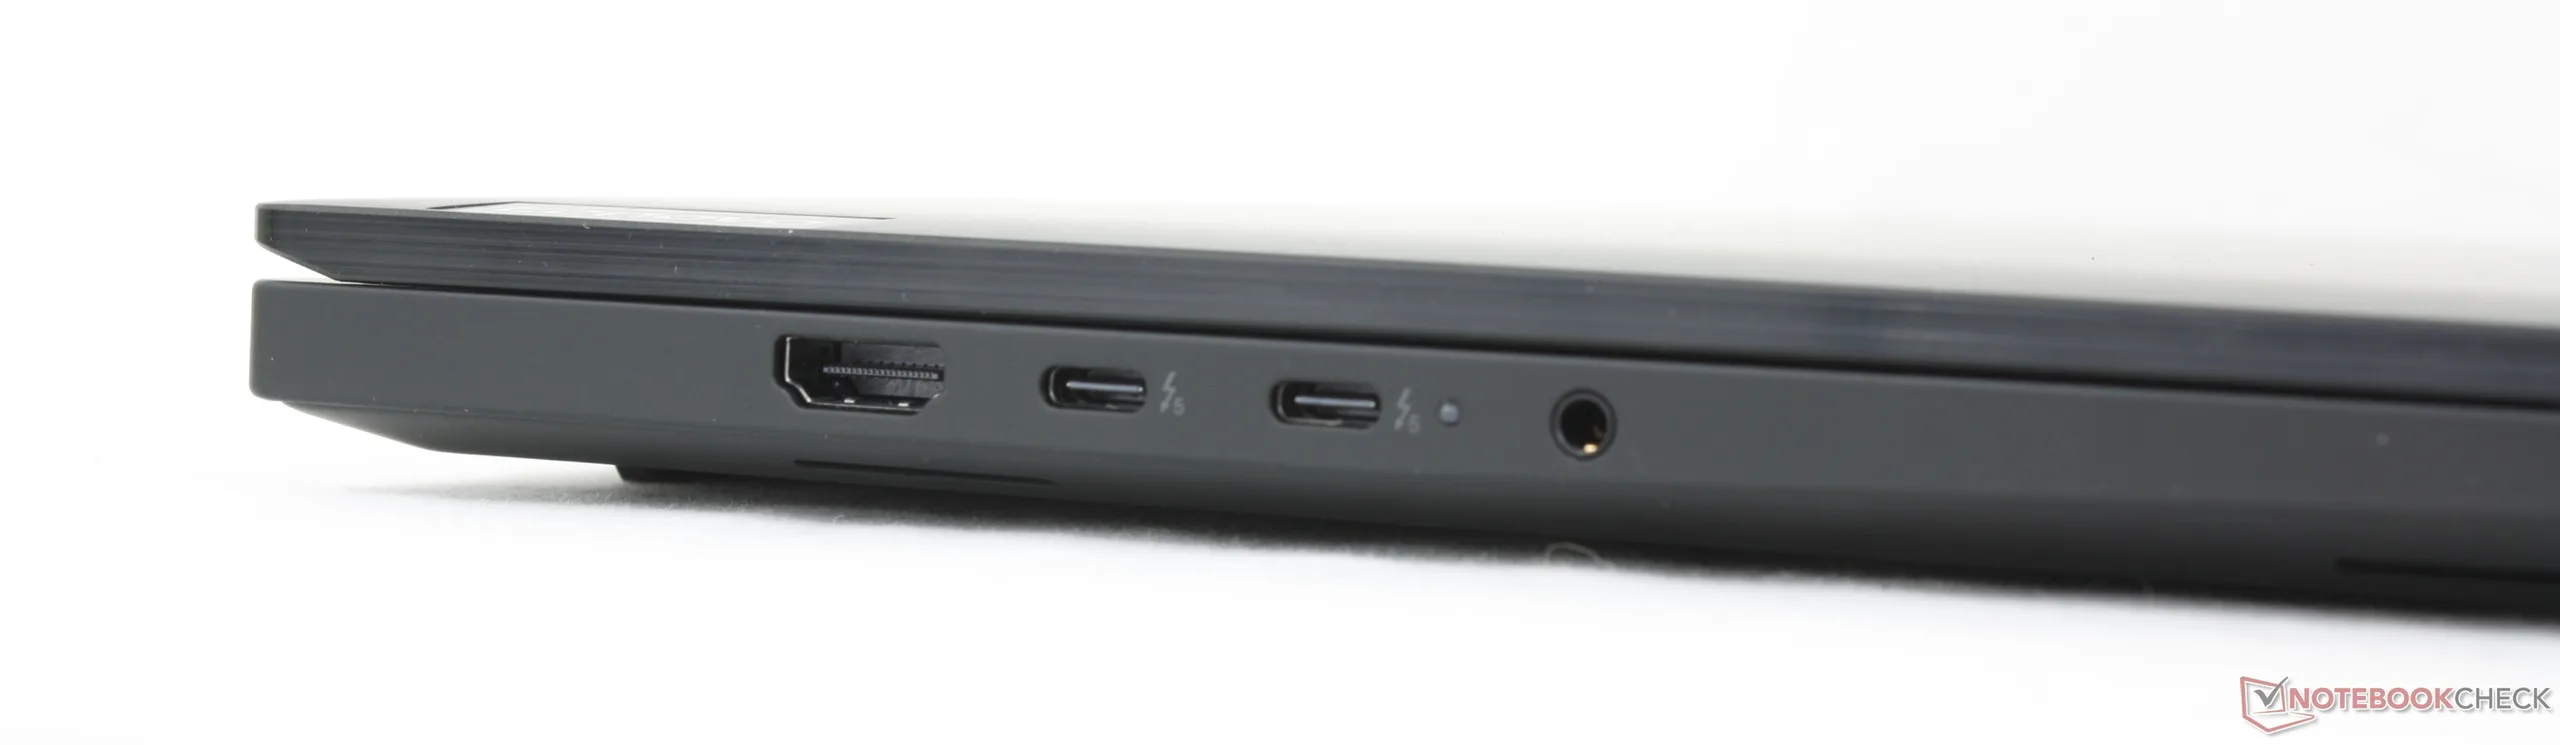
While the chassis and dimensions remain the same as before, the Gen 8 model introduces a few noteworthy port changes over Gen 7. Support for Thunderbolt 5 is now present while the proprietary AC adapter port has been dropped in favor of USB-C for power delivery only. Thus, one of the three USB-C ports will always be occupied for AC adapter power whereas this was not true for last year's model.
Connectivity
SD Card Reader
| SD Card Reader | |
| average JPG Copy Test (av. of 3 runs) | |
| HP ZBook X G1i 16 (Toshiba Exceria Pro SDXC 64 GB UHS-II) | |
| Lenovo ThinkPad P1 Gen 8 (Toshiba Exceria Pro SDXC 64 GB UHS-II) | |
| Dell Pro Max 16 Plus (Toshiba Exceria Pro SDXC 64 GB UHS-II) | |
| Lenovo ThinkPad P1 Gen 7 21KV001SGE (AV Pro V60) | |
| maximum AS SSD Seq Read Test (1GB) | |
| HP ZBook X G1i 16 (Toshiba Exceria Pro SDXC 64 GB UHS-II) | |
| Dell Pro Max 16 Plus (Toshiba Exceria Pro SDXC 64 GB UHS-II) | |
| Lenovo ThinkPad P1 Gen 8 (Toshiba Exceria Pro SDXC 64 GB UHS-II) | |
| Lenovo ThinkPad P1 Gen 7 21KV001SGE (AV Pro V60) | |
Communication
Webcam


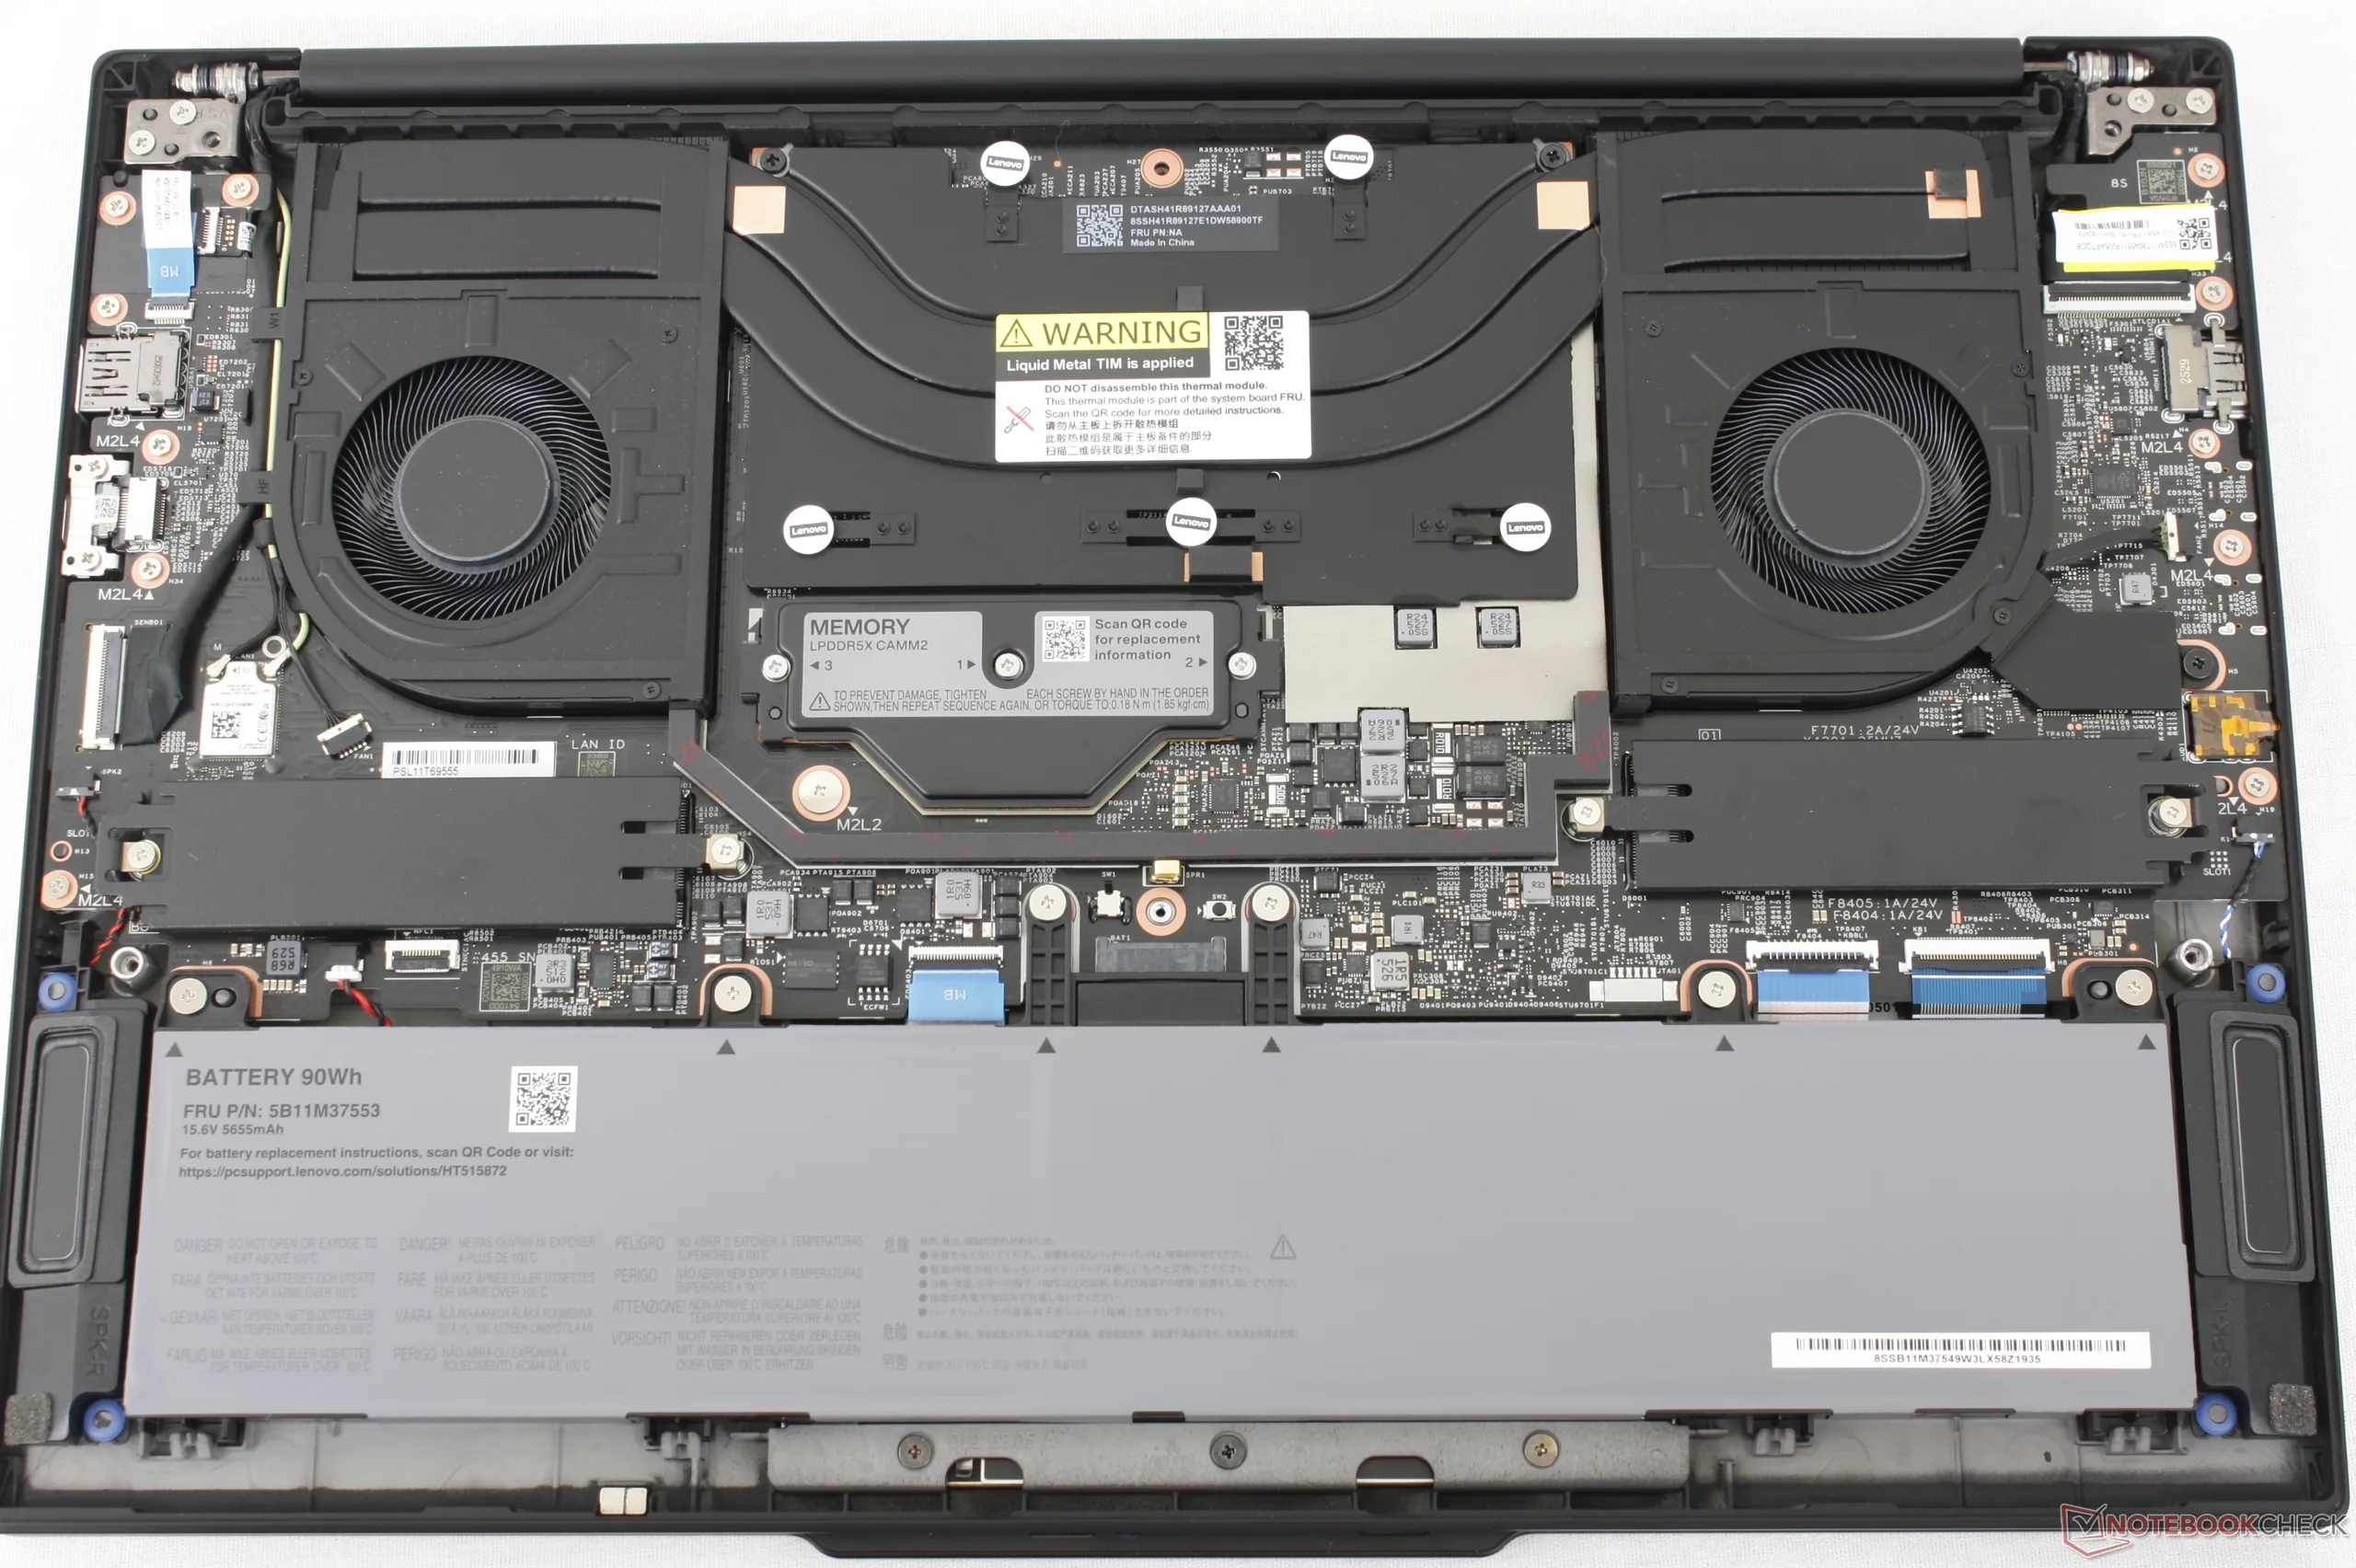
Maintenance
Sustainability
The skeleton consists of 90 percent recycled magnesium and aluminum for the keyboard base, 55 to 75 percent recycled aluminum for the top and bottom covers, and 50 to 90 percent plastic for almost everyone else. The packaging is also free of plastics.
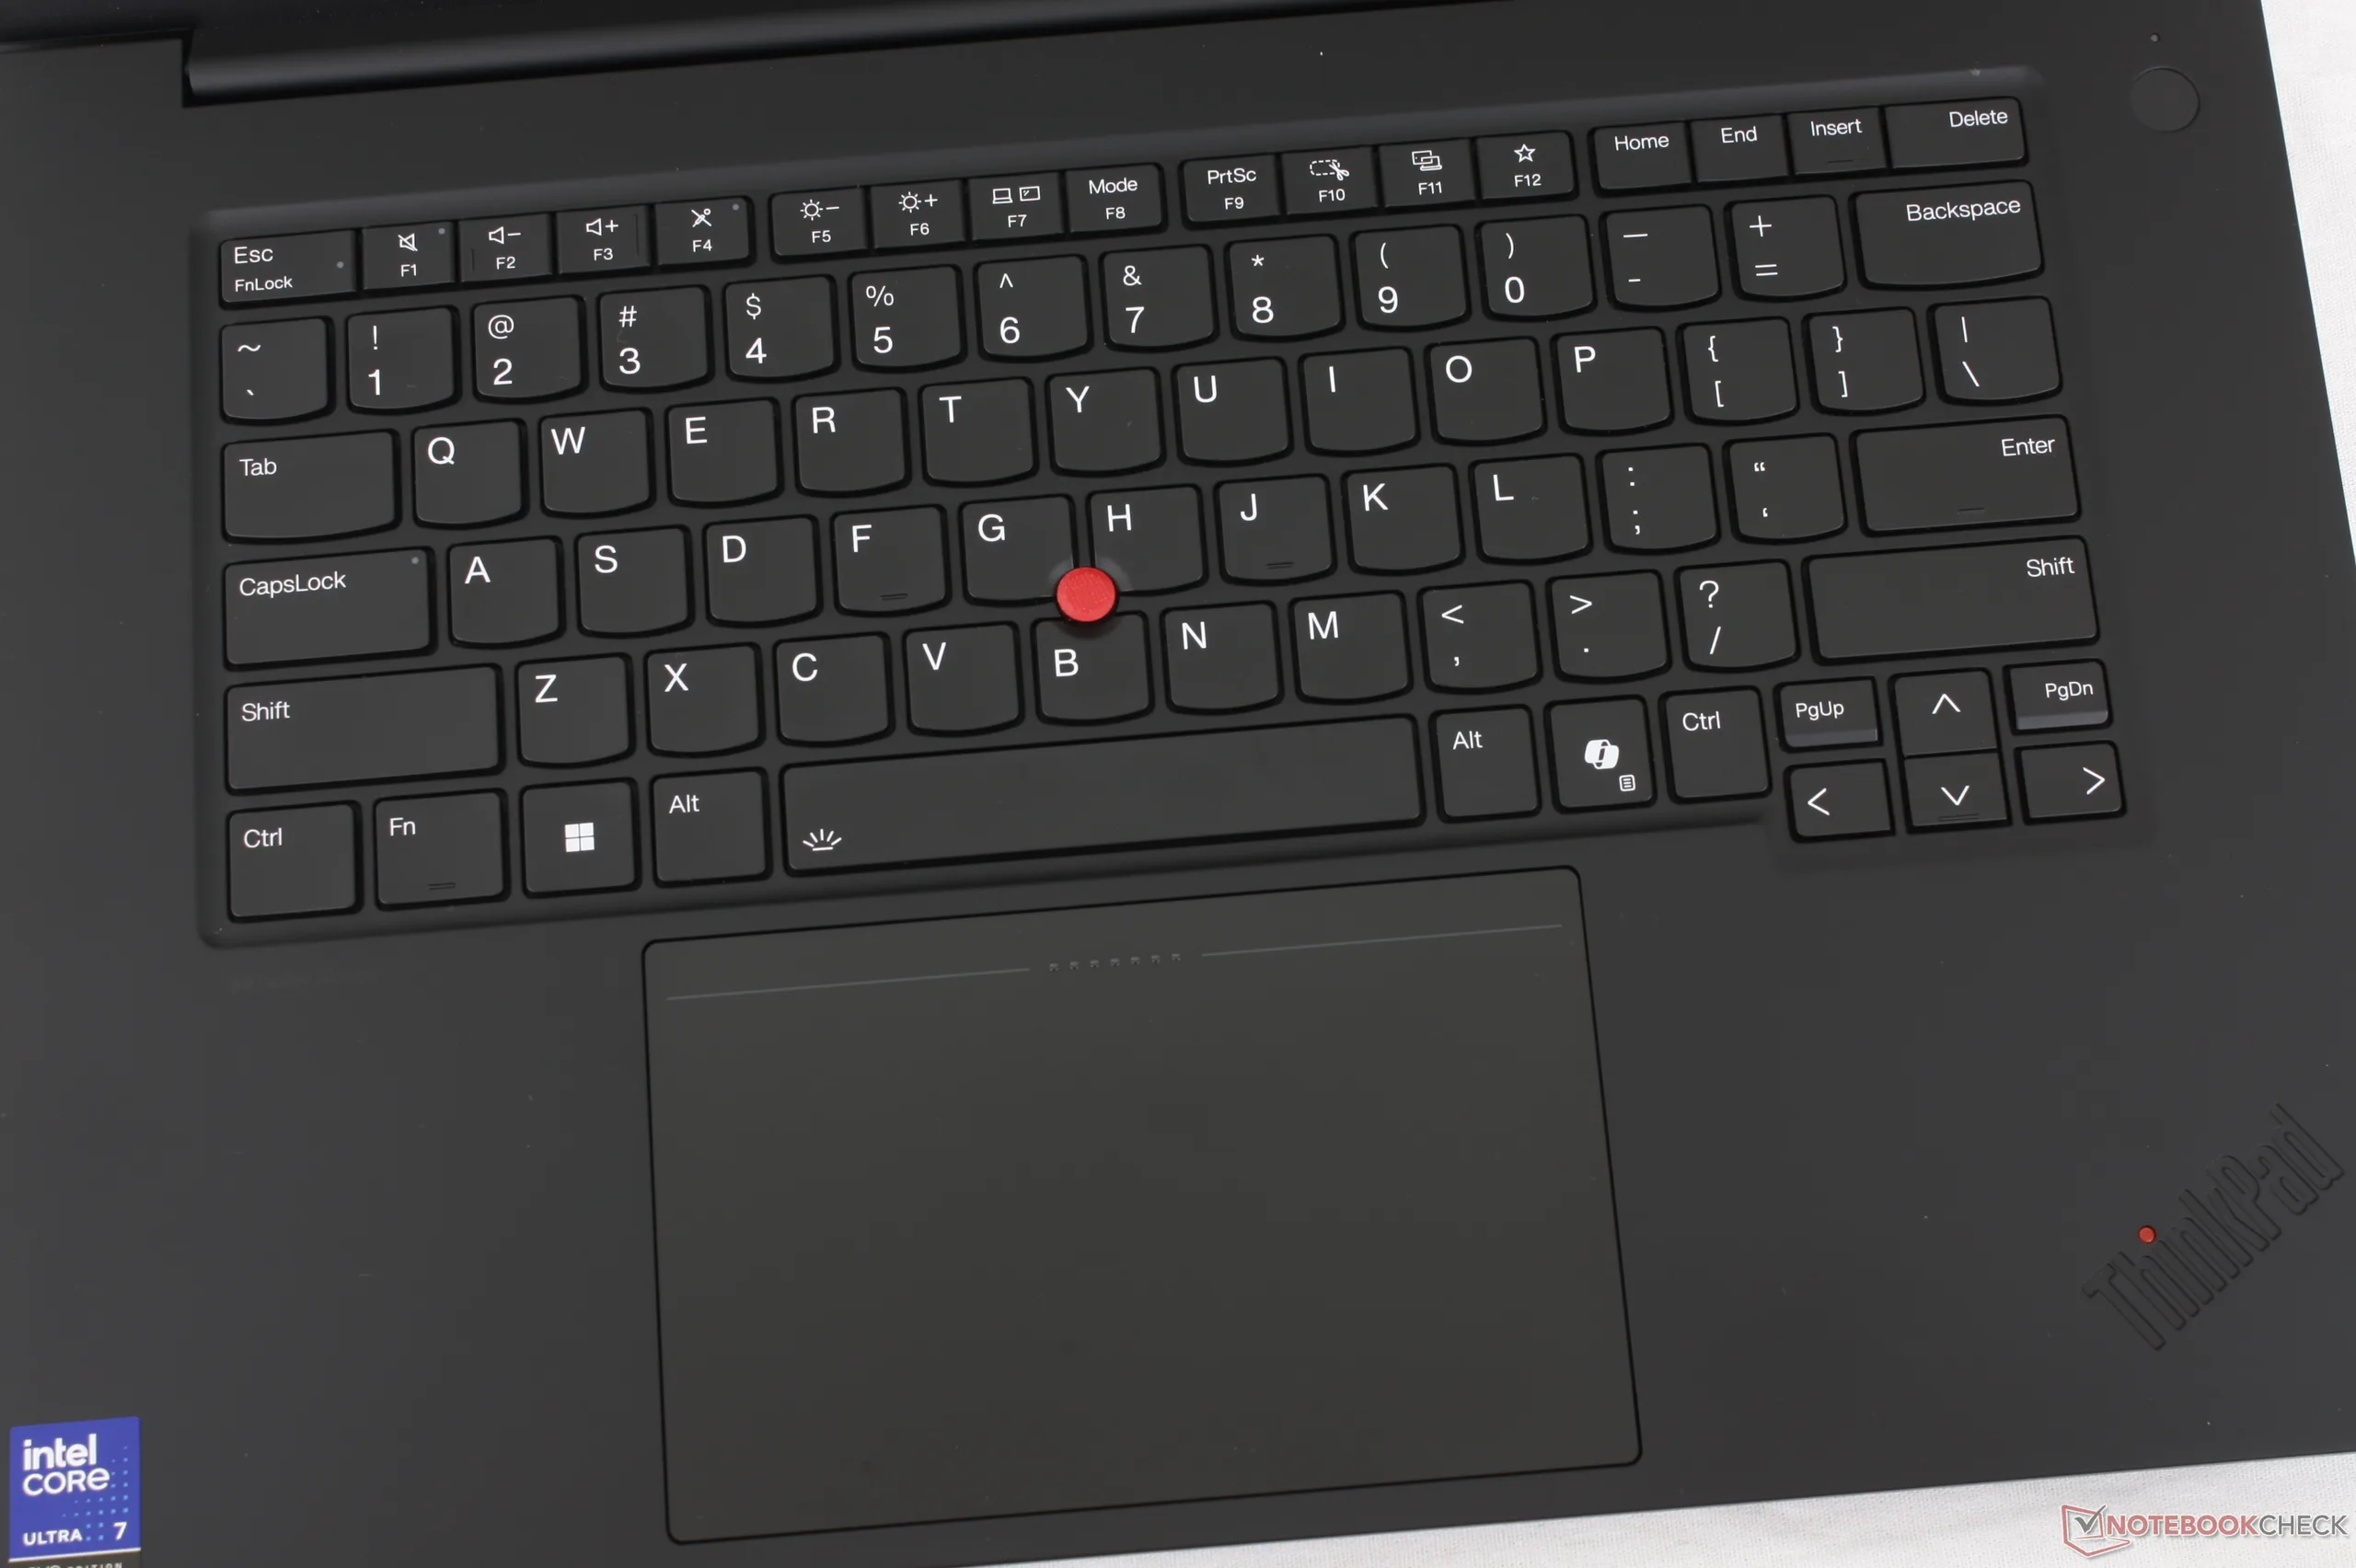
Input Devices
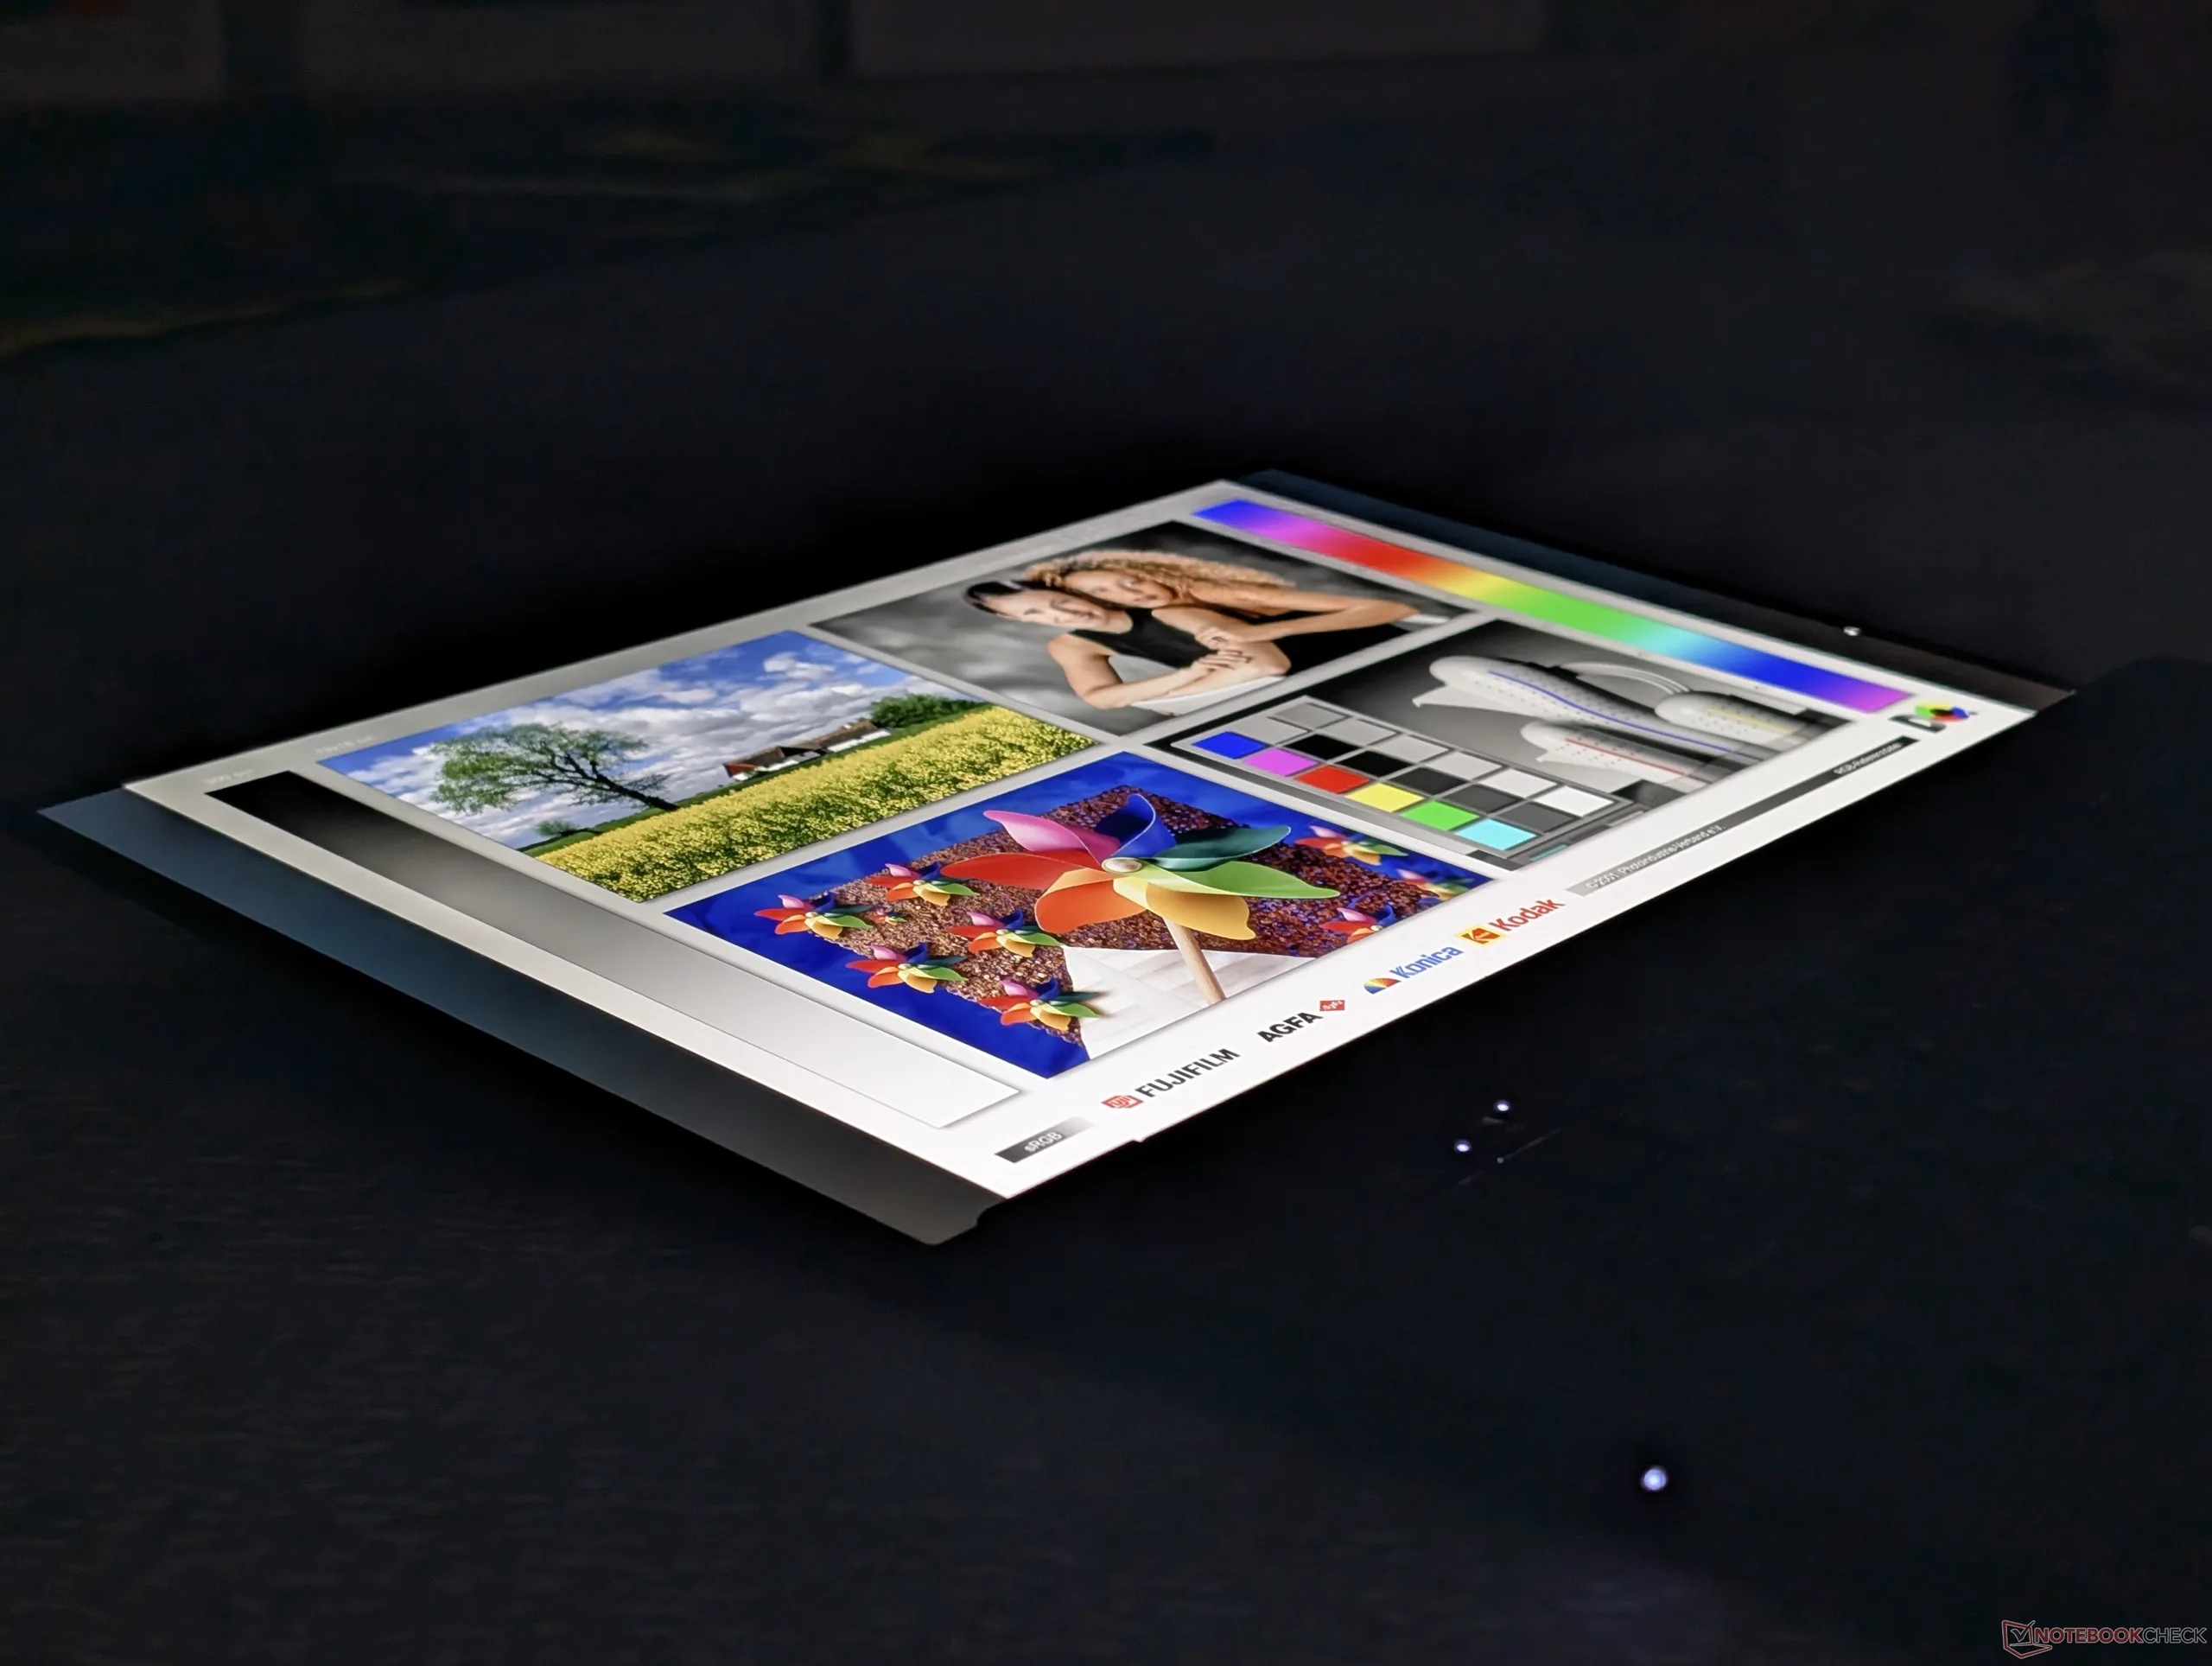
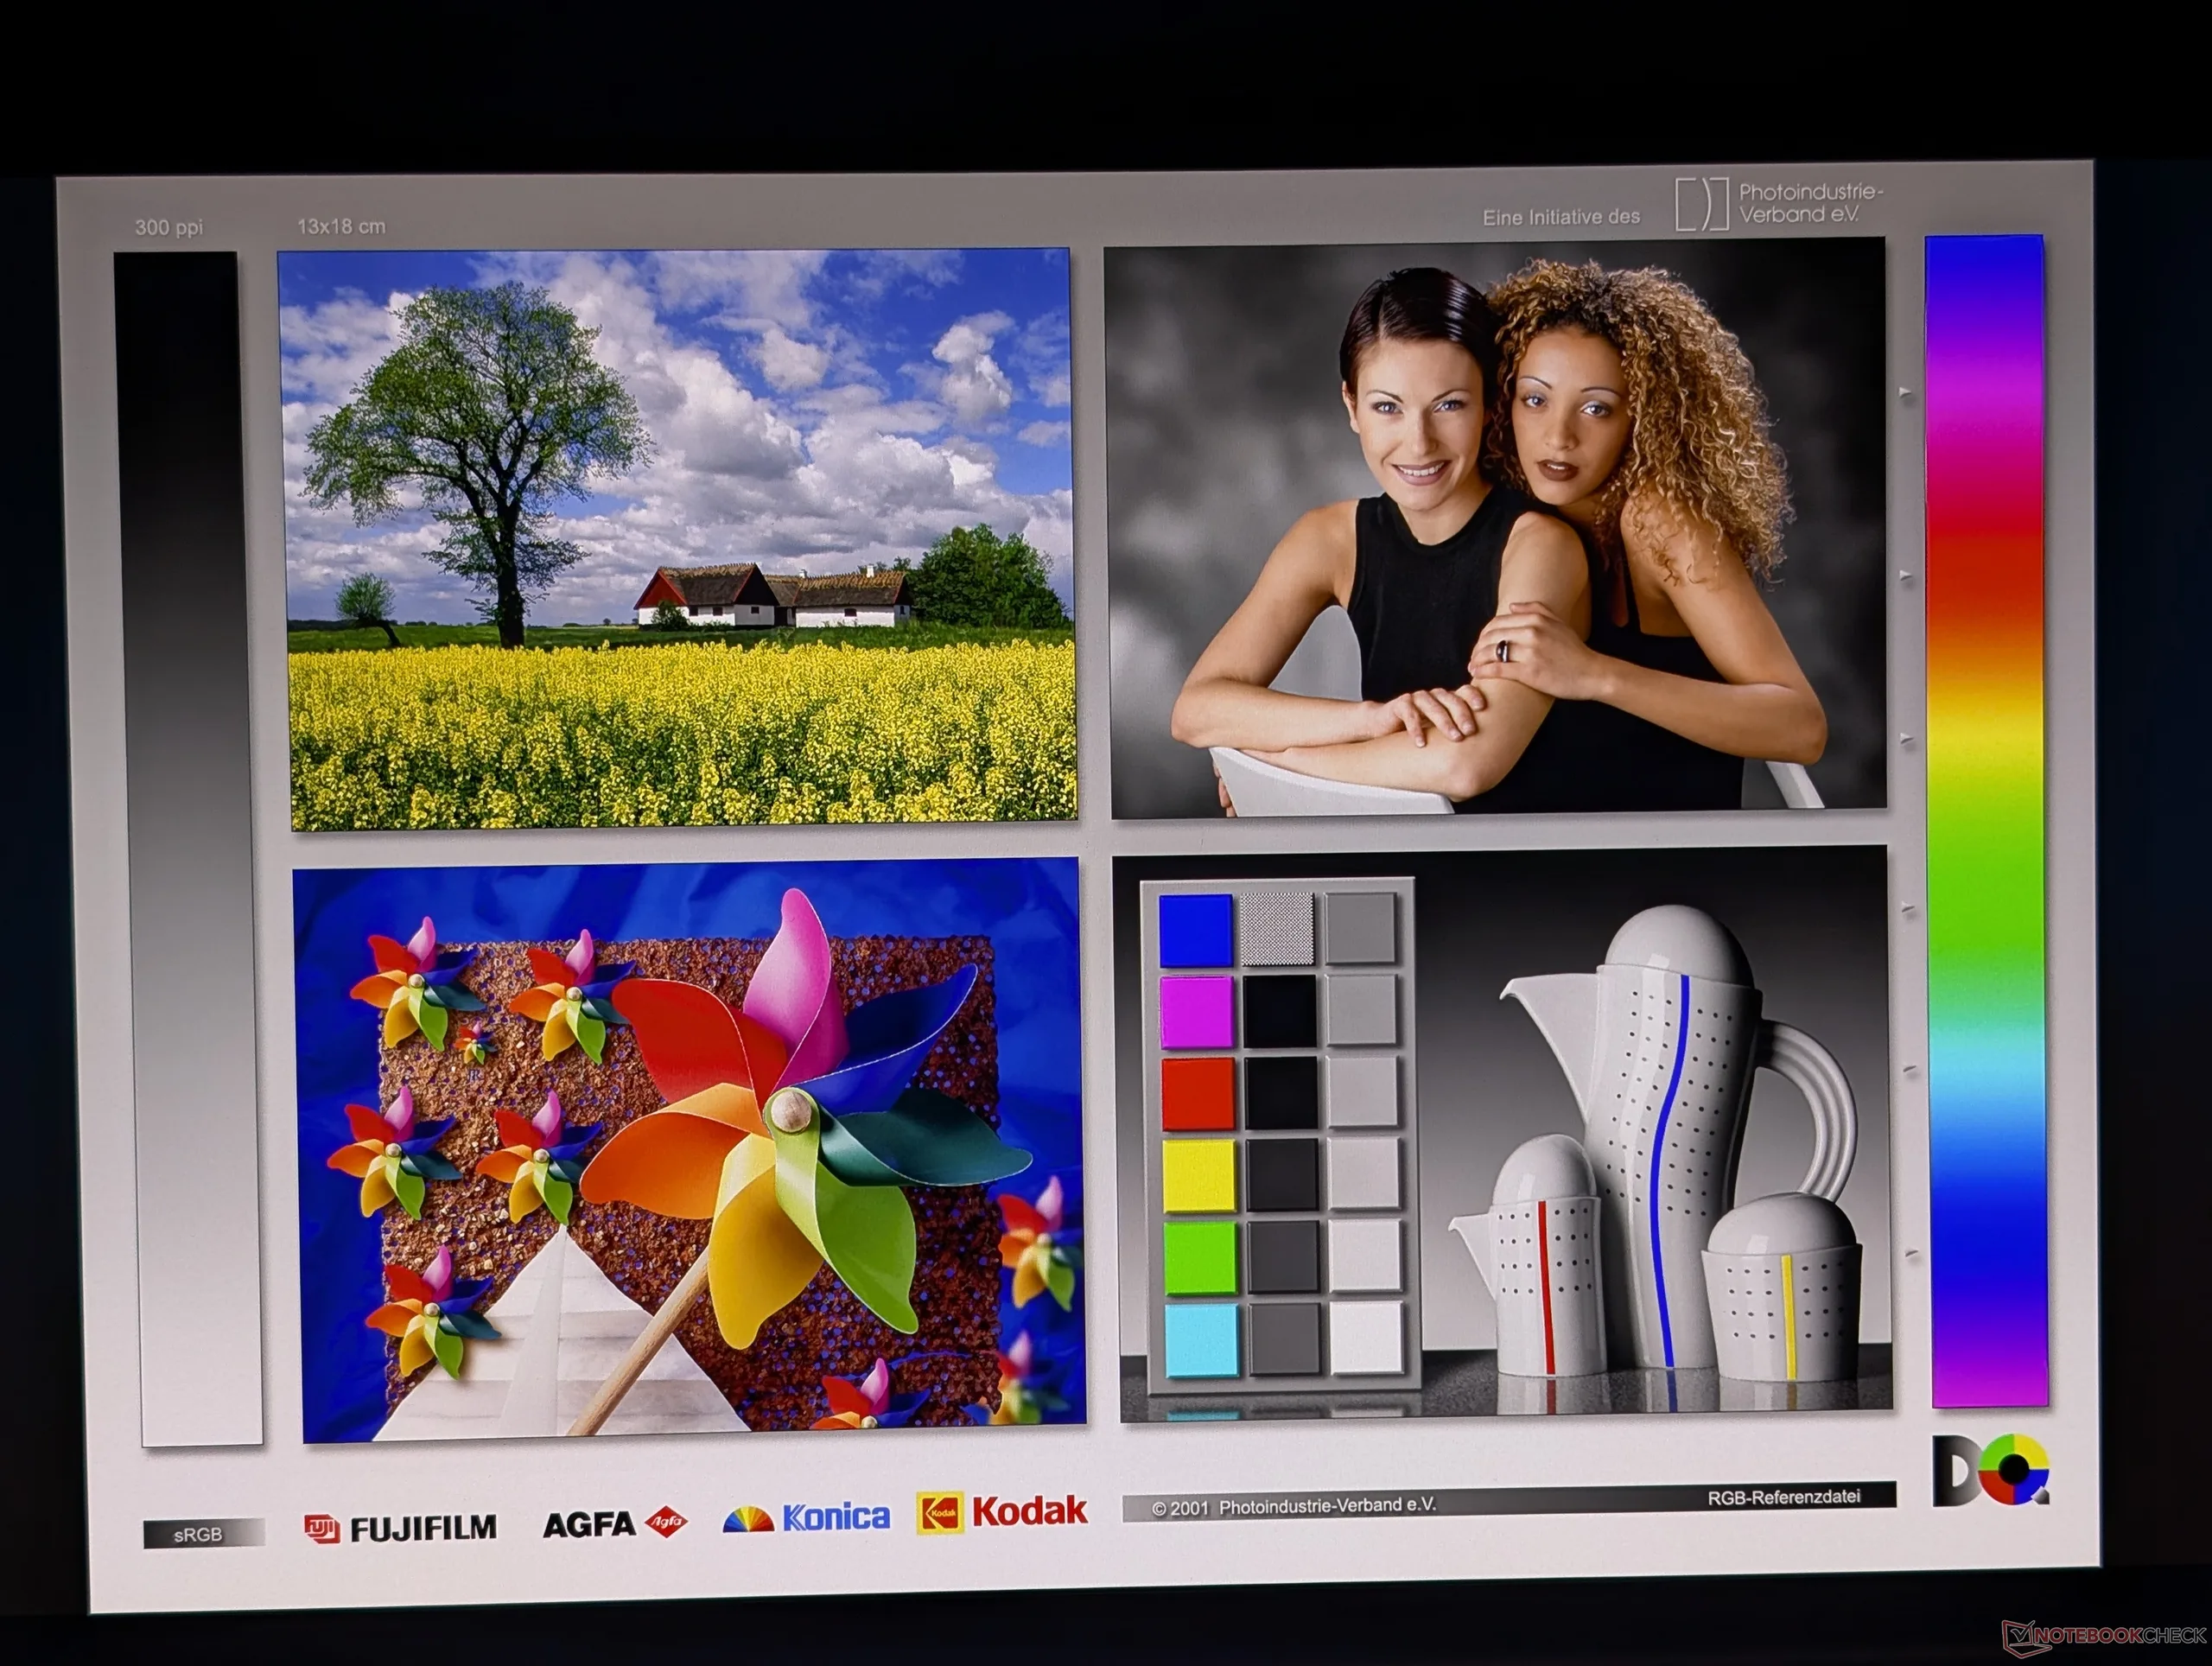
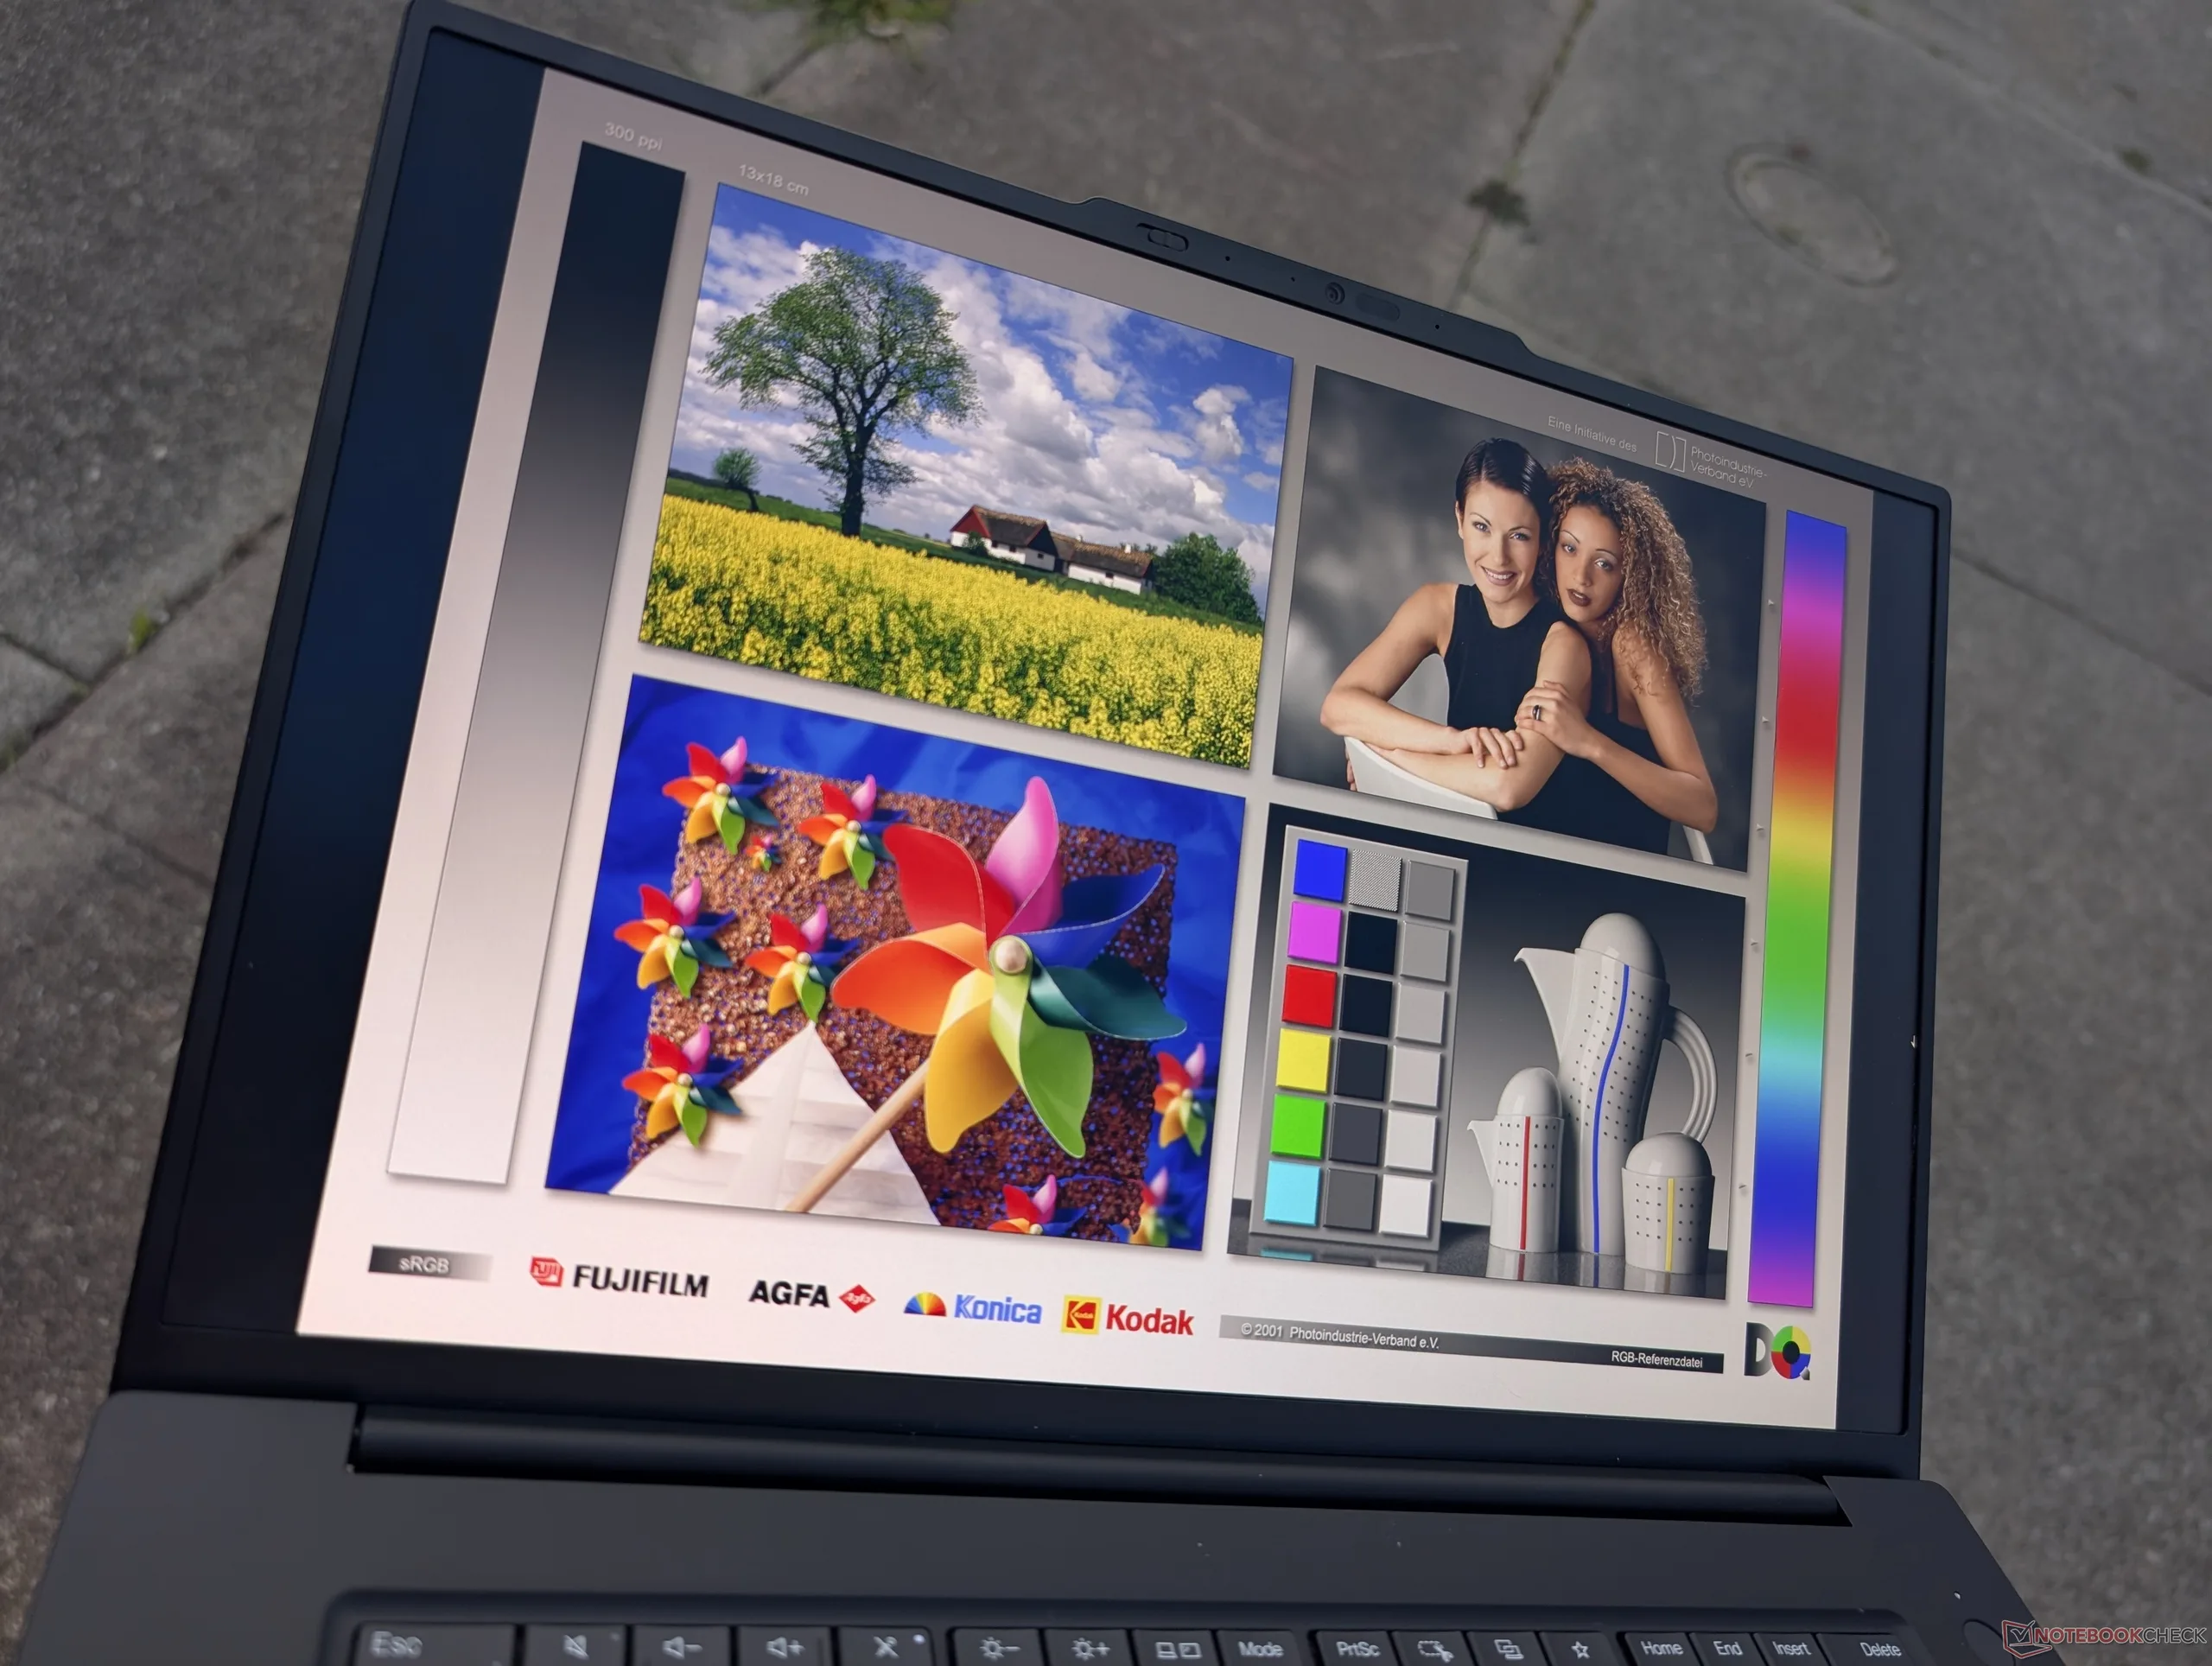
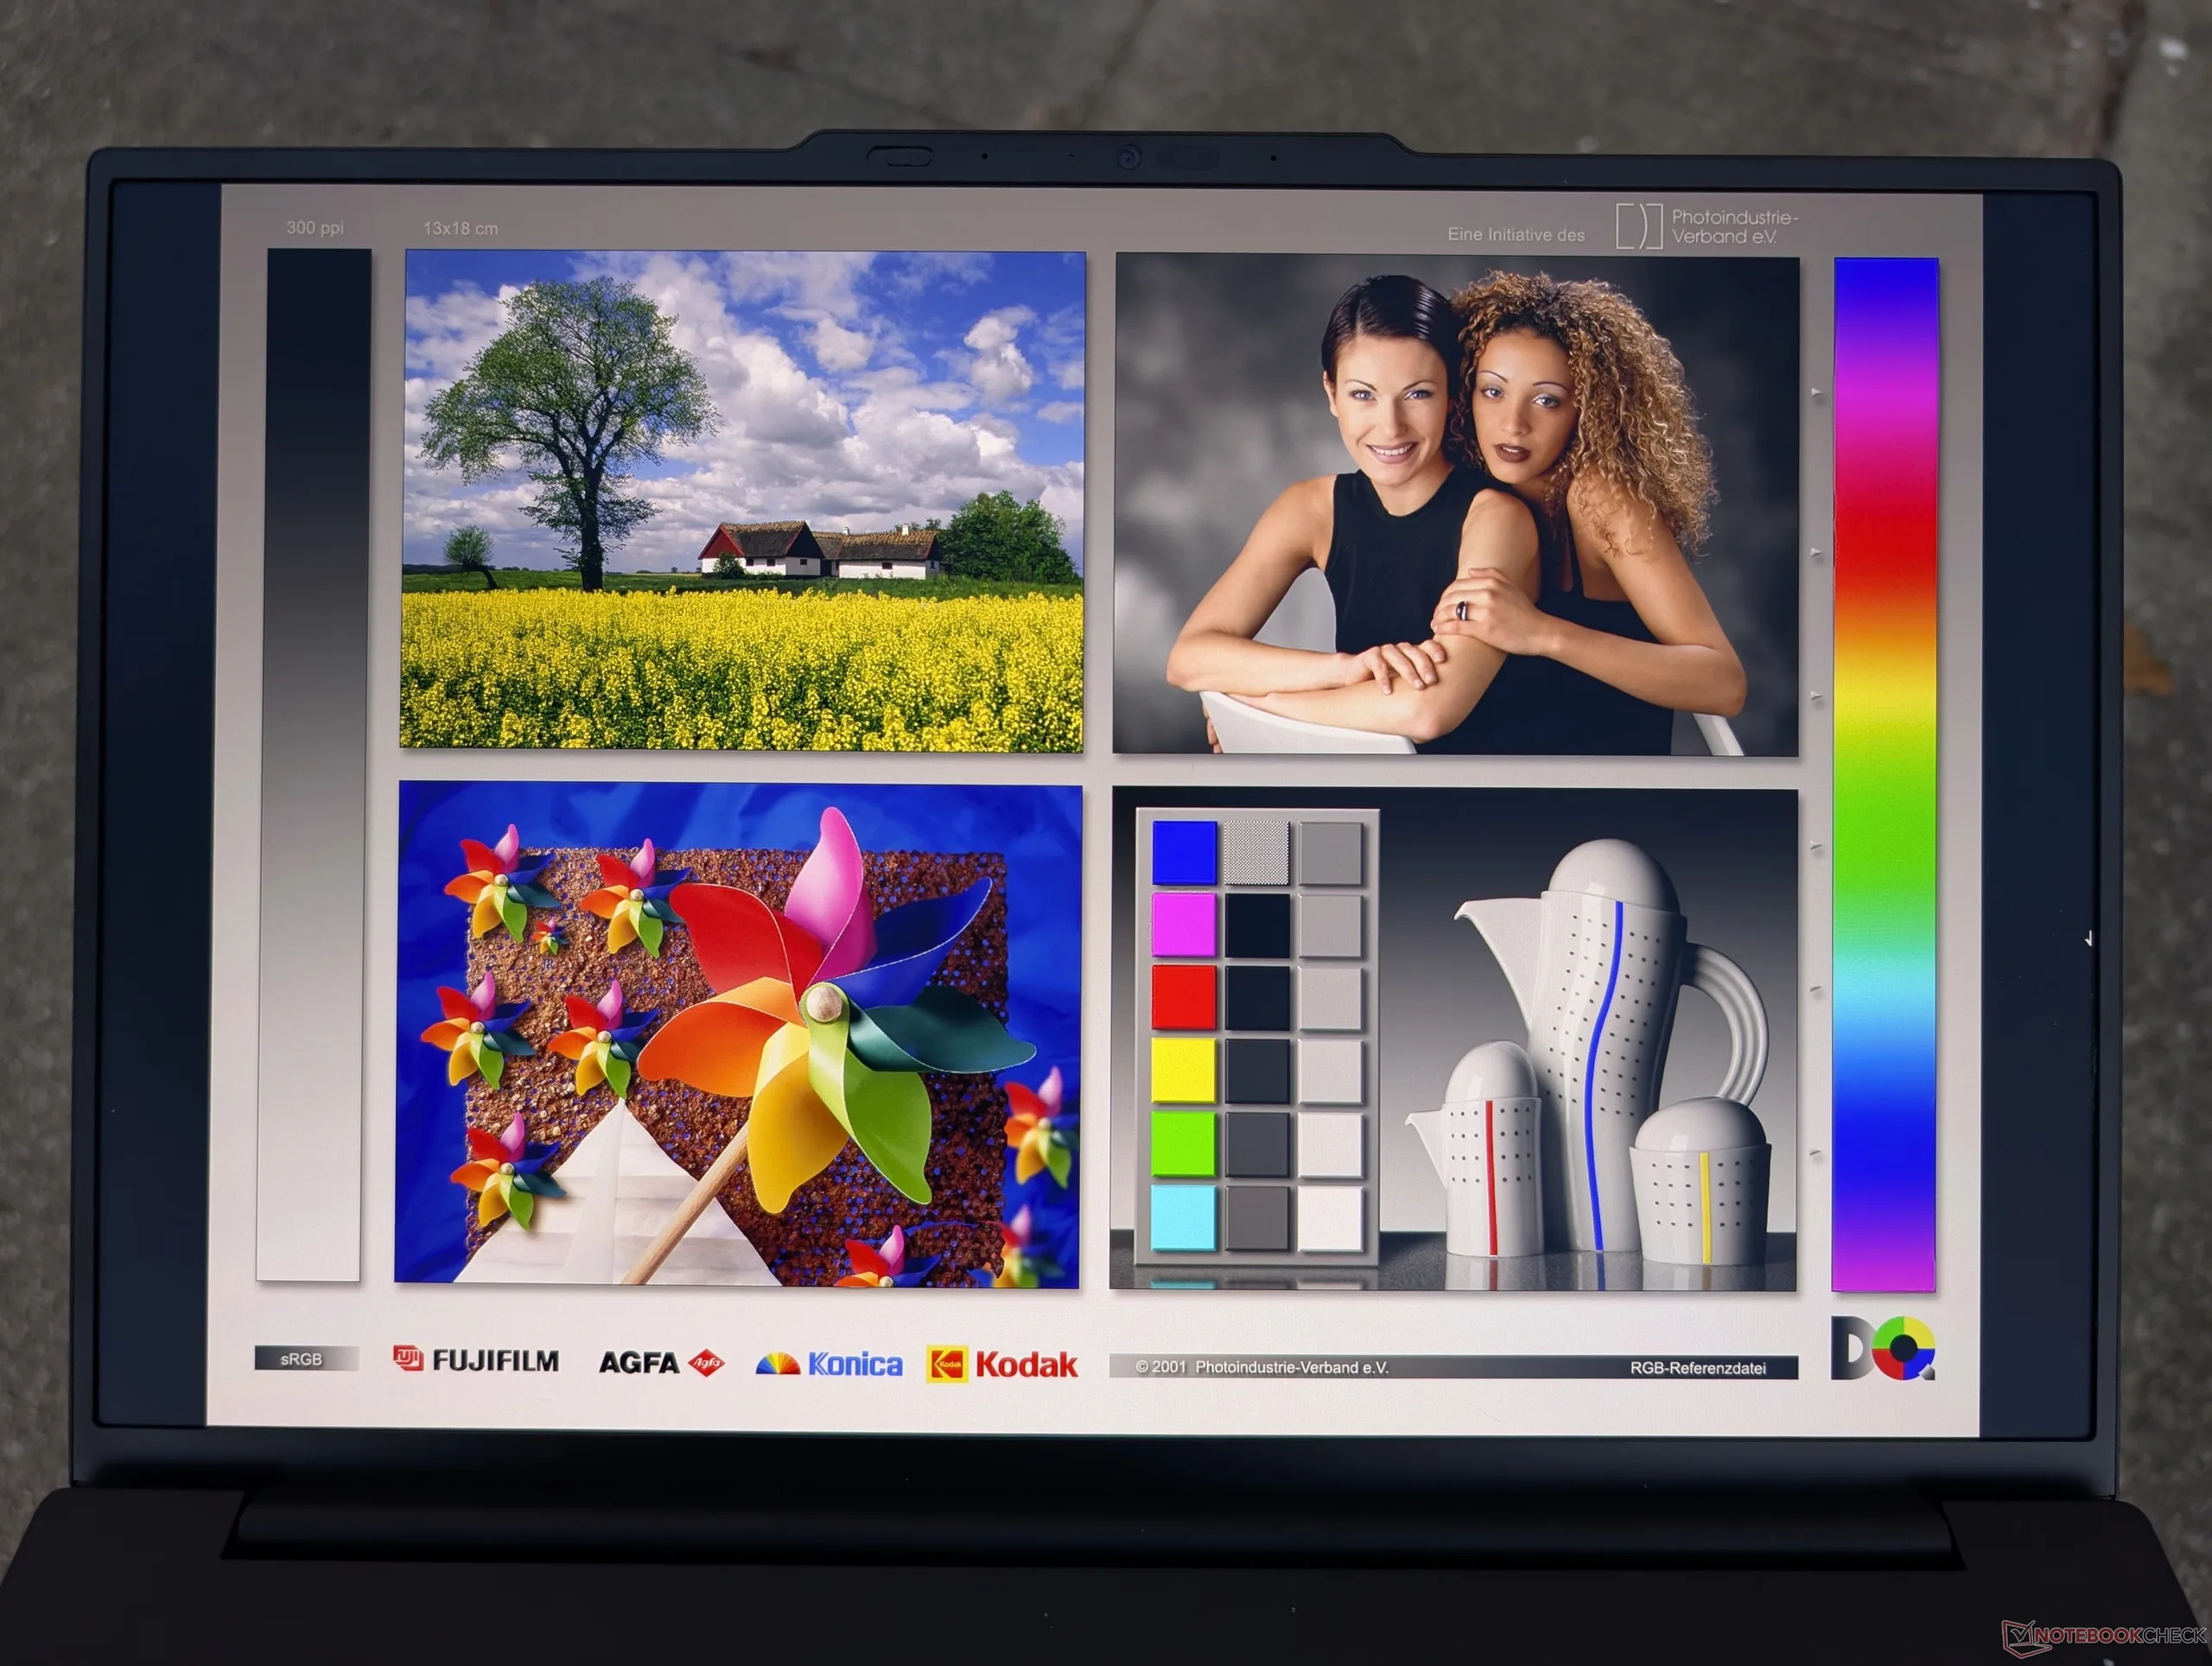
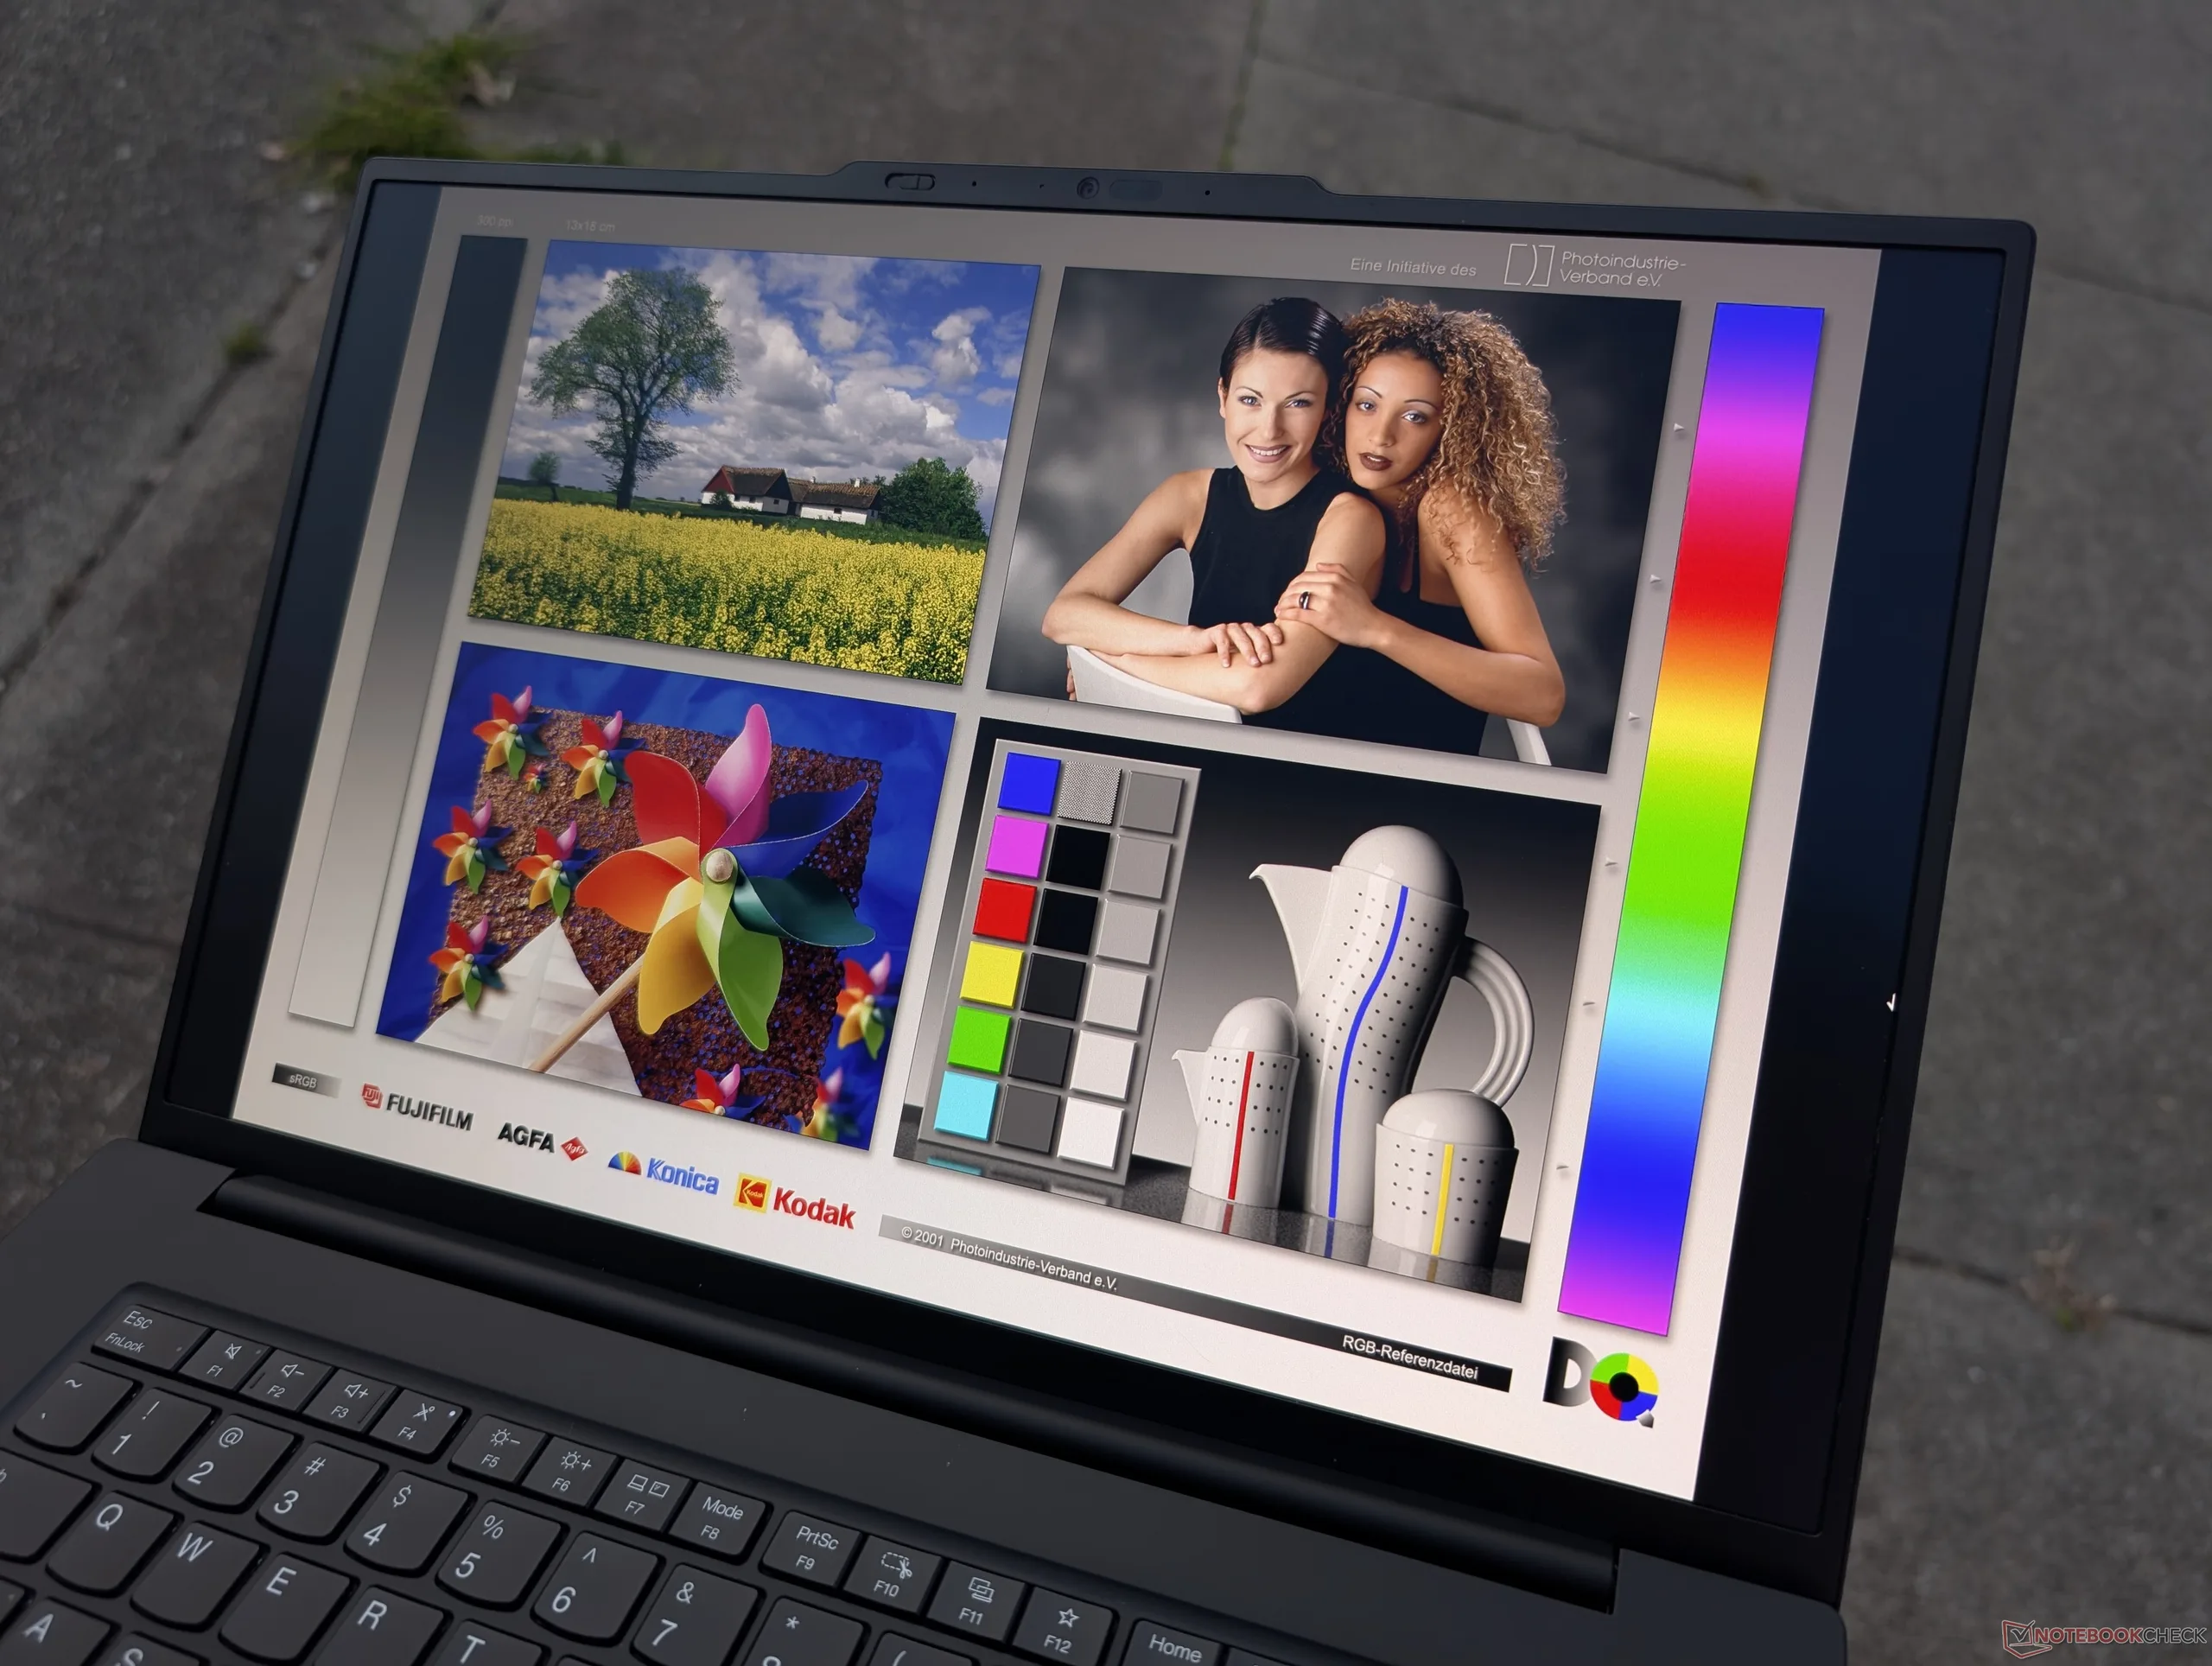
Display

Three display options are available as follows. Note that the highest resolution option sacrifices the faster refresh rate, deep black levels, touch functionality, and superior HDR support of the tandem OLED option.
- 1920 x 1200, non-touch, IPS, 500 nits, matte, 100% sRGB, 60 Hz, DC dimming
- 3200 x 2000, touch, Tandem OLED, 1500 nits HDR, matte, 100% DCI-P3, 120 Hz, PWM dimming
- 3840 x 2400, non-touch, IPS, 800 nits, 100% DCI-P3, 60 Hz, DC dimming
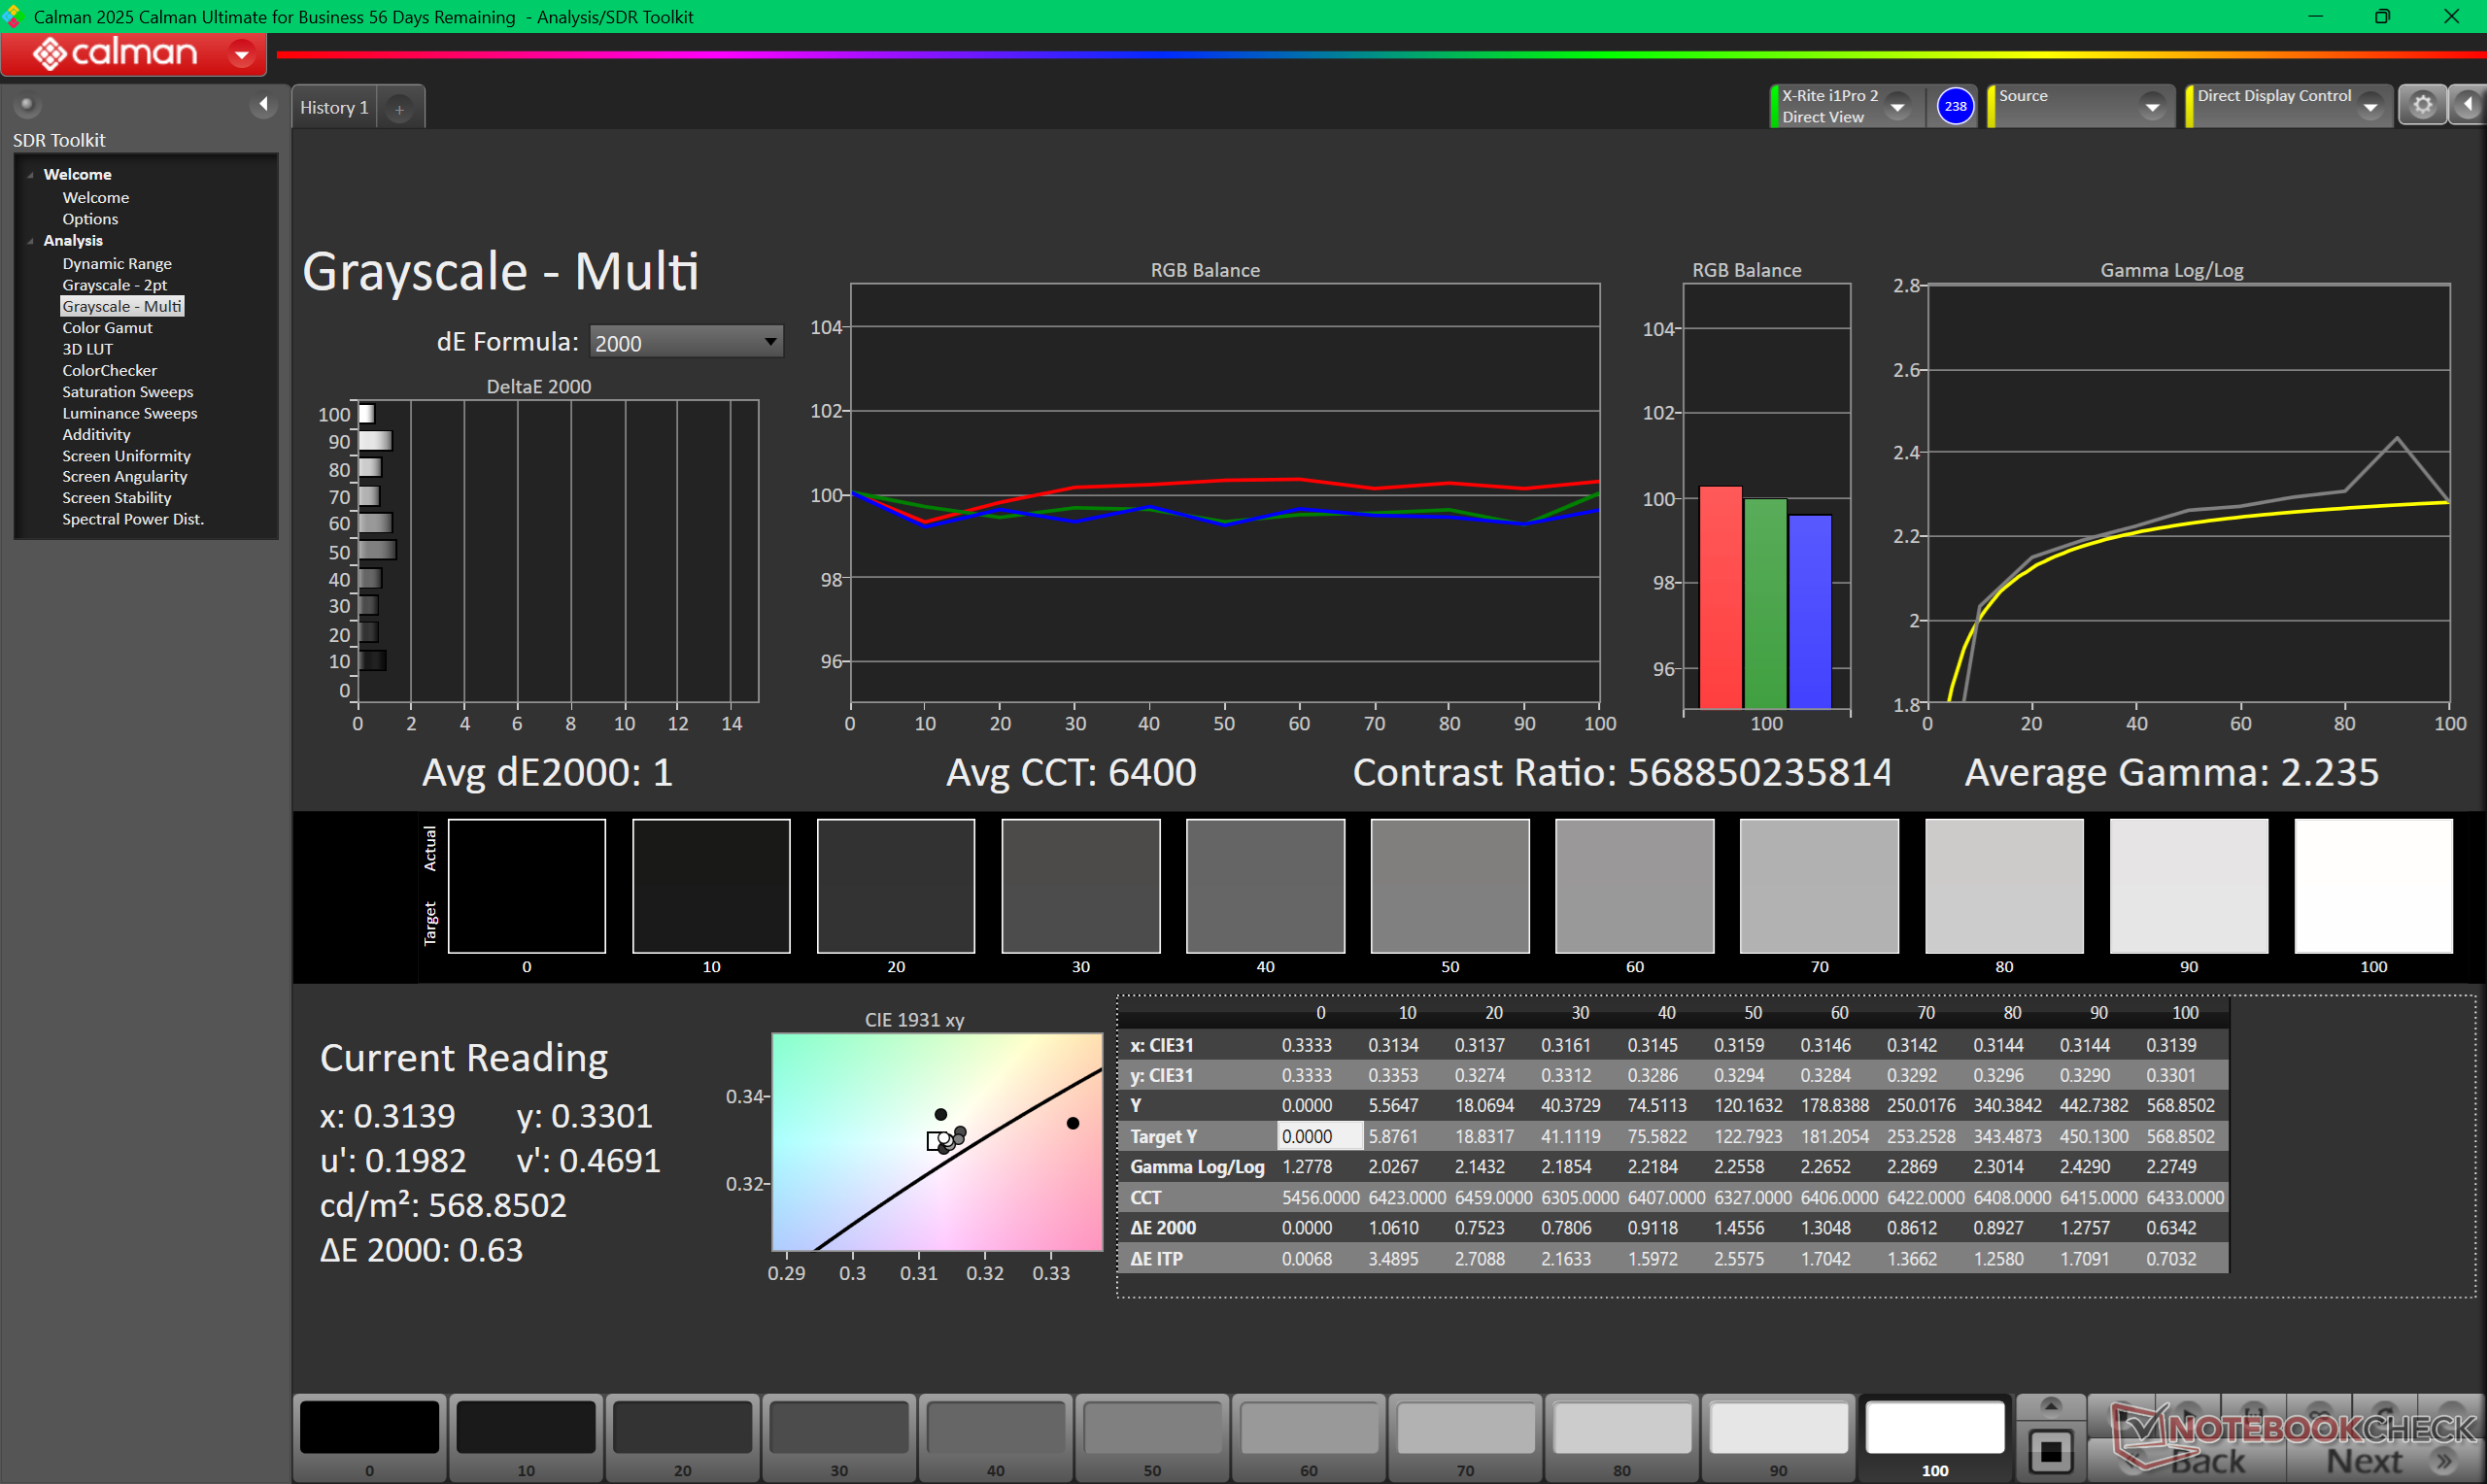
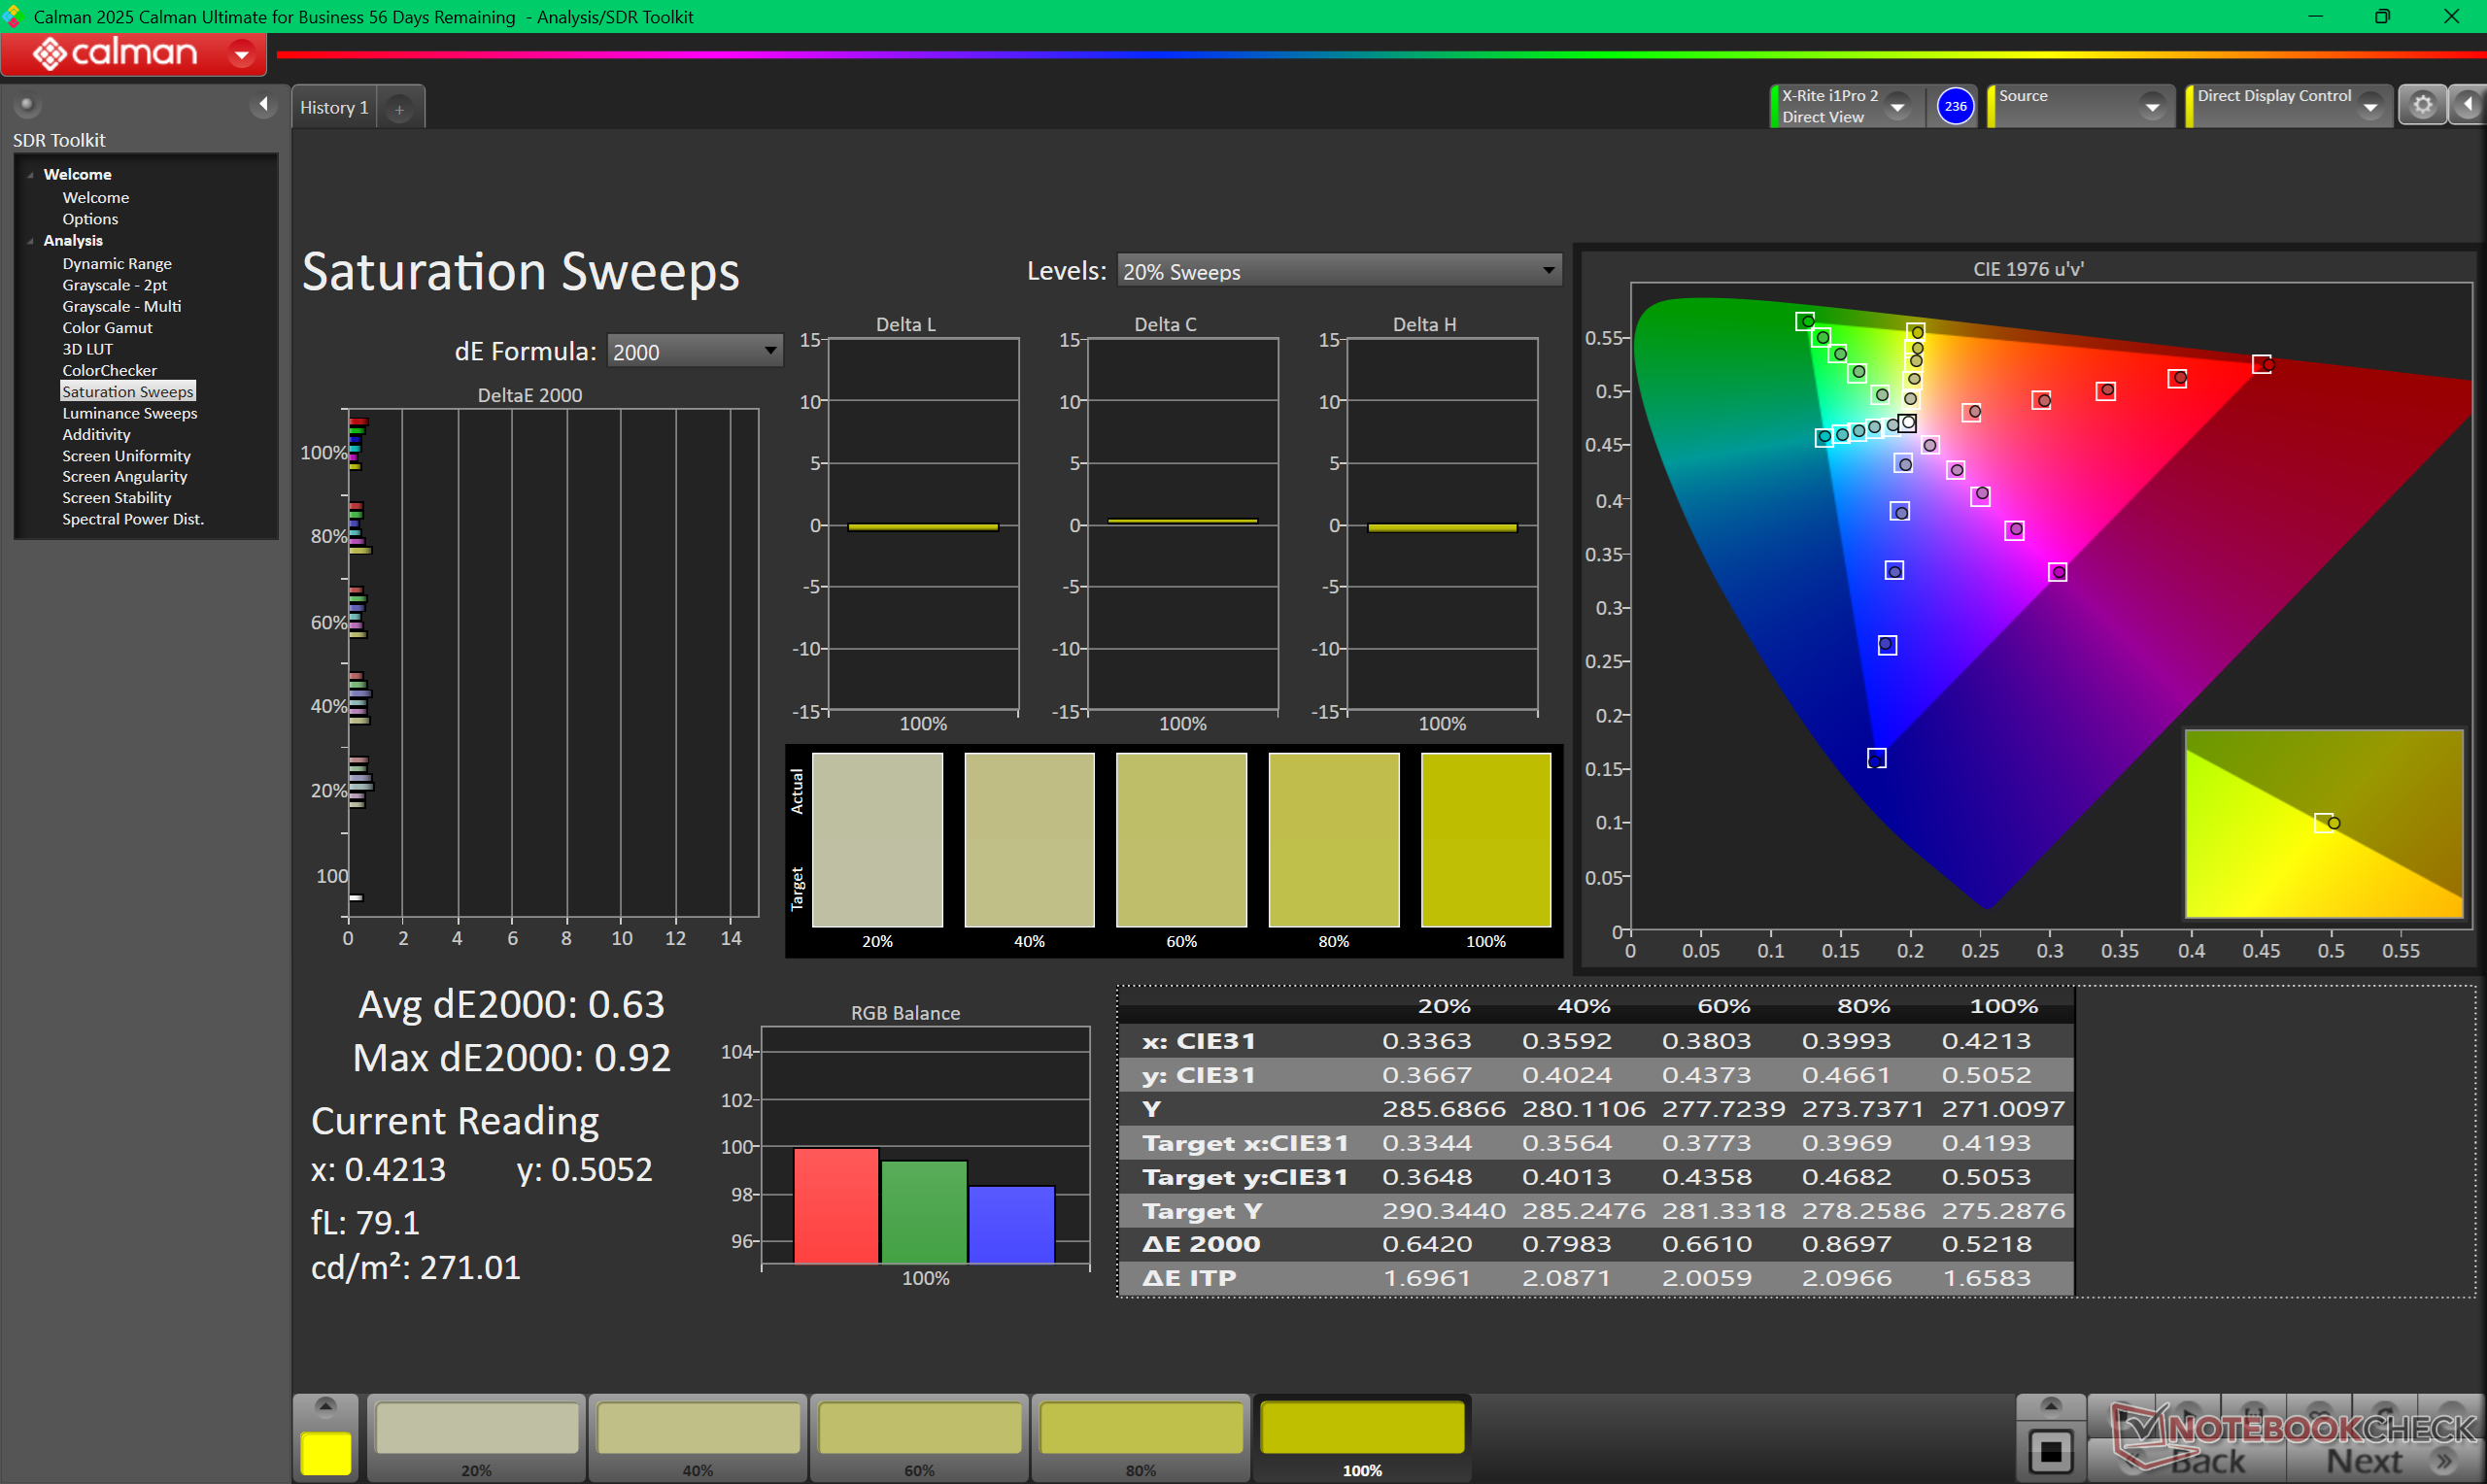
Subjectively, the matte tandem OLED screen on our test unit appears grainier than a traditional glossy alternative especially when displaying an all-white image. It nonetheless still excels in HDR playback for its very high brightness levels especially for an OLED panel. Our independent measurements with an X-Rite colorimeter show a maximum brightness of 566 nits on SDR mode and 1430 nits on HDR mode which come close to the advertised values of 600 nits and 1500 nits, respectively. If its touchscreen and HDR features are unimportant, however, then the 2400p option may be more worthwhile for its denser pixel count.
| |||||||||||||||||||||||||
Brightness Distribution: 99 %
Center on Battery: 561.8 cd/m²
Contrast: ∞:1 (Black: 0 cd/m²)
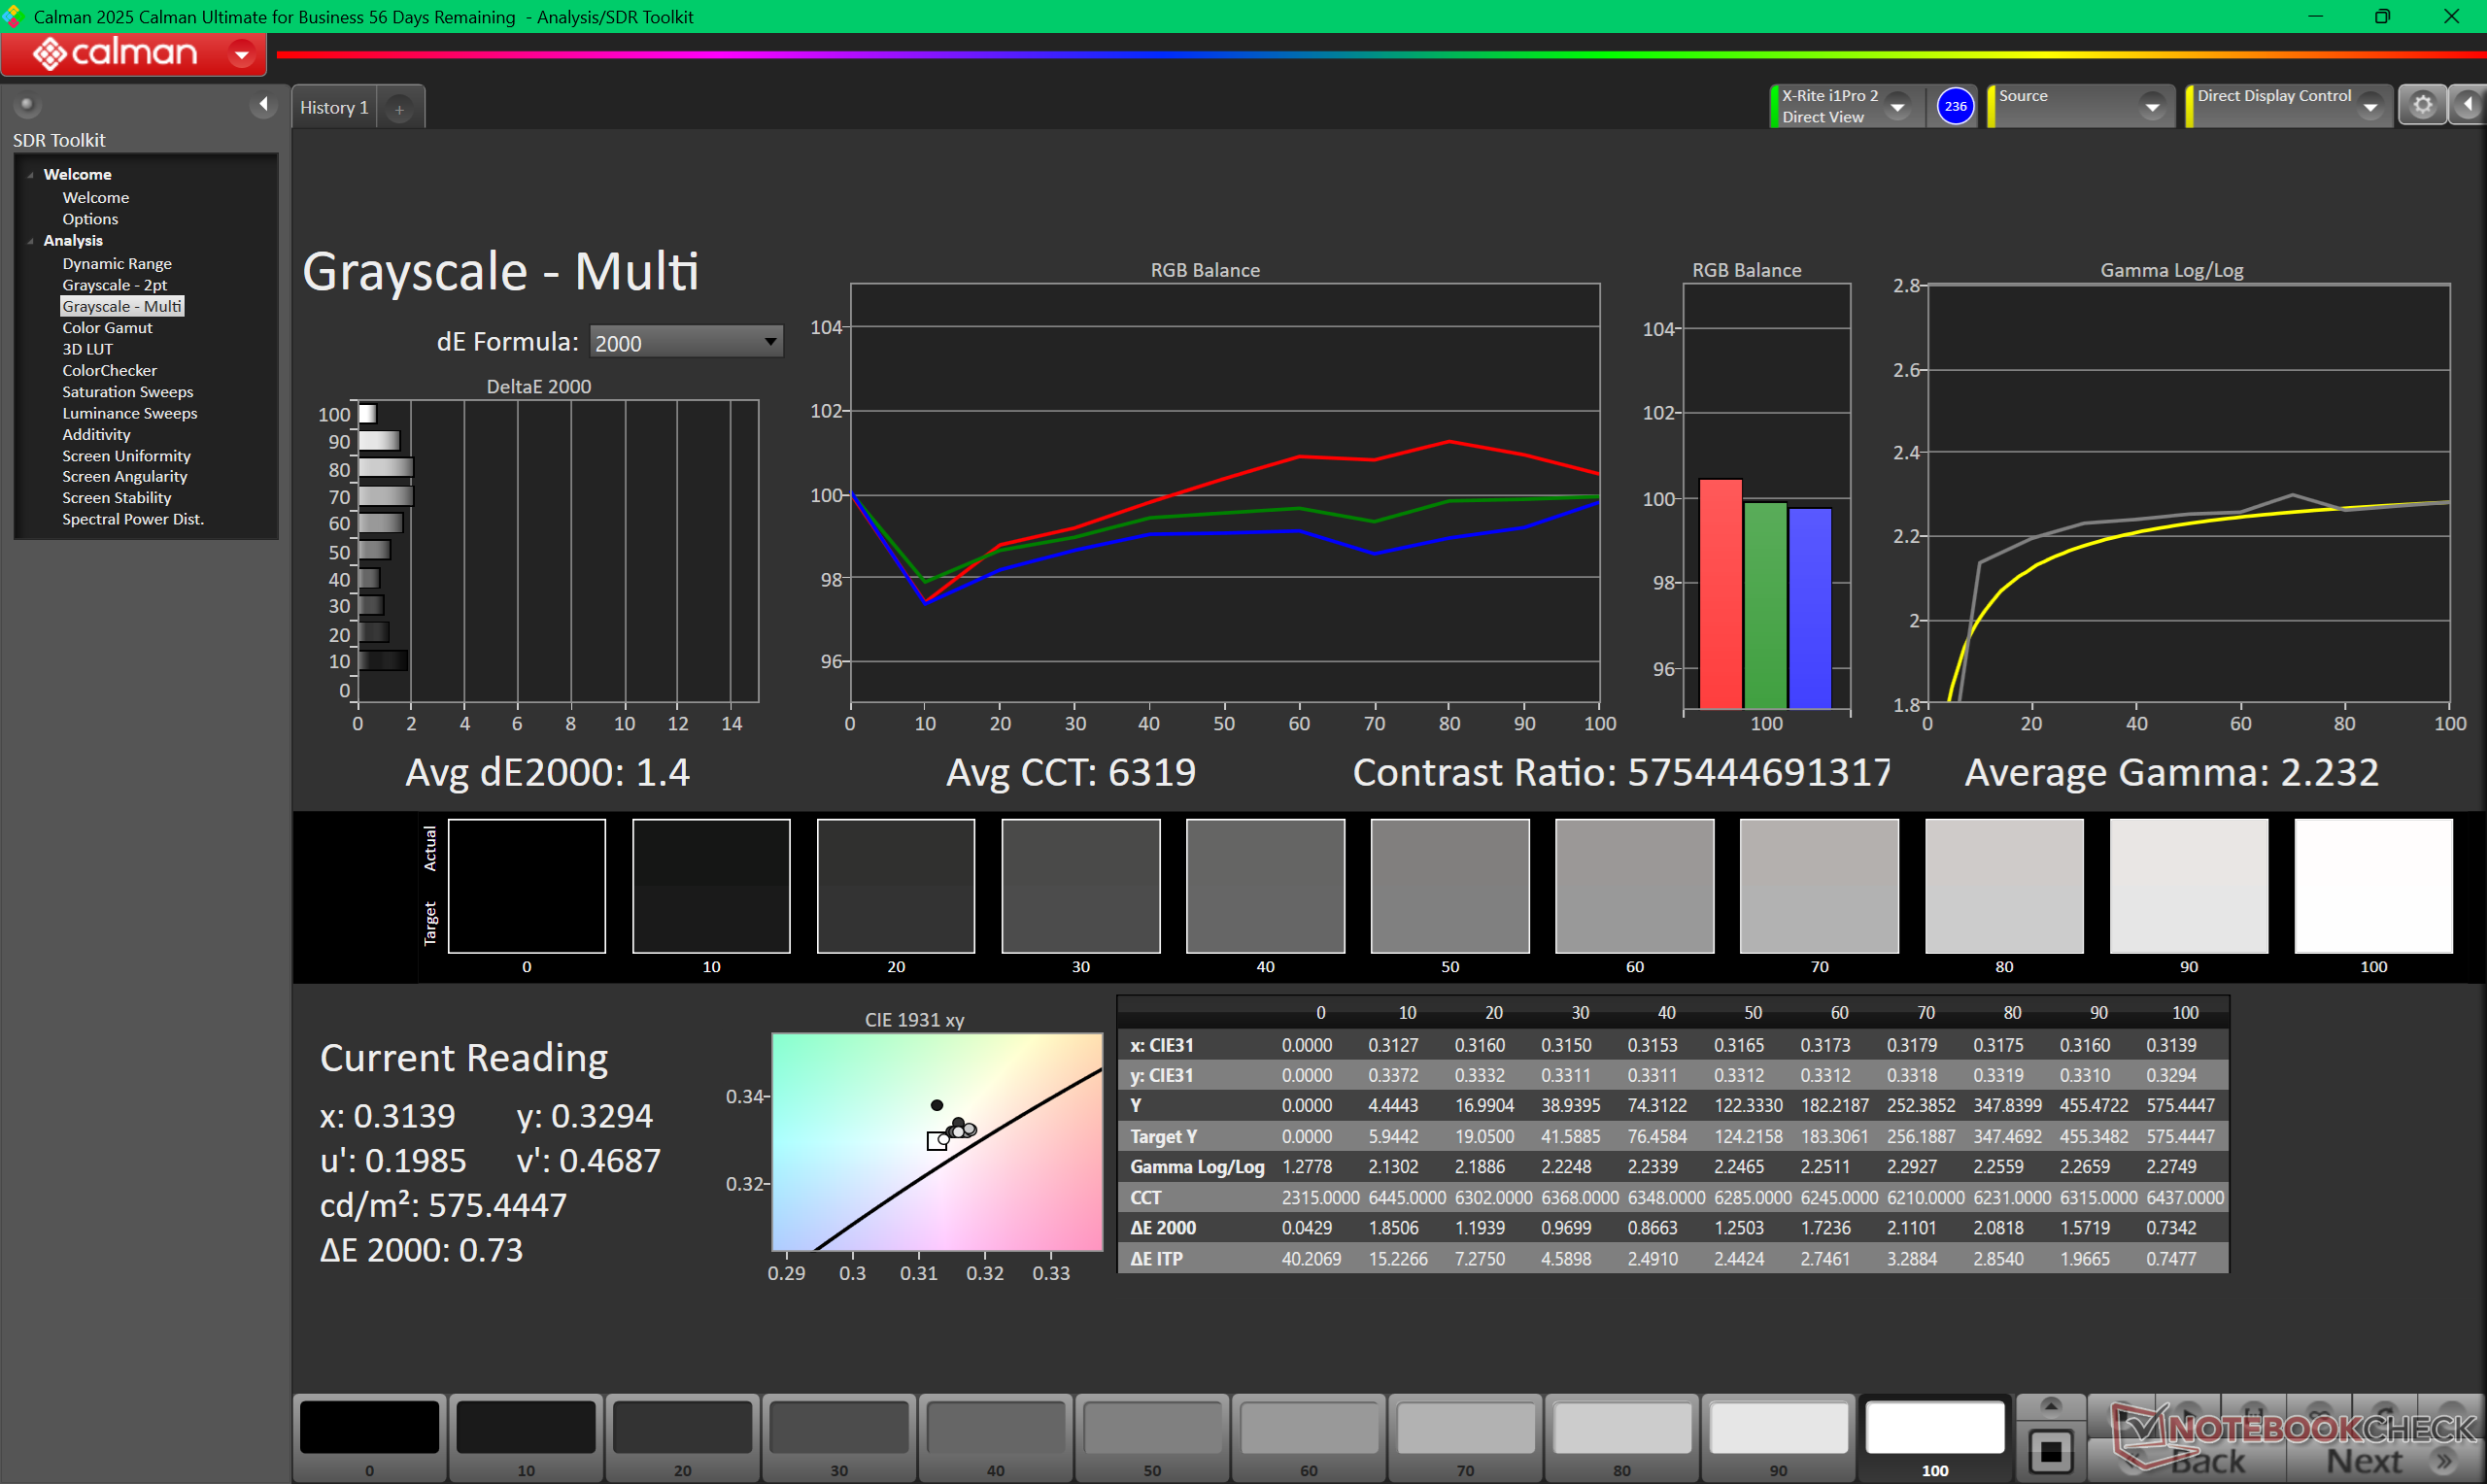
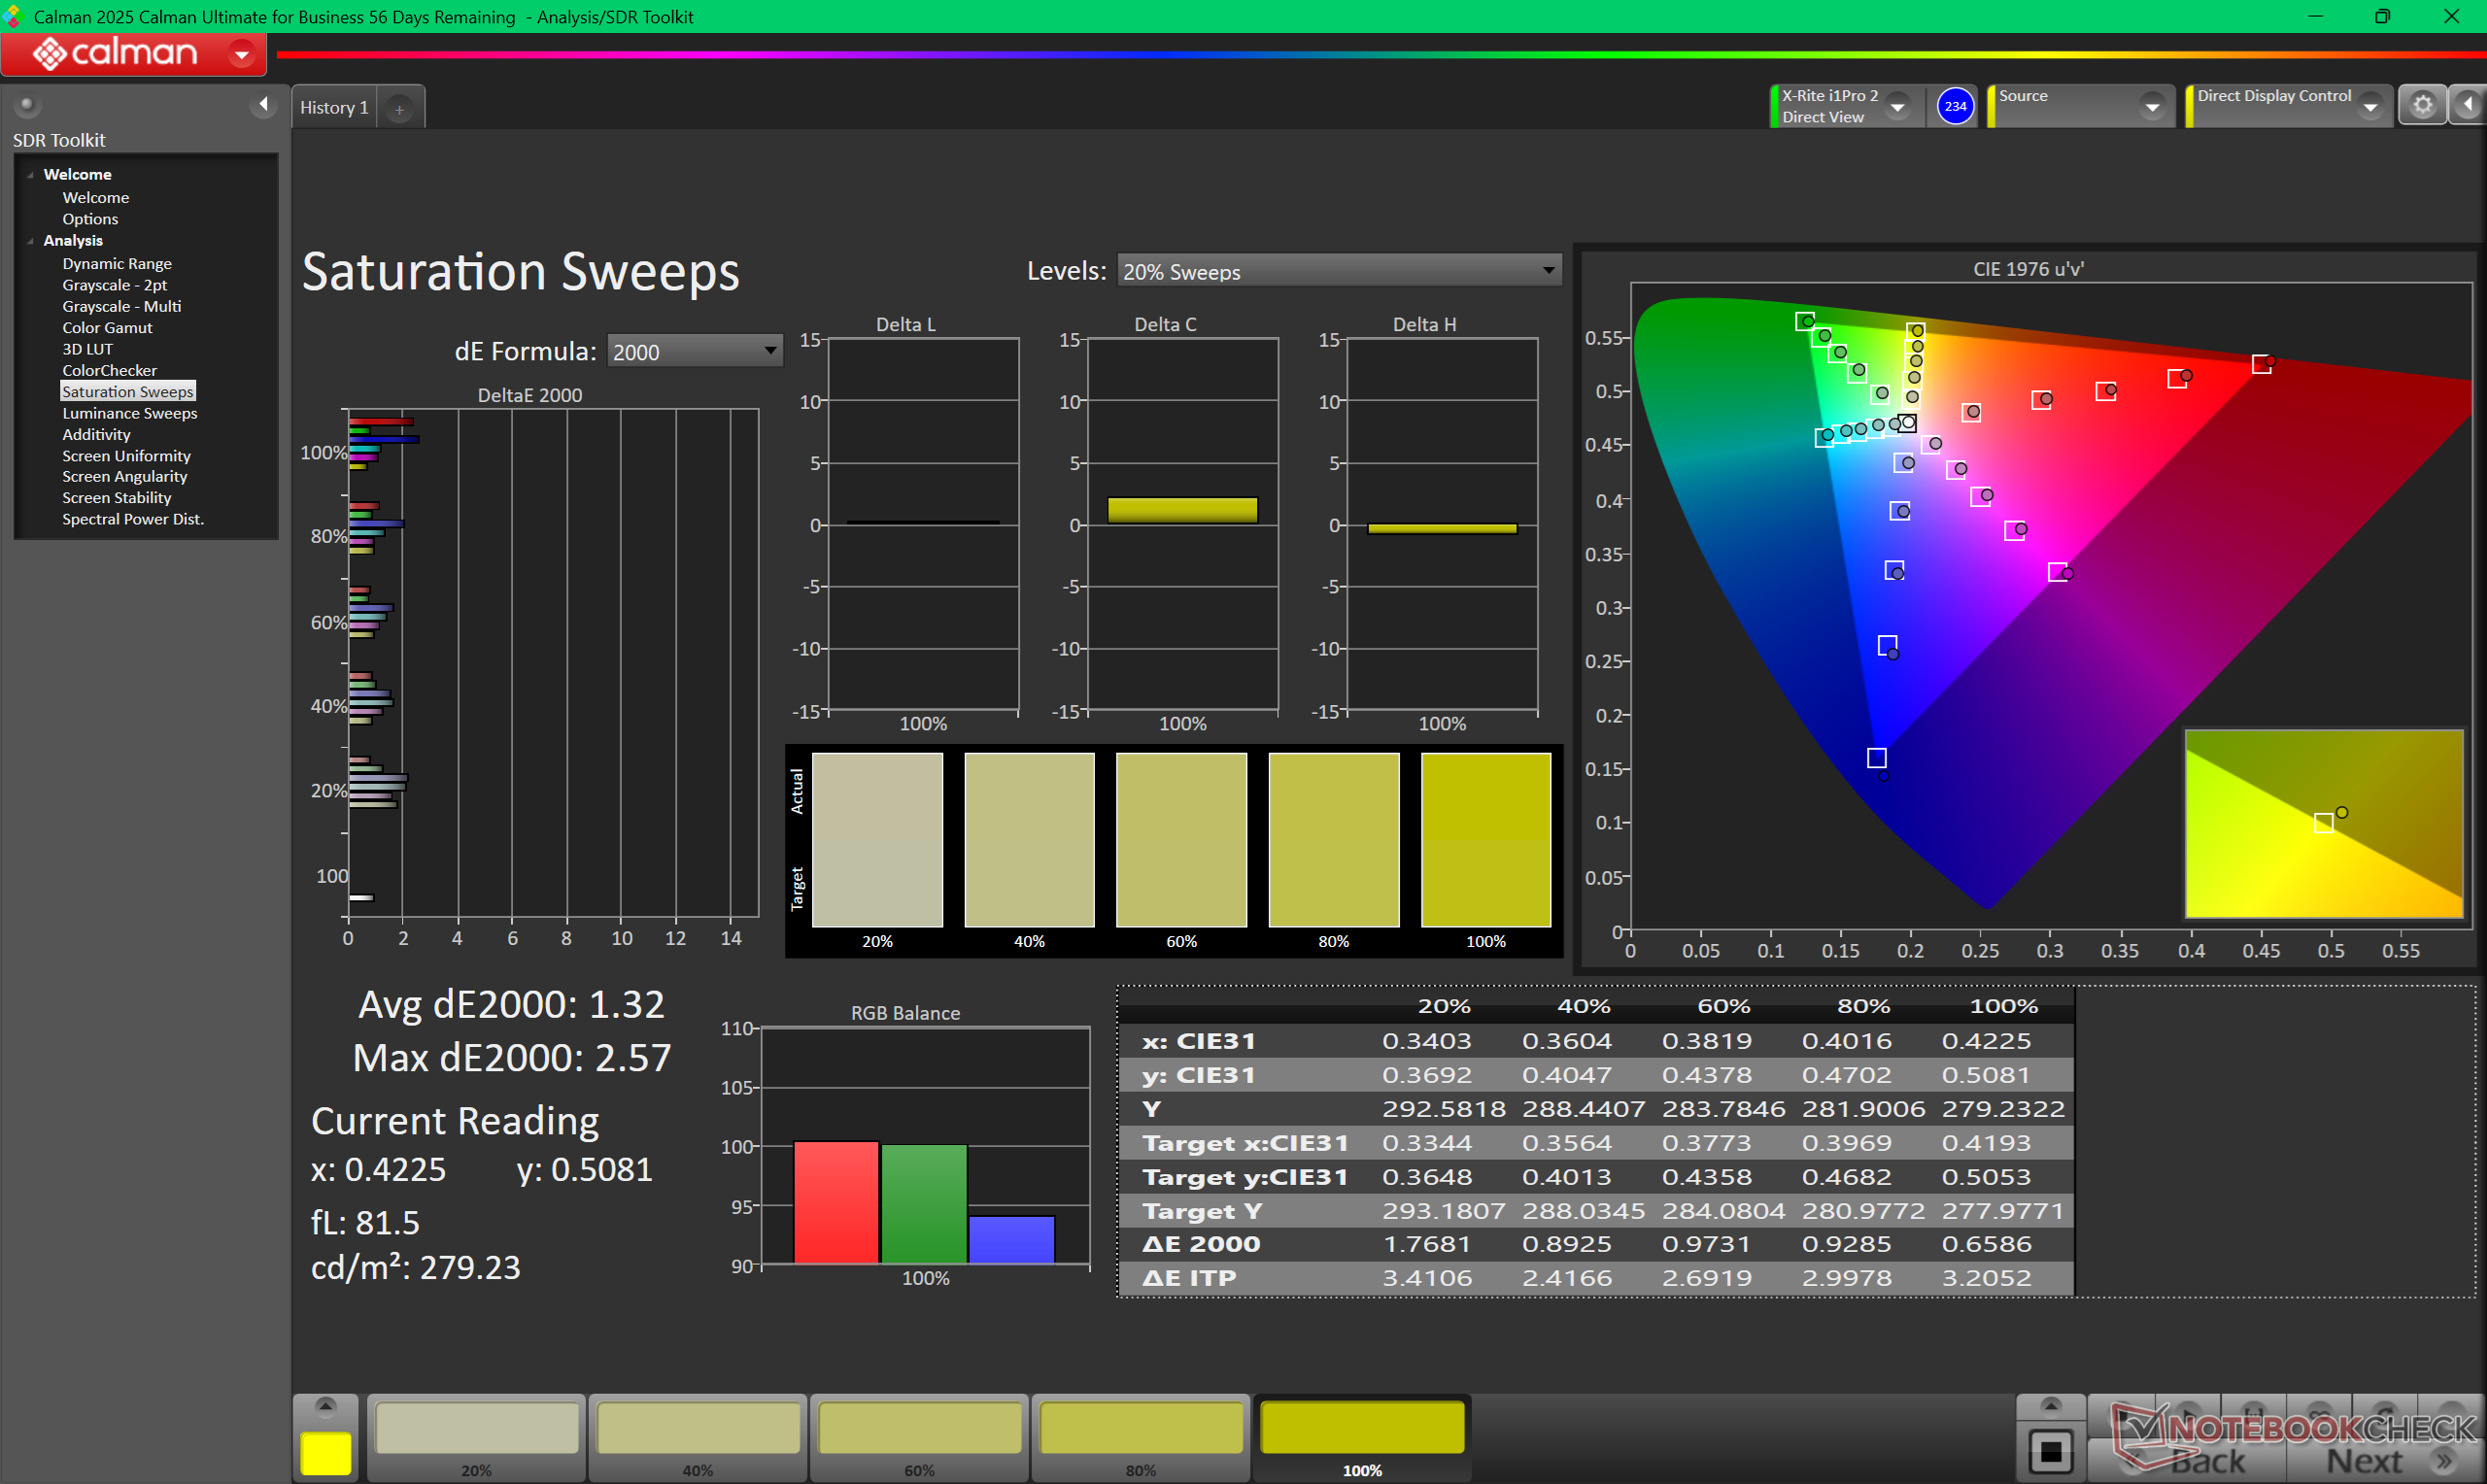
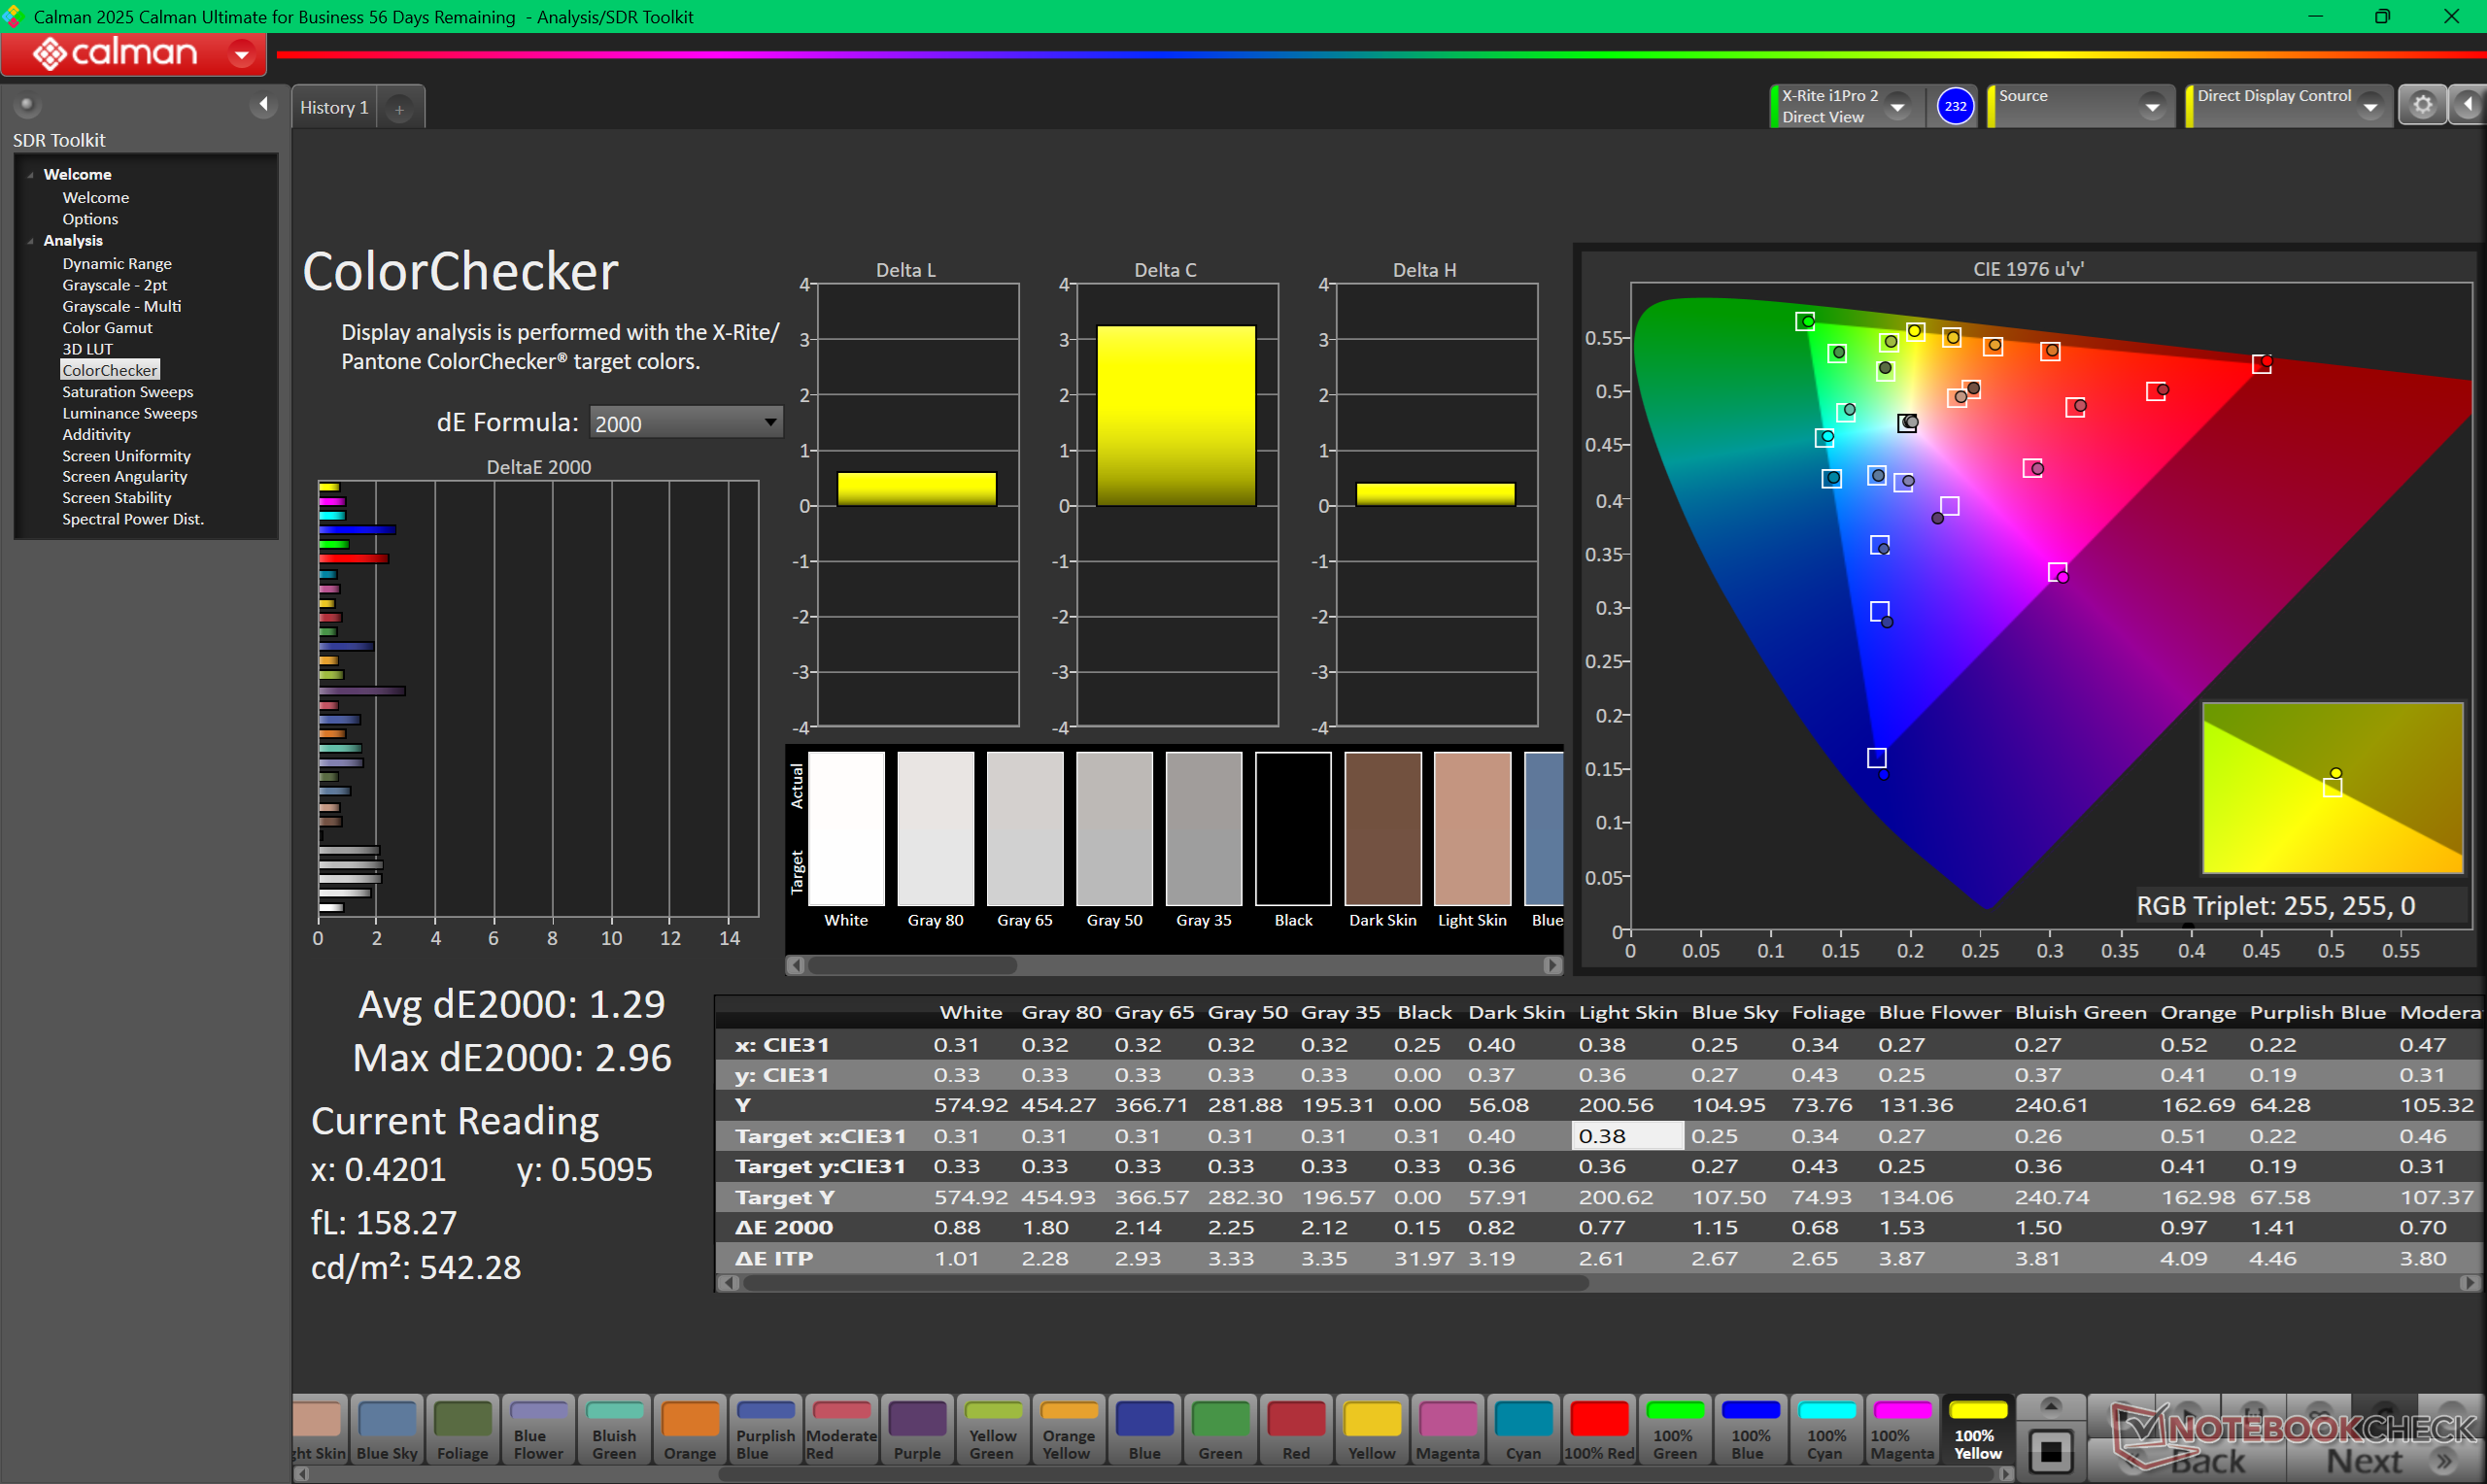
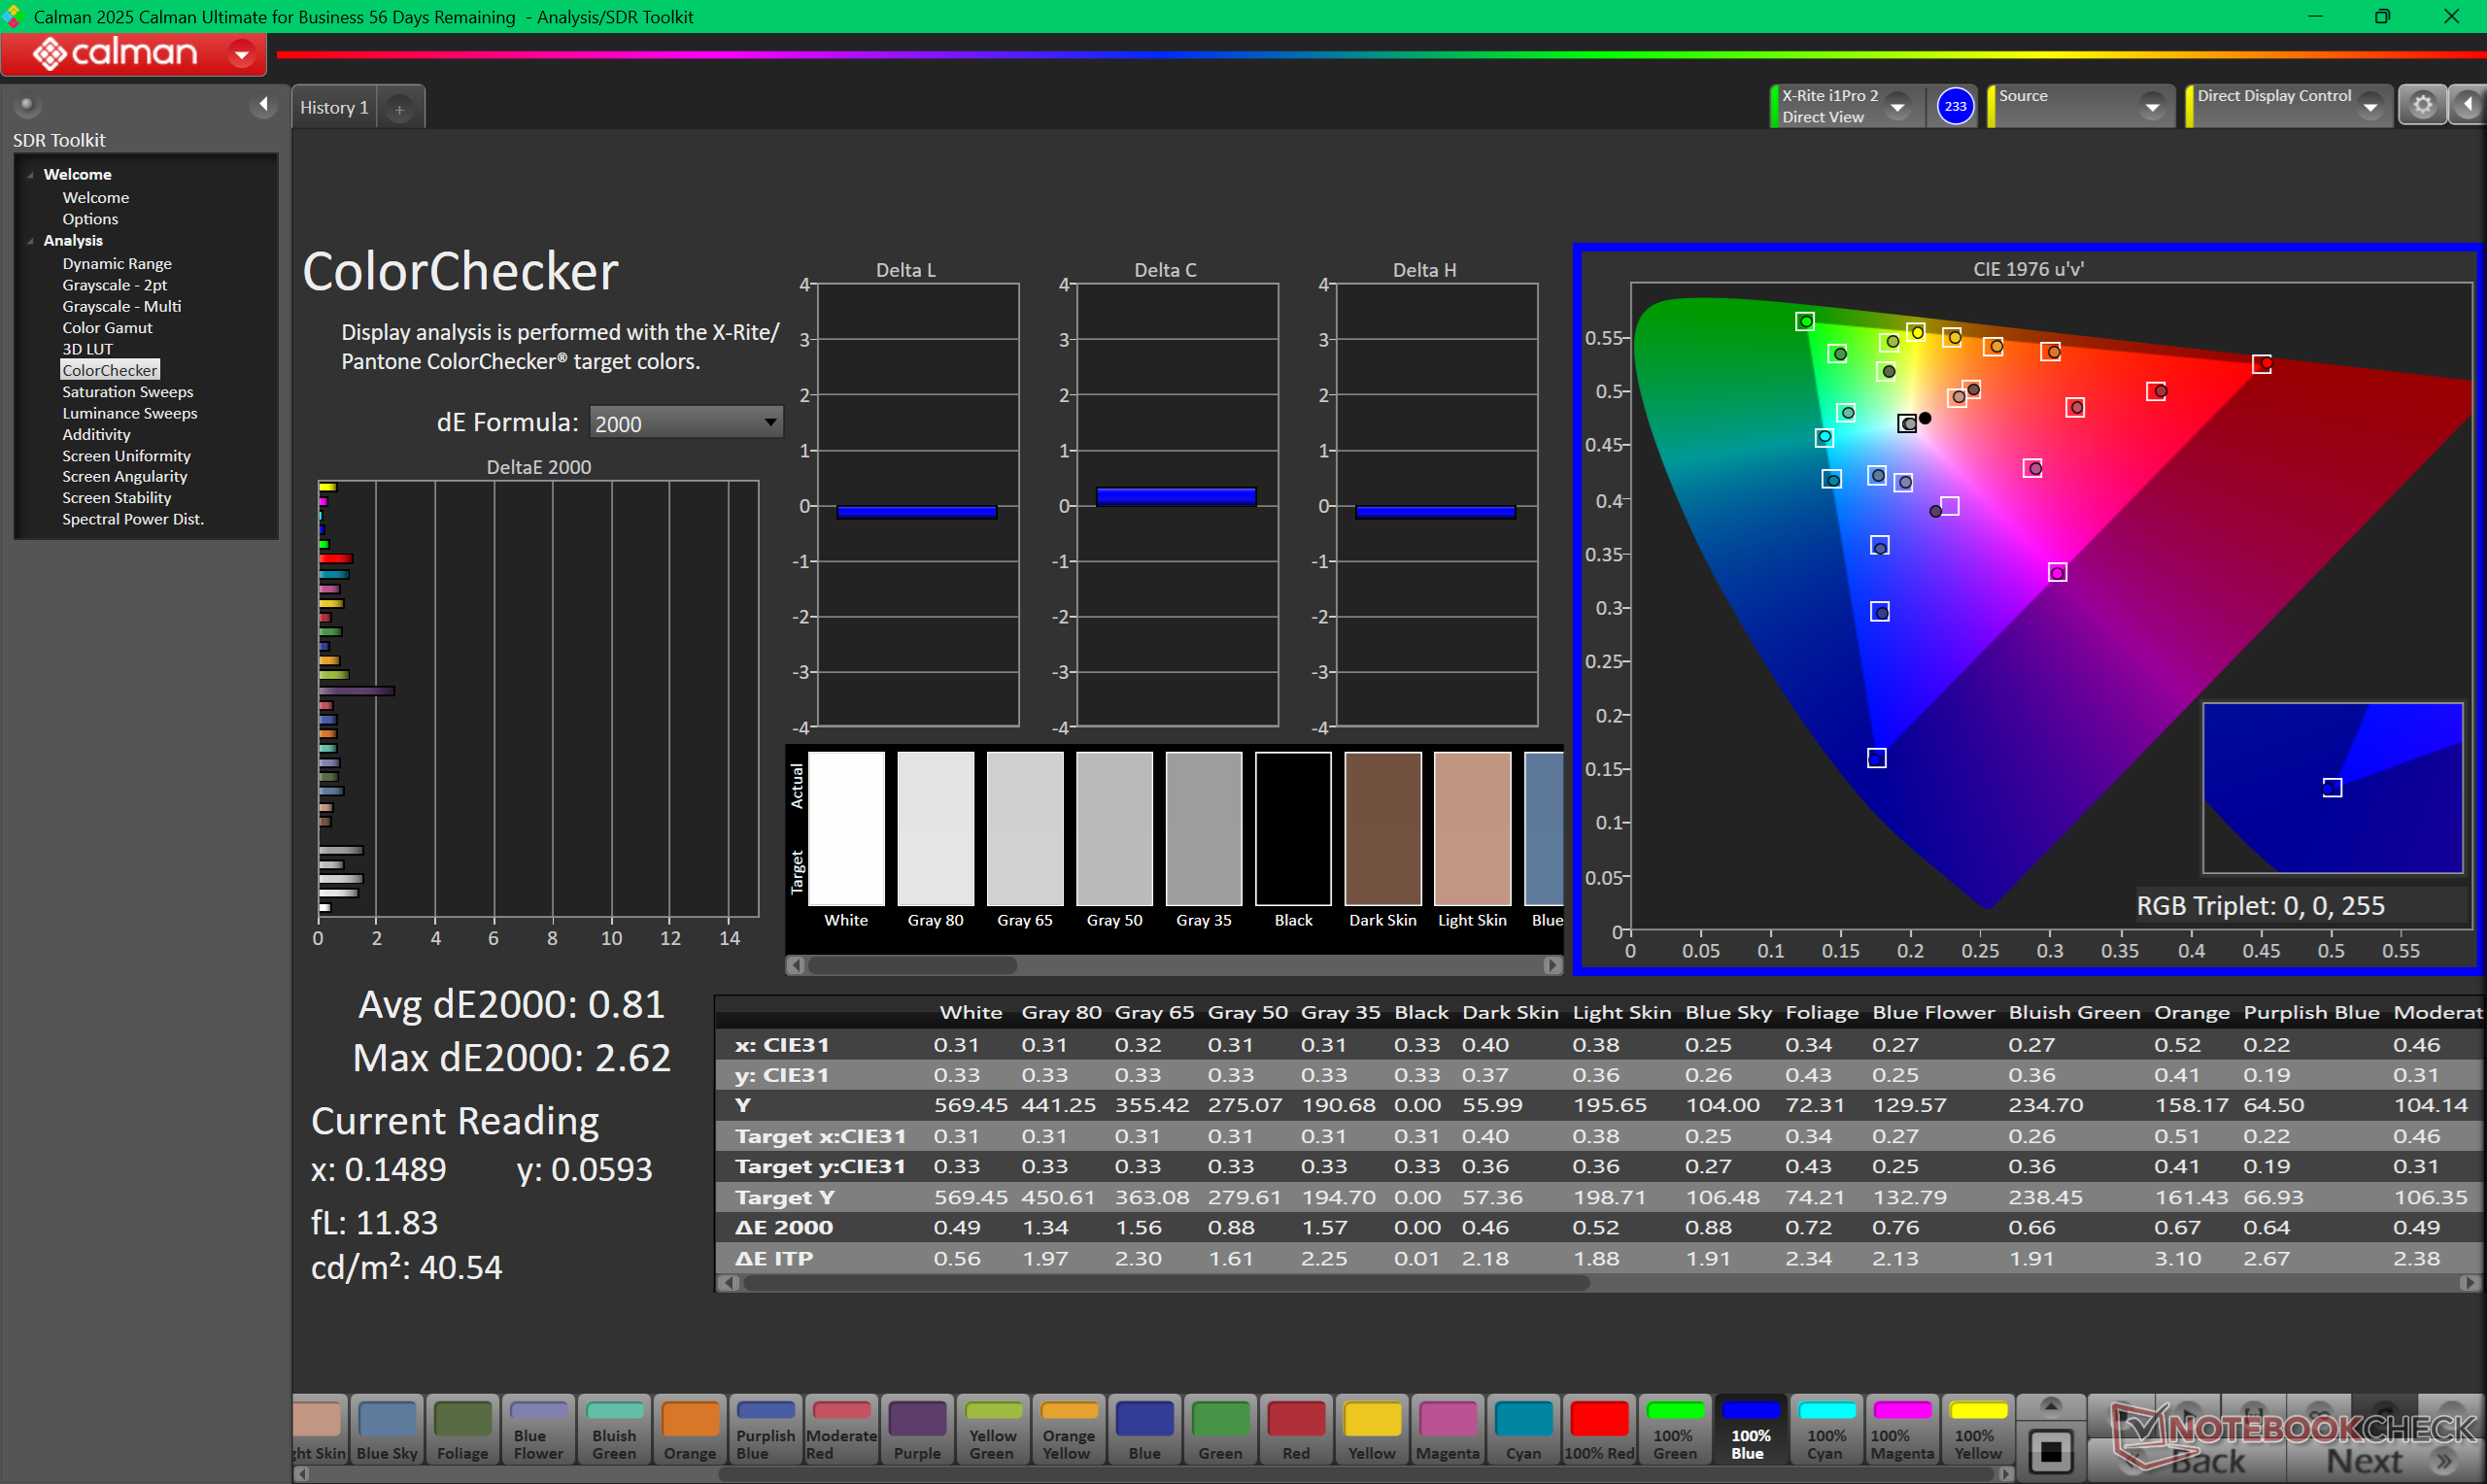
ΔE ColorChecker Calman: 1.29 | ∀{0.5-29.43 Ø4.73}
calibrated: 0.81
ΔE Greyscale Calman: 1.4 | ∀{0.09-98 Ø4.98}
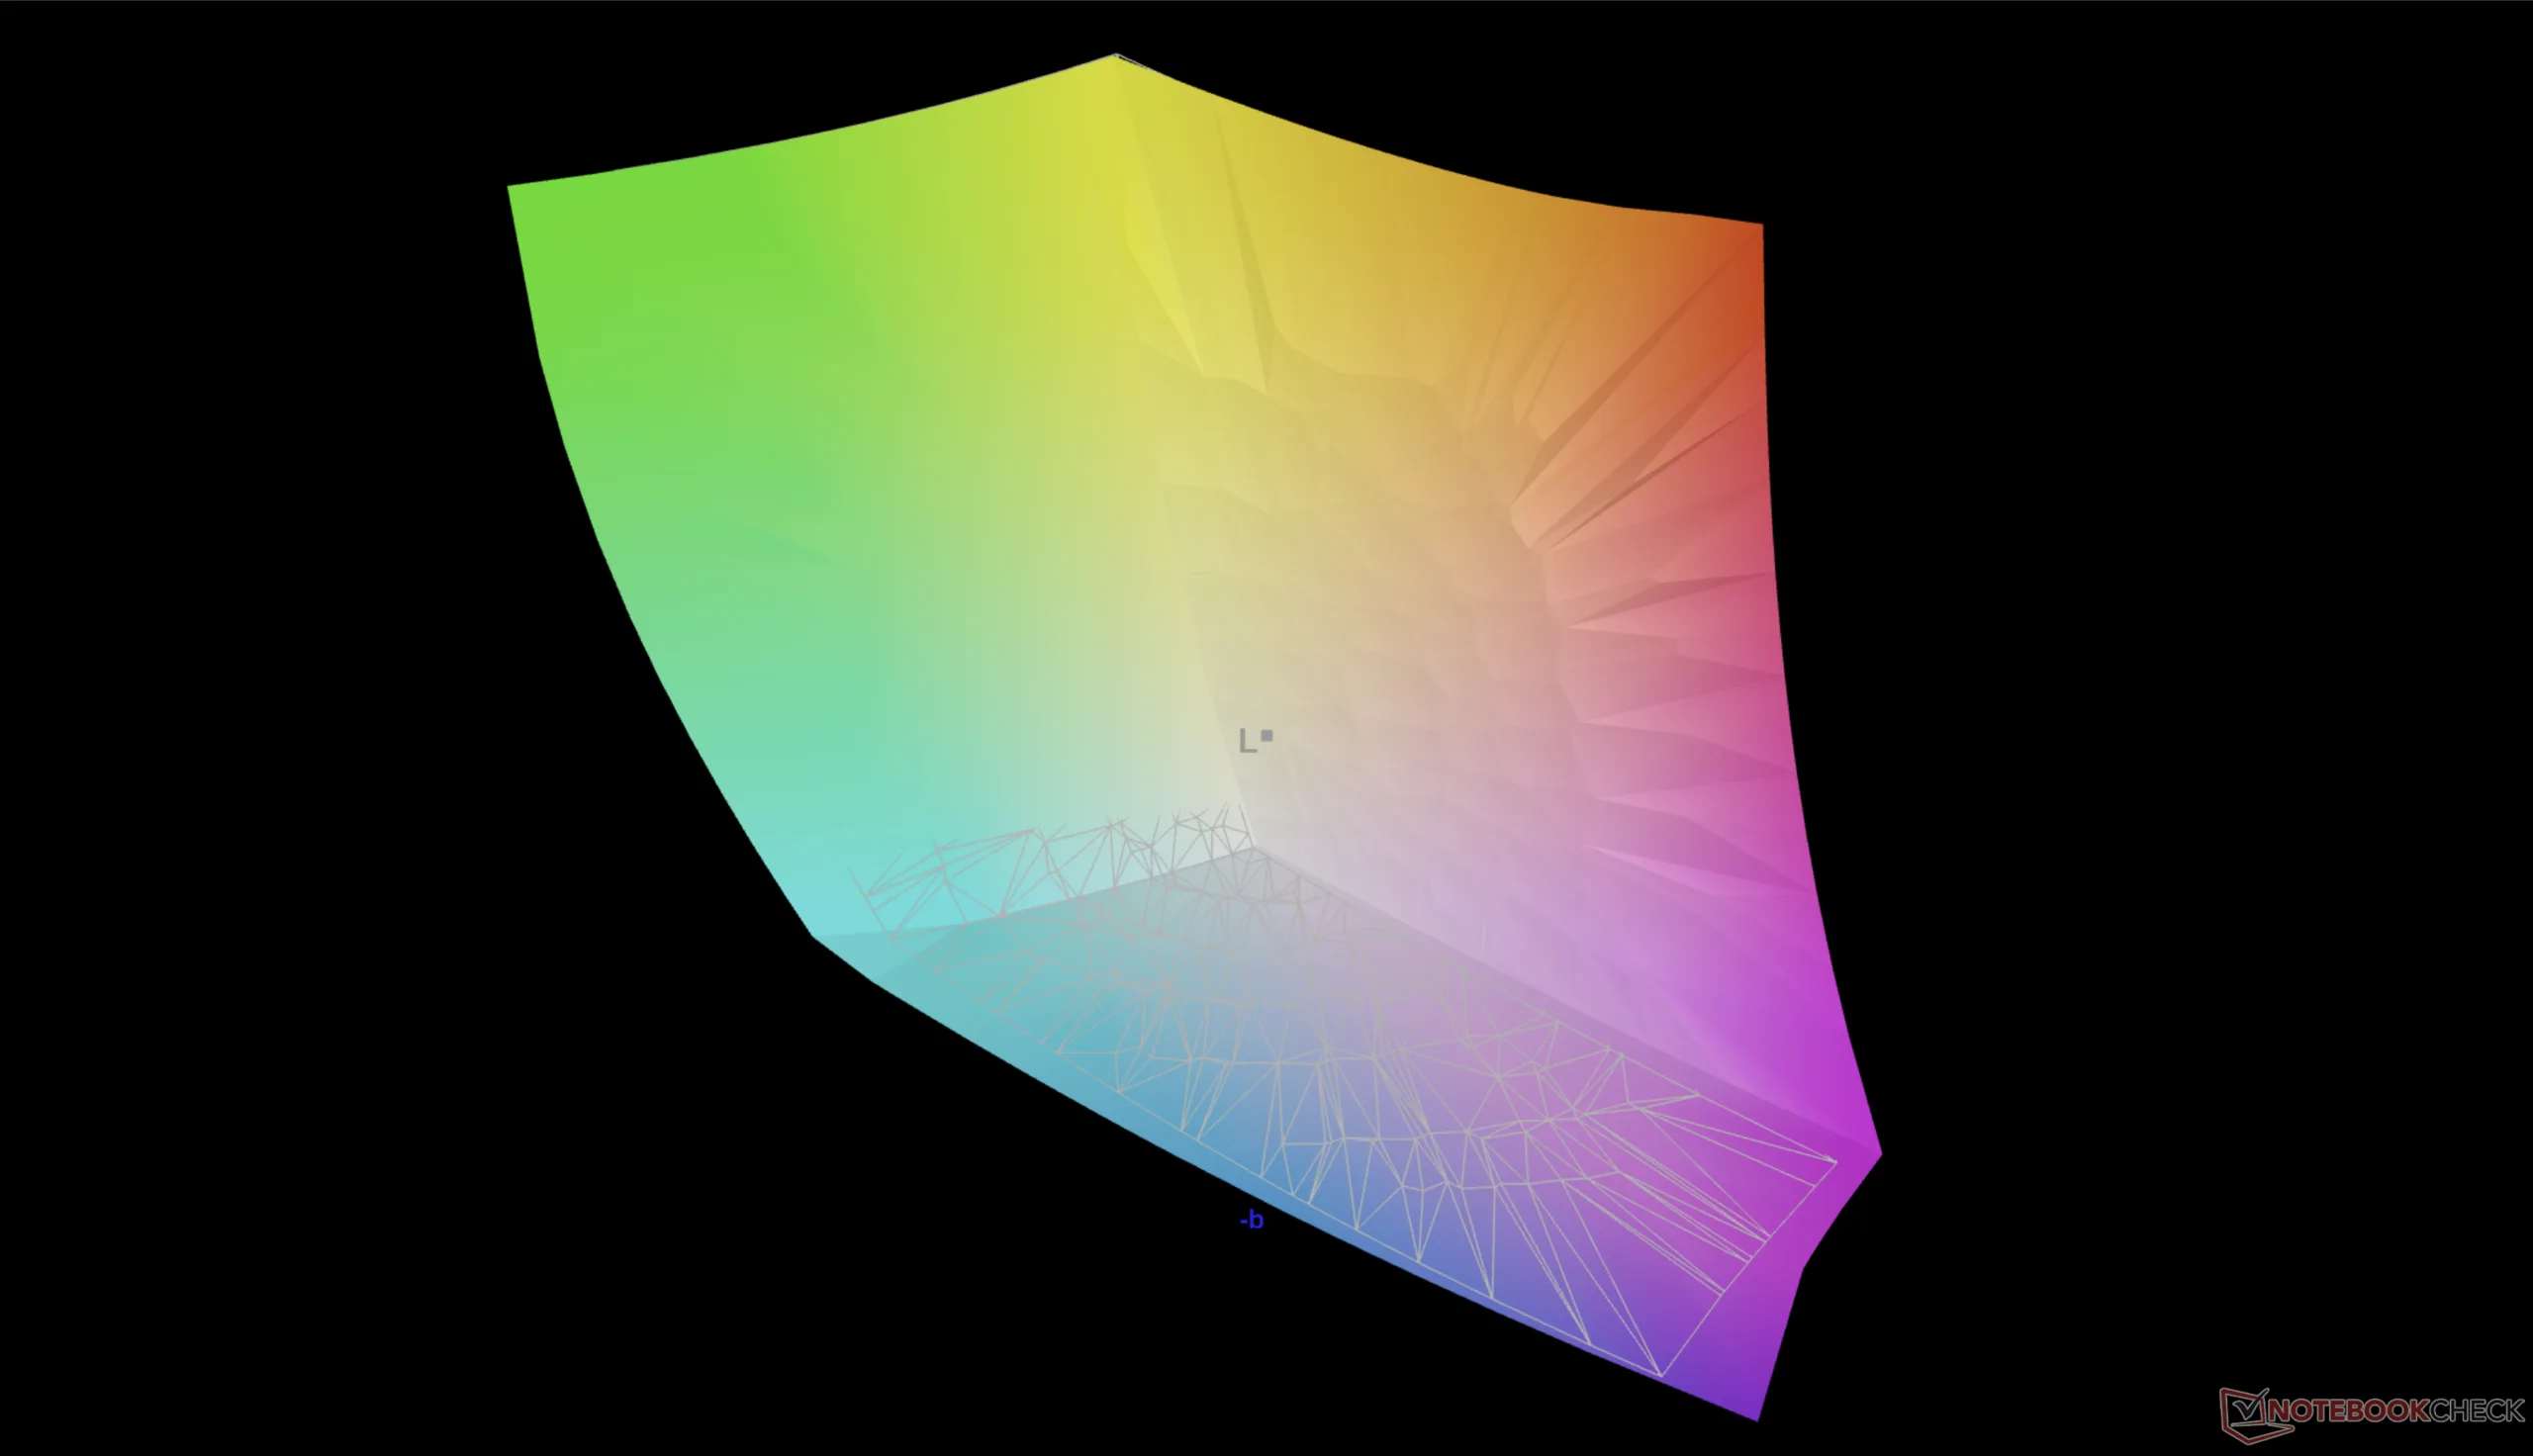
97.5% AdobeRGB 1998 (Argyll 3D)
100% sRGB (Argyll 3D)
98.8% Display P3 (Argyll 3D)
Gamma: 2.23
CCT: 6319 K
| Lenovo ThinkPad P1 Gen 8 Samsung ATNA60KA02-0, Tandem OLED, 3200x2000, 16", 120 Hz | Lenovo ThinkPad P16s Gen 4 21RX000YGE N160JCA-GT1, IPS LED, 1920x1200, 16", 60 Hz | Lenovo ThinkPad P1 Gen 7 21KV001SGE MNG007DA1-9 , IPS LED, 2560x1600, 16", 165 Hz | HP ZBook X G1i 16 LG Philips LGD07B3, IPS, 2560x1600, 16", 120 Hz | Dell Pro Max 16 Plus Samsung 160HC01, OLED, 3840x2400, 16", 120 Hz | Asus ExpertBook B6 Flip B6602FC2 AU Optronics Model: AUOE495, IPS, 2560x1600, 16", 120 Hz | |
|---|---|---|---|---|---|---|
| Display | -22% | -19% | 0% | -4% | -4% | |
| Display P3 Coverage (%) | 98.8 | 65.8 -33% | 69.4 -30% | 97.2 -2% | 97.3 -2% | 97.9 -1% |
| sRGB Coverage (%) | 100 | 96.8 -3% | 97.6 -2% | 100 0% | 100 0% | 99.89 0% |
| AdobeRGB 1998 Coverage (%) | 97.5 | 67.8 -30% | 71.8 -26% | 99.9 2% | 88.8 -9% | 85.52 -12% |
| Response Times | -4013% | -1609% | -3839% | -30% | -4223% | |
| Response Time Grey 50% / Grey 80% * (ms) | 0.57 ? | 29.4 ? -5058% | 11.2 ? -1865% | 45.5 ? -7882% | 0.63 ? -11% | 36 ? -6216% |
| Response Time Black / White * (ms) | 0.73 ? | 22.4 ? -2968% | 10.6 ? -1352% | 26.1 ? -3475% | 0.89 ? -22% | 17 ? -2229% |
| PWM Frequency (Hz) | 1199 | 26536 ? | 479.9 ? | |||
| PWM Amplitude * (%) | 18 | 47 -161% | 28 -56% | |||
| Screen | -72% | -106% | -84% | -20% | -68% | |
| Brightness middle (cd/m²) | 561.8 | 540 -4% | 516 -8% | 461.8 -18% | 530.9 -6% | 440 -22% |
| Brightness (cd/m²) | 566 | 516 -9% | 505 -11% | 427 -25% | 540 -5% | 418 -26% |
| Brightness Distribution (%) | 99 | 93 -6% | 89 -10% | 88 -11% | 95 -4% | 82 -17% |
| Black Level * (cd/m²) | 0.37 | 0.41 | 0.46 | 0.3 | ||
| Colorchecker dE 2000 * | 1.29 | 3.4 -164% | 3.5 -171% | 4.08 -216% | 2.42 -88% | 2.81 -118% |
| Colorchecker dE 2000 max. * | 2.96 | 5.6 -89% | 8.8 -197% | 8.1 -174% | 5.76 -95% | 4.62 -56% |
| Colorchecker dE 2000 calibrated * | 0.81 | 0.9 -11% | 1.2 -48% | 0.75 7% | 0.7 14% | 2.99 -269% |
| Greyscale dE 2000 * | 1.4 | 4.5 -221% | 5.6 -300% | 3.5 -150% | 0.8 43% | 0.91 35% |
| Gamma | 2.23 99% | 2.51 88% | 2.27 97% | 2.15 102% | 2.23 99% | 2.2 100% |
| CCT | 6319 103% | 6294 103% | 6071 107% | 6715 97% | 6488 100% | 6600 98% |
| Contrast (:1) | 1459 | 1259 | 1004 | 1467 | ||
| Total Average (Program / Settings) | -1369% /
-716% | -578% /
-335% | -1308% /
-931% | -18% /
-19% | -1432% /
-744% |
* ... smaller is better

The display comes pre-calibrated and so average deltaE values are already quite low out of the box as shown by our CalMAN results below.
Display Response Times
| ↔ Response Time Black to White | ||
|---|---|---|
| 0.73 ms ... rise ↗ and fall ↘ combined | ↗ 0.34 ms rise | 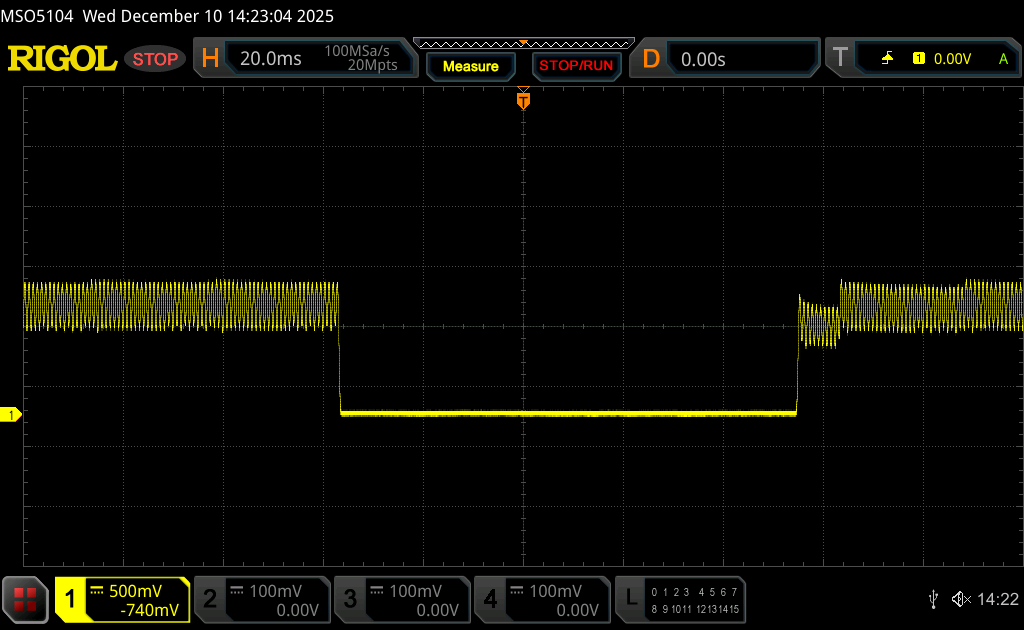 |
| ↘ 0.39 ms fall | ||
| The screen shows very fast response rates in our tests and should be very well suited for fast-paced gaming. In comparison, all tested devices range from 0.1 (minimum) to 240 (maximum) ms. » 2 % of all devices are better. This means that the measured response time is better than the average of all tested devices (19.9 ms). | ||
| ↔ Response Time 50% Grey to 80% Grey | ||
| 0.57 ms ... rise ↗ and fall ↘ combined | ↗ 0.29 ms rise | 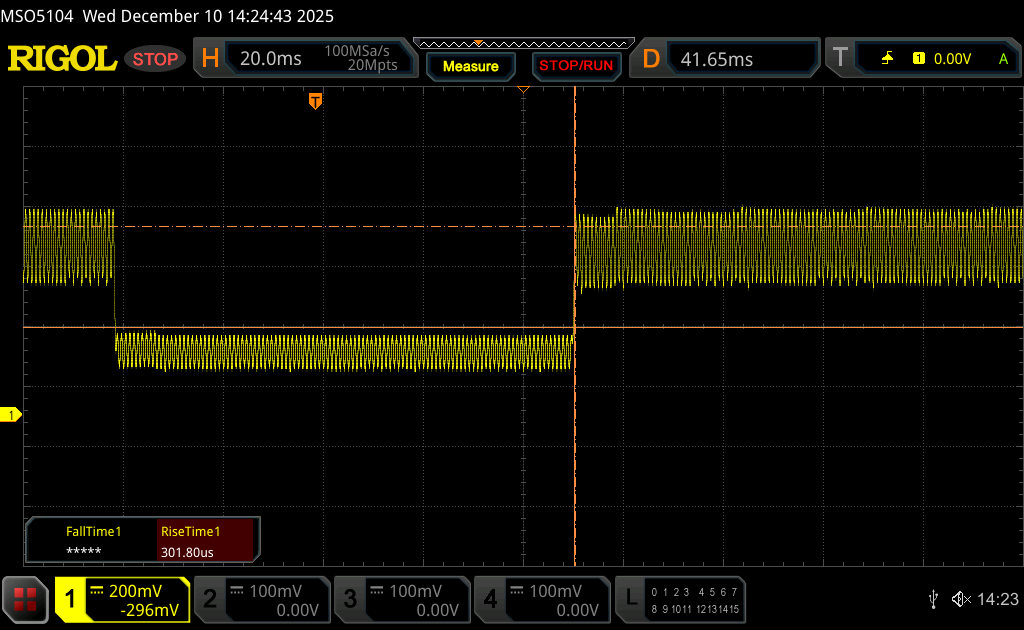 |
| ↘ 0.28 ms fall | ||
| The screen shows very fast response rates in our tests and should be very well suited for fast-paced gaming. In comparison, all tested devices range from 0.165 (minimum) to 636 (maximum) ms. » 1 % of all devices are better. This means that the measured response time is better than the average of all tested devices (31.1 ms). | ||
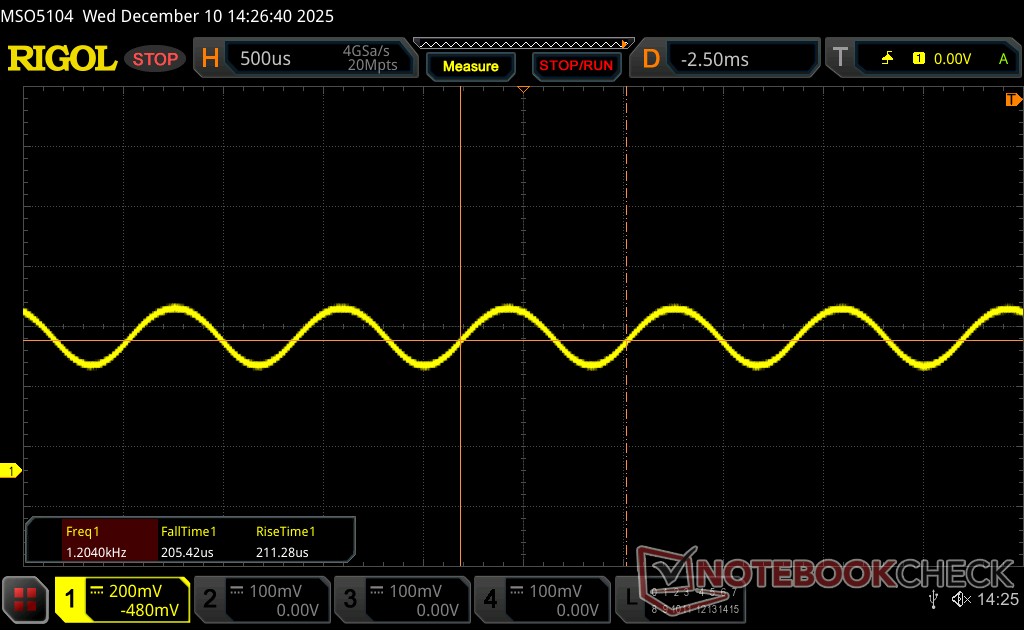
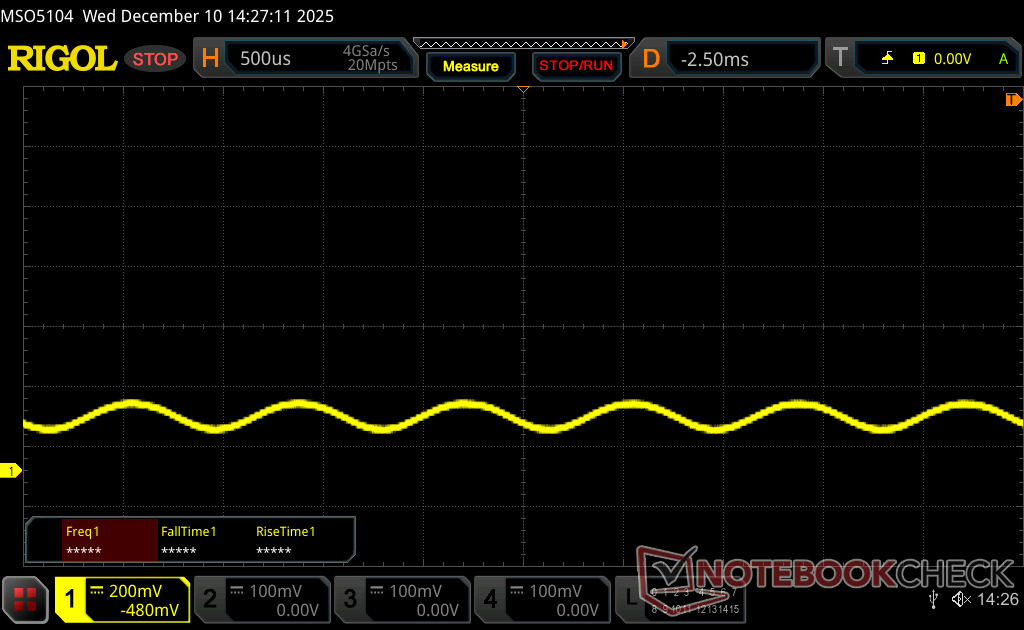
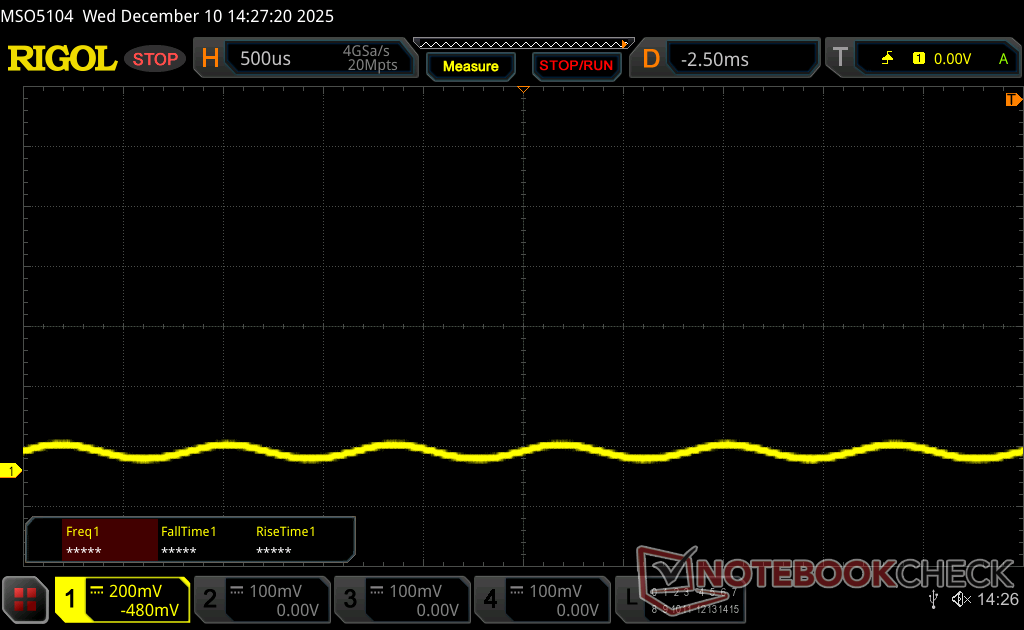
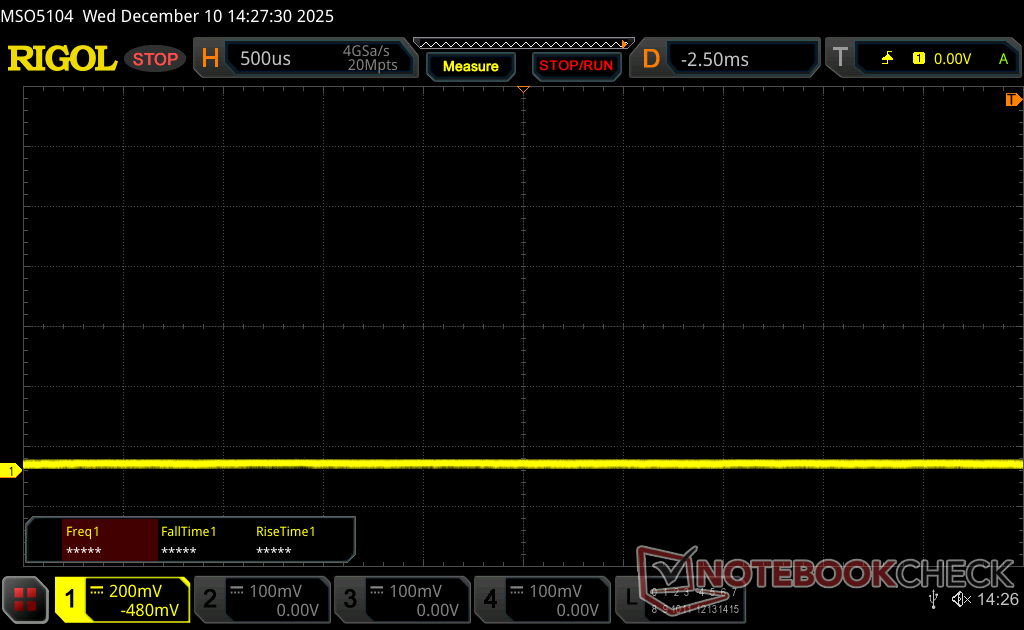
Screen Flickering / PWM (Pulse-Width Modulation)
| Screen flickering / PWM detected | 1199 Hz Amplitude: 18 % | 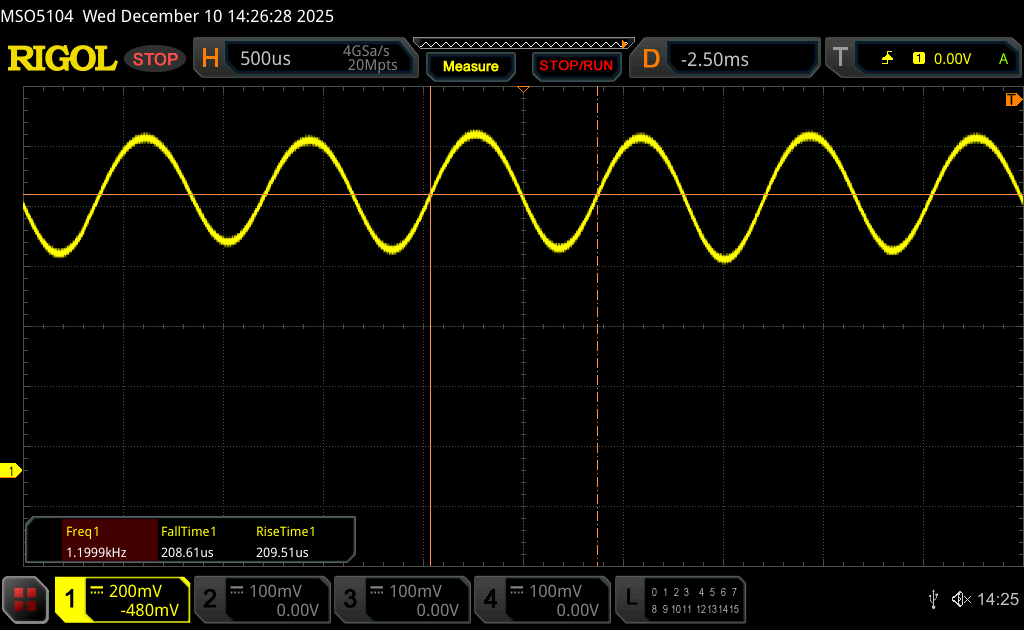 | |
The display backlight flickers at 1199 Hz (worst case, e.g., utilizing PWM) . The frequency of 1199 Hz is quite high, so most users sensitive to PWM should not notice any flickering. In comparison: 52 % of all tested devices do not use PWM to dim the display. If PWM was detected, an average of 7819 (minimum: 5 - maximum: 343500) Hz was measured. | |||

Performance
Testing Conditions
We set Windows and Nvidia to Performance mode prior to running the benchmarks below. Advanced Optimus and GPU ECC are not supported.
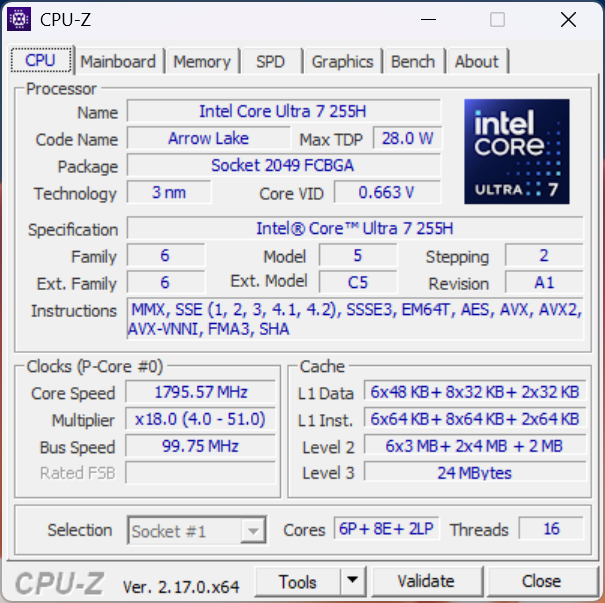
Processor
The Core Ultra 7 255H offers 15 to 20 percent faster multi-thread performance over the Core Ultra 7 155H in last year's ThinkPad P1 Gen 7. Upgrading to the highest-end Core Ultra 9 285H configuration is expected to increase performance even further albeit just marginally by 5 to 10 percent over the Core Ultra 7 255H.
Performance sustainability is good but not perfect; when running CineBench R15 xT in a loop, the original score of 3388 points would drop by almost 13 percent after just 4 or 5 cycles.
Cinebench R15 Multi Loop
Cinebench R23: Multi Core | Single Core
Cinebench R20: CPU (Multi Core) | CPU (Single Core)
Cinebench R15: CPU Multi 64Bit | CPU Single 64Bit
Blender: v2.79 BMW27 CPU
7-Zip 18.03: 7z b 4 | 7z b 4 -mmt1
Geekbench 6.6: Multi-Core | Single-Core
Geekbench 5.5: Multi-Core | Single-Core
HWBOT x265 Benchmark v2.2: 4k Preset
LibreOffice : 20 Documents To PDF
R Benchmark 2.5: Overall mean
* ... smaller is better
AIDA64: FP32 Ray-Trace | FPU Julia | CPU SHA3 | CPU Queen | FPU SinJulia | FPU Mandel | CPU AES | CPU ZLib | FP64 Ray-Trace | CPU PhotoWorxx
| Performance rating | |
| Dell Pro Max 16 Plus | |
| Lenovo ThinkPad P16s Gen 4 21RX000YGE | |
| Lenovo ThinkPad P1 Gen 8 | |
| Lenovo ThinkPad P1 Gen 7 21KV001SGE | |
| Average Intel Core Ultra 7 255H | |
| Asus ExpertBook B6 Flip B6602FC2 | |
| AIDA64 / FP32 Ray-Trace | |
| Dell Pro Max 16 Plus | |
| Lenovo ThinkPad P16s Gen 4 21RX000YGE | |
| Lenovo ThinkPad P1 Gen 8 | |
| Average Intel Core Ultra 7 255H (13863 - 24741, n=17) | |
| Lenovo ThinkPad P1 Gen 7 21KV001SGE | |
| Asus ExpertBook B6 Flip B6602FC2 | |
| AIDA64 / FPU Julia | |
| Dell Pro Max 16 Plus | |
| Lenovo ThinkPad P1 Gen 8 | |
| Lenovo ThinkPad P16s Gen 4 21RX000YGE | |
| Average Intel Core Ultra 7 255H (71030 - 119222, n=17) | |
| Lenovo ThinkPad P1 Gen 7 21KV001SGE | |
| Asus ExpertBook B6 Flip B6602FC2 | |
| AIDA64 / CPU SHA3 | |
| Dell Pro Max 16 Plus | |
| Lenovo ThinkPad P1 Gen 8 | |
| Lenovo ThinkPad P16s Gen 4 21RX000YGE | |
| Average Intel Core Ultra 7 255H (3408 - 5548, n=17) | |
| Lenovo ThinkPad P1 Gen 7 21KV001SGE | |
| Asus ExpertBook B6 Flip B6602FC2 | |
| AIDA64 / CPU Queen | |
| Dell Pro Max 16 Plus | |
| Asus ExpertBook B6 Flip B6602FC2 | |
| Lenovo ThinkPad P16s Gen 4 21RX000YGE | |
| Lenovo ThinkPad P1 Gen 7 21KV001SGE | |
| Lenovo ThinkPad P1 Gen 8 | |
| Average Intel Core Ultra 7 255H (59098 - 68460, n=16) | |
| AIDA64 / FPU SinJulia | |
| Lenovo ThinkPad P16s Gen 4 21RX000YGE | |
| Dell Pro Max 16 Plus | |
| Asus ExpertBook B6 Flip B6602FC2 | |
| Lenovo ThinkPad P1 Gen 7 21KV001SGE | |
| Lenovo ThinkPad P1 Gen 8 | |
| Average Intel Core Ultra 7 255H (6716 - 9006, n=17) | |
| AIDA64 / FPU Mandel | |
| Dell Pro Max 16 Plus | |
| Lenovo ThinkPad P1 Gen 8 | |
| Lenovo ThinkPad P16s Gen 4 21RX000YGE | |
| Average Intel Core Ultra 7 255H (37031 - 63347, n=17) | |
| Lenovo ThinkPad P1 Gen 7 21KV001SGE | |
| Asus ExpertBook B6 Flip B6602FC2 | |
| AIDA64 / CPU AES | |
| Dell Pro Max 16 Plus | |
| Lenovo ThinkPad P16s Gen 4 21RX000YGE | |
| Lenovo ThinkPad P1 Gen 7 21KV001SGE | |
| Lenovo ThinkPad P1 Gen 8 | |
| Asus ExpertBook B6 Flip B6602FC2 | |
| Average Intel Core Ultra 7 255H (58402 - 83568, n=17) | |
| AIDA64 / CPU ZLib | |
| Dell Pro Max 16 Plus | |
| Lenovo ThinkPad P1 Gen 8 | |
| Lenovo ThinkPad P16s Gen 4 21RX000YGE | |
| Lenovo ThinkPad P1 Gen 7 21KV001SGE | |
| Average Intel Core Ultra 7 255H (822 - 1316, n=17) | |
| Asus ExpertBook B6 Flip B6602FC2 | |
| AIDA64 / FP64 Ray-Trace | |
| Dell Pro Max 16 Plus | |
| Lenovo ThinkPad P16s Gen 4 21RX000YGE | |
| Lenovo ThinkPad P1 Gen 8 | |
| Average Intel Core Ultra 7 255H (7384 - 13231, n=17) | |
| Lenovo ThinkPad P1 Gen 7 21KV001SGE | |
| Asus ExpertBook B6 Flip B6602FC2 | |
| AIDA64 / CPU PhotoWorxx | |
| Dell Pro Max 16 Plus | |
| Lenovo ThinkPad P1 Gen 8 | |
| Average Intel Core Ultra 7 255H (23836 - 65787, n=17) | |
| Lenovo ThinkPad P16s Gen 4 21RX000YGE | |
| Lenovo ThinkPad P1 Gen 7 21KV001SGE | |
| Asus ExpertBook B6 Flip B6602FC2 | |
System Performance
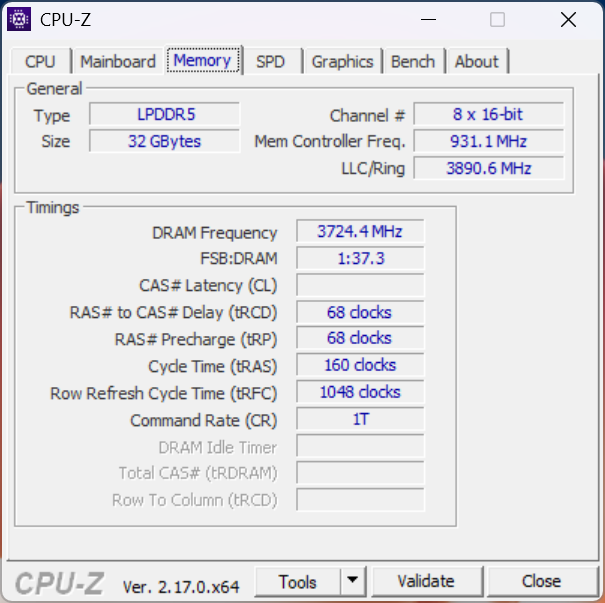
AIDA64 RAM benchmark scores are notably very good for a laptop with 32 GB of removable memory. The model comes standard with LPDDR5x-7467 LPCAMM2 which was designed to overcome many of the limitations of SODIMM.
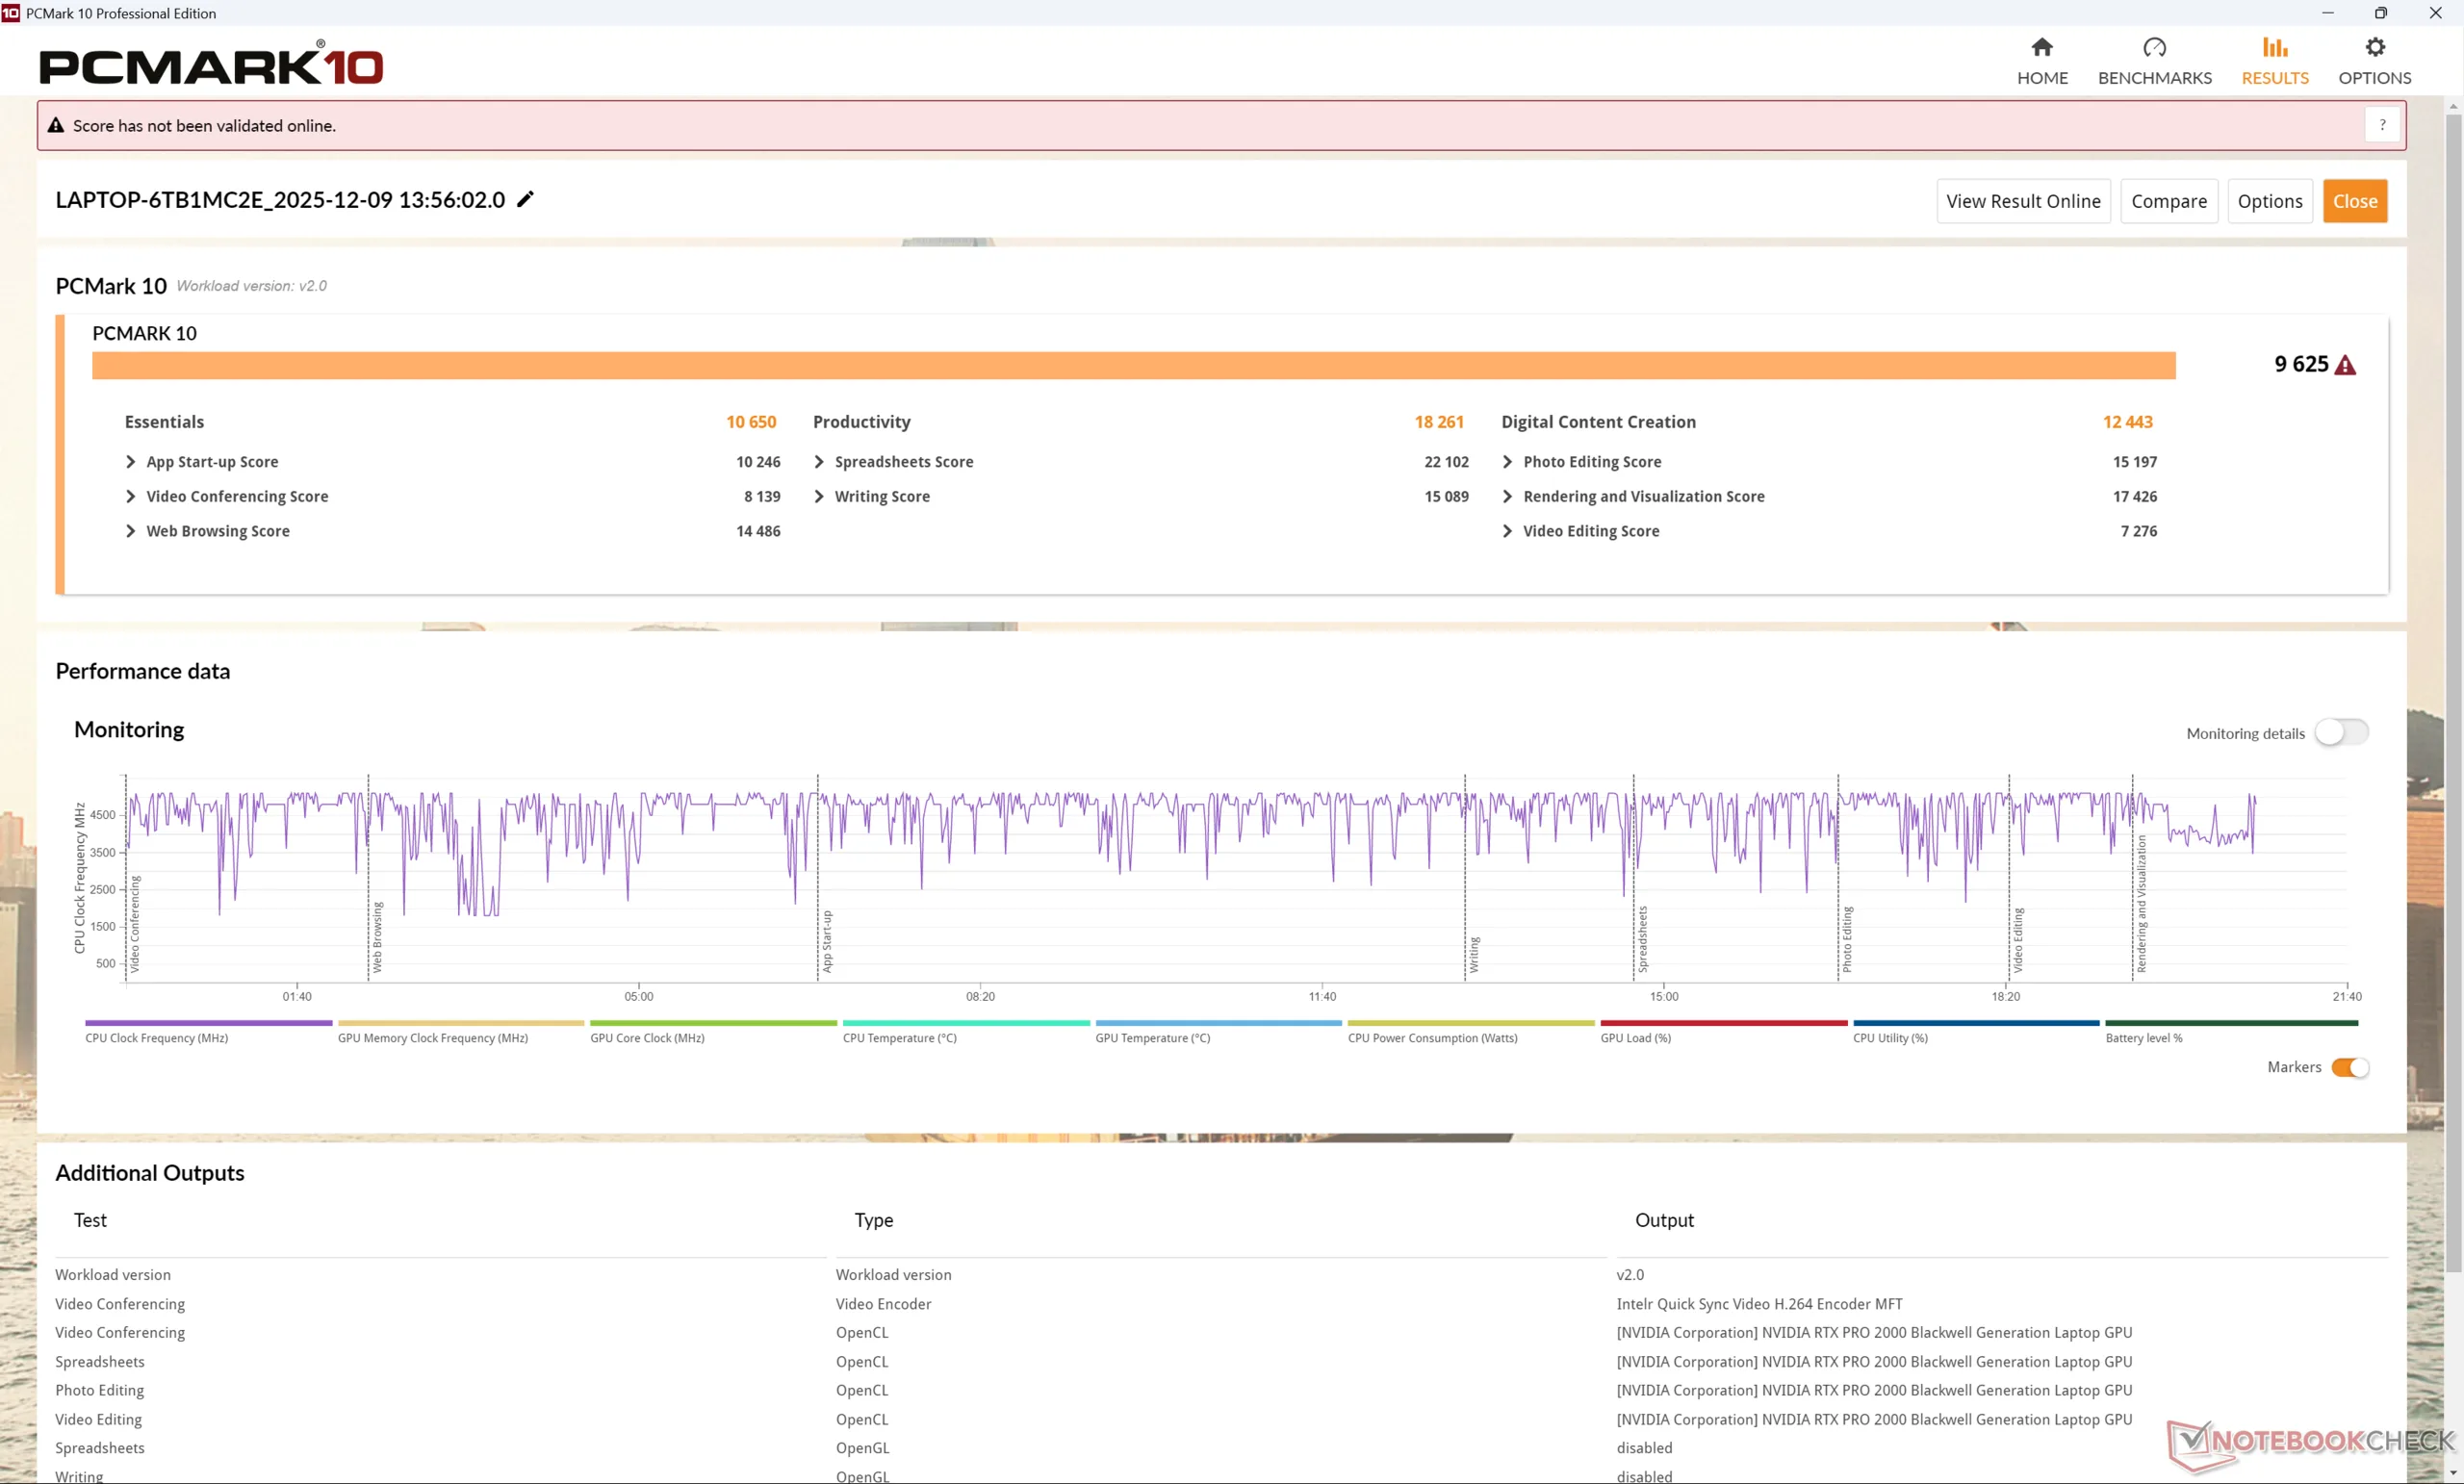
PCMark 10: Score | Essentials | Productivity | Digital Content Creation
CrossMark: Overall | Productivity | Creativity | Responsiveness
WebXPRT 3: Overall
WebXPRT 4: Overall
Mozilla Kraken 1.1: Total
| Performance rating | |
| Dell Pro Max 16 Plus -4! | |
| Lenovo ThinkPad P1 Gen 8 | |
| Average Intel Core Ultra 7 255H, NVIDIA RTX PRO 2000 Blackwell Generation Laptop | |
| HP ZBook X G1i 16 -4! | |
| Asus ExpertBook B6 Flip B6602FC2 | |
| Lenovo ThinkPad P1 Gen 7 21KV001SGE | |
| Lenovo ThinkPad P16s Gen 4 21RX000YGE | |
| PCMark 10 / Score | |
| Average Intel Core Ultra 7 255H, NVIDIA RTX PRO 2000 Blackwell Generation Laptop (9625 - 9723, n=2) | |
| Lenovo ThinkPad P1 Gen 8 | |
| Lenovo ThinkPad P16s Gen 4 21RX000YGE | |
| Lenovo ThinkPad P1 Gen 7 21KV001SGE | |
| Asus ExpertBook B6 Flip B6602FC2 | |
| PCMark 10 / Essentials | |
| Asus ExpertBook B6 Flip B6602FC2 | |
| Average Intel Core Ultra 7 255H, NVIDIA RTX PRO 2000 Blackwell Generation Laptop (10650 - 10921, n=2) | |
| Lenovo ThinkPad P16s Gen 4 21RX000YGE | |
| Lenovo ThinkPad P1 Gen 8 | |
| Lenovo ThinkPad P1 Gen 7 21KV001SGE | |
| PCMark 10 / Productivity | |
| Lenovo ThinkPad P1 Gen 8 | |
| Average Intel Core Ultra 7 255H, NVIDIA RTX PRO 2000 Blackwell Generation Laptop (18083 - 18261, n=2) | |
| Asus ExpertBook B6 Flip B6602FC2 | |
| Lenovo ThinkPad P16s Gen 4 21RX000YGE | |
| Lenovo ThinkPad P1 Gen 7 21KV001SGE | |
| PCMark 10 / Digital Content Creation | |
| Average Intel Core Ultra 7 255H, NVIDIA RTX PRO 2000 Blackwell Generation Laptop (12443 - 12631, n=2) | |
| Lenovo ThinkPad P1 Gen 8 | |
| Lenovo ThinkPad P1 Gen 7 21KV001SGE | |
| Lenovo ThinkPad P16s Gen 4 21RX000YGE | |
| Asus ExpertBook B6 Flip B6602FC2 | |
| CrossMark / Overall | |
| Dell Pro Max 16 Plus | |
| HP ZBook X G1i 16 | |
| Asus ExpertBook B6 Flip B6602FC2 | |
| Lenovo ThinkPad P1 Gen 8 | |
| Average Intel Core Ultra 7 255H, NVIDIA RTX PRO 2000 Blackwell Generation Laptop (1942 - 1953, n=2) | |
| Lenovo ThinkPad P1 Gen 7 21KV001SGE | |
| Lenovo ThinkPad P16s Gen 4 21RX000YGE | |
| CrossMark / Productivity | |
| Dell Pro Max 16 Plus | |
| HP ZBook X G1i 16 | |
| Asus ExpertBook B6 Flip B6602FC2 | |
| Lenovo ThinkPad P1 Gen 8 | |
| Average Intel Core Ultra 7 255H, NVIDIA RTX PRO 2000 Blackwell Generation Laptop (1834 - 1836, n=2) | |
| Lenovo ThinkPad P1 Gen 7 21KV001SGE | |
| Lenovo ThinkPad P16s Gen 4 21RX000YGE | |
| CrossMark / Creativity | |
| Dell Pro Max 16 Plus | |
| HP ZBook X G1i 16 | |
| Average Intel Core Ultra 7 255H, NVIDIA RTX PRO 2000 Blackwell Generation Laptop (2211 - 2232, n=2) | |
| Lenovo ThinkPad P1 Gen 8 | |
| Asus ExpertBook B6 Flip B6602FC2 | |
| Lenovo ThinkPad P1 Gen 7 21KV001SGE | |
| Lenovo ThinkPad P16s Gen 4 21RX000YGE | |
| CrossMark / Responsiveness | |
| Dell Pro Max 16 Plus | |
| Asus ExpertBook B6 Flip B6602FC2 | |
| Lenovo ThinkPad P1 Gen 8 | |
| Average Intel Core Ultra 7 255H, NVIDIA RTX PRO 2000 Blackwell Generation Laptop (1520 - 1622, n=2) | |
| HP ZBook X G1i 16 | |
| Lenovo ThinkPad P1 Gen 7 21KV001SGE | |
| Lenovo ThinkPad P16s Gen 4 21RX000YGE | |
| WebXPRT 3 / Overall | |
| Lenovo ThinkPad P1 Gen 8 | |
| Dell Pro Max 16 Plus | |
| Average Intel Core Ultra 7 255H, NVIDIA RTX PRO 2000 Blackwell Generation Laptop (322 - 330, n=2) | |
| HP ZBook X G1i 16 | |
| Lenovo ThinkPad P16s Gen 4 21RX000YGE | |
| Asus ExpertBook B6 Flip B6602FC2 | |
| Lenovo ThinkPad P1 Gen 7 21KV001SGE | |
| WebXPRT 4 / Overall | |
| Dell Pro Max 16 Plus | |
| Average Intel Core Ultra 7 255H, NVIDIA RTX PRO 2000 Blackwell Generation Laptop (298 - 307, n=2) | |
| HP ZBook X G1i 16 | |
| Lenovo ThinkPad P1 Gen 8 | |
| Asus ExpertBook B6 Flip B6602FC2 | |
| Lenovo ThinkPad P1 Gen 7 21KV001SGE | |
| Lenovo ThinkPad P16s Gen 4 21RX000YGE | |
| Mozilla Kraken 1.1 / Total | |
| Lenovo ThinkPad P1 Gen 7 21KV001SGE | |
| Asus ExpertBook B6 Flip B6602FC2 | |
| Lenovo ThinkPad P16s Gen 4 21RX000YGE | |
| Lenovo ThinkPad P1 Gen 8 | |
| HP ZBook X G1i 16 | |
| Average Intel Core Ultra 7 255H, NVIDIA RTX PRO 2000 Blackwell Generation Laptop (448 - 461, n=2) | |
| Dell Pro Max 16 Plus | |
* ... smaller is better
| PCMark 10 Score | 9625 points | |
Help | ||
| AIDA64 / Memory Copy | |
| Lenovo ThinkPad P1 Gen 8 | |
| Dell Pro Max 16 Plus | |
| Average Intel Core Ultra 7 255H (39188 - 110930, n=17) | |
| Lenovo ThinkPad P16s Gen 4 21RX000YGE | |
| Lenovo ThinkPad P1 Gen 7 21KV001SGE | |
| Asus ExpertBook B6 Flip B6602FC2 | |
| AIDA64 / Memory Read | |
| Dell Pro Max 16 Plus | |
| Lenovo ThinkPad P16s Gen 4 21RX000YGE | |
| Average Intel Core Ultra 7 255H (43703 - 90552, n=17) | |
| Lenovo ThinkPad P1 Gen 8 | |
| Lenovo ThinkPad P1 Gen 7 21KV001SGE | |
| Asus ExpertBook B6 Flip B6602FC2 | |
| AIDA64 / Memory Write | |
| Dell Pro Max 16 Plus | |
| Lenovo ThinkPad P16s Gen 4 21RX000YGE | |
| Average Intel Core Ultra 7 255H (36438 - 87199, n=17) | |
| Lenovo ThinkPad P1 Gen 7 21KV001SGE | |
| Lenovo ThinkPad P1 Gen 8 | |
| Asus ExpertBook B6 Flip B6602FC2 | |
| AIDA64 / Memory Latency | |
| Lenovo ThinkPad P1 Gen 8 | |
| Lenovo ThinkPad P1 Gen 7 21KV001SGE | |
| Average Intel Core Ultra 7 255H (107.6 - 147.2, n=17) | |
| Dell Pro Max 16 Plus | |
| Lenovo ThinkPad P16s Gen 4 21RX000YGE | |
| Asus ExpertBook B6 Flip B6602FC2 | |
* ... smaller is better
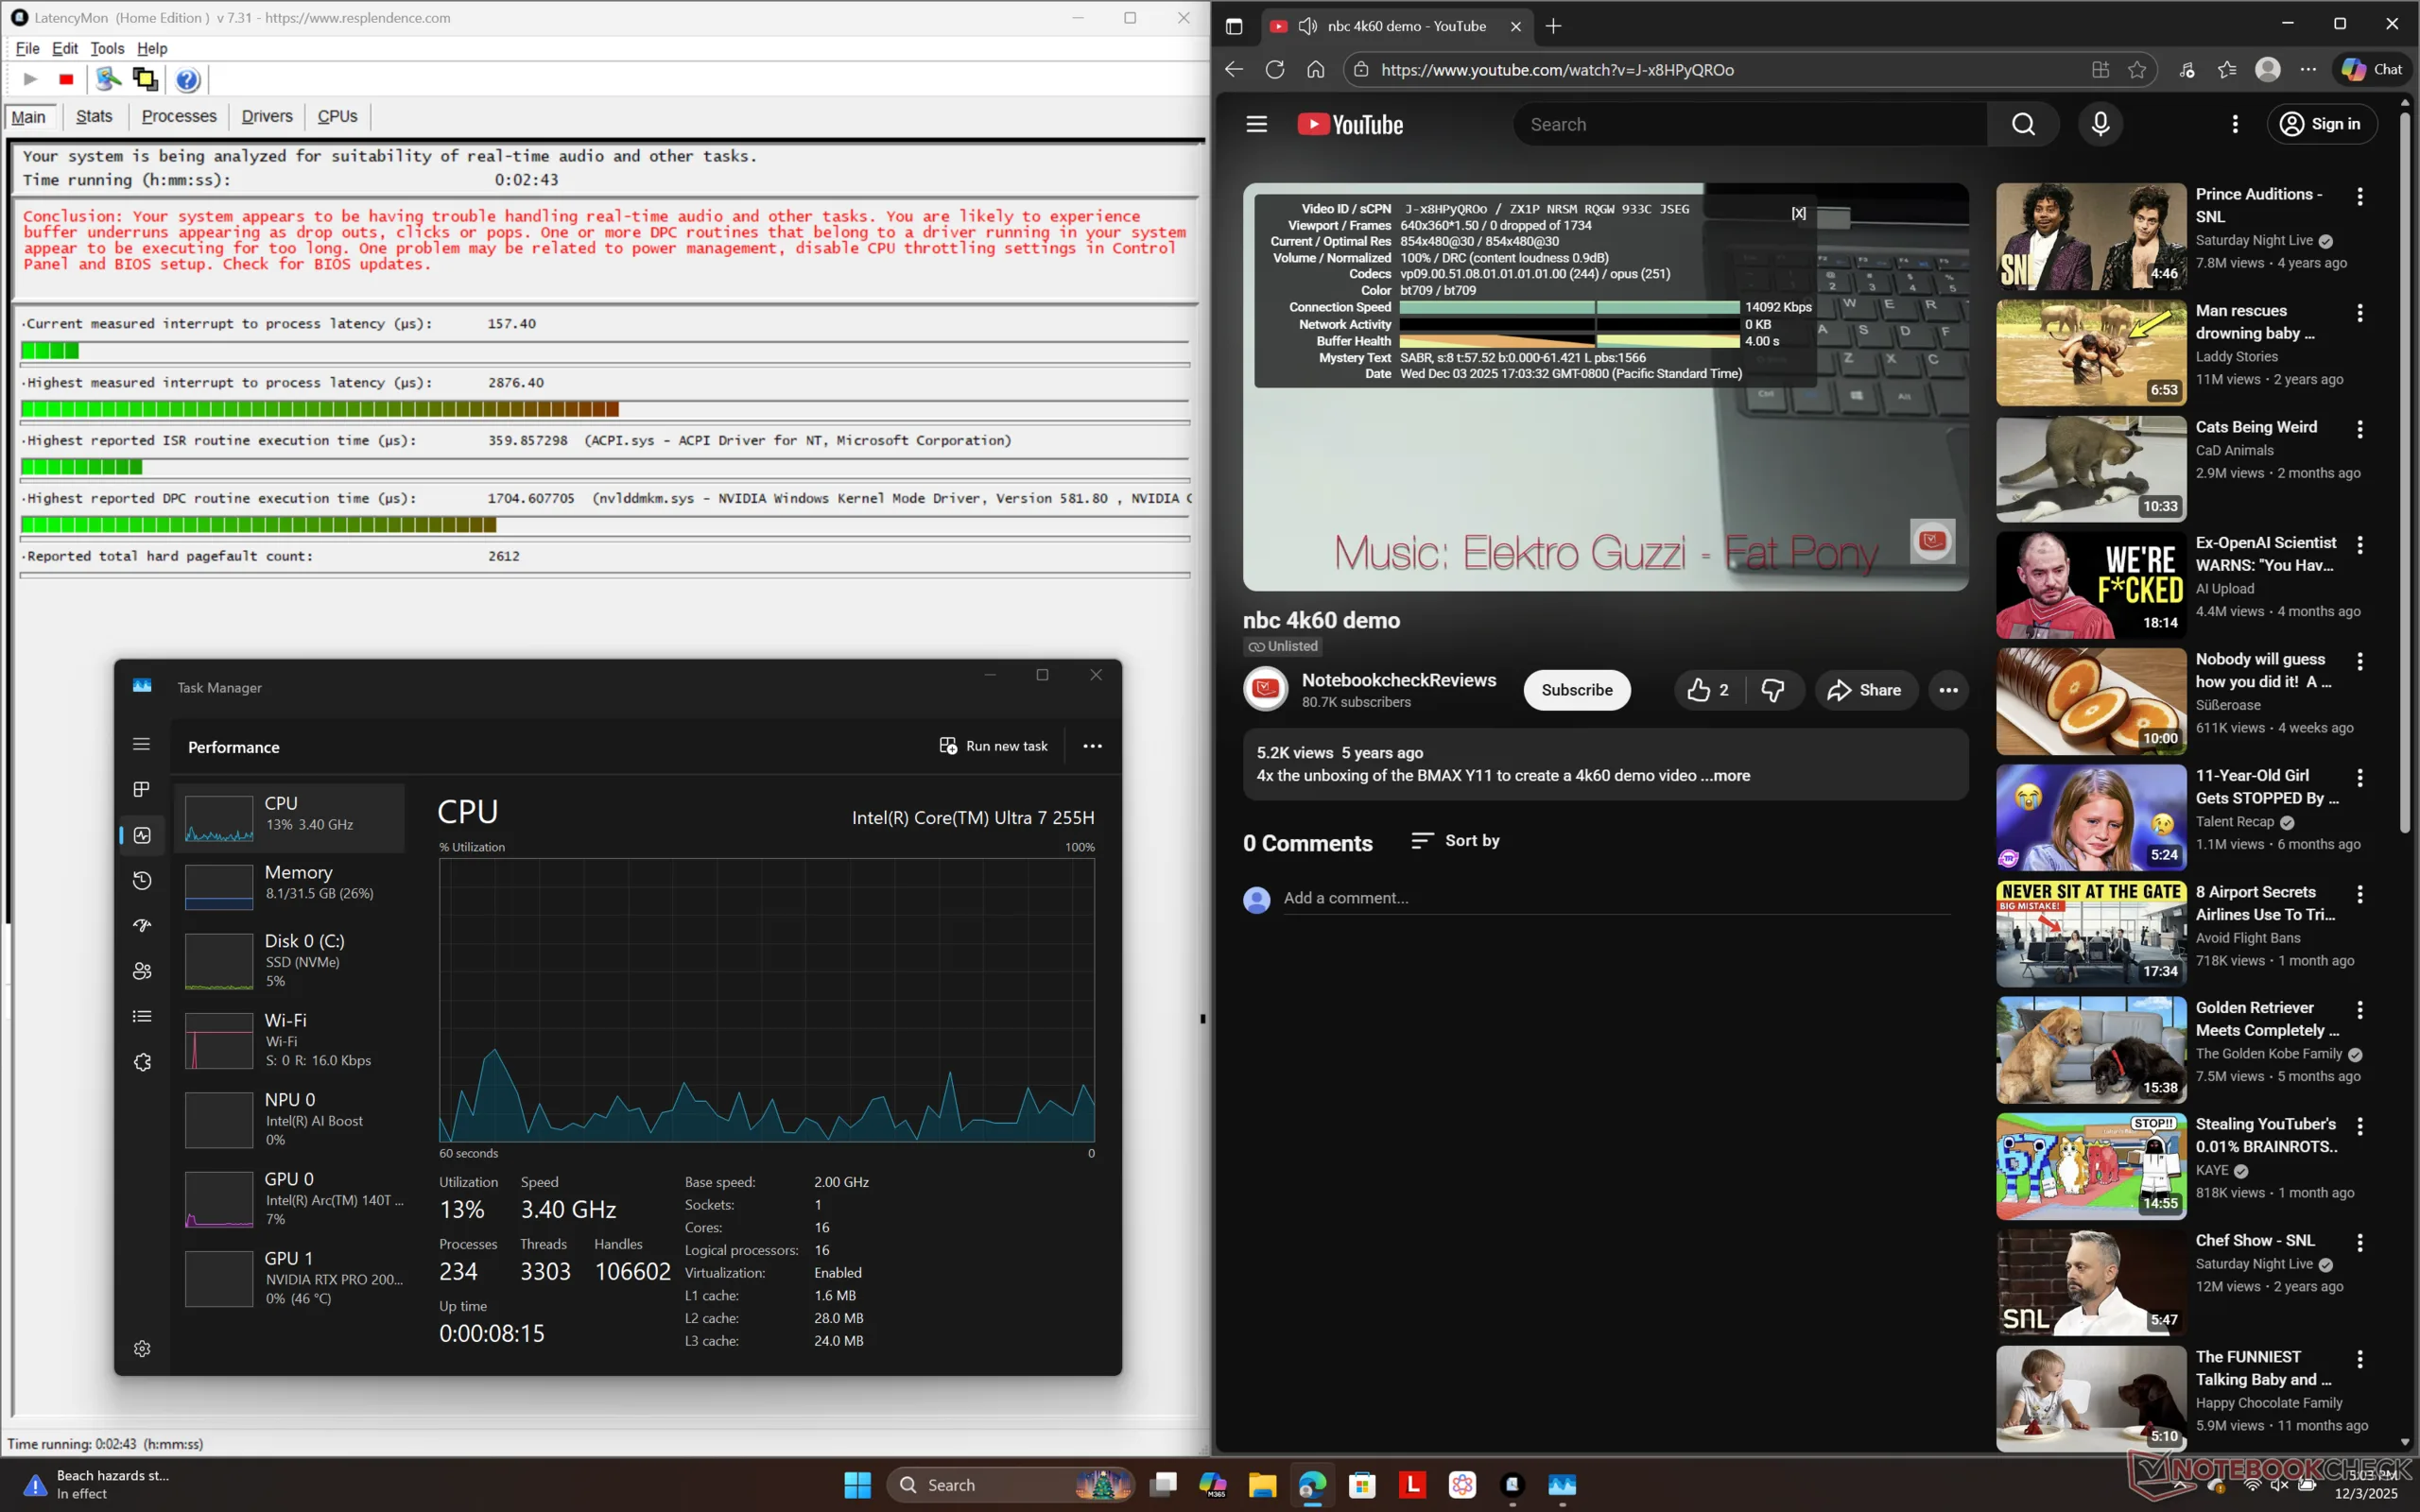
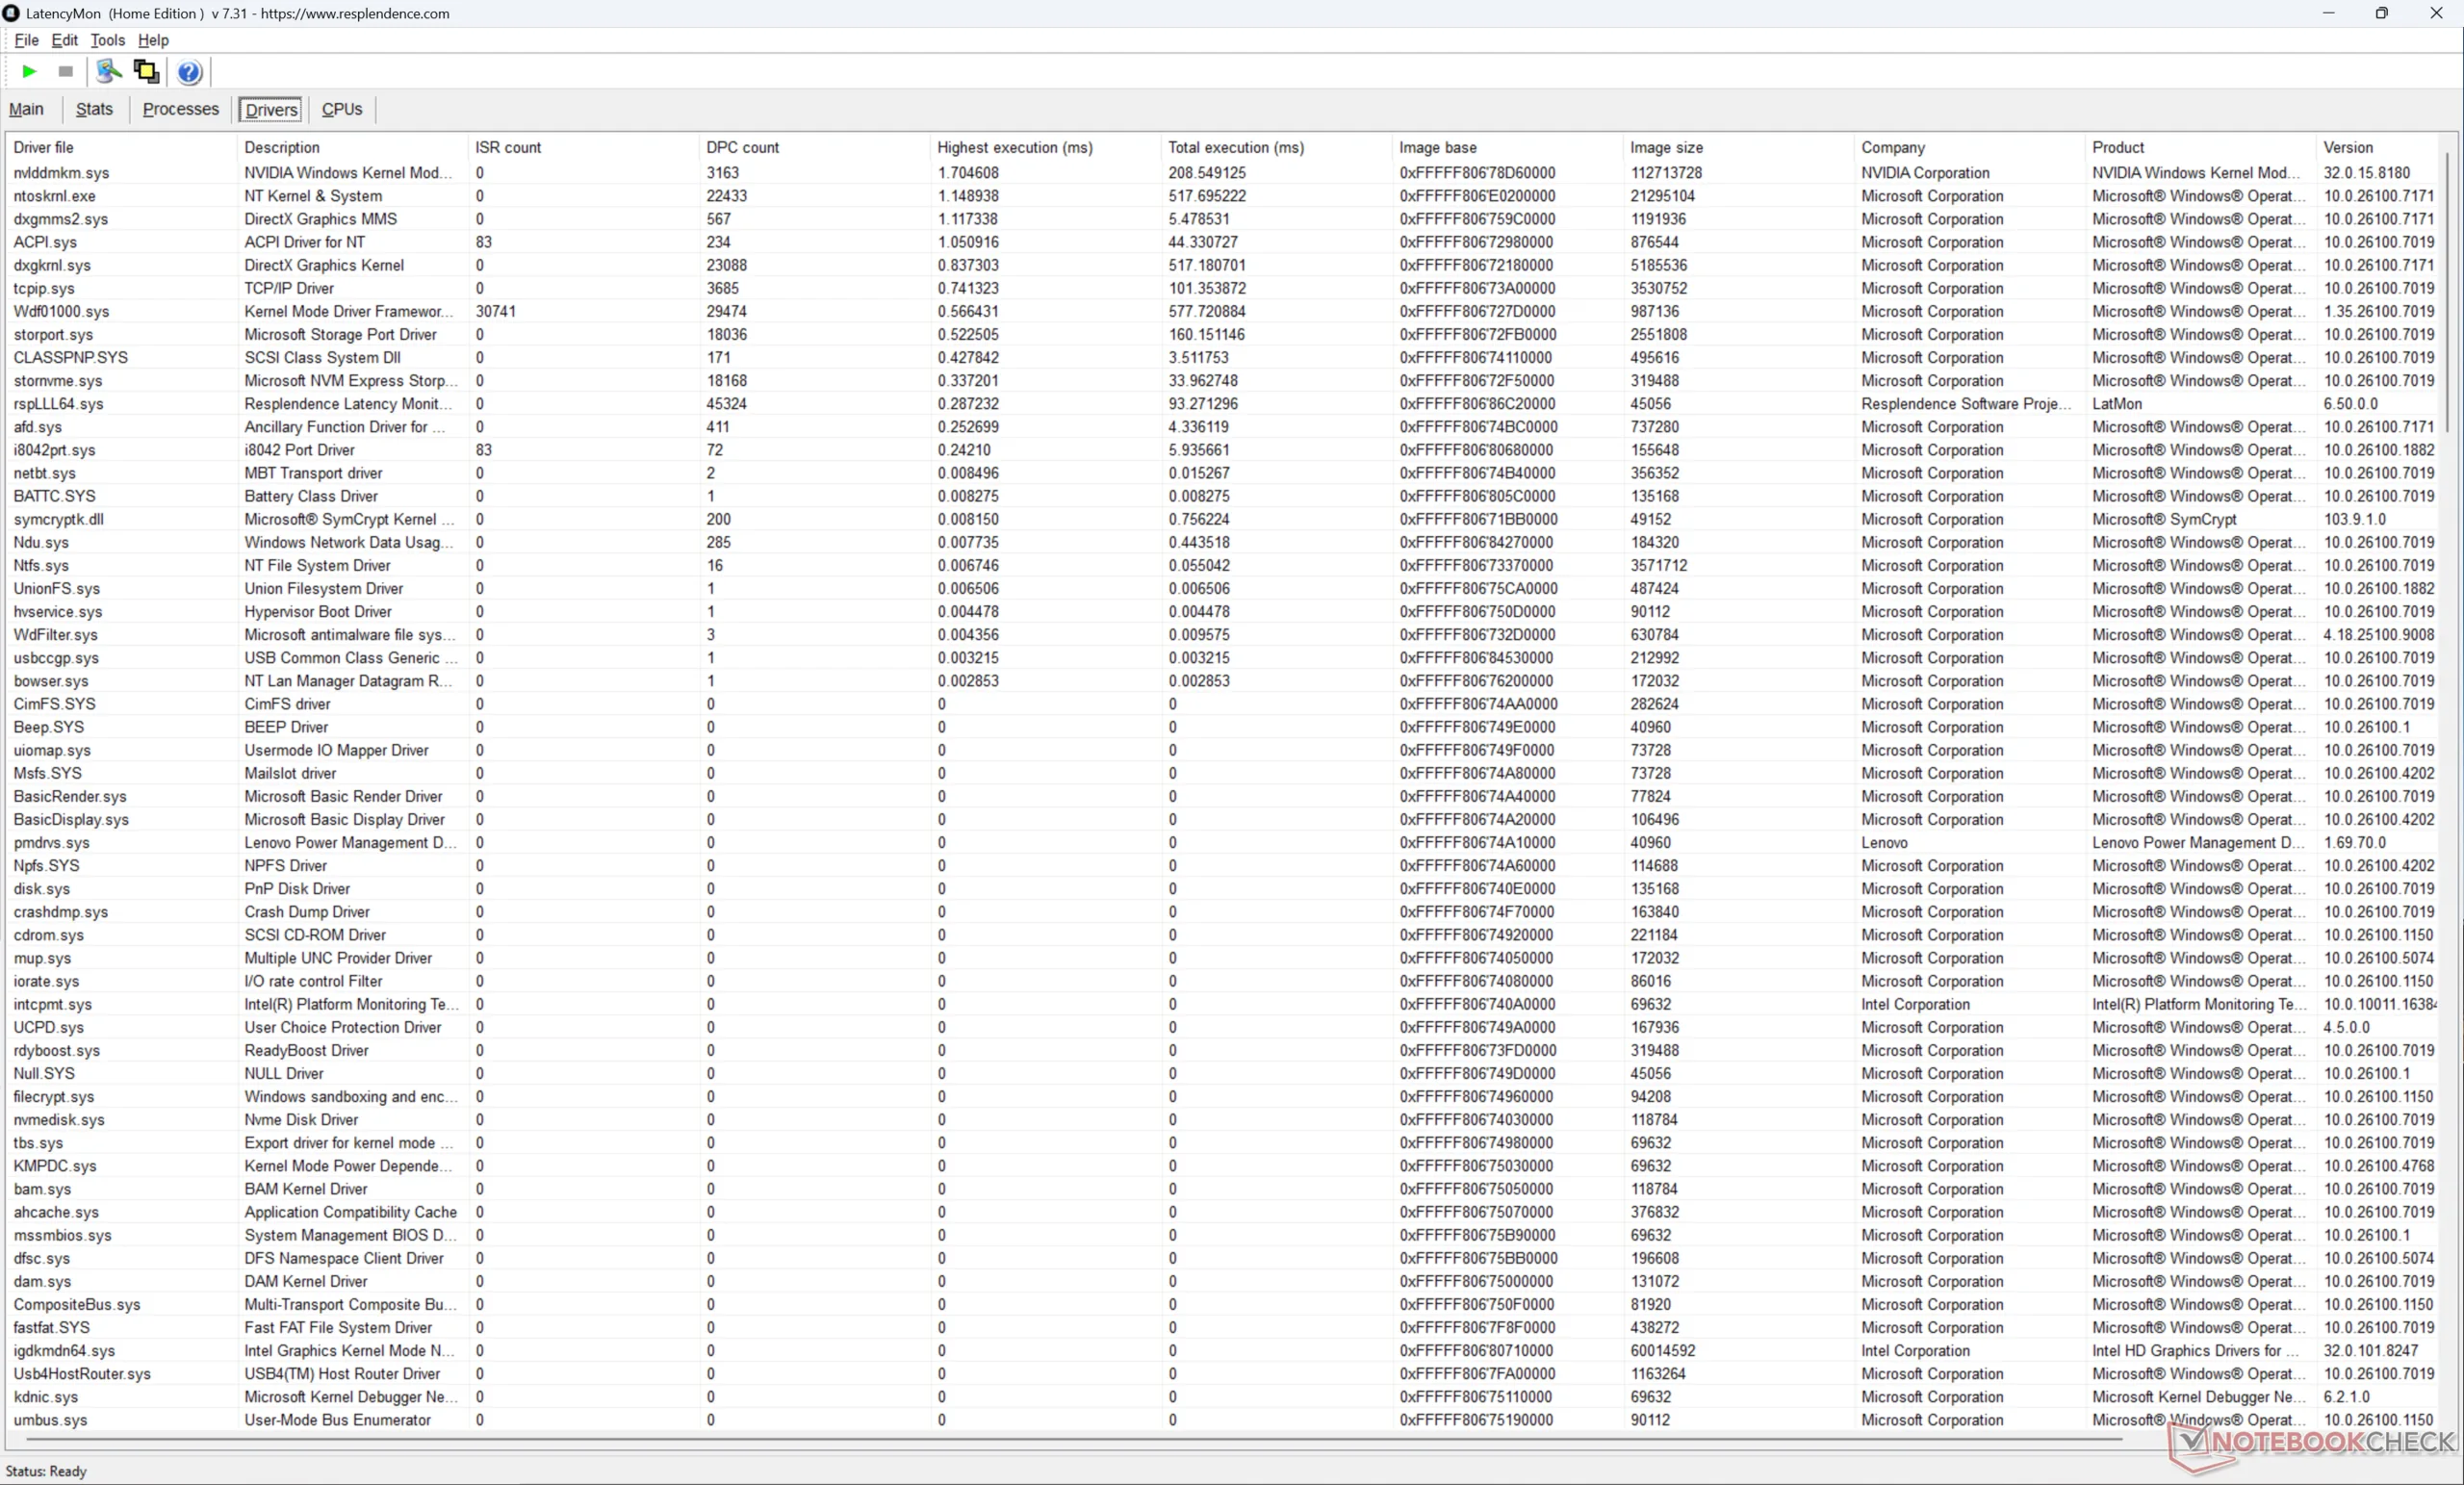
DPC Latency
LatencyMon reveals minor DPC issues but otherwise no dropped frames during 4K60 video playback.
| DPC Latencies / LatencyMon - interrupt to process latency (max), Web, Youtube, Prime95 | |
| Lenovo ThinkPad P1 Gen 8 | |
| Dell Pro Max 16 Plus | |
| Asus ExpertBook B6 Flip B6602FC2 | |
| Lenovo ThinkPad P1 Gen 7 21KV001SGE | |
| Lenovo ThinkPad P16s Gen 4 21RX000YGE | |
| HP ZBook X G1i 16 | |
* ... smaller is better
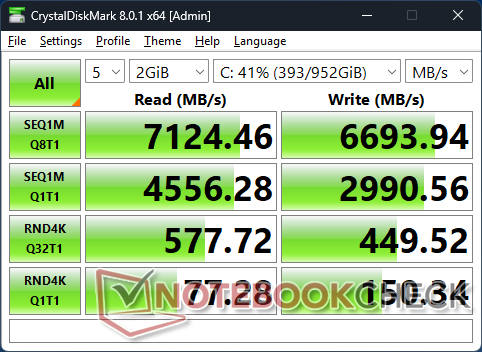
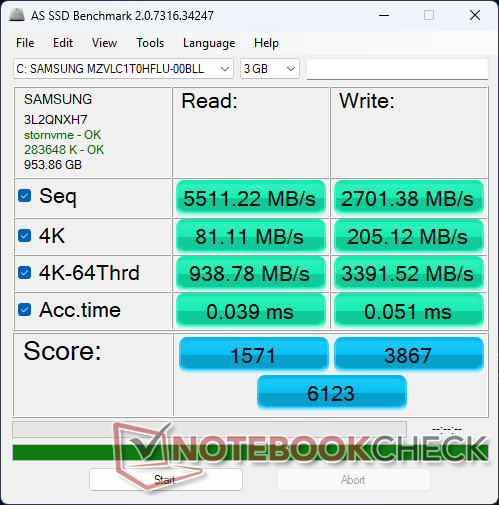
Storage Devices
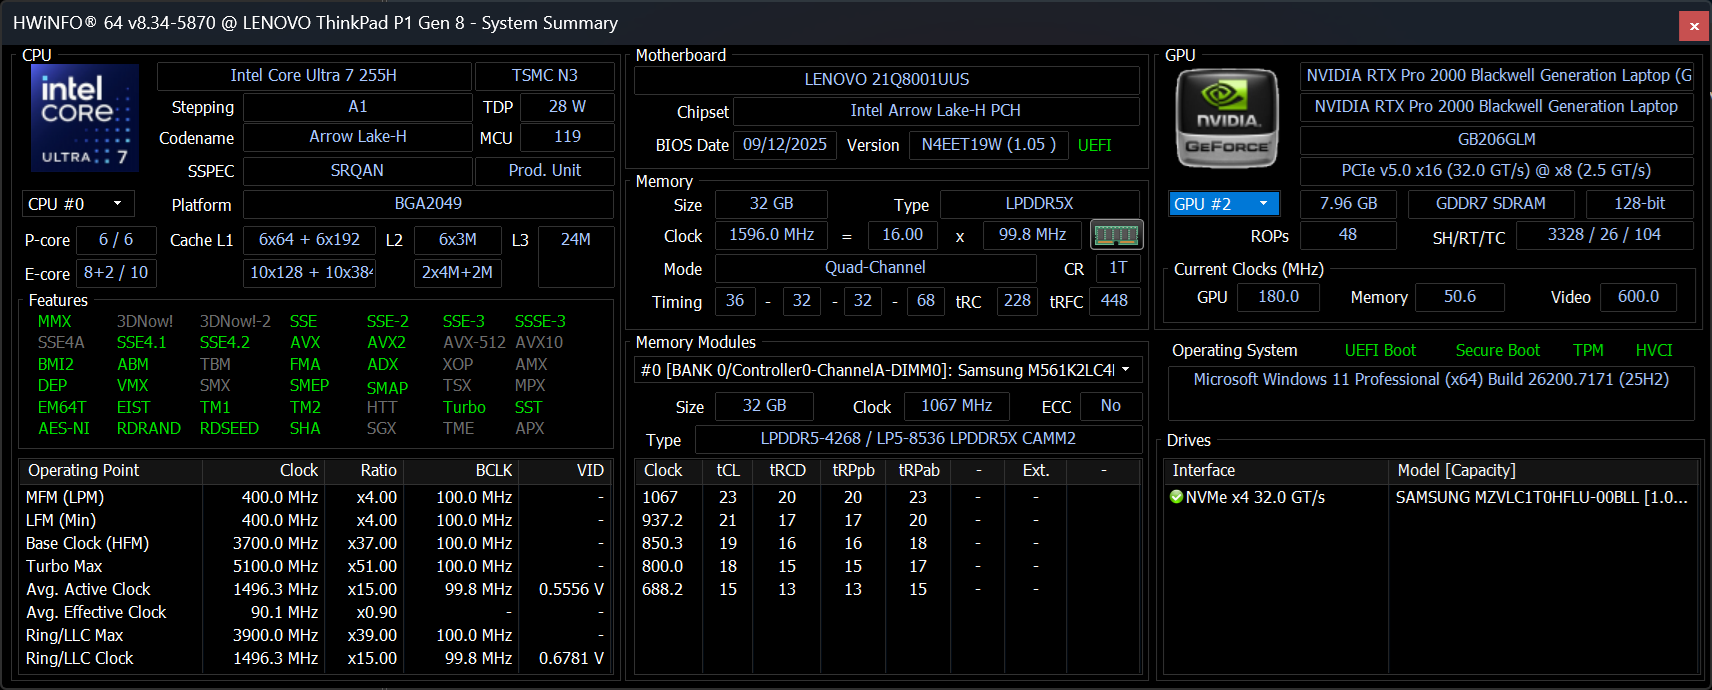
Our test unit ships with the Samsung PM9E1 PCIe5 NVMe SSD whereas last year's ThinkPad P1 Gen 7 would ship with the Kioxia XG8 KXG8AZNV1T02 PCIe4 NVMe SSD. Transfer rates are faster at up to a stable 7000 MB/s.

* ... smaller is better
Disk Throttling: DiskSpd Read Loop, Queue Depth 8
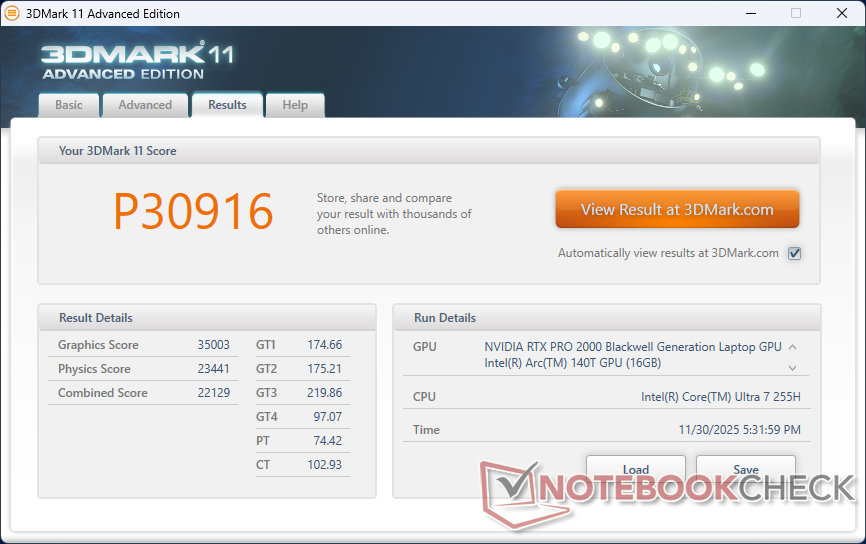
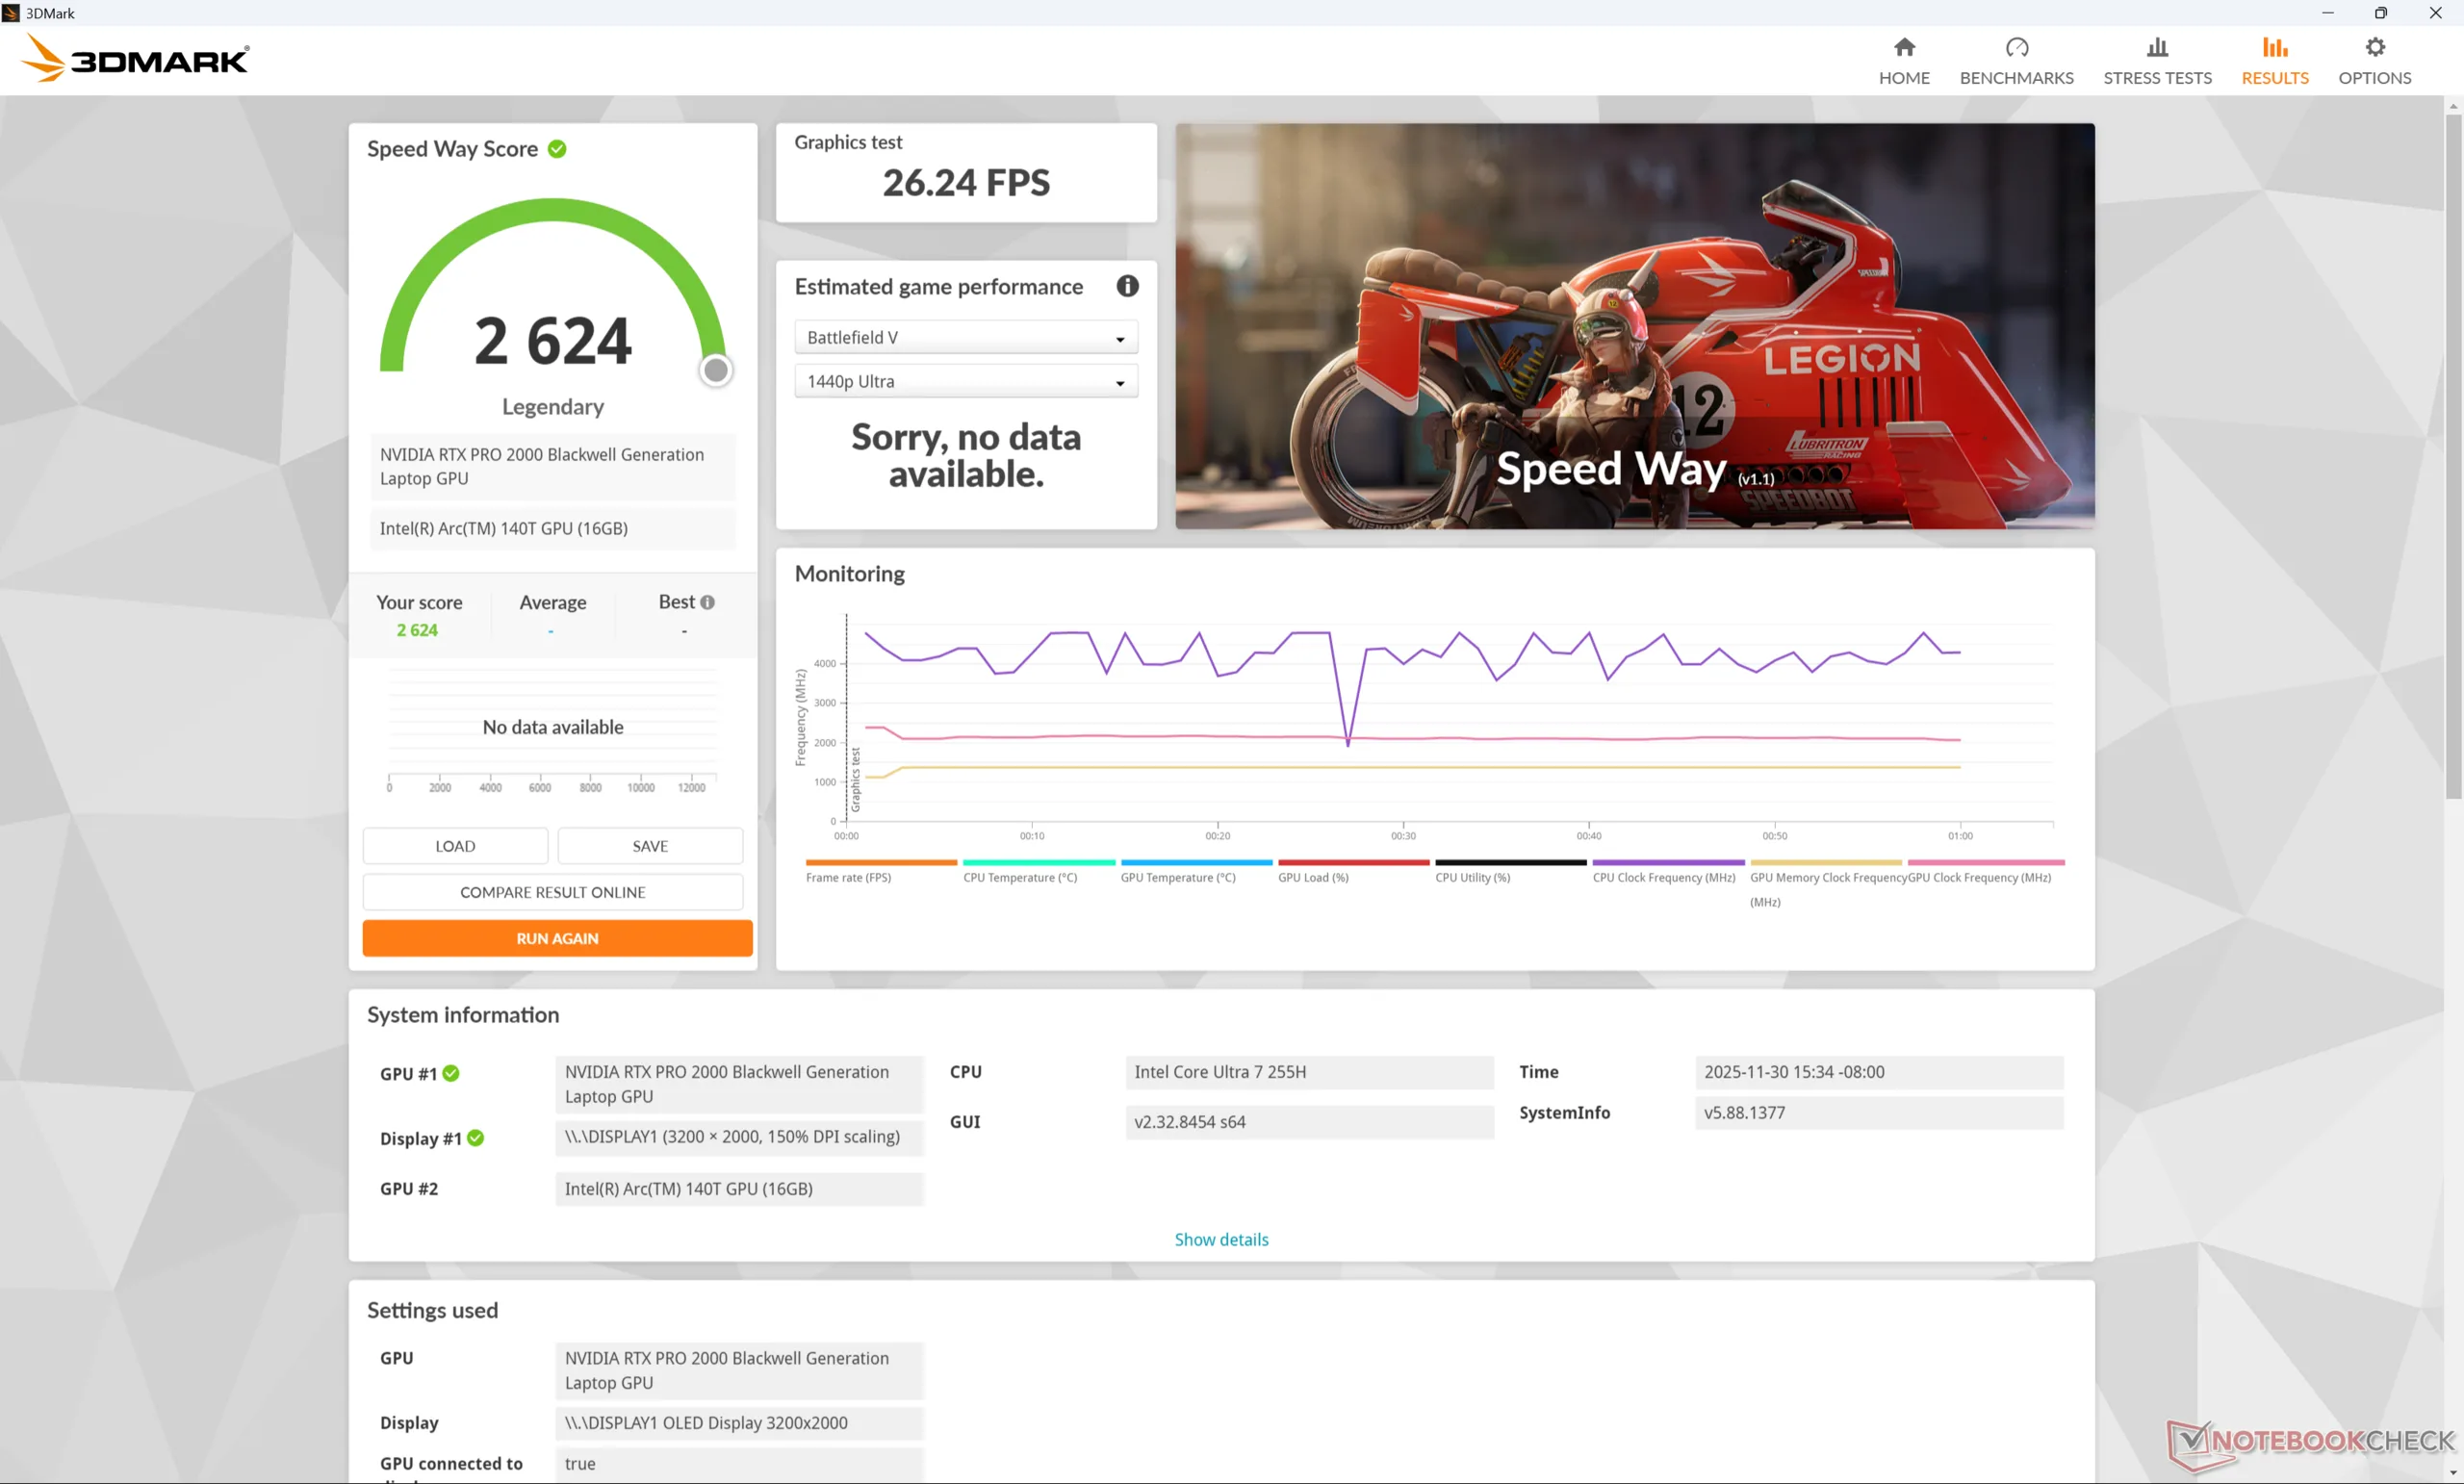
GPU Performance
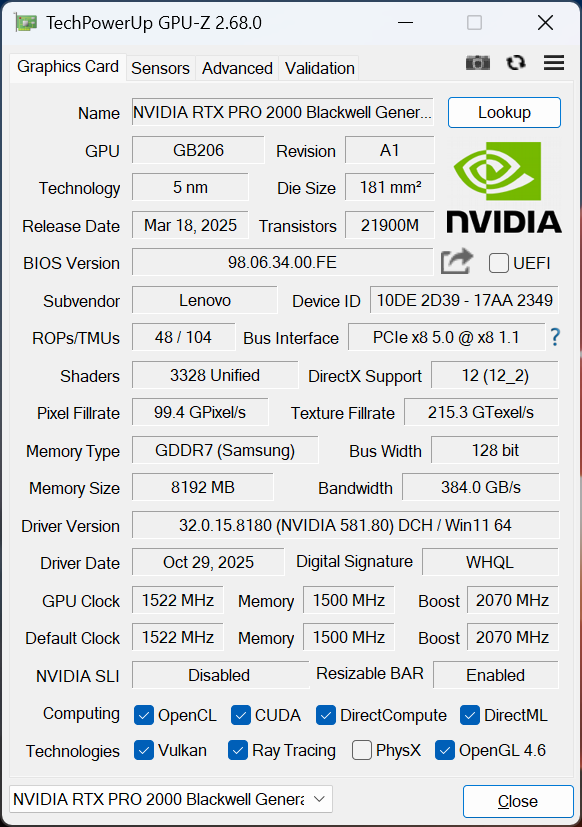
The mobile RTX Pro 2000 Blackwell is derived from the mobile GeForce RTX 5060 and so they both share similar features including the total number of unified pipelines, TMUs, tensor cores, and memory bandwidth. Raw performance is generally on par with the mobile RTX Pro 3000 Ada before accounting for Blackwell-specific enhancements like the 5th gen tensor cores or 6th gen NVDEC engines.
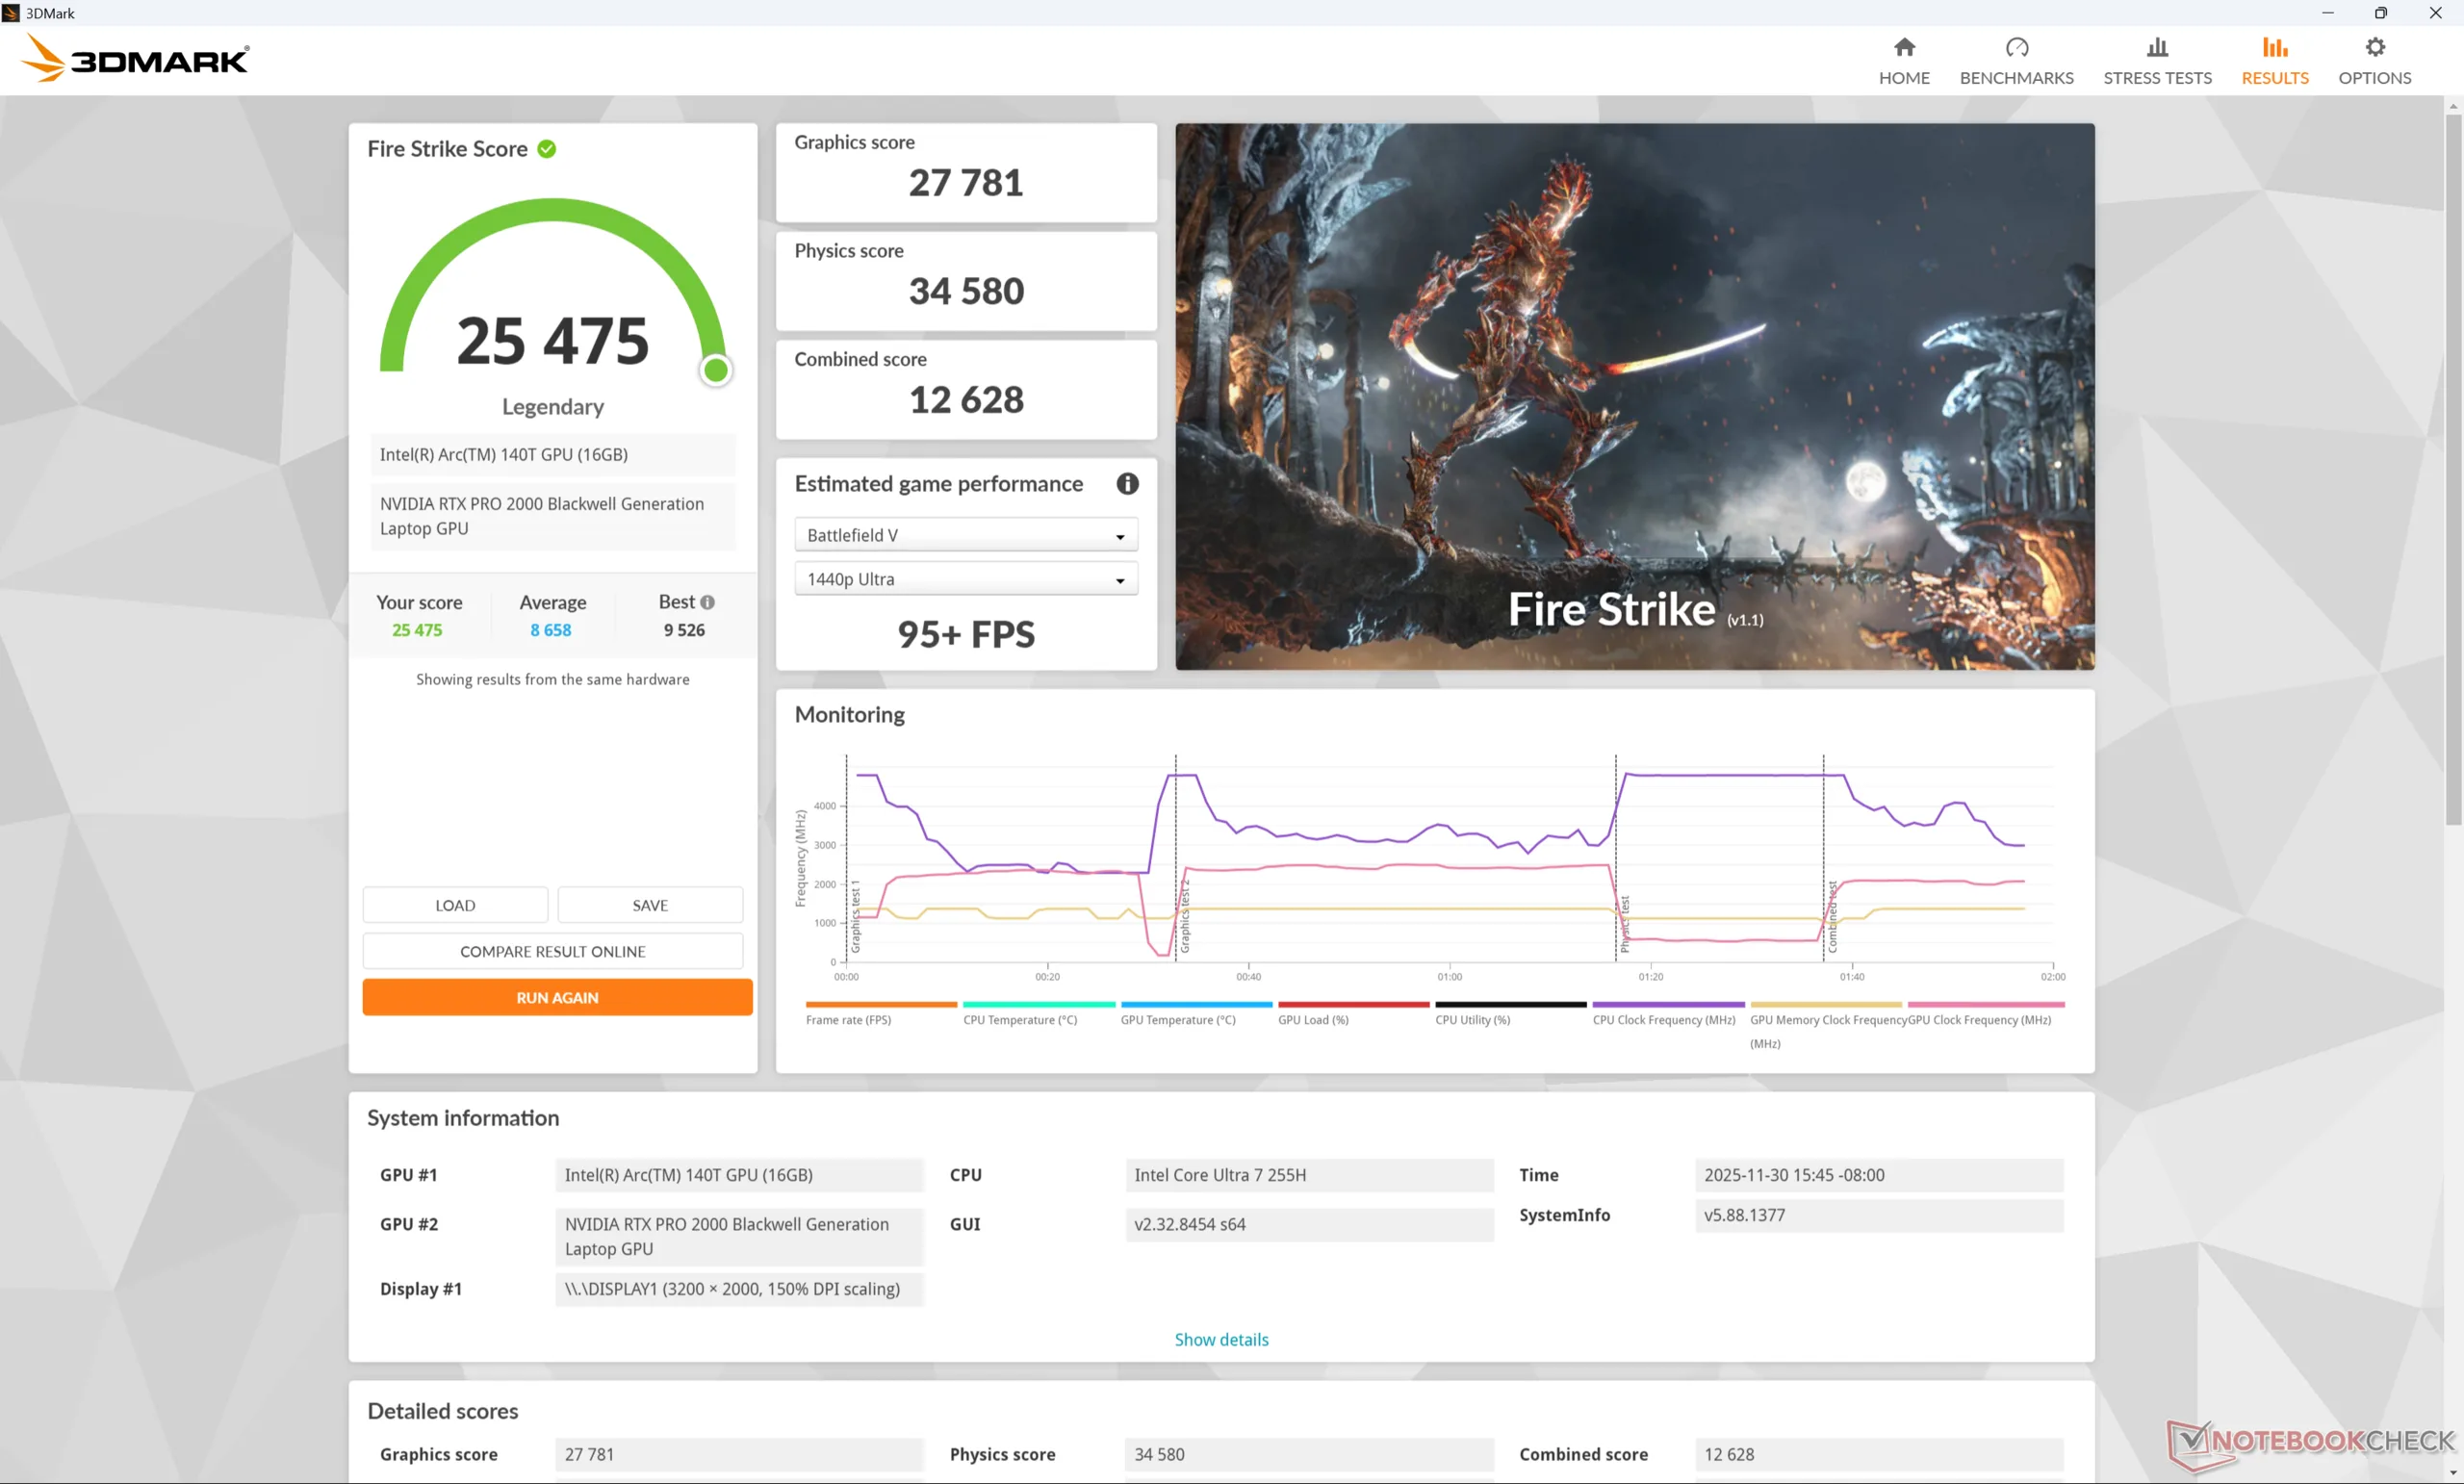
| Power Profile | Graphics Score | Physics Score | Combined Score |
| Performance Mode | 27781 | 34580 | 12628 |
| Balanced Mode | 26859 (-3%) | 35322 (+2%) | 11593 (-8%) |
| Battery Power | 25193 (-9%) | 26579 (-23%) | 10800 (-15%) |
| 3DMark Performance rating - Percent | |
| Dell Pro Max 16 Plus -10! | |
| Lenovo ThinkPad P1 Gen 8 -1! | |
| HP ZBook Fury 16 G11 -9! | |
| Average NVIDIA RTX PRO 2000 Blackwell Generation Laptop -1! | |
| HP ZBook X G1i 16 -10! | |
| HP ZBook Studio 16 G11 -9! | |
| HP ZBook Power 16 G11 A -9! | |
| Lenovo ThinkPad P1 Gen 7 21KV001SGE -26! | |
| Asus ExpertBook B6 Flip B6602FC2 -18! | |
| HP ZBook Studio 16 G9 62U04EA -11! | |
| Lenovo ThinkPad P1 G4-20Y4Z9DVUS -18! | |
| Lenovo ThinkPad P16s Gen 4 21RX000YGE -26! | |
| Lenovo ThinkPad P16s G2 21K9000CGE -18! | |
| 3DMark 11 Performance | 30916 points | |
| 3DMark Cloud Gate Standard Score | 62652 points | |
| 3DMark Fire Strike Score | 25475 points | |
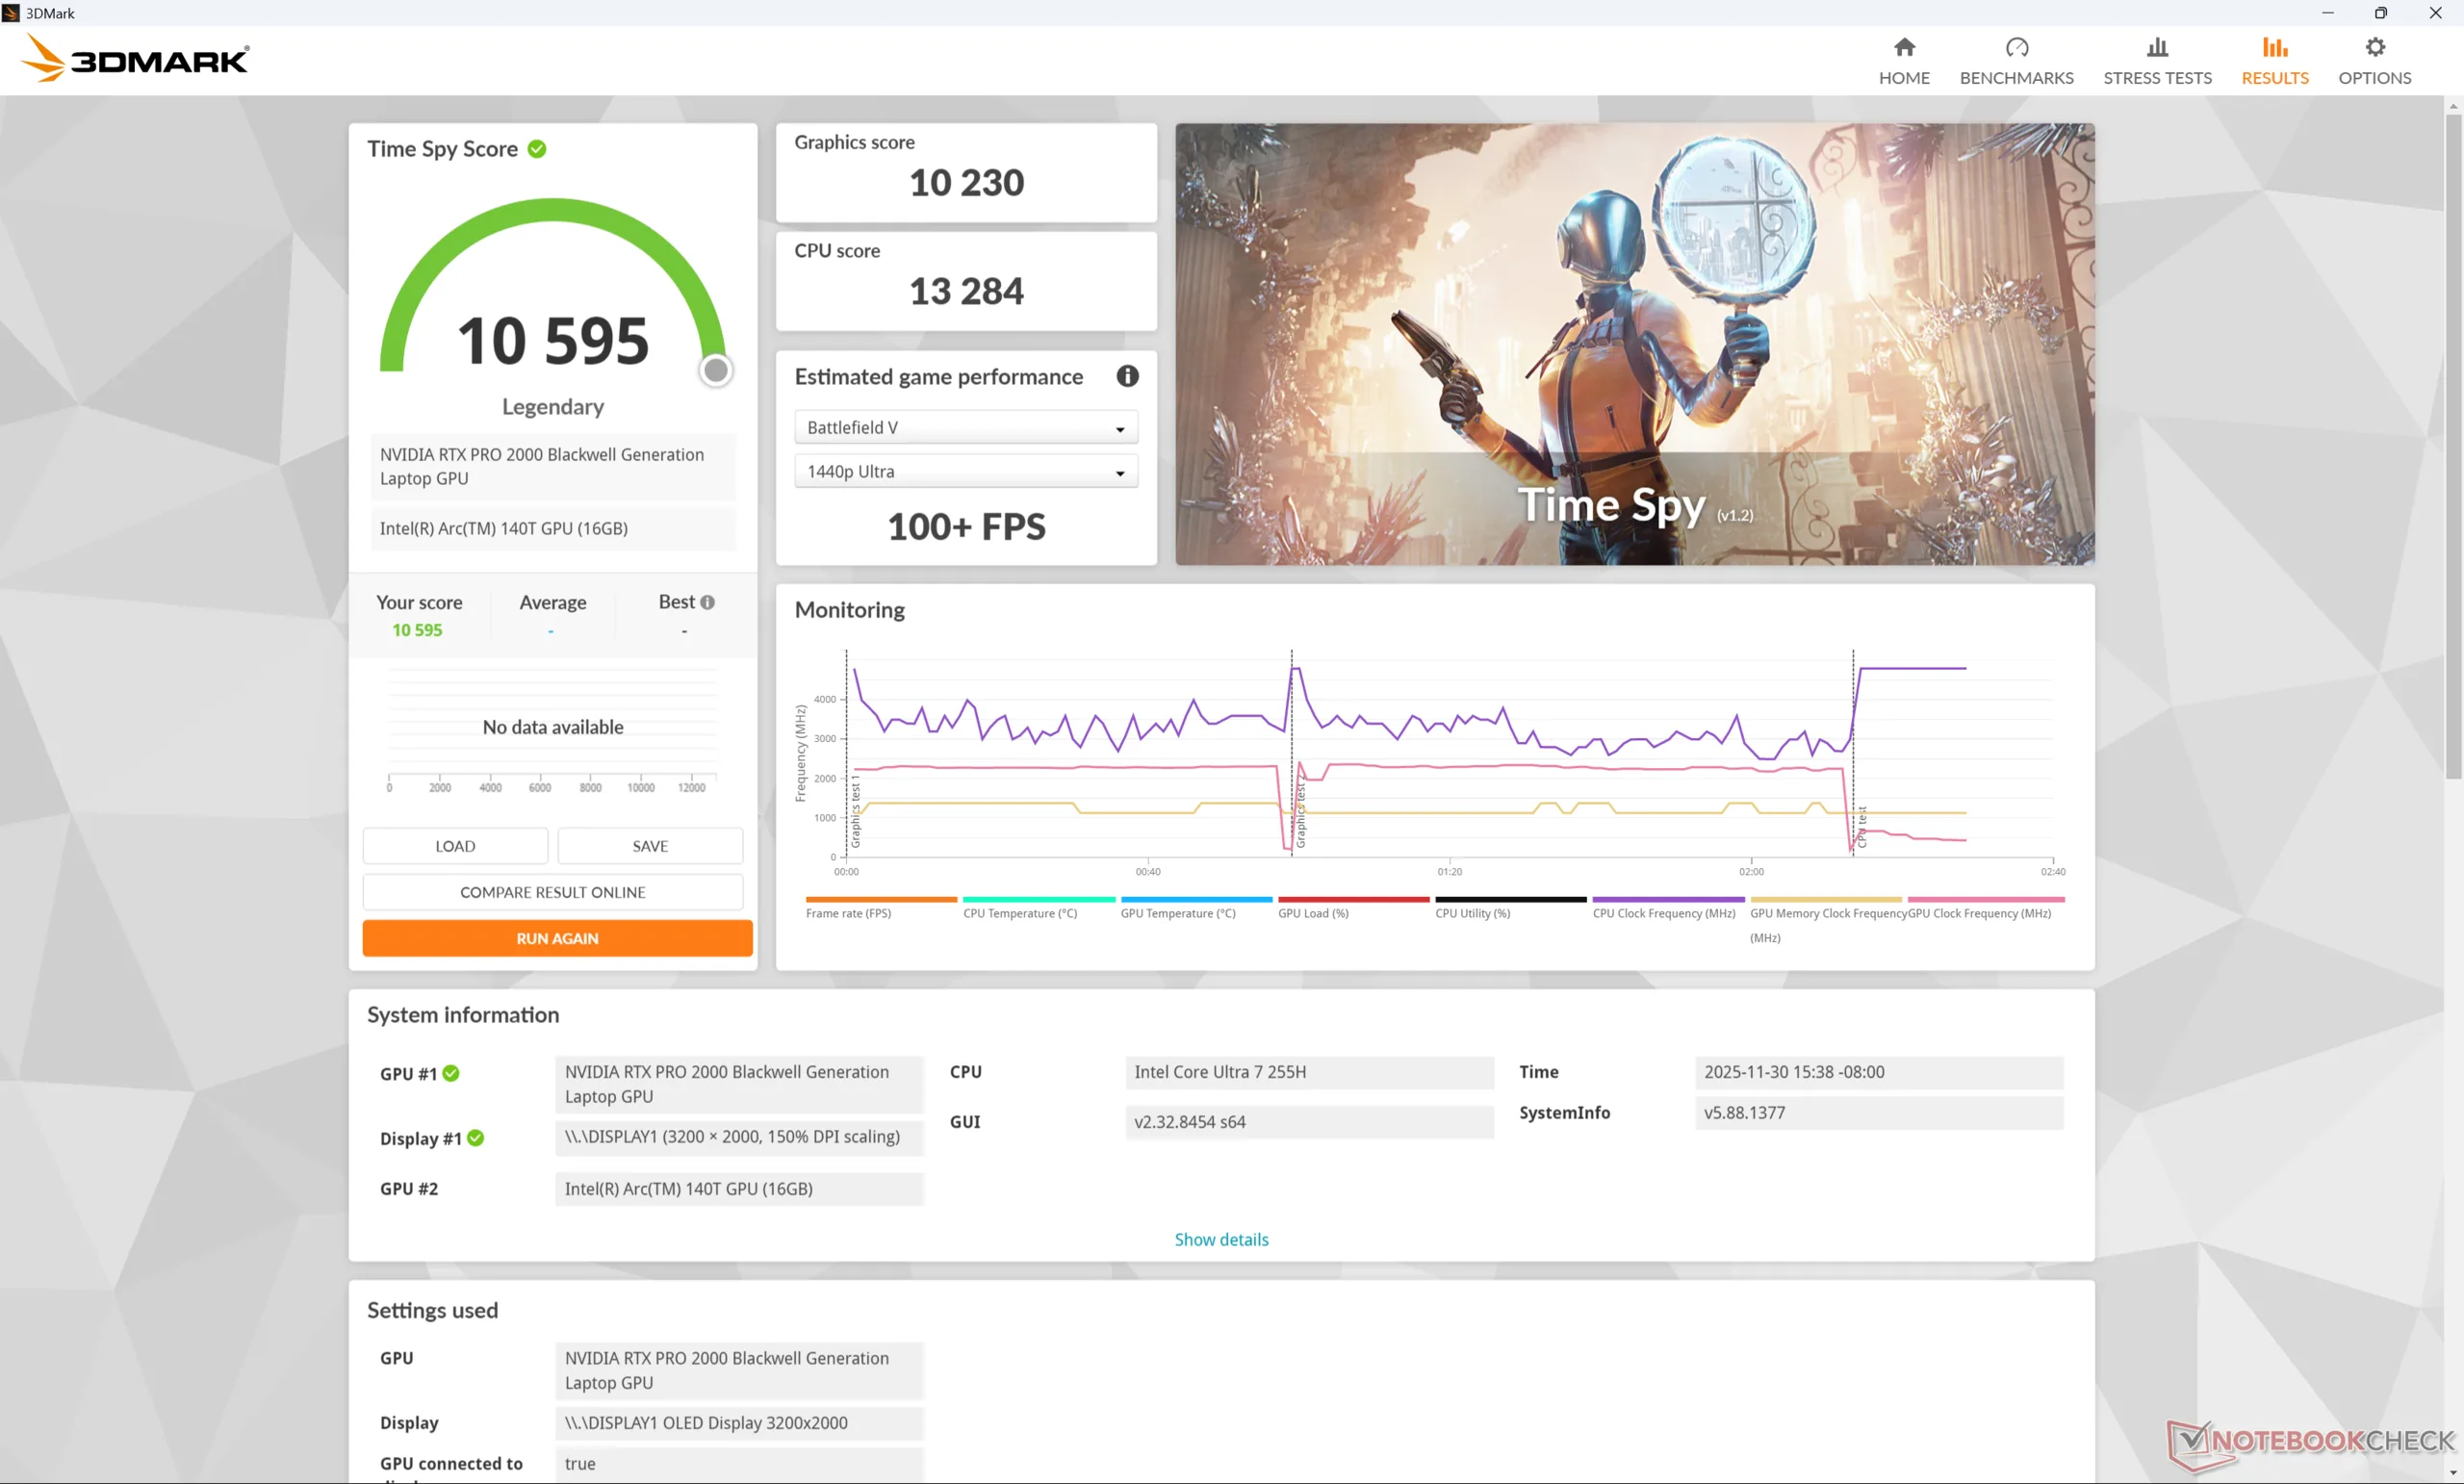
| 3DMark Time Spy Score | 10595 points | |
Help | ||
* ... smaller is better
Gaming Performance
While gaming isn't its primary function, the ThinkPad P1 Gen 8 is more than capable of running demanding games at 1080p to 2K resolutions with performance levels roughly 10 percent behind the HP Omen 16 powered by the RTX 5060.
| Performance rating - Percent | |
| Dell Pro Max 16 Plus | |
| Lenovo ThinkPad P1 Gen 8 | |
| HP ZBook X G1i 16 | |
| Asus ExpertBook B6 Flip B6602FC2 -2! | |
| Lenovo ThinkPad P1 Gen 7 21KV001SGE -1! | |
| Lenovo ThinkPad P16s Gen 4 21RX000YGE -1! | |
| Cyberpunk 2077 - 1920x1080 Ultra Preset (FSR off) | |
| Dell Pro Max 16 Plus | |
| Lenovo ThinkPad P1 Gen 8 | |
| HP ZBook X G1i 16 | |
| Lenovo ThinkPad P1 Gen 7 21KV001SGE | |
| Lenovo ThinkPad P16s Gen 4 21RX000YGE | |
| Baldur's Gate 3 - 1920x1080 Ultra Preset AA:T | |
| Dell Pro Max 16 Plus | |
| Lenovo ThinkPad P1 Gen 8 | |
| HP ZBook X G1i 16 | |
| Lenovo ThinkPad P1 Gen 7 21KV001SGE | |
| Lenovo ThinkPad P16s Gen 4 21RX000YGE | |
| GTA V - 1920x1080 Highest AA:4xMSAA + FX AF:16x | |
| Dell Pro Max 16 Plus | |
| Lenovo ThinkPad P1 Gen 8 | |
| HP ZBook X G1i 16 | |
| Lenovo ThinkPad P1 Gen 7 21KV001SGE | |
| Asus ExpertBook B6 Flip B6602FC2 | |
| Lenovo ThinkPad P16s Gen 4 21RX000YGE | |
| Final Fantasy XV Benchmark - 1920x1080 High Quality | |
| Dell Pro Max 16 Plus | |
| Lenovo ThinkPad P1 Gen 8 | |
| HP ZBook X G1i 16 | |
| Lenovo ThinkPad P1 Gen 7 21KV001SGE | |
| Asus ExpertBook B6 Flip B6602FC2 | |
| Lenovo ThinkPad P16s Gen 4 21RX000YGE | |
| Strange Brigade - 1920x1080 ultra AA:ultra AF:16 | |
| Dell Pro Max 16 Plus | |
| Lenovo ThinkPad P1 Gen 8 | |
| HP ZBook X G1i 16 | |
| Asus ExpertBook B6 Flip B6602FC2 | |
| Dota 2 Reborn - 1920x1080 ultra (3/3) best looking | |
| Dell Pro Max 16 Plus | |
| Asus ExpertBook B6 Flip B6602FC2 | |
| HP ZBook X G1i 16 | |
| Lenovo ThinkPad P1 Gen 7 21KV001SGE | |
| Lenovo ThinkPad P1 Gen 8 | |
| Lenovo ThinkPad P16s Gen 4 21RX000YGE | |
| X-Plane 11.11 - 1920x1080 high (fps_test=3) | |
| Asus ExpertBook B6 Flip B6602FC2 | |
| Dell Pro Max 16 Plus | |
| Lenovo ThinkPad P1 Gen 7 21KV001SGE | |
| HP ZBook X G1i 16 | |
| Lenovo ThinkPad P1 Gen 8 | |
| Lenovo ThinkPad P16s Gen 4 21RX000YGE | |
| F1 24 | |
| 1920x1080 High Preset AA:T AF:16x | |
| Dell Pro Max 16 Plus | |
| Lenovo ThinkPad P1 Gen 8 | |
| Average NVIDIA RTX PRO 2000 Blackwell Generation Laptop (161.4 - 185.2, n=3) | |
| HP ZBook X G1i 16 | |
| Lenovo ThinkPad P1 Gen 7 21KV001SGE | |
| 1920x1080 Ultra High Preset AA:T AF:16x | |
| Dell Pro Max 16 Plus | |
| Lenovo ThinkPad P1 Gen 8 | |
| Average NVIDIA RTX PRO 2000 Blackwell Generation Laptop (48.2 - 57.2, n=3) | |
| HP ZBook X G1i 16 | |
| Lenovo ThinkPad P1 Gen 7 21KV001SGE | |
| 2560x1440 Ultra High Preset AA:T AF:16x | |
| Dell Pro Max 16 Plus | |
| Lenovo ThinkPad P1 Gen 8 | |
| Average NVIDIA RTX PRO 2000 Blackwell Generation Laptop (32.2 - 36.5, n=2) | |
| HP ZBook X G1i 16 | |
| Lenovo ThinkPad P1 Gen 7 21KV001SGE | |
| 2560x1440 Ultra High Preset + Quality DLSS AF:16x | |
| Dell Pro Max 16 Plus | |
| HP ZBook X G1i 16 | |
| Average NVIDIA RTX PRO 2000 Blackwell Generation Laptop (n=1) | |
| Lenovo ThinkPad P1 Gen 7 21KV001SGE | |
Cyberpunk 2077 ultra FPS Chart
| low | med. | high | ultra | QHD DLSS | QHD | 4K | |
|---|---|---|---|---|---|---|---|
| GTA V (2015) | 184.4 | 179.9 | 175 | 119.3 | 97.2 | ||
| Dota 2 Reborn (2015) | 149.2 | 137.2 | 132.5 | 125.7 | 103.5 | ||
| Final Fantasy XV Benchmark (2018) | 204 | 142.7 | 106.5 | 79.4 | |||
| X-Plane 11.11 (2018) | 108.6 | 91 | 76.3 | 58.7 | |||
| Strange Brigade (2018) | 502 | 281 | 229 | 199.8 | 142.4 | ||
| Baldur's Gate 3 (2023) | 132.2 | 116.4 | 101.4 | 102 | 101.3 | 69.9 | |
| Cyberpunk 2077 (2023) | 124 | 101.5 | 86.4 | 77.8 | 57.9 | 48.9 | |
| F1 24 (2024) | 250 | 229 | 185.2 | 57.2 | 36.5 |
Emissions
System Noise
The fans are silent when browsing or running undemanding loads and they would remain quiet at just 27 dB(A) when streaming even when set to Performance mode. The 48 dB(A) maximum can be reached when gaming or when the CPU and GPU are stressed for longer periods.
Noise level
| Idle |
| 23.1 / 23.1 / 23.1 dB(A) |
| Load |
| 27.3 / 47.9 dB(A) |
 | ||
30 dB silent 40 dB(A) audible 50 dB(A) loud |
||
min: | ||
| Lenovo ThinkPad P1 Gen 8 Ultra 7 255H, RTX PRO 2000 Blackwell Generation Laptop | Lenovo ThinkPad P16s Gen 4 21RX000YGE Ryzen AI 9 HX PRO 370, Radeon 890M | Lenovo ThinkPad P1 Gen 7 21KV001SGE Ultra 7 155H, GeForce RTX 4060 Laptop GPU | HP ZBook X G1i 16 Ultra 7 265H, RTX PRO 2000 Blackwell Generation Laptop | Dell Pro Max 16 Plus Ultra 9 285HX, RTX PRO 5000 Blackwell Generation Laptop | Asus ExpertBook B6 Flip B6602FC2 i9-12950HX, RTX A2000 Laptop GPU | |
|---|---|---|---|---|---|---|
| Noise | -20% | -17% | -5% | -26% | -39% | |
| off / environment * (dB) | 23.1 | 25.9 -12% | 24.7 -7% | 23.7 -3% | 23.2 -0% | 26 -13% |
| Idle Minimum * (dB) | 23.1 | 25.9 -12% | 24.7 -7% | 23.7 -3% | 26.7 -16% | 32.4 -40% |
| Idle Average * (dB) | 23.1 | 25.9 -12% | 24.7 -7% | 23.7 -3% | 30.5 -32% | 32.4 -40% |
| Idle Maximum * (dB) | 23.1 | 28.5 -23% | 24.7 -7% | 23.7 -3% | 34 -47% | 32.4 -40% |
| Load Average * (dB) | 27.3 | 42.9 -57% | 43.7 -60% | 32.7 -20% | 39.8 -46% | 51.9 -90% |
| Load Maximum * (dB) | 47.9 | 48.5 -1% | 53.3 -11% | 48 -0% | 54.3 -13% | 52.1 -9% |
| Cyberpunk 2077 ultra * (dB) | 48.7 | 53.2 | 50.9 | 54.3 |
* ... smaller is better
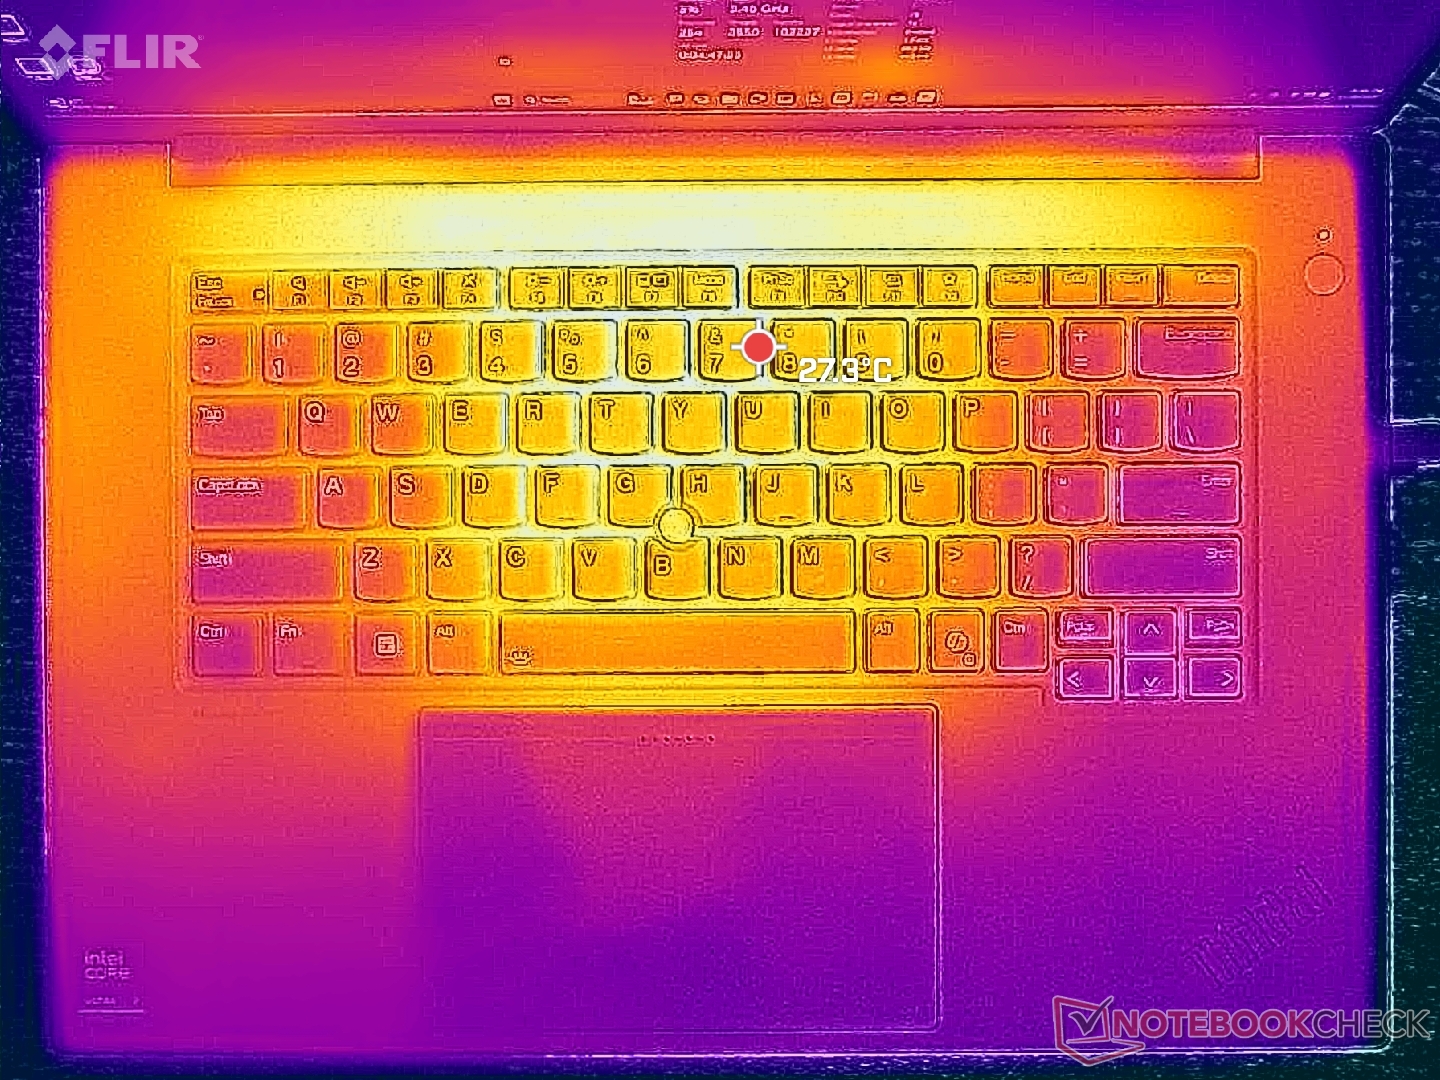
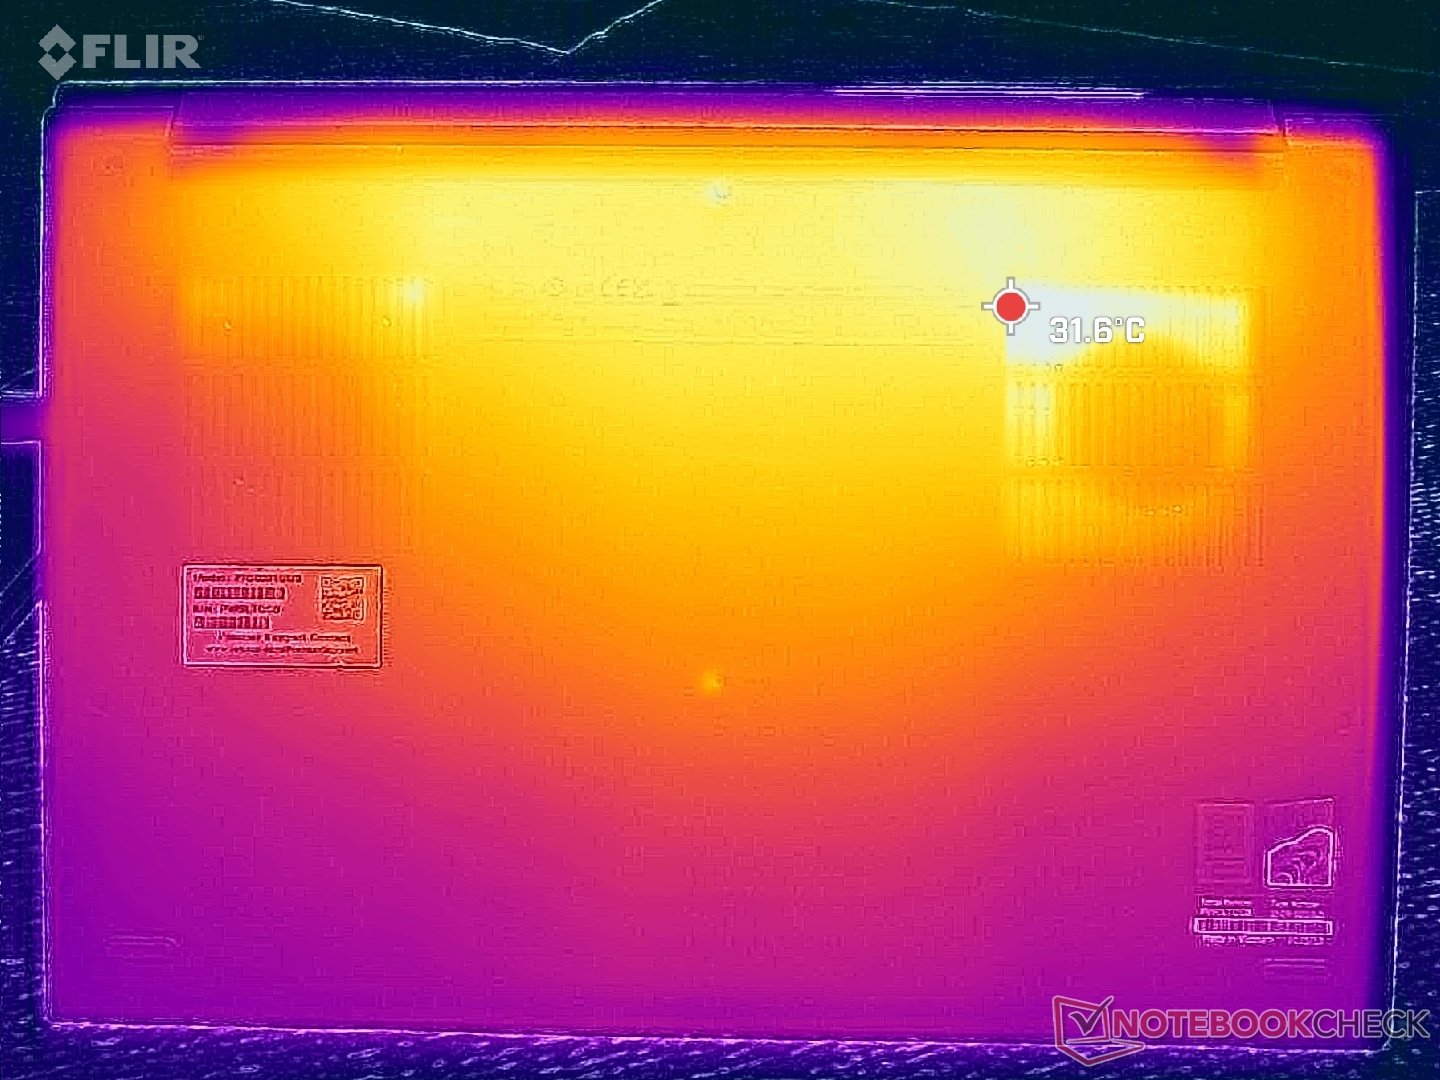
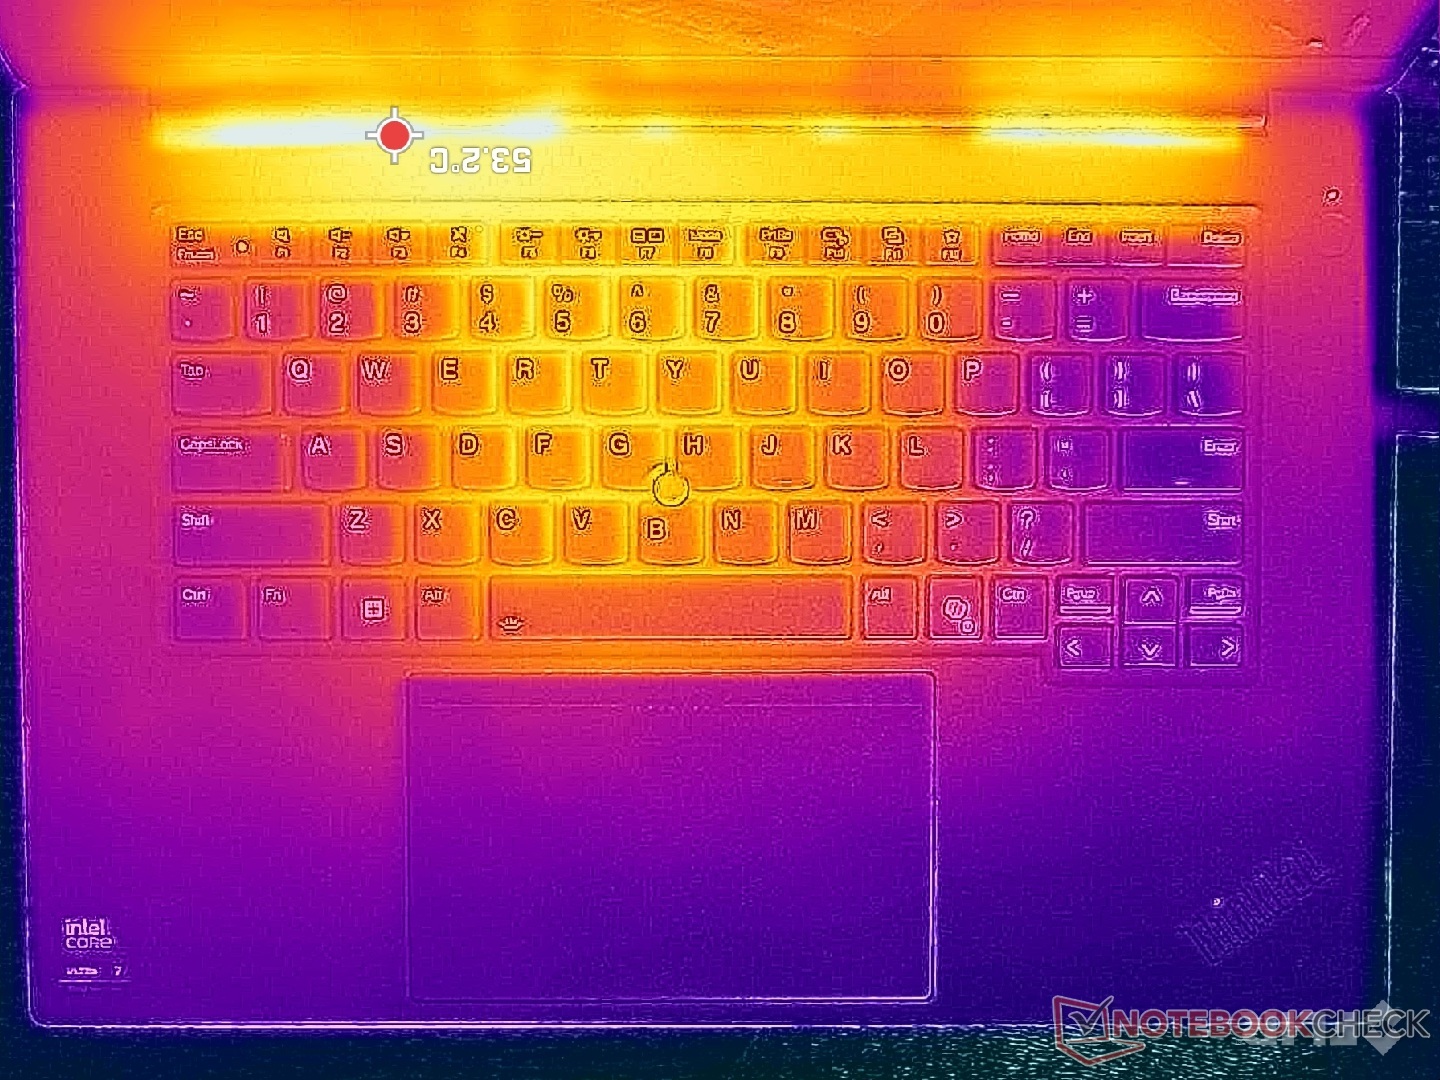
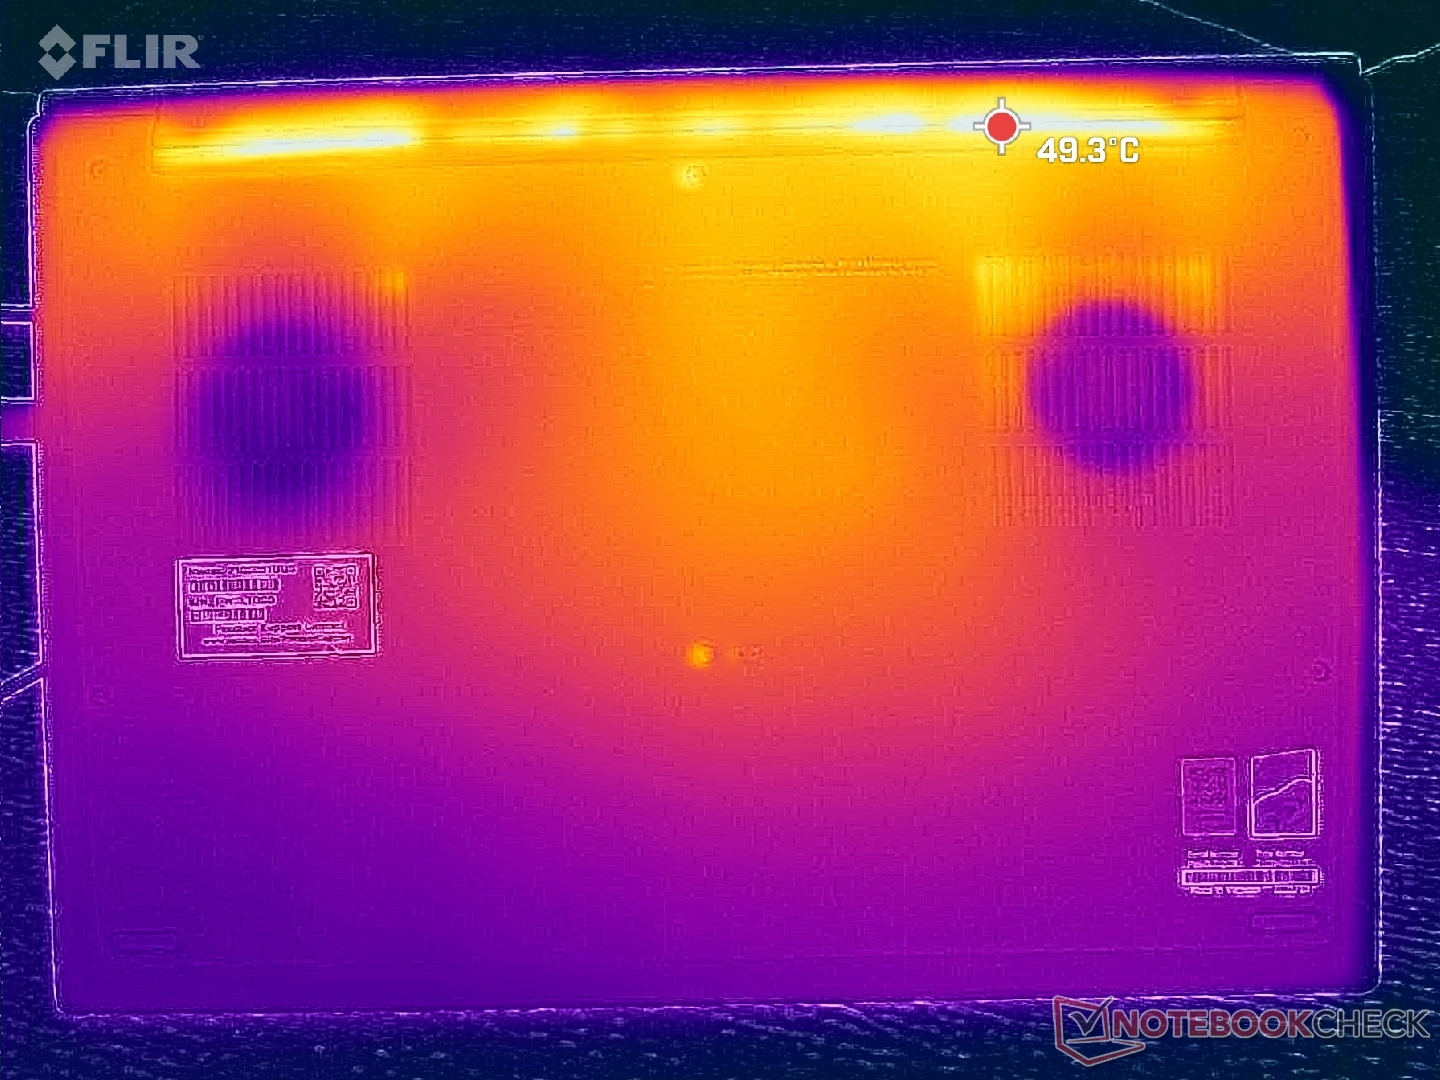
Temperature
Surface temperature development is symmetrical with hot spots near the keyboard center reaching 40 C to 45 C when running very demanding loads like Prime95 or FurMark. Results are cooler than expected considering the thin chassis design. Last year's ThinkPad P1 Gen 7 would reach warmer surface temperatures in comparison likely due to its higher 170 W power envelope.
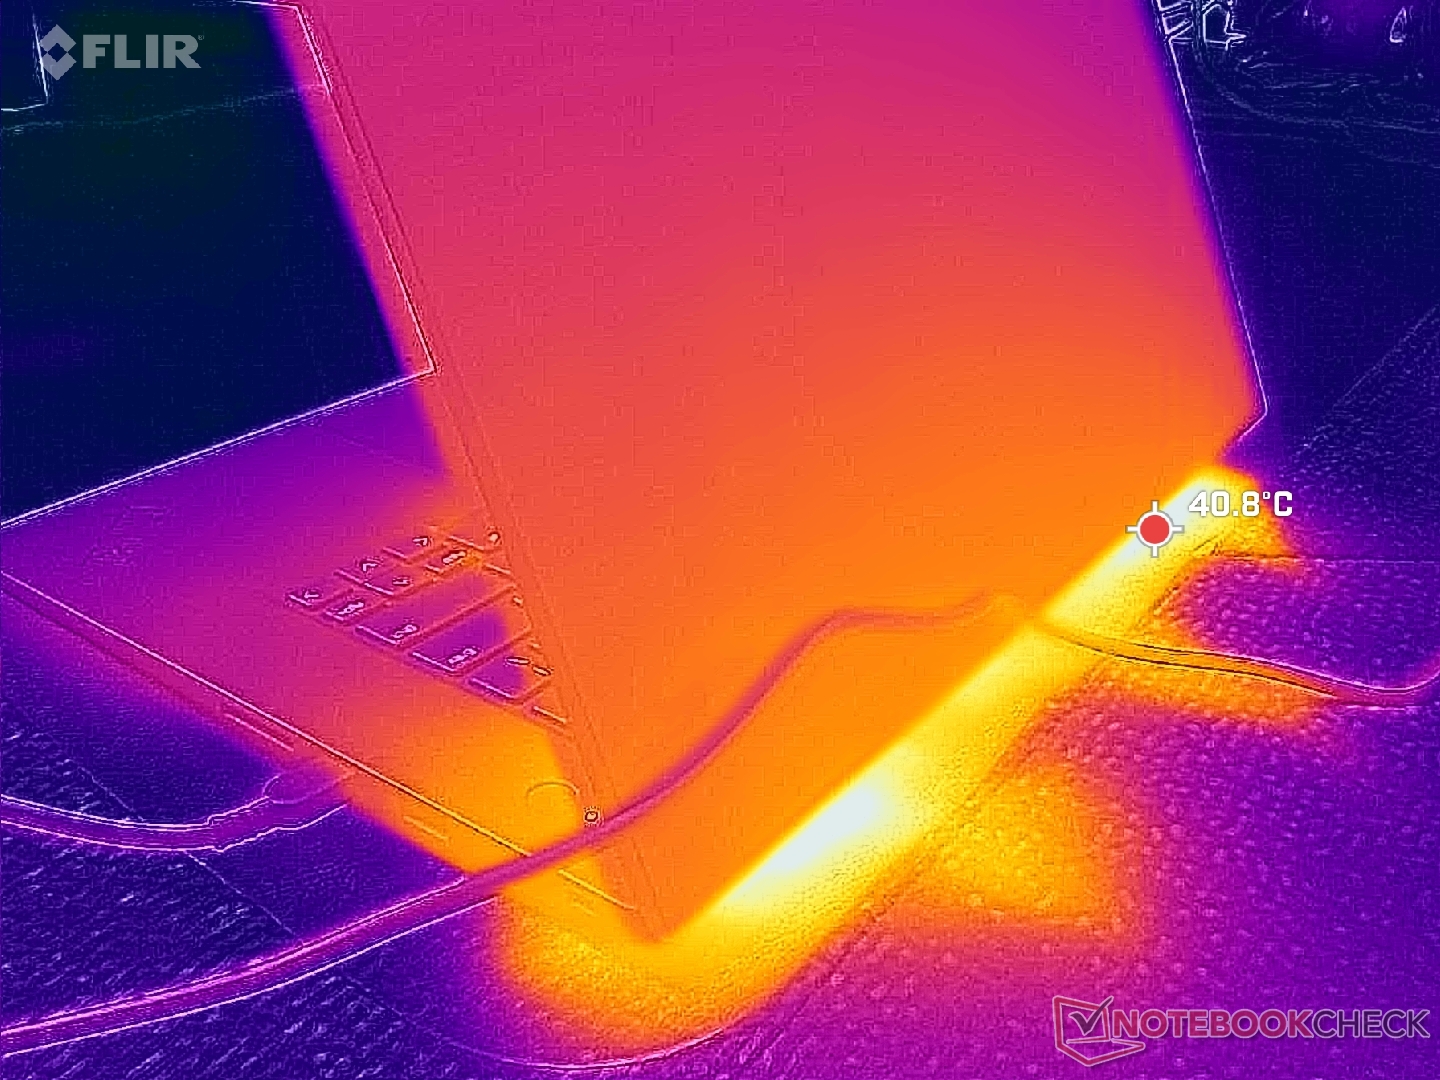
(±) The maximum temperature on the upper side is 45 °C / 113 F, compared to the average of 38.2 °C / 101 F, ranging from 22.2 to 69.8 °C for the class Workstation.
(+) The bottom heats up to a maximum of 33 °C / 91 F, compared to the average of 41.1 °C / 106 F
(+) In idle usage, the average temperature for the upper side is 26 °C / 79 F, compared to the device average of 32 °C / 90 F.
(+) The palmrests and touchpad are cooler than skin temperature with a maximum of 23.2 °C / 73.8 F and are therefore cool to the touch.
(+) The average temperature of the palmrest area of similar devices was 27.8 °C / 82 F (+4.6 °C / 8.2 F).
| Lenovo ThinkPad P1 Gen 8 Ultra 7 255H, RTX PRO 2000 Blackwell Generation Laptop | Lenovo ThinkPad P16s Gen 4 21RX000YGE Ryzen AI 9 HX PRO 370, Radeon 890M | Lenovo ThinkPad P1 Gen 7 21KV001SGE Ultra 7 155H, GeForce RTX 4060 Laptop GPU | HP ZBook X G1i 16 Ultra 7 265H, RTX PRO 2000 Blackwell Generation Laptop | Dell Pro Max 16 Plus Ultra 9 285HX, RTX PRO 5000 Blackwell Generation Laptop | Asus ExpertBook B6 Flip B6602FC2 i9-12950HX, RTX A2000 Laptop GPU | |
|---|---|---|---|---|---|---|
| Heat | -29% | -1% | 0% | -10% | -13% | |
| Maximum Upper Side * (°C) | 45 | 50.6 -12% | 50.3 -12% | 36 20% | 40.4 10% | 48.4 -8% |
| Maximum Bottom * (°C) | 33 | 54.3 -65% | 38 -15% | 39.4 -19% | 45.6 -38% | 52.3 -58% |
| Idle Upper Side * (°C) | 30.6 | 35.3 -15% | 28.3 8% | 30.4 1% | 32.8 -7% | 27.8 9% |
| Idle Bottom * (°C) | 31.6 | 38.5 -22% | 27.3 14% | 31.8 -1% | 33 -4% | 30.3 4% |
* ... smaller is better
Stress Test
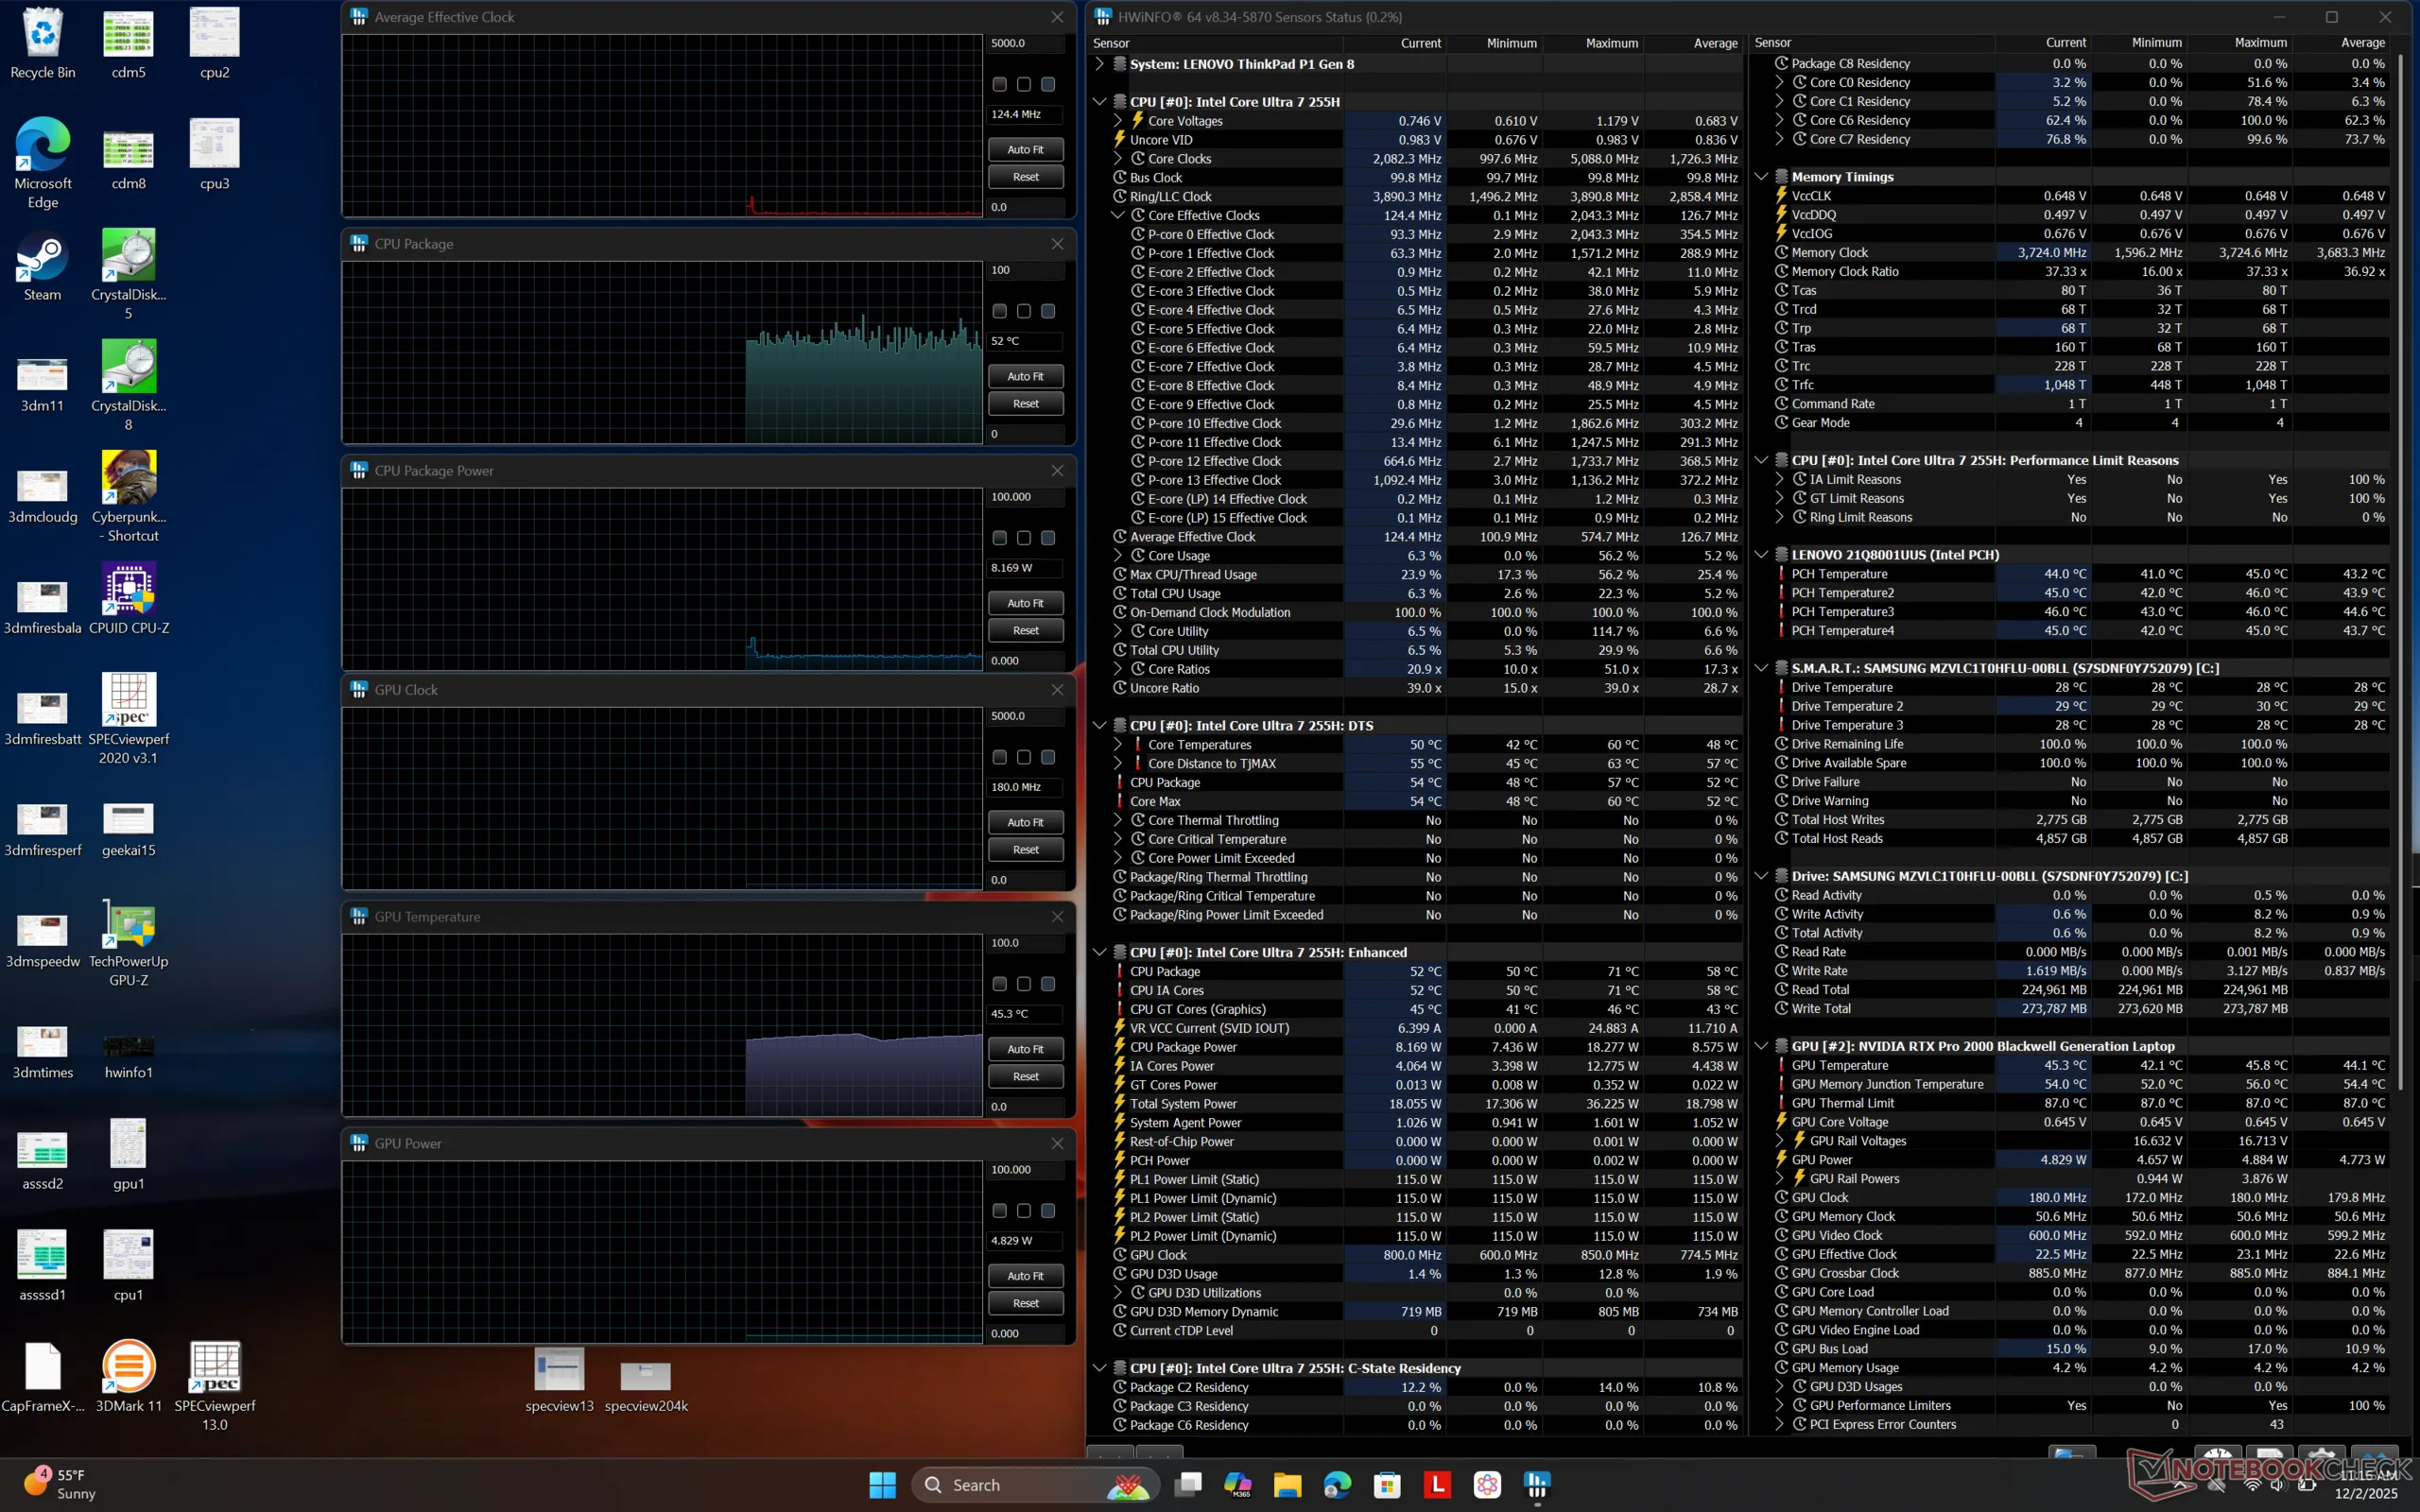
The CPU would boost to 3.8 GHz, 120 W, and 100 C when initiating Prime95 stress before dropping slightly and stabilizing at 3.6 GHz and 101 W in order to maintain a more manageable core temperature of 91 C. GPU board power draw jumps from 63 W to almost 70 W when switching from Balanced mode to Performance mode and so we suggest running on Performance mode despite its slightly higher core temperatures of ~75 C. GPU memory clock in particular jumps from 1125 MHz to 1375 MHz when switching to Performance mode.
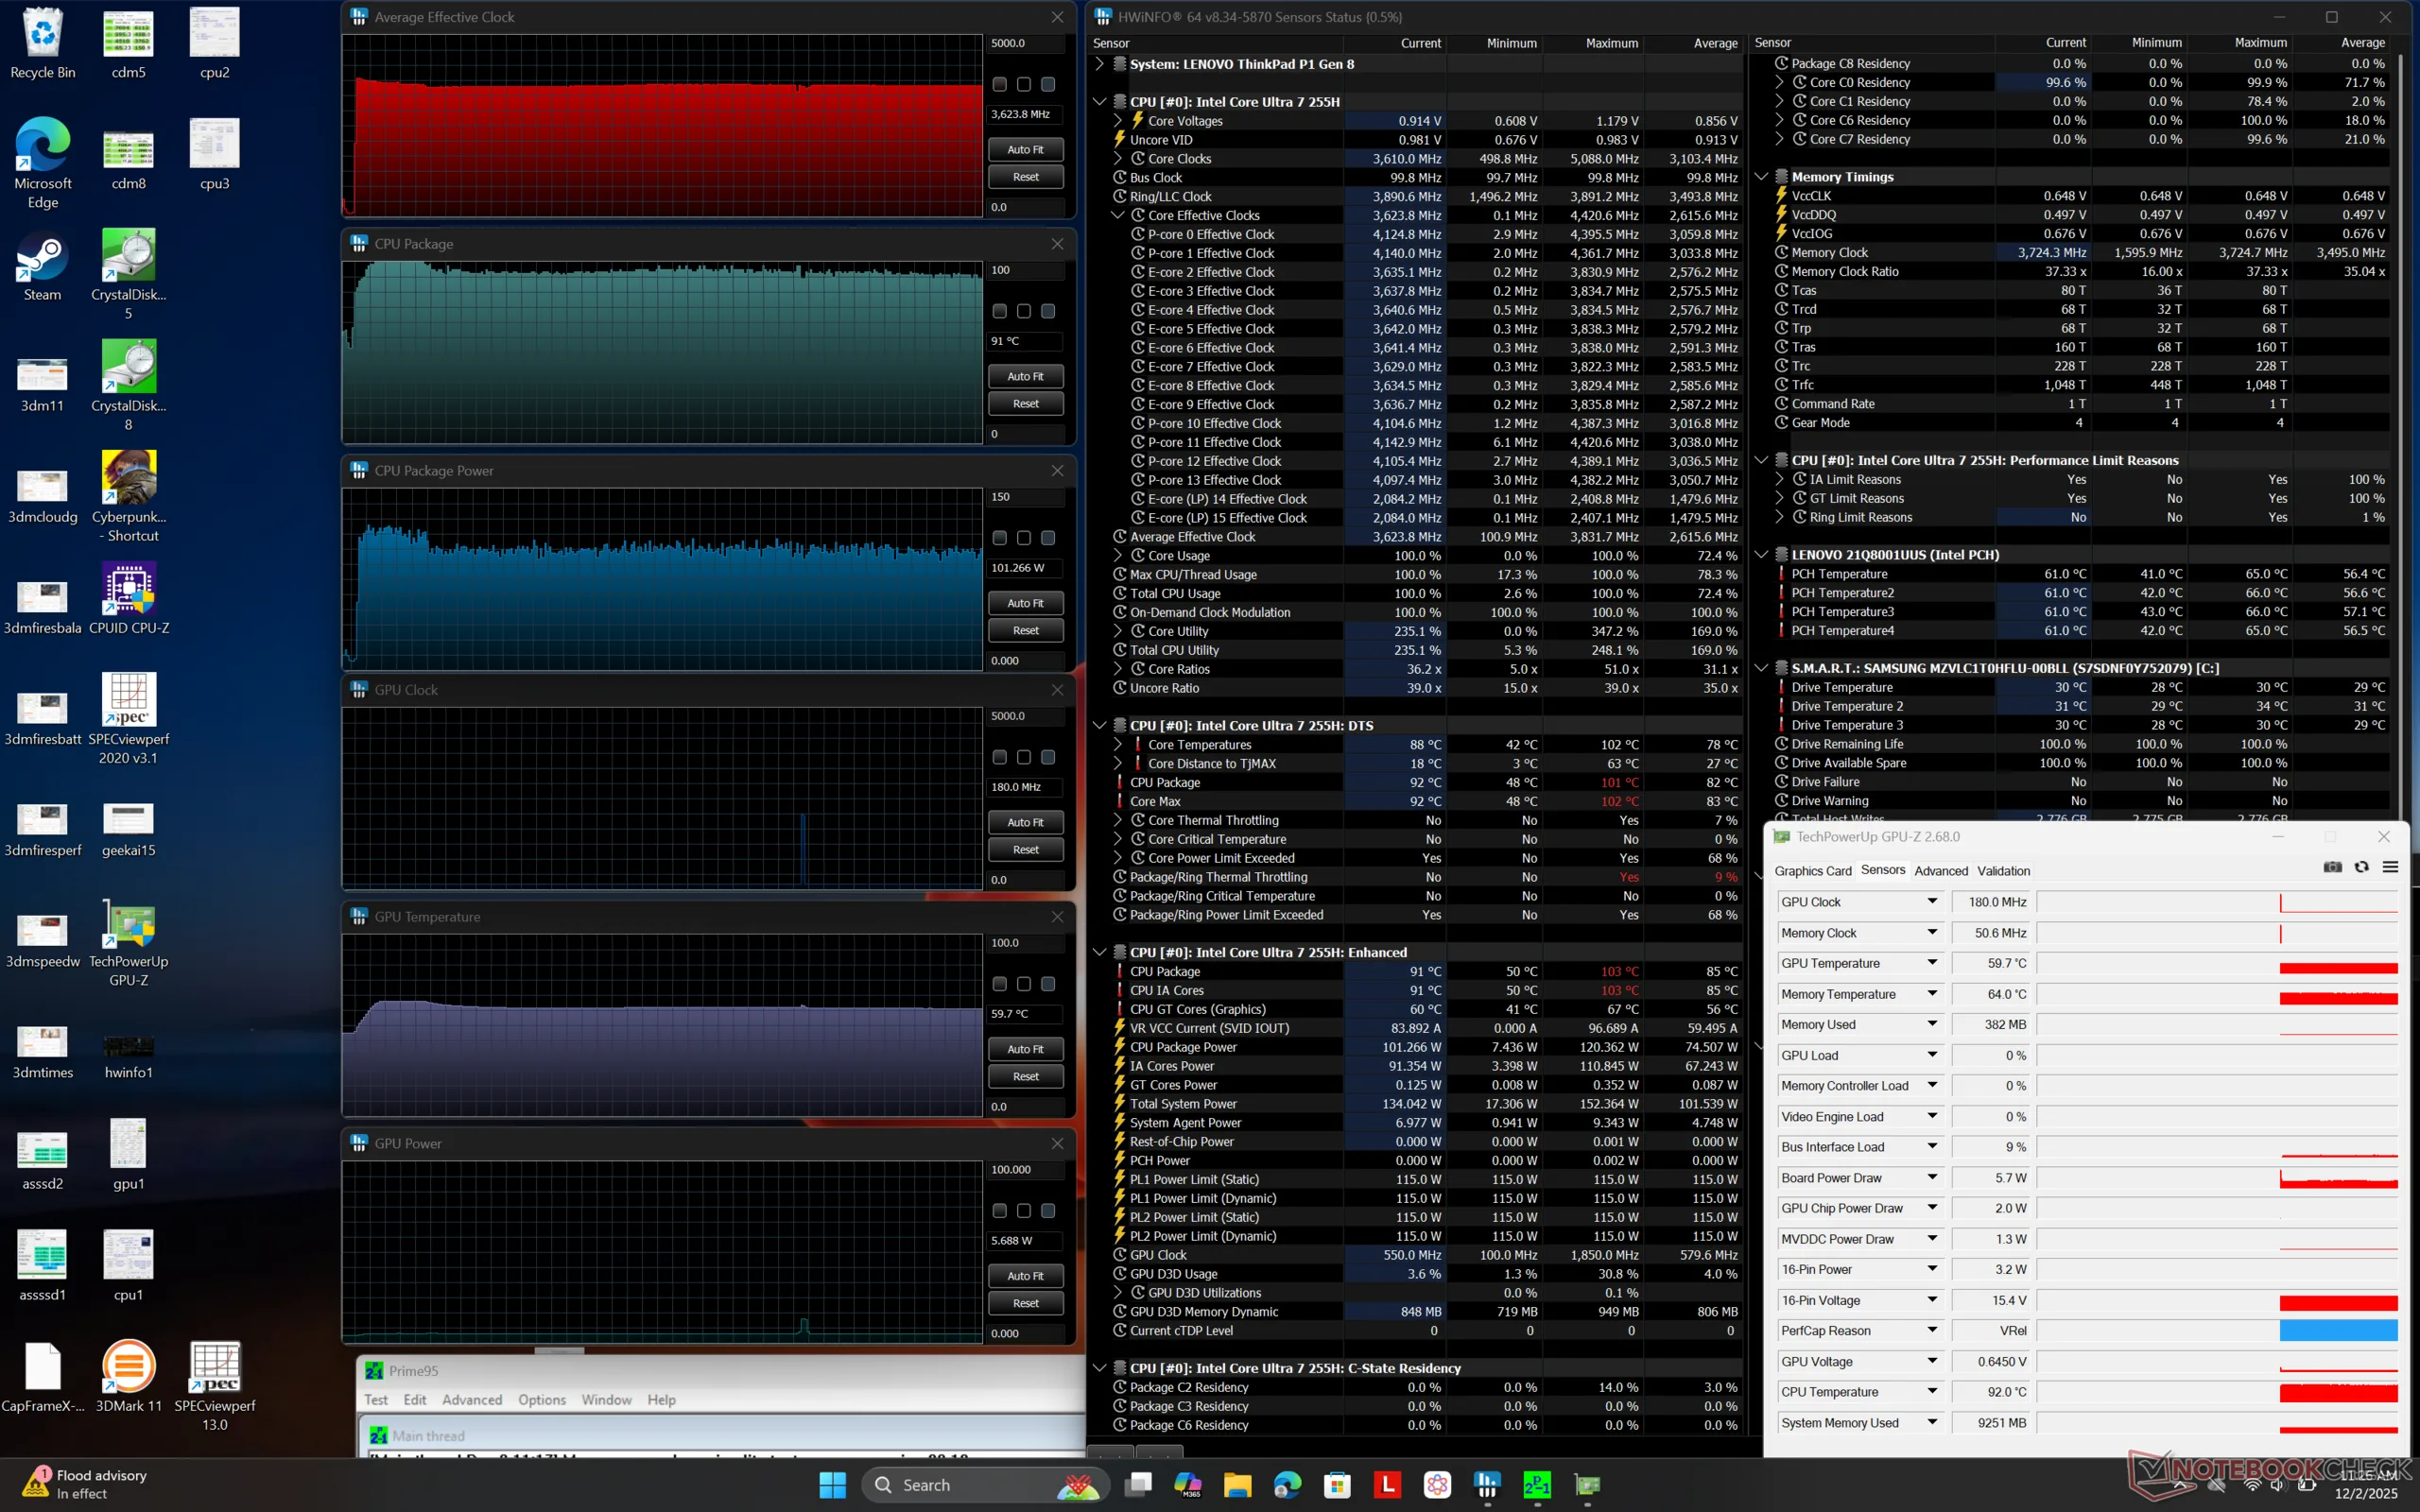
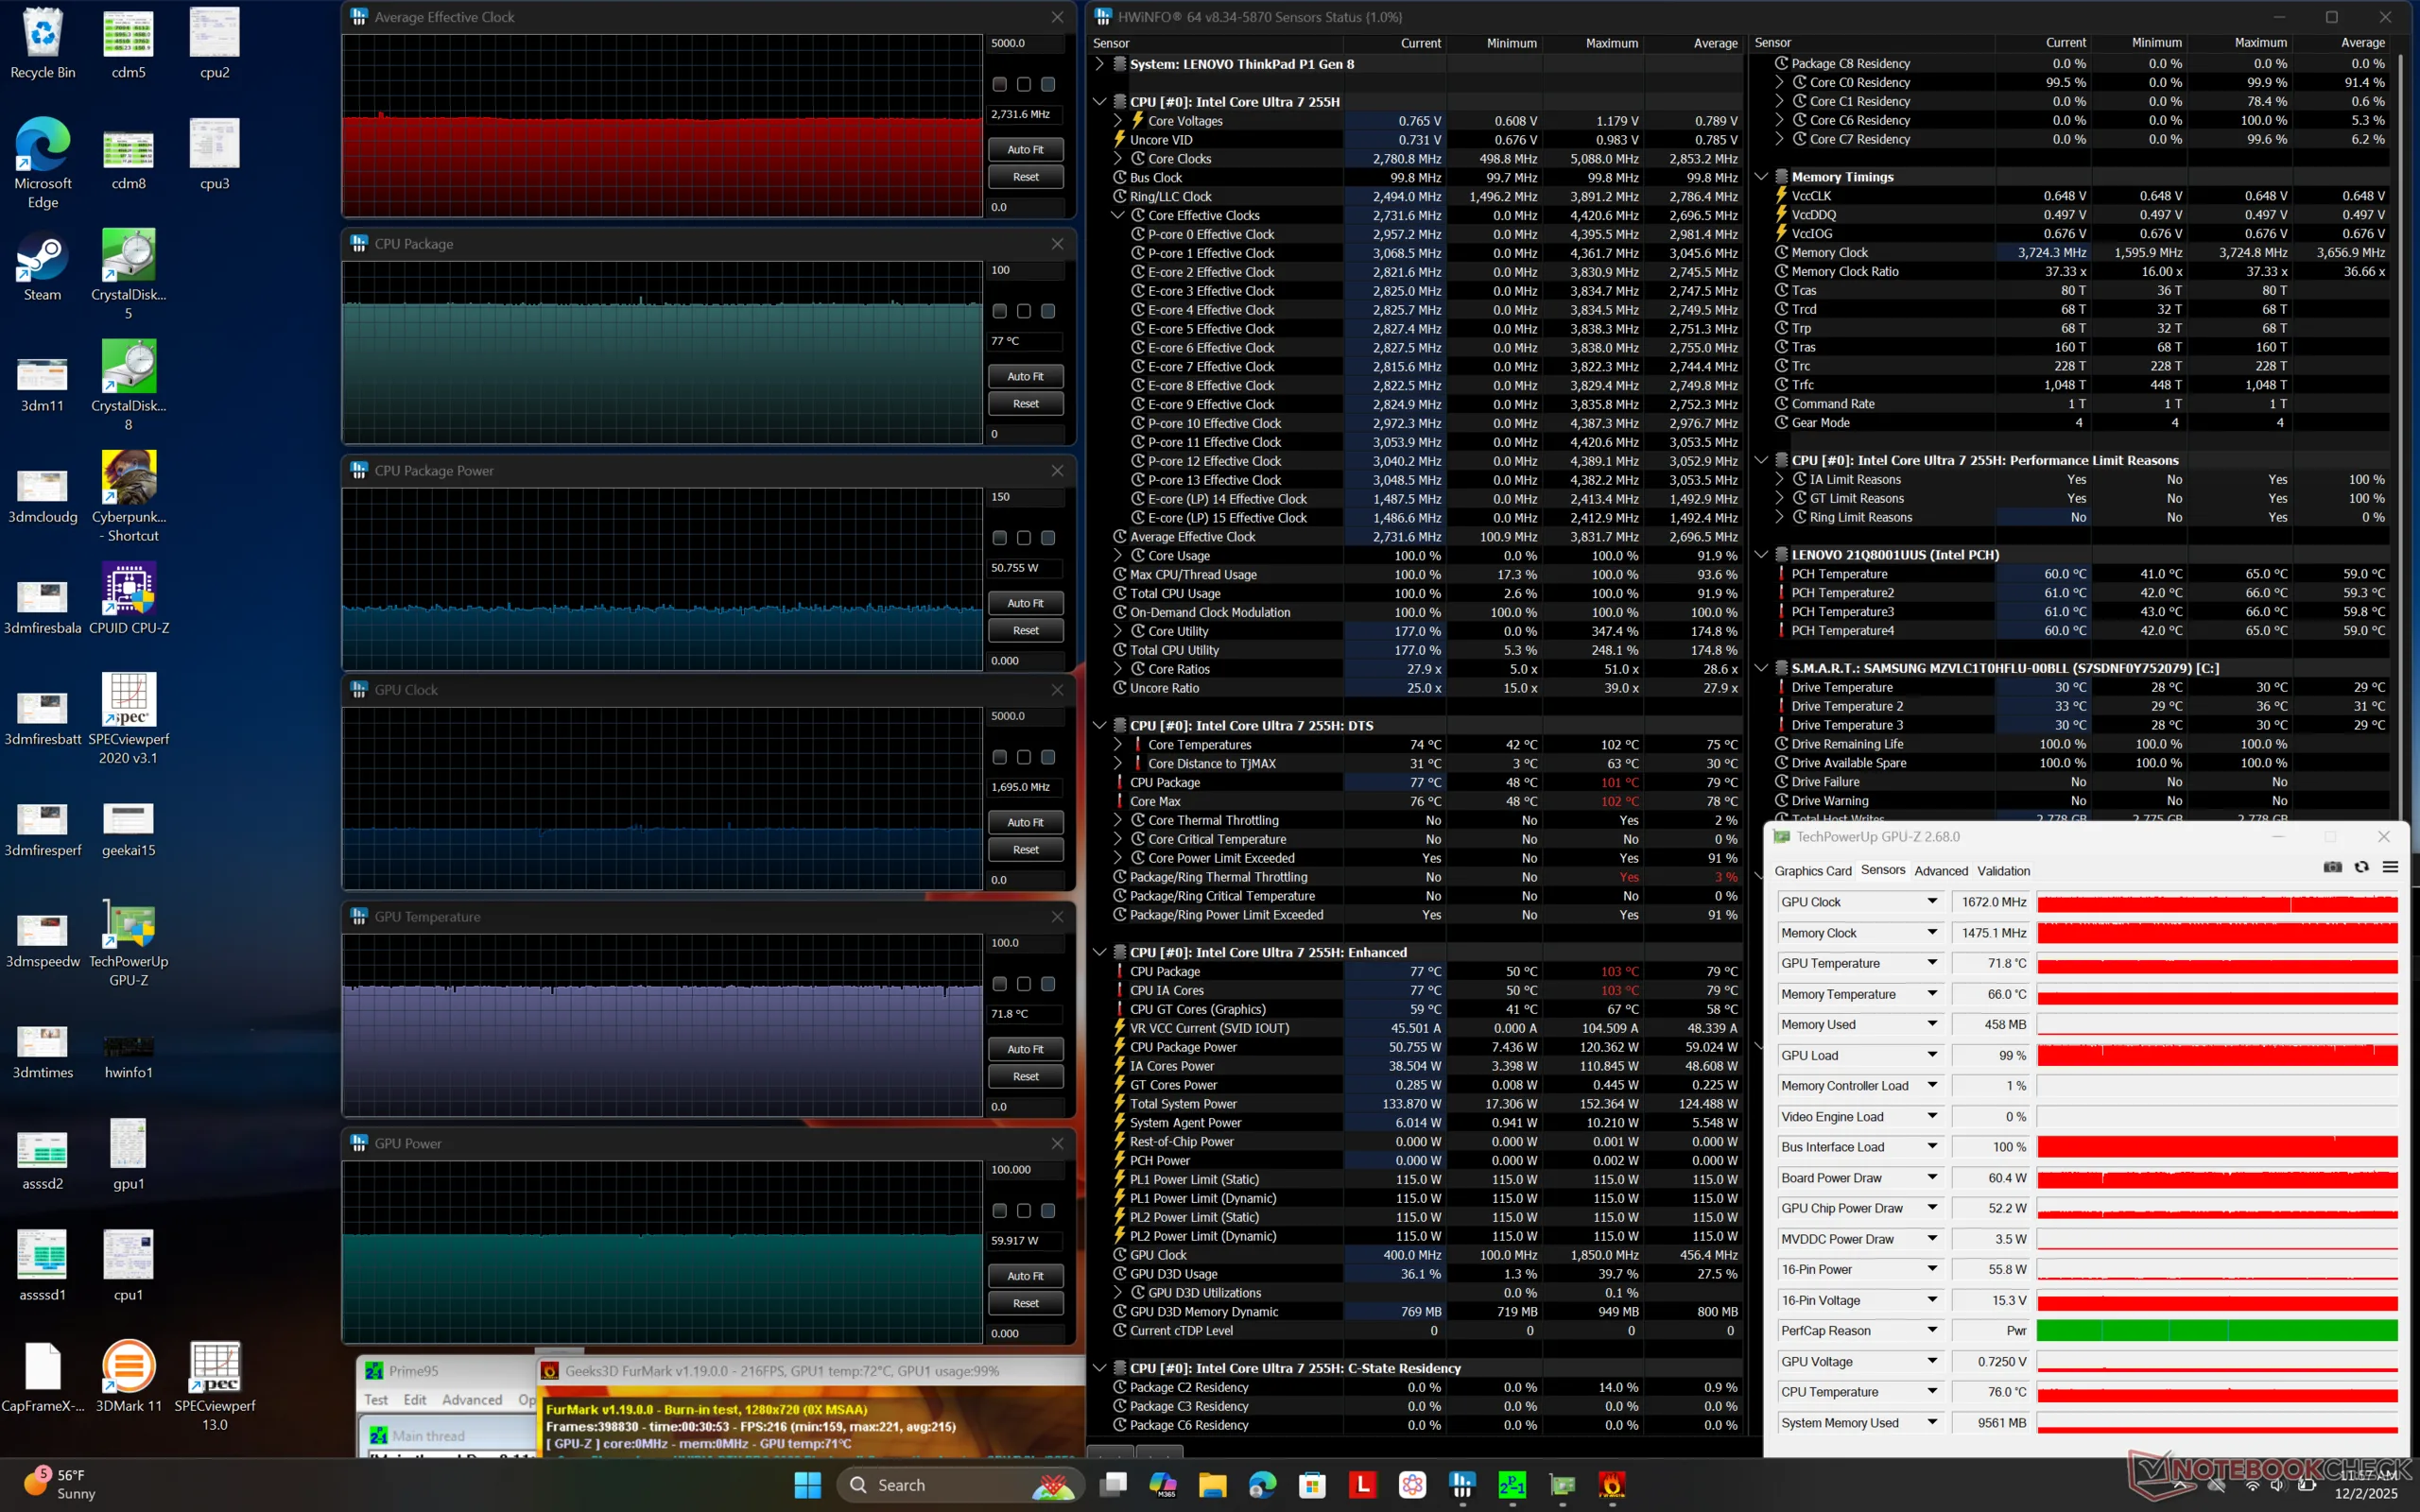
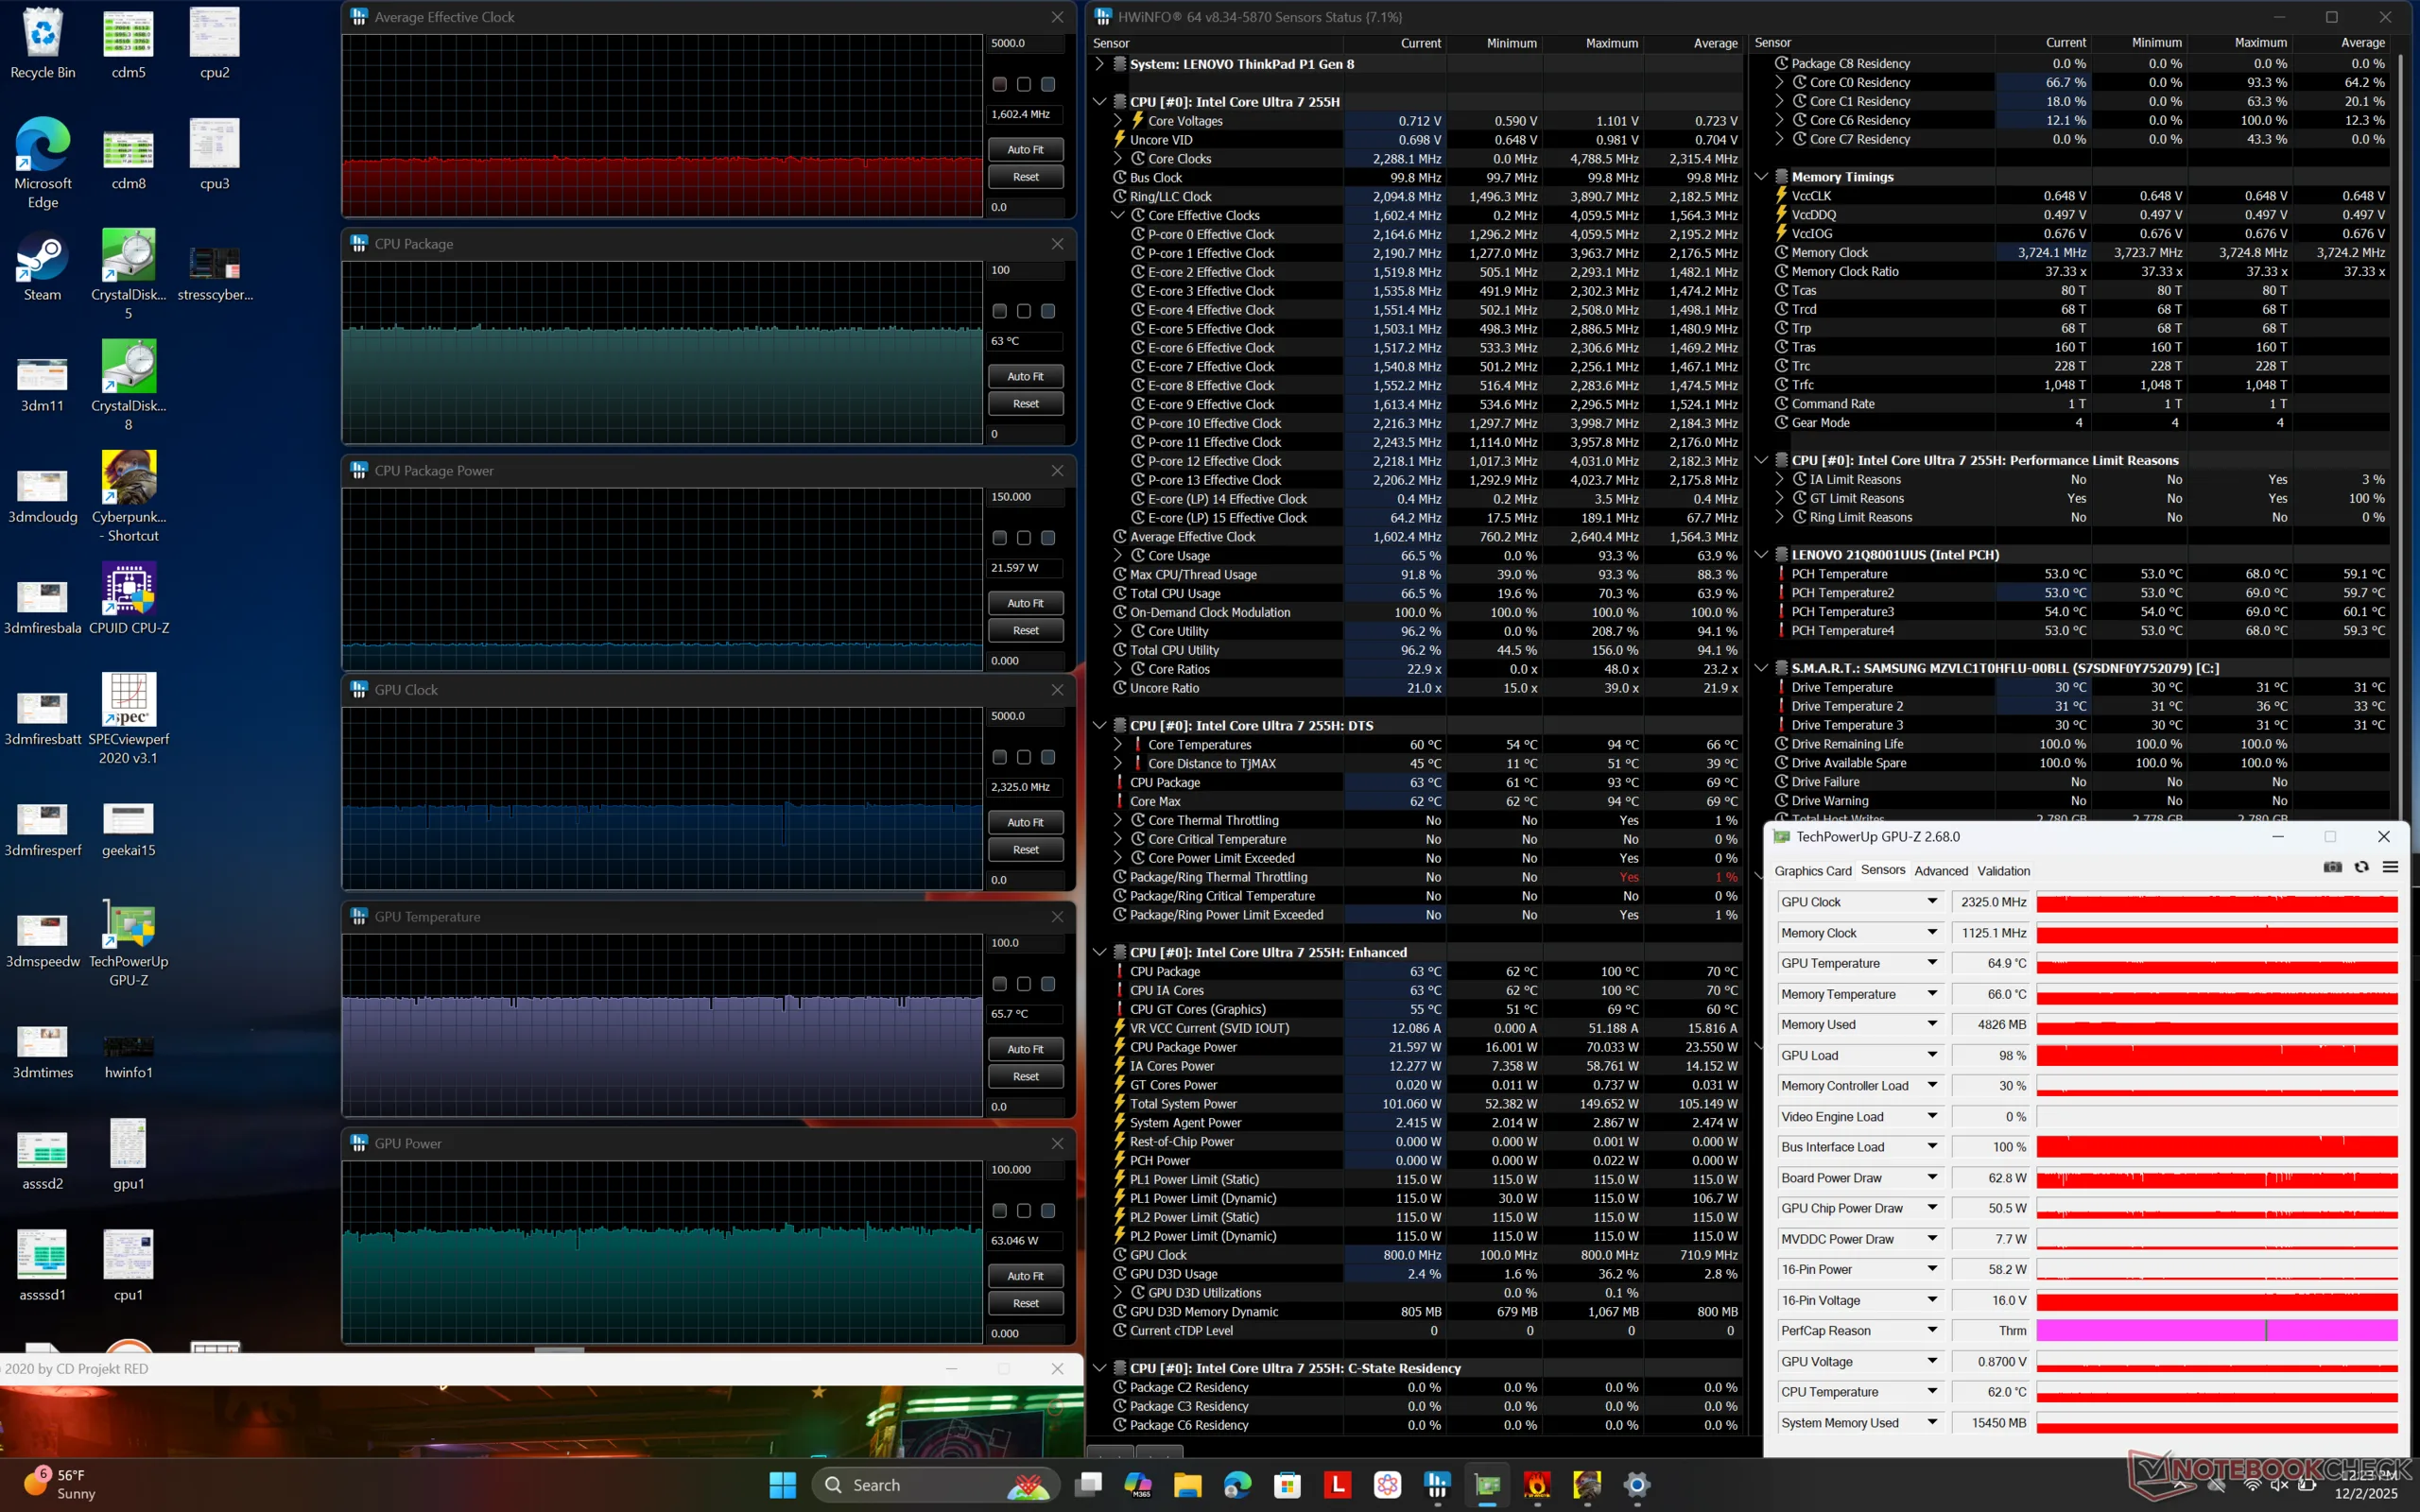
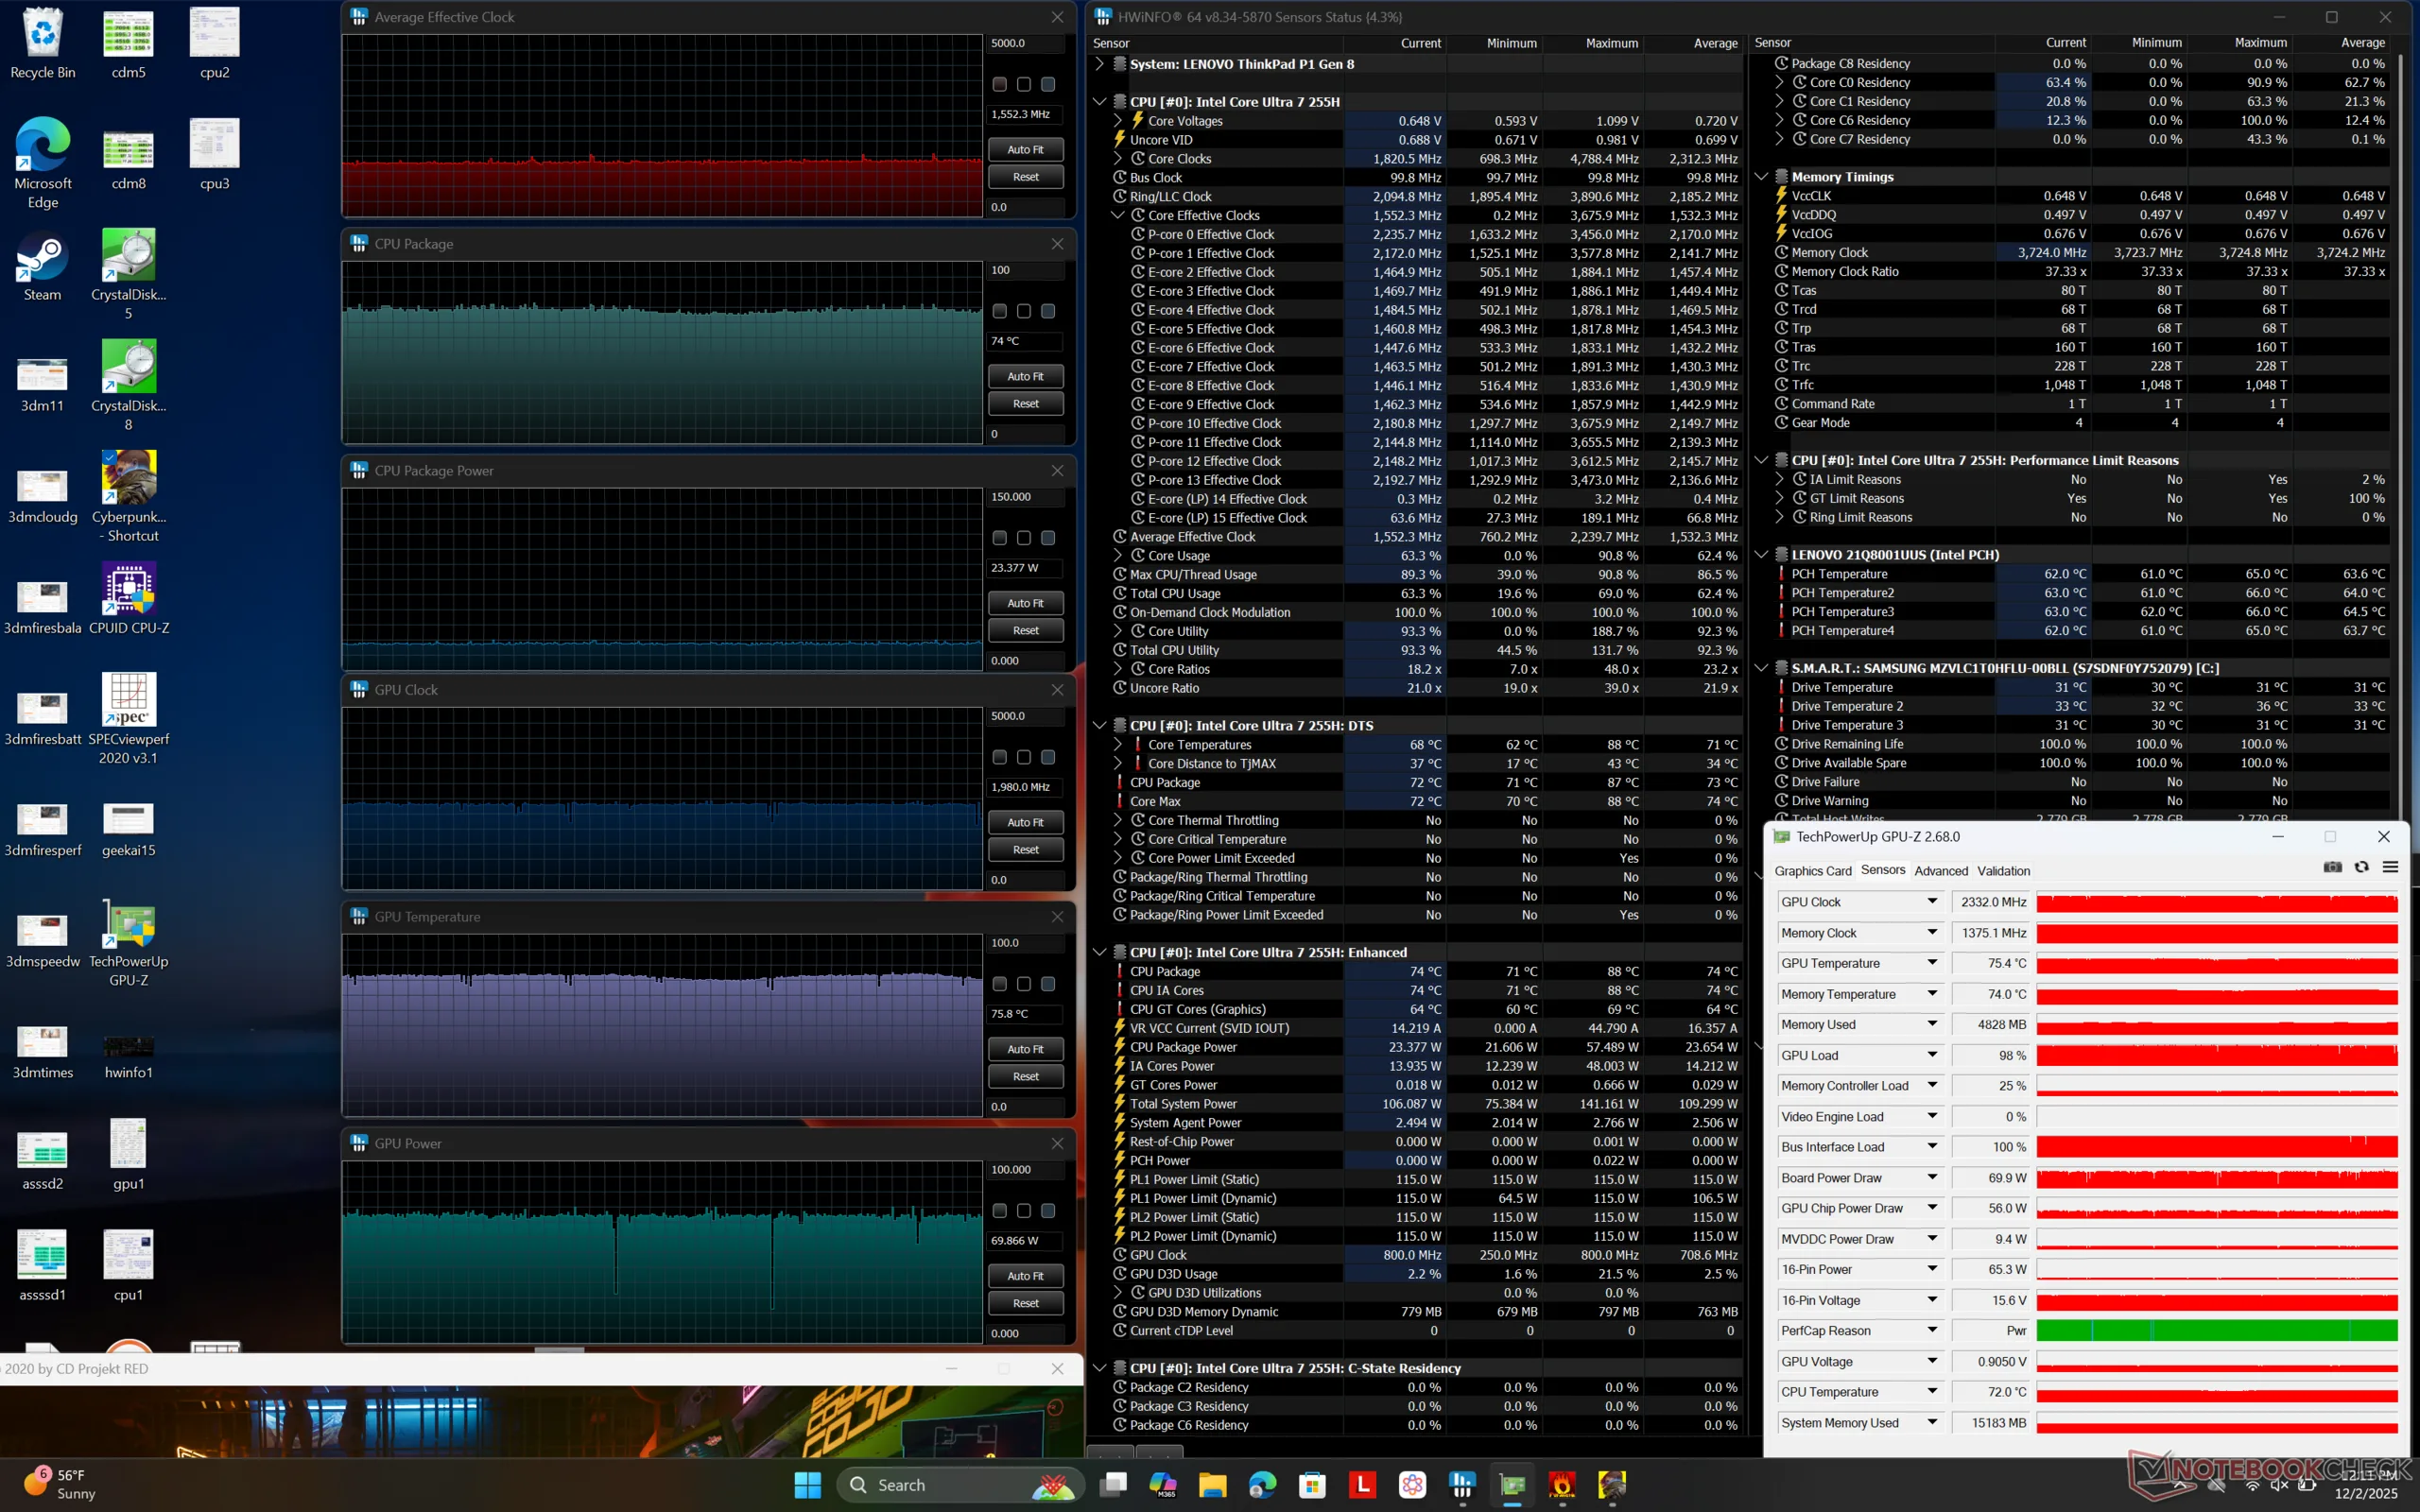
| CPU Clock (GHz) | GPU Clock (MHz) | Average CPU Temperature (°C) | Average GPU Temperature (°C) | |
| System Idle | -- | -- | 52 | 45 |
| Prime95 Stress | 3.6 | -- | 91 | 60 |
| Prime95 + FurMark Stress | 2.7 | 1672 | 77 | 72 |
| Cyberpunk 2077 Stress (Balanced mode) | 1.6 | 2325 | 63 | 66 |
| Cyberpunk 2077 Stress (Performance mode) | 1.6 | 2332 | 74 | 76 |
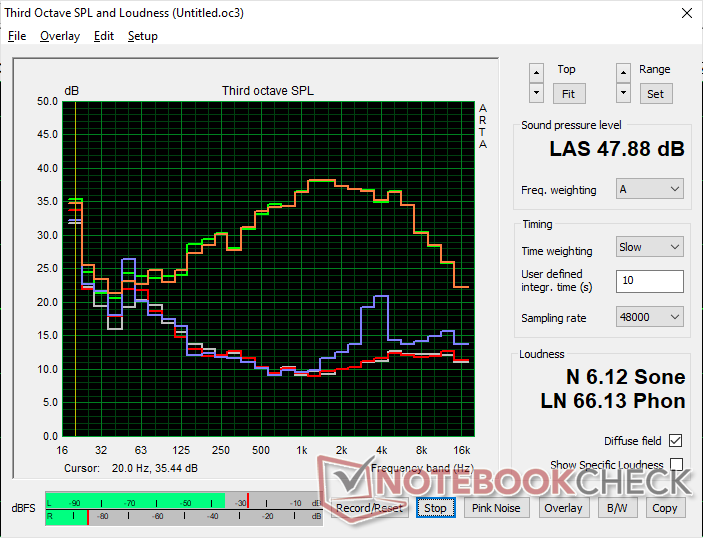
Speakers
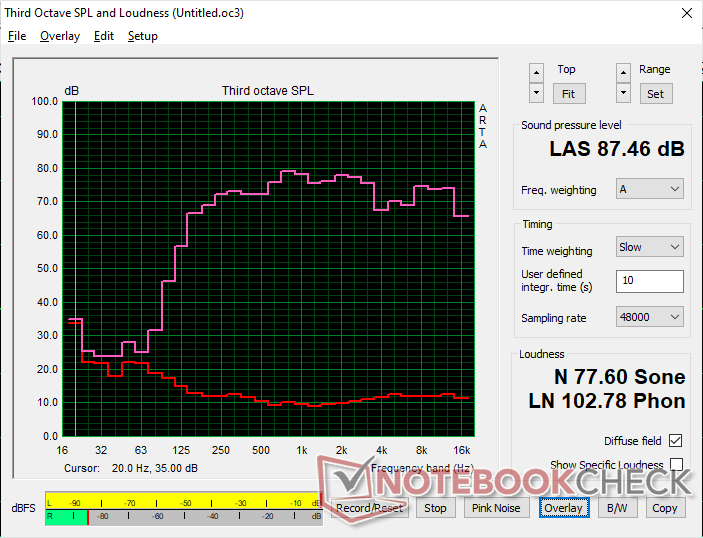
Lenovo ThinkPad P1 Gen 8 audio analysis
(+) | speakers can play relatively loud (87.5 dB)
Bass 100 - 315 Hz
(±) | reduced bass - on average 9.8% lower than median
(±) | linearity of bass is average (11.2% delta to prev. frequency)
Mids 400 - 2000 Hz
(+) | balanced mids - only 2.9% away from median
(+) | mids are linear (2.8% delta to prev. frequency)
Highs 2 - 16 kHz
(+) | balanced highs - only 3% away from median
(+) | highs are linear (4.7% delta to prev. frequency)
Overall 100 - 16.000 Hz
(+) | overall sound is linear (8.3% difference to median)
Compared to same class
» 1% of all tested devices in this class were better, 1% similar, 97% worse
» The best had a delta of 7%, average was 17%, worst was 35%
Compared to all devices tested
» 2% of all tested devices were better, 1% similar, 97% worse
» The best had a delta of 4%, average was 24%, worst was 134%
Apple MacBook Pro 16 2021 M1 Pro audio analysis
(+) | speakers can play relatively loud (84.7 dB)
Bass 100 - 315 Hz
(+) | good bass - only 3.8% away from median
(+) | bass is linear (5.2% delta to prev. frequency)
Mids 400 - 2000 Hz
(+) | balanced mids - only 1.3% away from median
(+) | mids are linear (2.1% delta to prev. frequency)
Highs 2 - 16 kHz
(+) | balanced highs - only 1.9% away from median
(+) | highs are linear (2.7% delta to prev. frequency)
Overall 100 - 16.000 Hz
(+) | overall sound is linear (4.6% difference to median)
Compared to same class
» 0% of all tested devices in this class were better, 0% similar, 100% worse
» The best had a delta of 5%, average was 17%, worst was 45%
Compared to all devices tested
» 0% of all tested devices were better, 0% similar, 100% worse
» The best had a delta of 4%, average was 24%, worst was 134%
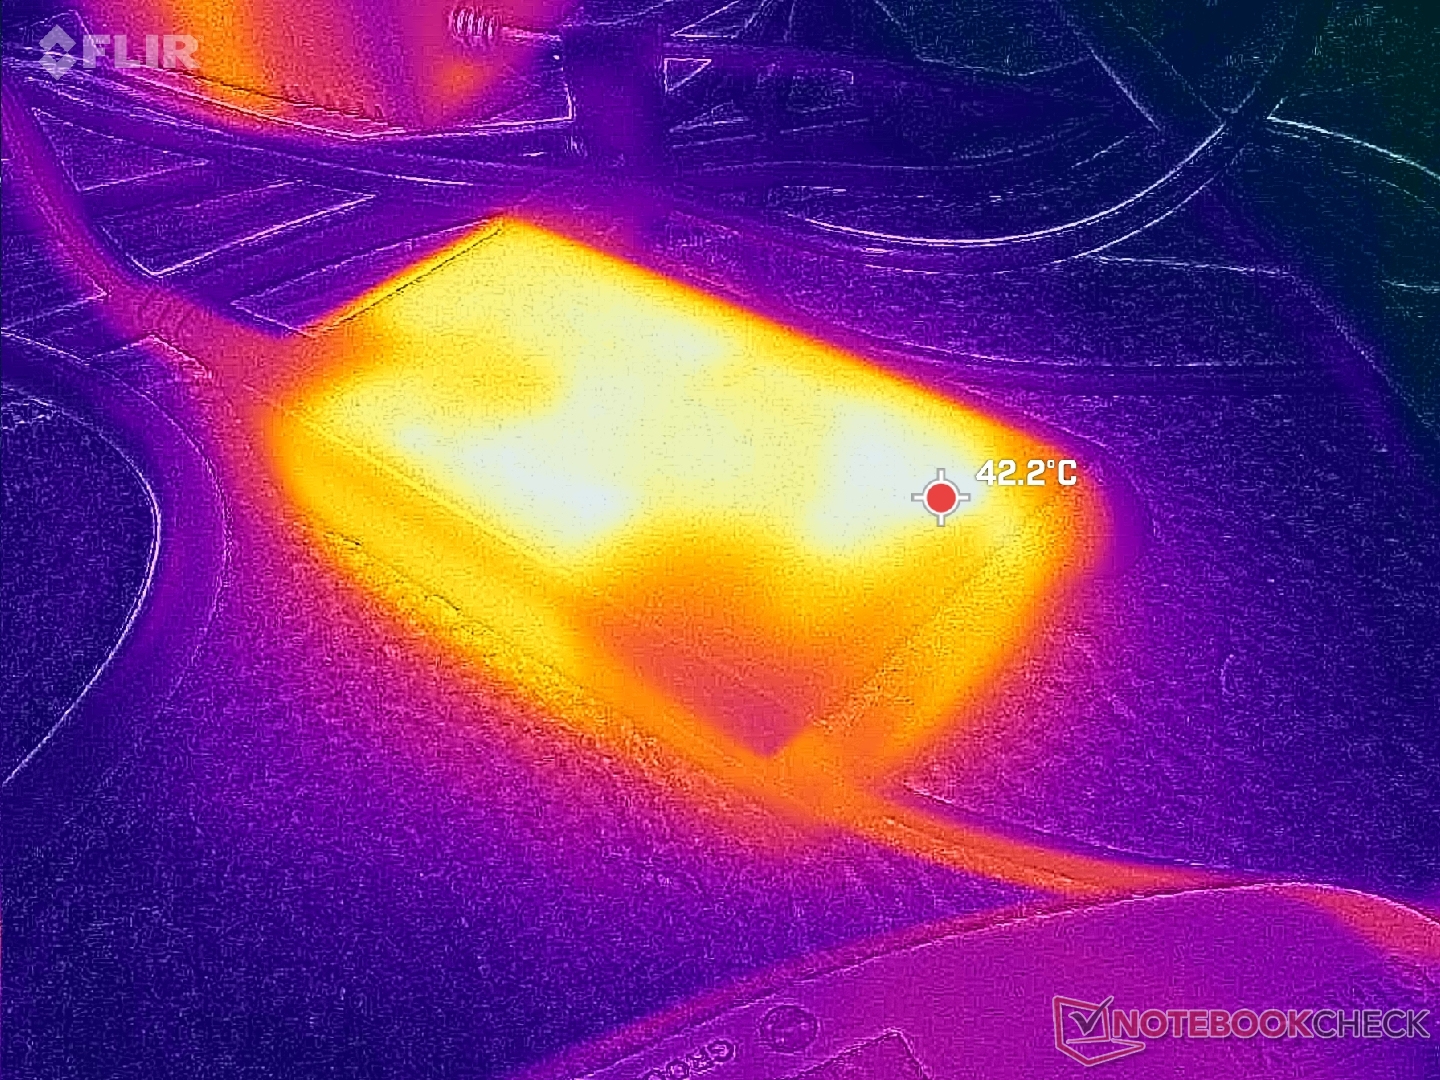
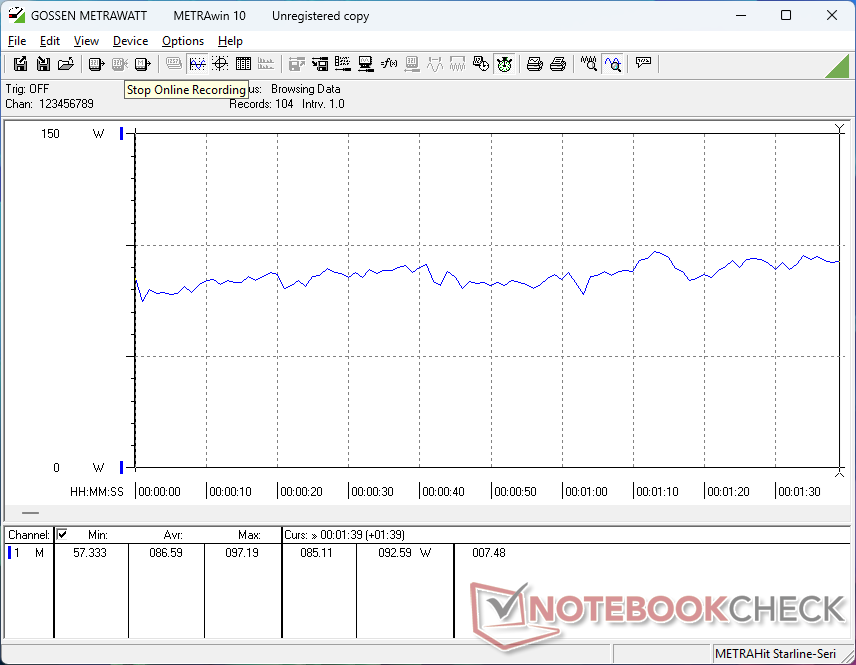
Energy Management
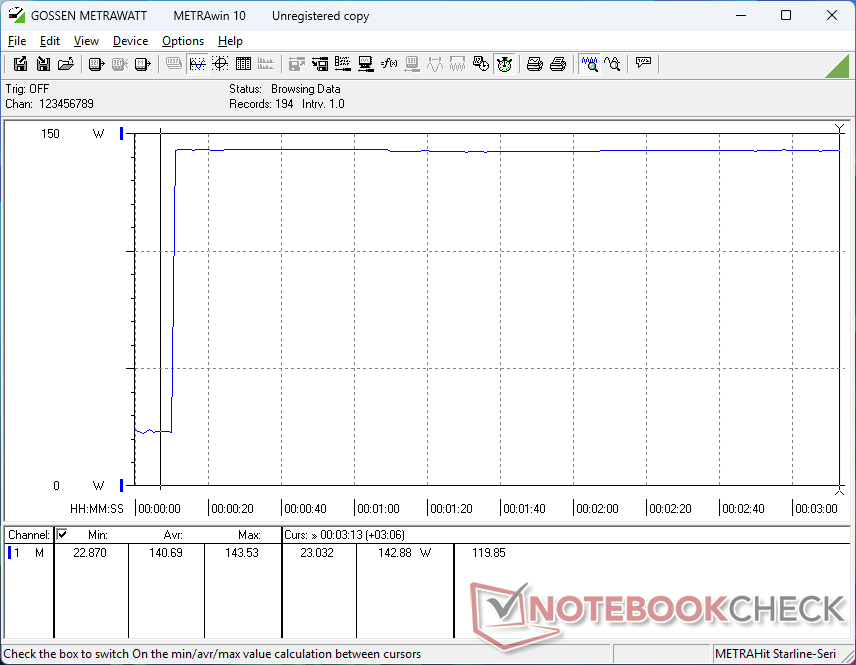
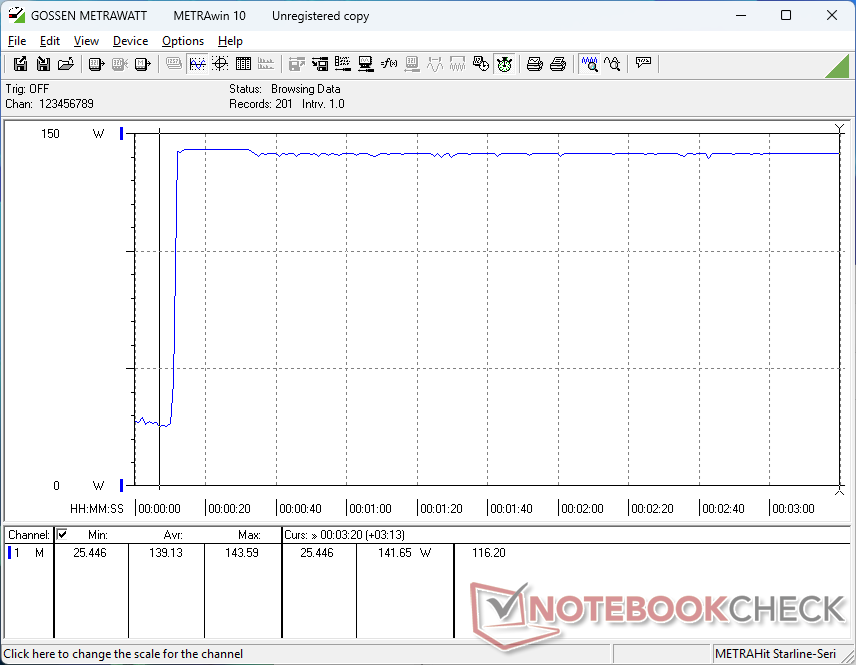
Power Consumption
Consumption when idling is generally higher than what we recorded on last year's IPS model leading to shorter runtimes. Consumption rates are otherwise very similar between the two models when running more demanding loads despite the higher performance levels of the Gen 8 model for improved performance-per-watt.
Note that the ThinkPad P1 Gen 8 ships with a smaller 140 W USB-C AC adapter (~12.8 x 6.2 x 2.3 cm) whereas the ThinkPad P1 Gen 7 ships with a 170 W adapter.
| Off / Standby | |
| Idle | |
| Load |
|
Key:
min: | |
| Lenovo ThinkPad P1 Gen 8 Ultra 7 255H, RTX PRO 2000 Blackwell Generation Laptop, Samsung PM9E1 1 TB MZVLC1T0HFLU, Tandem OLED, 3200x2000, 16" | Lenovo ThinkPad P16s Gen 4 21RX000YGE Ryzen AI 9 HX PRO 370, Radeon 890M, Micron 3500 1TB MTFDKBA1T0TGD, IPS LED, 1920x1200, 16" | Lenovo ThinkPad P1 Gen 7 21KV001SGE Ultra 7 155H, GeForce RTX 4060 Laptop GPU, Kioxia XG8 KXG8AZNV1T02, IPS LED, 2560x1600, 16" | HP ZBook X G1i 16 Ultra 7 265H, RTX PRO 2000 Blackwell Generation Laptop, Samsung PM9A1 MZVL22T0HBLB, IPS, 2560x1600, 16" | Dell Pro Max 16 Plus Ultra 9 285HX, RTX PRO 5000 Blackwell Generation Laptop, SK hynix PCB01 HFS001TFM9X186N, OLED, 3840x2400, 16" | Asus ExpertBook B6 Flip B6602FC2 i9-12950HX, RTX A2000 Laptop GPU, Samsung PM9A1 MZVL21T0HCLR, IPS, 2560x1600, 16" | |
|---|---|---|---|---|---|---|
| Power Consumption | 56% | 14% | 29% | -103% | -17% | |
| Idle Minimum * (Watt) | 15.4 | 3.9 75% | 7.3 53% | 4.1 73% | 35.1 -128% | 10.5 32% |
| Idle Average * (Watt) | 16.5 | 8.3 50% | 12.3 25% | 9 45% | 39.2 -138% | 11.9 28% |
| Idle Maximum * (Watt) | 23.1 | 8.7 62% | 17.9 23% | 9.4 59% | 56 -142% | 18 22% |
| Load Average * (Watt) | 86.6 | 51.6 40% | 78.2 10% | 86.7 -0% | 130.2 -50% | 182 -110% |
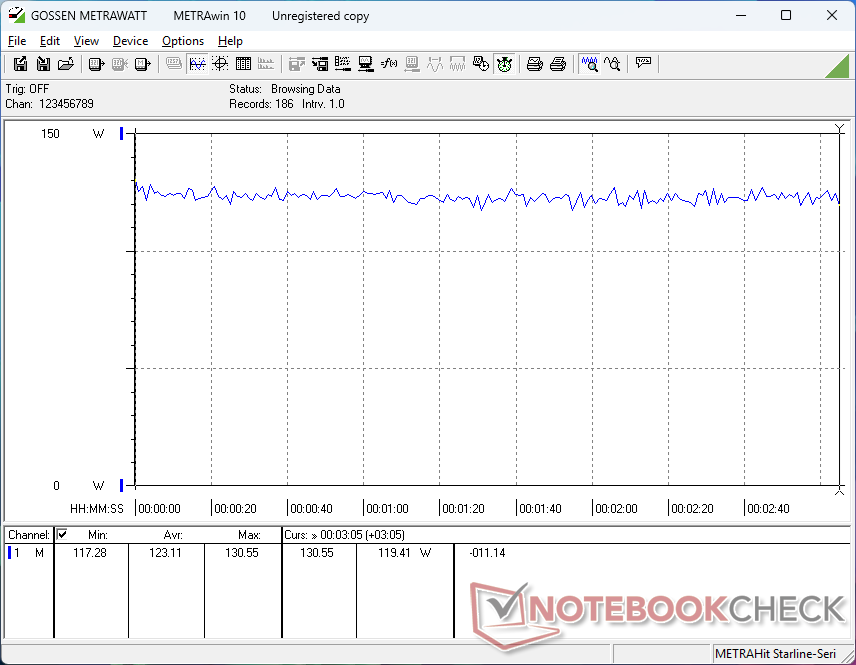
| Cyberpunk 2077 ultra external monitor * (Watt) | 121.8 | 54.6 55% | 117.7 3% | 102 16% | 213 -75% | |
| Cyberpunk 2077 ultra * (Watt) | 123.1 | 55.4 55% | 123.5 -0% | 106.1 14% | 229 -86% | |
| Load Maximum * (Watt) | 143.6 | 63.7 56% | 167.5 -17% | 152.9 -6% | 285.2 -99% | 229 -59% |
| Witcher 3 ultra * (Watt) | 177.5 |
* ... smaller is better
Power Consumption Cyberpunk / Stress Test
Power Consumption external Monitor
Battery Life
Runtimes are noticeably shorter than on last year's IPS configuration by several hours even when set to Balanced mode and the same ~150 nit brightness level.
| Lenovo ThinkPad P1 Gen 8 Ultra 7 255H, RTX PRO 2000 Blackwell Generation Laptop, 90 Wh | Lenovo ThinkPad P1 Gen 7 21KV001SGE Ultra 7 155H, GeForce RTX 4060 Laptop GPU, 90 Wh | HP ZBook X G1i 16 Ultra 7 265H, RTX PRO 2000 Blackwell Generation Laptop, 83 Wh | Dell Pro Max 16 Plus Ultra 9 285HX, RTX PRO 5000 Blackwell Generation Laptop, 96 Wh | Asus ExpertBook B6 Flip B6602FC2 i9-12950HX, RTX A2000 Laptop GPU, 90 Wh | |
|---|---|---|---|---|---|
| Battery runtime | 80% | 127% | -35% | 58% | |
| WiFi v1.3 (h) | 5.5 | 9.9 80% | 12.5 127% | 3.6 -35% | 8.7 58% |
| Load (h) | 1.9 | 1.7 | |||
| Reader / Idle (h) | 12.5 | ||||
| H.264 (h) | 5.8 |
Notebookcheck Rating
The ThinkPad P1 Gen 8 excels at being a super-thin 16-inch workstation with midrange Core H-series CPUs and discrete Nvidia Pro RTX graphics.
Lenovo ThinkPad P1 Gen 8
- 12/10/2025 v8
Allen Ngo
 Total Sustainability Score:
 Potential Competitors in Comparison
Image | Model / Review | Price | Weight | Height | Display |
|---|---|---|---|---|---|
1. 91.6%  | Lenovo ThinkPad P1 Gen 8 Intel Core Ultra 7 255H ⎘ NVIDIA RTX PRO 2000 Blackwell Generation Laptop ⎘ 32 GB Memory, 1024 GB SSD | Amazon: List Price: 2000 USD | 1.9 kg | 20.6 mm | 16.00" 3200x2000 236 PPI Tandem OLED |
2. 82%  | Lenovo ThinkPad P16s Gen 4 21RX000YGE AMD Ryzen AI 9 HX PRO 370 ⎘ AMD Radeon 890M ⎘ 64 GB Memory, 1024 GB SSD | Amazon: List Price: 2440 Euro | 2 kg | 23 mm | 16.00" 1920x1200 142 PPI IPS LED |
3. 83.5%  | Lenovo ThinkPad P1 Gen 7 21KV001SGE Intel Core Ultra 7 155H ⎘ NVIDIA GeForce RTX 4060 Laptop GPU ⎘ 32 GB Memory, 1024 GB SSD | Amazon: List Price: 3239 Euro | 2 kg | 20.5 mm | 16.00" 2560x1600 189 PPI IPS LED |
4. 87.4%  | HP ZBook X G1i 16 Intel Core Ultra 7 265H ⎘ NVIDIA RTX PRO 2000 Blackwell Generation Laptop ⎘ 64 GB Memory, 2048 GB SSD | Amazon: List Price: 2700 USD | 2.2 kg | 23 mm | 16.00" 2560x1600 189 PPI IPS |
5. 88.4%  | Dell Pro Max 16 Plus Intel Core Ultra 9 285HX ⎘ NVIDIA RTX PRO 5000 Blackwell Generation Laptop ⎘ 128 GB Memory, SSD | Amazon: List Price: 5000 USD | 2.8 kg | 30.9 mm | 16.00" 3840x2400 283 PPI OLED |
6. 89.6% v7 (old)  | Asus ExpertBook B6 Flip B6602FC2 Intel Core i9-12950HX ⎘ NVIDIA RTX A2000 Laptop GPU ⎘ 32 GB Memory, 1024 GB SSD | Amazon: 1. $1,529.99 ASUS ExpertBook B5 Thin & Li... 2. $240.00 Adamanta 16GB (2x8GB) Compat... 3. $1,299.95 ASUS ExpertBook B5 Thin & Li... | 2.8 kg | 27.2 mm | 16.00" 2560x1600 189 PPI IPS |
Transparency
The selection of devices to be reviewed is made by our editorial team. The test sample was provided to the author as a loan by the manufacturer or retailer for the purpose of this review. The lender had no influence on this review, nor did the manufacturer receive a copy of this review before publication. There was no obligation to publish this review. As an independent media company, Notebookcheck is not subjected to the authority of manufacturers, retailers or publishers.
This is how Notebookcheck is testing
Every year, Notebookcheck independently reviews hundreds of laptops and smartphones using standardized procedures to ensure that all results are comparable. We have continuously developed our test methods for around 20 years and set industry standards in the process. In our test labs, high-quality measuring equipment is utilized by experienced technicians and editors. These tests involve a multi-stage validation process. Our complex rating system is based on hundreds of well-founded measurements and benchmarks, which maintains objectivity. Further information on our test methods can be found here.
