Verdict - ThinkPad X13 makes too many compromises
The new ThinkPad X13 G6 is a compact business laptop, but its focus on mobility brings a number of compromises. These include the rigidity of the chassis, the quality of the keyboard, and the display hinges. Unfortunately, these are exactly the areas where long-time ThinkPad users are likely to feel let down.
In terms of features, the X13 AMD makes a strong impression with Thunderbolt 4, a SmartCard reader, 5G and Wi-Fi 7, but the competition shows that more is possible when it comes to power consumption and battery life. There is also only a 60 Hz Full HD display.
The CPU performance of the AMD processor is very good overall and ahead of the direct competition, but in terms of the complete package, the Dell Pro 13 Premium remains the stronger choice.
Pros
Cons
Price and availability

The ThinkPad X13 G6 AMD review unit is available from Campuspoint starting at 1,759 euros, while Lenovo currently offers configurable models of the ThinkPad X13 G6 from around 1,300 euros. In the United States, a comparable AMD configuration of the ThinkPad X13 G6 is currently listed at around $1,349 USD at retailers such as CDW, although prices may vary by region and configuration.
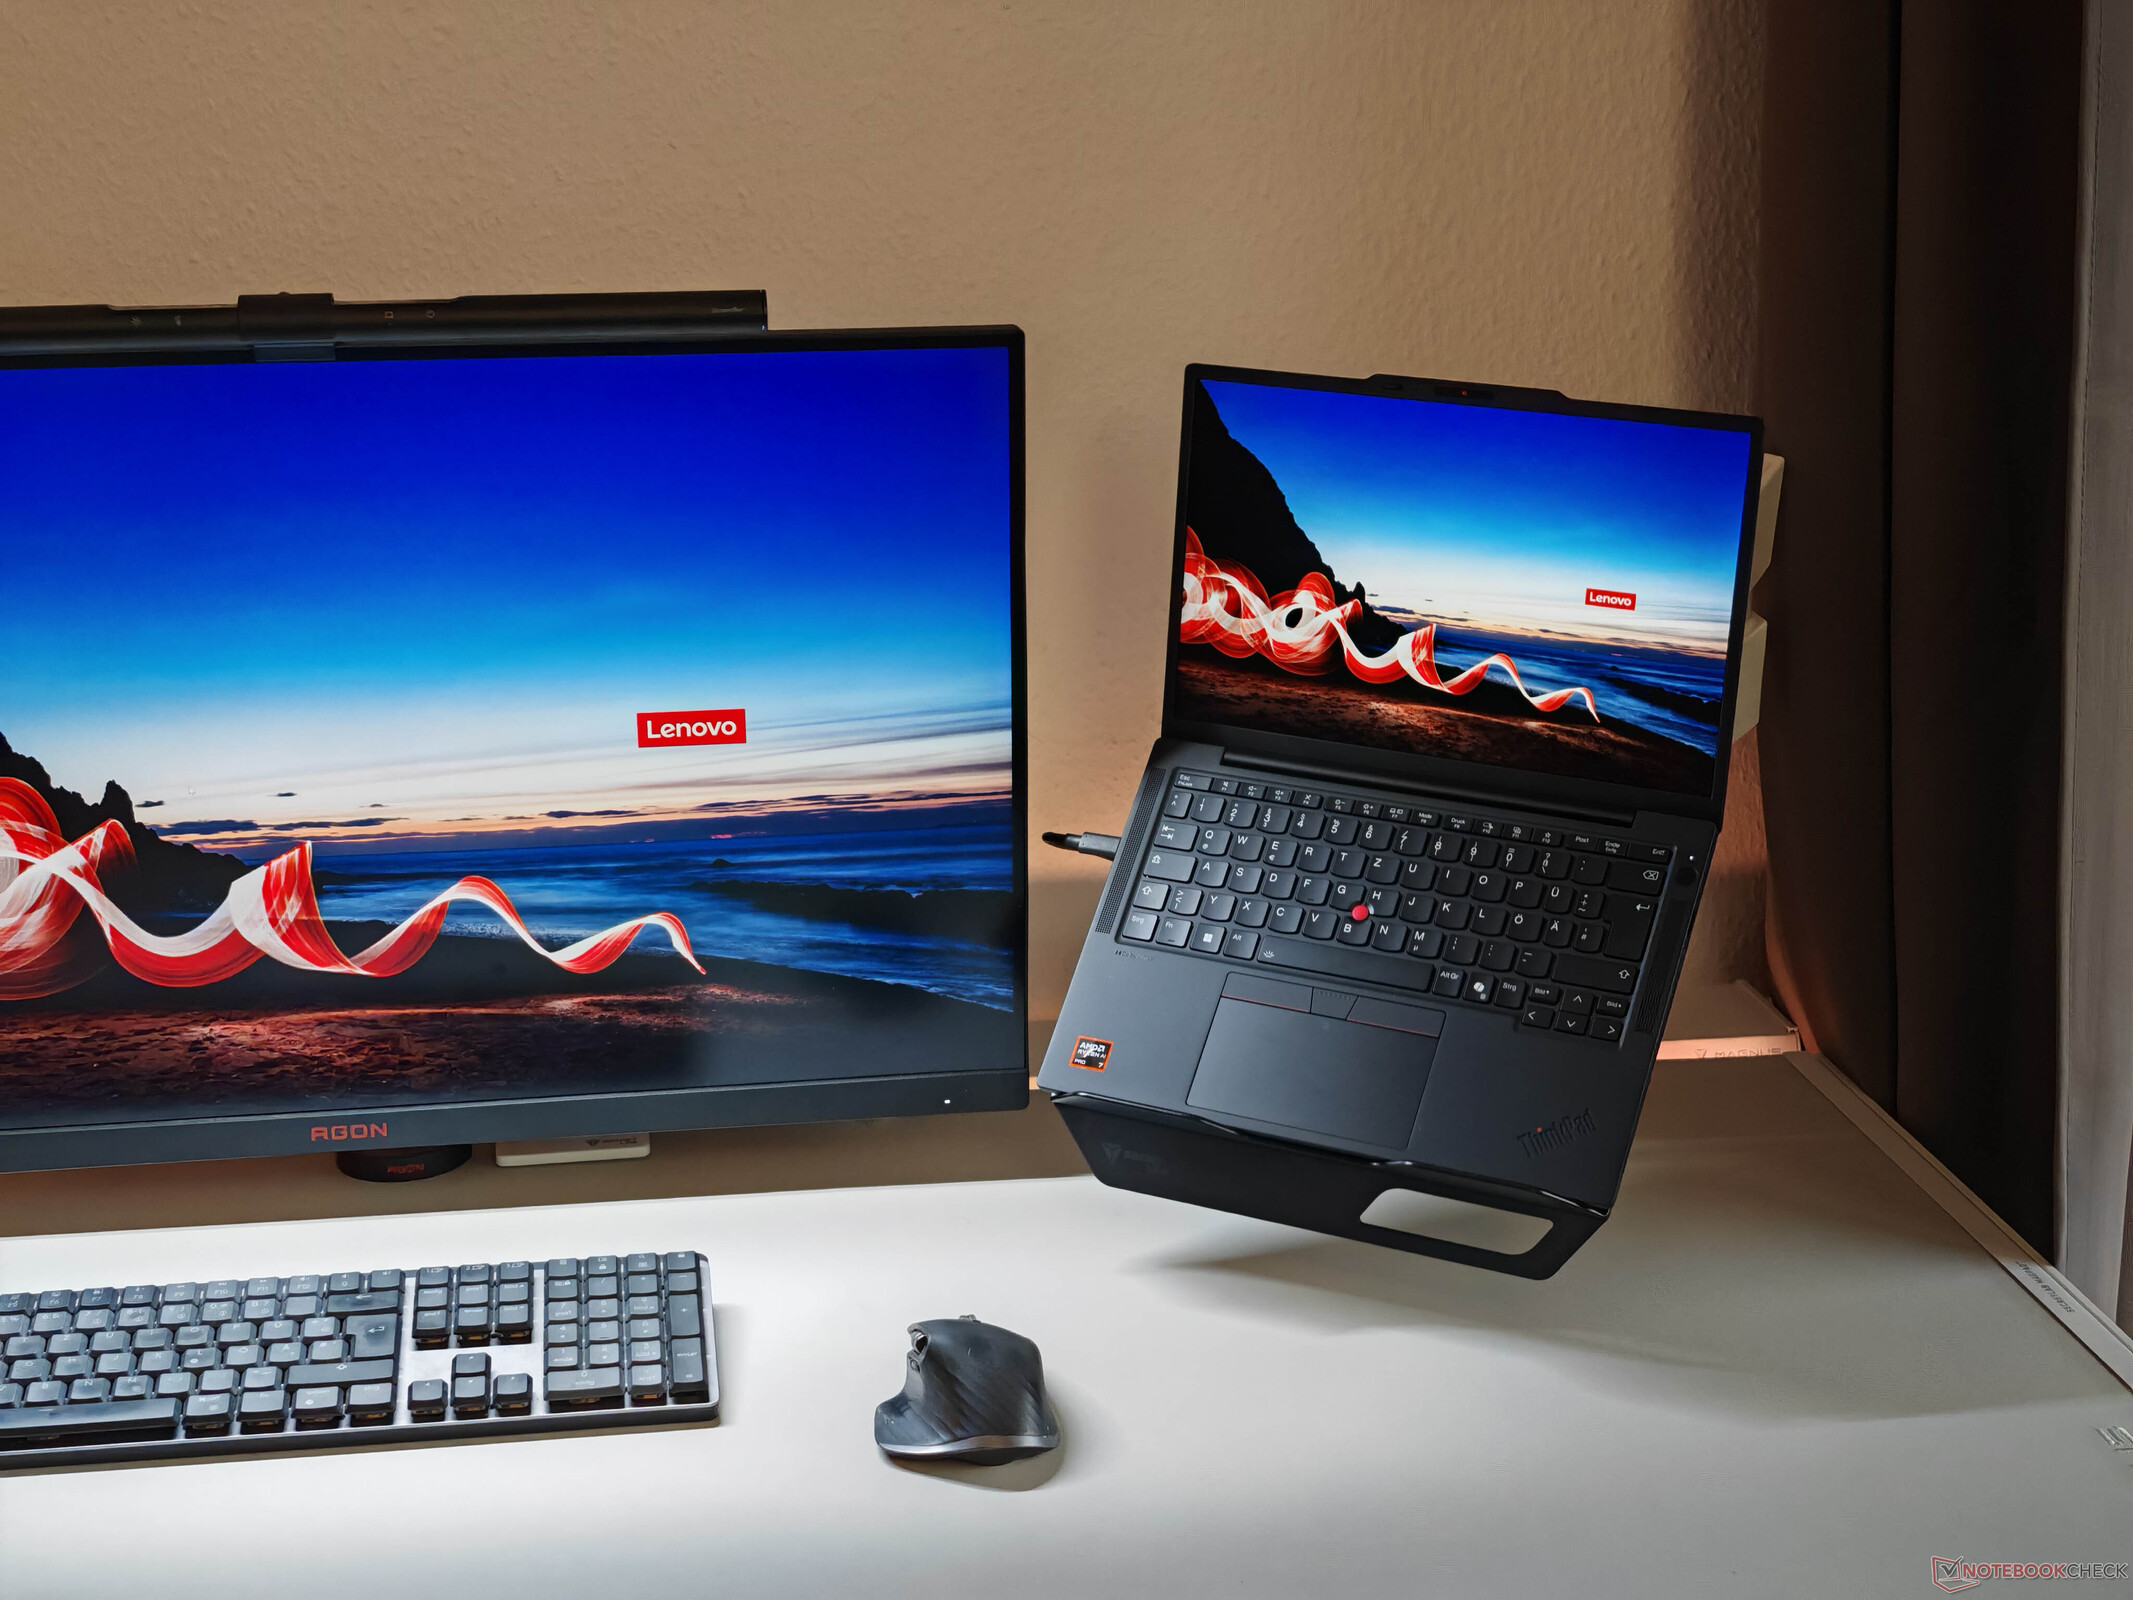
With the ThinkPad X13, Lenovo offers a very compact business laptop that has been completely redesigned for the sixth generation. The focus is now on improved mobility and models with Intel processors weigh less than 1 kg. To avoid overlapping with the ThinkPad X1 Carbon in Lenovo's line-up, the ThinkPad X13 is priced considerably lower and starts at around 1,300 euros. Our review unit, equipped with an AMD Ryzen AI 7 PRO 350, 32 GB of RAM, a 5G module and the power-efficient Full HD IPS display, costs 1,855 euros (1,759 euros under the Campus programme).
Specifications
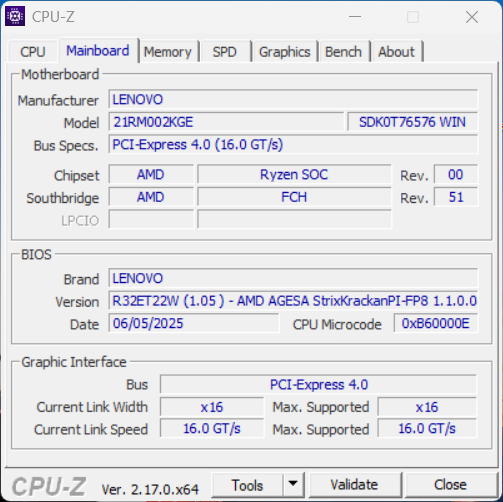
Case and features
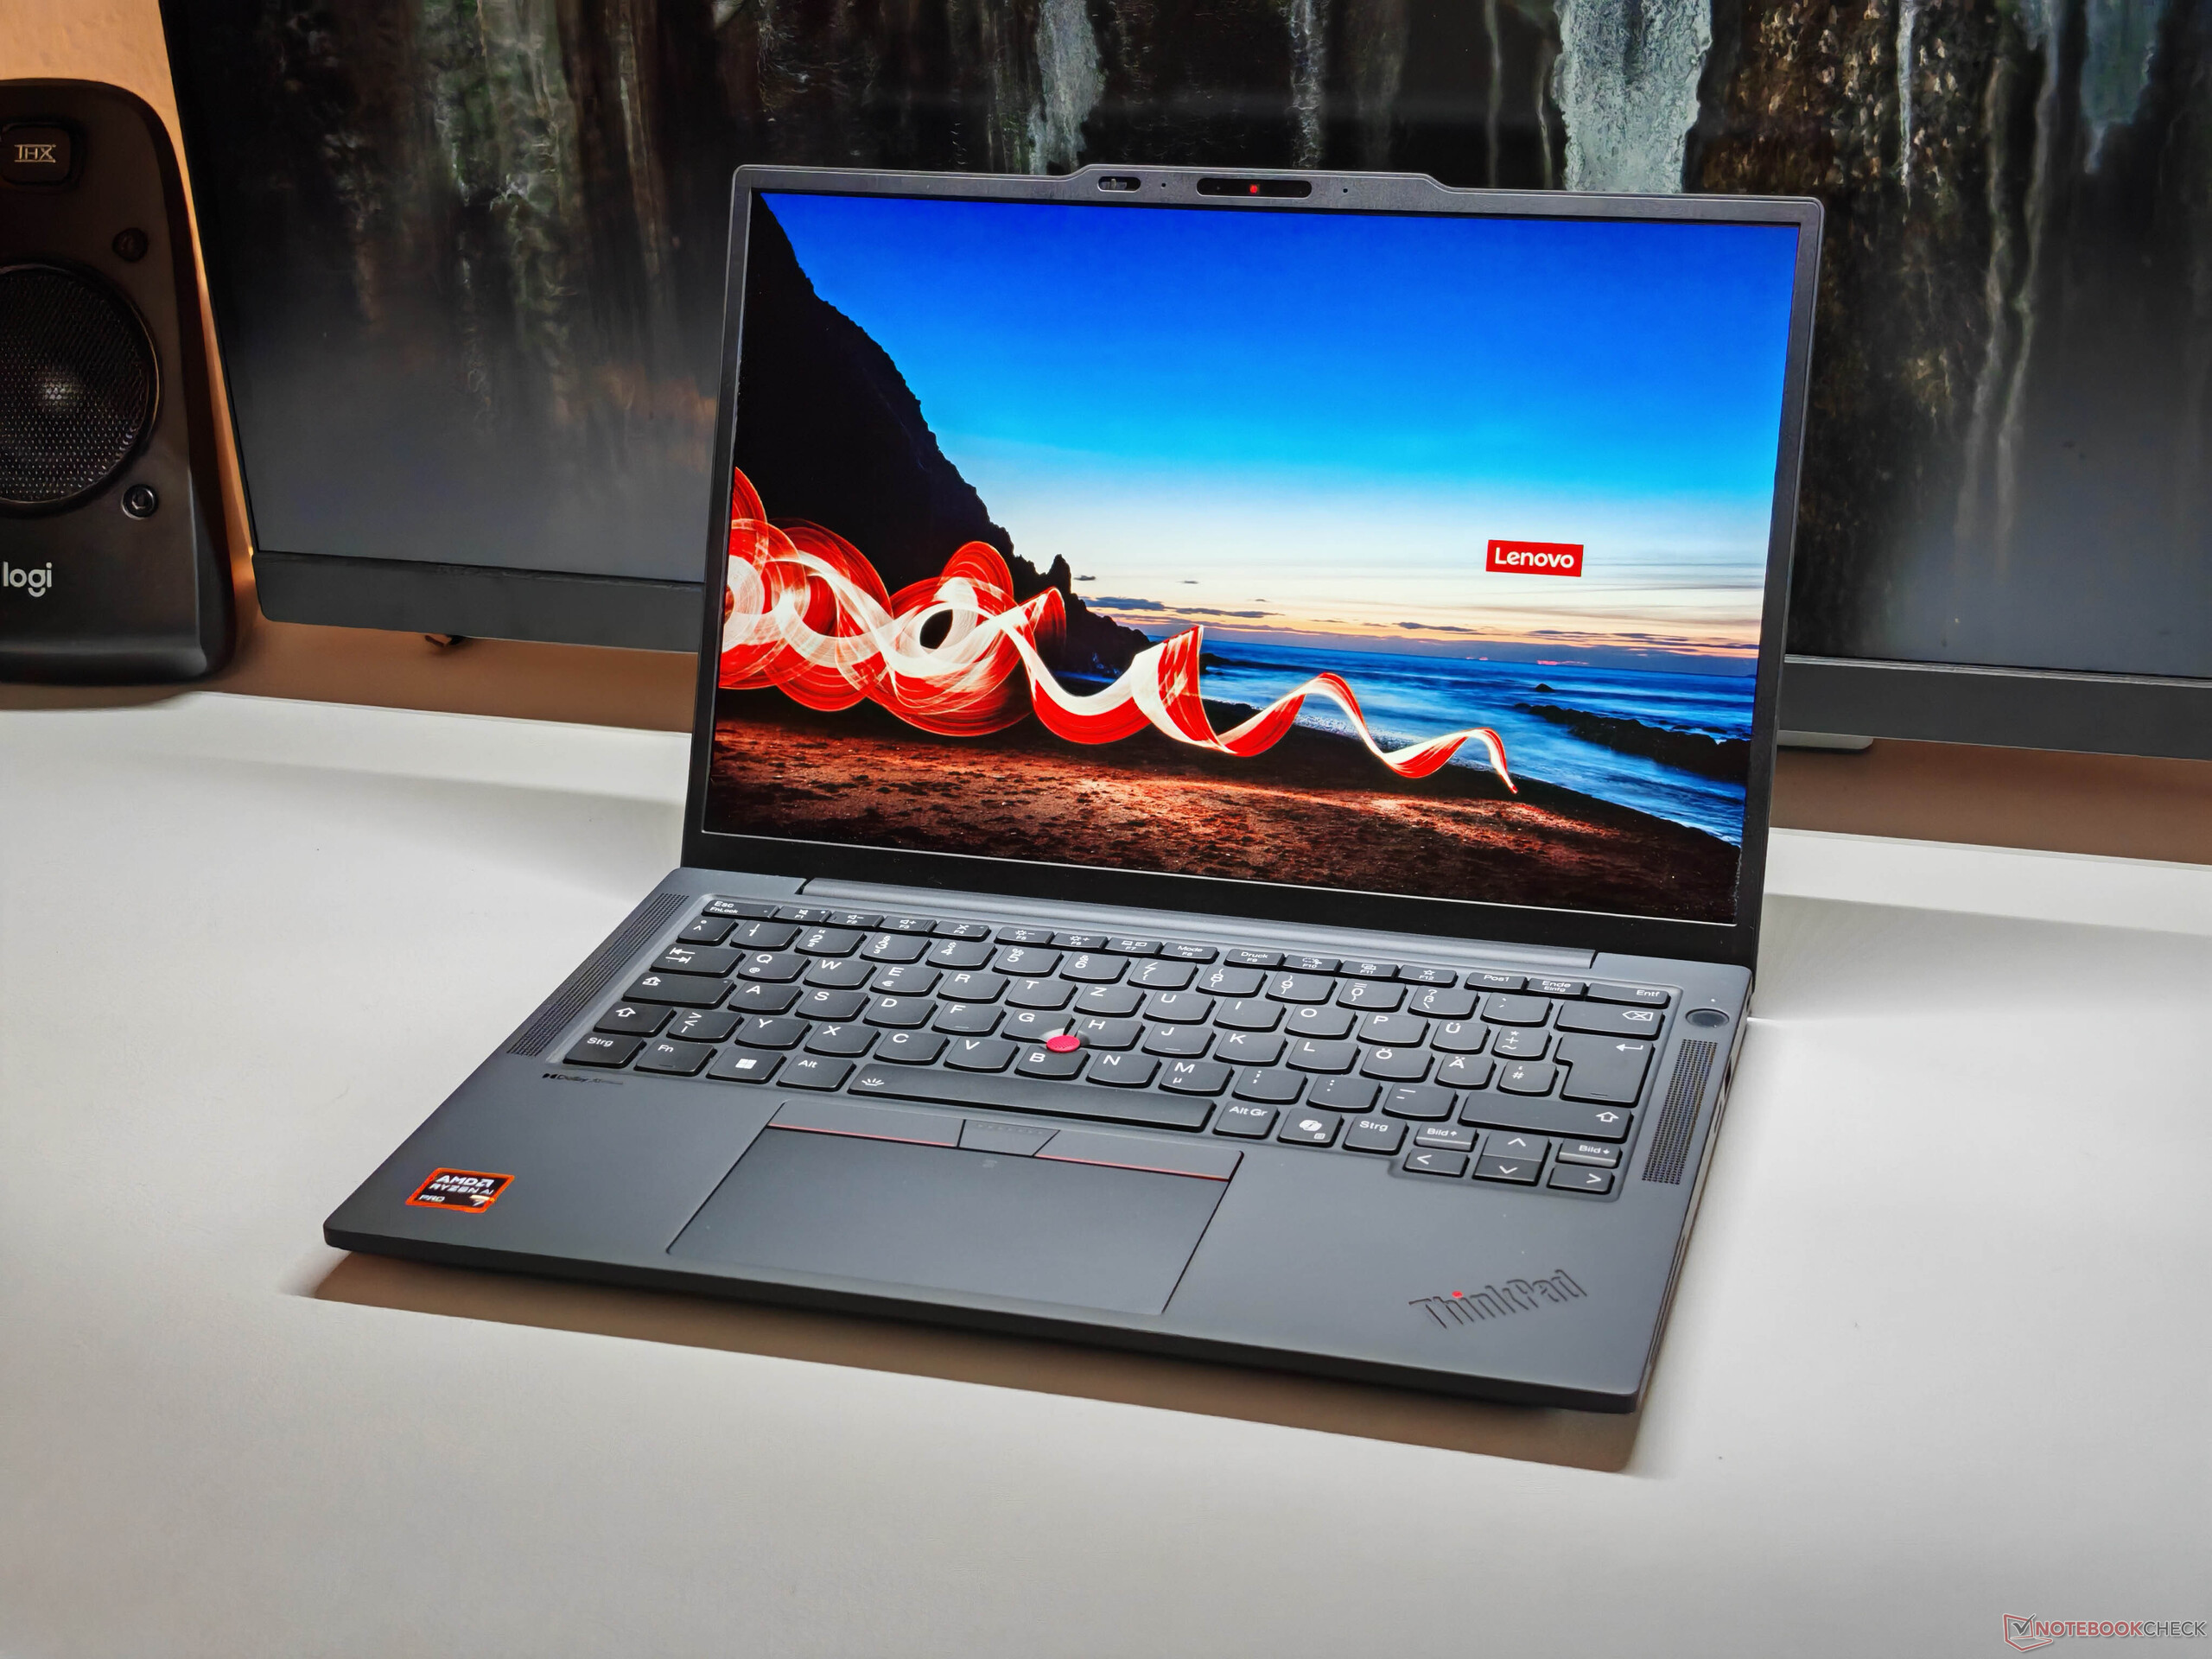
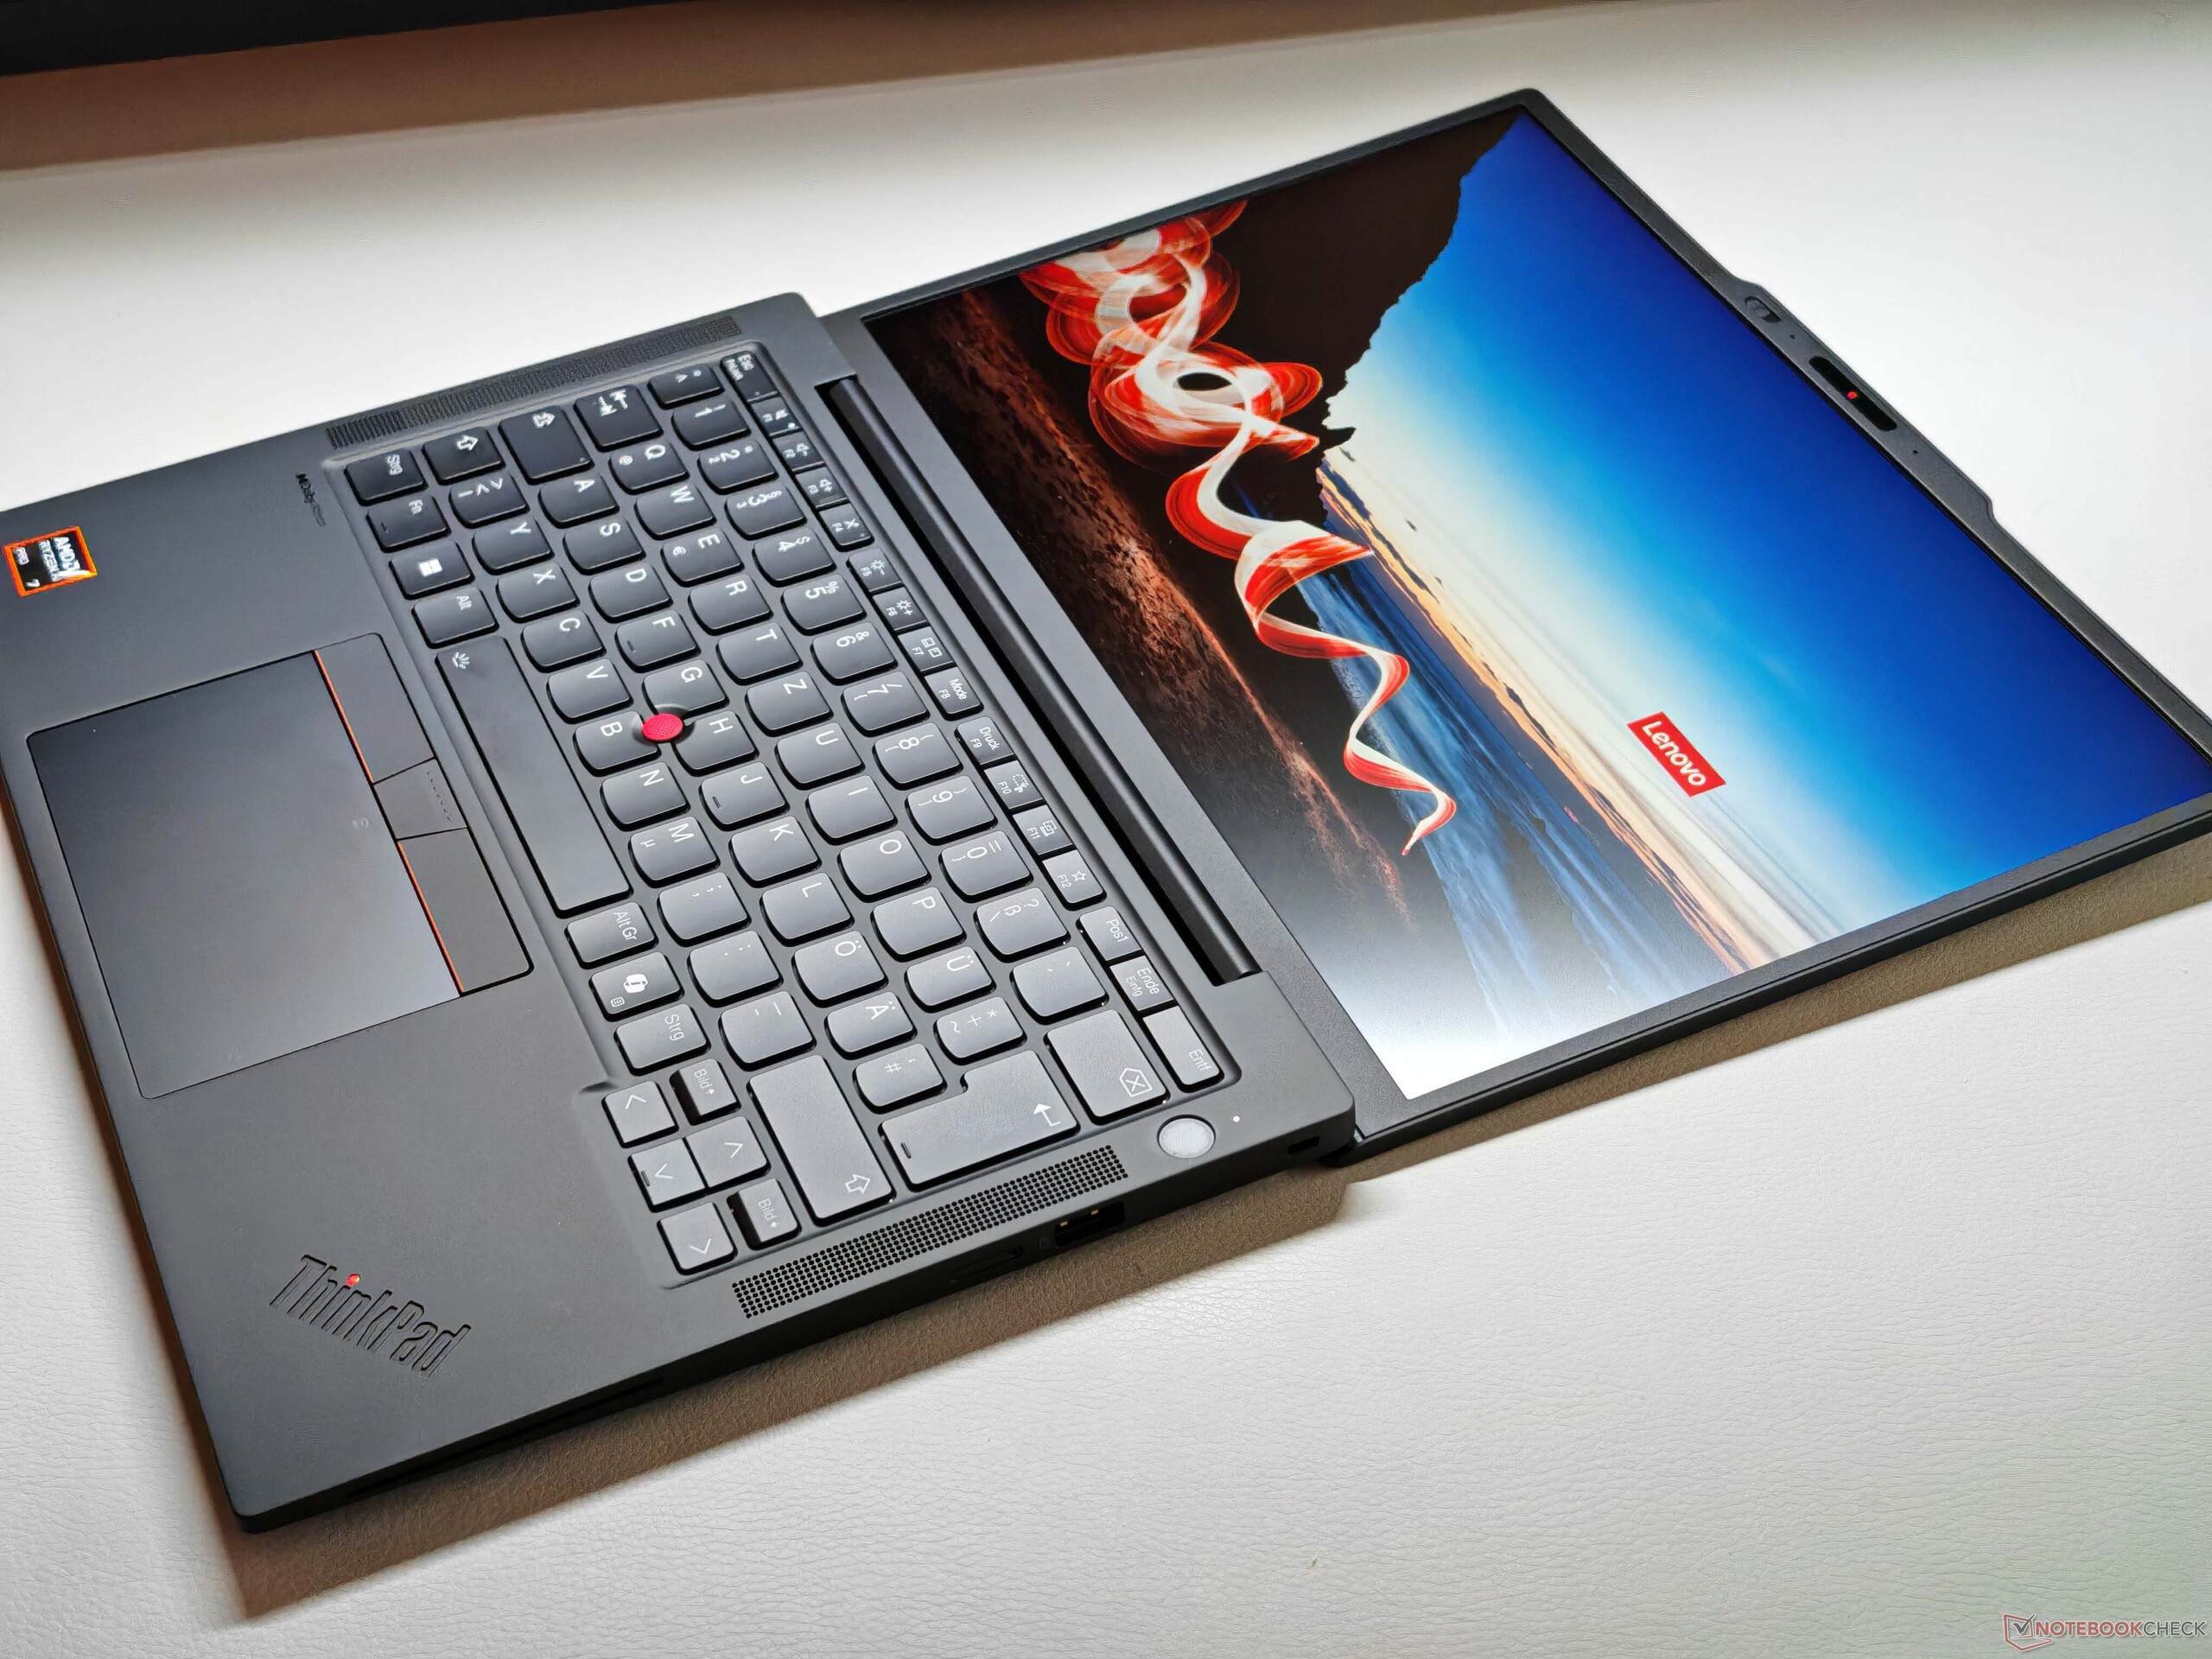
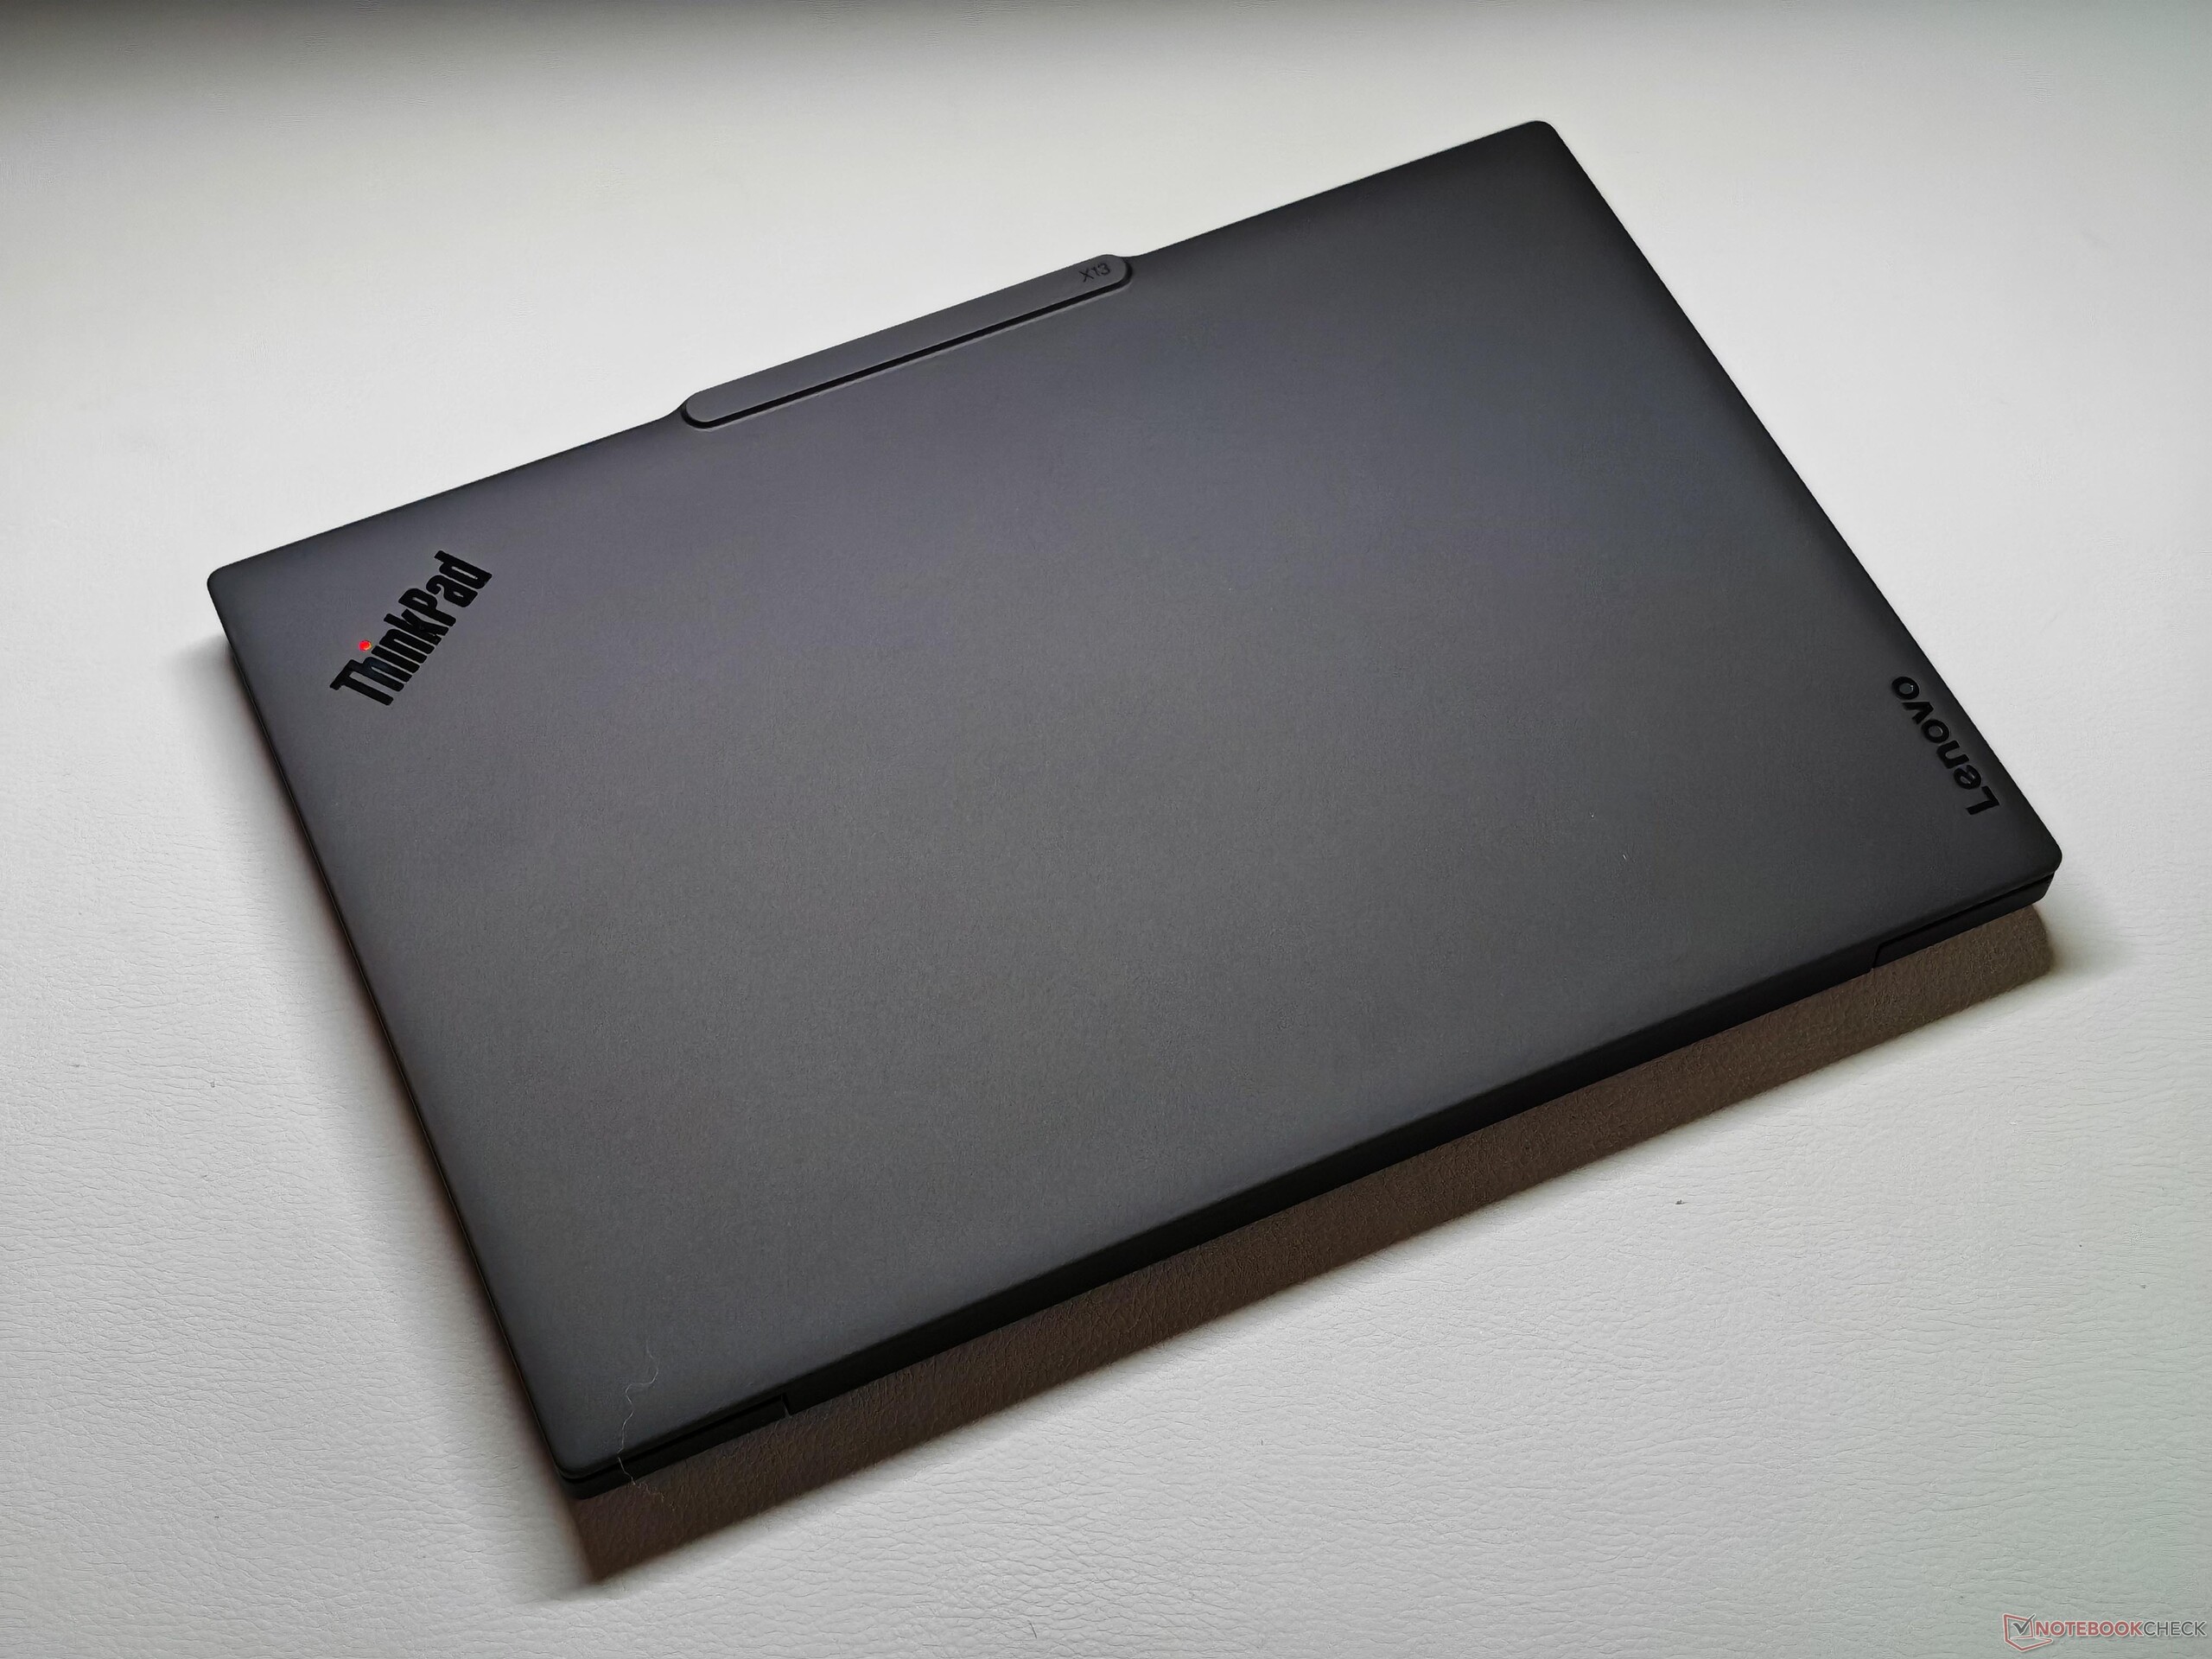
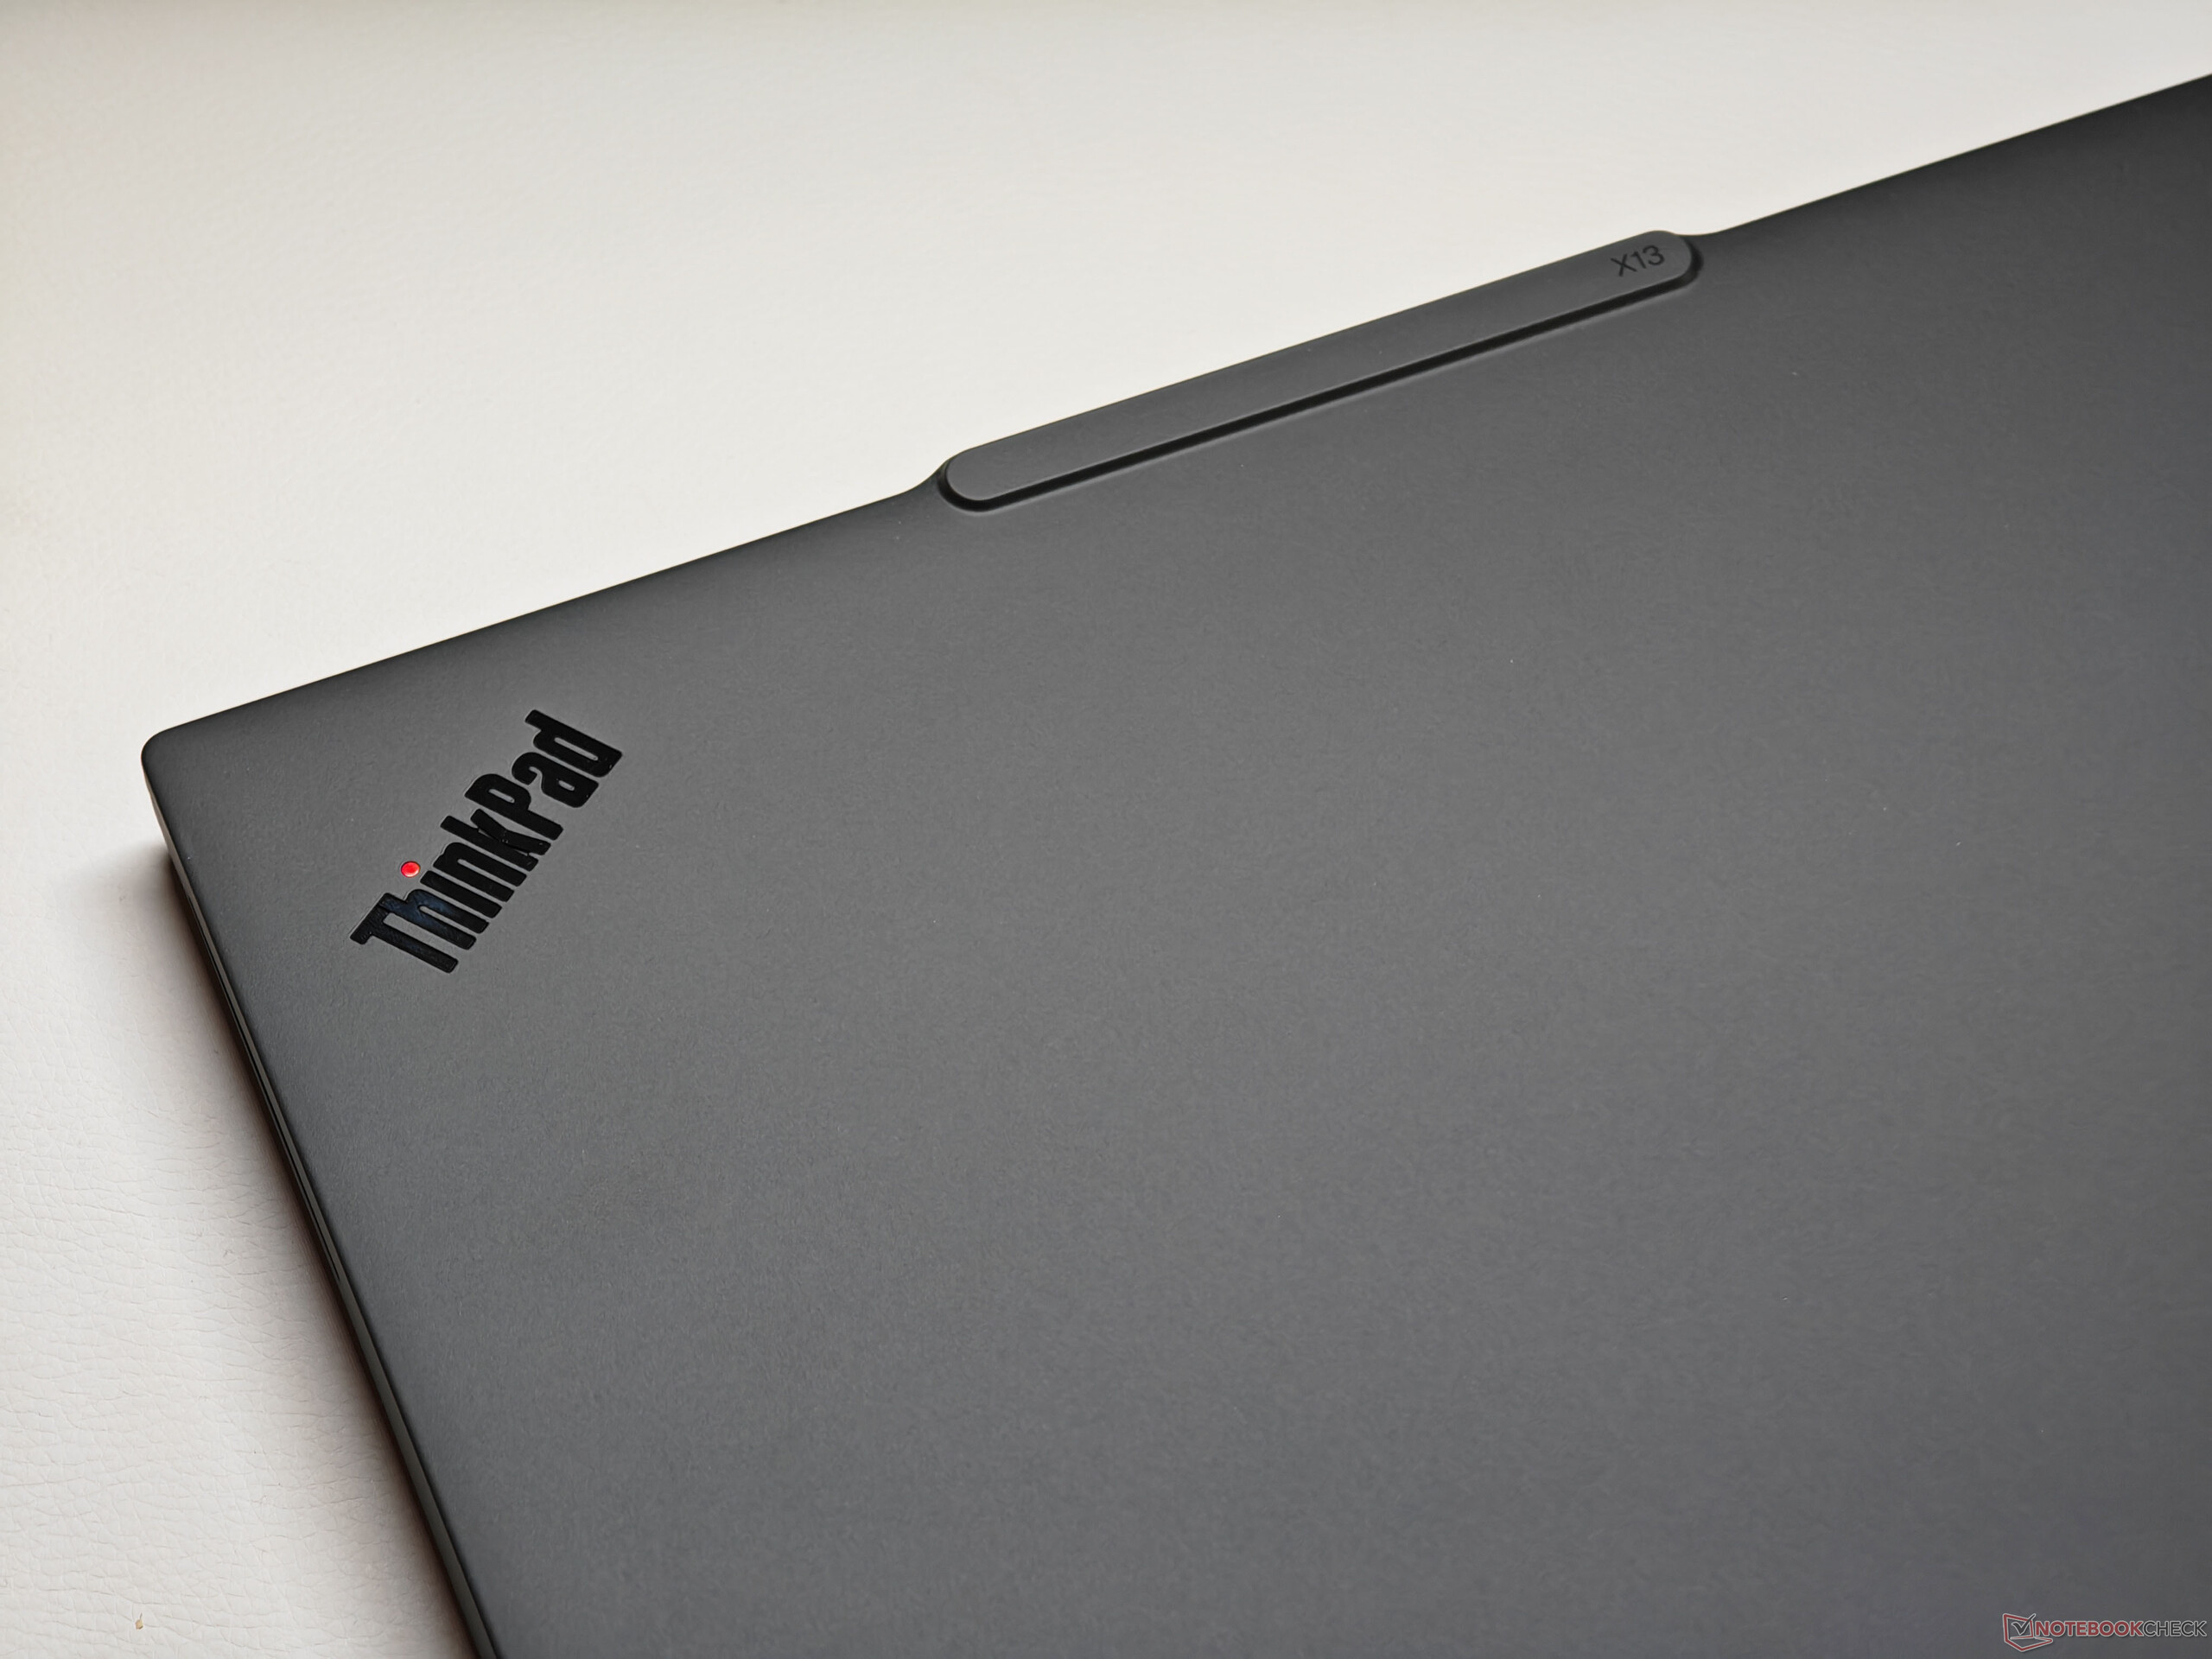
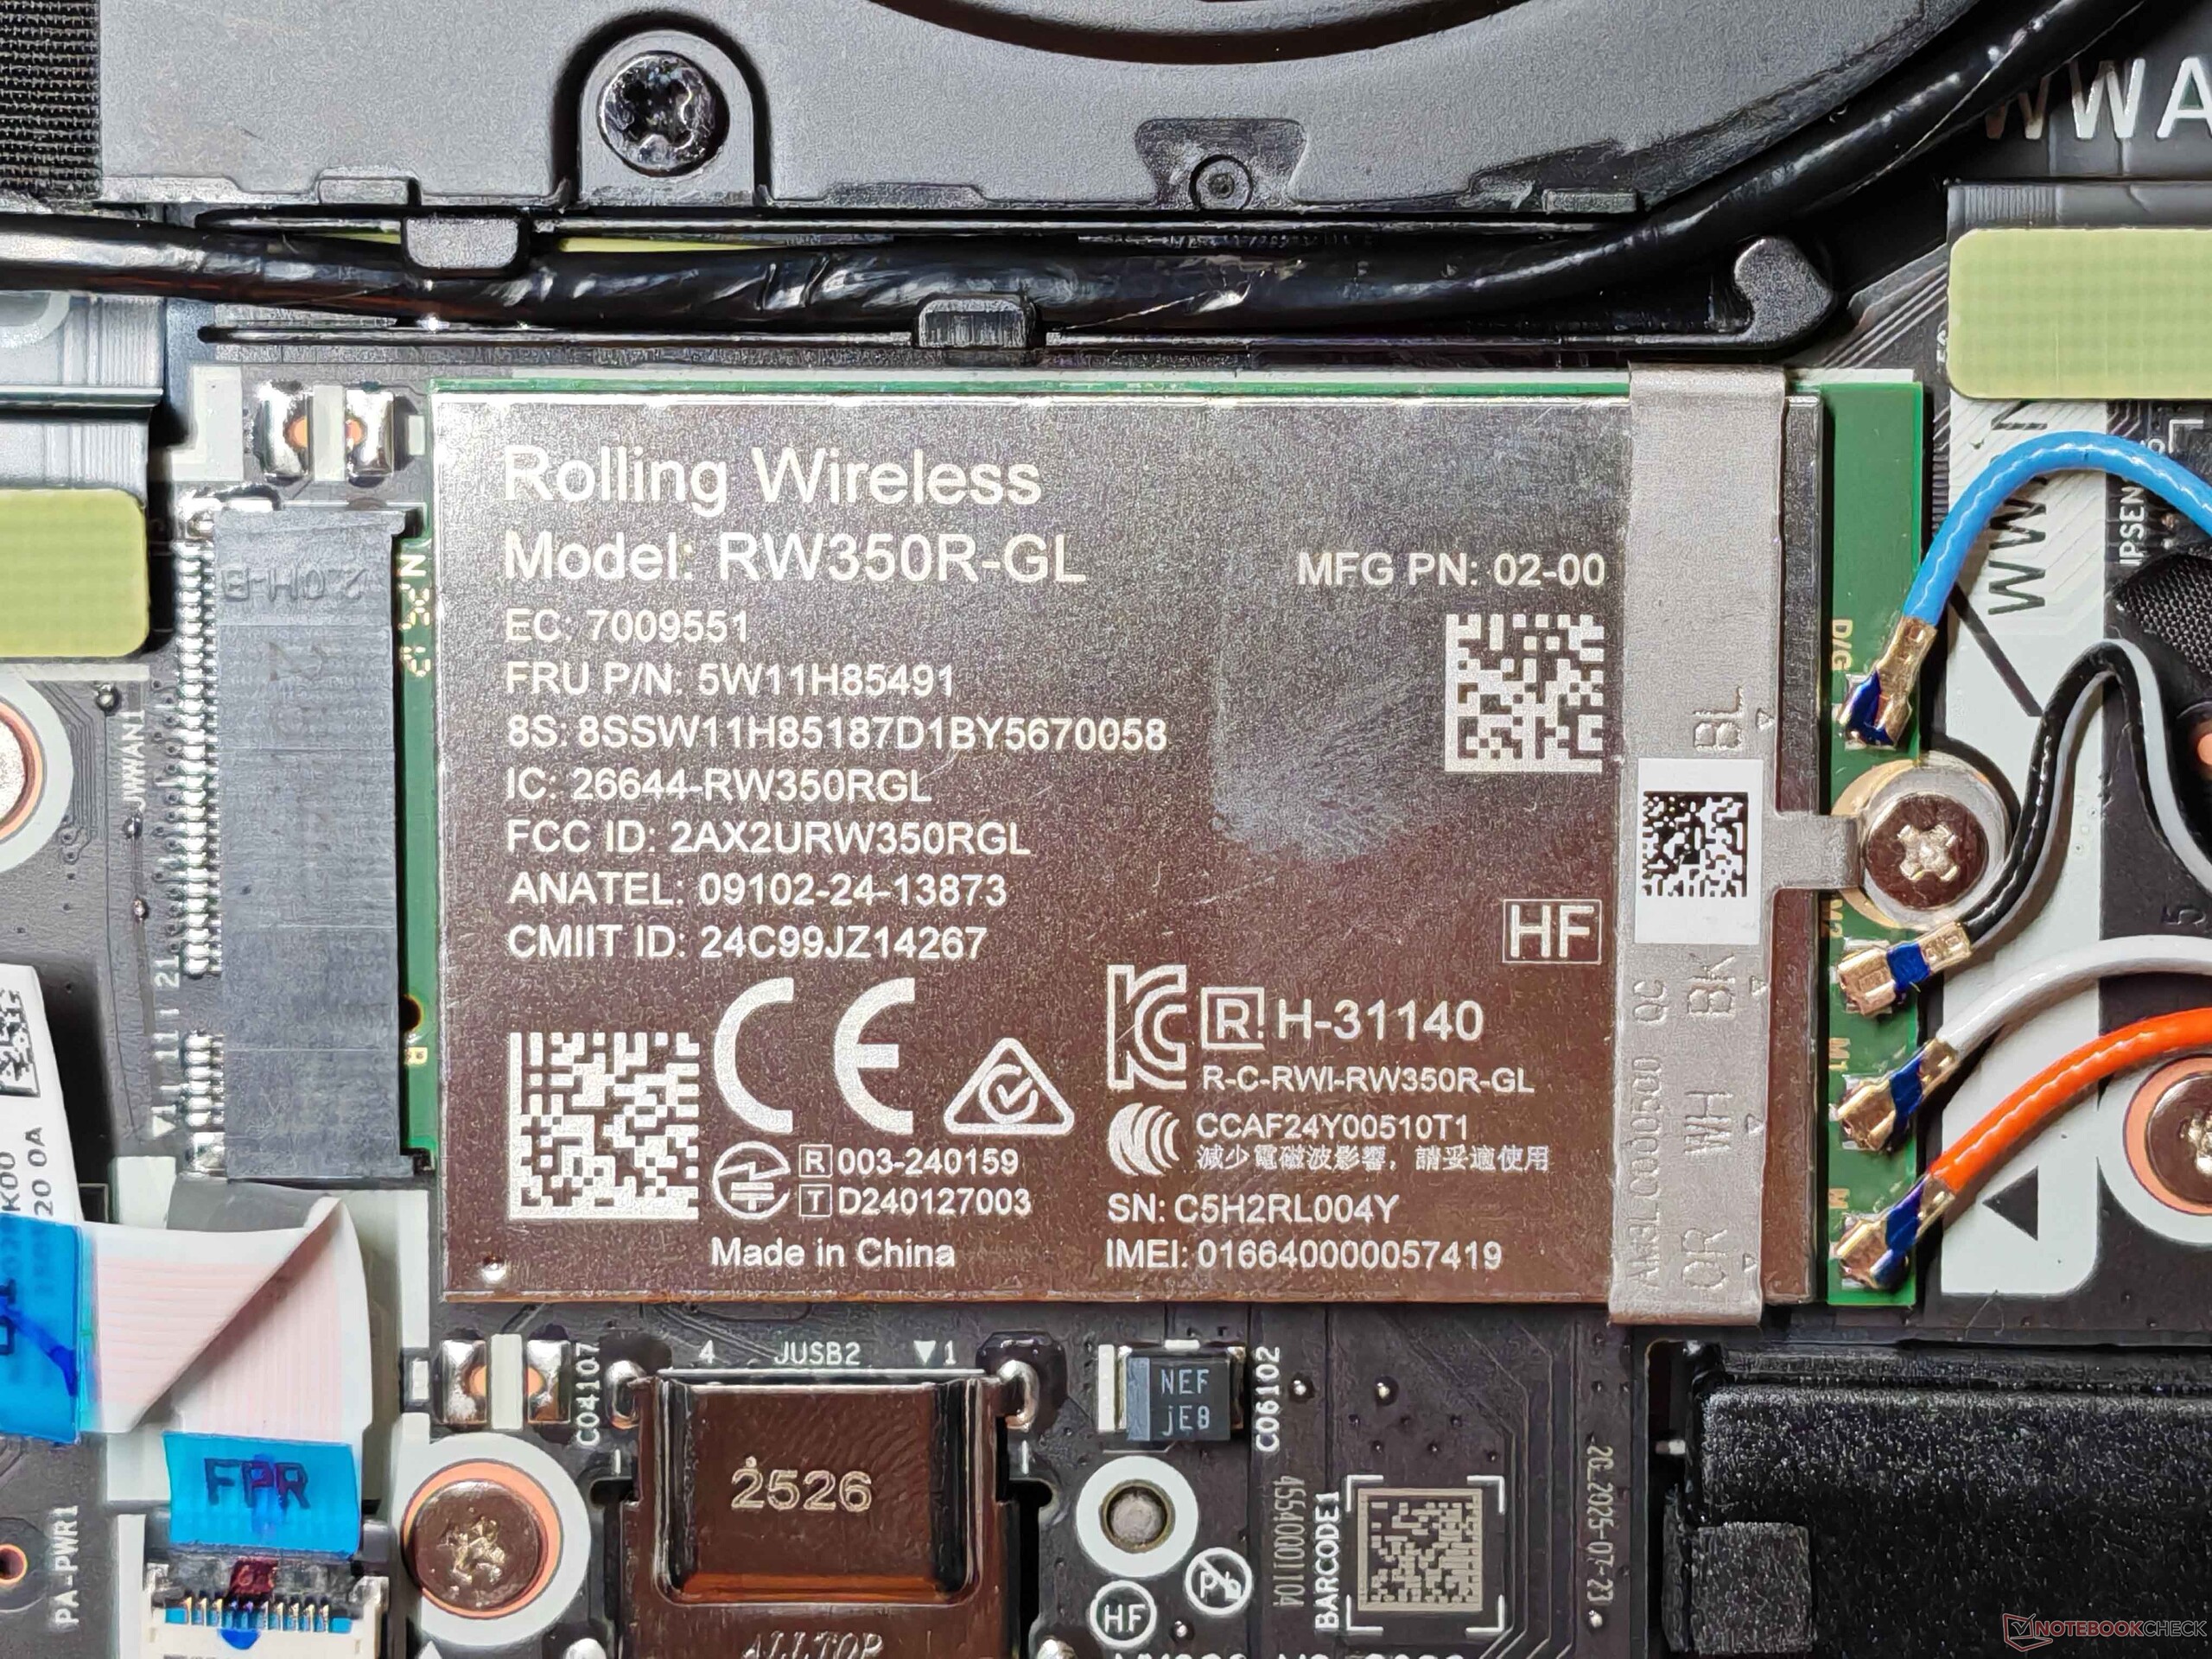
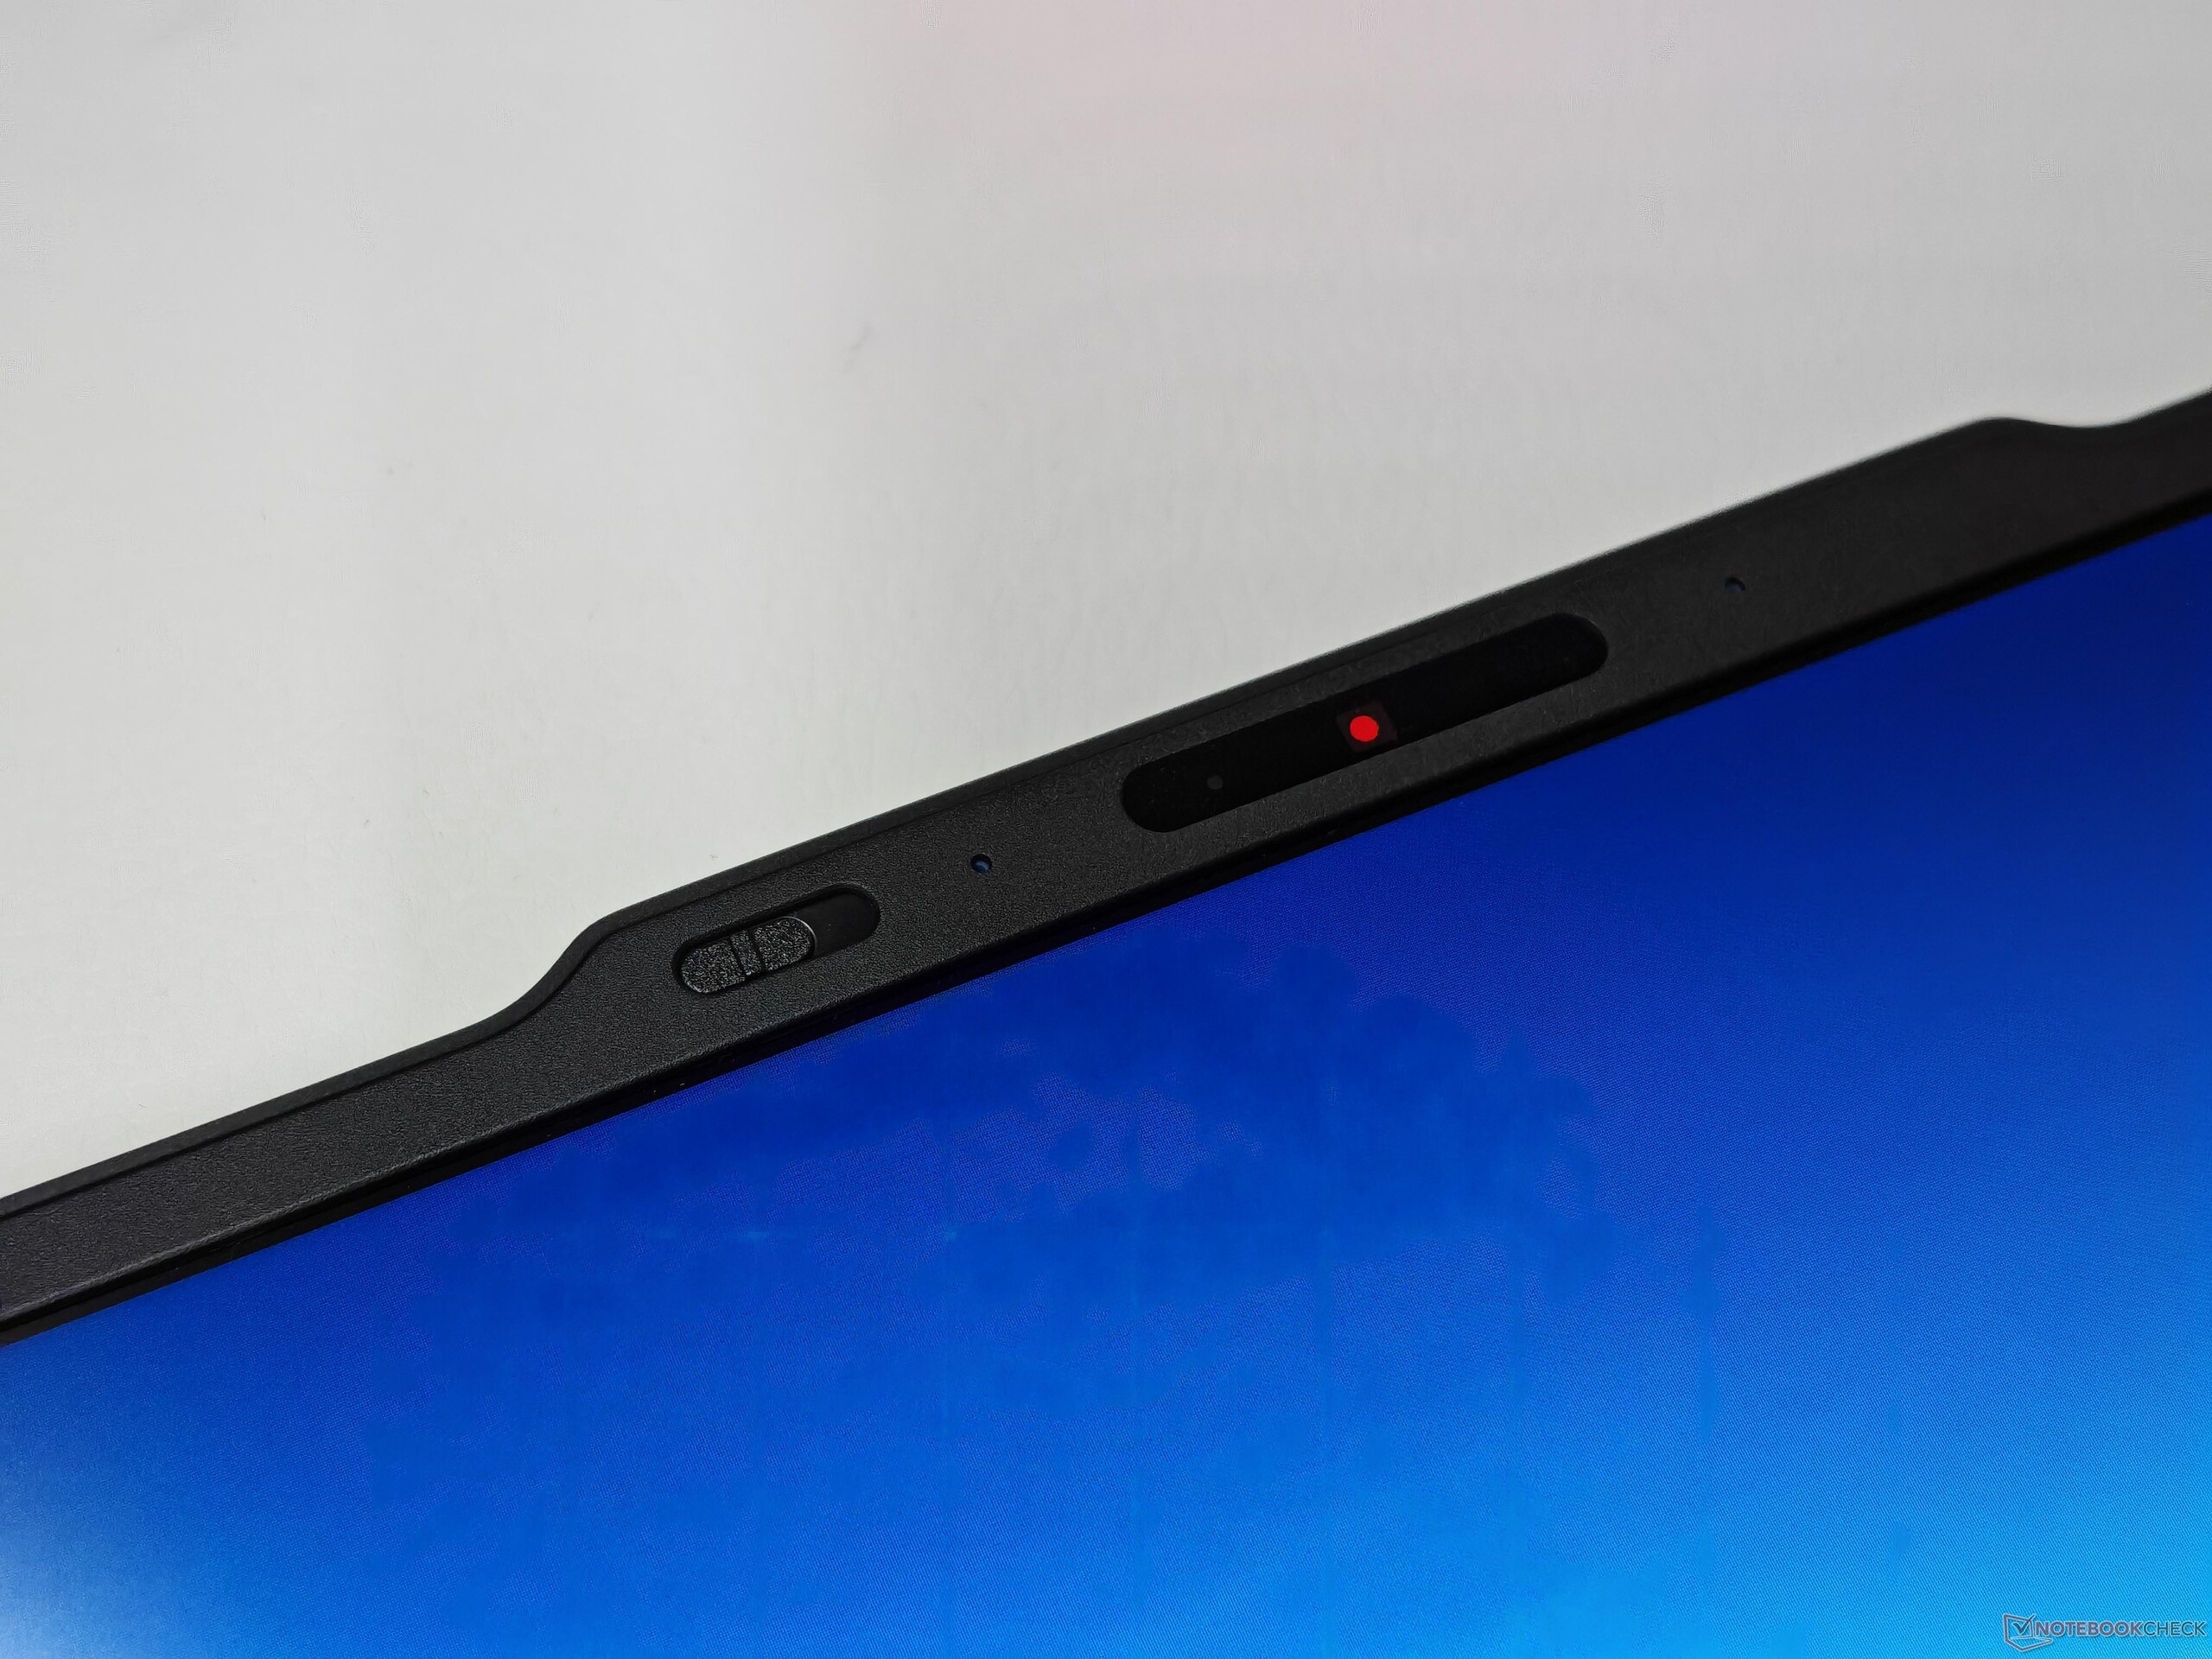
Visually, the new X13 G6 is unmistakably a ThinkPad and follows the current design language, including the rather prominent camera housing. When handling the device, its compact size and low weight are immediately noticeable. The surfaces have a slightly textured finish that feels premium, is not overly prone to fingerprints and is relatively easy to clean. The lid is made of carbon-fibre reinforced plastic and the base unit is aluminium. However, the focus on mobility does have an impact on overall rigidity. The base unit can be pressed in slightly in the central area and produces faint creaking noises when twisted. The lid itself is reasonably sturdy, but the hinges are the main issue. The maximum opening angle is 180 degrees, yet the hinges are a little too loose and wobble far too much. The bottom cover is secured with only four screws and is easy to remove. The fan, battery, WWAN module and SSD are serviceable, although the RAM and WLAN module are soldered.
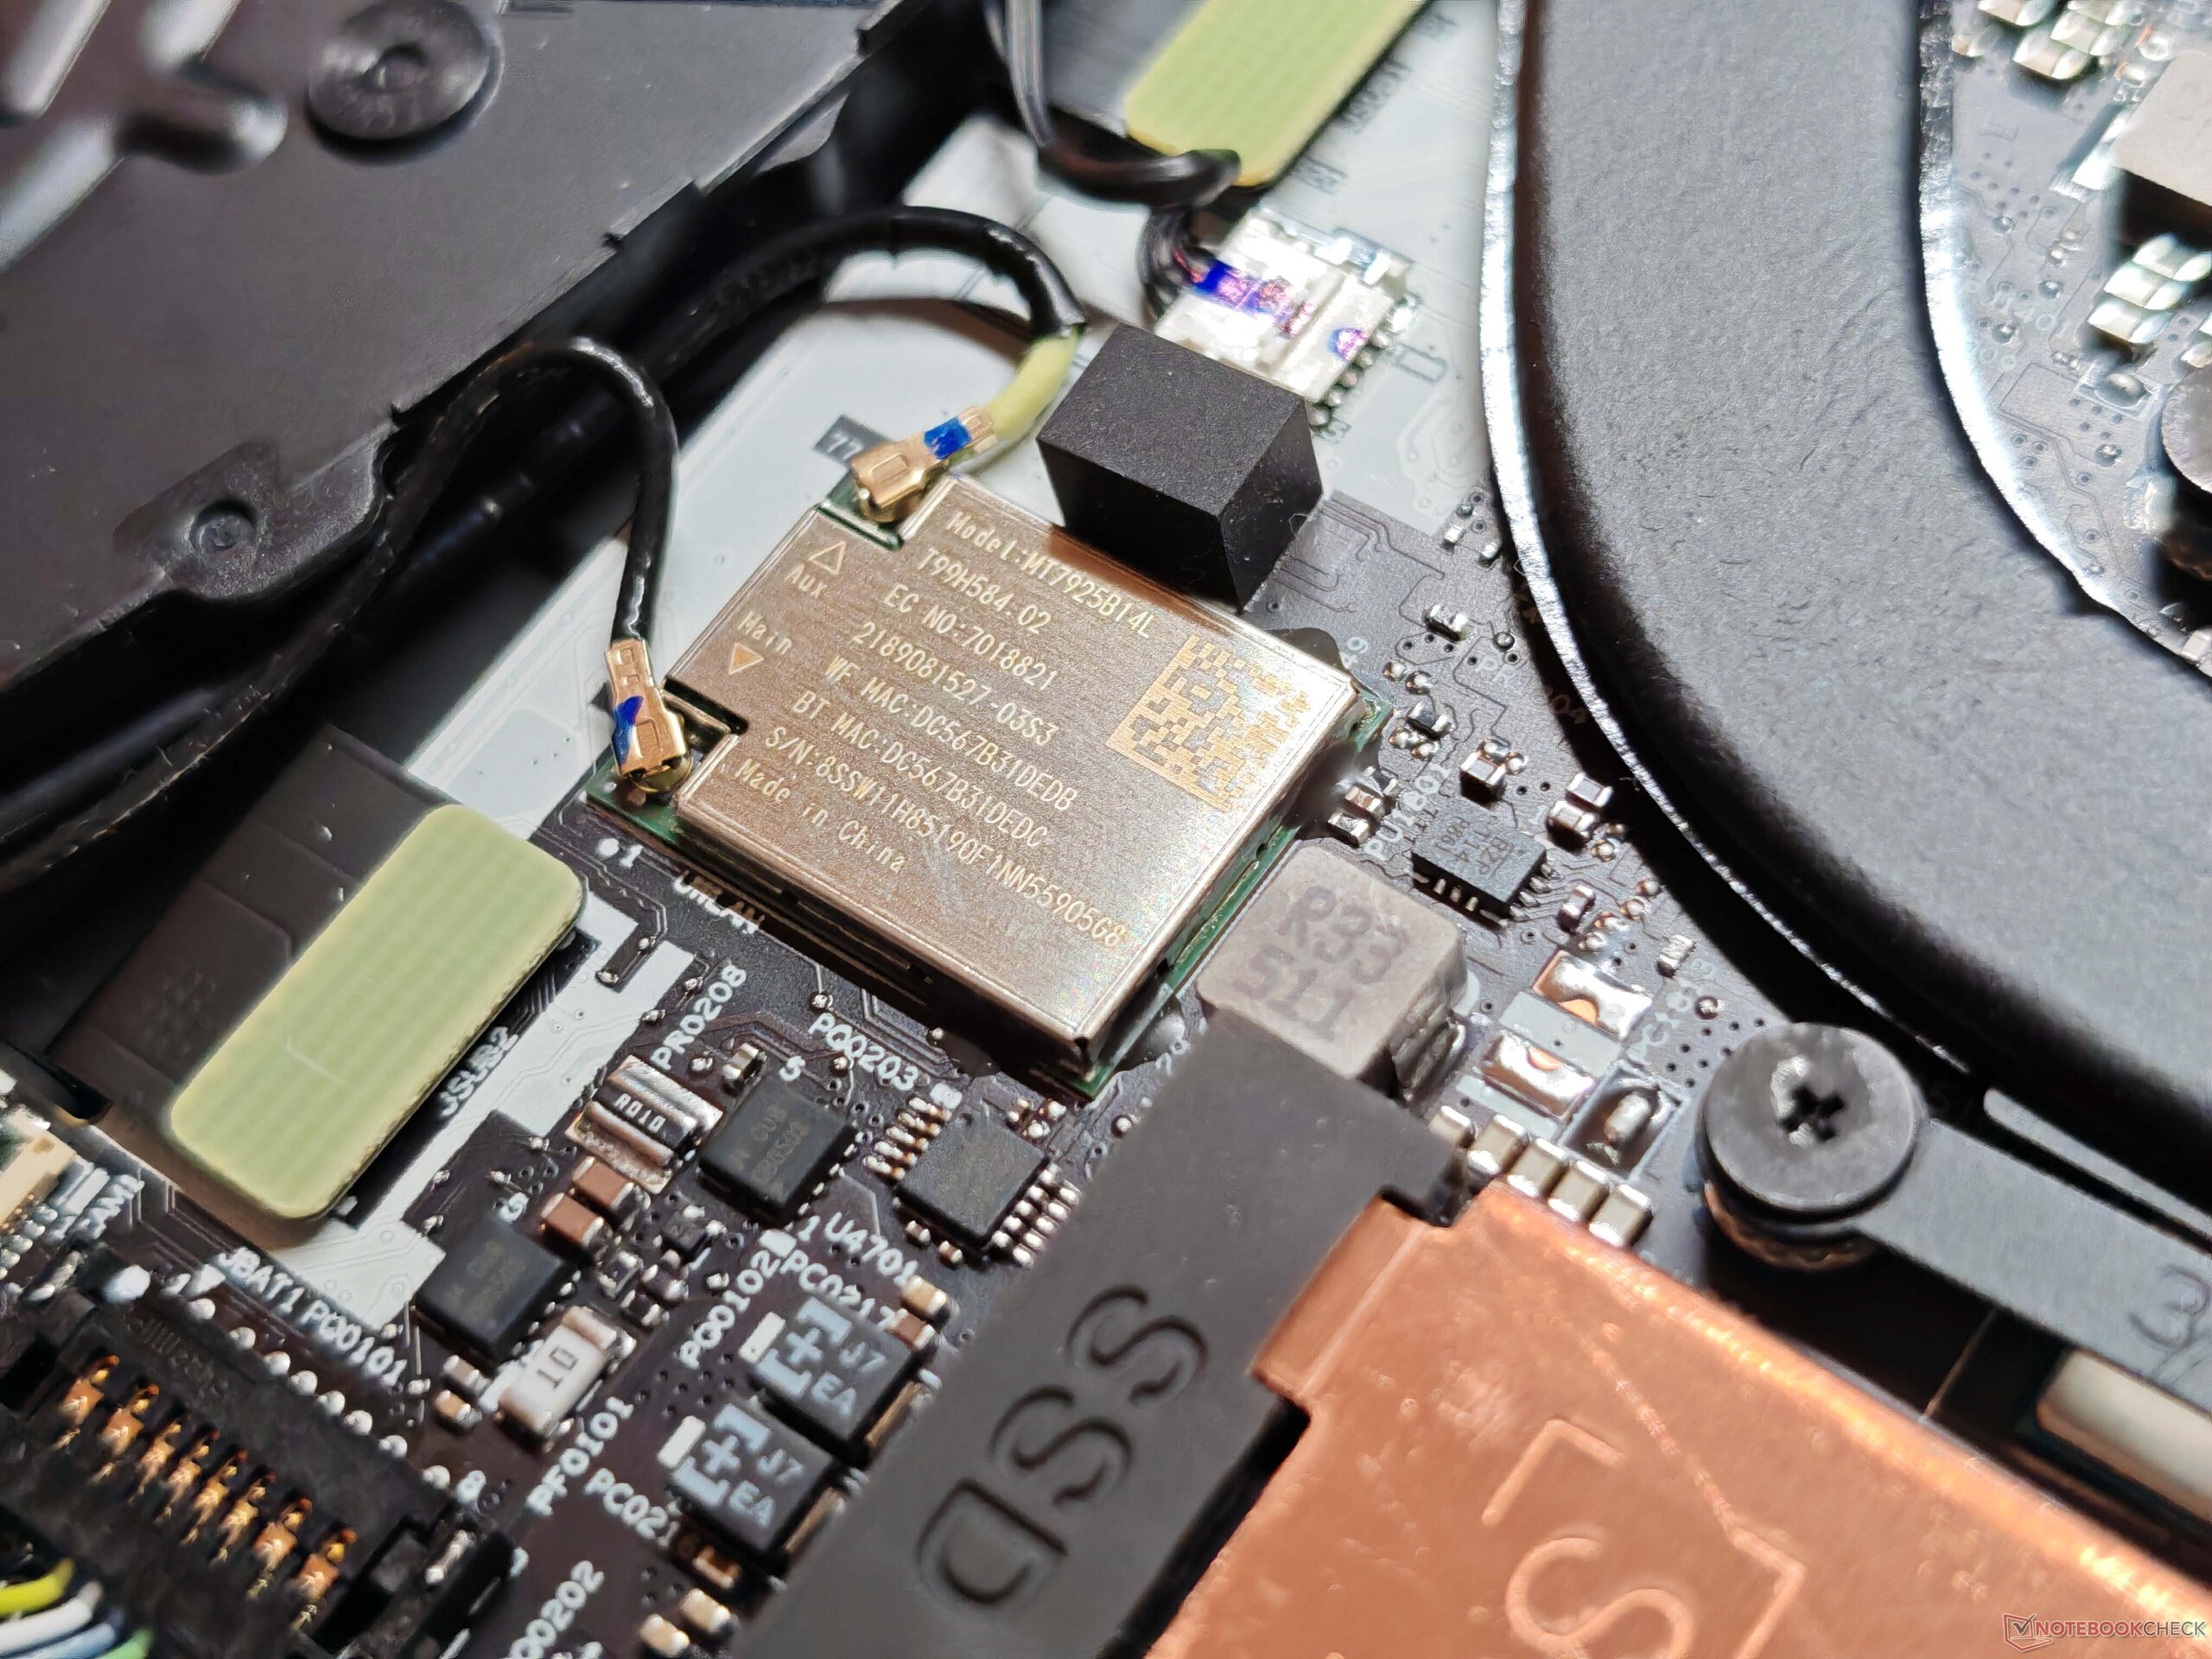
In terms of ports, there is now only a single USB-A connector on the right side, while the two USB-C ports including Thunderbolt 4 sit on the left. The WLAN module supports Wi-Fi 7 and offers very high and stable transfer rates. The 5 MP camera (including IR) delivers acceptable image quality and features a mechanical shutter.


| Networking | |
| Lenovo ThinkPad X13 G6 AMD | |
| iperf3 transmit AXE11000 | |
| iperf3 receive AXE11000 | |
| Dell Pro 13 Premium PA13250 | |
| iperf3 transmit AXE11000 | |
| iperf3 receive AXE11000 | |
| iperf3 transmit AXE11000 6GHz | |
| iperf3 receive AXE11000 6GHz | |
| MSI Prestige 13 AI Plus Evo A2VMG | |
| iperf3 transmit AXE11000 | |
| iperf3 receive AXE11000 | |
| iperf3 transmit AXE11000 6GHz | |
| iperf3 receive AXE11000 6GHz | |
| Microsoft Surface Laptop 7 13.8 Copilot+ | |
| iperf3 transmit AXE11000 | |
| iperf3 receive AXE11000 | |
| iperf3 transmit AXE11000 6GHz | |
| iperf3 receive AXE11000 6GHz | |
| Lenovo ThinkPad X1 Carbon Gen 13 21NS0010GE | |
| iperf3 transmit AXE11000 | |
| iperf3 receive AXE11000 | |
| iperf3 transmit AXE11000 6GHz | |
| iperf3 receive AXE11000 6GHz | |


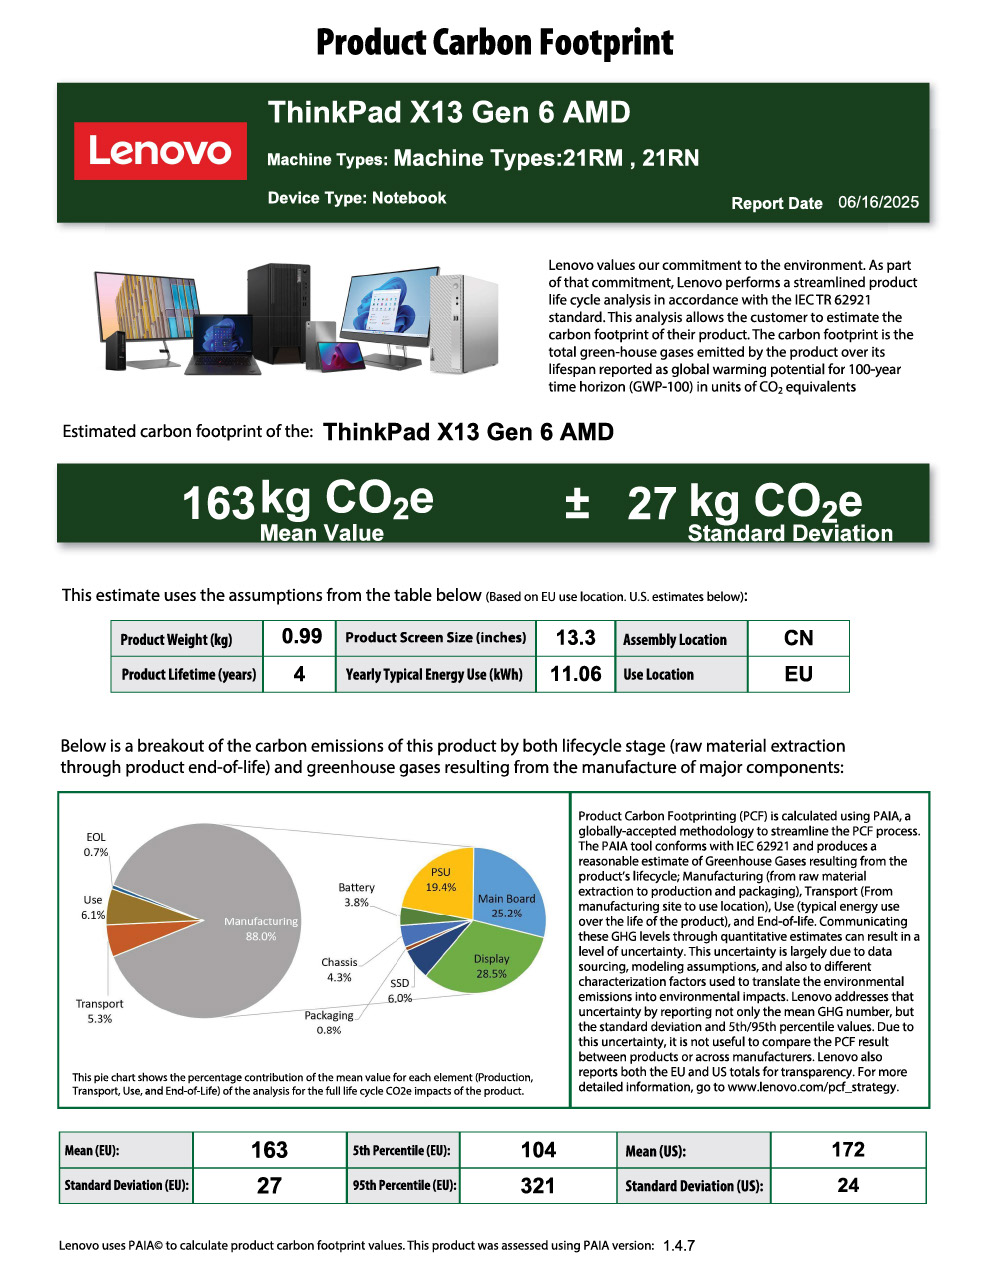
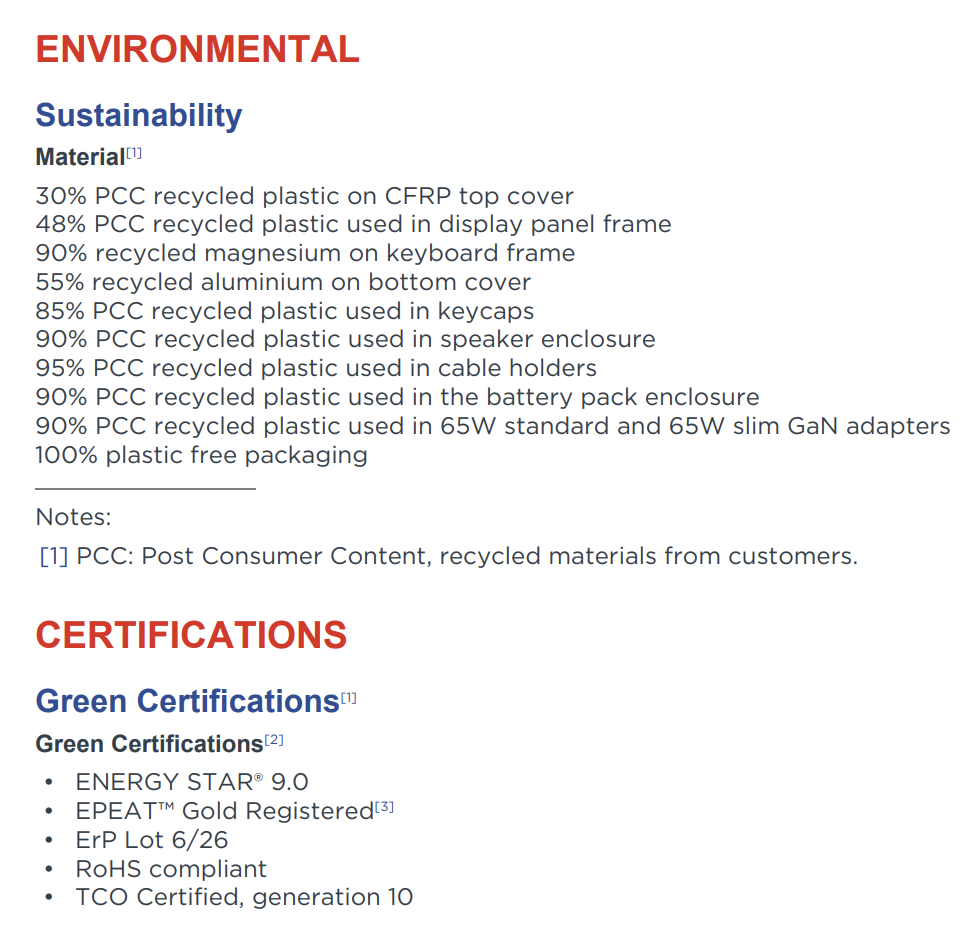
Sustainability
The ThinkPad X13 G6 meets several environmental standards, including Energy Star, and Lenovo provides extensive information on the device's carbon footprint and the use of recycled materials. The packaging is fully recyclable and contains no plastics.
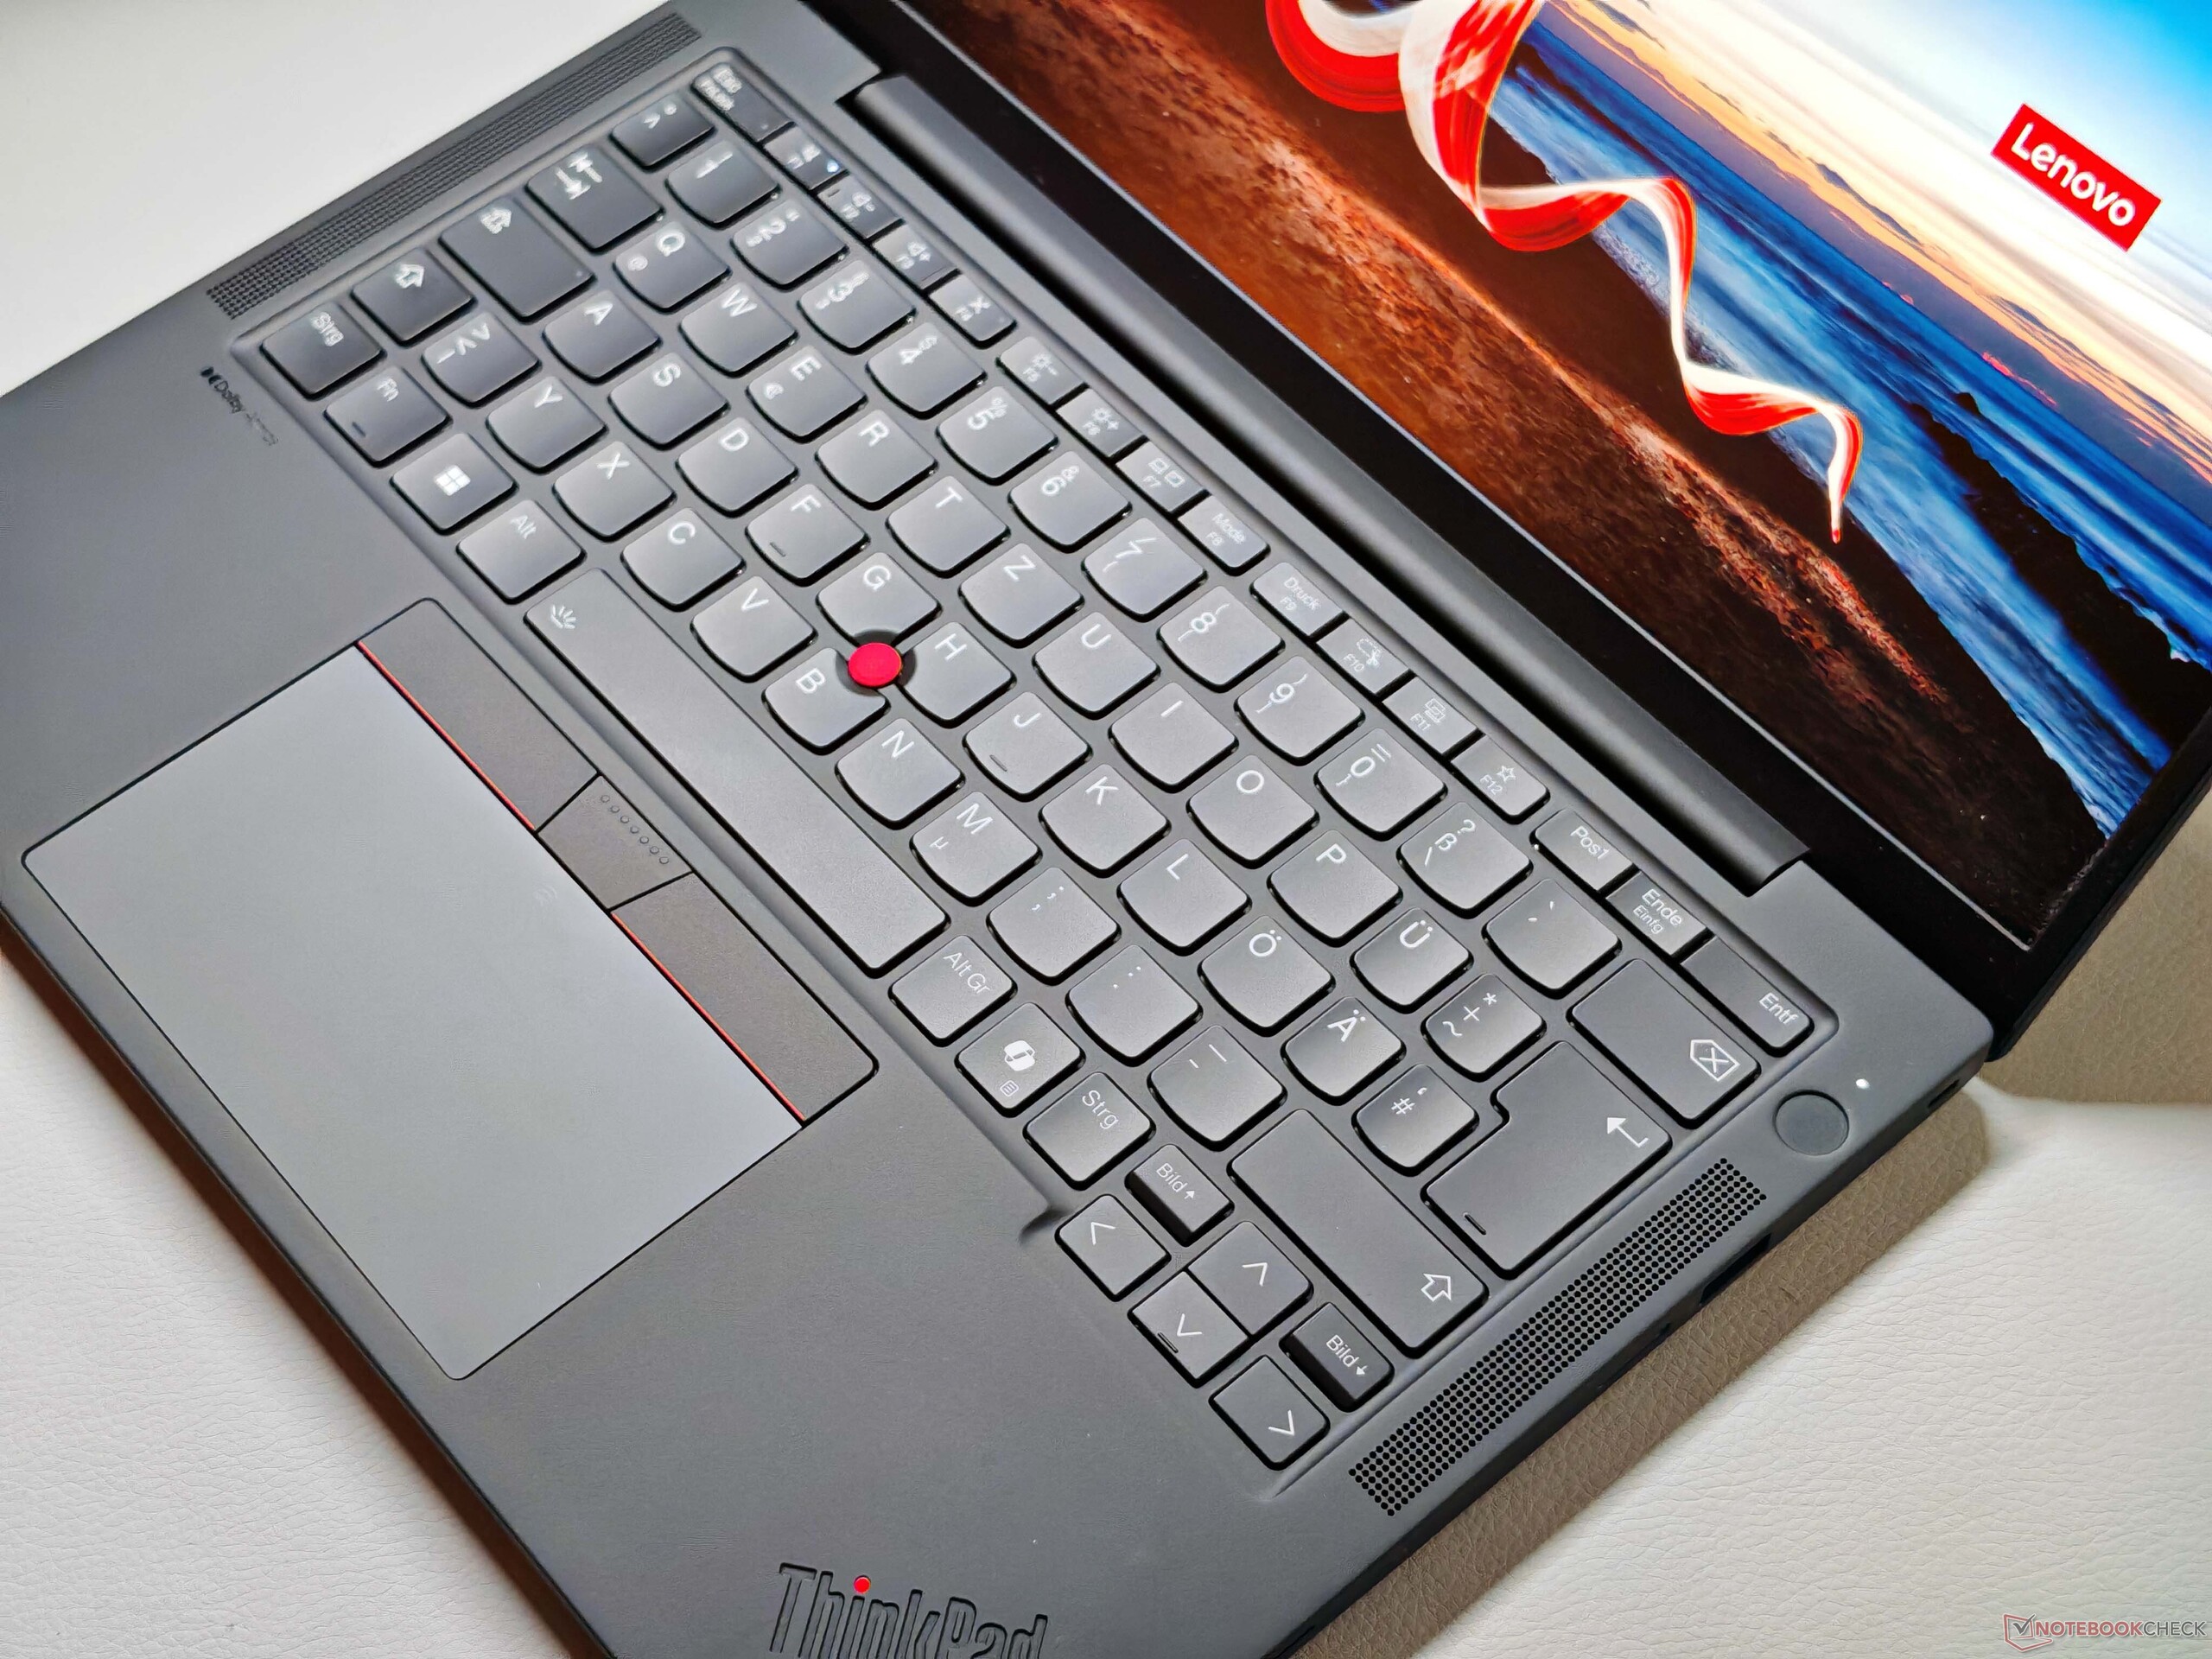
Input devices – Weak keyboard
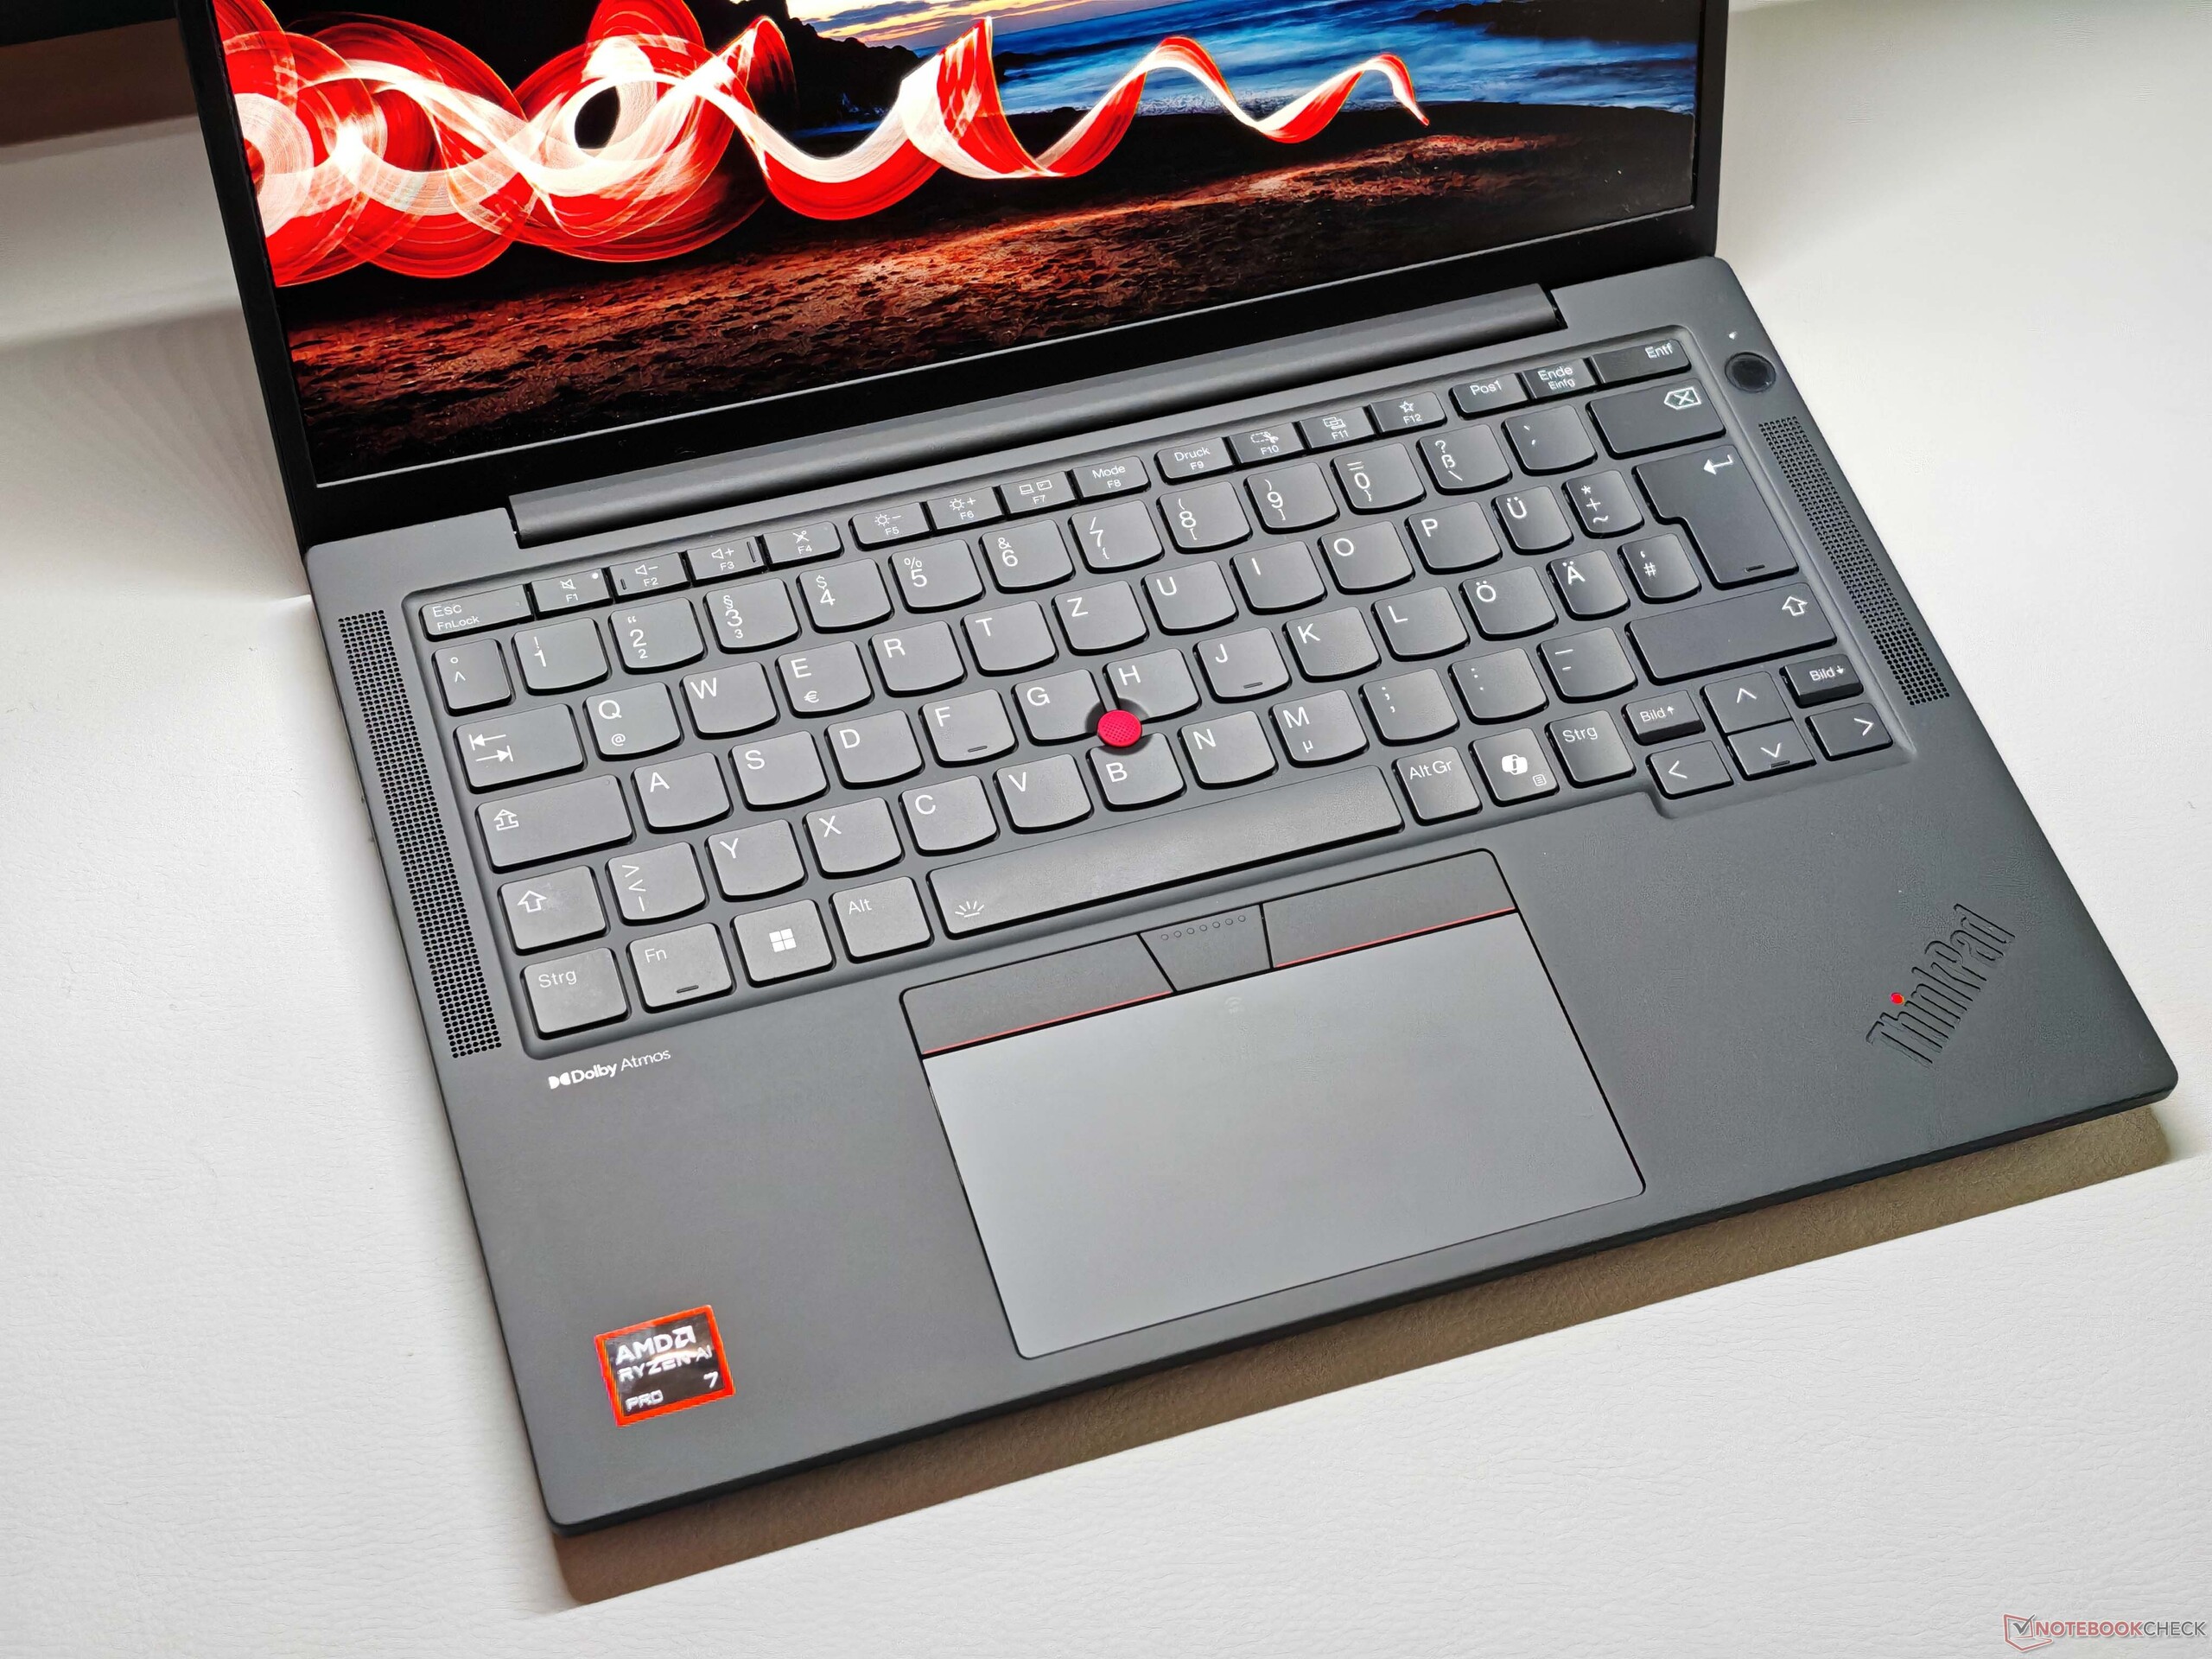
The backlit keyboard offers a travel of 1.5 mm for most keys, while the G, H and B keys (which sit next to the TrackPoint) and the function keys provide only 1.35 mm. Overall, the typing experience is merely average even by modern ThinkPad standards and is no longer really comparable to older models such as the 2018 ThinkPad X1 Carbon G6. The key presses are precise, but the overall typing feel is not particularly comfortable.


The TrackPoint works well and the associated buttons offer a satisfying click. The relatively small ClickPad (11.5 × 7.4 cm) performs as expected and provides good gliding properties, although the mechanical clicks in the lower area are a little loud.
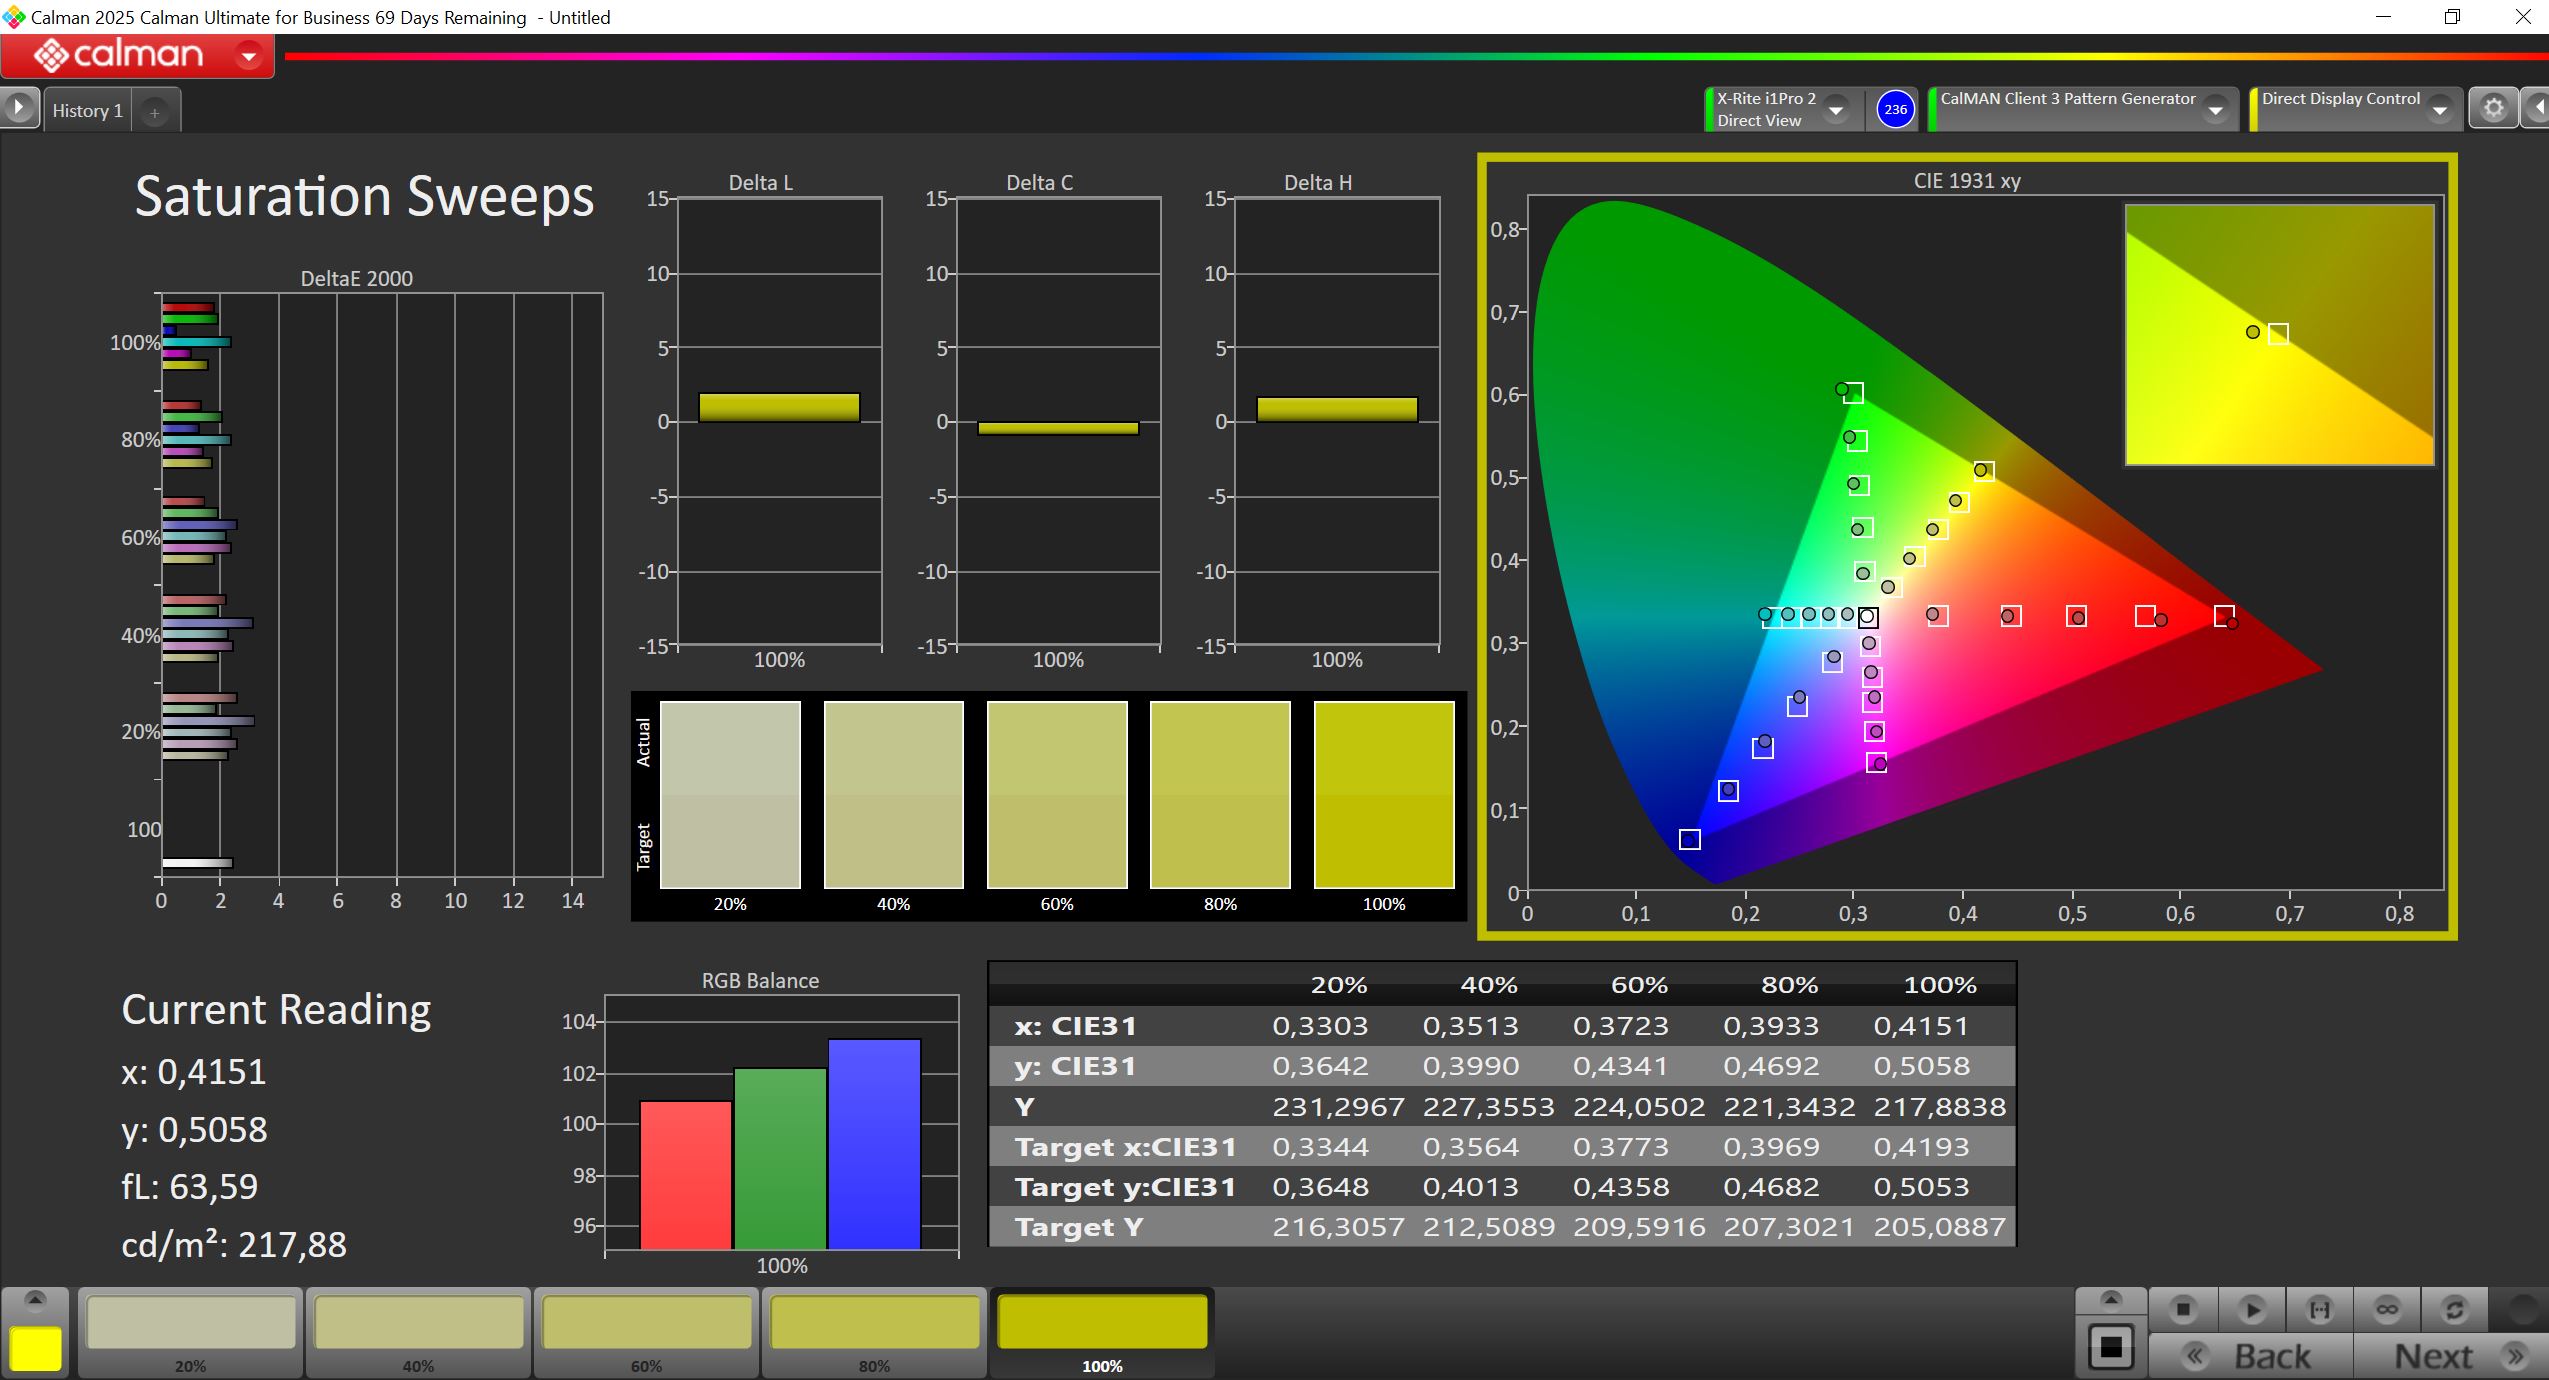
Display - LowPower IPS

Mobility is also the priority when it comes to the display, which is why only a matte Full HD panel in the low-power version is available (optionally with touch support). Overall image quality is decent for a business laptop, with rich colours and no graininess in bright areas. There is also no PWM flickering. However, the refresh rate is limited to 60 Hz and the response times are not particularly fast, which results in visible ghosting.
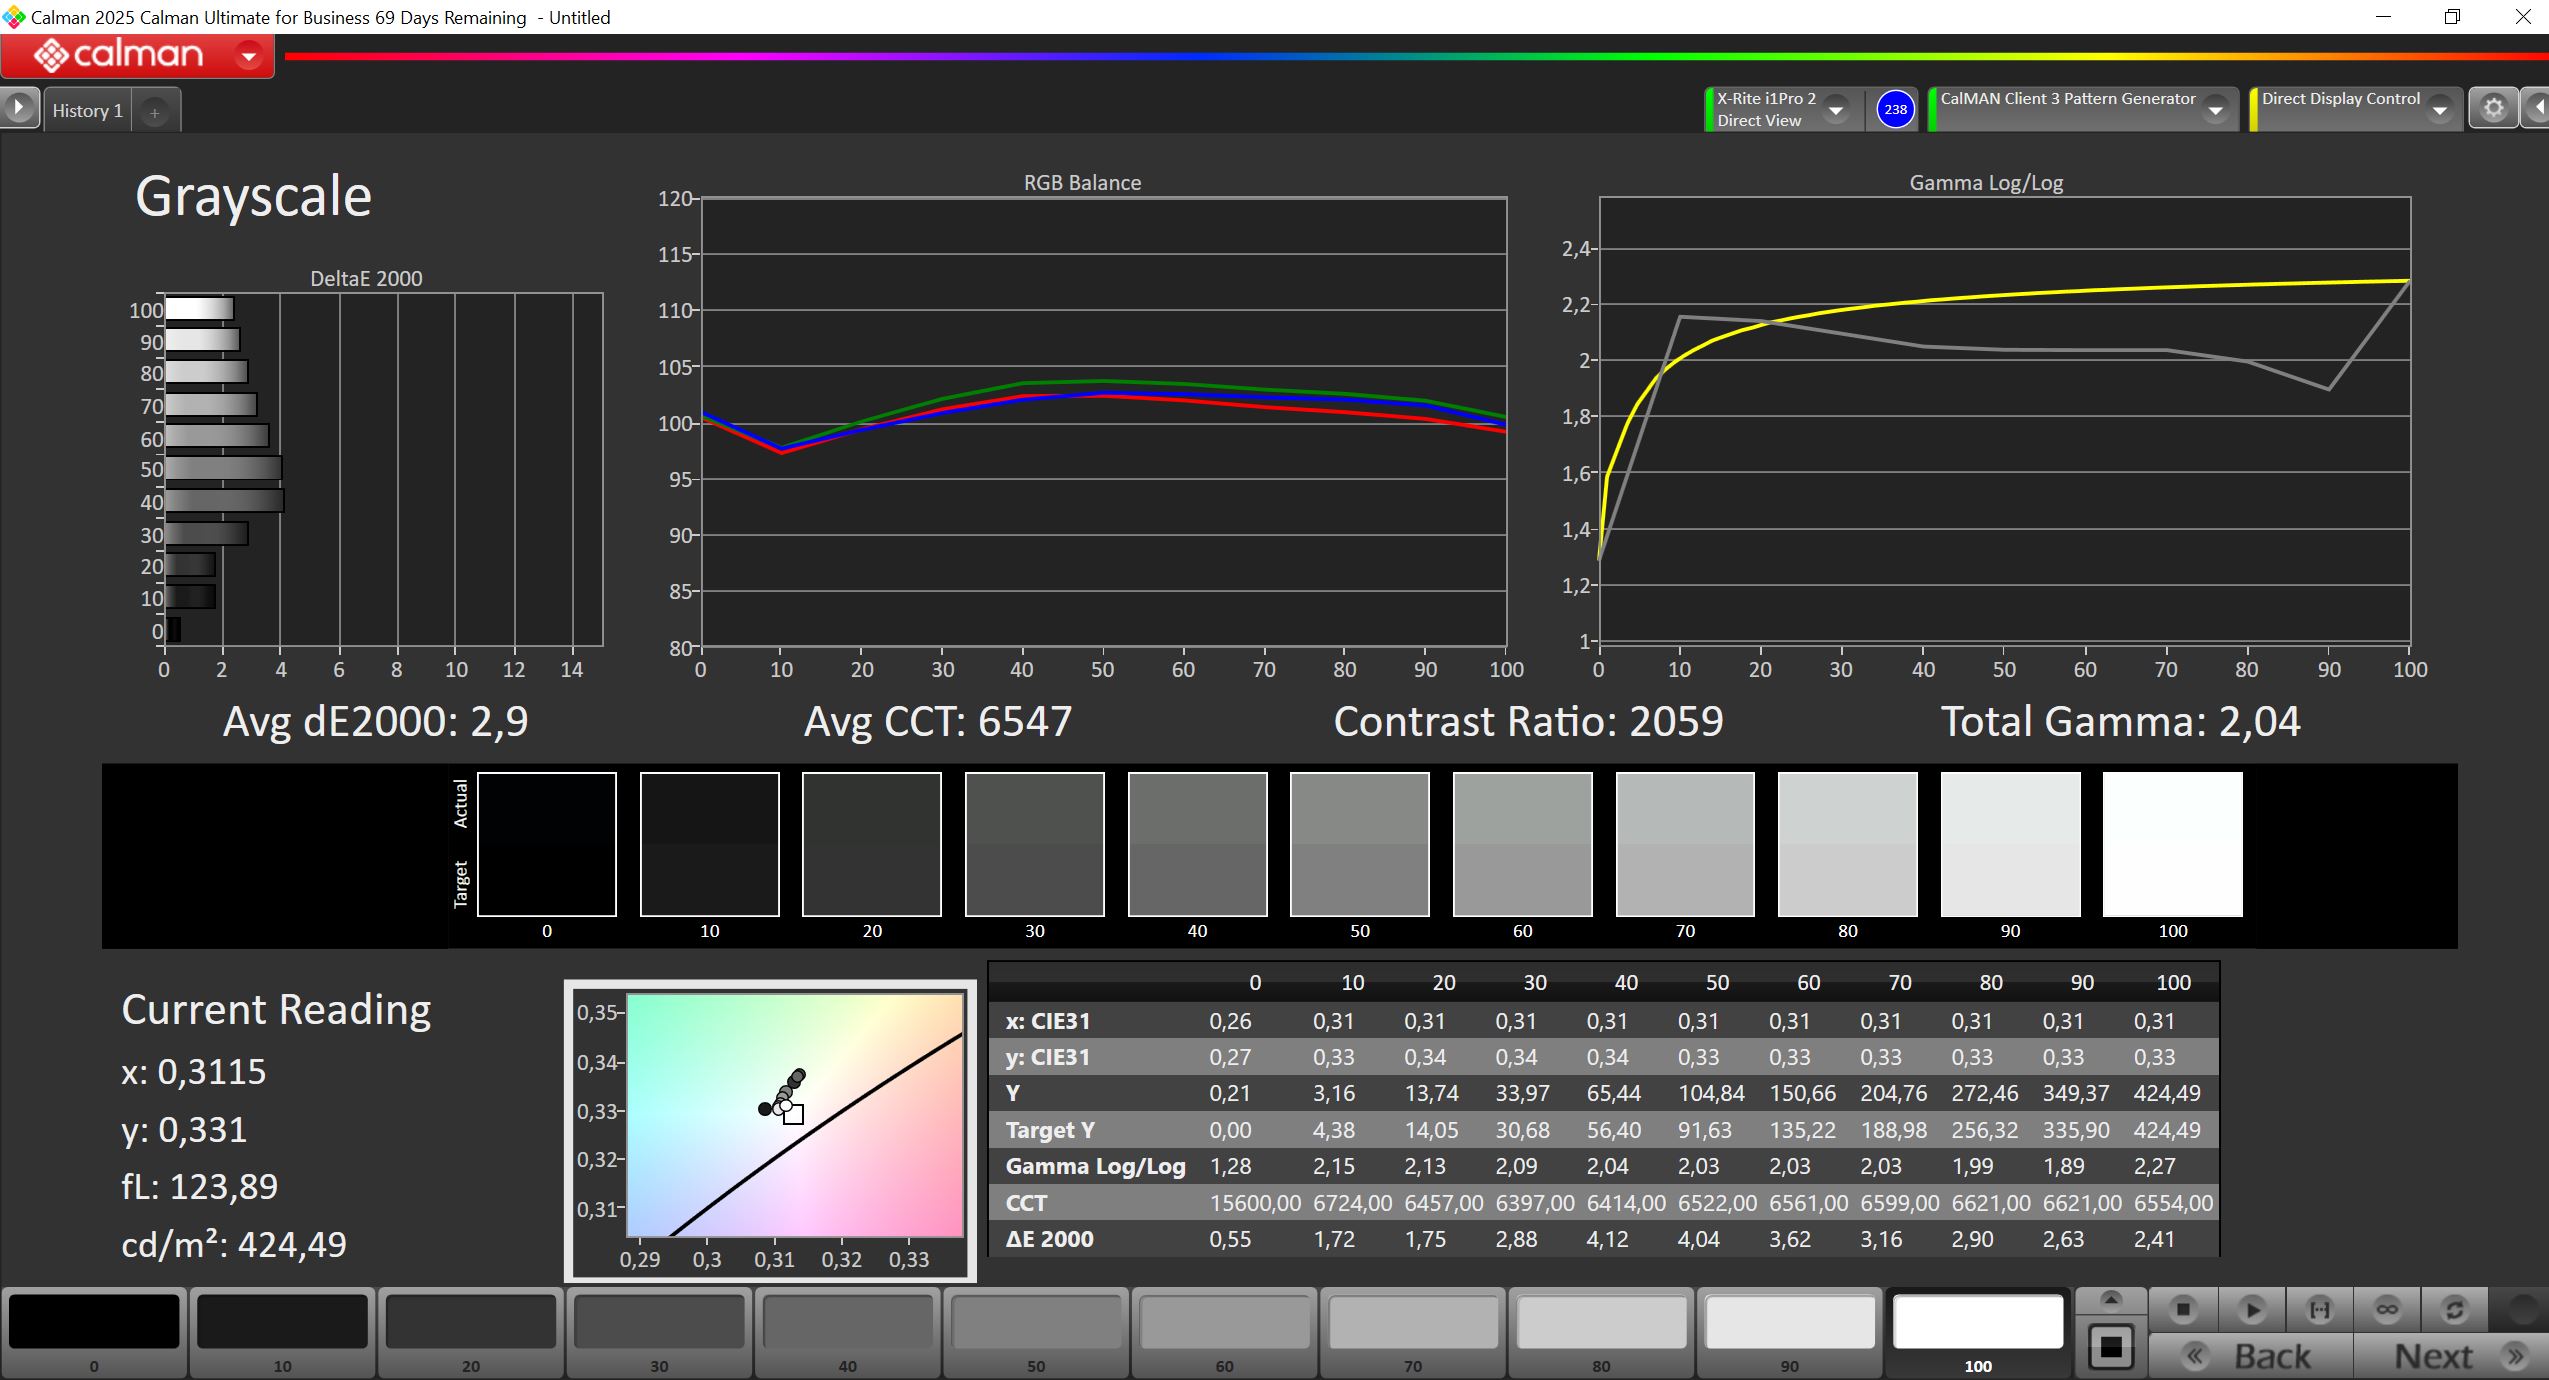
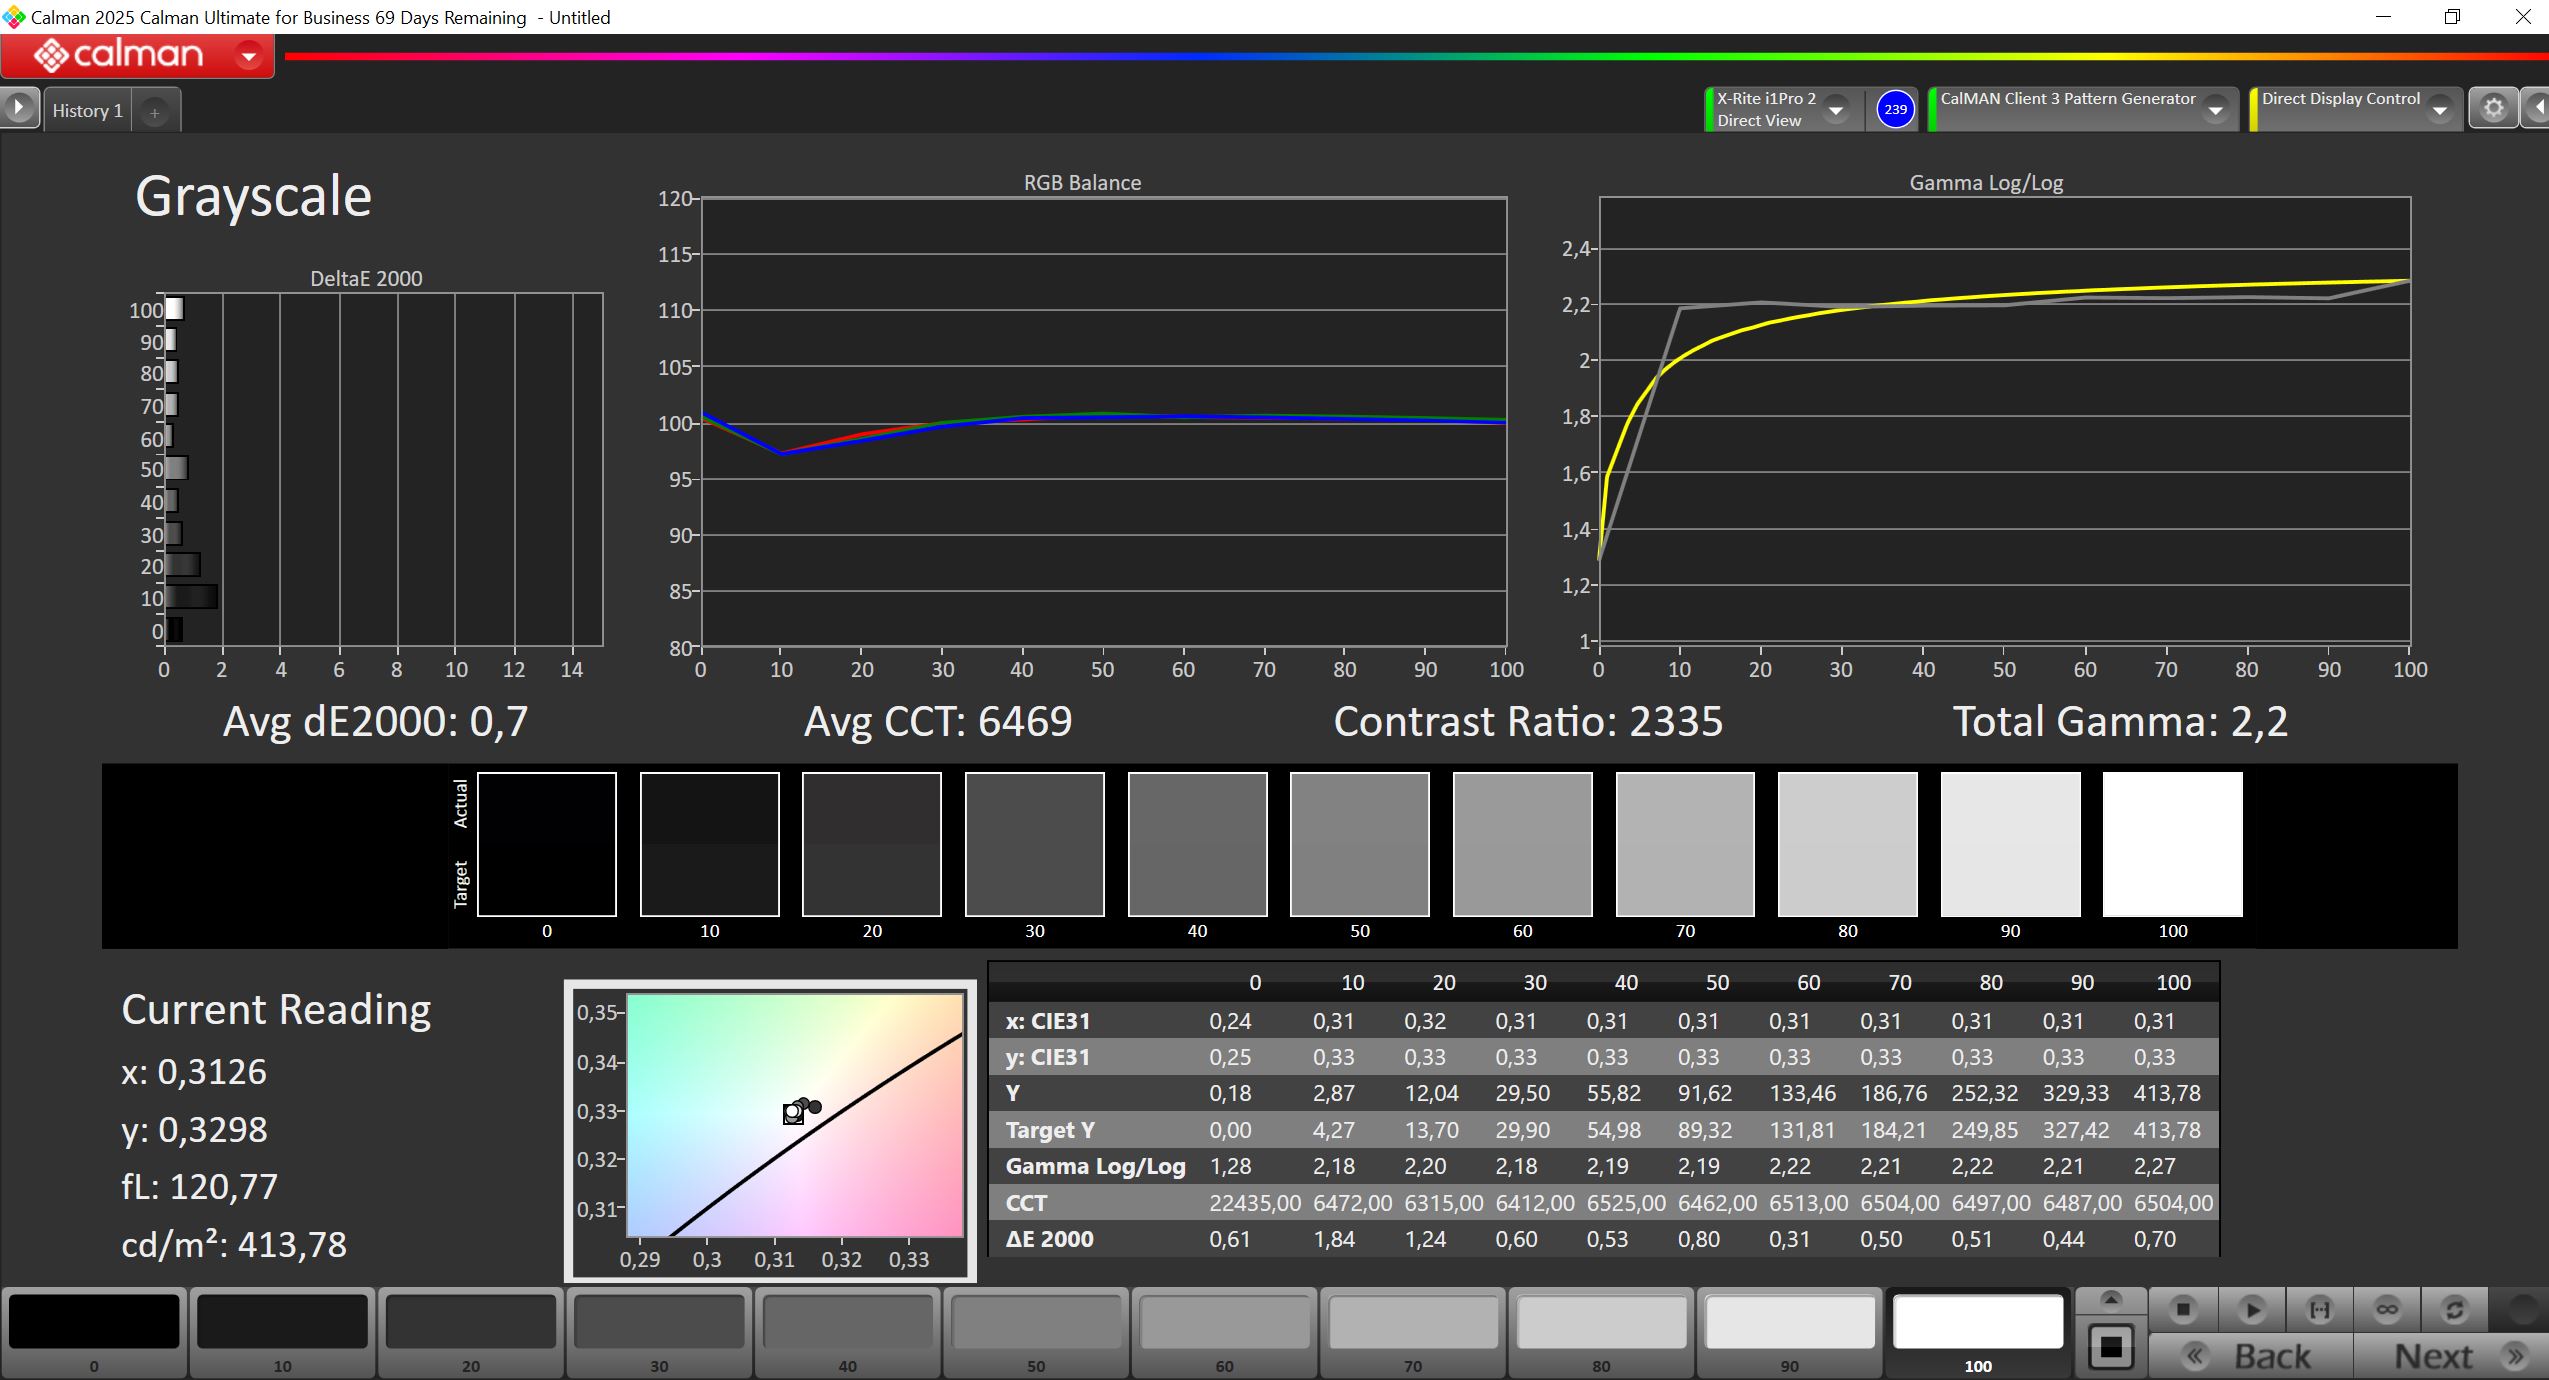
Lenovo rates the display at 400 cd/m², a value our review unit easily achieves. The black level is also very low, resulting in a very high contrast ratio. The factory calibration already delivers solid results in our analysis with the professional CalMAN software, although our own calibration improves colour accuracy even further (the profile is available for free download in the box to the right).
| |||||||||||||||||||||||||
Brightness Distribution: 92 %
Center on Battery: 424 cd/m²
Contrast: 2019:1 (Black: 0.21 cd/m²)
ΔE ColorChecker Calman: 2.3 | ∀{0.5-29.43 Ø4.72}
calibrated: 0.9
ΔE Greyscale Calman: 2.9 | ∀{0.09-98 Ø4.97}
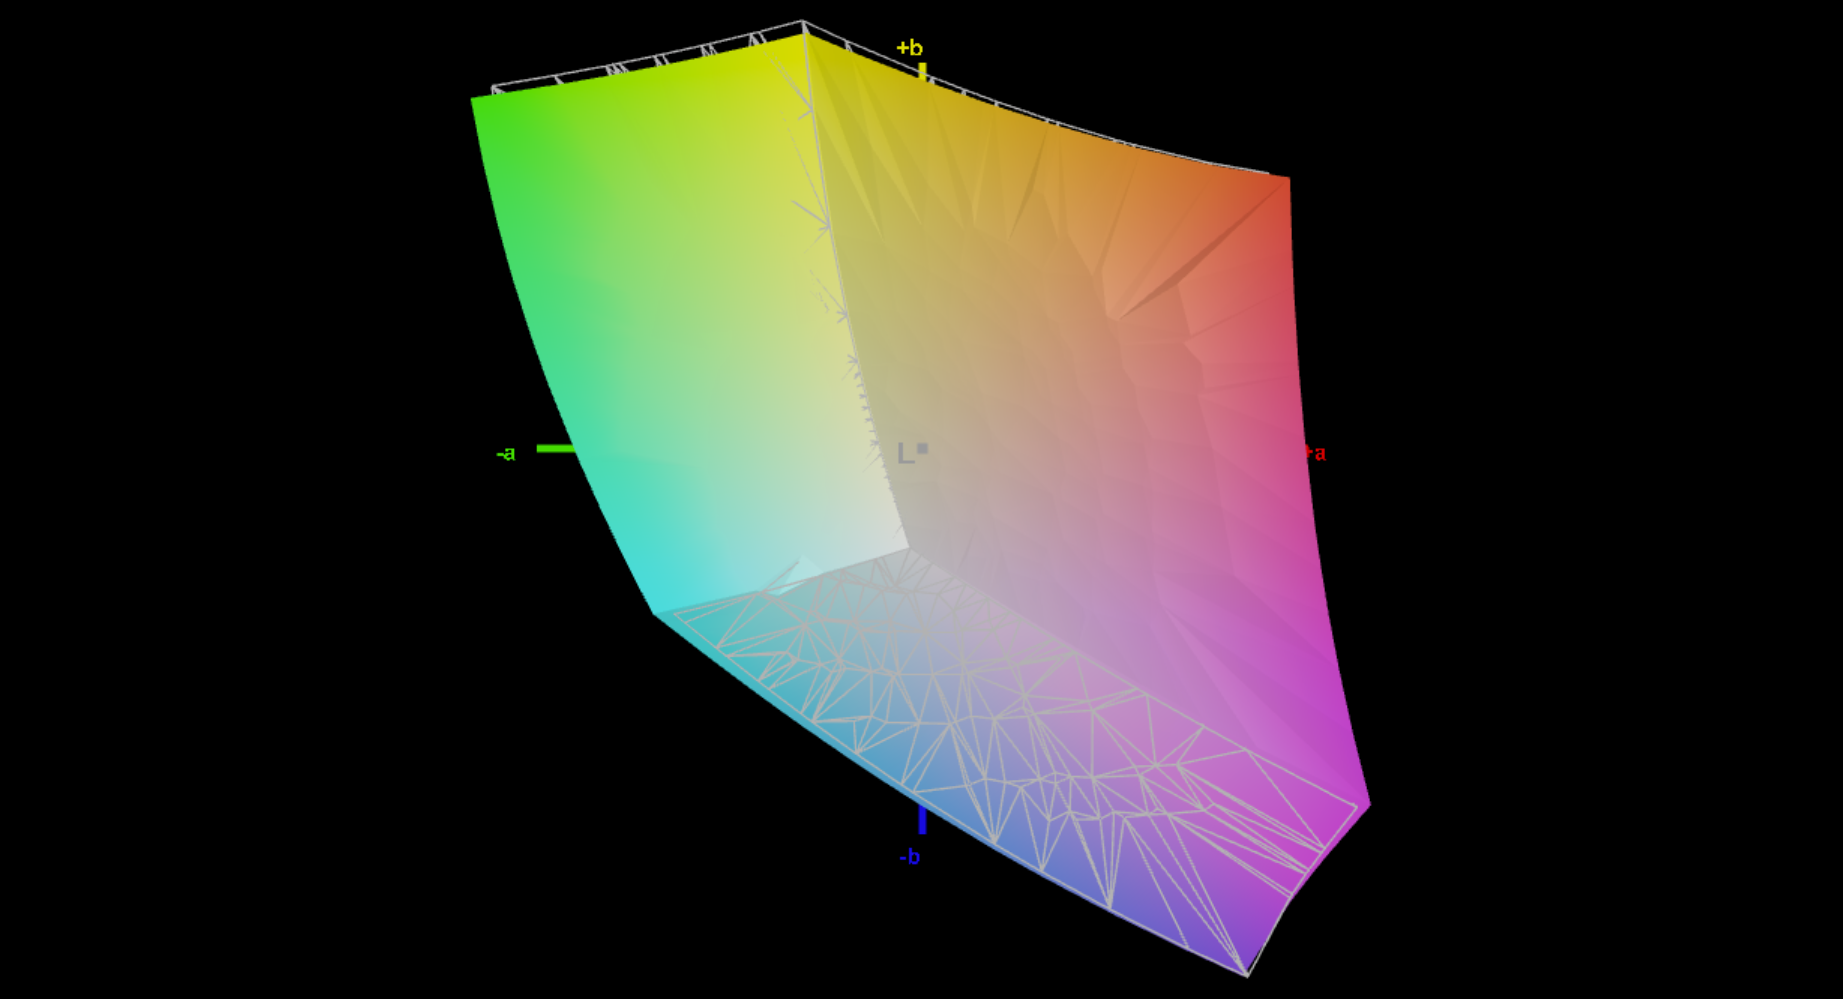
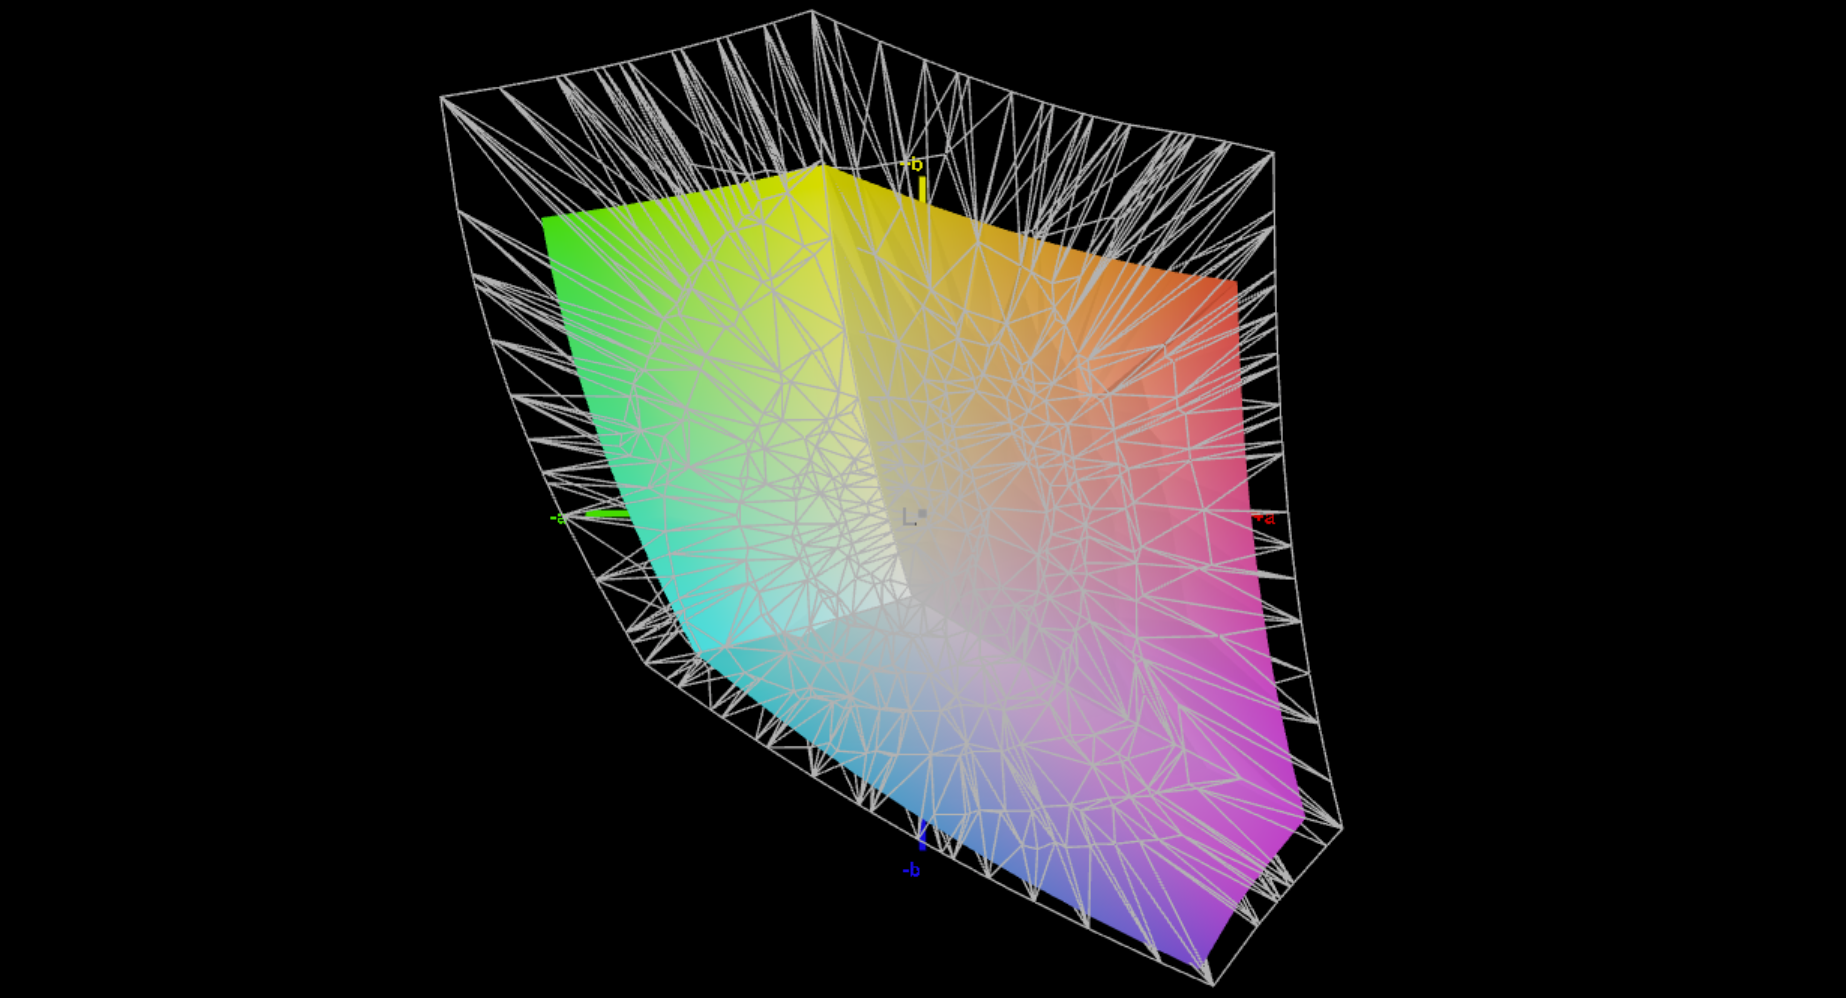
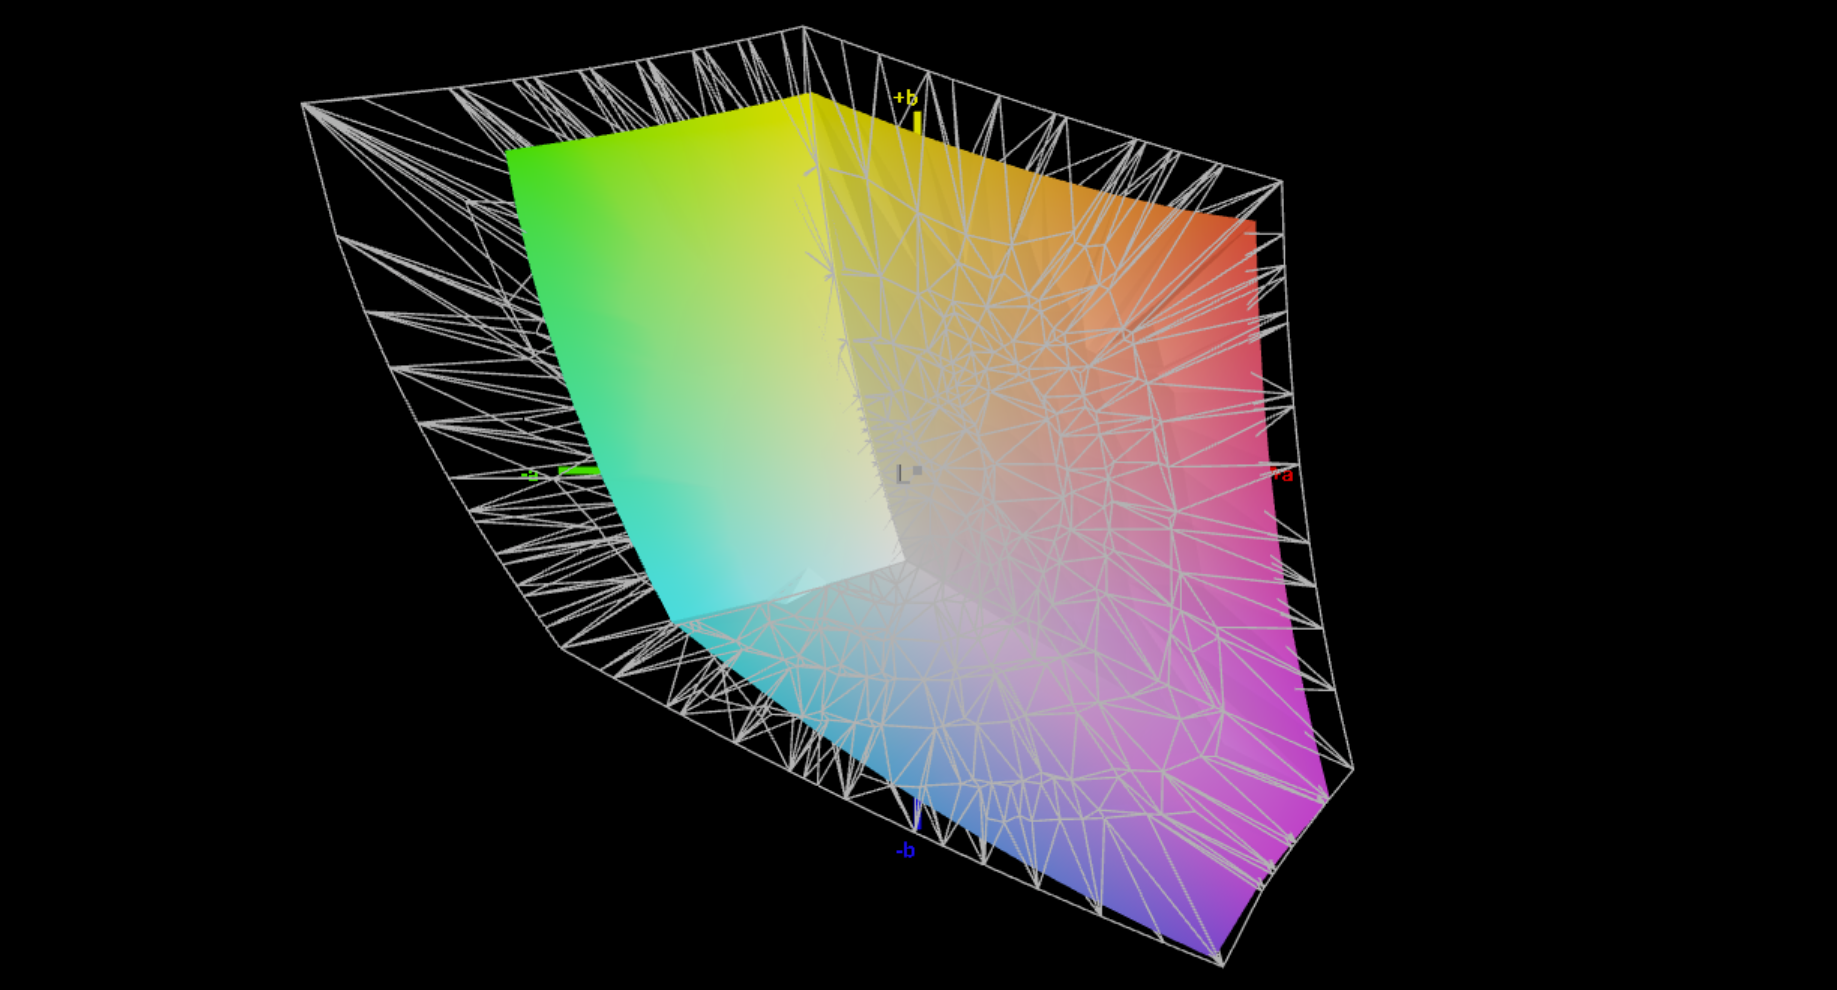
70.5% AdobeRGB 1998 (Argyll 3D)
98.4% sRGB (Argyll 3D)
69.6% Display P3 (Argyll 3D)
Gamma: 2.04
CCT: 6547 K
| Lenovo ThinkPad X13 G6 AMD NV133WUM-N6D, IPS, 1920x1200, 13.3", 60 Hz | Dell Pro 13 Premium PA13250 B133UAN (AUOBEB0), IPS, 1920x1200, 13.3", 60 Hz | MSI Prestige 13 AI Plus Evo A2VMG ATNA33AA07-0, OLED, 2880x1800, 13.3", 60 Hz | Microsoft Surface Laptop 7 13.8 Copilot+ LQ138P1JX61, IPS, 2304x1536, 13.8", 120 Hz | Lenovo ThinkPad X1 Carbon Gen 13 21NS0010GE ATNA40YK20-0, OLED, 2880x1800, 14", 120 Hz | |
|---|---|---|---|---|---|
| Display | 5% | 27% | 22% | 28% | |
| Display P3 Coverage (%) | 69.6 | 74.3 7% | 99.9 44% | 97.8 41% | 99.5 43% |
| sRGB Coverage (%) | 98.4 | 99.1 1% | 100 2% | 98.2 0% | 100 2% |
| AdobeRGB 1998 Coverage (%) | 70.5 | 75.9 8% | 95.8 36% | 87.3 24% | 97.1 38% |
| Response Times | -19% | 93% | 18% | 93% | |
| Response Time Grey 50% / Grey 80% * (ms) | 52.8 ? | 52.8 ? -0% | 1.94 ? 96% | 38.9 ? 26% | 2.4 ? 95% |
| Response Time Black / White * (ms) | 19.3 ? | 26.4 ? -37% | 2.02 ? 90% | 17.4 ? 10% | 1.9 ? 90% |
| PWM Frequency (Hz) | 60 ? | 240 ? | |||
| PWM Amplitude * (%) | 21.9 | 33 | |||
| Screen | -25% | 0% | 10% | -89% | |
| Brightness middle (cd/m²) | 424 | 456 8% | 382.4 -10% | 606 43% | 407 -4% |
| Brightness (cd/m²) | 409 | 460 12% | 383 -6% | 592 45% | 410 0% |
| Brightness Distribution (%) | 92 | 89 -3% | 99 8% | 94 2% | 99 8% |
| Black Level * (cd/m²) | 0.21 | 0.23 -10% | 0.43 -105% | ||
| Contrast (:1) | 2019 | 1983 -2% | 1409 -30% | ||
| Colorchecker dE 2000 * | 2.3 | 3.3 -43% | 3.84 -67% | 1.3 43% | 4.9 -113% |
| Colorchecker dE 2000 max. * | 4.3 | 6.47 -50% | 6.66 -55% | 2.1 51% | 9.1 -112% |
| Colorchecker dE 2000 calibrated * | 0.9 | 1.7 -89% | 0.41 54% | 4.7 -422% | |
| Greyscale dE 2000 * | 2.9 | 4.35 -50% | 0.7 76% | 2.1 28% | 2.3 21% |
| Gamma | 2.04 108% | 2.51 88% | 2.23 99% | 2.16 102% | 2.26 97% |
| CCT | 6547 99% | 6215 105% | 6475 100% | 6842 95% | 6310 103% |
| Total Average (Program / Settings) | -13% /
-18% | 40% /
22% | 17% /
14% | 11% /
-30% |
* ... smaller is better


Display Response Times
| ↔ Response Time Black to White | ||
|---|---|---|
| 19.3 ms ... rise ↗ and fall ↘ combined | ↗ 6.8 ms rise |  |
| ↘ 12.5 ms fall | ||
| The screen shows good response rates in our tests, but may be too slow for competitive gamers. In comparison, all tested devices range from 0.1 (minimum) to 240 (maximum) ms. » 43 % of all devices are better. This means that the measured response time is similar to the average of all tested devices (19.8 ms). | ||
| ↔ Response Time 50% Grey to 80% Grey | ||
| 52.8 ms ... rise ↗ and fall ↘ combined | ↗ 23 ms rise | 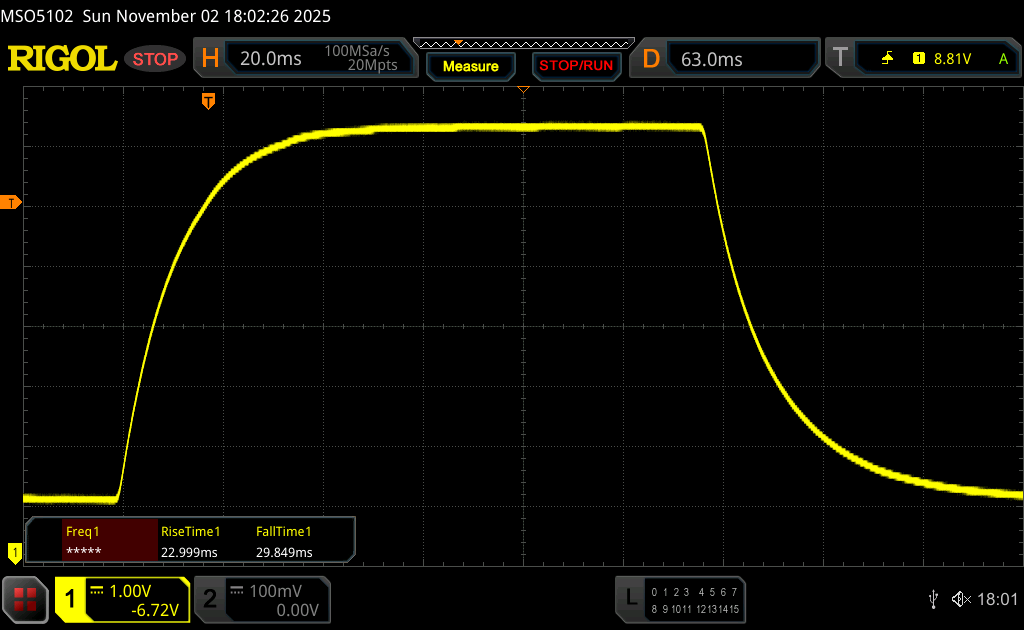 |
| ↘ 29.8 ms fall | ||
| The screen shows slow response rates in our tests and will be unsatisfactory for gamers. In comparison, all tested devices range from 0.165 (minimum) to 636 (maximum) ms. » 89 % of all devices are better. This means that the measured response time is worse than the average of all tested devices (31 ms). | ||
Screen Flickering / PWM (Pulse-Width Modulation)
| Screen flickering / PWM not detected | 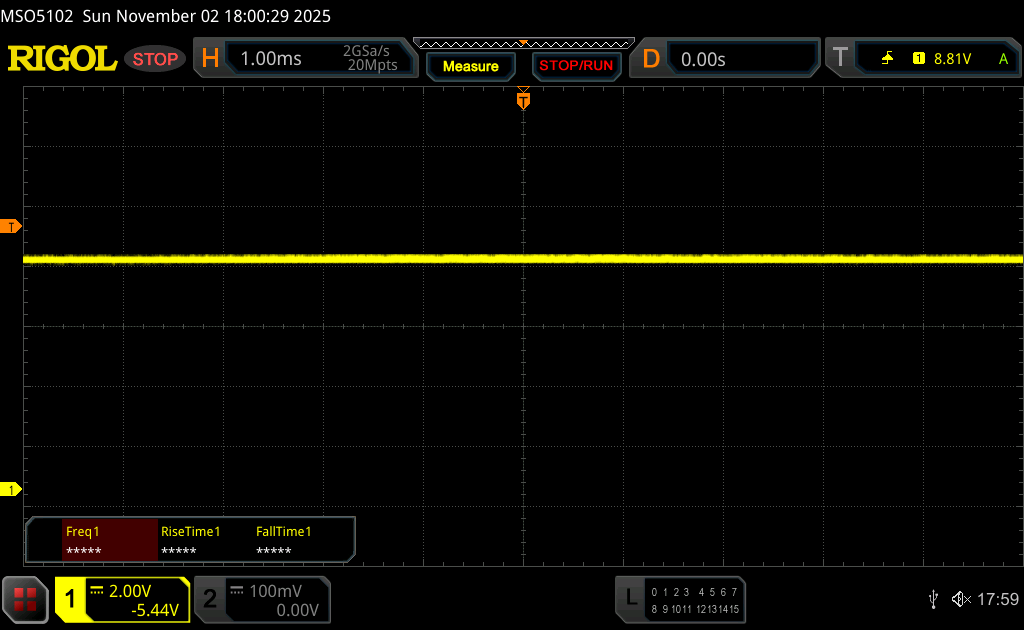 | ||
In comparison: 52 % of all tested devices do not use PWM to dim the display. If PWM was detected, an average of 7750 (minimum: 5 - maximum: 343500) Hz was measured. | |||


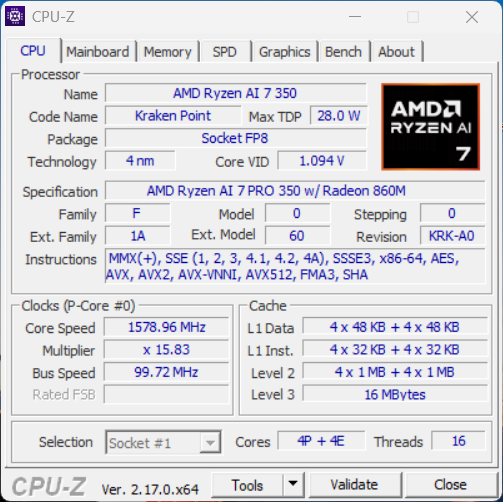
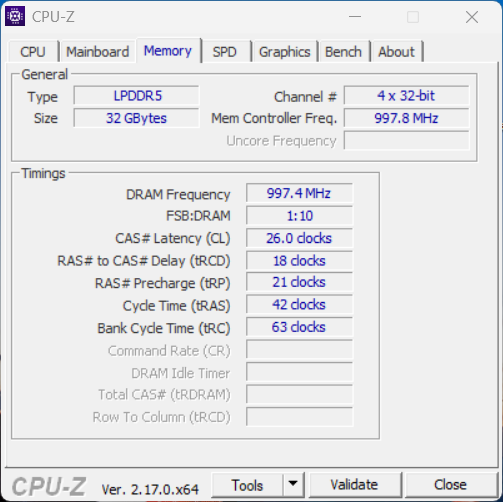
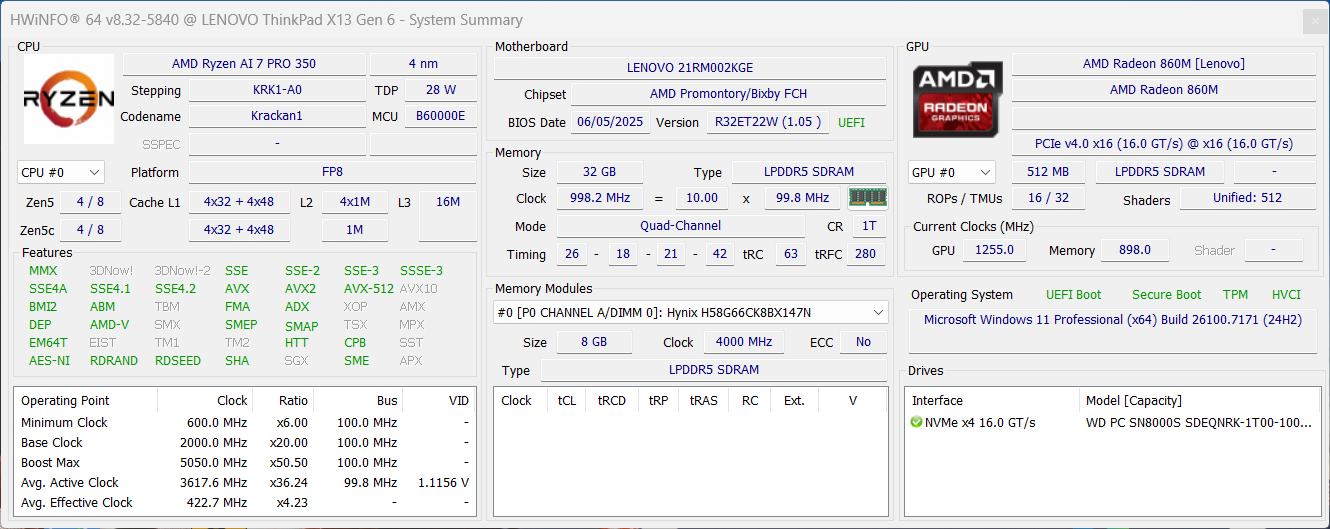
Performance – Zen 5 with 32 GB RAM
According to Lenovo's official specifications, the ThinkPad X13 G6 is available with up to 32 GB of LPDDR5x-8000 RAM, which cannot be upgraded.
Test conditions
On ThinkPad devices, Lenovo's power profiles are directly linked to the Windows power settings. We conducted all benchmarks using the Best performance mode.
Processor
The AMD Ryzen AI 7 PRO 350 (Krackan Point) is currently used in many laptops and features Zen 5 cores (4× Zen 5, 4× Zen 5c), with the PRO version also offering additional security features. In the X13, the processor is allowed to consume up to 40 watts and then settles at around 35 watts, which is a good result considering the compact size of the device. As a result, the X13 clearly outperforms its direct competitors in the CPU benchmarks. Performance remains consistent on battery power.
Cinebench R15 Multi loop
Cinebench R23: Multi Core | Single Core
Cinebench R20: CPU (Multi Core) | CPU (Single Core)
Cinebench R15: CPU Multi 64Bit | CPU Single 64Bit
Blender: v2.79 BMW27 CPU
7-Zip 18.03: 7z b 4 | 7z b 4 -mmt1
Geekbench 6.7: Multi-Core | Single-Core
Geekbench 5.5: Multi-Core | Single-Core
HWBOT x265 Benchmark v2.2: 4k Preset
LibreOffice : 20 Documents To PDF
R Benchmark 2.5: Overall mean
| CPU Performance rating | |
| Lenovo ThinkPad X13 G6 AMD | |
| Average AMD Ryzen AI 7 PRO 350 | |
| Average of class Subnotebook | |
| Lenovo ThinkPad X1 Carbon Gen 13 21NS0010GE | |
| MSI Prestige 13 AI Plus Evo A2VMG | |
| Dell Pro 13 Premium PA13250 | |
| Microsoft Surface Laptop 7 13.8 Copilot+ -2! | |
| Cinebench R23 / Multi Core | |
| Lenovo ThinkPad X13 G6 AMD | |
| Average AMD Ryzen AI 7 PRO 350 (12684 - 15543, n=6) | |
| Average of class Subnotebook (1555 - 21812, n=59, last 2 years) | |
| MSI Prestige 13 AI Plus Evo A2VMG | |
| Lenovo ThinkPad X1 Carbon Gen 13 21NS0010GE | |
| Microsoft Surface Laptop 7 13.8 Copilot+ | |
| Dell Pro 13 Premium PA13250 | |
| Cinebench R23 / Single Core | |
| Dell Pro 13 Premium PA13250 | |
| Lenovo ThinkPad X13 G6 AMD | |
| Average AMD Ryzen AI 7 PRO 350 (1950 - 1960, n=6) | |
| Lenovo ThinkPad X1 Carbon Gen 13 21NS0010GE | |
| MSI Prestige 13 AI Plus Evo A2VMG | |
| Average of class Subnotebook (358 - 2213, n=60, last 2 years) | |
| Microsoft Surface Laptop 7 13.8 Copilot+ | |
| Cinebench R20 / CPU (Multi Core) | |
| Lenovo ThinkPad X13 G6 AMD | |
| Average AMD Ryzen AI 7 PRO 350 (4950 - 6071, n=6) | |
| Average of class Subnotebook (579 - 8541, n=56, last 2 years) | |
| MSI Prestige 13 AI Plus Evo A2VMG | |
| Lenovo ThinkPad X1 Carbon Gen 13 21NS0010GE | |
| Dell Pro 13 Premium PA13250 | |
| Microsoft Surface Laptop 7 13.8 Copilot+ | |
| Cinebench R20 / CPU (Single Core) | |
| Lenovo ThinkPad X13 G6 AMD | |
| Average AMD Ryzen AI 7 PRO 350 (763 - 773, n=6) | |
| Dell Pro 13 Premium PA13250 | |
| Lenovo ThinkPad X1 Carbon Gen 13 21NS0010GE | |
| MSI Prestige 13 AI Plus Evo A2VMG | |
| Average of class Subnotebook (128 - 832, n=56, last 2 years) | |
| Microsoft Surface Laptop 7 13.8 Copilot+ | |
| Cinebench R15 / CPU Multi 64Bit | |
| Average AMD Ryzen AI 7 PRO 350 (1969 - 2439, n=6) | |
| Lenovo ThinkPad X13 G6 AMD | |
| Microsoft Surface Laptop 7 13.8 Copilot+ | |
| Average of class Subnotebook (327 - 3345, n=56, last 2 years) | |
| MSI Prestige 13 AI Plus Evo A2VMG | |
| Dell Pro 13 Premium PA13250 | |
| Lenovo ThinkPad X1 Carbon Gen 13 21NS0010GE | |
| Cinebench R15 / CPU Single 64Bit | |
| Dell Pro 13 Premium PA13250 | |
| Lenovo ThinkPad X1 Carbon Gen 13 21NS0010GE | |
| Lenovo ThinkPad X13 G6 AMD | |
| MSI Prestige 13 AI Plus Evo A2VMG | |
| Average of class Subnotebook (72.4 - 322, n=56, last 2 years) | |
| Average AMD Ryzen AI 7 PRO 350 (198.4 - 299, n=6) | |
| Microsoft Surface Laptop 7 13.8 Copilot+ | |
| Blender / v2.79 BMW27 CPU | |
| Dell Pro 13 Premium PA13250 | |
| Average of class Subnotebook (159 - 2271, n=57, last 2 years) | |
| Lenovo ThinkPad X1 Carbon Gen 13 21NS0010GE | |
| Microsoft Surface Laptop 7 13.8 Copilot+ | |
| MSI Prestige 13 AI Plus Evo A2VMG | |
| Average AMD Ryzen AI 7 PRO 350 (206 - 251, n=6) | |
| Lenovo ThinkPad X13 G6 AMD | |
| 7-Zip 18.03 / 7z b 4 | |
| Lenovo ThinkPad X13 G6 AMD | |
| Average AMD Ryzen AI 7 PRO 350 (50709 - 57736, n=6) | |
| Microsoft Surface Laptop 7 13.8 Copilot+ | |
| Average of class Subnotebook (11668 - 77867, n=56, last 2 years) | |
| Lenovo ThinkPad X1 Carbon Gen 13 21NS0010GE | |
| MSI Prestige 13 AI Plus Evo A2VMG | |
| Dell Pro 13 Premium PA13250 | |
| 7-Zip 18.03 / 7z b 4 -mmt1 | |
| Dell Pro 13 Premium PA13250 | |
| Lenovo ThinkPad X1 Carbon Gen 13 21NS0010GE | |
| Lenovo ThinkPad X13 G6 AMD | |
| Average AMD Ryzen AI 7 PRO 350 (4445 - 6052, n=6) | |
| MSI Prestige 13 AI Plus Evo A2VMG | |
| Average of class Subnotebook (2643 - 6699, n=58, last 2 years) | |
| Microsoft Surface Laptop 7 13.8 Copilot+ | |
| Geekbench 6.7 / Multi-Core | |
| Microsoft Surface Laptop 7 13.8 Copilot+ | |
| Lenovo ThinkPad X13 G6 AMD | |
| Average AMD Ryzen AI 7 PRO 350 (11406 - 13566, n=7) | |
| Average of class Subnotebook (2244 - 20325, n=62, last 2 years) | |
| Lenovo ThinkPad X1 Carbon Gen 13 21NS0010GE | |
| MSI Prestige 13 AI Plus Evo A2VMG | |
| Dell Pro 13 Premium PA13250 | |
| Geekbench 6.7 / Single-Core | |
| Lenovo ThinkPad X13 G6 AMD | |
| Average AMD Ryzen AI 7 PRO 350 (2720 - 2881, n=7) | |
| Dell Pro 13 Premium PA13250 | |
| Microsoft Surface Laptop 7 13.8 Copilot+ | |
| Average of class Subnotebook (960 - 4195, n=61, last 2 years) | |
| Lenovo ThinkPad X1 Carbon Gen 13 21NS0010GE | |
| MSI Prestige 13 AI Plus Evo A2VMG | |
| Geekbench 5.5 / Multi-Core | |
| Lenovo ThinkPad X13 G6 AMD | |
| Average AMD Ryzen AI 7 PRO 350 (10537 - 11719, n=6) | |
| Average of class Subnotebook (2557 - 17218, n=47, last 2 years) | |
| Lenovo ThinkPad X1 Carbon Gen 13 21NS0010GE | |
| MSI Prestige 13 AI Plus Evo A2VMG | |
| Dell Pro 13 Premium PA13250 | |
| Geekbench 5.5 / Single-Core | |
| Average AMD Ryzen AI 7 PRO 350 (2070 - 2128, n=6) | |
| Lenovo ThinkPad X13 G6 AMD | |
| Lenovo ThinkPad X1 Carbon Gen 13 21NS0010GE | |
| Dell Pro 13 Premium PA13250 | |
| MSI Prestige 13 AI Plus Evo A2VMG | |
| Average of class Subnotebook (726 - 2224, n=47, last 2 years) | |
| HWBOT x265 Benchmark v2.2 / 4k Preset | |
| Lenovo ThinkPad X13 G6 AMD | |
| Average AMD Ryzen AI 7 PRO 350 (15.8 - 19.7, n=6) | |
| MSI Prestige 13 AI Plus Evo A2VMG | |
| Average of class Subnotebook (0.97 - 25.1, n=56, last 2 years) | |
| Lenovo ThinkPad X1 Carbon Gen 13 21NS0010GE | |
| Dell Pro 13 Premium PA13250 | |
| Microsoft Surface Laptop 7 13.8 Copilot+ | |
| LibreOffice / 20 Documents To PDF | |
| Microsoft Surface Laptop 7 13.8 Copilot+ | |
| Average AMD Ryzen AI 7 PRO 350 (50.7 - 93.1, n=6) | |
| Dell Pro 13 Premium PA13250 | |
| Average of class Subnotebook (39.9 - 220, n=55, last 2 years) | |
| Lenovo ThinkPad X13 G6 AMD | |
| MSI Prestige 13 AI Plus Evo A2VMG | |
| Lenovo ThinkPad X1 Carbon Gen 13 21NS0010GE | |
| R Benchmark 2.5 / Overall mean | |
| Microsoft Surface Laptop 7 13.8 Copilot+ | |
| Average of class Subnotebook (0.4024 - 1.456, n=57, last 2 years) | |
| Average AMD Ryzen AI 7 PRO 350 (0.4136 - 0.733, n=6) | |
| MSI Prestige 13 AI Plus Evo A2VMG | |
| Lenovo ThinkPad X1 Carbon Gen 13 21NS0010GE | |
| Lenovo ThinkPad X13 G6 AMD | |
| Dell Pro 13 Premium PA13250 | |
* ... smaller is better
AIDA64: FP32 Ray-Trace | FPU Julia | CPU SHA3 | CPU Queen | FPU SinJulia | FPU Mandel | CPU AES | CPU ZLib | FP64 Ray-Trace | CPU PhotoWorxx
| Performance rating | |
| Lenovo ThinkPad X13 G6 AMD | |
| Average AMD Ryzen AI 7 PRO 350 | |
| Average of class Subnotebook | |
| MSI Prestige 13 AI Plus Evo A2VMG | |
| Lenovo ThinkPad X1 Carbon Gen 13 21NS0010GE | |
| Dell Pro 13 Premium PA13250 | |
| Microsoft Surface Laptop 7 13.8 Copilot+ | |
| AIDA64 / FP32 Ray-Trace | |
| Lenovo ThinkPad X13 G6 AMD | |
| Average AMD Ryzen AI 7 PRO 350 (20019 - 24795, n=7) | |
| Average of class Subnotebook (1135 - 32888, n=57, last 2 years) | |
| MSI Prestige 13 AI Plus Evo A2VMG | |
| Dell Pro 13 Premium PA13250 | |
| Lenovo ThinkPad X1 Carbon Gen 13 21NS0010GE | |
| Microsoft Surface Laptop 7 13.8 Copilot+ | |
| AIDA64 / FPU Julia | |
| Lenovo ThinkPad X13 G6 AMD | |
| Average AMD Ryzen AI 7 PRO 350 (74210 - 94532, n=7) | |
| MSI Prestige 13 AI Plus Evo A2VMG | |
| Average of class Subnotebook (5218 - 123315, n=57, last 2 years) | |
| Lenovo ThinkPad X1 Carbon Gen 13 21NS0010GE | |
| Dell Pro 13 Premium PA13250 | |
| Microsoft Surface Laptop 7 13.8 Copilot+ | |
| AIDA64 / CPU SHA3 | |
| Lenovo ThinkPad X13 G6 AMD | |
| Average AMD Ryzen AI 7 PRO 350 (3434 - 4091, n=7) | |
| Average of class Subnotebook (444 - 5287, n=57, last 2 years) | |
| Microsoft Surface Laptop 7 13.8 Copilot+ | |
| MSI Prestige 13 AI Plus Evo A2VMG | |
| Lenovo ThinkPad X1 Carbon Gen 13 21NS0010GE | |
| Dell Pro 13 Premium PA13250 | |
| AIDA64 / CPU Queen | |
| Average AMD Ryzen AI 7 PRO 350 (73484 - 77055, n=6) | |
| Lenovo ThinkPad X13 G6 AMD | |
| Microsoft Surface Laptop 7 13.8 Copilot+ | |
| Average of class Subnotebook (10579 - 95002, n=49, last 2 years) | |
| MSI Prestige 13 AI Plus Evo A2VMG | |
| Lenovo ThinkPad X1 Carbon Gen 13 21NS0010GE | |
| Dell Pro 13 Premium PA13250 | |
| AIDA64 / FPU SinJulia | |
| Lenovo ThinkPad X13 G6 AMD | |
| Average AMD Ryzen AI 7 PRO 350 (12252 - 13653, n=7) | |
| Average of class Subnotebook (744 - 18418, n=57, last 2 years) | |
| MSI Prestige 13 AI Plus Evo A2VMG | |
| Dell Pro 13 Premium PA13250 | |
| Lenovo ThinkPad X1 Carbon Gen 13 21NS0010GE | |
| Microsoft Surface Laptop 7 13.8 Copilot+ | |
| AIDA64 / FPU Mandel | |
| Lenovo ThinkPad X13 G6 AMD | |
| Average AMD Ryzen AI 7 PRO 350 (39707 - 50597, n=7) | |
| MSI Prestige 13 AI Plus Evo A2VMG | |
| Average of class Subnotebook (3341 - 65433, n=57, last 2 years) | |
| Lenovo ThinkPad X1 Carbon Gen 13 21NS0010GE | |
| Dell Pro 13 Premium PA13250 | |
| Microsoft Surface Laptop 7 13.8 Copilot+ | |
| AIDA64 / CPU AES | |
| Lenovo ThinkPad X13 G6 AMD | |
| Average AMD Ryzen AI 7 PRO 350 (65710 - 82843, n=7) | |
| Microsoft Surface Laptop 7 13.8 Copilot+ | |
| Average of class Subnotebook (638 - 96917, n=57, last 2 years) | |
| MSI Prestige 13 AI Plus Evo A2VMG | |
| Lenovo ThinkPad X1 Carbon Gen 13 21NS0010GE | |
| Dell Pro 13 Premium PA13250 | |
| AIDA64 / CPU ZLib | |
| Lenovo ThinkPad X13 G6 AMD | |
| Average AMD Ryzen AI 7 PRO 350 (834 - 1029, n=7) | |
| Average of class Subnotebook (164.9 - 1379, n=57, last 2 years) | |
| Microsoft Surface Laptop 7 13.8 Copilot+ | |
| MSI Prestige 13 AI Plus Evo A2VMG | |
| Lenovo ThinkPad X1 Carbon Gen 13 21NS0010GE | |
| Dell Pro 13 Premium PA13250 | |
| AIDA64 / FP64 Ray-Trace | |
| Lenovo ThinkPad X13 G6 AMD | |
| Average AMD Ryzen AI 7 PRO 350 (10760 - 13384, n=7) | |
| Average of class Subnotebook (610 - 17495, n=57, last 2 years) | |
| MSI Prestige 13 AI Plus Evo A2VMG | |
| Dell Pro 13 Premium PA13250 | |
| Lenovo ThinkPad X1 Carbon Gen 13 21NS0010GE | |
| Microsoft Surface Laptop 7 13.8 Copilot+ | |
| AIDA64 / CPU PhotoWorxx | |
| MSI Prestige 13 AI Plus Evo A2VMG | |
| Lenovo ThinkPad X1 Carbon Gen 13 21NS0010GE | |
| Average of class Subnotebook (6569 - 85600, n=57, last 2 years) | |
| Dell Pro 13 Premium PA13250 | |
| Lenovo ThinkPad X13 G6 AMD | |
| Microsoft Surface Laptop 7 13.8 Copilot+ | |
| Average AMD Ryzen AI 7 PRO 350 (26358 - 43805, n=7) | |
System performance
The ThinkPad X13 G6 is a very responsive machine, and we encountered no stability issues at any point during the test period.
PCMark 10: Score | Essentials | Productivity | Digital Content Creation
CrossMark: Overall | Productivity | Creativity | Responsiveness
WebXPRT 3: Overall
WebXPRT 4: Overall
Mozilla Kraken 1.1: Total
| Performance rating | |
| Lenovo ThinkPad X1 Carbon Gen 13 21NS0010GE -1! | |
| Lenovo ThinkPad X13 G6 AMD | |
| Average of class Subnotebook | |
| MSI Prestige 13 AI Plus Evo A2VMG | |
| Average AMD Ryzen AI 7 PRO 350, AMD Radeon 860M | |
| Dell Pro 13 Premium PA13250 | |
| Microsoft Surface Laptop 7 13.8 Copilot+ -4! | |
| PCMark 10 / Score | |
| Lenovo ThinkPad X13 G6 AMD | |
| Average AMD Ryzen AI 7 PRO 350, AMD Radeon 860M (6888 - 7626, n=6) | |
| Lenovo ThinkPad X1 Carbon Gen 13 21NS0010GE | |
| Average of class Subnotebook (4920 - 9939, n=44, last 2 years) | |
| MSI Prestige 13 AI Plus Evo A2VMG | |
| Dell Pro 13 Premium PA13250 | |
| PCMark 10 / Essentials | |
| Average AMD Ryzen AI 7 PRO 350, AMD Radeon 860M (10671 - 11594, n=6) | |
| Lenovo ThinkPad X13 G6 AMD | |
| Lenovo ThinkPad X1 Carbon Gen 13 21NS0010GE | |
| Average of class Subnotebook (8552 - 11646, n=44, last 2 years) | |
| MSI Prestige 13 AI Plus Evo A2VMG | |
| Dell Pro 13 Premium PA13250 | |
| PCMark 10 / Productivity | |
| Average AMD Ryzen AI 7 PRO 350, AMD Radeon 860M (9823 - 10925, n=6) | |
| Lenovo ThinkPad X13 G6 AMD | |
| Average of class Subnotebook (5435 - 16606, n=44, last 2 years) | |
| Lenovo ThinkPad X1 Carbon Gen 13 21NS0010GE | |
| Dell Pro 13 Premium PA13250 | |
| MSI Prestige 13 AI Plus Evo A2VMG | |
| PCMark 10 / Digital Content Creation | |
| Lenovo ThinkPad X1 Carbon Gen 13 21NS0010GE | |
| MSI Prestige 13 AI Plus Evo A2VMG | |
| Average of class Subnotebook (5722 - 13779, n=44, last 2 years) | |
| Lenovo ThinkPad X13 G6 AMD | |
| Dell Pro 13 Premium PA13250 | |
| Average AMD Ryzen AI 7 PRO 350, AMD Radeon 860M (8441 - 9503, n=6) | |
| CrossMark / Overall | |
| Lenovo ThinkPad X13 G6 AMD | |
| Lenovo ThinkPad X1 Carbon Gen 13 21NS0010GE | |
| MSI Prestige 13 AI Plus Evo A2VMG | |
| Average AMD Ryzen AI 7 PRO 350, AMD Radeon 860M (1426 - 1851, n=6) | |
| Average of class Subnotebook (365 - 2356, n=59, last 2 years) | |
| Dell Pro 13 Premium PA13250 | |
| Microsoft Surface Laptop 7 13.8 Copilot+ | |
| CrossMark / Productivity | |
| Lenovo ThinkPad X13 G6 AMD | |
| Lenovo ThinkPad X1 Carbon Gen 13 21NS0010GE | |
| MSI Prestige 13 AI Plus Evo A2VMG | |
| Average AMD Ryzen AI 7 PRO 350, AMD Radeon 860M (1256 - 1702, n=6) | |
| Dell Pro 13 Premium PA13250 | |
| Average of class Subnotebook (364 - 2277, n=59, last 2 years) | |
| Microsoft Surface Laptop 7 13.8 Copilot+ | |
| CrossMark / Creativity | |
| Lenovo ThinkPad X13 G6 AMD | |
| Average AMD Ryzen AI 7 PRO 350, AMD Radeon 860M (1734 - 2174, n=6) | |
| Lenovo ThinkPad X1 Carbon Gen 13 21NS0010GE | |
| MSI Prestige 13 AI Plus Evo A2VMG | |
| Dell Pro 13 Premium PA13250 | |
| Average of class Subnotebook (372 - 2743, n=59, last 2 years) | |
| Microsoft Surface Laptop 7 13.8 Copilot+ | |
| CrossMark / Responsiveness | |
| Lenovo ThinkPad X13 G6 AMD | |
| Average AMD Ryzen AI 7 PRO 350, AMD Radeon 860M (1161 - 1472, n=6) | |
| Average of class Subnotebook (312 - 1854, n=59, last 2 years) | |
| Microsoft Surface Laptop 7 13.8 Copilot+ | |
| Lenovo ThinkPad X1 Carbon Gen 13 21NS0010GE | |
| MSI Prestige 13 AI Plus Evo A2VMG | |
| Dell Pro 13 Premium PA13250 | |
| WebXPRT 3 / Overall | |
| Microsoft Surface Laptop 7 13.8 Copilot+ | |
| Average of class Subnotebook (156 - 530, n=55, last 2 years) | |
| MSI Prestige 13 AI Plus Evo A2VMG | |
| Average AMD Ryzen AI 7 PRO 350, AMD Radeon 860M (250 - 320, n=6) | |
| Dell Pro 13 Premium PA13250 | |
| Lenovo ThinkPad X13 G6 AMD | |
| WebXPRT 4 / Overall | |
| Microsoft Surface Laptop 7 13.8 Copilot+ | |
| MSI Prestige 13 AI Plus Evo A2VMG | |
| Lenovo ThinkPad X1 Carbon Gen 13 21NS0010GE | |
| Average of class Subnotebook (132 - 378, n=60, last 2 years) | |
| Dell Pro 13 Premium PA13250 | |
| Average AMD Ryzen AI 7 PRO 350, AMD Radeon 860M (166.3 - 270, n=6) | |
| Lenovo ThinkPad X13 G6 AMD | |
| Mozilla Kraken 1.1 / Total | |
| Average AMD Ryzen AI 7 PRO 350, AMD Radeon 860M (446 - 749, n=6) | |
| Lenovo ThinkPad X13 G6 AMD | |
| Dell Pro 13 Premium PA13250 | |
| Average of class Subnotebook (234 - 1104, n=60, last 2 years) | |
| MSI Prestige 13 AI Plus Evo A2VMG | |
| Lenovo ThinkPad X1 Carbon Gen 13 21NS0010GE | |
| Microsoft Surface Laptop 7 13.8 Copilot+ | |
* ... smaller is better
| PCMark 10 Score | 7271 points | |
Help | ||
| AIDA64 / Memory Copy | |
| Lenovo ThinkPad X1 Carbon Gen 13 21NS0010GE | |
| MSI Prestige 13 AI Plus Evo A2VMG | |
| Dell Pro 13 Premium PA13250 | |
| Average of class Subnotebook (14554 - 131023, n=57, last 2 years) | |
| Lenovo ThinkPad X13 G6 AMD | |
| Average AMD Ryzen AI 7 PRO 350 (36835 - 83623, n=7) | |
| Microsoft Surface Laptop 7 13.8 Copilot+ | |
| AIDA64 / Memory Read | |
| Microsoft Surface Laptop 7 13.8 Copilot+ | |
| Lenovo ThinkPad X1 Carbon Gen 13 21NS0010GE | |
| MSI Prestige 13 AI Plus Evo A2VMG | |
| Average of class Subnotebook (15948 - 127174, n=57, last 2 years) | |
| Dell Pro 13 Premium PA13250 | |
| Lenovo ThinkPad X13 G6 AMD | |
| Average AMD Ryzen AI 7 PRO 350 (42869 - 63536, n=7) | |
| AIDA64 / Memory Write | |
| Lenovo ThinkPad X1 Carbon Gen 13 21NS0010GE | |
| MSI Prestige 13 AI Plus Evo A2VMG | |
| Dell Pro 13 Premium PA13250 | |
| Lenovo ThinkPad X13 G6 AMD | |
| Average of class Subnotebook (15709 - 135141, n=57, last 2 years) | |
| Average AMD Ryzen AI 7 PRO 350 (39737 - 104146, n=7) | |
| Microsoft Surface Laptop 7 13.8 Copilot+ | |
| AIDA64 / Memory Latency | |
| Lenovo ThinkPad X13 G6 AMD | |
| Average AMD Ryzen AI 7 PRO 350 (103.2 - 119.1, n=7) | |
| Dell Pro 13 Premium PA13250 | |
| MSI Prestige 13 AI Plus Evo A2VMG | |
| Average of class Subnotebook (6.1 - 159.9, n=55, last 2 years) | |
| Lenovo ThinkPad X1 Carbon Gen 13 21NS0010GE | |
| Microsoft Surface Laptop 7 13.8 Copilot+ | |
* ... smaller is better
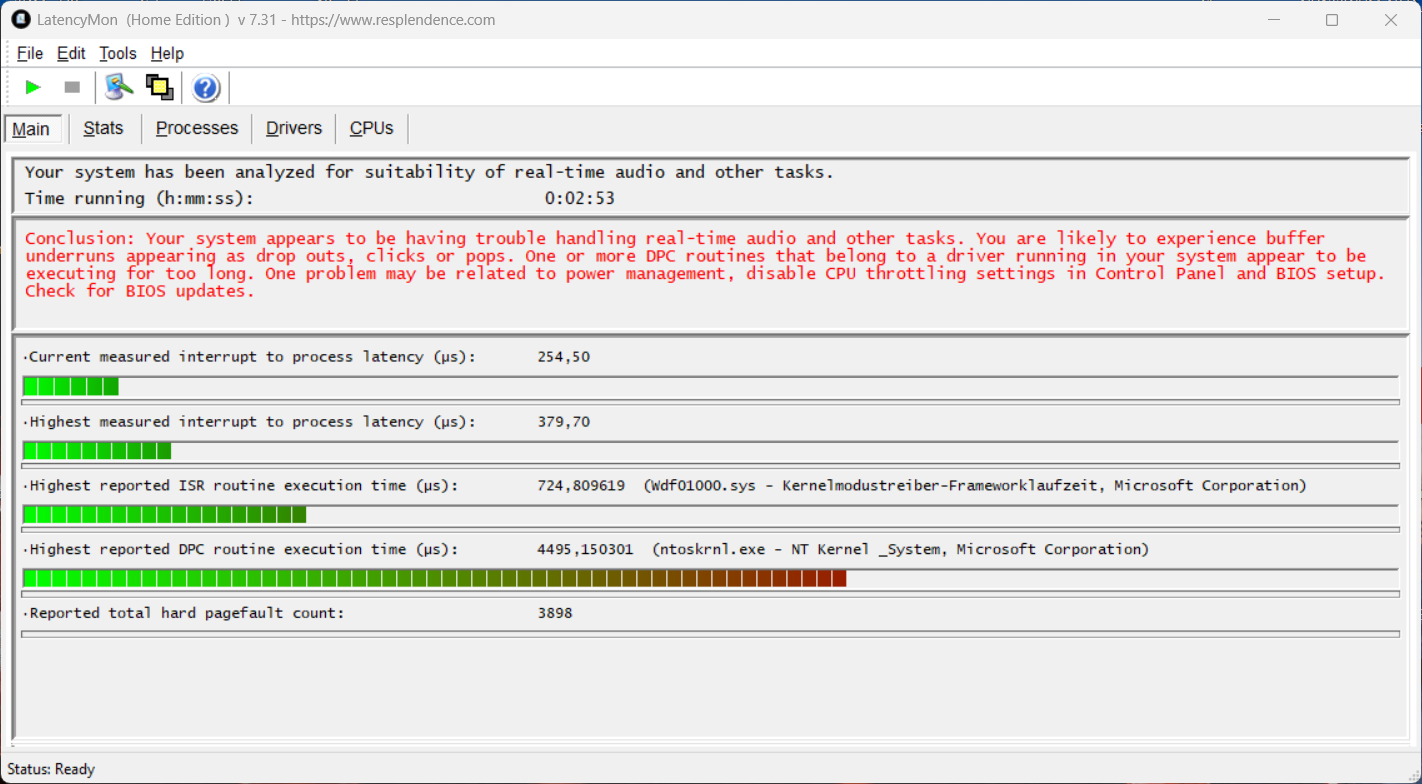
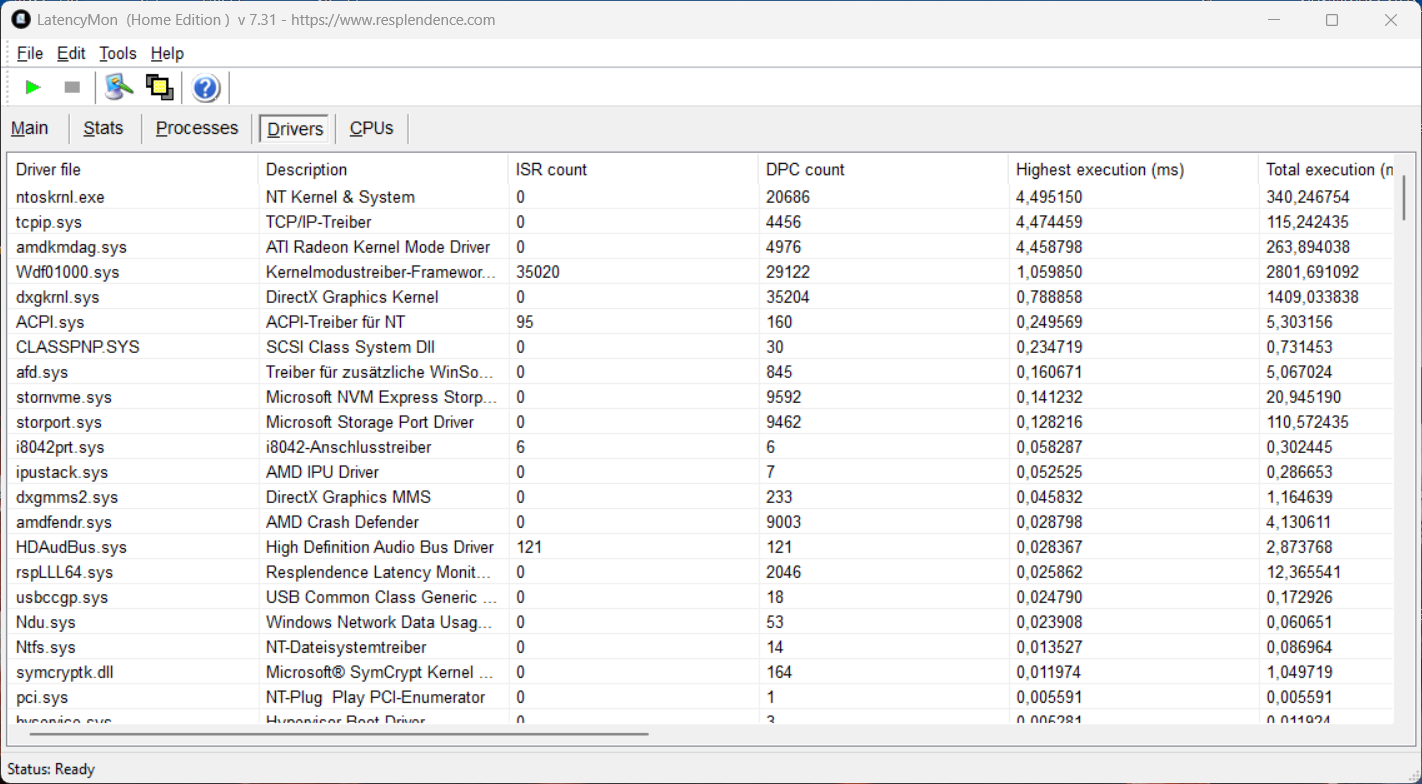
DPC latencies
In our standardised latency test (web browsing, 4K YouTube playback, CPU load), the review unit shows limitations for real-time audio applications with the current BIOS version.
| DPC Latencies / LatencyMon - interrupt to process latency (max), Web, Youtube, Prime95 | |
| Dell Pro 13 Premium PA13250 | |
| Lenovo ThinkPad X1 Carbon Gen 13 21NS0010GE | |
| MSI Prestige 13 AI Plus Evo A2VMG | |
| Lenovo ThinkPad X13 G6 AMD | |
* ... smaller is better
Storage devices
The 1 TB SSD from Western Digital (872 GB free) offers high transfer rates, although performance is not completely stable under sustained load. In everyday use, however, the throttling we uncovered causes few inconveniences.

* ... smaller is better
Sustained read performance: DiskSpd read loop, queue depth 8
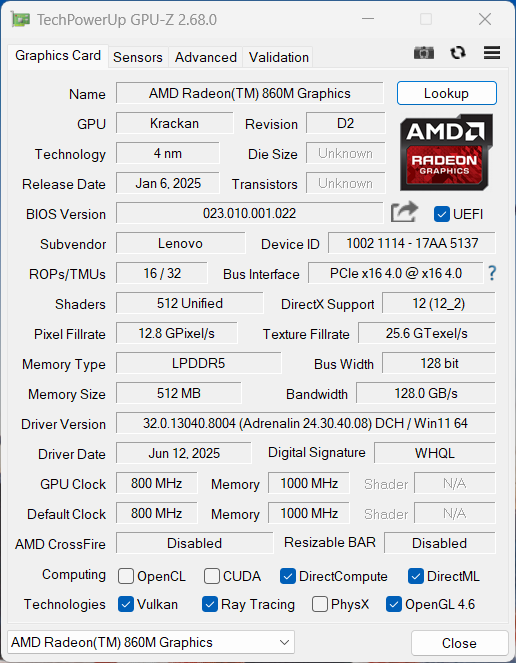
GPU performance
Graphics output is handled by the AMD Radeon 860M, which delivers respectable performance but cannot keep up with its Lunar Lake competitors. GPU performance remains stable on battery power, although there is a slight drop under sustained load (around −10 percent).
| 3DMark 11 Performance | 10993 points | |
| 3DMark Fire Strike Score | 6707 points | |
| 3DMark Time Spy Score | 3129 points | |
| 3DMark Steel Nomad Score | 462 points | |
| 3DMark Steel Nomad Light Score | 2454 points | |
Help | ||
| Blender / v3.3 Classroom CPU | |
| Dell Pro 13 Premium PA13250 | |
| Lenovo ThinkPad X1 Carbon Gen 13 21NS0010GE | |
| Microsoft Surface Laptop 7 13.8 Copilot+ | |
| MSI Prestige 13 AI Plus Evo A2VMG | |
| Average of class Subnotebook (241 - 861, n=59, last 2 years) | |
| Lenovo ThinkPad X13 G6 AMD | |
| Average AMD Radeon 860M (280 - 427, n=21) | |
| Blender / v3.3 Classroom oneAPI/Intel | |
| Dell Pro 13 Premium PA13250 | |
| Average of class Subnotebook (105 - 396, n=11, last 2 years) | |
| Lenovo ThinkPad X1 Carbon Gen 13 21NS0010GE | |
| MSI Prestige 13 AI Plus Evo A2VMG | |
* ... smaller is better
| Strange Brigade - 1920x1080 ultra AA:ultra AF:16 | |
| Dell Pro 13 Premium PA13250 | |
| MSI Prestige 13 AI Plus Evo A2VMG | |
| Average of class Subnotebook (19 - 101.3, n=49, last 2 years) | |
| Lenovo ThinkPad X13 G6 AMD | |
| Microsoft Surface Laptop 7 13.8 Copilot+ | |
| X-Plane 11.11 - 1920x1080 high (fps_test=3) | |
| Lenovo ThinkPad X13 G6 AMD | |
| MSI Prestige 13 AI Plus Evo A2VMG | |
| Average of class Subnotebook (20.7 - 50.5, n=52, last 2 years) | |
| Dell Pro 13 Premium PA13250 | |
| Lenovo ThinkPad X1 Carbon Gen 13 21NS0010GE | |
Cyberpunk 2077 Ultra – FPS chart
| low | med. | high | ultra | |
|---|---|---|---|---|
| GTA V (2015) | 167.1 | 158.3 | 67 | 27.9 |
| Dota 2 Reborn (2015) | 155 | 133.6 | 77.2 | 69.6 |
| Final Fantasy XV Benchmark (2018) | 70.2 | 32.4 | 22.3 | |
| X-Plane 11.11 (2018) | 62.2 | 48 | 38.8 | |
| Strange Brigade (2018) | 161.1 | 62.8 | 52.1 | 41.7 |
| Baldur's Gate 3 (2023) | 31.7 | 25.2 | 20.4 | 19.8 |
| Cyberpunk 2077 (2023) | 32.4 | 24.9 | 20 | 16.4 |
| F1 24 (2024) | 60.4 | 56.8 | 42.1 | 8.82 |
Emissions and energy
Noise emissions

In general, the ThinkPad X13 is a very quiet machine. When maximum CPU performance is required, the fan becomes clearly audible at just under 40 dB(A). In the other two power modes, however, it remains noticeably quieter (Balanced: 33.5 dB(A), Best power efficiency: 29.3 dB(A)). We did not observe any other electronic noises on the review unit.
Noise level
| Idle |
| 24.1 / 24.1 / 25.5 dB(A) |
| Load |
| 32.8 / 39.7 dB(A) |
 | ||
30 dB silent 40 dB(A) audible 50 dB(A) loud |
||
min: | ||
| Lenovo ThinkPad X13 G6 AMD Ryzen AI 7 PRO 350, Radeon 860M | Dell Pro 13 Premium PA13250 Core Ultra 7 268V, Arc 140V | MSI Prestige 13 AI Plus Evo A2VMG Core Ultra 7 258V, Arc 140V | Microsoft Surface Laptop 7 13.8 Copilot+ SD X Elite X1E-80-100, Adreno X1-85 3.8 TFLOPS | Lenovo ThinkPad X1 Carbon Gen 13 21NS0010GE Core Ultra 7 258V, Arc 140V | |
|---|---|---|---|---|---|
| Noise | -1% | -9% | 7% | 3% | |
| off / environment * (dB) | 24.1 | 23 5% | 24.1 -0% | 23.8 1% | 23.2 4% |
| Idle Minimum * (dB) | 24.1 | 23 5% | 24.8 -3% | 23.8 1% | 23.2 4% |
| Idle Average * (dB) | 24.1 | 23 5% | 24.8 -3% | 23.8 1% | 23.2 4% |
| Idle Maximum * (dB) | 25.5 | 23 10% | 26.7 -5% | 23.8 7% | 23.2 9% |
| Load Average * (dB) | 32.8 | 37 -13% | 36.8 -12% | 26 21% | 29.9 9% |
| Cyberpunk 2077 ultra * (dB) | 39.7 | 42.74 -8% | 44.5 -12% | 31.5 21% | 43.3 -9% |
| Load Maximum * (dB) | 39.7 | 42.74 -8% | 50.8 -28% | 40.3 -2% | 40.5 -2% |
* ... smaller is better
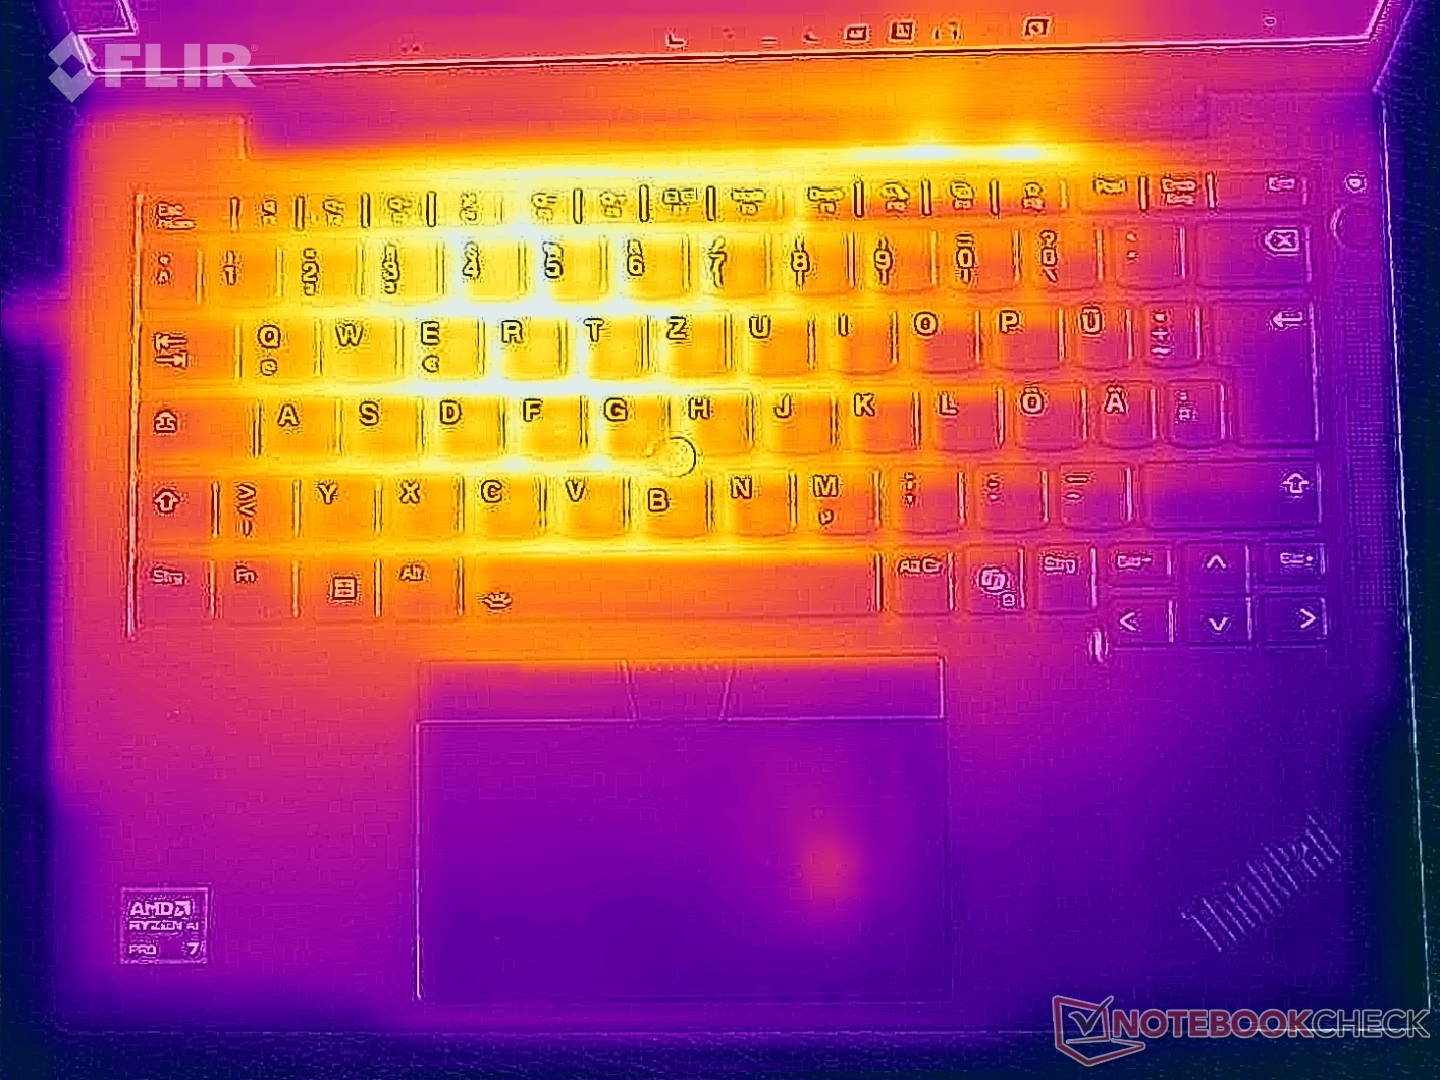
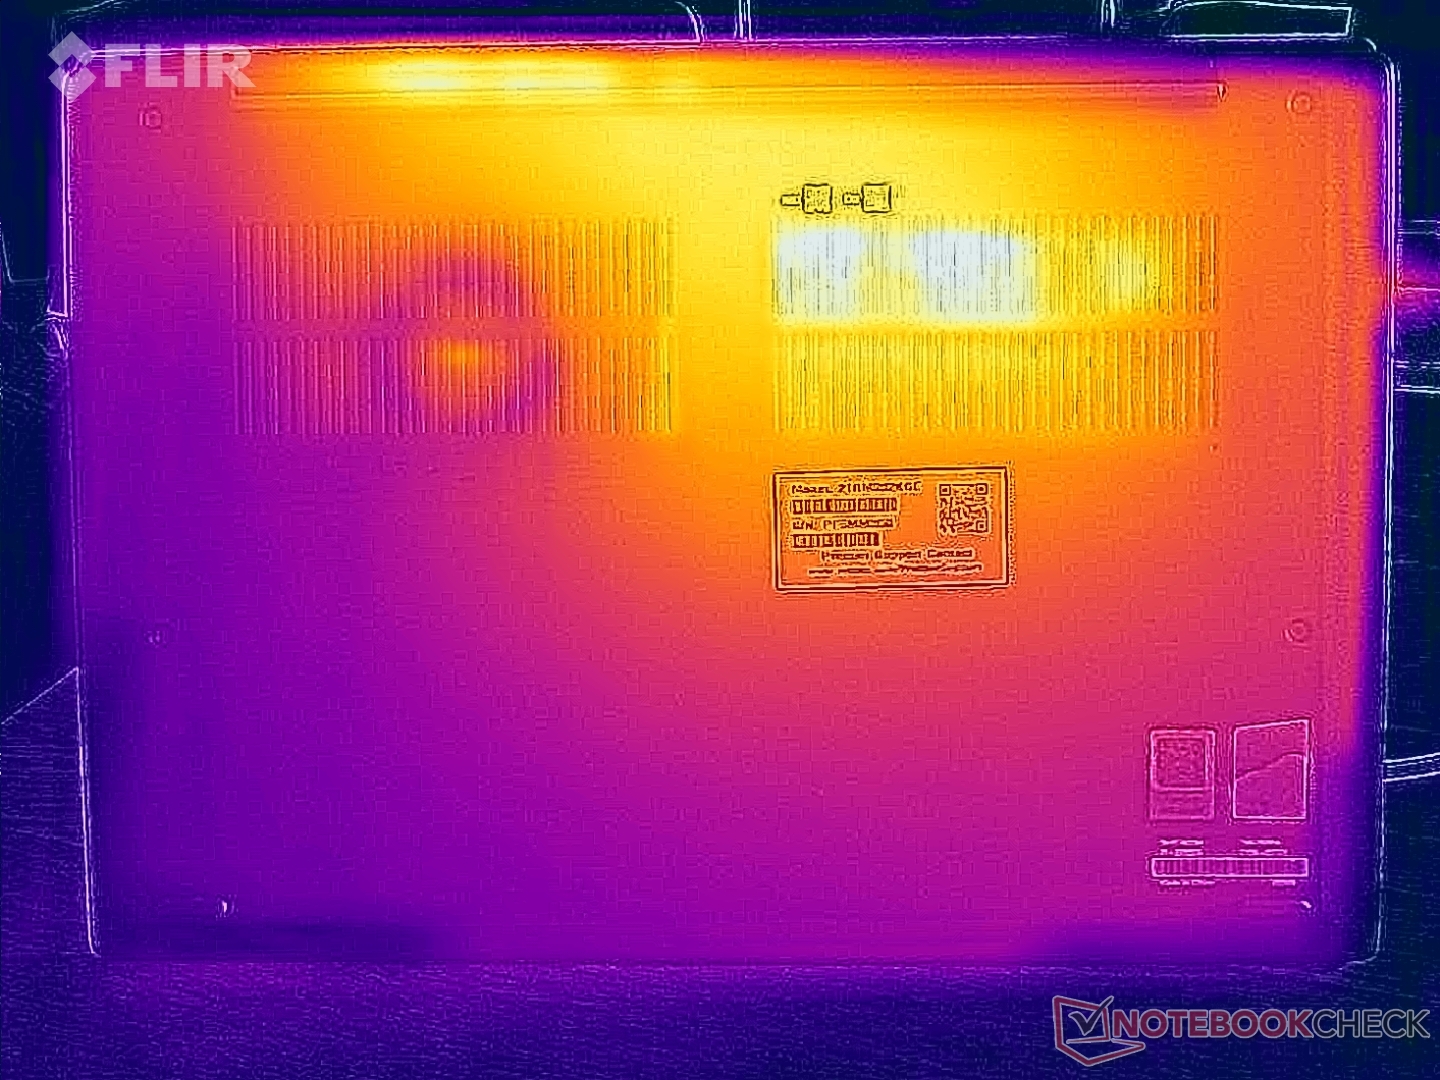
Temperature
Surface temperatures pose no problems, neither in everyday use nor under maximum load. In the stress test with combined CPU and GPU load, the processor quickly settles at around 22 watts.

(±) The maximum temperature on the upper side is 43.5 °C / 110 F, compared to the average of 35.9 °C / 97 F, ranging from 21.4 to 59 °C for the class Subnotebook.
(-) The bottom heats up to a maximum of 45.9 °C / 115 F, compared to the average of 39.2 °C / 103 F
(+) In idle usage, the average temperature for the upper side is 23.5 °C / 74 F, compared to the device average of 30.8 °C / 87 F.
(±) 3: The average temperature for the upper side is 35.2 °C / 95 F, compared to the average of 30.8 °C / 87 F for the class Subnotebook.
(+) The palmrests and touchpad are cooler than skin temperature with a maximum of 27.8 °C / 82 F and are therefore cool to the touch.
(±) The average temperature of the palmrest area of similar devices was 28.2 °C / 82.8 F (+0.4 °C / 0.8 F).
| Lenovo ThinkPad X13 G6 AMD Ryzen AI 7 PRO 350, Radeon 860M | Dell Pro 13 Premium PA13250 Core Ultra 7 268V, Arc 140V | MSI Prestige 13 AI Plus Evo A2VMG Core Ultra 7 258V, Arc 140V | Microsoft Surface Laptop 7 13.8 Copilot+ SD X Elite X1E-80-100, Adreno X1-85 3.8 TFLOPS | Lenovo ThinkPad X1 Carbon Gen 13 21NS0010GE Core Ultra 7 258V, Arc 140V | |
|---|---|---|---|---|---|
| Heat | 16% | -1% | -2% | -4% | |
| Maximum Upper Side * (°C) | 43.5 | 31 29% | 43.4 -0% | 47.1 -8% | 42.3 3% |
| Maximum Bottom * (°C) | 45.9 | 31 32% | 42.4 8% | 44.6 3% | 40.1 13% |
| Idle Upper Side * (°C) | 23.9 | 24 -0% | 25.4 -6% | 24.7 -3% | 27.3 -14% |
| Idle Bottom * (°C) | 24.2 | 24 1% | 25.6 -6% | 24.5 -1% | 28.3 -17% |
* ... smaller is better
Speakers
The speakers offer little to get excited about. Vocal reproduction is acceptable, but for anything beyond that we recommend using headphones or external speakers.
Lenovo ThinkPad X13 G6 AMD audio analysis
(±) | speaker loudness is average but good (78.2 dB)
Bass 100 - 315 Hz
(-) | nearly no bass - on average 15.8% lower than median
(±) | linearity of bass is average (9.3% delta to prev. frequency)
Mids 400 - 2000 Hz
(±) | higher mids - on average 6.9% higher than median
(+) | mids are linear (5.1% delta to prev. frequency)
Highs 2 - 16 kHz
(±) | higher highs - on average 6.2% higher than median
(+) | highs are linear (4.5% delta to prev. frequency)
Overall 100 - 16.000 Hz
(±) | linearity of overall sound is average (21.8% difference to median)
Compared to same class
» 73% of all tested devices in this class were better, 6% similar, 20% worse
» The best had a delta of 5%, average was 18%, worst was 53%
Compared to all devices tested
» 62% of all tested devices were better, 7% similar, 31% worse
» The best had a delta of 4%, average was 23%, worst was 134%
Dell Pro 13 Premium PA13250 audio analysis
(+) | speakers can play relatively loud (87.49 dB)
Bass 100 - 315 Hz
(-) | nearly no bass - on average 15.9% lower than median
(±) | linearity of bass is average (8.3% delta to prev. frequency)
Mids 400 - 2000 Hz
(+) | balanced mids - only 2.9% away from median
(+) | mids are linear (4.7% delta to prev. frequency)
Highs 2 - 16 kHz
(±) | reduced highs - on average 5.2% lower than median
(±) | linearity of highs is average (7.1% delta to prev. frequency)
Overall 100 - 16.000 Hz
(+) | overall sound is linear (12.2% difference to median)
Compared to same class
» 15% of all tested devices in this class were better, 5% similar, 81% worse
» The best had a delta of 5%, average was 18%, worst was 53%
Compared to all devices tested
» 10% of all tested devices were better, 2% similar, 88% worse
» The best had a delta of 4%, average was 23%, worst was 134%
MSI Prestige 13 AI Plus Evo A2VMG audio analysis
(+) | speakers can play relatively loud (84.5 dB)
Bass 100 - 315 Hz
(-) | nearly no bass - on average 19.4% lower than median
(±) | linearity of bass is average (9.6% delta to prev. frequency)
Mids 400 - 2000 Hz
(±) | higher mids - on average 6.4% higher than median
(+) | mids are linear (5.1% delta to prev. frequency)
Highs 2 - 16 kHz
(±) | higher highs - on average 6.1% higher than median
(+) | highs are linear (4.6% delta to prev. frequency)
Overall 100 - 16.000 Hz
(±) | linearity of overall sound is average (18.2% difference to median)
Compared to same class
» 52% of all tested devices in this class were better, 7% similar, 40% worse
» The best had a delta of 5%, average was 18%, worst was 53%
Compared to all devices tested
» 39% of all tested devices were better, 8% similar, 53% worse
» The best had a delta of 4%, average was 23%, worst was 134%
Microsoft Surface Laptop 7 13.8 Copilot+ audio analysis
(±) | speaker loudness is average but good (81.8 dB)
Bass 100 - 315 Hz
(±) | reduced bass - on average 12.7% lower than median
(±) | linearity of bass is average (9.8% delta to prev. frequency)
Mids 400 - 2000 Hz
(+) | balanced mids - only 4.1% away from median
(+) | mids are linear (2.4% delta to prev. frequency)
Highs 2 - 16 kHz
(+) | balanced highs - only 2.1% away from median
(+) | highs are linear (2.5% delta to prev. frequency)
Overall 100 - 16.000 Hz
(+) | overall sound is linear (12.1% difference to median)
Compared to same class
» 14% of all tested devices in this class were better, 5% similar, 81% worse
» The best had a delta of 5%, average was 18%, worst was 53%
Compared to all devices tested
» 10% of all tested devices were better, 2% similar, 88% worse
» The best had a delta of 4%, average was 23%, worst was 134%
Lenovo ThinkPad X1 Carbon Gen 13 21NS0010GE audio analysis
(+) | speakers can play relatively loud (84.8 dB)
Bass 100 - 315 Hz
(±) | reduced bass - on average 10.2% lower than median
(±) | linearity of bass is average (9.2% delta to prev. frequency)
Mids 400 - 2000 Hz
(±) | higher mids - on average 8.9% higher than median
(+) | mids are linear (3.6% delta to prev. frequency)
Highs 2 - 16 kHz
(+) | balanced highs - only 4.3% away from median
(+) | highs are linear (5.8% delta to prev. frequency)
Overall 100 - 16.000 Hz
(±) | linearity of overall sound is average (15% difference to median)
Compared to same class
» 33% of all tested devices in this class were better, 5% similar, 62% worse
» The best had a delta of 5%, average was 18%, worst was 53%
Compared to all devices tested
» 21% of all tested devices were better, 4% similar, 75% worse
» The best had a delta of 4%, average was 23%, worst was 134%
Power consumption

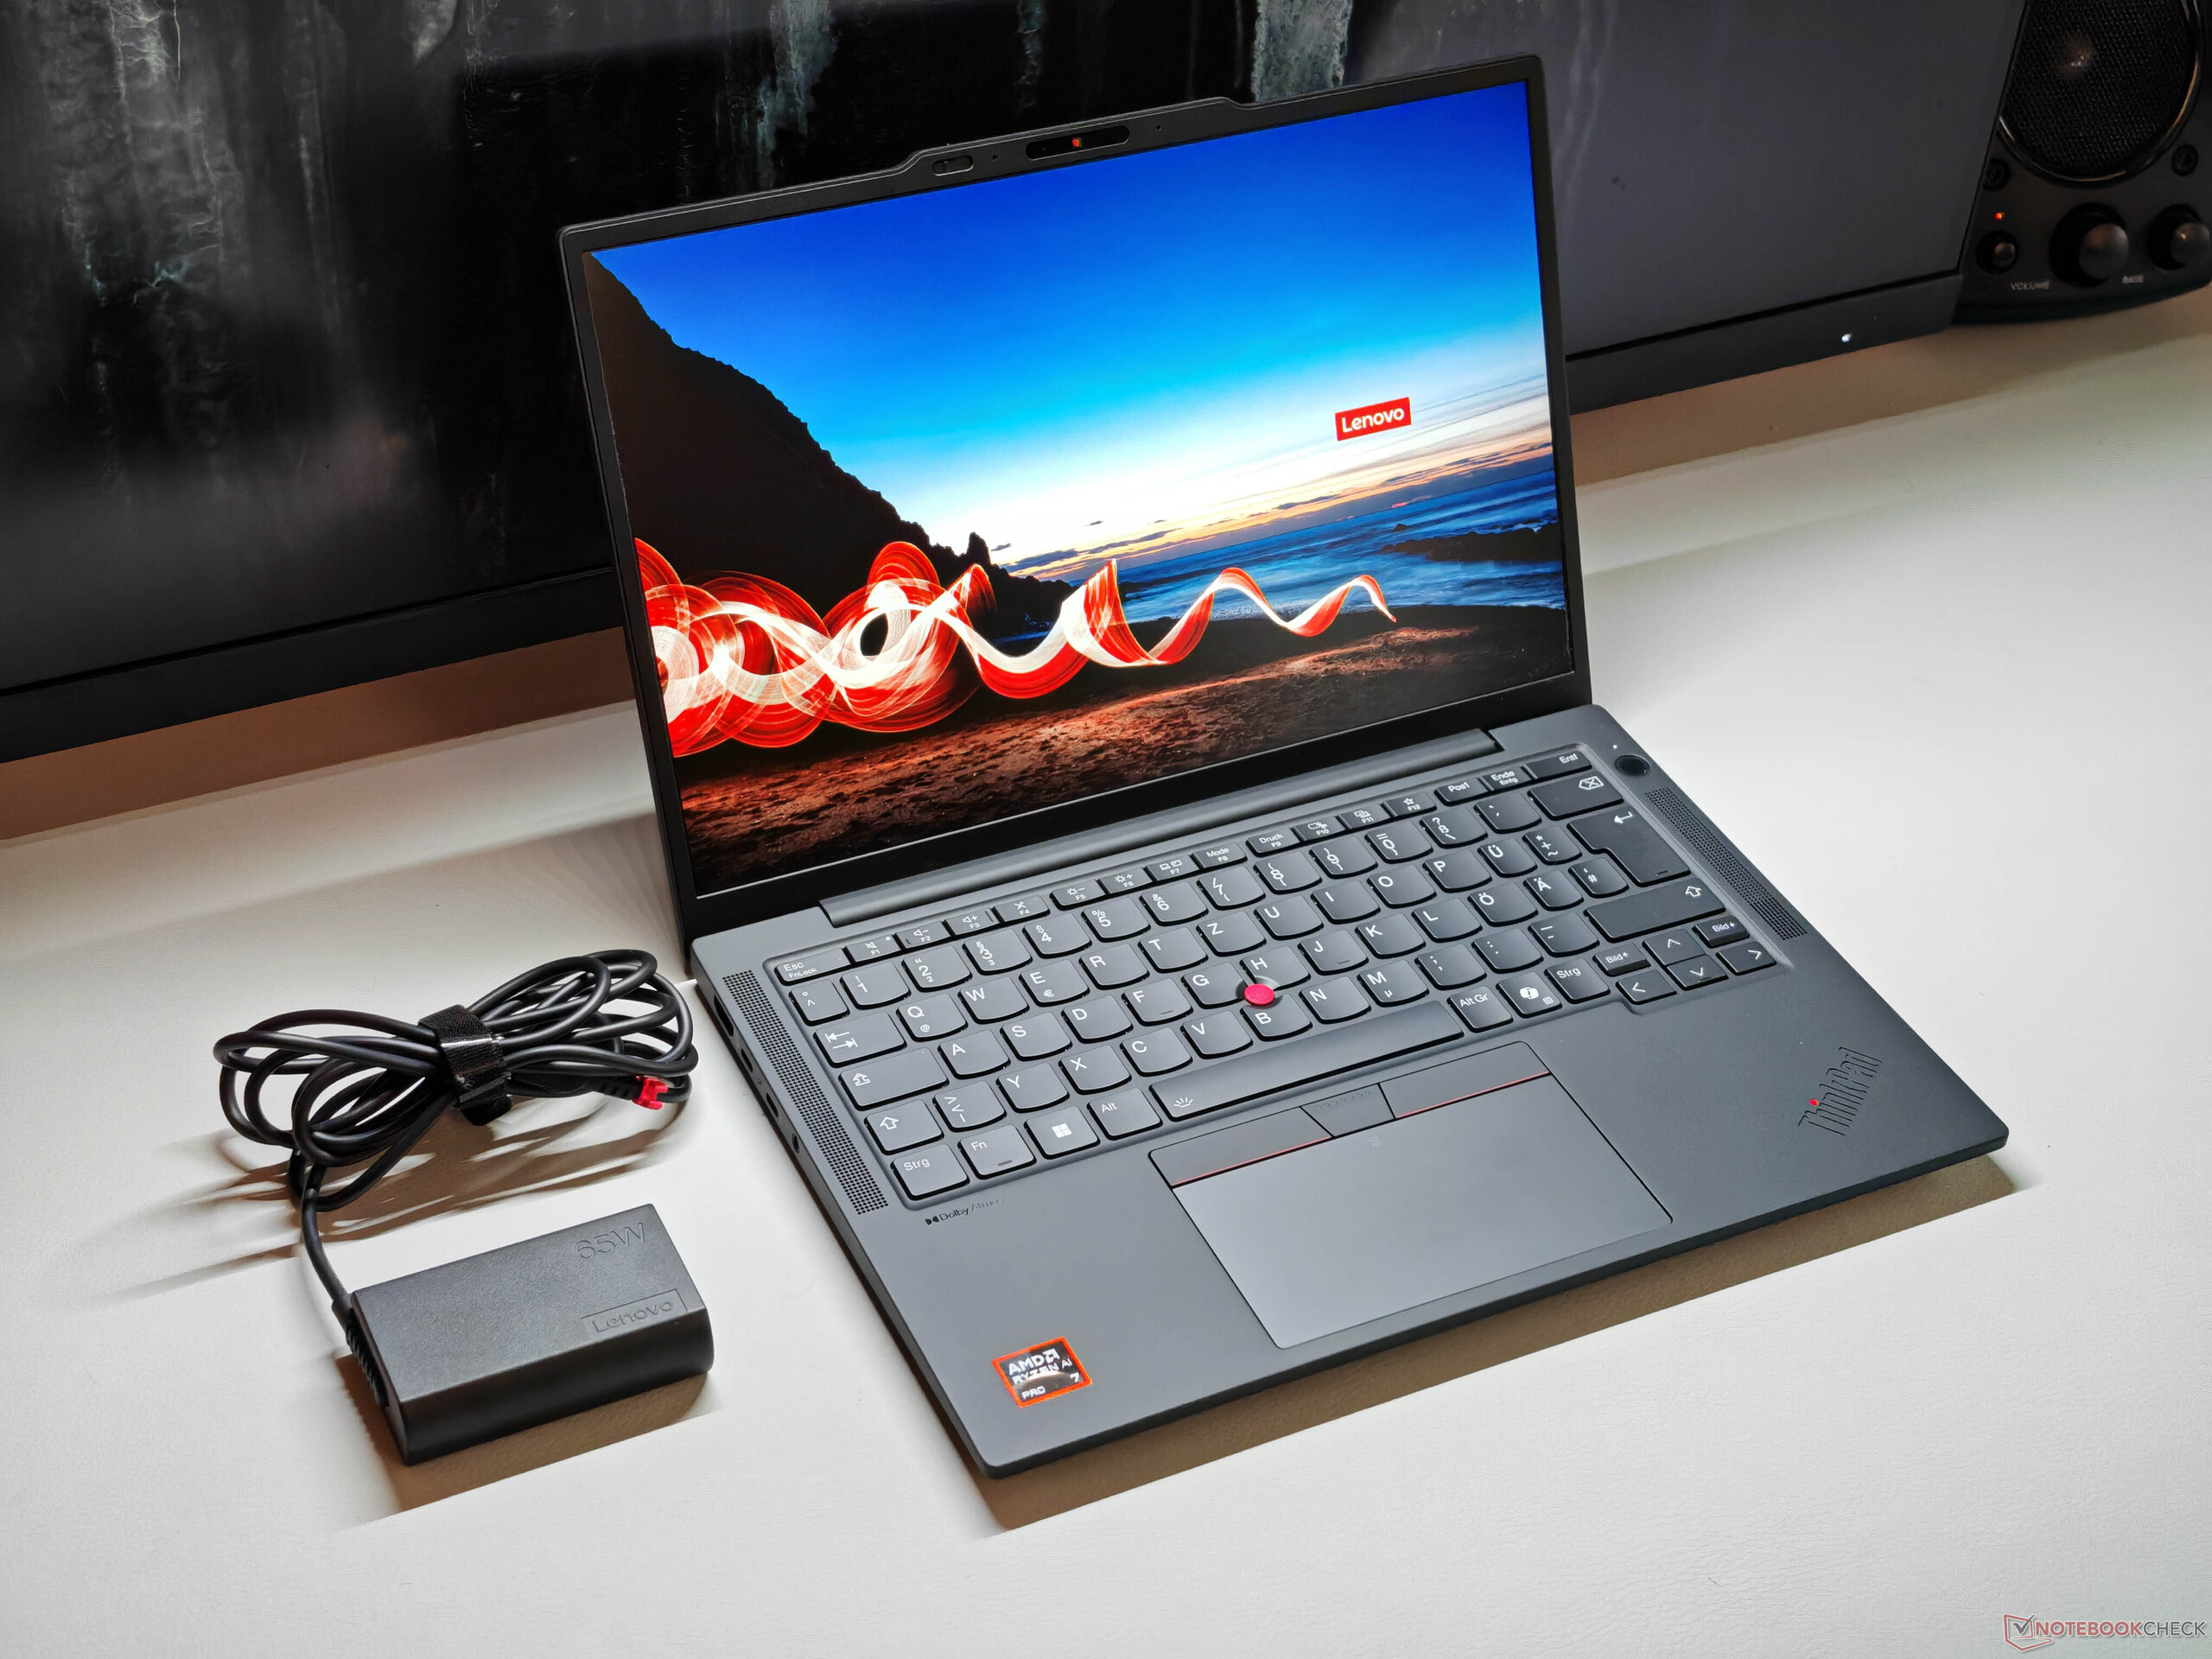
Despite the focus on mobility, power consumption still has room for improvement, particularly at low load. The Dell Pro 13 Premium is noticeably more efficient in this area. Under load we record a peak of just under 66 watts, which quickly settles at around 42 watts. The very compact 65-watt GaN power adapter is therefore adequately sized.
| Off / Standby | |
| Idle | |
| Load |
|
Key:
min: | |
| Lenovo ThinkPad X13 G6 AMD Ryzen AI 7 PRO 350, Radeon 860M, Western Digital PC SN8000S SDEPNRK-1T00, IPS, 1920x1200, 13.3" | Dell Pro 13 Premium PA13250 Core Ultra 7 268V, Arc 140V, Micron 2550 1TB, IPS, 1920x1200, 13.3" | MSI Prestige 13 AI Plus Evo A2VMG Core Ultra 7 258V, Arc 140V, , OLED, 2880x1800, 13.3" | Microsoft Surface Laptop 7 13.8 Copilot+ SD X Elite X1E-80-100, Adreno X1-85 3.8 TFLOPS, Samsung MZ9L4512HBLU-00BMV, IPS, 2304x1536, 13.8" | Lenovo ThinkPad X1 Carbon Gen 13 21NS0010GE Core Ultra 7 258V, Arc 140V, SK hynix PCB01 HFS001TFM9X179N GL, OLED, 2880x1800, 14" | Average AMD Radeon 860M | Average of class Subnotebook | |
|---|---|---|---|---|---|---|---|
| Power Consumption | 19% | -12% | 19% | 1% | -20% | -11% | |
| Idle Minimum * (Watt) | 2.7 | 2 26% | 3.5 -30% | 1.4 48% | 4.7 -74% | 3.99 ? -48% | 3.78 ? -40% |
| Idle Average * (Watt) | 5.7 | 4.3 25% | 5.9 -4% | 6.3 -11% | 5.7 -0% | 6.72 ? -18% | 6.57 ? -15% |
| Idle Maximum * (Watt) | 6.3 | 4.75 25% | 10 -59% | 7.6 -21% | 6.1 3% | 7.32 ? -16% | 7.94 ? -26% |
| Load Average * (Watt) | 55.3 | 40 28% | 38.7 30% | 26.9 51% | 29.8 46% | 55.9 ? -1% | 41.9 ? 24% |
| Cyberpunk 2077 ultra * (Watt) | 41.2 | 36.4 12% | 46.3 -12% | 38.5 7% | 35.3 14% | ||
| Cyberpunk 2077 ultra external monitor * (Watt) | 39.1 | 38 3% | 45.6 -17% | 34.1 13% | |||
| Load Maximum * (Watt) | 65.6 | 57 13% | 61.5 6% | 40.7 38% | 60.1 8% | 75.4 ? -15% | 64.4 ? 2% |
* ... smaller is better
energy consumption Cyberpunk / Stress test
energy consumption with external monitor
Battery life
The battery has a capacity of 54.7 Wh, and in our Wi-Fi test at 150 cd/m² we measure a good runtime of a little over 12 hours (or 8 hours and 20 minutes at maximum brightness). However, almost all competitors last even longer, especially the Dell.

Notebookcheck overall rating
Lenovo ThinkPad X13 G6 AMD
- 11/30/2025 v8
Andreas Osthoff
 Total Sustainability Score:
 Possible alternatives in comparison
Image | Model / Review | Price | Weight | Height | Display |
|---|---|---|---|---|---|
1. 87.4%  | Lenovo ThinkPad X13 G6 AMD AMD Ryzen AI 7 PRO 350 ⎘ AMD Radeon 860M ⎘ 32 GB Memory, 1024 GB SSD | Amazon: List Price: 1855€ | 1.1 kg | 13 mm | 13.30" 1920x1200 170 PPI IPS |
2. 90%  | Dell Pro 13 Premium PA13250 Intel Core Ultra 7 268V ⎘ Intel Arc Graphics 140V ⎘ 32 GB Memory, 1024 GB SSD | Amazon: List Price: 2700 Euro | 1.1 kg | 17.2 mm | 13.30" 1920x1200 170 PPI IPS |
3. 85%  | MSI Prestige 13 AI Plus Evo A2VMG Intel Core Ultra 7 258V ⎘ Intel Arc Graphics 140V ⎘ 32 GB Memory | Amazon: 1. $1,149.49 msi Prestige 13 AI Evo Lapto... 2. $31.99 CPU Cooling Fan Replacement ... 3. $1,349.00 HIDevolution [2024] MSI Pres... List Price: 1400 USD | 970 g | 16.9 mm | 13.30" 2880x1800 255 PPI OLED |
4. 86.2%  | Microsoft Surface Laptop 7 13.8 Copilot+ Qualcomm Snapdragon X Elite X1E-80-100 ⎘ Qualcomm SD X Adreno X1-85 3.8 TFLOPS ⎘ 16 GB Memory, 512 GB SSD | Amazon: List Price: 1649€ | 1.3 kg | 17.5 mm | 13.80" 2304x1536 201 PPI IPS |
5. 89.9% 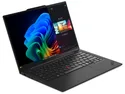 | Lenovo ThinkPad X1 Carbon Gen 13 21NS0010GE Intel Core Ultra 7 258V ⎘ Intel Arc Graphics 140V ⎘ 32 GB Memory, 1024 GB SSD | Amazon: 1. $1,699.99 Lenovo Gen 13 ThinkPad X1 Ca... 2. $1,899.00 Lenovo ThinkPad X1 Carbon Ge... 3. $1,599.99 Lenovo ThinkPad X1 Carbon Ge... List Price: 2700 Euro | 982 g | 16 mm | 14.00" 2880x1800 243 PPI OLED |
Transparency
The selection of devices to be reviewed is made by our editorial team. The test sample was provided to the author as a loan by the manufacturer or retailer for the purpose of this review. The lender had no influence on this review, nor did the manufacturer receive a copy of this review before publication. There was no obligation to publish this review. As an independent media company, Notebookcheck is not subjected to the authority of manufacturers, retailers or publishers.
This is how Notebookcheck is testing
Every year, Notebookcheck independently reviews hundreds of laptops and smartphones using standardized procedures to ensure that all results are comparable. We have continuously developed our test methods for around 20 years and set industry standards in the process. In our test labs, high-quality measuring equipment is utilized by experienced technicians and editors. These tests involve a multi-stage validation process. Our complex rating system is based on hundreds of well-founded measurements and benchmarks, which maintains objectivity. Further information on our test methods can be found here.

