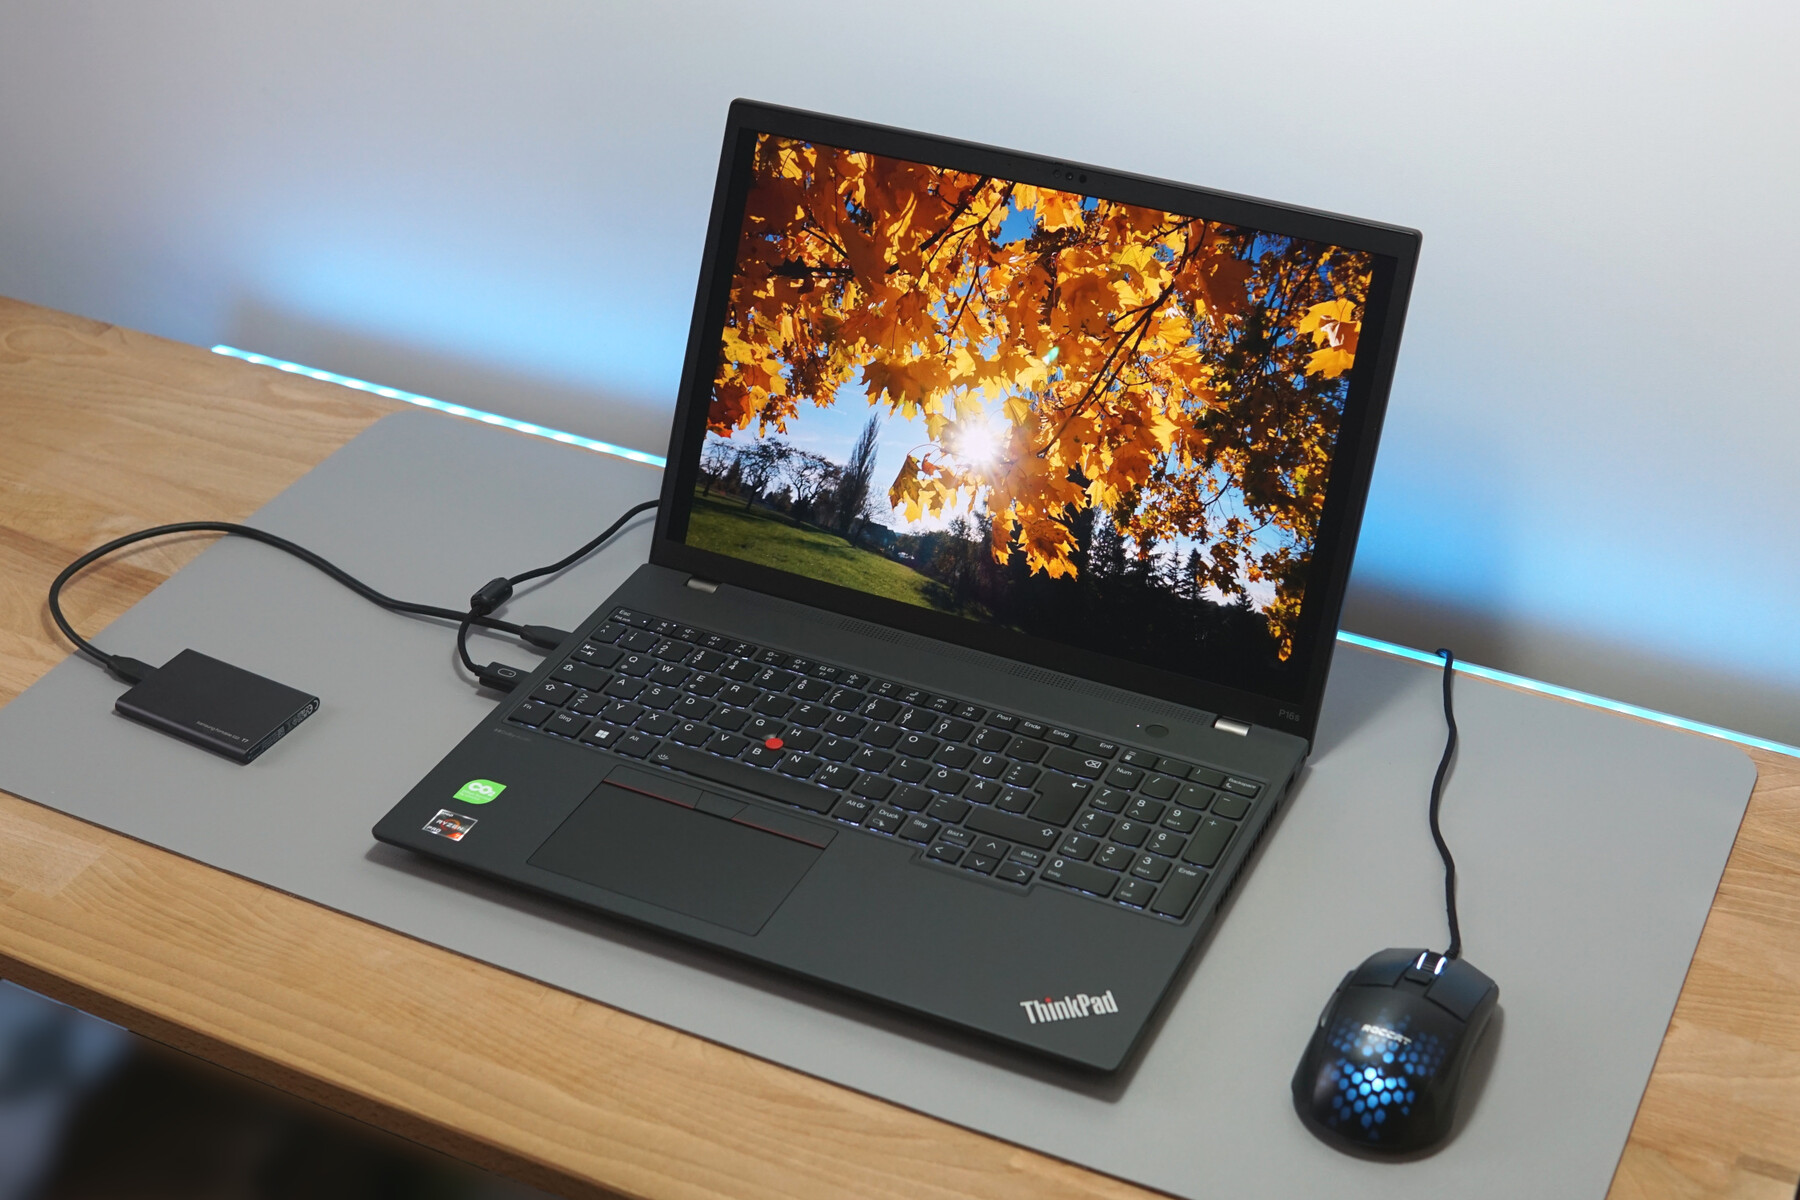
Lenovo ThinkPad P16s G2 AMD review: Power plus OLED inside this workstation laptop

While an additional security chip, the option to perform remote maintenance and a SmartCard reader may only be of interest to corporate customers, the laptop's power, graphics performance, long runtimes and nice display should pique the interest of the general public. Its powerful AMD Ryzen 7 Pro 7840U processor draws attention in particular.
This makes the ThinkPad P16s G2 suitable for working at home, on the go, at uni or even for creatives. Furthermore, an OLED display didn't have to be installed and its RAM and SSD offer a good range of configuration options for almost every field of use. In turn, its visuals could be described as rather conservative, but this doesn't have to be a negative point.
At the same time, comparable competitors such as the Microsoft Surface Laptop Studio 2 or the HP EliteBook 845 G10 have slightly braver designs. Our review will show whether these are better or worse or simply just different, and whether the ThinkPad P16s G2 still has room to grow.
Possible competitors compared
Rating | Date | Model | Weight | Height | Size | Resolution | Price |
|---|---|---|---|---|---|---|---|
| 88.6 % v7 (old) | 01 / 2024 | Lenovo ThinkPad P16s G2 21K9000CGE R7 PRO 7840U, Radeon 780M | 1.8 kg | 24.4 mm | 16.00" | 3840x2400 | |
| 90.1 % v7 (old) | 08 / 2023 | HP EliteBook 845 G10 818N0EA R9 PRO 7940HS, Radeon 780M | 1.5 kg | 17.9 mm | 14.00" | 2560x1600 | |
| 87.8 % v7 (old) | 01 / 2024 | Lenovo ThinkPad P14s G4 21K5000LGE R7 PRO 7840U, Radeon 780M | 1.3 kg | 21.8 mm | 14.00" | 1920x1200 | |
| 88.6 % v7 (old) | 08 / 2023 | Schenker Vision 16 PH6PRX1 i7-13700H, Iris Xe G7 96EUs | 1.5 kg | 17.1 mm | 16.00" | 2560x1600 | |
| 88.6 % v7 (old) | 10 / 2023 | Acer Swift Edge SFE16 Ryzen 7 7840U R7 7840U, Radeon 780M | 1.2 kg | 13 mm | 16.00" | 3200x2000 | |
| 86.2 % v7 (old) | 01 / 2024 | Lenovo ThinkPad P16v G1 AMD R7 PRO 7840HS, RTX A1000 Laptop GPU | 2.3 kg | 24.7 mm | 16.00" | 1920x1200 | |
| 85.5 % v7 (old) | 10 / 2023 | Microsoft Surface Laptop Studio 2 RTX 4060 i7-13700H, GeForce RTX 4060 Laptop GPU | 2 kg | 22 mm | 14.40" | 2400x1600 |
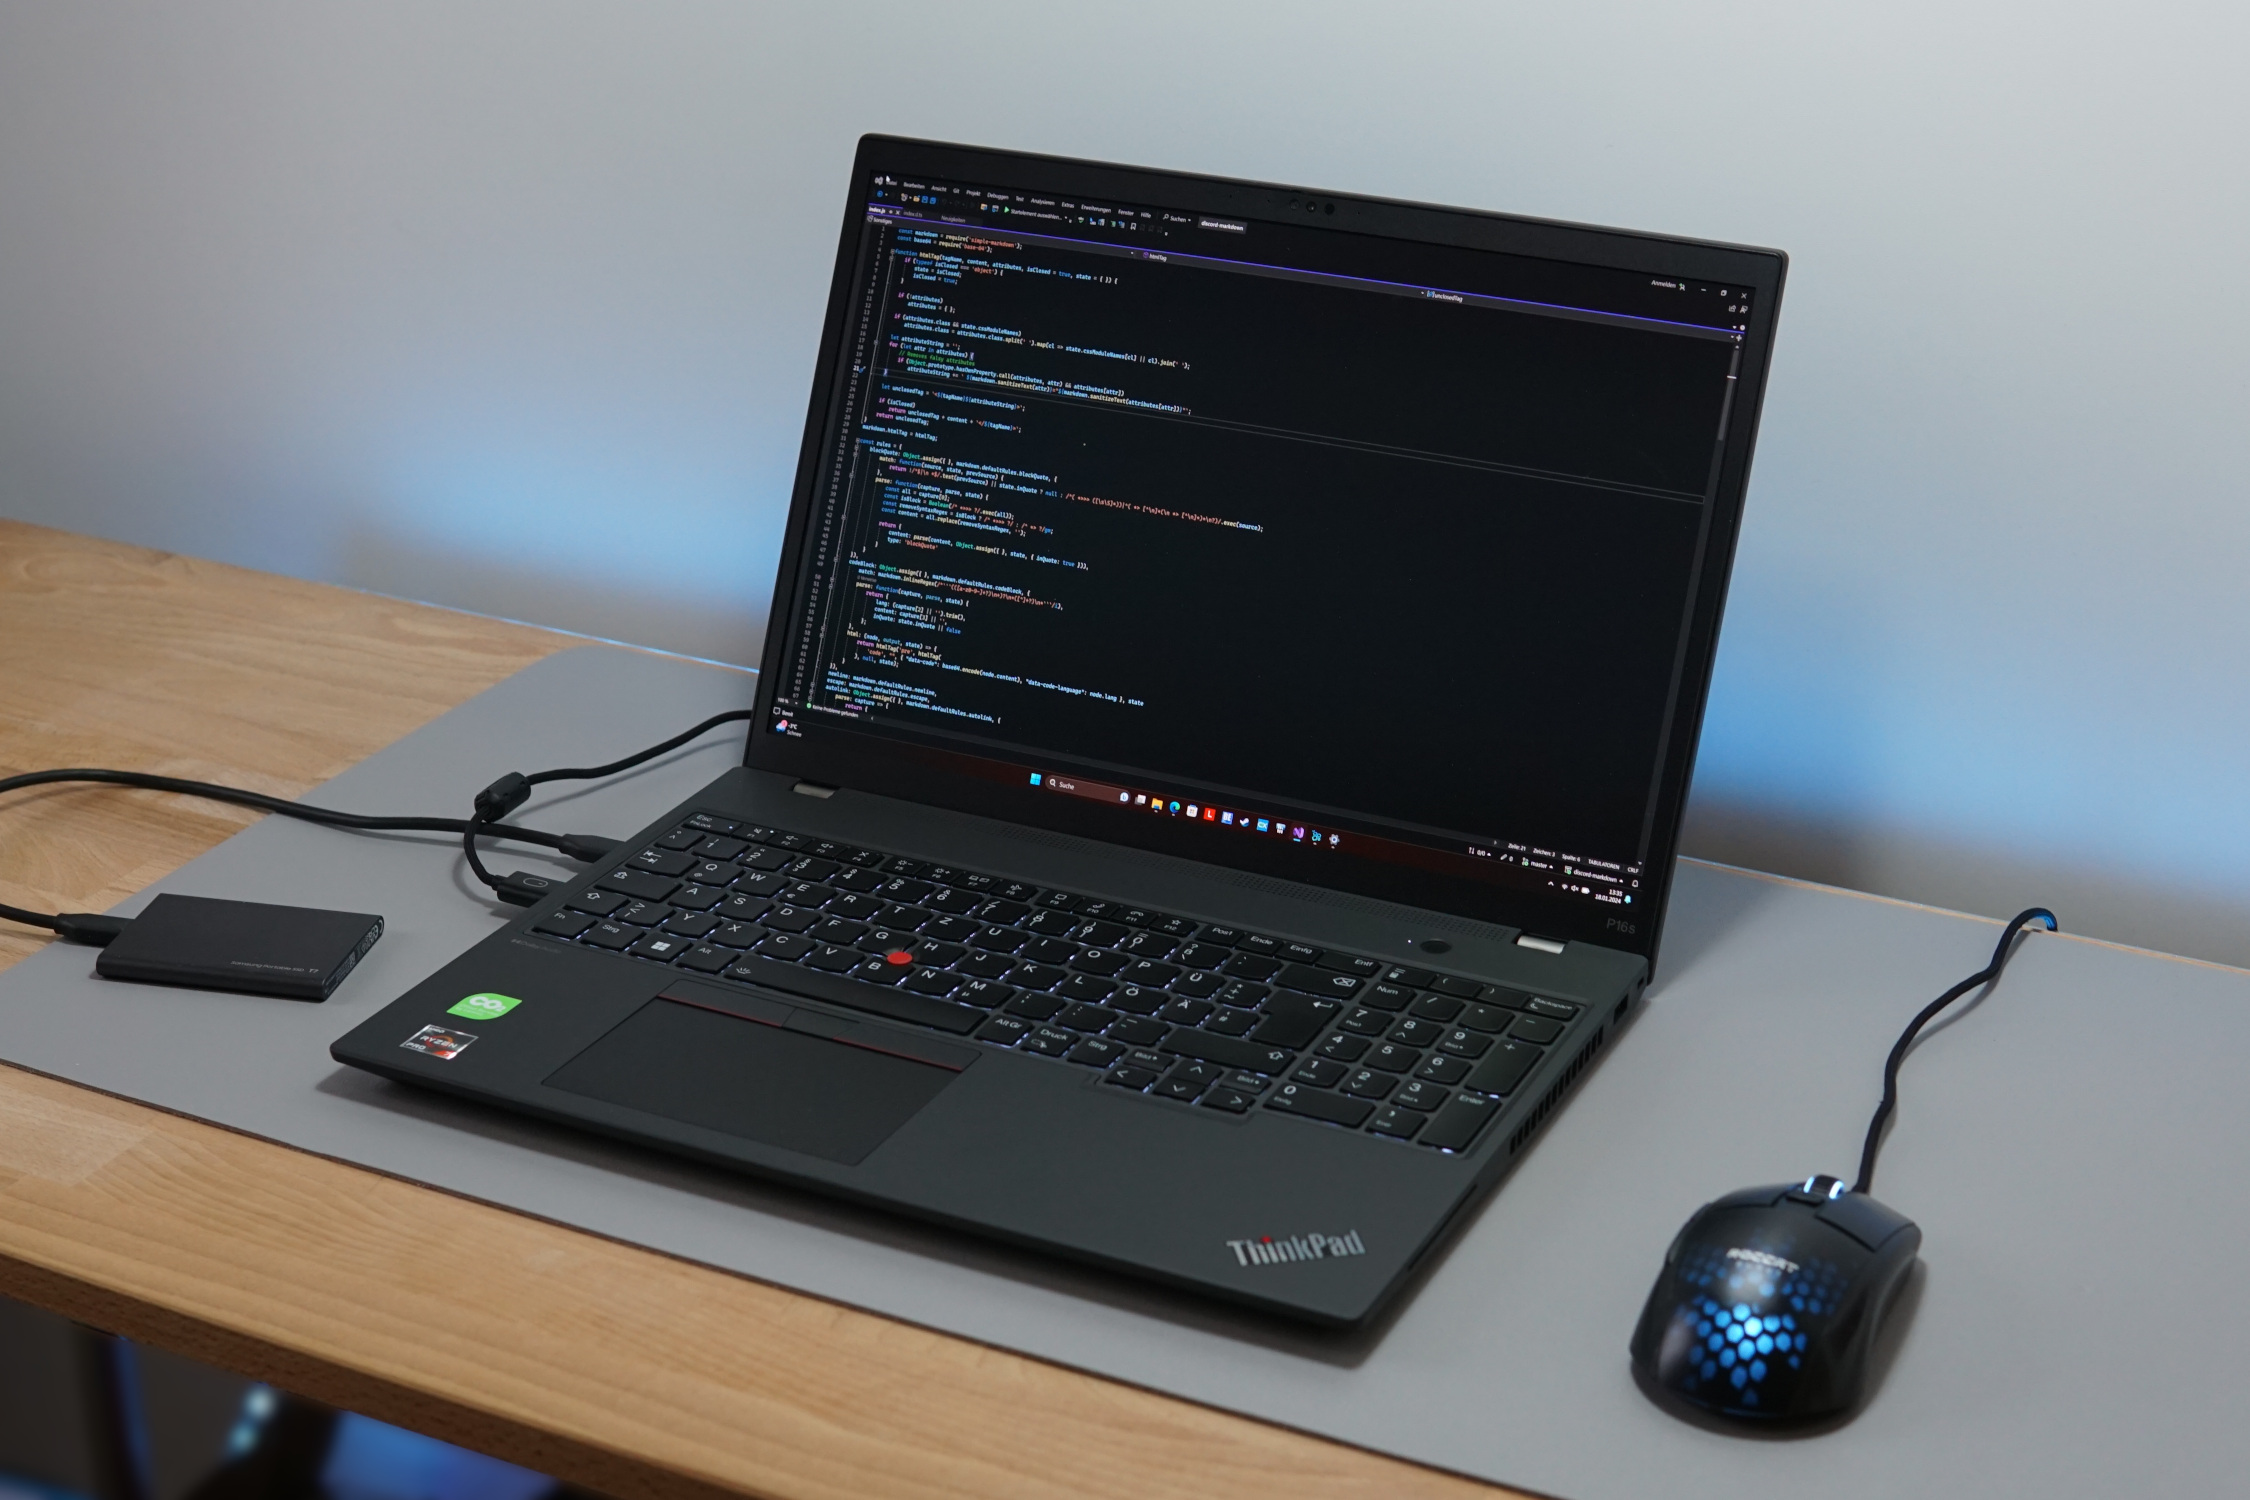
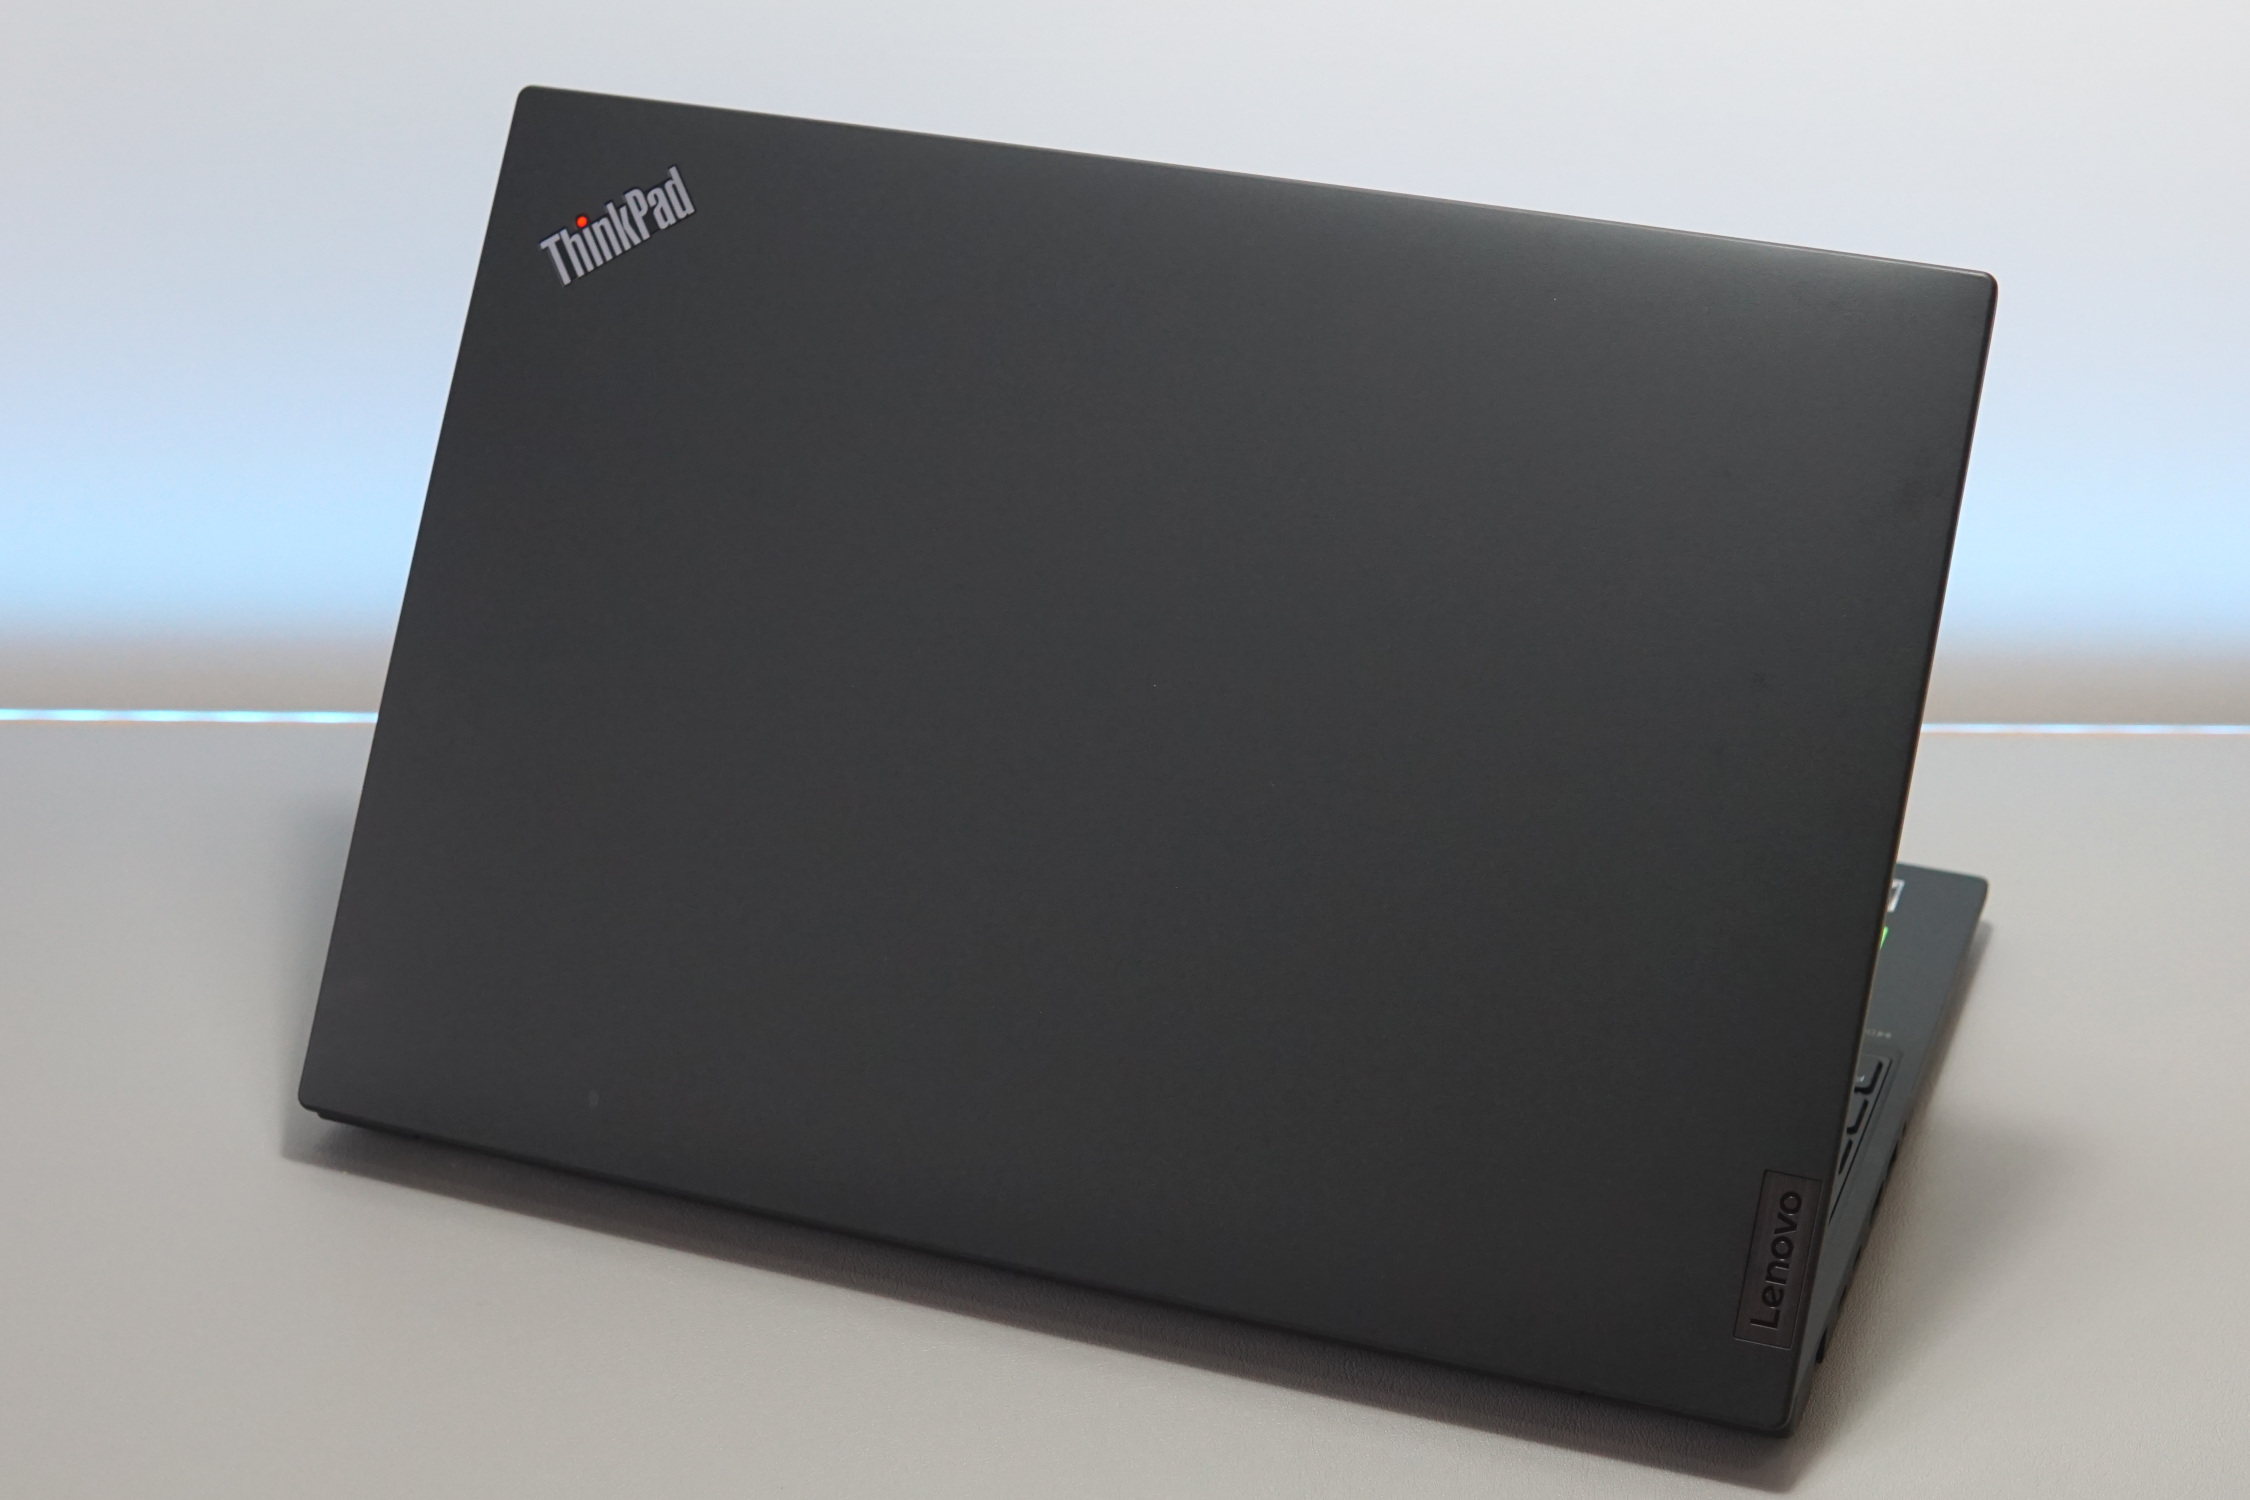
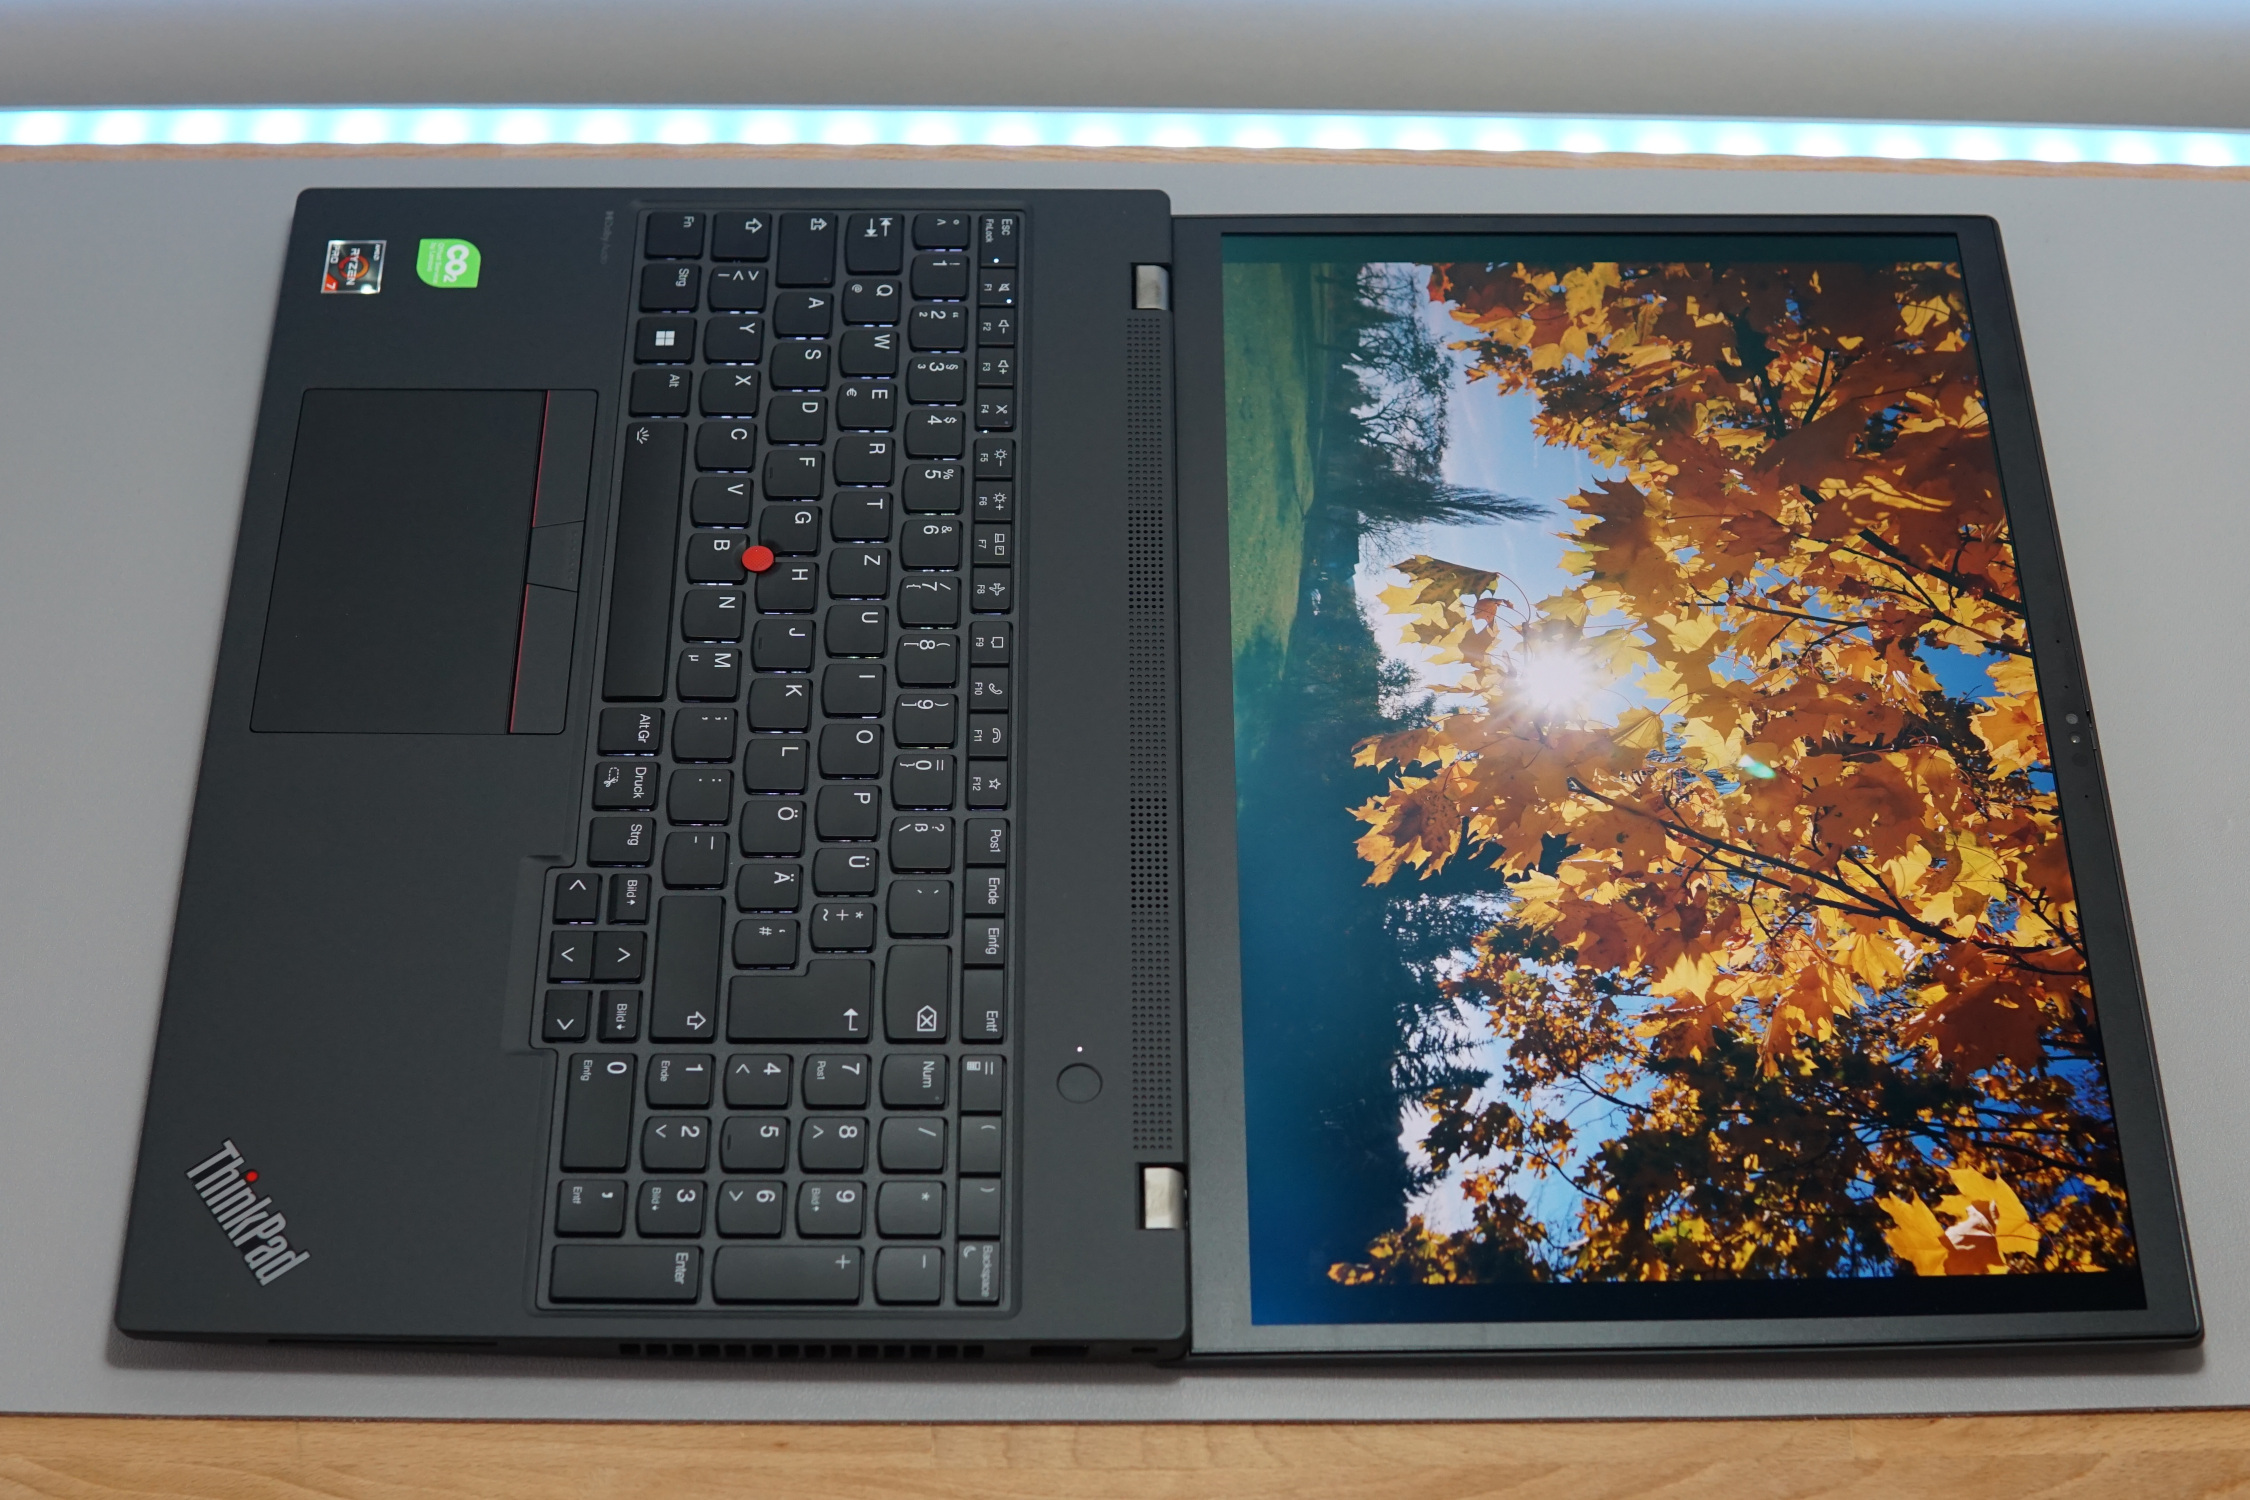
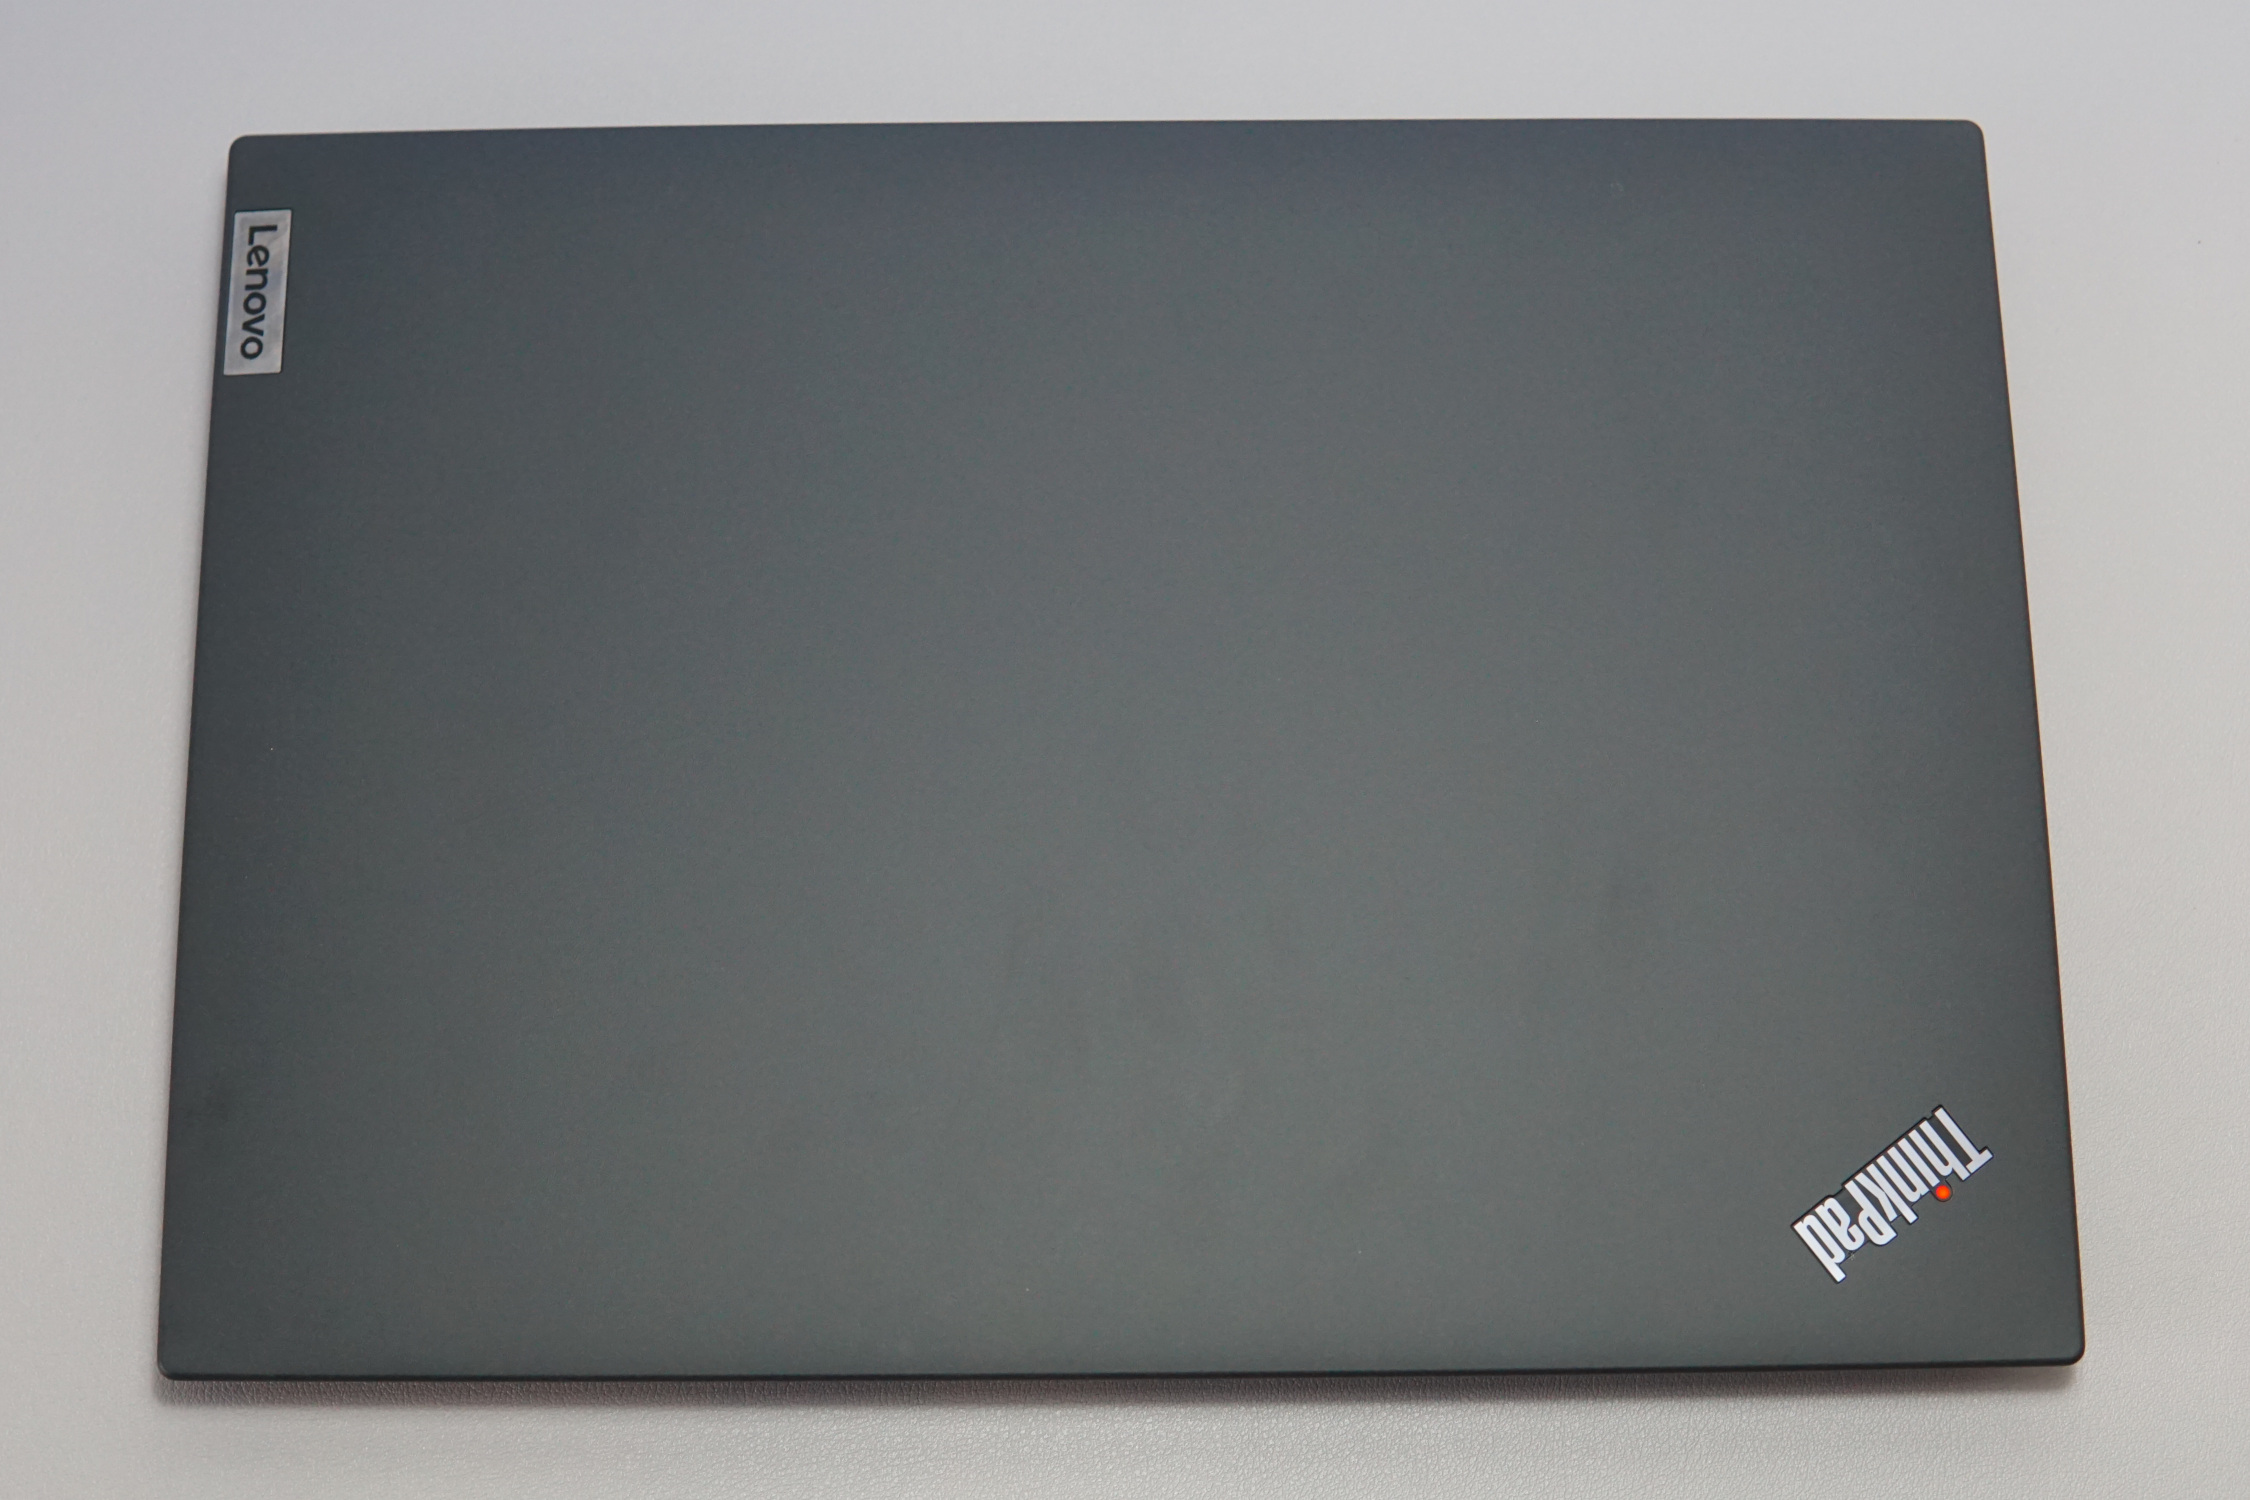
Case - The gray, robust ThinkPad
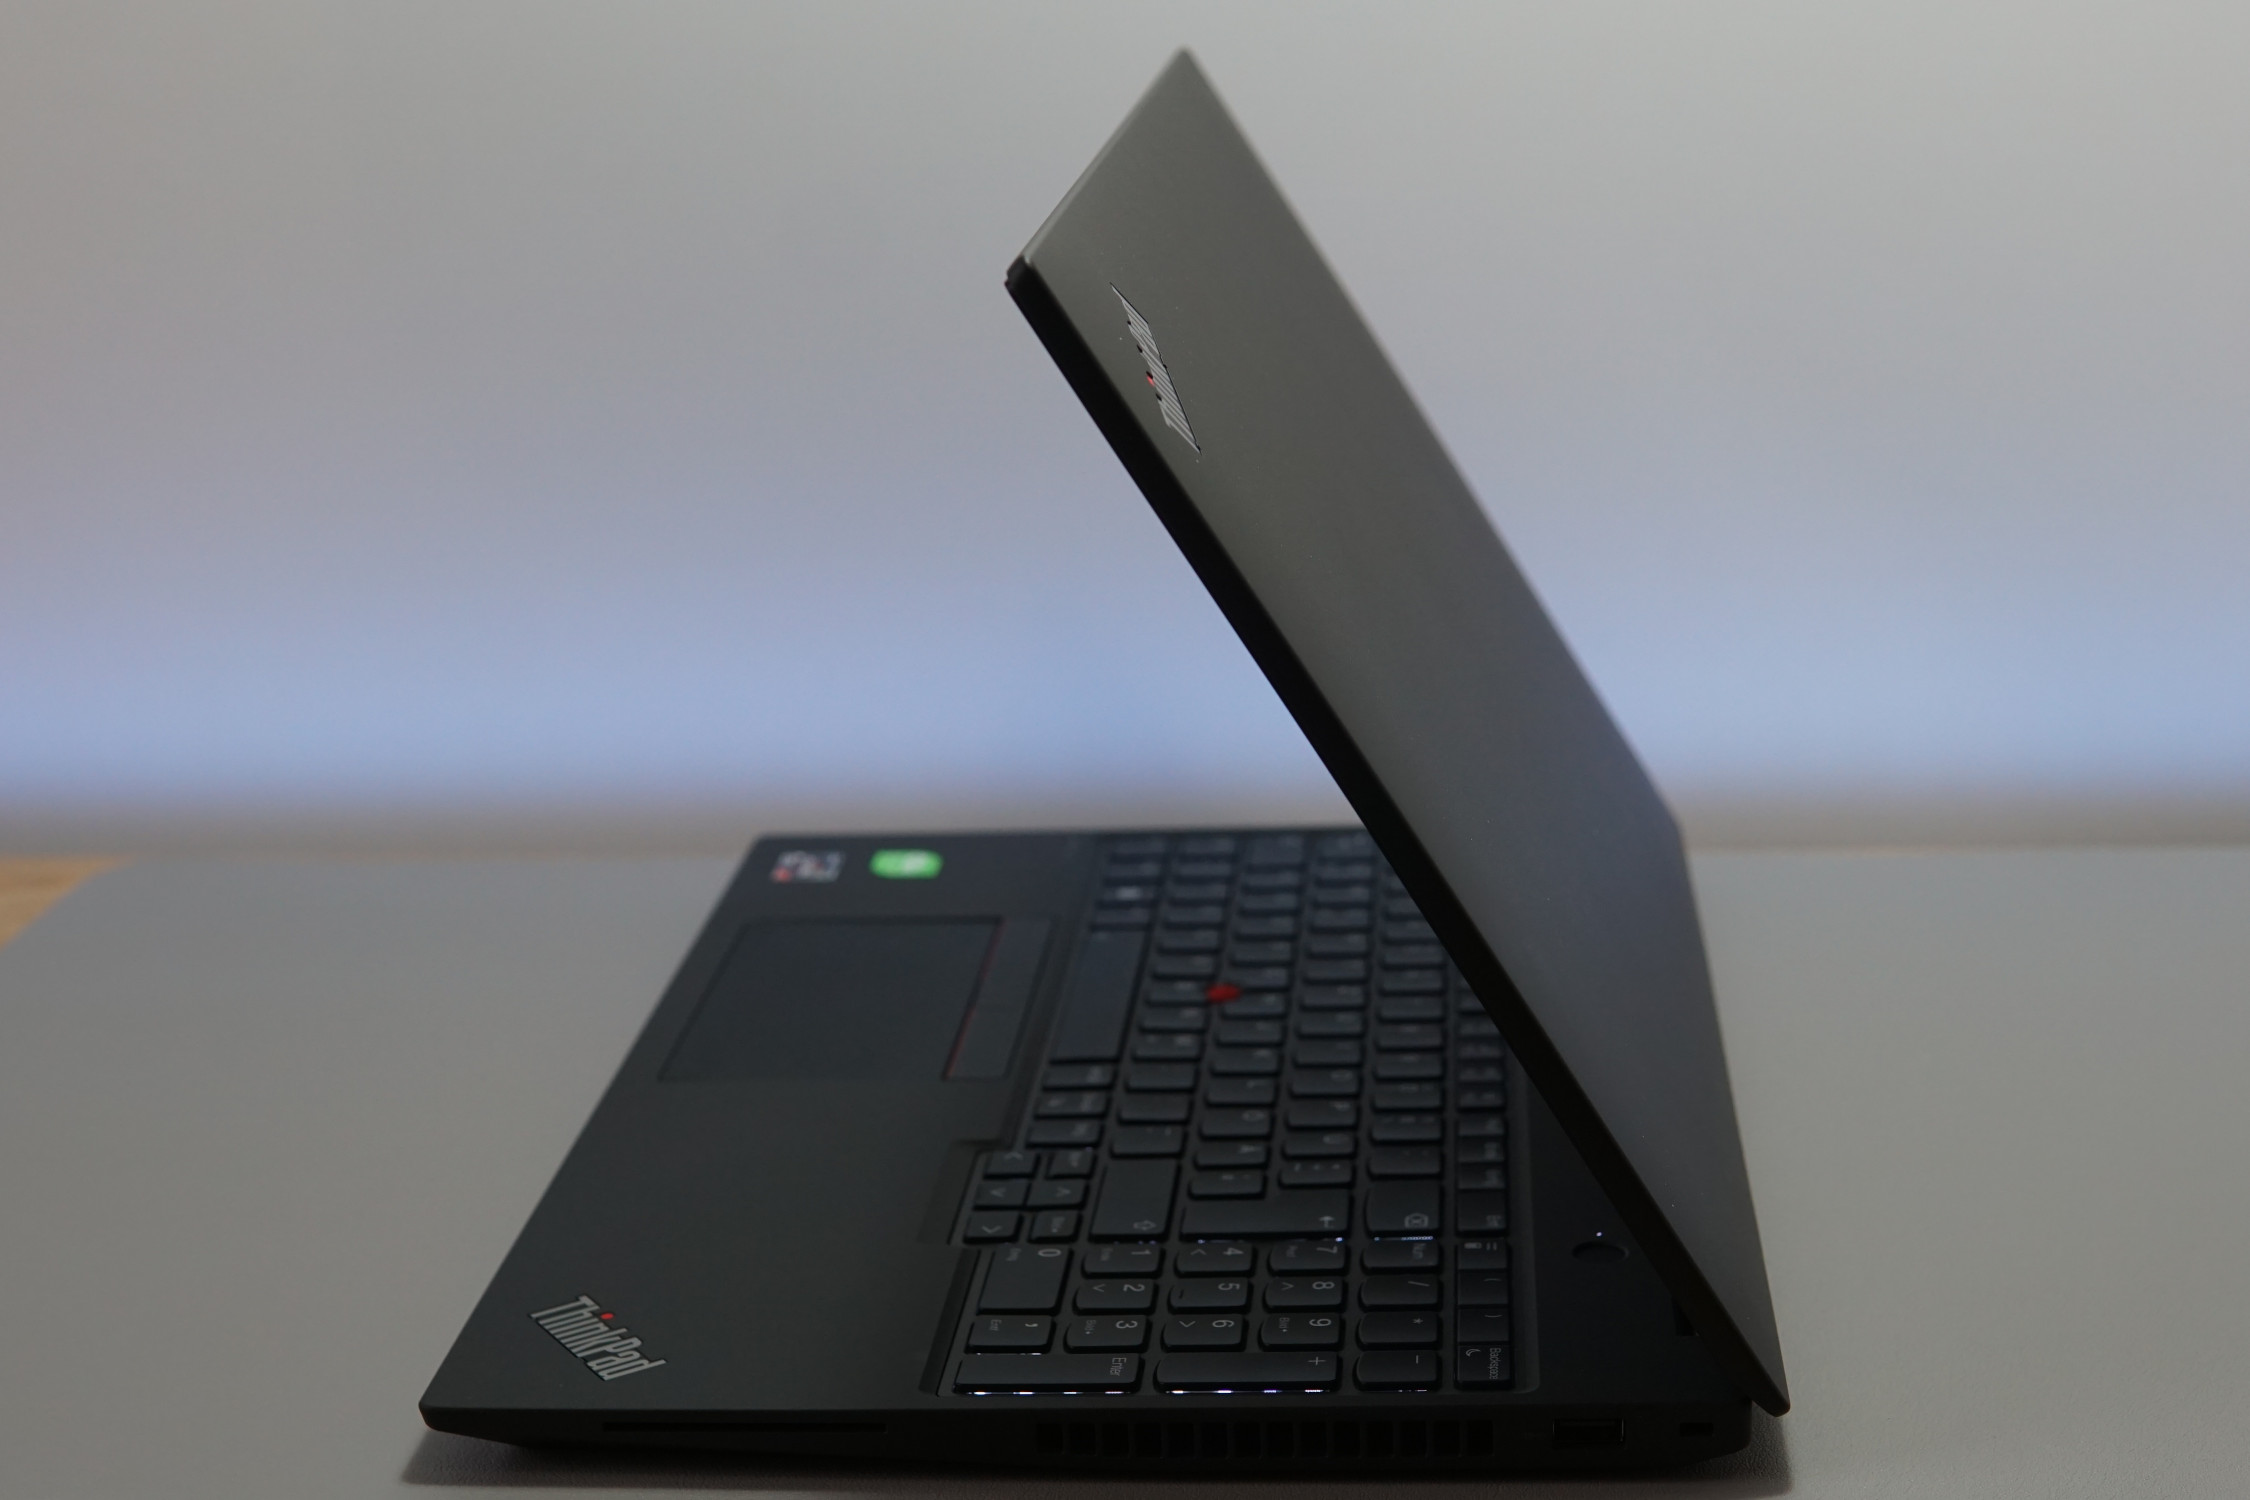
Textured surface, dark gray case: The ThinkPad visuals can be identified from a mile away. And as always, the dot above the "I" is illuminated. This doesn't appear sleek and by no means is it modern. Instead, it feels robust and durable. Tight hinges that hold the 16-inch display at any angle and a lid that closes almost seamlessly further cement this high-quality and stable impression—even without there being any metal components on the outer case.
Naturally, the relatively large display can be twisted ever so slightly. The base, on the other hand, remains totally stable in every situation. We also couldn't elicit any noises from the case. After all, it is a work laptop that won't always be handled with care.

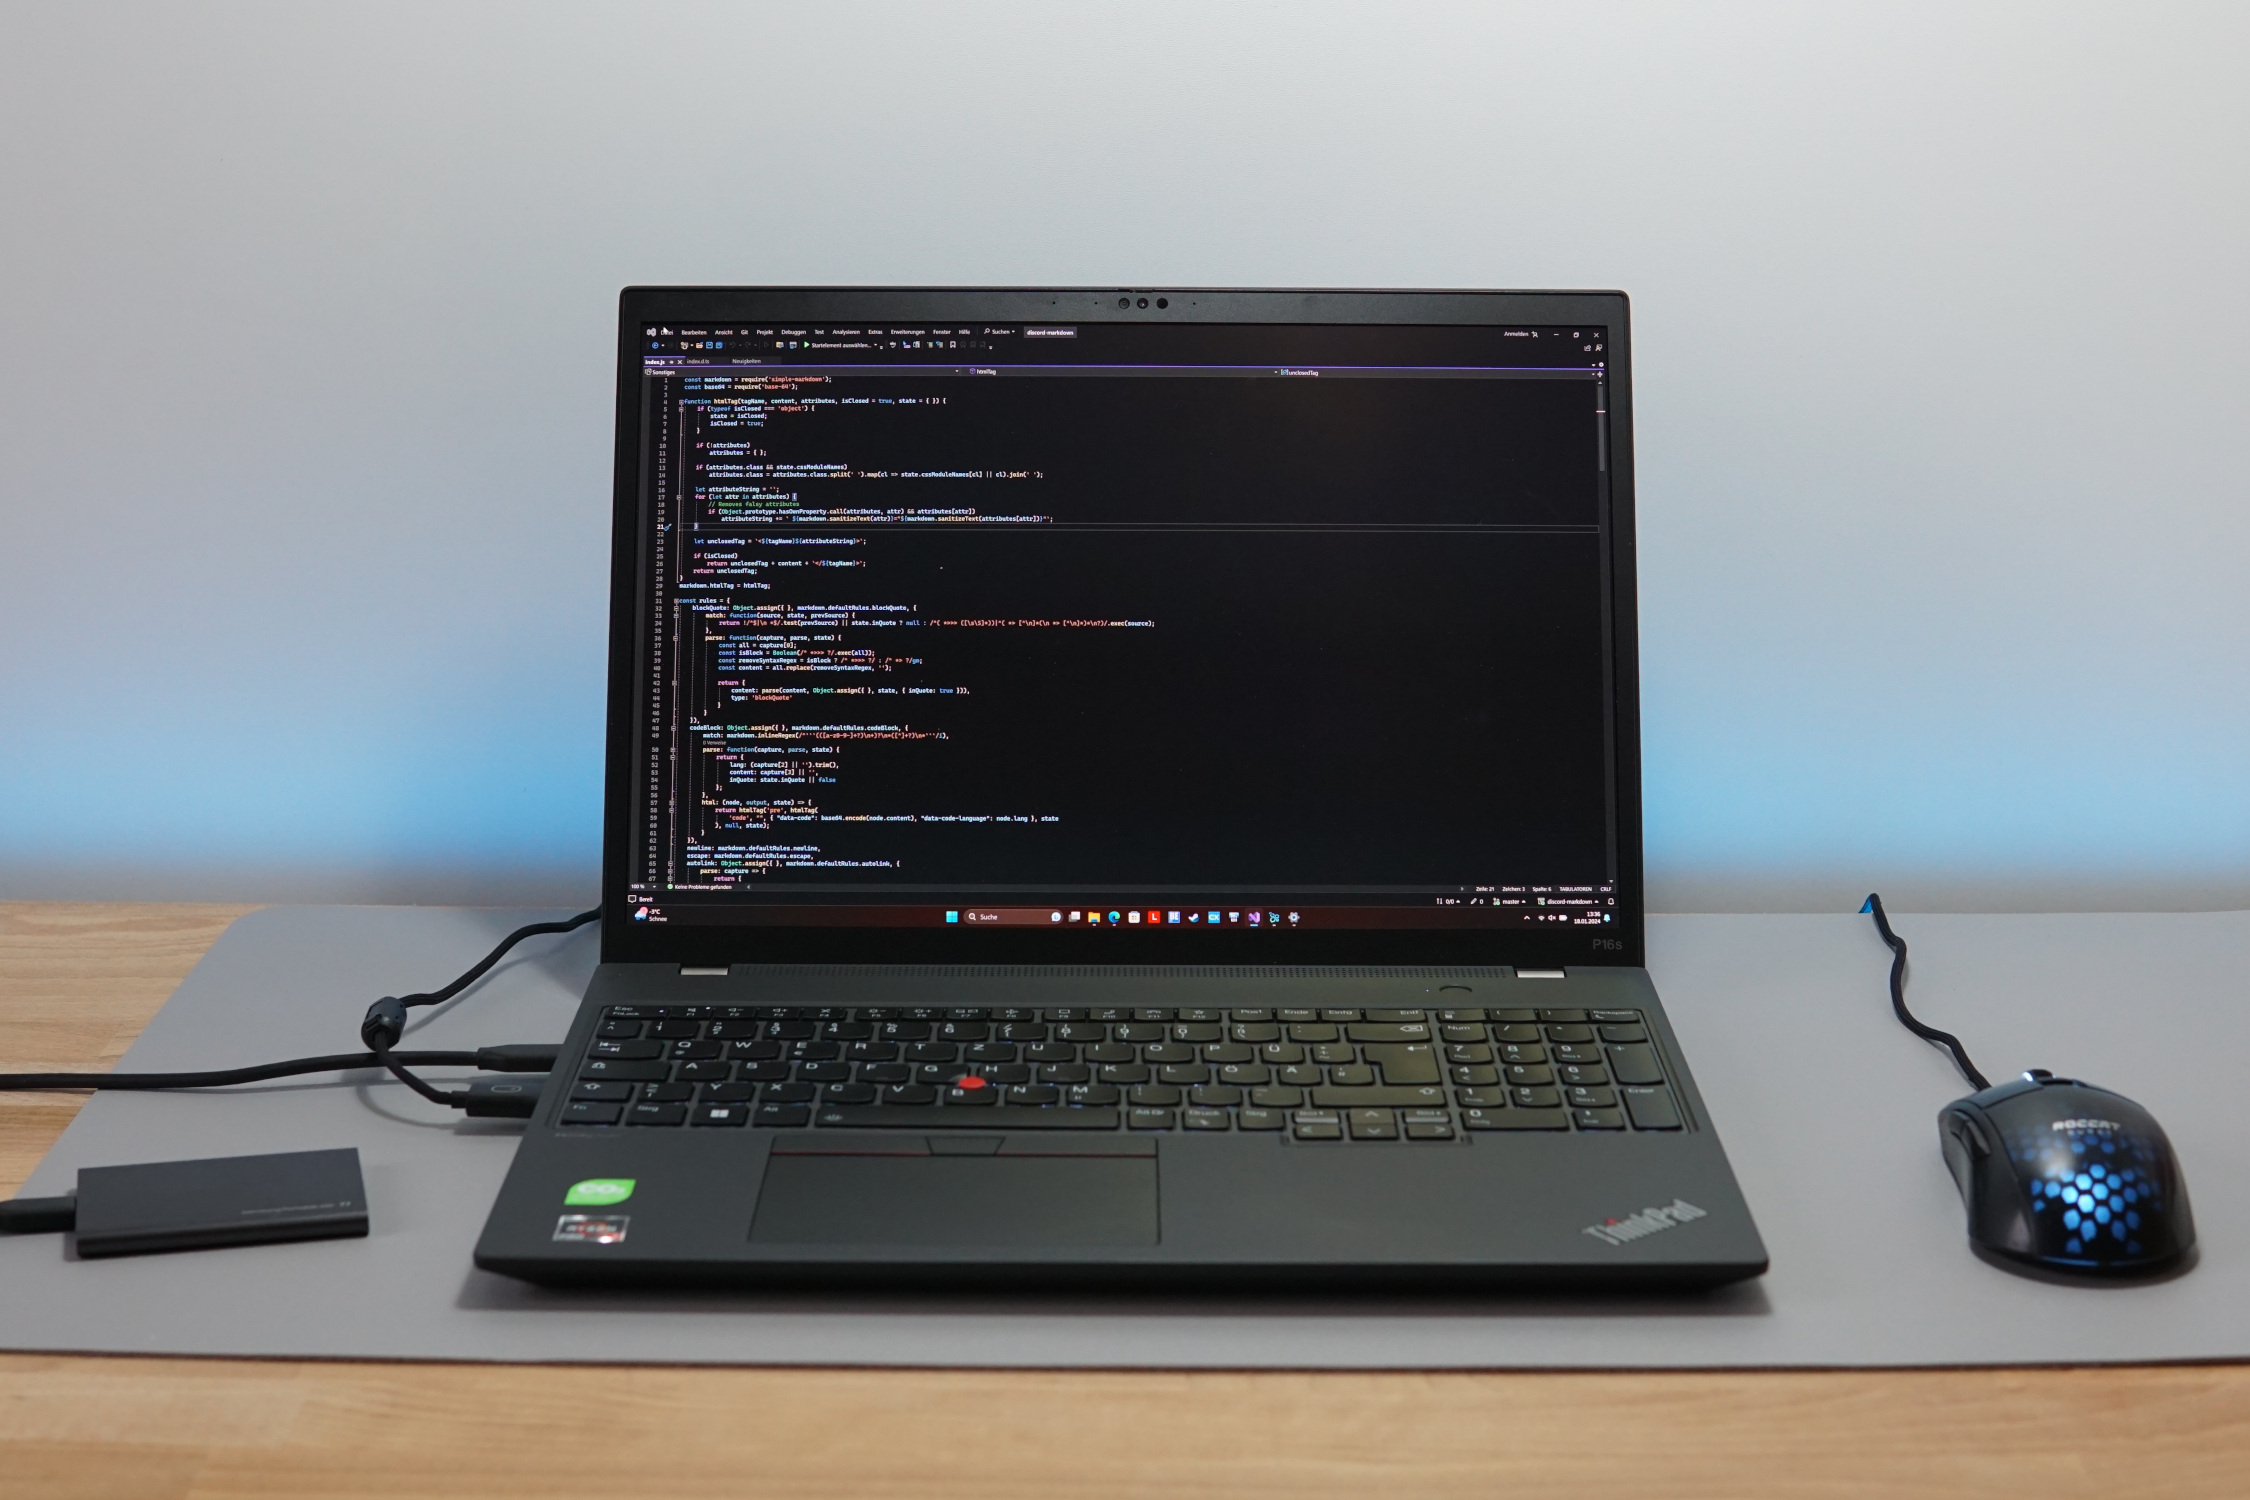
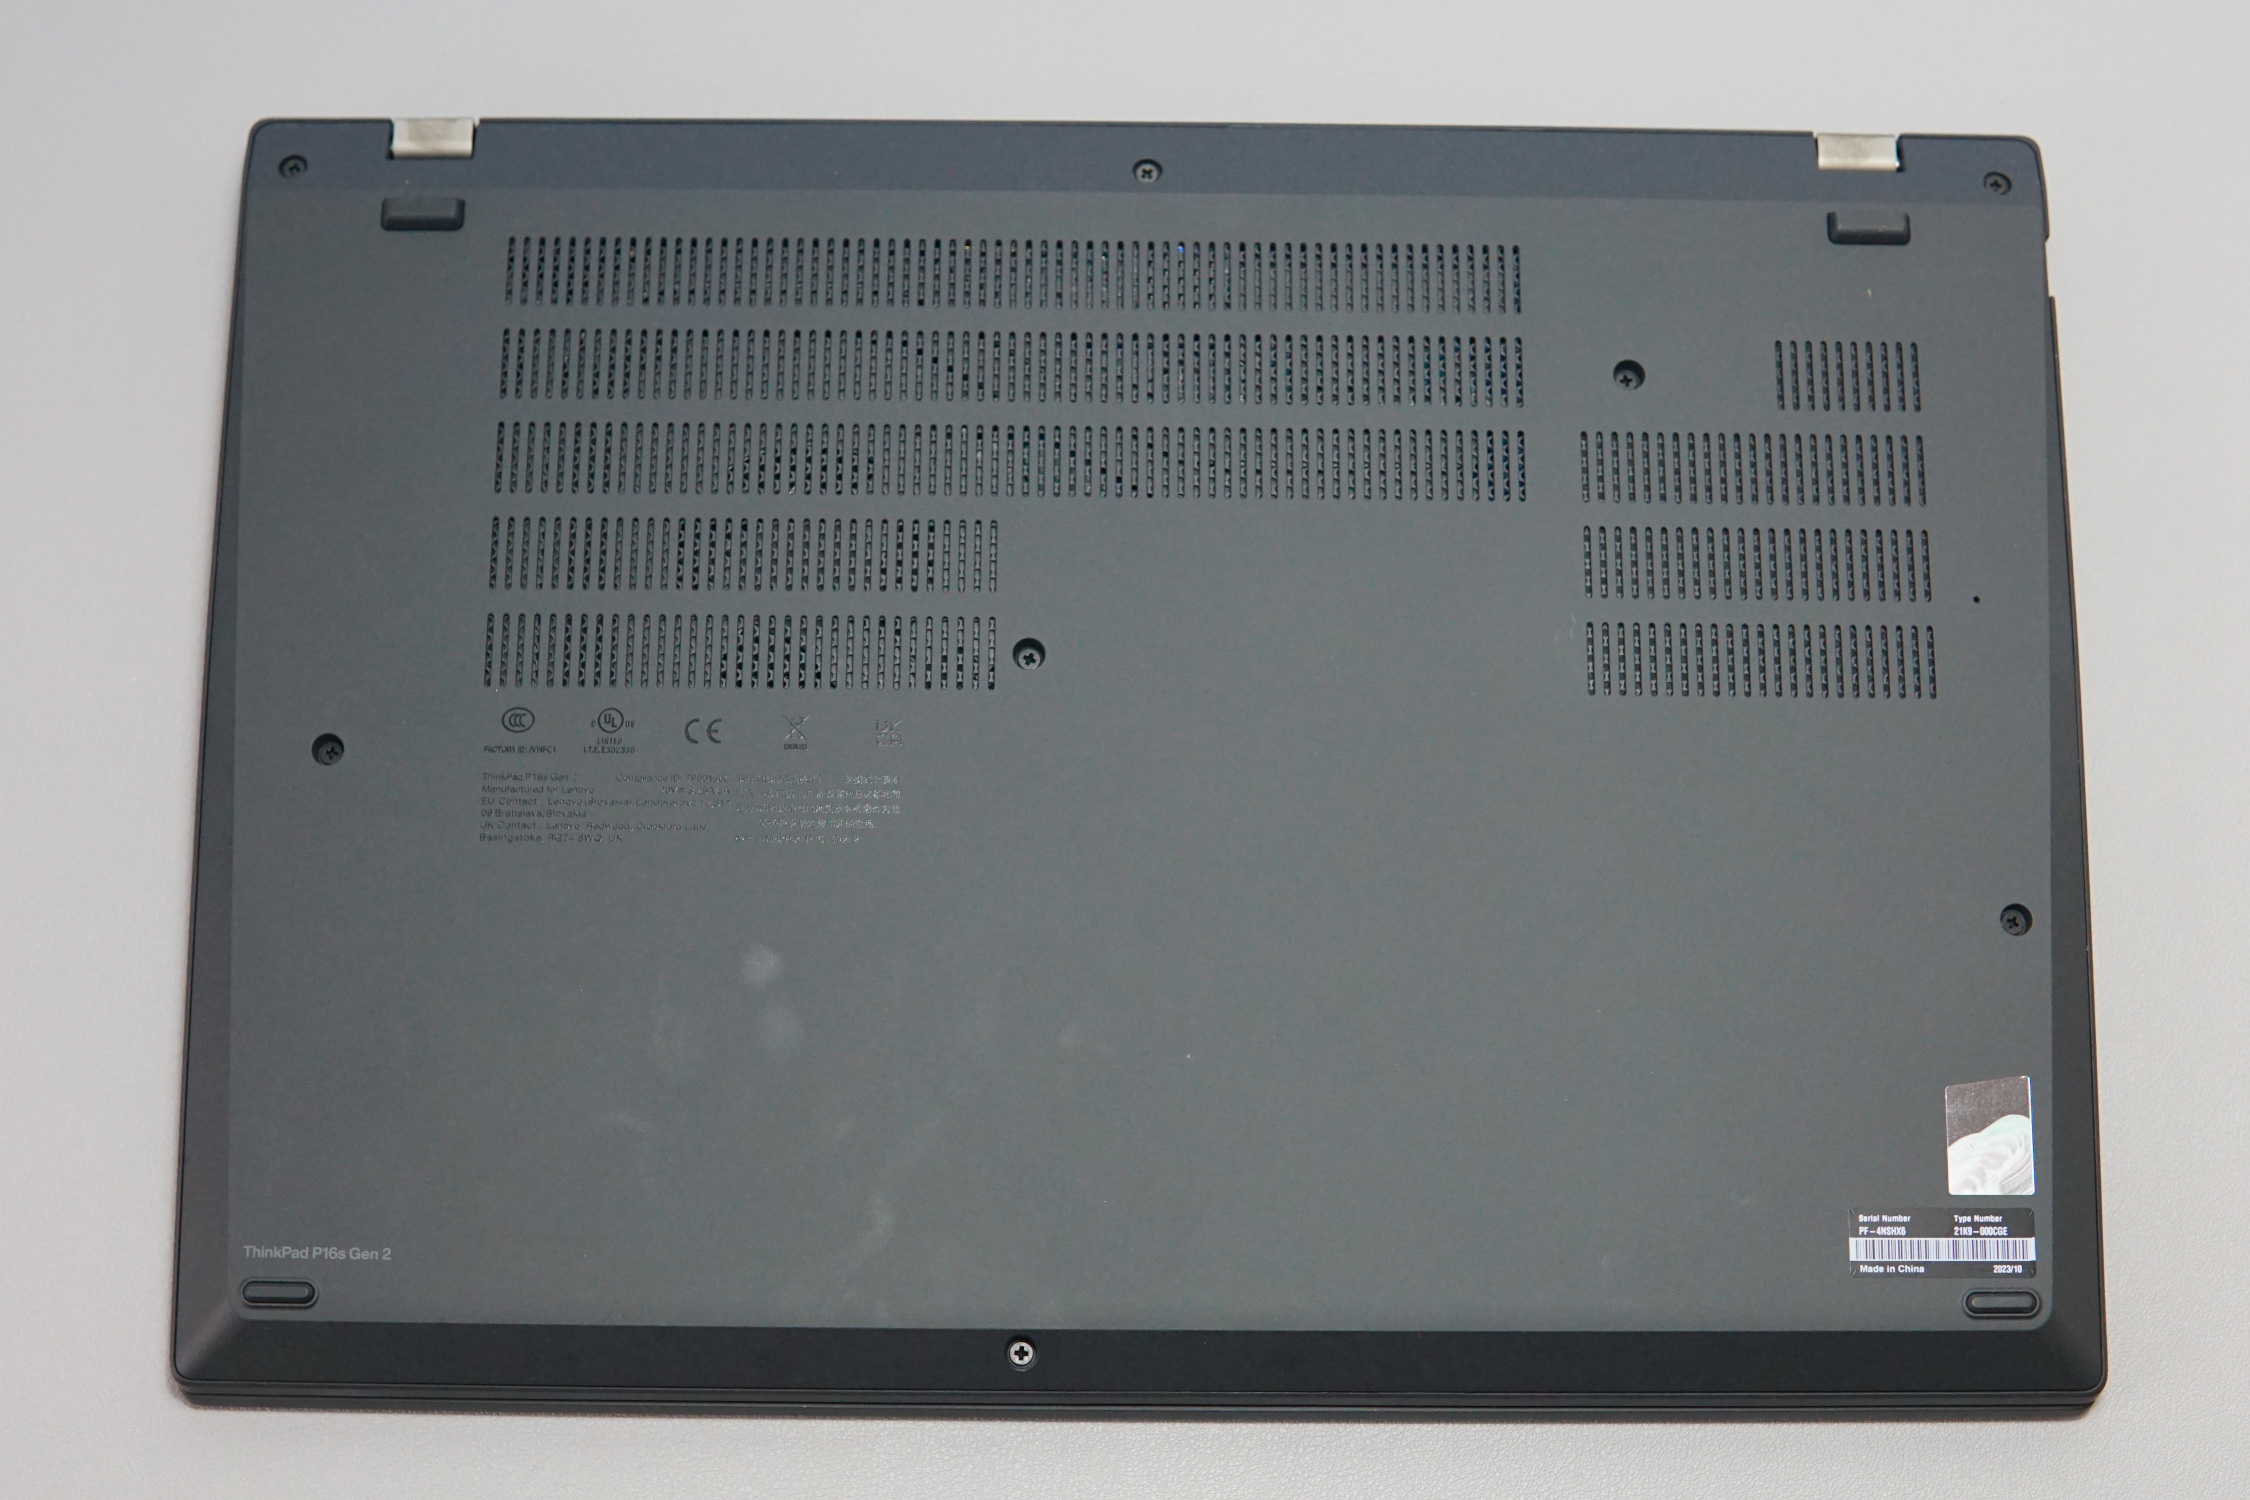
The device's size and weight show where the stability comes from. For a laptop without a dedicated graphics card that is made completely from plastic, 1.8 kg is certainly noteworthy. Even more so is its case thickness, which measures in at almost 24 millimetres. The almost identically configured Acer Swift Edge SFE16 is about half as thick and weighs 500 grams less. In turn, it does feel a little more fragile than the ThinkPad P16s.
Plus, a thick case has a few more advantages, which we will talk about in the "performance" section.
Connectivity - Light and a little bit of shade on the P16s
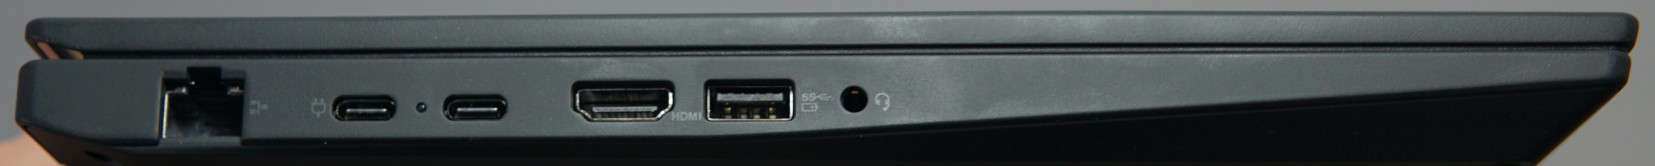
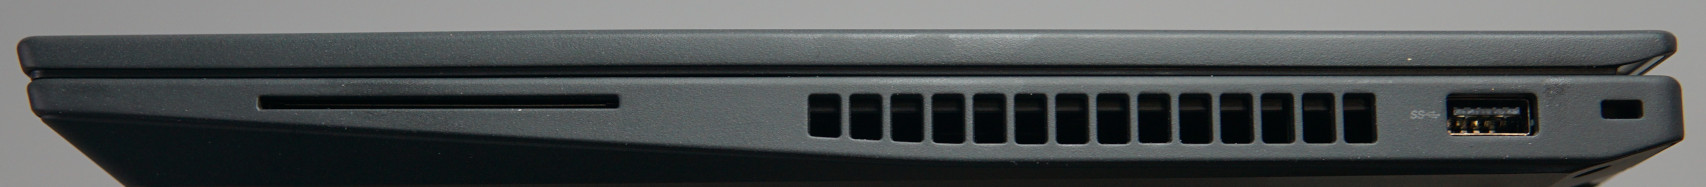
The laptop's selection of connectivity options seems to be good in general. It features a full-sized LAN port without a flap or an adapter. There's a fast USB-4 port and a total of four flexible USB ports, allowing you plenty of options for peripherals. An HMDI port is also installed.
On the other hand, only one USB-4 port isn't optimal. You would usually have the docking station connected to this in order to access the laptop's full performance. The second USB-C port at least supports charging as well as DisplayPort—but only at a quarter of the transfer speeds that USB 4 can achieve. Moreover, the other two USB ports could also do with being a little faster. They are both connected via USB 3.0, which a lot of SSDs now easily surpass.
Connected to the docking station while sitting on your desk, these small flaws shouldn't be too noticeable. But many of Intel's high-end laptops offer better connectivity options. This typically includes two TB4 ports. However, fast USB-A ports aren't common here either.
Communication
The device's transfer rates are a little weak when it comes to sending, at 5 GHz as well as 6 GHz. However, its receive rates are as expected for Wi-Fi 6E. This is a lot better than a simple LAN cable can offer. Plus, thanks to its frequency range being expanded, you should still be able to achieve a high transfer rate with overlapping wireless networks.
Webcam
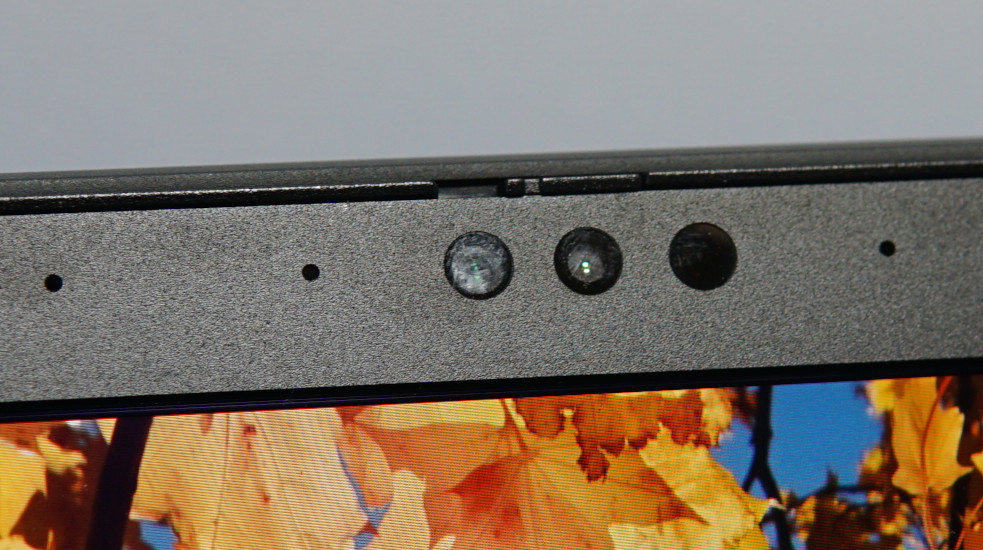
Its 5 MP alone ensure good picture quality, meaning people on the other end of your video call on a smartphone won't likely be able to tell that you are using a laptop's webcam—quite unlike the HD webcams that are so often installed which offer a fraction of the resolution.
The very high color deviations which we measured come as a result of the pictures being automatically lightened. And this works really well. Even in low-light conditions, faces remain recognizable. At the same time, the image quickly gets quite grainy. Even so, the camera in its present form is perfectly suitable for video conference calls.
This is not least due to its great dual-array microphone which records voices very accurately and at a consistent volume—even when your distance and direction of speech vary during the conversation.
An IR sensor makes facial recognition via Windows Hello possible and a mechanical cover to block the lens rounds out the webcam's features.


Security
You shouldn't be missing any security functions. Everything is included, from a SmartCard to a Kensington lock and biometric sign-in features. You can either use the fingerprint sensor or facial recognition for this. Adding to this are extras such as a self-recovering BIOS. Lenovo has summarized all these functions under the term "ThinkShield". Further information can be found here.
Accessories
The laptop doesn't come with any additional adapters, a case or anything else of the sort. Instead, only a simple USB-C power supply is included. On a positive note, the ThinkPad's packaging is made entirely of recycled cardboard.
Maintenance
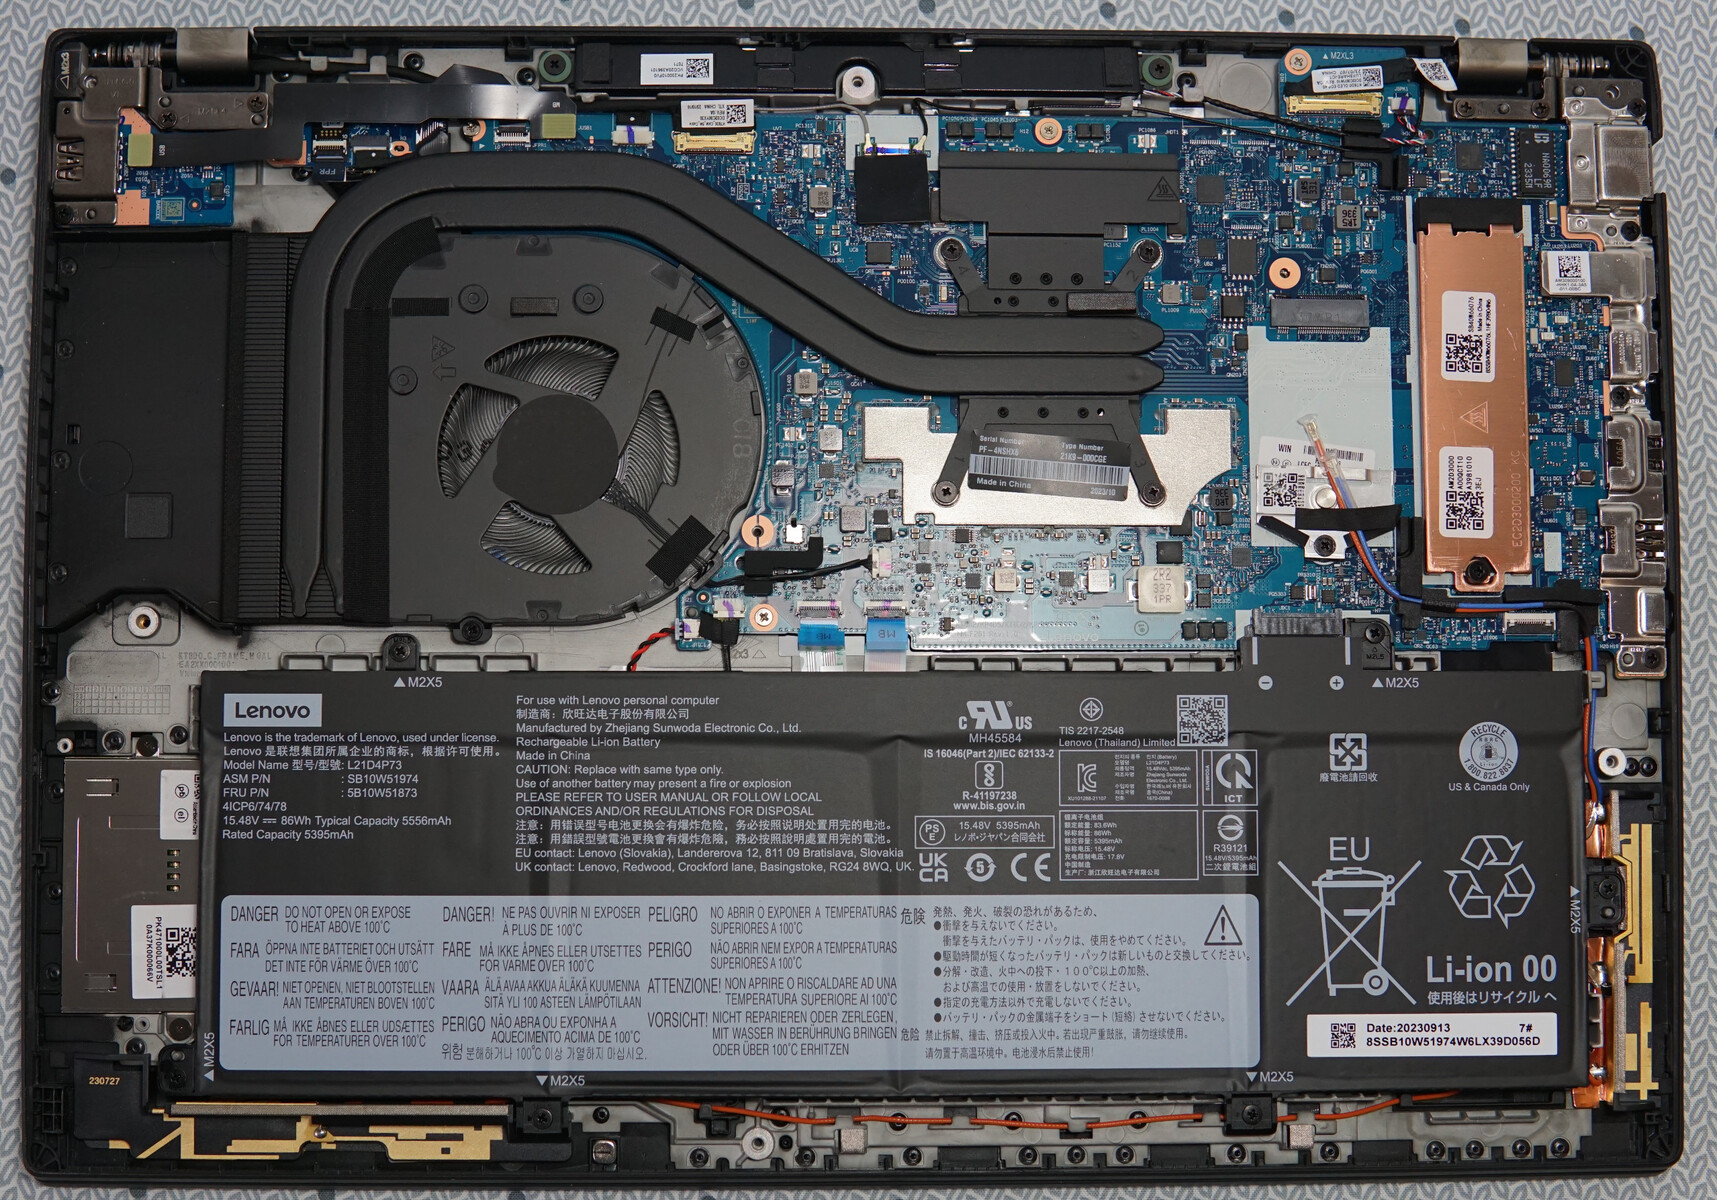
As expected, the ThinkPad P16s G2 AMD can be opened up easily and without any problems. All the Phillips screws are easily accessible. Subsequently, you can remove the bottom case part with enough patience and force (but without needing to tug at it violently)—and ideally with the help of a small lifting tool.
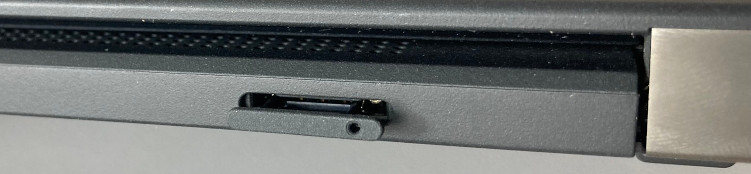
Its NVMe-M.2 SSD can be swapped out. The battery and fans can be accessed without any issues. Furthermore, you can install a 5G/LTE module into the case. There is space for this, the antenna cables are ready to be used and a SIM card slot is situated on the back.
Unfortunately, the WLAN and RAM modules have been soldered on. You would especially wish for the RAM to be a little more flexible in a workstation laptop. This means when purchasing, you should just be very clear about whether you might want to select too much RAM rather than too little.
Warranty
Lenovo offers one year of premium support which also covers on-site repairs by the next working day. For a surcharge, there are options to extend this warranty.
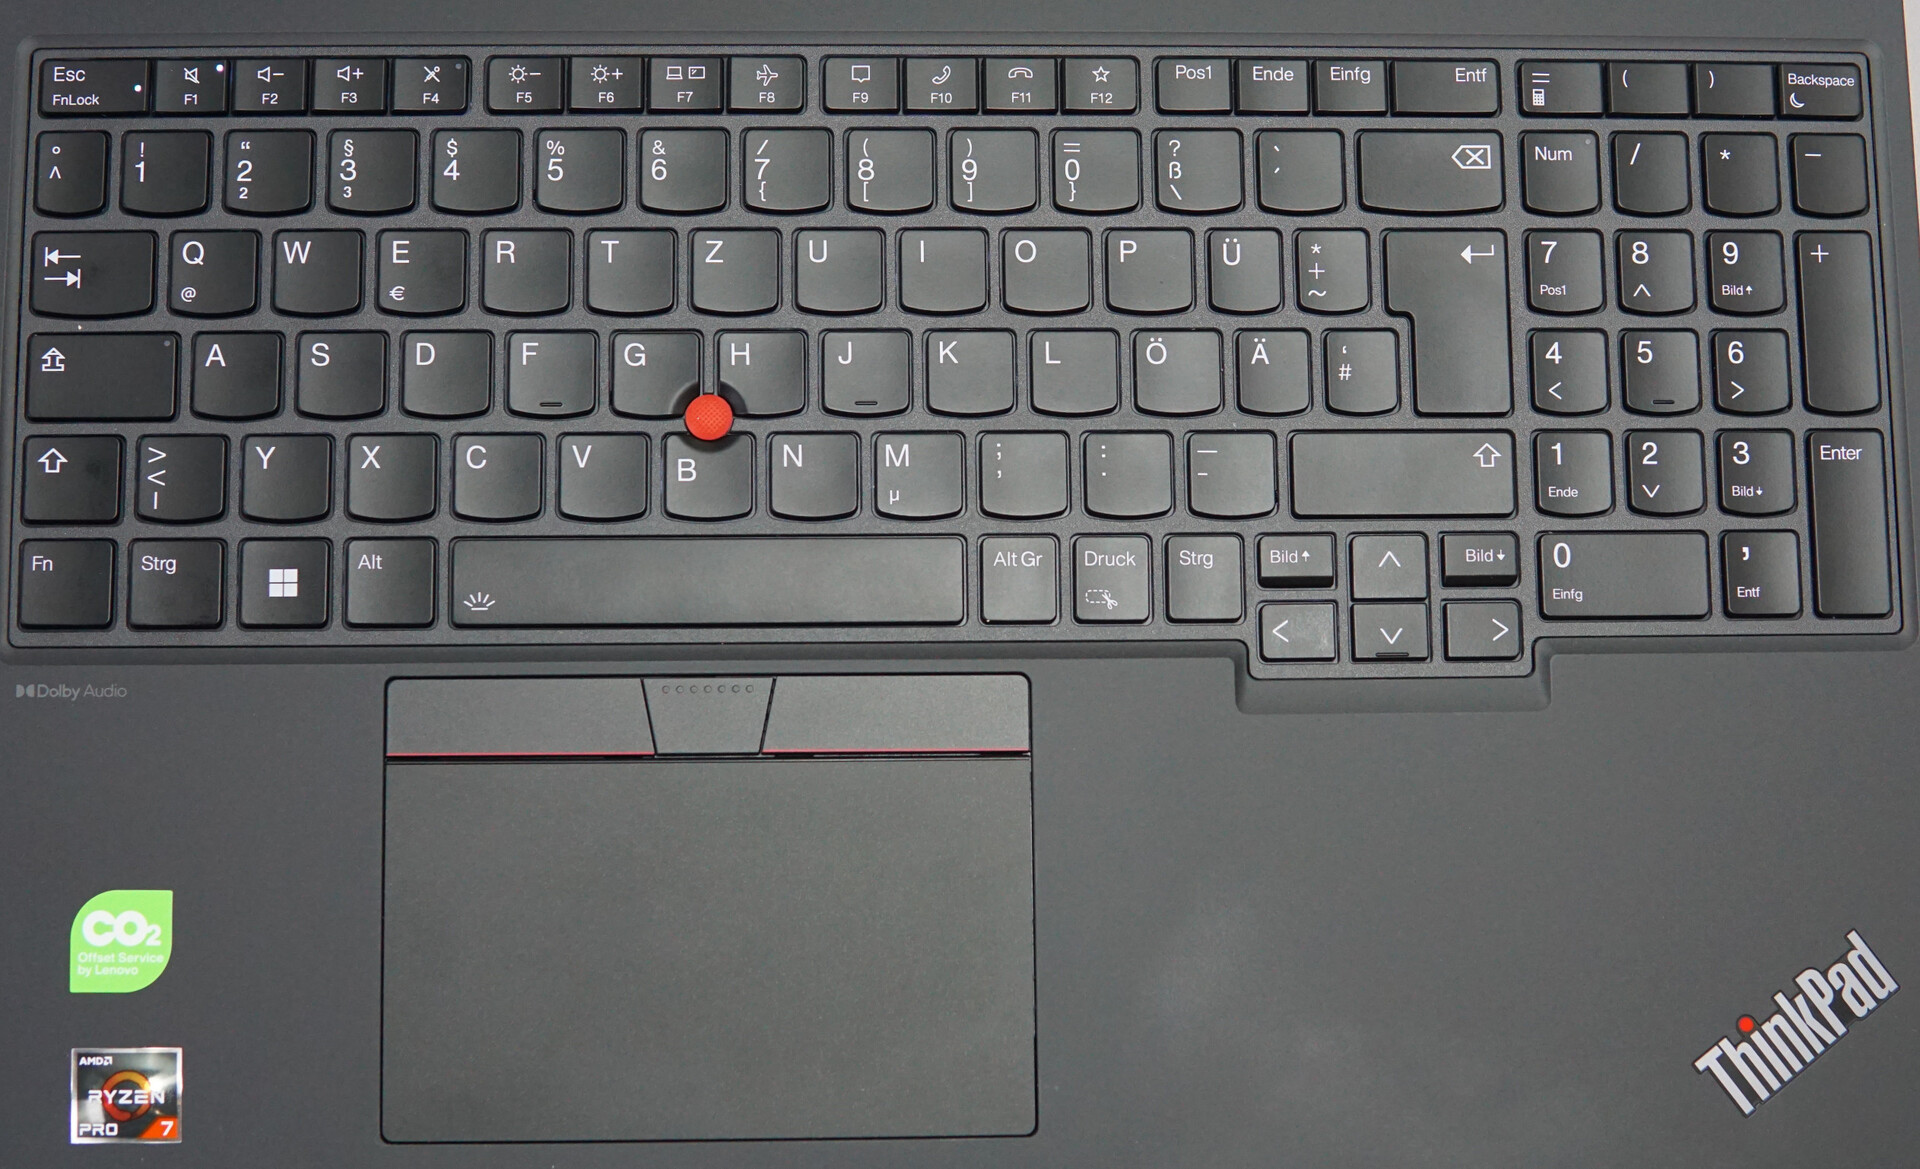
Input devices - Not perfect, but a solid keyboard for a workstation
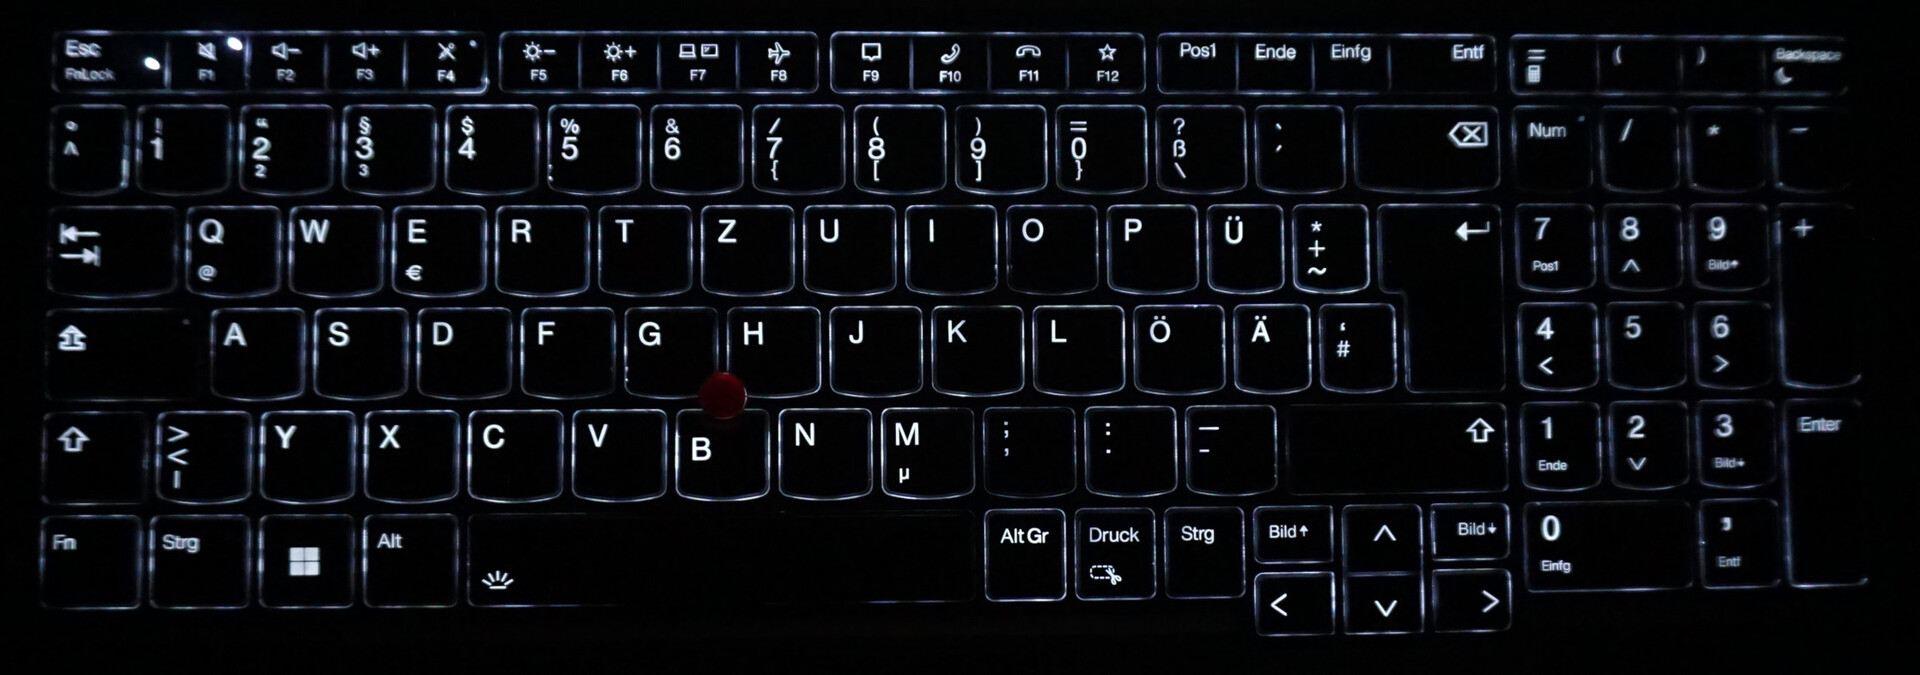
The keyboard, touchpad and trackpoint deserve praise. Satisfying pressure points, comfortable key resistance and precise inputs all make for smooth, speedy operation. You shouldn't likely have to deal with fatigue when typing or having to triple-click when controlling the pointer. In addition, the keyboard's backlighting, which has two brightness levels, keeps the keys legible at all times.
Although, it can't escape all criticism. Its lift of 1.5 mm (our measurement) isn't terribly big and you definitely notice this while typing if you are used to a much higher lift. Plus, the keyboard frame which—like all of the case's other components—is made from plastic has a little bit of give. You notice this on the right side more than on the left. You do, however, get used to this and these issues shouldn't really get in the way. It does mean that we can't give it top marks, though.
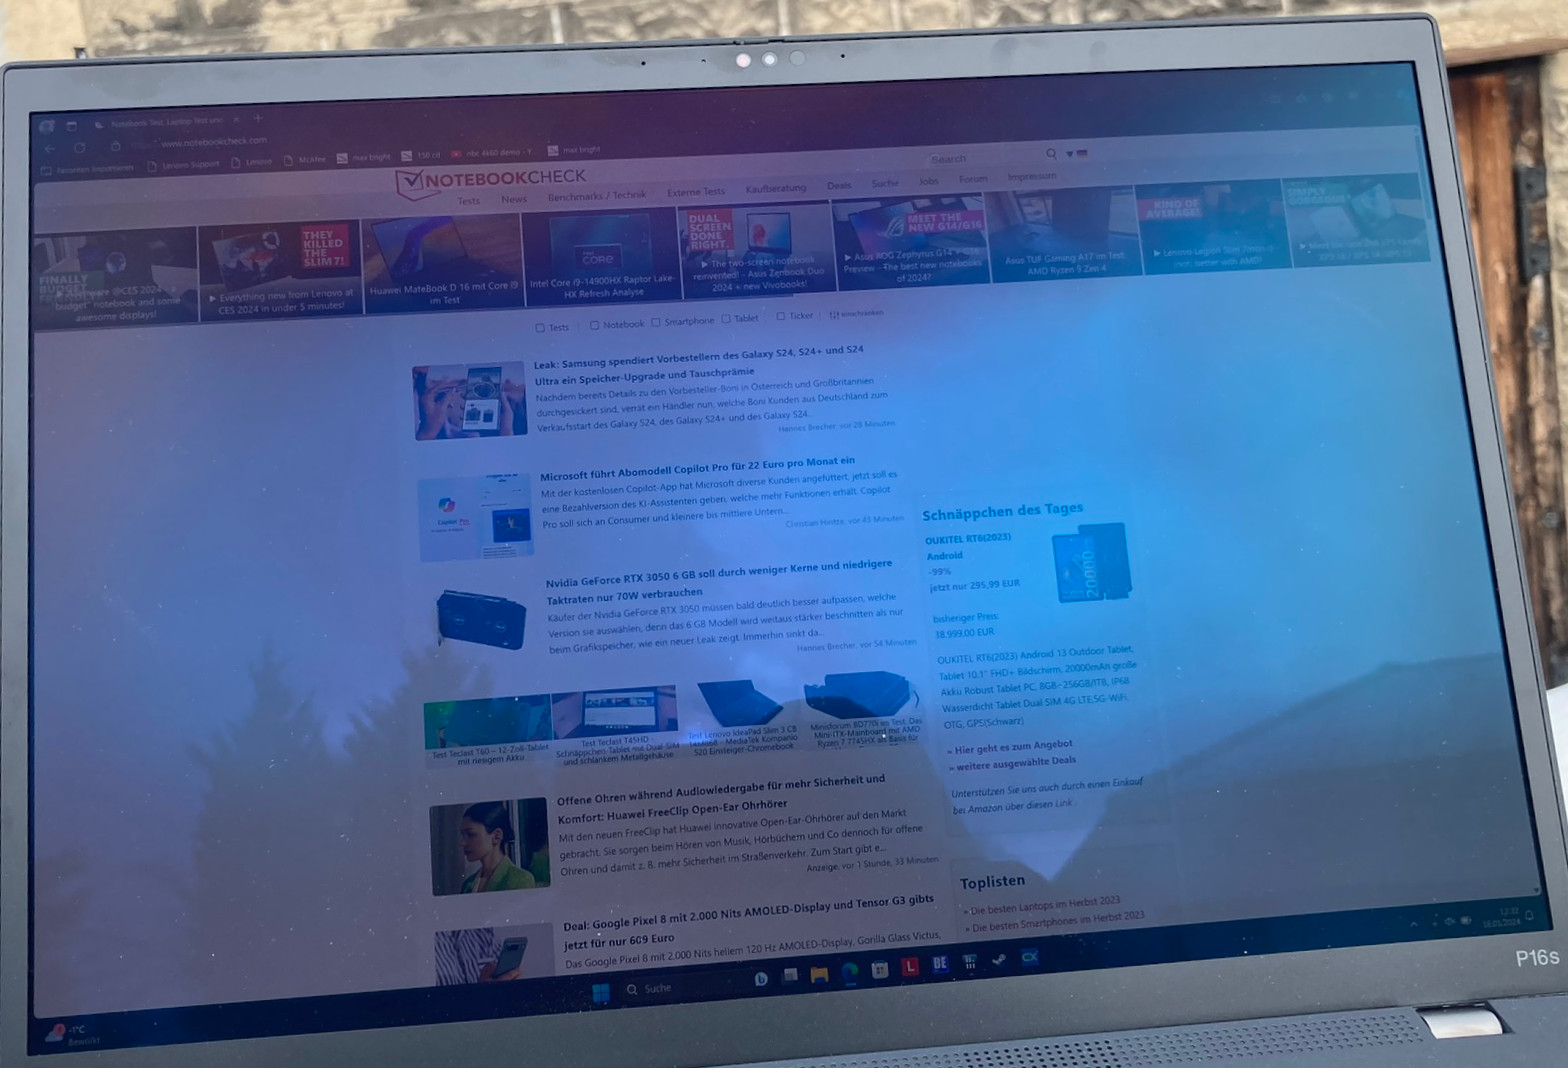
Display - The P16s has a vivid, bright OLED display
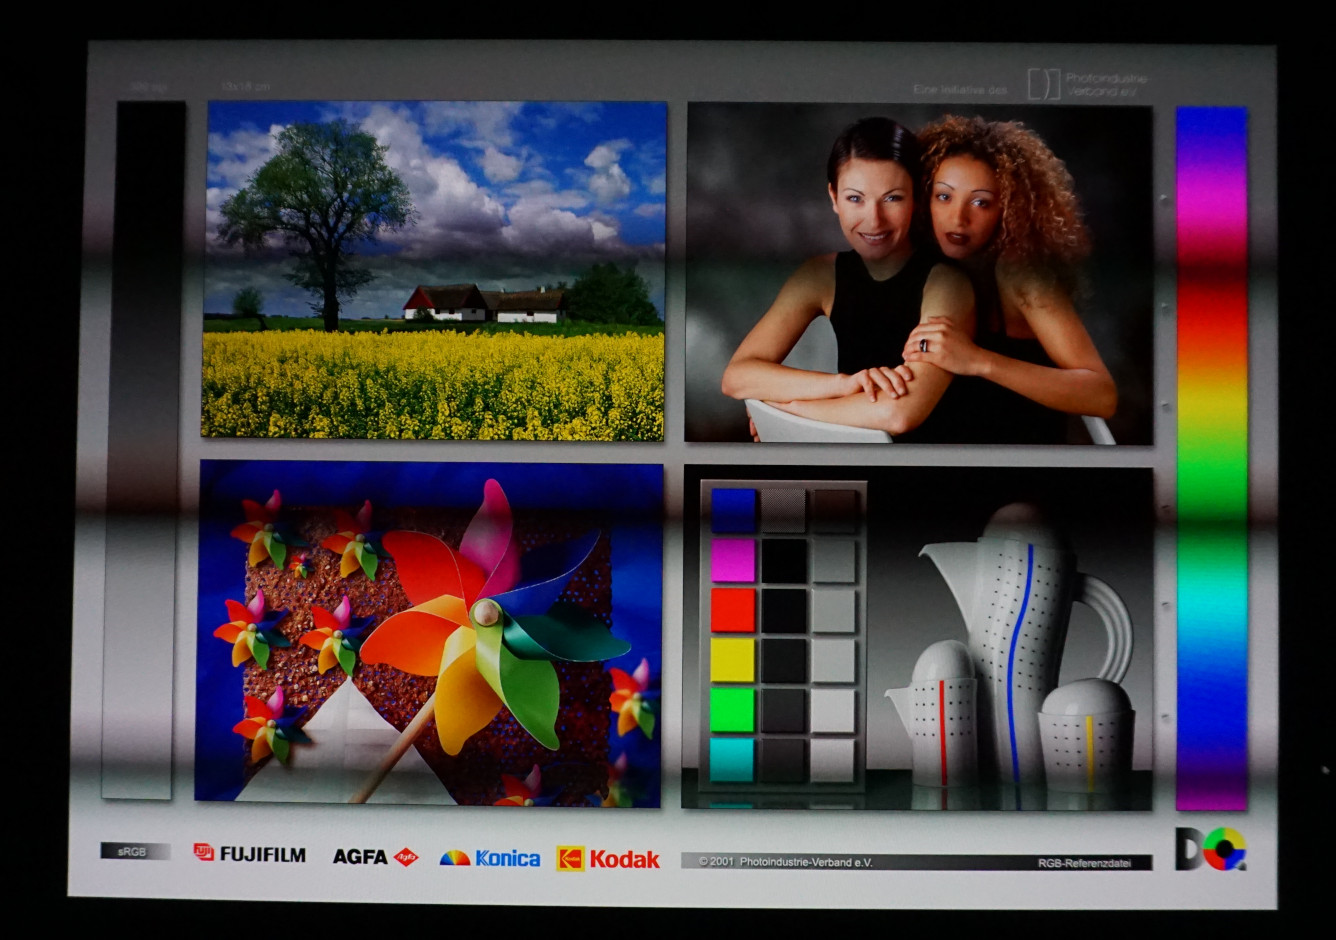
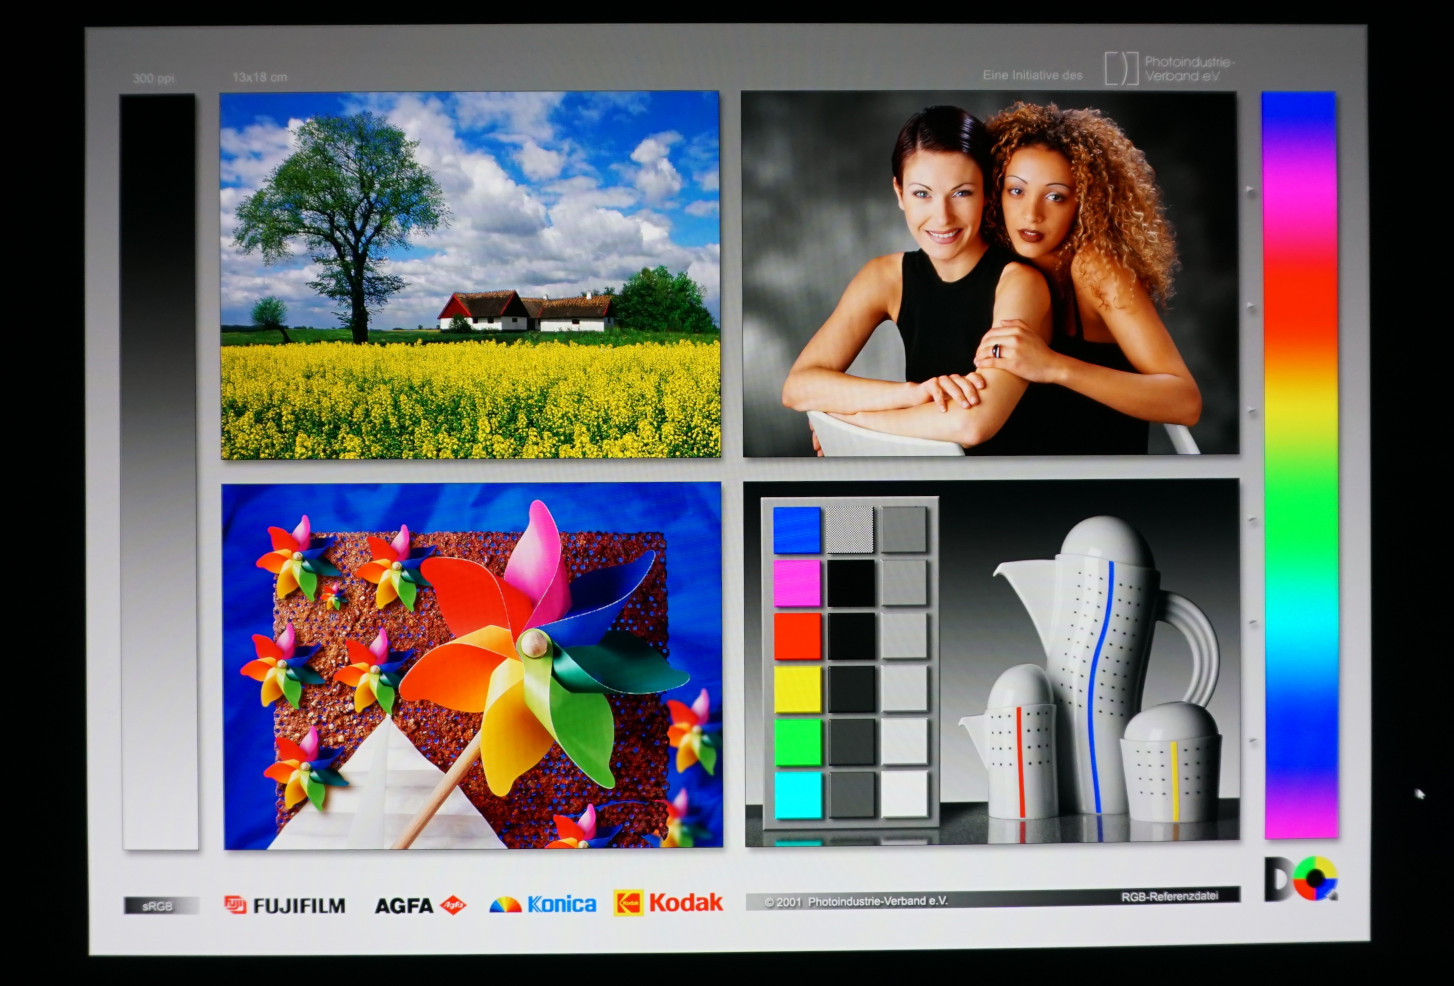
The installed OLED display shouldn't just be interesting for creative work. Although its 4K resolution which, in theory, covers the color space Display P3 in its entirety and assures strong contrast and color accuracy, is clearly a good start for demanding graphics applications.
Even just in general, content looks intense and radiant on the laptop's screen. Text being shown slightly uncleanly at times is made up for by its extremely high resolution. The subpixels not being evenly structured sometimes results in blurred edges. Enlarging text by the recommended value of 175 % leads to this not being noticeable.
You do have to take into account its reflective surface when it comes to the display's accurate color depiction—this isn't ideal when using the device outside. Inside, the screen's high contrast levels make up for this.
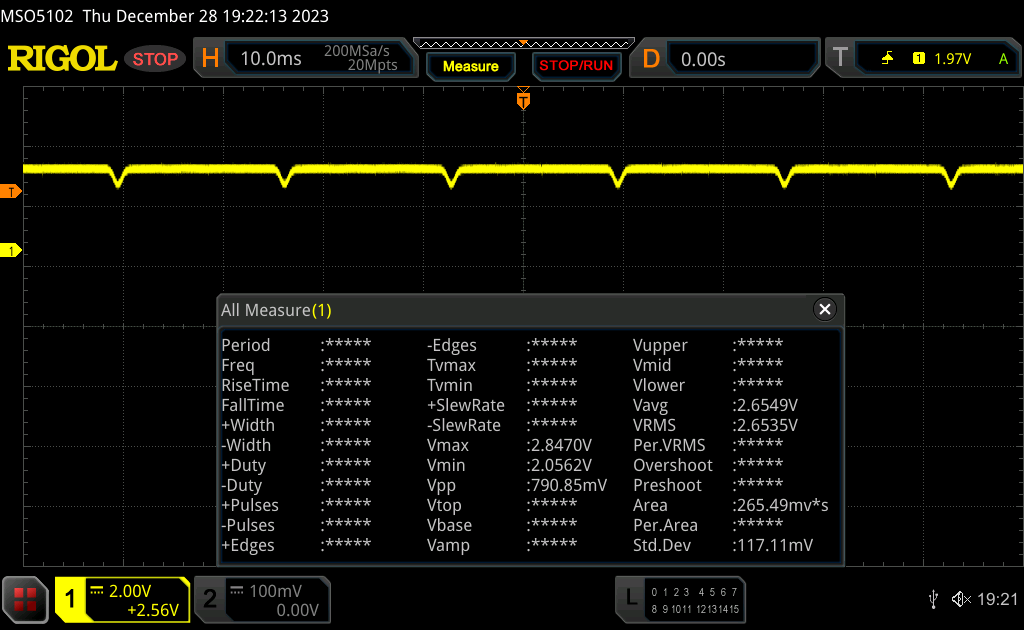
Moreover, the OLED display uses a type of pulse width modulation. It is by no means as aggressive as on quite a few older LCD monitors. However, you might notice it ever so slightly, as the frequency we measured at high brightness showed only 60 Hz.
For sensitive users, we would recommend one of the many other display options which use IPS panels and, in turn, don't use PWM:
- WUXGA (1920x1200), IPS, 300nits, Anti-glare, 16:10, 800:1, 45% NTSC
- WUXGA (1920x1200), Multi-touch, IPS, 300 nits, Anti-glare, 16:10, 800:1, 45% NTSC
- WUXGA (1920x1200), IPS, 400 nits, Anti-glare, 16:10, 1000:1, 100% sRGB
- WUXGA (1920x1200), Multi-touch, IPS, 500 nits, Anti-glare, 16:10, 1000:1, 100% sRGB
| |||||||||||||||||||||||||
Brightness Distribution: 98 %
Center on Battery: 417 cd/m²
Contrast: ∞:1 (Black: 0 cd/m²)
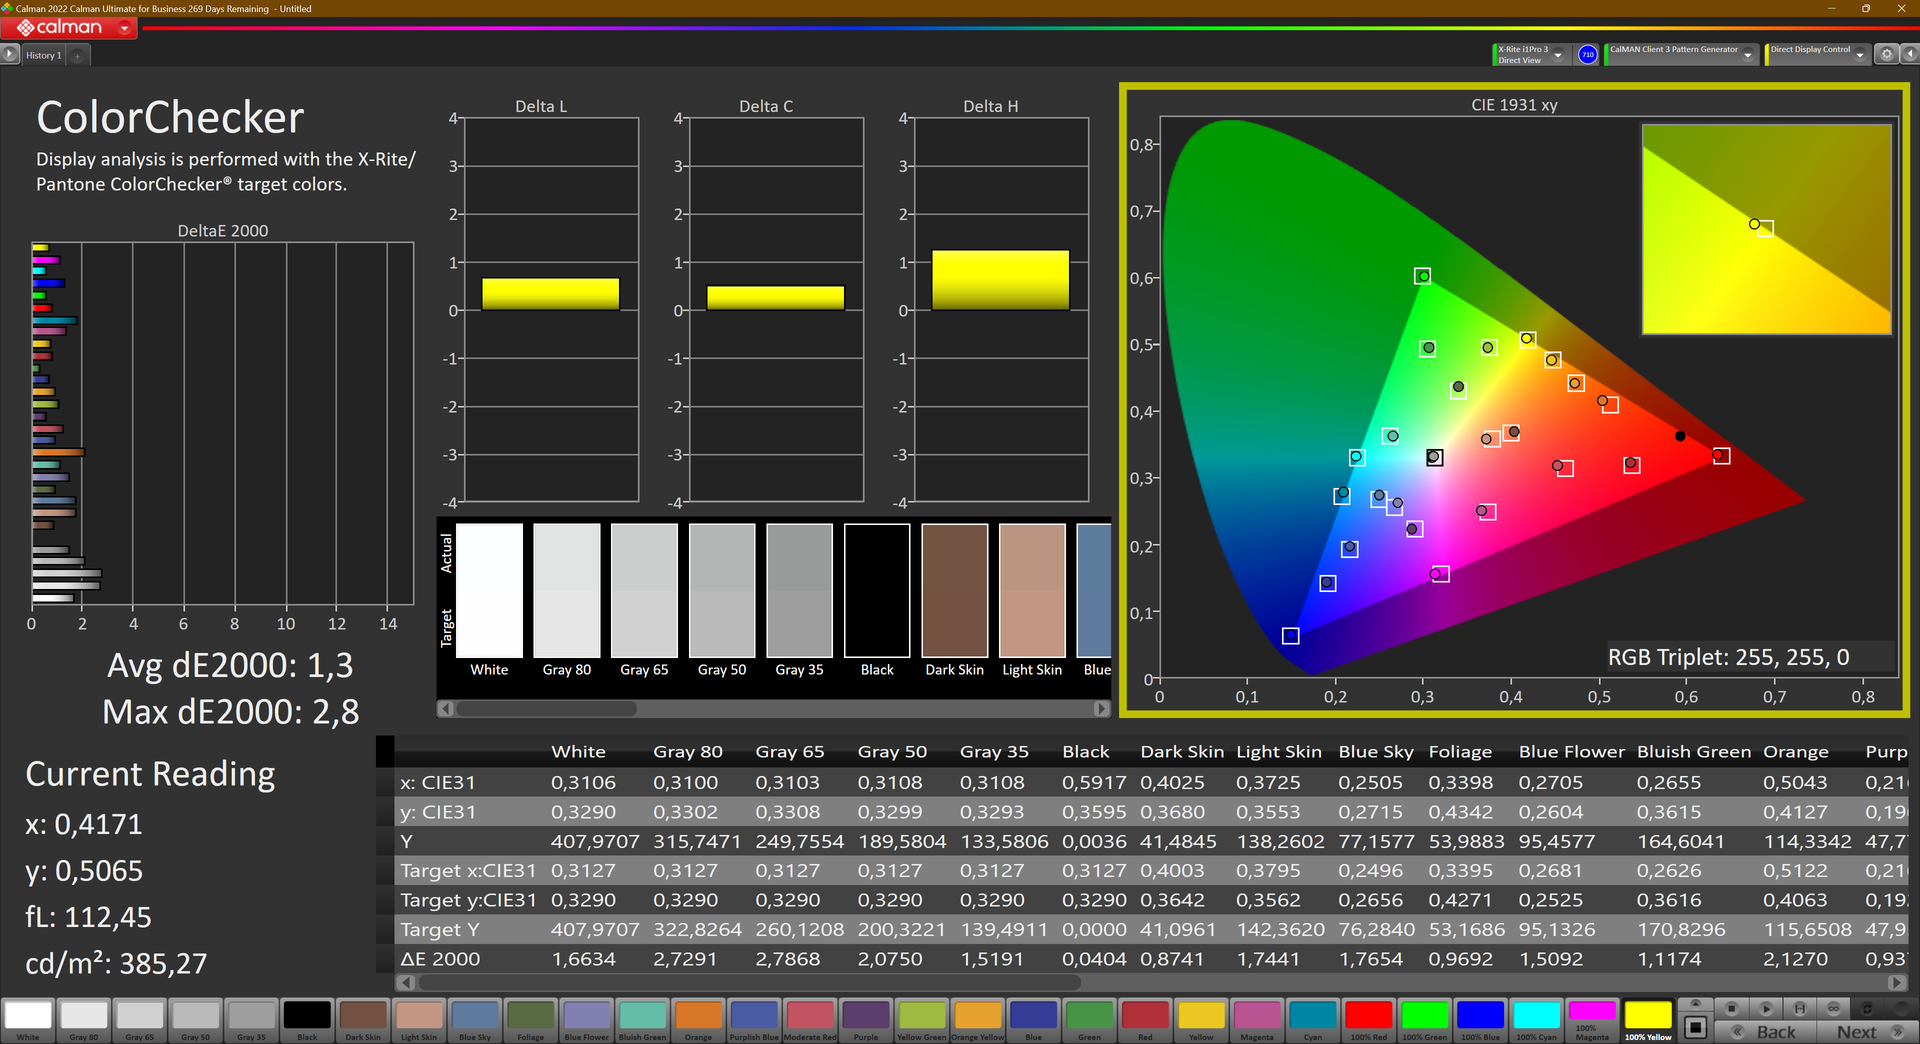
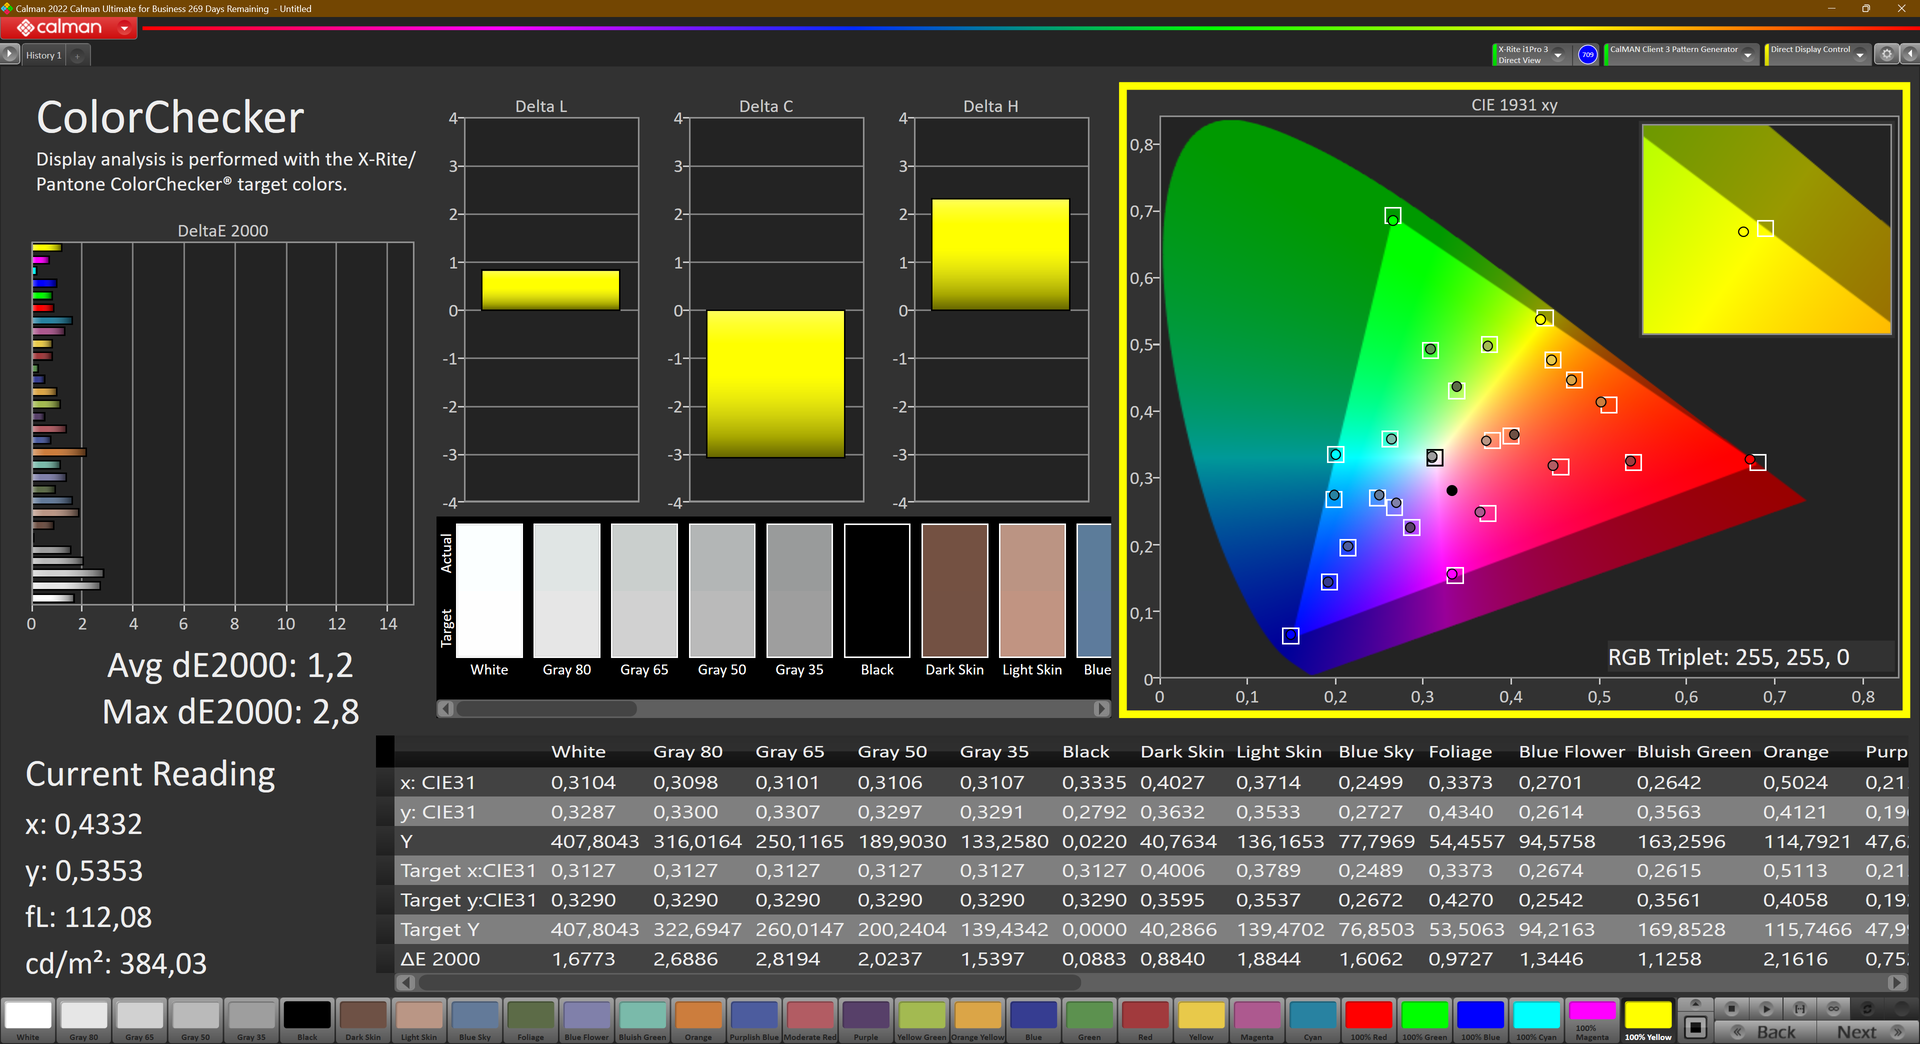
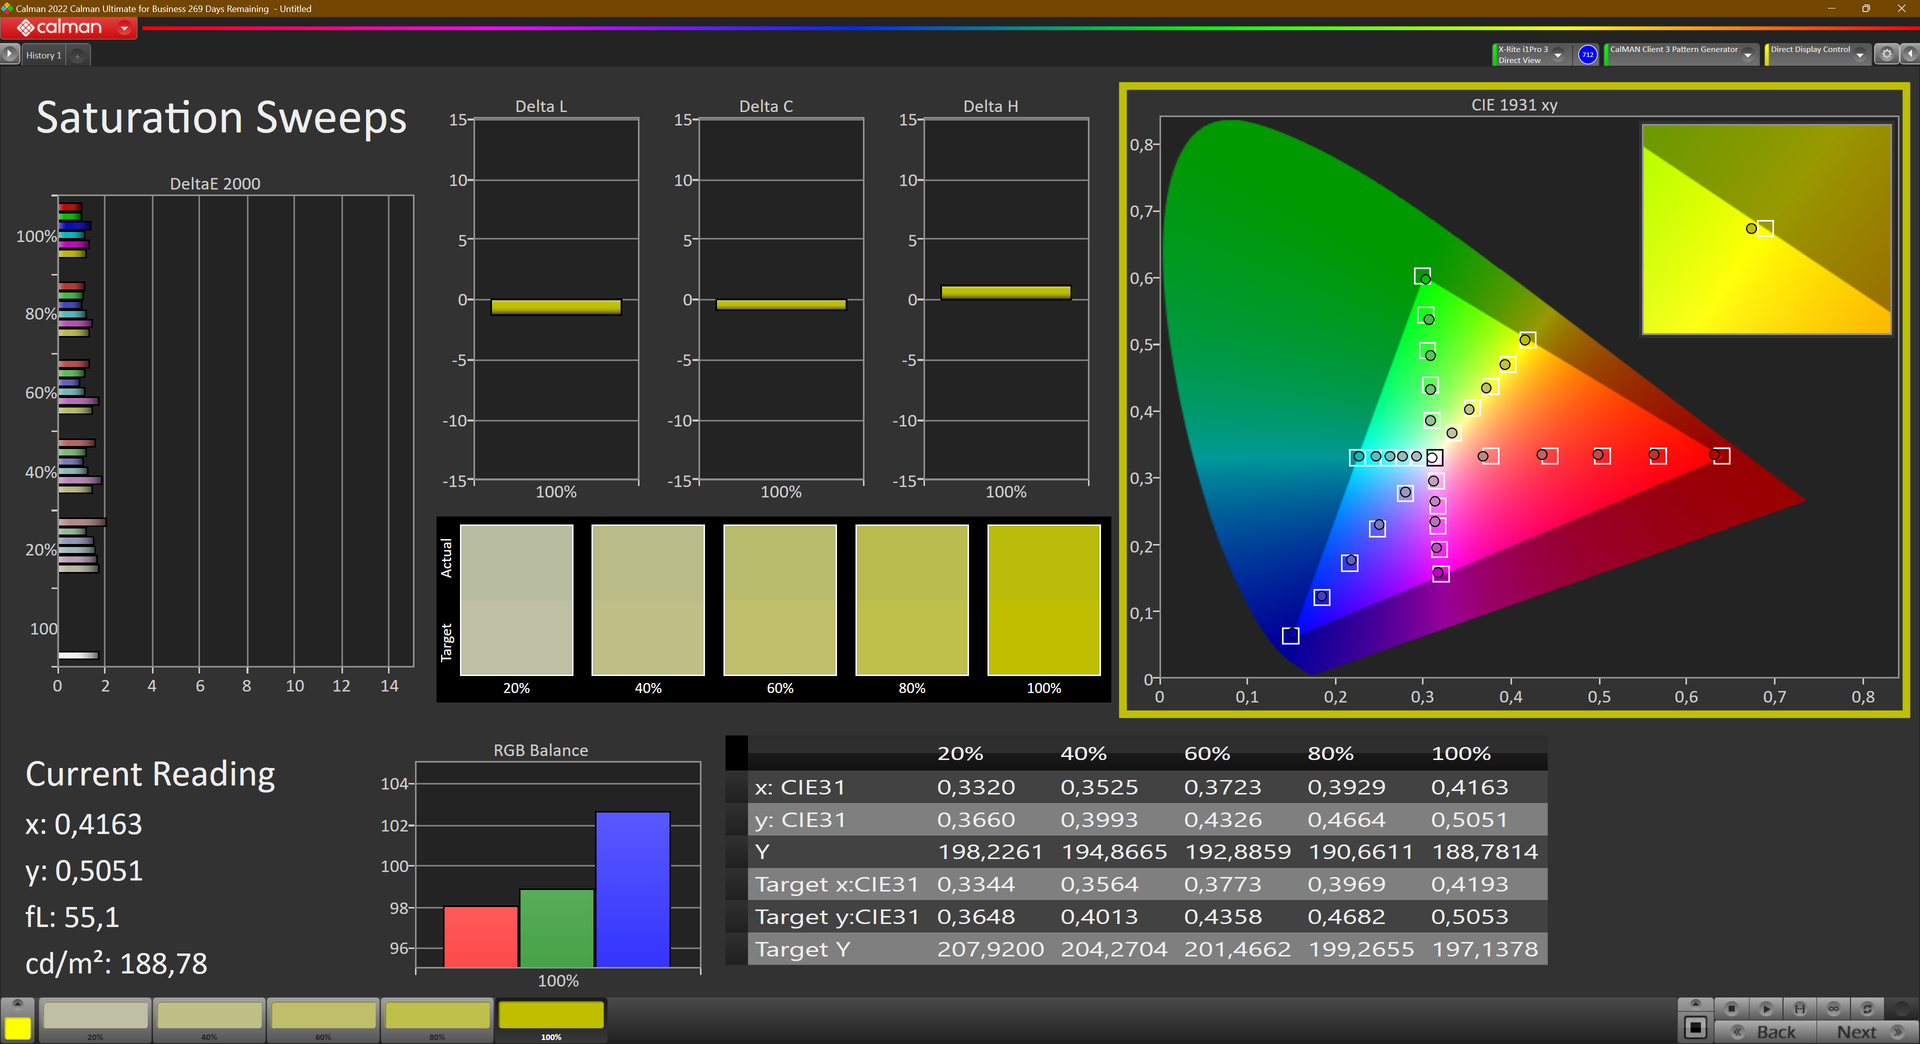
ΔE ColorChecker Calman: 1.3 | ∀{0.5-29.43 Ø4.73}
calibrated: 2.9
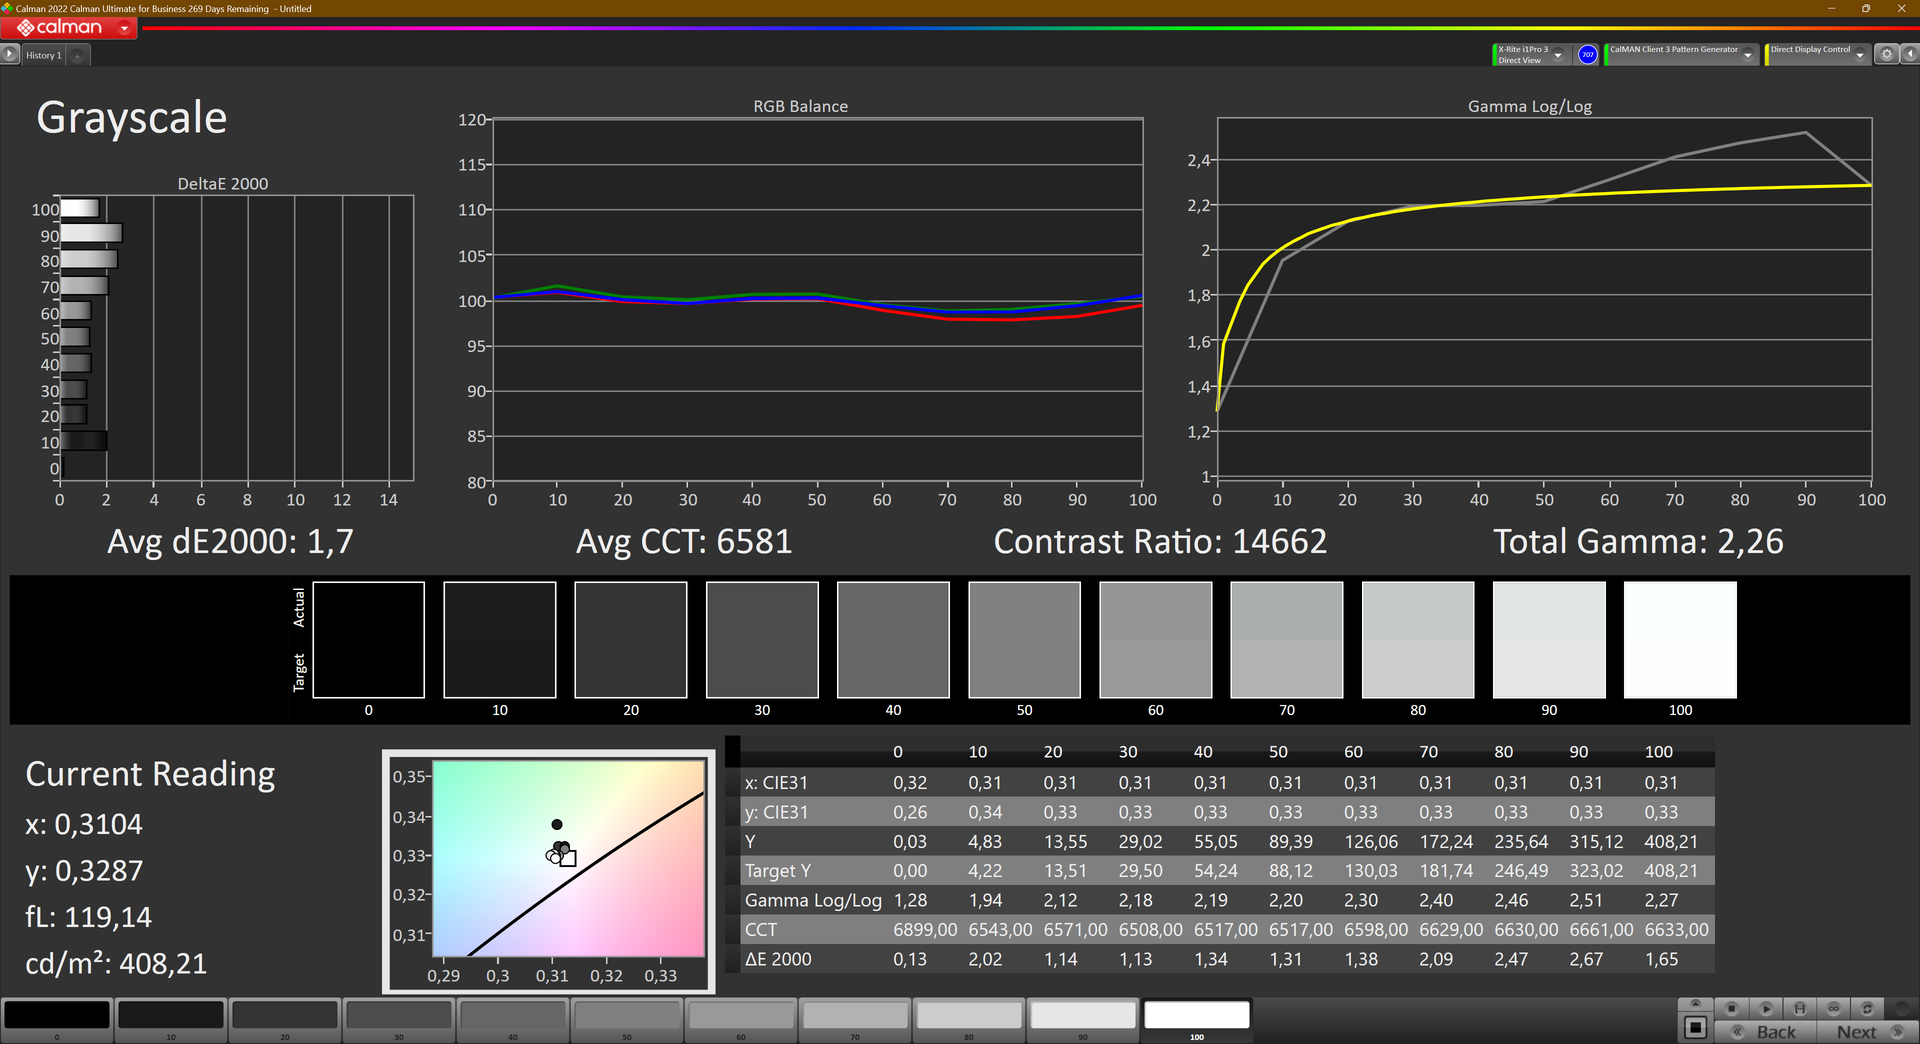
ΔE Greyscale Calman: 1.8 | ∀{0.09-98 Ø4.98}
96.9% AdobeRGB 1998 (Argyll 3D)
100% sRGB (Argyll 3D)
99.9% Display P3 (Argyll 3D)
Gamma: 2.25
CCT: 6574 K
| Lenovo ThinkPad P16s G2 21K9000CGE ATNA60YV04-0, OLED, 3840x2400, 16" | HP EliteBook 845 G10 818N0EA AUO6DA8, IPS, 2560x1600, 14" | Lenovo ThinkPad P14s G4 21K5000LGE Lenovo MNE007JA1-1, IPS, 1920x1200, 14" | Schenker Vision 16 PH6PRX1 BOE CQ NE160QDM-NZ1 , IPS, 2560x1600, 16" | Acer Swift Edge SFE16 Ryzen 7 7840U Samsung ATNA60BX03-0, OLED, 3200x2000, 16" | Lenovo ThinkPad P16v G1 AMD NE160WUM-N64, IPS, 1920x1200, 16" | Microsoft Surface Laptop Studio 2 RTX 4060 LQ144P1JX01, IPS, 2400x1600, 14.4" | |
|---|---|---|---|---|---|---|---|
| Display | -4% | -19% | -19% | 1% | -21% | -21% | |
| Display P3 Coverage (%) | 99.9 | 98.3 -2% | 69.4 -31% | 70 -30% | 99.9 0% | 67.8 -32% | 66.7 -33% |
| sRGB Coverage (%) | 100 | 99.8 0% | 99.9 0% | 99.3 -1% | 100 0% | 97.7 -2% | 99 -1% |
| AdobeRGB 1998 Coverage (%) | 96.9 | 86.2 -11% | 71.4 -26% | 71.2 -27% | 100 3% | 69.8 -28% | 68.9 -29% |
| Response Times | -628% | -2611% | -574% | 43% | -2587% | -3806% | |
| Response Time Grey 50% / Grey 80% * (ms) | 1.5 ? | 12.7 ? -747% | 45.9 ? -2960% | 11 ? -633% | 0.57 ? 62% | 50.6 ? -3273% | 77.6 ? -5073% |
| Response Time Black / White * (ms) | 1.3 ? | 7.9 ? -508% | 30.7 ? -2262% | 8 ? -515% | 1 ? 23% | 26 ? -1900% | 34.3 ? -2538% |
| PWM Frequency (Hz) | 60 | 238.8 | 17600 ? | ||||
| Screen | 9% | -11% | 3% | -44% | -51% | 35% | |
| Brightness middle (cd/m²) | 416 | 546 31% | 414 0% | 356 -14% | 379.8 -9% | 355 -15% | 511 23% |
| Brightness (cd/m²) | 421 | 564 34% | 392 -7% | 349 -17% | 383 -9% | 344 -18% | 503 19% |
| Brightness Distribution (%) | 98 | 86 -12% | 89 -9% | 93 -5% | 98 0% | 92 -6% | 89 -9% |
| Black Level * (cd/m²) | 0.38 | 0.26 | 0.28 | 0.17 | 0.26 | ||
| Colorchecker dE 2000 * | 1.3 | 1.3 -0% | 1.9 -46% | 1.7 -31% | 4.7 -262% | 2.9 -123% | 0.5 62% |
| Colorchecker dE 2000 max. * | 2.8 | 5.3 -89% | 3.6 -29% | 3 -7% | 7.51 -168% | 5.6 -100% | 1.1 61% |
| Colorchecker dE 2000 calibrated * | 2.9 | 1.2 59% | 0.8 72% | 1 66% | 0.55 81% | 1 66% | |
| Greyscale dE 2000 * | 1.8 | 1.1 39% | 2.9 -61% | 1.3 28% | 0.8 56% | 4.7 -161% | 0.8 56% |
| Gamma | 2.25 98% | 2.27 97% | 2.26 97% | 2.1 105% | 2.22 99% | 2.12 104% | 2.19 100% |
| CCT | 6574 99% | 6463 101% | 6227 104% | 6625 98% | 6381 102% | 6356 102% | 6650 98% |
| Contrast (:1) | 1437 | 1592 | 1271 | 2088 | 1965 | ||
| Total Average (Program / Settings) | -208% /
-101% | -880% /
-447% | -197% /
-99% | 0% /
-19% | -886% /
-466% | -1264% /
-678% |
* ... smaller is better
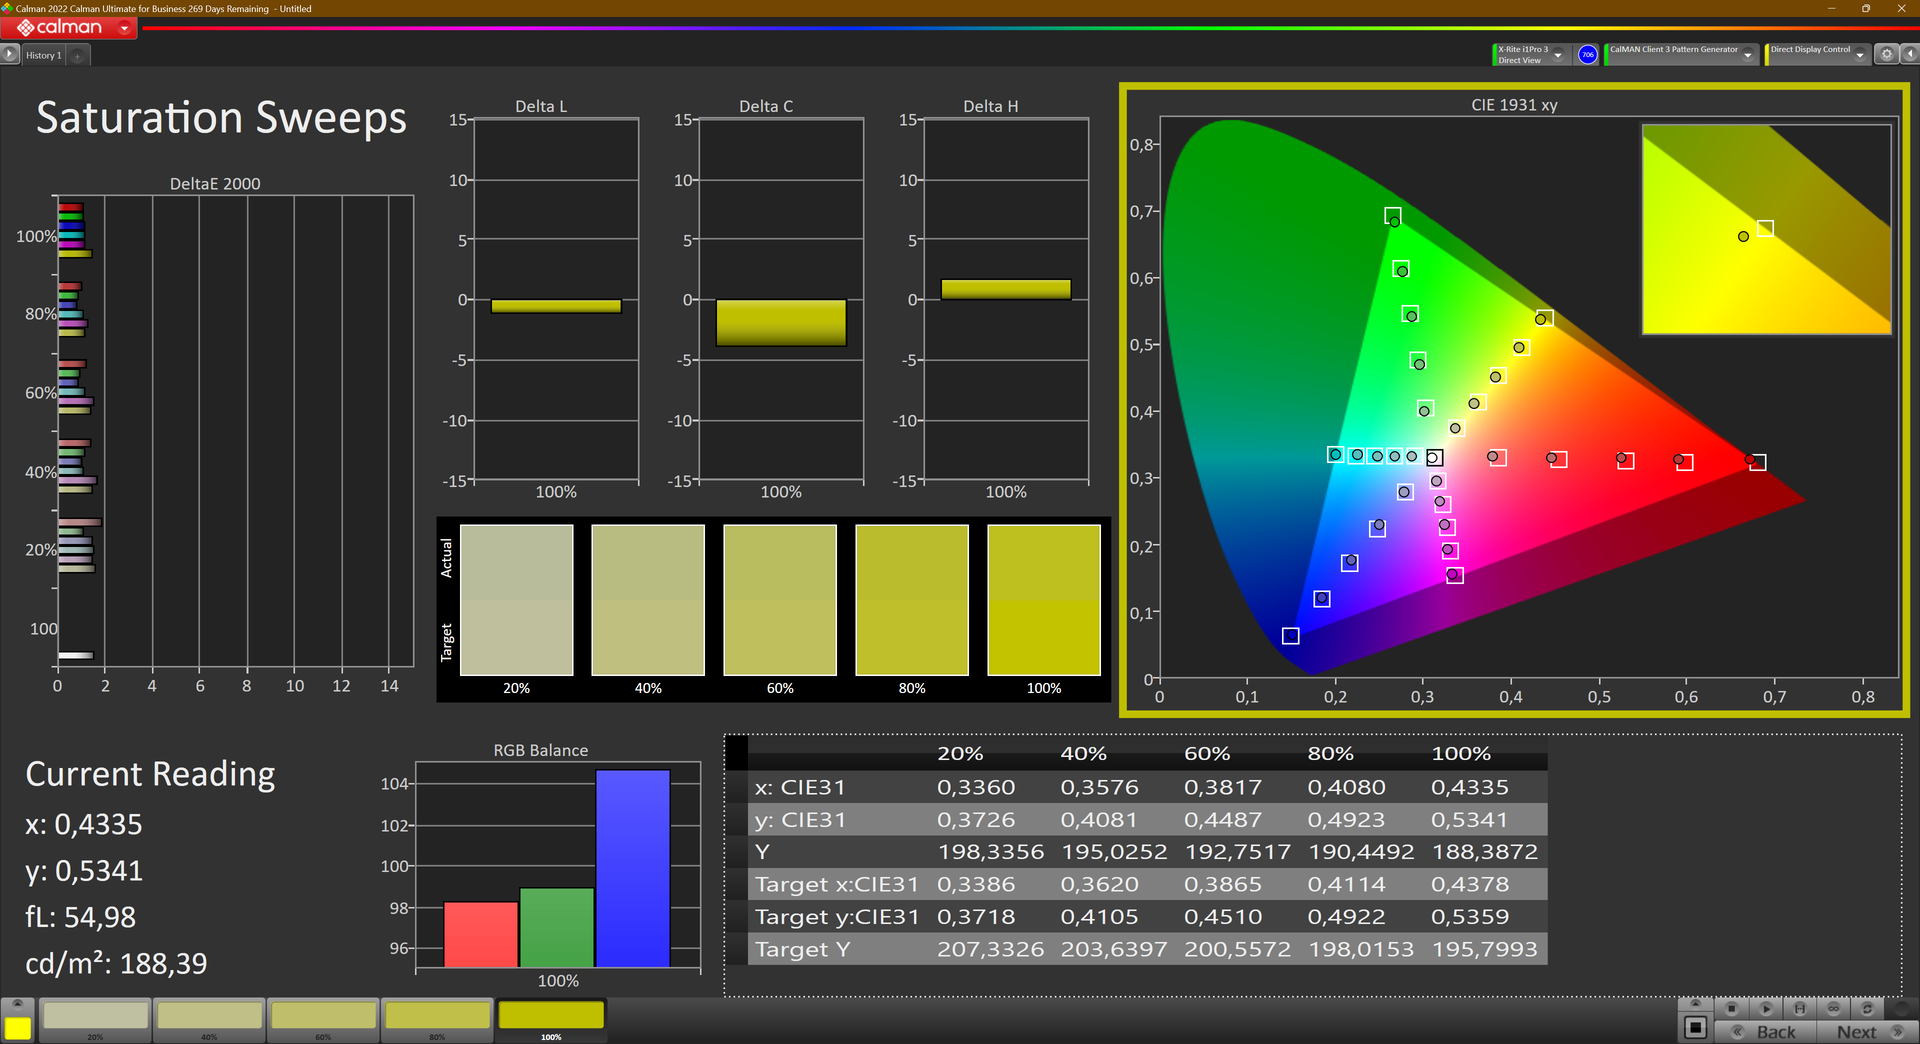
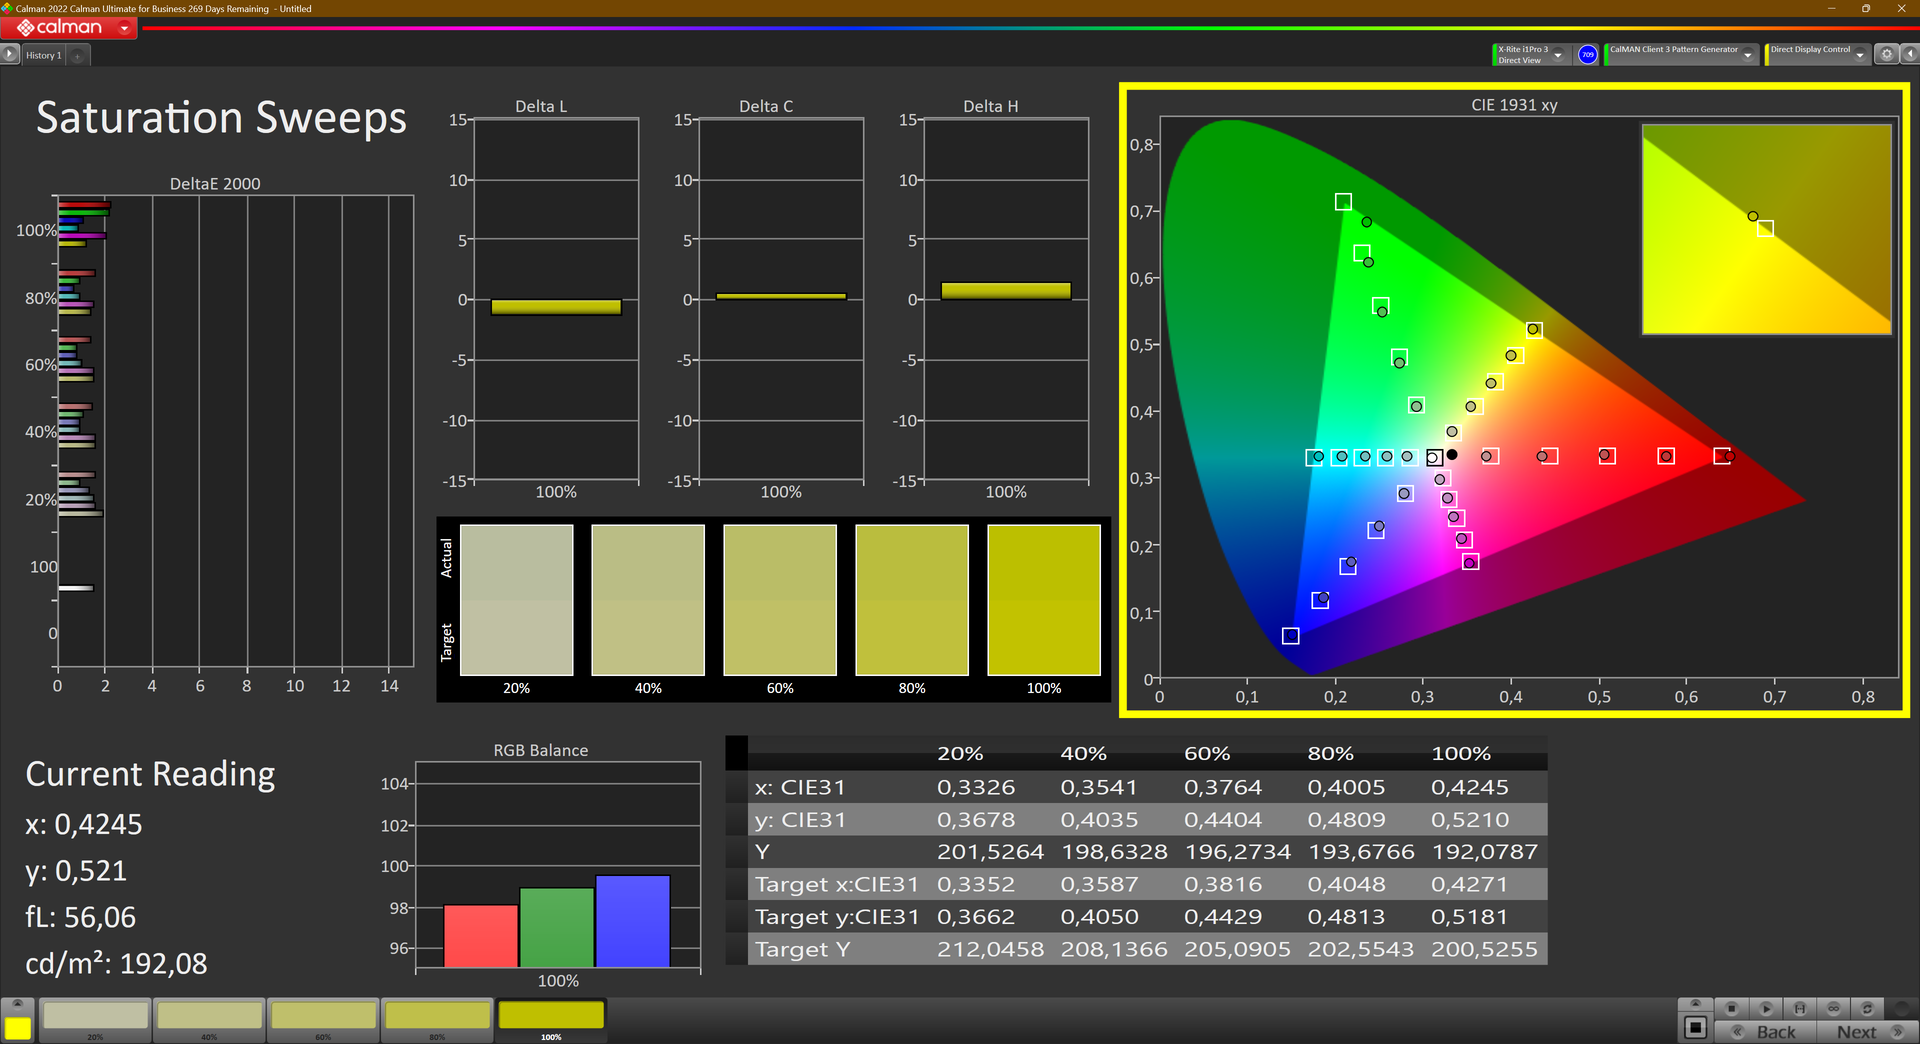
The OLED display is as generous as expected when it comes to color depiction. It completely covers Display-P3, a color space which is used for professional video productions. It only doesn't quite cover AdobeRGB in its entirety.
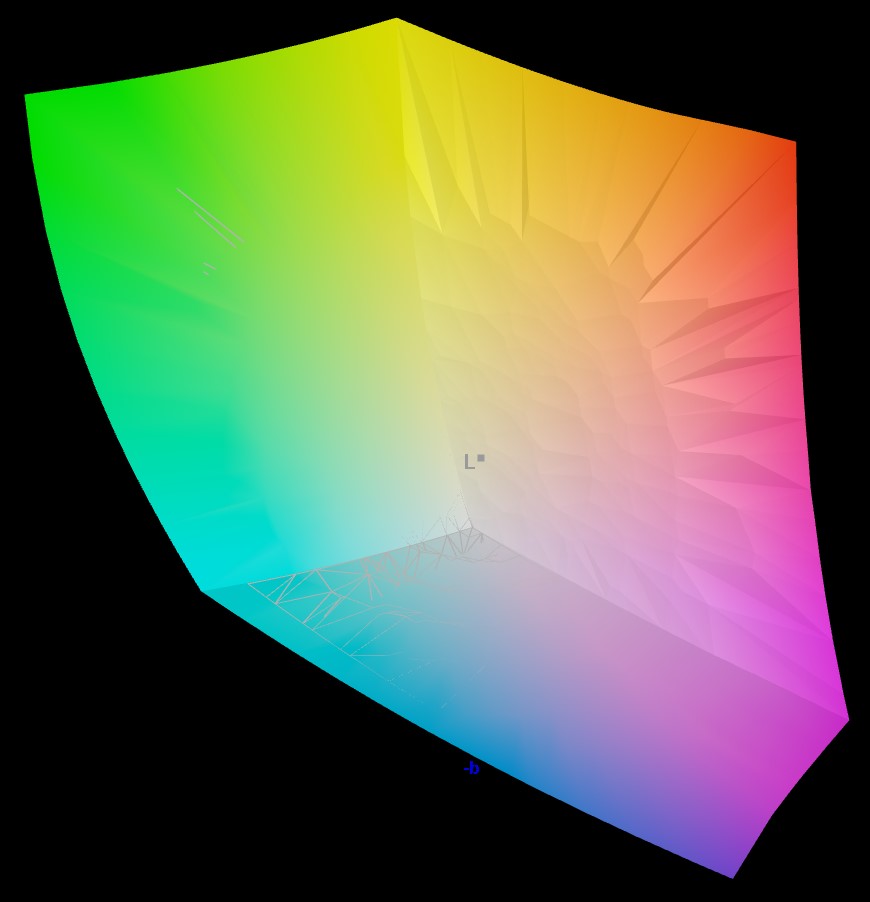
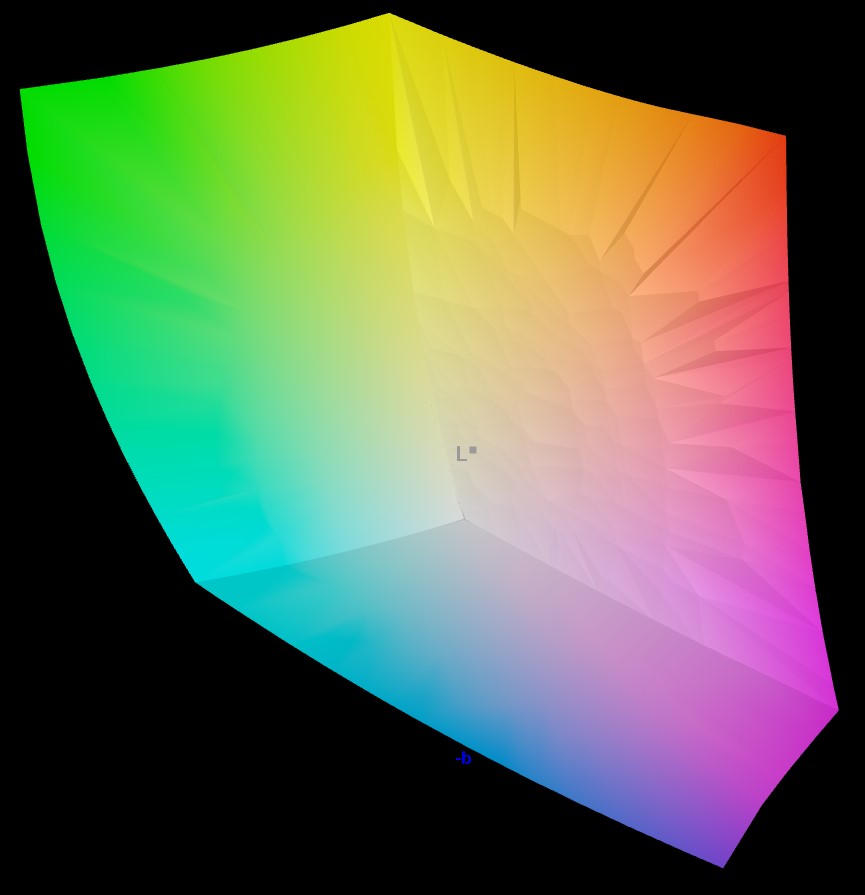
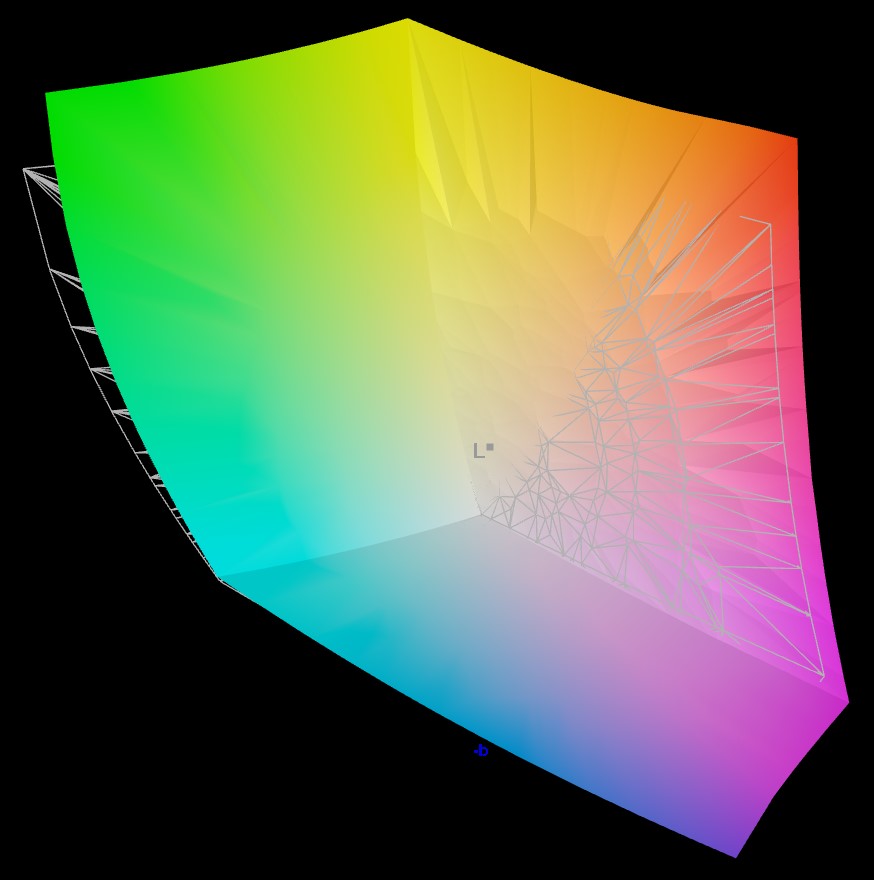
When measuring the screen's color accuracy, we noted values beneath what is perceptible by the naked eye—even when it came to the highest deviations. On average, the deviations were even smaller. This means colors are depicted with almost perfect accuracy.

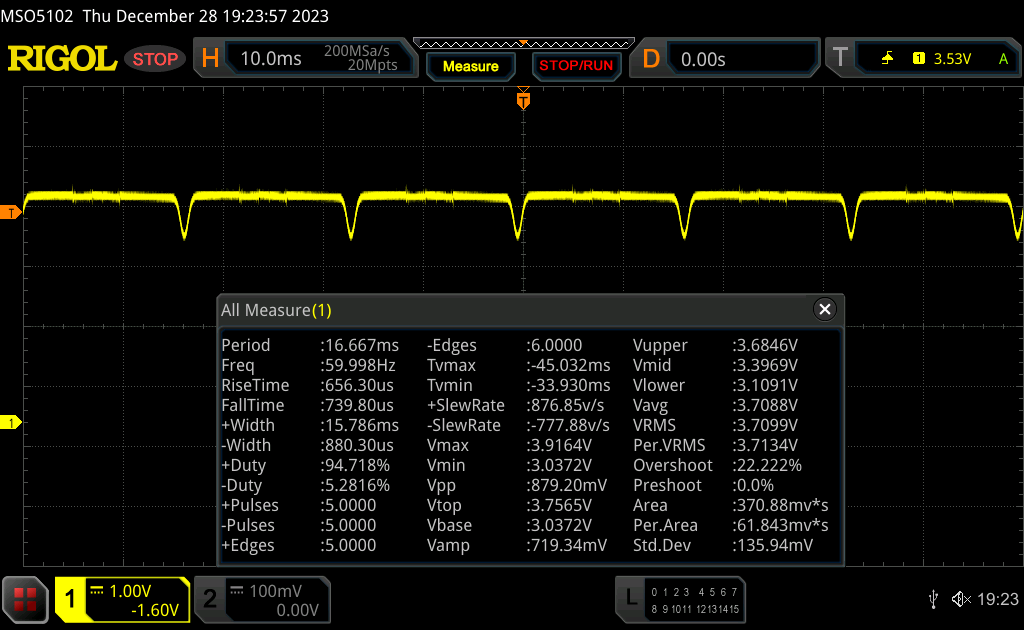
Display Response Times
| ↔ Response Time Black to White | ||
|---|---|---|
| 1.3 ms ... rise ↗ and fall ↘ combined | ↗ 0.7 ms rise | 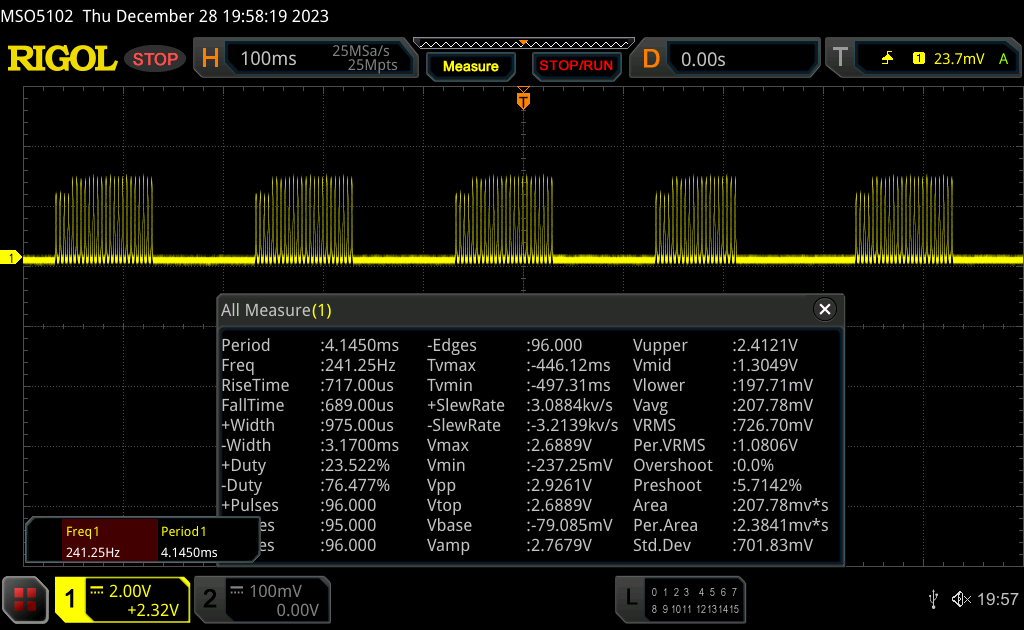 |
| ↘ 0.6 ms fall | ||
| The screen shows very fast response rates in our tests and should be very well suited for fast-paced gaming. In comparison, all tested devices range from 0.1 (minimum) to 240 (maximum) ms. » 7 % of all devices are better. This means that the measured response time is better than the average of all tested devices (19.9 ms). | ||
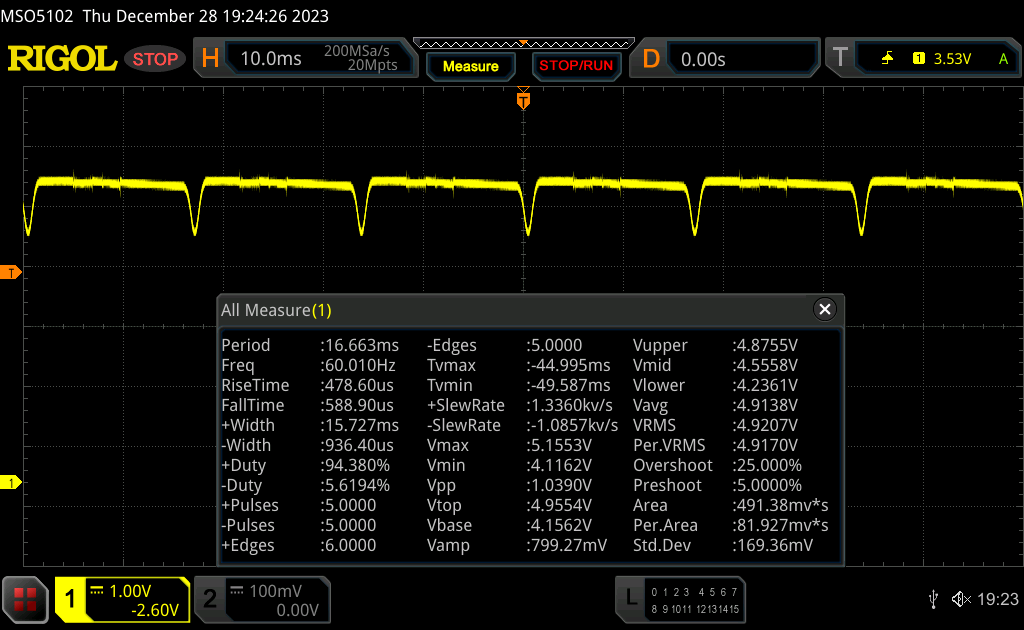
| ↔ Response Time 50% Grey to 80% Grey | ||
| 1.5 ms ... rise ↗ and fall ↘ combined | ↗ 0.8 ms rise |  |
| ↘ 0.7 ms fall | ||
| The screen shows very fast response rates in our tests and should be very well suited for fast-paced gaming. In comparison, all tested devices range from 0.165 (minimum) to 636 (maximum) ms. » 7 % of all devices are better. This means that the measured response time is better than the average of all tested devices (31.1 ms). | ||
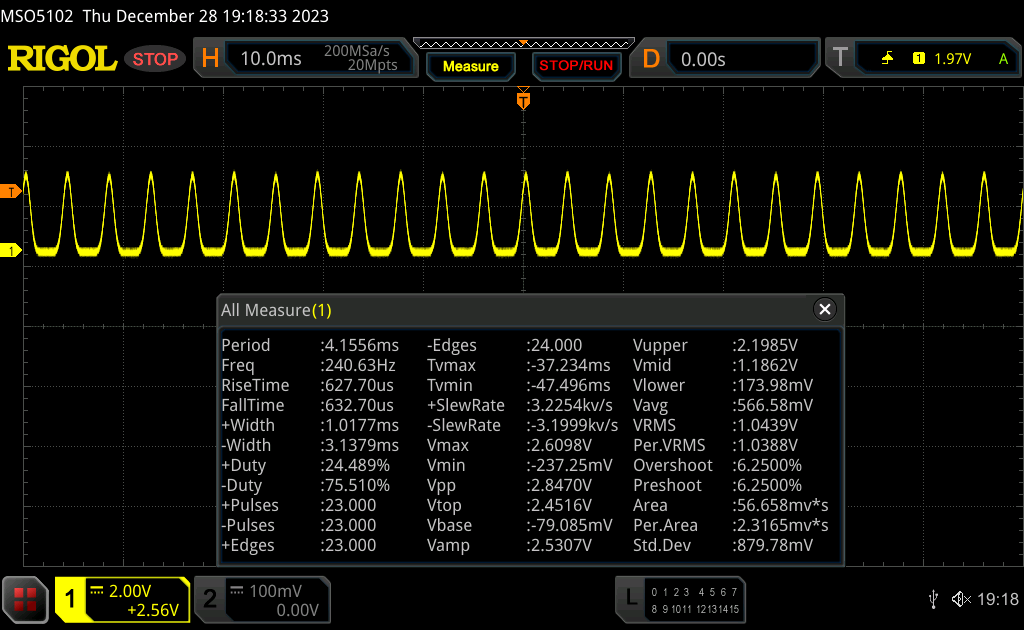
Screen Flickering / PWM (Pulse-Width Modulation)
| Screen flickering / PWM detected | 60 Hz |  | |
The display backlight flickers at 60 Hz (worst case, e.g., utilizing PWM) . The frequency of 60 Hz is very low, so the flickering may cause eyestrain and headaches after extended use. In comparison: 52 % of all tested devices do not use PWM to dim the display. If PWM was detected, an average of 7819 (minimum: 5 - maximum: 343500) Hz was measured. | |||

The high contrast levels and brightness of over 400 cd/m² ensure that content remains legible even outdoors. However, you should seek out a shaded spot, as reflections might otherwise get in the way.
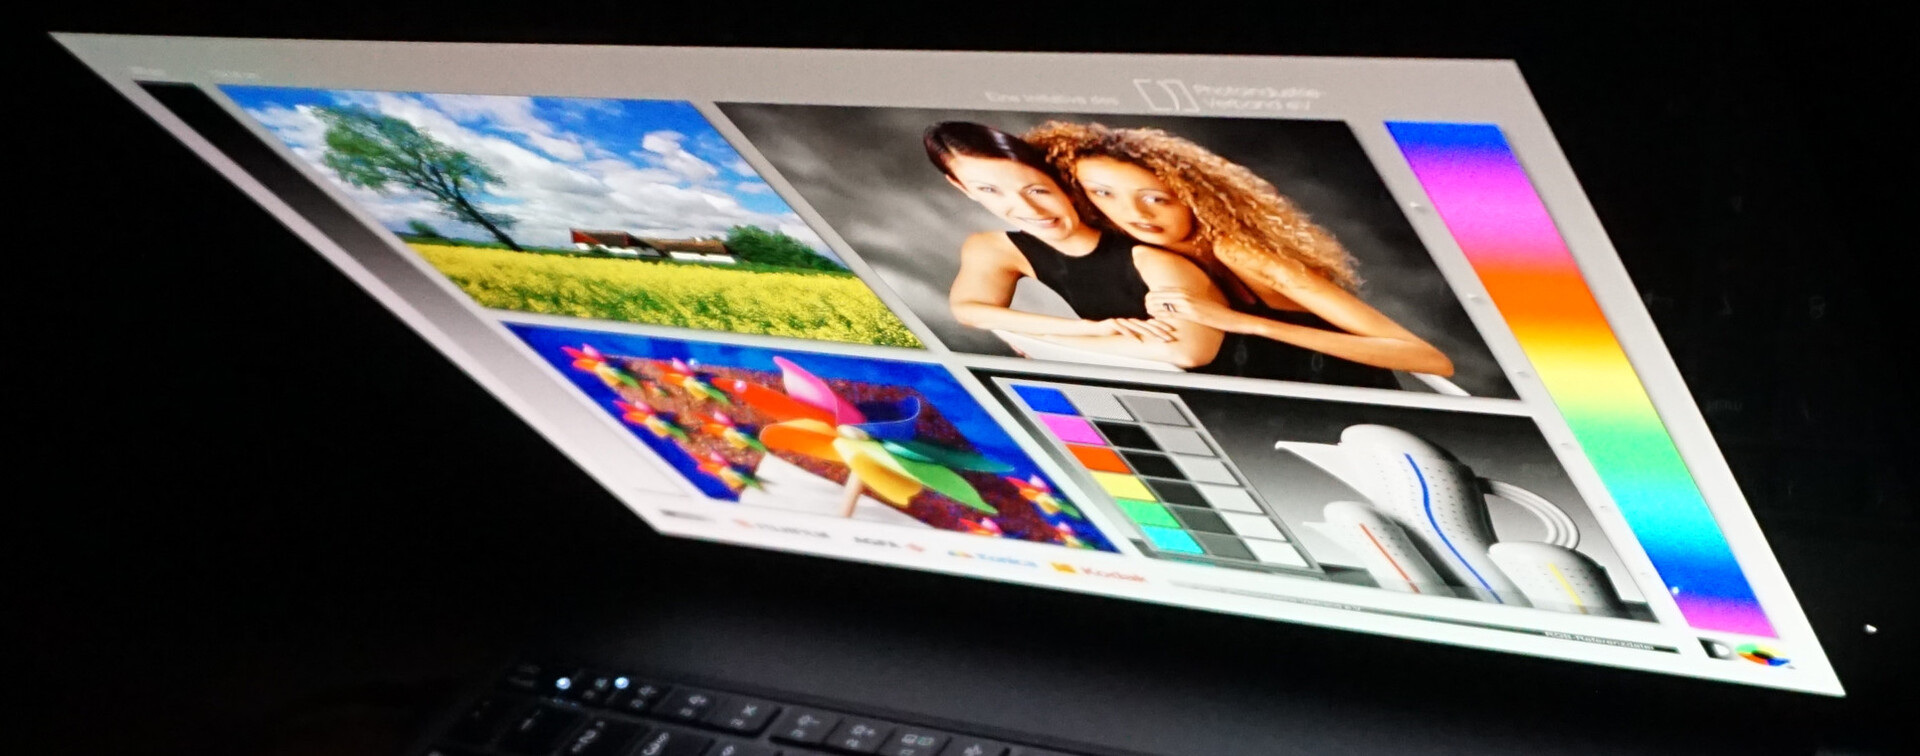
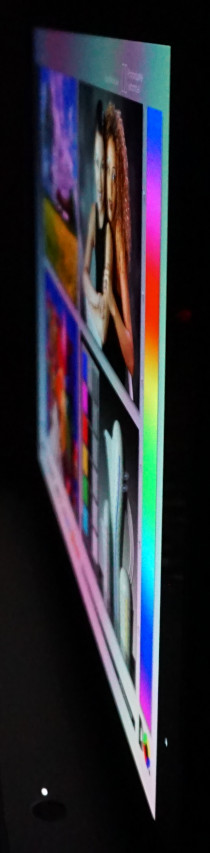
Colors and brightness always remain the same, almost regardless of the viewing angle. Color distortions which are typical of OLED displays only occur at more than 80 degrees.

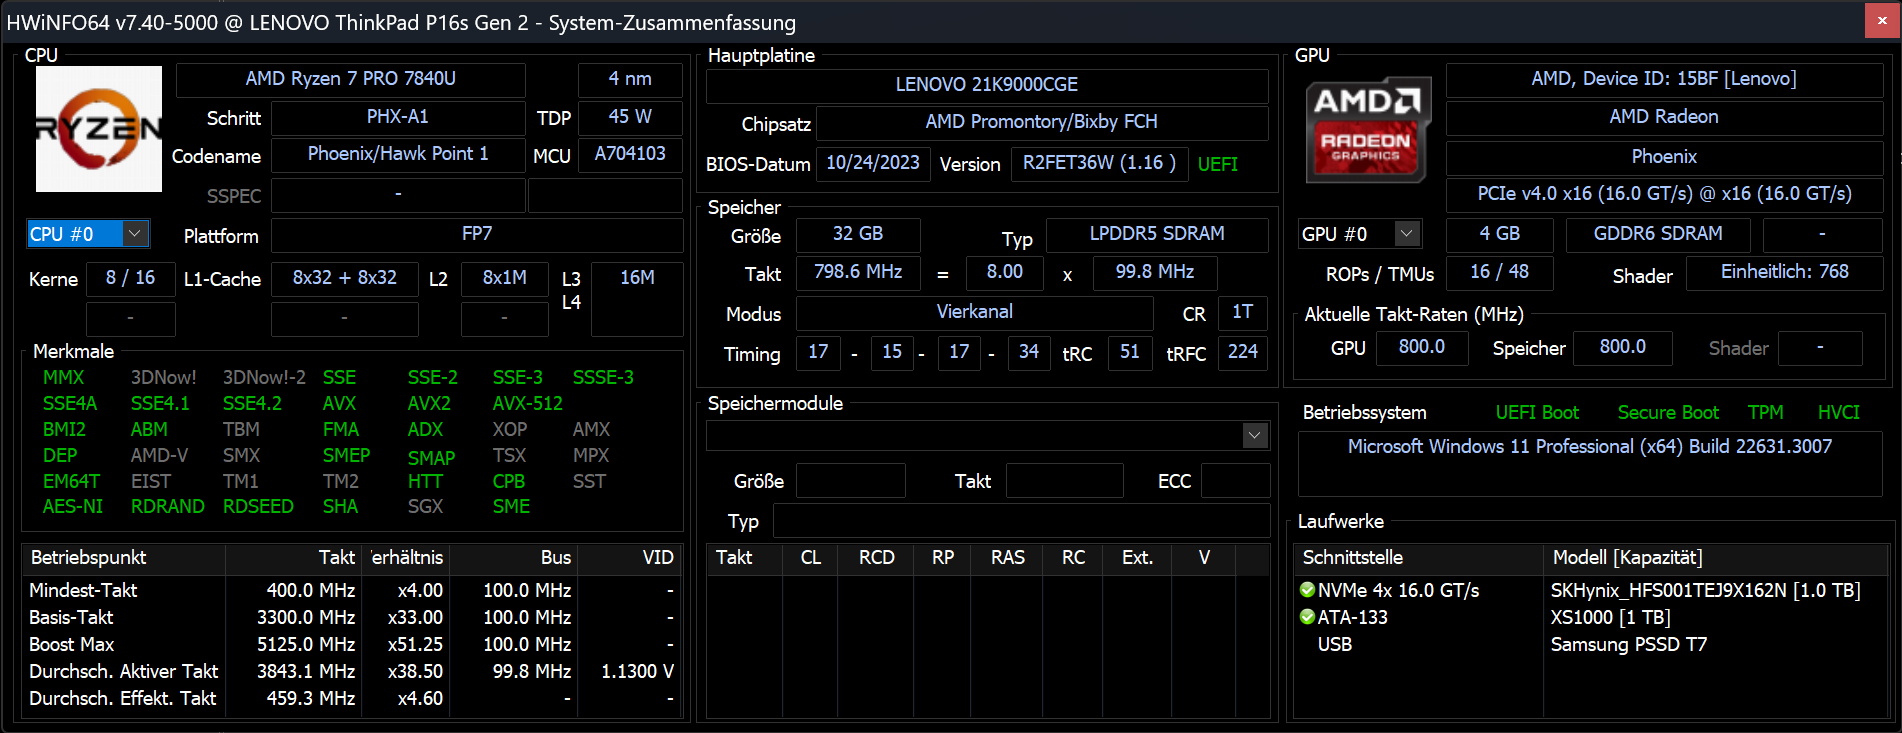
Performance - Ryzen 7 under power
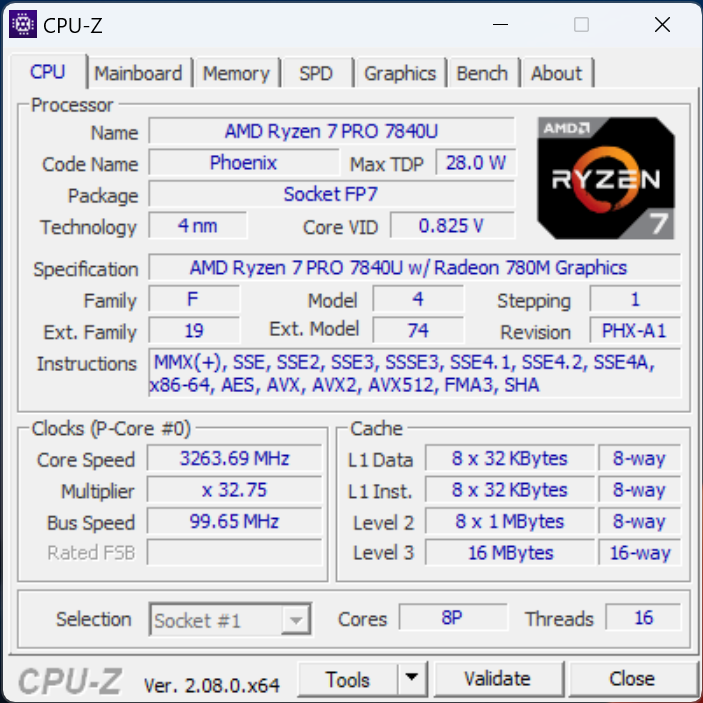
The AMD Ryzen 7 Pro 7840U is the powerhouse of the ThinkPads P16s G2, together with its Radeon 780M iGPU. This combination not only results in astounding computing power but also creates strong graphics performance—at least for an integrated GPU. The system's efficiency needn't shy away, either. Furthermore, you also have the option to select the smaller AMD Ryzen 5 Pro 7540U with the Radeon 740M.
In addition to its high performance for a mobile system, the Pro series also features a security chip and lots of remote maintenance options, which are particularly useful for fleet use.
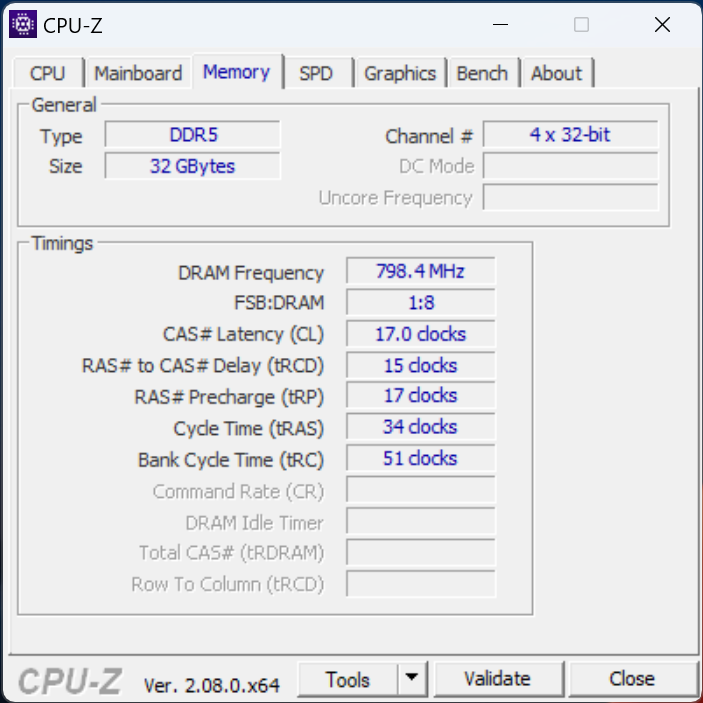
Moreover, you can choose between three RAM sizes, namely 16, 32 or 64 GB at 6,400 MHz. They are soldered on, meaning they can't be swapped out or expanded.
Testing conditions
The three familiar Windows performance modes highest performance, balanced and highest energy-saving are available. Using the supplied software "Lenovo Commercial Vantage", the performance is always set to the highest setting. Even using the low setting, the CPU's power consumption remains quite high. We performed all our tests using the mode highest performance.
On the other hand, if you select balanced mode, the laptop's computing power is reduced slightly. However, you shouldn't notice this when booting up applications, surfing the web or during most other day-to-day tasks. In turn, the fan noise only sinks by a small amount but even using highest-performance mode, it never truly gets in the way. As expected, its performance sinks further using energy-saving mode. At the same time, its computing speeds remain quite high, while starting programs leads to a slight delay. Plus, the fans remain considerably quieter with this mode selected.
If you disconnect the device from the mains, the settings switch to balanced. However, they can be changed back to maximum right away. As a result, you have access to the laptop's highest performance even in battery mode. The following table shows how exactly the power limits change:
| PL2 | PL1 | |
|---|---|---|
| Highest performance | 51 watts | 41 watts |
| Balanced | 40 watts | 36 watts |
| Energy-saving | 32 watts | 30 watts |
Processor
As expected, the AMD Ryzen 7 Pro 7840U processor, which is additionally fine-tuned for efficiency, delivers very high performance rates. It is one of the most powerful mobile CPUs. With a total of 16 threads and a maximum clock rate above 5 GHz, it always has plenty of reserves for multitasking and complex uses—as you would expect from a workstation laptop.
Its maximum power supply of 51 watts is appropriate for a 16-inch model and it evens out at 41 watts over a longer period of time. The 14-inch ThinkPad P14s G4 with an identical CPU has access to 20 per cent less power, for example, and did correspondingly worse in the CPU benchmarks.
But even the AMD Ryzen 9 Pro 7940HS within the HP EliteBook 845 G10, which is better on paper, could only keep up. The Intel Core i7-13700H is also on a similar level but inside the Microsoft Surface Laptop Studio 2, for example, it did worse under permanent load. Moreover, the i7-13700H's power consumption is much higher.
As a result, our test device made a very good total impression throughout all the tests, delivering above-average results with moderate power consumption values. AMD's CPU does extremely well inside the ThinkPad P16s G2.
You can find further benchmarks in our CPU benchmark list.
Cinebench R15 Multi continuous test
Cinebench R23: Multi Core | Single Core
Cinebench R20: CPU (Multi Core) | CPU (Single Core)
Cinebench R15: CPU Multi 64Bit | CPU Single 64Bit
Blender: v2.79 BMW27 CPU
7-Zip 18.03: 7z b 4 | 7z b 4 -mmt1
Geekbench 5.5: Multi-Core | Single-Core
HWBOT x265 Benchmark v2.2: 4k Preset
LibreOffice : 20 Documents To PDF
R Benchmark 2.5: Overall mean
| Cinebench R15 / CPU Multi 64Bit | |
| Average of class Workstation (2489 - 5810, n=25, last 2 years) | |
| Microsoft Surface Laptop Studio 2 RTX 4060 | |
| Lenovo ThinkPad P16s G2 21K9000CGE | |
| MSI Prestige 16 B1MG-001US | |
| Lenovo ThinkPad P16v G1 AMD | |
| HP EliteBook 845 G10 818N0EA | |
| Lenovo ThinkPad P14s G4 21K5000LGE | |
| Average AMD Ryzen 7 PRO 7840U (1590 - 2418, n=5) | |
| Lenovo ThinkPad P15v G3 21EM001AGE | |
| Lenovo ThinkPad X1 Carbon G11 21HNS54T00 | |
| Acer Swift Edge SFE16 Ryzen 7 7840U | |
| Schenker Vision 16 PH6PRX1 | |
| Cinebench R15 / CPU Single 64Bit | |
| Average of class Workstation (191.4 - 328, n=25, last 2 years) | |
| Microsoft Surface Laptop Studio 2 RTX 4060 | |
| Acer Swift Edge SFE16 Ryzen 7 7840U | |
| Schenker Vision 16 PH6PRX1 | |
| Lenovo ThinkPad P14s G4 21K5000LGE | |
| Lenovo ThinkPad P16s G2 21K9000CGE | |
| Average AMD Ryzen 7 PRO 7840U (247 - 273, n=5) | |
| Lenovo ThinkPad P16v G1 AMD | |
| Lenovo ThinkPad X1 Carbon G11 21HNS54T00 | |
| MSI Prestige 16 B1MG-001US | |
| HP EliteBook 845 G10 818N0EA | |
| Lenovo ThinkPad P15v G3 21EM001AGE | |
| HWBOT x265 Benchmark v2.2 / 4k Preset | |
| Average of class Workstation (14.4 - 40.5, n=25, last 2 years) | |
| Lenovo ThinkPad P16v G1 AMD | |
| Lenovo ThinkPad P16s G2 21K9000CGE | |
| Microsoft Surface Laptop Studio 2 RTX 4060 | |
| HP EliteBook 845 G10 818N0EA | |
| MSI Prestige 16 B1MG-001US | |
| Lenovo ThinkPad P14s G4 21K5000LGE | |
| Average AMD Ryzen 7 PRO 7840U (13.6 - 17.8, n=5) | |
| Acer Swift Edge SFE16 Ryzen 7 7840U | |
| Schenker Vision 16 PH6PRX1 | |
| Lenovo ThinkPad P15v G3 21EM001AGE | |
| Lenovo ThinkPad X1 Carbon G11 21HNS54T00 | |
| LibreOffice / 20 Documents To PDF | |
| Lenovo ThinkPad P15v G3 21EM001AGE | |
| Lenovo ThinkPad P16s G2 21K9000CGE | |
| Lenovo ThinkPad P14s G4 21K5000LGE | |
| HP EliteBook 845 G10 818N0EA | |
| Average AMD Ryzen 7 PRO 7840U (45.8 - 52, n=5) | |
| Average of class Workstation (37.1 - 74.7, n=25, last 2 years) | |
| MSI Prestige 16 B1MG-001US | |
| Lenovo ThinkPad P16v G1 AMD | |
| Lenovo ThinkPad X1 Carbon G11 21HNS54T00 | |
| Microsoft Surface Laptop Studio 2 RTX 4060 | |
| Acer Swift Edge SFE16 Ryzen 7 7840U | |
| Schenker Vision 16 PH6PRX1 | |
* ... smaller is better
AIDA64: FP32 Ray-Trace | FPU Julia | CPU SHA3 | CPU Queen | FPU SinJulia | FPU Mandel | CPU AES | CPU ZLib | FP64 Ray-Trace | CPU PhotoWorxx
* ... smaller is better
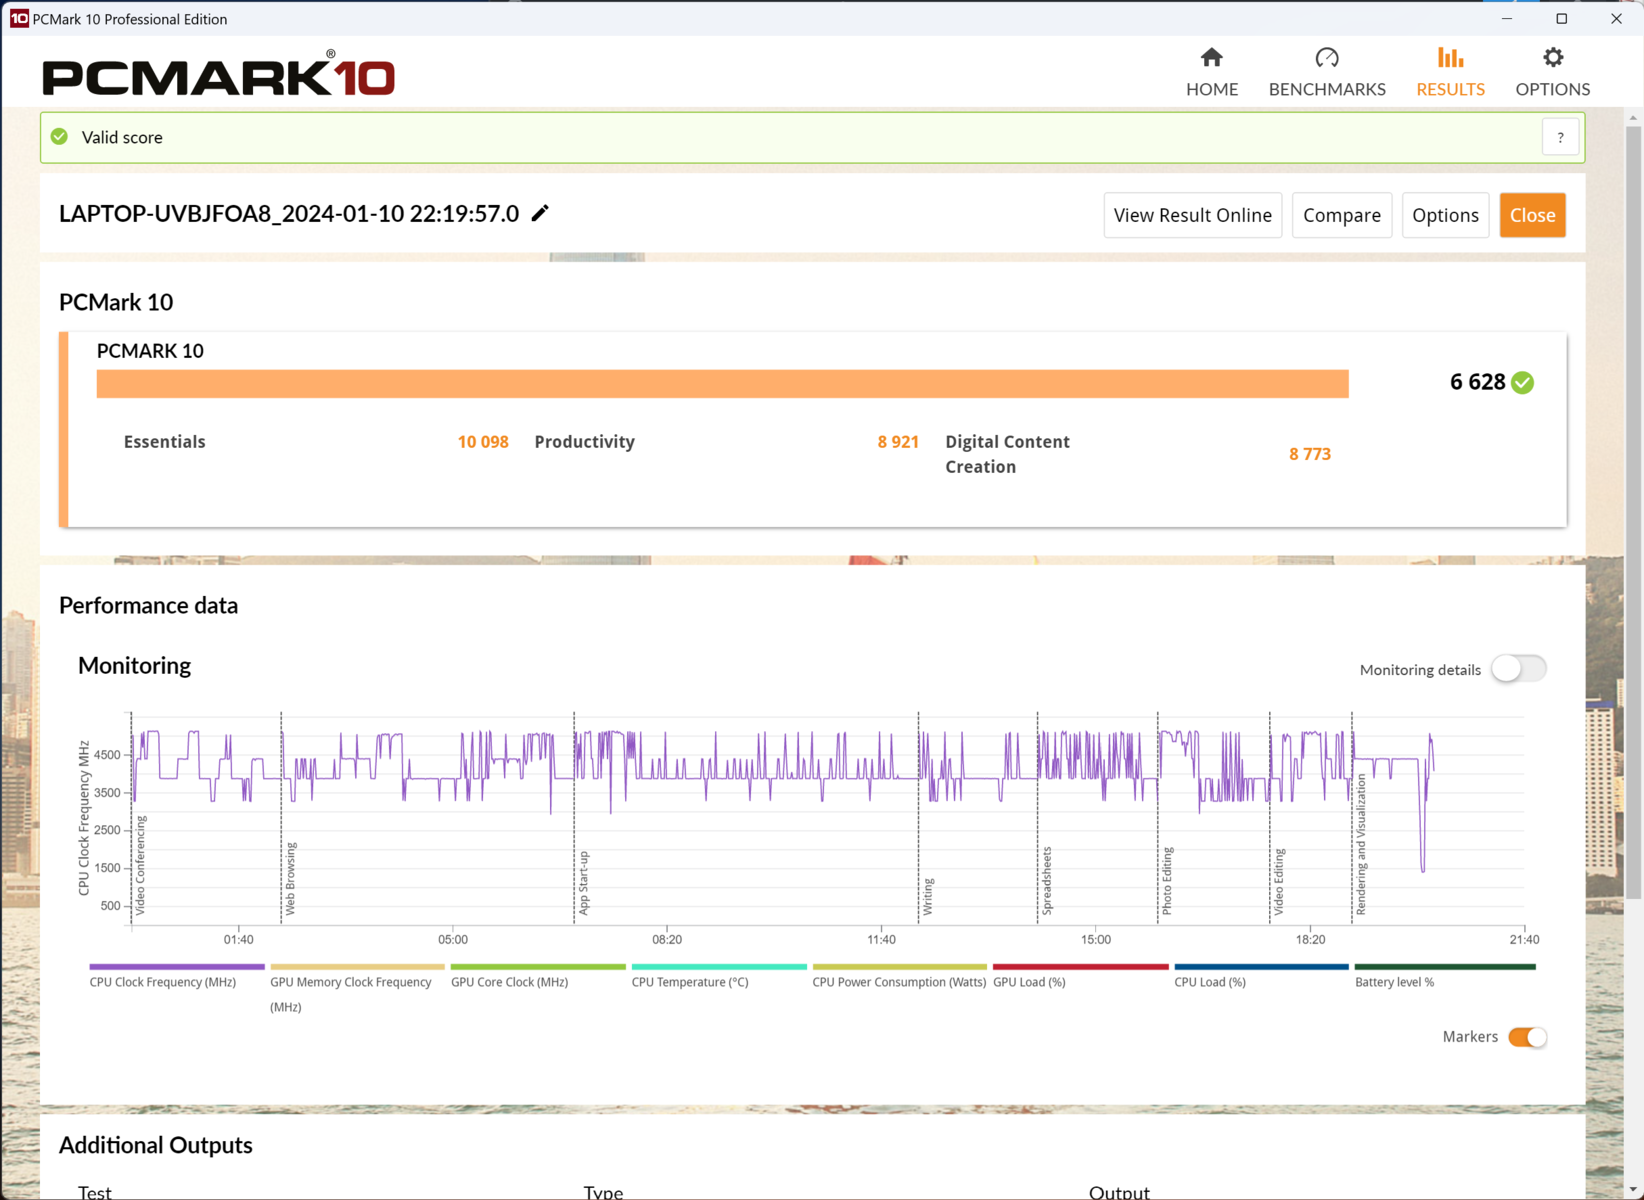
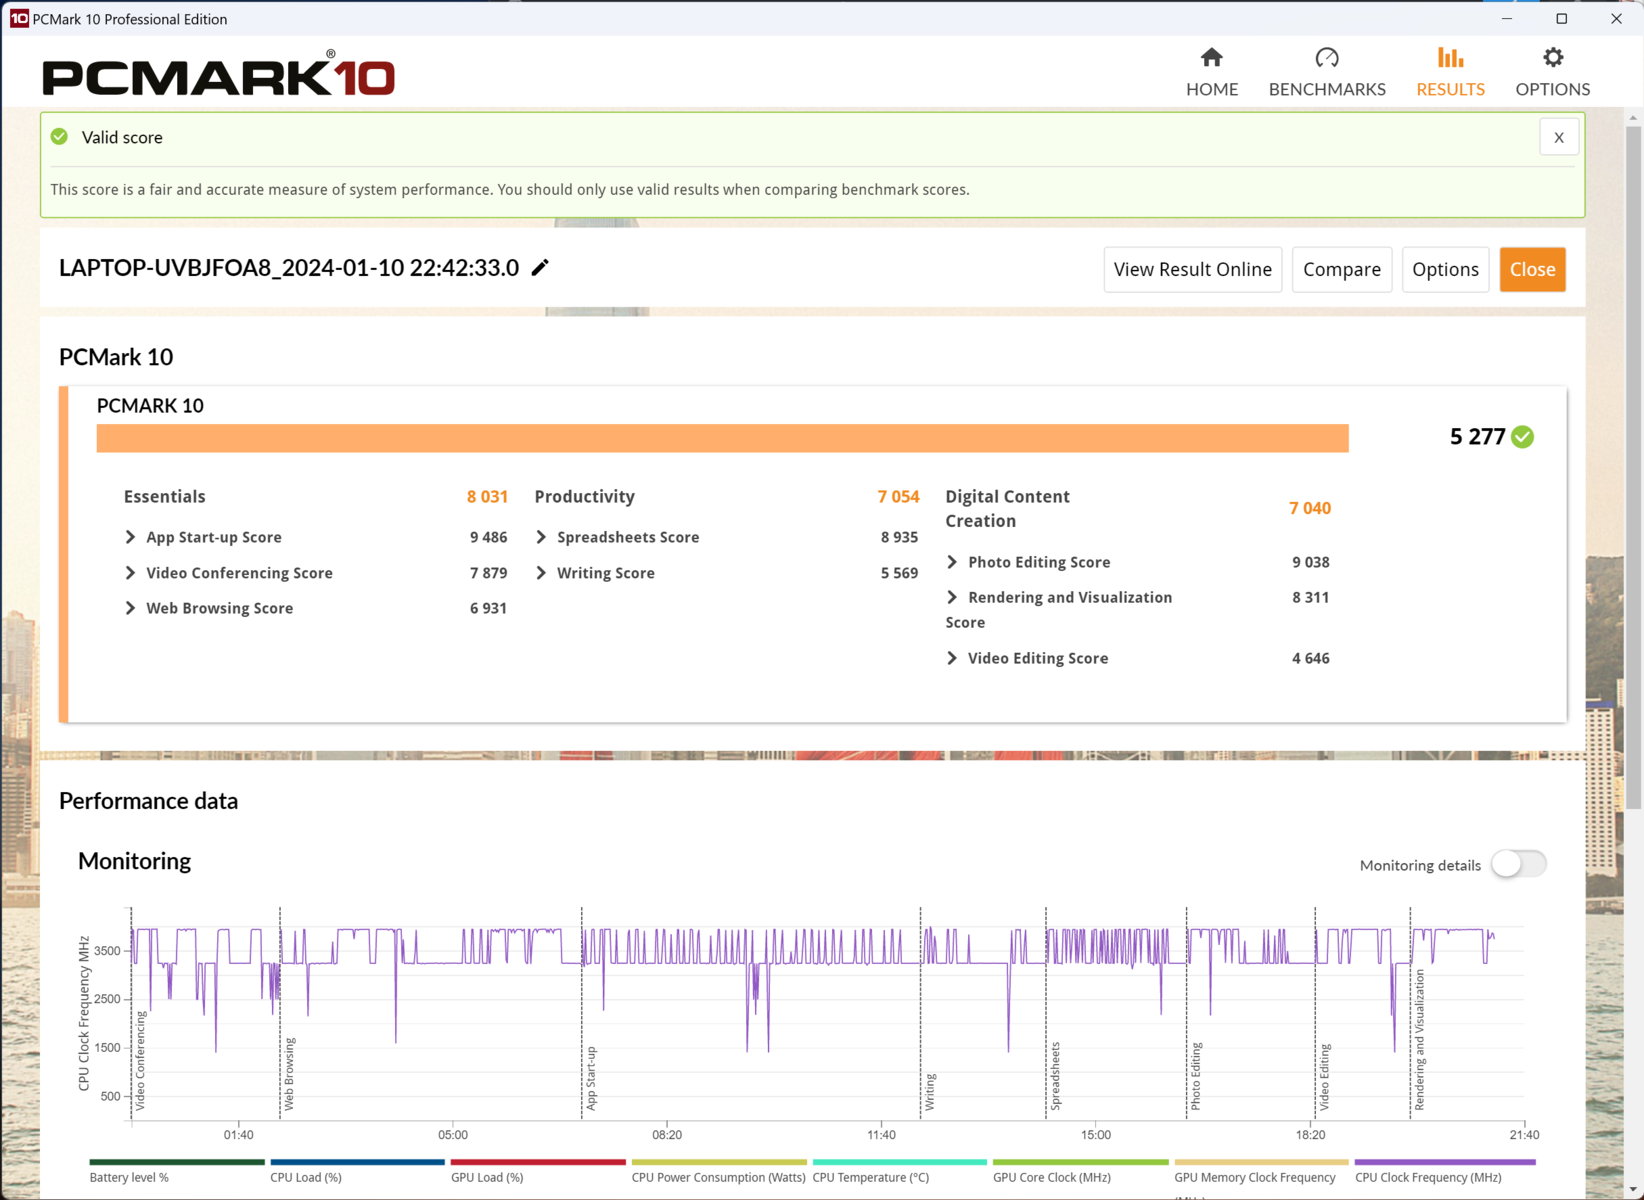
System performance
The ThinkPad P16s G2's general system performance is at a very high level. It clearly surpassed the Schenker Vision 16 with an i7-13700H, for example. And even a better-configured Lenovo ThinkPad P16v with a dedicated graphics card was only a few percentage points ahead.
This means the P16s G2 AMD's handling is accordingly smooth—almost independent of the current load. Even with benchmarks running in the background, the laptop can still be operated well and it reacts quickly. You can use a number of programs at the same time and installation processes or complex tasks can be completed in no time.
CrossMark: Overall | Productivity | Creativity | Responsiveness
WebXPRT 3: Overall
WebXPRT 4: Overall
Mozilla Kraken 1.1: Total
| PCMark 10 / Score | |
| Average of class Workstation (6436 - 10409, n=21, last 2 years) | |
| Microsoft Surface Laptop Studio 2 RTX 4060 | |
| MSI Prestige 16 B1MG-001US | |
| Lenovo ThinkPad P16v G1 AMD | |
| Acer Swift Edge SFE16 Ryzen 7 7840U | |
| Average AMD Ryzen 7 PRO 7840U, AMD Radeon 780M (6541 - 7012, n=5) | |
| Lenovo ThinkPad P14s G4 21K5000LGE | |
| Lenovo ThinkPad P16s G2 21K9000CGE | |
| HP EliteBook 845 G10 818N0EA | |
| Lenovo ThinkPad P15v G3 21EM001AGE | |
| Schenker Vision 16 PH6PRX1 | |
| Lenovo ThinkPad X1 Carbon G11 21HNS54T00 | |
| PCMark 10 / Essentials | |
| MSI Prestige 16 B1MG-001US | |
| Acer Swift Edge SFE16 Ryzen 7 7840U | |
| Microsoft Surface Laptop Studio 2 RTX 4060 | |
| Lenovo ThinkPad X1 Carbon G11 21HNS54T00 | |
| Average of class Workstation (9622 - 11157, n=21, last 2 years) | |
| Average AMD Ryzen 7 PRO 7840U, AMD Radeon 780M (10055 - 10934, n=5) | |
| Lenovo ThinkPad P16v G1 AMD | |
| Lenovo ThinkPad P16s G2 21K9000CGE | |
| Lenovo ThinkPad P14s G4 21K5000LGE | |
| Schenker Vision 16 PH6PRX1 | |
| Lenovo ThinkPad P15v G3 21EM001AGE | |
| HP EliteBook 845 G10 818N0EA | |
| PCMark 10 / Productivity | |
| Average of class Workstation (8789 - 20616, n=21, last 2 years) | |
| Acer Swift Edge SFE16 Ryzen 7 7840U | |
| Lenovo ThinkPad P16v G1 AMD | |
| Average AMD Ryzen 7 PRO 7840U, AMD Radeon 780M (8921 - 9933, n=5) | |
| Microsoft Surface Laptop Studio 2 RTX 4060 | |
| Lenovo ThinkPad P14s G4 21K5000LGE | |
| HP EliteBook 845 G10 818N0EA | |
| Lenovo ThinkPad P16s G2 21K9000CGE | |
| MSI Prestige 16 B1MG-001US | |
| Lenovo ThinkPad P15v G3 21EM001AGE | |
| Lenovo ThinkPad X1 Carbon G11 21HNS54T00 | |
| Schenker Vision 16 PH6PRX1 | |
| PCMark 10 / Digital Content Creation | |
| Average of class Workstation (7744 - 15631, n=21, last 2 years) | |
| Microsoft Surface Laptop Studio 2 RTX 4060 | |
| MSI Prestige 16 B1MG-001US | |
| Lenovo ThinkPad P16v G1 AMD | |
| Lenovo ThinkPad P16s G2 21K9000CGE | |
| Lenovo ThinkPad P14s G4 21K5000LGE | |
| Lenovo ThinkPad P15v G3 21EM001AGE | |
| Average AMD Ryzen 7 PRO 7840U, AMD Radeon 780M (7806 - 8874, n=5) | |
| Acer Swift Edge SFE16 Ryzen 7 7840U | |
| HP EliteBook 845 G10 818N0EA | |
| Schenker Vision 16 PH6PRX1 | |
| Lenovo ThinkPad X1 Carbon G11 21HNS54T00 | |
| CrossMark / Overall | |
| Average of class Workstation (1307 - 2267, n=24, last 2 years) | |
| Lenovo ThinkPad X1 Carbon G11 21HNS54T00 | |
| Acer Swift Edge SFE16 Ryzen 7 7840U | |
| MSI Prestige 16 B1MG-001US | |
| Microsoft Surface Laptop Studio 2 RTX 4060 | |
| Schenker Vision 16 PH6PRX1 | |
| Average AMD Ryzen 7 PRO 7840U, AMD Radeon 780M (1533 - 1669, n=5) | |
| Lenovo ThinkPad P16s G2 21K9000CGE | |
| Lenovo ThinkPad P14s G4 21K5000LGE | |
| Lenovo ThinkPad P16v G1 AMD | |
| HP EliteBook 845 G10 818N0EA | |
| Lenovo ThinkPad P15v G3 21EM001AGE | |
| CrossMark / Productivity | |
| Acer Swift Edge SFE16 Ryzen 7 7840U | |
| Average of class Workstation (1130 - 2122, n=24, last 2 years) | |
| Lenovo ThinkPad X1 Carbon G11 21HNS54T00 | |
| MSI Prestige 16 B1MG-001US | |
| Schenker Vision 16 PH6PRX1 | |
| Microsoft Surface Laptop Studio 2 RTX 4060 | |
| Lenovo ThinkPad P16v G1 AMD | |
| Average AMD Ryzen 7 PRO 7840U, AMD Radeon 780M (1461 - 1624, n=5) | |
| Lenovo ThinkPad P16s G2 21K9000CGE | |
| Lenovo ThinkPad P14s G4 21K5000LGE | |
| Lenovo ThinkPad P15v G3 21EM001AGE | |
| HP EliteBook 845 G10 818N0EA | |
| CrossMark / Creativity | |
| Average of class Workstation (1657 - 2725, n=24, last 2 years) | |
| Lenovo ThinkPad X1 Carbon G11 21HNS54T00 | |
| Microsoft Surface Laptop Studio 2 RTX 4060 | |
| MSI Prestige 16 B1MG-001US | |
| Acer Swift Edge SFE16 Ryzen 7 7840U | |
| Average AMD Ryzen 7 PRO 7840U, AMD Radeon 780M (1697 - 1824, n=5) | |
| Lenovo ThinkPad P16s G2 21K9000CGE | |
| Schenker Vision 16 PH6PRX1 | |
| Lenovo ThinkPad P14s G4 21K5000LGE | |
| Lenovo ThinkPad P16v G1 AMD | |
| HP EliteBook 845 G10 818N0EA | |
| Lenovo ThinkPad P15v G3 21EM001AGE | |
| CrossMark / Responsiveness | |
| Acer Swift Edge SFE16 Ryzen 7 7840U | |
| Schenker Vision 16 PH6PRX1 | |
| Average of class Workstation (993 - 2096, n=24, last 2 years) | |
| MSI Prestige 16 B1MG-001US | |
| Lenovo ThinkPad X1 Carbon G11 21HNS54T00 | |
| Microsoft Surface Laptop Studio 2 RTX 4060 | |
| Lenovo ThinkPad P14s G4 21K5000LGE | |
| Lenovo ThinkPad P16v G1 AMD | |
| Lenovo ThinkPad P16s G2 21K9000CGE | |
| Average AMD Ryzen 7 PRO 7840U, AMD Radeon 780M (1049 - 1499, n=5) | |
| Lenovo ThinkPad P15v G3 21EM001AGE | |
| HP EliteBook 845 G10 818N0EA | |
| WebXPRT 3 / Overall | |
| Lenovo ThinkPad P16v G1 AMD | |
| Average of class Workstation (260 - 360, n=25, last 2 years) | |
| Acer Swift Edge SFE16 Ryzen 7 7840U | |
| Microsoft Surface Laptop Studio 2 RTX 4060 | |
| MSI Prestige 16 B1MG-001US | |
| Lenovo ThinkPad X1 Carbon G11 21HNS54T00 | |
| Lenovo ThinkPad X1 Carbon G11 21HNS54T00 | |
| Average AMD Ryzen 7 PRO 7840U, AMD Radeon 780M (259 - 317, n=5) | |
| HP EliteBook 845 G10 818N0EA | |
| Lenovo ThinkPad P14s G4 21K5000LGE | |
| Lenovo ThinkPad P16s G2 21K9000CGE | |
| Lenovo ThinkPad P15v G3 21EM001AGE | |
| WebXPRT 4 / Overall | |
| Average of class Workstation (189.2 - 326, n=25, last 2 years) | |
| Microsoft Surface Laptop Studio 2 RTX 4060 | |
| MSI Prestige 16 B1MG-001US | |
| Lenovo ThinkPad P16v G1 AMD | |
| Acer Swift Edge SFE16 Ryzen 7 7840U | |
| Average AMD Ryzen 7 PRO 7840U, AMD Radeon 780M (234 - 245, n=2) | |
| HP EliteBook 845 G10 818N0EA | |
| Lenovo ThinkPad P15v G3 21EM001AGE | |
| Mozilla Kraken 1.1 / Total | |
| Lenovo ThinkPad P15v G3 21EM001AGE | |
| Lenovo ThinkPad P14s G4 21K5000LGE | |
| HP EliteBook 845 G10 818N0EA | |
| Lenovo ThinkPad P16s G2 21K9000CGE | |
| Average AMD Ryzen 7 PRO 7840U, AMD Radeon 780M (523 - 571, n=5) | |
| Lenovo ThinkPad P16v G1 AMD | |
| MSI Prestige 16 B1MG-001US | |
| Acer Swift Edge SFE16 Ryzen 7 7840U | |
| Microsoft Surface Laptop Studio 2 RTX 4060 | |
| Lenovo ThinkPad X1 Carbon G11 21HNS54T00 | |
| Lenovo ThinkPad X1 Carbon G11 21HNS54T00 | |
| Average of class Workstation (411 - 538, n=25, last 2 years) | |
* ... smaller is better
| PCMark 10 Score | 6628 points | |
Help | ||
| AIDA64 / Memory Copy | |
| Average of class Workstation (56003 - 164795, n=25, last 2 years) | |
| Acer Swift Edge SFE16 Ryzen 7 7840U | |
| Lenovo ThinkPad P14s G4 21K5000LGE | |
| Average AMD Ryzen 7 PRO 7840U (66487 - 67856, n=5) | |
| Lenovo ThinkPad P16s G2 21K9000CGE | |
| Microsoft Surface Laptop Studio 2 RTX 4060 | |
| Schenker Vision 16 PH6PRX1 | |
| HP EliteBook 845 G10 818N0EA | |
| Lenovo ThinkPad P16v G1 AMD | |
| AIDA64 / Memory Read | |
| Average of class Workstation (55795 - 121563, n=25, last 2 years) | |
| Schenker Vision 16 PH6PRX1 | |
| Microsoft Surface Laptop Studio 2 RTX 4060 | |
| Lenovo ThinkPad P16s G2 21K9000CGE | |
| Acer Swift Edge SFE16 Ryzen 7 7840U | |
| Average AMD Ryzen 7 PRO 7840U (47725 - 50543, n=5) | |
| Lenovo ThinkPad P14s G4 21K5000LGE | |
| Lenovo ThinkPad P16v G1 AMD | |
| HP EliteBook 845 G10 818N0EA | |
| AIDA64 / Memory Write | |
| Lenovo ThinkPad P14s G4 21K5000LGE | |
| Average AMD Ryzen 7 PRO 7840U (89477 - 94965, n=5) | |
| Acer Swift Edge SFE16 Ryzen 7 7840U | |
| Lenovo ThinkPad P16s G2 21K9000CGE | |
| Average of class Workstation (55663 - 214520, n=25, last 2 years) | |
| Microsoft Surface Laptop Studio 2 RTX 4060 | |
| Schenker Vision 16 PH6PRX1 | |
| HP EliteBook 845 G10 818N0EA | |
| Lenovo ThinkPad P16v G1 AMD | |
| AIDA64 / Memory Latency | |
| Lenovo ThinkPad P14s G4 21K5000LGE | |
| Average AMD Ryzen 7 PRO 7840U (128.6 - 138.9, n=5) | |
| Lenovo ThinkPad P16s G2 21K9000CGE | |
| Average of class Workstation (84.5 - 165.2, n=25, last 2 years) | |
| Acer Swift Edge SFE16 Ryzen 7 7840U | |
| HP EliteBook 845 G10 818N0EA | |
| Lenovo ThinkPad P16v G1 AMD | |
| Microsoft Surface Laptop Studio 2 RTX 4060 | |
| Schenker Vision 16 PH6PRX1 | |
* ... smaller is better
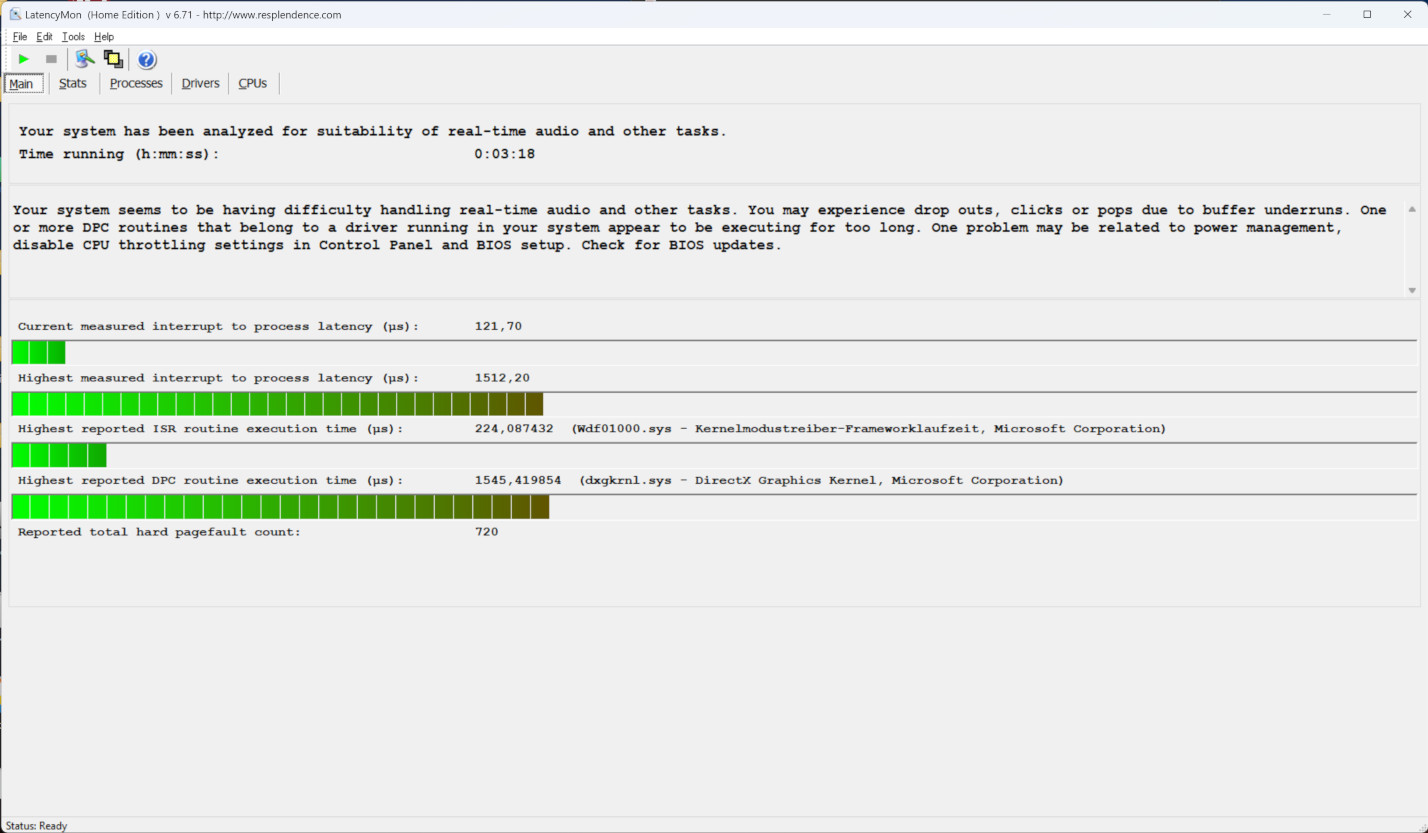
DPC latency
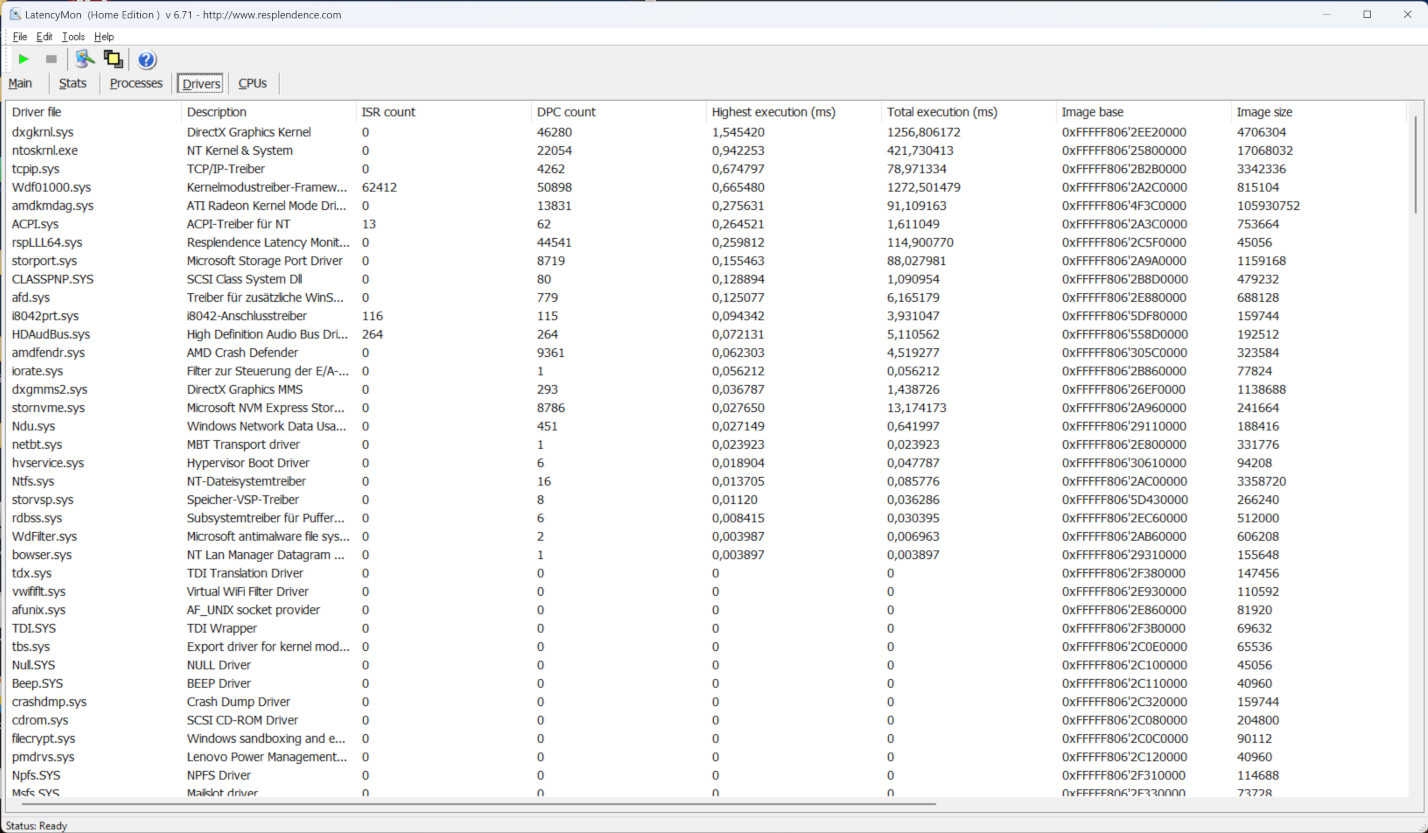
Its LatencyMon results weren't totally up to scratch. At least real-time audio editing could pose some issues for the device. It is interesting to note that the DirectX driver programs in particular led to some issues. An update would most likely solve a few of those. In general, the results could easily be changed in both directions through updated drivers or new software.
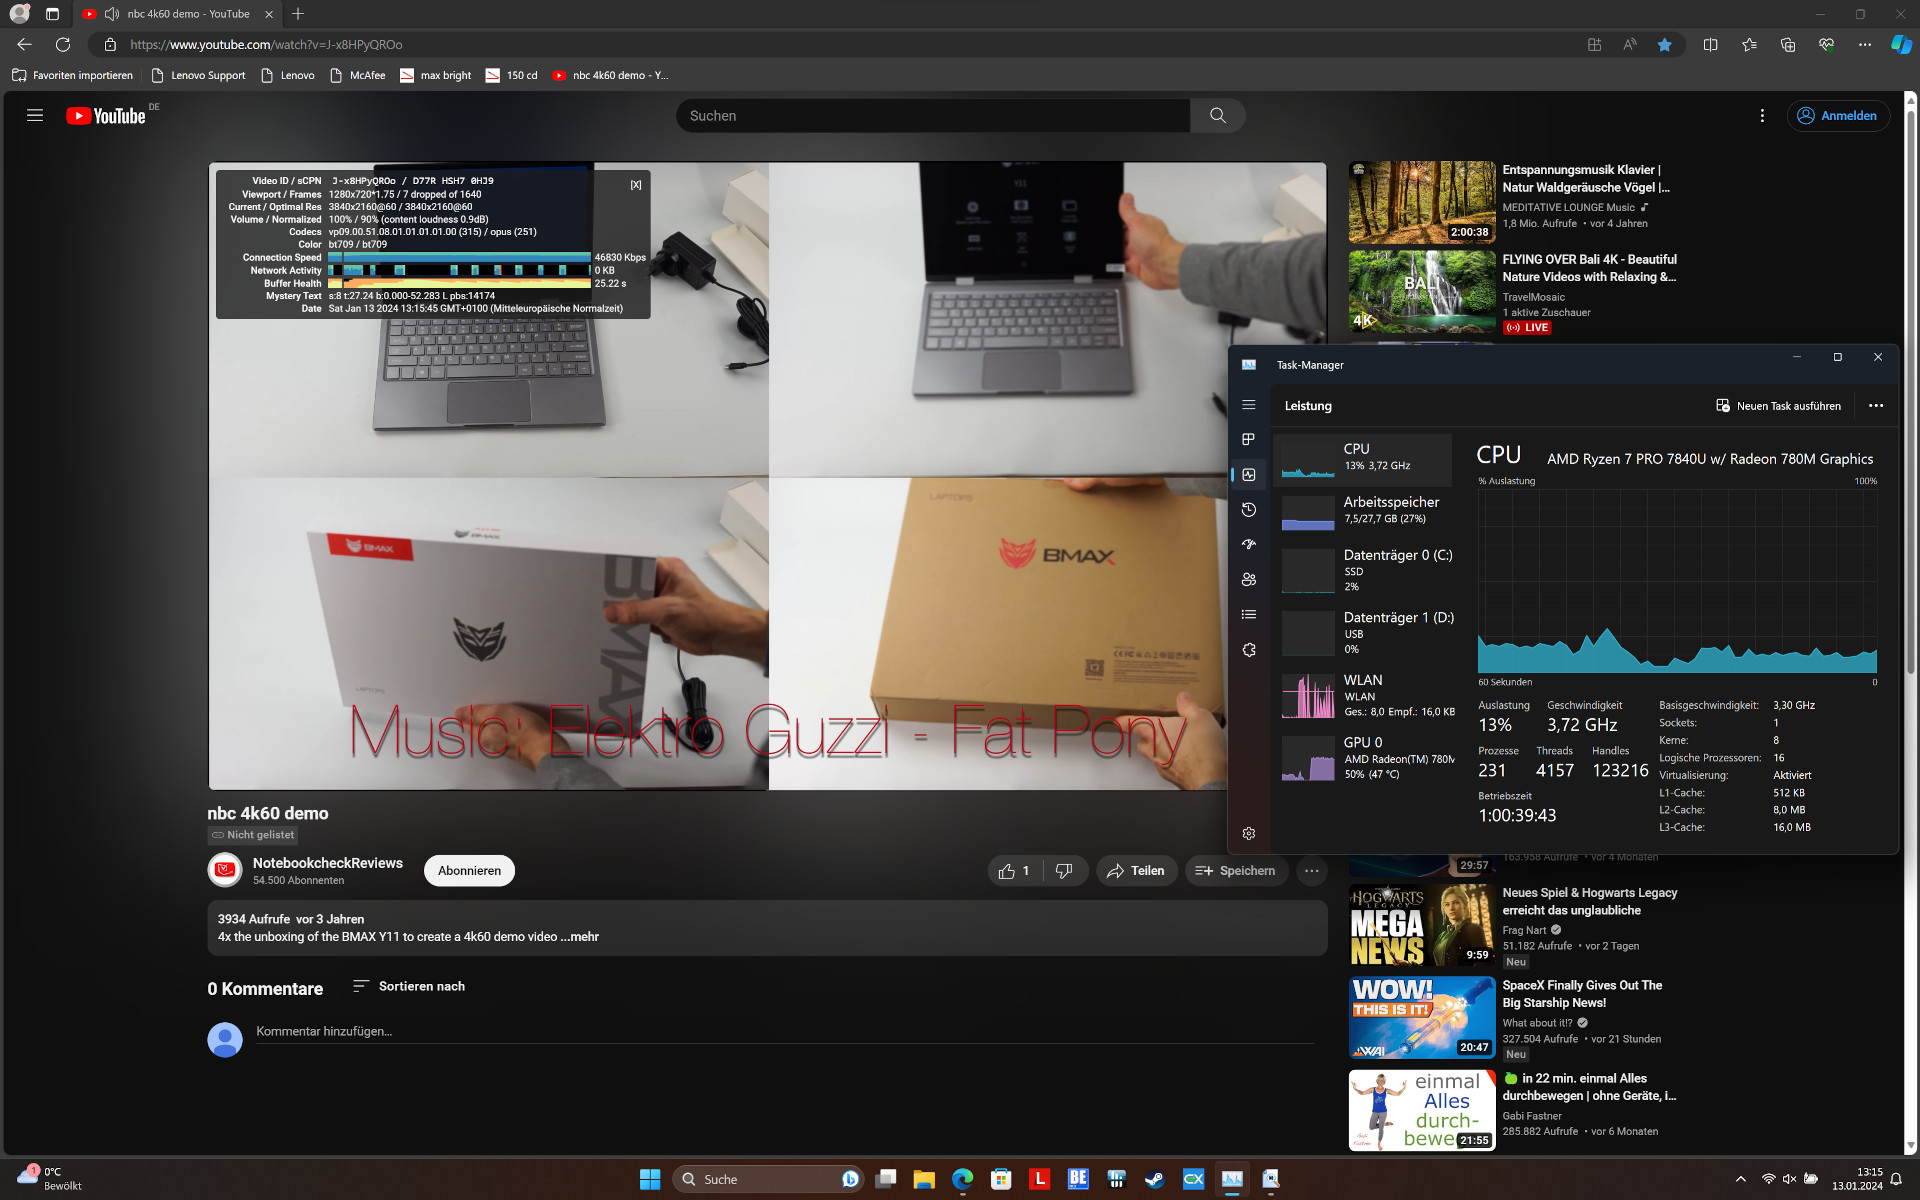
Its video-streaming results leave a similar amount of room for improvement. The 15 dropped frames are simply too many and a GPU load of 50 % shows that the graphics driver hasn't been tuned ideally as of yet (during our test, the current driver status was from 01/2024).
| DPC Latencies / LatencyMon - interrupt to process latency (max), Web, Youtube, Prime95 | |
| Microsoft Surface Laptop Studio 2 RTX 4060 | |
| Schenker Vision 16 PH6PRX1 | |
| Lenovo ThinkPad P16s G2 21K9000CGE | |
| Lenovo ThinkPad P14s G4 21K5000LGE | |
| HP EliteBook 845 G10 818N0EA | |
| Lenovo ThinkPad P16v G1 AMD | |
| Acer Swift Edge SFE16 Ryzen 7 7840U | |
* ... smaller is better
Storage devices
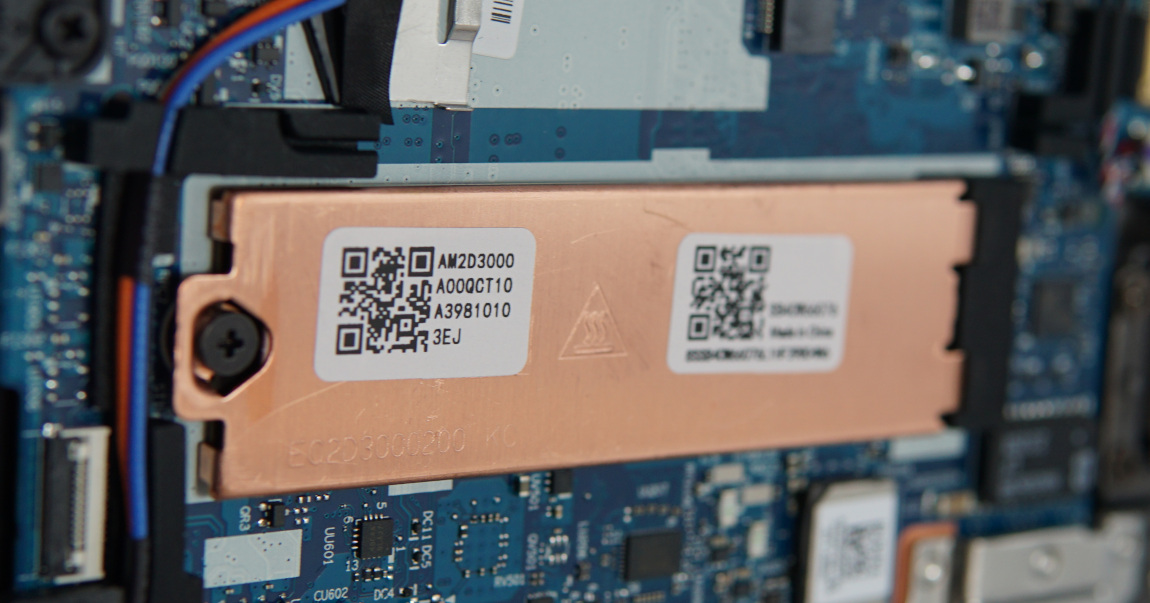
The laptop's elaborate cooling with a large copper plate really paid off during our continuous test. Its sequential write performance remained completely stable and high over a long period of time.
The M.2-SSD from SK Hynix can't handle large quantities of small files well with lots of parallel accesses. However, this should only have a small negative effect when booting up. In normal use, this shouldn't have a noticeable impact.

* ... smaller is better
Reading continuous performance: DiskSpd Read Loop, Queue Depth 8
Graphics card
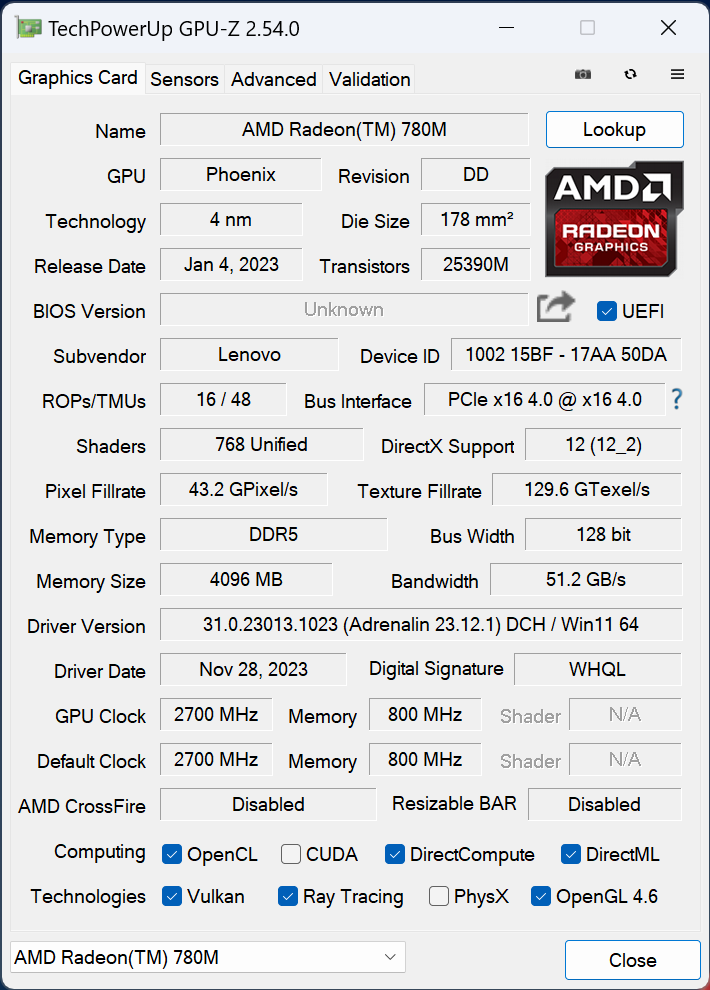
Of course, you shouldn't expect too much from an iGPU, although the AMD Radeon 780M did generally well. Even without its own RAM and with limited hardware and power supply, it was about on the same level as an RTX 2050 Mobile. Its distance to the Nvidia RTX A1000 or the RTX 3050 also wasn't too large.
The ThinkPad P16s G2 AMD did accordingly well in the SPECviewperf benchmark, which gives us an insight into how it performs using professional graphics software. Here, the Nvidia T550 could clearly be kept at a distance. And although the RTX A1000 came about 50 % ahead, it requires a lot more power, more space and workstation laptops such as a Dell Precision 5470 are also a lot more expensive.
Other iGPUs such as the Intel Iris Xe Graphics G7 96EUs are a lot weaker and its predecessor, the Radeon 680M, also remained far behind when it came to graphics performance.
Further measurements, tests and ratings can be found in our GPU benchmark list.
| 3DMark 11 Performance | 12655 points | |
| 3DMark Cloud Gate Standard Score | 35205 points | |
| 3DMark Fire Strike Score | 7524 points | |
| 3DMark Time Spy Score | 3126 points | |
Help | ||
Gaming performance
Gaming is by no means one of the P16s' core strengths. Even so, the ThinkPad proved to be able to play most games well with its integrated graphics unit. Even the relatively current F1 23 can be run at Full HD and with high details.
Complex games such as Starfield and in general high resolutions and maximum details quickly show where the iGPU's limits lie. In particular, its external video memory is then no longer sufficient.
| Starfield | |
| 1920x1080 High Preset | |
| Average AMD Radeon 780M (19 - 21.3, n=3) | |
| Lenovo ThinkPad P16s G2 21K9000CGE | |
| Lenovo ThinkPad P14s G4 21K5000LGE | |
| 1920x1080 Ultra Preset | |
| Average AMD Radeon 780M (15 - 19.1, n=3) | |
| Lenovo ThinkPad P14s G4 21K5000LGE | |
| Lenovo ThinkPad P16s G2 21K9000CGE | |
Using the highest detail setting, the continuous test using The Witcher 3 ran completely smoothly and without any nasty surprises. This means its good graphics performance remains available over longer periods of time as well.
Witcher 3 FPS diagram
| low | med. | high | ultra | QHD | 4K | |
|---|---|---|---|---|---|---|
| GTA V (2015) | 140 | 128.7 | 64.5 | 27.3 | 19.1 | 20.7 |
| The Witcher 3 (2015) | 138 | 94 | 47 | 30 | 20 | 15 |
| Dota 2 Reborn (2015) | 117.5 | 89.9 | 82.1 | 69.5 | 31.2 | |
| Final Fantasy XV Benchmark (2018) | 74.9 | 34.3 | 25.2 | 17.7 | 11.2 | |
| X-Plane 11.11 (2018) | 47.1 | 33.2 | 28.1 | 19.2 | ||
| Far Cry 5 (2018) | 69 | 46 | 42 | 40 | 27 | 12 |
| Strange Brigade (2018) | 157.4 | 65.5 | 56.1 | 46.9 | 31.7 | 16.3 |
| F1 23 (2023) | 81.6 | 72.3 | 51.3 | 11.9 | 7.36 | 3.24 |
| Starfield (2023) | 27 | 23 | 19 | 15 | 12 | 7 |
Emissions - The ThinkPad P16s is always reserved
Noise emissions
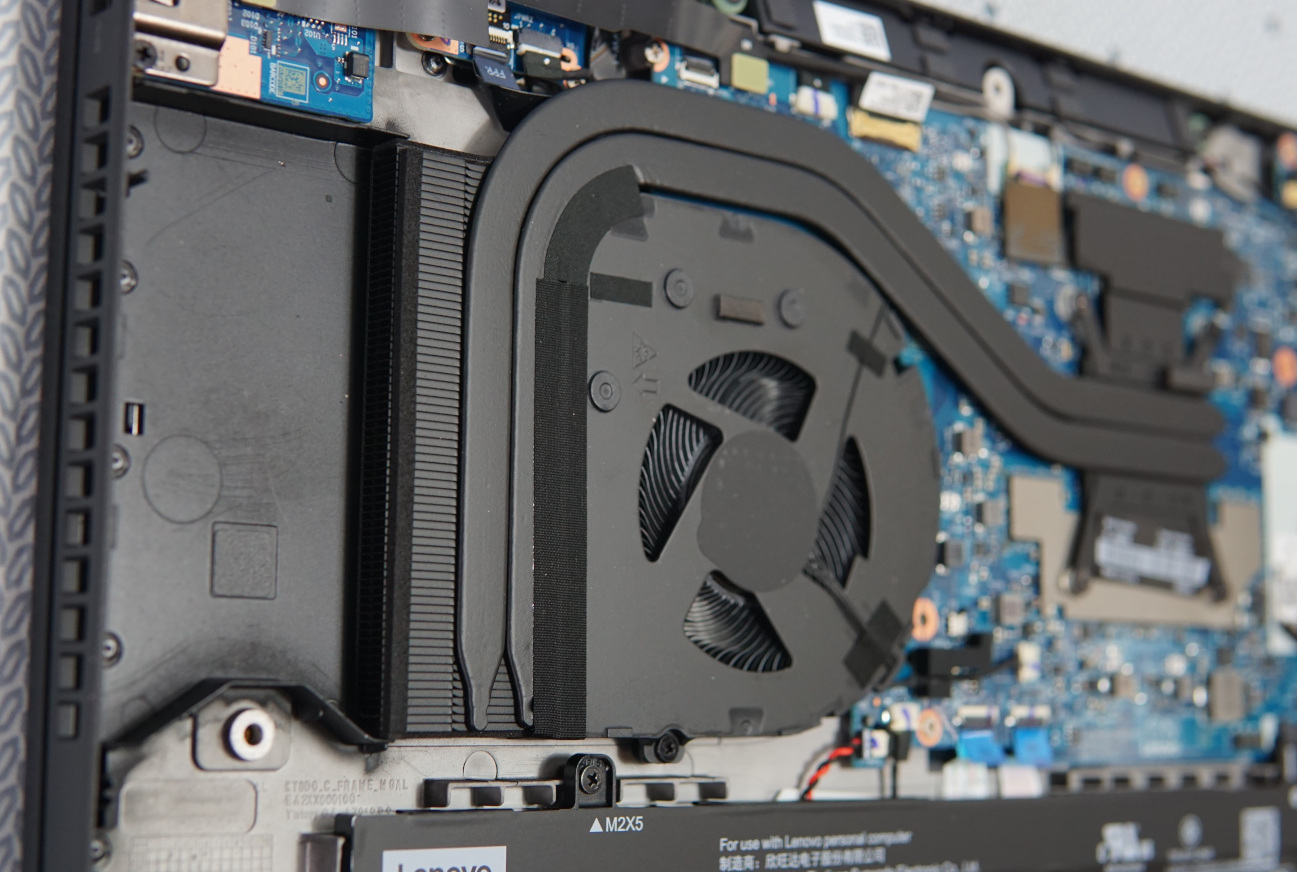

Compared to the smaller ThinkPad P14s G4, the same-sized fan within the present ThinkPad P16s G2 has to tackle a lot more heat. At the same time, it even has to overcome a small distance to the outside. This isn't ideal, but was most likely done to save some money.
This means the device's noise emissions are quite a bit more intense during high load, we would estimate them to be about twice as loud as the P14s G4. We measured maximum noise emissions of 40 dB, which is nothing to worry about. Furthermore, the P16s offers a bit more performance compared to the P14s G4 featuring the same CPU. A larger or better-positioned fan could've resulted in considerably better results.
A positive, on the other hand, is how it behaves during very simple tasks. Then the fan remains completely silent.
Noise level
| Idle |
| 22.6 / 22.6 / 22.6 dB(A) |
| Load |
| 37.8 / 40.5 dB(A) |
 | ||
30 dB silent 40 dB(A) audible 50 dB(A) loud |
||
min: | ||
| Lenovo ThinkPad P16s G2 21K9000CGE Radeon 780M, R7 PRO 7840U, SK hynix PC801 HFS001TEJ9X162N | HP EliteBook 845 G10 818N0EA Radeon 780M, R9 PRO 7940HS, SK hynix PC801 HFS001TEJ9X101N | Lenovo ThinkPad P14s G4 21K5000LGE Radeon 780M, R7 PRO 7840U, SK hynix PC801 HFS512GEJ9X162N | Schenker Vision 16 PH6PRX1 Iris Xe G7 96EUs, i7-13700H, Samsung 990 Pro 1 TB | Acer Swift Edge SFE16 Ryzen 7 7840U Radeon 780M, R7 7840U, SK hynix HFS512GEJ9X125N | Lenovo ThinkPad P16v G1 AMD RTX A1000 Laptop GPU, R7 PRO 7840HS, SK hynix PC801 HFS001TEJ9X101N | Microsoft Surface Laptop Studio 2 RTX 4060 GeForce RTX 4060 Laptop GPU, i7-13700H, Kioxia XG8 KXG80ZNV1T02 | |
|---|---|---|---|---|---|---|---|
| Noise | -8% | 4% | -11% | -8% | -8% | -18% | |
| off / environment * (dB) | 22.6 | 25.3 -12% | 22.4 1% | 25.5 -13% | 23.4 -4% | 24.3 -8% | 23.9 -6% |
| Idle Minimum * (dB) | 22.6 | 25.3 -12% | 22.4 1% | 25.5 -13% | 24.1 -7% | 24.3 -8% | 23.9 -6% |
| Idle Average * (dB) | 22.6 | 25.3 -12% | 22.4 1% | 28.7 -27% | 24.3 -8% | 24.3 -8% | 24.4 -8% |
| Idle Maximum * (dB) | 22.6 | 25.3 -12% | 22.4 1% | 29.1 -29% | 28 -24% | 24.3 -8% | 26.9 -19% |
| Load Average * (dB) | 37.8 | 34.4 9% | 31.3 17% | 33.8 11% | 41 -8% | 35.7 6% | 48.5 -28% |
| Witcher 3 ultra * (dB) | 40.3 | 43.4 -8% | 39.5 2% | 37.6 7% | 40.9 -1% | 43.7 -8% | 51.8 -29% |
| Load Maximum * (dB) | 40.5 | 43.4 -7% | 39.2 3% | 44.9 -11% | 40.9 -1% | 50.2 -24% | 51.8 -28% |
* ... smaller is better
Temperature
Even without the fans being active, the laptop only heats up minimally. This is the case as long as you are surfing the web, streaming, carrying out office work or anything similar. At no point does the case reach 30 °C in these scenarios.
On the flip side, the case gets quite a bit warmer as soon as heat has to be dissipated from the processor. We measured over 40 °C on the keyboard and even over 47 °C on the bottom. This means it might get a little uncomfortable to use under full load.
(±) The maximum temperature on the upper side is 42.7 °C / 109 F, compared to the average of 38.2 °C / 101 F, ranging from 22.2 to 69.8 °C for the class Workstation.
(-) The bottom heats up to a maximum of 47.2 °C / 117 F, compared to the average of 41.1 °C / 106 F
(+) In idle usage, the average temperature for the upper side is 25.7 °C / 78 F, compared to the device average of 32 °C / 90 F.
(±) Playing The Witcher 3, the average temperature for the upper side is 34.5 °C / 94 F, compared to the device average of 32 °C / 90 F.
(+) The palmrests and touchpad are reaching skin temperature as a maximum (32.9 °C / 91.2 F) and are therefore not hot.
(-) The average temperature of the palmrest area of similar devices was 27.8 °C / 82 F (-5.1 °C / -9.2 F).
| Lenovo ThinkPad P16s G2 21K9000CGE AMD Ryzen 7 PRO 7840U, AMD Radeon 780M | HP EliteBook 845 G10 818N0EA AMD Ryzen 9 PRO 7940HS, AMD Radeon 780M | Lenovo ThinkPad P14s G4 21K5000LGE AMD Ryzen 7 PRO 7840U, AMD Radeon 780M | Schenker Vision 16 PH6PRX1 Intel Core i7-13700H, Intel Iris Xe Graphics G7 96EUs | Acer Swift Edge SFE16 Ryzen 7 7840U AMD Ryzen 7 7840U, AMD Radeon 780M | Lenovo ThinkPad P16v G1 AMD AMD Ryzen 7 PRO 7840HS, NVIDIA RTX A1000 Laptop GPU | Microsoft Surface Laptop Studio 2 RTX 4060 Intel Core i7-13700H, NVIDIA GeForce RTX 4060 Laptop GPU | |
|---|---|---|---|---|---|---|---|
| Heat | -2% | 3% | 5% | -4% | 1% | 6% | |
| Maximum Upper Side * (°C) | 42.7 | 45.6 -7% | 41.1 4% | 41.1 4% | 41.6 3% | 40.9 4% | 40.4 5% |
| Maximum Bottom * (°C) | 47.2 | 51.9 -10% | 48.2 -2% | 42 11% | 46.6 1% | 57.9 -23% | 42.2 11% |
| Idle Upper Side * (°C) | 27.8 | 26.5 5% | 26.5 5% | 28.5 -3% | 30.4 -9% | 24.5 12% | 26.6 4% |
| Idle Bottom * (°C) | 28.4 | 27 5% | 26.9 5% | 26.8 6% | 31 -9% | 25.5 10% | 27 5% |
* ... smaller is better
Stress test
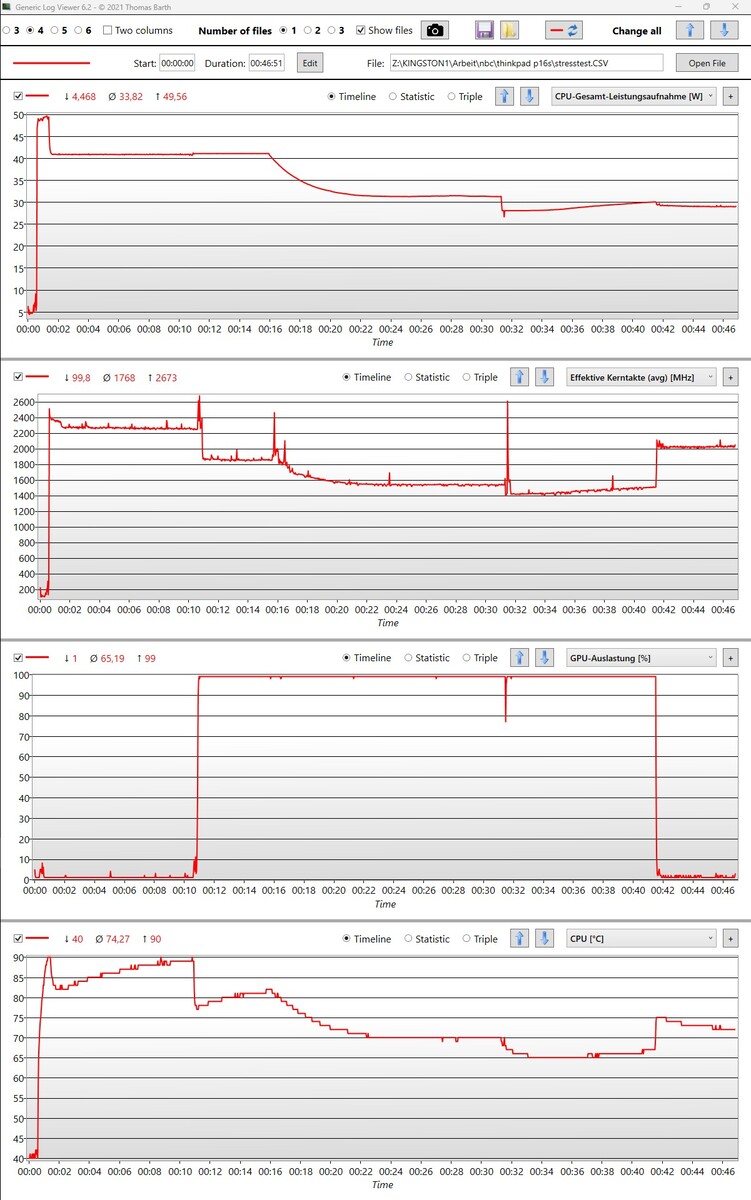
If the CPU and iGPU are completely loaded using Prime95 and FurMark, its power supply remains stable, with 41 watts being given to the processor. When switching the performance mode, the parameters adjust smoothly.
The graphics unit can be fully utilized at the same time, across the different power settings. The fan becomes a little quieter the more the maximum power supply is throttled.
The processor temperature which we measured only hit 90 °C for a short while under full load. With the most power being saved, temperatures remained at 65 °C despite the lower fan volume. Nothing stands in the way of being able to utilize the system at all times.
Speakers
The speakers are weak—they are missing bass. Even the low mids are barely prominent and their maximum volume could do with being louder. In addition, they are missing some detail, although voices do generally sound good, even during complex songs.
They are good enough for video calls, background music or the occasional streaming. We wouldn't expect anything better from simple laptop speakers, especially ones in a workstation.
Lenovo ThinkPad P16s G2 21K9000CGE audio analysis
(±) | speaker loudness is average but good (76.2 dB)
Bass 100 - 315 Hz
(-) | nearly no bass - on average 26.5% lower than median
(±) | linearity of bass is average (12.3% delta to prev. frequency)
Mids 400 - 2000 Hz
(+) | balanced mids - only 3.9% away from median
(+) | mids are linear (6.9% delta to prev. frequency)
Highs 2 - 16 kHz
(+) | balanced highs - only 3.5% away from median
(+) | highs are linear (4.8% delta to prev. frequency)
Overall 100 - 16.000 Hz
(±) | linearity of overall sound is average (21.3% difference to median)
Compared to same class
» 77% of all tested devices in this class were better, 6% similar, 18% worse
» The best had a delta of 7%, average was 17%, worst was 35%
Compared to all devices tested
» 59% of all tested devices were better, 7% similar, 34% worse
» The best had a delta of 4%, average was 24%, worst was 134%
Apple MacBook Pro 16 2021 M1 Pro audio analysis
(+) | speakers can play relatively loud (84.7 dB)
Bass 100 - 315 Hz
(+) | good bass - only 3.8% away from median
(+) | bass is linear (5.2% delta to prev. frequency)
Mids 400 - 2000 Hz
(+) | balanced mids - only 1.3% away from median
(+) | mids are linear (2.1% delta to prev. frequency)
Highs 2 - 16 kHz
(+) | balanced highs - only 1.9% away from median
(+) | highs are linear (2.7% delta to prev. frequency)
Overall 100 - 16.000 Hz
(+) | overall sound is linear (4.6% difference to median)
Compared to same class
» 0% of all tested devices in this class were better, 0% similar, 100% worse
» The best had a delta of 5%, average was 17%, worst was 45%
Compared to all devices tested
» 0% of all tested devices were better, 0% similar, 100% worse
» The best had a delta of 4%, average was 24%, worst was 134%
Power management - The workstation hits its limits
Power consumption
Due to the system's permanent high power consumption, the measly 65-watt power supply could reach its limit when the most is demanded from the hardware. However, the 68 watts which we measured should be made available without any big issues. Still, it doesn't have a buffer to charge the laptop. If it only has half a charge, then this will remain the case until the CPU and GPU require less power. At the same time, we didn't register any unwanted discharging during the stress test.
A larger 90-watt power surely would've been the better choice for the ThinkPad P16s G2 AMD.
| Off / Standby | |
| Idle | |
| Load |
|
Key:
min: | |
| Lenovo ThinkPad P16s G2 21K9000CGE R7 PRO 7840U, Radeon 780M, SK hynix PC801 HFS001TEJ9X162N, OLED, 3840x2400, 16" | HP EliteBook 845 G10 818N0EA R9 PRO 7940HS, Radeon 780M, SK hynix PC801 HFS001TEJ9X101N, IPS, 2560x1600, 14" | Lenovo ThinkPad P14s G4 21K5000LGE R7 PRO 7840U, Radeon 780M, SK hynix PC801 HFS512GEJ9X162N, IPS, 1920x1200, 14" | Schenker Vision 16 PH6PRX1 i7-13700H, Iris Xe G7 96EUs, Samsung 990 Pro 1 TB, IPS, 2560x1600, 16" | Acer Swift Edge SFE16 Ryzen 7 7840U R7 7840U, Radeon 780M, SK hynix HFS512GEJ9X125N, OLED, 3200x2000, 16" | Lenovo ThinkPad P16v G1 AMD R7 PRO 7840HS, RTX A1000 Laptop GPU, SK hynix PC801 HFS001TEJ9X101N, IPS, 1920x1200, 16" | Average AMD Radeon 780M | Average of class Workstation | |
|---|---|---|---|---|---|---|---|---|
| Power Consumption | -16% | 22% | -41% | -27% | -20% | -17% | -107% | |
| Idle Minimum * (Watt) | 6.1 | 4.3 30% | 2.9 52% | 6.3 -3% | 7.1 -16% | 4.1 33% | 6.01 ? 1% | 8.94 ? -47% |
| Idle Average * (Watt) | 6.5 | 10.1 -55% | 5.1 22% | 14.4 -122% | 10.1 -55% | 6.5 -0% | 8.15 ? -25% | 13.8 ? -112% |
| Idle Maximum * (Watt) | 7 | 11.2 -60% | 5.6 20% | 16.2 -131% | 18.6 -166% | 6.7 4% | 10.3 ? -47% | 17.5 ? -150% |
| Load Average * (Watt) | 56.6 | 64.4 -14% | 51.2 10% | 46.2 18% | 45.3 20% | 65.2 -15% | 57.6 ? -2% | 95 ? -68% |
| Witcher 3 ultra * (Watt) | 61.2 | 59.4 3% | 49.9 18% | 49.4 19% | 39.5 35% | 77.2 -26% | ||
| Load Maximum * (Watt) | 68.3 | 66.7 2% | 60.2 12% | 85.2 -25% | 52.9 23% | 147 -115% | 77 ? -13% | 175.2 ? -157% |
* ... smaller is better
Power consumption Witcher 3 / stress test
Power consumption with external monitor
Runtimes
The AMD Ryzen 7 Pro 7840U's high efficiency is somewhat dampened by the laptop's OLED display. Its good runtimes are largely due to the battery's large 84 Wh capacity and not because it is frugal under low load.
Its runtimes of over 13 hours and 10 hours (web surfing test) mean you can use the laptop on the go with no issues whatsoever. However, this is only the case when the brightness is reduced. In our test, this was set to around 60 %. At full brightness, on the other hand, the OLED display requires significantly more power, leading to web surfing draining the battery in less than 7 hours.
With a different display, for example the one in the very similar ThinkPad P14s G4, it is possible to open websites continuously for over 11 hours—with a significantly smaller 52-Wh battery. Carefully extrapolated, the P16s G2 with the IPS panel and average color depiction should then be able to be used for 16 hours of surfing.
| Lenovo ThinkPad P16s G2 21K9000CGE R7 PRO 7840U, Radeon 780M, 84 Wh | HP EliteBook 845 G10 818N0EA R9 PRO 7940HS, Radeon 780M, 51 Wh | Schenker Vision 16 PH6PRX1 i7-13700H, Iris Xe G7 96EUs, 80 Wh | Acer Swift Edge SFE16 Ryzen 7 7840U R7 7840U, Radeon 780M, 54 Wh | Lenovo ThinkPad P16v G1 AMD R7 PRO 7840HS, RTX A1000 Laptop GPU, 90 Wh | Microsoft Surface Laptop Studio 2 RTX 4060 i7-13700H, GeForce RTX 4060 Laptop GPU, 58 Wh | Average of class Workstation | |
|---|---|---|---|---|---|---|---|
| Battery runtime | -32% | 24% | -47% | 16% | 3% | -18% | |
| H.264 (h) | 13.3 | 9.3 -30% | 17.8 34% | 11.3 -15% | 9.51 ? -28% | ||
| WiFi v1.3 (h) | 10.6 | 7.9 -25% | 8 -25% | 5.6 -47% | 15 42% | 8.3 -22% | 8.53 ? -20% |
| Load (h) | 1.5 | 0.9 -40% | 2.6 73% | 1.1 -27% | 2.2 47% | 1.429 ? -5% |
Pros
Cons
Verdict - Performance and picture are great, everything else is okay

The ThinkPad P16s G2 AMD features an unusually large variety of potential uses. The CPU's high performance paired with its good Radeon 780M iGPU allows for professional use—even for more graphically demanding tasks. This may not be quite as speedy as on a device with a dedicated graphics card, however, the workstation laptop has other things to offer.
The fans are often quiet or remain completely deactivated and despite the OLED display's power-hungry nature, it delivers decent runtimes. Furthermore, its price is okay when you consider its performance capabilities. All this results in brilliant, contrast-rich images, allowing you to use the laptop for creative tasks. On the other hand, its portability could sure benefit from a slightly less elaborate display.
Lots of power, usually enough graphics performance and decent connectivity make the P16s G2 AMD an excellent laptop for work, uni or creative jobs.
Moreover, the device boasts a plethora of security features and its remote maintenance function could come in really handy for company devices. Its robust case and good keyboard also make it a great work laptop.
In turn, its criticism isn't the harshest. Of course, a second USB4 port would be handy. The fans could be a little more efficient, especially when you consider how much space isn't being used on the inside. In addition, the power delivered via its power supply may be a little tight, but it shouldn't cause any severe limitations.
An alternative featuring additional graphics performance could be the Lenovo ThinkPad P16v G1, for example. Better portability and slightly less performance are offered by the very similar Lenovo ThinkPad P14s G4 AMD—its 14-inch display may make it better suited to being used on the go.
Price and availability
The version of the ThinkPad P16s G2 with 64 GB RAM and an OLED display can be found for US$1,599 on Amazon.
Lenovo ThinkPad P16s G2 21K9000CGE
- 01/23/2024 v7 (old)
Mario Petzold
Transparency
The selection of devices to be reviewed is made by our editorial team. The test sample was provided to the author as a loan by the manufacturer or retailer for the purpose of this review. The lender had no influence on this review, nor did the manufacturer receive a copy of this review before publication. There was no obligation to publish this review. As an independent media company, Notebookcheck is not subjected to the authority of manufacturers, retailers or publishers.
This is how Notebookcheck is testing
Every year, Notebookcheck independently reviews hundreds of laptops and smartphones using standardized procedures to ensure that all results are comparable. We have continuously developed our test methods for around 20 years and set industry standards in the process. In our test labs, high-quality measuring equipment is utilized by experienced technicians and editors. These tests involve a multi-stage validation process. Our complex rating system is based on hundreds of well-founded measurements and benchmarks, which maintains objectivity. Further information on our test methods can be found here.
Price comparison

