Lenovo ThinkBook Plus Gen 5 Hybrid 2-in-1 review: Dual-boot Windows 11 and Android 13
Intel Core Ultra 7 and Snapdragon 8+ Gen 1 on one machine.
The hybrid Windows-Android approach can effectively replace your existing laptop and tablet all at once. However, the 2-in-1 Lenovo machine isn't necessarily better than a standalone laptop and standalone tablet in terms of battery life and weight.Allen Ngo 👁 Published 🇫🇷 🇪🇸 ...
Verdict
While a good idea on paper, the dual-boot ThinkBook Plus Gen 5 Hybrid doesn't work as well in practice. Its unique hardware and software features necessitate a larger and heavier design with shorter battery life than traditional clamshells. Furthermore, the typing experience and hinges need some work to be more on par with the quality of a Yoga or ThinkPad especially after considering the $2500+ asking price. The dual-boot 2-in-1 system is arguably a prime example of the "jack of all trades and master of none" idiom.
The model can still be a worthwhile purchase particularly for those who may be considering the Microsoft Surface Pro. Performance is great for a 14-inch detachable and the system can potentially replace your old Android tablet better than a Surface Pro can due to the dual-boot capabilities of the Lenovo. If you seldom use tablet mode, however, then a traditional clamshell or convertible laptop plus a standalone dedicated Android tablet can offer better experiences for less money.
Pros
Cons
Price and Availability
Lenovo is now shipping the ThinkBook Plus Gen 5 Hybrid for $2750 USD. The model is not yet available on Amazon at the time of writing.
Potential Competitors in Comparison
Image | Model / Review | Geizhals | Weight | Height | Display |
|---|---|---|---|---|---|
1. 83.3%  | Lenovo ThinkBook Plus Gen5 Hybrid Intel Core Ultra 7 155H ⎘ Intel Arc 8-Core iGPU ⎘ 32 GB Memory, 1024 GB SSD | Listenpreis 2750 USD | 1.7 kg | 16 mm | 14.00" 2880x1800 243 PPI OLED |
2. 87.4% v7 (old)  | Lenovo ThinkBook Plus Gen4 IRU Intel Core i7-1355U ⎘ Intel Iris Xe Graphics G7 96EUs ⎘ 16 GB Memory, 512 GB SSD | Listenpreis 3000 USD | 1.4 kg | 17.7 mm | 13.30" 2880x1800 255 PPI OLED |
3. 83.5%  | Acer Swift 14 AI SF14-51-58TU Intel Core Ultra 5 226V ⎘ Intel Arc Graphics 130V ⎘ 16 GB Memory, 512 GB SSD | Listenpreis 1200 EUR Geizhals Suche | 1.3 kg | 16 mm | 14.00" 2880x1800 243 PPI OLED |
4. 85.9%  | Asus ExpertBook P5 P5405-NZ0102X Intel Core Ultra 7 258V ⎘ Intel Arc Graphics 140V ⎘ 32 GB Memory, 1024 GB SSD | Listenpreis 1500€ Geizhals Suche | 1.3 kg | 16.5 mm | 14.00" 2560x1600 216 PPI IPS LED |
5. 87.2%  | HP EliteBook x360 1040 G11 Intel Core Ultra 7 165H ⎘ Intel Arc 8-Core iGPU ⎘ 16 GB Memory, 512 GB SSD | 1.5 kg | 14.7 mm | 14.00" 1920x1200 162 PPI IPS | |
6. 88.3% v7 (old)  | Dell Latitude 9450 2-in-1 Intel Core Ultra 7 165U ⎘ Intel Graphics 4-Core iGPU (Meteor / Arrow Lake) ⎘ 32 GB Memory | Listenpreis 3000 USD Geizhals Suche | 1.6 kg | 16.28 mm | 14.00" 2560x1600 216 PPI IPS |
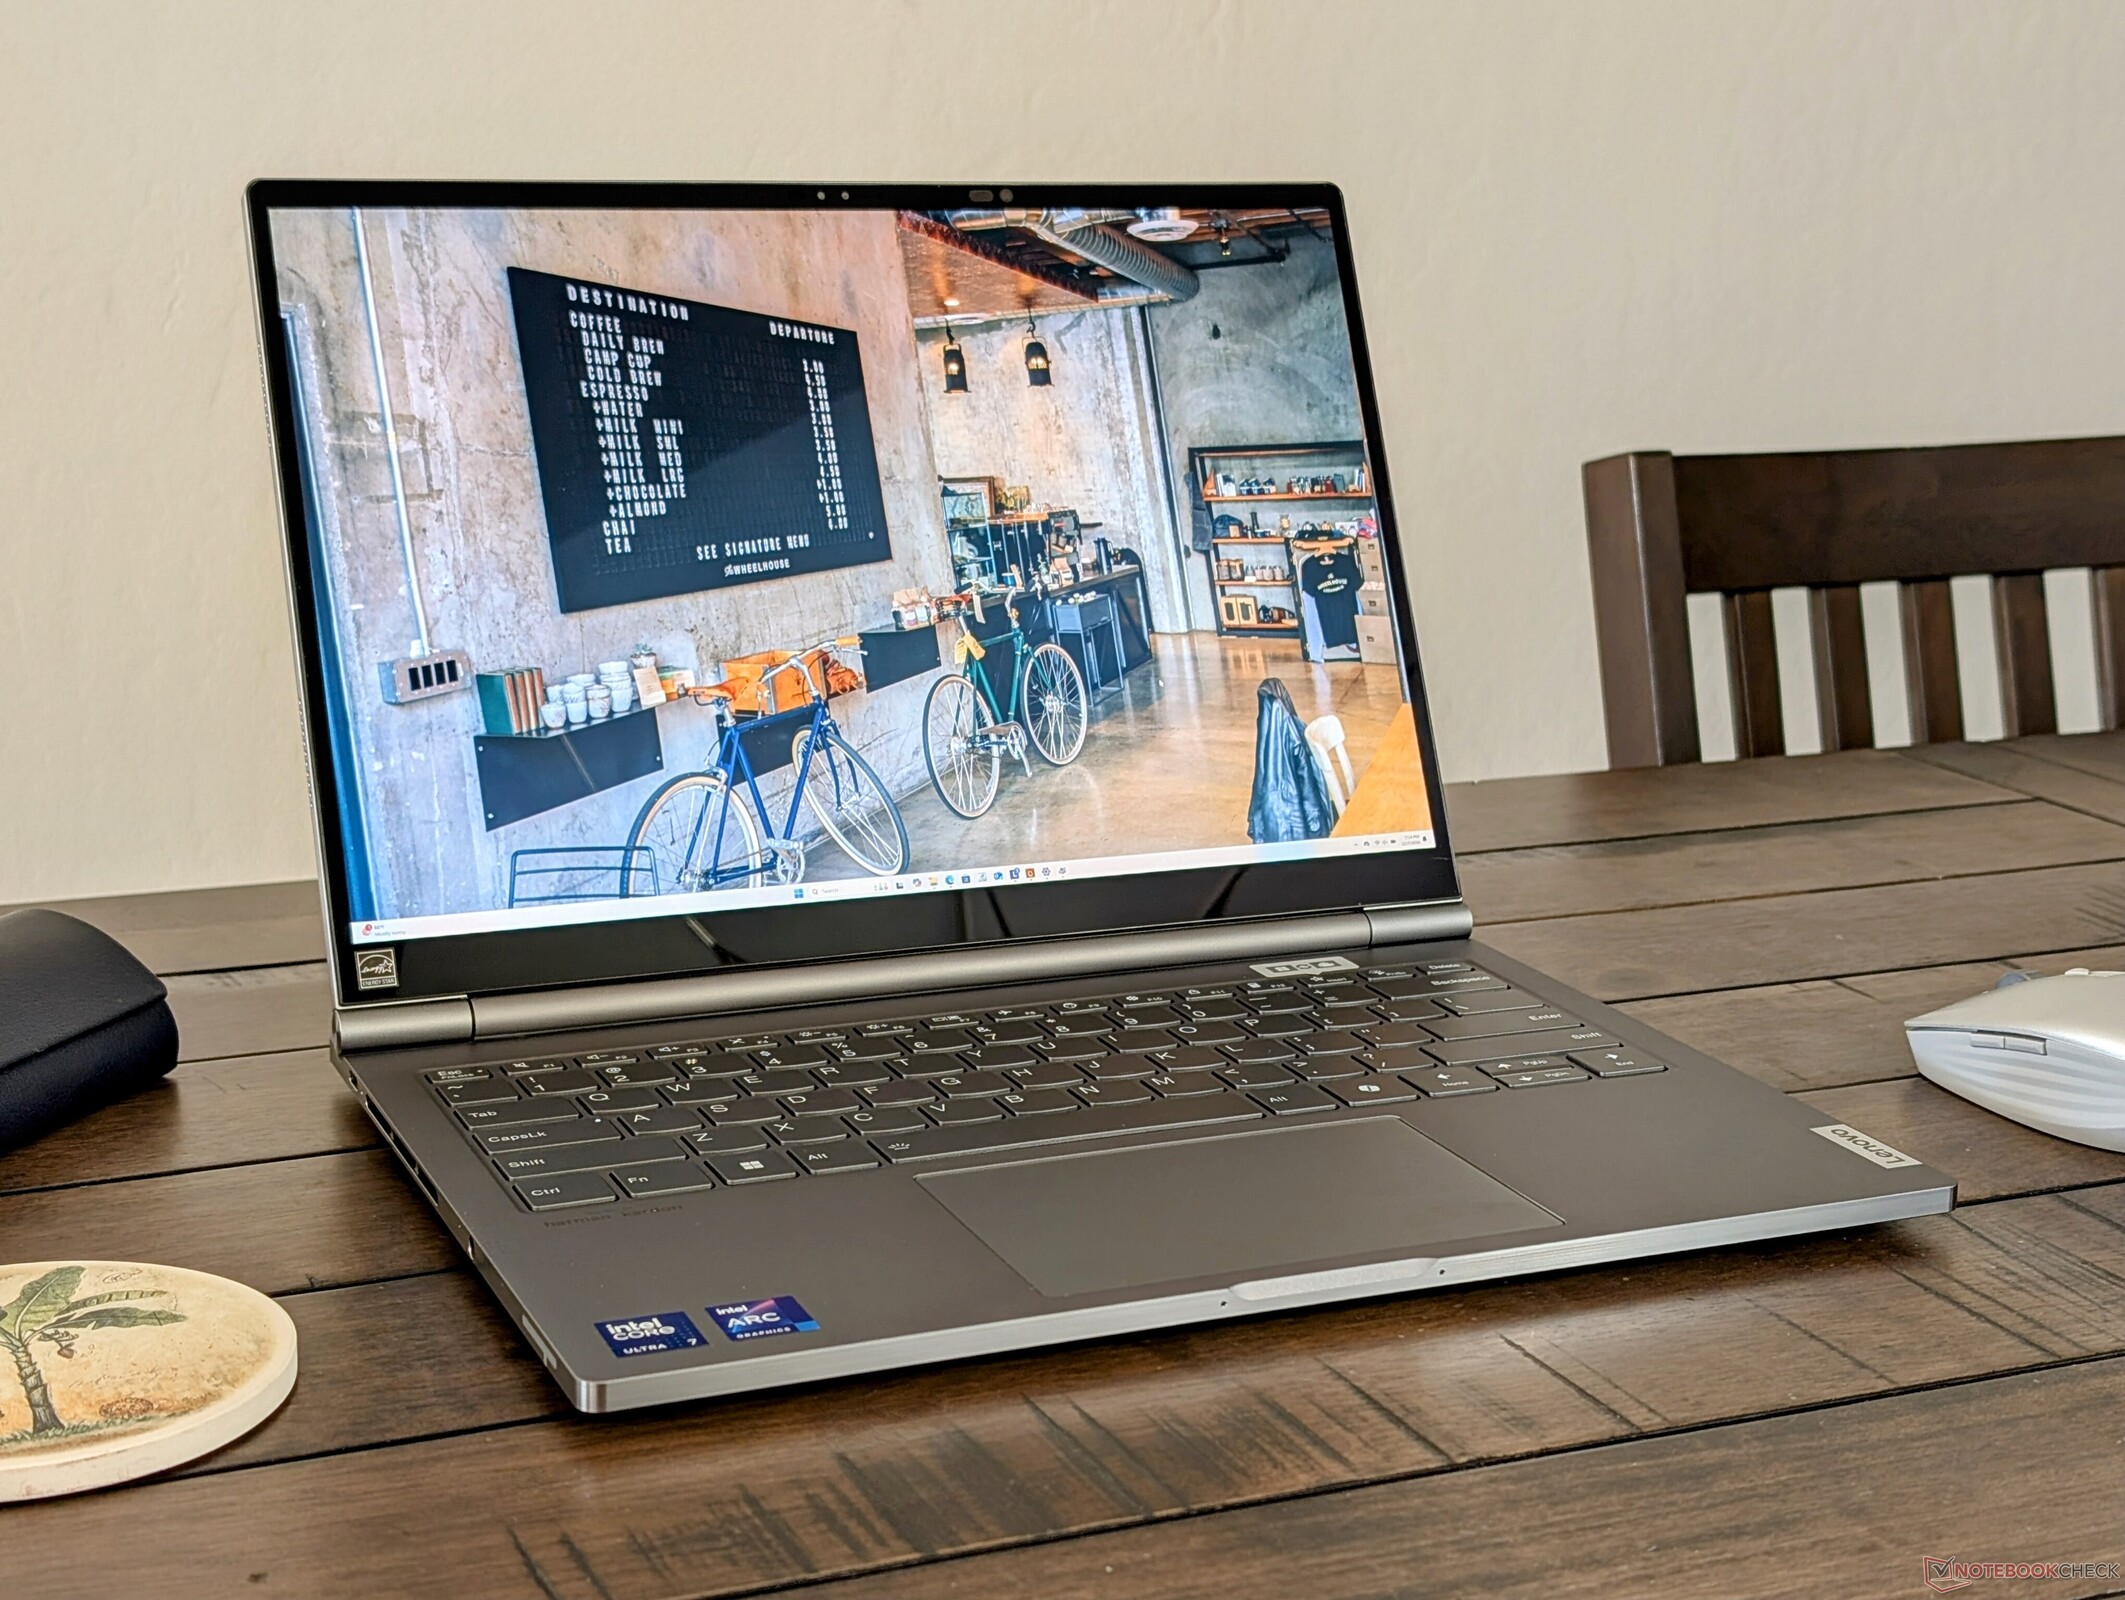
The ThinkBook Gen series consists of unique off-the-wall concepts to separate the models from the rest of the competition. Last year's ThinkBook Plus Gen 4 convertible would combine E-Ink and OLED touchscreens while this year's ThinkBook Plus Gen 5 is a detachable that allows for dual-booting between Windows 11 and Android 13 (with future support up to Android 14). If running Windows, the base must be attached as it houses the Intel Core Ultra 7 155H CPU. If running Android, the system instead runs on the Qualcomm Snapdragon 8+ Gen 1 processor which is inside of the tablet portion. This review focuses on the Windows aspect of the model.
There is only one configuration available at the moment with the aforementioned dual CPUs, 14-inch 2.8K OLED touchscreen, 32 GB LPDDR5x-7467 soldered RAM, and 1 TB NVMe SSD for approximately $2700.
The system competes with other convertibles or detachables like the HP EliteBook x360 1040 G11, Dell Latitude 9450 2-in-1, or Microsoft Surface Pro series. Of course, the Lenovo has the unique advantage of two separate processors for dual-booting into either Windows 11 or Android 13.
More Lenovo reviews:
Specifications
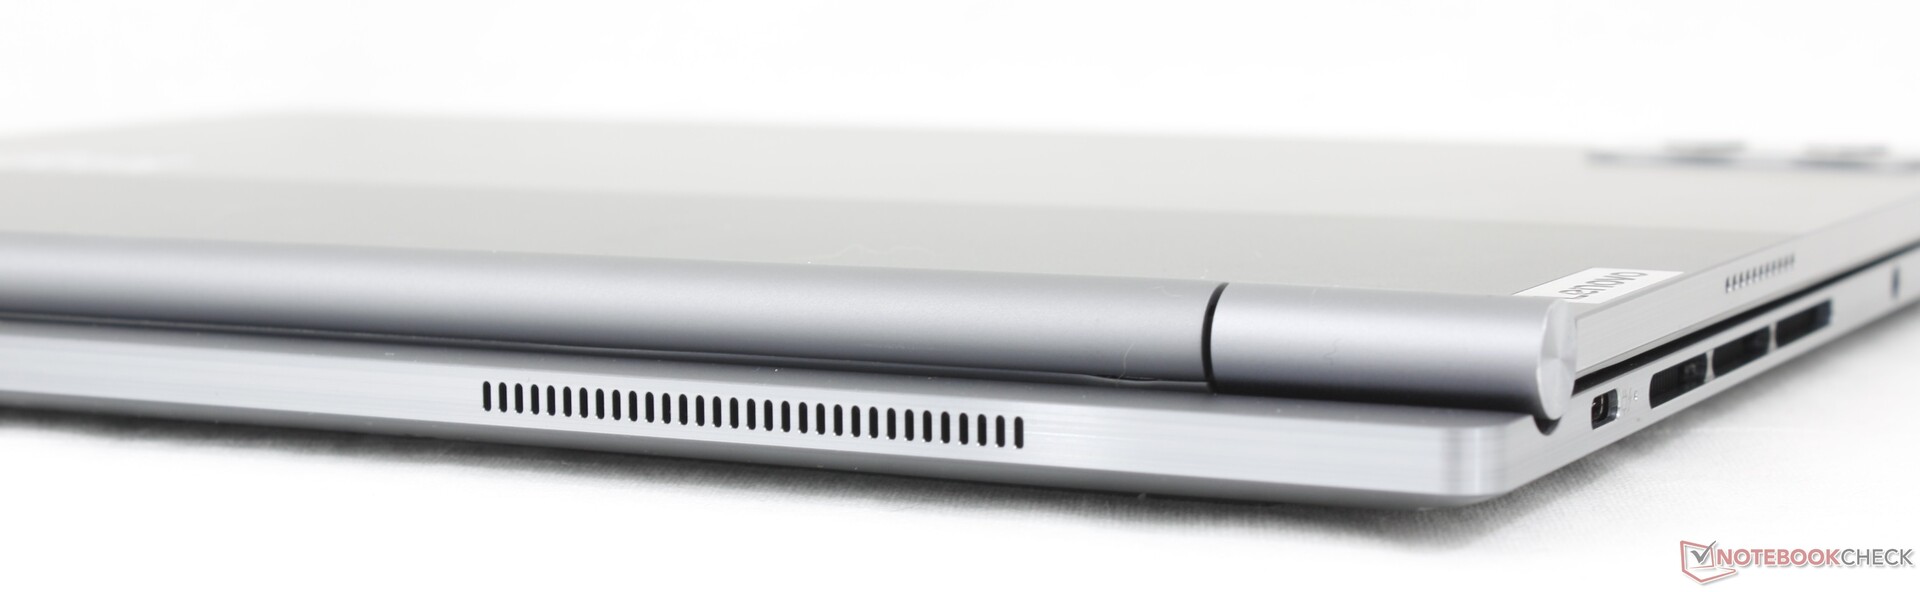
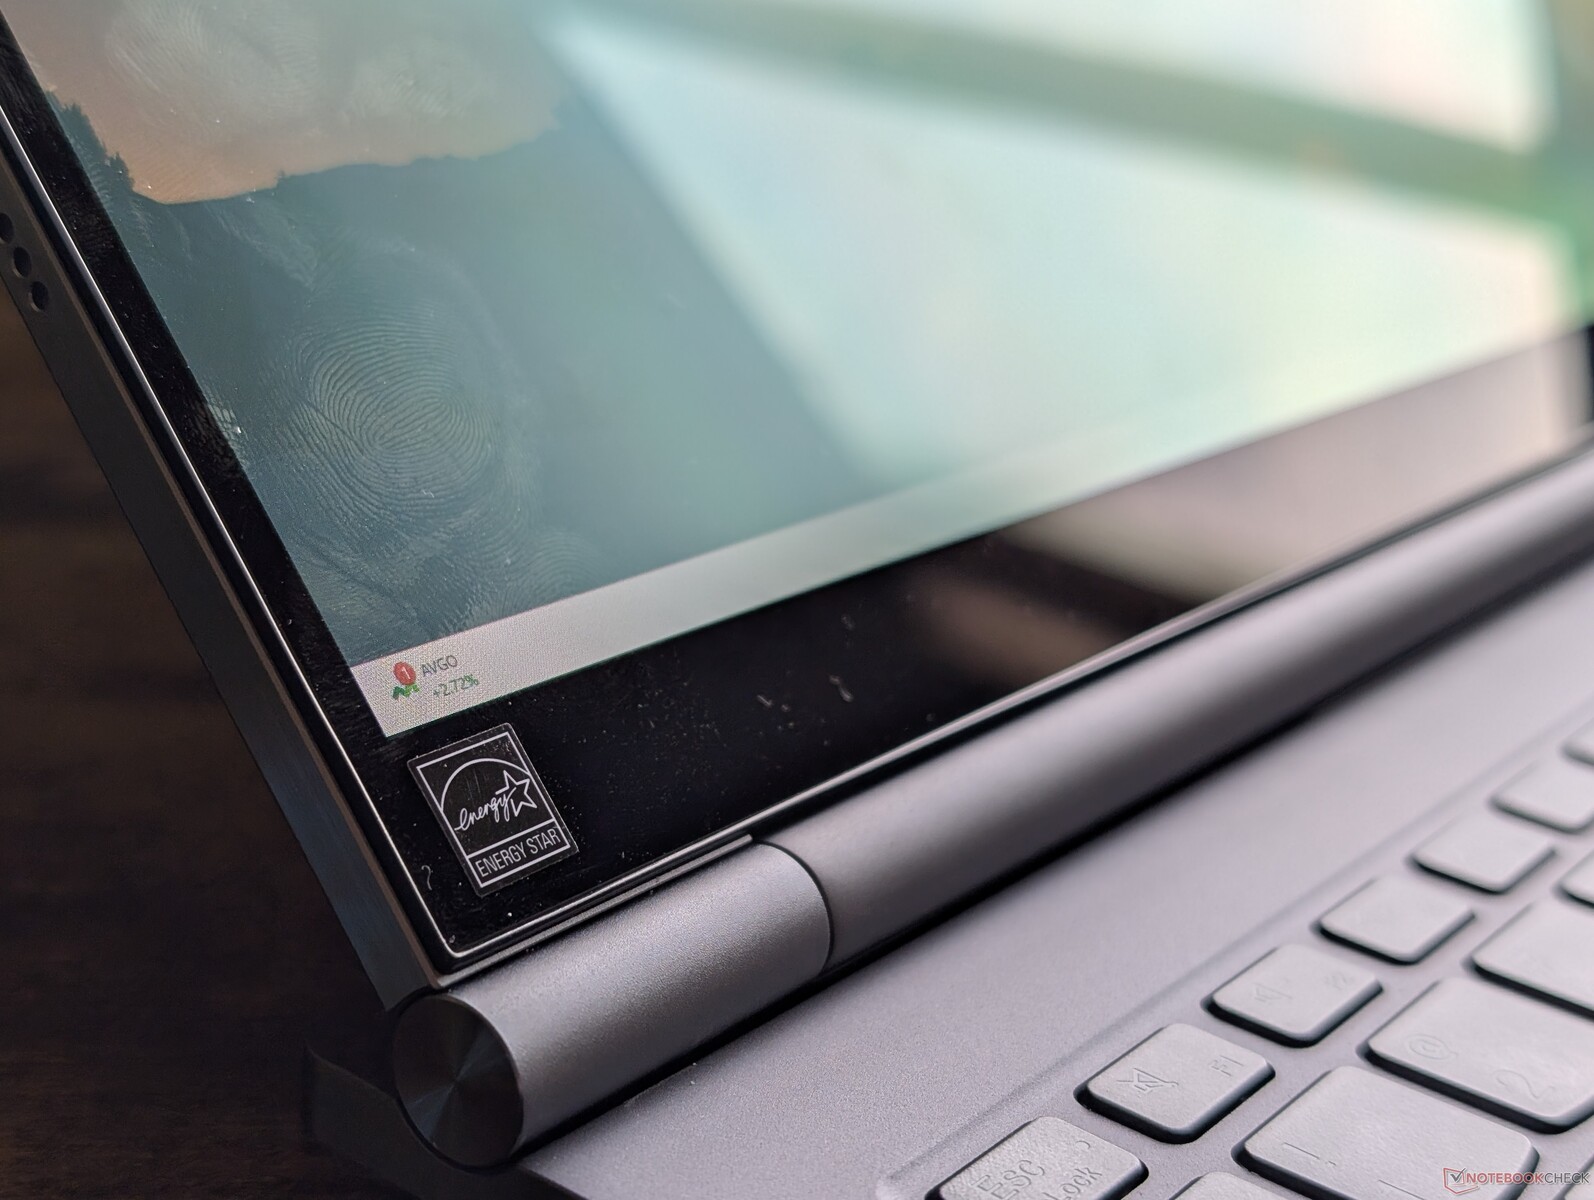
Case
The chassis features similar CNC aluminum as on the ThinkBook Gen 4 for the same gray color tone, smooth texture, and relatively firm surfaces. The biggest issue during our time with the unit instead relates to the hinges as they do not snap onto the tablet portion as smoothly as we would like. The tablet would then wobble and not be fully inserted. Larger hinges with stronger magnets could have potentially mitigated the problem to make attaching easier.
The system is relatively large and heavy when attached together. At 1.7 kg and 16 mm thick, the Lenovo is noticeably heavier than a traditional 14-inch convertible like the Asus ExpertBook P5 P5405.
| Lenovo ThinkBook Plus Gen 5 Hybrid | Length (mm) | Width (mm) | Height (mm) | Weight (g) |
| Tablet Portion | 313.5 | 224 | 6.6 | 777 |
| Base Portion | 313.5 | 234.5 | 9.4 | 963 |
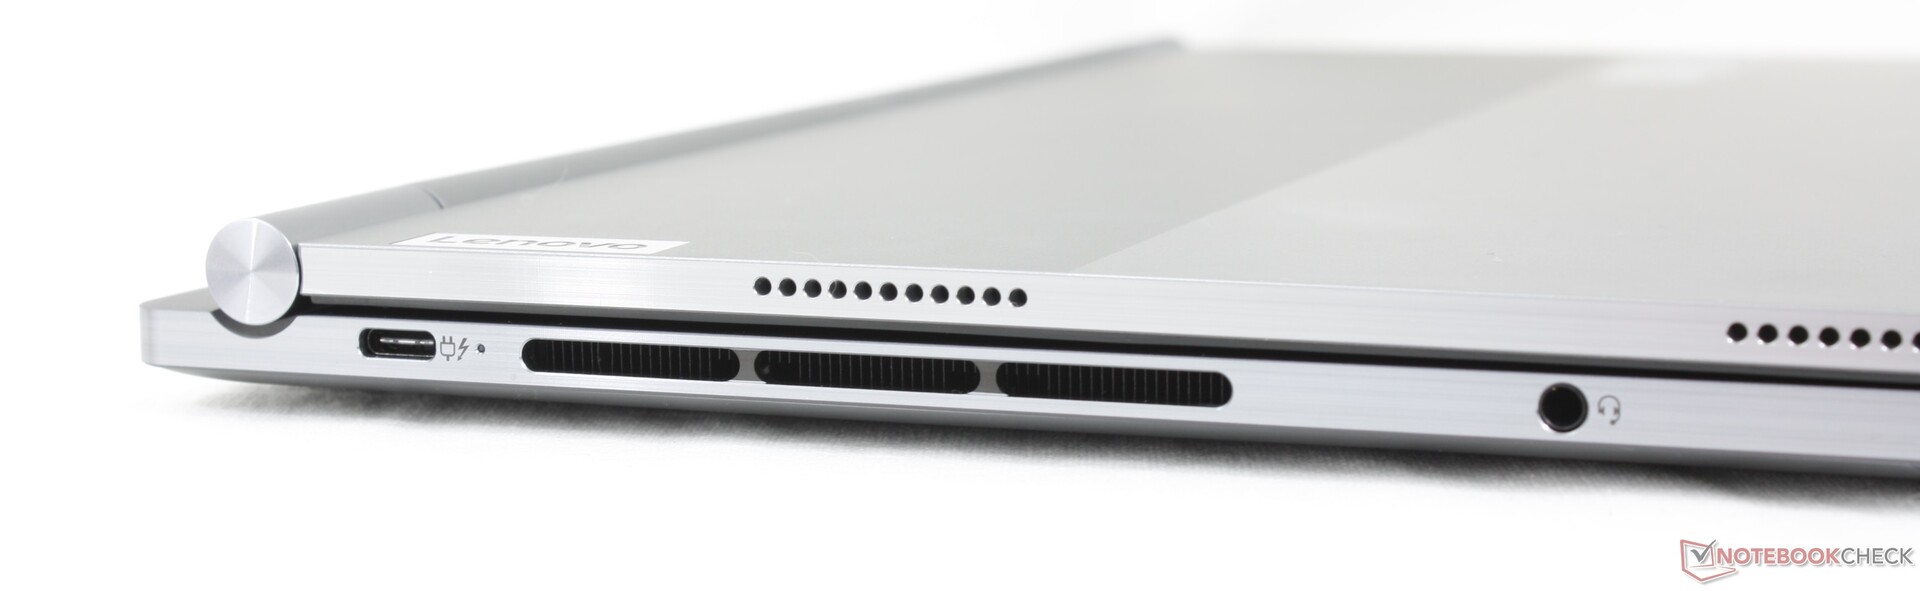
Connectivity
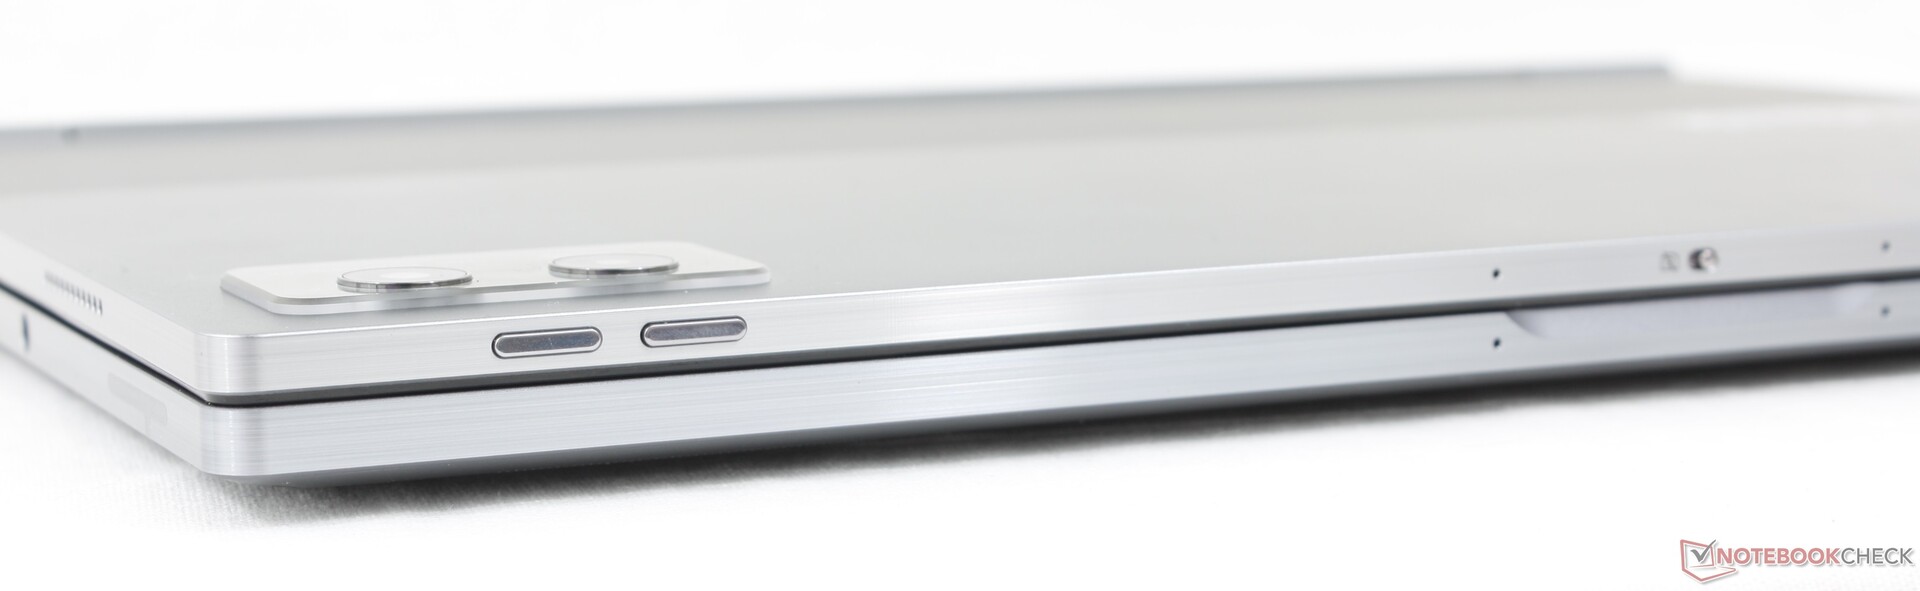
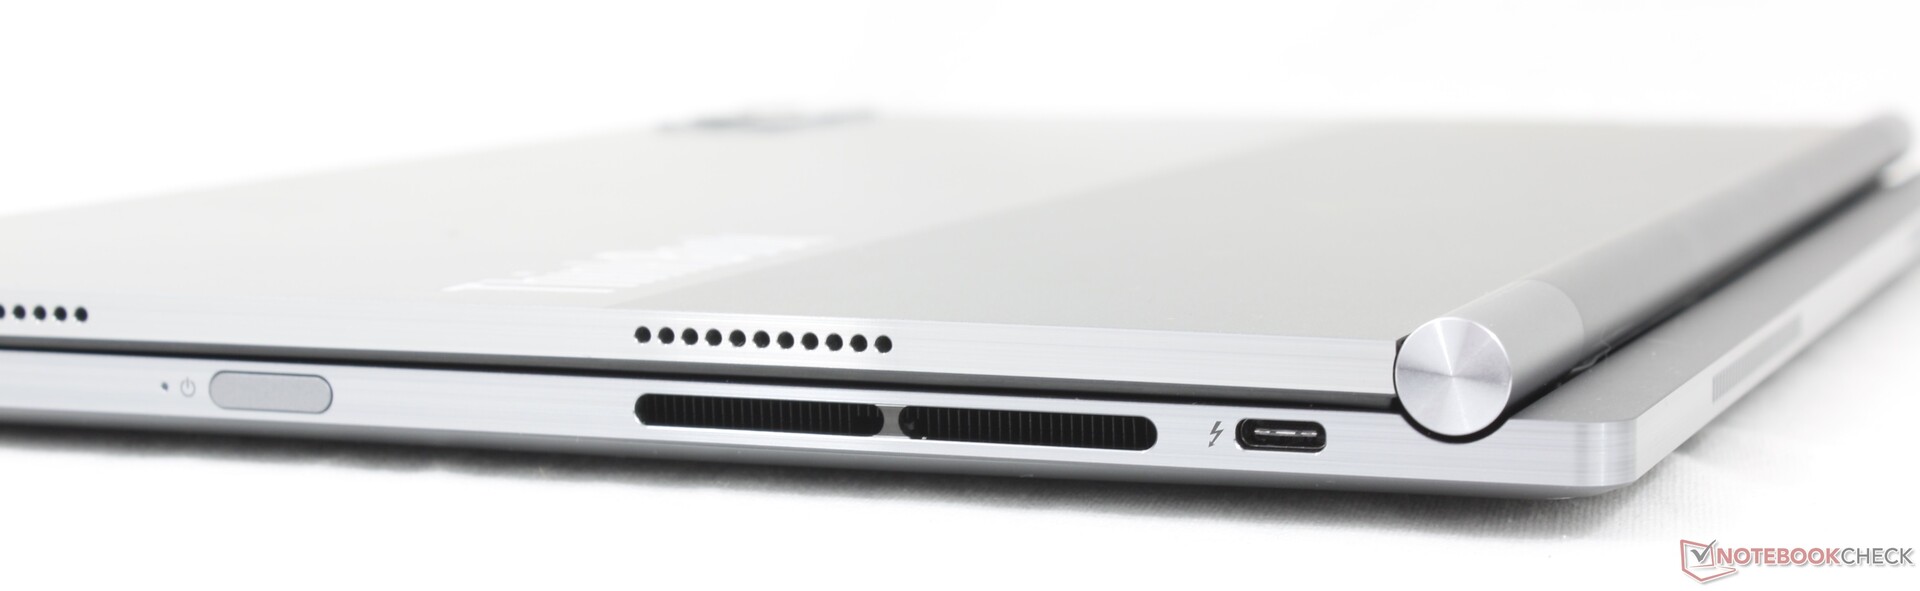
Although the system altogether features a total of three USB-C ports, only two are available when in docked mode and one is available when in Android mode. The two USB-C ports in docked mode support Thunderbolt 4 connectivity.
Communication
An Intel AX211 comes standard for Wi-Fi 6E and Bluetooth 5.3 connectivity.
Webcam
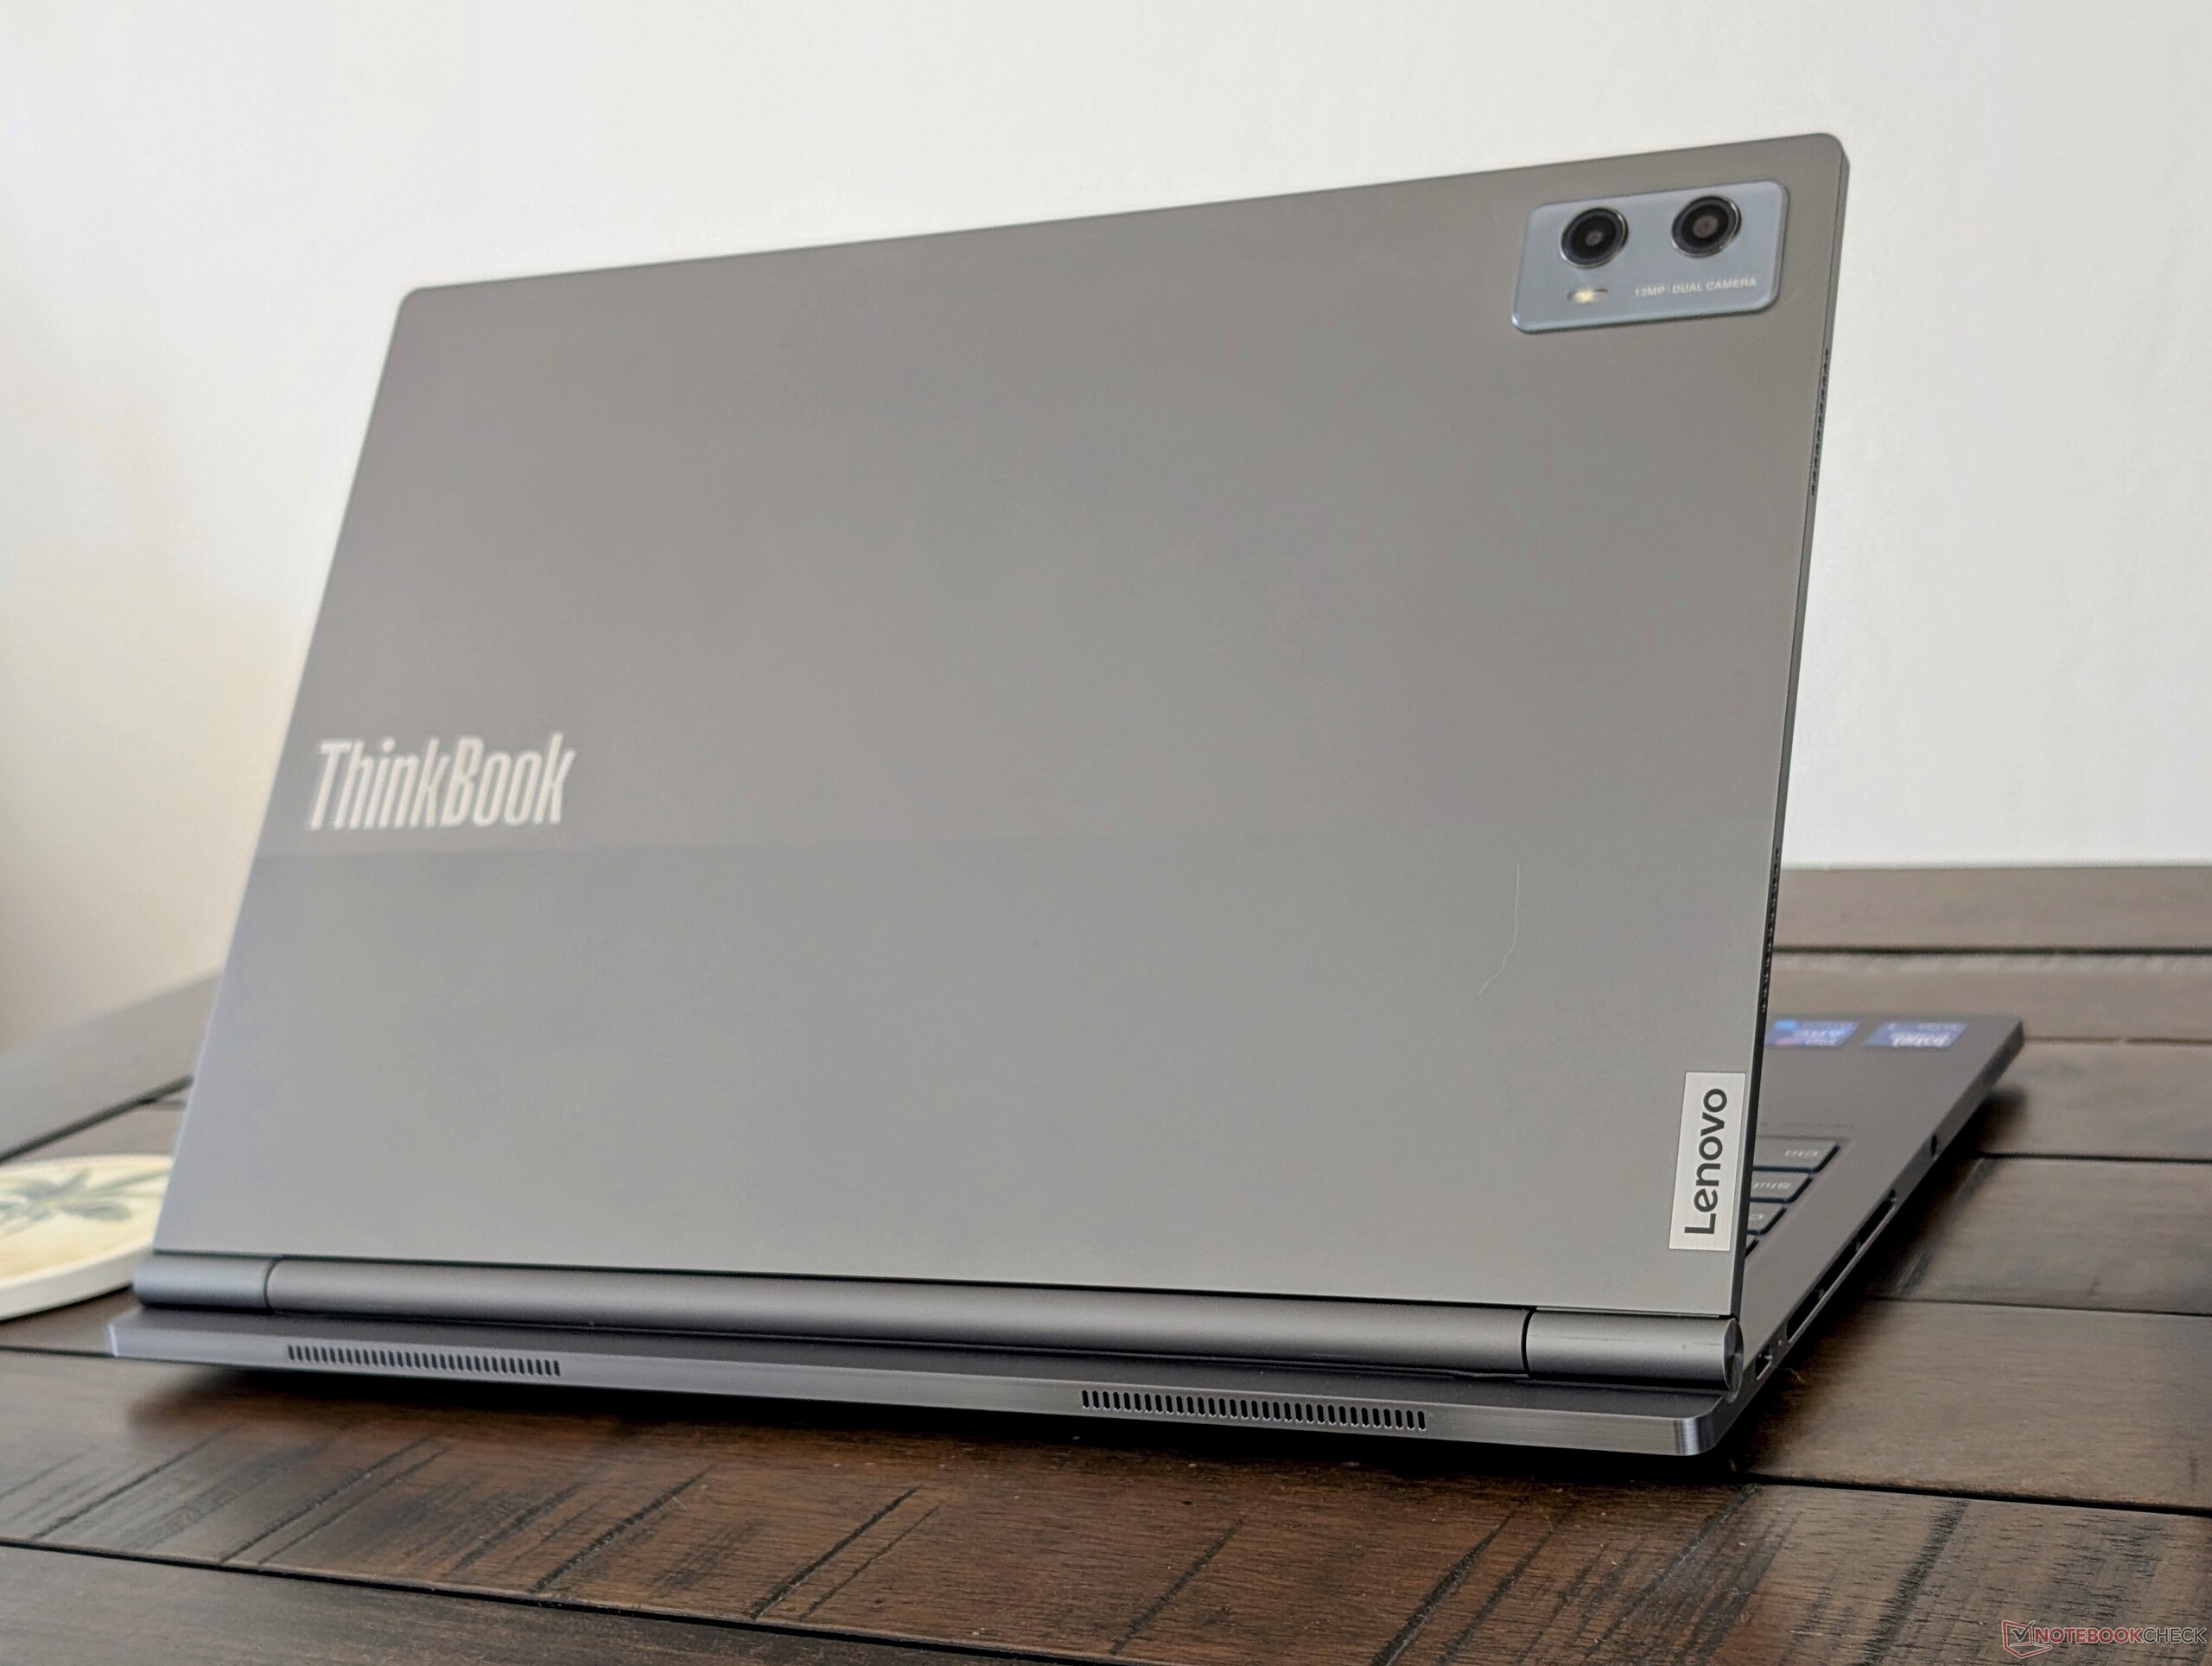
The two rear cameras (13 MP + 5 MP) are only available in Android mode meaning that only the front-facing 2 MP camera is available on Windows mode. IR and an electronic shutter come standard for the front-facing camera.


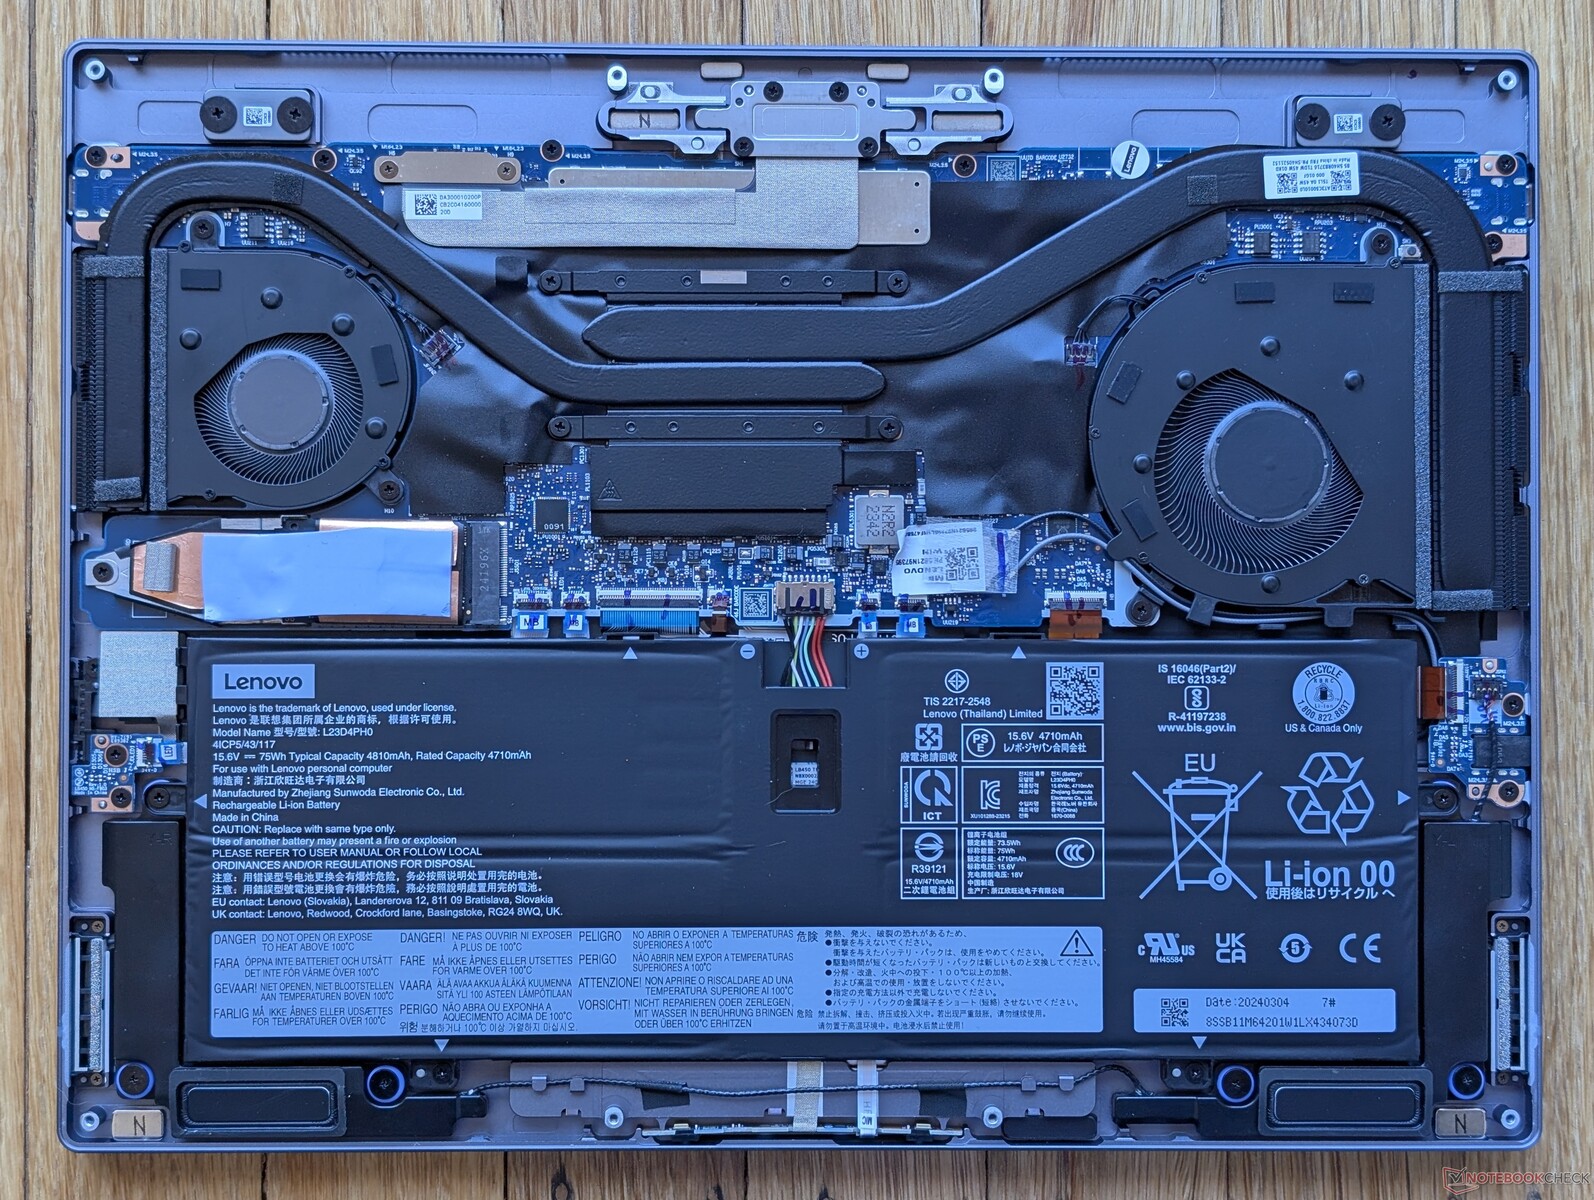
Maintenance
The bottom panel is secured by eight Torx screws for relatively easy servicing. However, there's not much to service aside from the battery and single M.2 SSD as both WLAN and RAM are soldered.
Sustainability
Lenovo utilizes 90 percent post-consumer content recycled plastic for its AC adapter and 90 percent recycled content for its packaging. The back cover of the screen (A cover) utilizes 100 percent recycled hydro-aluminum during production.
Accessories And Warranty
The retail box includes the detachable dock and active stylus pen. The standard one-year limited manufacturer warranty applies if purchased in the US.
Input Devices
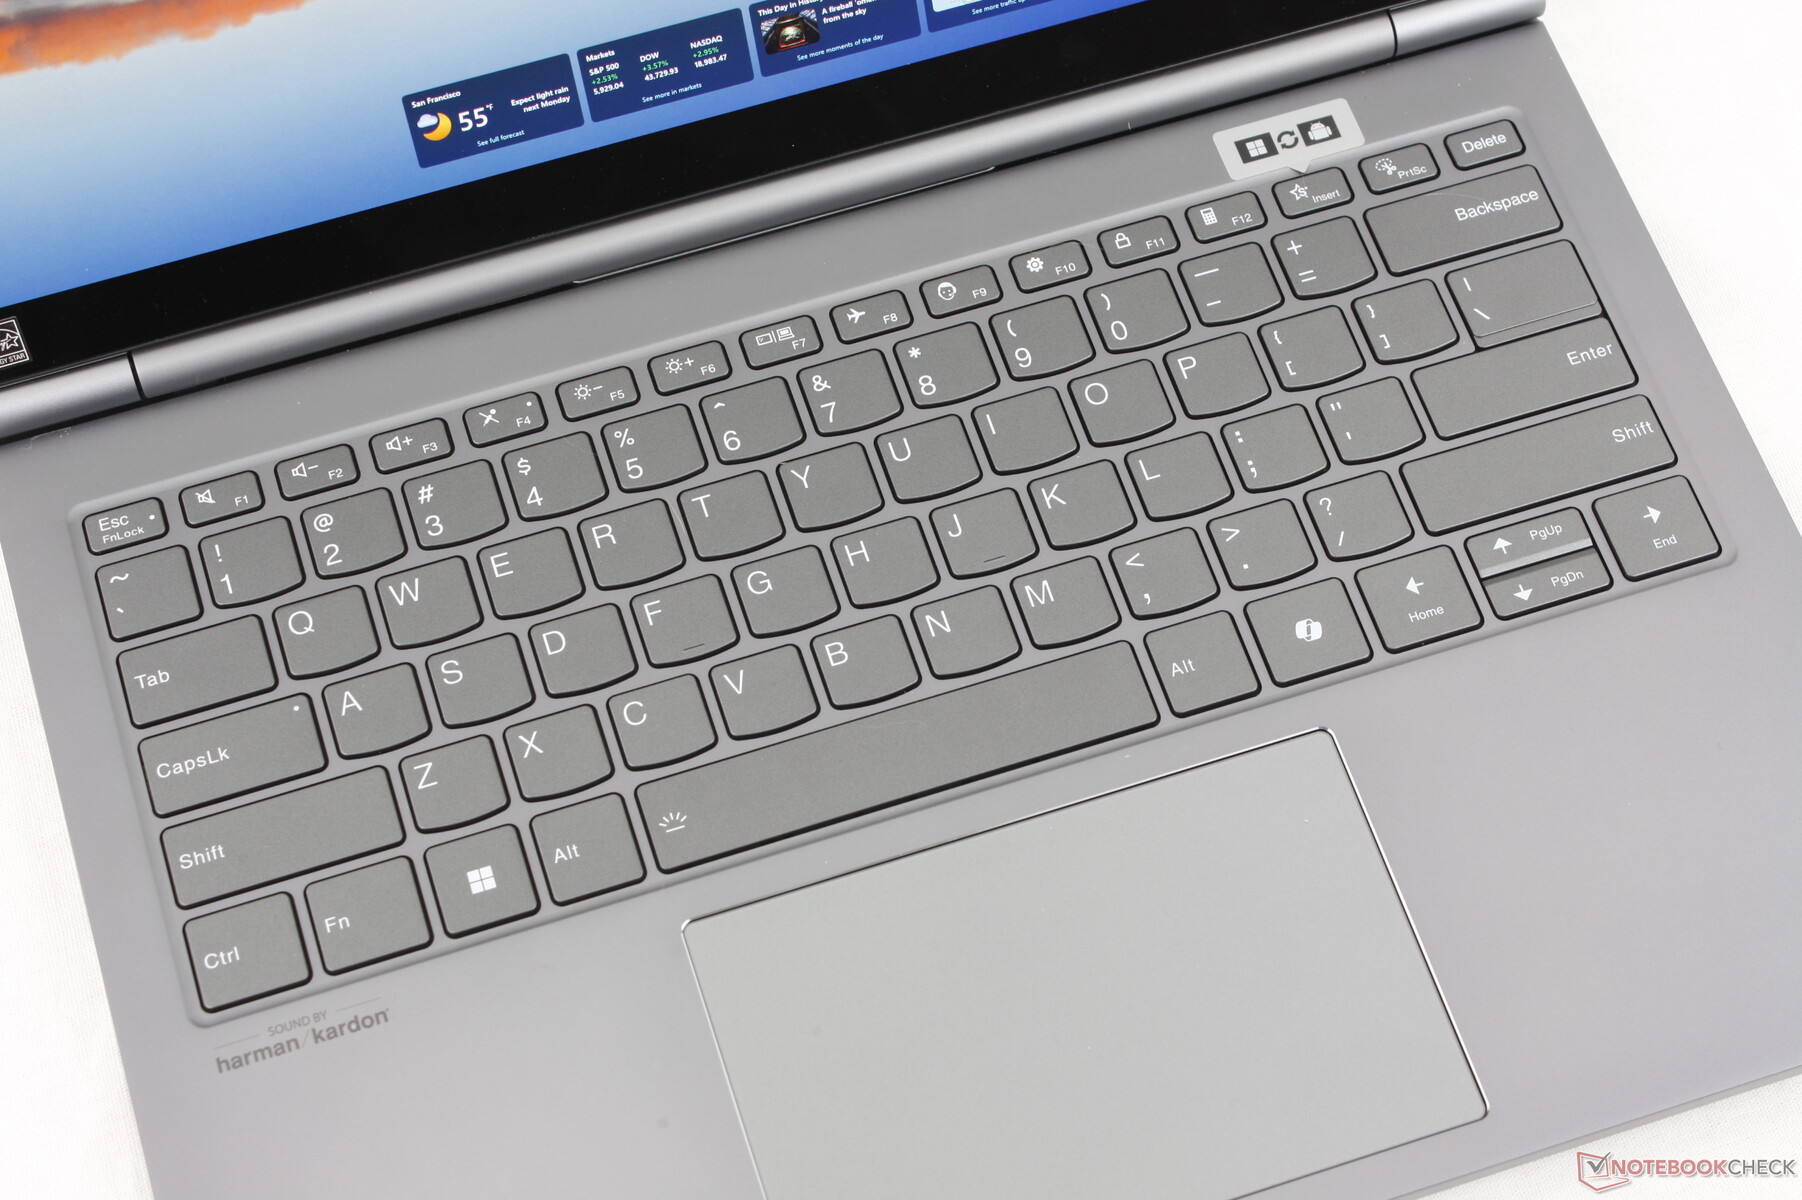
Keyboard
The keyboard is most similar to an IdeaPad clamshell like the IdeaPad Slim 7i Pro. The typing experience is unfortunately on the weaker side as the Space key in particular is too soft with an unsatisfyingly weak feedback when pressed. The difference in feedback between our ThinkBook Plus Gen 5 keyboard and a ThinkPad keyboard is night and day.
Touchpad
The clickpad is decent in size (12 x 7.5 cm) with an ultra-smooth texture. Feedback when pressing down is very shallow and somewhat spongy despite the loud auditory click.
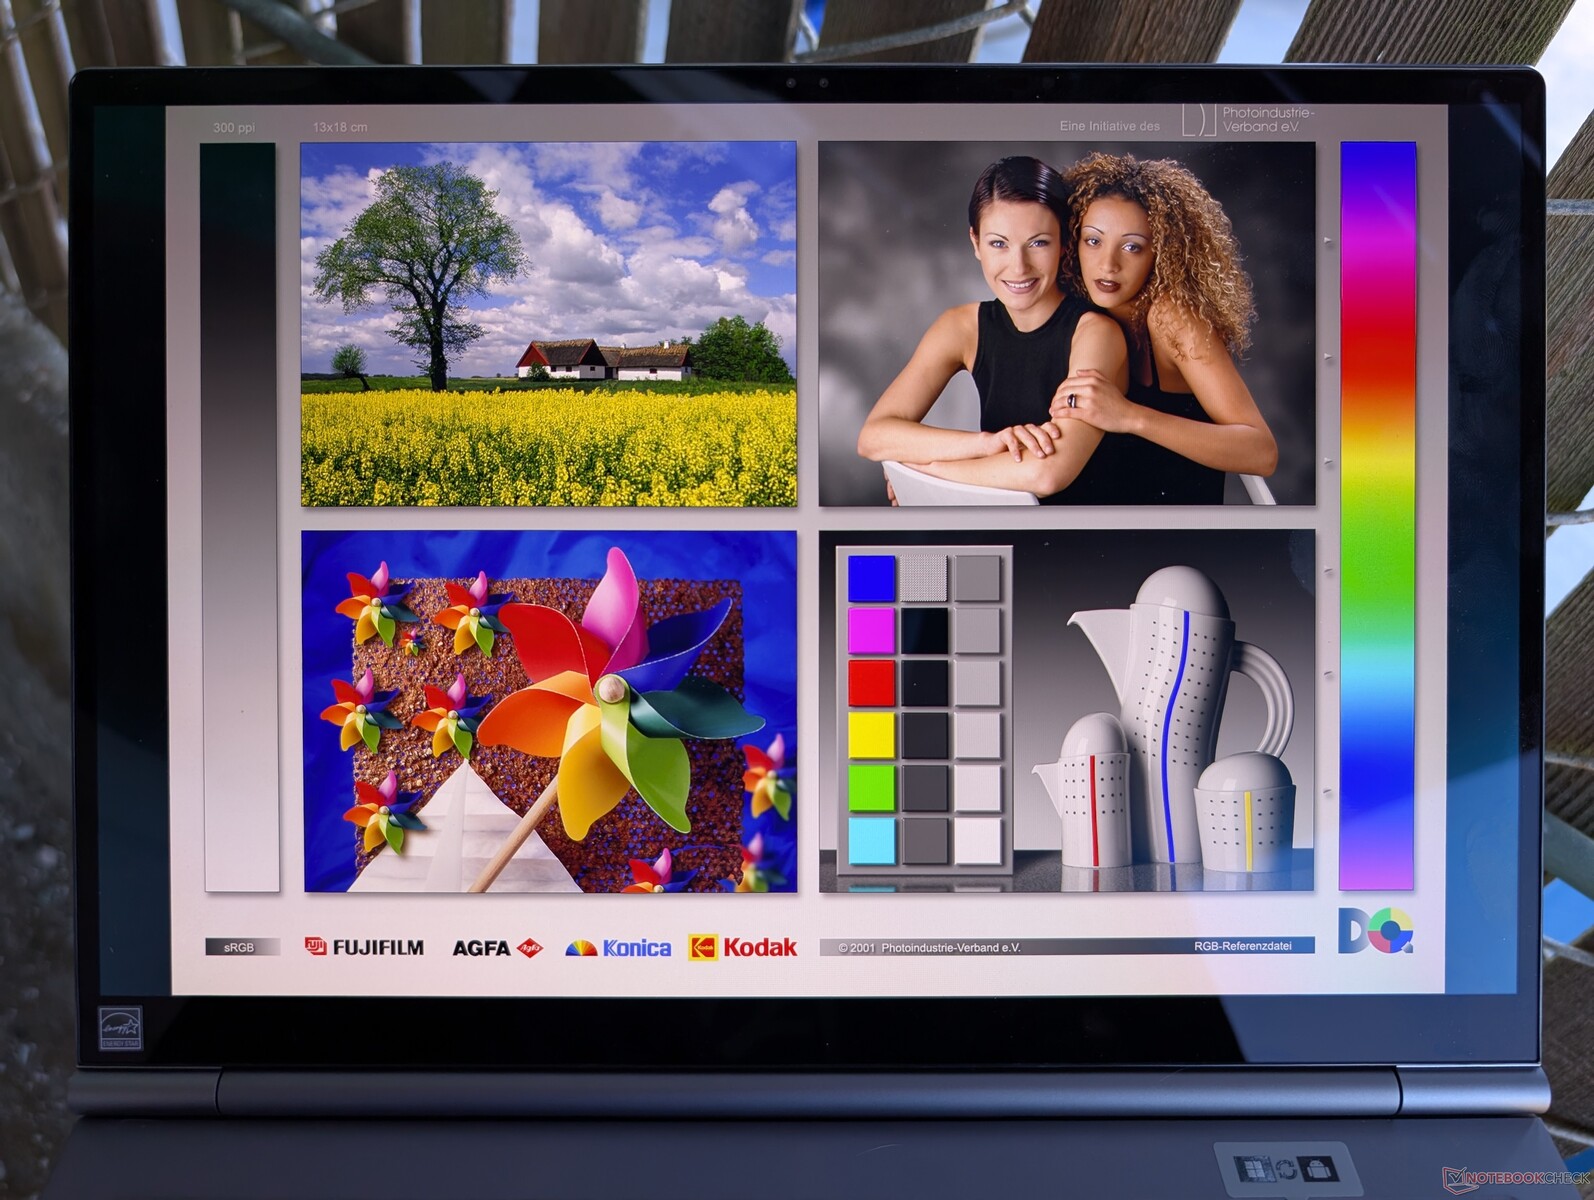
Display

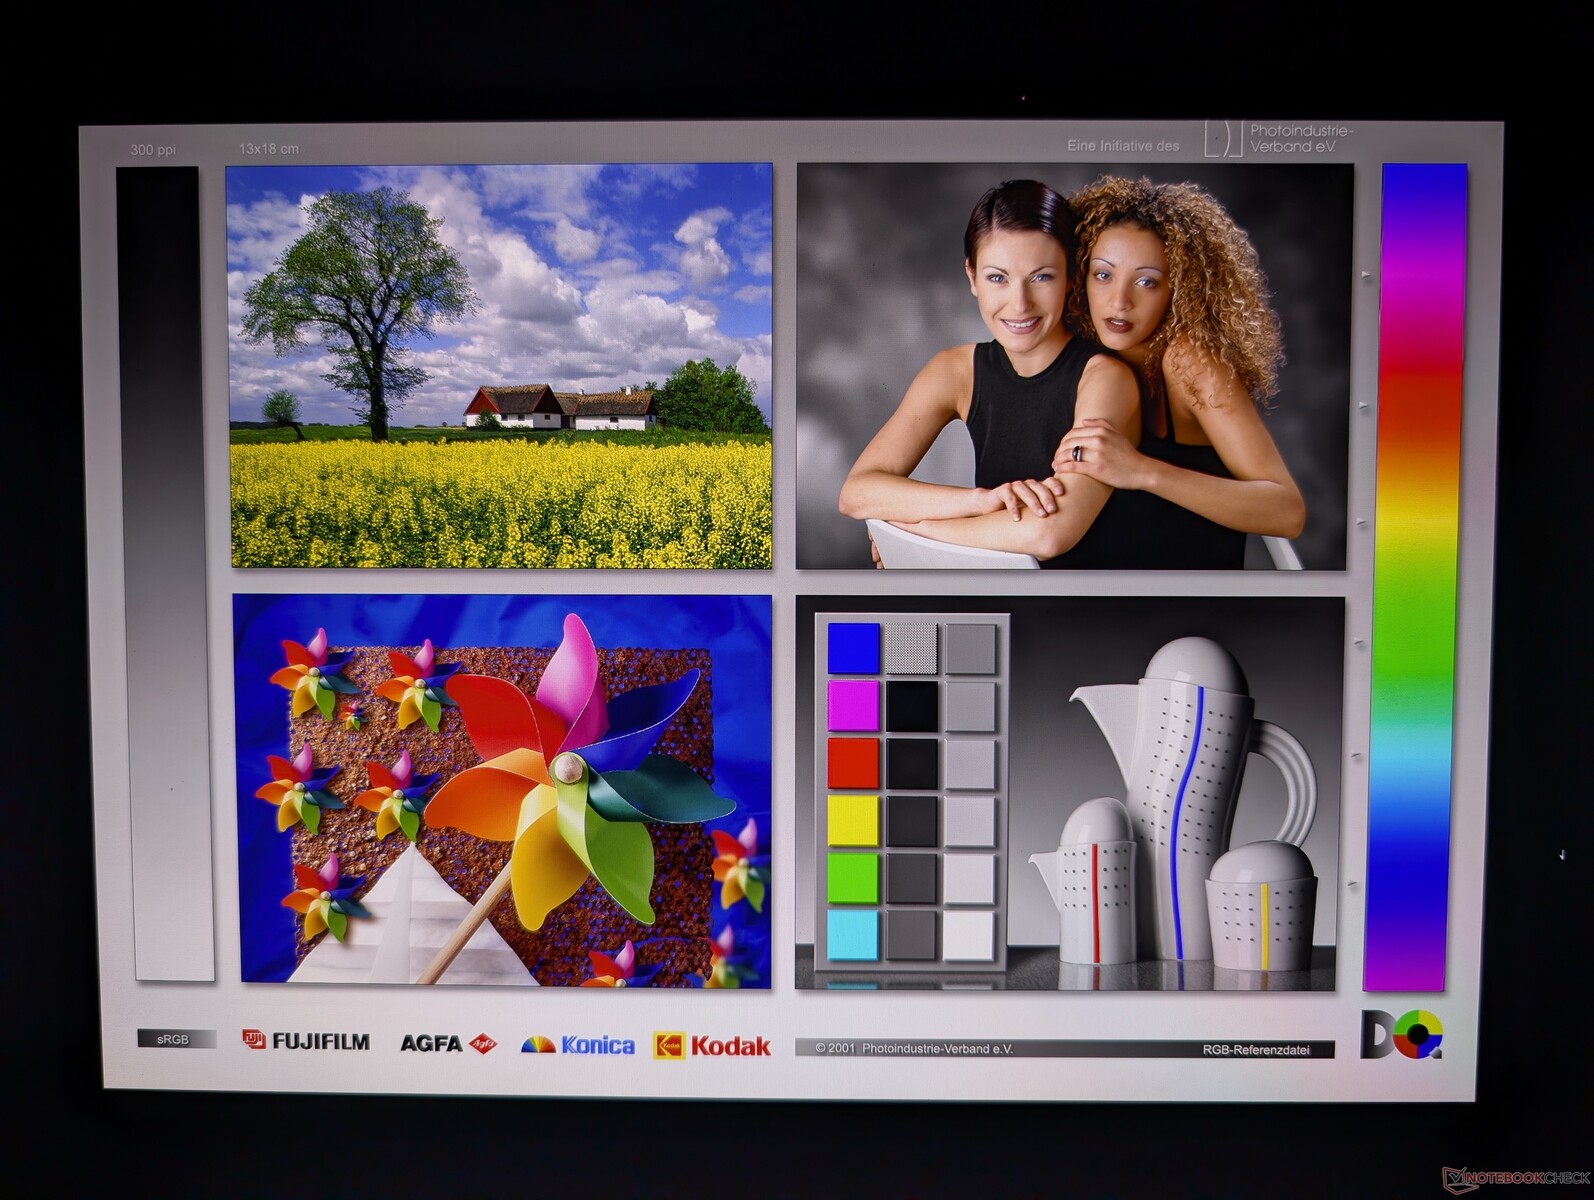
The OLED panel is similar to the one on last year's 13.3-inch ThinkBook Plus Gen 4 in terms of brightness, refresh rate, and color coverage. While perfectly serviceable, its native 60 Hz refresh rate is on the low side especially for a touchscreen and convertible form factor. The 90 Hz OLED panel on the Acer Swift 14 AI feels smoother and more responsive in comparison.
Maximum brightness would reach 572 nits on HDR mode during testing. Otherwise, maximum brightness is just short of 400 nits if set to the default SDR mode.
Note that the OLED panel is under a relatively thick layer of glass and so texts and images are grainier than expected even for a glossy panel. Some matte panels, like the one of the XPS 13, appear sharper and cleaner.

| |||||||||||||||||||||||||
Brightness Distribution: 97 %
Center on Battery: 390.1 cd/m²
Contrast: ∞:1 (Black: 0 cd/m²)
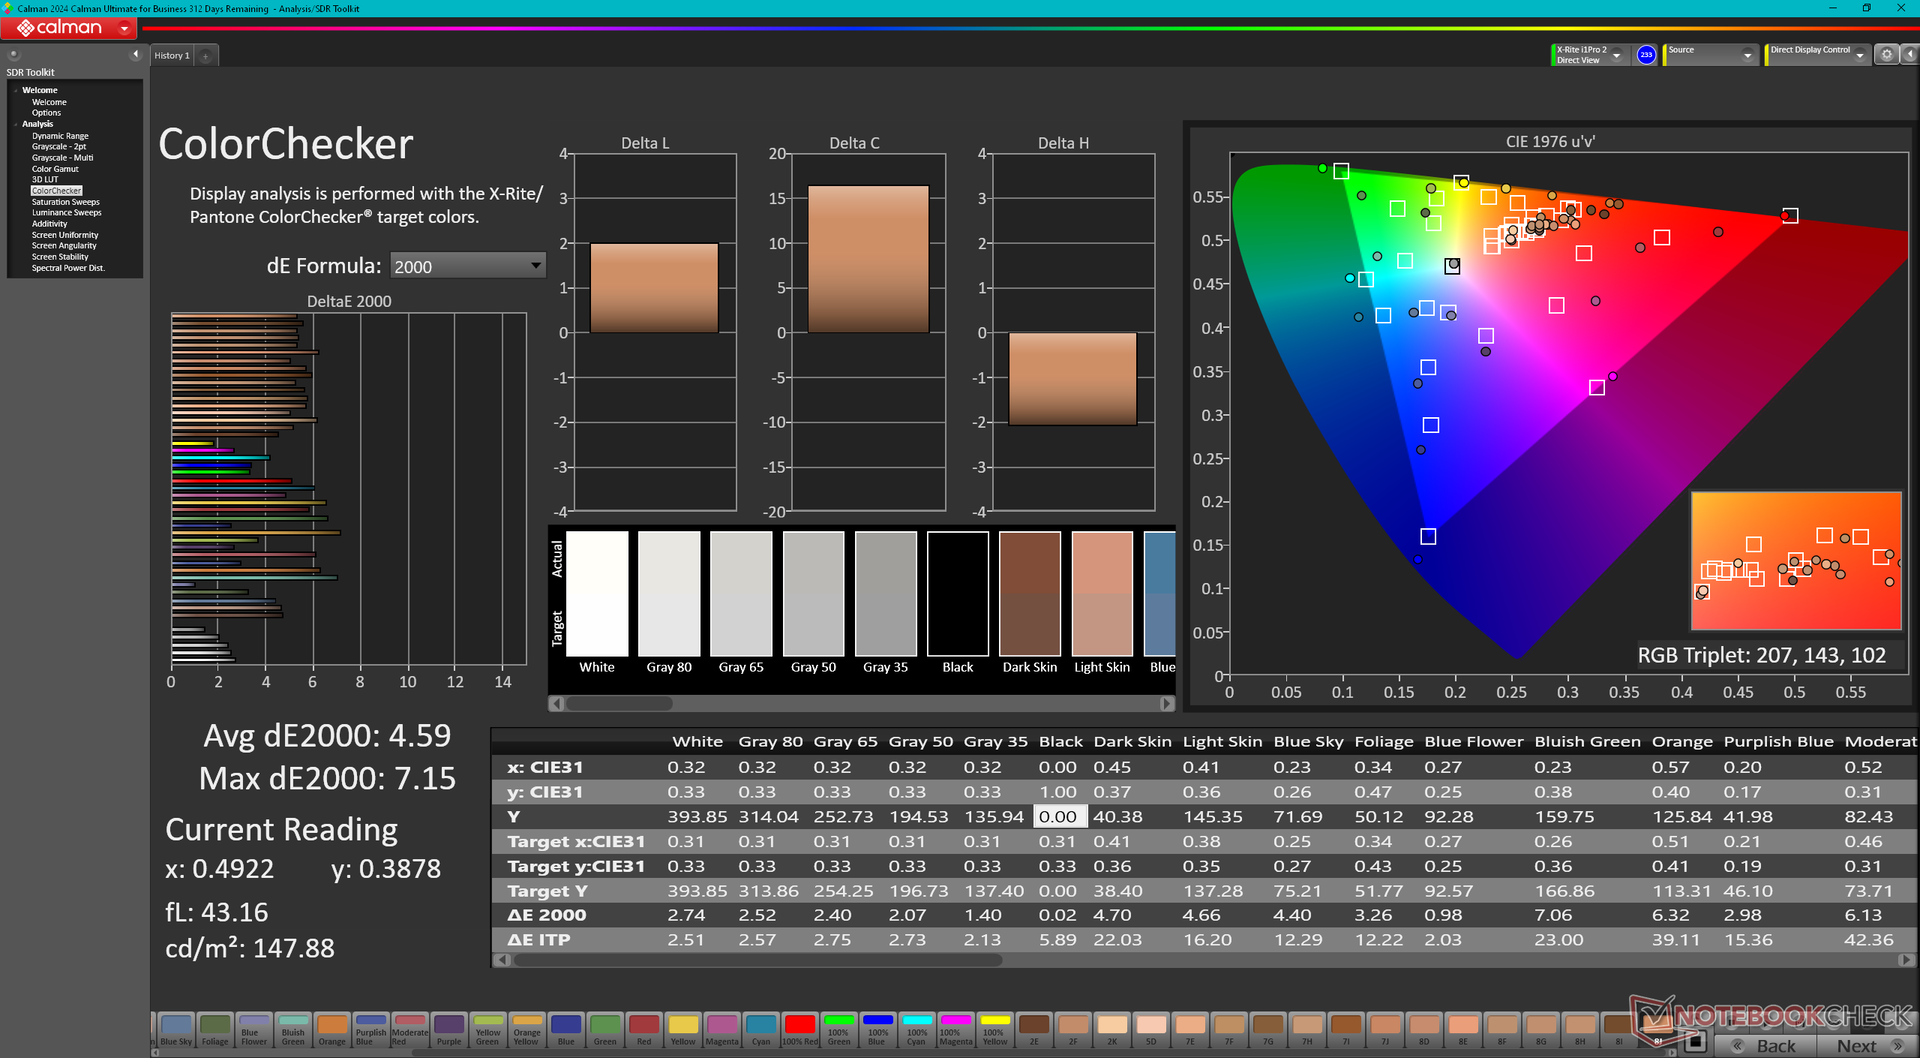
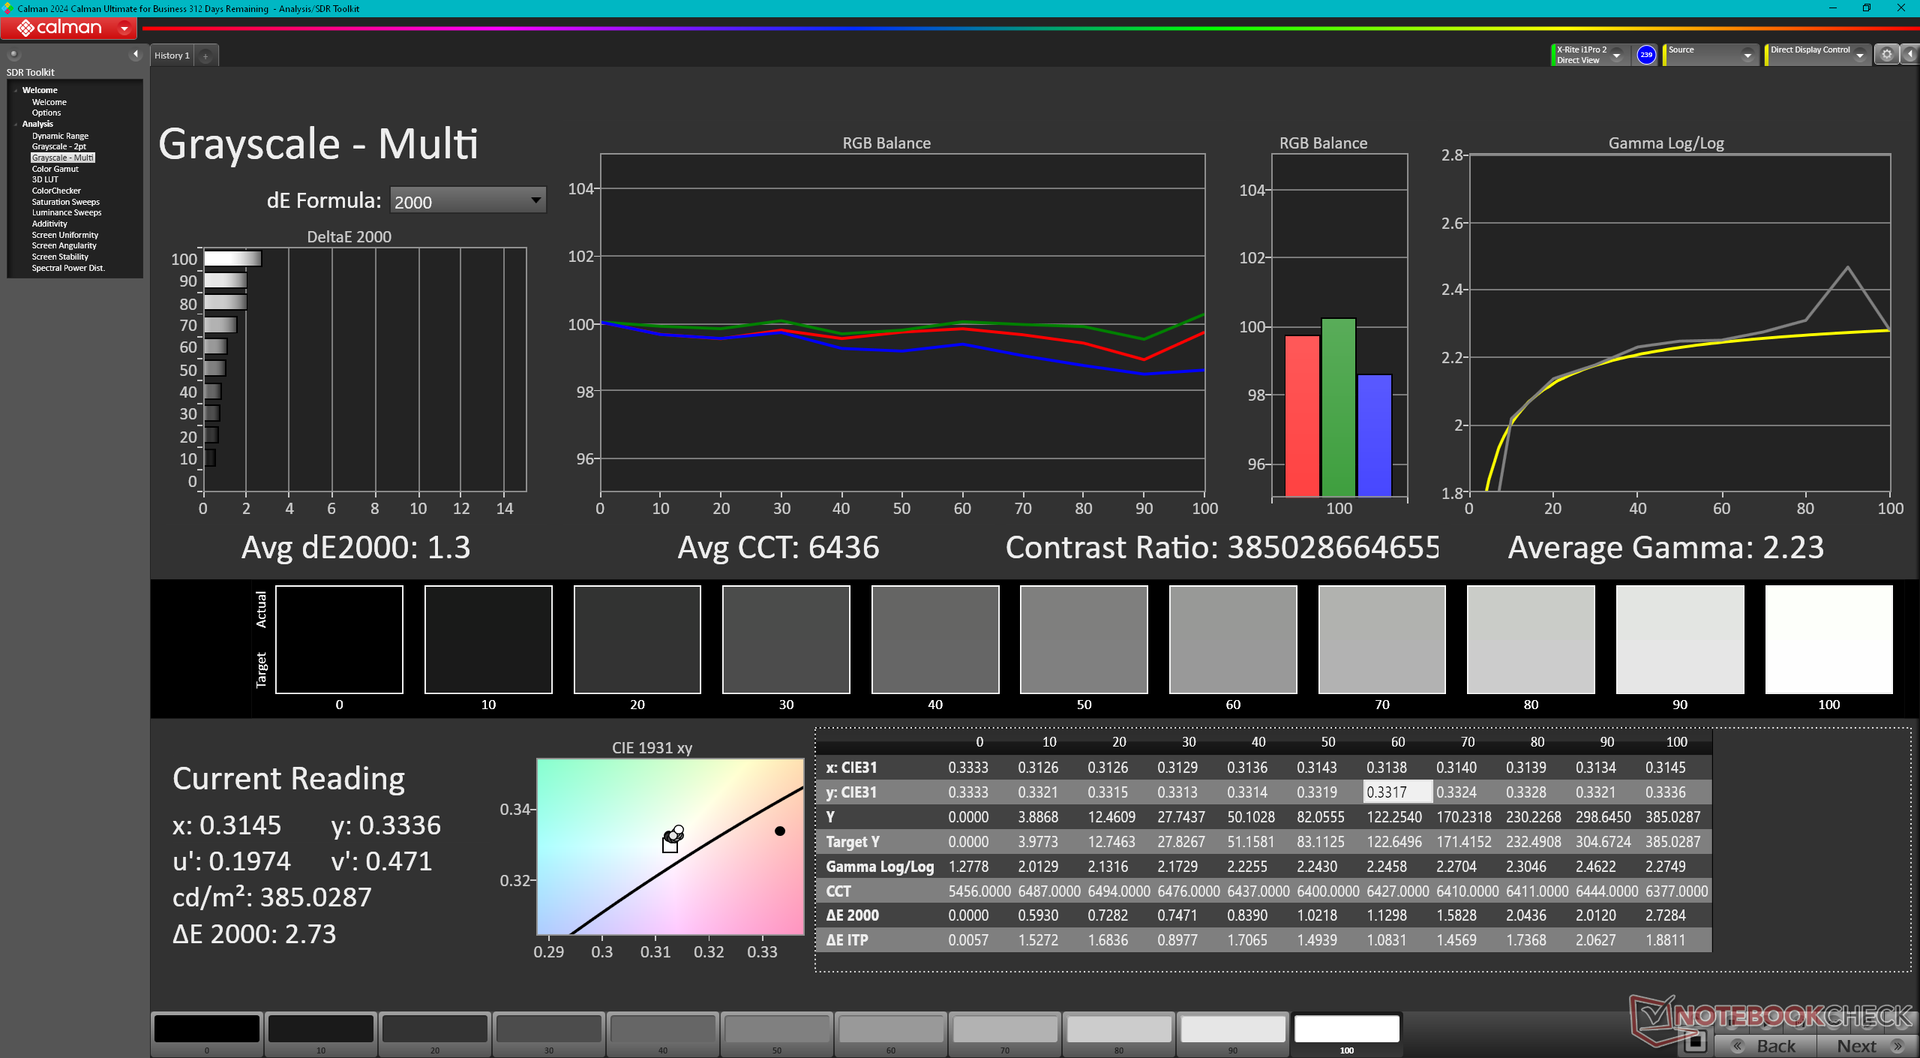
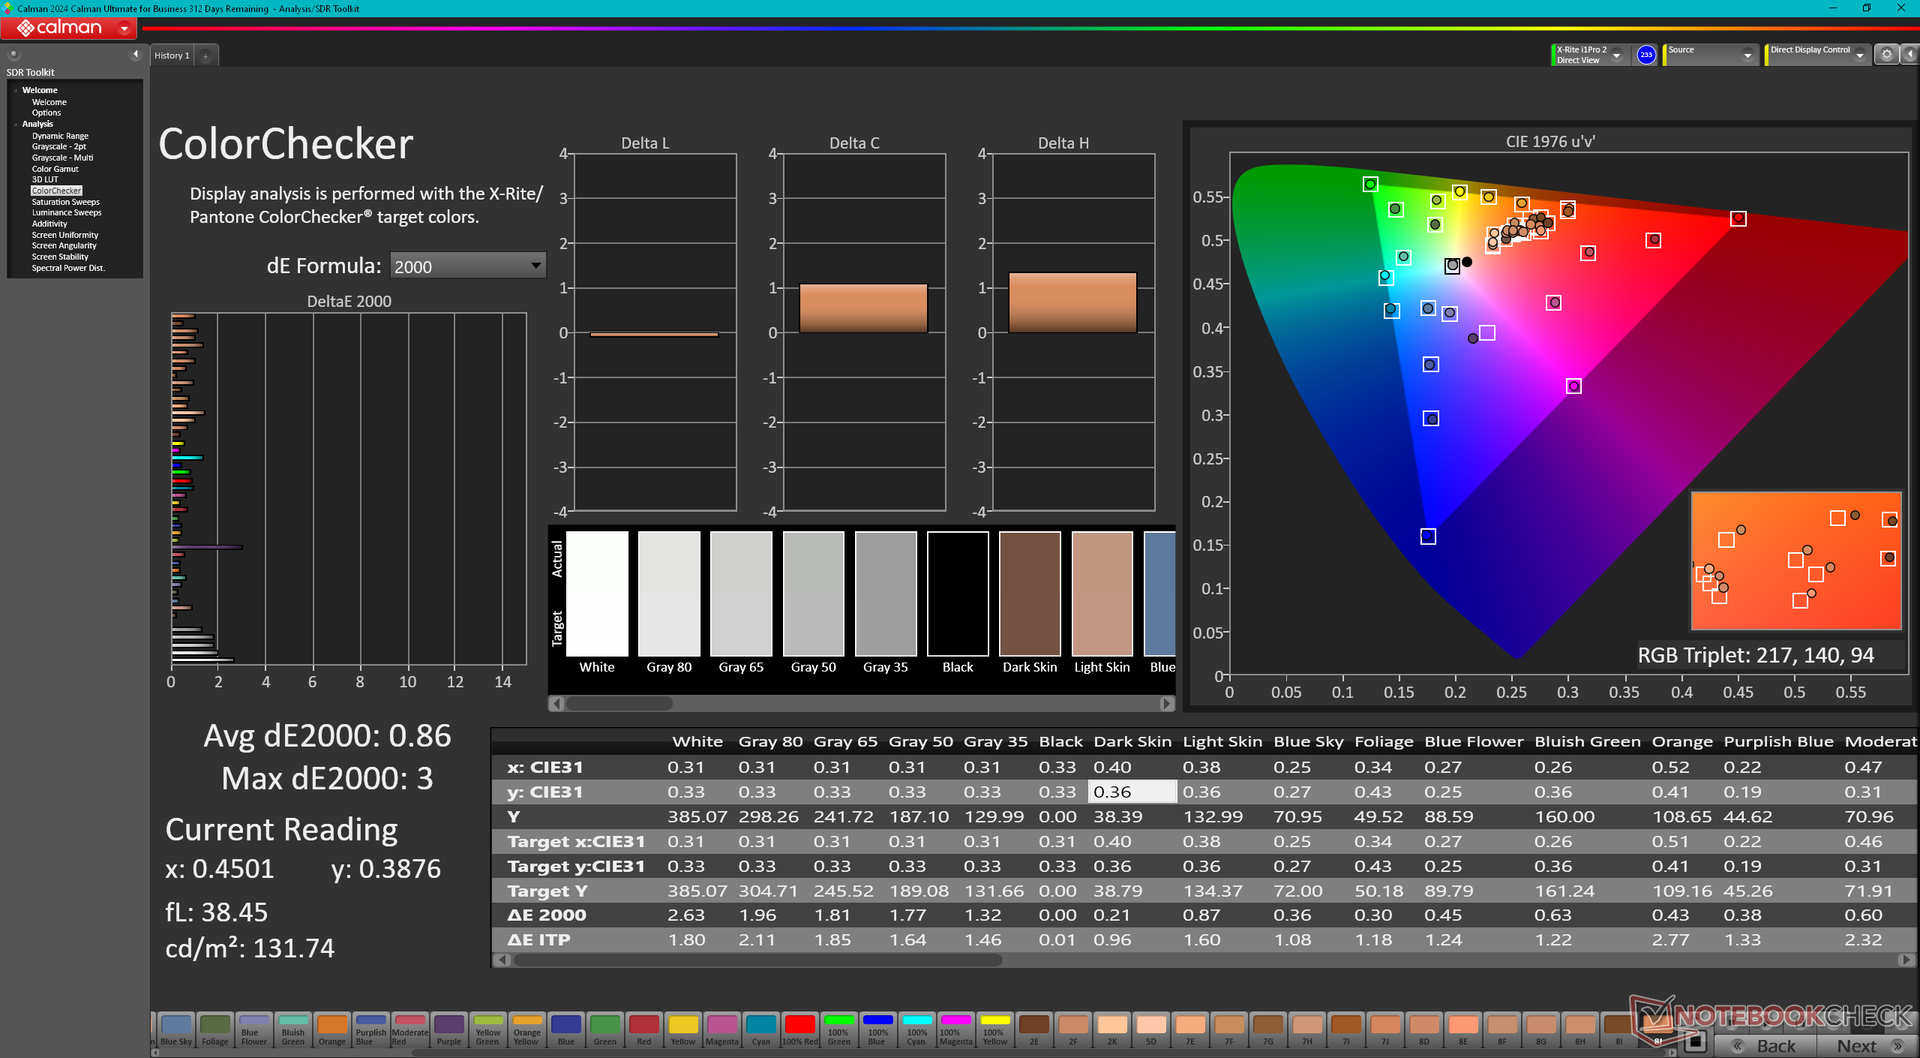
ΔE ColorChecker Calman: 4.59 | ∀{0.5-29.43 Ø4.73}
calibrated: 0.86
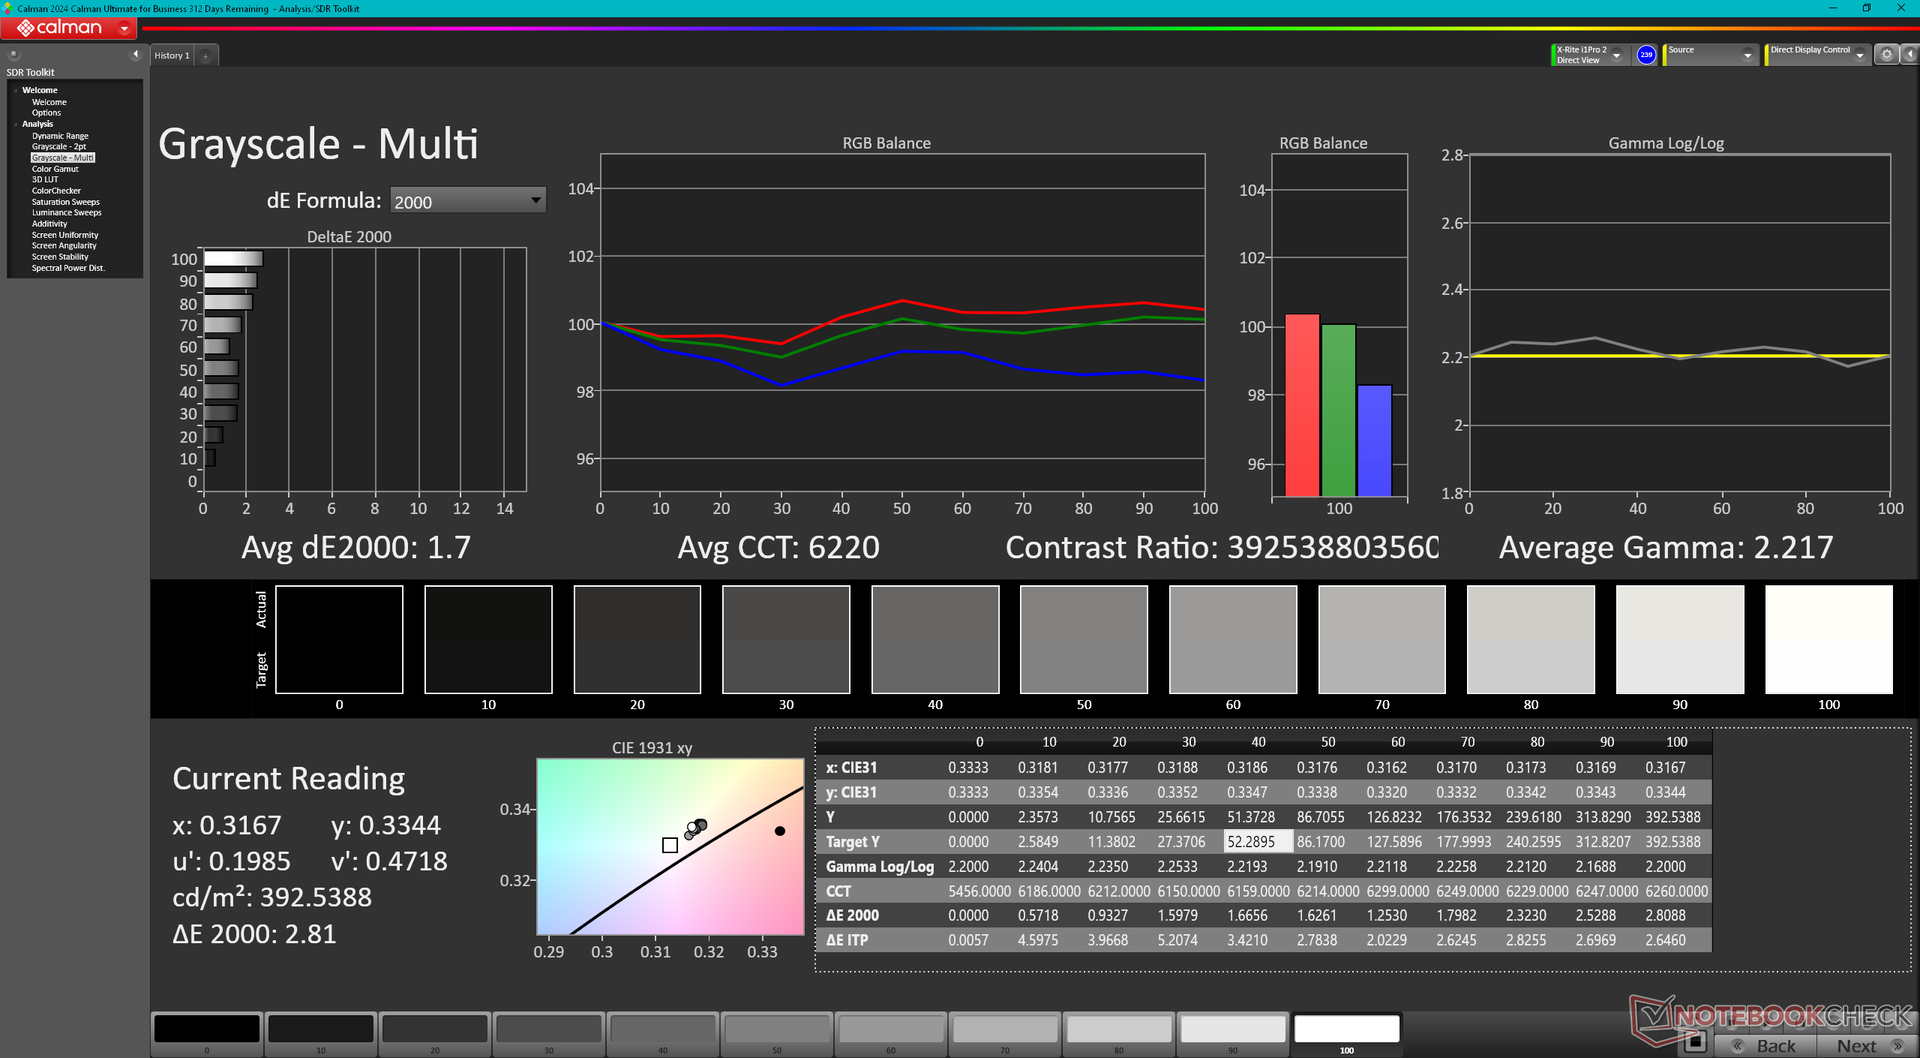
ΔE Greyscale Calman: 1.7 | ∀{0.09-98 Ø4.97}
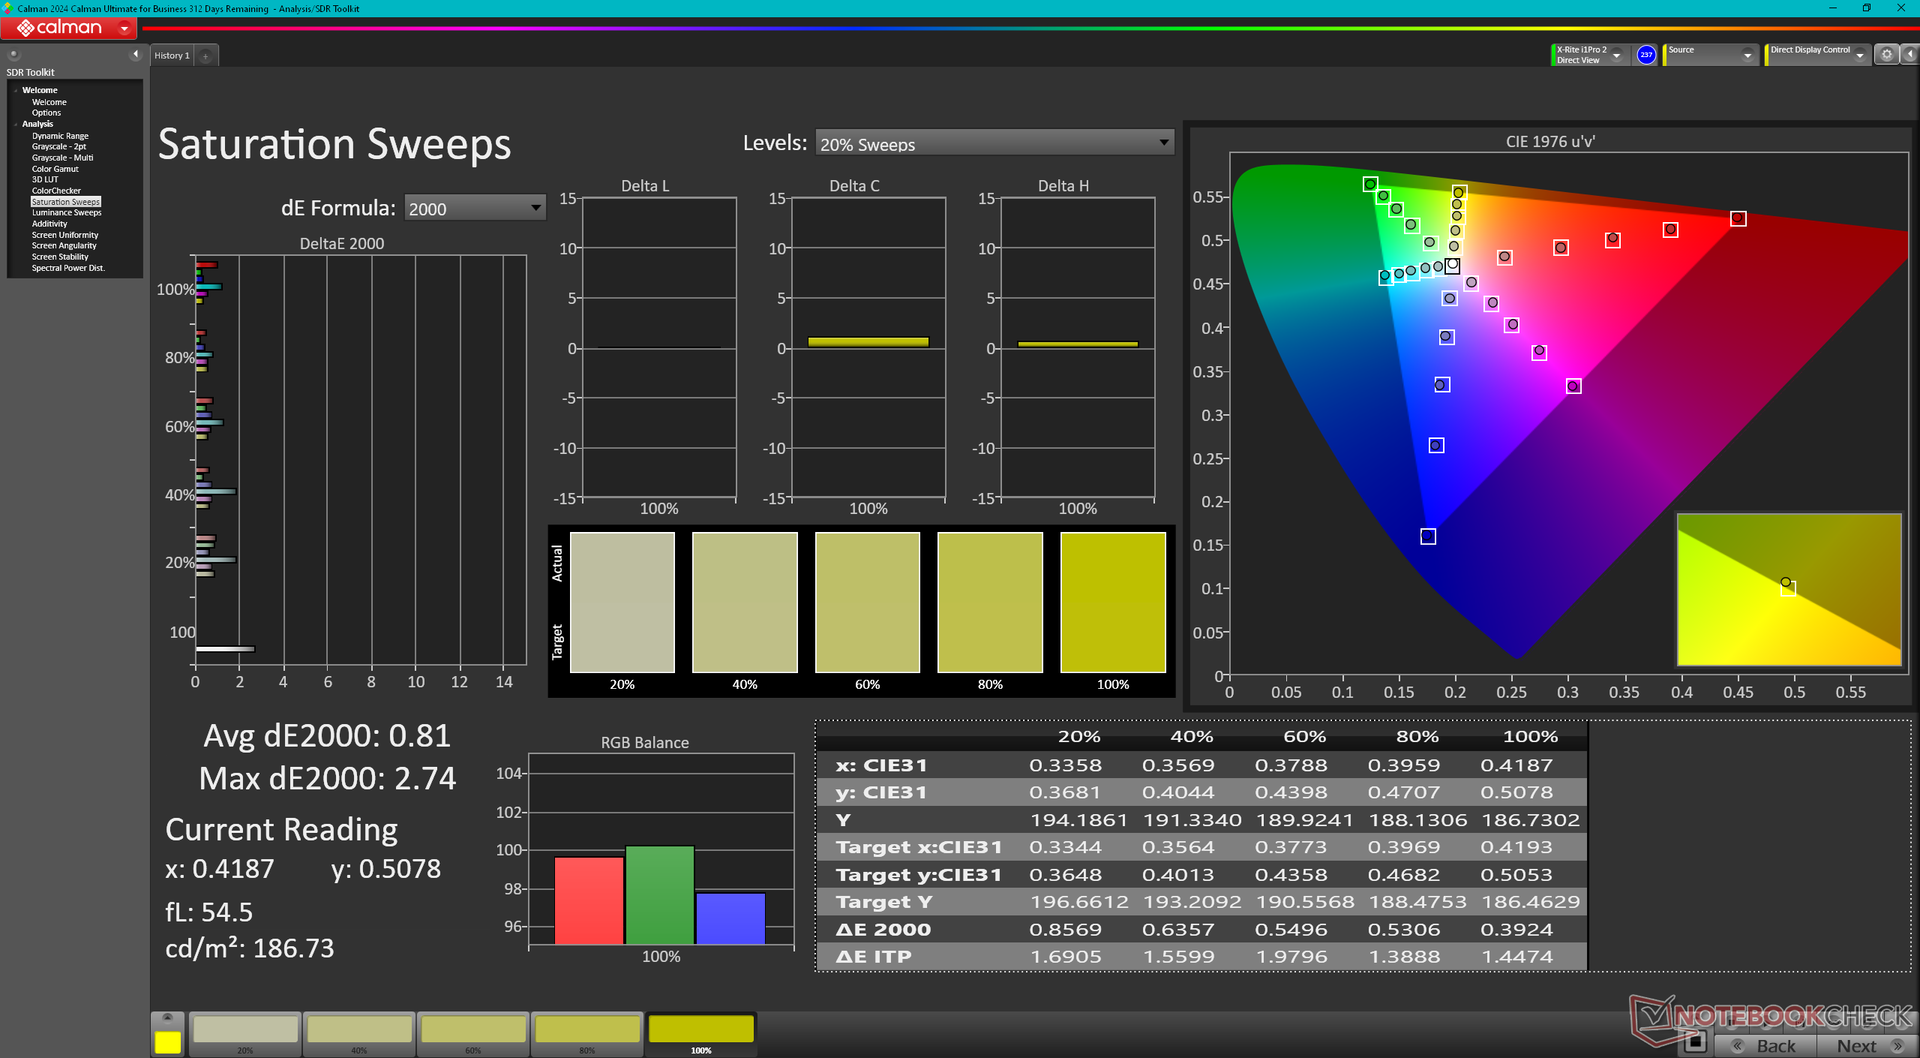
98.4% AdobeRGB 1998 (Argyll 3D)
100% sRGB (Argyll 3D)
99.7% Display P3 (Argyll 3D)
Gamma: 2.22
CCT: 6220 K
| Lenovo ThinkBook Plus Gen5 Hybrid LEN140WQ+, OLED, 2880x1800, 14", 60 Hz | Lenovo ThinkBook Plus Gen4 IRU SDC ATNA33AA06-0, OLED, 2880x1800, 13.3", 60 Hz | Acer Swift 14 AI SF14-51-58TU Samsung ATNA40YK11-0 (SDC4181), OLED, 2880x1800, 14", 90 Hz | Asus ExpertBook P5 P5405-NZ0102X NE140QDM-NX4, IPS LED, 2560x1600, 14", 144 Hz | HP EliteBook x360 1040 G11 CMN1474, IPS, 1920x1200, 14", 60 Hz | Dell Latitude 9450 2-in-1 AU Optronics B140QAN, IPS, 2560x1600, 14", 60 Hz | |
|---|---|---|---|---|---|---|
| Display | -0% | -0% | -19% | -20% | -13% | |
| Display P3 Coverage (%) | 99.7 | 99.6 0% | 99.9 0% | 70.8 -29% | 69 -31% | 80.6 -19% |
| sRGB Coverage (%) | 100 | 100 0% | 100 0% | 98 -2% | 99.2 -1% | 100 0% |
| AdobeRGB 1998 Coverage (%) | 98.4 | 97.1 -1% | 97.6 -1% | 71.6 -27% | 71.1 -28% | 80.1 -19% |
| Response Times | 3% | 62% | -1396% | -2096% | -2297% | |
| Response Time Grey 50% / Grey 80% * (ms) | 1.8 ? | 1.9 ? -6% | 0.8 ? 56% | 36.3 ? -1917% | 54.5 ? -2928% | 59.6 ? -3211% |
| Response Time Black / White * (ms) | 2.4 ? | 2.1 ? 12% | 0.8 ? 67% | 23.4 ? -875% | 32.7 ? -1263% | 35.6 ? -1383% |
| PWM Frequency (Hz) | 242.3 ? | 60 ? | 60 ? | |||
| PWM Amplitude * (%) | 9.4 | |||||
| Screen | -8% | -19% | -47% | 9% | 15% | |
| Brightness middle (cd/m²) | 390.1 | 367.5 -6% | 500 28% | 457 17% | 351.3 -10% | 501.4 29% |
| Brightness (cd/m²) | 389 | 370 -5% | 499 28% | 457 17% | 328 -16% | 491 26% |
| Brightness Distribution (%) | 97 | 98 1% | 97 0% | 95 -2% | 86 -11% | 88 -9% |
| Black Level * (cd/m²) | 0.01 | 0.12 | 0.24 | 0.32 | ||
| Colorchecker dE 2000 * | 4.59 | 4.61 -0% | 3.55 23% | 4.9 -7% | 2.29 50% | 2.52 45% |
| Colorchecker dE 2000 max. * | 7.15 | 7.68 -7% | 6.38 11% | 8.5 -19% | 4.55 36% | 4.87 32% |
| Colorchecker dE 2000 calibrated * | 0.86 | 0.66 23% | 2.55 -197% | 1.7 -98% | 0.49 43% | 0.45 48% |
| Greyscale dE 2000 * | 1.7 | 2.7 -59% | 2.2 -29% | 5.7 -235% | 2.2 -29% | 2.8 -65% |
| Gamma | 2.22 99% | 2.17 101% | 1.94 113% | 2.25 98% | 2.13 103% | 2.17 101% |
| CCT | 6220 105% | 6079 107% | 6405 101% | 7647 85% | 6321 103% | 6270 104% |
| Contrast (:1) | 50000 | 3808 | 1464 | 1567 | ||
| Total Average (Program / Settings) | -2% /
-4% | 14% /
-1% | -487% /
-265% | -702% /
-349% | -765% /
-377% |
* ... smaller is better

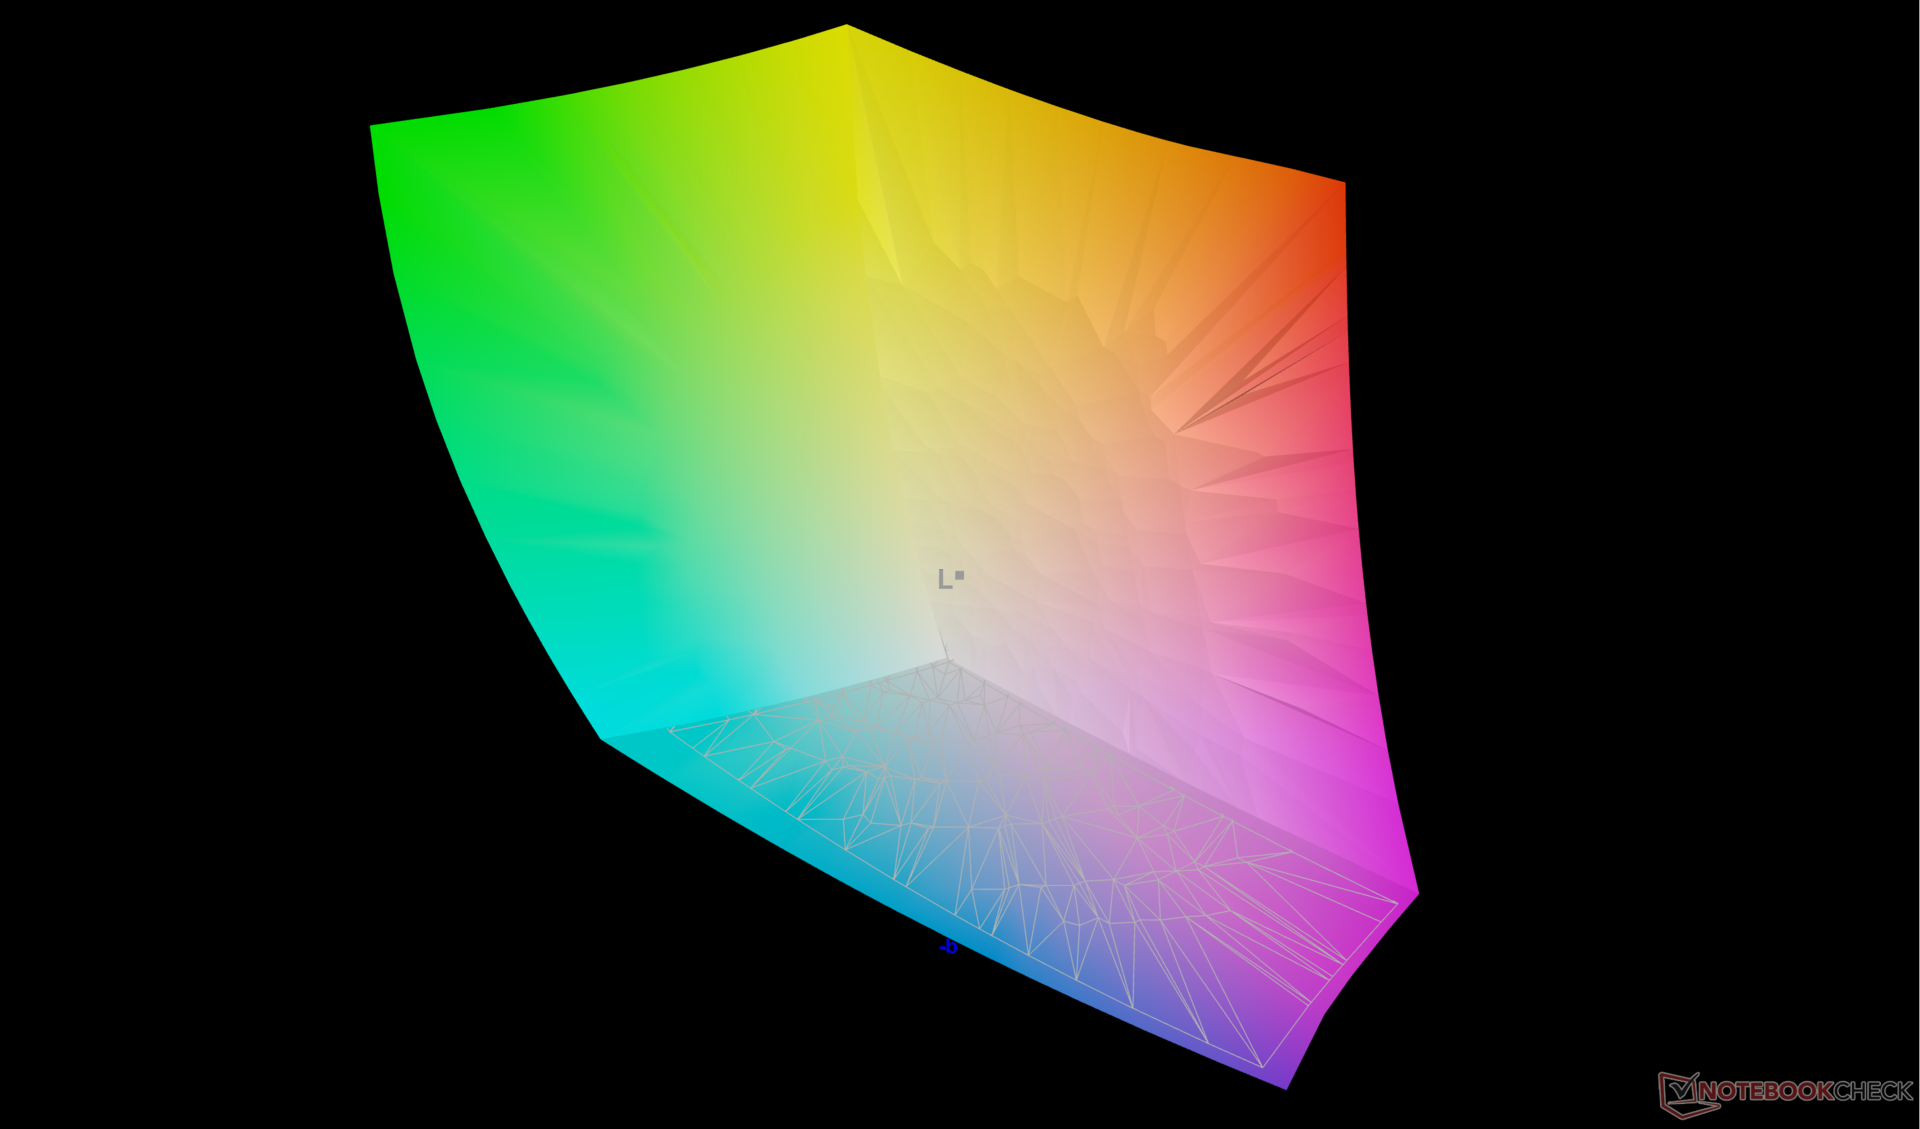
The display is decently calibrated out of the box against the P3 standard with average grayscale and color deltaE values of 1.7 and 4.59, respectively. Our calibrated ICM profile is available to download above for free.

Display Response Times
| ↔ Response Time Black to White | ||
|---|---|---|
| 2.4 ms ... rise ↗ and fall ↘ combined | ↗ 1.3 ms rise | 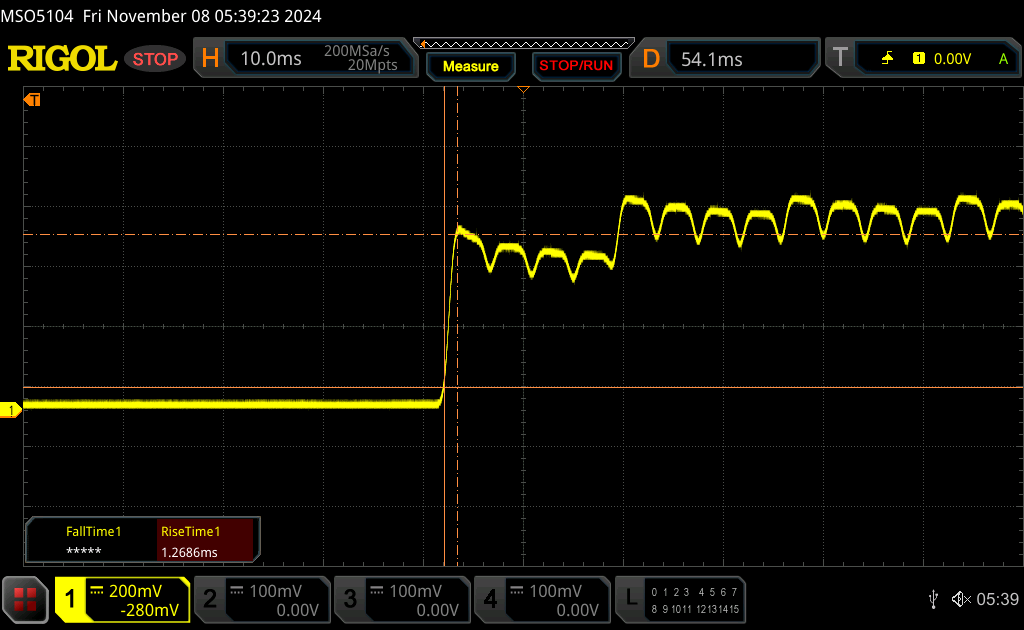 |
| ↘ 1.1 ms fall | ||
| The screen shows very fast response rates in our tests and should be very well suited for fast-paced gaming. In comparison, all tested devices range from 0.1 (minimum) to 240 (maximum) ms. » 12 % of all devices are better. This means that the measured response time is better than the average of all tested devices (19.9 ms). | ||
| ↔ Response Time 50% Grey to 80% Grey | ||
| 1.8 ms ... rise ↗ and fall ↘ combined | ↗ 0.9 ms rise |  |
| ↘ 0.9 ms fall | ||
| The screen shows very fast response rates in our tests and should be very well suited for fast-paced gaming. In comparison, all tested devices range from 0.165 (minimum) to 636 (maximum) ms. » 9 % of all devices are better. This means that the measured response time is better than the average of all tested devices (31.1 ms). | ||
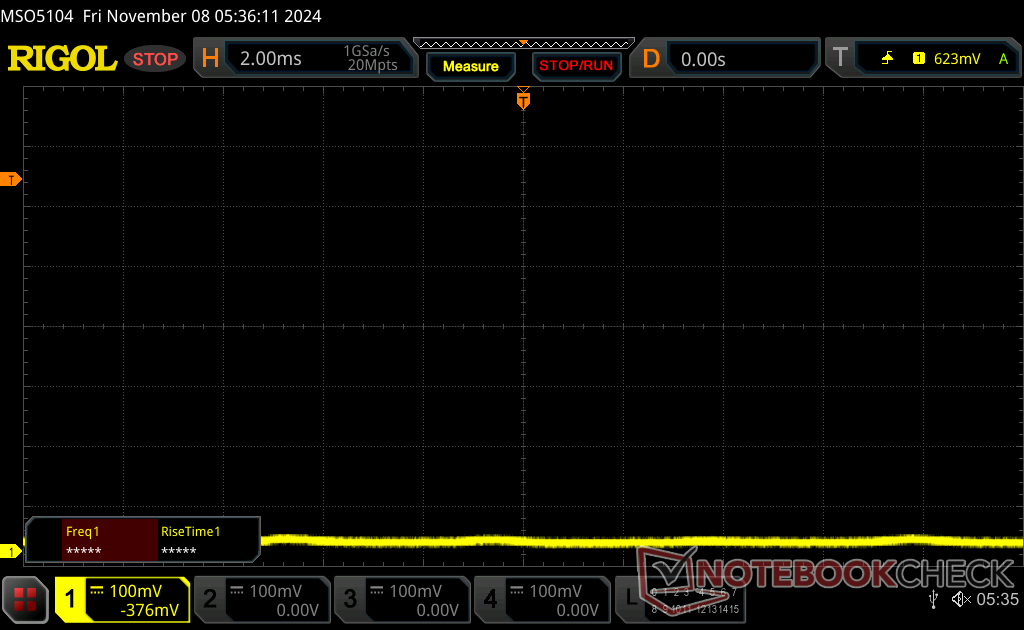
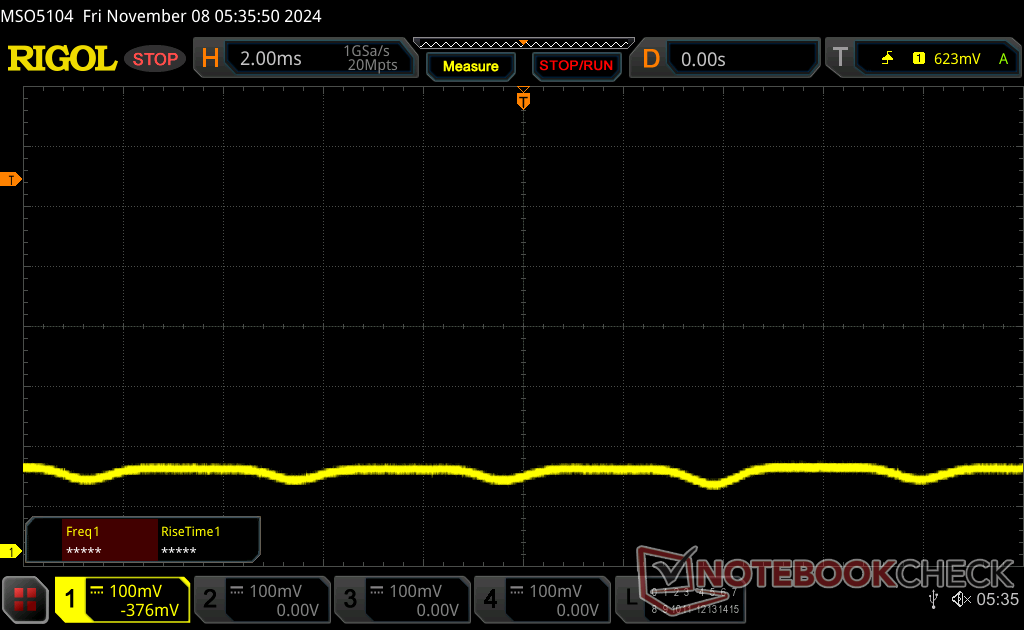
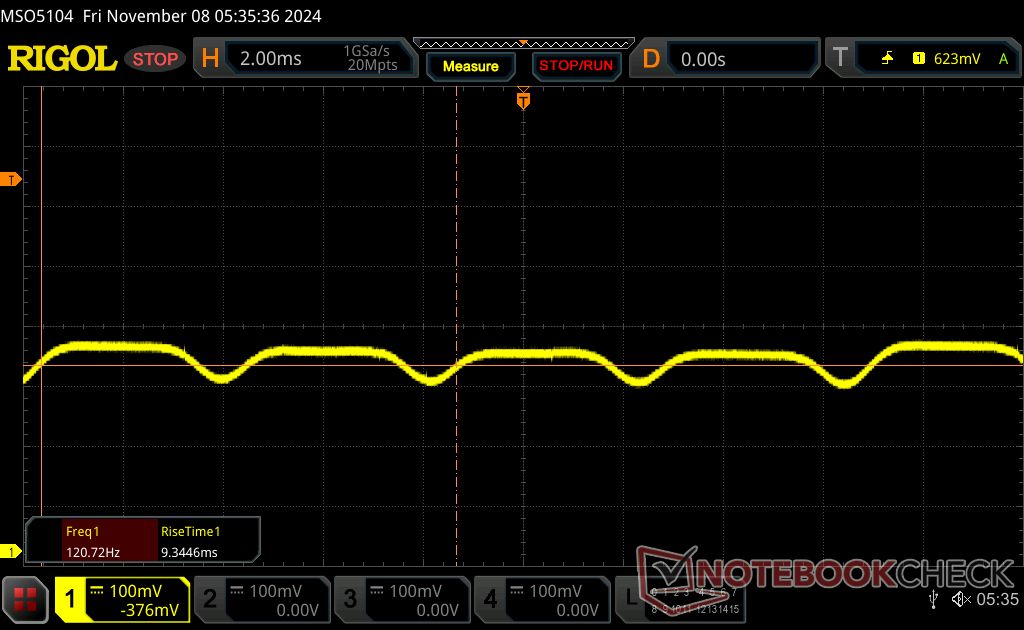
Screen Flickering / PWM (Pulse-Width Modulation)
| Screen flickering / PWM detected | 242.3 Hz Amplitude: 9.4 % | ≤ 100 % brightness setting |  |
The display backlight flickers at 242.3 Hz (worst case, e.g., utilizing PWM) Flickering detected at a brightness setting of 100 % and below. There should be no flickering or PWM above this brightness setting. The frequency of 242.3 Hz is relatively low, so sensitive users will likely notice flickering and experience eyestrain at the stated brightness setting and below. In comparison: 52 % of all tested devices do not use PWM to dim the display. If PWM was detected, an average of 7791 (minimum: 5 - maximum: 343500) Hz was measured. | |||

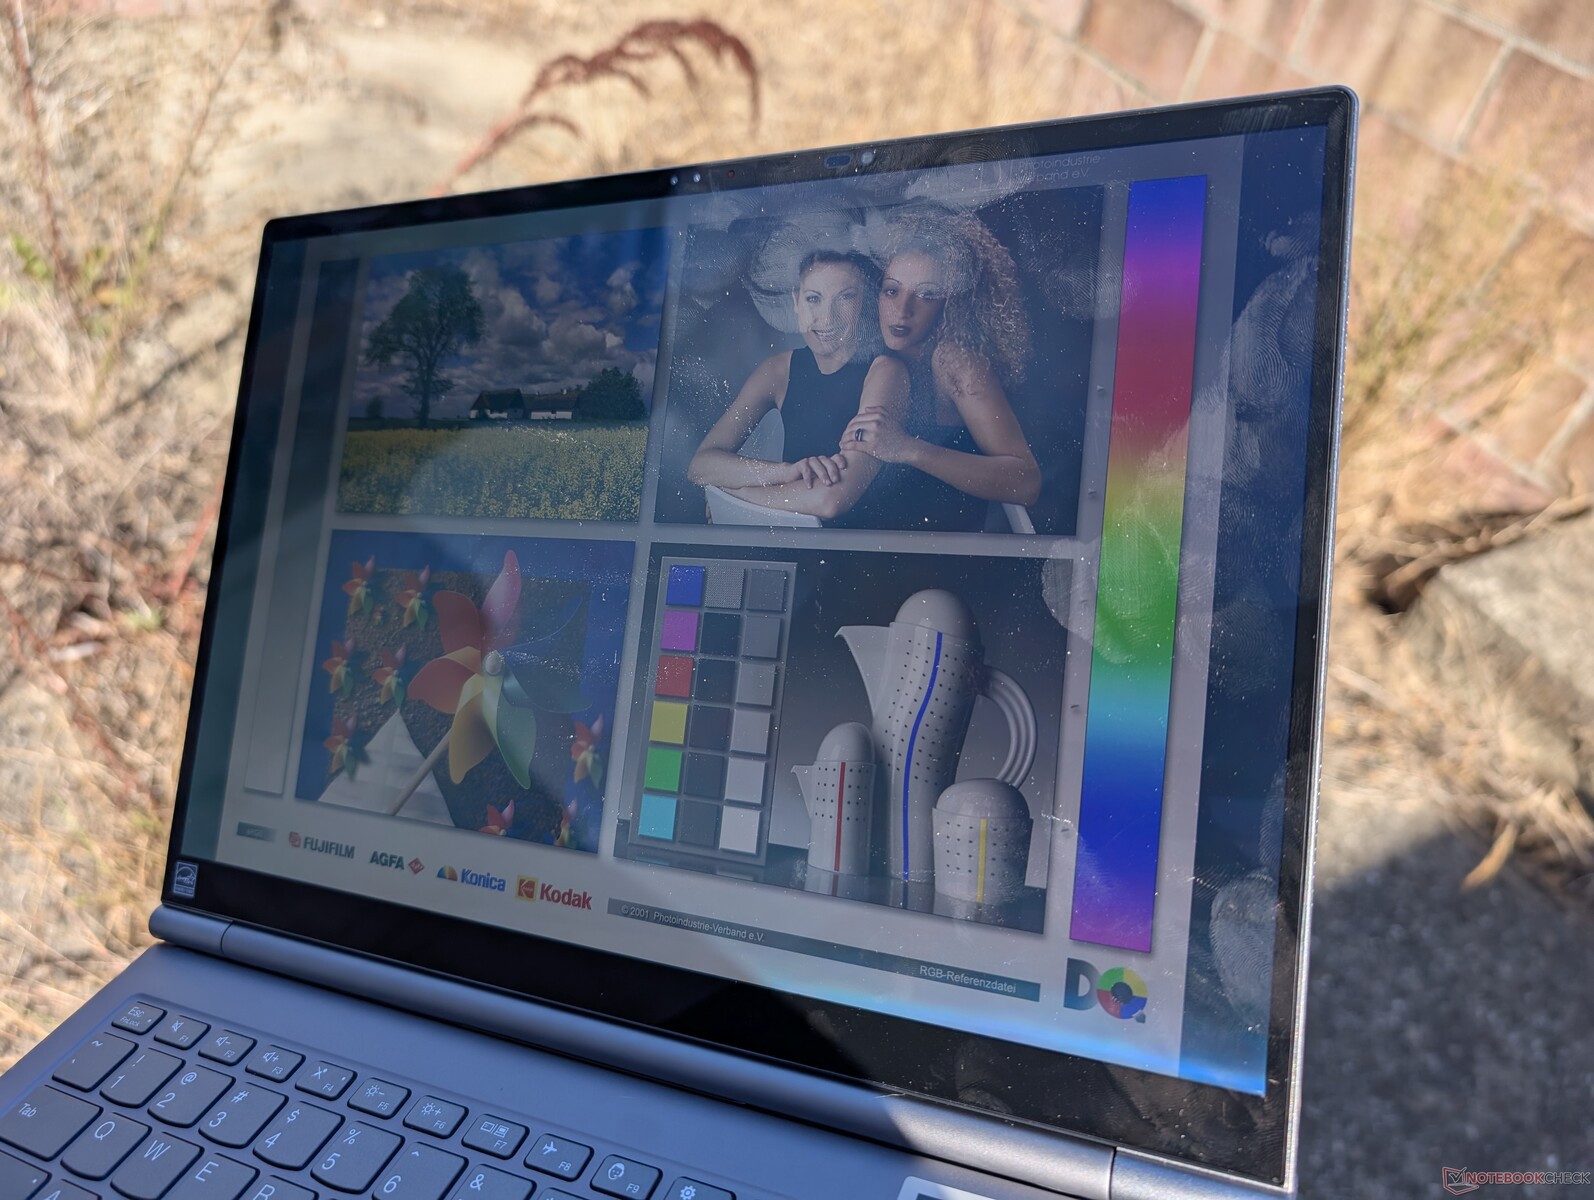
The display is bright enough to be used comfortably under shade, but direct sunlight will wash out content and colors.

Performance
Testing Conditions
We set both Windows and Lenovo Vantage to Performance mode prior to running the benchmarks below.
Processor
CPU performance is about 5 to 10 percent slower than the average laptop in our database with the same Core Ultra 7 155H. The deficit can be partly attributed to the poor Turbo Boost sustainability of the model. When running CineBench R15 xT in a loop, for example, performance would dip by almost 30 percent after just the first run as shown by the graph below.
Cinebench R15 Multi Loop
Cinebench R23: Multi Core | Single Core
Cinebench R20: CPU (Multi Core) | CPU (Single Core)
Cinebench R15: CPU Multi 64Bit | CPU Single 64Bit
Blender: v2.79 BMW27 CPU
7-Zip 18.03: 7z b 4 | 7z b 4 -mmt1
Geekbench 6.7: Multi-Core | Single-Core
Geekbench 5.5: Multi-Core | Single-Core
HWBOT x265 Benchmark v2.2: 4k Preset
LibreOffice : 20 Documents To PDF
R Benchmark 2.5: Overall mean
* ... smaller is better
AIDA64: FP32 Ray-Trace | FPU Julia | CPU SHA3 | CPU Queen | FPU SinJulia | FPU Mandel | CPU AES | CPU ZLib | FP64 Ray-Trace | CPU PhotoWorxx
| Performance rating | |
| Average Intel Core Ultra 7 155H | |
| HP EliteBook x360 1040 G11 | |
| Lenovo ThinkBook Plus Gen5 Hybrid | |
| Asus ExpertBook P5 P5405-NZ0102X | |
| Acer Swift 14 AI SF14-51-58TU | |
| Dell Latitude 9450 2-in-1 | |
| Lenovo ThinkBook Plus Gen4 IRU | |
| AIDA64 / FP32 Ray-Trace | |
| Average Intel Core Ultra 7 155H (6670 - 18470, n=50) | |
| HP EliteBook x360 1040 G11 | |
| Lenovo ThinkBook Plus Gen5 Hybrid | |
| Asus ExpertBook P5 P5405-NZ0102X | |
| Acer Swift 14 AI SF14-51-58TU | |
| Dell Latitude 9450 2-in-1 | |
| Lenovo ThinkBook Plus Gen4 IRU | |
| AIDA64 / FPU Julia | |
| Average Intel Core Ultra 7 155H (40905 - 93181, n=50) | |
| HP EliteBook x360 1040 G11 | |
| Lenovo ThinkBook Plus Gen5 Hybrid | |
| Asus ExpertBook P5 P5405-NZ0102X | |
| Acer Swift 14 AI SF14-51-58TU | |
| Dell Latitude 9450 2-in-1 | |
| Lenovo ThinkBook Plus Gen4 IRU | |
| AIDA64 / CPU SHA3 | |
| Average Intel Core Ultra 7 155H (1940 - 4436, n=50) | |
| HP EliteBook x360 1040 G11 | |
| Lenovo ThinkBook Plus Gen5 Hybrid | |
| Asus ExpertBook P5 P5405-NZ0102X | |
| Acer Swift 14 AI SF14-51-58TU | |
| Dell Latitude 9450 2-in-1 | |
| Lenovo ThinkBook Plus Gen4 IRU | |
| AIDA64 / CPU Queen | |
| Average Intel Core Ultra 7 155H (64698 - 94181, n=50) | |
| HP EliteBook x360 1040 G11 | |
| Lenovo ThinkBook Plus Gen5 Hybrid | |
| Lenovo ThinkBook Plus Gen4 IRU | |
| Asus ExpertBook P5 P5405-NZ0102X | |
| Acer Swift 14 AI SF14-51-58TU | |
| Dell Latitude 9450 2-in-1 | |
| AIDA64 / FPU SinJulia | |
| Average Intel Core Ultra 7 155H (5639 - 10647, n=50) | |
| HP EliteBook x360 1040 G11 | |
| Lenovo ThinkBook Plus Gen5 Hybrid | |
| Dell Latitude 9450 2-in-1 | |
| Lenovo ThinkBook Plus Gen4 IRU | |
| Asus ExpertBook P5 P5405-NZ0102X | |
| Acer Swift 14 AI SF14-51-58TU | |
| AIDA64 / FPU Mandel | |
| Average Intel Core Ultra 7 155H (18236 - 47685, n=50) | |
| HP EliteBook x360 1040 G11 | |
| Asus ExpertBook P5 P5405-NZ0102X | |
| Lenovo ThinkBook Plus Gen5 Hybrid | |
| Acer Swift 14 AI SF14-51-58TU | |
| Dell Latitude 9450 2-in-1 | |
| Lenovo ThinkBook Plus Gen4 IRU | |
| AIDA64 / CPU AES | |
| Average Intel Core Ultra 7 155H (45713 - 152179, n=50) | |
| HP EliteBook x360 1040 G11 | |
| Lenovo ThinkBook Plus Gen5 Hybrid | |
| Dell Latitude 9450 2-in-1 | |
| Asus ExpertBook P5 P5405-NZ0102X | |
| Lenovo ThinkBook Plus Gen4 IRU | |
| Acer Swift 14 AI SF14-51-58TU | |
| AIDA64 / CPU ZLib | |
| Average Intel Core Ultra 7 155H (557 - 1250, n=50) | |
| HP EliteBook x360 1040 G11 | |
| Lenovo ThinkBook Plus Gen5 Hybrid | |
| Dell Latitude 9450 2-in-1 | |
| Asus ExpertBook P5 P5405-NZ0102X | |
| Lenovo ThinkBook Plus Gen4 IRU | |
| Acer Swift 14 AI SF14-51-58TU | |
| AIDA64 / FP64 Ray-Trace | |
| Average Intel Core Ultra 7 155H (3569 - 9802, n=50) | |
| Asus ExpertBook P5 P5405-NZ0102X | |
| HP EliteBook x360 1040 G11 | |
| Acer Swift 14 AI SF14-51-58TU | |
| Lenovo ThinkBook Plus Gen5 Hybrid | |
| Dell Latitude 9450 2-in-1 | |
| Lenovo ThinkBook Plus Gen4 IRU | |
| AIDA64 / CPU PhotoWorxx | |
| Asus ExpertBook P5 P5405-NZ0102X | |
| Lenovo ThinkBook Plus Gen5 Hybrid | |
| Acer Swift 14 AI SF14-51-58TU | |
| Dell Latitude 9450 2-in-1 | |
| HP EliteBook x360 1040 G11 | |
| Average Intel Core Ultra 7 155H (32719 - 54223, n=50) | |
| Lenovo ThinkBook Plus Gen4 IRU | |
Stress Test
When running Prime95 stress, the CPU would boost to 2.8 GHz and 65 W lasting for only a few seconds until reaching a core temperature of 89 C. Thereafter, the CPU drops and stabilizes at 1.9 GHz and 32 W to signify limited Turbo Boost potential.
Core temperature stabilizes at around 65 C when running demanding loads compared to 75 C on last year's ThinkBook Plus Gen 4.
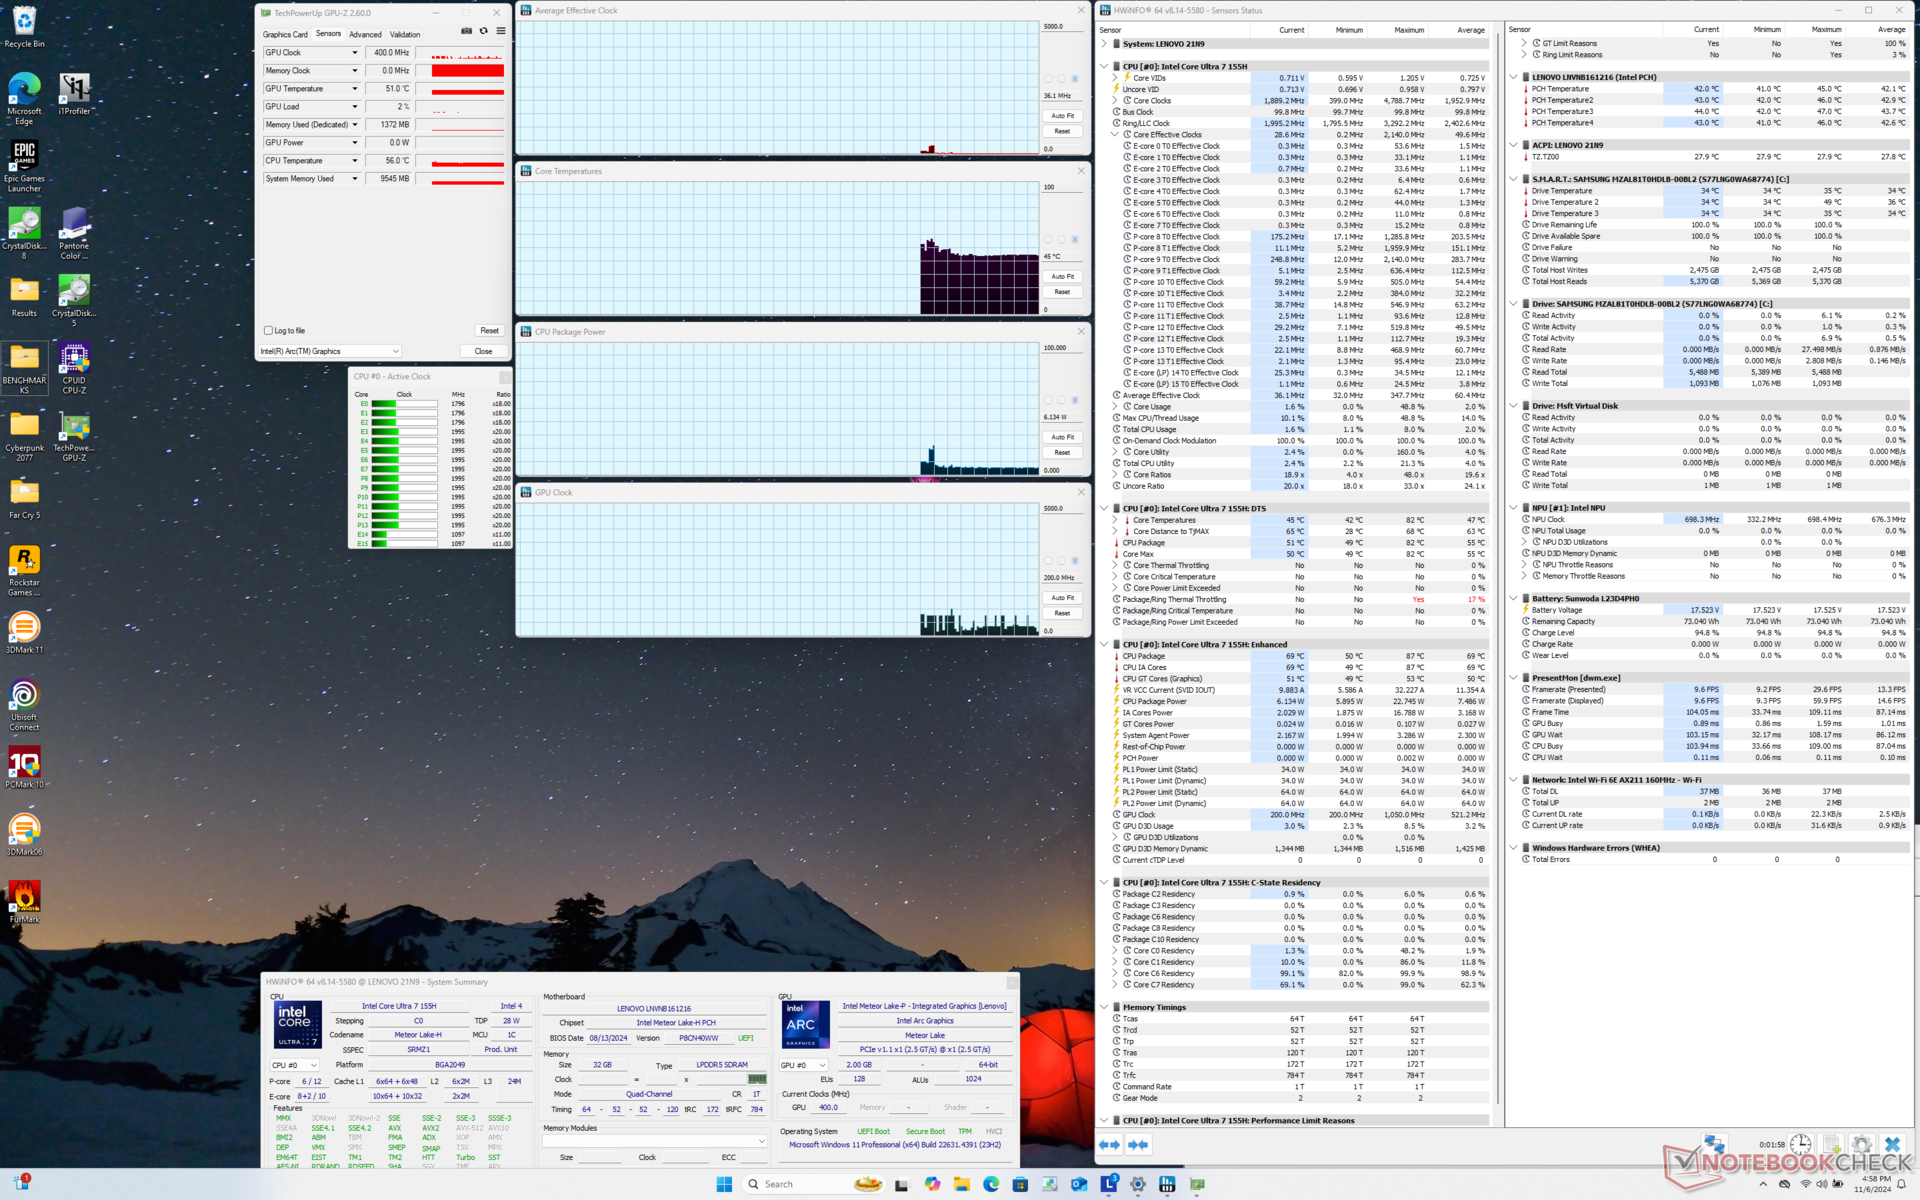
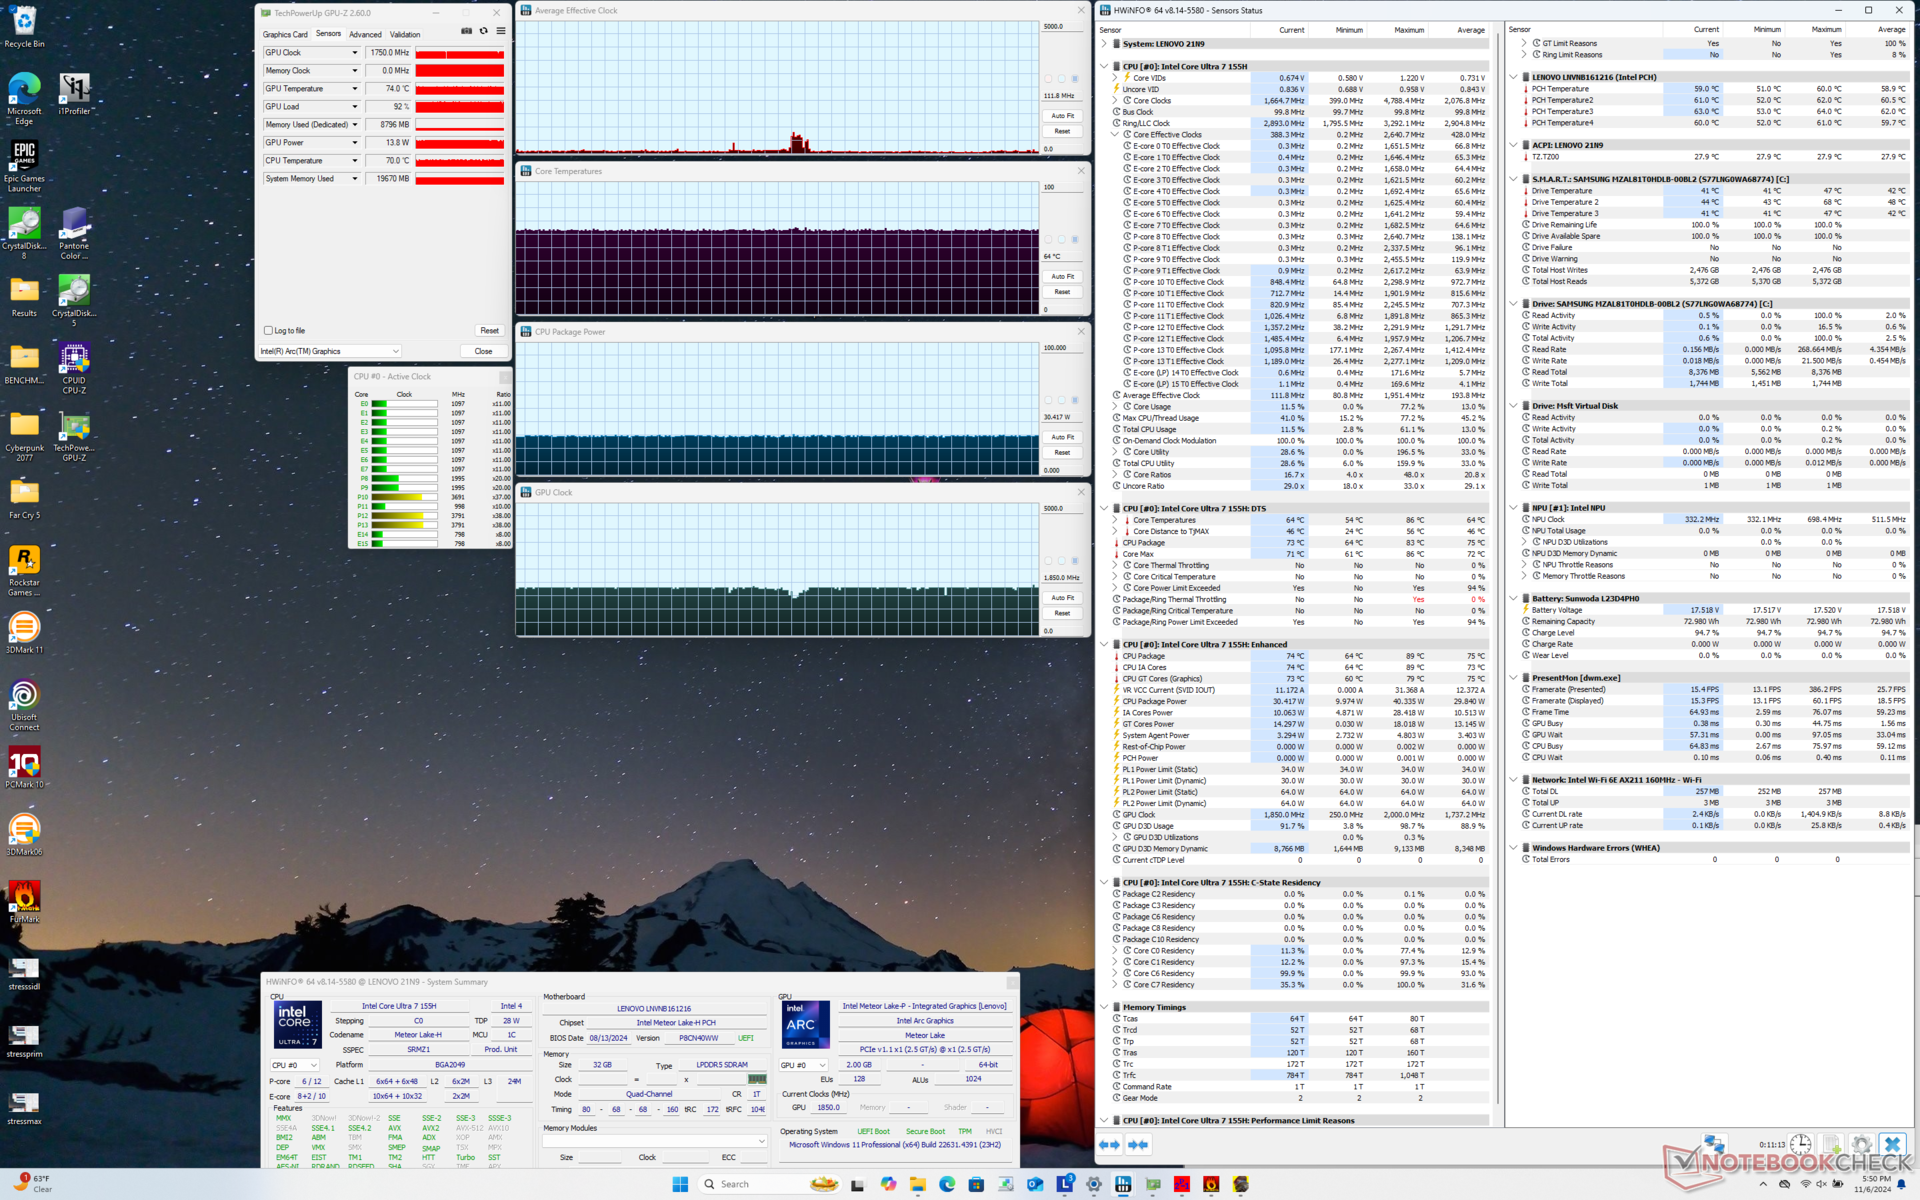
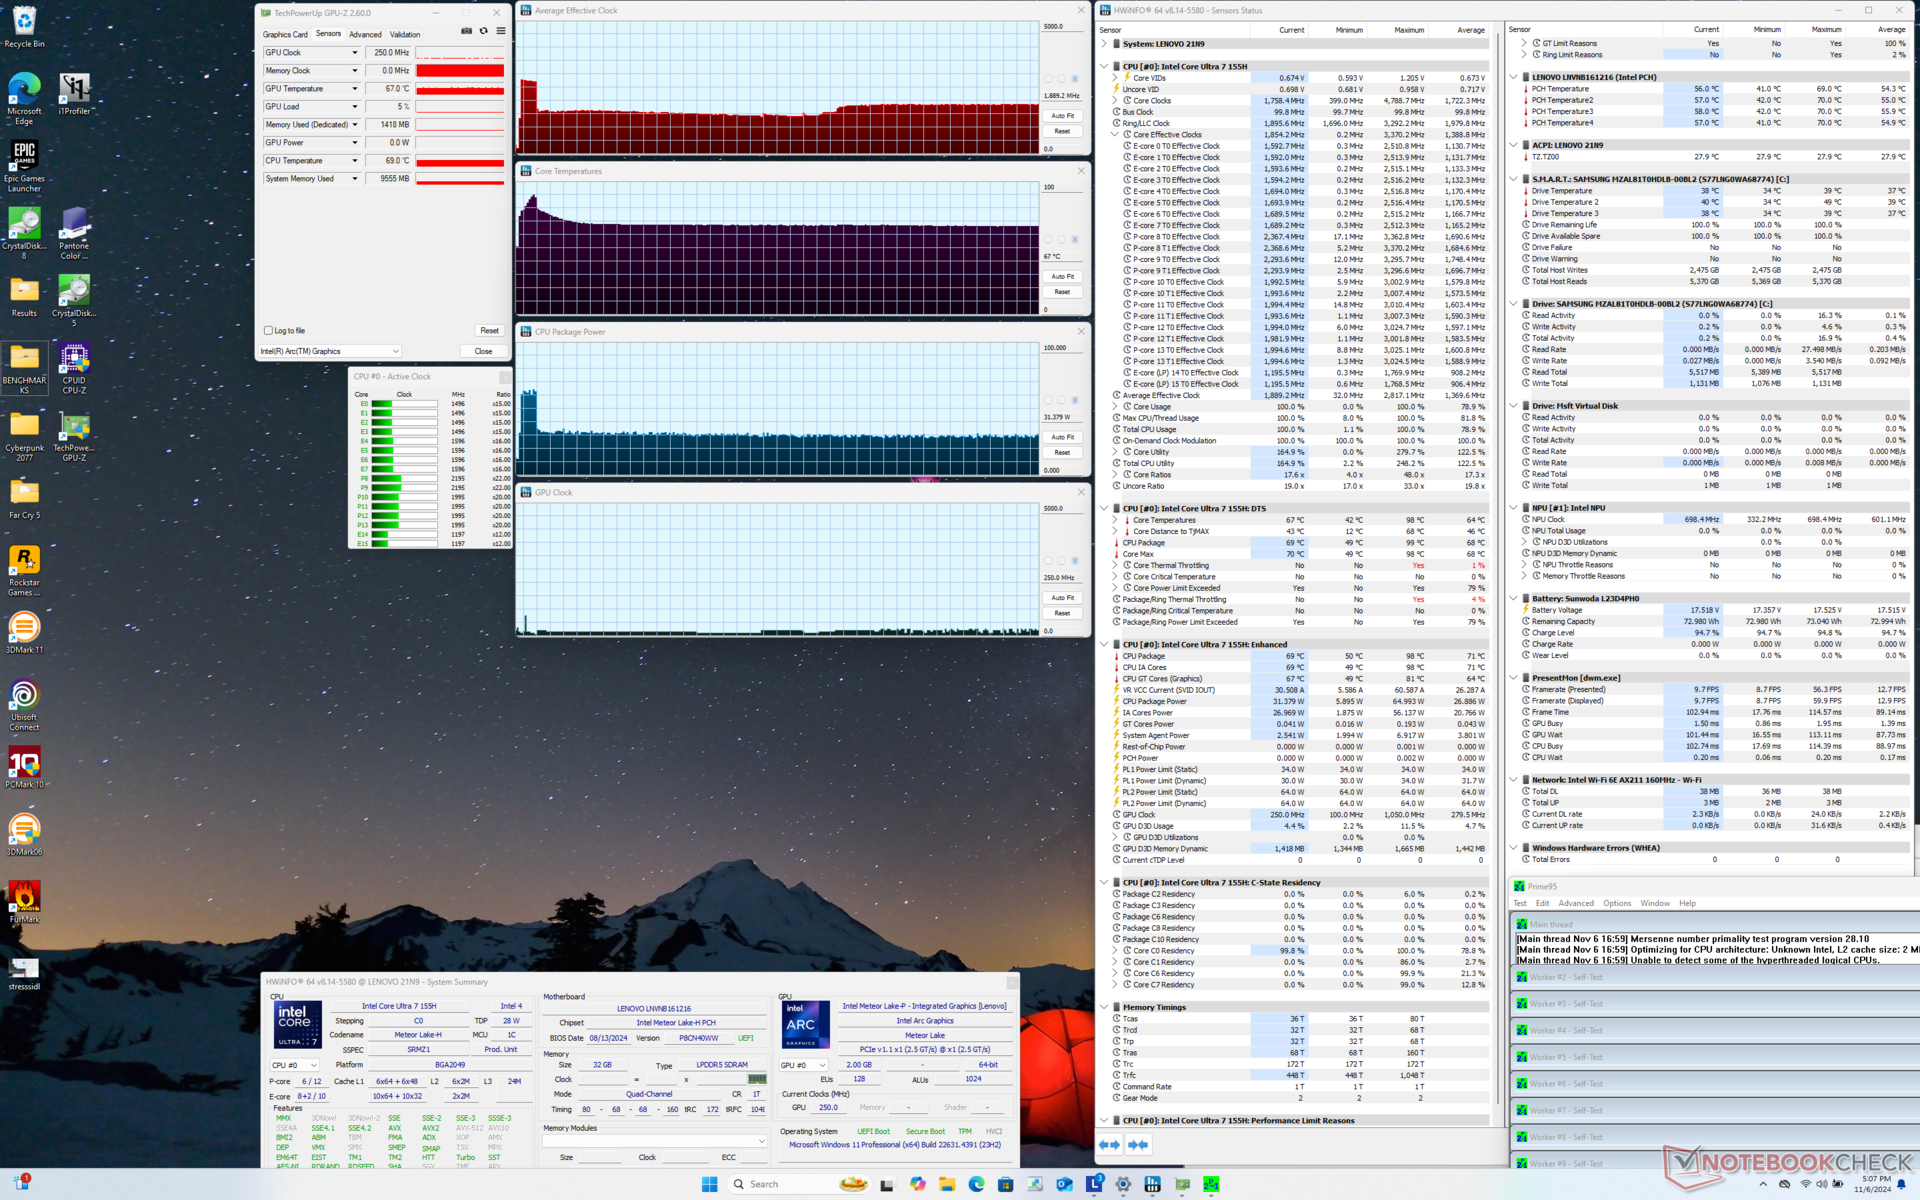
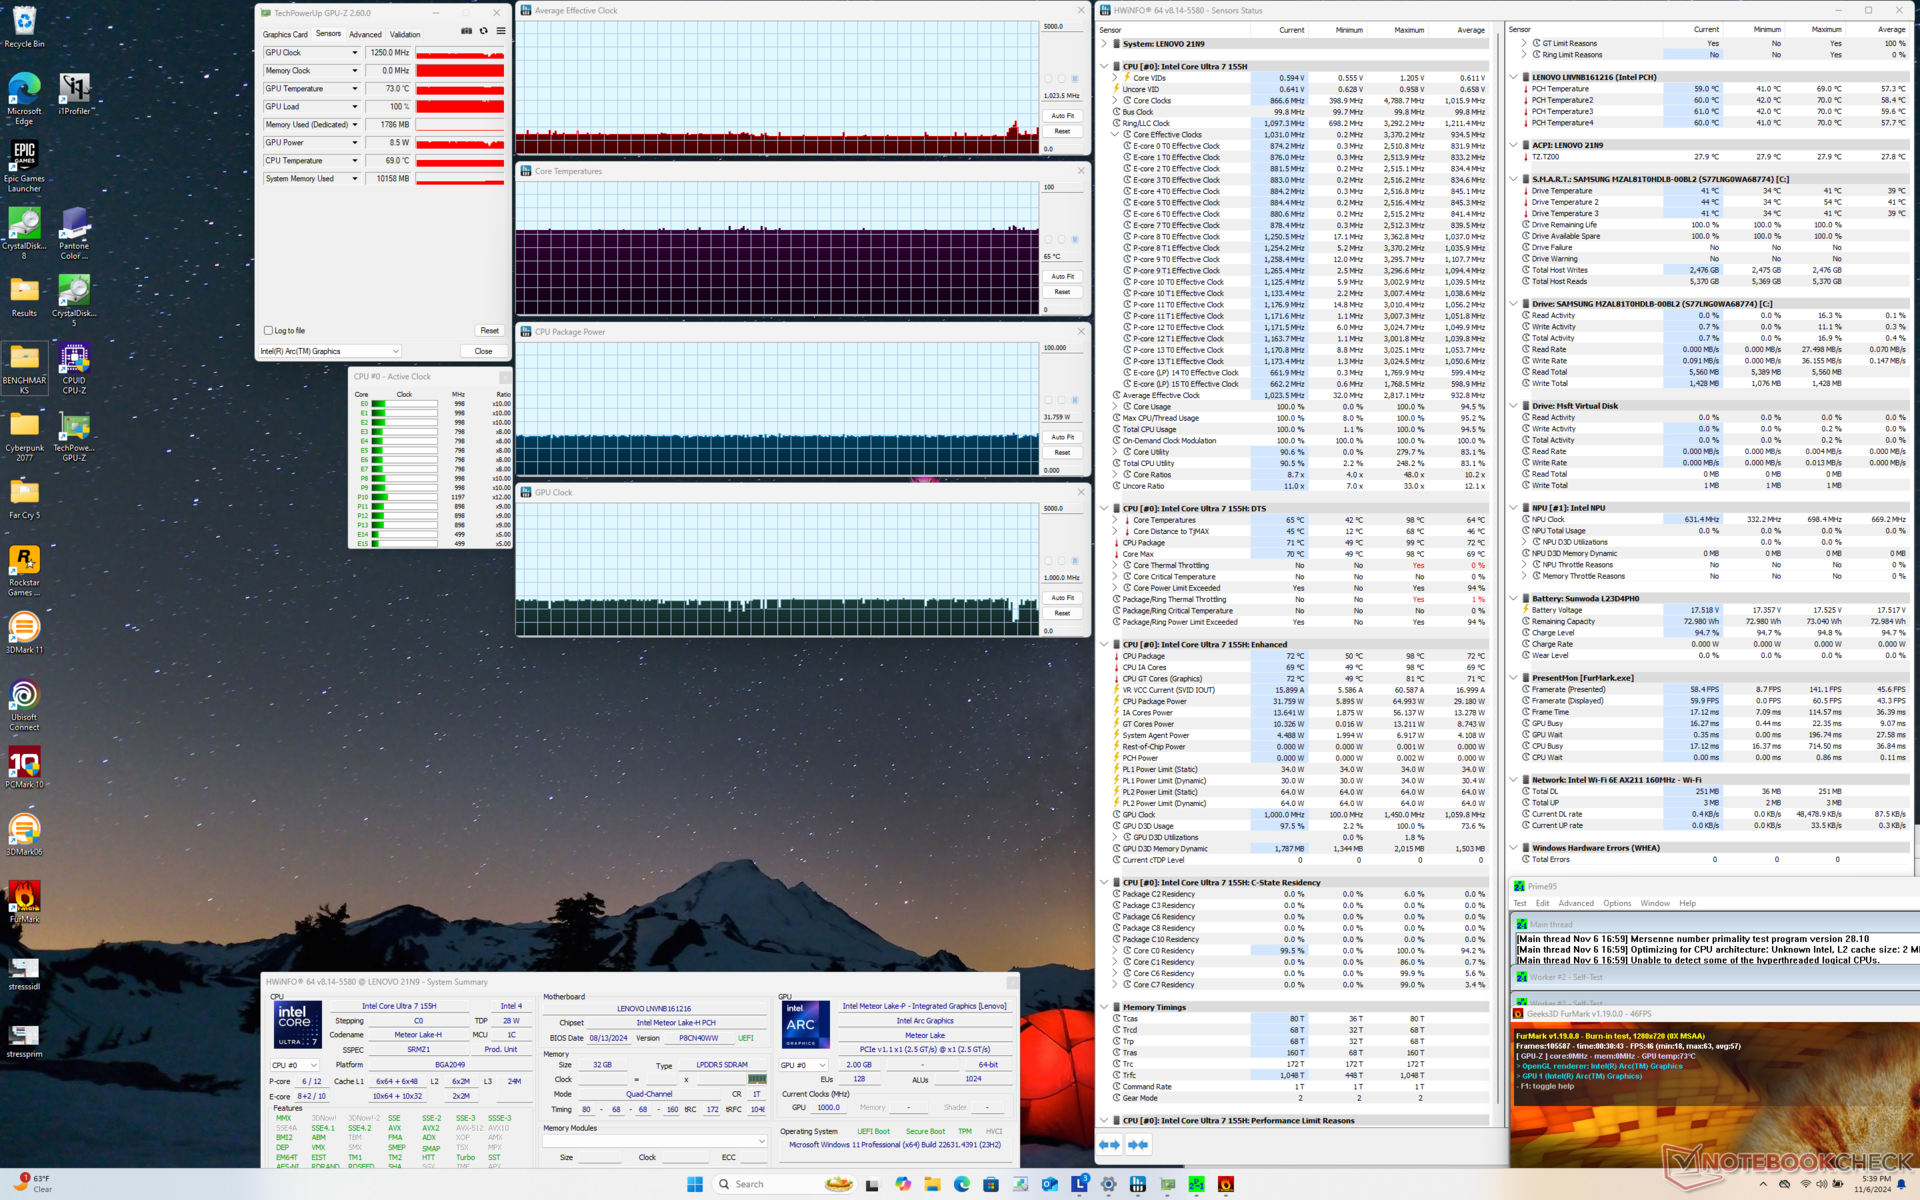
| Average CPU Clock (GHz) | GPU Clock (MHz) | Average CPU Temperature (°C) | |
| System Idle | -- | -- | 45 |
| Prime95 Stress | 1.9 | -- | 67 |
| Prime95 + FurMark Stress | 1.0 | 1000 | 65 |
| Cyberpunk 2077 Stress | 0.1 | 1850 | 64 |
System Performance
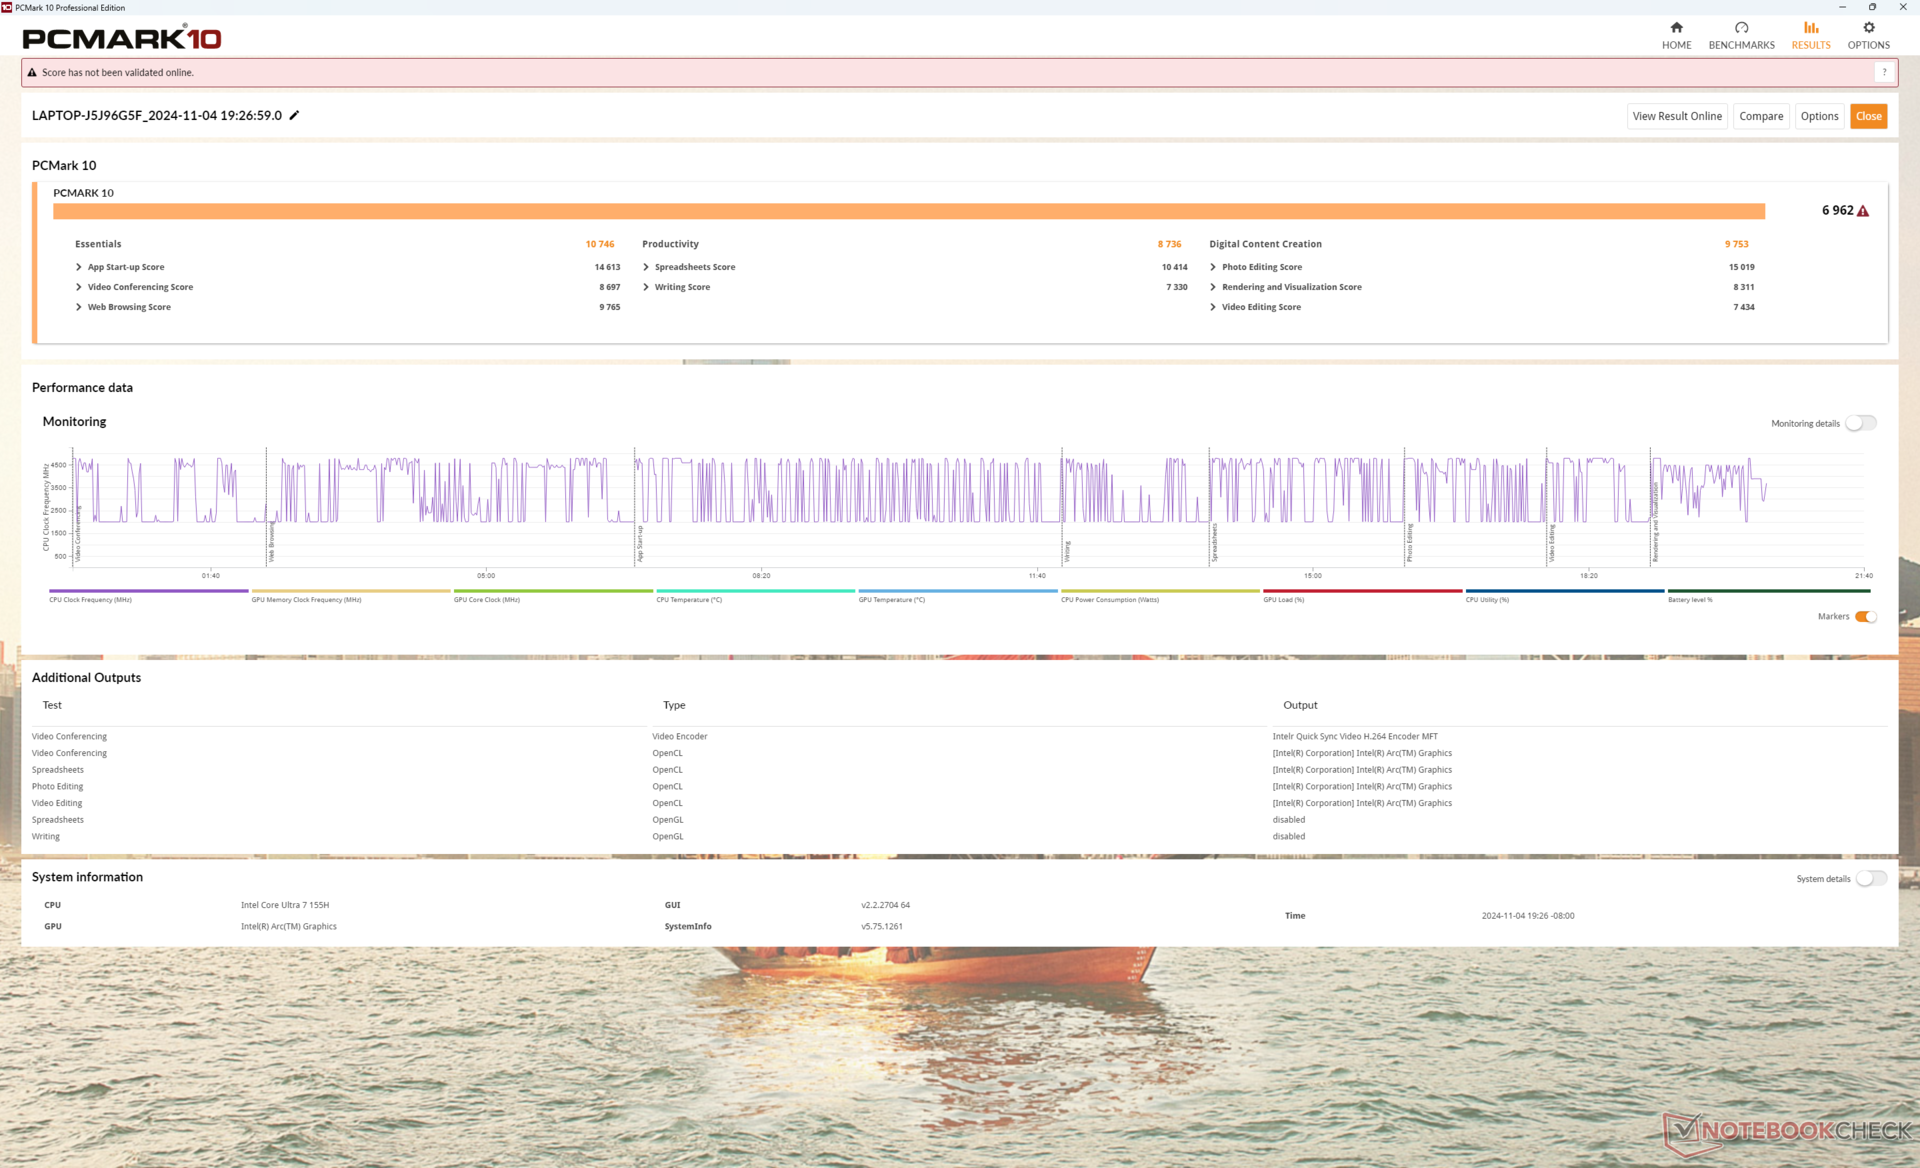
PCMark results are above average for the 14-inch category. Note that memory write speeds are slower when compared to systems with Lunar Lake CPUs like the Asus ExpertBook P5 P5405.
CrossMark: Overall | Productivity | Creativity | Responsiveness
WebXPRT 3: Overall
WebXPRT 4: Overall
Mozilla Kraken 1.1: Total
| PCMark 10 / Score | |
| HP EliteBook x360 1040 G11 | |
| Lenovo ThinkBook Plus Gen5 Hybrid | |
| Asus ExpertBook P5 P5405-NZ0102X | |
| Average Intel Core Ultra 7 155H, Intel Arc 8-Core iGPU (4809 - 7529, n=34) | |
| Acer Swift 14 AI SF14-51-58TU | |
| Dell Latitude 9450 2-in-1 | |
| Lenovo ThinkBook Plus Gen4 IRU | |
| PCMark 10 / Essentials | |
| Lenovo ThinkBook Plus Gen4 IRU | |
| Dell Latitude 9450 2-in-1 | |
| HP EliteBook x360 1040 G11 | |
| Lenovo ThinkBook Plus Gen5 Hybrid | |
| Average Intel Core Ultra 7 155H, Intel Arc 8-Core iGPU (7605 - 11289, n=34) | |
| Asus ExpertBook P5 P5405-NZ0102X | |
| Acer Swift 14 AI SF14-51-58TU | |
| PCMark 10 / Productivity | |
| Asus ExpertBook P5 P5405-NZ0102X | |
| Lenovo ThinkBook Plus Gen5 Hybrid | |
| HP EliteBook x360 1040 G11 | |
| Average Intel Core Ultra 7 155H, Intel Arc 8-Core iGPU (6042 - 10591, n=34) | |
| Acer Swift 14 AI SF14-51-58TU | |
| Dell Latitude 9450 2-in-1 | |
| Lenovo ThinkBook Plus Gen4 IRU | |
| PCMark 10 / Digital Content Creation | |
| Asus ExpertBook P5 P5405-NZ0102X | |
| Lenovo ThinkBook Plus Gen5 Hybrid | |
| HP EliteBook x360 1040 G11 | |
| Acer Swift 14 AI SF14-51-58TU | |
| Average Intel Core Ultra 7 155H, Intel Arc 8-Core iGPU (4985 - 10709, n=34) | |
| Dell Latitude 9450 2-in-1 | |
| Lenovo ThinkBook Plus Gen4 IRU | |
| CrossMark / Overall | |
| HP EliteBook x360 1040 G11 | |
| Asus ExpertBook P5 P5405-NZ0102X | |
| Average Intel Core Ultra 7 155H, Intel Arc 8-Core iGPU (1366 - 1903, n=34) | |
| Lenovo ThinkBook Plus Gen4 IRU | |
| Lenovo ThinkBook Plus Gen5 Hybrid | |
| Dell Latitude 9450 2-in-1 | |
| CrossMark / Productivity | |
| HP EliteBook x360 1040 G11 | |
| Asus ExpertBook P5 P5405-NZ0102X | |
| Lenovo ThinkBook Plus Gen4 IRU | |
| Average Intel Core Ultra 7 155H, Intel Arc 8-Core iGPU (1291 - 1798, n=33) | |
| Lenovo ThinkBook Plus Gen5 Hybrid | |
| Dell Latitude 9450 2-in-1 | |
| CrossMark / Creativity | |
| HP EliteBook x360 1040 G11 | |
| Asus ExpertBook P5 P5405-NZ0102X | |
| Average Intel Core Ultra 7 155H, Intel Arc 8-Core iGPU (1519 - 1929, n=33) | |
| Lenovo ThinkBook Plus Gen5 Hybrid | |
| Lenovo ThinkBook Plus Gen4 IRU | |
| Dell Latitude 9450 2-in-1 | |
| CrossMark / Responsiveness | |
| Lenovo ThinkBook Plus Gen4 IRU | |
| Average Intel Core Ultra 7 155H, Intel Arc 8-Core iGPU (939 - 1802, n=33) | |
| HP EliteBook x360 1040 G11 | |
| Lenovo ThinkBook Plus Gen5 Hybrid | |
| Dell Latitude 9450 2-in-1 | |
| Asus ExpertBook P5 P5405-NZ0102X | |
| WebXPRT 3 / Overall | |
| HP EliteBook x360 1040 G11 | |
| Lenovo ThinkBook Plus Gen4 IRU | |
| Dell Latitude 9450 2-in-1 | |
| Asus ExpertBook P5 P5405-NZ0102X | |
| Average Intel Core Ultra 7 155H, Intel Arc 8-Core iGPU (252 - 299, n=34) | |
| Lenovo ThinkBook Plus Gen5 Hybrid | |
| WebXPRT 4 / Overall | |
| HP EliteBook x360 1040 G11 | |
| Asus ExpertBook P5 P5405-NZ0102X | |
| Lenovo ThinkBook Plus Gen4 IRU | |
| Dell Latitude 9450 2-in-1 | |
| Average Intel Core Ultra 7 155H, Intel Arc 8-Core iGPU (166.4 - 309, n=29) | |
| Acer Swift 14 AI SF14-51-58TU | |
| Acer Swift 14 AI SF14-51-58TU | |
| Lenovo ThinkBook Plus Gen5 Hybrid | |
| Mozilla Kraken 1.1 / Total | |
| Acer Swift 14 AI SF14-51-58TU | |
| Acer Swift 14 AI SF14-51-58TU | |
| Average Intel Core Ultra 7 155H, Intel Arc 8-Core iGPU (517 - 614, n=35) | |
| Lenovo ThinkBook Plus Gen5 Hybrid | |
| Dell Latitude 9450 2-in-1 | |
| Asus ExpertBook P5 P5405-NZ0102X | |
| HP EliteBook x360 1040 G11 | |
| Lenovo ThinkBook Plus Gen4 IRU | |
* ... smaller is better
| PCMark 10 Score | 6962 points | |
Help | ||
| AIDA64 / Memory Copy | |
| Asus ExpertBook P5 P5405-NZ0102X | |
| Acer Swift 14 AI SF14-51-58TU | |
| Lenovo ThinkBook Plus Gen5 Hybrid | |
| HP EliteBook x360 1040 G11 | |
| Dell Latitude 9450 2-in-1 | |
| Average Intel Core Ultra 7 155H (62397 - 96791, n=50) | |
| Lenovo ThinkBook Plus Gen4 IRU | |
| AIDA64 / Memory Read | |
| Asus ExpertBook P5 P5405-NZ0102X | |
| HP EliteBook x360 1040 G11 | |
| Lenovo ThinkBook Plus Gen5 Hybrid | |
| Acer Swift 14 AI SF14-51-58TU | |
| Average Intel Core Ultra 7 155H (60544 - 90647, n=50) | |
| Dell Latitude 9450 2-in-1 | |
| Lenovo ThinkBook Plus Gen4 IRU | |
| AIDA64 / Memory Write | |
| Asus ExpertBook P5 P5405-NZ0102X | |
| Acer Swift 14 AI SF14-51-58TU | |
| Lenovo ThinkBook Plus Gen4 IRU | |
| HP EliteBook x360 1040 G11 | |
| Average Intel Core Ultra 7 155H (58692 - 93451, n=50) | |
| Lenovo ThinkBook Plus Gen5 Hybrid | |
| Dell Latitude 9450 2-in-1 | |
| AIDA64 / Memory Latency | |
| Lenovo ThinkBook Plus Gen5 Hybrid | |
| Average Intel Core Ultra 7 155H (116.2 - 233, n=50) | |
| Dell Latitude 9450 2-in-1 | |
| HP EliteBook x360 1040 G11 | |
| Lenovo ThinkBook Plus Gen4 IRU | |
| Asus ExpertBook P5 P5405-NZ0102X | |
| Acer Swift 14 AI SF14-51-58TU | |
* ... smaller is better
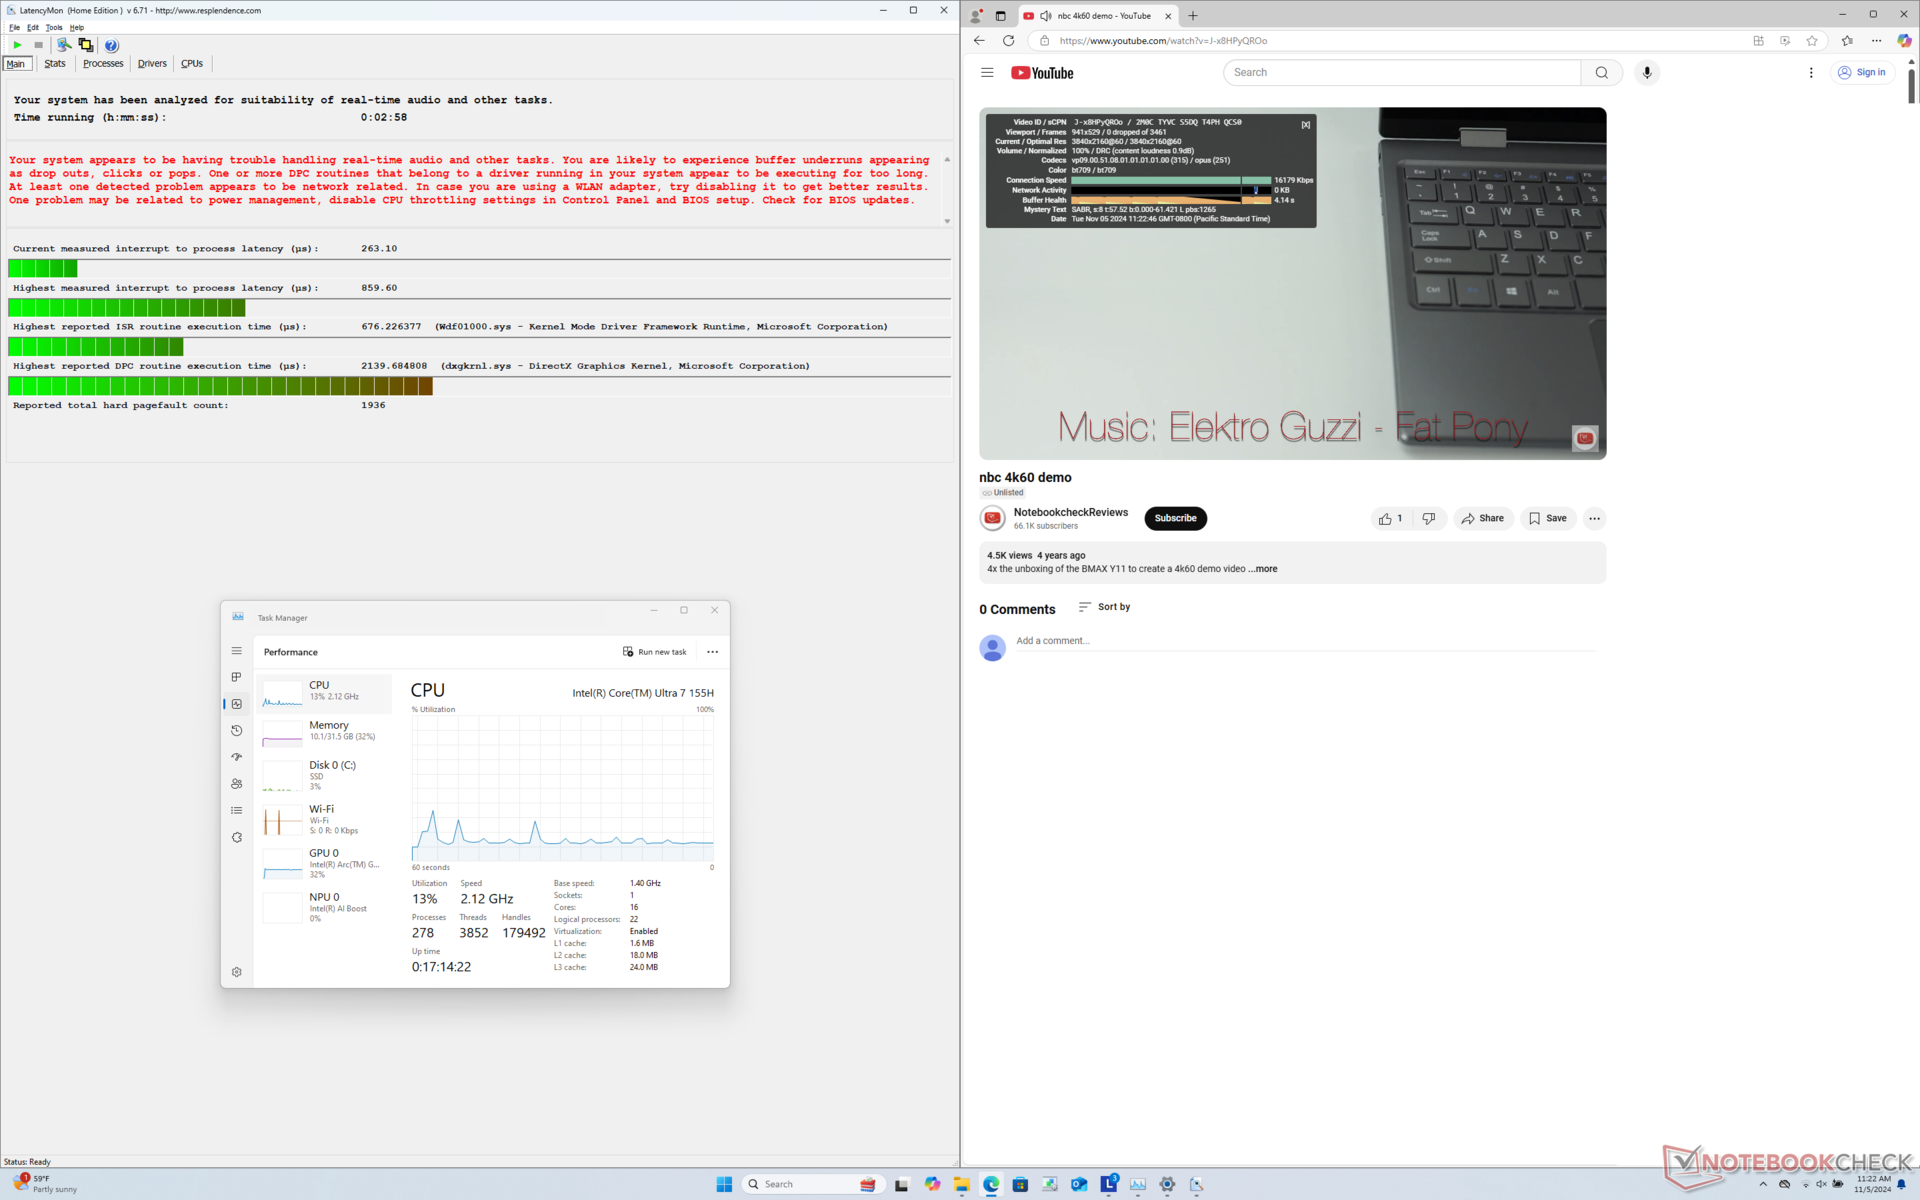
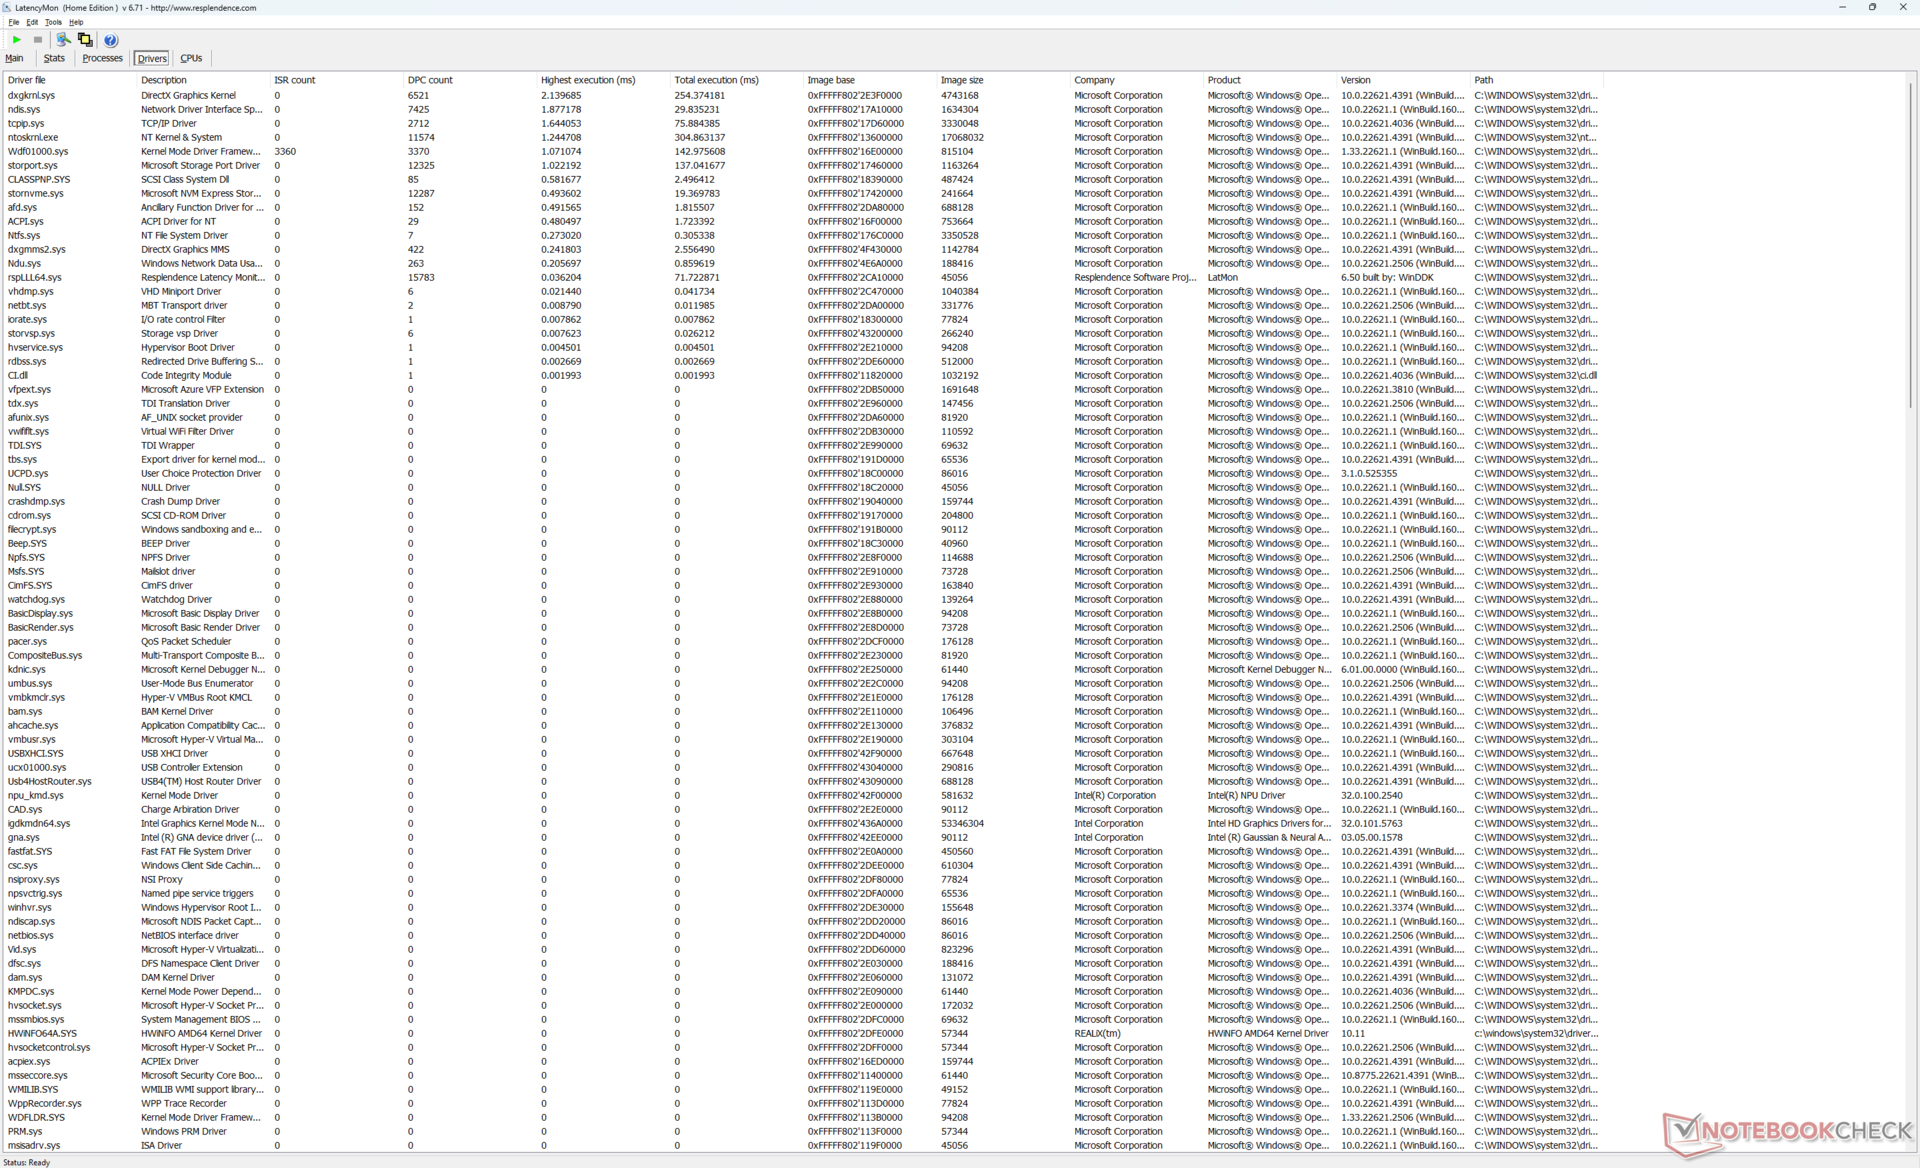
DPC Latency
4K60 video playback is perfect with no dropped frames recorded.
| DPC Latencies / LatencyMon - interrupt to process latency (max), Web, Youtube, Prime95 | |
| HP EliteBook x360 1040 G11 | |
| Dell Latitude 9450 2-in-1 | |
| Acer Swift 14 AI SF14-51-58TU | |
| Lenovo ThinkBook Plus Gen4 IRU | |
| Lenovo ThinkBook Plus Gen5 Hybrid | |
* ... smaller is better
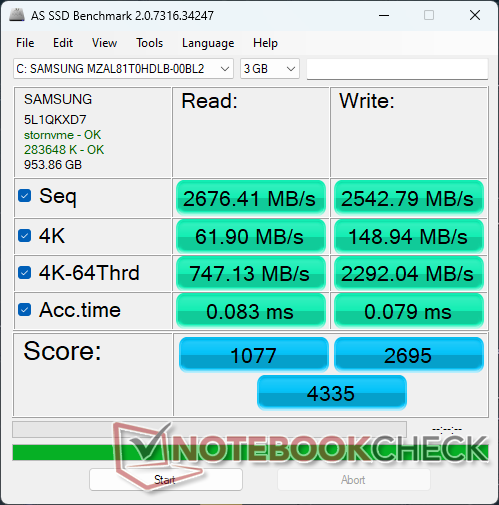
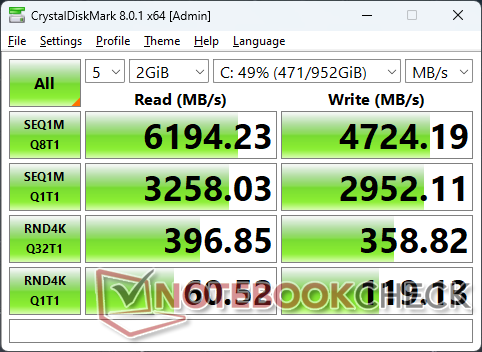
Storage Devices
The system ships with the same Samsung PM9C1a MZAL81T0HDLB M.2 2242 NVMe SSD as found on the Lenovo ThinkPad E16 Gen 2. Full length 2280 drives are supported, but there is no support for secondary drives.
If in tablet mode for Android, there is an internal 256 GB UFX 3.1 SSD with support for Lenovo Hybrid Folders to more easily access the same pictures, documents, spreadsheets, or other files between Android and Windows.

* ... smaller is better
Disk Throttling: DiskSpd Read Loop, Queue Depth 8
GPU Performance
Raw graphics performance from the integrated Arc 8 is on the upper-end of the spectrum for a 14-inch convertible as most others in this size category run on Core U-series CPUs with Iris Xe graphics instead. Gaming performance is comparable to the competing Radeon 680M or 780M, but newer 14-inch laptops with the AMD Radeon 890M or Arc Graphics 140V will still outperform our ThinkBook. Most games will not run well at the native 1800p resolution and so you'll have to tone them down to 1200p with low-medium settings for more playable frame rates.
| 3DMark 11 Performance | 12892 points | |
| 3DMark Cloud Gate Standard Score | 31965 points | |
| 3DMark Fire Strike Score | 8582 points | |
| 3DMark Time Spy Score | 3877 points | |
| 3DMark Steel Nomad Score | 784 points | |
Help | ||
* ... smaller is better
| Cyberpunk 2077 - 1920x1080 Ultra Preset (FSR off) | |
| Asus ExpertBook P5 P5405-NZ0102X | |
| Acer Swift 14 AI SF14-51-58TU | |
| HP EliteBook x360 1040 G11 | |
| Lenovo ThinkBook Plus Gen5 Hybrid | |
| Dell Latitude 9450 2-in-1 | |
| Baldur's Gate 3 - 1920x1080 Ultra Preset AA:T | |
| Asus ExpertBook P5 P5405-NZ0102X | |
| Lenovo ThinkBook Plus Gen5 Hybrid | |
| HP EliteBook x360 1040 G11 | |
| Acer Swift 14 AI SF14-51-58TU | |
| Dell Latitude 9450 2-in-1 | |
| GTA V - 1920x1080 Highest AA:4xMSAA + FX AF:16x | |
| Asus ExpertBook P5 P5405-NZ0102X | |
| Acer Swift 14 AI SF14-51-58TU | |
| Lenovo ThinkBook Plus Gen5 Hybrid | |
| HP EliteBook x360 1040 G11 | |
| Lenovo ThinkBook Plus Gen4 IRU | |
| Final Fantasy XV Benchmark - 1920x1080 High Quality | |
| Asus ExpertBook P5 P5405-NZ0102X | |
| Lenovo ThinkBook Plus Gen5 Hybrid | |
| Acer Swift 14 AI SF14-51-58TU | |
| HP EliteBook x360 1040 G11 | |
| Dell Latitude 9450 2-in-1 | |
| Lenovo ThinkBook Plus Gen4 IRU | |
| Strange Brigade - 1920x1080 ultra AA:ultra AF:16 | |
| Lenovo ThinkBook Plus Gen5 Hybrid | |
| Acer Swift 14 AI SF14-51-58TU | |
| HP EliteBook x360 1040 G11 | |
| Dell Latitude 9450 2-in-1 | |
| Lenovo ThinkBook Plus Gen4 IRU | |
| Dota 2 Reborn - 1920x1080 ultra (3/3) best looking | |
| Asus ExpertBook P5 P5405-NZ0102X | |
| HP EliteBook x360 1040 G11 | |
| Acer Swift 14 AI SF14-51-58TU | |
| Lenovo ThinkBook Plus Gen5 Hybrid | |
| Lenovo ThinkBook Plus Gen4 IRU | |
| Dell Latitude 9450 2-in-1 | |
| X-Plane 11.11 - 1920x1080 high (fps_test=3) | |
| HP EliteBook x360 1040 G11 | |
| Asus ExpertBook P5 P5405-NZ0102X | |
| Lenovo ThinkBook Plus Gen4 IRU | |
| Lenovo ThinkBook Plus Gen5 Hybrid | |
| Acer Swift 14 AI SF14-51-58TU | |
| Dell Latitude 9450 2-in-1 | |
Cyberpunk 2077 ultra FPS Chart
| low | med. | high | ultra | |
|---|---|---|---|---|
| GTA V (2015) | 141 | 133.9 | 48.6 | 20.2 |
| Dota 2 Reborn (2015) | 101.8 | 81.9 | 74.9 | 66.6 |
| Final Fantasy XV Benchmark (2018) | 69.3 | 41.3 | 30.6 | |
| X-Plane 11.11 (2018) | 50.5 | 39.9 | 32.7 | |
| Far Cry 5 (2018) | 68 | 48 | 45 | 40 |
| Strange Brigade (2018) | 188.9 | 85.2 | 69.3 | 53.2 |
| Tiny Tina's Wonderlands (2022) | 51.2 | 43.4 | 31.6 | 25.9 |
| F1 22 (2022) | 80.6 | 73.8 | 55.7 | 16.1 |
| Baldur's Gate 3 (2023) | 32.4 | 25.9 | 22.9 | 22.1 |
| Cyberpunk 2077 (2023) | 32 | 26.7 | 22.9 | 20.7 |
Emissions
System Noise
The system is very quiet considering its 14-inch form factor and Core Ultra H-series CPU. The fans are silent when browsing or video streaming and they would remain silent until the very end of the first benchmark scene of 3DMark 06. Even then, the fans would only reach 28 dB(A) against a silent background of 23 dB(A).
Fan noise would ramp up to 40.5 dB(A) when running more demanding loads like games. Running on Balanced (Adaptive) mode or Performance mode would make no difference to noise levels.

Noise level
| Idle |
| 23.2 / 23.2 / 23.2 dB(A) |
| Load |
| 28 / 40.4 dB(A) |
 | ||
30 dB silent 40 dB(A) audible 50 dB(A) loud |
||
min: | ||
| Lenovo ThinkBook Plus Gen5 Hybrid Arc 8-Core, Ultra 7 155H, Samsung PM9C1a MZAL81T0HDLB | Lenovo ThinkBook Plus Gen4 IRU Iris Xe G7 96EUs, i7-1355U, SK hynix PC801 HFS512GEJ9X115N | Acer Swift 14 AI SF14-51-58TU Arc 130V, Core Ultra 5 226V, Micron 2550 512GB | Asus ExpertBook P5 P5405-NZ0102X Arc 140V, Core Ultra 7 258V, Western Digital PC SN5000S SDEQNSJ-1T00 | HP EliteBook x360 1040 G11 Arc 8-Core, Ultra 7 165H, Kioxia XG8 KXG80ZNV512G | Dell Latitude 9450 2-in-1 Graphics 4-Core iGPU (Arrow Lake), Ultra 7 165U | |
|---|---|---|---|---|---|---|
| Noise | -10% | -14% | 3% | -5% | -9% | |
| off / environment * (dB) | 23.2 | 24.3 -5% | 25 -8% | 24.1 -4% | 23 1% | 23.9 -3% |
| Idle Minimum * (dB) | 23.2 | 24.3 -5% | 25 -8% | 24.1 -4% | 23 1% | 23.9 -3% |
| Idle Average * (dB) | 23.2 | 24.3 -5% | 26 -12% | 24.1 -4% | 23 1% | 23.9 -3% |
| Idle Maximum * (dB) | 23.2 | 24.3 -5% | 29 -25% | 24.1 -4% | 23 1% | 23.9 -3% |
| Load Average * (dB) | 28 | 38.2 -36% | 40 -43% | 31.2 -11% | 31 -11% | 36.4 -30% |
| Cyberpunk 2077 ultra * (dB) | 40.5 | 40 1% | 31.7 22% | 45.7 -13% | ||
| Load Maximum * (dB) | 40.4 | 41.8 -3% | 41 -1% | 31.2 23% | 47.7 -18% | 44.7 -11% |
| Witcher 3 ultra * (dB) | 41.9 | 44.7 |
* ... smaller is better
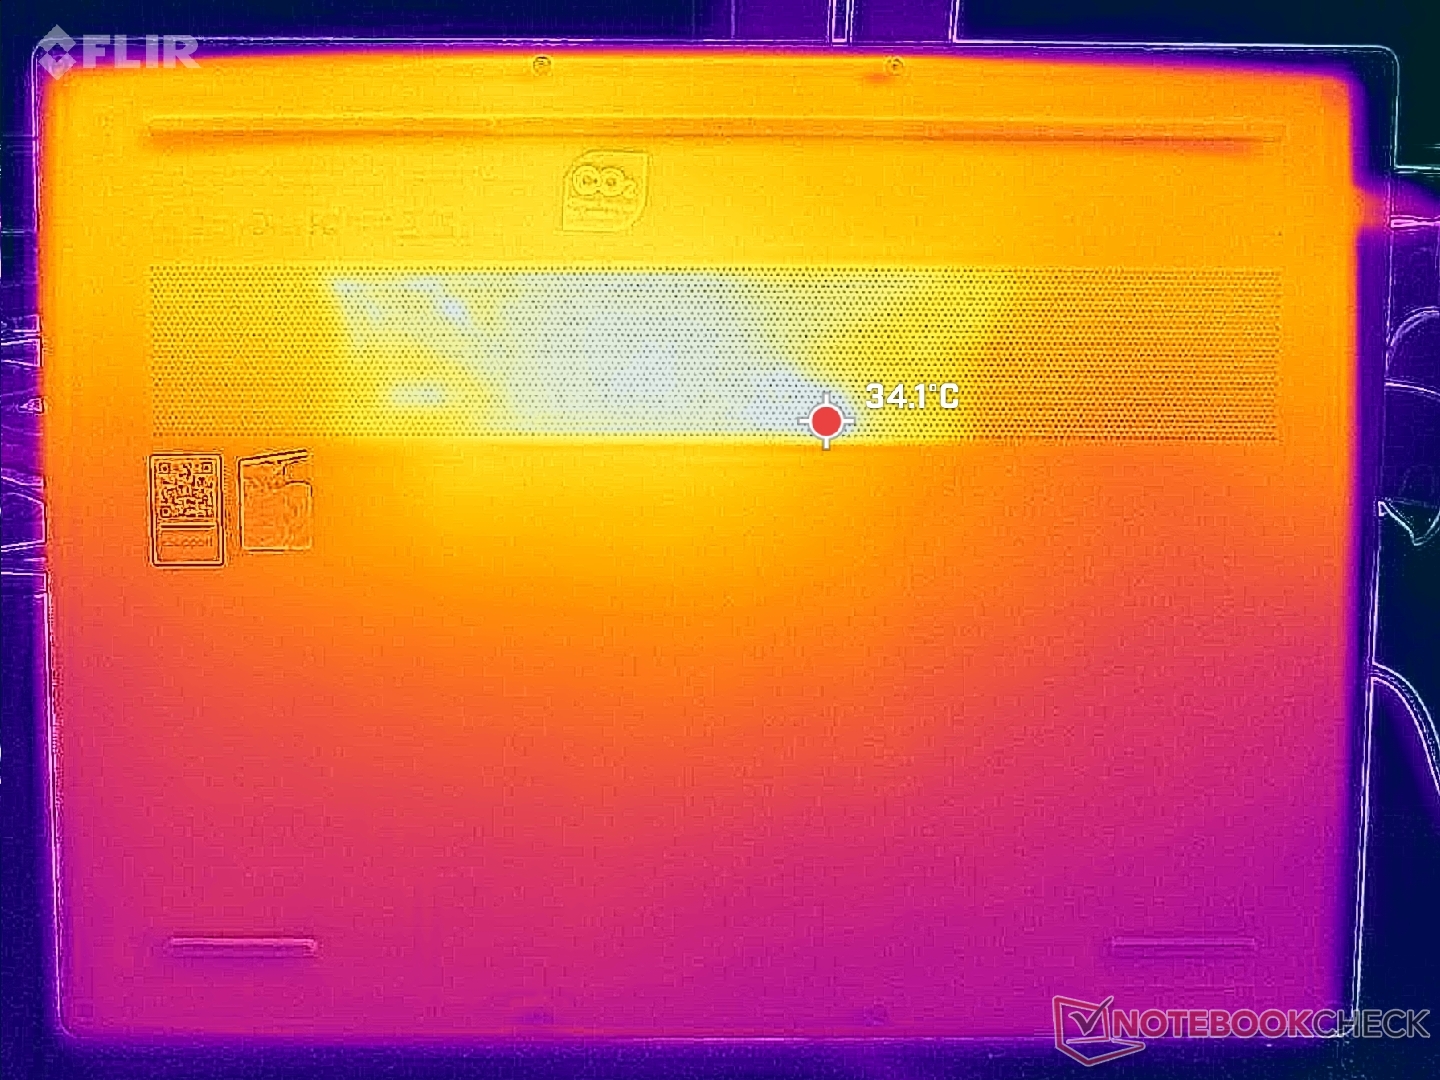
Temperature
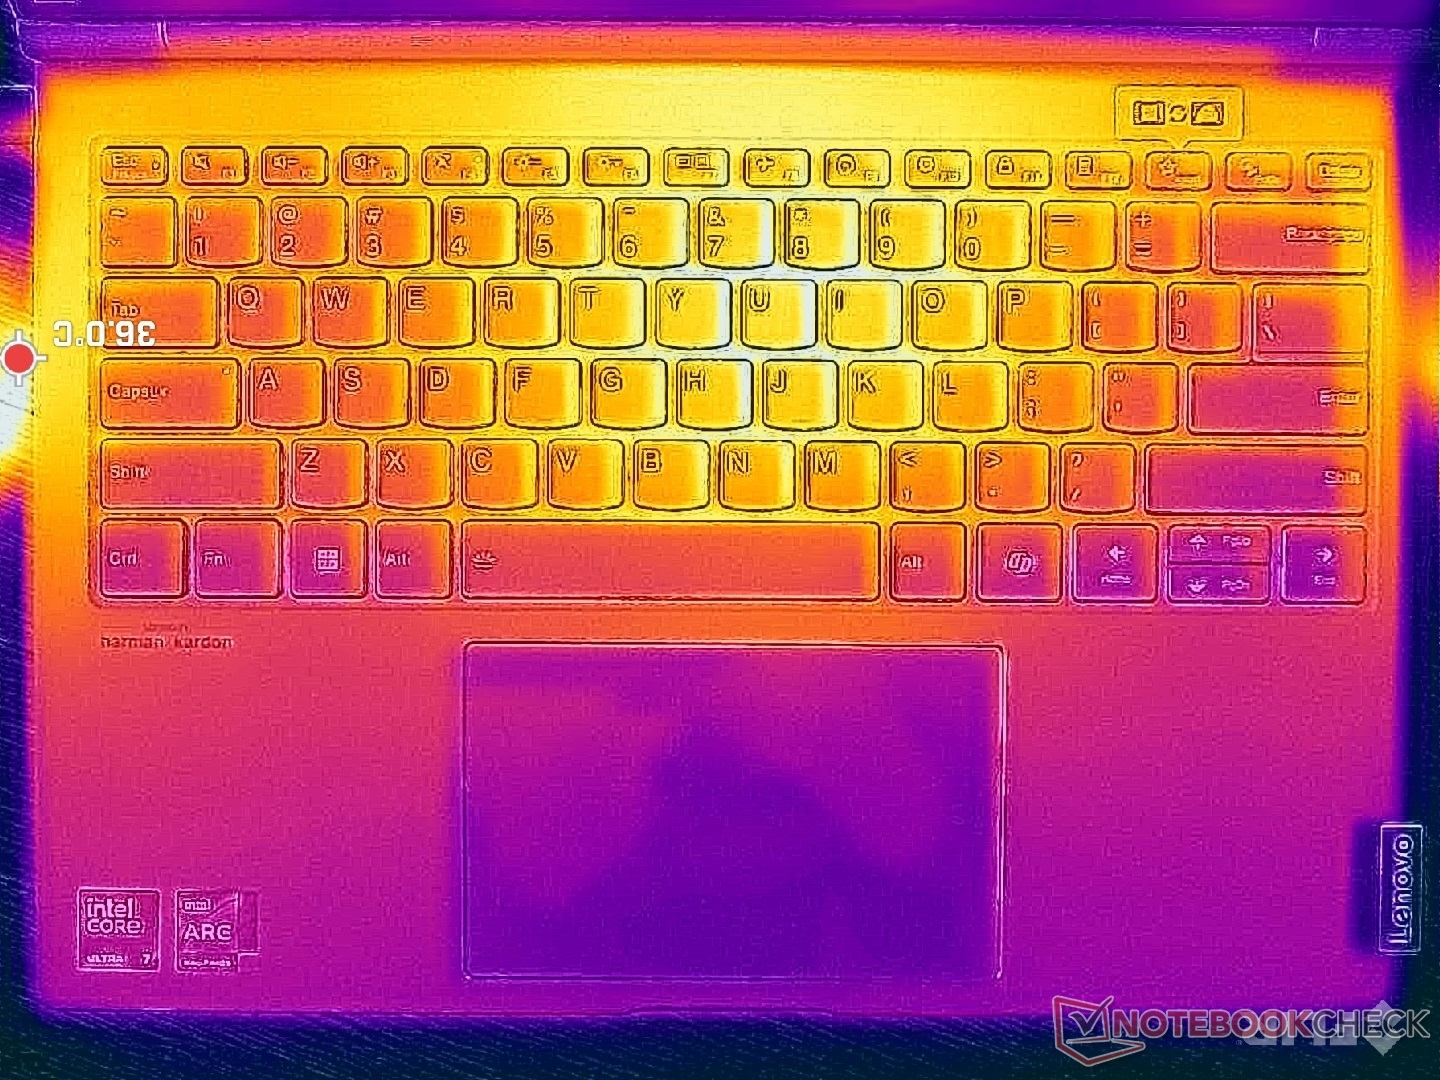
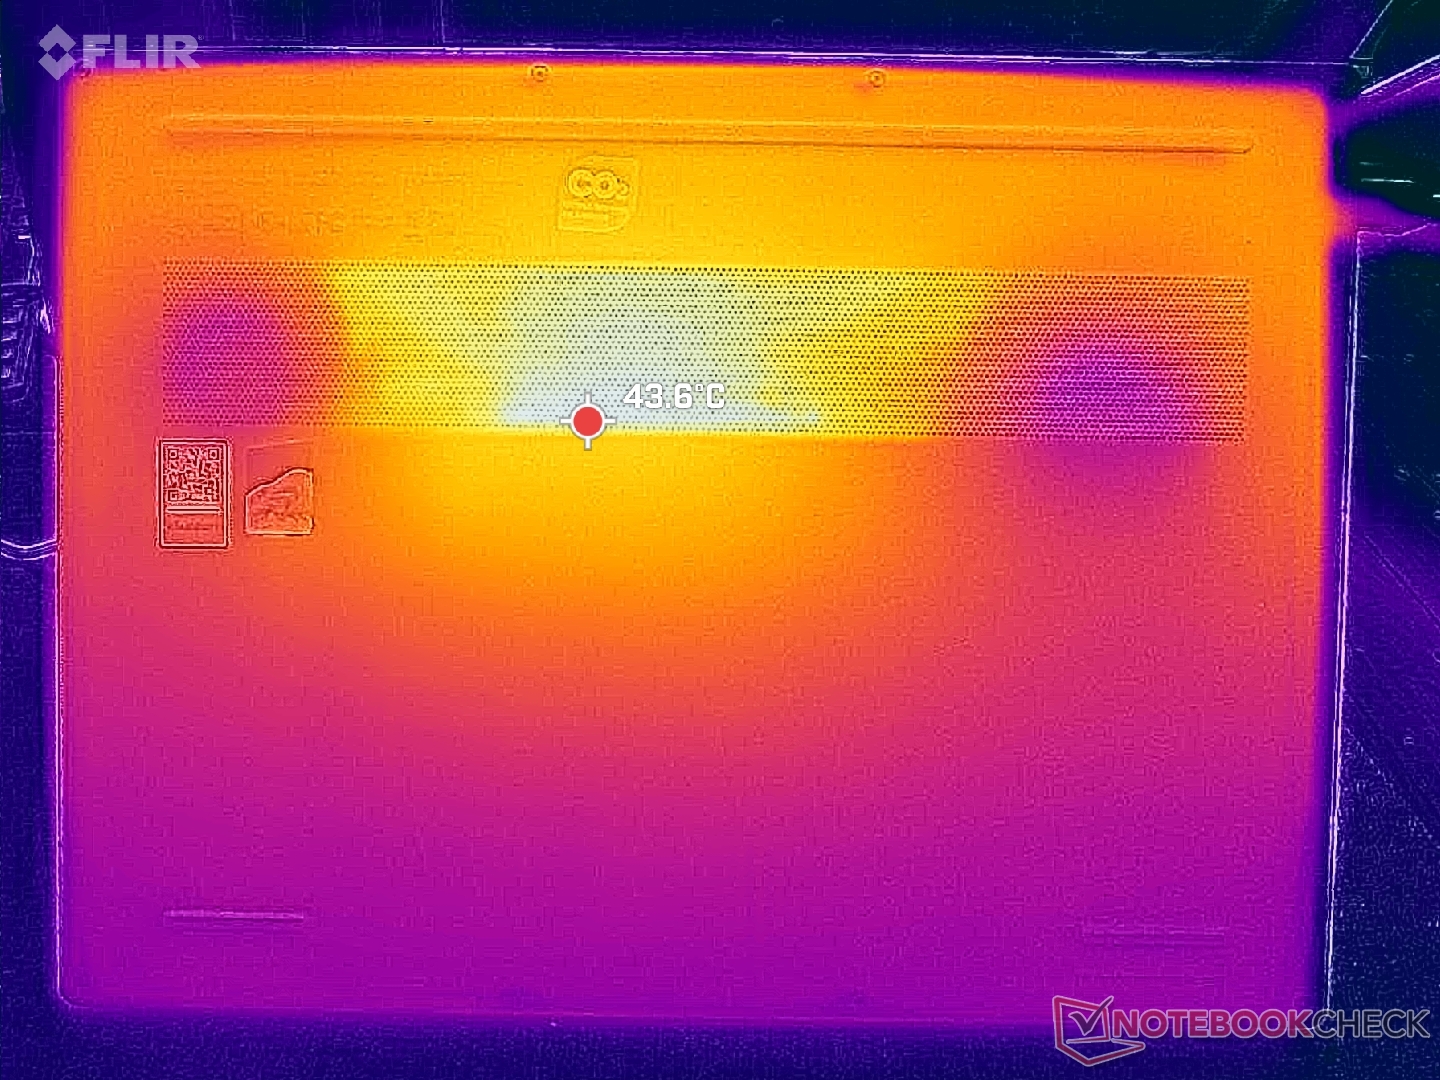
Surface temperature hot spots can reach over 35 C and 42 C on the keyboard base and bottom cover, respectively, compared to ~45 C on the Acer Swift 14 AI. The extended rear design of the ThinkBook Plus Gen 5 Hybrid allows for a larger cooling solution.
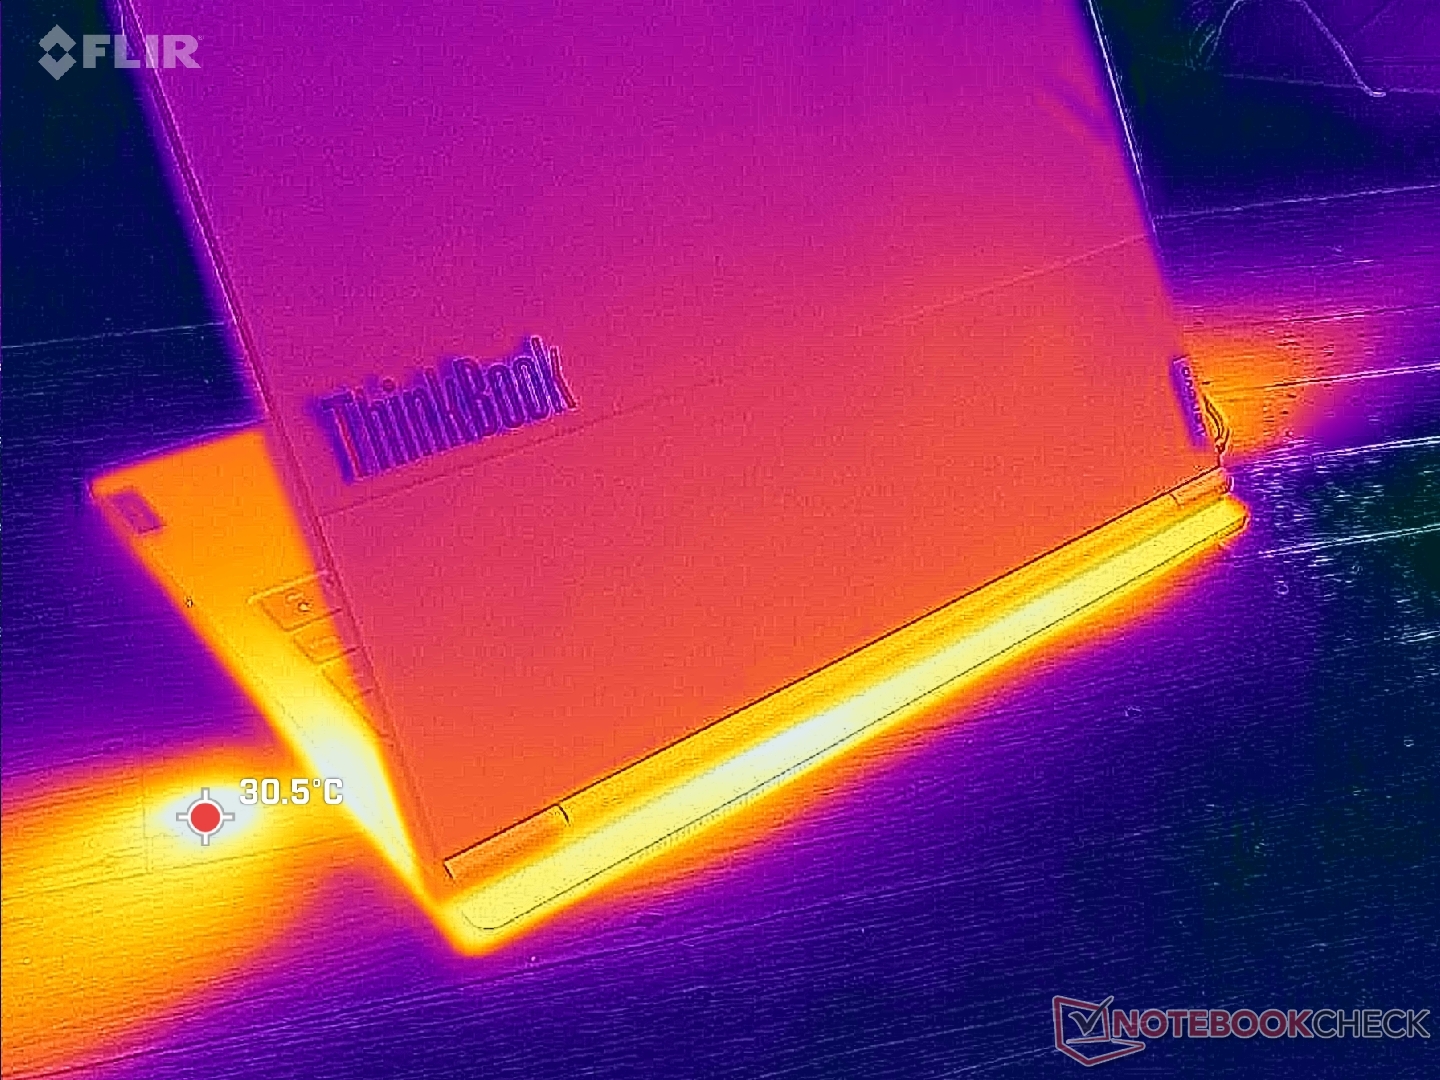
(+) The maximum temperature on the upper side is 35.6 °C / 96 F, compared to the average of 35.4 °C / 96 F, ranging from 19.6 to 60 °C for the class Convertible.
(±) The bottom heats up to a maximum of 41.6 °C / 107 F, compared to the average of 36.9 °C / 98 F
(+) In idle usage, the average temperature for the upper side is 28.2 °C / 83 F, compared to the device average of 30.3 °C / 87 F.
(+) The palmrests and touchpad are cooler than skin temperature with a maximum of 27.2 °C / 81 F and are therefore cool to the touch.
(±) The average temperature of the palmrest area of similar devices was 28 °C / 82.4 F (+0.8 °C / 1.4 F).

| Lenovo ThinkBook Plus Gen5 Hybrid Intel Core Ultra 7 155H, Intel Arc 8-Core iGPU | Lenovo ThinkBook Plus Gen4 IRU Intel Core i7-1355U, Intel Iris Xe Graphics G7 96EUs | Acer Swift 14 AI SF14-51-58TU Intel Core Ultra 5 226V, Intel Arc Graphics 130V | Asus ExpertBook P5 P5405-NZ0102X Intel Core Ultra 7 258V, Intel Arc Graphics 140V | HP EliteBook x360 1040 G11 Intel Core Ultra 7 165H, Intel Arc 8-Core iGPU | Dell Latitude 9450 2-in-1 Intel Core Ultra 7 165U, Intel Graphics 4-Core iGPU (Meteor / Arrow Lake) | |
|---|---|---|---|---|---|---|
| Heat | 9% | 2% | 5% | 6% | 10% | |
| Maximum Upper Side * (°C) | 35.6 | 34.2 4% | 41 -15% | 41.6 -17% | 39 -10% | 35.4 1% |
| Maximum Bottom * (°C) | 41.6 | 35.8 14% | 45 -8% | 43.2 -4% | 43.6 -5% | 37.8 9% |
| Idle Upper Side * (°C) | 30.4 | 28.6 6% | 26 14% | 25.7 15% | 24.4 20% | 27.2 11% |
| Idle Bottom * (°C) | 34 | 30.4 11% | 28 18% | 25.3 26% | 27.4 19% | 28.2 17% |
* ... smaller is better
Speakers
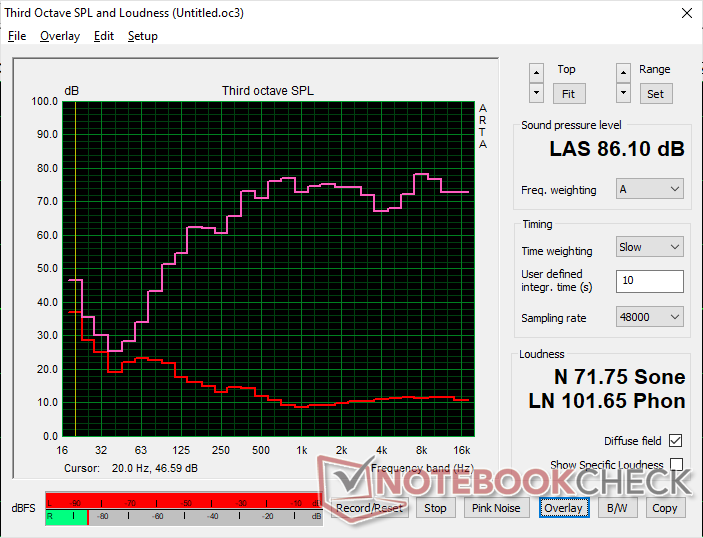
Lenovo ThinkBook Plus Gen5 Hybrid audio analysis
(+) | speakers can play relatively loud (86.1 dB)
Bass 100 - 315 Hz
(±) | reduced bass - on average 13.3% lower than median
(+) | bass is linear (6.9% delta to prev. frequency)
Mids 400 - 2000 Hz
(+) | balanced mids - only 2% away from median
(+) | mids are linear (4.7% delta to prev. frequency)
Highs 2 - 16 kHz
(+) | balanced highs - only 3.3% away from median
(+) | highs are linear (4.7% delta to prev. frequency)
Overall 100 - 16.000 Hz
(+) | overall sound is linear (8.7% difference to median)
Compared to same class
» 3% of all tested devices in this class were better, 1% similar, 96% worse
» The best had a delta of 6%, average was 20%, worst was 57%
Compared to all devices tested
» 3% of all tested devices were better, 1% similar, 97% worse
» The best had a delta of 4%, average was 24%, worst was 134%
Apple MacBook Pro 16 2021 M1 Pro audio analysis
(+) | speakers can play relatively loud (84.7 dB)
Bass 100 - 315 Hz
(+) | good bass - only 3.8% away from median
(+) | bass is linear (5.2% delta to prev. frequency)
Mids 400 - 2000 Hz
(+) | balanced mids - only 1.3% away from median
(+) | mids are linear (2.1% delta to prev. frequency)
Highs 2 - 16 kHz
(+) | balanced highs - only 1.9% away from median
(+) | highs are linear (2.7% delta to prev. frequency)
Overall 100 - 16.000 Hz
(+) | overall sound is linear (4.6% difference to median)
Compared to same class
» 0% of all tested devices in this class were better, 0% similar, 100% worse
» The best had a delta of 5%, average was 17%, worst was 45%
Compared to all devices tested
» 0% of all tested devices were better, 0% similar, 100% worse
» The best had a delta of 4%, average was 24%, worst was 134%
Energy Management
Power Consumption
Consumption is quite high across the board even after double-checking for background applications or unexpected activity. Simply idling would demand 9 W on the minimum brightness level or up to 17 W if set to maximum brightness with a mostly white screen. This is several watts more than most other 14-inch laptops and it is likely responsible for the short runtimes noted in our battery life section.
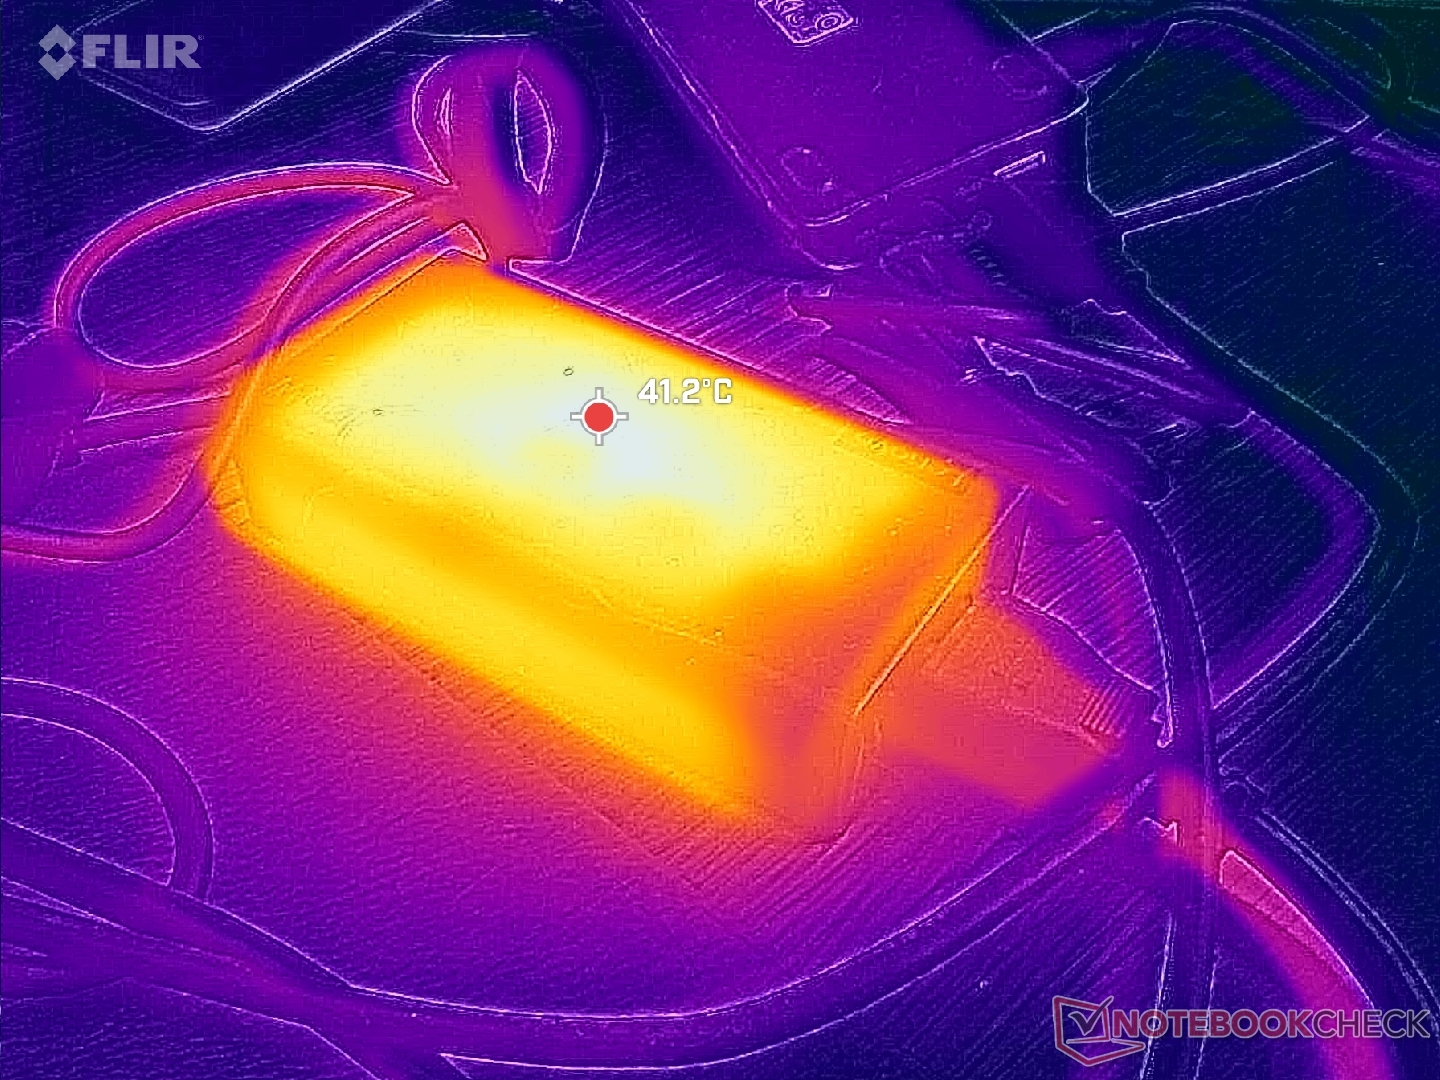
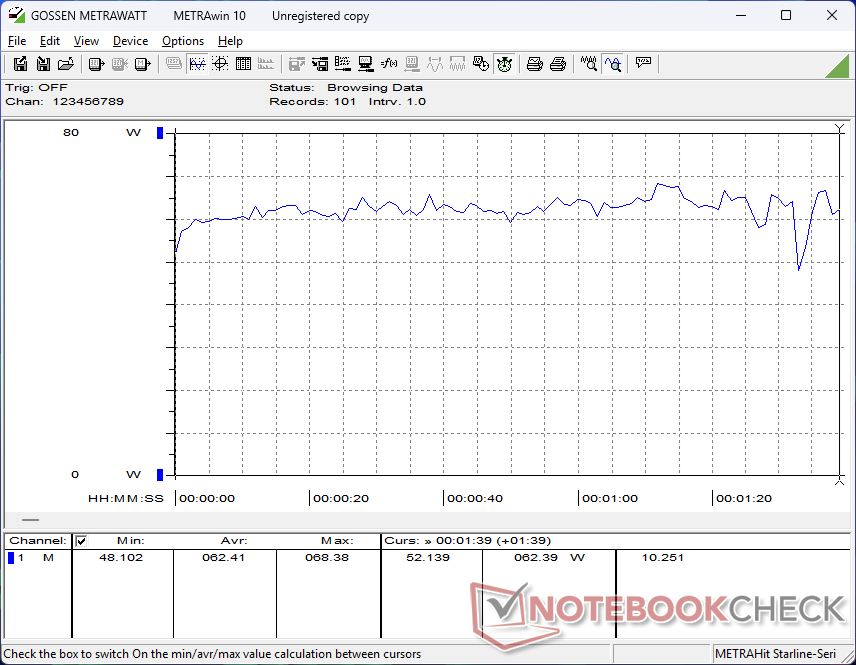
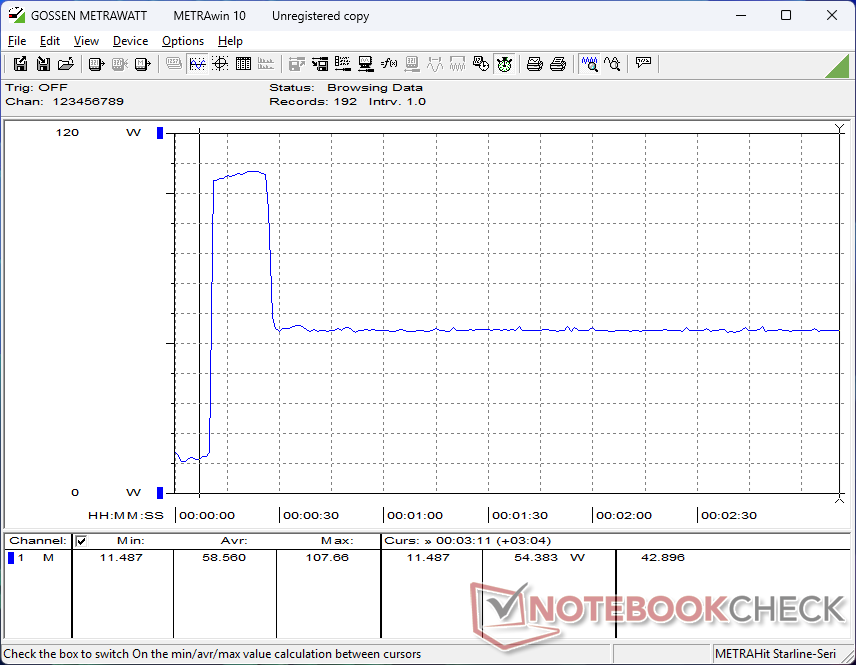
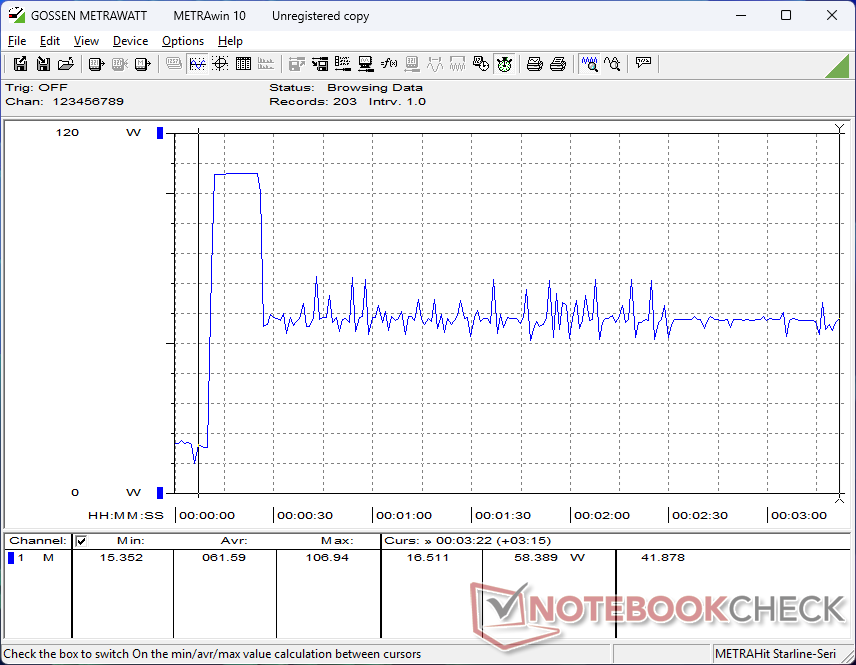
The system ships with a relatively small (~10.7 x 5.6 x 2.6 cm) 100 W USB-C AC adapter. The system can draw over 100 W albeit only temporarily as shown by our screenshots below.

| Off / Standby | |
| Idle | |
| Load |
|
Key:
min: | |
| Lenovo ThinkBook Plus Gen5 Hybrid Ultra 7 155H, Arc 8-Core, Samsung PM9C1a MZAL81T0HDLB, OLED, 2880x1800, 14" | Lenovo ThinkBook Plus Gen4 IRU i7-1355U, Iris Xe G7 96EUs, SK hynix PC801 HFS512GEJ9X115N, OLED, 2880x1800, 13.3" | Acer Swift 14 AI SF14-51-58TU Core Ultra 5 226V, Arc 130V, Micron 2550 512GB, OLED, 2880x1800, 14" | Asus ExpertBook P5 P5405-NZ0102X Core Ultra 7 258V, Arc 140V, Western Digital PC SN5000S SDEQNSJ-1T00, IPS LED, 2560x1600, 14" | HP EliteBook x360 1040 G11 Ultra 7 165H, Arc 8-Core, Kioxia XG8 KXG80ZNV512G, IPS, 1920x1200, 14" | Dell Latitude 9450 2-in-1 Ultra 7 165U, Graphics 4-Core iGPU (Arrow Lake), , IPS, 2560x1600, 14" | |
|---|---|---|---|---|---|---|
| Power Consumption | 32% | 41% | 36% | 43% | 39% | |
| Idle Minimum * (Watt) | 9.3 | 7.2 23% | 5 46% | 3.9 58% | 1.8 81% | 3.2 66% |
| Idle Average * (Watt) | 10.9 | 7.9 28% | 6 45% | 8.9 18% | 4.4 60% | 6.4 41% |
| Idle Maximum * (Watt) | 17.9 | 12.7 29% | 10 44% | 9.6 46% | 4.5 75% | 10.8 40% |
| Load Average * (Watt) | 62.4 | 37.6 40% | 36 42% | 43.4 30% | 40.7 35% | 54.6 12% |
| Cyberpunk 2077 ultra external monitor * (Watt) | 57.9 | 38.2 34% | 41.8 28% | 54.6 6% | ||
| Cyberpunk 2077 ultra * (Watt) | 61.5 | 41.6 32% | 42.8 30% | 56.5 8% | ||
| Load Maximum * (Watt) | 107 | 65 39% | 60 44% | 64.1 40% | 66 38% | 70.2 34% |
| Witcher 3 ultra * (Watt) | 39.1 | 35.5 |
* ... smaller is better
Power Consumption Cyberpunk / Stress Test
Power Consumption external Monitor
Battery Life
WLAN runtime is on the shorter side at just over 5 hours despite the relatively large 75 Wh battery. Other convertible laptops with more efficient U-series CPUs like the Acer Swift 14 AI can last for several hours longer.
Charging from empty to full capacity with the included AC adapter takes a little under 2 hours.
| Lenovo ThinkBook Plus Gen5 Hybrid Ultra 7 155H, Arc 8-Core, 75 Wh | Lenovo ThinkBook Plus Gen4 IRU i7-1355U, Iris Xe G7 96EUs, 56 Wh | Acer Swift 14 AI SF14-51-58TU Core Ultra 5 226V, Arc 130V, 65 Wh | Asus ExpertBook P5 P5405-NZ0102X Core Ultra 7 258V, Arc 140V, 63 Wh | HP EliteBook x360 1040 G11 Ultra 7 165H, Arc 8-Core, 68 Wh | Dell Latitude 9450 2-in-1 Ultra 7 165U, Graphics 4-Core iGPU (Arrow Lake), 60 Wh | |
|---|---|---|---|---|---|---|
| Battery runtime | 57% | 147% | 218% | 218% | 167% | |
| WiFi v1.3 (h) | 5.1 | 8 57% | 12.6 147% | 16.2 218% | 16.2 218% | 13.6 167% |
| Reader / Idle (h) | 15.5 | 55.9 | 21.7 | |||
| Load (h) | 1.3 | 2.9 | 1.7 | 2.4 |
Notebookcheck Rating
Lenovo ThinkBook Plus Gen5 Hybrid
- 11/08/2024 v8
Allen Ngo
 Total Sustainability Score: