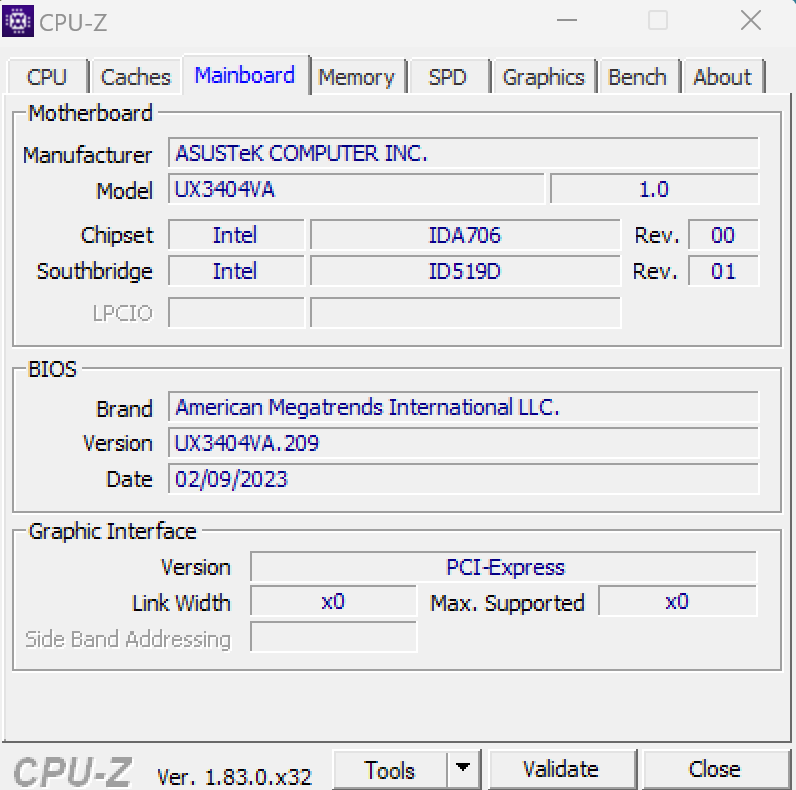
Asus ZenBook 14X (2023) laptop review: OLED ultrabook at its limit

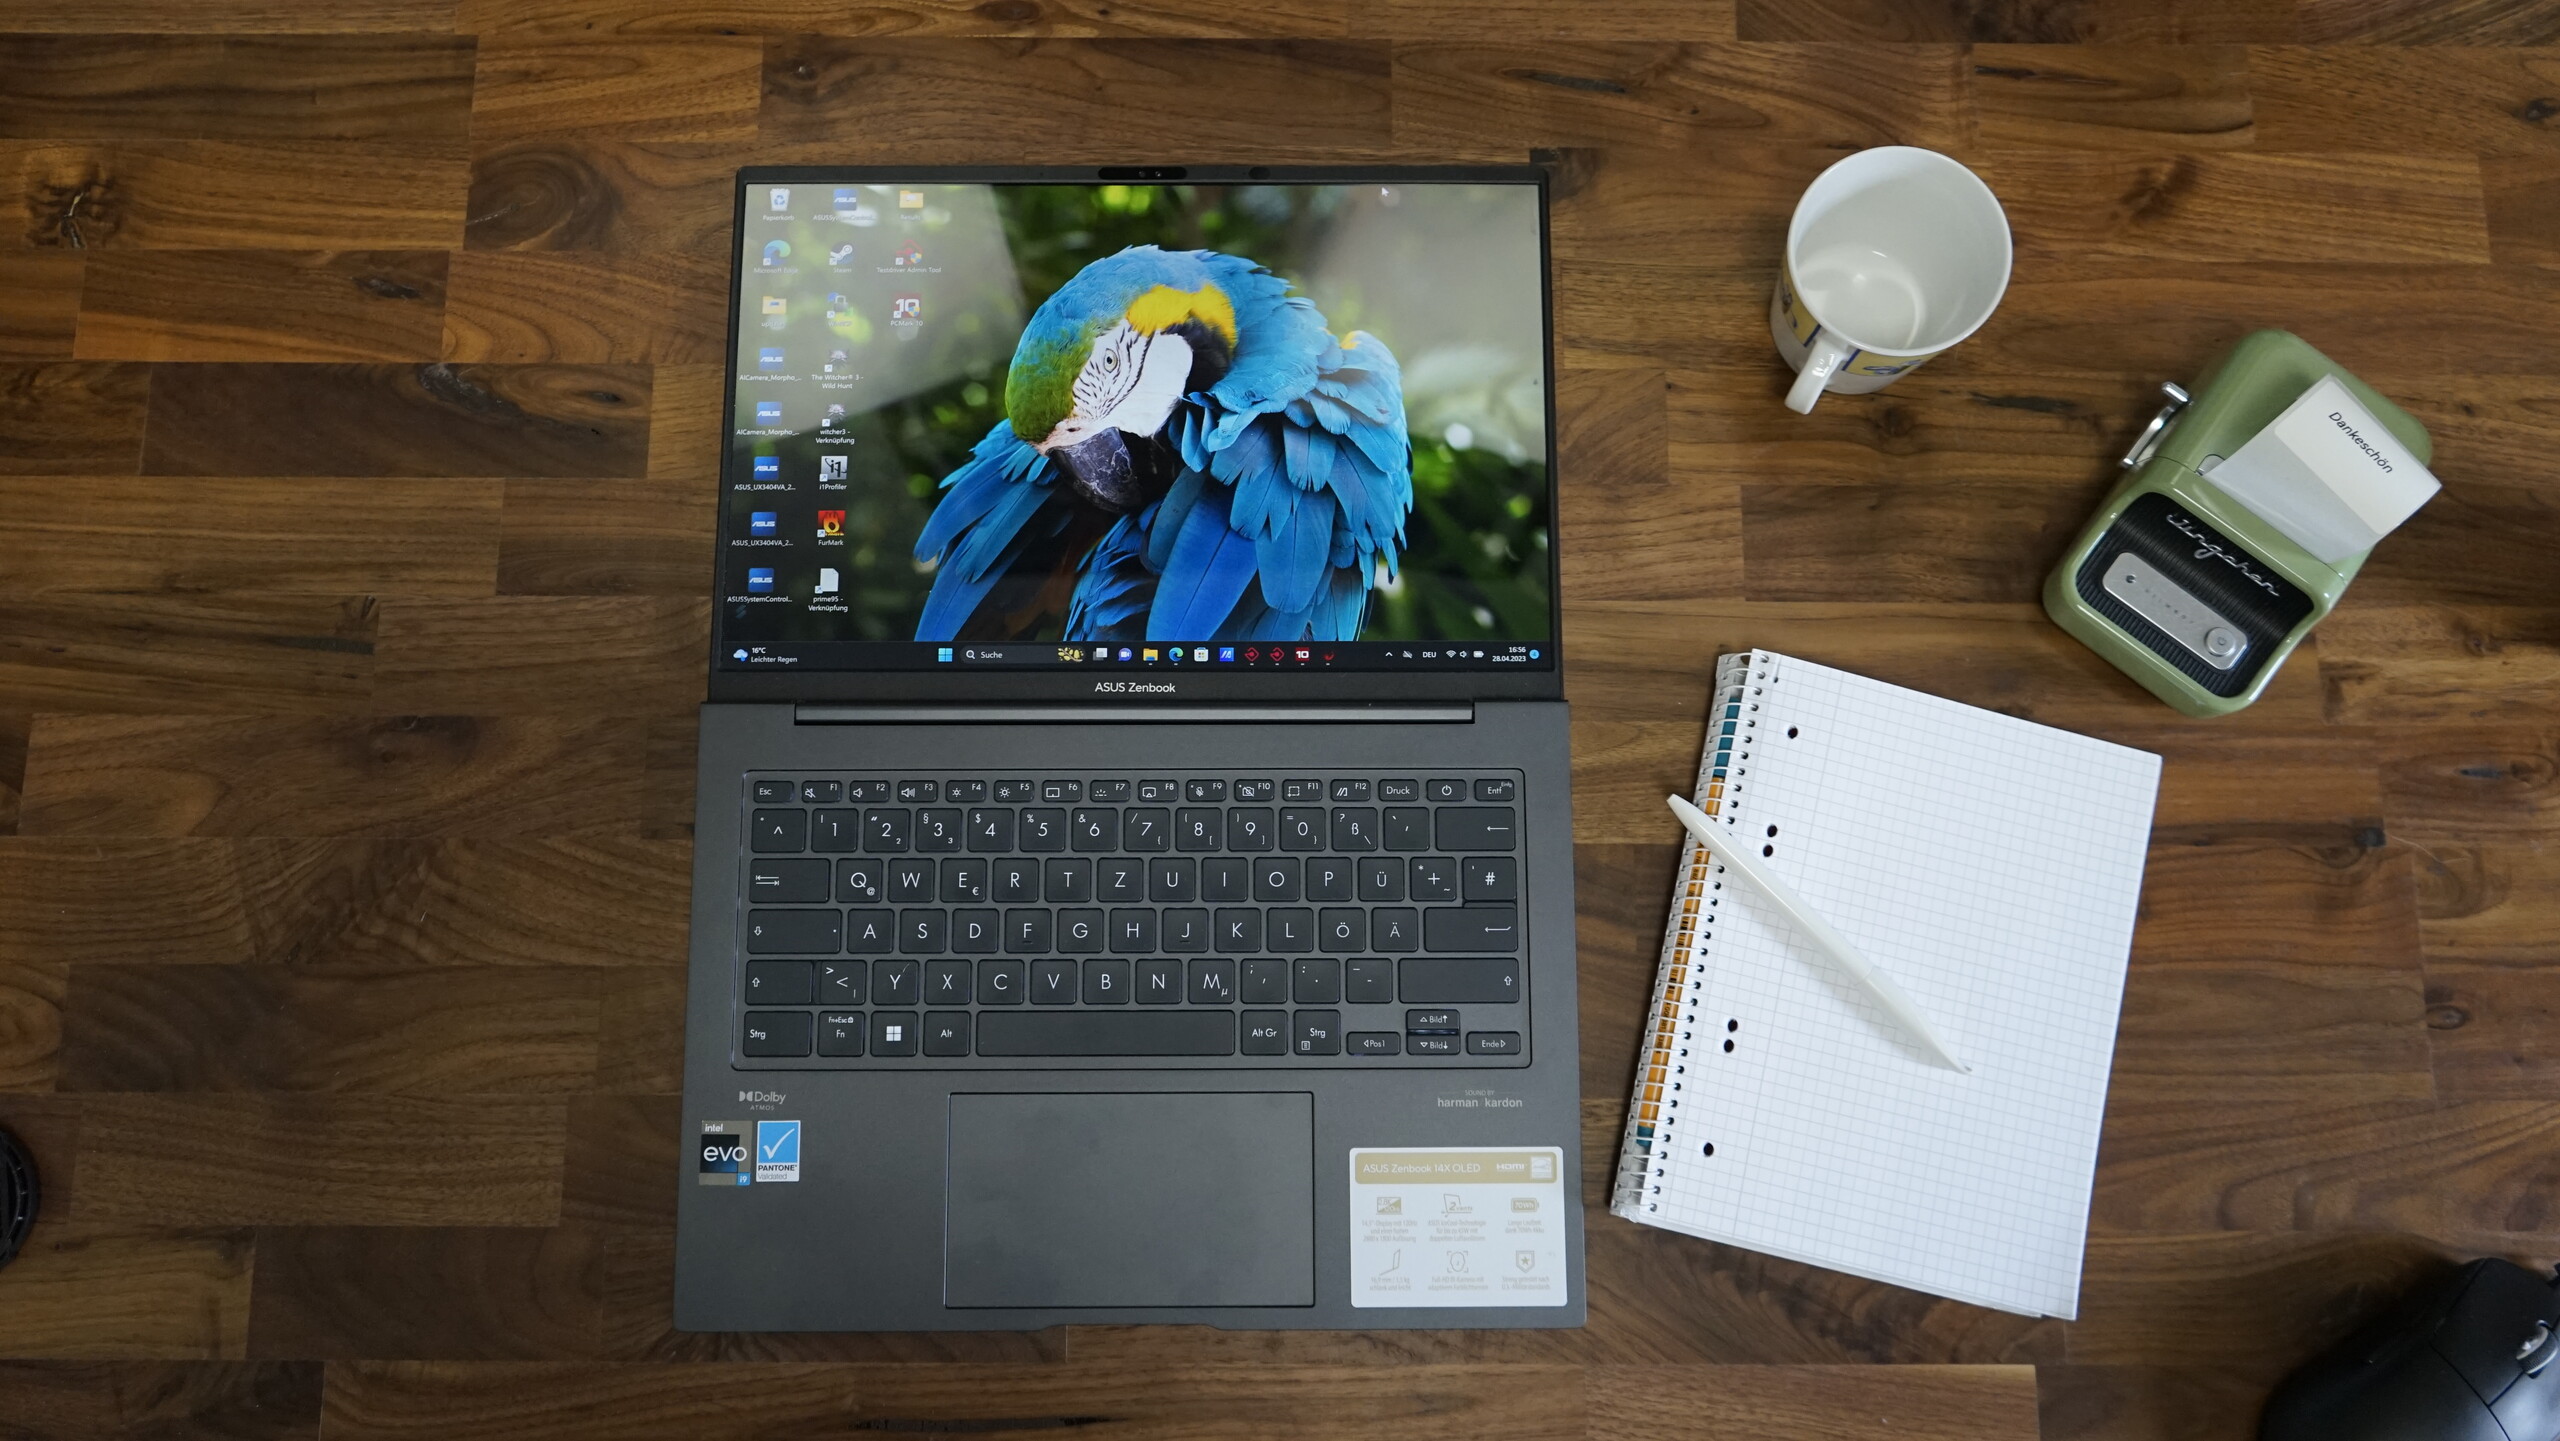
Asus has slightly revamped the Asus ZenBook 14X so that it now looks a lot like the compact 13-inch ultrabook ZenBook S13. However, the weight of the 14-incher with its exceptionally good chassis is significantly higher at 1.56 kilograms. In return, Asus installs the much more powerful Intel Core i9-13900H and, if required, an Nvidia GeForce RTX 3050. Like the predecessor, a 2.8K OLED display is installed, which has been upgraded from 90 Hz to a very good 120 Hz.
Since there aren't many competitors with an OLED display in the 14-inch segment, we have also included IPS competitors for comparison. Interesting here is the Asus ROG Flow Z13 GZ301V tablet, which is equipped with the same powerful Intel Core i9 processor.
Possible competitors in comparison
Rating | Date | Model | Weight | Height | Size | Resolution | Price |
|---|---|---|---|---|---|---|---|
| 88.5 % v7 (old) | 06 / 2023 | Asus ZenBook 14X UX3404VC i9-13900H, Iris Xe G7 96EUs | 1.6 kg | 16.9 mm | 14.50" | 2880x1800 | |
| 91.9 % v7 (old) | 06 / 2022 | Apple MacBook Pro 13 2022 M2 M2, M2 10-Core GPU | 1.4 kg | 15.6 mm | 13.30" | 2560x1600 | |
| 89.2 % v7 (old) | 04 / 2023 | Lenovo Slim Pro 7 14ARP8 R7 7735HS, GeForce RTX 3050 6GB Laptop GPU | 1.6 kg | 15.6 mm | 14.50" | 2560x1600 | |
| 89.1 % v7 (old) | 04 / 2023 | Asus ROG Flow Z13 GZ301V i9-13900H, GeForce RTX 4060 Laptop GPU | 1.6 kg | 14.2 mm | 13.40" | 2560x1600 | |
| 87.3 % v7 (old) | 09 / 2022 | Dell XPS 13 Plus 9320 i7-1280P OLED i7-1280P, Iris Xe G7 96EUs | 1.3 kg | 15.28 mm | 13.40" | 3456x2160 | |
| 87.2 % v7 (old) | 08 / 2022 | Dell Inspiron 14 Plus 7420 i7-12700H, GeForce RTX 3050 4GB Laptop GPU | 1.7 kg | 18.87 mm | 14.00" | 2240x1400 | |
| 86.6 % v7 (old) | 10 / 2022 | LG Gram 14Z90Q i5-1240P, Iris Xe G7 80EUs | 980 g | 16.8 mm | 14.00" | 1920x1200 |
Case - Doesn't get more high-quality than this
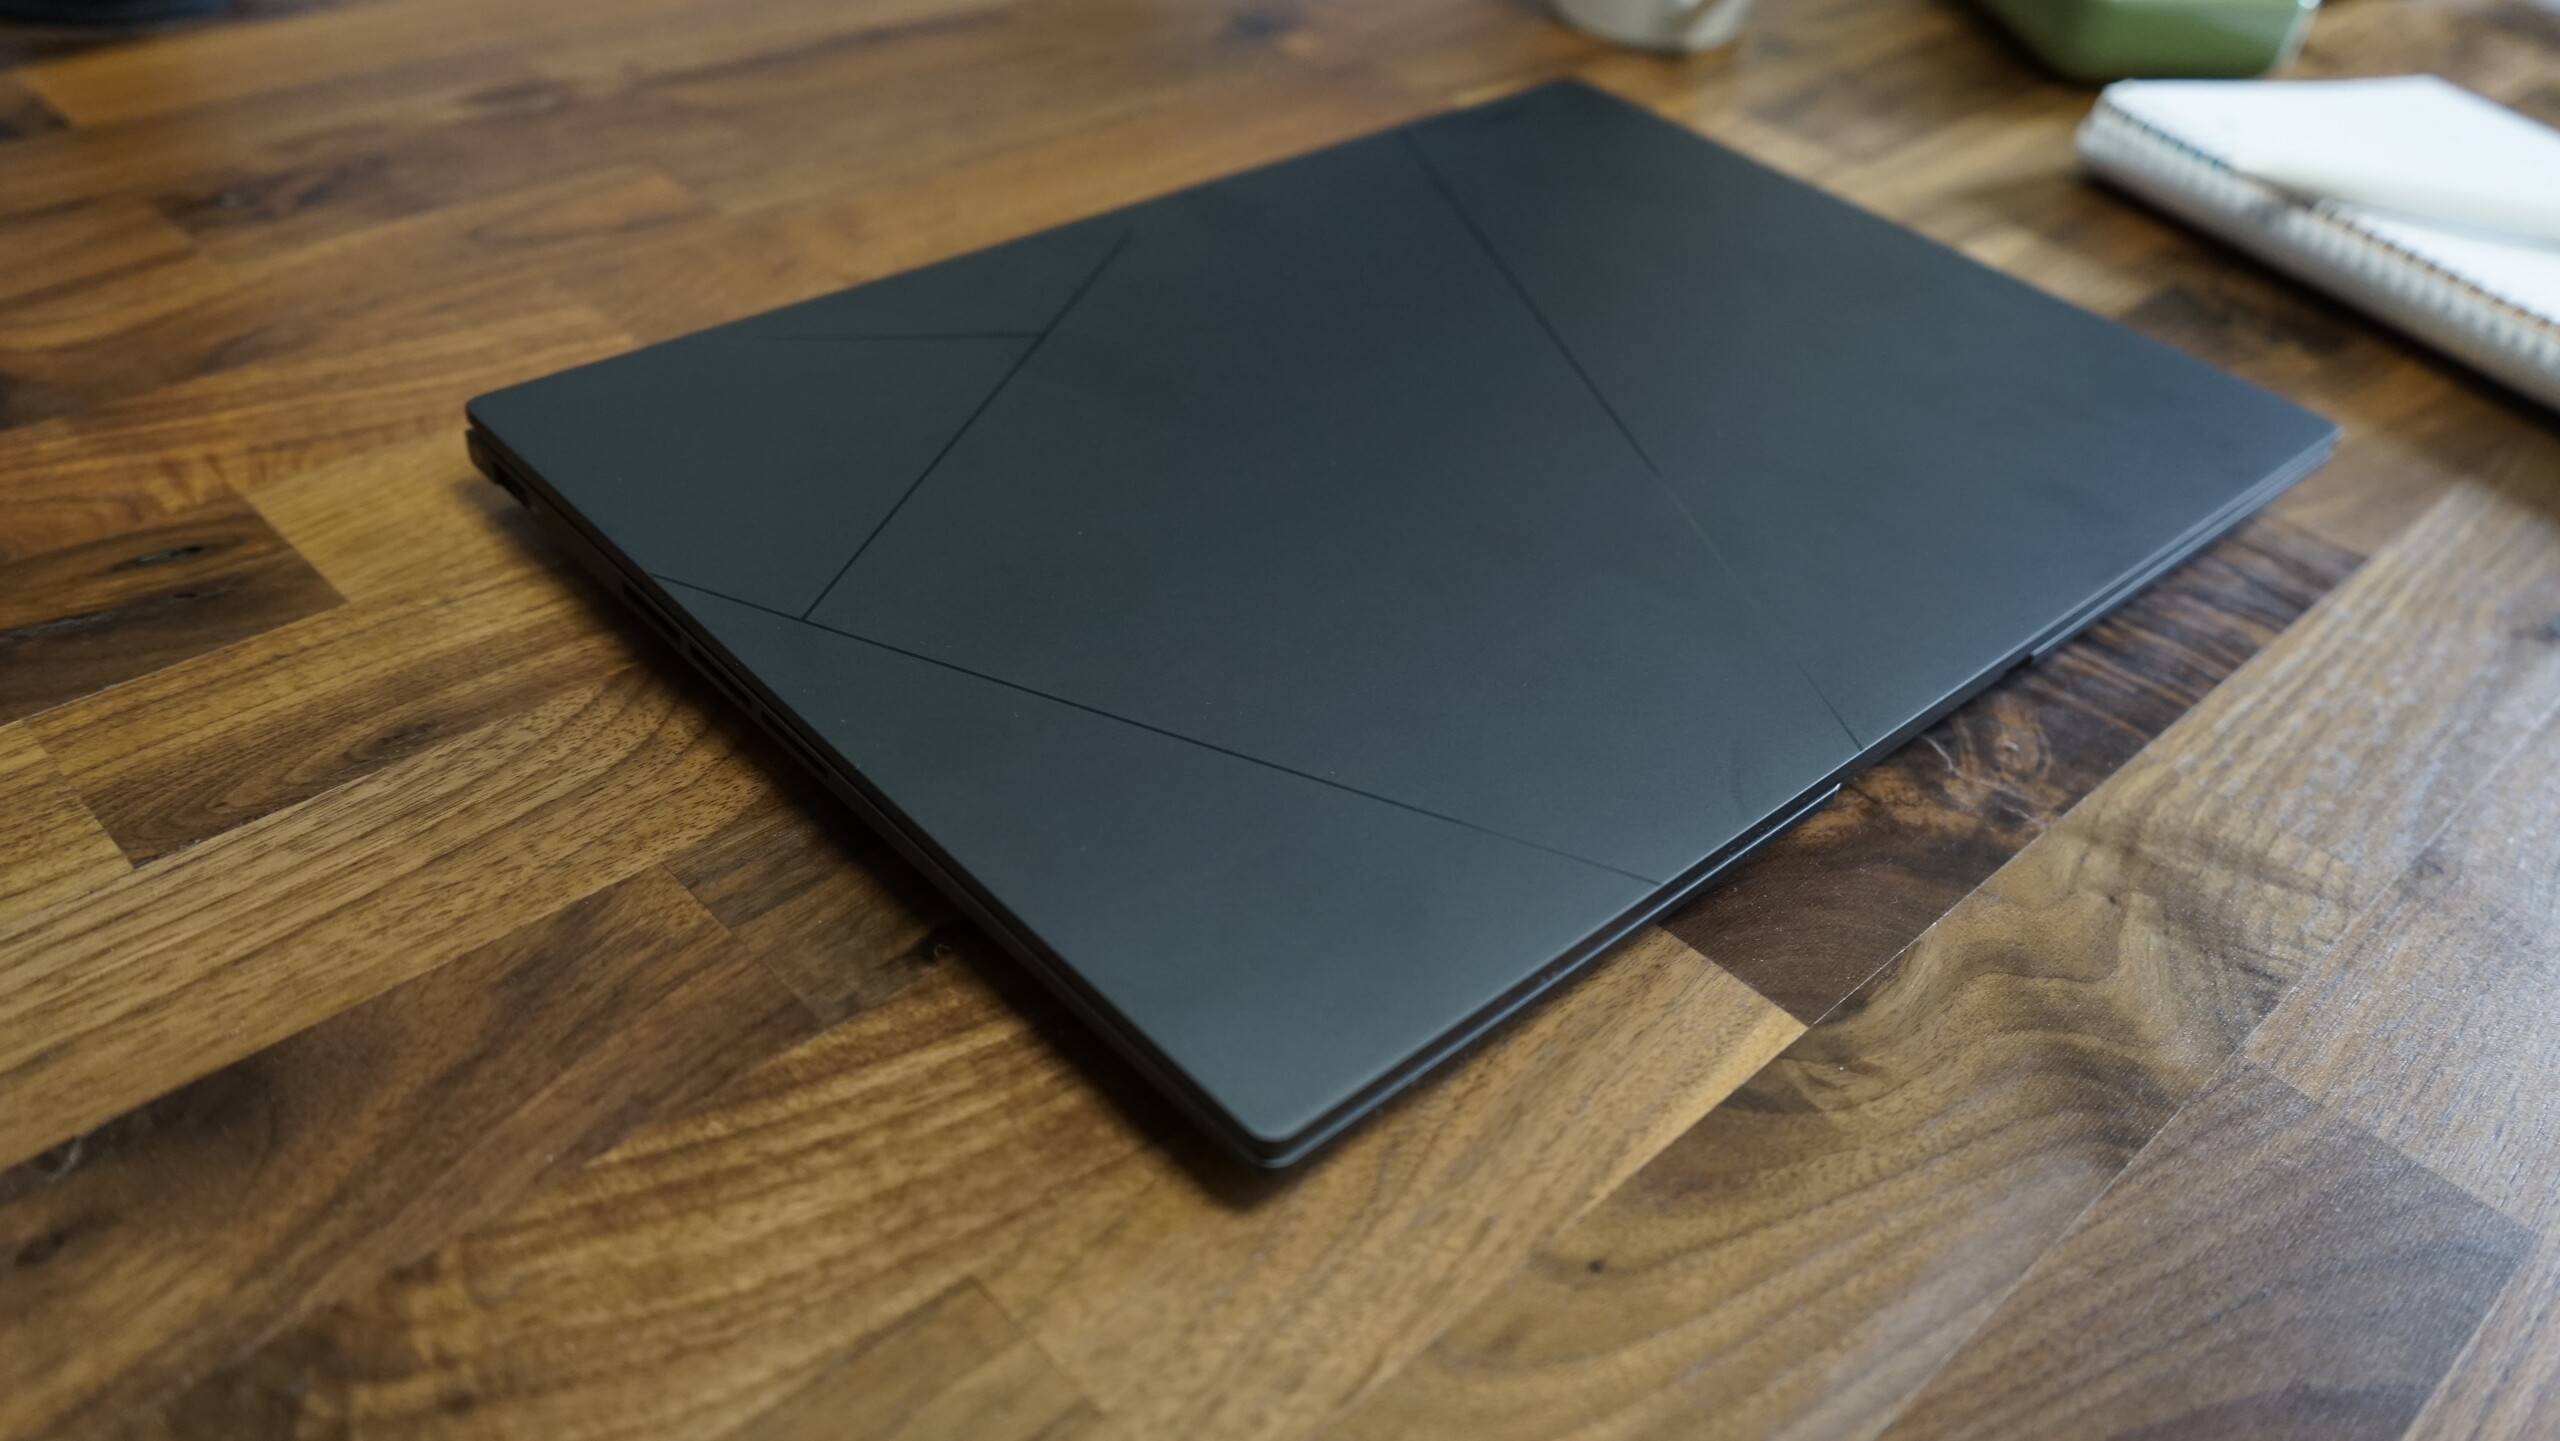
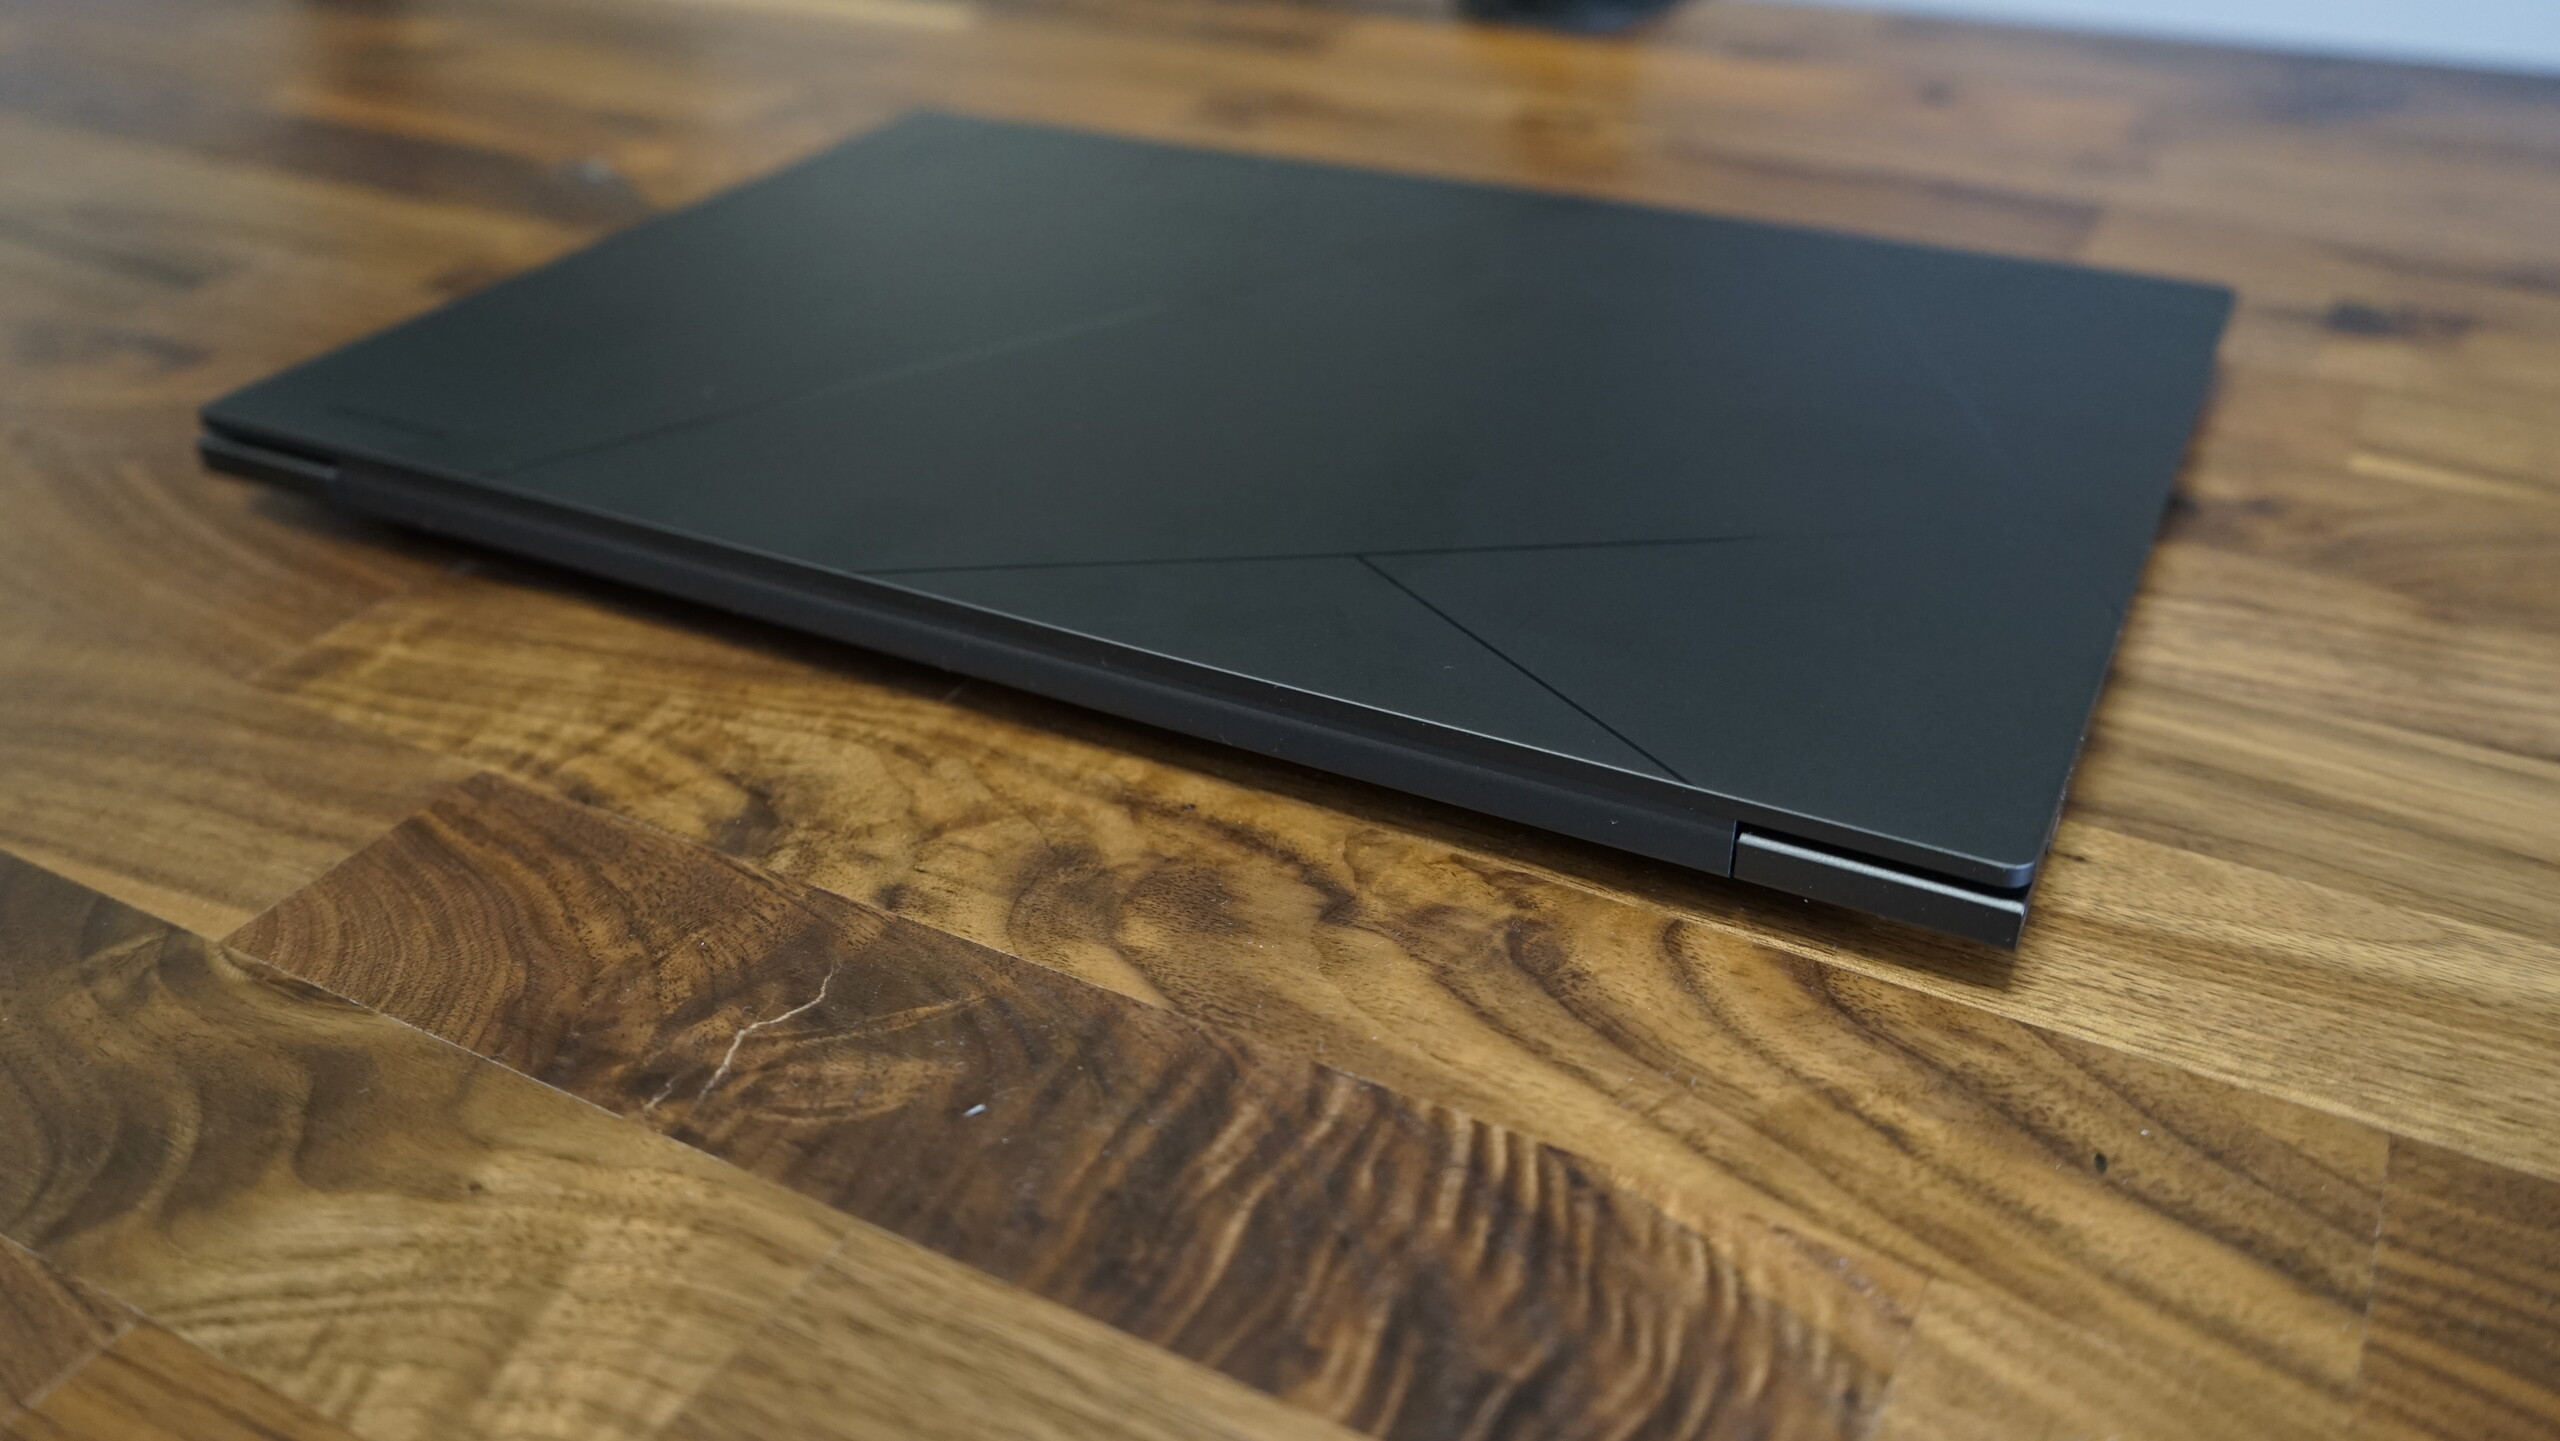
The case of the new Asus ZenBook 14X resembles the predecessor to a large extent, but is still slightly different in design. The entire chassis is made of aluminum and is thus particularly robust and torsion-resistant, which is also reflected in the higher weight. The lid cannot be warped without force and features the same ProArt logo as the 2023 ZenBook S 13. The new ZenBook is available in either Sandstone Beige or Inkwell Gray. The gray variant of our review looks high-quality and elegant, but fingerprints quickly show.
When closed, the lid is held magnetically to the base. The hinges, like the rest of the case, are high quality and tight. Nevertheless, one-handed opening of the laptop is possible. Despite the tight hinges, the display doesn't bob back and forth when typing as the base is heavy and stable enough.
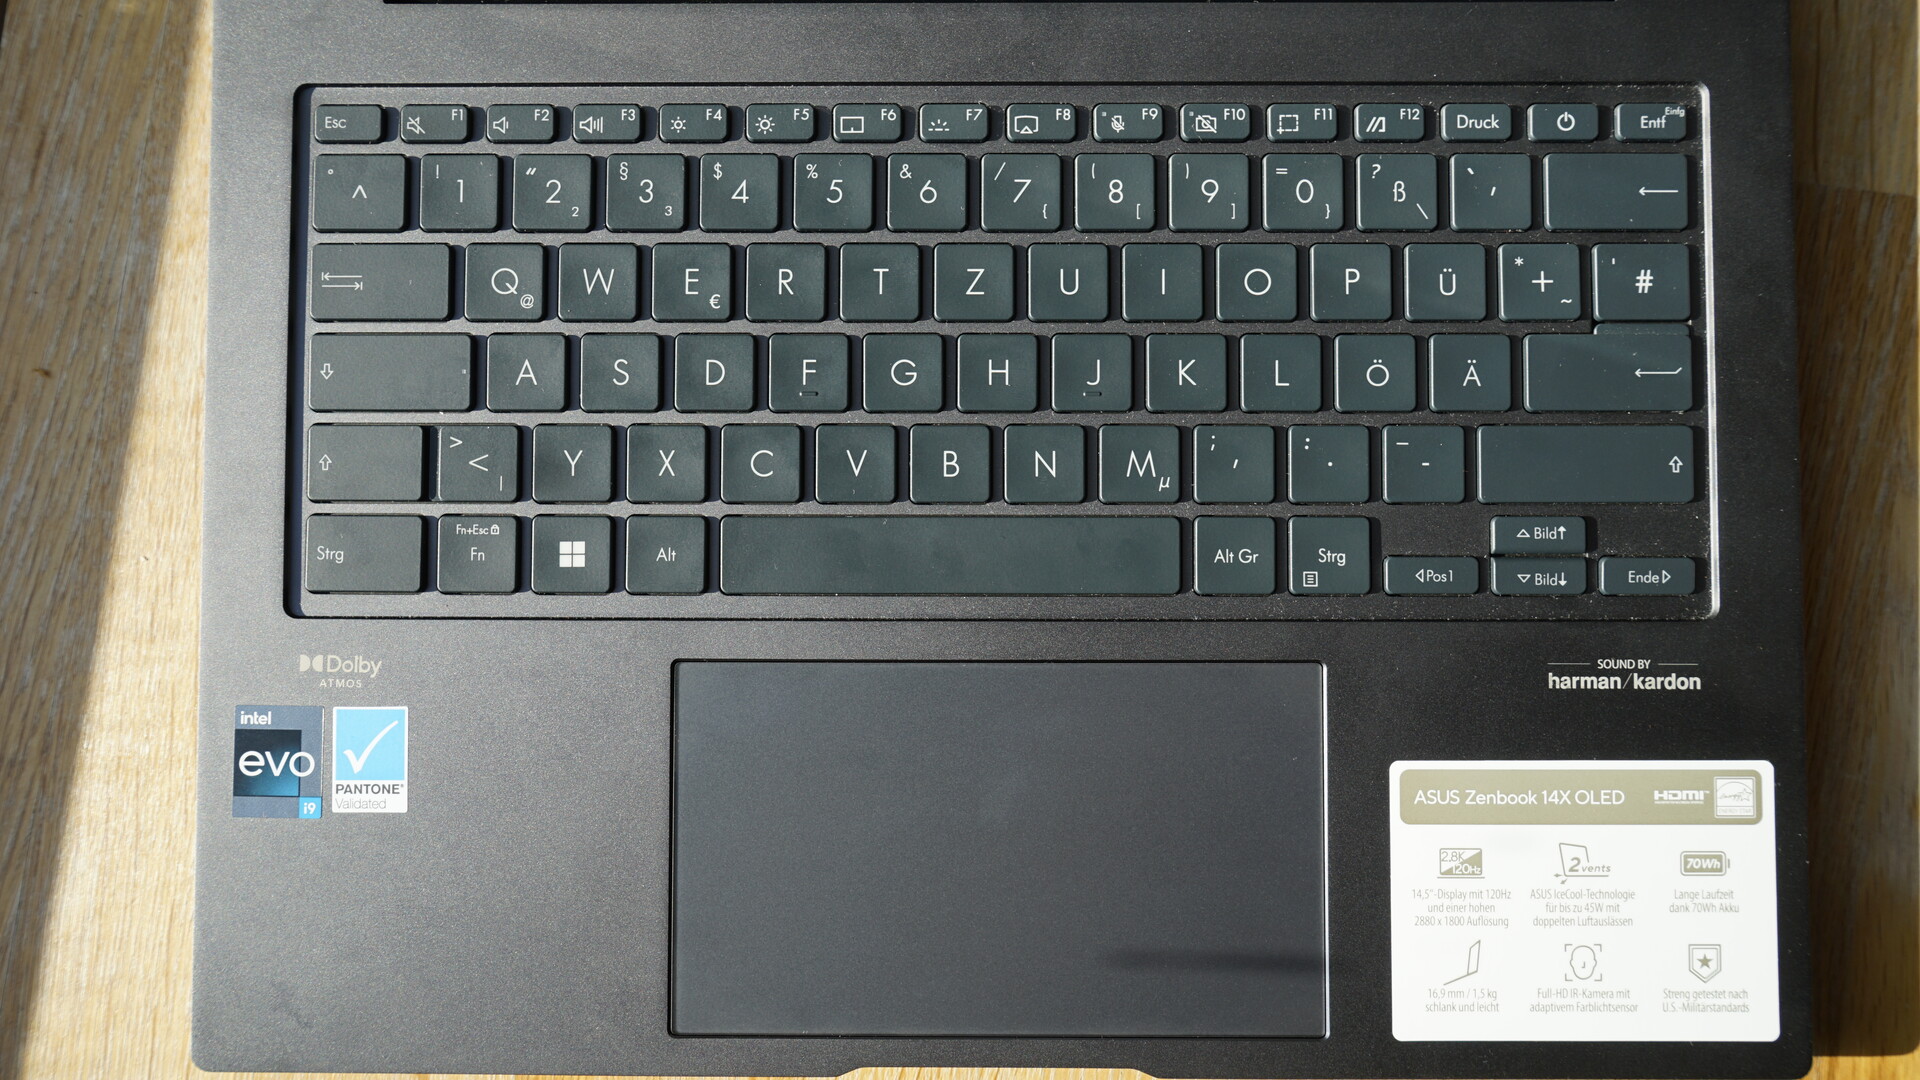
The robust design also extends to the keyboard area. Here, too, the ZenBook is extremely sturdy and the keyboard area does not yield anywhere.
Unlike the 2023 ZenBook S 13, the new ZenBook 14X does not use the ErgoLift mechanism, but rather falls back on the classic design. The comparatively large feet on the bottom provide enough space for the fans to work without restrictions.

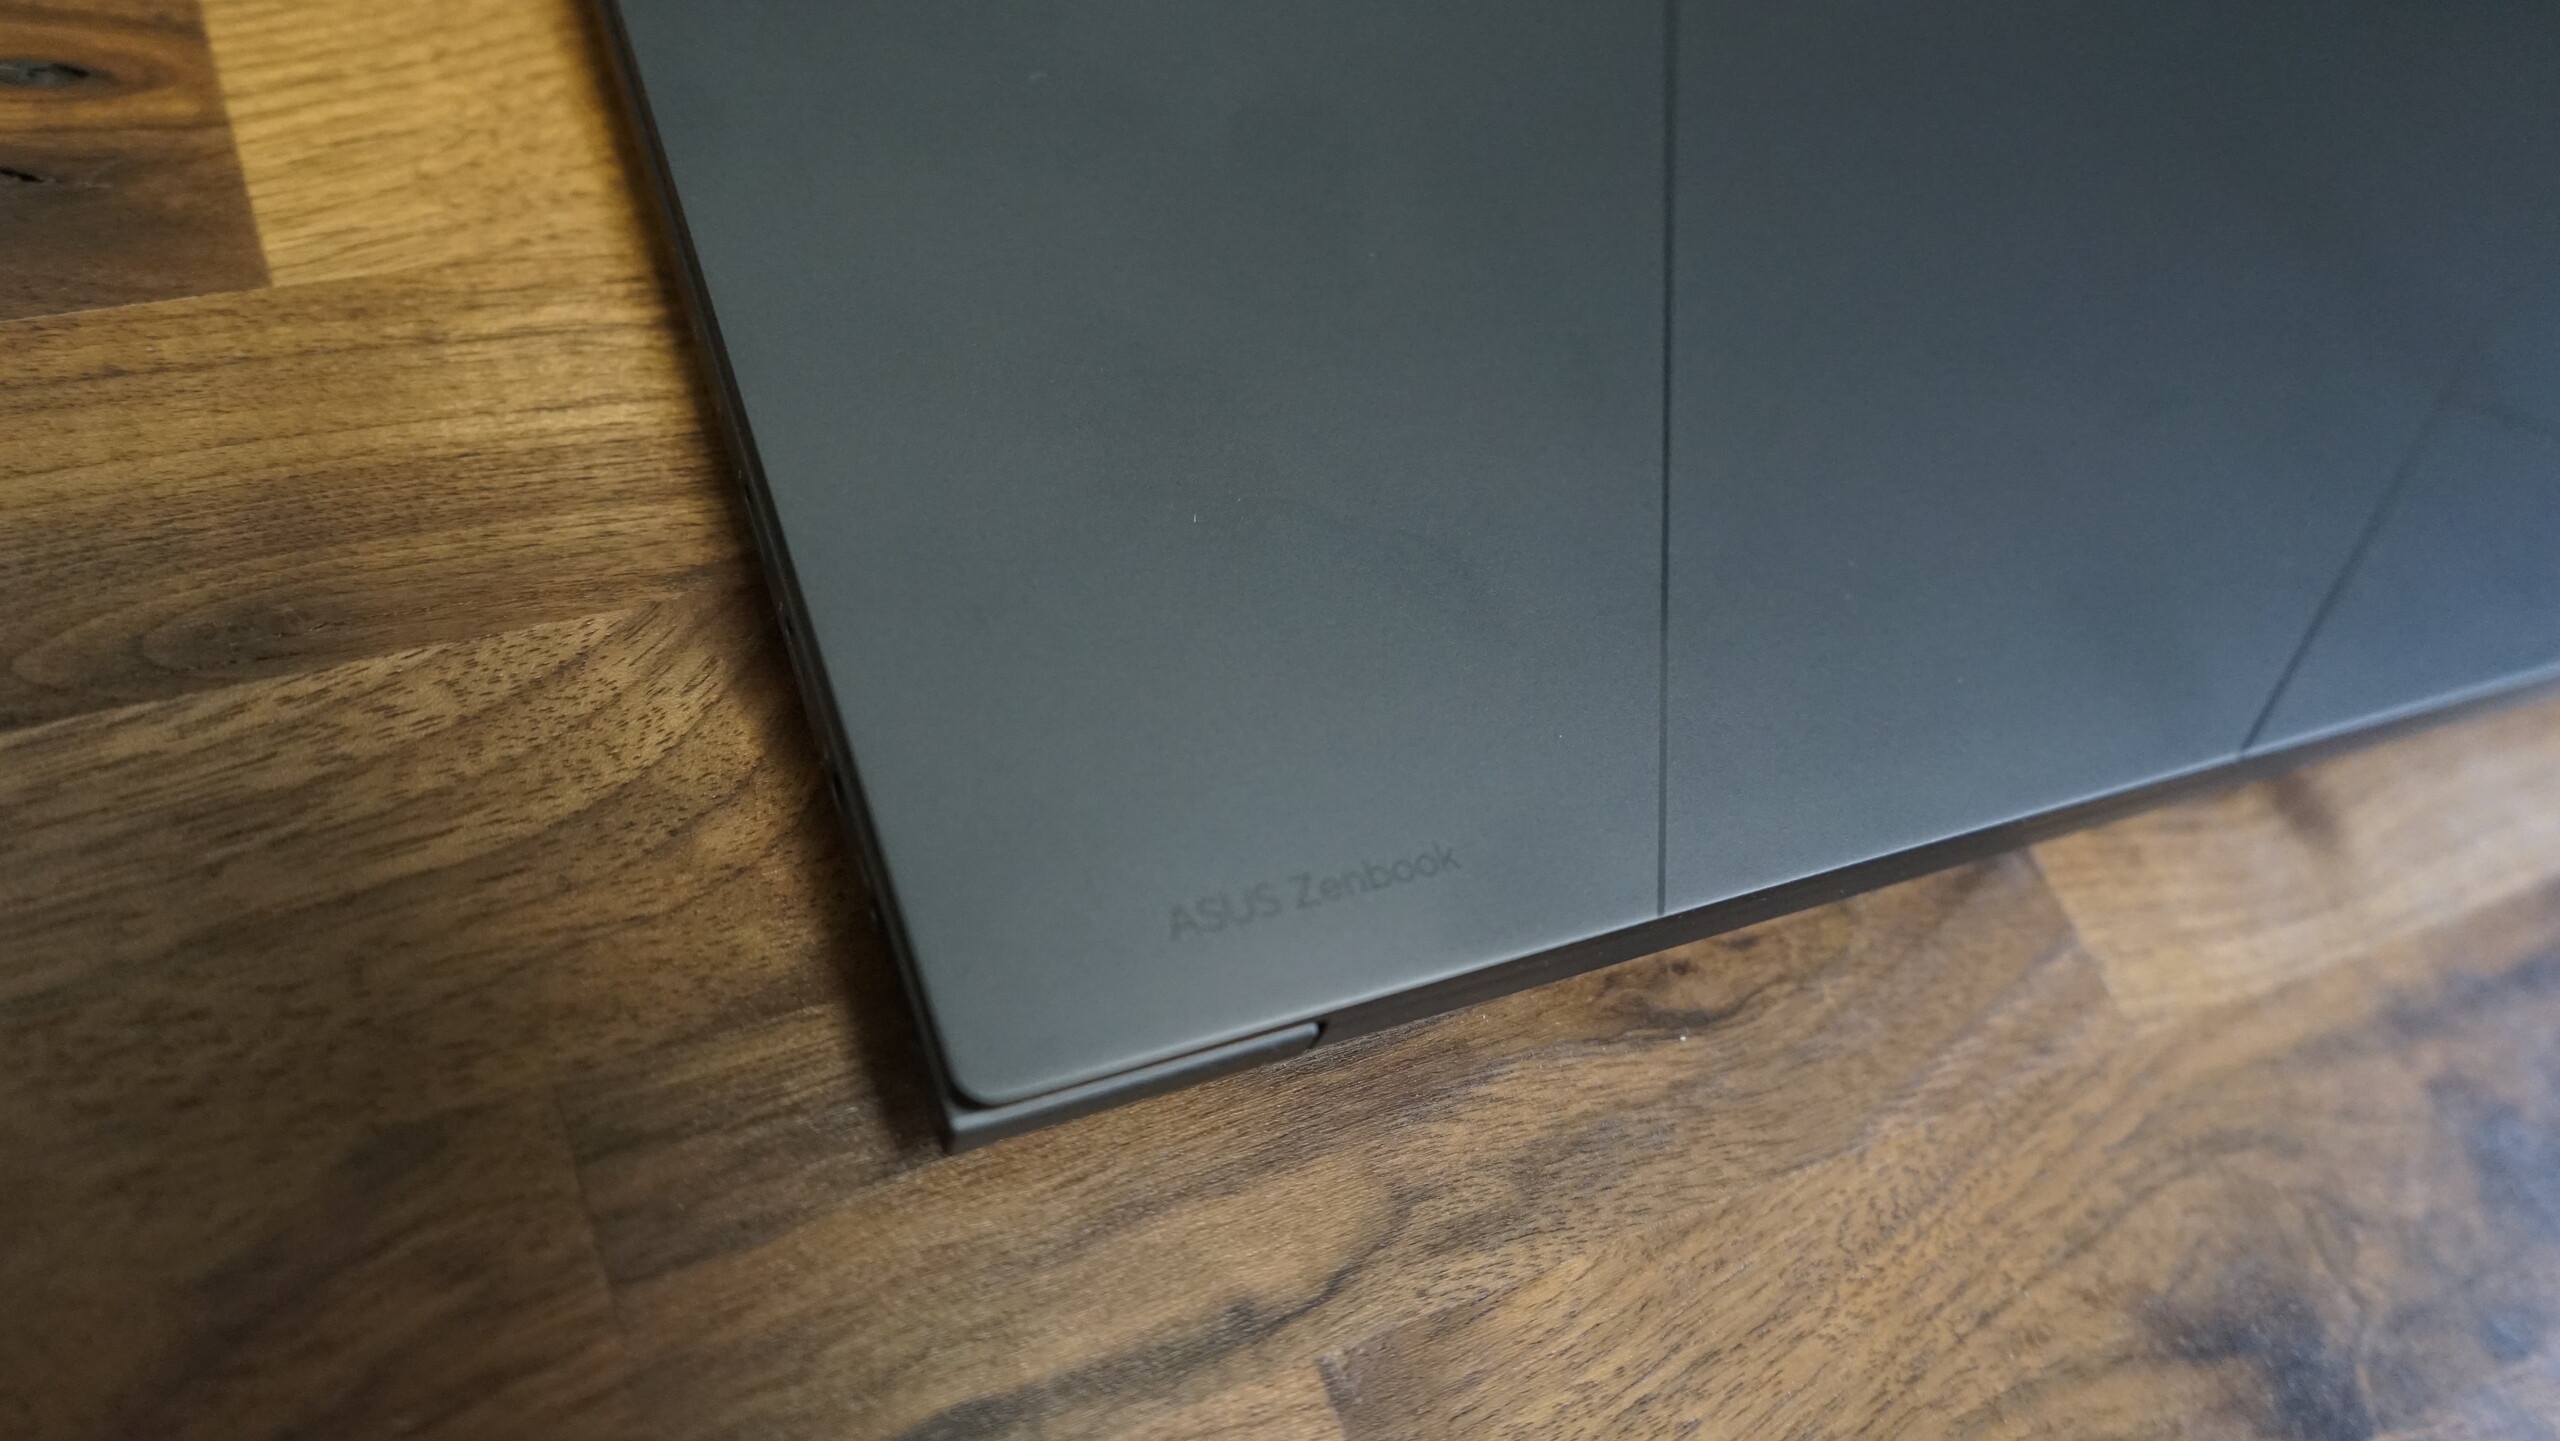
The previous version of the ZenBook 14X weighed more than many other subnotebooks at 1.406 kg. The 2023 ZenBook 14X takes this up a notch and now weighs 1.56 kg. In the comparison field, the Lenovo Slim Pro 7 14ARP8 and the Dell Inspiron 14 Plus 7420 are even higher, and the Asus ROG Flow Z13 GZ301V with the same Intel Core i9 processor weighs almost exactly the same at 1.551 kg. At 16.9 mm, the ZenBook 14X falls in the midfield and is not so above-average in terms of depth.
Equipment
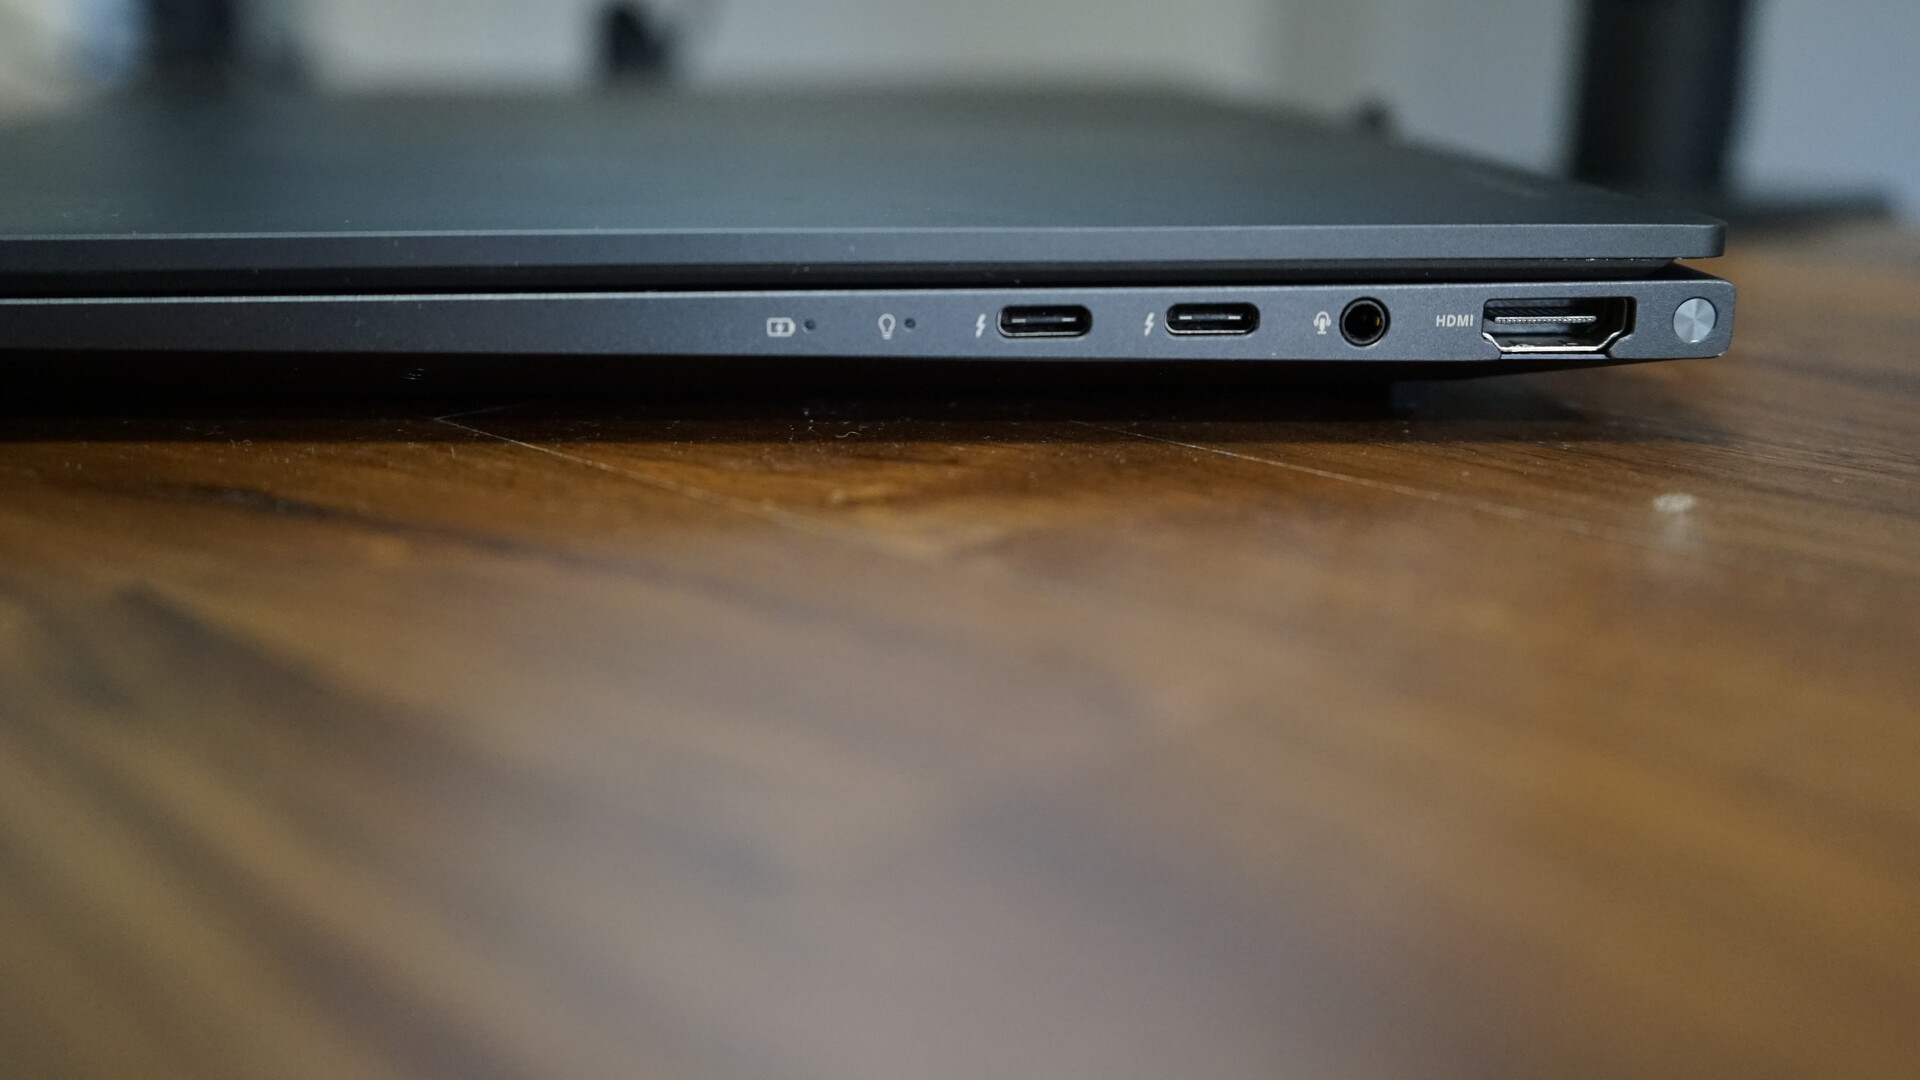
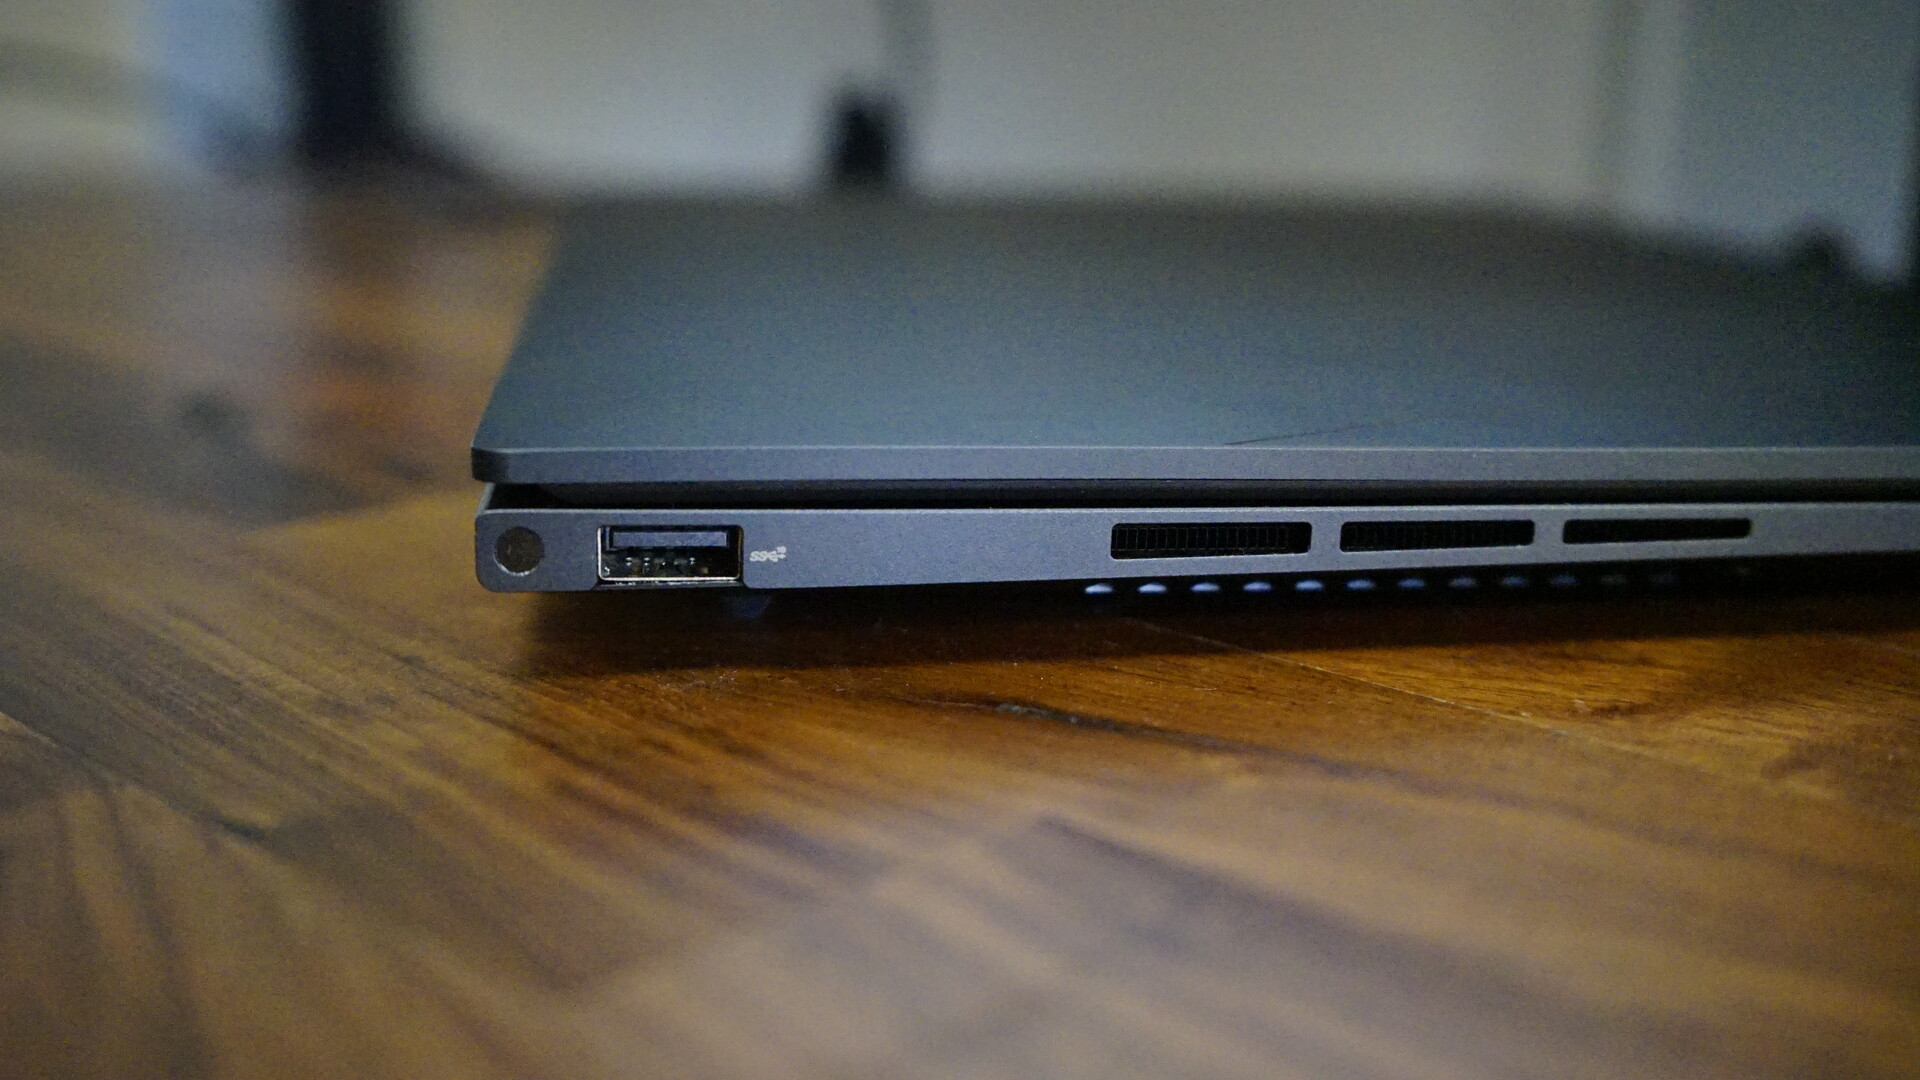
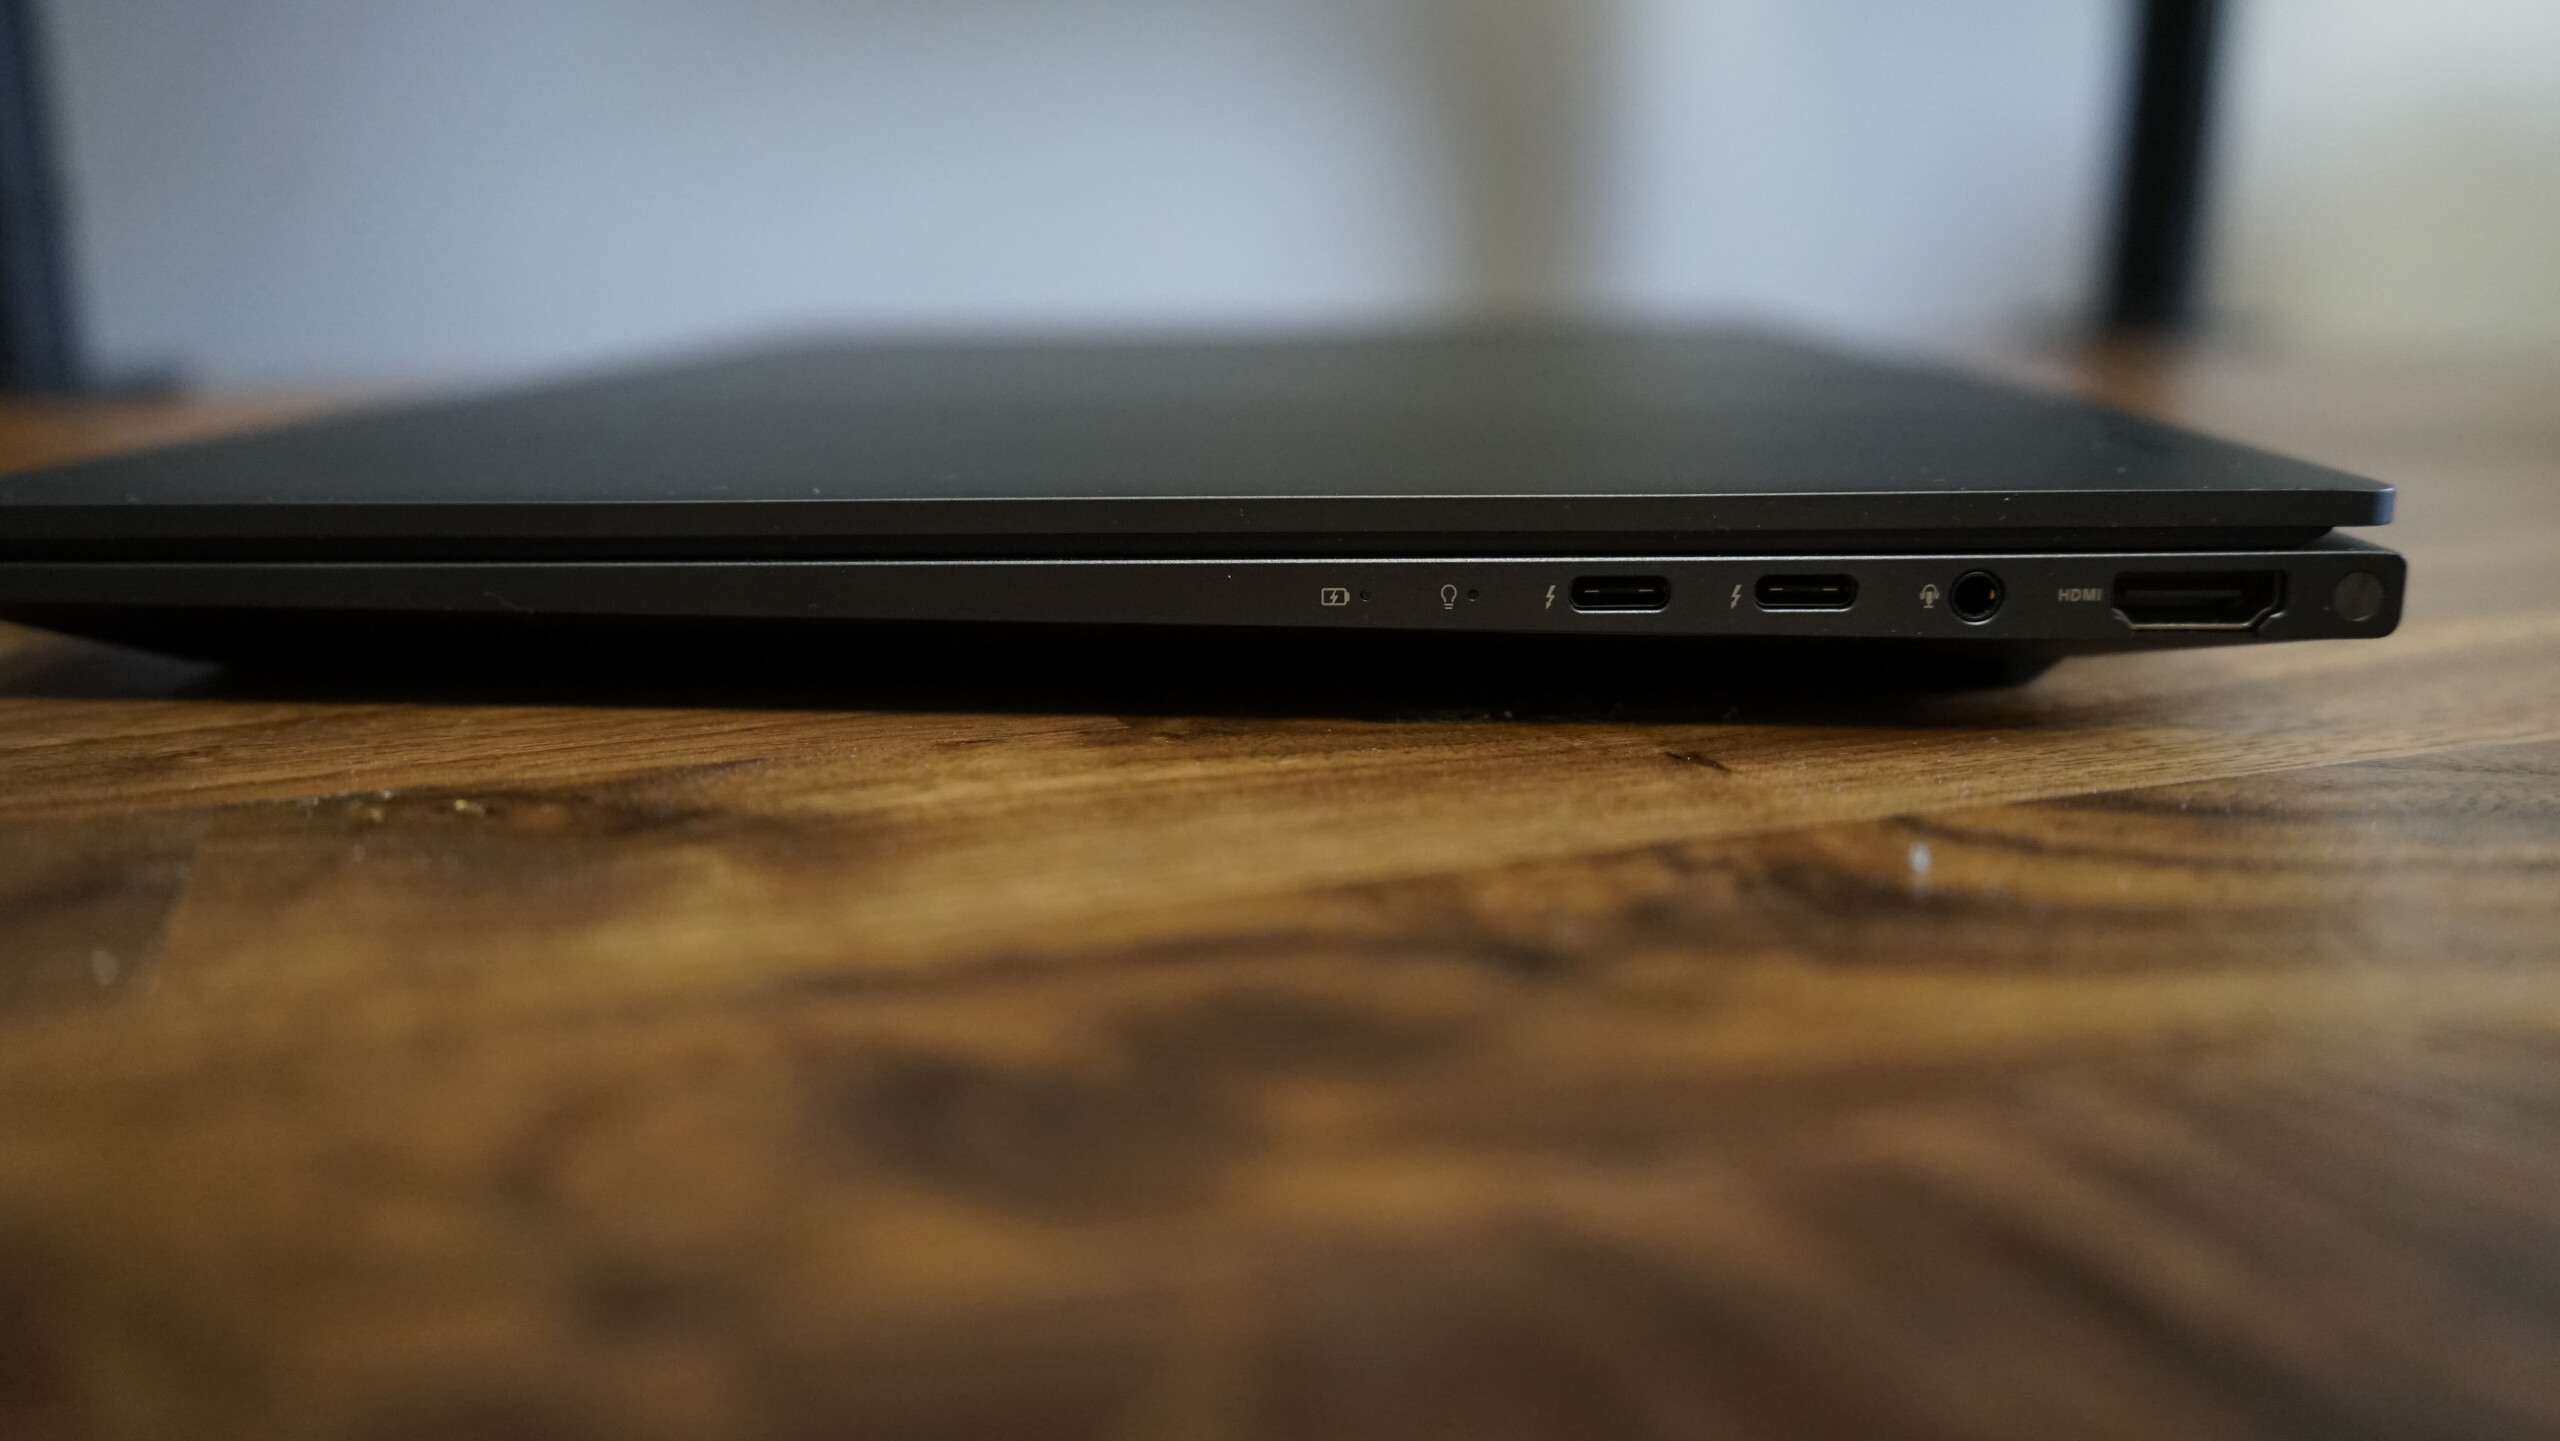
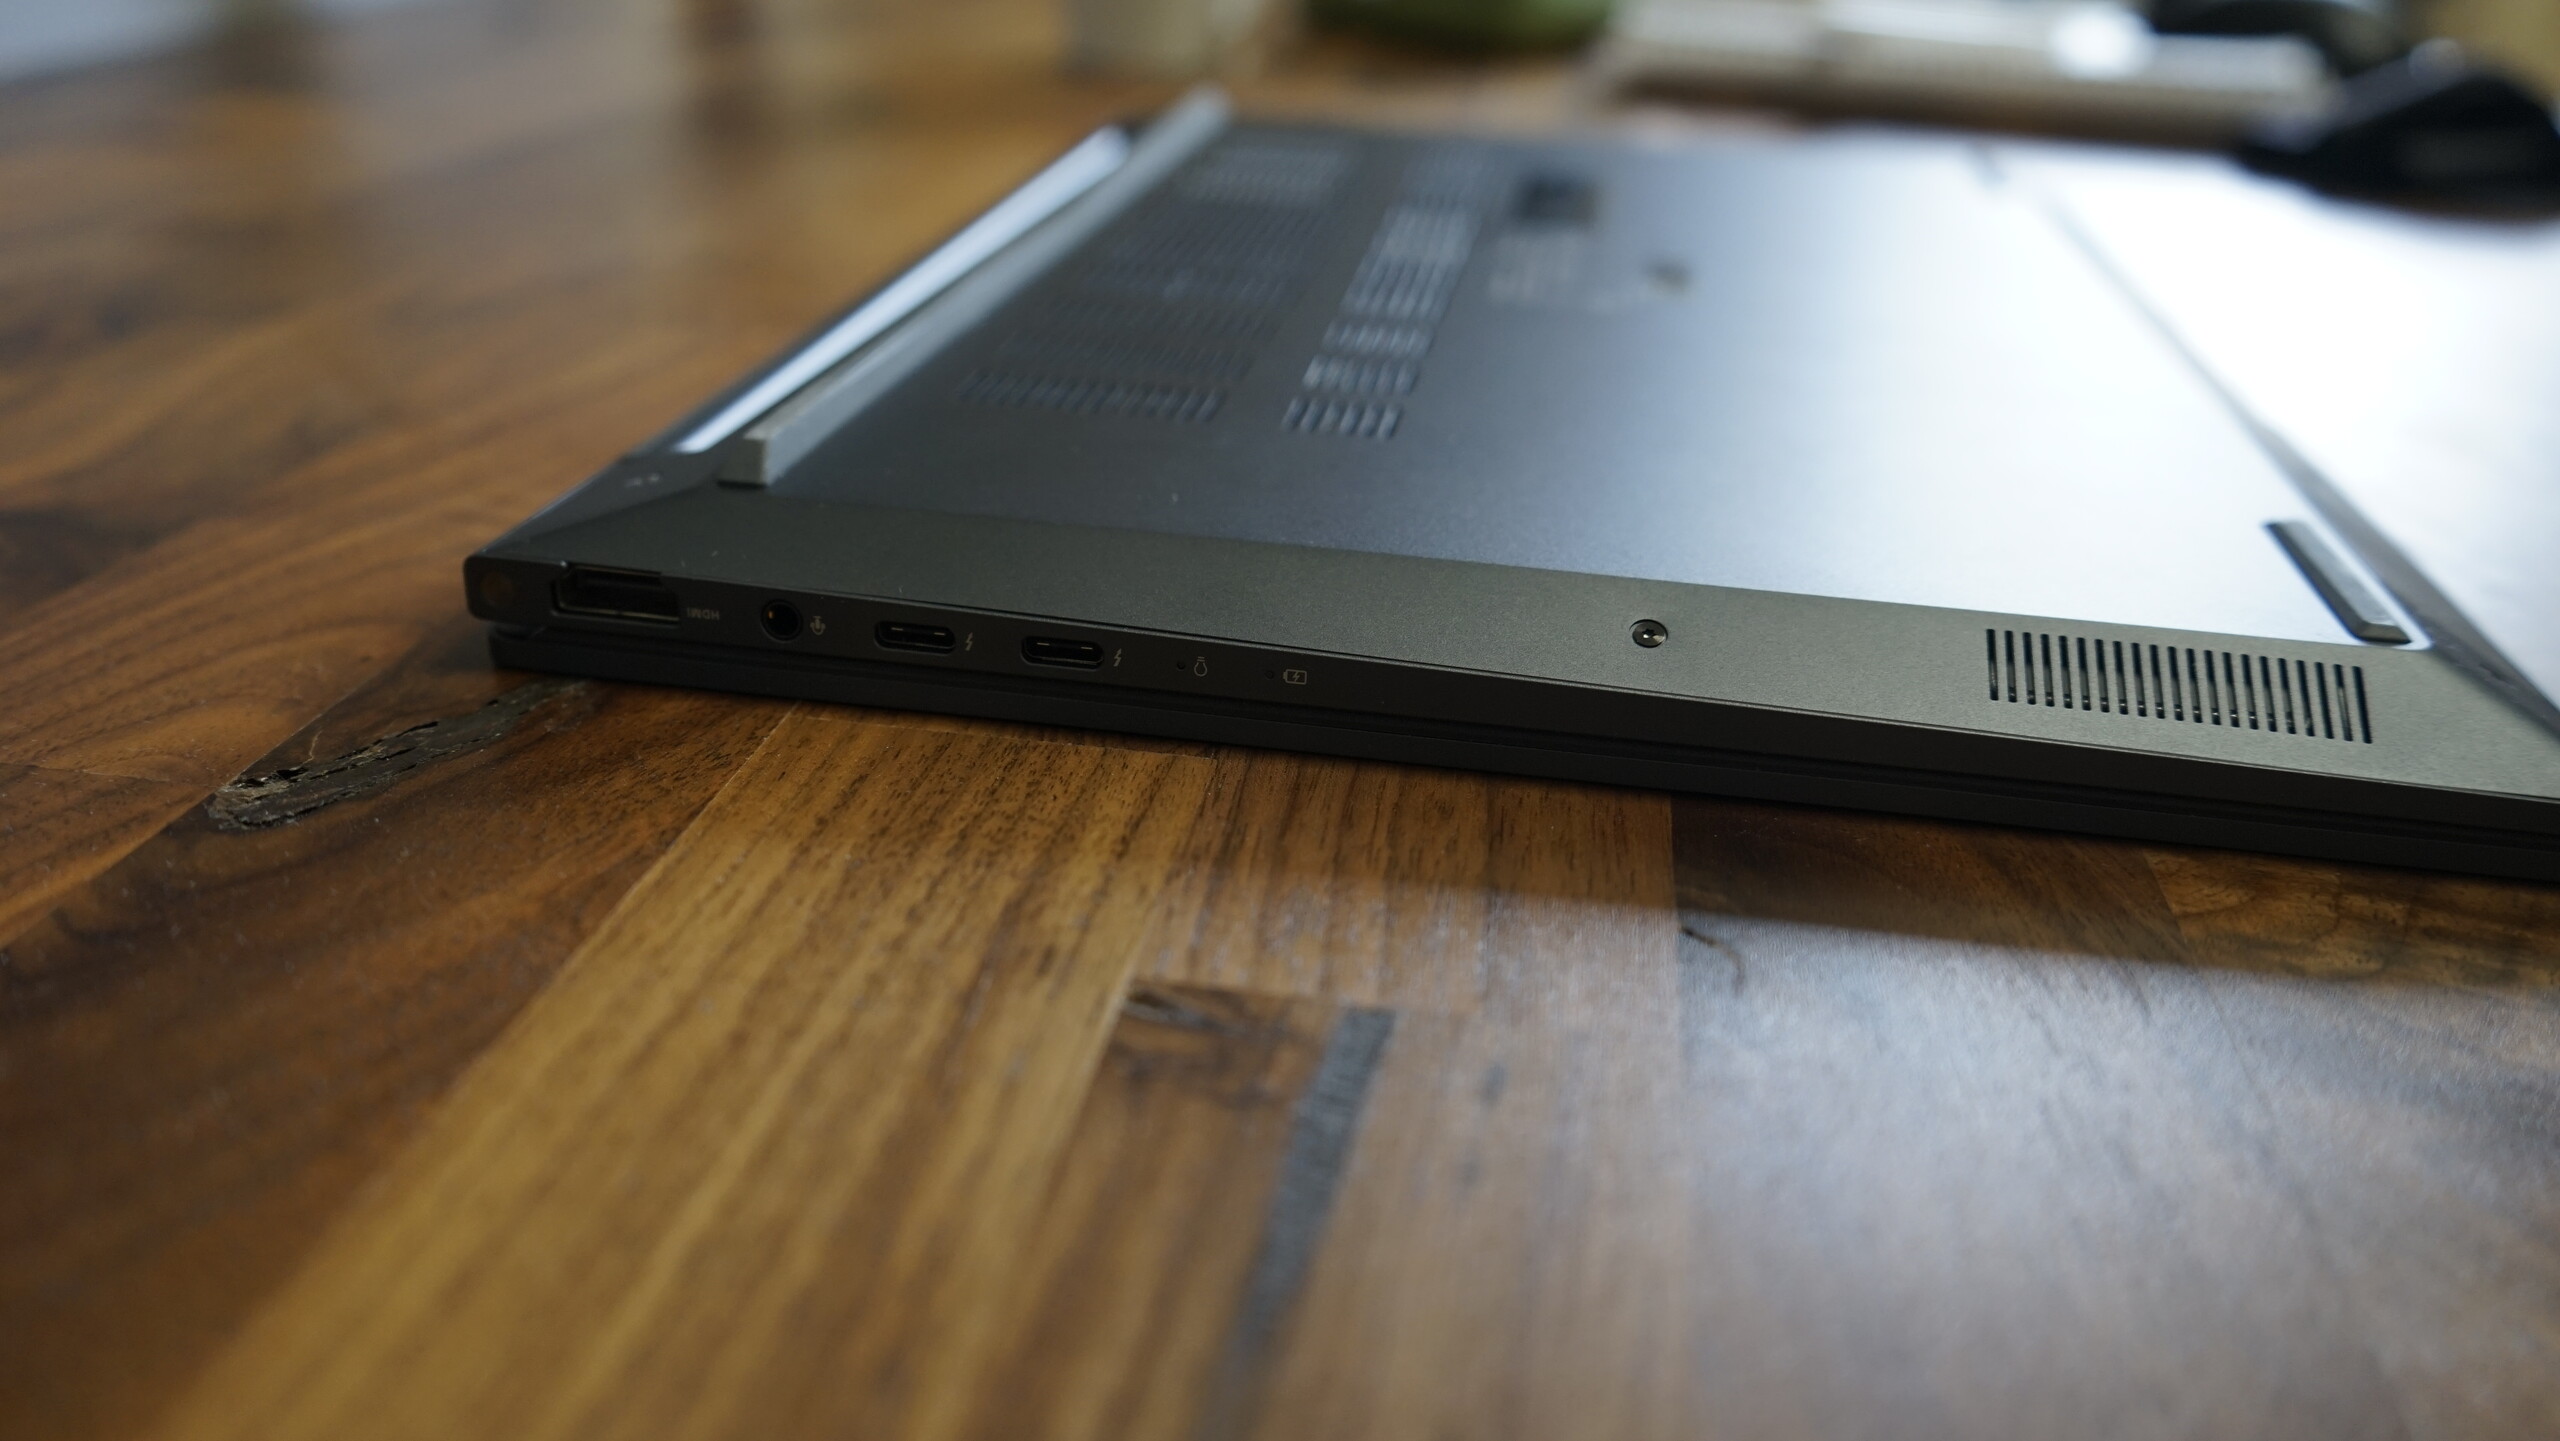
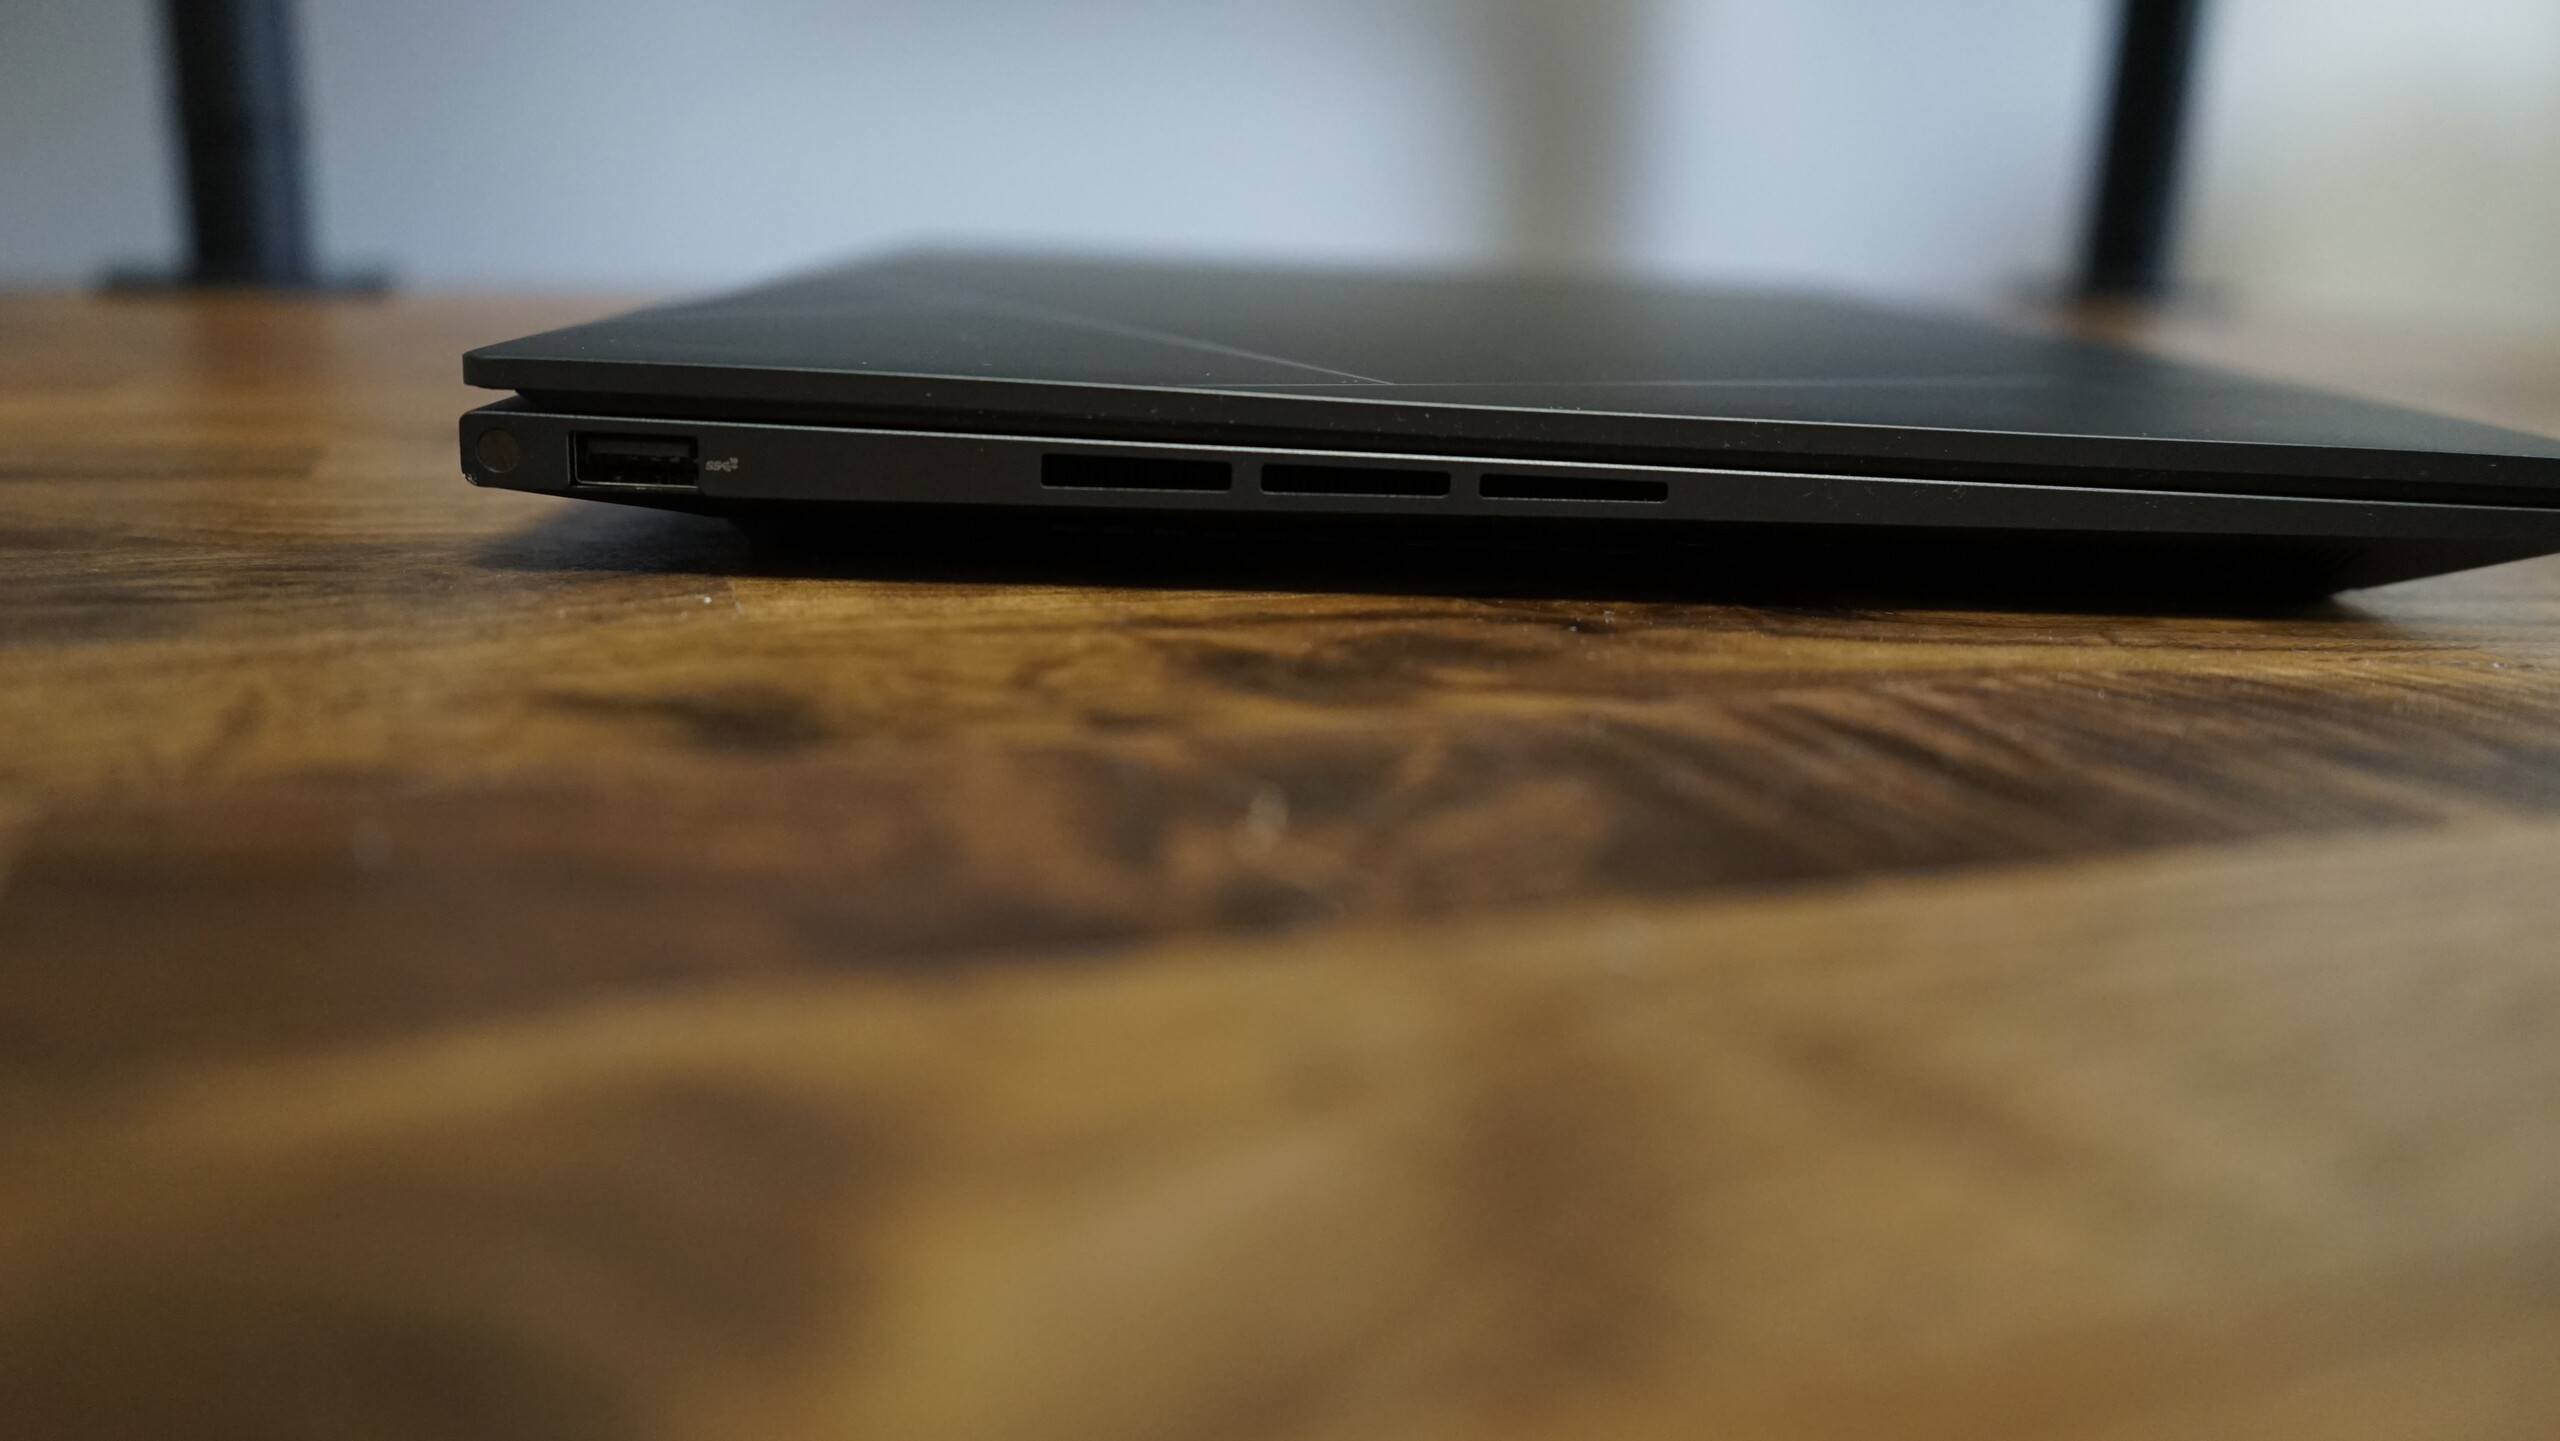
Compared to the predecessor, the microSD reader is unfortunately no longer available. The position of the other ports has also changed. On the left side there is now only one USB 3.2 Gen 2 Type-A port. All other ports, i.e. two Thunderbolt ports, one HDMI 2.1 port and the audio combo port are now on the right. Both Thunderbolt ports can be used for charging, so we would have preferred one on both sides.
Communication
The installed Intel Wi-Fi 6E-AX211 module is replaceable and delivers solid results with no connectivity issues. The card's results are above average for this model. The module not only supports the latest Wi-Fi 6E WLAN standard, but also Bluetooth 5.2.
Webcam
Asus has upgraded the webcam from the previous model and now offers Full HD instead of 720p. Windows Hello is possible thanks to the integrated IR sensor for facial recognition. Compared to last year, the image quality is significantly better, but the results depend heavily on the lighting conditions.


Accessories
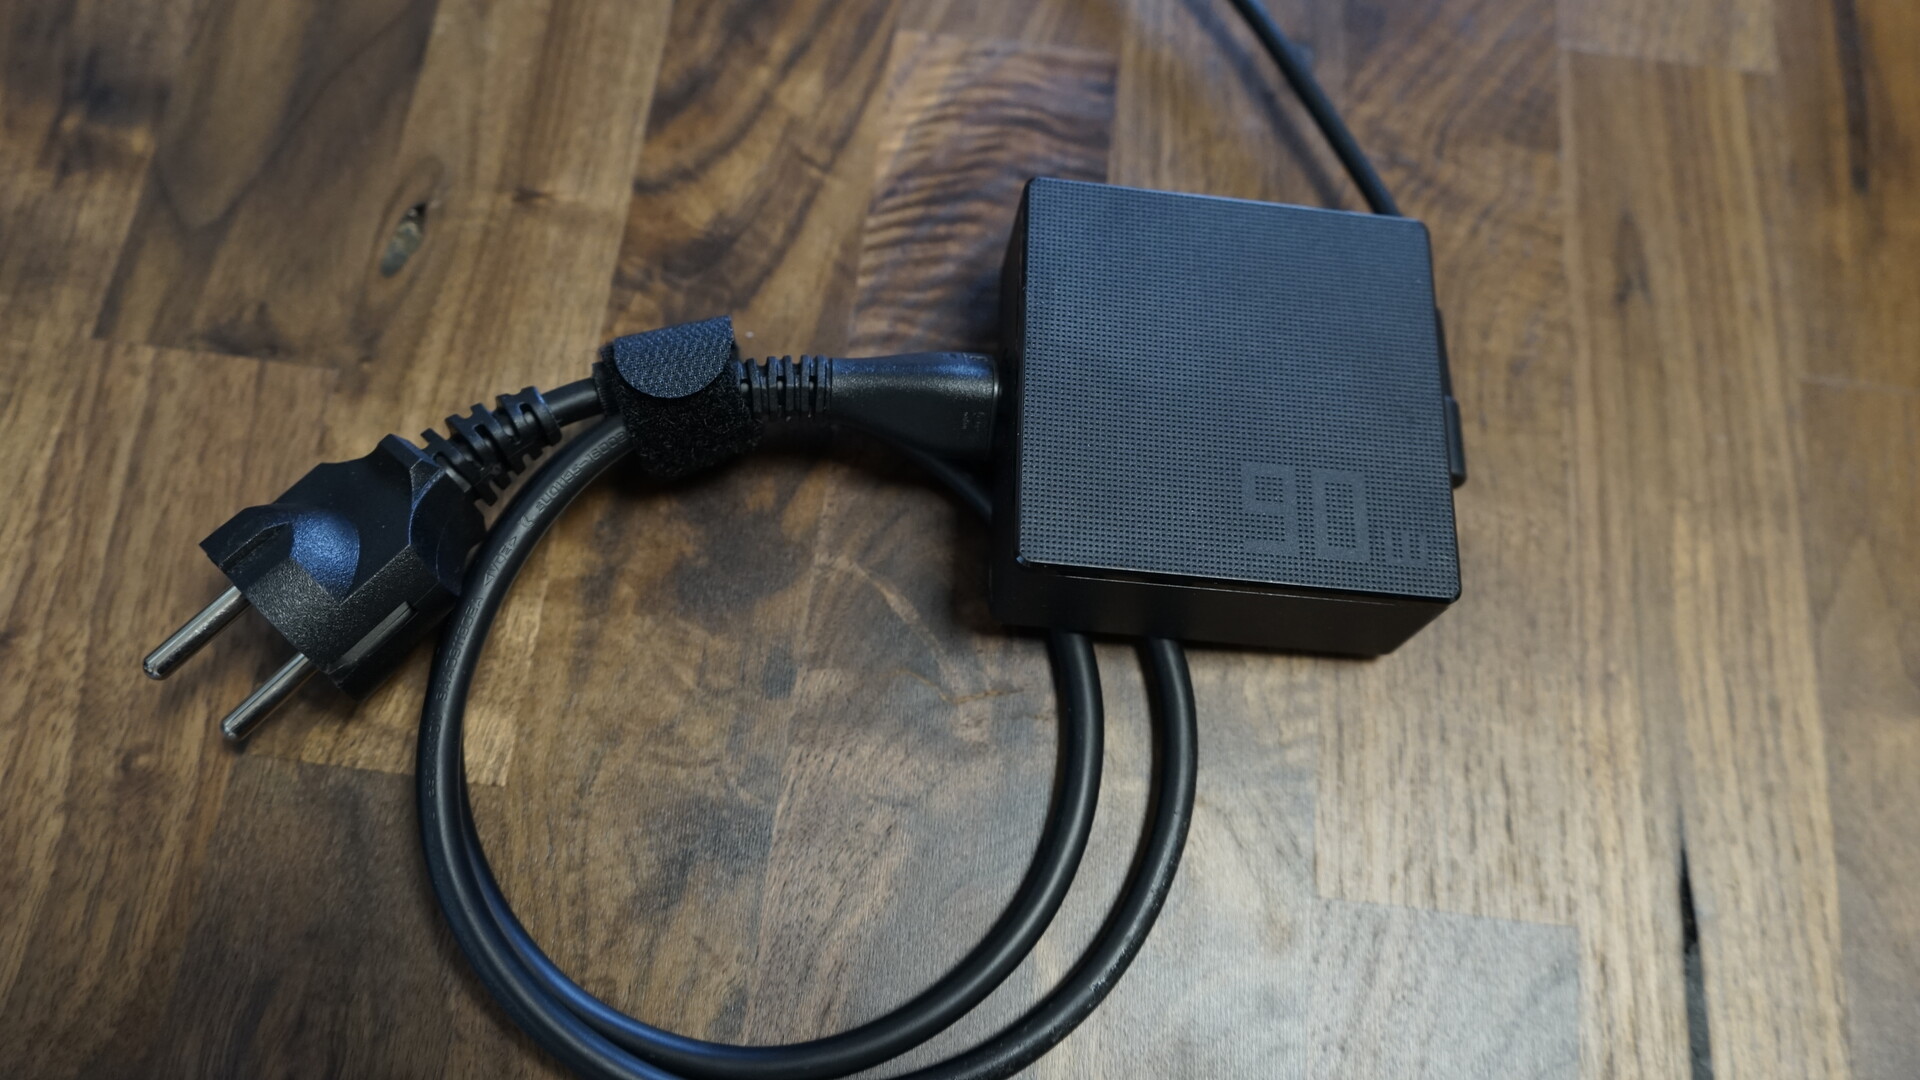
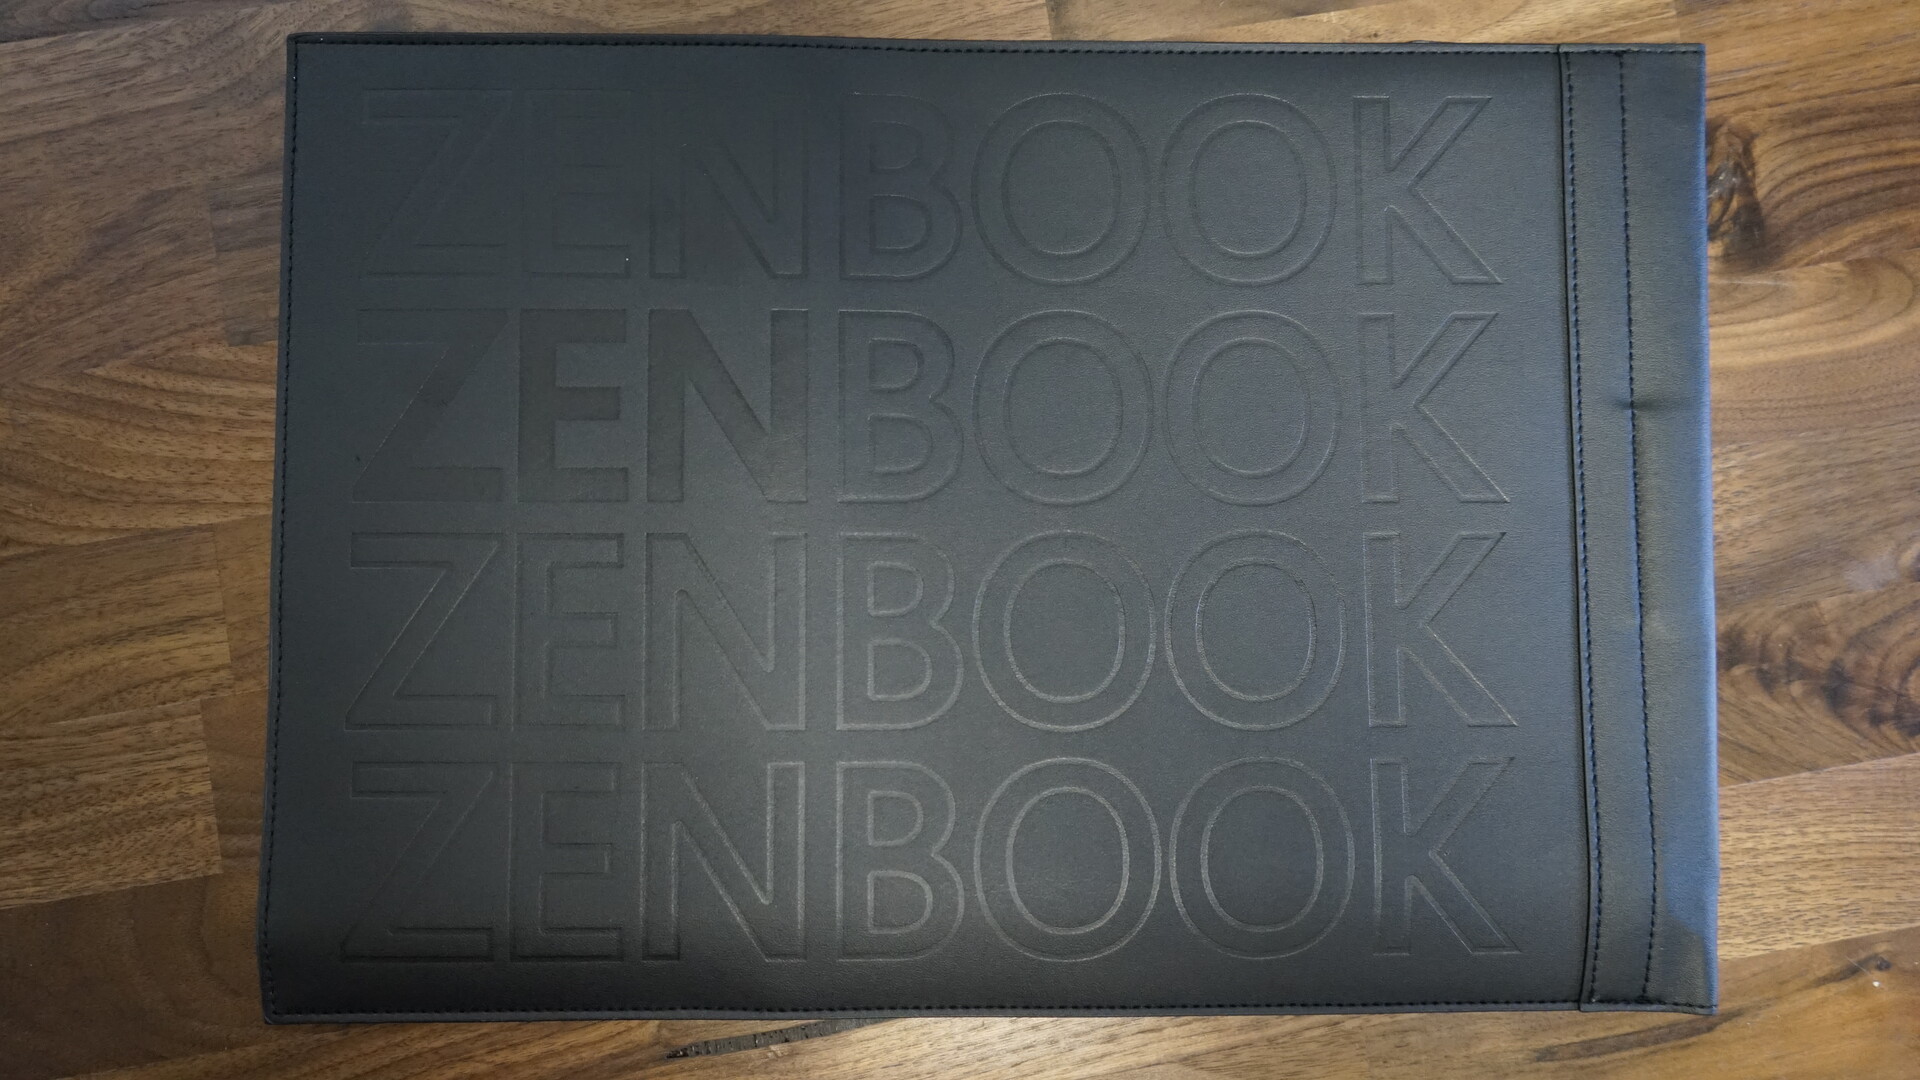
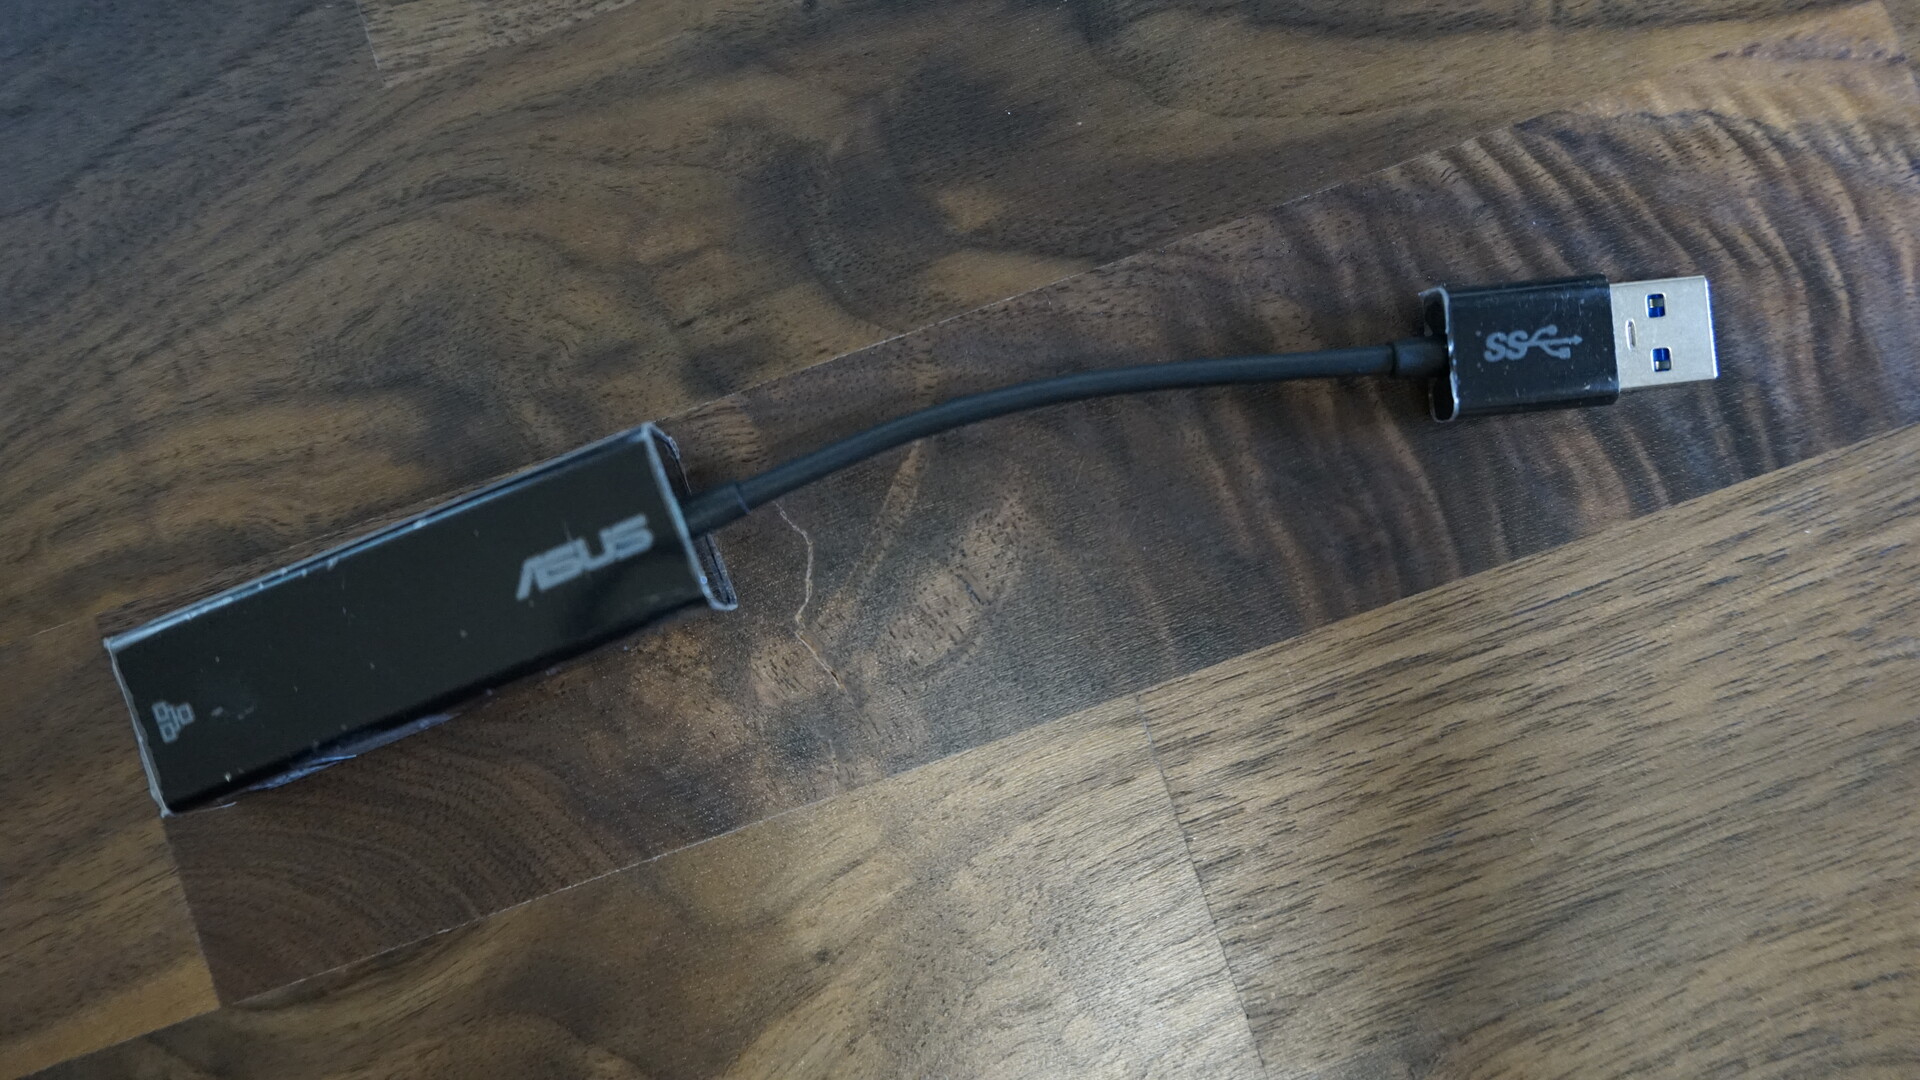
The accessories of the Asus ZenBook 14X consist of a compact 90-watt power supply, a USB Type-A Ethernet adapter and a practical protective sleeve. The protective sleeve is made of plastic with a soft-touch inner lining.
Maintenance
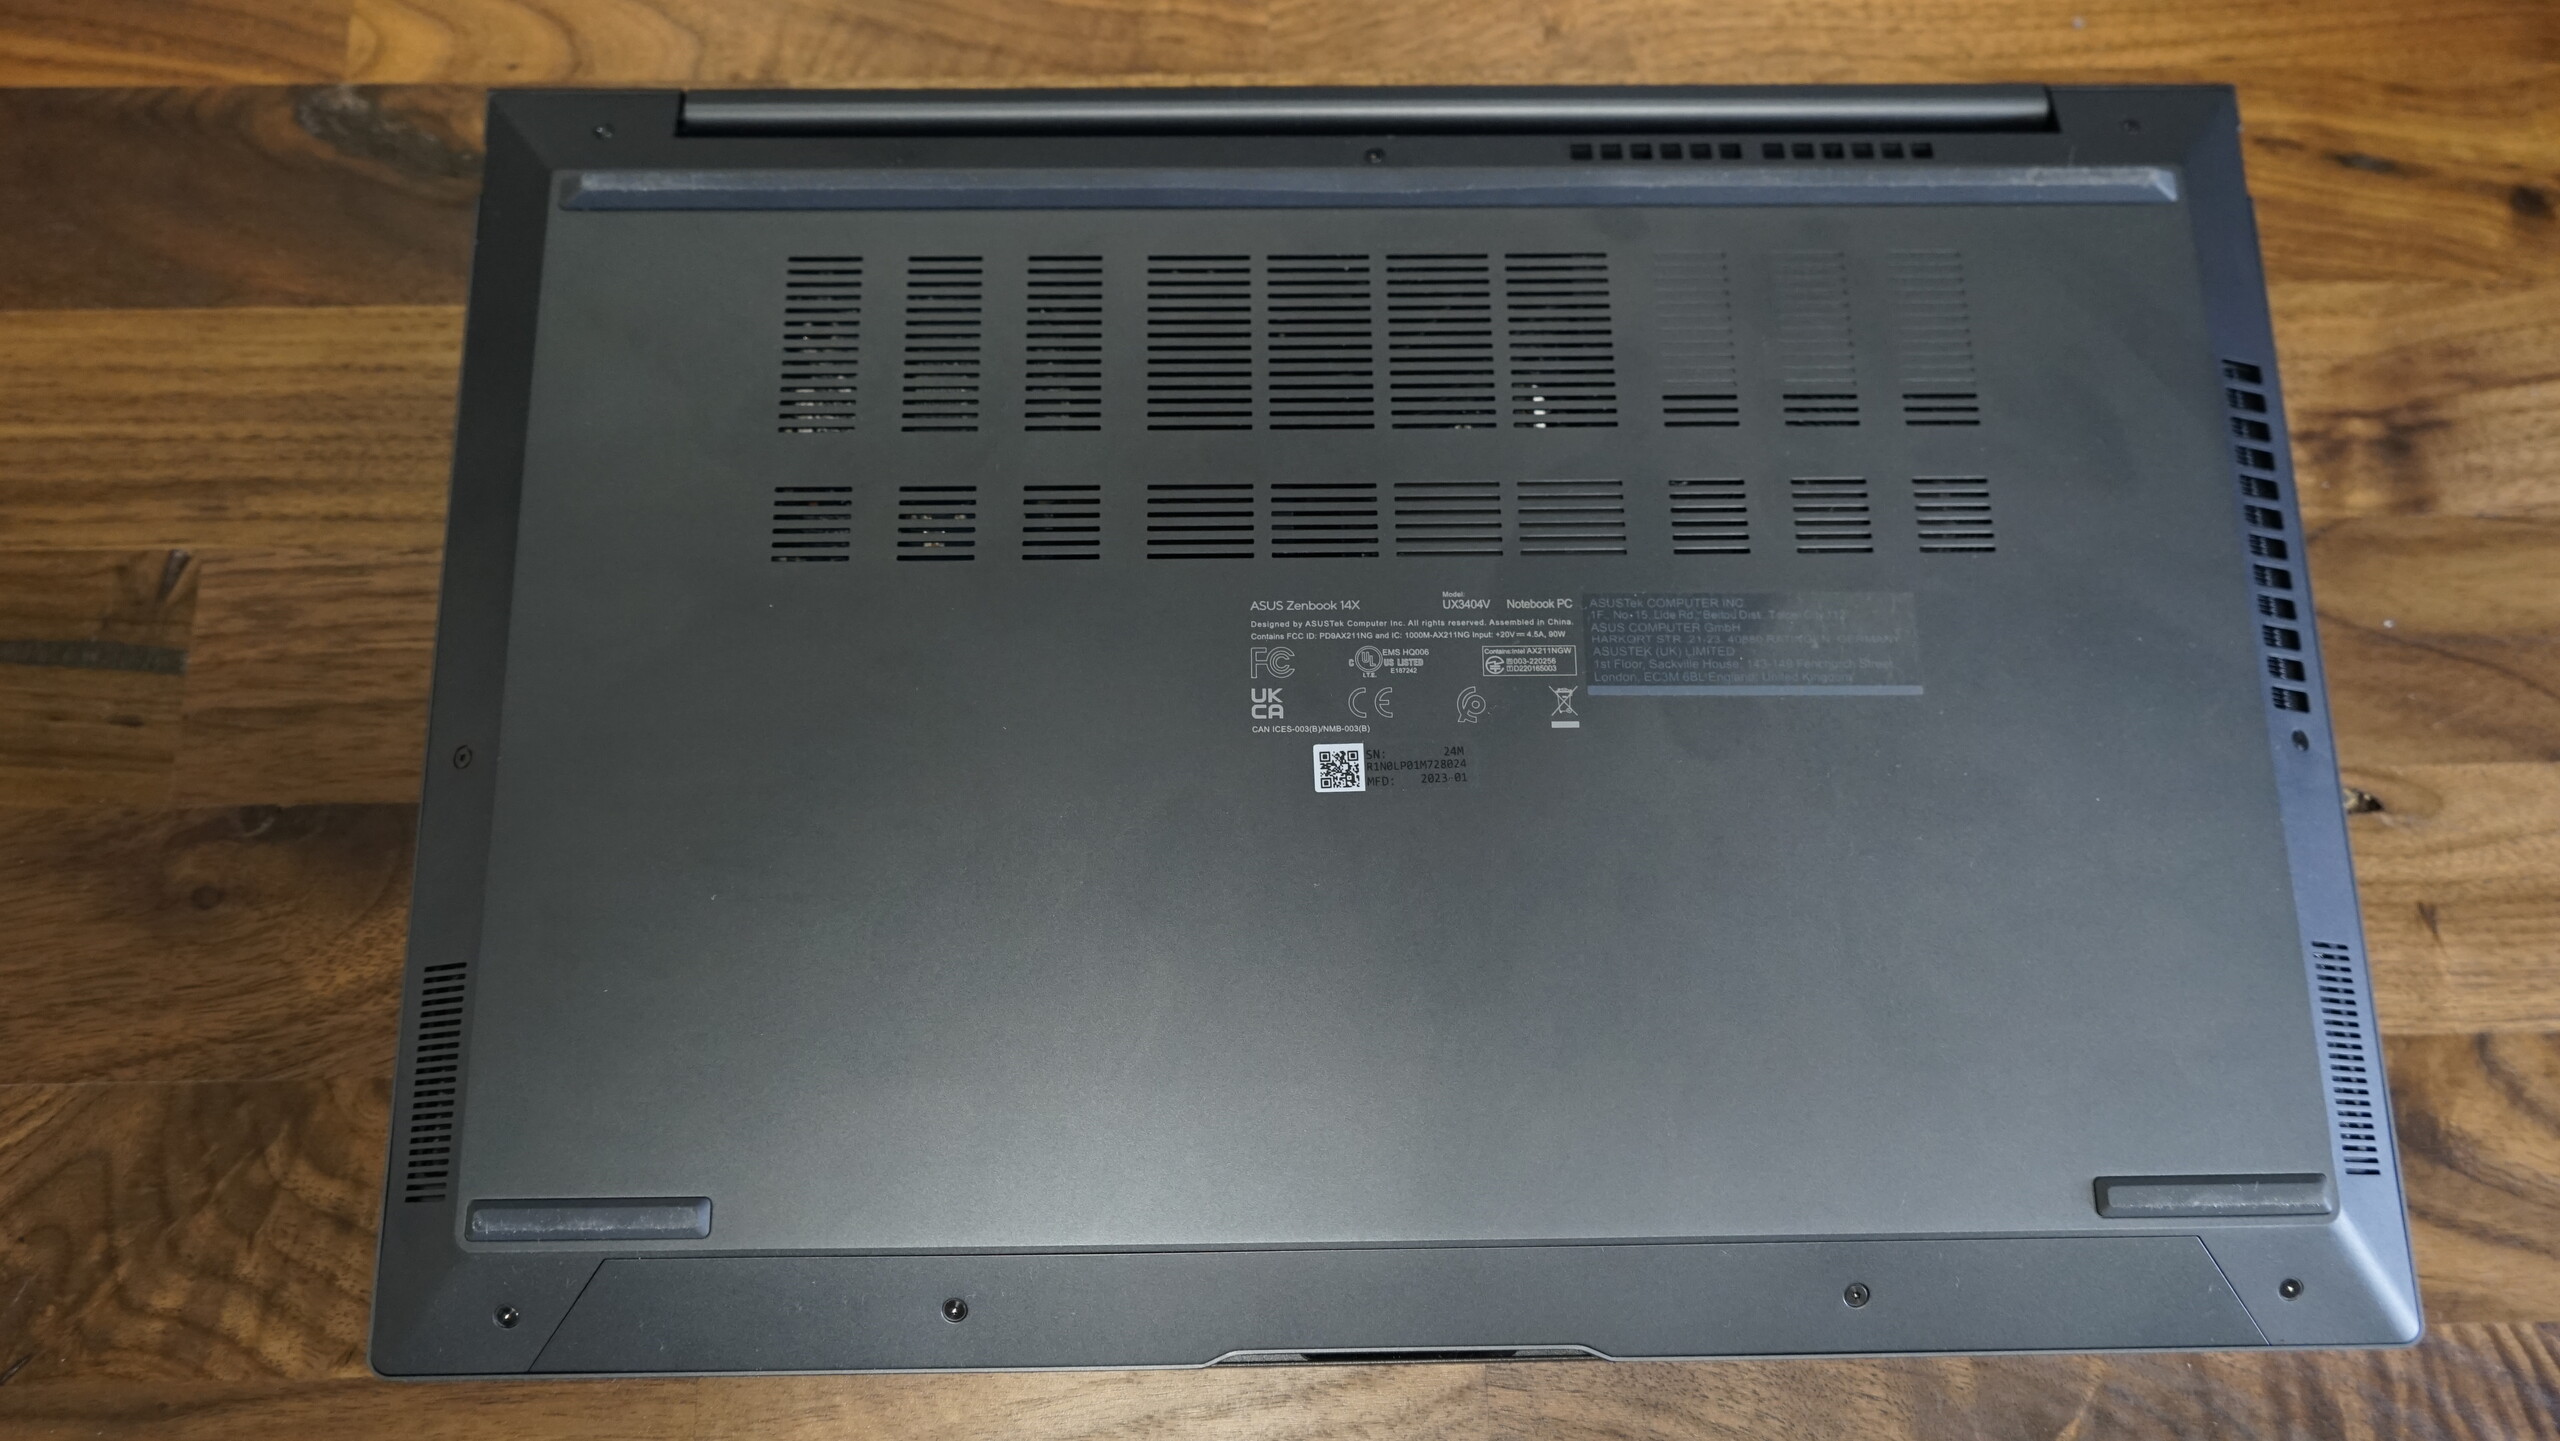
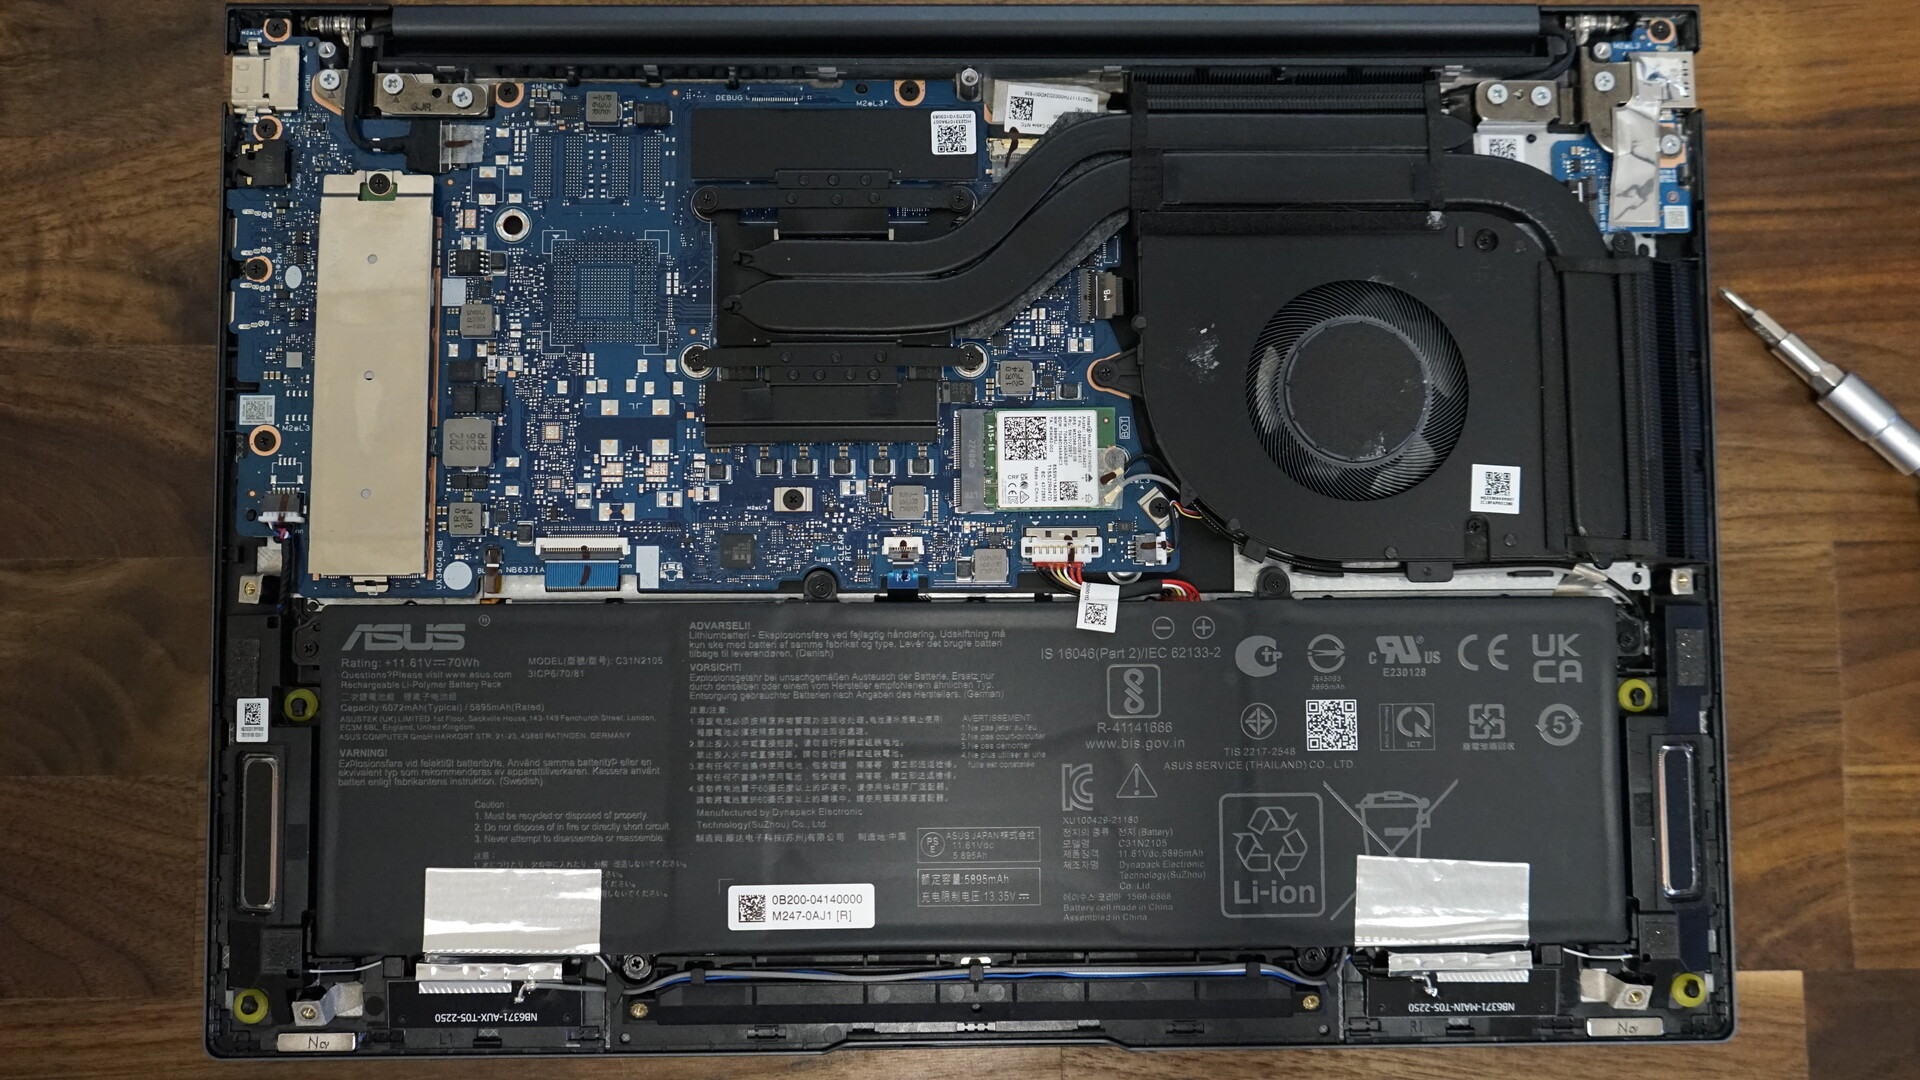
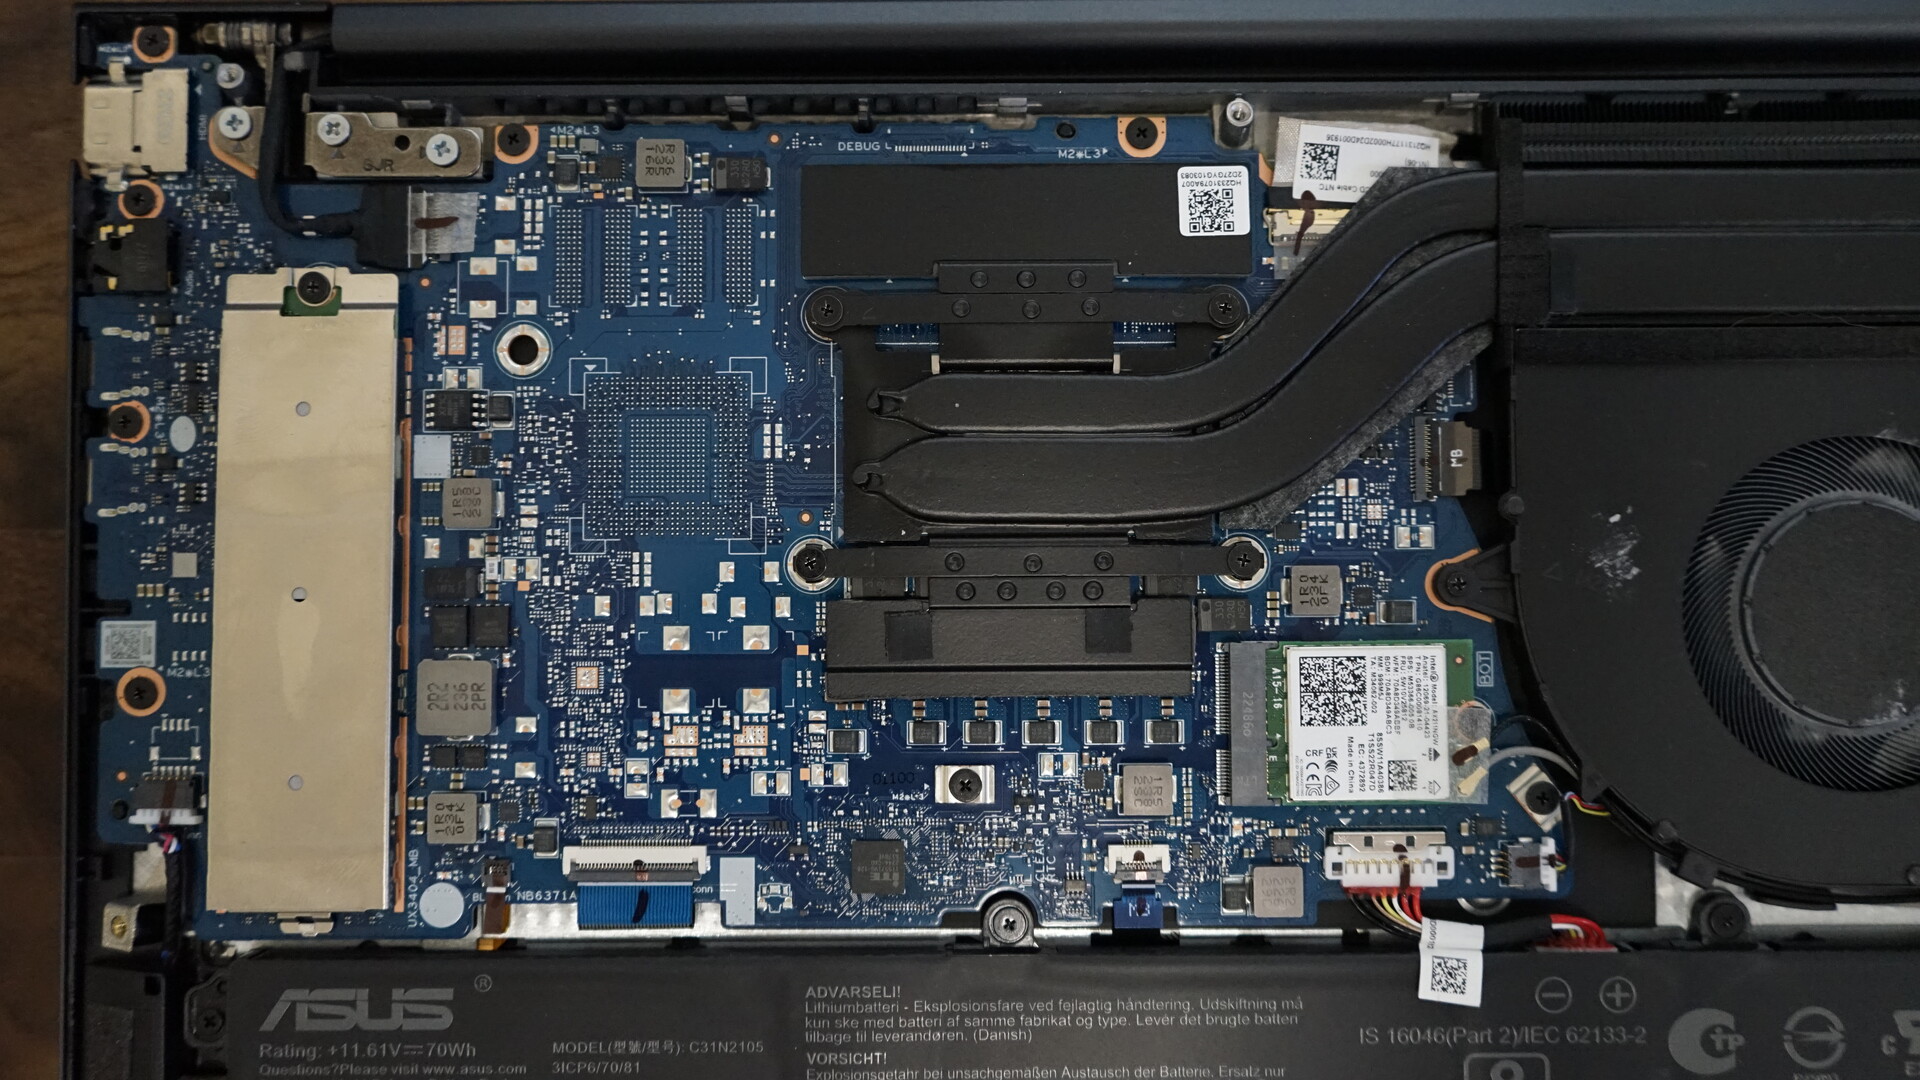
Opening the ZenBook is comparatively easy and only nine easily accessible screws have to be removed from the bottom. The Wi-Fi module, battery and SSD are replaceable, while the RAM is soldered. The internal structure also reveals the difference in cooling compared to the predecessor, since only one fan is installed in the 2023 model.
Warranty
Asus provides a two-year pickup & return warranty in Germany. This may differ in other countries, so interested buyers should double check before purchasing.
Input Devices
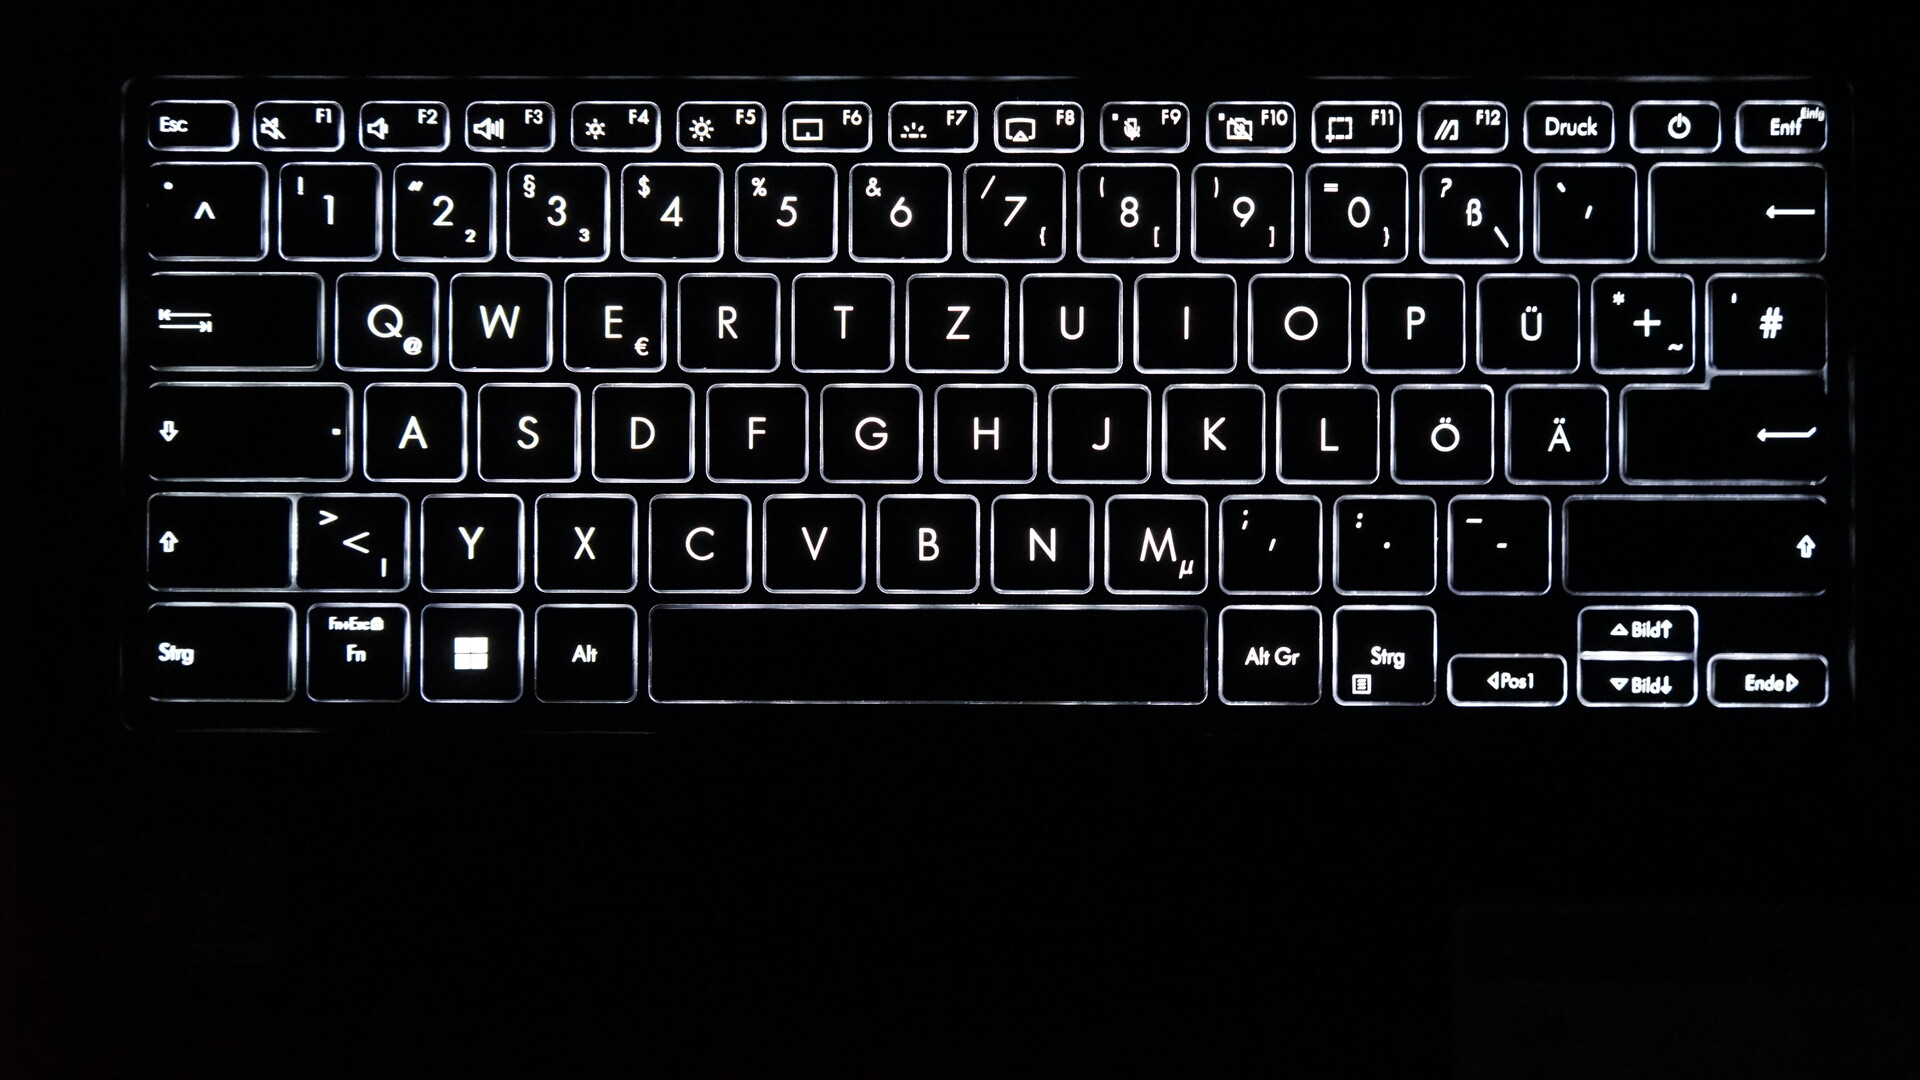
The keyboard of the 2023 model does without the dedicated image keys and the end key. Instead, these are found as a secondary function on the arrow keys. The keys themselves are matte and non-slip with a very clear pressure point, solid travel and a firm stroke. We would describe the typing feel as very crisp and the typing noise is moderate to quiet. The white backlight has three levels and the light is very evenly distributed, so that working in darker environments is not an issue. The key spacing is 2.5 mm, as in the predecessor model, which provides a pleasant typing feel without limitations. The ZenBook's sturdy base is also noticeable when typing, providing a stable and unyielding surface.
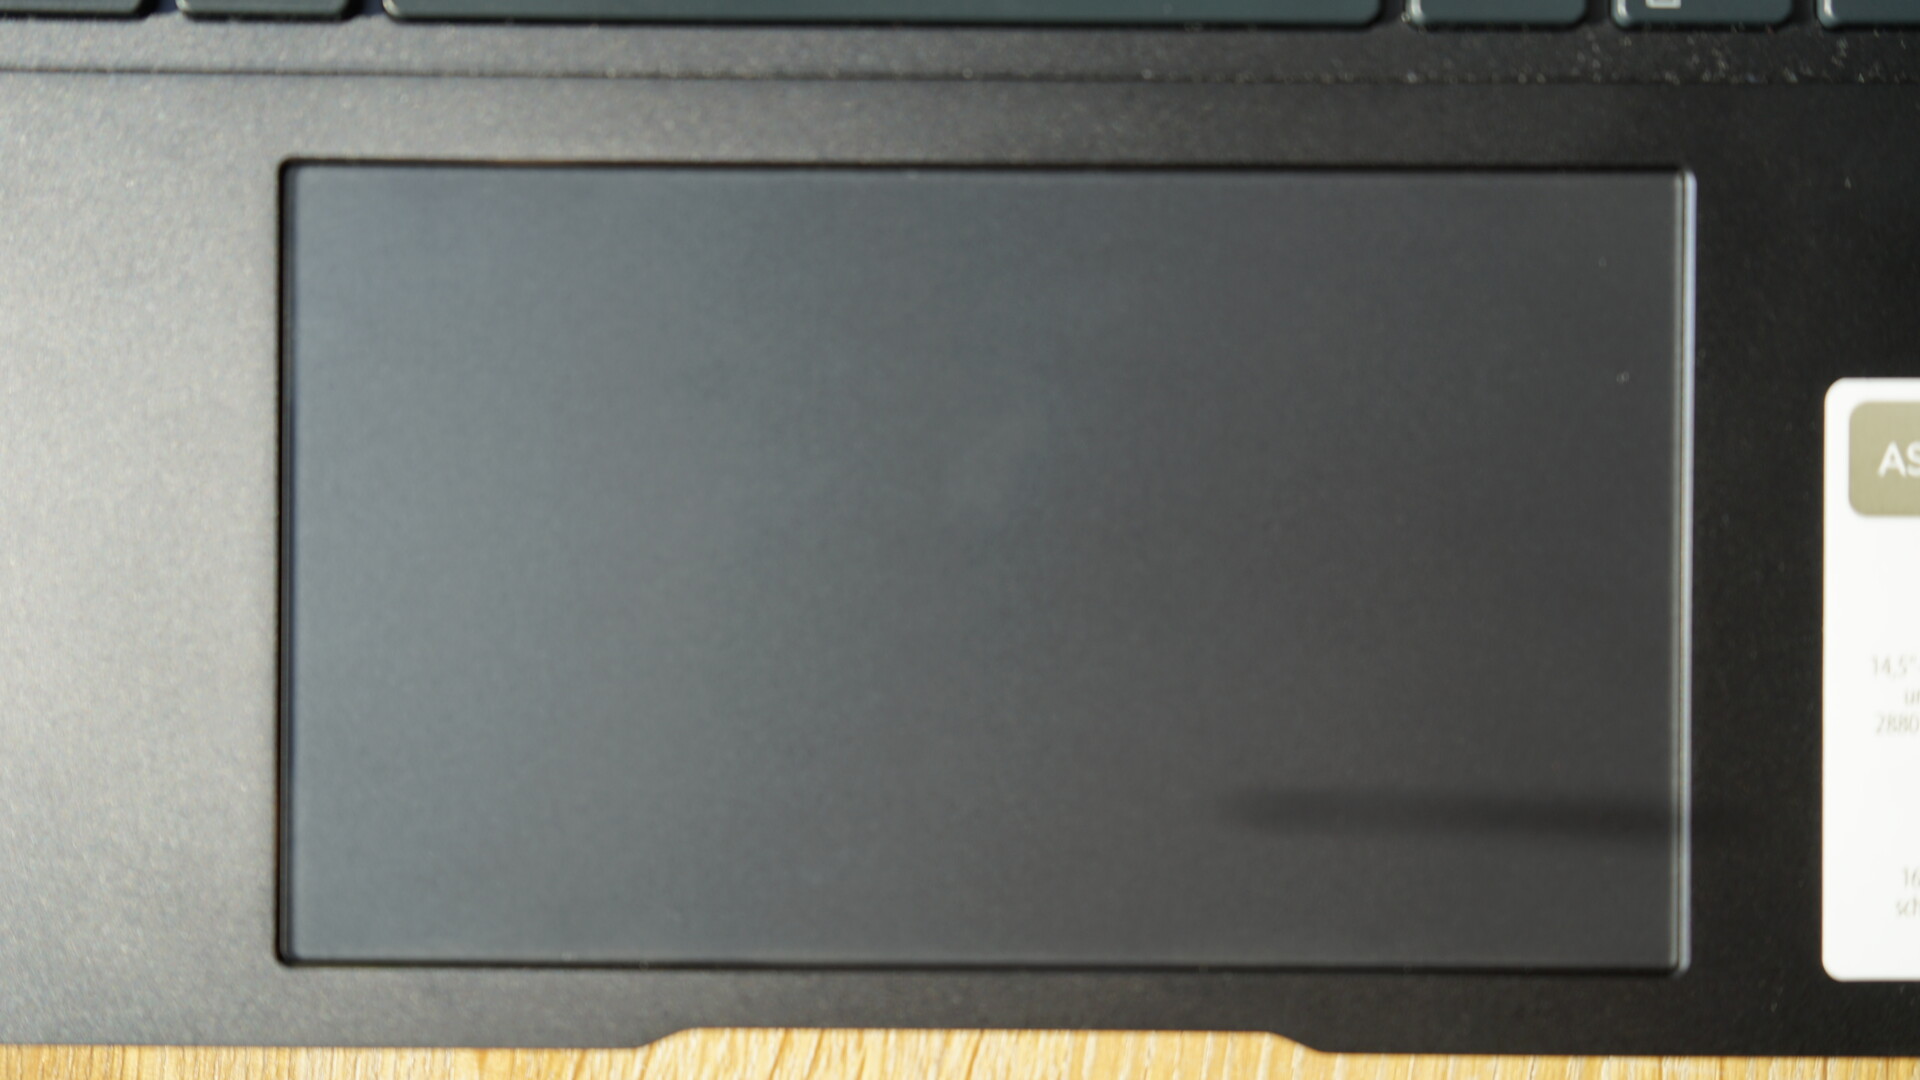
The clickpad measures 13 x 7.6 cm and is thus large enough for pointer movements and gestures with up to four fingers. Gliding properties are very good and clicks on both sides feel stable and high-quality with a solid clicking sound. The numpad, integrated into the touchpad of last year's device, is no longer available as such in our review device.
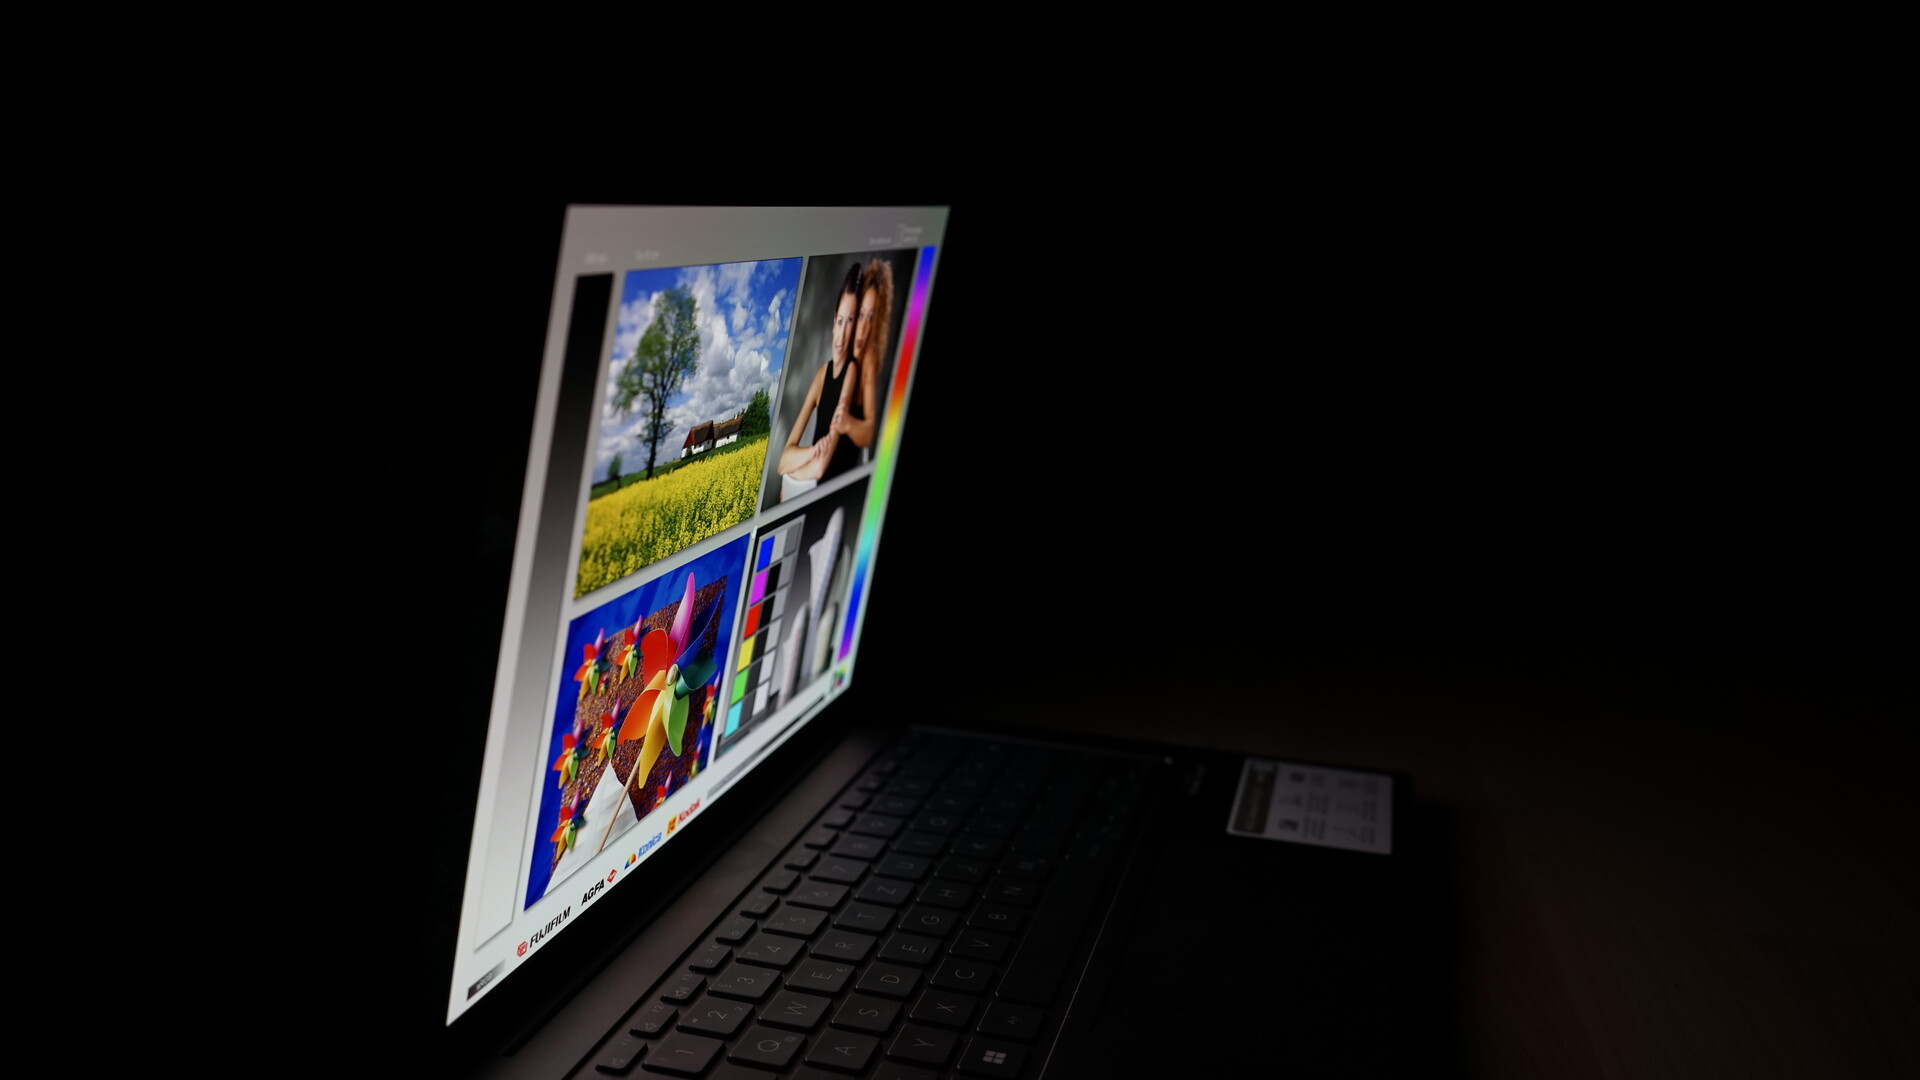
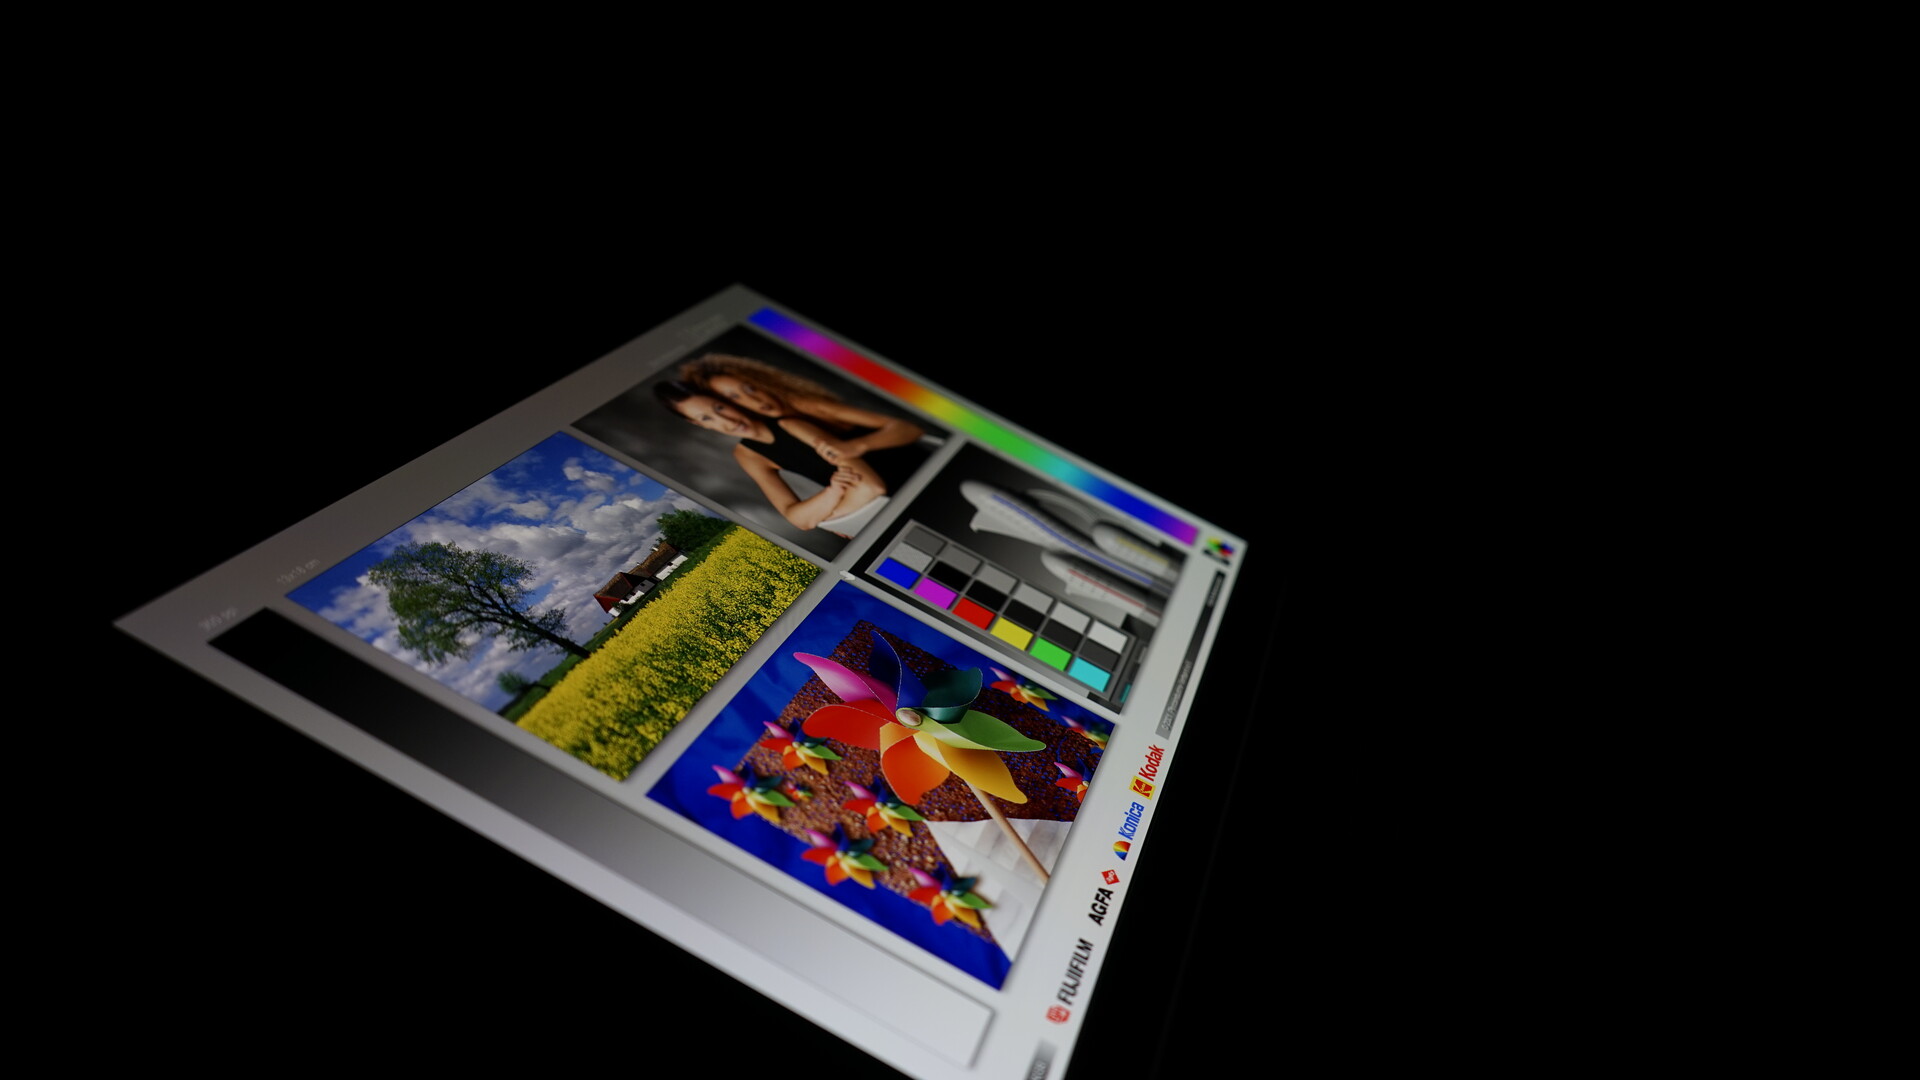
Display - 2.8K and 120 Hz
The star of the show on the Asus ZenBook 14X is the 14-inch OLED panel. The glossy display offers a resolution of 2,880x1,800 in 16:10 format, a 120 Hz refresh rate and a response time of just 2 milliseconds. The variant we tested is the non-touch variant. Alternatively, Asus also offers the display with the touch function.
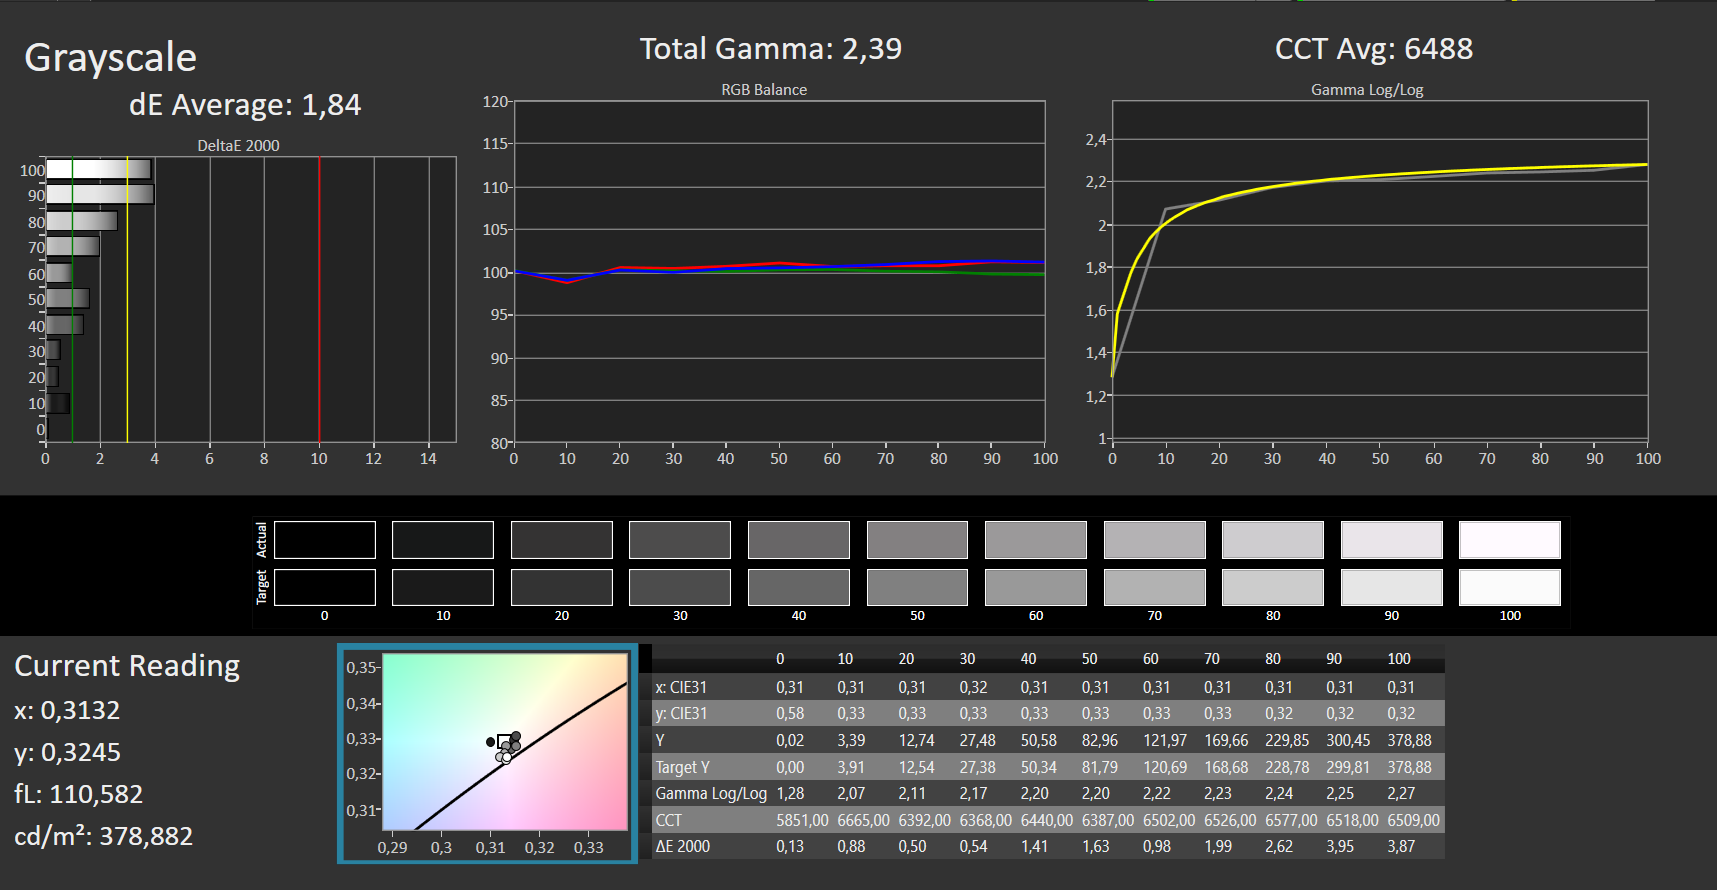
According to Asus, 100% DCI-P3 color gamut is a given, but our measurements resulted in "only" 99%. The sRGB color space, on the other hand, reaches 100% coverage and the AdobeRGB color space 95%. According to the manufacturer, the brightness of the display is estimated at an average of 400 nits. We measured an average of 376 cd/m2 and a maximum of 381 cd/m2, so we cannot fully confirm Asus' claim. As usual for OLED panels, the illumination is distributed homogeneously at 98%.
Lower brightness settings reduce the risk of burn-in on OLED displays, and the pixel shift function is activated by default via the MyAsus app. All pixels are thus always minimally in motion, so static pictures are avoided. The setting can be deactivated via the app, but we did not notice that the feature was activated during our tests.
| |||||||||||||||||||||||||
Brightness Distribution: 98 %
Center on Battery: 376 cd/m²
Contrast: 37200:1 (Black: 0.01 cd/m²)
ΔE ColorChecker Calman: 2.01 | ∀{0.5-29.43 Ø4.73}
calibrated: 2.17
ΔE Greyscale Calman: 1.84 | ∀{0.09-98 Ø4.97}
95% AdobeRGB 1998 (Argyll 3D)
100% sRGB (Argyll 3D)
99% Display P3 (Argyll 3D)
Gamma: 2.39
CCT: 6488 K
| Asus ZenBook 14X UX3404VC Samsung, OLED, 2880x1800, 14.5" | Apple MacBook Pro 13 2022 M2 IPS, 2560x1600, 13.3" | Dell XPS 13 Plus 9320 i7-1280P OLED Samsung 134XK04, OLED, 3456x2160, 13.4" | Lenovo Slim Pro 7 14ARP8 LEN89C1, IPS, 2560x1600, 14.5" | LG Gram 14Z90Q LG LP140WU1-SPF1, IPS, 1920x1200, 14" | Dell Inspiron 14 Plus 7420 InfoVision 140NWHE, IPS, 2240x1400, 14" | Asus ROG Flow Z13 GZ301V TL134ADXP01-0, IPS, 2560x1600, 13.4" | |
|---|---|---|---|---|---|---|---|
| Display | -2% | 2% | -16% | -4% | -20% | -4% | |
| Display P3 Coverage (%) | 99 | 98.8 0% | 99.5 1% | 72.9 -26% | 98.4 -1% | 68.8 -31% | 97 -2% |
| sRGB Coverage (%) | 100 | 100 0% | 100 0% | 98.2 -2% | 99.9 0% | 99.3 -1% | 99.9 0% |
| AdobeRGB 1998 Coverage (%) | 95 | 87.9 -7% | 98.4 4% | 74.6 -21% | 85.9 -10% | 69.5 -27% | 85.3 -10% |
| Response Times | -1645% | -18% | -1178% | -1700% | -1290% | -225% | |
| Response Time Grey 50% / Grey 80% * (ms) | 2 ? | 42 ? -2000% | 2.6 ? -30% | 31.8 ? -1490% | 47.5 ? -2275% | 32.8 ? -1540% | 6.5 ? -225% |
| Response Time Black / White * (ms) | 2 ? | 27.8 ? -1290% | 2.1 ? -5% | 19.3 ? -865% | 24.5 ? -1125% | 22.8 ? -1040% | 6.5 ? -225% |
| PWM Frequency (Hz) | 250 ? | 117780 ? | 59.5 | ||||
| Screen | -319% | -13% | -368% | -324% | -334% | -482% | |
| Brightness middle (cd/m²) | 372 | 514 38% | 371.8 0% | 344.7 -7% | 341 -8% | 331.1 -11% | 537 44% |
| Brightness (cd/m²) | 376 | 497 32% | 374 -1% | 334 -11% | 305 -19% | 326 -13% | 511 36% |
| Brightness Distribution (%) | 98 | 93 -5% | 98 0% | 92 -6% | 87 -11% | 85 -13% | 88 -10% |
| Black Level * (cd/m²) | 0.01 | 0.31 -3000% | 0.31 -3000% | 0.26 -2500% | 0.29 -2800% | 0.45 -4400% | |
| Contrast (:1) | 37200 | 1658 -96% | 1112 -97% | 1312 -96% | 1142 -97% | 1193 -97% | |
| Colorchecker dE 2000 * | 2.01 | 1.1 45% | 2.37 -18% | 3.01 -50% | 3.11 -55% | 2.23 -11% | 1.49 26% |
| Colorchecker dE 2000 max. * | 4.05 | 2.3 43% | 6.1 -51% | 6.3 -56% | 8.29 -105% | 5.44 -34% | 3.68 9% |
| Colorchecker dE 2000 calibrated * | 2.17 | 0.6 72% | 0.83 62% | 0.83 62% | 0.63 71% | 1.12 48% | |
| Greyscale dE 2000 * | 1.84 | 1.8 2% | 2 -9% | 4.6 -150% | 5.3 -188% | 3.6 -96% | 1.66 10% |
| Gamma | 2.39 92% | 2.23 99% | 2.29 96% | 2.28 96% | 2.037 108% | 2.21 100% | 2.43 91% |
| CCT | 6488 100% | 6764 96% | 6261 104% | 6420 101% | 7571 86% | 6022 108% | 6772 96% |
| Total Average (Program / Settings) | -655% /
-440% | -10% /
-10% | -521% /
-409% | -676% /
-452% | -548% /
-403% | -237% /
-343% |
* ... smaller is better
As usual with OLED displays, the contrast is excellent. Black is a rich black on the ZenBook 14X and the colors are vibrant. The OLED display is also clearly superior to the IPS displays of comparable devices in terms of response times. The image and display settings can be individually adjusted via the MyAsus software.

Our measurements of the DeltaE of the grayscale and colors produced very good values between 1.8 and 2.0 prior to calibration. Calibration improved the grayscale DeltaE to 1.6, while the color DeltaE deteriorated to 2.2. These results suggest that the display is already calibrated and further calibrations do not offer any added value here.


Display Response Times
| ↔ Response Time Black to White | ||
|---|---|---|
| 2 ms ... rise ↗ and fall ↘ combined | ↗ 1 ms rise |  |
| ↘ 1 ms fall | ||
| The screen shows very fast response rates in our tests and should be very well suited for fast-paced gaming. In comparison, all tested devices range from 0.1 (minimum) to 240 (maximum) ms. » 11 % of all devices are better. This means that the measured response time is better than the average of all tested devices (19.9 ms). | ||
| ↔ Response Time 50% Grey to 80% Grey | ||
| 2 ms ... rise ↗ and fall ↘ combined | ↗ 1 ms rise |  |
| ↘ 1 ms fall | ||
| The screen shows very fast response rates in our tests and should be very well suited for fast-paced gaming. In comparison, all tested devices range from 0.165 (minimum) to 636 (maximum) ms. » 10 % of all devices are better. This means that the measured response time is better than the average of all tested devices (31.1 ms). | ||
Screen Flickering / PWM (Pulse-Width Modulation)
| Screen flickering / PWM detected | 250 Hz | ≤ 70 % brightness setting |  |
The display backlight flickers at 250 Hz (worst case, e.g., utilizing PWM) Flickering detected at a brightness setting of 70 % and below. There should be no flickering or PWM above this brightness setting. The frequency of 250 Hz is relatively low, so sensitive users will likely notice flickering and experience eyestrain at the stated brightness setting and below. In comparison: 52 % of all tested devices do not use PWM to dim the display. If PWM was detected, an average of 7801 (minimum: 5 - maximum: 343500) Hz was measured. | |||


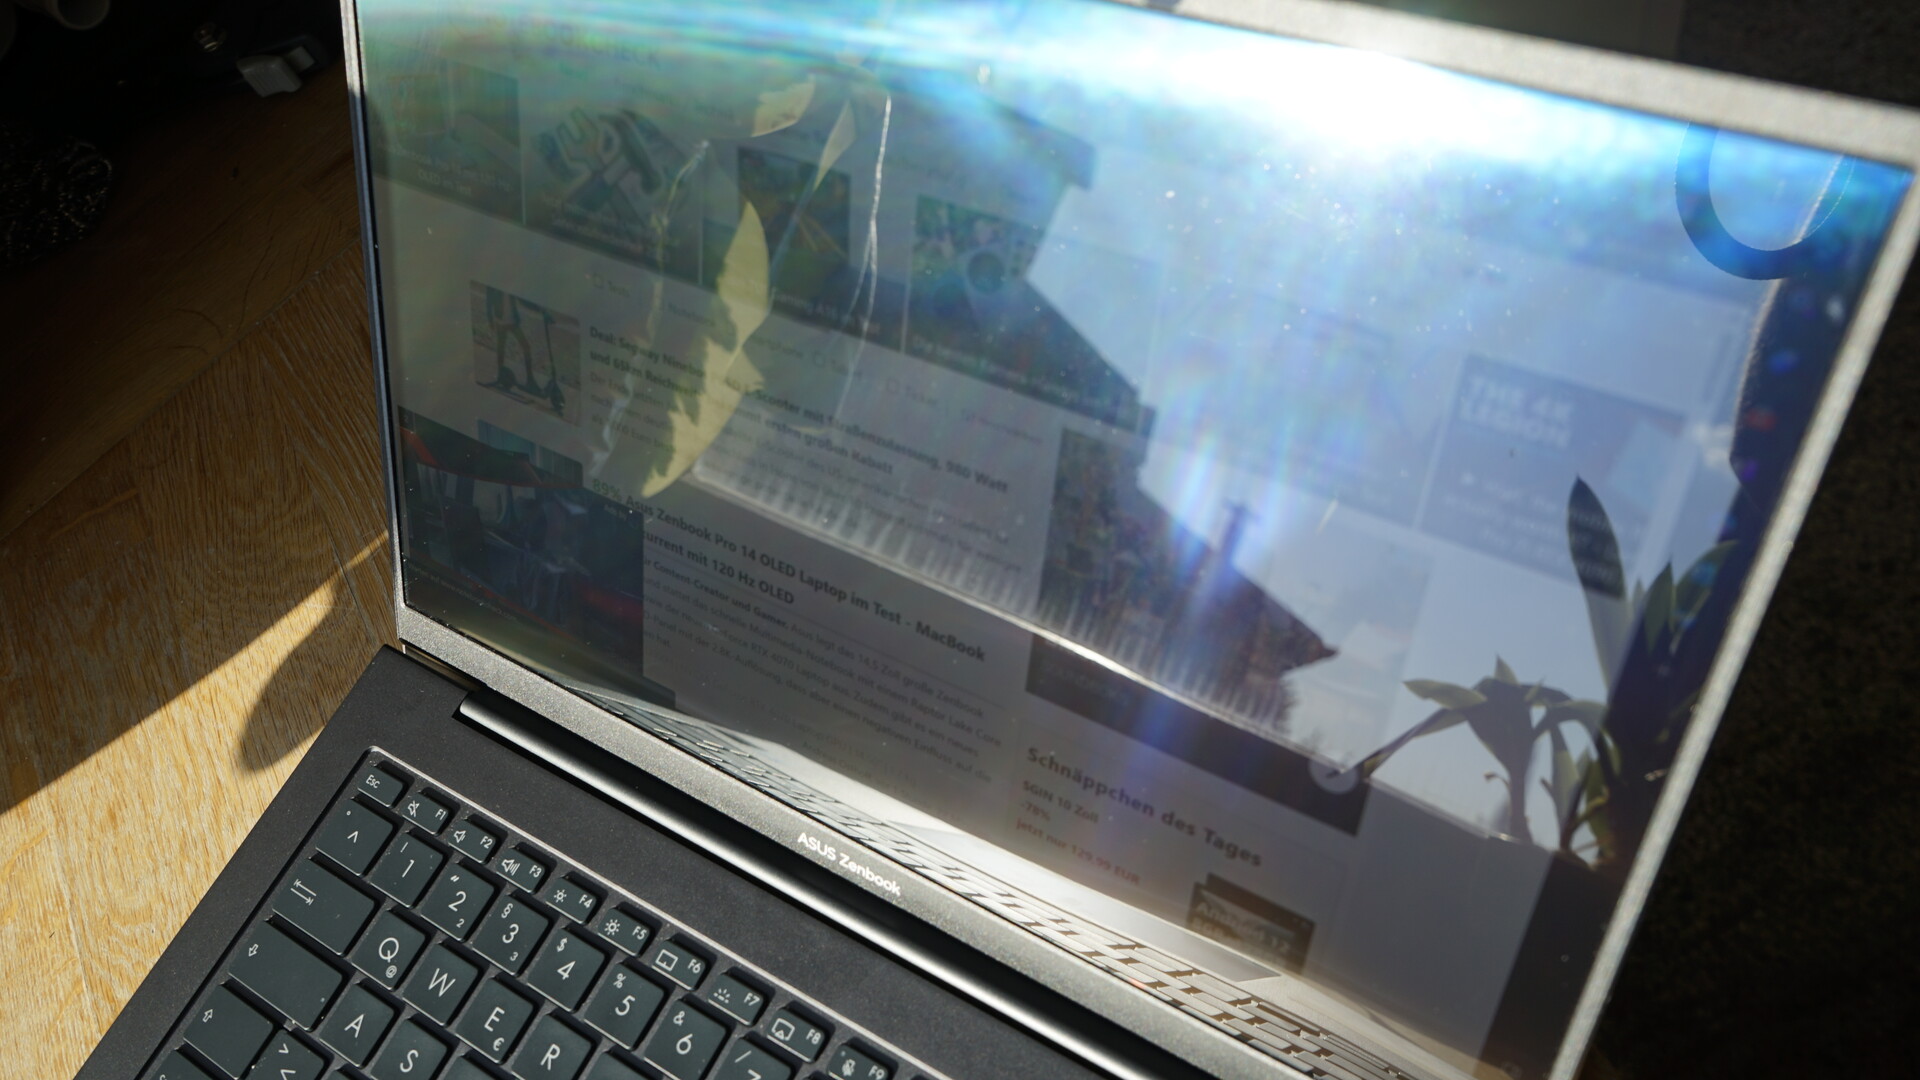
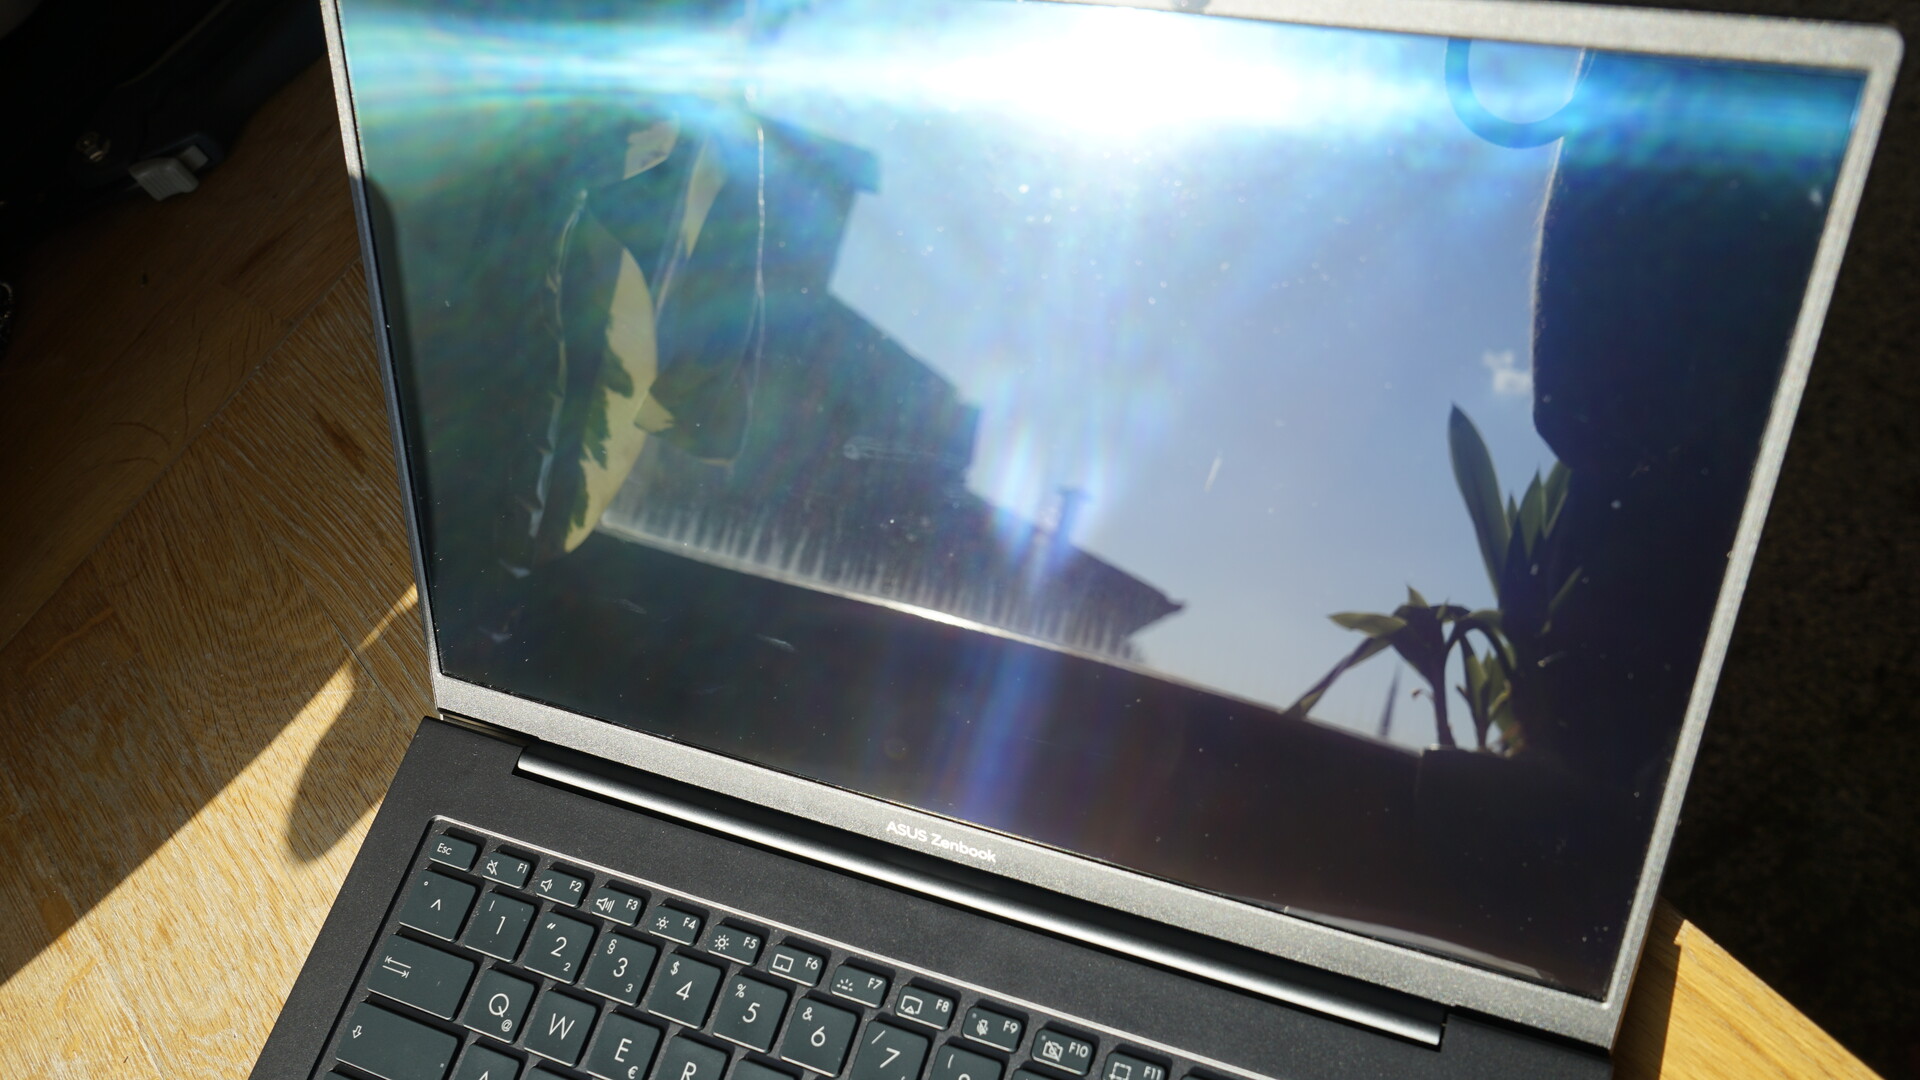
The OLED display of the Asus ZenBook 14X has problems in direct sunlight. The glare-type display can hardly cope here and comfortable viewing of the screen is no longer possible. The slightly higher peak brightness compared to the predecessor doesn't help either.
As usual with OLED panels, there is nothing to criticize about the viewing angle stability. Colors and the brightness remain perfectly stable, even at very steep angles. As usual for OLED panels, a certain blue tint is visible at very steep angles.


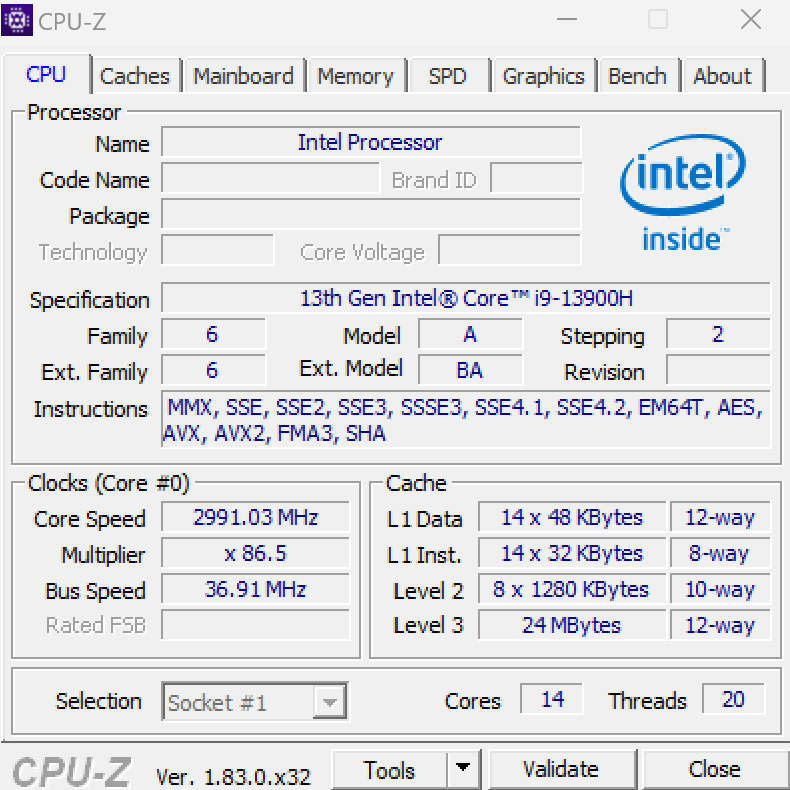
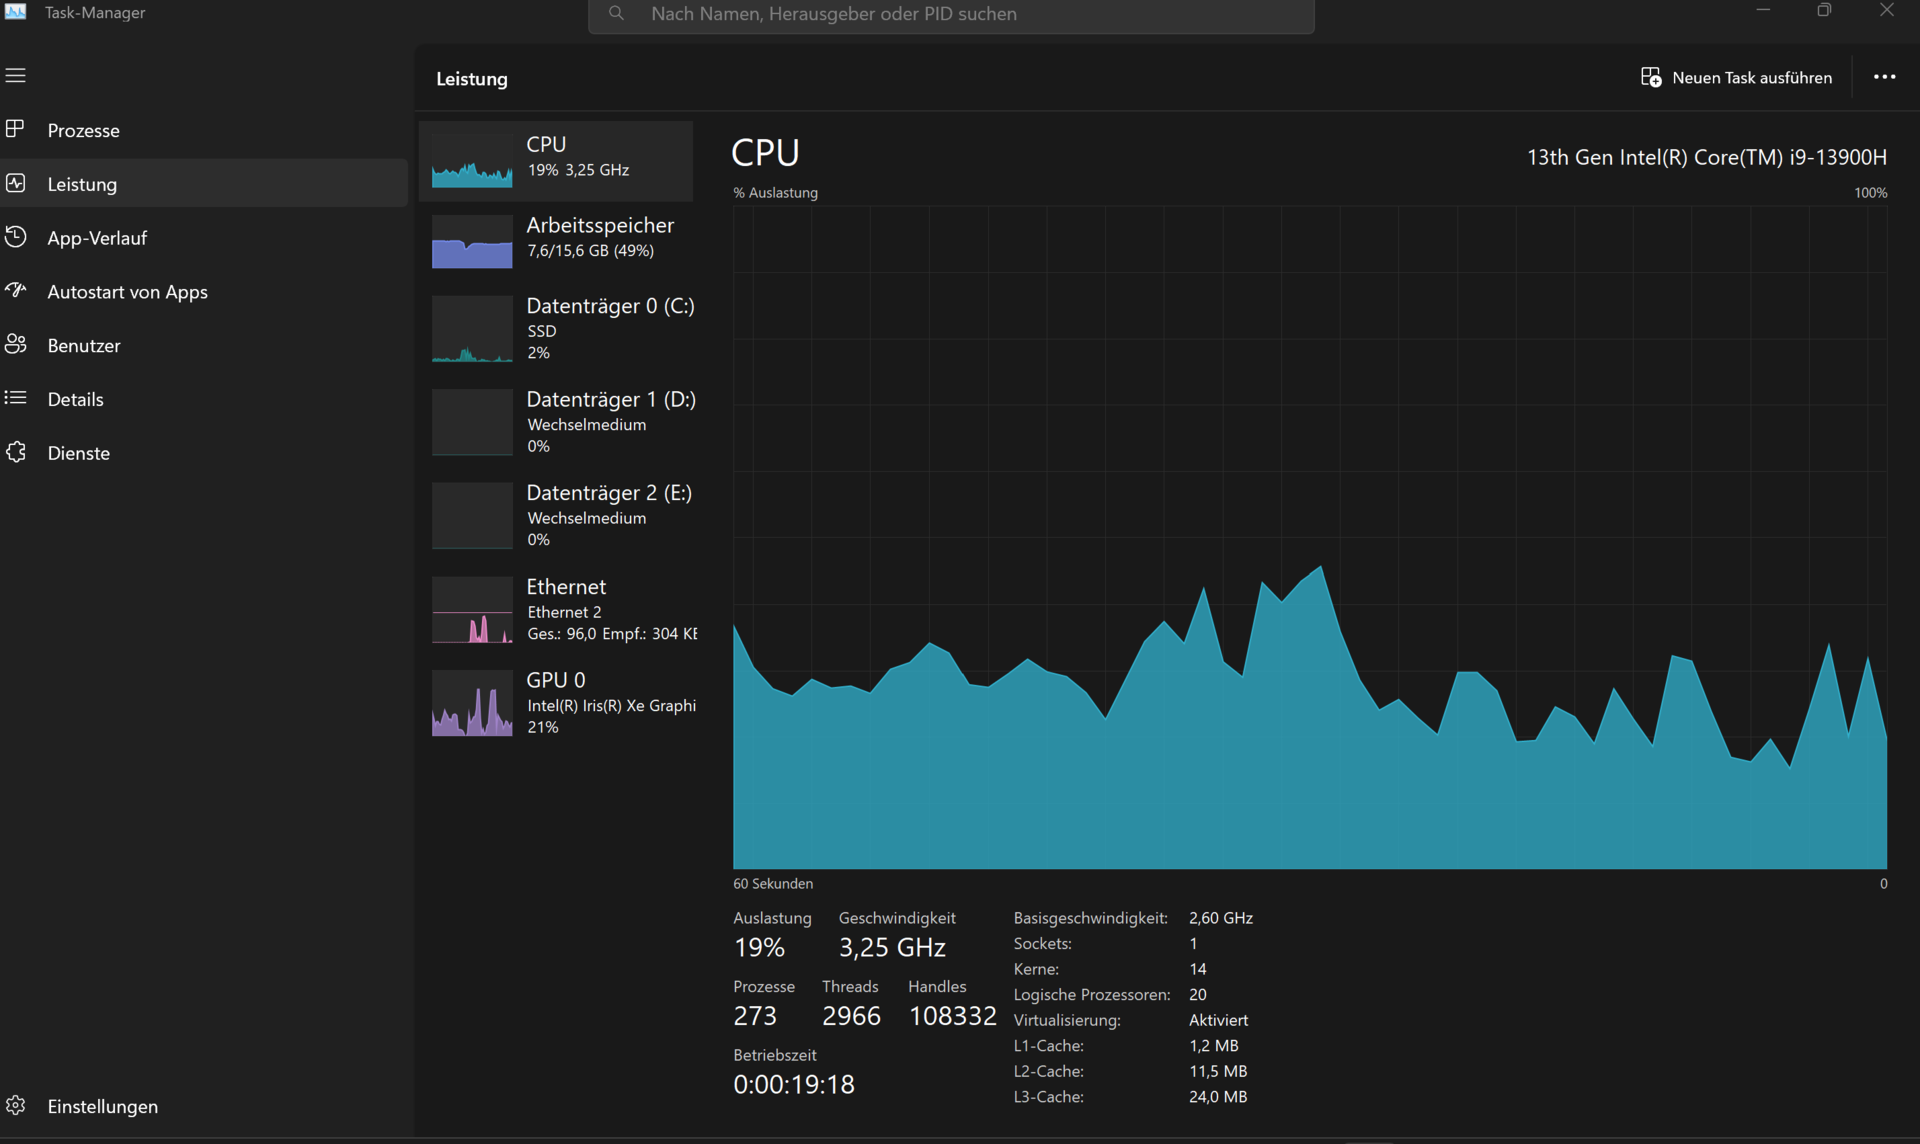
Performance - Powerful Intel i9-13900H
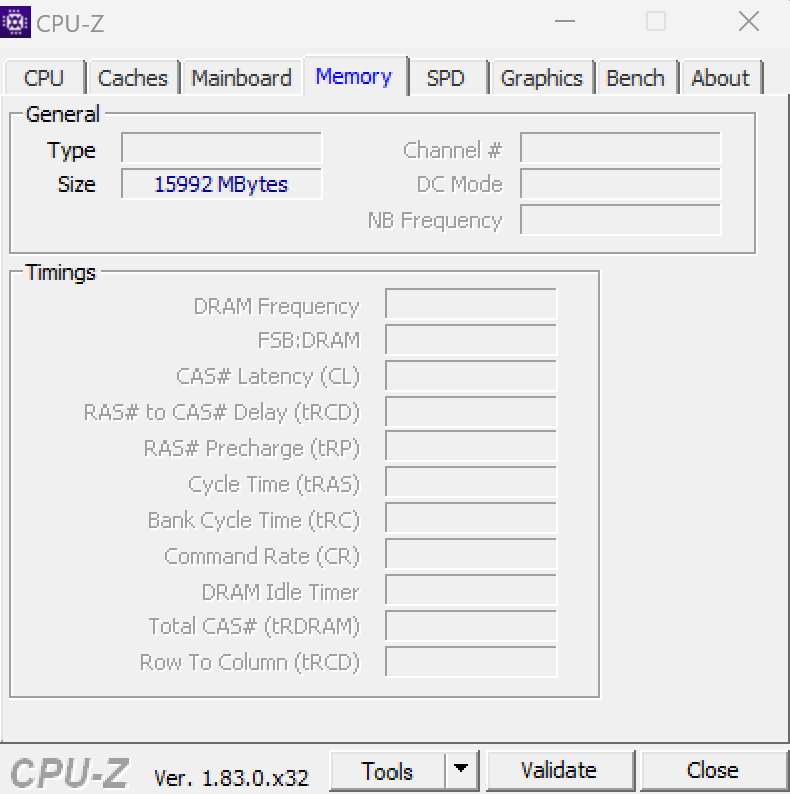
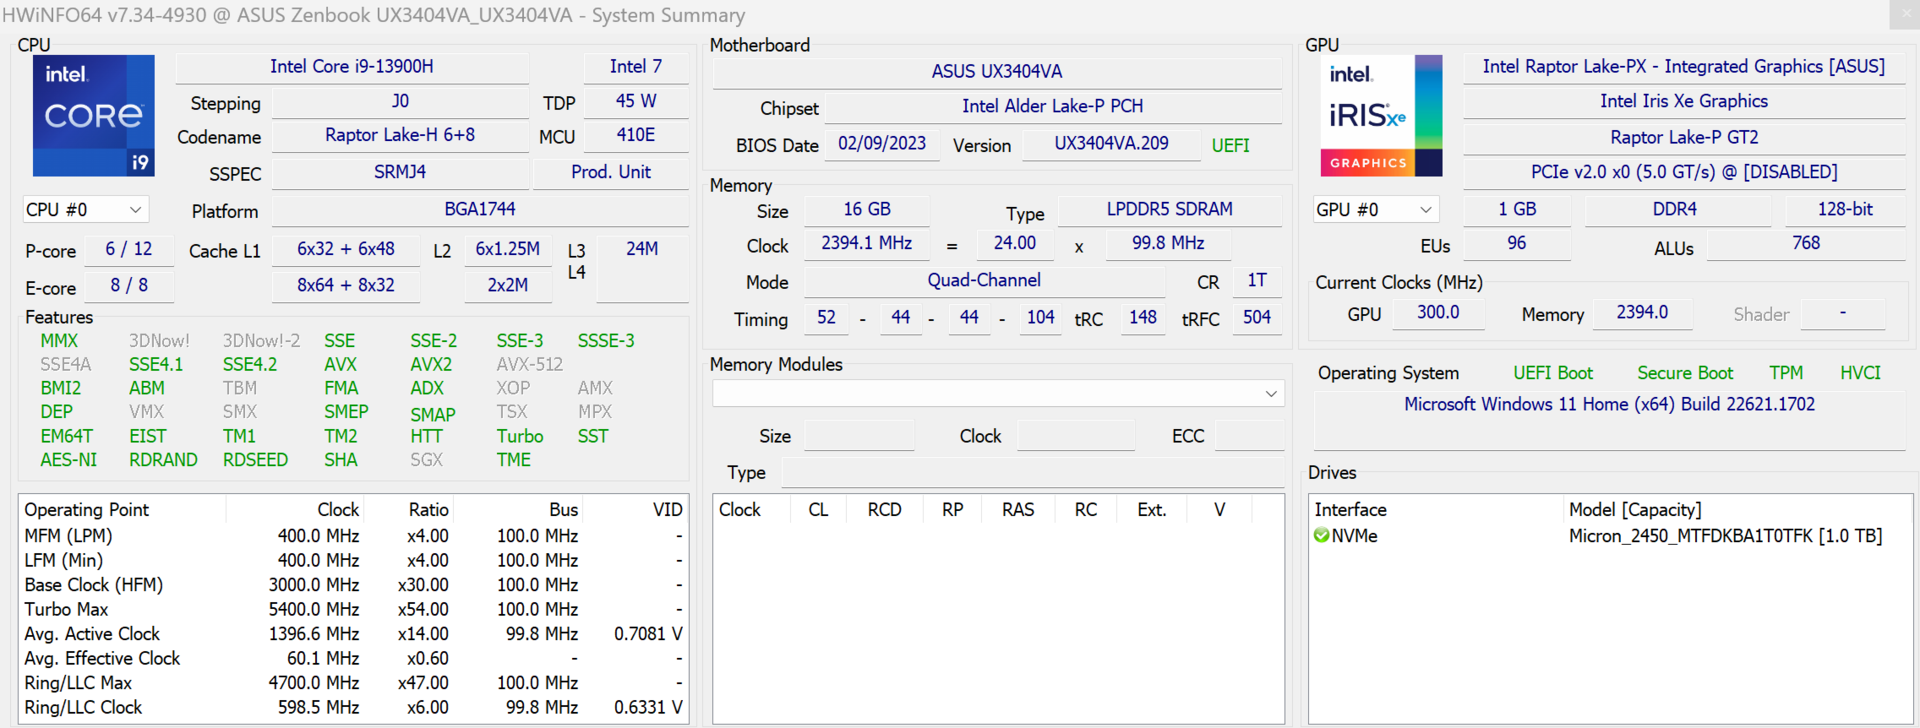
Asus installs the Intel Core Intel Core i9-13900H in the new ZenBook 14X, which, with the exception of the Asus ROG Flow Z13, is found only in larger notebooks. Our test model is the variant without a dedicated graphics card. Hence, only the internal Intel Iris X graphics is used here. Other hardware includes 16 GB LPDDR5 RAM (onboard) and a 1 TB M.2 NVME PCIe hard drive.
Testing Conditions
Three different performance profiles can be selected for the ZenBook 14X via the MyAsus app: Silent, Standard and Performance. The latter can only be used with the power supply plugged in. Benchmarks were run in Performance mode, while the battery endurance tests were carried out in Silent mode. Performance mode was used for the maximum energy consumption test, and noise emissions were checked for all three modes.
| Performance mode | Standard mode | Silent mode | |
|---|---|---|---|
| CPU PL1 (HWInfo) | 80 watts | 80 watts | 40 watts |
| CPU PL2 (HWInfo) | 80 watts | 80 watts | 80 watts |
Processor
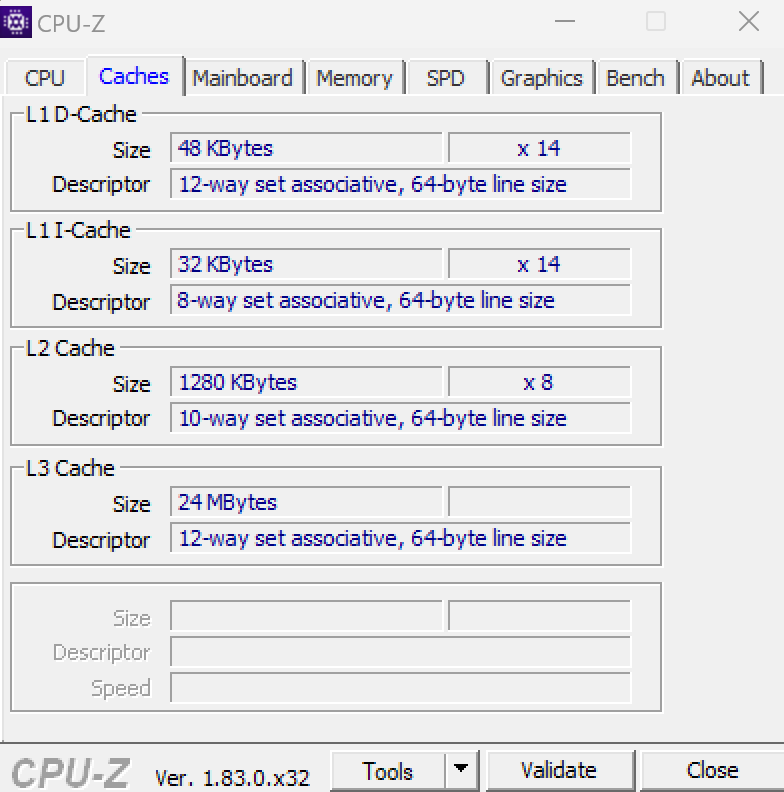
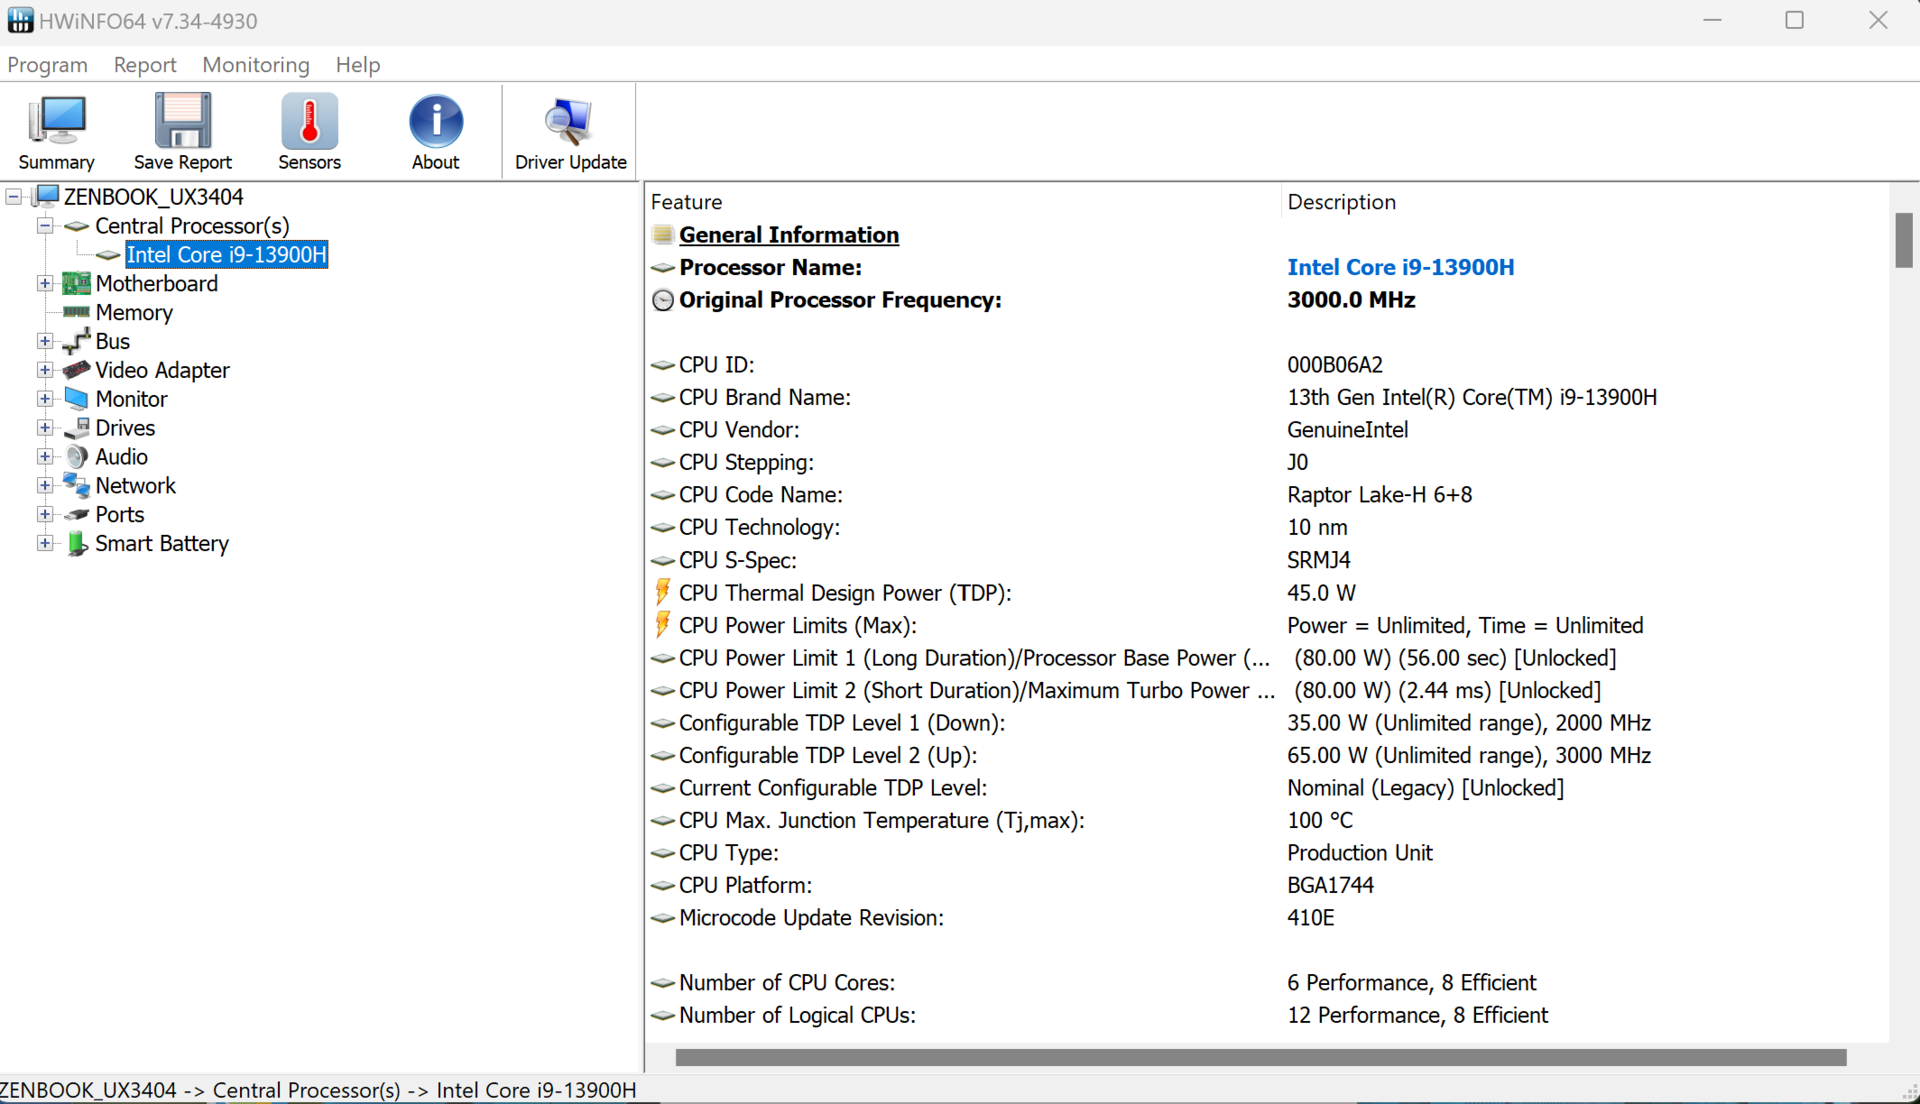
The Intel Core i9-13900H is a high-end mobile CPU from the Raptor Lake H series. The CPU combines 6 performance cores with 8 efficiency cores. Since the P cores support hyperthreading, the processor has 20 threads. While the P cores clock from 2.6 to 5.4 GHz, the E cores are between 1.9 and 4.1 GHz
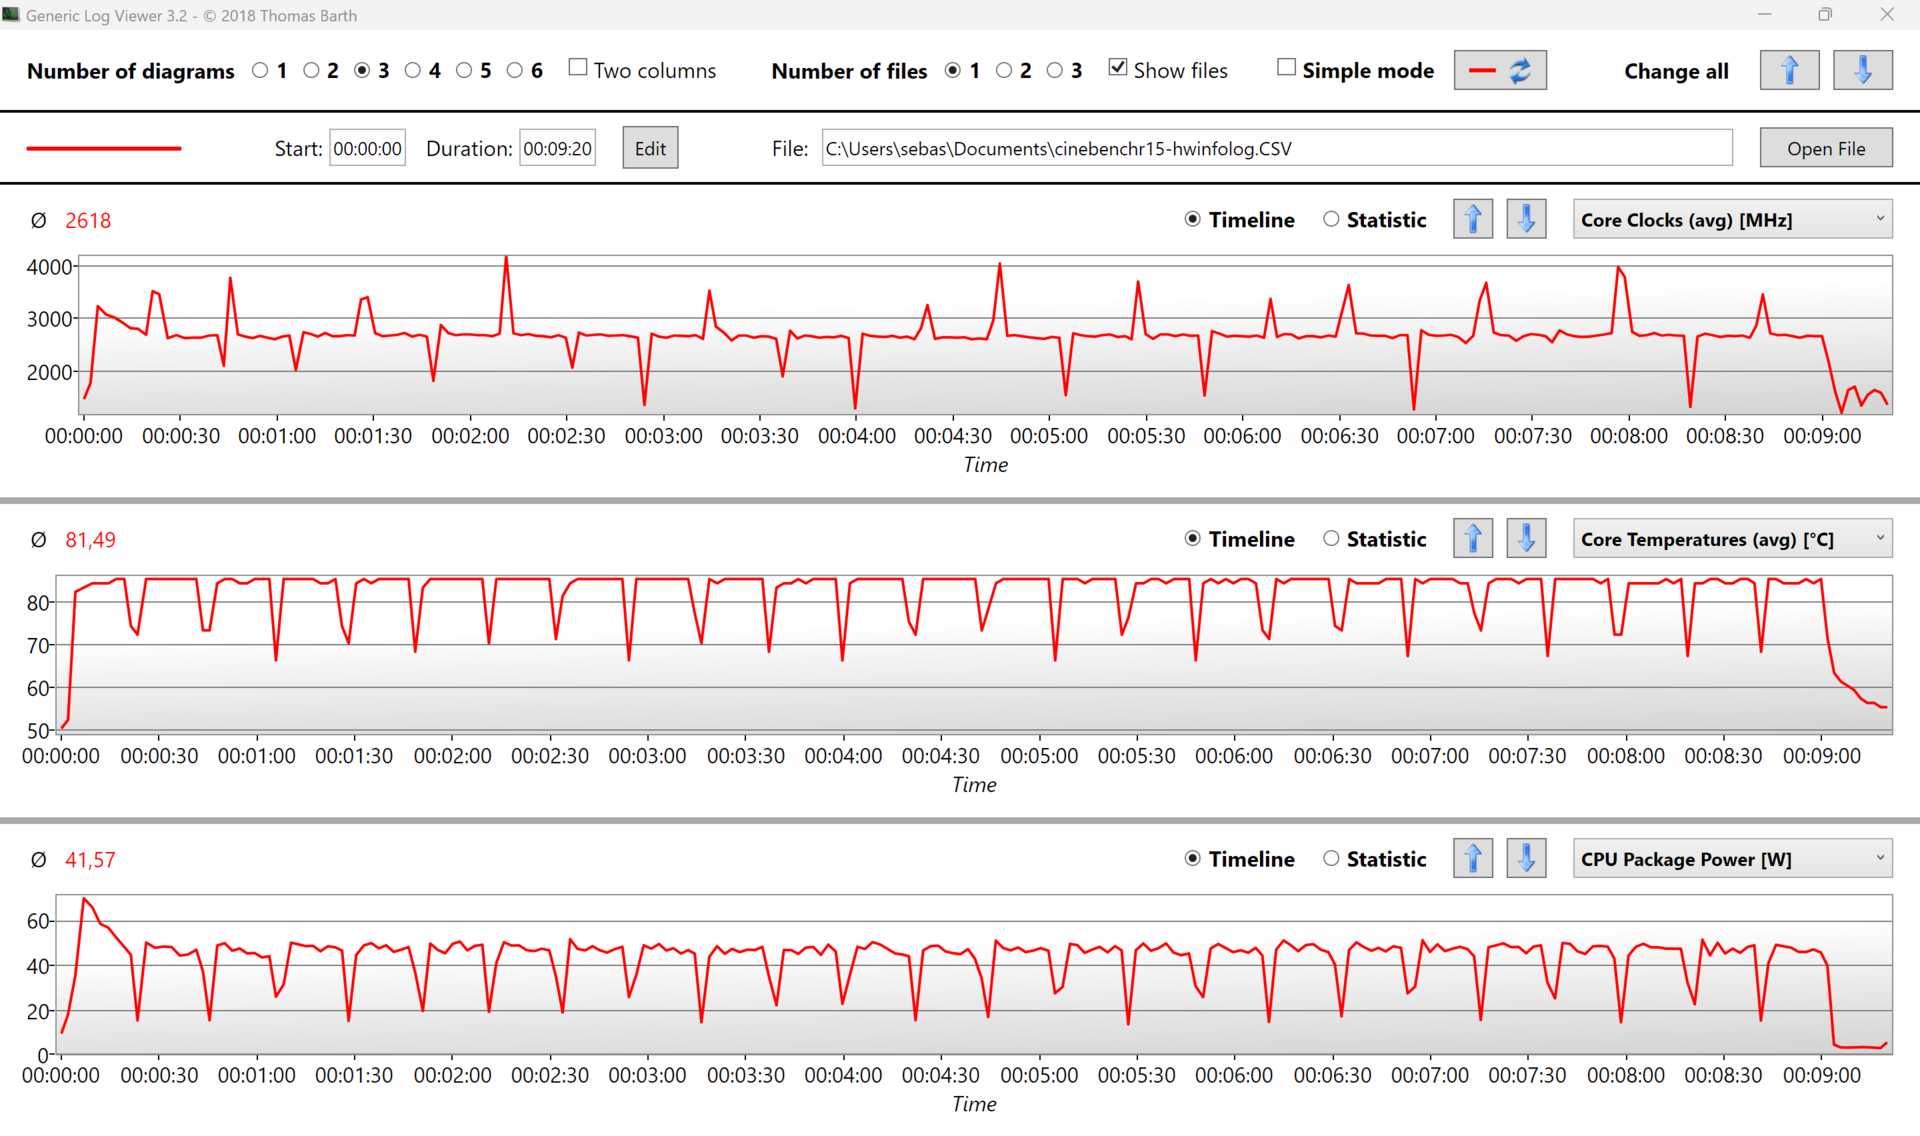
In the Cinebench loop, a sharp drop in the score can be seen after the first run, which then briefly stabilizes between 2250 and 2300 points, but drops again after the fifth run and then settles at around 2150 points. For the small form factor of the ZenBook, this would still be a good result if it weren't for the Asus ROG Flow Z13, which performs better as a tablet with the same processor. Since the processor quickly reaches 99°C under load, it can be assumed that the single-fan solution limits the performance here.
The processor is allowed to consume almost 80 watts for short periods of time, but then averages around 40 watts after the first run. After about 10 minutes, however, consumption drops to around 20 watts. As a result, the average is 36 watts under sustained load. The Cinebench loop shows that the Intel processor is also able to maintain high performance under sustained load.
Cinebench R15 Multi Sustained Load
Cinebench R23: Multi Core | Single Core
Cinebench R20: CPU (Multi Core) | CPU (Single Core)
Cinebench R15: CPU Multi 64Bit | CPU Single 64Bit
Blender: v2.79 BMW27 CPU
7-Zip 18.03: 7z b 4 | 7z b 4 -mmt1
Geekbench 5.5: Multi-Core | Single-Core
HWBOT x265 Benchmark v2.2: 4k Preset
LibreOffice : 20 Documents To PDF
R Benchmark 2.5: Overall mean
| CPU Performance rating | |
| Asus ROG Flow Z13 GZ301V | |
| Average Intel Core i9-13900H | |
| Asus ZenBook 14X UX3404VC | |
| Dell Inspiron 14 Plus 7420 | |
| Dell XPS 13 Plus 9320 i7-1280P OLED | |
| Average of class Subnotebook | |
| Lenovo Slim Pro 7 14ARP8 | |
| Apple MacBook Pro 13 2022 M2 -5! | |
| LG Gram 14Z90Q | |
| Cinebench R23 / Multi Core | |
| Asus ROG Flow Z13 GZ301V | |
| Average Intel Core i9-13900H (11997 - 20385, n=28) | |
| Asus ZenBook 14X UX3404VC | |
| Dell Inspiron 14 Plus 7420 | |
| Lenovo Slim Pro 7 14ARP8 | |
| Average of class Subnotebook (1555 - 21812, n=63, last 2 years) | |
| Dell XPS 13 Plus 9320 i7-1280P OLED | |
| Apple MacBook Pro 13 2022 M2 | |
| LG Gram 14Z90Q | |
| Cinebench R23 / Single Core | |
| Asus ROG Flow Z13 GZ301V | |
| Asus ZenBook 14X UX3404VC | |
| Average Intel Core i9-13900H (1297 - 2054, n=26) | |
| Dell Inspiron 14 Plus 7420 | |
| Average of class Subnotebook (358 - 2213, n=64, last 2 years) | |
| Dell XPS 13 Plus 9320 i7-1280P OLED | |
| Apple MacBook Pro 13 2022 M2 | |
| Lenovo Slim Pro 7 14ARP8 | |
| LG Gram 14Z90Q | |
| Cinebench R20 / CPU (Multi Core) | |
| Asus ROG Flow Z13 GZ301V | |
| Average Intel Core i9-13900H (4935 - 7716, n=25) | |
| Asus ZenBook 14X UX3404VC | |
| Dell Inspiron 14 Plus 7420 | |
| Lenovo Slim Pro 7 14ARP8 | |
| Average of class Subnotebook (579 - 8541, n=60, last 2 years) | |
| Dell XPS 13 Plus 9320 i7-1280P OLED | |
| Apple MacBook Pro 13 2022 M2 | |
| LG Gram 14Z90Q | |
| Cinebench R20 / CPU (Single Core) | |
| Asus ROG Flow Z13 GZ301V | |
| Asus ZenBook 14X UX3404VC | |
| Average Intel Core i9-13900H (428 - 792, n=25) | |
| Dell Inspiron 14 Plus 7420 | |
| Average of class Subnotebook (128 - 832, n=60, last 2 years) | |
| Dell XPS 13 Plus 9320 i7-1280P OLED | |
| Lenovo Slim Pro 7 14ARP8 | |
| LG Gram 14Z90Q | |
| Apple MacBook Pro 13 2022 M2 | |
| Cinebench R15 / CPU Multi 64Bit | |
| Asus ROG Flow Z13 GZ301V | |
| Average Intel Core i9-13900H (2061 - 3100, n=26) | |
| Asus ZenBook 14X UX3404VC | |
| Dell Inspiron 14 Plus 7420 | |
| Lenovo Slim Pro 7 14ARP8 | |
| Average of class Subnotebook (327 - 3345, n=60, last 2 years) | |
| Dell XPS 13 Plus 9320 i7-1280P OLED | |
| Apple MacBook Pro 13 2022 M2 | |
| LG Gram 14Z90Q | |
| Cinebench R15 / CPU Single 64Bit | |
| Asus ROG Flow Z13 GZ301V | |
| Average Intel Core i9-13900H (211 - 297, n=26) | |
| Asus ZenBook 14X UX3404VC | |
| Average of class Subnotebook (72.4 - 322, n=60, last 2 years) | |
| Dell Inspiron 14 Plus 7420 | |
| Dell XPS 13 Plus 9320 i7-1280P OLED | |
| Apple MacBook Pro 13 2022 M2 | |
| Lenovo Slim Pro 7 14ARP8 | |
| LG Gram 14Z90Q | |
| Blender / v2.79 BMW27 CPU | |
| Apple MacBook Pro 13 2022 M2 | |
| LG Gram 14Z90Q | |
| Average of class Subnotebook (159 - 2271, n=61, last 2 years) | |
| Dell XPS 13 Plus 9320 i7-1280P OLED | |
| Dell Inspiron 14 Plus 7420 | |
| Lenovo Slim Pro 7 14ARP8 | |
| Asus ZenBook 14X UX3404VC | |
| Average Intel Core i9-13900H (166 - 268, n=24) | |
| Asus ROG Flow Z13 GZ301V | |
| 7-Zip 18.03 / 7z b 4 | |
| Asus ROG Flow Z13 GZ301V | |
| Average Intel Core i9-13900H (45045 - 79032, n=25) | |
| Asus ZenBook 14X UX3404VC | |
| Dell Inspiron 14 Plus 7420 | |
| Lenovo Slim Pro 7 14ARP8 | |
| Dell XPS 13 Plus 9320 i7-1280P OLED | |
| Average of class Subnotebook (11668 - 77867, n=60, last 2 years) | |
| LG Gram 14Z90Q | |
| 7-Zip 18.03 / 7z b 4 -mmt1 | |
| Asus ROG Flow Z13 GZ301V | |
| Asus ZenBook 14X UX3404VC | |
| Average Intel Core i9-13900H (3665 - 6600, n=25) | |
| Dell Inspiron 14 Plus 7420 | |
| Average of class Subnotebook (2643 - 6699, n=62, last 2 years) | |
| Dell XPS 13 Plus 9320 i7-1280P OLED | |
| Lenovo Slim Pro 7 14ARP8 | |
| LG Gram 14Z90Q | |
| Geekbench 5.5 / Multi-Core | |
| Asus ROG Flow Z13 GZ301V | |
| Average Intel Core i9-13900H (9094 - 15410, n=26) | |
| Asus ZenBook 14X UX3404VC | |
| Dell Inspiron 14 Plus 7420 | |
| Dell XPS 13 Plus 9320 i7-1280P OLED | |
| Average of class Subnotebook (2557 - 17218, n=51, last 2 years) | |
| Lenovo Slim Pro 7 14ARP8 | |
| Apple MacBook Pro 13 2022 M2 | |
| LG Gram 14Z90Q | |
| Geekbench 5.5 / Single-Core | |
| Asus ROG Flow Z13 GZ301V | |
| Asus ZenBook 14X UX3404VC | |
| Apple MacBook Pro 13 2022 M2 | |
| Average of class Subnotebook (726 - 2224, n=51, last 2 years) | |
| Average Intel Core i9-13900H (1140 - 2043, n=26) | |
| Dell XPS 13 Plus 9320 i7-1280P OLED | |
| Dell Inspiron 14 Plus 7420 | |
| LG Gram 14Z90Q | |
| Lenovo Slim Pro 7 14ARP8 | |
| HWBOT x265 Benchmark v2.2 / 4k Preset | |
| Asus ROG Flow Z13 GZ301V | |
| Average Intel Core i9-13900H (14.1 - 22.3, n=25) | |
| Asus ZenBook 14X UX3404VC | |
| Lenovo Slim Pro 7 14ARP8 | |
| Dell Inspiron 14 Plus 7420 | |
| Dell XPS 13 Plus 9320 i7-1280P OLED | |
| Average of class Subnotebook (0.97 - 25.1, n=60, last 2 years) | |
| LG Gram 14Z90Q | |
| LibreOffice / 20 Documents To PDF | |
| Lenovo Slim Pro 7 14ARP8 | |
| Average of class Subnotebook (39.9 - 220, n=59, last 2 years) | |
| LG Gram 14Z90Q | |
| Dell XPS 13 Plus 9320 i7-1280P OLED | |
| Dell Inspiron 14 Plus 7420 | |
| Asus ZenBook 14X UX3404VC | |
| Average Intel Core i9-13900H (34.4 - 82.8, n=25) | |
| Asus ROG Flow Z13 GZ301V | |
| R Benchmark 2.5 / Overall mean | |
| Lenovo Slim Pro 7 14ARP8 | |
| LG Gram 14Z90Q | |
| Average of class Subnotebook (0.4024 - 1.456, n=61, last 2 years) | |
| Dell XPS 13 Plus 9320 i7-1280P OLED | |
| Dell Inspiron 14 Plus 7420 | |
| Average Intel Core i9-13900H (0.4052 - 0.723, n=25) | |
| Asus ZenBook 14X UX3404VC | |
| Asus ROG Flow Z13 GZ301V | |
* ... smaller is better
AIDA64: FP32 Ray-Trace | FPU Julia | CPU SHA3 | CPU Queen | FPU SinJulia | FPU Mandel | CPU AES | CPU ZLib | FP64 Ray-Trace | CPU PhotoWorxx
| Performance rating | |
| Asus ROG Flow Z13 GZ301V | |
| Average Intel Core i9-13900H | |
| Lenovo Slim Pro 7 14ARP8 | |
| Asus ZenBook 14X UX3404VC | |
| Dell Inspiron 14 Plus 7420 | |
| Average of class Subnotebook | |
| Dell XPS 13 Plus 9320 i7-1280P OLED | |
| LG Gram 14Z90Q | |
| AIDA64 / FP32 Ray-Trace | |
| Asus ROG Flow Z13 GZ301V | |
| Lenovo Slim Pro 7 14ARP8 | |
| Average Intel Core i9-13900H (6788 - 19557, n=25) | |
| Asus ZenBook 14X UX3404VC | |
| Average of class Subnotebook (1135 - 32888, n=61, last 2 years) | |
| Dell Inspiron 14 Plus 7420 | |
| Dell XPS 13 Plus 9320 i7-1280P OLED | |
| LG Gram 14Z90Q | |
| AIDA64 / FPU Julia | |
| Lenovo Slim Pro 7 14ARP8 | |
| Asus ROG Flow Z13 GZ301V | |
| Average Intel Core i9-13900H (22551 - 95579, n=25) | |
| Asus ZenBook 14X UX3404VC | |
| Dell Inspiron 14 Plus 7420 | |
| Average of class Subnotebook (5218 - 123315, n=61, last 2 years) | |
| Dell XPS 13 Plus 9320 i7-1280P OLED | |
| LG Gram 14Z90Q | |
| AIDA64 / CPU SHA3 | |
| Average Intel Core i9-13900H (2491 - 4270, n=25) | |
| Asus ROG Flow Z13 GZ301V | |
| Asus ZenBook 14X UX3404VC | |
| Lenovo Slim Pro 7 14ARP8 | |
| Average of class Subnotebook (444 - 5287, n=61, last 2 years) | |
| Dell Inspiron 14 Plus 7420 | |
| Dell XPS 13 Plus 9320 i7-1280P OLED | |
| LG Gram 14Z90Q | |
| AIDA64 / CPU Queen | |
| Asus ROG Flow Z13 GZ301V | |
| Asus ZenBook 14X UX3404VC | |
| Average Intel Core i9-13900H (65121 - 120936, n=25) | |
| Dell Inspiron 14 Plus 7420 | |
| Dell XPS 13 Plus 9320 i7-1280P OLED | |
| Lenovo Slim Pro 7 14ARP8 | |
| LG Gram 14Z90Q | |
| Average of class Subnotebook (10579 - 95002, n=54, last 2 years) | |
| AIDA64 / FPU SinJulia | |
| Lenovo Slim Pro 7 14ARP8 | |
| Asus ROG Flow Z13 GZ301V | |
| Average Intel Core i9-13900H (6108 - 11631, n=25) | |
| Asus ZenBook 14X UX3404VC | |
| Dell Inspiron 14 Plus 7420 | |
| Dell XPS 13 Plus 9320 i7-1280P OLED | |
| Average of class Subnotebook (744 - 18418, n=61, last 2 years) | |
| LG Gram 14Z90Q | |
| AIDA64 / FPU Mandel | |
| Lenovo Slim Pro 7 14ARP8 | |
| Asus ROG Flow Z13 GZ301V | |
| Average Intel Core i9-13900H (11283 - 48474, n=25) | |
| Asus ZenBook 14X UX3404VC | |
| Average of class Subnotebook (3341 - 65433, n=61, last 2 years) | |
| Dell Inspiron 14 Plus 7420 | |
| Dell XPS 13 Plus 9320 i7-1280P OLED | |
| LG Gram 14Z90Q | |
| AIDA64 / CPU AES | |
| Average Intel Core i9-13900H (3691 - 149377, n=25) | |
| Asus ROG Flow Z13 GZ301V | |
| Asus ZenBook 14X UX3404VC | |
| Dell Inspiron 14 Plus 7420 | |
| Dell XPS 13 Plus 9320 i7-1280P OLED | |
| Average of class Subnotebook (638 - 96917, n=61, last 2 years) | |
| Lenovo Slim Pro 7 14ARP8 | |
| LG Gram 14Z90Q | |
| AIDA64 / CPU ZLib | |
| Asus ROG Flow Z13 GZ301V | |
| Average Intel Core i9-13900H (789 - 1254, n=25) | |
| Asus ZenBook 14X UX3404VC | |
| Dell Inspiron 14 Plus 7420 | |
| Lenovo Slim Pro 7 14ARP8 | |
| Average of class Subnotebook (164.9 - 1379, n=61, last 2 years) | |
| Dell XPS 13 Plus 9320 i7-1280P OLED | |
| LG Gram 14Z90Q | |
| AIDA64 / FP64 Ray-Trace | |
| Asus ROG Flow Z13 GZ301V | |
| Average Intel Core i9-13900H (3655 - 10716, n=25) | |
| Lenovo Slim Pro 7 14ARP8 | |
| Asus ZenBook 14X UX3404VC | |
| Average of class Subnotebook (610 - 17495, n=61, last 2 years) | |
| Dell Inspiron 14 Plus 7420 | |
| Dell XPS 13 Plus 9320 i7-1280P OLED | |
| LG Gram 14Z90Q | |
| AIDA64 / CPU PhotoWorxx | |
| Dell XPS 13 Plus 9320 i7-1280P OLED | |
| Average of class Subnotebook (6569 - 85600, n=61, last 2 years) | |
| Asus ROG Flow Z13 GZ301V | |
| Asus ZenBook 14X UX3404VC | |
| Average Intel Core i9-13900H (10871 - 50488, n=25) | |
| Dell Inspiron 14 Plus 7420 | |
| Lenovo Slim Pro 7 14ARP8 | |
| LG Gram 14Z90Q | |
System Performance
Our subjective performance impression of the ZenBook 14X is very good and we did not register any limitations or noticeable lags in our tests. The results in the synthetic benchmarks are in the average range, but compared to last year's AMD variant of the ZenBook, a much better result is achieved here.
CrossMark: Overall | Productivity | Creativity | Responsiveness
| PCMark 10 / Score | |
| Asus ROG Flow Z13 GZ301V | |
| Average of class Subnotebook (4920 - 9939, n=46, last 2 years) | |
| Dell Inspiron 14 Plus 7420 | |
| Lenovo Slim Pro 7 14ARP8 | |
| Asus ZenBook 14X UX3404VC | |
| Average Intel Core i9-13900H, Intel Iris Xe Graphics G7 96EUs (5944 - 6802, n=8) | |
| Dell XPS 13 Plus 9320 i7-1280P OLED | |
| LG Gram 14Z90Q | |
| PCMark 10 / Essentials | |
| Asus ROG Flow Z13 GZ301V | |
| Average Intel Core i9-13900H, Intel Iris Xe Graphics G7 96EUs (10347 - 12286, n=8) | |
| Asus ZenBook 14X UX3404VC | |
| Dell XPS 13 Plus 9320 i7-1280P OLED | |
| Average of class Subnotebook (8552 - 11646, n=46, last 2 years) | |
| Dell Inspiron 14 Plus 7420 | |
| Lenovo Slim Pro 7 14ARP8 | |
| LG Gram 14Z90Q | |
| PCMark 10 / Productivity | |
| Asus ROG Flow Z13 GZ301V | |
| Average of class Subnotebook (5435 - 16606, n=46, last 2 years) | |
| Dell Inspiron 14 Plus 7420 | |
| Lenovo Slim Pro 7 14ARP8 | |
| Asus ZenBook 14X UX3404VC | |
| Average Intel Core i9-13900H, Intel Iris Xe Graphics G7 96EUs (7319 - 8526, n=8) | |
| Dell XPS 13 Plus 9320 i7-1280P OLED | |
| LG Gram 14Z90Q | |
| PCMark 10 / Digital Content Creation | |
| Asus ROG Flow Z13 GZ301V | |
| Average of class Subnotebook (5722 - 13779, n=46, last 2 years) | |
| Lenovo Slim Pro 7 14ARP8 | |
| Dell Inspiron 14 Plus 7420 | |
| Average Intel Core i9-13900H, Intel Iris Xe Graphics G7 96EUs (7527 - 8155, n=8) | |
| Asus ZenBook 14X UX3404VC | |
| Dell XPS 13 Plus 9320 i7-1280P OLED | |
| LG Gram 14Z90Q | |
| CrossMark / Overall | |
| Asus ROG Flow Z13 GZ301V | |
| Average Intel Core i9-13900H, Intel Iris Xe Graphics G7 96EUs (1766 - 2146, n=7) | |
| Asus ZenBook 14X UX3404VC | |
| Dell XPS 13 Plus 9320 i7-1280P OLED | |
| Dell Inspiron 14 Plus 7420 | |
| Average of class Subnotebook (365 - 2356, n=63, last 2 years) | |
| Apple MacBook Pro 13 2022 M2 | |
| Lenovo Slim Pro 7 14ARP8 | |
| CrossMark / Productivity | |
| Asus ROG Flow Z13 GZ301V | |
| Average Intel Core i9-13900H, Intel Iris Xe Graphics G7 96EUs (1684 - 2064, n=7) | |
| Asus ZenBook 14X UX3404VC | |
| Dell XPS 13 Plus 9320 i7-1280P OLED | |
| Dell Inspiron 14 Plus 7420 | |
| Average of class Subnotebook (364 - 2277, n=63, last 2 years) | |
| Apple MacBook Pro 13 2022 M2 | |
| Lenovo Slim Pro 7 14ARP8 | |
| CrossMark / Creativity | |
| Asus ROG Flow Z13 GZ301V | |
| Asus ZenBook 14X UX3404VC | |
| Average Intel Core i9-13900H, Intel Iris Xe Graphics G7 96EUs (1789 - 2224, n=7) | |
| Dell XPS 13 Plus 9320 i7-1280P OLED | |
| Dell Inspiron 14 Plus 7420 | |
| Apple MacBook Pro 13 2022 M2 | |
| Average of class Subnotebook (372 - 2743, n=63, last 2 years) | |
| Lenovo Slim Pro 7 14ARP8 | |
| CrossMark / Responsiveness | |
| Average Intel Core i9-13900H, Intel Iris Xe Graphics G7 96EUs (1474 - 2171, n=7) | |
| Asus ROG Flow Z13 GZ301V | |
| Asus ZenBook 14X UX3404VC | |
| Dell XPS 13 Plus 9320 i7-1280P OLED | |
| Dell Inspiron 14 Plus 7420 | |
| Average of class Subnotebook (312 - 1854, n=63, last 2 years) | |
| Lenovo Slim Pro 7 14ARP8 | |
| Apple MacBook Pro 13 2022 M2 | |
| PCMark 10 Score | 6330 points | |
Help | ||
| AIDA64 / Memory Copy | |
| Average of class Subnotebook (14554 - 131023, n=61, last 2 years) | |
| Asus ZenBook 14X UX3404VC | |
| Average Intel Core i9-13900H (37448 - 74486, n=25) | |
| AIDA64 / Memory Read | |
| Average of class Subnotebook (15948 - 127174, n=61, last 2 years) | |
| Average Intel Core i9-13900H (41599 - 75433, n=25) | |
| Asus ZenBook 14X UX3404VC | |
| AIDA64 / Memory Write | |
| Average of class Subnotebook (15709 - 135141, n=61, last 2 years) | |
| Asus ZenBook 14X UX3404VC | |
| Average Intel Core i9-13900H (36152 - 88505, n=25) | |
| AIDA64 / Memory Latency | |
| Asus ZenBook 14X UX3404VC | |
| Average of class Subnotebook (6.1 - 159.9, n=59, last 2 years) | |
| Average Intel Core i9-13900H (75.8 - 102.3, n=25) | |
* ... smaller is better
DPC Latency
Our standardized latency test (web browsing, 4K YouTube playback, CPU load) revealed anomalies. Hence, the system is not suitable for real-time video and audio editing without limitations. This may change with upcoming BIOS versions and device drivers.
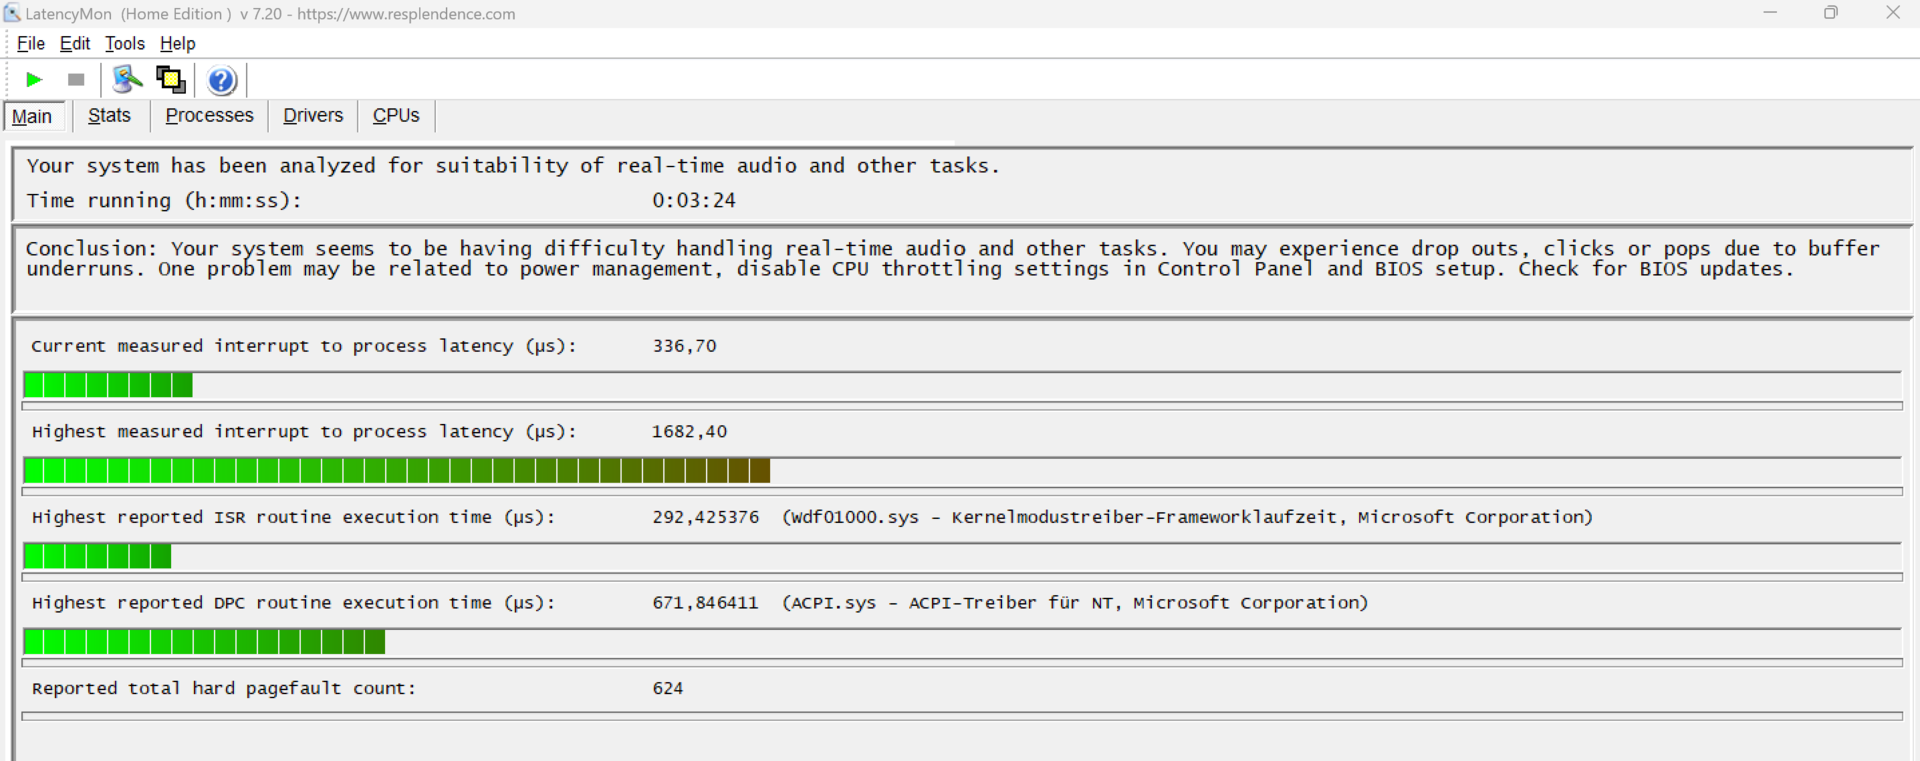
| DPC Latencies / LatencyMon - interrupt to process latency (max), Web, Youtube, Prime95 | |
| Asus ROG Flow Z13 GZ301V | |
| Asus ZenBook 14X UX3404VC | |
| Lenovo Slim Pro 7 14ARP8 | |
| LG Gram 14Z90Q | |
| Dell Inspiron 14 Plus 7420 | |
| Dell XPS 13 Plus 9320 i7-1280P OLED | |
* ... smaller is better
Storage Devices
Asus installs a Micron 2450 PCIe 4.0 SSD with a storage capacity of 1 TB in the ZenBook 14X. 862 GB of this is available when switching on for the first time. The SSD performs well in comparison to the average for subnotebooks, but our benchmark table shows clear disadvantages compared to comparable devices.

* ... smaller is better
Sustained Read Performance: DiskSpd Read Loop, Queue Depth 8
Graphics Card
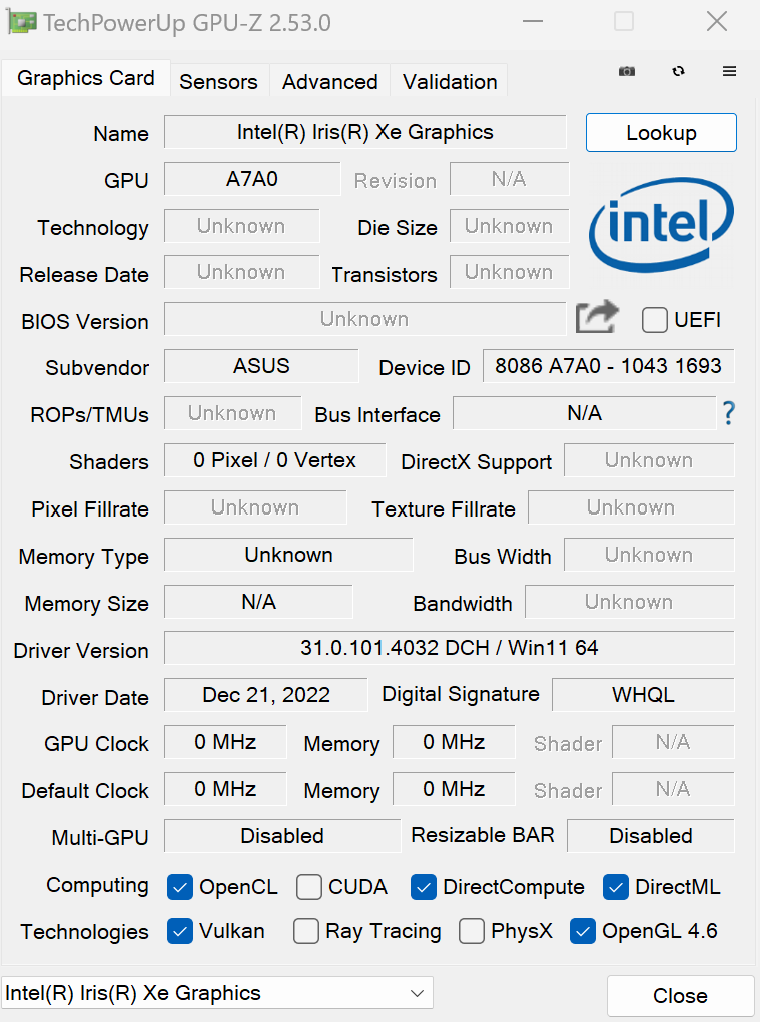
The Asus ZenBook 14X uses the well-known integrated Iris XE Graphics G7 from Intel in the faster version with 96 EUs and a maximum clock speed of 1,300 MHz. The iGPU is easily sufficient for everyday tasks, but clear compromises have to be made for more demanding services such as gaming. The AMD-based predecessor performs better here thanks to AMD's Radeon RX Vega 8.
It's worth noting, however, that the iGPU in the new Asus ZenBook 14X performs a solid 14% better than the average Intel Iris Xe Graphics G7.
| 3DMark Cloud Gate Standard Score | 22427 points | |
| 3DMark Fire Strike Score | 5160 points | |
Help | ||
| Blender - v3.3 Classroom CPU | |
| Average Intel Iris Xe Graphics G7 96EUs (336 - 1259, n=109) | |
| Average of class Subnotebook (241 - 861, n=63, last 2 years) | |
| Asus ZenBook 14X UX3404VC | |
* ... smaller is better
Gaming Performance
As previously mentioned, the gaming performance of the Intel iGPU remains mediocre. AMD clearly has the edge here with the Radeon 680M and the 780M. Older games are playable at lower resolutions and lowered graphics settings, but the potential of the 120 Hz display of the Asus ZenBook 14X is by no means exhausted here. If you want more performance, you can equip the ZenBook with a dedicated Nvidia GeForce RTX 3050, which makes most games playable, at least at lower graphics settings.
| The Witcher 3 - 1920x1080 Ultra Graphics & Postprocessing (HBAO+) | |
| Asus ROG Flow Z13 GZ301V | |
| Lenovo Slim Pro 7 14ARP8 | |
| Dell Inspiron 14 Plus 7420 | |
| Average of class Subnotebook (13.9 - 34.6, n=16, last 2 years) | |
| Asus ZenBook 14X UX3404VC | |
| Dell XPS 13 Plus 9320 i7-1280P OLED | |
| LG Gram 14Z90Q | |
| GTA V - 1920x1080 Highest AA:4xMSAA + FX AF:16x | |
| Asus ROG Flow Z13 GZ301V | |
| Lenovo Slim Pro 7 14ARP8 | |
| Dell Inspiron 14 Plus 7420 | |
| Average of class Subnotebook (10.7 - 43.7, n=57, last 2 years) | |
| Dell XPS 13 Plus 9320 i7-1280P OLED | |
| Asus ZenBook 14X UX3404VC | |
| Final Fantasy XV Benchmark - 1920x1080 High Quality | |
| Asus ROG Flow Z13 GZ301V | |
| Lenovo Slim Pro 7 14ARP8 | |
| Dell Inspiron 14 Plus 7420 | |
| Average of class Subnotebook (11.6 - 54.5, n=57, last 2 years) | |
| Dell XPS 13 Plus 9320 i7-1280P OLED | |
| LG Gram 14Z90Q | |
| Strange Brigade - 1920x1080 ultra AA:ultra AF:16 | |
| Asus ROG Flow Z13 GZ301V | |
| Dell Inspiron 14 Plus 7420 | |
| Average of class Subnotebook (19 - 101.3, n=53, last 2 years) | |
| Dell XPS 13 Plus 9320 i7-1280P OLED | |
| Asus ZenBook 14X UX3404VC | |
| Asus ZenBook 14X UX3404VC | |
| Dota 2 Reborn - 1920x1080 ultra (3/3) best looking | |
| Asus ROG Flow Z13 GZ301V | |
| Dell Inspiron 14 Plus 7420 | |
| Lenovo Slim Pro 7 14ARP8 | |
| Asus ZenBook 14X UX3404VC | |
| Average of class Subnotebook (13 - 97, n=64, last 2 years) | |
| Dell XPS 13 Plus 9320 i7-1280P OLED | |
| LG Gram 14Z90Q | |
The iGPU in the ZenBook 14X runs stably in the Witcher test. Running Witcher 3 (in a loop) at Ultra settings and in FHD resolution resulted in an average of 17 fps.
Witcher 3 FPS chart
| low | med. | high | ultra | QHD | |
|---|---|---|---|---|---|
| GTA V (2015) | 116.7 | 103.9 | 25.2 | 10.6 | 6.79 |
| The Witcher 3 (2015) | 87 | 59 | 33 | 17 | |
| Dota 2 Reborn (2015) | 126.5 | 94.1 | 74.9 | 68.3 | |
| X-Plane 11.11 (2018) | 50.8 | 41.8 | 34.5 | ||
| Far Cry 5 (2018) | 55 | 30 | 28 | 26 | 17 |
| Strange Brigade (2018) | 99.7 | 42.5 | 34 | 27.2 | 19.6 |
| F1 22 (2022) | 52.8 | 48.7 | 34.1 | 26.1 | 18.7 |
Emissions
Noise - Inconspicuously quiet
At a maximum of 45.5 dB(A), the ZenBook 14X is definitely one of the quieter subnotebooks on the market. The fans are barely audible in everyday use and the device stays below 40 dB(A) on average, even under load. However, since only one fan is installed (compared to last year's model), the cooling system is somewhat weaker and so this limits the Intel Core i9-13900H. In Performance mode, the fan also spins up more frequently during normal office tasks and never stays completely silent in Standard mode either.
On the other hand, Silent mode can be activated for a small drop in performance, whereby the subnotebook is barely audible.
Noise level
| Idle |
| 25.2 / 25.2 / 26.5 dB(A) |
| Load |
| 39.8 / 45.5 dB(A) |
 | ||
30 dB silent 40 dB(A) audible 50 dB(A) loud |
||
min: | ||
| Asus ZenBook 14X UX3404VC Iris Xe G7 96EUs, i9-13900H, Micron 2450 1TB MTFDKBA1T0TFK | Apple MacBook Pro 13 2022 M2 M2 10-Core GPU, M2, Apple SSD AP1024Z | Dell XPS 13 Plus 9320 i7-1280P OLED Iris Xe G7 96EUs, i7-1280P, WDC PC SN810 512GB | Lenovo Slim Pro 7 14ARP8 GeForce RTX 3050 6GB Laptop GPU, R7 7735HS, SK hynix PC801 HFS512GEJ9X115N | LG Gram 14Z90Q Iris Xe G7 80EUs, i5-1240P, Samsung PM9A1 MZVL2512HCJQ | Dell Inspiron 14 Plus 7420 GeForce RTX 3050 4GB Laptop GPU, i7-12700H, SK Hynix BC711 512GB HFM512GD3GX013N | Asus ROG Flow Z13 GZ301V GeForce RTX 4060 Laptop GPU, i9-13900H, WD PC SN740 SDDPTQD-1T00 | |
|---|---|---|---|---|---|---|---|
| Noise | 10% | 10% | 5% | 3% | 1% | 5% | |
| off / environment * (dB) | 25.2 | 23.9 5% | 23.4 7% | 22.7 10% | 25 1% | 23.2 8% | 24 5% |
| Idle Minimum * (dB) | 25.2 | 23.9 5% | 23.4 7% | 22.8 10% | 26 -3% | 23.2 8% | 24 5% |
| Idle Average * (dB) | 25.2 | 23.9 5% | 23.4 7% | 22.8 10% | 27 -7% | 23.2 8% | 24 5% |
| Idle Maximum * (dB) | 26.5 | 23.9 10% | 23.4 12% | 22.8 14% | 28 -6% | 23.2 12% | 24 9% |
| Load Average * (dB) | 39.8 | 23.9 40% | 35 12% | 43.8 -10% | 35 12% | 47.5 -19% | 38.61 3% |
| Load Maximum * (dB) | 45.5 | 49 -8% | 39.9 12% | 47.1 -4% | 36 21% | 51.7 -14% | 43.59 4% |
| Witcher 3 ultra * (dB) | 34.6 | 41.6 | 43.8 | 36 | 51.7 | 41.24 |
* ... smaller is better
Temperature
In everyday use (office, internet), temperatures remain within an inconspicuous range and only the middle area above the keyboard gets a little warmer under load. The single fan draws air from the bottom and expels the waste heat on the left side and the back. Accordingly, the palm rest always stays cool, while the keyboard hovers around 31 °C, which did not prove discomforting.
(+) The maximum temperature on the upper side is 38.9 °C / 102 F, compared to the average of 35.9 °C / 97 F, ranging from 21.4 to 59 °C for the class Subnotebook.
(±) The bottom heats up to a maximum of 43.4 °C / 110 F, compared to the average of 39.2 °C / 103 F
(+) In idle usage, the average temperature for the upper side is 31.1 °C / 88 F, compared to the device average of 30.8 °C / 87 F.
(±) Playing The Witcher 3, the average temperature for the upper side is 32.7 °C / 91 F, compared to the device average of 30.8 °C / 87 F.
(+) The palmrests and touchpad are reaching skin temperature as a maximum (33.9 °C / 93 F) and are therefore not hot.
(-) The average temperature of the palmrest area of similar devices was 28.2 °C / 82.8 F (-5.7 °C / -10.2 F).
| Asus ZenBook 14X UX3404VC Intel Core i9-13900H, Intel Iris Xe Graphics G7 96EUs | Apple MacBook Pro 13 2022 M2 Apple M2, Apple M2 10-Core GPU | Lenovo Slim Pro 7 14ARP8 AMD Ryzen 7 7735HS, NVIDIA GeForce RTX 3050 6GB Laptop GPU | LG Gram 14Z90Q Intel Core i5-1240P, Intel Iris Xe Graphics G7 80EUs | Dell Inspiron 14 Plus 7420 Intel Core i7-12700H, NVIDIA GeForce RTX 3050 4GB Laptop GPU | Asus ROG Flow Z13 GZ301V Intel Core i9-13900H, NVIDIA GeForce RTX 4060 Laptop GPU | |
|---|---|---|---|---|---|---|
| Heat | 10% | 9% | 6% | 12% | 5% | |
| Maximum Upper Side * (°C) | 38.9 | 45.1 -16% | 42.2 -8% | 43 -11% | 40 -3% | 42 -8% |
| Maximum Bottom * (°C) | 43.4 | 43 1% | 49 -13% | 45 -4% | 36.4 16% | 47 -8% |
| Idle Upper Side * (°C) | 33.5 | 25.2 25% | 24.4 27% | 27 19% | 27 19% | 27 19% |
| Idle Bottom * (°C) | 35.3 | 25.4 28% | 25.2 29% | 28 21% | 29.2 17% | 30 15% |
* ... smaller is better
Stress Test - Clock rate too low
At the beginning of the stress test (Prime95 and Furmark), the CPU briefly clocked at 3.5 GHz and the iGPU at 1.3 GHz. However, the clock rates drop directly afterwards so that the CPU settles at 1.9 GHz and the iGPU at 1.2 GHz. The stress test represents an extreme scenario in which we check if the system can remain stable under full load.

Speakers
For a Windows laptop, the speakers perform well: bass and lows are even discernible. The speakers are located under the palm rest and fire downwards, using the surface as a reflector. If the laptop is placed on fabric or a mouse pad, for example, the sound quality deteriorates significantly.
The dual-array microphone works well and records voices without noise, so the quality is sufficient for video calls and conferences. Typing noise from the keyboard is audible during audio recordings, but not annoying.
Asus ZenBook 14X UX3404VC audio analysis
(+) | speakers can play relatively loud (86.4 dB)
Bass 100 - 315 Hz
(-) | nearly no bass - on average 16.3% lower than median
(-) | bass is not linear (15.8% delta to prev. frequency)
Mids 400 - 2000 Hz
(+) | balanced mids - only 1.2% away from median
(+) | mids are linear (3.1% delta to prev. frequency)
Highs 2 - 16 kHz
(+) | balanced highs - only 4.1% away from median
(+) | highs are linear (3.4% delta to prev. frequency)
Overall 100 - 16.000 Hz
(+) | overall sound is linear (11.3% difference to median)
Compared to same class
» 11% of all tested devices in this class were better, 2% similar, 86% worse
» The best had a delta of 5%, average was 18%, worst was 53%
Compared to all devices tested
» 7% of all tested devices were better, 2% similar, 91% worse
» The best had a delta of 4%, average was 24%, worst was 134%
Apple MacBook Pro 16 2021 M1 Pro audio analysis
(+) | speakers can play relatively loud (84.7 dB)
Bass 100 - 315 Hz
(+) | good bass - only 3.8% away from median
(+) | bass is linear (5.2% delta to prev. frequency)
Mids 400 - 2000 Hz
(+) | balanced mids - only 1.3% away from median
(+) | mids are linear (2.1% delta to prev. frequency)
Highs 2 - 16 kHz
(+) | balanced highs - only 1.9% away from median
(+) | highs are linear (2.7% delta to prev. frequency)
Overall 100 - 16.000 Hz
(+) | overall sound is linear (4.6% difference to median)
Compared to same class
» 0% of all tested devices in this class were better, 0% similar, 100% worse
» The best had a delta of 5%, average was 17%, worst was 45%
Compared to all devices tested
» 0% of all tested devices were better, 0% similar, 100% worse
» The best had a delta of 4%, average was 24%, worst was 134%
Energy Management
Power Consumption
When idling, the new model is about as economical as the AMD predecessor; the maximum idle power consumption is just under 12 watts. This falls within the limits of models with an OLED display, but the watt consumption increases in the presence of brighter image content.
Under maximum gaming load with Witcher 3 Ultra, we measured just under 43 watts, 6 watts less than the comparable Dell XPS 13 Plus 9320 OLED with the same iGPU. However, the stress test from Prime95 and Furmark shows that the 90 watt power supply is too tight, as we briefly measured 95 watts at the beginning. Still, this phase does not last long and the power consumption settles at 65 watts and then at 45 watts, so that the weaker power supply shouldn't be too much of a problem. Nevertheless, the 100 watt power supply of the previous model would have been the better choice here.
| Off / Standby | |
| Idle | |
| Load |
|
Key:
min: | |
| Asus ZenBook 14X UX3404VC i9-13900H, Iris Xe G7 96EUs, Micron 2450 1TB MTFDKBA1T0TFK, OLED, 2880x1800, 14.5" | Apple MacBook Pro 13 2022 M2 M2, M2 10-Core GPU, Apple SSD AP1024Z, IPS, 2560x1600, 13.3" | Lenovo Slim Pro 7 14ARP8 R7 7735HS, GeForce RTX 3050 6GB Laptop GPU, SK hynix PC801 HFS512GEJ9X115N, IPS, 2560x1600, 14.5" | Asus ROG Flow Z13 GZ301V i9-13900H, GeForce RTX 4060 Laptop GPU, WD PC SN740 SDDPTQD-1T00, IPS, 2560x1600, 13.4" | Dell XPS 13 Plus 9320 i7-1280P OLED i7-1280P, Iris Xe G7 96EUs, WDC PC SN810 512GB, OLED, 3456x2160, 13.4" | Dell Inspiron 14 Plus 7420 i7-12700H, GeForce RTX 3050 4GB Laptop GPU, SK Hynix BC711 512GB HFM512GD3GX013N, IPS, 2240x1400, 14" | LG Gram 14Z90Q i5-1240P, Iris Xe G7 80EUs, Samsung PM9A1 MZVL2512HCJQ, IPS, 1920x1200, 14" | Average Intel Iris Xe Graphics G7 96EUs | Average of class Subnotebook | |
|---|---|---|---|---|---|---|---|---|---|
| Power Consumption | 33% | -56% | -65% | -7% | -72% | 20% | 3% | 23% | |
| Idle Minimum * (Watt) | 6 | 1.77 70% | 7.6 -27% | 8.5 -42% | 6.5 -8% | 6.3 -5% | 3 50% | 5.51 ? 8% | 3.78 ? 37% |
| Idle Average * (Watt) | 7 | 6.7 4% | 12.2 -74% | 12.4 -77% | 7.8 -11% | 10.3 -47% | 6 14% | 8.66 ? -24% | 6.6 ? 6% |
| Idle Maximum * (Watt) | 11.8 | 6.9 42% | 12.8 -8% | 13.3 -13% | 13 -10% | 20 -69% | 12 -2% | 10.9 ? 8% | 7.93 ? 33% |
| Load Average * (Watt) | 44 | 30.9 30% | 76.5 -74% | 93 -111% | 56.6 -29% | 106.2 -141% | 40 9% | 45.6 ? -4% | 41.8 ? 5% |
| Witcher 3 ultra * (Watt) | 42.6 | 38.9 9% | 89.5 -110% | 87.8 -106% | 49.2 -15% | 96.1 -126% | 36.5 14% | ||
| Load Maximum * (Watt) | 95 | 56 41% | 135.7 -43% | 135 -42% | 63 34% | 136.5 -44% | 63 34% | 67.8 ? 29% | 64.7 ? 32% |
* ... smaller is better
Power consumption Witcher 3 / Stress test
Power consumption with an external monitor
Battery Life
The battery life of the Asus ZenBook 14X is really strong, considering the high-end Intel Core i9 processor. In our WLAN test, the 14-incher achieved a runtime of exactly 10 hours. This test uses a script to measure the load when accessing websites.
The Apple MacBook Pro 13 2022 M2, the Lenovo Slim Pro 7 14ARP8 and the LG Gram 14Z90Q perform better in our benchmark table, but they do not have OLED displays. Compared to the Dell XPS 13 Plus 9320 with its OLED display, the strong battery performance of the ZenBook is clearly noticeable, as the Dell model only lasts around 5:30 hours.
| Asus ZenBook 14X UX3404VC i9-13900H, Iris Xe G7 96EUs, 70 Wh | Apple MacBook Pro 13 2022 M2 M2, M2 10-Core GPU, 58.2 Wh | Dell XPS 13 Plus 9320 i7-1280P OLED i7-1280P, Iris Xe G7 96EUs, 55 Wh | Lenovo Slim Pro 7 14ARP8 R7 7735HS, GeForce RTX 3050 6GB Laptop GPU, 73 Wh | LG Gram 14Z90Q i5-1240P, Iris Xe G7 80EUs, 72 Wh | Dell Inspiron 14 Plus 7420 i7-12700H, GeForce RTX 3050 4GB Laptop GPU, 64 Wh | Asus ROG Flow Z13 GZ301V i9-13900H, GeForce RTX 4060 Laptop GPU, 56 Wh | Average of class Subnotebook | |
|---|---|---|---|---|---|---|---|---|
| Battery runtime | 91% | -42% | 5% | 49% | -36% | -46% | 37% | |
| Reader / Idle (h) | 17.6 | 28.9 64% | 11.9 -32% | 27.8 ? 58% | ||||
| WiFi v1.3 (h) | 10 | 19.1 91% | 5.8 -42% | 10.5 5% | 11.9 19% | 7.2 -28% | 5 -50% | 14 ? 40% |
| Load (h) | 1.7 | 2.8 65% | 0.9 -47% | 1 -41% | 1.942 ? 14% | |||
| H.264 (h) | 19.2 | 4.7 | 15.8 ? | |||||
| Witcher 3 ultra (h) | 0.8 |
Pros
Cons
Verdict - New processor is unable to fully spread its wings
The ZenBook 14X is a very solid laptop overall, which is only spoiled by the somewhat disappointing processor performance. It definitely would have benefited from an additional fan, such as in last year's model. On the other hand, the 120 Hz OLED display, fast response times and above-average battery life are very positive points. Despite the installed Intel Core i9-13900H, we measured exactly 10 hours in our WLAN test. The display's DeltaE values are below 3 and so the subnotebook is suitable for photo and video editing.
The quality of the aluminum chassis is also excellent and ensures above-average stability, which is also noticeable when typing. The variety of ports is solid, but inferior to the predecessor since the microSD reader has been omitted. The positioning of the ports isn't really ideal either.
Asus' new ZenBook 14X is a robust all-rounder with very good battery life, an outstanding OLED display and solid performance.
Fan noise is moderate and the device remains largely inaudible during normal office tasks thanks to the option of a Silent mode in the MyAsus app.
The price for the basic configuration has increased compared to the predecessor in both the AMD version and the Intel version. Our reviewed variant, without a dedicated graphics card, costs EUR 1,699 (~US$1,850). If you want the Nvidia GeForce RTX 3050 instead, you'll have to fork out an extra EUR 400 (US$440).
If an OLED display doesn't play a major role in the choice of notebook, there are two cheaper 14-inch devices in the form of the Lenovo Slim Pro 7 14ARP8 and the Dell Inspiron 14 Plus 7420, which offer better graphics performance thanks to AMD Radeon 680M in the Lenovo or RTX 3050 in the Dell.
Price and Availability
In the US, the basic configuration of the Asus Zenbook 14X UX3404 is priced at $1,799.00 on Asus' webstore.
Asus ZenBook 14X UX3404VC
- 06/01/2023 v7 (old)
Philip Macdonald
Transparency
The selection of devices to be reviewed is made by our editorial team. The test sample was provided to the author as a loan by the manufacturer or retailer for the purpose of this review. The lender had no influence on this review, nor did the manufacturer receive a copy of this review before publication. There was no obligation to publish this review. As an independent media company, Notebookcheck is not subjected to the authority of manufacturers, retailers or publishers.
This is how Notebookcheck is testing
Every year, Notebookcheck independently reviews hundreds of laptops and smartphones using standardized procedures to ensure that all results are comparable. We have continuously developed our test methods for around 20 years and set industry standards in the process. In our test labs, high-quality measuring equipment is utilized by experienced technicians and editors. These tests involve a multi-stage validation process. Our complex rating system is based on hundreds of well-founded measurements and benchmarks, which maintains objectivity. Further information on our test methods can be found here.
Price comparison

