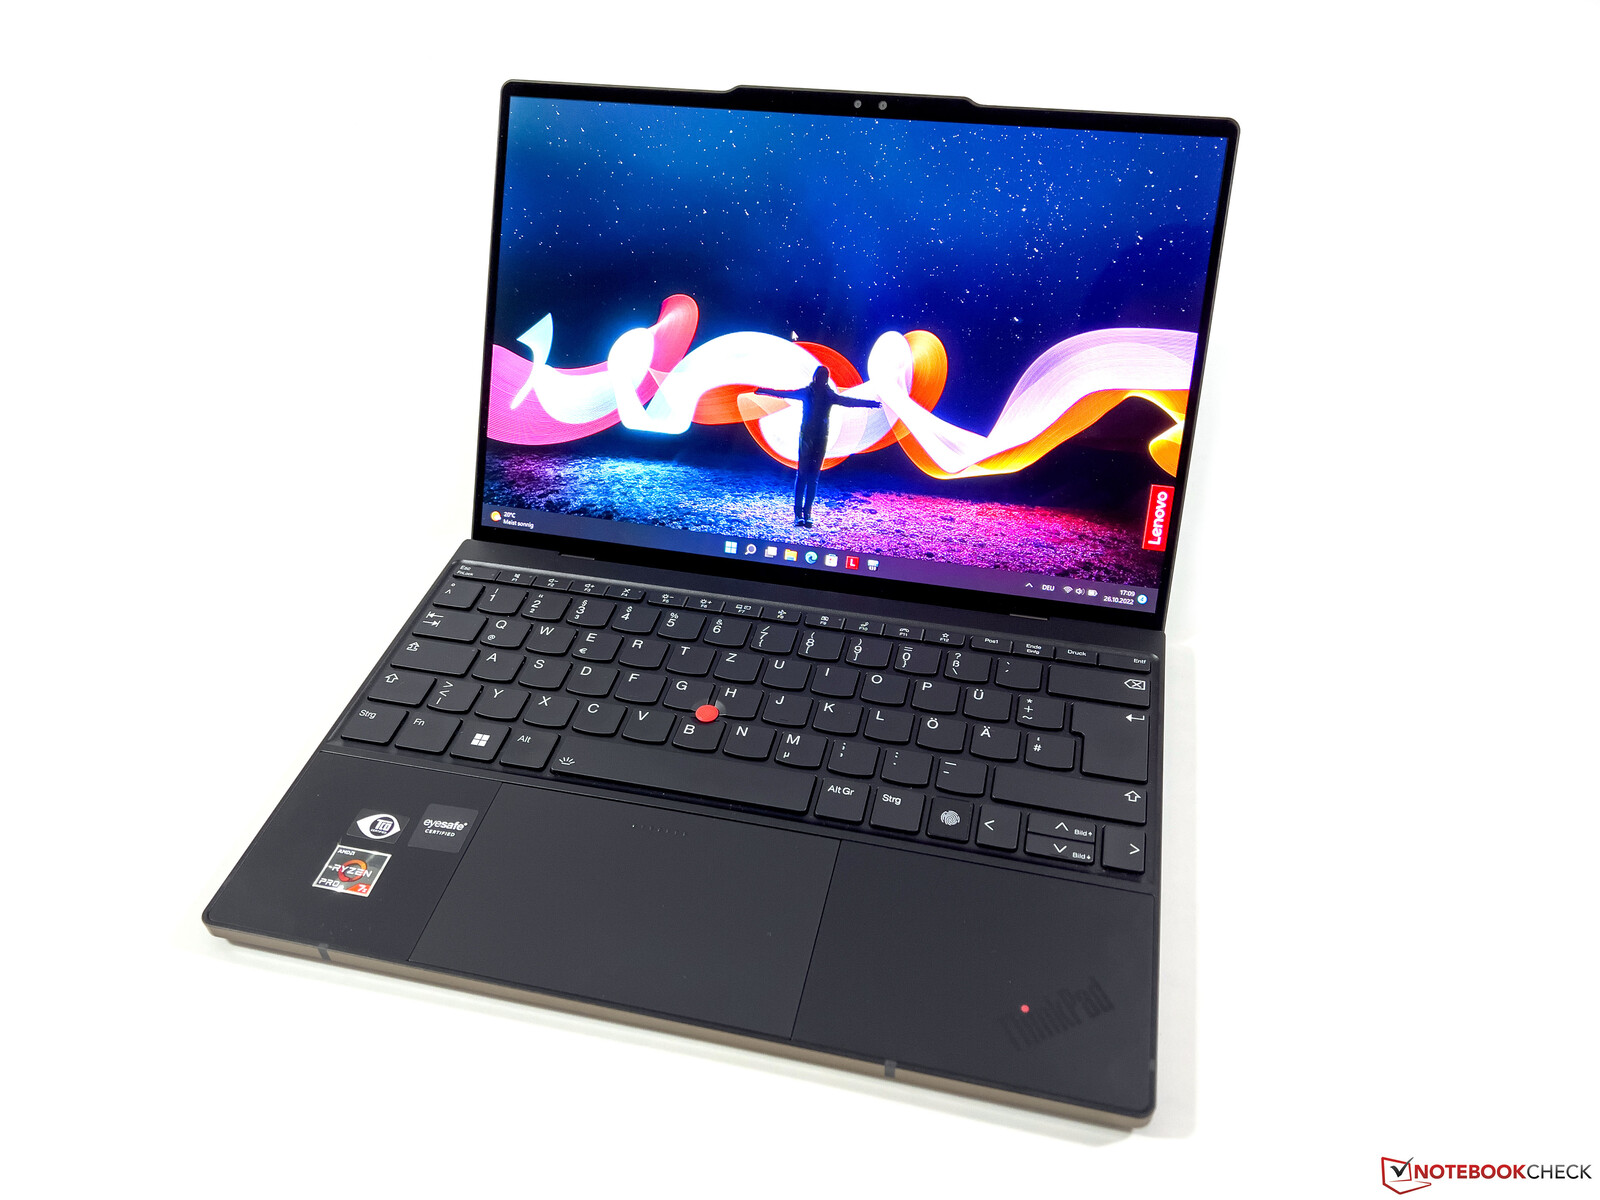
Lenovo ThinkPad Z13 G1 OLED Review - Business Laptop with an AMD Ryzen 7 Pro 6860Z ↺
With its ThinkPad Z series, Lenovo has had a dedicated product line for its AMD models for several months now. We have already extensively tested the entry-level model of the ThinkPad Z13 with a Ryzen 5 Pro and a normal Full HD IPS panel. The completely new design offers some new approaches and long-time ThinkPad users will have to get used to some changes (TrackPoint without dedicated keys, hinge only opens up to 135 degrees, repositioning of the Fn key, no Kensington Lock).
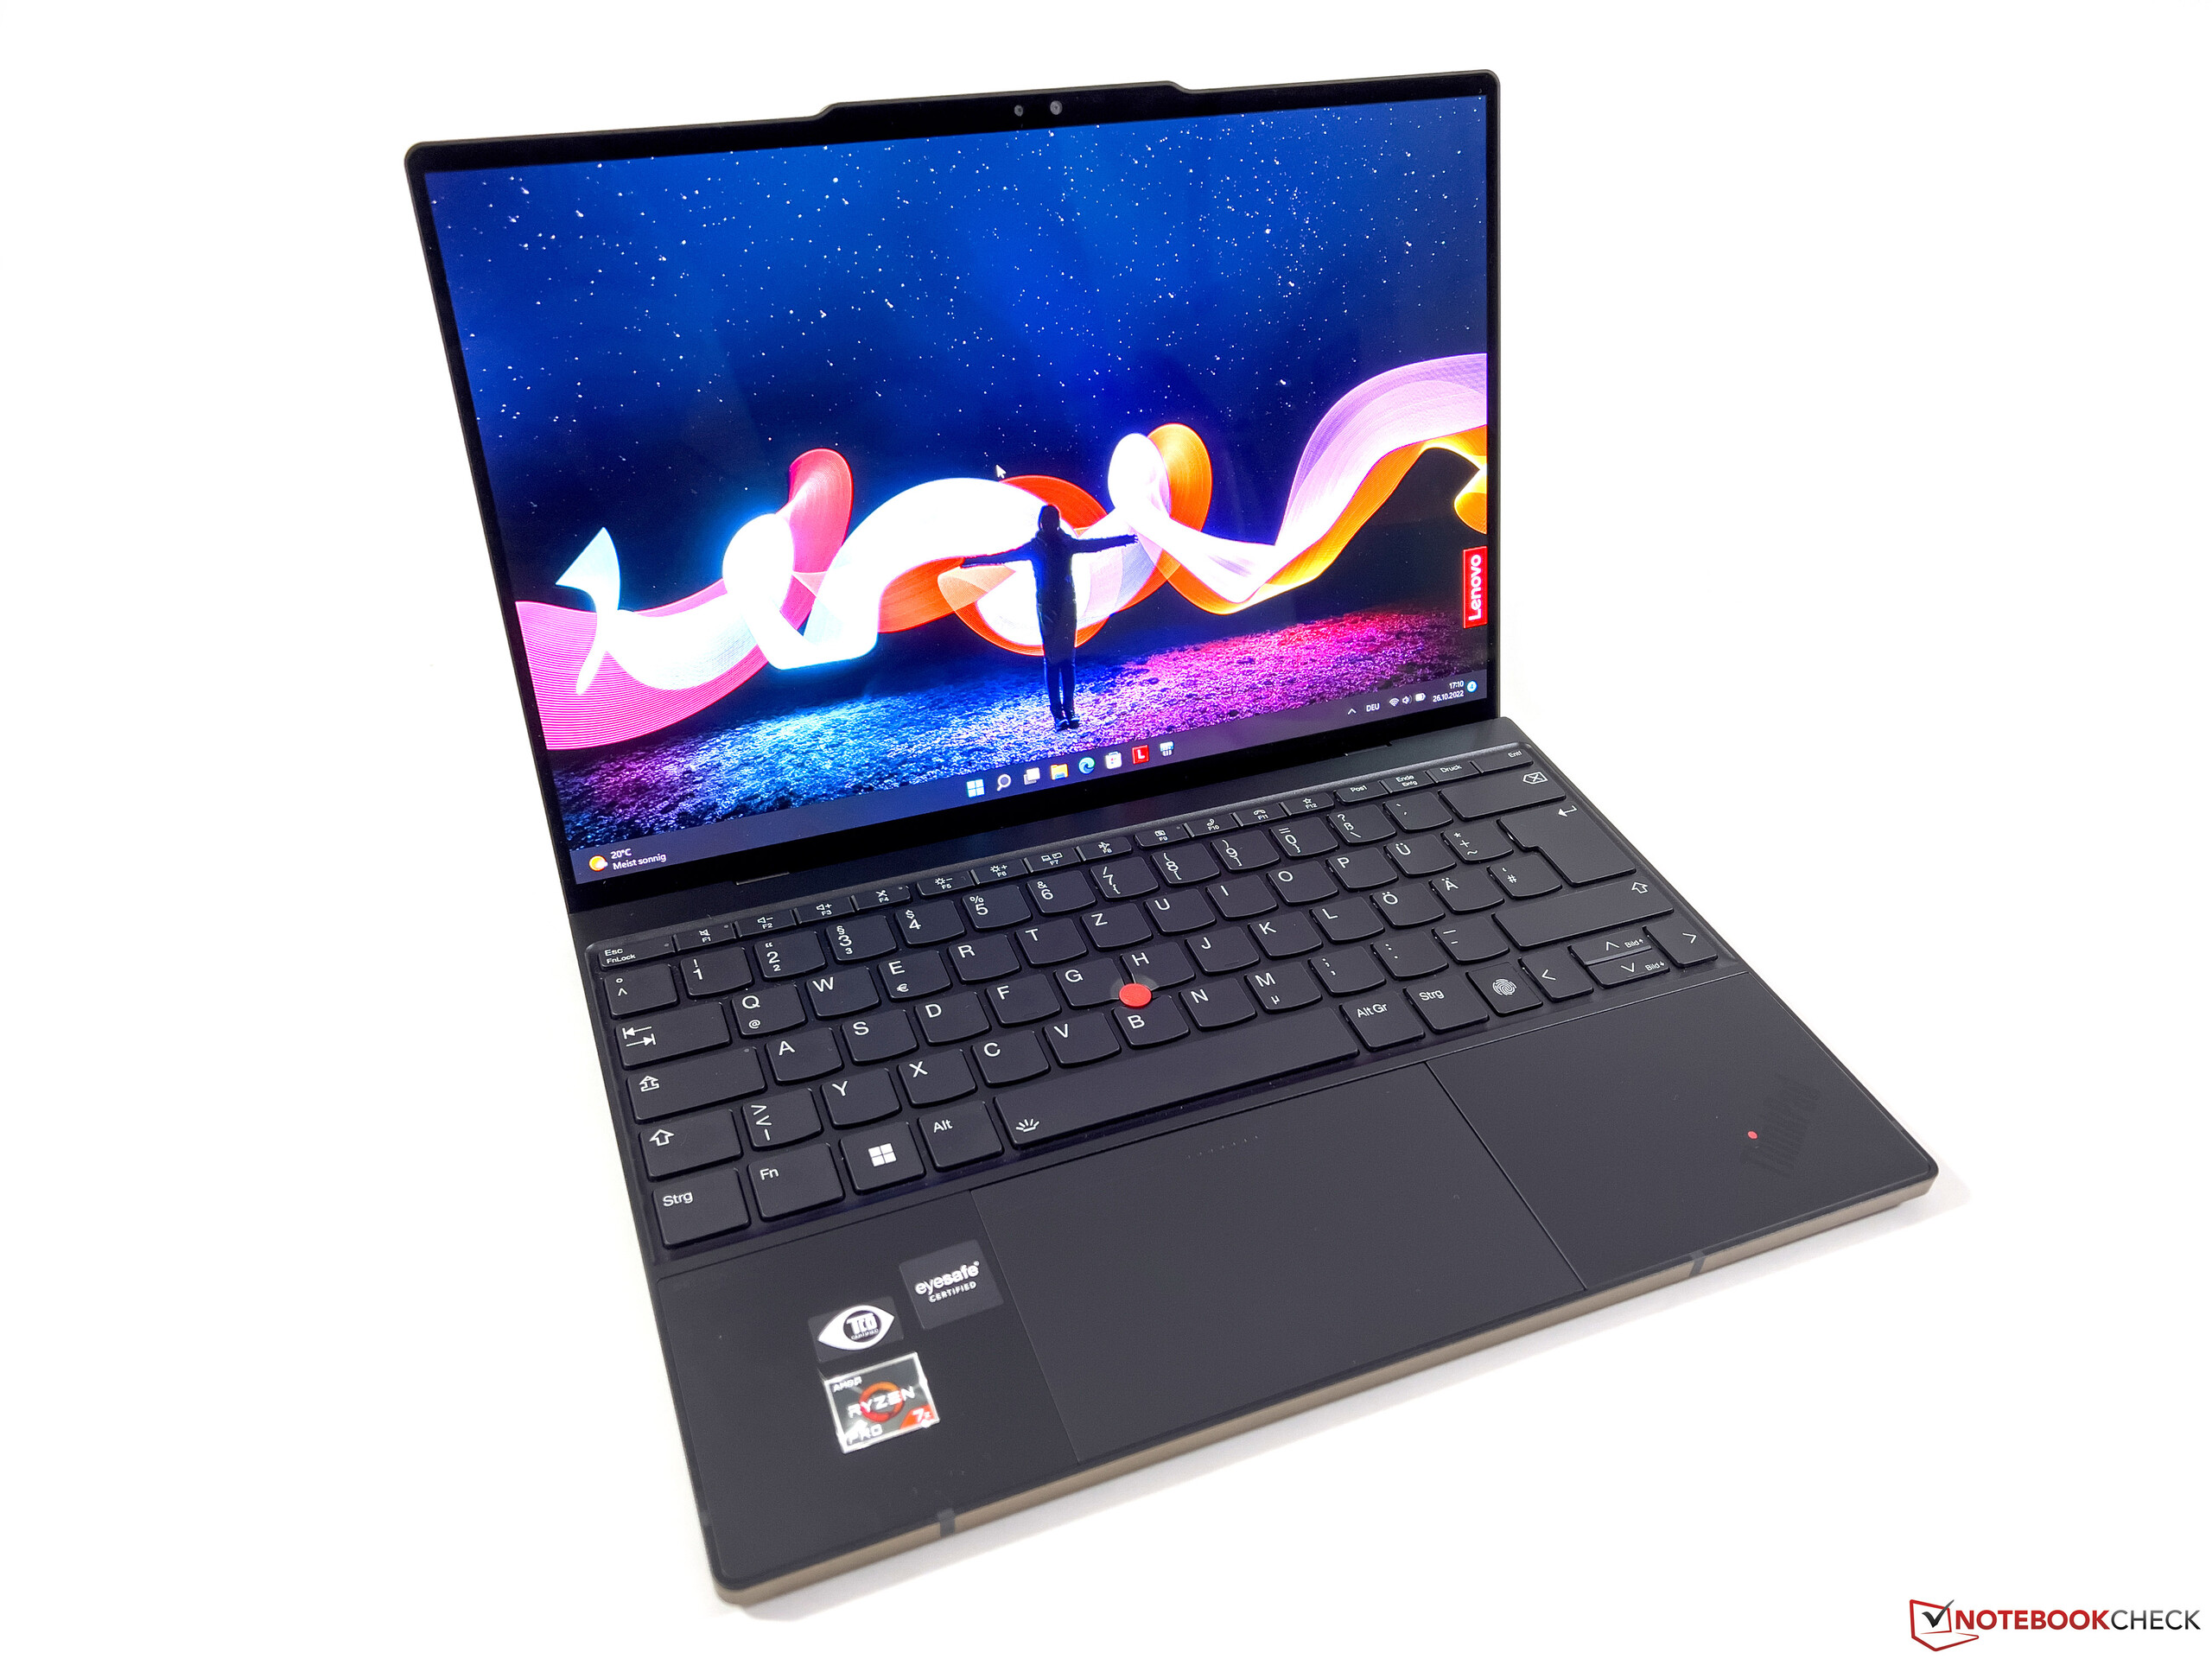
Today we take a look at the high-end model of the ThinkPad Z13 with its AMD Ryzen 7 Pro 6860Z which is offered exclusively in the ThinkPad Z13. This configuration has an OLED screen, an LTE module and a special design with an imitation leather screen lid with bronze-hued highlights. In this report, we focus primarily on the differences to the entry-level model and will not go over their similarities. Pertinent information is available in our detailed review of the ThinkPad Z13 with the Ryzen 5 Pro 6650U:
• Lenovo ThinkPad Z13 laptop review: AMD's premium ThinkPad with long battery life
• Lenovo ThinkPad Z16 G1 laptop review: Powerful AMD flagship with a hiccup
Potential Competitors in Comparison
Rating | Date | Model | Weight | Height | Size | Resolution | Price |
|---|---|---|---|---|---|---|---|
| 88.8 % v7 (old) | 10 / 2022 | Lenovo ThinkPad Z13 G1-21D20016GE R7 PRO 6860Z, Radeon 680M | 1.3 kg | 14 mm | 13.30" | 2880x1800 | |
| 90.1 % v7 (old) | 07 / 2022 | Asus Zenbook S 13 OLED R7 6800U, Radeon 680M | 1.1 kg | 14.9 mm | 13.30" | 2880x1800 | |
| 87.3 % v7 (old) | 09 / 2022 | Dell XPS 13 Plus 9320 i7-1280P OLED i7-1280P, Iris Xe G7 96EUs | 1.3 kg | 15.28 mm | 13.40" | 3456x2160 | |
| 92 % v7 (old) | 08 / 2022 | Apple MacBook Air M2 10C GPU M2, M2 10-Core GPU | 1.2 kg | 11.3 mm | 13.60" | 2560x1664 | |
| 90.5 % v7 (old) | 08 / 2022 | Lenovo ThinkPad Z13 21D2CTO1WW R5 PRO 6650U, Radeon 660M | 1.2 kg | 13.99 mm | 13.30" | 1920x1200 |
Case
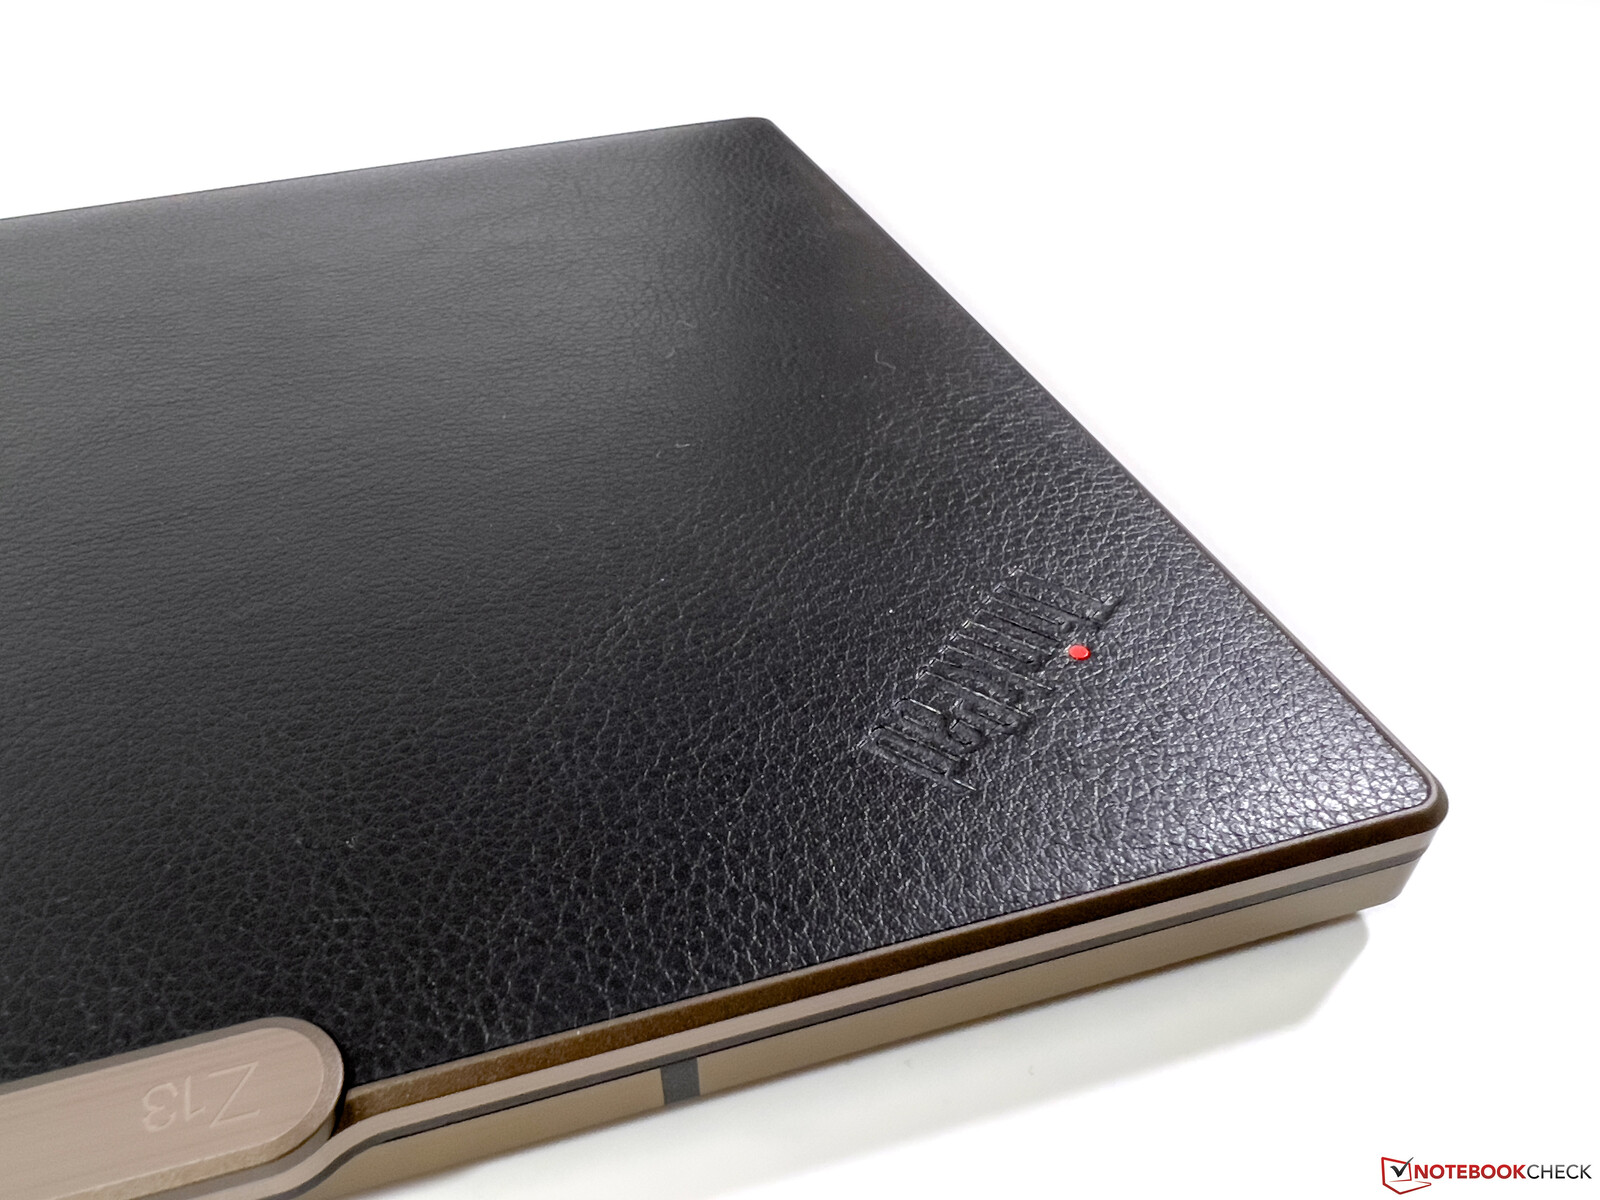
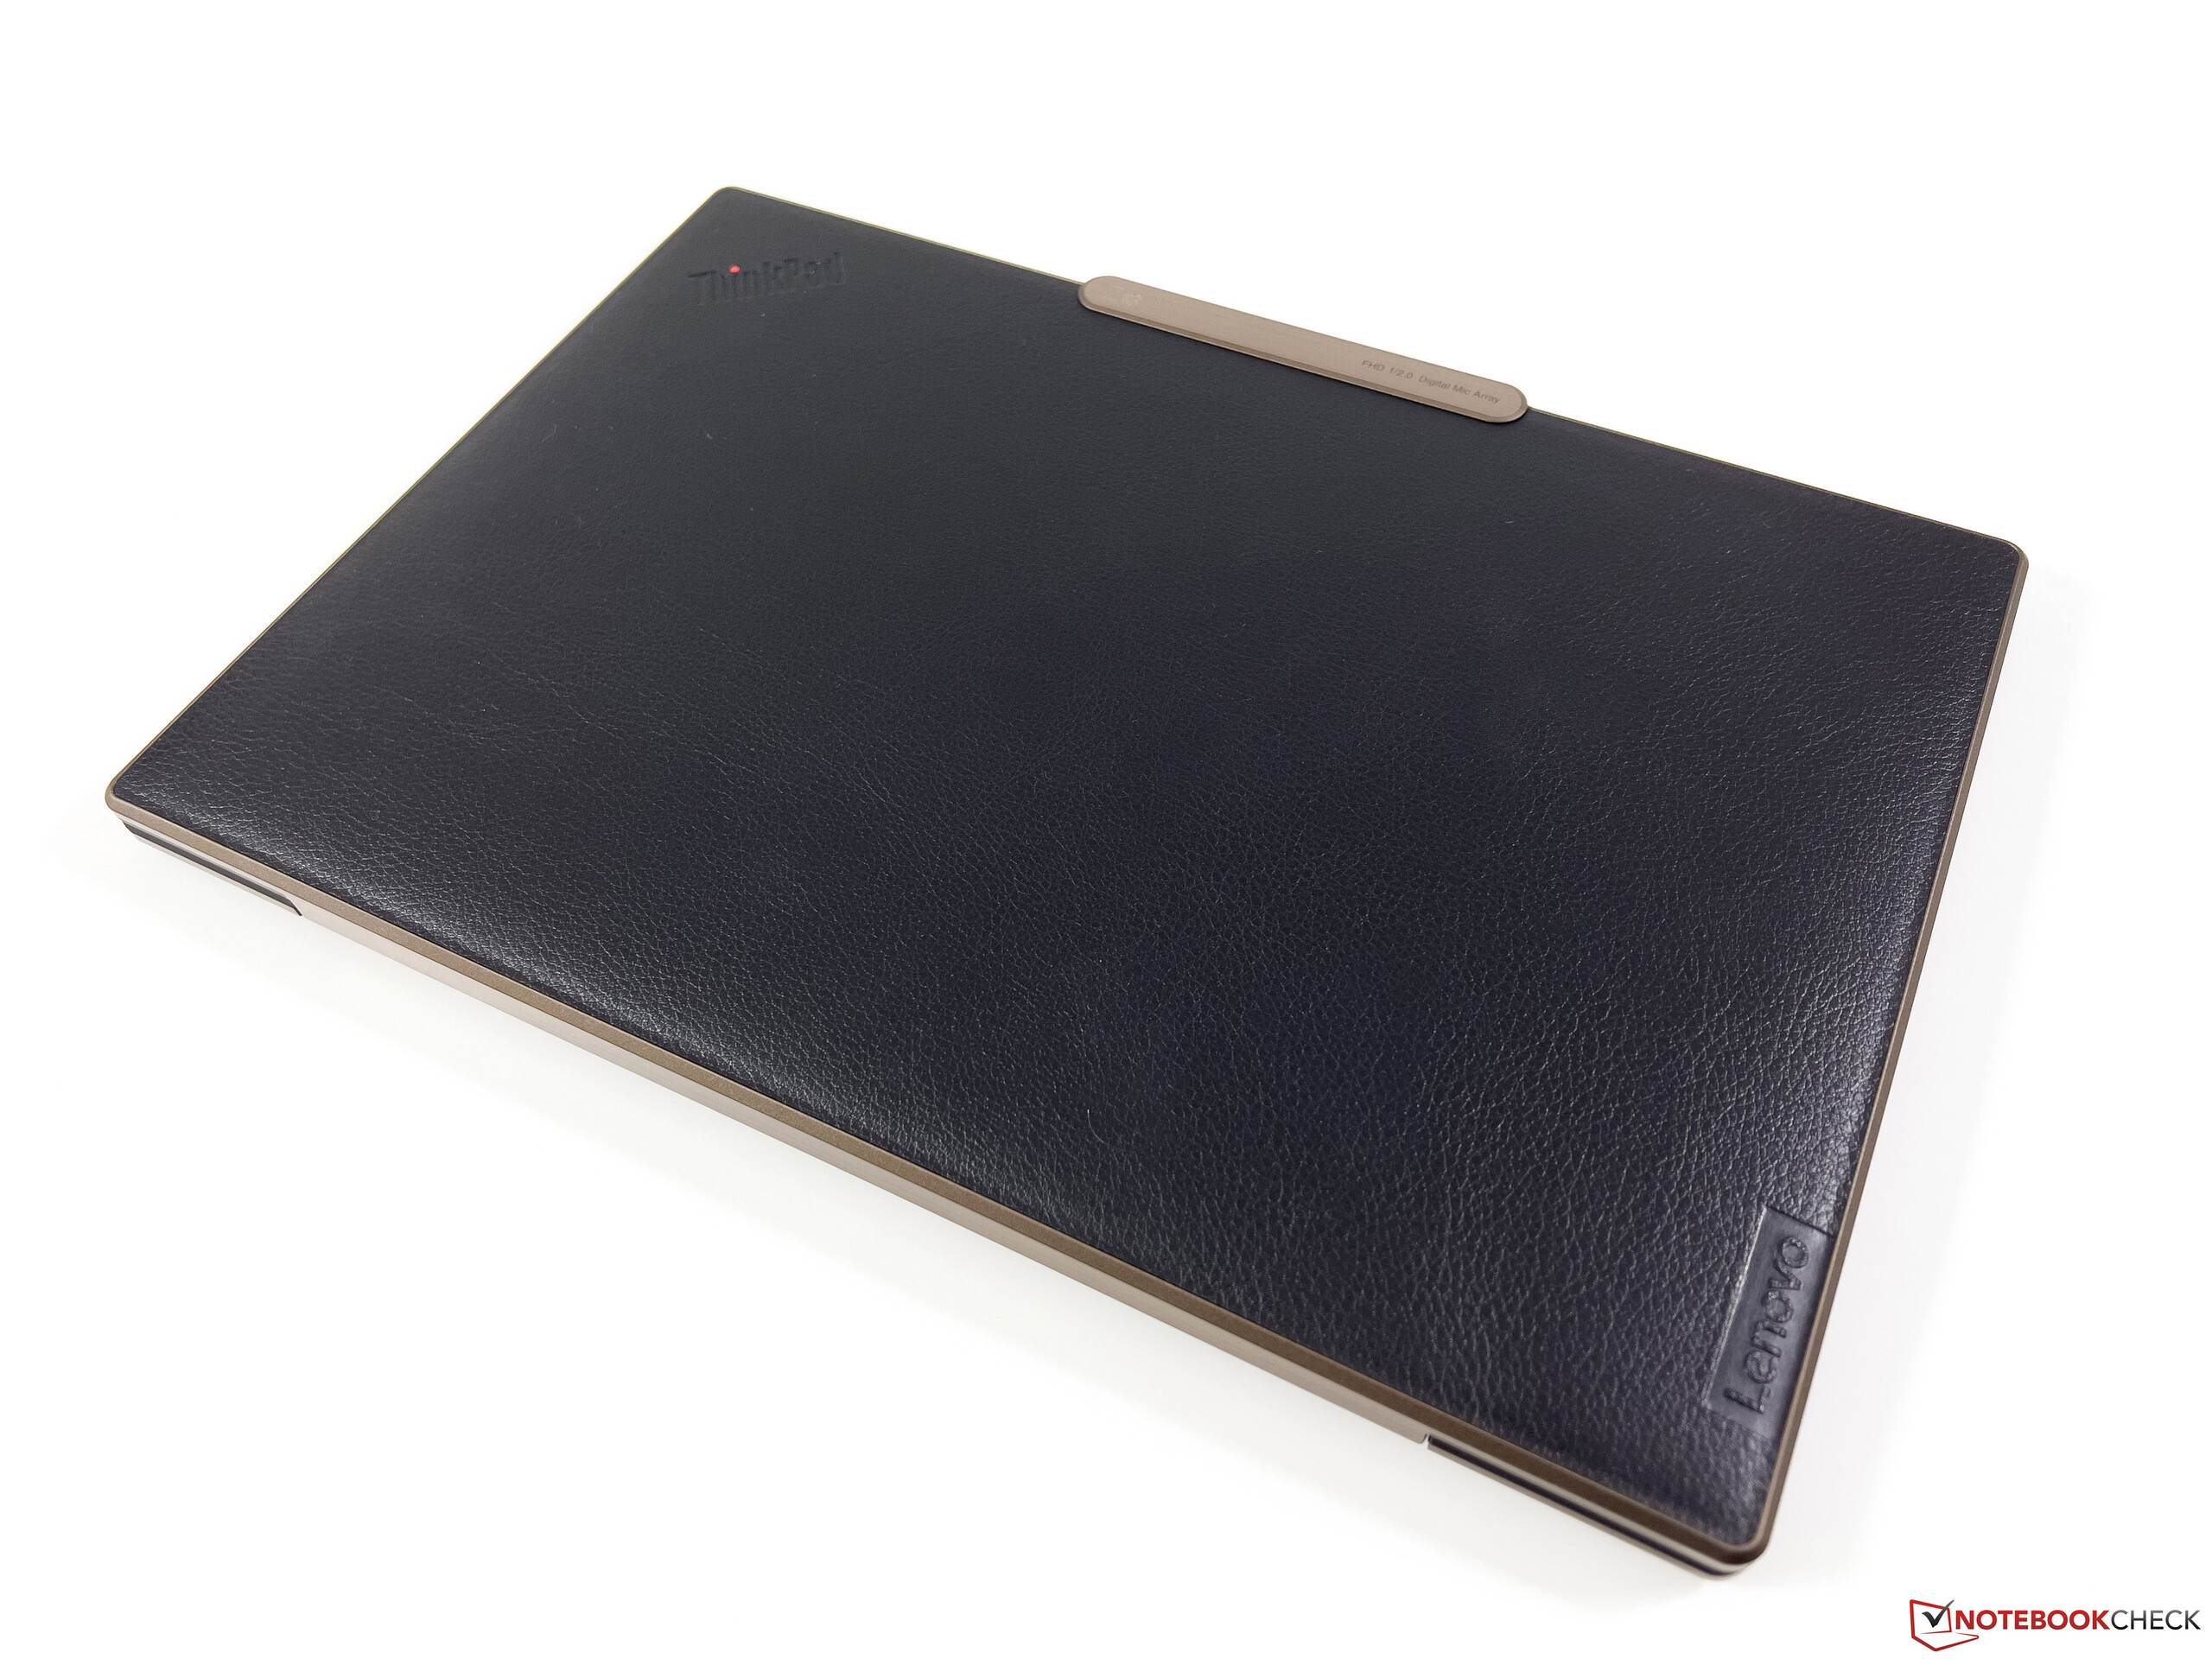
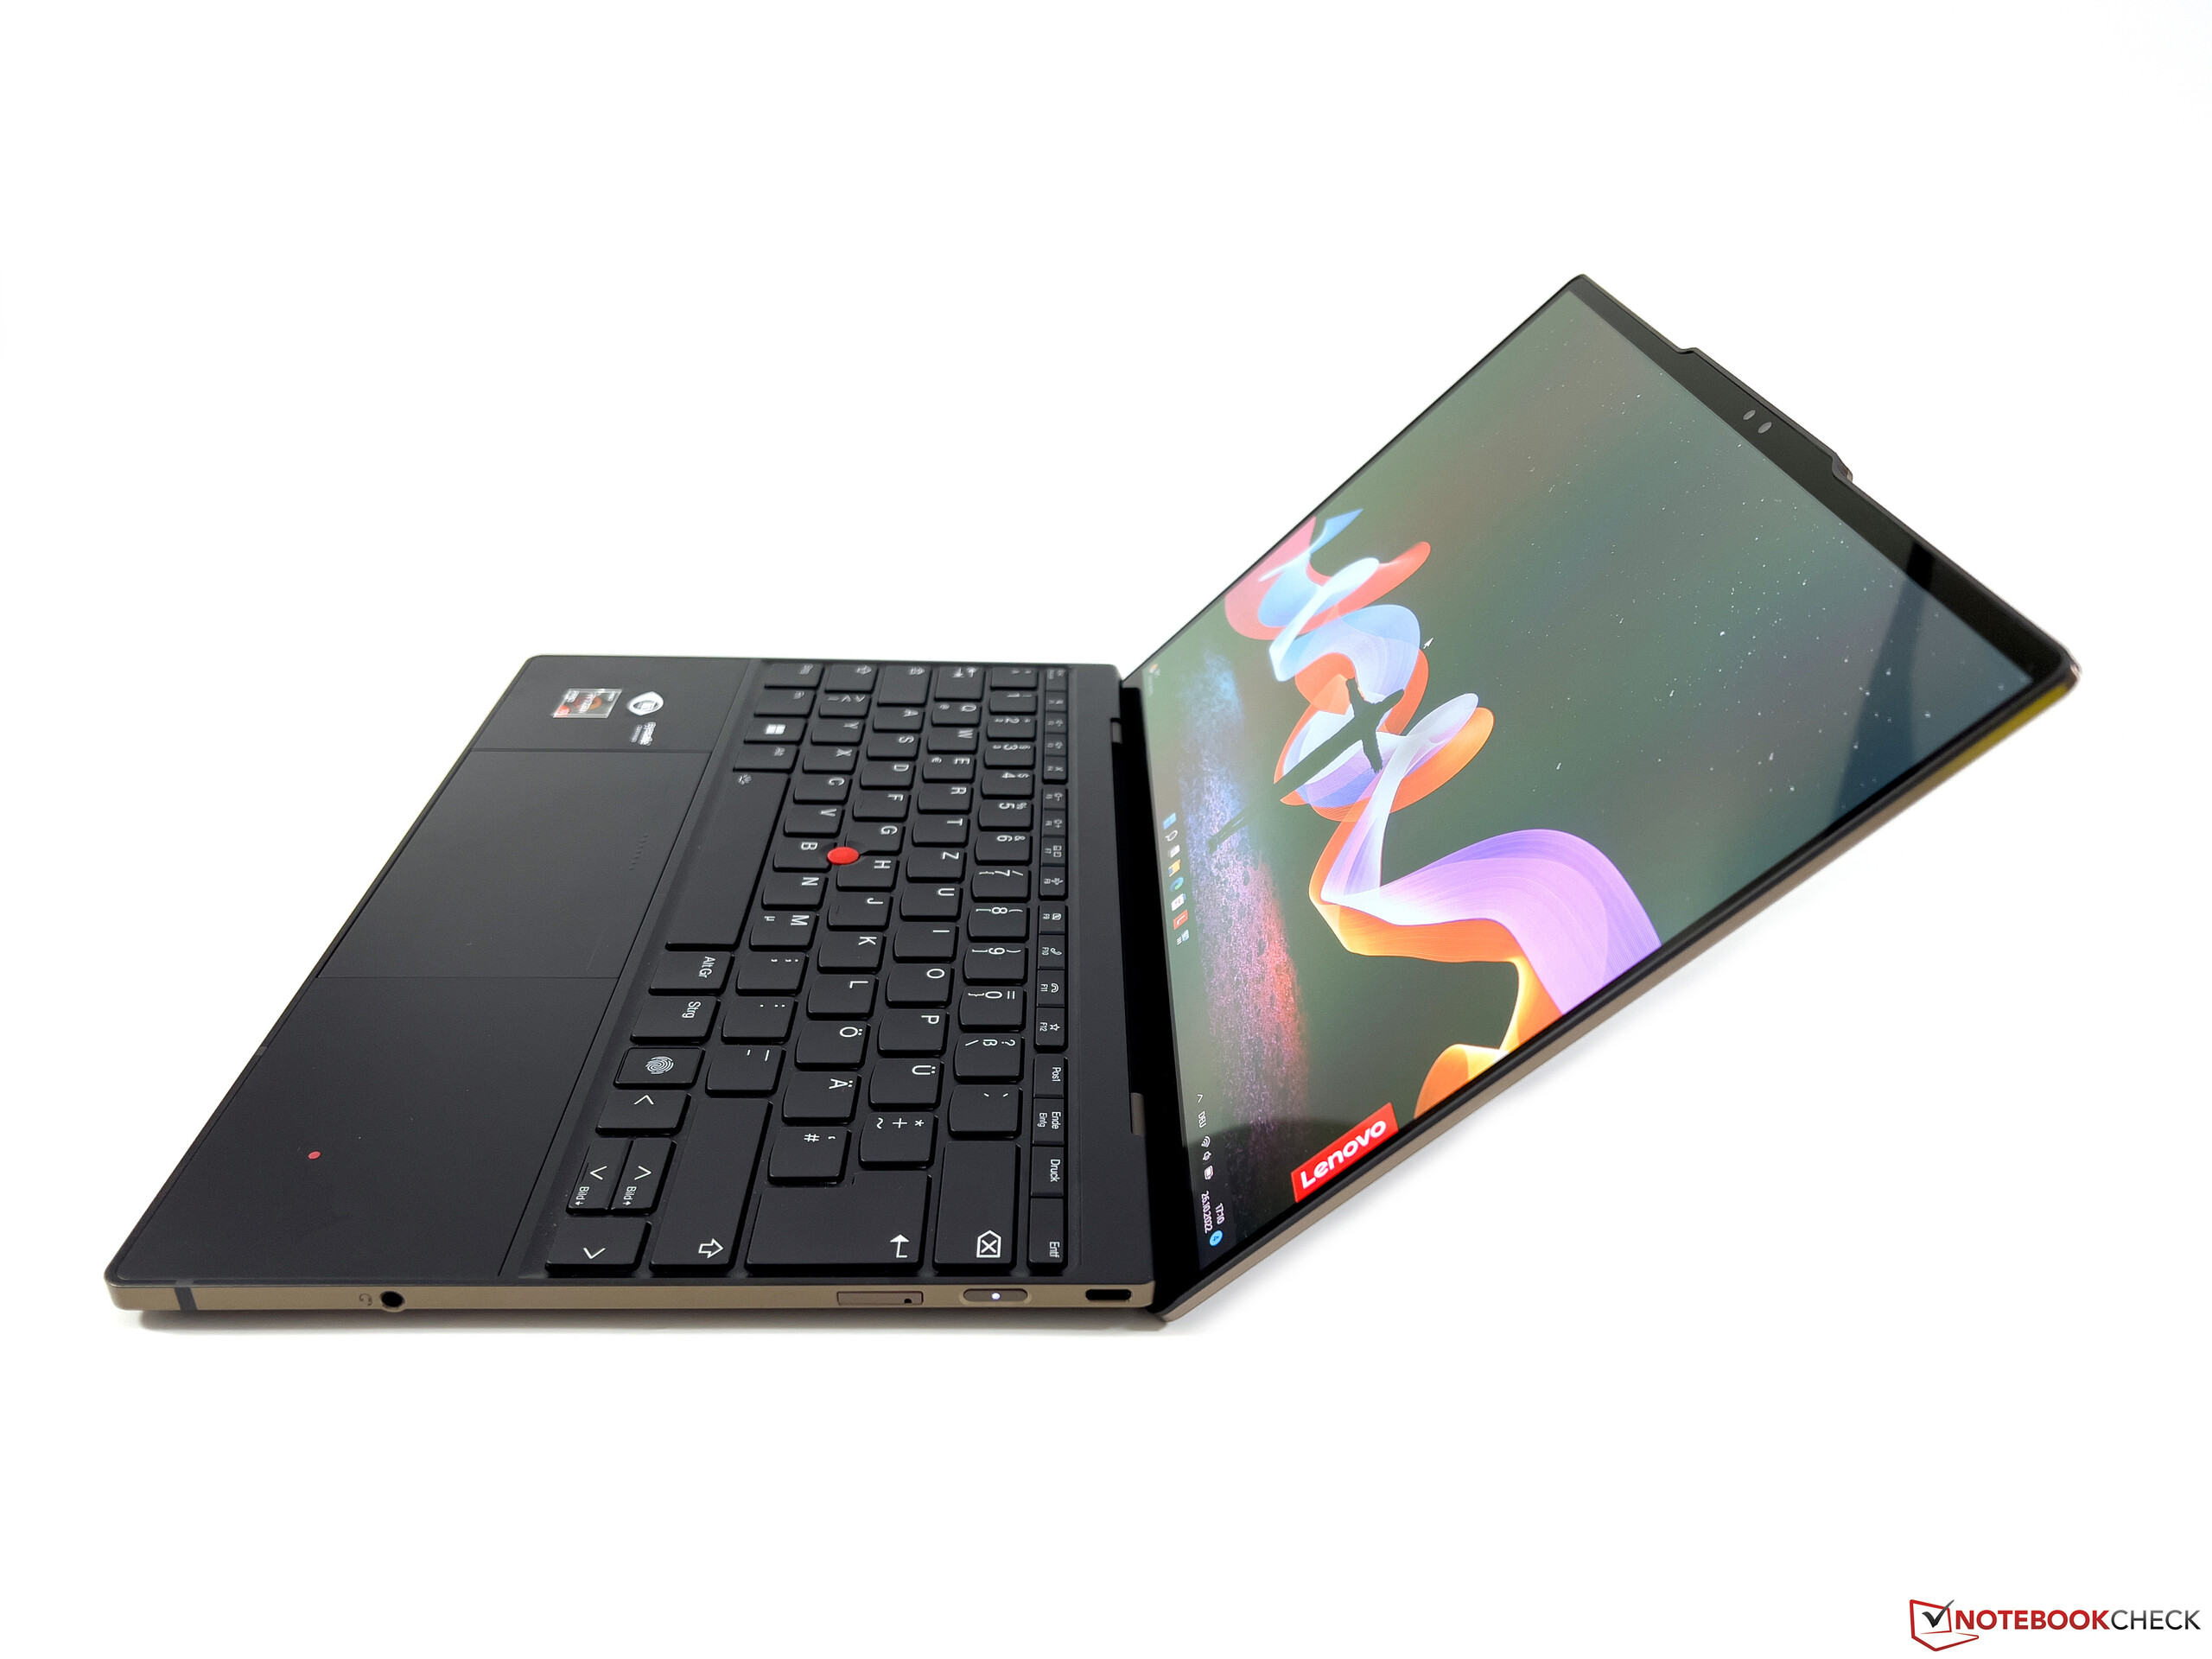
The case is basically identical to the entry-level model of the ThinkPad Z13, but in the high-end version there is a screen lid with a black imitation leather surface with bronze-hued trim. It’s undoubtedly a question of personal taste and Lenovo does offer alternatives, but comparison with a handbag is hard to avoid. Whether the current Z13 has become more of a fashion item or visually still fits into a business setting, is a question of personal choice. From a quality perspective, however, there is nothing wrong with the case and the ThinkPad Z13 is indeed of extremely high-quality.
Connectivity - Z13 with Wi-Fi 6E and LTE
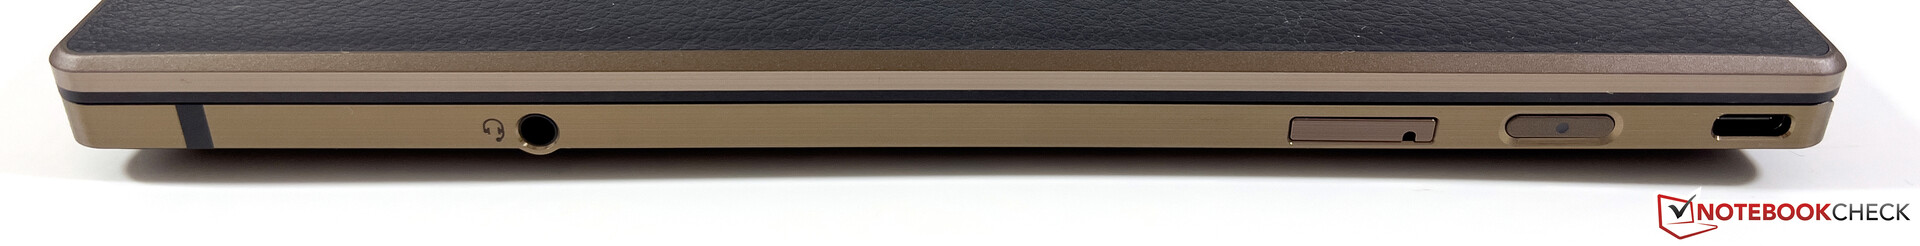
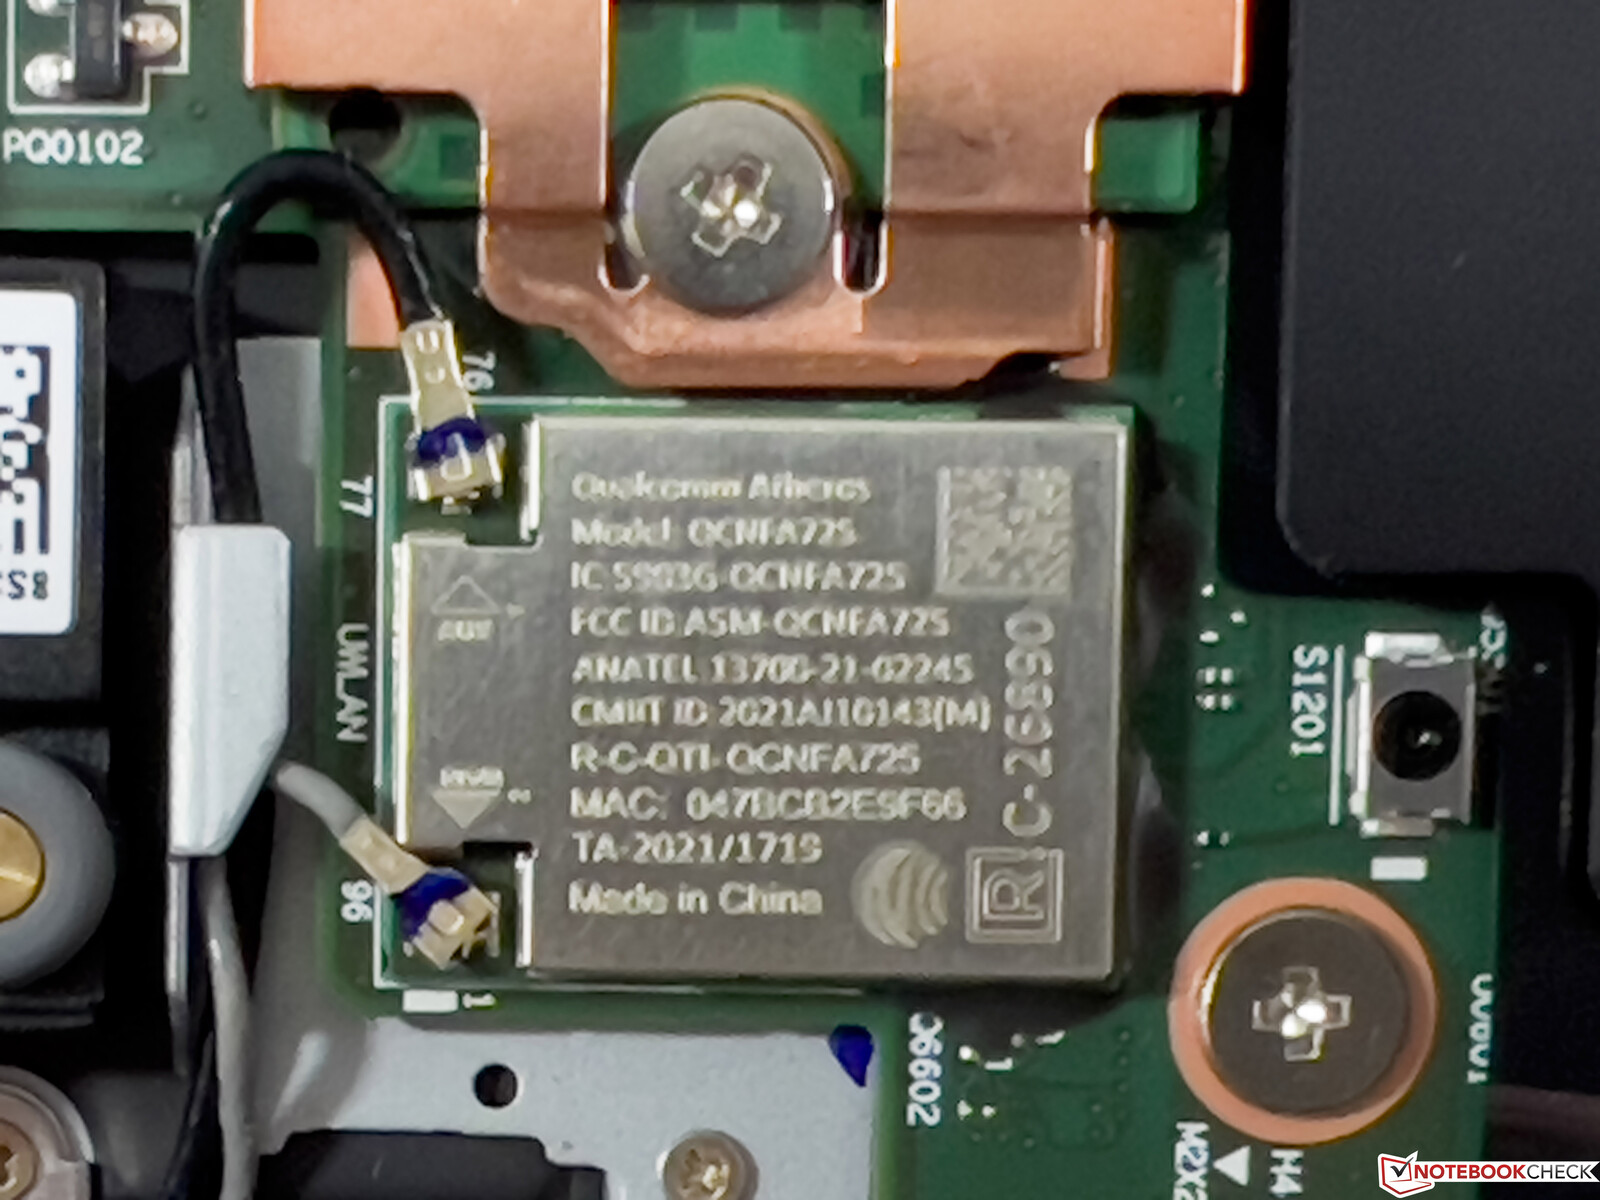
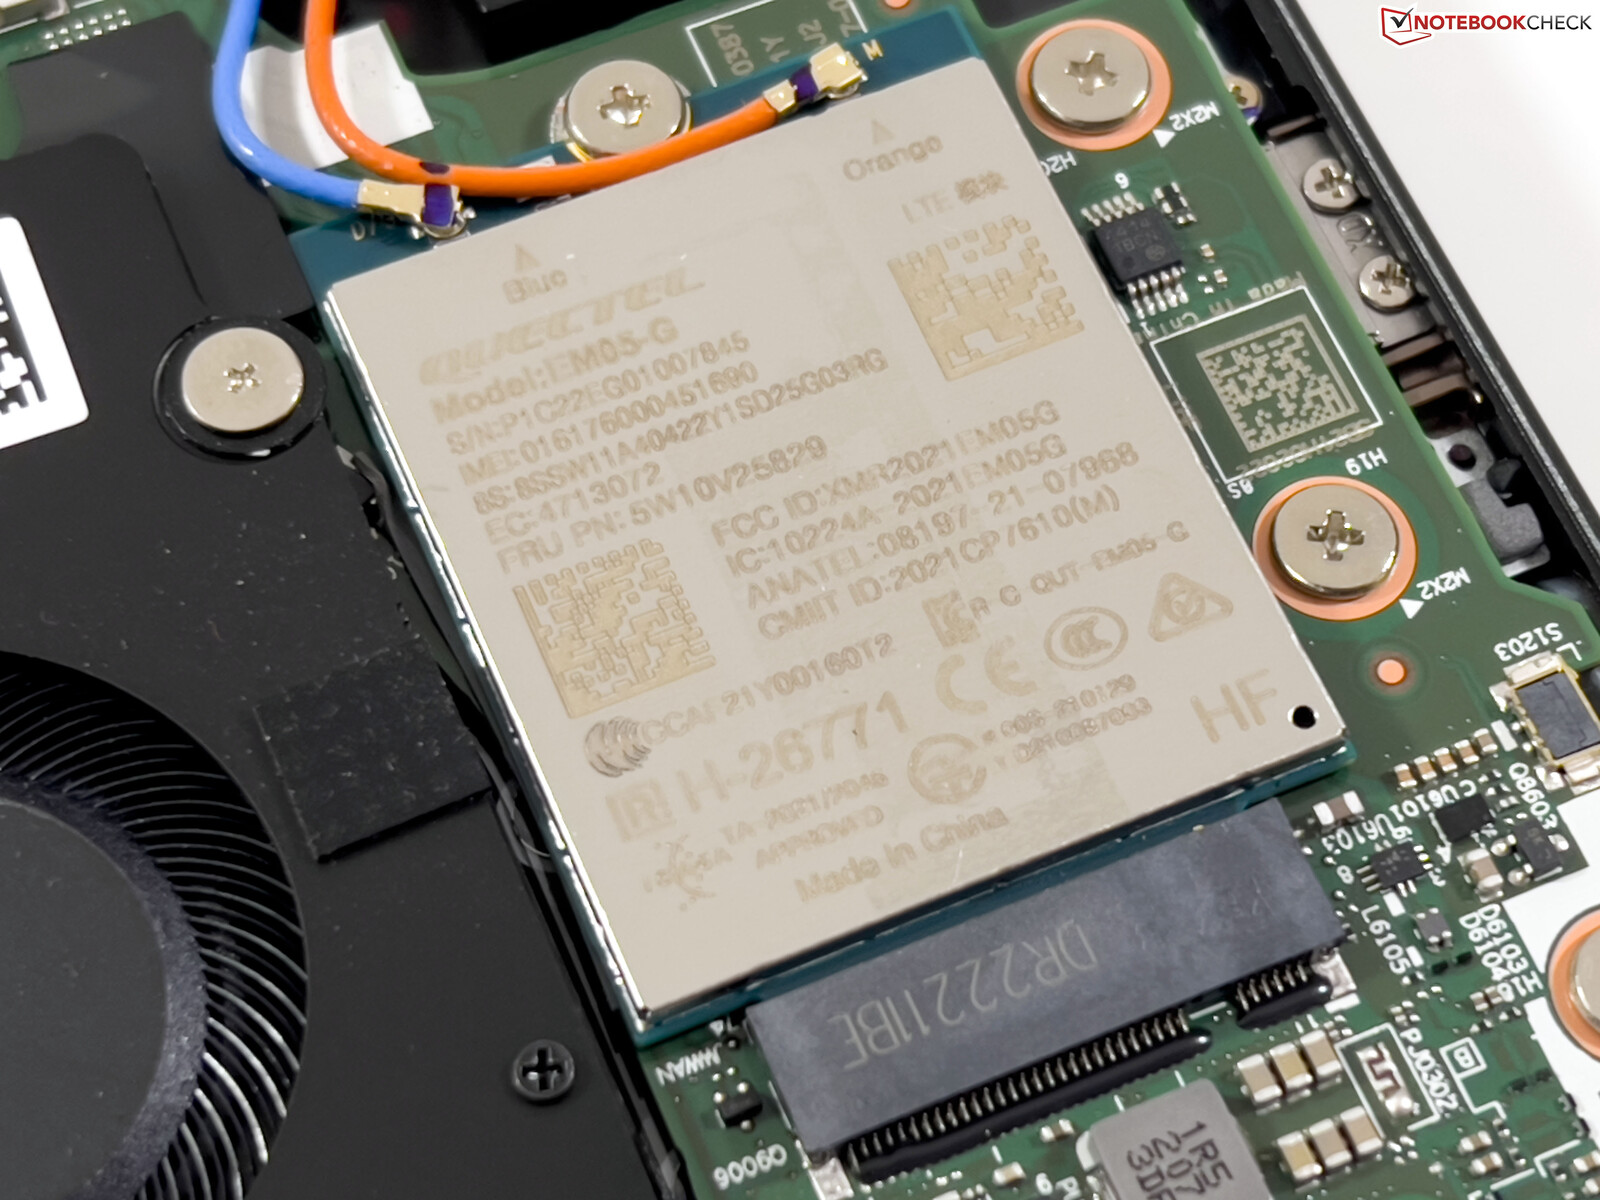
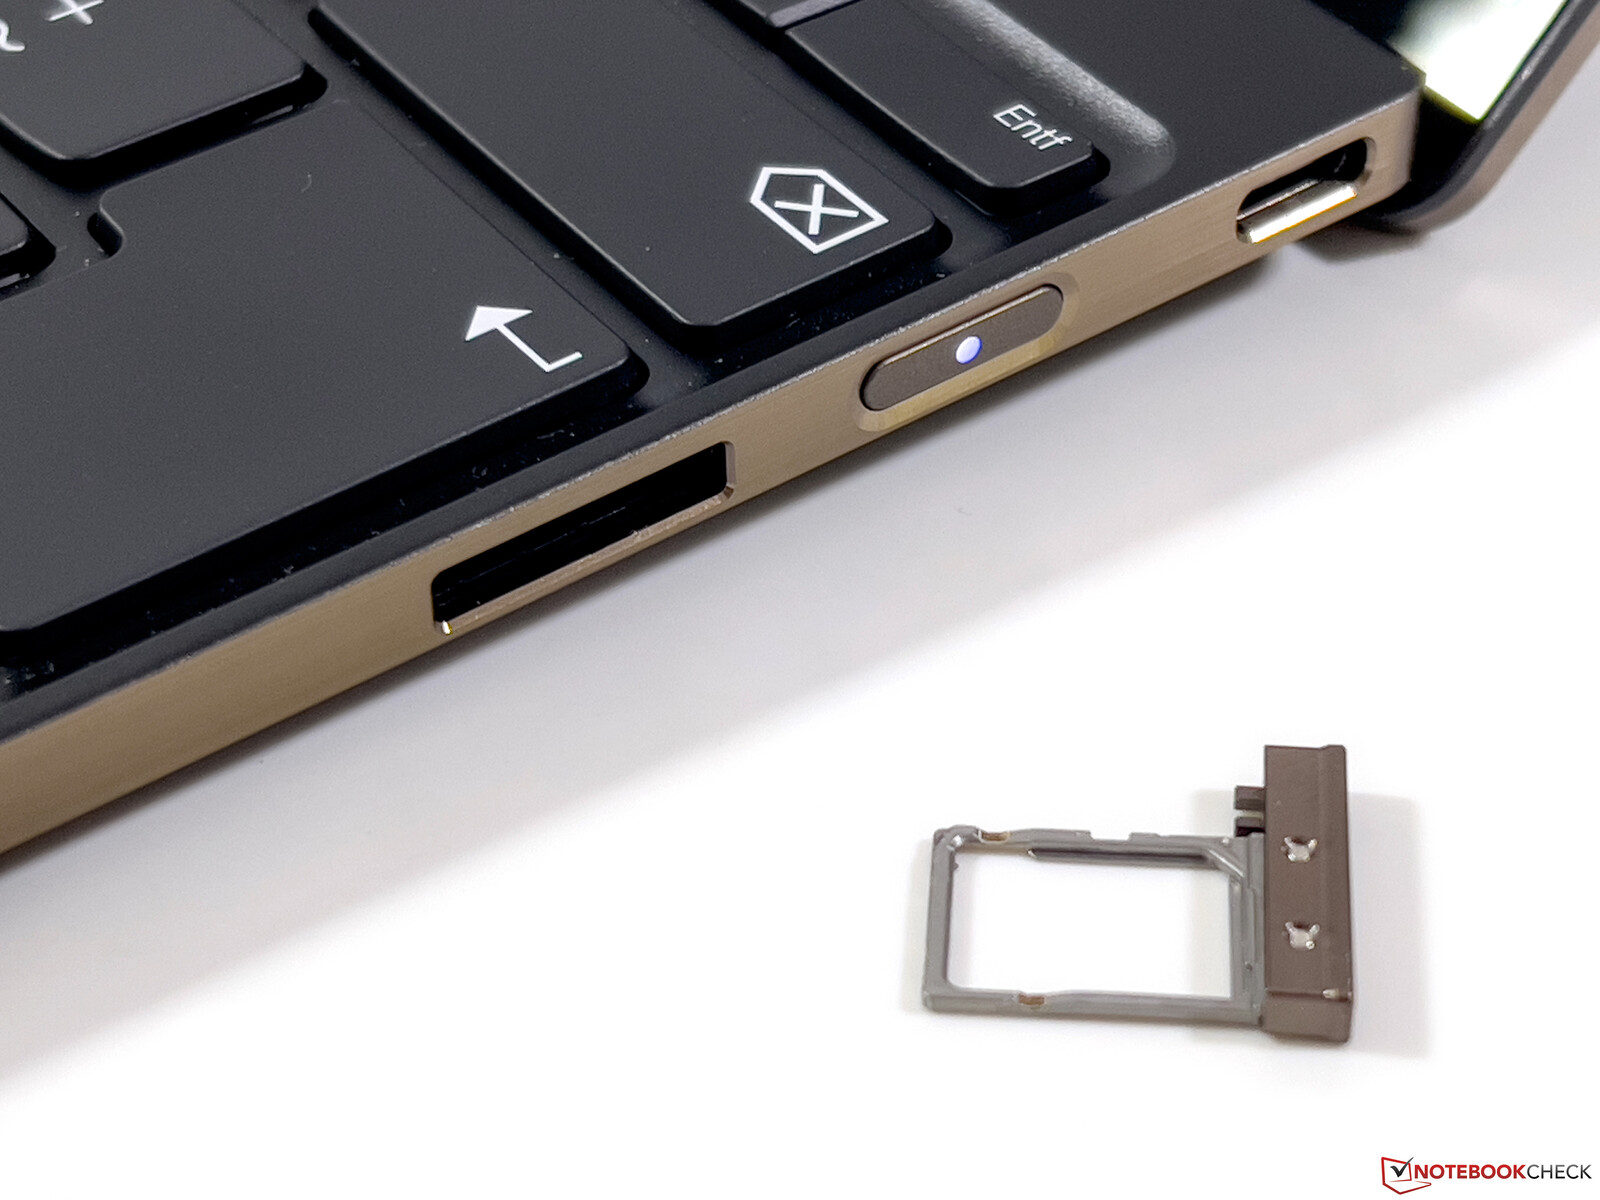
Our review unit was equipped with a Wi-Fi 6E module (Qualcomm WCN685x) and we were able to easily connect to the 6 GHz network on our Asus reference router. The transfer rates in the test were very high and also stable. A WWAN module from Quectel was also installed in the test device, which only supports LTE Cat.4. In addition to an eSIM, a nano-SIM card can also be inserted on the right edge. We were able to use a Telekom (Germany) SIM card in the LTE network without issue. However, a 5G module is not available.
| Networking | |
| Lenovo ThinkPad Z13 G1-21D20016GE | |
| iperf3 receive AXE11000 6GHz | |
| iperf3 transmit AXE11000 6GHz | |
| Asus Zenbook S 13 OLED | |
| iperf3 receive AXE11000 | |
| iperf3 transmit AXE11000 | |
| Lenovo ThinkPad Z13 21D2CTO1WW | |
| iperf3 receive AXE11000 6GHz | |
| iperf3 transmit AXE11000 6GHz | |
| Apple MacBook Air M2 Entry | |
| iperf3 receive AXE11000 | |
| iperf3 transmit AXE11000 | |
| Dell XPS 13 Plus 9320 4K | |
| iperf3 receive AXE11000 | |
| iperf3 transmit AXE11000 | |
| Average Qualcomm WCN685x | |
| iperf3 receive AXE11000 6GHz | |
| iperf3 transmit AXE11000 6GHz | |
| iperf3 receive AXE11000 | |
| iperf3 transmit AXE11000 | |


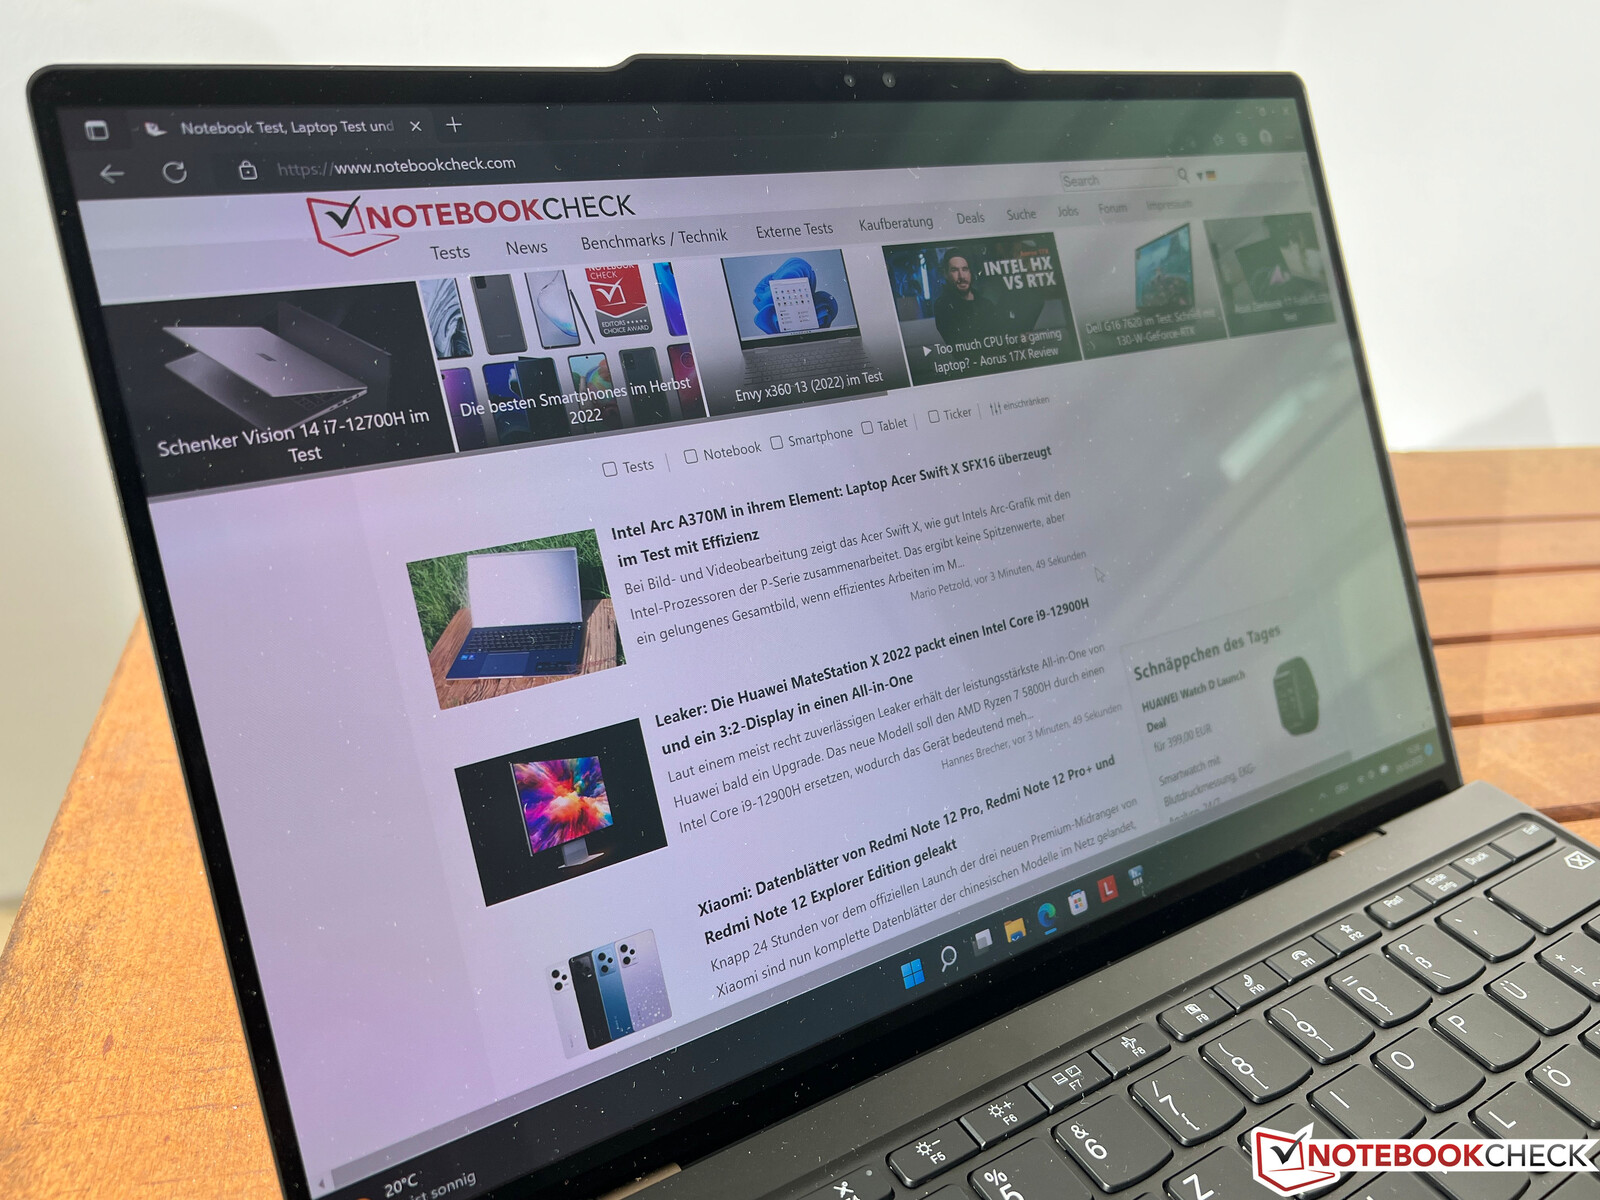
Display - 2.8K OLED Touchscreen
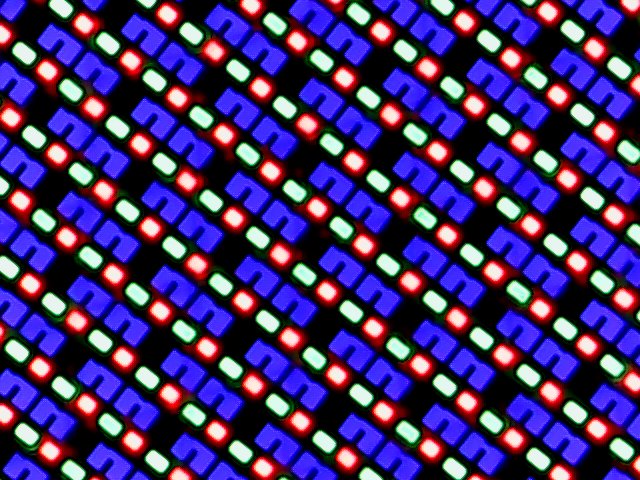
Our test device uses the optional 13.3-inch OLED touchscreen with a resolution of 2,880 x 1,800 pixels. Subjectively, the image of the reflective panel makes a good impression in principle. Content is displayed very sharply, and colors are very strong. With bright content, however, a grid effect (moiré effect) is visible and requires that one sit relatively close to the display. Windows uses its dark color mode by default to save power, so in practice the effect is not noticeable.
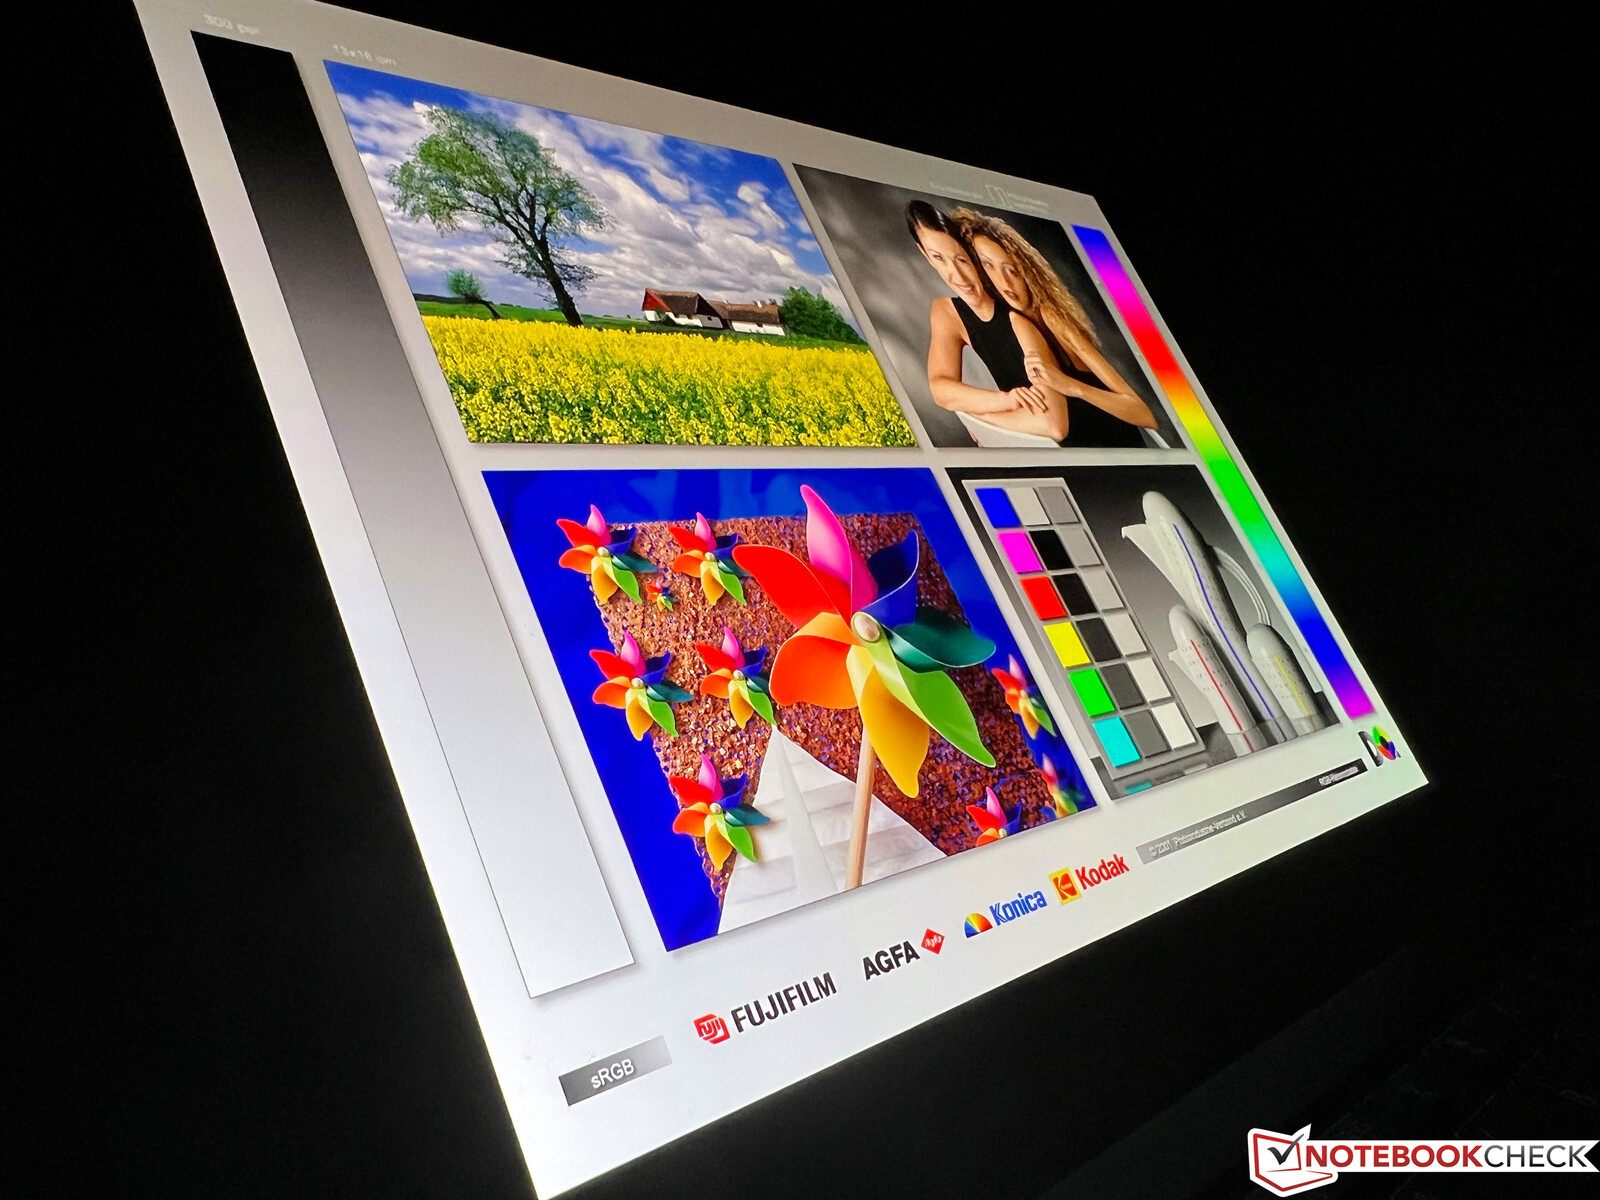
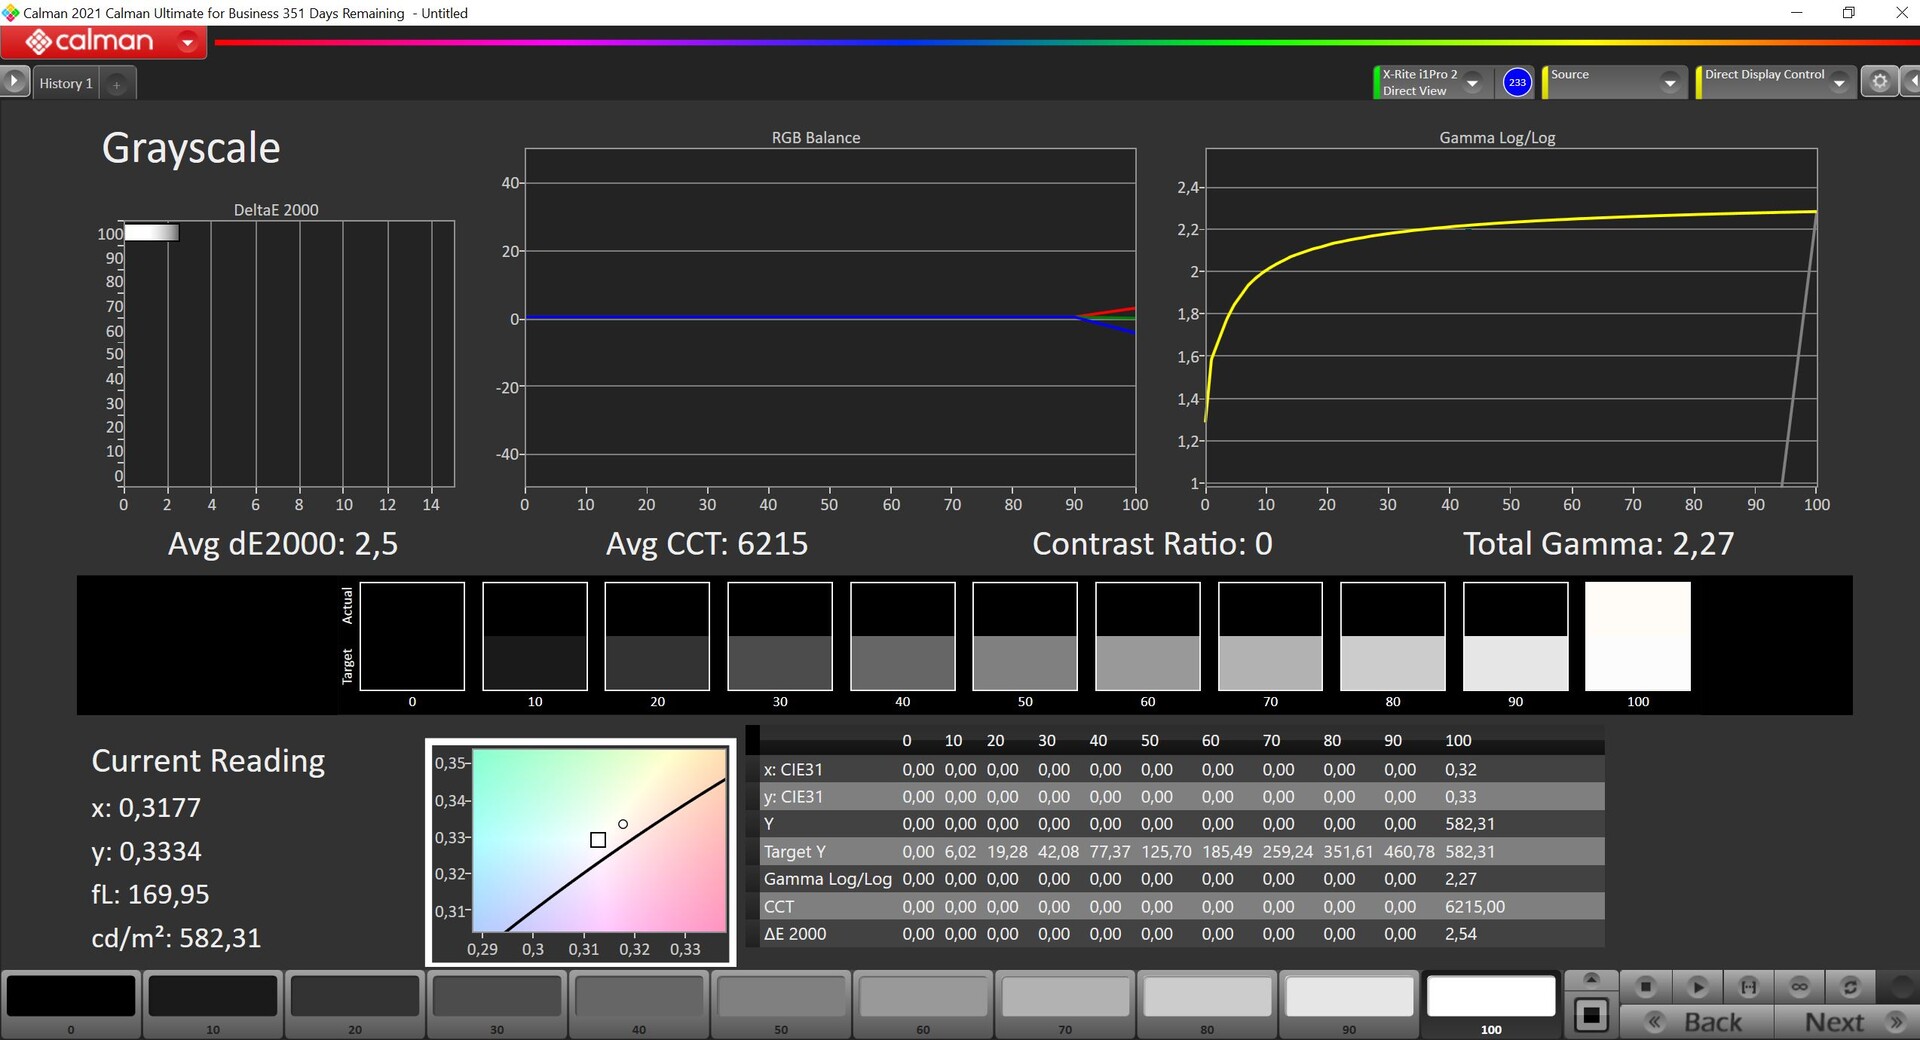
Lenovo advertises brightness of 400 cd/m², whereby one must distinguish here (as is the norm with OLED panels) between SDR and HDR content. In normal SDR mode, we determined a brightness of around 380 cd/m² and together with the extremely low black level, an extremely high contrast ratio is obtained. In HDR mode (which has to be activated manually), it reaches a maximum of 582 cd/m² for small image sections and around 470 cd/m² for an almost completely bright image. The viewing angle stability is very good and the response times are extremely fast. There are no halos on OLED panels.
| |||||||||||||||||||||||||
Brightness Distribution: 98 %
Center on Battery: 373 cd/m²
Contrast: 9275:1 (Black: 0.04 cd/m²)
ΔE ColorChecker Calman: 2.5 | ∀{0.5-29.43 Ø4.71}
calibrated: 1.9
ΔE Greyscale Calman: 2 | ∀{0.09-98 Ø4.96}
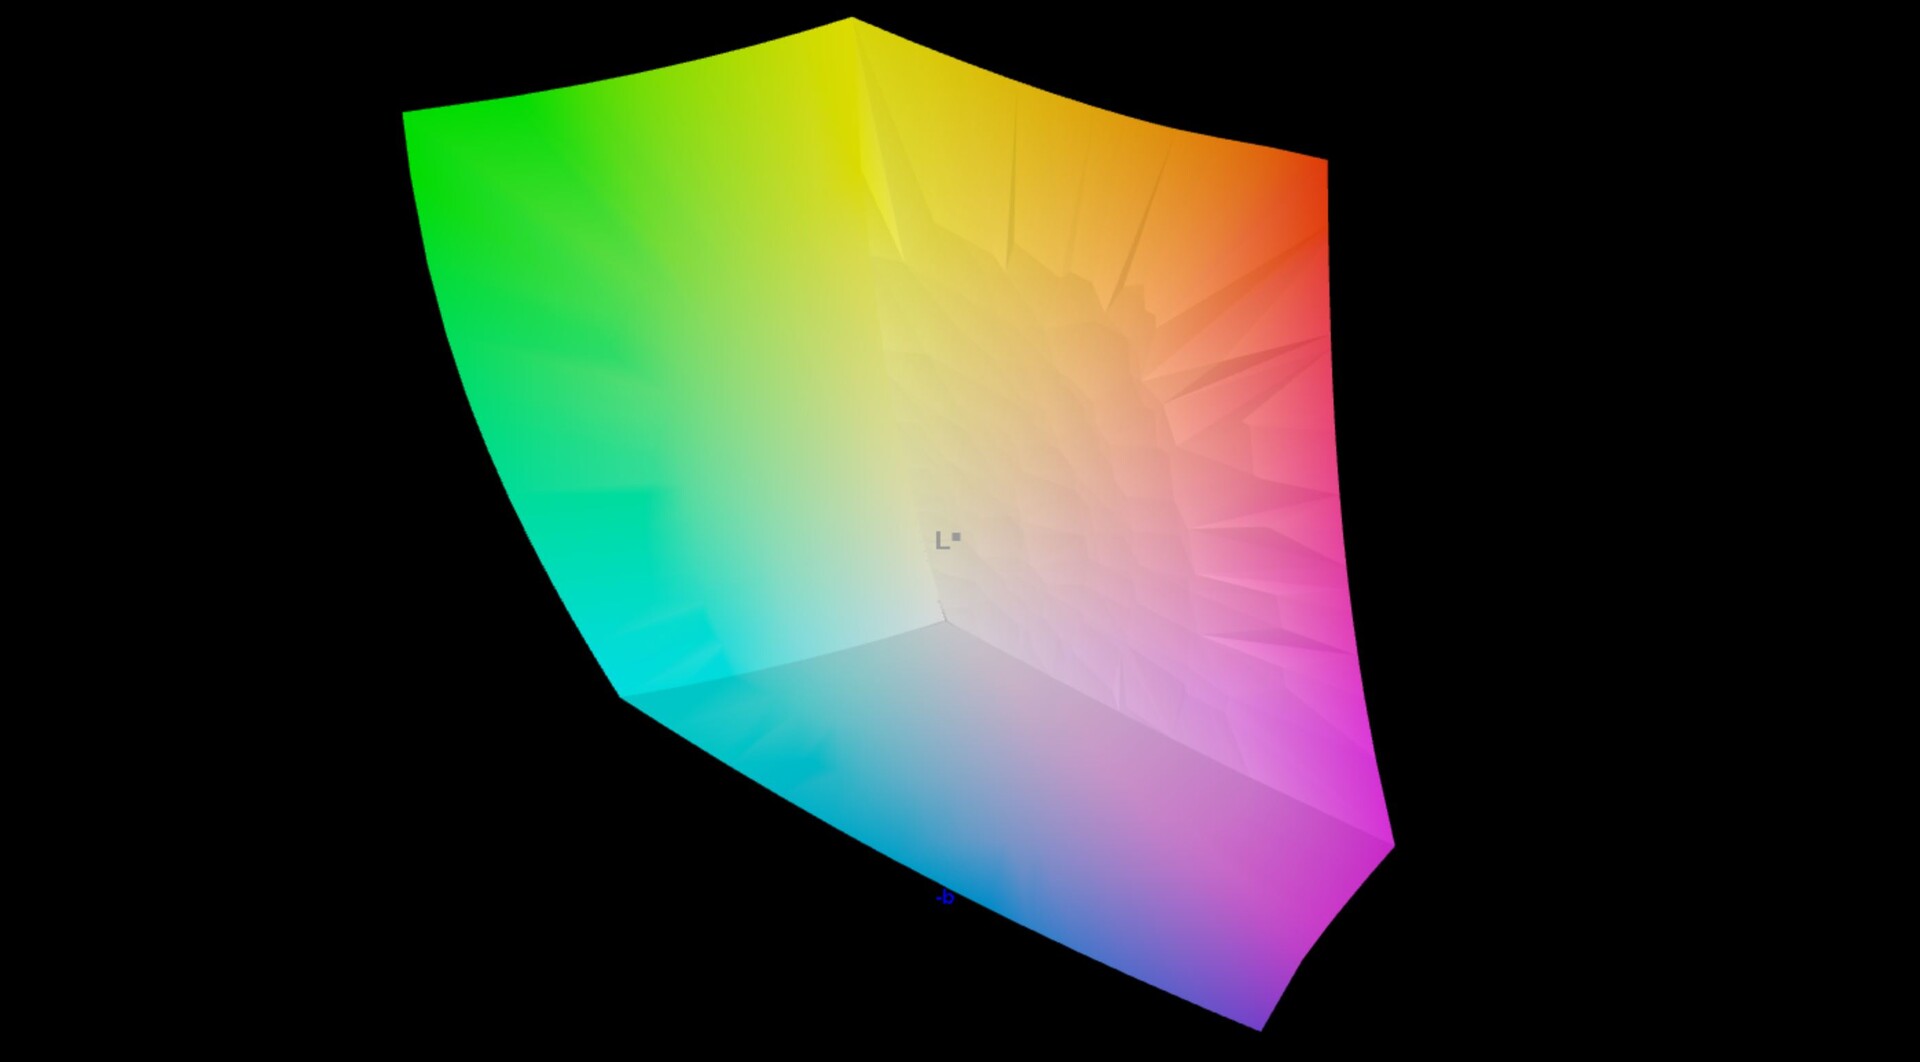
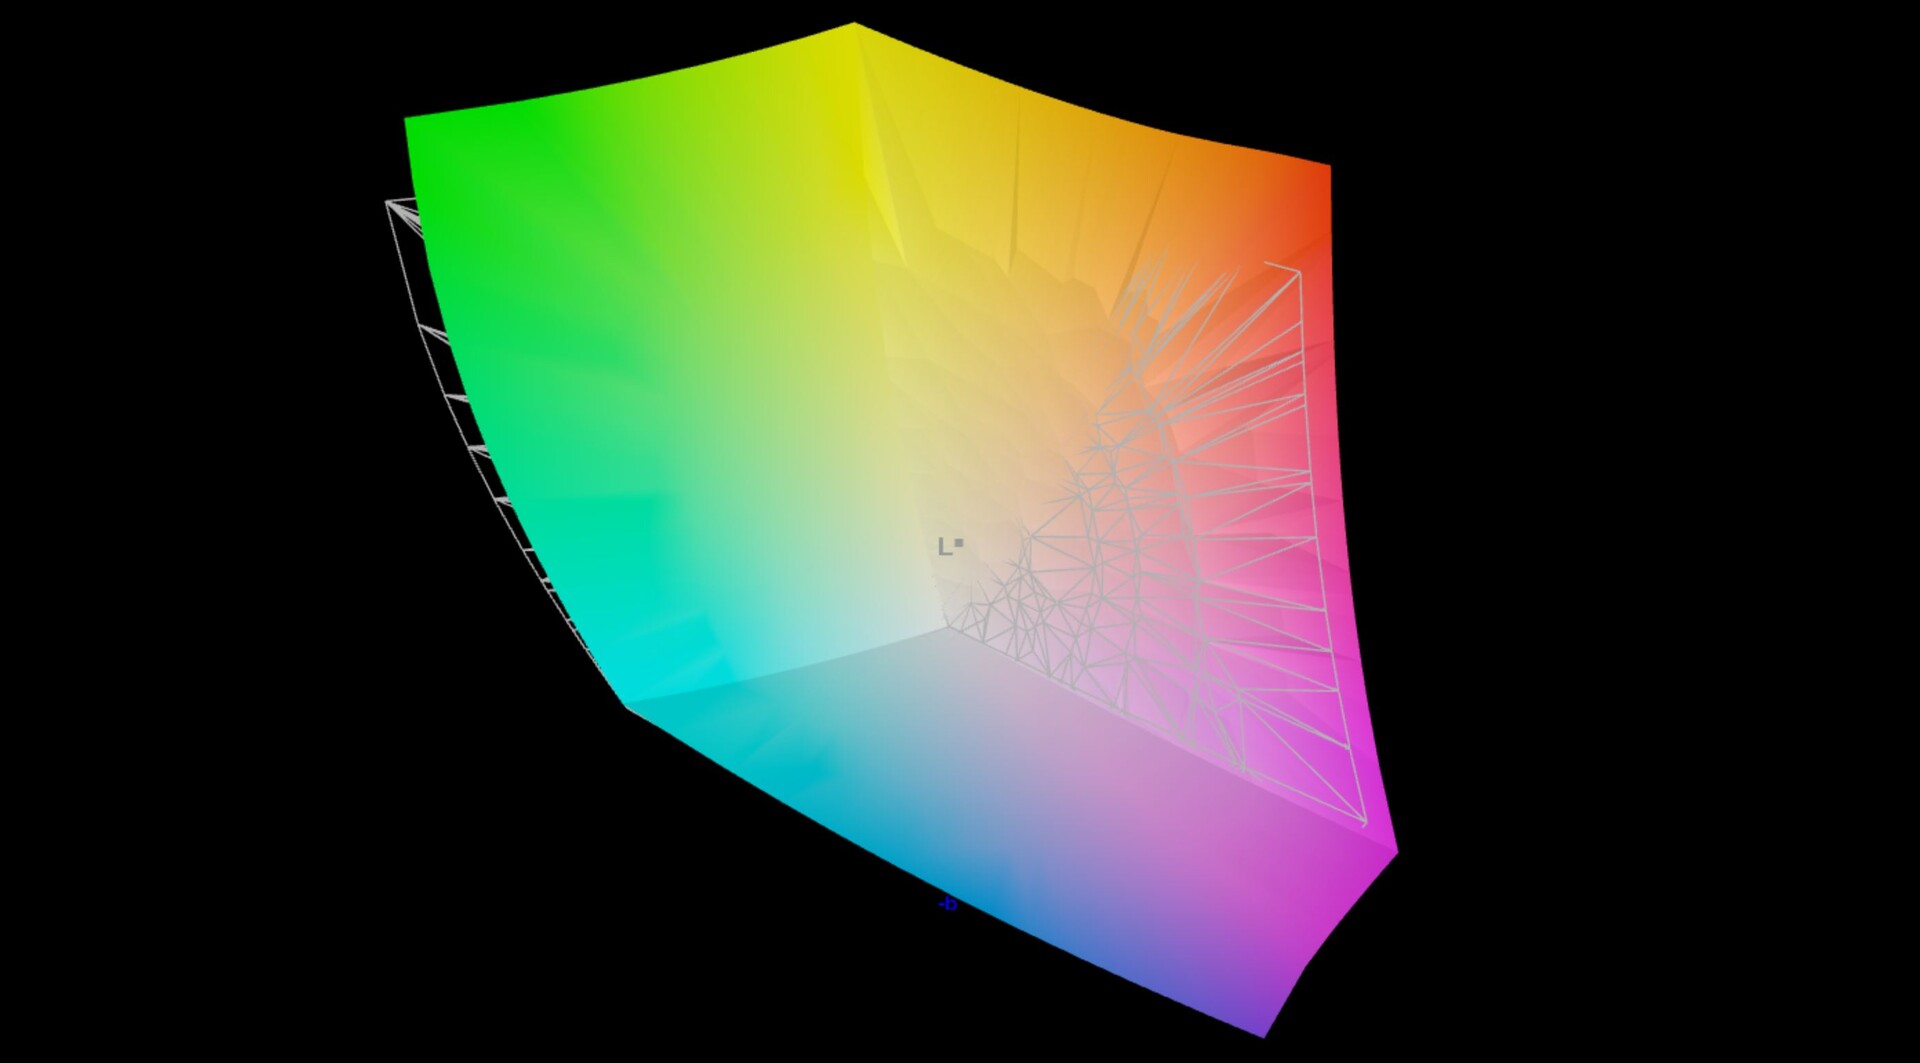
97.5% AdobeRGB 1998 (Argyll 3D)
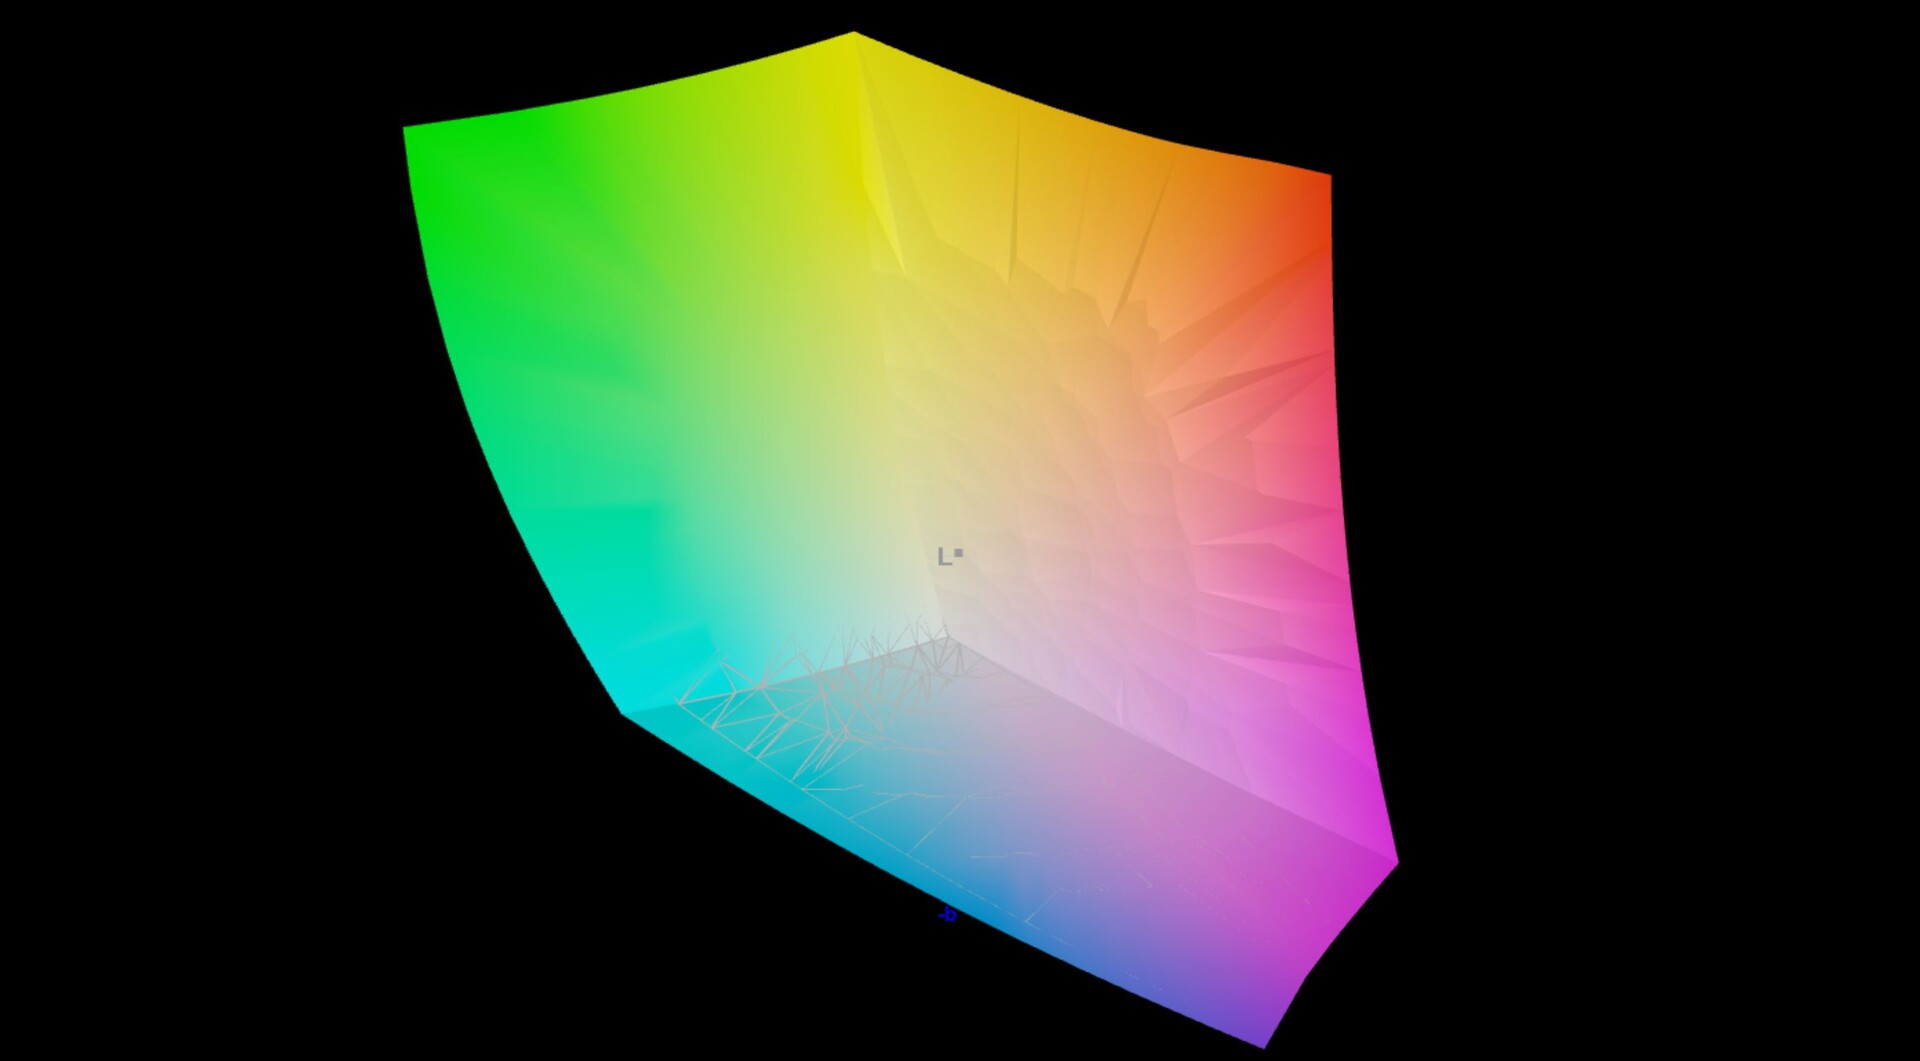
100% sRGB (Argyll 3D)
99.9% Display P3 (Argyll 3D)
Gamma: 2.17
CCT: 6228 K
| Lenovo ThinkPad Z13 G1-21D20016GE ATNA33AA02-0, OLED, 2880x1800, 13.3" | Asus Zenbook S 13 OLED SDC4172, OLED, 2880x1800, 13.3" | Dell XPS 13 Plus 9320 i7-1280P OLED Samsung 134XK04, OLED, 3456x2160, 13.4" | Lenovo ThinkPad Z13 21D2CTO1WW NV133WUM-N63, IPS LED, 1920x1200, 13.3" | Apple MacBook Air M2 Entry IPS, 2560x1664, 13.6" | |
|---|---|---|---|---|---|
| Display | 0% | 0% | -21% | -4% | |
| Display P3 Coverage (%) | 99.9 | 99.8 0% | 99.5 0% | 67.7 -32% | 98.4 -2% |
| sRGB Coverage (%) | 100 | 100 0% | 100 0% | 96.5 -3% | 99.9 0% |
| AdobeRGB 1998 Coverage (%) | 97.5 | 97.8 0% | 98.4 1% | 69.7 -29% | 87.6 -10% |
| Response Times | -8% | -34% | -1909% | -1544% | |
| Response Time Grey 50% / Grey 80% * (ms) | 1.9 ? | 2.1 ? -11% | 2.6 ? -37% | 49 ? -2479% | 32.9 ? -1632% |
| Response Time Black / White * (ms) | 1.6 ? | 1.68 ? -5% | 2.1 ? -31% | 23 ? -1338% | 24.9 ? -1456% |
| PWM Frequency (Hz) | 240 ? | 240.4 ? | 59.5 | ||
| Screen | 24% | -6% | -81% | -81% | |
| Brightness middle (cd/m²) | 371 | 336 -9% | 371.8 0% | 418 13% | 526 42% |
| Brightness (cd/m²) | 378 | 338 -11% | 374 -1% | 379 0% | 486 29% |
| Brightness Distribution (%) | 98 | 99 1% | 98 0% | 81 -17% | 87 -11% |
| Black Level * (cd/m²) | 0.04 | 0.02 50% | 0.33 -725% | 0.38 -850% | |
| Contrast (:1) | 9275 | 16800 81% | 1267 -86% | 1384 -85% | |
| Colorchecker dE 2000 * | 2.5 | 1.8 28% | 2.37 5% | 1.7 32% | 1.3 48% |
| Colorchecker dE 2000 max. * | 4.4 | 3.8 14% | 6.1 -39% | 3.3 25% | 2.7 39% |
| Colorchecker dE 2000 calibrated * | 1.9 | 1.8 5% | 1.1 42% | 0.7 63% | |
| Greyscale dE 2000 * | 2 | 0.9 55% | 2 -0% | 2.3 -15% | 2 -0% |
| Gamma | 2.17 101% | 2.22 99% | 2.29 96% | 2.14 103% | 2.25 98% |
| CCT | 6228 104% | 6580 99% | 6261 104% | 6499 100% | 6858 95% |
| Total Average (Program / Settings) | 5% /
14% | -13% /
-9% | -670% /
-329% | -543% /
-273% |
* ... smaller is better
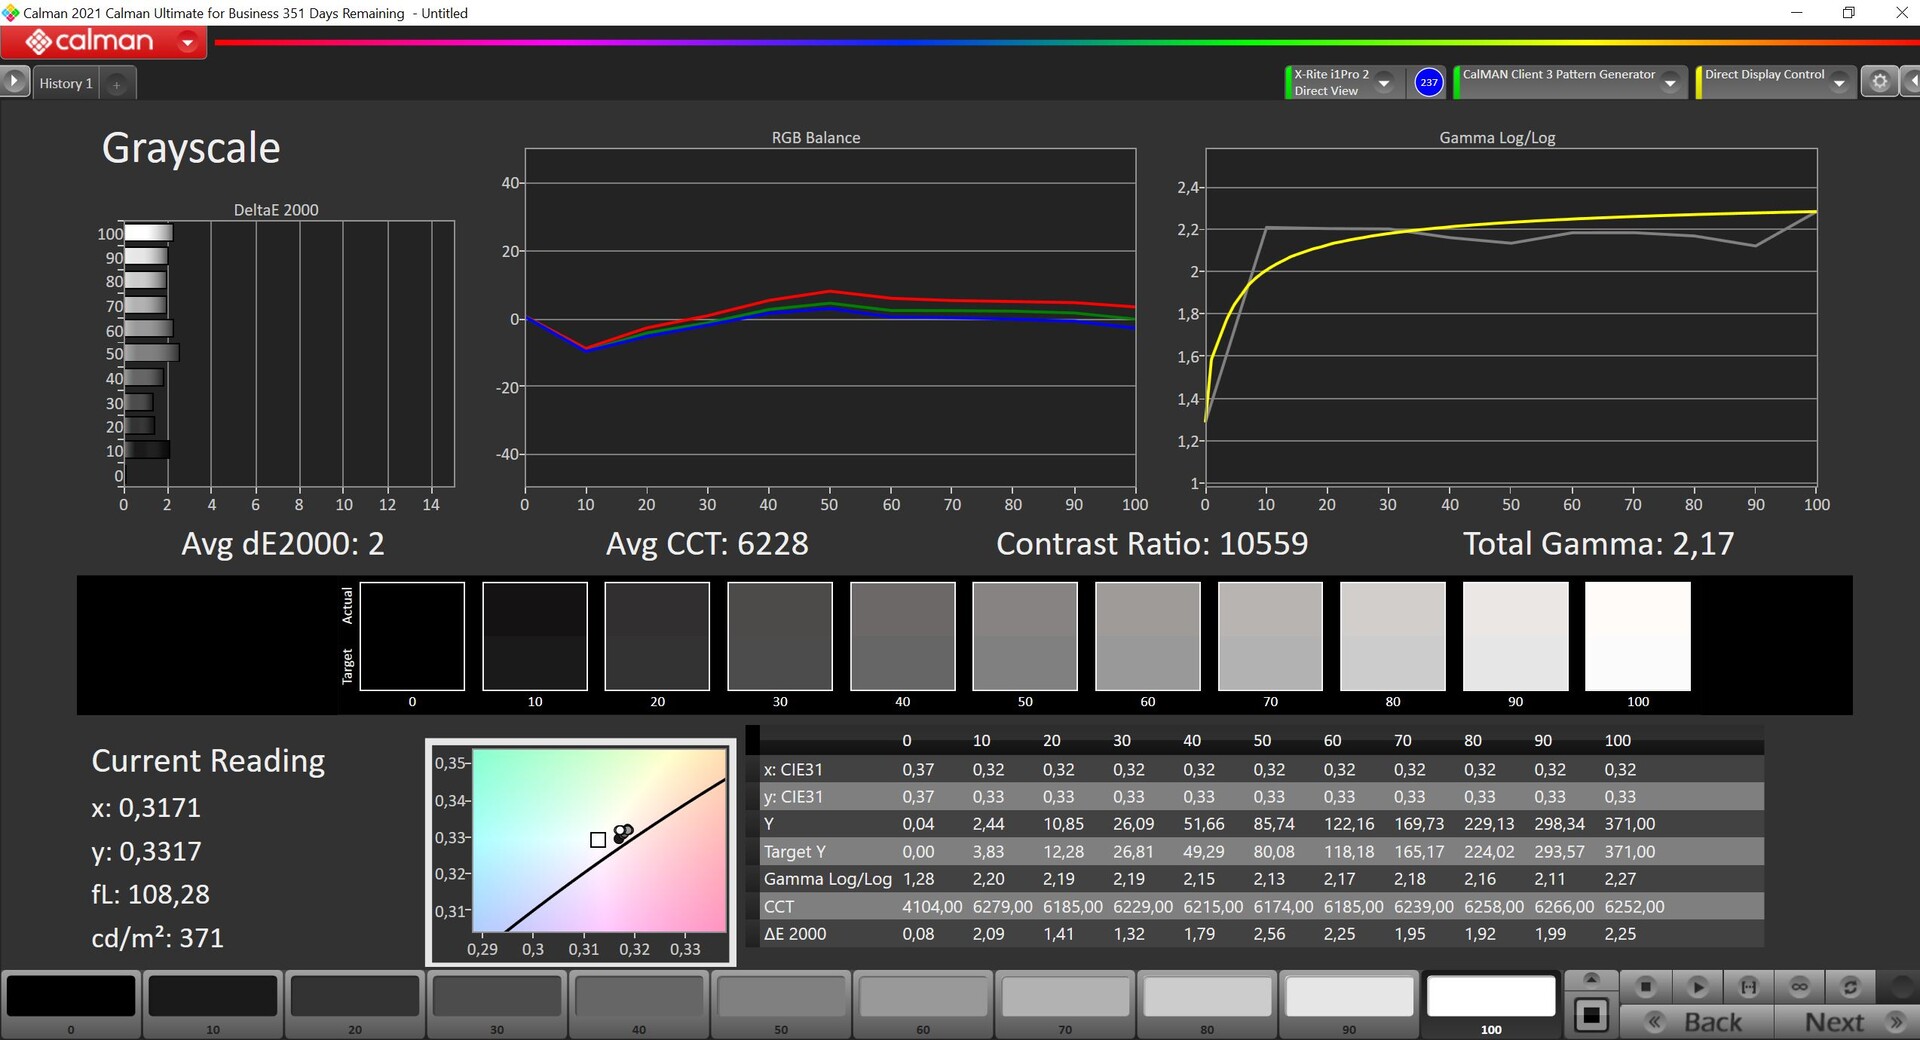
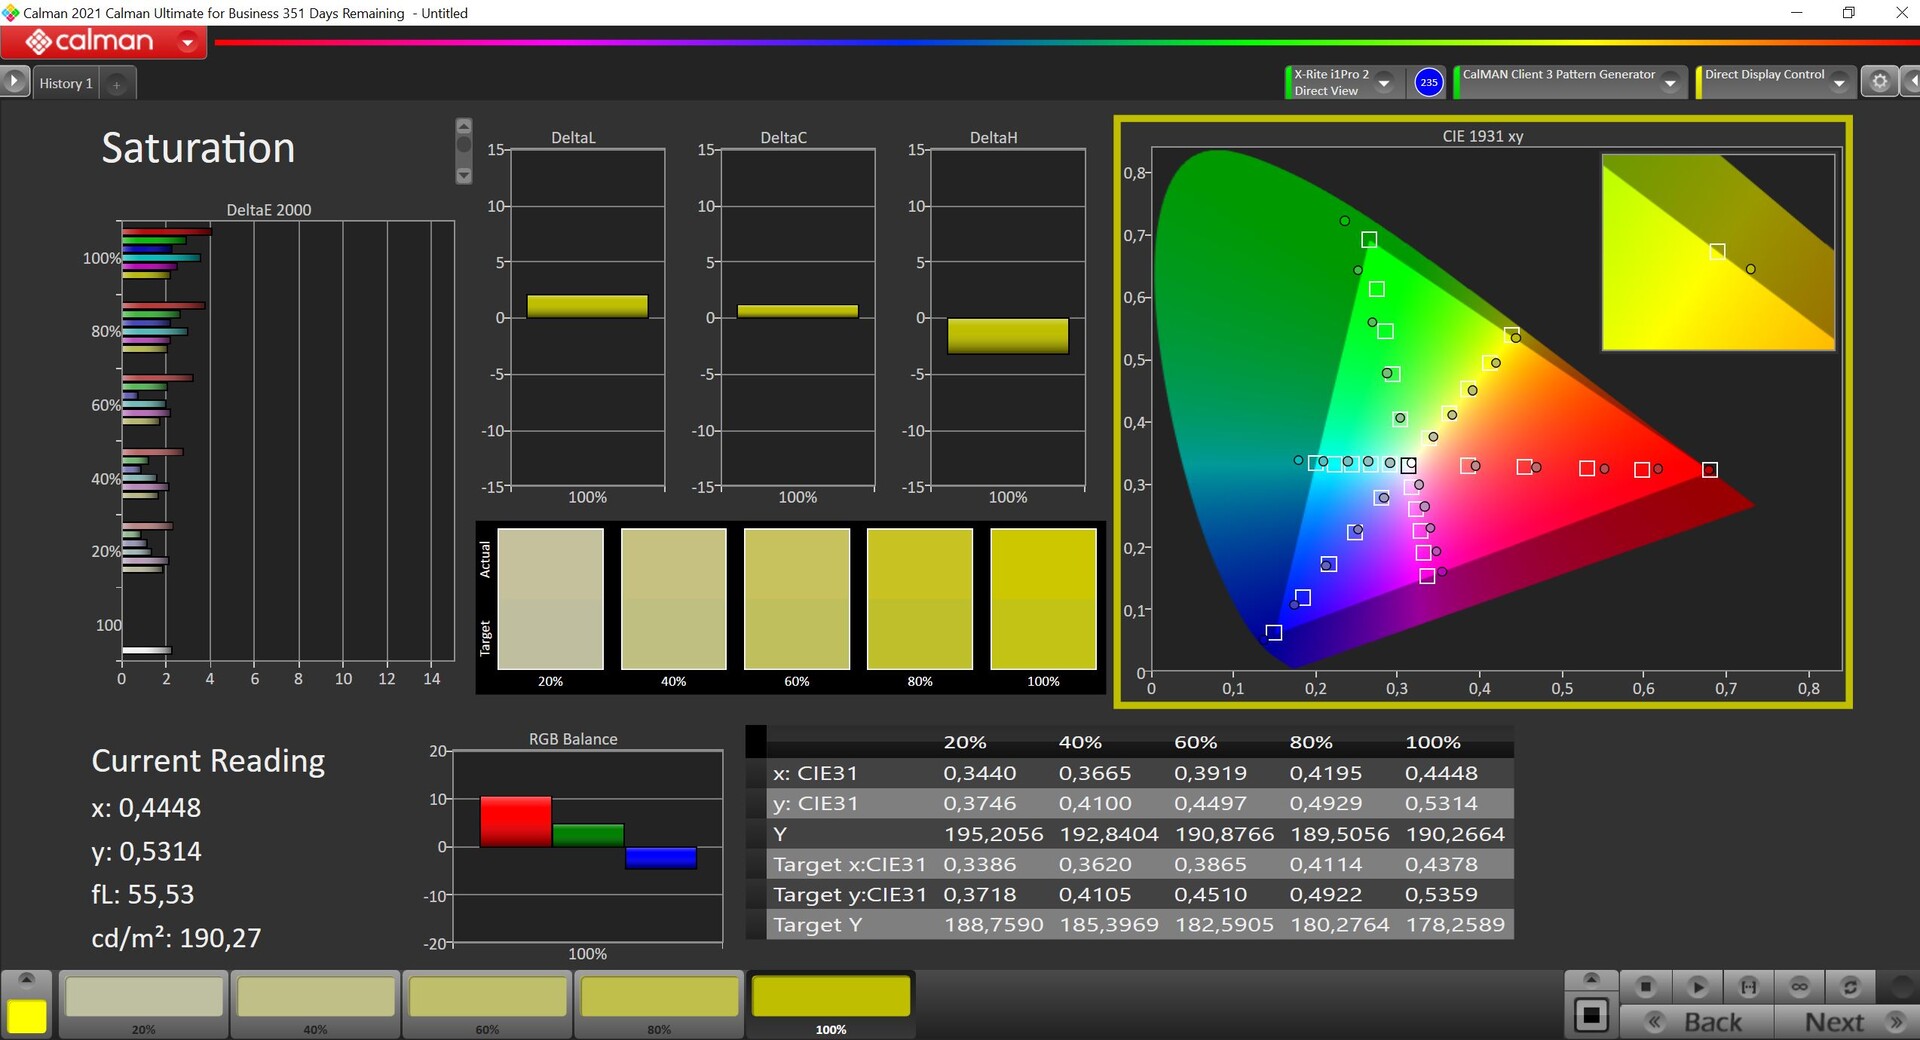
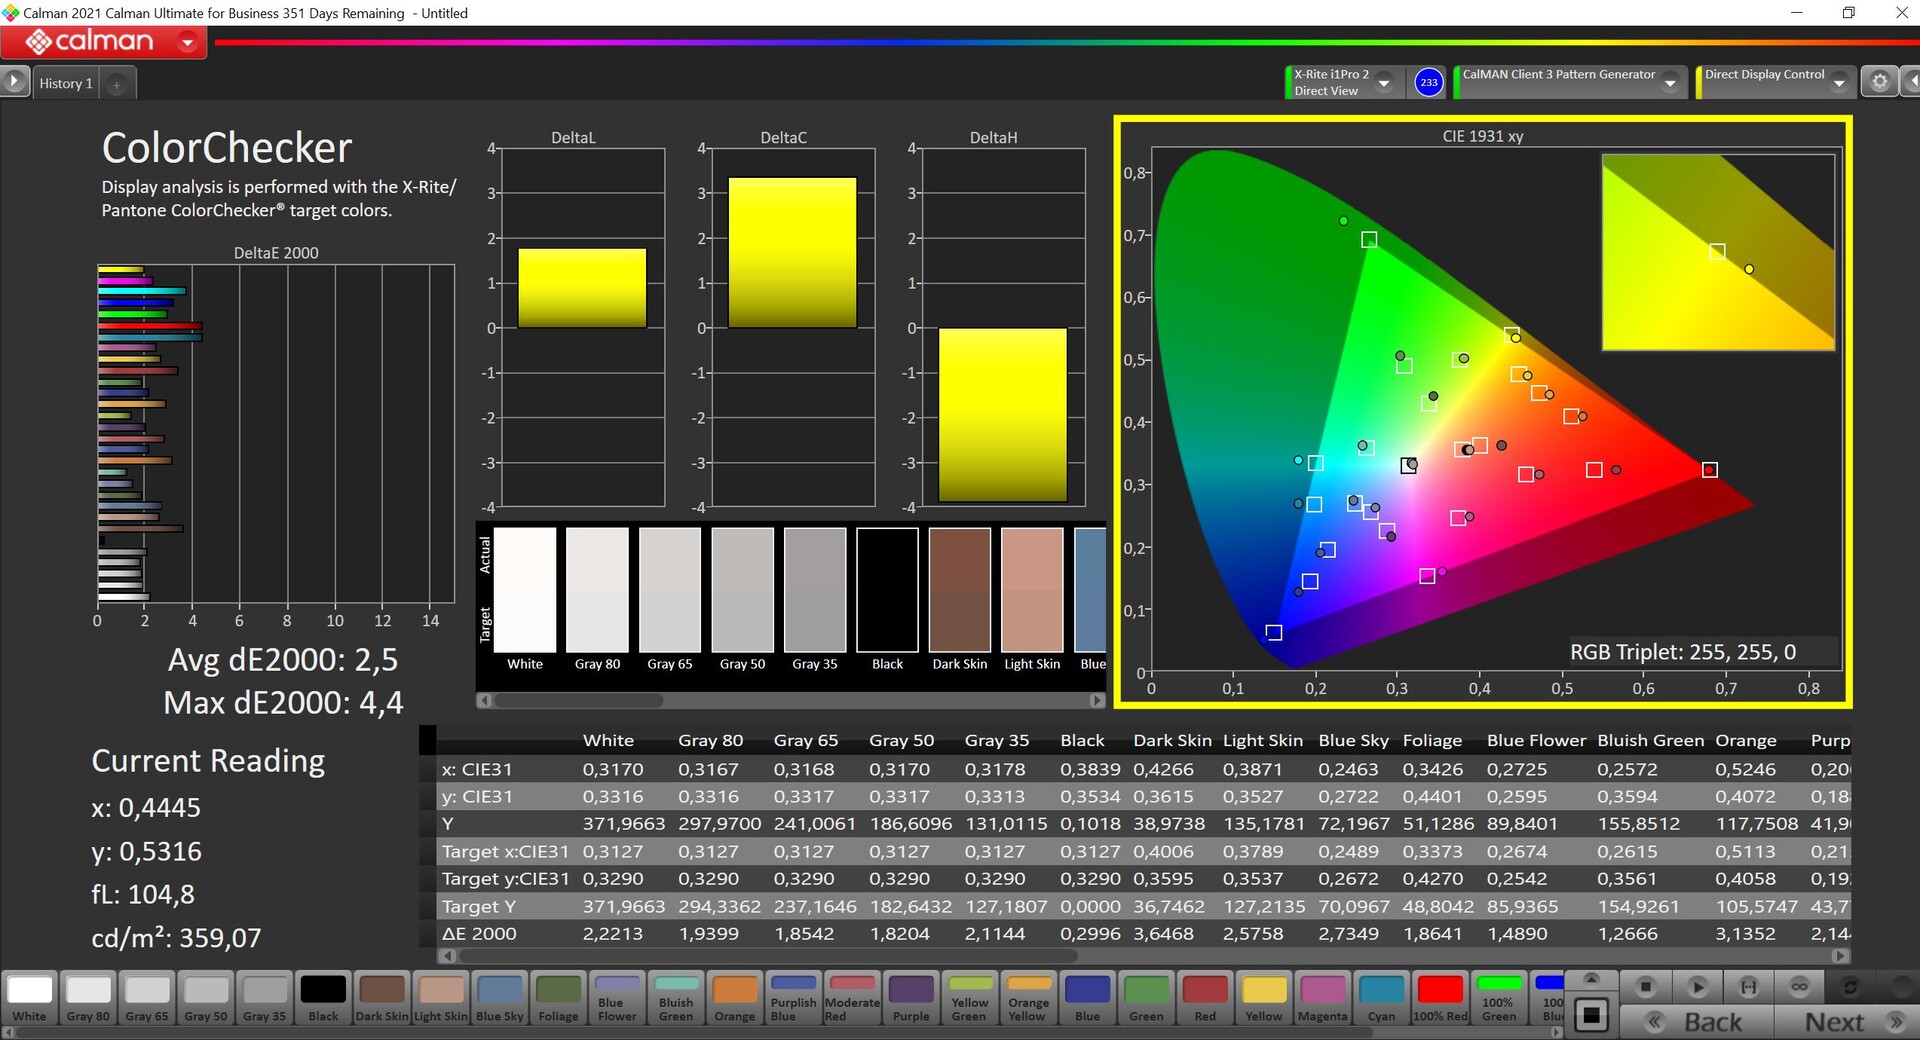
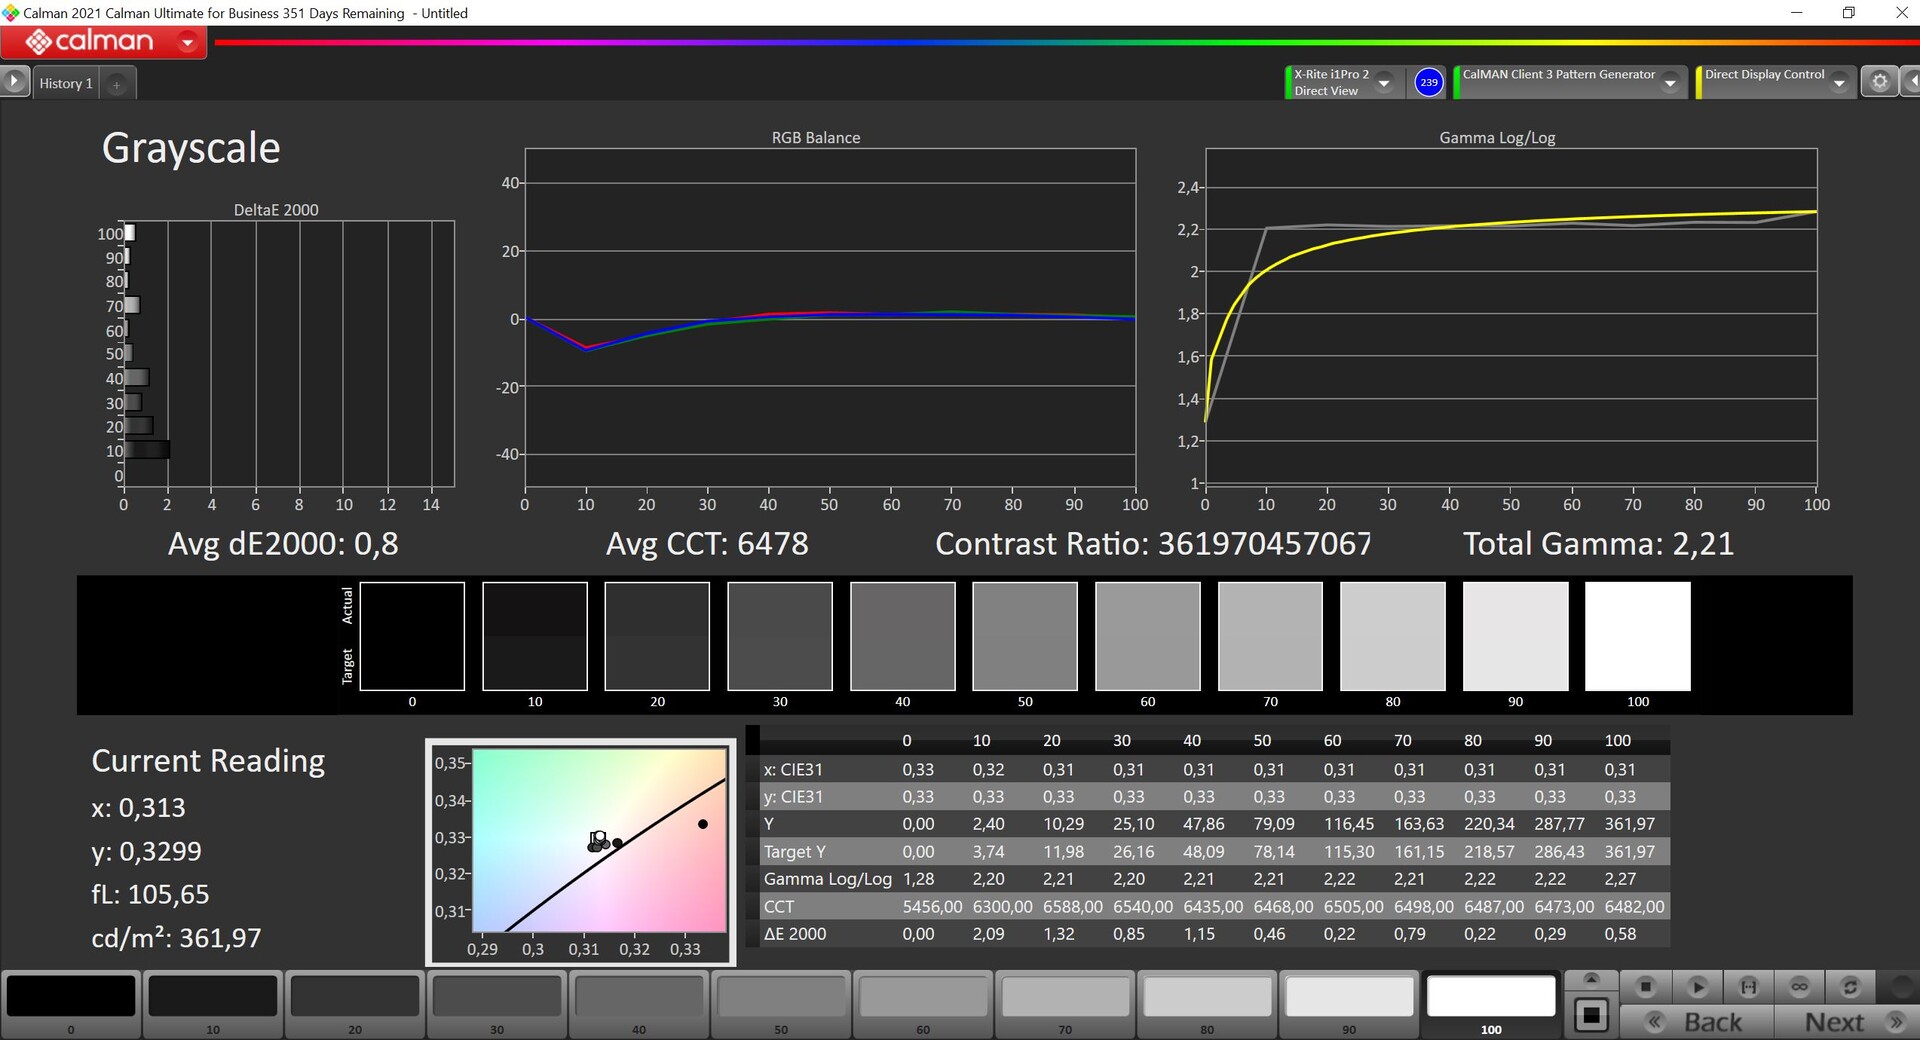
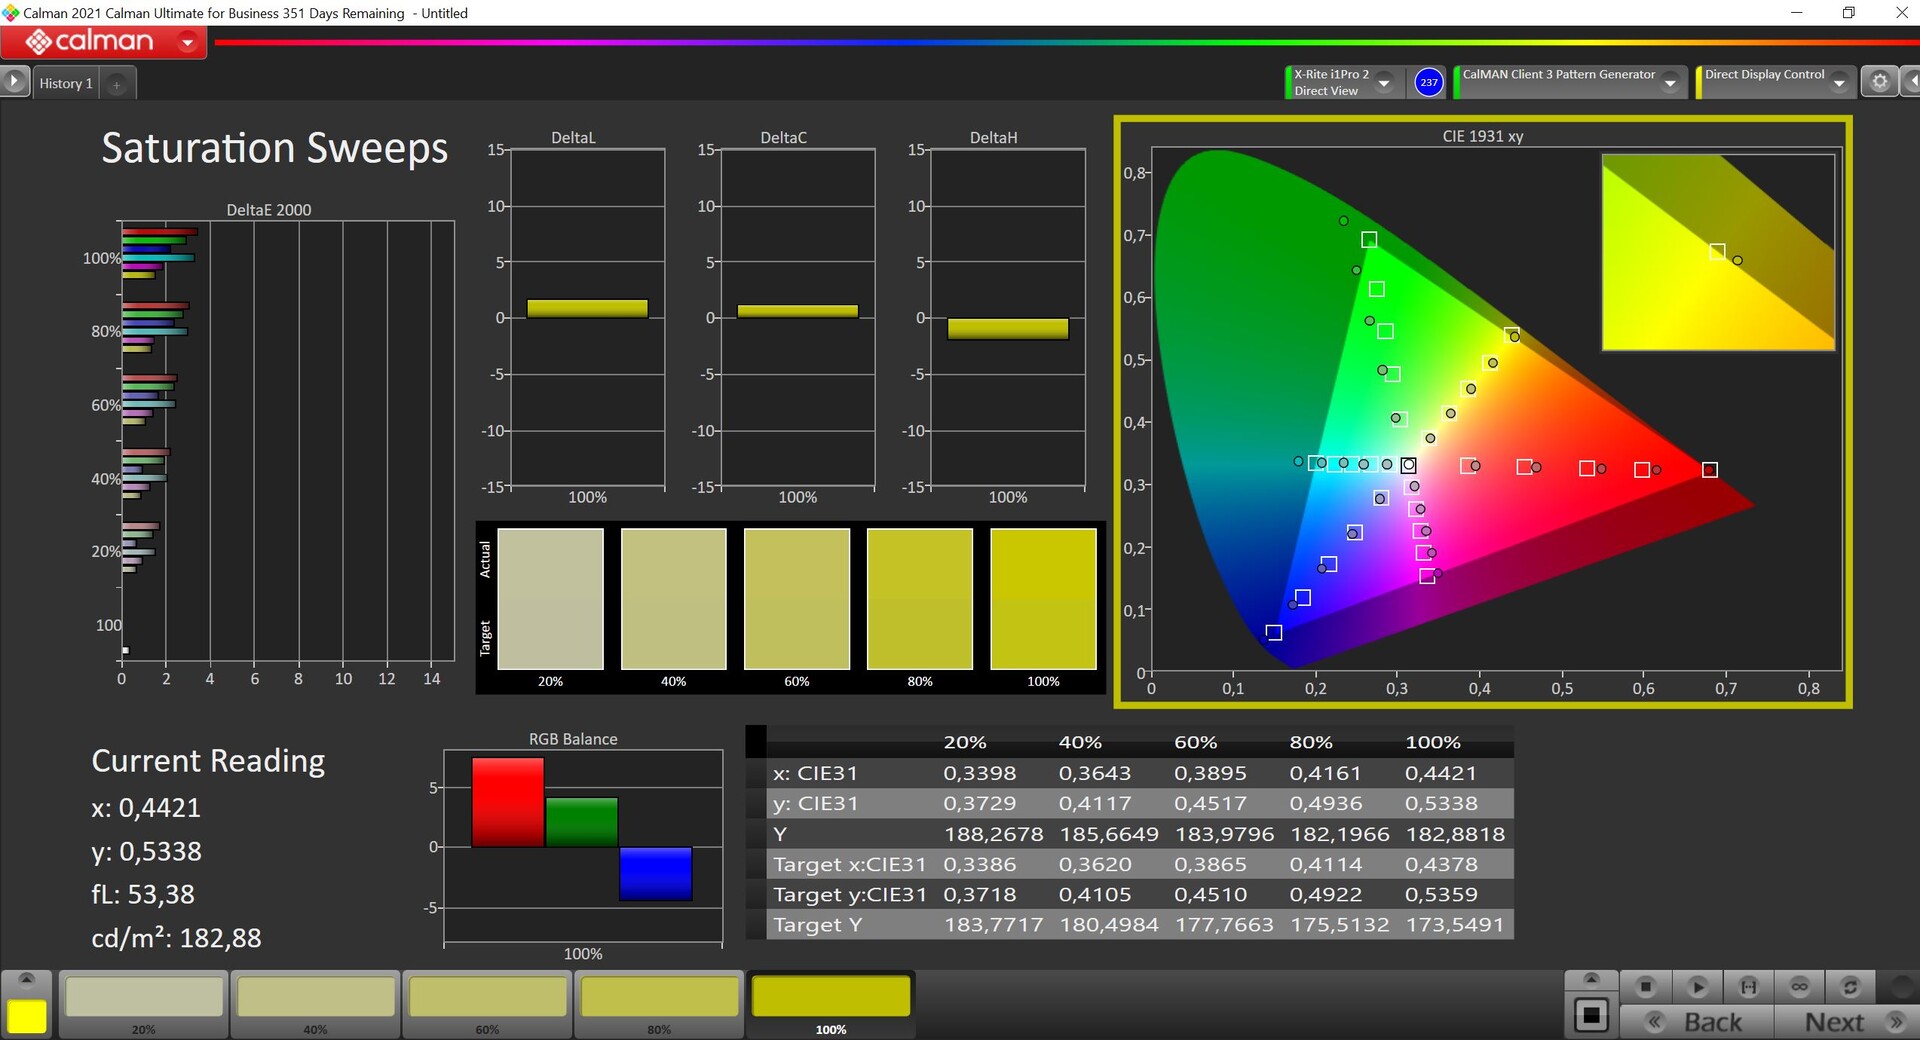
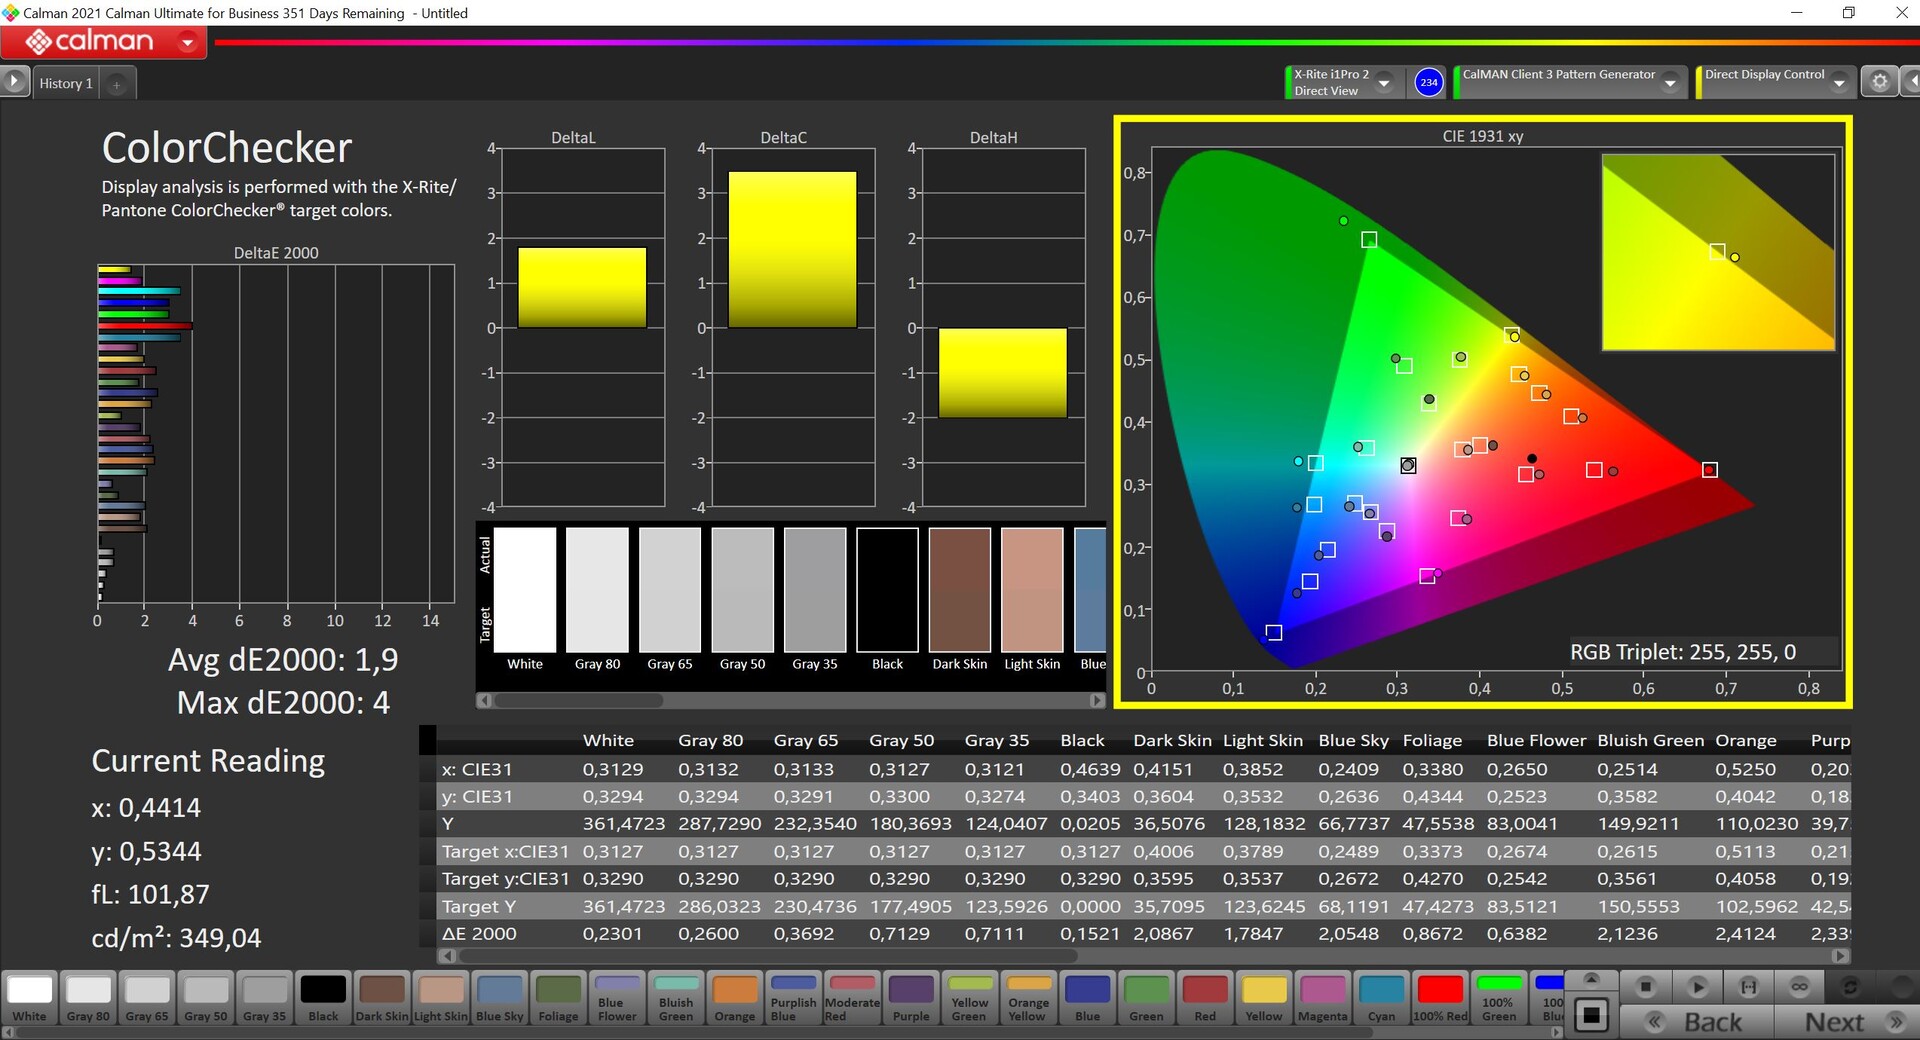
Our analysis using professional CalMAN software (X-Rite i1 Pro 2) shows that the OLED screen as delivered is already properly calibrated. There is minimal color cast in true red in conjunction with a color temperature that is slightly too warm. We were able to further improve the display with our own calibration (profile is available for download above) and most of the colors are below the important limit of 3. The P3 color space is fully covered.
Display Response Times
| ↔ Response Time Black to White | ||
|---|---|---|
| 1.6 ms ... rise ↗ and fall ↘ combined | ↗ 0.8 ms rise | 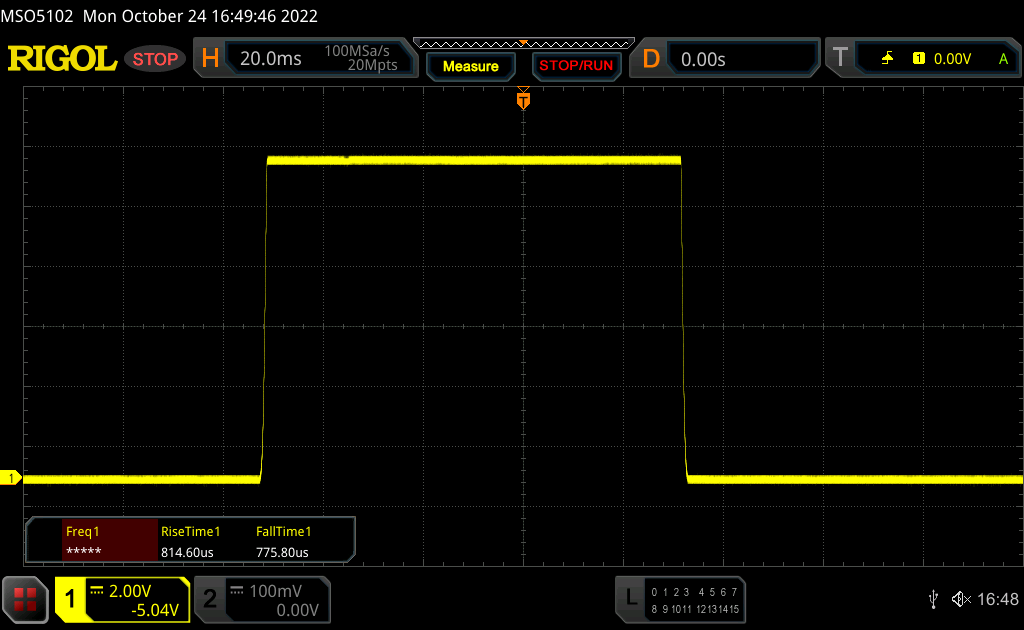 |
| ↘ 0.8 ms fall | ||
| The screen shows very fast response rates in our tests and should be very well suited for fast-paced gaming. In comparison, all tested devices range from 0.1 (minimum) to 240 (maximum) ms. » 10 % of all devices are better. This means that the measured response time is better than the average of all tested devices (19.8 ms). | ||
| ↔ Response Time 50% Grey to 80% Grey | ||
| 1.9 ms ... rise ↗ and fall ↘ combined | ↗ 1 ms rise | 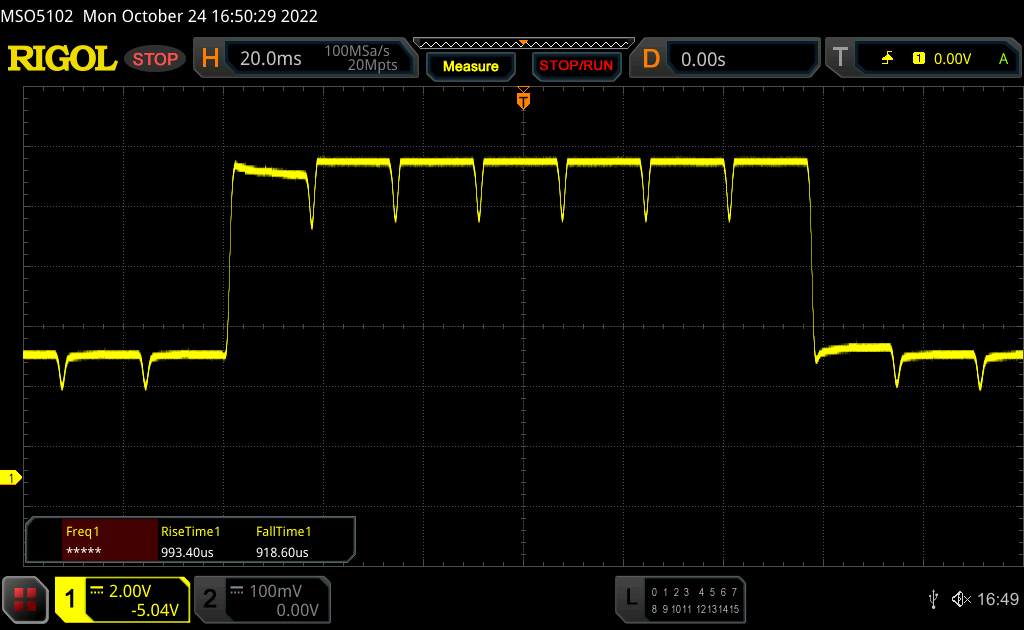 |
| ↘ 0.9 ms fall | ||
| The screen shows very fast response rates in our tests and should be very well suited for fast-paced gaming. In comparison, all tested devices range from 0.165 (minimum) to 636 (maximum) ms. » 9 % of all devices are better. This means that the measured response time is better than the average of all tested devices (31 ms). | ||
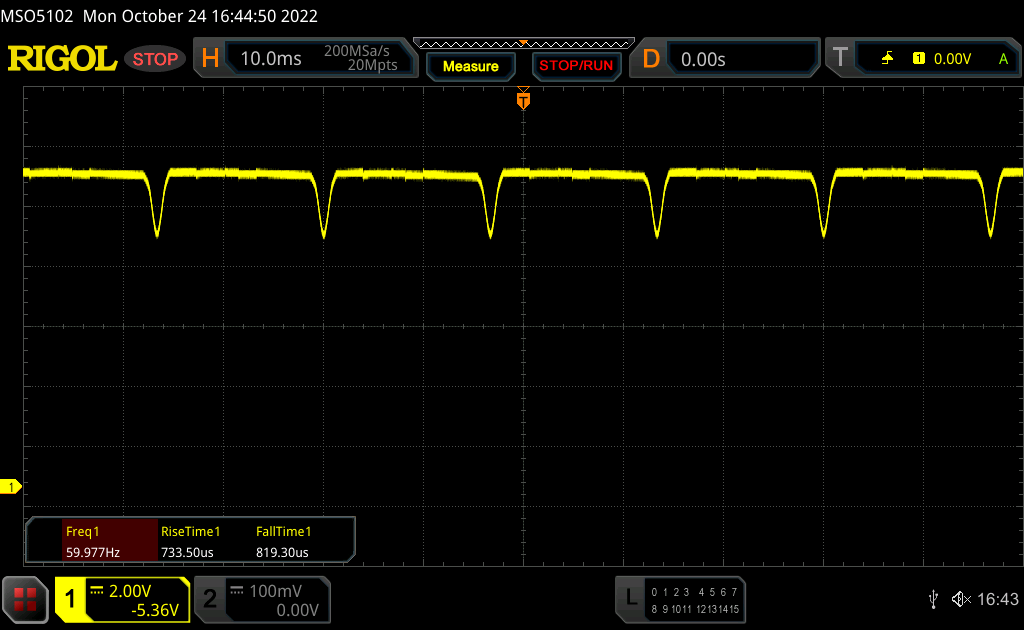
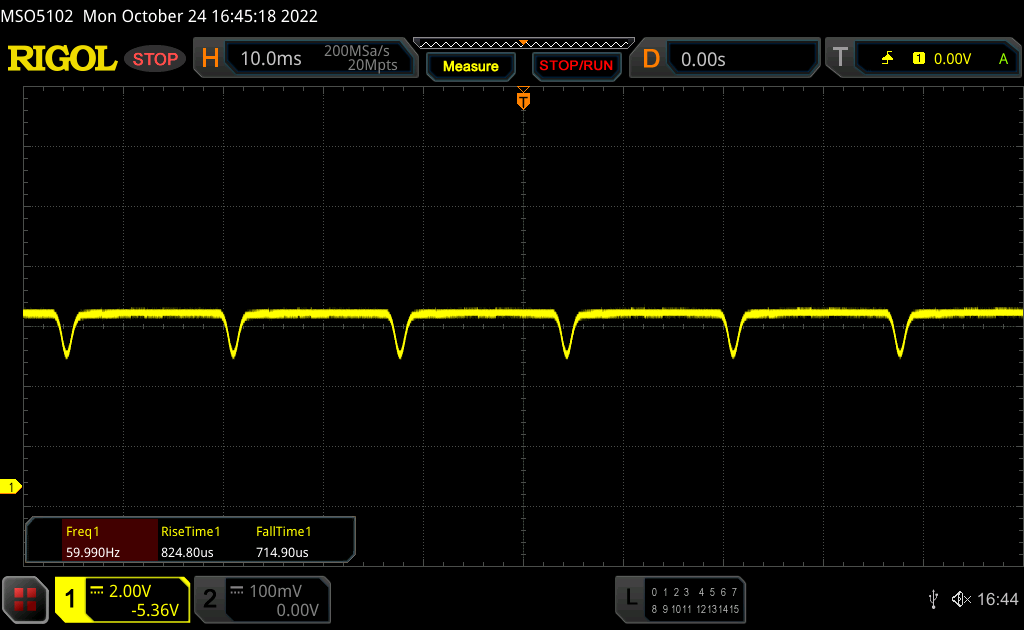
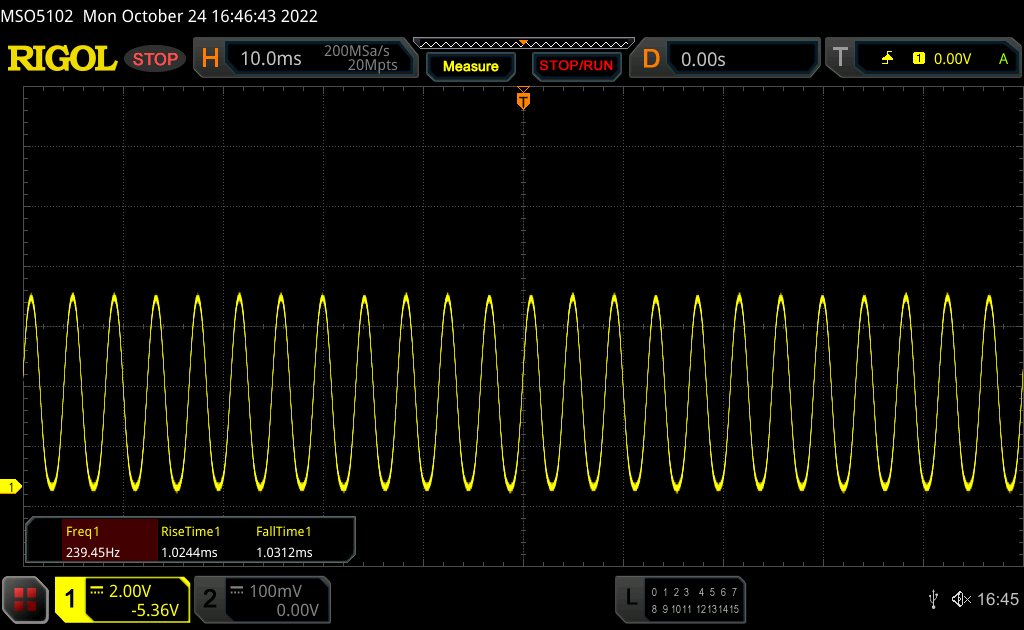
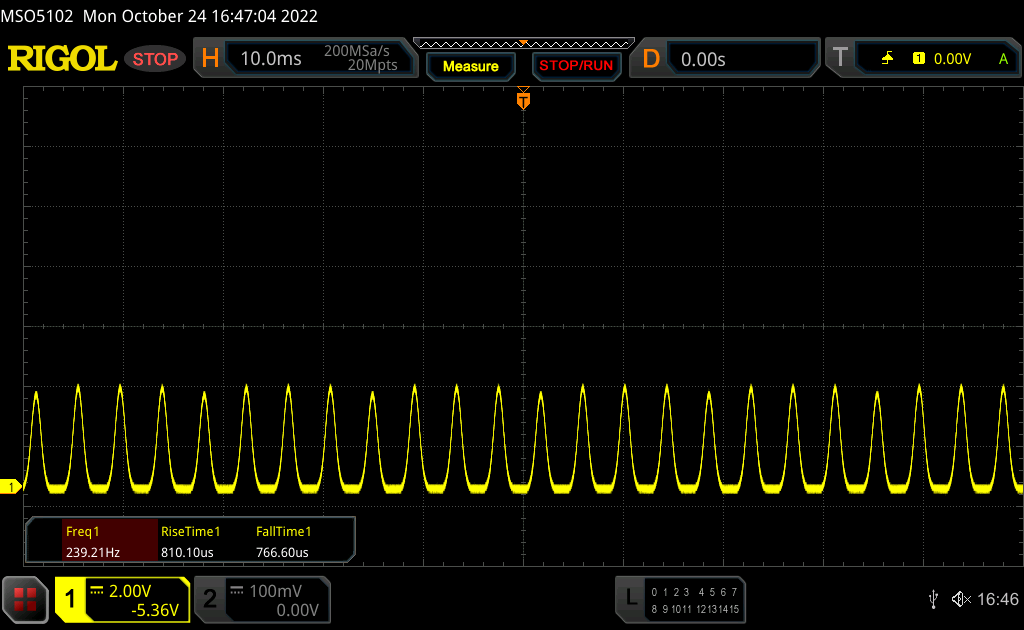
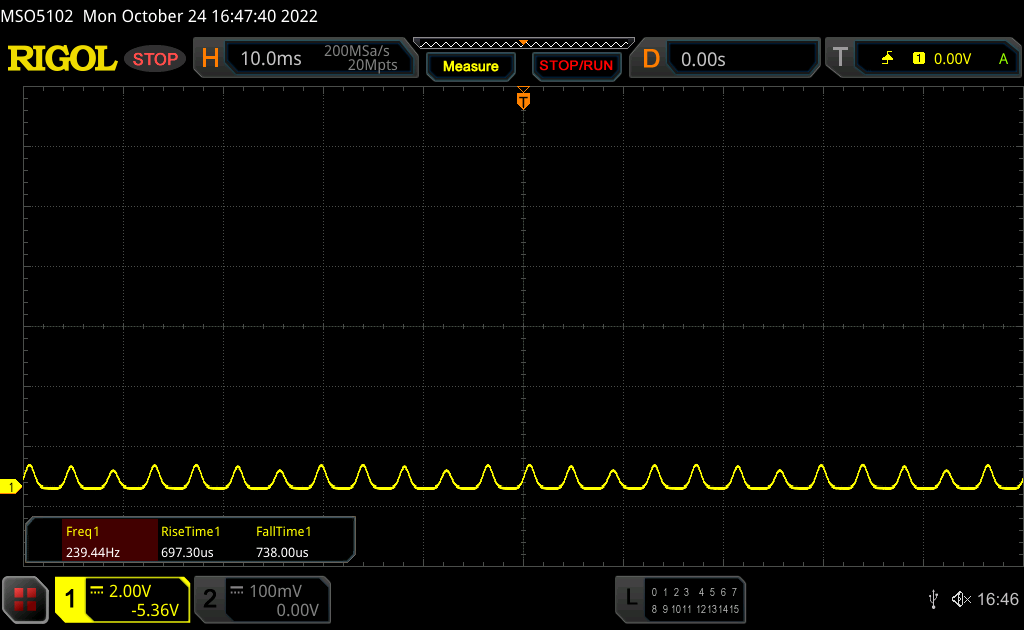
Screen Flickering / PWM (Pulse-Width Modulation)
| Screen flickering / PWM detected | 240 Hz | ≤ 50 % brightness setting | 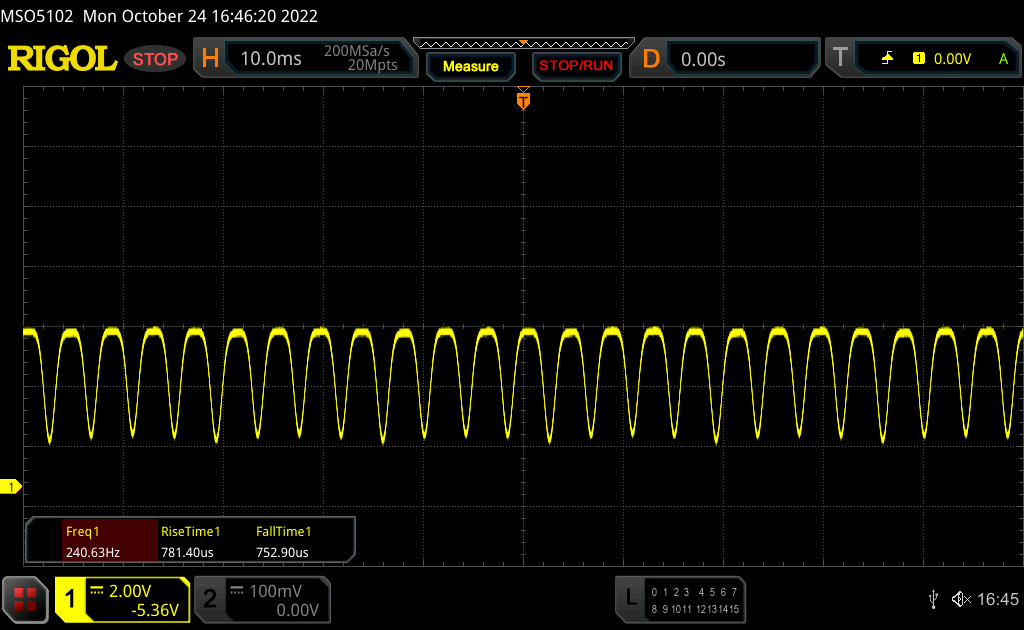 |
| ≤ 86 cd/m² brightness | |||
The display backlight flickers at 240 Hz (worst case, e.g., utilizing PWM) Flickering detected at a brightness setting of 50 % (86 cd/m²) and below. There should be no flickering or PWM above this brightness setting. The frequency of 240 Hz is relatively low, so sensitive users will likely notice flickering and experience eyestrain at the stated brightness setting and below. Flickering occurs at relatively low brightness settings, so extended use at this brightness setting or lower can cause eyestrain. In comparison: 52 % of all tested devices do not use PWM to dim the display. If PWM was detected, an average of 7754 (minimum: 5 - maximum: 343500) Hz was measured. | |||
In the range of 51-90% brightness, DC dimming with a frequency of 60 Hz is deployed, but since the amplitude is very low here, there should be no issue. Starting at a brightness of 50 % (~86 cd/m²) and less we can detect the well-known PWM flickering at 240 Hz. Lenovo does not offer a software solution such as the Asus Zenbook S 13 to enable DC dimming even at lower brightness levels.

Reflections are of course an issue on the reflective display when they occur, but as long as you can avoid them, the screen content can be read properly outdoors thanks to the extremely high contrast ratio even on bright days.
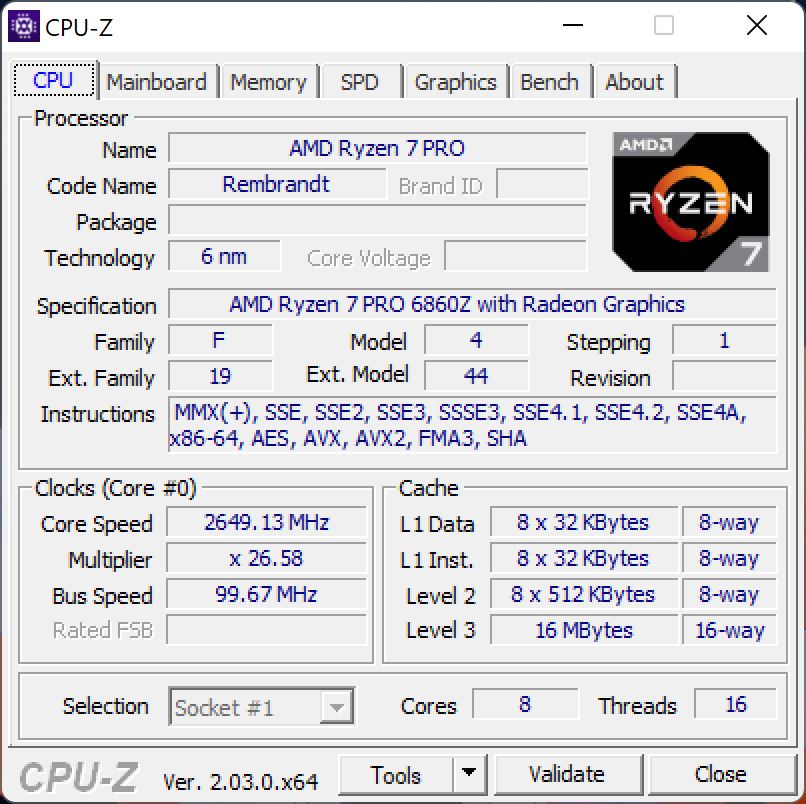
Performance - AMD Ryzen 7 Pro 6860Z

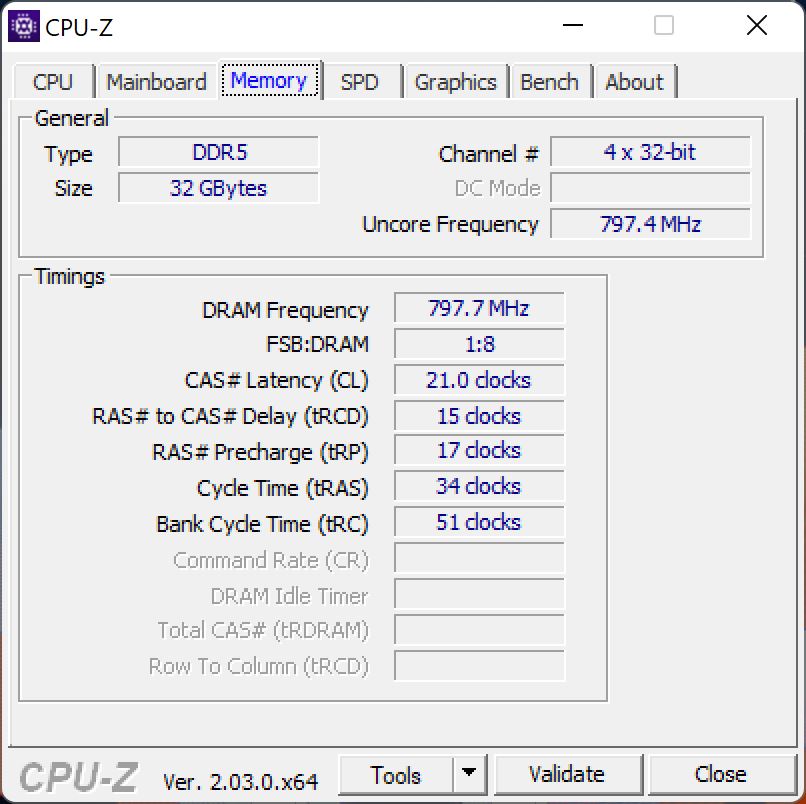
Test conditions
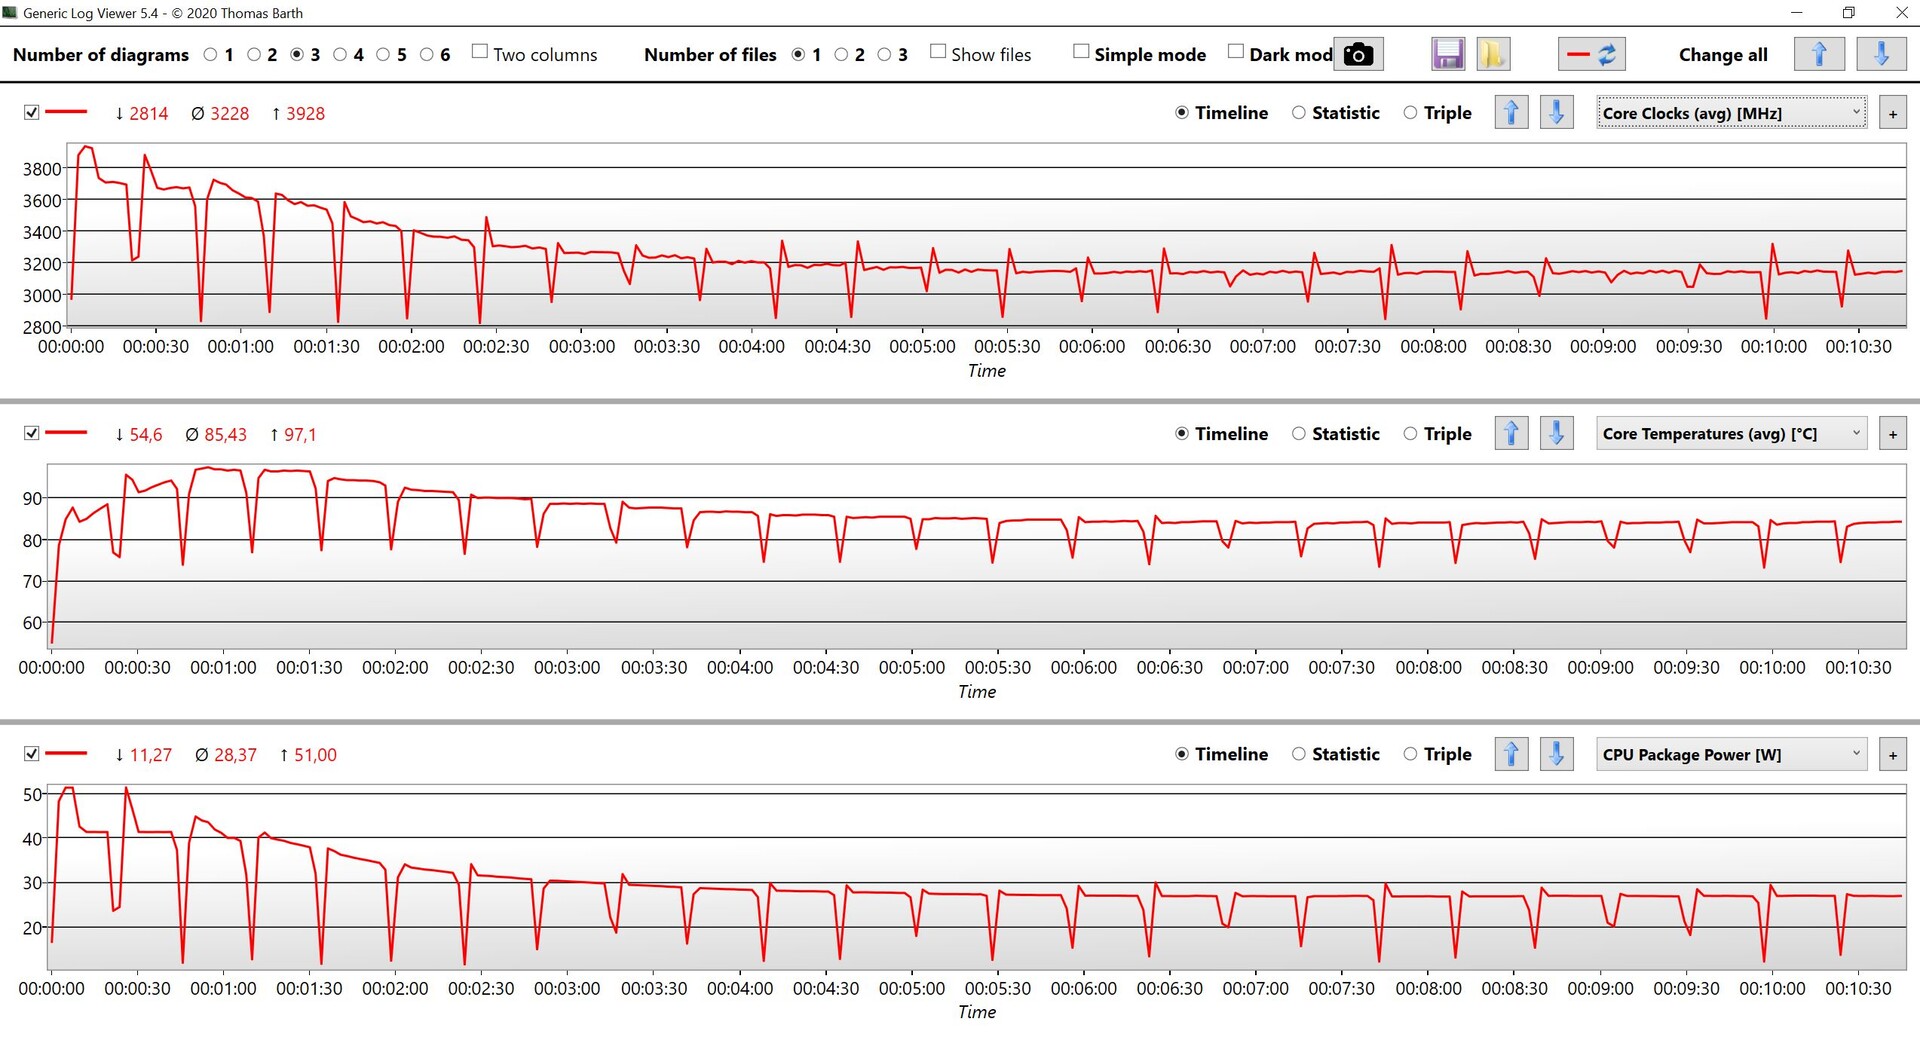
In addition to the normal Windows performance settings, the AMD ThinkPad offers intelligent cooling, which can be deactivated via the key combination Fn+T. In our tests with the Ryzen 7 Pro we got slightly better results when the function was activated. Basically, the processor is allocated 51 watts for a short period and then settles down to 27 watts.
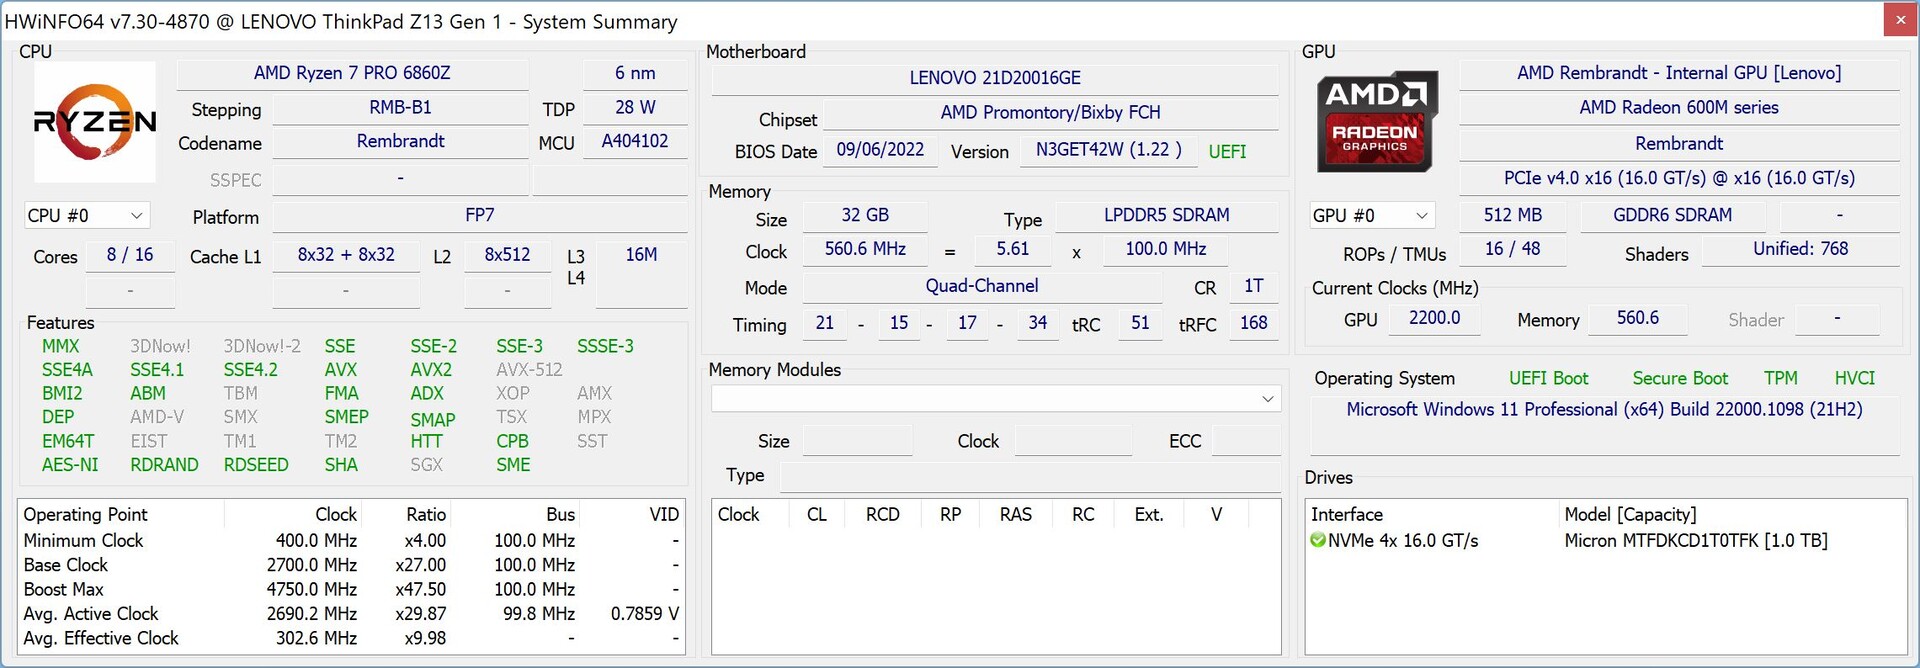
Processor
Lenovo equips the top model of the ThinkPad Z13 with an AMD Ryzen 7 Pro 6860Z, which is exclusive to this model. Very little documentation about adjustments for this chip is available and even following our test we are not much the wiser. In principle, it is a standard Ryzen 7 Pro 6850U (which is also available for the Z13), only the maximum boost clock is set 50 MHz higher at 4.75 GHz. Both Ryzen 7 Pro models can be configured with up to 32GB of RAM.
CPU performance is very good, especially in the first few minutes, as power consumption does not drop immediately. Under permanent load, however, the Ryzen 7 Pro 6860Z is on par with the Ryzen 7 Pro 6850U and also the consumer Ryzen 7 6800U, if they are operated at the same/similar TDP (generally 25 watts). The Ryzen 5 Pro 6650U in the ThinkPad Z13 is 19% slower on average across all our CPU benchmarks.
Cinebench R15 score
On battery power, multi-core performance is about 30% lower, but single-core performance remains stable. More CPU benchmarks are available in our tech section.
Cinebench R23: Multi Core | Single Core
Cinebench R20: CPU (Multi Core) | CPU (Single Core)
Cinebench R15: CPU Multi 64Bit | CPU Single 64Bit
Blender: v2.79 BMW27 CPU
7-Zip 18.03: 7z b 4 | 7z b 4 -mmt1
Geekbench 5.5: Multi-Core | Single-Core
HWBOT x265 Benchmark v2.2: 4k Preset
LibreOffice : 20 Documents To PDF
R Benchmark 2.5: Overall mean
| CPU Performance rating | |
| Average of class Subnotebook | |
| Lenovo ThinkPad Z16 G1 21D5S00T00 | |
| Dell XPS 13 Plus 9320 i7-1280P OLED | |
| Lenovo ThinkPad Z13 G1-21D20016GE | |
| Average AMD Ryzen 7 PRO 6860Z | |
| Lenovo ThinkPad T14 G3-21CF004NGE | |
| Asus Zenbook S 13 OLED | |
| Apple MacBook Air M2 10C GPU -5! | |
| Lenovo ThinkPad Z13 21D2CTO1WW | |
| Cinebench R23 / Multi Core | |
| Average of class Subnotebook (1555 - 21812, n=59, last 2 years) | |
| Lenovo ThinkPad Z16 G1 21D5S00T00 | |
| Dell XPS 13 Plus 9320 i7-1280P OLED | |
| Lenovo ThinkPad Z13 G1-21D20016GE | |
| Average AMD Ryzen 7 PRO 6860Z (n=1) | |
| Asus Zenbook S 13 OLED | |
| Lenovo ThinkPad T14 G3-21CF004NGE | |
| Lenovo ThinkPad Z13 21D2CTO1WW | |
| Apple MacBook Air M2 10C GPU | |
| Cinebench R23 / Single Core | |
| Average of class Subnotebook (358 - 2213, n=60, last 2 years) | |
| Dell XPS 13 Plus 9320 i7-1280P OLED | |
| Apple MacBook Air M2 10C GPU | |
| Lenovo ThinkPad T14 G3-21CF004NGE | |
| Lenovo ThinkPad Z16 G1 21D5S00T00 | |
| Asus Zenbook S 13 OLED | |
| Lenovo ThinkPad Z13 G1-21D20016GE | |
| Average AMD Ryzen 7 PRO 6860Z (n=1) | |
| Lenovo ThinkPad Z13 21D2CTO1WW | |
| Cinebench R20 / CPU (Multi Core) | |
| Lenovo ThinkPad Z16 G1 21D5S00T00 | |
| Average of class Subnotebook (579 - 8541, n=56, last 2 years) | |
| Dell XPS 13 Plus 9320 i7-1280P OLED | |
| Lenovo ThinkPad Z13 G1-21D20016GE | |
| Average AMD Ryzen 7 PRO 6860Z (n=1) | |
| Lenovo ThinkPad T14 G3-21CF004NGE | |
| Asus Zenbook S 13 OLED | |
| Lenovo ThinkPad Z13 21D2CTO1WW | |
| Apple MacBook Air M2 10C GPU | |
| Cinebench R20 / CPU (Single Core) | |
| Average of class Subnotebook (128 - 832, n=56, last 2 years) | |
| Dell XPS 13 Plus 9320 i7-1280P OLED | |
| Lenovo ThinkPad Z13 G1-21D20016GE | |
| Average AMD Ryzen 7 PRO 6860Z (n=1) | |
| Lenovo ThinkPad T14 G3-21CF004NGE | |
| Lenovo ThinkPad Z16 G1 21D5S00T00 | |
| Lenovo ThinkPad Z13 21D2CTO1WW | |
| Asus Zenbook S 13 OLED | |
| Apple MacBook Air M2 10C GPU | |
| Cinebench R15 / CPU Multi 64Bit | |
| Lenovo ThinkPad Z16 G1 21D5S00T00 | |
| Average of class Subnotebook (327 - 3345, n=56, last 2 years) | |
| Lenovo ThinkPad Z13 G1-21D20016GE | |
| Average AMD Ryzen 7 PRO 6860Z (n=1) | |
| Dell XPS 13 Plus 9320 i7-1280P OLED | |
| Lenovo ThinkPad T14 G3-21CF004NGE | |
| Asus Zenbook S 13 OLED | |
| Lenovo ThinkPad Z13 21D2CTO1WW | |
| Apple MacBook Air M2 10C GPU | |
| Cinebench R15 / CPU Single 64Bit | |
| Average of class Subnotebook (72.4 - 322, n=56, last 2 years) | |
| Lenovo ThinkPad Z16 G1 21D5S00T00 | |
| Asus Zenbook S 13 OLED | |
| Lenovo ThinkPad T14 G3-21CF004NGE | |
| Lenovo ThinkPad Z13 21D2CTO1WW | |
| Lenovo ThinkPad Z13 G1-21D20016GE | |
| Average AMD Ryzen 7 PRO 6860Z (n=1) | |
| Dell XPS 13 Plus 9320 i7-1280P OLED | |
| Apple MacBook Air M2 10C GPU | |
| Blender / v2.79 BMW27 CPU | |
| Apple MacBook Air M2 10C GPU | |
| Lenovo ThinkPad Z13 21D2CTO1WW | |
| Average of class Subnotebook (159 - 2271, n=57, last 2 years) | |
| Asus Zenbook S 13 OLED | |
| Lenovo ThinkPad T14 G3-21CF004NGE | |
| Lenovo ThinkPad Z13 G1-21D20016GE | |
| Average AMD Ryzen 7 PRO 6860Z (n=1) | |
| Dell XPS 13 Plus 9320 i7-1280P OLED | |
| Lenovo ThinkPad Z16 G1 21D5S00T00 | |
| 7-Zip 18.03 / 7z b 4 | |
| Lenovo ThinkPad Z16 G1 21D5S00T00 | |
| Lenovo ThinkPad Z13 G1-21D20016GE | |
| Average AMD Ryzen 7 PRO 6860Z (n=1) | |
| Lenovo ThinkPad T14 G3-21CF004NGE | |
| Dell XPS 13 Plus 9320 i7-1280P OLED | |
| Asus Zenbook S 13 OLED | |
| Average of class Subnotebook (11668 - 77867, n=56, last 2 years) | |
| Lenovo ThinkPad Z13 21D2CTO1WW | |
| 7-Zip 18.03 / 7z b 4 -mmt1 | |
| Average of class Subnotebook (2643 - 6699, n=58, last 2 years) | |
| Asus Zenbook S 13 OLED | |
| Lenovo ThinkPad Z16 G1 21D5S00T00 | |
| Lenovo ThinkPad T14 G3-21CF004NGE | |
| Lenovo ThinkPad Z13 G1-21D20016GE | |
| Average AMD Ryzen 7 PRO 6860Z (n=1) | |
| Lenovo ThinkPad Z13 21D2CTO1WW | |
| Dell XPS 13 Plus 9320 i7-1280P OLED | |
| Geekbench 5.5 / Multi-Core | |
| Dell XPS 13 Plus 9320 i7-1280P OLED | |
| Average of class Subnotebook (2557 - 17218, n=48, last 2 years) | |
| Apple MacBook Air M2 10C GPU | |
| Lenovo ThinkPad Z16 G1 21D5S00T00 | |
| Lenovo ThinkPad Z13 G1-21D20016GE | |
| Average AMD Ryzen 7 PRO 6860Z (n=1) | |
| Lenovo ThinkPad T14 G3-21CF004NGE | |
| Asus Zenbook S 13 OLED | |
| Lenovo ThinkPad Z13 21D2CTO1WW | |
| Geekbench 5.5 / Single-Core | |
| Apple MacBook Air M2 10C GPU | |
| Average of class Subnotebook (726 - 2224, n=48, last 2 years) | |
| Dell XPS 13 Plus 9320 i7-1280P OLED | |
| Asus Zenbook S 13 OLED | |
| Lenovo ThinkPad T14 G3-21CF004NGE | |
| Lenovo ThinkPad Z16 G1 21D5S00T00 | |
| Lenovo ThinkPad Z13 21D2CTO1WW | |
| Lenovo ThinkPad Z13 G1-21D20016GE | |
| Average AMD Ryzen 7 PRO 6860Z (n=1) | |
| HWBOT x265 Benchmark v2.2 / 4k Preset | |
| Lenovo ThinkPad Z16 G1 21D5S00T00 | |
| Lenovo ThinkPad Z13 G1-21D20016GE | |
| Average AMD Ryzen 7 PRO 6860Z (n=1) | |
| Dell XPS 13 Plus 9320 i7-1280P OLED | |
| Average of class Subnotebook (0.97 - 25.1, n=56, last 2 years) | |
| Lenovo ThinkPad T14 G3-21CF004NGE | |
| Asus Zenbook S 13 OLED | |
| Lenovo ThinkPad Z13 21D2CTO1WW | |
| LibreOffice / 20 Documents To PDF | |
| Lenovo ThinkPad Z13 21D2CTO1WW | |
| Average of class Subnotebook (39.9 - 220, n=55, last 2 years) | |
| Asus Zenbook S 13 OLED | |
| Lenovo ThinkPad T14 G3-21CF004NGE | |
| Lenovo ThinkPad Z16 G1 21D5S00T00 | |
| Lenovo ThinkPad Z13 G1-21D20016GE | |
| Average AMD Ryzen 7 PRO 6860Z (n=1) | |
| Dell XPS 13 Plus 9320 i7-1280P OLED | |
| R Benchmark 2.5 / Overall mean | |
| Lenovo ThinkPad Z13 21D2CTO1WW | |
| Asus Zenbook S 13 OLED | |
| Lenovo ThinkPad T14 G3-21CF004NGE | |
| Lenovo ThinkPad Z13 G1-21D20016GE | |
| Average AMD Ryzen 7 PRO 6860Z (n=1) | |
| Average of class Subnotebook (0.4024 - 1.456, n=57, last 2 years) | |
| Lenovo ThinkPad Z16 G1 21D5S00T00 | |
| Dell XPS 13 Plus 9320 i7-1280P OLED | |
* ... smaller is better
However, the high power consumption values also have a negative effect on efficiency, and you can clearly see that the Ryzen 7 CPUs run much more efficiently in the range of 25-30 watts. In the following analysis, we look at efficiency in the two CPU benchmarks Cinebench R15 & Cinebench R23 Multi each running on an external monitor. That way we can exclude the varying monitor performance as influence factors. Here you can clearly see that the Ryzen 7 Pro 6860Z falls behind the Asus Zenbook S 13 (Ryzen 7 6800U) and the Lenovo ThinkPad T14 G3 (Ryzen 7 Pro 6850U).
| Power Consumption / Cinebench R23 Multi Power Efficiency - external Monitor | |
| Apple MacBook Air M2 10C GPU | |
| Lenovo ThinkPad T14 G3-21CF004NGE | |
| Lenovo Yoga 7-14ARB G7 | |
| Lenovo Yoga Slim 7 Carbon 13IAP7-82U9005FGE | |
| Lenovo ThinkPad Z13 G1-21D20016GE | |
| Schenker Vision 14 2022 RTX 3050 Ti | |
AIDA64: FP32 Ray-Trace | FPU Julia | CPU SHA3 | CPU Queen | FPU SinJulia | FPU Mandel | CPU AES | CPU ZLib | FP64 Ray-Trace | CPU PhotoWorxx
| Performance rating | |
| Lenovo ThinkPad Z16 G1 21D5S00T00 | |
| Lenovo ThinkPad Z13 G1-21D20016GE | |
| Average AMD Ryzen 7 PRO 6860Z | |
| Asus Zenbook S 13 OLED | |
| Average of class Subnotebook | |
| Lenovo ThinkPad T14 G3-21CF004NGE | |
| Dell XPS 13 Plus 9320 i7-1280P OLED | |
| Lenovo ThinkPad Z13 21D2CTO1WW | |
| AIDA64 / FP32 Ray-Trace | |
| Lenovo ThinkPad Z16 G1 21D5S00T00 | |
| Average of class Subnotebook (1135 - 32888, n=57, last 2 years) | |
| Lenovo ThinkPad Z13 G1-21D20016GE | |
| Average AMD Ryzen 7 PRO 6860Z (n=1) | |
| Lenovo ThinkPad T14 G3-21CF004NGE | |
| Asus Zenbook S 13 OLED | |
| Dell XPS 13 Plus 9320 i7-1280P OLED | |
| Lenovo ThinkPad Z13 21D2CTO1WW | |
| AIDA64 / FPU Julia | |
| Lenovo ThinkPad Z16 G1 21D5S00T00 | |
| Lenovo ThinkPad Z13 G1-21D20016GE | |
| Average AMD Ryzen 7 PRO 6860Z (n=1) | |
| Lenovo ThinkPad T14 G3-21CF004NGE | |
| Asus Zenbook S 13 OLED | |
| Average of class Subnotebook (5218 - 123315, n=57, last 2 years) | |
| Lenovo ThinkPad Z13 21D2CTO1WW | |
| Dell XPS 13 Plus 9320 i7-1280P OLED | |
| AIDA64 / CPU SHA3 | |
| Lenovo ThinkPad Z16 G1 21D5S00T00 | |
| Average of class Subnotebook (444 - 5287, n=57, last 2 years) | |
| Lenovo ThinkPad Z13 G1-21D20016GE | |
| Average AMD Ryzen 7 PRO 6860Z (n=1) | |
| Dell XPS 13 Plus 9320 i7-1280P OLED | |
| Lenovo ThinkPad T14 G3-21CF004NGE | |
| Asus Zenbook S 13 OLED | |
| Lenovo ThinkPad Z13 21D2CTO1WW | |
| AIDA64 / CPU Queen | |
| Lenovo ThinkPad Z16 G1 21D5S00T00 | |
| Lenovo ThinkPad Z13 G1-21D20016GE | |
| Average AMD Ryzen 7 PRO 6860Z (n=1) | |
| Dell XPS 13 Plus 9320 i7-1280P OLED | |
| Lenovo ThinkPad T14 G3-21CF004NGE | |
| Asus Zenbook S 13 OLED | |
| Lenovo ThinkPad Z13 21D2CTO1WW | |
| Average of class Subnotebook (10579 - 95002, n=48, last 2 years) | |
| AIDA64 / FPU SinJulia | |
| Lenovo ThinkPad Z16 G1 21D5S00T00 | |
| Lenovo ThinkPad Z13 G1-21D20016GE | |
| Average AMD Ryzen 7 PRO 6860Z (n=1) | |
| Lenovo ThinkPad T14 G3-21CF004NGE | |
| Asus Zenbook S 13 OLED | |
| Lenovo ThinkPad Z13 21D2CTO1WW | |
| Dell XPS 13 Plus 9320 i7-1280P OLED | |
| Average of class Subnotebook (744 - 18418, n=57, last 2 years) | |
| AIDA64 / FPU Mandel | |
| Lenovo ThinkPad Z16 G1 21D5S00T00 | |
| Lenovo ThinkPad Z13 G1-21D20016GE | |
| Average AMD Ryzen 7 PRO 6860Z (n=1) | |
| Lenovo ThinkPad T14 G3-21CF004NGE | |
| Asus Zenbook S 13 OLED | |
| Lenovo ThinkPad Z13 21D2CTO1WW | |
| Average of class Subnotebook (3341 - 65433, n=57, last 2 years) | |
| Dell XPS 13 Plus 9320 i7-1280P OLED | |
| AIDA64 / CPU AES | |
| Asus Zenbook S 13 OLED | |
| Lenovo ThinkPad Z16 G1 21D5S00T00 | |
| Lenovo ThinkPad Z13 G1-21D20016GE | |
| Average AMD Ryzen 7 PRO 6860Z (n=1) | |
| Dell XPS 13 Plus 9320 i7-1280P OLED | |
| Average of class Subnotebook (638 - 96917, n=57, last 2 years) | |
| Lenovo ThinkPad T14 G3-21CF004NGE | |
| Lenovo ThinkPad Z13 21D2CTO1WW | |
| AIDA64 / CPU ZLib | |
| Lenovo ThinkPad Z16 G1 21D5S00T00 | |
| Average of class Subnotebook (164.9 - 1379, n=57, last 2 years) | |
| Dell XPS 13 Plus 9320 i7-1280P OLED | |
| Lenovo ThinkPad T14 G3-21CF004NGE | |
| Lenovo ThinkPad Z13 G1-21D20016GE | |
| Average AMD Ryzen 7 PRO 6860Z (n=1) | |
| Asus Zenbook S 13 OLED | |
| Lenovo ThinkPad Z13 21D2CTO1WW | |
| AIDA64 / FP64 Ray-Trace | |
| Lenovo ThinkPad Z16 G1 21D5S00T00 | |
| Average of class Subnotebook (610 - 17495, n=57, last 2 years) | |
| Lenovo ThinkPad Z13 G1-21D20016GE | |
| Average AMD Ryzen 7 PRO 6860Z (n=1) | |
| Lenovo ThinkPad T14 G3-21CF004NGE | |
| Dell XPS 13 Plus 9320 i7-1280P OLED | |
| Asus Zenbook S 13 OLED | |
| Lenovo ThinkPad Z13 21D2CTO1WW | |
| AIDA64 / CPU PhotoWorxx | |
| Average of class Subnotebook (6569 - 85600, n=57, last 2 years) | |
| Dell XPS 13 Plus 9320 i7-1280P OLED | |
| Lenovo ThinkPad Z16 G1 21D5S00T00 | |
| Lenovo ThinkPad Z13 21D2CTO1WW | |
| Lenovo ThinkPad T14 G3-21CF004NGE | |
| Asus Zenbook S 13 OLED | |
| Lenovo ThinkPad Z13 G1-21D20016GE | |
| Average AMD Ryzen 7 PRO 6860Z (n=1) | |
System Performance
The ThinkPad Z13 is a very responsive device and the synthetic benchmark results are also very good. We could not detect any issues while running the test.
CrossMark: Overall | Productivity | Creativity | Responsiveness
| PCMark 10 / Score | |
| Average of class Subnotebook (4920 - 9939, n=45, last 2 years) | |
| Lenovo ThinkPad Z16 G1 21D5S00T00 | |
| Asus Zenbook S 13 OLED | |
| Lenovo ThinkPad Z13 G1-21D20016GE | |
| Average AMD Ryzen 7 PRO 6860Z, AMD Radeon 680M (n=1) | |
| Lenovo ThinkPad T14 G3-21CF004NGE | |
| Dell XPS 13 Plus 9320 i7-1280P OLED | |
| Lenovo ThinkPad Z13 21D2CTO1WW | |
| PCMark 10 / Essentials | |
| Asus Zenbook S 13 OLED | |
| Dell XPS 13 Plus 9320 i7-1280P OLED | |
| Average of class Subnotebook (8552 - 11646, n=45, last 2 years) | |
| Lenovo ThinkPad Z13 G1-21D20016GE | |
| Average AMD Ryzen 7 PRO 6860Z, AMD Radeon 680M (n=1) | |
| Lenovo ThinkPad Z16 G1 21D5S00T00 | |
| Lenovo ThinkPad T14 G3-21CF004NGE | |
| Lenovo ThinkPad Z13 21D2CTO1WW | |
| PCMark 10 / Productivity | |
| Average of class Subnotebook (5435 - 16606, n=45, last 2 years) | |
| Asus Zenbook S 13 OLED | |
| Lenovo ThinkPad T14 G3-21CF004NGE | |
| Lenovo ThinkPad Z16 G1 21D5S00T00 | |
| Lenovo ThinkPad Z13 G1-21D20016GE | |
| Average AMD Ryzen 7 PRO 6860Z, AMD Radeon 680M (n=1) | |
| Lenovo ThinkPad Z13 21D2CTO1WW | |
| Dell XPS 13 Plus 9320 i7-1280P OLED | |
| PCMark 10 / Digital Content Creation | |
| Average of class Subnotebook (5722 - 13779, n=45, last 2 years) | |
| Lenovo ThinkPad Z16 G1 21D5S00T00 | |
| Lenovo ThinkPad Z13 G1-21D20016GE | |
| Average AMD Ryzen 7 PRO 6860Z, AMD Radeon 680M (n=1) | |
| Lenovo ThinkPad T14 G3-21CF004NGE | |
| Asus Zenbook S 13 OLED | |
| Dell XPS 13 Plus 9320 i7-1280P OLED | |
| Lenovo ThinkPad Z13 21D2CTO1WW | |
| CrossMark / Overall | |
| Dell XPS 13 Plus 9320 i7-1280P OLED | |
| Average of class Subnotebook (365 - 2356, n=59, last 2 years) | |
| Lenovo ThinkPad Z13 G1-21D20016GE | |
| Average AMD Ryzen 7 PRO 6860Z, AMD Radeon 680M (n=1) | |
| Apple MacBook Air M2 10C GPU | |
| Asus Zenbook S 13 OLED | |
| Lenovo ThinkPad Z16 G1 21D5S00T00 | |
| Lenovo ThinkPad Z13 21D2CTO1WW | |
| Lenovo ThinkPad T14 G3-21CF004NGE | |
| CrossMark / Productivity | |
| Dell XPS 13 Plus 9320 i7-1280P OLED | |
| Average of class Subnotebook (364 - 2277, n=59, last 2 years) | |
| Lenovo ThinkPad Z13 G1-21D20016GE | |
| Average AMD Ryzen 7 PRO 6860Z, AMD Radeon 680M (n=1) | |
| Asus Zenbook S 13 OLED | |
| Lenovo ThinkPad Z16 G1 21D5S00T00 | |
| Lenovo ThinkPad Z13 21D2CTO1WW | |
| Lenovo ThinkPad T14 G3-21CF004NGE | |
| Apple MacBook Air M2 10C GPU | |
| CrossMark / Creativity | |
| Dell XPS 13 Plus 9320 i7-1280P OLED | |
| Average of class Subnotebook (372 - 2743, n=59, last 2 years) | |
| Apple MacBook Air M2 10C GPU | |
| Lenovo ThinkPad Z16 G1 21D5S00T00 | |
| Lenovo ThinkPad Z13 G1-21D20016GE | |
| Average AMD Ryzen 7 PRO 6860Z, AMD Radeon 680M (n=1) | |
| Asus Zenbook S 13 OLED | |
| Lenovo ThinkPad Z13 21D2CTO1WW | |
| Lenovo ThinkPad T14 G3-21CF004NGE | |
| CrossMark / Responsiveness | |
| Dell XPS 13 Plus 9320 i7-1280P OLED | |
| Average of class Subnotebook (312 - 1854, n=59, last 2 years) | |
| Asus Zenbook S 13 OLED | |
| Lenovo ThinkPad Z13 G1-21D20016GE | |
| Average AMD Ryzen 7 PRO 6860Z, AMD Radeon 680M (n=1) | |
| Lenovo ThinkPad Z16 G1 21D5S00T00 | |
| Lenovo ThinkPad T14 G3-21CF004NGE | |
| Lenovo ThinkPad Z13 21D2CTO1WW | |
| Apple MacBook Air M2 10C GPU | |
| PCMark 10 Score | 6240 points | |
Help | ||
| AIDA64 / Memory Copy | |
| Average of class Subnotebook (14554 - 131023, n=57, last 2 years) | |
| Dell XPS 13 Plus 9320 i7-1280P OLED | |
| Lenovo ThinkPad T14 G3-21CF004NGE | |
| Lenovo ThinkPad Z13 21D2CTO1WW | |
| Lenovo ThinkPad Z16 G1 21D5S00T00 | |
| Lenovo ThinkPad Z13 G1-21D20016GE | |
| Average AMD Ryzen 7 PRO 6860Z (n=1) | |
| Asus Zenbook S 13 OLED | |
| AIDA64 / Memory Read | |
| Average of class Subnotebook (15948 - 127174, n=57, last 2 years) | |
| Dell XPS 13 Plus 9320 i7-1280P OLED | |
| Lenovo ThinkPad Z16 G1 21D5S00T00 | |
| Lenovo ThinkPad T14 G3-21CF004NGE | |
| Lenovo ThinkPad Z13 21D2CTO1WW | |
| Asus Zenbook S 13 OLED | |
| Lenovo ThinkPad Z13 G1-21D20016GE | |
| Average AMD Ryzen 7 PRO 6860Z (n=1) | |
| AIDA64 / Memory Write | |
| Average of class Subnotebook (15709 - 135141, n=57, last 2 years) | |
| Dell XPS 13 Plus 9320 i7-1280P OLED | |
| Lenovo ThinkPad Z16 G1 21D5S00T00 | |
| Lenovo ThinkPad Z13 21D2CTO1WW | |
| Lenovo ThinkPad Z13 G1-21D20016GE | |
| Average AMD Ryzen 7 PRO 6860Z (n=1) | |
| Lenovo ThinkPad T14 G3-21CF004NGE | |
| Asus Zenbook S 13 OLED | |
| AIDA64 / Memory Latency | |
| Lenovo ThinkPad Z16 G1 21D5S00T00 | |
| Lenovo ThinkPad Z13 21D2CTO1WW | |
| Lenovo ThinkPad Z13 G1-21D20016GE | |
| Average AMD Ryzen 7 PRO 6860Z (n=1) | |
| Asus Zenbook S 13 OLED | |
| Lenovo ThinkPad T14 G3-21CF004NGE | |
| Dell XPS 13 Plus 9320 i7-1280P OLED | |
| Average of class Subnotebook (6.1 - 159.9, n=55, last 2 years) | |
* ... smaller is better
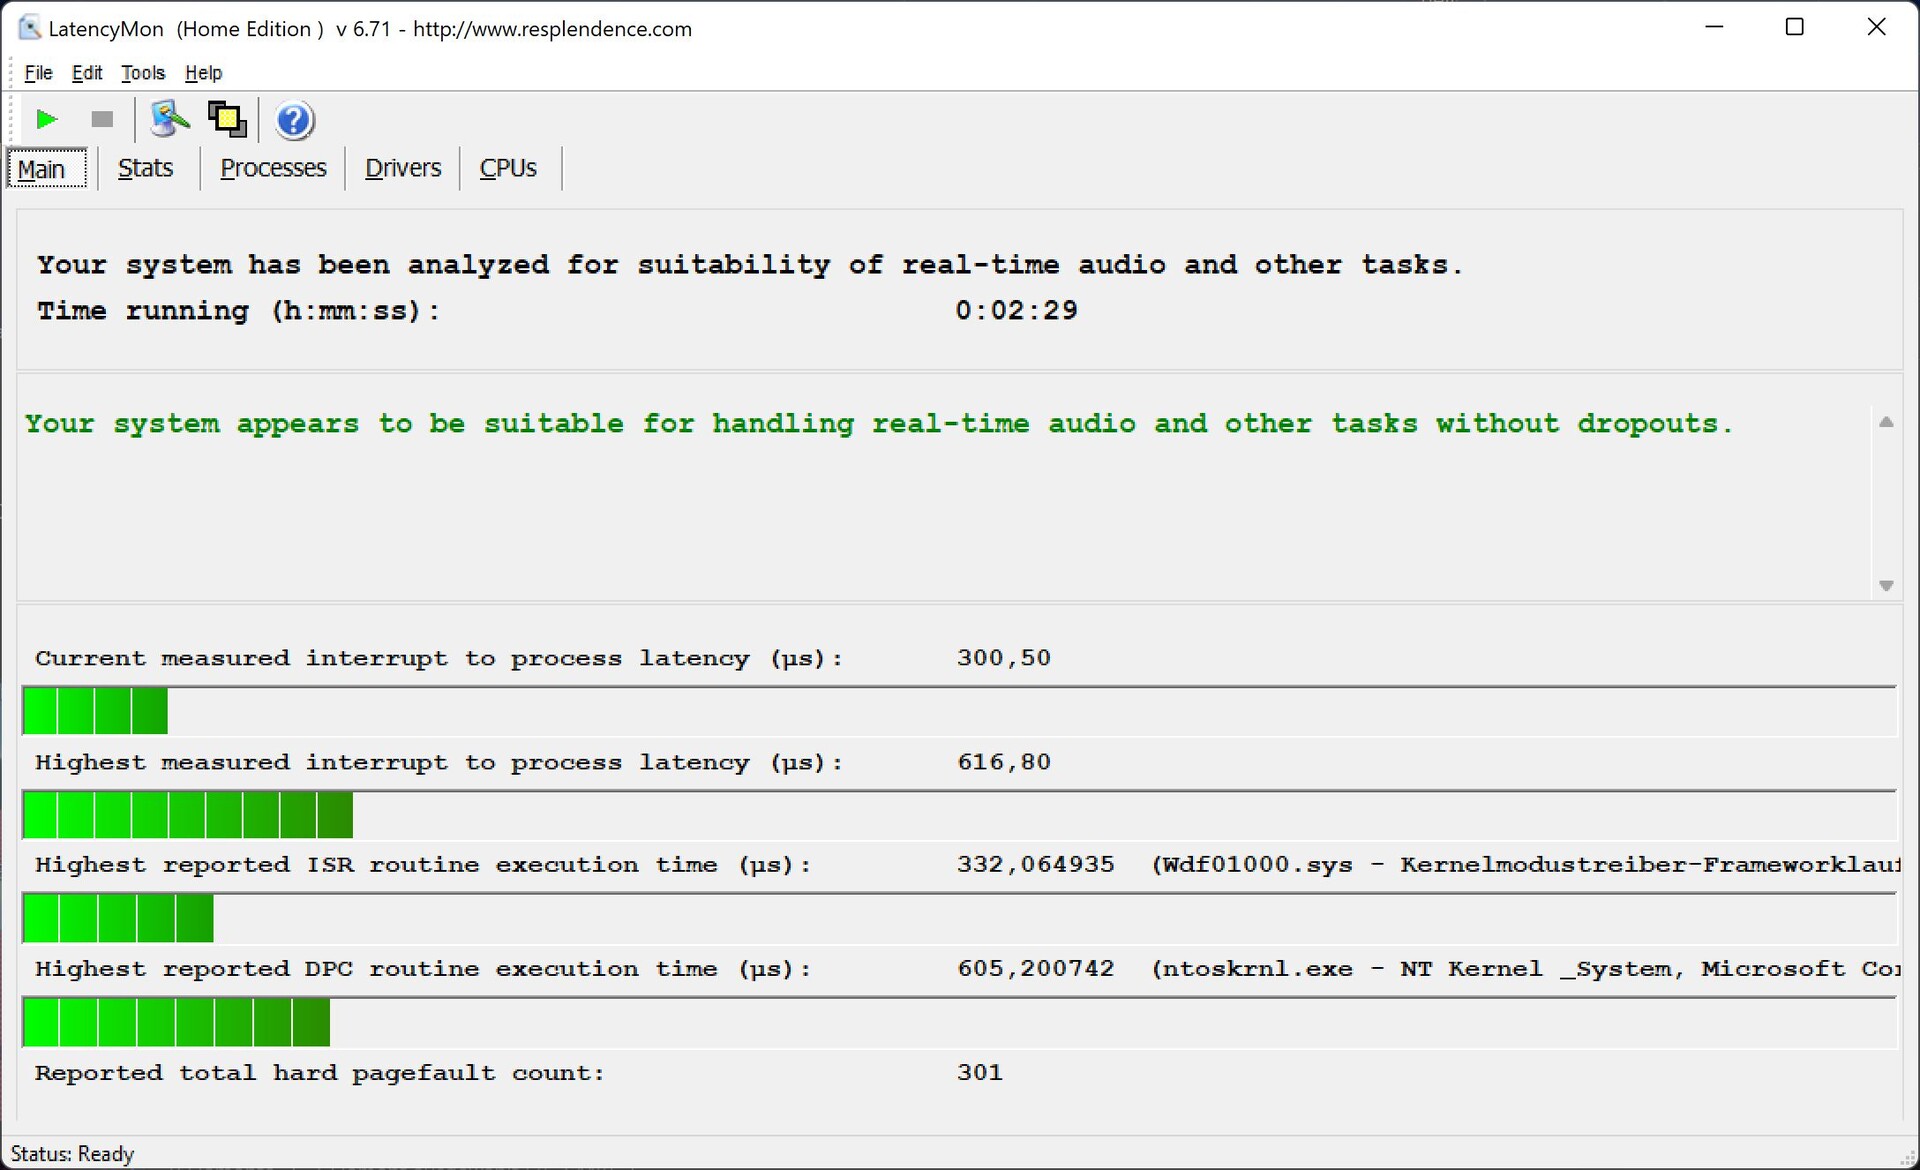
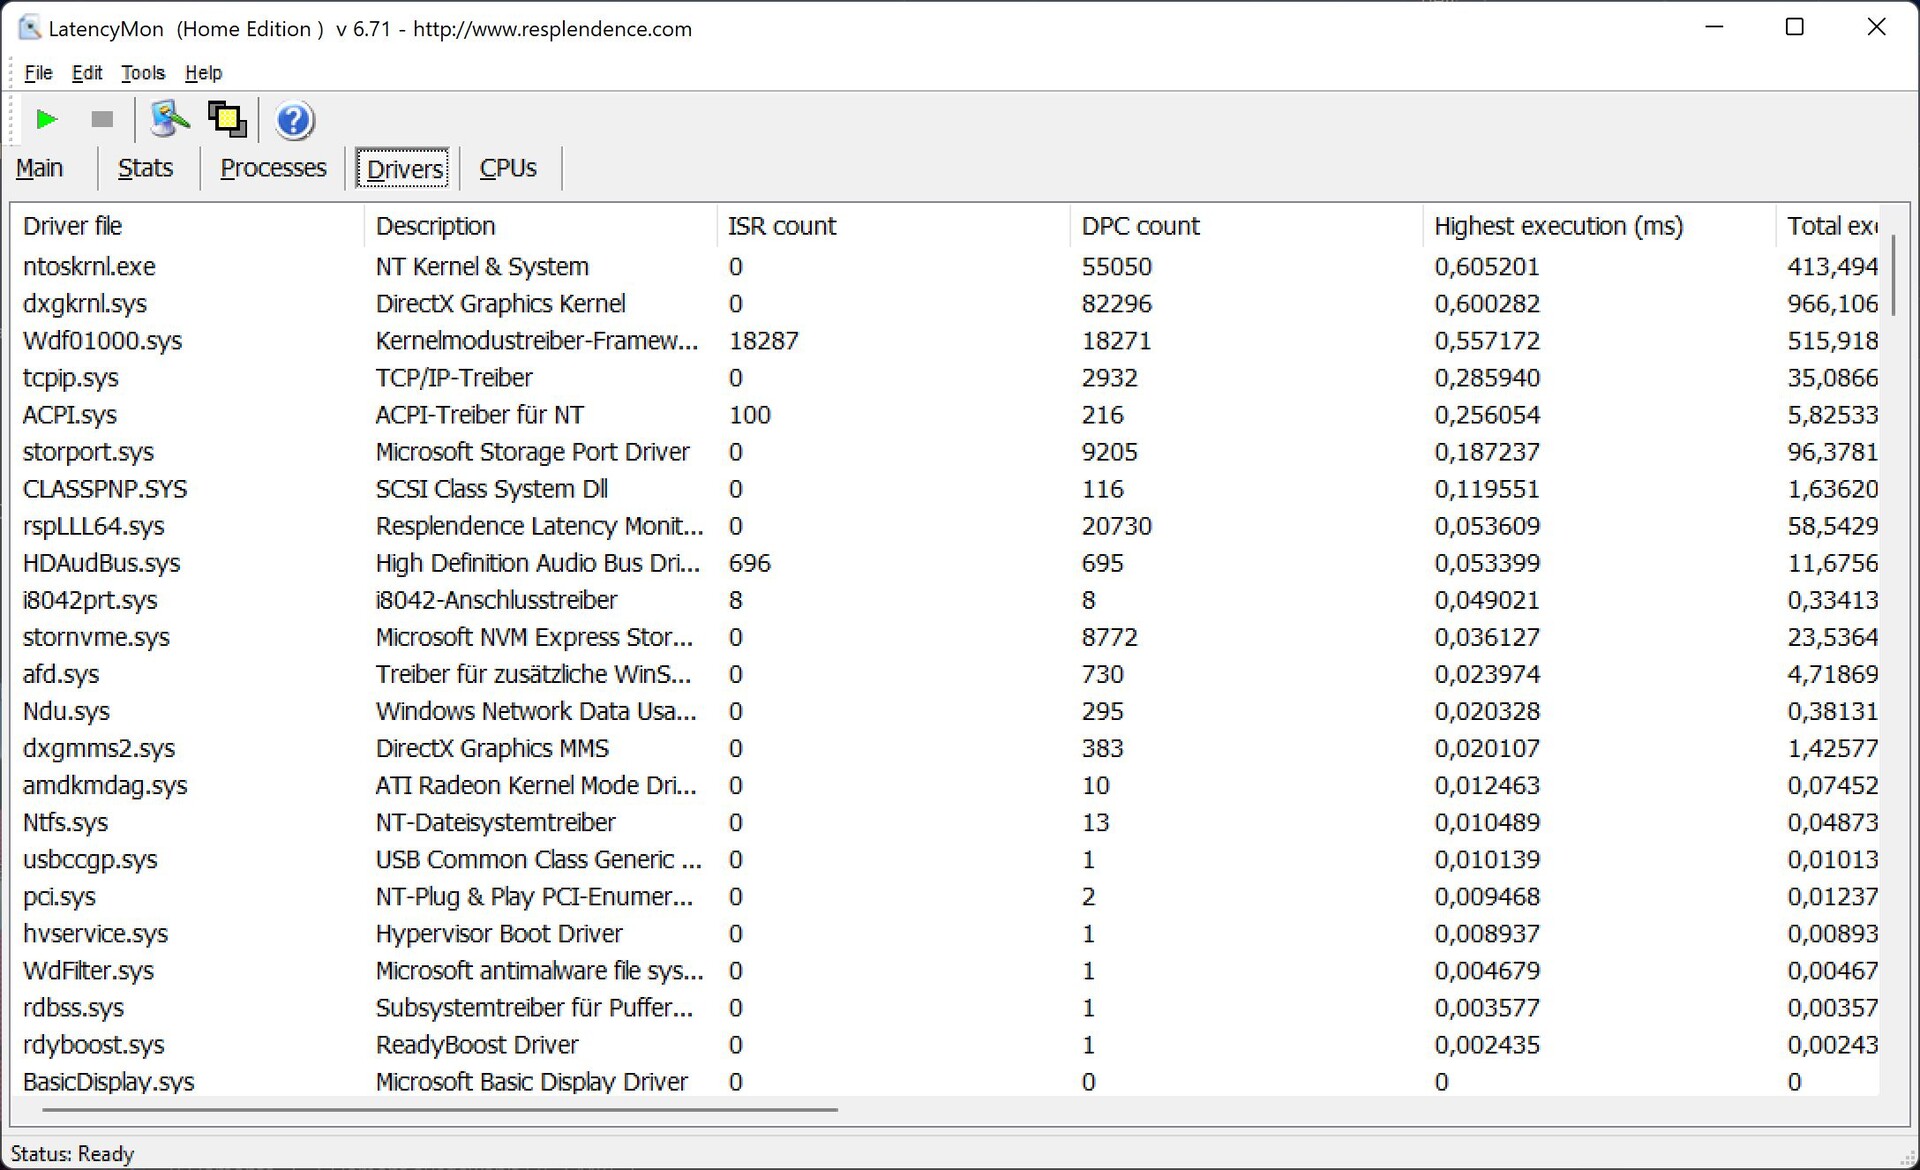
DPC Latency
In our standardized latency test (web browsing, 4K YouTube playback, CPU load), the test device performed very well on the current BIOS version and showed no evidence of technical performance deficiency.
| DPC Latencies / LatencyMon - interrupt to process latency (max), Web, Youtube, Prime95 | |
| Lenovo ThinkPad Z13 21D2CTO1WW | |
| Lenovo ThinkPad T14 G3-21CF004NGE | |
| Lenovo ThinkPad Z16 G1 21D5S00T00 | |
| Lenovo ThinkPad Z13 G1-21D20016GE | |
| Asus Zenbook S 13 OLED | |
| Dell XPS 13 Plus 9320 i7-1280P OLED | |
* ... smaller is better
Storage Devices
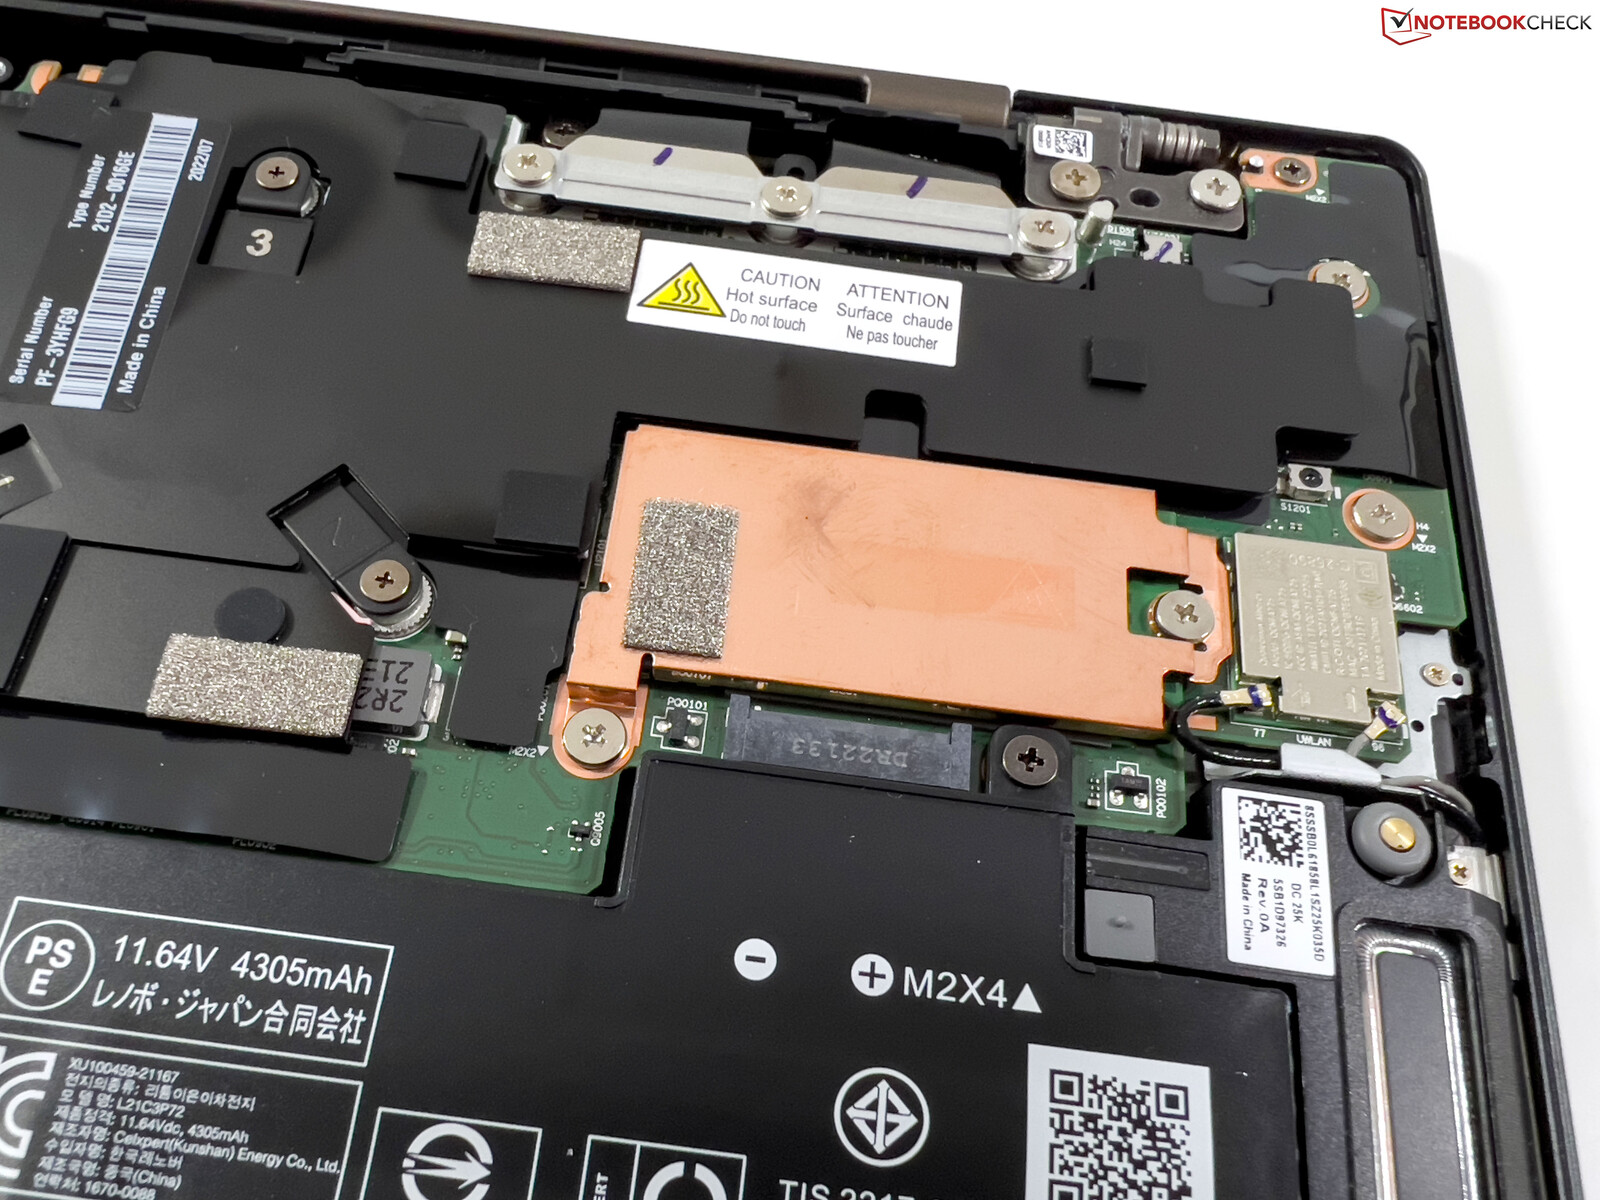
The ThinkPad Z13 only has space for a compact M.2-2242 SSD, which is at least connected via a current PCIe 4.0 interface. The Micron 2450, allows for the install of a PCIe 4.0 SSD with maximum transfer rates of around 3.3 GB/s. This may waste some potential capacity, but at least performance remains constant even under permanent load. Of the 1 TB, around 900 GB are still freely available to the user on first use of the laptop. More SSD benchmarks can be found here.

* ... smaller is better
Disk Throttling: DiskSpd Read Loop, Queue Depth 8
Graphics Card
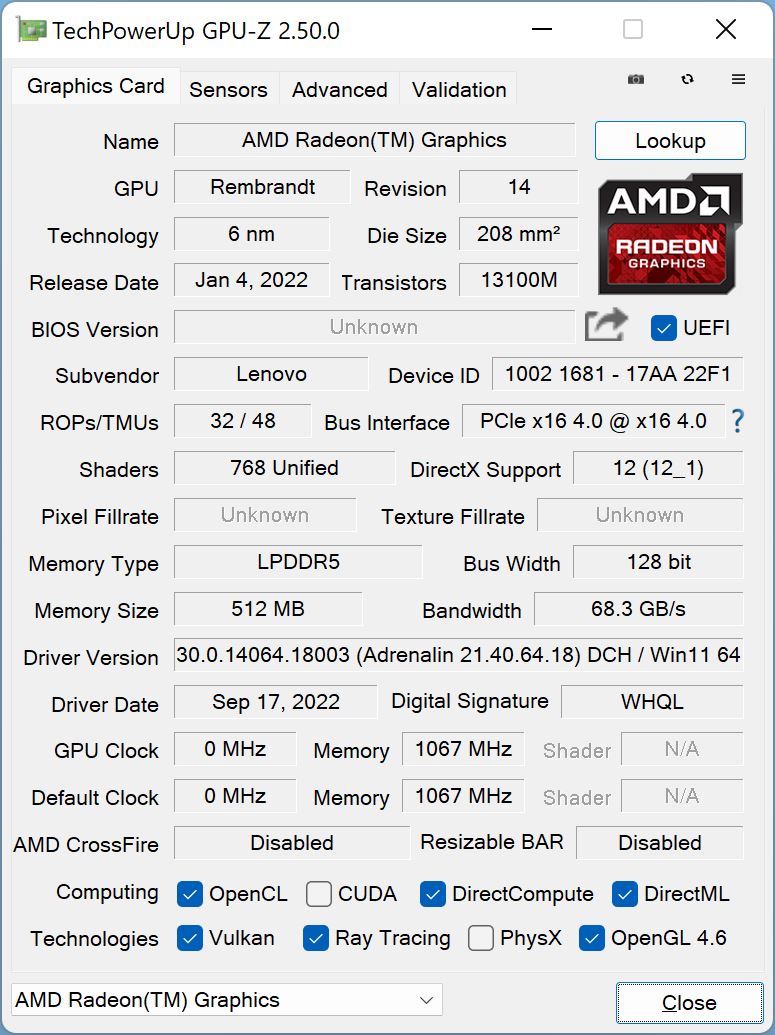
The Ryzen 7 Pro 6860Z uses the well-known integrated GPU Radeon 680M with a maximum clock speed of 2.2 GHz as with the conventional Ryzen 7 CPUs. In the synthetic benchmarks, the results are also very good initially, but performance does not remain stable. The 3DMark stress test (Time Spy) fails with 82.7% and when experimenting (which would be quite possible with the Radeon 680M) with simultaneous CPU load, the chip was throttled even more (to a total of about 19 watts). The Asus Zenbook S 13 or Lenovo’s own ThinkPad T14 G3 perform significantly better under simultaneous load.
The Radeon 660M on the entry-level ThinkPad Z13 is about 35% slower and is also affected by throttling. Battery power does not reduce graphics performance. More GPU benchmarks are available here.
| 3DMark 11 Performance | 10387 points | |
| 3DMark Cloud Gate Standard Score | 31075 points | |
| 3DMark Fire Strike Score | 6287 points | |
| 3DMark Time Spy Score | 2416 points | |
Help | ||
* ... smaller is better
Witcher 3 FPS-Diagramm
| low | med. | high | ultra | QHD | |
|---|---|---|---|---|---|
| GTA V (2015) | 136.9 | 122.7 | 46.8 | 20.9 | |
| The Witcher 3 (2015) | 131 | 78 | 33 | 18.3 | |
| Dota 2 Reborn (2015) | 107.7 | 91.8 | 72.2 | 60.6 | |
| Final Fantasy XV Benchmark (2018) | 59.3 | 30.5 | 21.7 | ||
| X-Plane 11.11 (2018) | 51.8 | 40.6 | 34.3 | ||
| Far Cry 5 (2018) | 55 | 34 | 30 | 28 | |
| Strange Brigade (2018) | 133.5 | 55.3 | 44.8 | 38.9 | |
| F1 2021 (2021) | 155.3 | 75.1 | 54.9 | 23 | 15.8 |
| F1 22 (2022) | 71.4 | 61.1 | 44.5 | 9.35 |
Emissions and Power Consumption
System Noise
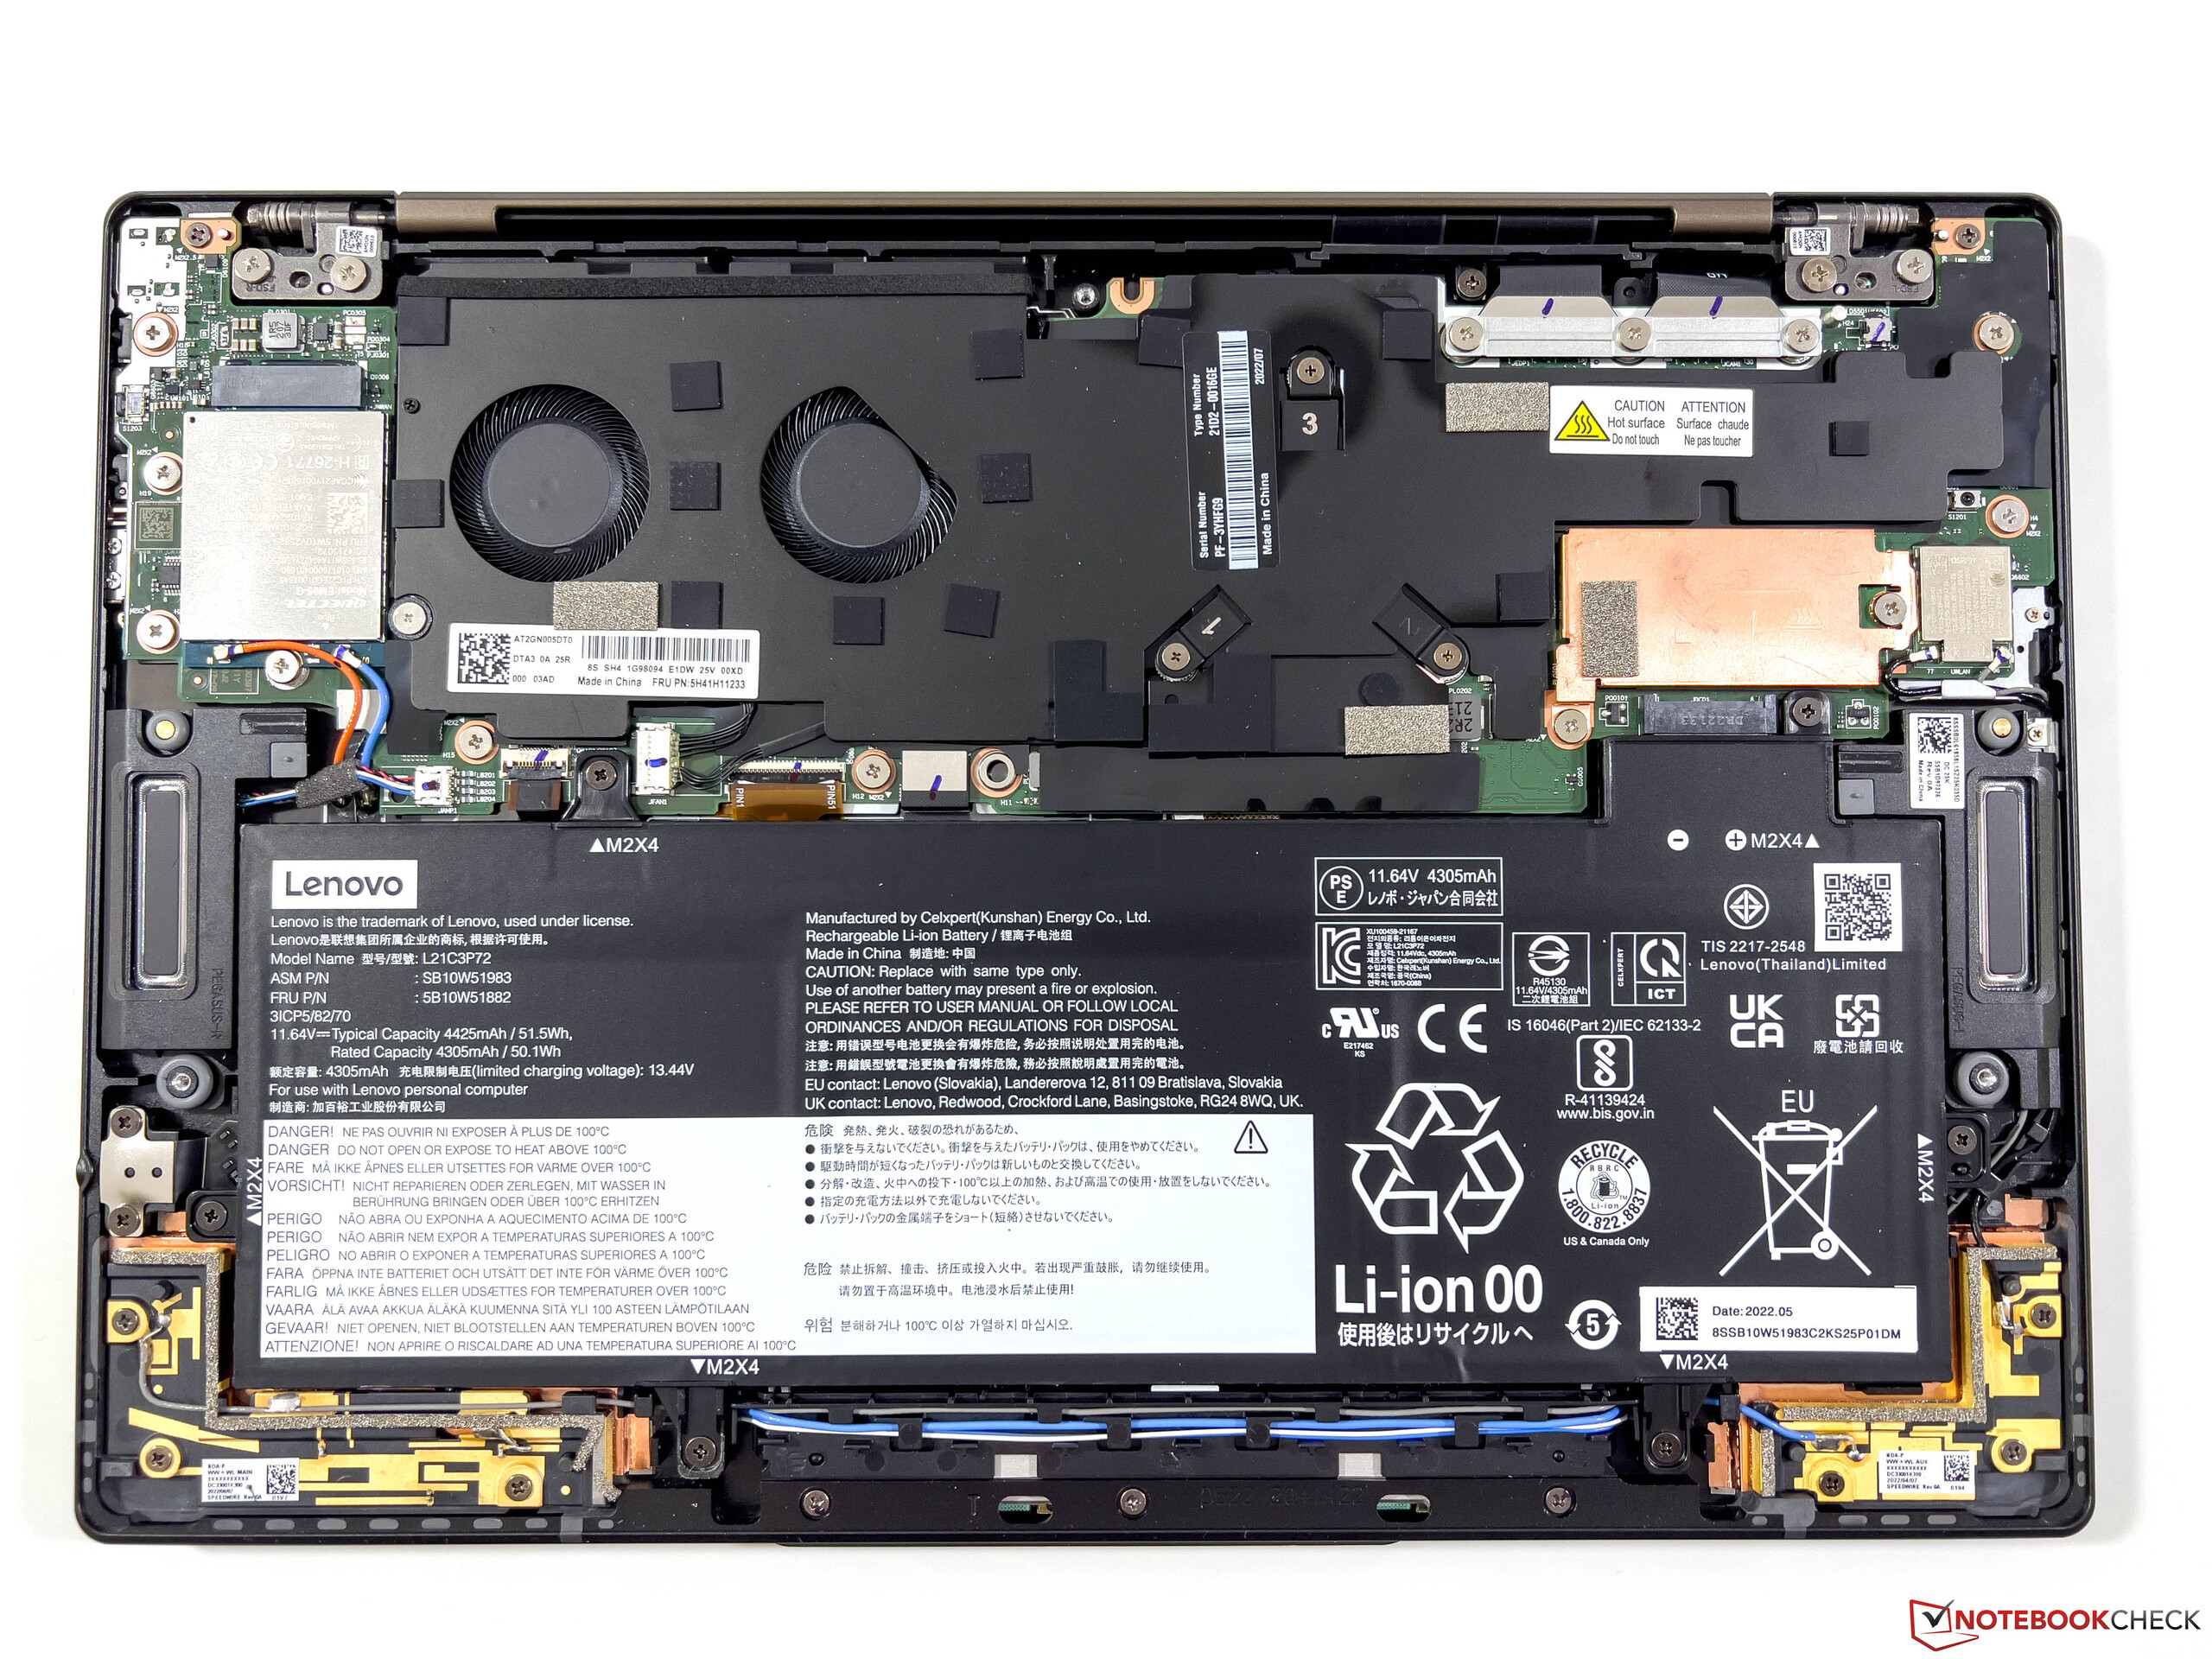
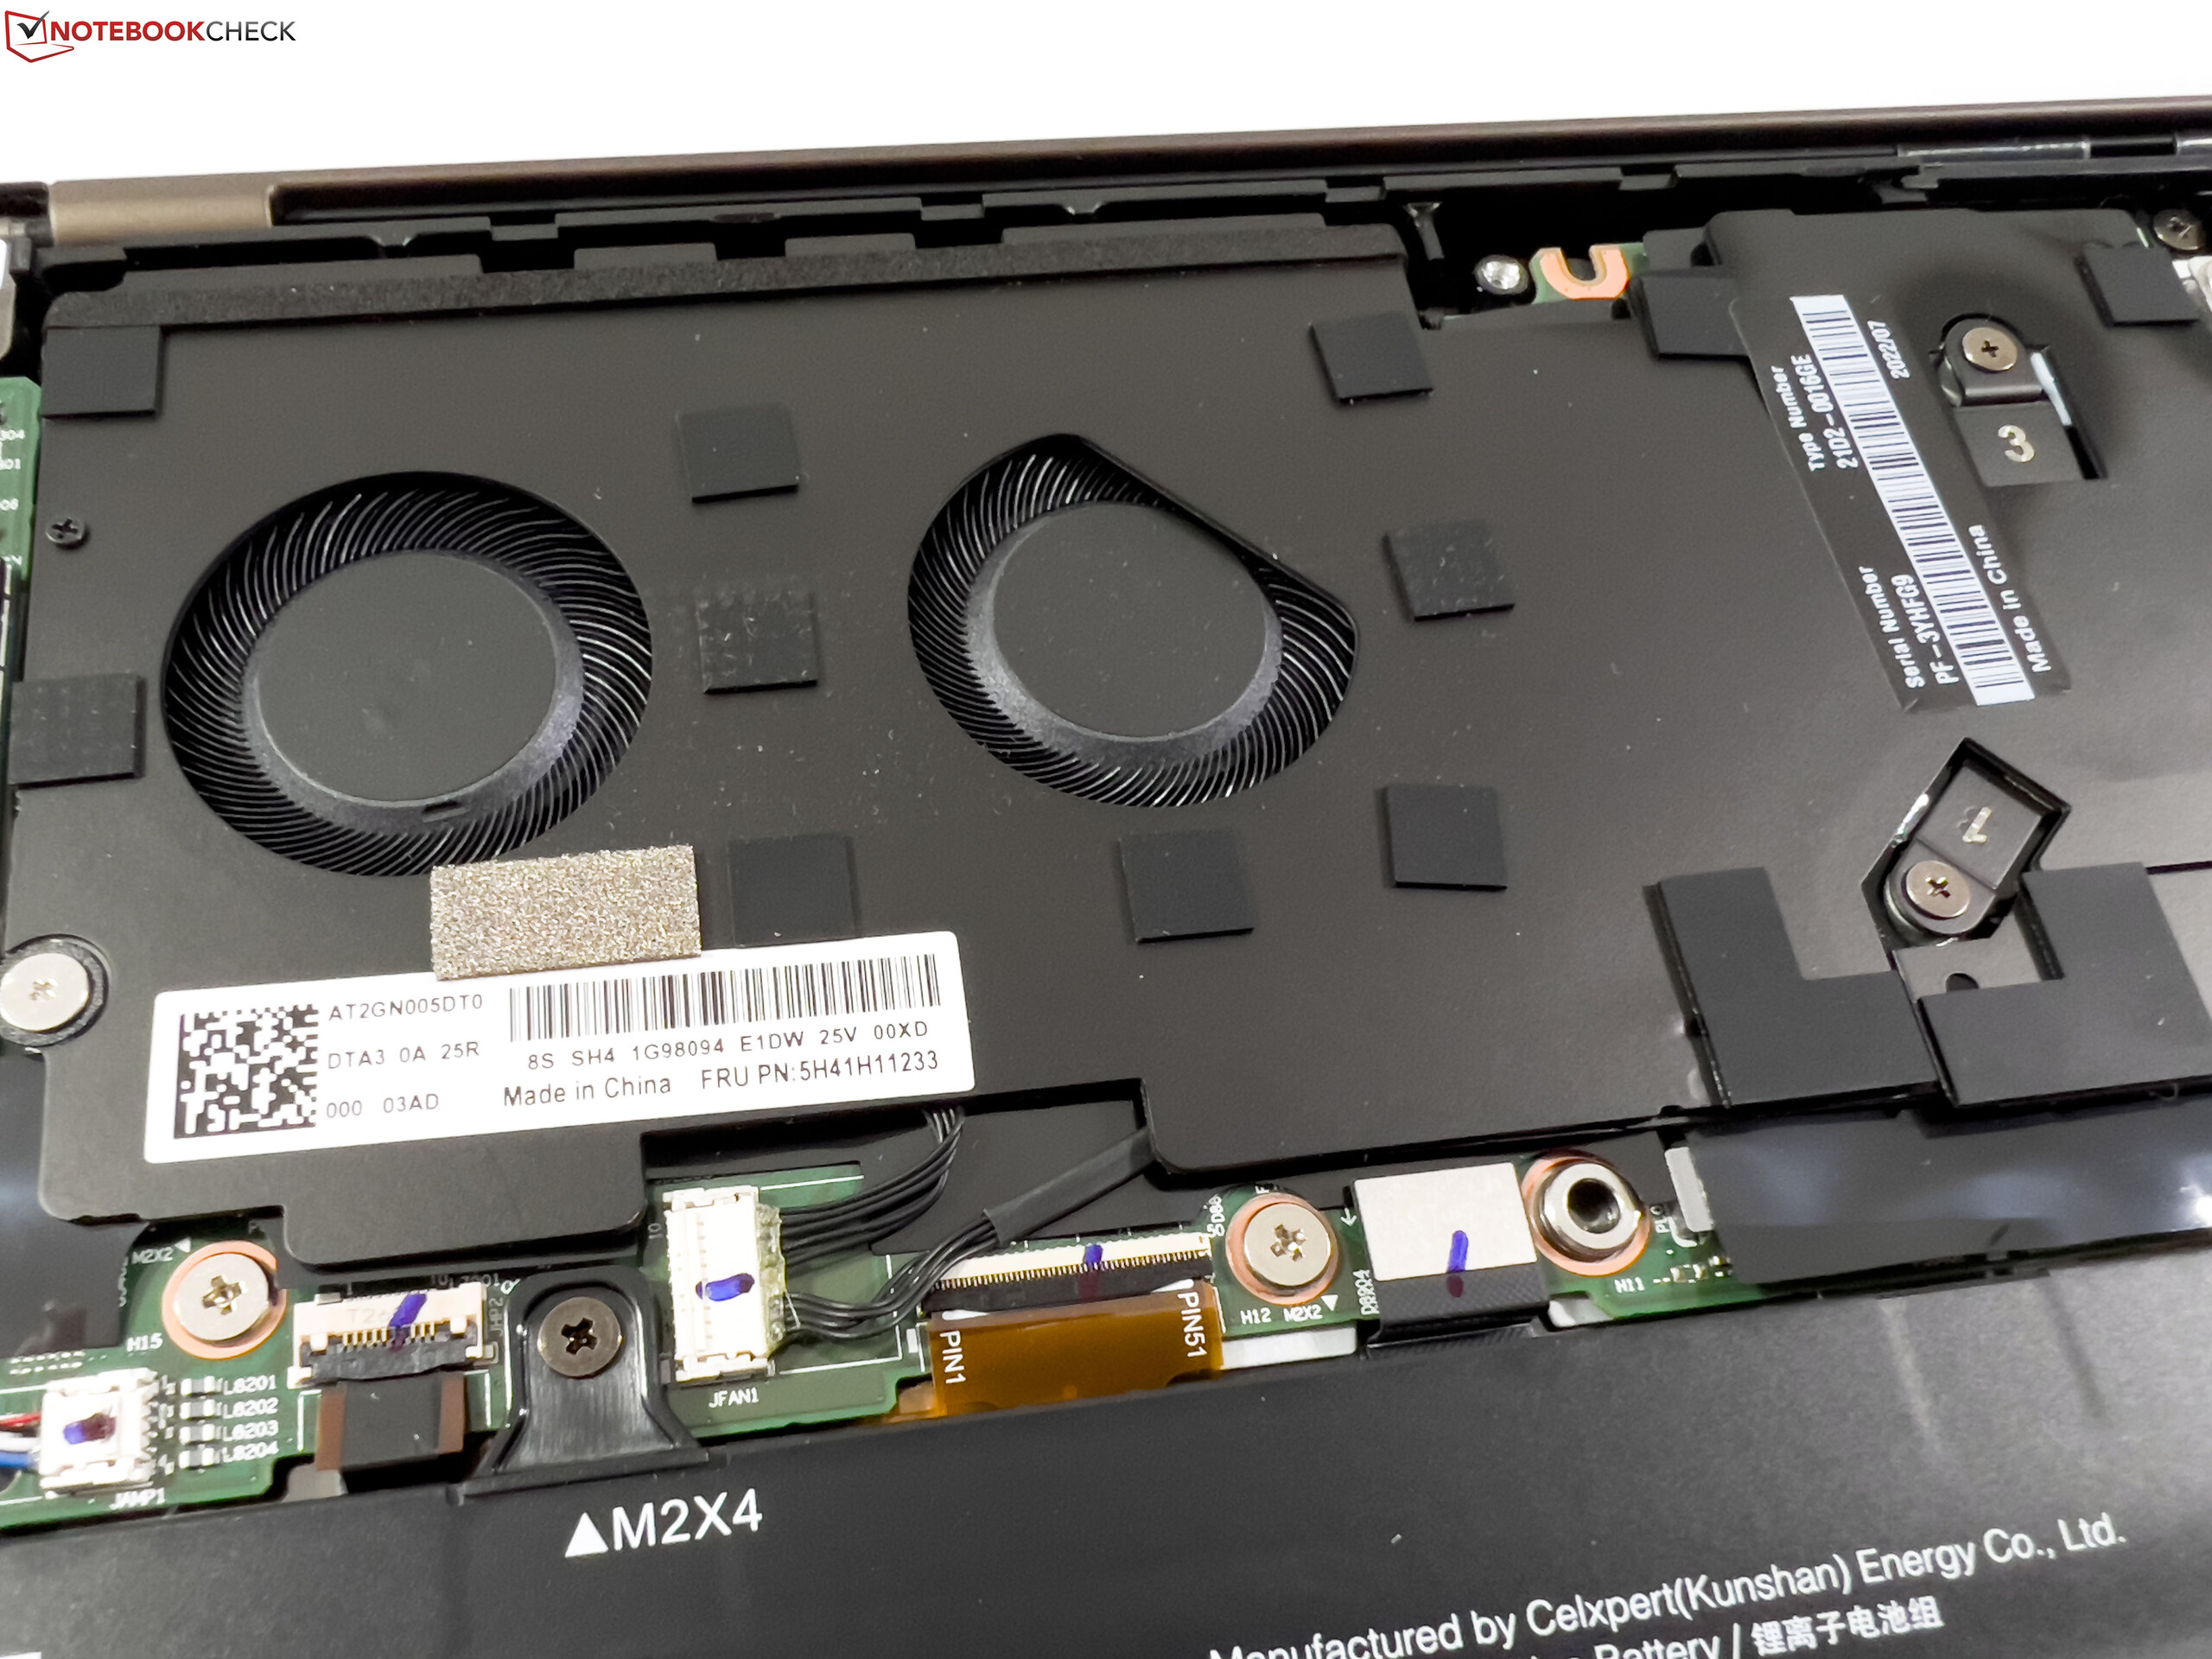
The ThinkPad Z13 uses cooling with two small fans. These are normally idle and for very light tasks they are usually silent. But the fans will sometimes start up even when just browsing. Due to high TDP values, the fans reach their maximum speed almost immediately under increased load, which corresponds to about 41 dB(A). The noise is clearly audible, but there are no annoying frequencies. We could not detect any other noises of electronic origin.
Noise level
| Idle |
| 24.3 / 24.3 / 24.3 dB(A) |
| Load |
| 41 / 41 dB(A) |
 | ||
30 dB silent 40 dB(A) audible 50 dB(A) loud |
||
min: | ||
| Lenovo ThinkPad Z13 G1-21D20016GE Radeon 680M, R7 PRO 6860Z, Micron 2450 1TB MTFDKCD1T0TFK | Asus Zenbook S 13 OLED Radeon 680M, R7 6800U, Samsung PM9A1 MZVL21T0HCLR | Dell XPS 13 Plus 9320 i7-1280P OLED Iris Xe G7 96EUs, i7-1280P, WDC PC SN810 512GB | Lenovo ThinkPad Z13 21D2CTO1WW Radeon 660M, R5 PRO 6650U, Lenovo UMIS AM630 RPJTJ512MGE1QDQ | Lenovo ThinkPad T14 G3-21CF004NGE Radeon 680M, R7 PRO 6850U, Kioxia BG5 KBG5AZNV512G | |
|---|---|---|---|---|---|
| Noise | 3% | 5% | 5% | 5% | |
| off / environment * (dB) | 24.3 | 24 1% | 23.4 4% | 23.71 2% | 24.2 -0% |
| Idle Minimum * (dB) | 24.3 | 24 1% | 23.4 4% | 23.71 2% | 24.2 -0% |
| Idle Average * (dB) | 24.3 | 24 1% | 23.4 4% | 23.71 2% | 24.2 -0% |
| Idle Maximum * (dB) | 24.3 | 24 1% | 23.4 4% | 23.71 2% | 25.8 -6% |
| Load Average * (dB) | 41 | 33.1 19% | 35 15% | 32.35 21% | 32.2 21% |
| Witcher 3 ultra * (dB) | 41 | 40.2 2% | 41.6 -1% | 38.8 5% | 34.1 17% |
| Load Maximum * (dB) | 41 | 41.7 -2% | 39.9 3% | 39.53 4% | 38.8 5% |
* ... smaller is better
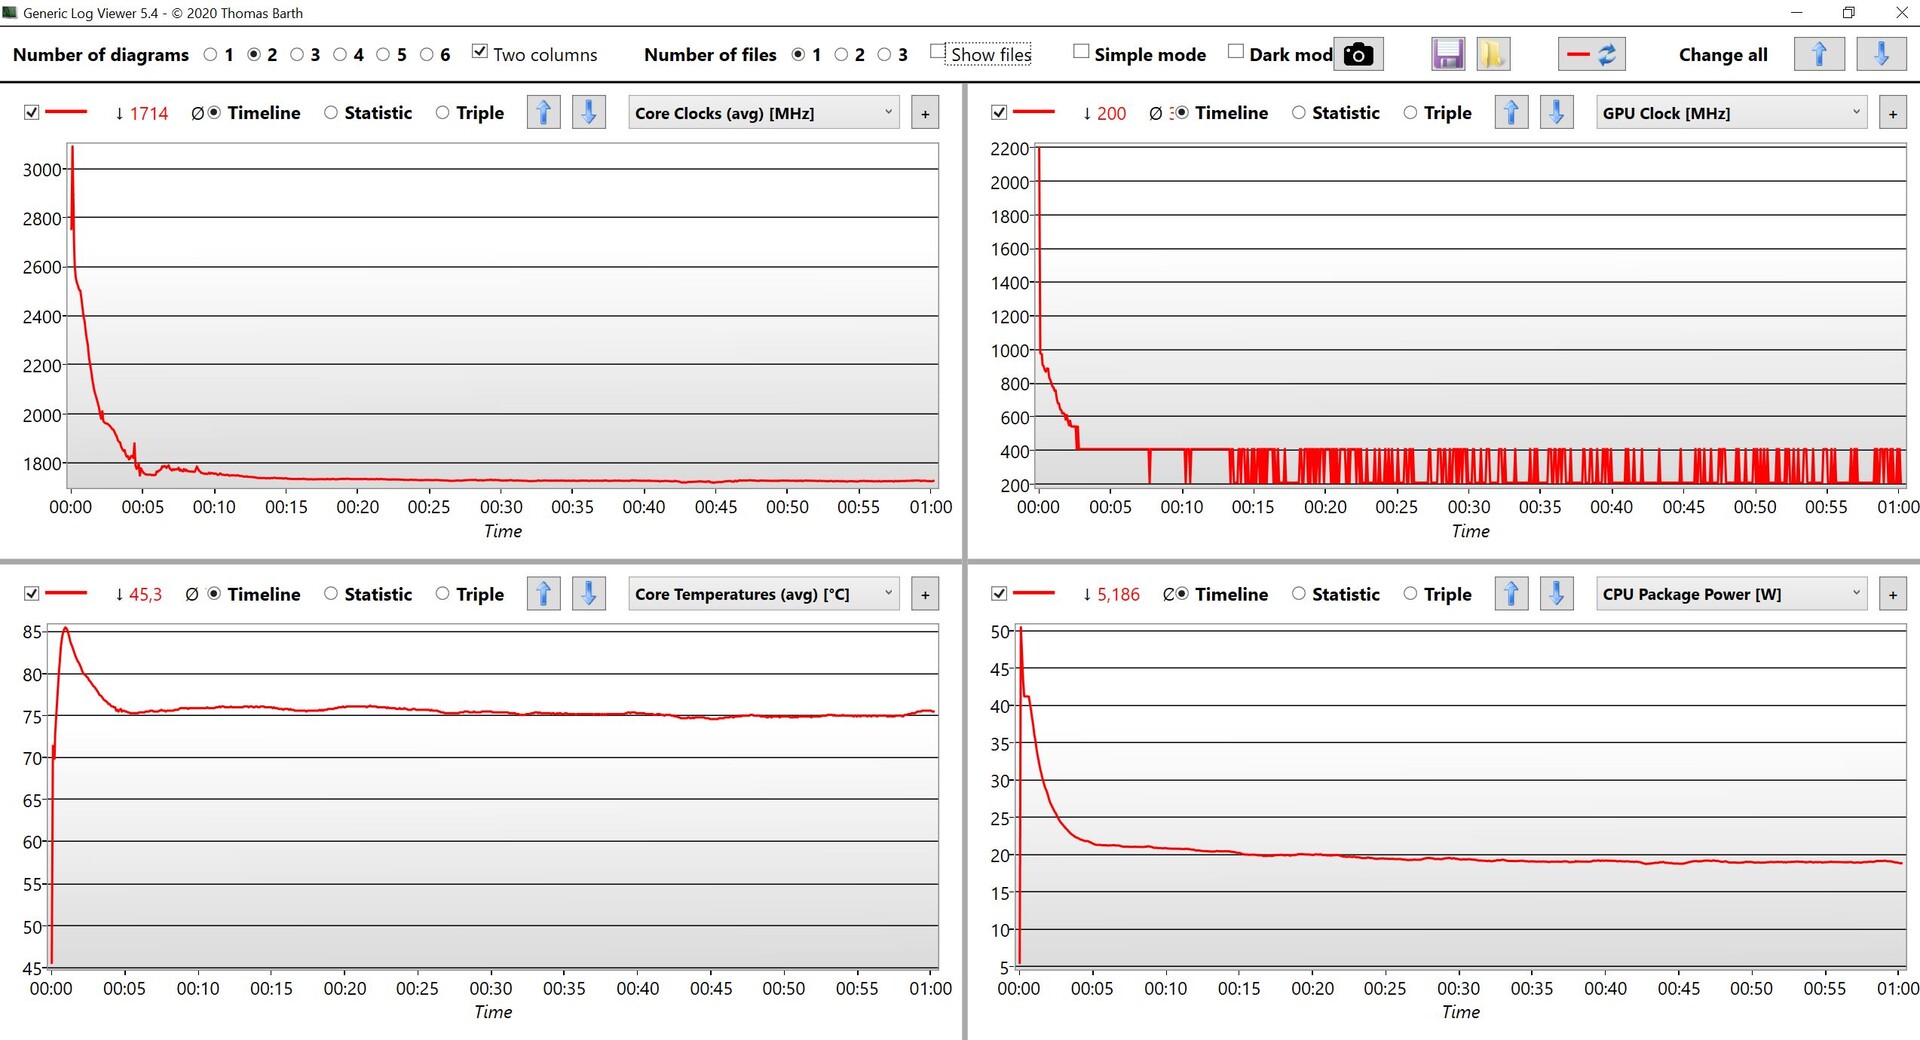
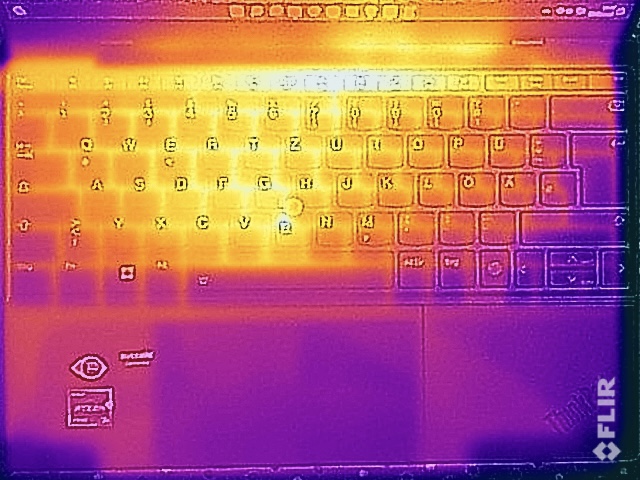
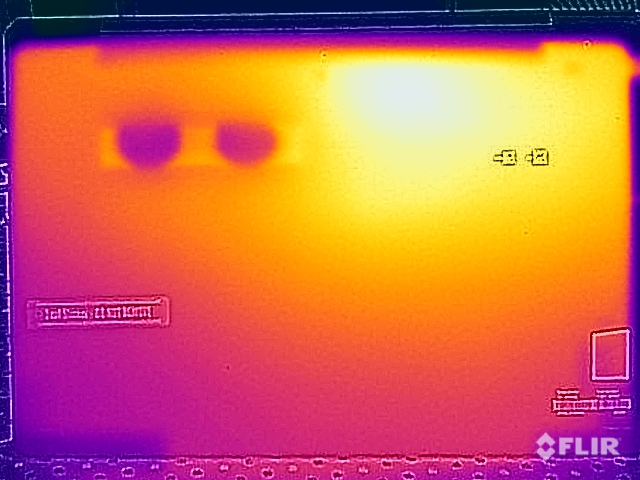
Temperature
The surface temperatures of the ThinkPad Z13 are inconsequential under low load, but under load we measured higher values than the entry-level model. This is not surprising, since the cooling is identical and the fans also work at a comparable level, but the TDP of the processor is higher. Temperatures on the top cover surface remain within normal bounds not exceeding 45 °C and remain safe. But we measured over 50 °C in the central upper area of the bottom surface. With direct skin contact, this can quickly become uncomfortable.
While Ryzen 7 Pro power consumption stabilizes at 27 watts under pure CPU load, it is only 19 watts in the stress test with combined CPU/GPU load (in the Z13 with the Ryzen 5 Pro it was around 14 watts). In view of these low values, the surface temperatures are already quite high. It takes a few minutes before full power is available again immediately after the stress test.
(-) The maximum temperature on the upper side is 45.6 °C / 114 F, compared to the average of 35.9 °C / 97 F, ranging from 21.4 to 59 °C for the class Subnotebook.
(-) The bottom heats up to a maximum of 51 °C / 124 F, compared to the average of 39.2 °C / 103 F
(+) In idle usage, the average temperature for the upper side is 25.9 °C / 79 F, compared to the device average of 30.8 °C / 87 F.
(-) Playing The Witcher 3, the average temperature for the upper side is 38.9 °C / 102 F, compared to the device average of 30.8 °C / 87 F.
(+) The palmrests and touchpad are reaching skin temperature as a maximum (33 °C / 91.4 F) and are therefore not hot.
(-) The average temperature of the palmrest area of similar devices was 28.2 °C / 82.8 F (-4.8 °C / -8.6 F).
| Lenovo ThinkPad Z13 G1-21D20016GE AMD Ryzen 7 PRO 6860Z, AMD Radeon 680M | Asus Zenbook S 13 OLED AMD Ryzen 7 6800U, AMD Radeon 680M | Apple MacBook Air M2 10C GPU Apple M2, Apple M2 10-Core GPU | Lenovo ThinkPad Z13 21D2CTO1WW AMD Ryzen 5 PRO 6650U, AMD Radeon 660M | Lenovo ThinkPad T14 G3-21CF004NGE AMD Ryzen 7 PRO 6850U, AMD Radeon 680M | Dell XPS 13 Plus 9320 4K Intel Core i7-1260P, Intel Iris Xe Graphics G7 96EUs | |
|---|---|---|---|---|---|---|
| Heat | -3% | 8% | -4% | 3% | 1% | |
| Maximum Upper Side * (°C) | 45.6 | 47.9 -5% | 44.7 2% | 44.9 2% | 48.2 -6% | 41.1 10% |
| Maximum Bottom * (°C) | 51 | 56.1 -10% | 44.6 13% | 44.3 13% | 52.8 -4% | 48.8 4% |
| Idle Upper Side * (°C) | 27 | 26.8 1% | 25.1 7% | 31.4 -16% | 24.4 10% | 28 -4% |
| Idle Bottom * (°C) | 27.9 | 27.3 2% | 25.3 9% | 31.5 -13% | 24.5 12% | 29.3 -5% |
* ... smaller is better
Speakers
Lenovo ThinkPad Z13 G1-21D20016GE audio analysis
(±) | speaker loudness is average but good (77.6 dB)
Bass 100 - 315 Hz
(-) | nearly no bass - on average 15.4% lower than median
(±) | linearity of bass is average (9.5% delta to prev. frequency)
Mids 400 - 2000 Hz
(+) | balanced mids - only 3.2% away from median
(+) | mids are linear (5.1% delta to prev. frequency)
Highs 2 - 16 kHz
(+) | balanced highs - only 3.1% away from median
(+) | highs are linear (3.8% delta to prev. frequency)
Overall 100 - 16.000 Hz
(+) | overall sound is linear (14.7% difference to median)
Compared to same class
» 31% of all tested devices in this class were better, 5% similar, 64% worse
» The best had a delta of 5%, average was 18%, worst was 53%
Compared to all devices tested
» 19% of all tested devices were better, 4% similar, 77% worse
» The best had a delta of 4%, average was 23%, worst was 134%
Apple MacBook Air M2 10C GPU audio analysis
(+) | speakers can play relatively loud (82.7 dB)
Bass 100 - 315 Hz
(±) | reduced bass - on average 12.2% lower than median
(±) | linearity of bass is average (12.6% delta to prev. frequency)
Mids 400 - 2000 Hz
(+) | balanced mids - only 1.1% away from median
(+) | mids are linear (3.1% delta to prev. frequency)
Highs 2 - 16 kHz
(+) | balanced highs - only 2.4% away from median
(+) | highs are linear (1.9% delta to prev. frequency)
Overall 100 - 16.000 Hz
(+) | overall sound is linear (9.5% difference to median)
Compared to same class
» 5% of all tested devices in this class were better, 2% similar, 93% worse
» The best had a delta of 5%, average was 18%, worst was 53%
Compared to all devices tested
» 4% of all tested devices were better, 1% similar, 95% worse
» The best had a delta of 4%, average was 23%, worst was 134%
Power Consumption
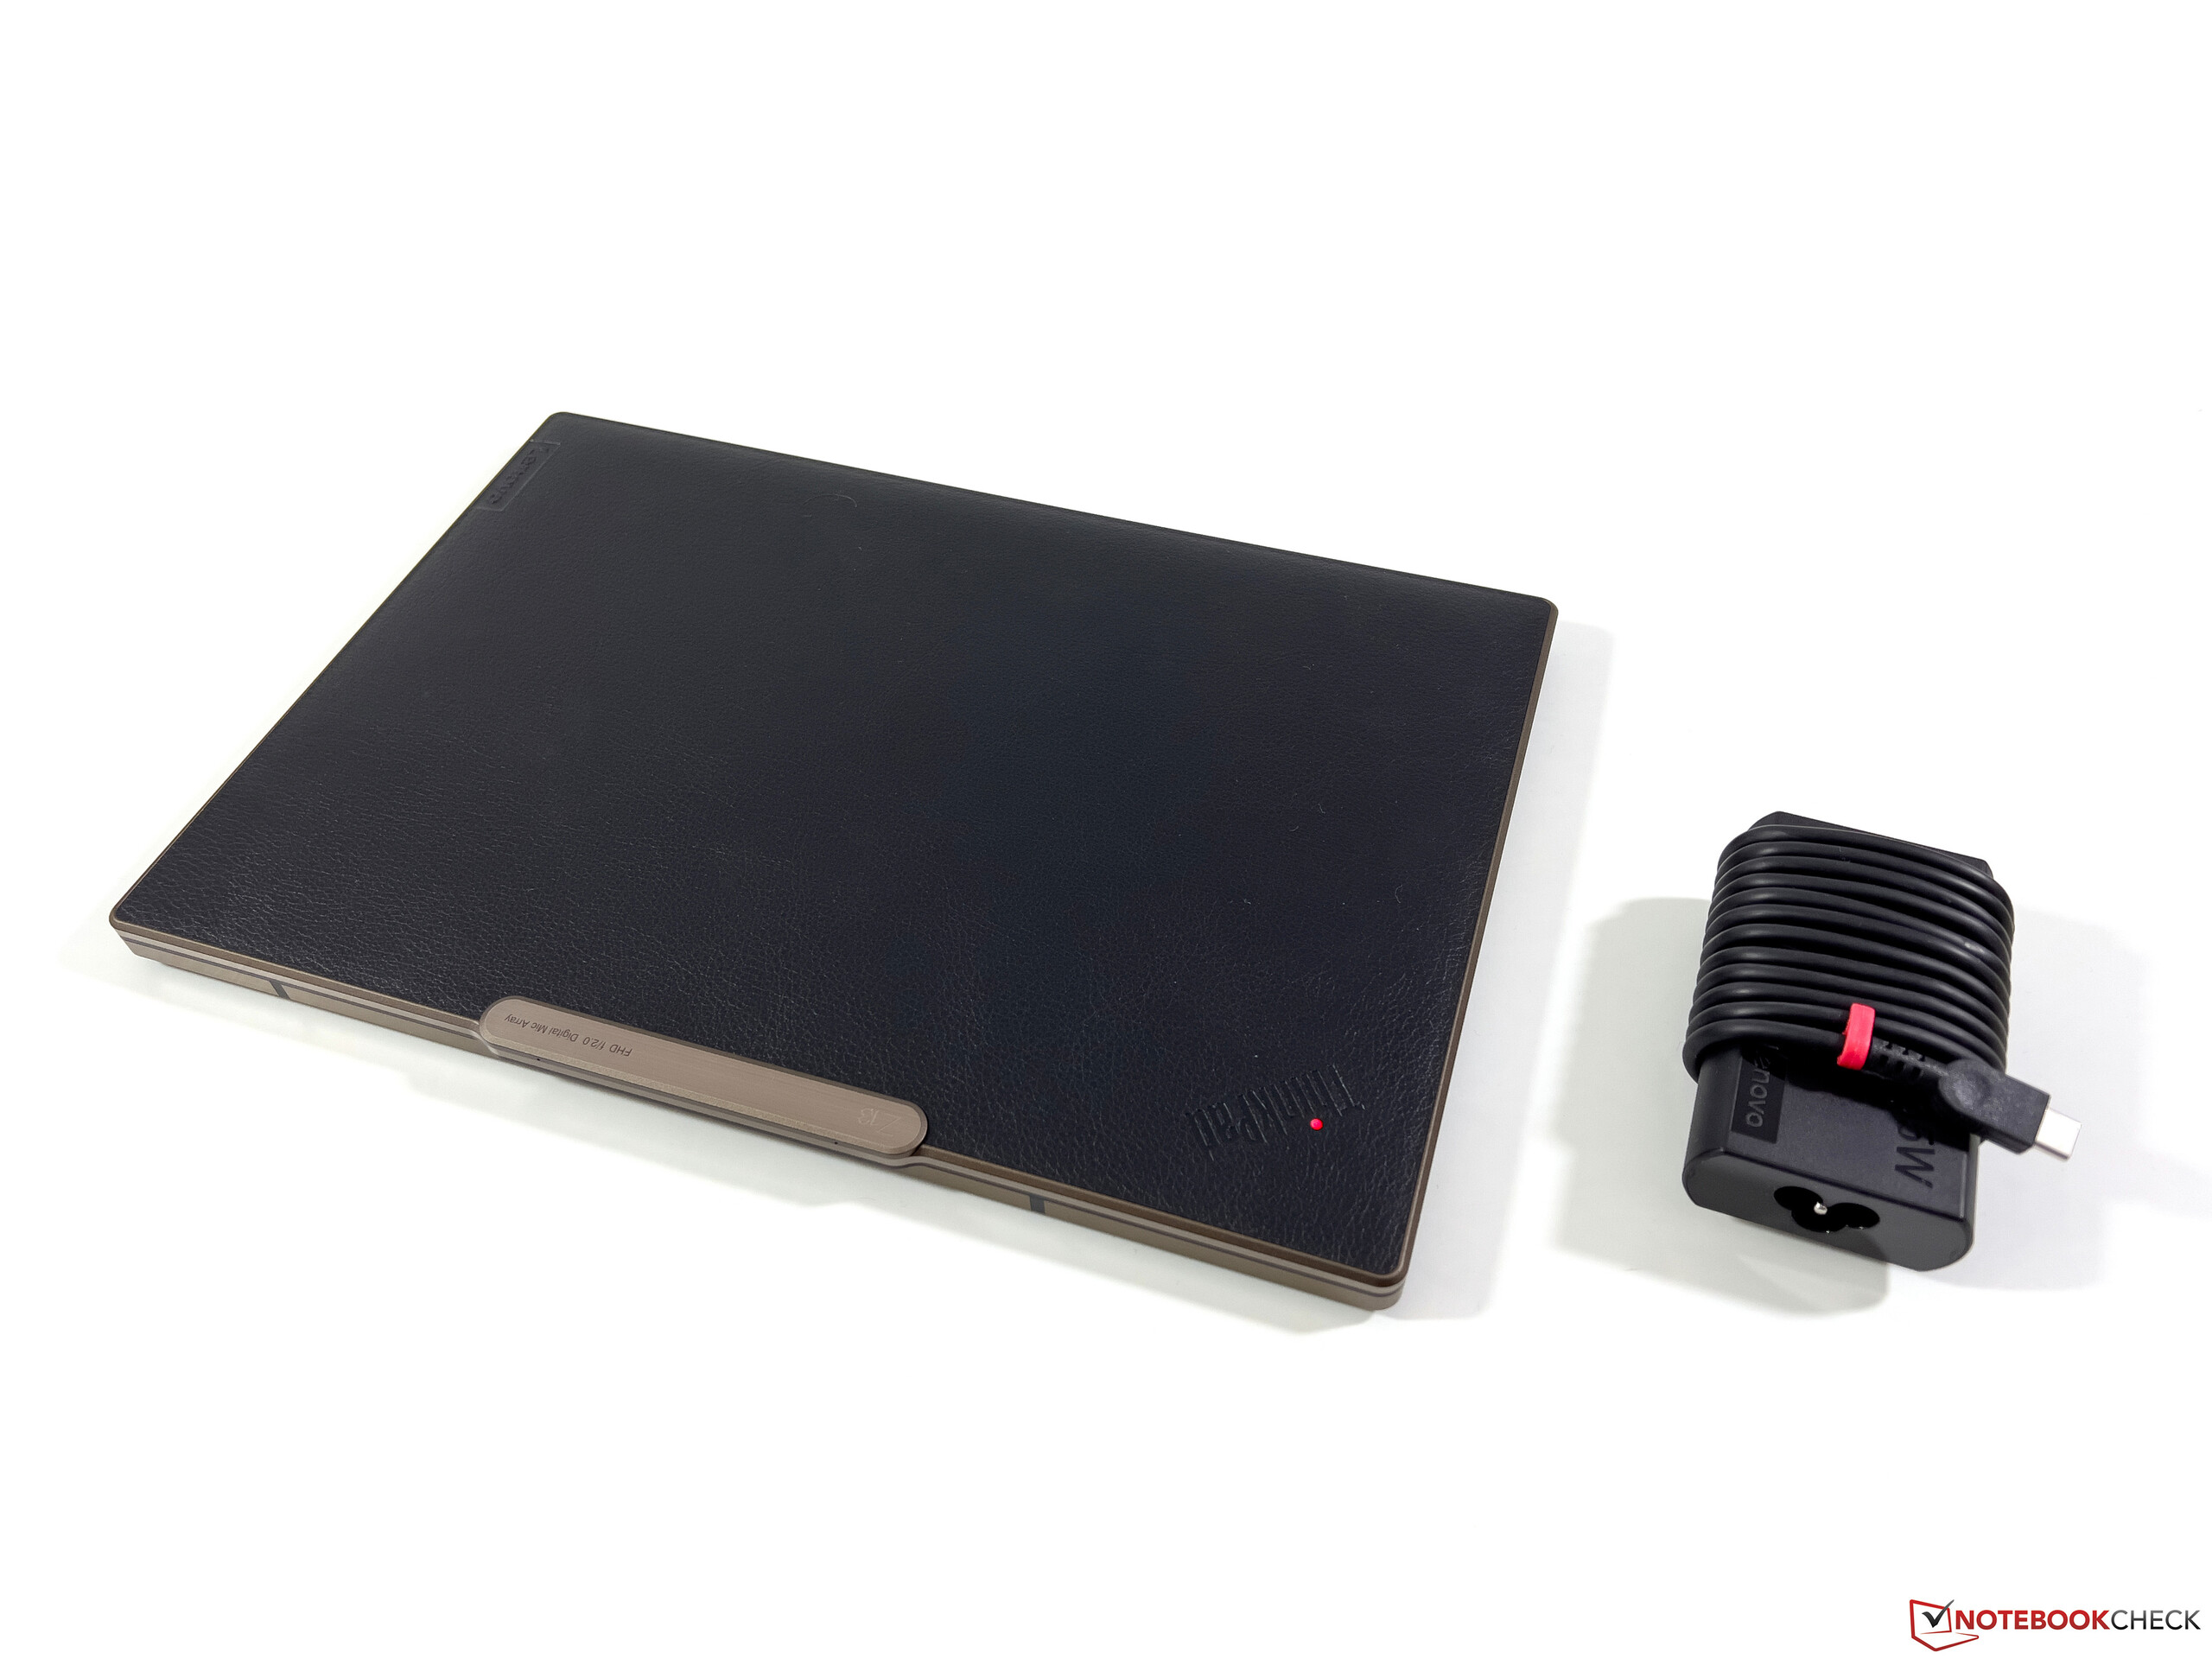
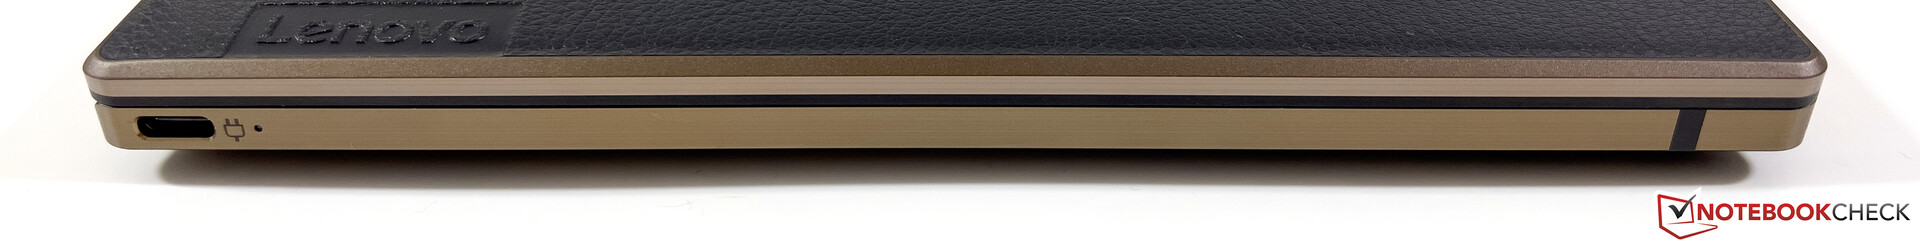
In power consumption measurements, the impact of the OLED screen is clearly noticeable. Even with the rather dark background image, we measured a maximum of 8.4 watts when idle, but with a bright image it was 11-12 watts. Under load, it is a maximum of around 63 watts, although the value quickly drops to around 46 watts under continuous load and then stabilizes at around 30 watts. The supplied 65-watt power supply is therefore completely adequate.
| Off / Standby | |
| Idle | |
| Load |
|
Key:
min: | |
Power Consumption Witcher 3 / Stresstest
Power Consumption external Monitor
Battery Life
The OLED screen significantly reduces battery life, and our WLAN test that includes a large number of websites evokes a worst-case scenario for OLED panels. Battery life is significantly worse than for the entry-level model of the Z13 with the IPS panel, which managed more than 10 hours even at full brightness. The OLED model, on the other hand, achieves only 7.5 hours at 150 cd/m² and less than 6 hours at full SDR brightness and thus also a significantly shorter runtime than the Zenbook S 13 with the larger 67 Wh battery.
Full charging takes just over two hours when the device is on; 80% of the capacity is available again after around 64 minutes.
Pros
Cons
Verdict - ThinkPad Z13 poses some questions
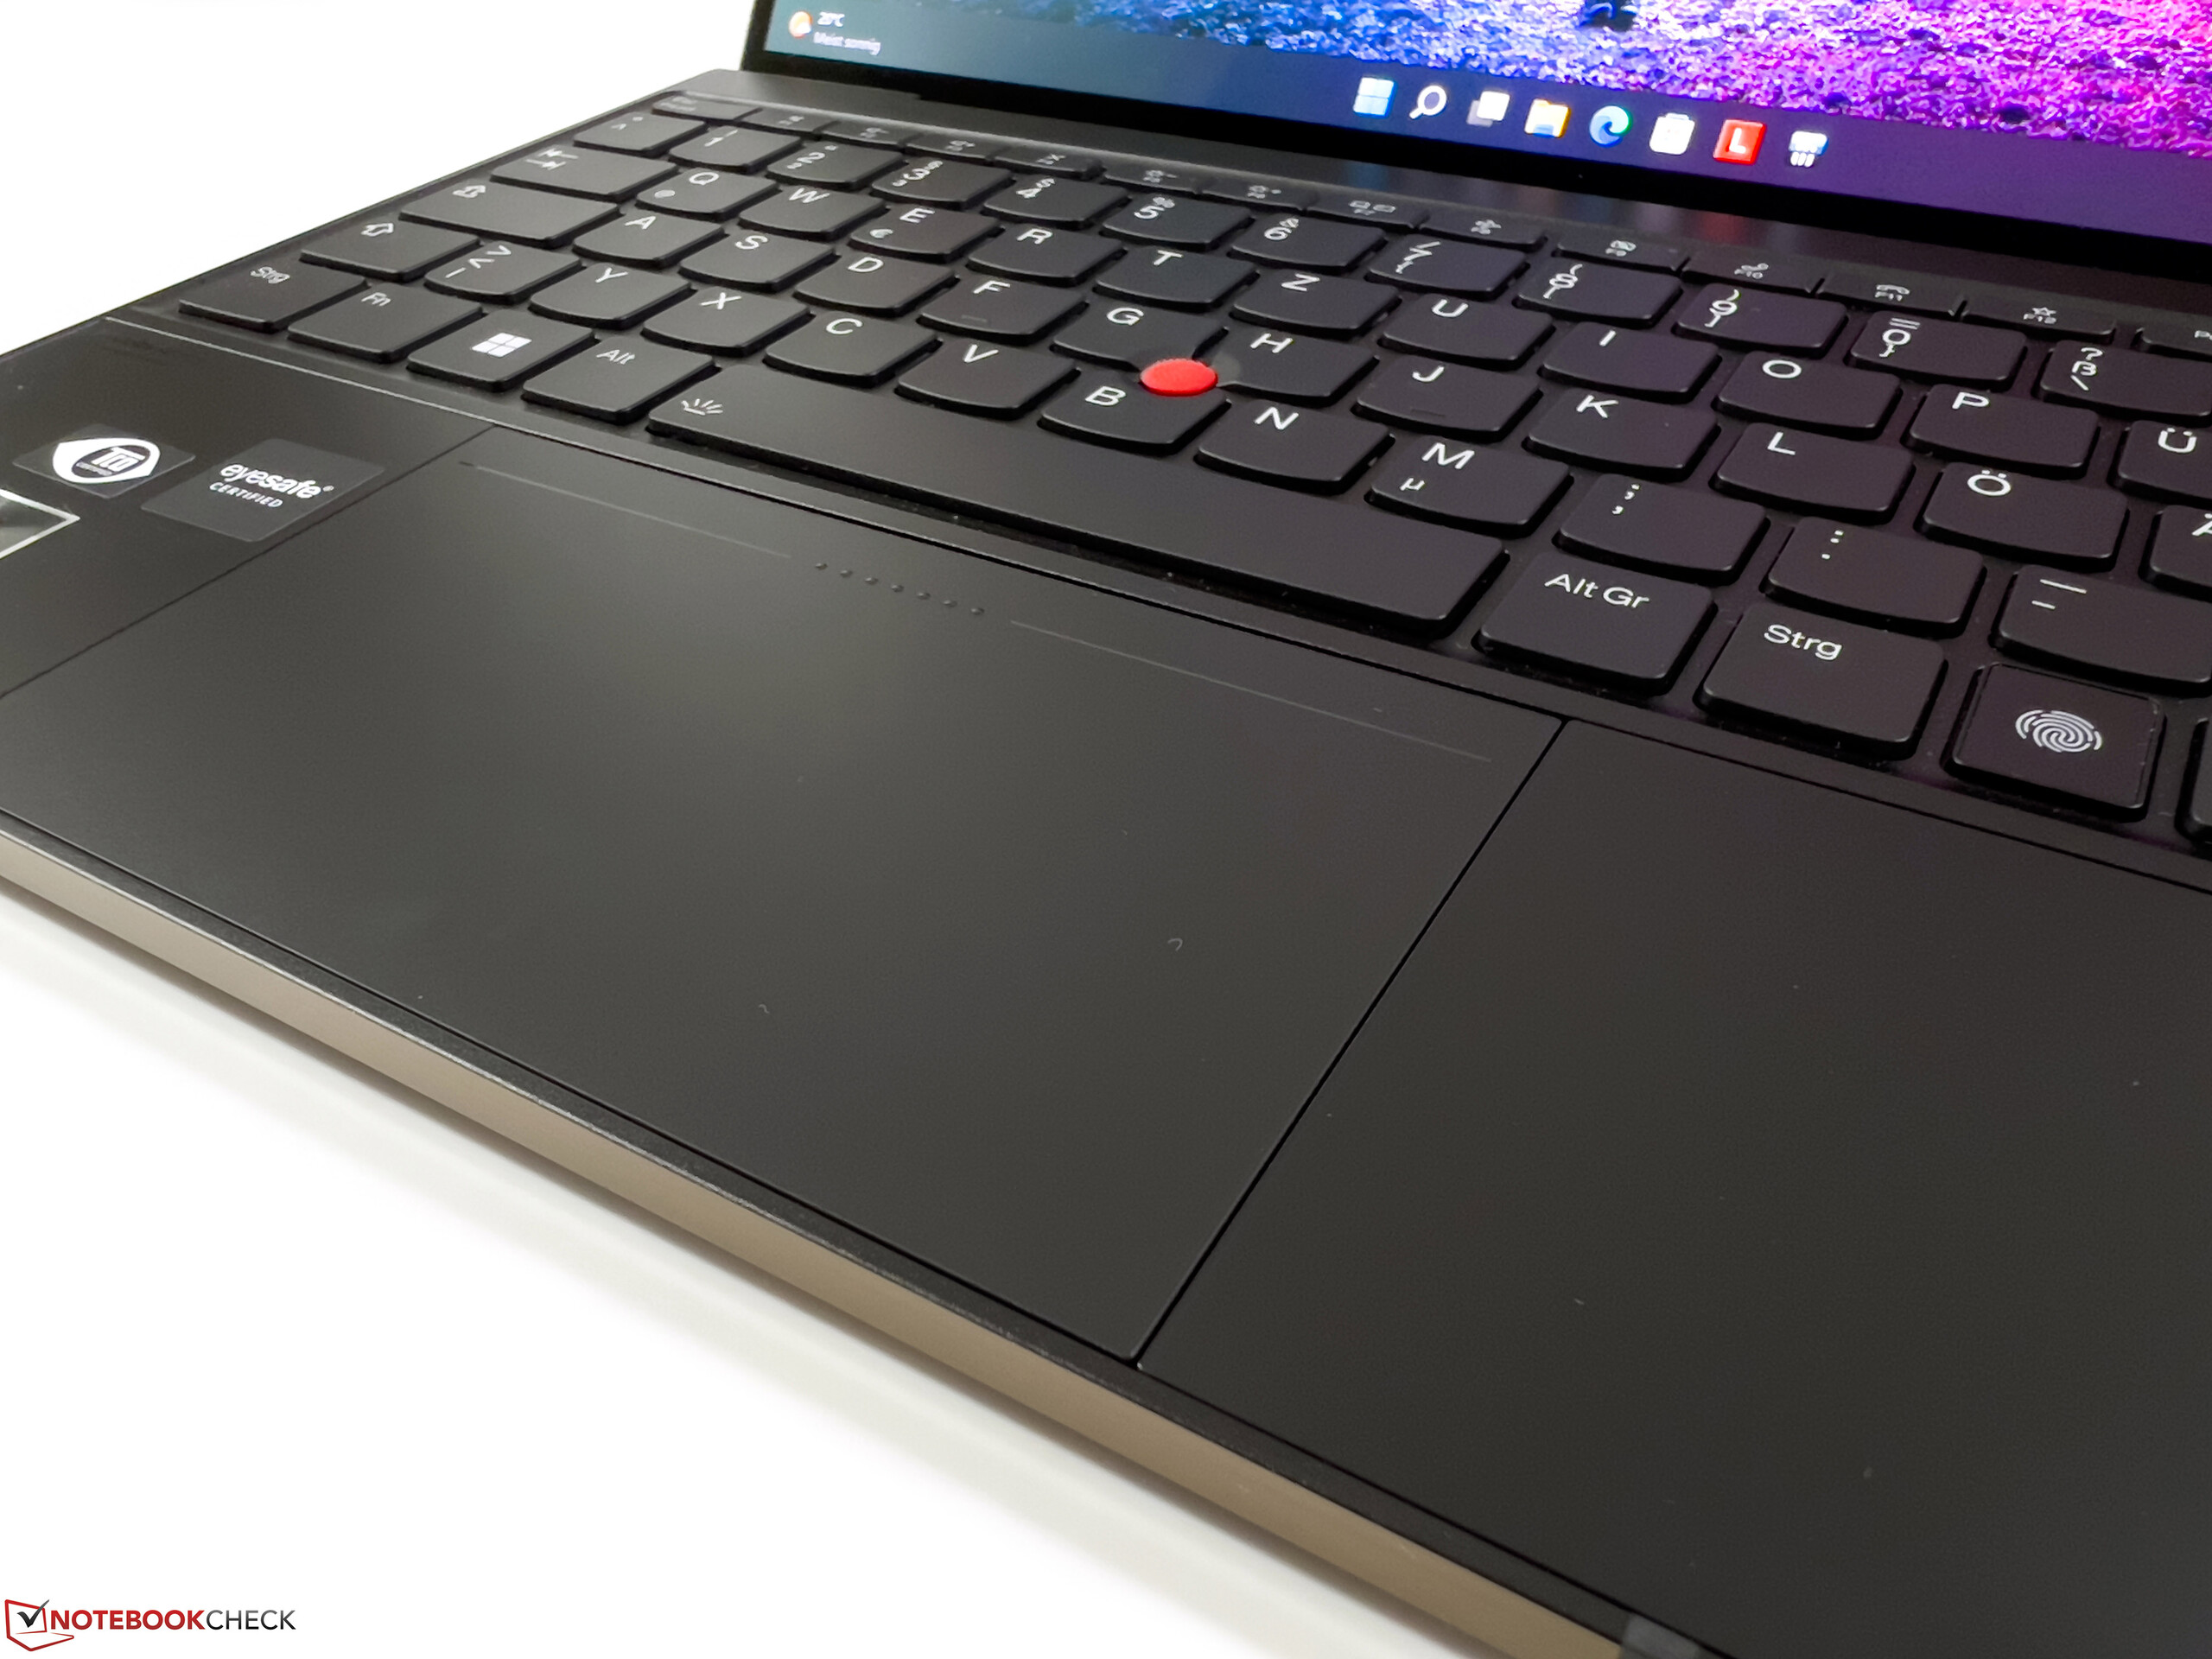
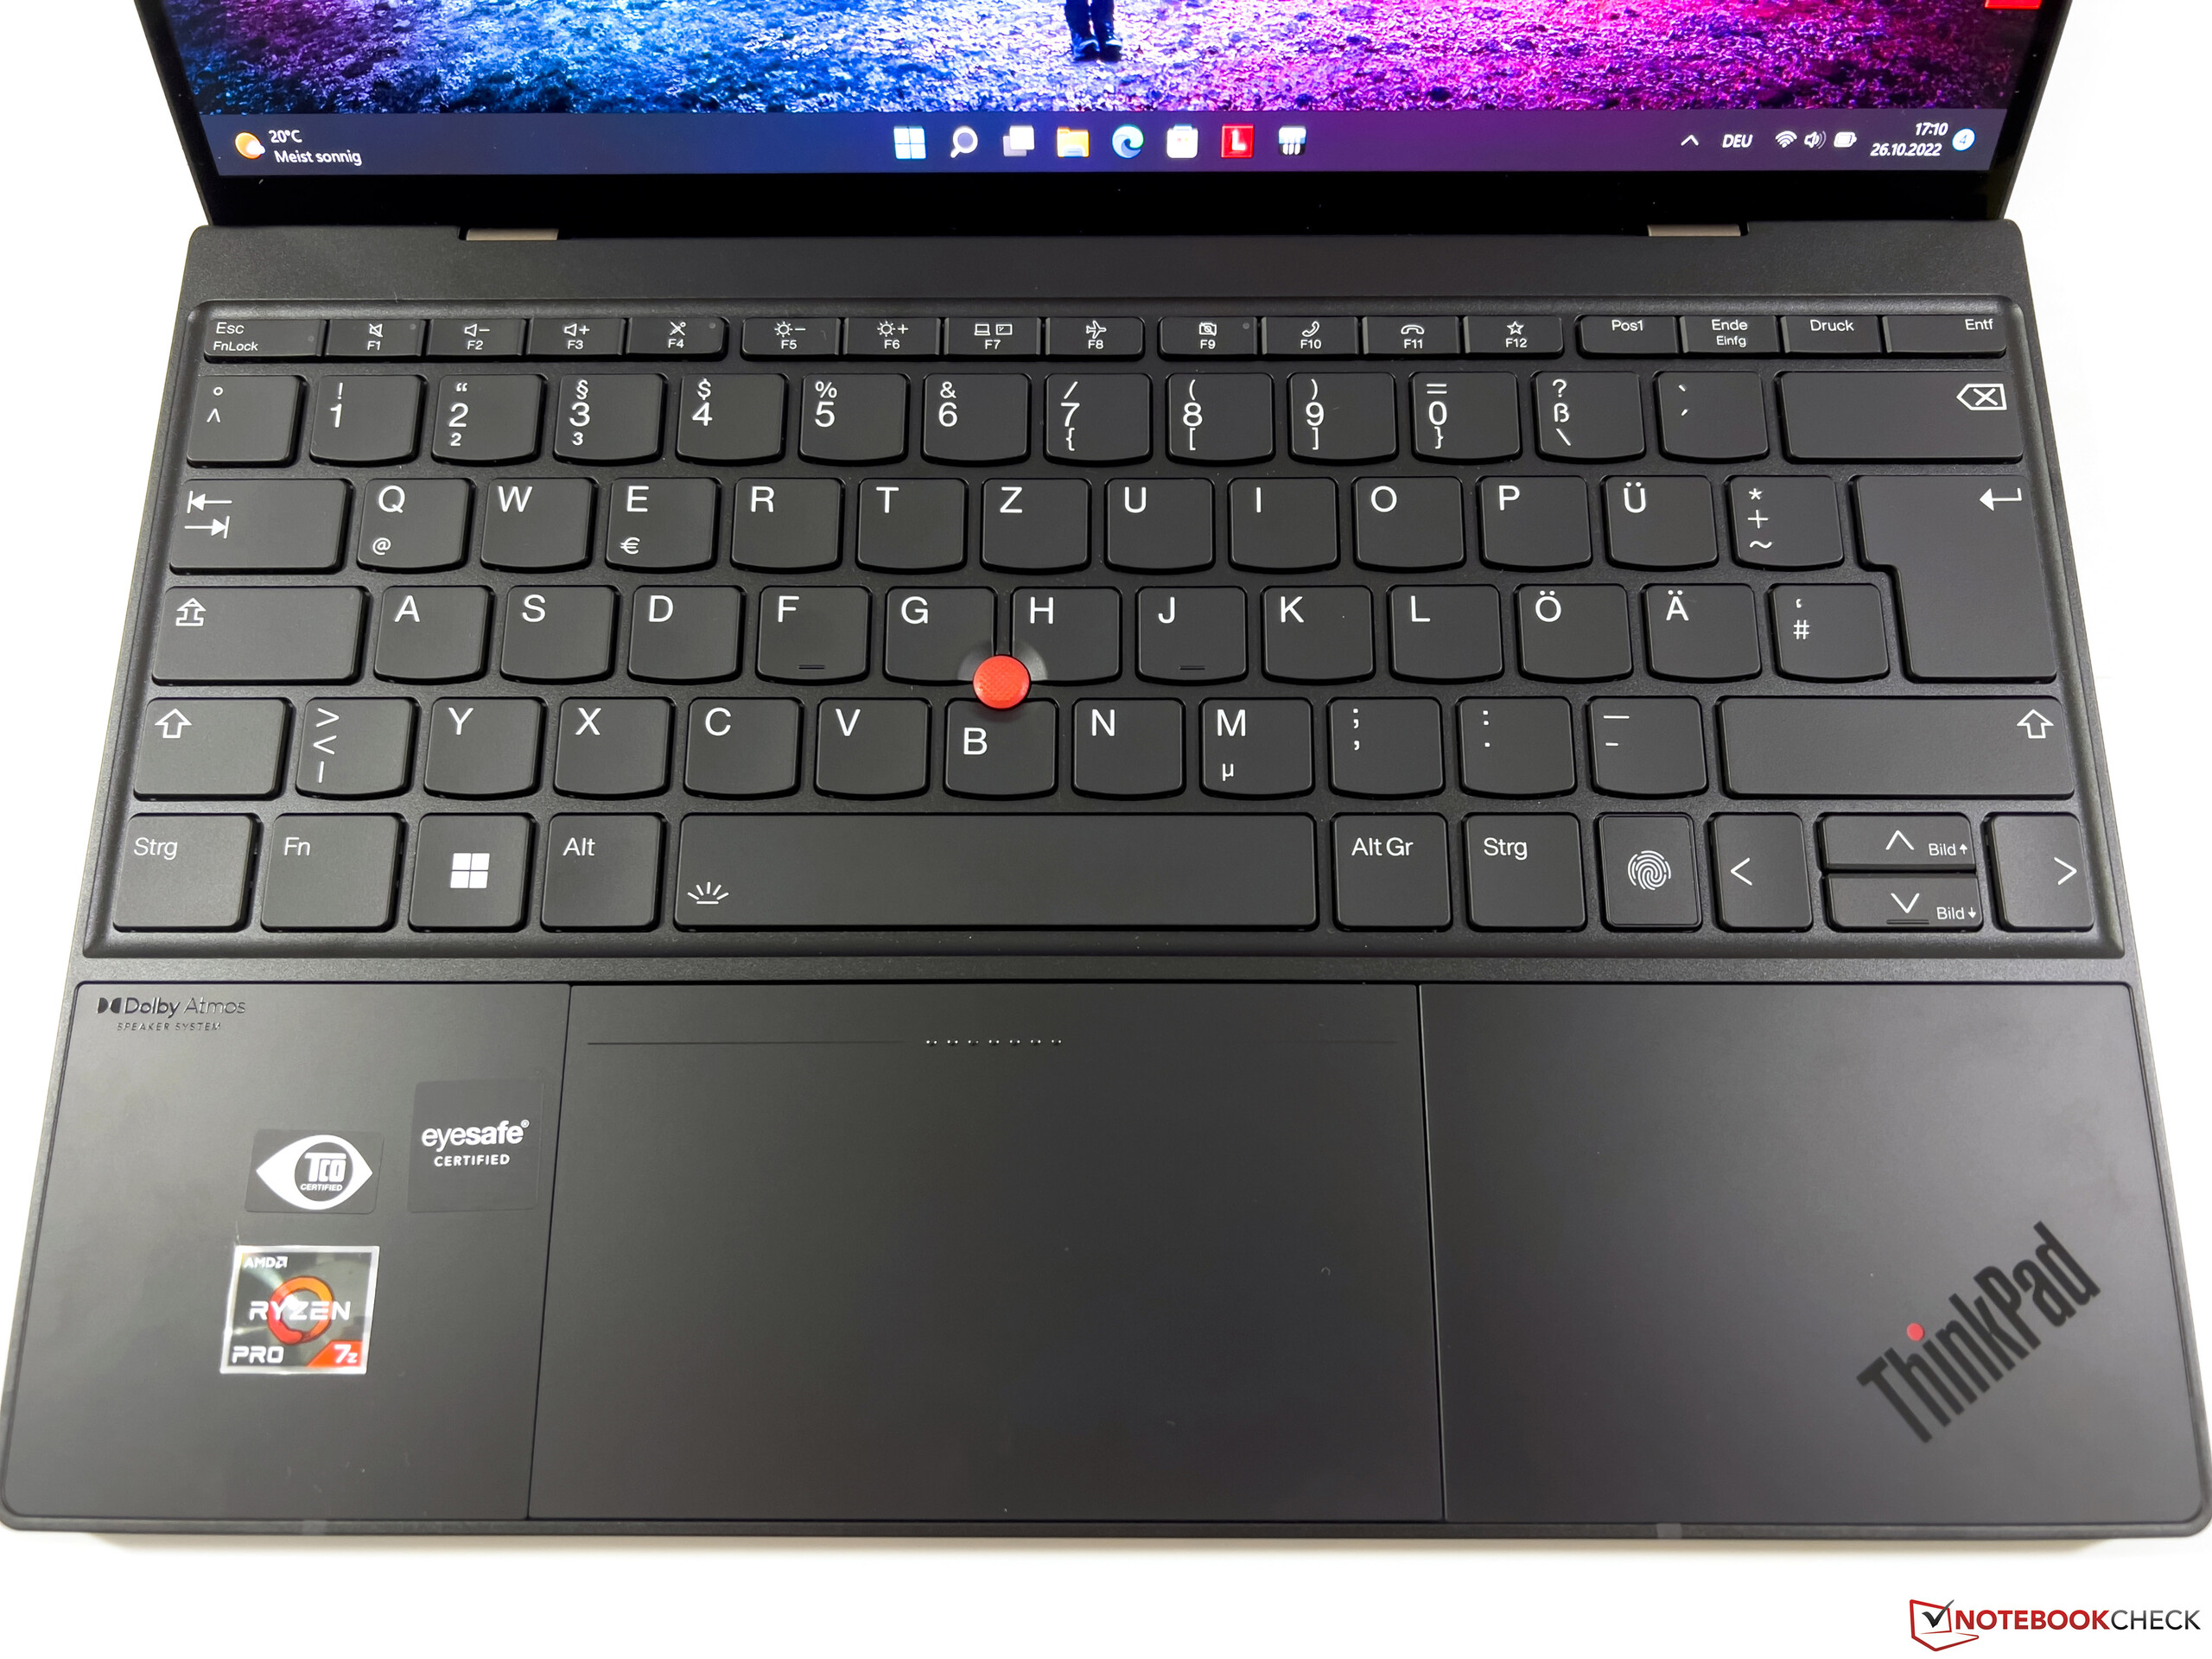
After testing the high-end version of the ThinkPad Z13, we wonder whether this is indeed still a business laptop, whether it really is still a ThinkPad. In the configuration with the OLED screen and the leatherette lid, it is in effect an ideal competitor for the consumer model Asus Zenbook S 13. What’s more, you have to do without some ThinkPad-typical features. These include a limited opening angle of the display, the omission of the slot for a Kensington Lock and also a changed button layout that doesn’t include dedicated buttons for Page Up & Page Off. The biggest problem for long-time ThinkPad users, however, is the elimination of dedicated TrackPoint keys. We can only hope that Lenovo does not adopt this solution for other model series.
The notebook itself proves convincing for everyday use with its high-quality housing, its great keyboard and glass touchpad and also its excellent system performance. However, one has to seriously question why the Ryzen 7 Pro 6860Z exists as a processor in the first place, since it is in effect a regular 6850U. And while the high-power limit ensures good benchmark results, it also leads to more fan activity and performance inconsistencies. Above all, graphics performance tends to be somewhat erratic under permanent load, something that other devices such as the ThinkPad T14 G3 or the Asus Zenbook S 13 are not affected by. The OLED screen with its extremely high contrast ratio basically provides very good image quality, but a slight grid effect is noticeable in bright areas. There is PWM flickering, and the OLED screen draws heavily on the battery.
With the OLED panel and the use of imitation leather, the ThinkPad Z13 high-end model looks more like a fashion item than a business laptop. Overall, it is a very good subnotebook, but not necessarily a very good business notebook.
For productive use, the ThinkPad Z13 with a regular IPS panel is the better choice, as it allows for significantly longer battery runtimes. If you have been using and liked the TrackPoint as a ThinkPad user, you should try out the new Z13 before purchasing it, as the omission of the dedicated TrackPoint keys would be a reason not to buy for many users. On the other hand, if you are looking for a subnotebook with OLED panel and AMD CPU, you should have a look at the Asus Zenbook S13, which has a good keyboard, more stable performance, and a software solution for annoying PWM flickering. It’s simply the better overall package.
Price and Availability
The ThinkPad Z13 with an AMD Ryzen 7 Pro 6860Z can be configured on the Lenovo website with prices starting at around 2,700 euros (US$ 2,700).
Lenovo ThinkPad Z13 G1-21D20016GE
- 10/28/2022 v7 (old)
Andreas Osthoff
Price comparison

