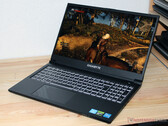
Gigabyte G5 KF review: Gaming laptop with RTX 4060 for 969 euros
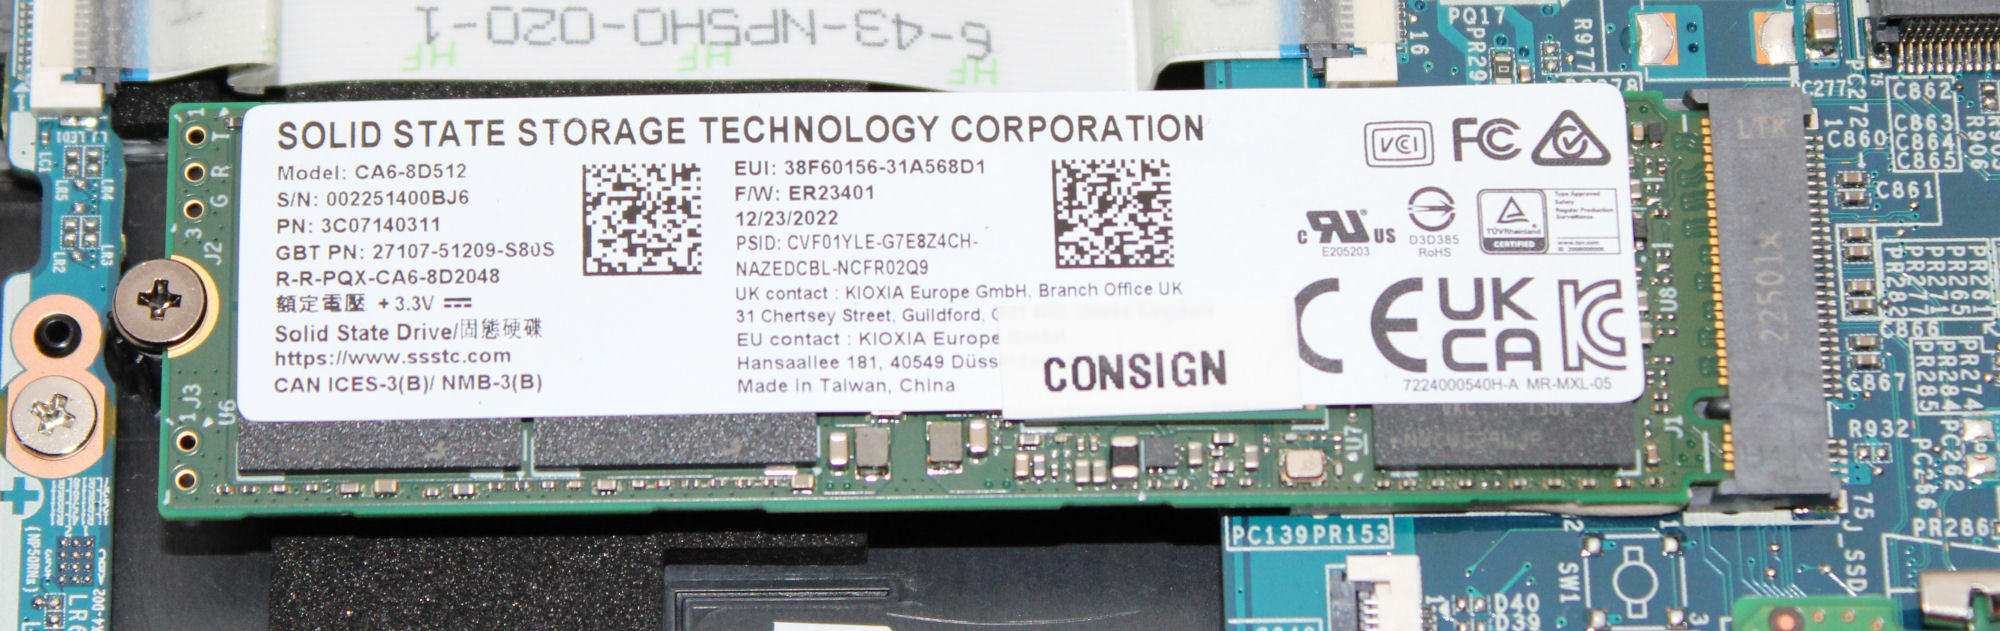
This budget gaming notebook from Gigabyte features an Alder Lake processor and an Ada Lovelace GPU. It also has a PCIe 4.0 SSD (512 GB), 16 GB of RAM and an FHD panel (144Hz), but Windows doesn’t come preinstalled. One serious drawback: the included charger can sometimes be overloaded by the laptop.
Intel Core i5-12500H, NVIDIA GeForce RTX 4060 Laptop GPU, 15.6", 1.9 kg