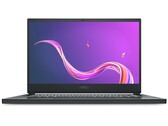
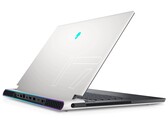
Alienware x17 R1 RTX 3080 laptop review: A new beginning
After only a year with the older Alienware m17 R2, R3, and R4 design, Dell is ready to hit the reset button with the Alienware x17 R1. Does the full-on makeover address all the issues we had with the previous generation model?
Intel Core i7-11800H, NVIDIA GeForce RTX 3080 Laptop GPU, 17.3", 3.2 kg