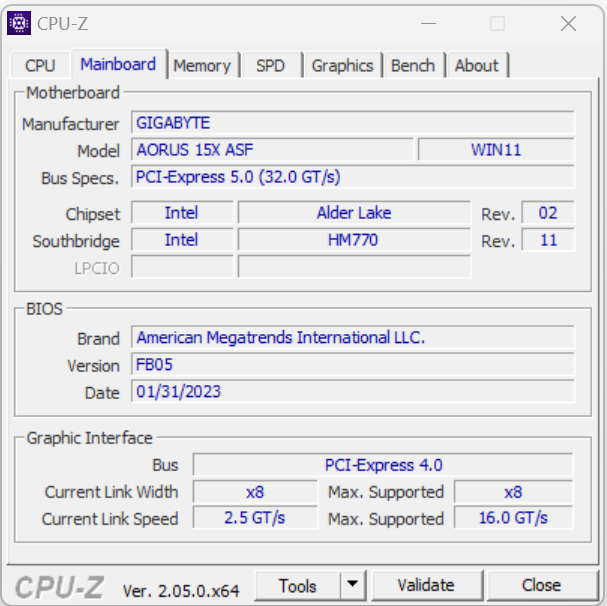
Aorus 15X ASF review: Gaming laptop with RTX 4070 power and stamina
The Aorus 15X - a midrange gaming laptop - is powered by a Raptor Lake Core i7 and an RTX 4070 GPU. The total package retails for around $2,099. Its competitors include devices such as the Razer Blade 15 OLED (Early 2022), the Asus ROG Strix G17 G713PI, the MSI Katana 17 B13VFK and the Acer Predator Helios 300.
possible competitors
Rating | Date | Model | Weight | Height | Size | Resolution | Price |
|---|---|---|---|---|---|---|---|
| 86.2 % v7 (old) | 04 / 2023 | Aorus 15X ASF i7-13700HX, GeForce RTX 4070 Laptop GPU | 2.3 kg | 19.7 mm | 15.60" | 2560x1440 | |
| 89.9 % v7 (old) | 03 / 2023 | Razer Blade 15 OLED (Early 2022) i9-12900H, GeForce RTX 3070 Ti Laptop GPU | 2 kg | 16.99 mm | 15.60" | 2560x1440 | |
| 82.1 % v7 (old) | 02 / 2023 | MSI Katana 17 B13VFK i7-13620H, GeForce RTX 4060 Laptop GPU | 2.8 kg | 25.2 mm | 17.30" | 1920x1080 | |
| 88.4 % v7 (old) | 04 / 2023 | Asus ROG Strix G17 G713PI R9 7945HX, GeForce RTX 4070 Laptop GPU | 2.8 kg | 30.7 mm | 17.30" | 2560x1440 | |
| 86.5 % v7 (old) | 11 / 2022 | Acer Predator Helios 300 (i7-12700H, RTX 3070 Ti) i7-12700H, GeForce RTX 3070 Ti Laptop GPU | 3 kg | 27.65 mm | 17.30" | 2560x1440 |
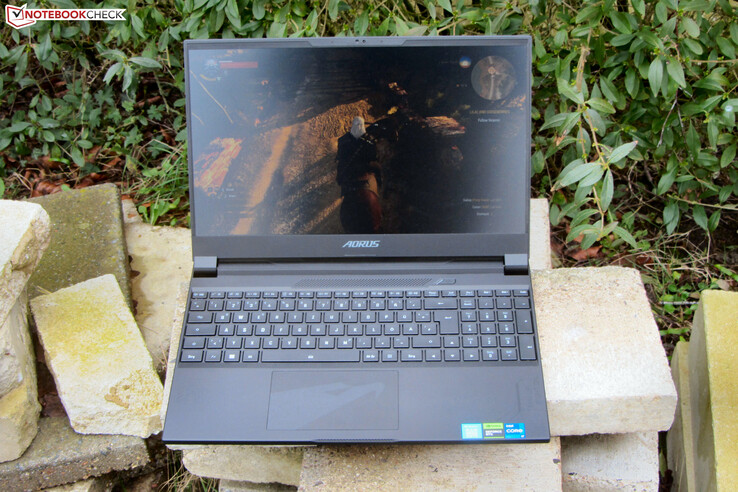
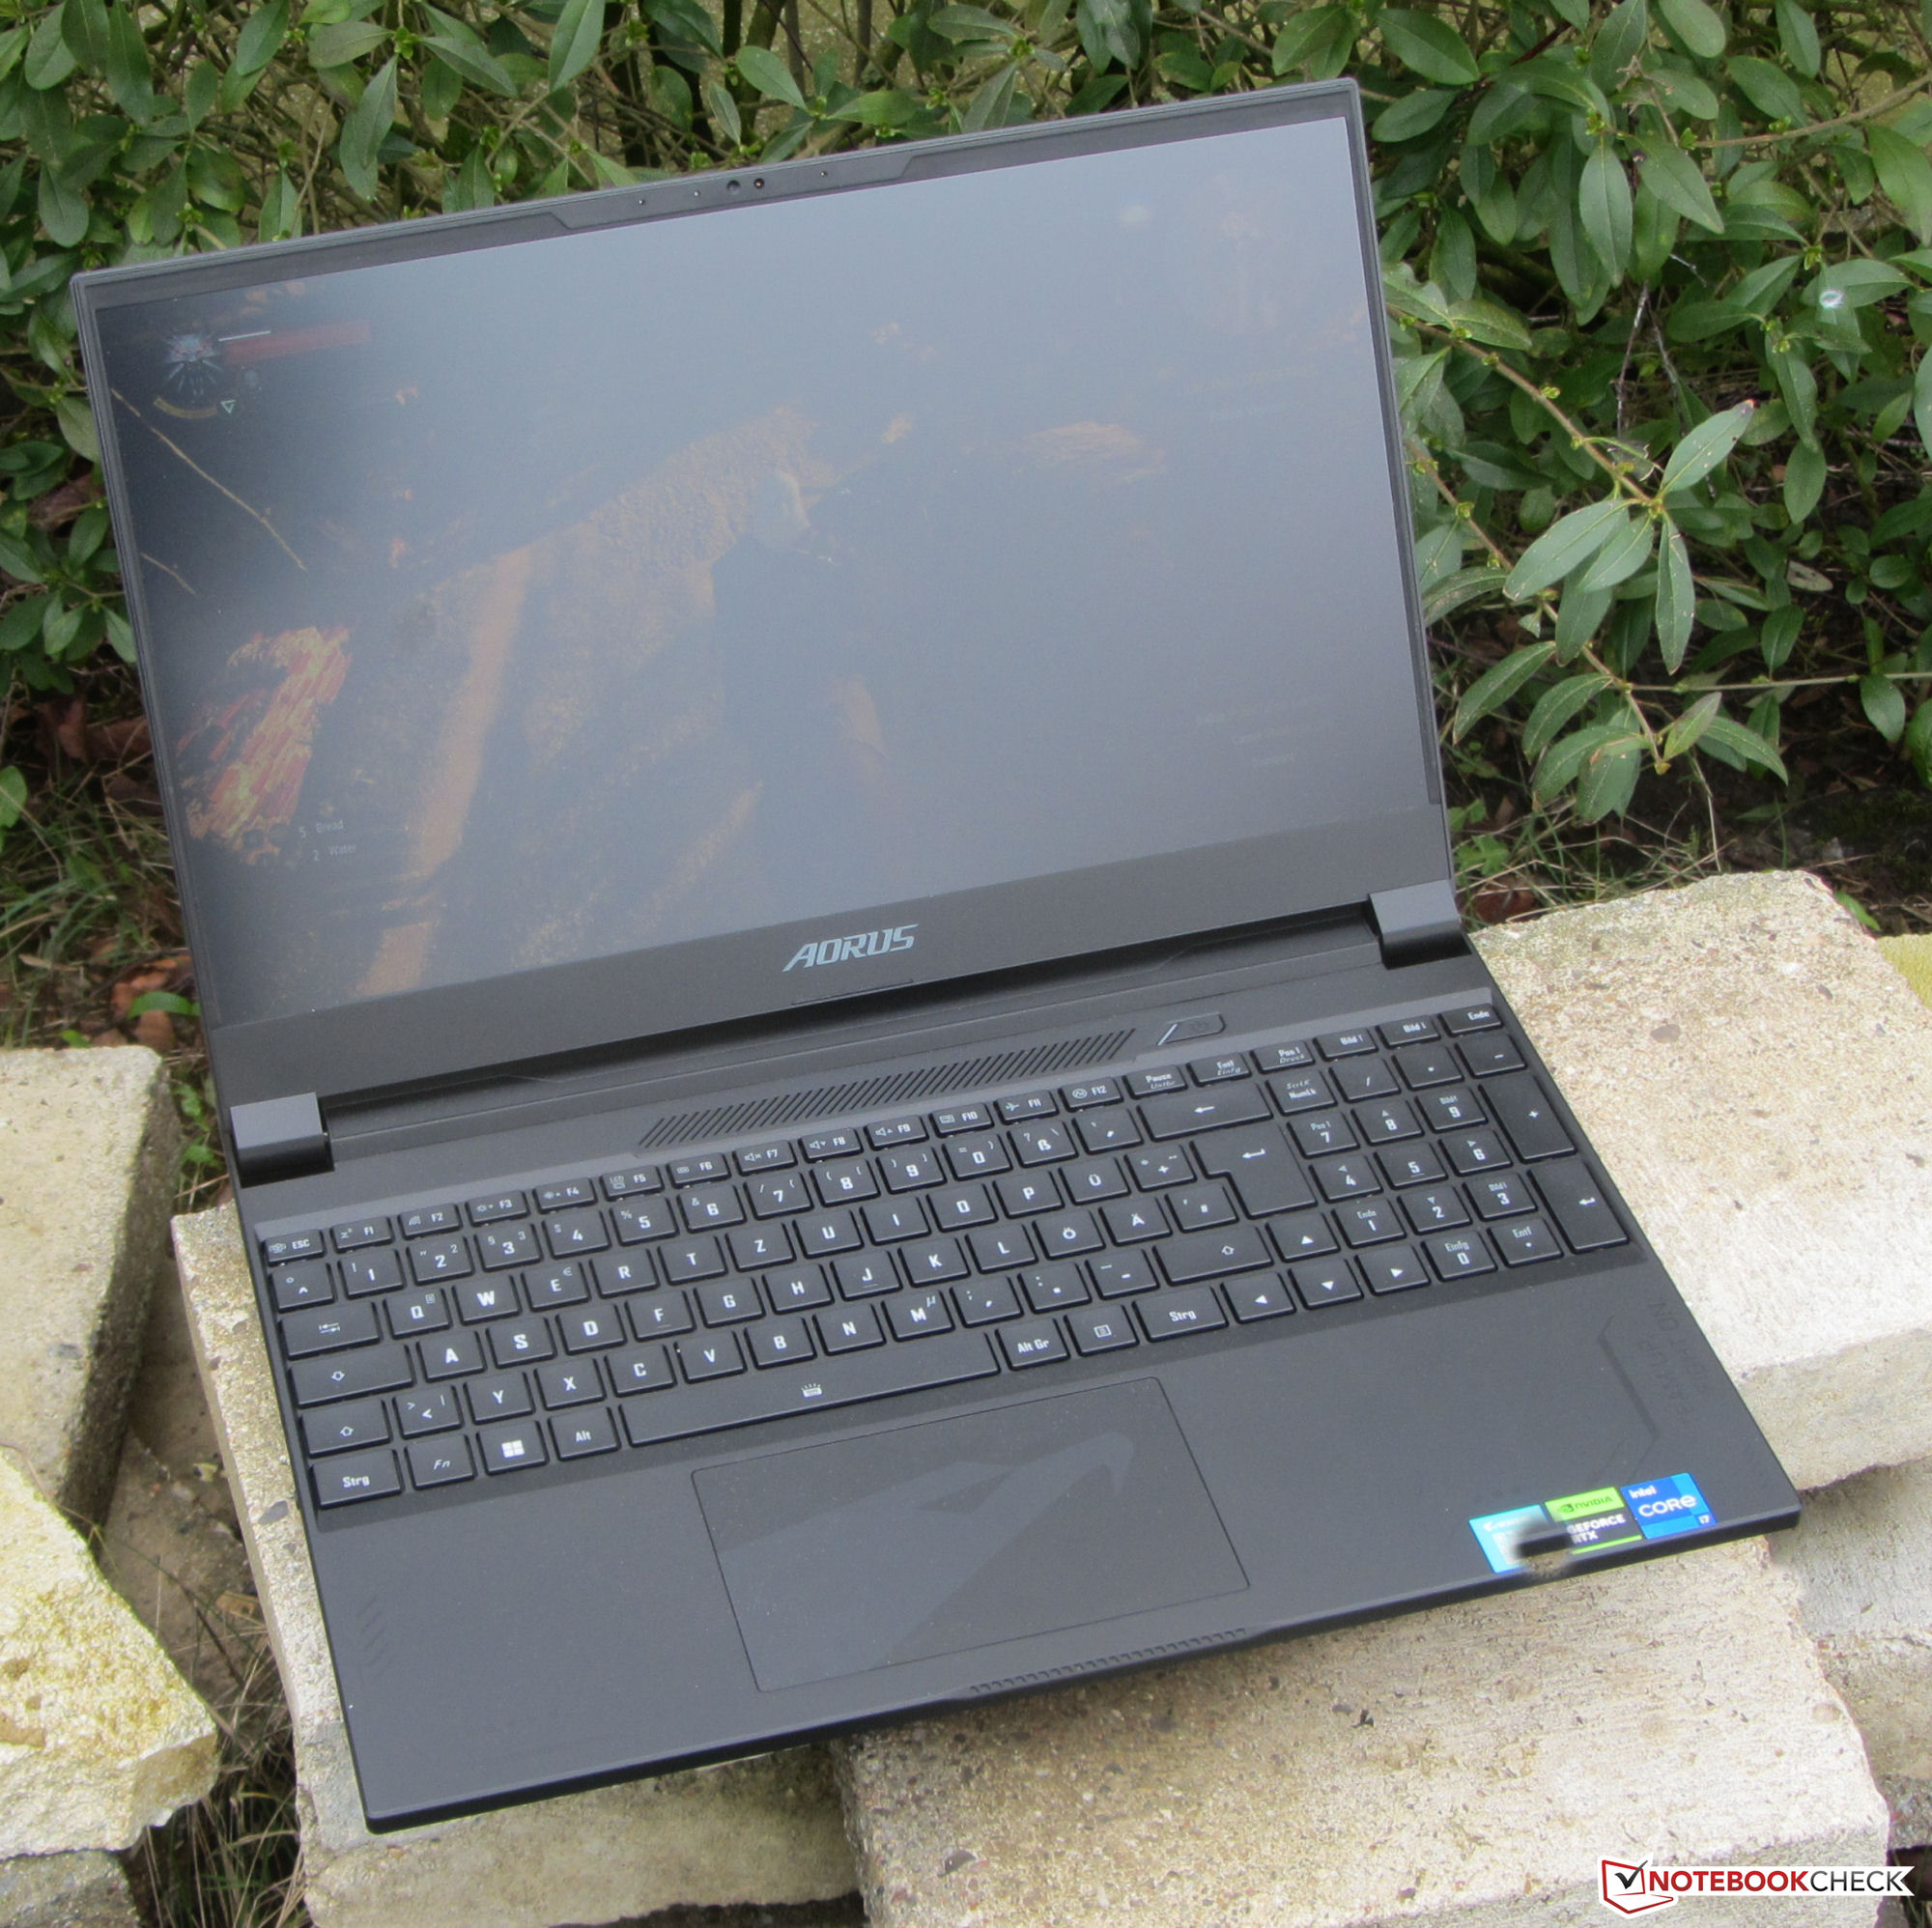
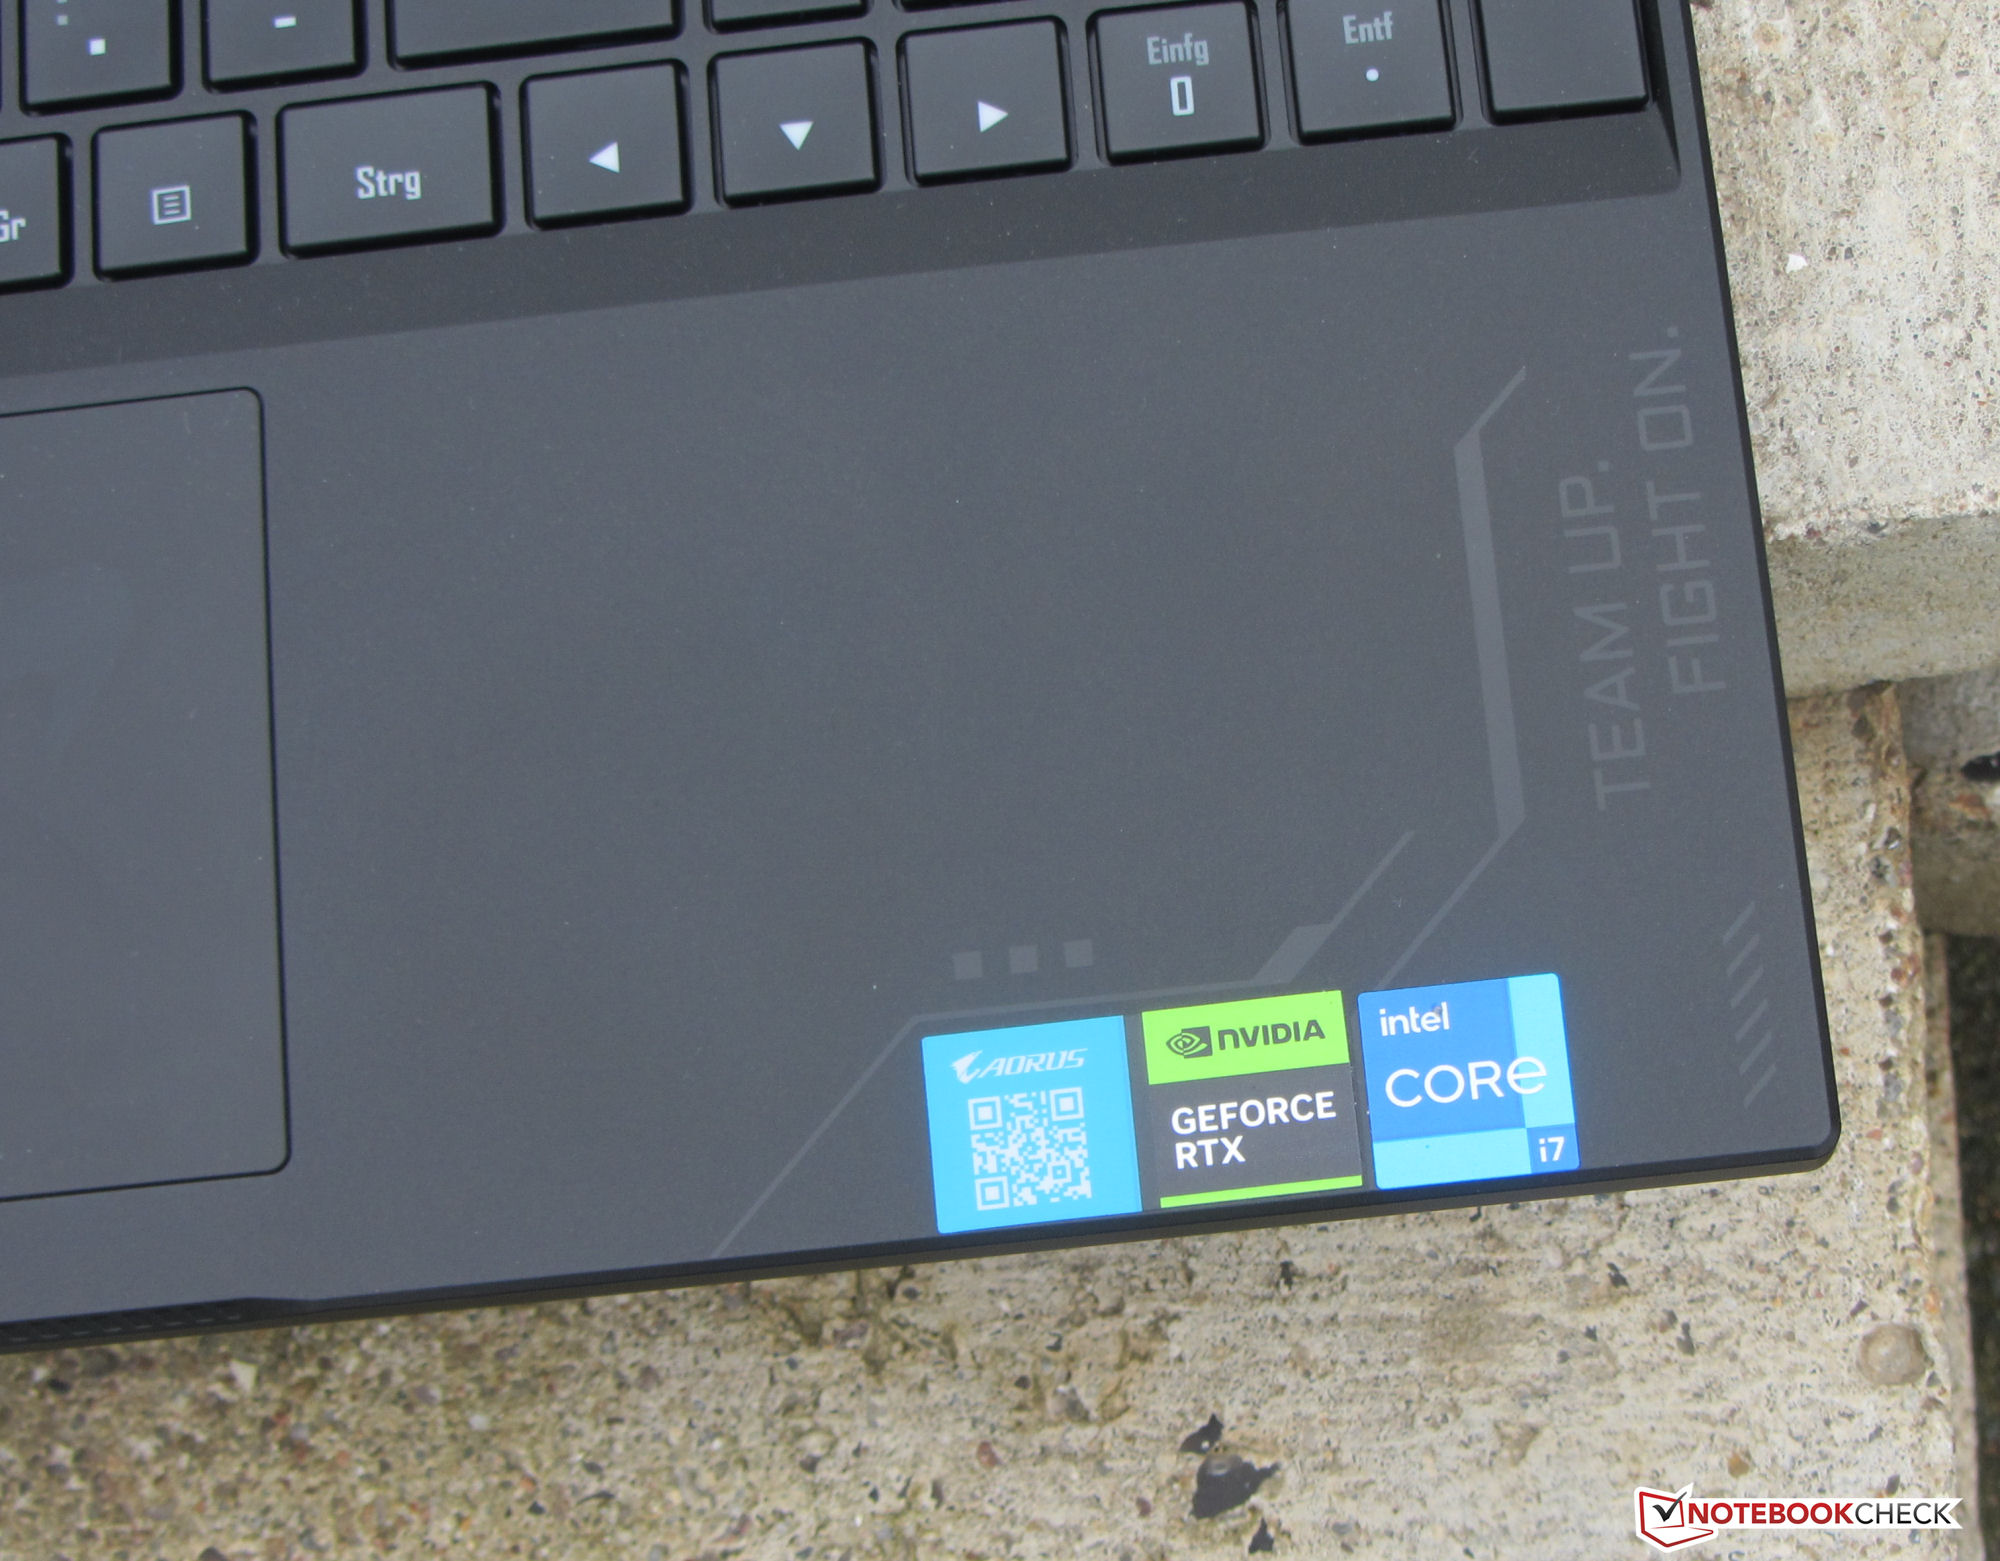
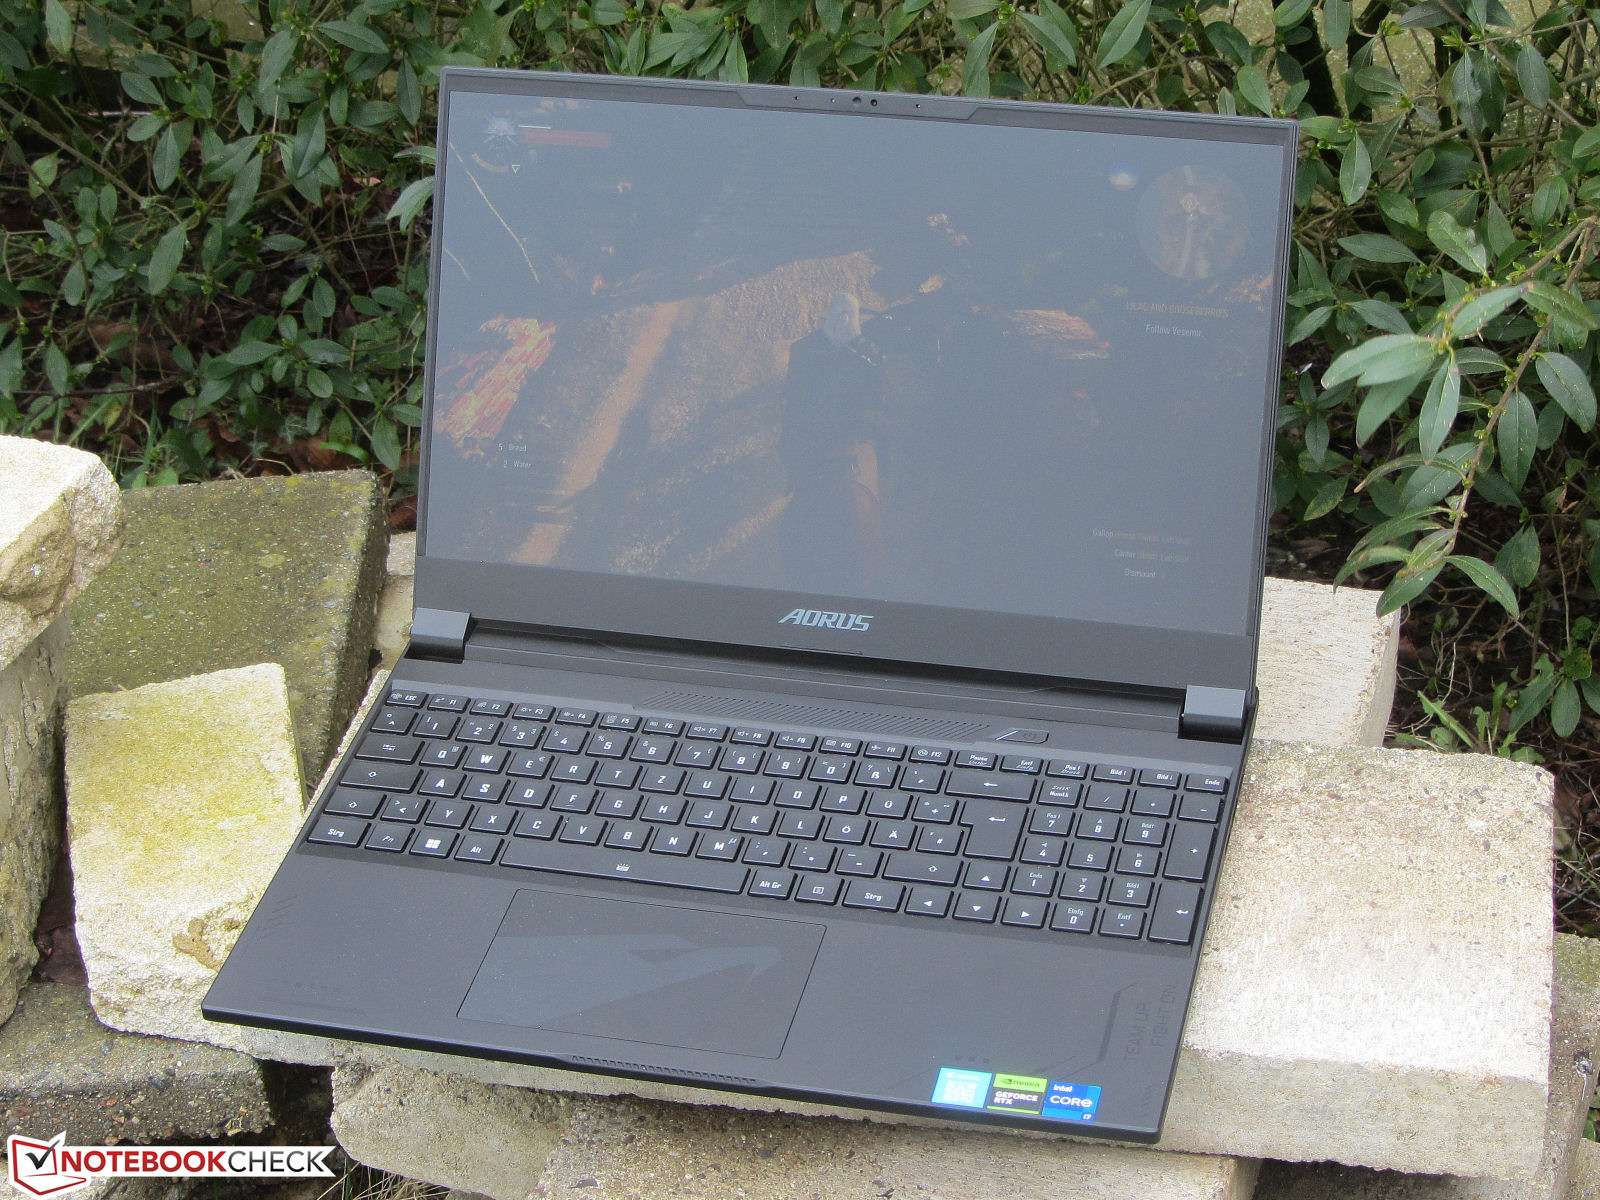
Case - Gigabyte utilize a mix of materials
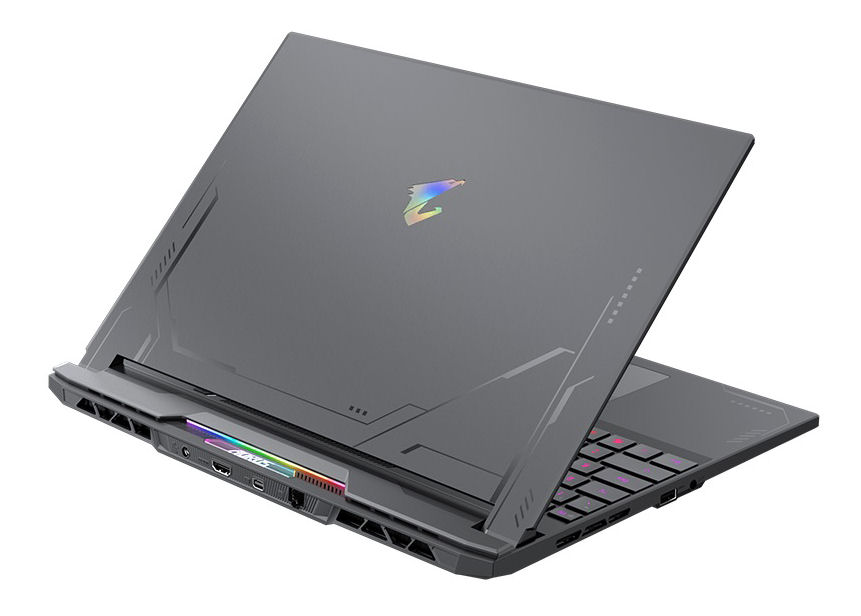
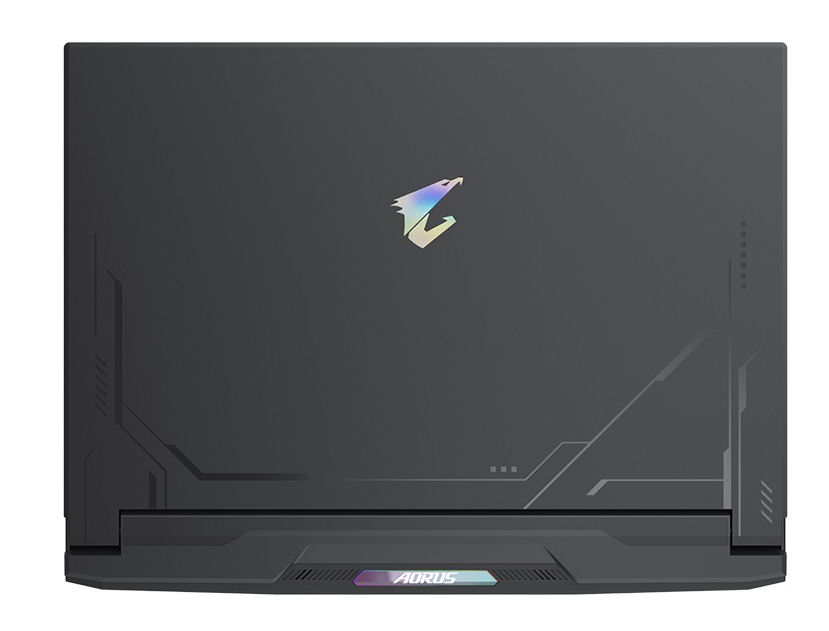
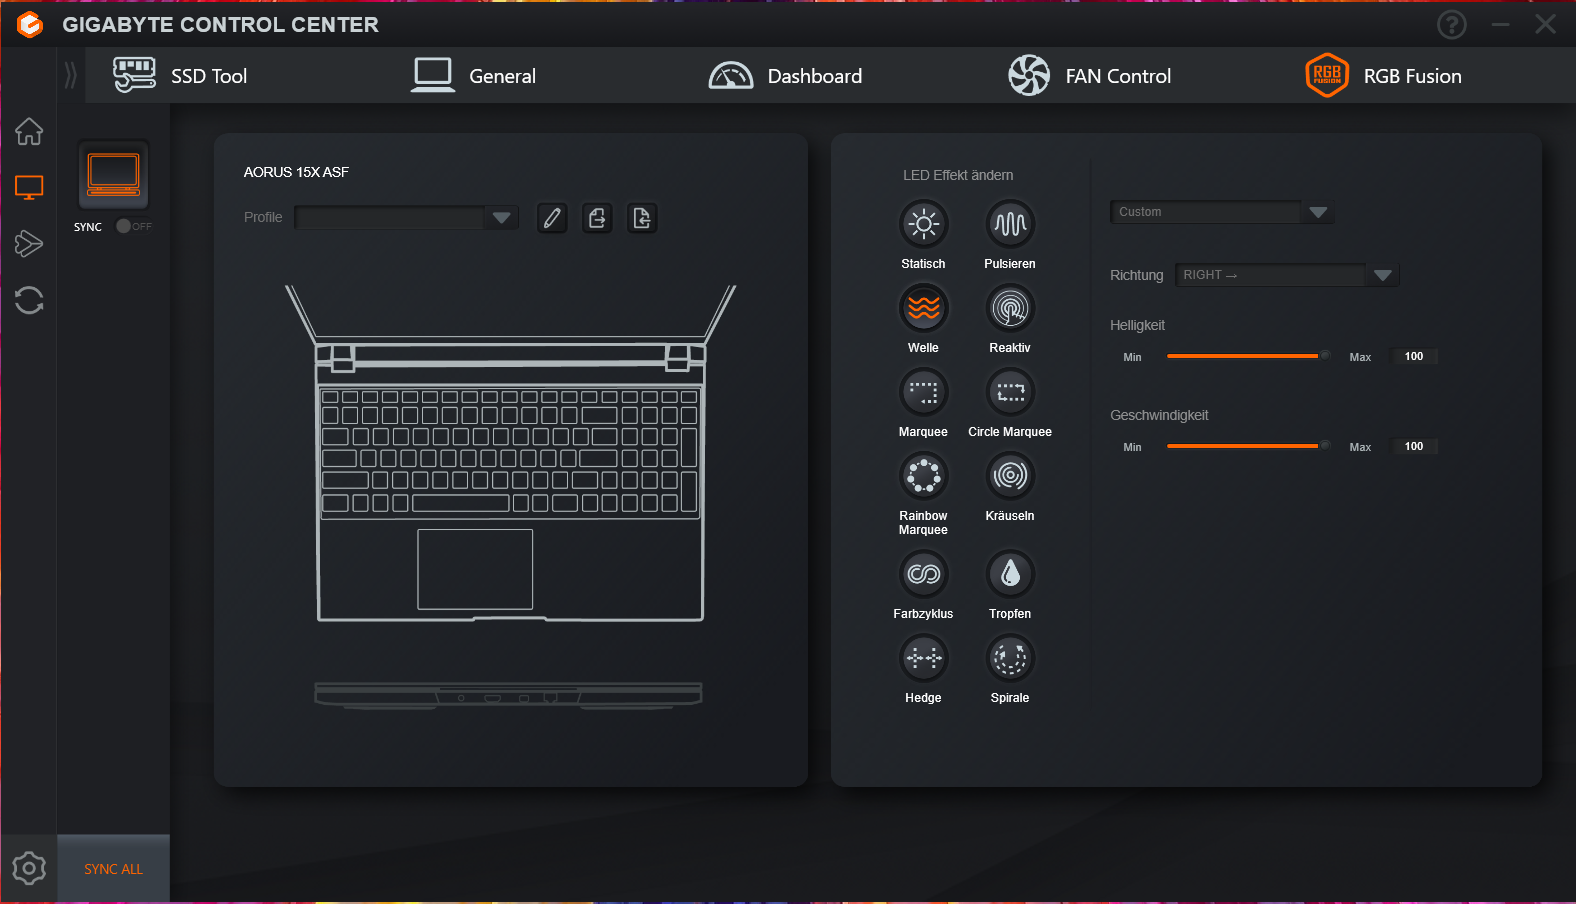
Only the back of the lid is made out of matte black metal - the base unit is made out of plastic. Gigabyte didn't add any fancy visual embellishments apart from the pattern which is etched into the smooth case surface. An LED strip (RGB, customizable) at the back of the base unit and the illuminated keys (RGB) add a pop of color to the device.
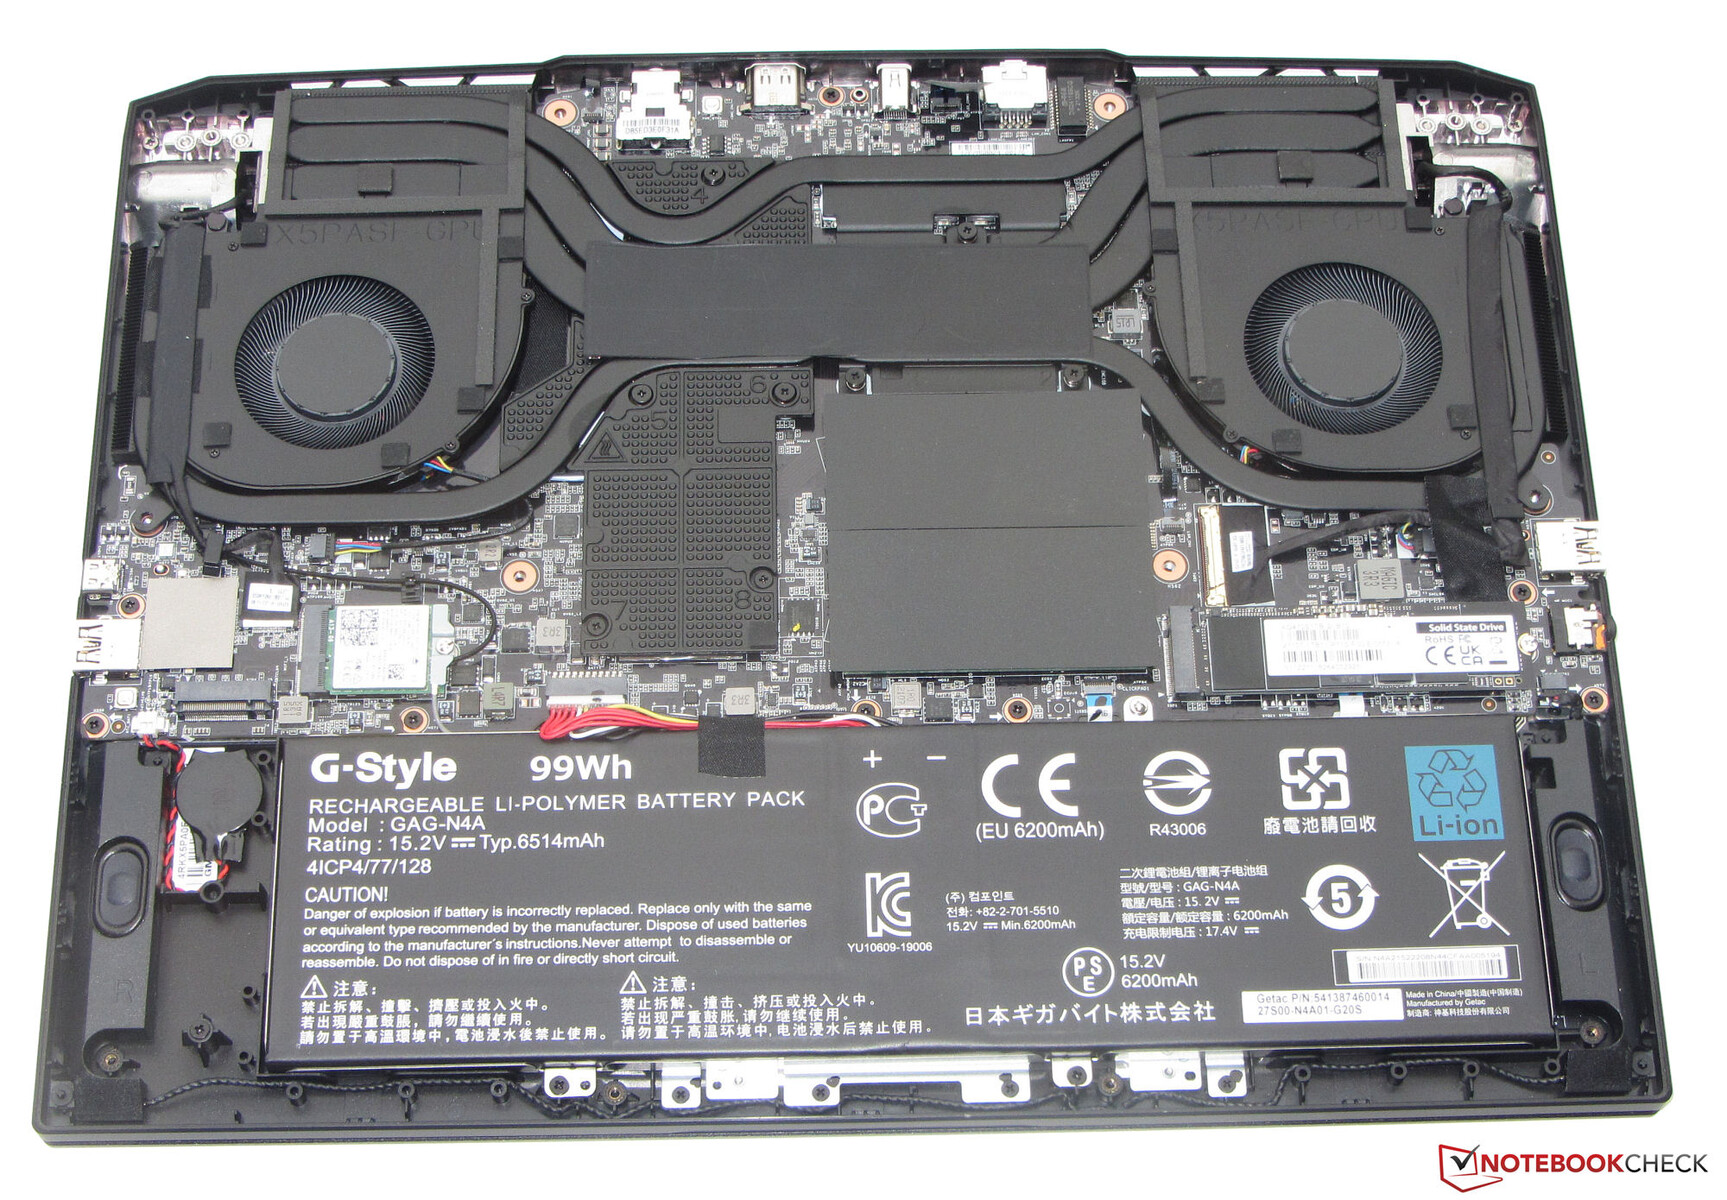
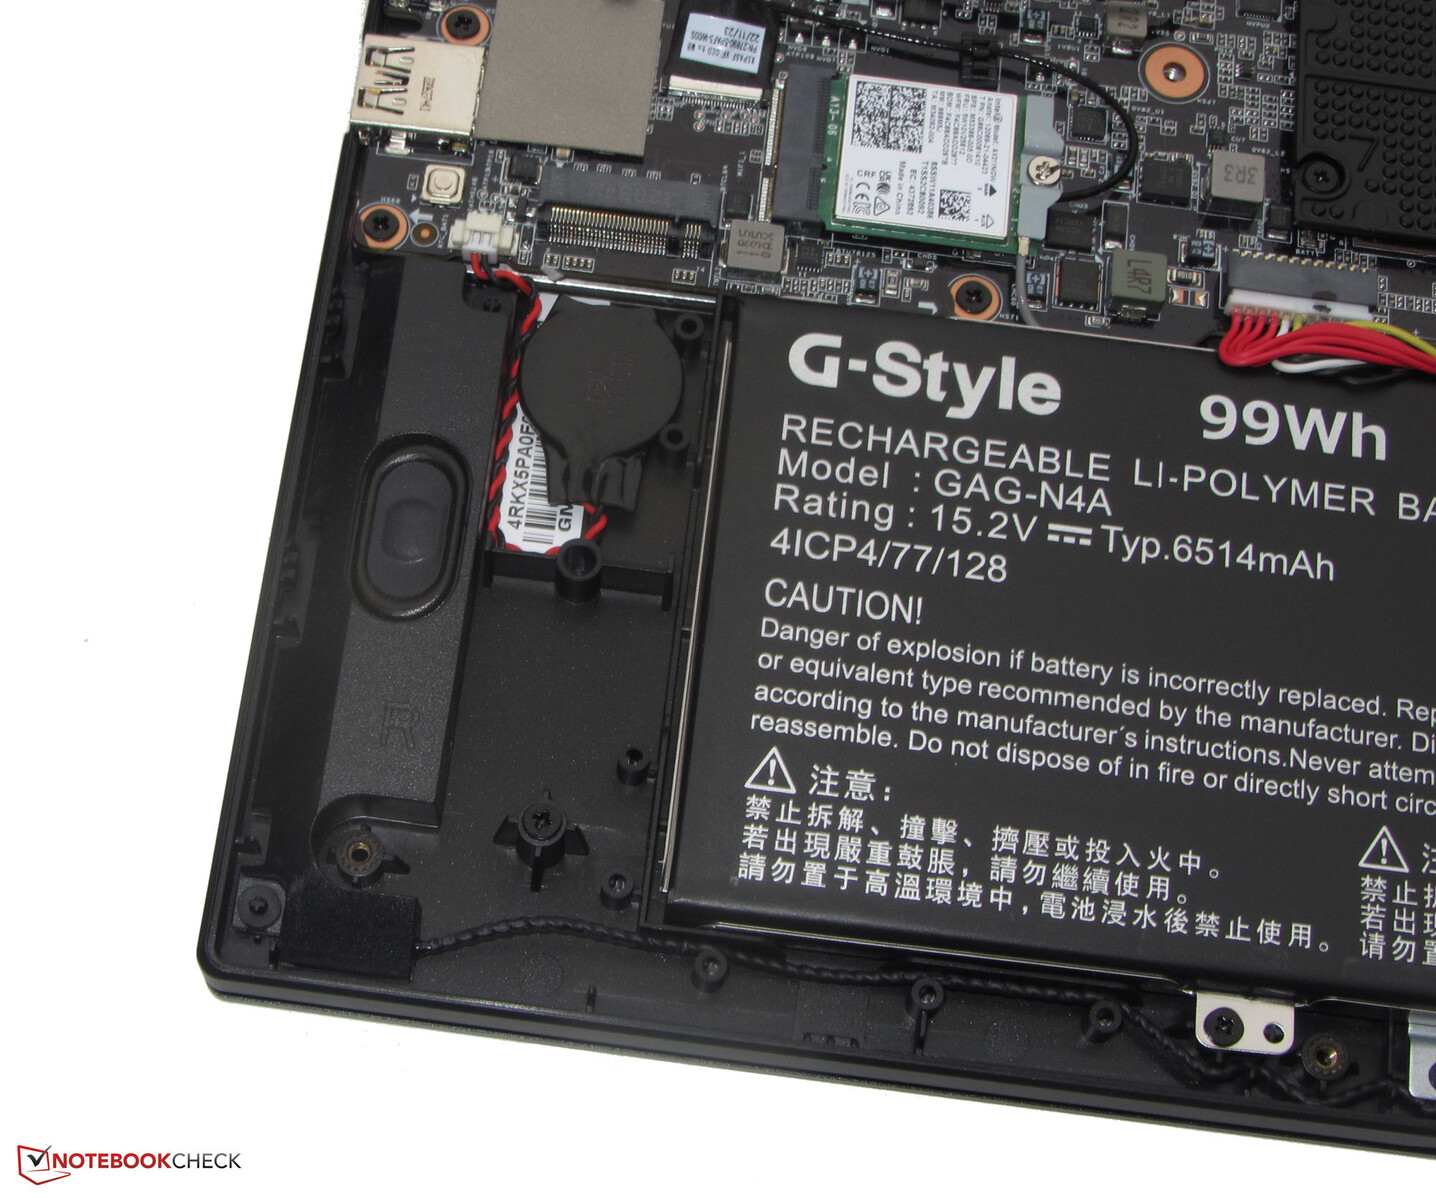
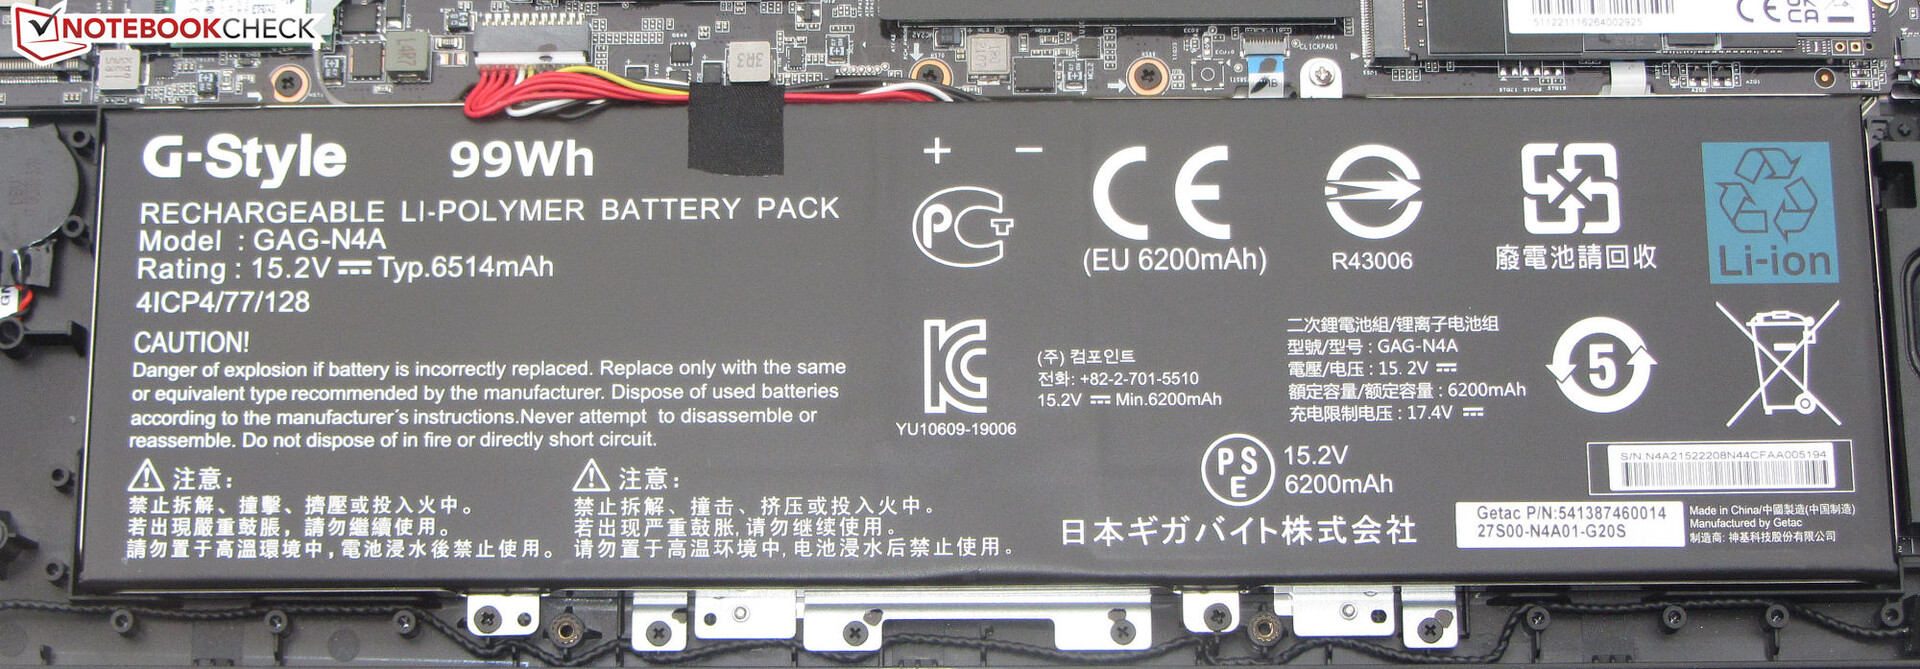
The case is put together flawlessly - there are no material excesses and the gap dimensions are all correct. The base unit can only be slightly twisted, the lid more so. But this all remains within a normal range. The battery (screwed in - not glued) and the rest of the laptop's innards can be accessed when the bottom shell is removed. The hinges hold the lid firmly in place and the maximum opening angle is around 130 degrees. It is possible to open the lid with one hand.
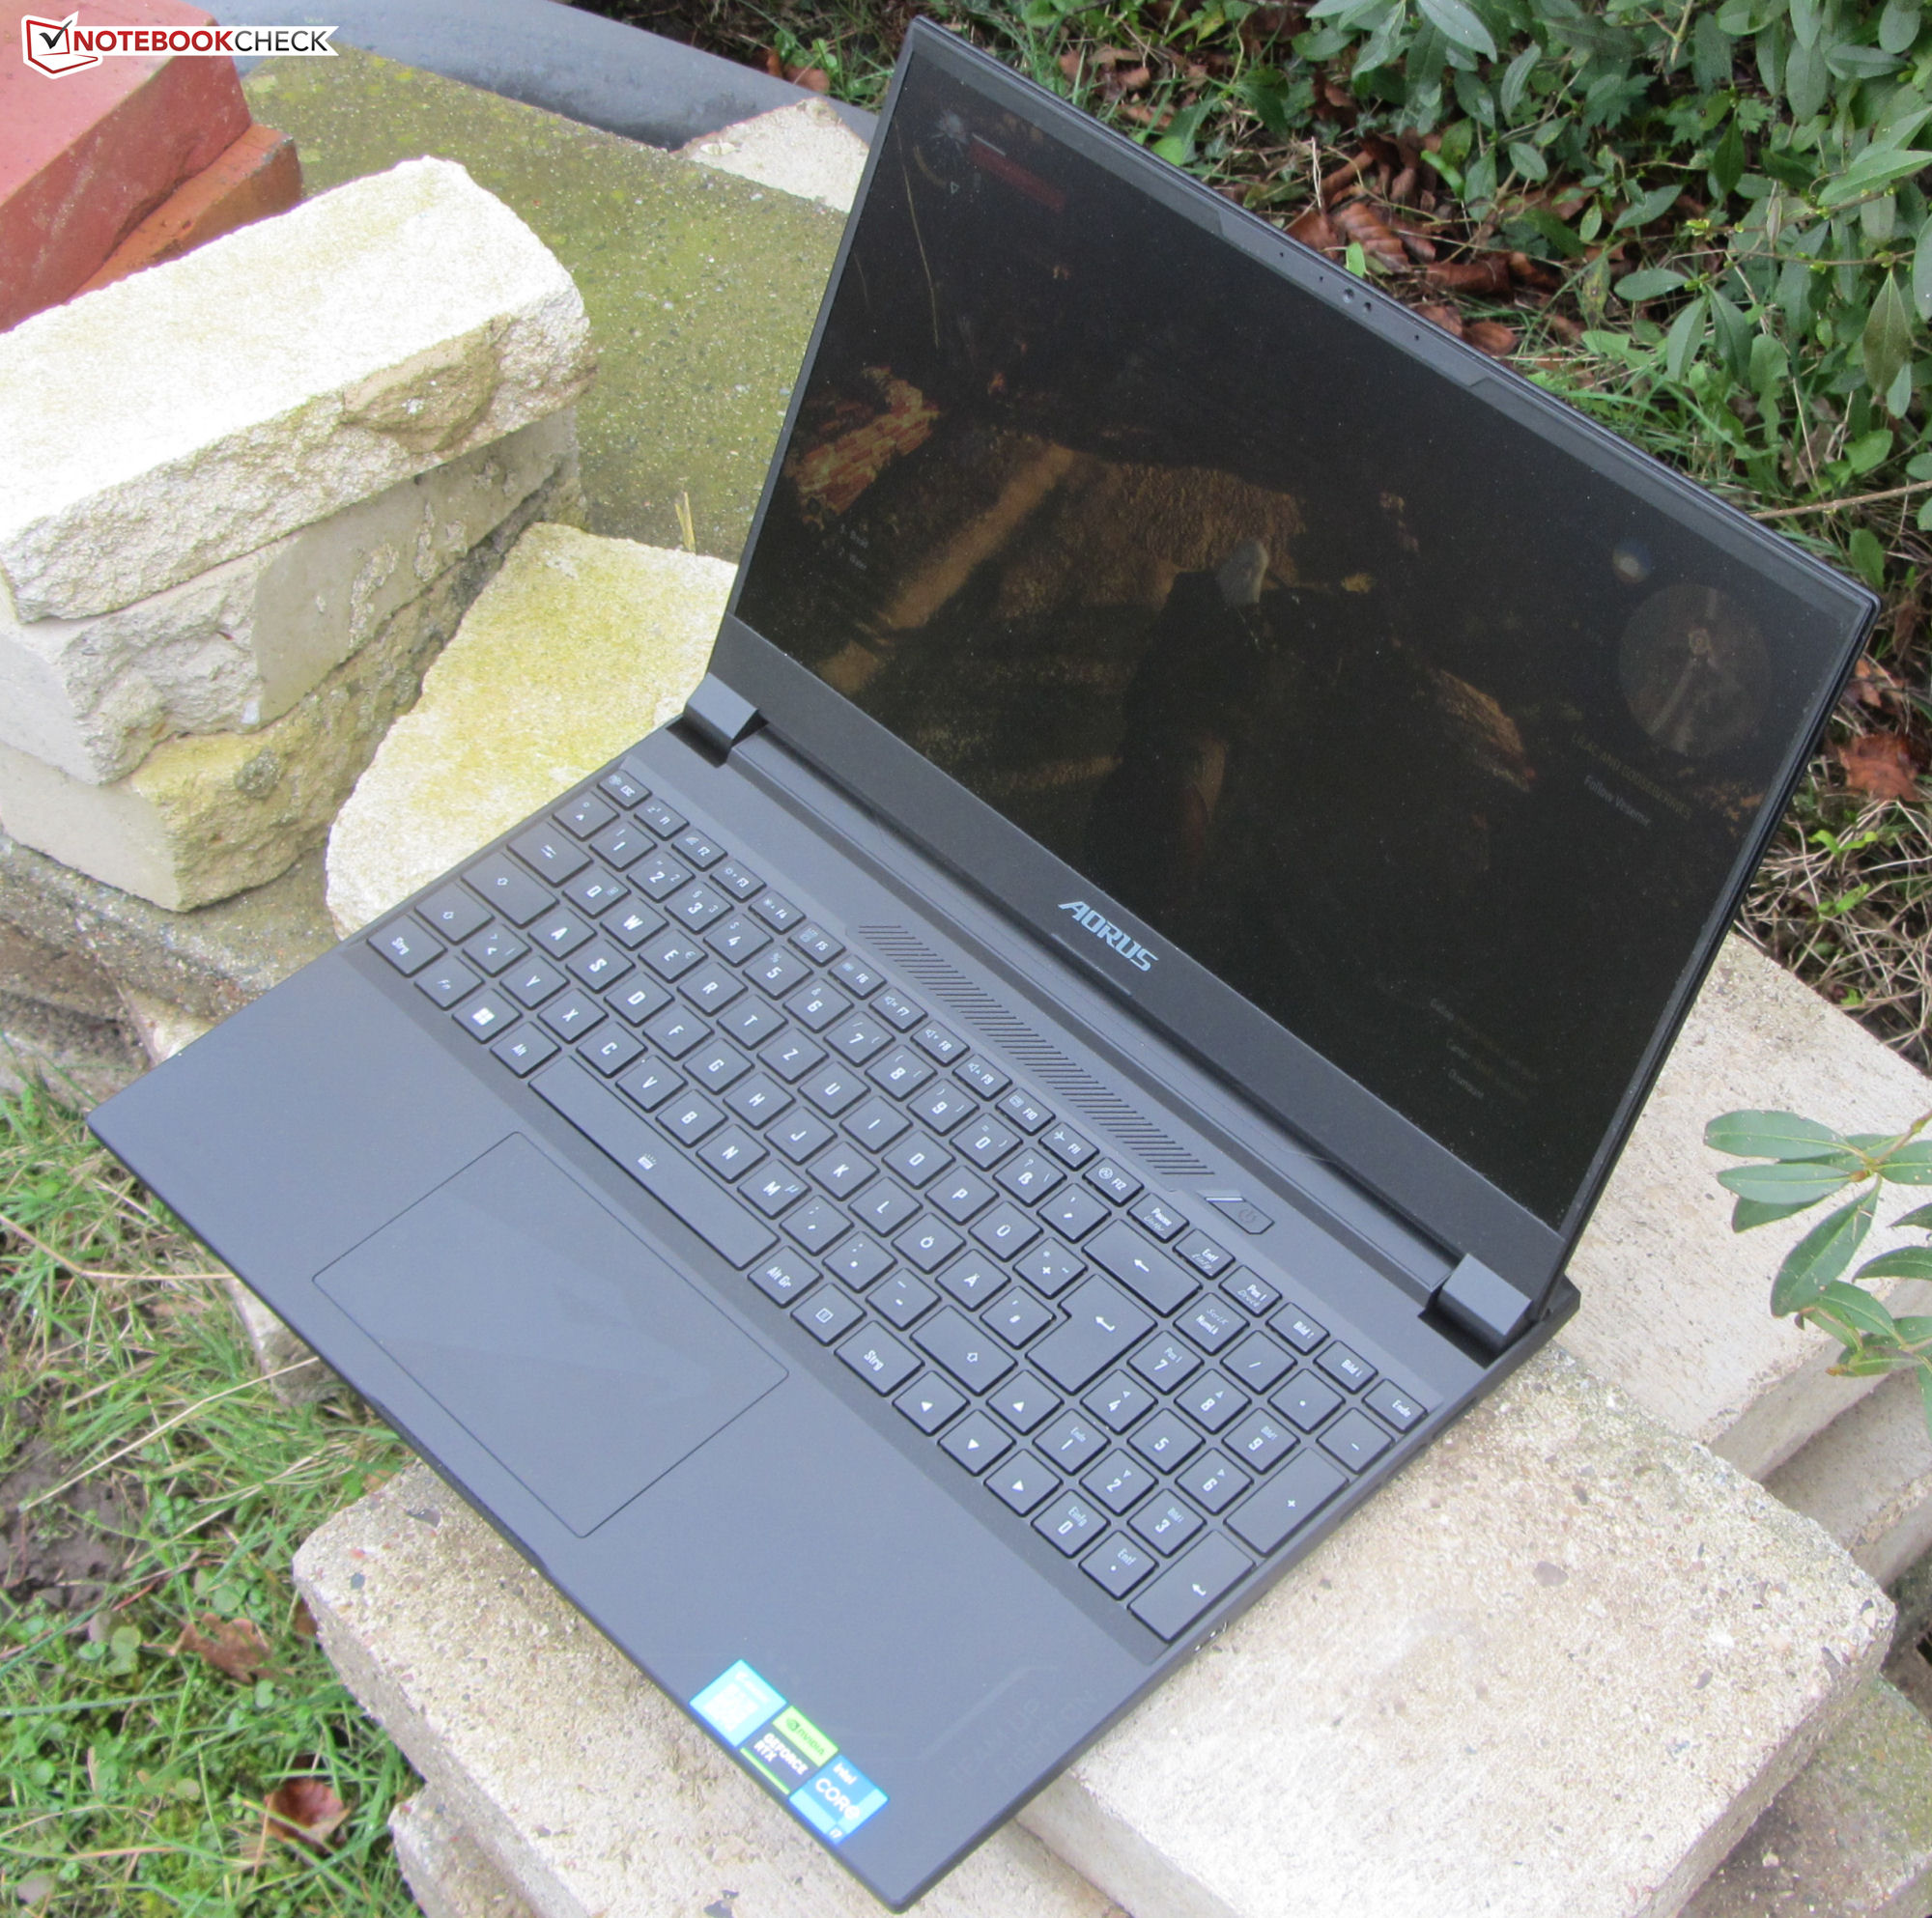
The 15X can be placed pretty much in the middle range of all the 15.6 inch laptops: It is neither compact, nor is it particularly massive. The same thing can be said for its weight.
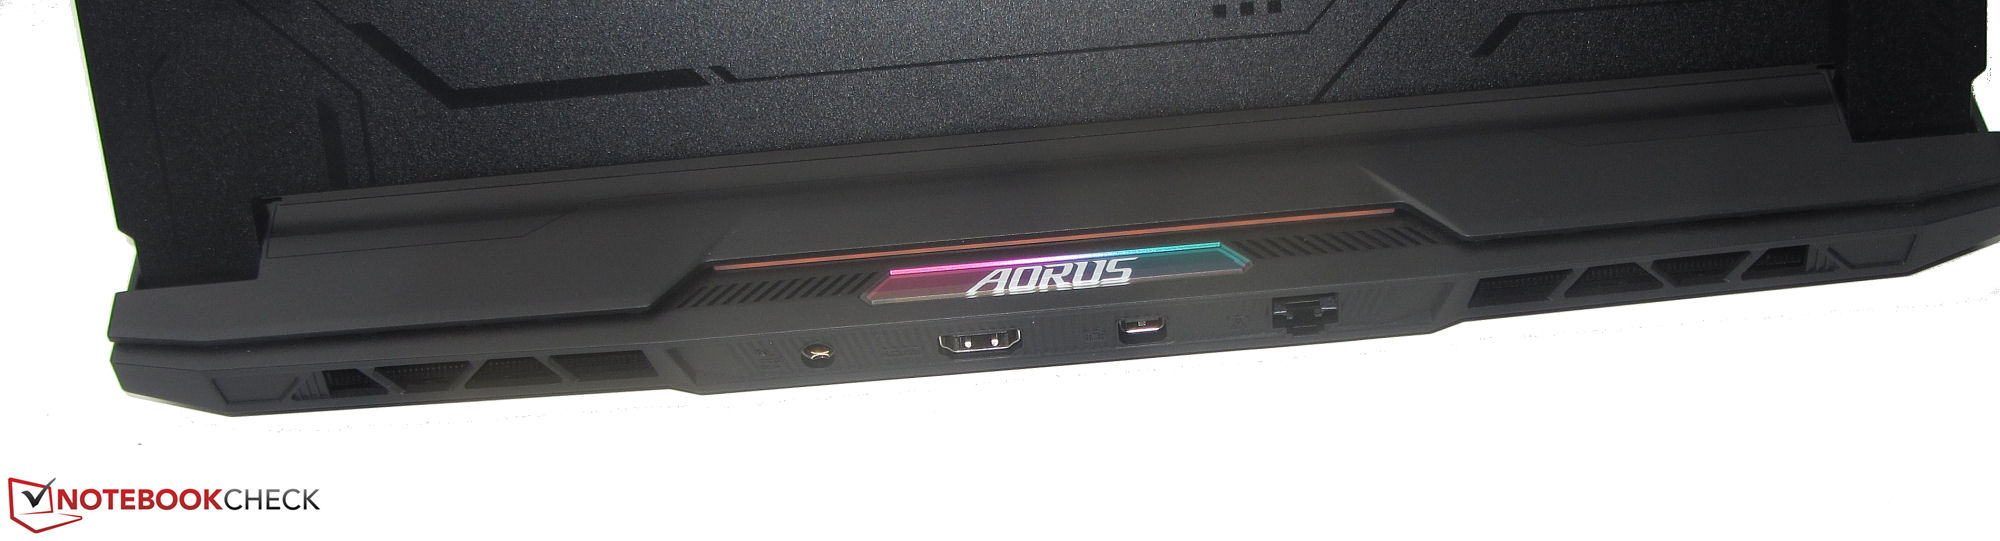
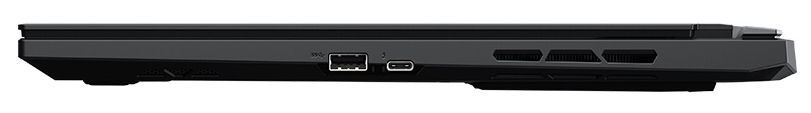
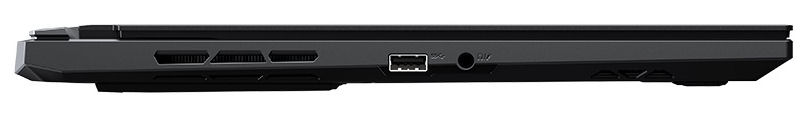
Connectivity - the Aorus computer features Thunderbolt 4
The 15X has two USB-A ports (USB 3.2 Gen 2) and one USB-C port (Thunderbolt 4). The latter supports Power Delivery and can output a DisplayPort signal. This, along with the HDMI port (2.1) and the dedicated Mini DisplayPort (1.4), makes for three video outputs. The computer doesn't feature an SD card reader.
The two dedicated video outputs, as well as the ethernet port, can be found on the back of the device. This means that the cables will not get in your way when you are using the laptop.

Communication
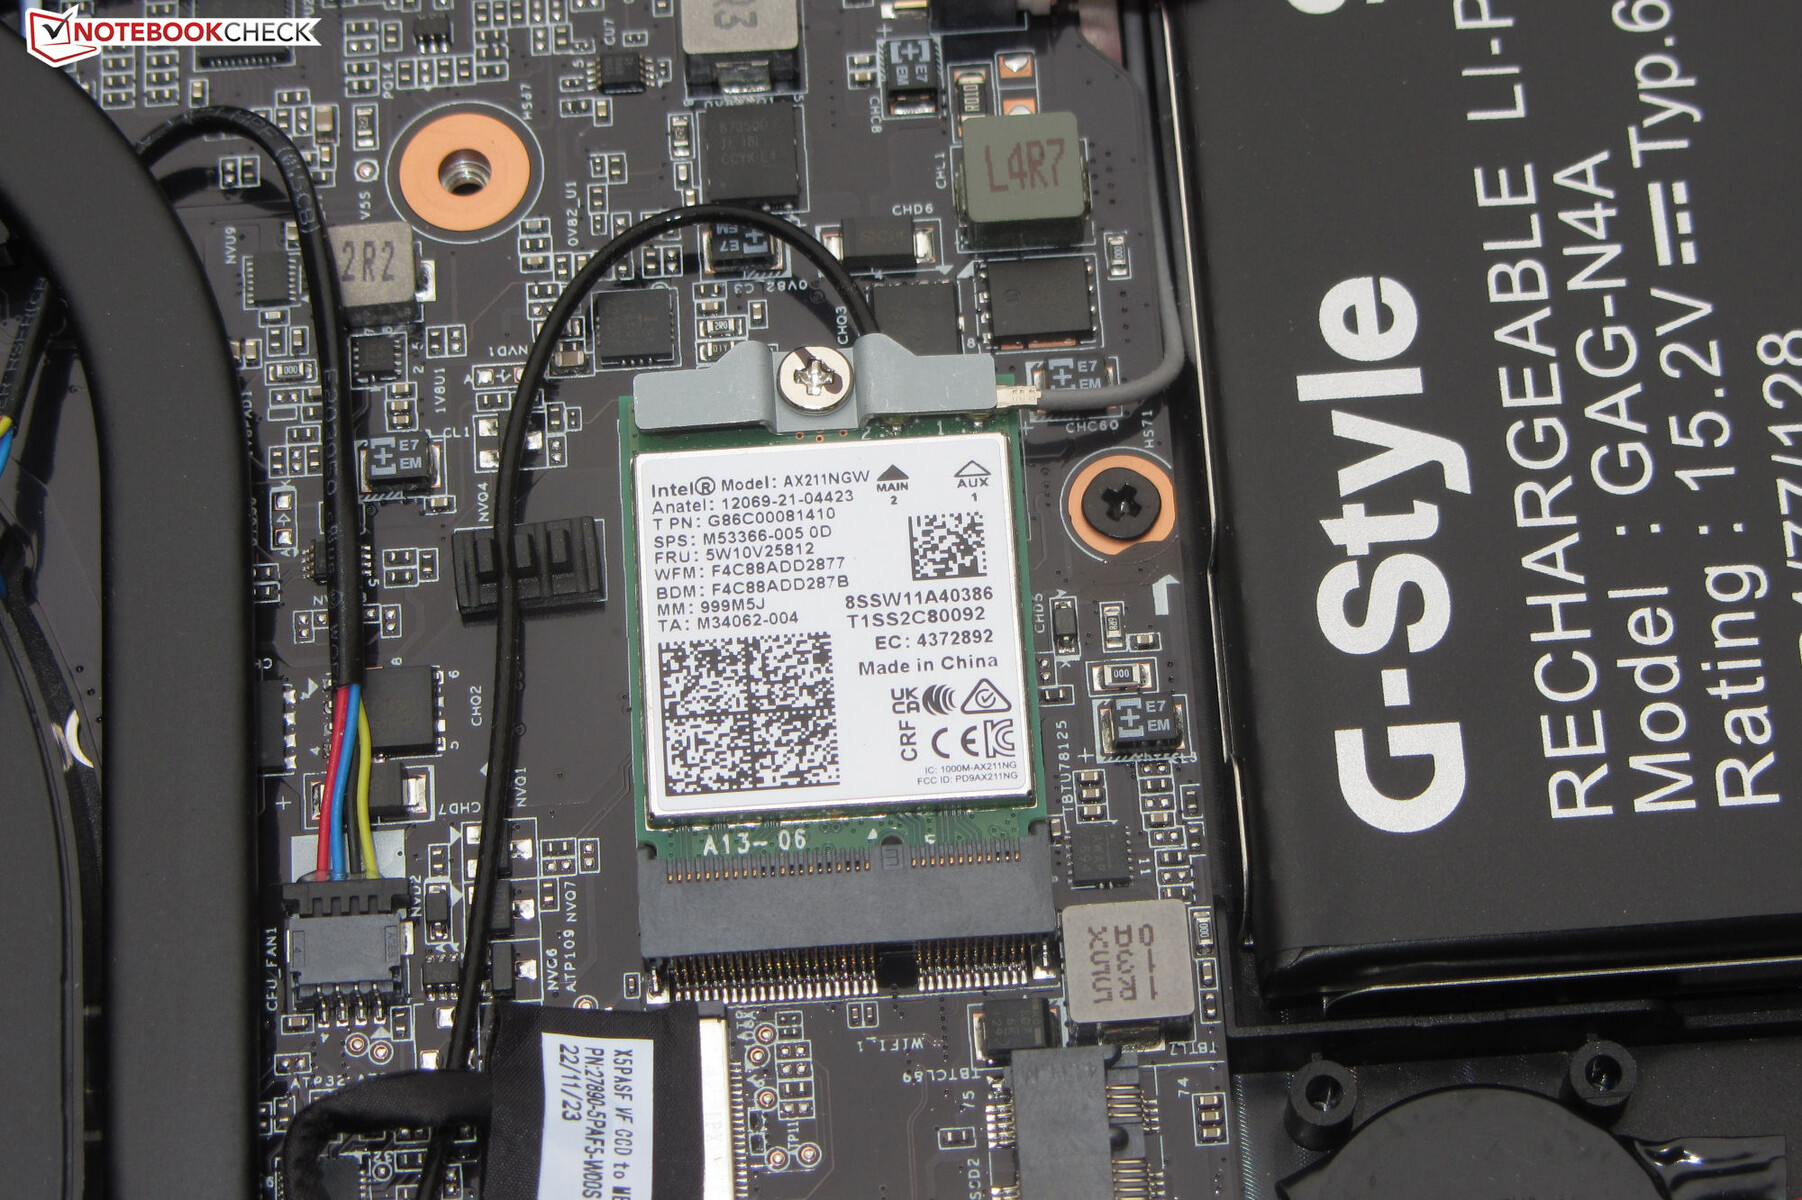
Under optimum conditions (no additional WLAN devices in the vicinity, small distance between laptop and server PC), the laptop's WLAN transfer rates are good, however, they remain slightly below average considering what is possible with this Wi-Fi chip (Intel AX211; Wi-Fi 6E). Wired network connection is made possible through a Gigabit Ethernet chip (RTL8125; 2.5 Gbit) by Realtek.
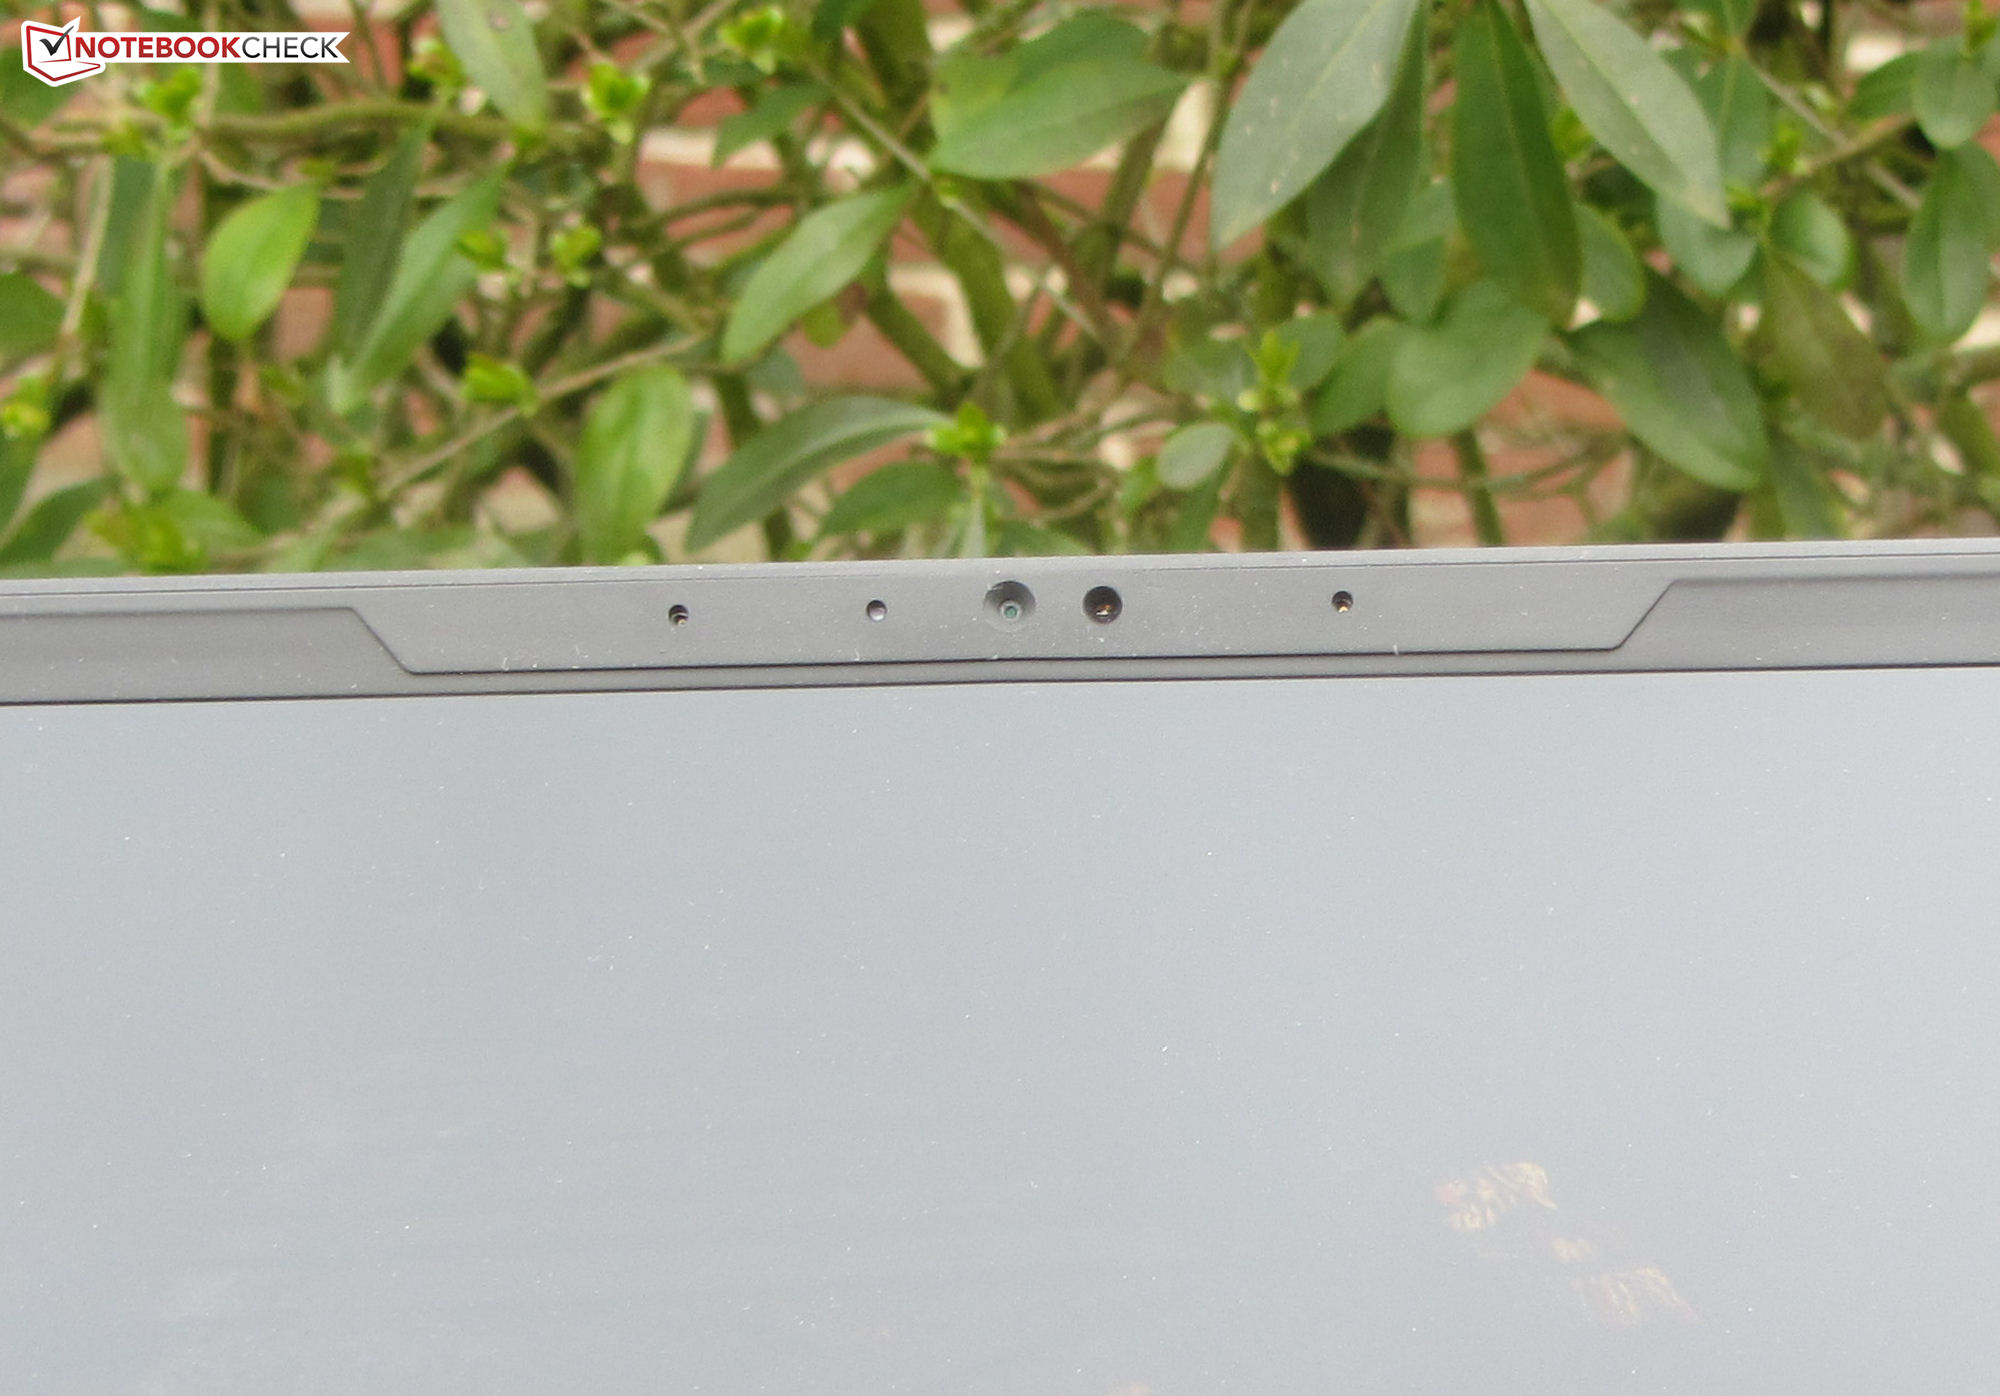
Webcam
The device's webcam (2.1 MP, max. 1,920 x 1,080 pixels) doesn't have a cover, however, its quality is pretty standard. It struggles a little with color accuracy: Its color deviation of 11 means this falls within an unacceptable range (desirable: DeltaE less than 3).


Accessories
Next to the usual documents (quick start guide and warranty information), the laptop doesn't come with any additional accessories.
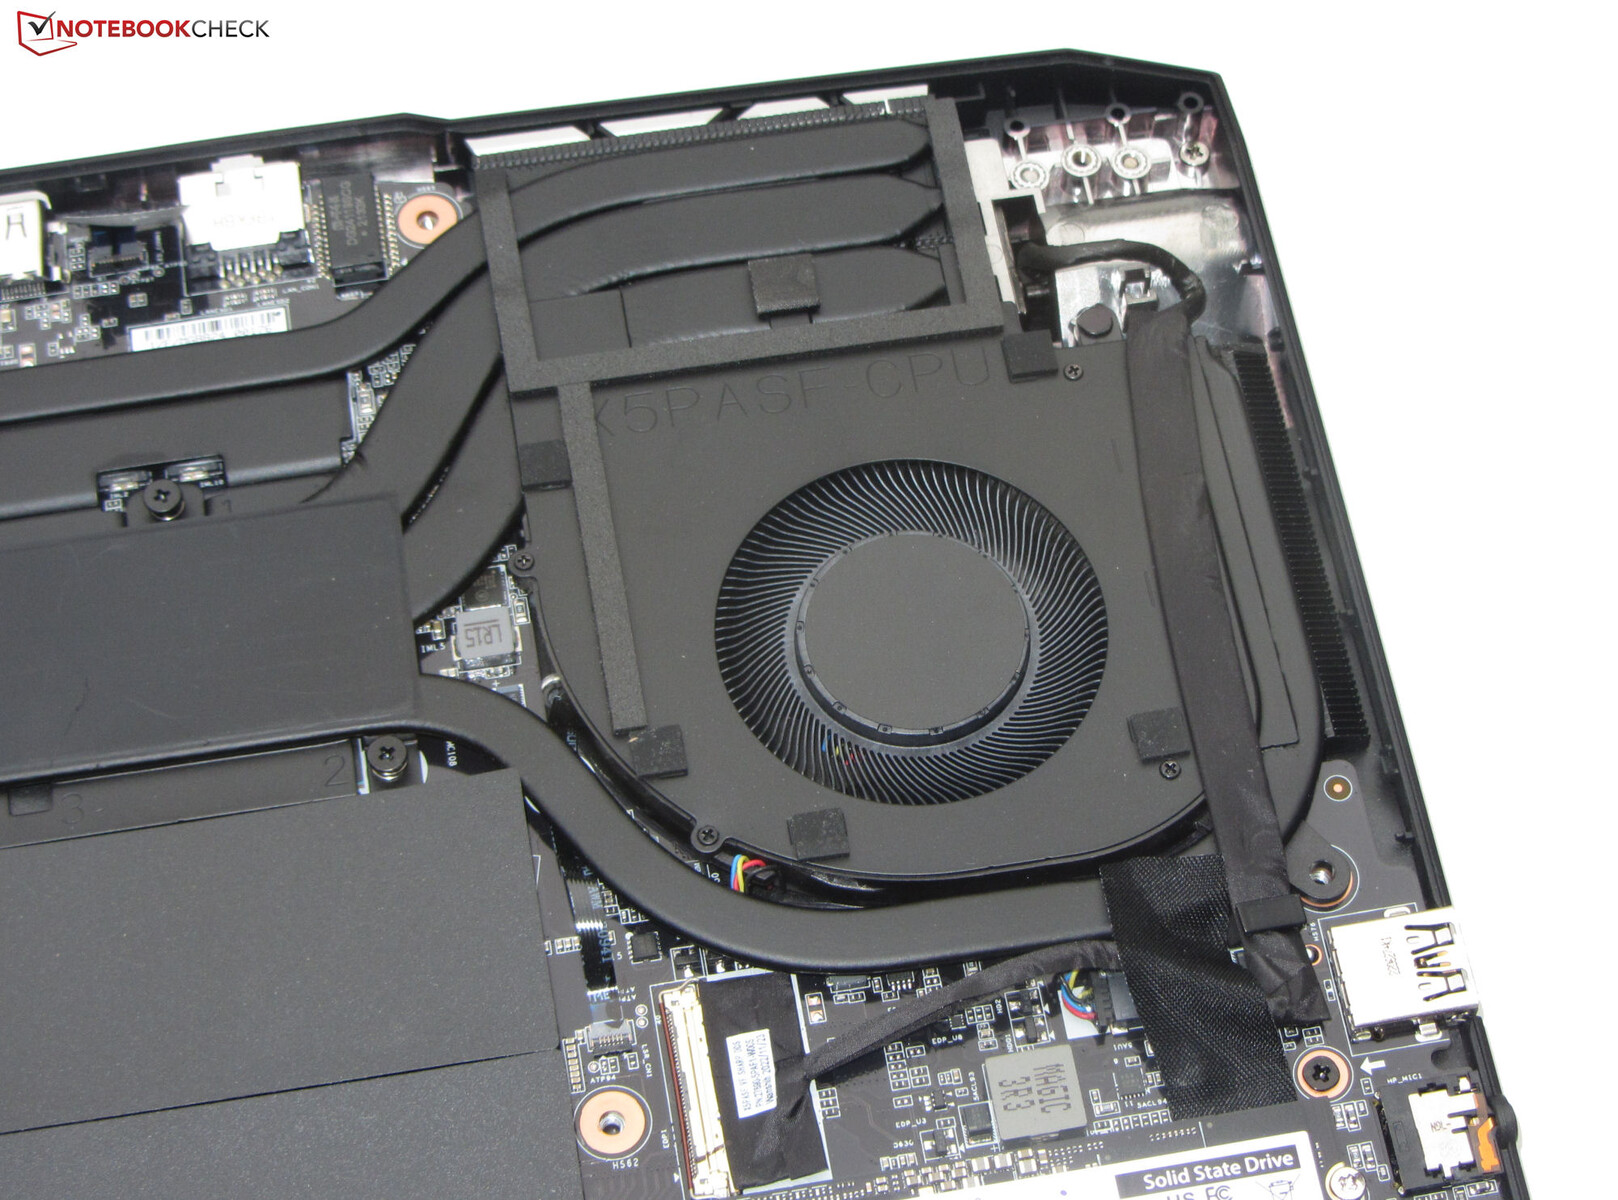
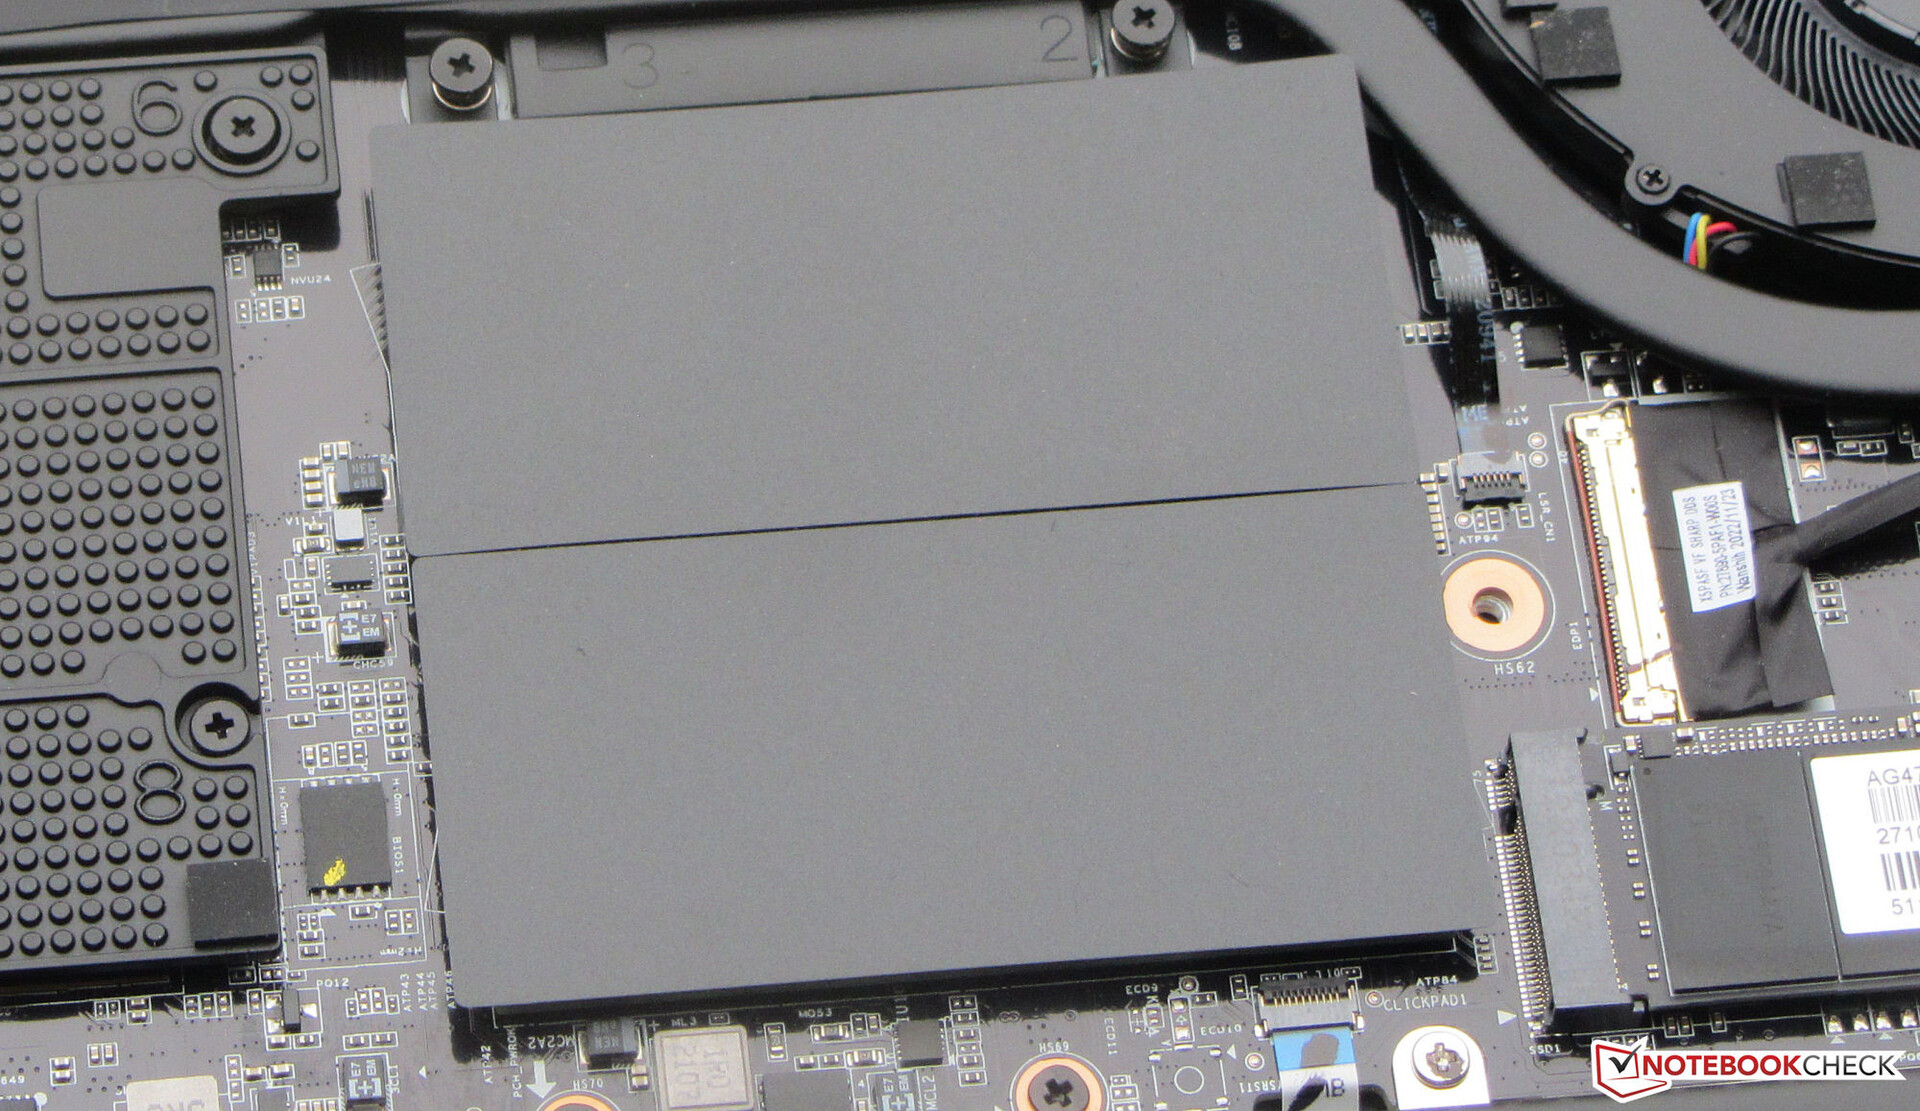
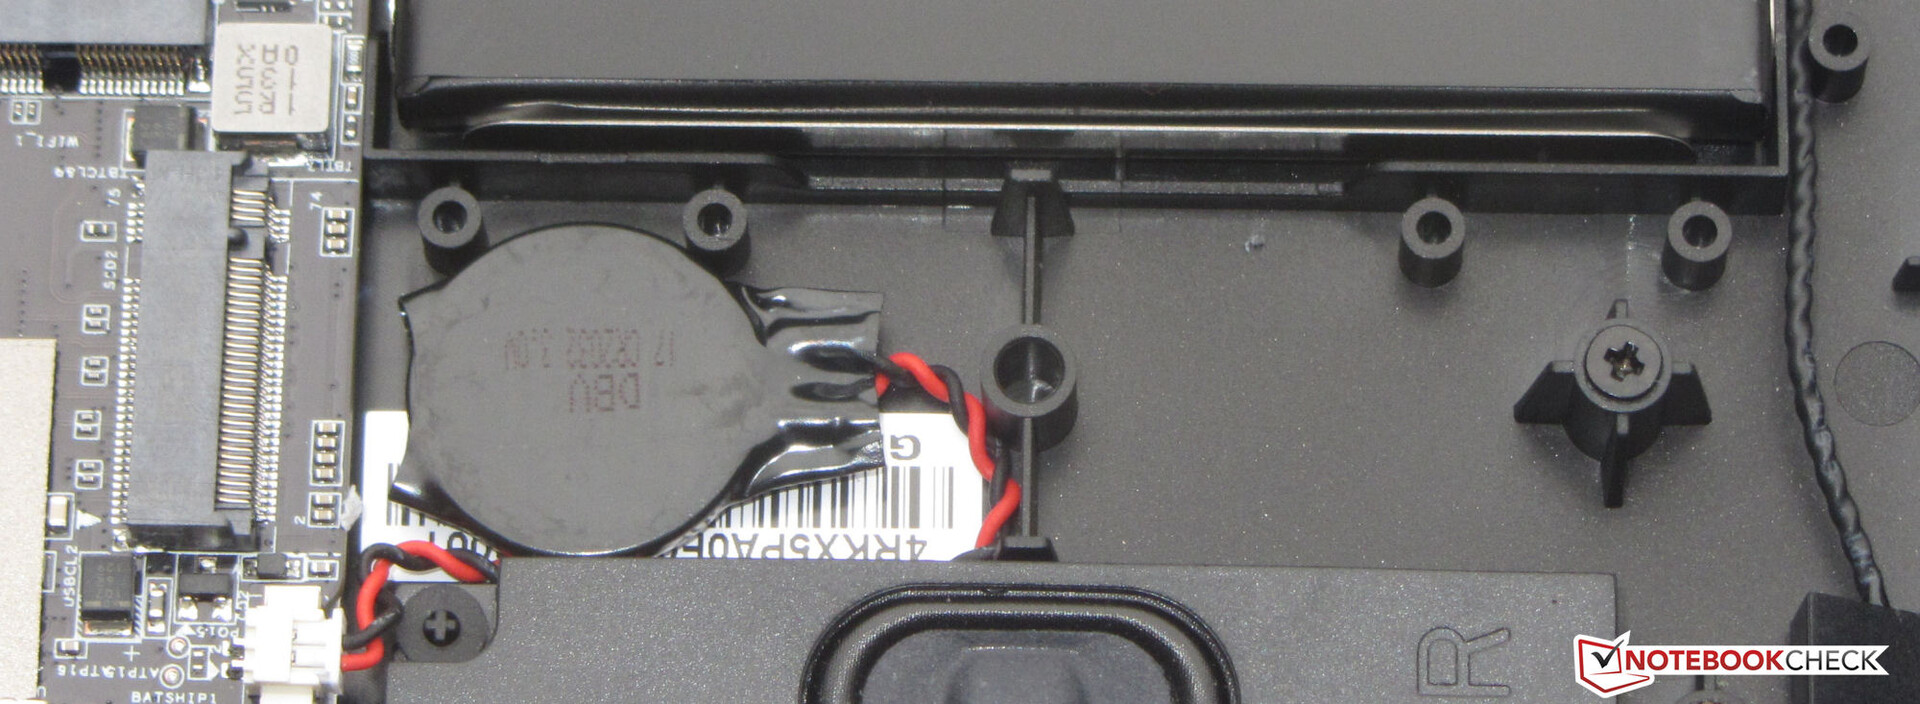
Maintenance
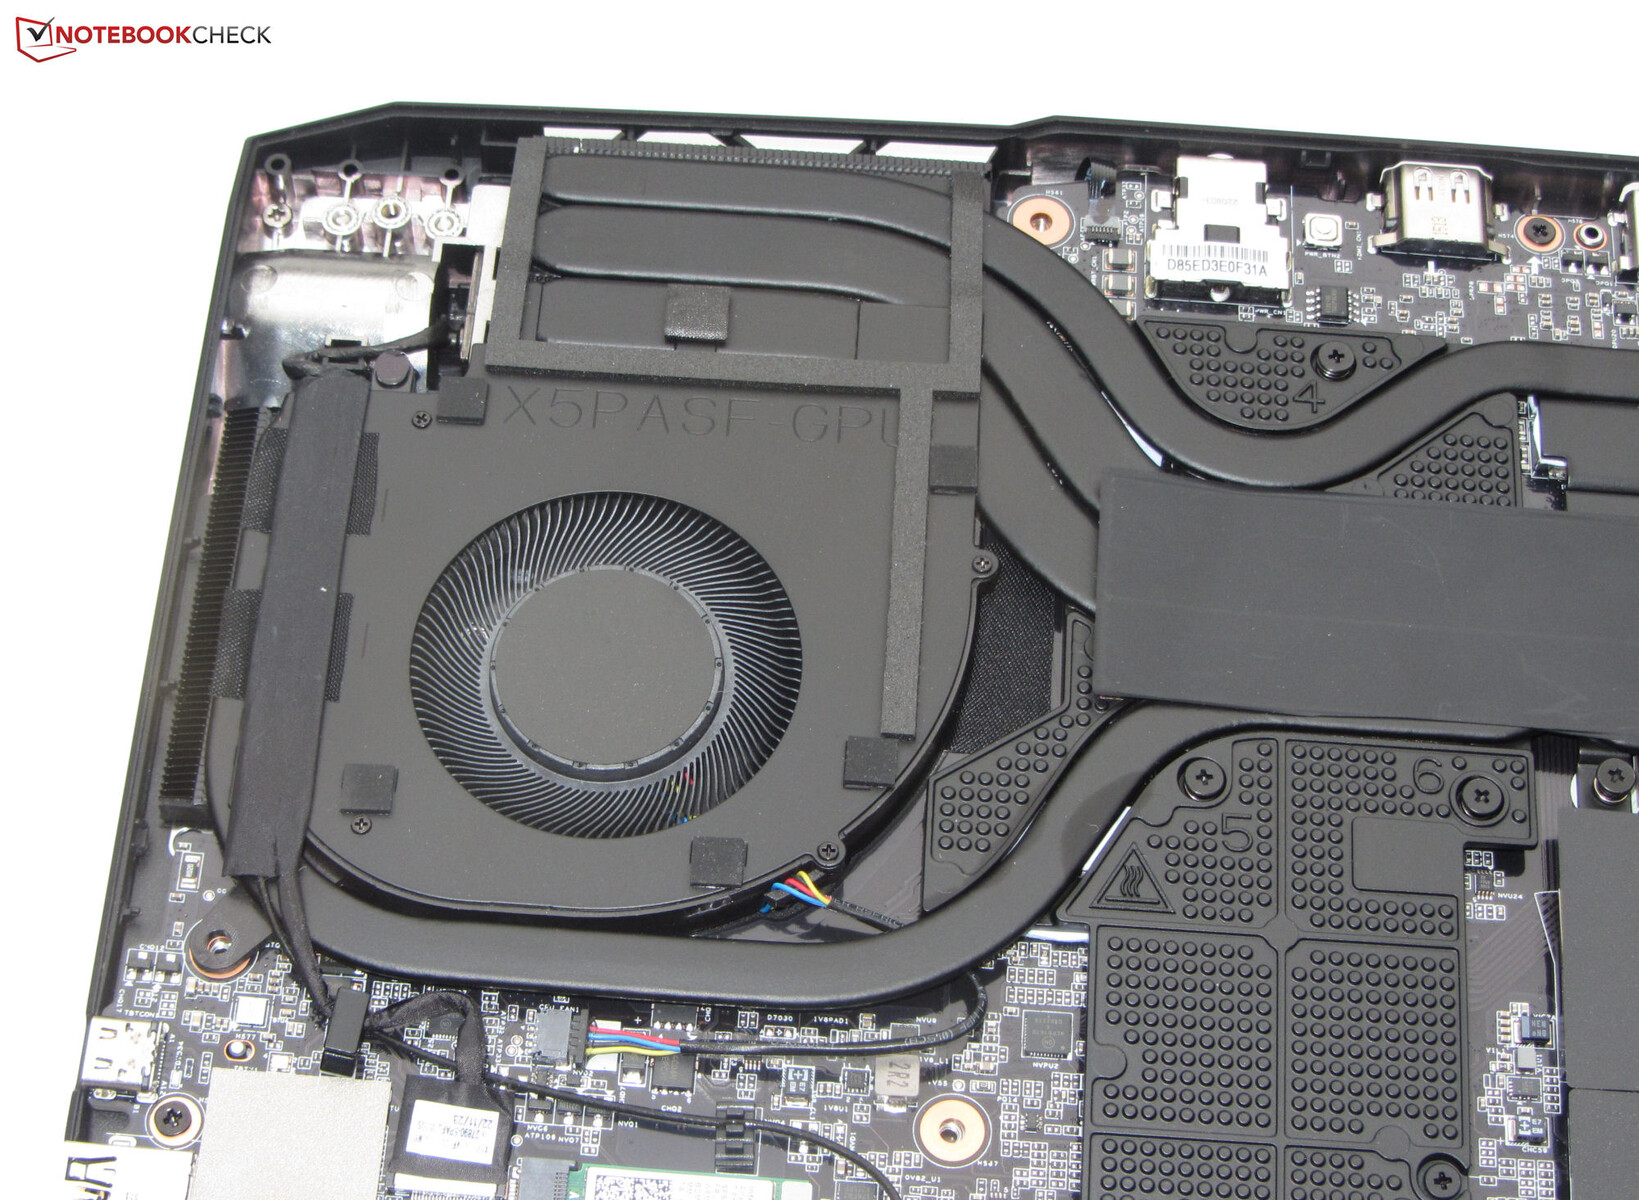
After all the screws are removed from the bottom of the device, the bottom shell can be removed with the help of a flat spatula or palette knife. Subsequently, the RAM slots (both in use), SSD (PCIe 4), second M.2 2280 slot (PCIe 4), BIOS battery, WLAN module, fans, speakers and the battery can be accessed.
Warranty
The 15.6-inch Gigabyte laptop comes with a two year warranty. Warranty extensions are not available.
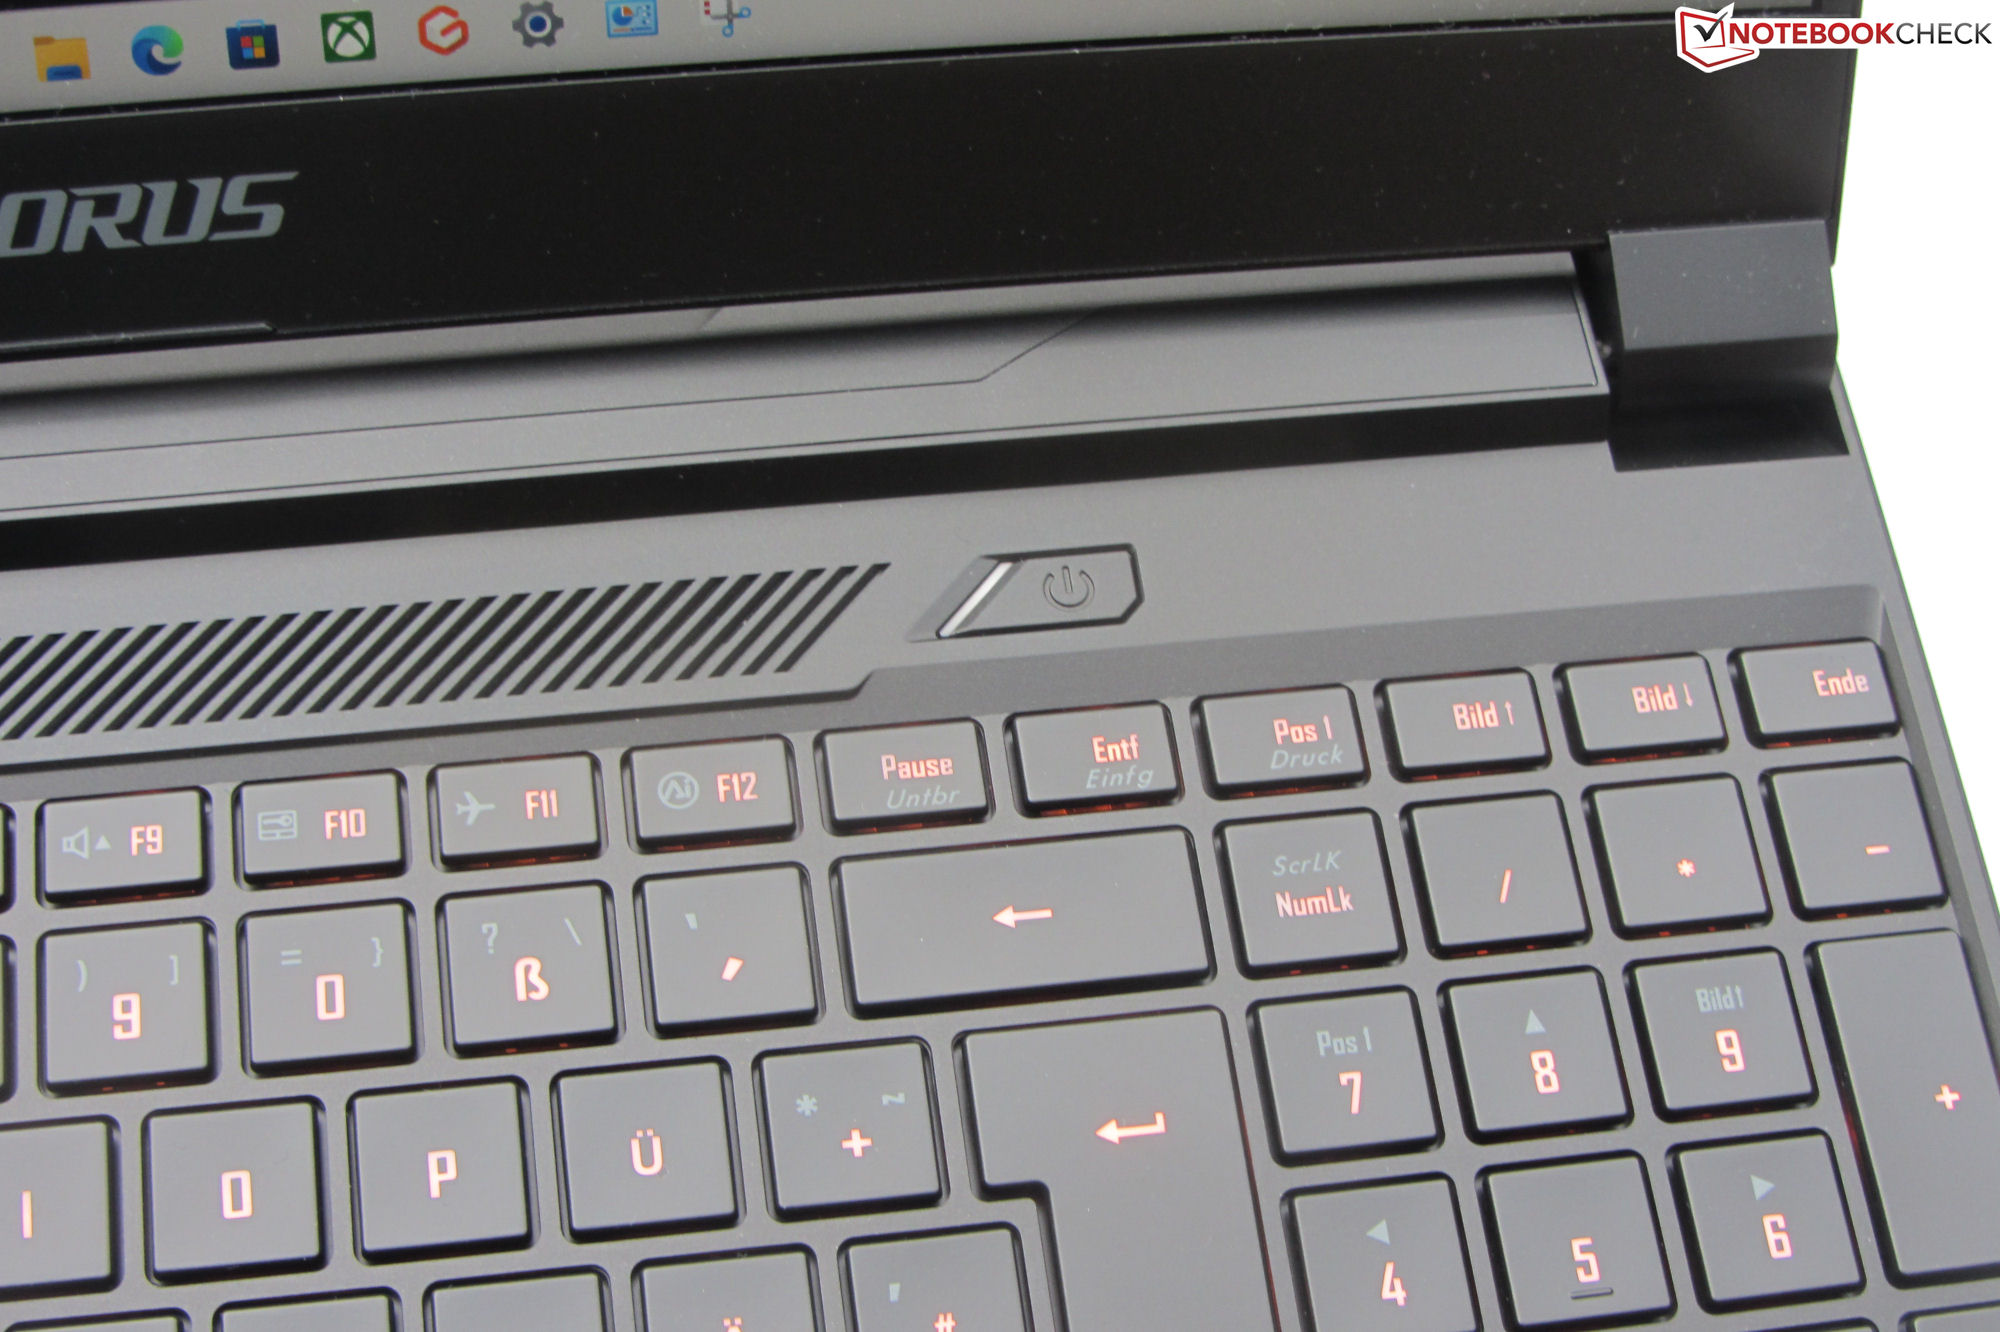
Input devices - a gaming laptop with individually-lit keys
Keyboard
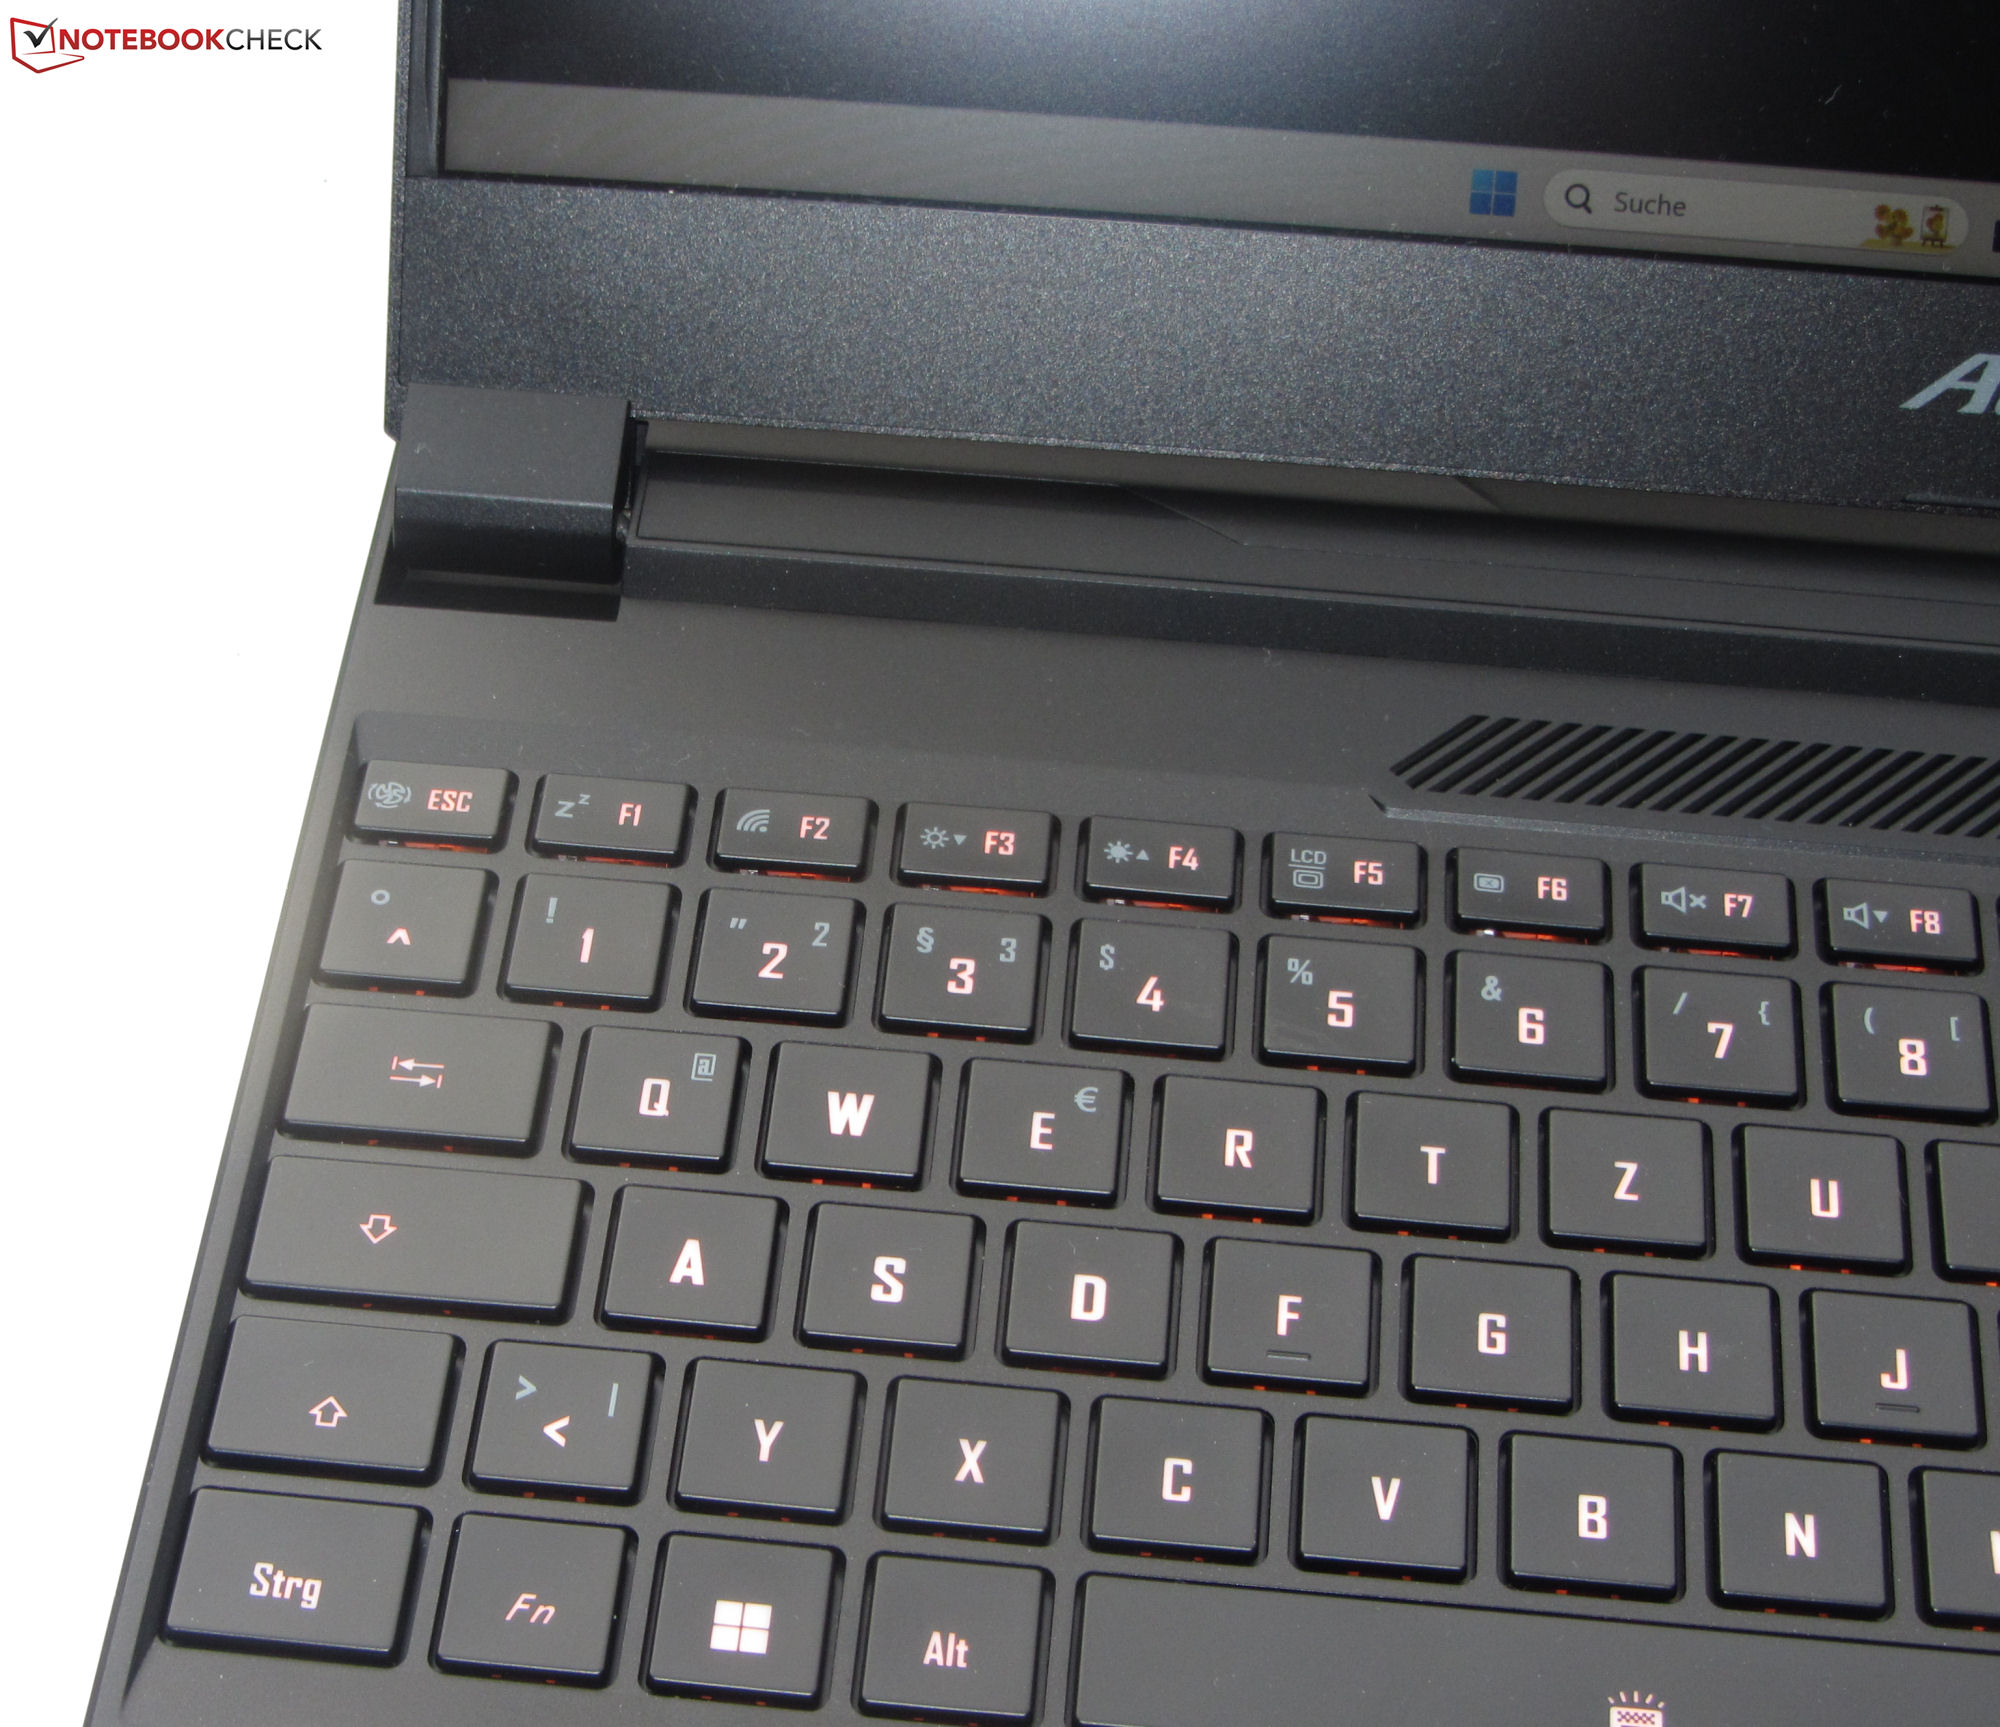
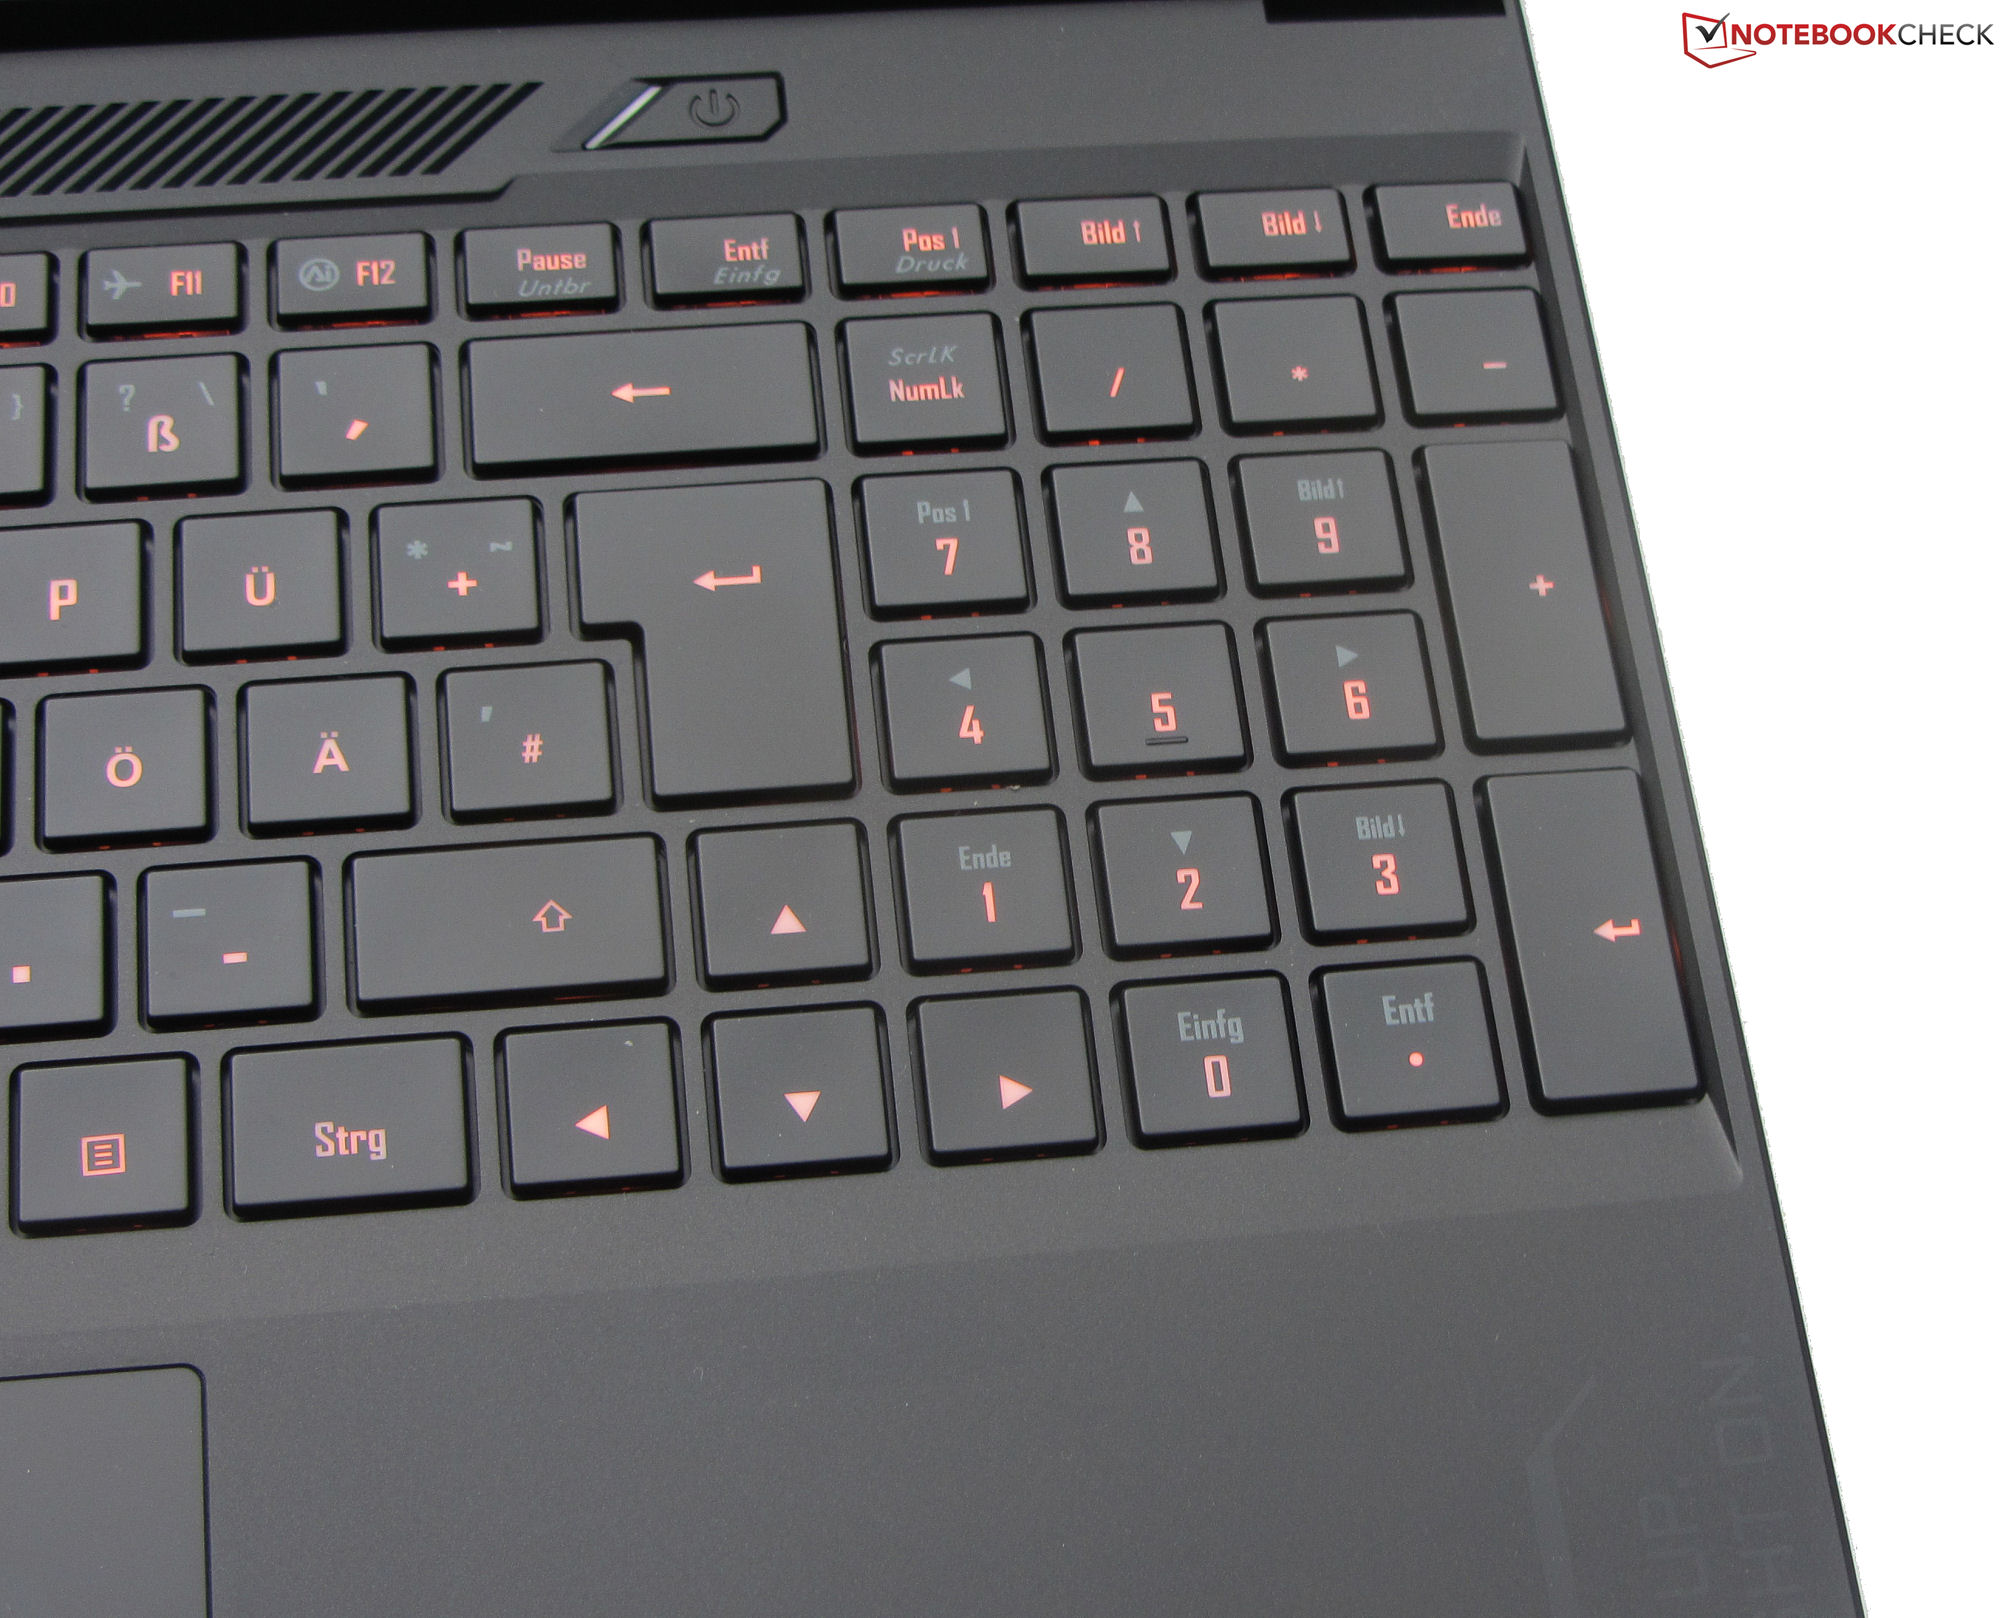
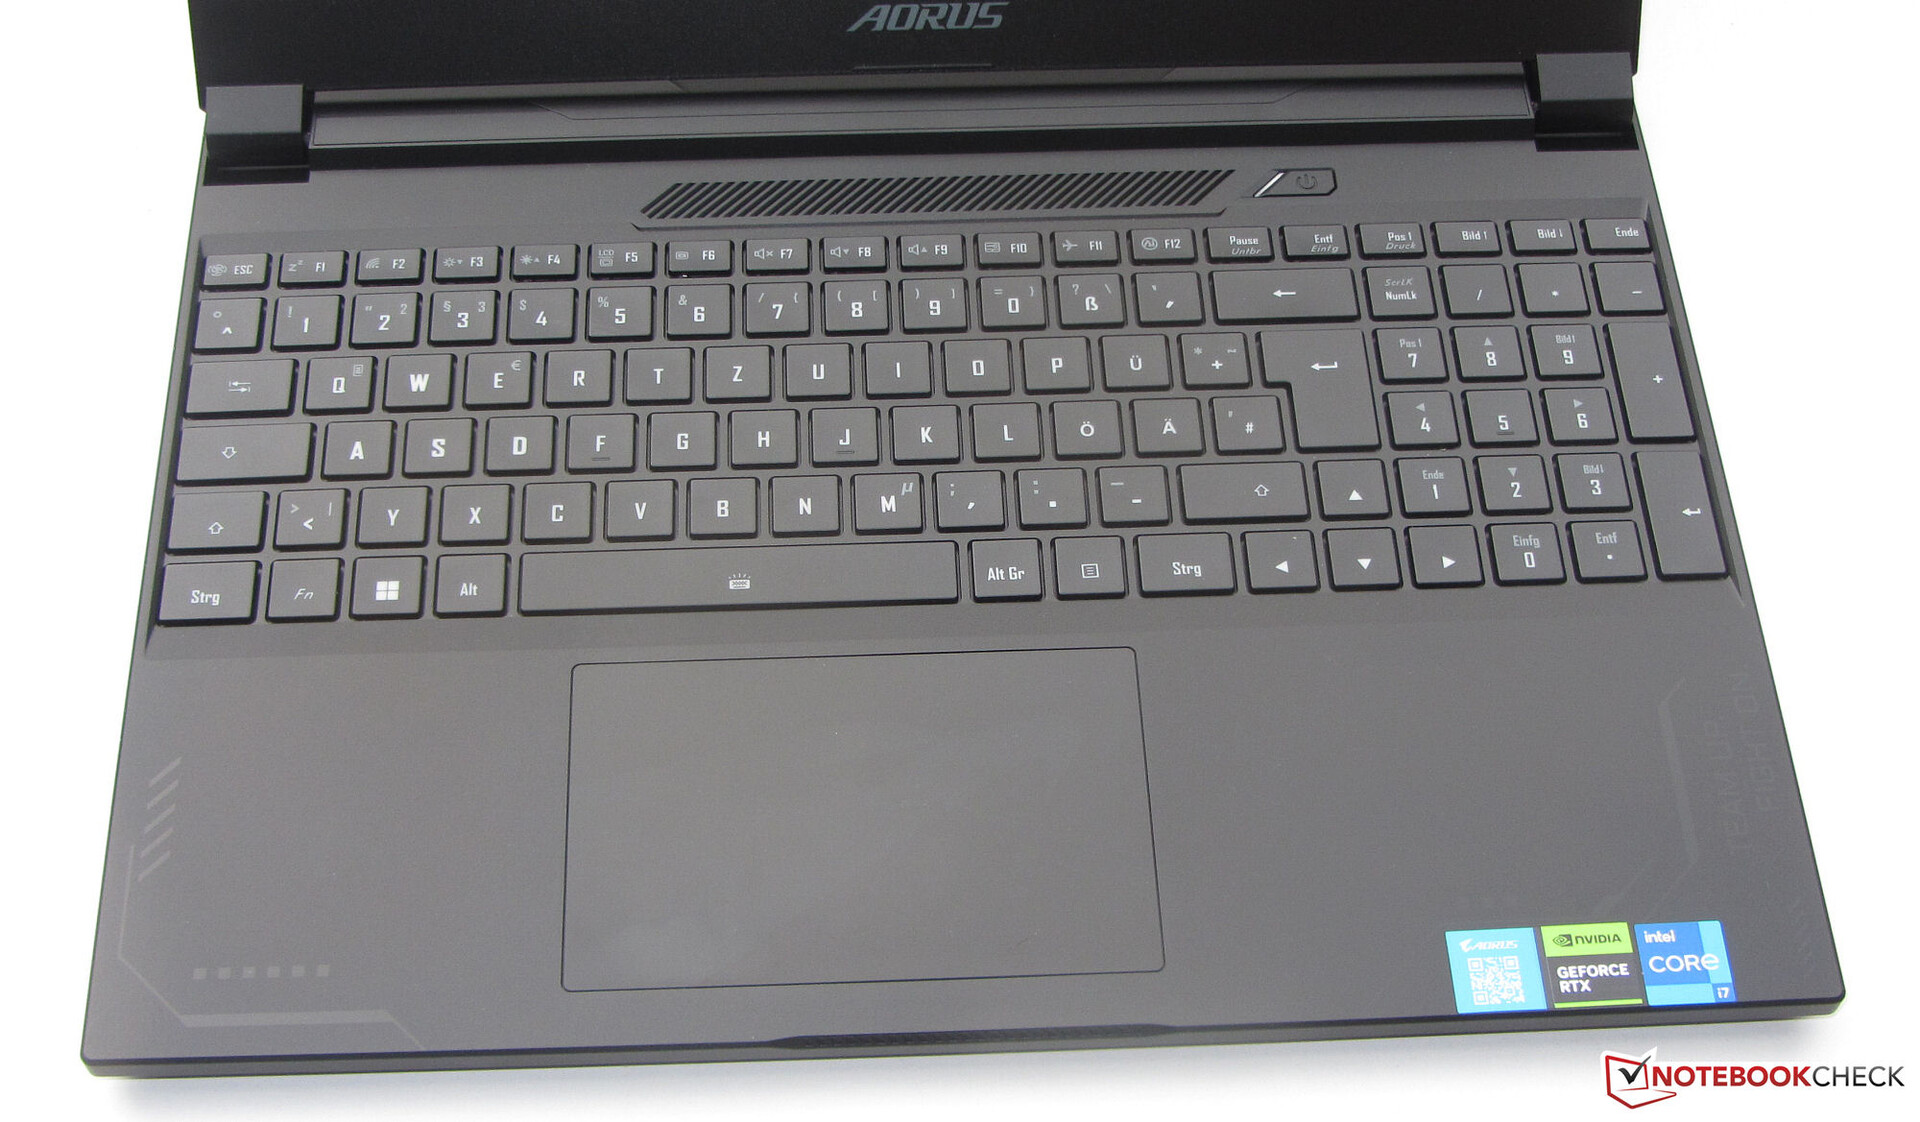
The Chiclet keyboard's smooth keys have a medium-level lift and a clear pressure point. Each key is lit individually (three brightness levels). Negative: The keys' secondary functions don't catch any of the light, which means they are barely legible. While you are typing, the keys only have a tiny amount of give - but this shouldn't be too annoying. All-in-all, Gigabyte have provided this device with a good everyday keyboard.
Touchpad
A multi-touch click pad (roughly 12.1 x 7.6 cm) replaces a mouse on this computer - its smooth surface makes for easy use. The corners react to inputs, have a slight give and have a clear pressure point.
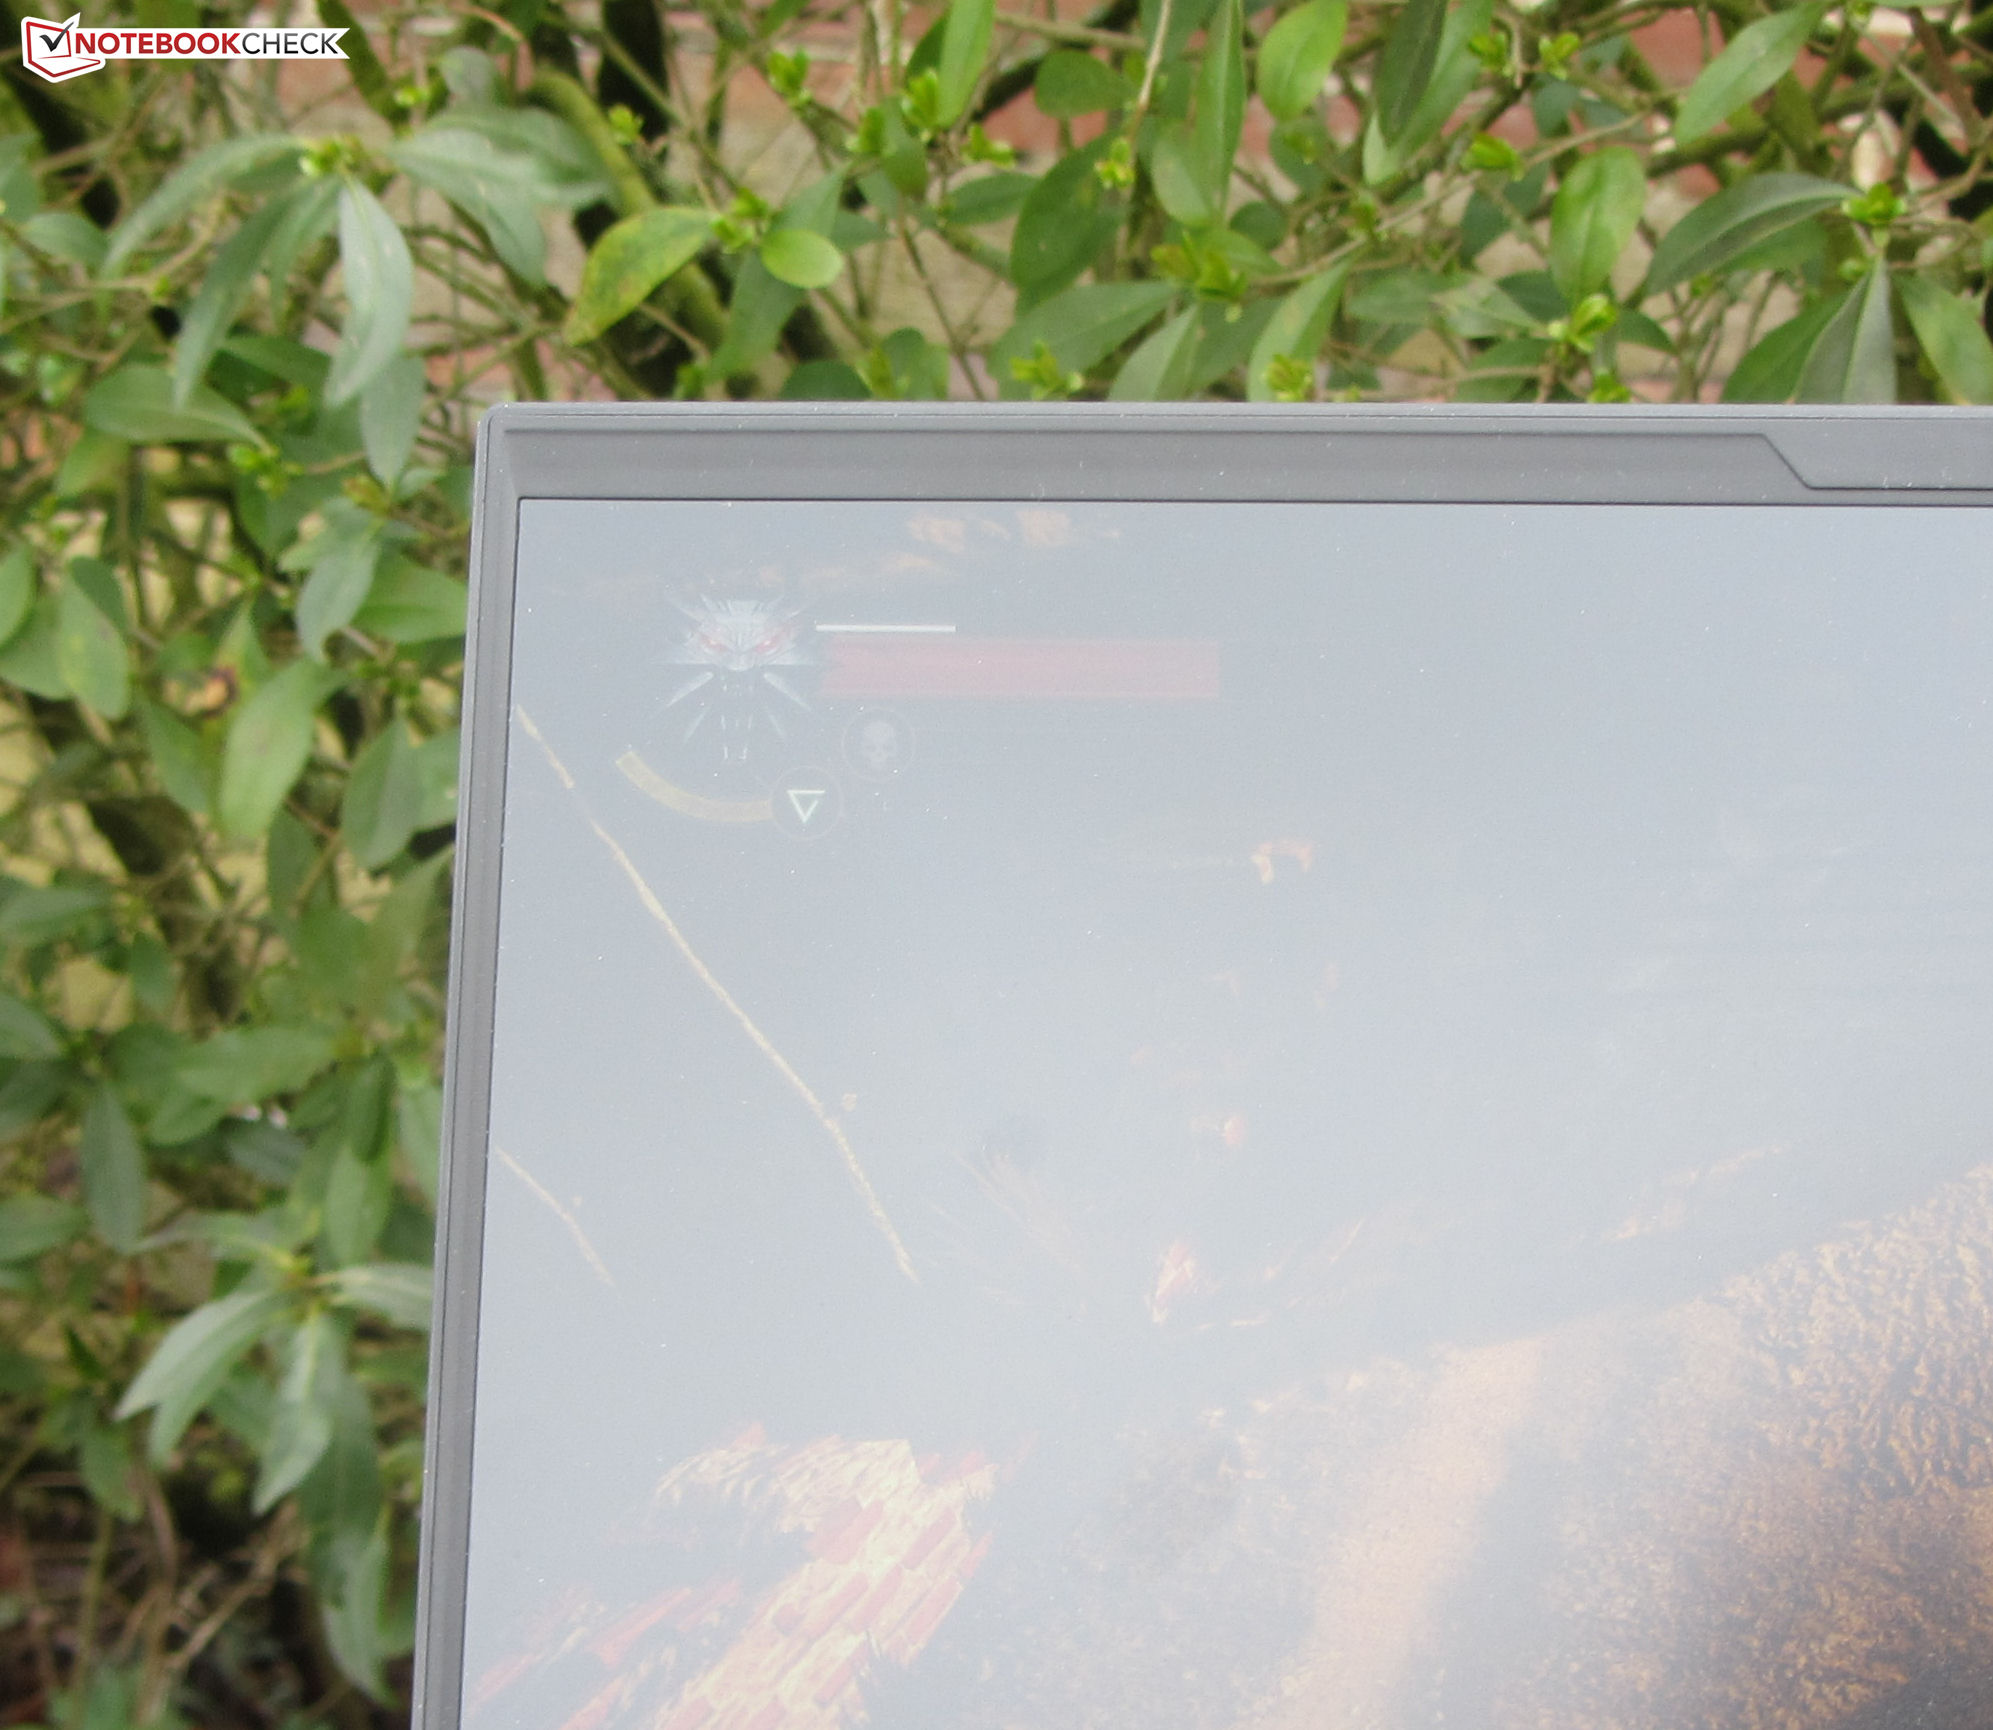
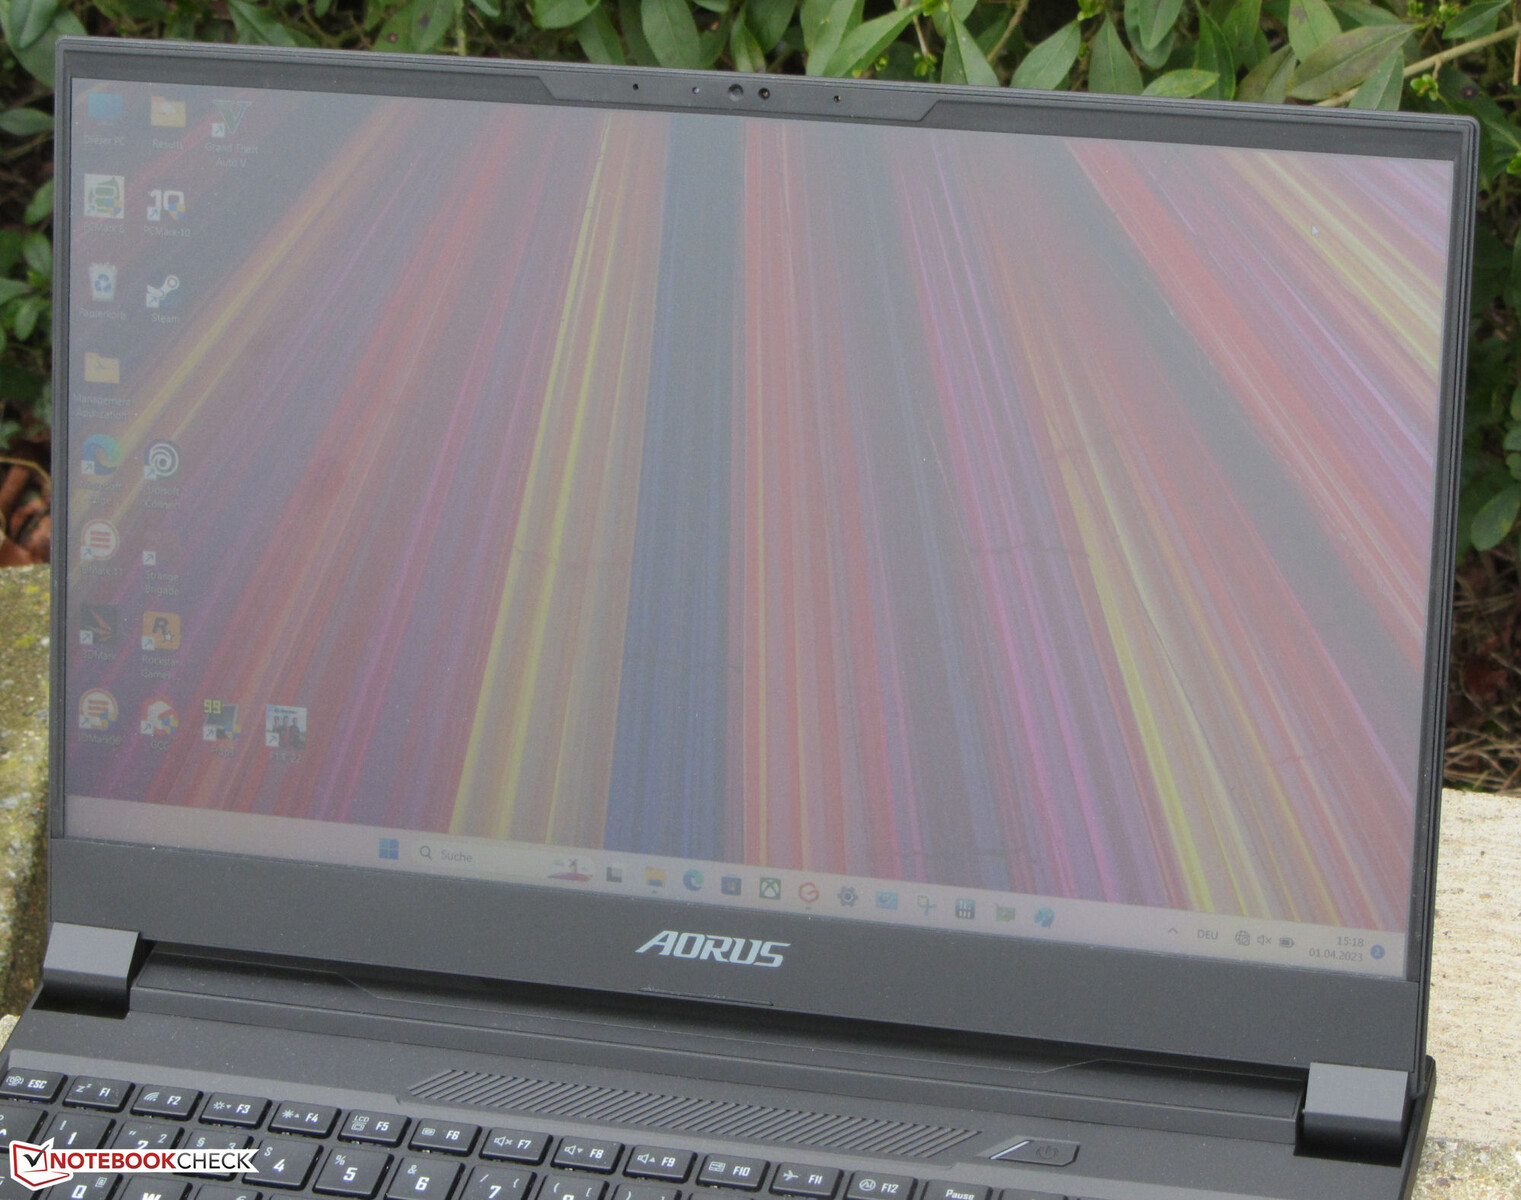
Display - 240 Hz QHD panel
Gigabyte's 15X is equipped with a fast-reacting 16:9 format 240 Hz panel, which doesn't suffer from a PWM flicker at any brightness level. Brightness and contrast levels on the matte 15.6-inch display (2,560 x 1,440 pixels) fall within an acceptable range (> 300 cd/m² and 1,000:1).
Compared to its competitors, the Blade 15 excels thanks to its OLED panel.
| |||||||||||||||||||||||||
Brightness Distribution: 90 %
Center on Battery: 316 cd/m²
Contrast: 1129:1 (Black: 0.28 cd/m²)
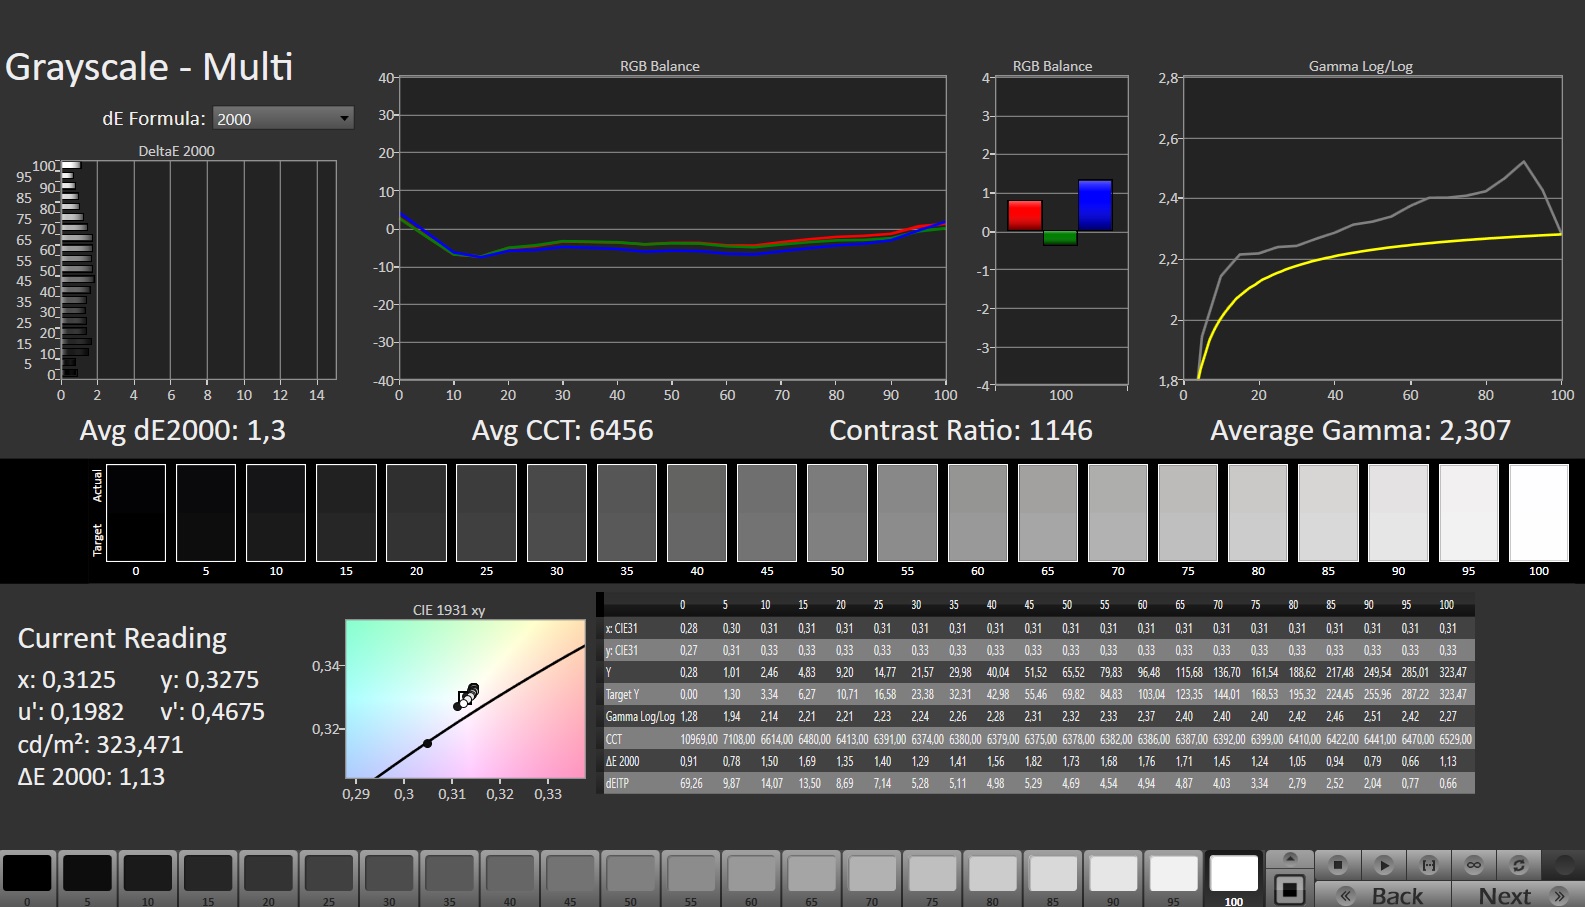
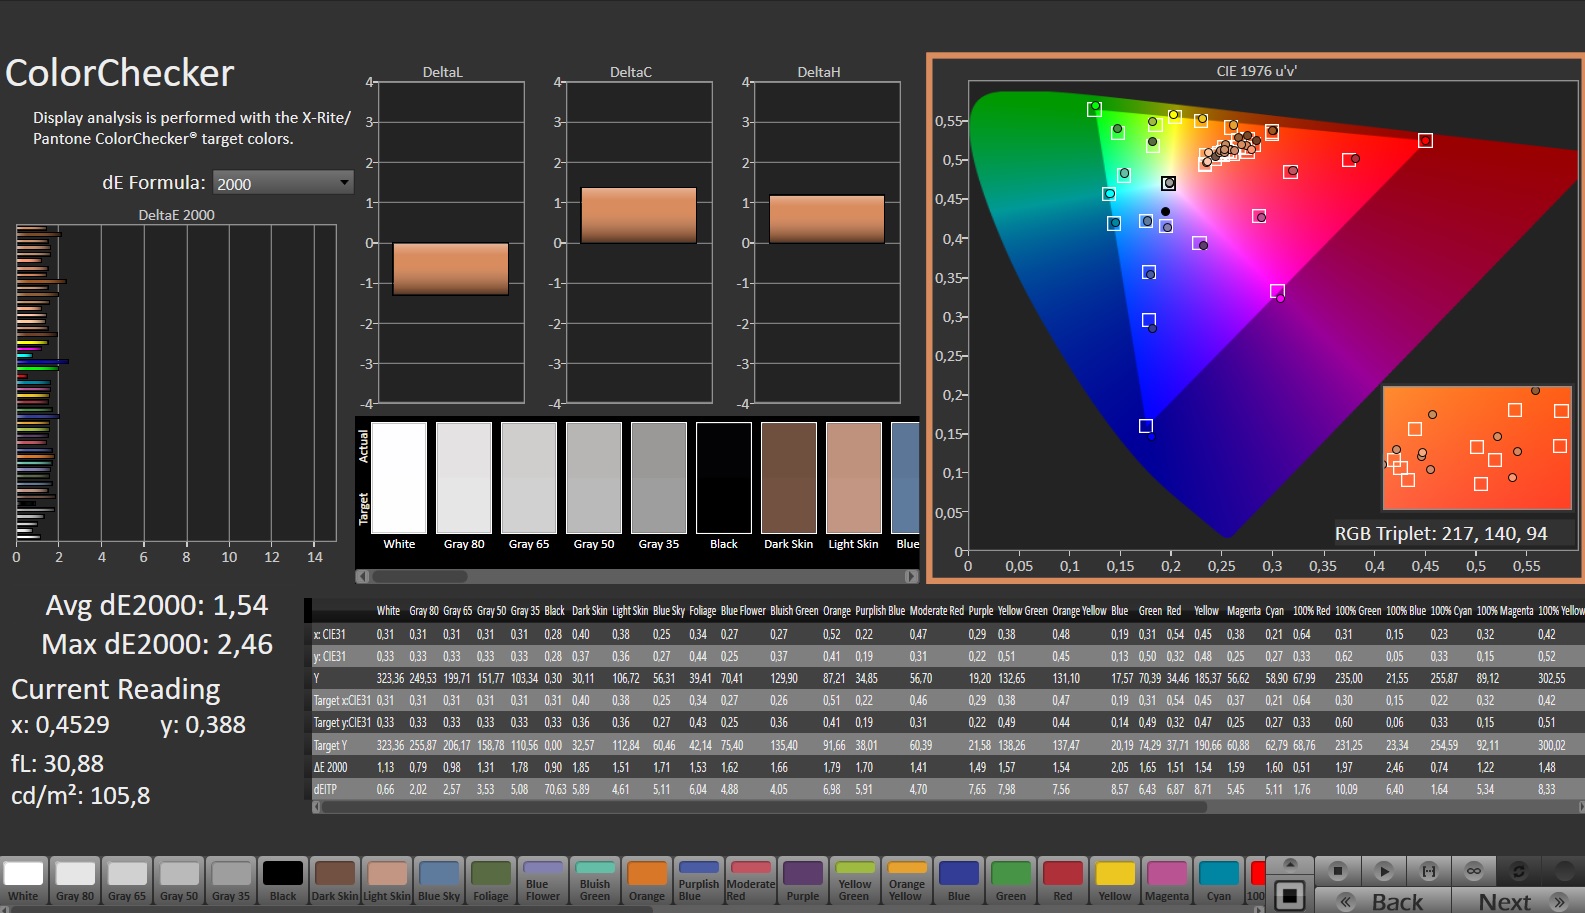
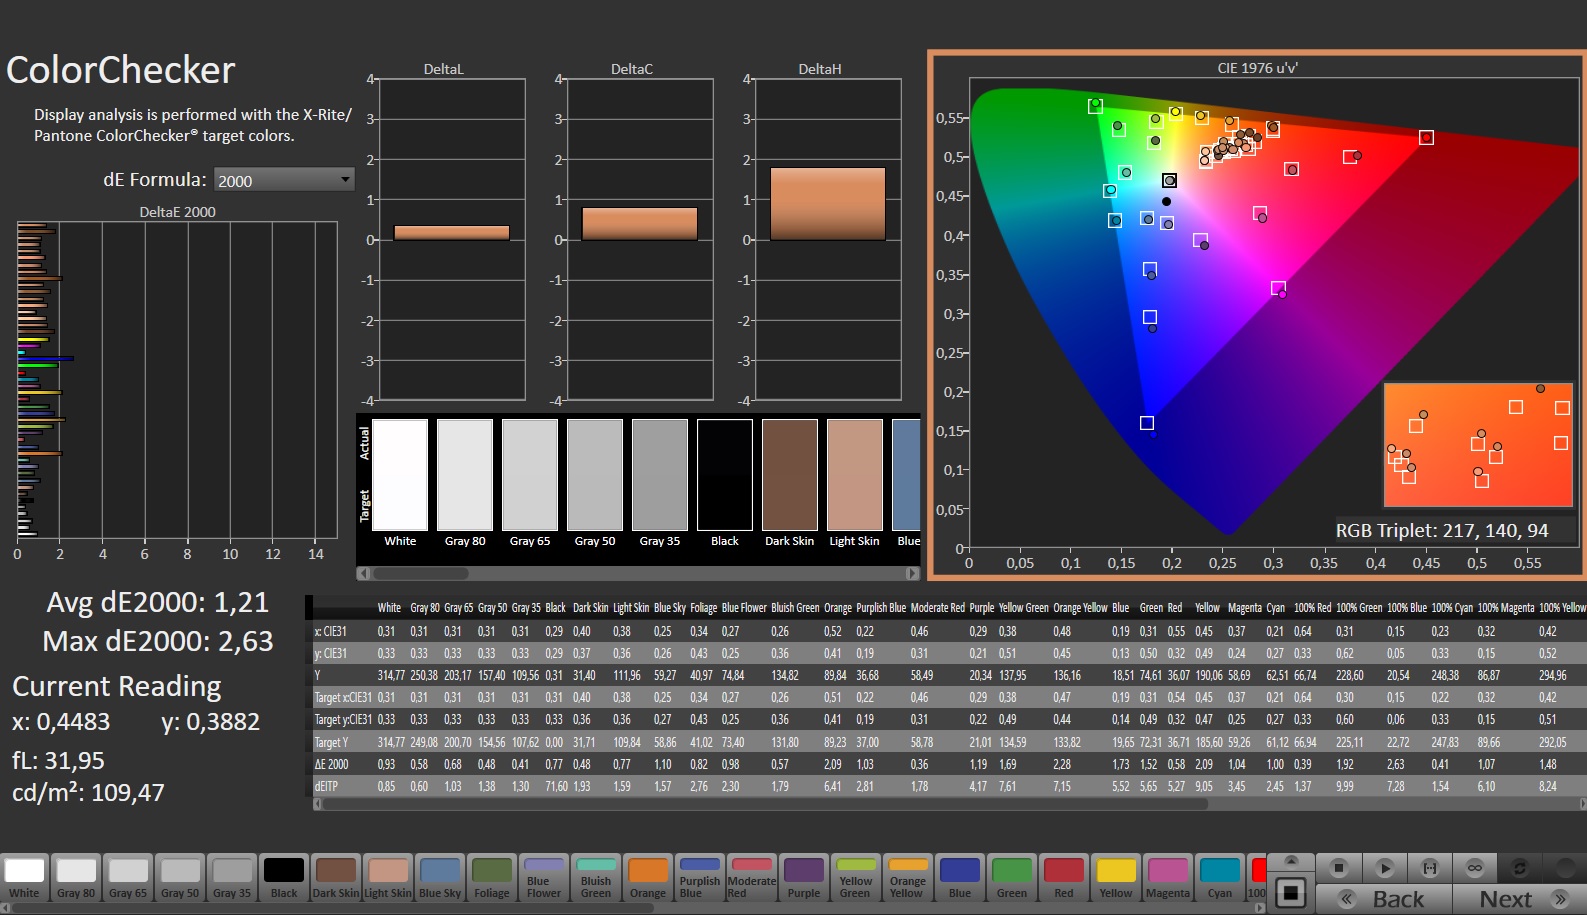
ΔE ColorChecker Calman: 1.54 | ∀{0.5-29.43 Ø4.71}
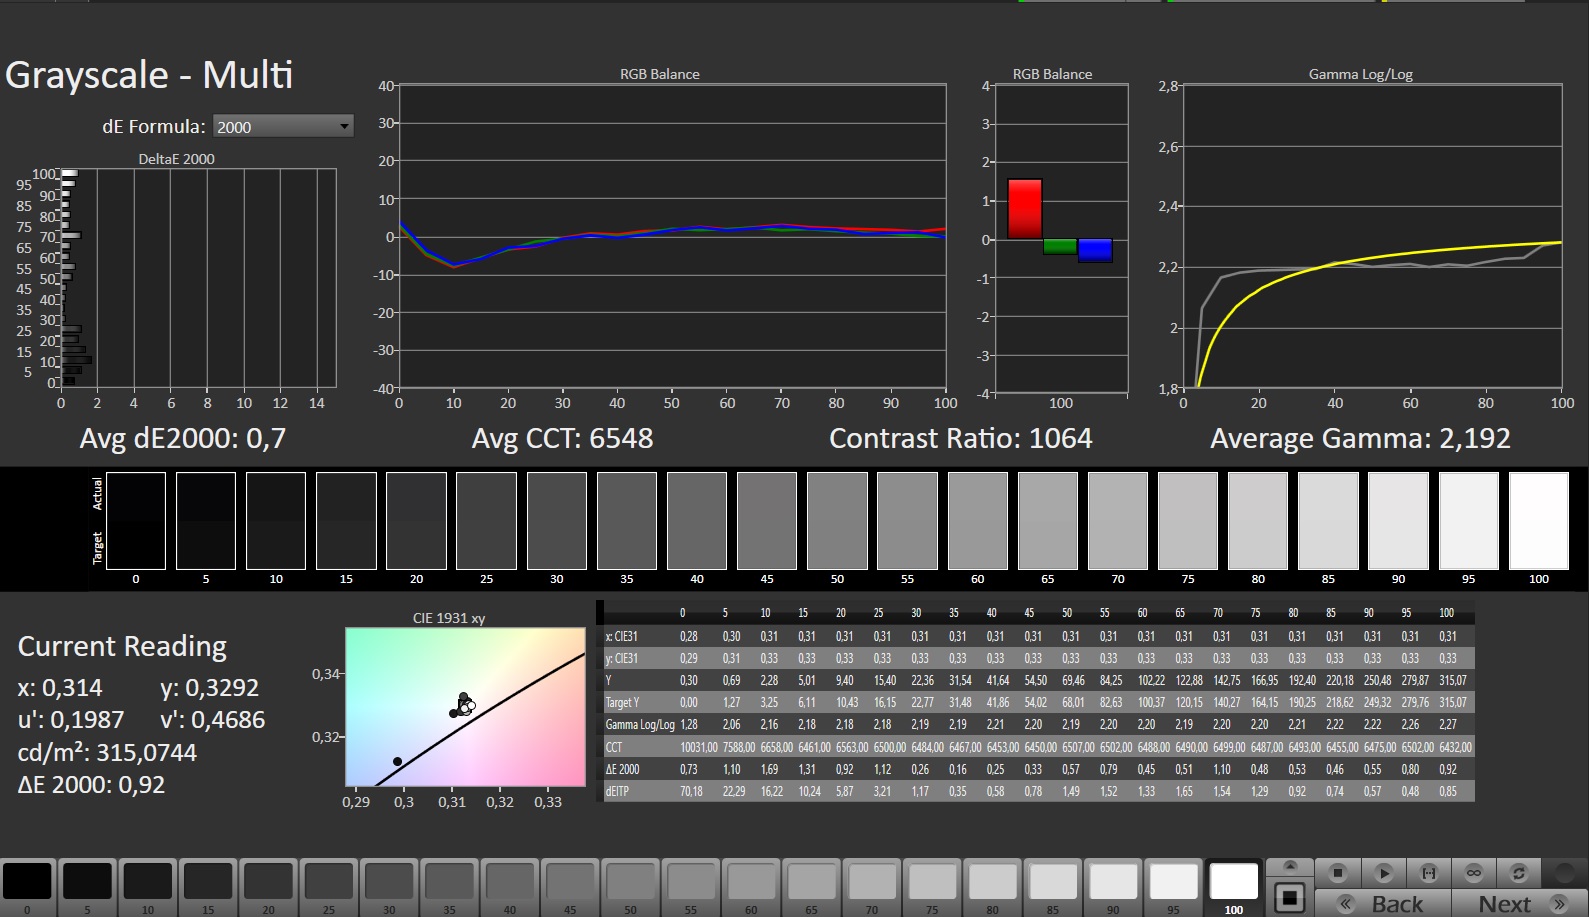
calibrated: 1.21
ΔE Greyscale Calman: 1.3 | ∀{0.09-98 Ø4.96}
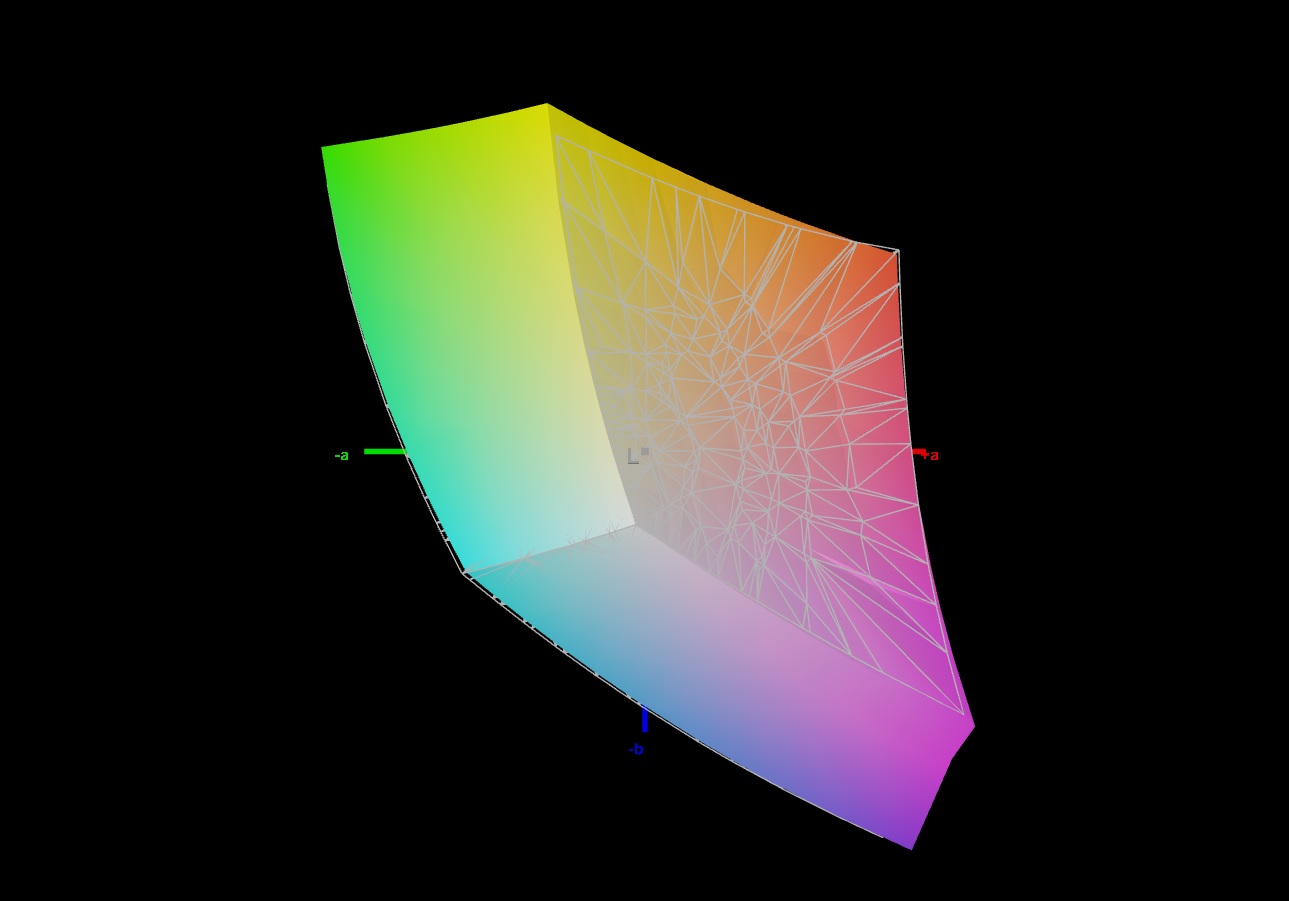
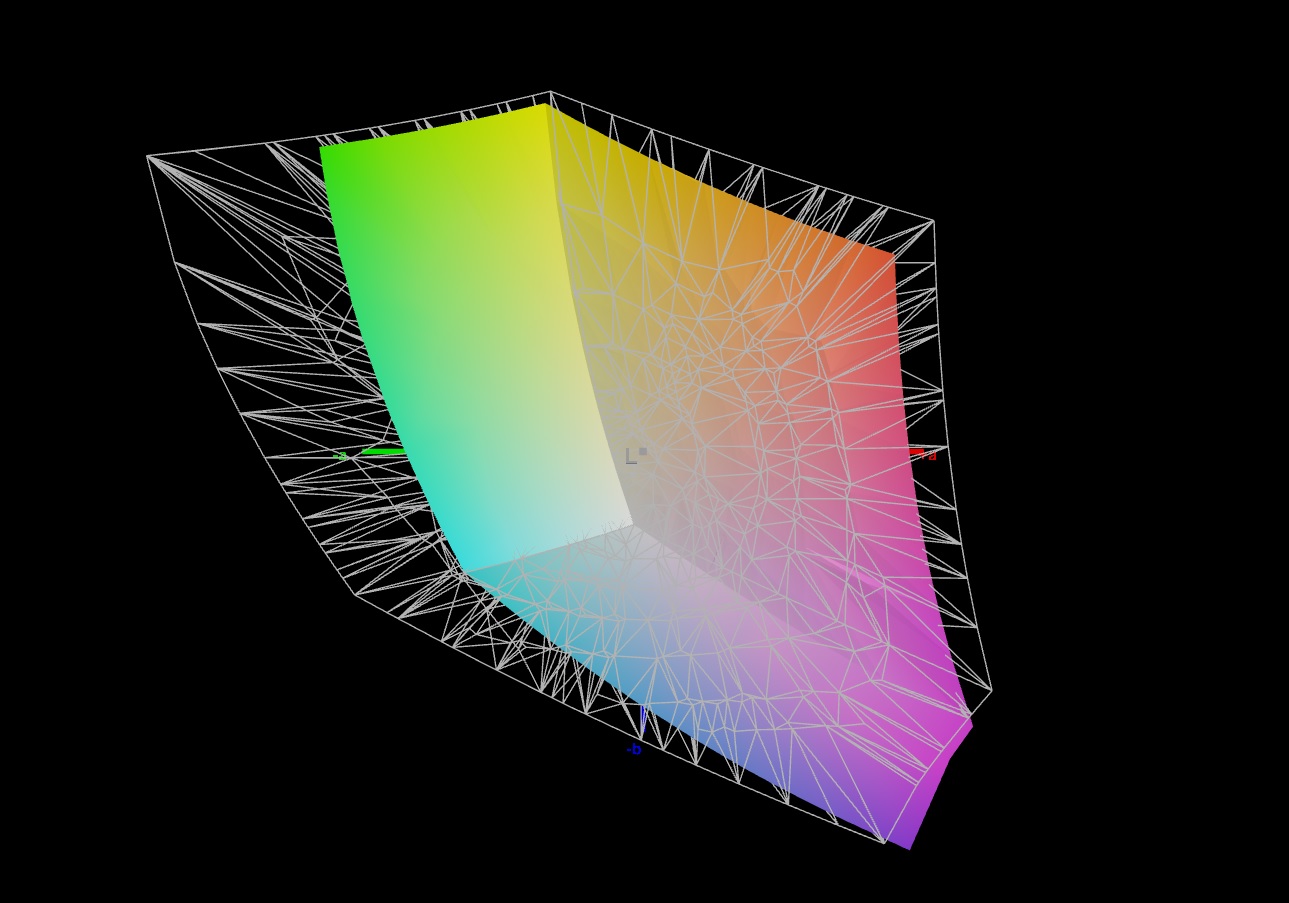
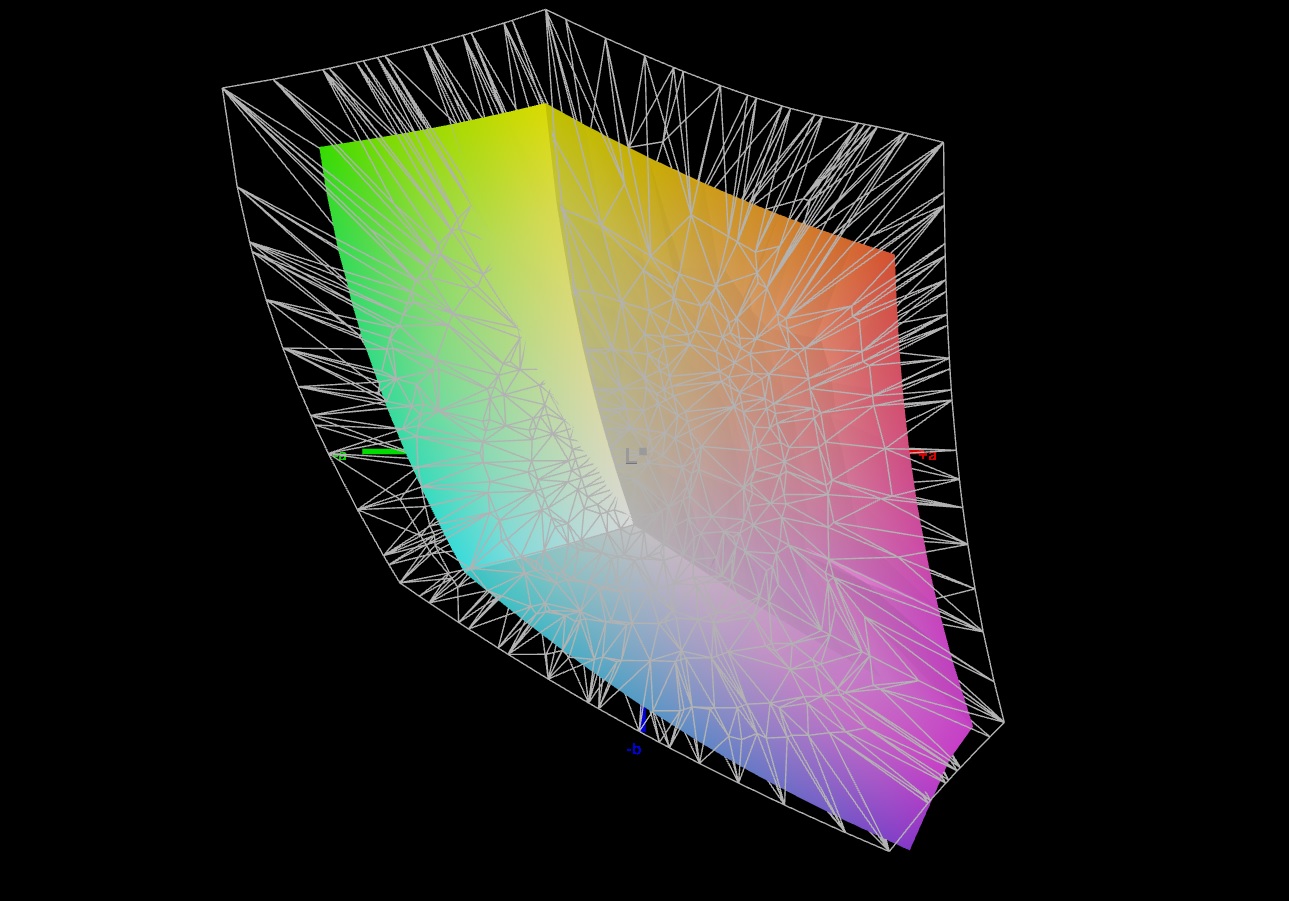
70.5% AdobeRGB 1998 (Argyll 3D)
98.2% sRGB (Argyll 3D)
69.3% Display P3 (Argyll 3D)
Gamma: 2.307
CCT: 6456 K
| Aorus 15X ASF BOE CQ NE156QHM-NZ1, IPS, 2560x1440, 15.6" | Razer Blade 15 OLED (Early 2022) Samsung ATNA562P02-0, OLED, 2560x1440, 15.6" | MSI Katana 17 B13VFK B173HAN04.9, IPS LED, 1920x1080, 17.3" | Asus ROG Strix G17 G713PI BOE0B69, IPS, 2560x1440, 17.3" | Acer Predator Helios 300 (i7-12700H, RTX 3070 Ti) BOE0A1A, IPS, 2560x1440, 17.3" | |
|---|---|---|---|---|---|
| Display | 25% | -40% | 22% | 21% | |
| Display P3 Coverage (%) | 69.3 | 97.6 41% | 40.8 -41% | 98.3 42% | 96.8 40% |
| sRGB Coverage (%) | 98.2 | 99.4 1% | 61 -38% | 100 2% | 99.9 2% |
| AdobeRGB 1998 Coverage (%) | 70.5 | 94 33% | 42.2 -40% | 85.9 22% | 84.8 20% |
| Response Times | 82% | -172% | 33% | -26% | |
| Response Time Grey 50% / Grey 80% * (ms) | 12.4 ? | 2 ? 84% | 33 ? -166% | 5.3 ? 57% | 16.4 ? -32% |
| Response Time Black / White * (ms) | 9.4 ? | 2 ? 79% | 26 ? -177% | 8.6 ? 9% | 11.2 ? -19% |
| PWM Frequency (Hz) | 500 ? | ||||
| Screen | 109% | -135% | -4% | -60% | |
| Brightness middle (cd/m²) | 316 | 383 21% | 267 -16% | 327 3% | 366 16% |
| Brightness (cd/m²) | 301 | 384 28% | 256 -15% | 320 6% | 340 13% |
| Brightness Distribution (%) | 90 | 99 10% | 93 3% | 89 -1% | 85 -6% |
| Black Level * (cd/m²) | 0.28 | 0.03 89% | 0.21 25% | 0.38 -36% | 0.31 -11% |
| Contrast (:1) | 1129 | 12767 1031% | 1271 13% | 861 -24% | 1181 5% |
| Colorchecker dE 2000 * | 1.54 | 1.89 -23% | 4.7 -205% | 1.01 34% | 3.56 -131% |
| Colorchecker dE 2000 max. * | 2.46 | 3.76 -53% | 20.4 -729% | 4.01 -63% | 5.66 -130% |
| Colorchecker dE 2000 calibrated * | 1.21 | 2.67 -121% | 4.5 -272% | 0.41 66% | 3.31 -174% |
| Greyscale dE 2000 * | 1.3 | 1.26 3% | 1.5 -15% | 1.6 -23% | 2.84 -118% |
| Gamma | 2.307 95% | 2.41 91% | 2.12 104% | 2.168 101% | 2.29 96% |
| CCT | 6456 101% | 6386 102% | 6552 99% | 6659 98% | 6835 95% |
| Total Average (Program / Settings) | 72% /
87% | -116% /
-120% | 17% /
7% | -22% /
-38% |
* ... smaller is better
Straight out of the box, the display already shows great color reproduction: With a deviation of 1.54, it falls within an acceptable range (DeltaE < 3). Calibration brings the number down to 1.21 and helps more evenly display gray tones.
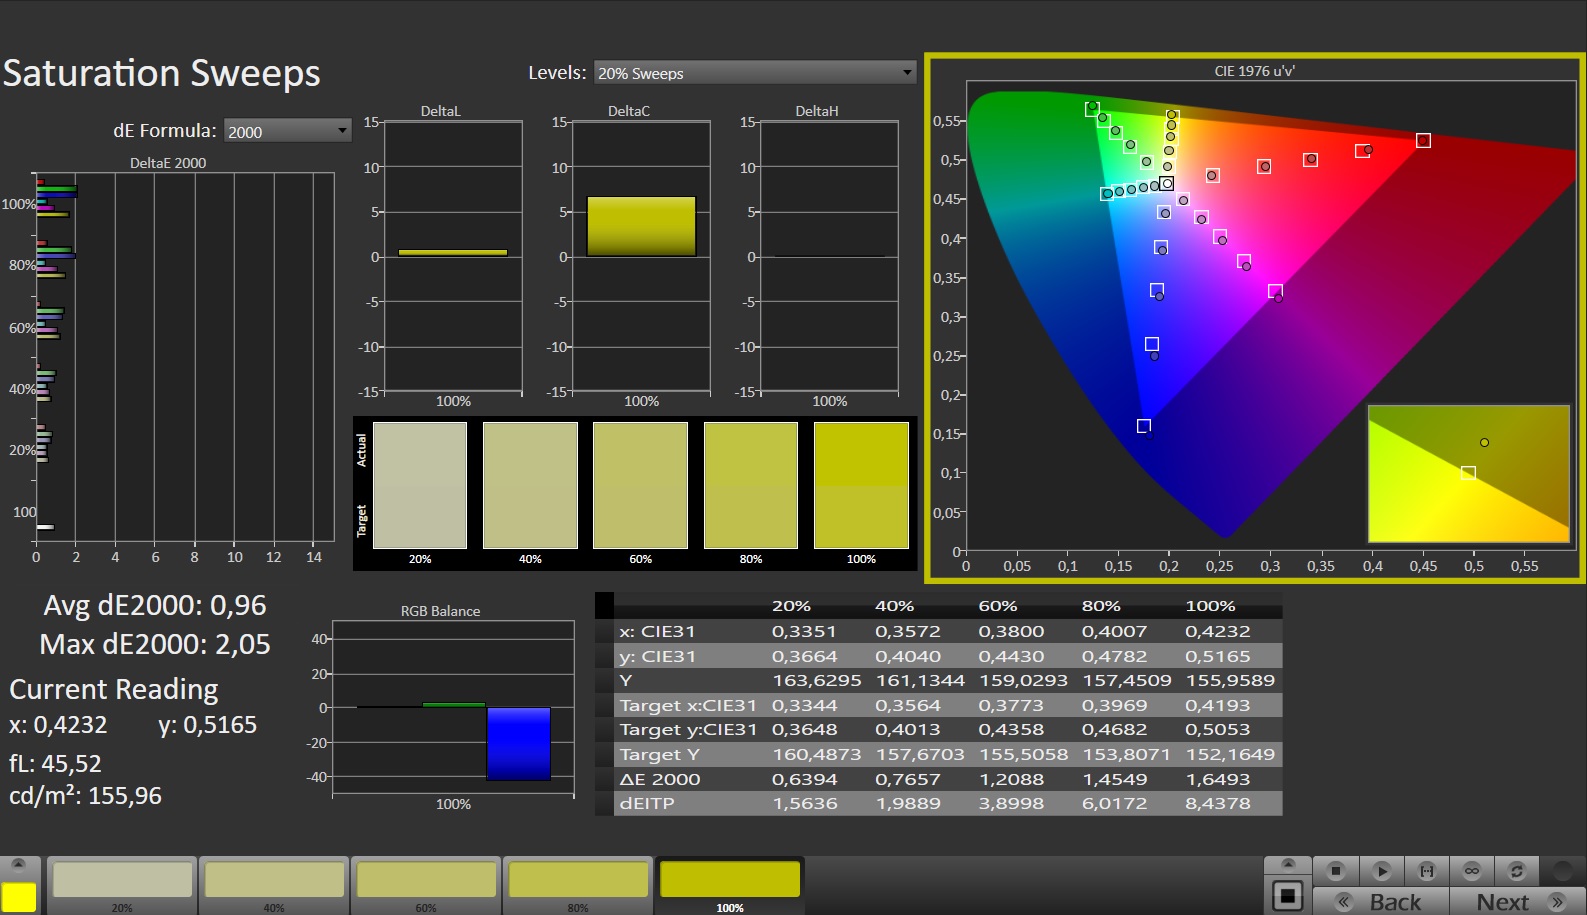
The display can depict nearly the entire sRGB color space - but not the AdobeRGB and DCI-P3 color spaces. This means most competitors do a bit of a better job with this.

Display Response Times
| ↔ Response Time Black to White | ||
|---|---|---|
| 9.4 ms ... rise ↗ and fall ↘ combined | ↗ 4.9 ms rise | 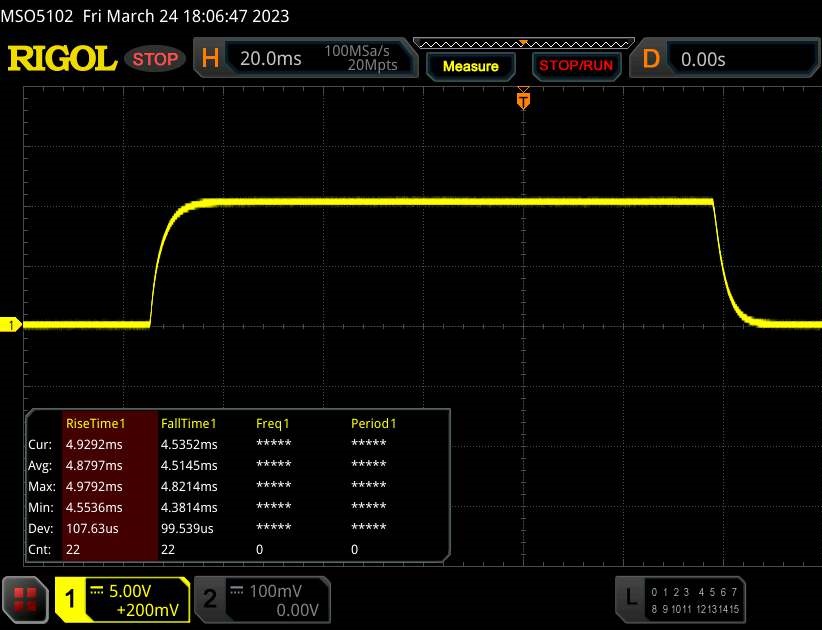 |
| ↘ 4.5 ms fall | ||
| The screen shows fast response rates in our tests and should be suited for gaming. In comparison, all tested devices range from 0.1 (minimum) to 240 (maximum) ms. » 26 % of all devices are better. This means that the measured response time is better than the average of all tested devices (19.8 ms). | ||
| ↔ Response Time 50% Grey to 80% Grey | ||
| 12.4 ms ... rise ↗ and fall ↘ combined | ↗ 6 ms rise | 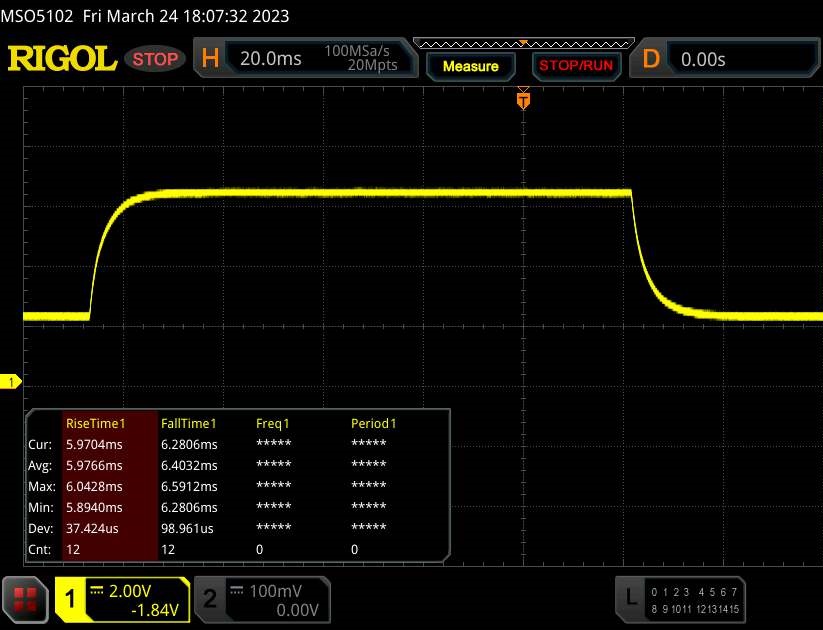 |
| ↘ 6.4 ms fall | ||
| The screen shows good response rates in our tests, but may be too slow for competitive gamers. In comparison, all tested devices range from 0.165 (minimum) to 636 (maximum) ms. » 26 % of all devices are better. This means that the measured response time is better than the average of all tested devices (31 ms). | ||
Screen Flickering / PWM (Pulse-Width Modulation)
| Screen flickering / PWM not detected | 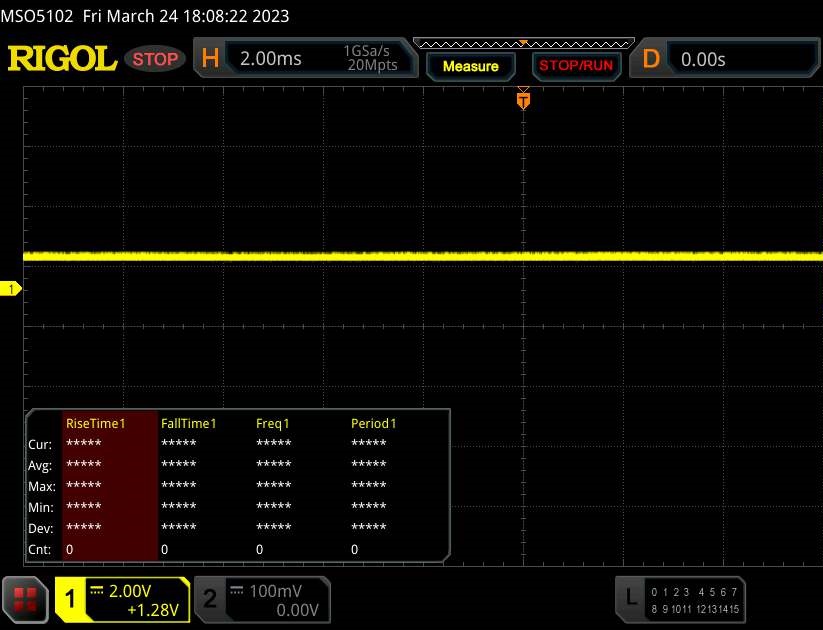 | ||
In comparison: 52 % of all tested devices do not use PWM to dim the display. If PWM was detected, an average of 7754 (minimum: 5 - maximum: 343500) Hz was measured. | |||
The viewing angle stable IPS panel can be viewed from every position. Outside, the display is mostly visible, as long as the sun isn't shining too brightly.

Performance
The Aorus 15X is classed as a powerful gaming laptop - but it is not limited to just this area. Its good performance is made possible by Raptor Lake and Ada Lovelace. The presented test device can be purchased for around $2,099.
Testing conditions
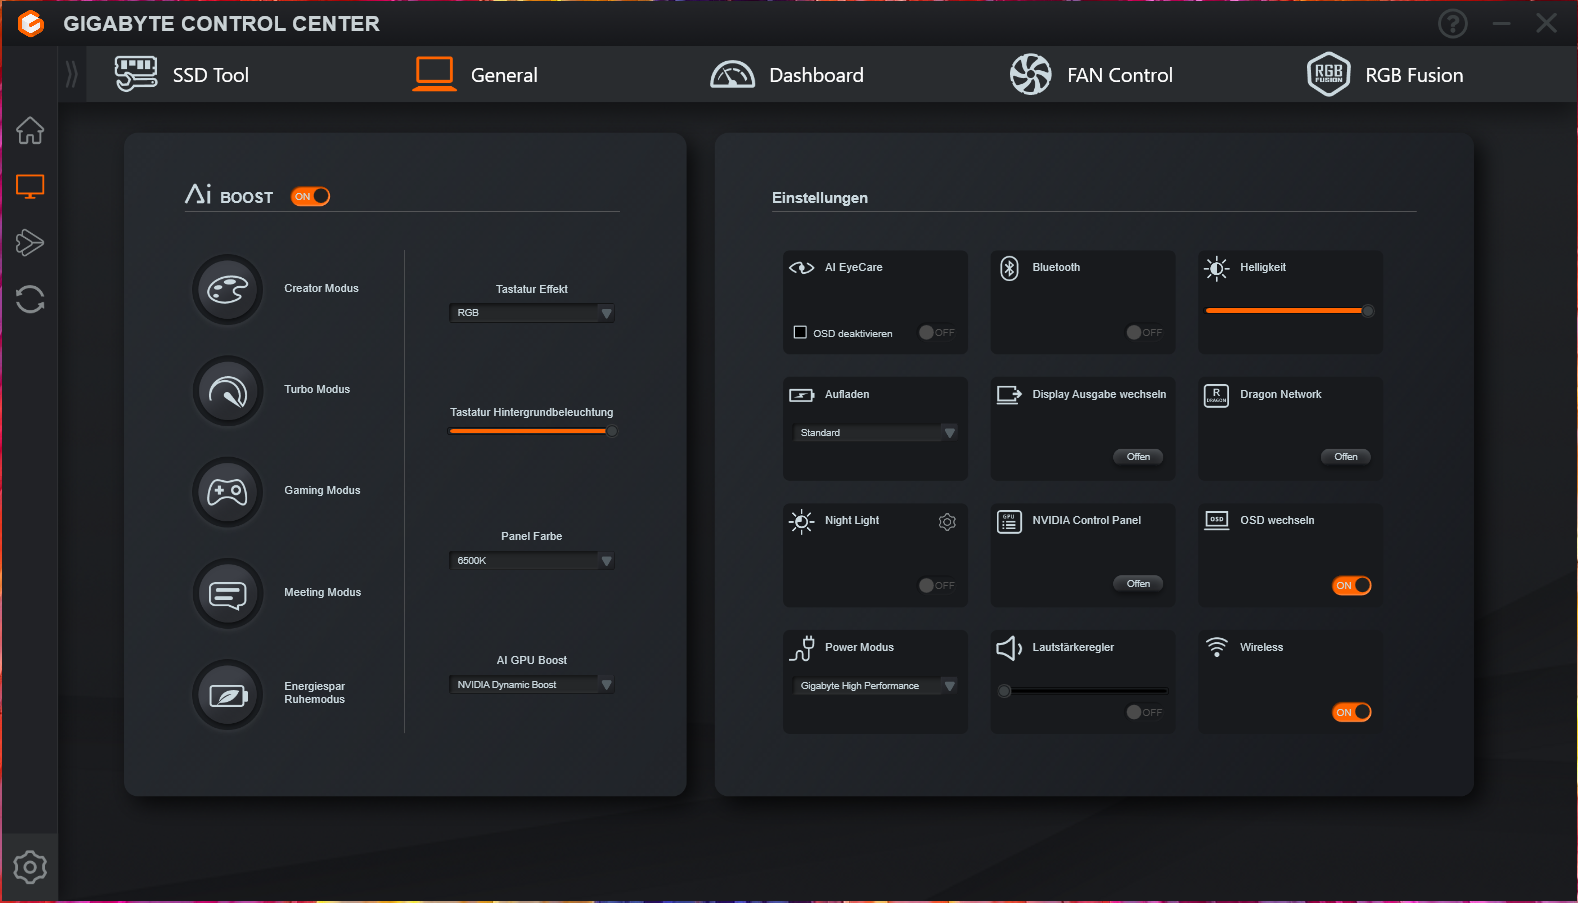
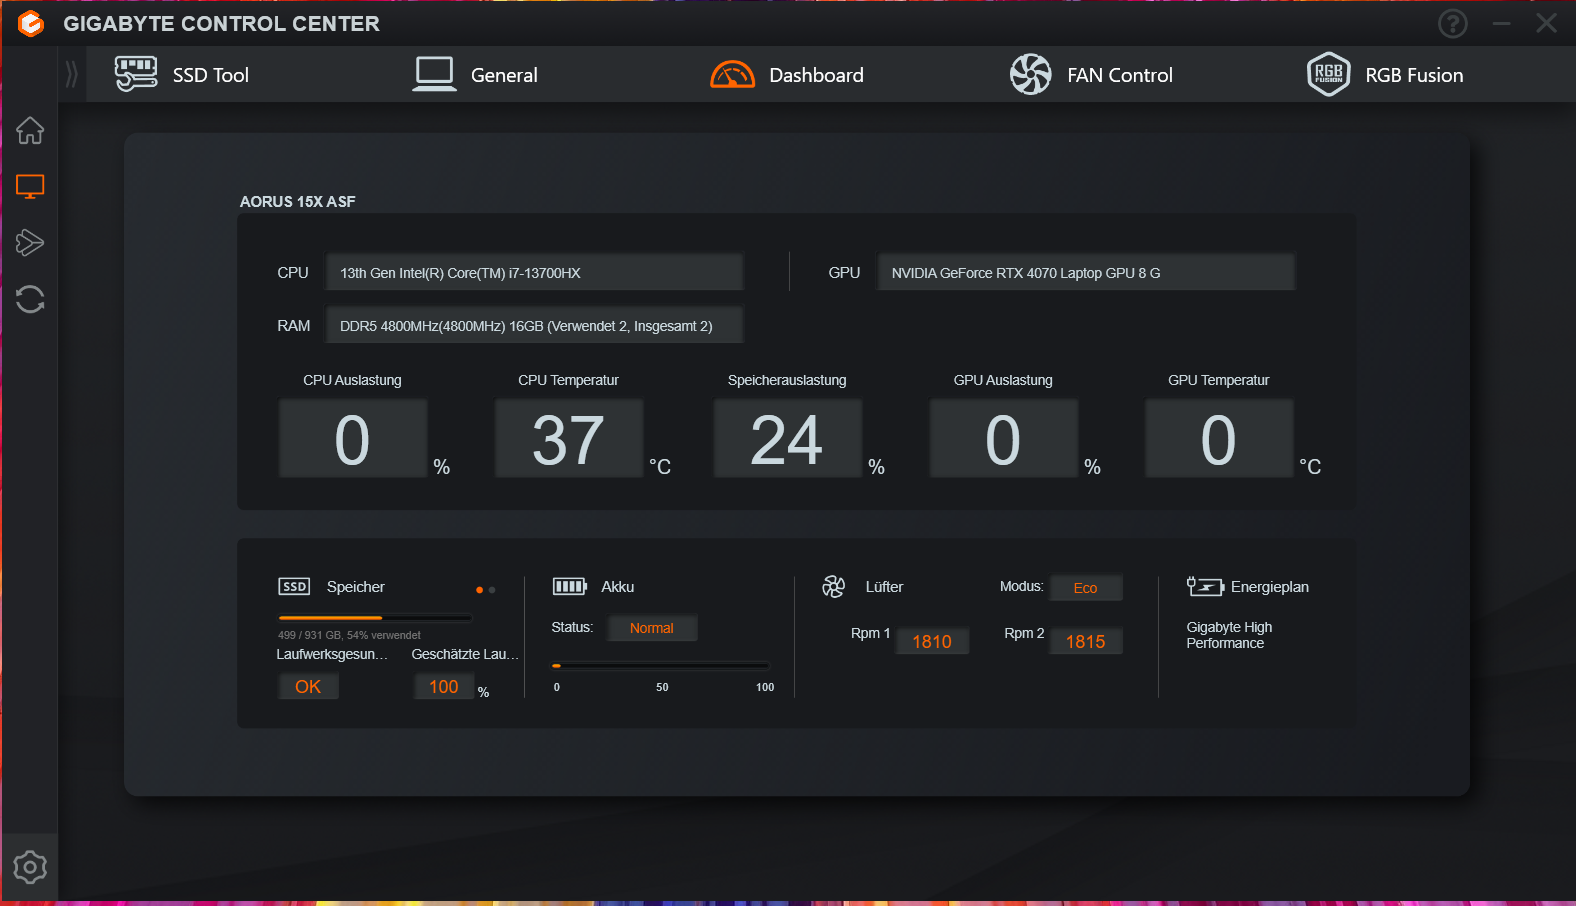
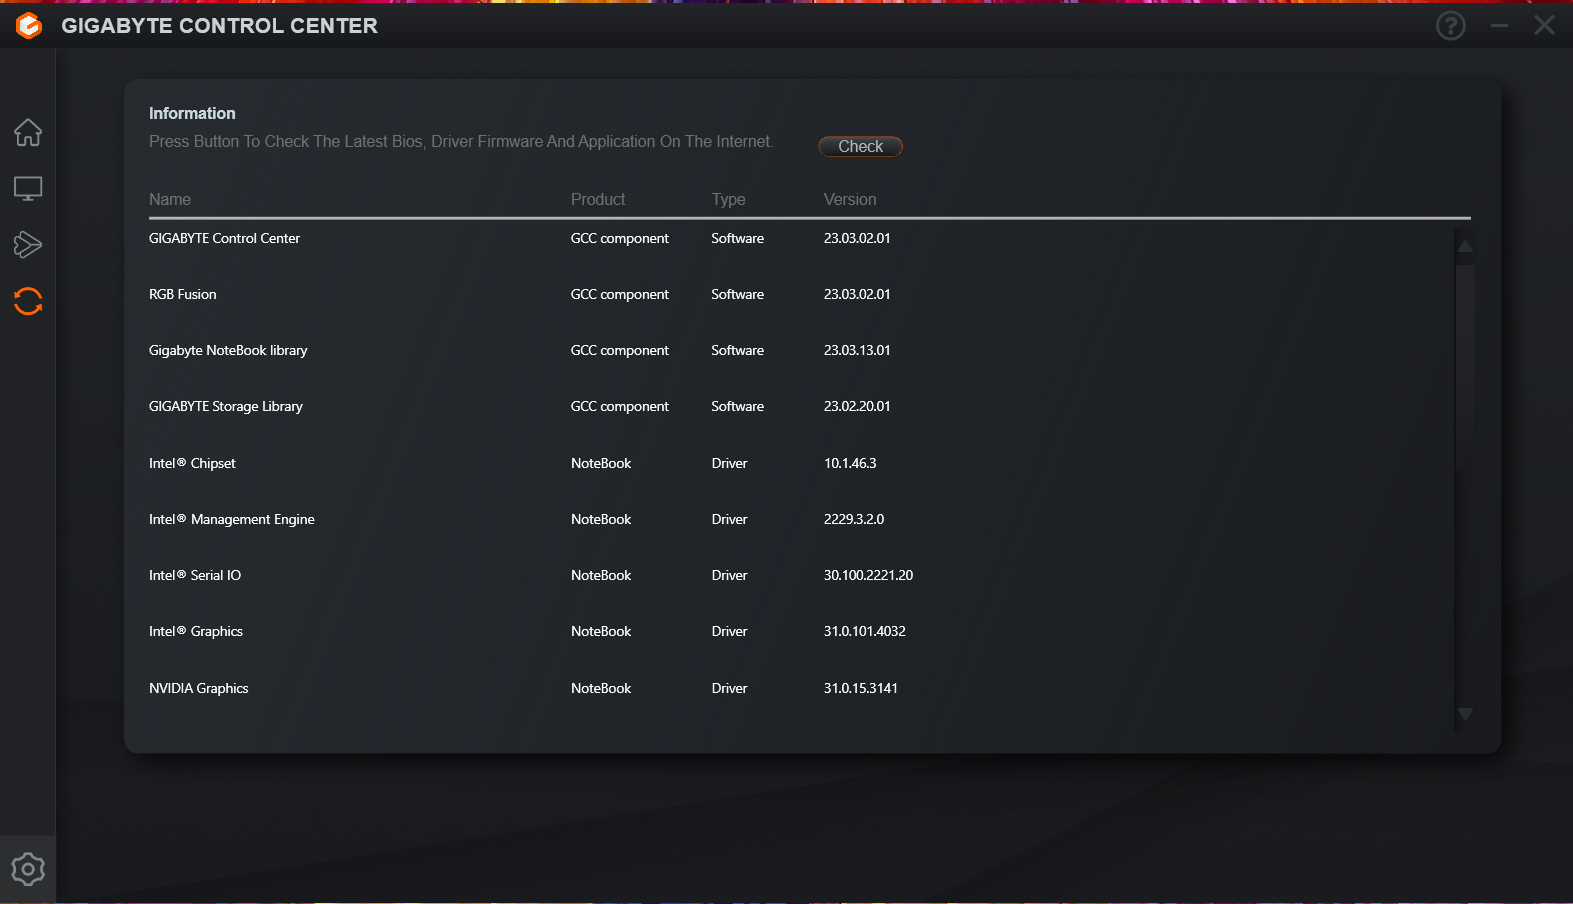
The computer's control center (Gigabyte Control Center) has all the usual performance modes (see table) and a superior AI boost function, which we used. This meant that the control center chose the best-fitting profile - "gaming mode" and "creator mode" for the benchmarks and "energy-saving idle mode" for the battery tests.
"Turbo mode" can in certain cases provide slightly improved performance - but this comes at a price: The fans are constantly working at full power. You can achieve the quietest working levels - close to completely silent - using "meeting mode". Here, the single-thread performance, which is more important for everyday use, shrinks to a lesser extent than the multi-thread performance. Even gaming would be possible at reduced settings.
| Creator mode | Turbo mode | Gaming mode | Meeting mode | Energy saving idle mode | |
|---|---|---|---|---|---|
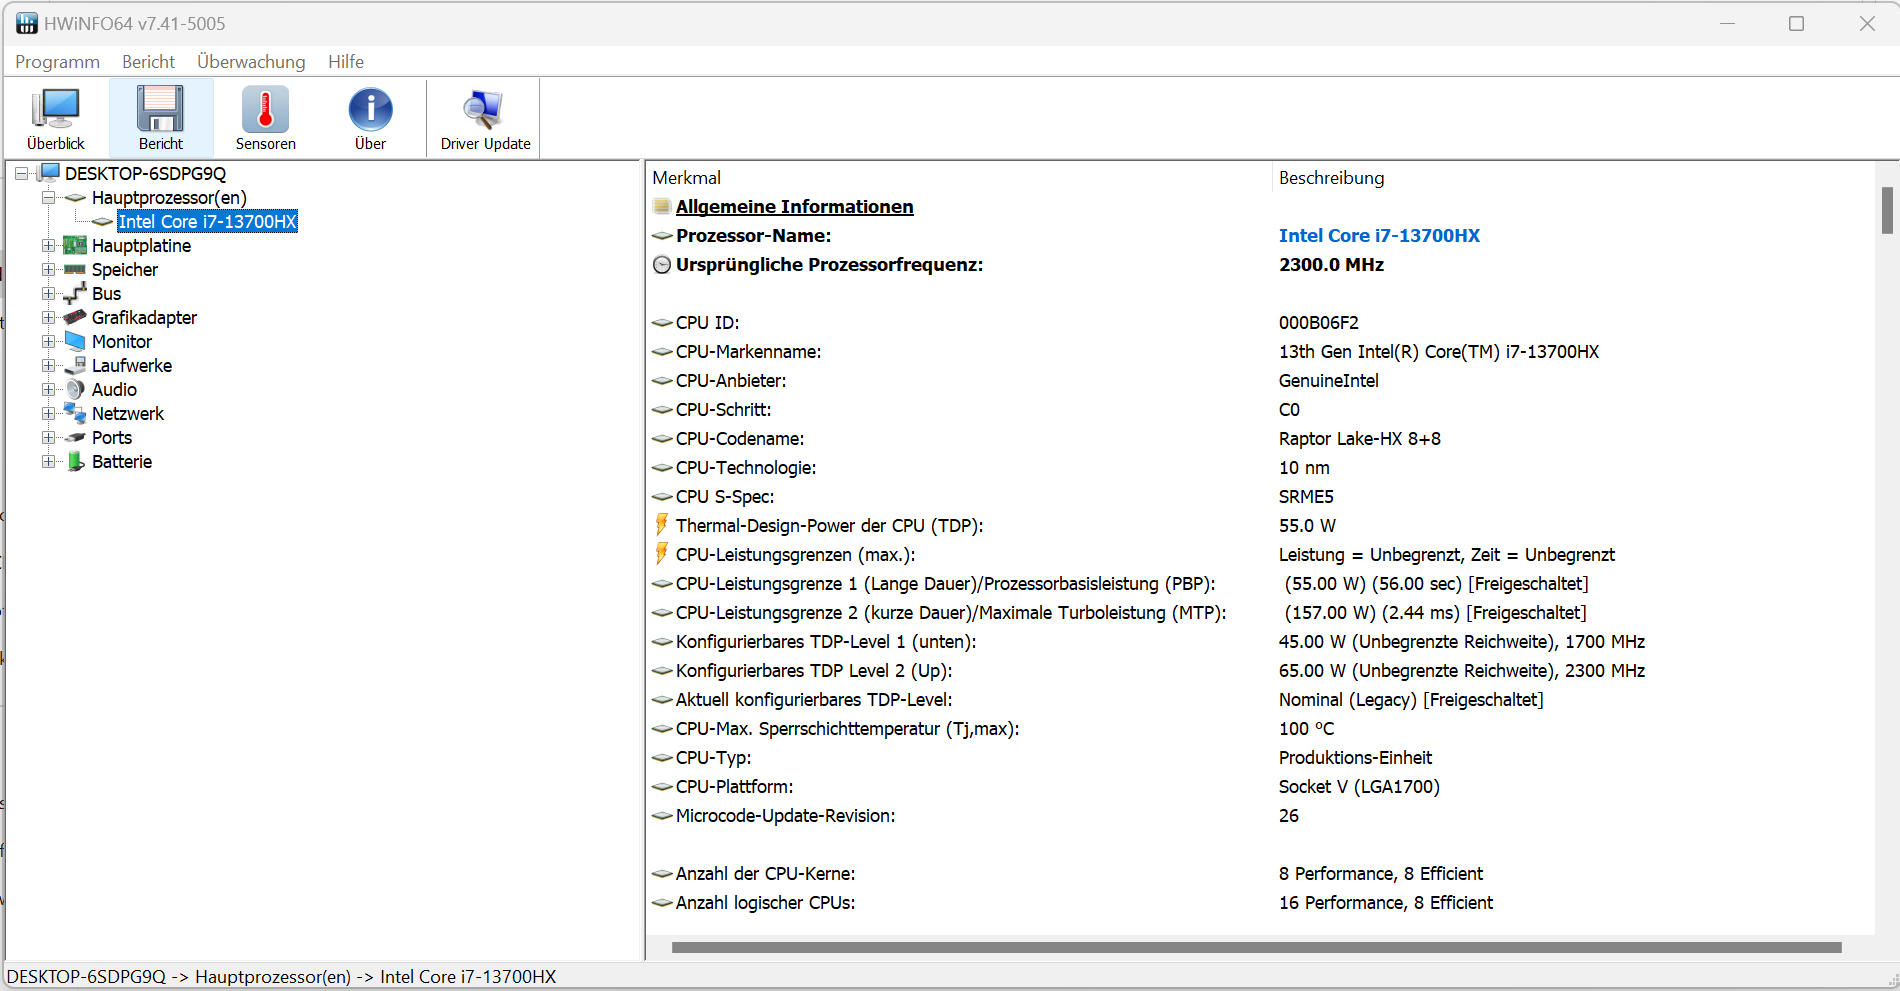
| Power limit 1 | 70 watts | 70 watts | 55 watts | 15 watts | 15 watts |
| Power limit 2 | 157 watts | 157 watts | 157 watts | 30 watts | 30 watts |
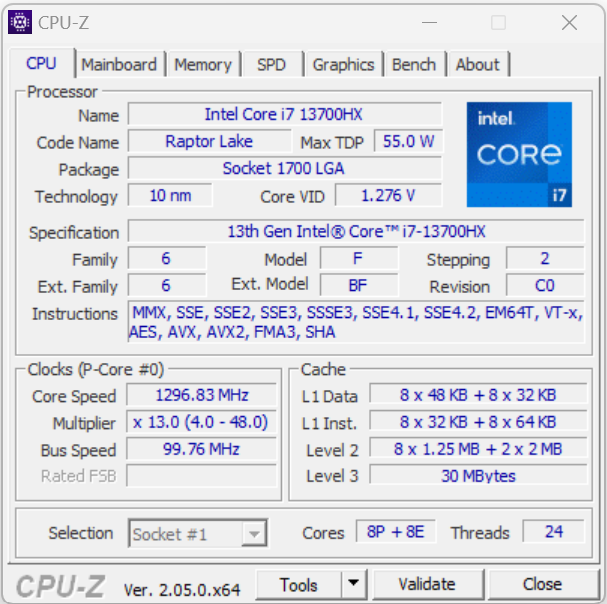
Processor
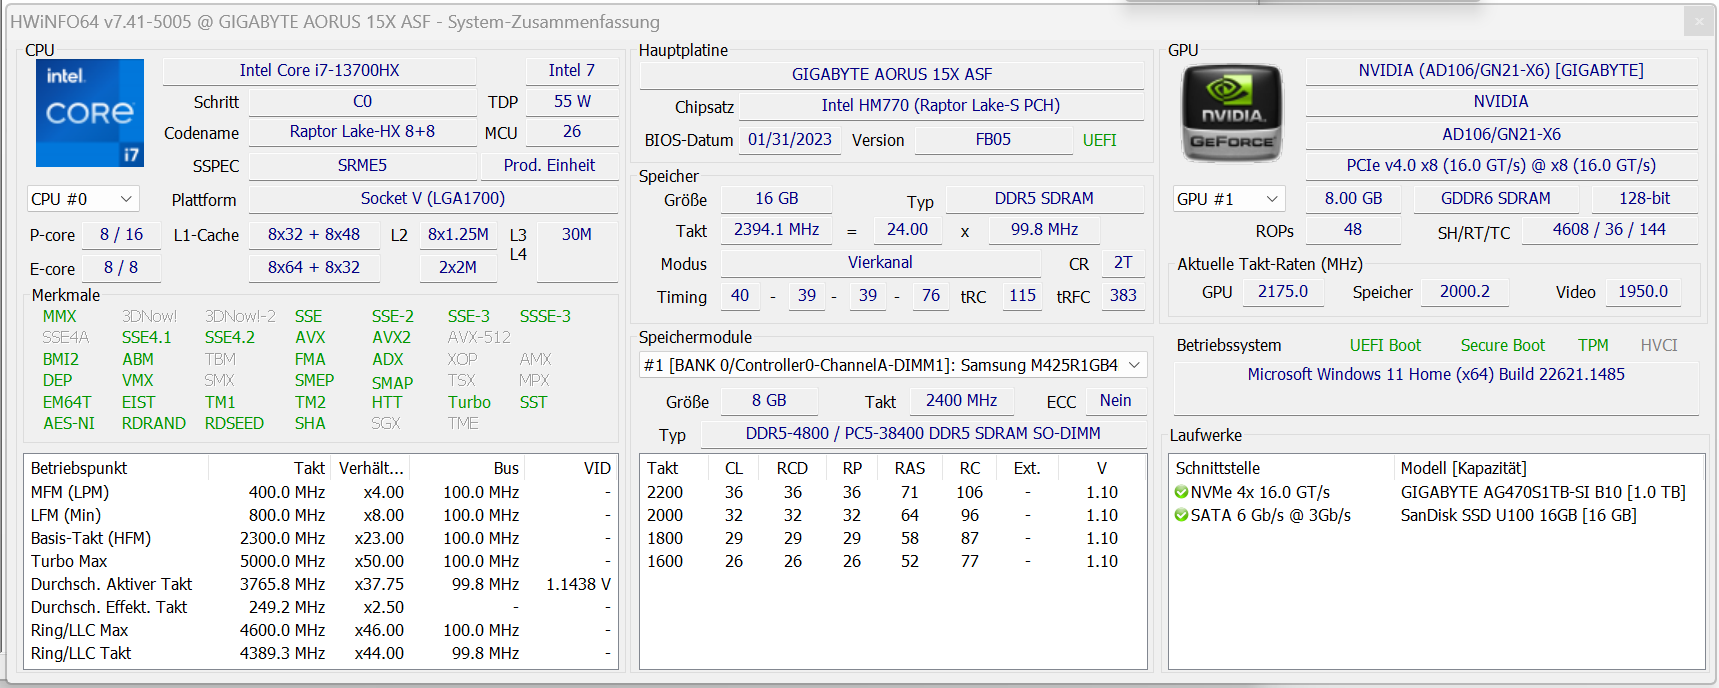
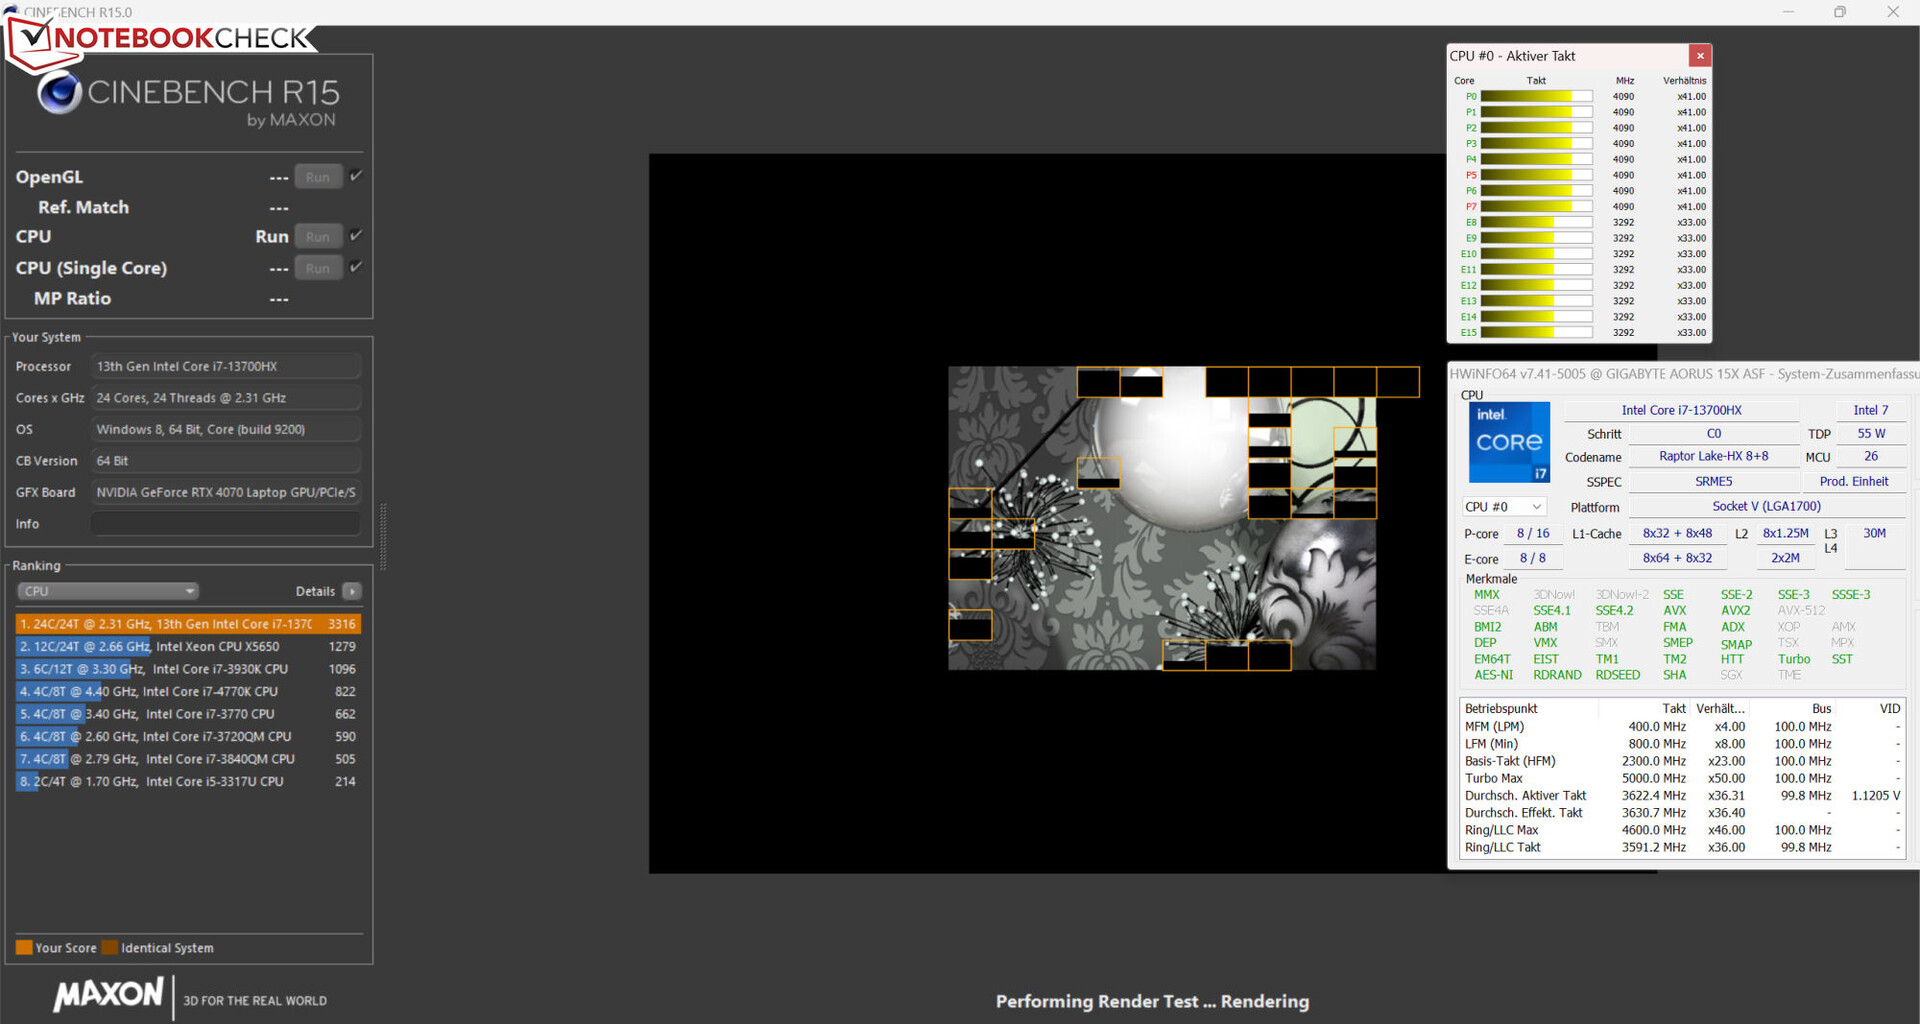
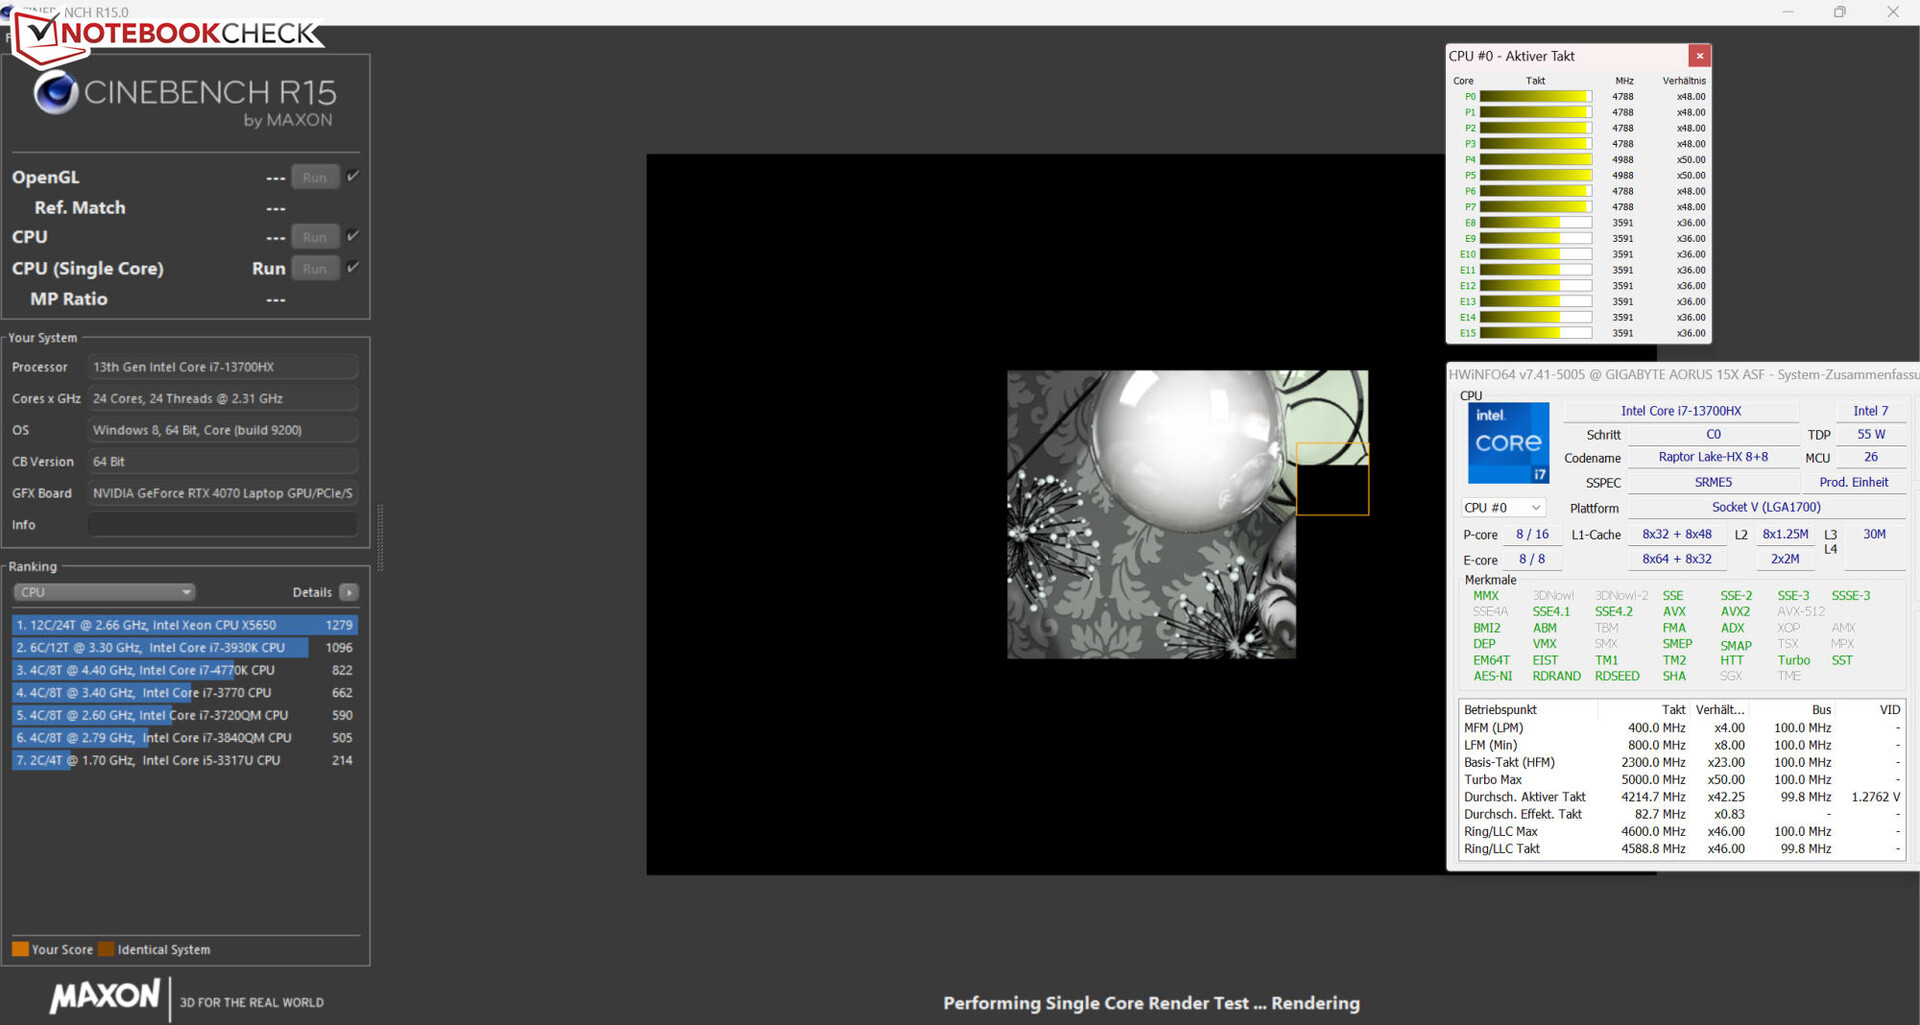
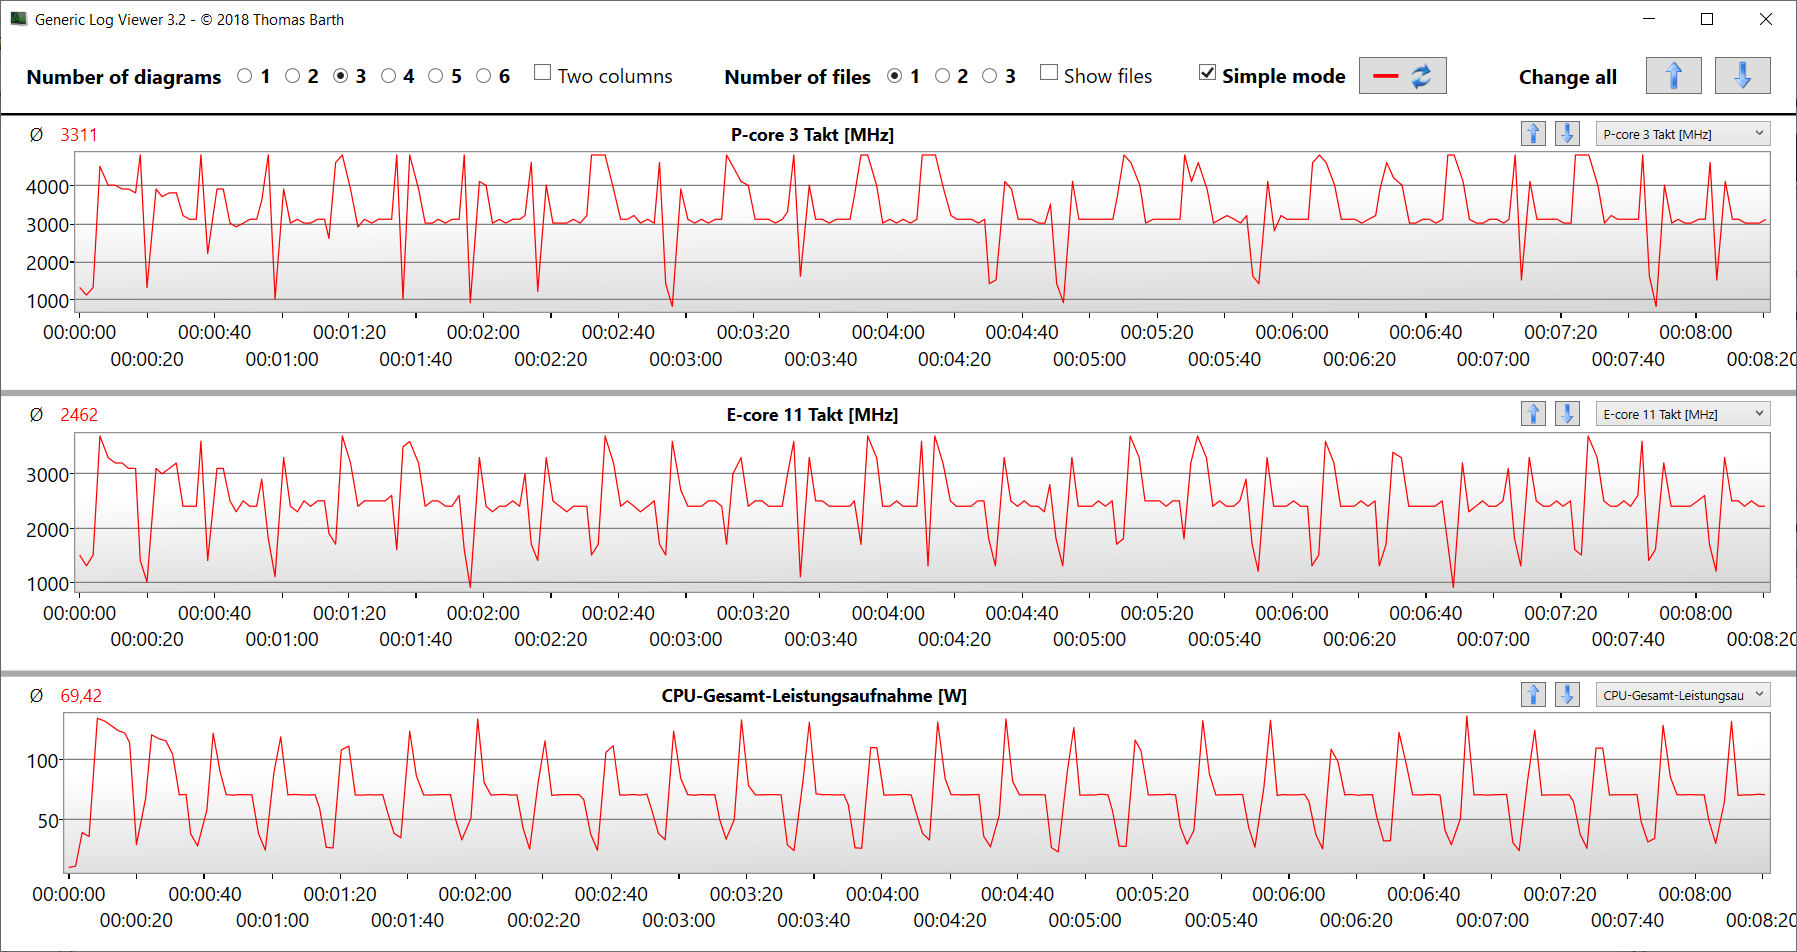
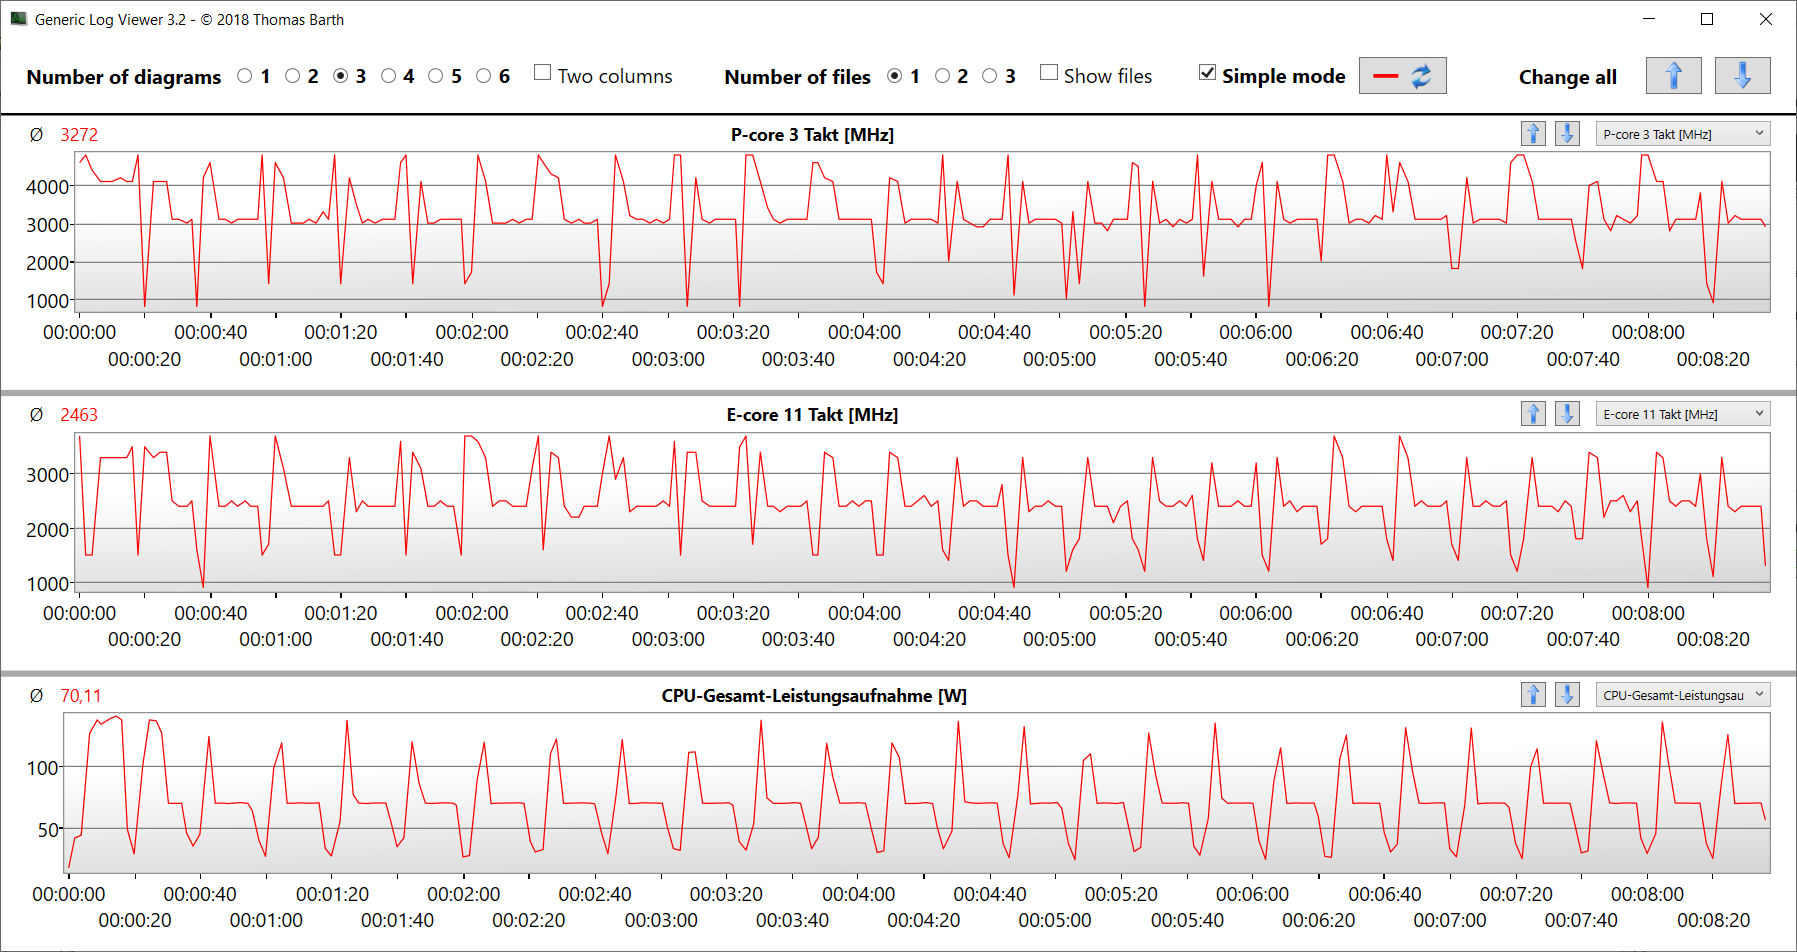
Its Core-i7-13700HX processor (Raptor Lake) consists of 8 efficiency cores (no hyper threading, 1.5 to 3.7 GHz) and 8 performance cores (hyper threading, 2.1 to 5 GHz). In total, this adds up to 24 logistical CPU cores. The benchmarks provide results on par with the CPU's determined average.
The CPU tests of the Cinebench R15 benchmark were run with high (multi-thread) or high to maximum (single-thread) clock rates while connected to the mains. Using the battery, these rates dropped - significantly more under single-thread load than multi-thread load.
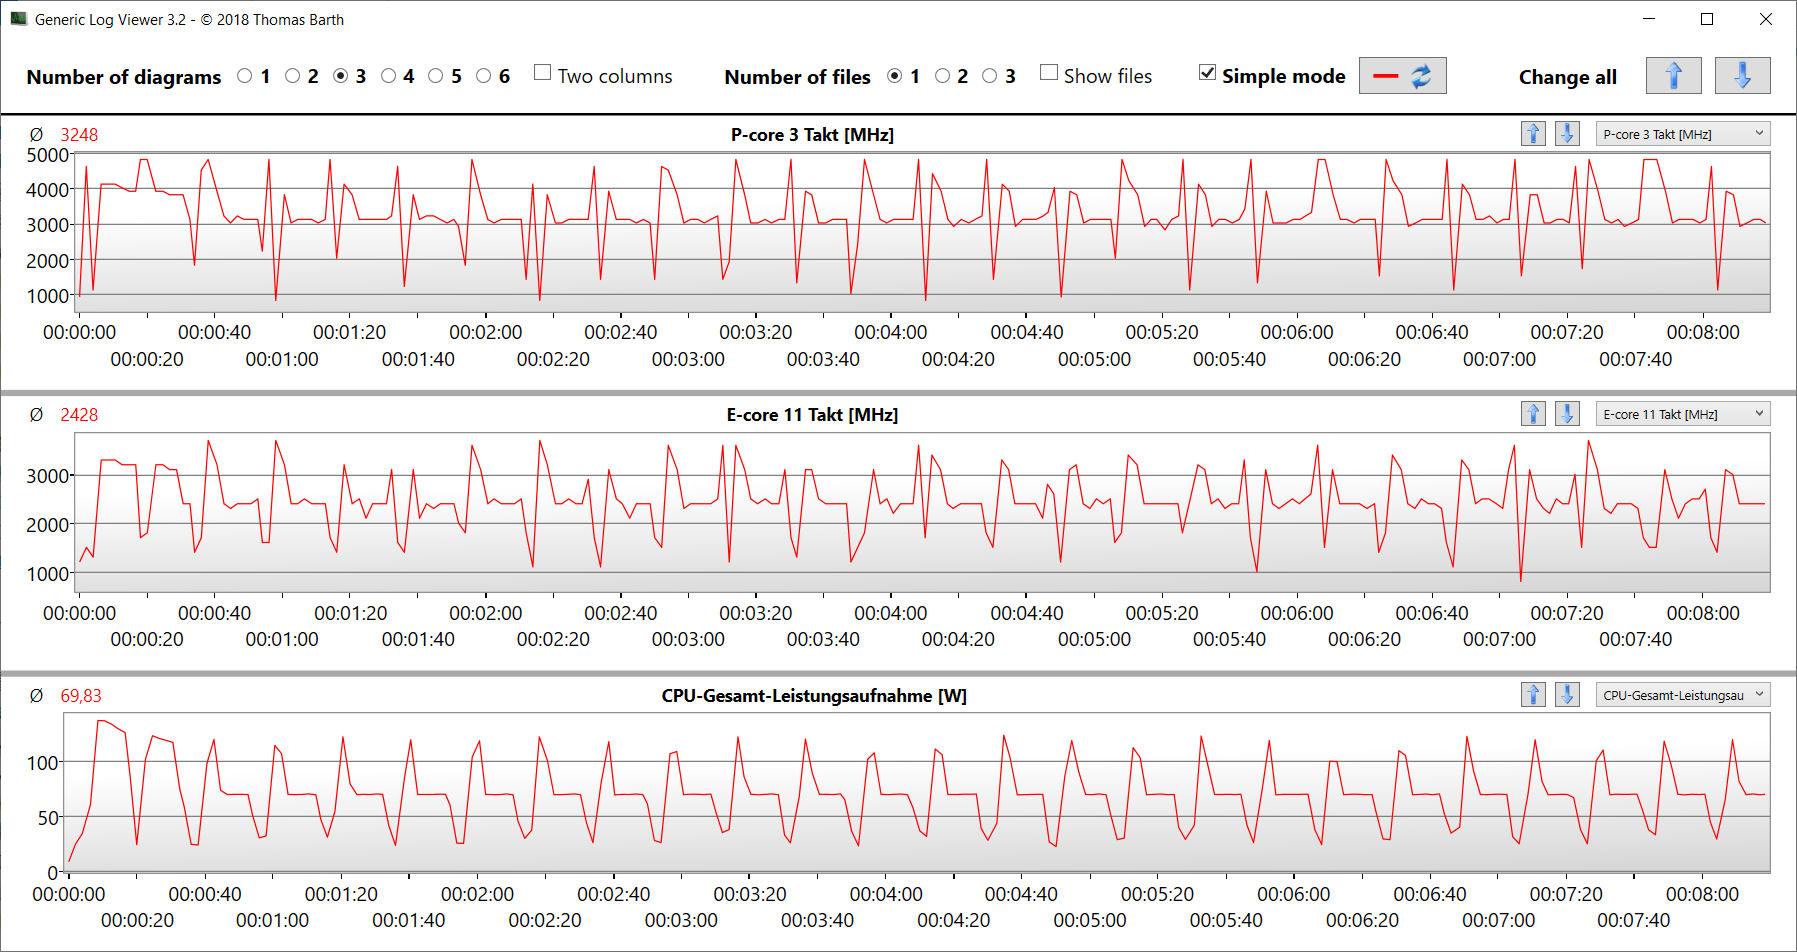
The CB15 loop test showed: The CPU turbo was utilized and continuous multi-thread load caused the clock rates to drop slightly from the first to the third run.
Cinebench R15 Multi Loop test
* ... smaller is better
AIDA64: FP32 Ray-Trace | FPU Julia | CPU SHA3 | CPU Queen | FPU SinJulia | FPU Mandel | CPU AES | CPU ZLib | FP64 Ray-Trace | CPU PhotoWorxx
| Performance rating | |
| Asus ROG Strix G17 G713PI | |
| Average of class Gaming | |
| Average Intel Core i7-13700HX | |
| Aorus 15X ASF | |
| Acer Predator Helios 300 (i7-12700H, RTX 3070 Ti) | |
| Razer Blade 15 OLED (Early 2022) | |
| MSI Katana 17 B13VFK | |
| AIDA64 / FP32 Ray-Trace | |
| Asus ROG Strix G17 G713PI | |
| Average of class Gaming (10227 - 85542, n=105, last 2 years) | |
| Average Intel Core i7-13700HX (14261 - 21999, n=11) | |
| Acer Predator Helios 300 (i7-12700H, RTX 3070 Ti) | |
| Aorus 15X ASF | |
| MSI Katana 17 B13VFK | |
| Razer Blade 15 OLED (Early 2022) | |
| AIDA64 / FPU Julia | |
| Asus ROG Strix G17 G713PI | |
| Average of class Gaming (51376 - 238426, n=105, last 2 years) | |
| Average Intel Core i7-13700HX (74636 - 109364, n=11) | |
| Acer Predator Helios 300 (i7-12700H, RTX 3070 Ti) | |
| Aorus 15X ASF | |
| Razer Blade 15 OLED (Early 2022) | |
| MSI Katana 17 B13VFK | |
| AIDA64 / CPU SHA3 | |
| Asus ROG Strix G17 G713PI | |
| Average of class Gaming (2180 - 10115, n=105, last 2 years) | |
| Average Intel Core i7-13700HX (3359 - 5053, n=11) | |
| Acer Predator Helios 300 (i7-12700H, RTX 3070 Ti) | |
| Aorus 15X ASF | |
| Razer Blade 15 OLED (Early 2022) | |
| MSI Katana 17 B13VFK | |
| AIDA64 / CPU Queen | |
| Asus ROG Strix G17 G713PI | |
| Average of class Gaming (49785 - 173351, n=90, last 2 years) | |
| Aorus 15X ASF | |
| Average Intel Core i7-13700HX (86532 - 114717, n=11) | |
| Razer Blade 15 OLED (Early 2022) | |
| Acer Predator Helios 300 (i7-12700H, RTX 3070 Ti) | |
| MSI Katana 17 B13VFK | |
| AIDA64 / FPU SinJulia | |
| Asus ROG Strix G17 G713PI | |
| Average of class Gaming (4424 - 33636, n=105, last 2 years) | |
| Average Intel Core i7-13700HX (9290 - 13519, n=11) | |
| Aorus 15X ASF | |
| Acer Predator Helios 300 (i7-12700H, RTX 3070 Ti) | |
| Razer Blade 15 OLED (Early 2022) | |
| MSI Katana 17 B13VFK | |
| AIDA64 / FPU Mandel | |
| Asus ROG Strix G17 G713PI | |
| Average of class Gaming (25115 - 128721, n=105, last 2 years) | |
| Average Intel Core i7-13700HX (35751 - 53484, n=11) | |
| Acer Predator Helios 300 (i7-12700H, RTX 3070 Ti) | |
| Aorus 15X ASF | |
| Razer Blade 15 OLED (Early 2022) | |
| MSI Katana 17 B13VFK | |
| AIDA64 / CPU AES | |
| Asus ROG Strix G17 G713PI | |
| Aorus 15X ASF | |
| Average Intel Core i7-13700HX (67846 - 182575, n=11) | |
| Average of class Gaming (39258 - 247074, n=105, last 2 years) | |
| Razer Blade 15 OLED (Early 2022) | |
| Acer Predator Helios 300 (i7-12700H, RTX 3070 Ti) | |
| MSI Katana 17 B13VFK | |
| AIDA64 / CPU ZLib | |
| Asus ROG Strix G17 G713PI | |
| Average of class Gaming (574 - 2531, n=105, last 2 years) | |
| Average Intel Core i7-13700HX (981 - 1451, n=11) | |
| Acer Predator Helios 300 (i7-12700H, RTX 3070 Ti) | |
| Aorus 15X ASF | |
| Razer Blade 15 OLED (Early 2022) | |
| MSI Katana 17 B13VFK | |
| AIDA64 / FP64 Ray-Trace | |
| Asus ROG Strix G17 G713PI | |
| Average of class Gaming (5509 - 45446, n=105, last 2 years) | |
| Average Intel Core i7-13700HX (7728 - 11837, n=11) | |
| Acer Predator Helios 300 (i7-12700H, RTX 3070 Ti) | |
| Aorus 15X ASF | |
| MSI Katana 17 B13VFK | |
| Razer Blade 15 OLED (Early 2022) | |
| AIDA64 / CPU PhotoWorxx | |
| Average of class Gaming (12271 - 89891, n=105, last 2 years) | |
| Acer Predator Helios 300 (i7-12700H, RTX 3070 Ti) | |
| Aorus 15X ASF | |
| Average Intel Core i7-13700HX (19678 - 42415, n=11) | |
| Razer Blade 15 OLED (Early 2022) | |
| Razer Blade 15 OLED (Early 2022) | |
| MSI Katana 17 B13VFK | |
| Asus ROG Strix G17 G713PI | |
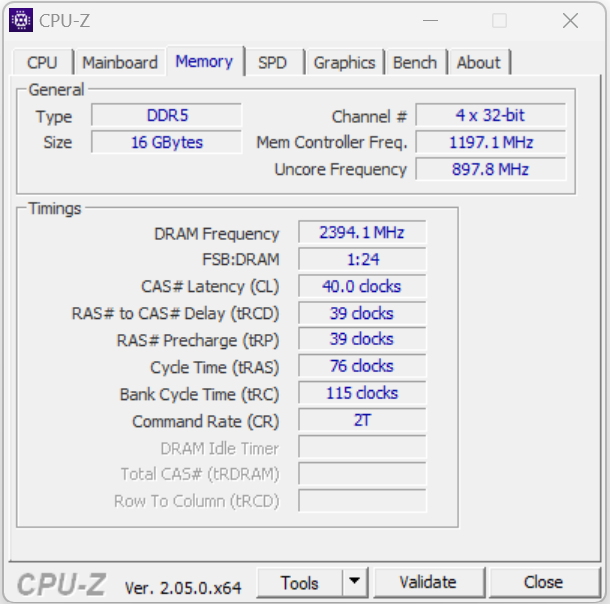
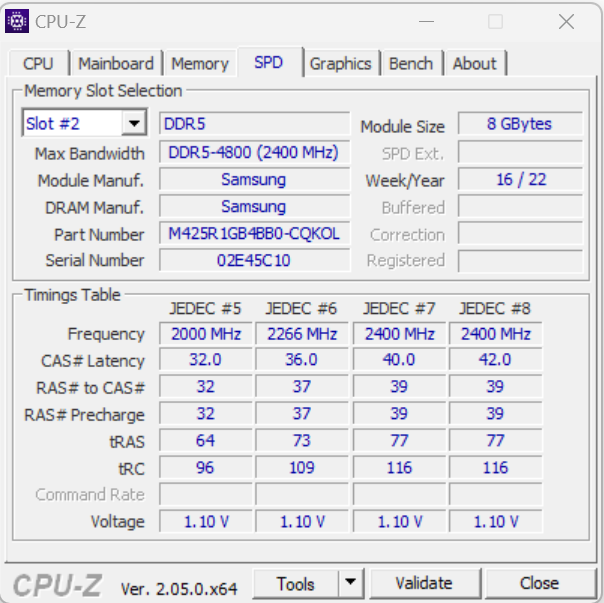
System performance
The spec sheet already reveals: 15X users don't have to worry about a lack of performance. The smoothly running system is well prepared for demanding tasks such as rendering or gaming - the good PCMark results confirm this. The RAM transfer rates don't show anything unusual and are on a normal level for DDR5-4800 RAM.
CrossMark: Overall | Productivity | Creativity | Responsiveness
| PCMark 10 / Score | |
| Average of class Gaming (5828 - 12414, n=93, last 2 years) | |
| Acer Predator Helios 300 (i7-12700H, RTX 3070 Ti) | |
| Average Intel Core i7-13700HX, NVIDIA GeForce RTX 4070 Laptop GPU (7178 - 8486, n=4) | |
| Asus ROG Strix G17 G713PI | |
| Razer Blade 15 OLED (Early 2022) | |
| Aorus 15X ASF | |
| MSI Katana 17 B13VFK | |
| PCMark 10 / Essentials | |
| Asus ROG Strix G17 G713PI | |
| MSI Katana 17 B13VFK | |
| Aorus 15X ASF | |
| Acer Predator Helios 300 (i7-12700H, RTX 3070 Ti) | |
| Average of class Gaming (8810 - 11935, n=97, last 2 years) | |
| Average Intel Core i7-13700HX, NVIDIA GeForce RTX 4070 Laptop GPU (9679 - 11652, n=4) | |
| Razer Blade 15 OLED (Early 2022) | |
| PCMark 10 / Productivity | |
| Average of class Gaming (6845 - 25323, n=95, last 2 years) | |
| Asus ROG Strix G17 G713PI | |
| Razer Blade 15 OLED (Early 2022) | |
| Acer Predator Helios 300 (i7-12700H, RTX 3070 Ti) | |
| Average Intel Core i7-13700HX, NVIDIA GeForce RTX 4070 Laptop GPU (9236 - 10517, n=4) | |
| Aorus 15X ASF | |
| MSI Katana 17 B13VFK | |
| PCMark 10 / Digital Content Creation | |
| Average of class Gaming (7602 - 19954, n=95, last 2 years) | |
| Acer Predator Helios 300 (i7-12700H, RTX 3070 Ti) | |
| Average Intel Core i7-13700HX, NVIDIA GeForce RTX 4070 Laptop GPU (9731 - 13534, n=4) | |
| Razer Blade 15 OLED (Early 2022) | |
| MSI Katana 17 B13VFK | |
| Aorus 15X ASF | |
| Asus ROG Strix G17 G713PI | |
| CrossMark / Overall | |
| Aorus 15X ASF | |
| Asus ROG Strix G17 G713PI | |
| Average of class Gaming (1366 - 2409, n=94, last 2 years) | |
| Average Intel Core i7-13700HX, NVIDIA GeForce RTX 4070 Laptop GPU (1756 - 2065, n=3) | |
| Acer Predator Helios 300 (i7-12700H, RTX 3070 Ti) | |
| MSI Katana 17 B13VFK | |
| Razer Blade 15 OLED (Early 2022) | |
| CrossMark / Productivity | |
| Aorus 15X ASF | |
| Asus ROG Strix G17 G713PI | |
| Average of class Gaming (1386 - 2254, n=94, last 2 years) | |
| Average Intel Core i7-13700HX, NVIDIA GeForce RTX 4070 Laptop GPU (1731 - 1960, n=3) | |
| Acer Predator Helios 300 (i7-12700H, RTX 3070 Ti) | |
| MSI Katana 17 B13VFK | |
| Razer Blade 15 OLED (Early 2022) | |
| CrossMark / Creativity | |
| Asus ROG Strix G17 G713PI | |
| Average of class Gaming (1343 - 2786, n=94, last 2 years) | |
| Aorus 15X ASF | |
| Acer Predator Helios 300 (i7-12700H, RTX 3070 Ti) | |
| Average Intel Core i7-13700HX, NVIDIA GeForce RTX 4070 Laptop GPU (1797 - 2193, n=3) | |
| MSI Katana 17 B13VFK | |
| Razer Blade 15 OLED (Early 2022) | |
| CrossMark / Responsiveness | |
| Aorus 15X ASF | |
| Average Intel Core i7-13700HX, NVIDIA GeForce RTX 4070 Laptop GPU (1708 - 2016, n=3) | |
| MSI Katana 17 B13VFK | |
| Acer Predator Helios 300 (i7-12700H, RTX 3070 Ti) | |
| Average of class Gaming (1226 - 2334, n=94, last 2 years) | |
| Asus ROG Strix G17 G713PI | |
| Razer Blade 15 OLED (Early 2022) | |
| PCMark 8 Home Score Accelerated v2 | 4764 points | |
| PCMark 8 Work Score Accelerated v2 | 5976 points | |
| PCMark 10 Score | 7178 points | |
Help | ||
| AIDA64 / Memory Copy | |
| Average of class Gaming (21750 - 129946, n=105, last 2 years) | |
| Aorus 15X ASF | |
| Acer Predator Helios 300 (i7-12700H, RTX 3070 Ti) | |
| Razer Blade 15 OLED (Early 2022) | |
| Average Intel Core i7-13700HX (36125 - 63990, n=11) | |
| MSI Katana 17 B13VFK | |
| Asus ROG Strix G17 G713PI | |
| AIDA64 / Memory Read | |
| Average of class Gaming (22956 - 118858, n=105, last 2 years) | |
| Aorus 15X ASF | |
| MSI Katana 17 B13VFK | |
| Razer Blade 15 OLED (Early 2022) | |
| Average Intel Core i7-13700HX (36510 - 69729, n=11) | |
| Asus ROG Strix G17 G713PI | |
| Acer Predator Helios 300 (i7-12700H, RTX 3070 Ti) | |
| AIDA64 / Memory Write | |
| Average of class Gaming (22297 - 135096, n=105, last 2 years) | |
| Average Intel Core i7-13700HX (33598 - 85675, n=11) | |
| Asus ROG Strix G17 G713PI | |
| Razer Blade 15 OLED (Early 2022) | |
| Acer Predator Helios 300 (i7-12700H, RTX 3070 Ti) | |
| Aorus 15X ASF | |
| MSI Katana 17 B13VFK | |
| AIDA64 / Memory Latency | |
| Average of class Gaming (75.3 - 259, n=105, last 2 years) | |
| MSI Katana 17 B13VFK | |
| Razer Blade 15 OLED (Early 2022) | |
| Acer Predator Helios 300 (i7-12700H, RTX 3070 Ti) | |
| Average Intel Core i7-13700HX (81.5 - 97.9, n=11) | |
| Asus ROG Strix G17 G713PI | |
| Aorus 15X ASF | |
* ... smaller is better
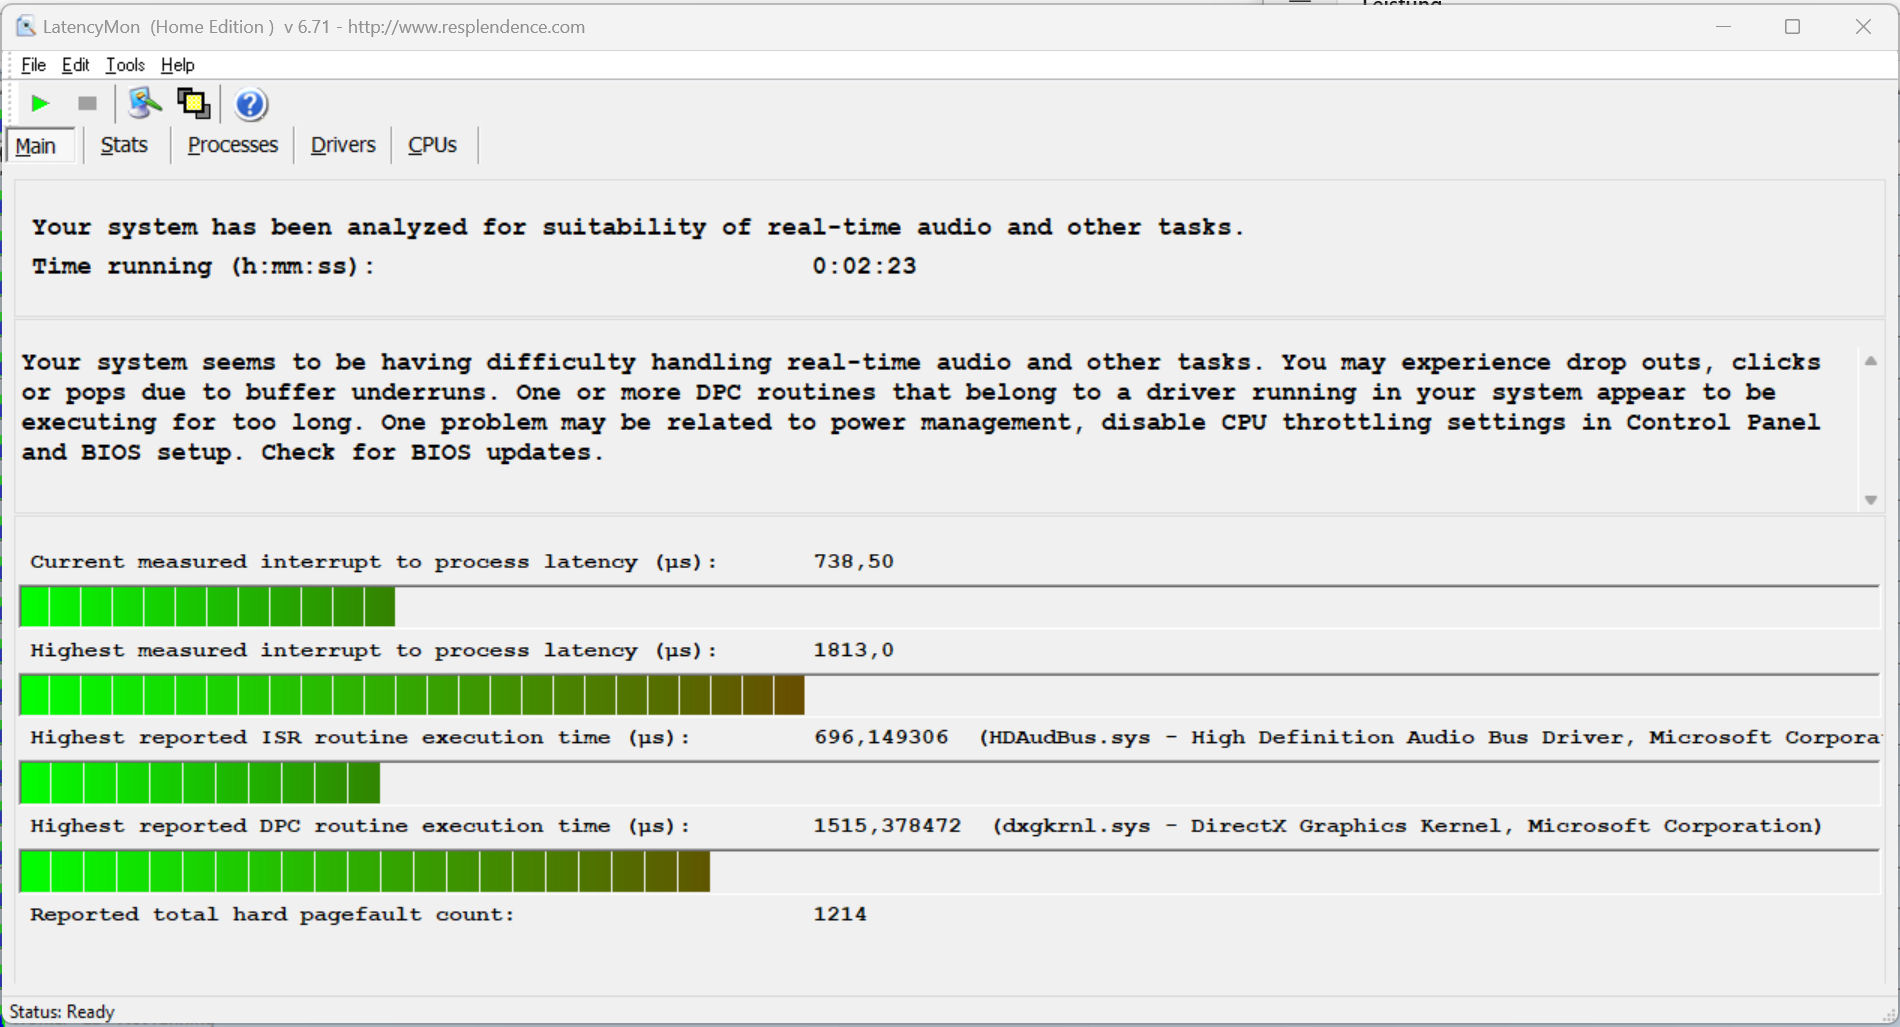
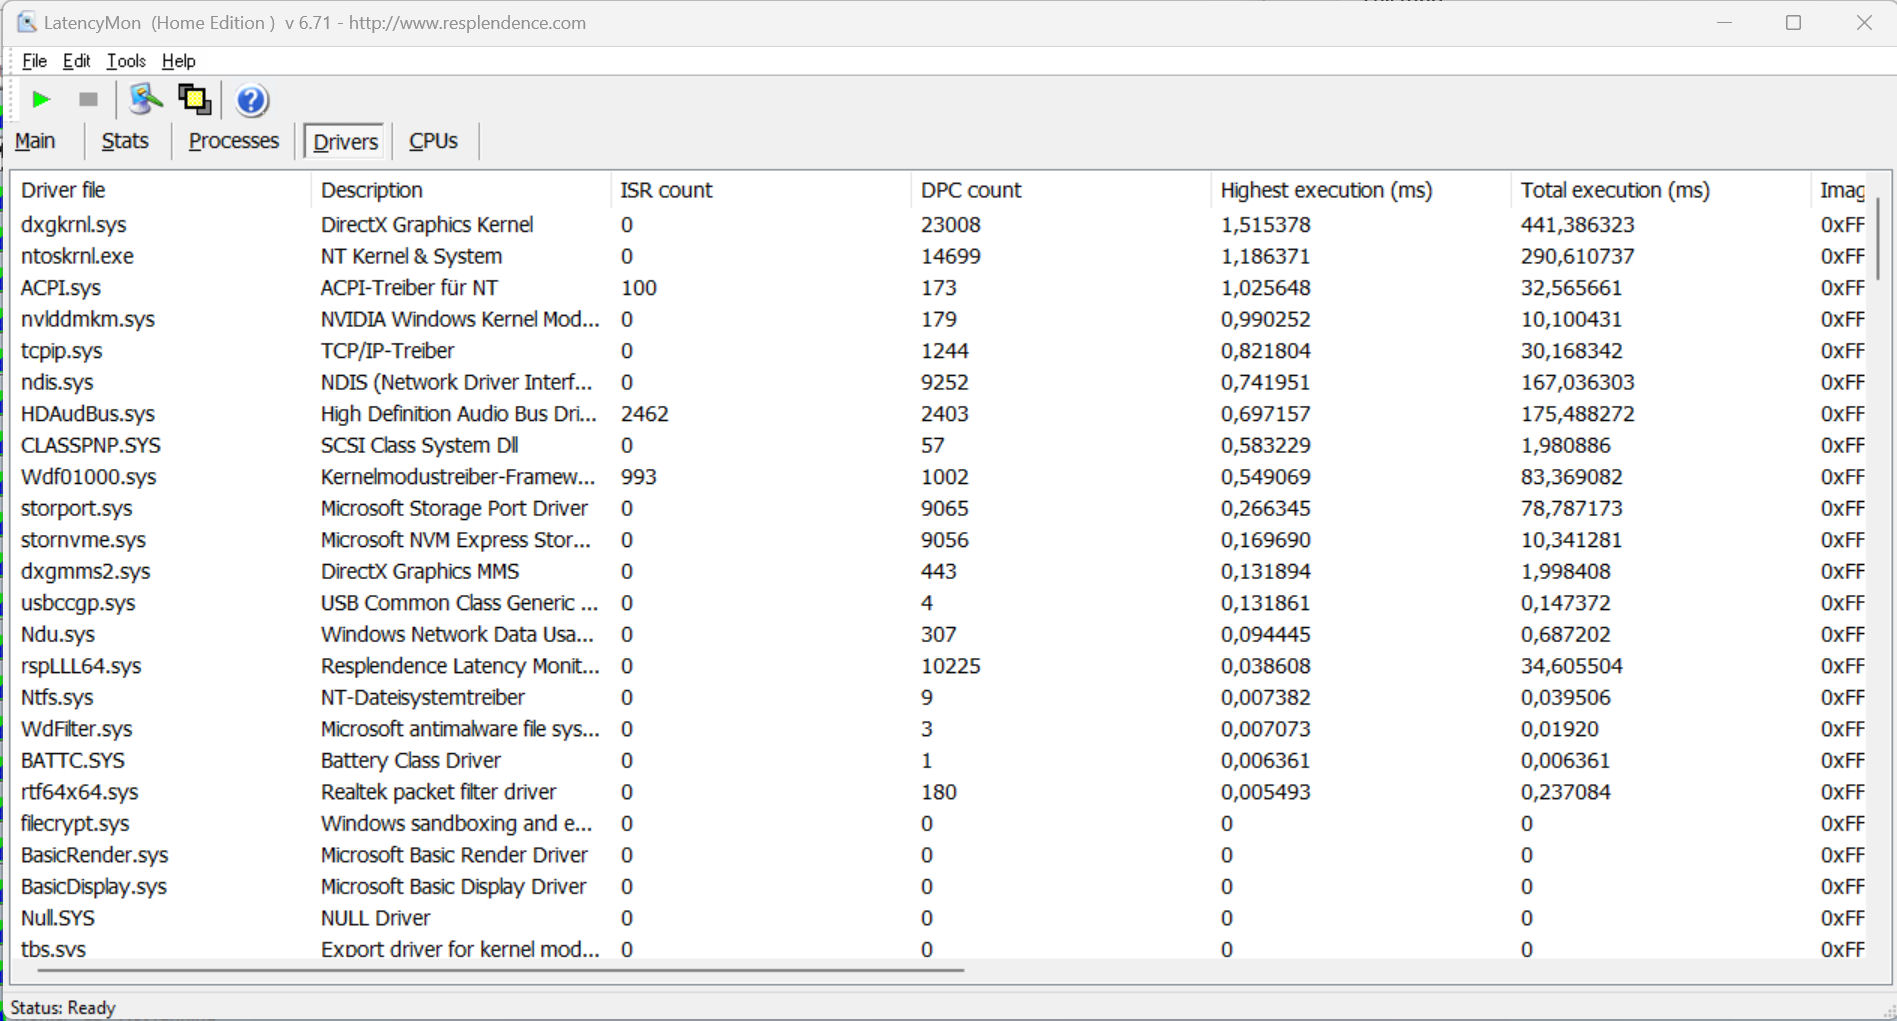
DPC latency
The standardized latency monitor test (web surfing, 4k video playback, Prime95 high-load) revealed a few abnormalities. This system doesn't seem to be suitable for real-time video and audio editing. Future software updates could bring some improvements - but they could possibly also worsen this issue.
| DPC Latencies / LatencyMon - interrupt to process latency (max), Web, Youtube, Prime95 | |
| MSI Katana 17 B13VFK | |
| Aorus 15X ASF | |
| Acer Predator Helios 300 (i7-12700H, RTX 3070 Ti) | |
| Asus ROG Strix G17 G713PI | |
| Razer Blade 15 OLED (Early 2022) | |
* ... smaller is better
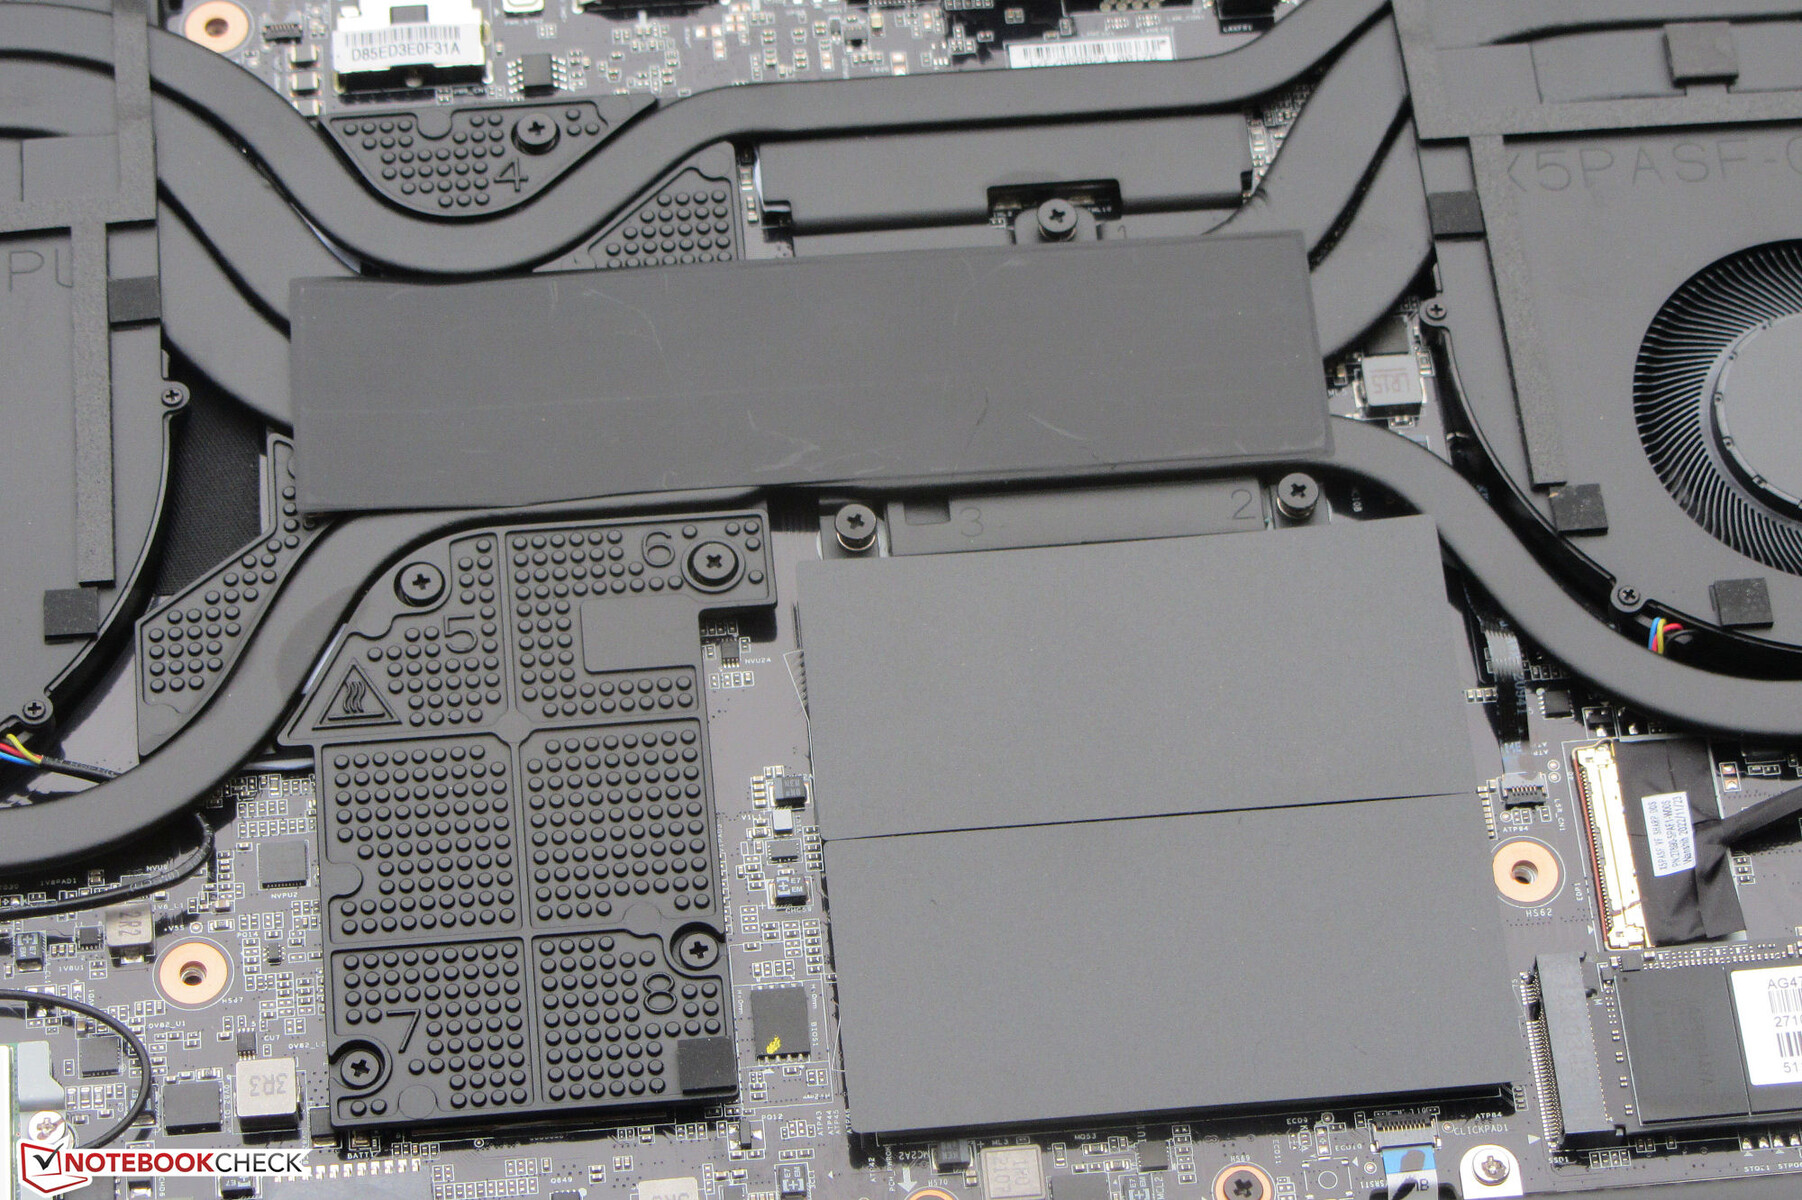
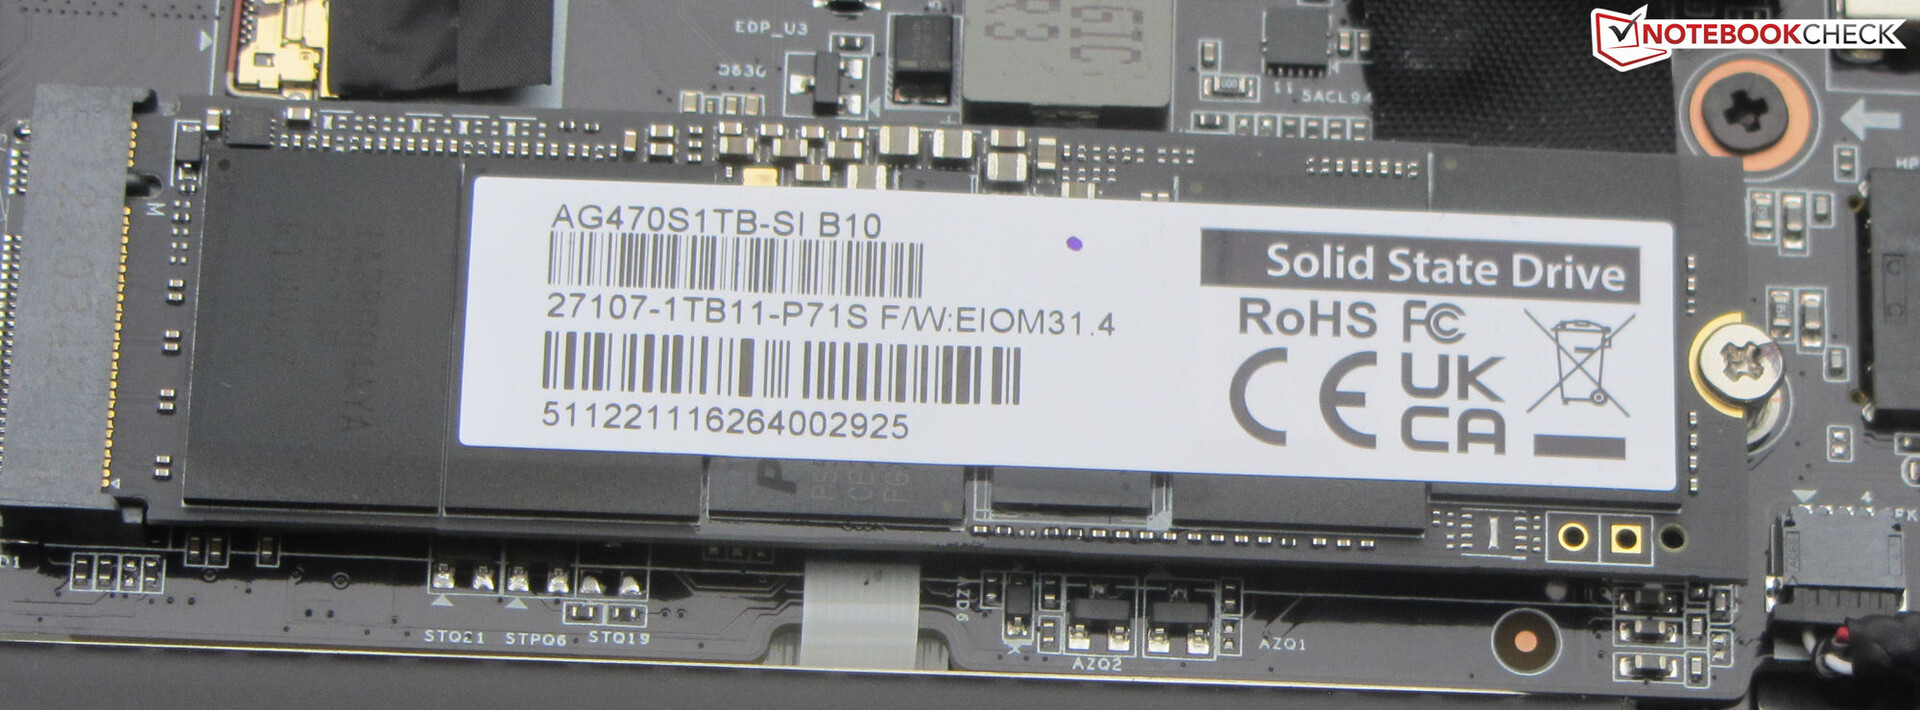
Storage devices
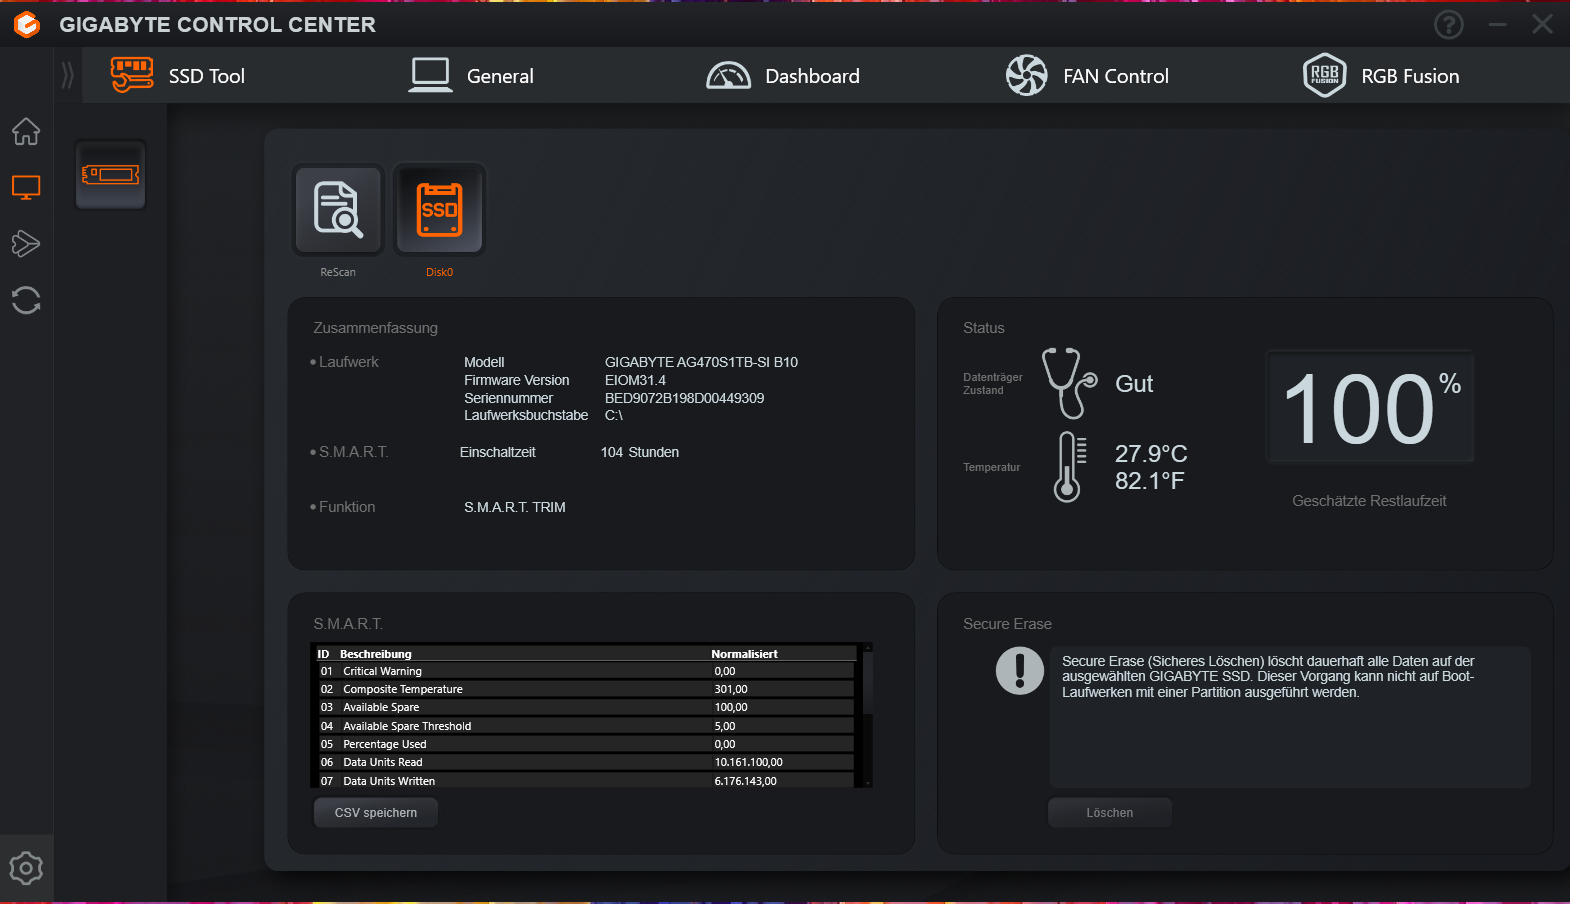
The 15X has space for two PCIe-4 SSDs in M.2-2280 format - however, only one is included with the laptop. The installed PCIe-4 model (1 TB) from Gigabyte delivers very good transfer rates. However: In the later course of the DiskSpd loop, occasional performance drops could be observed - probably due to thermal throttling.

* ... smaller is better
Reading continuous performance: DiskSpd Read Loop, Queue Depth 8
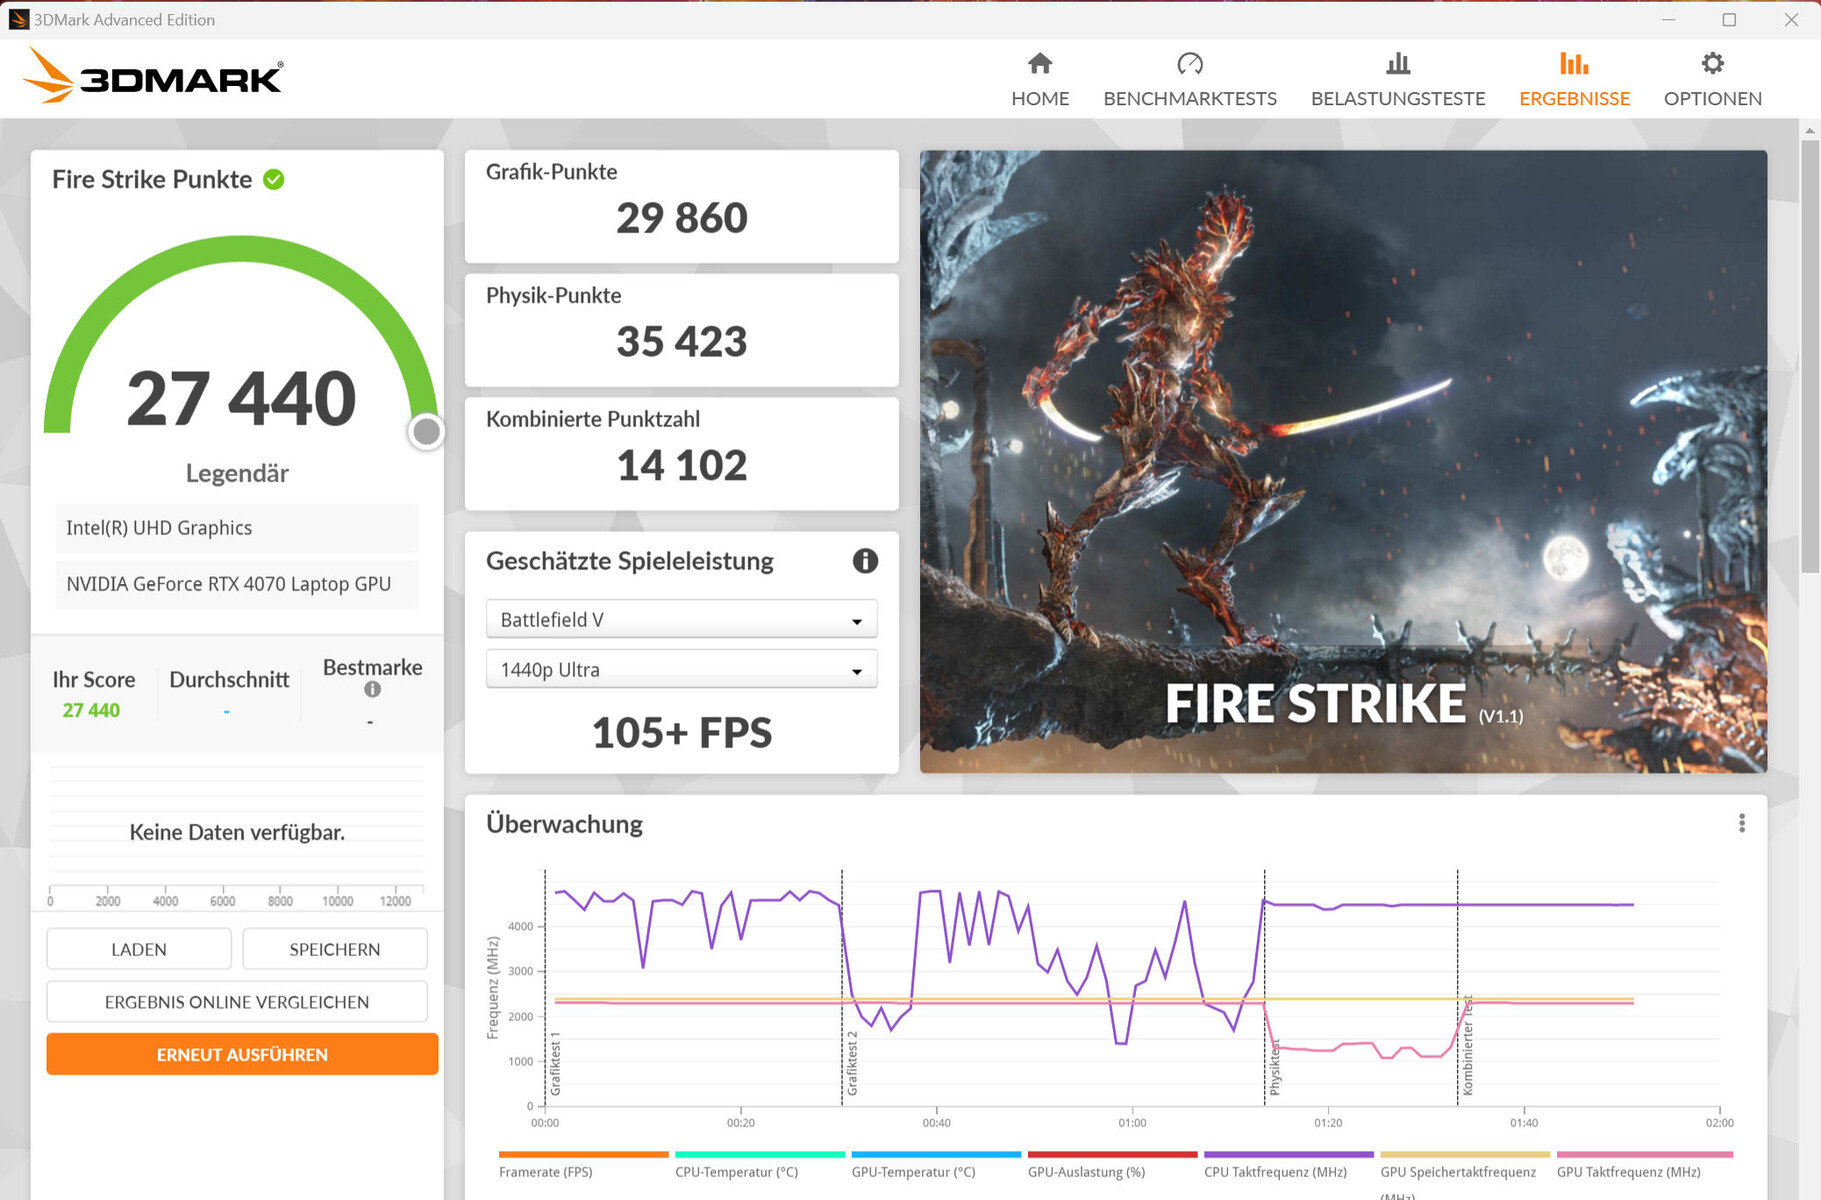
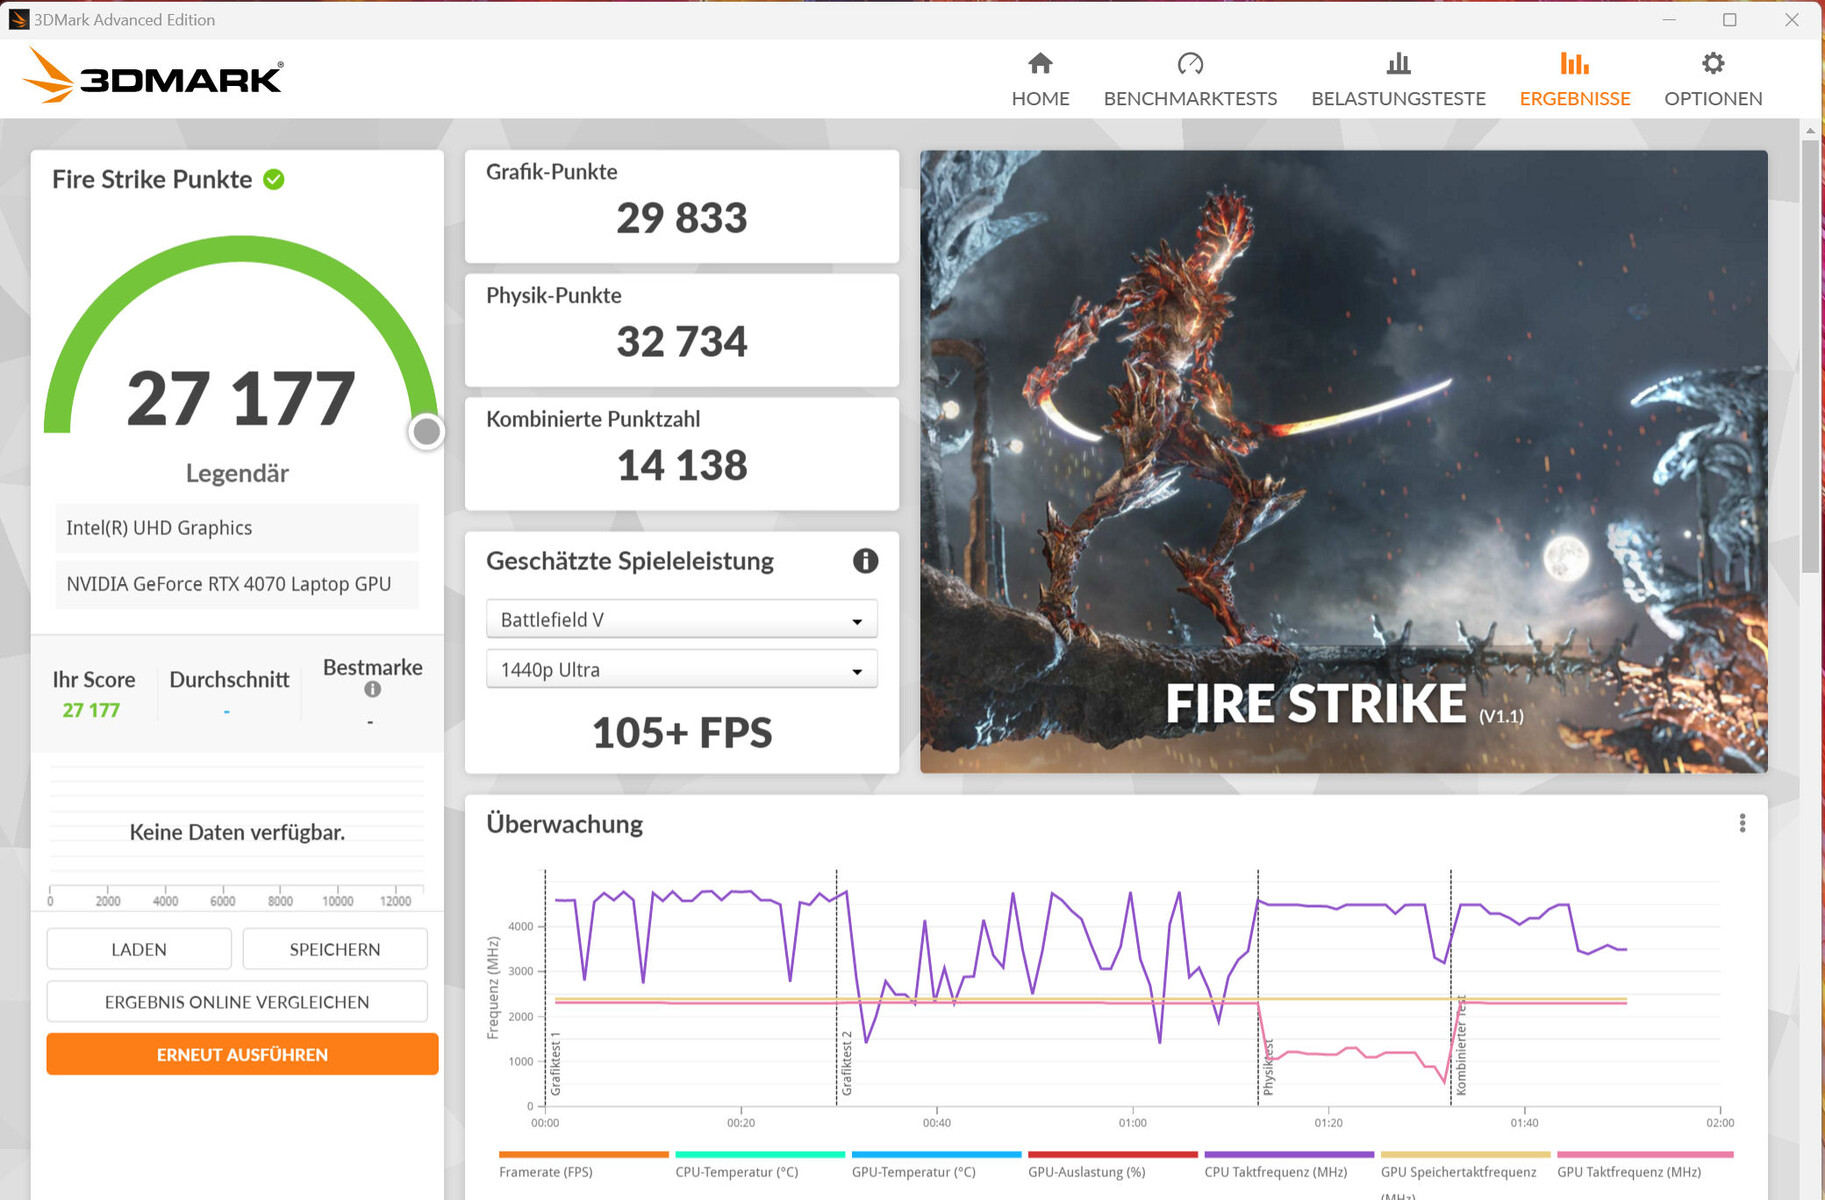
Graphics card
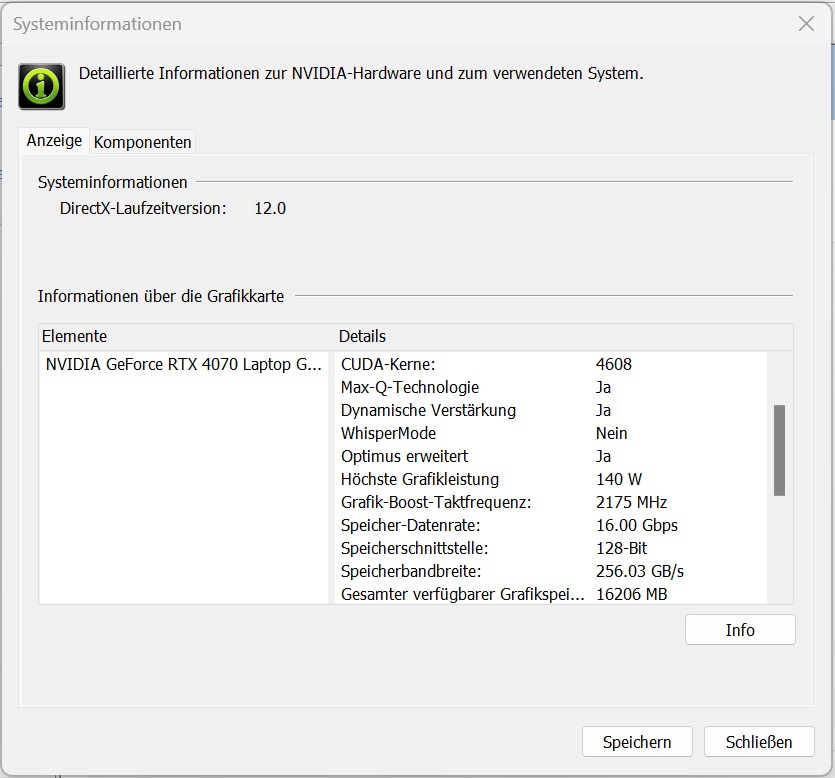
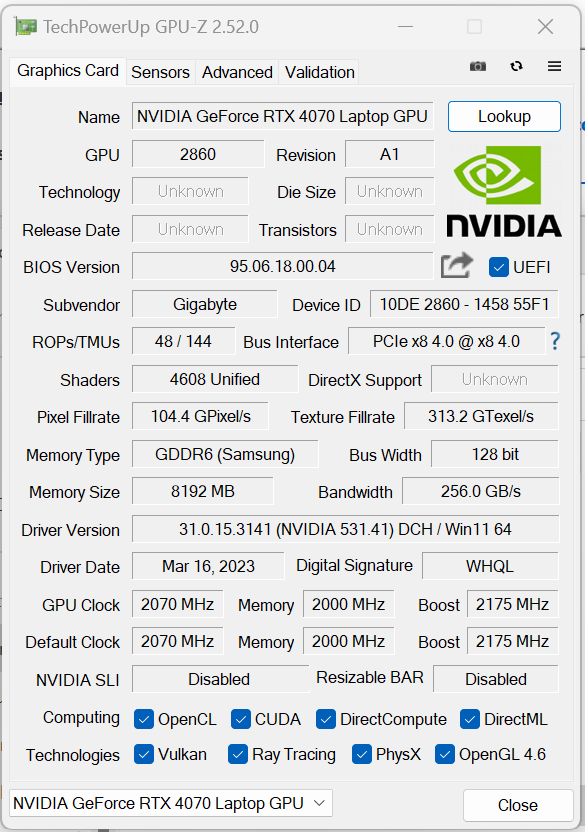
Aorus relies on a GeForce-RTX-4070 laptop GPU and grants it the maximum possible TGP of 140 watts (115 watts + 25 watts Dynamic Boost) - this is not fully utilized according to the Witcher 3 test. The GPU has 4,608 shaders, a 128 bit wide bus and fast GDDR6 memory (8,192 MB).
The benchmark results were higher than the previous RTX 4070 average. The dGPU mode didn't lead to any improvements. Switching between dGPU and Optimus didn't require a restart - Advanced Optimus is supported.


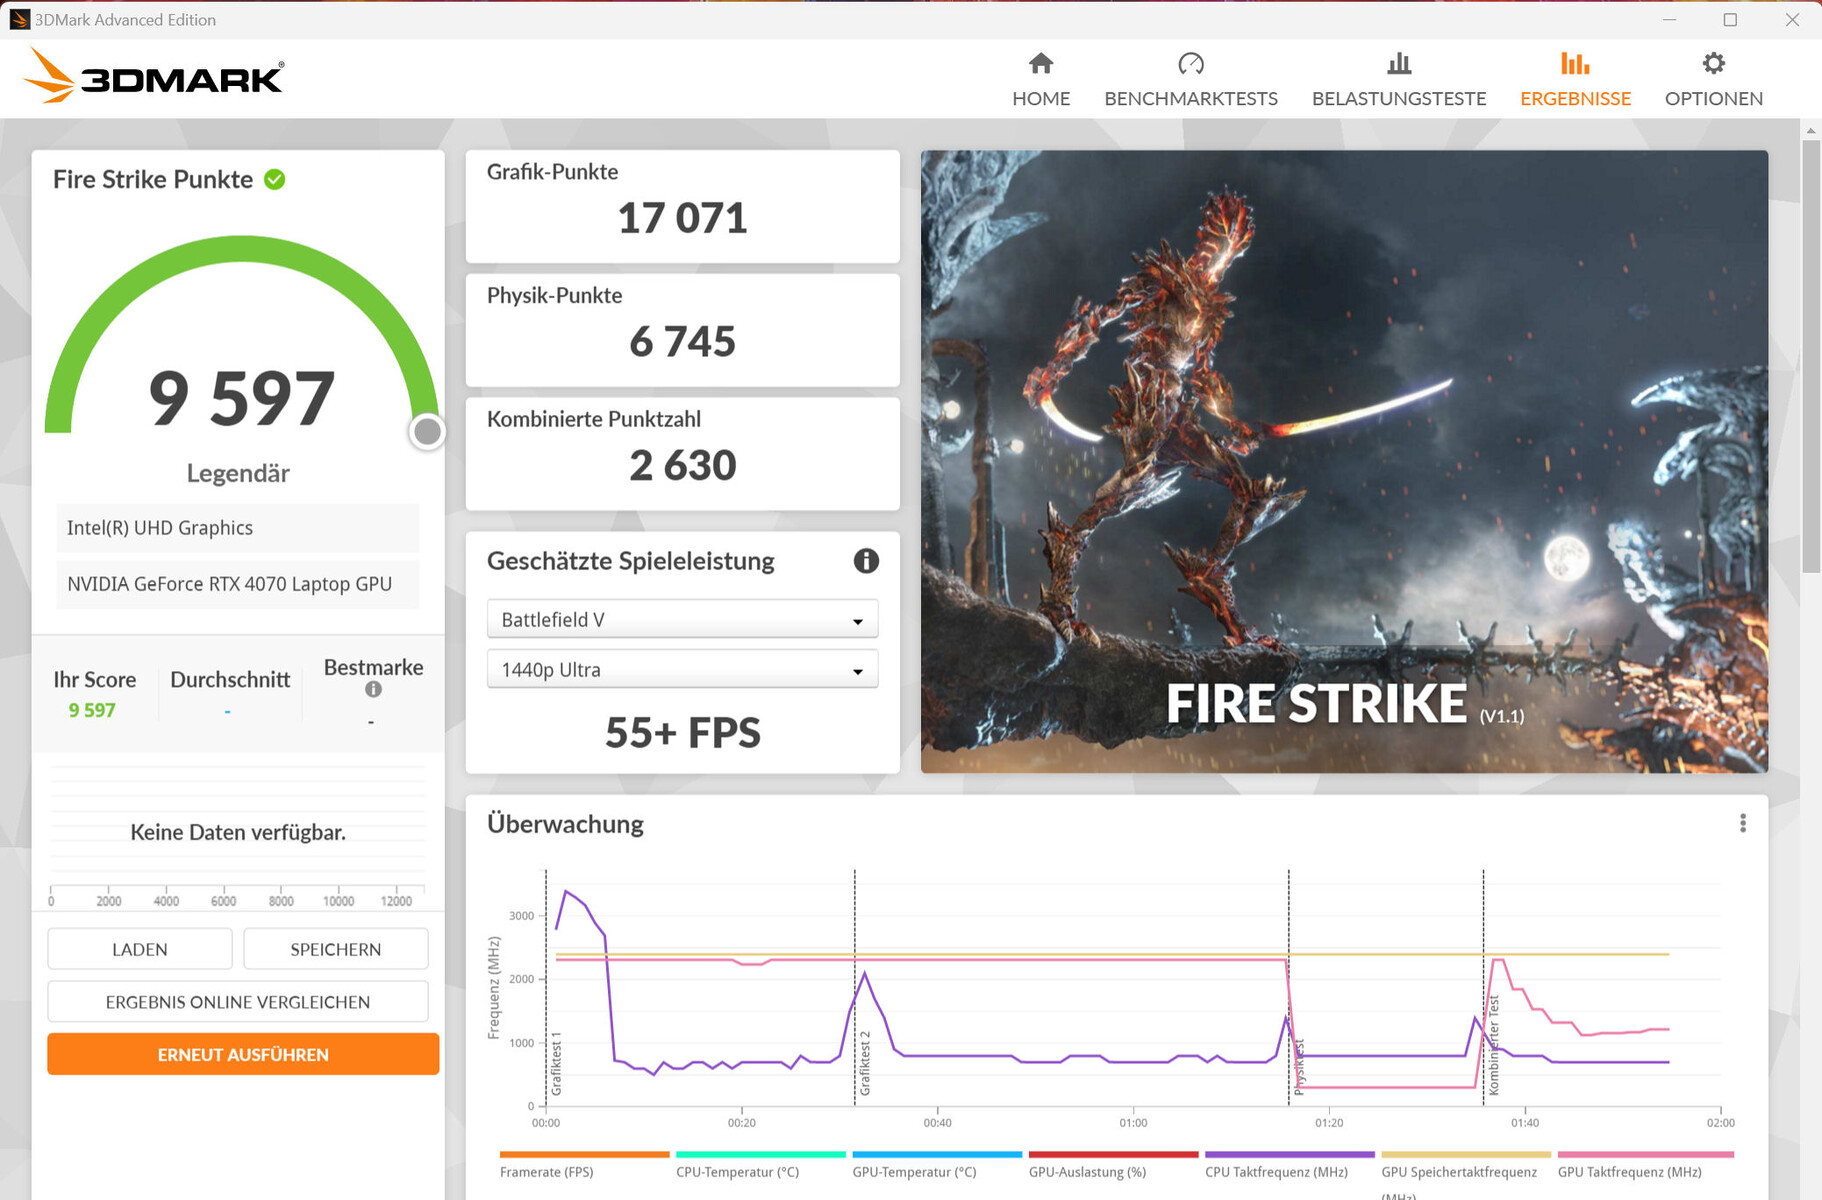
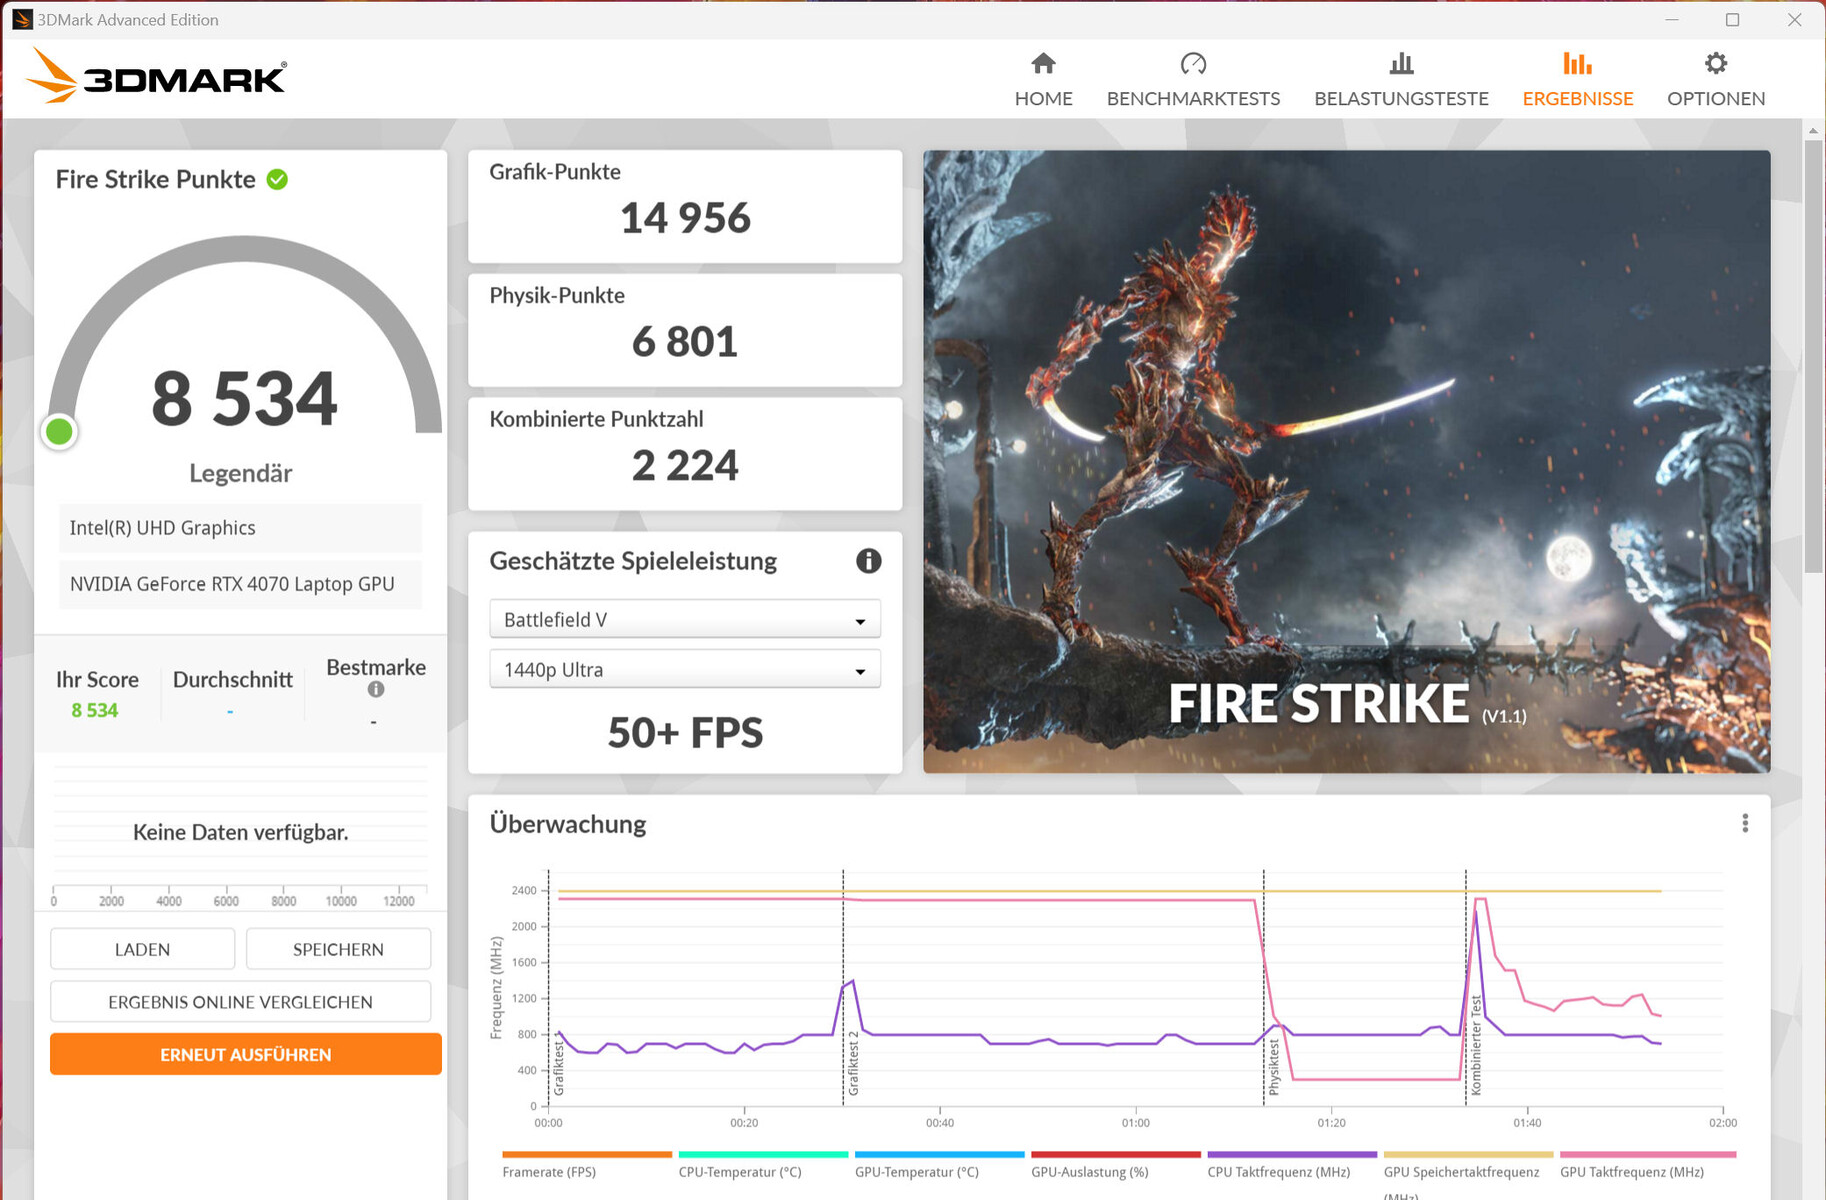
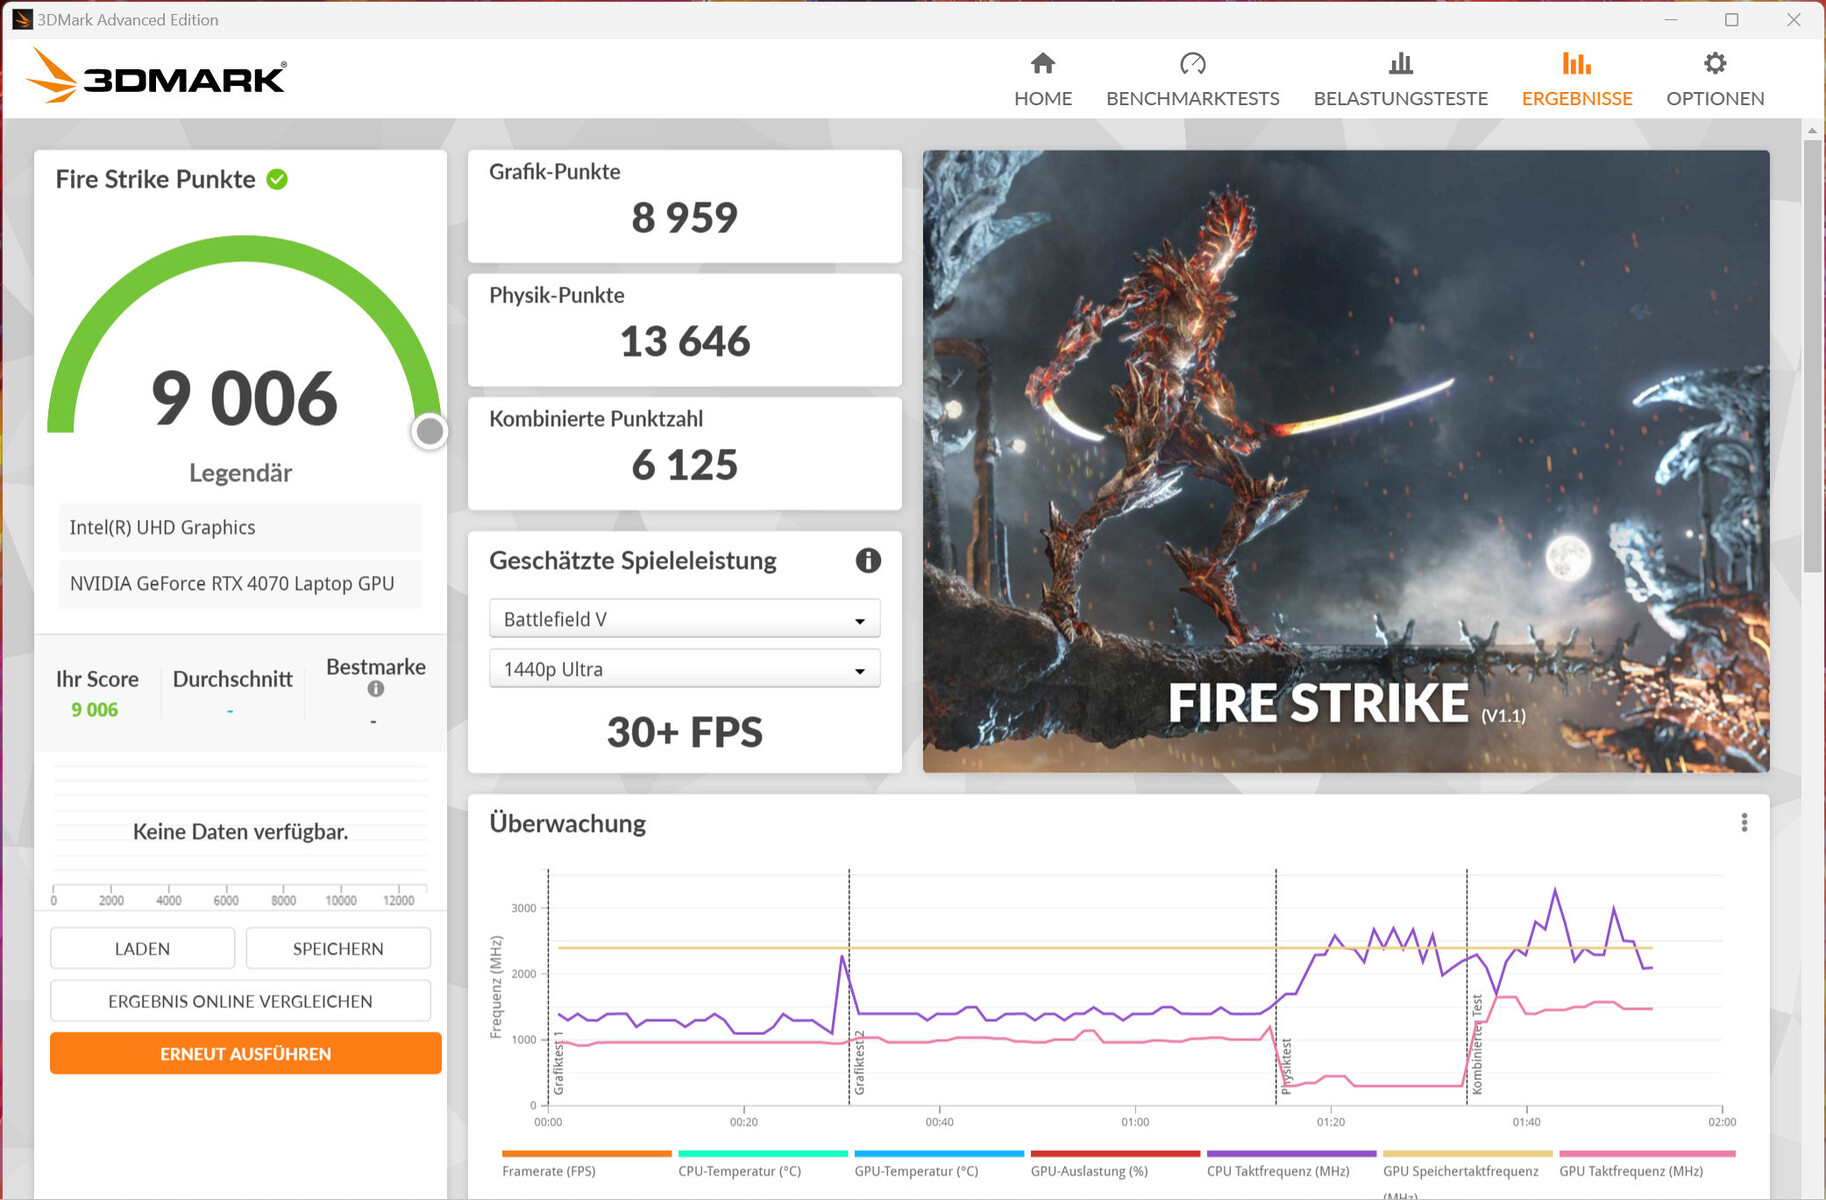

| 3DMark 06 Standard Score | 55615 points | |
| 3DMark 11 Performance | 34985 points | |
| 3DMark Cloud Gate Standard Score | 65819 points | |
| 3DMark Fire Strike Score | 27468 points | |
| 3DMark Time Spy Score | 12421 points | |
Help | ||
* ... smaller is better
Gaming performance
The laptop is designed for QHD gaming at high to maximum settings. Higher resolutions would be possible with the corresponding monitor - possibly with reduced settings. The frame rates of the games we tested were on par with the determined RTX 4070 average. The dGPU mode increased the frame rates of some games slightly.
| The Witcher 3 - 1920x1080 Ultra Graphics & Postprocessing (HBAO+) | |
| Average of class Gaming (104.7 - 240, n=7, last 2 years) | |
| Asus ROG Strix G17 G713PI | |
| Acer Predator Helios 300 (i7-12700H, RTX 3070 Ti) | |
| Aorus 15X ASF | |
| Average NVIDIA GeForce RTX 4070 Laptop GPU (69.8 - 133.7, n=57) | |
| MSI Katana 17 B13VFK | |
| Razer Blade 15 OLED (Early 2022) | |
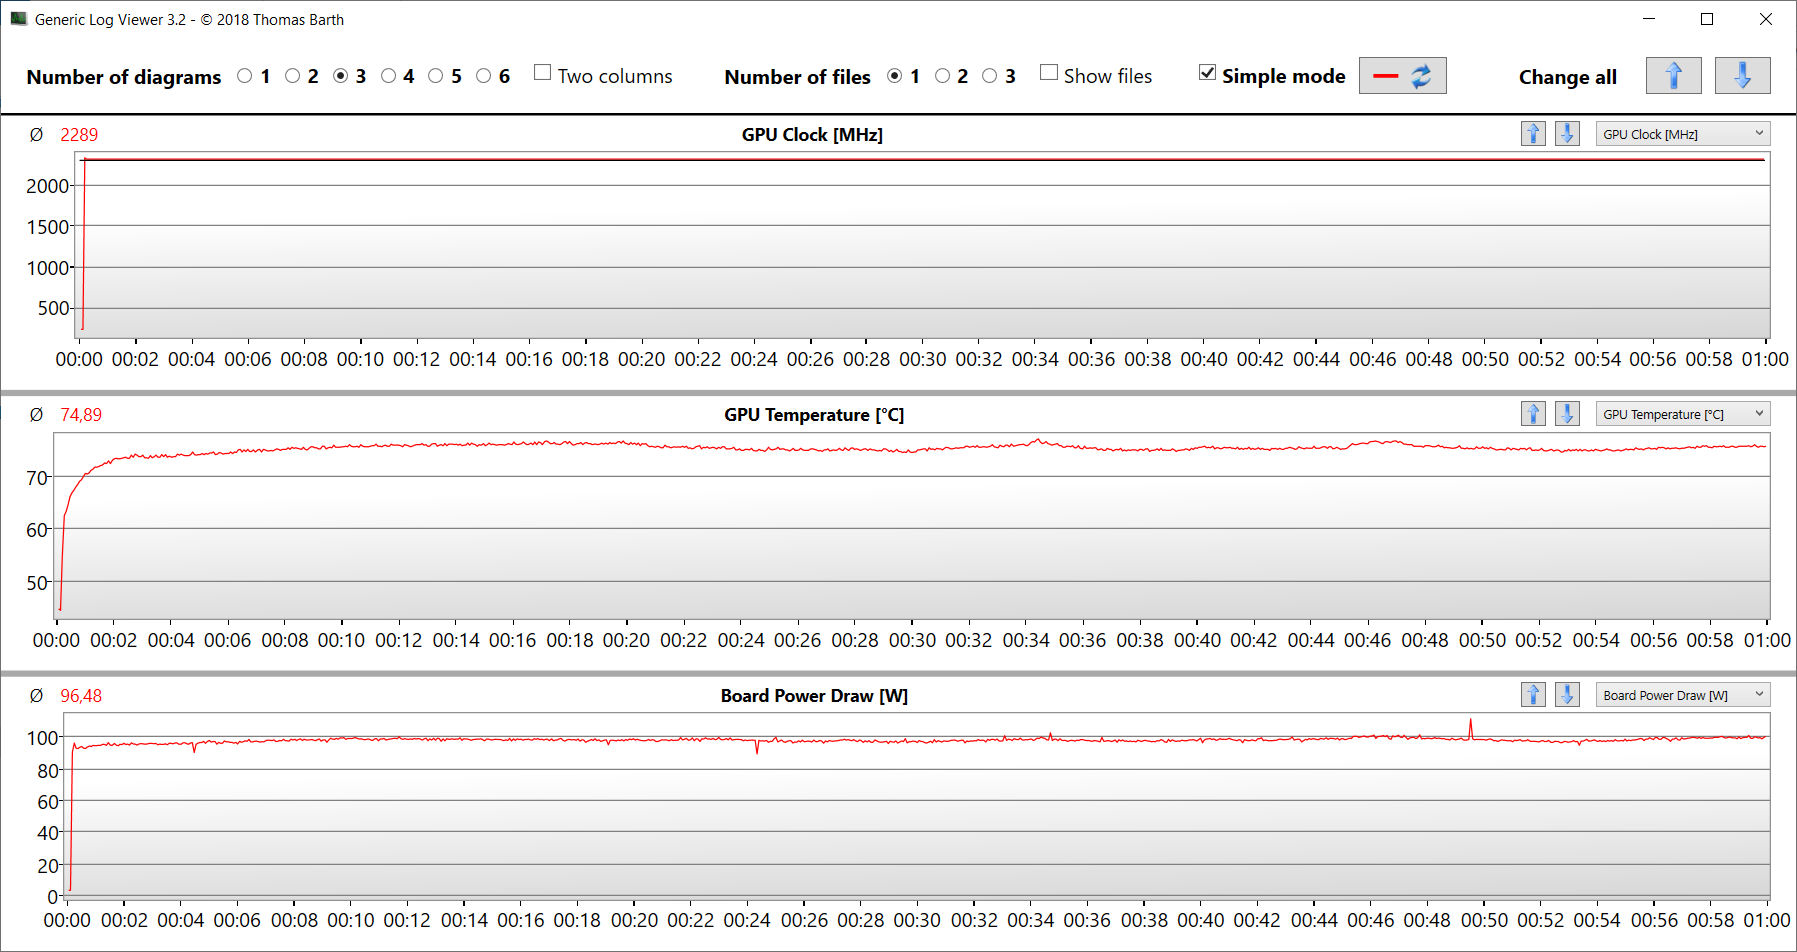
To check whether the frame rate remained consistent over a longer period of use, we ran the game The Witcher 3 for about 60 minutes in Full HD resolution using maximum quality settings. The game character wasn't moved. A drop in frame rate was not noticed.
Witcher 3 FPS diagram
| low | med. | high | ultra | QHD | |
|---|---|---|---|---|---|
| GTA V (2015) | 185.1 | 185.9 | 180.2 | 117.8 | 88.8 |
| The Witcher 3 (2015) | 484.7 | 366.3 | 228.3 | 117 | |
| Dota 2 Reborn (2015) | 191.9 | 181.1 | 161.1 | 149.4 | |
| Final Fantasy XV Benchmark (2018) | 208 | 167.2 | 117.5 | 83.7 | |
| X-Plane 11.11 (2018) | 164.9 | 145.5 | 117.1 | ||
| Far Cry 5 (2018) | 183 | 157 | 151 | 141 | 111 |
| Strange Brigade (2018) | 537 | 300 | 235 | 201 | 133.2 |
| Flight Simulator 2020 (2020) | 158.8 | 117.2 | 82.5 | 64.8 | 50.1 |
| F1 22 (2022) | 256 | 251 | 193.7 | 78.7 | 52.2 |
| FIFA 23 (2022) | 166.2 | ||||
| Uncharted Legacy of Thieves Collection (2022) | 92.7 | 89.4 | 84.4 | 82.1 | 61 |
| The Callisto Protocol (2022) | 155.6 | 127.5 | 121.8 | 79.7 | 58.4 |
| Need for Speed Unbound (2022) | 118.1 | 112.1 | 101 | 89.1 | 77.7 |
| High On Life (2023) | 236 | 185.9 | 141.6 | 114 | 68.5 |
| Dead Space Remake (2023) | 100.9 | 95.7 | 85.3 | 82.4 | 53.1 |
| Returnal (2023) | 119 | 117 | 106 | 90 | 66 |
| Atomic Heart (2023) | 199.8 | 158.3 | 96.4 | 79 | 58.9 |
| Company of Heroes 3 (2023) | 228.9 | 205.1 | 159.7 | 157.5 | 115.1 |
| Sons of the Forest (2023) | 98.3 | 86.8 | 83.3 | 82.3 | 69.5 |
| Resident Evil 4 Remake (2023) | 185.9 | 133.5 | 120.8 | 86.7 | 61.5 |
| The Last of Us (2023) | 73.1 | 60.9 | 56.9 | 56 | 53.3 |
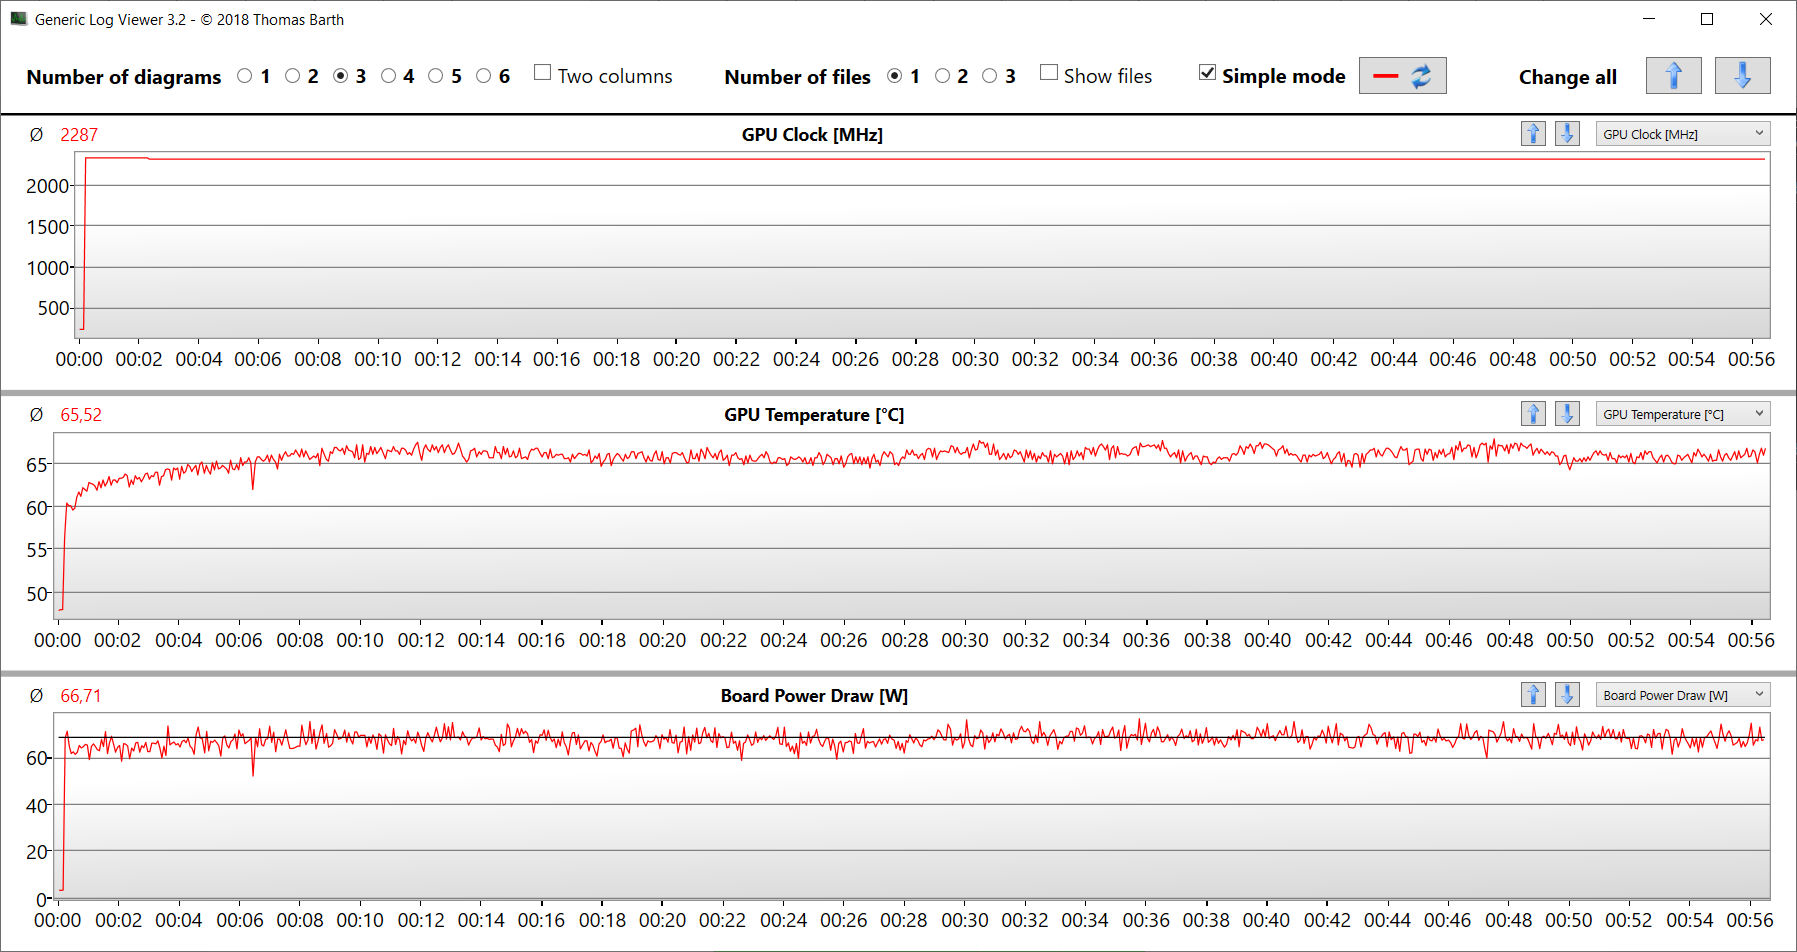
Gaming performance at reduced volume
To a certain extent, the 15X can fulfil the wishes of users who don't want too loud a gaming laptop. The energy profile "meeting mode" ensures an overall lower operating volume with reduced processing power. The latter is still sufficient enough for gaming at medium to partly high settings. The Witcher 3 test was run at an average frame rate of 69 FPS with a GPU TGP of about 67 watts.
| HD low | FHD low | FHD medium | FHD high | FHD ultra | |
|---|---|---|---|---|---|
| GTA V | - | 73.7 fps | 68.2 fps | 50.3 fps | 27.2 fps |
| Dota 2 Reborn | 87.1 fps | - | - | 61.8 fps | 52.7 fps |
| Final Fantasy XV Benchmark | 56.7 fps | - | 49 fps | 40.7 fps | - |
| X-Plane 11.11 | 59.5 fps | - | 52.2 fps | 45.6 fps | - |
| Strange Brigade | 123.8 fps | - | 96.4 fps | 92.3 fps | 88.8 fps |
Emissions - The Aorus ASF can run quietly
Noise emissions
The two fans usually work at a low speed at no load and in everyday use (office, Internet). However, it is not impossible for them to rev up - levels of up to 38 dB(A) are possible. Under load, it got very loud with maximum values of 58 dB(A) (stress test) and 54 dB(A) (Witcher 3 test).
The Aorus 15X is capable of quiet to practically silent operation. This requires the energy profiles "meeting mode" or "energy saving idle mode" to be used. The subsequent reduced performance of the computer is still more than enough for everyday use and even allows gaming at reduced settings.
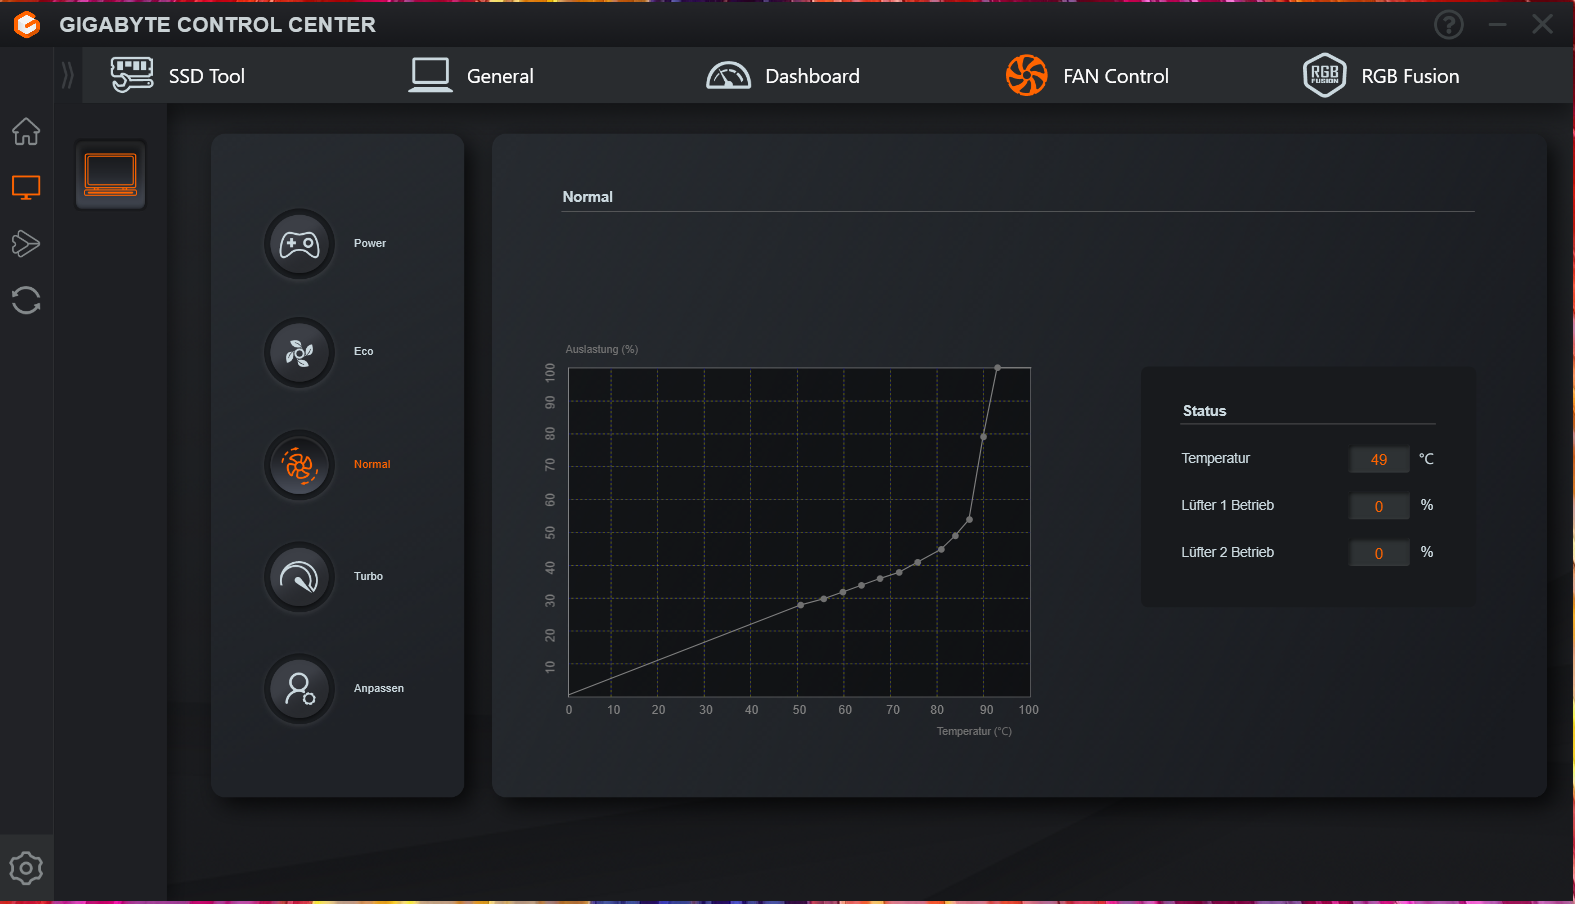
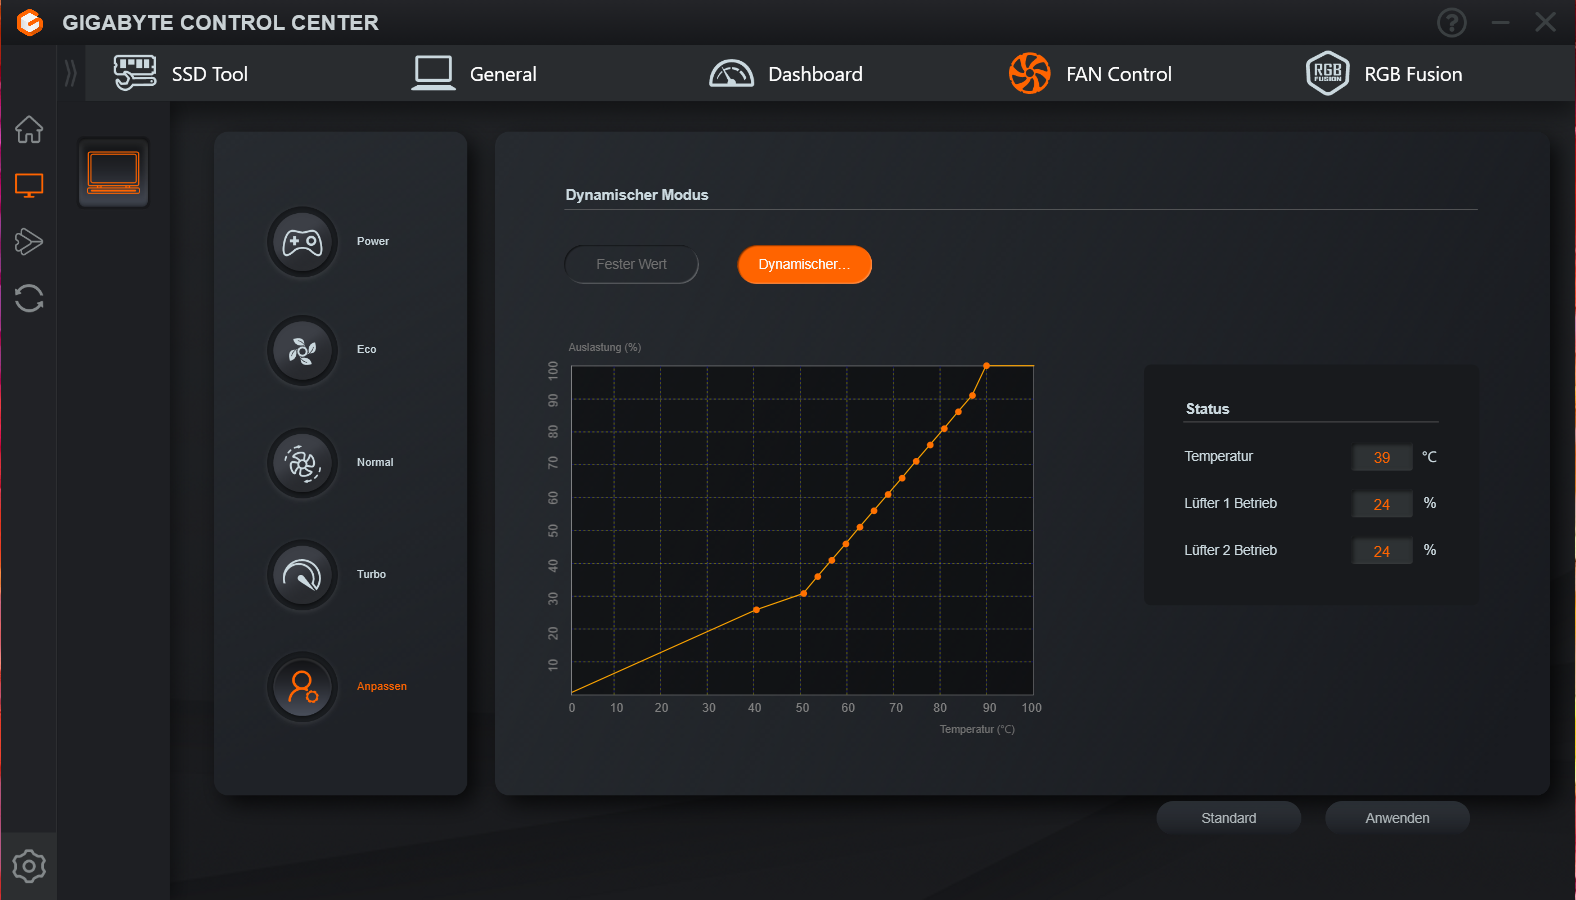
Gigabyte's Control Center lets you control the fan. Various fan profiles are available, and an individual fan curve can also be created.
Noise level
| Idle |
| 28 / 29 / 36 dB(A) |
| Load |
| 50 / 58 dB(A) |
 | ||
30 dB silent 40 dB(A) audible 50 dB(A) loud |
||
min: | ||
| Aorus 15X ASF i7-13700HX, GeForce RTX 4070 Laptop GPU | Razer Blade 15 OLED (Early 2022) i9-12900H, GeForce RTX 3070 Ti Laptop GPU | MSI Katana 17 B13VFK i7-13620H, GeForce RTX 4060 Laptop GPU | Asus ROG Strix G17 G713PI R9 7945HX, GeForce RTX 4070 Laptop GPU | Acer Predator Helios 300 (i7-12700H, RTX 3070 Ti) i7-12700H, GeForce RTX 3070 Ti Laptop GPU | |
|---|---|---|---|---|---|
| Noise | 11% | 2% | 9% | 2% | |
| off / environment * (dB) | 25 | 26 -4% | 24.5 2% | 25 -0% | 23 8% |
| Idle Minimum * (dB) | 28 | 28 -0% | 24.5 12% | 26 7% | 23 18% |
| Idle Average * (dB) | 29 | 28 3% | 24.5 16% | 29 -0% | 25.92 11% |
| Idle Maximum * (dB) | 36 | 28 22% | 40 -11% | 30 17% | 40.67 -13% |
| Load Average * (dB) | 50 | 38.5 23% | 48.3 3% | 46 8% | 42.7 15% |
| Witcher 3 ultra * (dB) | 54 | 56 -4% | 46 15% | 62.48 -16% | |
| Load Maximum * (dB) | 58 | 43.9 24% | 59.1 -2% | 47 19% | 62.67 -8% |
* ... smaller is better
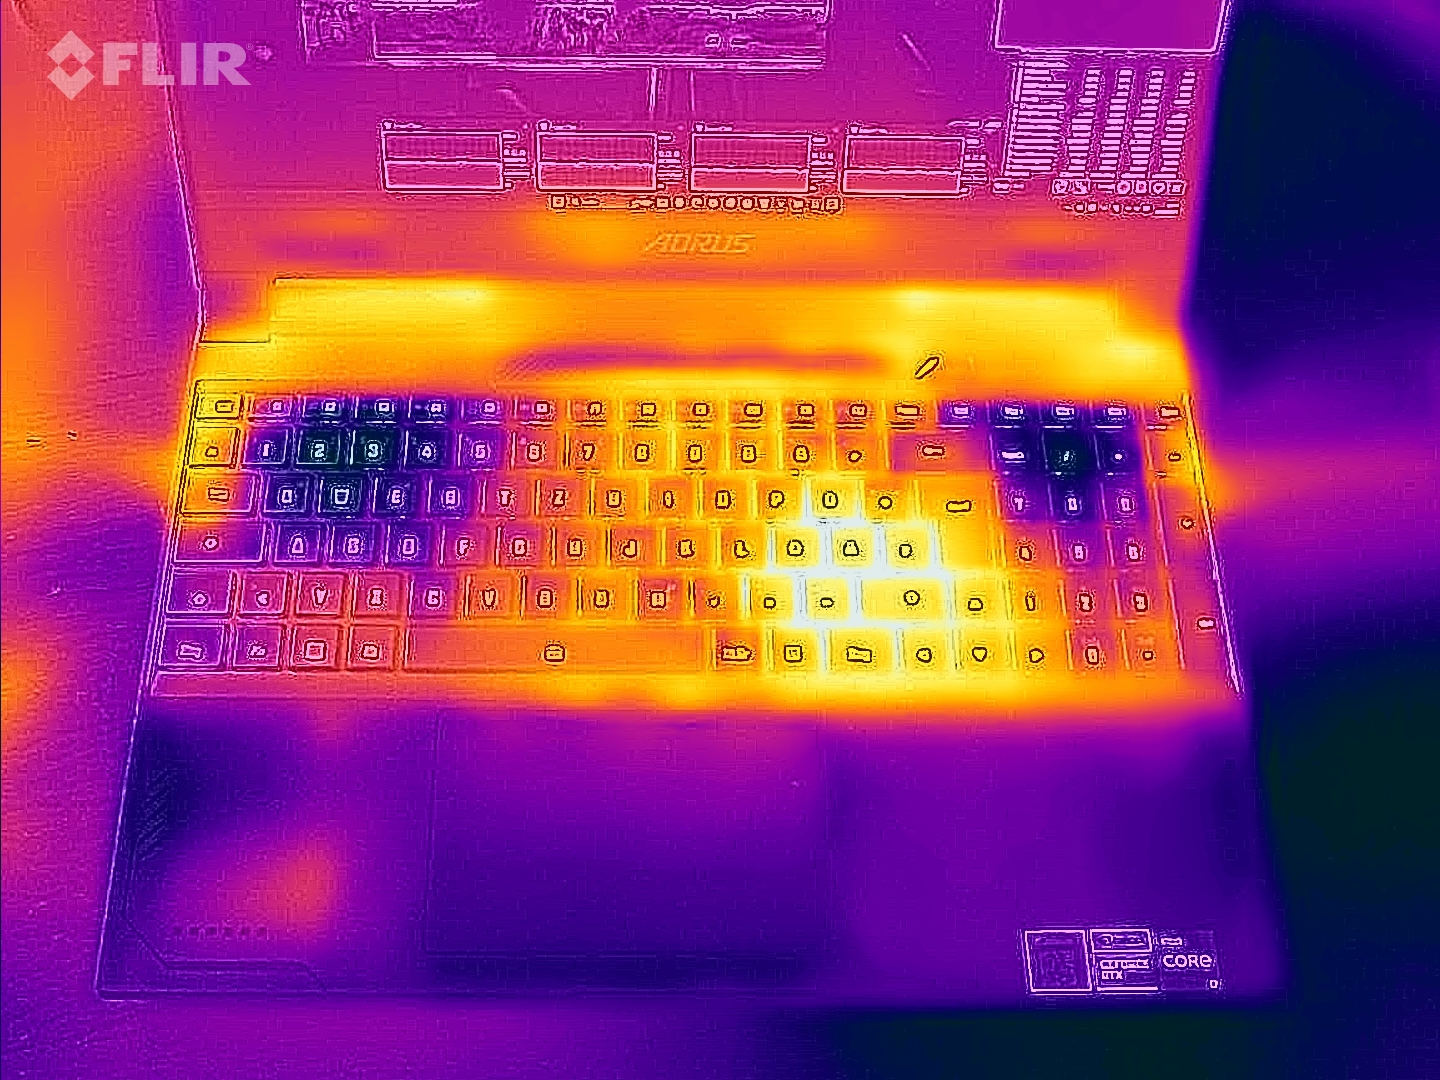
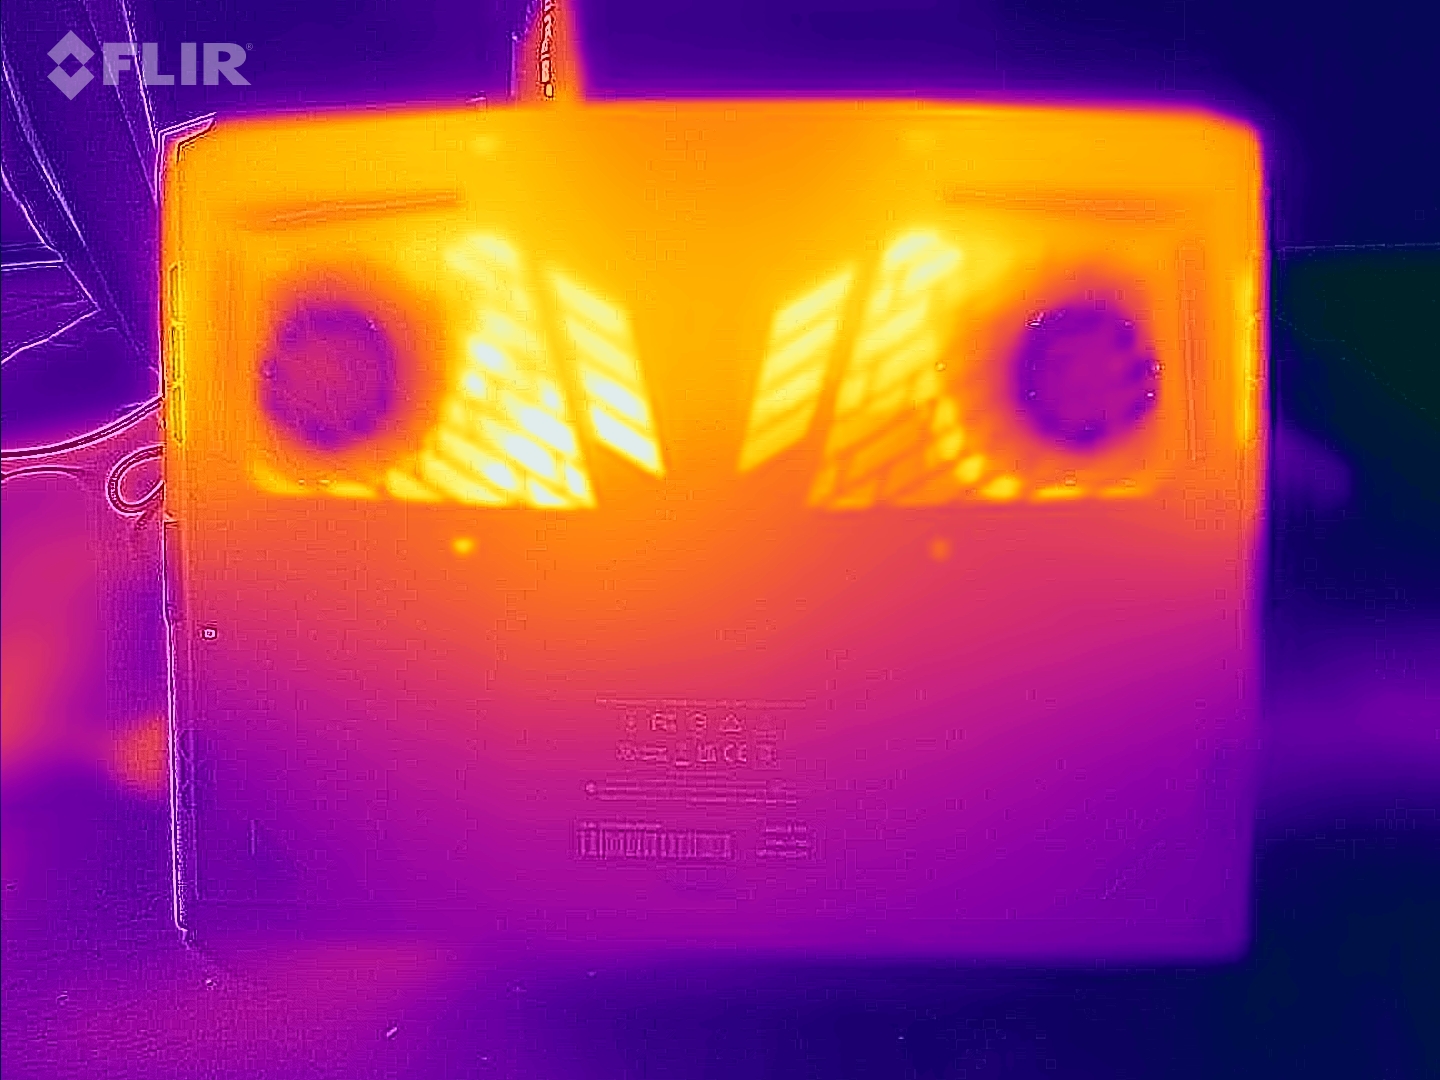
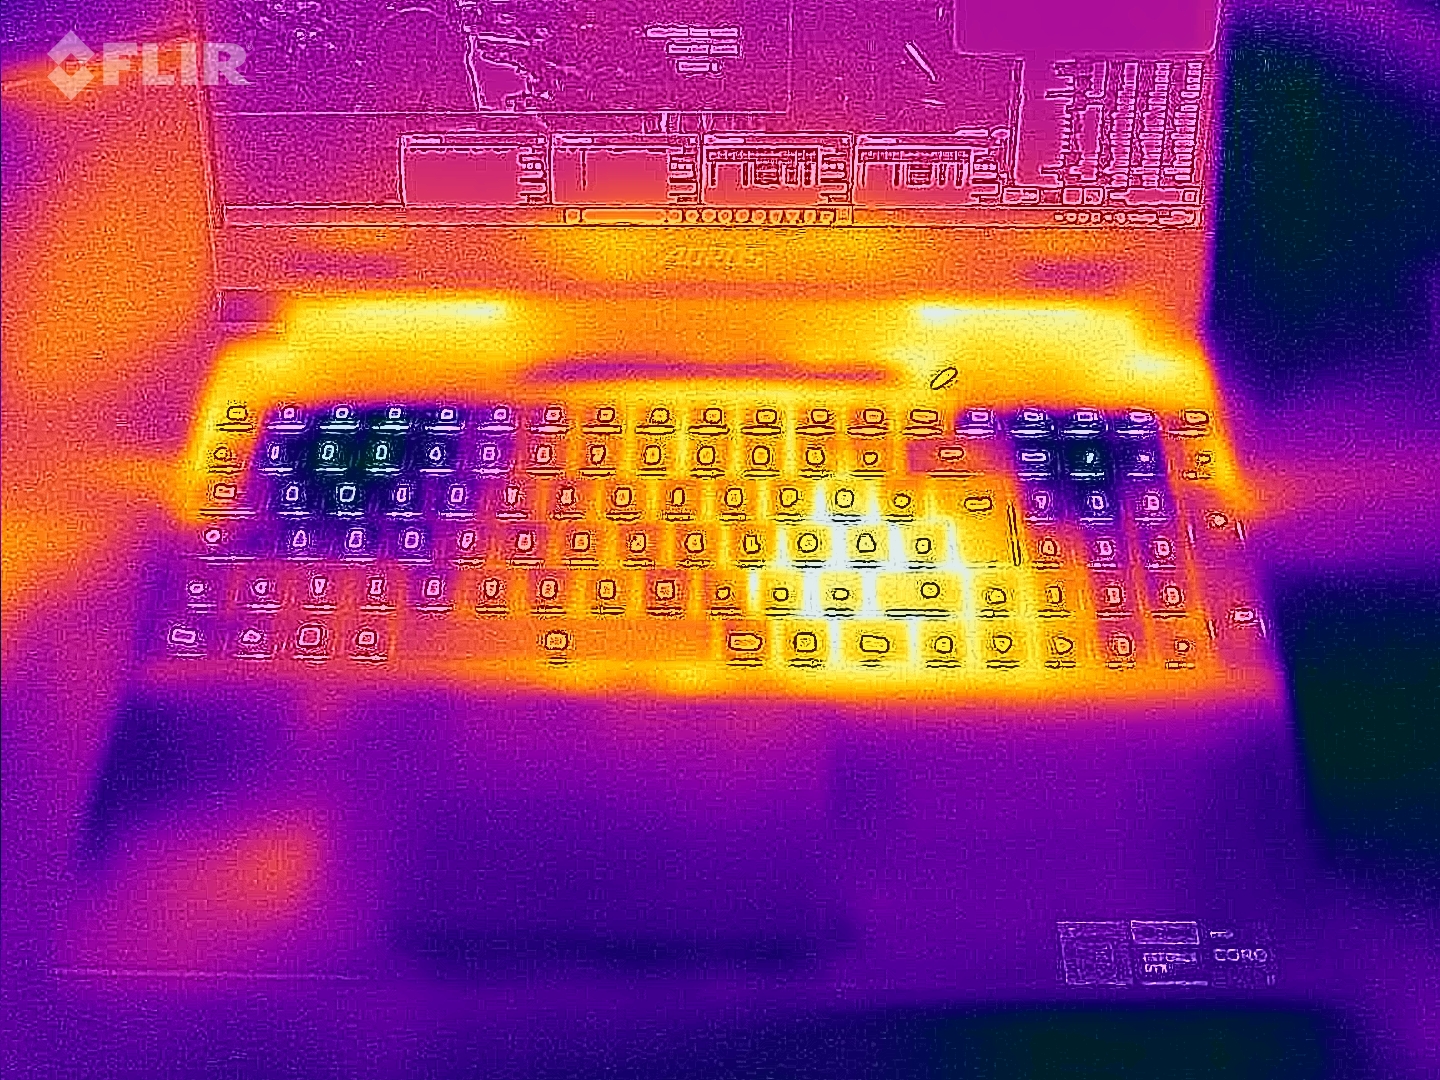
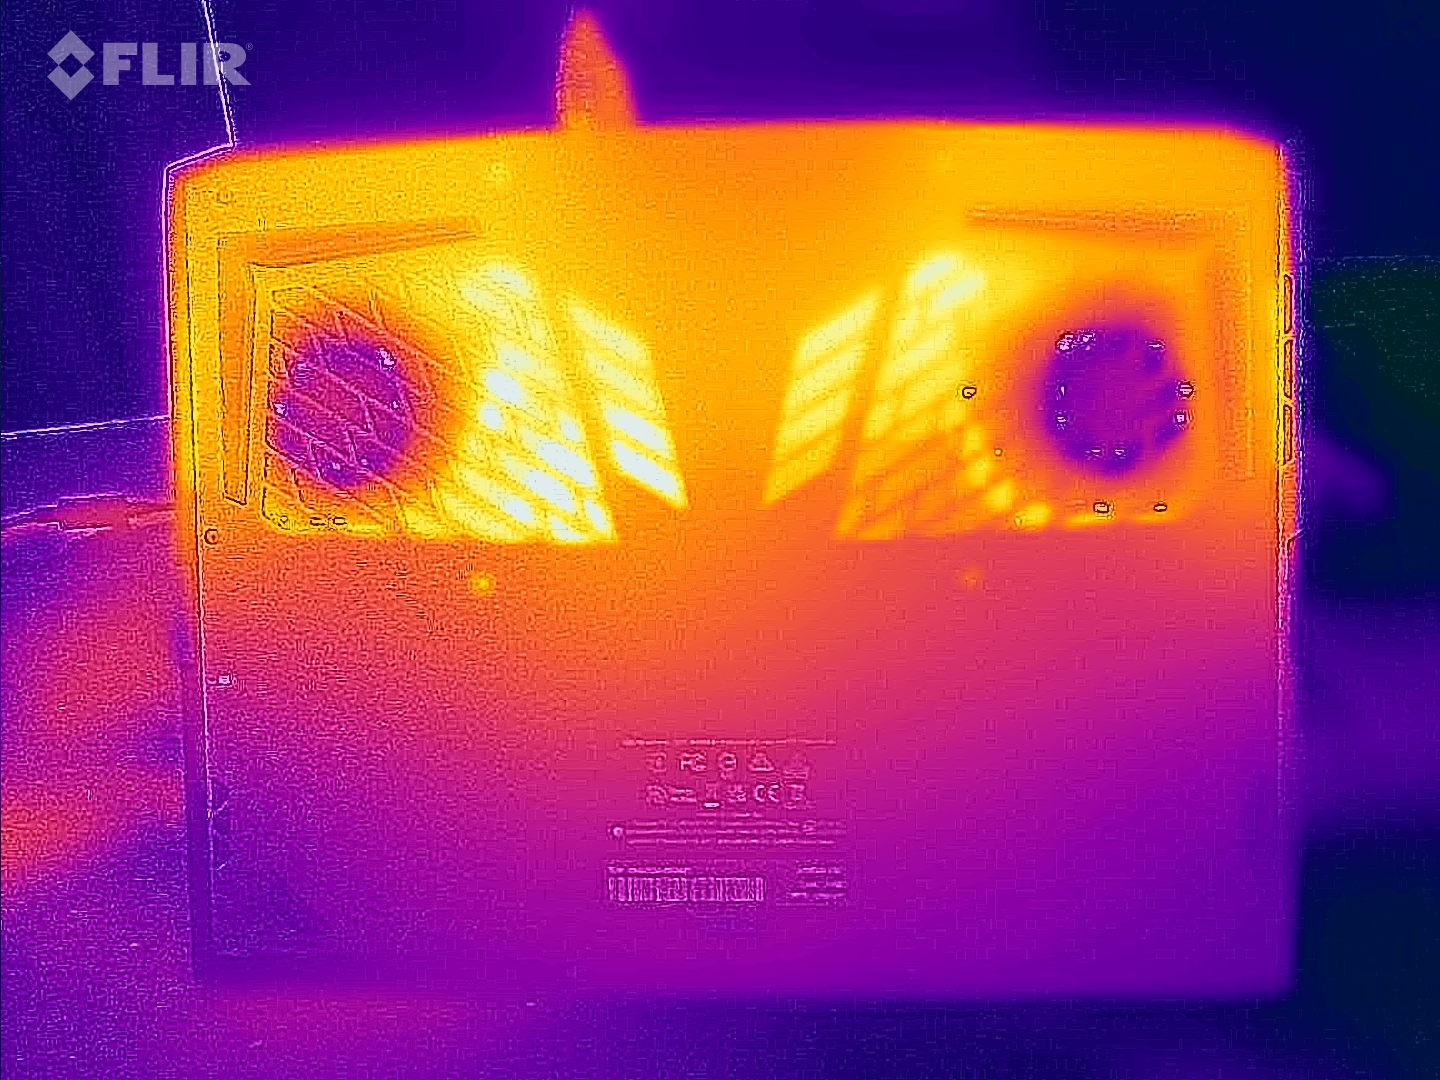
Temperature
The case temperatures remained within the green zone in everyday use (office, Internet). Under load (stress test, Witcher 3 test), the laptop heated up noticeably, but not excessively. The CPU temperatures are not a cause for concern.
(±) The maximum temperature on the upper side is 42 °C / 108 F, compared to the average of 40.4 °C / 105 F, ranging from 21.2 to 68.8 °C for the class Gaming.
(-) The bottom heats up to a maximum of 51 °C / 124 F, compared to the average of 43.2 °C / 110 F
(+) In idle usage, the average temperature for the upper side is 25.7 °C / 78 F, compared to the device average of 33.9 °C / 93 F.
(±) Playing The Witcher 3, the average temperature for the upper side is 34.2 °C / 94 F, compared to the device average of 33.9 °C / 93 F.
(+) The palmrests and touchpad are cooler than skin temperature with a maximum of 28 °C / 82.4 F and are therefore cool to the touch.
(±) The average temperature of the palmrest area of similar devices was 28.8 °C / 83.8 F (+0.8 °C / 1.4 F).
| Aorus 15X ASF Intel Core i7-13700HX, NVIDIA GeForce RTX 4070 Laptop GPU | Razer Blade 15 OLED (Early 2022) Intel Core i9-12900H, NVIDIA GeForce RTX 3070 Ti Laptop GPU | MSI Katana 17 B13VFK Intel Core i7-13620H, NVIDIA GeForce RTX 4060 Laptop GPU | Asus ROG Strix G17 G713PI AMD Ryzen 9 7945HX, NVIDIA GeForce RTX 4070 Laptop GPU | Acer Predator Helios 300 (i7-12700H, RTX 3070 Ti) Intel Core i7-12700H, NVIDIA GeForce RTX 3070 Ti Laptop GPU | |
|---|---|---|---|---|---|
| Heat | -18% | -10% | -8% | -6% | |
| Maximum Upper Side * (°C) | 42 | 49.5 -18% | 41.6 1% | 42 -0% | 35 17% |
| Maximum Bottom * (°C) | 51 | 47.5 7% | 43.1 15% | 41 20% | 53 -4% |
| Idle Upper Side * (°C) | 27 | 33.4 -24% | 32 -19% | 33 -22% | 29 -7% |
| Idle Bottom * (°C) | 26 | 35 -35% | 35.8 -38% | 34 -31% | 34 -31% |
* ... smaller is better
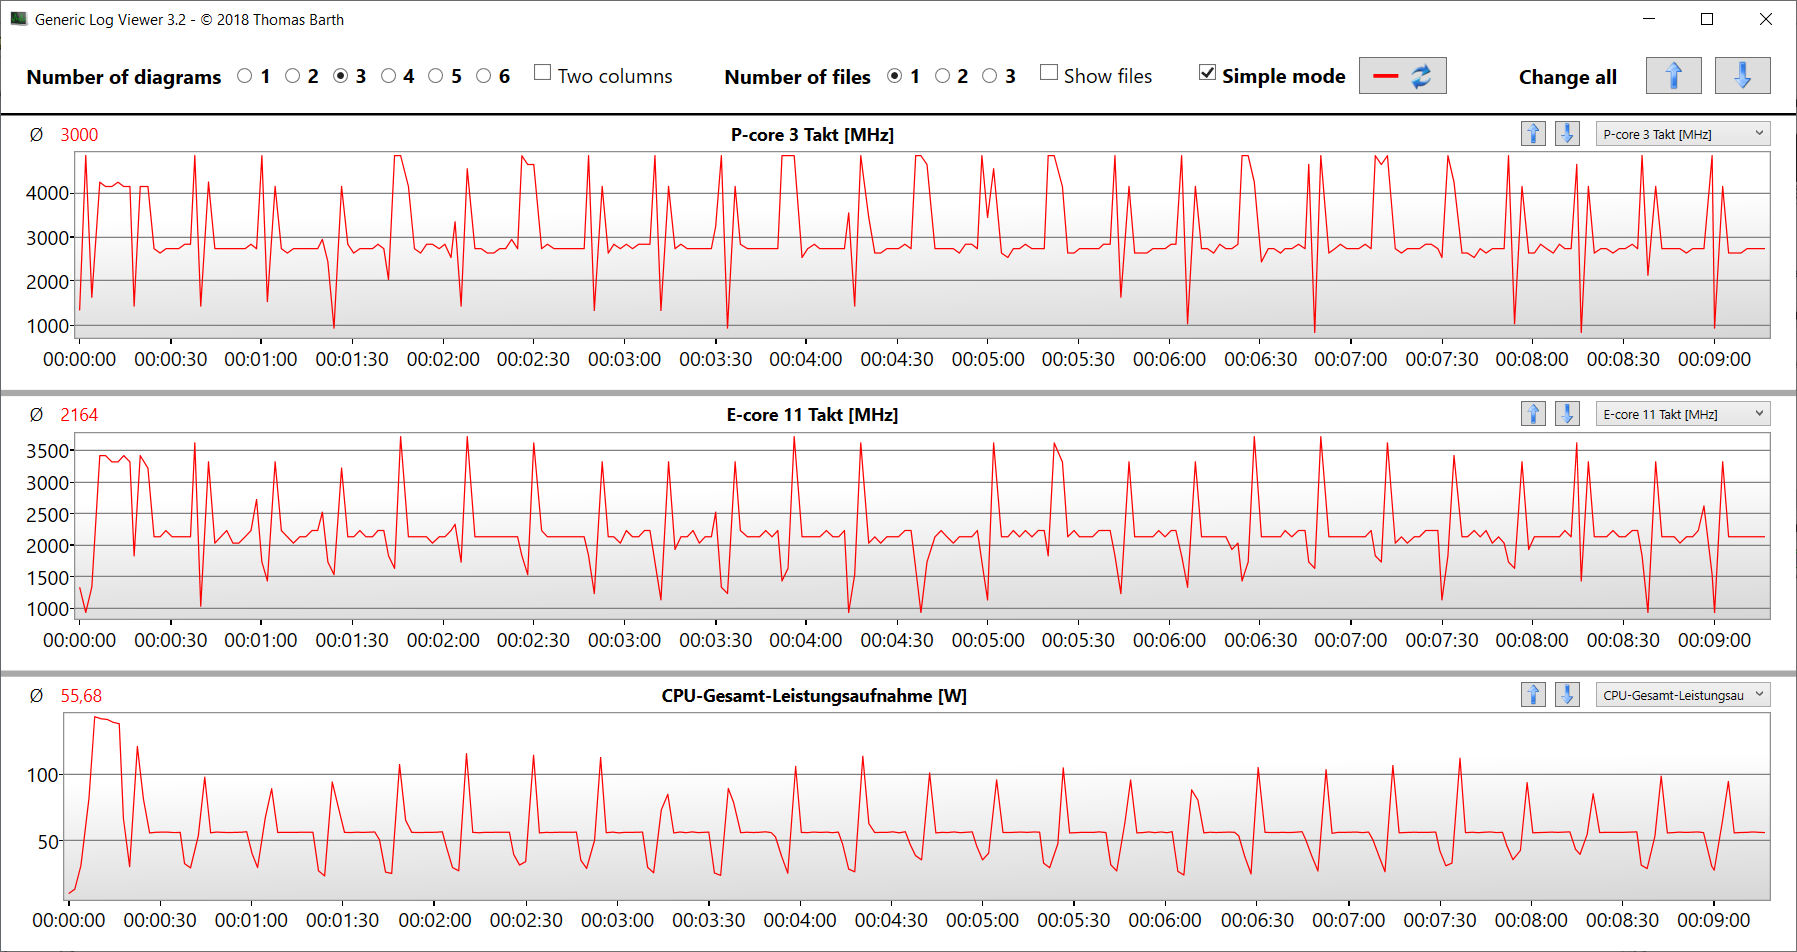
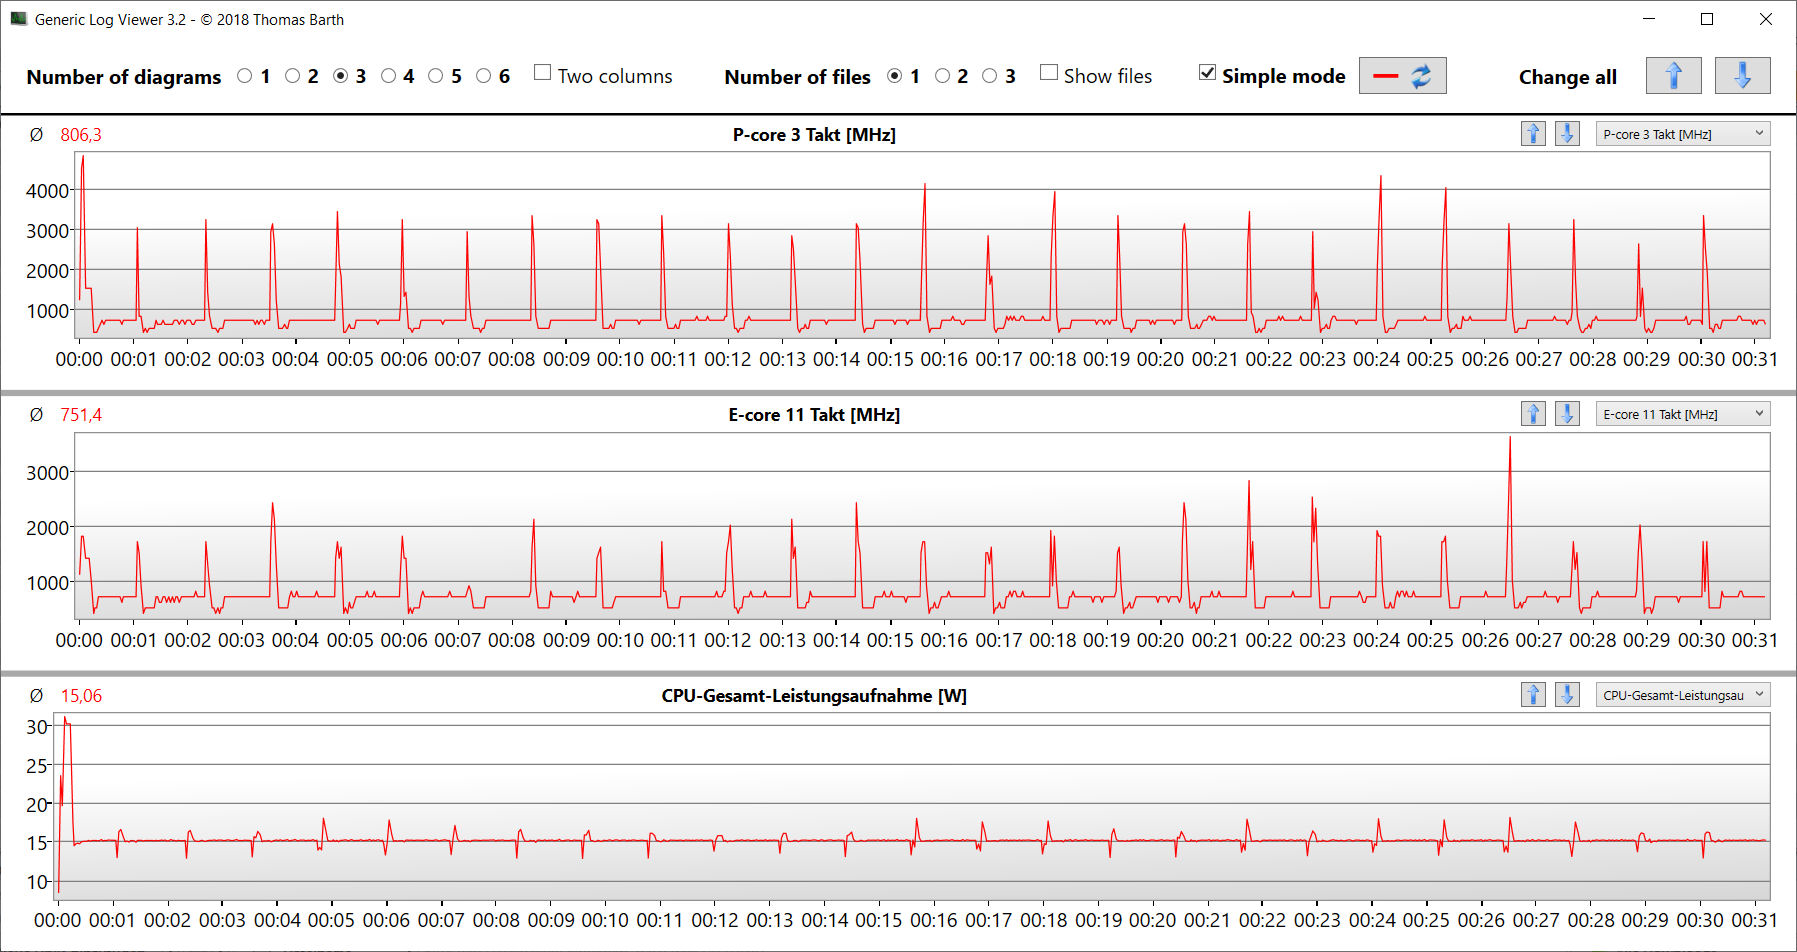
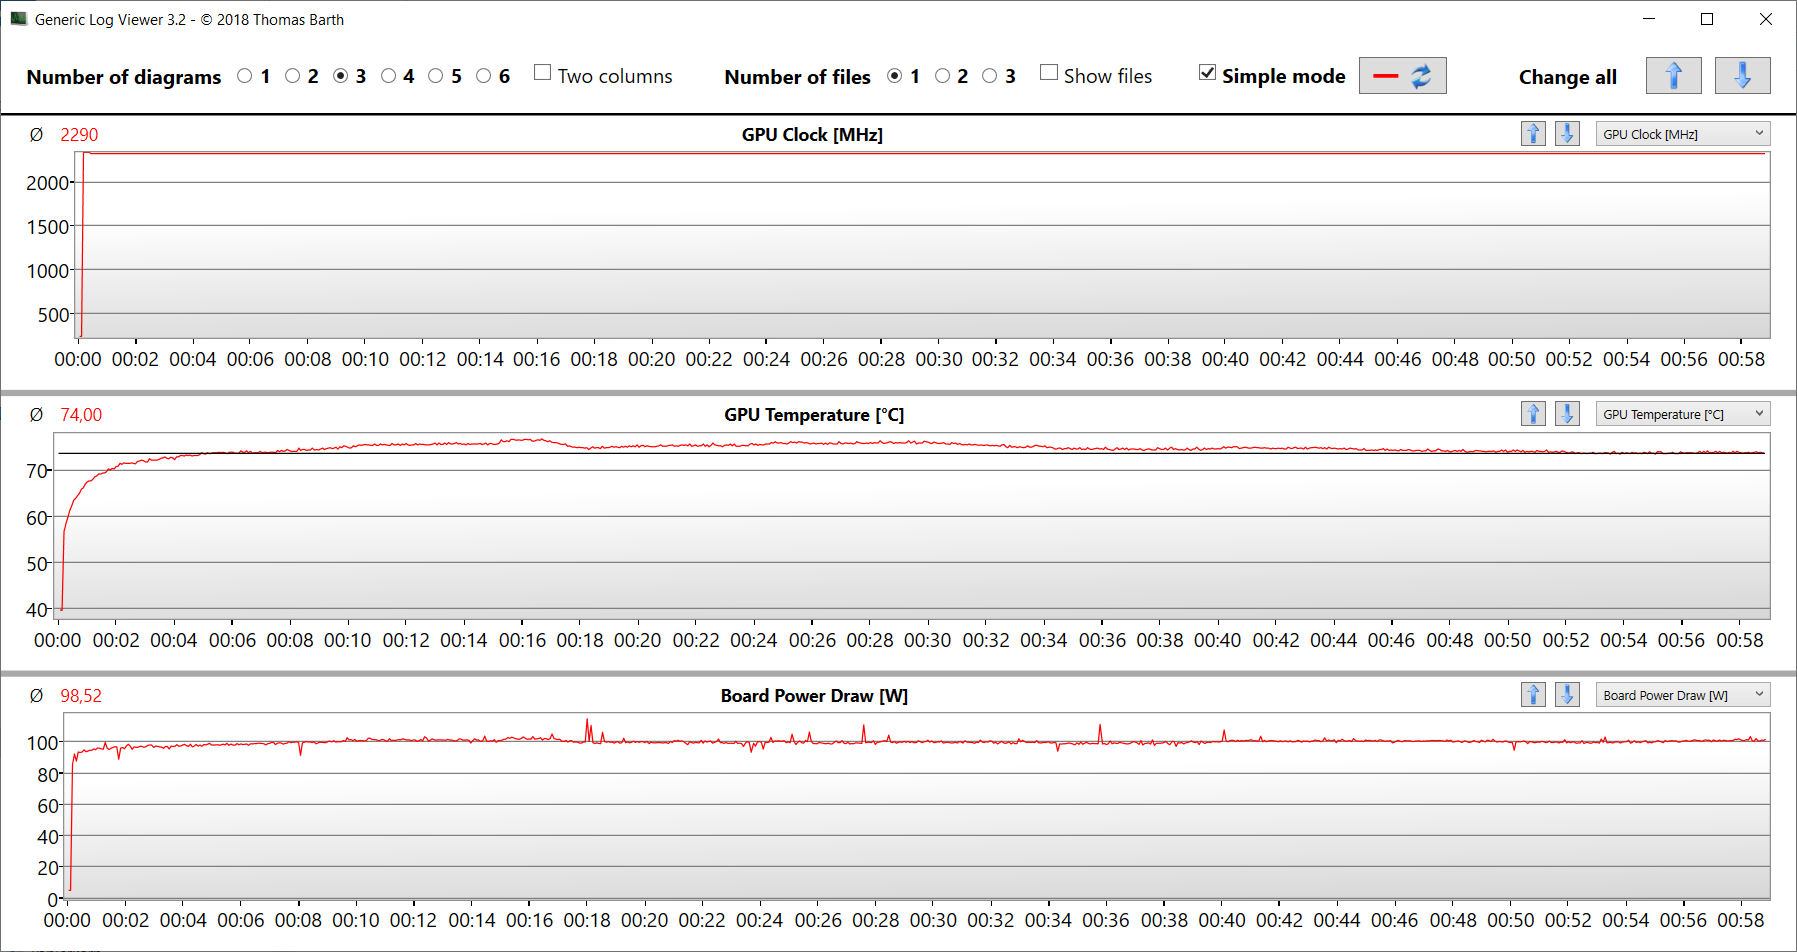
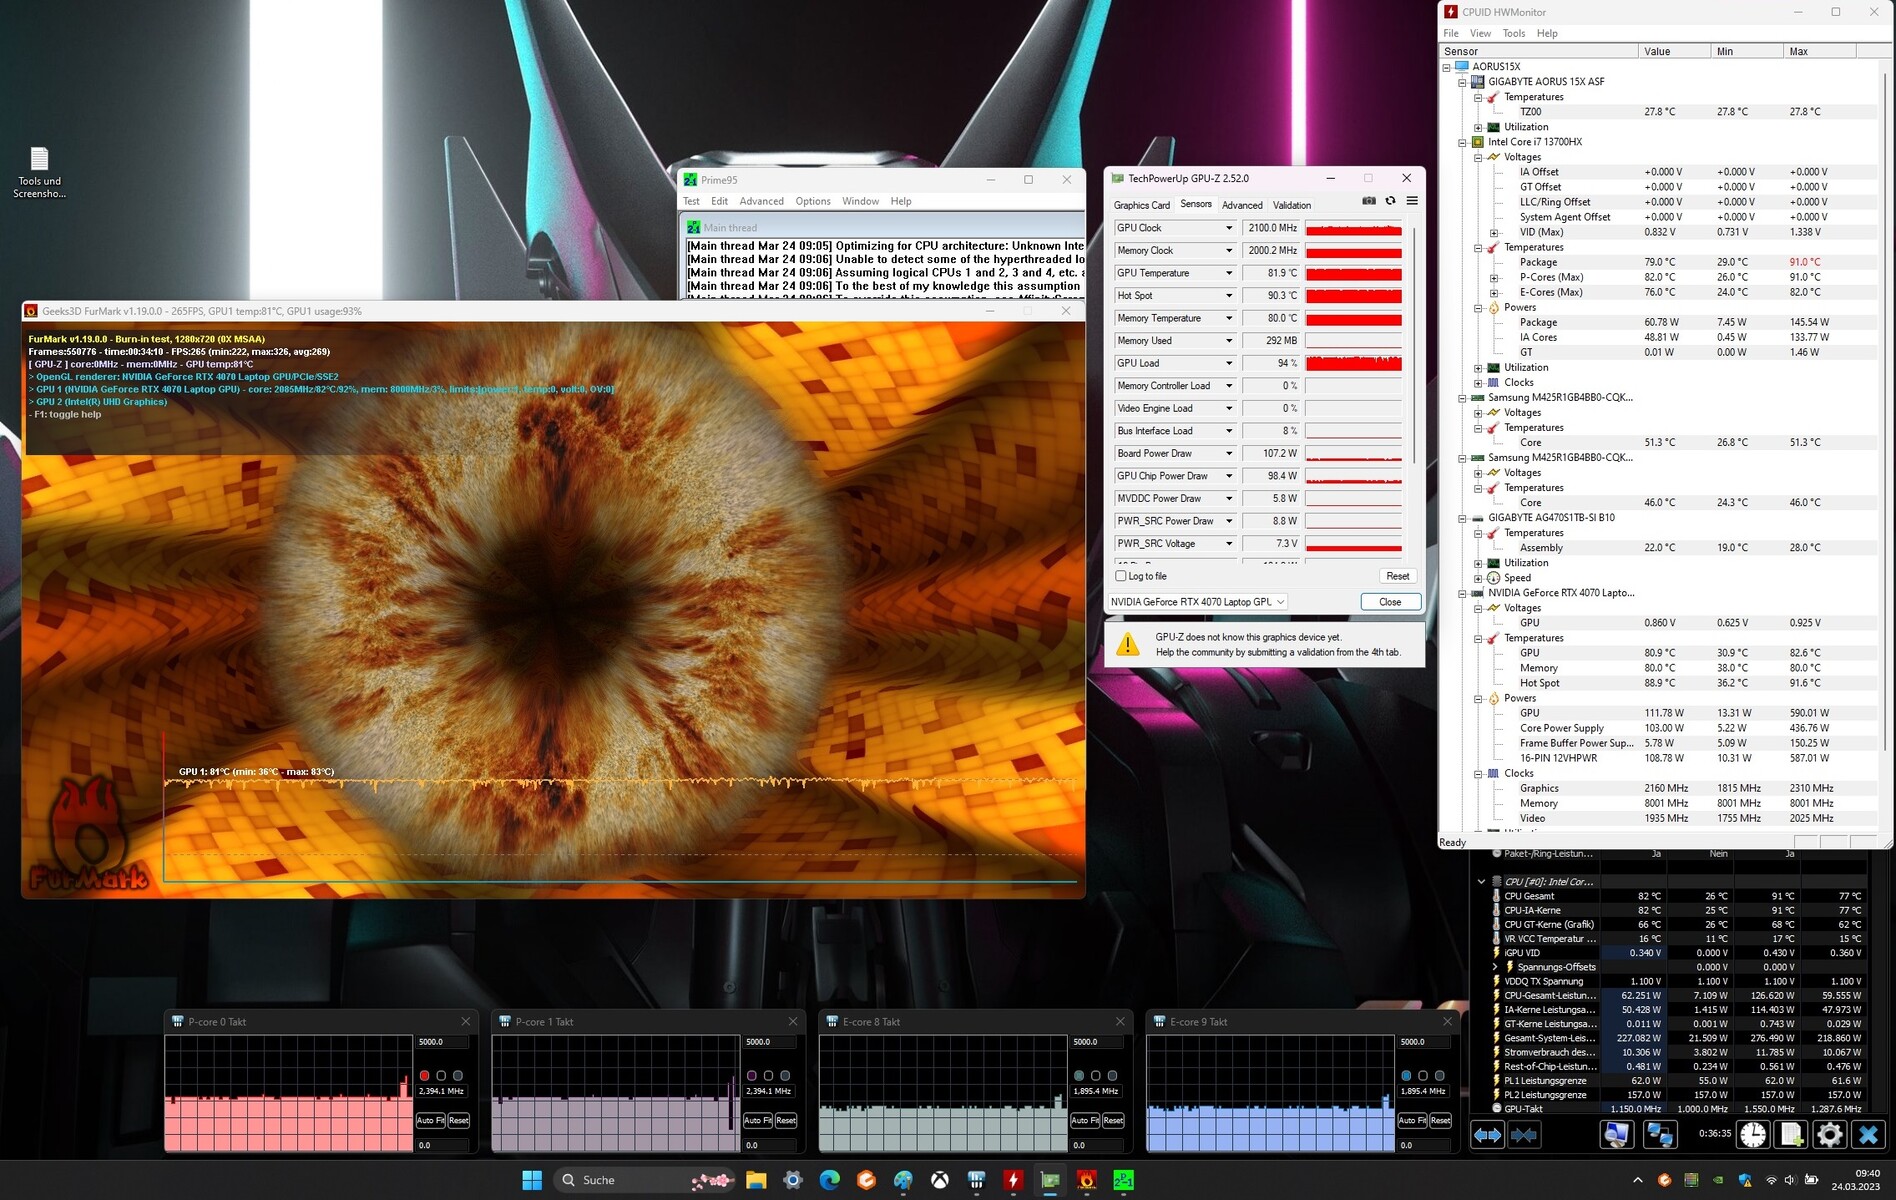
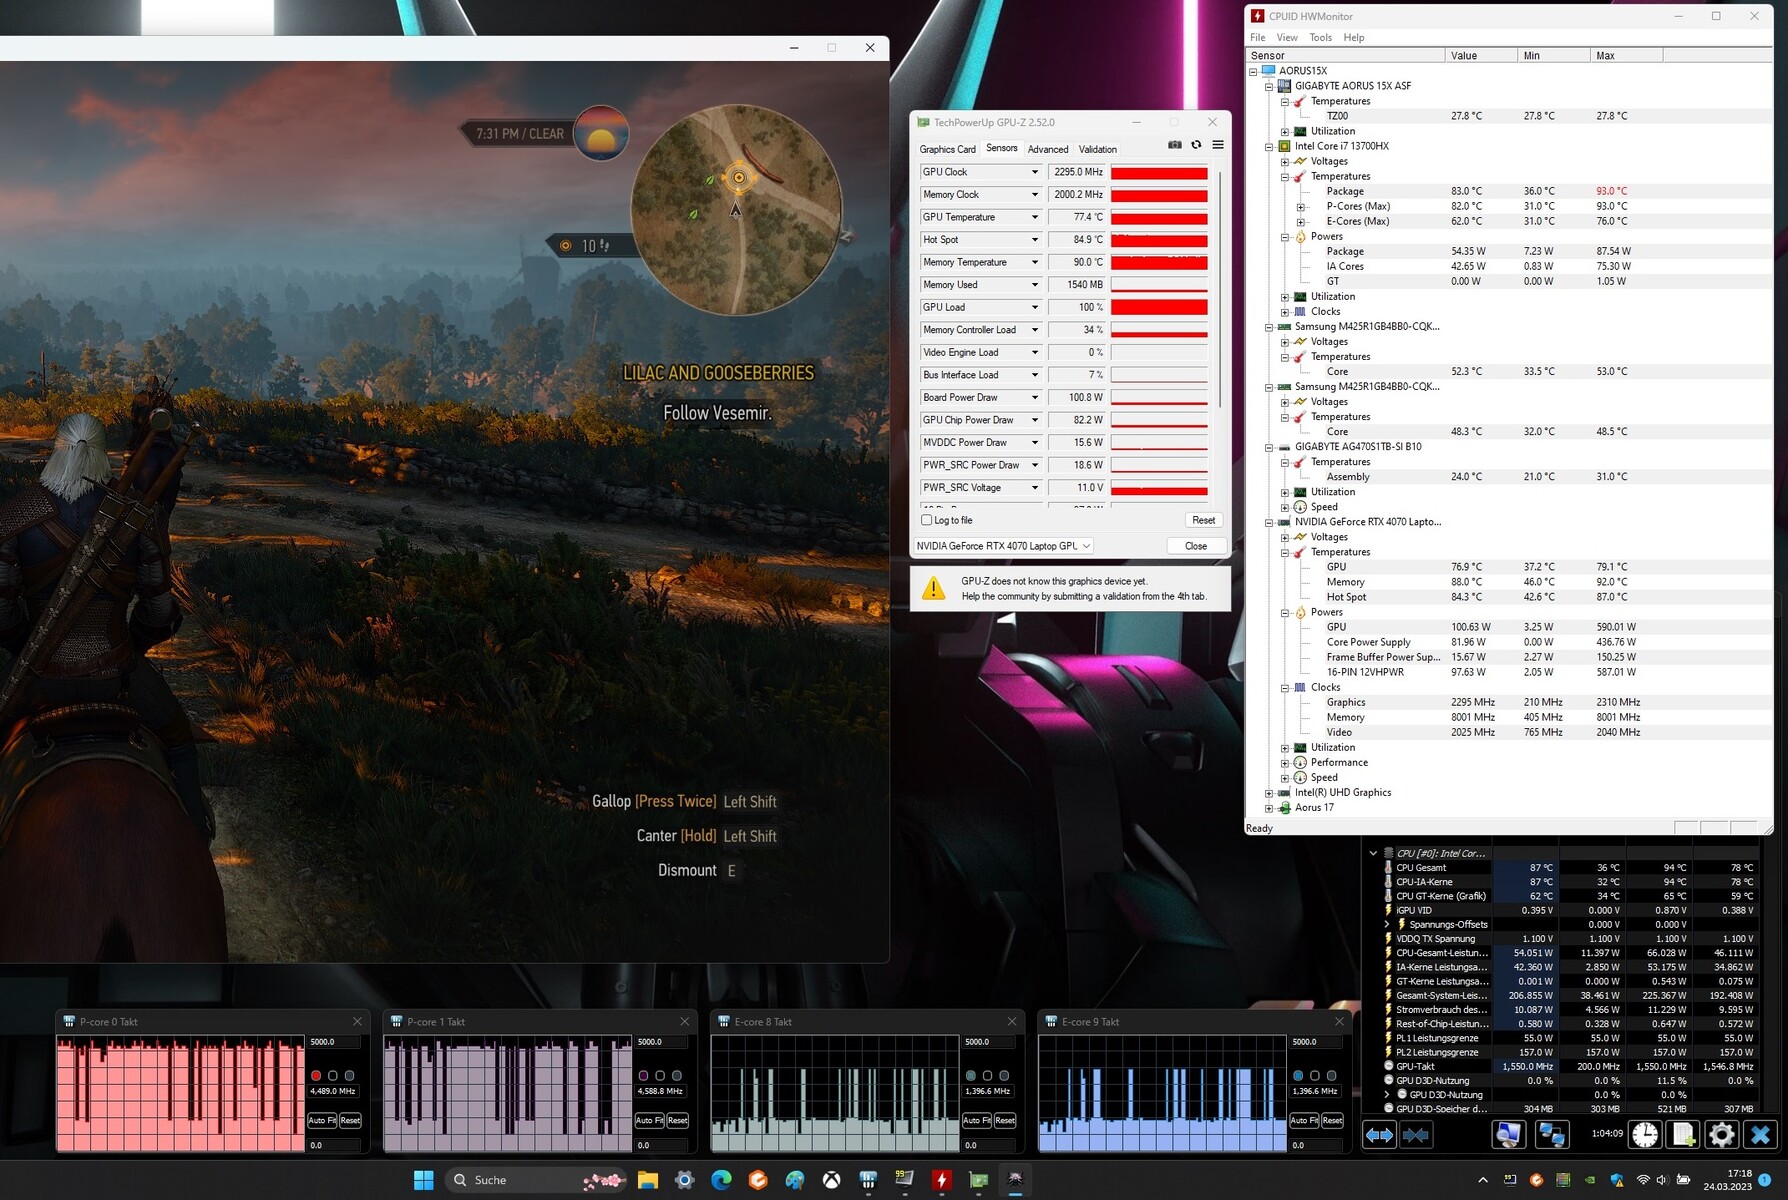
Stress test
The stress test (Prime95 and Furmark in continuous use) simulates an extreme scenario to check how stable the system is under maximum load.
The CPU (P: 2.7 to 2.8 GHz, E: 2.1 to 2.2 GHz) began the test with medium clock rates. After a short amount of time, the clock rates sank to around 2 to 2.5 GHz (P-cores) and 1.8 to 1.9 GHz (E-cores). The GPU clock rate sank from 2.4 GHz to 2.1 GHz.
Speakers
The stereo speakers produce a decent sound, but there is hardly any bass. Headphones or external speakers are recommended for a better sound experience.
Aorus 15X ASF audio analysis
(+) | speakers can play relatively loud (83 dB)
Bass 100 - 315 Hz
(-) | nearly no bass - on average 27.3% lower than median
(-) | bass is not linear (15.1% delta to prev. frequency)
Mids 400 - 2000 Hz
(±) | higher mids - on average 5.8% higher than median
(+) | mids are linear (4.8% delta to prev. frequency)
Highs 2 - 16 kHz
(+) | balanced highs - only 3.1% away from median
(+) | highs are linear (6.3% delta to prev. frequency)
Overall 100 - 16.000 Hz
(±) | linearity of overall sound is average (20.1% difference to median)
Compared to same class
» 71% of all tested devices in this class were better, 6% similar, 23% worse
» The best had a delta of 6%, average was 18%, worst was 132%
Compared to all devices tested
» 52% of all tested devices were better, 8% similar, 40% worse
» The best had a delta of 4%, average was 23%, worst was 134%
Asus ROG Strix G17 G713PI audio analysis
(±) | speaker loudness is average but good (81 dB)
Bass 100 - 315 Hz
(+) | good bass - only 4.6% away from median
(+) | bass is linear (6.5% delta to prev. frequency)
Mids 400 - 2000 Hz
(+) | balanced mids - only 3.1% away from median
(+) | mids are linear (5.9% delta to prev. frequency)
Highs 2 - 16 kHz
(+) | balanced highs - only 3.5% away from median
(+) | highs are linear (6.8% delta to prev. frequency)
Overall 100 - 16.000 Hz
(+) | overall sound is linear (9.5% difference to median)
Compared to same class
» 3% of all tested devices in this class were better, 1% similar, 95% worse
» The best had a delta of 6%, average was 18%, worst was 132%
Compared to all devices tested
» 4% of all tested devices were better, 1% similar, 95% worse
» The best had a delta of 4%, average was 23%, worst was 134%
Energy management - the Aorus computer is not lacking in stamina
Power consumption
The Gigabyte laptop didn't show any abnormalities in terms of energy consumption. The rates were on a normal level for the installed hardware. The Witcher 3 test and stress test were run with relatively constant power consumption. The power connector (280 watts) is sufficiently sized.
| Off / Standby | |
| Idle | |
| Load |
|
Key:
min: | |
| Aorus 15X ASF i7-13700HX, GeForce RTX 4070 Laptop GPU | Razer Blade 15 OLED (Early 2022) i9-12900H, GeForce RTX 3070 Ti Laptop GPU | MSI Katana 17 B13VFK i7-13620H, GeForce RTX 4060 Laptop GPU | Asus ROG Strix G17 G713PI R9 7945HX, GeForce RTX 4070 Laptop GPU | Acer Predator Helios 300 (i7-12700H, RTX 3070 Ti) i7-12700H, GeForce RTX 3070 Ti Laptop GPU | Average NVIDIA GeForce RTX 4070 Laptop GPU | Average of class Gaming | |
|---|---|---|---|---|---|---|---|
| Power Consumption | -57% | 15% | -14% | -19% | -2% | -8% | |
| Idle Minimum * (Watt) | 11 | 31.6 -187% | 12.2 -11% | 15 -36% | 15 -36% | 13.2 ? -20% | 13 ? -18% |
| Idle Average * (Watt) | 16 | 33.3 -108% | 14.9 7% | 20 -25% | 20 -25% | 18.2 ? -14% | 19 ? -19% |
| Idle Maximum * (Watt) | 24 | 38.6 -61% | 15.8 34% | 29 -21% | 22.3 7% | 24.6 ? -3% | 24.6 ? -3% |
| Load Average * (Watt) | 104 | 149 -43% | 85.22 18% | 121 -16% | 133 -28% | 97 ? 7% | 110.7 ? -6% |
| Witcher 3 ultra * (Watt) | 185.4 | 149.6 19% | 151.1 19% | 179.8 3% | 231 -25% | ||
| Load Maximum * (Watt) | 272 | 160 41% | 212.8 22% | 246 10% | 290 -7% | 221 ? 19% | 259 ? 5% |
* ... smaller is better
Power consumption Witcher 3 / stress test
Power consumption with external monitor
Runtimes
The 15.6-inch device achieved runtimes of 8:09 hours and 7:52 hours in the WLAN test (calling up websites via a script) and video test (short movie Big Buck Bunny (H.264 encoding, FHD) in a loop), respectively. During both tests, the notebook's energy-saving features were disabled and the display brightness was set to about 150 cd/m². The wireless modules were also disabled for the video test.
The Aorus 15 delivered good battery runtimes overall - not just for a gaming laptop. Taking into consideration the enormous battery capacity (99 Wh), these rates are not surprising. Nevertheless, Gigabyte's laptop is also ahead in terms of watt-hours.
| Aorus 15X ASF i7-13700HX, GeForce RTX 4070 Laptop GPU, 99 Wh | Razer Blade 15 OLED (Early 2022) i9-12900H, GeForce RTX 3070 Ti Laptop GPU, 80 Wh | MSI Katana 17 B13VFK i7-13620H, GeForce RTX 4060 Laptop GPU, 53.5 Wh | Asus ROG Strix G17 G713PI R9 7945HX, GeForce RTX 4070 Laptop GPU, 90 Wh | Acer Predator Helios 300 (i7-12700H, RTX 3070 Ti) i7-12700H, GeForce RTX 3070 Ti Laptop GPU, 90 Wh | Average of class Gaming | |
|---|---|---|---|---|---|---|
| Battery runtime | -26% | -58% | -54% | -21% | -15% | |
| Reader / Idle (h) | 11.3 | 6.7 -41% | 8.27 ? -27% | |||
| H.264 (h) | 7.9 | 5.9 -25% | 2.8 -65% | 5.9 -25% | 8.32 ? 5% | |
| WiFi v1.3 (h) | 8.2 | 4.6 -44% | 2.9 -65% | 4.3 -48% | 6 -27% | 7.11 ? -13% |
| Load (h) | 2 | 2.1 5% | 1 -50% | 1 -50% | 1.8 -10% | 1.502 ? -25% |
| Witcher 3 ultra (h) | 1.1 |
Pros
Cons
Verdict - A well-rounded gaming laptop
While the Aorus 15X is designed for QHD gaming at high to maximum settings, it also performs well in other demanding areas such as video editing and rendering. The Core i7-13700HX and GeForce RTX 4070 laptop provide the necessary processing power. A super-fast PCIe-4-SSD (1 TB) ensures short loading times.
Powerful, enduring, quiet when needed - the Aorus 15X ASF can meet many of the demands placed on a modern gaming laptop.
The CPU and GPU work with consistently high clock rates. Noise and heat development are on the usual high level. However, quiet to completely silent operation is possible - with significantly reduced processing power. Nevertheless, this would still meet users' demands for everyday use and allow gaming at reduced settings.
The matte QHD screen (15.6 inch, IPS, 240 Hz) doesn't need to be critiqued. A Thunderbolt 4 port opens up expansion options (docking solution, external GPU). It can also be used to power the laptop via a USB-C power adapter (minimum 65 watts) - Power Delivery is supported. Battery runtimes of about 8 hours round off the overall package.
The Razer Blade 15 OLED could prove to be a viable alternative to this device. It offers less processing power than the Aorus laptop, but scores extra points with its more compact dimensions, lower weight and a high-contrast, true-color OLED screen.
Price and availability
The Aorus 15X ASF can be purchased in the setup which we tested for $2,099 on Amazon.
Aorus 15X ASF
- 04/05/2023 v7 (old)
Sascha Mölck
Transparency
The selection of devices to be reviewed is made by our editorial team. The test sample was provided to the author as a loan by the manufacturer or retailer for the purpose of this review. The lender had no influence on this review, nor did the manufacturer receive a copy of this review before publication. There was no obligation to publish this review. As an independent media company, Notebookcheck is not subjected to the authority of manufacturers, retailers or publishers.
This is how Notebookcheck is testing
Every year, Notebookcheck independently reviews hundreds of laptops and smartphones using standardized procedures to ensure that all results are comparable. We have continuously developed our test methods for around 20 years and set industry standards in the process. In our test labs, high-quality measuring equipment is utilized by experienced technicians and editors. These tests involve a multi-stage validation process. Our complex rating system is based on hundreds of well-founded measurements and benchmarks, which maintains objectivity. Further information on our test methods can be found here.
Price comparison

