Aorus 15P WB in review: Compact gaming powerhouse offers very good battery life

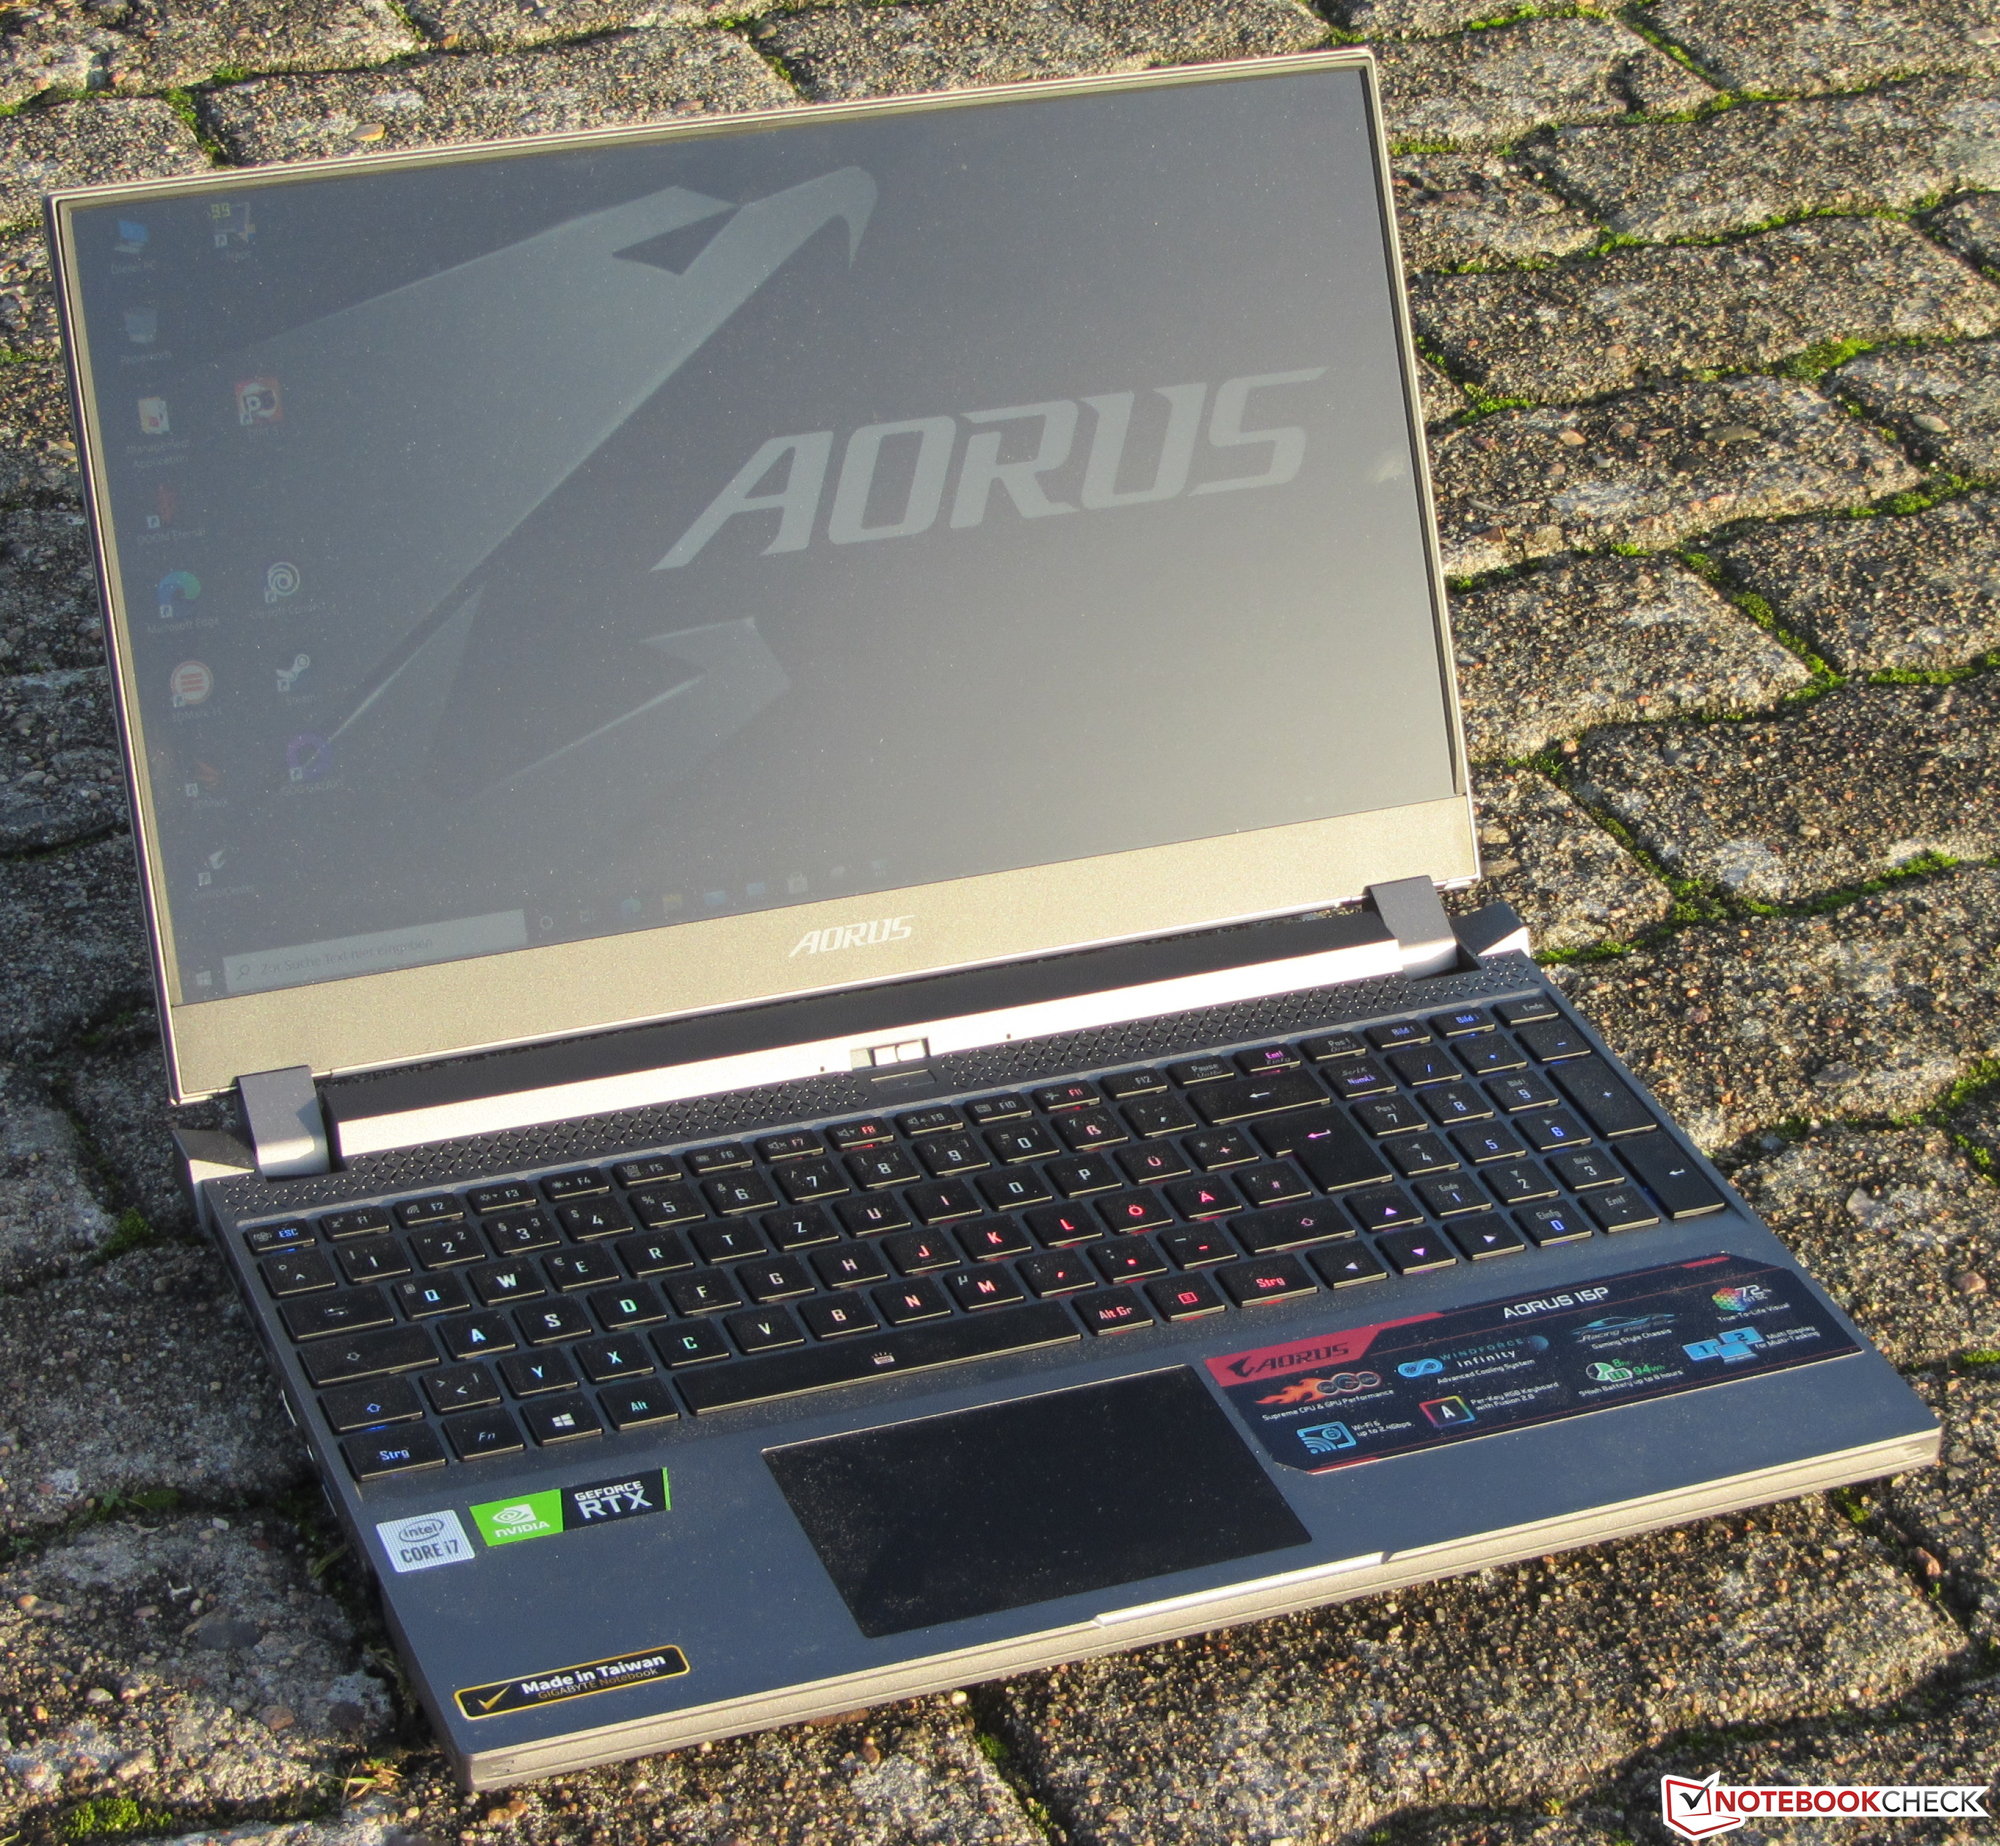
The Aorus 15P WB is a slim, compact gaming laptop in the 15.6-inch format. The device can definitely be considered a watered-down, lower-priced version of the previously reviewed Aorus 15G XB. The test model provided to us has a Core i7-10750H processor and a GeForce RTX 2070 Max-Q graphics core on board. Competitors include devices like the Acer Predator Triton 300 PT315-52, the Dell G5 15 SE 5505, and the Asus ROG Strix G15 G512LW.
Rating | Date | Model | Weight | Height | Size | Resolution | Price |
|---|---|---|---|---|---|---|---|
| 84.5 % v7 (old) | 01 / 2021 | Aorus 15P WB i7-10750H, GeForce RTX 2070 Max-Q | 2.1 kg | 23 mm | 15.60" | 1920x1080 | |
| 82.1 % v7 (old) | 12 / 2020 | Acer Predator Triton 300 PT315-52-79LP i7-10750H, GeForce RTX 2060 Mobile | 2.1 kg | 19.9 mm | 15.60" | 1920x1080 | |
| 83.4 % v7 (old) | 11 / 2020 | Asus ROG Strix G15 G512LW i7-10750H, GeForce RTX 2070 Mobile | 2.3 kg | 25.8 mm | 15.60" | 1920x1080 | |
| 83.7 % v7 (old) | 06 / 2020 | Dell G5 15 SE 5505 P89F R7 4800H, Radeon RX 5600M | 2.4 kg | 21.6 mm | 15.60" | 1920x1080 |
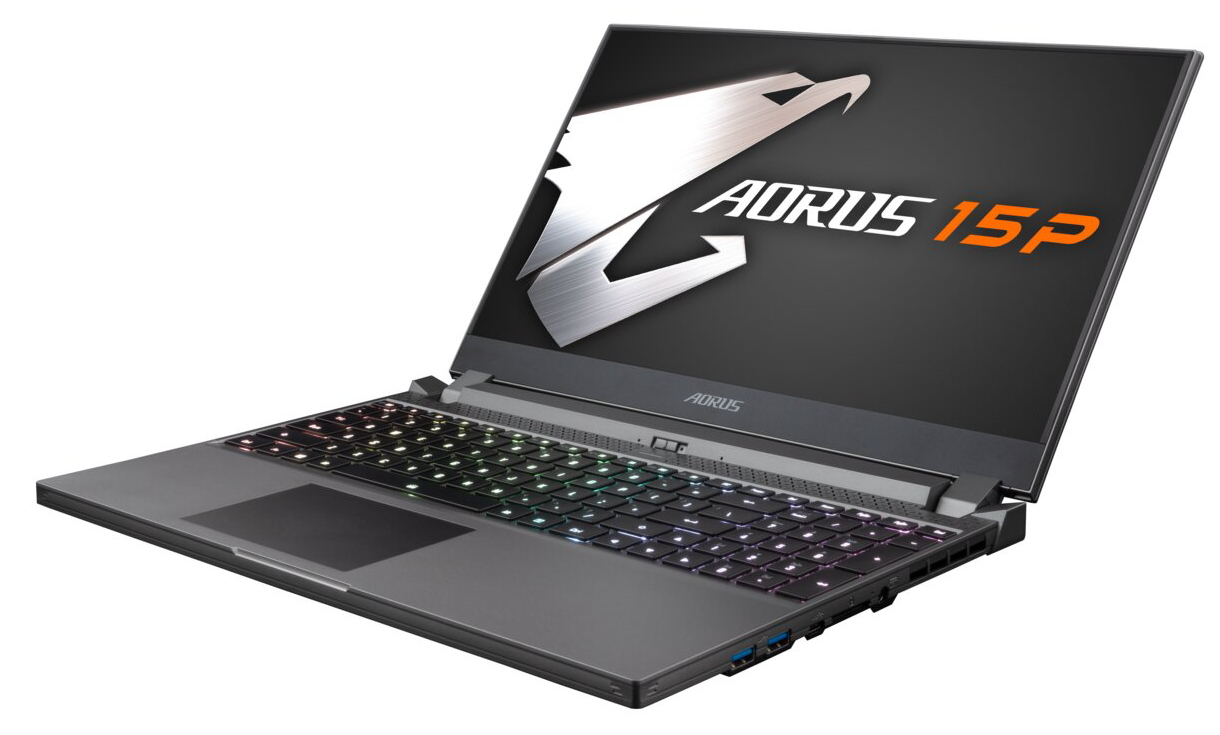
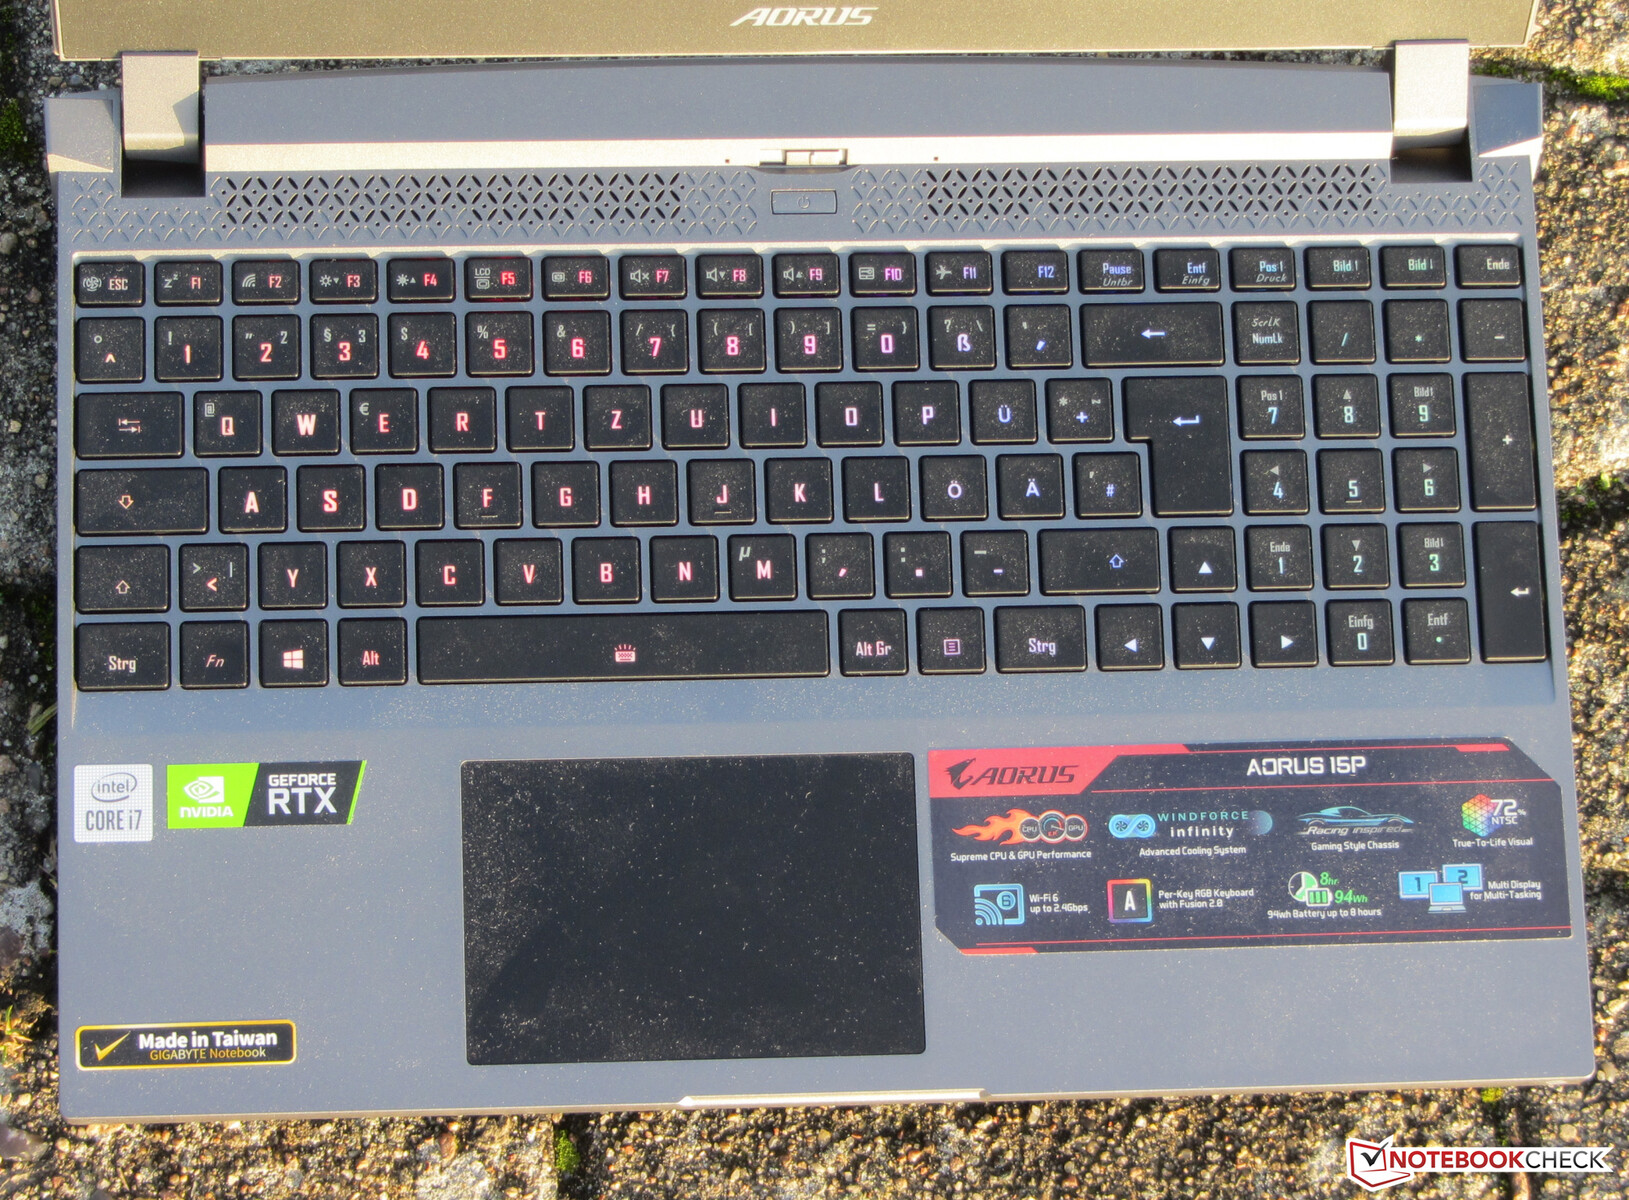
Case - A plastic chassis for the 15P
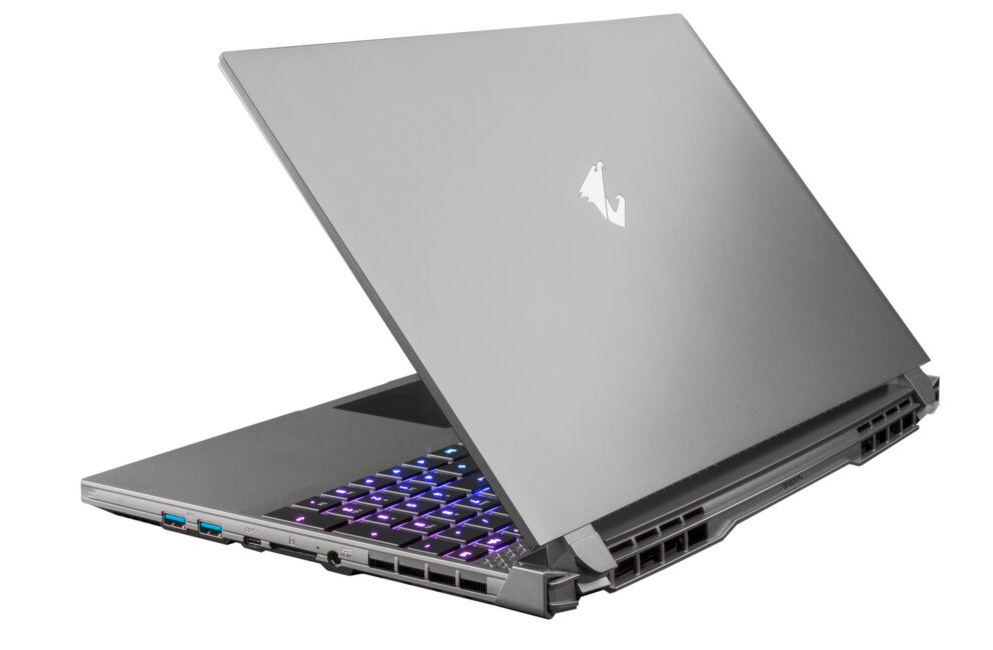
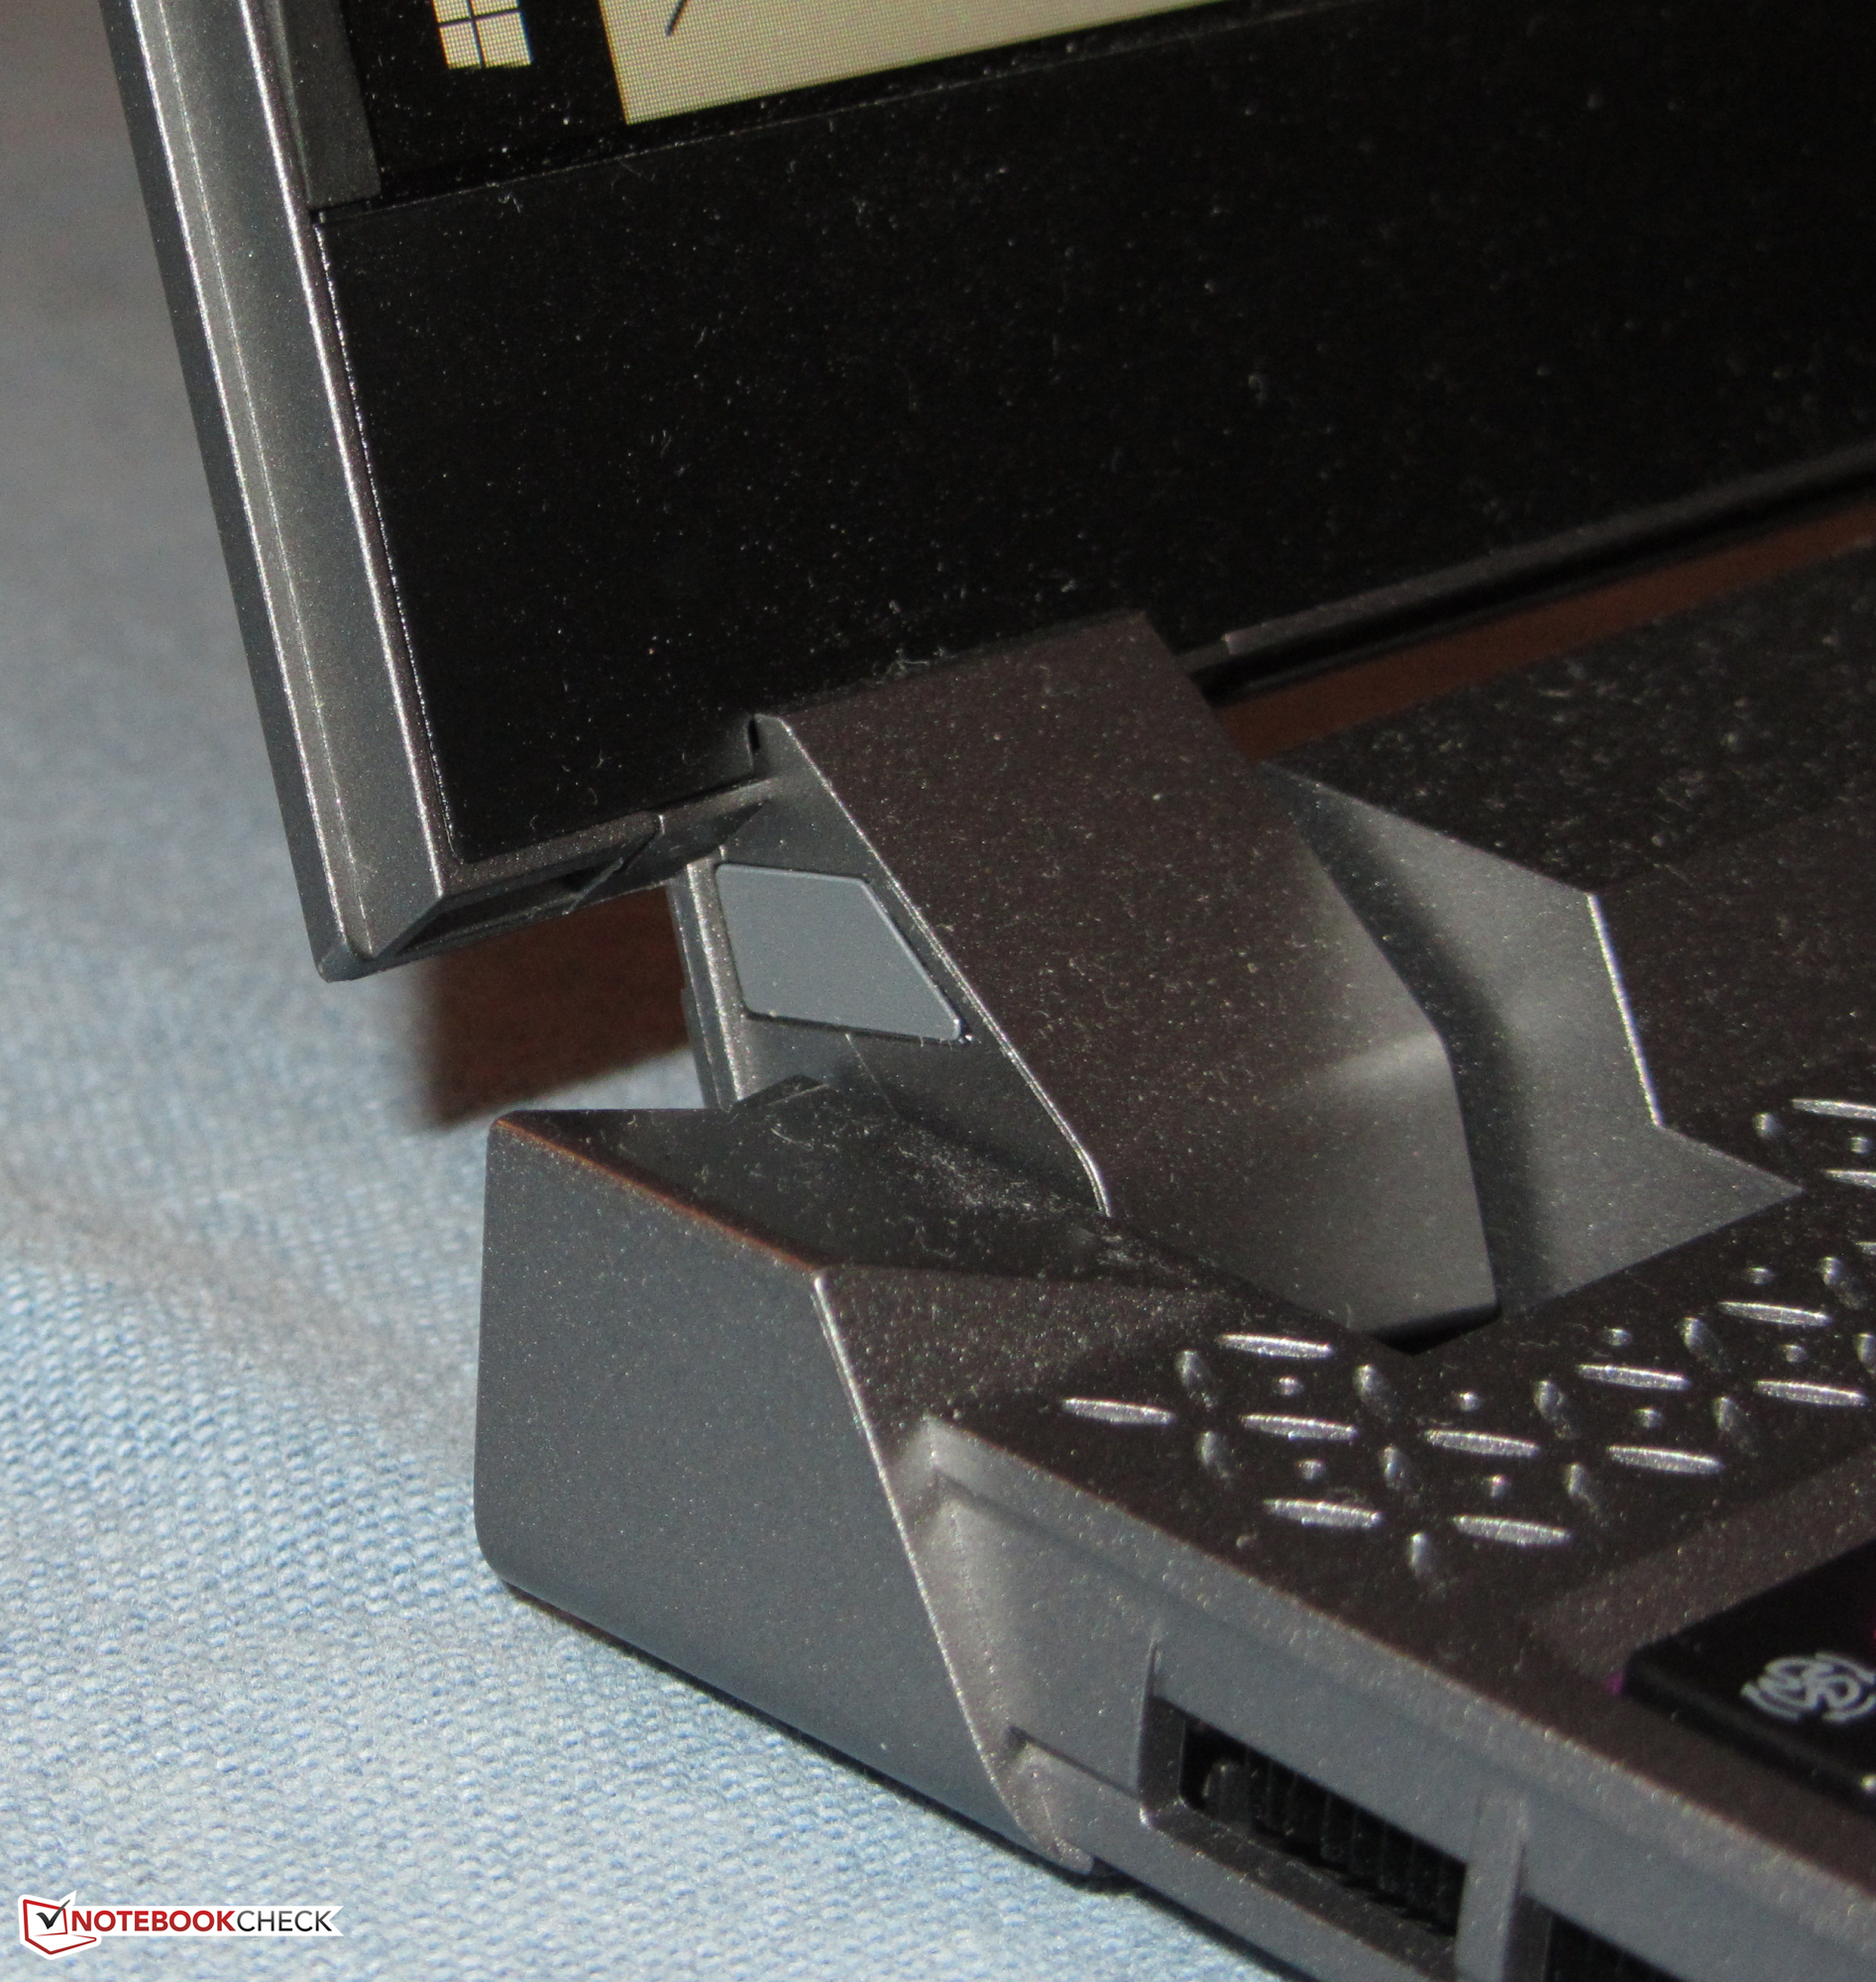
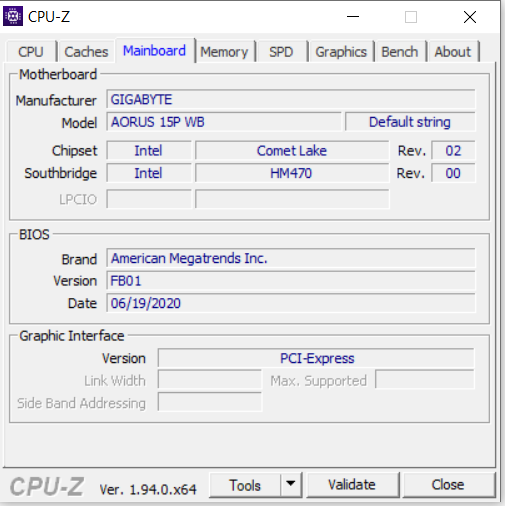
The 15P can't hide its rather strong resemblance to the Aorus 15G XB, but the two devices are not identical in construction. While the case of the 15G is made of metal, Gigabyte uses silver-gray plastic for the 15P. The devices have the very narrow display bezel in common, which contributes to its attractiveness. The palm rest and the lid's back have smooth surfaces. The laptop doesn't have a maintenance hatch. Moreover, the battery is firmly installed.
The laptop proves to be well manufactured for the most part. The lower corners of the lid as well as the rear corners of the two "horns", which are found on the base unit's back, deserve criticism. These are very sharp. There is definitely a risk of injury here. Furthermore, the case should have a greater rigidity overall. The hinges keep the lid firmly in position, but they let it wobble a bit. Opening the lid with one hand is possible. The maximum aperture angle is about 135 degrees.
Within our comparison field, the Aorus 15P represents the most compact and lightest device together with the Acer Predator Triton 300.
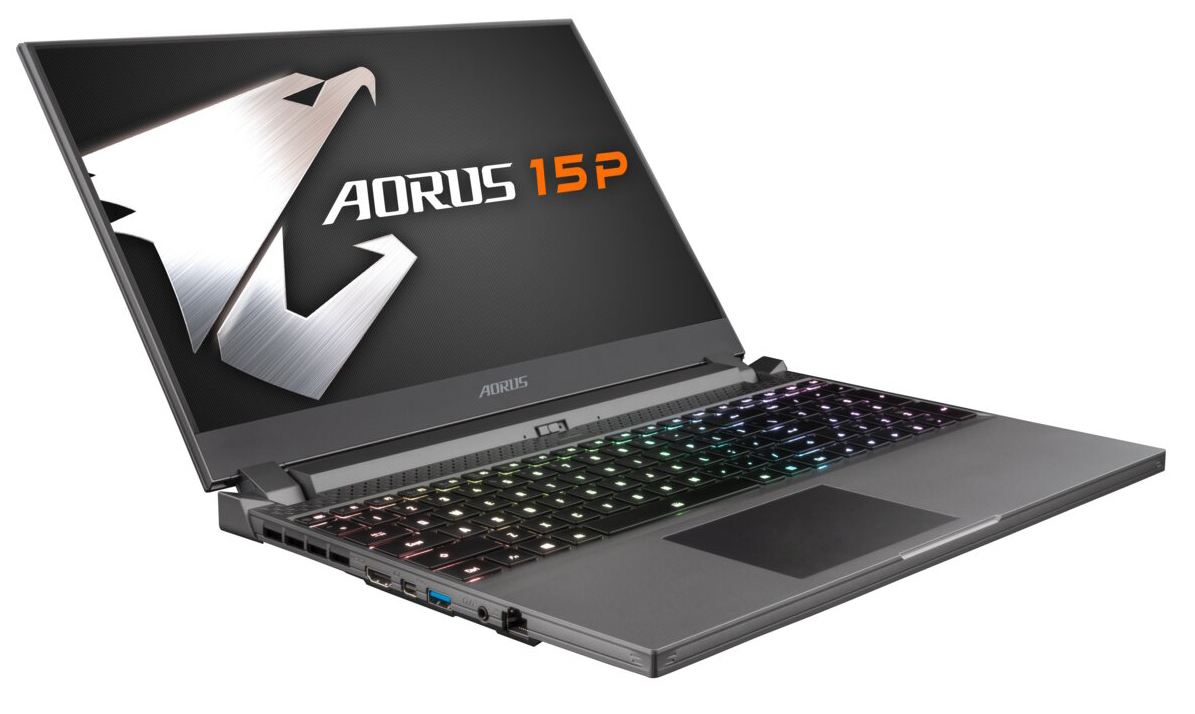
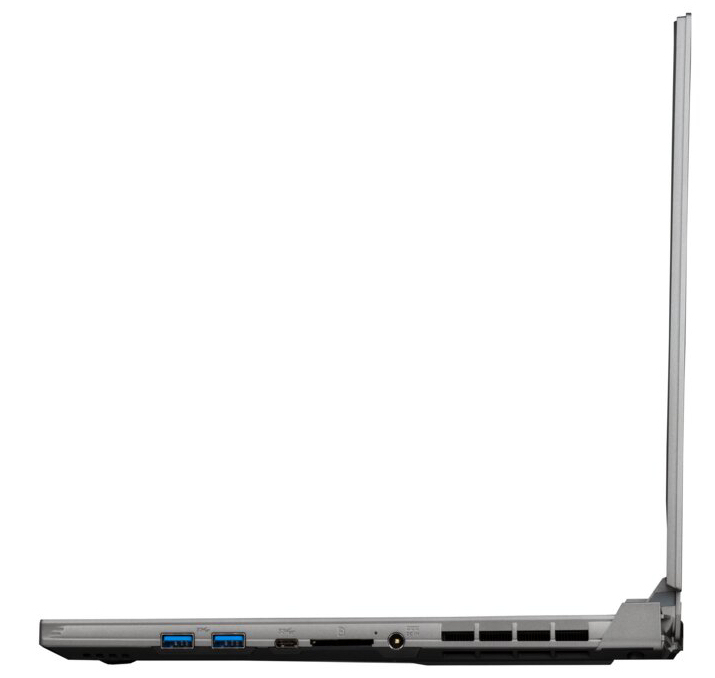
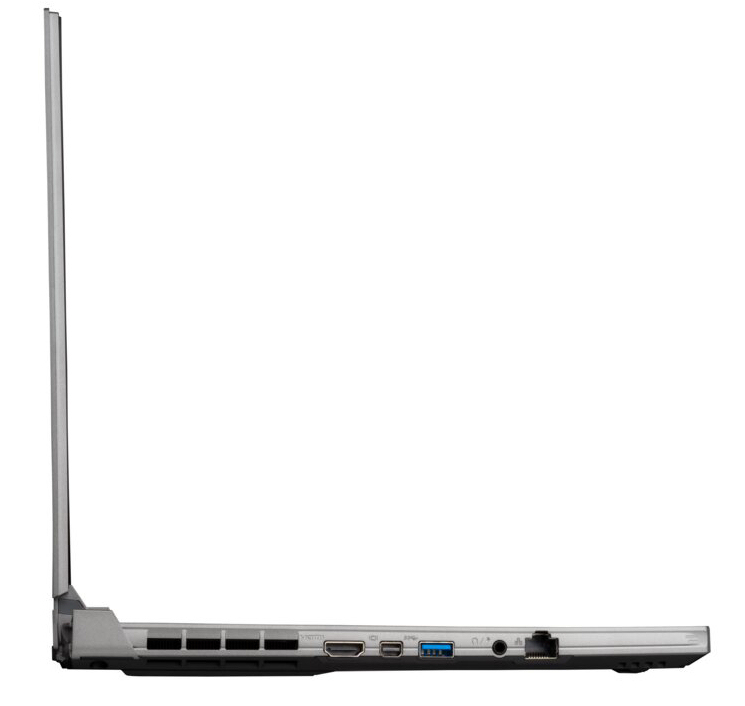
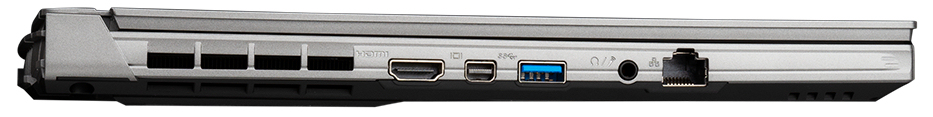
Connectivity - No Thunderbolt on board
The 15.6-incher provides a well-rounded range of interfaces. The four USB ports (3x Type-A, 1x Type-C) work according to the USB 3.2 Gen 1 standard. In addition, there are two video outputs (HDMI 2.0, Mini DisplayPort 1.4), a combo audio port, and a Gigabit Ethernet port. The laptop does not offer Thunderbolt.
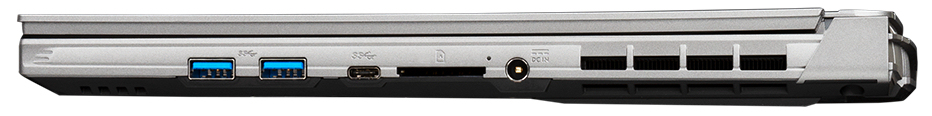
SD card reader
The SD memory card reader (reference card: Toshiba Exceria Pro SDXC 64 GB UHS-II) is a very fast model with maximum transfer rates of 208 MB/s (transferring 250 jpg image files of 5 MB each) and 243 MB/s (copying large data blocks). It doesn't accommodate memory cards completely; they protrude a good 14 mm.
| SD Card Reader | |
| average JPG Copy Test (av. of 3 runs) | |
| Aorus 15P WB (Toshiba Exceria Pro SDXC 64 GB UHS-II) | |
| Average of class Gaming (20.9 - 210, n=55, last 2 years) | |
| Dell G5 15 SE 5505 P89F (Toshiba Exceria Pro SDXC 64 GB UHS-II) | |
| maximum AS SSD Seq Read Test (1GB) | |
| Aorus 15P WB (Toshiba Exceria Pro SDXC 64 GB UHS-II) | |
| Average of class Gaming (25.5 - 261, n=52, last 2 years) | |
| Dell G5 15 SE 5505 P89F (Toshiba Exceria Pro SDXC 64 GB UHS-II) | |
Communication
The WLAN chip (Intel AX200) supports the 802.11a/b/g/n/ac/ax standards and offers Bluetooth 5 functionality. The data rates determined under optimal conditions (no other WLAN devices nearby, short distance between laptop and server PC) are very good. Wired network connections are handled by a Gigabit Ethernet controller from Realtek's RTL8168/8111 family. It performs its tasks smoothly.
Webcam
The webcam (0.9 MP) produces images with a maximum resolution of 1280x720 pixels. Moreover, there are issues with color accuracy. With a color deviation of almost 18, the target (Delta E less than 3) is missed. The camera isn't located in the display frame but in the base unit instead - above the keyboard.


")
")
Accessories
The laptop comes with the usual documents: A quick-start guide and warranty information. Furthermore, a thermal pad for a second M.2 SSD is found in the box.
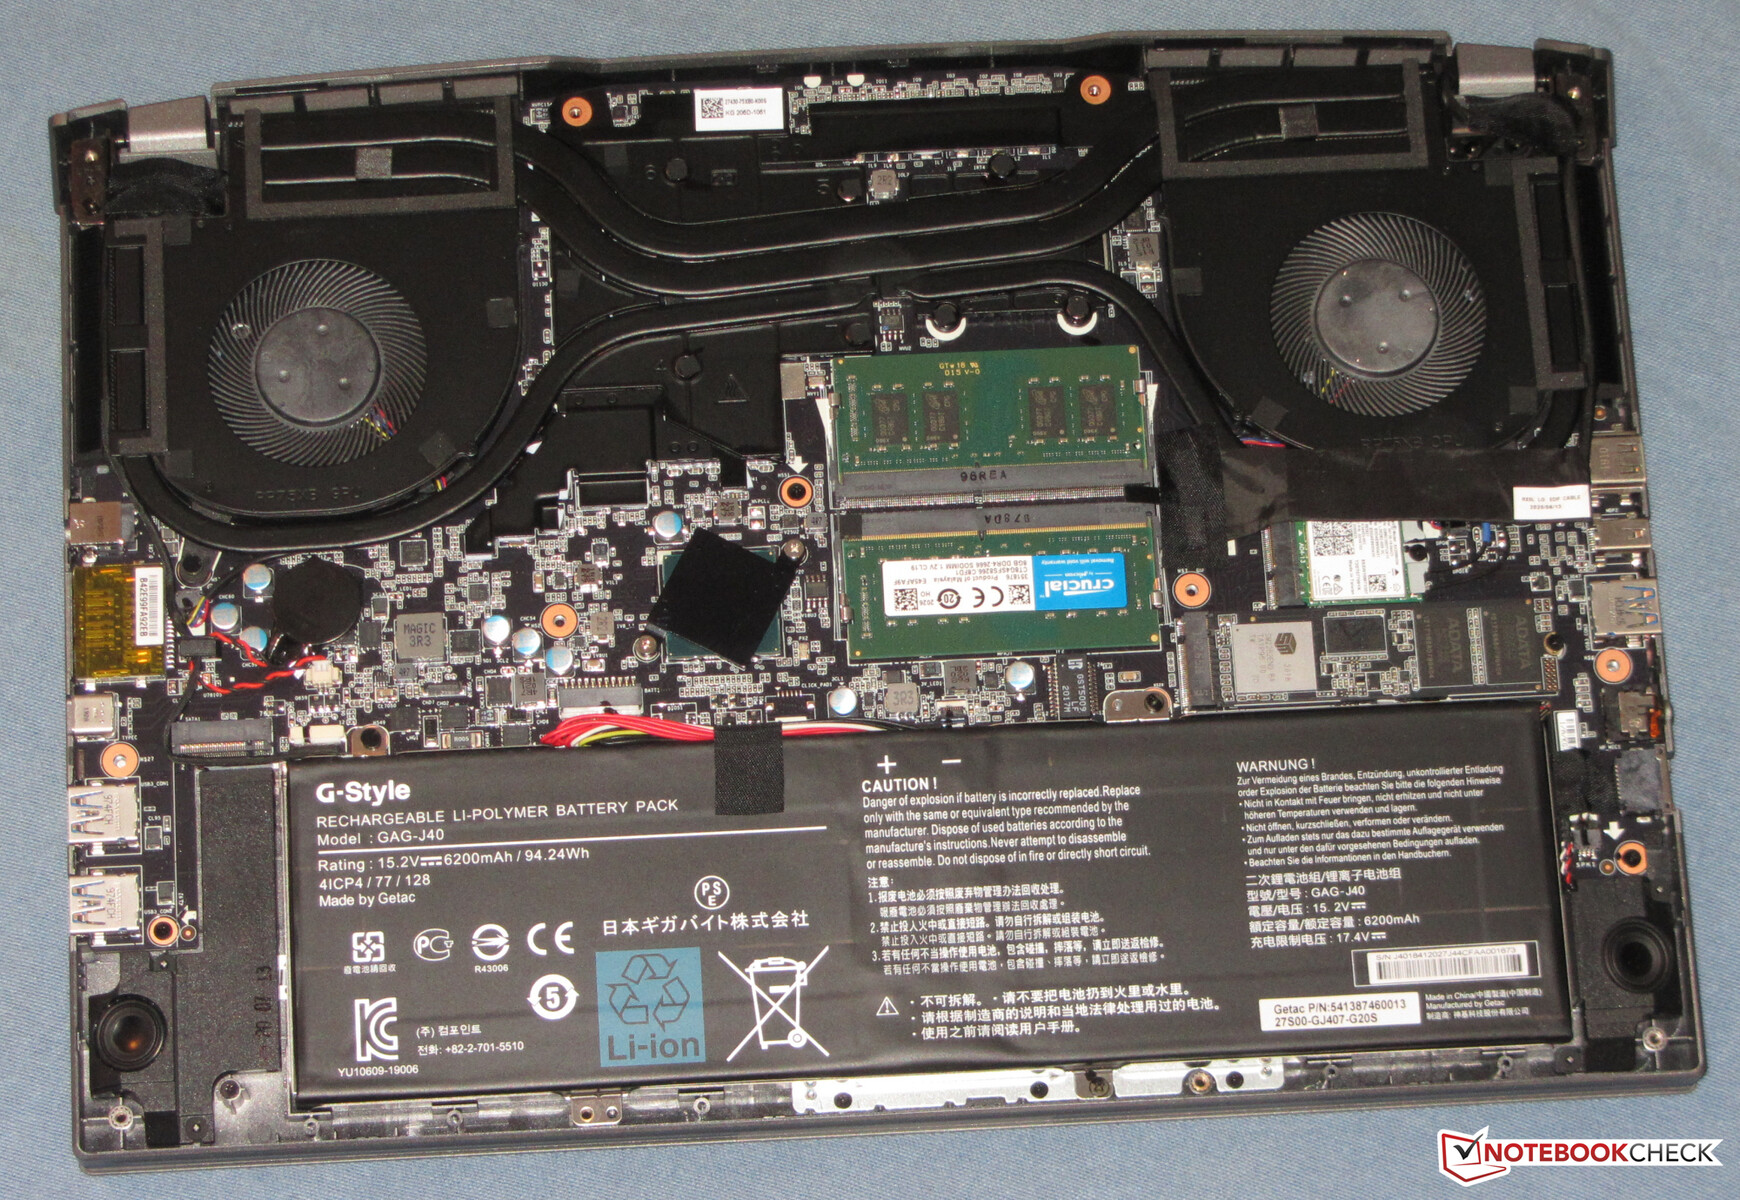
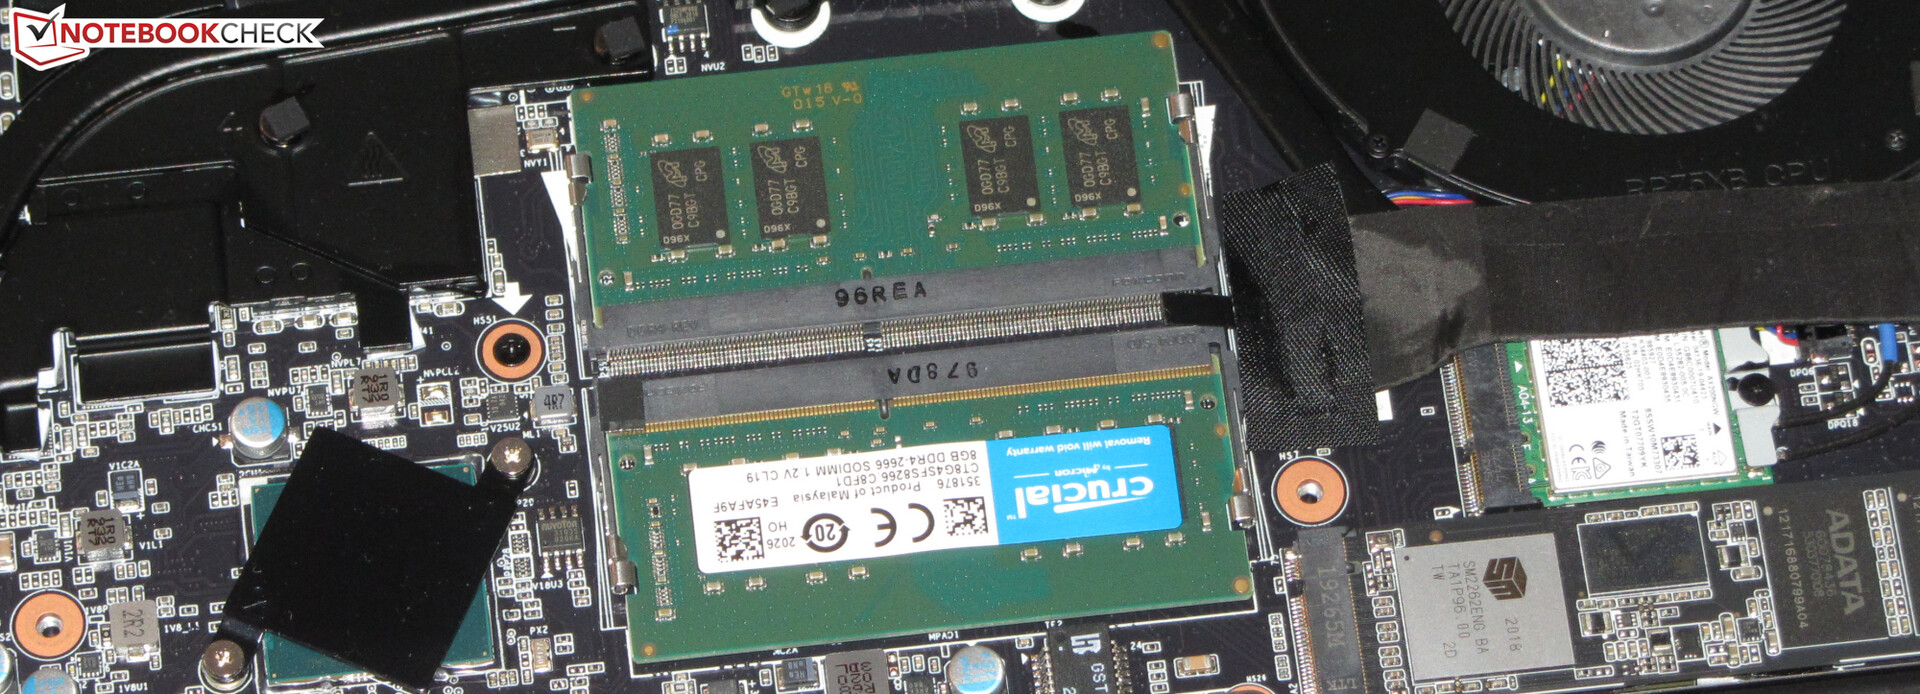
Maintenance
The laptop doesnt have a maintenance hatch. The bottom cover needs to be removed in order to access the inside. After removing all screws on the underside of the device, the bottom cover can be taken off - at least that was the case with our test device. A grout finishing tool or a flat spatula should be at hand, just in case.
Warranty
Gigabyte grants the laptop a two-year warranty. We couldn't find any warranty extensions.
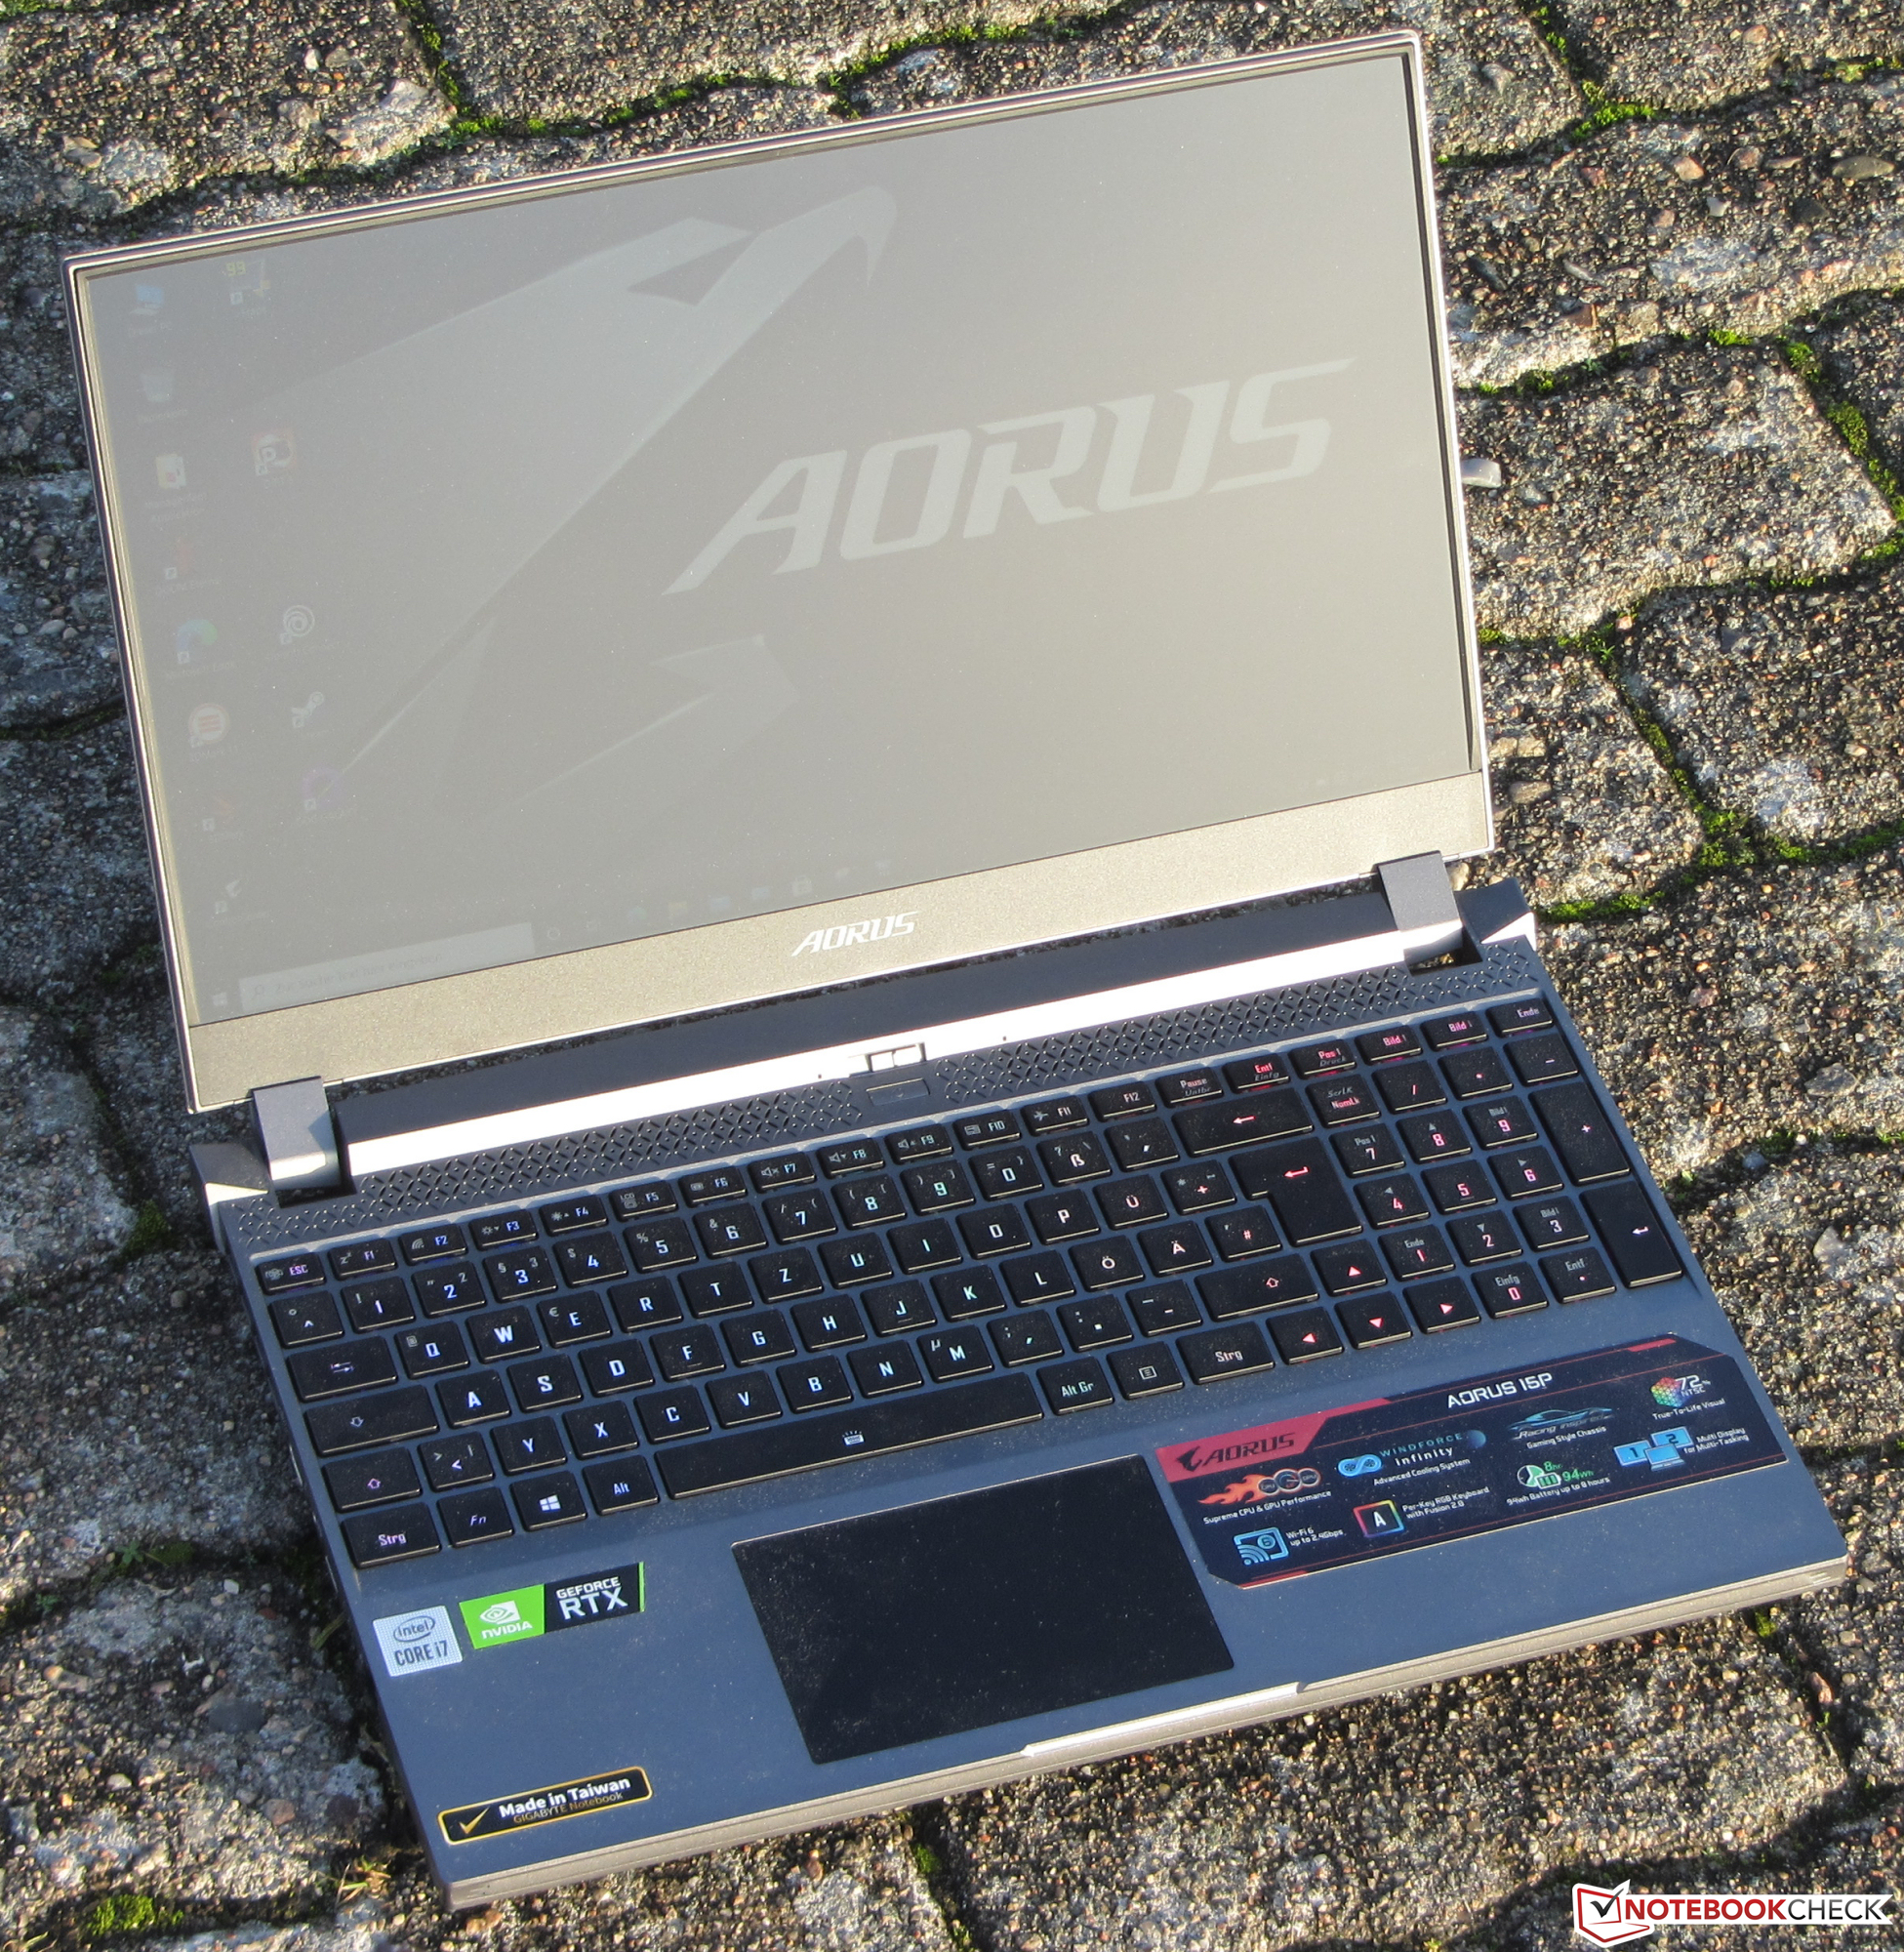
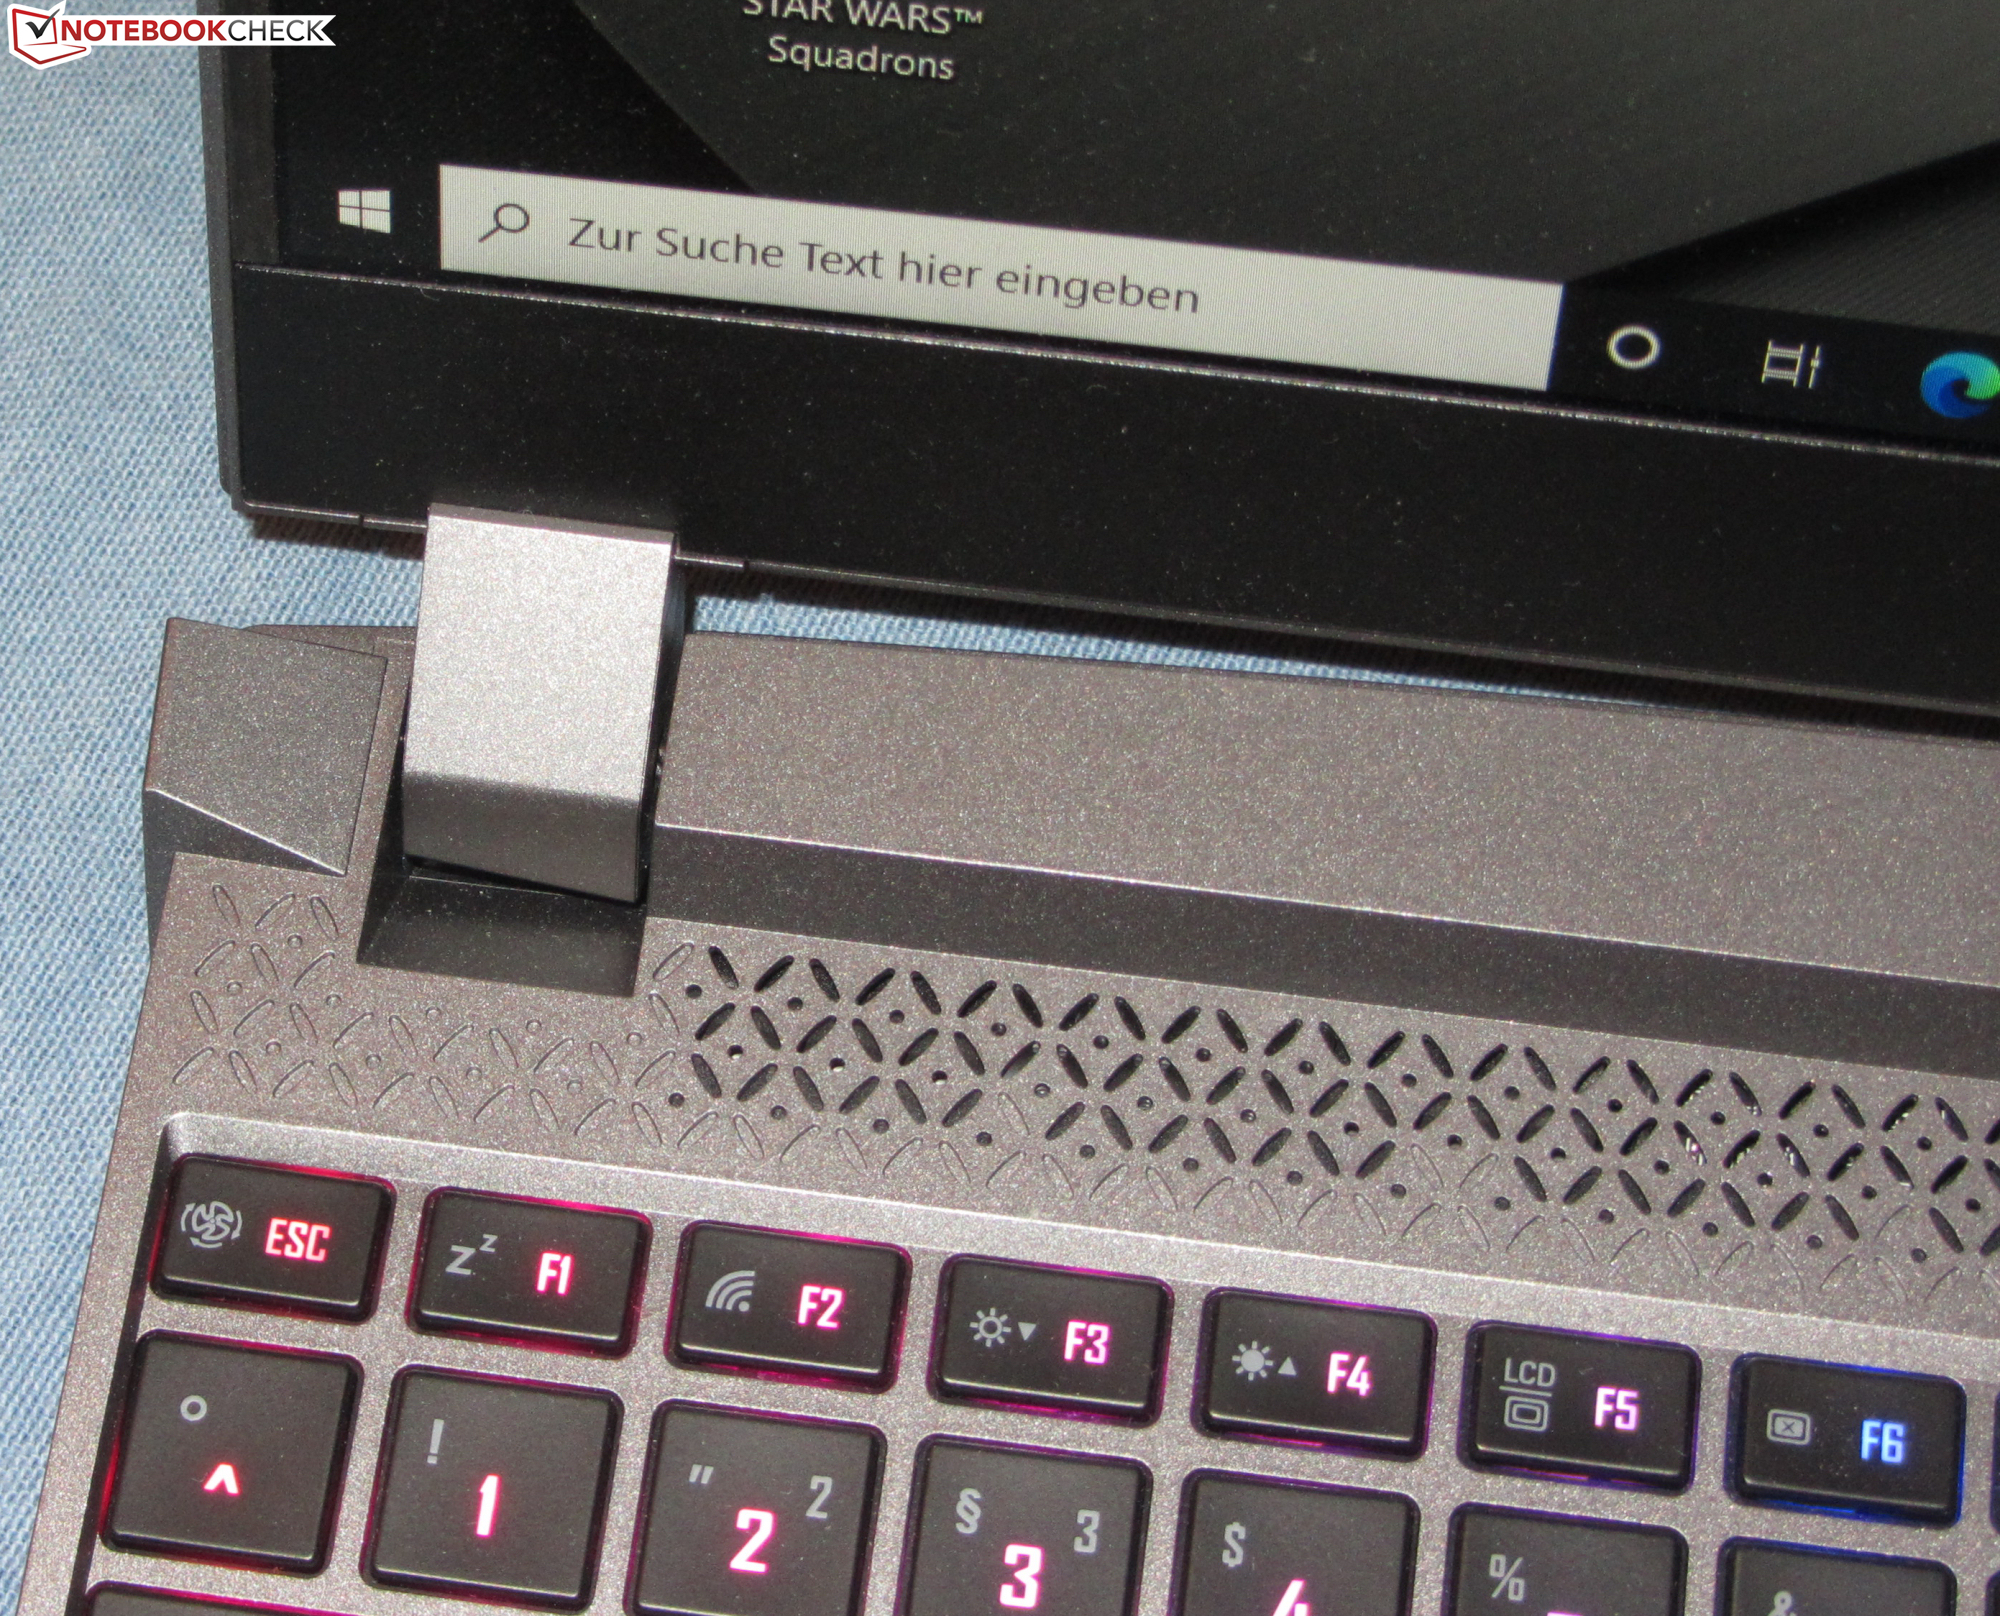
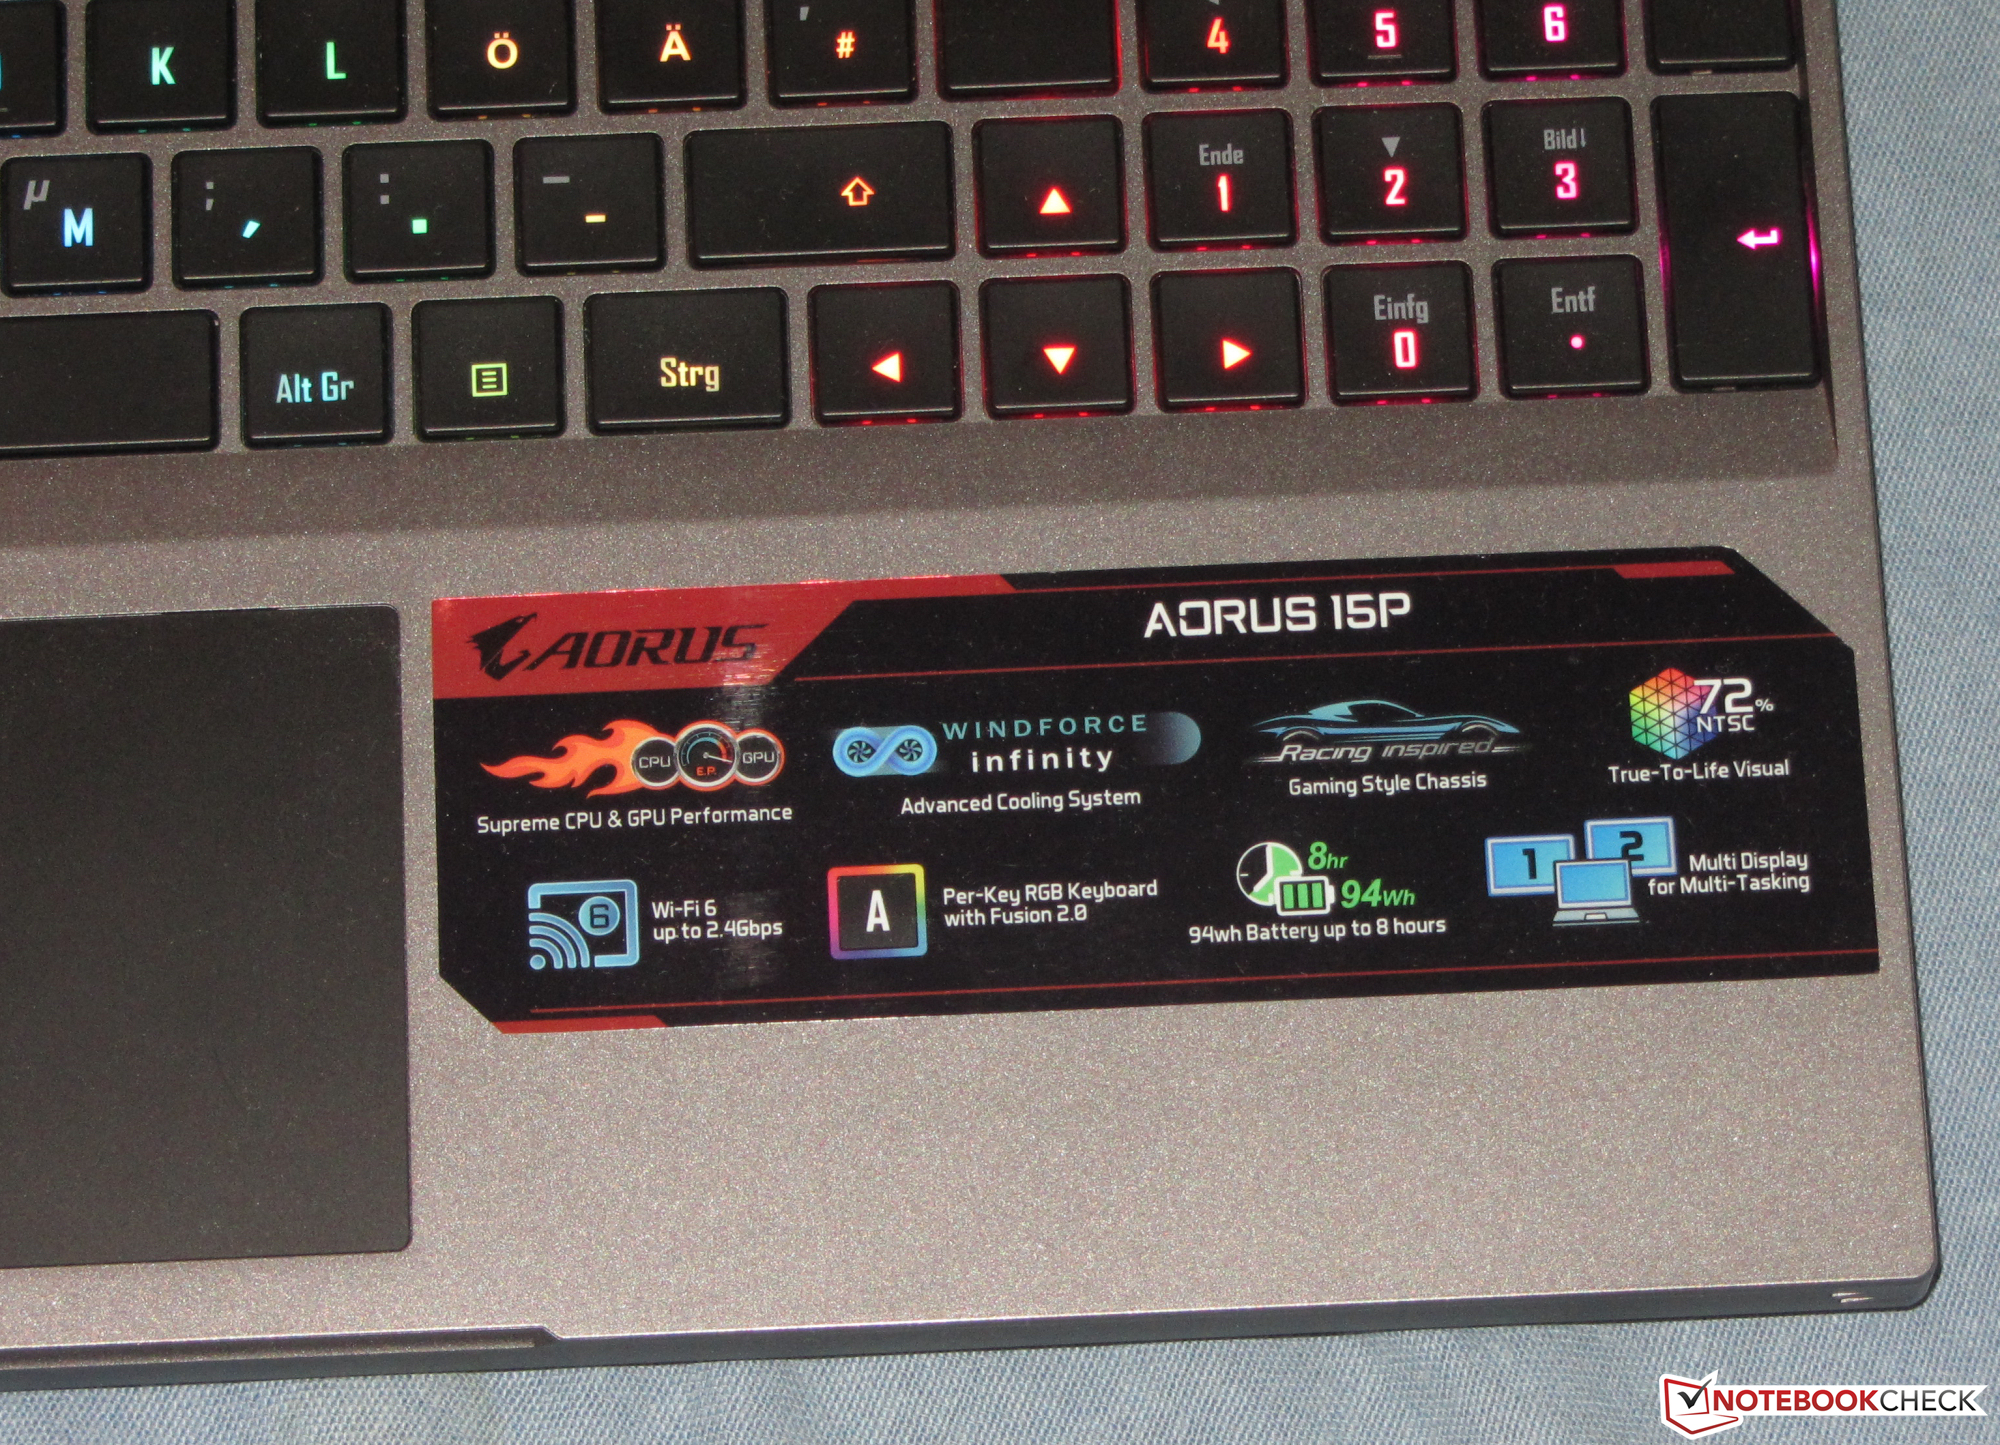
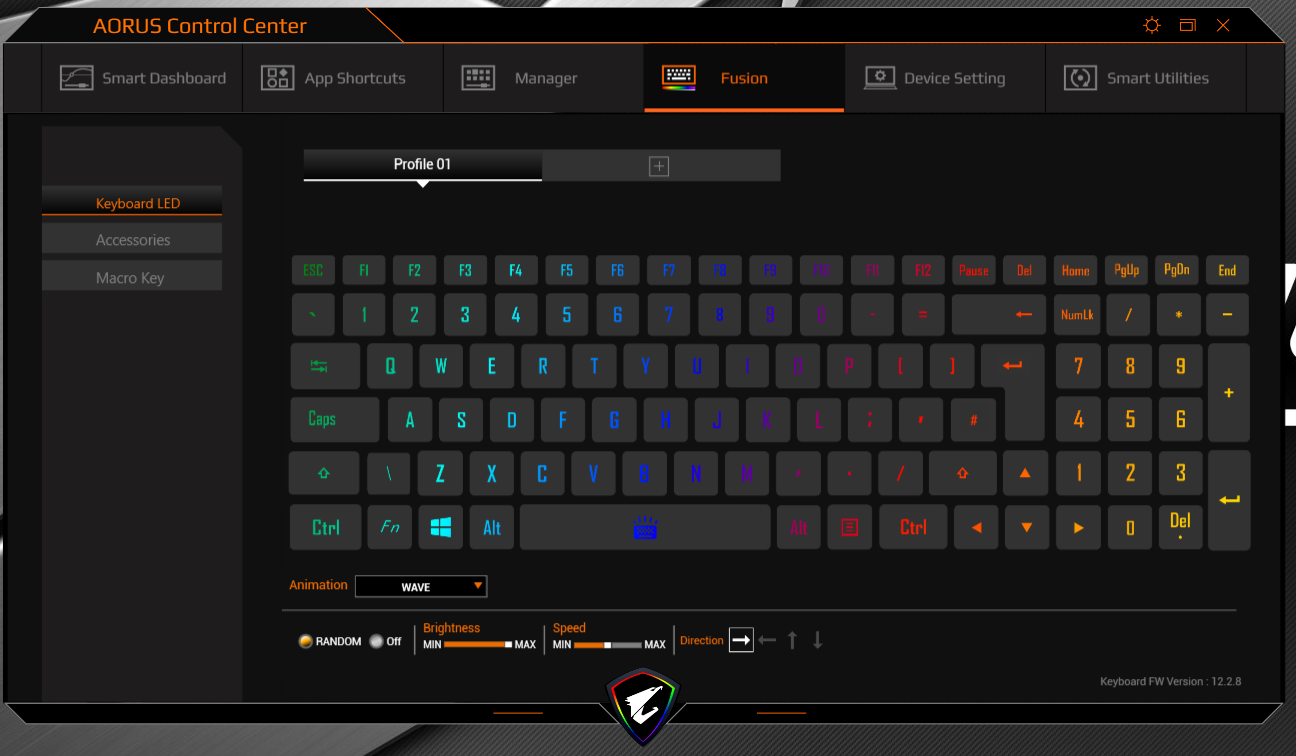
Input devices - Aorus laptop with backlit keyboard
Keyboard
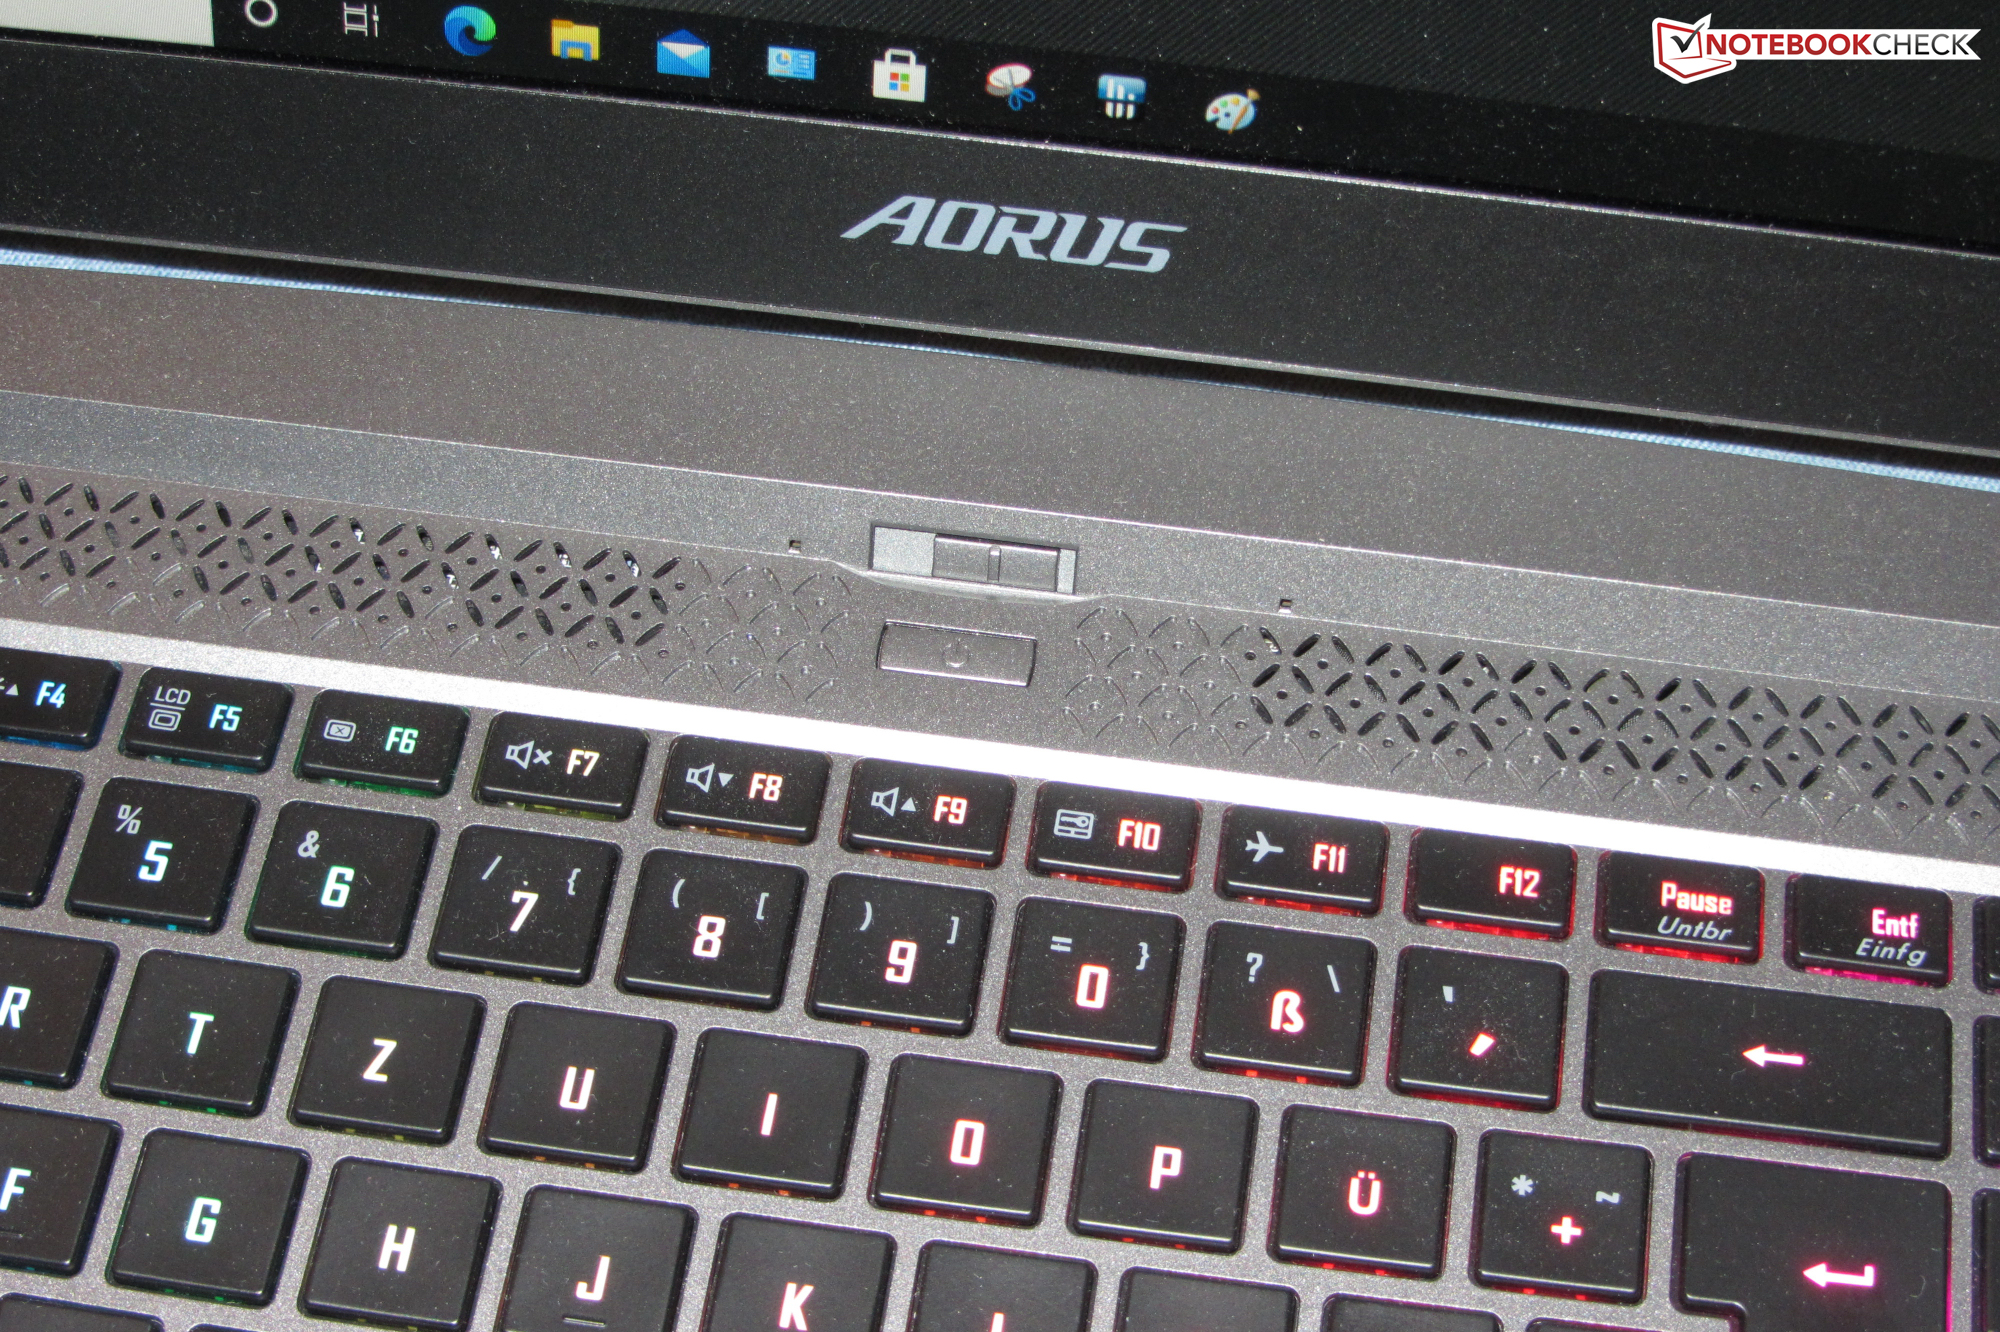
The 15P comes with a backlit chiclet keyboard that includes a number pad. The smooth keys offer a medium travel and a clear pressure point. The quite crisp key resistance is pleasing. Moreover, the keyboard yields slightly during typing. It didn't prove to be overly annoying, though. Overall, Gigabyte delivers a keyboard that is suitable for everyday use here.
Touchpad
A multitouch-capable ClickPad (10.6 x 7.1 cm) serves as a mouse replacement. Its smooth surface makes it easy for fingers to glide on it. It also responds to inputs in the corners. The pad offers a short travel and a clear pressure point.
Display - 144 Hz IPS
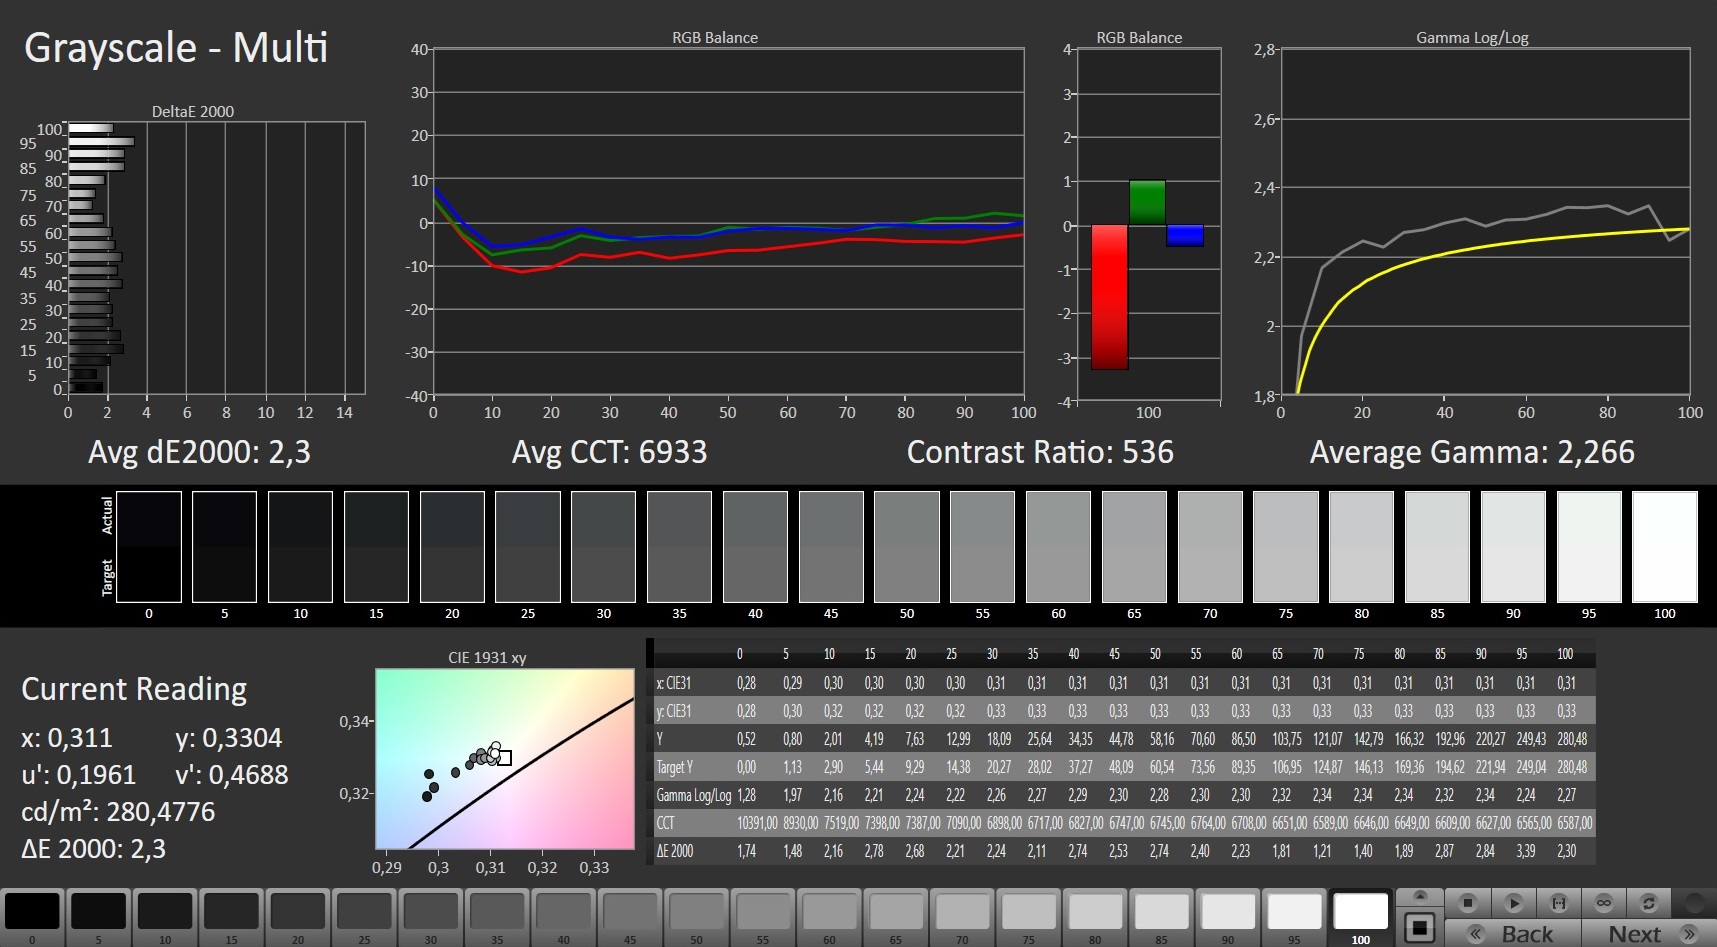
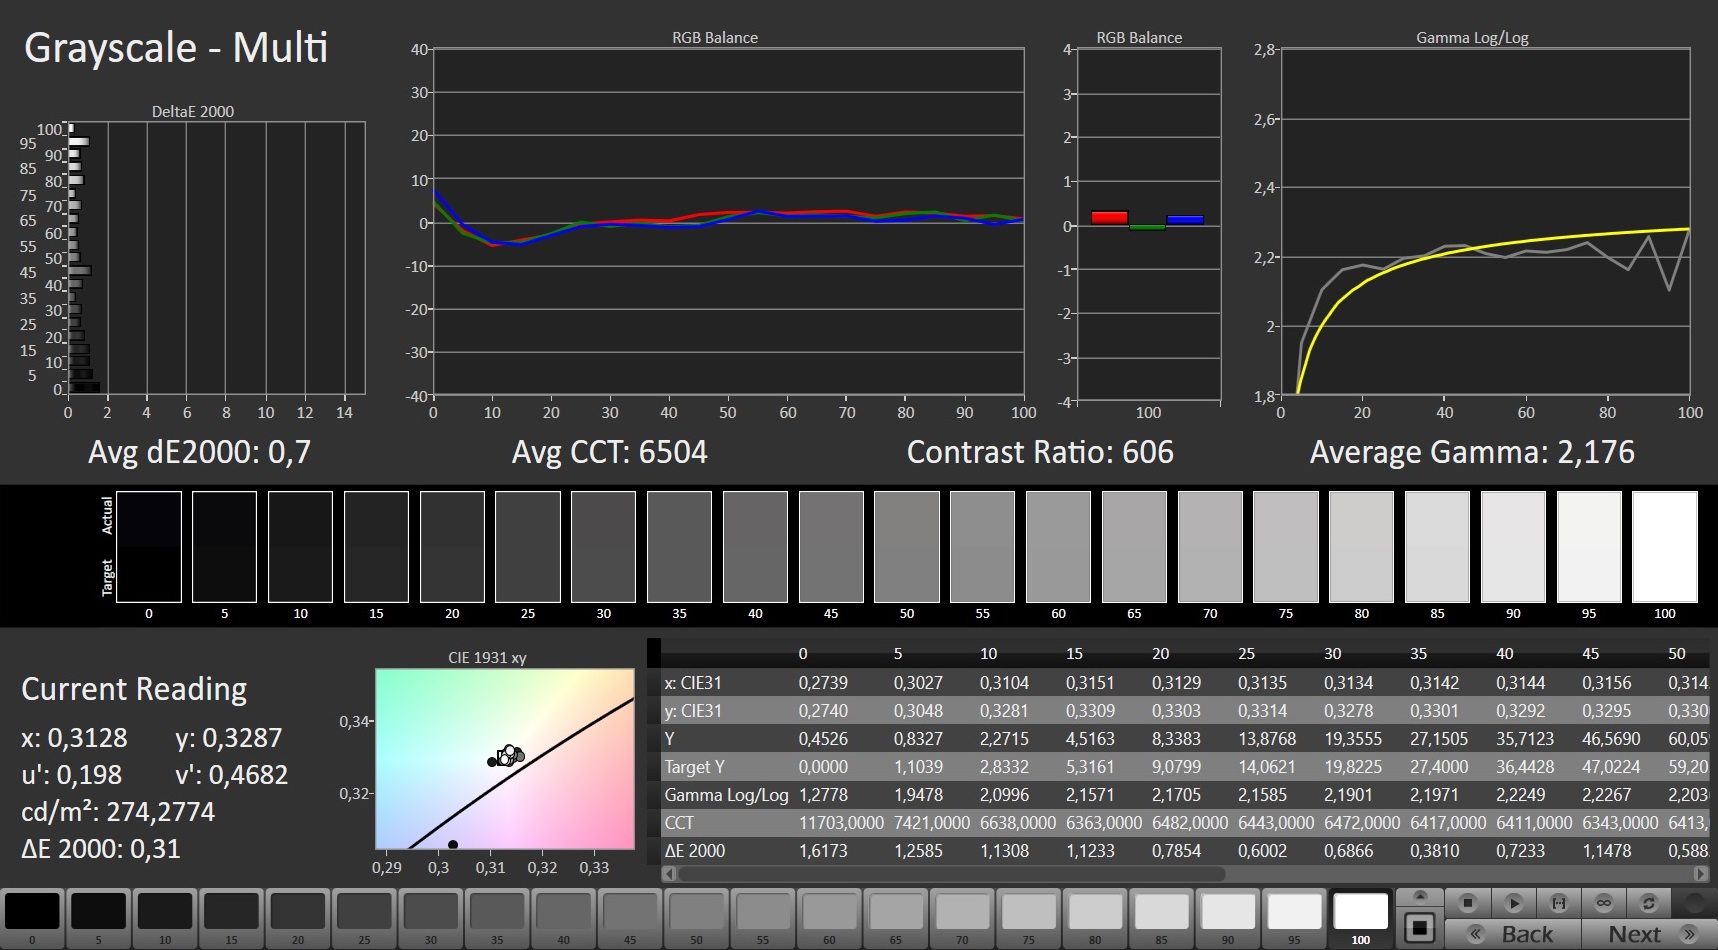
The matte 15.6-inch display has a native resolution of 1920x1080 pixels. The contrast (833:1) and brightness (267.7 cd/m²) are too low. We consider values beyond 1,000:1 and 300 cd/m², respectively, to be good. The 144 Hz panel used here scores points with fast response times.
| |||||||||||||||||||||||||
Brightness Distribution: 91 %
Center on Battery: 275 cd/m²
Contrast: 833:1 (Black: 0.33 cd/m²)
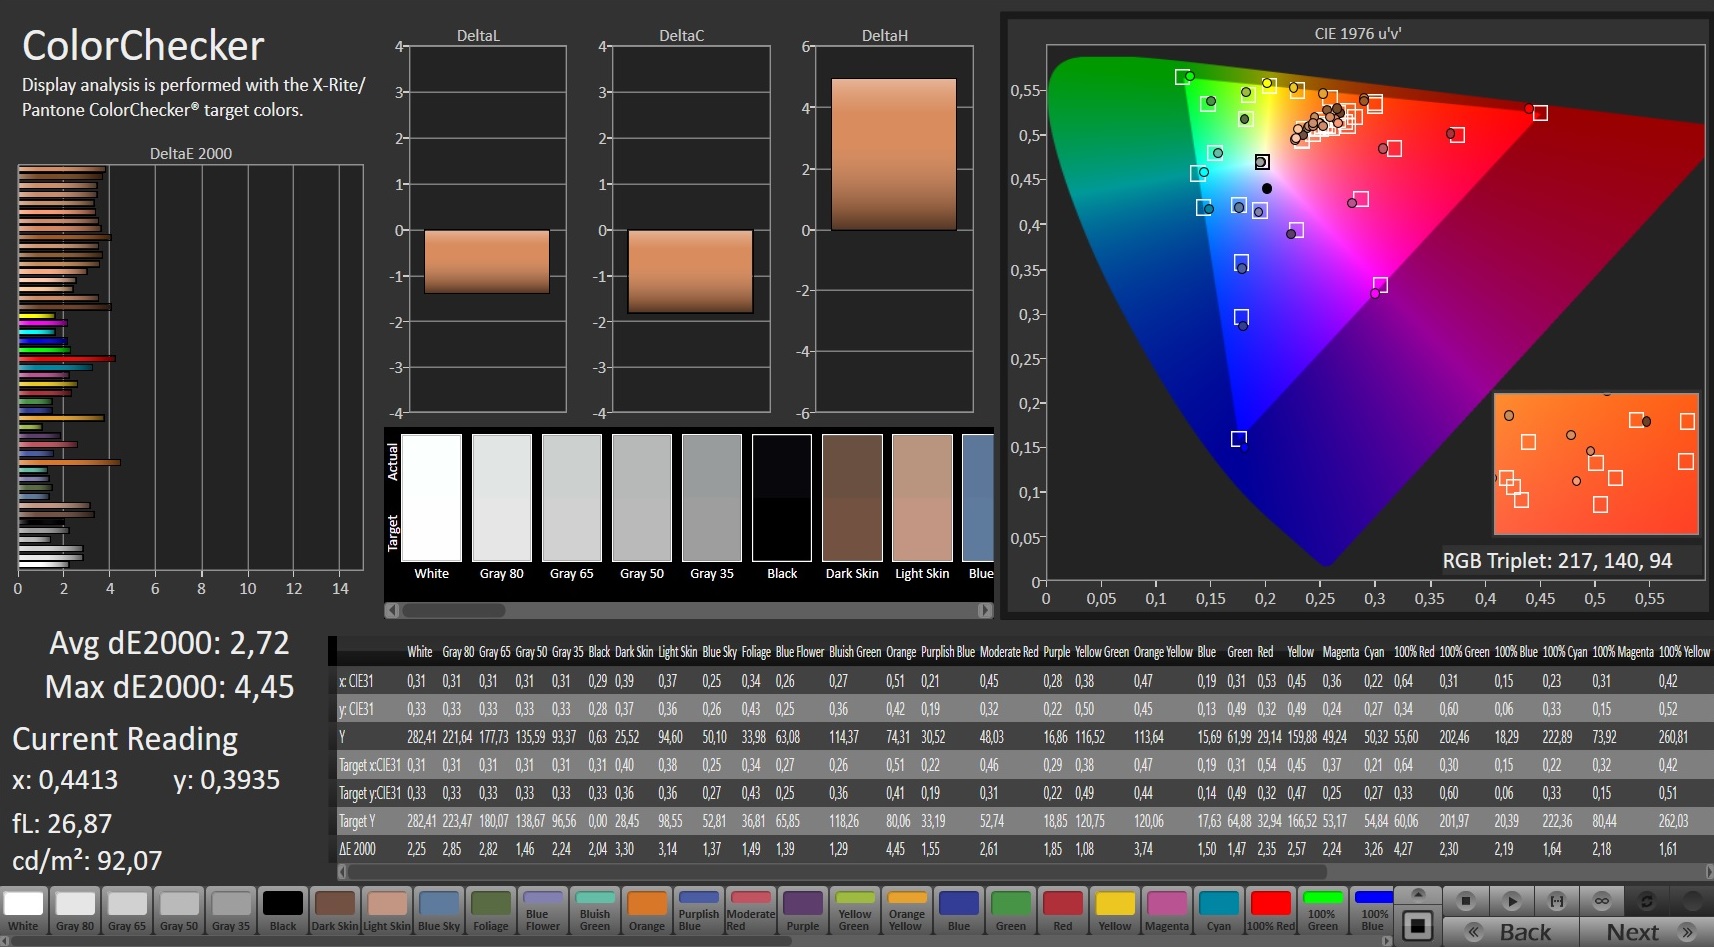
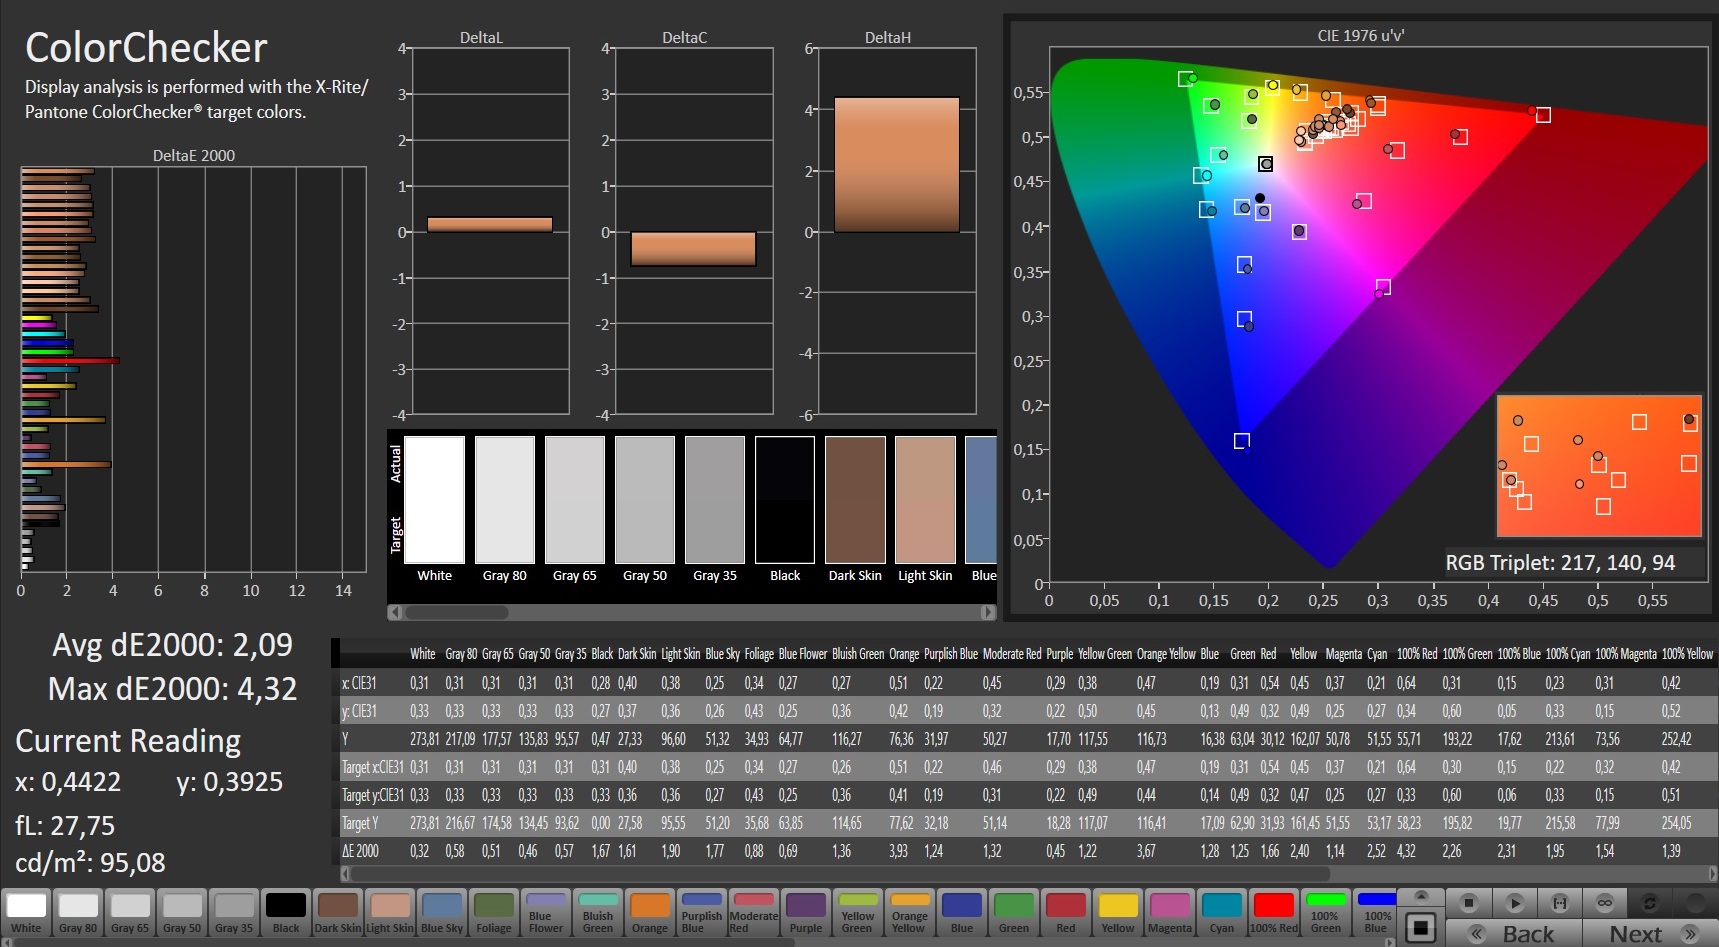
ΔE ColorChecker Calman: 2.72 | ∀{0.5-29.43 Ø4.71}
calibrated: 2.09
ΔE Greyscale Calman: 2.3 | ∀{0.09-98 Ø4.96}
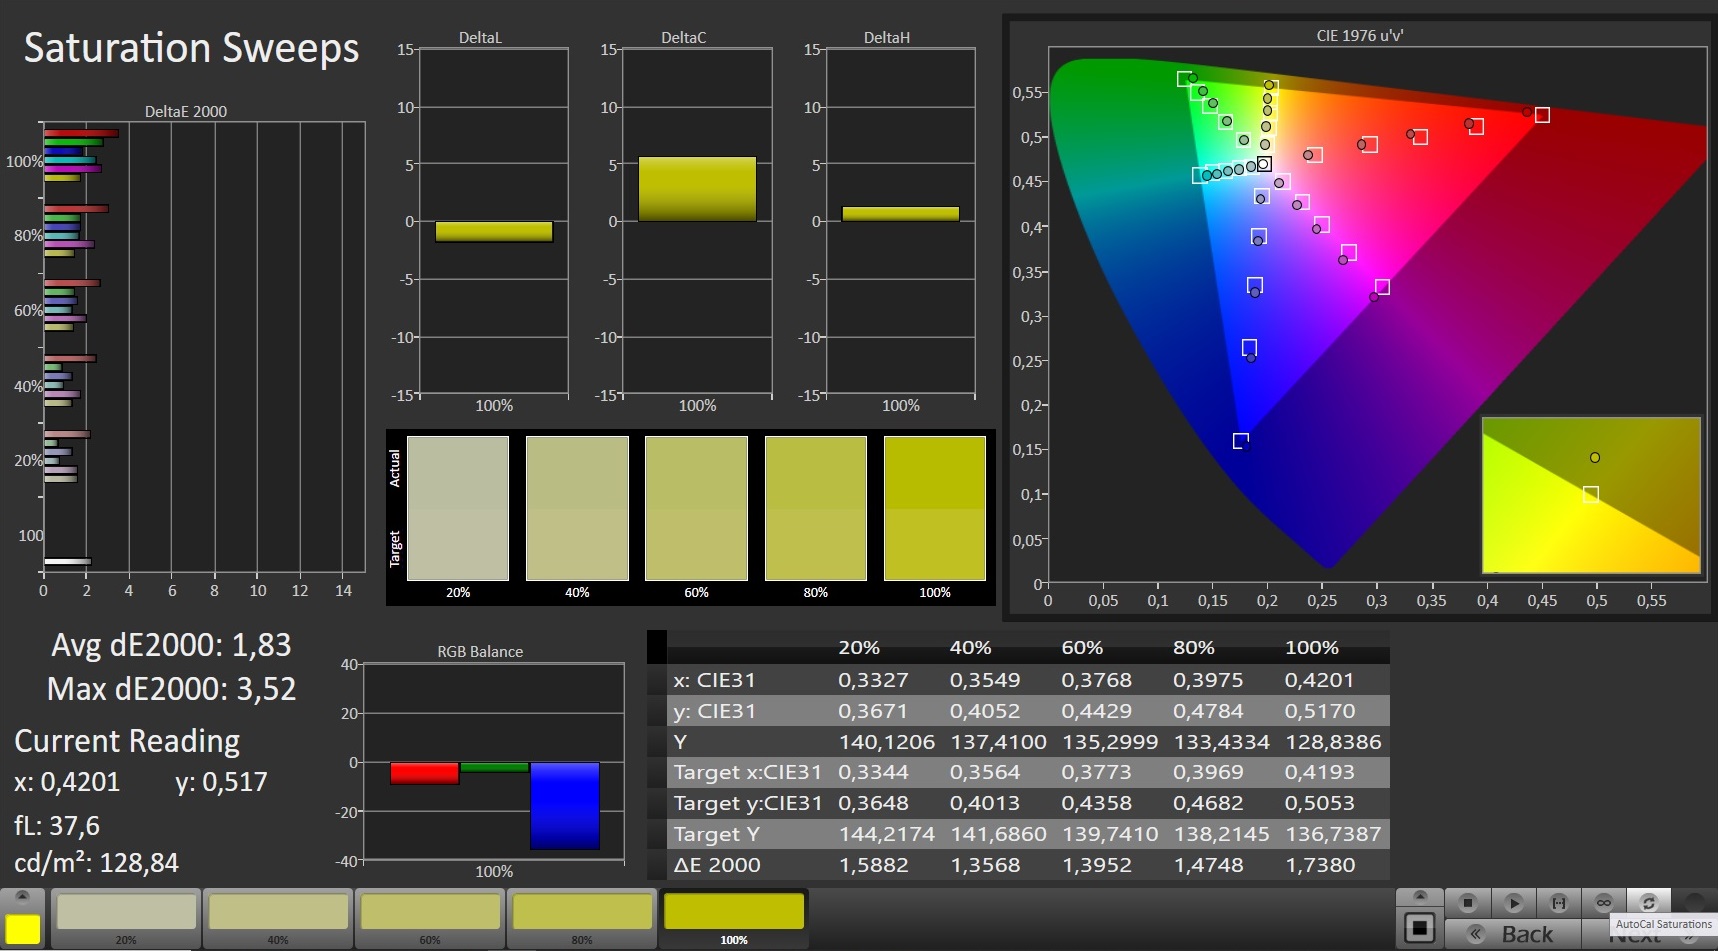
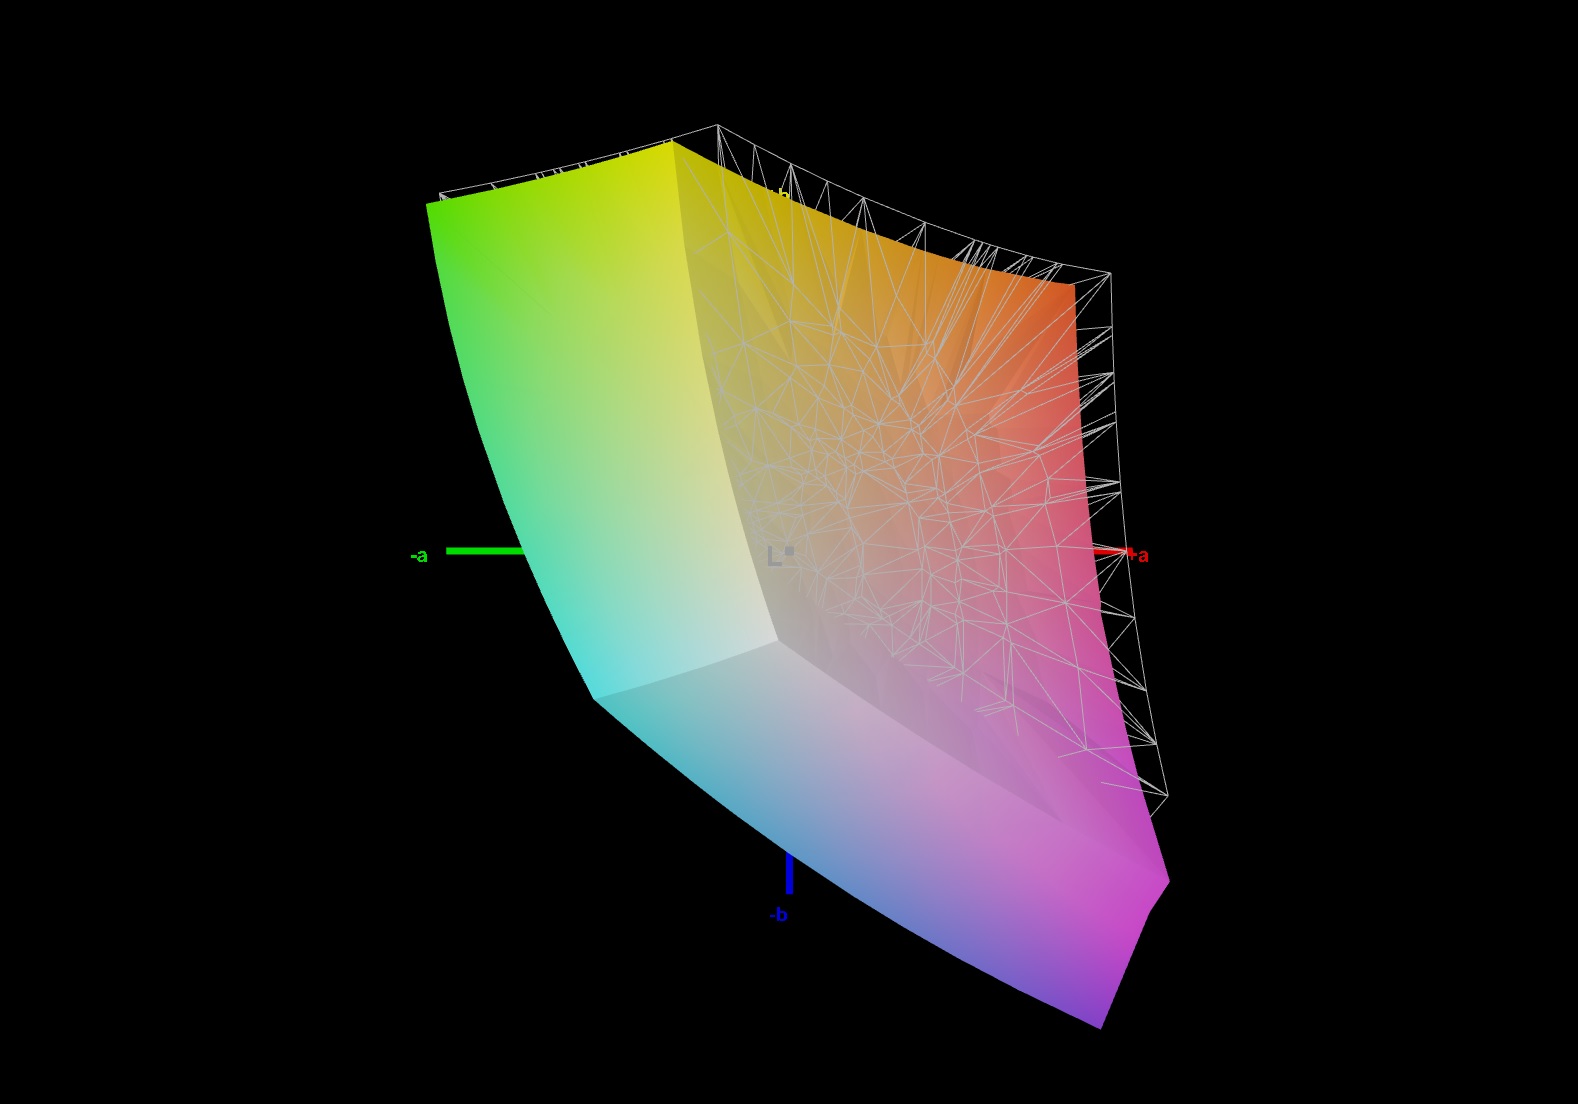
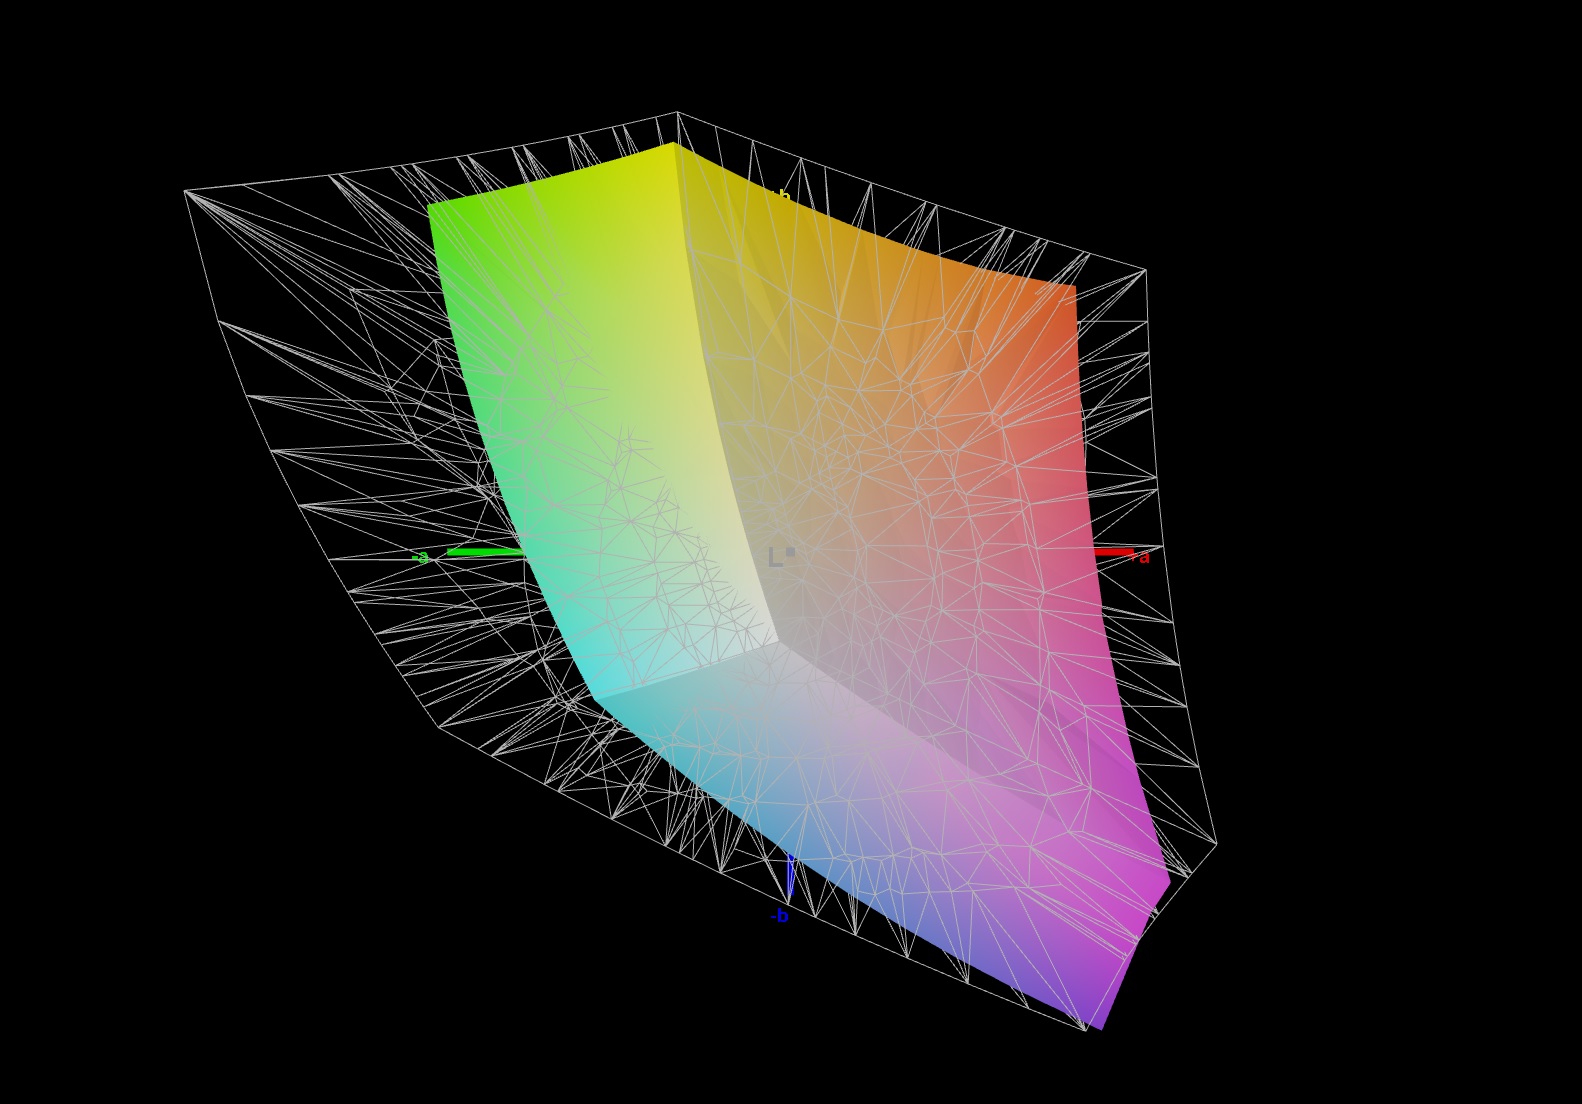
90% sRGB (Argyll 1.6.3 3D)
65% AdobeRGB 1998 (Argyll 1.6.3 3D)
64.6% AdobeRGB 1998 (Argyll 3D)
91.3% sRGB (Argyll 3D)
63% Display P3 (Argyll 3D)
Gamma: 2.266
CCT: 6933 K
| Aorus 15P WB BOE HF NV156FHM-N4G, IPS, 1920x1080, 15.6" | Acer Predator Triton 300 PT315-52-79LP BOE08FB, IPS, 1920x1080, 15.6" | Asus ROG Strix G15 G512LW Sharp LQ156M1JW09, IPS, 1920x1080, 15.6" | Dell G5 15 SE 5505 P89F BOE NV156FH, WVA, 1920x1080, 15.6" | |
|---|---|---|---|---|
| Display | -37% | 7% | -1% | |
| Display P3 Coverage (%) | 63 | 39.51 -37% | 67.8 8% | 63 0% |
| sRGB Coverage (%) | 91.3 | 58.1 -36% | 98.3 8% | 90.1 -1% |
| AdobeRGB 1998 Coverage (%) | 64.6 | 40.81 -37% | 68.5 6% | 64.1 -1% |
| Response Times | -175% | -48% | -75% | |
| Response Time Grey 50% / Grey 80% * (ms) | 8.8 ? | 29.2 ? -232% | 16 ? -82% | 20.4 ? -132% |
| Response Time Black / White * (ms) | 9.2 ? | 20 ? -117% | 10.4 ? -13% | 10.8 ? -17% |
| PWM Frequency (Hz) | 23580 ? | 198.4 ? | ||
| Screen | -65% | -19% | -12% | |
| Brightness middle (cd/m²) | 275 | 279 1% | 300.9 9% | 292 6% |
| Brightness (cd/m²) | 268 | 257 -4% | 289 8% | 290 8% |
| Brightness Distribution (%) | 91 | 89 -2% | 92 1% | 77 -15% |
| Black Level * (cd/m²) | 0.33 | 0.31 6% | 0.31 6% | 0.27 18% |
| Contrast (:1) | 833 | 900 8% | 971 17% | 1081 30% |
| Colorchecker dE 2000 * | 2.72 | 5.84 -115% | 3.54 -30% | 3.99 -47% |
| Colorchecker dE 2000 max. * | 4.45 | 21.8 -390% | 9.82 -121% | 6.11 -37% |
| Colorchecker dE 2000 calibrated * | 2.09 | 4.54 -117% | 1 52% | 3.02 -44% |
| Greyscale dE 2000 * | 2.3 | 3.1 -35% | 5.9 -157% | 3.3 -43% |
| Gamma | 2.266 97% | 2.116 104% | 2.37 93% | 2.25 98% |
| CCT | 6933 94% | 6577 99% | 7456 87% | 7047 92% |
| Color Space (Percent of AdobeRGB 1998) (%) | 65 | 41 -37% | 63.3 -3% | 58.1 -11% |
| Color Space (Percent of sRGB) (%) | 90 | 59 -34% | 98.3 9% | 89.7 0% |
| Total Average (Program / Settings) | -92% /
-74% | -20% /
-18% | -29% /
-18% |
* ... smaller is better
Already out of the box, the display shows good color reproduction. With a color deviation of 2.72, the target (Delta E less than 3) is met. The display doesn't suffer from a blue tint. Moreover, improvements are achieved by means of calibration: The color deviation drops to 2.09, and the grayscales are displayed in a more balanced way. The AdobeRGB (65%) and sRGB (90%) color spaces are not completely reproduced.

Display Response Times
| ↔ Response Time Black to White | ||
|---|---|---|
| 9.2 ms ... rise ↗ and fall ↘ combined | ↗ 4.8 ms rise | 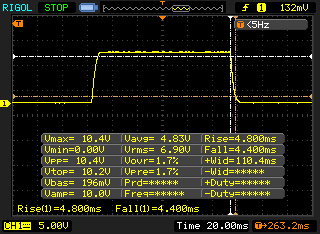 |
| ↘ 4.4 ms fall | ||
| The screen shows fast response rates in our tests and should be suited for gaming. In comparison, all tested devices range from 0.1 (minimum) to 240 (maximum) ms. » 26 % of all devices are better. This means that the measured response time is better than the average of all tested devices (19.8 ms). | ||
| ↔ Response Time 50% Grey to 80% Grey | ||
| 8.8 ms ... rise ↗ and fall ↘ combined | ↗ 4.4 ms rise | 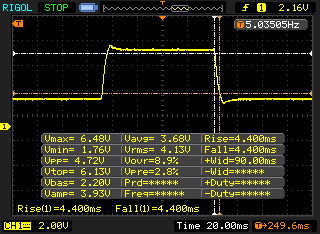 |
| ↘ 4.4 ms fall | ||
| The screen shows fast response rates in our tests and should be suited for gaming. In comparison, all tested devices range from 0.165 (minimum) to 636 (maximum) ms. » 22 % of all devices are better. This means that the measured response time is better than the average of all tested devices (30.9 ms). | ||
Screen Flickering / PWM (Pulse-Width Modulation)
| Screen flickering / PWM not detected | 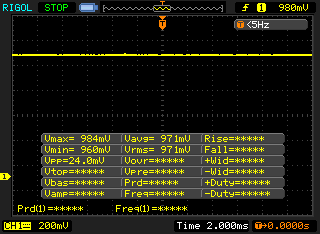 | ||
In comparison: 52 % of all tested devices do not use PWM to dim the display. If PWM was detected, an average of 7748 (minimum: 5 - maximum: 343500) Hz was measured. | |||
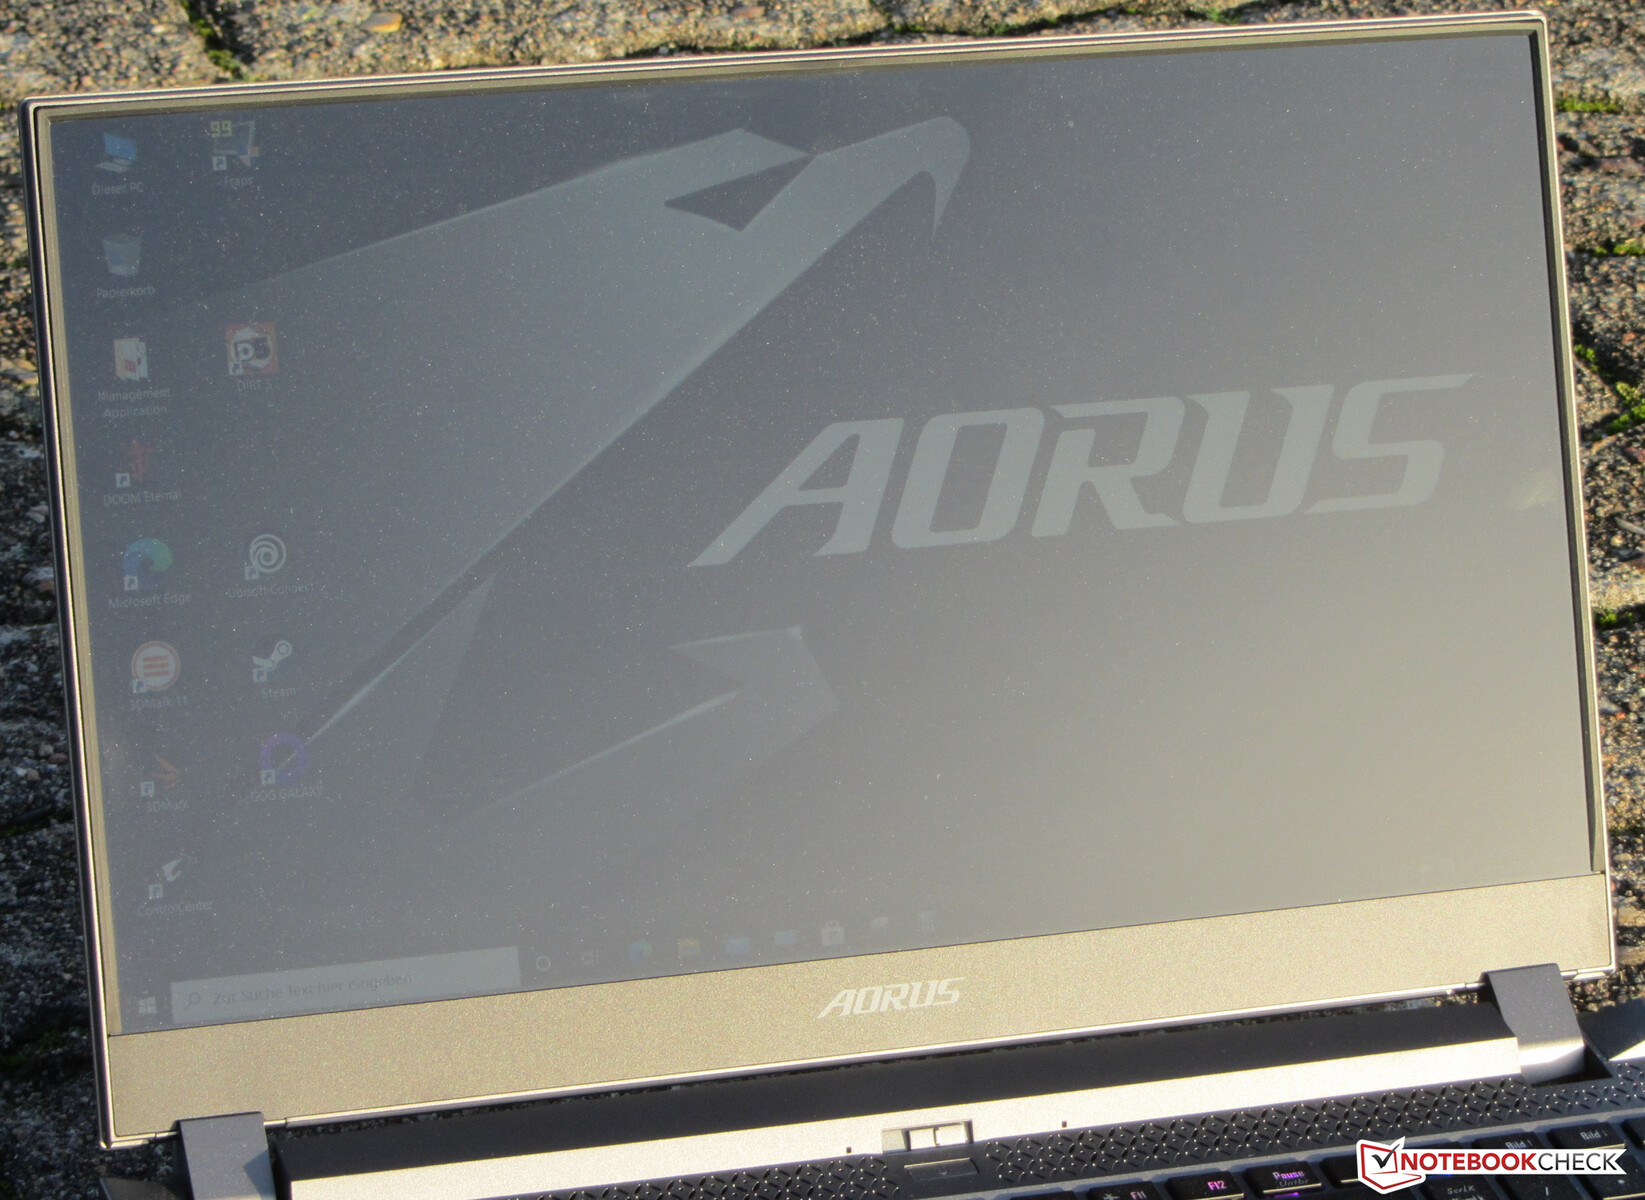
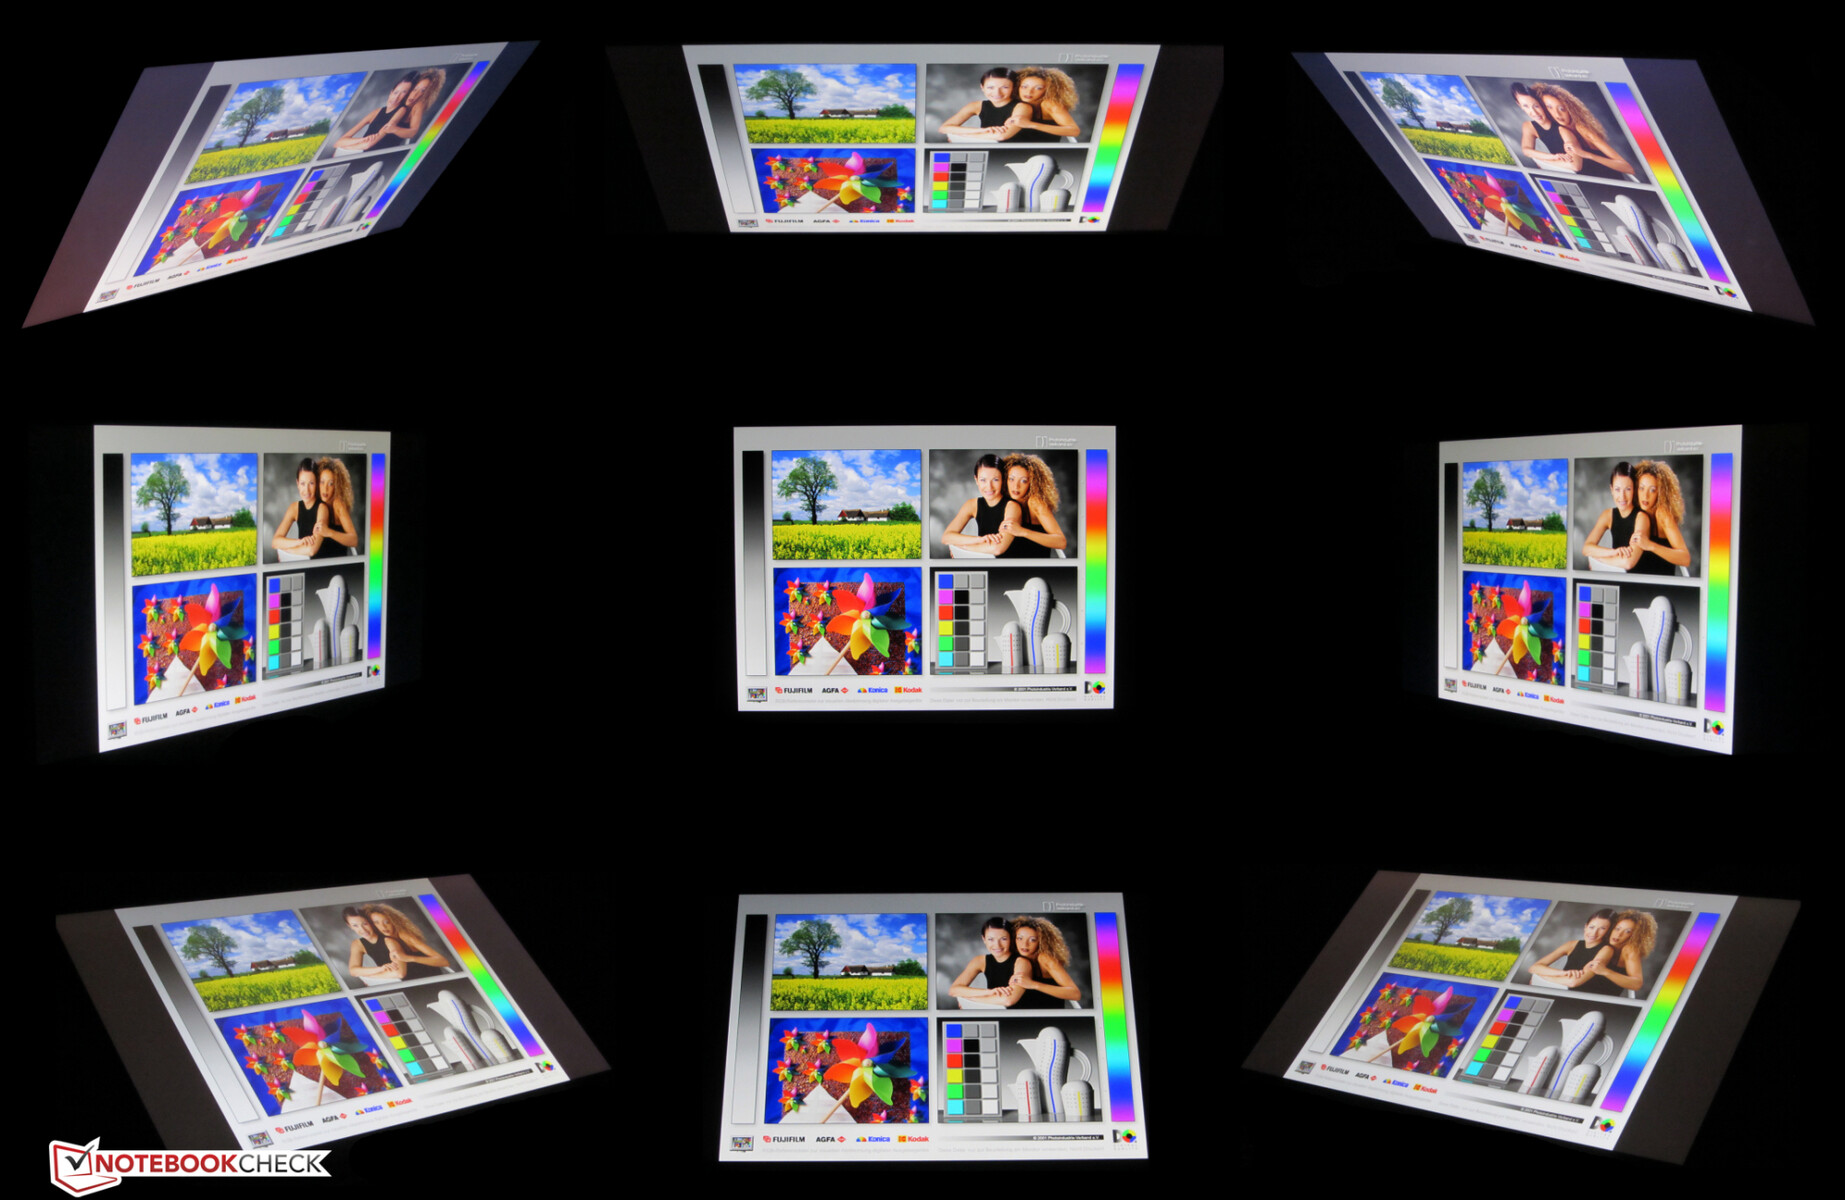
The viewing-angle stable IPS panel can be read from any position. Outdoors, reading the display is possible when the sun doesn't shine too brightly.
Performance - Enough for the coming years
With the Aorus 15P WB, Gigabyte has a 15.6-inch gaming laptop in its range that brings every modern game smoothly onto the screen and also cuts a fine figure in all other application areas.
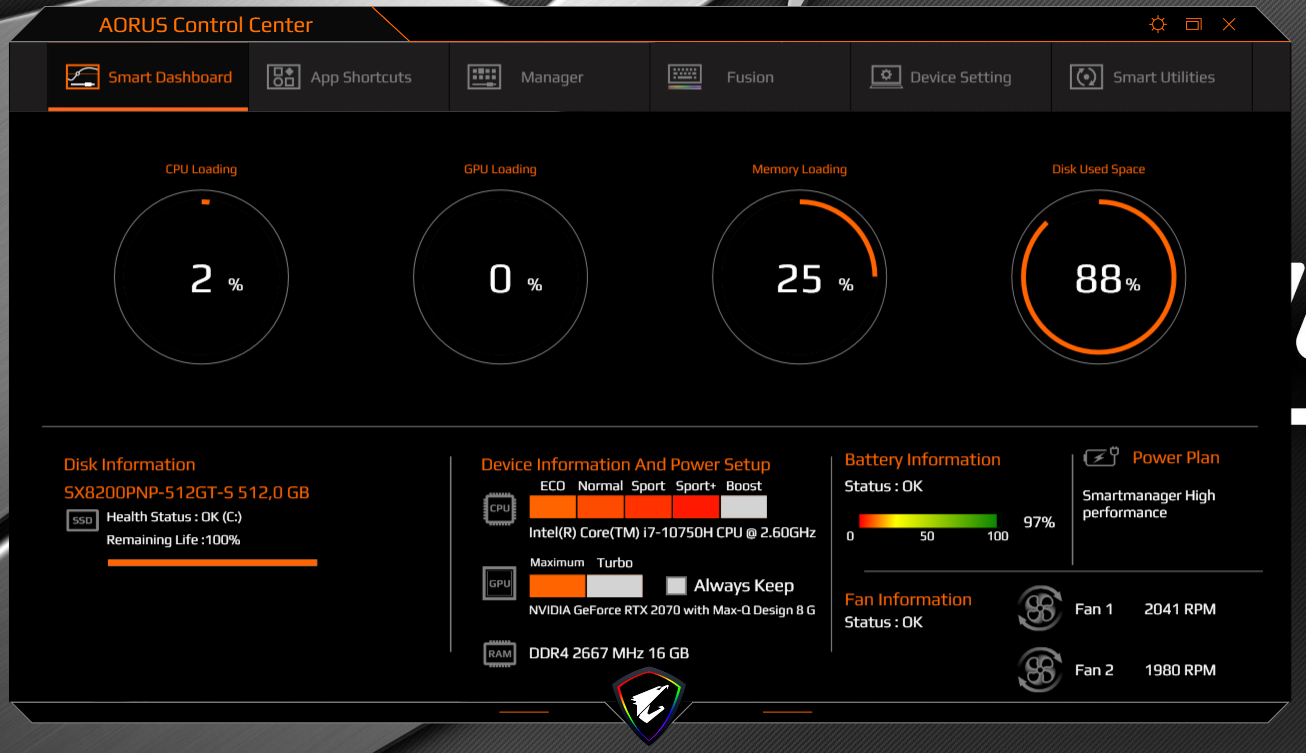
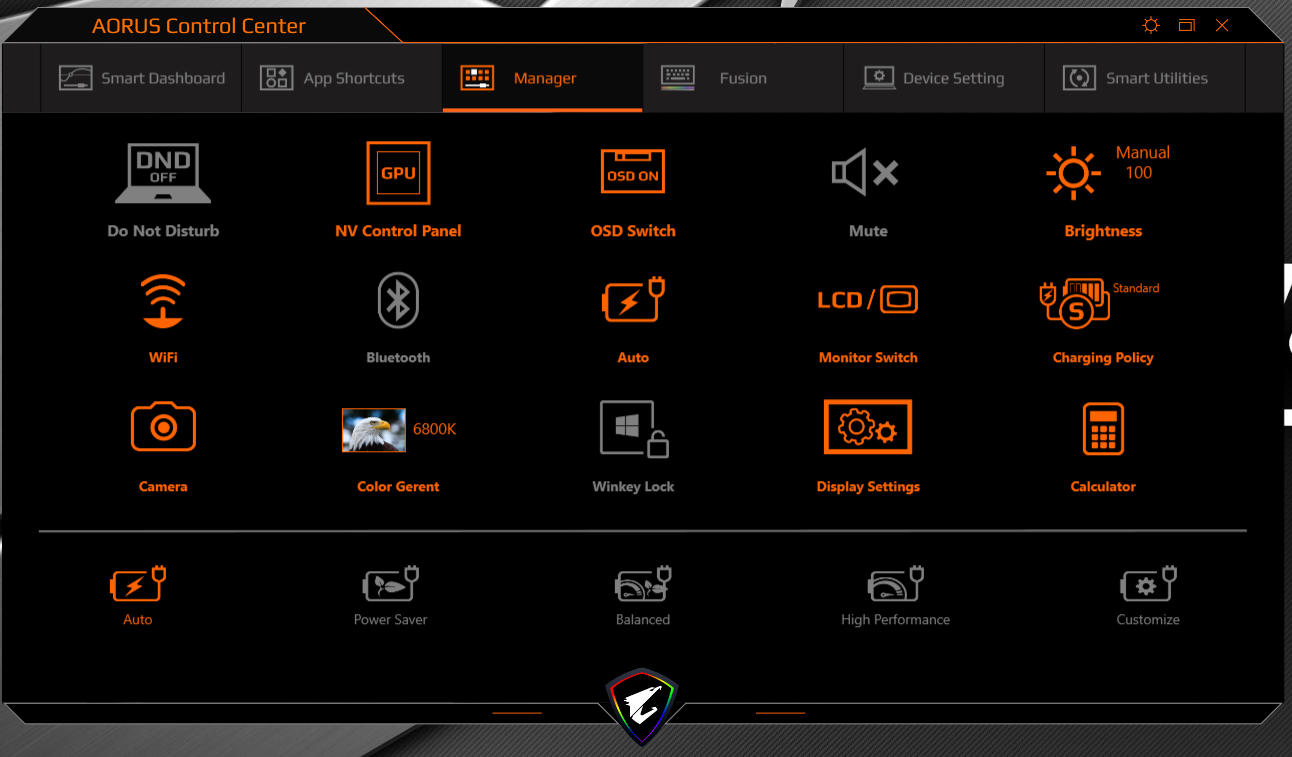
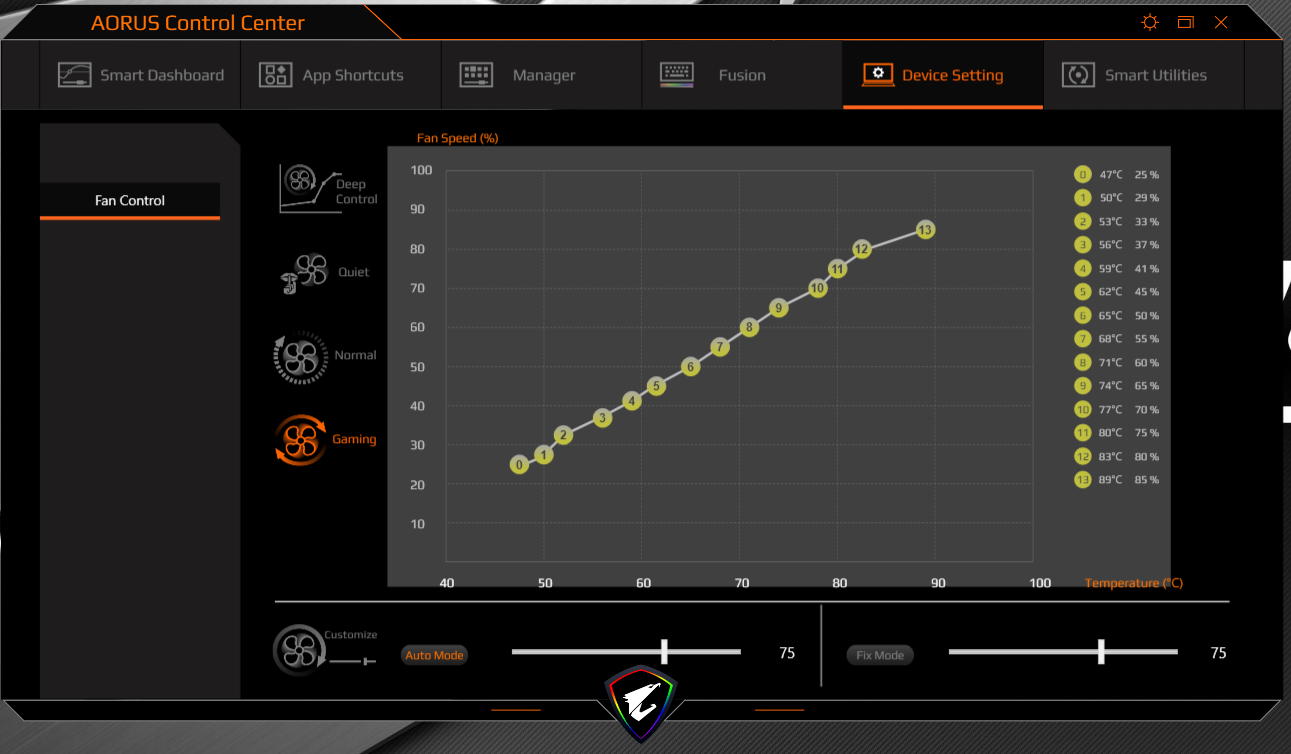
Test conditions
The preinstalled Aorus Control Center offers the option to set an energy profile, among other things. We use the "Auto" option here (with active AI function). Subsequently, the Control Center chooses the appropriate settings itself.

Processor
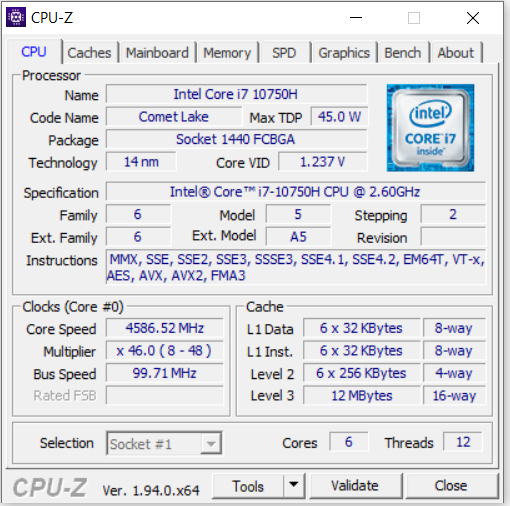
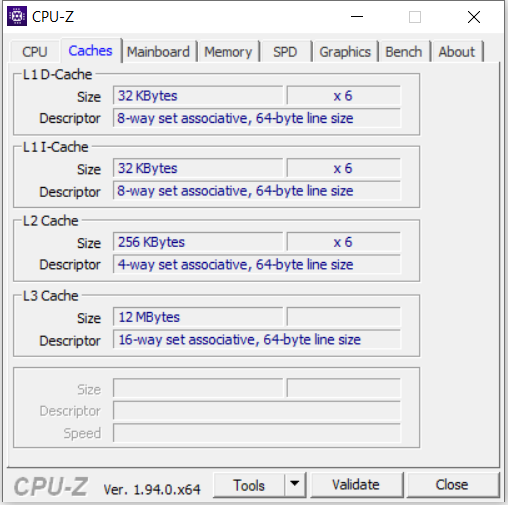
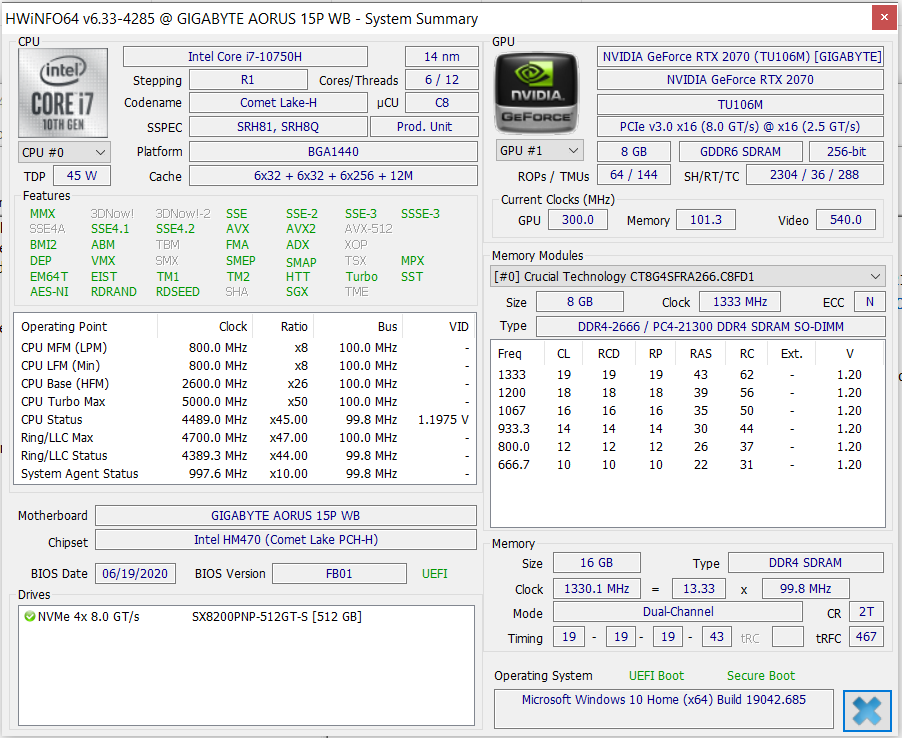
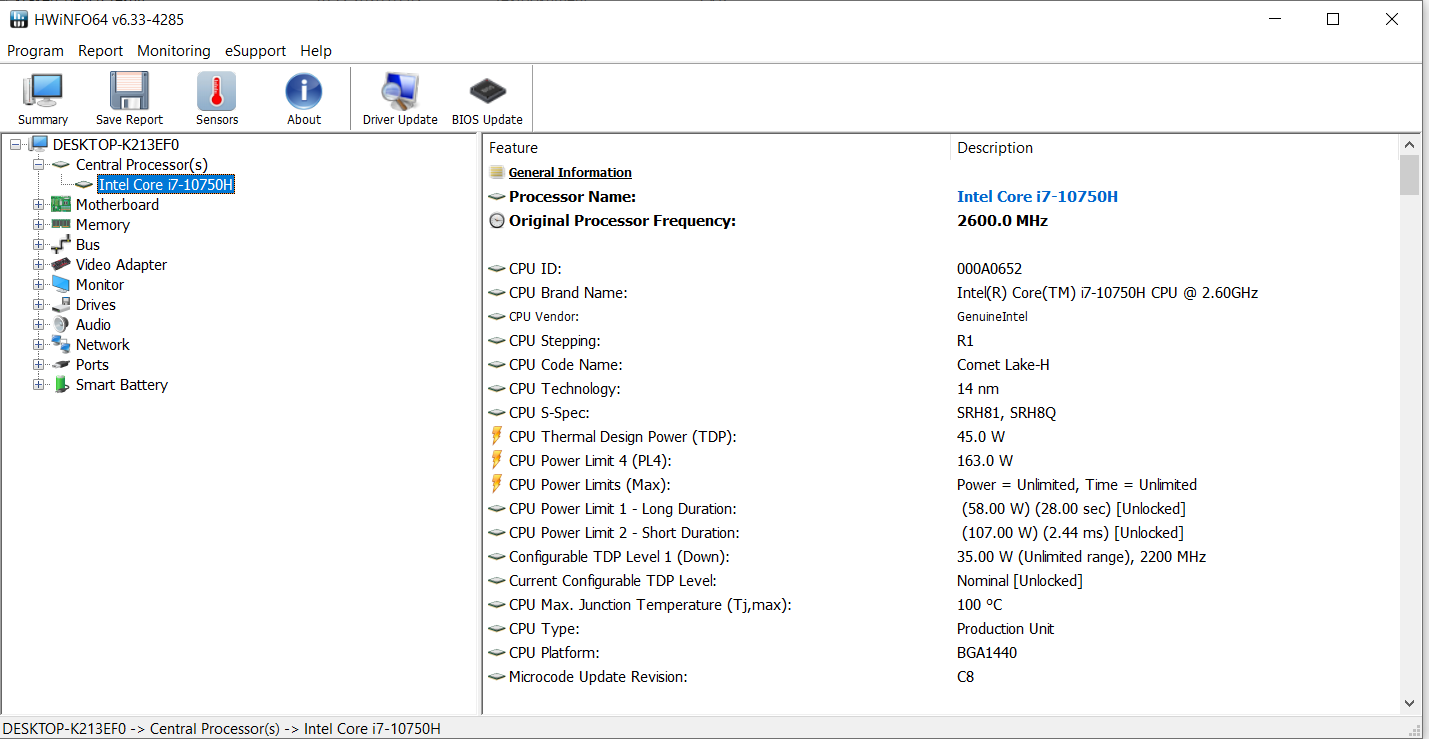
The Core i7-10750H hexa-core processor (Comet Lake) operates at a base clock of 2.6 GHz. An increase to 4.3 GHz (six cores) and 5 GHz (one core) is possible via Turbo. Hyper-Threading (two threads per core) is supported.
The processor executes the multithread test of the Cinebench R15 benchmark at 4.2 to 4.3 GHz. The single-thread test is run at 4.3 to 5 GHz. On battery power, the CPU operates at 2 GHz (multithread and single-thread).
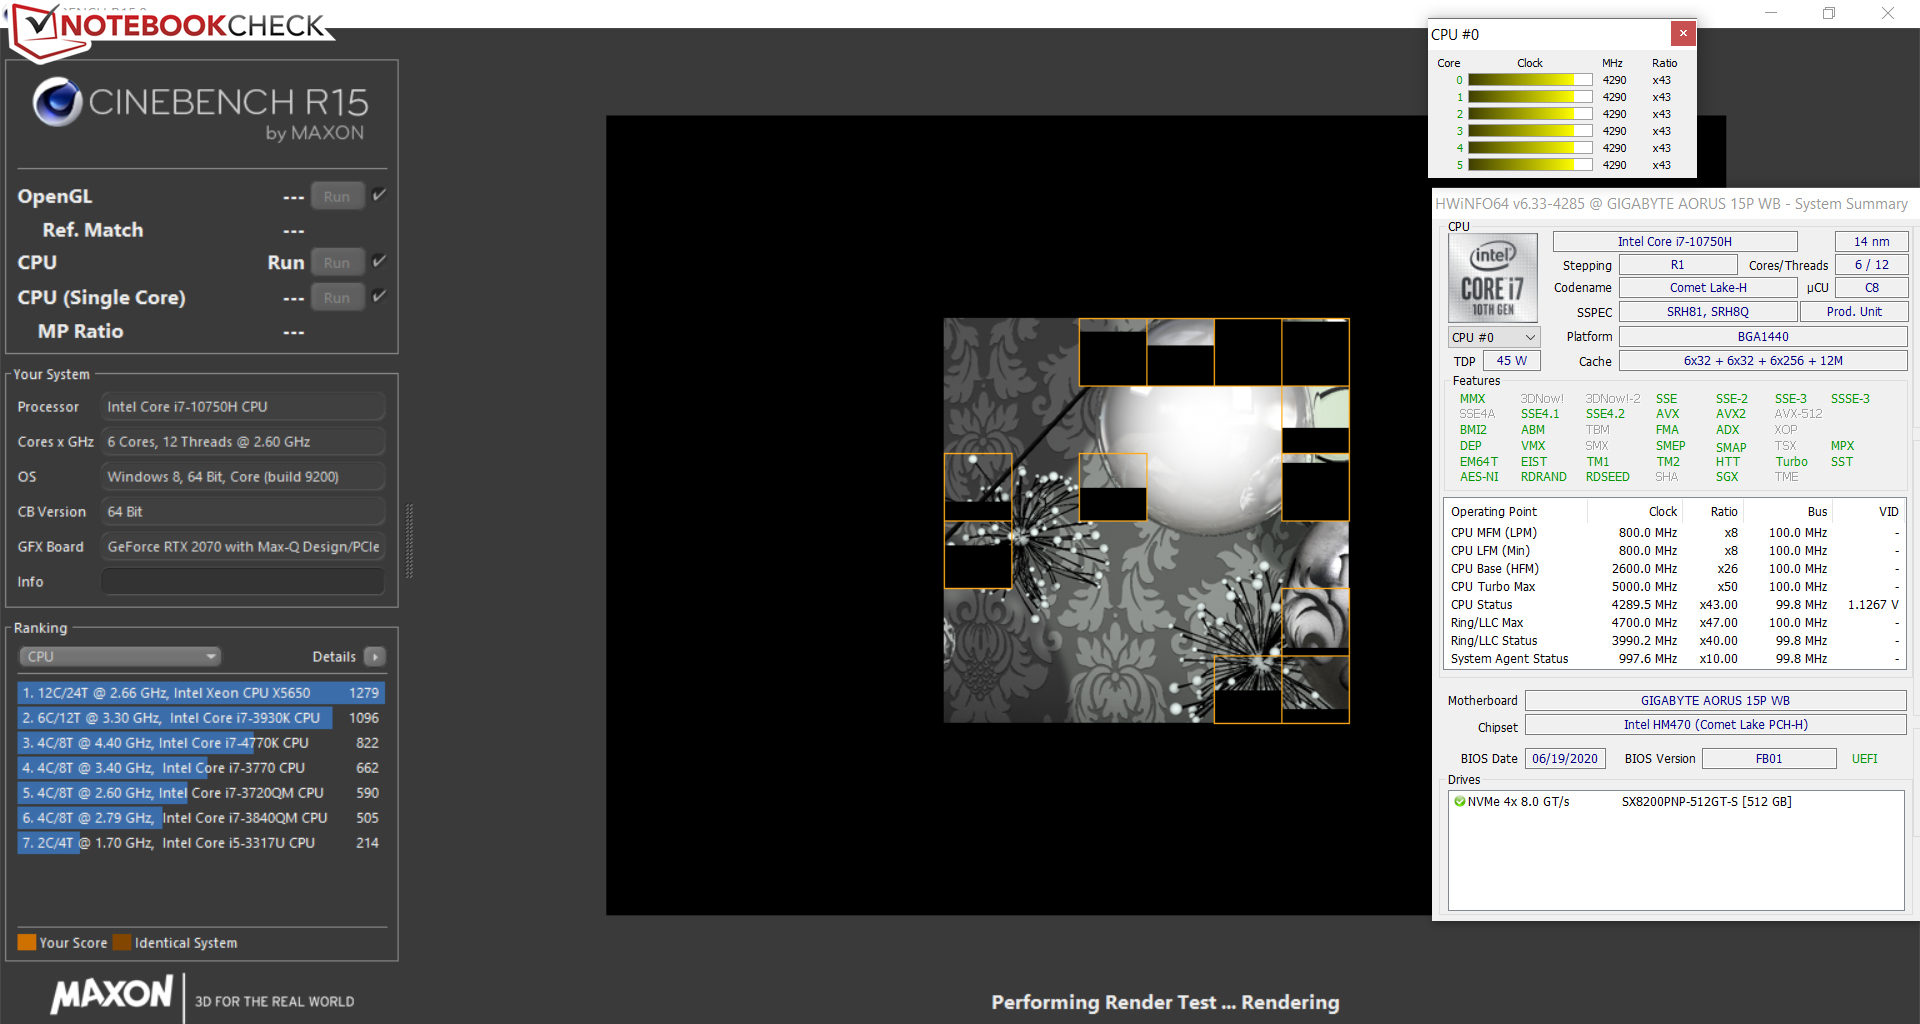
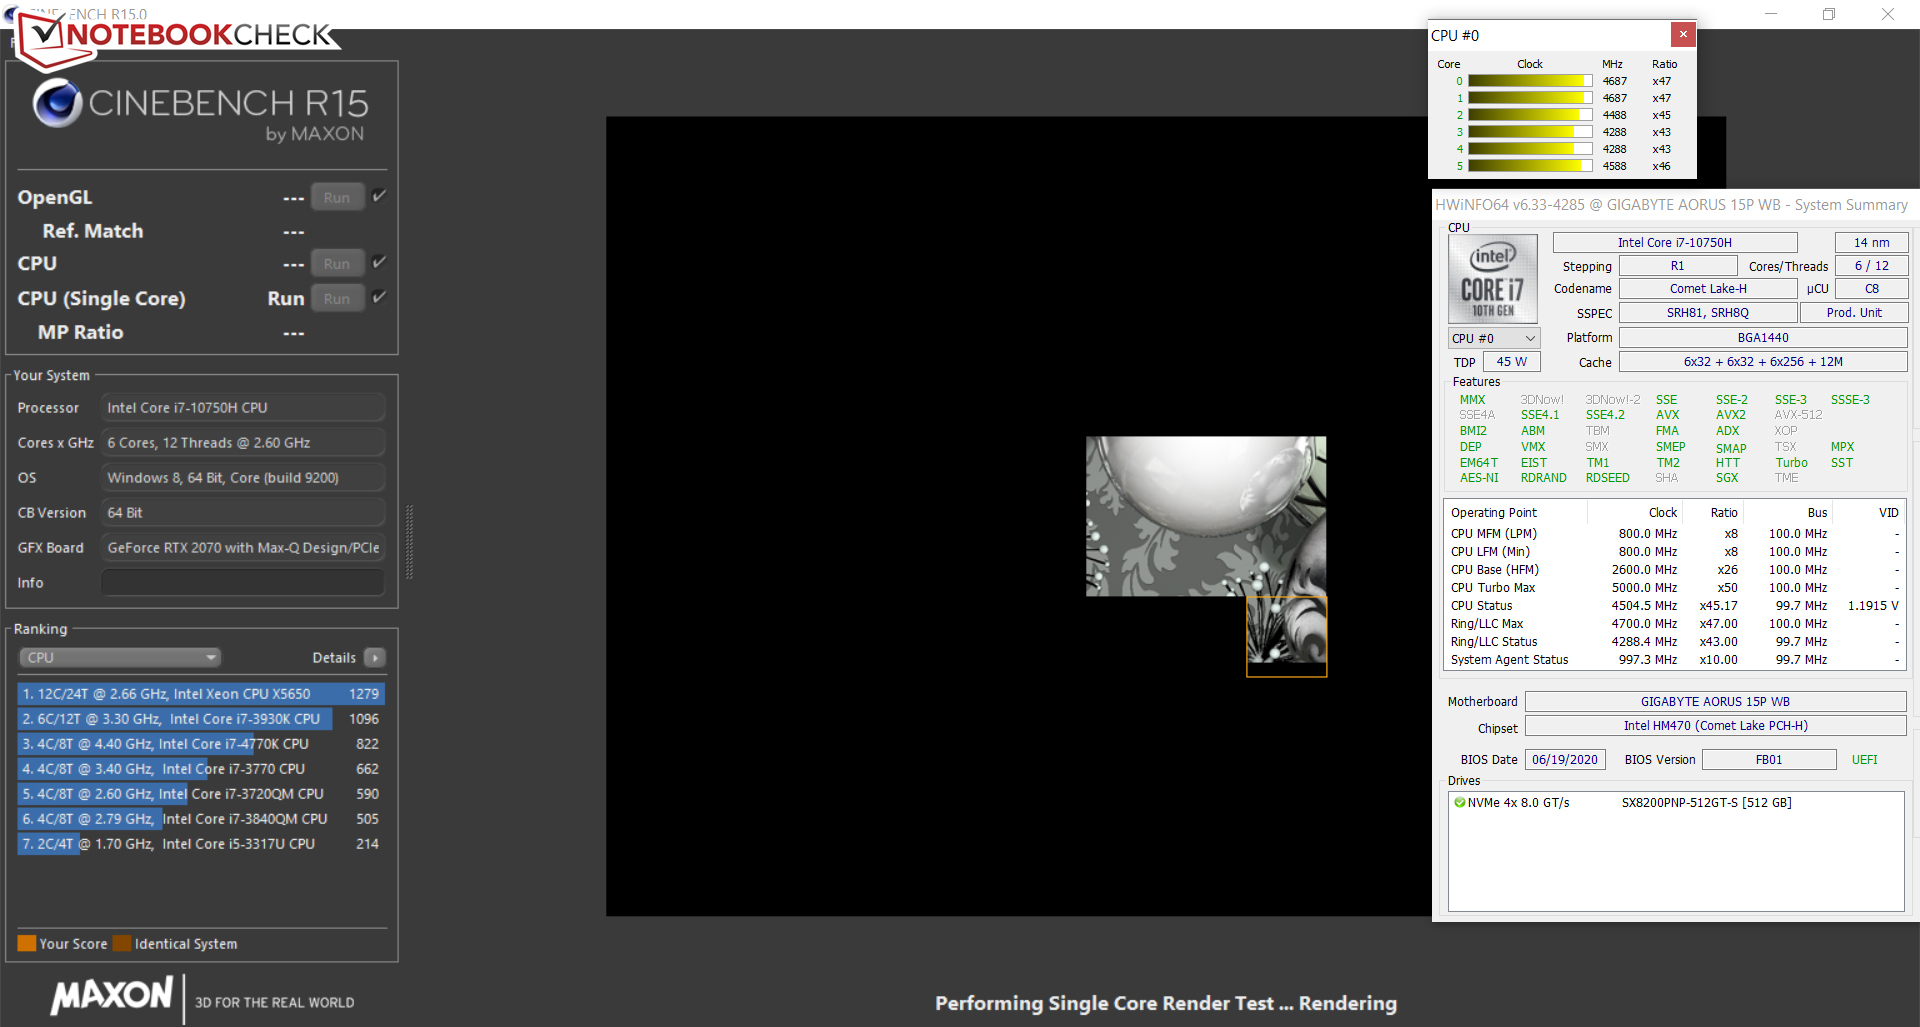
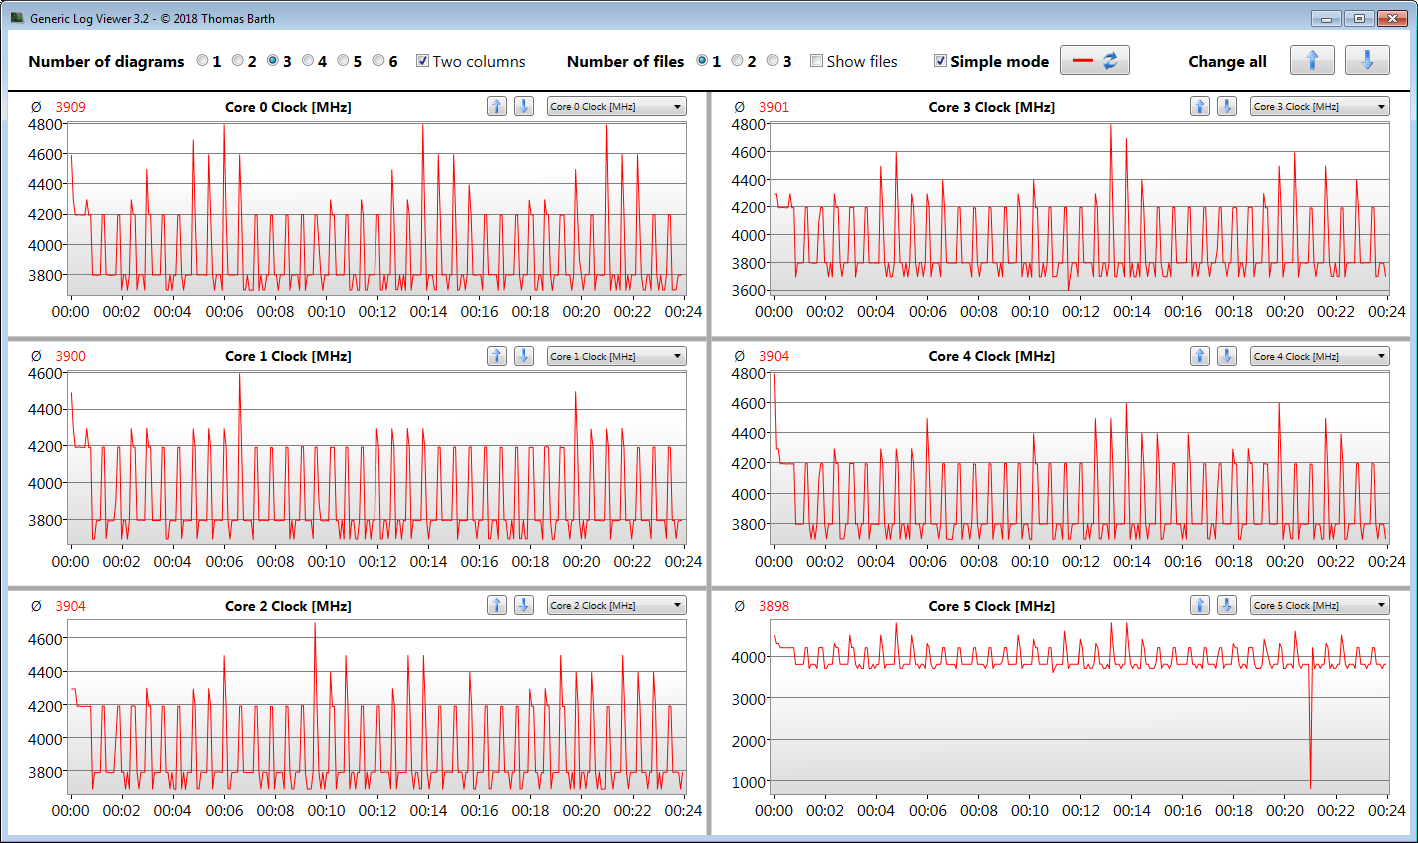
We verify if the CPU Turbo is consistently used when plugged in by running the Cinebench R15 benchmark's multithread test in a continuous loop for at least 30 minutes. Turbo is used at a fairly high level.
* ... smaller is better
System performance
The laptop offers enough computing power for all common application areas for the next few years. Gaming, video-editing, and image-editing don't pose a big challenge for the device. Furthermore, the system runs well and smoothly. This is accompanied by very good results in the PCMark benchmarks.
| PCMark 8 Home Score Accelerated v2 | 4410 points | |
| PCMark 8 Creative Score Accelerated v2 | 6169 points | |
| PCMark 8 Work Score Accelerated v2 | 5556 points | |
| PCMark 10 Score | 6301 points | |
Help | ||
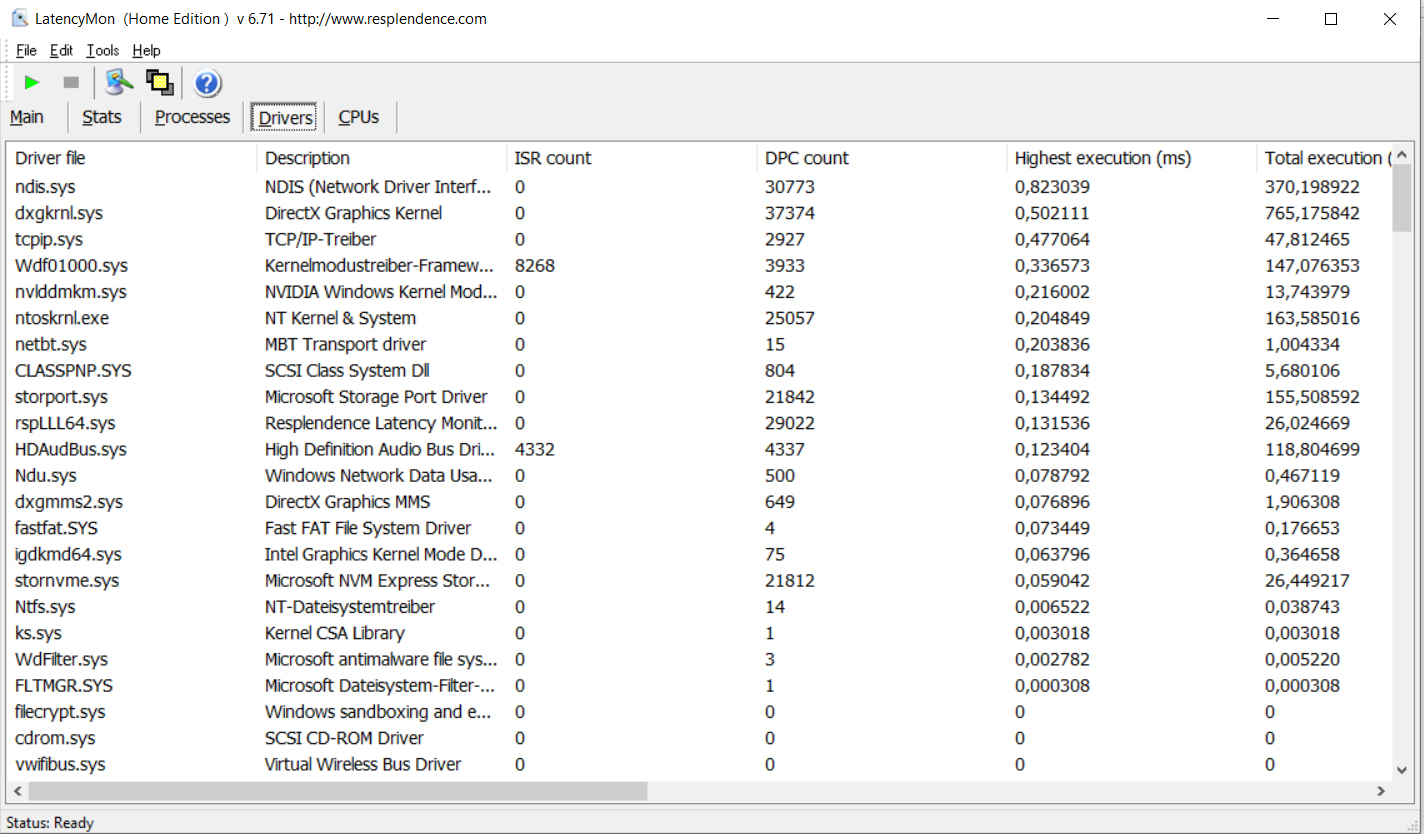
DPC latencies
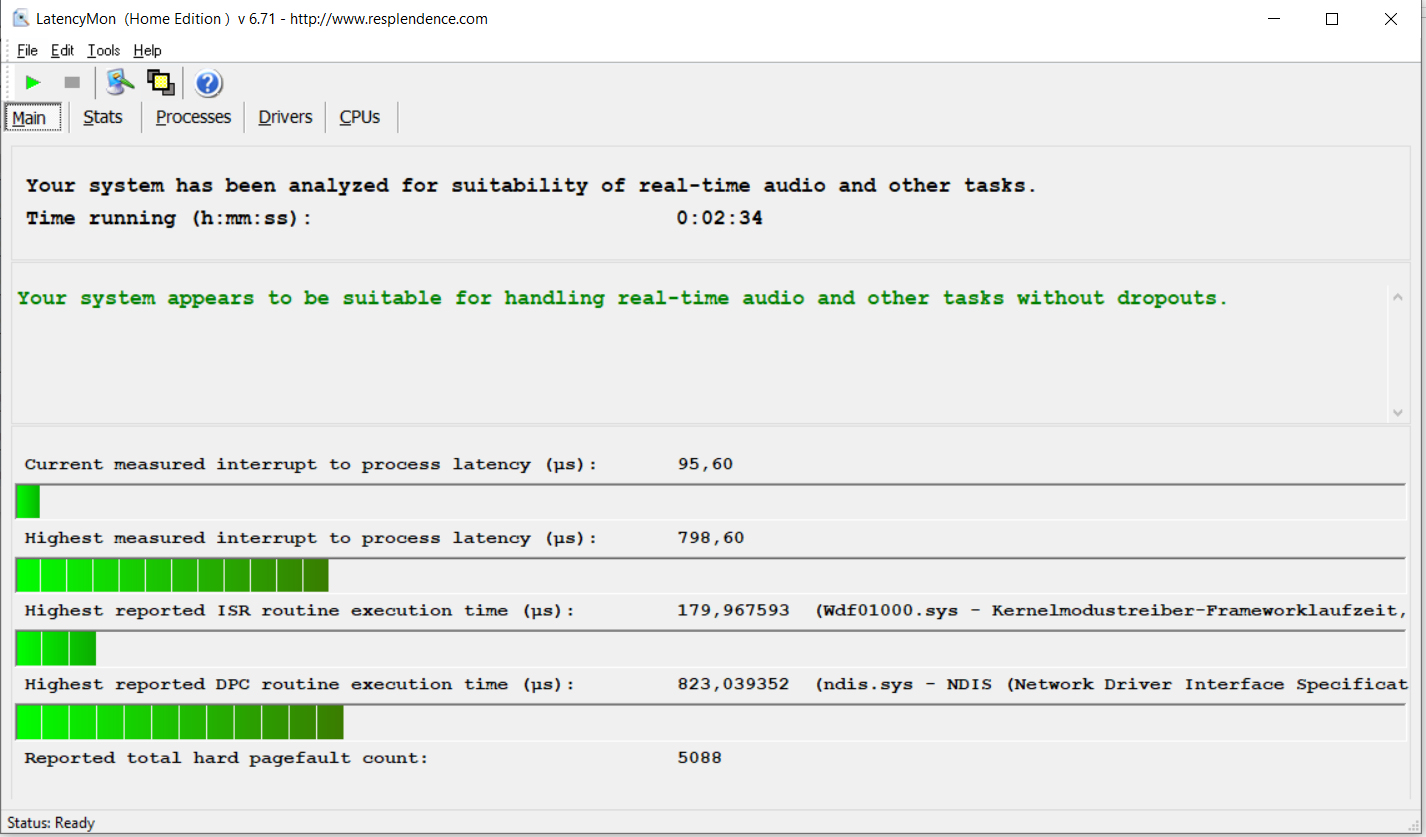
In our standardized latency monitor test (web surfing, 4K video playback, high-load Prime95), we didn't observe any abnormalities with the DPC latencies. The system seems to be suitable for real-time video and audio-editing.
| DPC Latencies / LatencyMon - interrupt to process latency (max), Web, Youtube, Prime95 | |
| Asus ROG Strix G15 G512LW | |
| Dell G5 15 SE 5505 P89F | |
| Acer Predator Triton 300 PT315-52-79LP | |
| Aorus 15P WB | |
* ... smaller is better
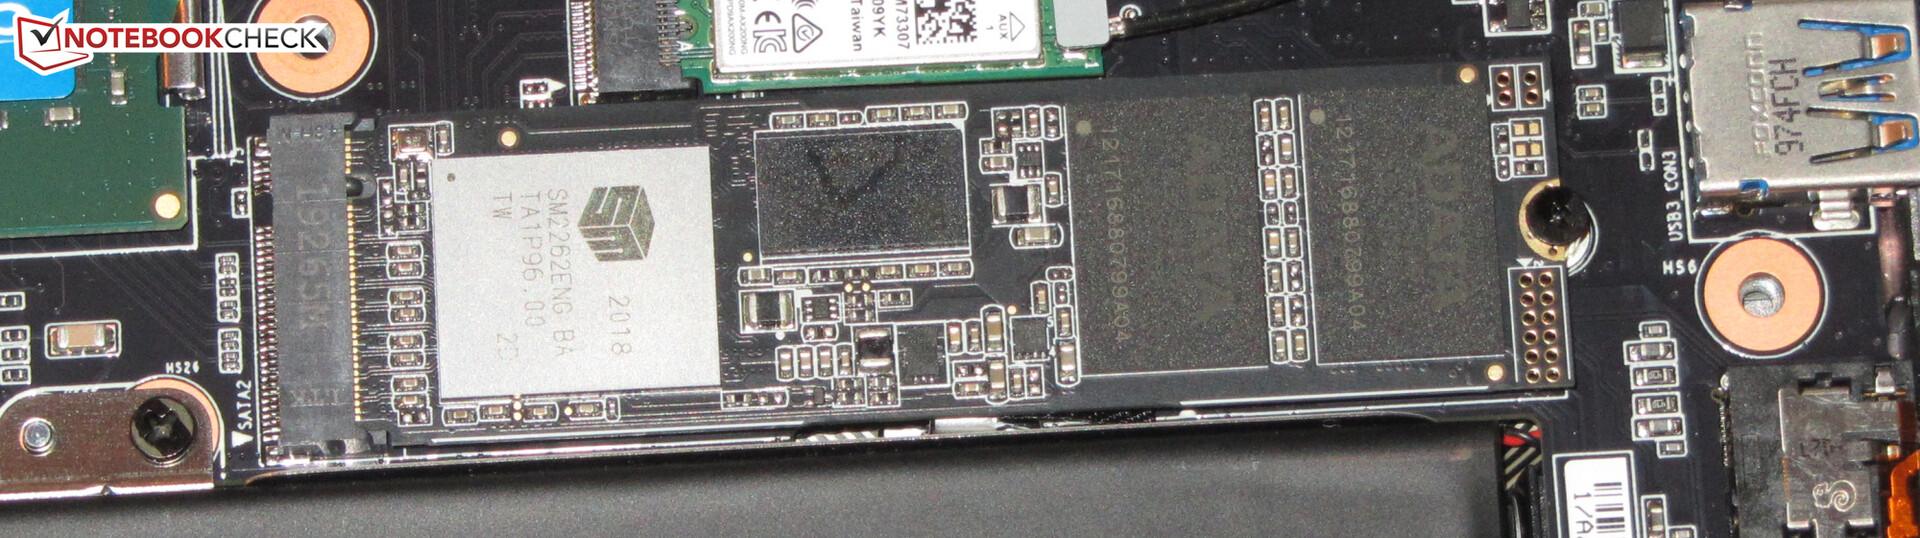
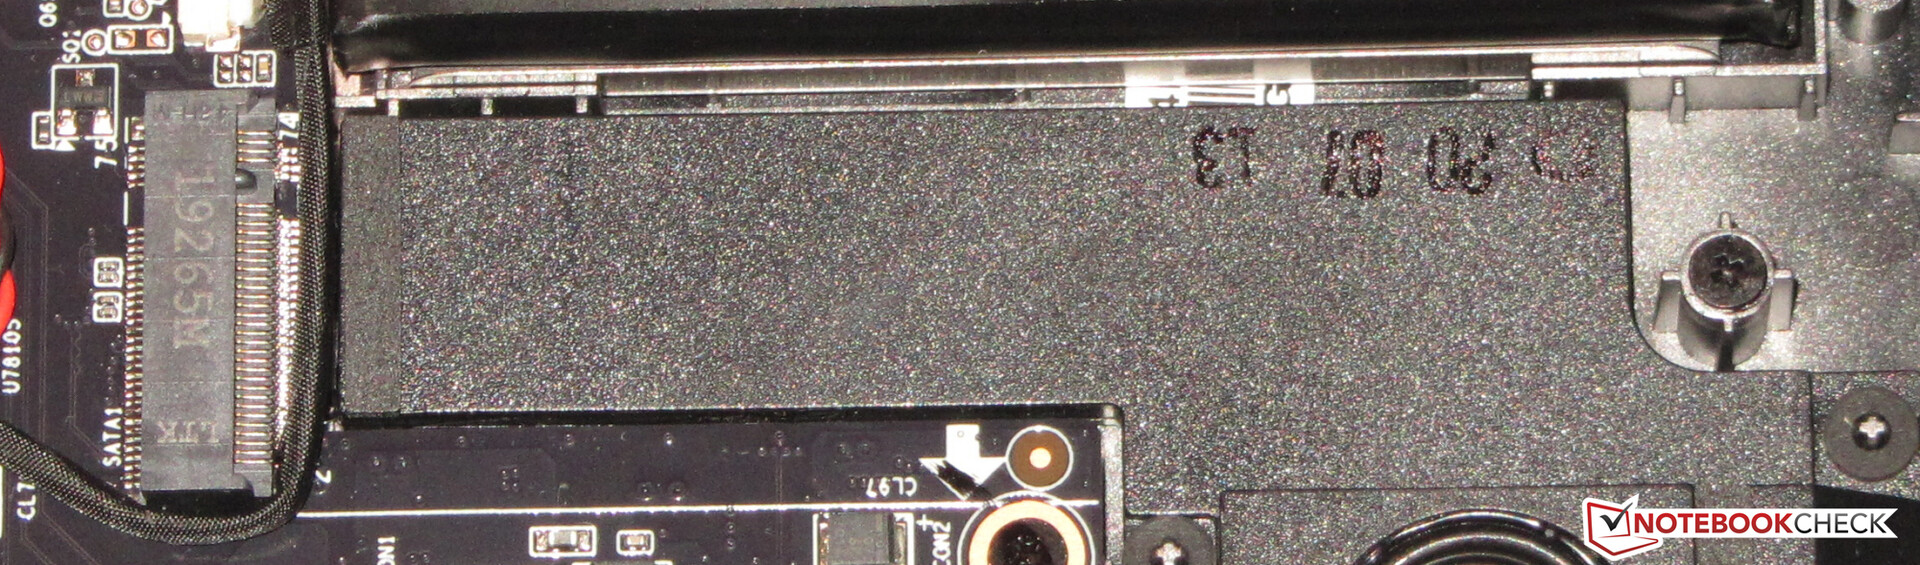
Storage
An NVMe SSD (M.2 2280) from Adata serves as the system drive. It provides 512 GB of storage space and delivers good transfer rates. The laptop can accommodate a total of two M.2 2280 SSDs (1x NVMe, 1x NVMe/SATA). RAID 0/1 is not supported, though.

| Aorus 15P WB ADATA XPG SX8200 Pro (ASX8200PNP-512GT) | Acer Predator Triton 300 PT315-52-79LP WDC PC SN730 SDBQNTY-1T00 | Asus ROG Strix G15 G512LW Toshiba XG5-P KXG50PNV2T04 | Dell G5 15 SE 5505 P89F Samsung PM991 MZ9LQ512HALU | Average ADATA XPG SX8200 Pro (ASX8200PNP-512GT) | |
|---|---|---|---|---|---|
| CrystalDiskMark 5.2 / 6 | -3% | -31% | -23% | -1% | |
| Write 4K (MB/s) | 131.7 | 117.5 -11% | 116.5 -12% | 142.1 8% | 149.5 ? 14% |
| Read 4K (MB/s) | 55.7 | 47.36 -15% | 27.6 -50% | 46.43 -17% | 53.6 ? -4% |
| Write Seq (MB/s) | 2273 | 2748 21% | 1020 -55% | 1108 -51% | 2346 ? 3% |
| Read Seq (MB/s) | 2533 | 2084 -18% | 1999 -21% | 1622 -36% | 2501 ? -1% |
| Write 4K Q32T1 (MB/s) | 475.1 | 407.3 -14% | 375.9 -21% | 467 -2% | 419 ? -12% |
| Read 4K Q32T1 (MB/s) | 590 | 474.6 -20% | 398.5 -32% | 525 -11% | 520 ? -12% |
| Write Seq Q32T1 (MB/s) | 2373 | 3069 29% | 1015 -57% | 1203 -49% | 2463 ? 4% |
| Read Seq Q32T1 (MB/s) | 3068 | 3154 3% | 3049 -1% | 2288 -25% | 2997 ? -2% |
| AS SSD | 47% | -44% | -35% | 8% | |
| Seq Read (MB/s) | 2241 | 2369 6% | 1933 -14% | 1386 -38% | 2688 ? 20% |
| Seq Write (MB/s) | 2121 | 2446 15% | 787 -63% | 1234 -42% | 1888 ? -11% |
| 4K Read (MB/s) | 52.3 | 40.61 -22% | 26.4 -50% | 41.32 -21% | 53.3 ? 2% |
| 4K Write (MB/s) | 116.2 | 103.2 -11% | 109.8 -6% | 128 10% | 124.8 ? 7% |
| 4K-64 Read (MB/s) | 713 | 1637 130% | 848 19% | 854 20% | 714 ? 0% |
| 4K-64 Write (MB/s) | 827 | 1961 137% | 923 12% | 721 -13% | 1114 ? 35% |
| Access Time Read * (ms) | 0.054 | 0.06 -11% | 0.044 19% | 0.098 -81% | 0.05575 ? -3% |
| Access Time Write * (ms) | 0.031 | 0.036 -16% | 0.158 -410% | 0.095 -206% | 0.03125 ? -1% |
| Score Read (Points) | 989 | 1915 94% | 1067 8% | 1034 5% | 1036 ? 5% |
| Score Write (Points) | 1155 | 2309 100% | 1112 -4% | 973 -16% | 1428 ? 24% |
| Score Total (Points) | 2659 | 5205 96% | 2669 0% | 2536 -5% | 2968 ? 12% |
| Total Average (Program / Settings) | 22% /
26% | -38% /
-39% | -29% /
-30% | 4% /
4% |
* ... smaller is better
Continuous load read: DiskSpd Read Loop, Queue Depth 8
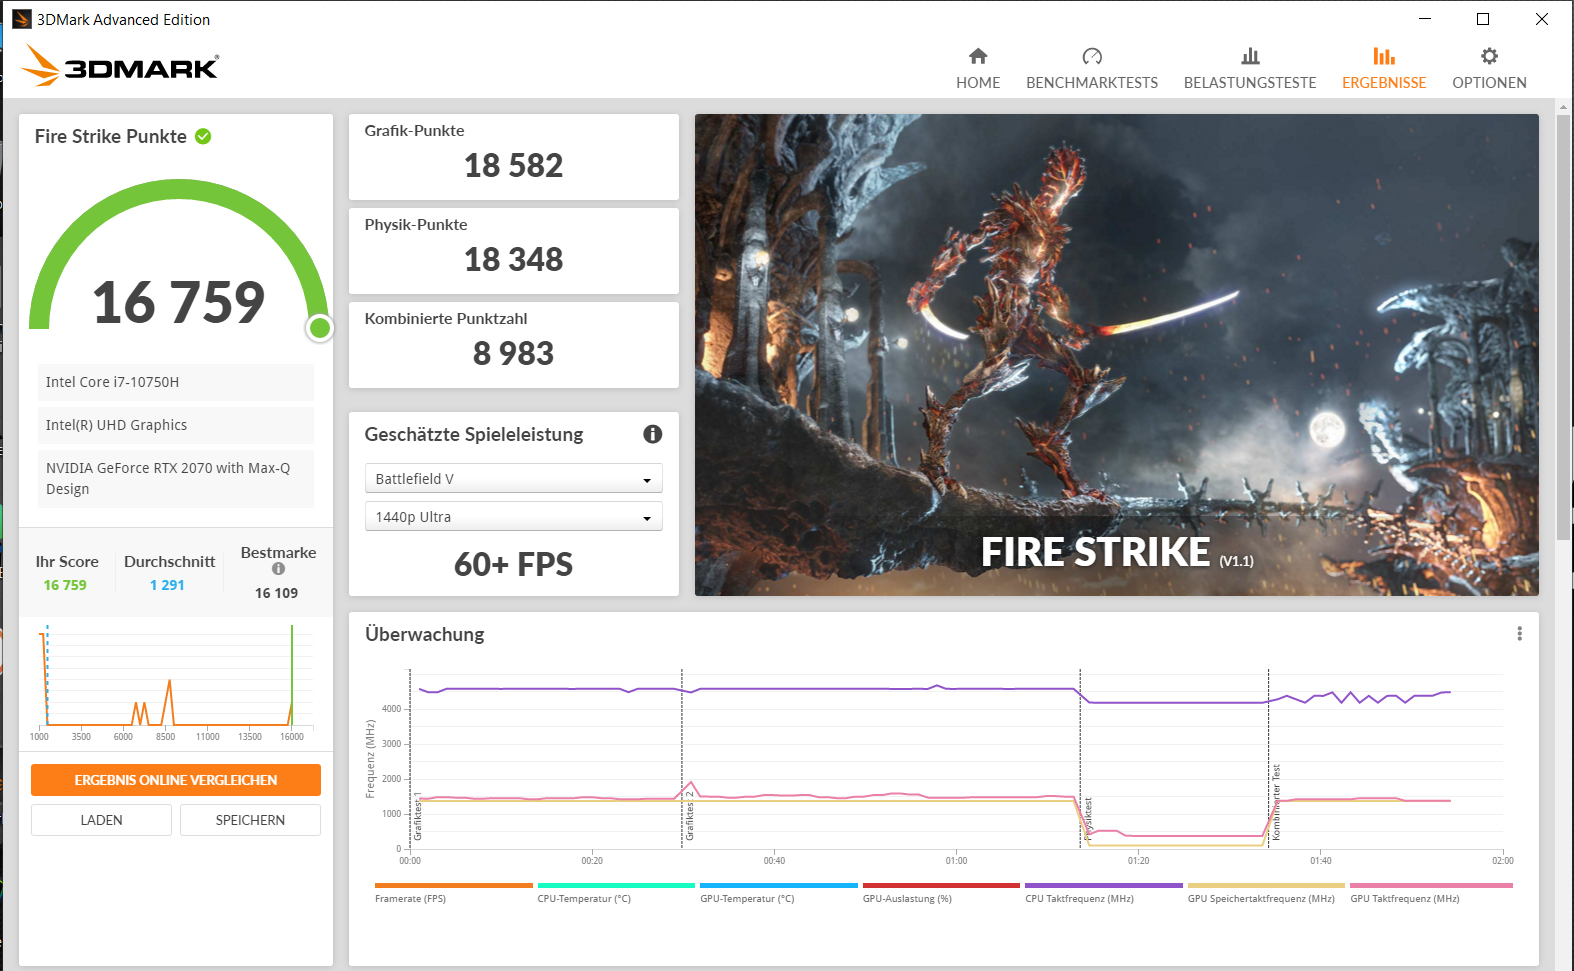
Graphics card
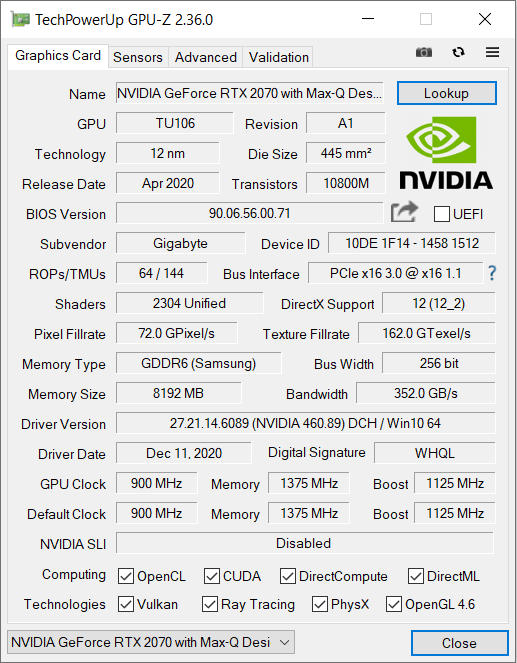
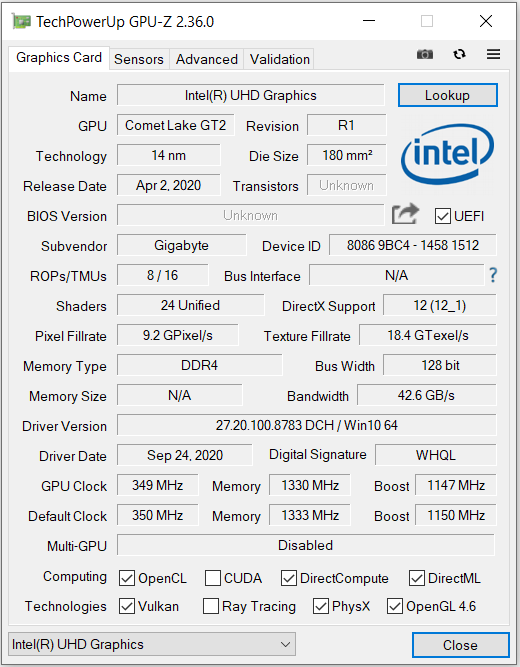
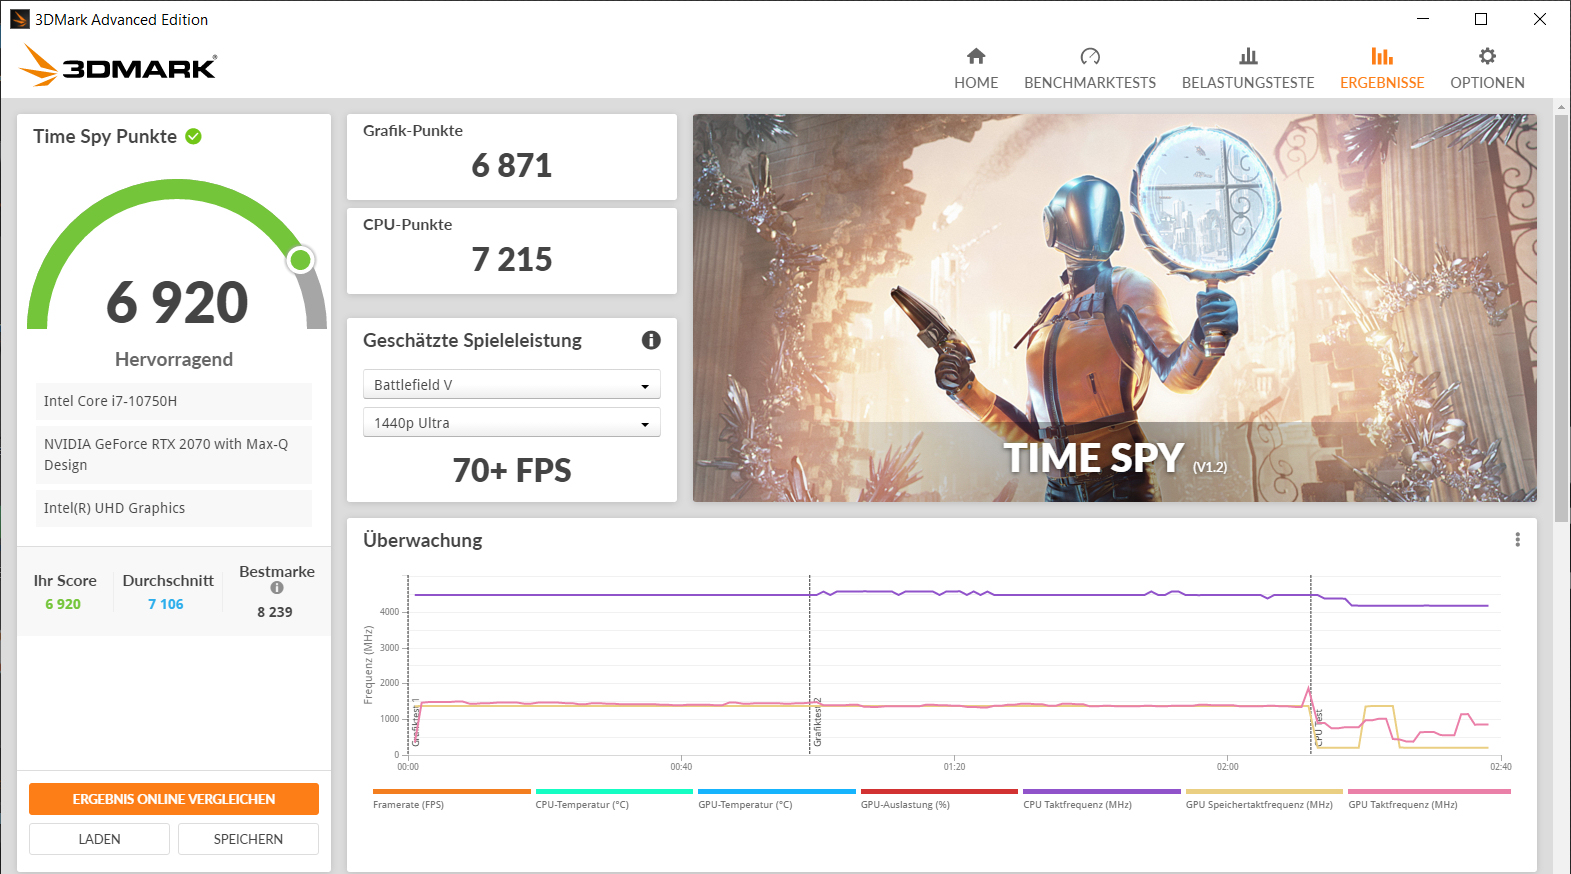
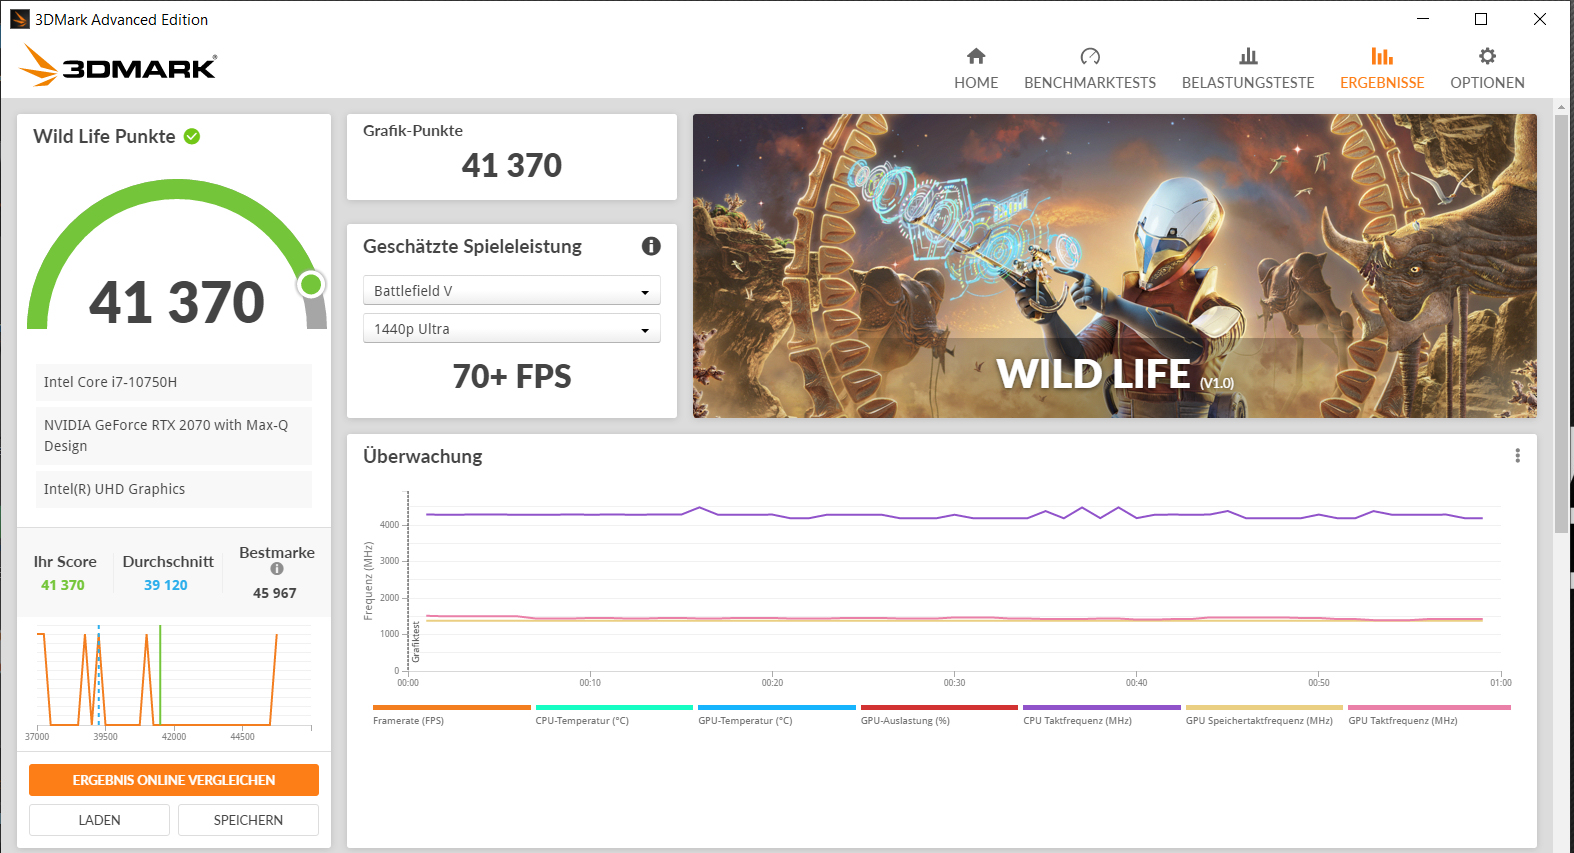
The dedicated GeForce RTX 2070 Max-Q graphics core is a high-end GPU. This is an efficiency-tuned version of the regular RTX 2070 that is intended for thin and light laptops. The GPU is supported by fast GDDR6 memory (8,192 MB). The 3DMark results are at a normal level for the GPU installed here. The UHD Graphics 630 GPU integrated into the processor is active, and the laptop works with Nvidia's Optimus graphics-switching solution. The GeForce GPU can be disabled in the computer's BIOS.
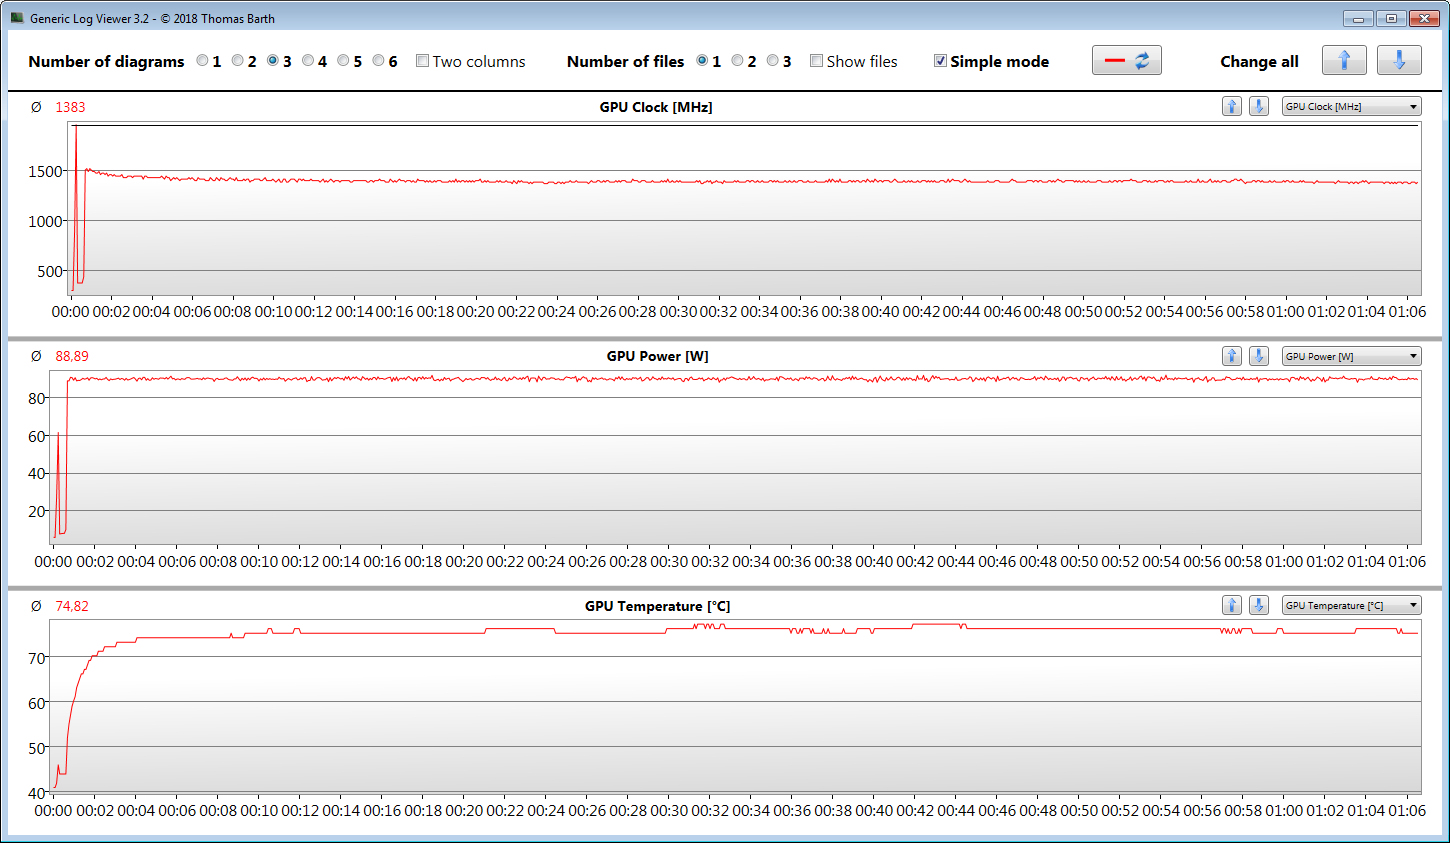
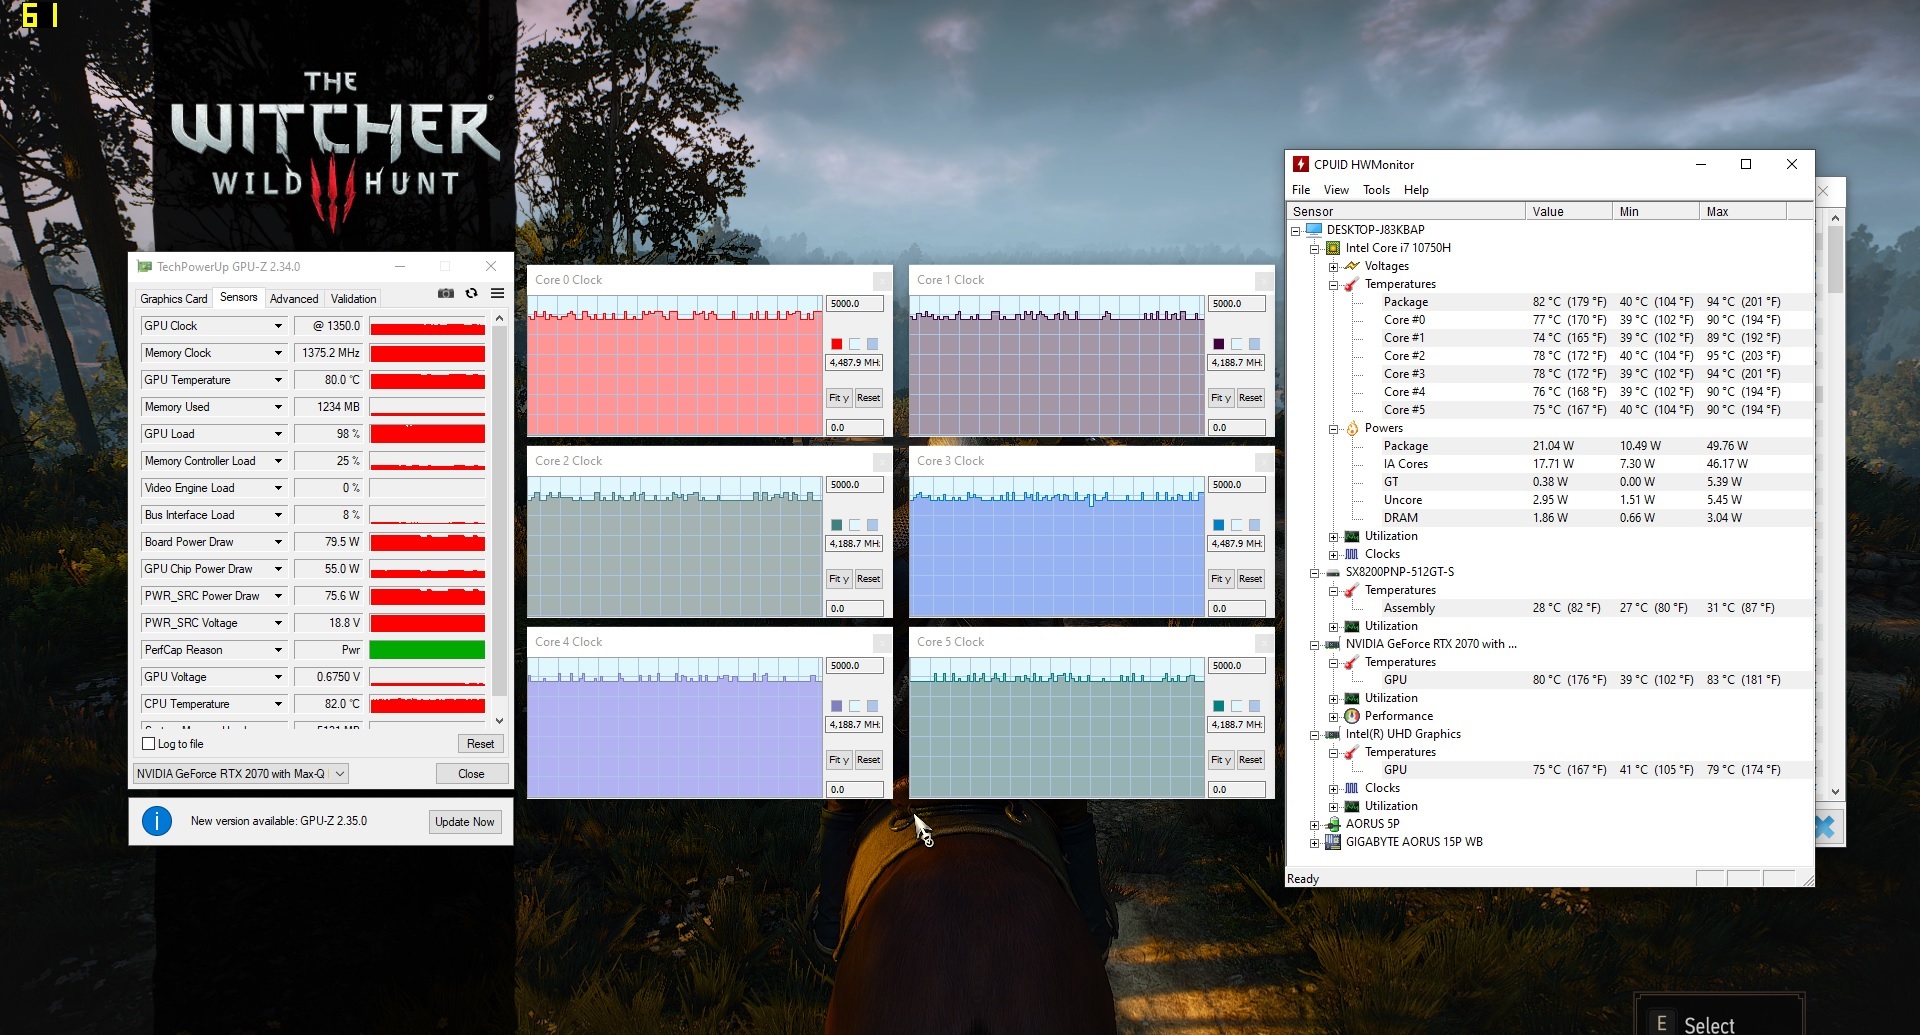
Nvidia specifies a clock range between 900 MHz (base) and 1,125 MHz (boost) for this DirectX 12 GPU. Higher speeds are feasible when a predetermined temperature and/or energy threshold is not reached. We register a maximum of 1,939 MHz. Our The Witcher 3 test is run at an average of 1,383 MHz.
| 3DMark 11 Performance | 19910 points | |
| 3DMark Cloud Gate Standard Score | 39445 points | |
| 3DMark Fire Strike Score | 16759 points | |
| 3DMark Time Spy Score | 6920 points | |
Help | ||
Gaming performance
The installed hardware brings all modern games smoothly onto the screen at Full HD resolution and high to maximum quality settings. Higher resolutions (a suitable monitor would have to be plugged in for this) often require lowering the quality level.
| The Witcher 3 - 1920x1080 Ultra Graphics & Postprocessing (HBAO+) | |
| Average of class Gaming (104.7 - 240, n=7, last 2 years) | |
| Asus ROG Strix G15 G512LW | |
| Aorus 15P WB | |
| Average NVIDIA GeForce RTX 2070 Max-Q (56 - 83.8, n=31) | |
| Dell G5 15 SE 5505 P89F | |
| Acer Predator Triton 300 PT315-52-79LP | |
| Far Cry 5 - 1920x1080 Ultra Preset AA:T | |
| Average of class Gaming (70 - 151, n=6, last 2 years) | |
| Aorus 15P WB | |
| Average NVIDIA GeForce RTX 2070 Max-Q (67 - 101, n=7) | |
| Acer Predator Triton 300 PT315-52-79LP | |
| Doom Eternal - 1920x1080 Ultra Preset | |
| Aorus 15P WB | |
| Average NVIDIA GeForce RTX 2070 Max-Q (125.6 - 137.9, n=4) | |
| Dell G5 15 SE 5505 P89F | |
| Call of Duty Black Ops Cold War - 1920x1080 Highest Settings | |
| Aorus 15P WB | |
| Average NVIDIA GeForce RTX 2070 Max-Q (n=1) | |
| Yakuza Like a Dragon - 1920x1080 Ultra Preset | |
| Aorus 15P WB | |
| Average NVIDIA GeForce RTX 2070 Max-Q (n=1) | |
| Star Wars Squadrons - 1920x1080 Ultra Preset | |
| Aorus 15P WB | |
| Average NVIDIA GeForce RTX 2070 Max-Q (n=1) | |
In order to verify whether the frame rates remain largely constant over a prolonged period of time, we let the game The Witcher 3 run for about 60 minutes at Full HD resolution and maximum quality settings. The character is not moved. A drop in frame rates wasn't found.
| low | med. | high | ultra | |
|---|---|---|---|---|
| The Witcher 3 (2015) | 275.4 | 222.4 | 129.2 | 69.8 |
| Dota 2 Reborn (2015) | 150.7 | 136.2 | 124.8 | 115.1 |
| X-Plane 11.11 (2018) | 106 | 93.3 | 78.8 | |
| Far Cry 5 (2018) | 132 | 109 | 102 | 97 |
| Doom Eternal (2020) | 260.8 | 152.7 | 136.4 | 131.1 |
| Crysis Remastered (2020) | 196 | 117 | 56.6 | 43 |
| Star Wars Squadrons (2020) | 272.2 | 192.7 | 182.4 | 172.4 |
| Watch Dogs Legion (2020) | 107 | 88 | 77 | 51 |
| Assassin´s Creed Valhalla (2020) | 113 | 75 | 63 | 55 |
| Call of Duty Black Ops Cold War (2020) | 159 | 79.3 | 70.5 | 64.1 |
| Yakuza Like a Dragon (2020) | 111.1 | 80.8 | 81.1 | 72 |
| Immortals Fenyx Rising (2020) | 117 | 78 | 66 | 61 |
| Cyberpunk 2077 1.0 (2020) | 106 | 62 | 51.5 | 43.8 |
Emissions - Noise levels are acceptable
Noise emissions
The two fans work consistently at low speeds in idle mode. The resulting noise is completely acceptable. Under load, the fans turn up, though. We register maximum sound pressure levels of 45 dB(A) (stress test) and 43 dB(A) (our The Witcher 3 test), respectively. The whole situation manifests itself in a constant, tolerable fan noise. A headset is not an absolute necessity.
Noise level
| Idle |
| 29 / 30 / 31 dB(A) |
| Load |
| 41 / 45 dB(A) |
 | ||
30 dB silent 40 dB(A) audible 50 dB(A) loud |
||
min: | ||
| Aorus 15P WB i7-10750H, GeForce RTX 2070 Max-Q | Acer Predator Triton 300 PT315-52-79LP i7-10750H, GeForce RTX 2060 Mobile | Asus ROG Strix G15 G512LW i7-10750H, GeForce RTX 2070 Mobile | Dell G5 15 SE 5505 P89F R7 4800H, Radeon RX 5600M | Average of class Gaming | |
|---|---|---|---|---|---|
| Noise | -3% | -7% | 1% | -1% | |
| off / environment * (dB) | 25 | 25 -0% | 25.7 -3% | 28 -12% | 24.1 ? 4% |
| Idle Minimum * (dB) | 29 | 25 14% | 25.7 11% | 28 3% | 26 ? 10% |
| Idle Average * (dB) | 30 | 29 3% | 29.7 1% | 28 7% | 27.5 ? 8% |
| Idle Maximum * (dB) | 31 | 34 -10% | 34 -10% | 28 10% | 30.1 ? 3% |
| Load Average * (dB) | 41 | 44 -7% | 38.9 5% | 28 32% | 43.8 ? -7% |
| Witcher 3 ultra * (dB) | 43 | 49 -14% | 54.1 -26% | 50.6 -18% | |
| Load Maximum * (dB) | 45 | 49 -9% | 57.4 -28% | 50.6 -12% | 54.3 ? -21% |
* ... smaller is better
Temperature
Our stress test (Prime95 and FurmMark run for at least an hour) is run by the CPU and GPU at 2.8 to 2.9 GHz and 1,230 MHz, respectively. The stress test is an extreme scenario that doesn't occur in everyday use. We perform this test to check whether the system remains stable even under full load.
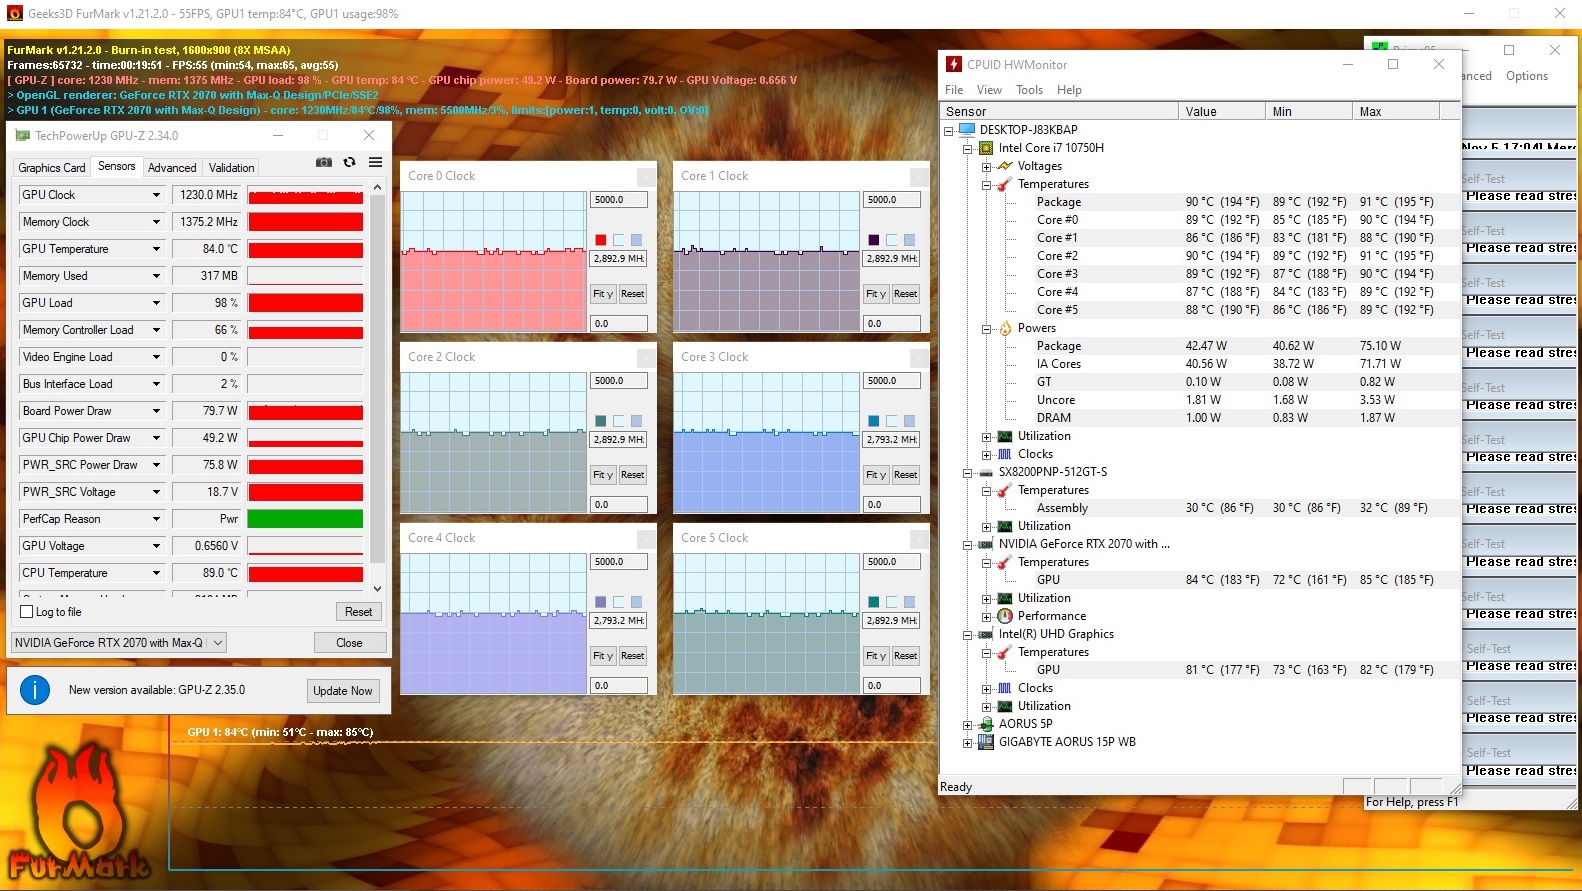
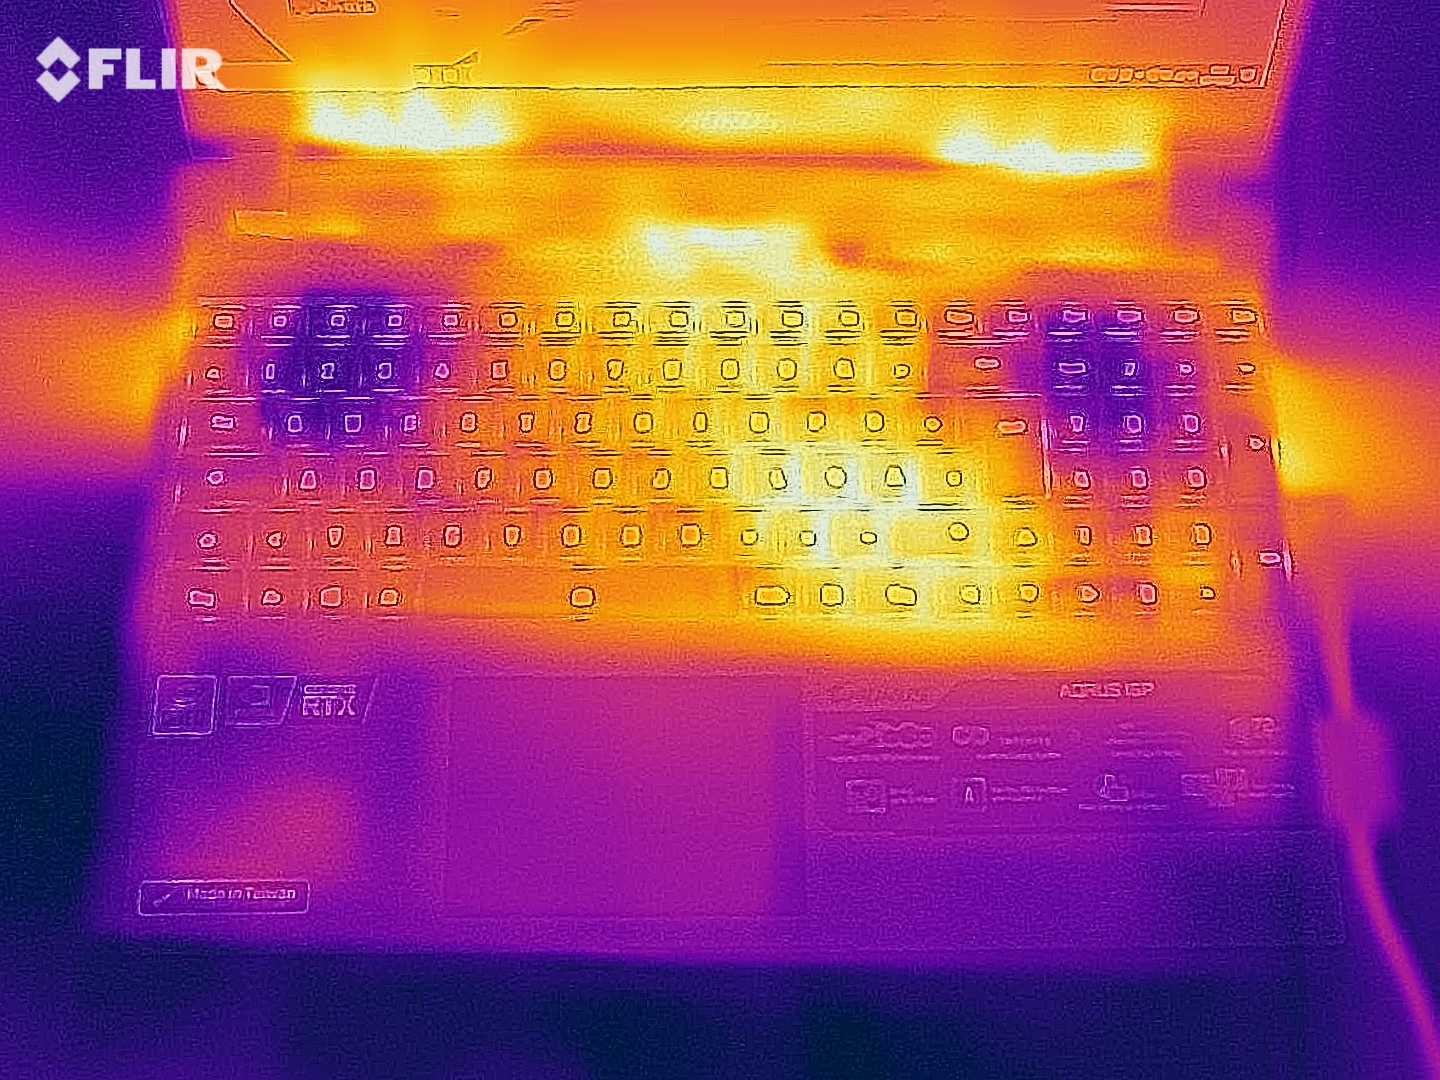
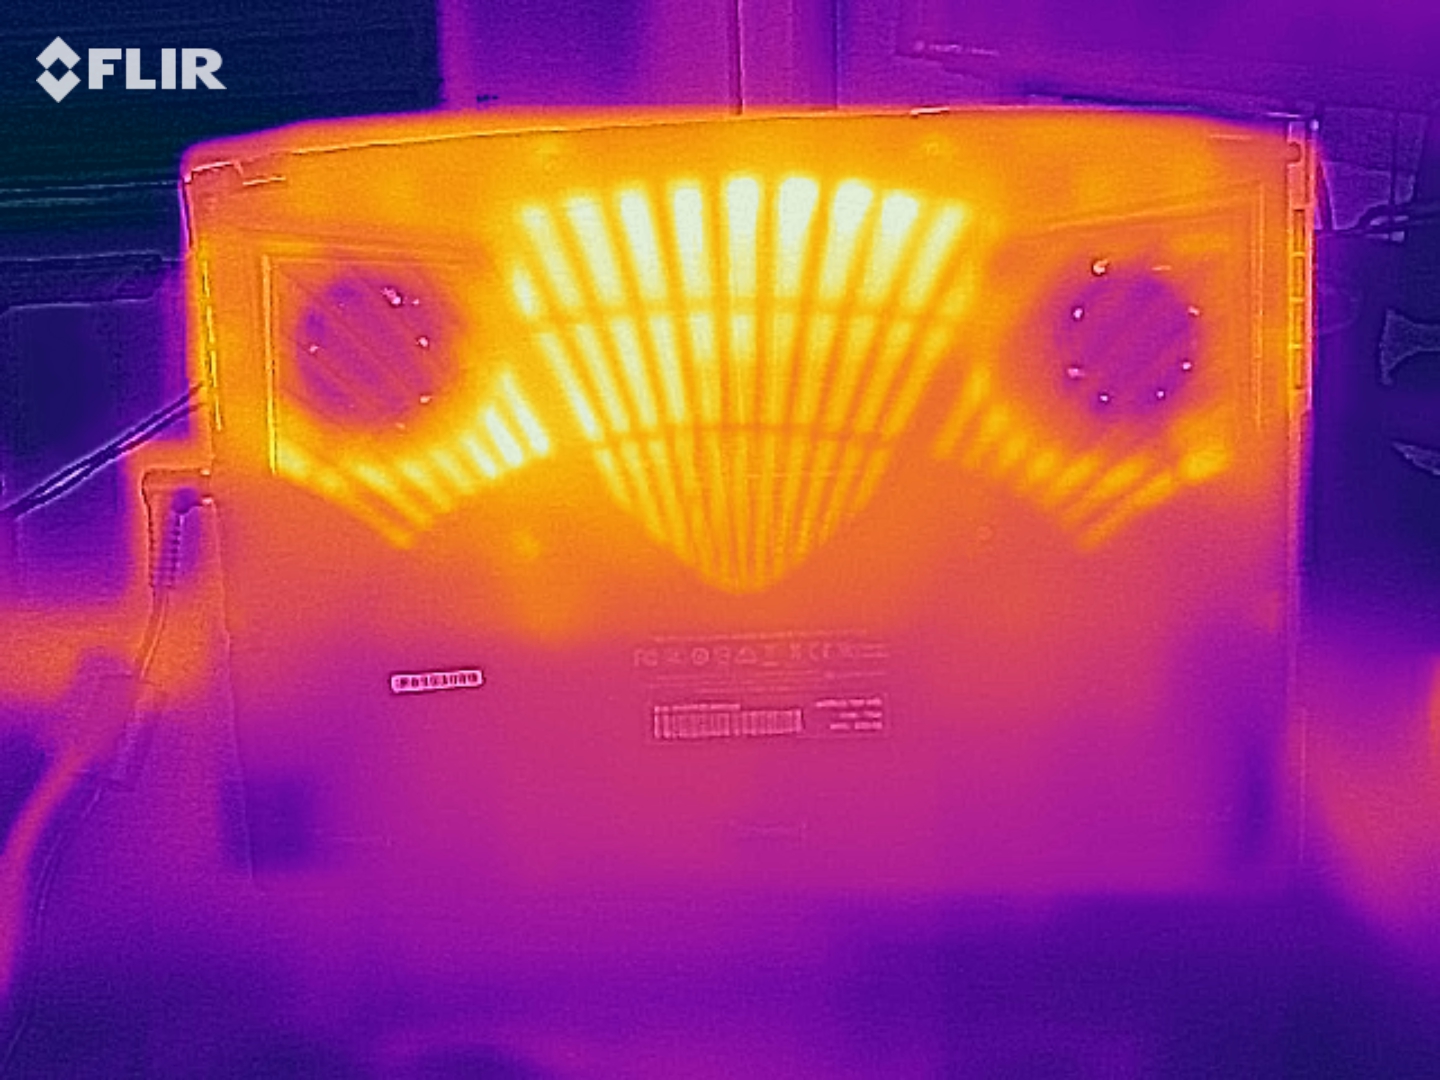
The Aorus laptop heats up considerably under load. During the stress test, we registered temperatures above 60 °C (~140 °F) at several measuring points on the underside. Furthermore, the temperature increases slightly less during our The Witcher 3 test. The laptop should not be placed on the lap in either case. In everyday use, however, the temperatures are within the green range.
(-) The maximum temperature on the upper side is 47 °C / 117 F, compared to the average of 40.4 °C / 105 F, ranging from 21.2 to 68.8 °C for the class Gaming.
(-) The bottom heats up to a maximum of 62 °C / 144 F, compared to the average of 43.2 °C / 110 F
(+) In idle usage, the average temperature for the upper side is 24.7 °C / 76 F, compared to the device average of 33.9 °C / 93 F.
(±) Playing The Witcher 3, the average temperature for the upper side is 37 °C / 99 F, compared to the device average of 33.9 °C / 93 F.
(+) The palmrests and touchpad are reaching skin temperature as a maximum (32 °C / 89.6 F) and are therefore not hot.
(-) The average temperature of the palmrest area of similar devices was 28.8 °C / 83.8 F (-3.2 °C / -5.8 F).
| Aorus 15P WB i7-10750H, GeForce RTX 2070 Max-Q | Acer Predator Triton 300 PT315-52-79LP i7-10750H, GeForce RTX 2060 Mobile | Asus ROG Strix G15 G512LW i7-10750H, GeForce RTX 2070 Mobile | Dell G5 15 SE 5505 P89F R7 4800H, Radeon RX 5600M | Average of class Gaming | |
|---|---|---|---|---|---|
| Heat | -18% | -4% | -7% | -5% | |
| Maximum Upper Side * (°C) | 47 | 55 -17% | 53.4 -14% | 53 -13% | 45.2 ? 4% |
| Maximum Bottom * (°C) | 62 | 65 -5% | 49 21% | 57.6 7% | 48.2 ? 22% |
| Idle Upper Side * (°C) | 26 | 32 -23% | 29.6 -14% | 27.4 -5% | 31 ? -19% |
| Idle Bottom * (°C) | 27 | 34 -26% | 29.4 -9% | 31 -15% | 34.2 ? -27% |
* ... smaller is better
Speakers
The stereo speakers are located in the front area of the device's underside. They produce a decent sound that lacks bass. A better sound experience can be achieved with headphones or external speakers.
Aorus 15P WB audio analysis
(±) | speaker loudness is average but good (76 dB)
Bass 100 - 315 Hz
(-) | nearly no bass - on average 20.8% lower than median
(±) | linearity of bass is average (13% delta to prev. frequency)
Mids 400 - 2000 Hz
(±) | higher mids - on average 5.4% higher than median
(+) | mids are linear (4.9% delta to prev. frequency)
Highs 2 - 16 kHz
(+) | balanced highs - only 2.6% away from median
(+) | highs are linear (6.7% delta to prev. frequency)
Overall 100 - 16.000 Hz
(±) | linearity of overall sound is average (20.4% difference to median)
Compared to same class
» 72% of all tested devices in this class were better, 6% similar, 22% worse
» The best had a delta of 6%, average was 18%, worst was 132%
Compared to all devices tested
» 54% of all tested devices were better, 8% similar, 38% worse
» The best had a delta of 4%, average was 23%, worst was 134%
Energy management - Aorus laptop offers very good battery life
Energy consumption
The gaming laptop doesn't have any surprises in store in terms of energy consumption. We register a maximum power consumption of 19 watts in idle usage. The stress test and our The Witcher 3 test let the demand rise up to 249 watts and to an average of 150 watts, respectively. The power adapter's output is 230 watts.
| Off / Standby | |
| Idle | |
| Load |
|
Key:
min: | |
| Aorus 15P WB i7-10750H, GeForce RTX 2070 Max-Q | Acer Predator Triton 300 PT315-52-79LP i7-10750H, GeForce RTX 2060 Mobile | Asus ROG Strix G15 G512LW i7-10750H, GeForce RTX 2070 Mobile | Dell G5 15 SE 5505 P89F R7 4800H, Radeon RX 5600M | Average of class Gaming | |
|---|---|---|---|---|---|
| Power Consumption | 22% | -33% | 27% | -14% | |
| Idle Minimum * (Watt) | 13 | 4 69% | 16.2 -25% | 6.5 50% | 13 ? -0% |
| Idle Average * (Watt) | 15 | 10 33% | 24.1 -61% | 10.6 29% | 19 ? -27% |
| Idle Maximum * (Watt) | 19 | 19 -0% | 30.8 -62% | 11 42% | 24.5 ? -29% |
| Load Average * (Watt) | 100 | 96 4% | 127.6 -28% | 84.1 16% | 111.1 ? -11% |
| Witcher 3 ultra * (Watt) | 150 | 136 9% | 187.5 -25% | 152.9 -2% | |
| Load Maximum * (Watt) | 249 | 214 14% | 239 4% | 180.4 28% | 260 ? -4% |
* ... smaller is better
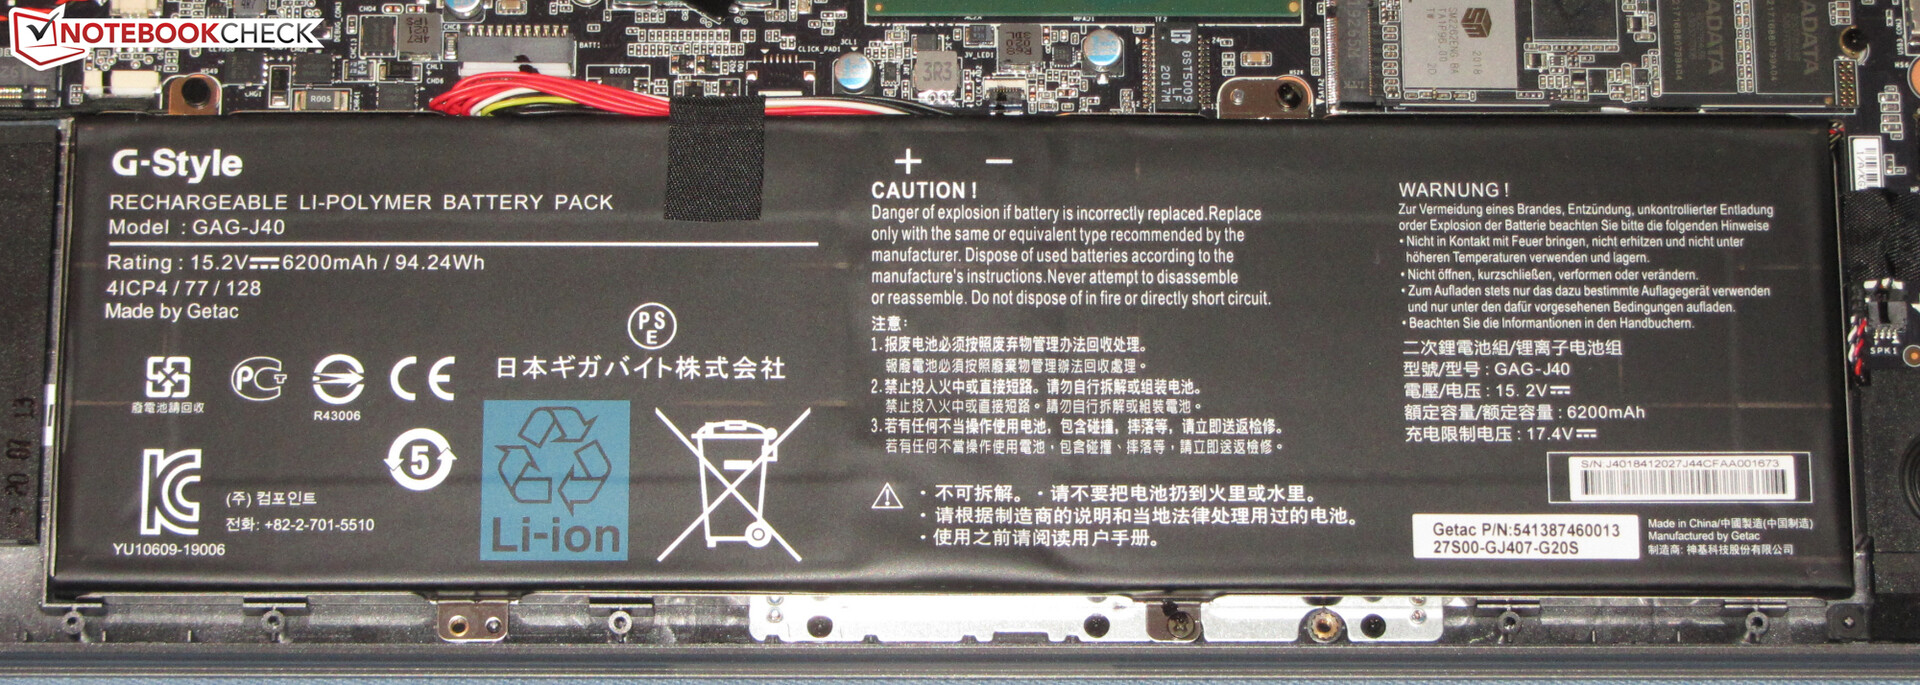
Battery life
The Aorus 15P achieves runtimes of 7:07 hours and 8:04 hours in our WLAN test (accessing websites using a script) and video test (the short film Big Buck Bunny (H.264 encoding, Full HD) running in a loop), respectively. During both tests, the laptop's power-saving functions are disabled, and the display brightness is set to about 150 cd/m². In addition, the wireless modules are disabled for the video test.
| Aorus 15P WB i7-10750H, GeForce RTX 2070 Max-Q, 94.24 Wh | Acer Predator Triton 300 PT315-52-79LP i7-10750H, GeForce RTX 2060 Mobile, 58.7 Wh | Asus ROG Strix G15 G512LW i7-10750H, GeForce RTX 2070 Mobile, 66 Wh | Dell G5 15 SE 5505 P89F R7 4800H, Radeon RX 5600M, 51 Wh | Average of class Gaming | |
|---|---|---|---|---|---|
| Battery runtime | -24% | -10% | -16% | -15% | |
| Reader / Idle (h) | 11.3 | 9.6 -15% | 11.2 -1% | 8.27 ? -27% | |
| H.264 (h) | 8.1 | 8.32 ? 3% | |||
| WiFi v1.3 (h) | 7.1 | 5.5 -23% | 6.4 -10% | 6.2 -13% | 7.11 ? 0% |
| Load (h) | 2.3 | 1.5 -35% | 1.5 -35% | 1.502 ? -35% |
Pros
Cons
Verdict
With the Aorus 15P WB, Gigabyte has released a compact 15.6-inch gaming laptop that brings all modern games smoothly onto the screen thanks to the Core i7-10750H processor and the GeForce RTX 2070 Max-Q graphics core. Full HD resolution and high to maximum quality settings can usually be selected.
All in all, the Aorus 15P WB is a well-rounded gaming laptop that doesn't have any major weaknesses.
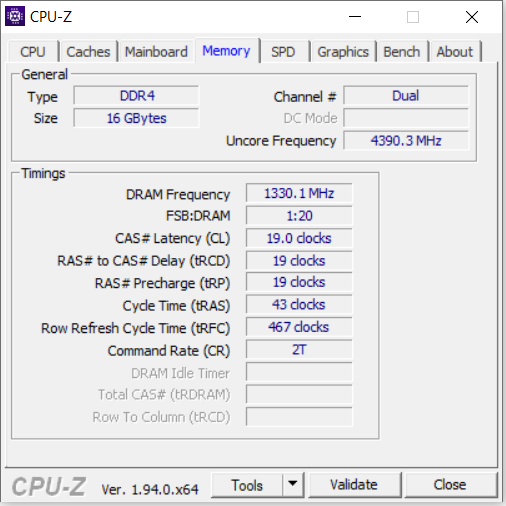
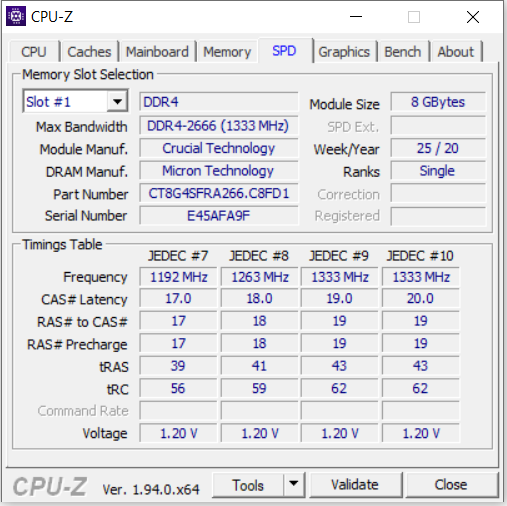
The hardware is supported by 16 GB of RAM (2x 8 GB, dual-channel mode, max. 64 GB) and a 512 GB NVMe SSD. The storage capacity is not exactly generous for a gaming laptop. A second NVMe SSD can be retrofitted if necessary, though. Since the bottom cover can be removed without any difficulty, upgrades should be easy.
The display (Full HD, IPS, 144 Hz) offers stable viewing angles, a matte surface, fast response times, good color reproduction, and decent color-space coverage. However, the maximum brightness and contrast should be higher. The keyboard (RGB backlighting) proved to be suitable for everyday use. Furthermore, the excellent battery life shouldn't go unmentioned. One battery charge is enough for practical runtimes of 7 to 8 hours - many office laptops can't pull this off.
Price and availability
The Aorus 15P WB is currently available in the WB-7DE1130SH configuration (Core i7-10750H, GeForce RTX 2070 Max-Q, 16 GB of RAM, 512 GB SSD) at a price of just under 1,540 Euros (~$1,891) at Computeruniverse.net.
Aorus 15P WB
- 01/02/2021 v7 (old)
Sascha Mölck
Price comparison

