Lenovo ThinkPad P15s Gen 2 laptop review: Ultrabook workstation now with Nvidia T500
A mobile workstation - this kind of laptop is supposed to be heavy, thick, and expensive. While you might think that, in previous years manufacturers also started to expand their portfolios with more affordable, thinner and lighter models, in order to cover all usage scenarios.
The Lenovo ThinkPad P15s Gen 2 is a mobile workstation of this "alternative" type. In the ThinkPad P portfolio, which is particularly targeted toward users that need to run CAD applications, the models with the "s" suffix represent the affordable entry level. In contrast to the ThinkPad P15 Gen 1, the P15s Gen 2 contains Tiger Lake UP3 CPUs. In addition, our test configuration includes a 1-TB SSD, 32 GB of RAM, a 4K UHD display, and the Nvidia T500 GPU - for the Lenovo ThinkPad P15s G2, this is a top configuration.
Possible Competitors in Comparison
Rating | Date | Model | Weight | Height | Size | Resolution | Price |
|---|---|---|---|---|---|---|---|
| 85.3 % v7 (old) | 06 / 2021 | Lenovo ThinkPad P15s Gen2-20W6000GGE i7-1165G7, T500 Laptop GPU | 1.9 kg | 19.1 mm | 15.60" | 3840x2160 | |
| 82.5 % v7 (old) | 01 / 2021 | Lenovo ThinkPad P15s Gen1-20T4000JGE i7-10510U, Quadro P520 | 1.8 kg | 19.1 mm | 15.60" | 3840x2160 | |
| 85.6 % v7 (old) | 03 / 2021 | Lenovo ThinkPad P15 Gen1-20ST000DGE i7-10750H, Quadro T1000 (Laptop) | 2.7 kg | 31.45 mm | 15.60" | 1920x1080 | |
| 83.8 % v7 (old) | 04 / 2021 | HP ZBook Firefly 15 G8 2C9R7EA i7-1165G7, T500 Laptop GPU | 1.8 kg | 19.2 mm | 15.60" | 1920x1080 | |
| 81.2 % v7 (old) | 10 / 2020 | Dell Precision 3000 3551 i9-10885H, Quadro P620 | 2.2 kg | 24.92 mm | 15.60" | 1920x1080 |
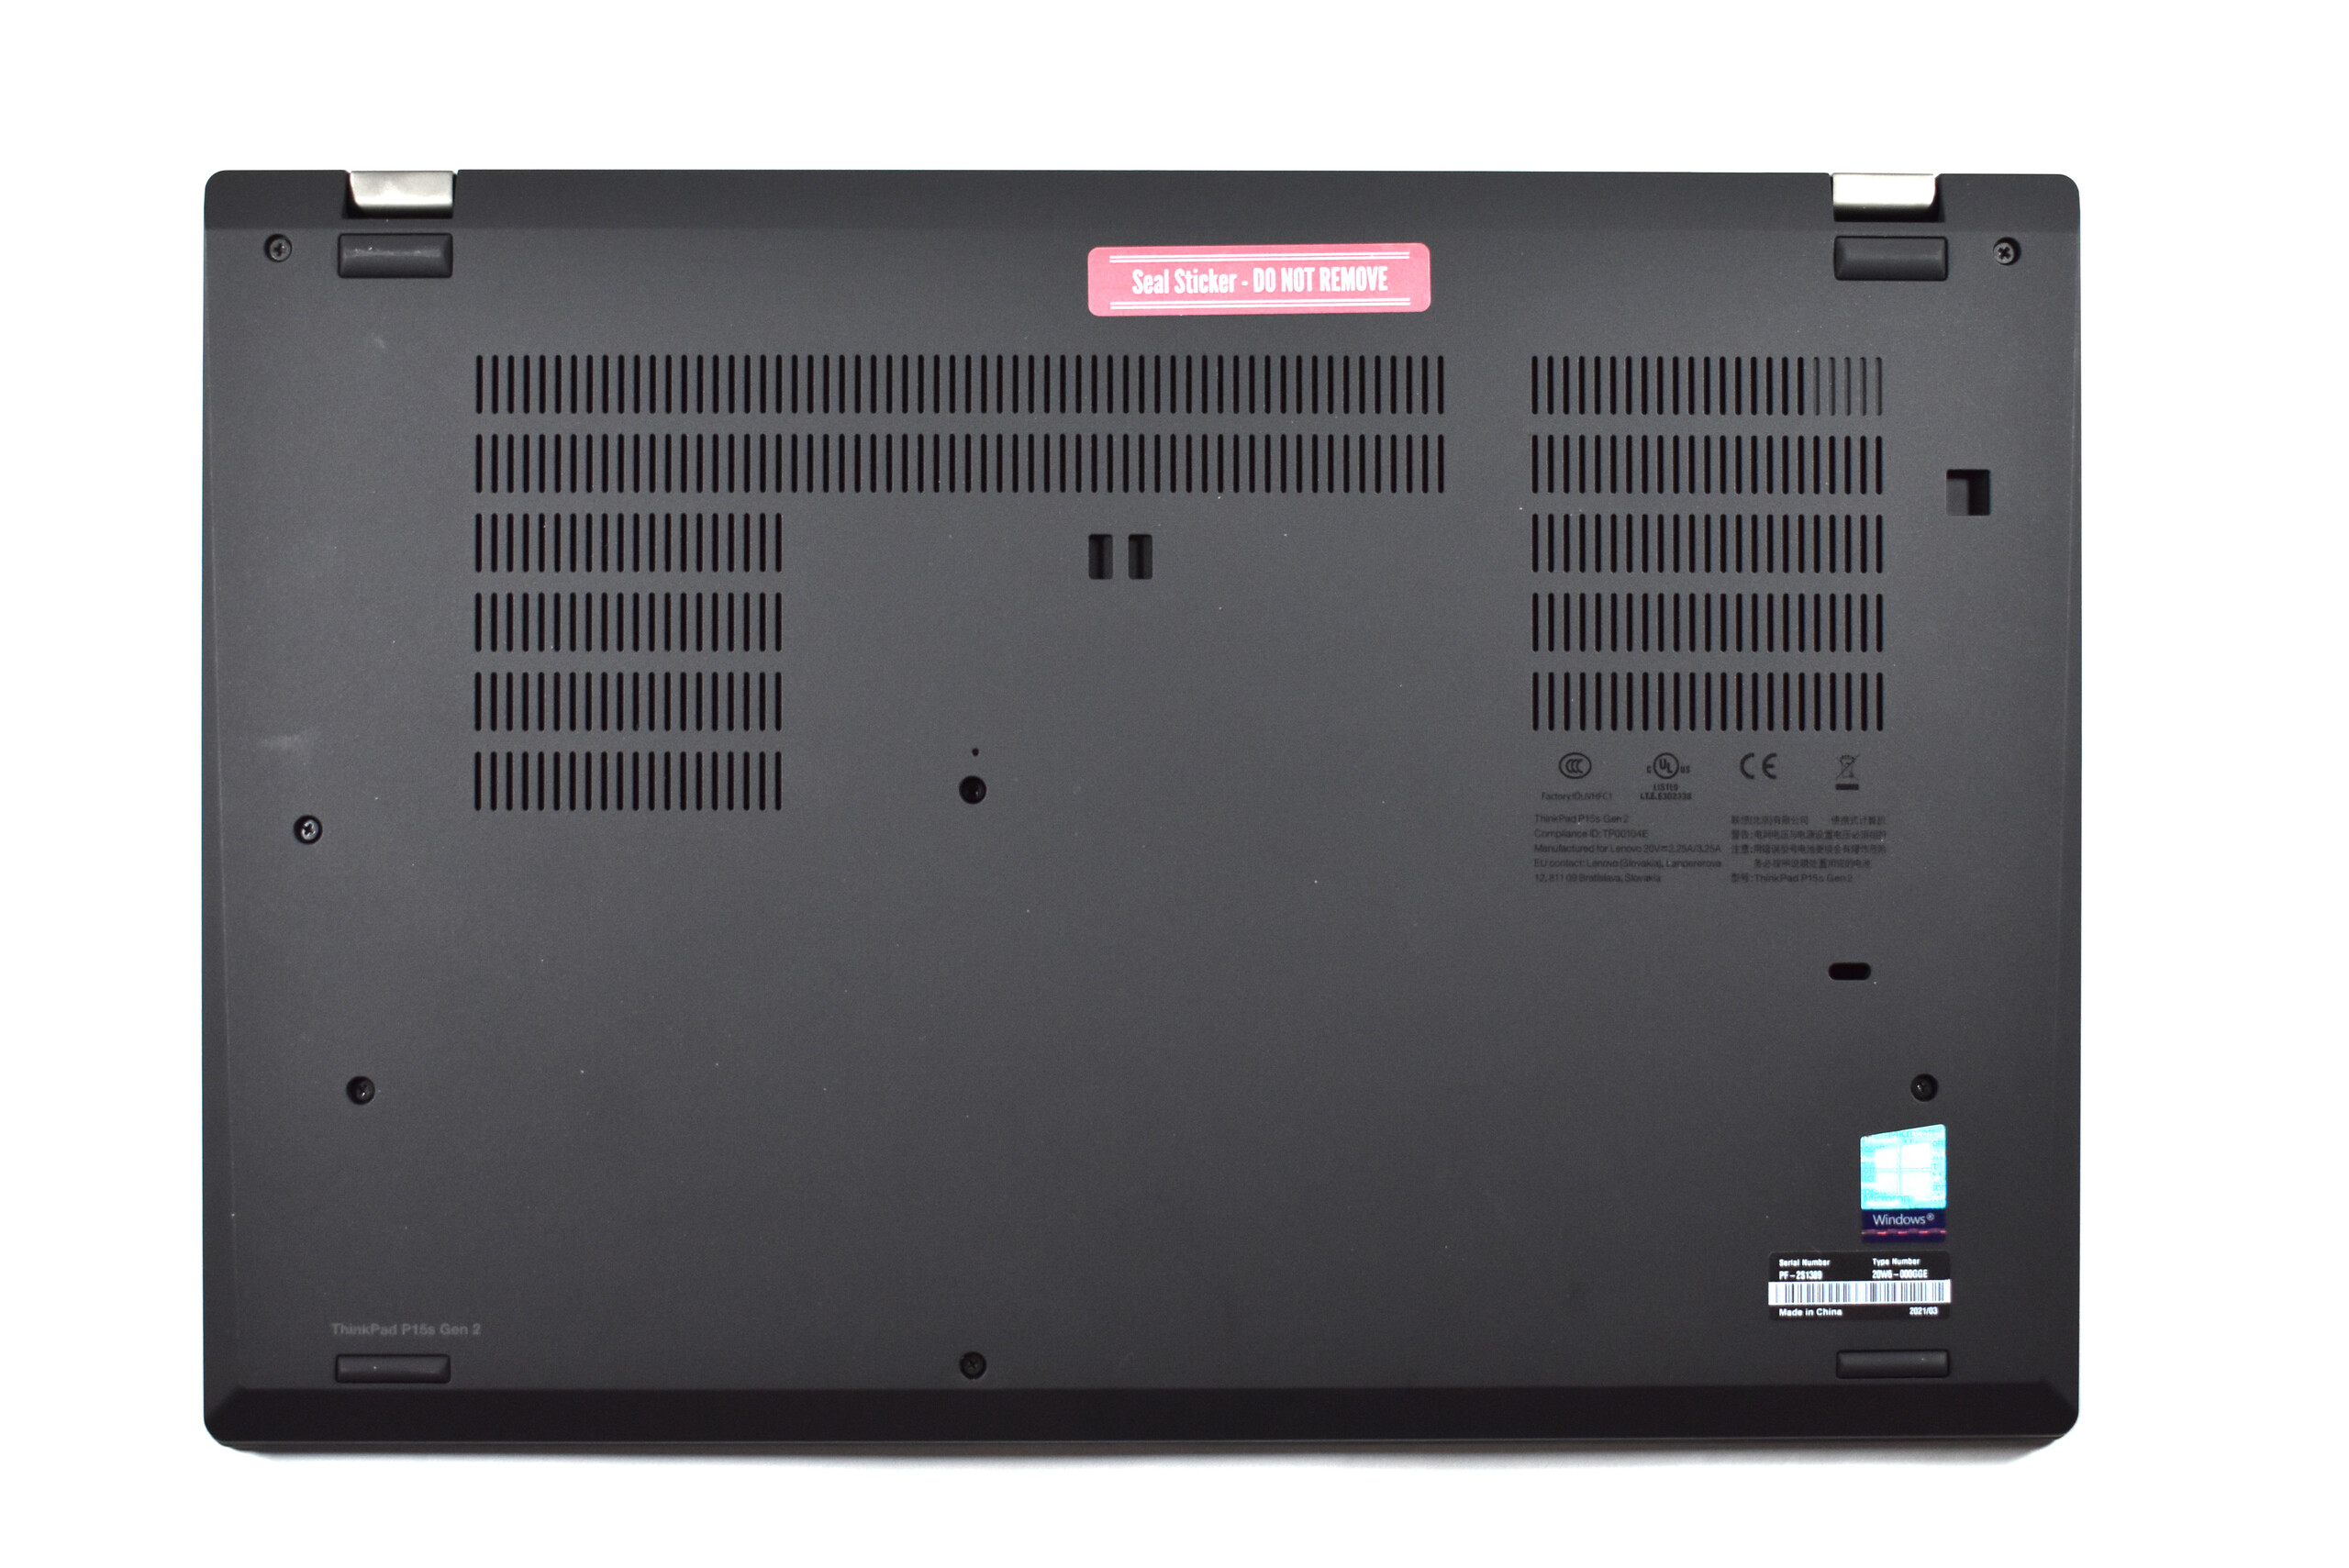
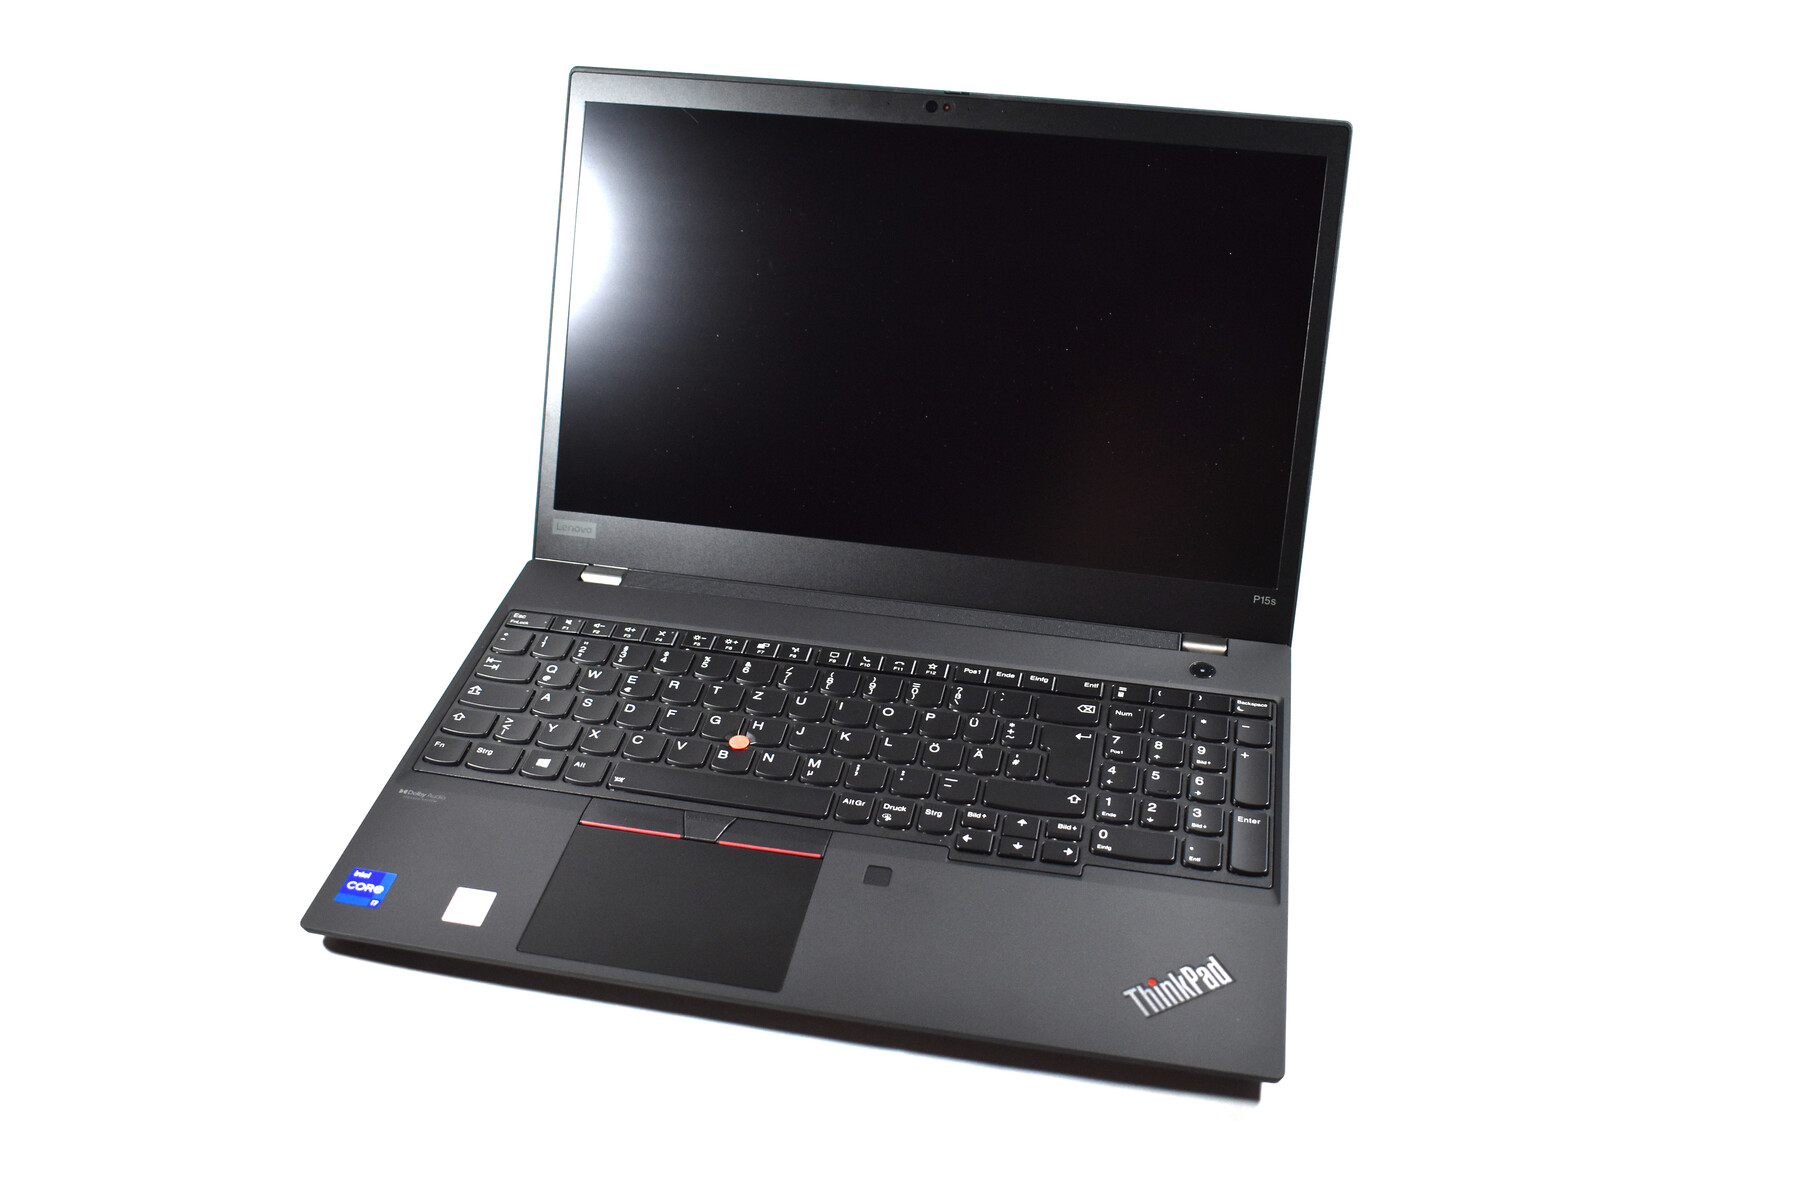
Case and Equipment remain unchanged from the Lenovo ThinkPad P15s G1
We already saw the ThinkPad P15s Gen 2 case in various other models: ThinkPad T590, P53s, T15 Gen 1, T15 Gen 2, and P15s Gen 1, all of which used the same design. However, its lifespan is noticeably nearing its end, since the Lenovo ThinkPad P15s G2 has to make do without some new features that other ThinkPads of the 2021 generation can offer, such as the integration of the fingerprint reader into the power button, or the taller 16:10 format, for example. One novelty of the P15s Gen 2 is the availability of a silver-gray color variant with an aluminum lid. However, our test unit is the classic model in black. In terms of the quality, there continues to be no reason for complaint. The P15s Gen 2 has a sturdy plastic case with a magnesium core and a comfortable rubberized surface that is a bit prone to show dirt, though.
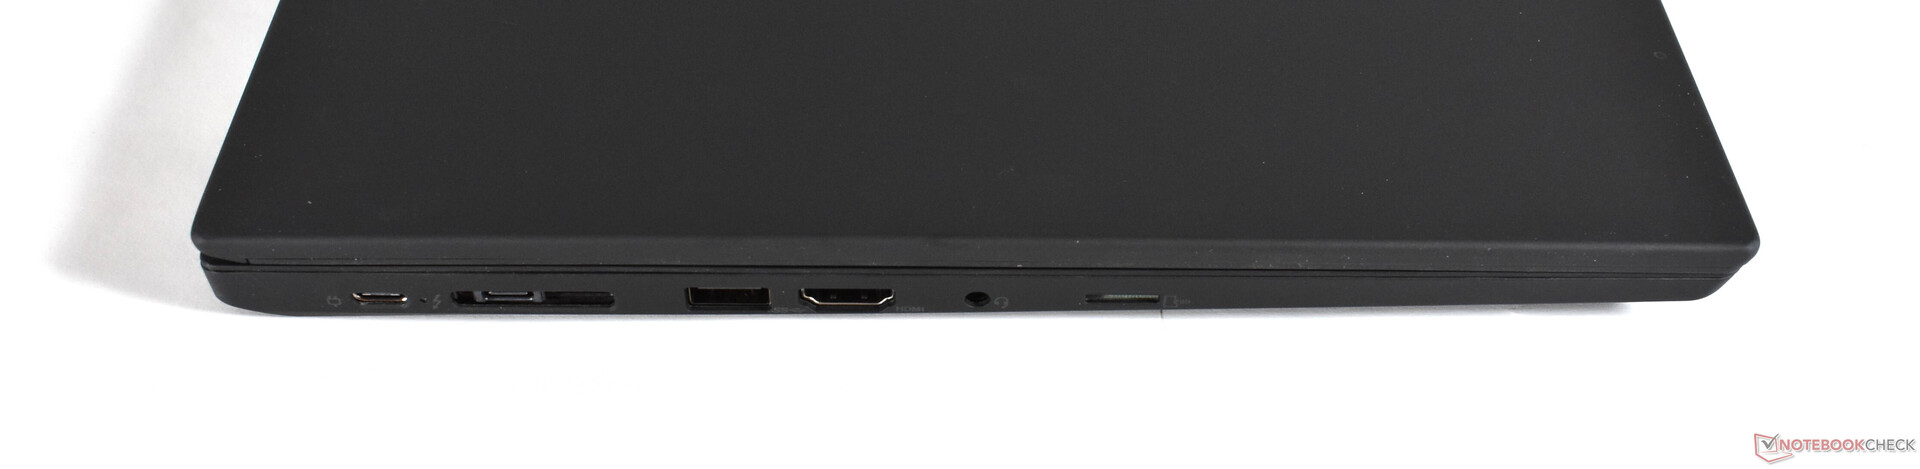
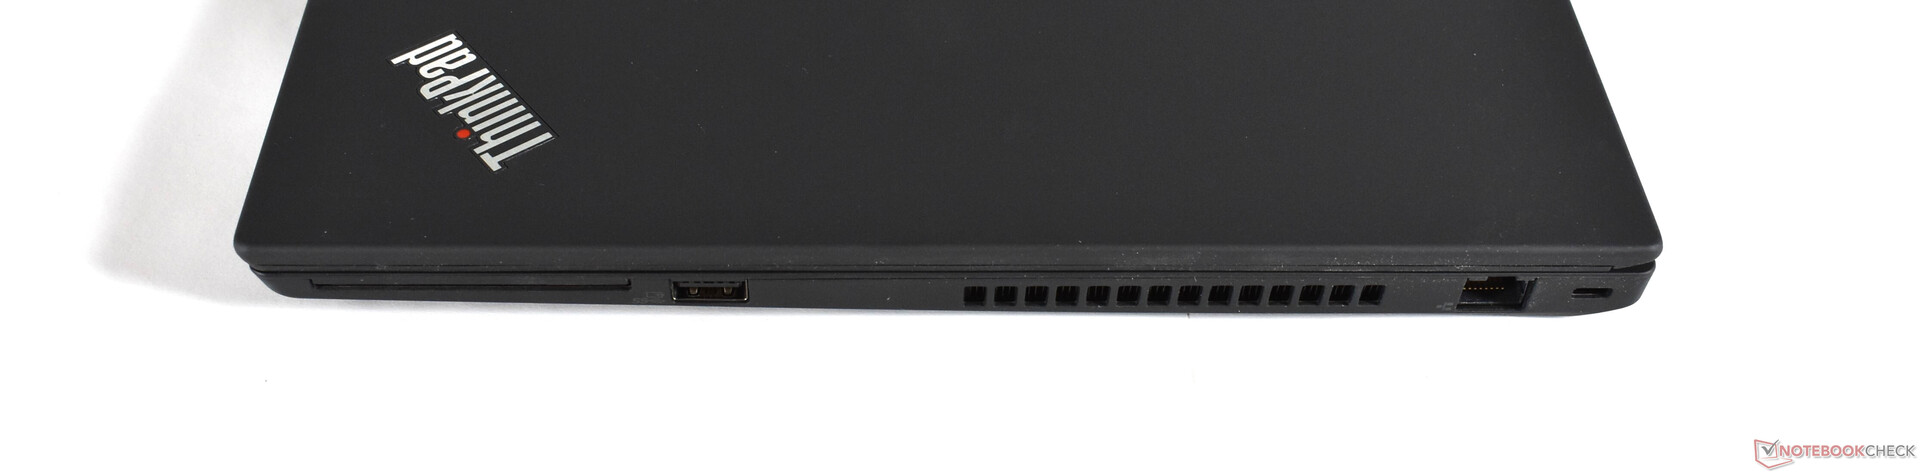
While everything remains the same on the exterior, there are at least some changes in terms of the connection equipment. The Lenovo ThinkPad P15s Gen 2 now offers two Thunderbolt 4 ports instead of the Thunderbolt 3 connections, and as a first in the P series, Lenovo offers a Wi-Fi 6e module. In this case, it is the Intel Wireless AX210, which is the most current Intel Wi-Fi solution.

Connection Equipment
| SD Card Reader | |
| average JPG Copy Test (av. of 3 runs) | |
| Dell Precision 3000 3551 (Toshiba Exceria Pro M501 64 GB UHS-II) | |
| Average of class Workstation (49.6 - 681, n=14, last 2 years) | |
| Lenovo ThinkPad P15 Gen1-20ST000DGE (Toshiba Exceria Pro SDXC 64 GB UHS-II) | |
| Lenovo ThinkPad P15s Gen1-20T4000JGE (Toshiba Exceria Pro M501 64 GB UHS-II) | |
| Lenovo ThinkPad P15s Gen2-20W6000GGE (AV Pro V60) | |
| maximum AS SSD Seq Read Test (1GB) | |
| Average of class Workstation (87.6 - 1455, n=14, last 2 years) | |
| Dell Precision 3000 3551 (Toshiba Exceria Pro M501 64 GB UHS-II) | |
| Lenovo ThinkPad P15 Gen1-20ST000DGE (Toshiba Exceria Pro SDXC 64 GB UHS-II) | |
| Lenovo ThinkPad P15s Gen2-20W6000GGE (AV Pro V60) | |
| Lenovo ThinkPad P15s Gen1-20T4000JGE (Toshiba Exceria Pro M501 64 GB UHS-II) | |


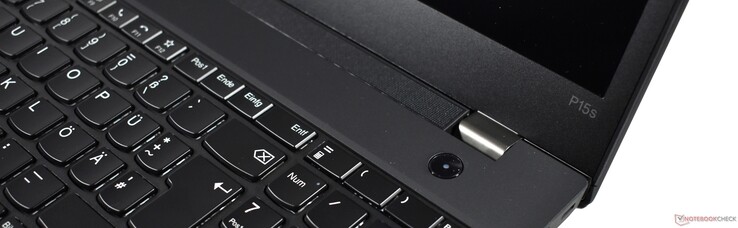
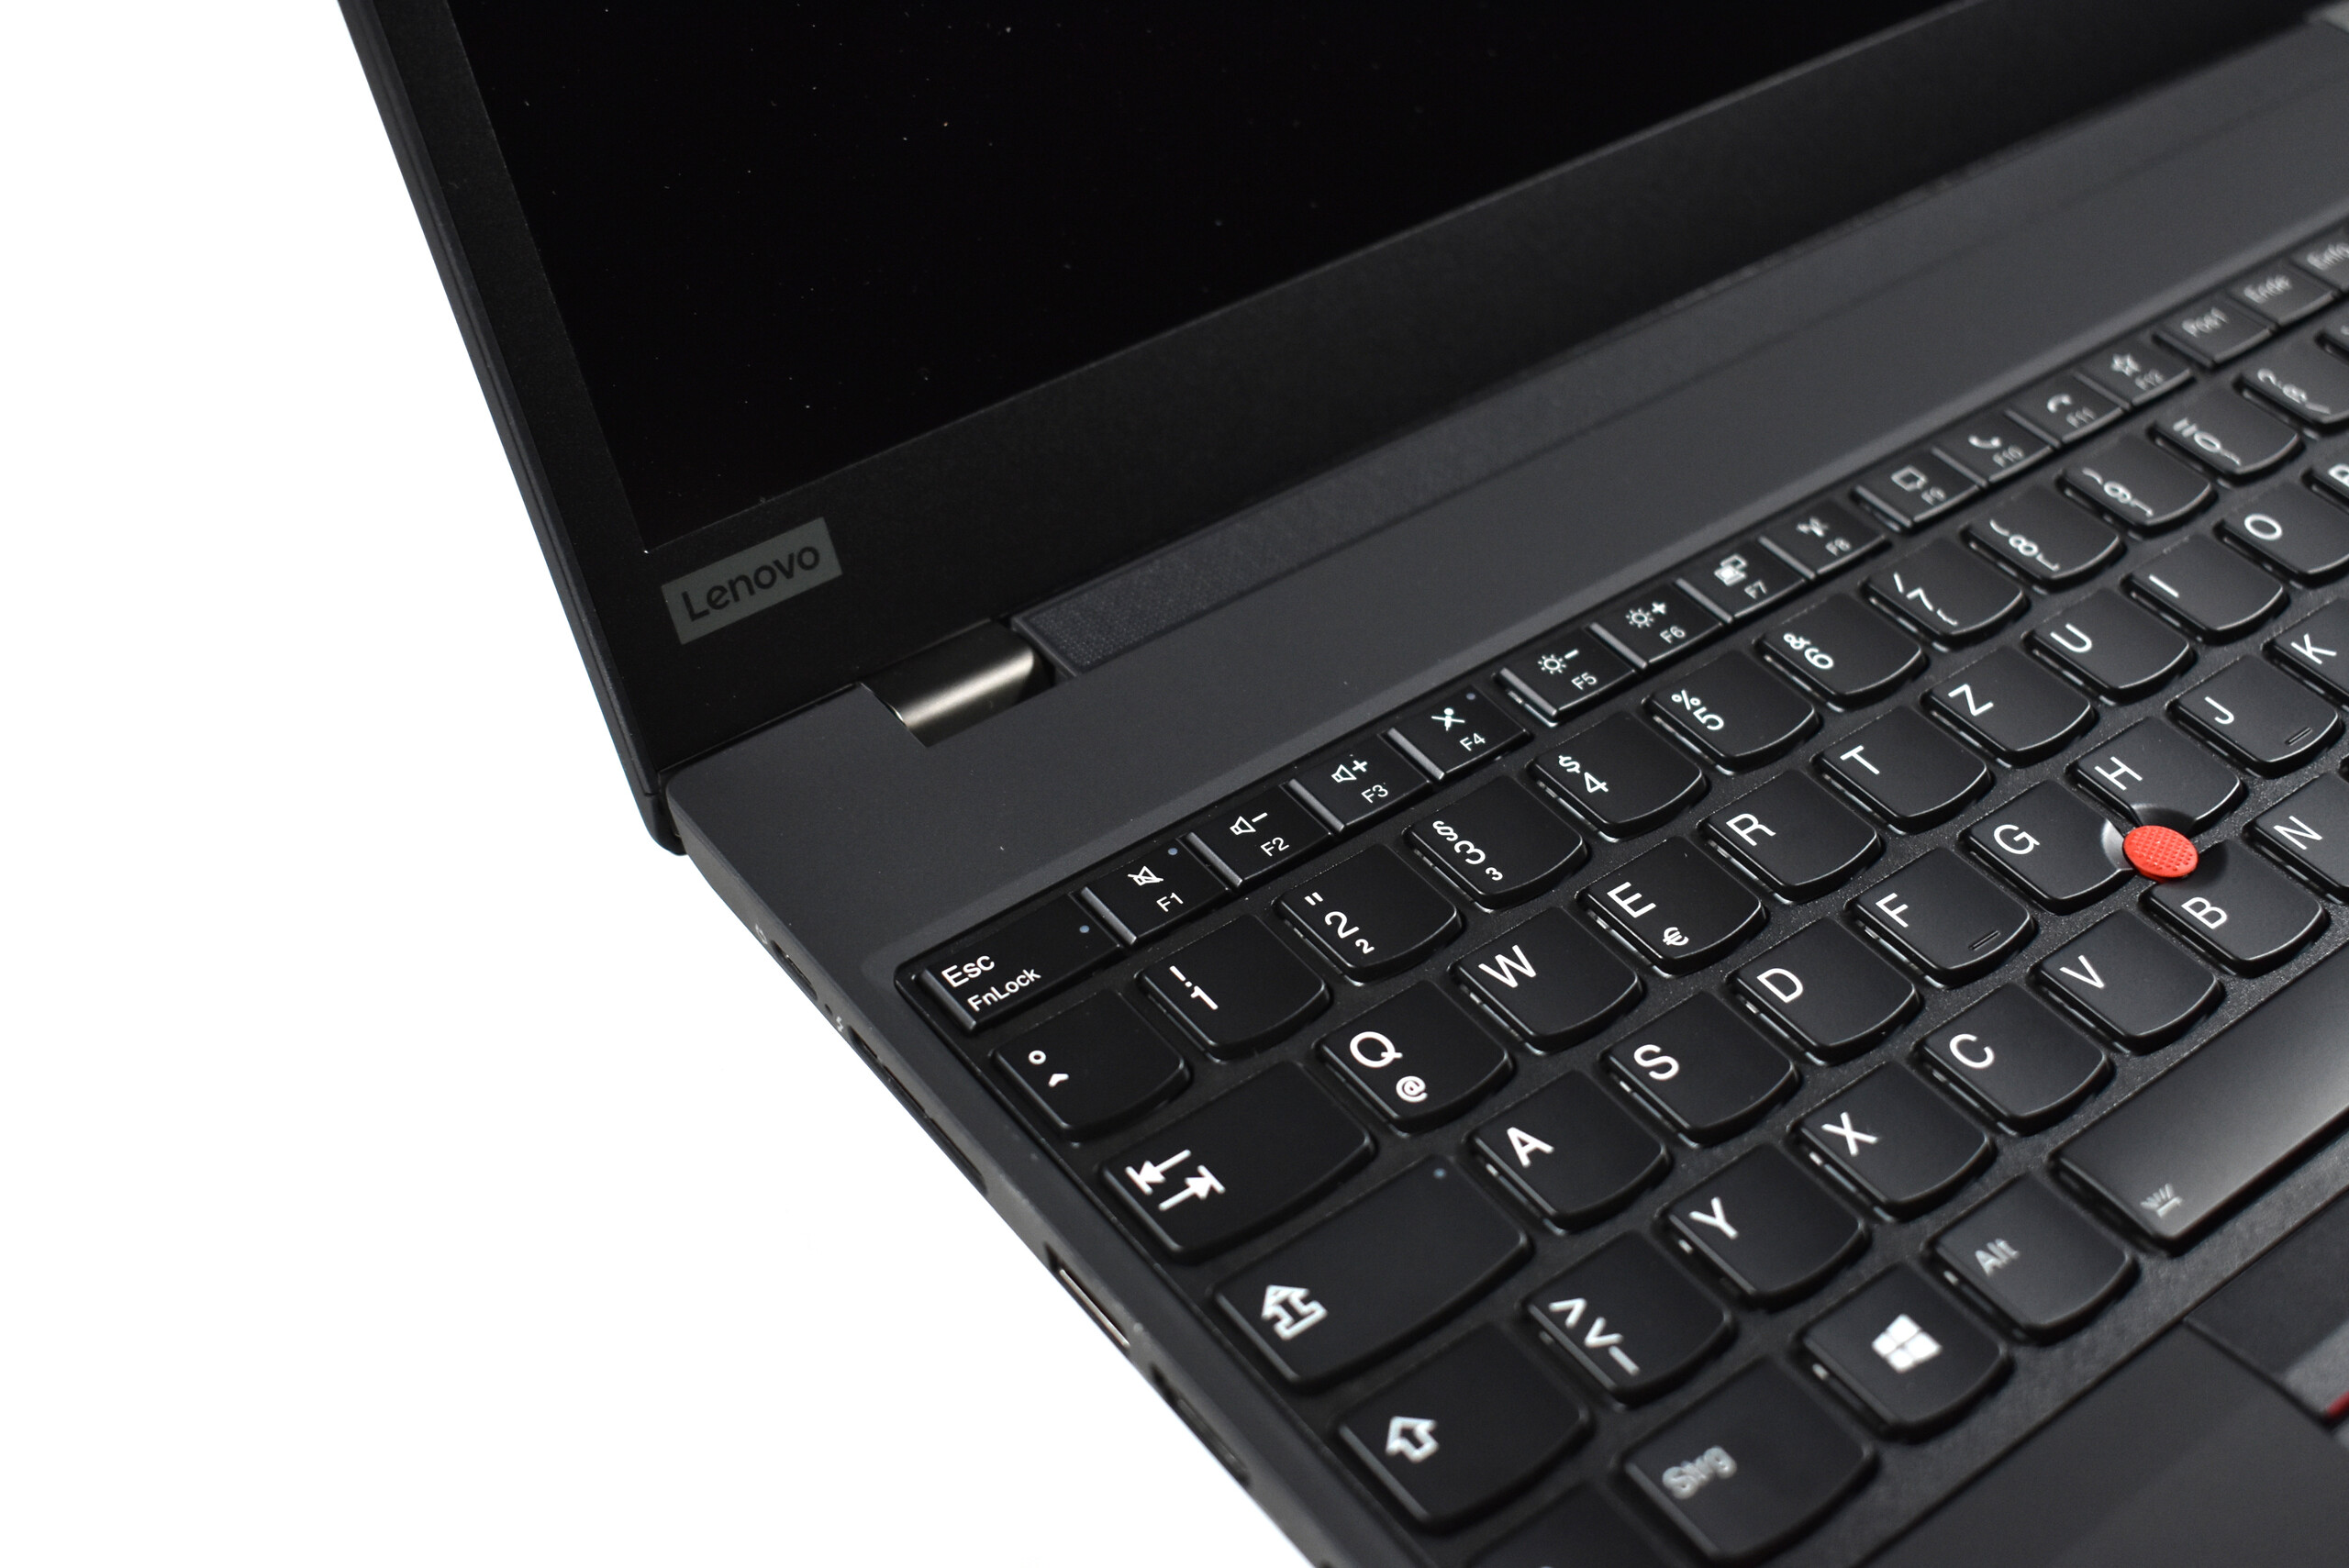
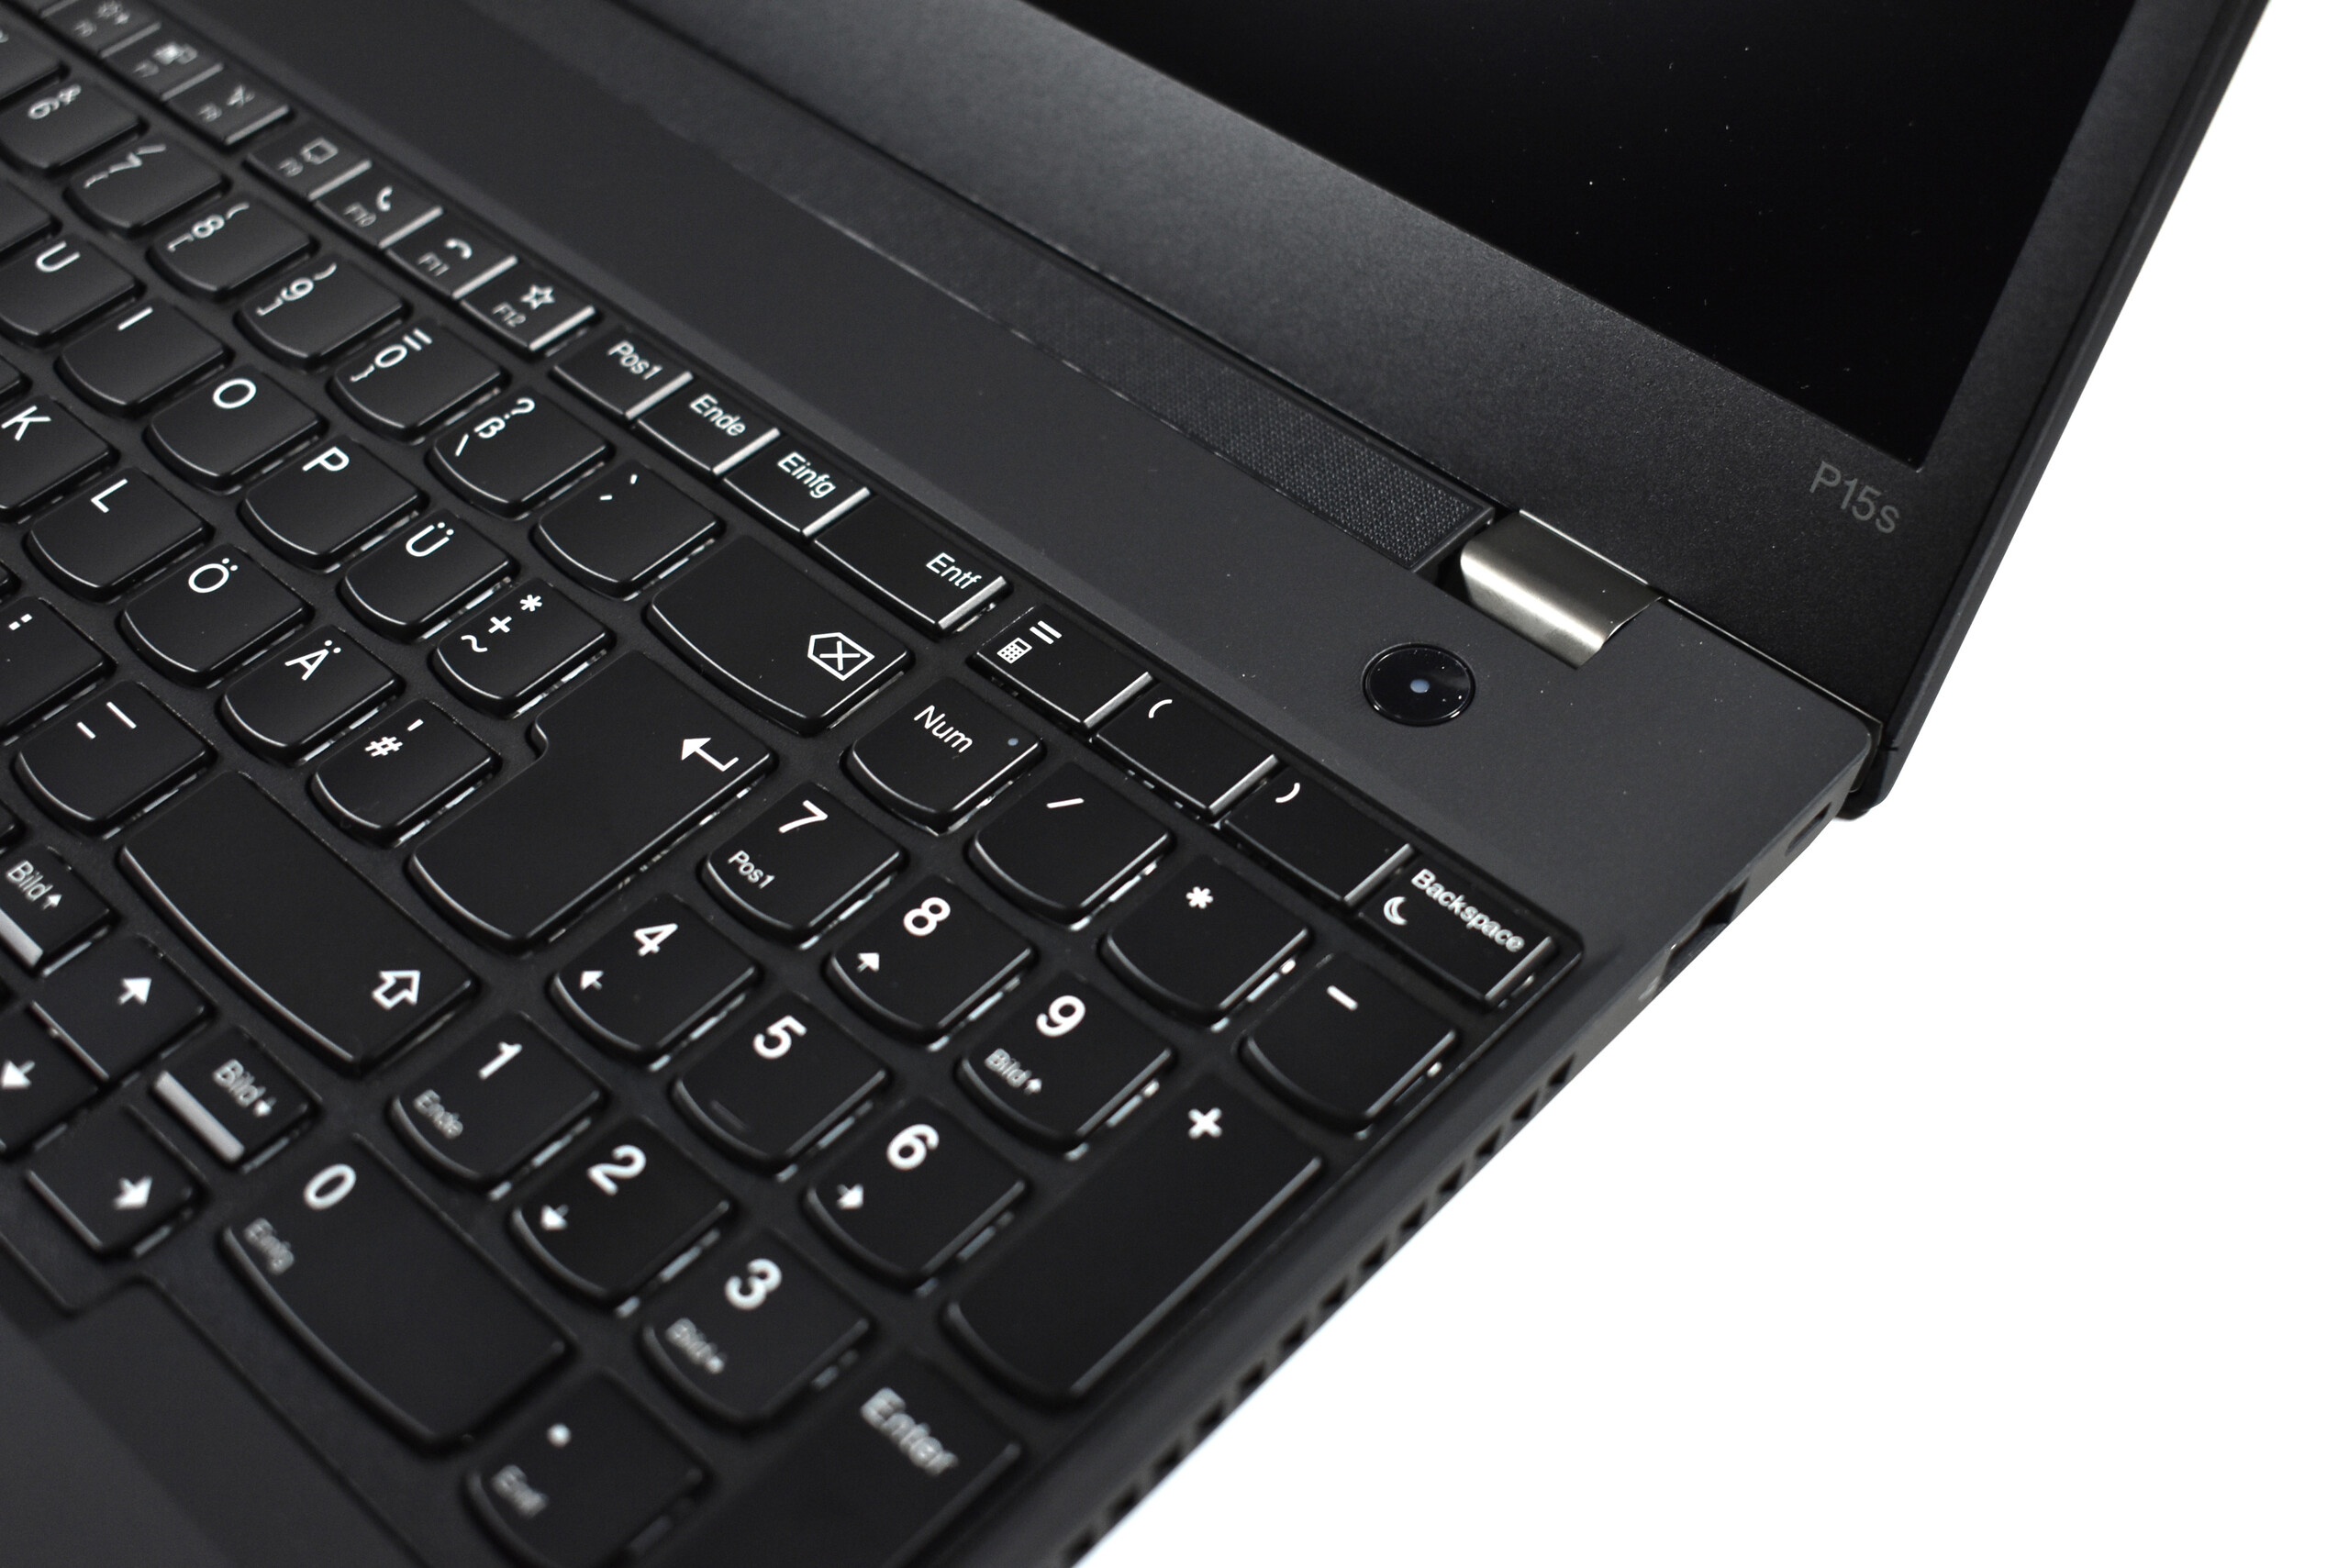
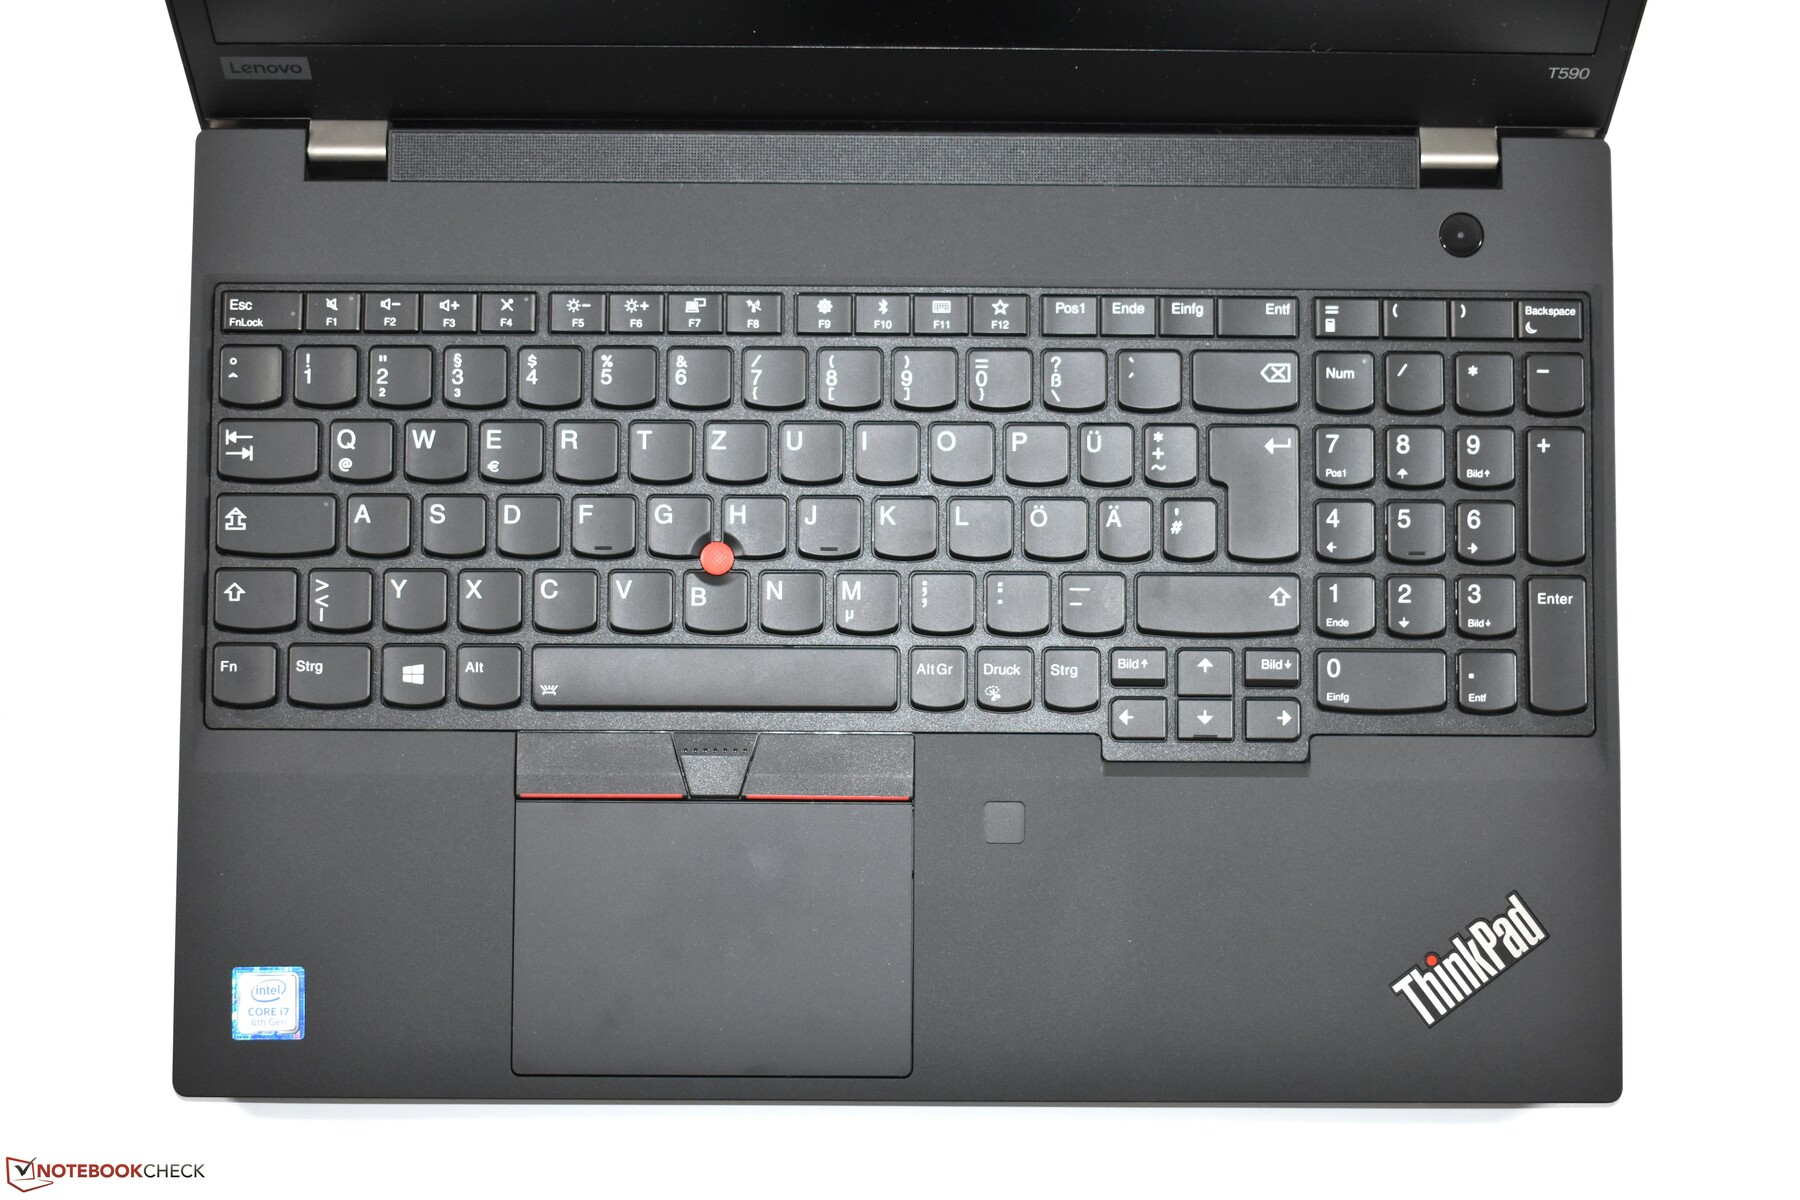
Input Devices: The ThinkPad P15s 2021 continues to offer a 1.8 mm stroke
As one of the few ThinkPads of 2021, the Lenovo ThinkPad P15s Gen 2 continues to offer a keyboard with a 1.8-mm stroke. In terms of the comfort, this means that it offers the same excellent typing experience as its predecessor. Since all the ThinkPad laptops that were redesigned this year only offer a 1.5-mm stroke, we expect this to be the same in the ThinkPad P15s Gen 3 next year.
Lenovo also uses an old design in terms of the TrackPoint keys above the touchpad that still have an angled surface. This is certainly not any worse than the newer, flat design. In addition to the obligatory TrackPoint, there is of course also a touchpad in form of a ClickPad without its own keys. With its plastic surface, its quality is not quite as high as that of a glass touchpad, but we have no complaints about its usability.
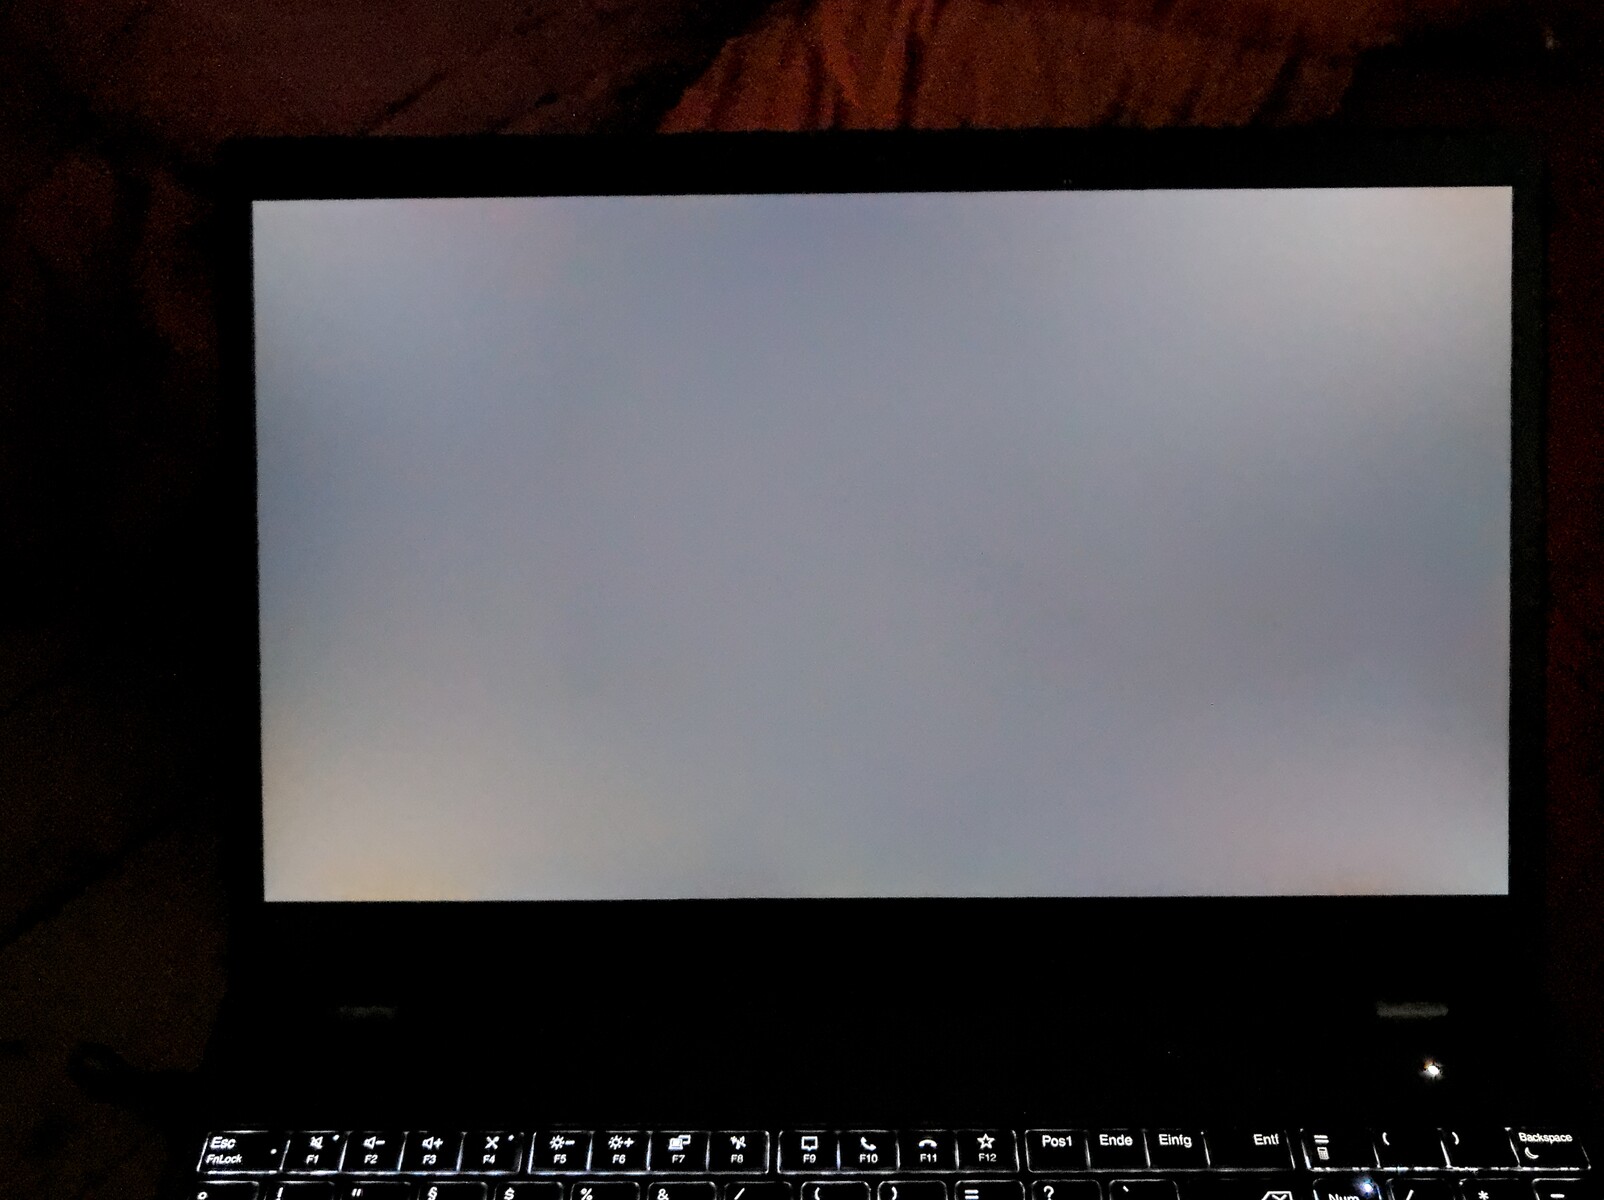
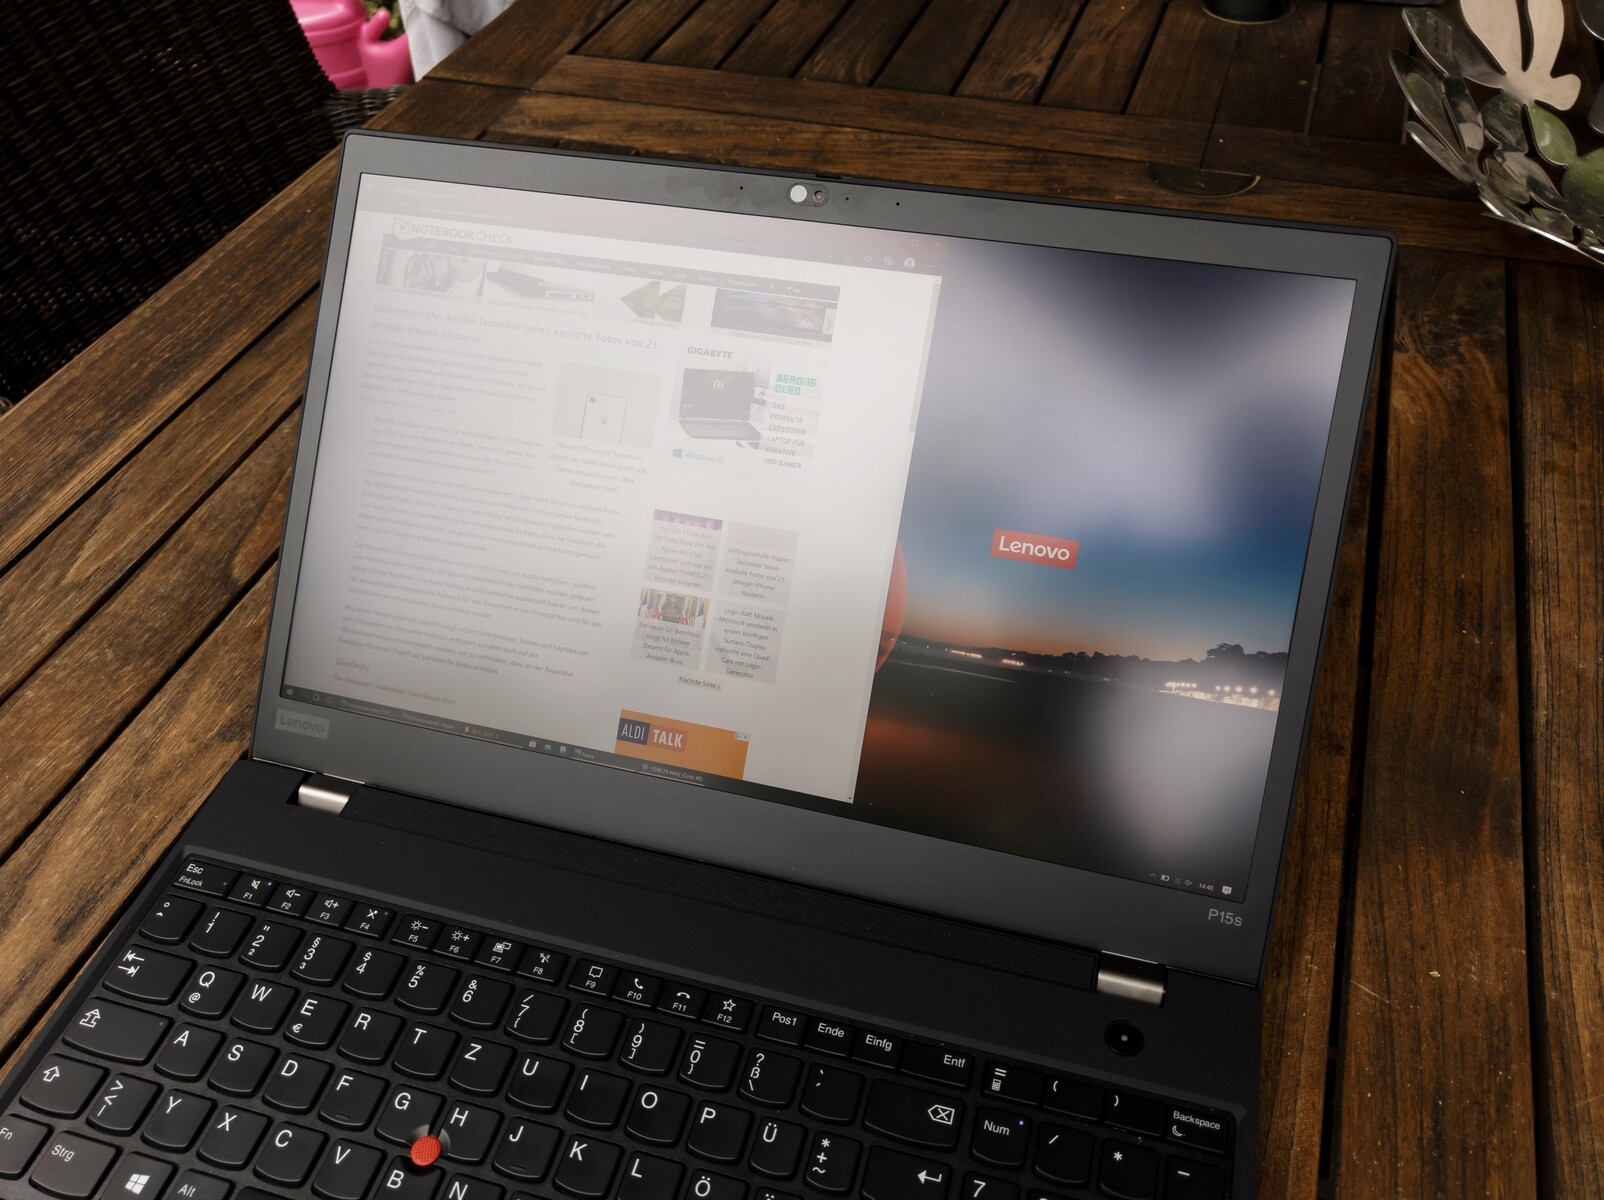
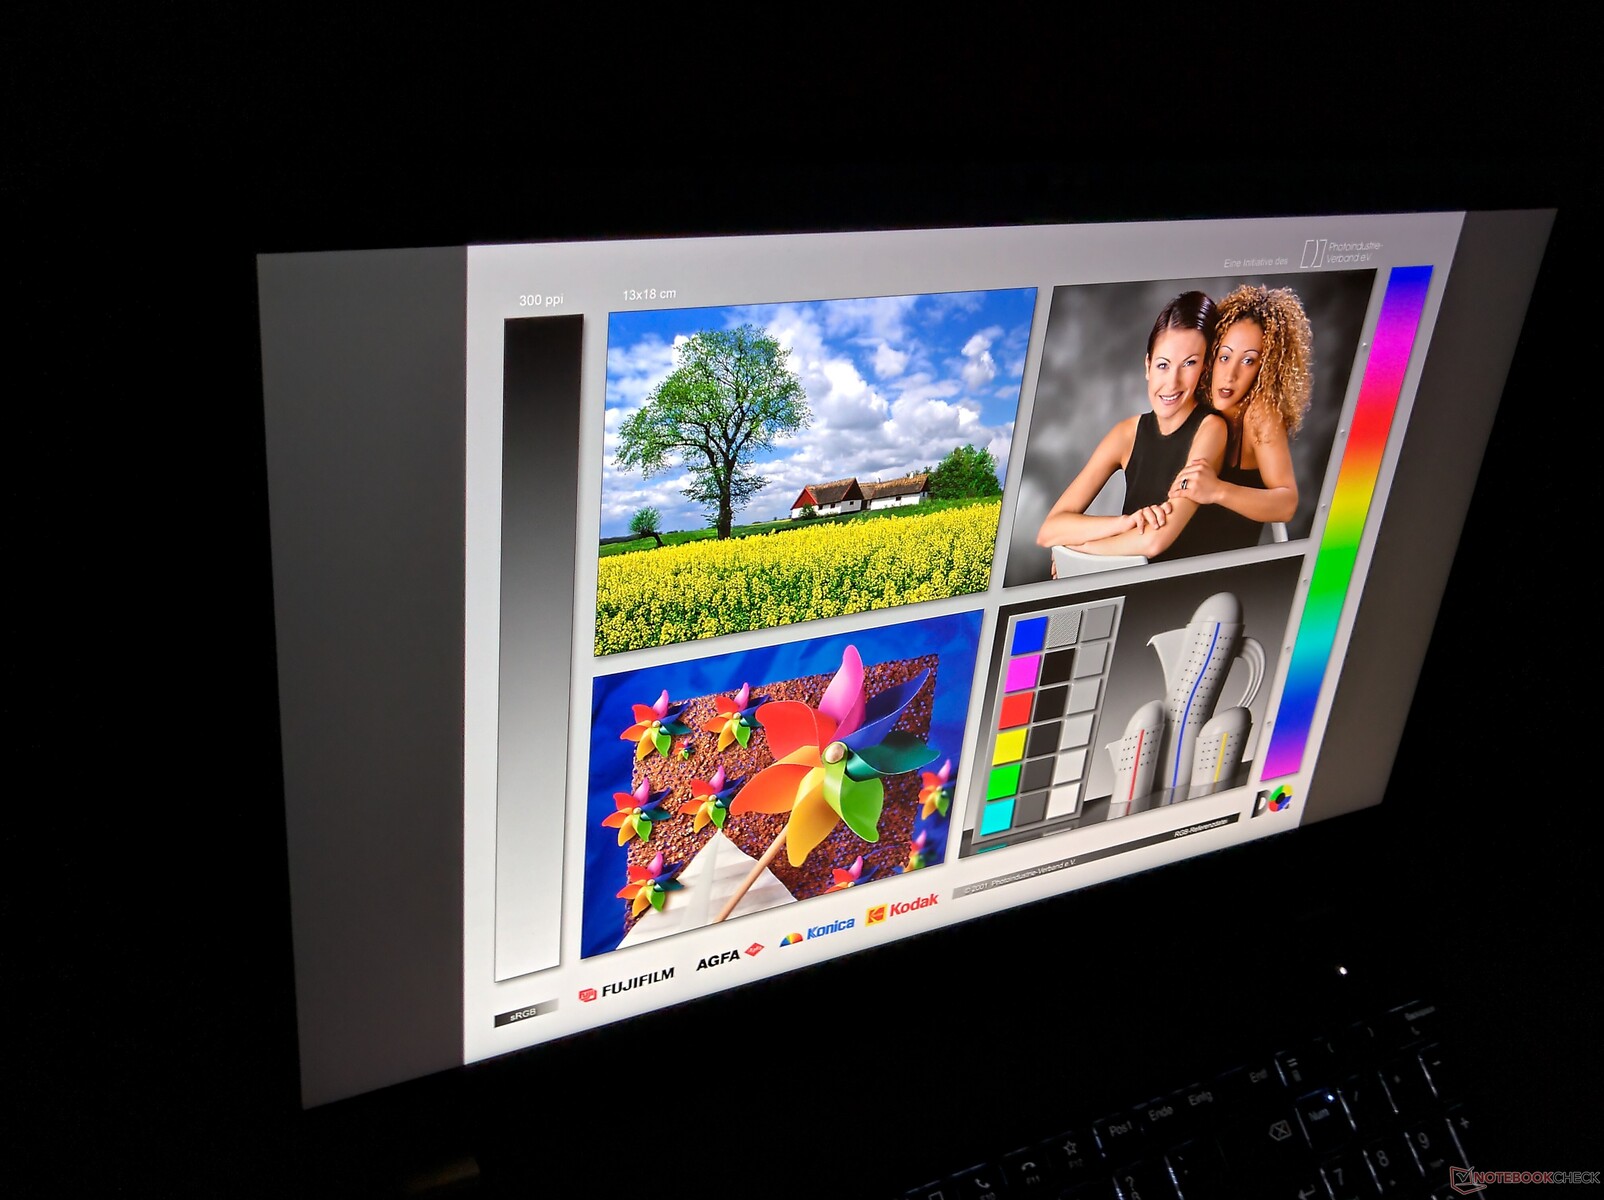
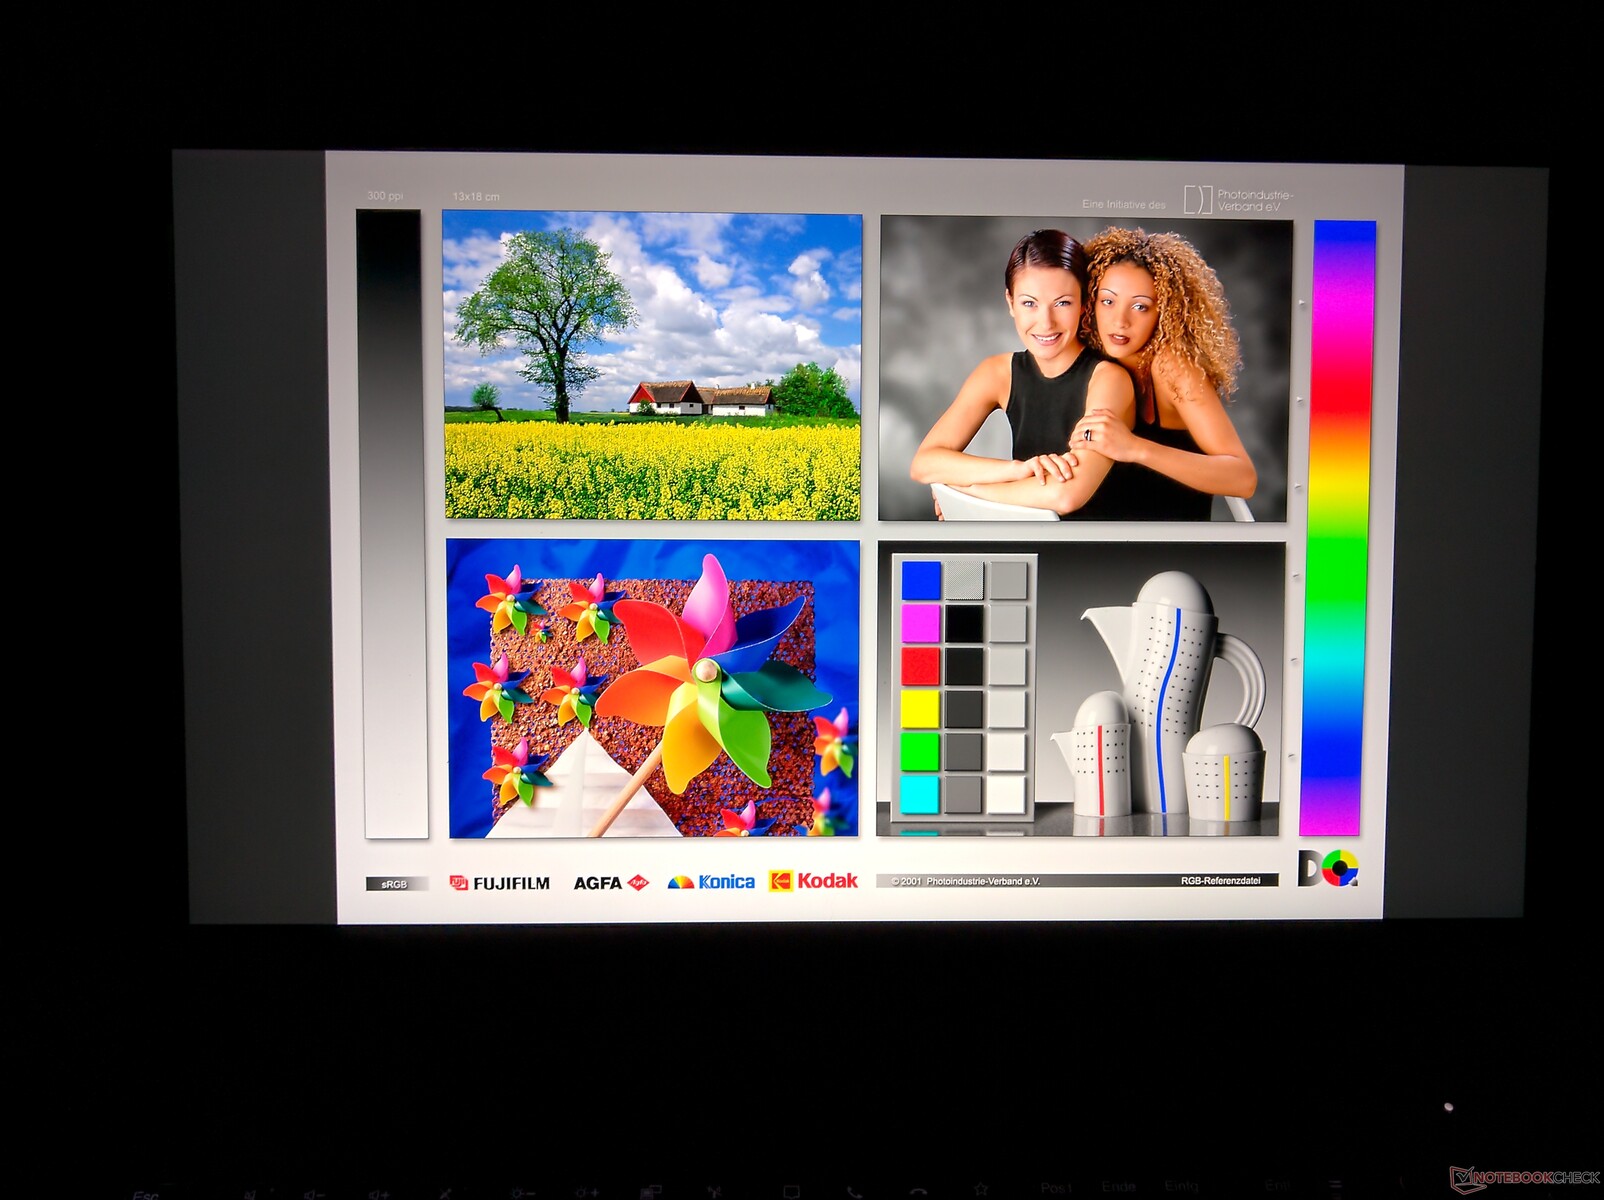
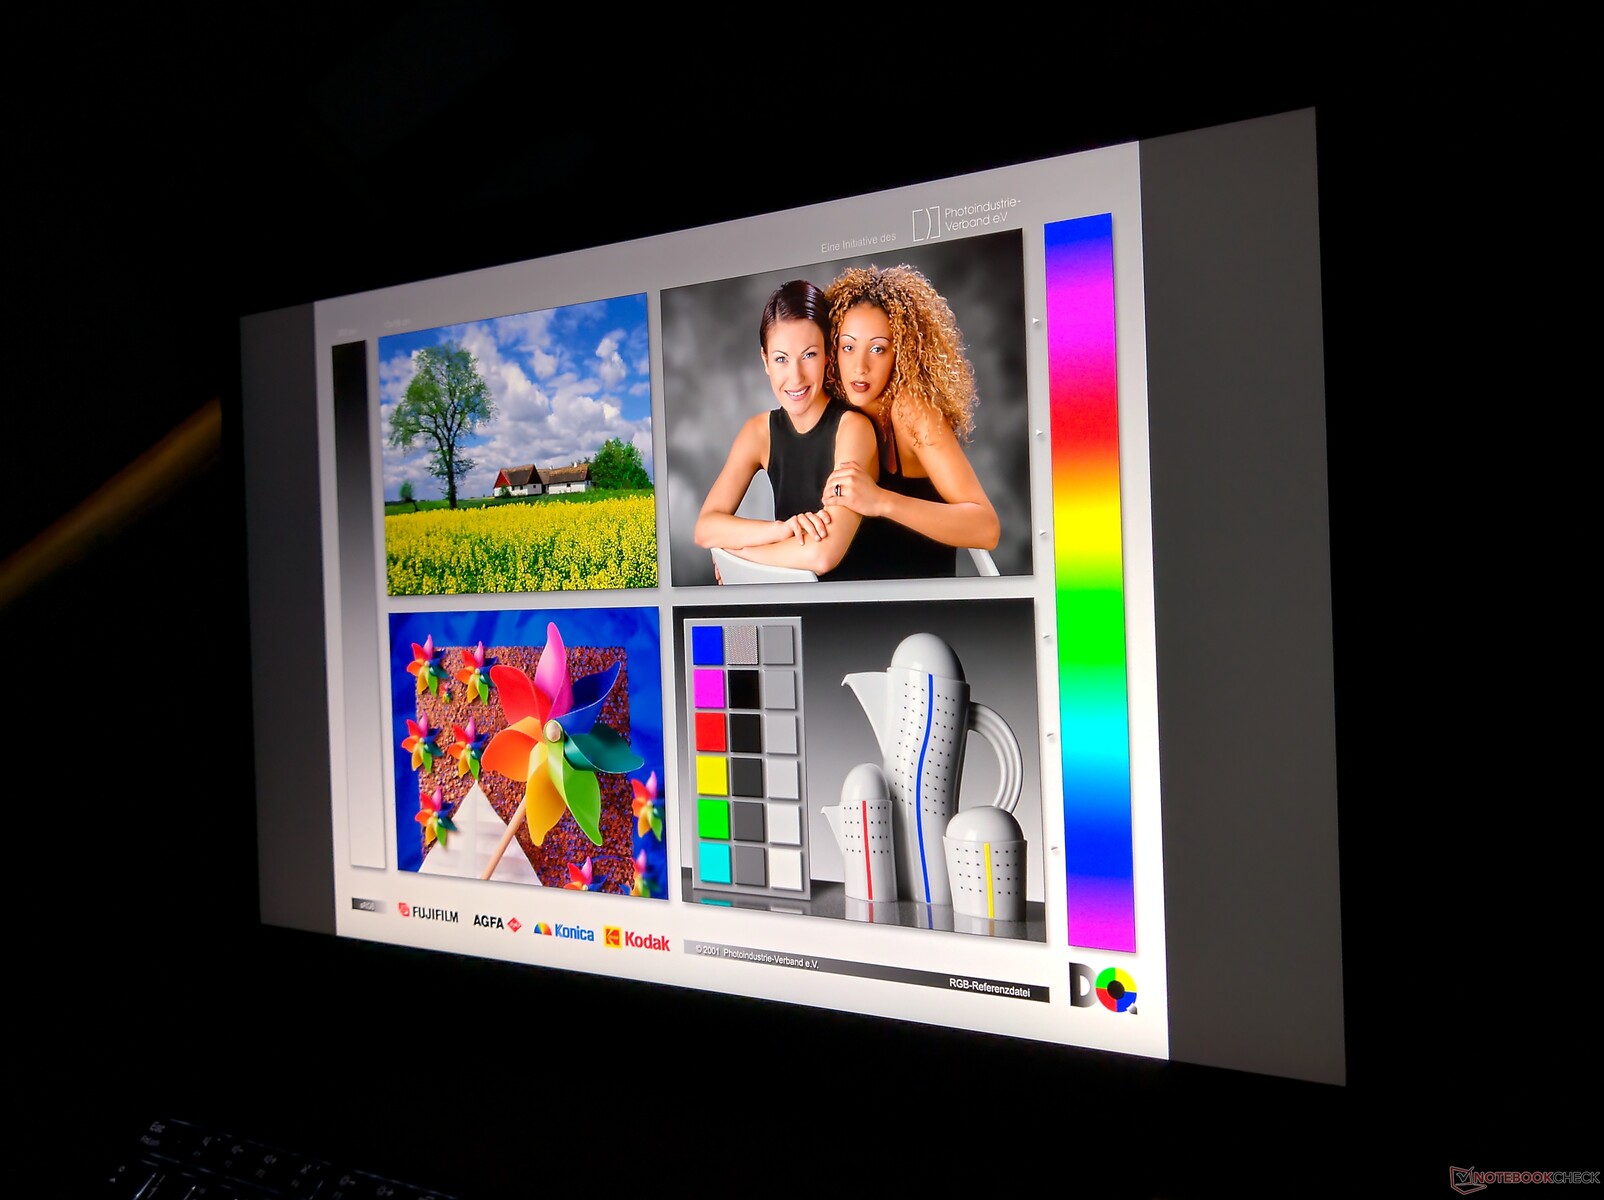
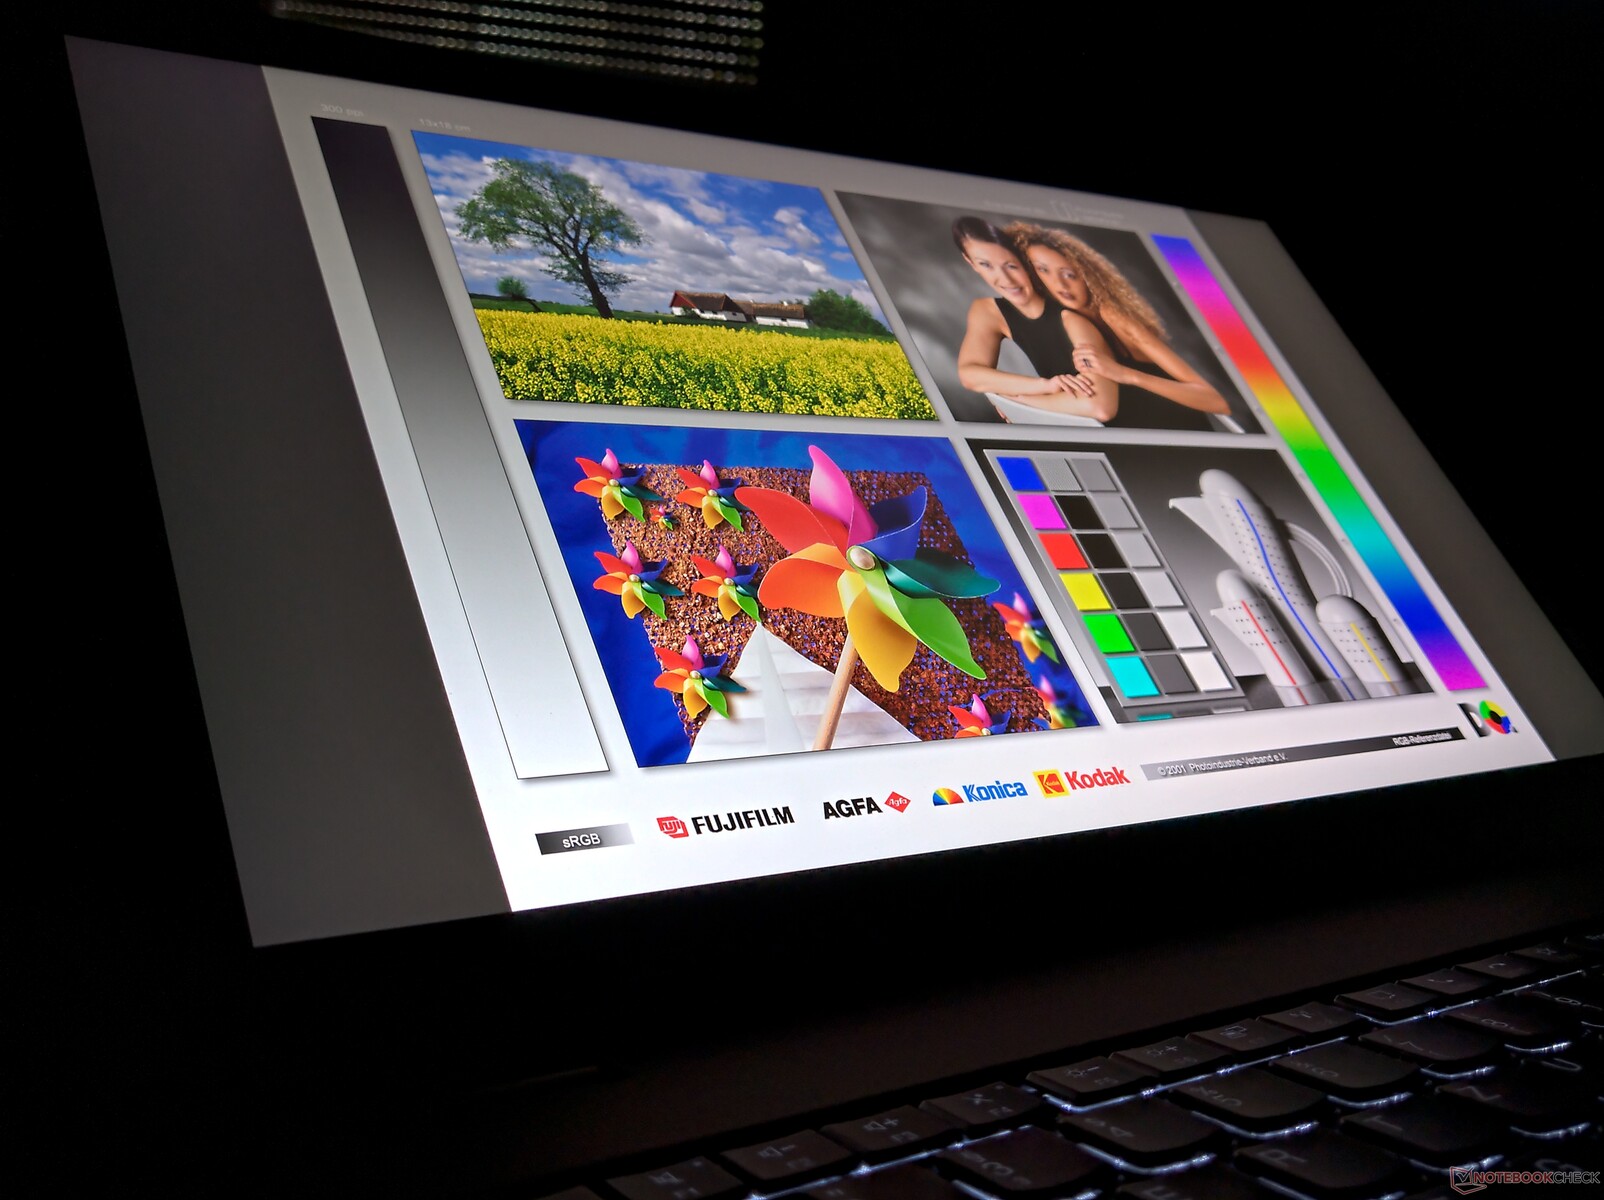
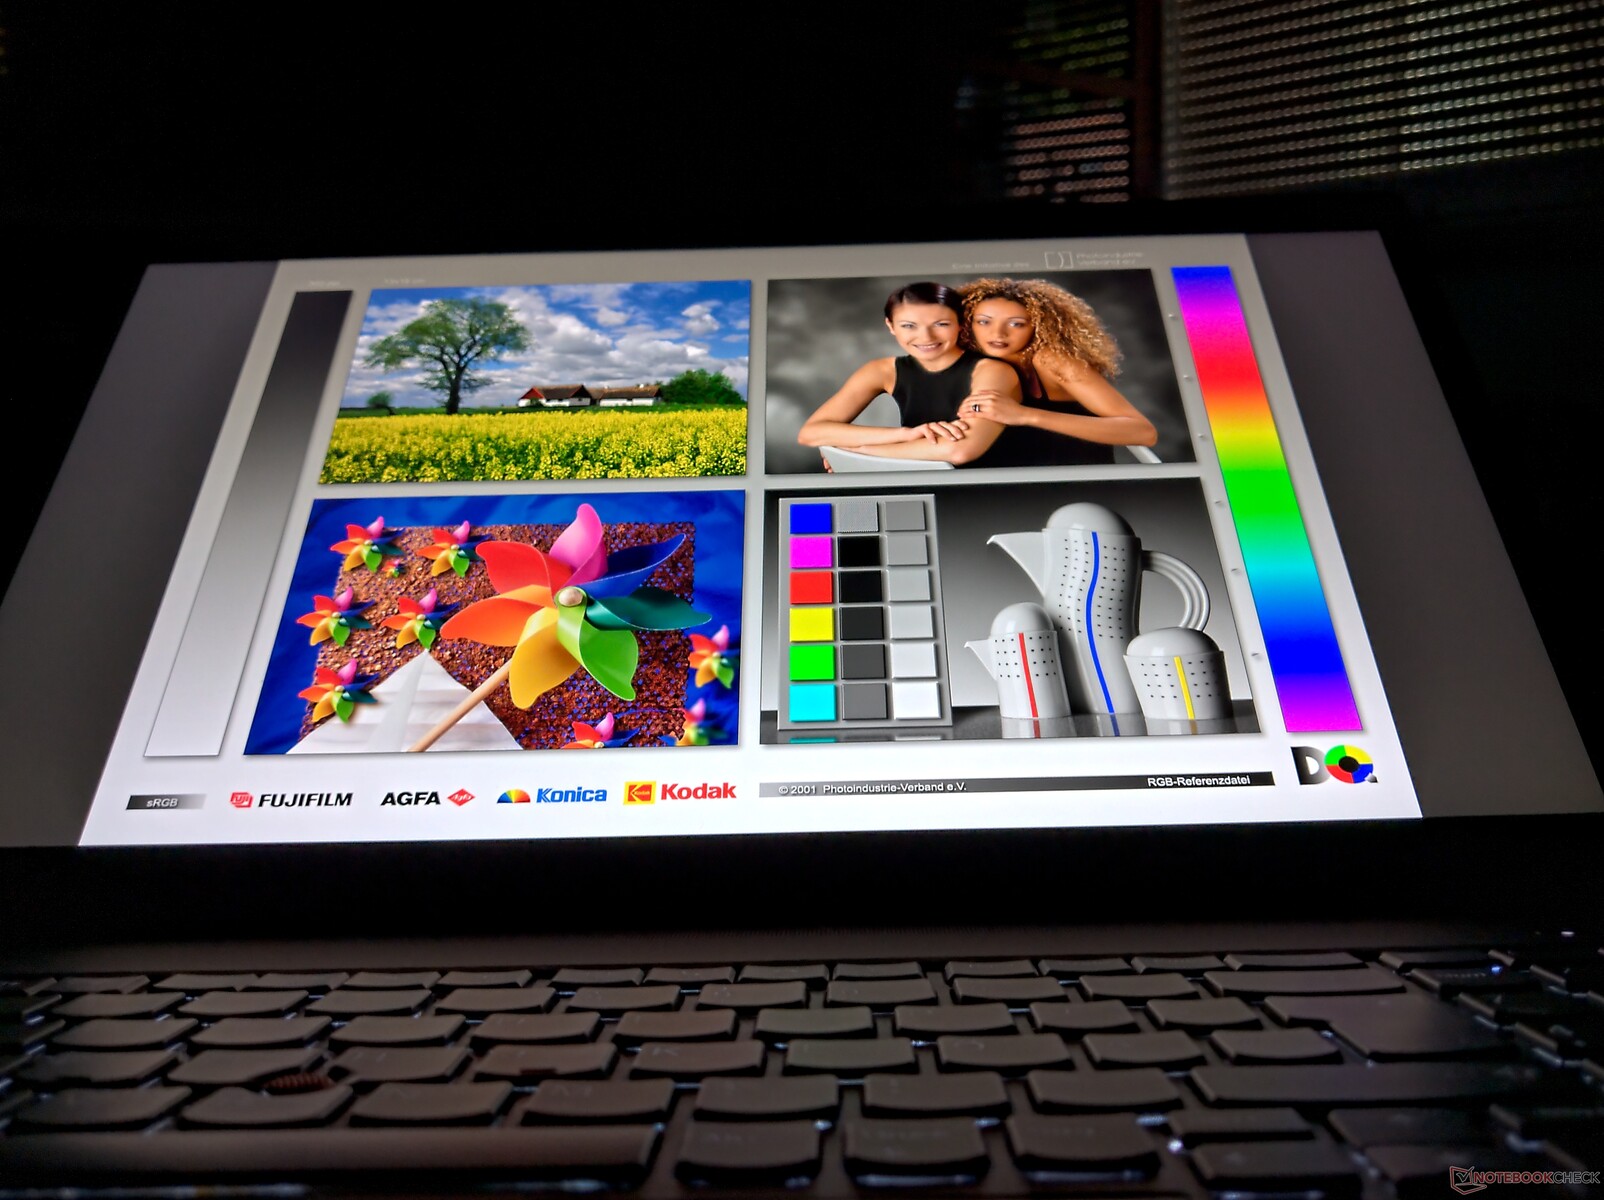
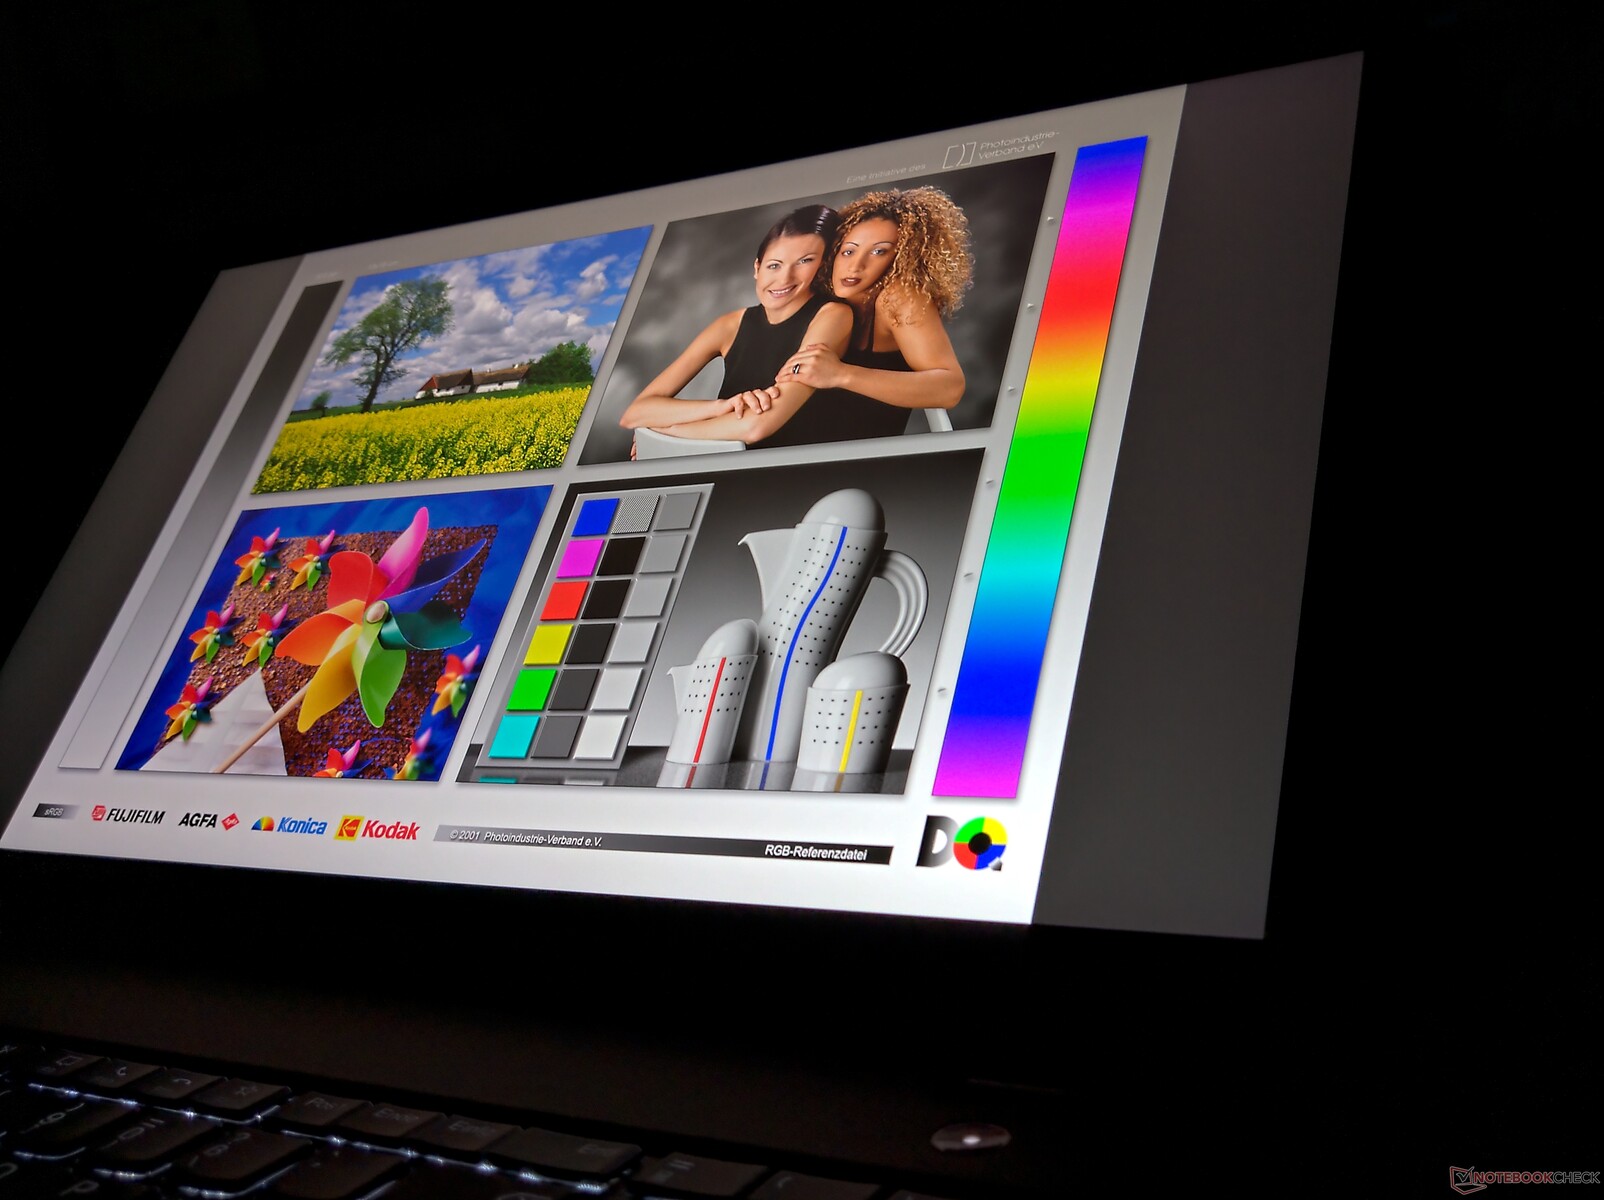
The 4K UHD display is convincing throughout
When buying the P15s G2, you have the choice between Full-HD (1920 x 1080) with or without touch, and 4K UHD (3840 x 2160) without touch. The 15.6-inch displays all have a matte surface and offer the 16:9 format - the Lenovo ThinkPad P15s does not follow the trend toward 16:10 yet.
At 600 cd/m², the 4K UHD LCD used here is supposed to be twice as bright as the available Full-HD panels. We are able to confirm this value specified by Lenovo with our measurements, and at an average of 609 cd/m², the panel even exceeds the specified value.
| |||||||||||||||||||||||||
Brightness Distribution: 91 %
Center on Battery: 596 cd/m²
Contrast: 1776:1 (Black: 0.34 cd/m²)
ΔE ColorChecker Calman: 0.9 | ∀{0.5-29.43 Ø4.71}
calibrated: 0.8
ΔE Greyscale Calman: 1.1 | ∀{0.09-98 Ø4.96}
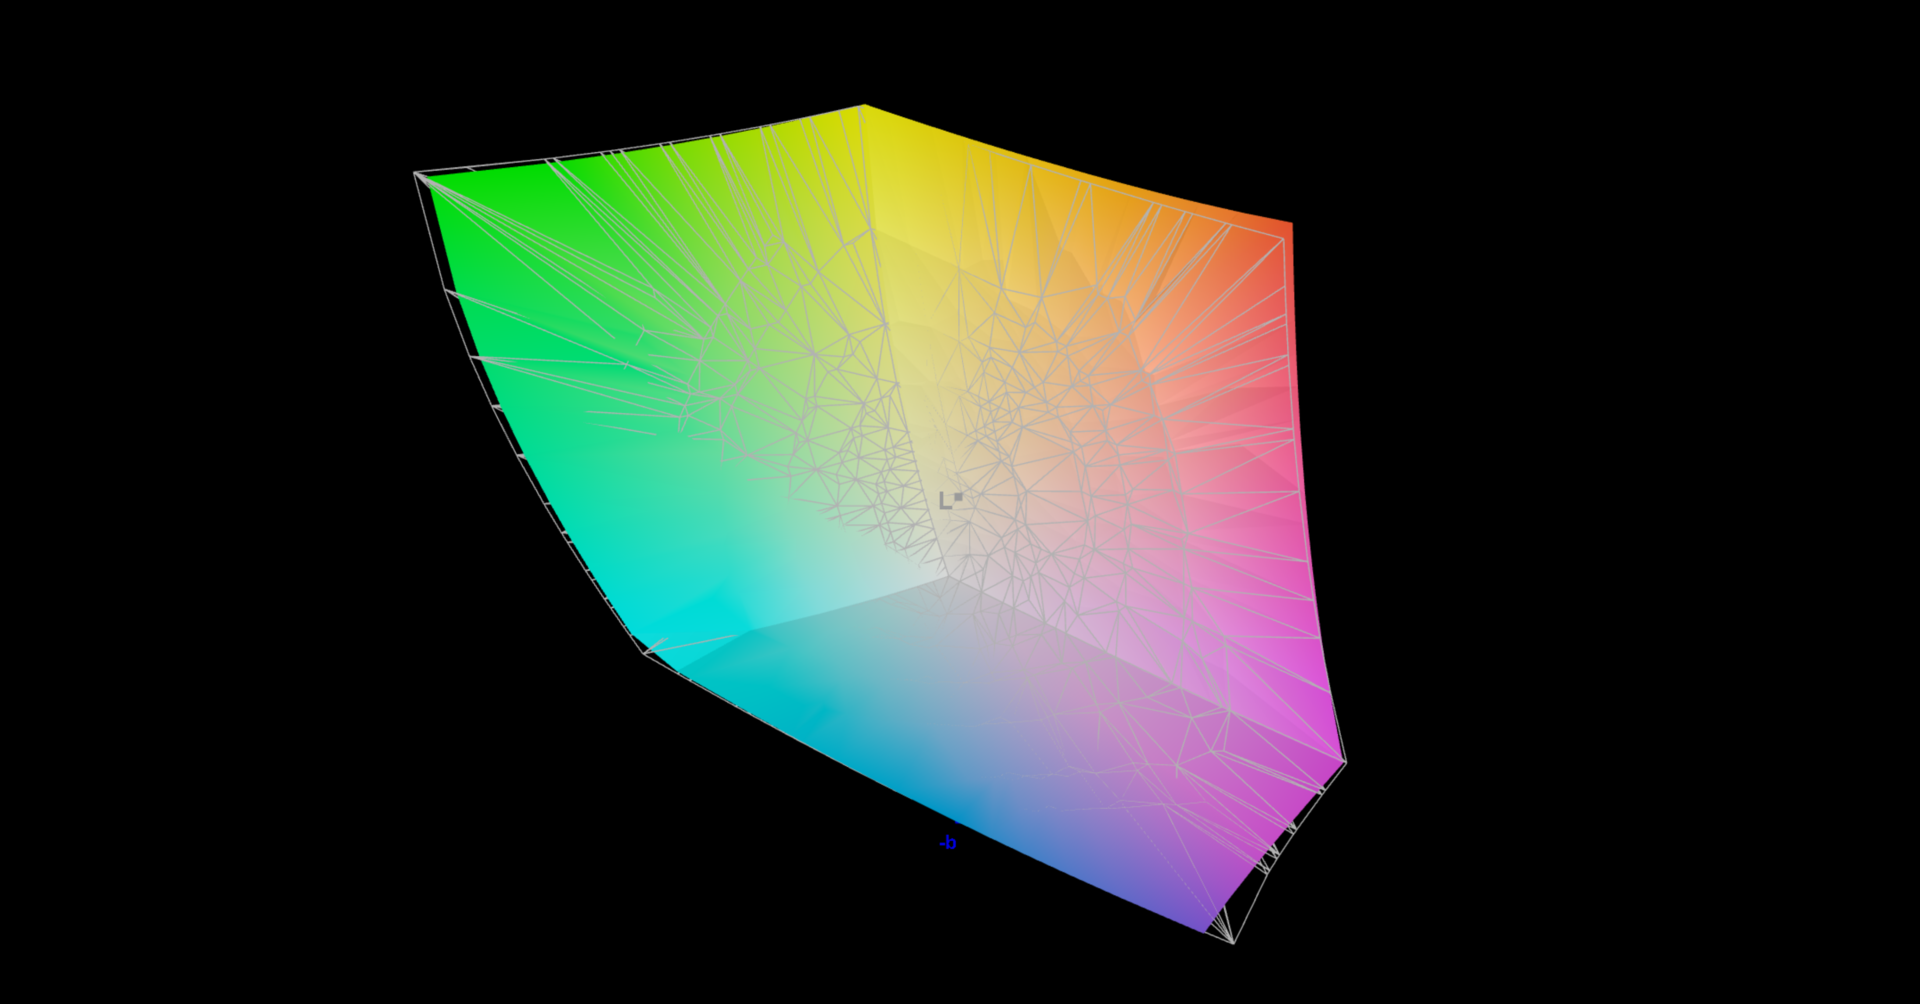
98.6% sRGB (Argyll 1.6.3 3D)
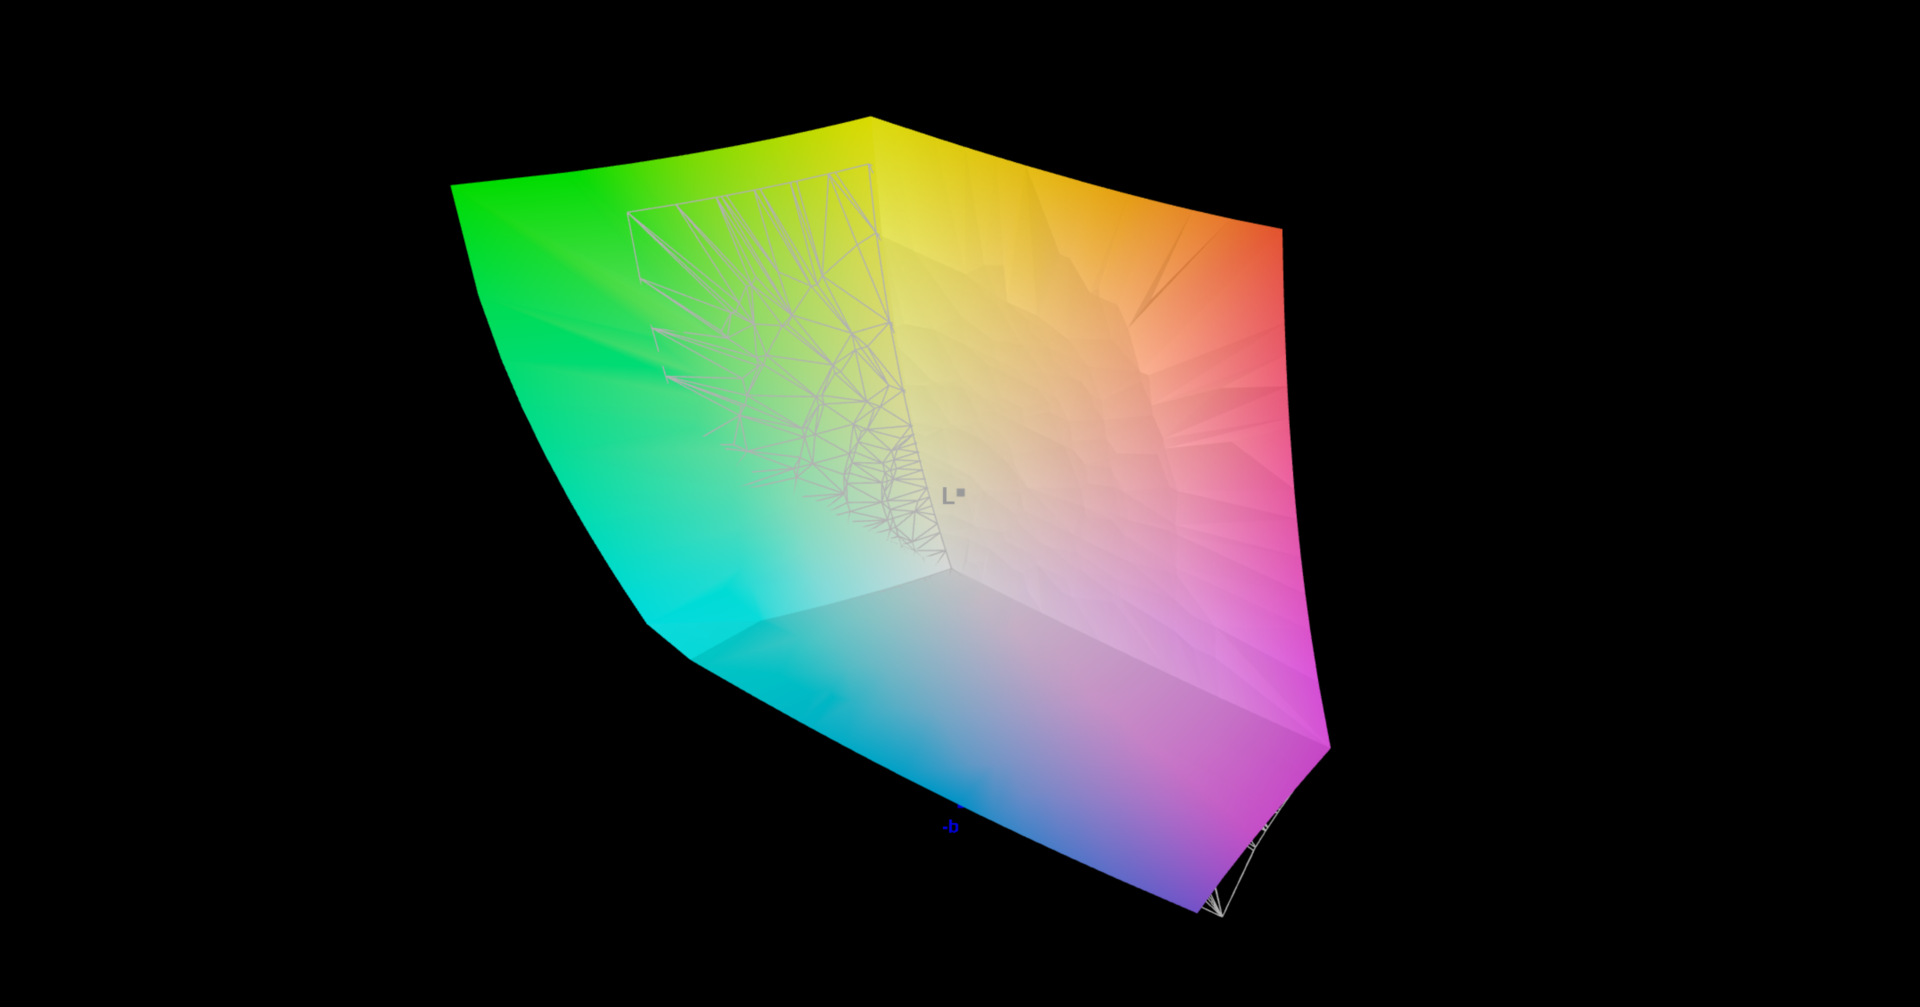
84.5% AdobeRGB 1998 (Argyll 1.6.3 3D)
97.8% AdobeRGB 1998 (Argyll 3D)
98.7% sRGB (Argyll 3D)
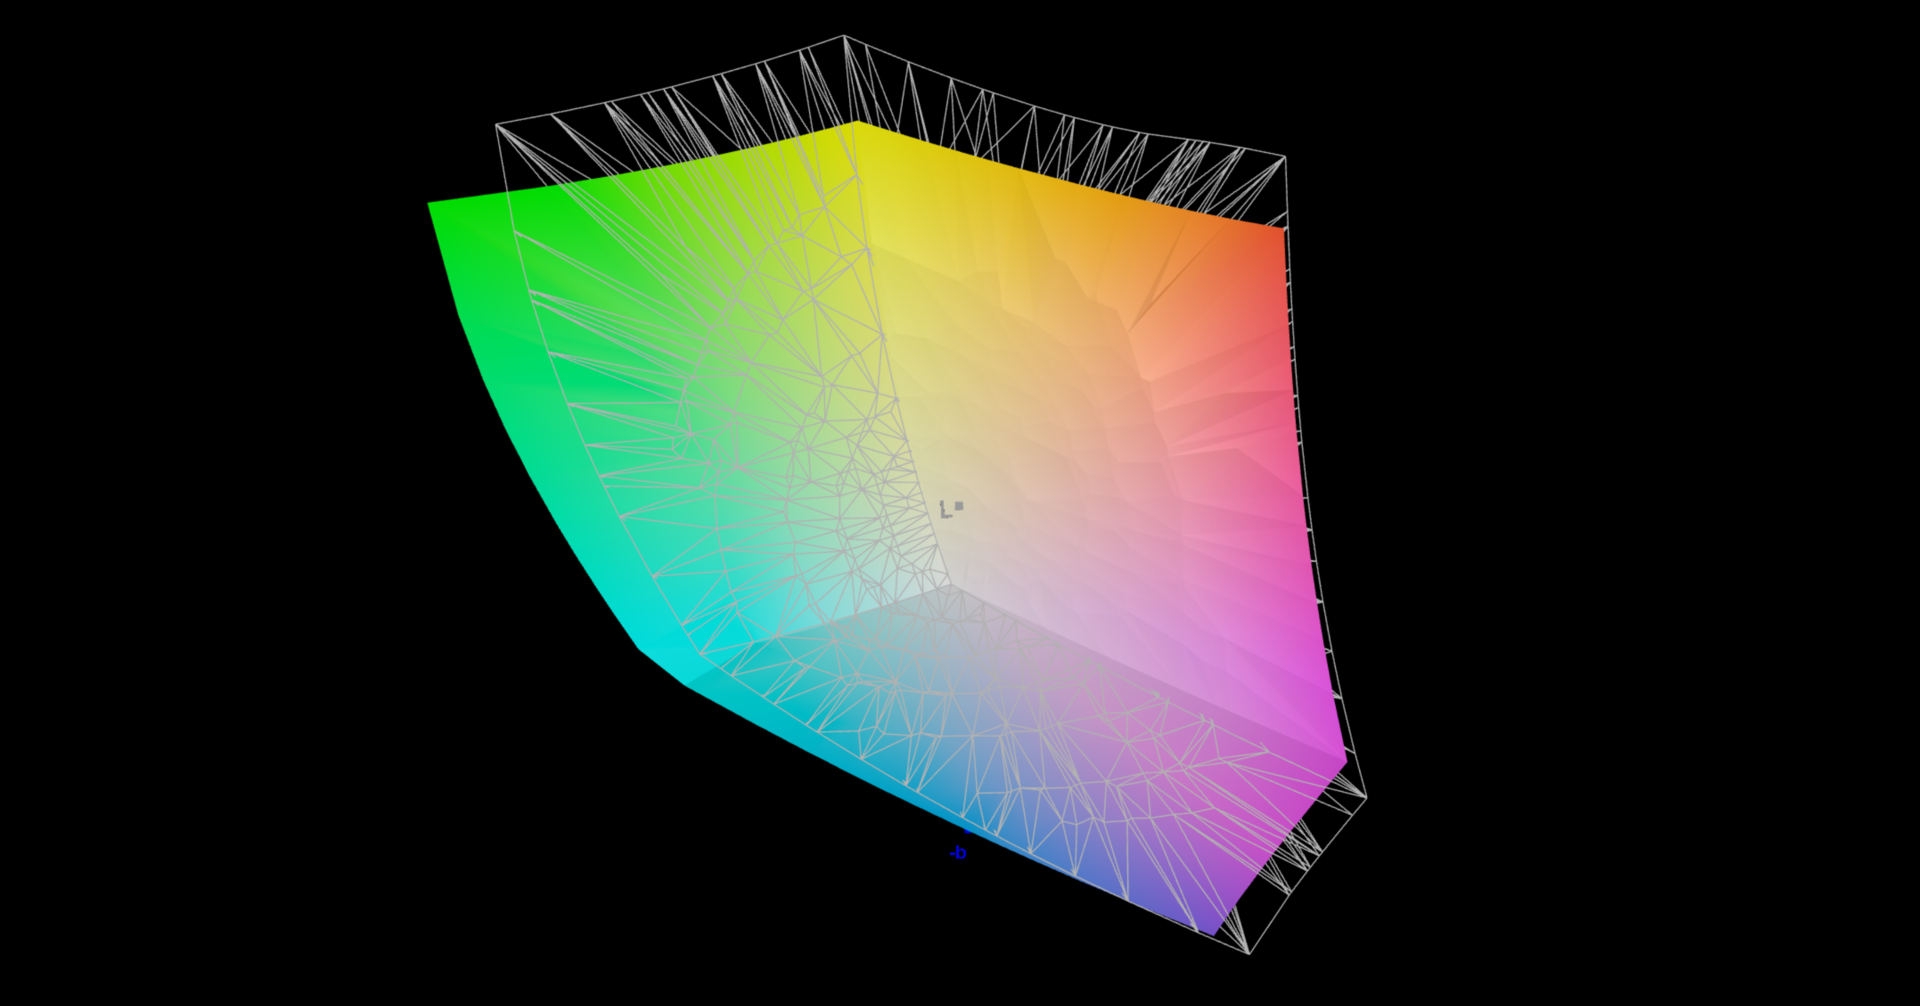
84.5% Display P3 (Argyll 3D)
Gamma: 2.15
CCT: 6656 K
| Lenovo ThinkPad P15s Gen2-20W6000GGE MNF601EA1-1, IPS LED, 3840x2160, 15.6" | Lenovo ThinkPad P15s Gen1-20T4000JGE MNF601EA1-1, IPS LED, 3840x2160, 15.6" | Lenovo ThinkPad P15 Gen1-20ST000DGE N156HCE-EN1, a-Si IPS LED, 1920x1080, 15.6" | HP ZBook Firefly 15 G8 2C9R7EA LGD069B, IPS, 1920x1080, 15.6" | Dell Precision 3000 3551 LG Philips 156WFD, IPS, 1920x1080, 15.6" | |
|---|---|---|---|---|---|
| Display | 1% | -19% | -16% | -53% | |
| Display P3 Coverage (%) | 84.5 | 85.8 2% | 66.6 -21% | 68.6 -19% | 37.5 -56% |
| sRGB Coverage (%) | 98.7 | 99.4 1% | 92.3 -6% | 98.5 0% | 56.5 -43% |
| AdobeRGB 1998 Coverage (%) | 97.8 | 98.7 1% | 67.1 -31% | 70 -28% | 38.74 -60% |
| Response Times | -6% | -22% | -39% | 6% | |
| Response Time Grey 50% / Grey 80% * (ms) | 40 ? | 42 ? -5% | 41.2 ? -3% | 56 ? -40% | 29.6 ? 26% |
| Response Time Black / White * (ms) | 23.2 ? | 24.8 ? -7% | 32.8 ? -41% | 32 ? -38% | 26.4 ? -14% |
| PWM Frequency (Hz) | 24270 | ||||
| Screen | -50% | -166% | -138% | -173% | |
| Brightness middle (cd/m²) | 604 | 628 4% | 338 -44% | 397 -34% | 235.5 -61% |
| Brightness (cd/m²) | 609 | 608 0% | 304 -50% | 402 -34% | 228 -63% |
| Brightness Distribution (%) | 91 | 90 -1% | 81 -11% | 84 -8% | 89 -2% |
| Black Level * (cd/m²) | 0.34 | 0.38 -12% | 0.45 -32% | 0.13 62% | 0.25 26% |
| Contrast (:1) | 1776 | 1653 -7% | 751 -58% | 3054 72% | 942 -47% |
| Colorchecker dE 2000 * | 0.9 | 2.3 -156% | 5.5 -511% | 5.9 -556% | 5.44 -504% |
| Colorchecker dE 2000 max. * | 2.6 | 4.9 -88% | 11.5 -342% | 9.4 -262% | 13.58 -422% |
| Colorchecker dE 2000 calibrated * | 0.8 | 1.2 -50% | 1.9 -137% | 1.1 -38% | 5.2 -550% |
| Greyscale dE 2000 * | 1.1 | 3.8 -245% | 7.8 -609% | 8.8 -700% | 3.1 -182% |
| Gamma | 2.15 102% | 2.22 99% | 2.24 98% | 2.47 89% | 2.42 91% |
| CCT | 6656 98% | 6914 94% | 6764 96% | 6416 101% | 7070 92% |
| Color Space (Percent of AdobeRGB 1998) (%) | 84.5 | 85.6 1% | 60 -29% | 63.7 -25% | 35.5 -58% |
| Color Space (Percent of sRGB) (%) | 98.6 | 99.4 1% | 92.1 -7% | 98.5 0% | 56.1 -43% |
| Total Average (Program / Settings) | -18% /
-35% | -69% /
-121% | -64% /
-103% | -73% /
-128% |
* ... smaller is better
Display Response Times
| ↔ Response Time Black to White | ||
|---|---|---|
| 23.2 ms ... rise ↗ and fall ↘ combined | ↗ 10.8 ms rise | 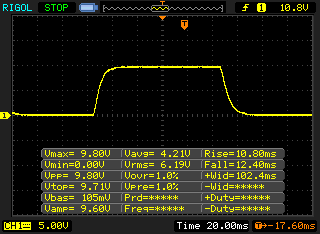 |
| ↘ 12.4 ms fall | ||
| The screen shows good response rates in our tests, but may be too slow for competitive gamers. In comparison, all tested devices range from 0.1 (minimum) to 240 (maximum) ms. » 53 % of all devices are better. This means that the measured response time is worse than the average of all tested devices (19.8 ms). | ||
| ↔ Response Time 50% Grey to 80% Grey | ||
| 40 ms ... rise ↗ and fall ↘ combined | ↗ 19.6 ms rise | 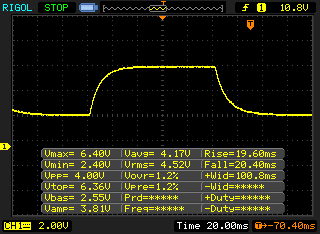 |
| ↘ 20.4 ms fall | ||
| The screen shows slow response rates in our tests and will be unsatisfactory for gamers. In comparison, all tested devices range from 0.165 (minimum) to 636 (maximum) ms. » 61 % of all devices are better. This means that the measured response time is worse than the average of all tested devices (31 ms). | ||
Screen Flickering / PWM (Pulse-Width Modulation)
| Screen flickering / PWM not detected |  | ||
In comparison: 52 % of all tested devices do not use PWM to dim the display. If PWM was detected, an average of 7754 (minimum: 5 - maximum: 343500) Hz was measured. | |||
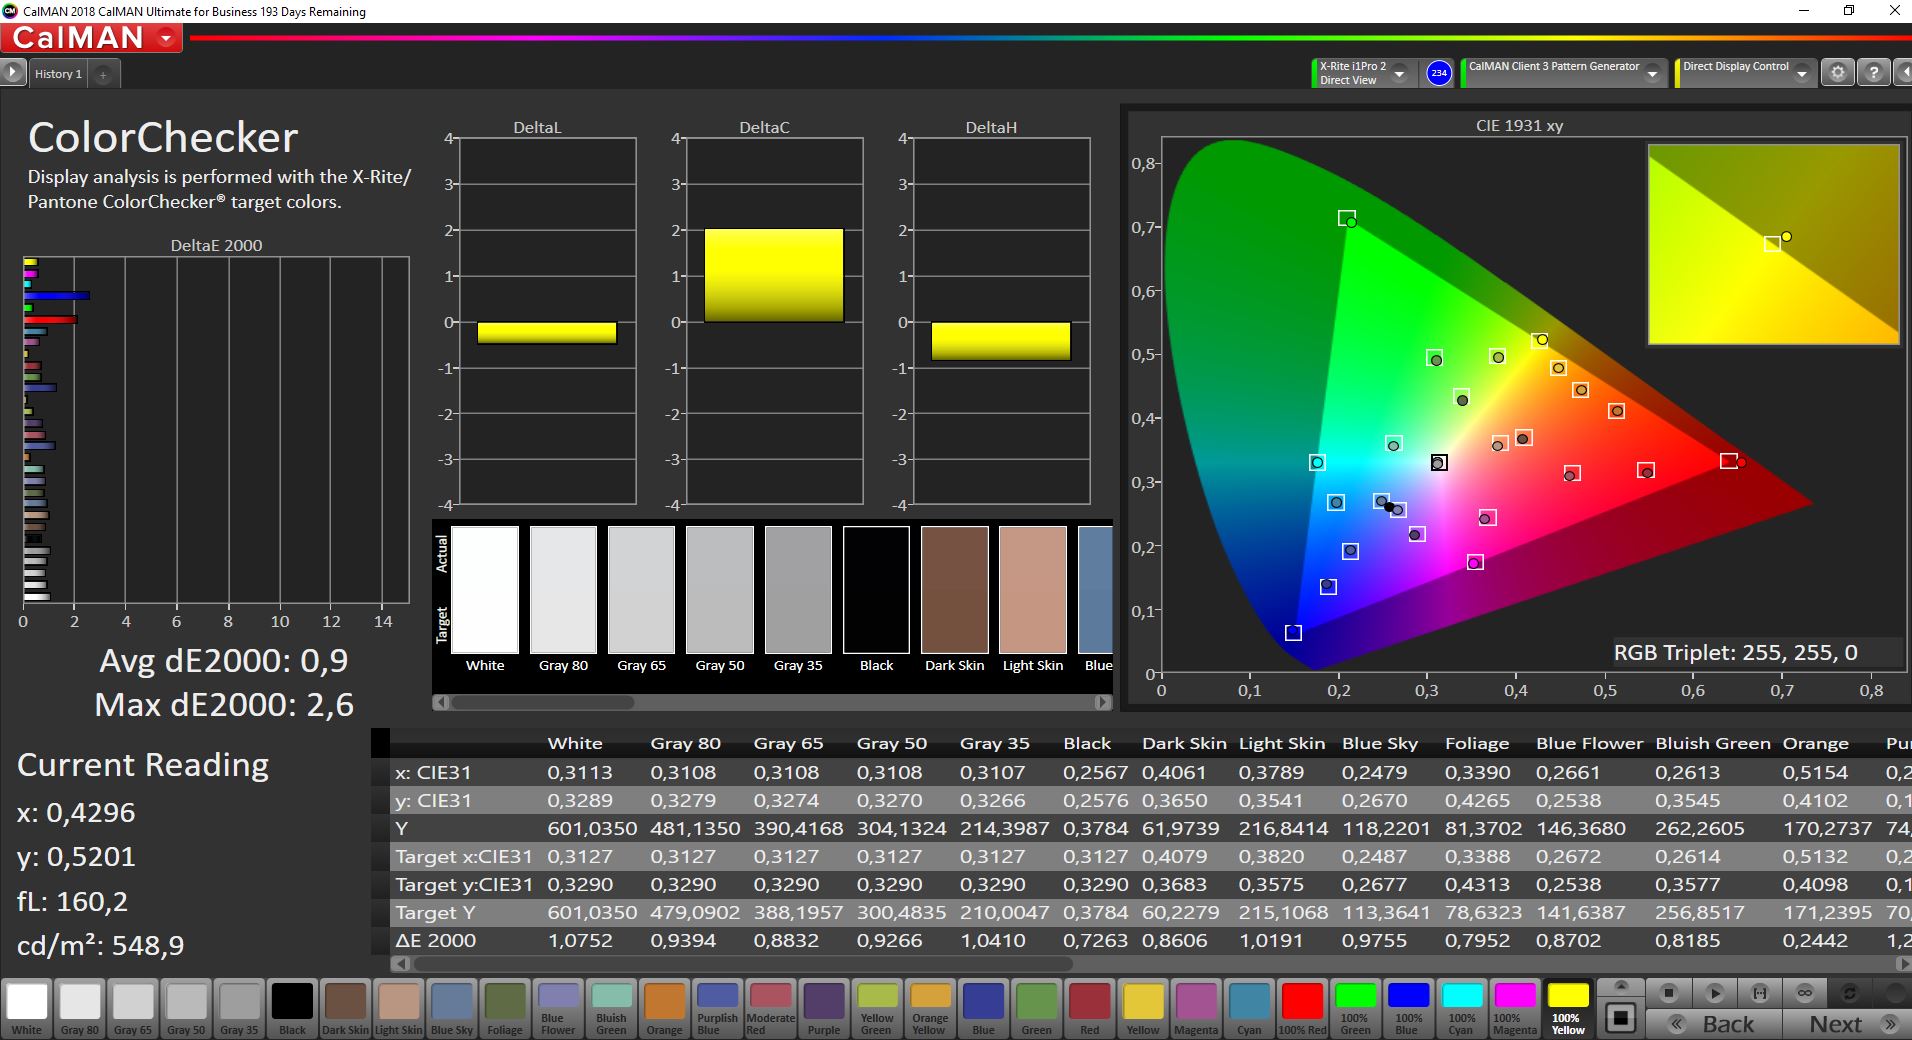

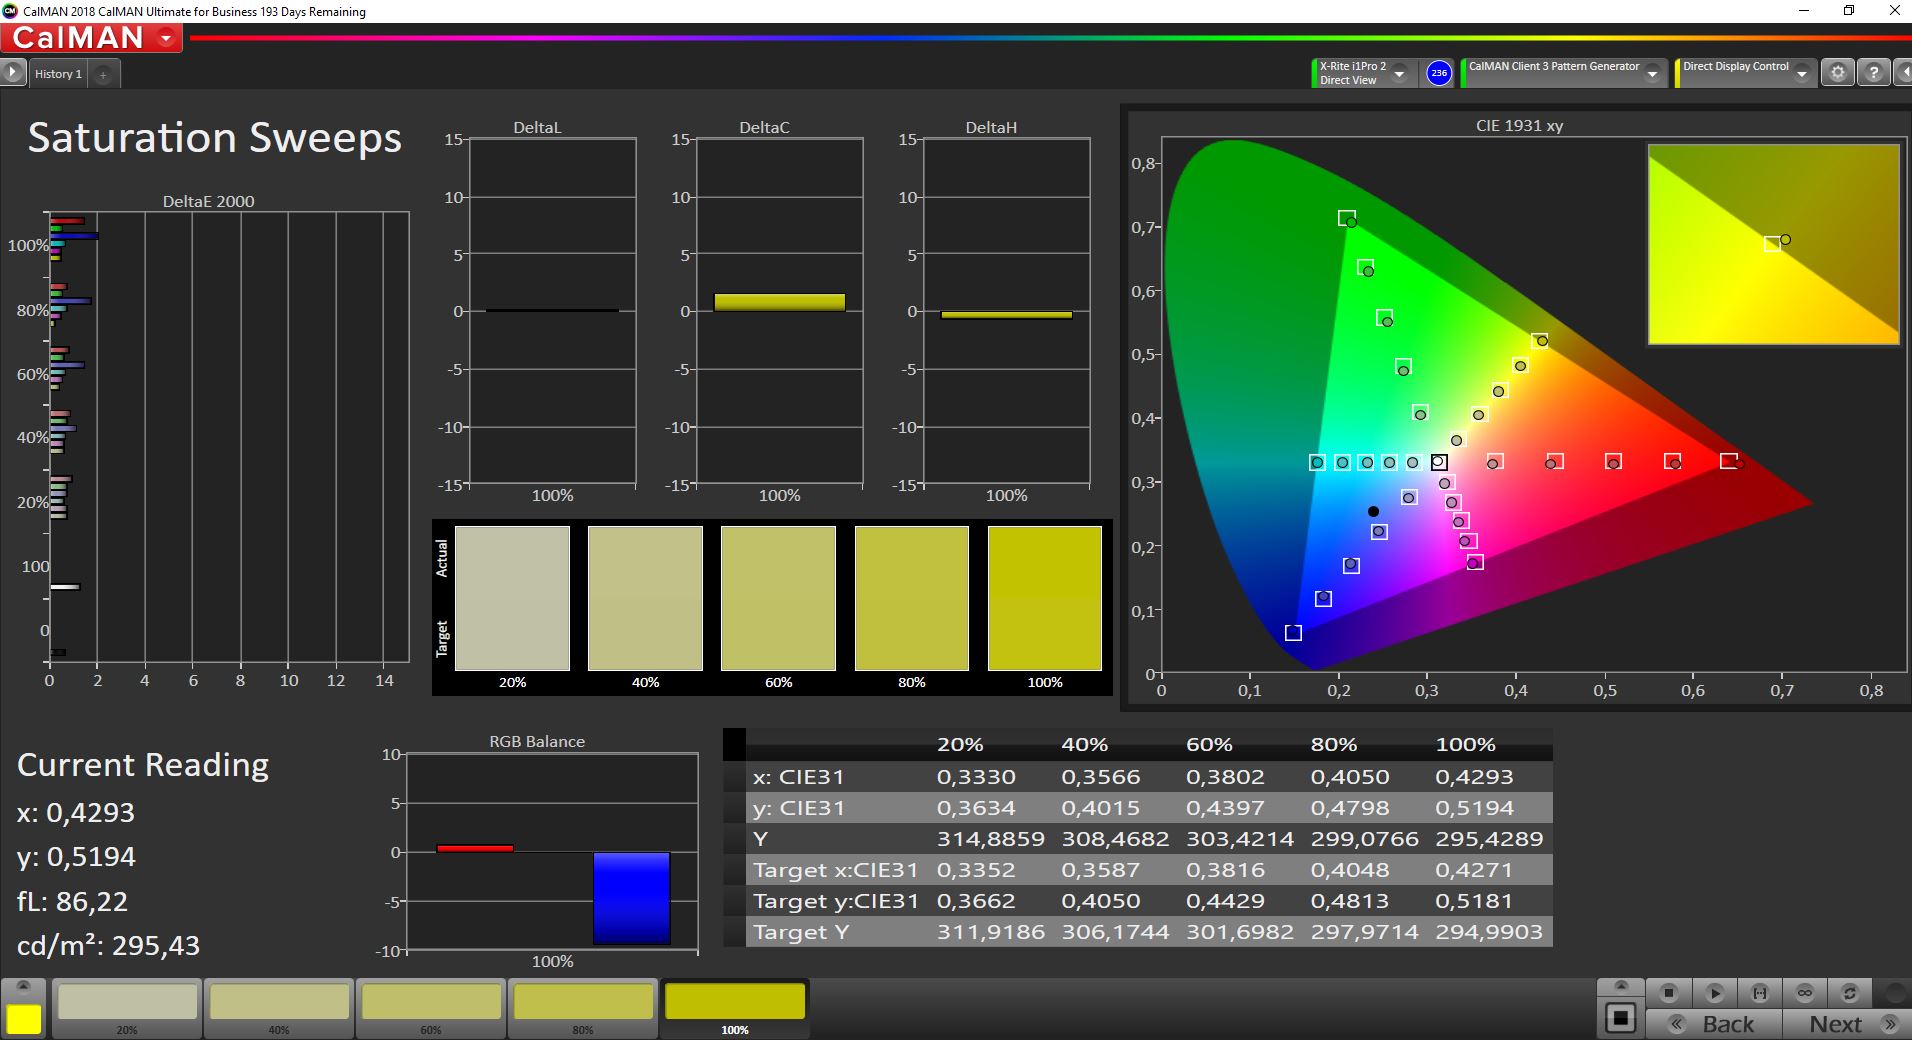
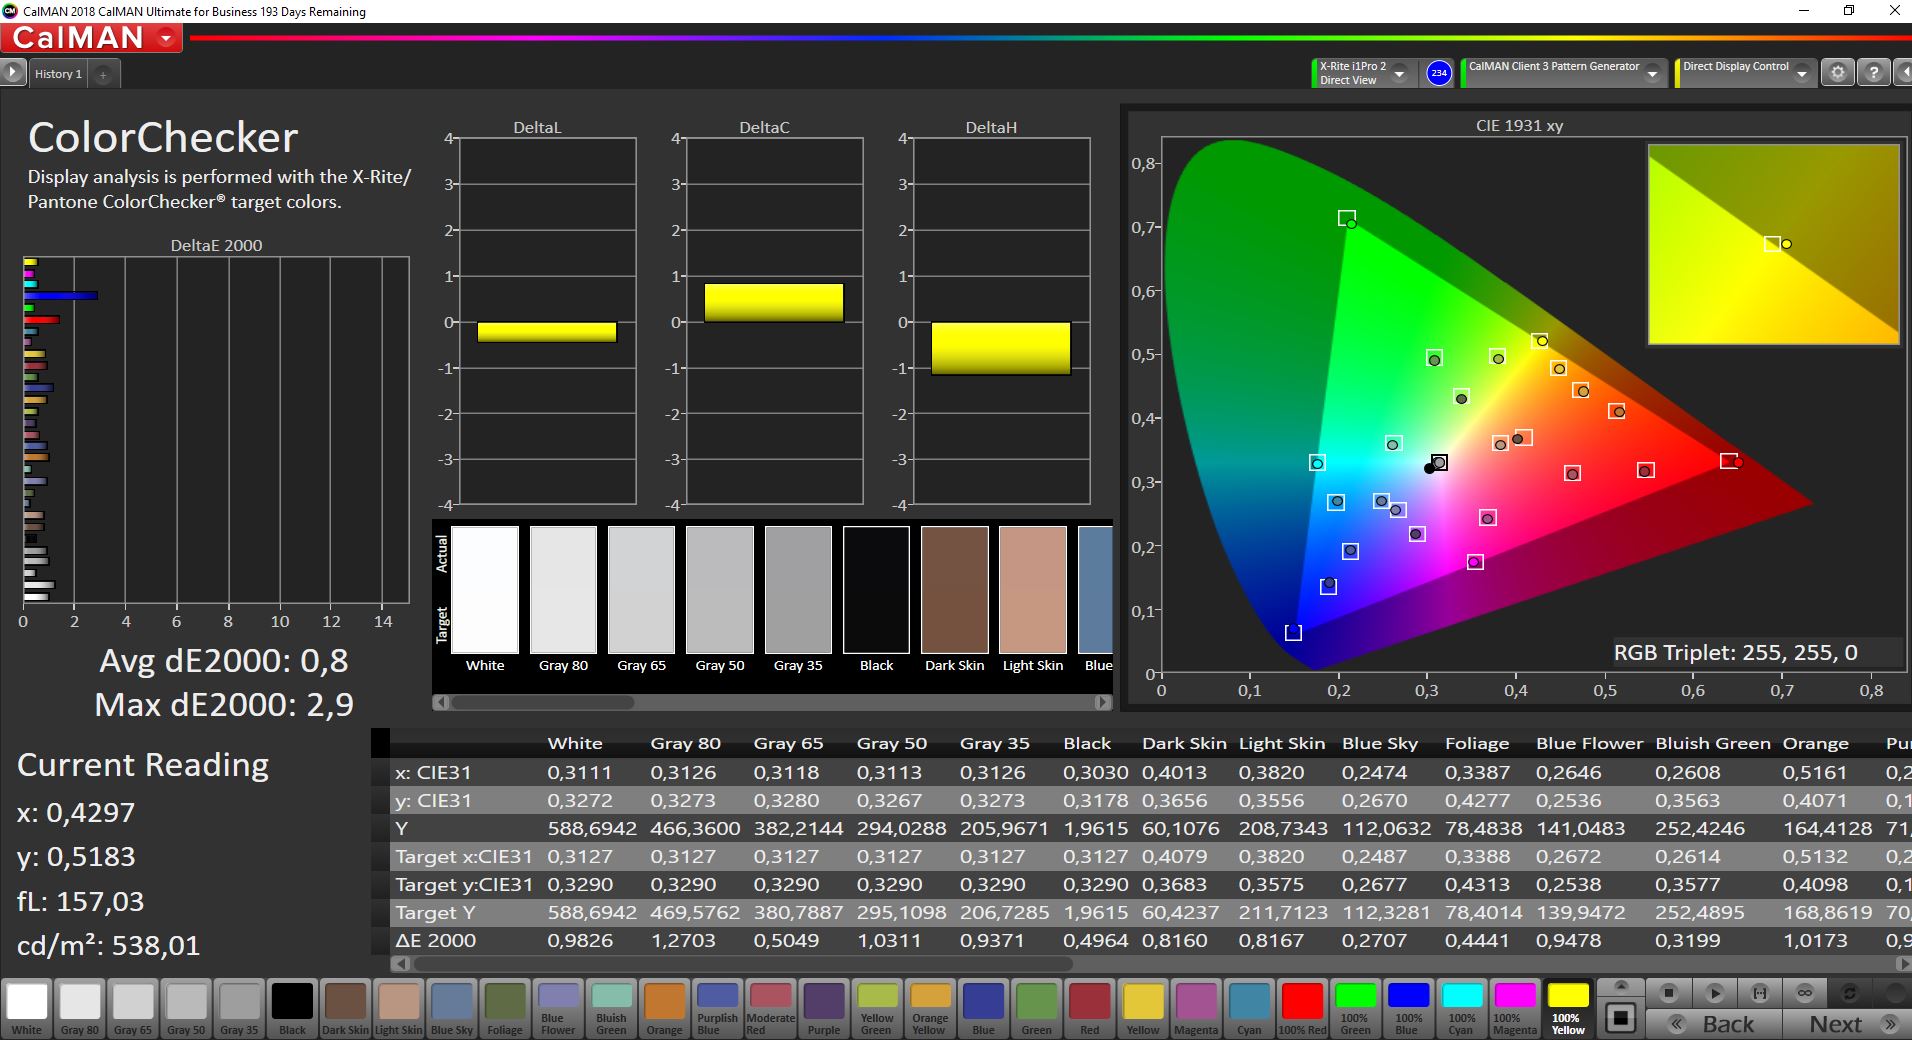
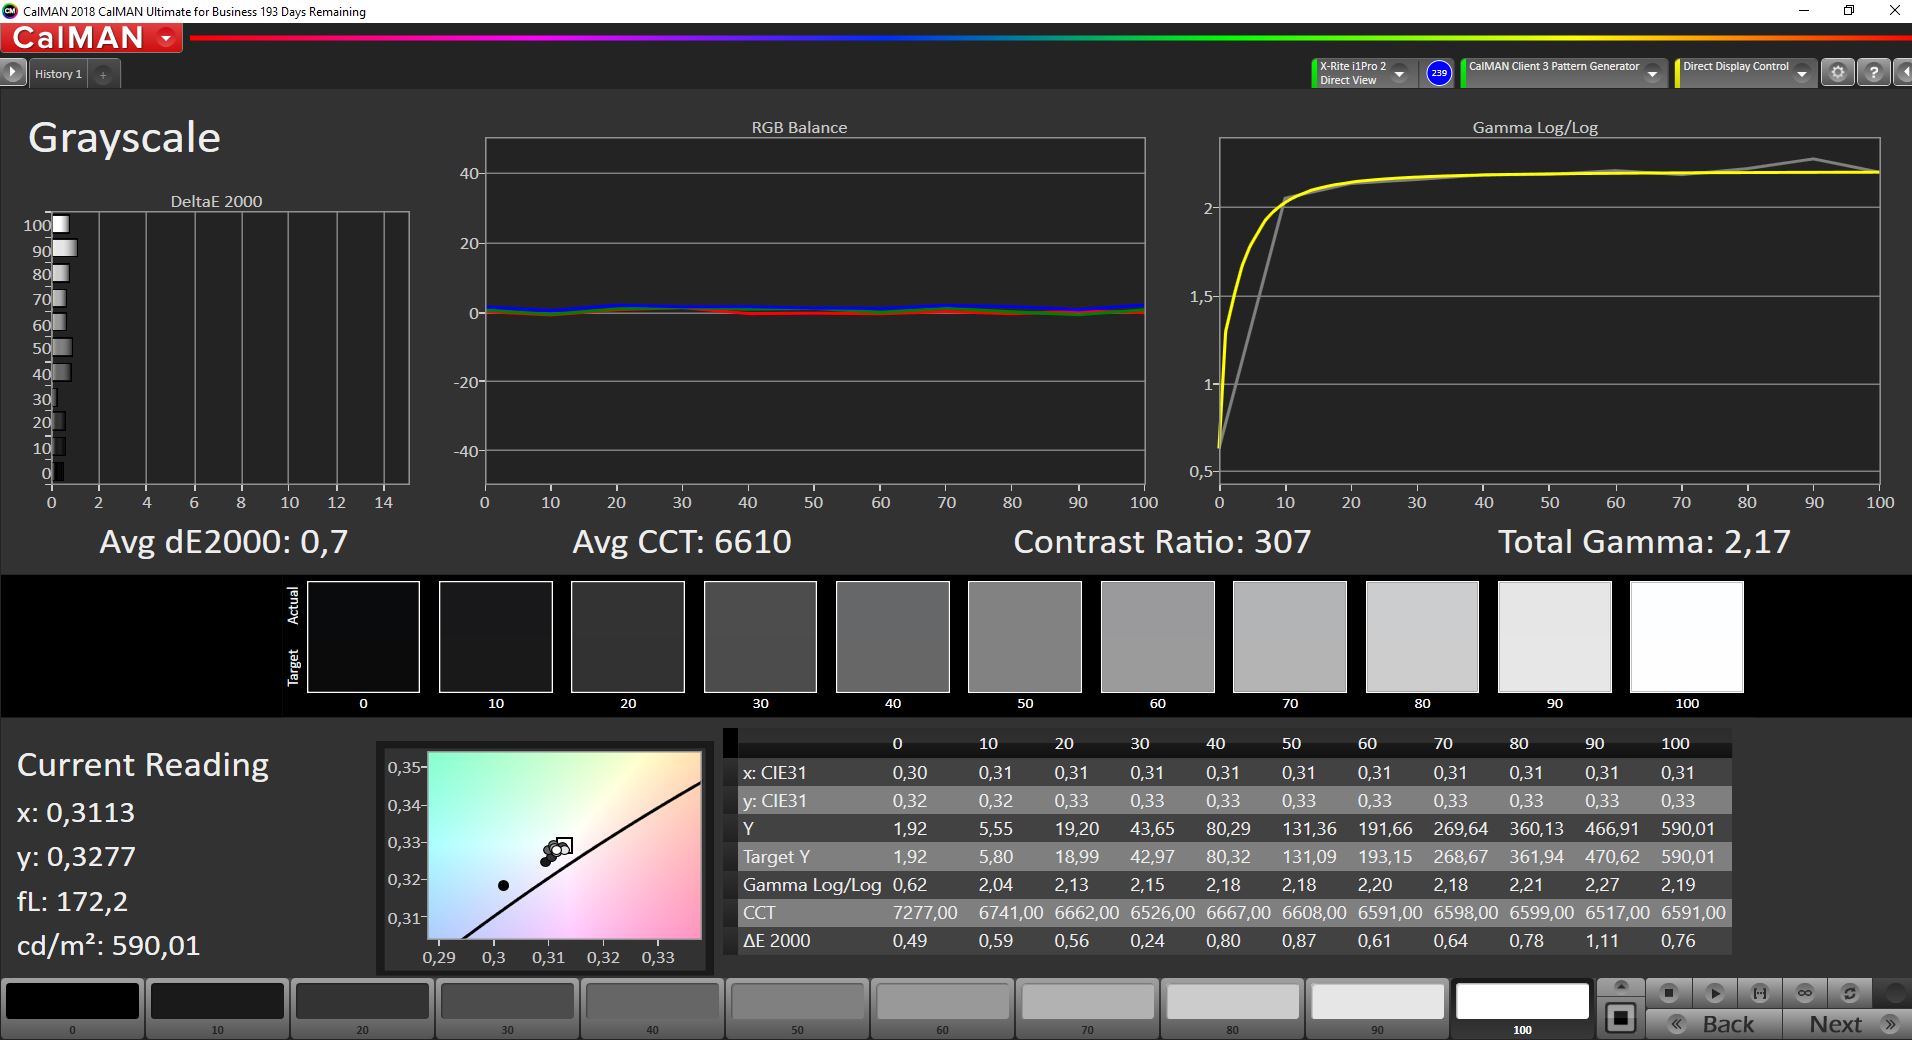

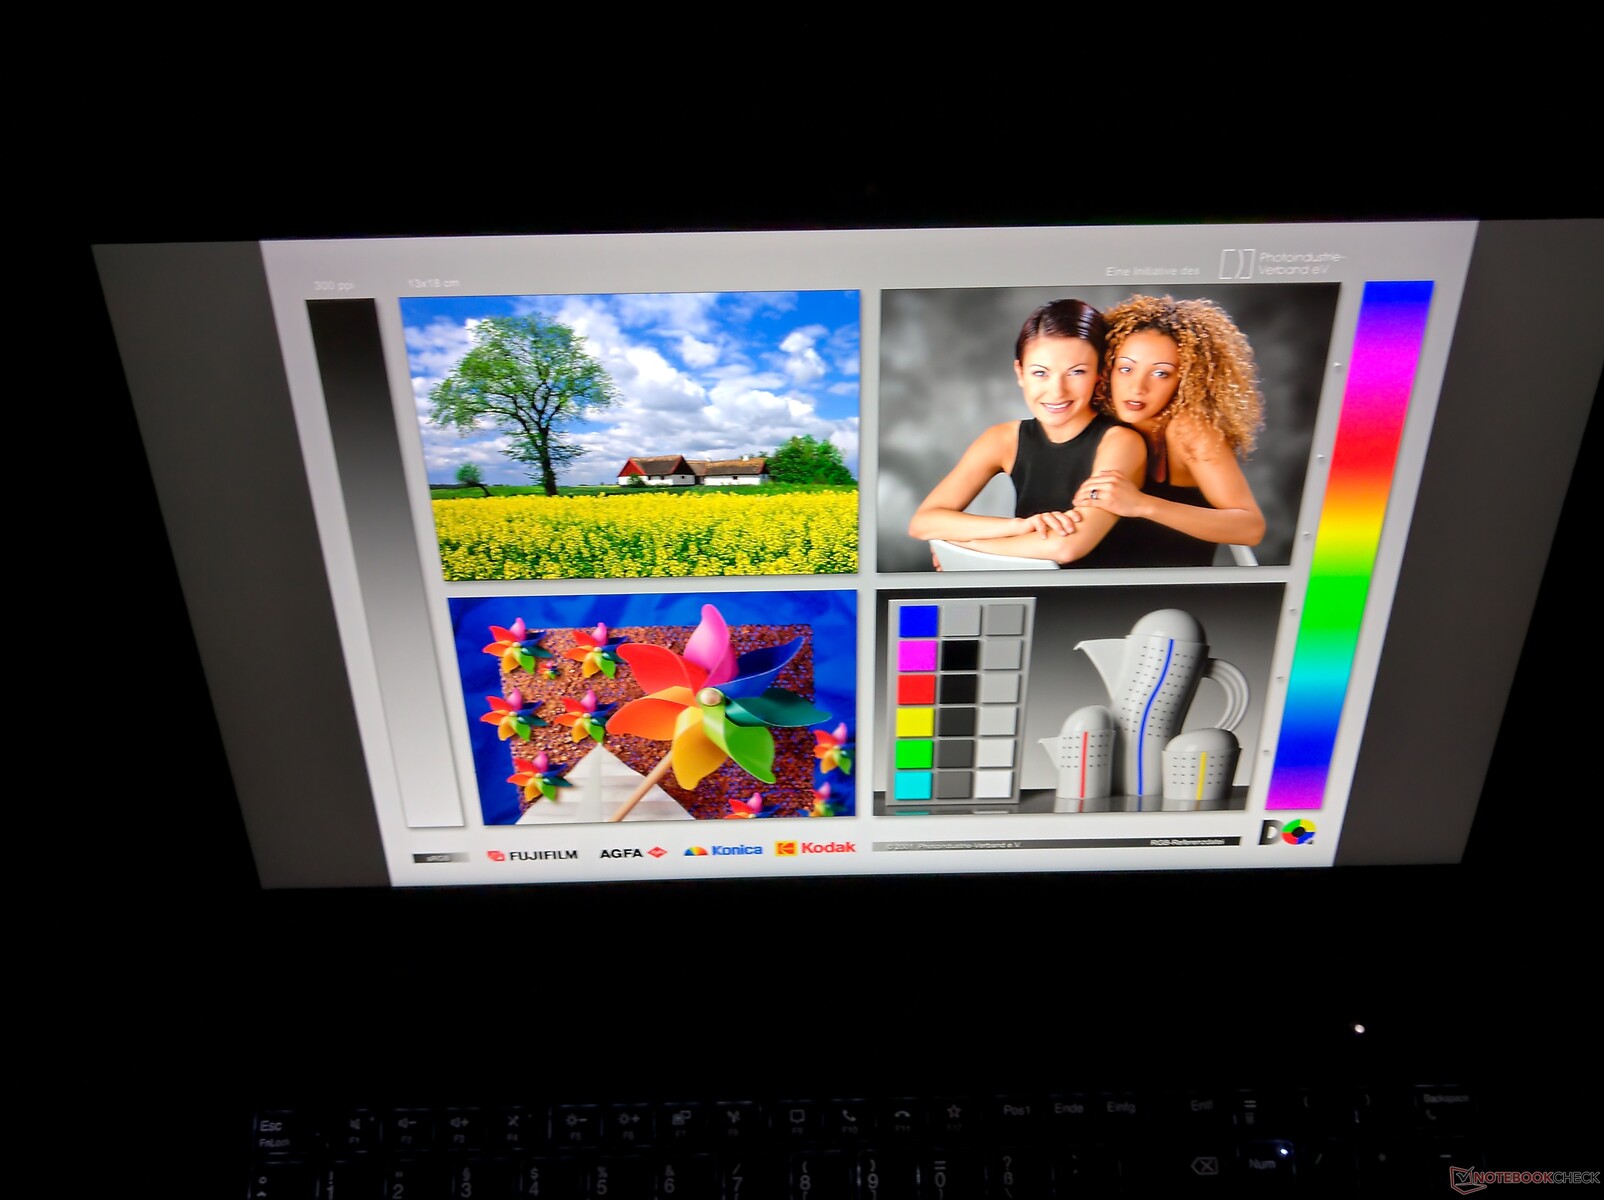
The color accuracy of the ThinkPad display is already good in the state of delivery. The contrast of 1776:1 as well as the excellent values of the color space coverage are also convincing, and the wide AdobeRGB color space is almost completely covered.
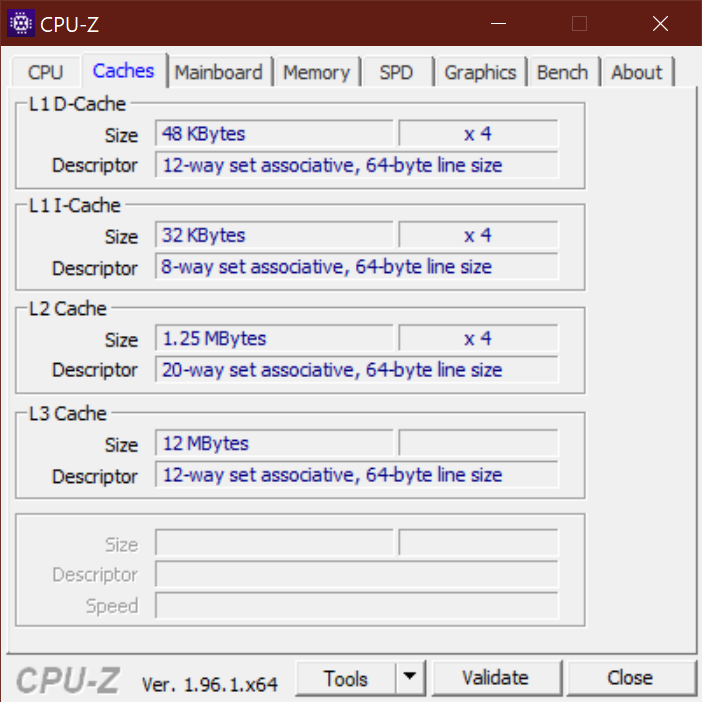
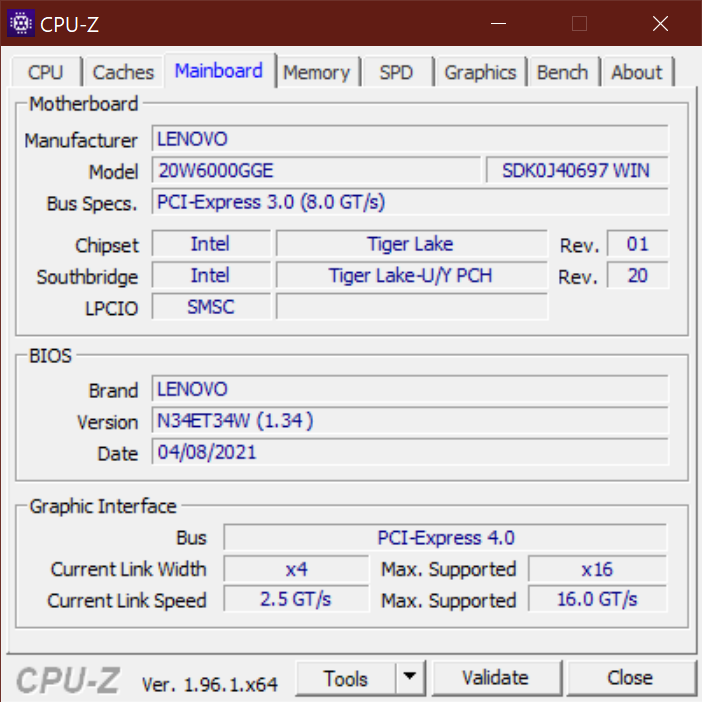
Better performance due to Intel Tiger Lake
In terms of the available processors, Lenovo offers the Intel Core i5-1135G7, i5-1145G7, i7-1165G7, and i7-1185G7 for the ThinkPad P15s Gen 2. In contrast to the smaller P14s Gen 2, there are no AMD chips available. In addition to the integrated Intel GPU, all the models also include the Nvidia T500 GPU.
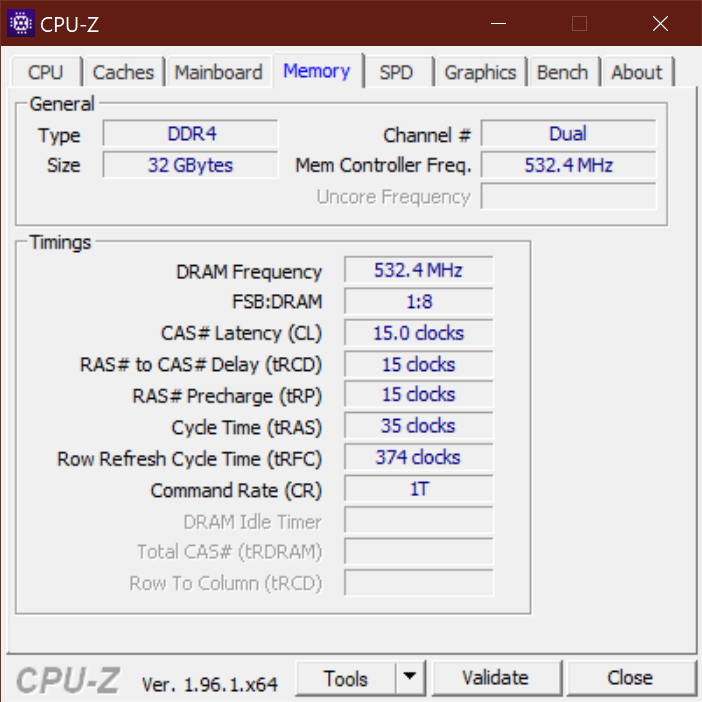
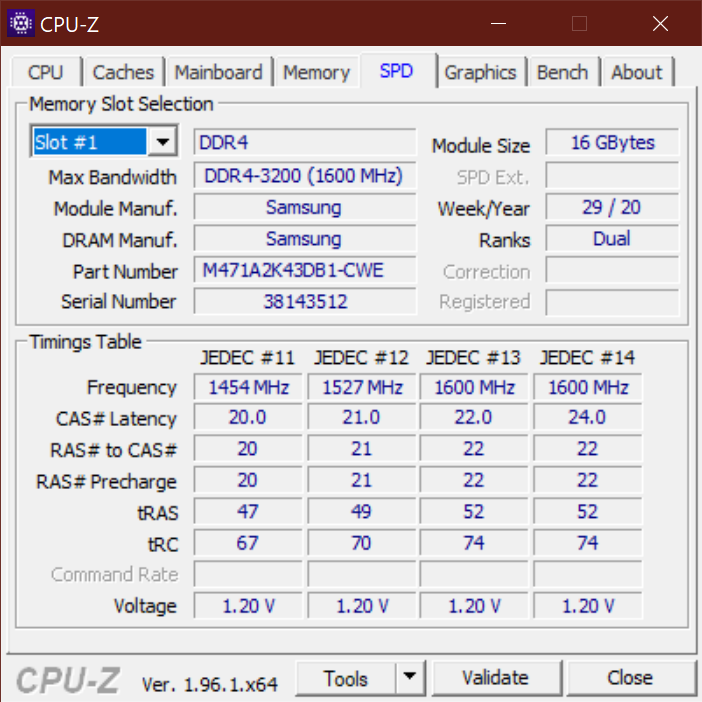
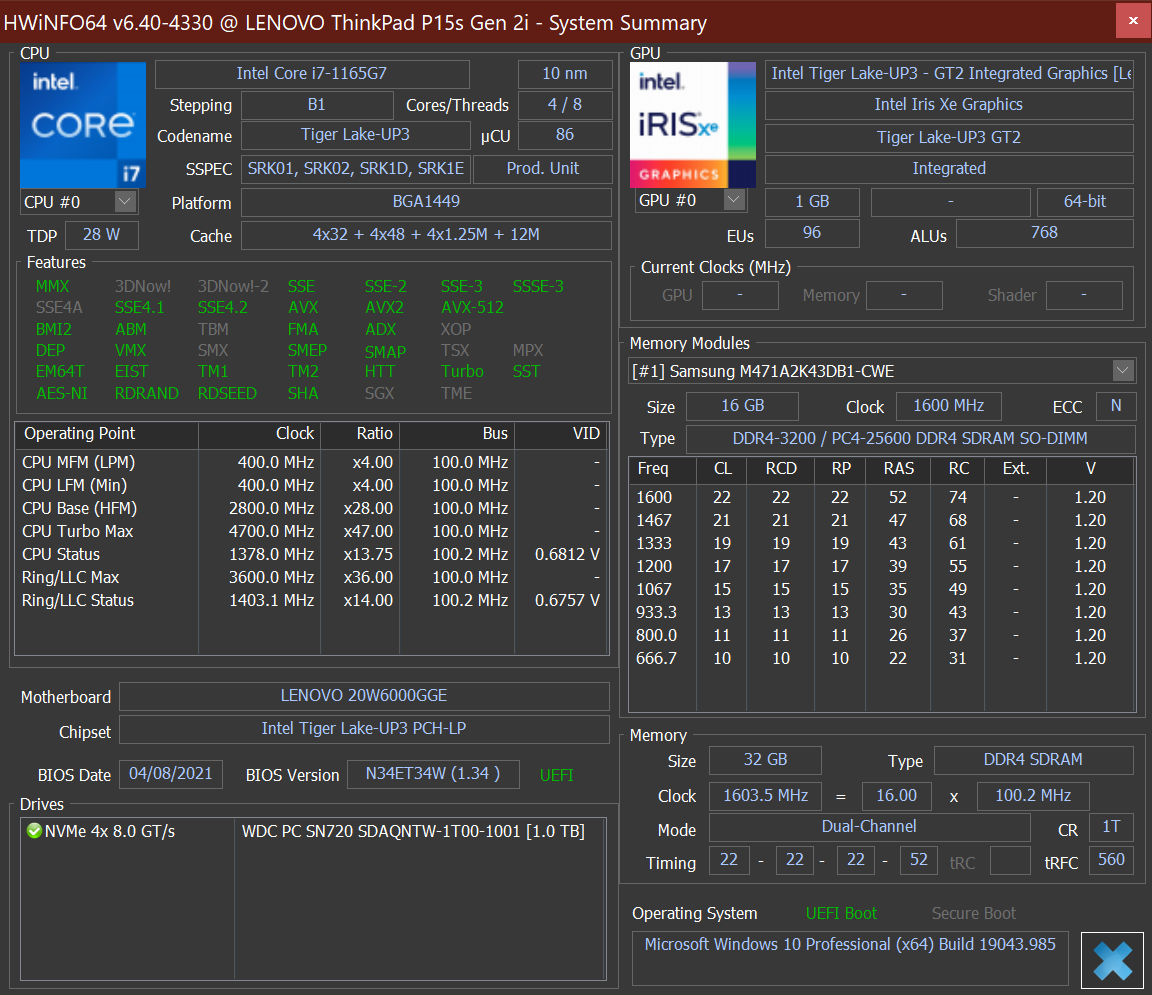
There are 8 to 16 GB DDR4-3200 memory modules soldered in, and with the additional SO-DIMM, up to 48 GB are possible. The storage solution consists of an M.2-2280 SSD.
Processor
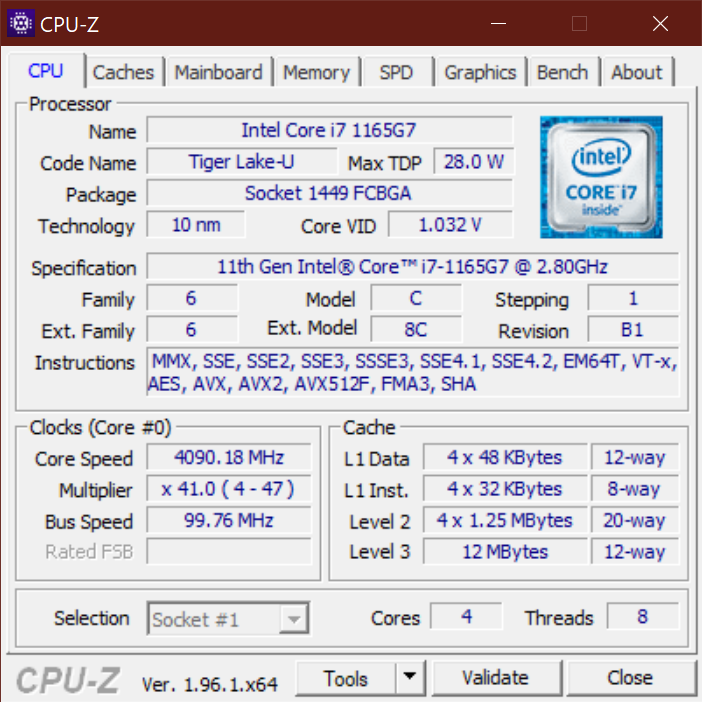
The Intel Core i7-1165G7 is a current UP3 Tiger Lake processor with four cores that have a clock speed between 2.8 and 4.7 GHz - the exact clock speed depends on the power limit. For this CPU, the consumption that is possible to maintain constantly ranges between 12 and 28 watts. You can find a comparison with other CPUs in our CPU list.
The processor in the Lenovo ThinkPad P15s Gen 2 is able to use up to 47 watts, but only for a few seconds. After that, the consumption levels out initially at 35 watts and after about 10 minutes it drops to around 20 watts. Overall, the ThinkPad laptop delivers a very good performance in the Cinebench benchmark, running about as fast as the comparable HP ZBook Firefly 15 G8 and clearly faster than its predecessor, the P15s Gen 1.
The Intel chip is also able to develop its full performance in battery operation.
Cinebench R23: Single Core | Multi Core
Cinebench R15: CPU Single 64Bit | CPU Multi 64Bit
Blender: v2.79 BMW27 CPU
7-Zip 18.03: 7z b 4 -mmt1 | 7z b 4
Geekbench 5.5: Single-Core | Multi-Core
HWBOT x265 Benchmark v2.2: 4k Preset
LibreOffice : 20 Documents To PDF
R Benchmark 2.5: Overall mean
| Cinebench R20 / CPU (Single Core) | |
| Average of class Workstation (671 - 857, n=23, last 2 years) | |
| HP ZBook Firefly 15 G8 2C9R7EA | |
| Lenovo ThinkPad P15s Gen2-20W6000GGE | |
| Average Intel Core i7-1165G7 (442 - 589, n=81) | |
| Lenovo ThinkPad P15 Gen1-20ST000DGE | |
| Lenovo ThinkPad P15s Gen1-20T4000JGE | |
| Dell Precision 3000 3551 | |
| Cinebench R20 / CPU (Multi Core) | |
| Average of class Workstation (5760 - 15043, n=23, last 2 years) | |
| Lenovo ThinkPad P15 Gen1-20ST000DGE | |
| Dell Precision 3000 3551 | |
| HP ZBook Firefly 15 G8 2C9R7EA | |
| Average Intel Core i7-1165G7 (1060 - 2657, n=81) | |
| Lenovo ThinkPad P15s Gen2-20W6000GGE | |
| Lenovo ThinkPad P15s Gen1-20T4000JGE | |
| Cinebench R23 / Single Core | |
| Average of class Workstation (1712 - 2228, n=23, last 2 years) | |
| Lenovo ThinkPad P15s Gen2-20W6000GGE | |
| Average Intel Core i7-1165G7 (1110 - 1539, n=59) | |
| Lenovo ThinkPad P15 Gen1-20ST000DGE | |
| Cinebench R23 / Multi Core | |
| Average of class Workstation (14621 - 38520, n=23, last 2 years) | |
| Lenovo ThinkPad P15 Gen1-20ST000DGE | |
| Lenovo ThinkPad P15s Gen2-20W6000GGE | |
| Average Intel Core i7-1165G7 (2525 - 6862, n=64) | |
| Cinebench R15 / CPU Single 64Bit | |
| Average of class Workstation (191.4 - 328, n=23, last 2 years) | |
| HP ZBook Firefly 15 G8 2C9R7EA | |
| Lenovo ThinkPad P15s Gen2-20W6000GGE | |
| Average Intel Core i7-1165G7 (115 - 230, n=78) | |
| Lenovo ThinkPad P15 Gen1-20ST000DGE | |
| Dell Precision 3000 3551 | |
| Lenovo ThinkPad P15s Gen1-20T4000JGE | |
| Cinebench R15 / CPU Multi 64Bit | |
| Average of class Workstation (2489 - 5810, n=23, last 2 years) | |
| Lenovo ThinkPad P15 Gen1-20ST000DGE | |
| Dell Precision 3000 3551 | |
| Lenovo ThinkPad P15s Gen2-20W6000GGE | |
| HP ZBook Firefly 15 G8 2C9R7EA | |
| Average Intel Core i7-1165G7 (553 - 1027, n=86) | |
| Lenovo ThinkPad P15s Gen1-20T4000JGE | |
| Blender / v2.79 BMW27 CPU | |
| Lenovo ThinkPad P15s Gen1-20T4000JGE | |
| Average Intel Core i7-1165G7 (468 - 1138, n=80) | |
| HP ZBook Firefly 15 G8 2C9R7EA | |
| Lenovo ThinkPad P15s Gen2-20W6000GGE | |
| Lenovo ThinkPad P15 Gen1-20ST000DGE | |
| Dell Precision 3000 3551 | |
| Average of class Workstation (91 - 222, n=23, last 2 years) | |
| 7-Zip 18.03 / 7z b 4 -mmt1 | |
| Average of class Workstation (5126 - 6960, n=23, last 2 years) | |
| HP ZBook Firefly 15 G8 2C9R7EA | |
| Lenovo ThinkPad P15s Gen2-20W6000GGE | |
| Dell Precision 3000 3551 | |
| Lenovo ThinkPad P15 Gen1-20ST000DGE | |
| Average Intel Core i7-1165G7 (4478 - 5507, n=80) | |
| Lenovo ThinkPad P15s Gen1-20T4000JGE | |
| 7-Zip 18.03 / 7z b 4 | |
| Average of class Workstation (60489 - 116969, n=23, last 2 years) | |
| Lenovo ThinkPad P15 Gen1-20ST000DGE | |
| Dell Precision 3000 3551 | |
| HP ZBook Firefly 15 G8 2C9R7EA | |
| Average Intel Core i7-1165G7 (15347 - 27405, n=80) | |
| Lenovo ThinkPad P15s Gen2-20W6000GGE | |
| Lenovo ThinkPad P15s Gen1-20T4000JGE | |
| Geekbench 5.5 / Single-Core | |
| Average of class Workstation (1783 - 2183, n=23, last 2 years) | |
| HP ZBook Firefly 15 G8 2C9R7EA | |
| Lenovo ThinkPad P15s Gen2-20W6000GGE | |
| Average Intel Core i7-1165G7 (1302 - 1595, n=77) | |
| Lenovo ThinkPad P15 Gen1-20ST000DGE | |
| Dell Precision 3000 3551 | |
| Lenovo ThinkPad P15s Gen1-20T4000JGE | |
| Geekbench 5.5 / Multi-Core | |
| Average of class Workstation (11542 - 25554, n=23, last 2 years) | |
| Dell Precision 3000 3551 | |
| Lenovo ThinkPad P15 Gen1-20ST000DGE | |
| Lenovo ThinkPad P15s Gen2-20W6000GGE | |
| Average Intel Core i7-1165G7 (3078 - 5926, n=77) | |
| HP ZBook Firefly 15 G8 2C9R7EA | |
| Lenovo ThinkPad P15s Gen1-20T4000JGE | |
| HWBOT x265 Benchmark v2.2 / 4k Preset | |
| Average of class Workstation (17.8 - 40.5, n=23, last 2 years) | |
| Dell Precision 3000 3551 | |
| Lenovo ThinkPad P15 Gen1-20ST000DGE | |
| Lenovo ThinkPad P15s Gen2-20W6000GGE | |
| HP ZBook Firefly 15 G8 2C9R7EA | |
| Average Intel Core i7-1165G7 (1.39 - 8.47, n=80) | |
| Lenovo ThinkPad P15s Gen1-20T4000JGE | |
| LibreOffice / 20 Documents To PDF | |
| Lenovo ThinkPad P15s Gen1-20T4000JGE | |
| Lenovo ThinkPad P15 Gen1-20ST000DGE | |
| Average Intel Core i7-1165G7 (21.5 - 88.1, n=78) | |
| Average of class Workstation (37.1 - 74.7, n=23, last 2 years) | |
| Dell Precision 3000 3551 | |
| Lenovo ThinkPad P15s Gen2-20W6000GGE | |
| HP ZBook Firefly 15 G8 2C9R7EA | |
| R Benchmark 2.5 / Overall mean | |
| Lenovo ThinkPad P15s Gen1-20T4000JGE | |
| Lenovo ThinkPad P15 Gen1-20ST000DGE | |
| Average Intel Core i7-1165G7 (0.552 - 1.002, n=80) | |
| Dell Precision 3000 3551 | |
| HP ZBook Firefly 15 G8 2C9R7EA | |
| Lenovo ThinkPad P15s Gen2-20W6000GGE | |
| Average of class Workstation (0.3825 - 0.603, n=23, last 2 years) | |
* ... smaller is better
System Performance
There is nothing to complain about in terms of the system performance, and the ThinkPad laptop also scores well in the PCMark 10 benchmark.
| PCMark 10 / Score | |
| Average of class Workstation (6563 - 10409, n=19, last 2 years) | |
| Lenovo ThinkPad P15 Gen1-20ST000DGE | |
| HP ZBook Firefly 15 G8 2C9R7EA | |
| Average Intel Core i7-1165G7, NVIDIA T500 Laptop GPU (5237 - 5550, n=3) | |
| Lenovo ThinkPad P15s Gen2-20W6000GGE | |
| Dell Precision 3000 3551 | |
| Lenovo ThinkPad P15s Gen1-20T4000JGE | |
| PCMark 10 / Essentials | |
| Average of class Workstation (9622 - 11157, n=19, last 2 years) | |
| Dell Precision 3000 3551 | |
| Lenovo ThinkPad P15 Gen1-20ST000DGE | |
| Lenovo ThinkPad P15s Gen2-20W6000GGE | |
| HP ZBook Firefly 15 G8 2C9R7EA | |
| Average Intel Core i7-1165G7, NVIDIA T500 Laptop GPU (8765 - 9540, n=3) | |
| Lenovo ThinkPad P15s Gen1-20T4000JGE | |
| PCMark 10 / Productivity | |
| Average of class Workstation (8789 - 20616, n=19, last 2 years) | |
| Lenovo ThinkPad P15s Gen2-20W6000GGE | |
| HP ZBook Firefly 15 G8 2C9R7EA | |
| Average Intel Core i7-1165G7, NVIDIA T500 Laptop GPU (8337 - 9317, n=3) | |
| Dell Precision 3000 3551 | |
| Lenovo ThinkPad P15 Gen1-20ST000DGE | |
| Lenovo ThinkPad P15s Gen1-20T4000JGE | |
| PCMark 10 / Digital Content Creation | |
| Average of class Workstation (8108 - 15631, n=19, last 2 years) | |
| Lenovo ThinkPad P15 Gen1-20ST000DGE | |
| HP ZBook Firefly 15 G8 2C9R7EA | |
| Average Intel Core i7-1165G7, NVIDIA T500 Laptop GPU (4477 - 5604, n=3) | |
| Dell Precision 3000 3551 | |
| Lenovo ThinkPad P15s Gen2-20W6000GGE | |
| Lenovo ThinkPad P15s Gen1-20T4000JGE | |
| PCMark 10 Score | 5237 points | |
Help | ||
DPC Latencies
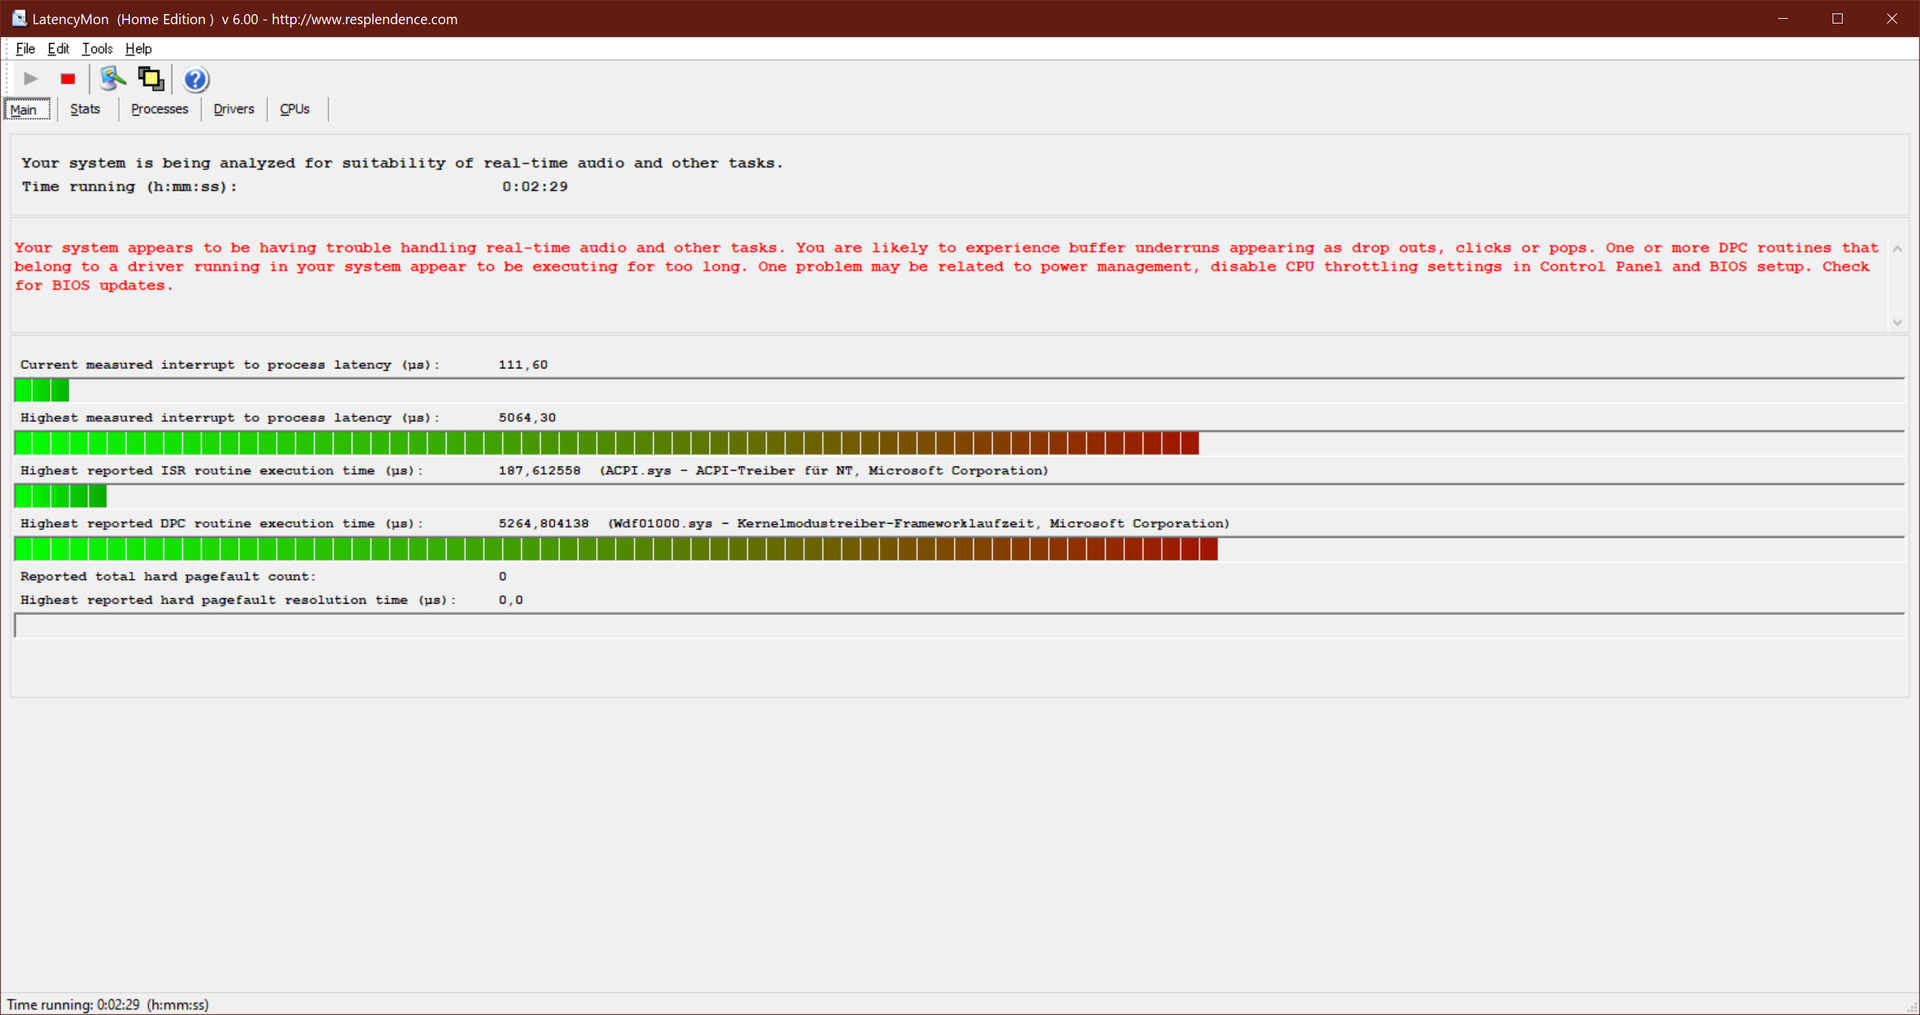
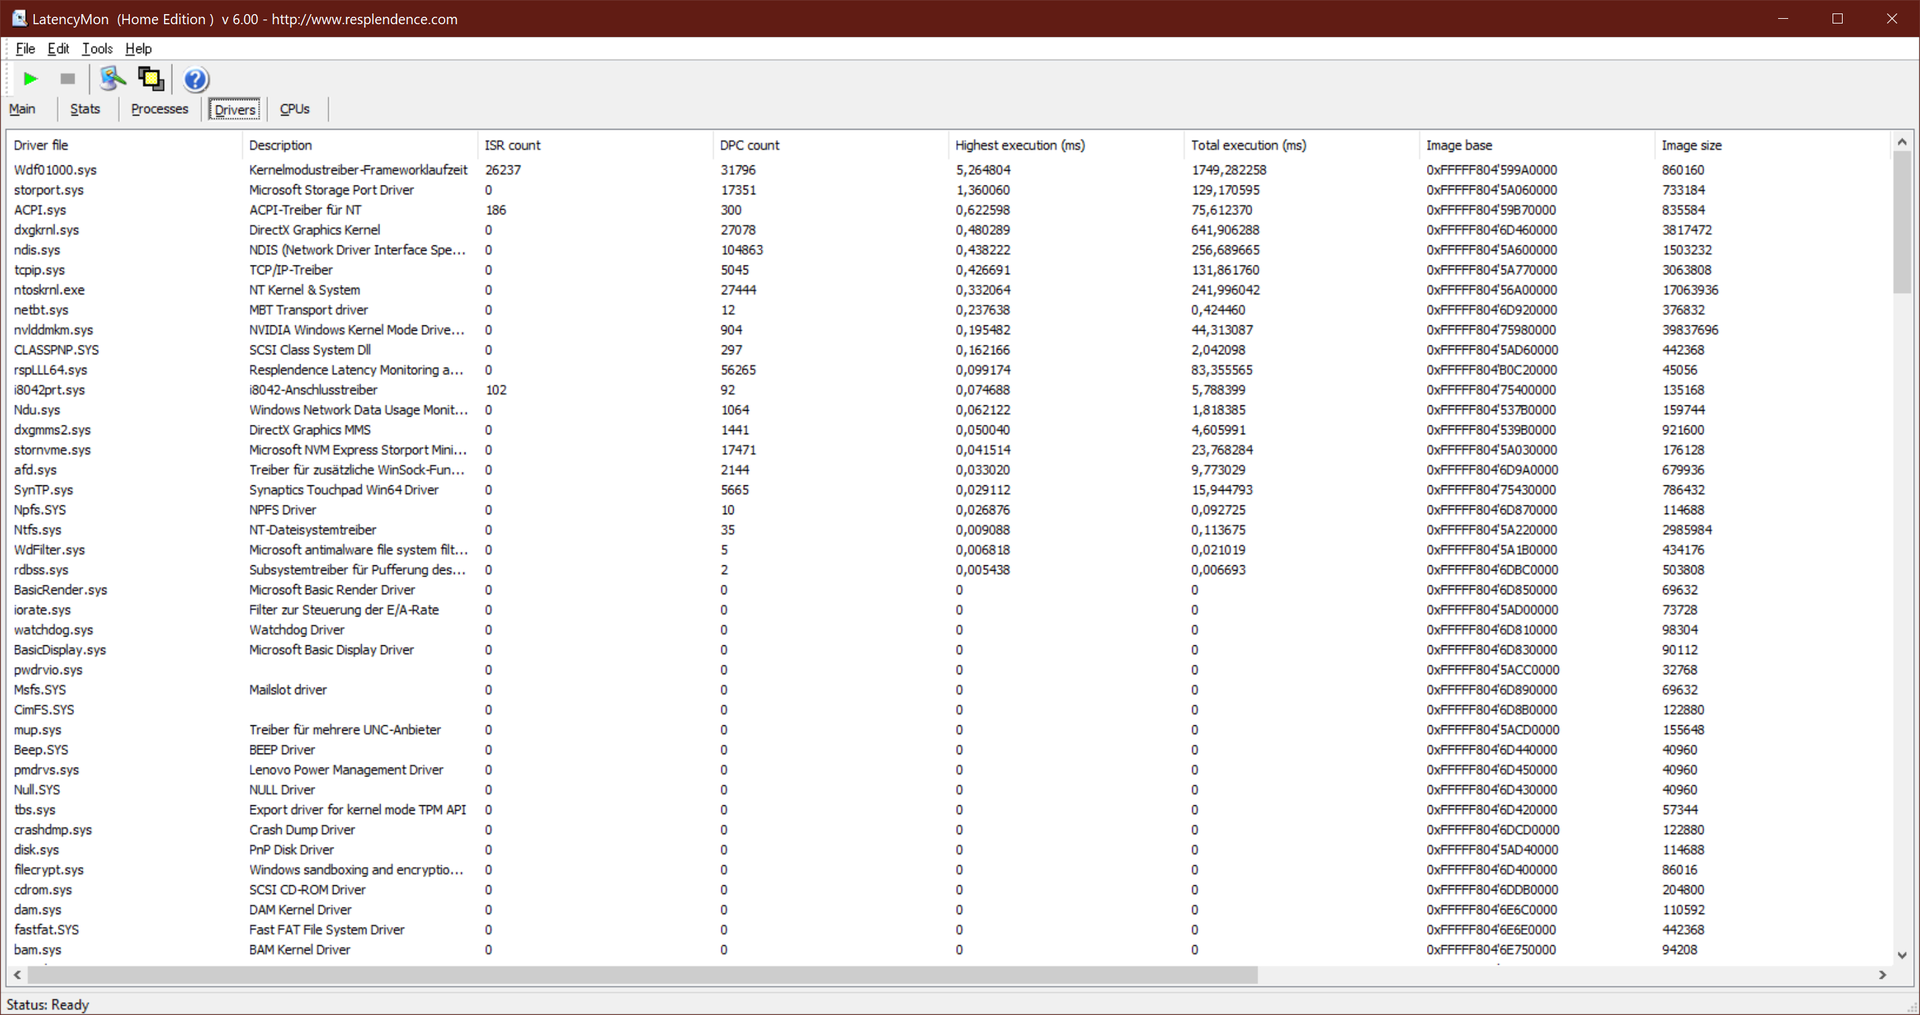
| DPC Latencies / LatencyMon - interrupt to process latency (max), Web, Youtube, Prime95 | |
| Lenovo ThinkPad P15s Gen2-20W6000GGE | |
* ... smaller is better
Storage Solution
The M.2-2280 SSD used in the Lenovo ThinkPad P15s Gen 2 has a capacity of 1 TB and comes from Western Digital. Compared to the Samsung SSD of the predecessor, it is faster overall, but the differences are small.
| Lenovo ThinkPad P15s Gen2-20W6000GGE WDC PC SN720 SDAQNTW-1T00 | Lenovo ThinkPad P15s Gen1-20T4000JGE Samsung PM981a MZVLB1T0HBLR | Lenovo ThinkPad P15 Gen1-20ST000DGE Toshiba XG6 KXG6AZNV512G | HP ZBook Firefly 15 G8 2C9R7EA Toshiba XG6 KXG60ZNV1T02 | Dell Precision 3000 3551 Toshiba Kioxia XG6 KXG60PNV512G | Average WDC PC SN720 SDAQNTW-1T00 | Average of class Workstation | |
|---|---|---|---|---|---|---|---|
| CrystalDiskMark 5.2 / 6 | -11% | -7% | -12% | -18% | -10% | 60% | |
| Write 4K (MB/s) | 237.6 | 142.8 -40% | 129.5 -45% | 140.6 -41% | 120.9 -49% | 168.6 ? -29% | 169.9 ? -28% |
| Read 4K (MB/s) | 54.7 | 47.51 -13% | 49.54 -9% | 52.8 -3% | 46.79 -14% | 47.6 ? -13% | 71.1 ? 30% |
| Write Seq (MB/s) | 2603 | 2051 -21% | 2379 -9% | 1844 -29% | 1916 -26% | 2602 ? 0% | 3945 ? 52% |
| Read Seq (MB/s) | 1889 | 2219 17% | 1989 5% | 2108 12% | 2216 17% | 2084 ? 10% | 4364 ? 131% |
| Write 4K Q32T1 (MB/s) | 505 | 470.6 -7% | 663 31% | 418 -17% | 393.9 -22% | 391 ? -23% | 511 ? 1% |
| Read 4K Q32T1 (MB/s) | 606 | 419.5 -31% | 425.2 -30% | 476.8 -21% | 375.1 -38% | 481 ? -21% | 615 ? 1% |
| Write Seq Q32T1 (MB/s) | 2795 | 3011 8% | 2960 6% | 3064 10% | 2795 0% | 2792 ? 0% | 6681 ? 139% |
| Read Seq Q32T1 (MB/s) | 3448 | 3563 3% | 3182 -8% | 3289 -5% | 3106 -10% | 3377 ? -2% | 8610 ? 150% |

Constant Performance Reads: DiskSpd Read Loop, Queue Depth 8
Graphics Card
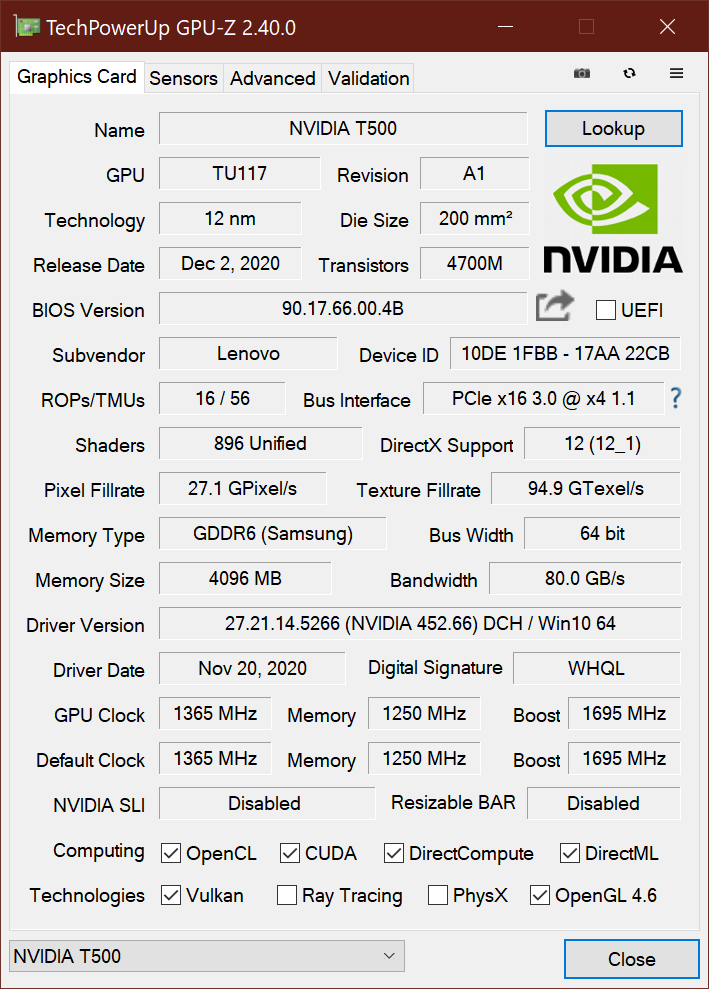
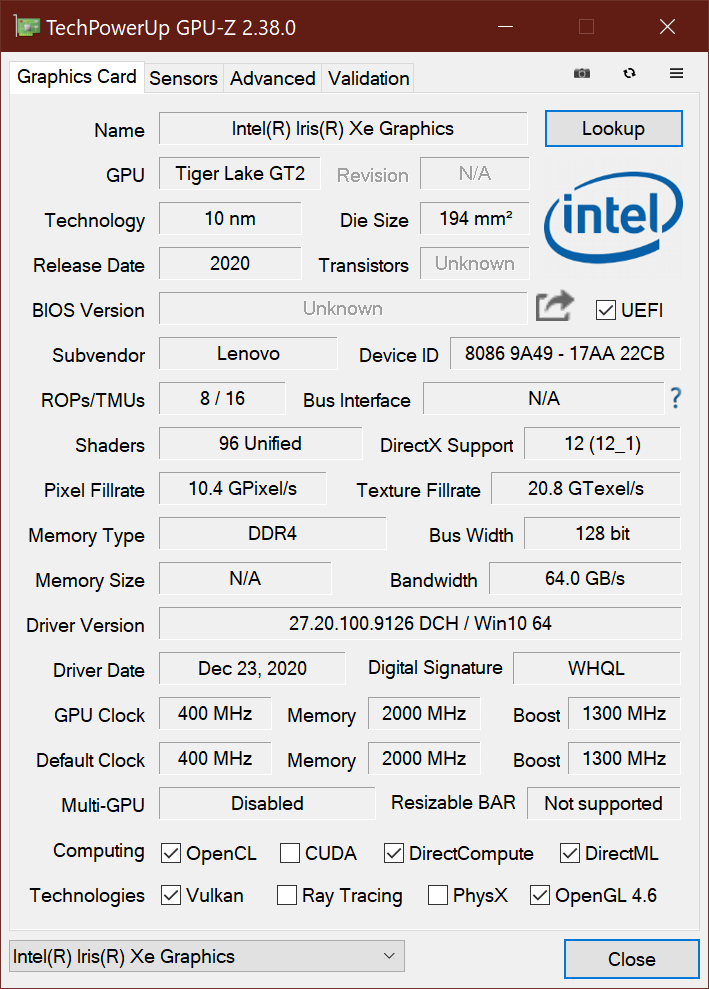
The Nvidia T500 replaces the Nvidia Quadro P520, meaning that Turing has arrived in the low-end segment for the first time. Compared to the GeForce GPUs, the main advantage of this graphics chip is its ISV certification with particular drivers. Technically, the GPU corresponds roughly to the Nvidia GeForce MX450. You can compare the Nvidia T500 with this and other GPUs in our GPU list.
Lenovo provides the dedicated graphics chip with a thermal budget of 18 watts. With this, the ThinkPad P15s 2021 is 13 to 59% faster than the predecessor, depending on the 3DMark test. However, compared to the ZBook Firefly 15 G8, this result is weak, since that performed 25 to 39% better.
The full graphics performance is also available in battery operation.
| 3DMark 11 Performance | 6293 points | |
| 3DMark Fire Strike Score | 3406 points | |
| 3DMark Time Spy Score | 1627 points | |
Help | ||
Gaming Performance
The Nvidia T500 is designed for professional applications and gaming is not one of its specialties. But this does not mean that it is unusable for this purpose, even if you cannot play modern games at the highest detail settings. However, you can completely forget about gaming in 4K resolution.
| low | med. | high | ultra | QHD | 4K | |
|---|---|---|---|---|---|---|
| GTA V (2015) | 133 | 76.1 | 42.1 | 23.2 | 13.2 | 14 |
| The Witcher 3 (2015) | 114 | 50.4 | 28.4 | 16.9 | ||
| Dota 2 Reborn (2015) | 97.5 | 120 | 77.1 | 70.5 | 27.7 | |
| Final Fantasy XV Benchmark (2018) | 51.1 | 23.6 | 16.5 | 12.4 | 5.73 | |
| X-Plane 11.11 (2018) | 76.1 | 48.1 | 65.1 | 29.4 | ||
| Strange Brigade (2018) | 113 | 33.8 | 29.2 | 25.6 | 17.9 | 9.6 |
| F1 2020 (2020) | 100 | 59.8 | 44 | 29.3 |
Emissions and Power Management: Fan control failures of the Lenovo laptop
Noise Emissions
Fortunately the fan remains completely turned off in idle operation. However, this doesn't mean that the Lenovo ThinkPad P15s Gen 2 remains completely quiet, since we noticed a relatively loud coil whine.
During our testing, the laptop received a BIOS update that was supposed to adjust the fan noise. And indeed, the noise level under load dropped from 38 dB(a) to around 35.65 dB(a), which is a good improvement. However, the new firmware seems to be a bit faulty. After the stress test was completed, the fan just continued to run, and we were only able to turn it off by rebooting.
Noise level
| Idle |
| 25.5 / 25.5 / 25.5 dB(A) |
| Load |
| 35.65 / 35.65 dB(A) |
 | ||
30 dB silent 40 dB(A) audible 50 dB(A) loud |
||
min: | ||
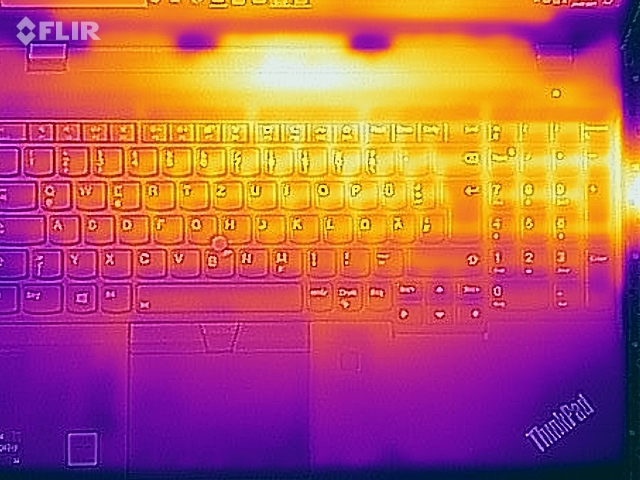
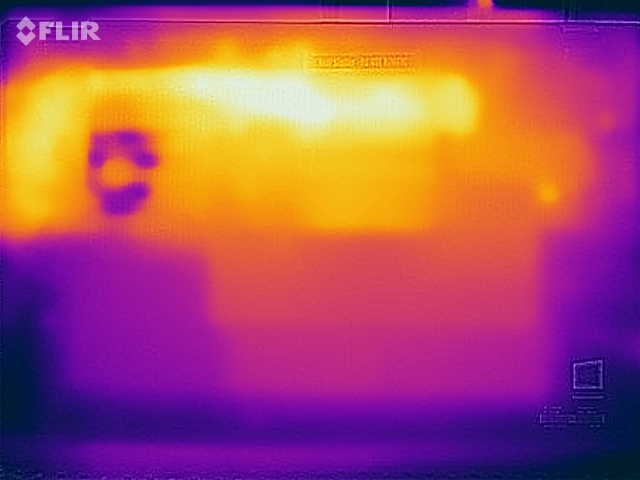
Temperature
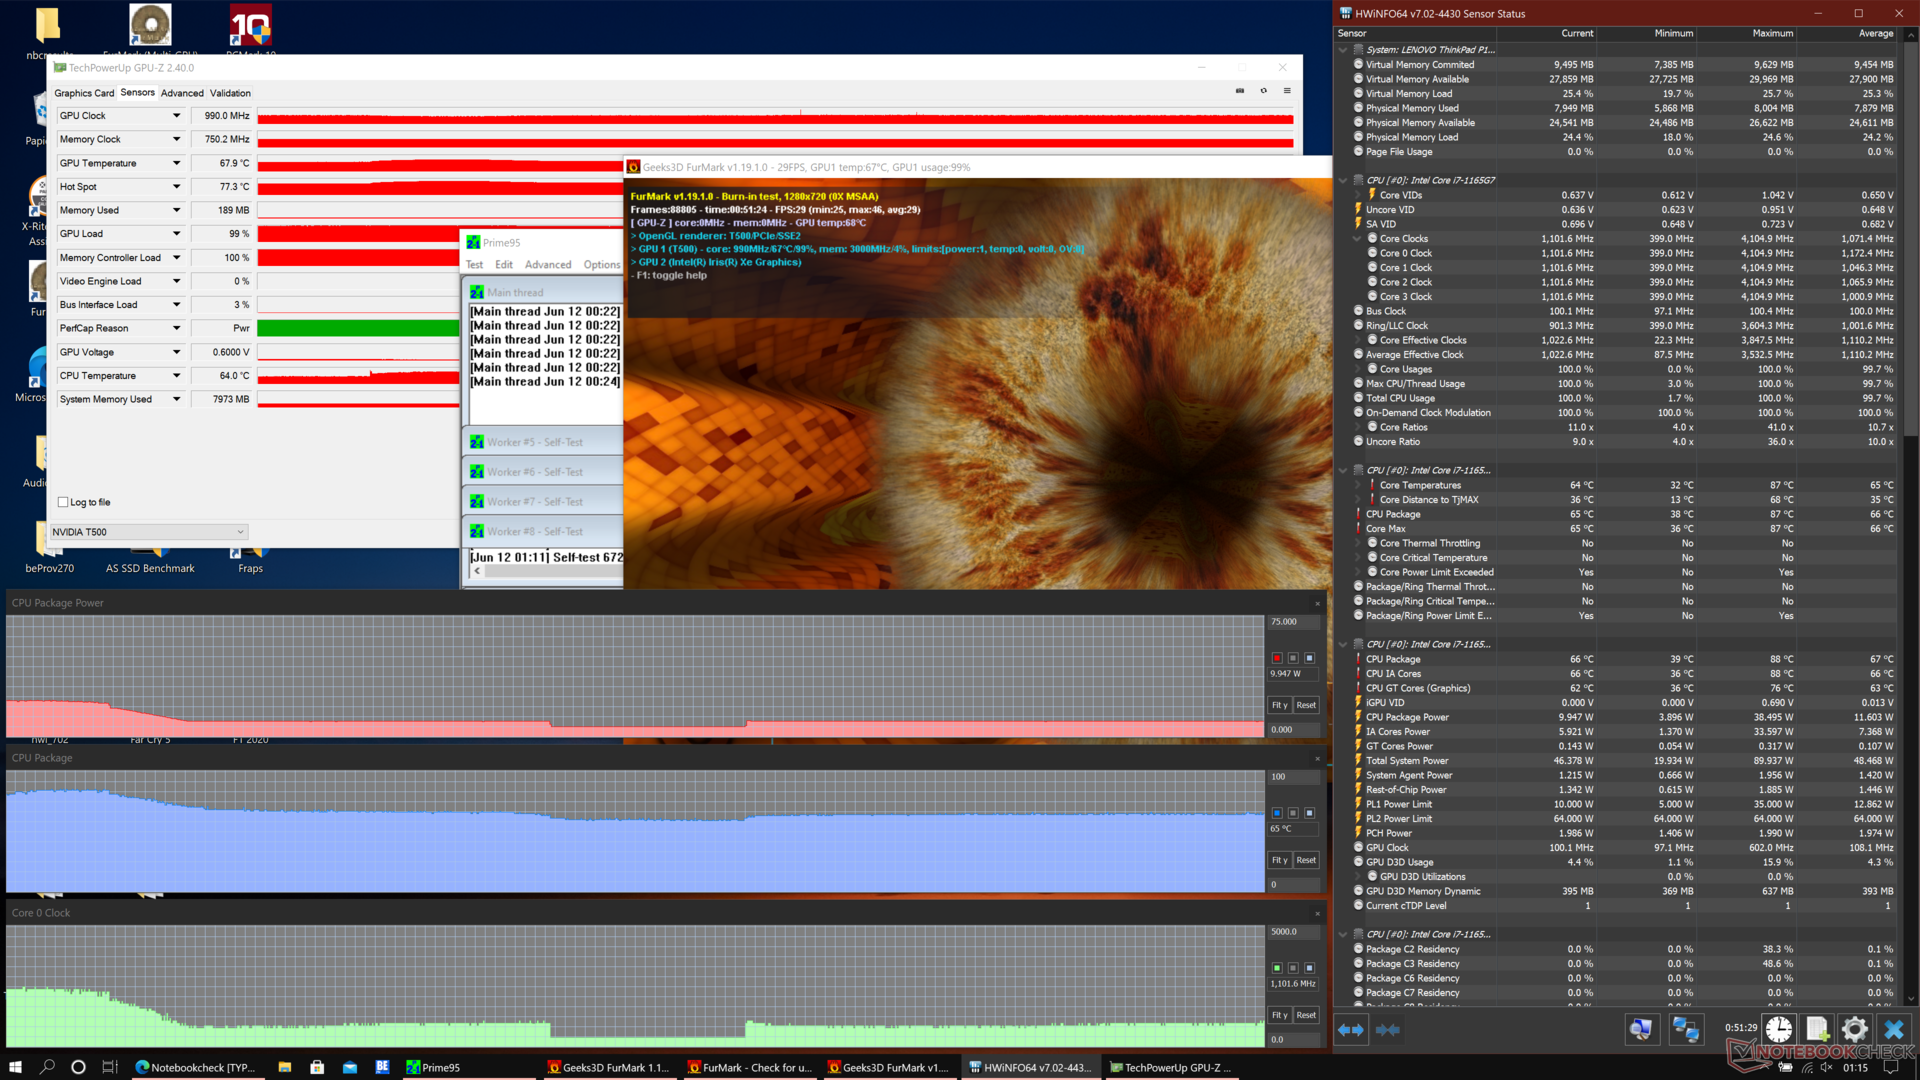
While the area in the frontal third of the Lenovo ThinkPad P15s G2 hardly warms up under load, the area in the back can become quite hot. We measure between 49 and 59 ºC (120-138 ºF) in the back area at the bottom. This means that it is better to avoid running the ThinkPad laptop under full load on your lap, even though the CPU and GPU each have to be throttled in the stress test.
(±) The maximum temperature on the upper side is 42.8 °C / 109 F, compared to the average of 38.2 °C / 101 F, ranging from 22.2 to 69.8 °C for the class Workstation.
(-) The bottom heats up to a maximum of 59.1 °C / 138 F, compared to the average of 41.1 °C / 106 F
(+) In idle usage, the average temperature for the upper side is 25.5 °C / 78 F, compared to the device average of 32 °C / 90 F.
(±) Playing The Witcher 3, the average temperature for the upper side is 34 °C / 93 F, compared to the device average of 32 °C / 90 F.
(+) The palmrests and touchpad are reaching skin temperature as a maximum (32.1 °C / 89.8 F) and are therefore not hot.
(-) The average temperature of the palmrest area of similar devices was 27.8 °C / 82 F (-4.3 °C / -7.8 F).
Speakers
The stereo speakers that are placed above the keyboard produce a good average sound, but bass is almost completely lacking. However, the competitor from HP isn't any better either.
Lenovo ThinkPad P15s Gen2-20W6000GGE audio analysis
(±) | speaker loudness is average but good (76.7 dB)
Bass 100 - 315 Hz
(-) | nearly no bass - on average 20.6% lower than median
(±) | linearity of bass is average (14.6% delta to prev. frequency)
Mids 400 - 2000 Hz
(±) | higher mids - on average 5% higher than median
(+) | mids are linear (6.9% delta to prev. frequency)
Highs 2 - 16 kHz
(+) | balanced highs - only 3.1% away from median
(+) | highs are linear (5.5% delta to prev. frequency)
Overall 100 - 16.000 Hz
(±) | linearity of overall sound is average (20.1% difference to median)
Compared to same class
» 71% of all tested devices in this class were better, 6% similar, 23% worse
» The best had a delta of 7%, average was 17%, worst was 35%
Compared to all devices tested
» 52% of all tested devices were better, 8% similar, 40% worse
» The best had a delta of 4%, average was 23%, worst was 134%
HP ZBook Firefly 15 G8 2C9R7EA audio analysis
(±) | speaker loudness is average but good (79.1 dB)
Bass 100 - 315 Hz
(-) | nearly no bass - on average 18% lower than median
(±) | linearity of bass is average (11.3% delta to prev. frequency)
Mids 400 - 2000 Hz
(+) | balanced mids - only 3% away from median
(+) | mids are linear (4.1% delta to prev. frequency)
Highs 2 - 16 kHz
(+) | balanced highs - only 3.3% away from median
(+) | highs are linear (5.6% delta to prev. frequency)
Overall 100 - 16.000 Hz
(±) | linearity of overall sound is average (16.2% difference to median)
Compared to same class
» 43% of all tested devices in this class were better, 7% similar, 50% worse
» The best had a delta of 7%, average was 17%, worst was 35%
Compared to all devices tested
» 26% of all tested devices were better, 6% similar, 68% worse
» The best had a delta of 4%, average was 23%, worst was 134%
Power Consumption
The 4K UHD display built into our test unit increases the power consumption significantly. A minimum consumption of 5.8 watts in idle operation is a very high value.
The maximum consumption under load is 67.3 watts, while the power supply delivers a maximum of 65 watts. However, the consumption quickly drops below the critical limit, so that the power supply is sufficient overall.
| Off / Standby | |
| Idle | |
| Load |
|
Key:
min: | |
Battery Life
The high power consumption of the Lenovo ThinkPad P15s G2 becomes very noticeable in the battery life. The HP ZBook Firefly 15 G8 lasted for almost 3 hours longer in the Wi-Fi test (150 cd/m²).
Pros
Cons
Verdict: The ThinkPad P15s G2 is worthwhile for some particular application areas
The evolution of Lenovo's "ultrabook workstation" continues. What once started with the ThinkPad W550s as a very weak-powered laptop is at this point powerful enough for workstation applications. However, you still cannot expect top performance even with Intel Tiger Lake and Nvidia Turing.
Because Lenovo still uses the case of the ThinkPad T15 Gen 2, the ThinkPad P15s continues to lack some functionalities that you should really be able to expect from a workstation. Those include a full-size SD card reader, and we also miss a second M.2-2280 slot. In addition, the cooling is not very powerful, and the case temperatures are particularly high at the bottom. Although the fan runs quieter with the newest BIOS update, it never stops after the stress test was completed.
We can recommend the ThinkPad P15s Gen 2 for users that need an extremely good LCD, great keyboard, and an ISV certified GPU.
Lenovo should really fix this bug, since there are otherwise many things that we like about the Lenovo laptop. These include the extremely bright 4K UHD display that produces vibrant colors, the comfortable keyboard with a 1.8-mm stroke, and the overall good equipment. However, we are not giving a general recommendation for the ThinkPad P15s G2, since the identically constructed ThinkPad T15 Gen 2 is the more logical alternative in most cases. But for those users who need the ISV certified GPU, it can be a good selection.
Price and Availability
In the US, the ThinkPad P15s Gen 2 is available directly from Lenovo currently starting from $1275.
Lenovo ThinkPad P15s Gen2-20W6000GGE
- 06/14/2021 v7 (old)
Benjamin Herzig
Price comparison

