Dell Inspiron 15 5518 laptop in review: The CPU is slowed down

Dell has a 15.6-inch all-rounder in its lineup with the Inspiron 15 5518, which is powered by a Core i5-11300H-CPU and a GeForce-MX450-GPU. The competitors include devices like the Xiaomi RedmiBook Pro 15, the HP Pavilion 15, the Lenovo IdeaPad 5 Pro 16IHU6 and the Asus VivoBook S15 D533UA.
Possible competitors in comparison
Rating | Date | Model | Weight | Height | Size | Resolution | Price |
|---|---|---|---|---|---|---|---|
| 82.3 % v7 (old) | 09 / 2021 | Dell Inspiron 15 5518-2X3JR i5-11300H, GeForce MX450 | 1.8 kg | 18 mm | 15.60" | 1920x1080 | |
| 81.2 % v7 (old) | 06 / 2021 | HP Pavilion 15-eg i7-1165G7, GeForce MX450 | 1.7 kg | 17.9 mm | 15.60" | 1920x1080 | |
| 83.2 % v7 (old) | 06 / 2021 | Xiaomi RedmiBook Pro 15 i7-11370H, GeForce MX450 | 1.7 kg | 16 mm | 15.60" | 3200x2000 | |
| 86 % v7 (old) | 08 / 2021 | Lenovo IdeaPad 5 Pro 16IHU6 i5-11300H, GeForce MX450 | 1.9 kg | 18.4 mm | 16.00" | 2560x1600 | |
| 82.1 % v7 (old) | 07 / 2021 | Asus VivoBook S15 D533UA R7 5700U, Vega 8 | 1.8 kg | 16.1 mm | 15.60" | 1920x1080 | |
| 83.5 % v7 (old) | 08 / 2021 | Lenovo IdeaPad 5 15ALC05 R5 5500U, Vega 7 | 1.7 kg | 19.1 mm | 15.60" | 1920x1080 |
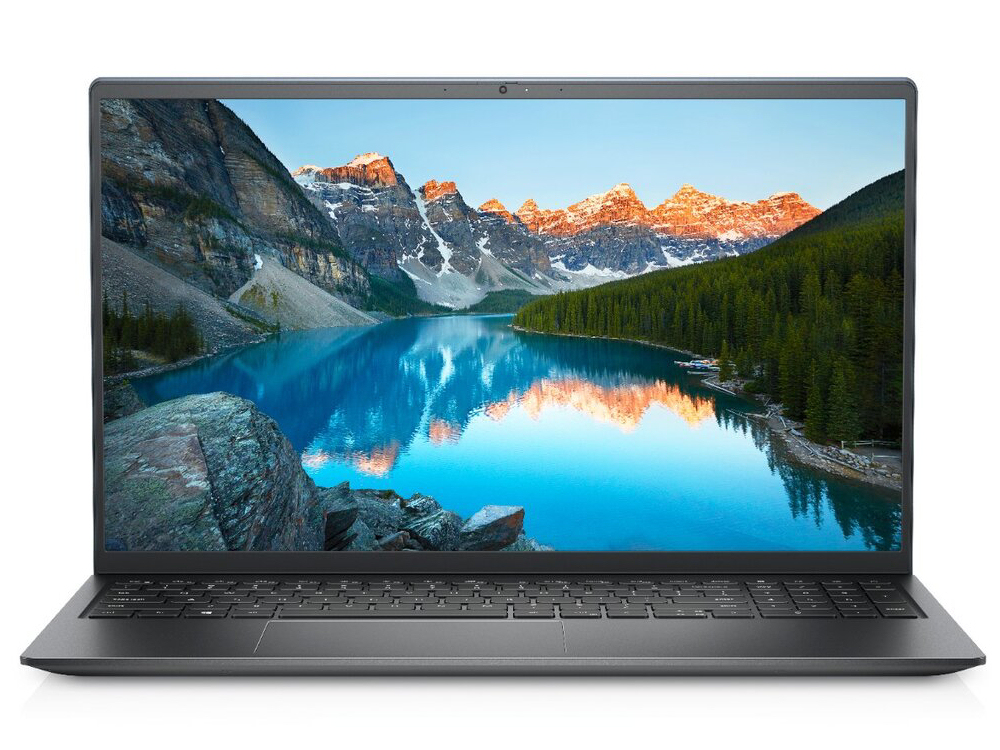
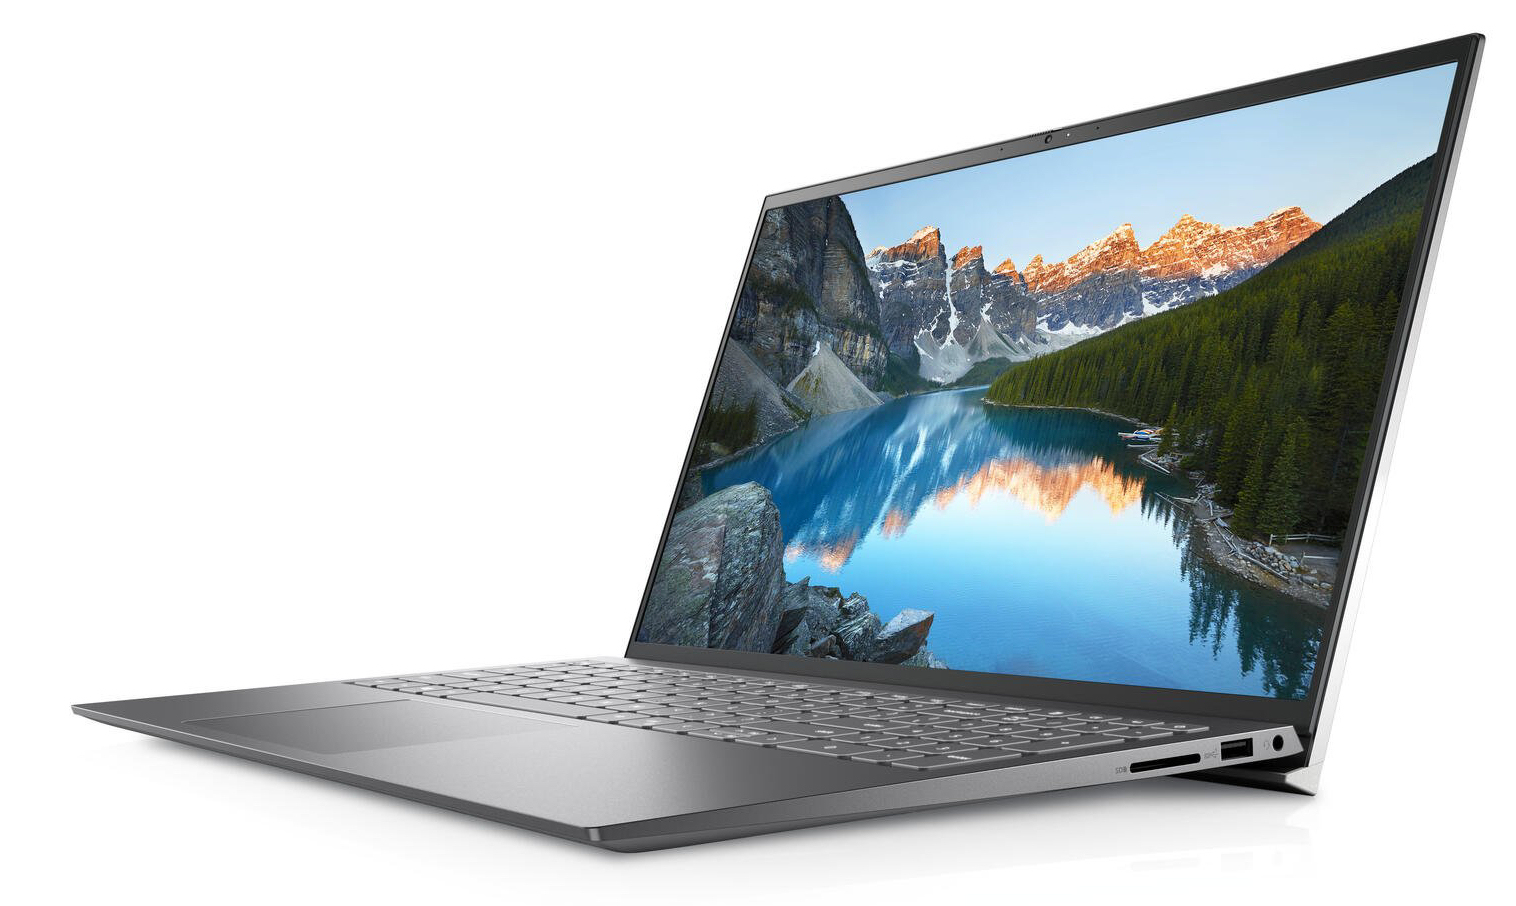
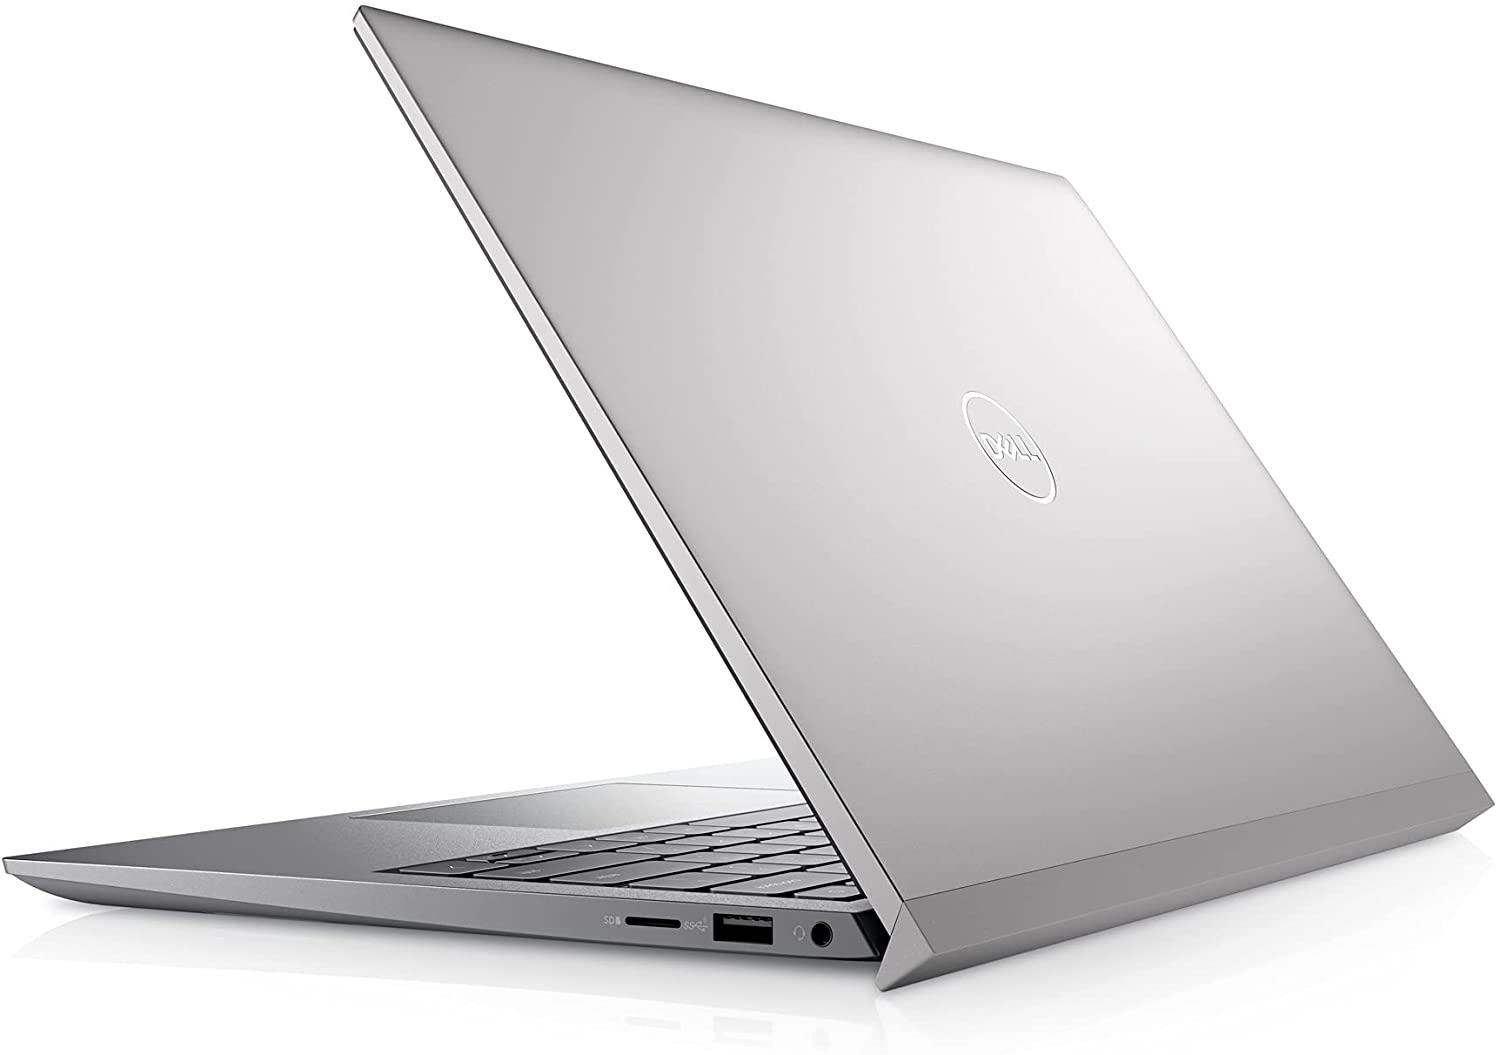
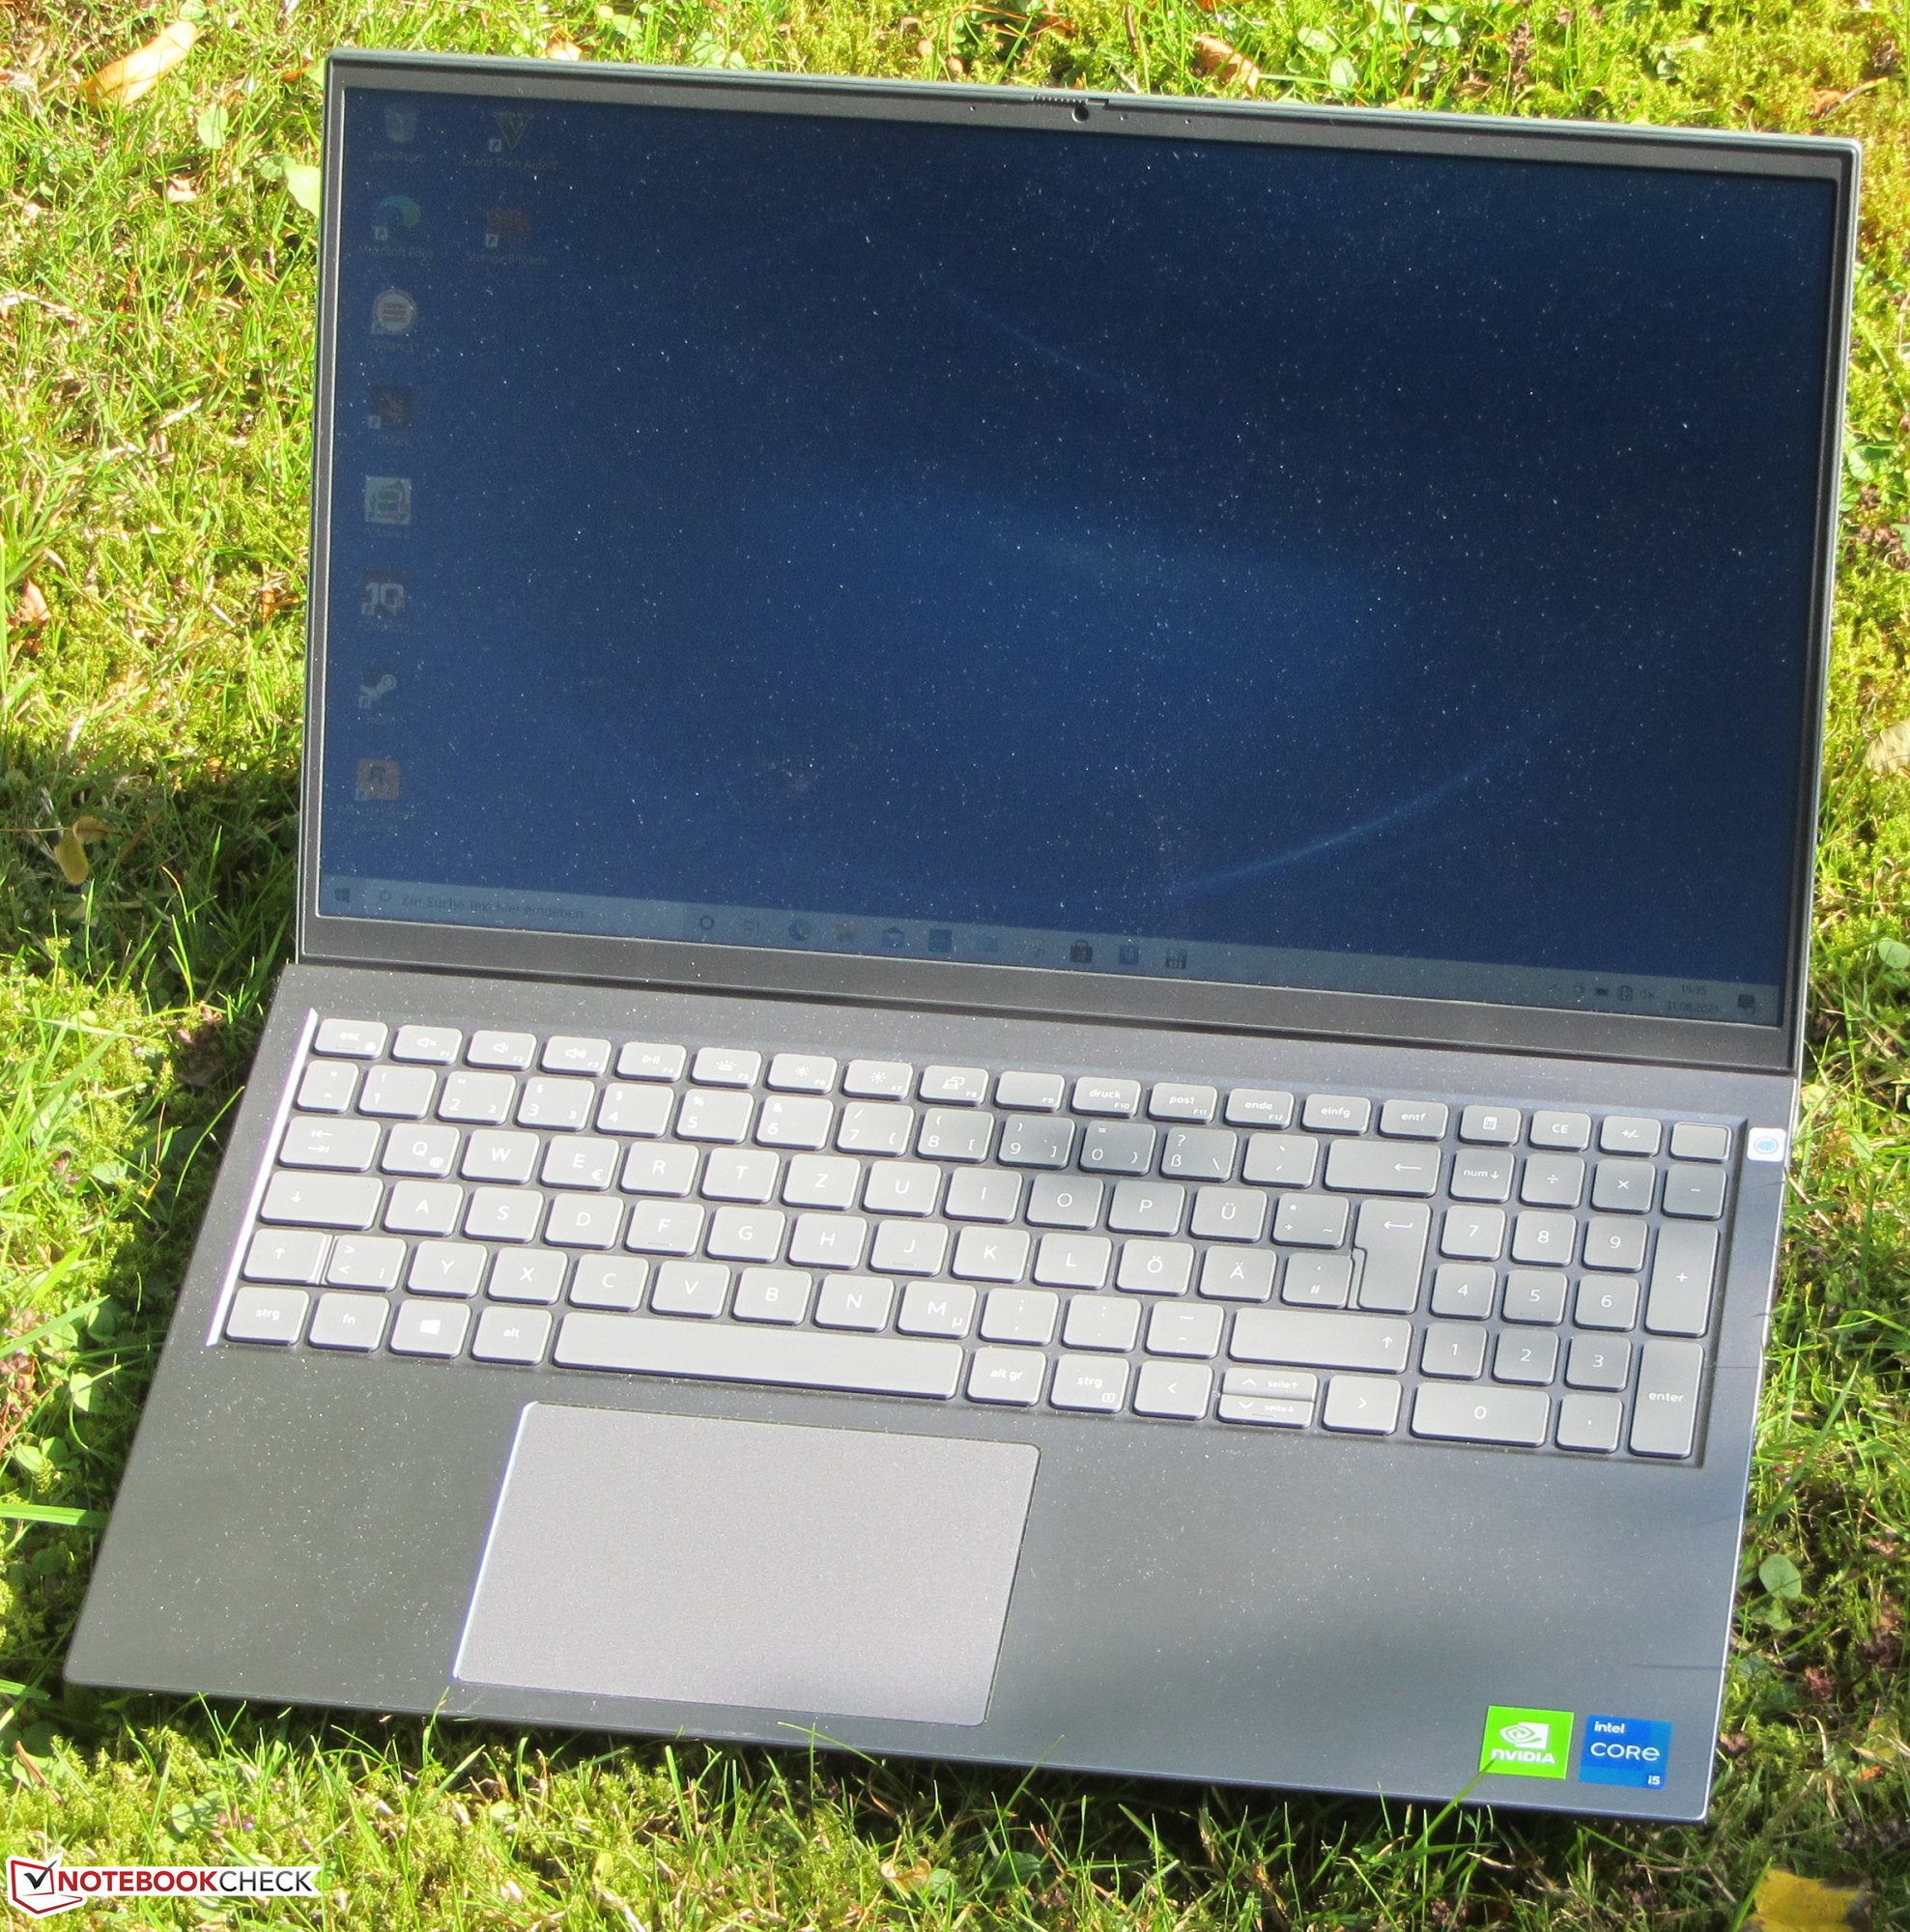
Case & features - The Inspiron comes with a chic metal case
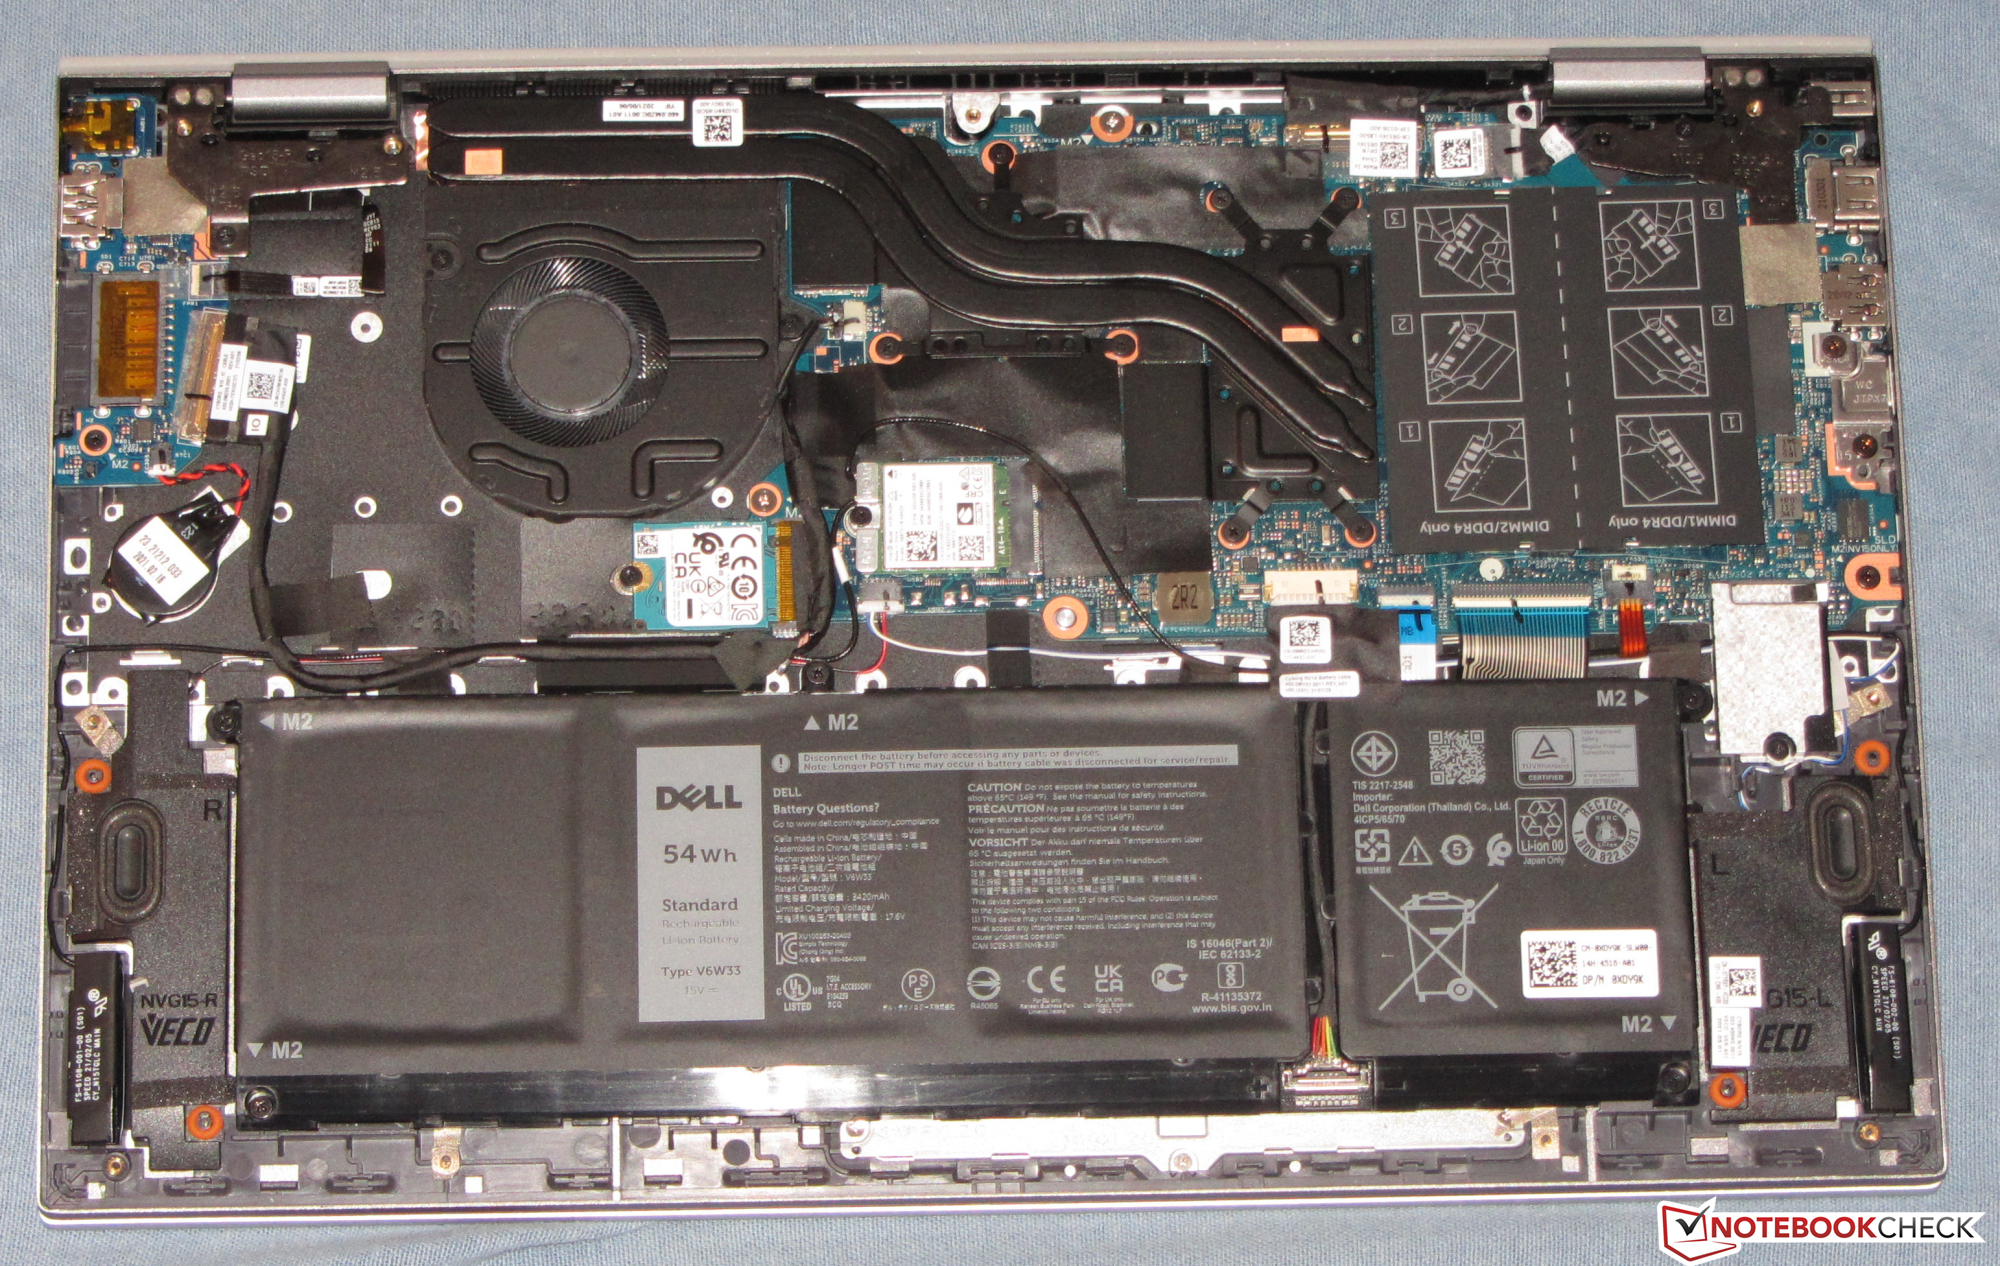
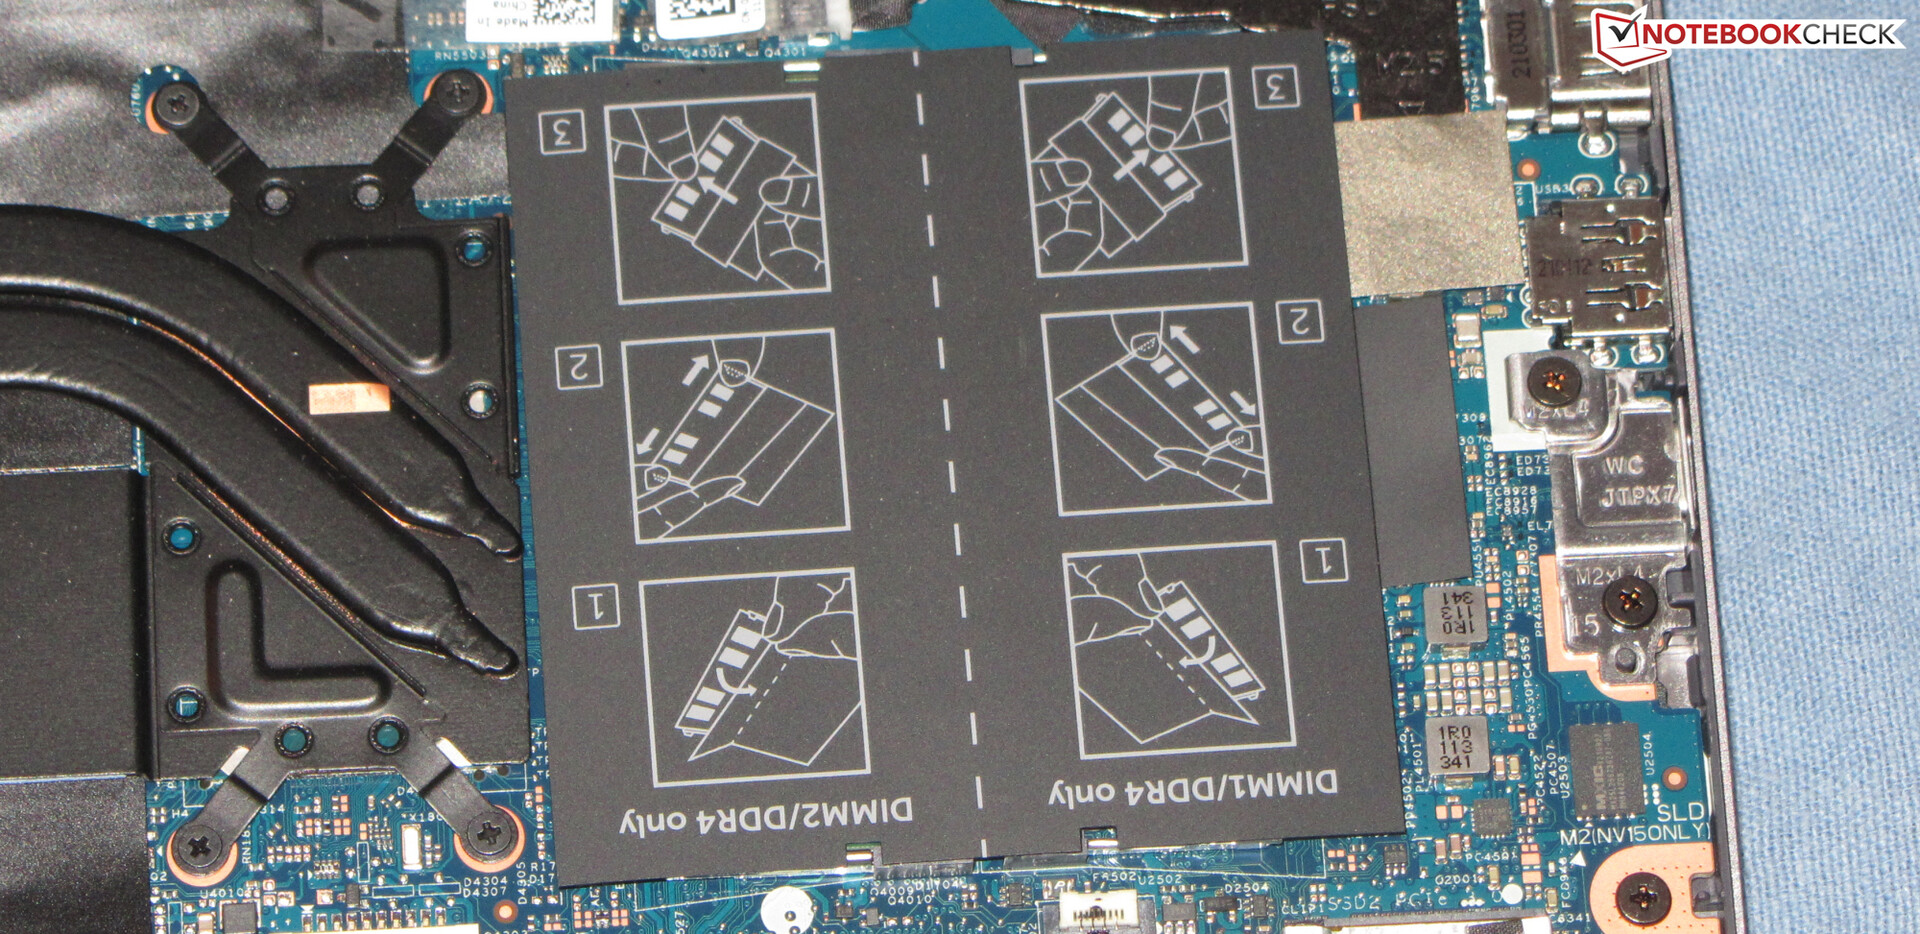
Dell relies on a sleek, chic design with smooth surfaces for the Inspiron's slim, matte-silver-gray metal case. The laptop does not reveal any manufacturing flaws, but it should be stiffer overall. The base unit and lid can be twisted too much. The battery is firmly installed. The innards are accessible after removing the bottom shell.
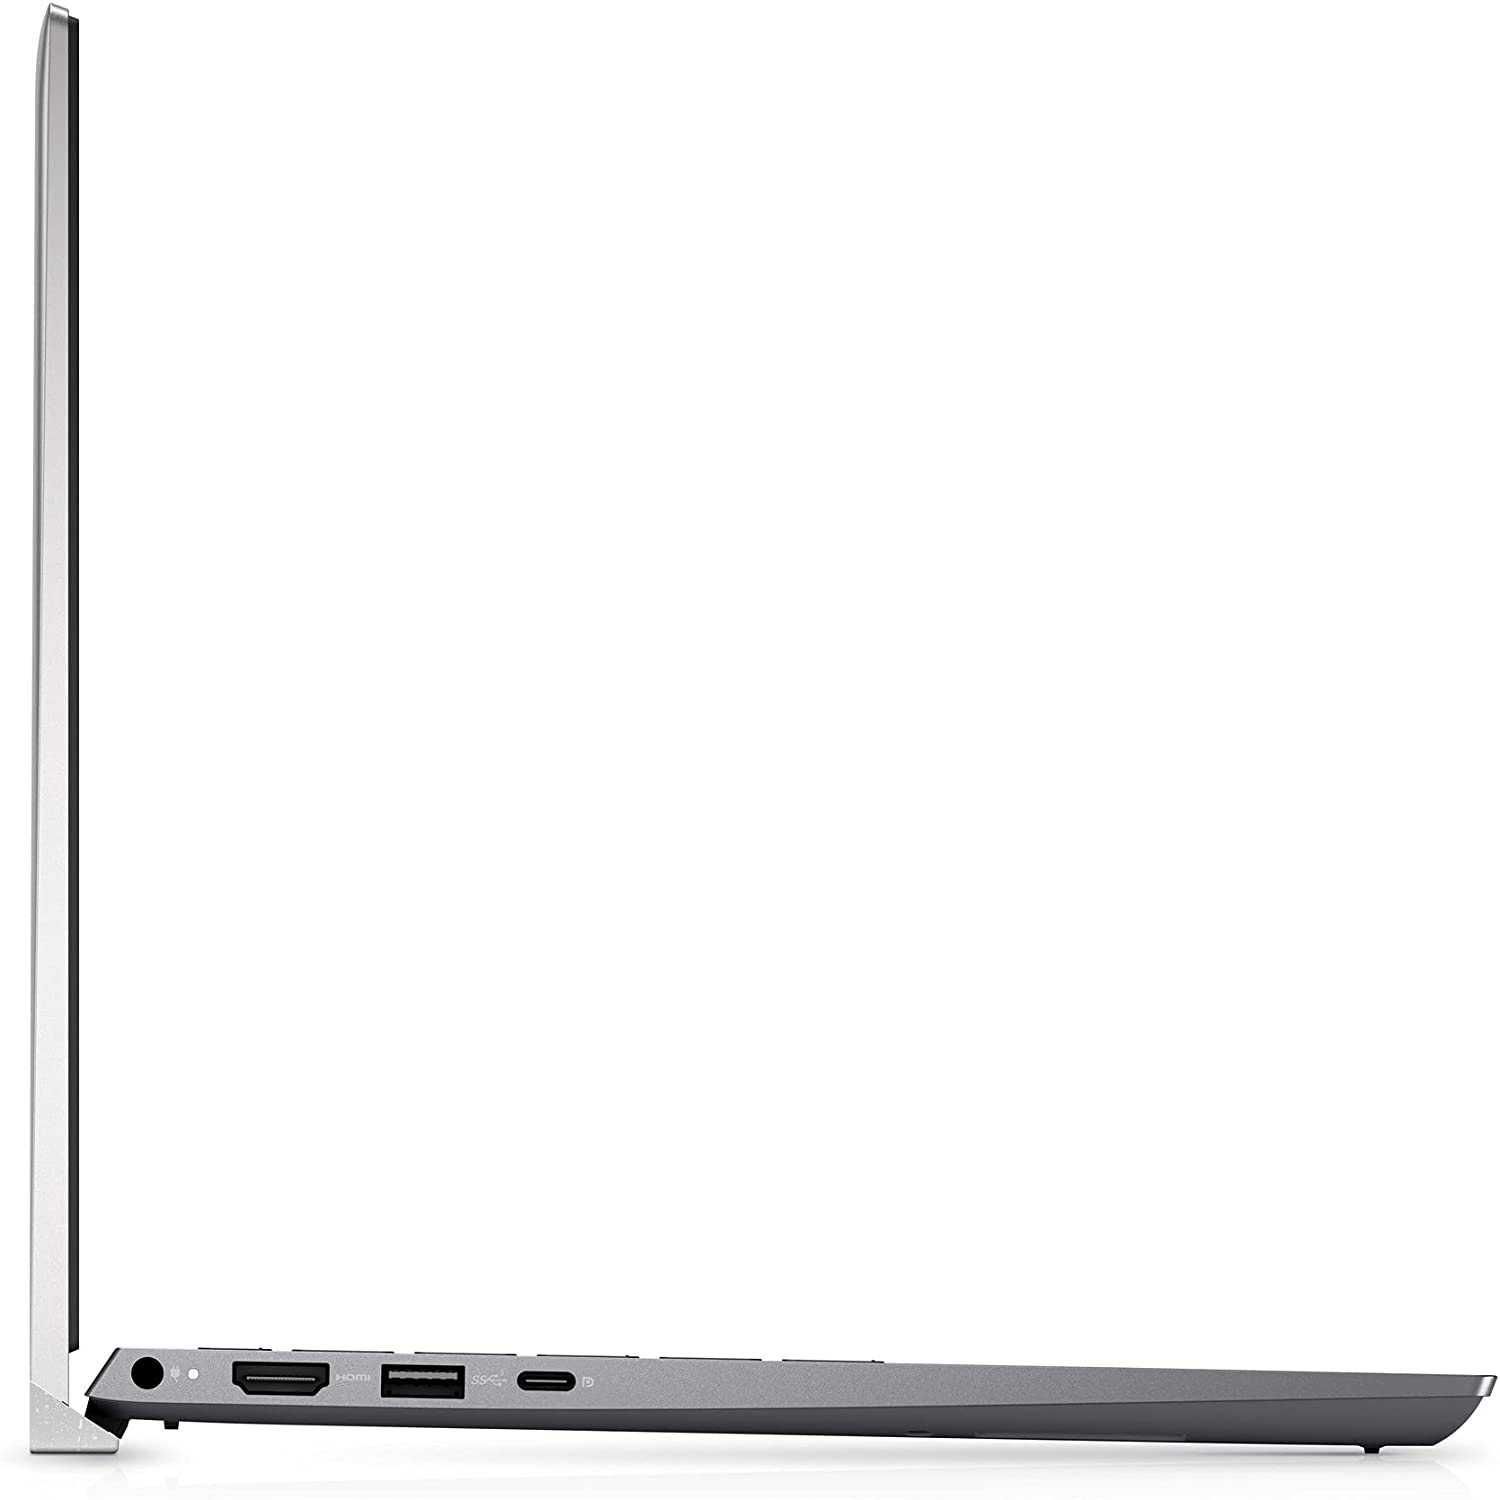
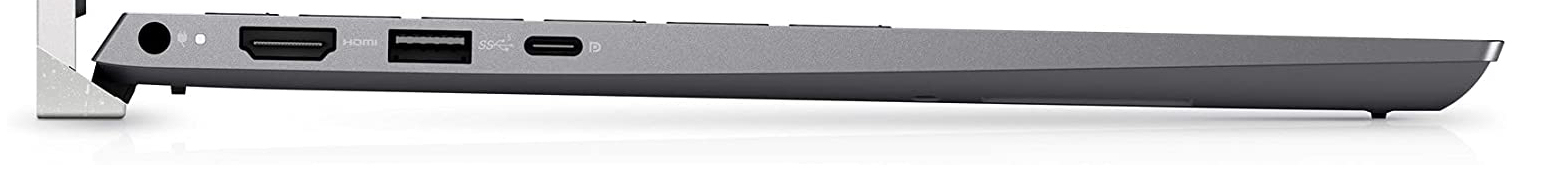
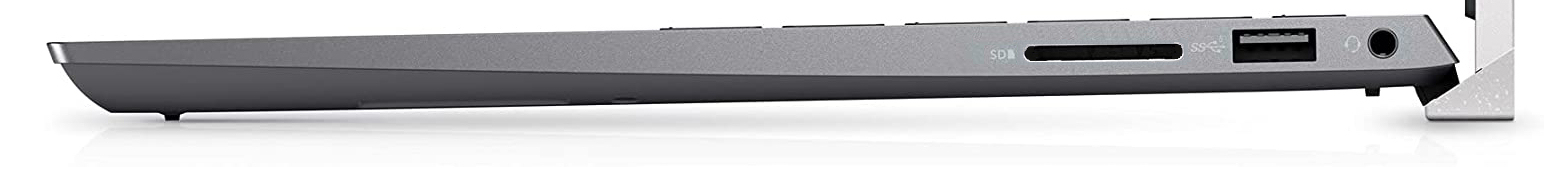
The Inspiron has two USB-A ports (USB 3.2 Gen 1) and one USB-C port (USB 3.2 Gen 2x2; Core i7 models: Thunderbolt 4). The latter supports Power Delivery and Displayport-per-USB-C. Thus, the 5518 has two video outputs together with the HDMI slot. The SD memory card reader (reference card: AV PRO SD 128 GB V60) belongs to the slow models.
The WLAN data rates determined under optimal conditions (no other WLAN devices in the near vicinity, short distance between notebook and server PC; router: Netgear Nighthawk AX12) turn out well, but remain slightly below the capabilities of the installed Intel AX201 chip.
Connection equipment
| SD Card Reader | |
| average JPG Copy Test (av. of 3 runs) | |
| HP Pavilion 15-eg (AV PRO microSD 128 GB V60) | |
| Average of class Office (19.8 - 198.5, n=22, last 2 years) | |
| Asus VivoBook S15 D533UA (AV PRO microSD 128 GB V60) | |
| Lenovo IdeaPad 5 15ALC05 (Toshiba Exceria Pro SDXC 64 GB UHS-II) | |
| Dell Inspiron 15 5518-2X3JR (AV Pro SD 128 GB V60) | |
| maximum AS SSD Seq Read Test (1GB) | |
| Lenovo IdeaPad 5 Pro 16IHU6 (AV PRO microSD 128 GB V60) | |
| Average of class Office (27.4 - 249, n=21, last 2 years) | |
| HP Pavilion 15-eg (AV PRO microSD 128 GB V60) | |
| Asus VivoBook S15 D533UA (AV PRO microSD 128 GB V60) | |
| Lenovo IdeaPad 5 15ALC05 (Toshiba Exceria Pro SDXC 64 GB UHS-II) | |
| Dell Inspiron 15 5518-2X3JR (AV Pro SD 128 GB V60) | |


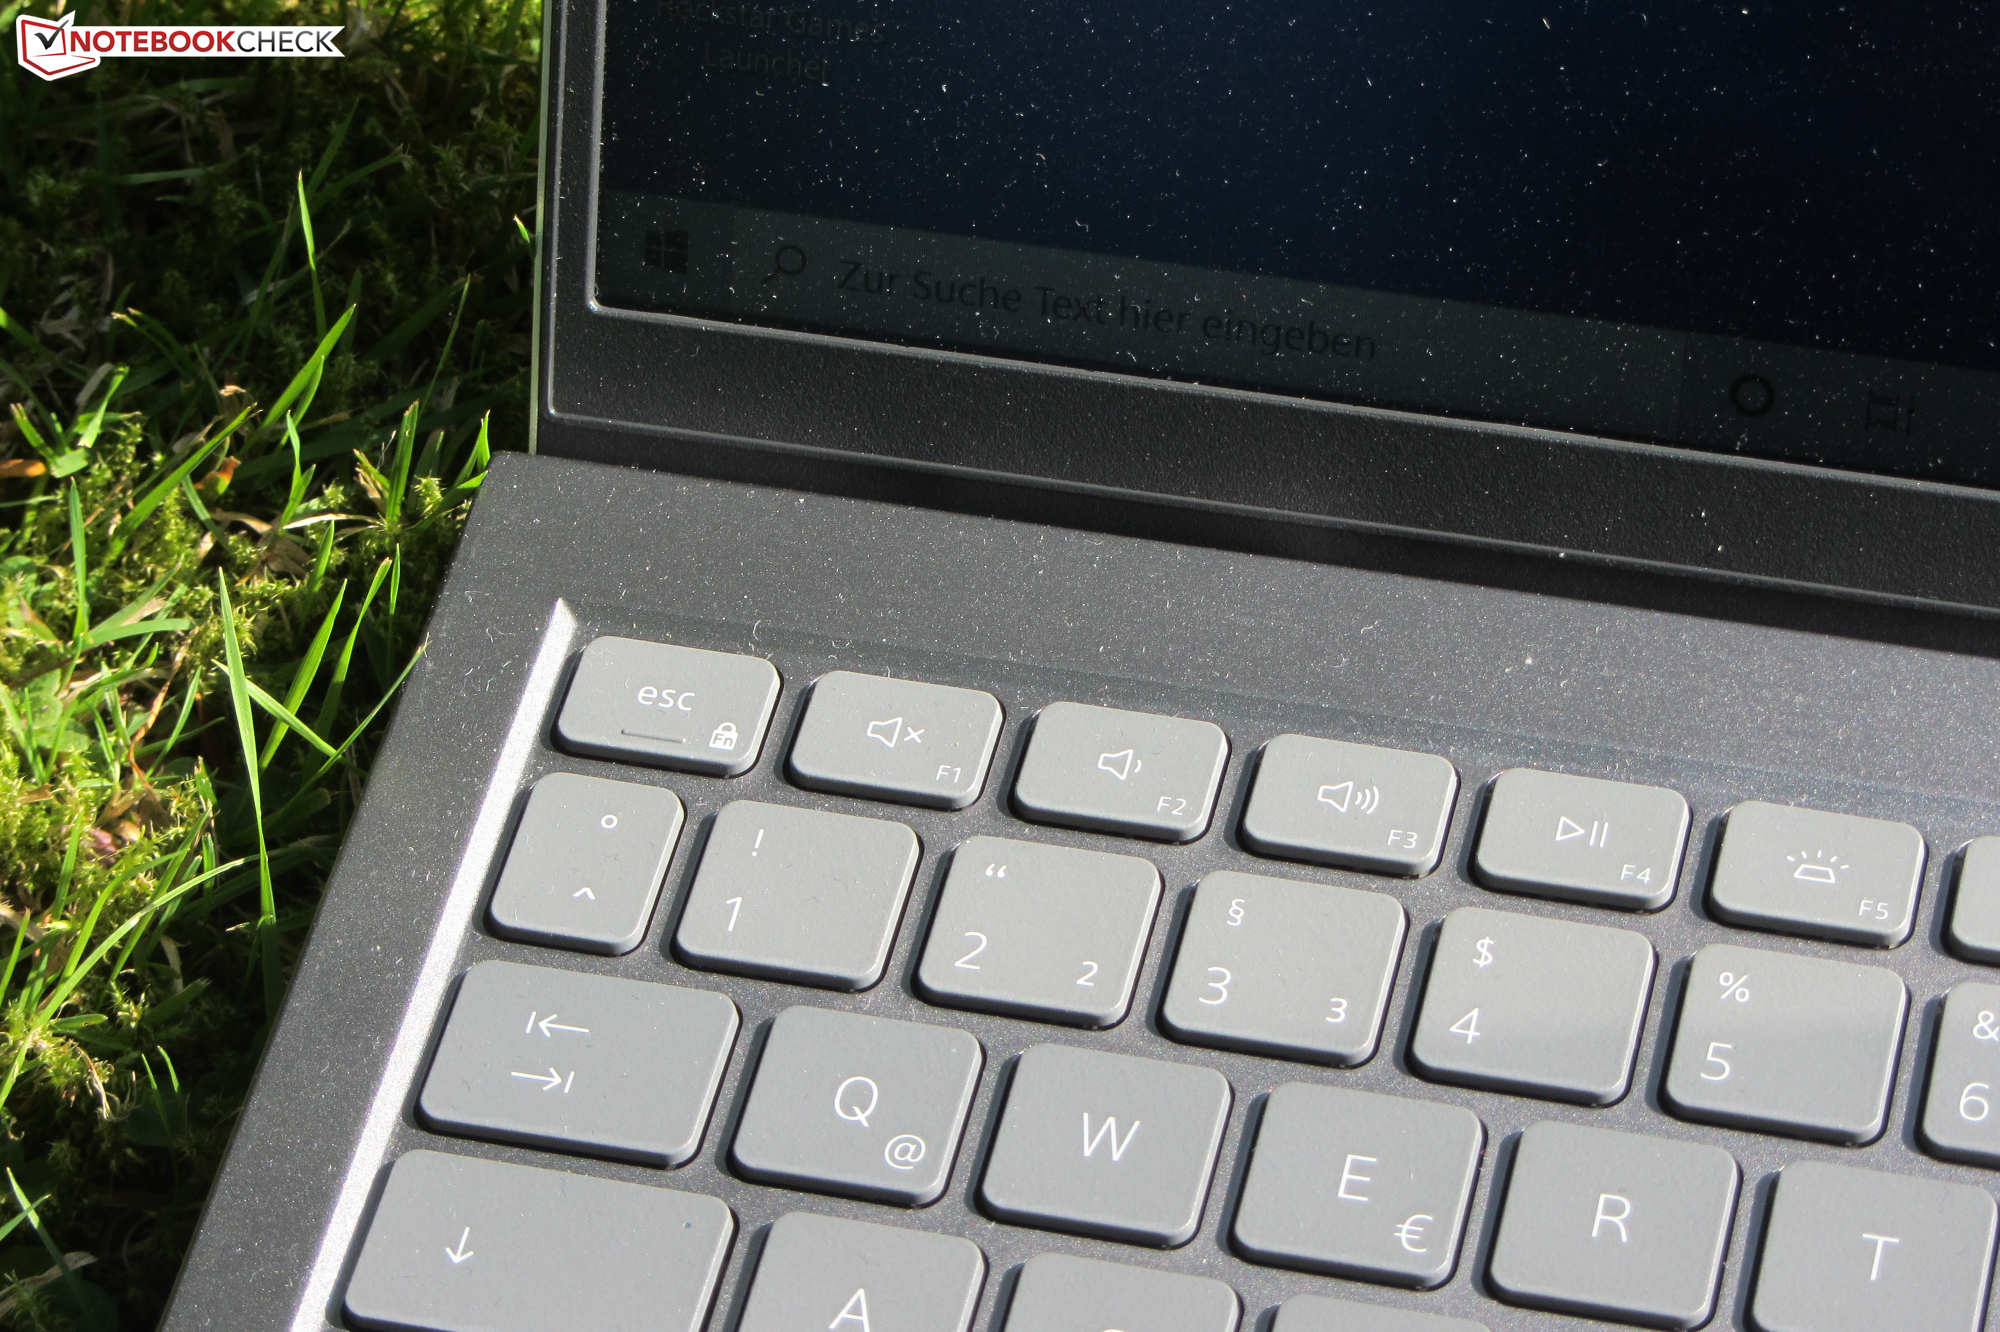
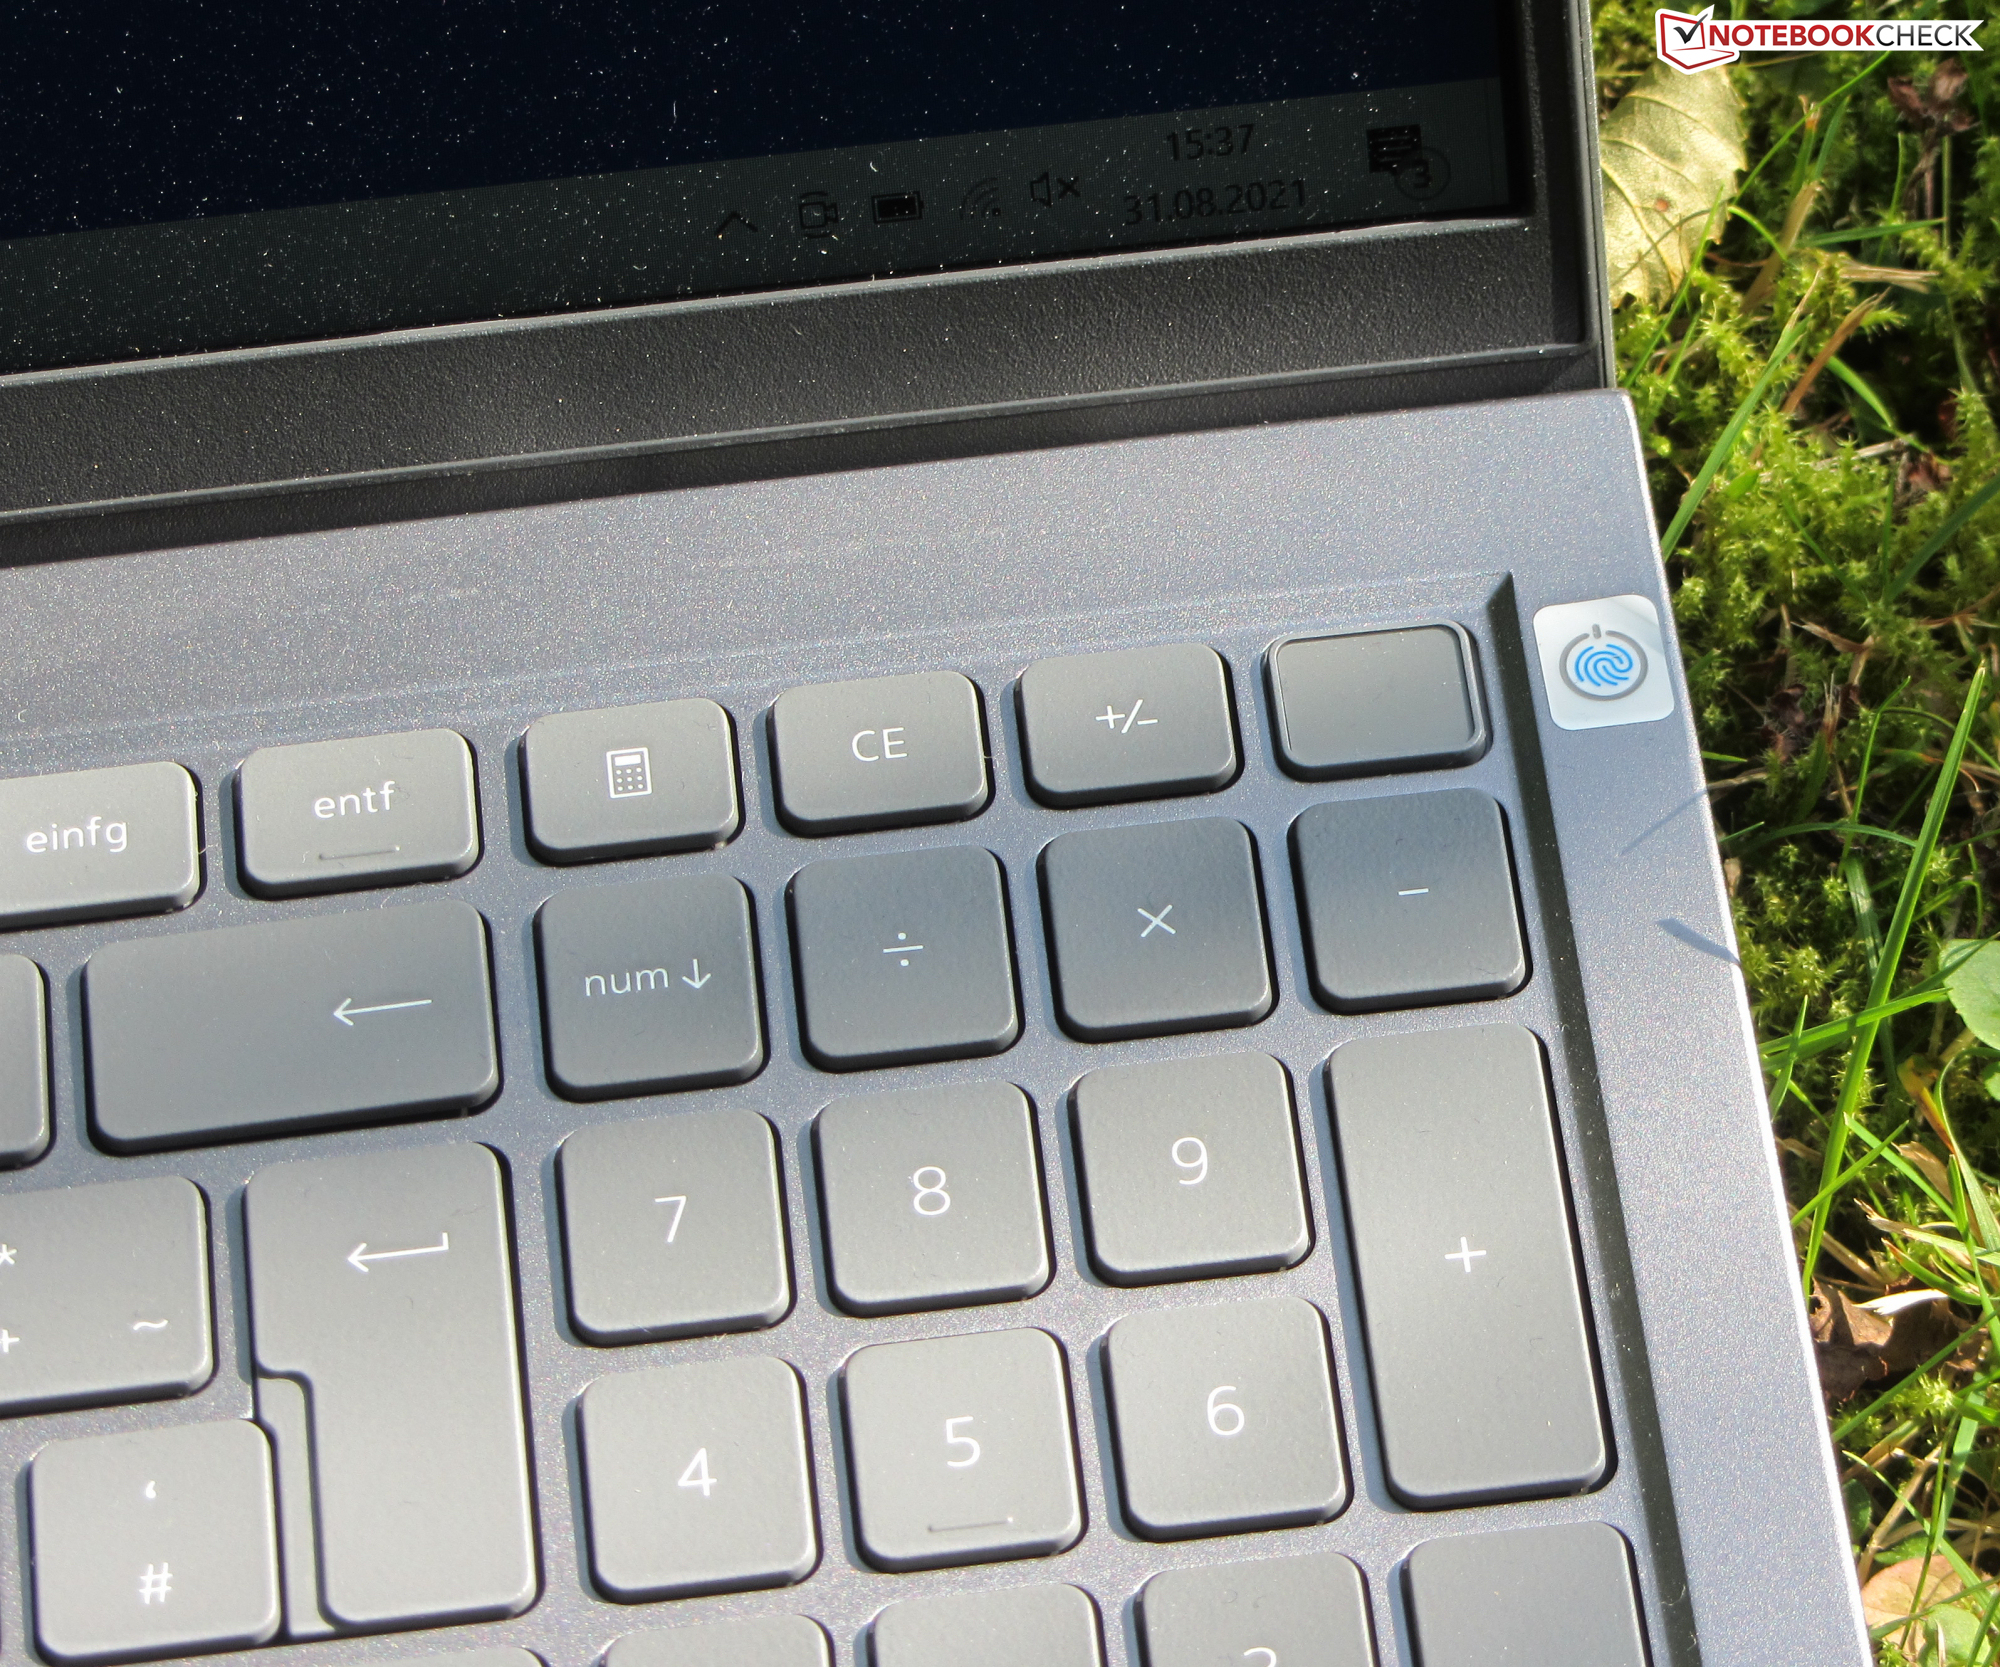
Input devices - Dell 5518 offers key illumination
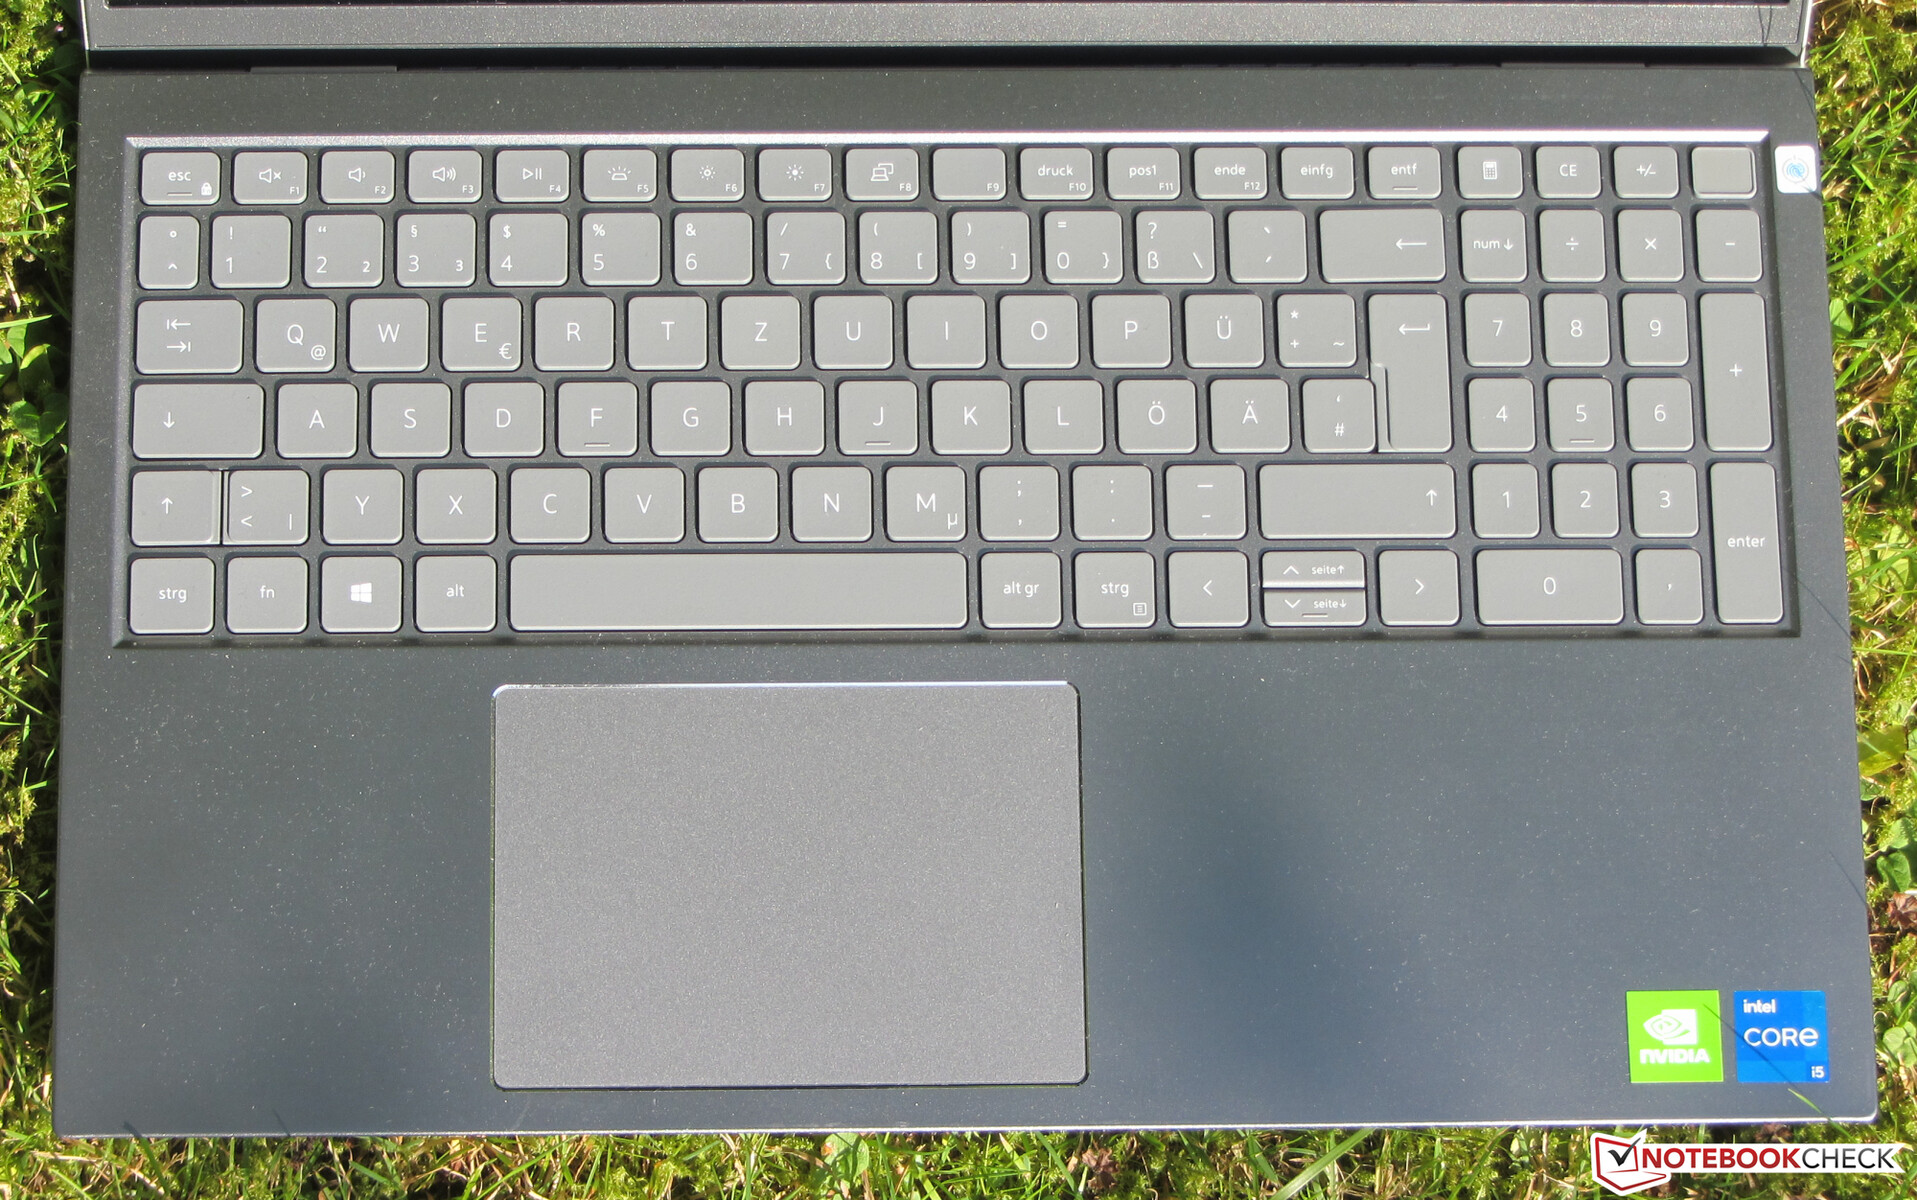
The slightly roughened keys of the illuminated chiclet keyboard have a short stroke and a clear pressure point. The key resistance is pleasing. The keyboard yields a bit during typing - more in the center than at the edges. The illumination (two brightness levels) is controlled via a function key. All in all, Dell delivers a keyboard suitable for everyday use here.
The multi-touch capable ClickPad (approx. 11.5 x 8 cm/~4.5 x 3.2 in) responds to inputs even in the corners. The smooth surface makes it easy for the fingers to glide. The pad has a short stroke and a clear pressure point.
Display - IPS on board
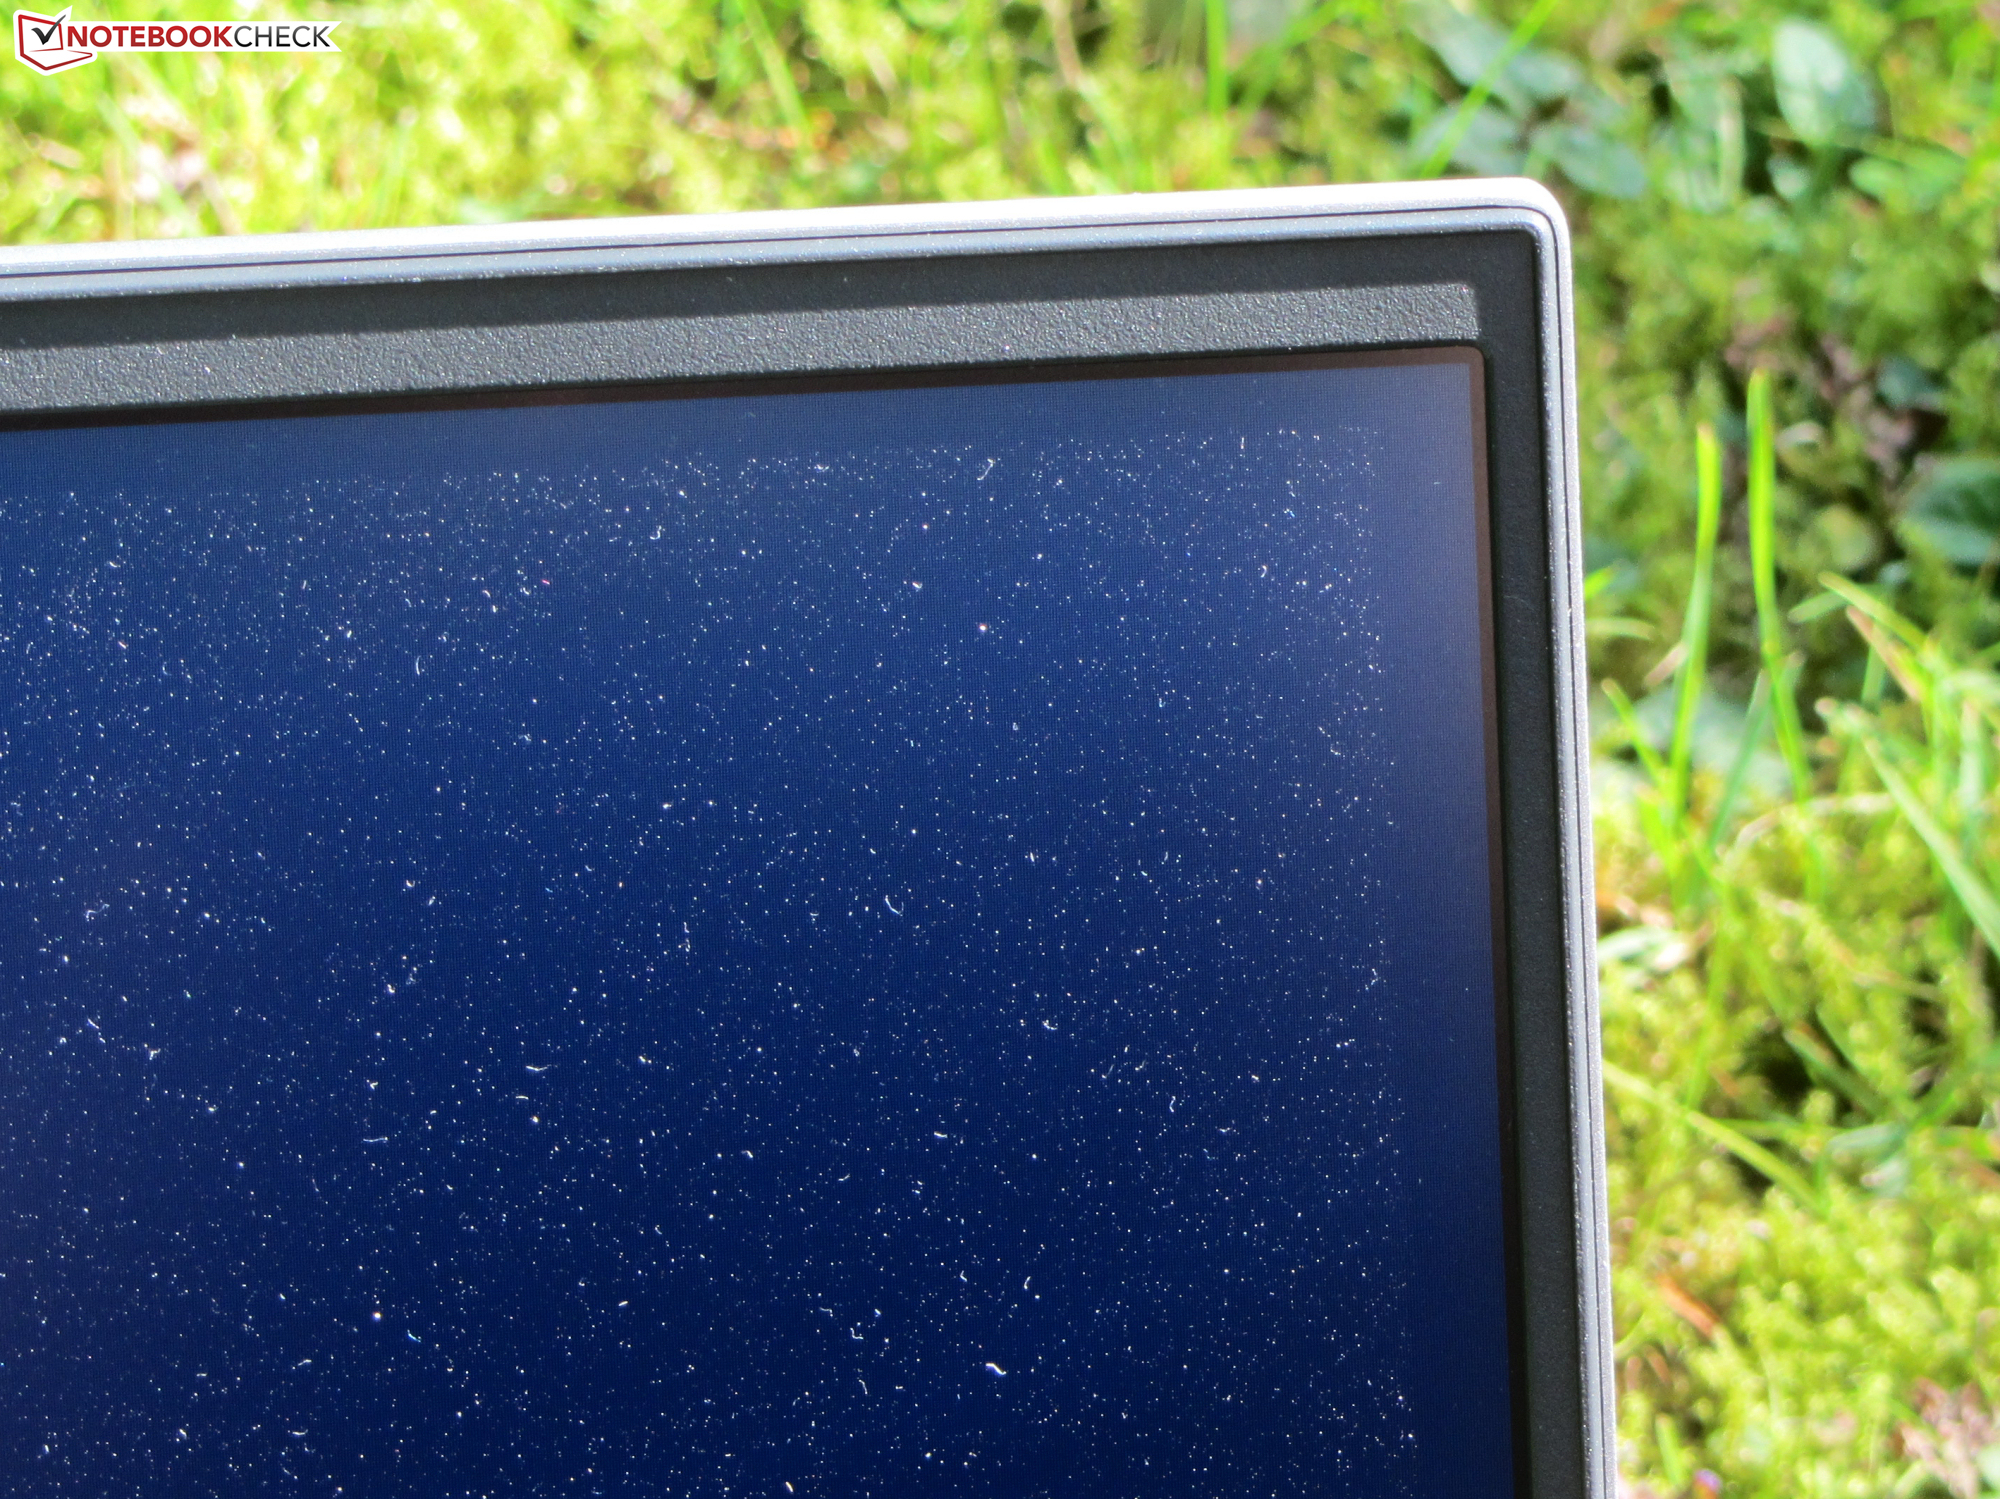
While the matte 15.6-inch display (1,920 x 1,080 pixels) delivers a good contrast (1,040:1), the brightness (267.8 cd/m²) is too low. The value drops a bit further in battery mode. We consider values beyond 300 cd/m² to be good.
The screen shows flickering with a frequency of 1,000 Hz at brightness levels of 90 percent and below. Due to the quite high frequency, sensitive people should be spared from headaches and/or eye problems.
| |||||||||||||||||||||||||
Brightness Distribution: 87 %
Center on Battery: 257 cd/m²
Contrast: 1040:1 (Black: 0.275 cd/m²)
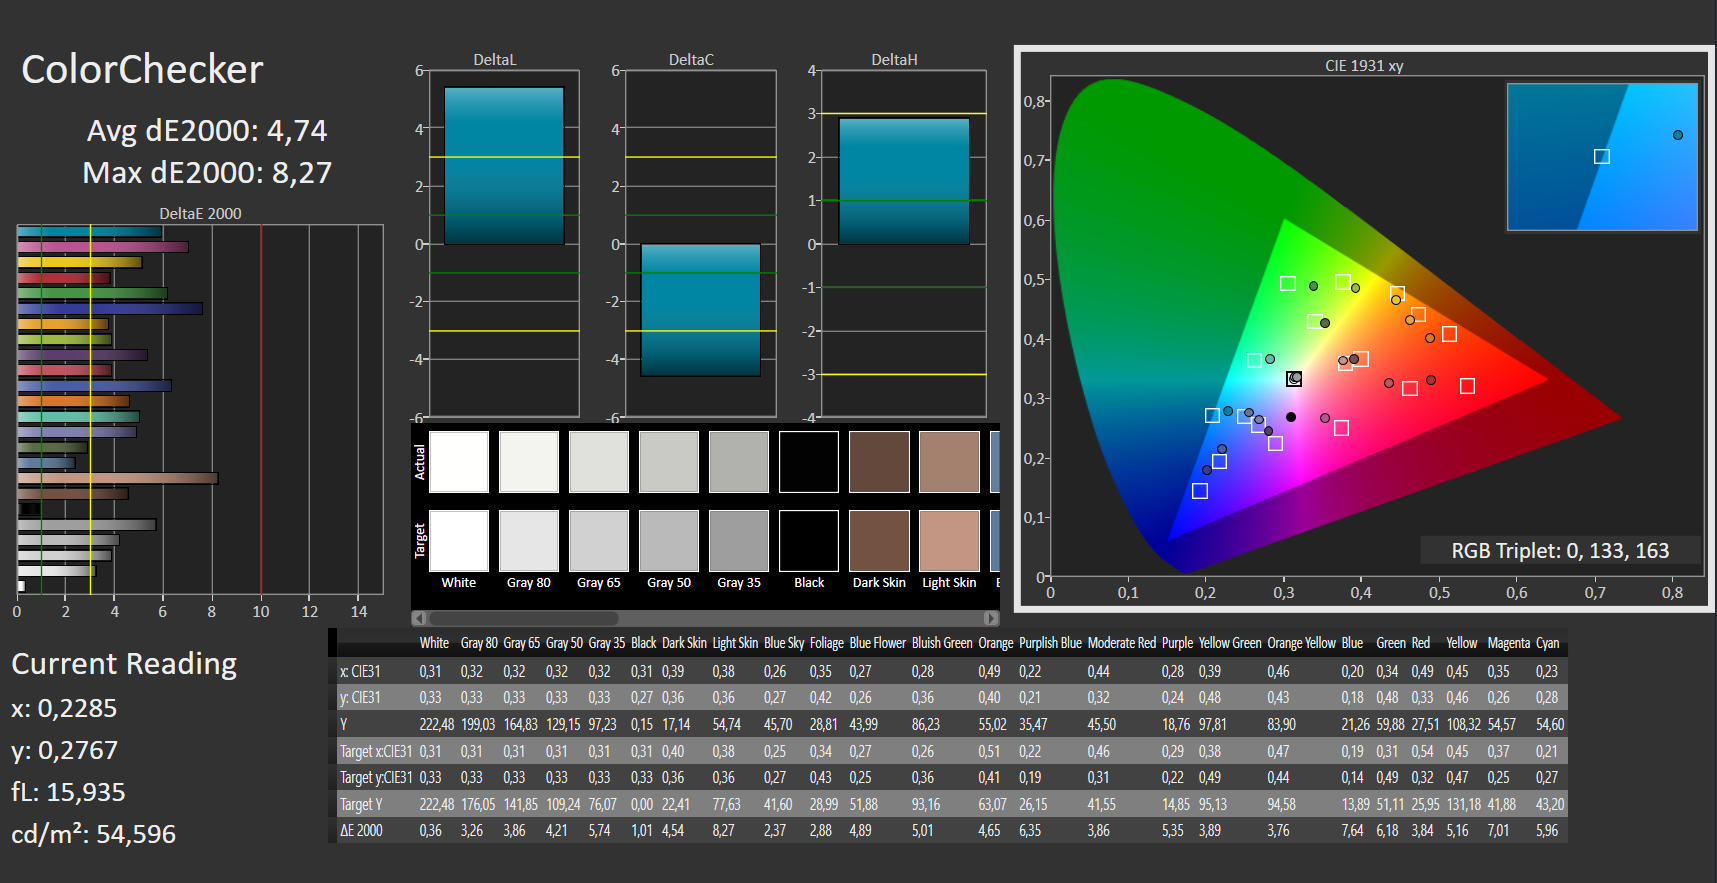
ΔE ColorChecker Calman: 4.74 | ∀{0.5-29.43 Ø4.71}
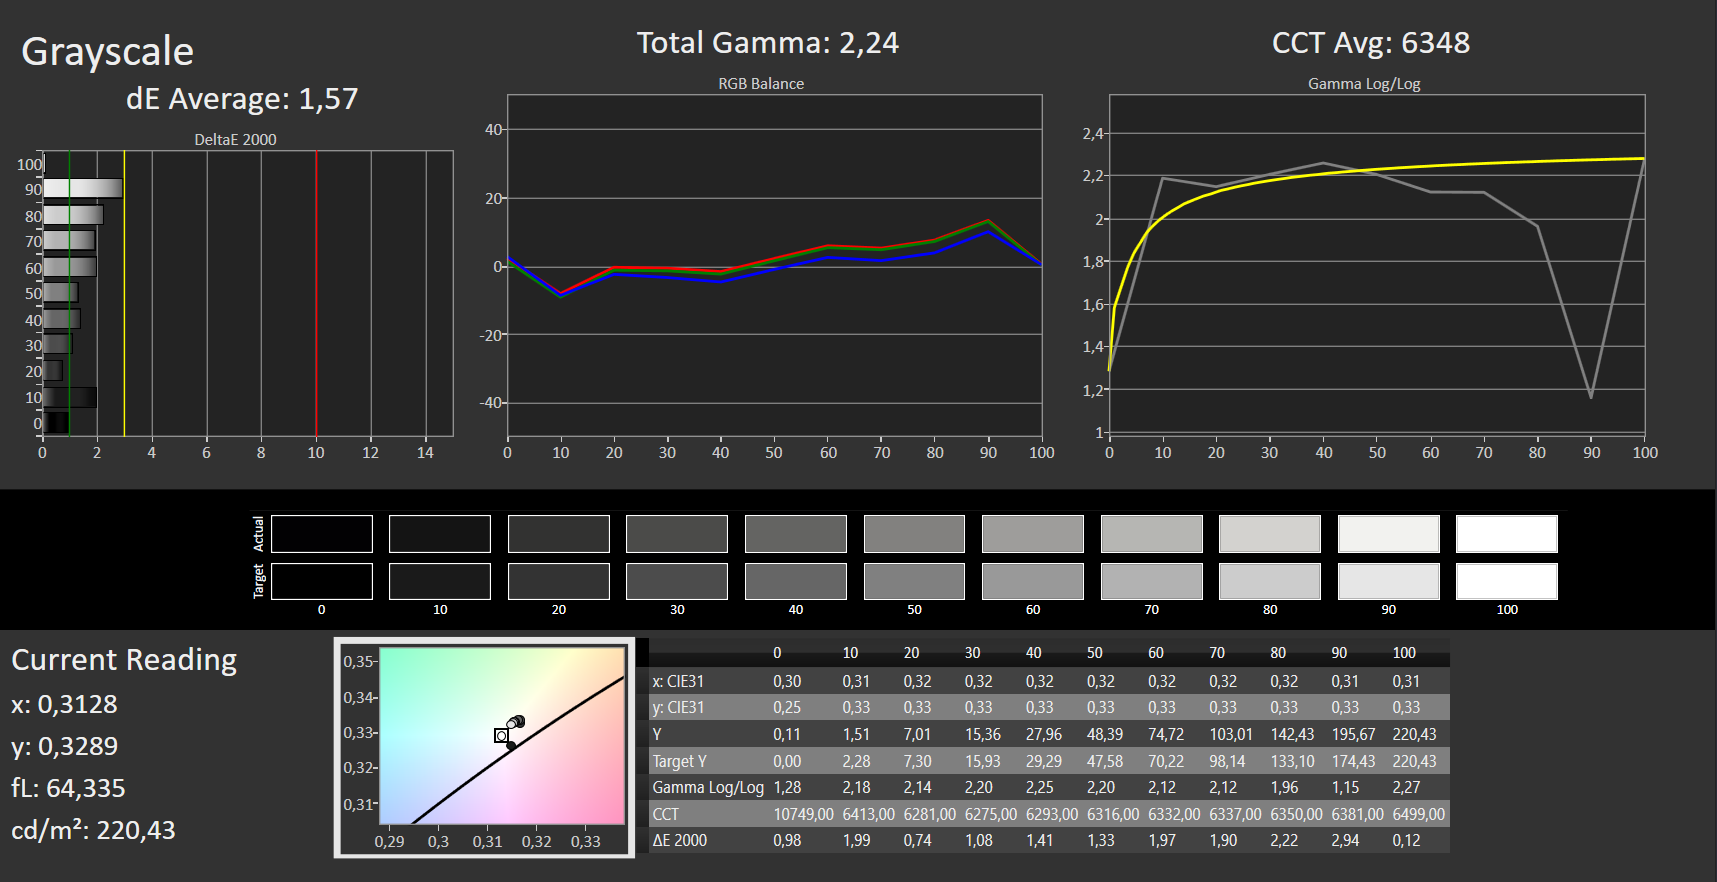
ΔE Greyscale Calman: 1.57 | ∀{0.09-98 Ø4.96}
41.24% AdobeRGB 1998 (Argyll 3D)
58.8% sRGB (Argyll 3D)
39.92% Display P3 (Argyll 3D)
Gamma: 2.24
CCT: 6348 K
| Dell Inspiron 15 5518-2X3JR BOE NV15N4V, IPS, 1920x1080, 15.6" | HP Pavilion 15-eg Chi Mei CMN1523, IPS, 1920x1080, 15.6" | Xiaomi RedmiBook Pro 15 IPS, 3200x2000, 15.6" | Lenovo IdeaPad 5 Pro 16IHU6 Lenovo LEN160WQXGA, IPS, 2560x1600, 16" | Asus VivoBook S15 D533UA Chi Mei N156HCA-EAB, IPS, 1920x1080, 15.6" | Lenovo IdeaPad 5 15ALC05 Lenovo LEN156FHD, IPS, 1920x1080, 15.6" | |
|---|---|---|---|---|---|---|
| Display | 8% | 66% | 78% | 10% | -4% | |
| Display P3 Coverage (%) | 39.92 | 42.9 7% | 66.7 67% | 74 85% | 43.6 9% | |
| sRGB Coverage (%) | 58.8 | 64 9% | 96.3 64% | 98.7 68% | 65.2 11% | 59 0% |
| AdobeRGB 1998 Coverage (%) | 41.24 | 44.4 8% | 68.5 66% | 74.5 81% | 45 9% | 38 -8% |
| Response Times | 34% | 19% | 71% | 48% | 36% | |
| Response Time Grey 50% / Grey 80% * (ms) | 41 ? | 22.8 ? 44% | 34.8 ? 15% | 13 ? 68% | 18 ? 56% | 29 ? 29% |
| Response Time Black / White * (ms) | 31 ? | 23.6 ? 24% | 24 ? 23% | 8 ? 74% | 19 ? 39% | 18 ? 42% |
| PWM Frequency (Hz) | 1000 ? | 26320 ? | ||||
| Screen | -27% | -27% | 10% | -30% | -64% | |
| Brightness middle (cd/m²) | 286 | 294.3 3% | 312 9% | 356 24% | 289 1% | 376 31% |
| Brightness (cd/m²) | 268 | 251 -6% | 298 11% | 322 20% | 267 0% | 341 27% |
| Brightness Distribution (%) | 87 | 76 -13% | 87 0% | 80 -8% | 85 -2% | 78 -10% |
| Black Level * (cd/m²) | 0.275 | 0.26 5% | 0.18 35% | 0.27 2% | 0.56 -104% | 0.66 -140% |
| Contrast (:1) | 1040 | 1132 9% | 1733 67% | 1319 27% | 516 -50% | 570 -45% |
| Colorchecker dE 2000 * | 4.74 | 4.08 14% | 5.39 -14% | 2.4 49% | 3.96 16% | 6.4 -35% |
| Colorchecker dE 2000 max. * | 8.27 | 19.49 -136% | 9.95 -20% | 4.42 47% | 6.76 18% | 20.45 -147% |
| Greyscale dE 2000 * | 1.57 | 3 -91% | 6.3 -301% | 2.81 -79% | 3.43 -118% | 4.59 -192% |
| Gamma | 2.24 98% | 2.21 100% | 2.192 100% | 2.4 92% | 2.28 96% | 2.26 97% |
| CCT | 6348 102% | 6616 98% | 7473 87% | 6294 103% | 7191 90% | 6819 95% |
| Colorchecker dE 2000 calibrated * | 3.7 | 3.15 | ||||
| Color Space (Percent of AdobeRGB 1998) (%) | 69 | 42 | 38 | |||
| Color Space (Percent of sRGB) (%) | 96 | 65 | 59 | |||
| Total Average (Program / Settings) | 5% /
-9% | 19% /
2% | 53% /
35% | 9% /
-9% | -11% /
-37% |
* ... smaller is better
Display Response Times
| ↔ Response Time Black to White | ||
|---|---|---|
| 31 ms ... rise ↗ and fall ↘ combined | ↗ 17 ms rise |  |
| ↘ 14 ms fall | ||
| The screen shows slow response rates in our tests and will be unsatisfactory for gamers. In comparison, all tested devices range from 0.1 (minimum) to 240 (maximum) ms. » 84 % of all devices are better. This means that the measured response time is worse than the average of all tested devices (19.8 ms). | ||
| ↔ Response Time 50% Grey to 80% Grey | ||
| 41 ms ... rise ↗ and fall ↘ combined | ↗ 21 ms rise |  |
| ↘ 20 ms fall | ||
| The screen shows slow response rates in our tests and will be unsatisfactory for gamers. In comparison, all tested devices range from 0.165 (minimum) to 636 (maximum) ms. » 65 % of all devices are better. This means that the measured response time is worse than the average of all tested devices (31 ms). | ||
Screen Flickering / PWM (Pulse-Width Modulation)
| Screen flickering / PWM detected | 1000 Hz | ≤ 90 % brightness setting |  |
The display backlight flickers at 1000 Hz (worst case, e.g., utilizing PWM) Flickering detected at a brightness setting of 90 % and below. There should be no flickering or PWM above this brightness setting. The frequency of 1000 Hz is quite high, so most users sensitive to PWM should not notice any flickering. In comparison: 52 % of all tested devices do not use PWM to dim the display. If PWM was detected, an average of 7757 (minimum: 5 - maximum: 343500) Hz was measured. | |||
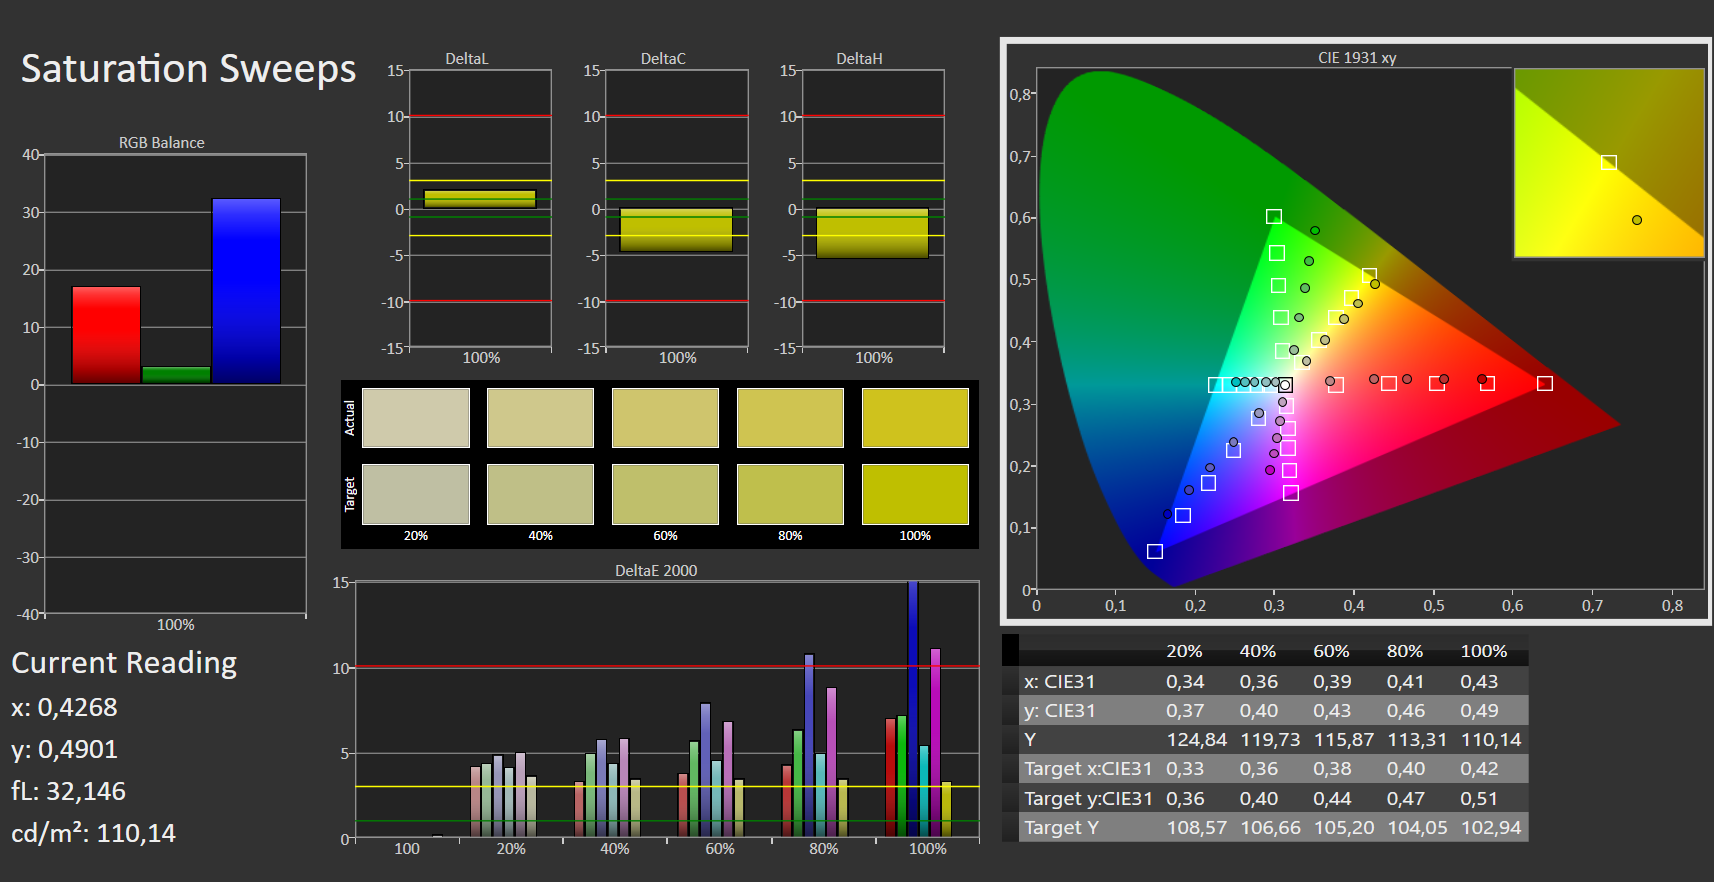
The screen has a decent color reproduction in its state of delivery, but the colors deviate a bit from the target - the whole thing is still within an acceptable range. It does not suffer from a blue cast. The display cannot reproduce the AdobeRGB (41%), sRGB (59%) and DCI-P3 (40%) color spaces.
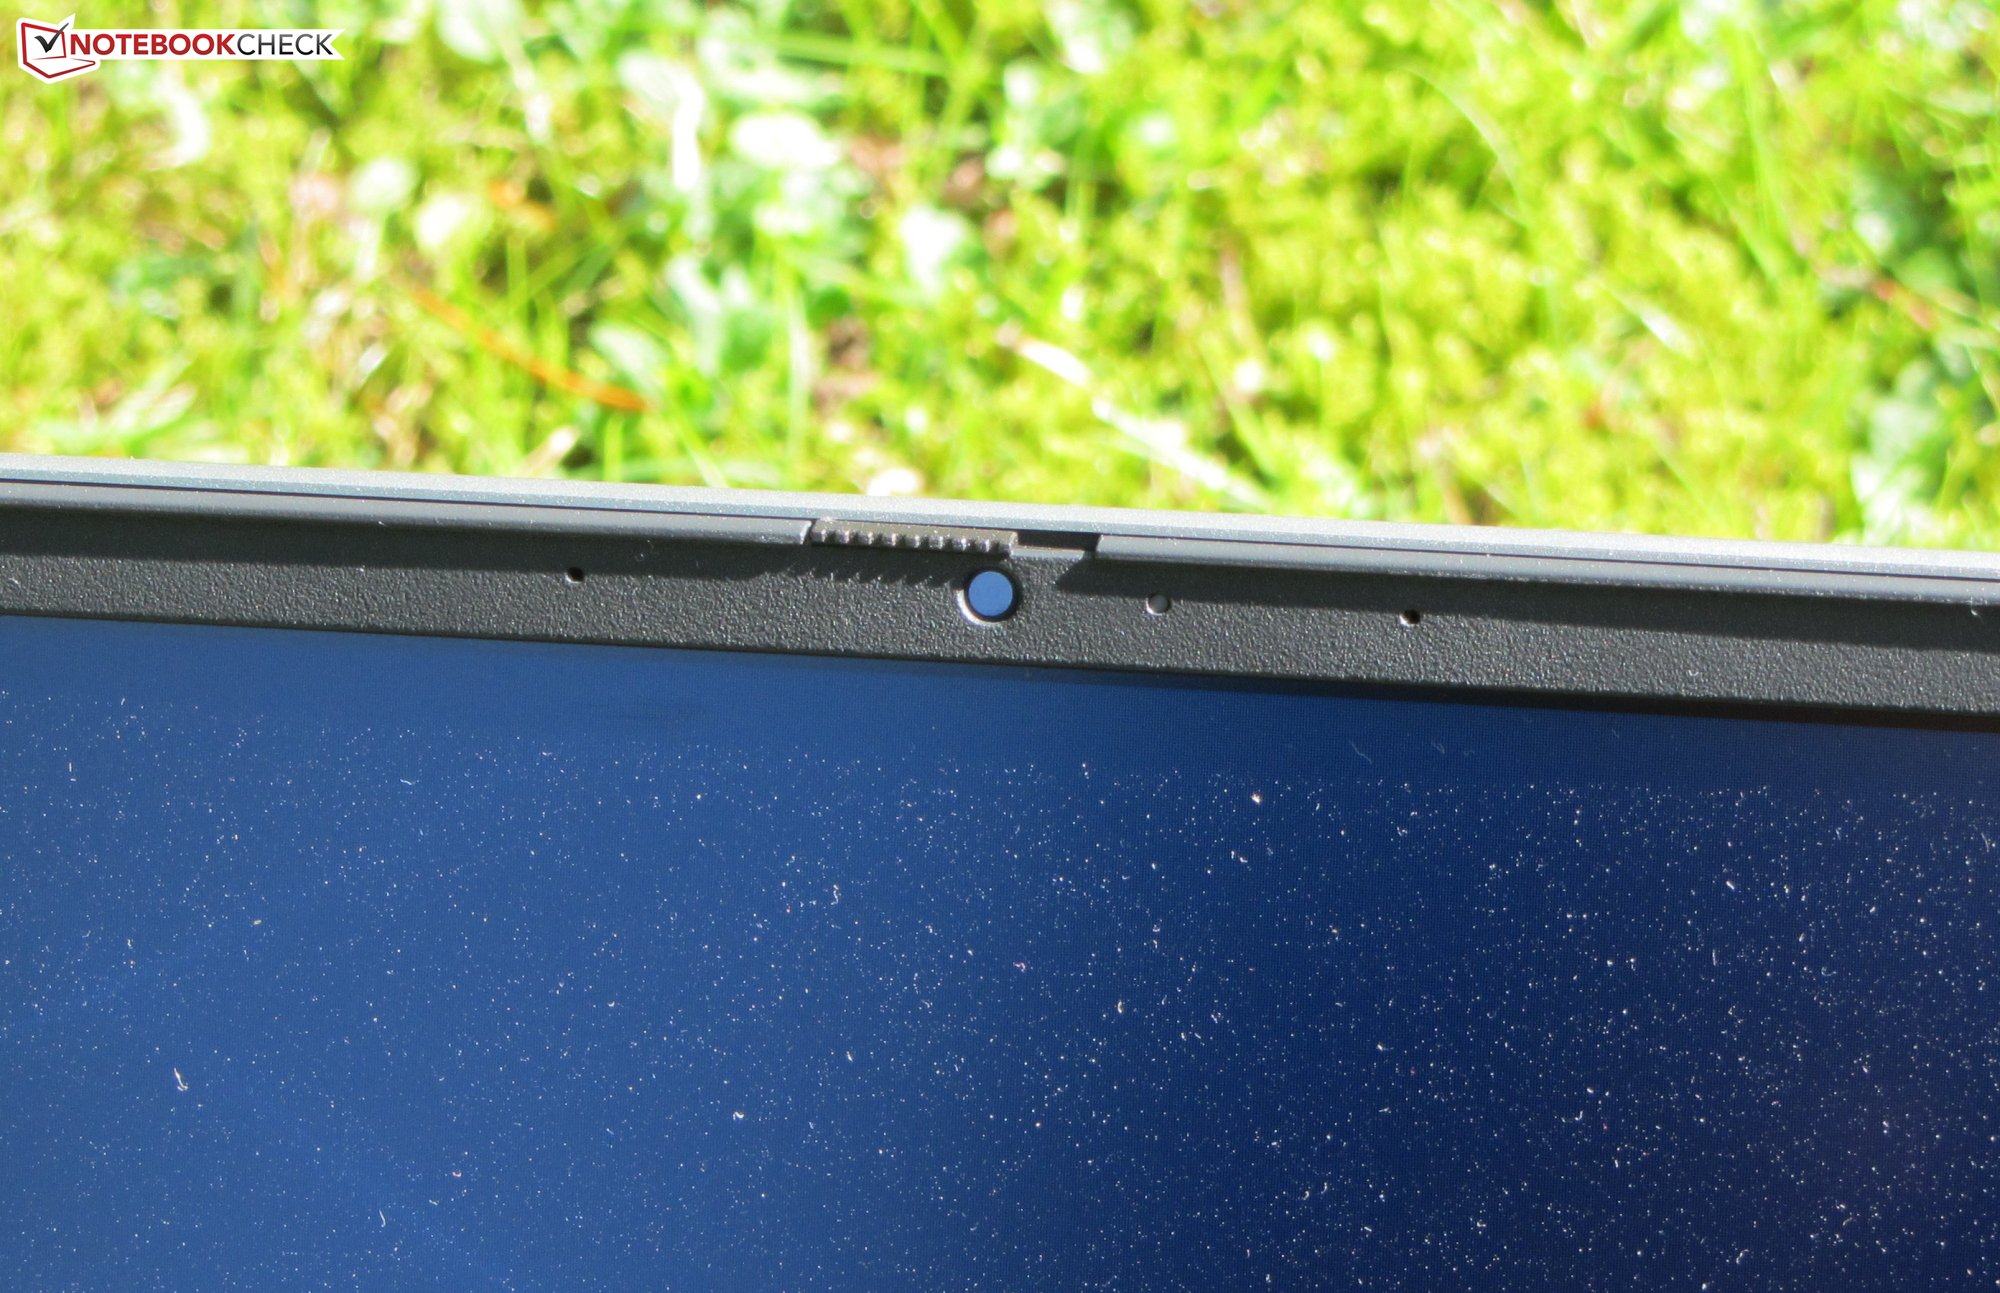
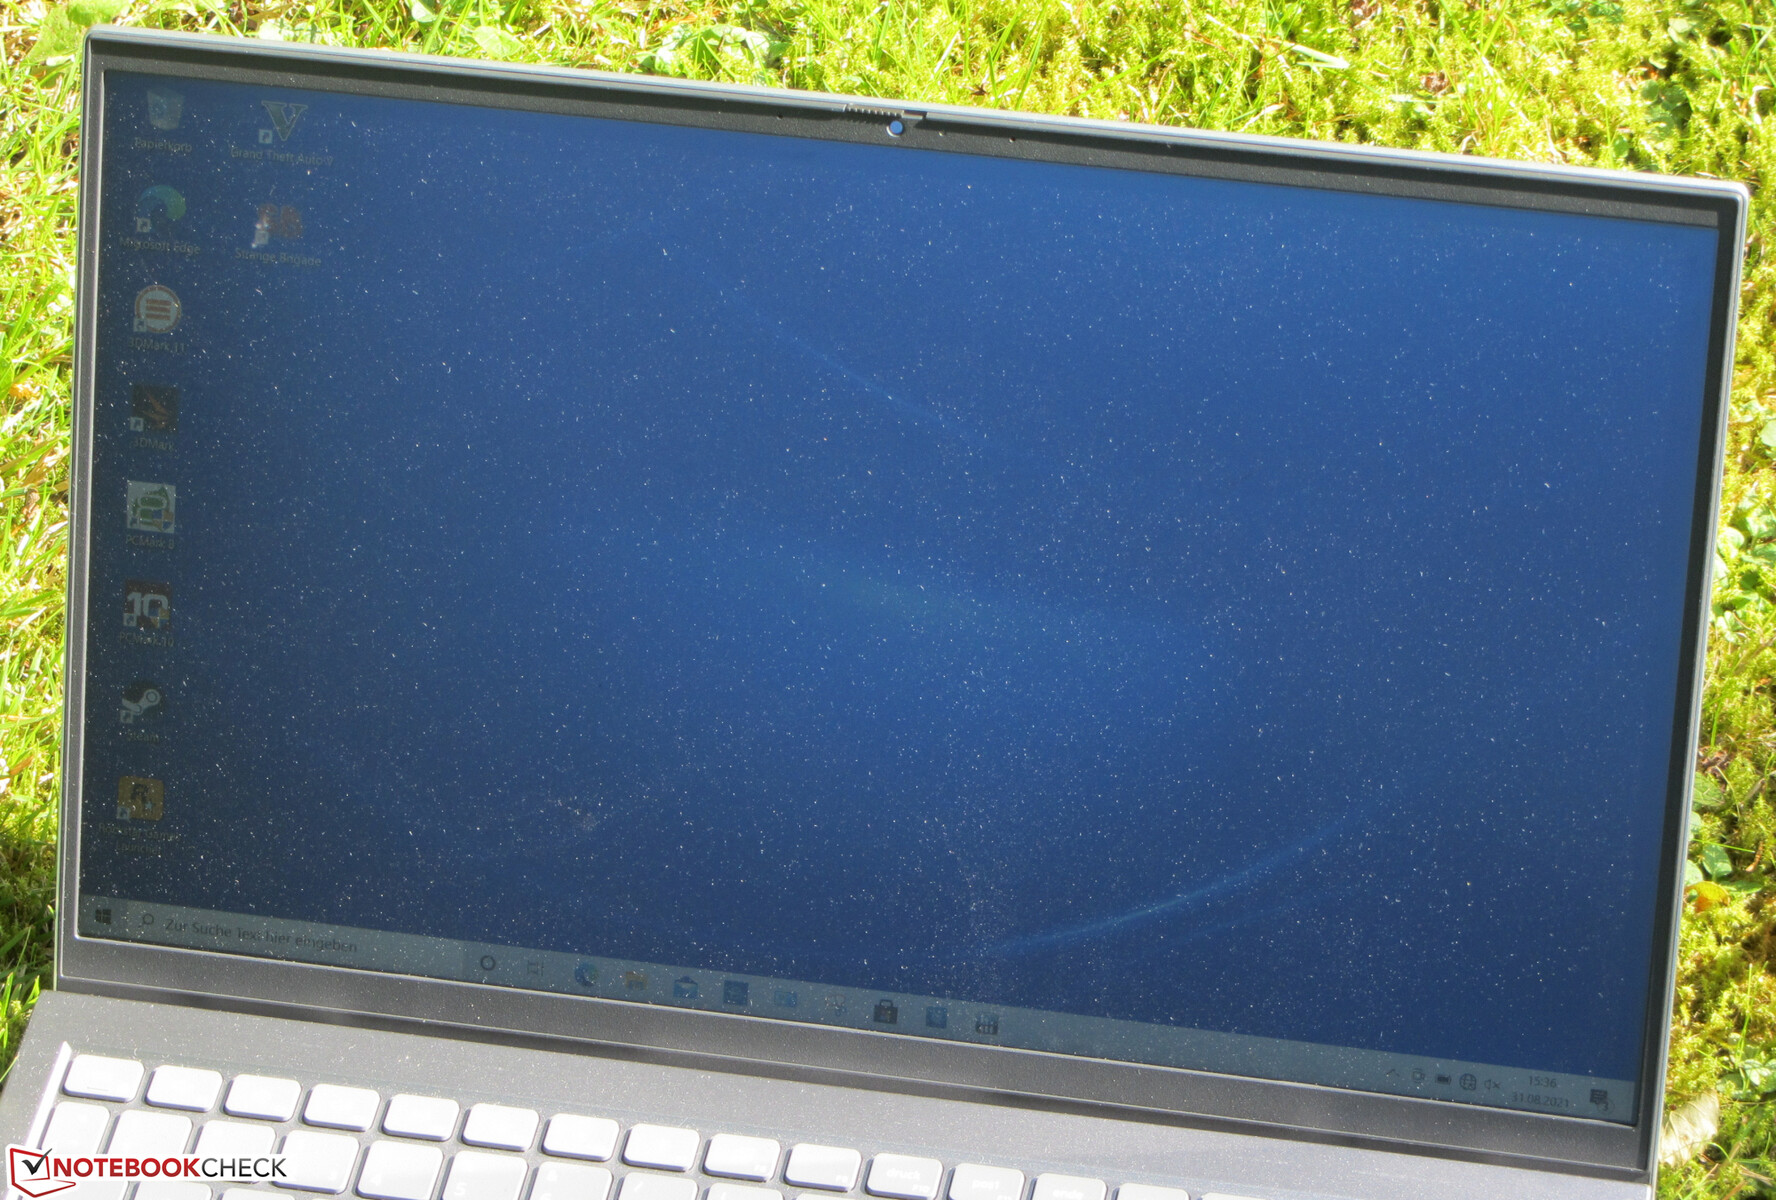
The viewing-angle stable IPS panel can be read from any position. Outdoor reading of the screen is possible when the sun does not shine too brightly.
Performance - The CPU of the Dell computer remains below its capabilities
Dell's 15.6-inch all-rounder offers enough performance for office and Internet applications and allows using computer games.
Test conditions
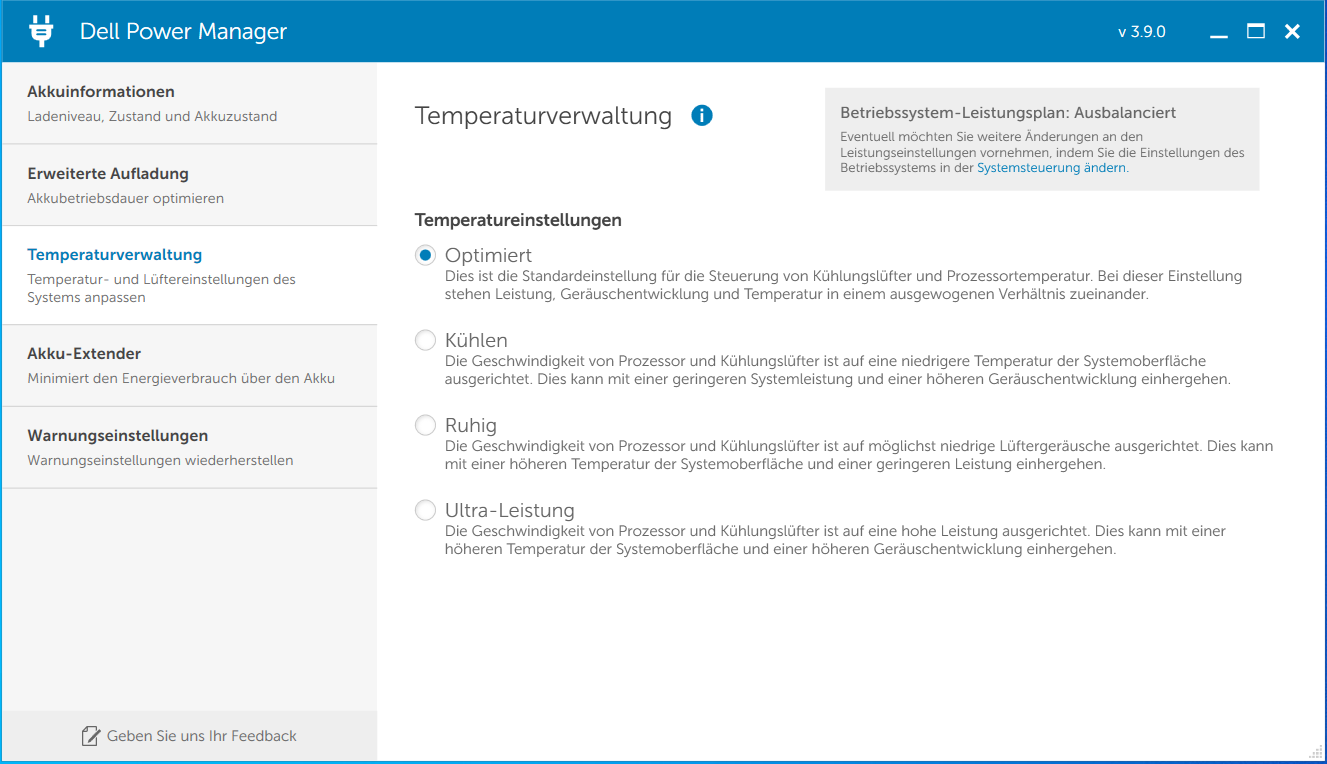
Dell Power Manager provides profiles that affect the notebook's temperature and power development. We used the profile "Optimized". Some benchmarks were additionally run with the "Ultra Performance" profile active.
| Optimized | Cool | Quiet | Ultra performance | |
|---|---|---|---|---|
| PL1 | 25 watts | 15 watts | 30 watts | |
| PL2 | 51 Watts | 51 Watts | 51 Watts |
Processor
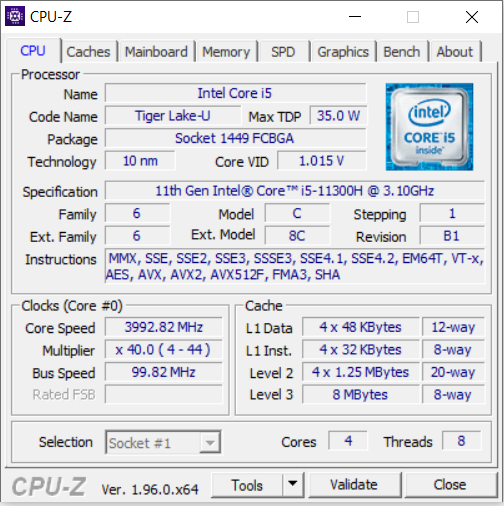
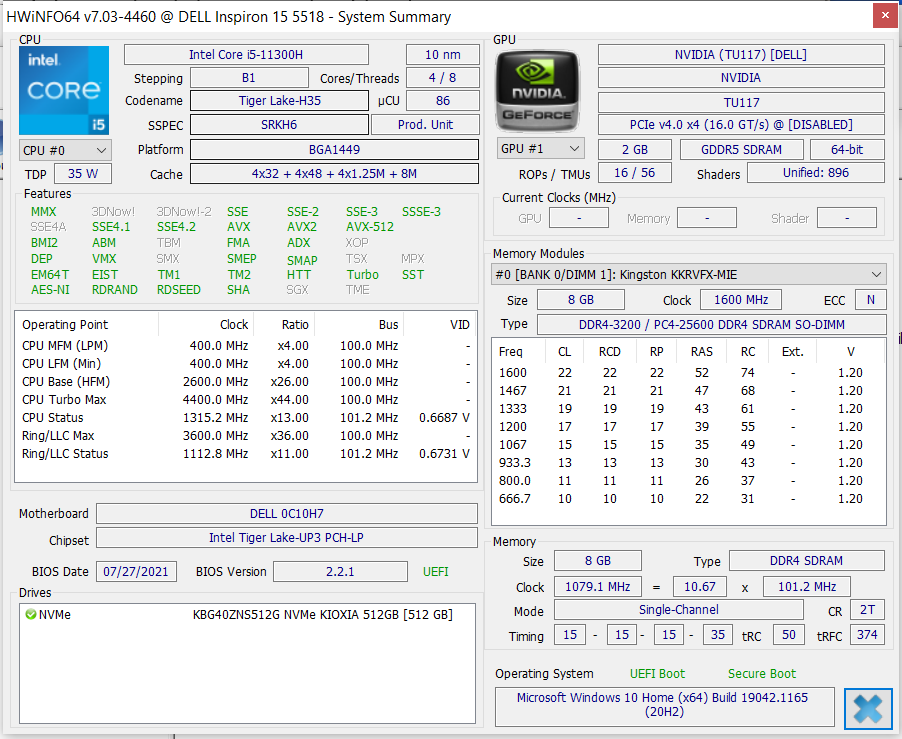
The Core i7-11300H-Quad-core processor (Tiger Lake) works with a base clock of 3.1 GHz. An increase to 4 GHz (four cores) up to 4.4 GHz (one core) is possible via Turbo. Hyperthreading (two threads per core) is supported.
The multi-thread test of the Cinebench R15 benchmark is run at 3.3 to 4 GHz for a short time, then the clock fluctuates between 600 MHz and 3 GHz. The single-thread test is run with 1.6 to 4.4 GHz. The clock rates are lower in battery mode.
Dell has chosen relatively low power limits for the CPU. As a result, the 11300H remains below its capabilities, as a comparison with the benchmark results of the Ideapad 5 Pro 16IHU6 shows. The gap is significantly larger in the multi-thread tests than in the single-thread tests.

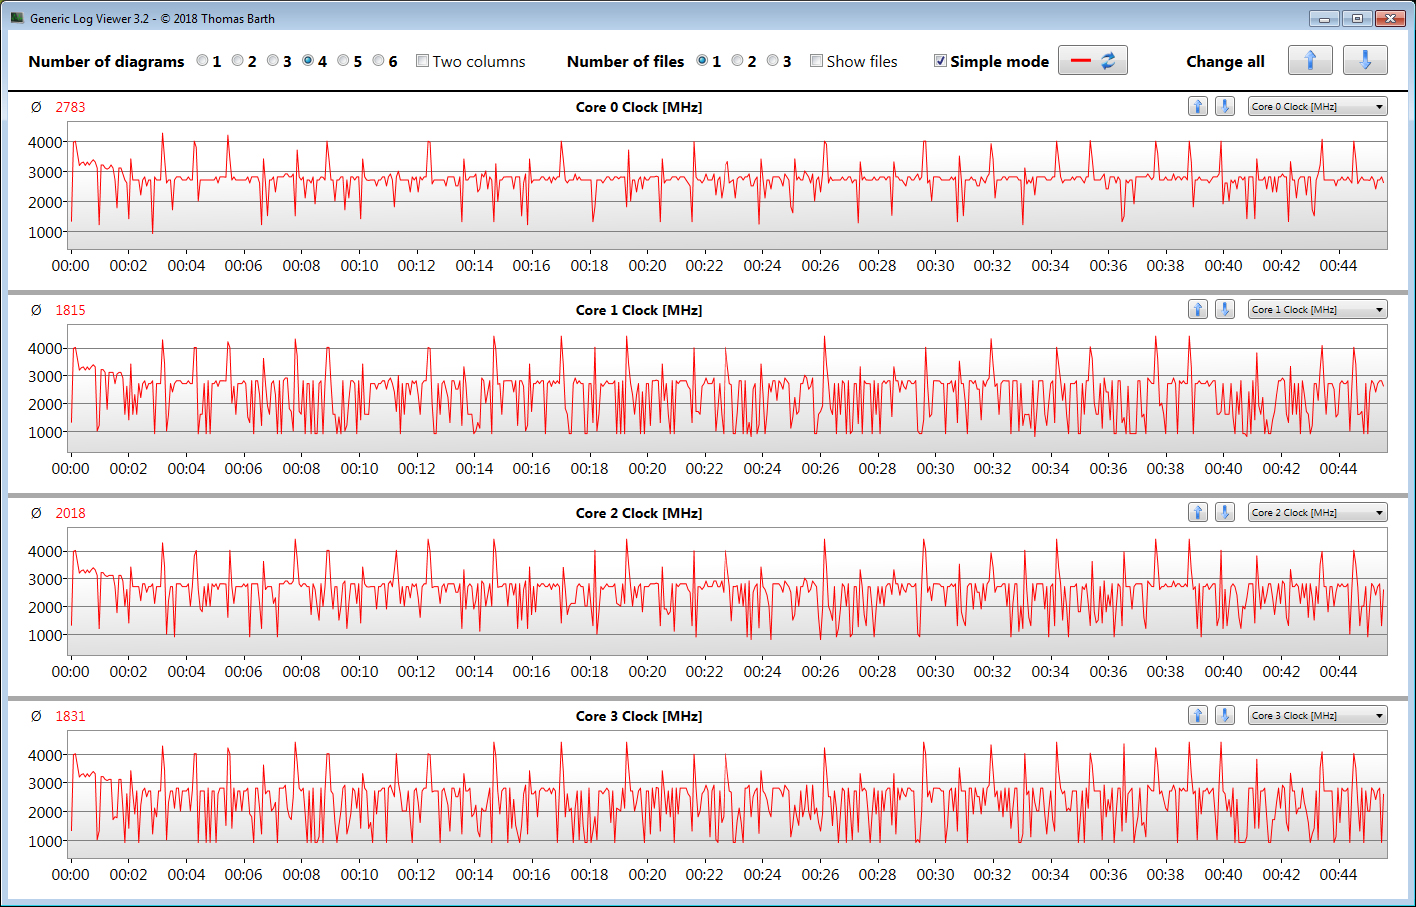
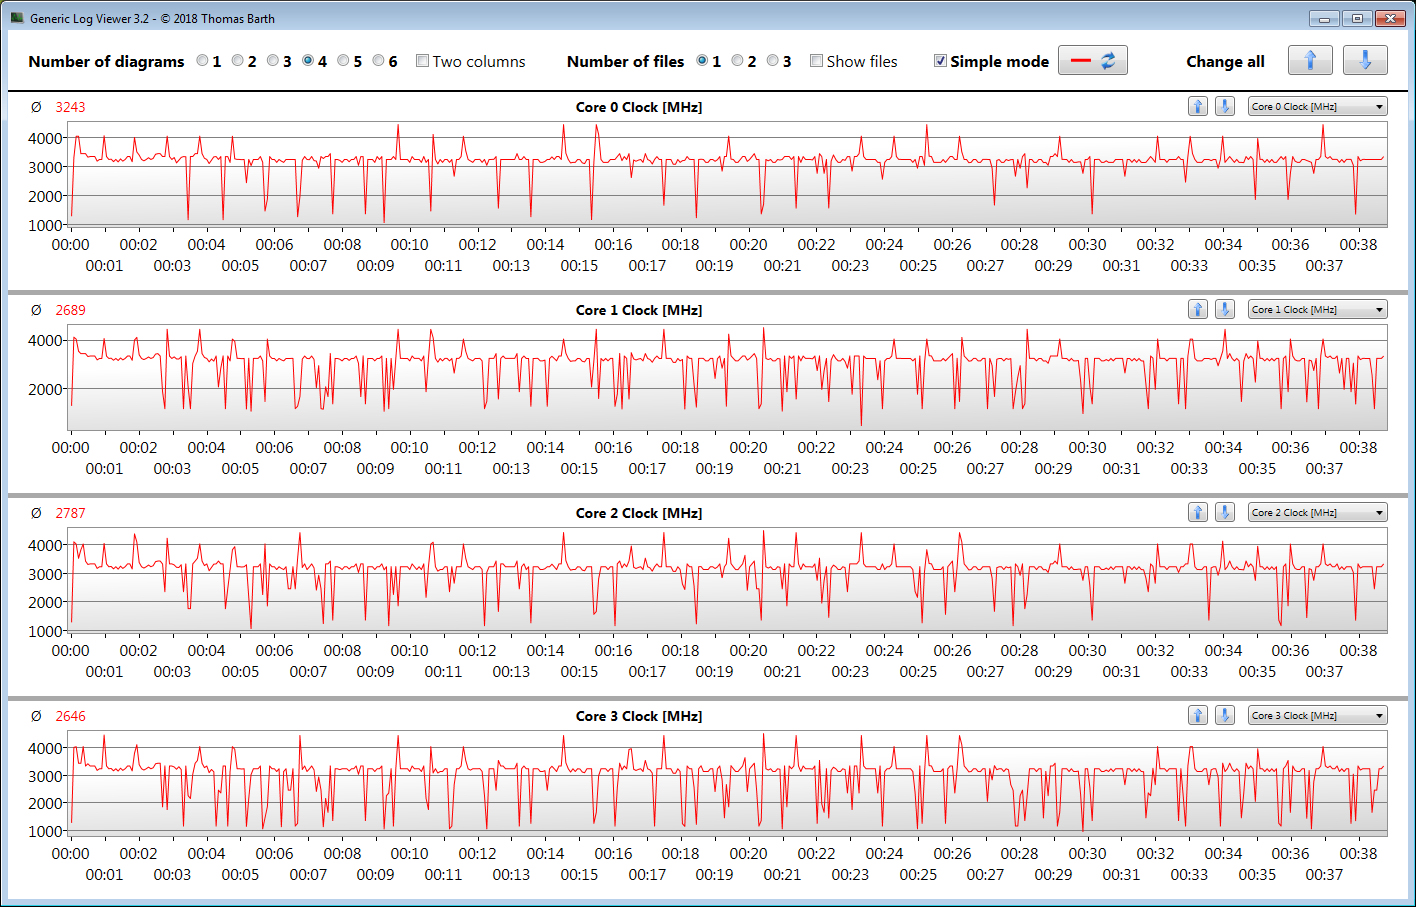
We check whether the CPU Turbo is also used permanently in mains operation by running the multi-thread test of the Cinebench R15 benchmark in a loop for at least 30 minutes. The Turbo is only used at the beginning, usually the base clock is undercut. The "Ultra Performance" profile lets the CPU run at higher speeds.
Cinebench R15 Multi Endurance test
| Cinebench R23 | |
| Single Core | |
| Average of class Office (708 - 2130, n=76, last 2 years) | |
| Xiaomi RedmiBook Pro 15 | |
| HP Pavilion 15-eg | |
| Lenovo IdeaPad 5 Pro 16IHU6 | |
| Dell Inspiron 15 5518-2X3JR (Ultra-Leistung) | |
| Average Intel Core i5-11300H (1218 - 1431, n=11) | |
| Dell Inspiron 15 5518-2X3JR | |
| Asus VivoBook S15 D533UA | |
| Lenovo IdeaPad 5 15ALC05 | |
| Multi Core | |
| Average of class Office (1673 - 22808, n=76, last 2 years) | |
| Asus VivoBook S15 D533UA | |
| Lenovo IdeaPad 5 15ALC05 | |
| Lenovo IdeaPad 5 Pro 16IHU6 | |
| Xiaomi RedmiBook Pro 15 | |
| Xiaomi RedmiBook Pro 15 | |
| Average Intel Core i5-11300H (3313 - 6581, n=10) | |
| HP Pavilion 15-eg | |
| Dell Inspiron 15 5518-2X3JR (Ultra-Leistung) | |
| Dell Inspiron 15 5518-2X3JR | |
| Cinebench R20 | |
| CPU (Single Core) | |
| Average of class Office (345 - 816, n=75, last 2 years) | |
| Xiaomi RedmiBook Pro 15 | |
| HP Pavilion 15-eg | |
| Lenovo IdeaPad 5 Pro 16IHU6 | |
| Dell Inspiron 15 5518-2X3JR (Ultra-Leistung) | |
| Dell Inspiron 15 5518-2X3JR | |
| Average Intel Core i5-11300H (431 - 548, n=11) | |
| Asus VivoBook S15 D533UA | |
| Lenovo IdeaPad 5 15ALC05 | |
| CPU (Multi Core) | |
| Average of class Office (648 - 8840, n=75, last 2 years) | |
| Asus VivoBook S15 D533UA | |
| Lenovo IdeaPad 5 15ALC05 | |
| Lenovo IdeaPad 5 Pro 16IHU6 | |
| Xiaomi RedmiBook Pro 15 | |
| Average Intel Core i5-11300H (1300 - 2533, n=10) | |
| Dell Inspiron 15 5518-2X3JR | |
| HP Pavilion 15-eg | |
| Dell Inspiron 15 5518-2X3JR (Ultra-Leistung) | |
| Cinebench R15 | |
| CPU Single 64Bit | |
| Average of class Office (99.5 - 316, n=77, last 2 years) | |
| Xiaomi RedmiBook Pro 15 | |
| Xiaomi RedmiBook Pro 15 | |
| HP Pavilion 15-eg | |
| Asus VivoBook S15 D533UA | |
| Lenovo IdeaPad 5 15ALC05 | |
| Lenovo IdeaPad 5 Pro 16IHU6 | |
| Average Intel Core i5-11300H (123 - 211, n=8) | |
| Dell Inspiron 15 5518-2X3JR | |
| CPU Multi 64Bit | |
| Average of class Office (250 - 3380, n=77, last 2 years) | |
| Asus VivoBook S15 D533UA | |
| Lenovo IdeaPad 5 15ALC05 | |
| Xiaomi RedmiBook Pro 15 (Variable PL1 ) | |
| Xiaomi RedmiBook Pro 15 (Pl1 @ 25W) | |
| Xiaomi RedmiBook Pro 15 (PL1 fixed @ 28W) | |
| Lenovo IdeaPad 5 Pro 16IHU6 | |
| Average Intel Core i5-11300H (632 - 990, n=11) | |
| Dell Inspiron 15 5518-2X3JR (Ultra-Leistung) | |
| Dell Inspiron 15 5518-2X3JR | |
| HP Pavilion 15-eg | |
| Blender - v2.79 BMW27 CPU | |
| Dell Inspiron 15 5518-2X3JR | |
| Dell Inspiron 15 5518-2X3JR (Ultra-Leistung) | |
| HP Pavilion 15-eg | |
| Average Intel Core i5-11300H (466 - 862, n=10) | |
| Lenovo IdeaPad 5 Pro 16IHU6 | |
| Xiaomi RedmiBook Pro 15 | |
| Lenovo IdeaPad 5 15ALC05 | |
| Average of class Office (158 - 1940, n=76, last 2 years) | |
| Asus VivoBook S15 D533UA | |
| 7-Zip 18.03 | |
| 7z b 4 -mmt1 | |
| Average of class Office (3387 - 6469, n=77, last 2 years) | |
| HP Pavilion 15-eg | |
| Xiaomi RedmiBook Pro 15 | |
| Lenovo IdeaPad 5 Pro 16IHU6 | |
| Dell Inspiron 15 5518-2X3JR | |
| Dell Inspiron 15 5518-2X3JR (Ultra-Leistung) | |
| Average Intel Core i5-11300H (4603 - 4969, n=10) | |
| Asus VivoBook S15 D533UA | |
| Lenovo IdeaPad 5 15ALC05 | |
| 7z b 4 | |
| Average of class Office (7098 - 76886, n=77, last 2 years) | |
| Asus VivoBook S15 D533UA | |
| Lenovo IdeaPad 5 15ALC05 | |
| Xiaomi RedmiBook Pro 15 | |
| Lenovo IdeaPad 5 Pro 16IHU6 | |
| Average Intel Core i5-11300H (17573 - 26001, n=10) | |
| HP Pavilion 15-eg | |
| Dell Inspiron 15 5518-2X3JR (Ultra-Leistung) | |
| Dell Inspiron 15 5518-2X3JR | |
| Geekbench 5.5 | |
| Single-Core | |
| Average of class Office (811 - 2175, n=73, last 2 years) | |
| Xiaomi RedmiBook Pro 15 | |
| Lenovo IdeaPad 5 Pro 16IHU6 | |
| Average Intel Core i5-11300H (1342 - 1462, n=10) | |
| Dell Inspiron 15 5518-2X3JR (Ultra-Leistung) | |
| Dell Inspiron 15 5518-2X3JR | |
| Asus VivoBook S15 D533UA | |
| Lenovo IdeaPad 5 15ALC05 | |
| Multi-Core | |
| Average of class Office (1483 - 16999, n=73, last 2 years) | |
| Asus VivoBook S15 D533UA | |
| Lenovo IdeaPad 5 15ALC05 | |
| Xiaomi RedmiBook Pro 15 | |
| Lenovo IdeaPad 5 Pro 16IHU6 | |
| Average Intel Core i5-11300H (3631 - 5499, n=10) | |
| Dell Inspiron 15 5518-2X3JR (Ultra-Leistung) | |
| Dell Inspiron 15 5518-2X3JR | |
| HWBOT x265 Benchmark v2.2 - 4k Preset | |
| Average of class Office (2.21 - 26, n=76, last 2 years) | |
| Asus VivoBook S15 D533UA | |
| Lenovo IdeaPad 5 15ALC05 | |
| Lenovo IdeaPad 5 Pro 16IHU6 | |
| Average Intel Core i5-11300H (4.32 - 8.38, n=10) | |
| Xiaomi RedmiBook Pro 15 | |
| HP Pavilion 15-eg | |
| Dell Inspiron 15 5518-2X3JR (Ultra-Leistung) | |
| Dell Inspiron 15 5518-2X3JR | |
| LibreOffice - 20 Documents To PDF | |
| Lenovo IdeaPad 5 15ALC05 | |
| Asus VivoBook S15 D533UA | |
| Average of class Office (39.9 - 102.3, n=76, last 2 years) | |
| Lenovo IdeaPad 5 Pro 16IHU6 | |
| Average Intel Core i5-11300H (43.6 - 59.4, n=10) | |
| Xiaomi RedmiBook Pro 15 | |
| Dell Inspiron 15 5518-2X3JR | |
| HP Pavilion 15-eg | |
| Dell Inspiron 15 5518-2X3JR (Ultra-Leistung) | |
| R Benchmark 2.5 - Overall mean | |
| Lenovo IdeaPad 5 15ALC05 | |
| Dell Inspiron 15 5518-2X3JR (Ultra-Leistung) | |
| Dell Inspiron 15 5518-2X3JR | |
| Average Intel Core i5-11300H (0.6 - 0.644, n=10) | |
| Lenovo IdeaPad 5 Pro 16IHU6 | |
| Asus VivoBook S15 D533UA | |
| HP Pavilion 15-eg | |
| Xiaomi RedmiBook Pro 15 | |
| Average of class Office (0.393 - 0.888, n=76, last 2 years) | |
* ... smaller is better
System performance
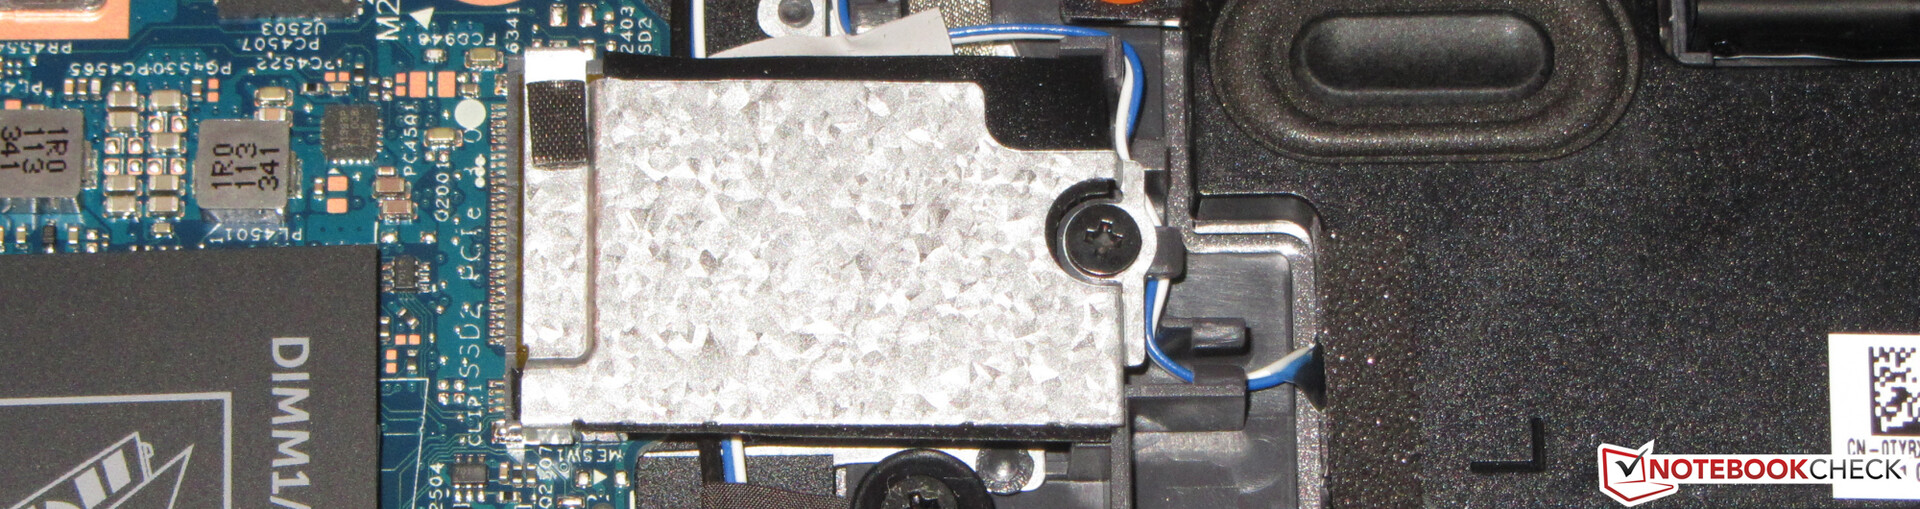
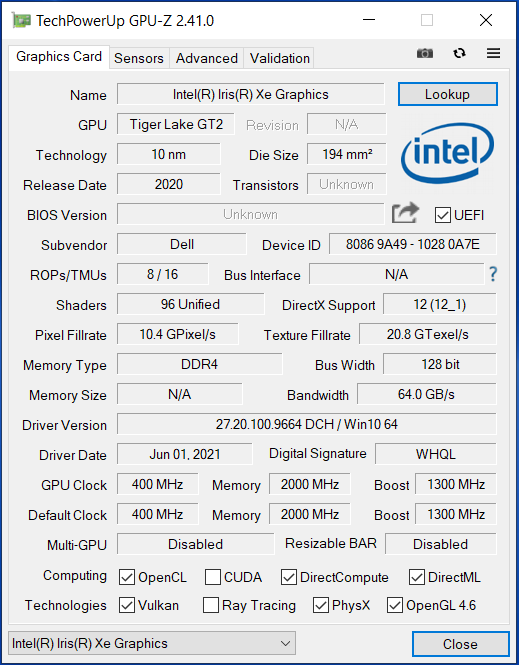
The nimble and smoothly working system provides enough performance for all common application areas. The basically good PCMark results are a bit behind the competition.
Part of the performance remains unused due to the working memory running in single-channel mode. Dual-channel mode could be activated by installing a second memory module.
| PCMark 10 Score | 4899 points | |
Help | ||
| PCMark 10 / Score | |
| Average of class Office (2601 - 9298, n=68, last 2 years) | |
| HP Pavilion 15-eg | |
| Xiaomi RedmiBook Pro 15 | |
| Asus VivoBook S15 D533UA | |
| Lenovo IdeaPad 5 Pro 16IHU6 | |
| Lenovo IdeaPad 5 15ALC05 | |
| Average Intel Core i5-11300H, NVIDIA GeForce MX450 (4899 - 5391, n=3) | |
| Dell Inspiron 15 5518-2X3JR | |
| PCMark 10 / Essentials | |
| Average of class Office (3245 - 11594, n=68, last 2 years) | |
| HP Pavilion 15-eg | |
| Asus VivoBook S15 D533UA | |
| Lenovo IdeaPad 5 15ALC05 | |
| Lenovo IdeaPad 5 Pro 16IHU6 | |
| Average Intel Core i5-11300H, NVIDIA GeForce MX450 (8366 - 8931, n=3) | |
| Xiaomi RedmiBook Pro 15 | |
| Dell Inspiron 15 5518-2X3JR | |
| PCMark 10 / Productivity | |
| Average of class Office (5336 - 17243, n=68, last 2 years) | |
| Xiaomi RedmiBook Pro 15 | |
| HP Pavilion 15-eg | |
| Average Intel Core i5-11300H, NVIDIA GeForce MX450 (8292 - 9188, n=3) | |
| Lenovo IdeaPad 5 Pro 16IHU6 | |
| Dell Inspiron 15 5518-2X3JR | |
| Asus VivoBook S15 D533UA | |
| Lenovo IdeaPad 5 15ALC05 | |
| PCMark 10 / Digital Content Creation | |
| Average of class Office (2049 - 13541, n=68, last 2 years) | |
| Xiaomi RedmiBook Pro 15 | |
| HP Pavilion 15-eg | |
| Asus VivoBook S15 D533UA | |
| Lenovo IdeaPad 5 Pro 16IHU6 | |
| Lenovo IdeaPad 5 15ALC05 | |
| Average Intel Core i5-11300H, NVIDIA GeForce MX450 (4600 - 5388, n=3) | |
| Dell Inspiron 15 5518-2X3JR | |
DPC latencies
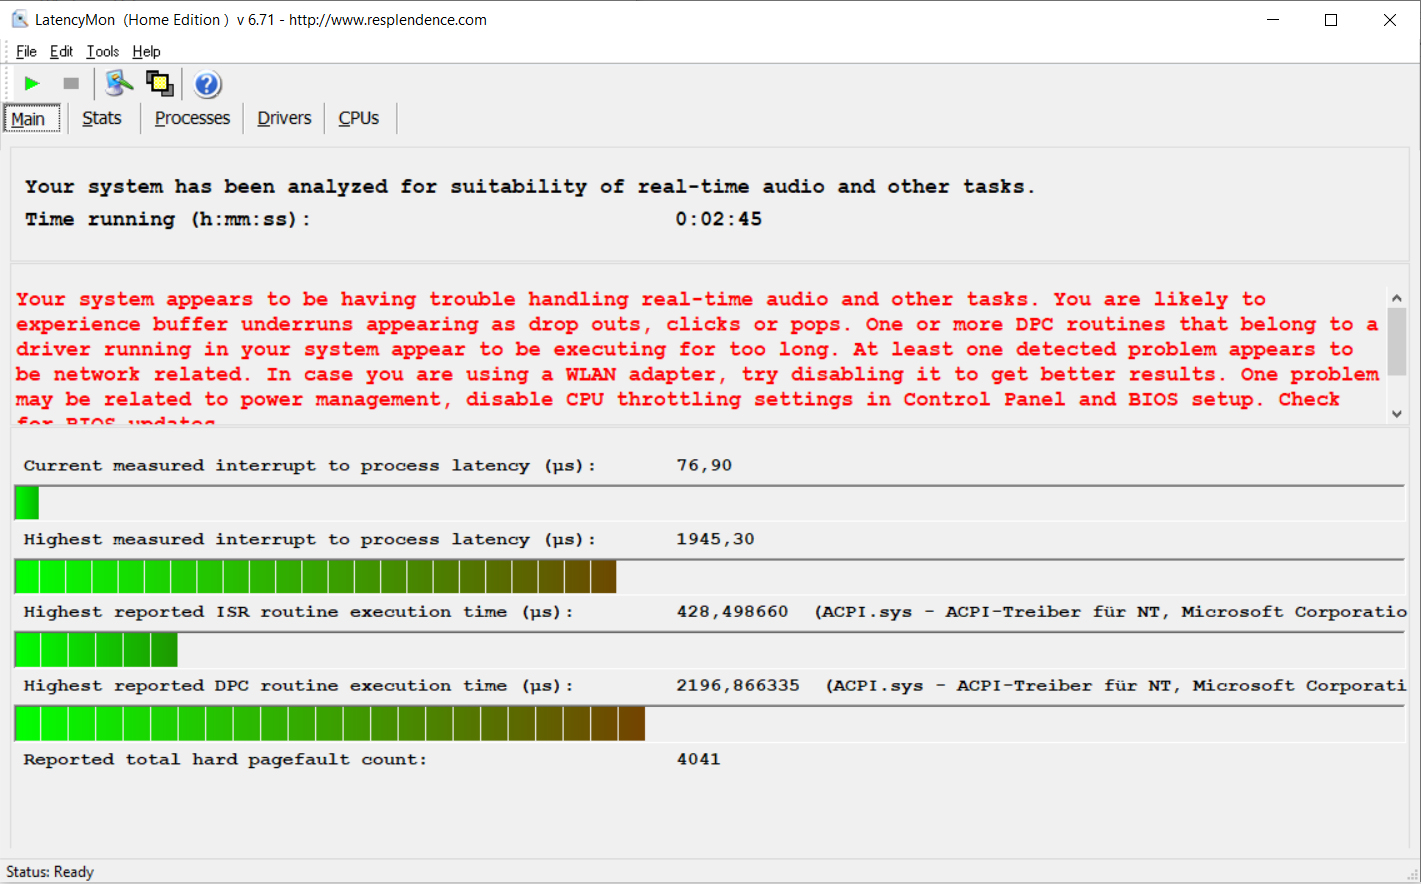
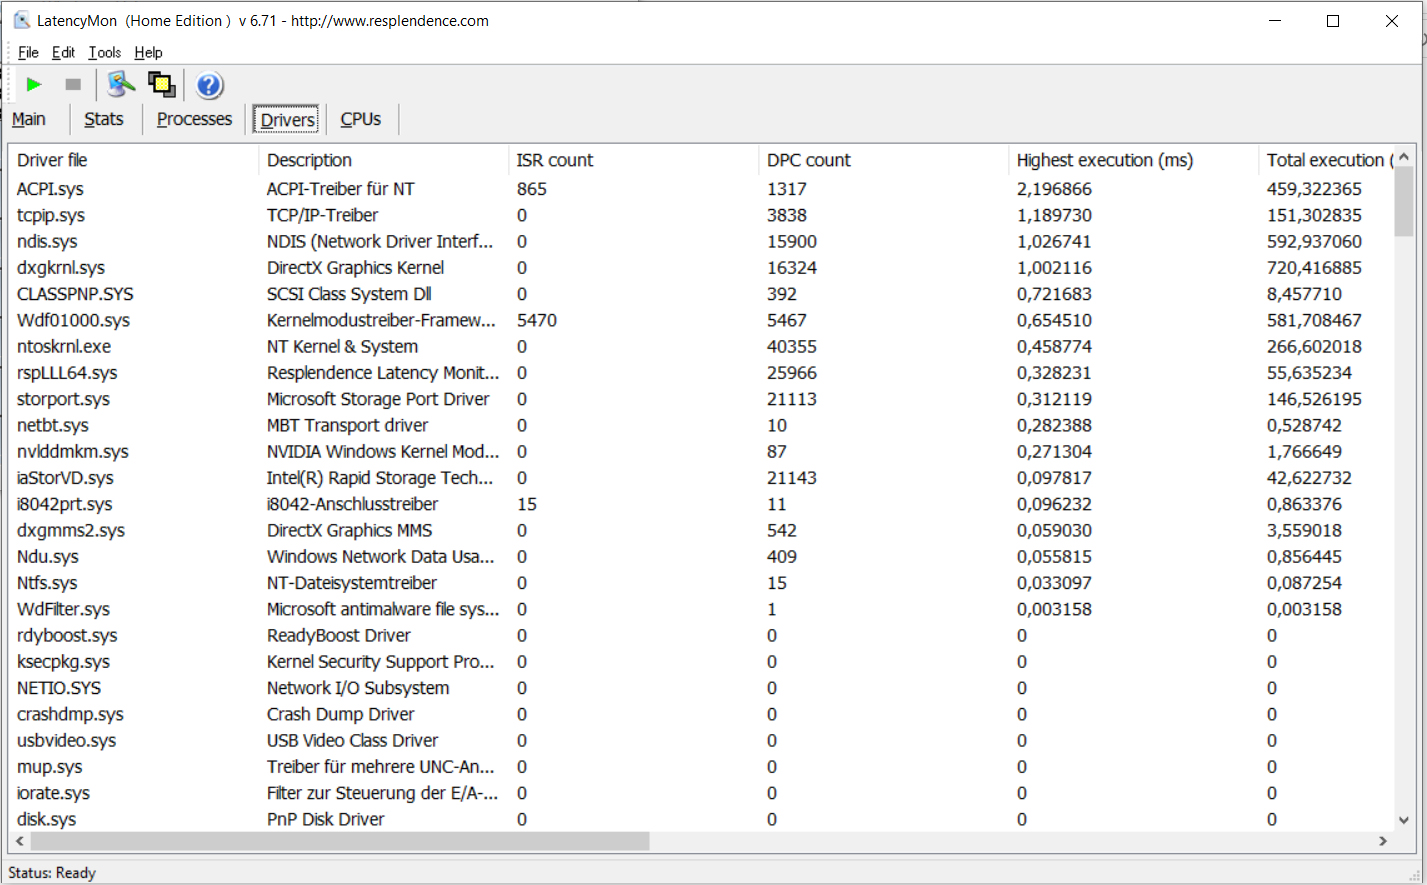
| DPC Latencies / LatencyMon - interrupt to process latency (max), Web, Youtube, Prime95 | |
| Xiaomi RedmiBook Pro 15 | |
| HP Pavilion 15-eg | |
| Dell Inspiron 15 5518-2X3JR | |
| Lenovo IdeaPad 5 15ALC05 | |
| Lenovo IdeaPad 5 Pro 16IHU6 | |
| Asus VivoBook S15 D533UA | |
* ... smaller is better
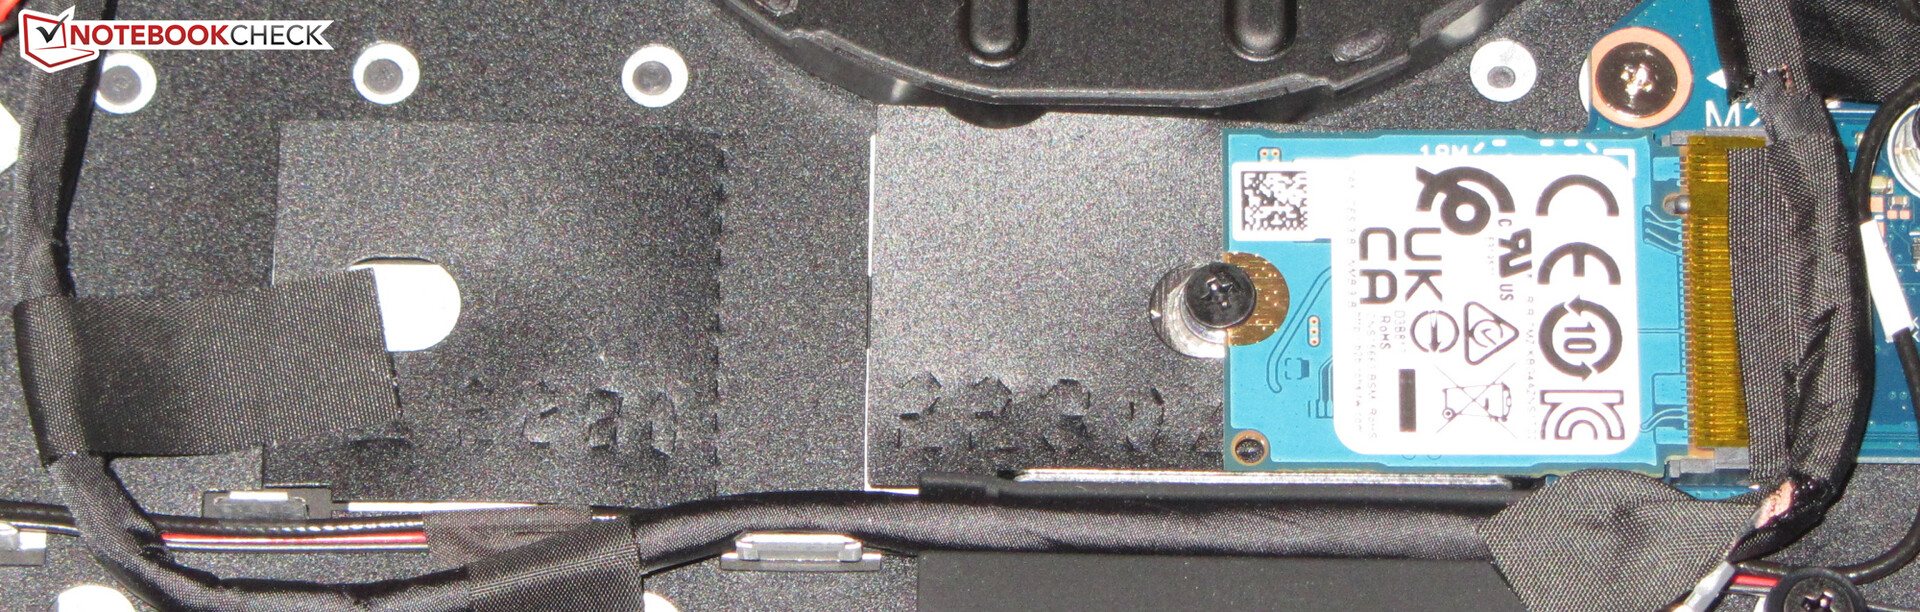
Mass storage
The transfer rates of the512 GB NVMe SSD (M.2-2230) are good, but it is not one of the top SSDs. The use of an SSD in 2280 format requires the mounting bracket to be relocated. The second M.2 slot can only accommodate models in the 2230 format.

| Dell Inspiron 15 5518-2X3JR Toshiba KBG40ZNS512G NVMe | HP Pavilion 15-eg Samsung PM991 MZVLQ1T0HALB | Xiaomi RedmiBook Pro 15 Toshiba KBG40ZNV512G | Lenovo IdeaPad 5 Pro 16IHU6 Samsung SSD PM981a MZVLB512HBJQ | Asus VivoBook S15 D533UA WDC PC SN530 SDBPNPZ-1T00 | Lenovo IdeaPad 5 15ALC05 | Average Toshiba KBG40ZNS512G NVMe | Average of class Office | |
|---|---|---|---|---|---|---|---|---|
| CrystalDiskMark 5.2 / 6 | -16% | -12% | 27% | -5% | -21% | -23% | 55% | |
| Write 4K (MB/s) | 207.3 | 141.6 -32% | 136 -34% | 203 -2% | 116.8 -44% | 82.7 -60% | 126.4 ? -39% | 153.2 ? -26% |
| Read 4K (MB/s) | 61.3 | 42.61 -30% | 60.4 -1% | 52.3 -15% | 43.92 -28% | 39.96 -35% | 50 ? -18% | 73.4 ? 20% |
| Write Seq (MB/s) | 1499 | 1337 -11% | 1447 -3% | 2138 43% | 1990 33% | 1273 -15% | 1207 ? -19% | 2531 ? 69% |
| Read Seq (MB/s) | 1858 | 1575 -15% | 1507 -19% | 1974 6% | 1959 5% | 1601 -14% | 1567 ? -16% | 3292 ? 77% |
| Write 4K Q32T1 (MB/s) | 510 | 397.8 -22% | 235.6 -54% | 640 25% | 373.3 -27% | 360.4 -29% | 347 ? -32% | 431 ? -15% |
| Read 4K Q32T1 (MB/s) | 640 | 454.2 -29% | 737 15% | 707 10% | 524 -18% | 410.4 -36% | 425 ? -34% | 516 ? -19% |
| Write Seq Q32T1 (MB/s) | 1521 | 1648 8% | 1529 1% | 2973 95% | 1985 31% | 1589 4% | 1224 ? -20% | 4178 ? 175% |
| Read Seq Q32T1 (MB/s) | 2316 | 2388 3% | 2357 2% | 3559 54% | 2456 6% | 2652 15% | 2278 ? -2% | 6043 ? 161% |
| AS SSD | 35% | -7% | 86% | 43% | 30% | -10% | 85% | |
| Seq Read (MB/s) | 2086 | 2030 -3% | 1972 -5% | 2541 22% | 2082 0% | 2549 22% | 1871 ? -10% | 4326 ? 107% |
| Seq Write (MB/s) | 1124 | 1003 -11% | 981 -13% | 2555 127% | 1844 64% | 1571 40% | 810 ? -28% | 2771 ? 147% |
| 4K Read (MB/s) | 54.1 | 46.74 -14% | 55.8 3% | 56 4% | 44.33 -18% | 41.92 -23% | 45.8 ? -15% | 58.1 ? 7% |
| 4K Write (MB/s) | 138.1 | 164.2 19% | 133.5 -3% | 129.6 -6% | 157.5 14% | 110.3 -20% | 110.9 ? -20% | 162.6 ? 18% |
| 4K-64 Read (MB/s) | 1295 | 1098 -15% | 1277 -1% | 1633 26% | 1039 -20% | 1086 -16% | 997 ? -23% | 958 ? -26% |
| 4K-64 Write (MB/s) | 750 | 891 19% | 313.9 -58% | 1863 148% | 1556 107% | 1083 44% | 452 ? -40% | 1643 ? 119% |
| Access Time Read * (ms) | 0.141 | 0.053 62% | 0.15 -6% | 0.077 45% | 0.05 65% | 0.119 16% | 0.1024 ? 27% | 0.08448 ? 40% |
| Access Time Write * (ms) | 0.169 | 0.062 63% | 0.513 -204% | 0.029 83% | 0.065 62% | 0.034 80% | 0.4026 ? -138% | 0.05931 ? 65% |
| Score Read (Points) | 1558 | 1348 -13% | 1530 -2% | 1944 25% | 1292 -17% | 1383 -11% | 1232 ? -21% | 1449 ? -7% |
| Score Write (Points) | 1001 | 1155 15% | 546 -45% | 2248 125% | 1898 90% | 1351 35% | 644 ? -36% | 2083 ? 108% |
| Score Total (Points) | 3316 | 3149 -5% | 2819 -15% | 5192 57% | 3845 16% | 3398 2% | 2461 ? -26% | 4207 ? 27% |
| Copy ISO MB/s (MB/s) | 678 | 1583 133% | 1105 63% | 2246 231% | 1441 113% | 1286 90% | 1785 ? 163% | 2541 ? 275% |
| Copy Program MB/s (MB/s) | 364.8 | 682 87% | 799 119% | 861 136% | 484.9 33% | 574 57% | 388 ? 6% | 790 ? 117% |
| Copy Game MB/s (MB/s) | 557 | 1428 156% | 957 72% | 1552 179% | 1098 97% | 1133 103% | 715 ? 28% | 1627 ? 192% |
| Total Average (Program / Settings) | 10% /
17% | -10% /
-9% | 57% /
64% | 19% /
26% | 5% /
11% | -17% /
-14% | 70% /
74% |
* ... smaller is better
Continuous load read: DiskSpd Read Loop, Queue Depth 8
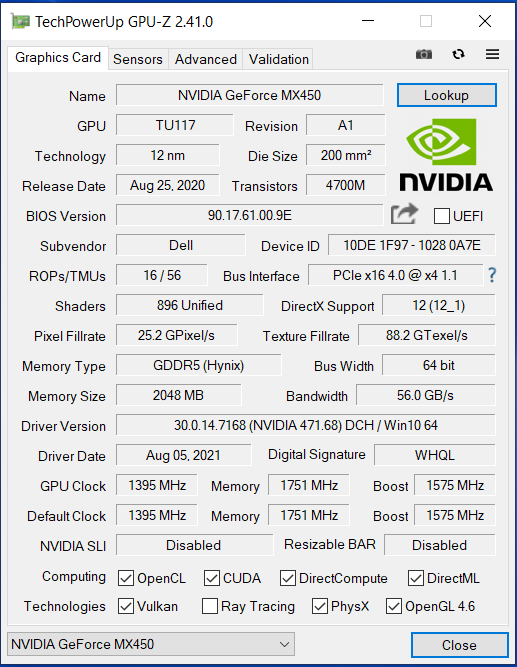
Graphics card
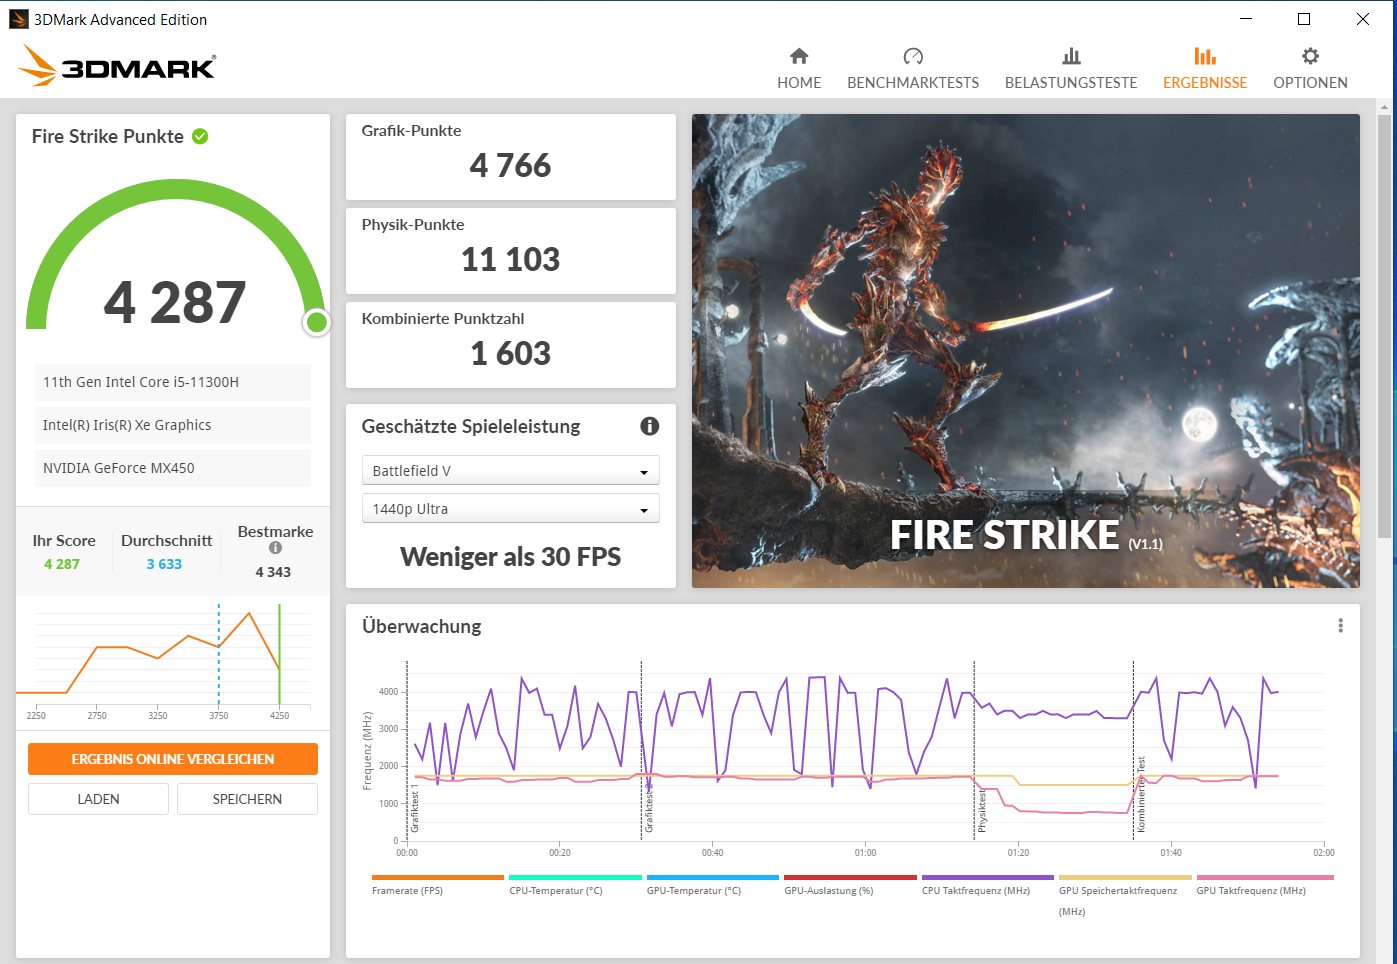
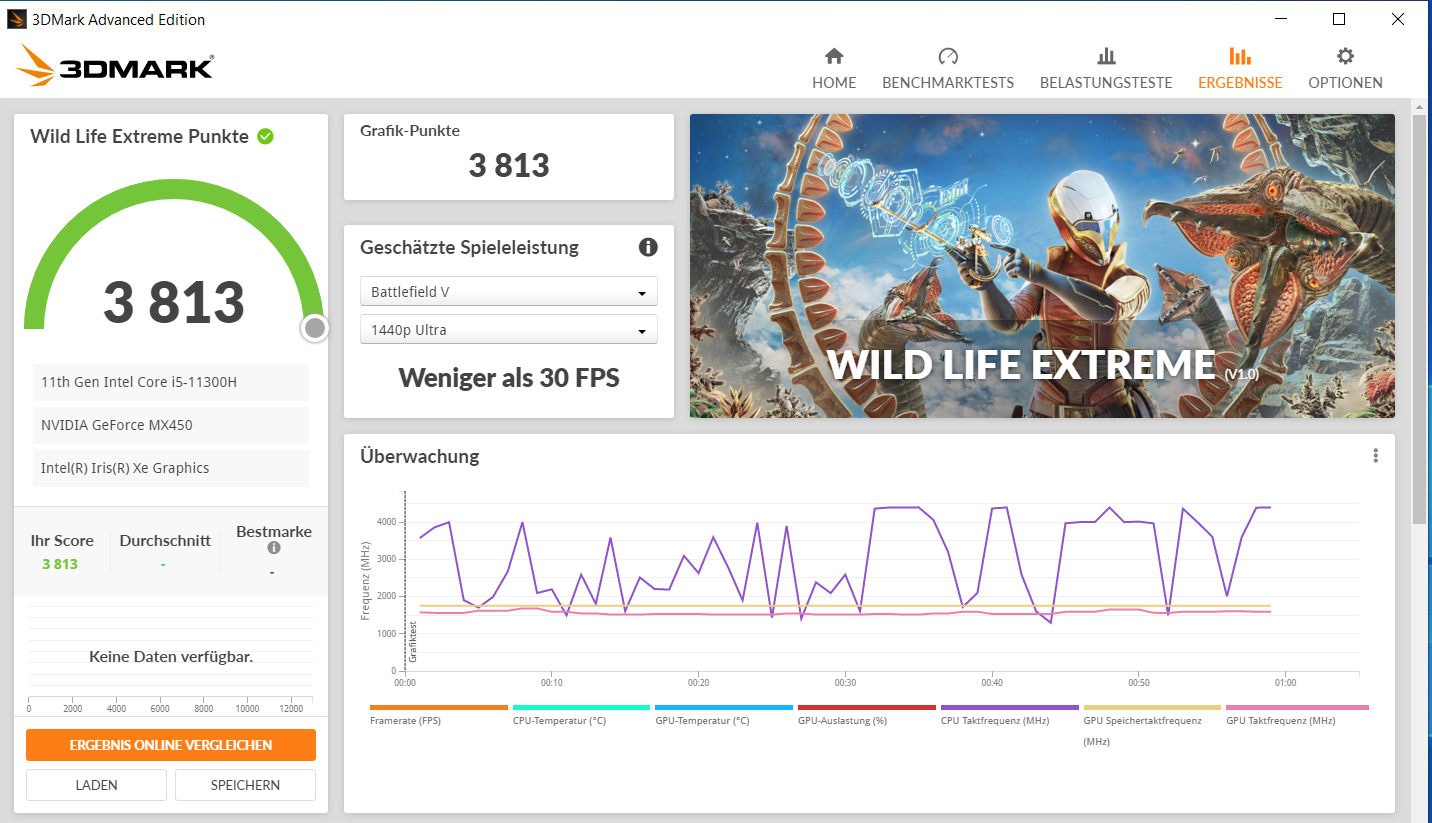
The GeForce-MX450 GPU (Turing) is Nvidia's current mid-range model. It is supported by fast GDDR5 memory (2,048 MB) that is connected via a 64-bit line. The 3DMark results are on par with the MX450 average that we have determined so far. The "Ultra Performance" profile does not affect the graphics performance.
| 3DMark 11 Performance | 7524 points | |
| 3DMark Ice Storm Standard Score | 55566 points | |
| 3DMark Cloud Gate Standard Score | 14683 points | |
| 3DMark Fire Strike Score | 4287 points | |
| 3DMark Time Spy Score | 2030 points | |
Help | ||
| 3DMark 11 - 1280x720 Performance GPU | |
| Lenovo IdeaPad 5 Pro 16IHU6 | |
| Dell Inspiron 15 5518-2X3JR (Ultra-Leistung) | |
| Dell Inspiron 15 5518-2X3JR | |
| Average of class Office (2551 - 18313, n=72, last 2 years) | |
| HP Pavilion 15-eg | |
| Average NVIDIA GeForce MX450 (6341 - 9580, n=16) | |
| Xiaomi RedmiBook Pro 15 | |
| Asus VivoBook S15 D533UA | |
| Lenovo IdeaPad 5 15ALC05 | |
| 3DMark | |
| 1920x1080 Fire Strike Graphics | |
| Average of class Office (736 - 21871, n=75, last 2 years) | |
| Lenovo IdeaPad 5 Pro 16IHU6 | |
| Average NVIDIA GeForce MX450 (4336 - 5753, n=17) | |
| Dell Inspiron 15 5518-2X3JR | |
| HP Pavilion 15-eg | |
| Dell Inspiron 15 5518-2X3JR (Ultra-Leistung) | |
| Xiaomi RedmiBook Pro 15 | |
| Asus VivoBook S15 D533UA | |
| Lenovo IdeaPad 5 15ALC05 | |
| 1280x720 Cloud Gate Standard Graphics | |
| Average of class Office (11640 - 118515, n=38, last 2 years) | |
| Lenovo IdeaPad 5 Pro 16IHU6 | |
| Average NVIDIA GeForce MX450 (25467 - 33806, n=13) | |
| Dell Inspiron 15 5518-2X3JR (Ultra-Leistung) | |
| HP Pavilion 15-eg | |
| Dell Inspiron 15 5518-2X3JR | |
| Xiaomi RedmiBook Pro 15 | |
| Lenovo IdeaPad 5 15ALC05 | |
| 2560x1440 Time Spy Graphics | |
| Average of class Office (493 - 6679, n=70, last 2 years) | |
| Lenovo IdeaPad 5 Pro 16IHU6 | |
| Dell Inspiron 15 5518-2X3JR (Ultra-Leistung) | |
| HP Pavilion 15-eg | |
| Dell Inspiron 15 5518-2X3JR | |
| Average NVIDIA GeForce MX450 (1086 - 2300, n=16) | |
| Lenovo IdeaPad 5 15ALC05 | |
| Asus VivoBook S15 D533UA | |
Gaming performance
Most games in our database achieve playable frame rates at low resolutions and low to medium quality levels. Titles with moderate hardware requirements allow more. The frame rates are slightly below the MX450 average. The Inspiron cannot keep up with the excellent rates of the Lenovo Ideapad 5 Pro 16IHU6.
| Dota 2 Reborn - 1920x1080 ultra (3/3) best looking | |
| Lenovo IdeaPad 5 Pro 16IHU6 | |
| HP Pavilion 15-eg | |
| MSI Modern 14 B11SB-085 | |
| Average NVIDIA GeForce MX450 (34.9 - 104.6, n=20) | |
| Xiaomi RedmiBook Pro 15 | |
| Dell Inspiron 15 5518-2X3JR (Ultra-Leistung) | |
| Dell Inspiron 15 5518-2X3JR | |
| Average of class Office (14.6 - 135, n=77, last 2 years) | |
| Asus VivoBook S15 D533UA | |
| Lenovo IdeaPad 5 15ALC05 | |
| X-Plane 11.11 - 1920x1080 high (fps_test=3) | |
| HP Pavilion 15-eg | |
| Lenovo IdeaPad 5 Pro 16IHU6 | |
| Xiaomi RedmiBook Pro 15 | |
| MSI Modern 14 B11SB-085 | |
| Average NVIDIA GeForce MX450 (35.4 - 71.4, n=20) | |
| Dell Inspiron 15 5518-2X3JR | |
| Dell Inspiron 15 5518-2X3JR (Ultra-Leistung) | |
| Average of class Office (12 - 82.4, n=69, last 2 years) | |
| Lenovo IdeaPad 5 15ALC05 | |
| Asus VivoBook S15 D533UA | |
| Final Fantasy XV Benchmark - 1280x720 Lite Quality | |
| Lenovo IdeaPad 5 Pro 16IHU6 (1.3) | |
| Average of class Office (16.5 - 171.2, n=73, last 2 years) | |
| Average NVIDIA GeForce MX450 (27.6 - 72.2, n=16) | |
| MSI Modern 14 B11SB-085 (1.3) | |
| Dell Inspiron 15 5518-2X3JR (1.3, Ultra-Leistung) | |
| Xiaomi RedmiBook Pro 15 (1.3) | |
| Dell Inspiron 15 5518-2X3JR (1.3) | |
| HP Pavilion 15-eg (1.3) | |
| Asus VivoBook S15 D533UA (1.3) | |
| GTA V - 1920x1080 High/On (Advanced Graphics Off) AA:2xMSAA + FX AF:8x | |
| Lenovo IdeaPad 5 Pro 16IHU6 | |
| Average NVIDIA GeForce MX450 (30.6 - 68.3, n=11) | |
| Dell Inspiron 15 5518-2X3JR (Ultra-Leistung) | |
| Dell Inspiron 15 5518-2X3JR | |
| MSI Modern 14 B11SB-085 | |
| HP Pavilion 15-eg | |
| Average of class Office (11.4 - 163.1, n=70, last 2 years) | |
| Asus VivoBook S15 D533UA | |
| Strange Brigade - 1280x720 lowest AF:1 | |
| Average of class Office (19.4 - 388, n=53, last 2 years) | |
| Lenovo IdeaPad 5 Pro 16IHU6 (1.47.22.14 D3D12) | |
| Average NVIDIA GeForce MX450 (61.4 - 137.7, n=12) | |
| MSI Modern 14 B11SB-085 (1.47.22.14 D3D12) | |
| Dell Inspiron 15 5518-2X3JR (1.47.22.14 D3D12) | |
| Dell Inspiron 15 5518-2X3JR (1.47.22.14 D3D12, Ultra-Leistung) | |
| Xiaomi RedmiBook Pro 15 (1.47.22.14 D3D12) | |
| Asus VivoBook S15 D533UA (1.47.22.14 D3D12) | |
To check whether the frame rates remain largely constant over a longer period, we run the game "The Witcher 3" for about 60 minutes with Full HD resolution and maximum quality settings. The game character is not moved. The GPU clock is lowered slightly after just under two minutes, but this does not affect the frame rates.
Witcher 3 FPS-Diagram
| low | med. | high | ultra | |
|---|---|---|---|---|
| GTA V (2015) | 115 | 95.8 | 51.8 | 23.8 |
| The Witcher 3 (2015) | 99.3 | 57.8 | 30.7 | 17.7 |
| Dota 2 Reborn (2015) | 104 | 90.5 | 80.7 | 75.3 |
| Final Fantasy XV Benchmark (2018) | 54.1 | 25.3 | 13.8 | |
| X-Plane 11.11 (2018) | 68.8 | 53.7 | 47 | |
| Strange Brigade (2018) | 106 | 40.6 | 35.4 | 25 |
| Control (2019) | 74.8 | 24.7 | 15.7 | |
| Flight Simulator 2020 (2020) | 61 | 22.7 | 14.8 | 7.86 |
| Deathloop (2021) | 27.7 | 13.5 | 11 | |
| Alan Wake Remastered (2021) | 25.5 | 16.2 | 13.4 | |
| Back 4 Blood (2021) | 128.3 | 46.9 | 29.4 | 26.7 |
| Riders Republic (2021) | 62 | 28 | 23 | 20 |
| Forza Horizon 5 (2021) | 72 | 28 | 23 | 13 |
| Halo Infinite (2021) | 8.6 | |||
| God of War (2022) | 25.8 | 18.4 | 8.66 | 3.09 |
| Rainbow Six Extraction (2022) | 54 | 28 | 26 | 16 |
| Dying Light 2 (2022) | 22 | 16.7 | 11.8 | |
| GRID Legends (2022) | 67.7 | 45.8 | 39.7 | 24.9 |
| Elden Ring (2022) | 31 | 19 | 17.2 | 15.1 |
| Elex 2 (2022) | 23.1 | 10.7 | 6.62 | |
| Ghostwire Tokyo (2022) | 38.2 | 25.8 | 25.8 | 24.9 |
| Tiny Tina's Wonderlands (2022) | 37.2 | 22.7 | 14 | 10.5 |
| Vampire Bloodhunt (2022) | 96.5 | 59.3 | 50.7 | 33.4 |
| F1 22 (2022) | 54.7 | 49.2 | 36 | 22.2 |
| The Quarry (2022) | 30 | 21.1 | 14.9 | 9.31 |
| FIFA 23 (2022) | 57.4 | 42.1 | 37.8 | 33.9 |
| A Plague Tale Requiem (2022) | 22.6 | 18.3 | 12.4 | 8.51 |
| Uncharted Legacy of Thieves Collection (2022) | 9.73 | 8.41 | 5.83 | 5.51 |
| Call of Duty Modern Warfare 2 2022 (2022) | 37 | 33 | 15 | 17 |
| Spider-Man Miles Morales (2022) | 22.9 | 21 | 17.6 | 11.2 |
| The Callisto Protocol (2022) | 34.2 | 15 | 8 | 7.4 |
| Need for Speed Unbound (2022) | 28.7 | 21.4 | 13.5 | |
| High On Life (2023) | 29.4 | 15.8 | 14 | 12.4 |
| The Witcher 3 v4 (2023) | 45.8 | 32.4 | 24.9 | 14.1 |
| Dead Space Remake (2023) | 17.1 | 15.7 | 6.37 | |
| Baldur's Gate 3 (2023) | 11.3 | 5.94 | ||
| Cyberpunk 2077 (2023) | 22.6 | 14 | 8.12 | 7.09 |
| Counter-Strike 2 (2023) | 87.5 | 67 | 34.8 | 21.7 |
| EA Sports FC 24 (2023) | 58 | 57.3 | 56.4 | 55.9 |
| Assassin's Creed Mirage (2023) | 18 | 15 | ||
| Skull & Bones (2024) | 21 | 21 | 13 | |
| Horizon Forbidden West (2024) | 11.6 | |||
| F1 24 (2024) | 31.9 | 25.7 | 20.4 | 13.4 |
Emissions & energy - Dell laptop with good battery runtimes
Noise emissions
In everyday use (office, Internet), the notebook produces little to no noise - the fan often stands still. Under heavier load, higher sound pressure levels are reached than in comparably equipped notebooks like the RedmiBook Pro 15 and the Ideapad 5 Pro 16IHU6. A lower noise level can be achieved by using the "Quiet" profile - at the expense of computing performance.
Noise level
| Idle |
| 26 / 26 / 26 dB(A) |
| Load |
| 47.4 / 48.4 dB(A) |
 | ||
30 dB silent 40 dB(A) audible 50 dB(A) loud |
||
min: | ||
| Dell Inspiron 15 5518-2X3JR Intel Core i5-11300H, NVIDIA GeForce MX450 | HP Pavilion 15-eg Intel Core i7-1165G7, NVIDIA GeForce MX450 | Xiaomi RedmiBook Pro 15 Intel Core i7-11370H, NVIDIA GeForce MX450 | Lenovo IdeaPad 5 Pro 16IHU6 Intel Core i5-11300H, NVIDIA GeForce MX450 | Asus VivoBook S15 D533UA AMD Ryzen 7 5700U, AMD Radeon RX Vega 8 (Ryzen 4000/5000) | Lenovo IdeaPad 5 15ALC05 AMD Ryzen 5 5500U, AMD Radeon RX Vega 7 | |
|---|---|---|---|---|---|---|
| Noise | 7% | 4% | 8% | 0% | 6% | |
| off / environment * (dB) | 26 | 25.4 2% | 25 4% | 25 4% | 26 -0% | 26 -0% |
| Idle Minimum * (dB) | 26 | 25.6 2% | 25 4% | 25 4% | 26 -0% | 26 -0% |
| Idle Average * (dB) | 26 | 25.6 2% | 26 -0% | 25 4% | 26 -0% | 26 -0% |
| Idle Maximum * (dB) | 26 | 25.6 2% | 27 -4% | 25 4% | 28.8 -11% | 26 -0% |
| Load Average * (dB) | 47.4 | 39.2 17% | 43 9% | 44.5 6% | 45 5% | 42.6 10% |
| Load Maximum * (dB) | 48.4 | 41.5 14% | 44 9% | 36.5 25% | 45 7% | 37.4 23% |
| Witcher 3 ultra * (dB) | 39.1 | 42 |
* ... smaller is better
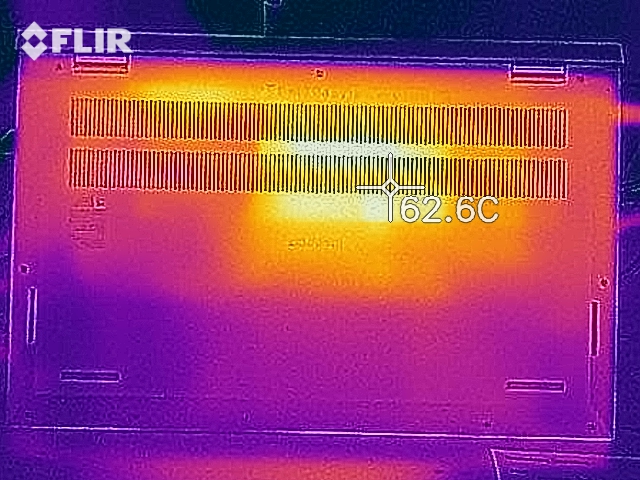
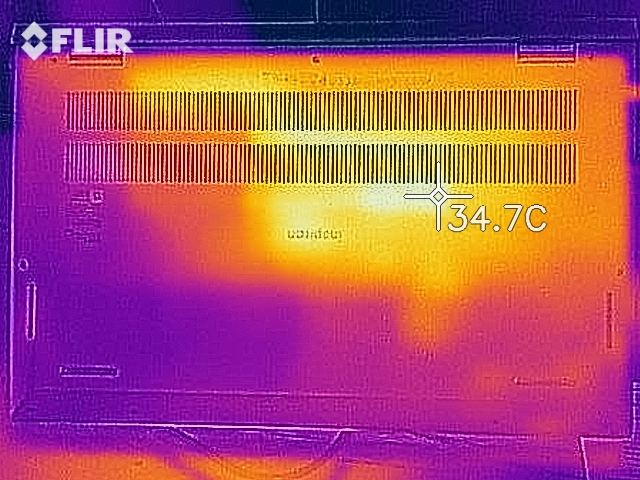
Temperature
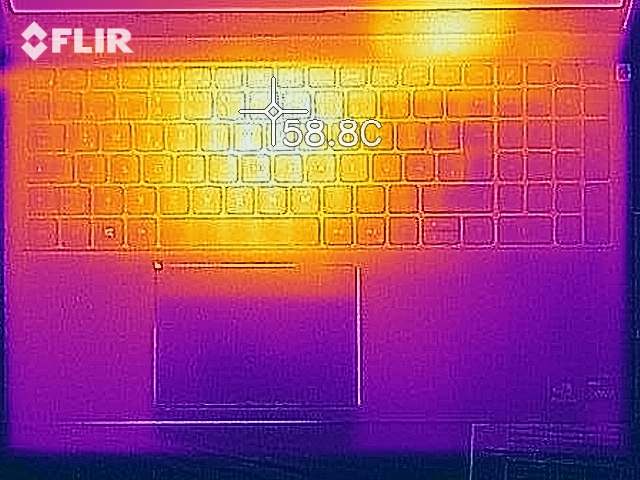
The case temperatures are within the green zone in everyday use (office, Internet).Values beyond 50 or 60 °C (122 or 140 °F) are reached in the heat sink's area during full hardware load. The competition usually heats up less selectively, but in total they heat up more.
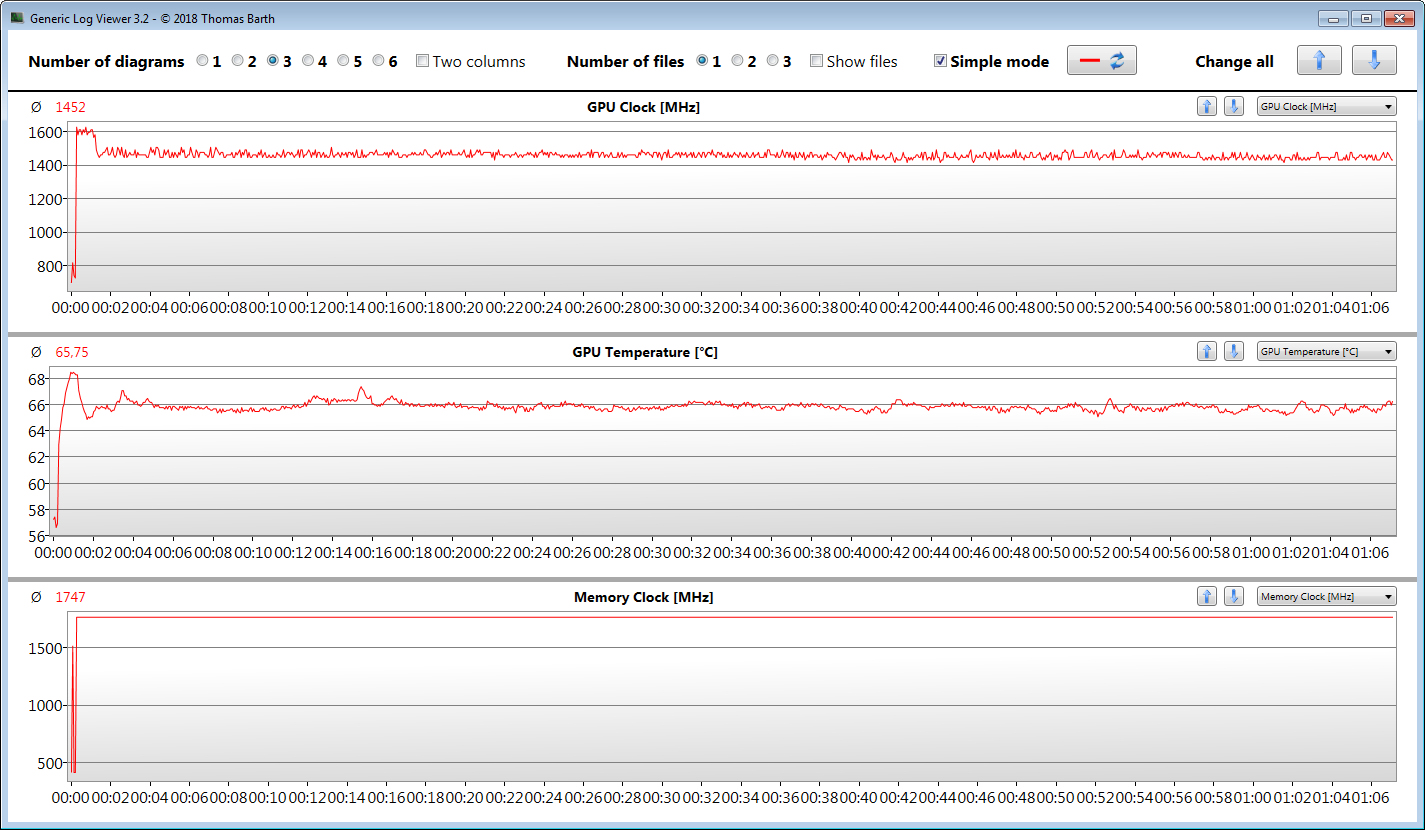
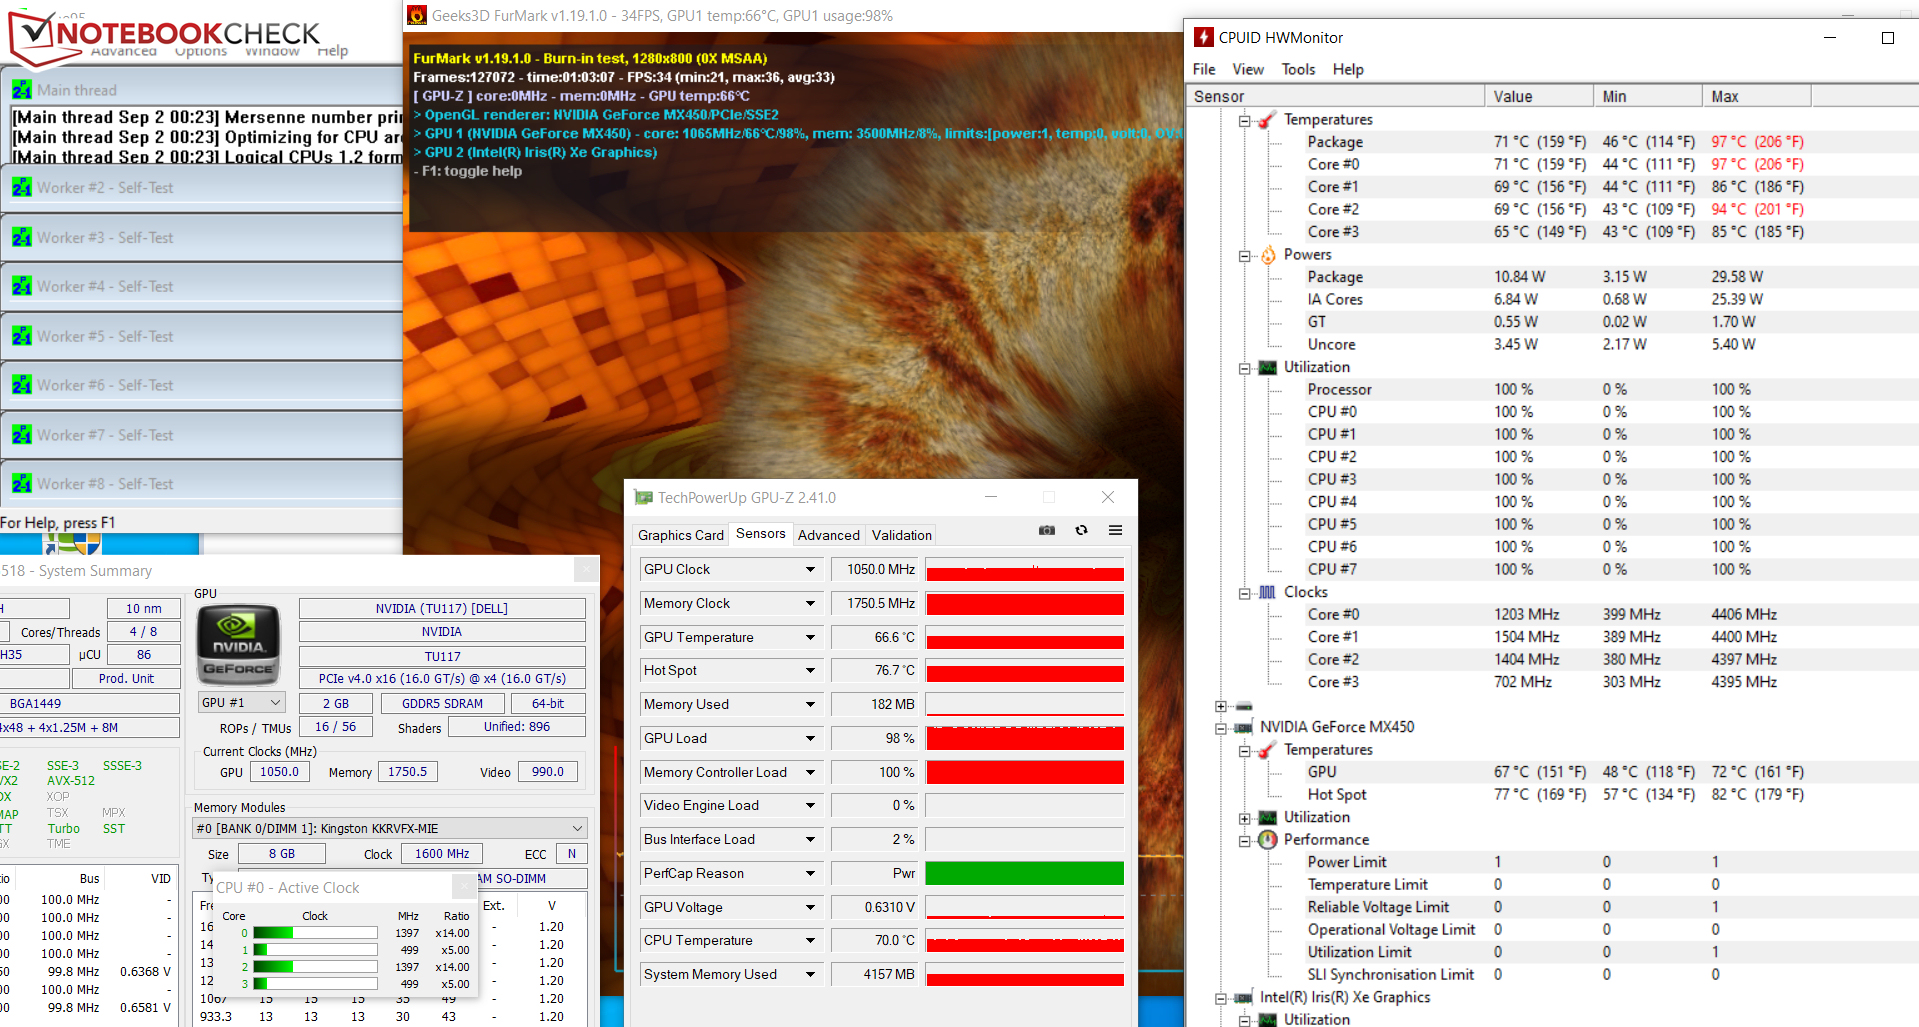
The CPU and GPU start the stress test (Prime95 and FurMark run for at least one hour) with relatively high speeds. Beyond this period, the rates drop to 400 MHz to 1.4 GHz or about 1,050 MHz. The stress test represents an extreme scenario. We use this test to check whether the system runs stably under full load.
(-) The maximum temperature on the upper side is 55.1 °C / 131 F, compared to the average of 34.3 °C / 94 F, ranging from 21.2 to 62.5 °C for the class Office.
(-) The bottom heats up to a maximum of 62.4 °C / 144 F, compared to the average of 36.8 °C / 98 F
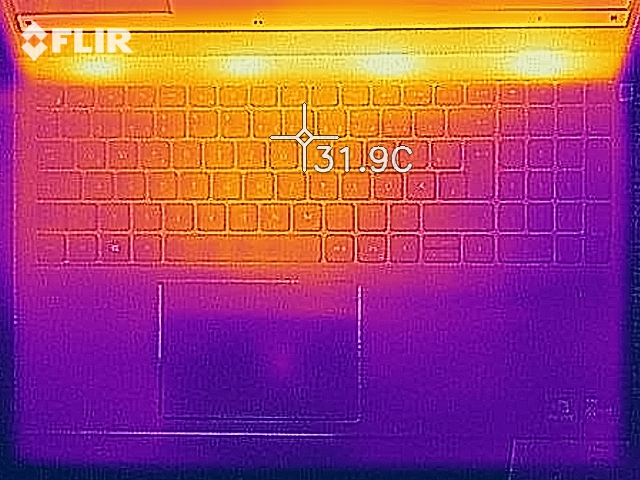
(+) In idle usage, the average temperature for the upper side is 26.3 °C / 79 F, compared to the device average of 29.5 °C / 85 F.
(+) The palmrests and touchpad are cooler than skin temperature with a maximum of 28.3 °C / 82.9 F and are therefore cool to the touch.
(±) The average temperature of the palmrest area of similar devices was 27.5 °C / 81.5 F (-0.8 °C / -1.4 F).
| Dell Inspiron 15 5518-2X3JR Intel Core i5-11300H, NVIDIA GeForce MX450 | HP Pavilion 15-eg Intel Core i7-1165G7, NVIDIA GeForce MX450 | Xiaomi RedmiBook Pro 15 Intel Core i7-11370H, NVIDIA GeForce MX450 | Lenovo IdeaPad 5 Pro 16IHU6 Intel Core i5-11300H, NVIDIA GeForce MX450 | Asus VivoBook S15 D533UA AMD Ryzen 7 5700U, AMD Radeon RX Vega 8 (Ryzen 4000/5000) | Lenovo IdeaPad 5 15ALC05 AMD Ryzen 5 5500U, AMD Radeon RX Vega 7 | |
|---|---|---|---|---|---|---|
| Heat | 13% | 6% | 6% | 16% | 20% | |
| Maximum Upper Side * (°C) | 55.1 | 44 20% | 54 2% | 65.3 -19% | 46.1 16% | 40.5 26% |
| Maximum Bottom * (°C) | 62.4 | 53.4 14% | 52 17% | 55.4 11% | 46.6 25% | 42 33% |
| Idle Upper Side * (°C) | 29.8 | 27.4 8% | 33 -11% | 25.4 15% | 27.4 8% | 26.5 11% |
| Idle Bottom * (°C) | 32.5 | 28.8 11% | 28 14% | 26.8 18% | 28.2 13% | 29 11% |
* ... smaller is better
Speaker
The stereo speakers produce a decent sound, which hardly has any bass.
Dell Inspiron 15 5518-2X3JR audio analysis
(+) | speakers can play relatively loud (88.4 dB)
Bass 100 - 315 Hz
(-) | nearly no bass - on average 21.3% lower than median
(+) | bass is linear (5.8% delta to prev. frequency)
Mids 400 - 2000 Hz
(+) | balanced mids - only 3.1% away from median
(+) | mids are linear (4.2% delta to prev. frequency)
Highs 2 - 16 kHz
(±) | higher highs - on average 5.5% higher than median
(+) | highs are linear (6.4% delta to prev. frequency)
Overall 100 - 16.000 Hz
(±) | linearity of overall sound is average (17% difference to median)
Compared to same class
» 24% of all tested devices in this class were better, 7% similar, 68% worse
» The best had a delta of 7%, average was 21%, worst was 53%
Compared to all devices tested
» 31% of all tested devices were better, 8% similar, 61% worse
» The best had a delta of 4%, average was 23%, worst was 134%
HP Pavilion 15-eg audio analysis
(±) | speaker loudness is average but good (81.3 dB)
Bass 100 - 315 Hz
(-) | nearly no bass - on average 18% lower than median
(±) | linearity of bass is average (12.8% delta to prev. frequency)
Mids 400 - 2000 Hz
(+) | balanced mids - only 2.8% away from median
(+) | mids are linear (4% delta to prev. frequency)
Highs 2 - 16 kHz
(+) | balanced highs - only 1% away from median
(+) | highs are linear (3% delta to prev. frequency)
Overall 100 - 16.000 Hz
(+) | overall sound is linear (13.2% difference to median)
Compared to same class
» 27% of all tested devices in this class were better, 5% similar, 68% worse
» The best had a delta of 5%, average was 17%, worst was 45%
Compared to all devices tested
» 13% of all tested devices were better, 3% similar, 84% worse
» The best had a delta of 4%, average was 23%, worst was 134%
Power consumption
When idle and under low load, the Dell computer's energy consumption is roughly on par with the values of the Ideapad 5 Pro and the RedmiBook Pro 15. It consumes considerably less energy under high load. On the one hand, the CPU's low power limits are noticeable here, and on the other hand, Dell only includes a 65-watt power supply (Lenovo: 95 watts, Xiaomi: 100 watts). Consequently, the Inspiron cannot keep up with the competition in terms of computing power.
The graph of the CPU and GPU power consumption during the stress test and the Witcher 3 test depicts their behavior well: The clock rates drop over the course of the tests.
| Off / Standby | |
| Idle | |
| Load |
|
Key:
min: | |
Power consumption Witcher 3 / Stress test
| Dell Inspiron 15 5518-2X3JR Intel Core i5-11300H, NVIDIA GeForce MX450 | HP Pavilion 15-eg Intel Core i7-1165G7, NVIDIA GeForce MX450 | Xiaomi RedmiBook Pro 15 Intel Core i7-11370H, NVIDIA GeForce MX450 | Lenovo IdeaPad 5 Pro 16IHU6 Intel Core i5-11300H, NVIDIA GeForce MX450 | Asus VivoBook S15 D533UA AMD Ryzen 7 5700U, AMD Radeon RX Vega 8 (Ryzen 4000/5000) | Lenovo IdeaPad 5 15ALC05 AMD Ryzen 5 5500U, AMD Radeon RX Vega 7 | |
|---|---|---|---|---|---|---|
| Power Consumption | -19% | -37% | -30% | -3% | 11% | |
| Idle Minimum * (Watt) | 4 | 4.9 -23% | 6 -50% | 5 -25% | 5 -25% | 3.7 7% |
| Idle Average * (Watt) | 7.6 | 7.9 -4% | 9 -18% | 9 -18% | 7.7 -1% | 7.9 -4% |
| Idle Maximum * (Watt) | 10.2 | 14.2 -39% | 12 -18% | 9.4 8% | 12.2 -20% | 9.3 9% |
| Load Average * (Watt) | 49.4 | 64.3 -30% | 74 -50% | 71 -44% | 41 17% | 41 17% |
| Witcher 3 ultra * (Watt) | 49.4 | 55.6 -13% | 70.7 -43% | 72.4 -47% | 43 13% | 41 17% |
| Load Maximum * (Watt) | 63.4 | 65.4 -3% | 91 -44% | 99 -56% | 65 -3% | 52.2 18% |
* ... smaller is better
Battery life
The Inspiron 5518 achieves a runtime of 9:24 h in our practical WLAN test. The load during web page loads is mapped via a script.
Pros
Cons
Verdict - The Inspiron 15 5518 offers potential for improvement

The installed Core i5-11300H CPU delivers enough performance for office and Internet applications, the GeForce-MX450 Graphics core allows the use of computer games or GPU-heavy applications. The hardware is housed in a chic aluminum case.
Thunderbolt 4 is reserved for the Core i7 model of the Inspiron.
A WLAN runtime of almost 9.5 hours should get you through the day without a power adapter. Power can be recharged via the included proprietary Dell power adapter or via a USB-C power adapter - the USB-C port of the 5518 works according to the USB 3.2 Gen 2x2 standard.
The laptop does not produce much noise in everyday use (office, Internet), and the heat development is on an acceptable level. The matte screen (FHD, IPS) offers stable viewing angles, good contrast and decent color reproduction. Brightness and color space coverage are too low.
The processor falls short of its capabilities due to low power limits. The working memory (1x 8 GB, DDR4-3200) running in single-channel mode costs further performance. This could be improved by installing a second memory module. The aluminum case lacks stiffness.
An alternative to the Inspiron in the 800 Euro (~$939) segment would be the Lenovo IdeaPad 5 15ALC05. It scores with a lot of multi-thread CPU performance, a bright screen, low emissions as well as excellent battery runtimes. The weaknesses: The working memory is soldered and the screen delivers a low contrast.
Price and availability
Dell's Inspiron 15 5518 (Core i5-11300H, GeForce MX450, 8 GB RAM, 512 GB SSD) is currently available at Cyberport.de at a price of just under 800 Euros (~$939).
Dell Inspiron 15 5518-2X3JR
- 09/14/2021 v7 (old)
Sascha Mölck
Price comparison

