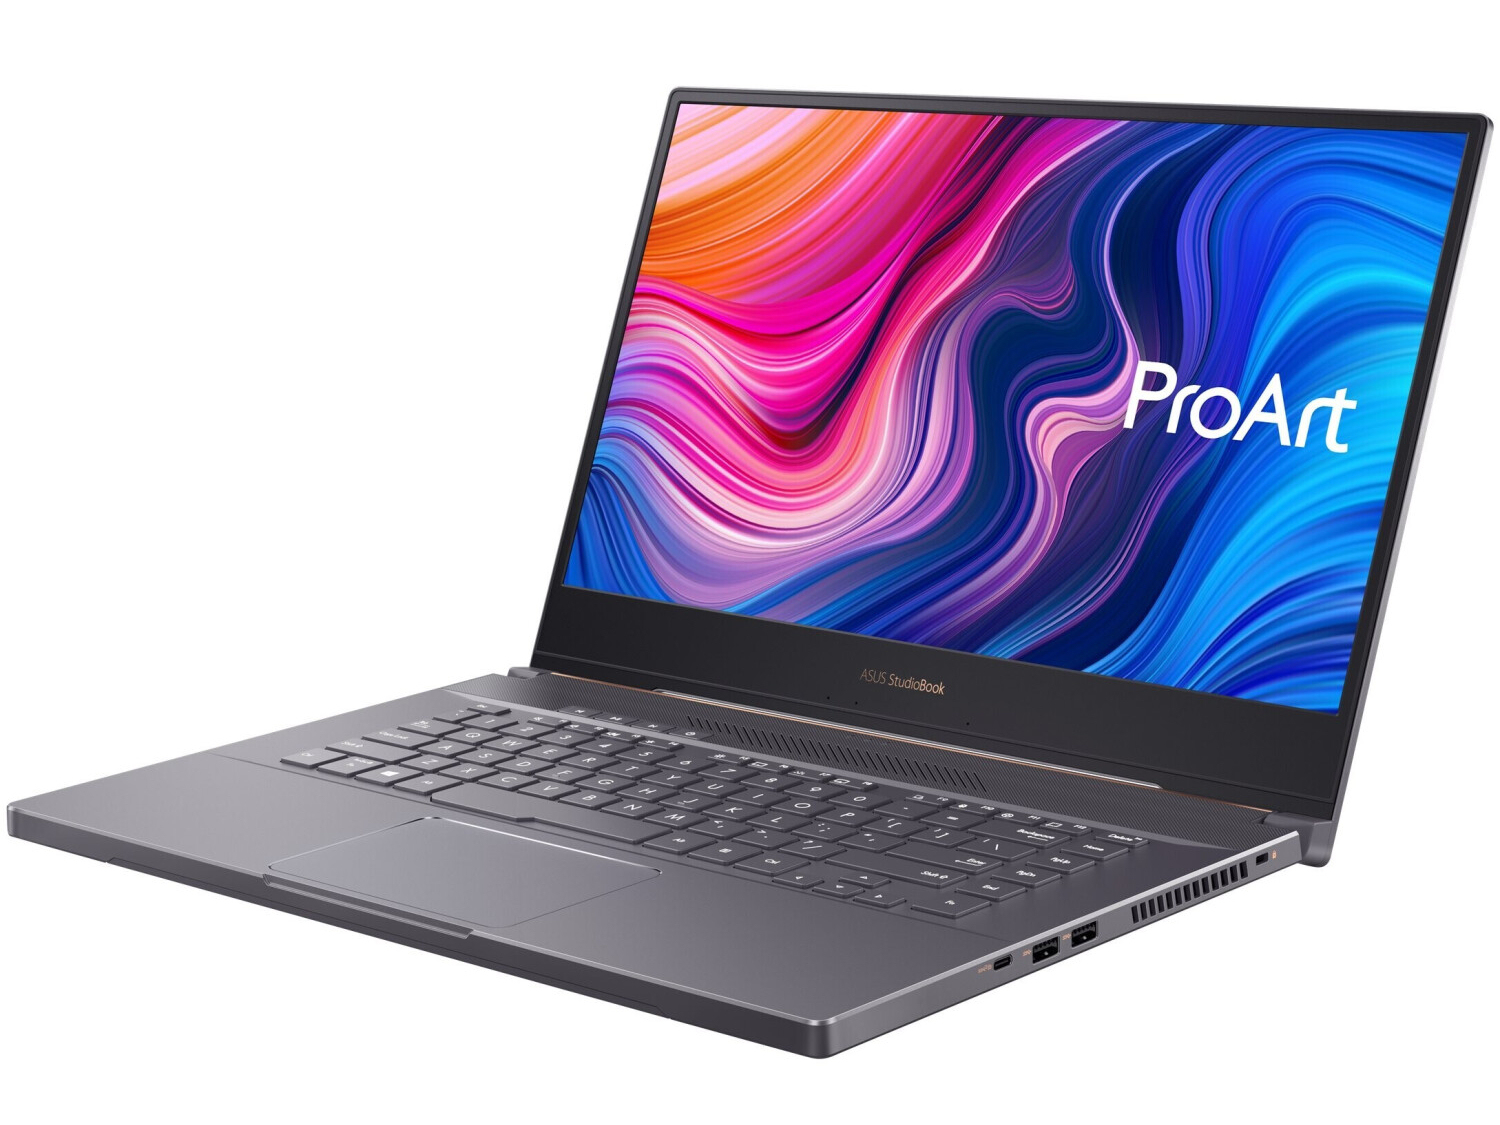
Asus ProArt StudioBook Pro 15 W500G5T Review: Powerful workstation with weaknesses

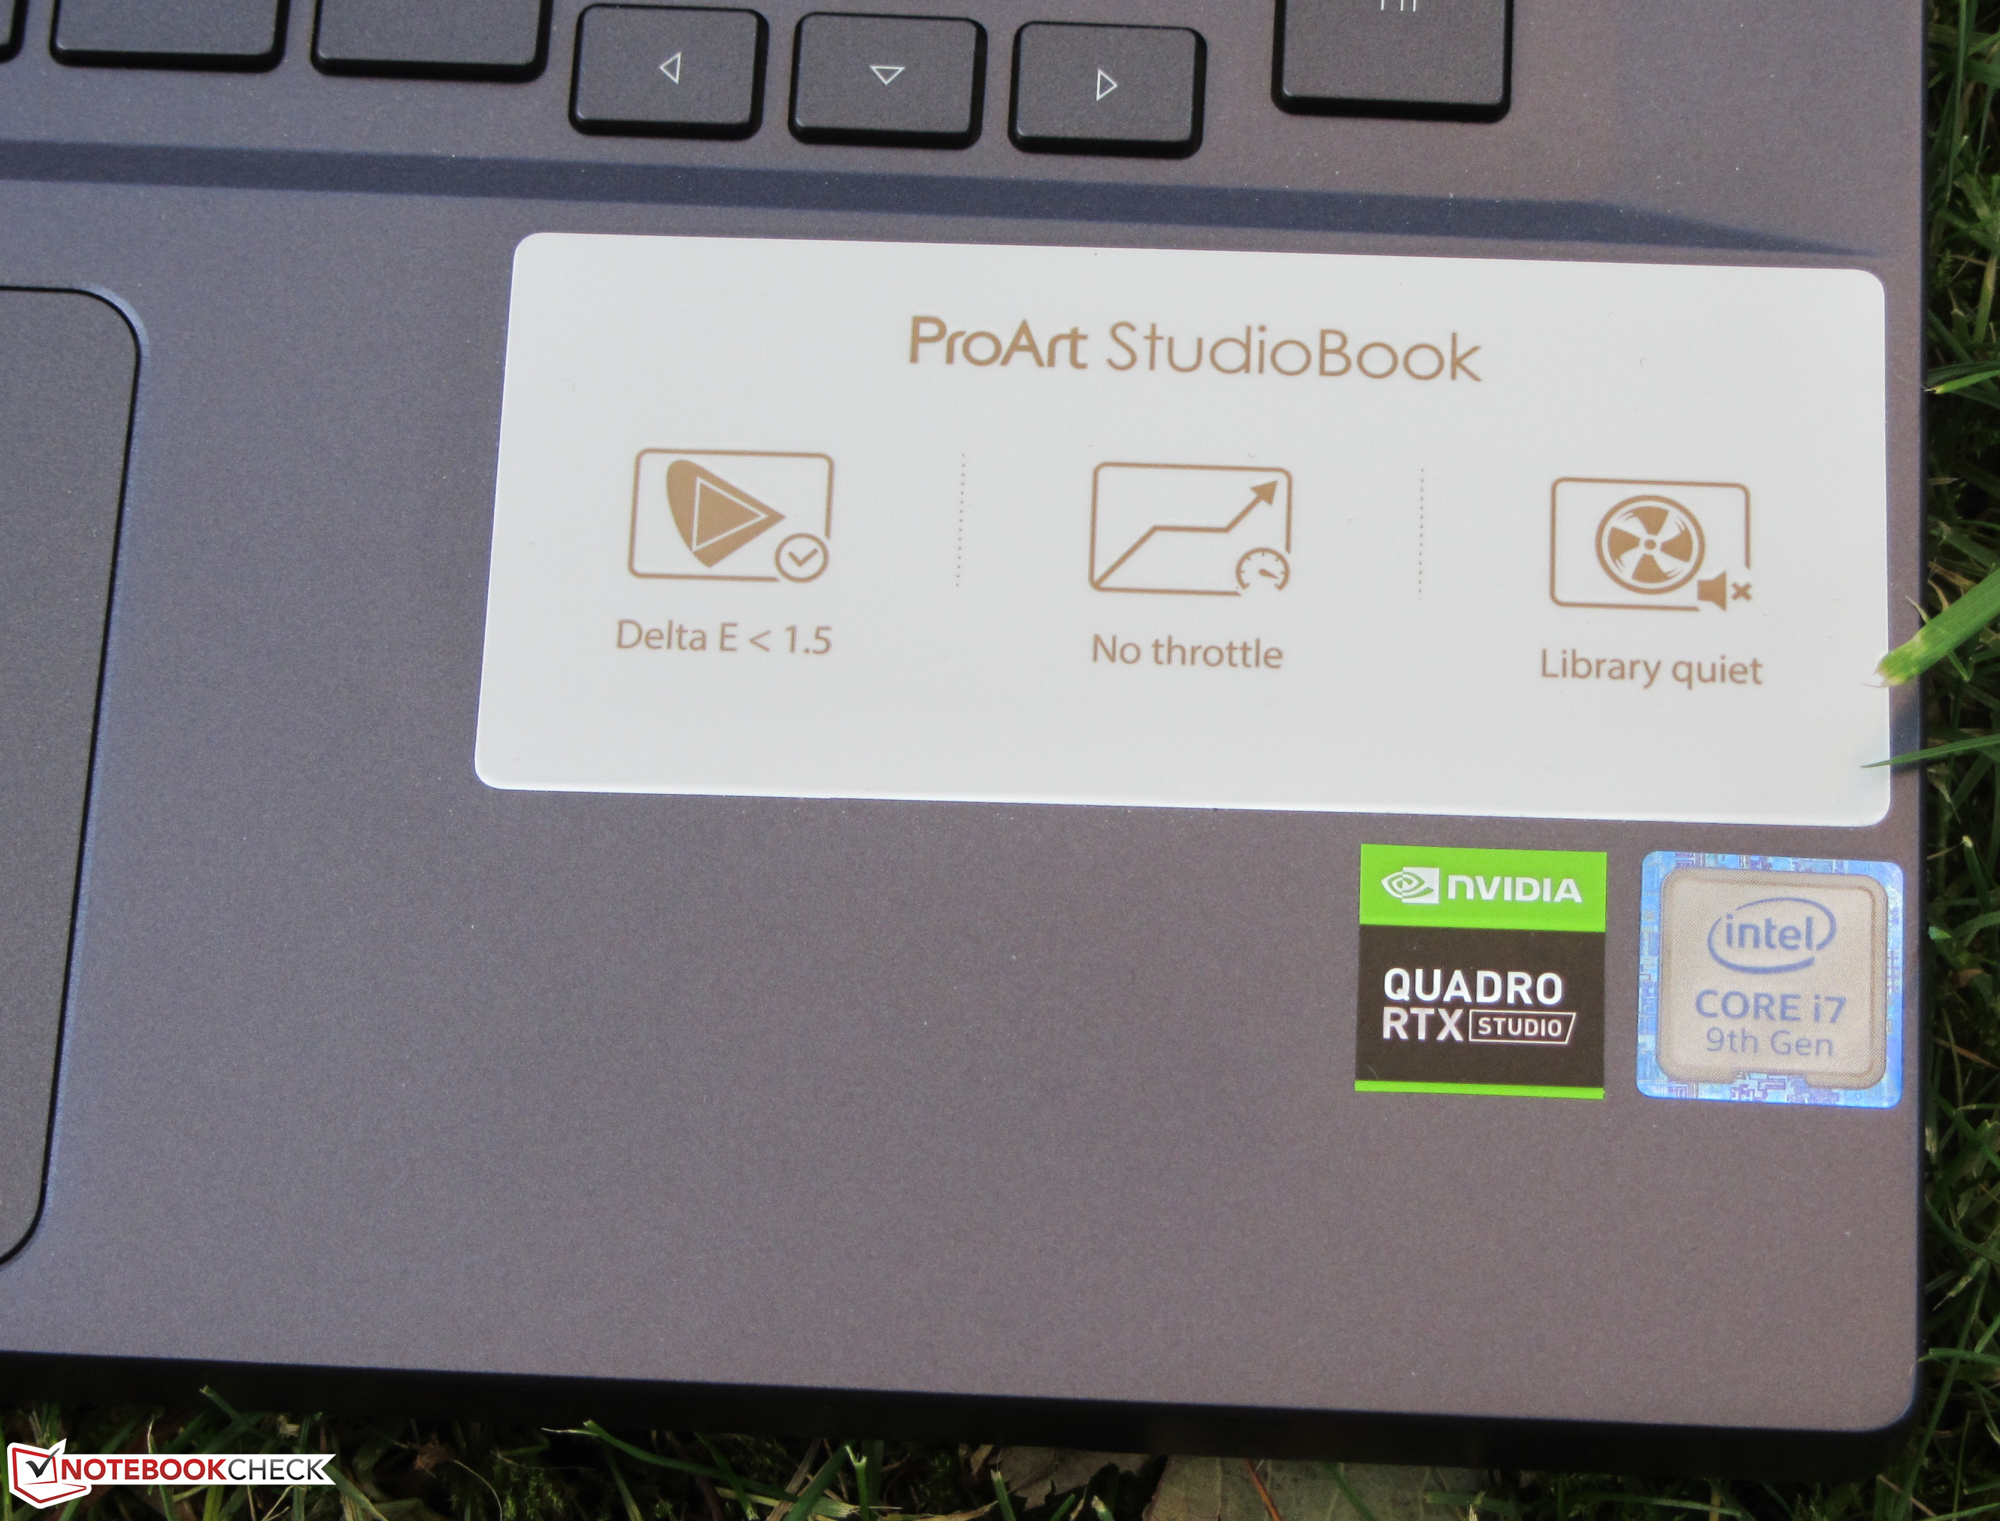
The Asus ProArt StudioBook Pro 15 is a 15.6-inch workstation, which is powered by the Core i7-9750H and the Quadro RTX 5000 Max-Q. Competing devices include: the Razer Blade 15 Studio Edition 2020, the Dell Precision 7550 and the MSI WS66 10TMT.
Rating | Date | Model | Weight | Height | Size | Resolution | Price |
|---|---|---|---|---|---|---|---|
| 83.1 % v7 (old) | 11 / 2020 | Asus ProArt StudioBook Pro 15 W500G5T i7-9750H, Quadro RTX 5000 Max-Q | 2 kg | 18.9 mm | 15.60" | 3840x2160 | |
| 83.4 % v7 (old) | 08 / 2020 | MSI WS66 10TMT-207US i9-10980HK, Quadro RTX 5000 Max-Q | 2.3 kg | 19.8 mm | 15.60" | 1920x1080 | |
| 87.8 % v7 (old) | 08 / 2020 | Dell Precision 7550 W-10885M, Quadro RTX 5000 Max-Q | 2.8 kg | 27.36 mm | 15.60" | 3840x2160 | |
| 87 % v7 (old) | 08 / 2020 | Razer Blade 15 Studio Edition 2020 i7-10875H, Quadro RTX 5000 Max-Q | 2.2 kg | 13.98 mm | 15.60" | 3840x2160 |
Case & Connectivity - No Thunderbolt 3 for the W500G5T
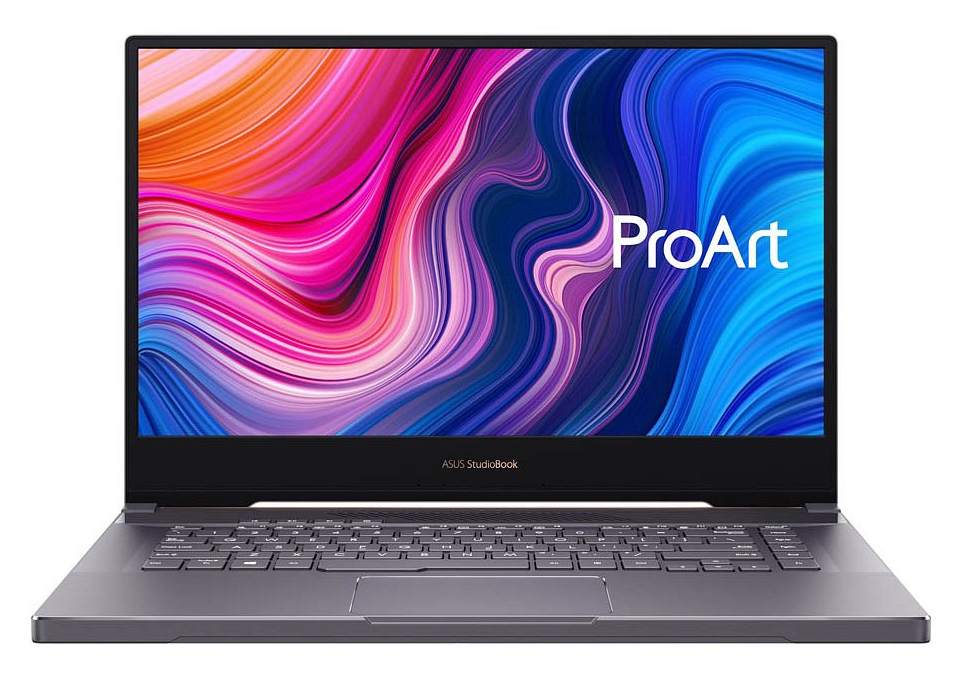
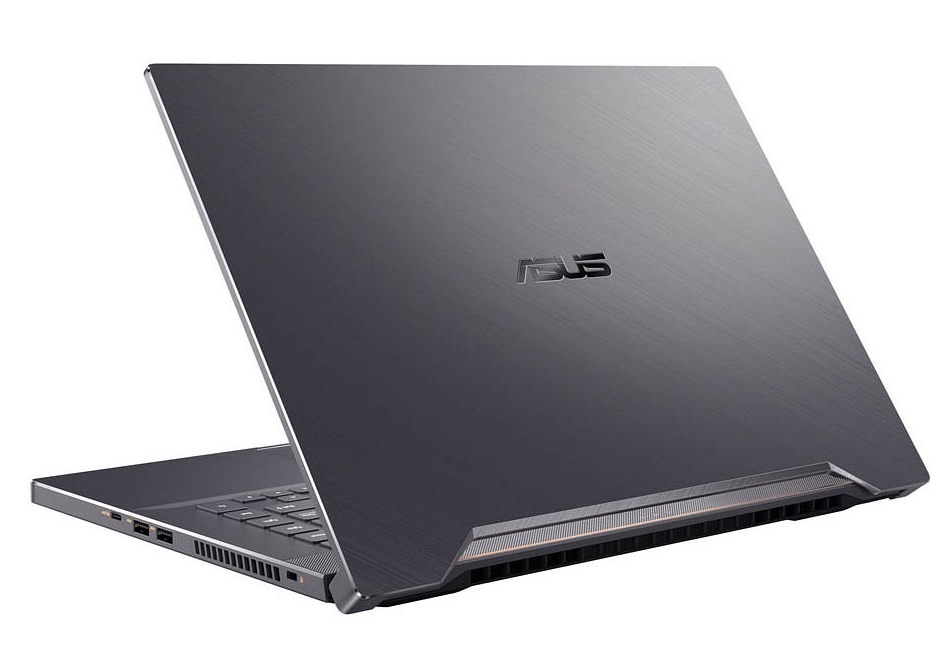
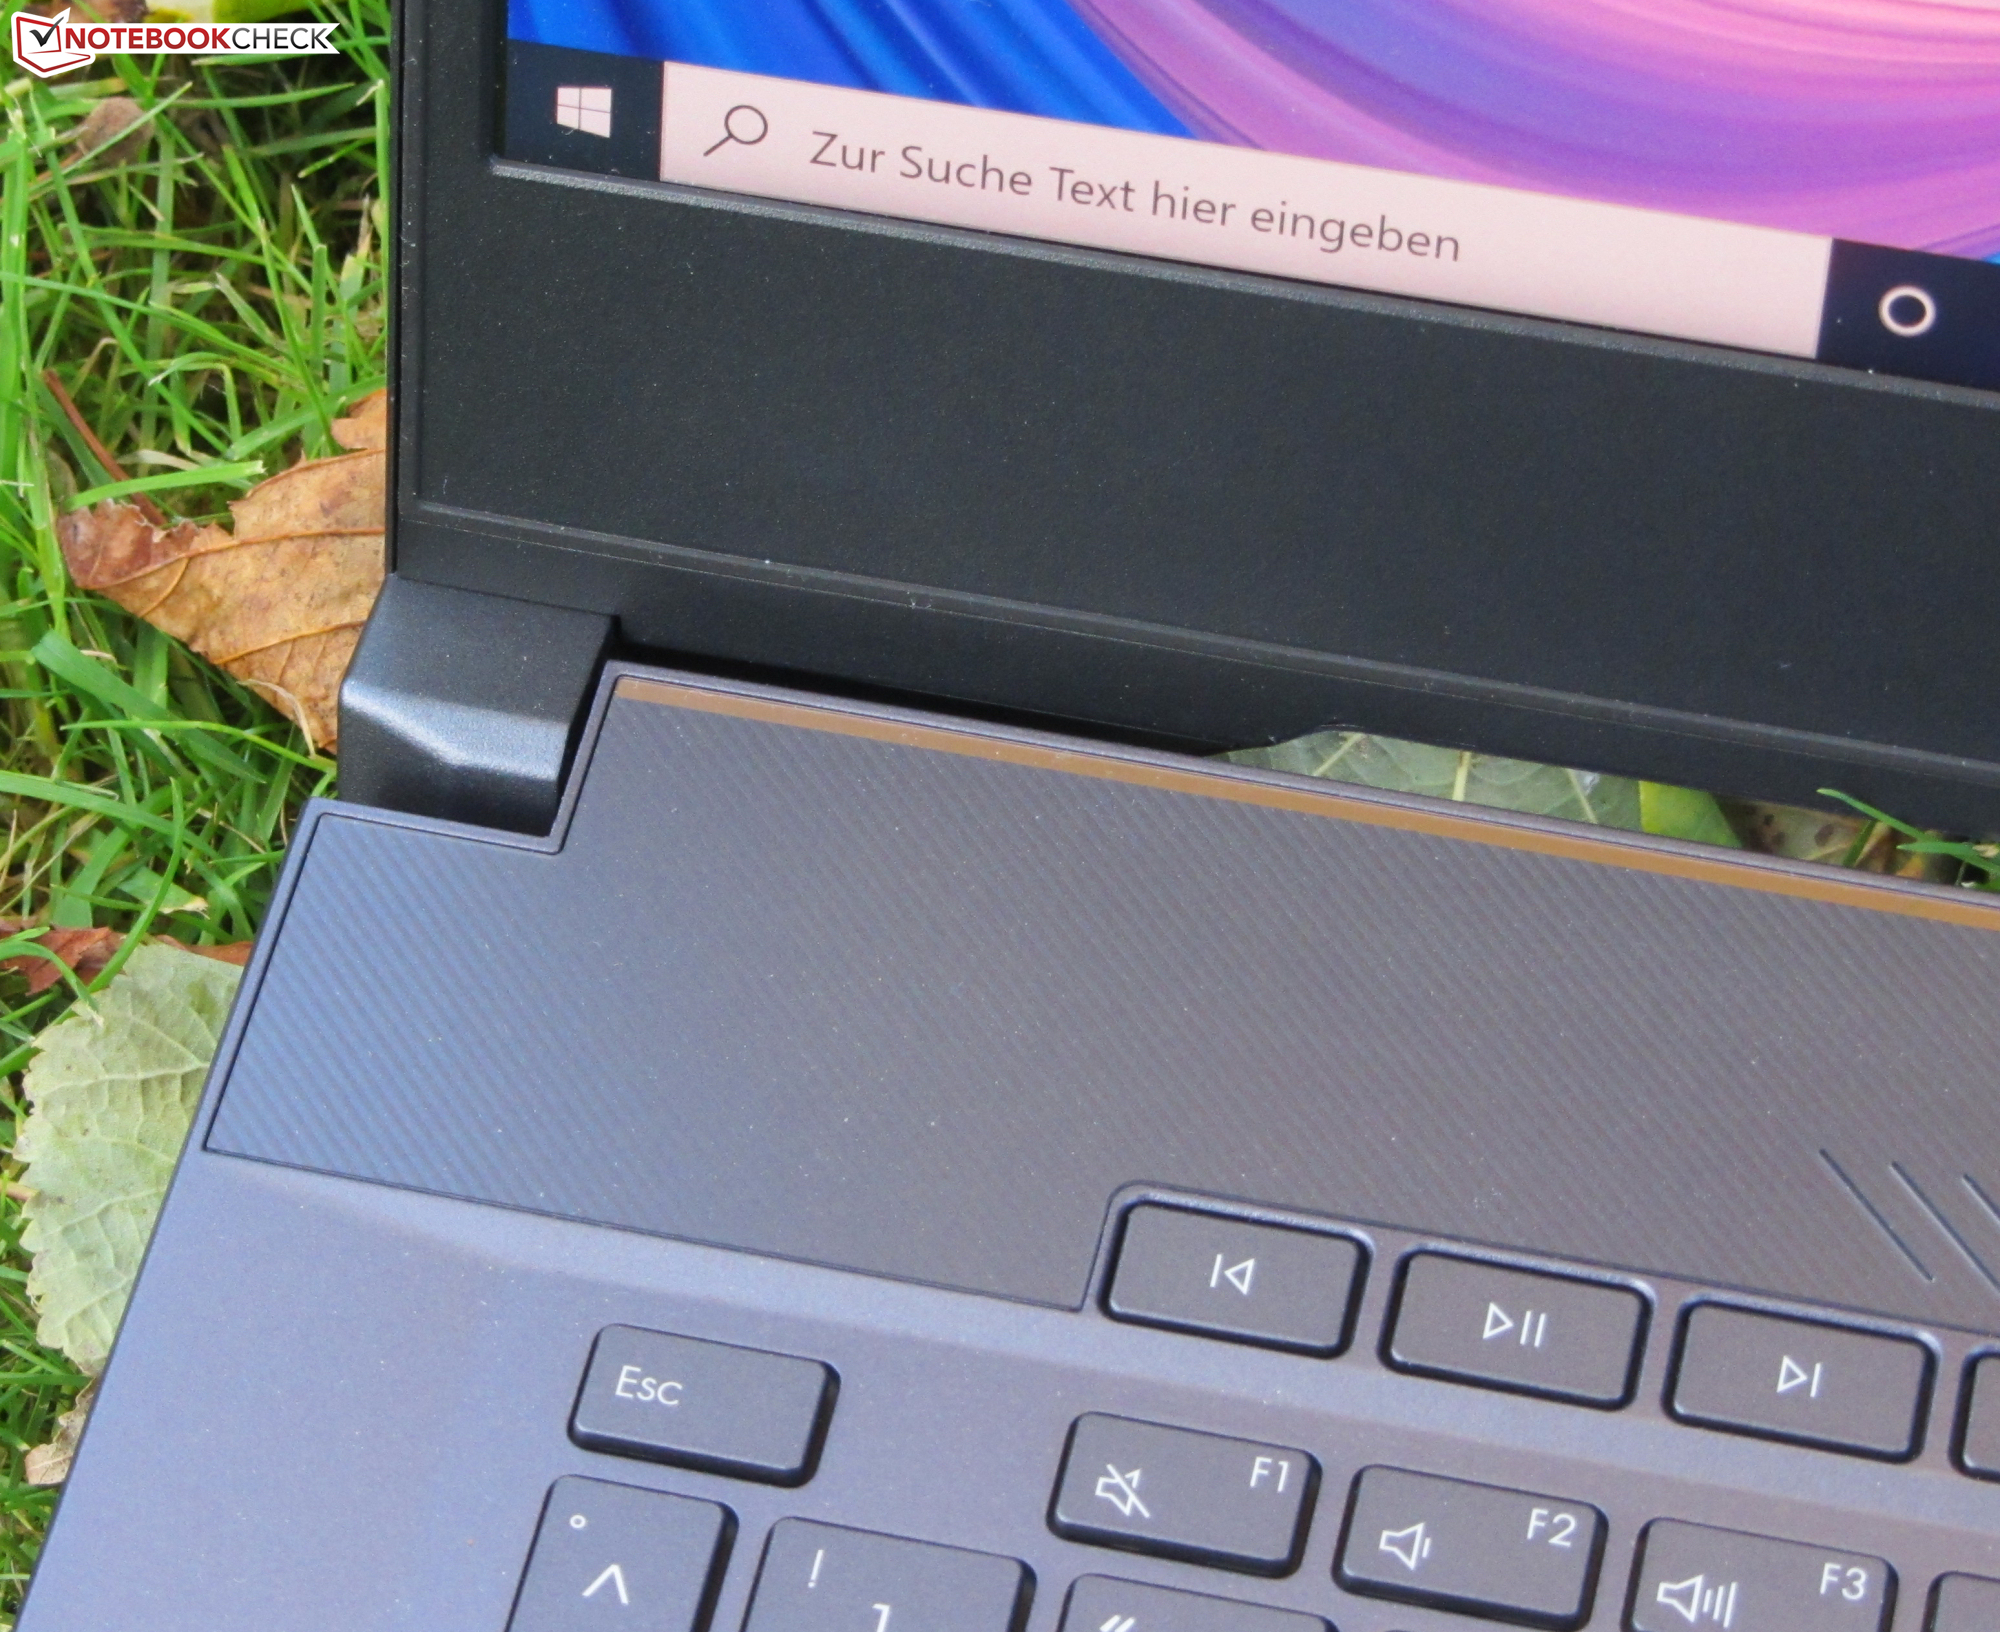
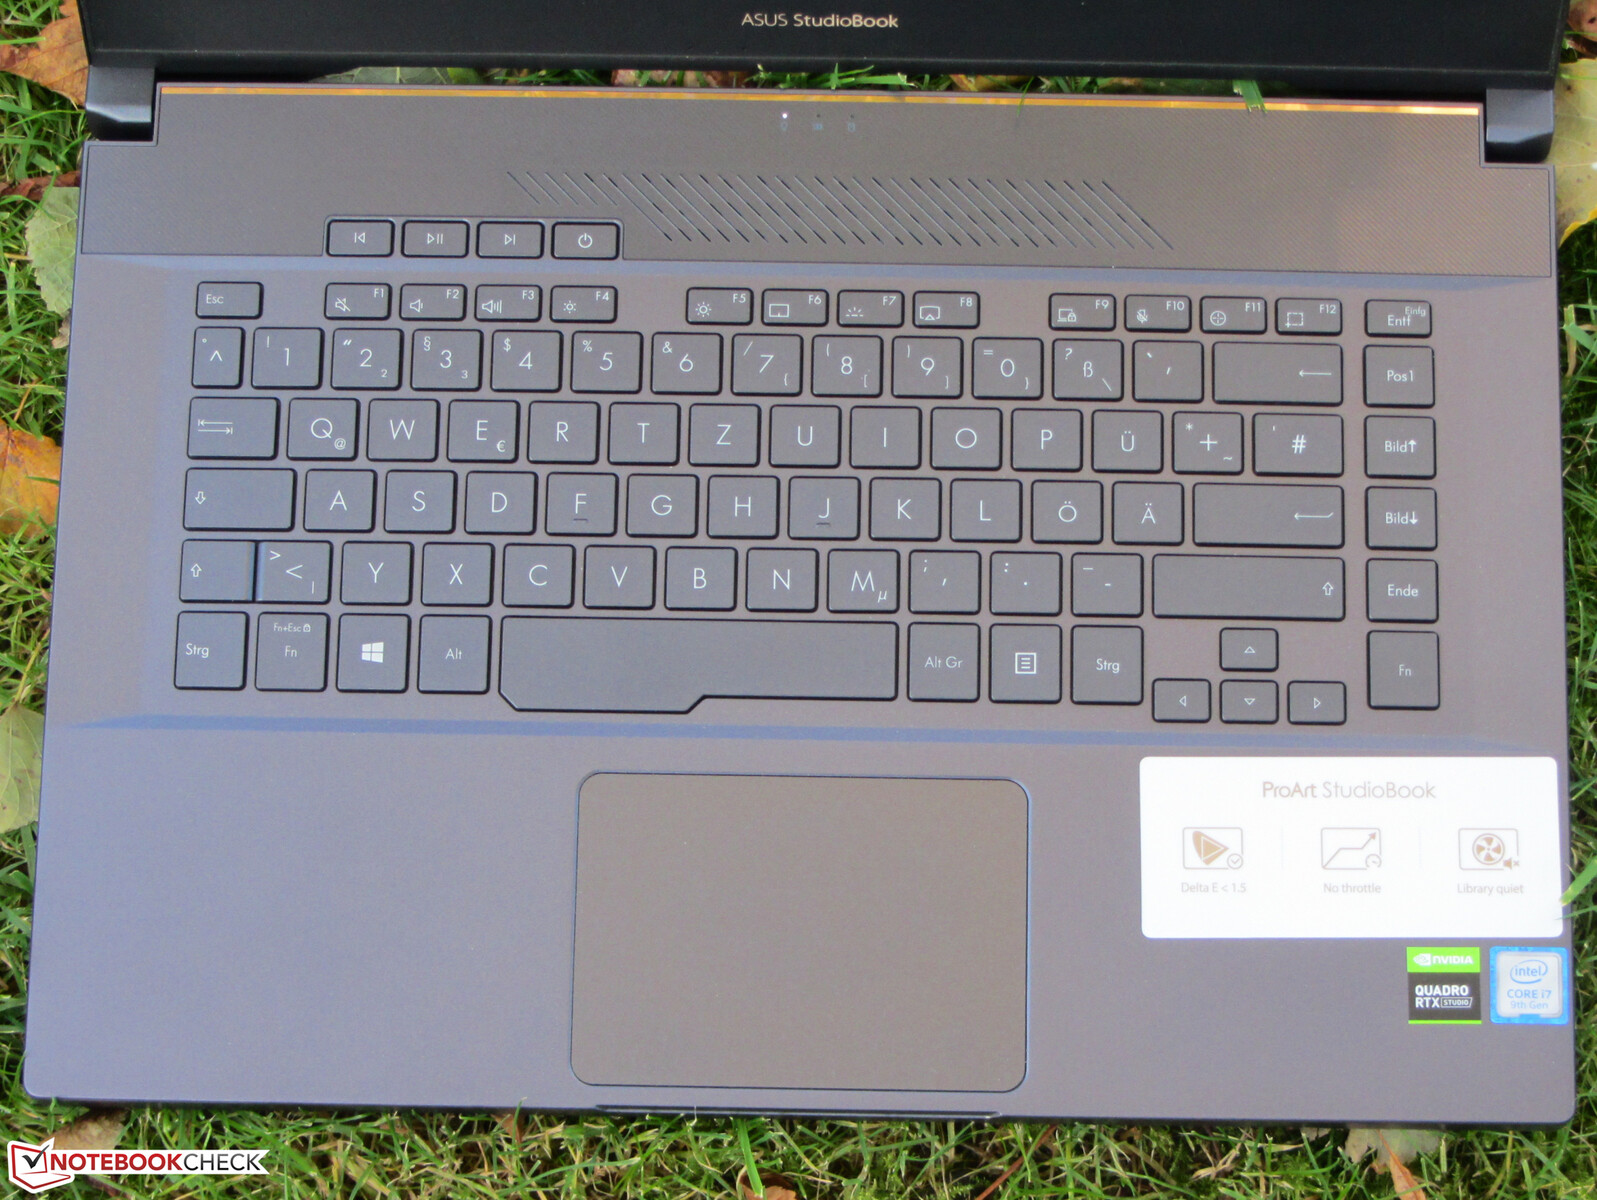
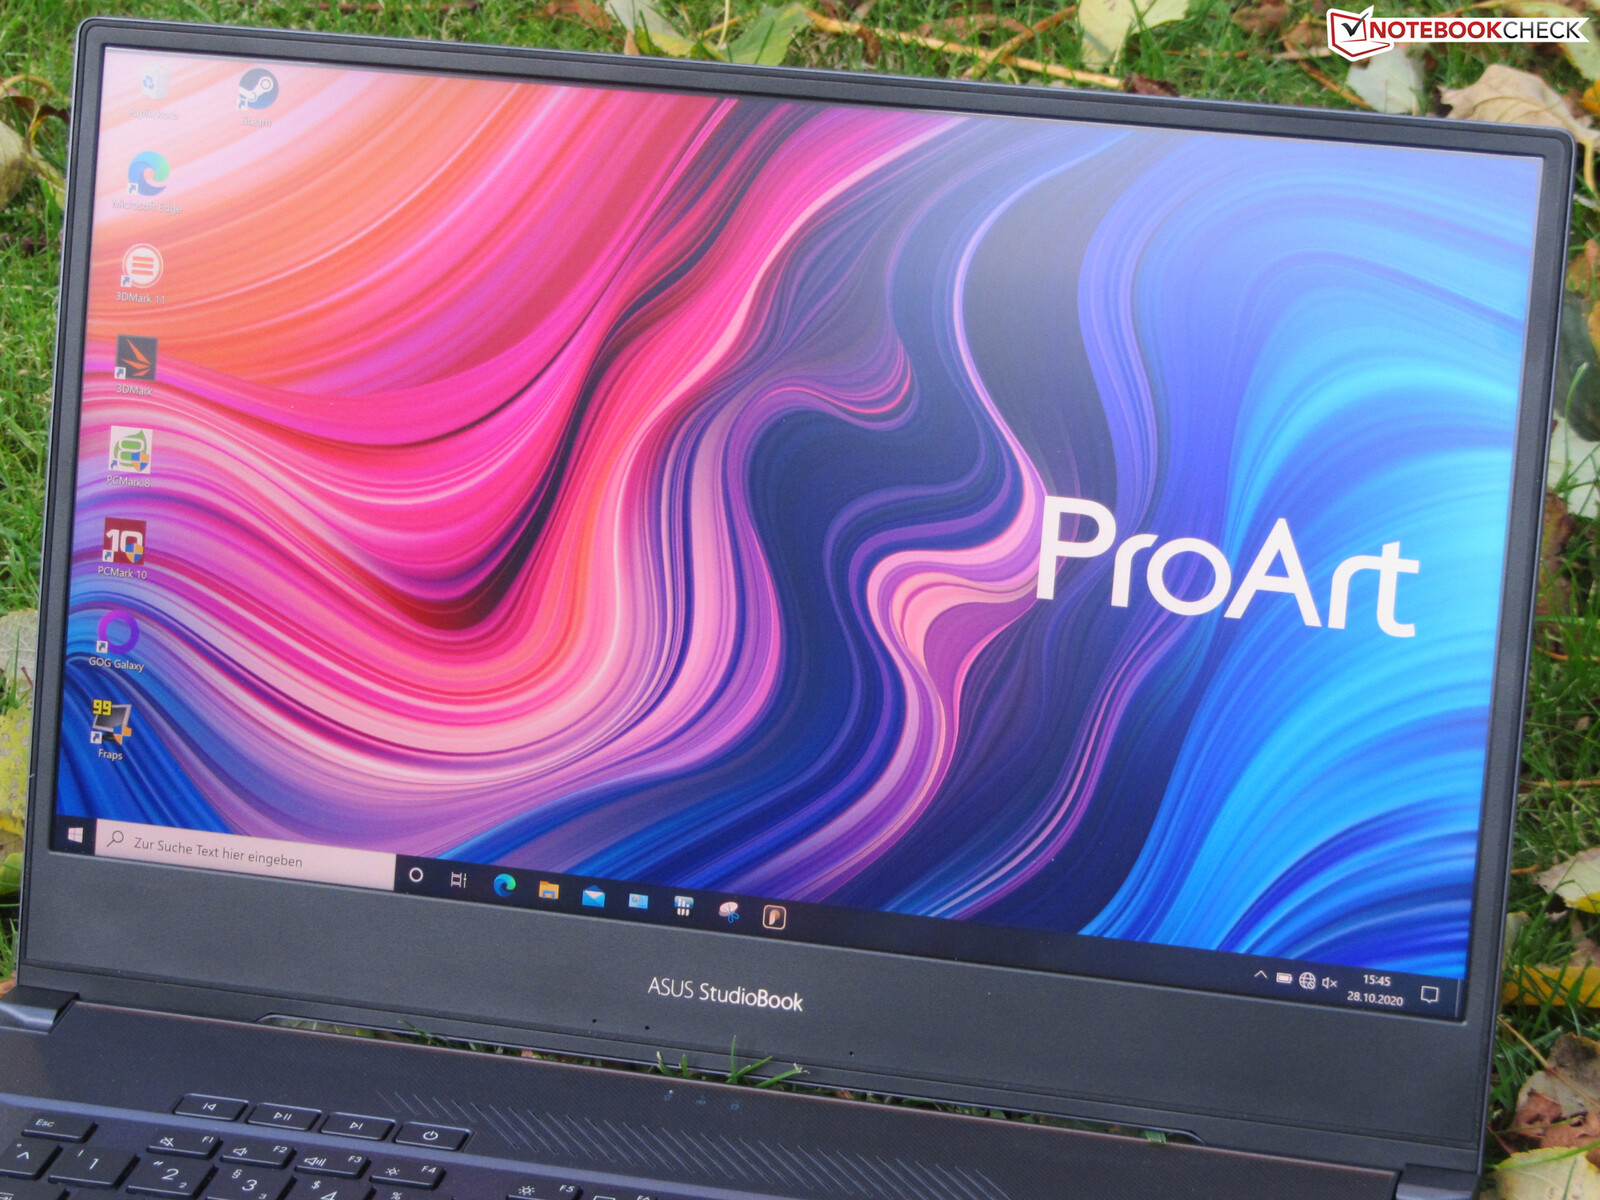
The metal housing of the Asus StudioBook looks very premium and comes in the colour scheme known as Star Grey
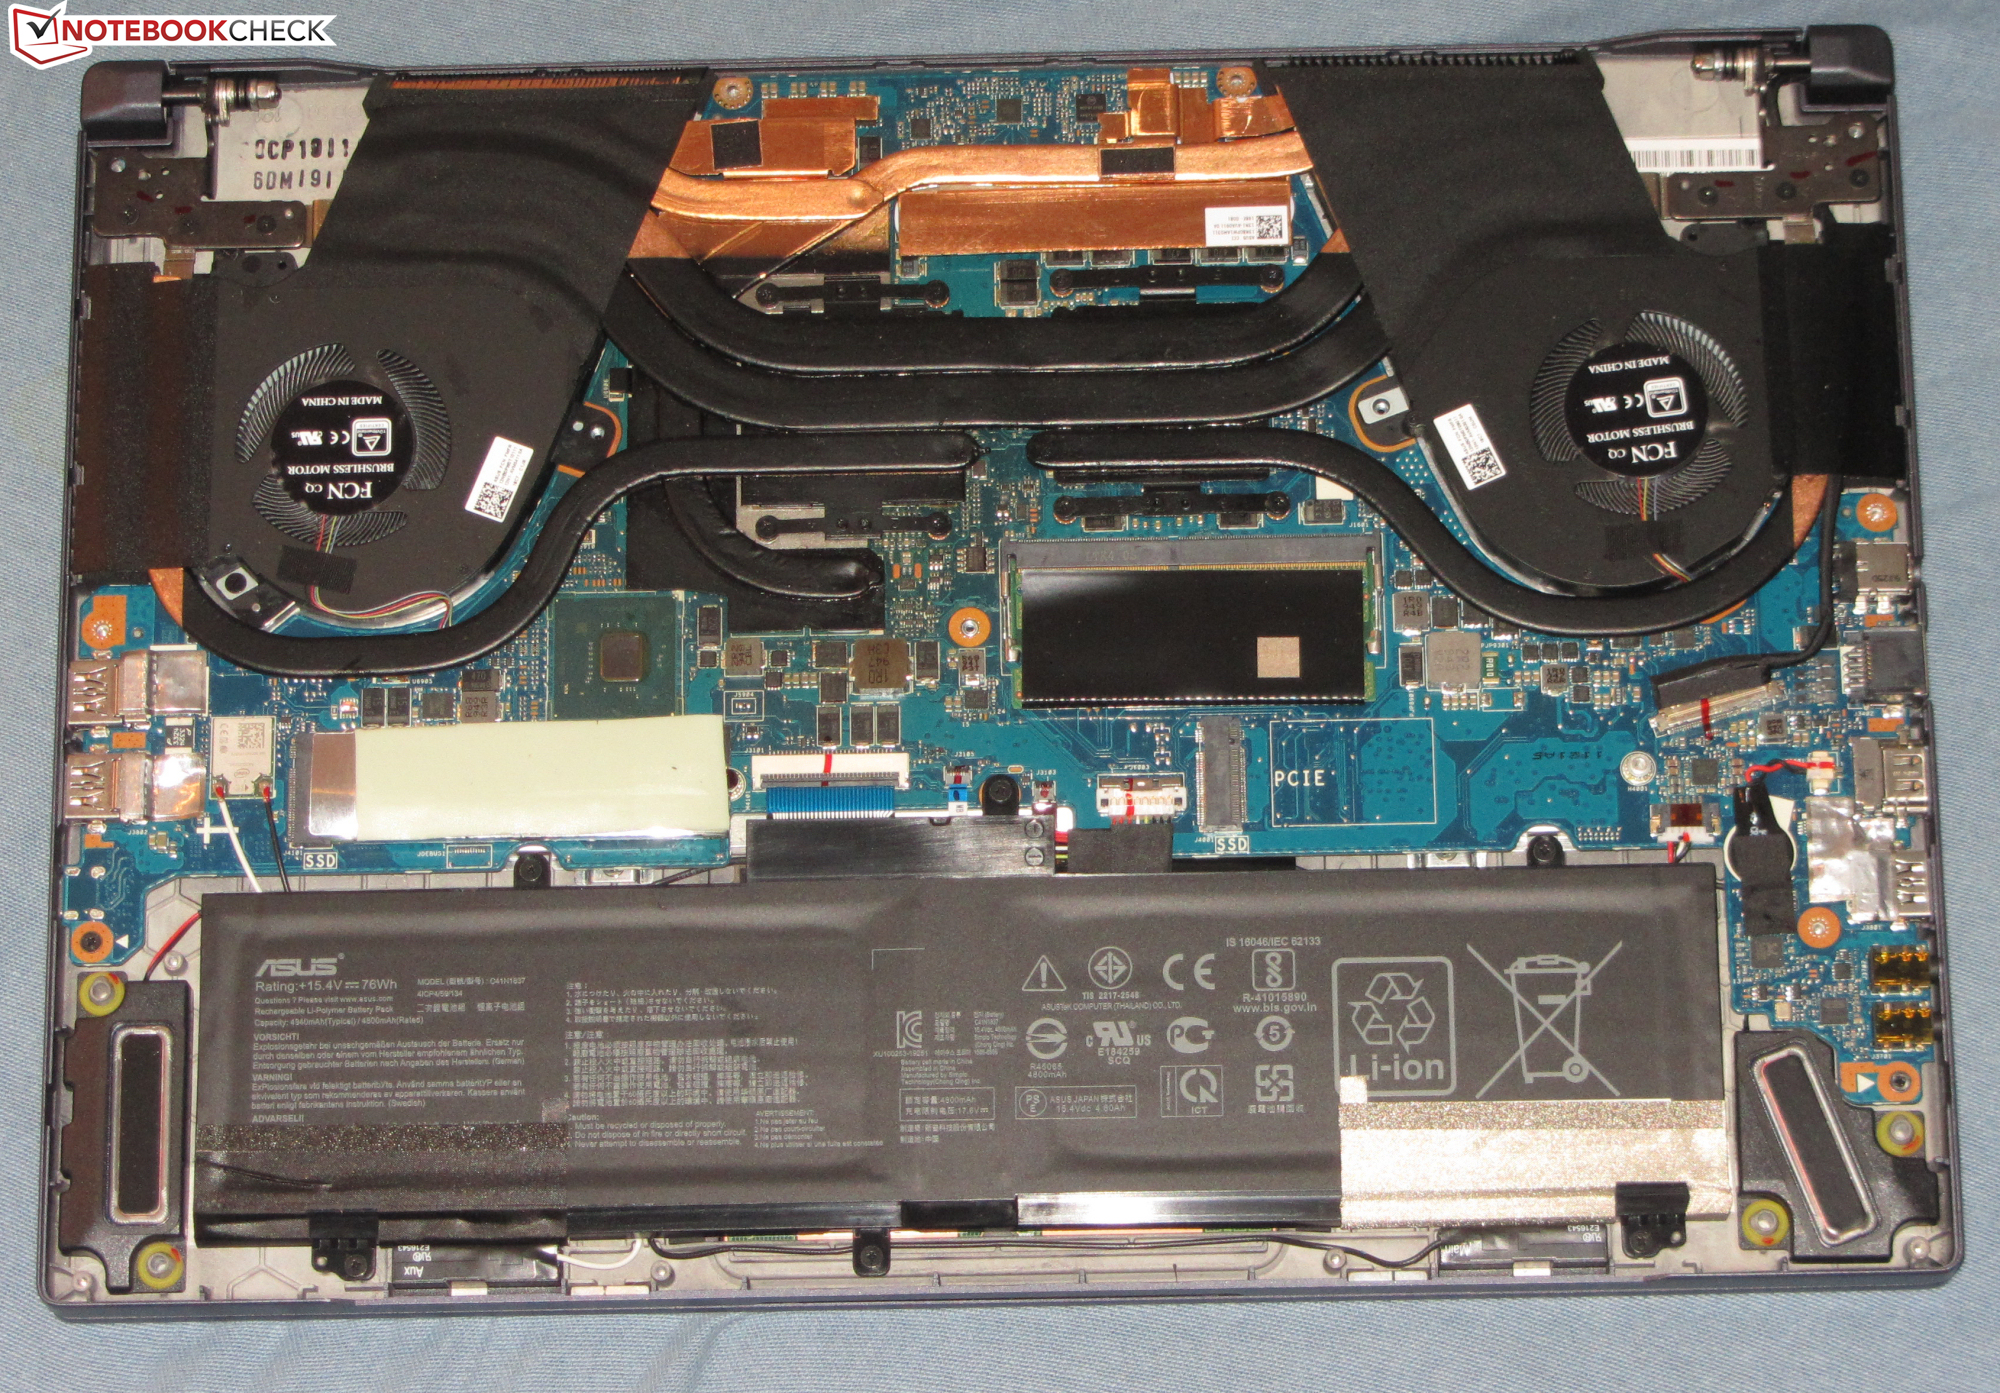
. There are no gaps or chinks anywhere. Both the display lid and the chassis are very rigid. The battery is built in. To get to the internal components, users will have to remove the bottom cover.
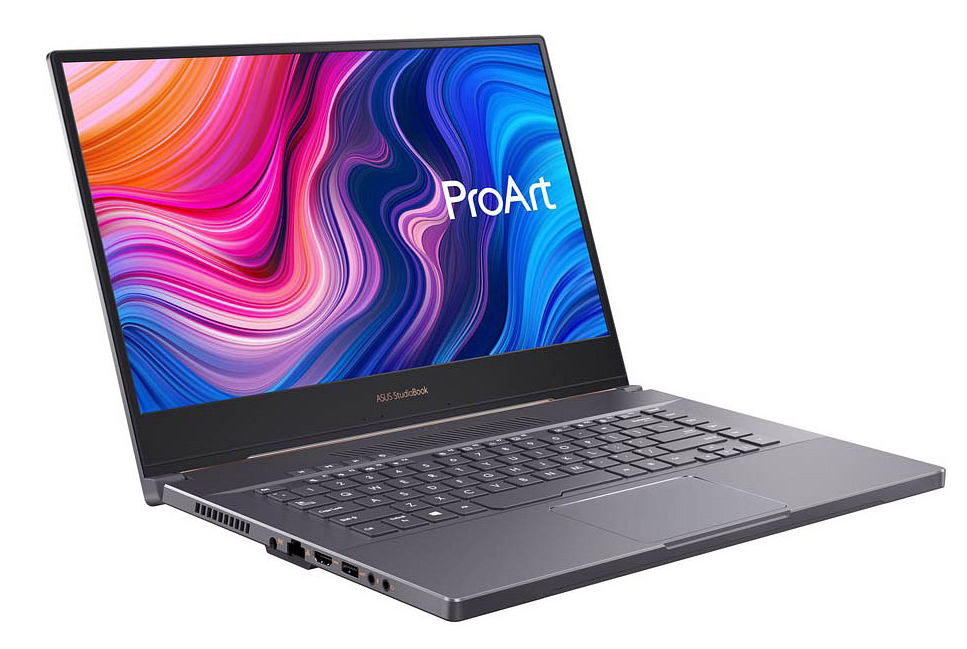
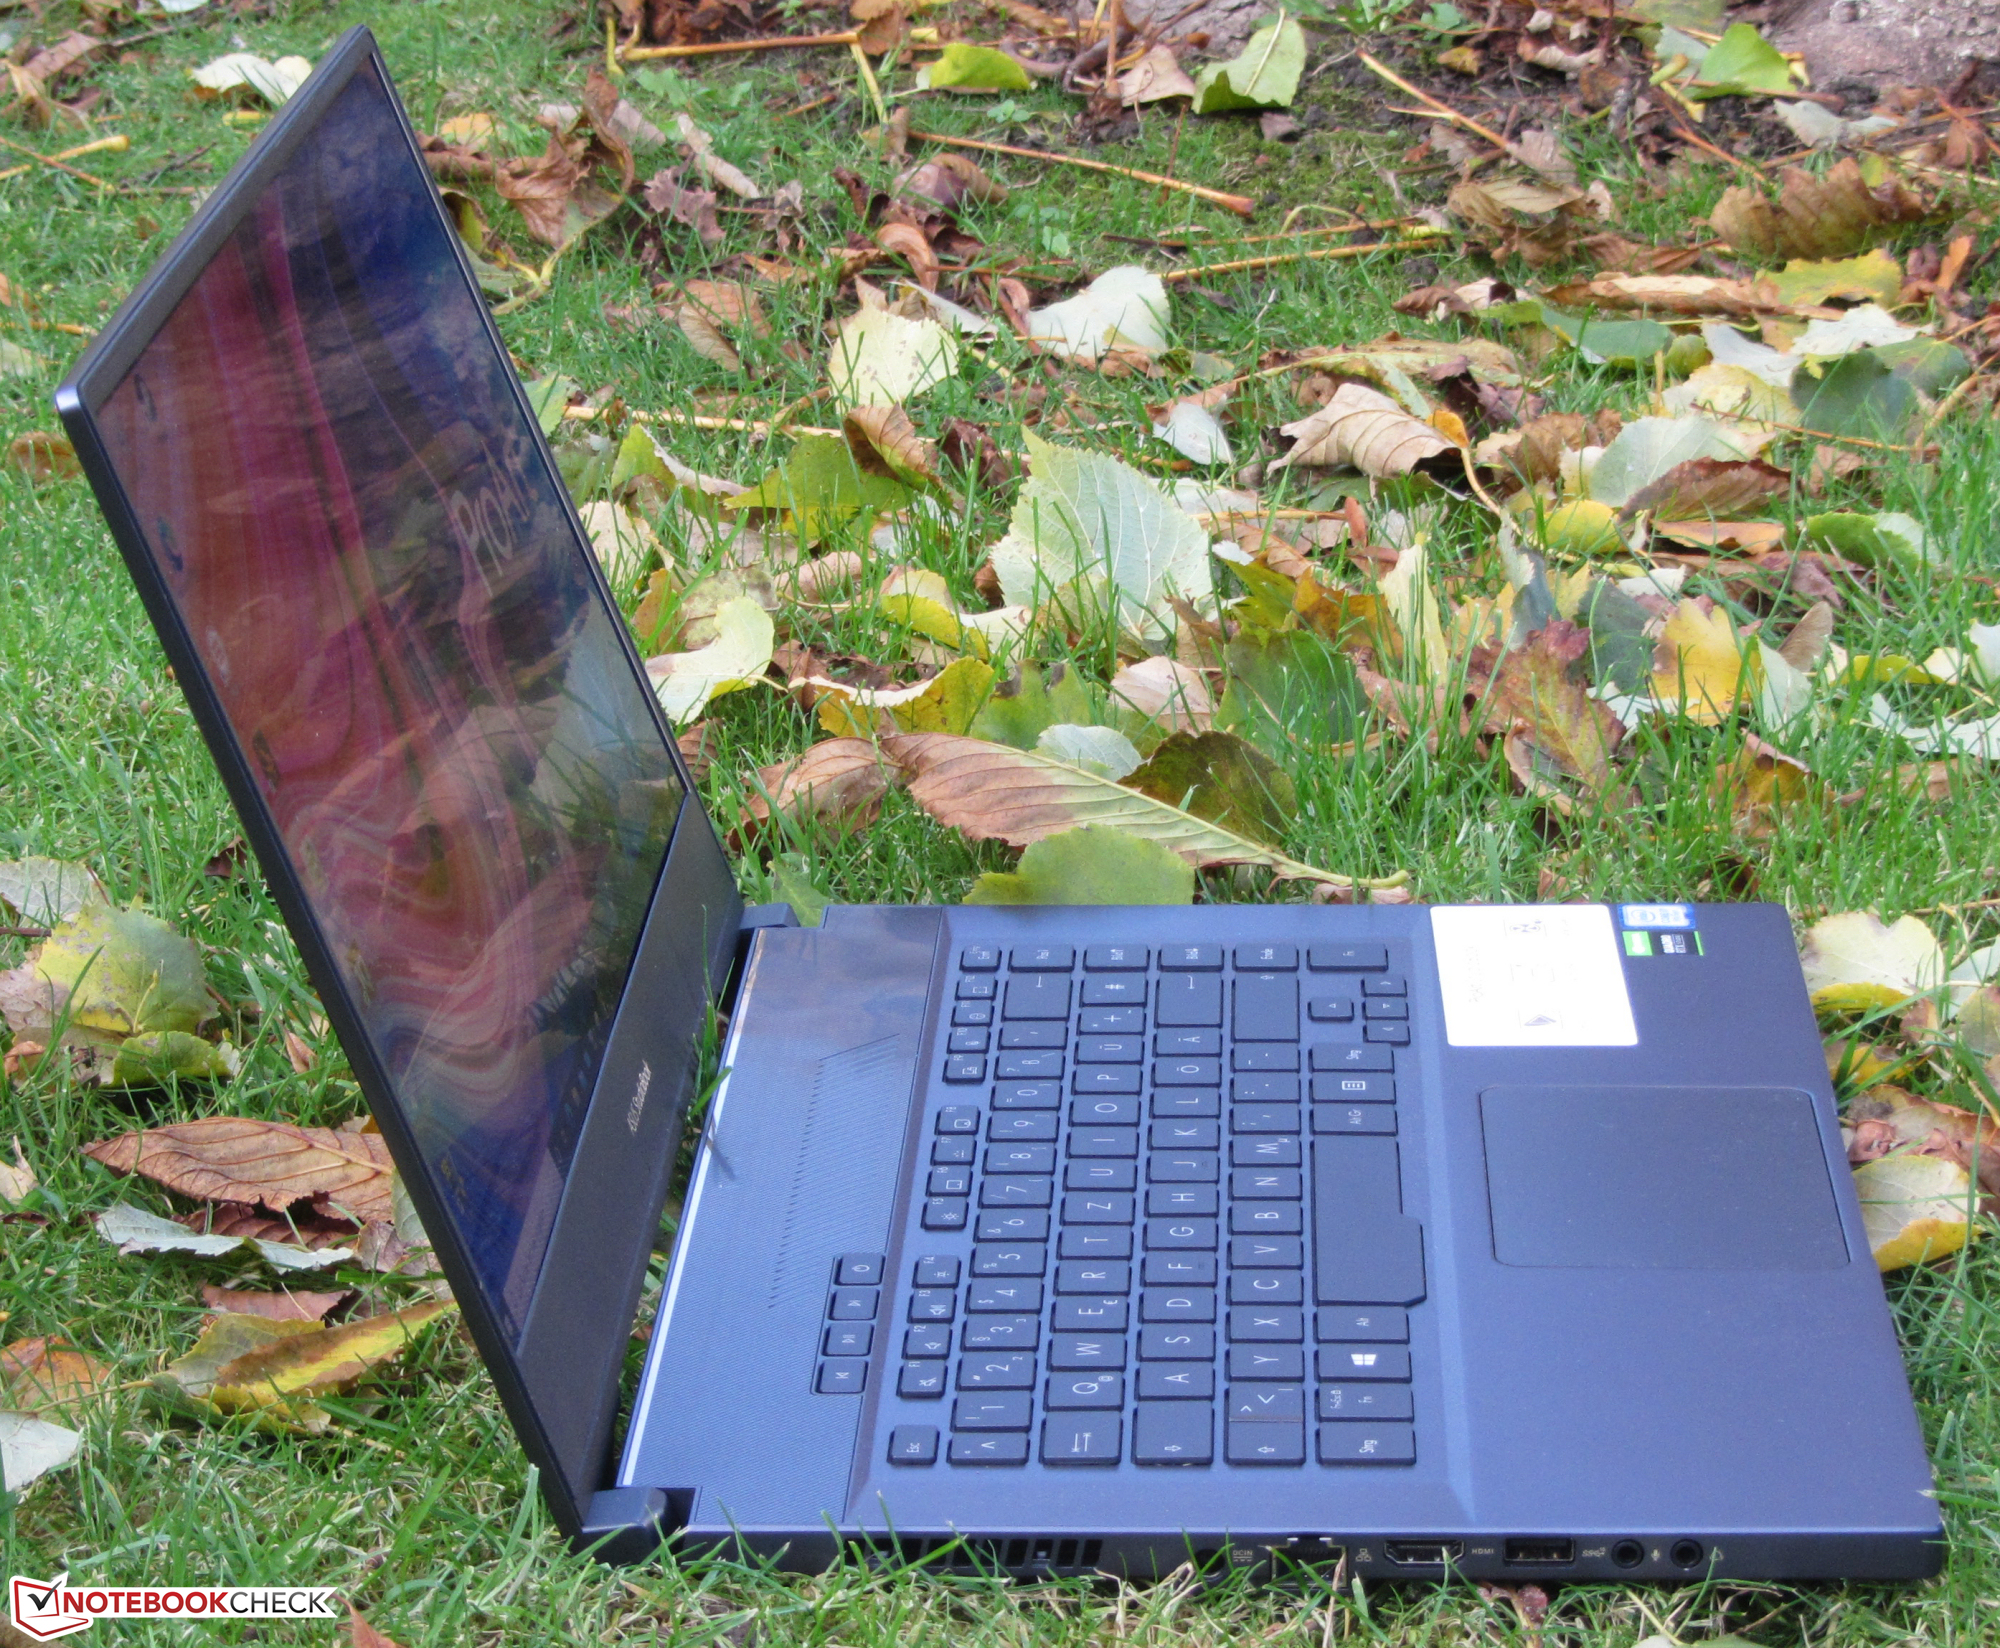
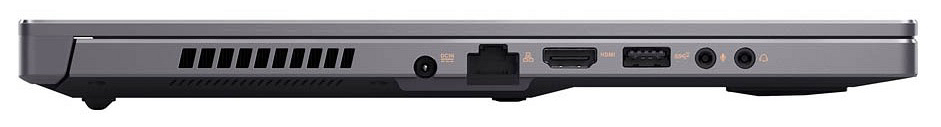
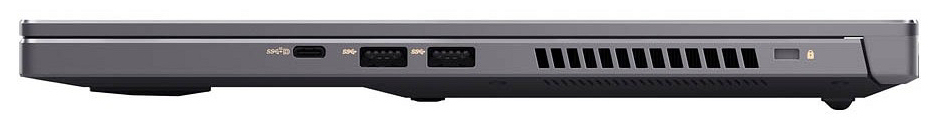
The workstation has three USB Type-A ports (2x USB 3.2 Gen 1, 1x USB 3.2 Gen 2) and one USB Type-C port (USB 3.2 Gen 2). The USB-C port can output a DisplayPort signal (with an adapter that is sold separately). Together with the HDMI port, our review device offers two video outputs. There is no SD card reader.
The StudioBook supports the following IEEE standards: 802.11a, b, g, n, ac and ax. It also comes with a Bluetooth 5.0 module. The data transfer speeds that we have measured under the optimal conditions (no other Wi-Fi-enabled devices in close proximity, a short distance between the notebook and the server PC; Router: Netgear Nighthawk AX12) are very good.
Anschlussausstattung
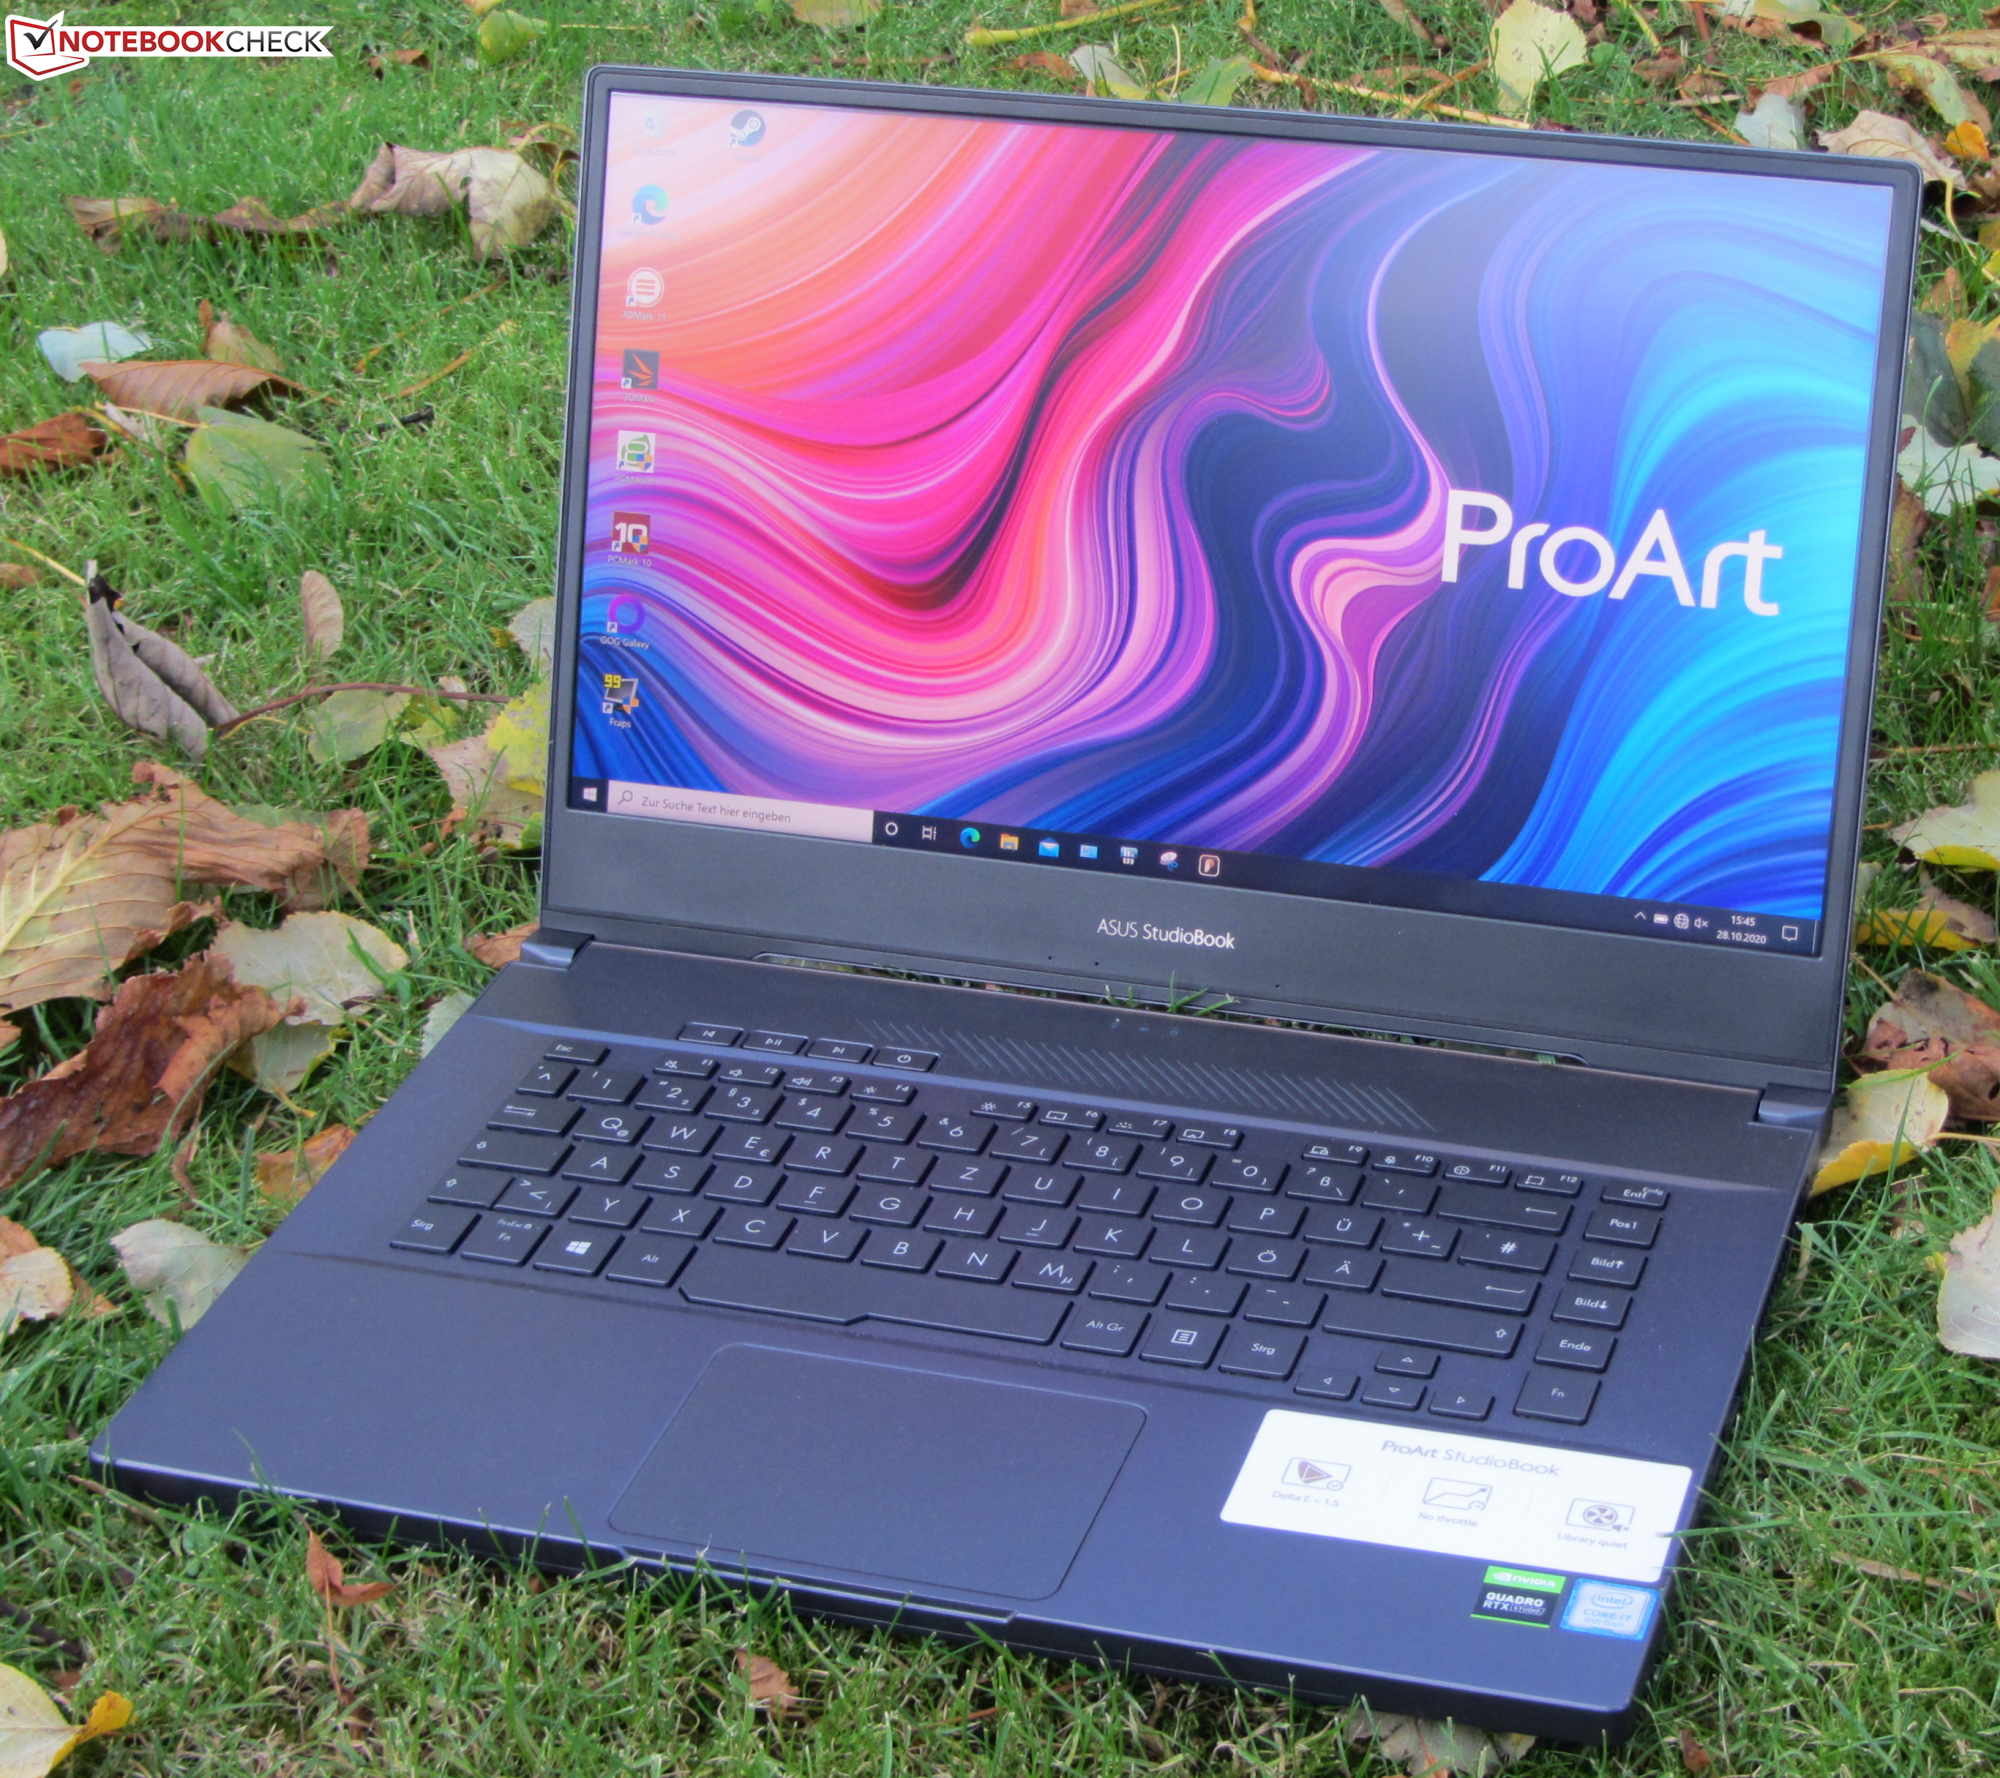
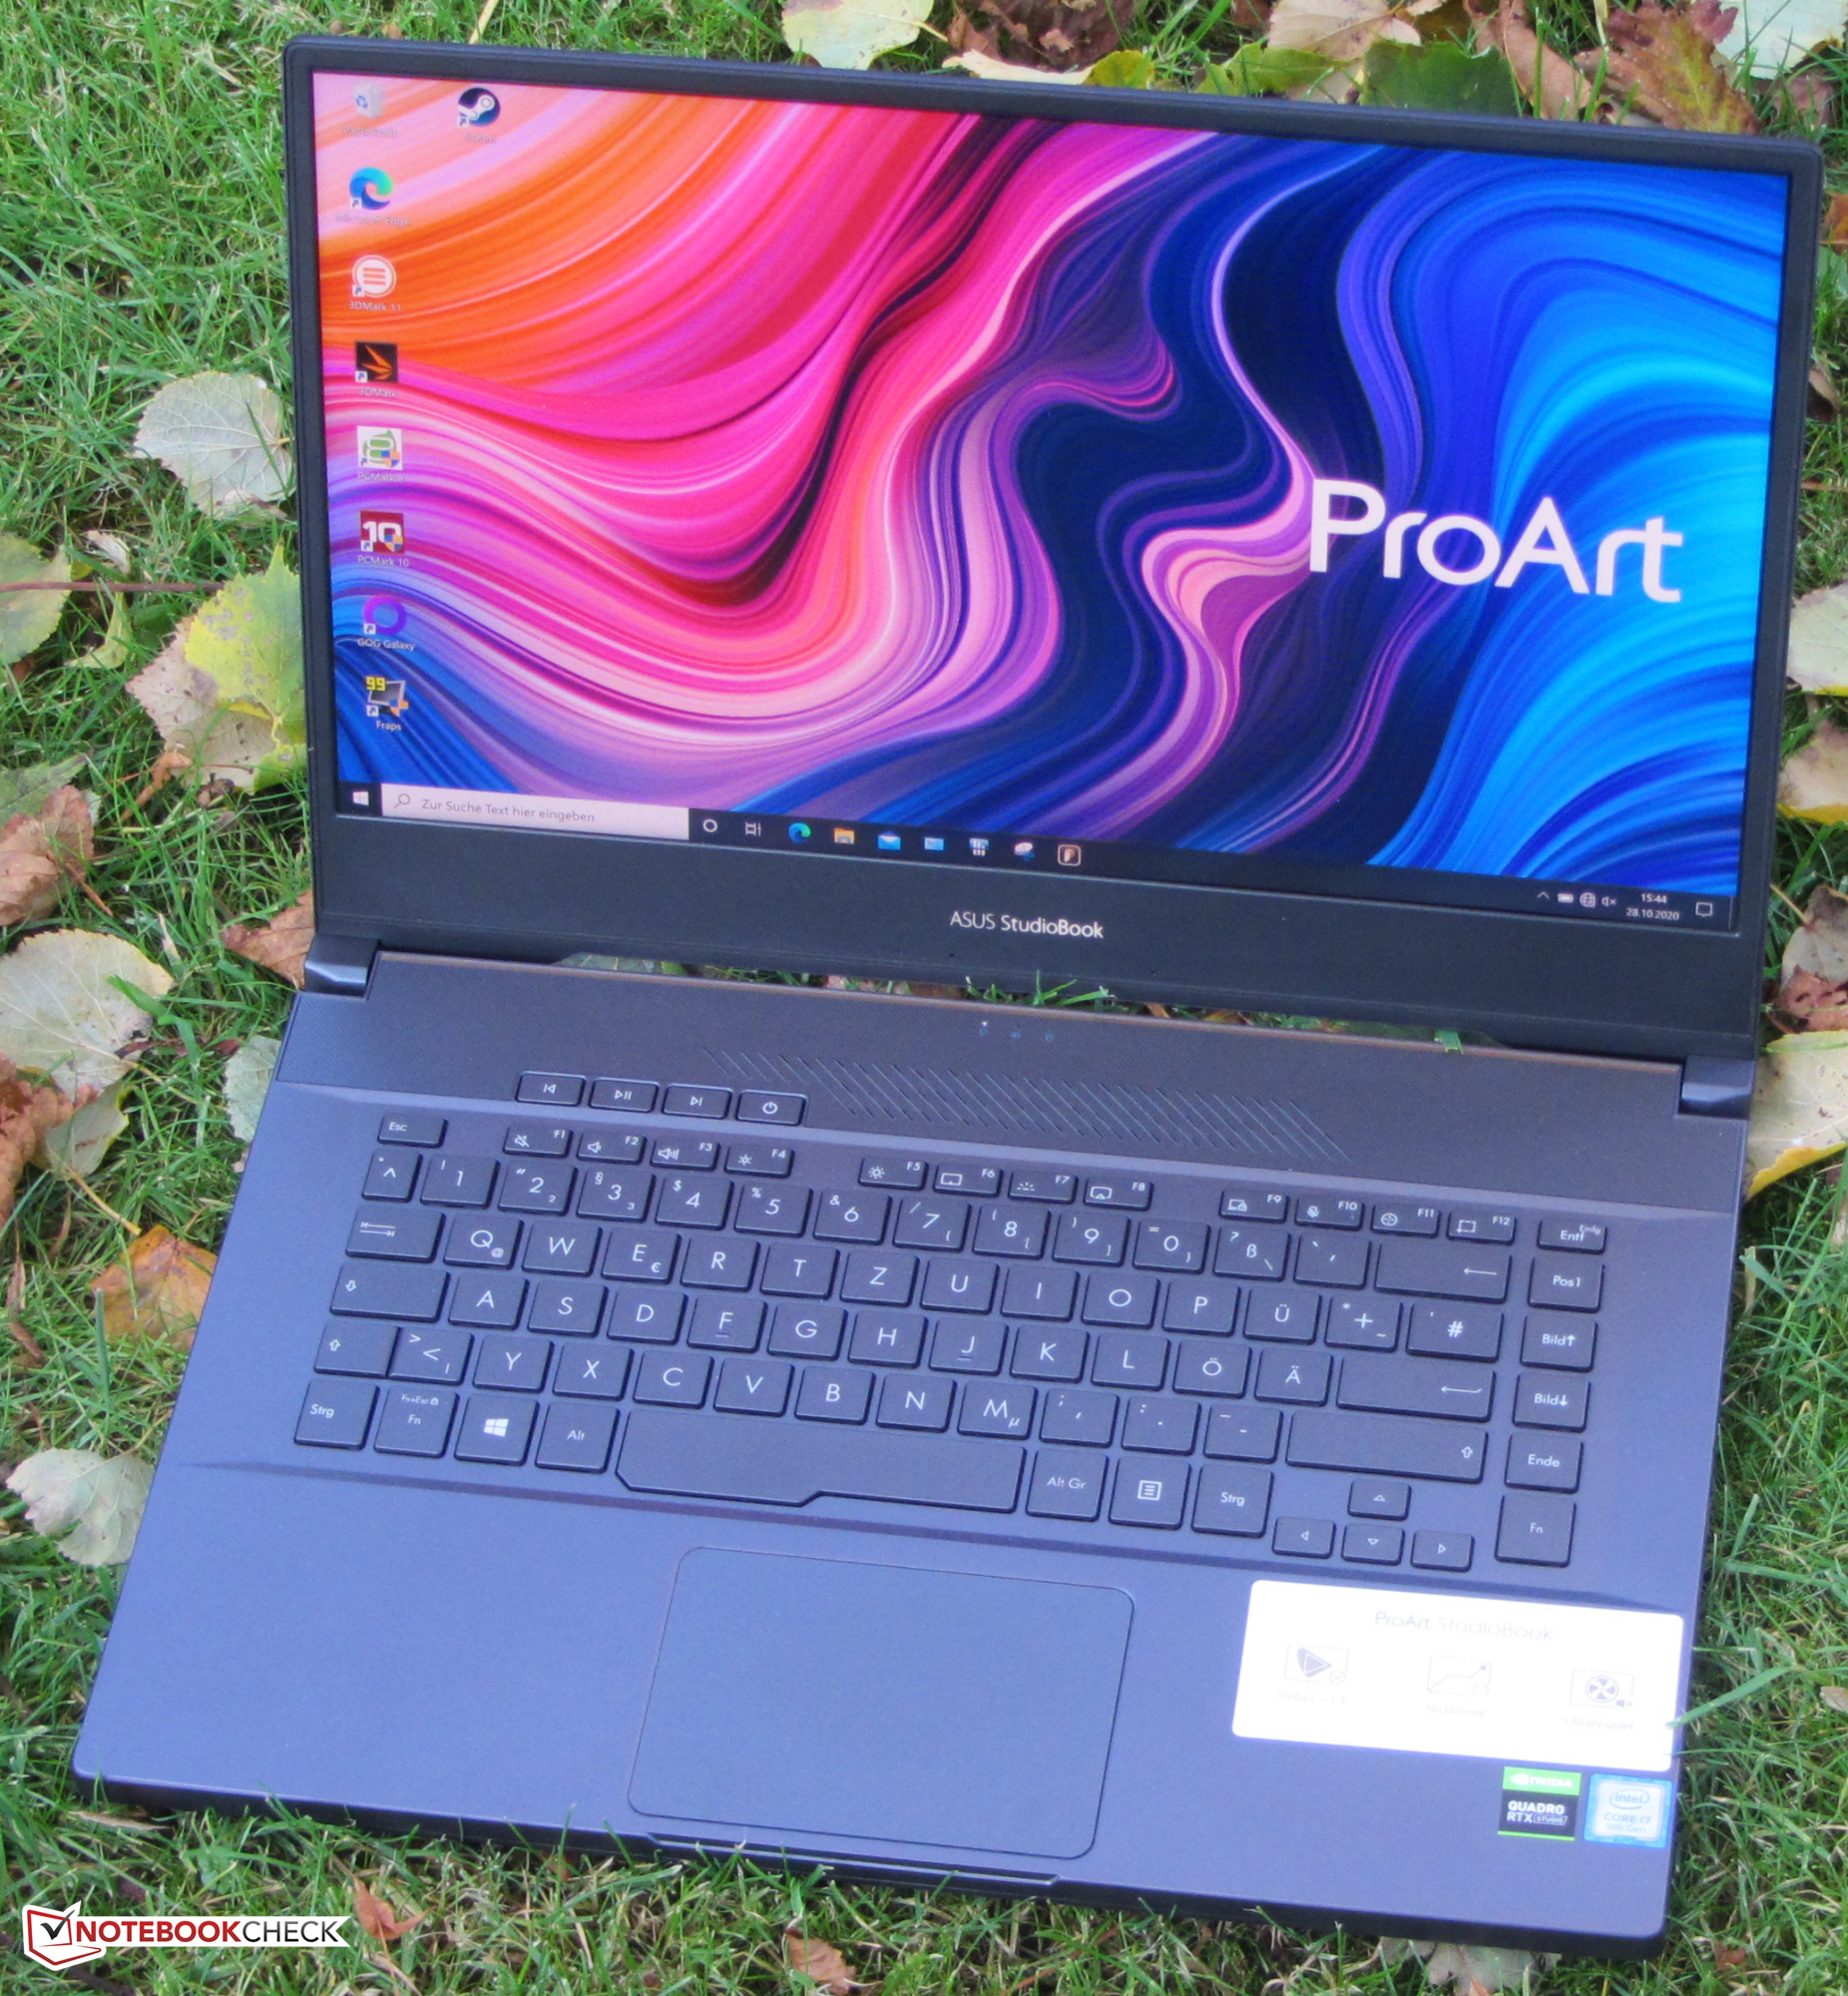
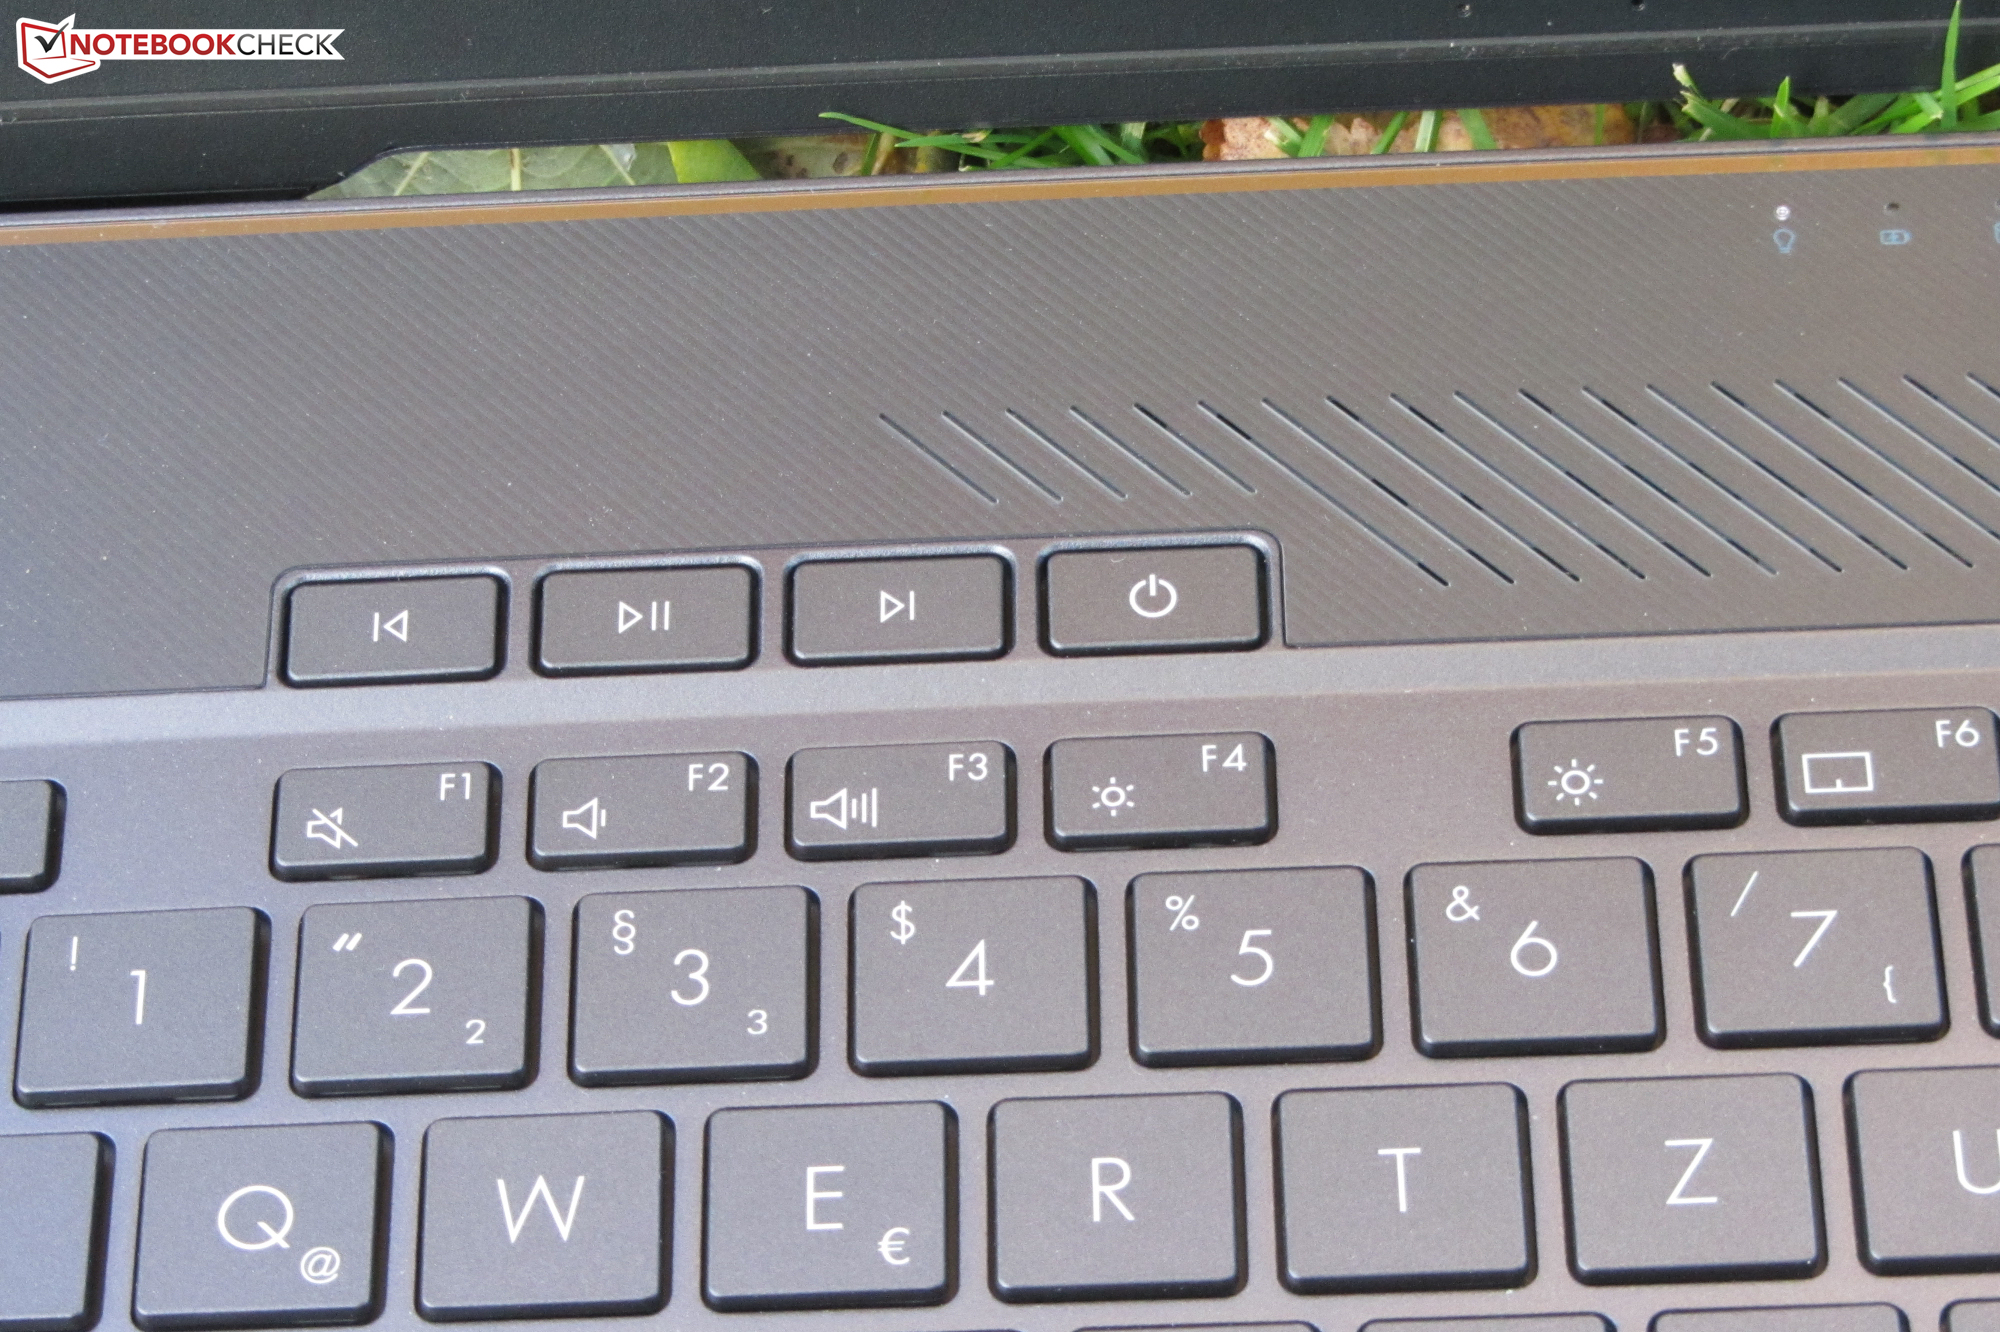
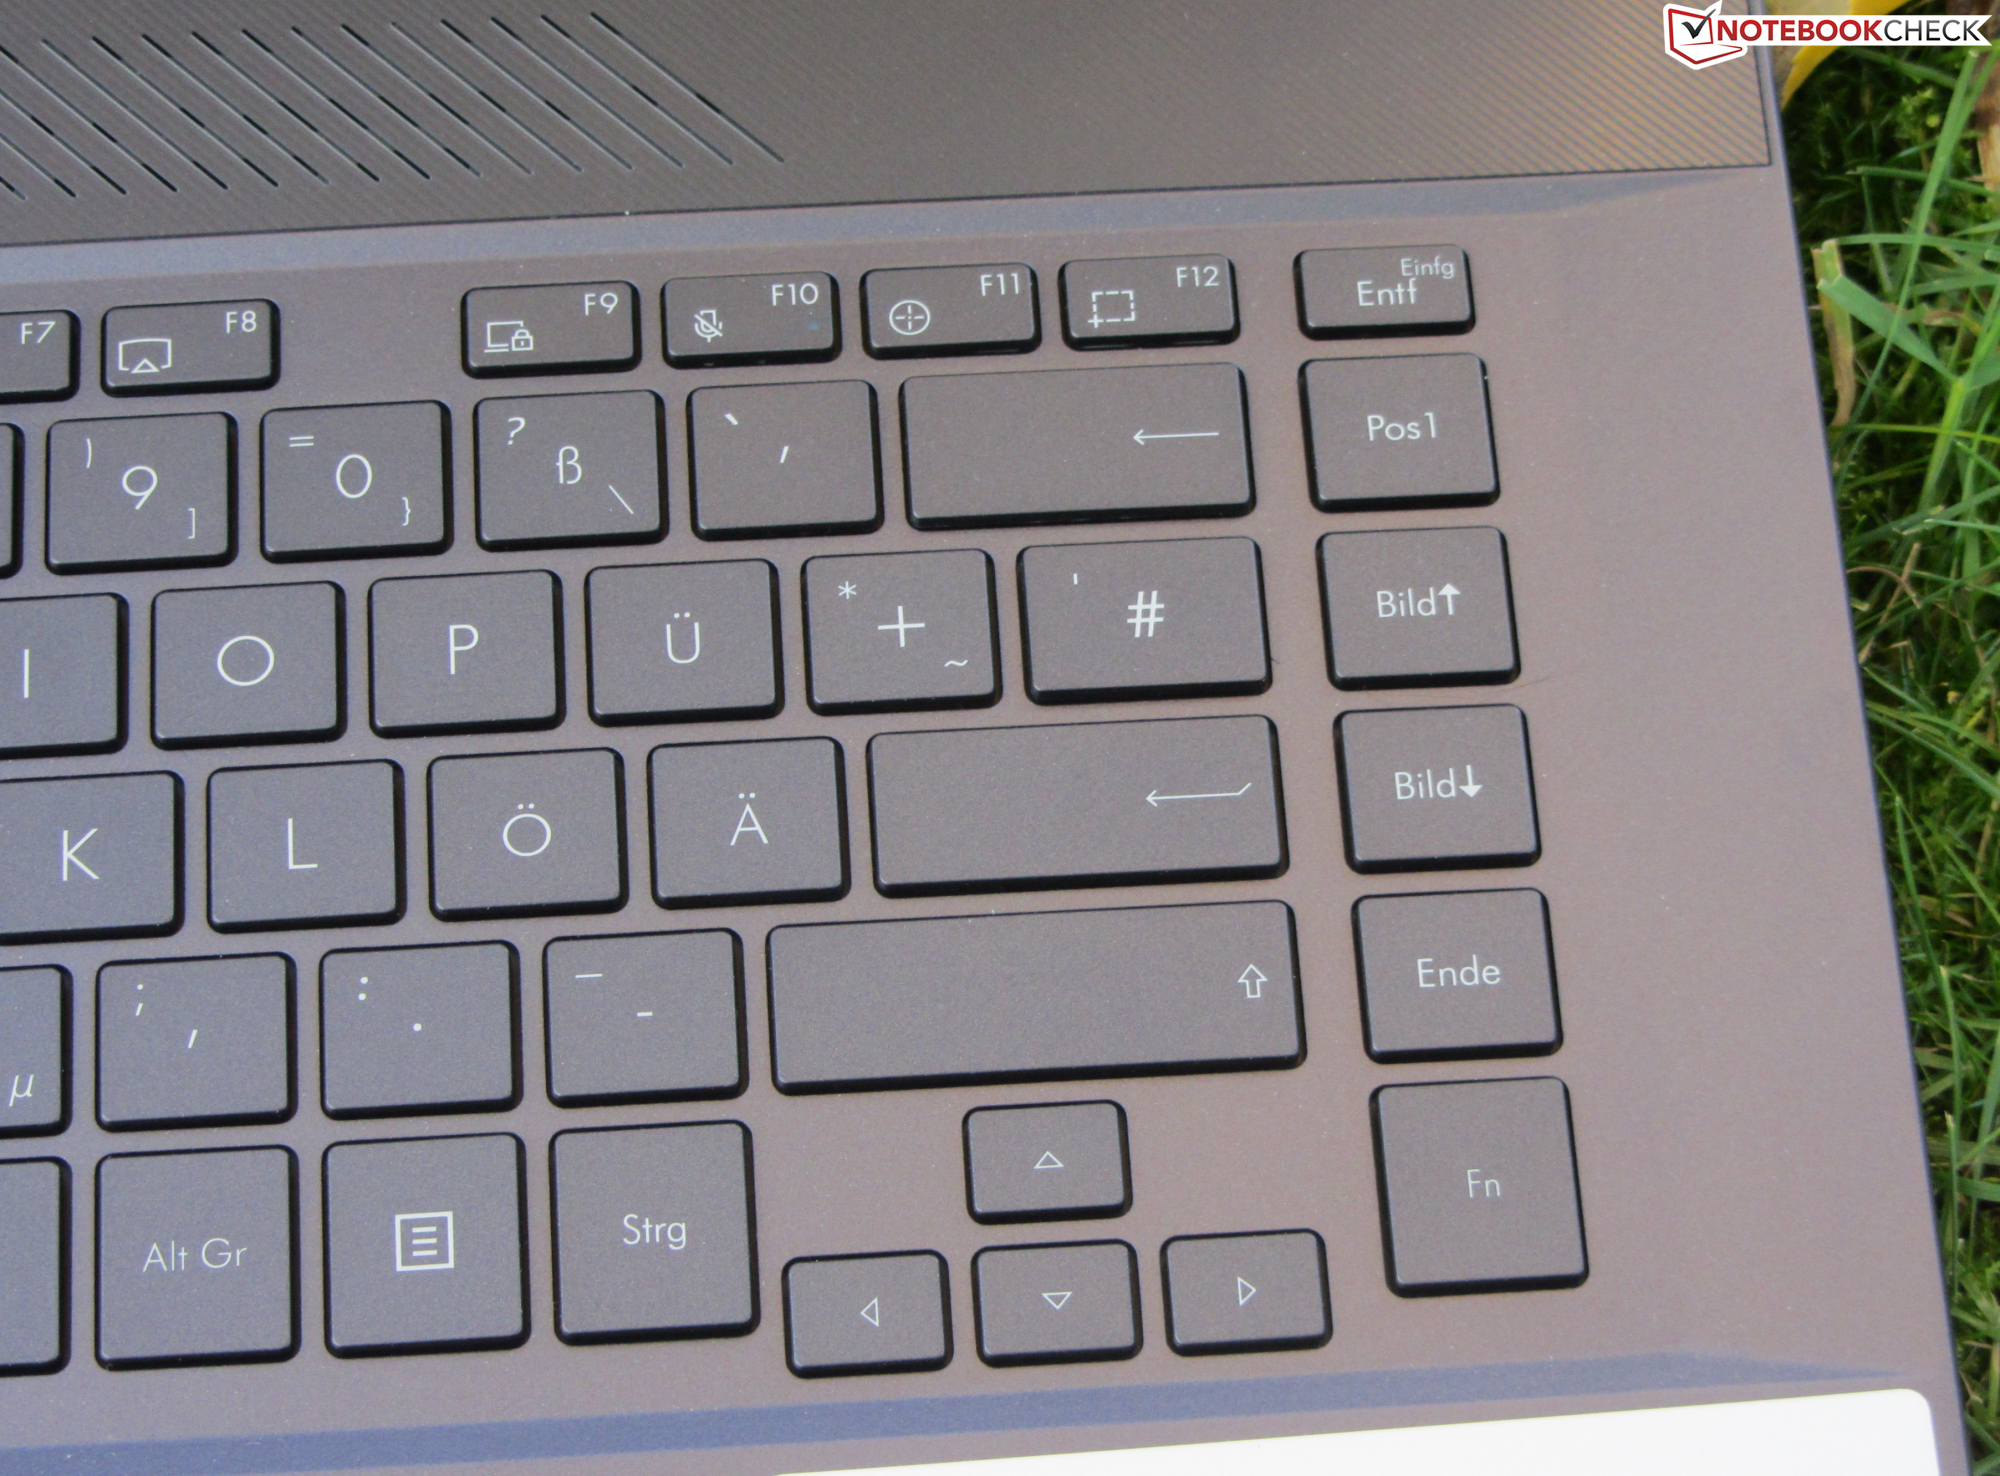
Input Devices - The StudioBook offers a keyboard backlight
The Asus StudioBook comes with a chiclet-style keyboard, which offers short travel distance. The keycaps have a smooth surface. When typing the keyboard deck exhibits some flex. All in all, the StudioBook has a good keyboard. The multitouch-enabled Clickpad (10.5x7.3 cm - 4.1x2.9 in) offers enough space for gestures. The smooth surface makes finger-gliding easy. The pad has a clear actuation point and short travel distance.
Display - 4K IPS panel

The 15.6-inch display of the StudioBook operates with a native resolution of 3840x2160 pixels. The screen offers a contrast ratio of 930:1. We view a contrast ratio above 1000:1 as good. The display brightness of 334.8 cd/m² is quite good. The response times of the 60-Hz panel could have been faster. Positive: The display does not suffer from PWM flickering.
| |||||||||||||||||||||||||
Brightness Distribution: 93 %
Center on Battery: 337 cd/m²
Contrast: 930:1 (Black: 0.37 cd/m²)
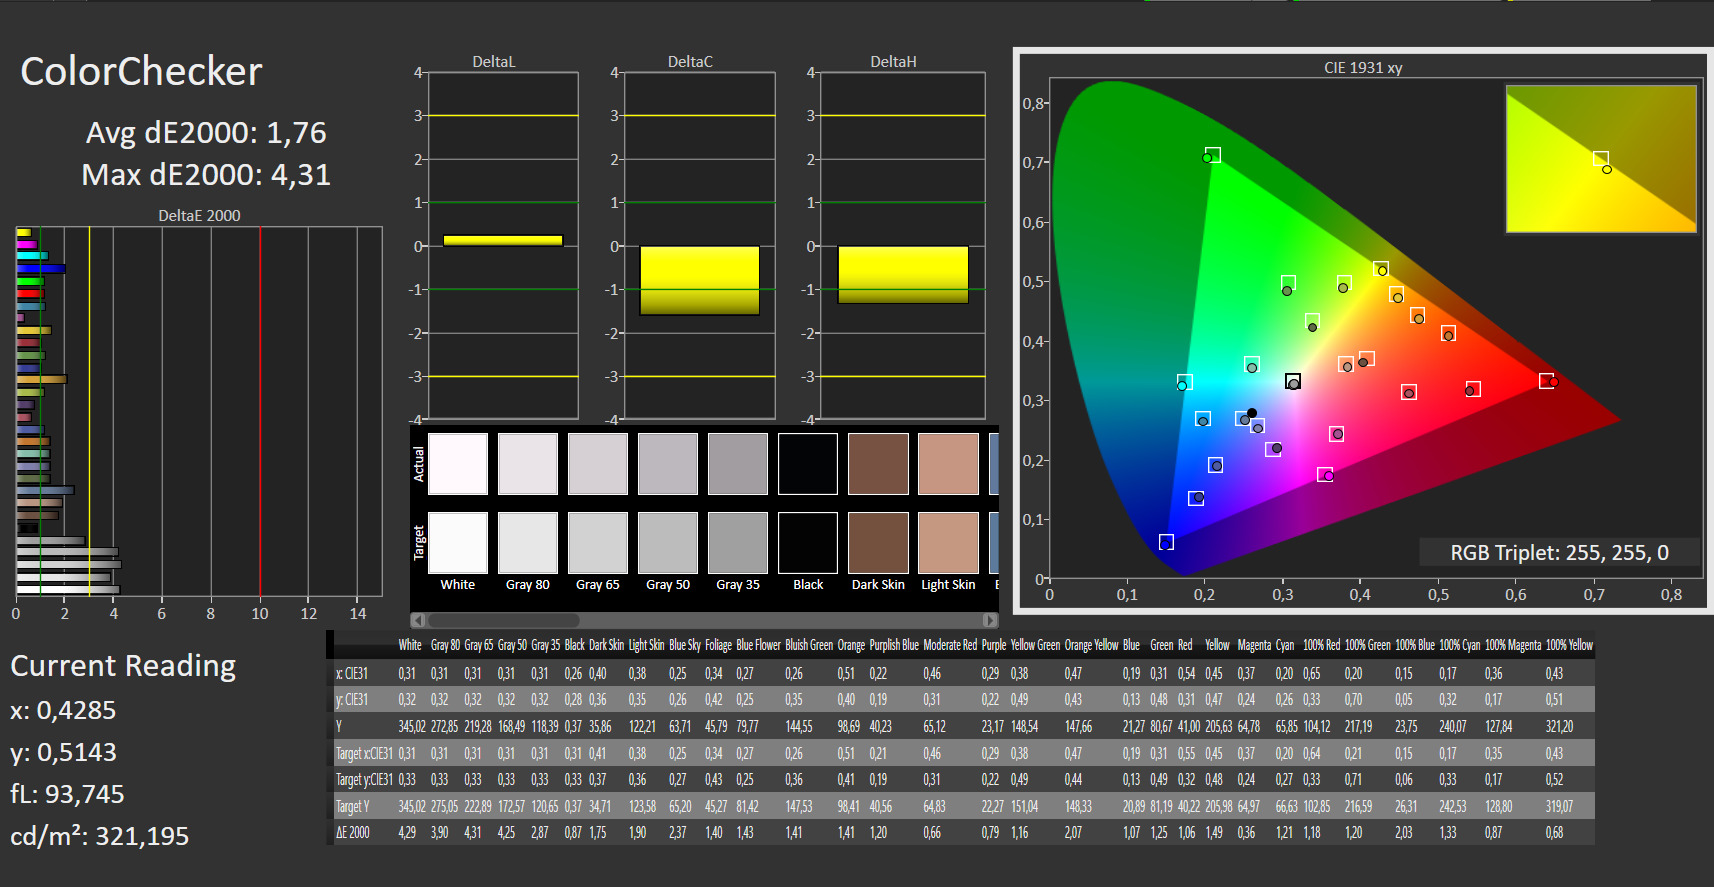
ΔE ColorChecker Calman: 1.76 | ∀{0.5-29.43 Ø4.74}
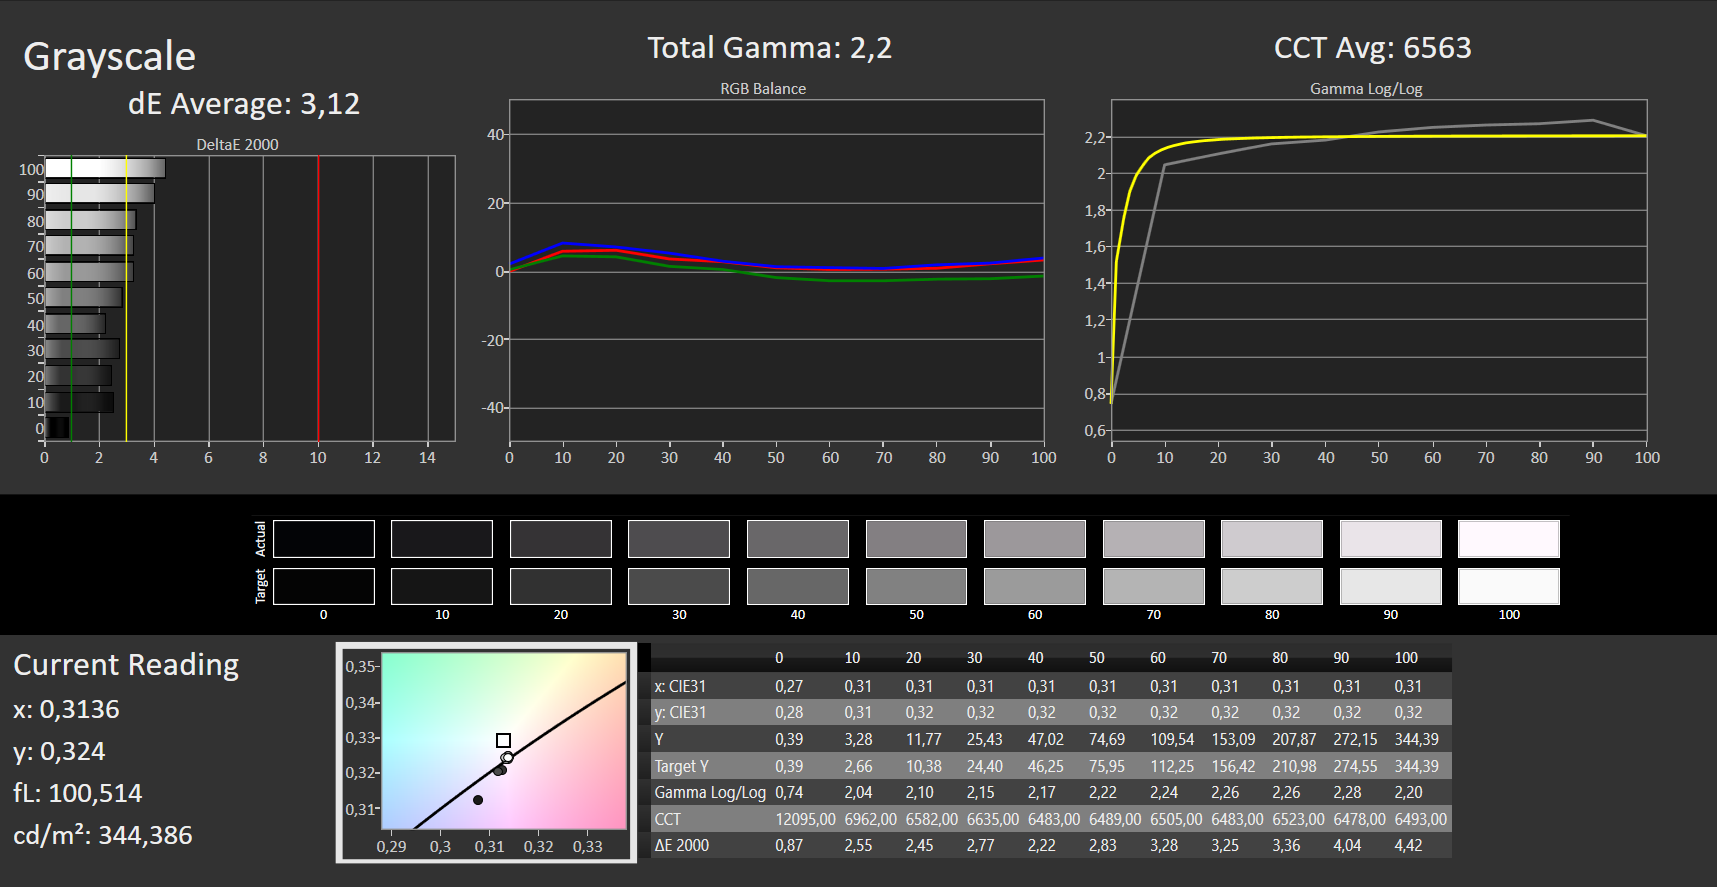
ΔE Greyscale Calman: 3.12 | ∀{0.09-98 Ø4.98}
98% sRGB (Argyll 1.6.3 3D)
85% AdobeRGB 1998 (Argyll 1.6.3 3D)
95% AdobeRGB 1998 (Argyll 3D)
97.6% sRGB (Argyll 3D)
82.1% Display P3 (Argyll 3D)
Gamma: 2.2
CCT: 6563 K
| Asus ProArt StudioBook Pro 15 W500G5T AU Optronics B156ZAN03.1, IPS, 3840x2160, 15.6" | MSI WS66 10TMT-207US AU Optronics B156HAB03.0, IPS, 1920x1080, 15.6" | Dell Precision 7550 AU Optronics B156ZAN, IPS, 3840x2160, 15.6" | Razer Blade 15 Studio Edition 2020 Samsung SDCA029, OLED, 3840x2160, 15.6" | |
|---|---|---|---|---|
| Display | -23% | 1% | 9% | |
| Display P3 Coverage (%) | 82.1 | 62.8 -24% | 82.1 0% | 99.9 22% |
| sRGB Coverage (%) | 97.6 | 86.9 -11% | 99.6 2% | 100 2% |
| AdobeRGB 1998 Coverage (%) | 95 | 63.6 -33% | 96.8 2% | 97.3 2% |
| Response Times | 21% | 8% | 91% | |
| Response Time Grey 50% / Grey 80% * (ms) | 58 ? | 44.8 ? 23% | 51.2 ? 12% | 4 ? 93% |
| Response Time Black / White * (ms) | 35 ? | 28.8 ? 18% | 34 ? 3% | 4 ? 89% |
| PWM Frequency (Hz) | ||||
| Screen | -25% | -33% | 192% | |
| Brightness middle (cd/m²) | 344 | 374.5 9% | 473.5 38% | 380 10% |
| Brightness (cd/m²) | 335 | 363 8% | 461 38% | 388 16% |
| Brightness Distribution (%) | 93 | 91 -2% | 90 -3% | 93 0% |
| Black Level * (cd/m²) | 0.37 | 0.42 -14% | 0.55 -49% | 0.018 95% |
| Contrast (:1) | 930 | 892 -4% | 861 -7% | 21111 2170% |
| Colorchecker dE 2000 * | 1.76 | 4.05 -130% | 4.8 -173% | 5.47 -211% |
| Colorchecker dE 2000 max. * | 4.31 | 8.17 -90% | 8.73 -103% | 8.19 -90% |
| Greyscale dE 2000 * | 3.12 | 2.6 17% | 5.6 -79% | 5.3 -70% |
| Gamma | 2.2 100% | 2.21 100% | 2.34 94% | 2.15 102% |
| CCT | 6563 99% | 7027 93% | 7549 86% | 6128 106% |
| Color Space (Percent of AdobeRGB 1998) (%) | 85 | 56.4 -34% | 86.4 2% | 86 1% |
| Color Space (Percent of sRGB) (%) | 98 | 86.3 -12% | 99.7 2% | 100 2% |
| Colorchecker dE 2000 calibrated * | 4.36 | 3.08 | 3.04 | |
| Total Average (Program / Settings) | -9% /
-19% | -8% /
-21% | 97% /
142% |
* ... smaller is better
Display Response Times
| ↔ Response Time Black to White | ||
|---|---|---|
| 35 ms ... rise ↗ and fall ↘ combined | ↗ 20 ms rise | 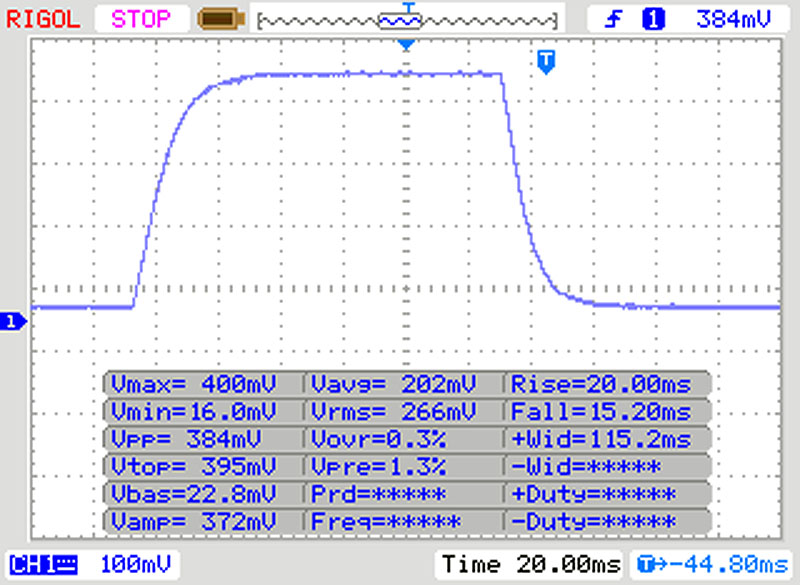 |
| ↘ 15 ms fall | ||
| The screen shows slow response rates in our tests and will be unsatisfactory for gamers. In comparison, all tested devices range from 0.1 (minimum) to 240 (maximum) ms. » 92 % of all devices are better. This means that the measured response time is worse than the average of all tested devices (19.9 ms). | ||
| ↔ Response Time 50% Grey to 80% Grey | ||
| 58 ms ... rise ↗ and fall ↘ combined | ↗ 27 ms rise | 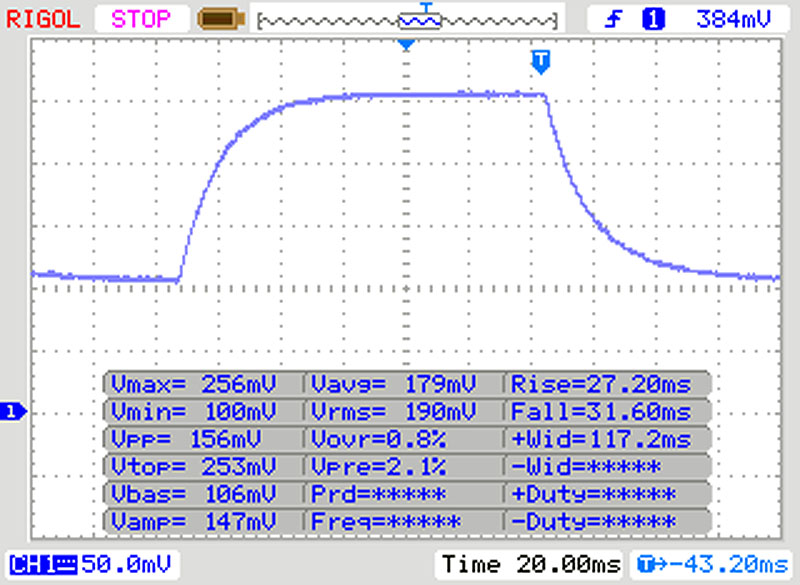 |
| ↘ 31 ms fall | ||
| The screen shows slow response rates in our tests and will be unsatisfactory for gamers. In comparison, all tested devices range from 0.165 (minimum) to 636 (maximum) ms. » 94 % of all devices are better. This means that the measured response time is worse than the average of all tested devices (31.2 ms). | ||
Screen Flickering / PWM (Pulse-Width Modulation)
| Screen flickering / PWM not detected | 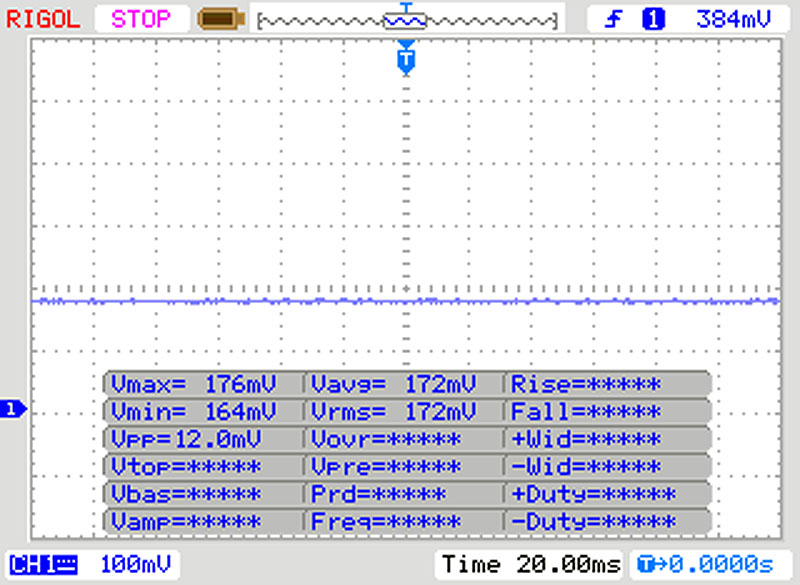 | ||
In comparison: 52 % of all tested devices do not use PWM to dim the display. If PWM was detected, an average of 7867 (minimum: 5 - maximum: 343500) Hz was measured. | |||
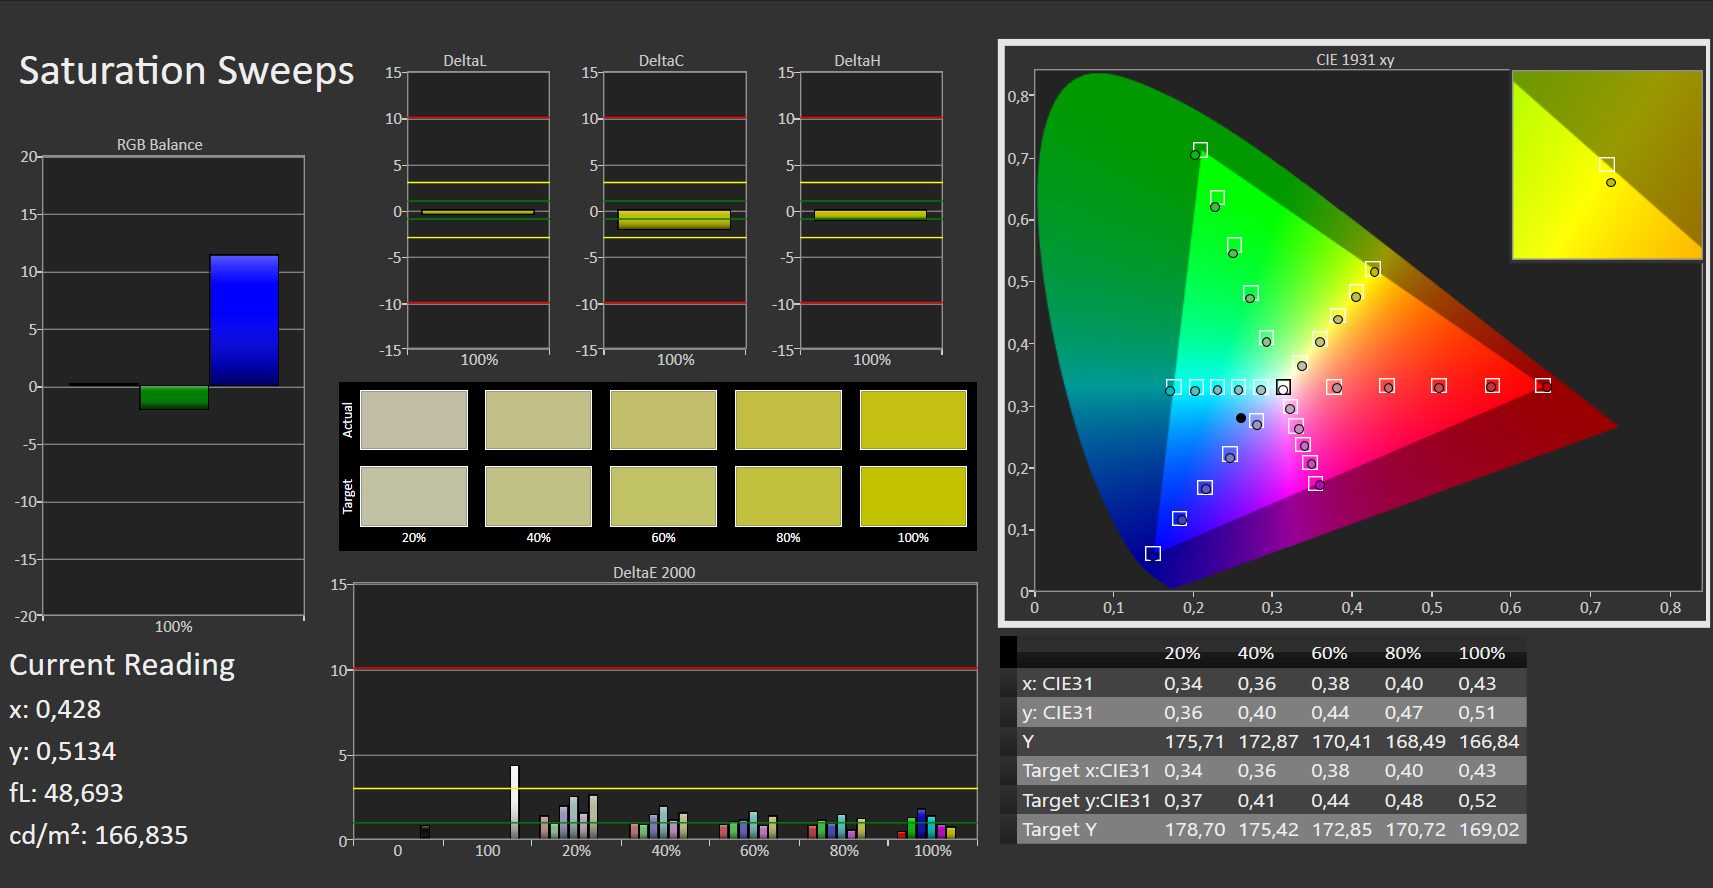
Right out of the box, the Pantone-certified display offers a very good color reproduction. The DeltaE 2000 colour deviation amounts to 1.8 (DeltaE less than 3 is the ideal value). The display does not suffer from a bluish cast. The screen does very well when it comes to colour space coverage. The panel covers 98% of sRGB and 85% of AdobeRGB.
The IPS panel of the W500G5T offers very stable viewing angles. This is why the screen content can be read from any position. Outside, the device can only be used when the sun does not shine too brightly.
Performance - Powerful enough for all applications
The Asus ProArt StudioBook Pro 15 W500G5T is a slim, compact workstation with a 15.6-inch screen. It can handle all current applications. Our review device retails for about 5000 Euros (~$5908) and represents the most expensive configuration.
System Settings
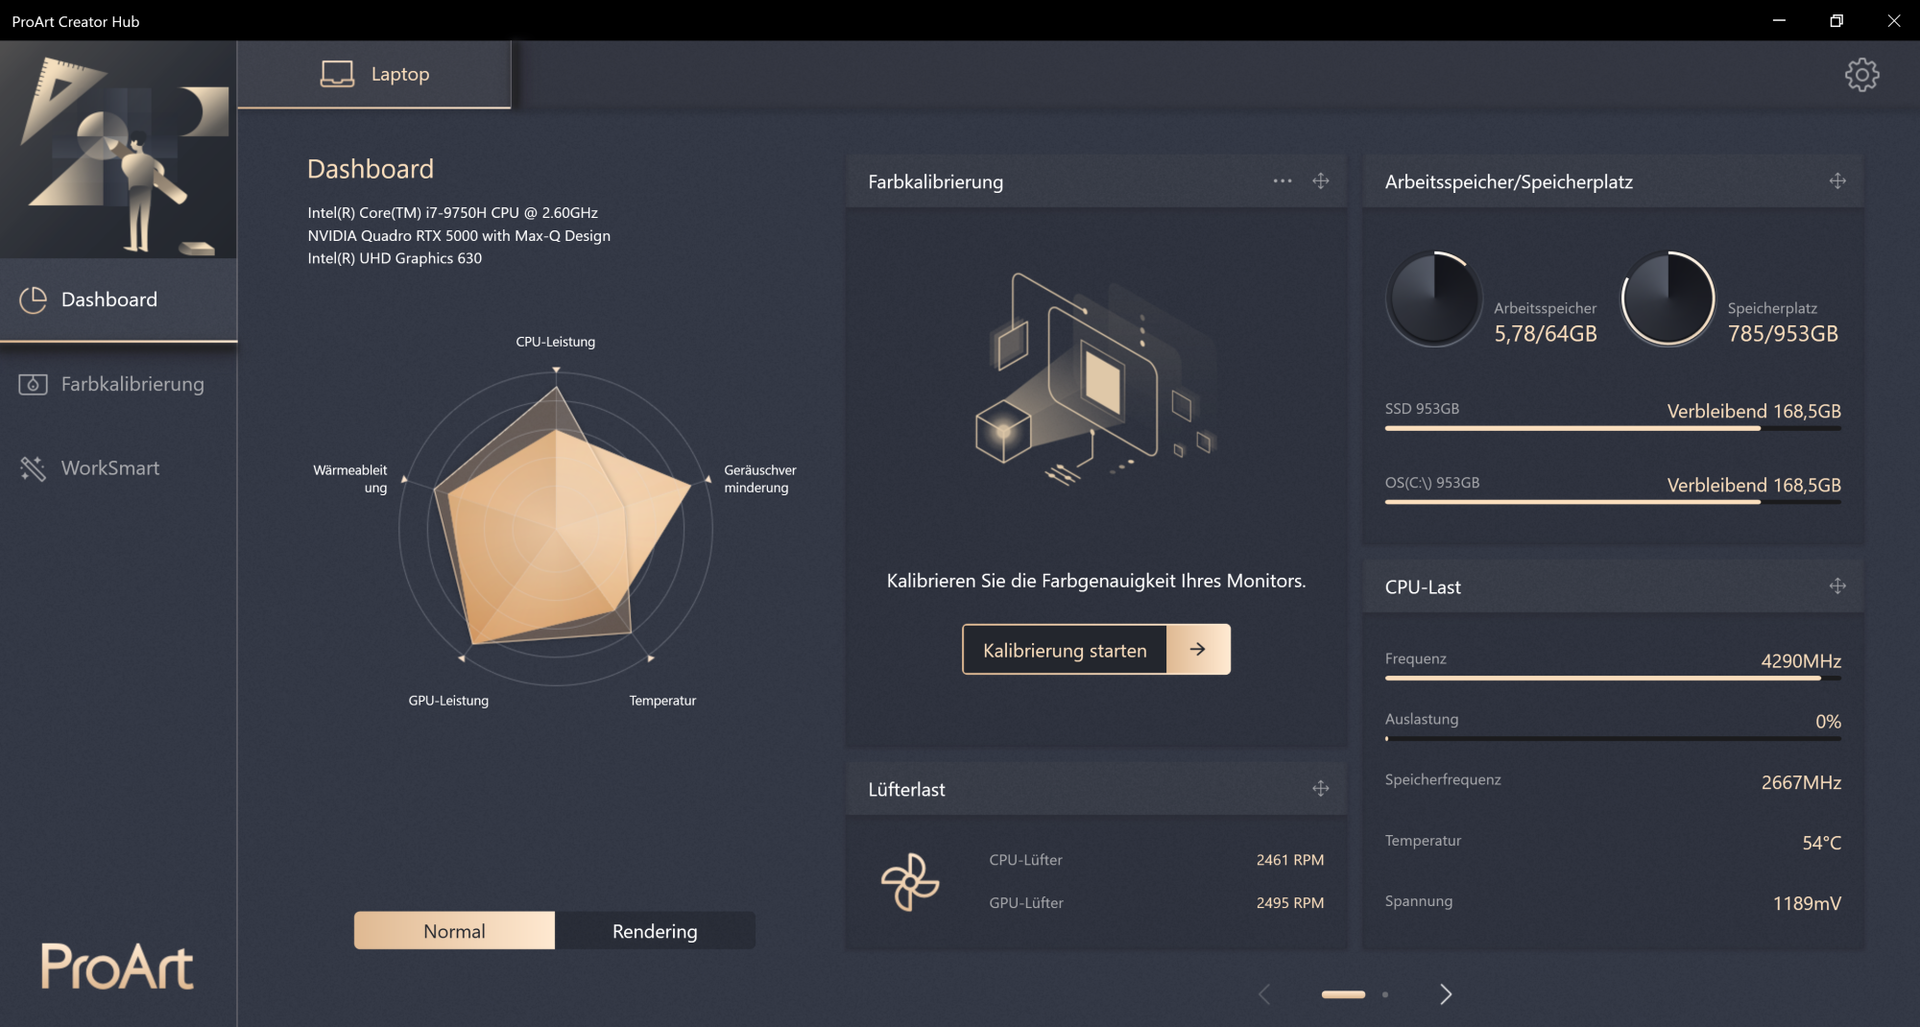
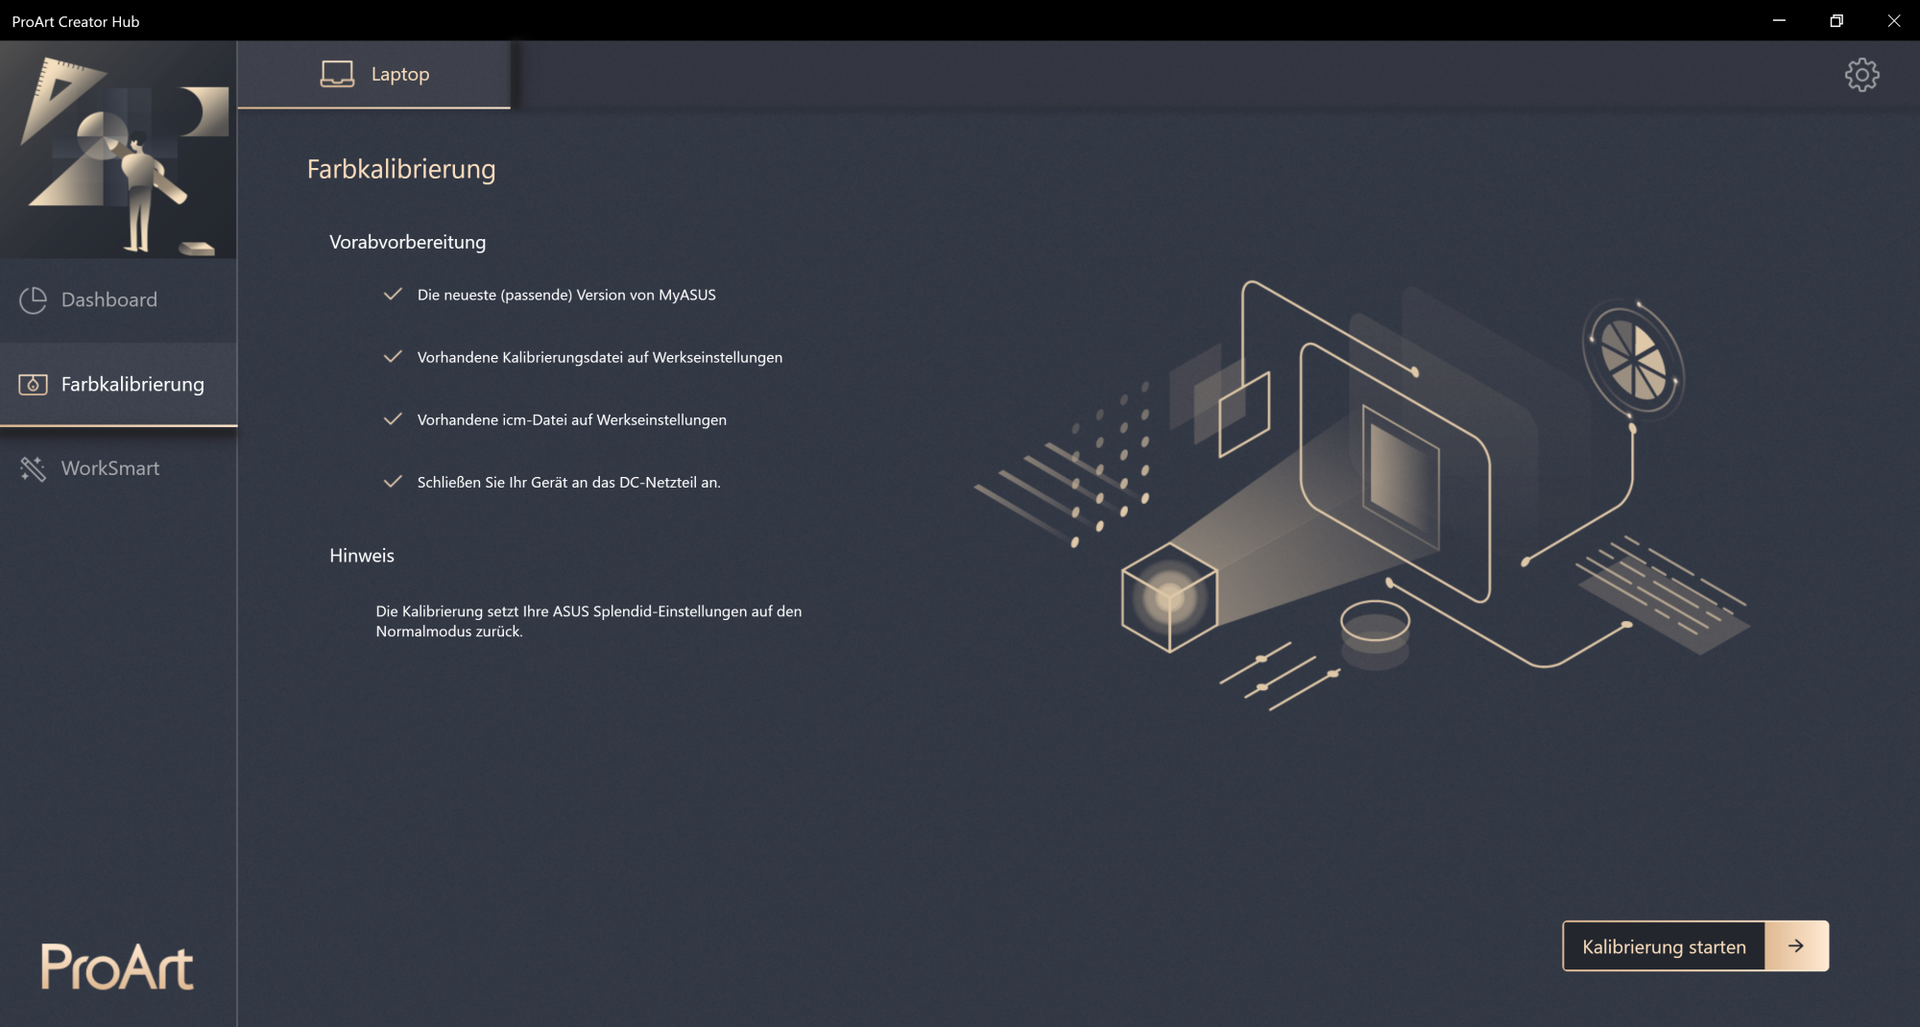
The ProArt Creator Hub
utility offers two power plans. We have conducted most of our benchmarks using the Normal
power plan. However, we have run some benchmarks with the Rendering
power plan as well. Users can switch between the two power plans by pressing F11
or in ProArt Creator Hub
. However, it is not preinstalled, but it can be easily downloaded from the Microsoft Store.
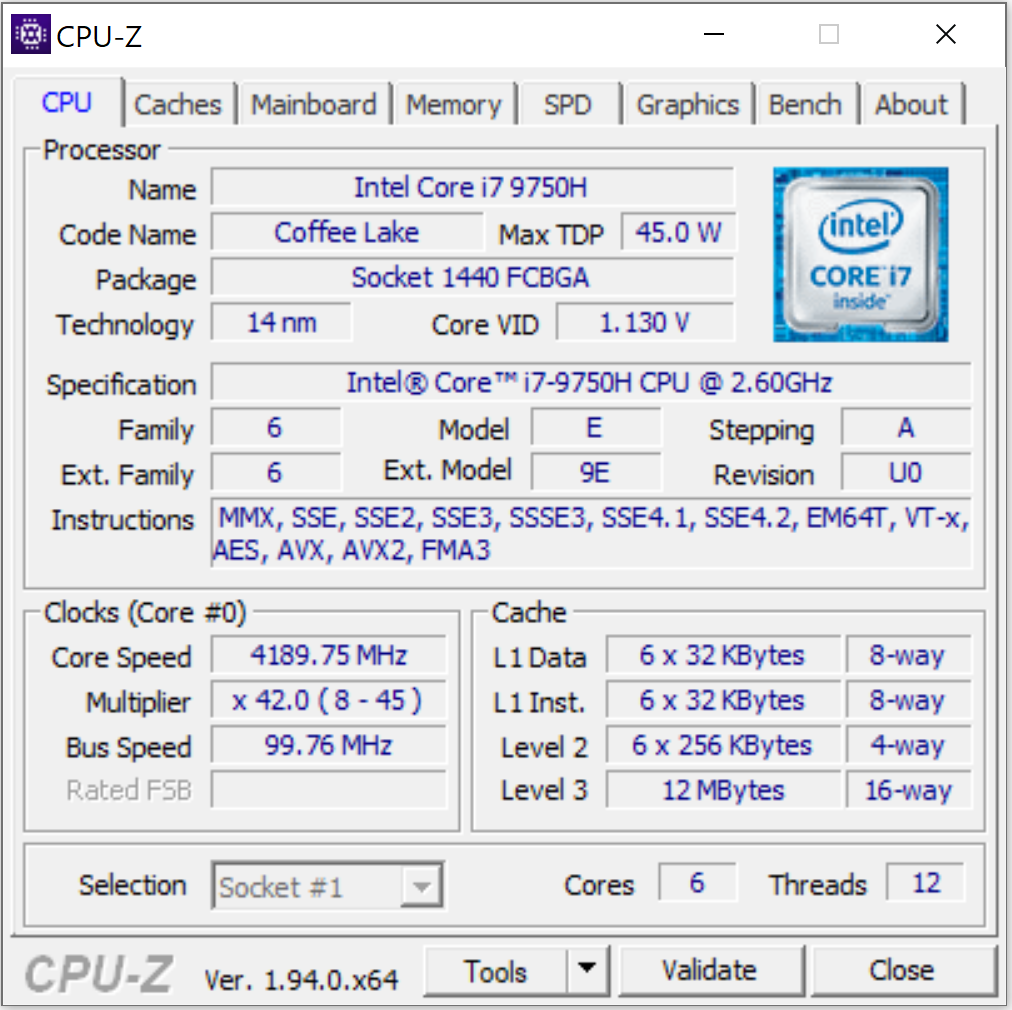
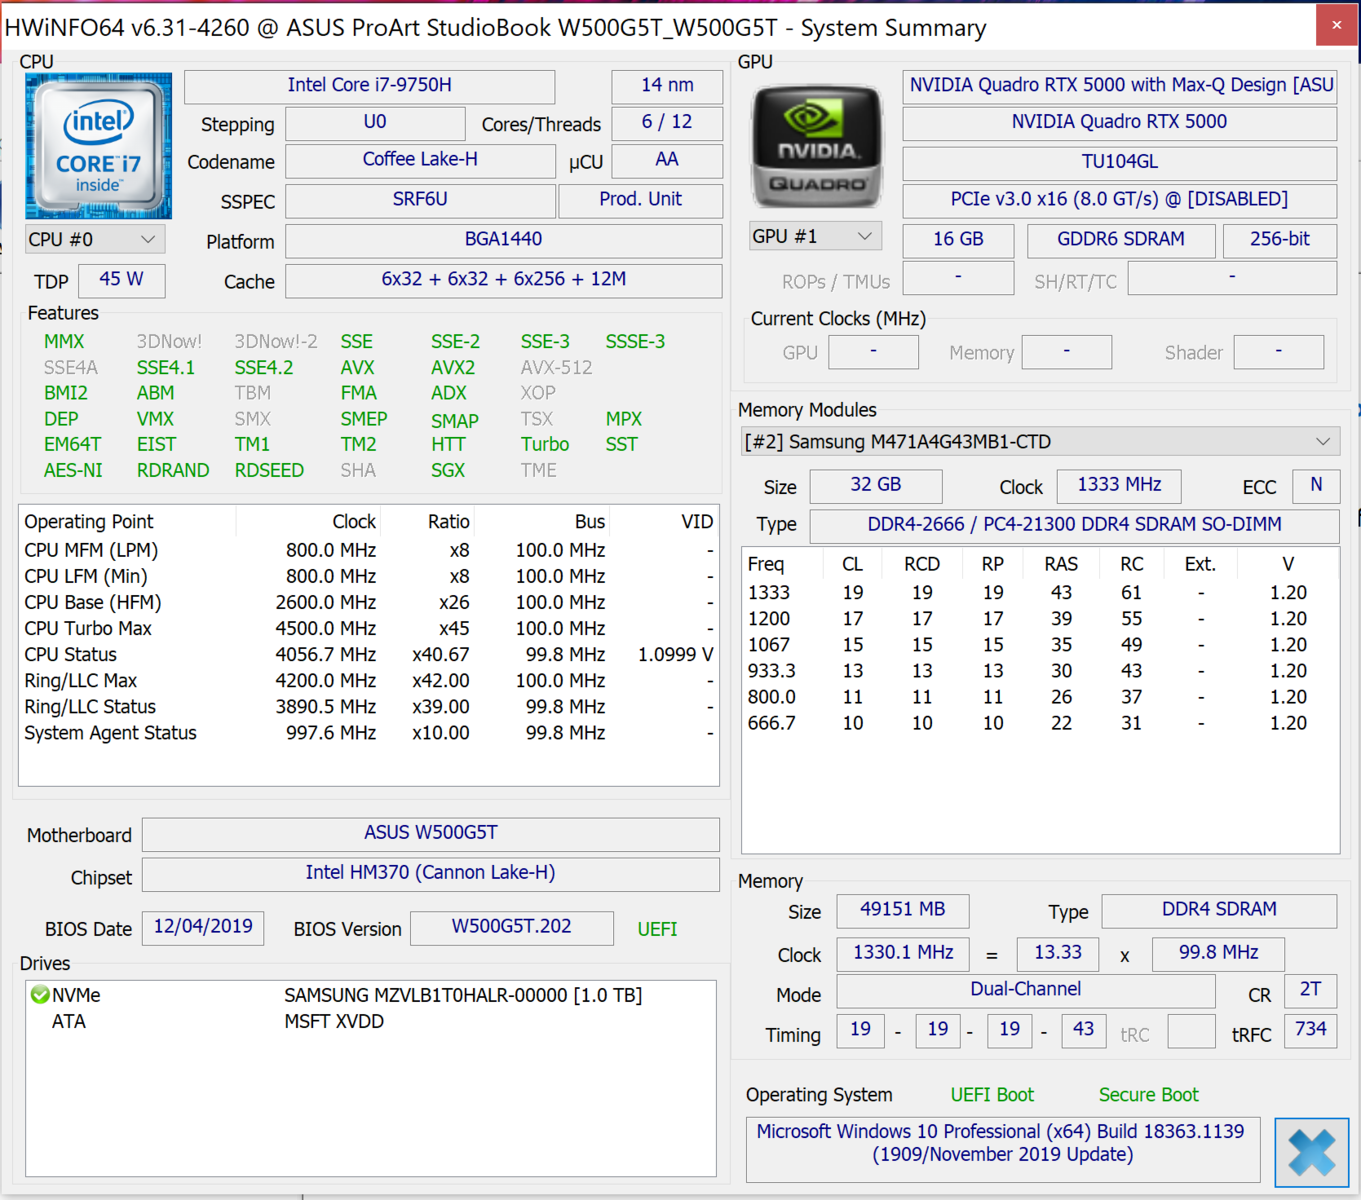
Processor
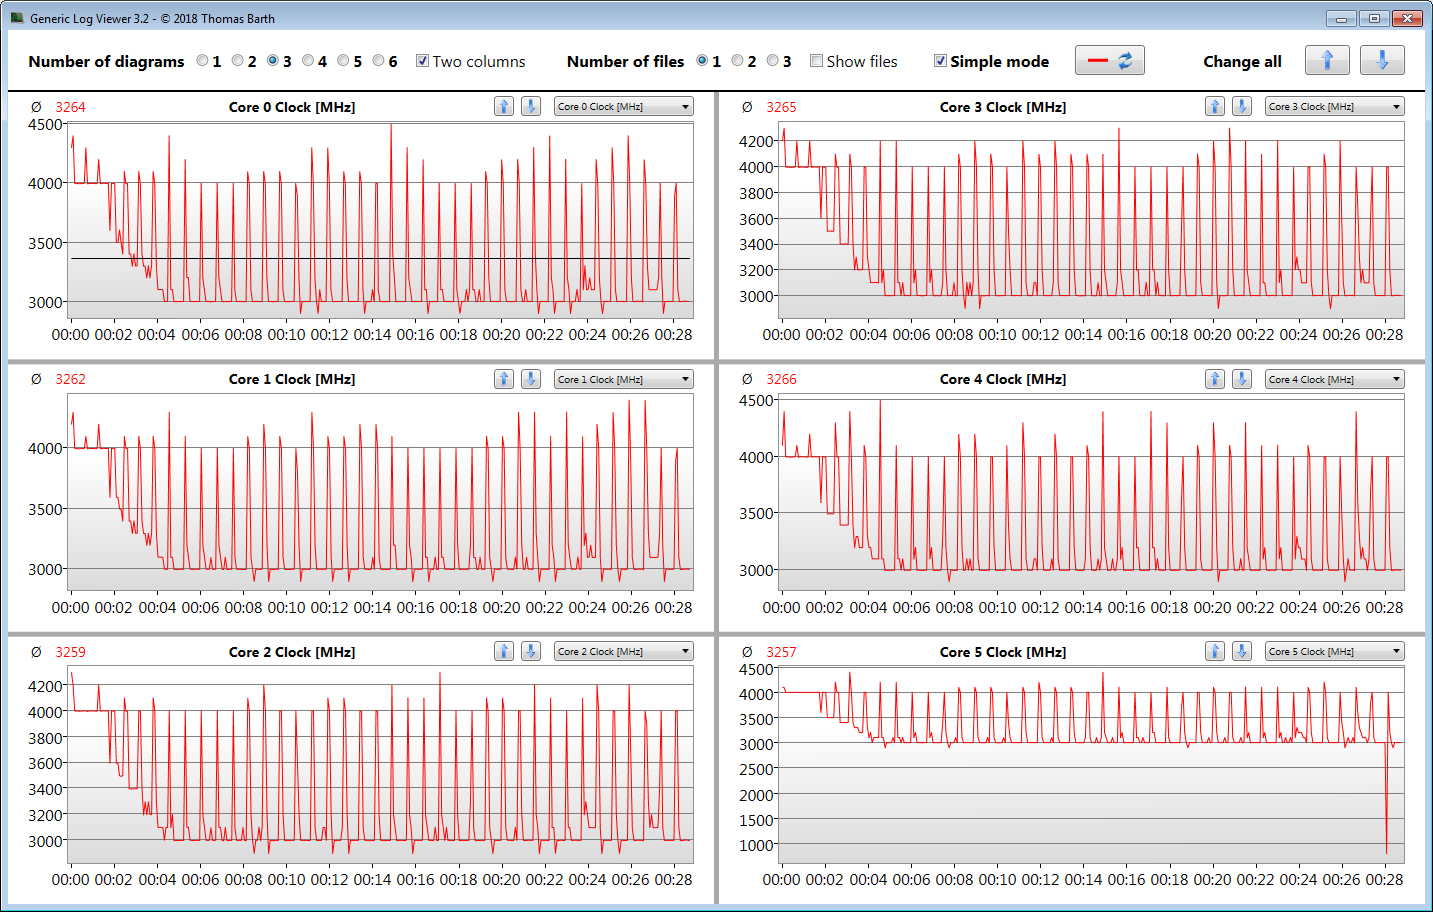
The StudioBook comes with the Core i7-9750H, which is a hexa-core CPU based on the Coffee Lake Refresh architecture. The processor has a base clock rate of 2.6 GHz. Thanks to Intel’s Turbo Boost technology, the clock rate can be boosted up to 4 GHz for all six cores and up to 4.5 GHz for a single core. The Intel chip supports Hyper-threading, which means that each core can process two threads at the same time.
In the multi-core section of the Cinebench R15 benchmark, the CPU runs at 4 GHz when plugged in. When running on battery power, the CPU frequency fluctuates between 800 MHz and 4 GHz. The clock rates fluctuate between 4 and 4.5 GHz in the single-core benchmark.
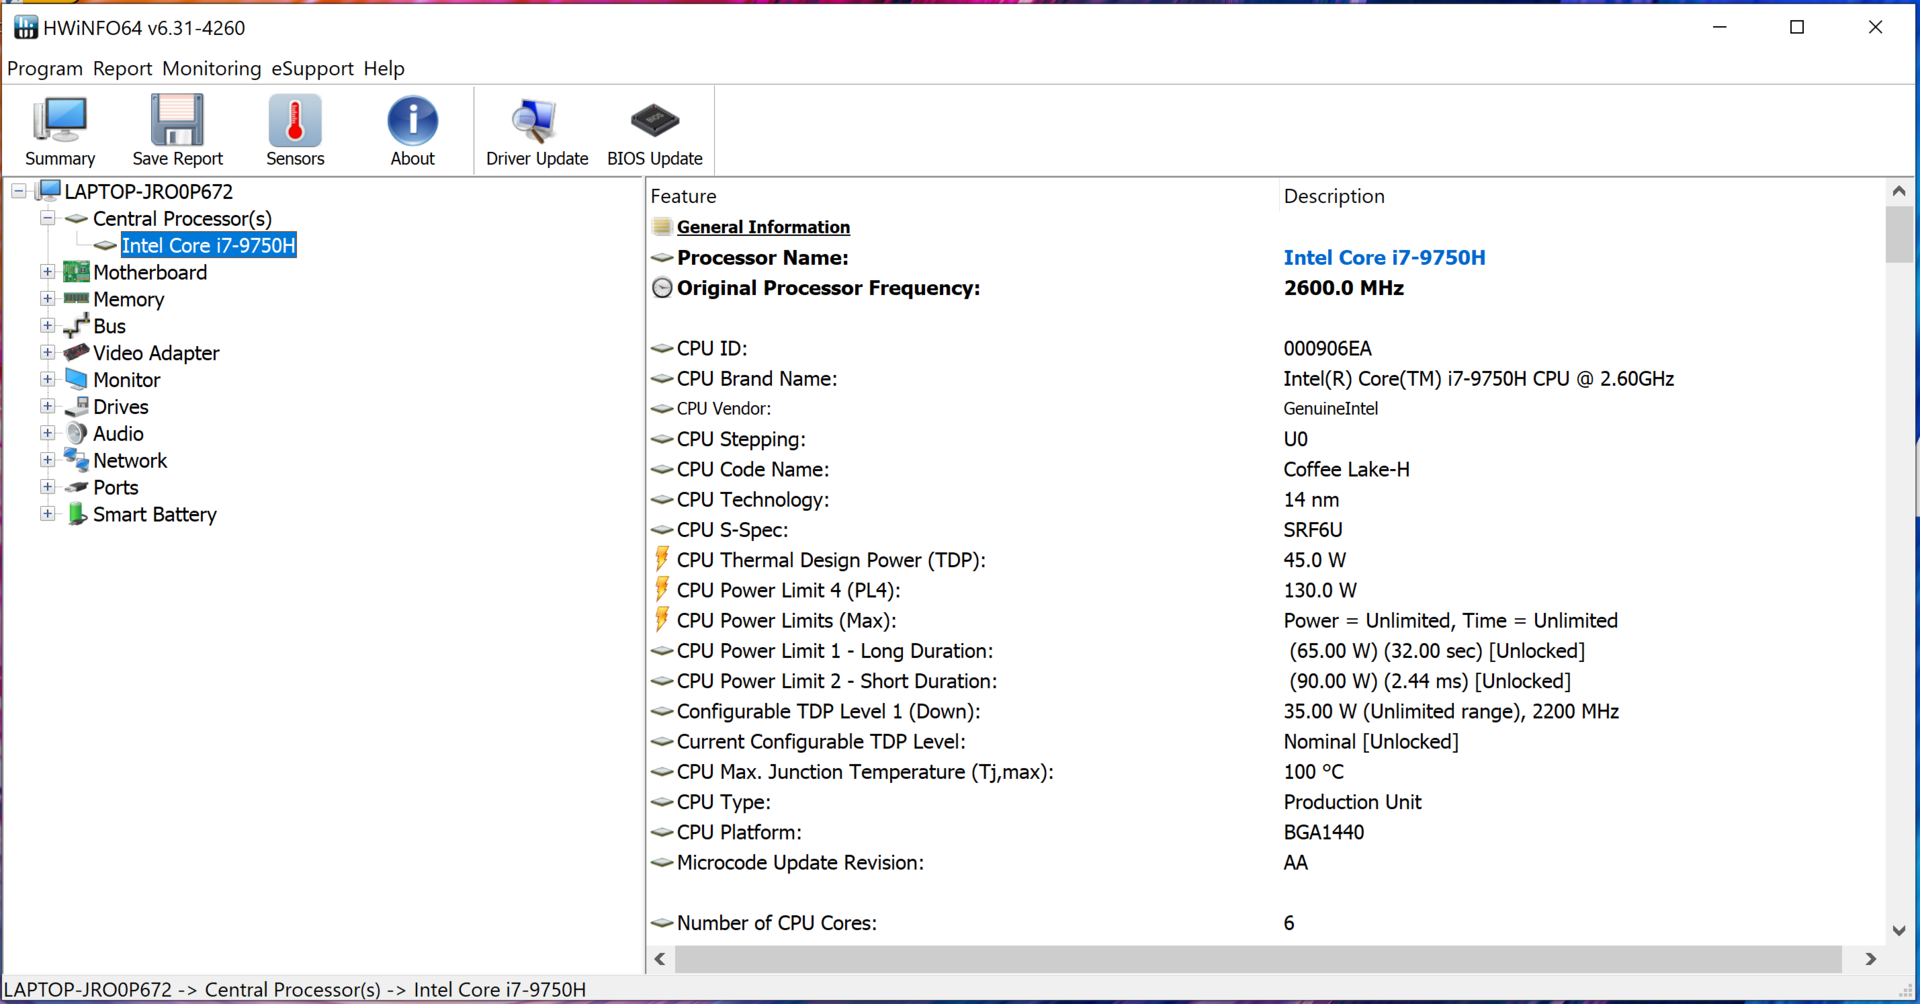
We check if the Turbo boost can be used over an extended period of time by running the Cinebench multi-core benchmark in a continuous loop for 30 minutes. The Turbo boost technology is utilised at a medium level. In Rendering
mode, which you can enable in ProArt Creator Hub
, the CPU is able to maintain higher clock speeds.
| Cinebench R15 | |
| CPU Single 64Bit | |
| Average of class Workstation (191.4 - 328, n=25, last 2 years) | |
| MSI WS66 10TMT-207US | |
| Dell Precision 7550 | |
| Razer Blade 15 Studio Edition 2020 | |
| Asus ProArt StudioBook Pro 15 W500G5T | |
| Asus ProArt StudioBook Pro 15 W500G5T (Rendering) | |
| Average Intel Core i7-9750H (170 - 194, n=82) | |
| CPU Multi 64Bit | |
| Average of class Workstation (2489 - 5810, n=25, last 2 years) | |
| MSI WS66 10TMT-207US | |
| Dell Precision 7550 | |
| Asus ProArt StudioBook Pro 15 W500G5T (Rendering) | |
| Asus ProArt StudioBook Pro 15 W500G5T | |
| Average Intel Core i7-9750H (952 - 1306, n=85) | |
| Razer Blade 15 Studio Edition 2020 | |
| Blender - v2.79 BMW27 CPU | |
| Asus ProArt StudioBook Pro 15 W500G5T | |
| Average Intel Core i7-9750H (342 - 495, n=21) | |
| Razer Blade 15 Studio Edition 2020 | |
| Asus ProArt StudioBook Pro 15 W500G5T (Rendering) | |
| Dell Precision 7550 | |
| MSI WS66 10TMT-207US | |
| Average of class Workstation (91 - 261, n=25, last 2 years) | |
| 7-Zip 18.03 | |
| 7z b 4 -mmt1 | |
| Average of class Workstation (5126 - 6960, n=25, last 2 years) | |
| Dell Precision 7550 | |
| MSI WS66 10TMT-207US | |
| Razer Blade 15 Studio Edition 2020 | |
| Asus ProArt StudioBook Pro 15 W500G5T | |
| Average Intel Core i7-9750H (4580 - 5090, n=21) | |
| Asus ProArt StudioBook Pro 15 W500G5T (Rendering) | |
| 7z b 4 | |
| Average of class Workstation (54741 - 116969, n=25, last 2 years) | |
| MSI WS66 10TMT-207US | |
| Dell Precision 7550 | |
| Razer Blade 15 Studio Edition 2020 | |
| Asus ProArt StudioBook Pro 15 W500G5T (Rendering) | |
| Asus ProArt StudioBook Pro 15 W500G5T | |
| Average Intel Core i7-9750H (28512 - 35174, n=21) | |
| HWBOT x265 Benchmark v2.2 - 4k Preset | |
| Average of class Workstation (14.4 - 40.5, n=25, last 2 years) | |
| Dell Precision 7550 | |
| MSI WS66 10TMT-207US | |
| Asus ProArt StudioBook Pro 15 W500G5T (Rendering) | |
| Razer Blade 15 Studio Edition 2020 | |
| Average Intel Core i7-9750H (7.1 - 10.7, n=21) | |
| Asus ProArt StudioBook Pro 15 W500G5T | |
| LibreOffice - 20 Documents To PDF | |
| Asus ProArt StudioBook Pro 15 W500G5T (Rendering) | |
| Asus ProArt StudioBook Pro 15 W500G5T | |
| Average Intel Core i7-9750H (54.5 - 64.7, n=9) | |
| Average of class Workstation (37.1 - 74.7, n=25, last 2 years) | |
| Razer Blade 15 Studio Edition 2020 | |
| Dell Precision 7550 | |
| MSI WS66 10TMT-207US | |
| R Benchmark 2.5 - Overall mean | |
| Asus ProArt StudioBook Pro 15 W500G5T (Rendering) | |
| Asus ProArt StudioBook Pro 15 W500G5T | |
| Average Intel Core i7-9750H (0.608 - 0.695, n=14) | |
| Razer Blade 15 Studio Edition 2020 | |
| MSI WS66 10TMT-207US | |
| Dell Precision 7550 | |
| Average of class Workstation (0.3825 - 0.603, n=25, last 2 years) | |
* ... smaller is better
System Performance
The StudioBook feels very responsive. It offers enough computing power for all current applications. The good results in the PCMark benchmarks confirm this impression.
| PCMark 8 Home Score Accelerated v2 | 3524 points | |
| PCMark 8 Creative Score Accelerated v2 | 3985 points | |
| PCMark 8 Work Score Accelerated v2 | 4436 points | |
| PCMark 10 Score | 4877 points | |
Help | ||
DPC Latencies
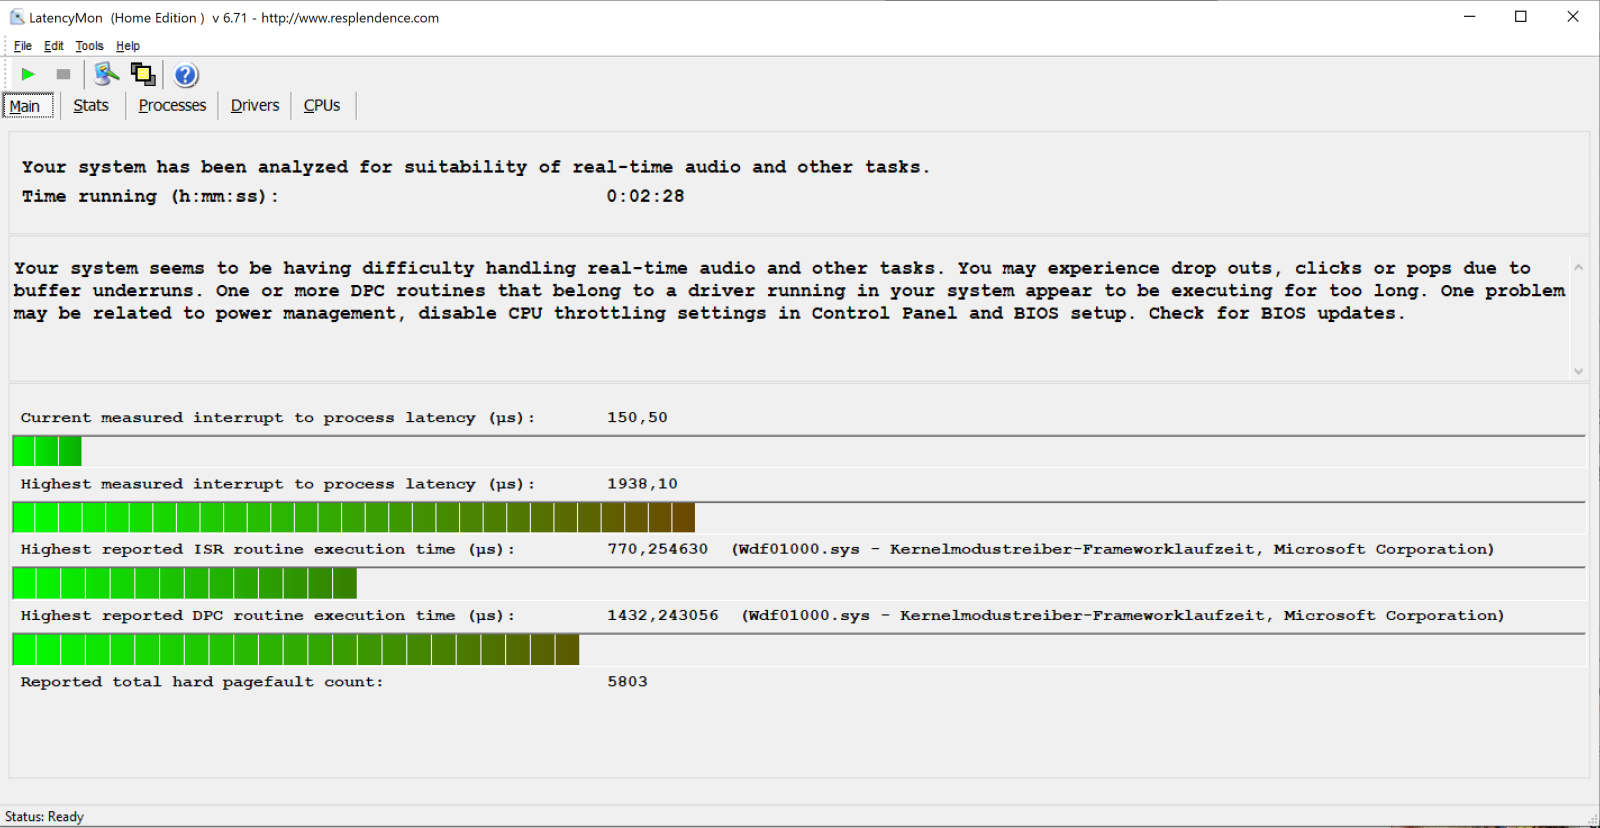
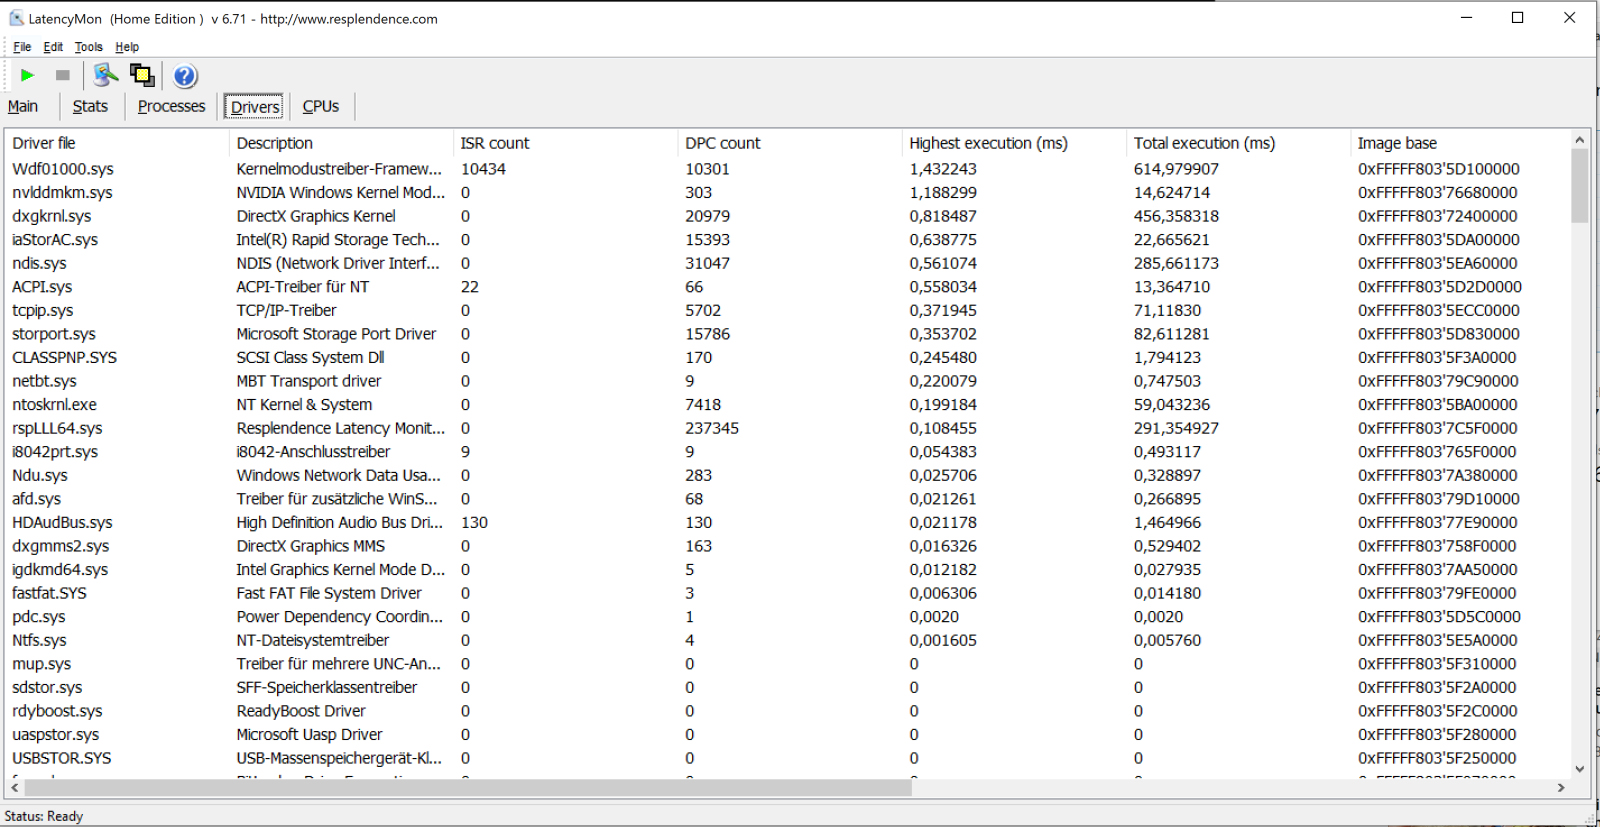
| DPC Latencies / LatencyMon - interrupt to process latency (max), Web, Youtube, Prime95 | |
| Asus ProArt StudioBook Pro 15 W500G5T | |
* ... smaller is better
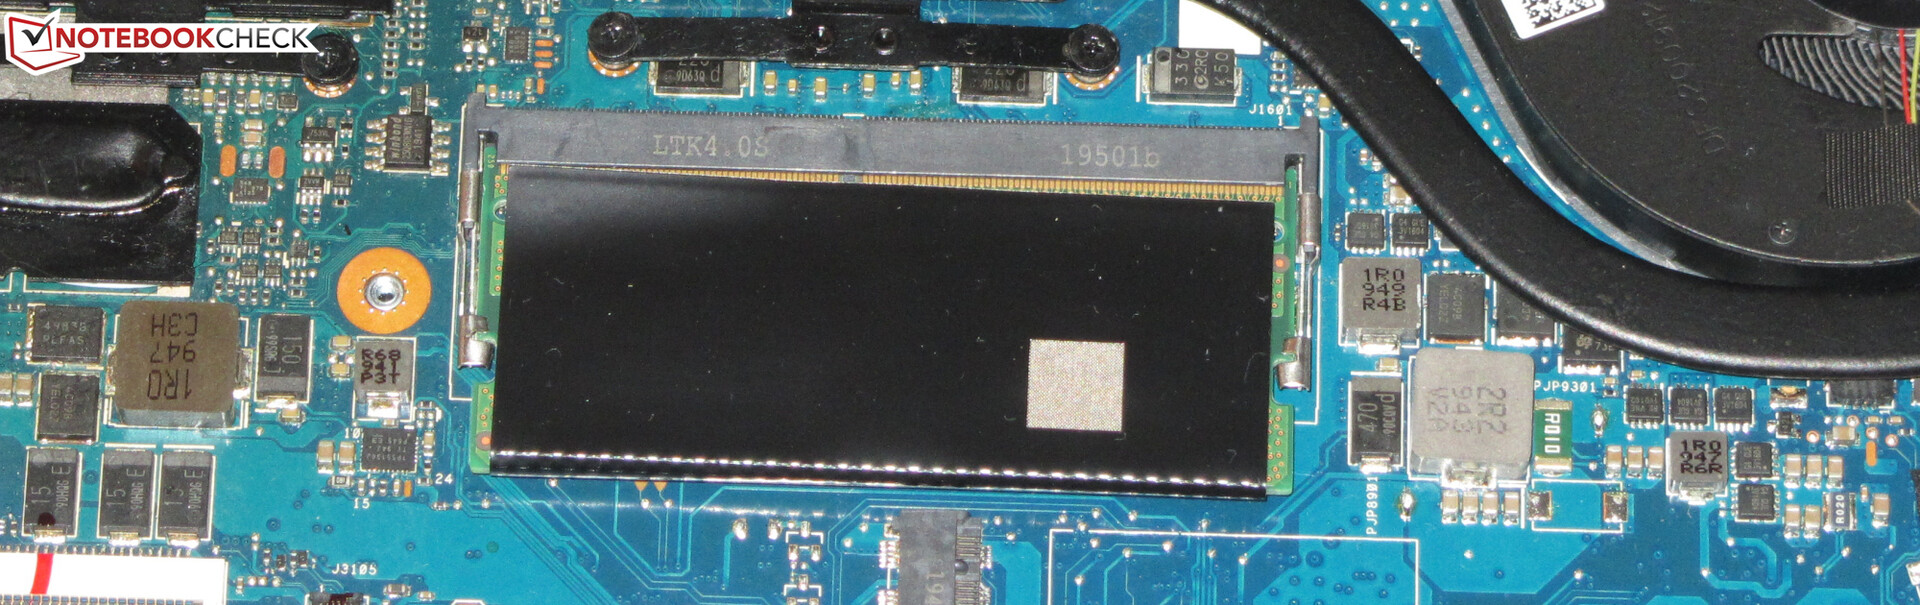
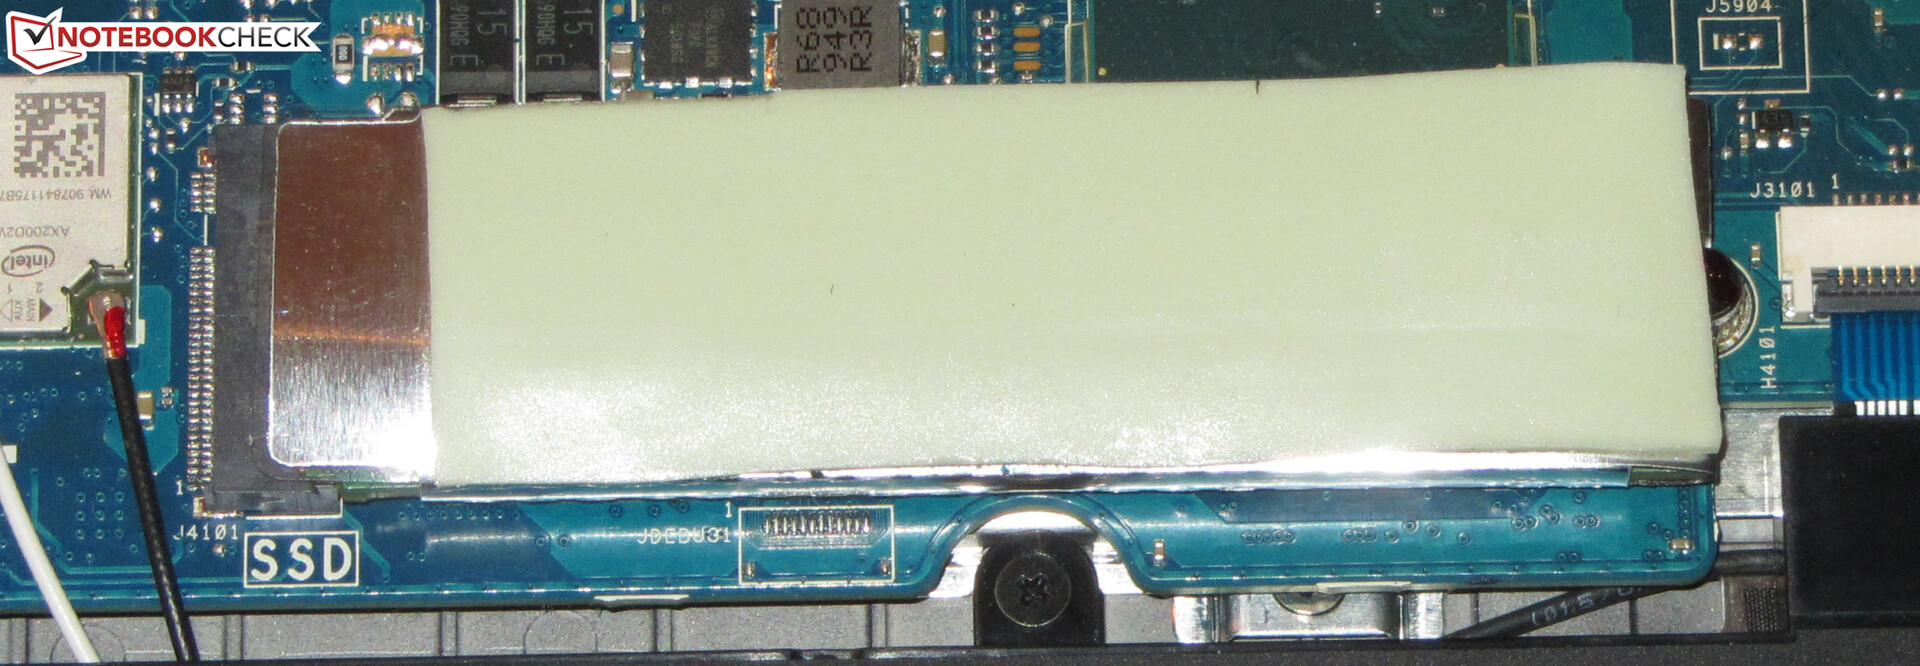
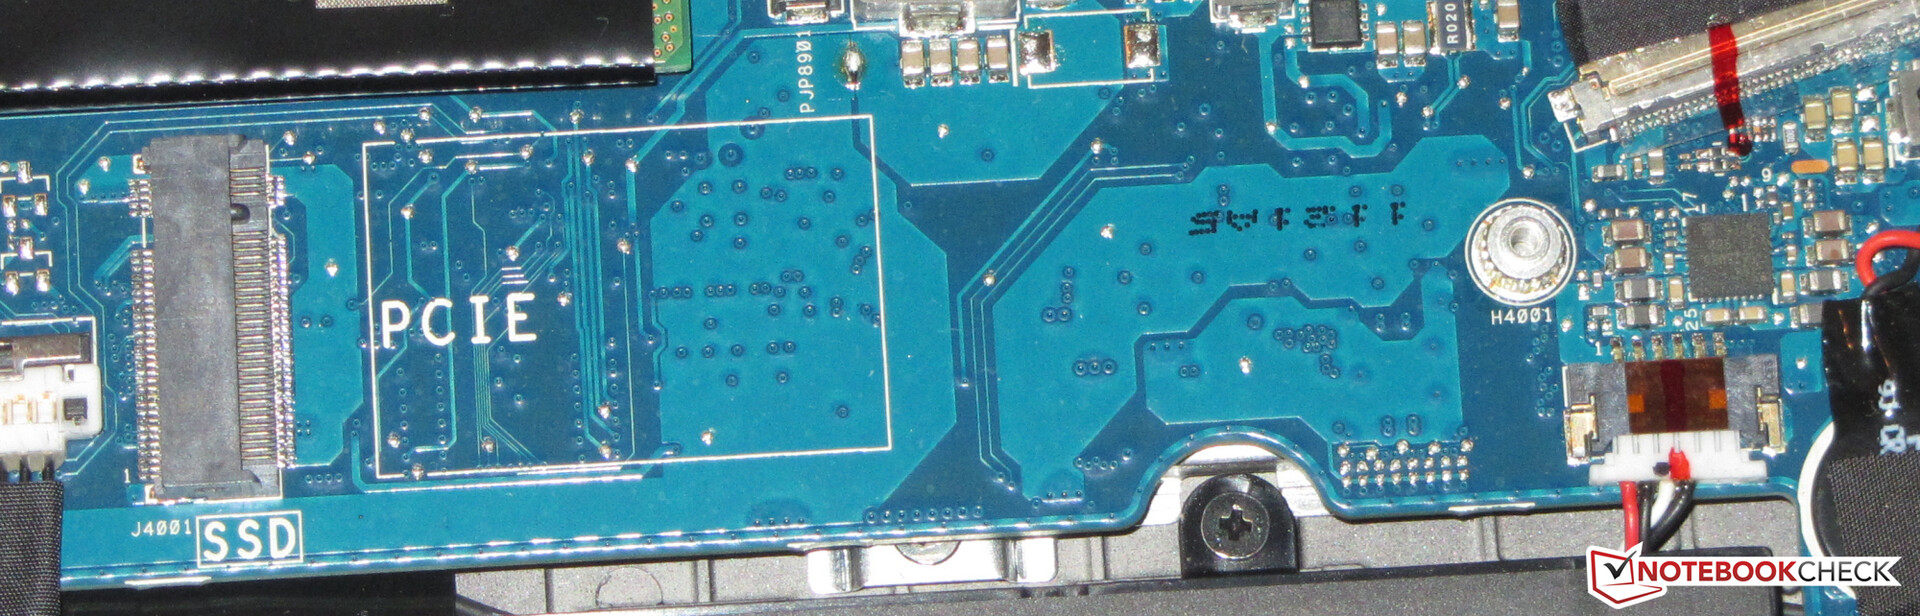
Storage Devices
Asus uses an NVMe SSD from Samsung. The SSD comes in the M.2-2280 form-factor and has a capacity of 1 TB. An additional NVMe SSD can be installed. RAID 0 is supported.

| Asus ProArt StudioBook Pro 15 W500G5T Samsung SSD PM981 MZVLB1T0HALR | MSI WS66 10TMT-207US WDC PC SN730 SDBPNTY-1T00 | Dell Precision 7550 SK Hynix PC601A NVMe 1TB | Razer Blade 15 Studio Edition 2020 Samsung PM981a MZVLB1T0HBLR | Average Samsung SSD PM981 MZVLB1T0HALR | Average of class Workstation | |
|---|---|---|---|---|---|---|
| CrystalDiskMark 5.2 / 6 | 3% | -13% | -2% | -14% | 65% | |
| Write 4K (MB/s) | 1107 | 185.8 -83% | 121 -89% | 132.9 -88% | 165.7 ? -85% | 168.1 ? -85% |
| Read 4K (MB/s) | 43.38 | 47.21 9% | 42.16 -3% | 46.73 8% | 44.6 ? 3% | 69.6 ? 60% |
| Write Seq (MB/s) | 2387 | 2874 20% | 2150 -10% | 2214 -7% | 1982 ? -17% | 3868 ? 62% |
| Read Seq (MB/s) | 2431 | 1786 -27% | 1755 -28% | 2018 -17% | 1764 ? -27% | 4279 ? 76% |
| Write 4K Q32T1 (MB/s) | 340.7 | 466.8 37% | 395.3 16% | 478.9 41% | 395 ? 16% | 495 ? 45% |
| Read 4K Q32T1 (MB/s) | 397.8 | 563 42% | 381.8 -4% | 540 36% | 434 ? 9% | 604 ? 52% |
| Write Seq Q32T1 (MB/s) | 2390 | 3091 29% | 2730 14% | 2975 24% | 2351 ? -2% | 6486 ? 171% |
| Read Seq Q32T1 (MB/s) | 3502 | 3395 -3% | 3468 -1% | 3195 -9% | 3234 ? -8% | 8420 ? 140% |
| AS SSD | 8% | -30% | -12% | -9% | 46% | |
| Seq Read (MB/s) | 2702 | 2321 -14% | 2028 -25% | 1982 -27% | 1993 ? -26% | 6044 ? 124% |
| Seq Write (MB/s) | 2348 | 2620 12% | 1193 -49% | 2252 -4% | 2036 ? -13% | 4240 ? 81% |
| 4K Read (MB/s) | 37.59 | 48.57 29% | 42.31 13% | 47.13 25% | 46.4 ? 23% | 65.4 ? 74% |
| 4K Write (MB/s) | 107.1 | 165.1 54% | 105.5 -1% | 88.2 -18% | 109.7 ? 2% | 187.6 ? 75% |
| 4K-64 Read (MB/s) | 1491 | 1712 15% | 1128 -24% | 1481 -1% | 1502 ? 1% | 1383 ? -7% |
| 4K-64 Write (MB/s) | 1794 | 2174 21% | 1537 -14% | 1842 3% | 1625 ? -9% | 3005 ? 68% |
| Access Time Read * (ms) | 0.046 | 0.057 -24% | 0.069 -50% | 0.087 -89% | 0.05158 ? -12% | 0.05364 ? -17% |
| Access Time Write * (ms) | 0.034 | 0.068 -100% | 0.106 -212% | 0.04 -18% | 0.05581 ? -64% | 0.04396 ? -29% |
| Score Read (Points) | 1798 | 1993 11% | 1373 -24% | 1726 -4% | 1747 ? -3% | 2050 ? 14% |
| Score Write (Points) | 2136 | 2601 22% | 1762 -18% | 2155 1% | 1942 ? -9% | 3617 ? 69% |
| Score Total (Points) | 4835 | 5630 16% | 3801 -21% | 4781 -1% | 4588 ? -5% | 6638 ? 37% |
| Copy ISO MB/s (MB/s) | 2302 | 2589 12% | 1768 -23% | 1982 -14% | 2280 ? -1% | 3191 ? 39% |
| Copy Program MB/s (MB/s) | 564 | 791 40% | 627 11% | 501 -11% | 558 ? -1% | 915 ? 62% |
| Copy Game MB/s (MB/s) | 1336 | 1625 22% | 1477 11% | 1140 -15% | 1302 ? -3% | 2097 ? 57% |
| Total Average (Program / Settings) | 6% /
6% | -22% /
-24% | -7% /
-8% | -12% /
-11% | 56% /
53% |
* ... smaller is better
Continuous read speed: DiskSpd Read Loop, Queue Depth 8
Graphics Card
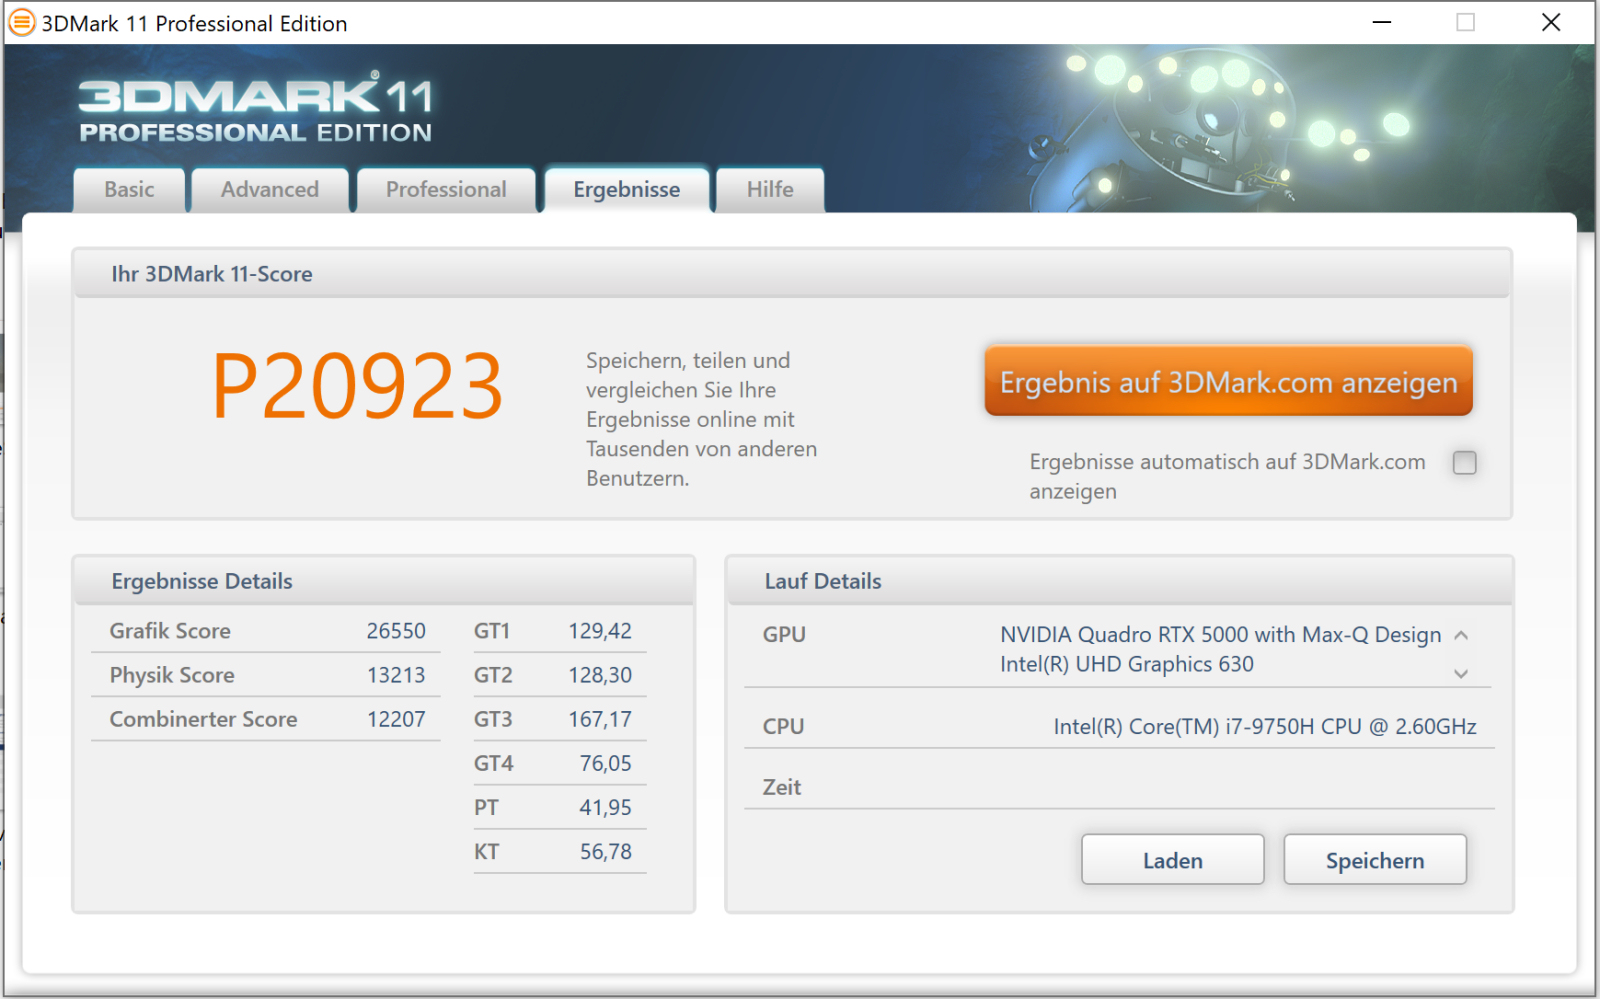
The Quadro RTX 5000 Max-Q is the professional version of the GeForce RTX 2080 Max-Q. It features 16.384 GB of VRAM. The 3DMark results are on a normal level for this kind of GPU. We did not observe a boost performance in Rendering
mode. The integrated UHD Graphics 630 in the Core i7-9750H is enabled and NVIDIA’s Optimus technology is utilised.
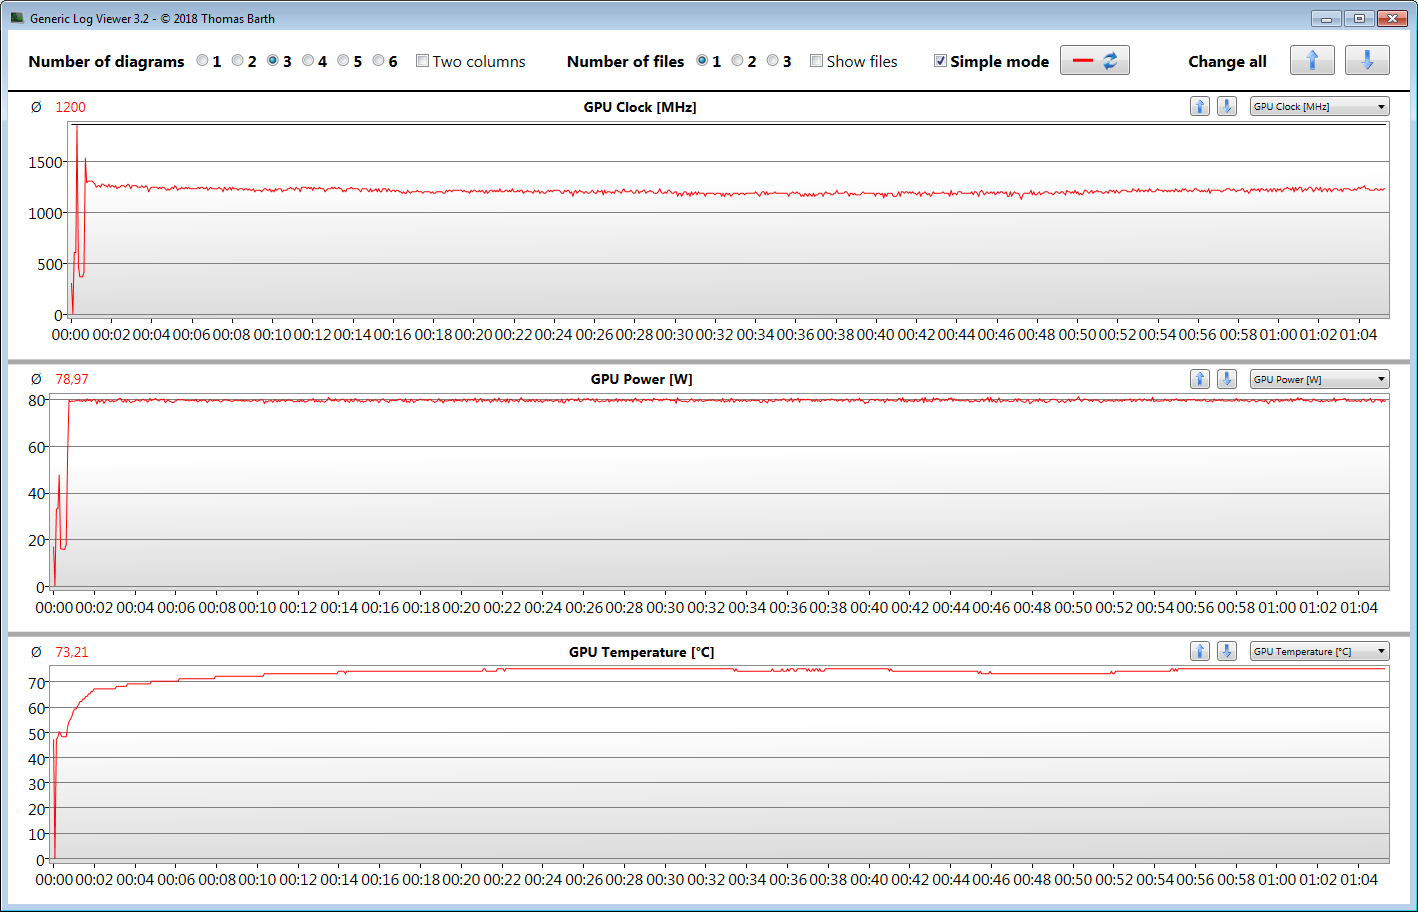
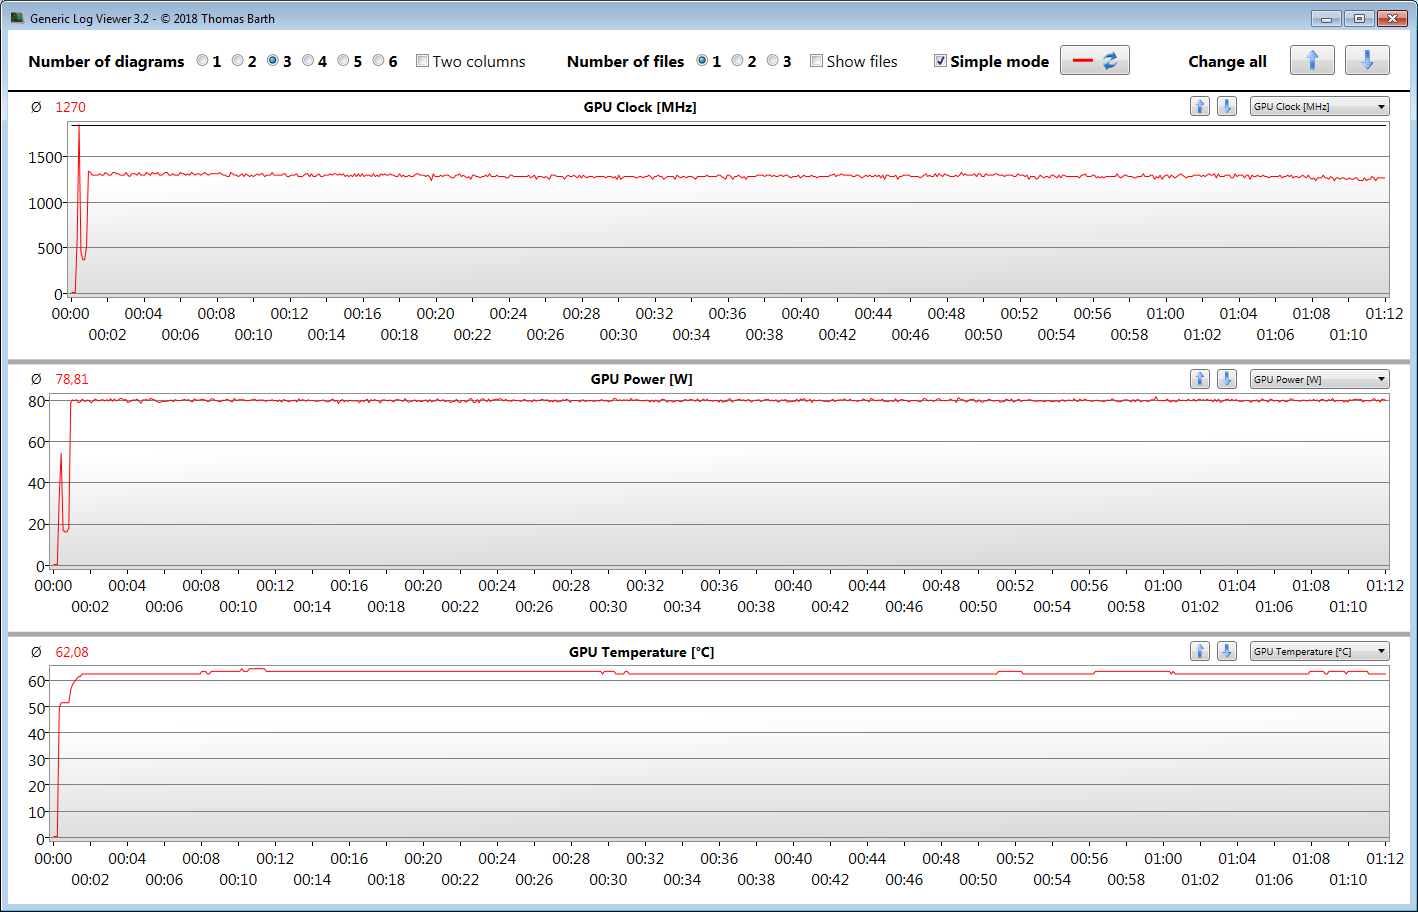
Nvidia specifies a base clock of 600 MHz and a boost clock of 1350 MHz for this GPU. Higher clocks are possible as long as the GPU does not reach a thermal or power limit. The maximum clock amounts to 1849 MHz. In the benchmark with the Witcher 3
, we saw the average clock speeds of 1200 MHz and 1270 MHz (in Rendering
mode).
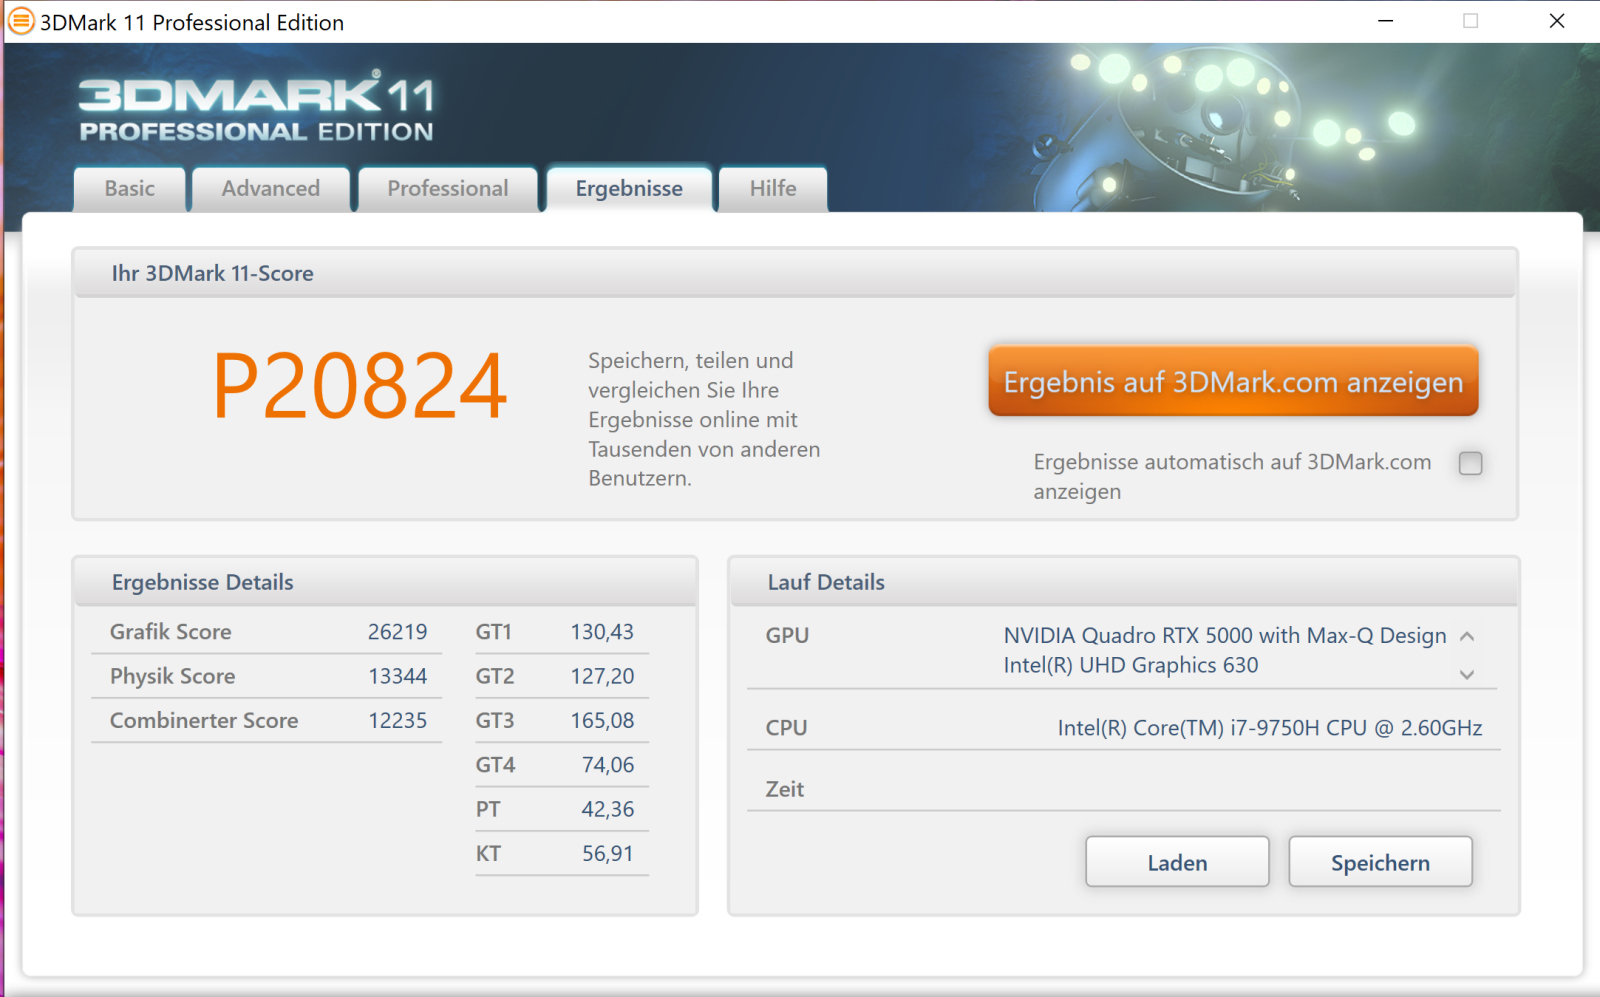


| 3DMark 11 Performance | 20824 points | |
| 3DMark Cloud Gate Standard Score | 29456 points | |
| 3DMark Fire Strike Score | 16986 points | |
| 3DMark Time Spy Score | 6972 points | |
Help | ||
| 3DMark 11 - 1280x720 Performance GPU | |
| Average of class Workstation (10888 - 69594, n=25, last 2 years) | |
| Razer Blade 15 Studio Edition 2020 | |
| MSI WS66 10TMT-207US | |
| Average NVIDIA Quadro RTX 5000 Max-Q (24156 - 28524, n=9) | |
| Asus ProArt StudioBook Pro 15 W500G5T (Rendering) | |
| Dell Precision 7550 | |
| Asus ProArt StudioBook Pro 15 W500G5T | |
| 3DMark | |
| 1920x1080 Fire Strike Graphics | |
| Average of class Workstation (7578 - 52560, n=25, last 2 years) | |
| MSI WS66 10TMT-207US | |
| Razer Blade 15 Studio Edition 2020 | |
| Average NVIDIA Quadro RTX 5000 Max-Q (18247 - 21115, n=10) | |
| Asus ProArt StudioBook Pro 15 W500G5T | |
| Asus ProArt StudioBook Pro 15 W500G5T (Rendering) | |
| Dell Precision 7550 | |
| 1280x720 Cloud Gate Standard Graphics | |
| MSI WS66 10TMT-207US | |
| Average of class Workstation (46927 - 152418, n=15, last 2 years) | |
| Average NVIDIA Quadro RTX 5000 Max-Q (50993 - 126073, n=7) | |
| Razer Blade 15 Studio Edition 2020 | |
| Asus ProArt StudioBook Pro 15 W500G5T | |
| Dell Precision 7550 | |
| 2560x1440 Time Spy Graphics | |
| Average of class Workstation (2725 - 24806, n=25, last 2 years) | |
| MSI WS66 10TMT-207US | |
| Razer Blade 15 Studio Edition 2020 | |
| Average NVIDIA Quadro RTX 5000 Max-Q (6999 - 7977, n=10) | |
| Dell Precision 7550 | |
| Asus ProArt StudioBook Pro 15 W500G5T (Rendering) | |
| Asus ProArt StudioBook Pro 15 W500G5T | |
Gaming Performance
The Asus laptop can run all current games smoothly. It can usually achieve playable frame rates at 1080p on the highest settings. The GPU struggles to handle resolutions above 1080p. To achieve playable frame rates at 4K, users will have to lower graphics settings.
While there is no difference between the Normal
and the Rendering
mode in the 3DMark benchmark, the Rendering
mode provides a slight boost in performance when gaming. In this mode, the GPU is able to achieve somewhat higher clocks in the gaming stress test with the Witcher 3
.
| The Witcher 3 - 1920x1080 Ultra Graphics & Postprocessing (HBAO+) | |
| Asus ProArt StudioBook Pro 15 W500G5T (Rendering) | |
| Asus ProArt StudioBook Pro 15 W500G5T | |
| Razer Blade 15 Studio Edition 2020 | |
| Average NVIDIA Quadro RTX 5000 Max-Q (71 - 88.5, n=10) | |
| MSI WS66 10TMT-207US | |
| Dell Precision 7550 | |
| Average of class Workstation (26.3 - 91.7, n=3, last 2 years) | |
| Death Stranding - 1920x1080 Very High Preset | |
| Razer Blade 15 Studio Edition 2020 | |
| Average NVIDIA Quadro RTX 5000 Max-Q (97.4 - 101.5, n=2) | |
| Asus ProArt StudioBook Pro 15 W500G5T | |
| Horizon Zero Dawn - 1920x1080 Ultimate Quality | |
| Asus ProArt StudioBook Pro 15 W500G5T (rendering) | |
| Average NVIDIA Quadro RTX 5000 Max-Q (86 - 89, n=2) | |
| Asus ProArt StudioBook Pro 15 W500G5T | |
| Doom Eternal - 1920x1080 Ultra Preset | |
| Asus ProArt StudioBook Pro 15 W500G5T (Rendering) | |
| Average NVIDIA Quadro RTX 5000 Max-Q (137.8 - 145.3, n=3) | |
| Razer Blade 15 Studio Edition 2020 | |
| Asus ProArt StudioBook Pro 15 W500G5T | |
We use the video game known as The Witcher 3
to check if the frame rates can be maintained consistently over an extended period of time. For this, we run the game on the highest settings at 1080p for one hour. Over the entire run of gameplay, the player-controlled character just stands still. There are no frame rate drops to report.
| low | med. | high | ultra | QHD | 4K | |
|---|---|---|---|---|---|---|
| The Witcher 3 (2015) | 281.8 | 225.5 | 145.3 | 84.6 | 50.4 | |
| Dota 2 Reborn (2015) | 140.8 | 128.7 | 120.1 | 114.9 | ||
| X-Plane 11.11 (2018) | 100 | 88 | 72.9 | |||
| Red Dead Redemption 2 (2019) | 107.5 | 89.1 | 63.9 | 41.3 | 32.9 | 25.2 |
| Hunt Showdown (2020) | 158.2 | 106.2 | 94 | 52.5 | 26.7 | |
| Doom Eternal (2020) | 213.8 | 159.9 | 142.3 | 137.8 | 103.2 | 54.5 |
| Gears Tactics (2020) | 226.8 | 151 | 110.2 | 84.6 | 54.3 | 27.6 |
| F1 2020 (2020) | 219 | 158 | 135 | 108 | 83 | 47 |
| Death Stranding (2020) | 100.1 | 100.5 | 97.3 | 97.4 | 70 | 39 |
| Horizon Zero Dawn (2020) | 120 | 103 | 93 | 86 | 69 | 42 |
| Flight Simulator 2020 (2020) | 58.3 | 49 | 44 | 34.3 | 26.9 | 16.1 |
| Serious Sam 4 (2020) | 106 | 84.7 | 79.8 | 69.6 | 57.5 | 34.9 |
| Mafia Definitive Edition (2020) | 113.6 | 90.3 | 82.9 | 56.7 | 30.2 | |
| Star Wars Squadrons (2020) | 296 | 225.7 | 203.3 | 185.3 | 125.9 | 70.4 |
| FIFA 21 (2020) | 208.3 | 188.7 | 181.6 | 170 | 143 | 84.4 |
| Watch Dogs Legion (2020) | 90 | 85 | 75 | 51 | 37 | 21 |
Emissions & Energy Management - The StudioBook gets warm and loud
System Noise
When idle, the fans often stand completely still, which leads to silent operation. Under load, the fans pick up speed. We measured 47 dB(A) under medium load and 46.9 dB(A) during the stress test. In Rendering
mode, the fans spin faster.
Noise level
| Idle |
| 27.9 / 27.9 / 27.9 dB(A) |
| Load |
| 47 / 46.9 dB(A) |
 | ||
30 dB silent 40 dB(A) audible 50 dB(A) loud |
||
min: | ||
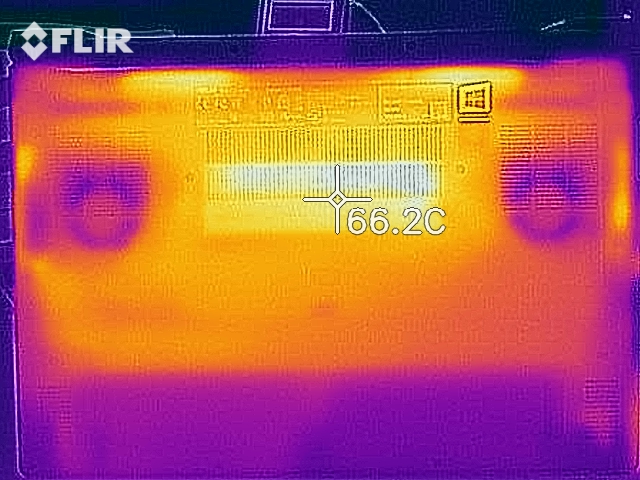
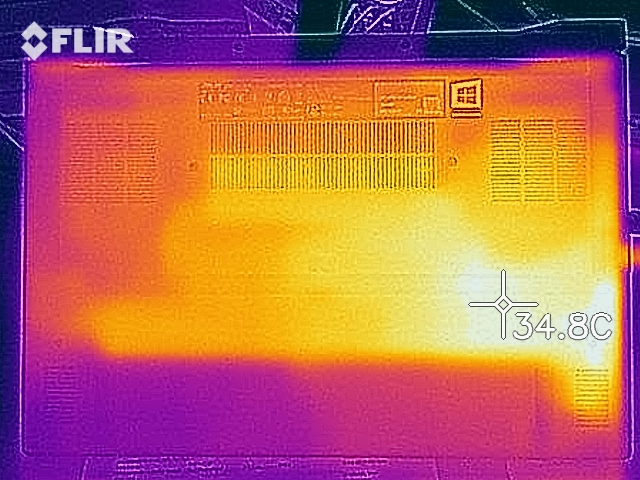
Temperature
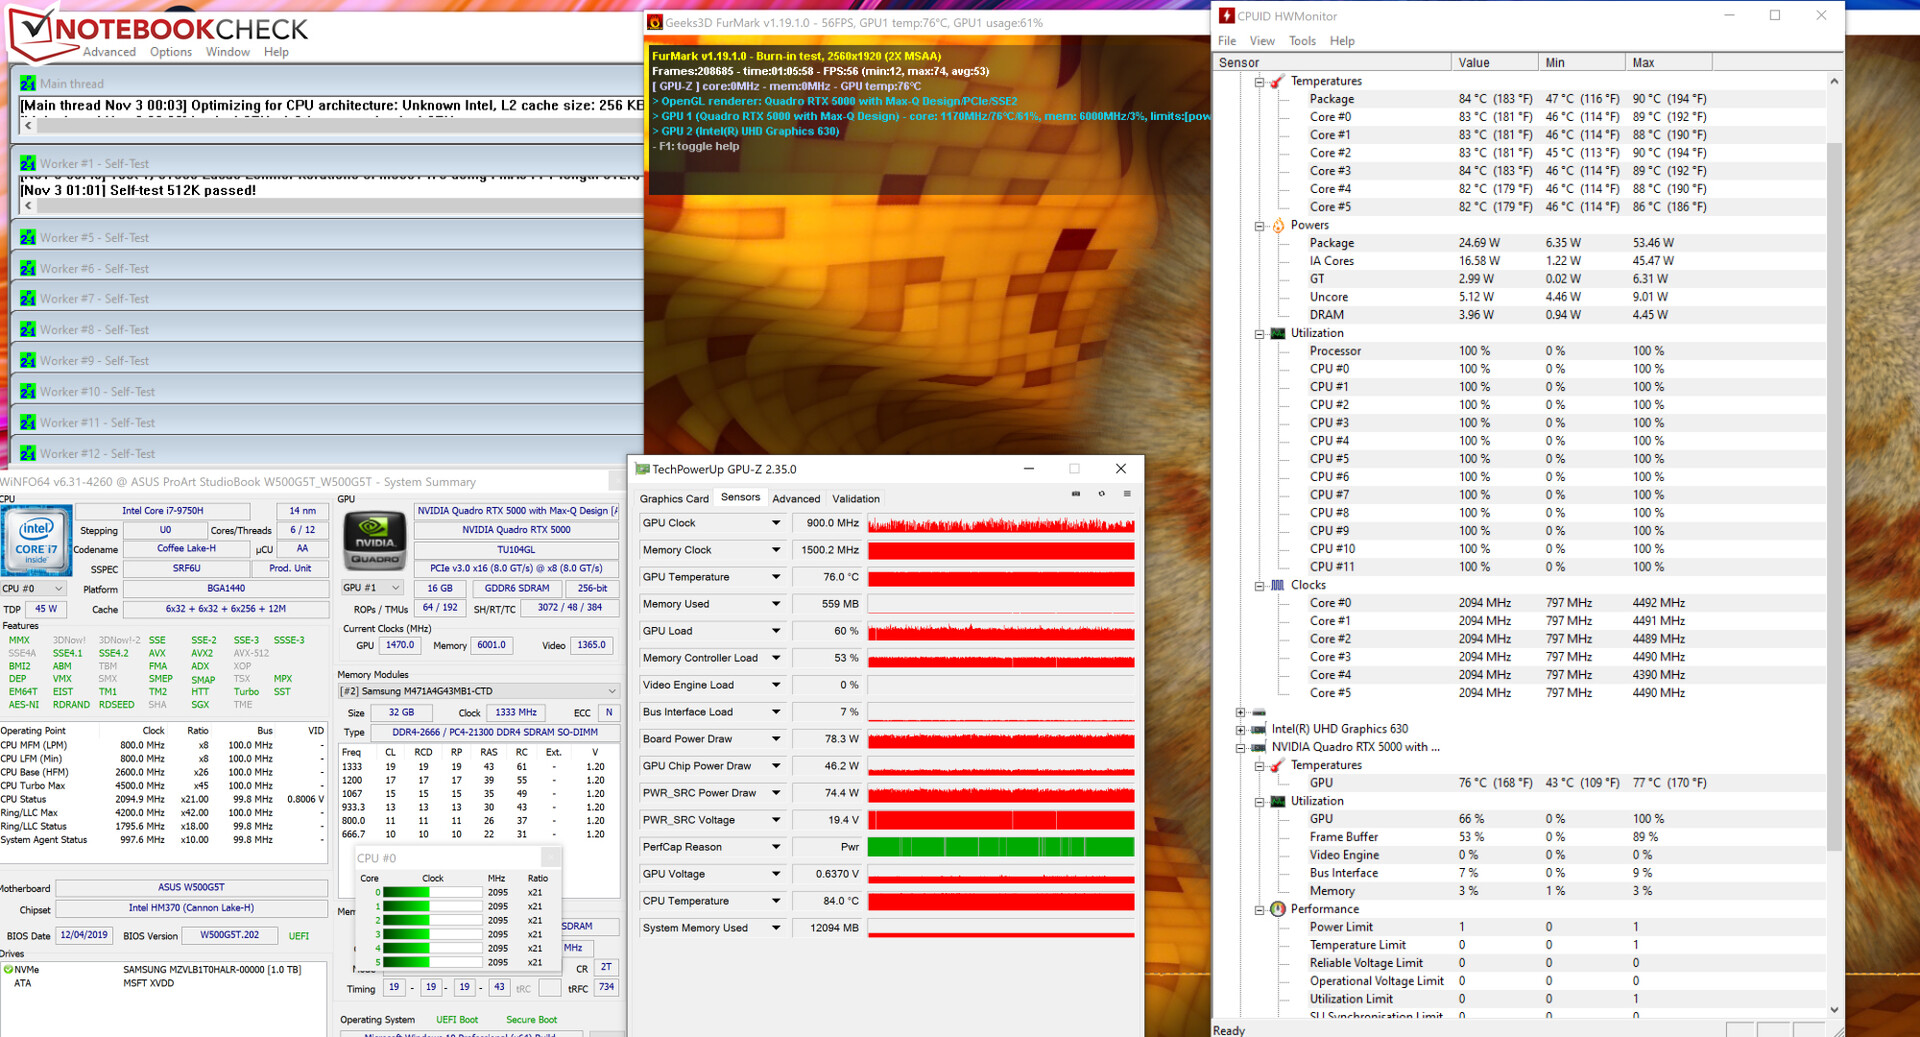
In our stress test (Prime95 and FurMark running continuously for at least one hour), the CPU clocks fluctuated between 3.5 and 4 GHz and the GPU clocks fluctuated between 800 and 1700 MHz in the first minute. Subsequently, the CPU ran at 2.1 GHz and the GPU at 900 MHz. On battery power, the CPU frequency amounted to 900 MHz and the GPU frequency to 300 MHz. The stress test is an extreme case scenario, which is very unlikely to occur in real life. We use it to test system stability under full load.
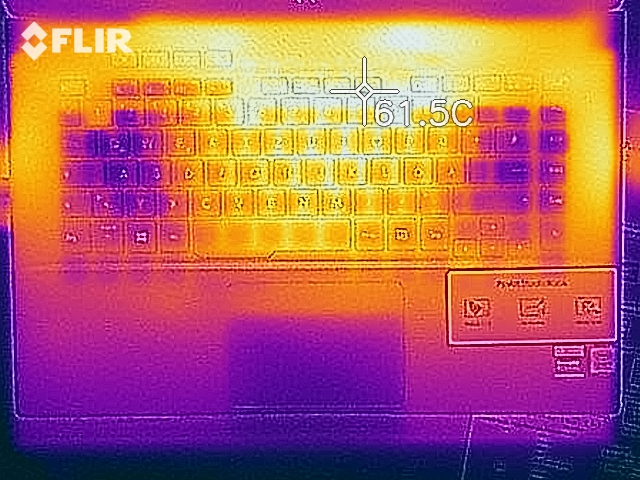
The W500G5T gets considerably hot. During our stress test, the 50-degree Celsius (122 °F) mark was exceeded at one measurement point. This is why we cannot recommend using the Asus notebook on the lap. In day-to-day use, the temperatures always remain reasonable.
(-) The maximum temperature on the upper side is 61.5 °C / 143 F, compared to the average of 38.2 °C / 101 F, ranging from 22.2 to 69.8 °C for the class Workstation.
(-) The bottom heats up to a maximum of 66.2 °C / 151 F, compared to the average of 41.1 °C / 106 F
(+) In idle usage, the average temperature for the upper side is 25.7 °C / 78 F, compared to the device average of 32 °C / 90 F.
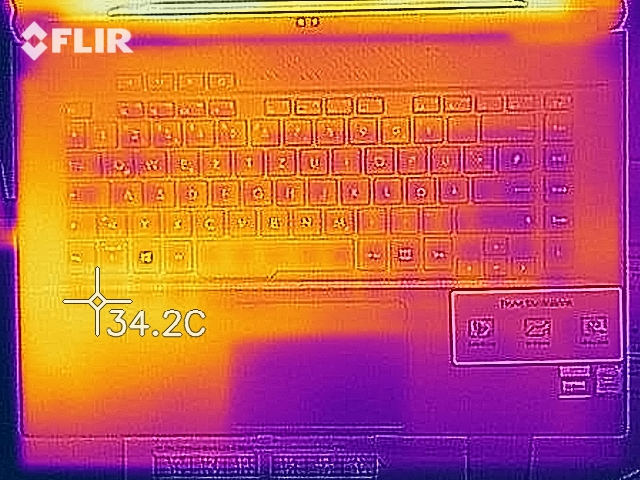
(+) The palmrests and touchpad are reaching skin temperature as a maximum (34.2 °C / 93.6 F) and are therefore not hot.
(-) The average temperature of the palmrest area of similar devices was 27.8 °C / 82 F (-6.4 °C / -11.6 F).
Speakers
The stereo speakers produce an okay sound. However, the maximum volume is relatively low.
Asus ProArt StudioBook Pro 15 W500G5T audio analysis
(-) | not very loud speakers (69.3 dB)
Bass 100 - 315 Hz
(±) | reduced bass - on average 9.5% lower than median
(±) | linearity of bass is average (14.9% delta to prev. frequency)
Mids 400 - 2000 Hz
(+) | balanced mids - only 3% away from median
(+) | mids are linear (5.1% delta to prev. frequency)
Highs 2 - 16 kHz
(±) | higher highs - on average 6.3% higher than median
(+) | highs are linear (6.8% delta to prev. frequency)
Overall 100 - 16.000 Hz
(±) | linearity of overall sound is average (15% difference to median)
Compared to same class
» 33% of all tested devices in this class were better, 6% similar, 61% worse
» The best had a delta of 7%, average was 17%, worst was 35%
Compared to all devices tested
» 20% of all tested devices were better, 4% similar, 76% worse
» The best had a delta of 4%, average was 24%, worst was 134%
Energy Consumption
There are no anomalies when it comes to energy consumption. The system draws 20.6 watts when idle. During the stress test, the power consumption peaked at 178 watts. The rated output of the AC adapter amounts to 230 watts.
| Off / Standby | |
| Idle | |
| Load |
|
Key:
min: | |
Battery Life
Our practically oriented Wi-Fi test simulates loads that are consistent with surfing the web. The “balanced” power plan is selected, the energy saving functions are turned off and the display brightness is set to 150 cd/m². Our review device achieves a battery runtime of 4 h 41 m.
Pros
Cons
Verdict
The StudioBook is a workstation, with which Asus is going after content creators. It also does well as a gaming notebook. The Core i7-9750H and the Quadro RTX 5000 Max-Q provide enough performance for all usage scenarios. However, the W500G5T has only a "hexa-core" CPU. Many competitors feature octa-core processors, which is why the StudioBook performs considerably worse in CPU intensive applications.
The Asus StudioBook is a well-rounded workstation. However, its weaknesses cannot be overlooked given its 5000-Euro (~$5908) price tag.
Our review device features 32 GB of RAM (16 GB SODIMM stick + 16 GB of onboard memory; RAM runs in dual-channel mode). The Asus workstation supports up to 48 GB of RAM. Many competitors support up to 64 GB of RAM. The storage capacity (1 TB, NVMe SSD) can be expanded by installing an additional NVMe drive. RAID 0 is supported.
The 4K IPS screen scores some major point with its matte surface, good brightness, stable viewing angles and - thanks to a Pantone certification - great colour reproduction. The colour space coverage is also on a good level. However, the contrast ratio should have been higher given the price tag. The battery life is not very impressive. The backlit keyboard is good enough for daily use.
The Asus StudioBook does not feature a Thunderbolt 3 port. There is only a USB 3.2 Gen 2 Type-C port, which can output a DP signal. This is why an external GPU cannot be connected to the workstation. The battery of the StudioBook cannot be charged via the USB-C port.
Even though the StudioBook costs 5000 Euros (~$5908), it has some weaknesses (display with a low contrast ratio, soldered-in RAM, no Thunderbolt 3 port, no USB Power Delivery), which such an expensive device should not have. The Blade 15 Studio Edition delivers more for this kind of money. Those who like the StudioBook anyway, but do not need the Quadro GPU, should take a look at a StudioBook model with a GeForce RTX graphics card.
Asus ProArt StudioBook Pro 15 W500G5T
- 11/09/2020 v7 (old)
Sascha Mölck
Price comparison
