Lenovo ThinkPad P1 G4 laptop review: Success with Vapor-Chamber & GeForce RTX 3070
When Lenovo launched the ThinkPad P1 in 2018, the distribution of roles in the workstation lineup was clear: The new premium model was supposed to pick up buyers who needed a particularly thin and light mobile workstation and could sacrifice some performance for it. The classic workstation model Lenovo ThinkPad P52 on the other hand, offered more performance with less mobility.
The new Lenovo ThinkPad P1 G4 still has its mobility advantage compared to the ThinkPad P15 G2, the current full-fat ThinkPad workstation. However, customers do not necessarily have to sacrifice performance anymore - at least on paper. Lenovo has significantly upgraded the ThinkPad P1 and equipped our test model with an Nvidia GeForce RTX 3070 and 4K UHD+ resolution that corresponds to one of the strongest configuration variants. Since we recently tested the ThinkPad P1 2021 in a lower-end configuration, we refer to the review of the ThinkPad P1 Gen 4 with Nvidia T1200 for details about the configuration, input devices and design.
Possible competitors in comparison
Rating | Date | Model | Weight | Height | Size | Resolution | Price |
|---|---|---|---|---|---|---|---|
| 89.8 % v7 (old) | 11 / 2021 | Lenovo ThinkPad P1 G4-20Y4S0KS00 i7-11850H, GeForce RTX 3070 Laptop GPU | 2 kg | 17.7 mm | 16.00" | 3840x2400 | |
| 89.4 % v7 (old) | 10 / 2021 | Lenovo ThinkPad P1 G4-20Y30017GE i7-11800H, T1200 Laptop GPU | 1.8 kg | 17.7 mm | 16.00" | 2560x1600 | |
| 88.3 % v7 (old) | 10 / 2021 | Dell Precision 5000 5560 i7-11850H, RTX A2000 Laptop GPU | 2 kg | 18 mm | 15.60" | 3840x2400 | |
| 89.7 % v7 (old) | 12 / 2019 | Apple MacBook Pro 16 2019 i9 5500M i9-9880H, Radeon Pro 5500M | 2 kg | 16.2 mm | 16.00" | 3072x1920 | |
| 87.8 % v7 (old) | 08 / 2021 | HP ZBook Studio 15 G8 i9-11950H, GeForce RTX 3070 Laptop GPU | 1.9 kg | 18 mm | 15.60" | 3840x2160 | |
| 90.1 % v7 (old) | 01 / 2021 | Lenovo ThinkPad X1 Extreme Gen3-20TLS0UV00 i7-10750H, GeForce GTX 1650 Ti Max-Q | 1.7 kg | 18.7 mm | 15.60" | 1920x1080 |
| SD Card Reader | |
| average JPG Copy Test (av. of 3 runs) | |
| Lenovo ThinkPad P1 G4-20Y30017GE (AV PRO V60) | |
| Dell Precision 5000 5560 (AV Pro V60) | |
| Average of class Workstation (49.6 - 681, n=14, last 2 years) | |
| Lenovo ThinkPad X1 Extreme Gen3-20TLS0UV00 (Toshiba Exceria Pro SDXC 64 GB UHS-II) | |
| HP ZBook Studio 15 G8 (AV Pro V60) | |
| maximum AS SSD Seq Read Test (1GB) | |
| Average of class Workstation (87.6 - 1455, n=14, last 2 years) | |
| Lenovo ThinkPad X1 Extreme Gen3-20TLS0UV00 (Toshiba Exceria Pro SDXC 64 GB UHS-II) | |
| Dell Precision 5000 5560 (AV Pro V60) | |
| Lenovo ThinkPad P1 G4-20Y30017GE (AV PRO V60) | |
| HP ZBook Studio 15 G8 (AV Pro V60) | |


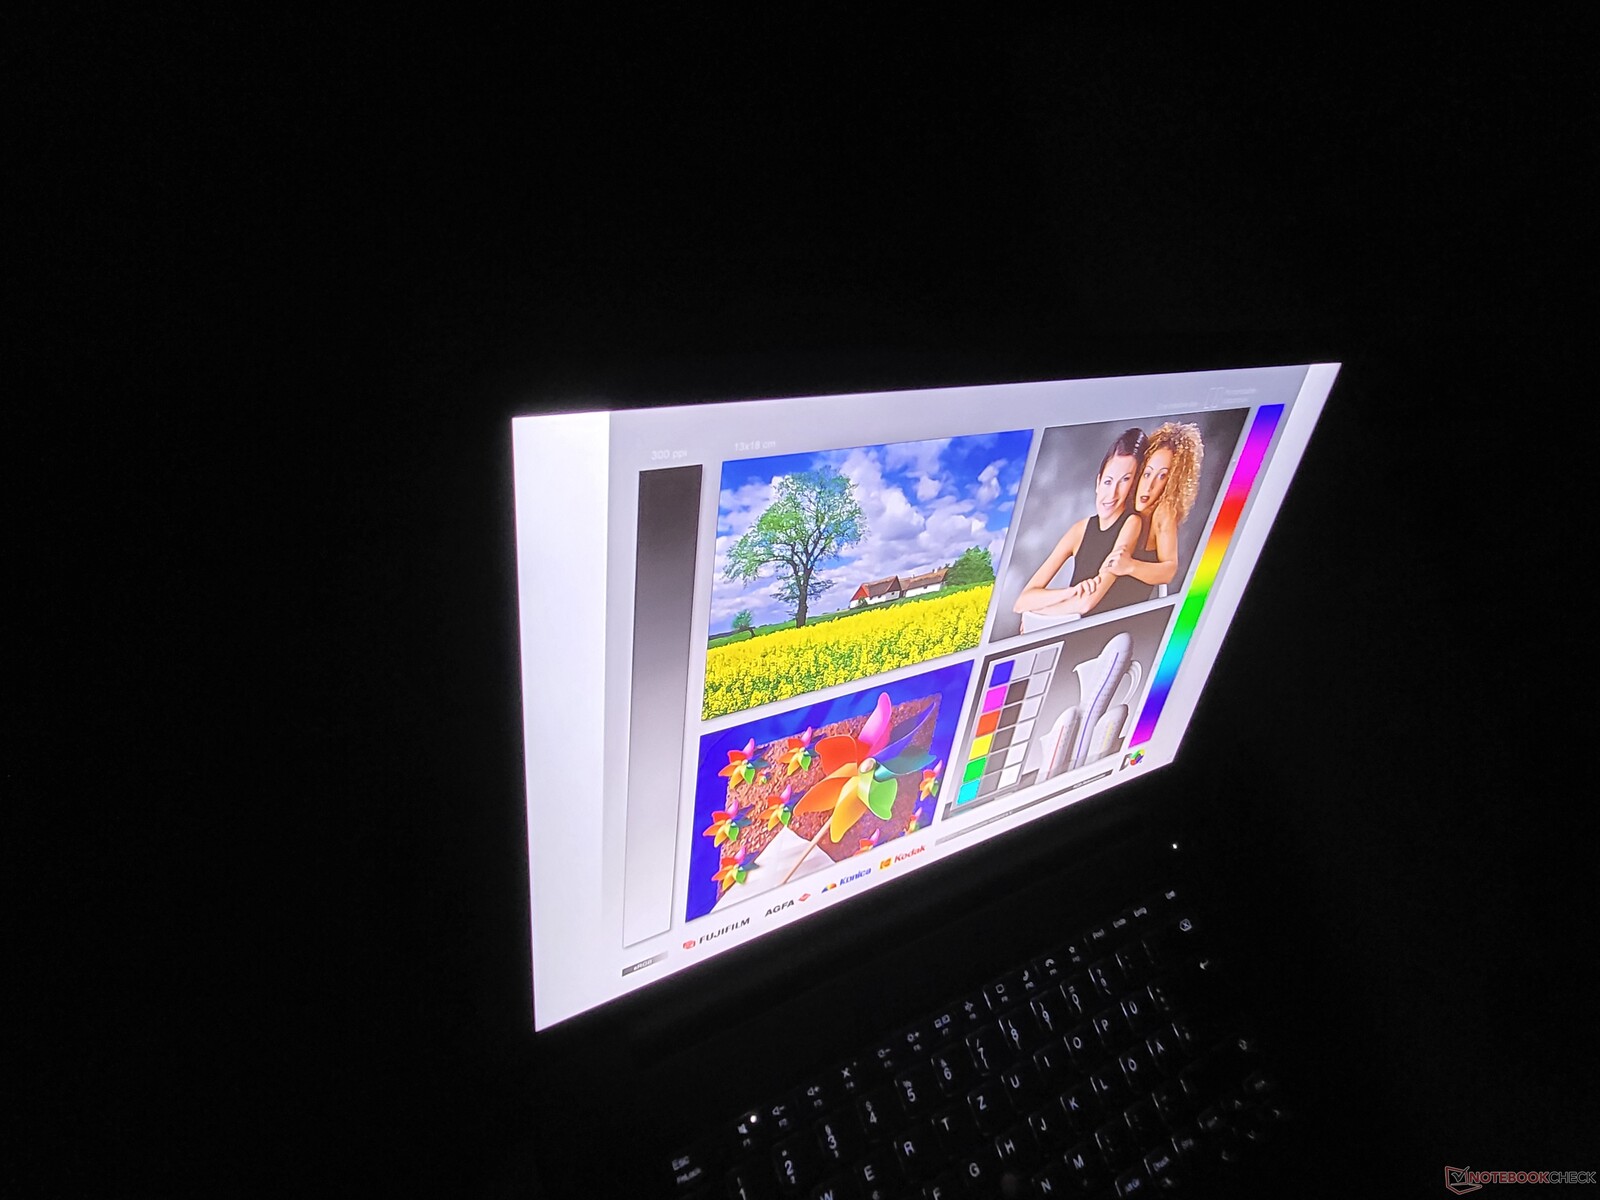
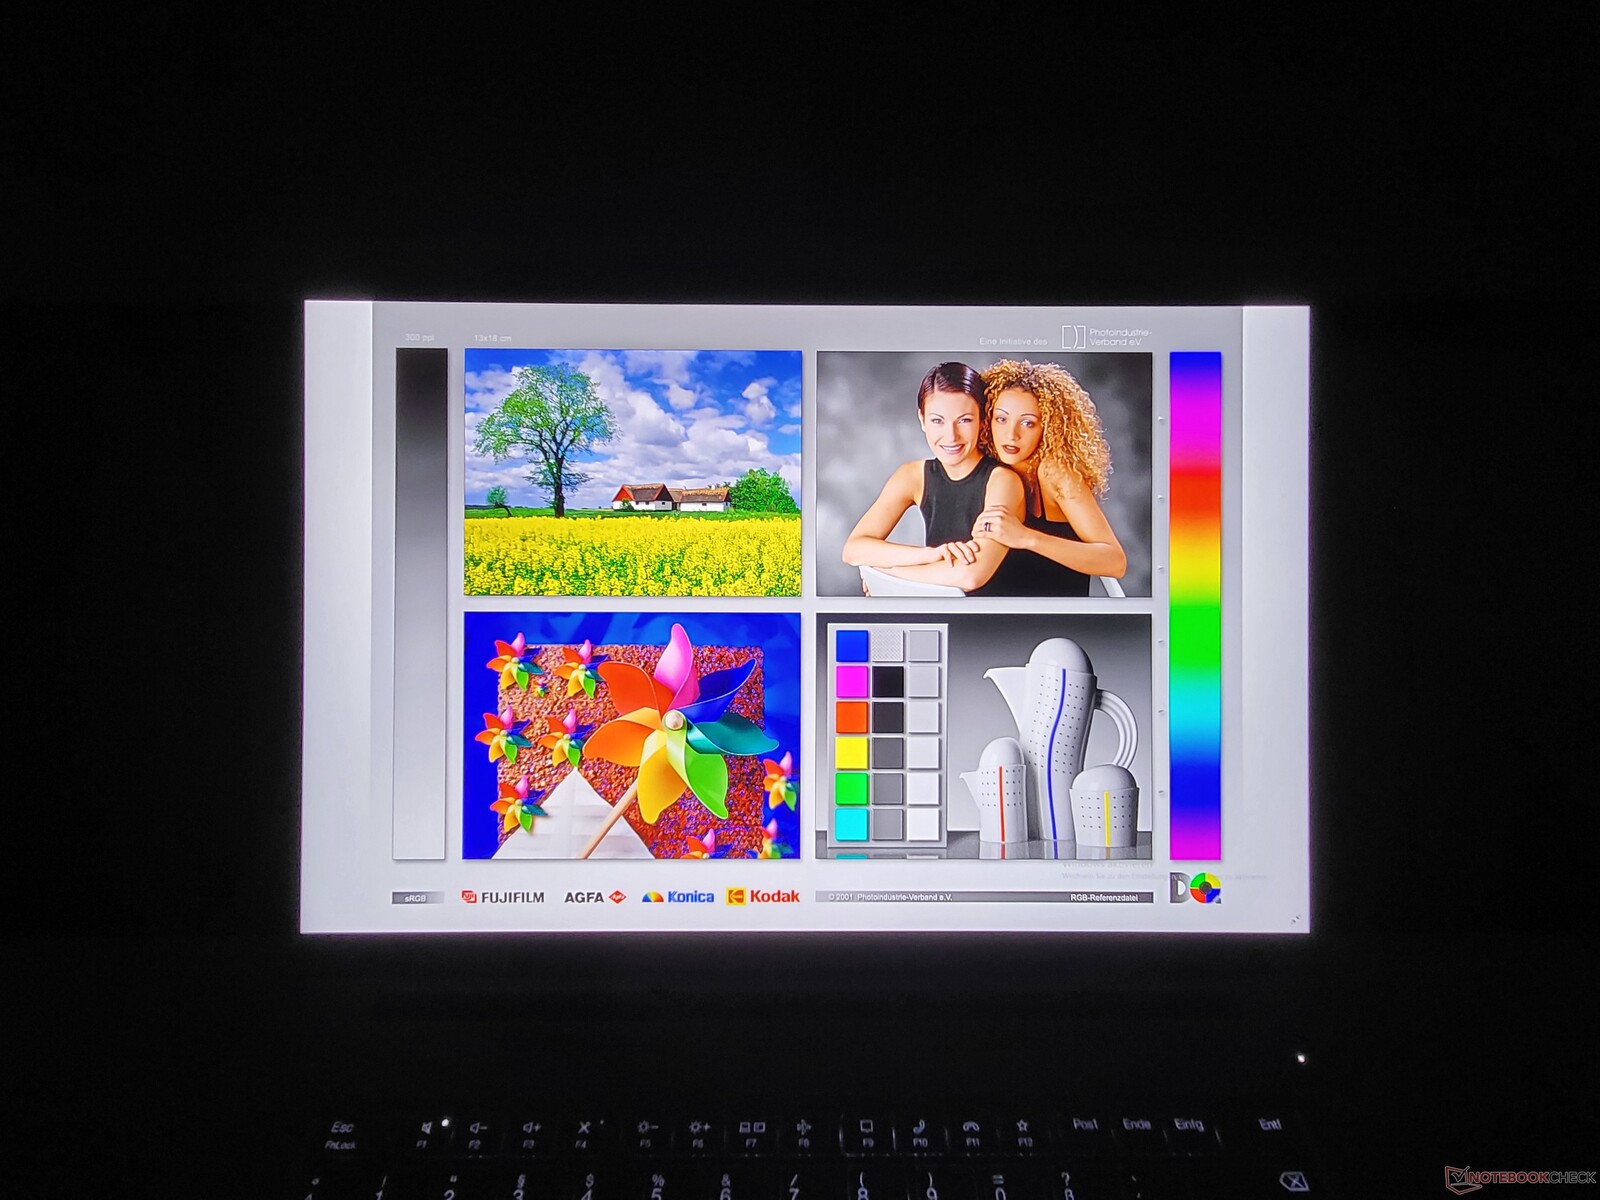
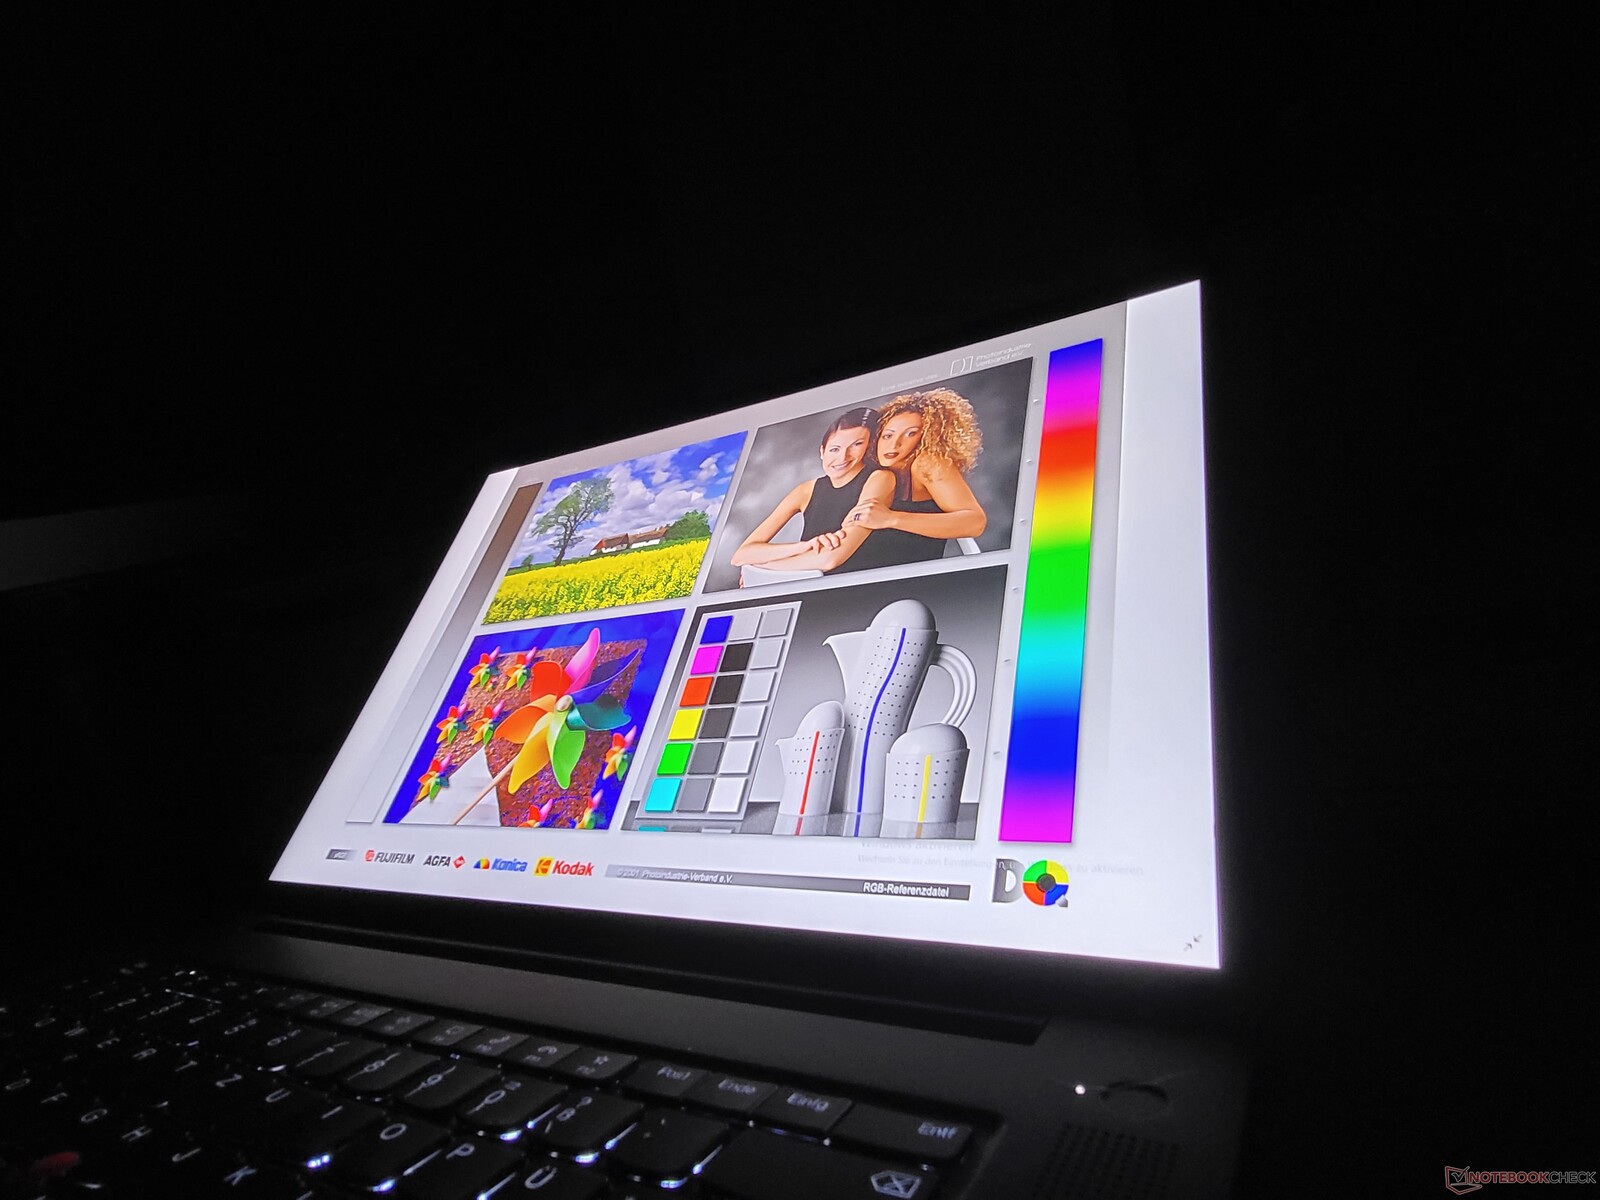
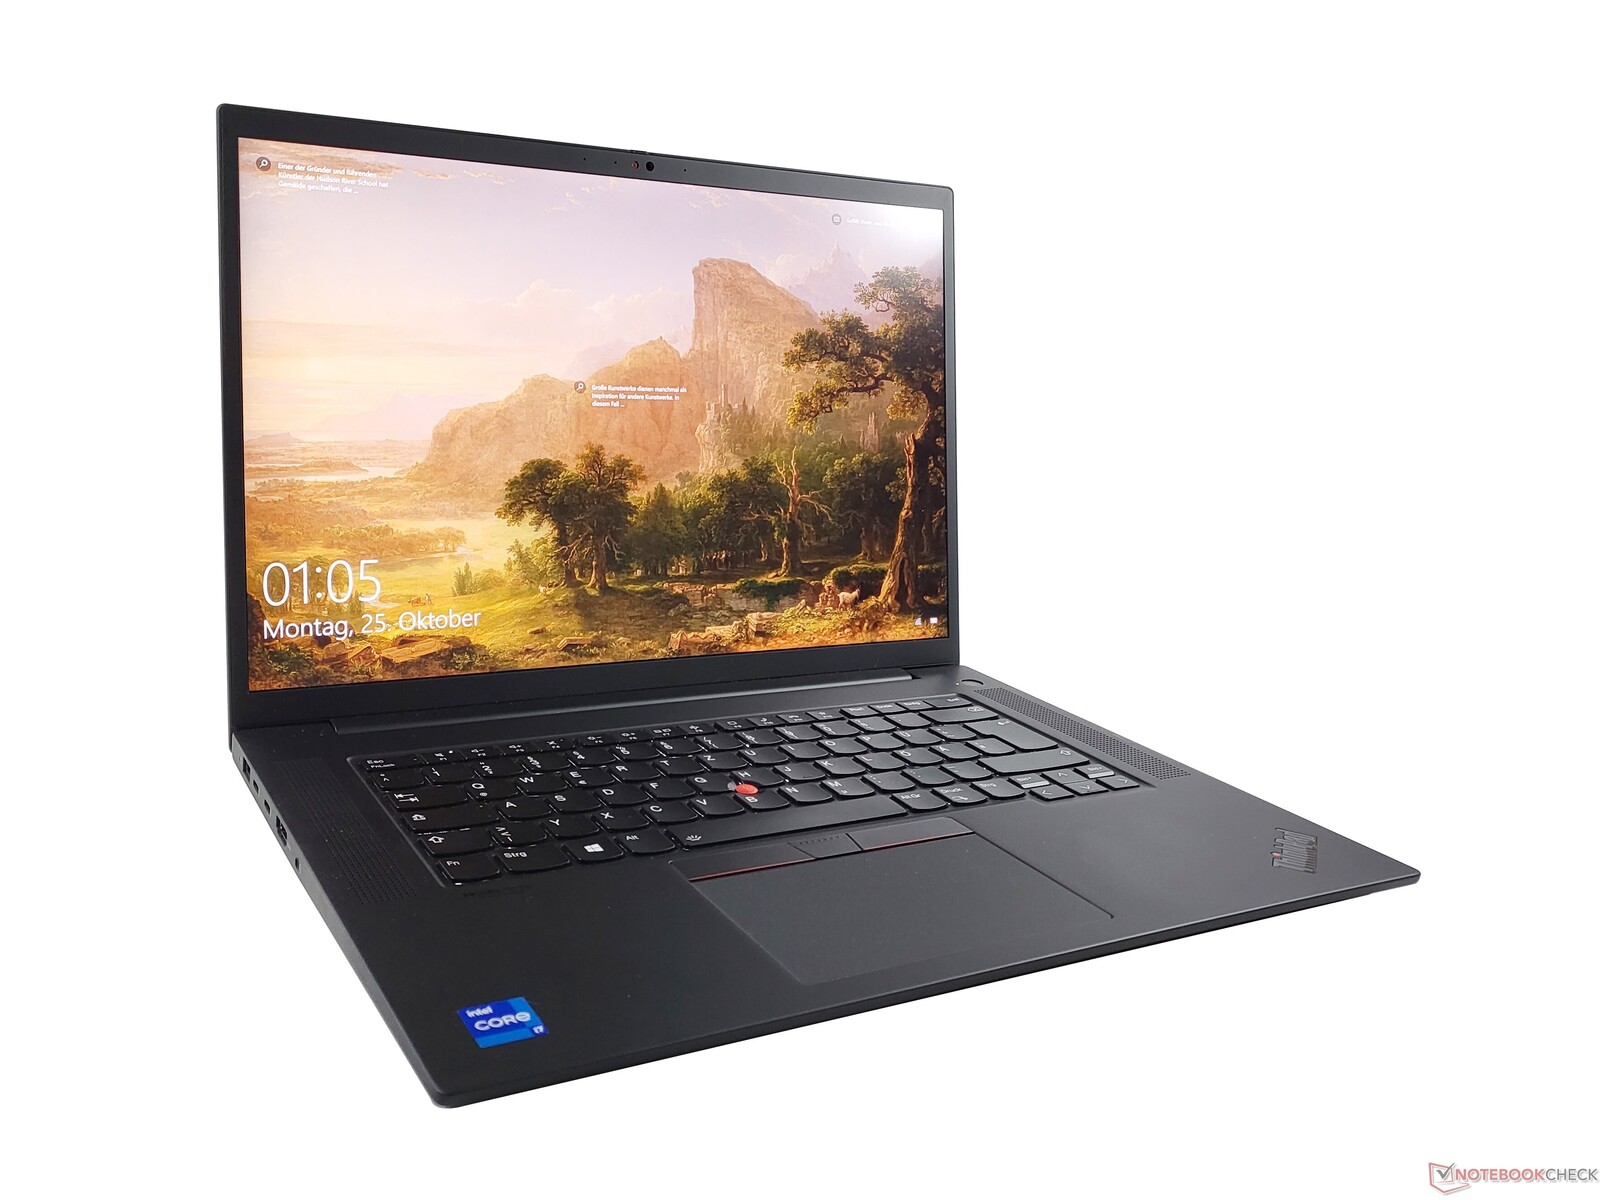
Matte 4K UHD+ display of the Lenovo ThinkPad P1 G4 is excellent


The Lenovo ThinkPad P1 Gen 4 is available with three different 16-inch displays in 16:10 format. The basic option, a WQXGA LCD (2,560 x 1,600), we have already tested. Our review unit includes the matte 4K UHD+/WQUXGA screen without touch - the third option is the same display, in glossy, with touch and Wacom digitizer.
The brightness value of 600 cd/m² stated by Lenovo is exceeded by the LG panel with an average of 610 cd/m². In the test field of premium laptops in the 15- to 16-inch format, the screen of Lenovo's ThinkPad P1 G4 is clearly the brightest.
The response times are not particularly good - the WQXGA option is better in this respect. The difference is particularly glaring compared to the OLED display of the HP ZBook Studio 15 G8; the OLED variant of the ThinkPad P1 G3 is unfortunately no longer available in the ThinkPad P1 2021.
| |||||||||||||||||||||||||
Brightness Distribution: 90 %
Center on Battery: 629 cd/m²
Contrast: 1537:1 (Black: 0.41 cd/m²)
ΔE ColorChecker Calman: 2.2 | ∀{0.5-29.43 Ø4.72}
calibrated: 1
ΔE Greyscale Calman: 2.7 | ∀{0.09-98 Ø4.97}
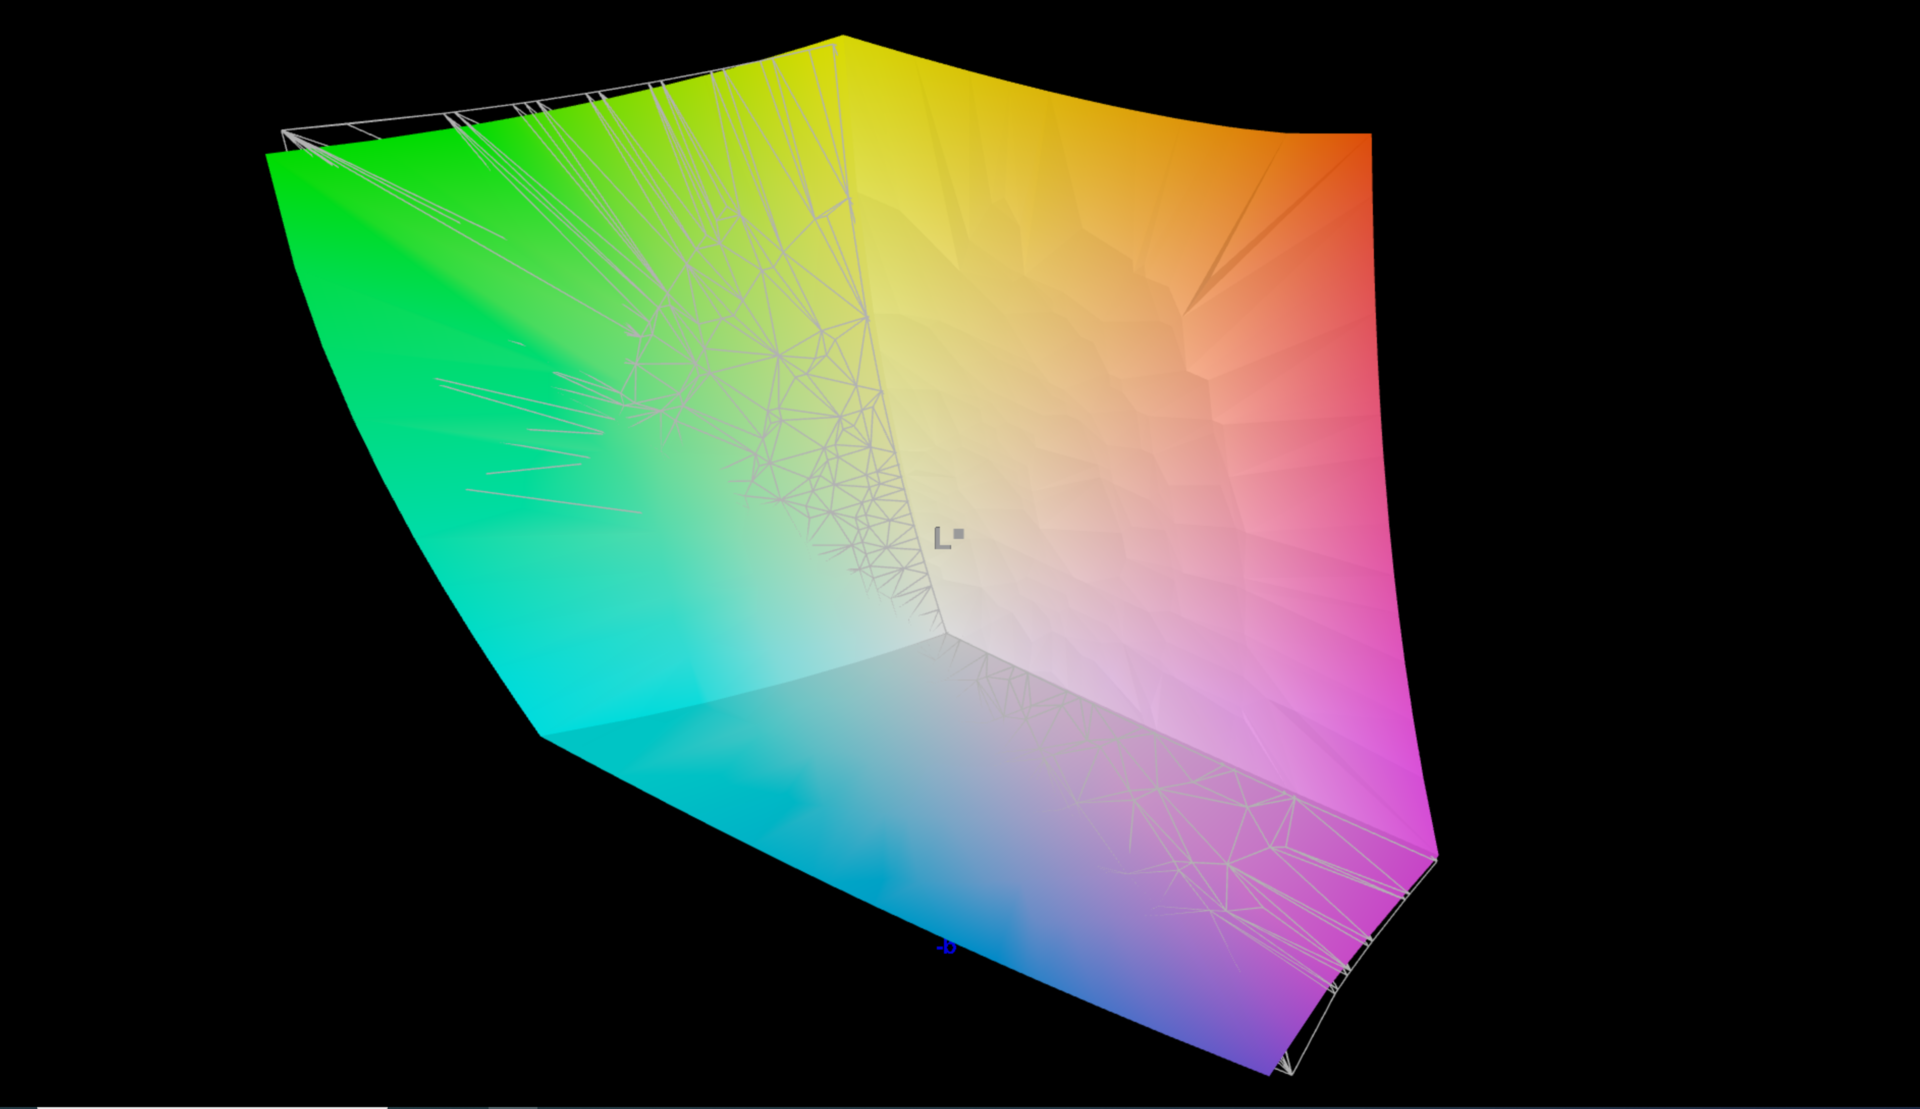
98.9% AdobeRGB 1998 (Argyll 3D)
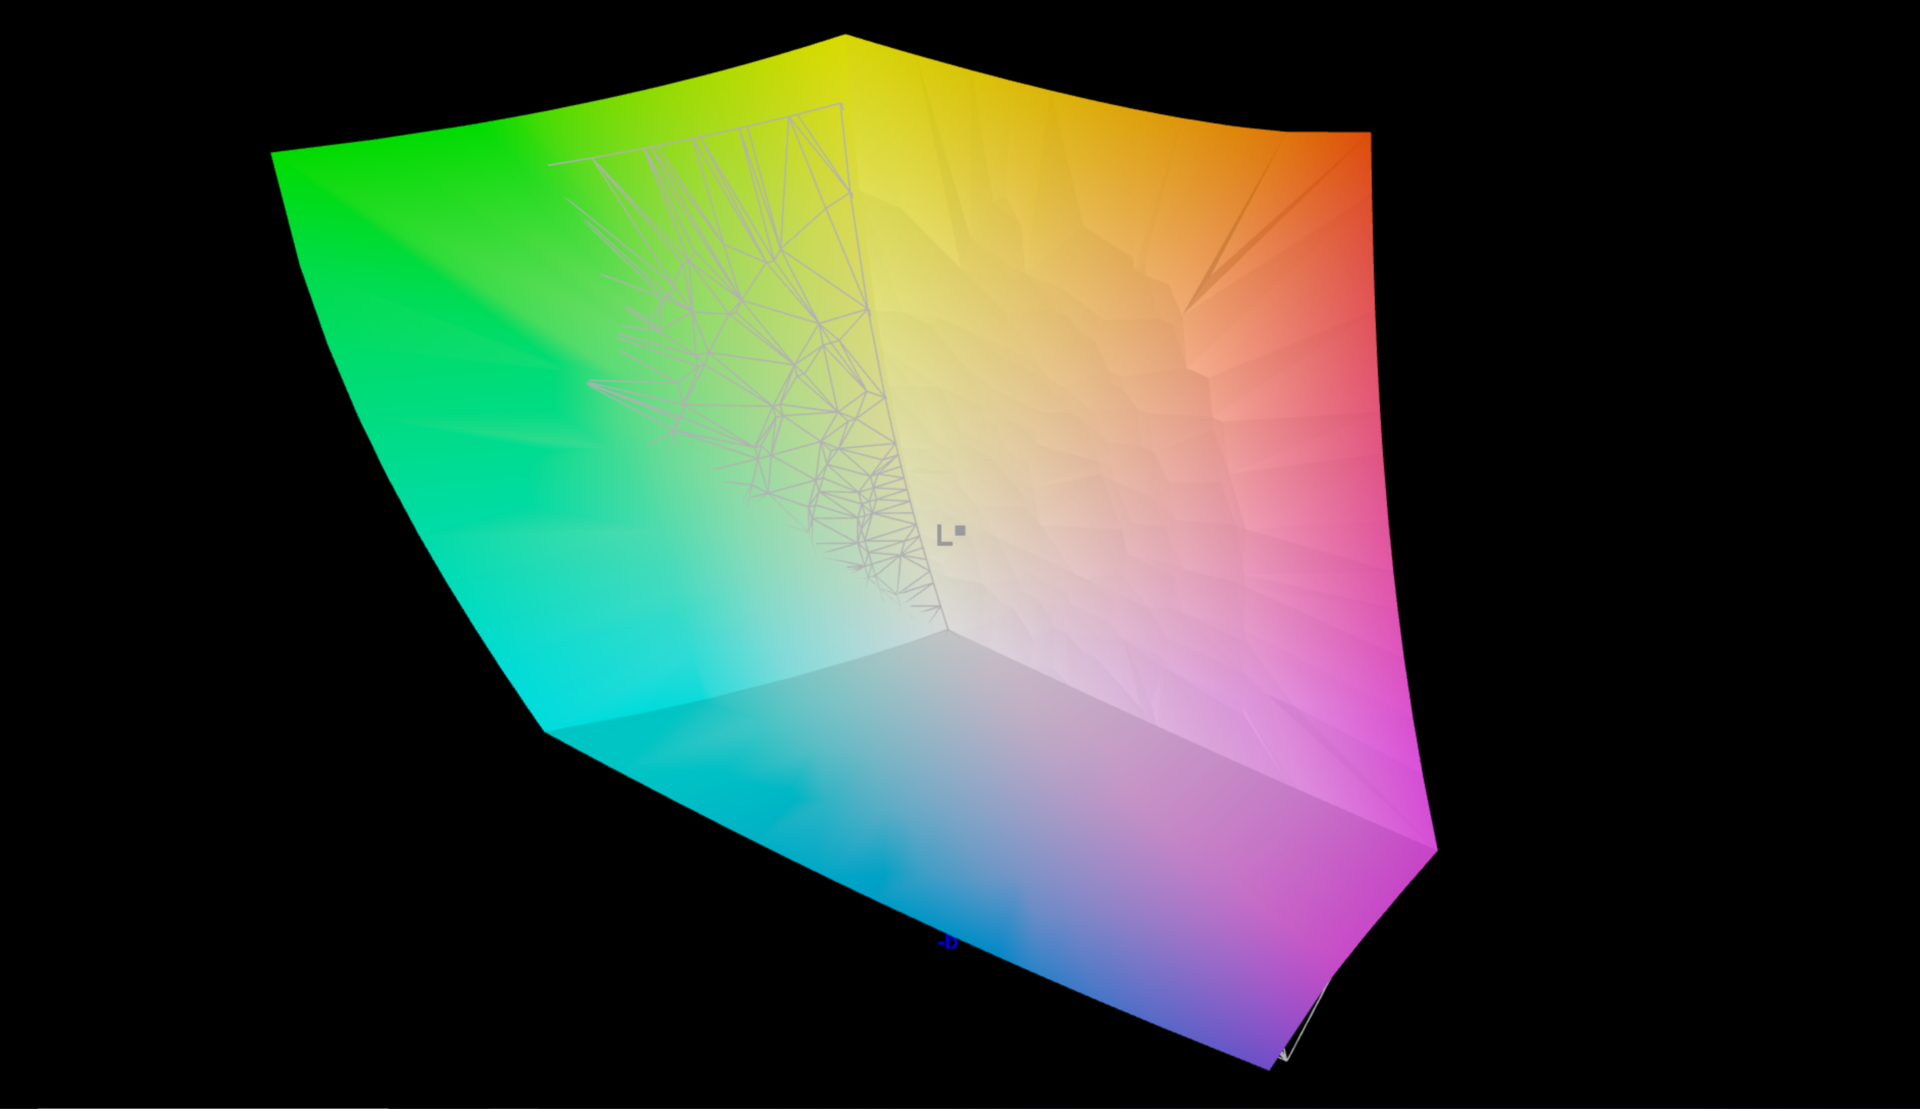
99.4% sRGB (Argyll 3D)
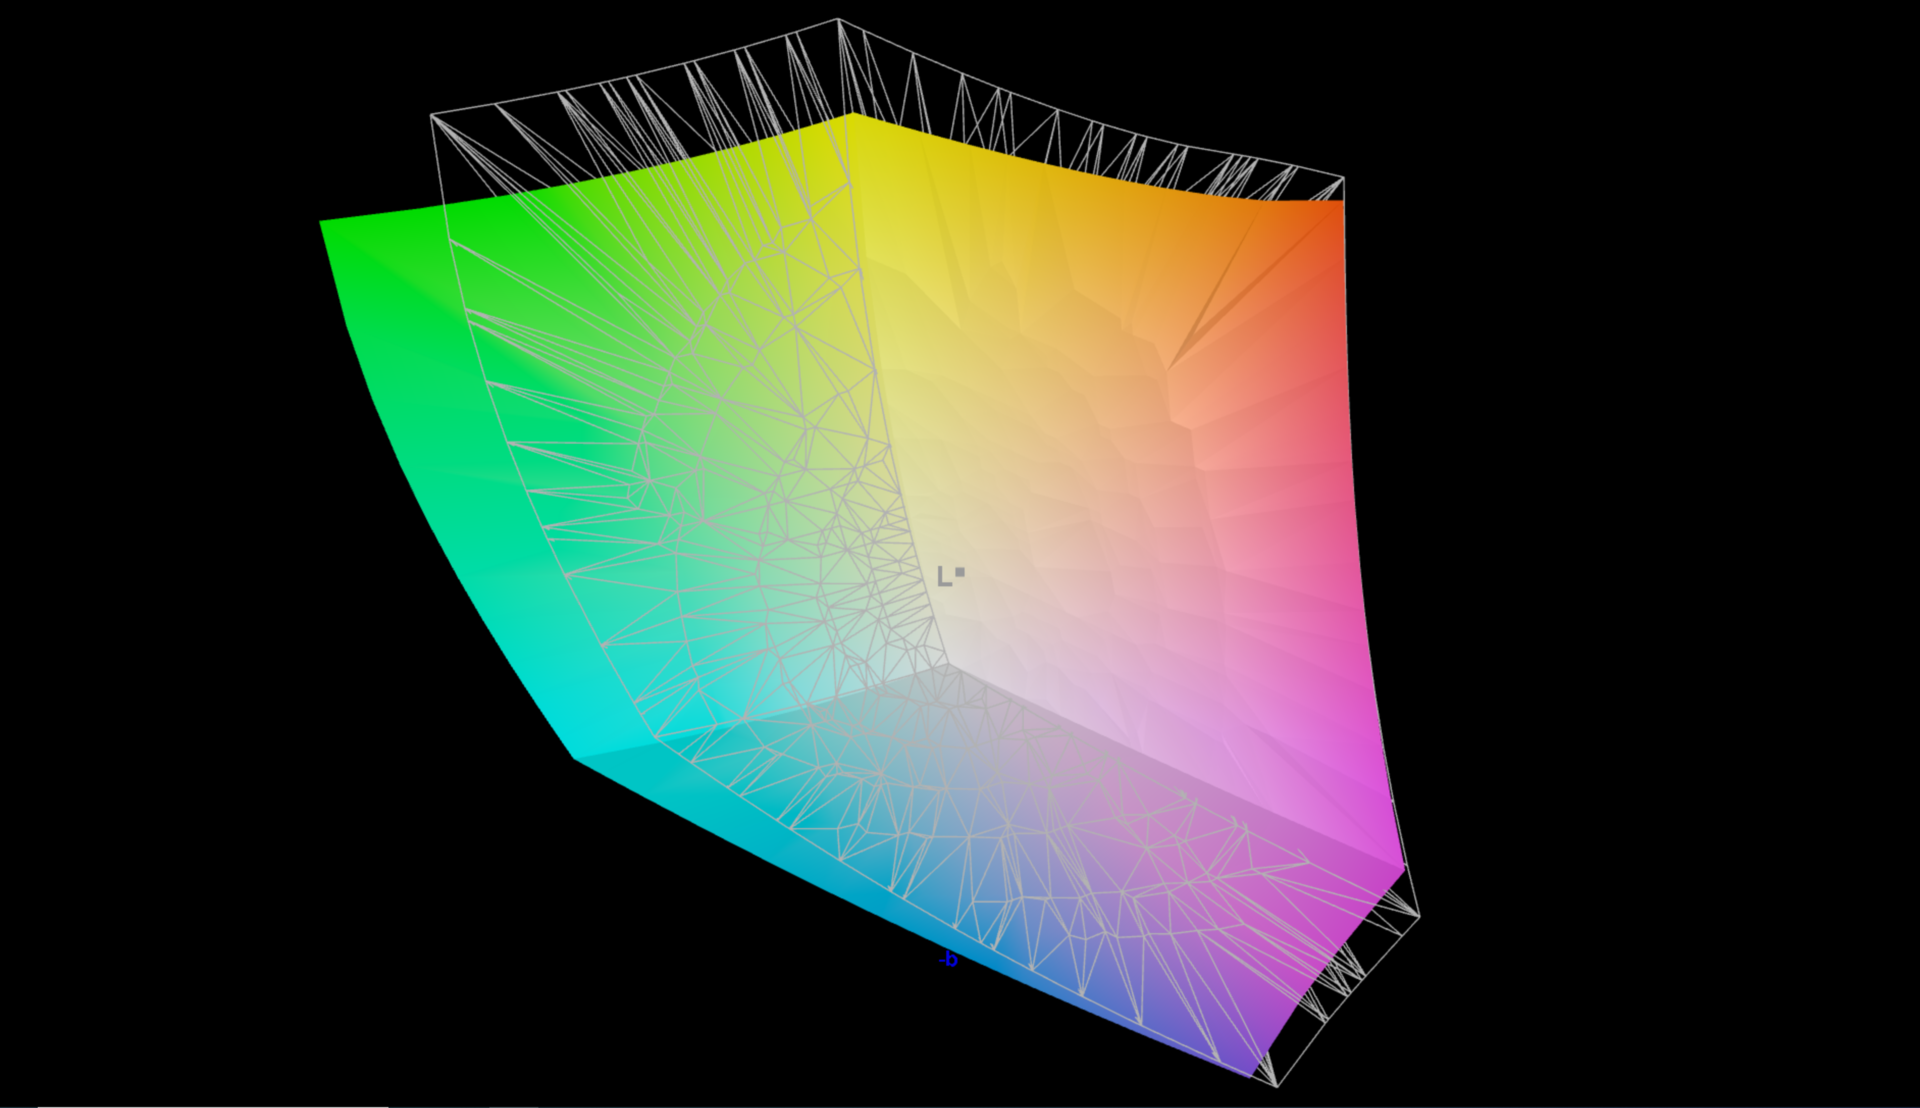
85.7% Display P3 (Argyll 3D)
Gamma: 2.26
CCT: 6886 K
| Lenovo ThinkPad P1 G4-20Y4S0KS00 LP160UQ1-SPB1, IPS LED, 3840x2400, 16" | Lenovo ThinkPad P1 G4-20Y30017GE B160QAN02.M, IPS, 2560x1600, 16" | Dell Precision 5000 5560 Sharp LQ156R1, IPS, 3840x2400, 15.6" | Apple MacBook Pro 16 2019 i9 5500M APPA044, IPS, 3072x1920, 16" | HP ZBook Studio 15 G8 SDC4145, OLED, 3840x2160, 15.6" | Lenovo ThinkPad X1 Extreme Gen3-20TLS0UV00 N156HCE-GN1, IPS, 1920x1080, 15.6" | |
|---|---|---|---|---|---|---|
| Display | -10% | 4% | 5% | -25% | ||
| Display P3 Coverage (%) | 85.7 | 77.3 -10% | 94.9 11% | 99.9 17% | 61 -29% | |
| sRGB Coverage (%) | 99.4 | 99.9 1% | 100 1% | 100 1% | 89.9 -10% | |
| AdobeRGB 1998 Coverage (%) | 98.9 | 78.1 -21% | 100 1% | 95.3 -4% | 62.2 -37% | |
| Response Times | 21% | 9% | -4% | 94% | 34% | |
| Response Time Grey 50% / Grey 80% * (ms) | 55.2 ? | 40.8 ? 26% | 47.2 ? 14% | 52.4 ? 5% | 2.4 ? 96% | 33.6 ? 39% |
| Response Time Black / White * (ms) | 31.2 ? | 26.4 ? 15% | 30.4 ? 3% | 34.9 ? -12% | 2.4 ? 92% | 22.4 ? 28% |
| PWM Frequency (Hz) | 131700 | 240.4 ? | 26040 ? | |||
| Screen | -17% | -28% | -1% | -67% | -6% | |
| Brightness middle (cd/m²) | 630 | 420 -33% | 501.5 -20% | 519 -18% | 379.6 -40% | 518 -18% |
| Brightness (cd/m²) | 622 | 401 -36% | 467 -25% | 477 -23% | 380 -39% | 513 -18% |
| Brightness Distribution (%) | 90 | 90 0% | 83 -8% | 86 -4% | 95 6% | 88 -2% |
| Black Level * (cd/m²) | 0.41 | 0.3 27% | 0.44 -7% | 0.39 5% | 0.38 7% | |
| Contrast (:1) | 1537 | 1400 -9% | 1140 -26% | 1331 -13% | 1363 -11% | |
| Colorchecker dE 2000 * | 2.2 | 2.5 -14% | 4.73 -115% | 2.28 -4% | 5.15 -134% | 2.1 5% |
| Colorchecker dE 2000 max. * | 5 | 4.9 2% | 8.45 -69% | 6.54 -31% | 7.79 -56% | 4.5 10% |
| Colorchecker dE 2000 calibrated * | 1 | 1.6 -60% | 0.51 49% | 0.86 14% | 3.1 -210% | 1.3 -30% |
| Greyscale dE 2000 * | 2.7 | 3.4 -26% | 3.6 -33% | 0.9 67% | 2.6 4% | 2.7 -0% |
| Gamma | 2.26 97% | 2.24 98% | 2.08 106% | 2145 0% | 1.99 111% | 2.35 94% |
| CCT | 6886 94% | 6479 100% | 6447 101% | 6572 99% | 6166 105% | 7042 92% |
| Color Space (Percent of AdobeRGB 1998) (%) | 78 | 57.7 | ||||
| Color Space (Percent of sRGB) (%) | 90.4 | |||||
| Total Average (Program / Settings) | -2% /
-10% | -5% /
-16% | -3% /
-1% | 11% /
-22% | 1% /
-5% |
* ... smaller is better
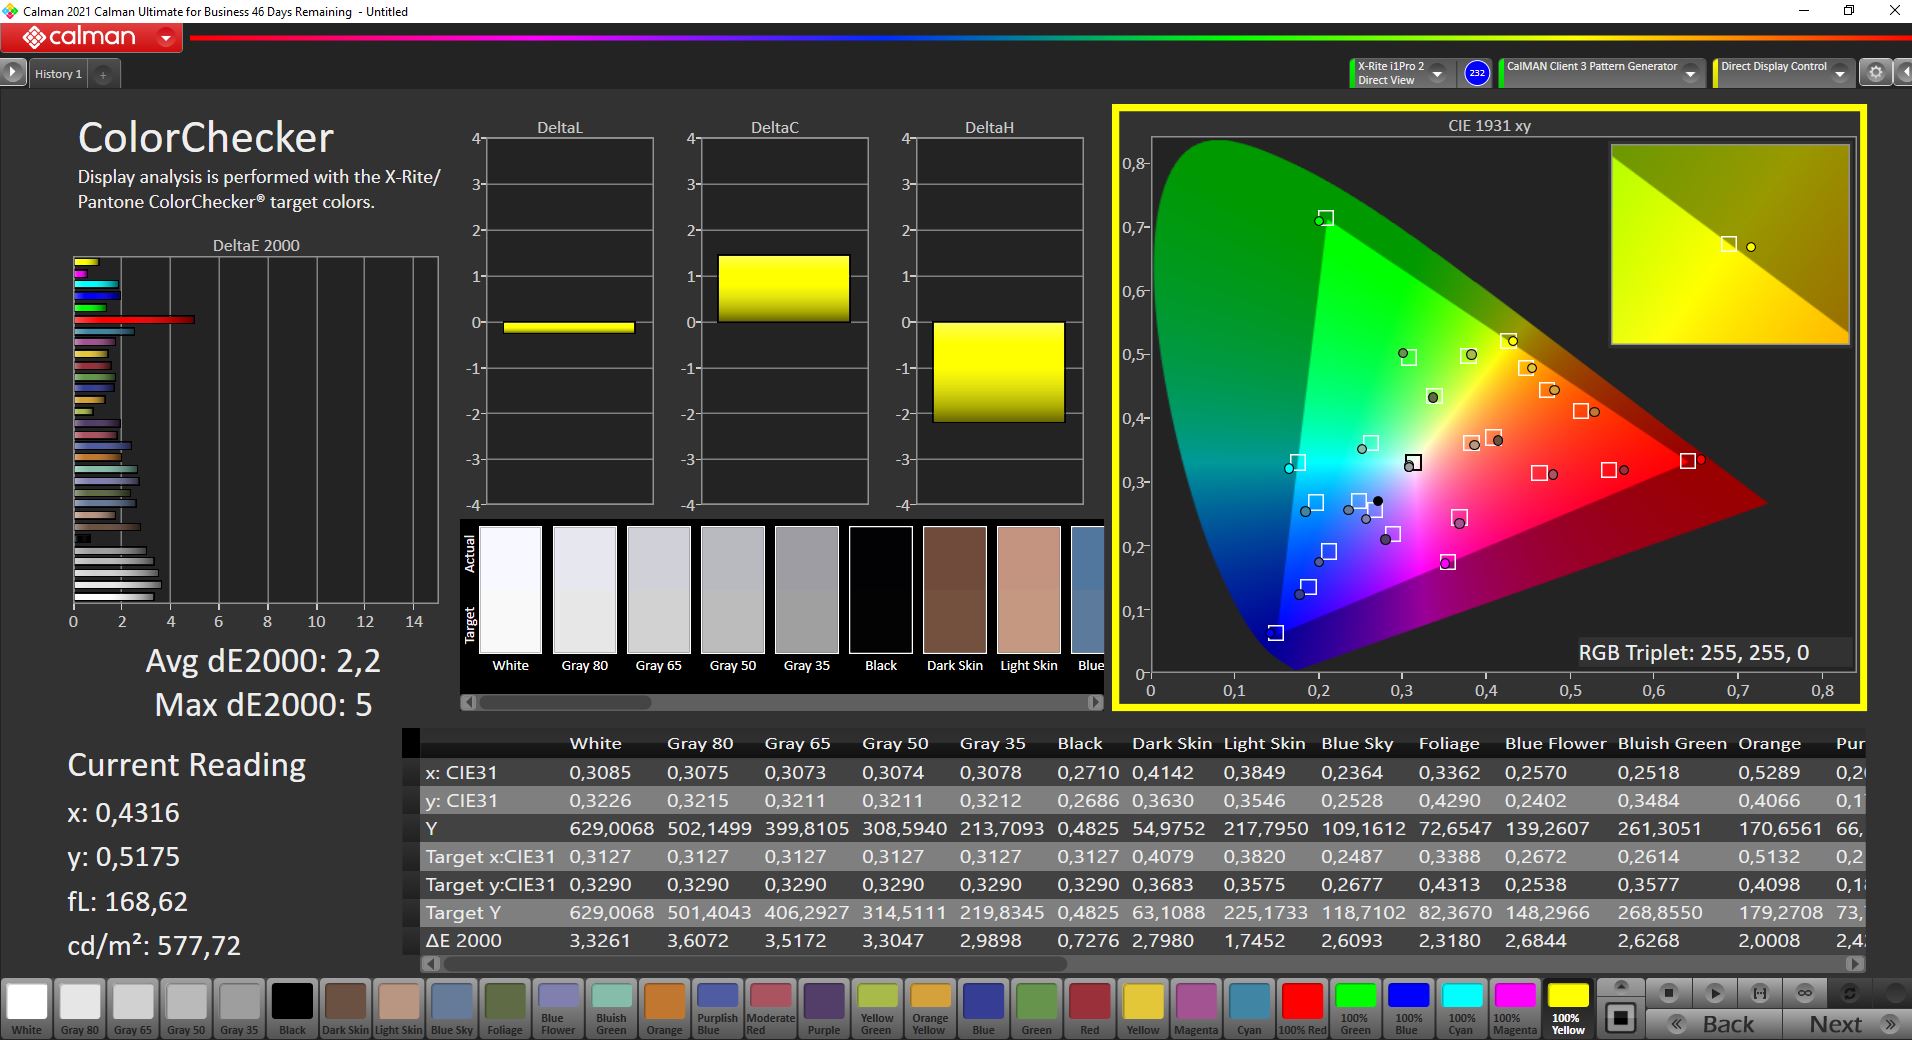
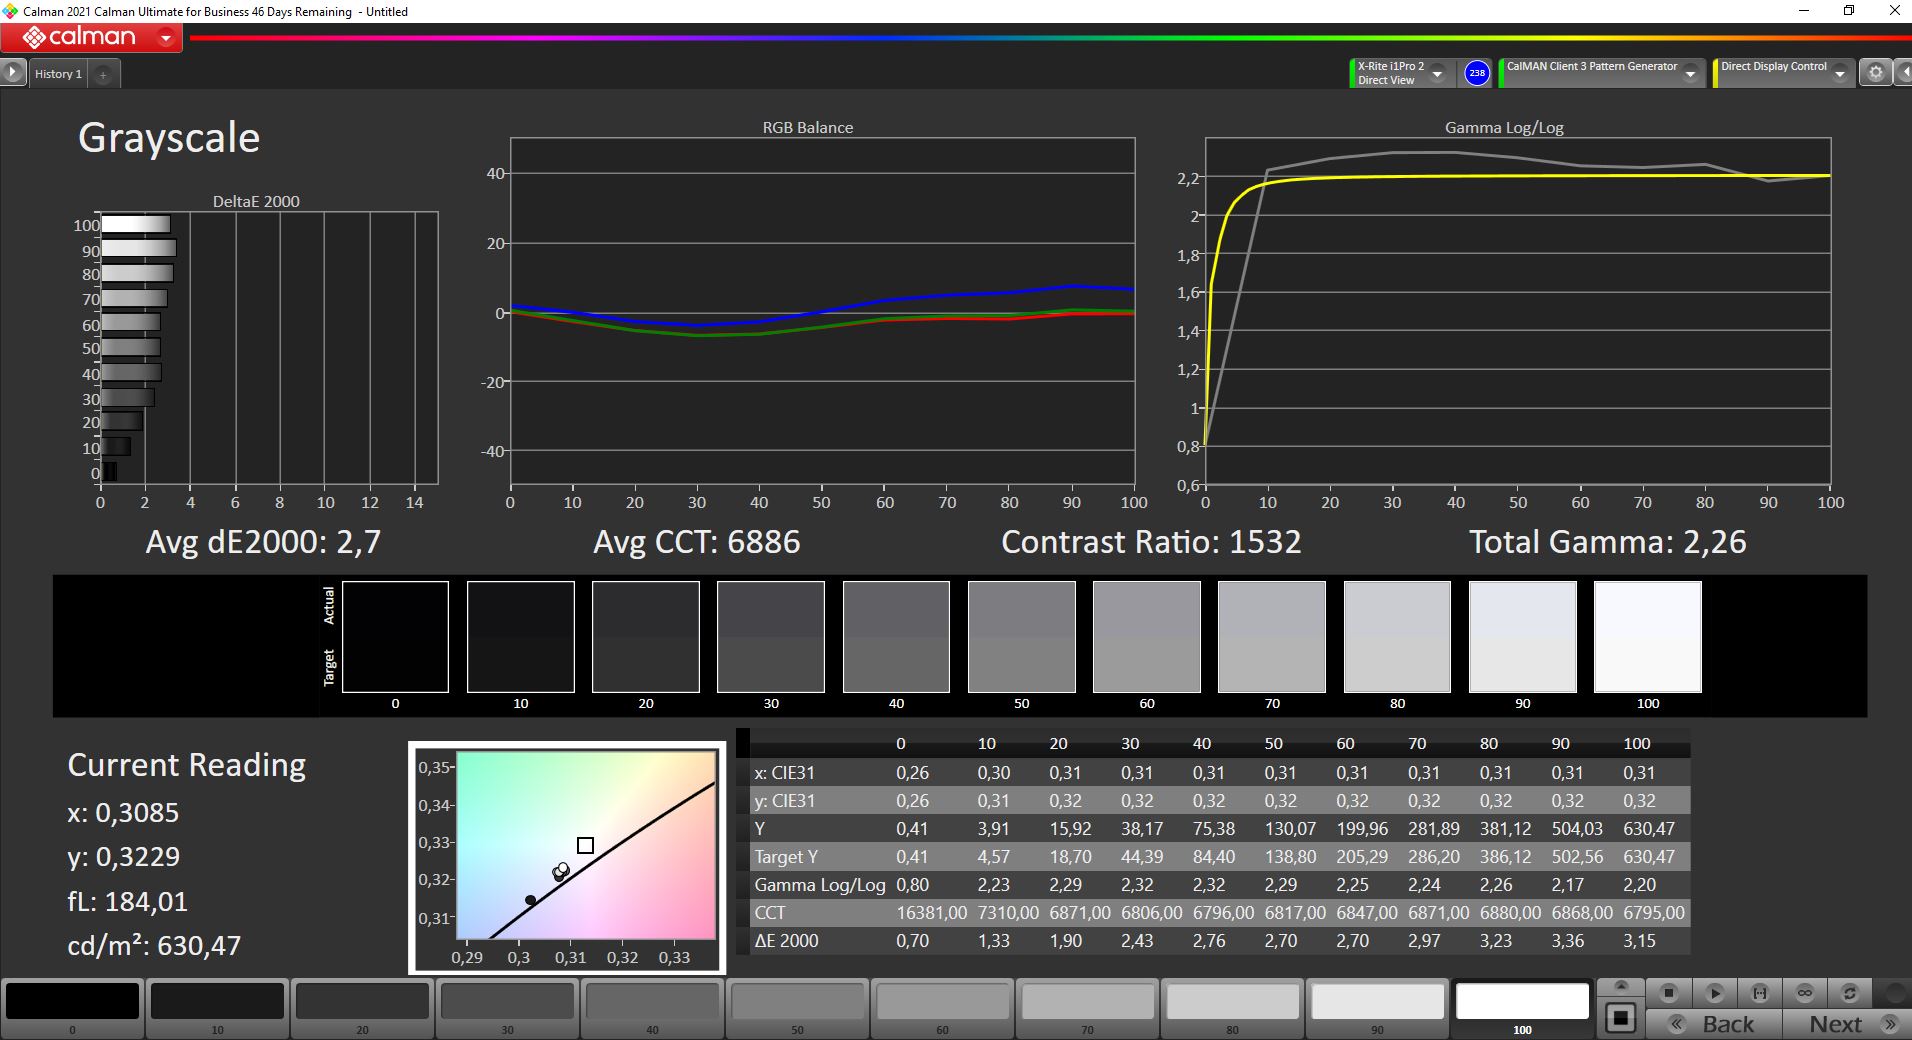
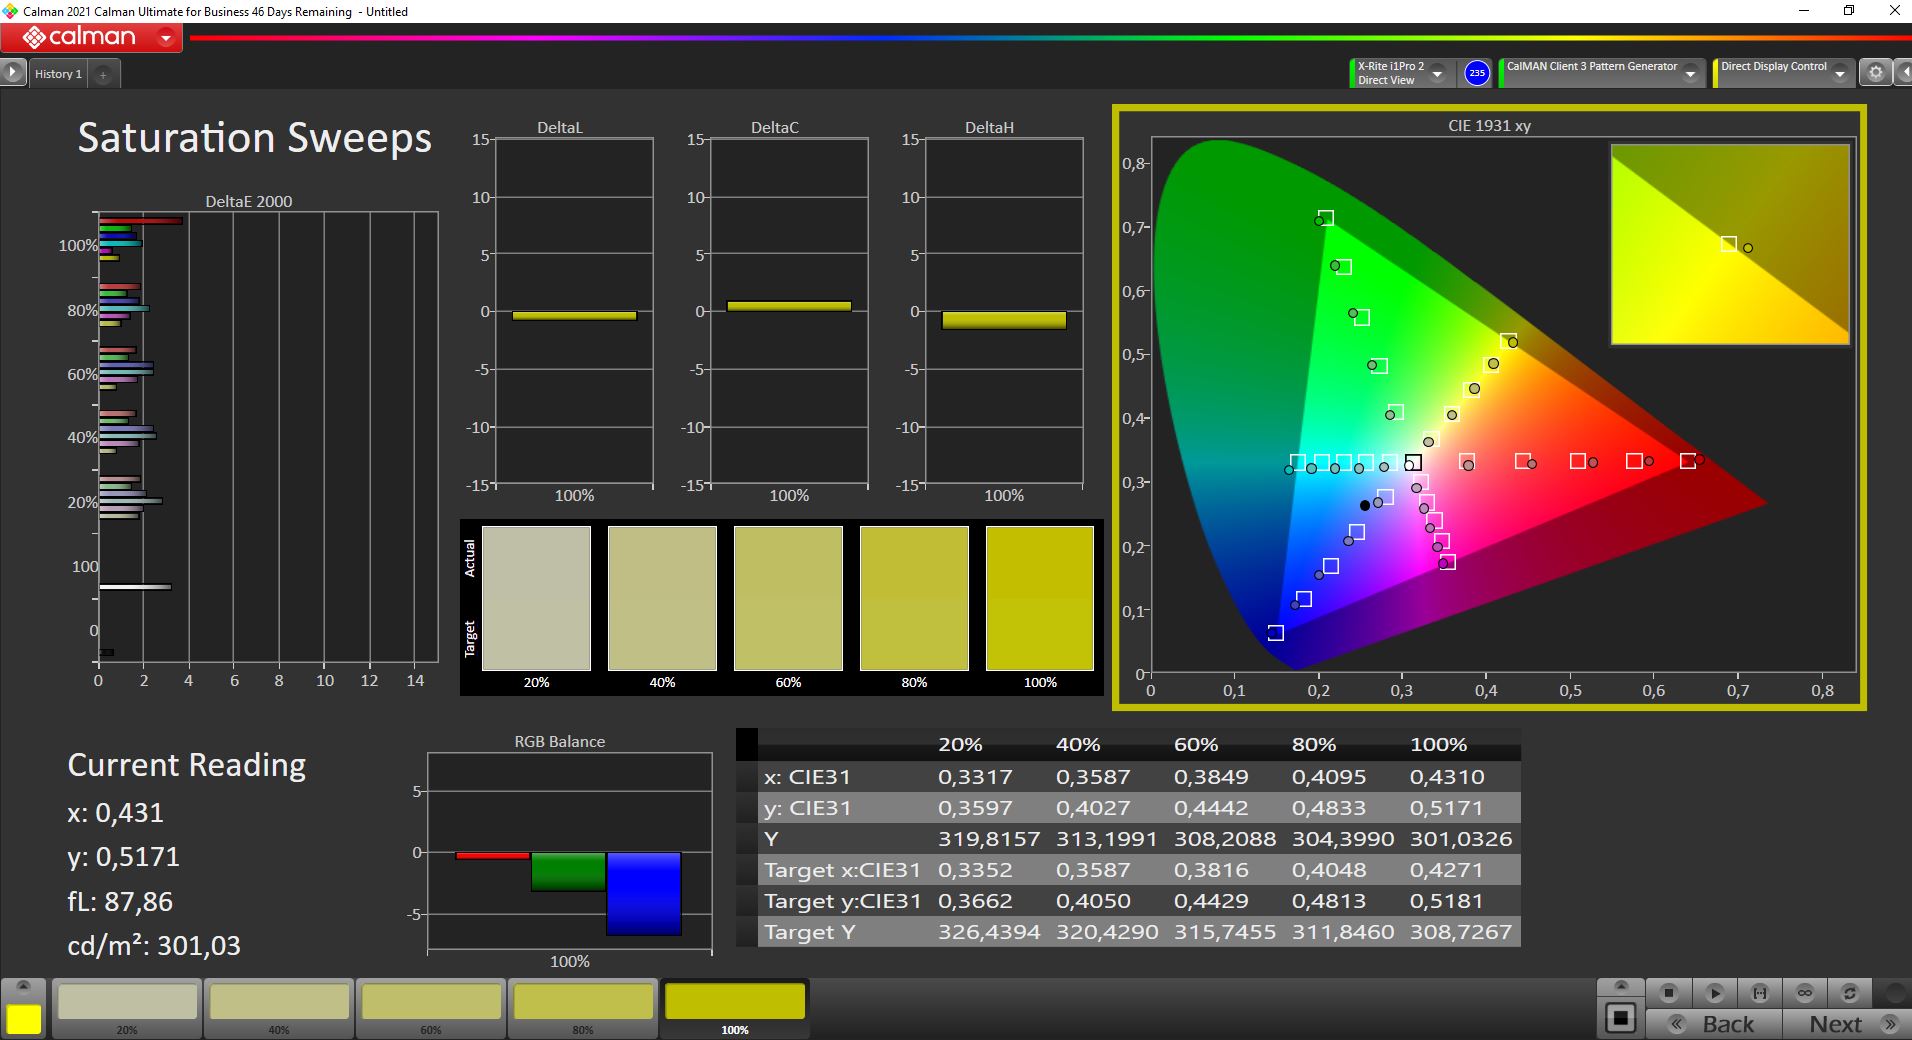
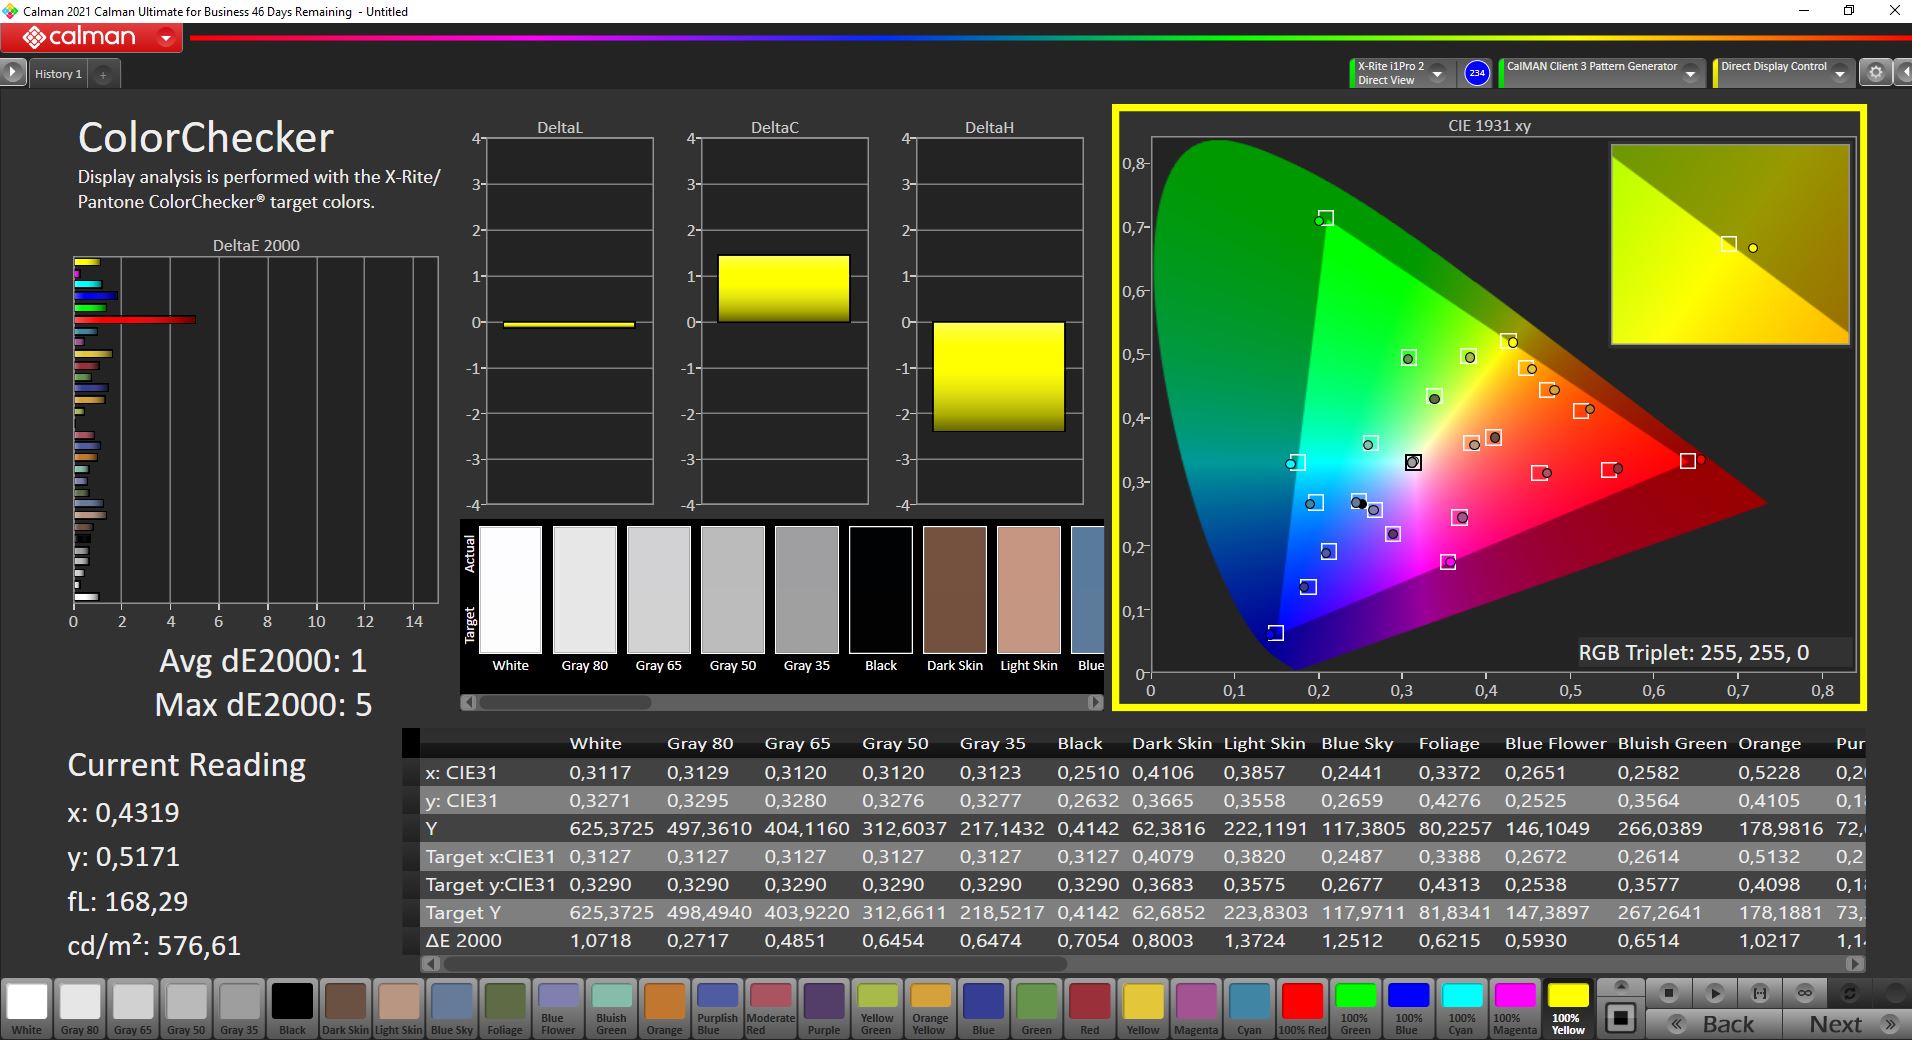
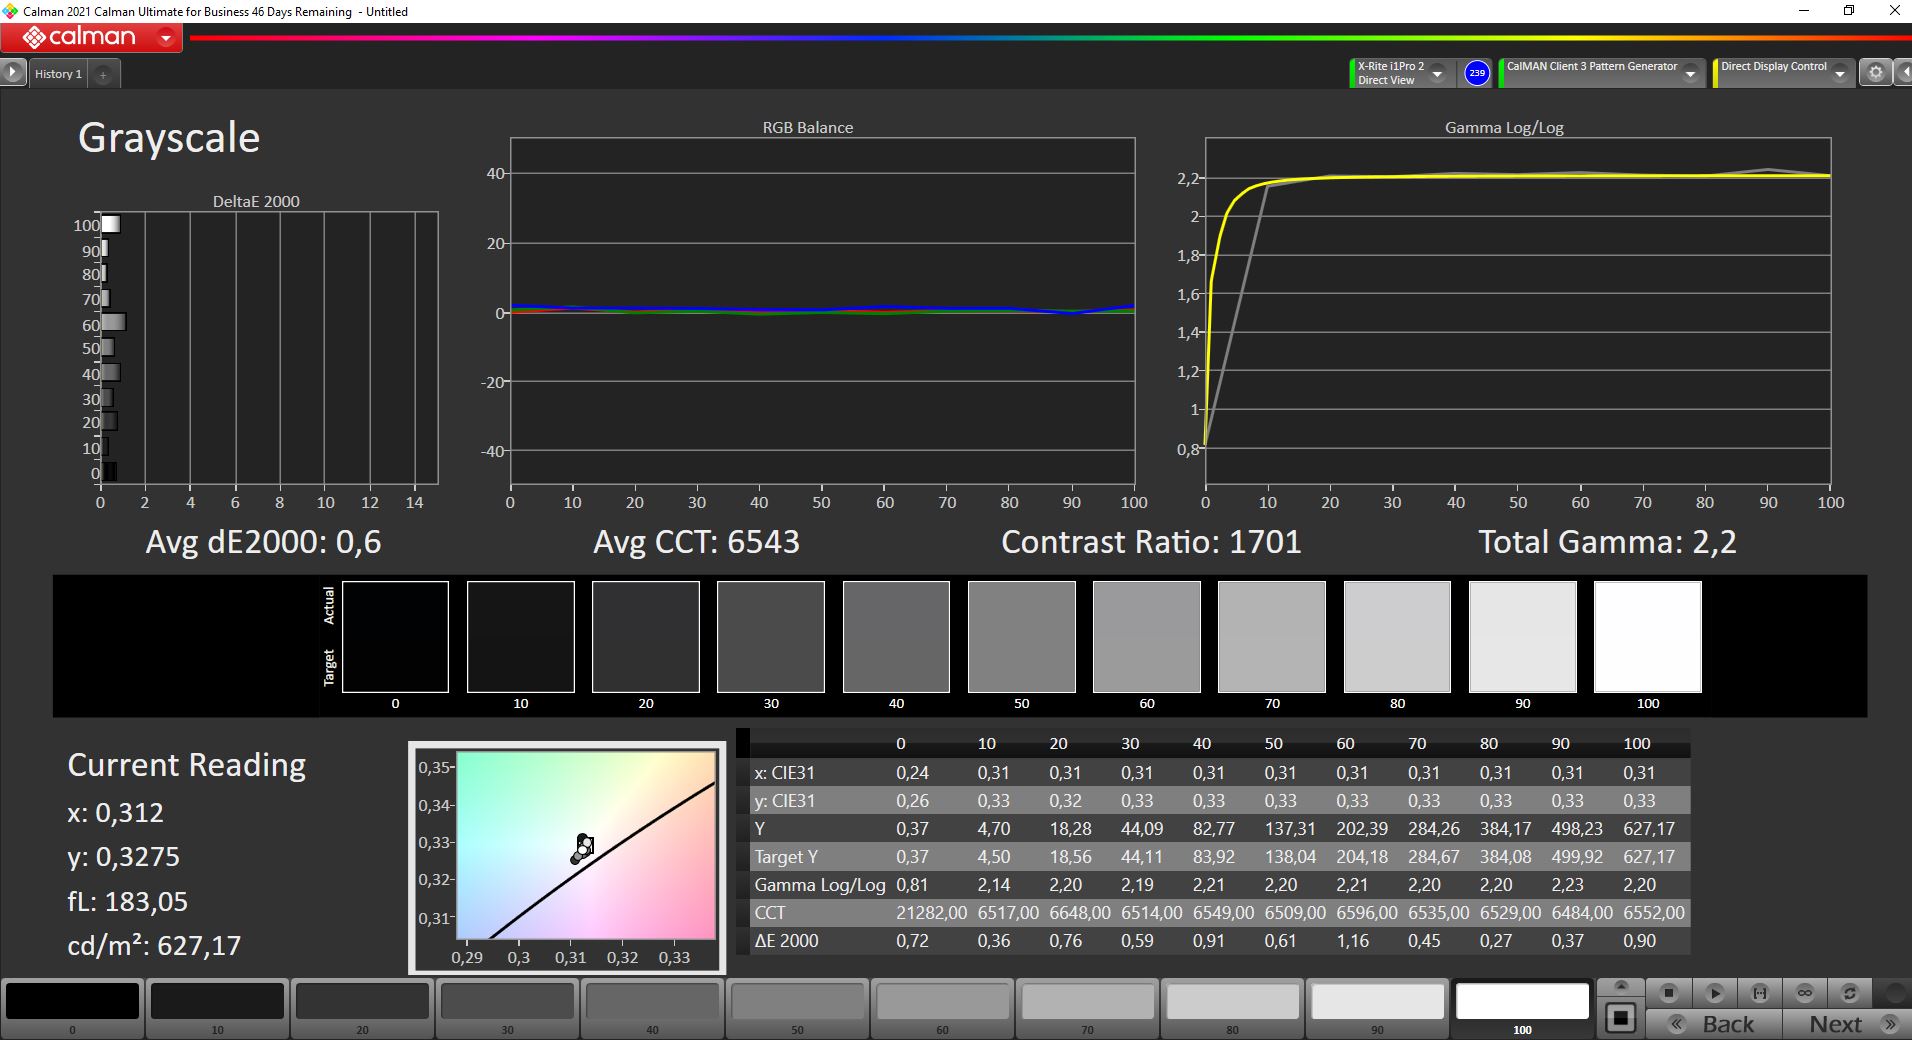

Lenovo advertises the WQUXGA screen installed here with a factory calibration. In fact, we measure pretty good values ex-factory with Calman and the X-Rite i1Pro 2. A DeltaE value of 2.2 for the color values means that the deviations are minor. However, there was still room for improvement. After calibration with the X-Rite i1Profiler, the DeltaE dropped to 1.0. As always, we provide the corresponding color profile for free download.
The black value of 0.41 cd/m² is not particularly outstanding for an IPS LED display, but the high brightness still ensures a good contrast of 1537:1. Together with the high color space coverage of 98.9% of the wide AdobeRGB color space (Lenovo advertises 100% AdobeRGB), the picture quality of the Lenovo ThinkPad P1 Gen 4 is excellent, and the 8-bit panel is well suited for image editing.
The Lenovo ThinkPad P1 2021 easily masters outdoor use. The matte surface helps the bright 4K UHD+ display easily outshine daylight on cloudy days. However, direct sunlight can still be challenging even at 600 cd/m².
Display Response Times
| ↔ Response Time Black to White | ||
|---|---|---|
| 31.2 ms ... rise ↗ and fall ↘ combined | ↗ 16.4 ms rise | 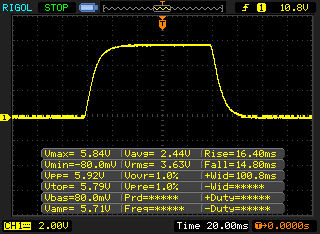 |
| ↘ 14.8 ms fall | ||
| The screen shows slow response rates in our tests and will be unsatisfactory for gamers. In comparison, all tested devices range from 0.1 (minimum) to 240 (maximum) ms. » 84 % of all devices are better. This means that the measured response time is worse than the average of all tested devices (19.8 ms). | ||
| ↔ Response Time 50% Grey to 80% Grey | ||
| 55.2 ms ... rise ↗ and fall ↘ combined | ↗ 26.8 ms rise | 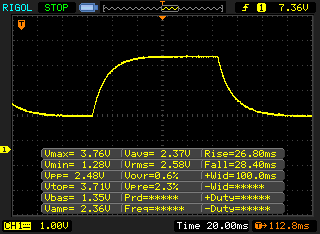 |
| ↘ 28.4 ms fall | ||
| The screen shows slow response rates in our tests and will be unsatisfactory for gamers. In comparison, all tested devices range from 0.165 (minimum) to 636 (maximum) ms. » 92 % of all devices are better. This means that the measured response time is worse than the average of all tested devices (31 ms). | ||
Screen Flickering / PWM (Pulse-Width Modulation)
| Screen flickering / PWM not detected | 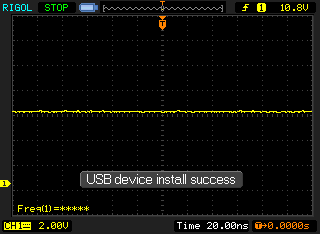 | ||
In comparison: 52 % of all tested devices do not use PWM to dim the display. If PWM was detected, an average of 7747 (minimum: 5 - maximum: 343500) Hz was measured. | |||
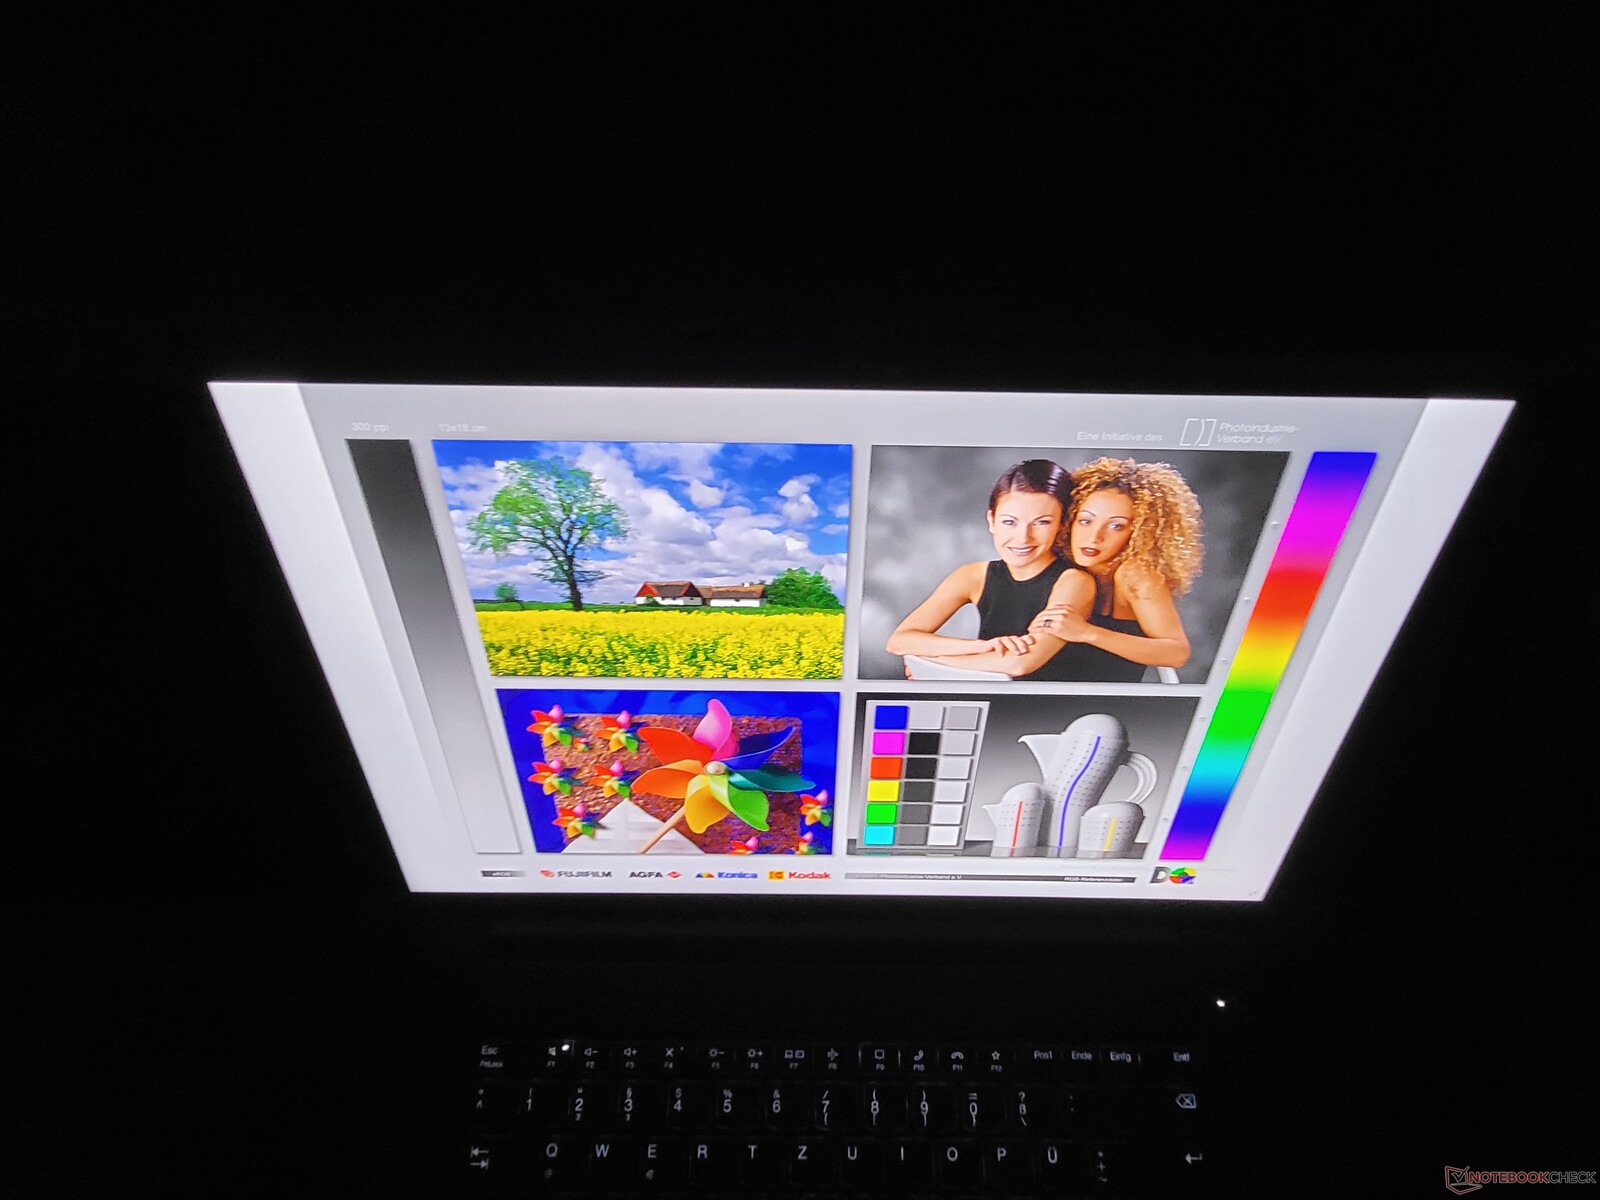
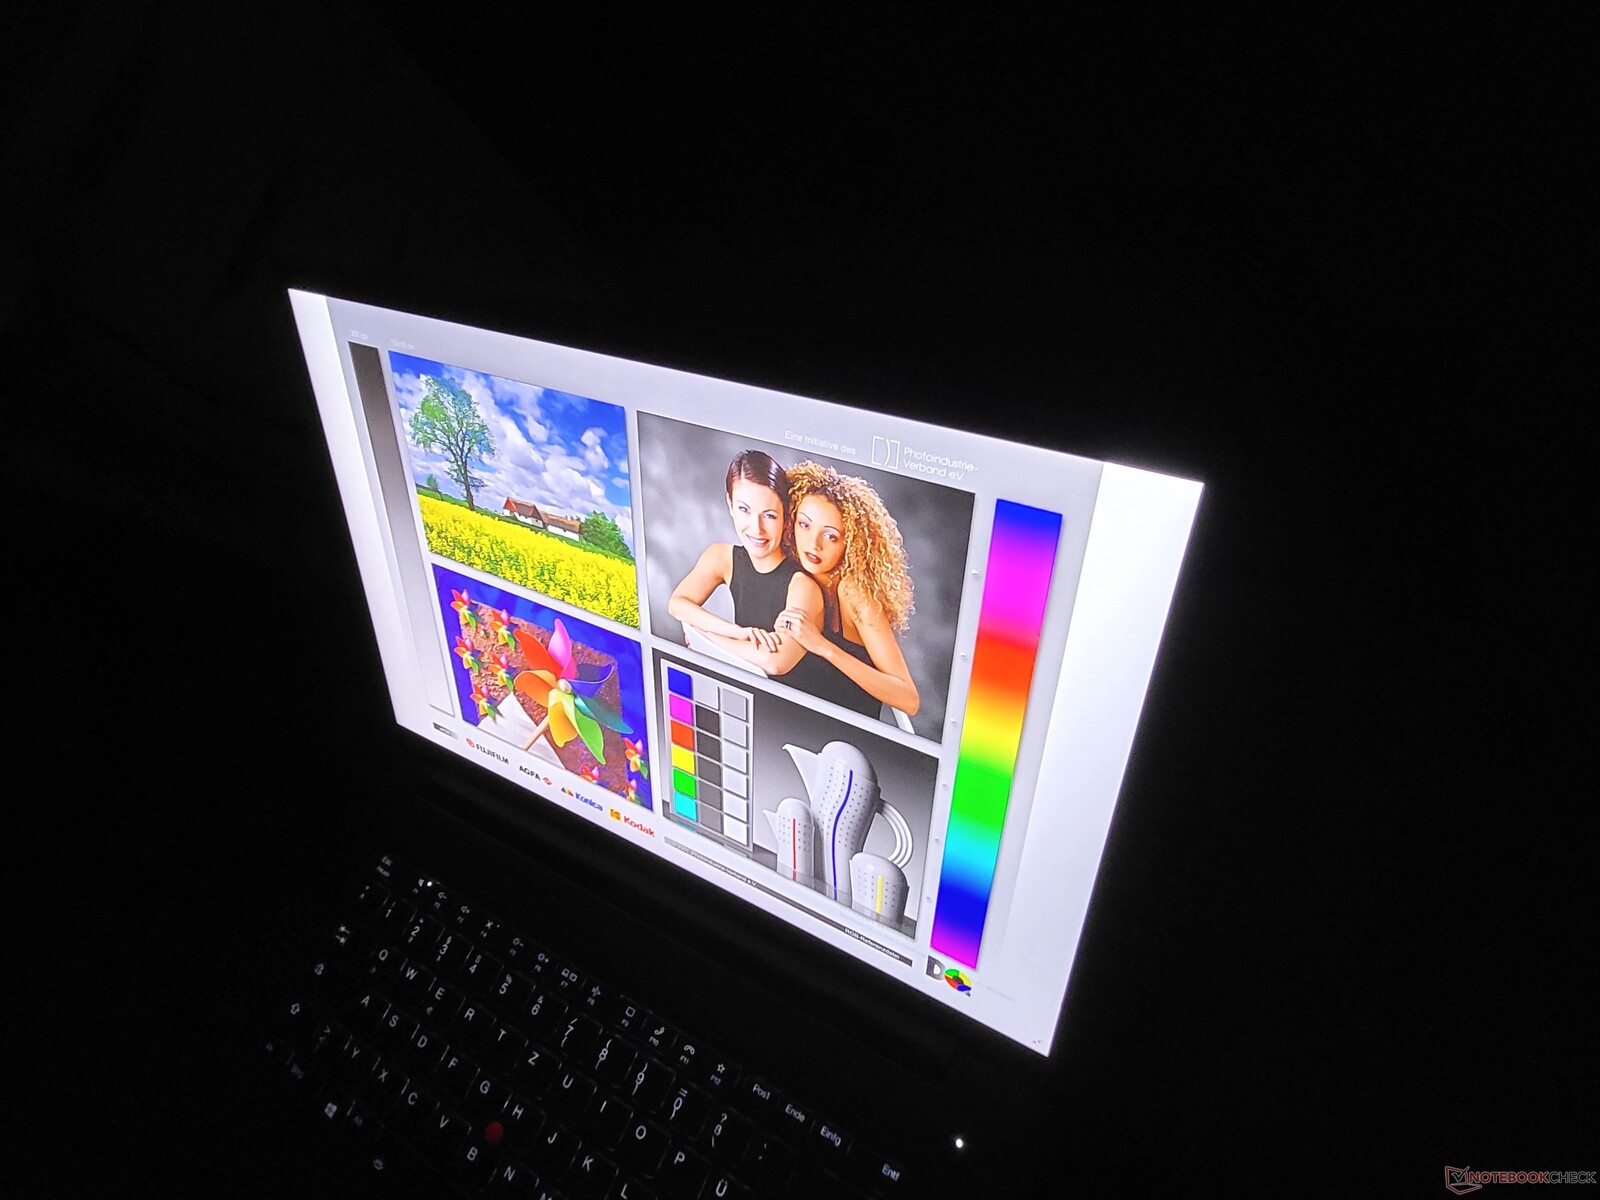
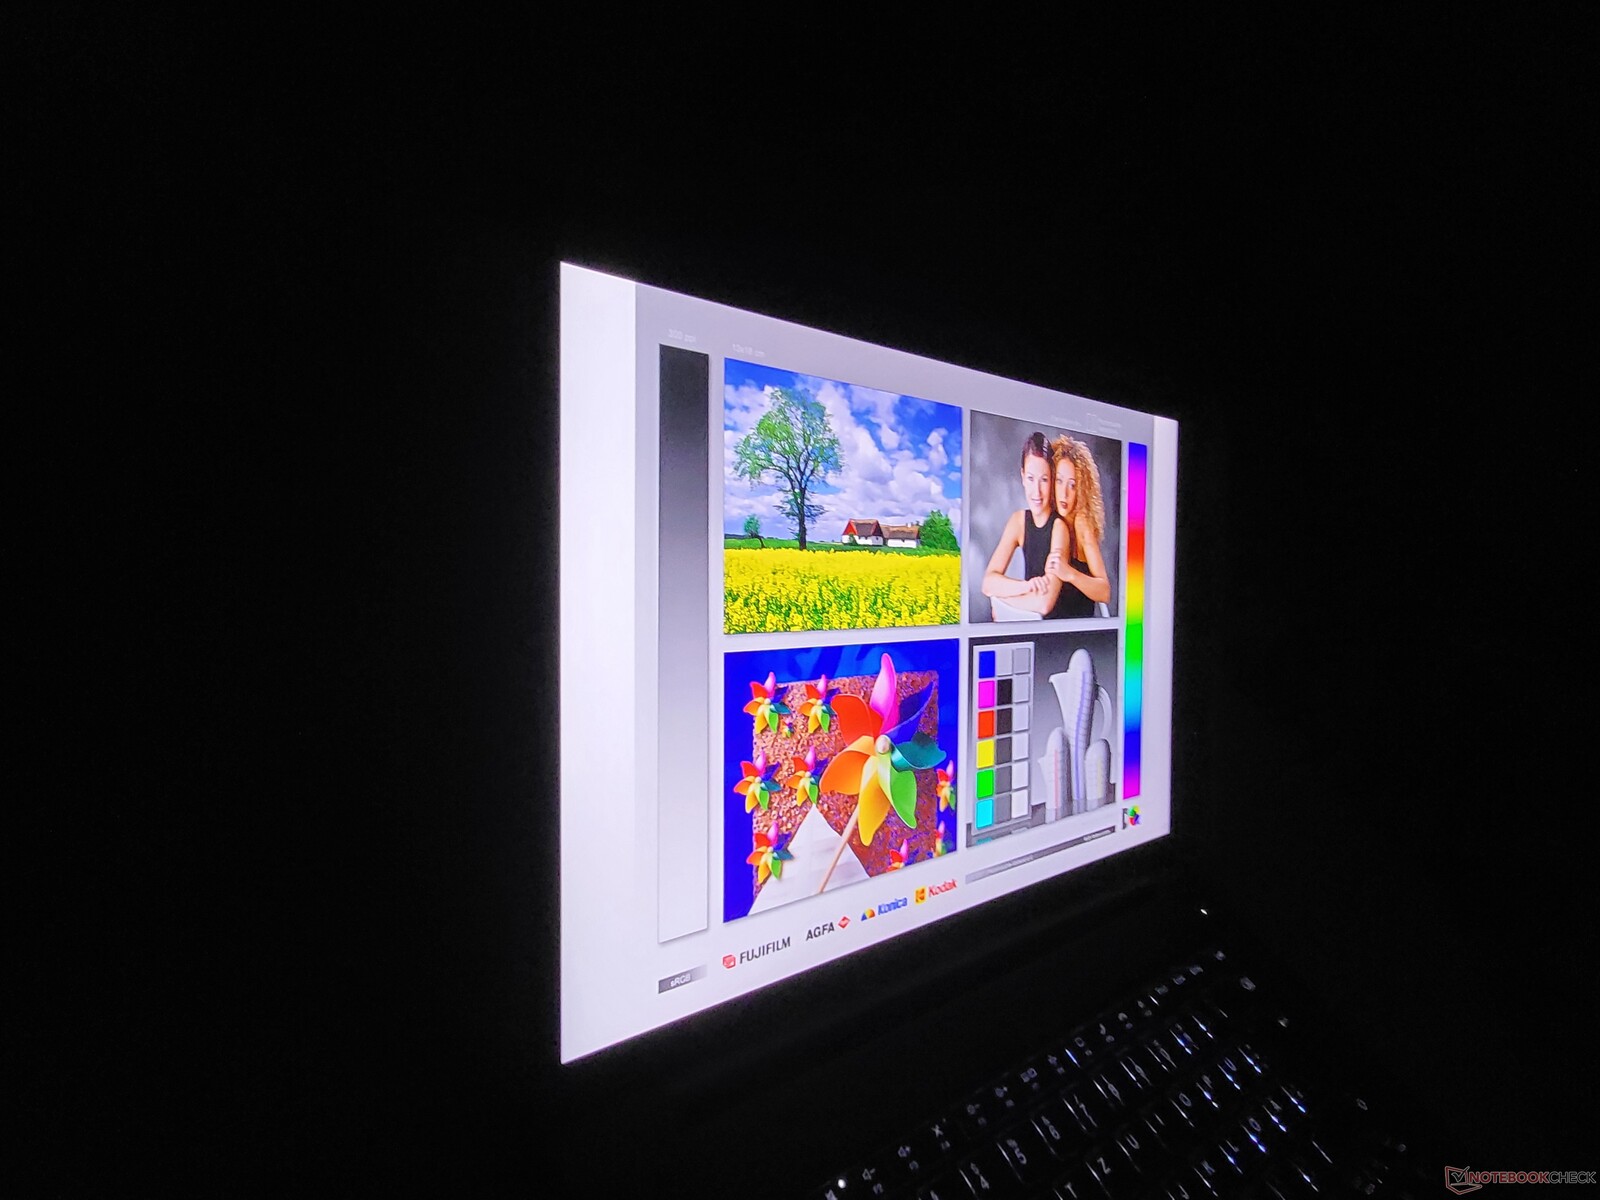
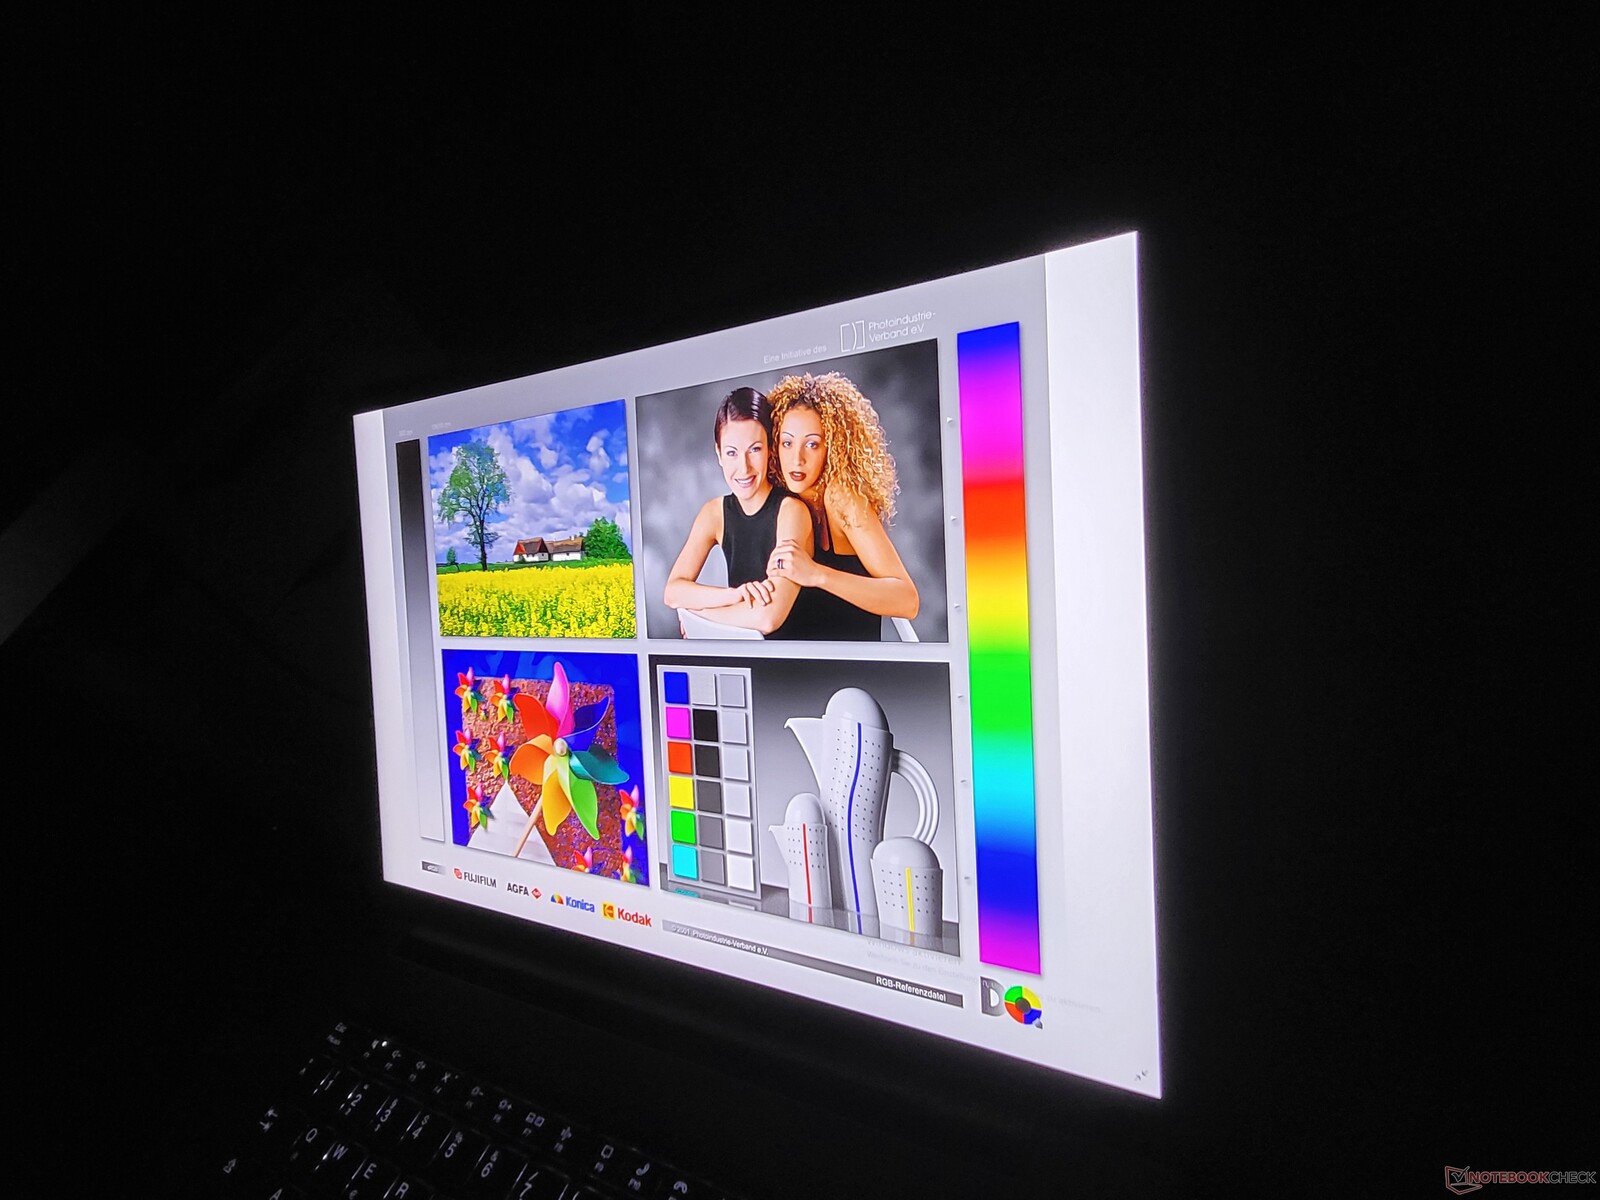
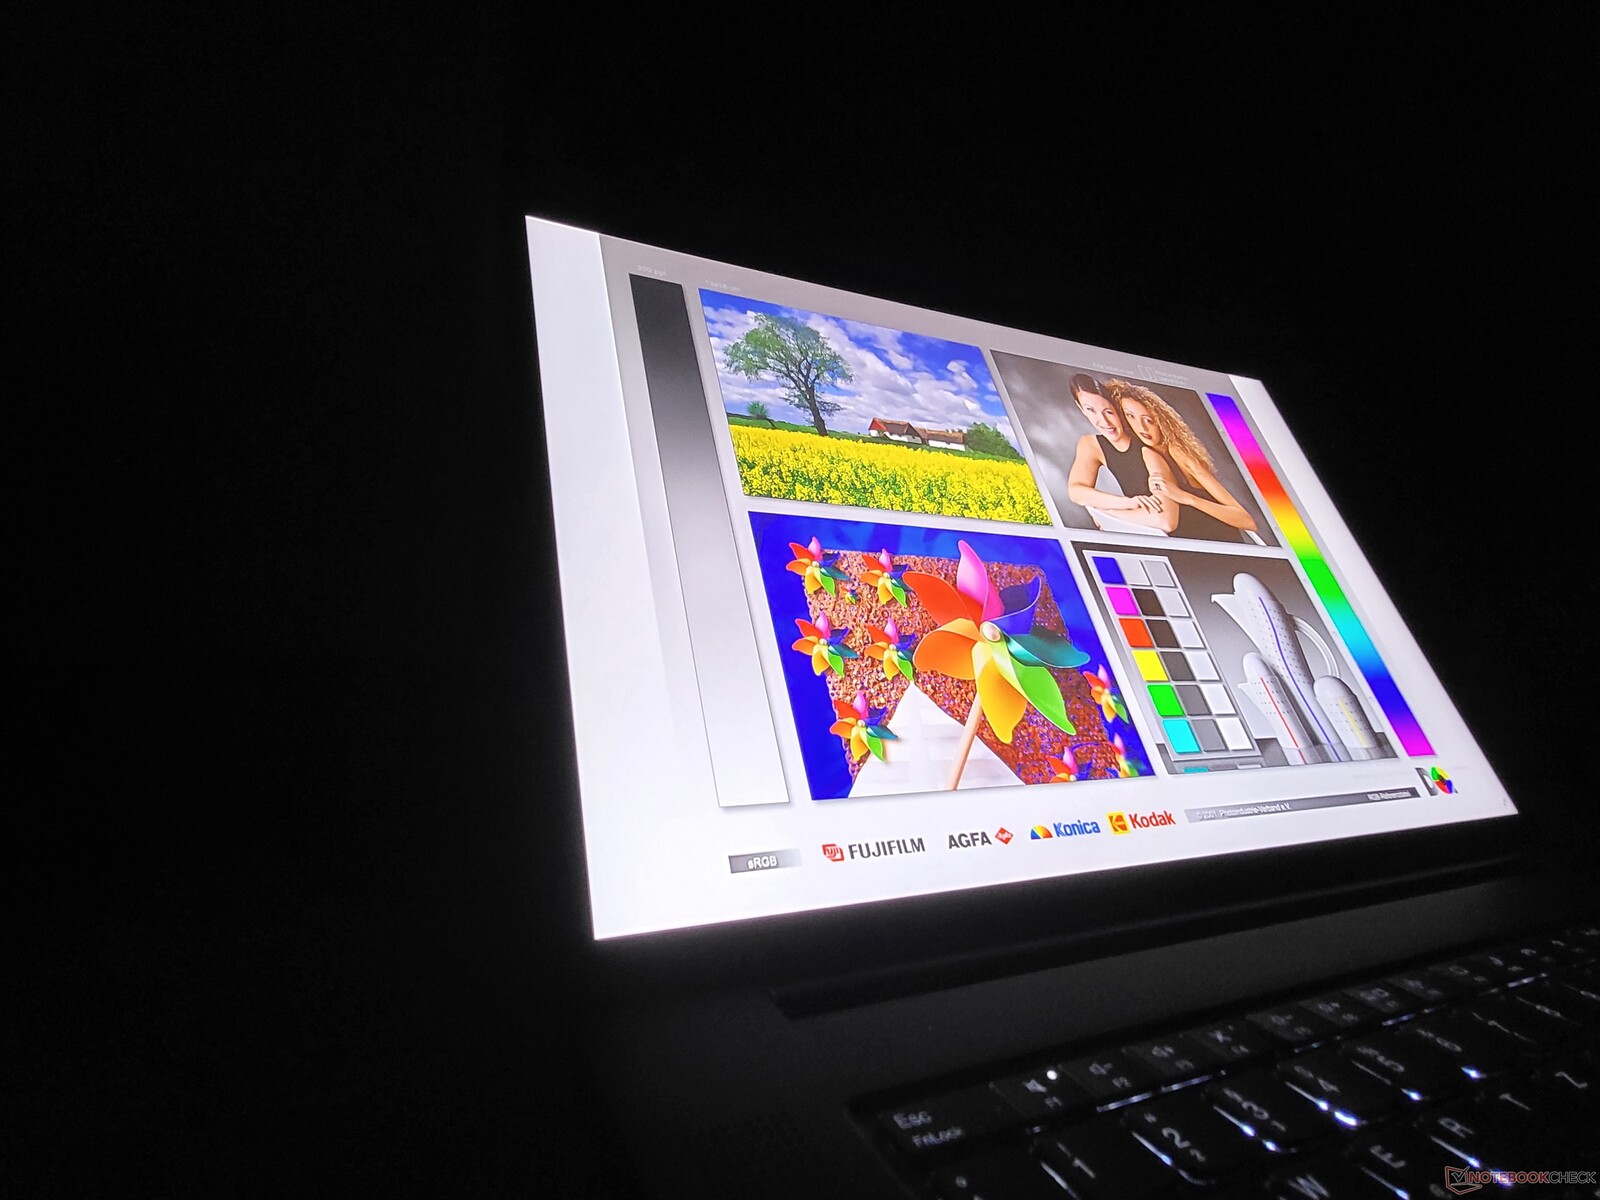
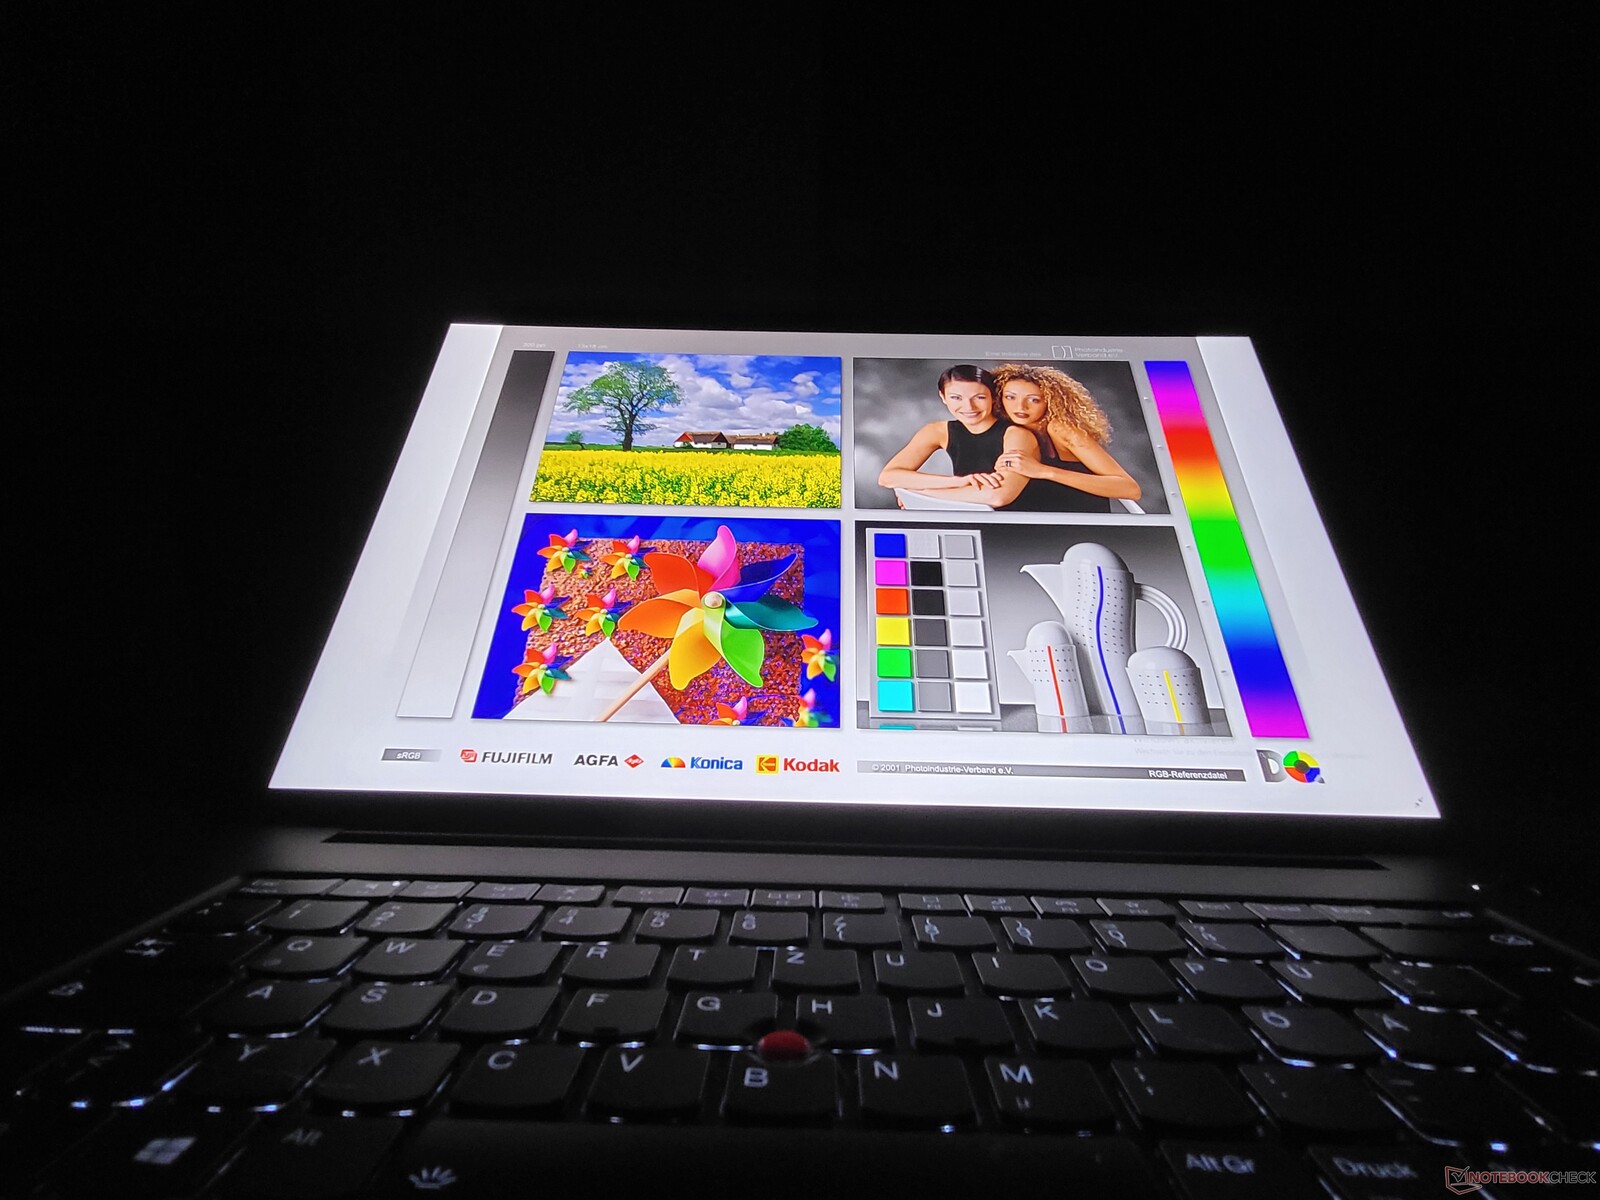
The quality of the IPS technology is reflected in its excellent viewing angle stability, which is also without fault in Lenovo's ThinkPad P1 2021.
Lenovo workstation performance significantly better with VaporChamber
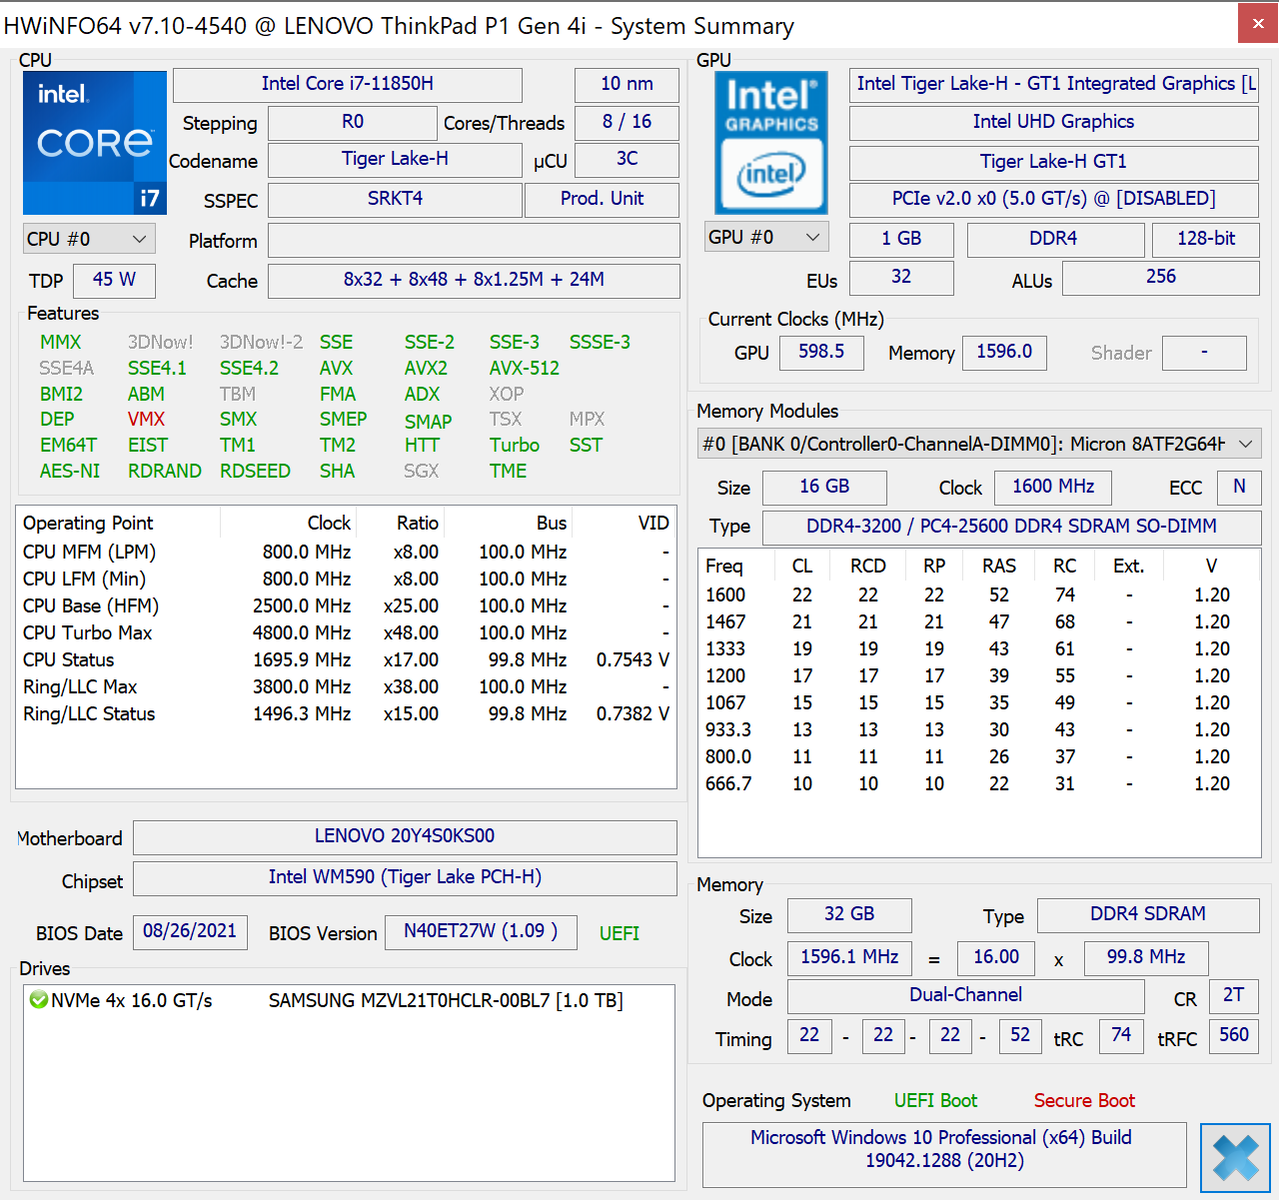
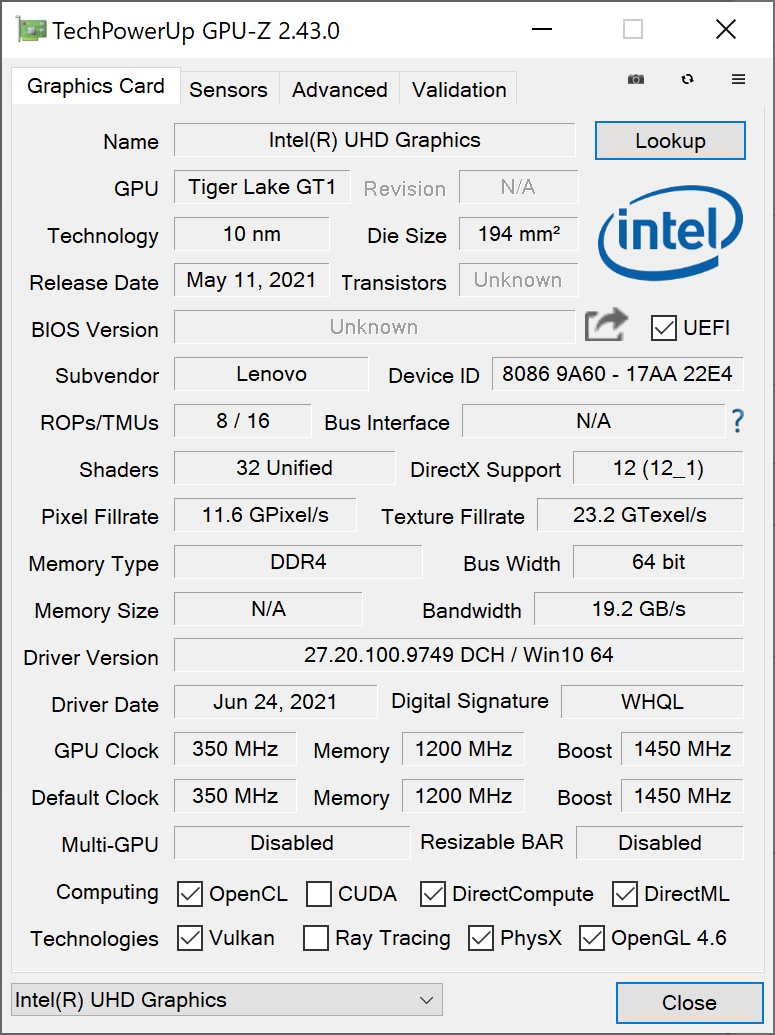
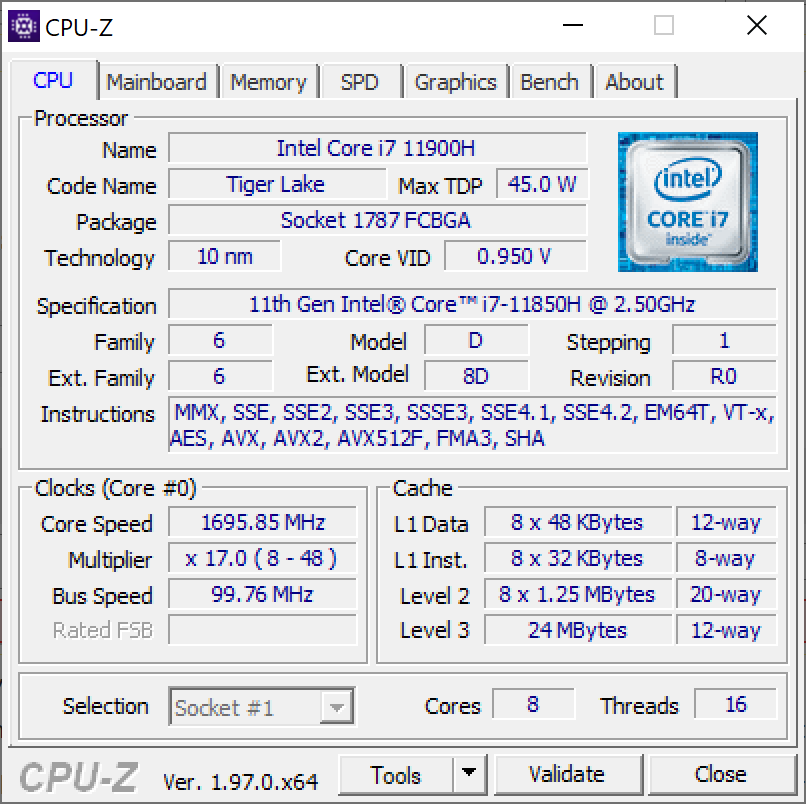
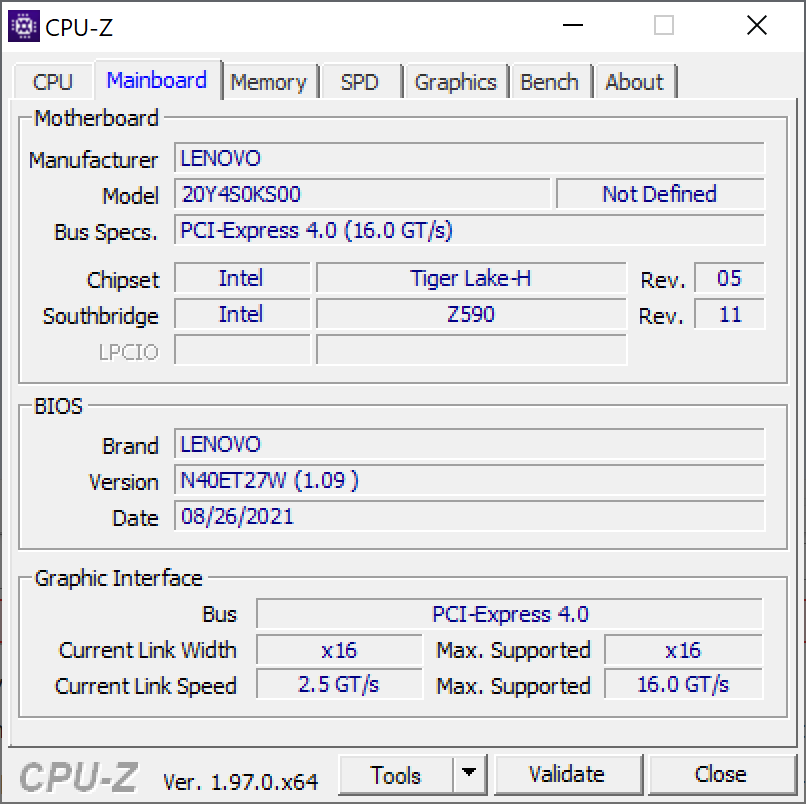
Lenovo relies on the latest and most powerful components that Intel and Nvidia currently offer. In Intel's case, this means processors from the Tiger-Lake H series. The three Core CPUs (i7-11800H, i7-11850H, i9-11950H) have eight cores, the also offered Xeon W-11855M is a six-core.
The selection of available graphics chips is much bigger. As an absolute basic option, the P1 G4 is available without a dedicated GPU, i.e. only with the integrated Intel graphics. There are seven dedicated graphics chips; Nvidia T1200, RTX A2000, RTX A3000, RTX A4000, RTX 5000 and for the first time in the P1 GeForce RTX 3070 and RTX 3080.
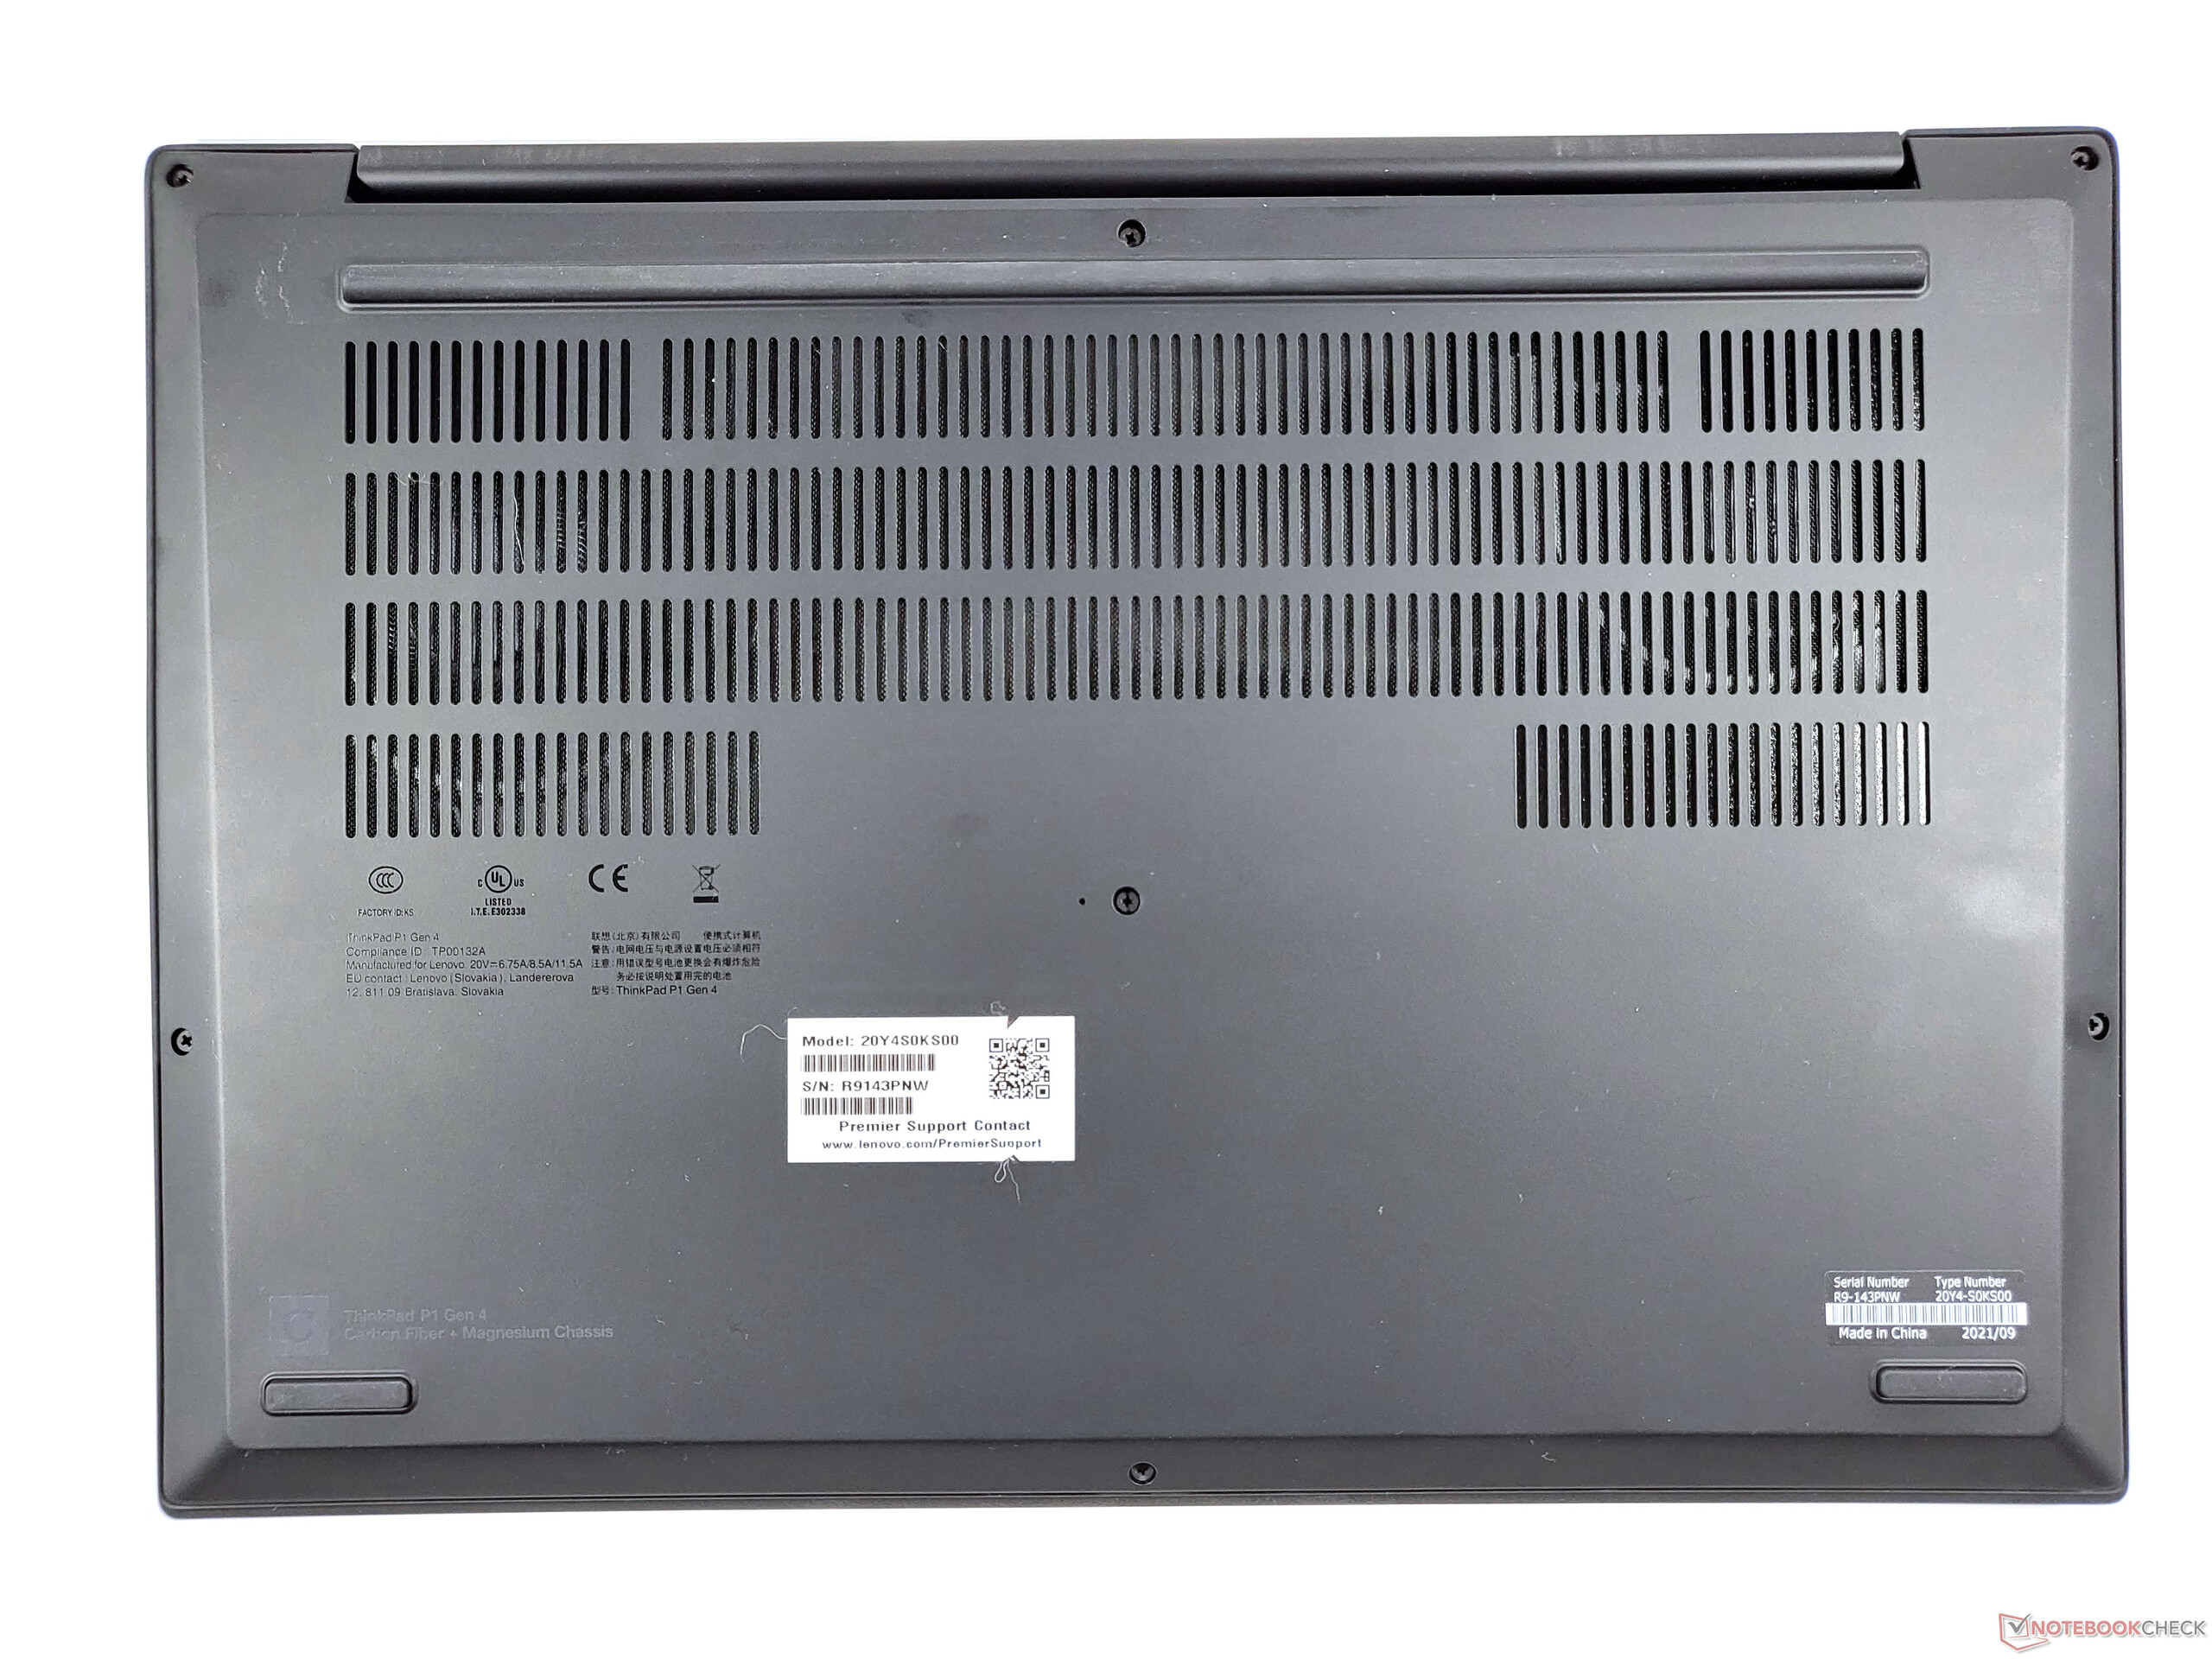
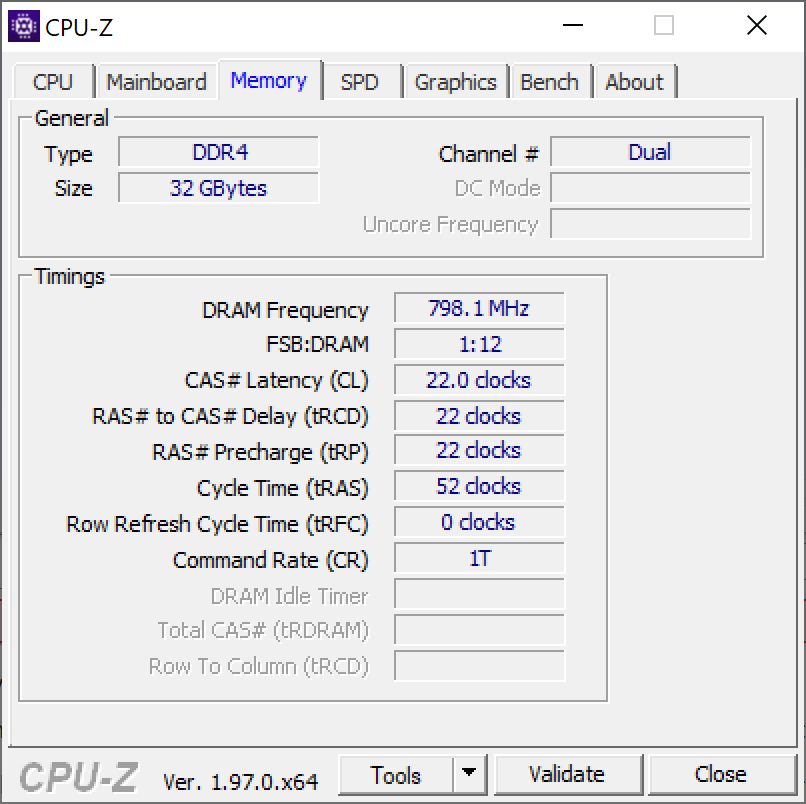
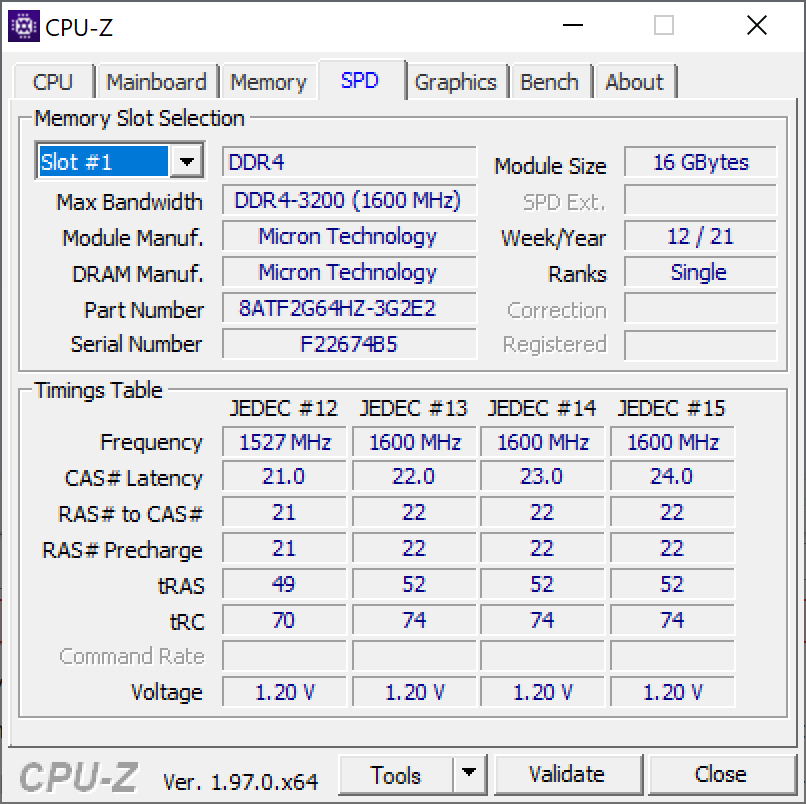
In any case, the Lenovo ThinkPad P1 Gen 4 has two SO-DIMM slots for a maximum of 64 GB of memory. This can also be ECC RAM when the ThinkPad laptop is configured with Xeon. Depending on the model variant, the Lenovo laptop has one or two M.2 2280 ports - model variants with Intel GPU, T1200 or RTX A2000 have two, all others only one mass storage slot.
Processor
The Intel Core i7-11850H is a current processor from the "Tiger-Lake" series with eight cores and 16 threads. Nominally, the TDP of this CPU is 45 watts; however, this consumption is not sufficient to reach the maximum clock rates of 4.8 GHz on all cores. With our CPU list the Intel processor can be compared with other CPUs.
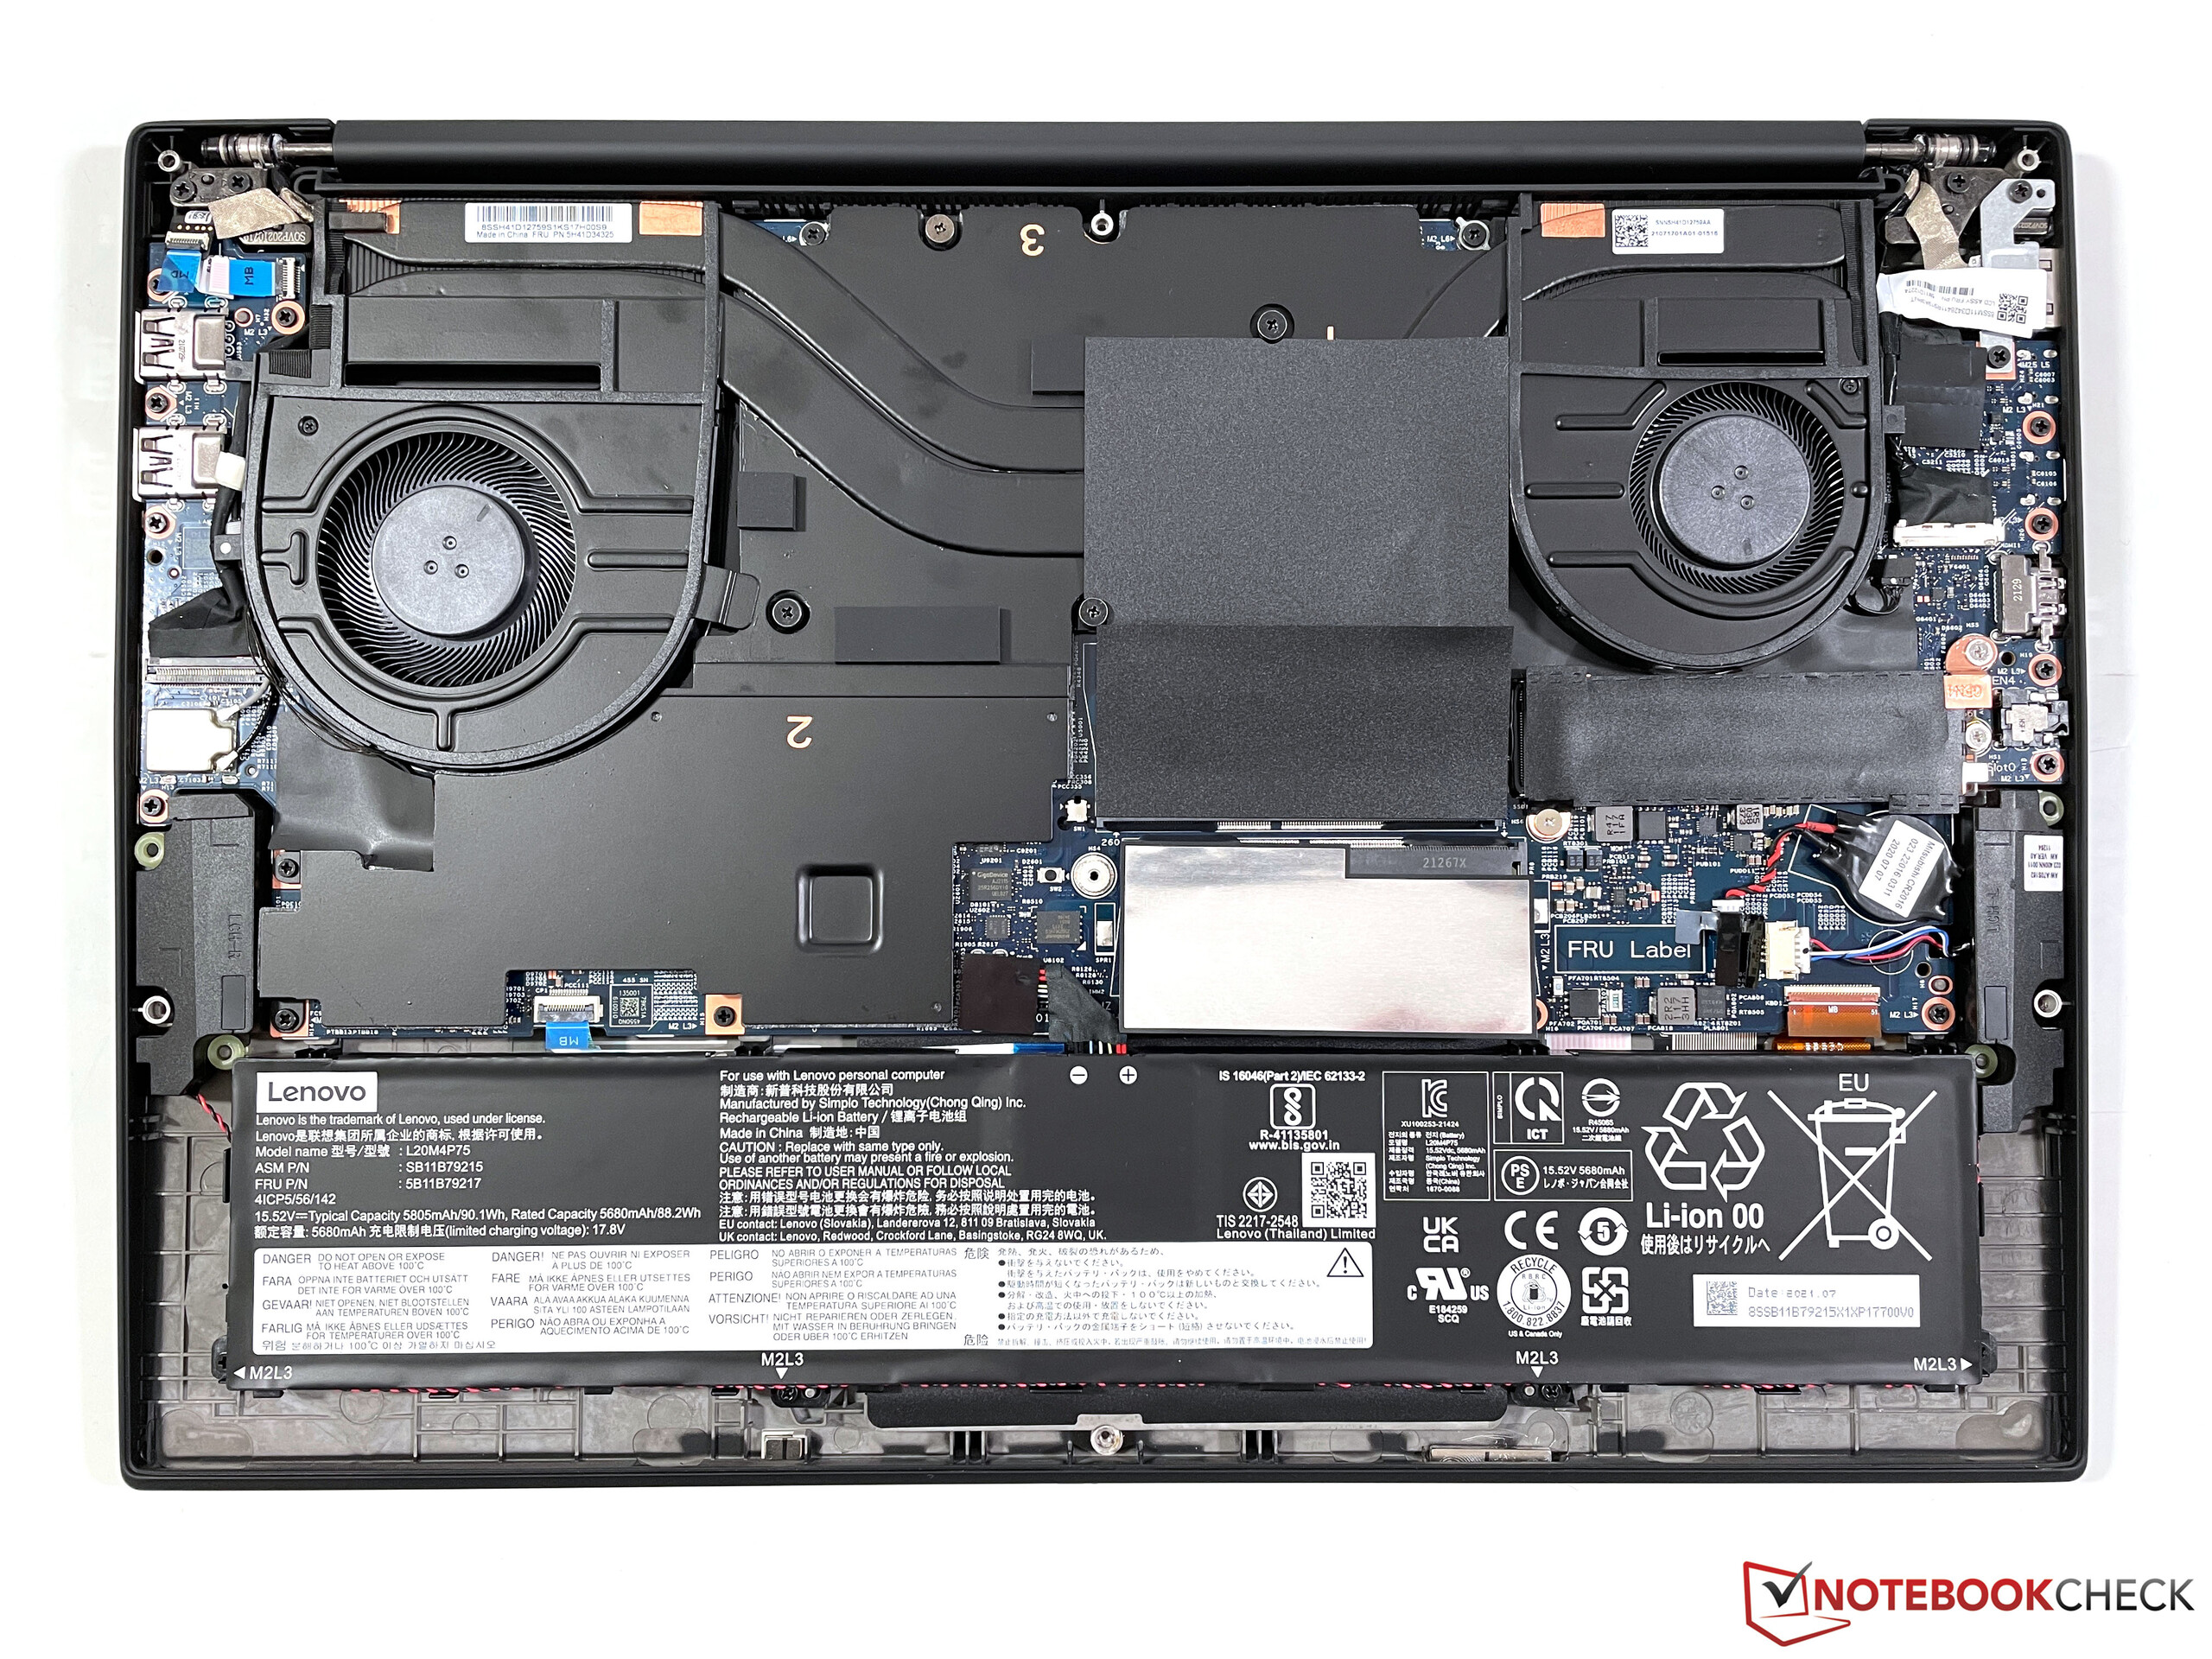
Actually, the i7-11850H is practically as fast as the i7-11800H, the difference is mainly due to the vPro support of the 11850H - but in the ThinkPad P1 G4, the difference between the two is big. The reason is not the processor, but the cooling system: The model with GeForce RTX 3070 tested here contains vapor-chamber cooling. Therefore, the processor can permanently consume around 60 watts under pure CPU load here, whereas the CPU of the less equipped ThinkPad P1 Gen 4 with Nvidia T1200 was limited to around 40 watts. In the Cinebench R23 multi-core test, the Vapor-Chamber P1 is 27% faster than the cheaper model, it is roughly on par with the HP ZBook Studio 15 G8.
We could not determine a CPU performance limitation in battery mode.
Cinebench R15 Multi Endurance test
Cinebench R23: Multi Core | Single Core
Cinebench R20: CPU (Multi Core) | CPU (Single Core)
Cinebench R15: CPU Multi 64Bit | CPU Single 64Bit
Blender: v2.79 BMW27 CPU
7-Zip 18.03: 7z b 4 | 7z b 4 -mmt1
Geekbench 5.5: Multi-Core | Single-Core
HWBOT x265 Benchmark v2.2: 4k Preset
LibreOffice : 20 Documents To PDF
R Benchmark 2.5: Overall mean
| CPU Performance rating | |
| Average of class Workstation | |
| Lenovo ThinkPad P1 G4-20Y4S0KS00 | |
| HP ZBook Studio 15 G8 | |
| Average Intel Core i7-11850H | |
| Huawei MateBook 16 R7 5800H | |
| Apple MacBook Pro 13 Late 2020 M1 Entry (8 / 256 GB) -6! | |
| Dell Precision 5000 5560 -2! | |
| Lenovo ThinkPad P1 G4-20Y30017GE | |
| Apple MacBook Pro 16 2019 i9 5500M | |
| Lenovo ThinkPad X1 Extreme Gen3-20TLS0UV00 | |
| Cinebench R23 / Multi Core | |
| Average of class Workstation (14621 - 38520, n=23, last 2 years) | |
| HP ZBook Studio 15 G8 | |
| Lenovo ThinkPad P1 G4-20Y4S0KS00 | |
| Average Intel Core i7-11850H (9779 - 11935, n=2) | |
| Huawei MateBook 16 R7 5800H | |
| Dell Precision 5000 5560 | |
| Lenovo ThinkPad P1 G4-20Y30017GE | |
| Apple MacBook Pro 16 2019 i9 5500M | |
| Apple MacBook Pro 16 2019 i9 5500M | |
| Apple MacBook Pro 13 Late 2020 M1 Entry (8 / 256 GB) | |
| Lenovo ThinkPad X1 Extreme Gen3-20TLS0UV00 | |
| Cinebench R23 / Single Core | |
| Average of class Workstation (1712 - 2228, n=23, last 2 years) | |
| HP ZBook Studio 15 G8 | |
| Lenovo ThinkPad P1 G4-20Y4S0KS00 | |
| Average Intel Core i7-11850H (1513 - 1552, n=2) | |
| Apple MacBook Pro 13 Late 2020 M1 Entry (8 / 256 GB) | |
| Dell Precision 5000 5560 | |
| Lenovo ThinkPad P1 G4-20Y30017GE | |
| Huawei MateBook 16 R7 5800H | |
| Lenovo ThinkPad X1 Extreme Gen3-20TLS0UV00 | |
| Apple MacBook Pro 16 2019 i9 5500M | |
| Cinebench R20 / CPU (Multi Core) | |
| Average of class Workstation (5760 - 15043, n=23, last 2 years) | |
| Lenovo ThinkPad P1 G4-20Y4S0KS00 | |
| HP ZBook Studio 15 G8 | |
| Average Intel Core i7-11850H (3826 - 4663, n=2) | |
| Huawei MateBook 16 R7 5800H | |
| Dell Precision 5000 5560 | |
| Lenovo ThinkPad P1 G4-20Y30017GE | |
| Apple MacBook Pro 16 2019 i9 5500M | |
| Apple MacBook Pro 16 2019 i9 5500M | |
| Lenovo ThinkPad X1 Extreme Gen3-20TLS0UV00 | |
| Apple MacBook Pro 13 Late 2020 M1 Entry (8 / 256 GB) | |
| Cinebench R20 / CPU (Single Core) | |
| Average of class Workstation (671 - 857, n=23, last 2 years) | |
| HP ZBook Studio 15 G8 | |
| Lenovo ThinkPad P1 G4-20Y4S0KS00 | |
| Average Intel Core i7-11850H (583 - 607, n=2) | |
| Dell Precision 5000 5560 | |
| Lenovo ThinkPad P1 G4-20Y30017GE | |
| Huawei MateBook 16 R7 5800H | |
| Lenovo ThinkPad X1 Extreme Gen3-20TLS0UV00 | |
| Apple MacBook Pro 16 2019 i9 5500M | |
| Apple MacBook Pro 16 2019 i9 5500M | |
| Apple MacBook Pro 13 Late 2020 M1 Entry (8 / 256 GB) | |
| Cinebench R15 / CPU Multi 64Bit | |
| Average of class Workstation (2489 - 5810, n=23, last 2 years) | |
| Huawei MateBook 16 R7 5800H | |
| Lenovo ThinkPad P1 G4-20Y4S0KS00 | |
| HP ZBook Studio 15 G8 | |
| Average Intel Core i7-11850H (1547 - 1988, n=2) | |
| Lenovo ThinkPad P1 G4-20Y30017GE | |
| Dell Precision 5000 5560 | |
| Apple MacBook Pro 16 2019 i9 5500M | |
| Apple MacBook Pro 16 2019 i9 5500M | |
| Lenovo ThinkPad X1 Extreme Gen3-20TLS0UV00 | |
| Apple MacBook Pro 13 Late 2020 M1 Entry (8 / 256 GB) | |
| Cinebench R15 / CPU Single 64Bit | |
| Average of class Workstation (191.4 - 328, n=23, last 2 years) | |
| HP ZBook Studio 15 G8 | |
| Lenovo ThinkPad P1 G4-20Y4S0KS00 | |
| Average Intel Core i7-11850H (232 - 233, n=2) | |
| Huawei MateBook 16 R7 5800H | |
| Dell Precision 5000 5560 | |
| Lenovo ThinkPad P1 G4-20Y30017GE | |
| Apple MacBook Pro 13 Late 2020 M1 Entry (8 / 256 GB) | |
| Lenovo ThinkPad X1 Extreme Gen3-20TLS0UV00 | |
| Apple MacBook Pro 16 2019 i9 5500M | |
| Apple MacBook Pro 16 2019 i9 5500M | |
| Blender / v2.79 BMW27 CPU | |
| Lenovo ThinkPad X1 Extreme Gen3-20TLS0UV00 | |
| Apple MacBook Pro 16 2019 i9 5500M | |
| Lenovo ThinkPad P1 G4-20Y30017GE | |
| Dell Precision 5000 5560 | |
| Average Intel Core i7-11850H (257 - 313, n=2) | |
| Lenovo ThinkPad P1 G4-20Y4S0KS00 | |
| HP ZBook Studio 15 G8 | |
| Huawei MateBook 16 R7 5800H | |
| Average of class Workstation (91 - 222, n=23, last 2 years) | |
| 7-Zip 18.03 / 7z b 4 | |
| Average of class Workstation (60489 - 116969, n=23, last 2 years) | |
| Huawei MateBook 16 R7 5800H | |
| Lenovo ThinkPad P1 G4-20Y4S0KS00 | |
| HP ZBook Studio 15 G8 | |
| Average Intel Core i7-11850H (44890 - 50552, n=2) | |
| Dell Precision 5000 5560 | |
| Apple MacBook Pro 16 2019 i9 5500M | |
| Lenovo ThinkPad P1 G4-20Y30017GE | |
| Lenovo ThinkPad X1 Extreme Gen3-20TLS0UV00 | |
| 7-Zip 18.03 / 7z b 4 -mmt1 | |
| Average of class Workstation (5126 - 6960, n=23, last 2 years) | |
| HP ZBook Studio 15 G8 | |
| Lenovo ThinkPad P1 G4-20Y4S0KS00 | |
| Average Intel Core i7-11850H (5727 - 5762, n=2) | |
| Dell Precision 5000 5560 | |
| Huawei MateBook 16 R7 5800H | |
| Lenovo ThinkPad P1 G4-20Y30017GE | |
| Lenovo ThinkPad X1 Extreme Gen3-20TLS0UV00 | |
| Apple MacBook Pro 16 2019 i9 5500M | |
| Geekbench 5.5 / Multi-Core | |
| Average of class Workstation (11542 - 25554, n=23, last 2 years) | |
| Lenovo ThinkPad P1 G4-20Y4S0KS00 | |
| Average Intel Core i7-11850H (9049 - 9451, n=2) | |
| Huawei MateBook 16 R7 5800H | |
| Apple MacBook Pro 13 Late 2020 M1 Entry (8 / 256 GB) | |
| HP ZBook Studio 15 G8 | |
| Apple MacBook Pro 16 2019 i9 5500M | |
| Lenovo ThinkPad P1 G4-20Y30017GE | |
| Lenovo ThinkPad X1 Extreme Gen3-20TLS0UV00 | |
| Geekbench 5.5 / Single-Core | |
| Average of class Workstation (1783 - 2183, n=23, last 2 years) | |
| Apple MacBook Pro 13 Late 2020 M1 Entry (8 / 256 GB) | |
| HP ZBook Studio 15 G8 | |
| Average Intel Core i7-11850H (1659 - 1686, n=2) | |
| Lenovo ThinkPad P1 G4-20Y4S0KS00 | |
| Lenovo ThinkPad P1 G4-20Y30017GE | |
| Huawei MateBook 16 R7 5800H | |
| Lenovo ThinkPad X1 Extreme Gen3-20TLS0UV00 | |
| Apple MacBook Pro 16 2019 i9 5500M | |
| HWBOT x265 Benchmark v2.2 / 4k Preset | |
| Average of class Workstation (17.8 - 40.5, n=23, last 2 years) | |
| HP ZBook Studio 15 G8 | |
| Huawei MateBook 16 R7 5800H | |
| Lenovo ThinkPad P1 G4-20Y4S0KS00 | |
| Average Intel Core i7-11850H (12.6 - 14.4, n=2) | |
| Dell Precision 5000 5560 | |
| Lenovo ThinkPad P1 G4-20Y30017GE | |
| Apple MacBook Pro 16 2019 i9 5500M | |
| Lenovo ThinkPad X1 Extreme Gen3-20TLS0UV00 | |
| LibreOffice / 20 Documents To PDF | |
| Apple MacBook Pro 16 2019 i9 5500M | |
| Apple MacBook Pro 16 2019 i9 5500M | |
| Huawei MateBook 16 R7 5800H | |
| Lenovo ThinkPad X1 Extreme Gen3-20TLS0UV00 | |
| Lenovo ThinkPad P1 G4-20Y30017GE | |
| HP ZBook Studio 15 G8 | |
| Dell Precision 5000 5560 | |
| Average of class Workstation (37.1 - 74.7, n=23, last 2 years) | |
| Average Intel Core i7-11850H (45.8 - 48, n=2) | |
| Lenovo ThinkPad P1 G4-20Y4S0KS00 | |
| R Benchmark 2.5 / Overall mean | |
| Apple MacBook Pro 16 2019 i9 5500M | |
| Apple MacBook Pro 16 2019 i9 5500M | |
| Lenovo ThinkPad X1 Extreme Gen3-20TLS0UV00 | |
| Lenovo ThinkPad P1 G4-20Y30017GE | |
| HP ZBook Studio 15 G8 | |
| Dell Precision 5000 5560 | |
| Average Intel Core i7-11850H (0.541 - 0.543, n=2) | |
| Lenovo ThinkPad P1 G4-20Y4S0KS00 | |
| Huawei MateBook 16 R7 5800H | |
| Average of class Workstation (0.3825 - 0.603, n=23, last 2 years) | |
* ... smaller is better
System performance
The Lenovo ThinkPad P1 G4 is very fast in everyday use. In PCMark10, it is overall in the top position in the comparison field, which also speaks for the very good system performance.
As good as the performance is: We had to restart the ThinkPad laptop very often. The reason was graphics errors that sometimes occurred after standby; the entire picture was then covered with black and white stripes. Since this error did not occur in the first test model, we assume it is a singular problem of this test device.
| PCMark 10 / Score | |
| Average of class Workstation (6563 - 10409, n=19, last 2 years) | |
| Lenovo ThinkPad P1 G4-20Y4S0KS00 | |
| Average Intel Core i7-11850H, NVIDIA GeForce RTX 3070 Laptop GPU (n=1) | |
| HP ZBook Studio 15 G8 | |
| Dell Precision 5000 5560 | |
| Lenovo ThinkPad P1 G4-20Y30017GE | |
| Apple MacBook Pro 16 2019 i9 5500M | |
| Lenovo ThinkPad X1 Extreme Gen3-20TLS0UV00 | |
| PCMark 10 / Essentials | |
| Lenovo ThinkPad P1 G4-20Y4S0KS00 | |
| Average Intel Core i7-11850H, NVIDIA GeForce RTX 3070 Laptop GPU (n=1) | |
| Dell Precision 5000 5560 | |
| Average of class Workstation (9622 - 11157, n=19, last 2 years) | |
| HP ZBook Studio 15 G8 | |
| Lenovo ThinkPad P1 G4-20Y30017GE | |
| Lenovo ThinkPad X1 Extreme Gen3-20TLS0UV00 | |
| PCMark 10 / Productivity | |
| Average of class Workstation (8789 - 20616, n=19, last 2 years) | |
| Dell Precision 5000 5560 | |
| Lenovo ThinkPad P1 G4-20Y4S0KS00 | |
| Average Intel Core i7-11850H, NVIDIA GeForce RTX 3070 Laptop GPU (n=1) | |
| HP ZBook Studio 15 G8 | |
| Lenovo ThinkPad P1 G4-20Y30017GE | |
| Lenovo ThinkPad X1 Extreme Gen3-20TLS0UV00 | |
| PCMark 10 / Digital Content Creation | |
| Average of class Workstation (8108 - 15631, n=19, last 2 years) | |
| Lenovo ThinkPad P1 G4-20Y4S0KS00 | |
| Average Intel Core i7-11850H, NVIDIA GeForce RTX 3070 Laptop GPU (n=1) | |
| HP ZBook Studio 15 G8 | |
| Dell Precision 5000 5560 | |
| Lenovo ThinkPad P1 G4-20Y30017GE | |
| Lenovo ThinkPad X1 Extreme Gen3-20TLS0UV00 | |
| PCMark 10 Score | 7156 points | |
Help | ||
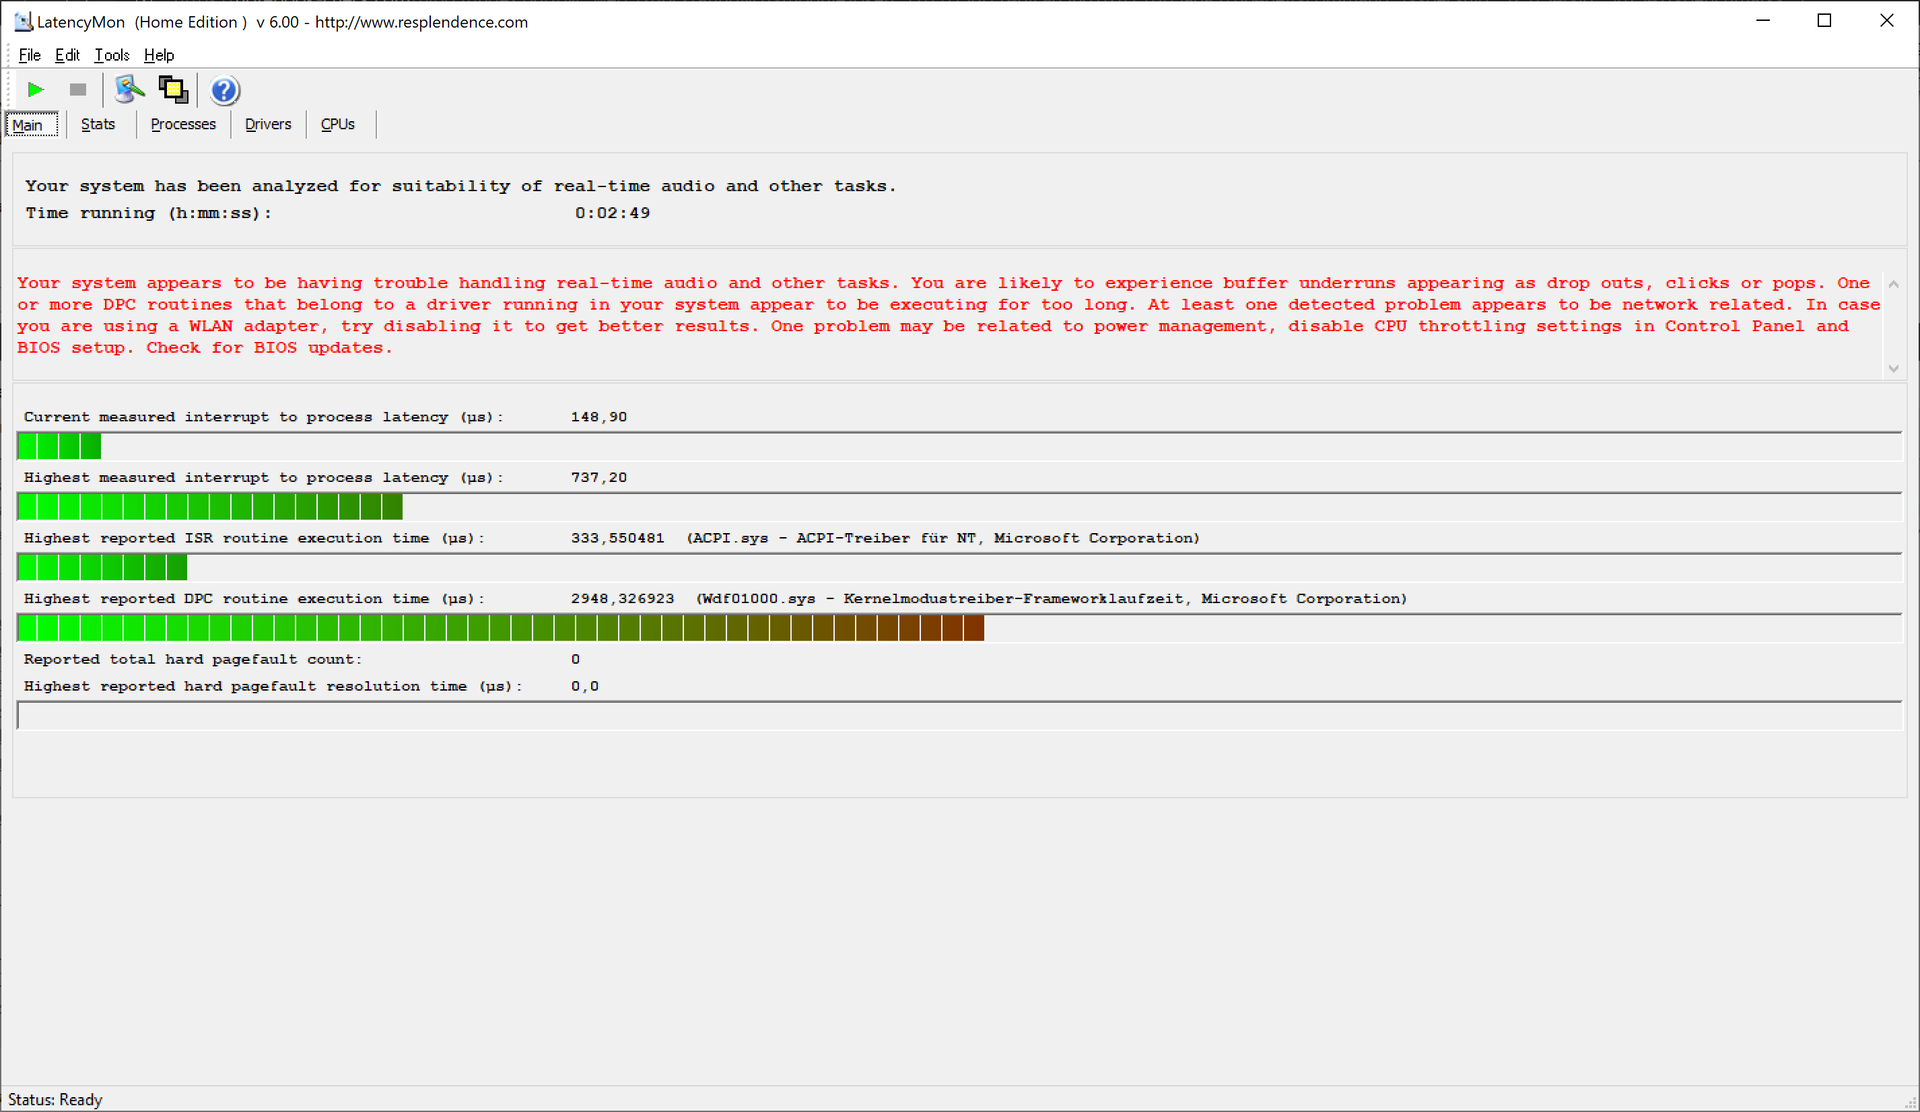
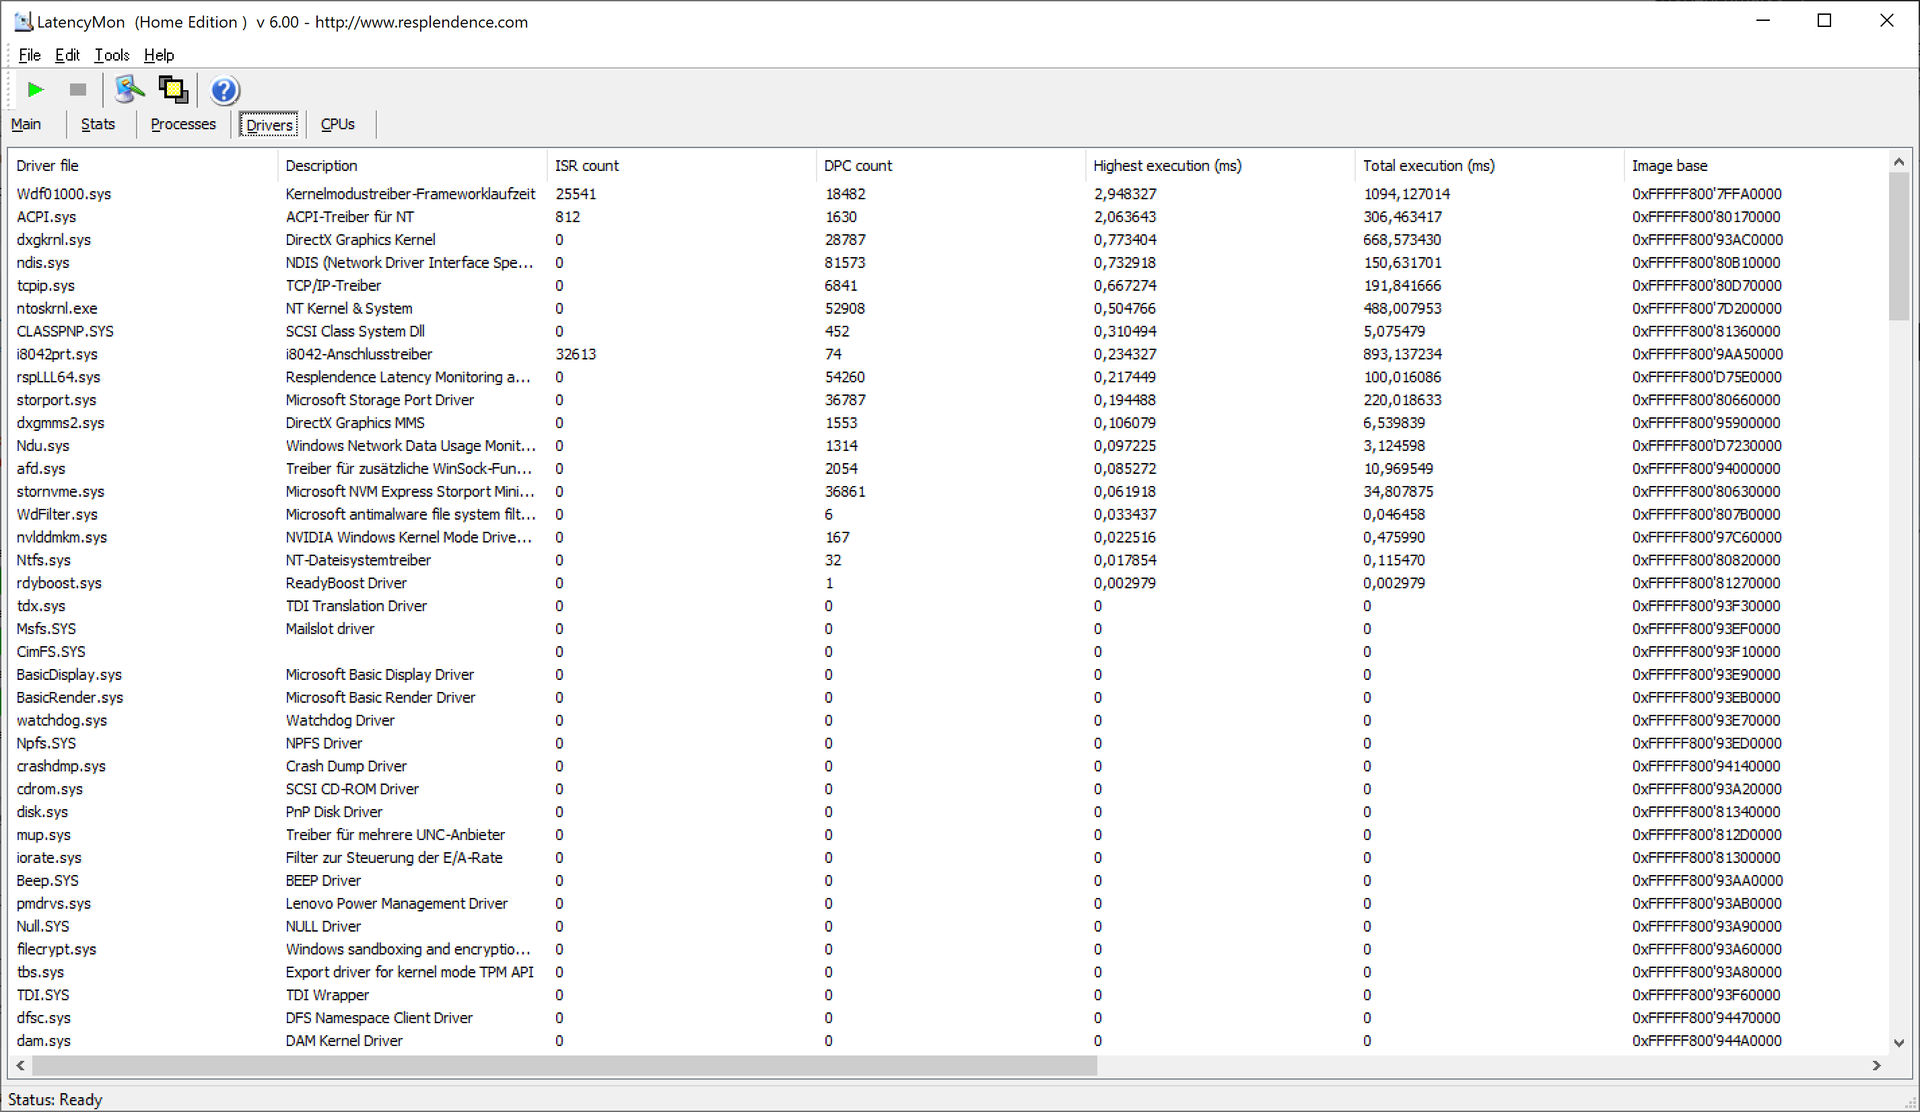
DPC latencies
Working with audio and video files is one of the possible uses of a laptop like the ThinkPad P1 Gen 4. Here, the DPC latencies could cause problems because the high rates also led to dropouts in our YouTube video test.
| DPC Latencies / LatencyMon - interrupt to process latency (max), Web, Youtube, Prime95 | |
| Lenovo ThinkPad P1 G4-20Y30017GE | |
| HP ZBook Studio 15 G8 | |
| Dell Precision 5000 5560 | |
| Lenovo ThinkPad P1 G4-20Y4S0KS00 | |
| Lenovo ThinkPad X1 Extreme Gen3-20TLS0UV00 | |
* ... smaller is better
Mass storage
In this configuration, the Lenovo ThinkPad P1 G4 only has one M.2-2280 slot. At least this one is very well equipped with a 1 TB Samsung PM9A1. This NMVe PCIe 4.0 SSD performs extremely well in our benchmarks.
* ... smaller is better

Continuous load read: DiskSpd Read Loop, Queue Depth 8
GPU performance
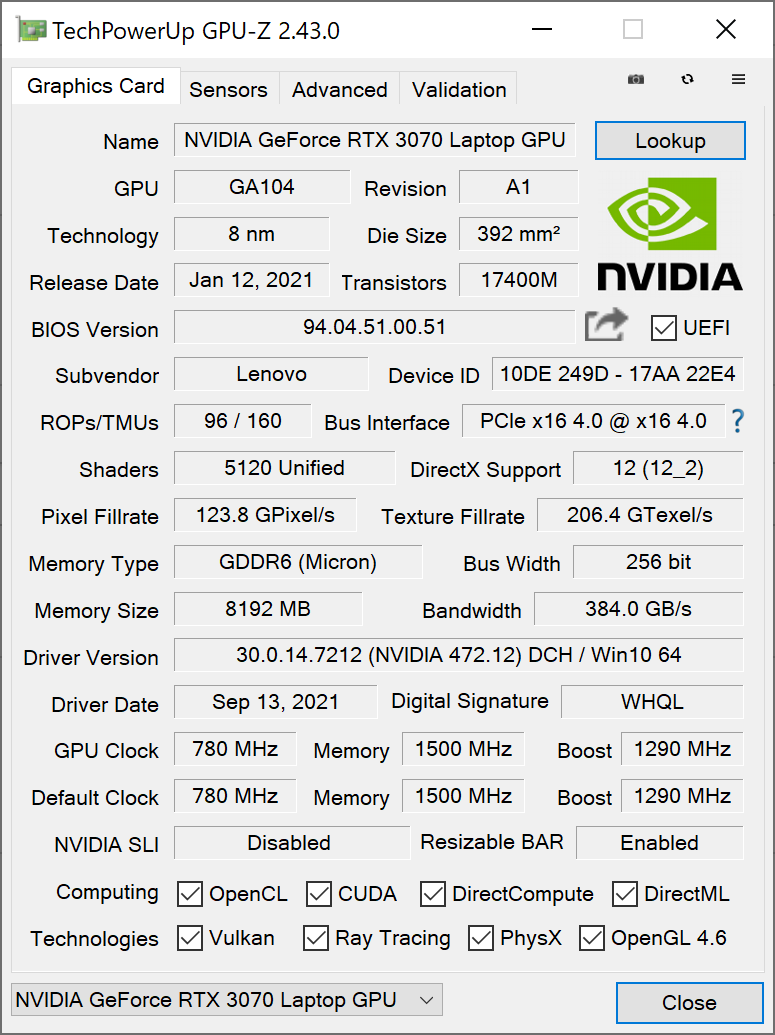
The Nvidia GeForce RTX 3070 is one of the most powerful mobile GPUs of Nvidia's current "Ampere" generation. In the case of Lenovo's ThinkPad P1 G4, however, the 5120 shader units are far from their maximum performance because Lenovo sets the GPU to a TGP of 80 watts - in the past, this variant would have been called "Max-Q".
Thus, it is no wonder that the RTX 3070 is about 10% faster on average across all laptops than here in the Lenovo ThinkPad P1 2021. Nevertheless, the gap to the ThinkPad X1 Extreme G3 with GeForce GTX 1650 Ti Max-Q is huge (+148%), even compared to the Nvidia T1200 variant of the P1, the GeForce RTX 3070 is more than twice as fast in the 3DMark benchmarks (+118%). In this case, the GeForce is certainly worth it. The conclusion for the professional benchmark suite SPECviewperf is more mixed: Here, the GeForce-P1 achieves partly good, but also partly poor results. A ThinkPad P1 with an ISV-certified Nvidia GPU should be chosen for CAD.
The GPU performance is clearly limited in battery mode. The 3DMark 11 result is about 56% lower without a power supply (13,508 points in the 3DMark 11 GPU score).
| 3DMark 11 Performance | 24753 points | |
| 3DMark Fire Strike Score | 17860 points | |
| 3DMark Time Spy Score | 8430 points | |
Help | ||
Gaming performance
The Lenovo ThinkPad P1 G4 is explicitly not a gaming laptop. At the same time, the Nvidia GeForce 3070 allows the Lenovo laptop to be used for gaming. Even for gaming in 4K, the GPU can be sufficiently fast, depending on the title. In our Witcher 3 test, the ThinkPad P1 2021 can also consistently call up its performance - with minor fluctuations.
| The Witcher 3 - 1920x1080 Ultra Graphics & Postprocessing (HBAO+) | |
| Average NVIDIA GeForce RTX 3070 Laptop GPU (34.9 - 109, n=52) | |
| Average of class Workstation (n=1last 2 years) | |
| Lenovo ThinkPad P1 G4-20Y4S0KS00 | |
| HP ZBook Studio 15 G8 | |
| Dell Precision 5000 5560 | |
| Apple MacBook Pro 16 2019 i9 5500M | |
| Lenovo ThinkPad P1 G4-20Y30017GE | |
| Lenovo ThinkPad X1 Extreme Gen3-20TLS0UV00 | |
Witcher 3 FPS-Diagram
| low | med. | high | ultra | QHD | 4K | |
|---|---|---|---|---|---|---|
| GTA V (2015) | 185 | 179 | 164 | 88.1 | 74.5 | 74.3 |
| The Witcher 3 (2015) | 345 | 243 | 158 | 86.8 | 56.5 | |
| Dota 2 Reborn (2015) | 171 | 148 | 124 | 106 | 109 | |
| X-Plane 11.11 (2018) | 105 | 102 | 76.8 | 52.4 | ||
| Strange Brigade (2018) | 408 | 206 | 171 | 151 | 113 | 61.1 |
Emissions: Strong components make ThinkPad P1 G4 hot
Fan noise
Lenovo traditionally exercises restraint when it comes to the fan volume of the ThinkPads. However, this does not apply to the ThinkPad P1 workstation model. The two fans run at a maximum of 47.4 dB(a), which is clearly audible. At least this is not always the case, there is also a lower level at 38.6 dB(a) and the active cooling often remains disabled in idle.
Coil whine is unfortunately still a problem far too often, but the Lenovo ThinkPad P1 Gen 4 is not affected by this.
| Lenovo ThinkPad P1 G4-20Y4S0KS00 GeForce RTX 3070 Laptop GPU, i7-11850H, Samsung PM9A1 MZVL21T0HCLR | Lenovo ThinkPad P1 G4-20Y30017GE T1200 Laptop GPU, i7-11800H, Samsung PM9A1 MZVL2512HCJQ | Dell Precision 5000 5560 RTX A2000 Laptop GPU, i7-11850H, Samsung PM9A1 MZVL22T0HBLB | Apple MacBook Pro 16 2019 i9 5500M Radeon Pro 5500M, i9-9880H, Apple SSD AP1024 7171 | HP ZBook Studio 15 G8 GeForce RTX 3070 Laptop GPU, i9-11950H, Samsung PM981a MZVLB2T0HALB | Lenovo ThinkPad X1 Extreme Gen3-20TLS0UV00 GeForce GTX 1650 Ti Max-Q, i7-10750H, Toshiba XG6 KXG6AZNV1T02 | |
|---|---|---|---|---|---|---|
| Noise | -3% | 12% | -12% | -2% | -9% | |
| off / environment * (dB) | 23.8 | 24.3 -2% | 23.4 2% | 29.8 -25% | 23.5 1% | 29.5 -24% |
| Idle Minimum * (dB) | 23.8 | 24.3 -2% | 23.6 1% | 29.9 -26% | 25.3 -6% | 29.5 -24% |
| Idle Average * (dB) | 23.8 | 24.3 -2% | 23.6 1% | 29.9 -26% | 25.3 -6% | 29.5 -24% |
| Idle Maximum * (dB) | 28.3 | 26.6 6% | 23.6 17% | 29.9 -6% | 25.3 11% | 29.9 -6% |
| Load Average * (dB) | 38.6 | 46.8 -21% | 25.8 33% | 43 -11% | 41.2 -7% | 44.2 -15% |
| Witcher 3 ultra * (dB) | 47.4 | 46.8 1% | 40.1 15% | 45.4 4% | 49.4 -4% | 36.1 24% |
| Load Maximum * (dB) | 47.4 | 46.8 1% | 41.4 13% | 46.1 3% | 49.4 -4% | 44.2 7% |
* ... smaller is better
Noise level
| Idle |
| 23.8 / 23.8 / 28.3 dB(A) |
| Load |
| 38.6 / 47.4 dB(A) |
 | ||
30 dB silent 40 dB(A) audible 50 dB(A) loud |
||
min: | ||
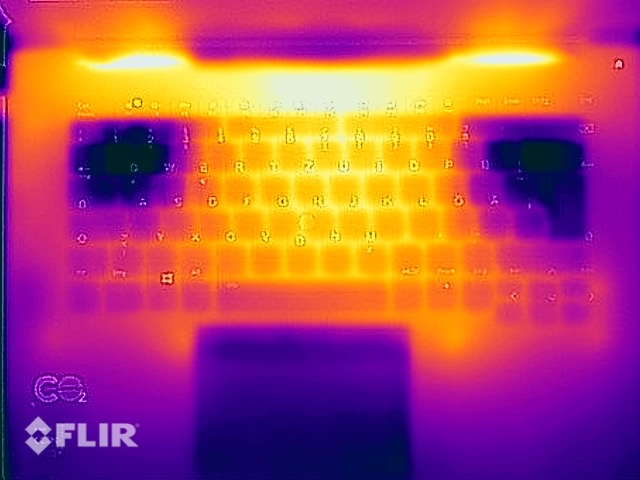
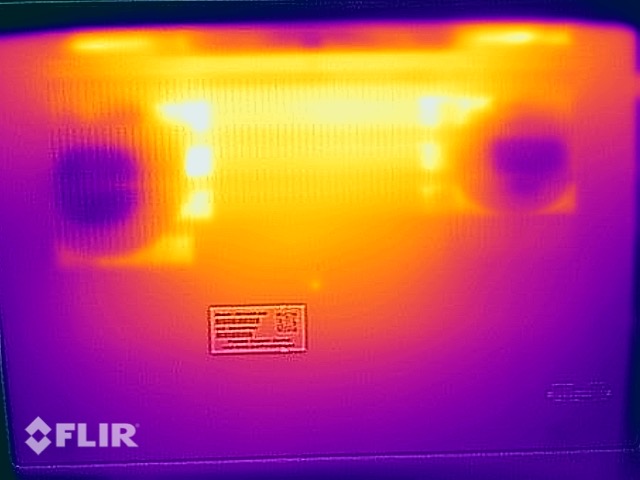
Temperature
Lenovo has designed the ThinkPad P1 Gen 4 at the thermal limit. As expected, the Lenovo notebook remains cool in idle mode, but the heating under load clearly shows: The limits of what is possible with the current Intel CPUs and Nvidia GPUs are exhausted. With 53.8 degrees Celsius (~129 degrees Fahrenheit) on the underside, it is not so much the maximum temperature as the even heating of the case that shows this. Even the palm rest heats up noticeably to 40 degrees Celsius (104 degrees Fahrenheit), and the temperatures are only slightly lower in the Witcher 3 test.
(-) The maximum temperature on the upper side is 51 °C / 124 F, compared to the average of 38.2 °C / 101 F, ranging from 22.2 to 69.8 °C for the class Workstation.
(-) The bottom heats up to a maximum of 53.5 °C / 128 F, compared to the average of 41.1 °C / 106 F
(+) In idle usage, the average temperature for the upper side is 26.7 °C / 80 F, compared to the device average of 32 °C / 90 F.
(-) Playing The Witcher 3, the average temperature for the upper side is 43 °C / 109 F, compared to the device average of 32 °C / 90 F.
(-) The palmrests and touchpad can get very hot to the touch with a maximum of 40 °C / 104 F.
(-) The average temperature of the palmrest area of similar devices was 27.8 °C / 82 F (-12.2 °C / -22 F).
Stress test
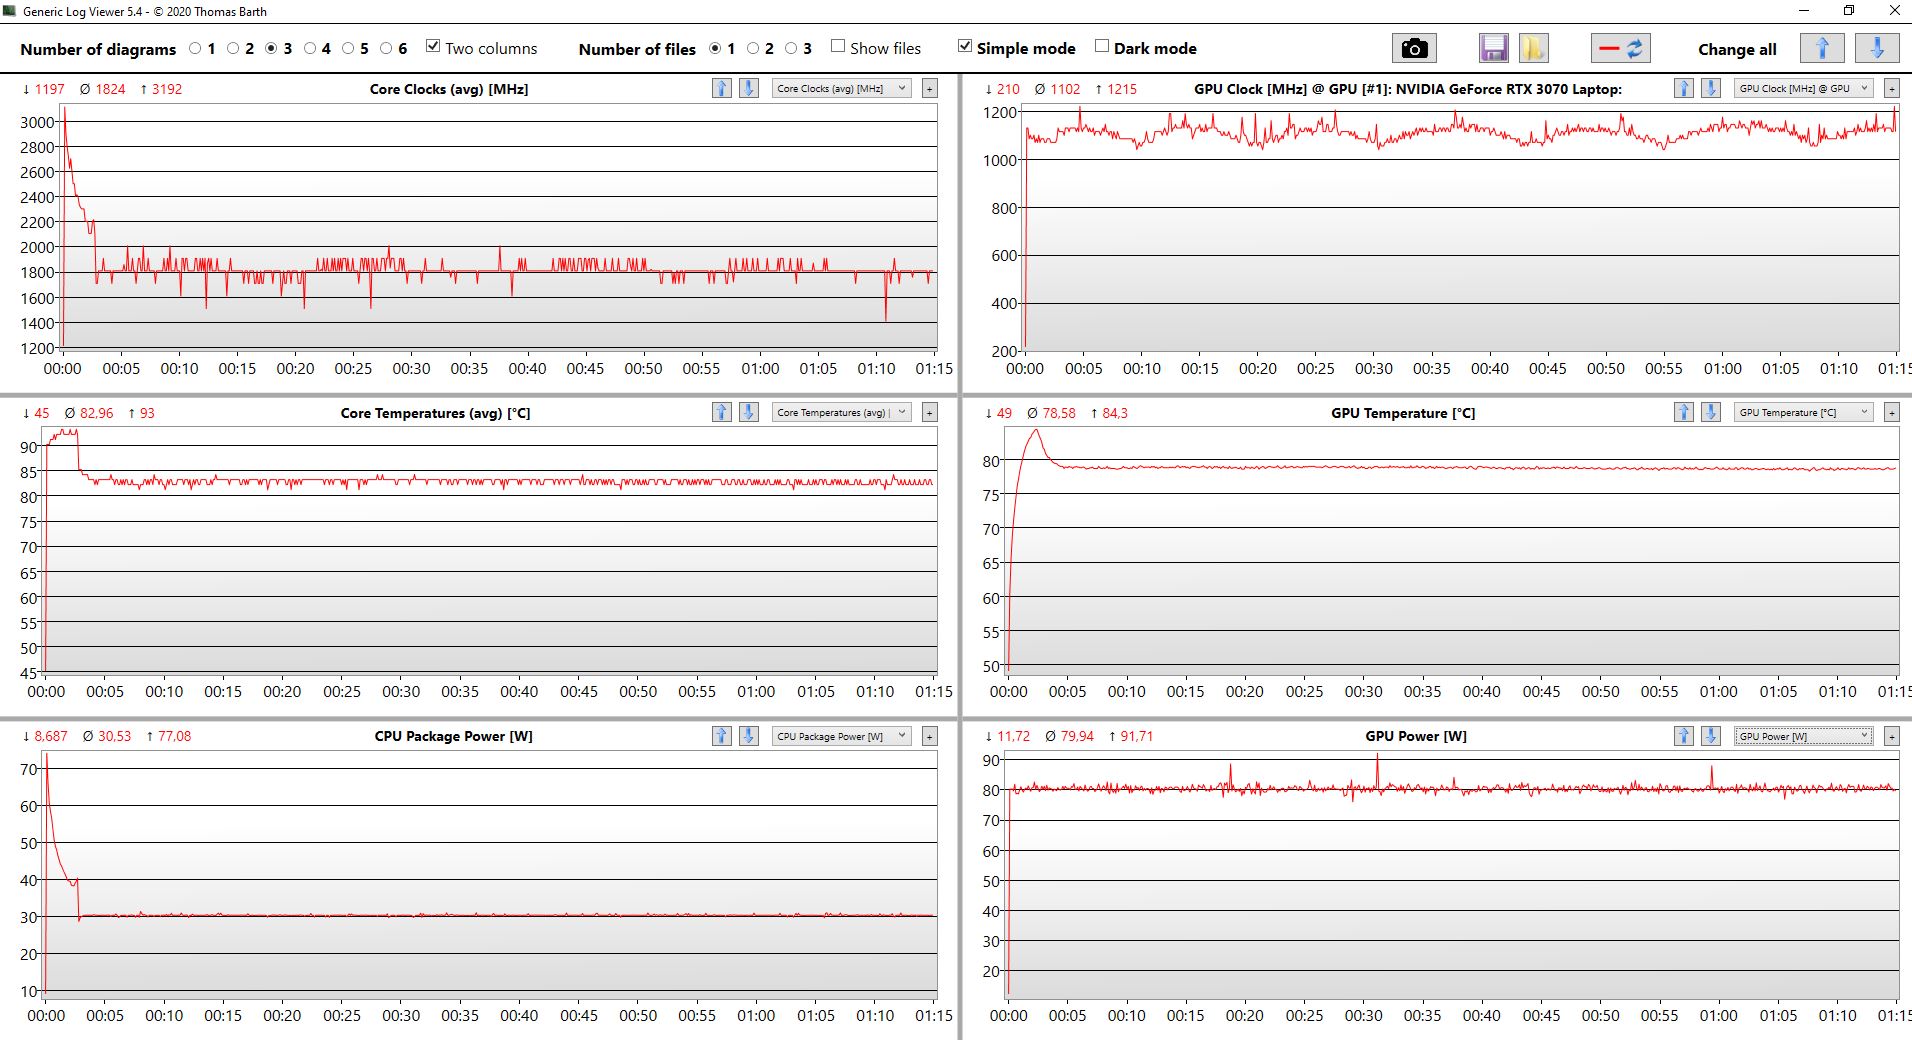
With the temperature measurements, it was already clear that Lenovo cannot run its ThinkPad at unrestrained performance in the stress test. In fact, the processor is quickly limited to 30 watts when the GPU and CPU are fully loaded at the same time, while the GPU performance remains stable at 80 watts.
The clear throttling in the extreme scenario stress test should not be reflected in everyday use, though, because 3DMark 11 following the stress test produced a normal result.
Speaker
An analysis of the speaker quality can be found in the review of the QHD model of the Lenovo ThinkPad P1 Gen 4.
Lenovo ThinkPad P1 G4-20Y30017GE audio analysis
(+) | speakers can play relatively loud (84.3 dB)
Bass 100 - 315 Hz
(±) | reduced bass - on average 12.2% lower than median
(±) | linearity of bass is average (9.8% delta to prev. frequency)
Mids 400 - 2000 Hz
(+) | balanced mids - only 3.4% away from median
(+) | mids are linear (3.4% delta to prev. frequency)
Highs 2 - 16 kHz
(+) | balanced highs - only 2.9% away from median
(+) | highs are linear (5% delta to prev. frequency)
Overall 100 - 16.000 Hz
(+) | overall sound is linear (11.8% difference to median)
Compared to same class
» 16% of all tested devices in this class were better, 3% similar, 81% worse
» The best had a delta of 7%, average was 17%, worst was 35%
Compared to all devices tested
» 8% of all tested devices were better, 3% similar, 89% worse
» The best had a delta of 4%, average was 23%, worst was 134%
Apple MacBook Pro 16 2019 i9 5500M audio analysis
(+) | speakers can play relatively loud (82.3 dB)
Bass 100 - 315 Hz
(+) | good bass - only 2.3% away from median
(+) | bass is linear (5% delta to prev. frequency)
Mids 400 - 2000 Hz
(+) | balanced mids - only 2.7% away from median
(+) | mids are linear (3.4% delta to prev. frequency)
Highs 2 - 16 kHz
(+) | balanced highs - only 2.1% away from median
(+) | highs are linear (2.6% delta to prev. frequency)
Overall 100 - 16.000 Hz
(+) | overall sound is linear (6.9% difference to median)
Compared to same class
» 5% of all tested devices in this class were better, 1% similar, 94% worse
» The best had a delta of 5%, average was 17%, worst was 45%
Compared to all devices tested
» 1% of all tested devices were better, 0% similar, 99% worse
» The best had a delta of 4%, average was 23%, worst was 134%
Energy consumption: WQUXGA LCD eats up battery of the Lenovo laptop
Interestingly, the minimum consumption of this version of the ThinkPad P1 Gen 4 is hardly noticeably higher than the already tested one with a QHD LCD. The difference is stark in the idle median with maximized LCD brightness: The consumption of 20.2 watts is extremely high here. None of the other workstation or multimedia laptops has a comparable consumption at this rate.
This variant of Lenovo's ThinkPad P1 2021 is shipped with a 230 watt power supply. This would not even be necessary; a 170 watt power supply would also suffice for the maximum consumption.
| Off / Standby | |
| Idle | |
| Load |
|
Key:
min: | |
| Lenovo ThinkPad P1 G4-20Y4S0KS00 i7-11850H, GeForce RTX 3070 Laptop GPU, Samsung PM9A1 MZVL21T0HCLR, IPS LED, 3840x2400, 16" | Lenovo ThinkPad P1 G4-20Y30017GE i7-11800H, T1200 Laptop GPU, Samsung PM9A1 MZVL2512HCJQ, IPS, 2560x1600, 16" | Dell Precision 5000 5560 i7-11850H, RTX A2000 Laptop GPU, Samsung PM9A1 MZVL22T0HBLB, IPS, 3840x2400, 15.6" | Apple MacBook Pro 16 2019 i9 5500M i9-9880H, Radeon Pro 5500M, Apple SSD AP1024 7171, IPS, 3072x1920, 16" | HP ZBook Studio 15 G8 i9-11950H, GeForce RTX 3070 Laptop GPU, Samsung PM981a MZVLB2T0HALB, OLED, 3840x2160, 15.6" | Lenovo ThinkPad X1 Extreme Gen3-20TLS0UV00 i7-10750H, GeForce GTX 1650 Ti Max-Q, Toshiba XG6 KXG6AZNV1T02, IPS, 1920x1080, 15.6" | Average NVIDIA GeForce RTX 3070 Laptop GPU | Average of class Workstation | |
|---|---|---|---|---|---|---|---|---|
| Power Consumption | 23% | 17% | 31% | -16% | 32% | -36% | 5% | |
| Idle Minimum * (Watt) | 8.1 | 7.7 5% | 6.2 23% | 3.7 54% | 11 -36% | 5 38% | 15.6 ? -93% | 9.11 ? -12% |
| Idle Average * (Watt) | 20.2 | 11.8 42% | 13.9 31% | 12.1 40% | 18.8 7% | 9 55% | 20.1 ? -0% | 13.8 ? 32% |
| Idle Maximum * (Watt) | 21.9 | 12.4 43% | 23.8 -9% | 17 22% | 31.7 -45% | 12.2 44% | 29.4 ? -34% | 17.9 ? 18% |
| Load Average * (Watt) | 88.2 | 94.6 -7% | 95.7 -9% | 91.5 -4% | 105.2 -19% | 94.4 -7% | 110.8 ? -26% | 96 ? -9% |
| Witcher 3 ultra * (Watt) | 149 | 99.6 33% | 87 42% | 103 31% | 148 1% | 89 40% | ||
| Load Maximum * (Watt) | 170.6 | 134 21% | 132.6 22% | 102.3 40% | 171.8 -1% | 133.9 22% | 214 ? -25% | 180.3 ? -6% |
* ... smaller is better
Energy consumption Witcher 3 / Stress test
Battery life
The larger battery, compared to the predecessor generation, with a capacity of 90 watt hours is emptied quite quickly by the 4K screen's consumption. The Lenovo ThinkPad P1 G4 lasts for around seven hours in the Wi-Fi test when the display is set to 150 cd/m². At maximum brightness, the battery life decreases to four hours. The model with a QHD monitor is clearly better suited for mobile use - after all, the 4K ThinkPad manages to beat the direct workstation rivals Dell Precision 5560 and HP ZBook Studio 15 G8.
| Lenovo ThinkPad P1 G4-20Y4S0KS00 i7-11850H, GeForce RTX 3070 Laptop GPU, 90 Wh | Lenovo ThinkPad P1 G4-20Y30017GE i7-11800H, T1200 Laptop GPU, 90 Wh | Dell Precision 5000 5560 i7-11850H, RTX A2000 Laptop GPU, 86 Wh | Apple MacBook Pro 16 2019 i9 5500M i9-9880H, Radeon Pro 5500M, 99.8 Wh | HP ZBook Studio 15 G8 i9-11950H, GeForce RTX 3070 Laptop GPU, 83 Wh | Lenovo ThinkPad X1 Extreme Gen3-20TLS0UV00 i7-10750H, GeForce GTX 1650 Ti Max-Q, 80 Wh | Average of class Workstation | |
|---|---|---|---|---|---|---|---|
| Battery runtime | 26% | 20% | 30% | 20% | 51% | 27% | |
| H.264 (h) | 7.2 | 9 25% | 9.7 35% | 12.2 69% | 10.1 ? 40% | ||
| WiFi v1.3 (h) | 7 | 9 29% | 6.3 -10% | 12 71% | 6.2 -11% | 11.6 66% | 8.55 ? 22% |
| Load (h) | 1.2 | 1.5 25% | 1.8 50% | 1 -17% | 1.8 50% | 1.4 17% | 1.441 ? 20% |
| Witcher 3 ultra (h) | 0.9 |
Pros
Cons
Verdict: ThinkPad P1 Gen 4 better with stronger cooling system

Once with Vapor-Chamber, once without (ThinkPad P1 with T1200 here in review): The Lenovo ThinkPad P1 G4 went through our test course twice. It quickly becomes clear which of the two versions is better: the one with Vapor-Chamber.
These days, good cooling is probably the most important feature of all for laptops with Intel H-series processors. The model with Vapor-Chamber tested here gives the CPU a significantly higher consumption than its sister model with conventional cooling. The performance difference is significant, which is why the conclusion has to be based on this one difference alone: If Lenovo ThinkPad P1 Gen 4, then with Vapor-Chamber - even if the options of a second M.2-2280 SSD or a WWAN modem are lost. Only the variants with GeForce RTX 3070, RTX 3080 as well as Nvidia RTX A3000, A4000 and A5000 include the better cooling system.
Our conclusion is less clear in relation to the second major differentiator of the tested device: The WQUXGA LCD delivers what it promises in terms of quality; it is one of the best LC displays of all current laptops - but at the expense of battery life. Depending on the user's priorities, the QHD display may well be the better choice if prolonged operation without a connected power supply is desired.
Vapor-Chamber, yes please: The cooling system of this Lenovo ThinkPad P1 G4 is much better than that of the heatpipe variant.
Overall, the Lenovo ThinkPad P1 G4 clearly earns our recommendation as a top-of-the-line 16-inch laptop. The price is correspondingly steep, and if the buyer is willing to spend this much money, it should definitely be the Vapor-Chamber model.
The direct workstation rivals are above all the Dell Precision 5560 and the HP ZBook Studio 15 G8 whereby both have weaknesses - the more compact Precision has fewer ports and delivers less performance, while 16:9 and soldered RAM do not necessarily speak for the ZBook. Outside of the Windows sphere, the Apple MacBook Pro 16 should be mentioned, whereby a comparison with the new model with M1 Max will be of particular interest here.
Price and availability
The tested Lenovo ThinkPad P1 2021 costs 2,850 Euro (~$3,266) at Campuspoint. It is a special model that is exclusively available in Lenovo's Campus Program for students, trainees and other eligible persons. The same configuration costs 3,982 Euros (~$4,564) in the Lenovo Store.
Lenovo ThinkPad P1 G4-20Y4S0KS00
- 10/25/2021 v7 (old)
Benjamin Herzig
Price comparison

