Huawei MateBook 16 AMD Review - Multimedia laptop impresses with its Ryzen 7 CPU
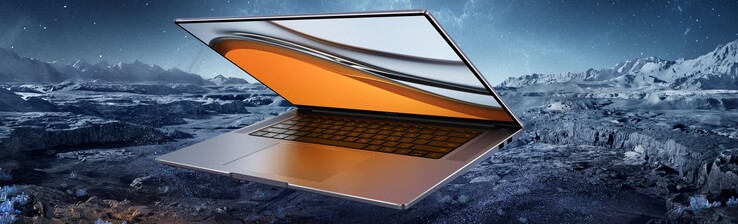
The new MateBook 16 is Huawei's newest addition to its lineup of high-quality multimedia laptops in the style of the MateBook X Pro or the new MateBook 14s. It has recently been launched in Europe for a starting price of 1100 Euro (~1300 USD), which positions it above the old MateBook D16, which was available from around 850 Euro. The new MateBook 16 is directed at customers that are looking for a powerful device with a large display but who do not require a dedicated GPU for gaming.
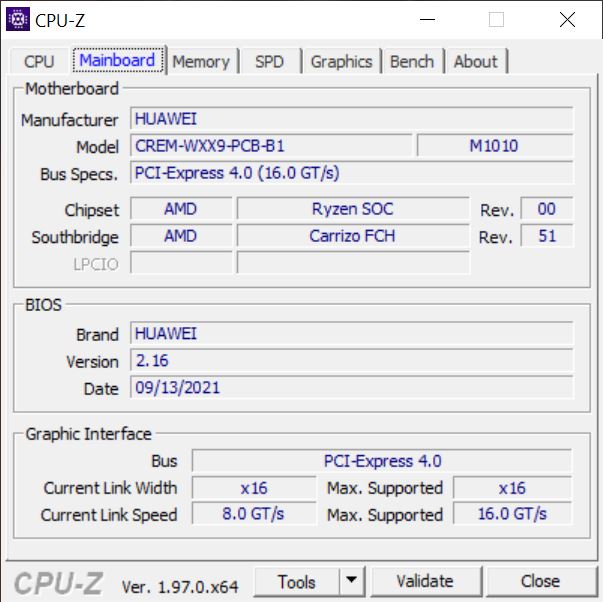
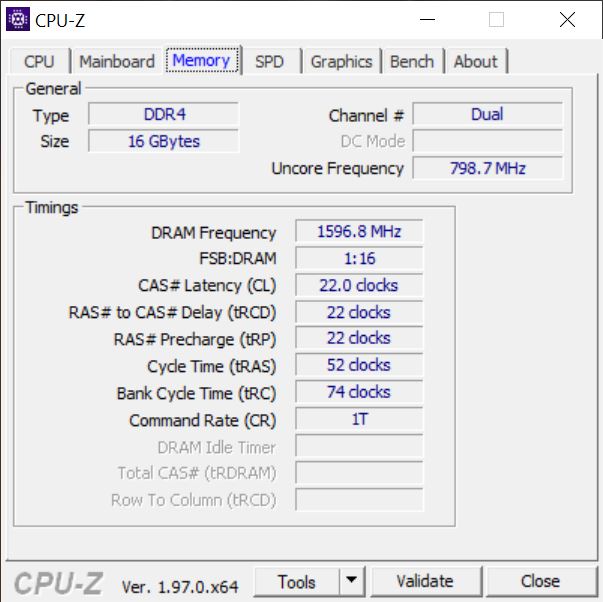
We have reviewed the more powerful configuration equipped with the new AMD Ryzen 7 5800H including a Radeon RX Vega 8 iGPU, 16 GB of RAM, a 512 GB PCIe SSD and a high-resolution 16-inch 3:2 IPS display for 1200 Euro. The competitors include the MateBook D 16 mentioned above, the Acer Swift 3 16, the Lenovo IdeaPad 5 Pro 16, the Schenker Vision 15 and the Dell XPS 15 9510.
potential competitors in comparison
Rating | Date | Model | Weight | Height | Size | Resolution | Price |
|---|---|---|---|---|---|---|---|
| 86.5 % v7 (old) | 10 / 2021 | Huawei MateBook 16 R7 5800H R7 5800H, Vega 8 | 2 kg | 17.8 mm | 16.00" | 2520x1680 | |
| 86.4 % v7 (old) | 10 / 2021 | Acer Swift 3 SF316-51 i7-11370H, Iris Xe G7 96EUs | 1.7 kg | 15.9 mm | 16.10" | 1920x1080 | |
| 86 % v7 (old) | 04 / 2021 | Huawei MateBook D 16-53011VFJ R5 4600H, Vega 6 | 1.7 kg | 18.4 mm | 16.10" | 1920x1080 | |
| 86.1 % v7 (old) | 09 / 2021 | Lenovo IdeaPad 5 Pro 16ACH R7 5800H, GeForce GTX 1650 Mobile | 2 kg | 17.5 mm | 16.00" | 2560x1600 | |
| 87.7 % v7 (old) | 12 / 2020 | Schenker Vision 15 i7-1165G7, Iris Xe G7 96EUs | 1.7 kg | 15 mm | 15.60" | 1920x1080 | |
| 84.2 % v7 (old) | 10 / 2021 | Dell XPS 15 9510 i5 11400H FHD i5-11400H, UHD Graphics Xe 16EUs | 1.8 kg | 18 mm | 15.60" | 1920x1200 |
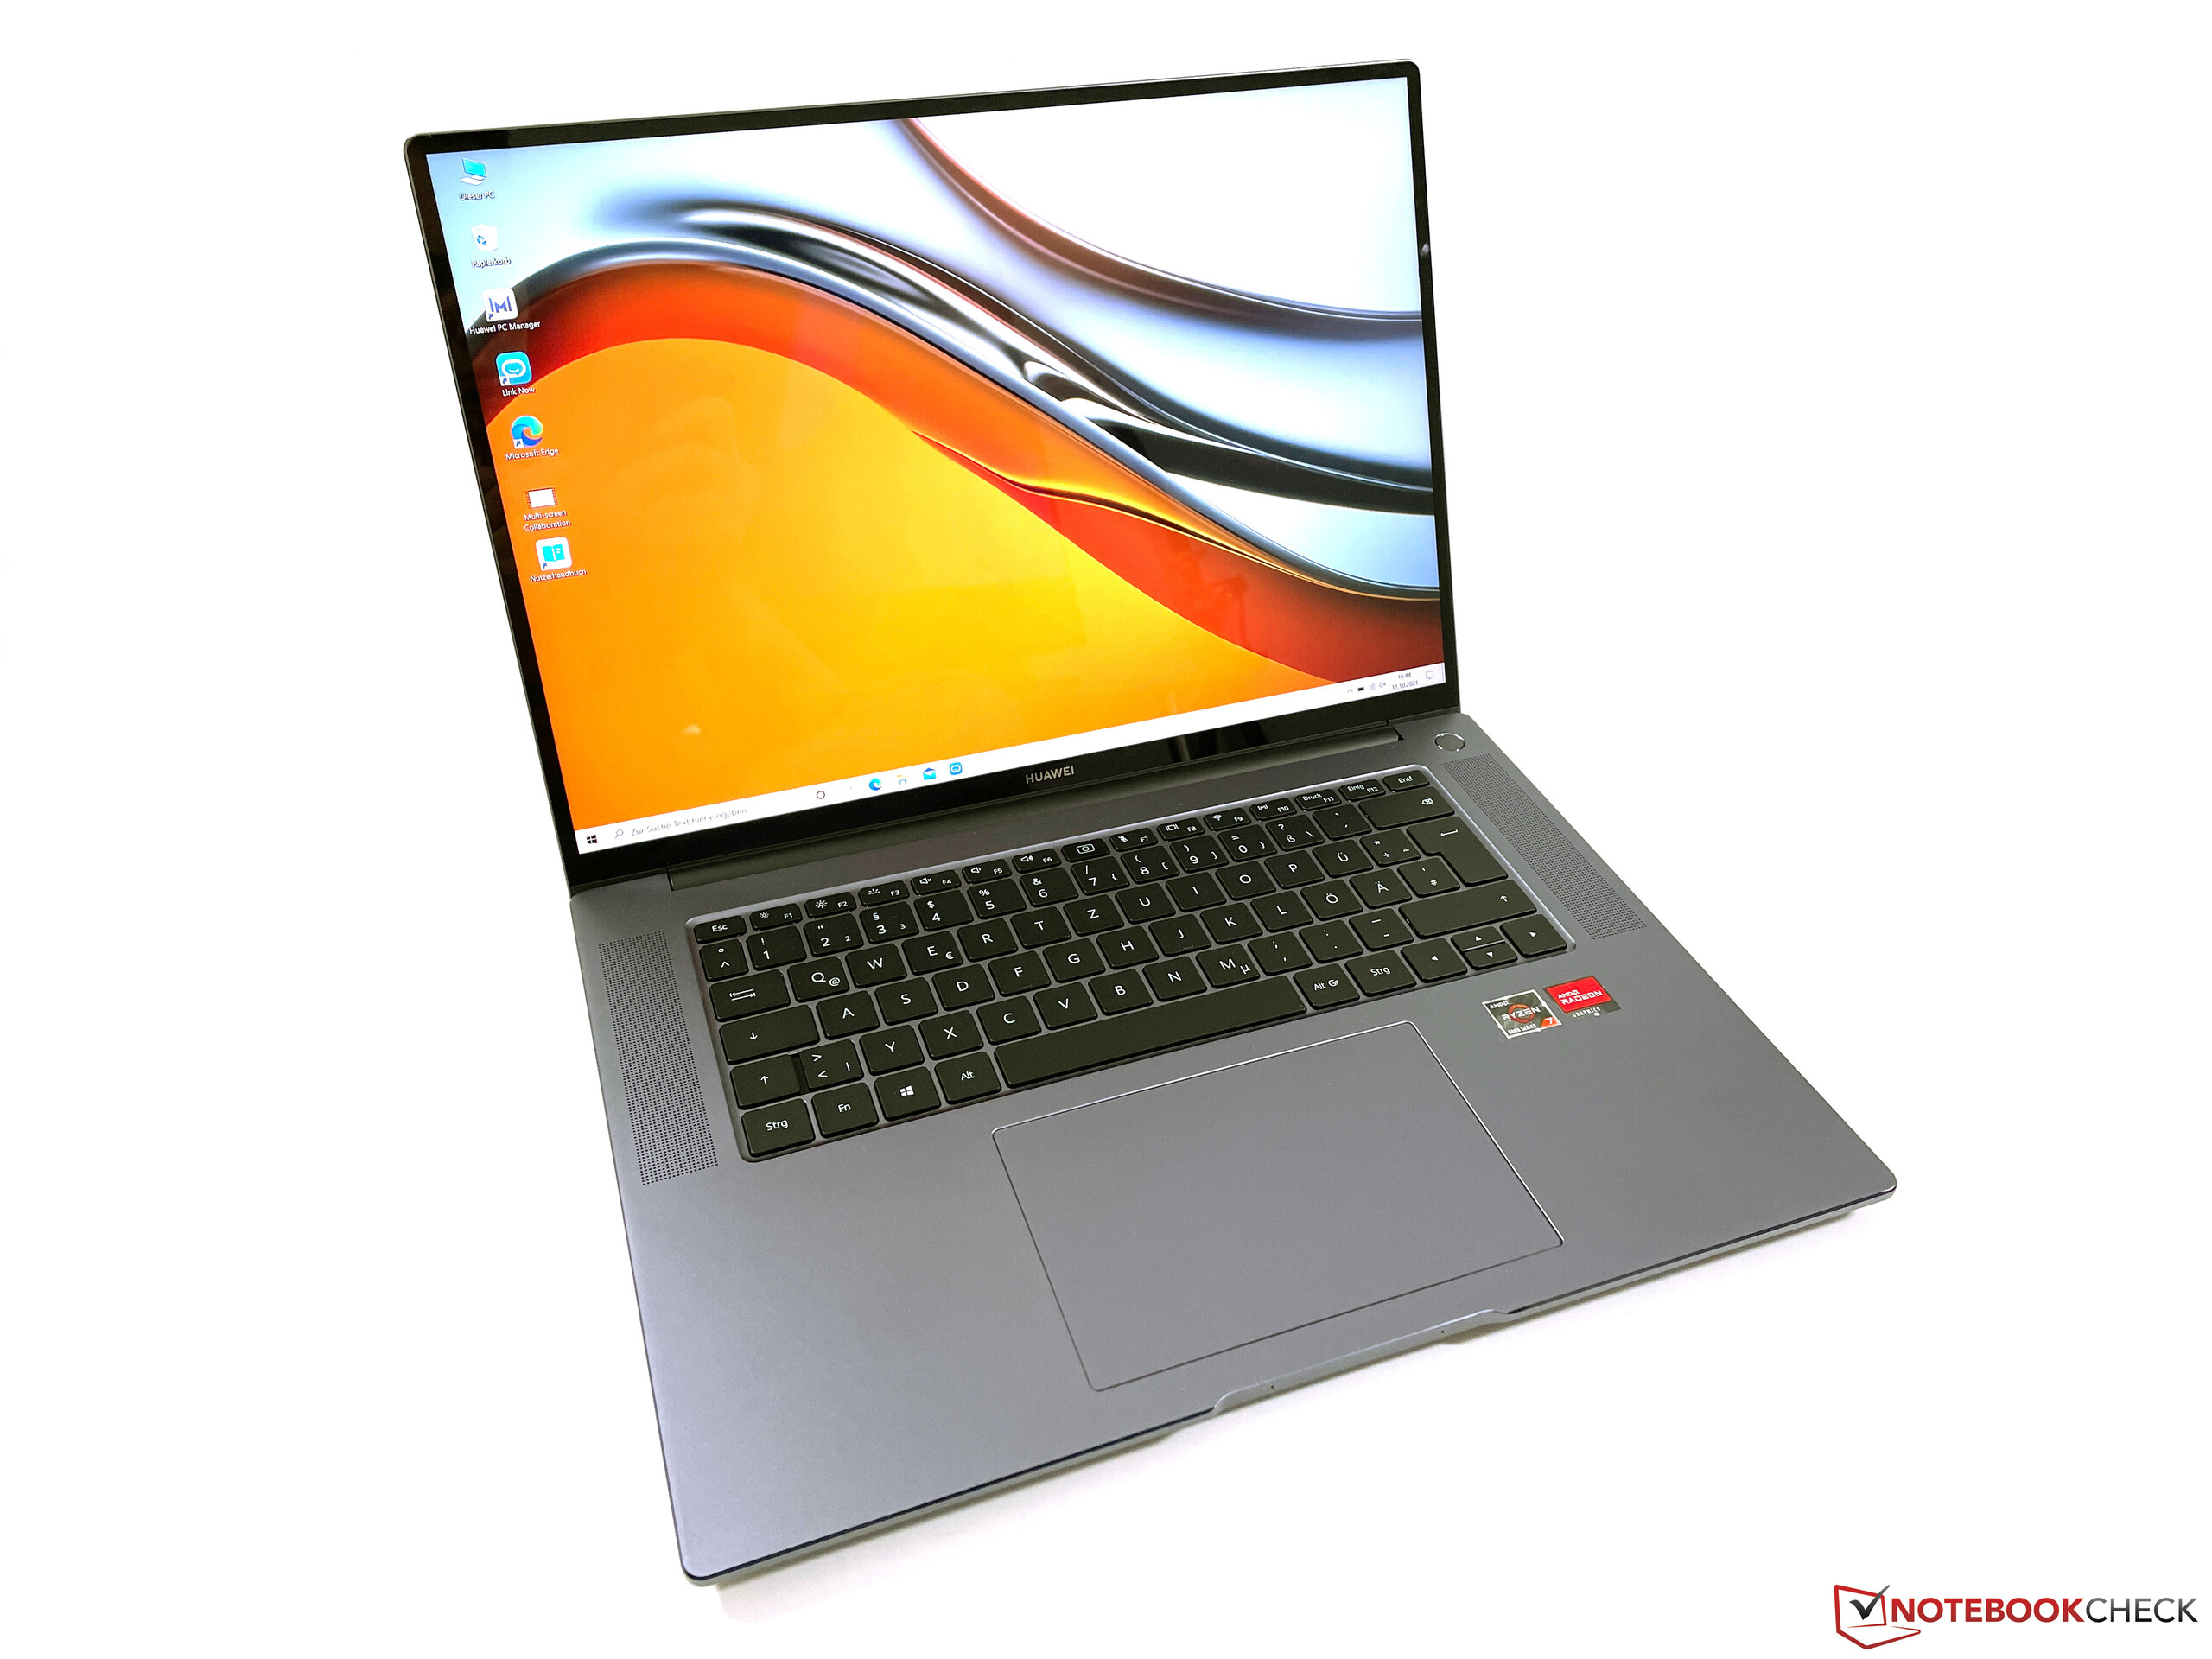
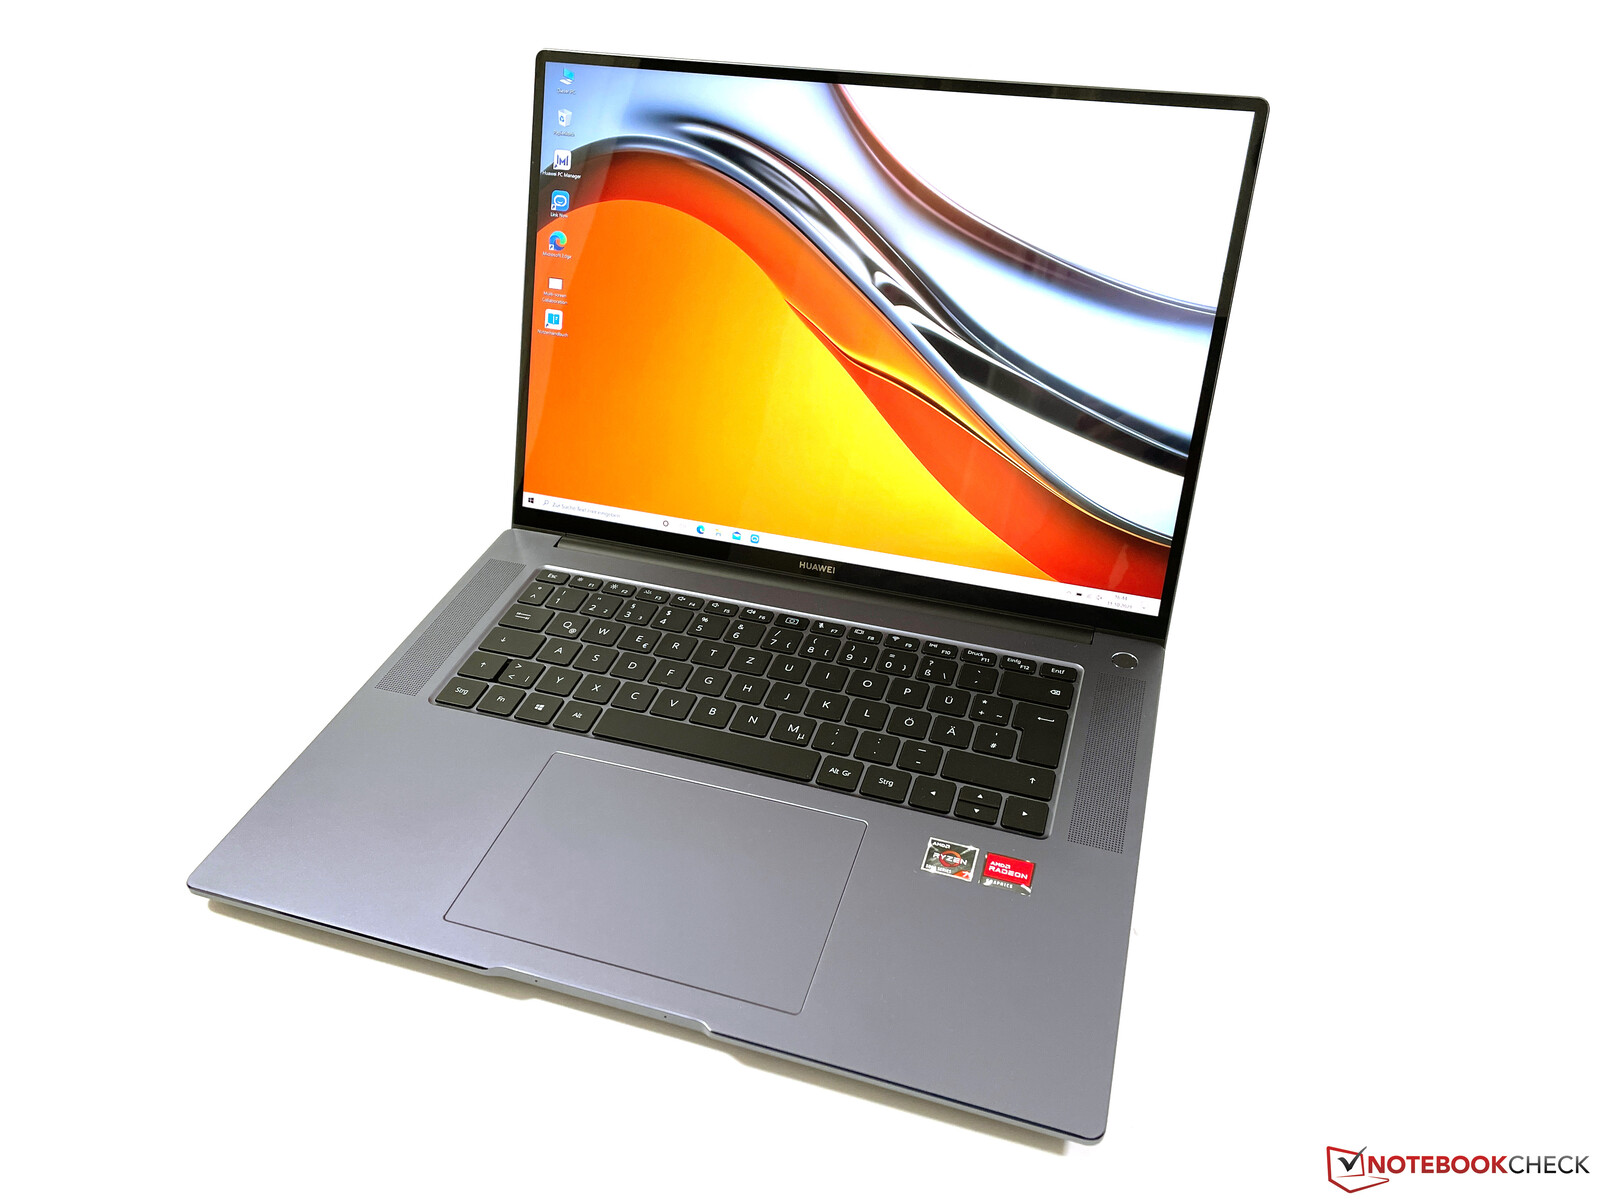
Case - MateBook 16 with an attractive aluminum case
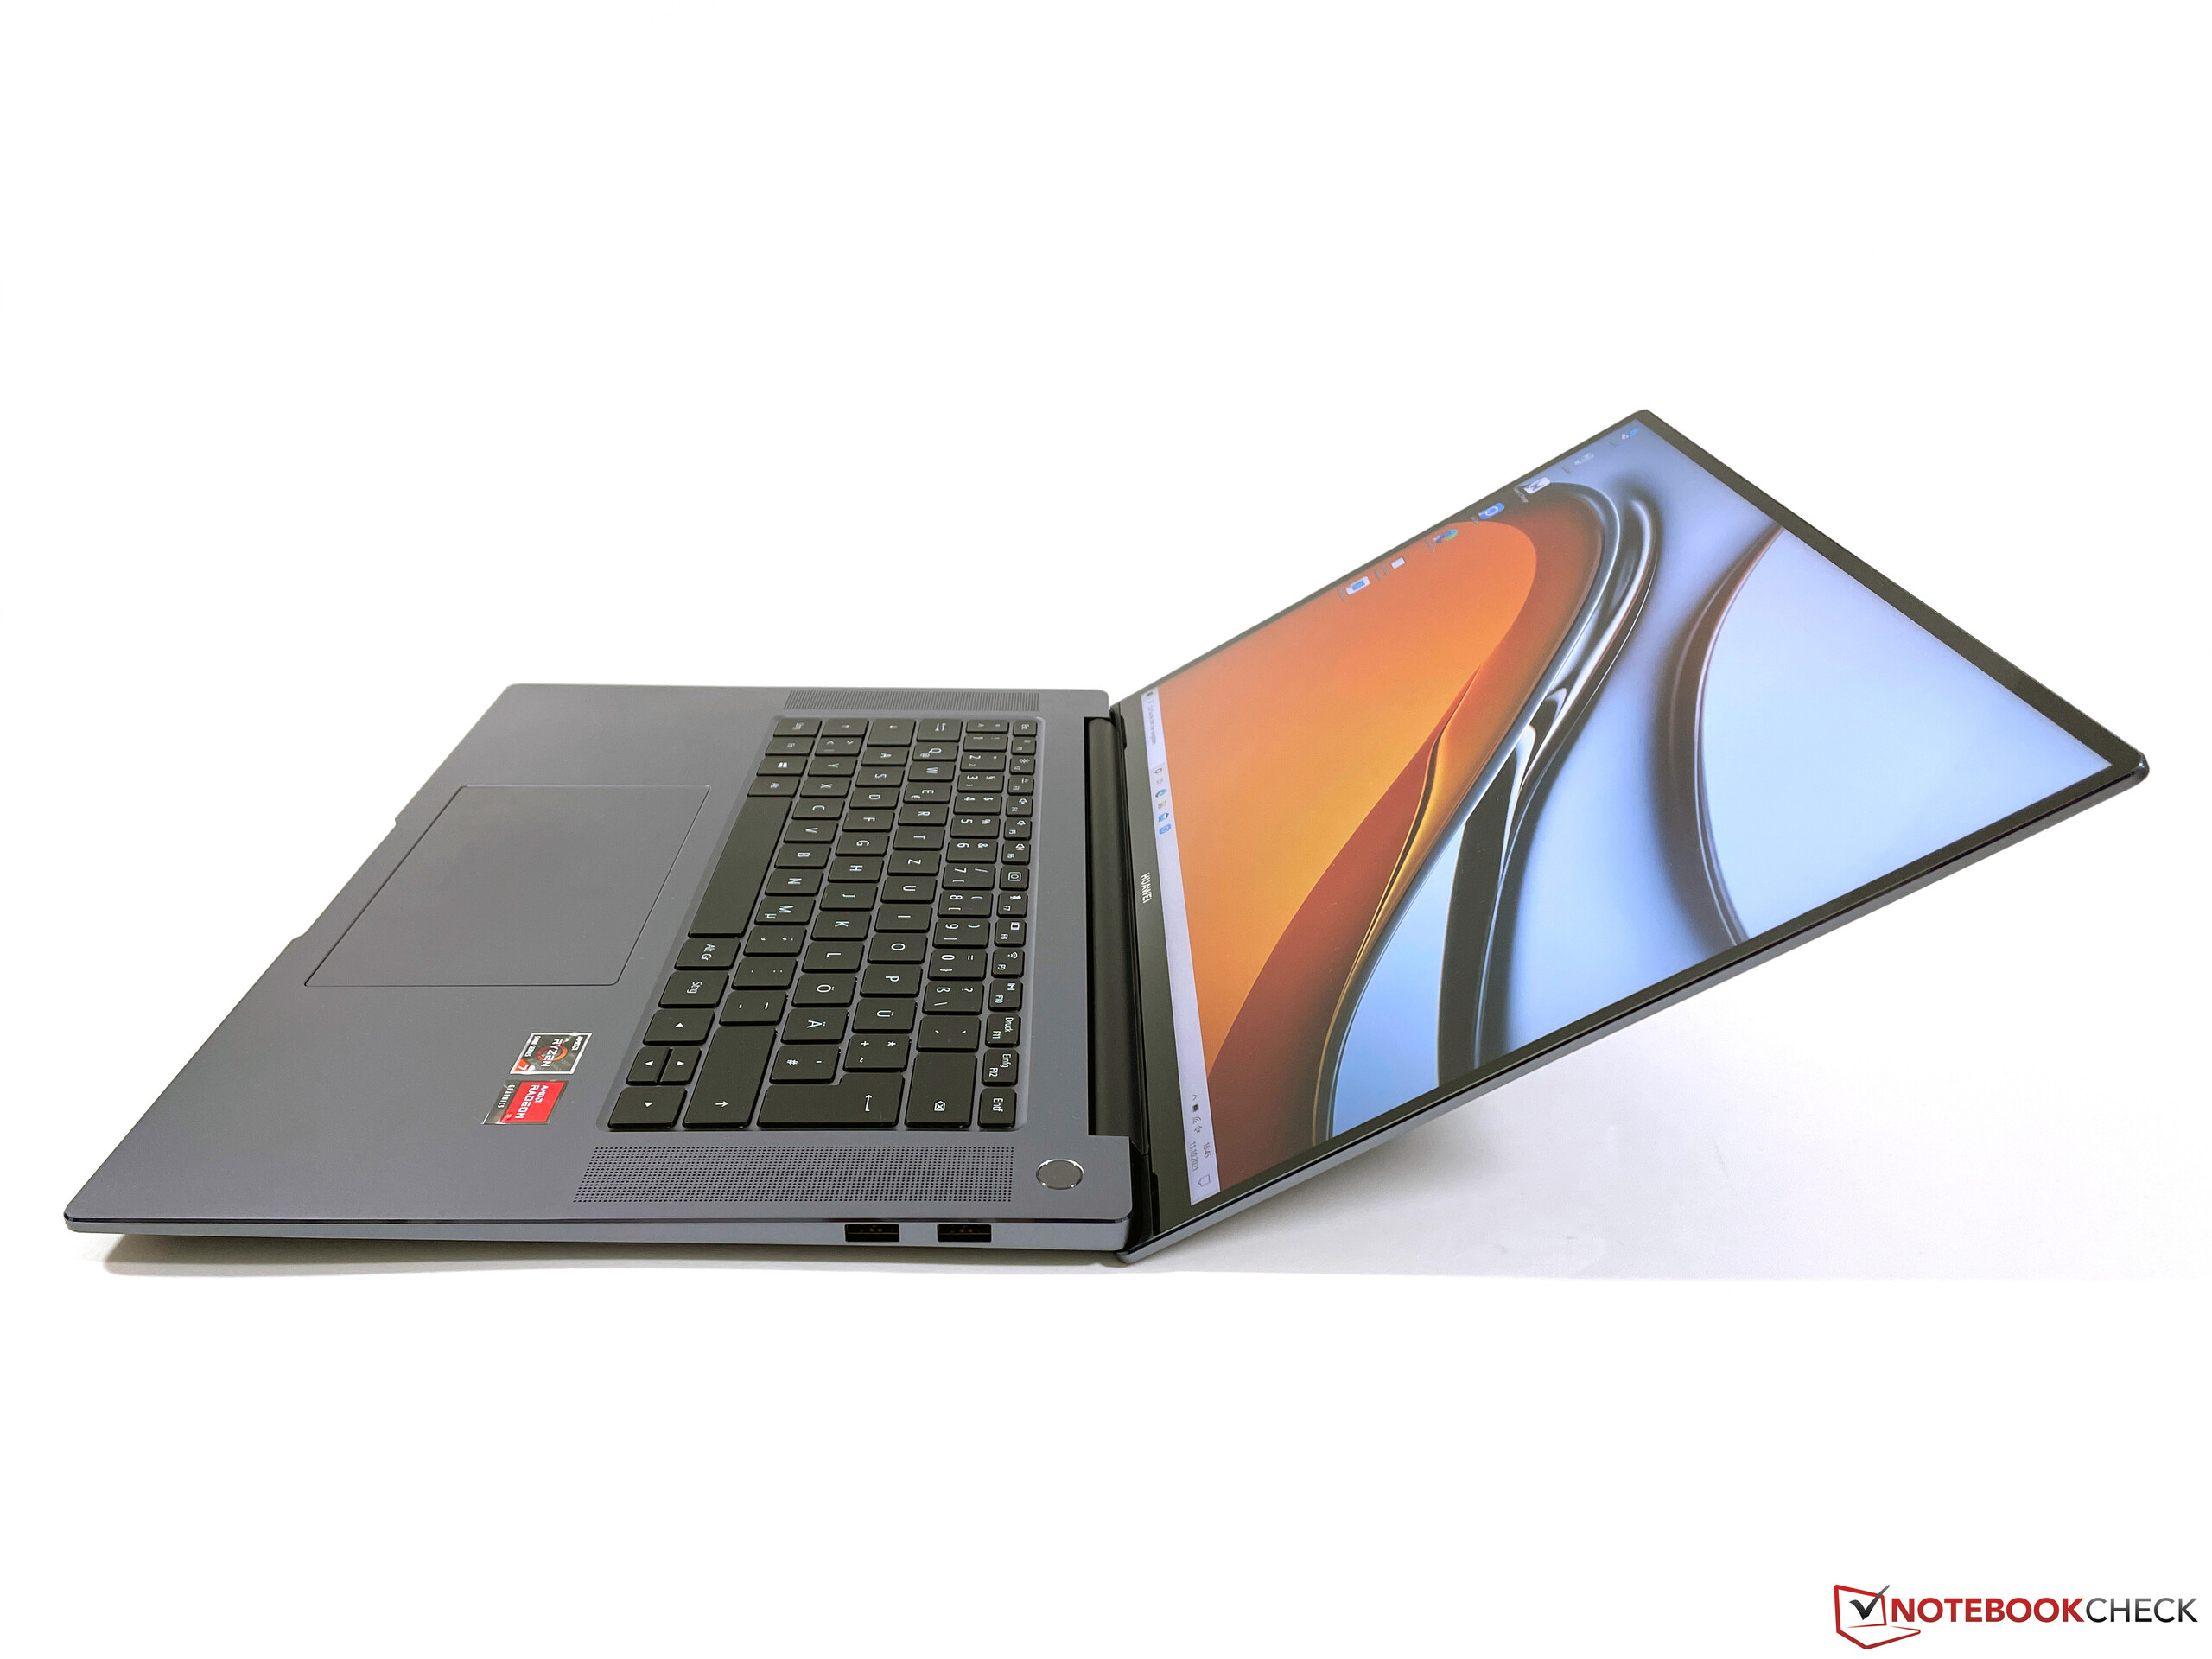
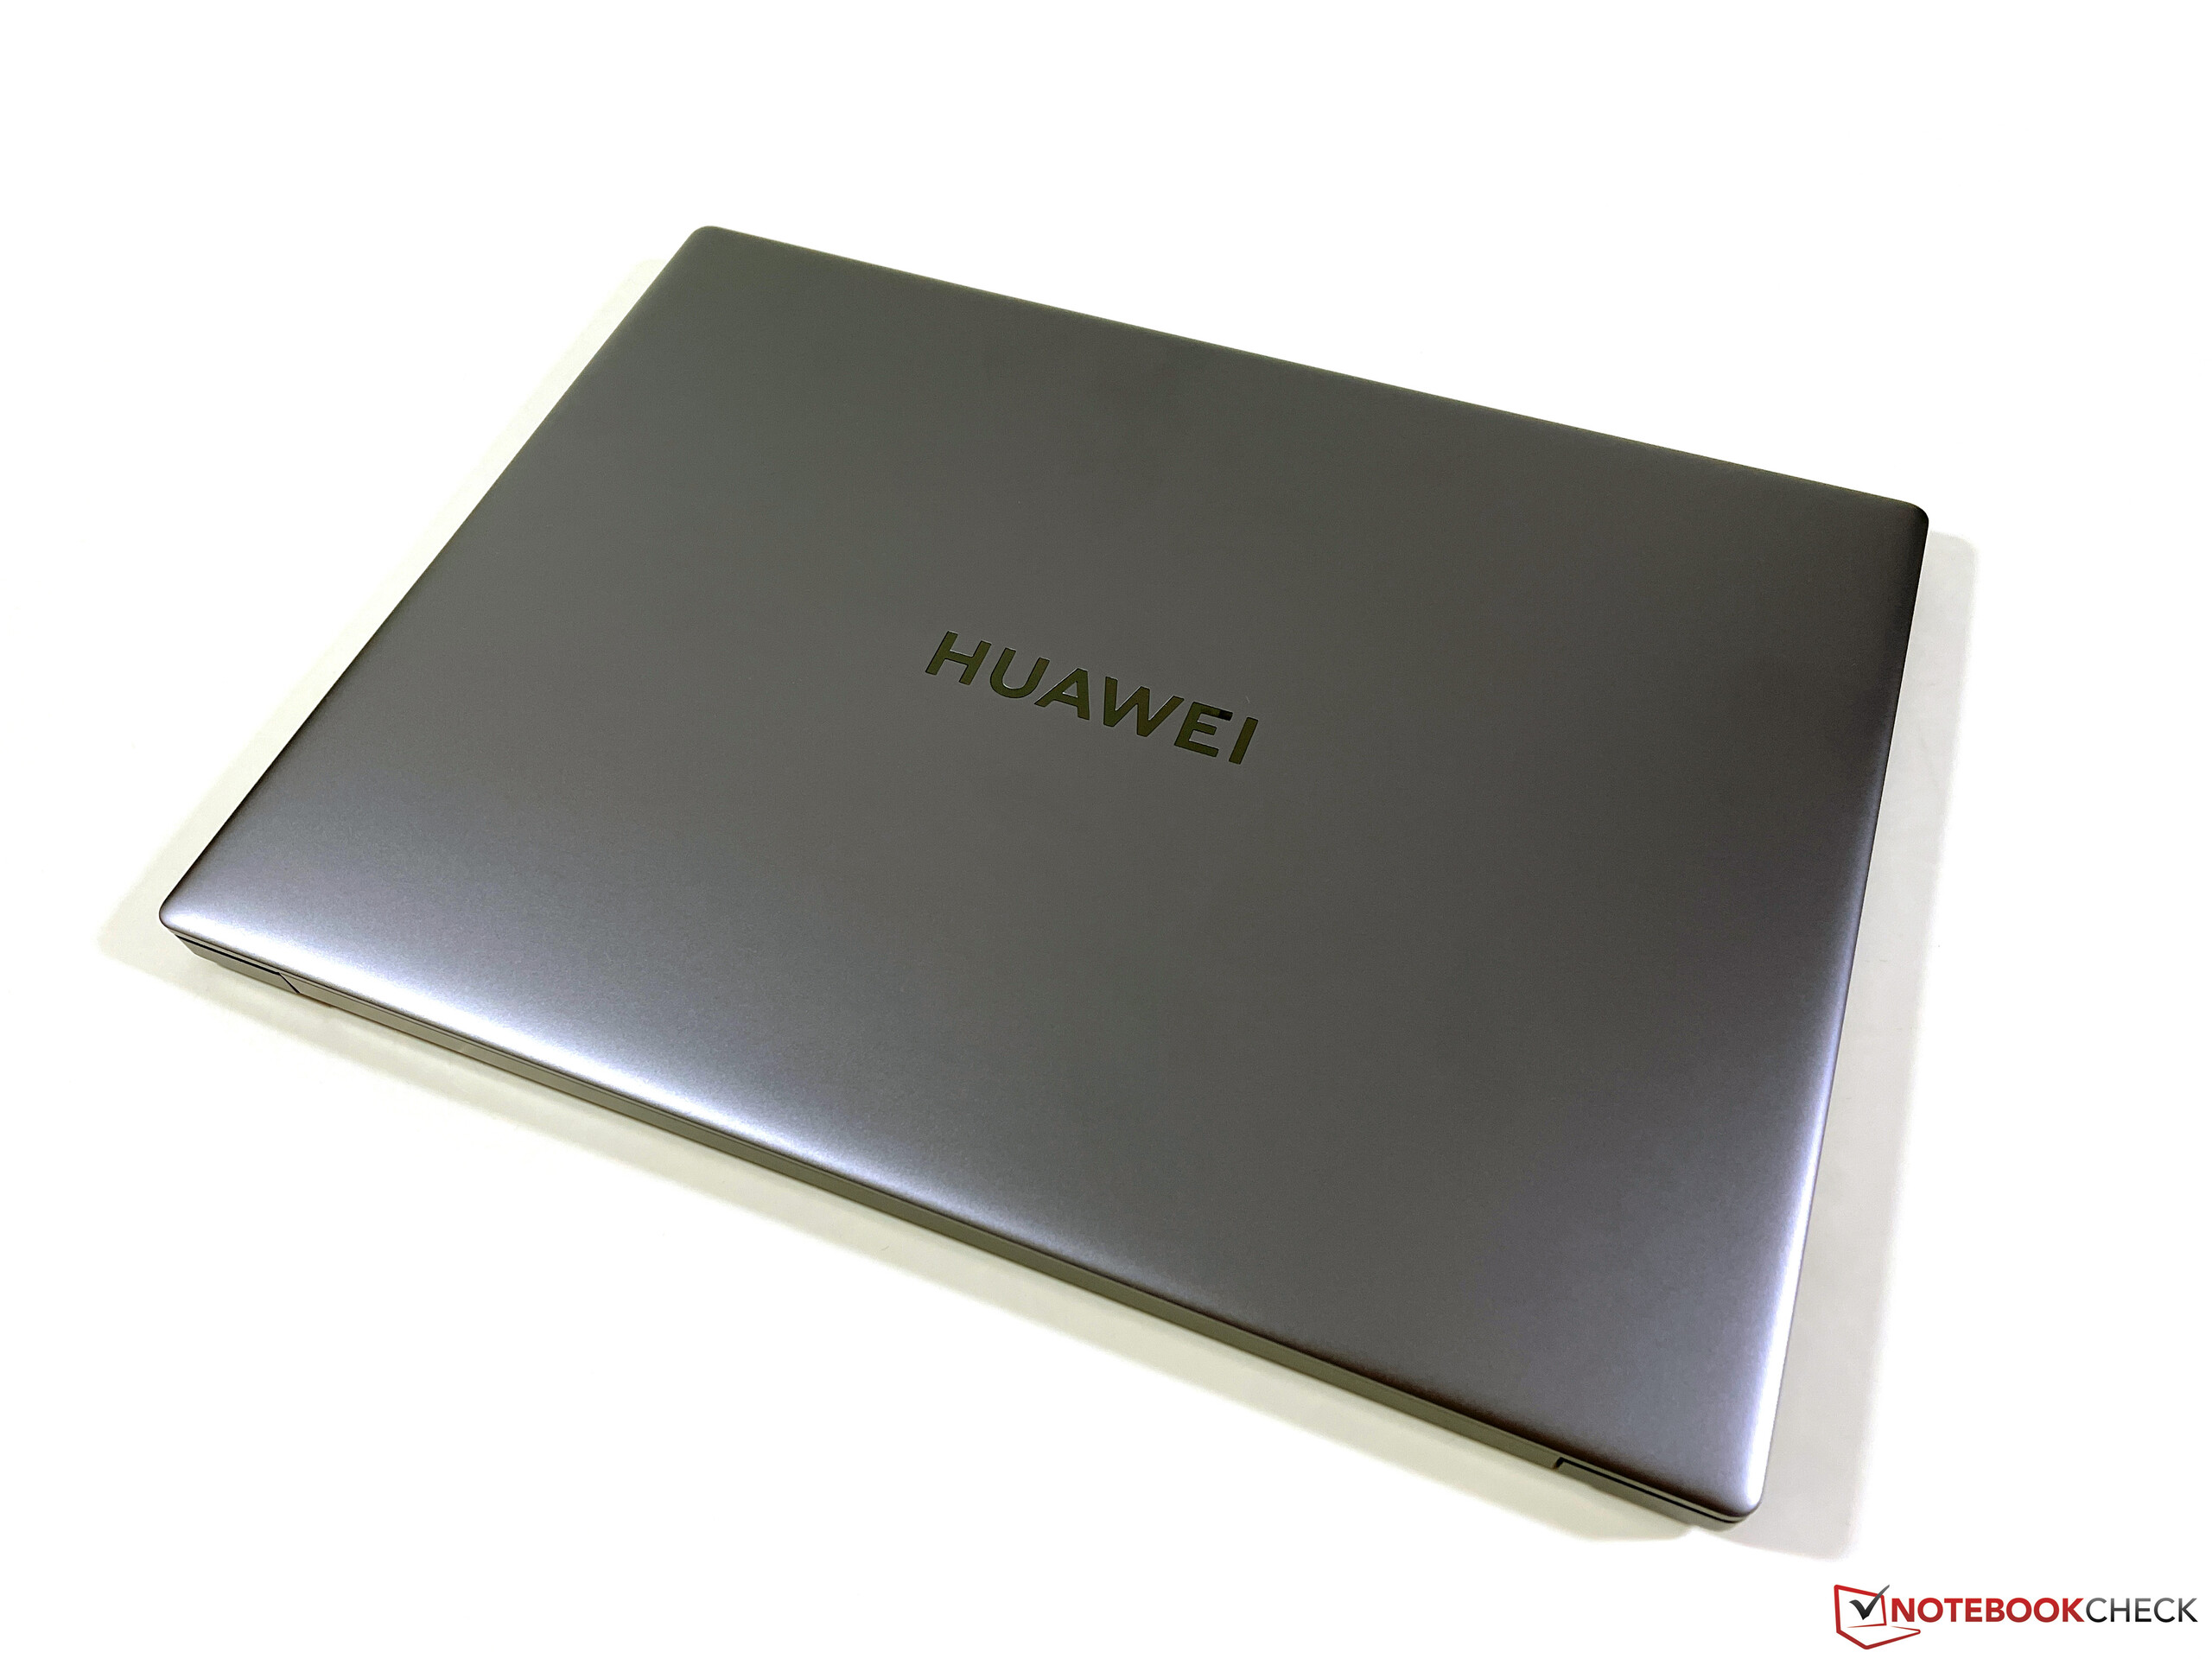
The MateBook 16's new aluminum case is equal to the MateBook X Pro or the new MateBook 14s in terms of quality and gives a better impression than the older MateBook D16. The device has a very high-quality feel to it and the workmanship appears to be perfect. Its design is similar to that of the other MateBooks and includes a small hollow to open the display cover and a polished edge on the top of the base unit. The only color available on this device is Space Gray. If the light falls onto the surface in a certain way, this color, unlike Apple's Space Gray, actually looks slightly purple. Not everyone will appreciate this color choice, so we would have liked at least one other color option. The bezels above and on the sides of the display are only 5.2 mm wide, which leads to a screen-to-body ratio of almost 90 percent.
Both the base unit and display cover are very solid and sturdy. The base unit only gives way to pressure in the middle above the keyboard. This shouldn't impact everyday use in any way. The hinges are well adjusted but cannot quite make up for the fact that the display is rather large and deep due to the 3:2 screen ratio. The laptop is fairly easy to open with one hand, but the display teeters slightly when adjusting the opening angle (max 145 degrees).
Despite its large 16-inch panel, the MateBook is the narrowest device in our group of comparison devices. Its 3:2 screen ratio also makes it the deepest. All comparison devices are very similar in terms of thickness. The MateBook is one of the heaviest devices in our comparison table at exactly 2 kg, which doesn't make it the most portable solution. The AC adapter weighs another 400 grams.
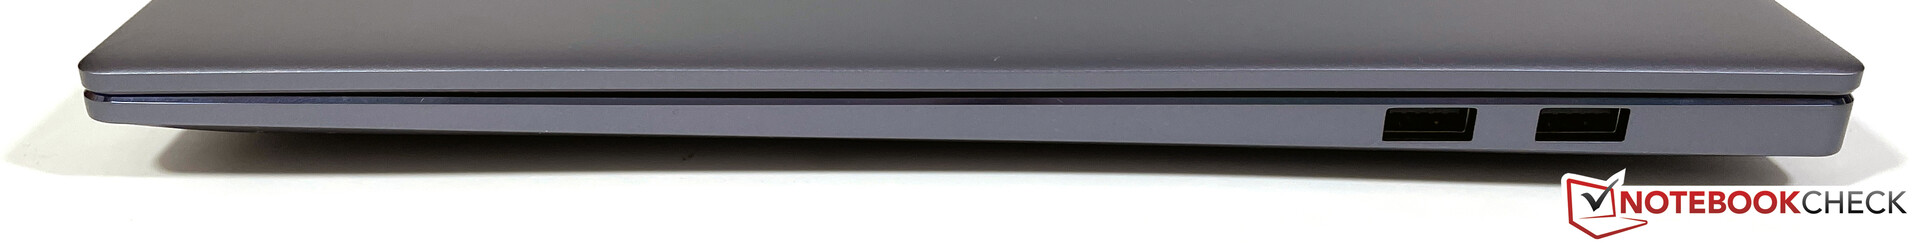
Connectivity - Huawei chooses USB-C & USB-A
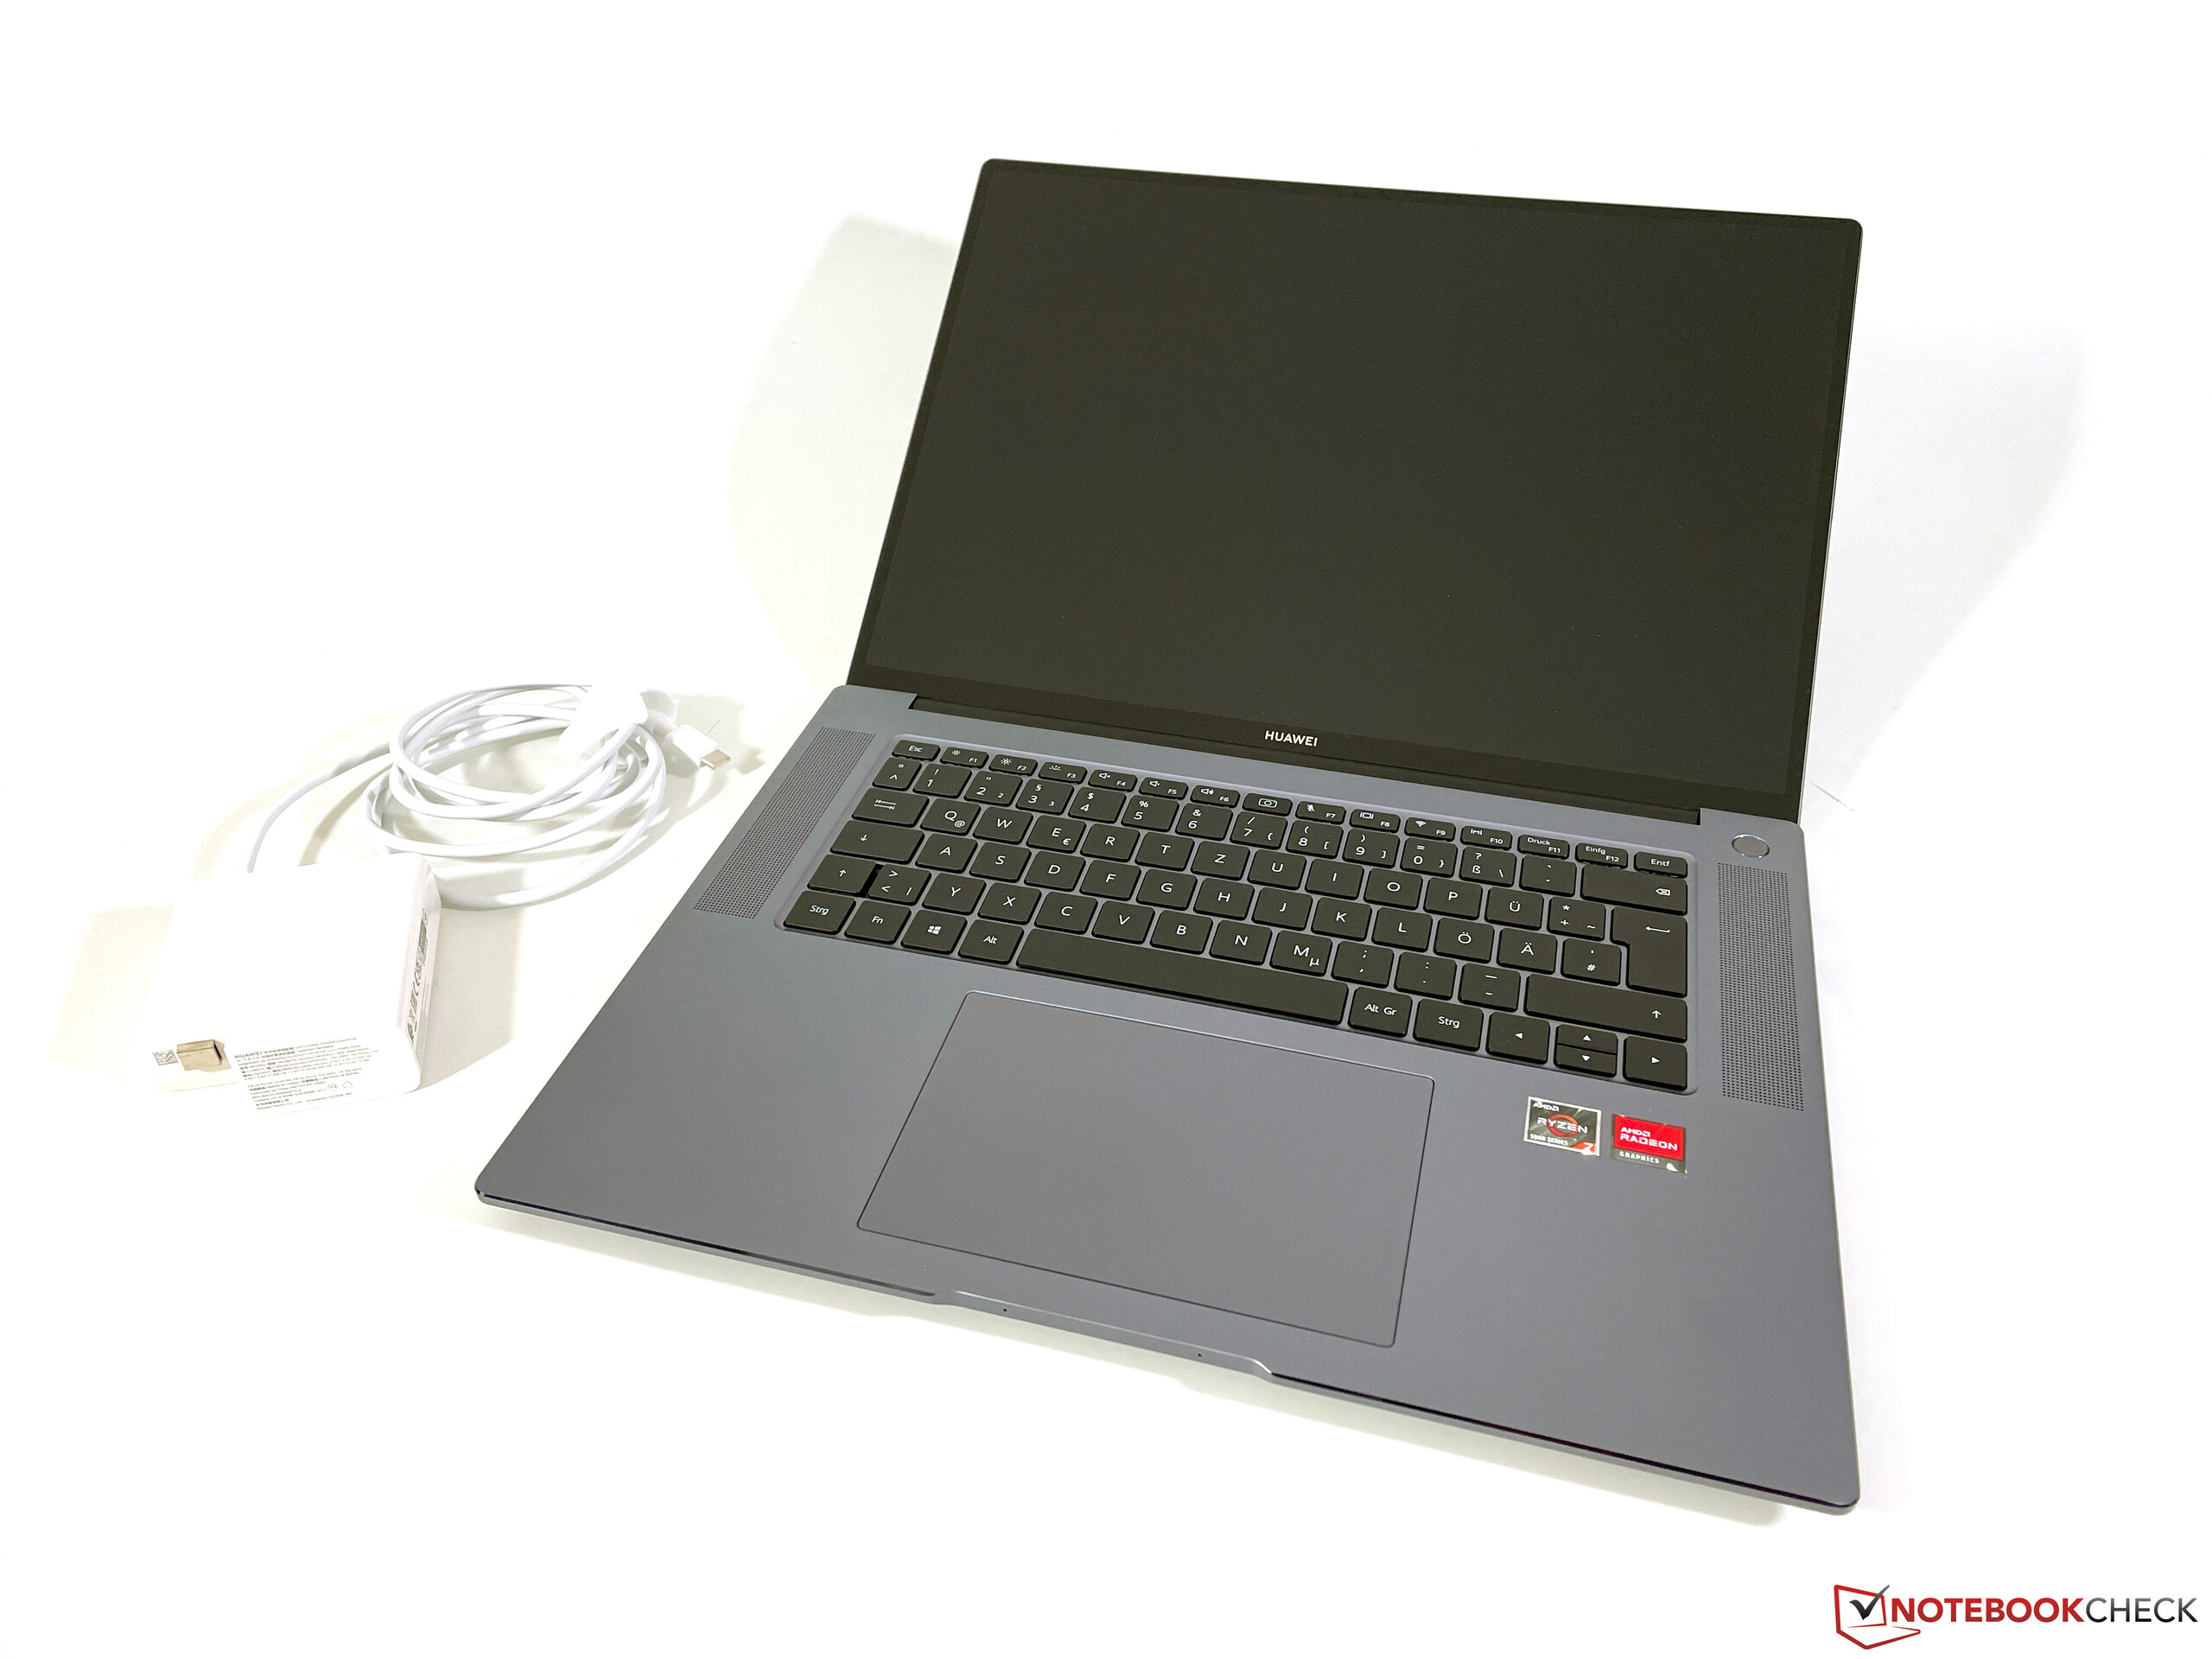
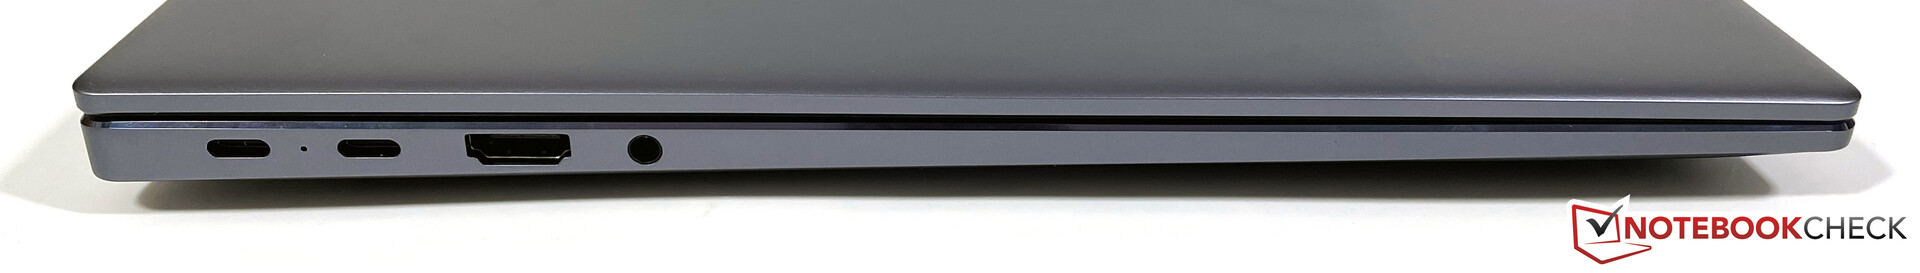
Huawei has decided to equip its MateBook 16 with both USB C ports (that can be used for recharging) and USB A ports. This is very useful as users do not need to resort to adapters. The HDMI port supports the 2.0 standard, which means the device can connect to 4K monitors with up to 60 Hz.
Communication
Huawei has chosen to equip the MateBook 16 with the well-known Intel Wi-Fi module AX200 that supports the current Wi-Fi 6 standard (802.11ax) with 160 Hz as well as Bluetooth 5.1. Our standardized Wi-Fi test with the Netgear Nighthawk RAX120 router results in very good transfer rates, which we can confirm based on our experience while using the device. We did not encounter any limitations in terms of speed or signal. The device behaved just as well with the AVM Fritz!Box 7590 (Wi-Fi 5, 802.11ac).
Webcam
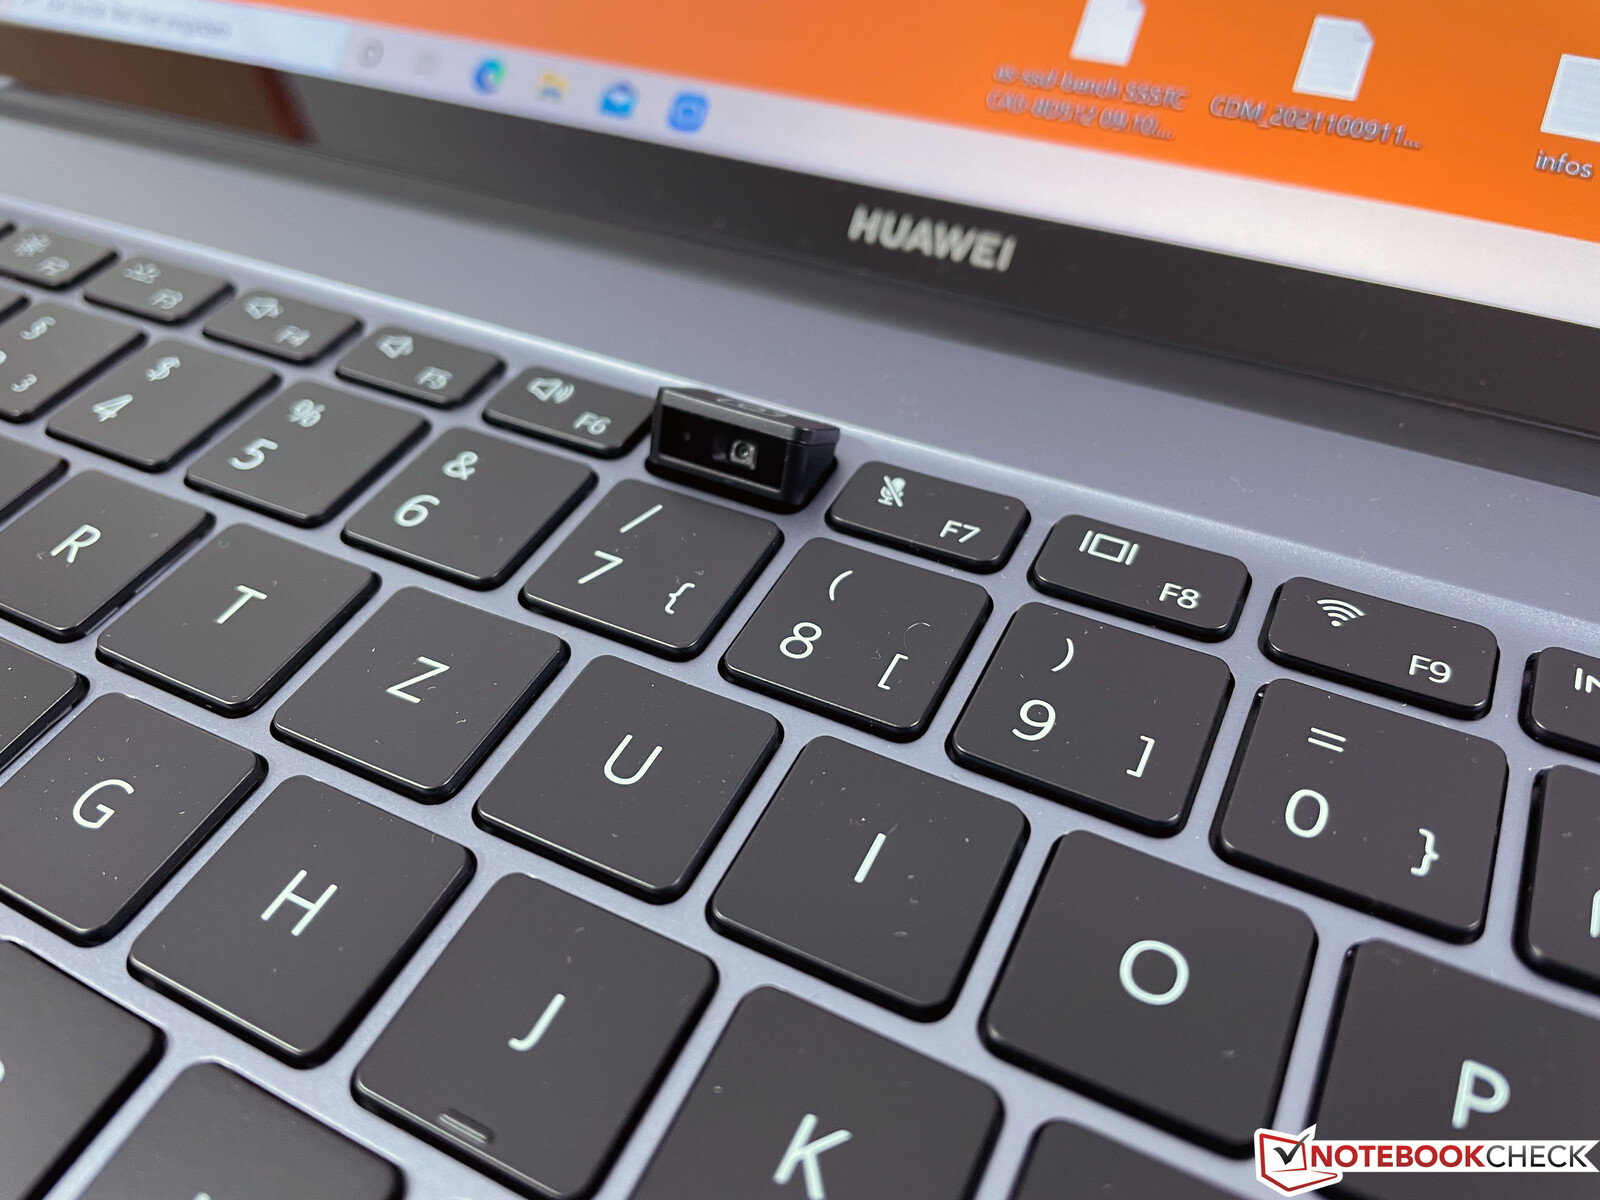
While Huawei has repositioned the webcam to the top of the screen for the new MateBook 14s, the manufacturer has kept the MateBook 16's webcam in its usual position in the top row of the keyboard. This is good in terms of security but leads to a rather distorted perspective. The quality of the 720p sensor is quite meager as well, even in good lighting.


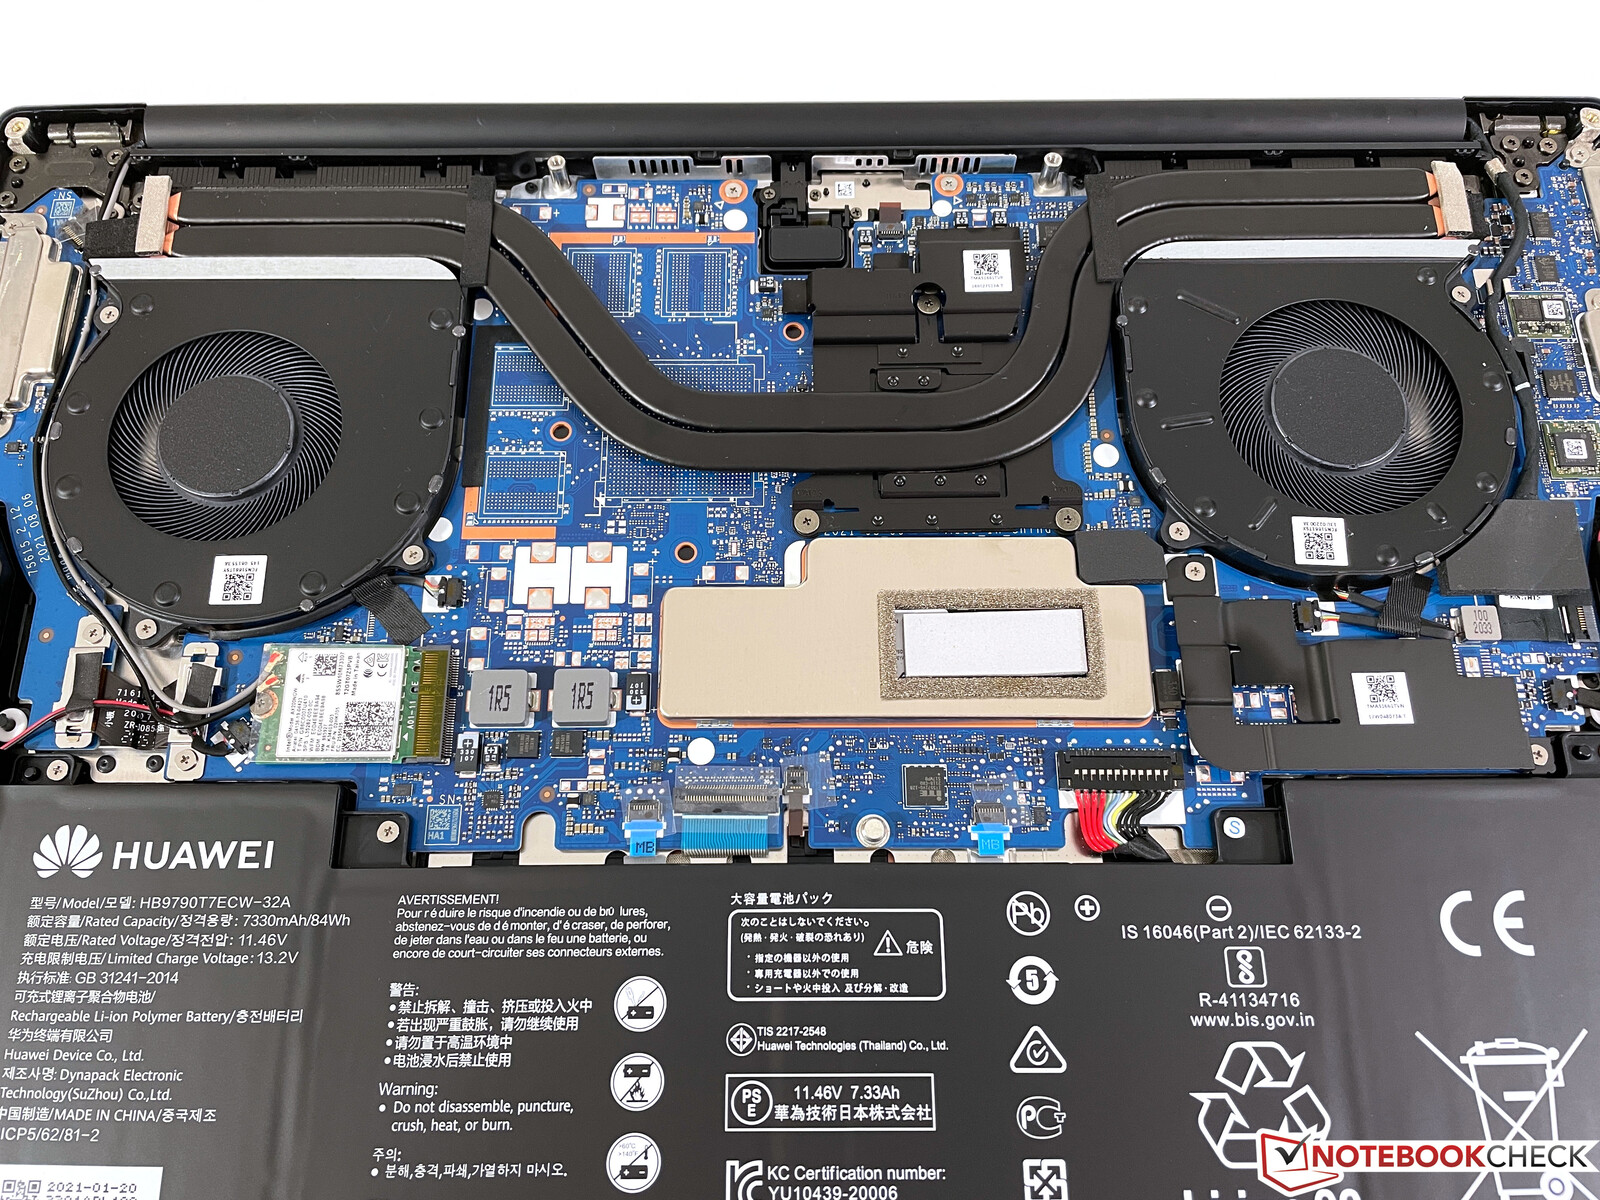
Maintenance
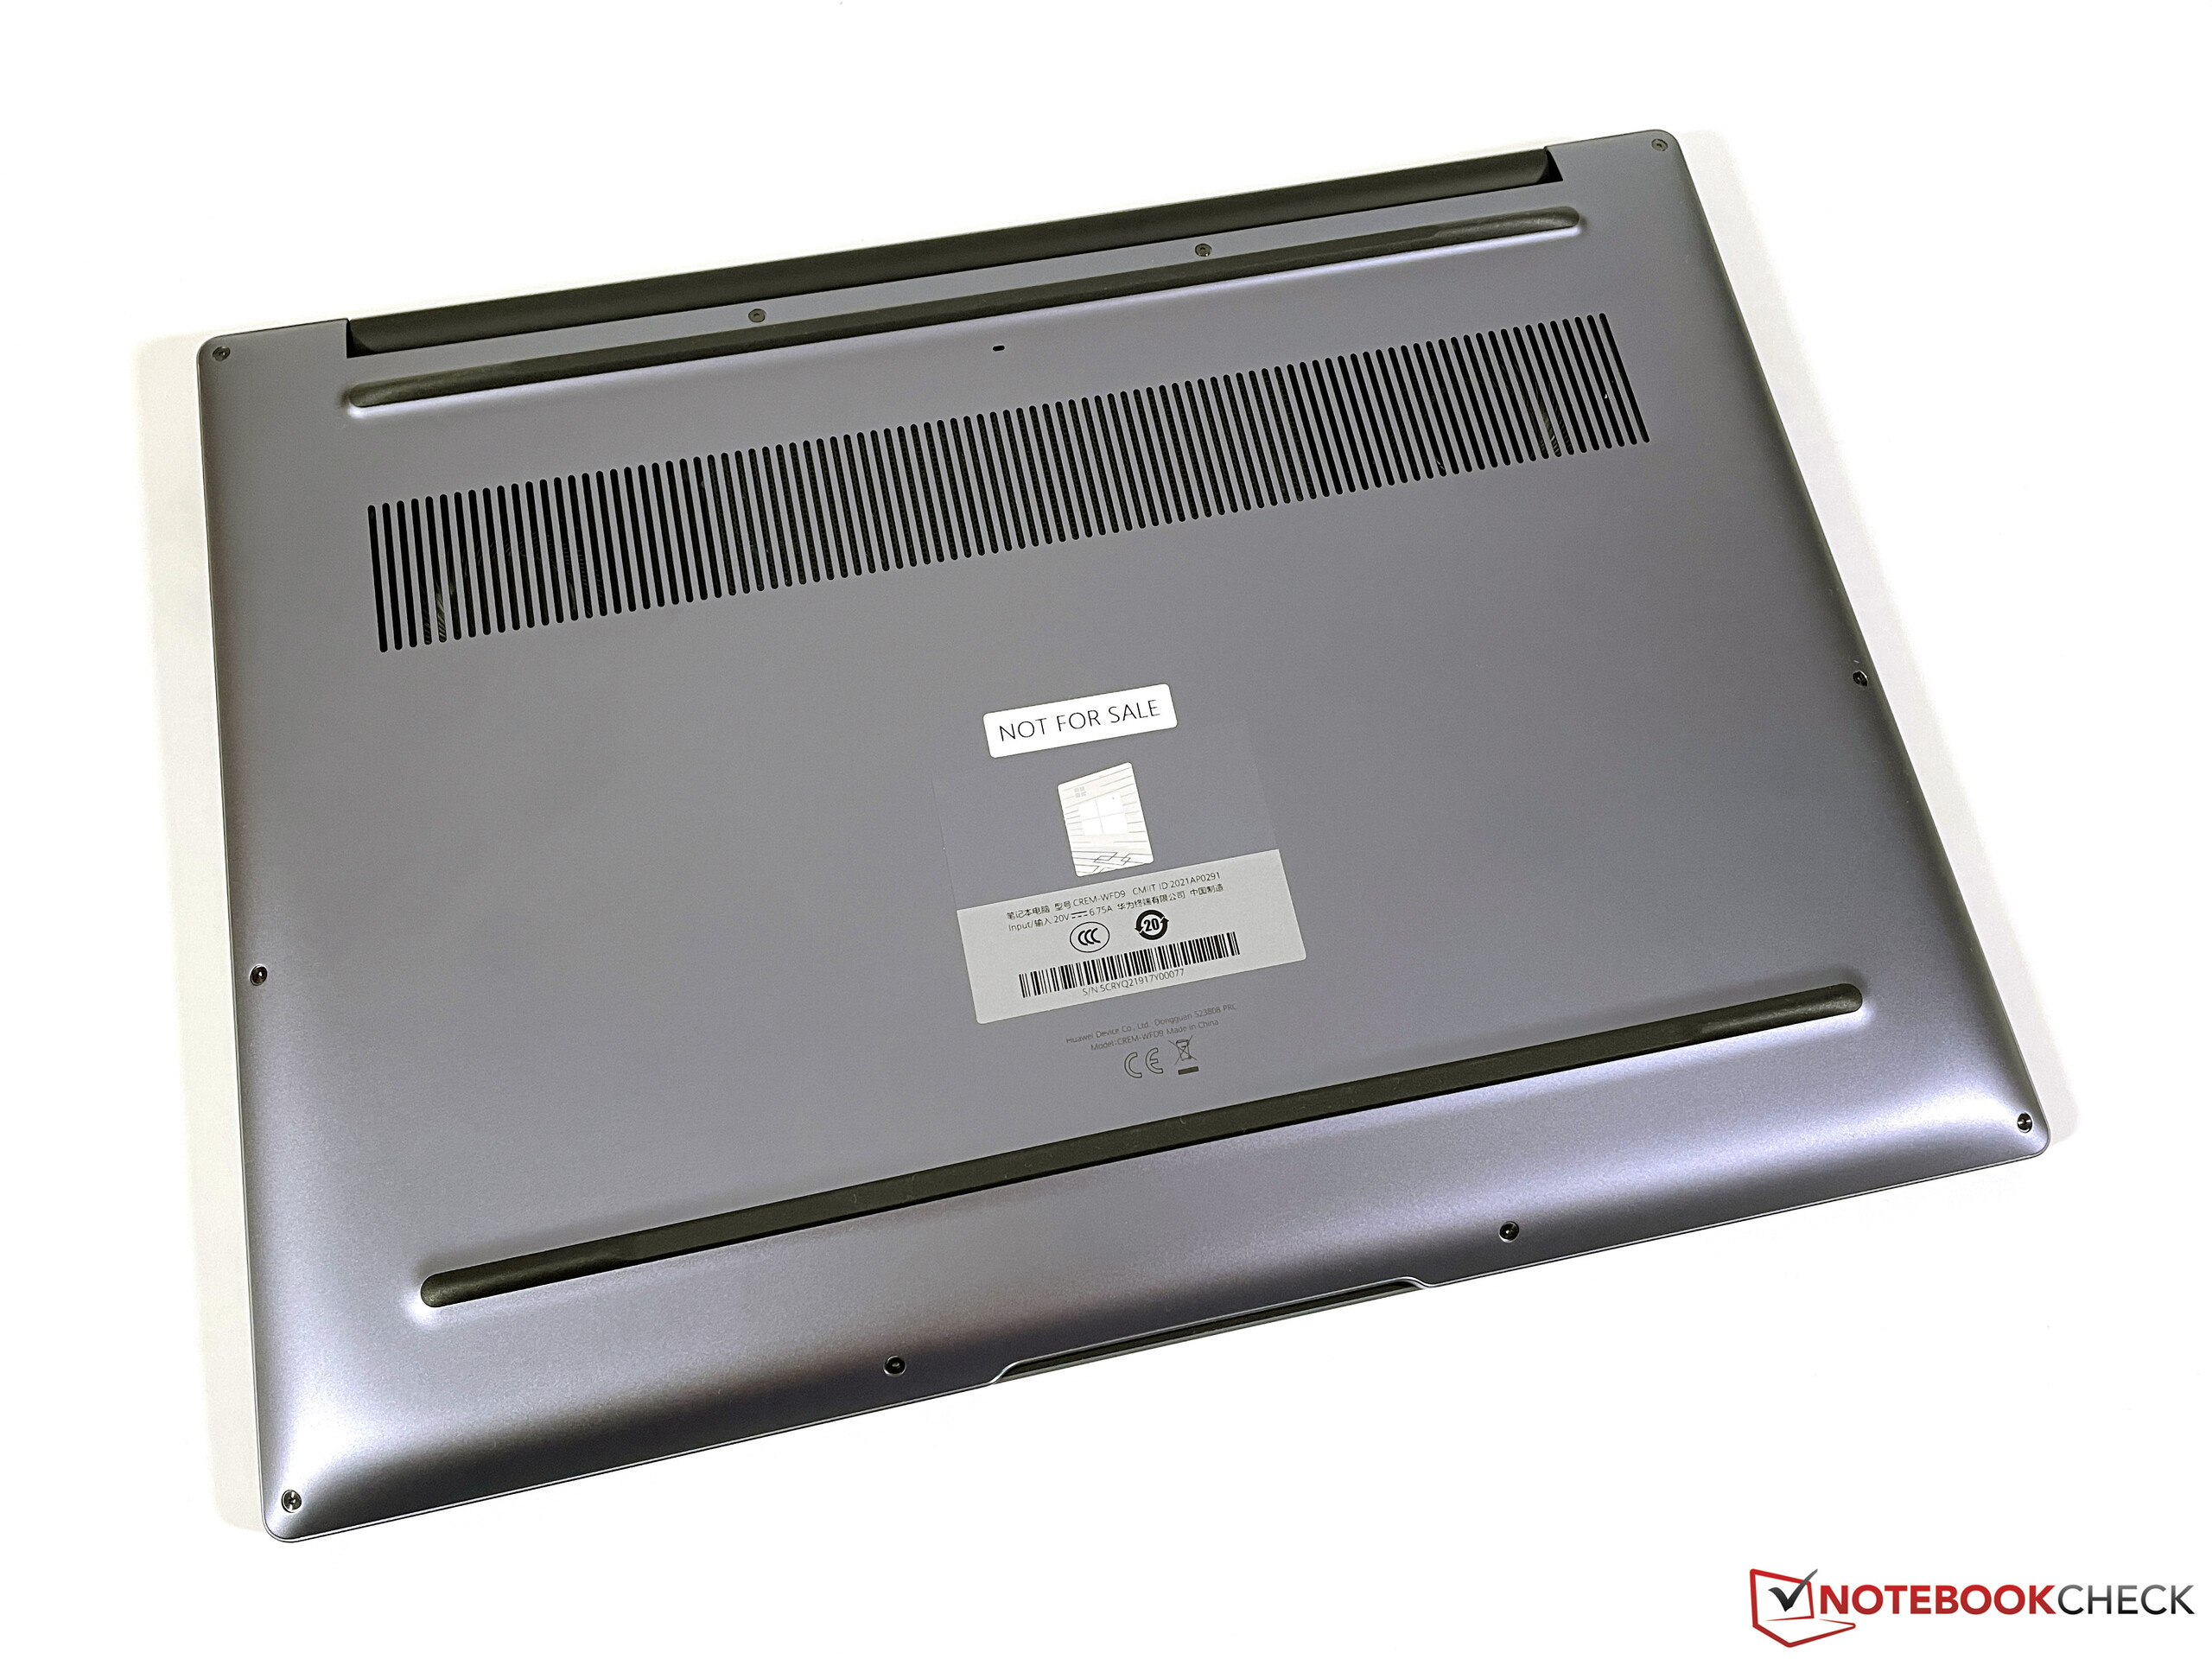
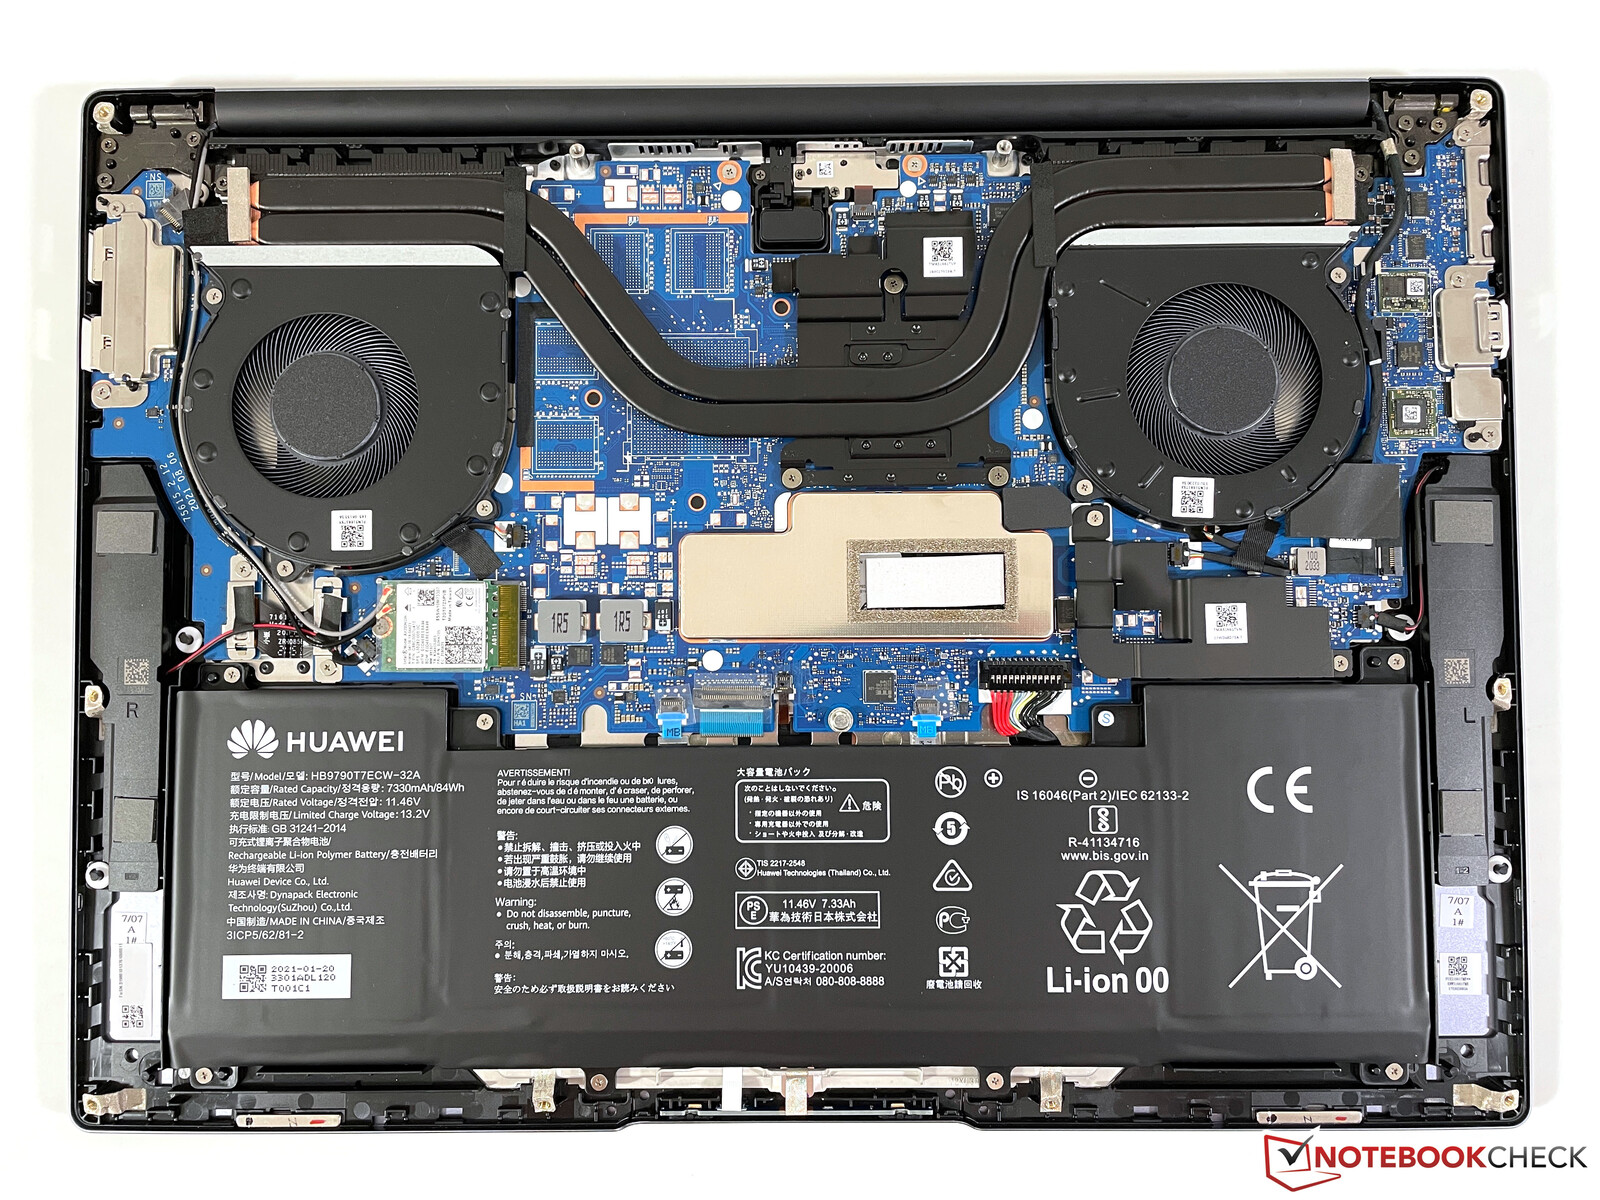
The bottom of the base unit is held in place with only a few Torx T6 screws and is easy to remove. Not that there is much to do on the inside - only the Wi-Fi module and the M.2 2280 SSD (which is beneath another metal plate that can be removed easily) can be replaced. The RAM module is soldered on and cannot be upgraded.
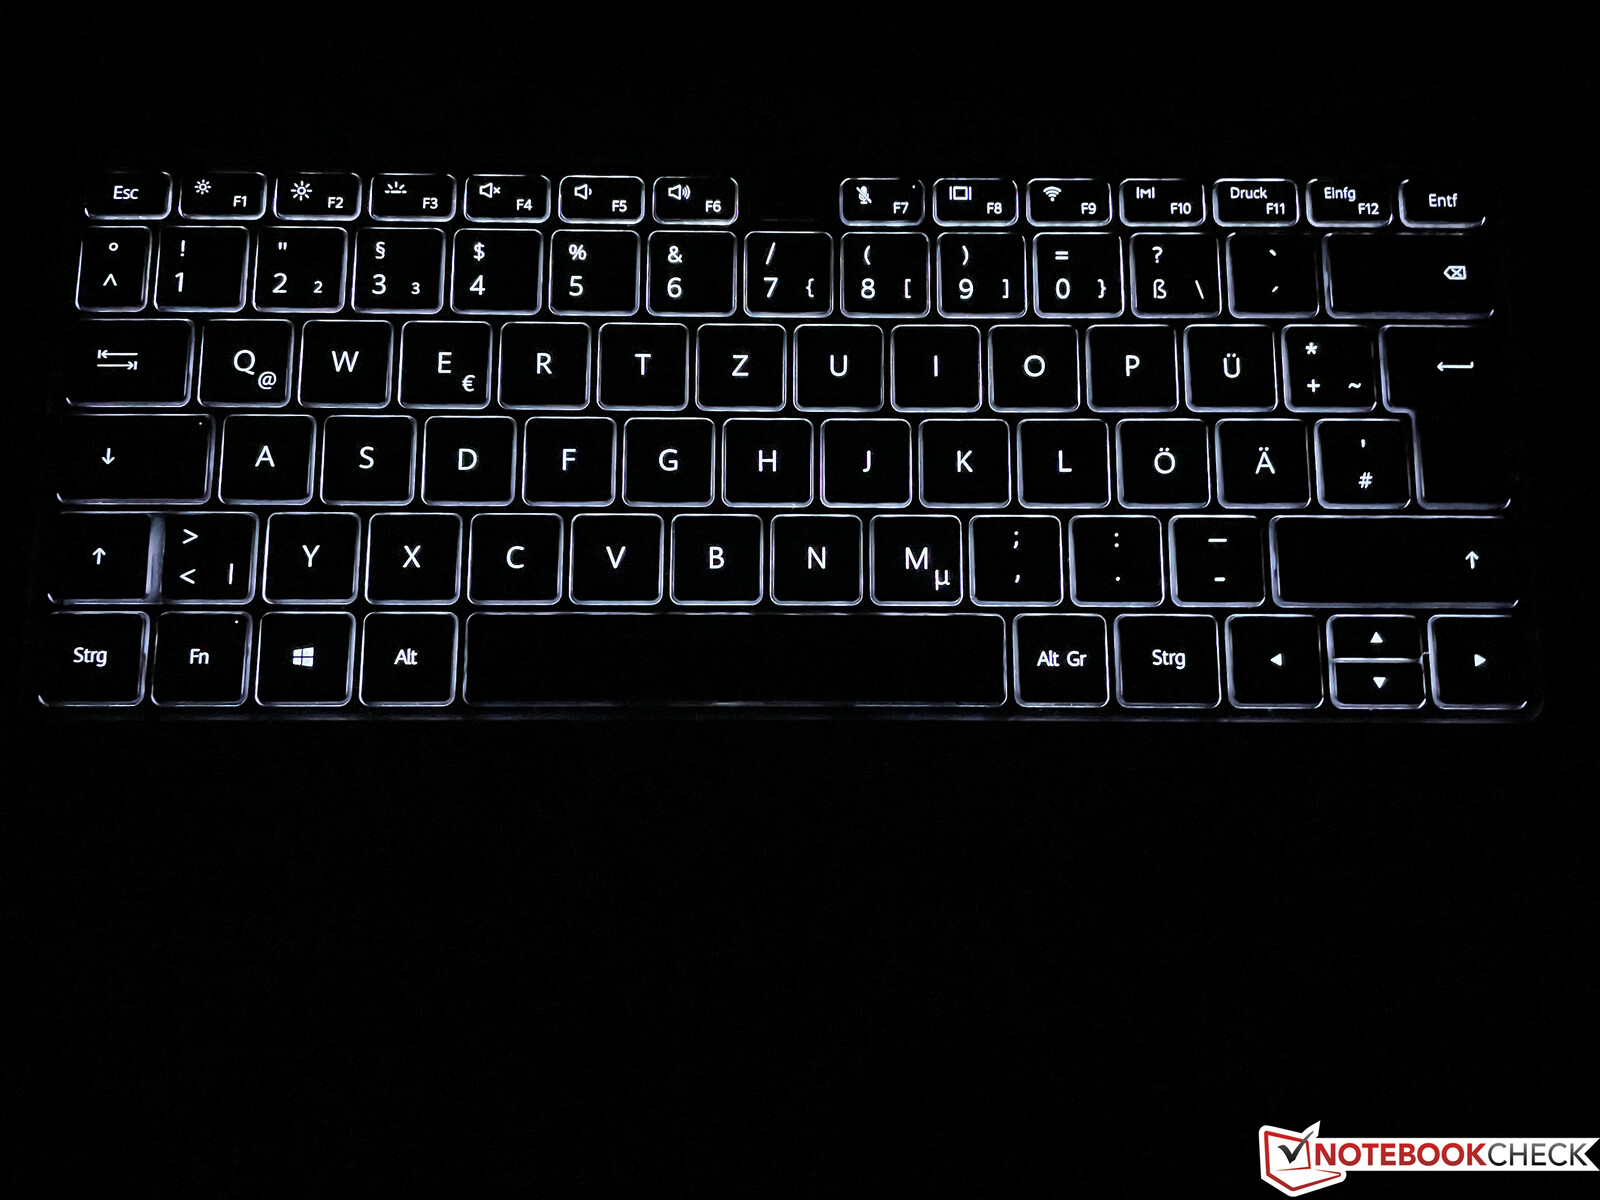
Input Devices - Backlighting and a fingerprint scanner
Keyboard
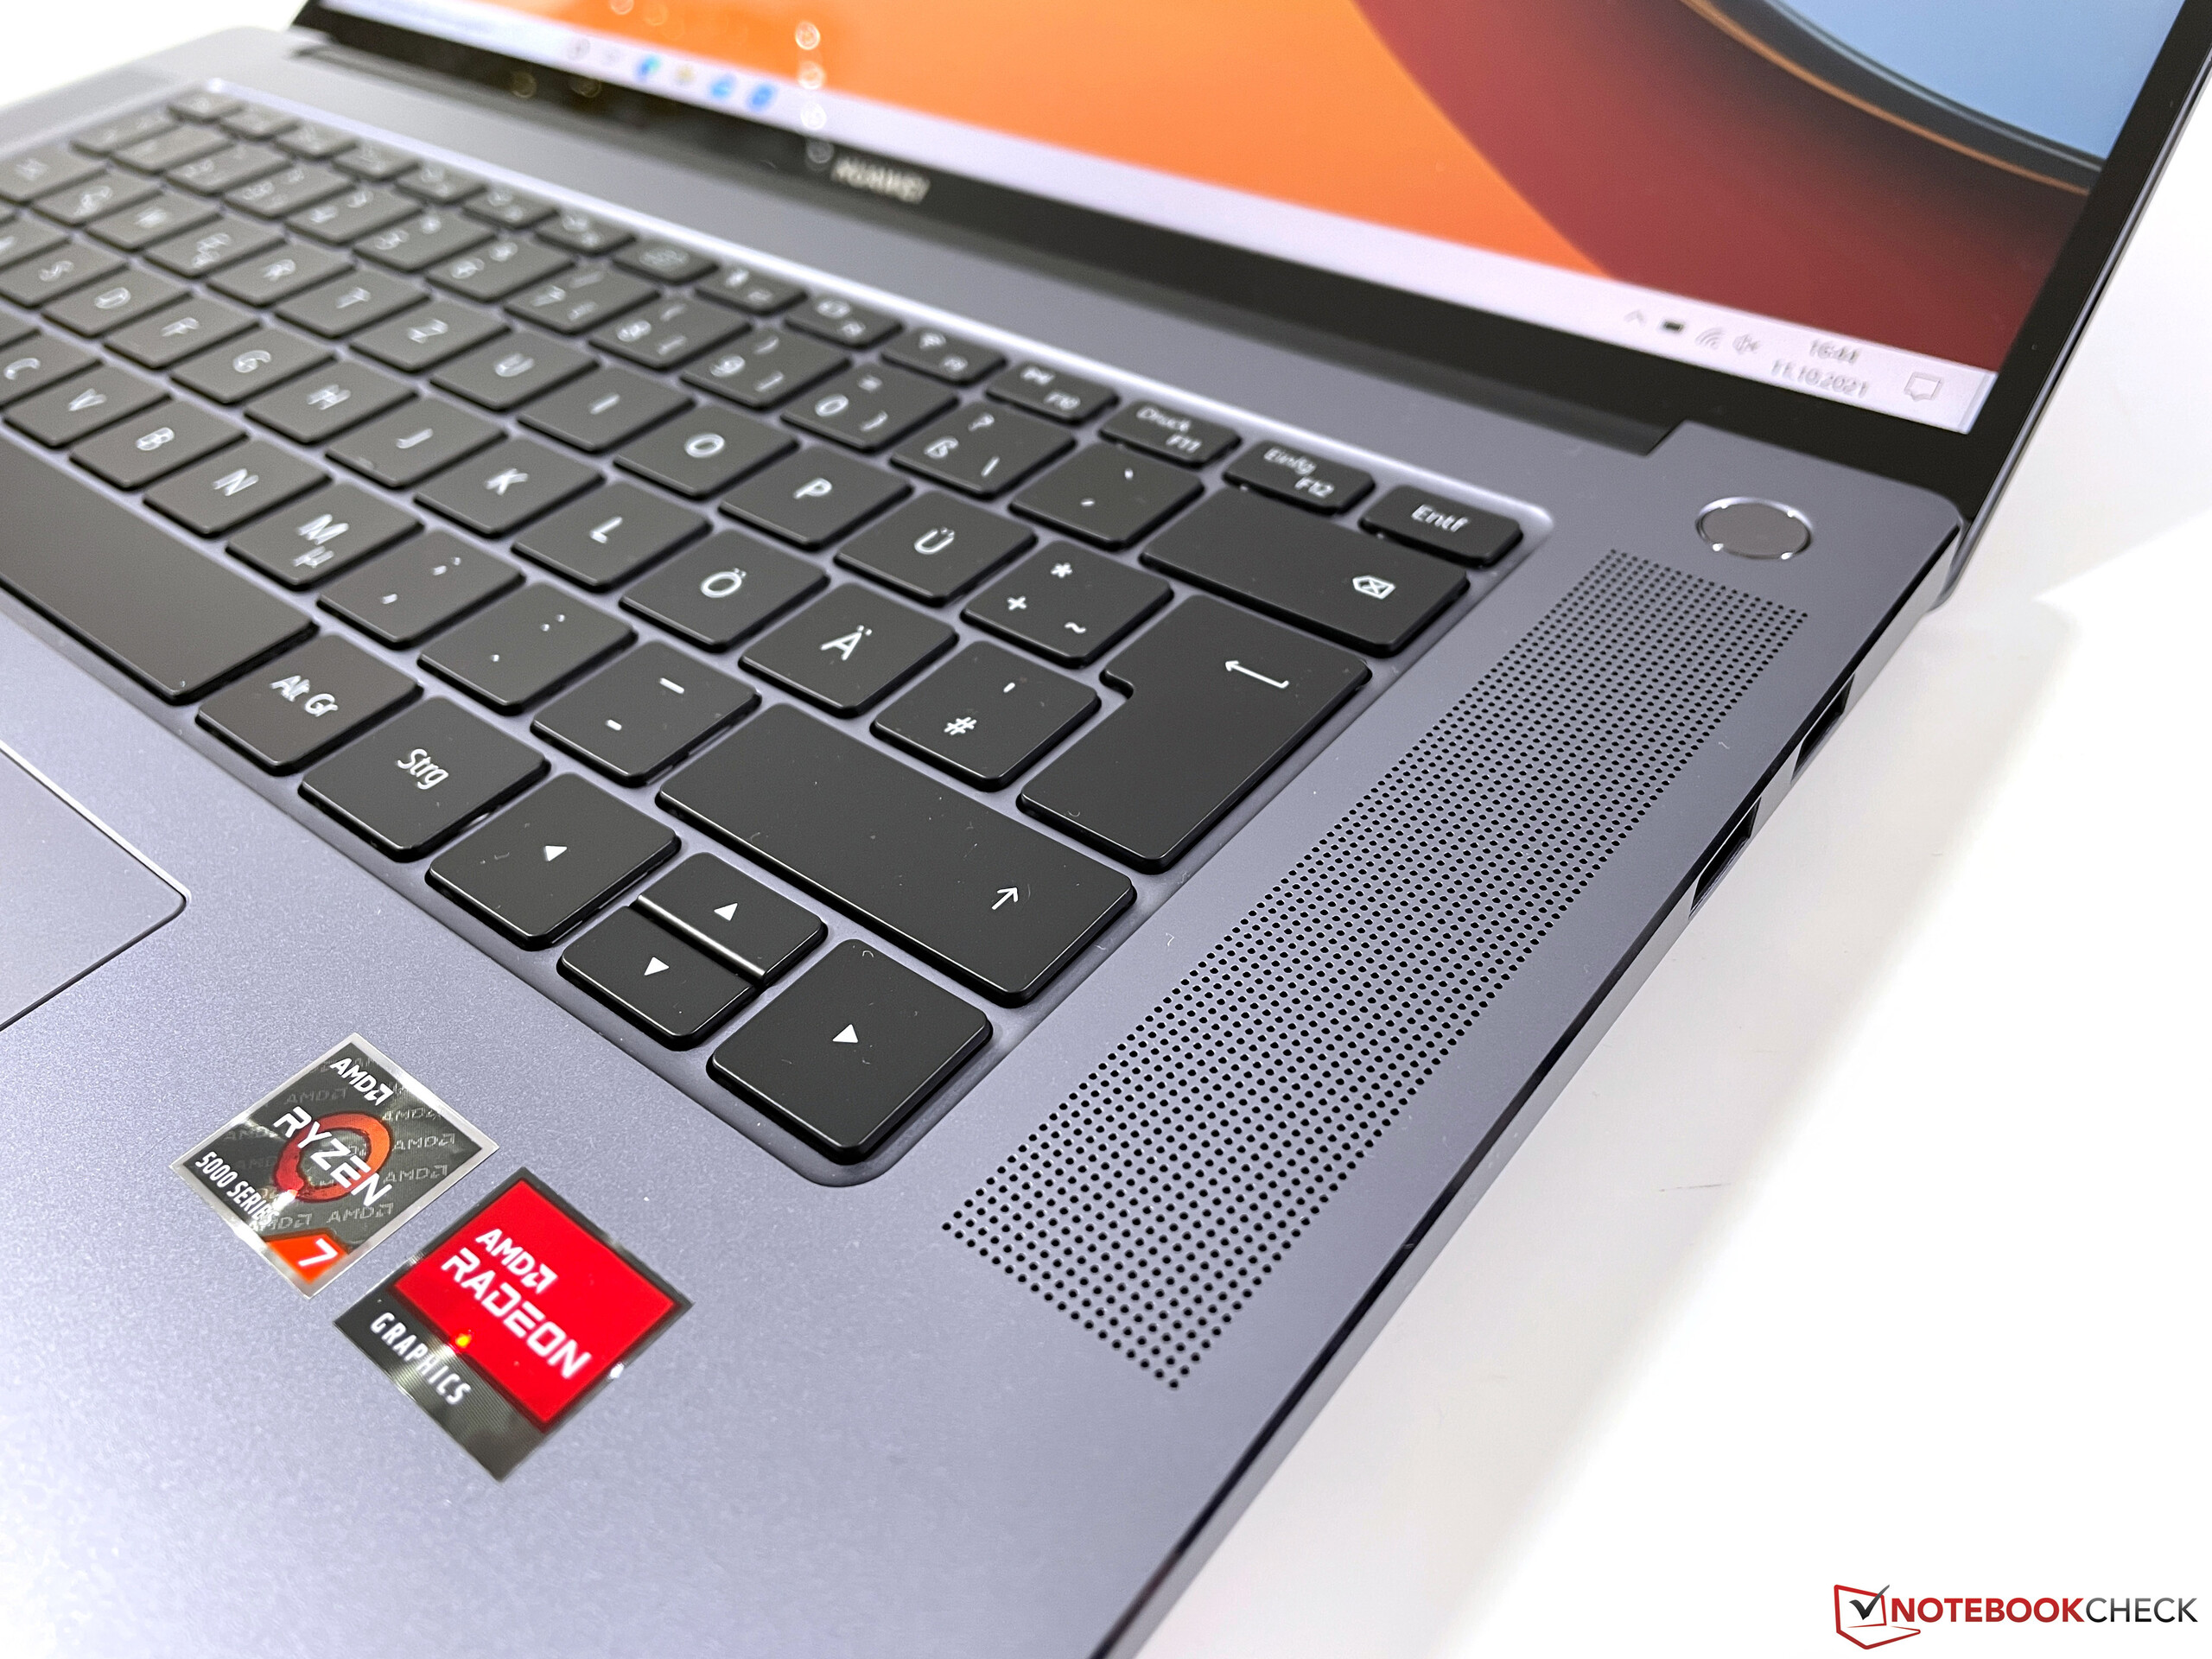
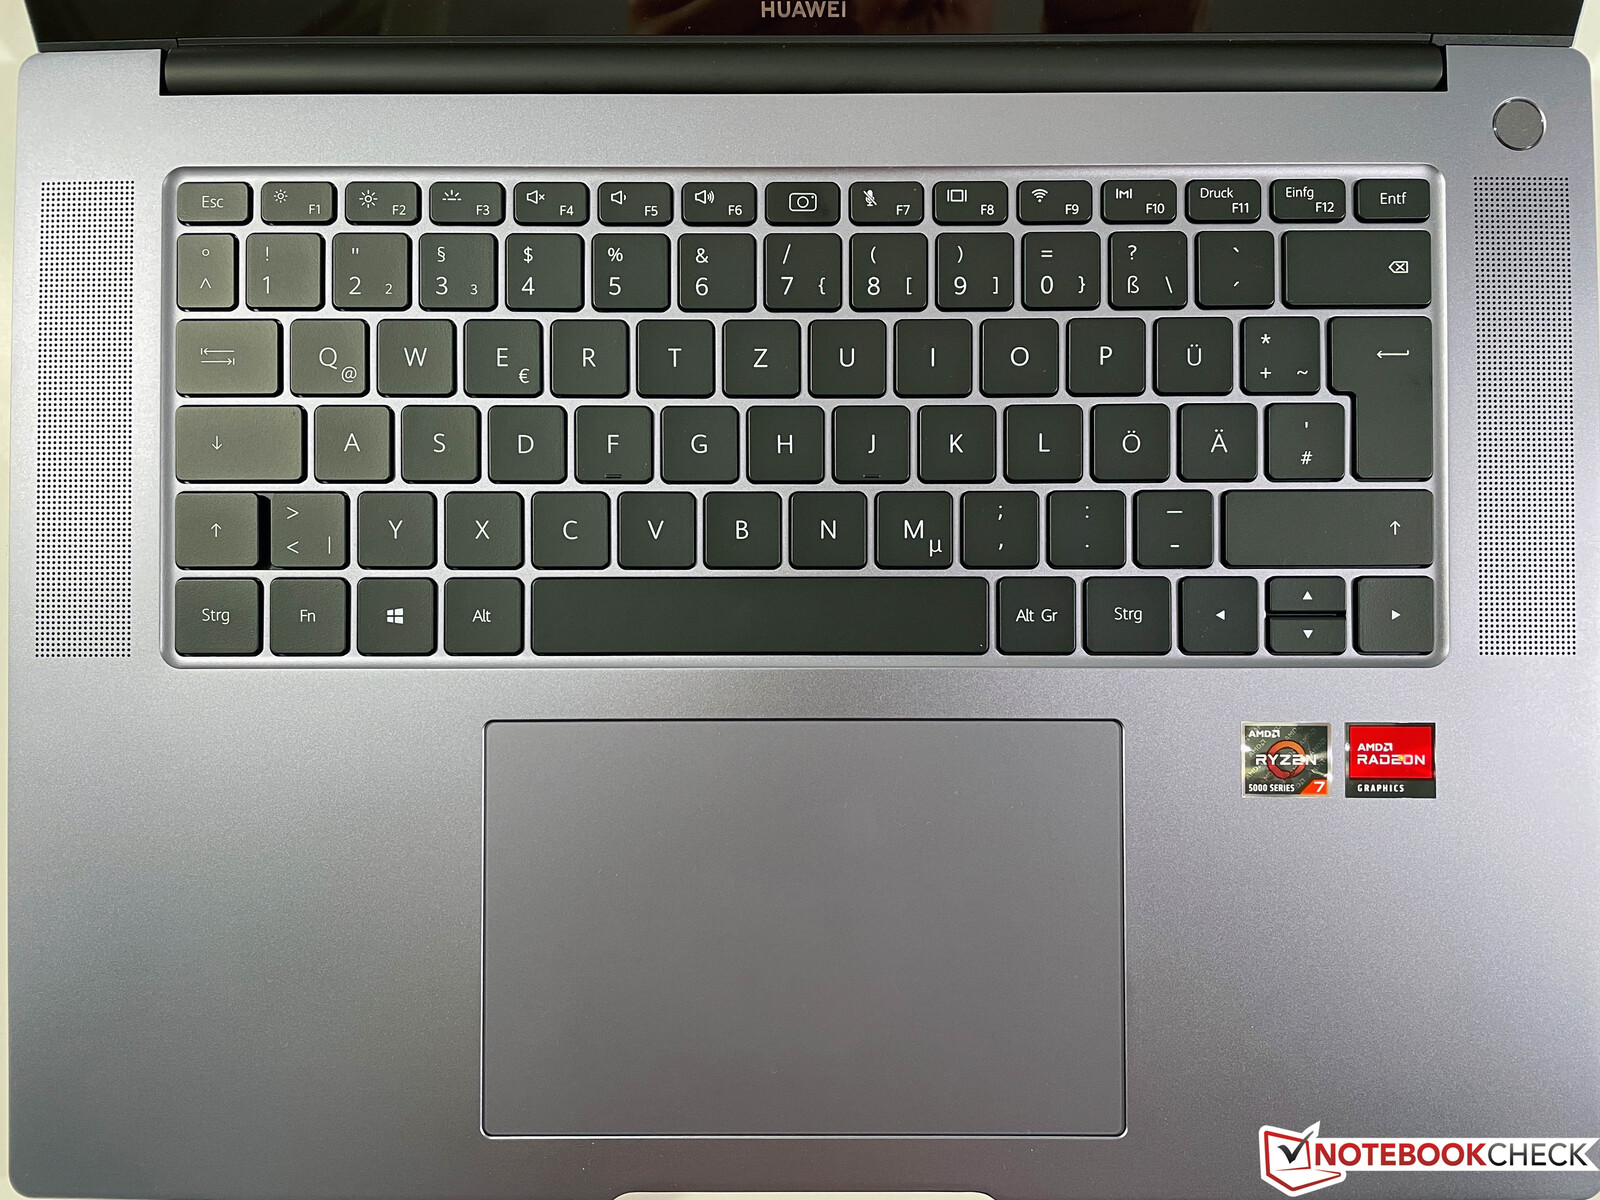
Huawei has equipped the MateBook 16 with the well-known black chiclet keyboard without a dedicated number pad. Fortunately, the available space on either side of the keyboard isn't wasted as the manufacturer has used it for the speakers. The typing experience is average with an even and pronounced pressure point. The keyboard is very quiet, although some keys rattle more than others. The base of the keyboard probably isn't completely even. There are definitely better keyboards out there, especially when looking at professional laptops, but the MateBook 16 still is perfectly acceptable even if you spend many hours typing.
The keyboard is equipped with white two-tier background lighting for working in dark surroundings. Users can set the backlighting to automatically turn off during inactivity via the preinstalled PC Manager (can be accessed by pressing the F10 key). The power button is positioned outside the keyboard and has an integrated fingerprint scanner that works reliably and quickly in our test.
Touchpad
The ClickPad is very large at 14 x 9.1 cm and offers sufficient space for gestures with up to four fingers. The fingers glide over the pad easily. As is the case with many devices, the noise the integrated keys make is a little too loud, which slightly impacts the overall high-quality impression. We would recommend simply using tap to click to avoid the issue.
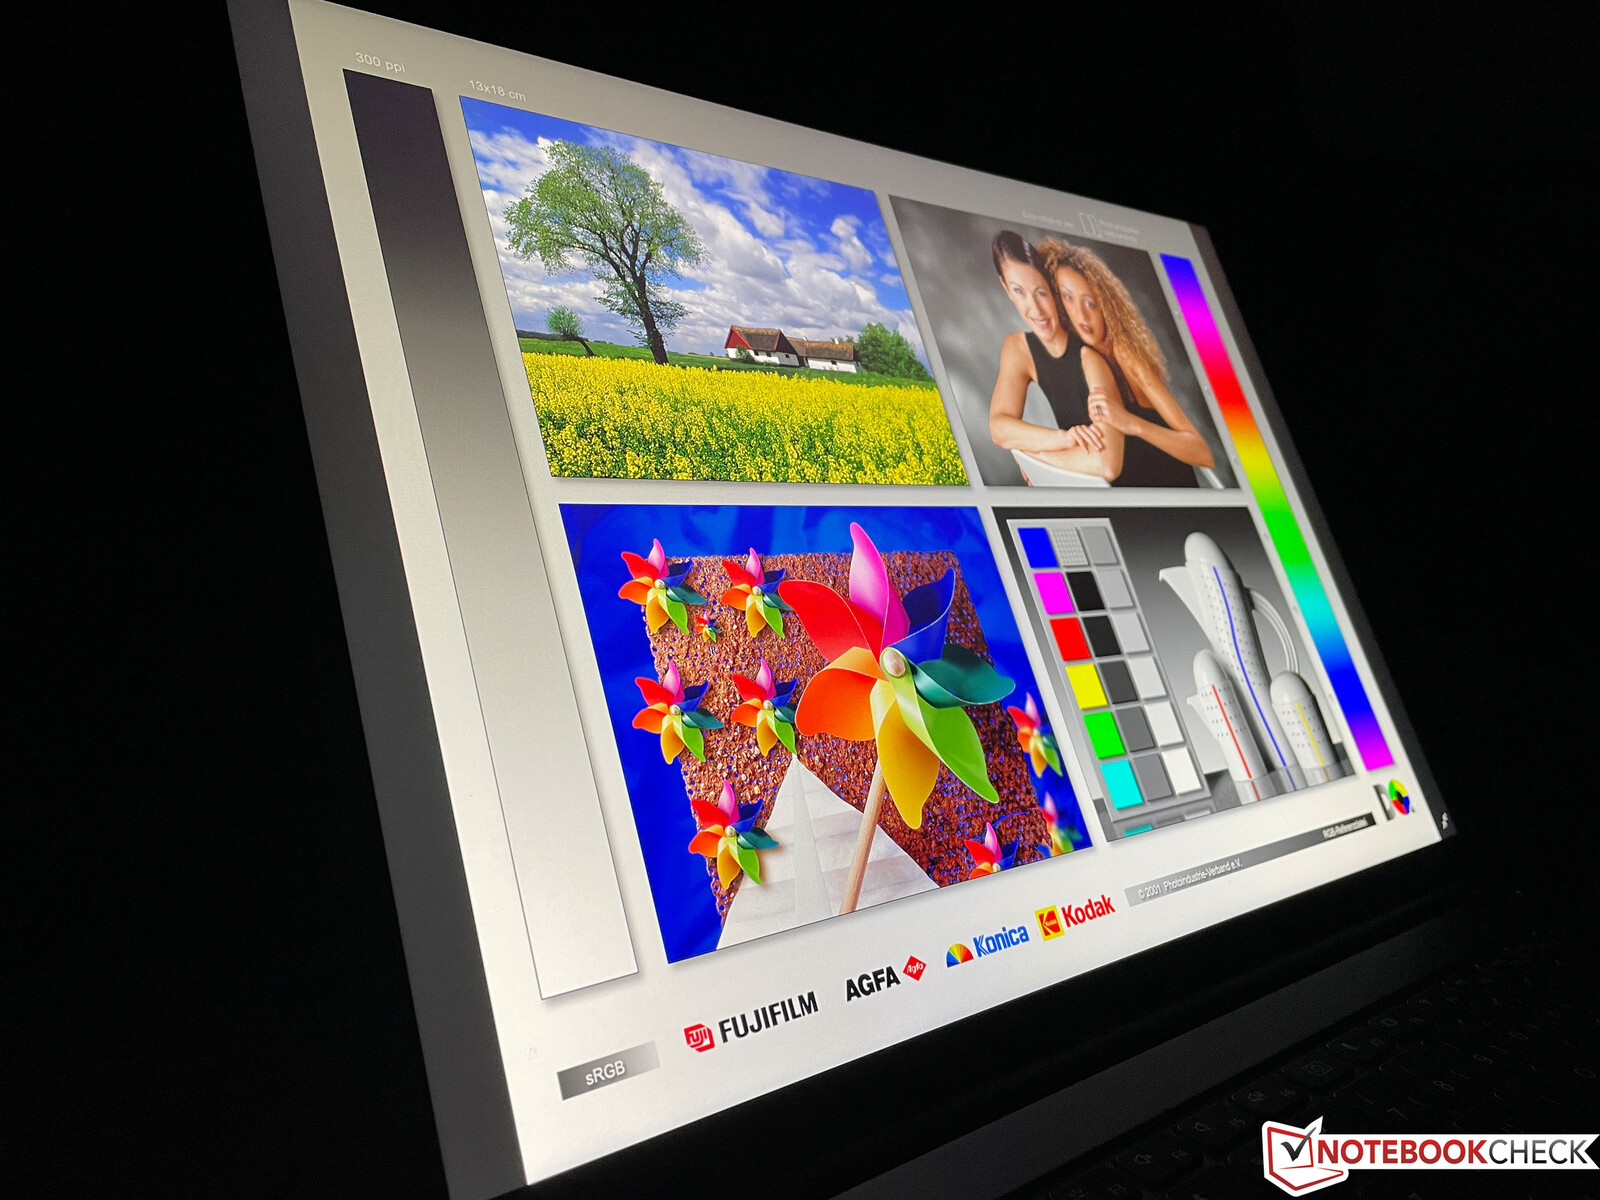
Display - 2.5K IPS with 3:2 screen ratio
Similar to other Huawei models, the new MateBook 16 is equipped with a panel that has a 3:2 screen ratio. The 16-inch panel has 2520 x 1680 pixels, which results in a pixel density of 189 DPI. The reflective display gives a great impression, subjectively. Screen contents is displayed very clearly and colors are strong. The viewing angle stability of the BOE IPS panel is very good.
According to the technical data sheet, the Huawei MateBook 16 has a brightness of 300 nits. Our panel actually tops this with an average 350 nits. The black value is very low, which corresponds to a very good contrast ratio of 1700:1. There is some backlight bleeding along the edges at maximum brightness. This isn't an issue in everyday use and is only visible along the bottom when displaying videos with a ratio of 16:9. We did not detect any PWM flickering.
| |||||||||||||||||||||||||
Brightness Distribution: 93 %
Center on Battery: 354 cd/m²
Contrast: 1700:1 (Black: 0.21 cd/m²)
ΔE ColorChecker Calman: 1.6 | ∀{0.5-29.43 Ø4.72}
calibrated: 0.6
ΔE Greyscale Calman: 2.4 | ∀{0.09-98 Ø4.97}
65.1% AdobeRGB 1998 (Argyll 3D)
94.9% sRGB (Argyll 3D)
63.1% Display P3 (Argyll 3D)
Gamma: 2.14
CCT: 6728 K
| Huawei MateBook 16 R7 5800H BOE TV160DKT-NH0, , 2520x1680, 16" | Acer Swift 3 SF316-51 Chi Mei CMN160B, IPS, 1920x1080, 16.1" | Huawei MateBook D 16-53011VFJ N161HCA-EA3, IPS, 1920x1080, 16.1" | Lenovo IdeaPad 5 Pro 16ACH IPS LED, 2560x1600, 16" | Schenker Vision 15 BOE08F5, IPS, 1920x1080, 15.6" | Dell XPS 15 9510 i5 11400H FHD Sharp LQ156N1, IPS, 1920x1200, 15.6" | |
|---|---|---|---|---|---|---|
| Display | 5% | 5% | 10% | 6% | 18% | |
| Display P3 Coverage (%) | 63.1 | 66.6 6% | 66.8 6% | 71 13% | 69.3 10% | 80.9 28% |
| sRGB Coverage (%) | 94.9 | 99.5 5% | 99 4% | 99 4% | 94 -1% | 100 5% |
| AdobeRGB 1998 Coverage (%) | 65.1 | 68.5 5% | 69 6% | 73.3 13% | 70.8 9% | 79.1 22% |
| Response Times | 23% | 28% | 64% | -47% | -49% | |
| Response Time Grey 50% / Grey 80% * (ms) | 41.2 ? | 32 ? 22% | 25 ? 39% | 16.4 ? 60% | 60 ? -46% | 62.4 ? -51% |
| Response Time Black / White * (ms) | 26.4 ? | 20 ? 24% | 22 ? 17% | 8.8 ? 67% | 39 ? -48% | 38.8 ? -47% |
| PWM Frequency (Hz) | 2500 ? | 2500 ? | 24940 ? | |||
| Screen | -0% | -0% | -32% | -55% | -43% | |
| Brightness middle (cd/m²) | 357 | 304 -15% | 352 -1% | 395 11% | 478 34% | 632 77% |
| Brightness (cd/m²) | 349 | 284 -19% | 330 -5% | 375 7% | 462 32% | 606 74% |
| Brightness Distribution (%) | 93 | 88 -5% | 89 -4% | 90 -3% | 94 1% | 91 -2% |
| Black Level * (cd/m²) | 0.21 | 0.165 21% | 0.28 -33% | 0.32 -52% | 0.27 -29% | 0.29 -38% |
| Contrast (:1) | 1700 | 1842 8% | 1257 -26% | 1234 -27% | 1770 4% | 2179 28% |
| Colorchecker dE 2000 * | 1.6 | 1.44 10% | 1.35 16% | 2.6 -63% | 3.2 -100% | 3.5 -119% |
| Colorchecker dE 2000 max. * | 3.9 | 3.62 7% | 2.58 34% | 5.4 -38% | 8.4 -115% | 6.4 -64% |
| Colorchecker dE 2000 calibrated * | 0.6 | 1.1 -83% | 2 -233% | 2 -233% | ||
| Greyscale dE 2000 * | 2.4 | 2.6 -8% | 2.02 16% | 3.4 -42% | 4.5 -88% | 5 -108% |
| Gamma | 2.14 103% | 2.41 91% | 2.49 88% | 2.12 104% | 2.16 102% | 2.26 97% |
| CCT | 6728 97% | 6527 100% | 6445 101% | 6140 106% | 6788 96% | 7033 92% |
| Color Space (Percent of AdobeRGB 1998) (%) | 68.5 | 63 | 63.1 | |||
| Color Space (Percent of sRGB) (%) | 99.5 | 99 | 93.6 | |||
| Total Average (Program / Settings) | 9% /
5% | 11% /
5% | 14% /
-10% | -32% /
-41% | -25% /
-31% |
* ... smaller is better
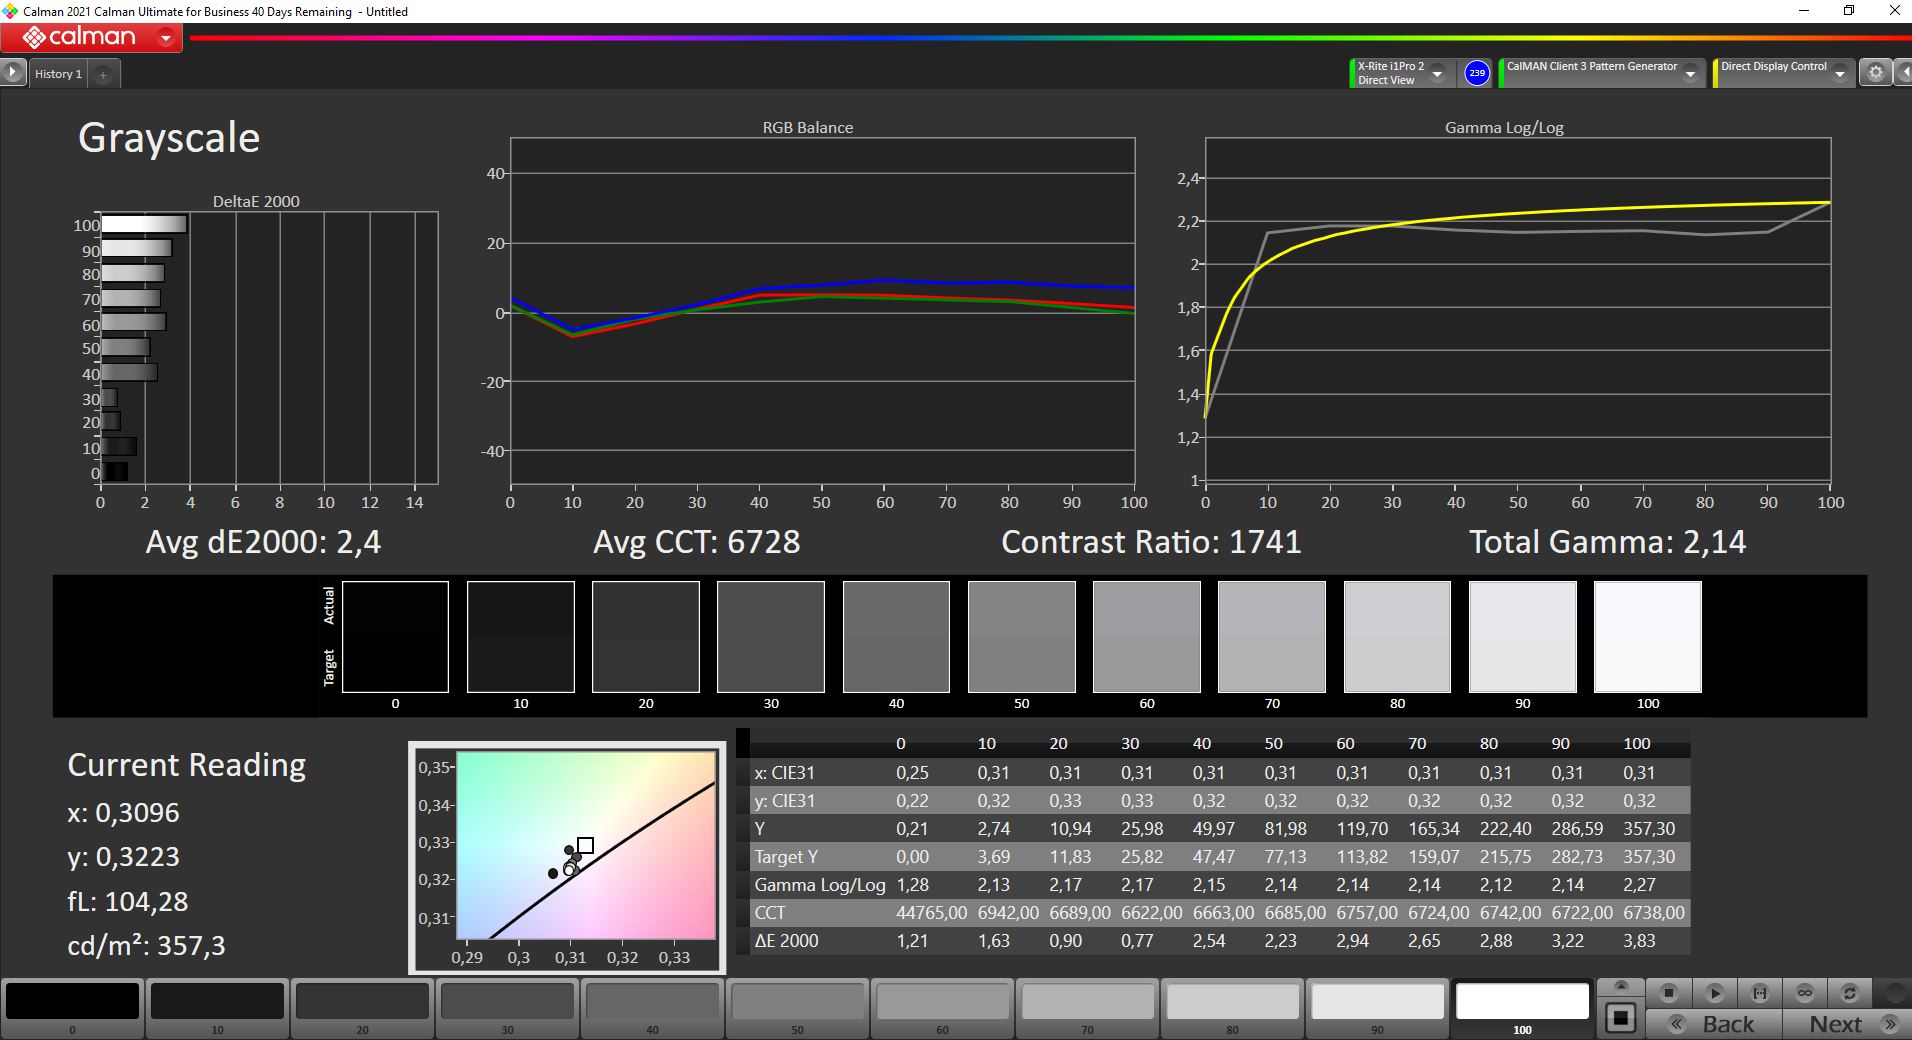
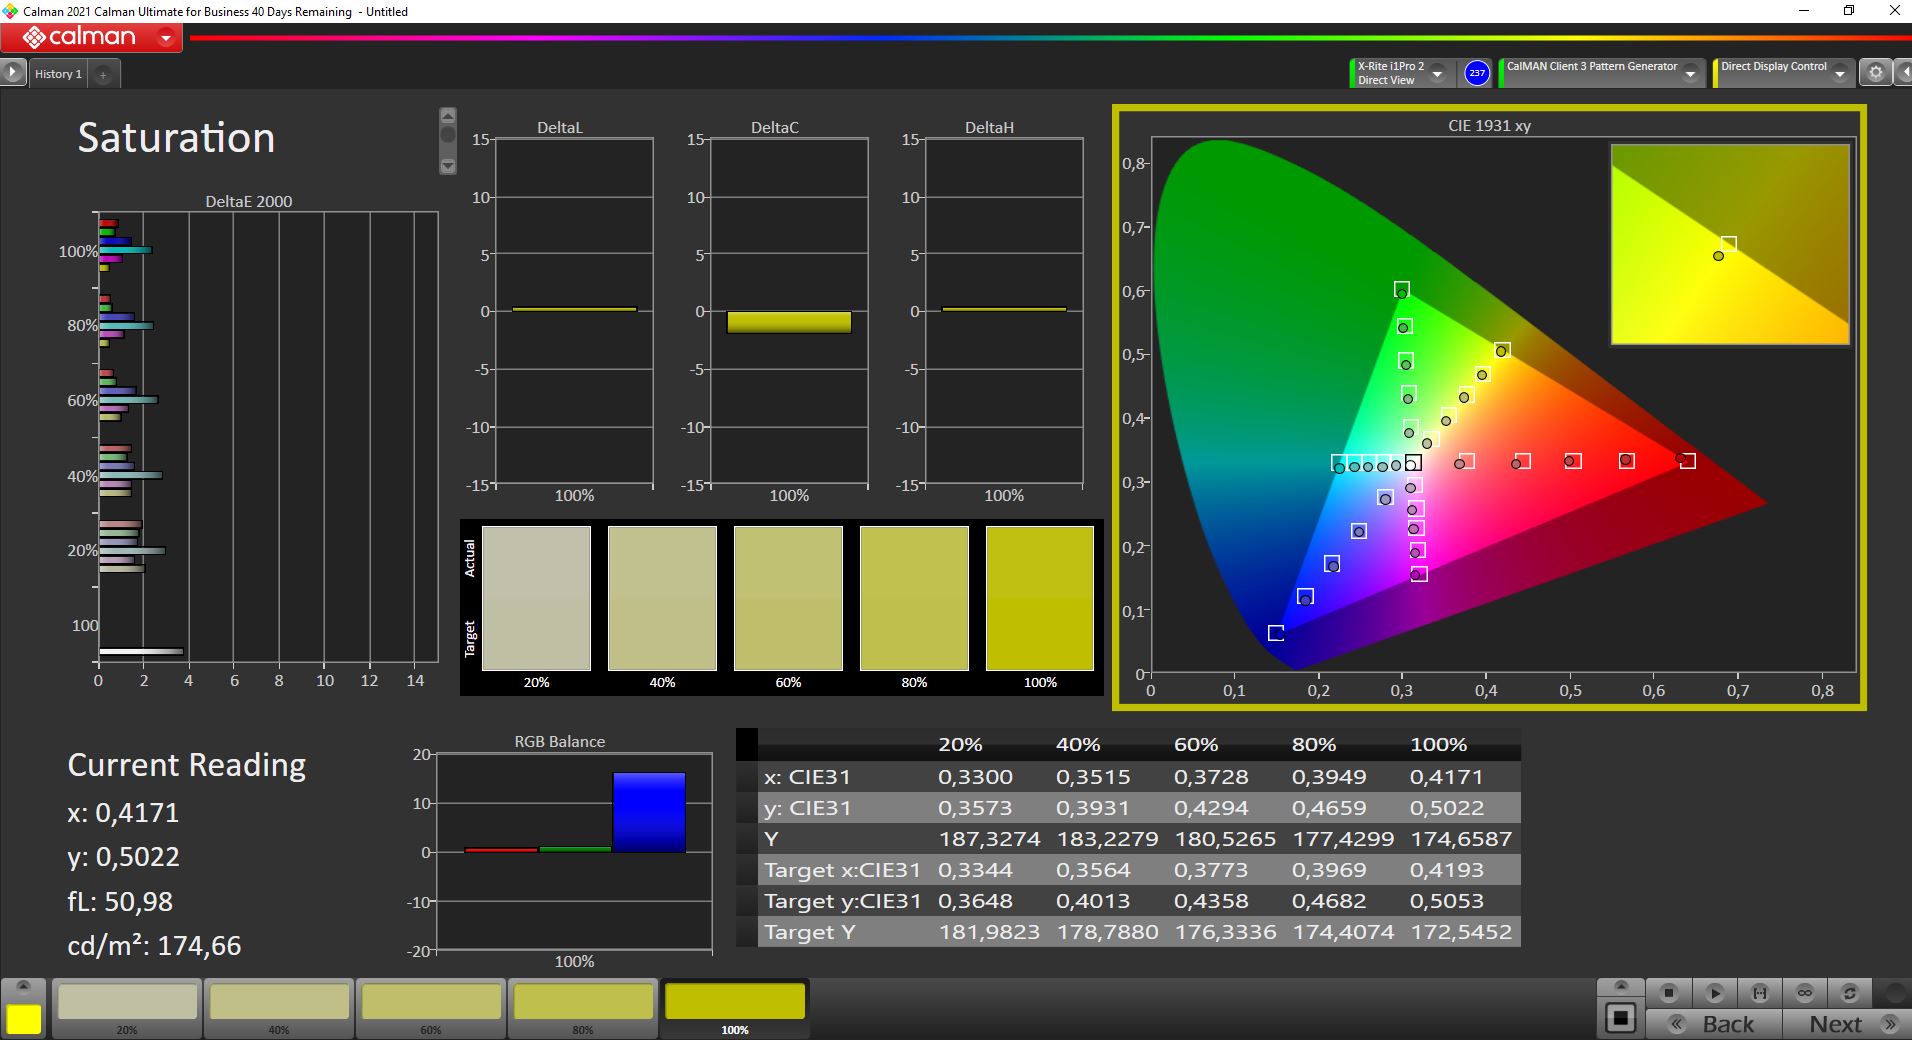
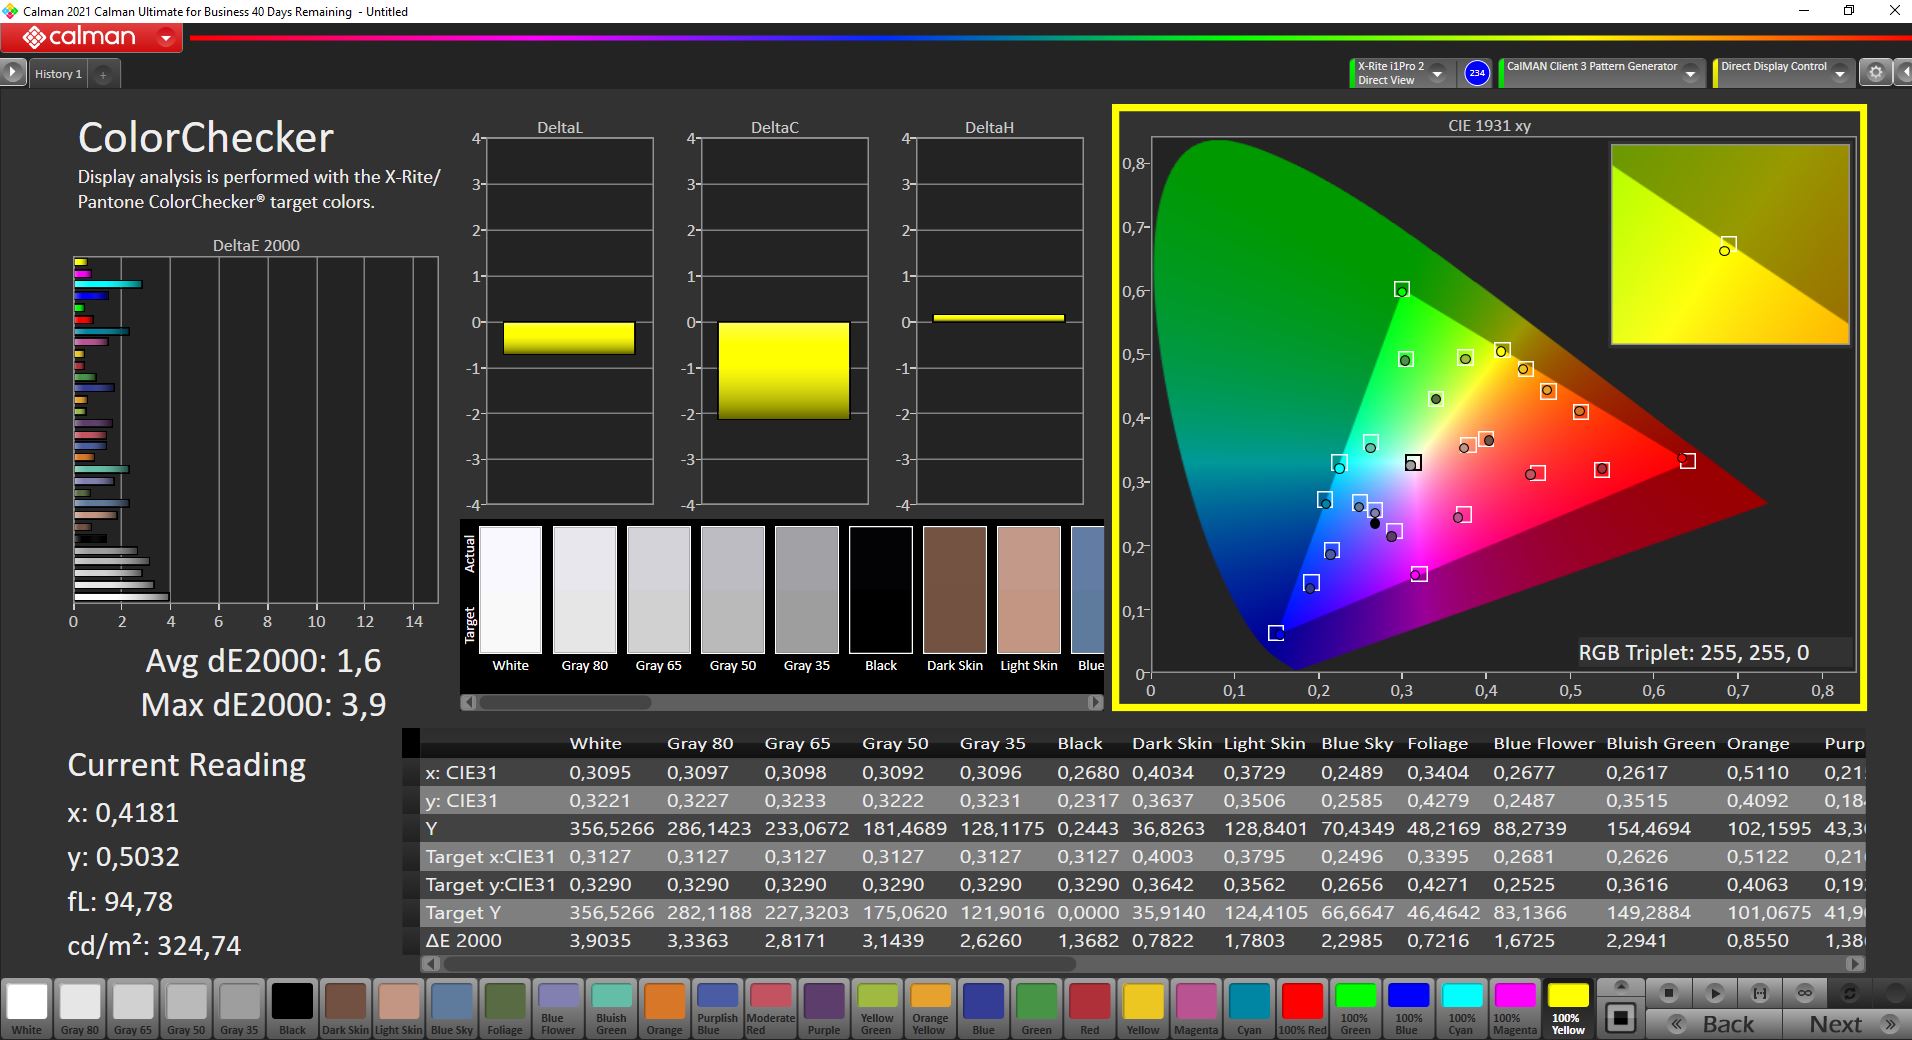
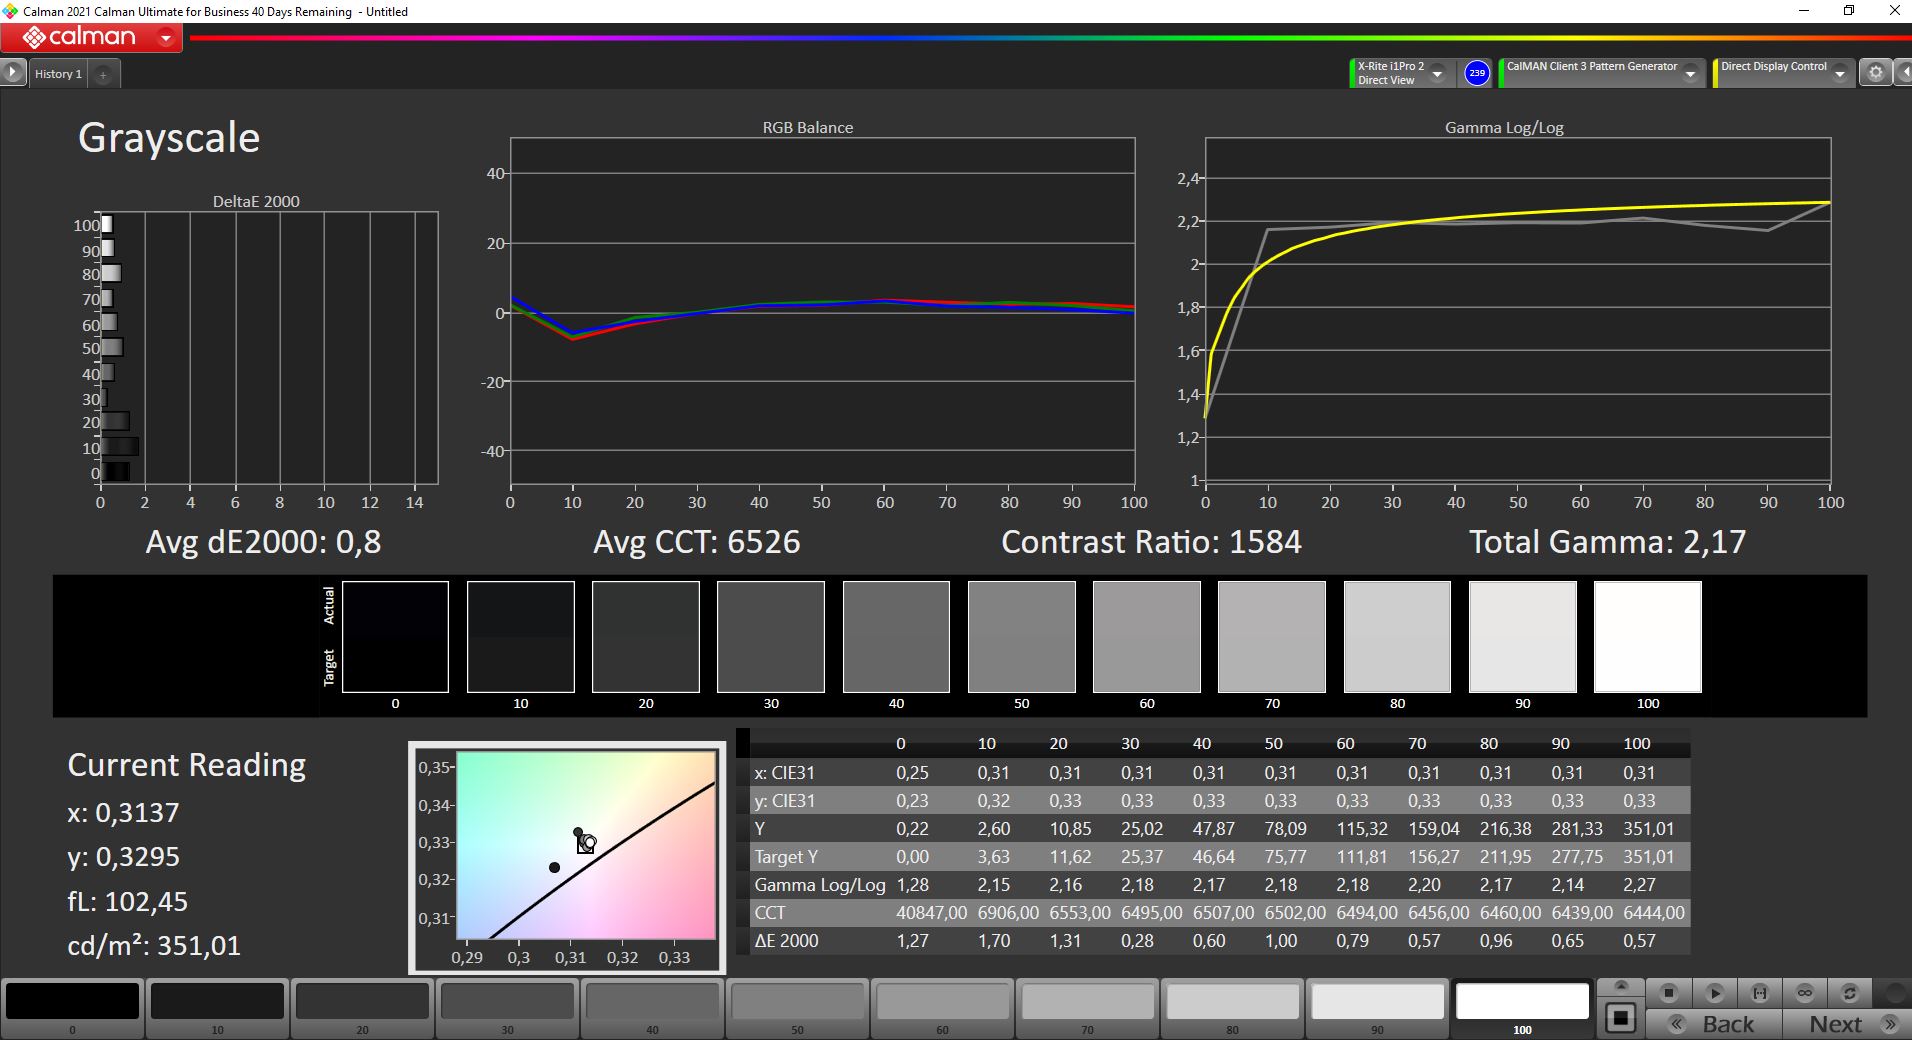
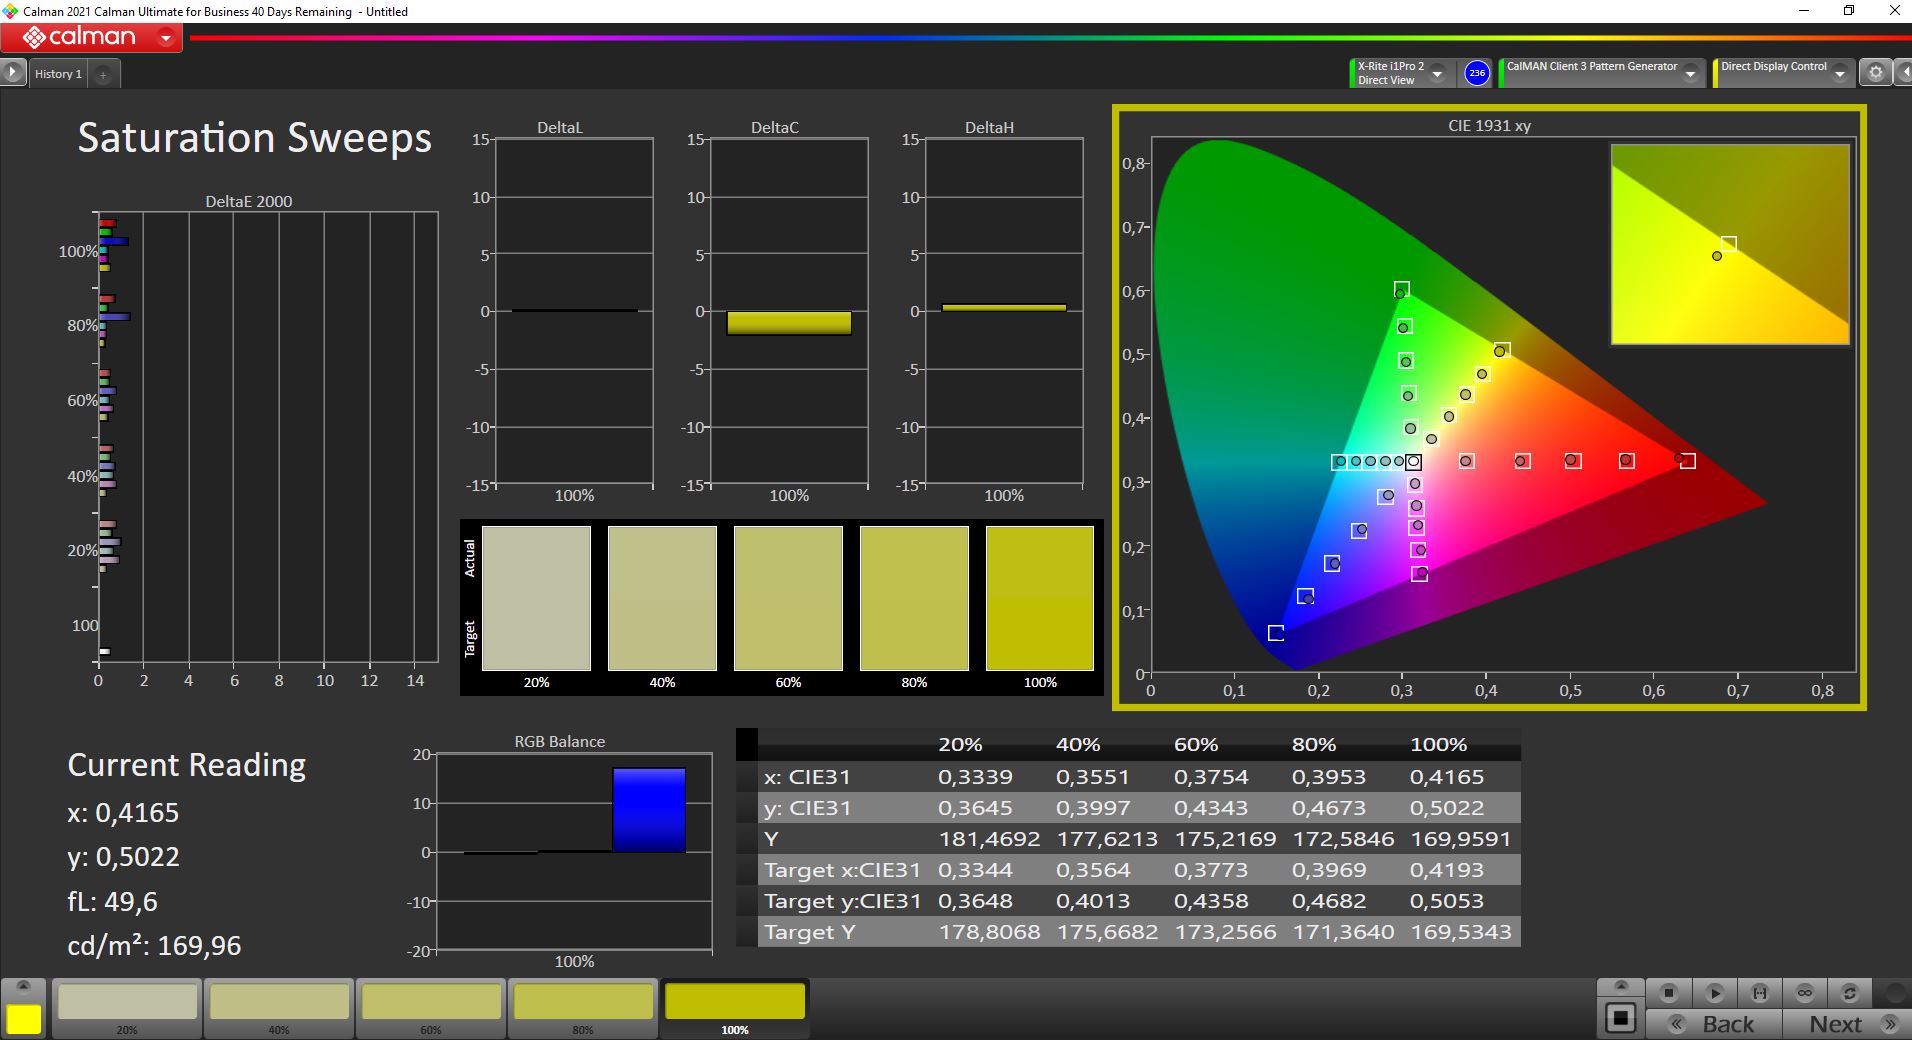
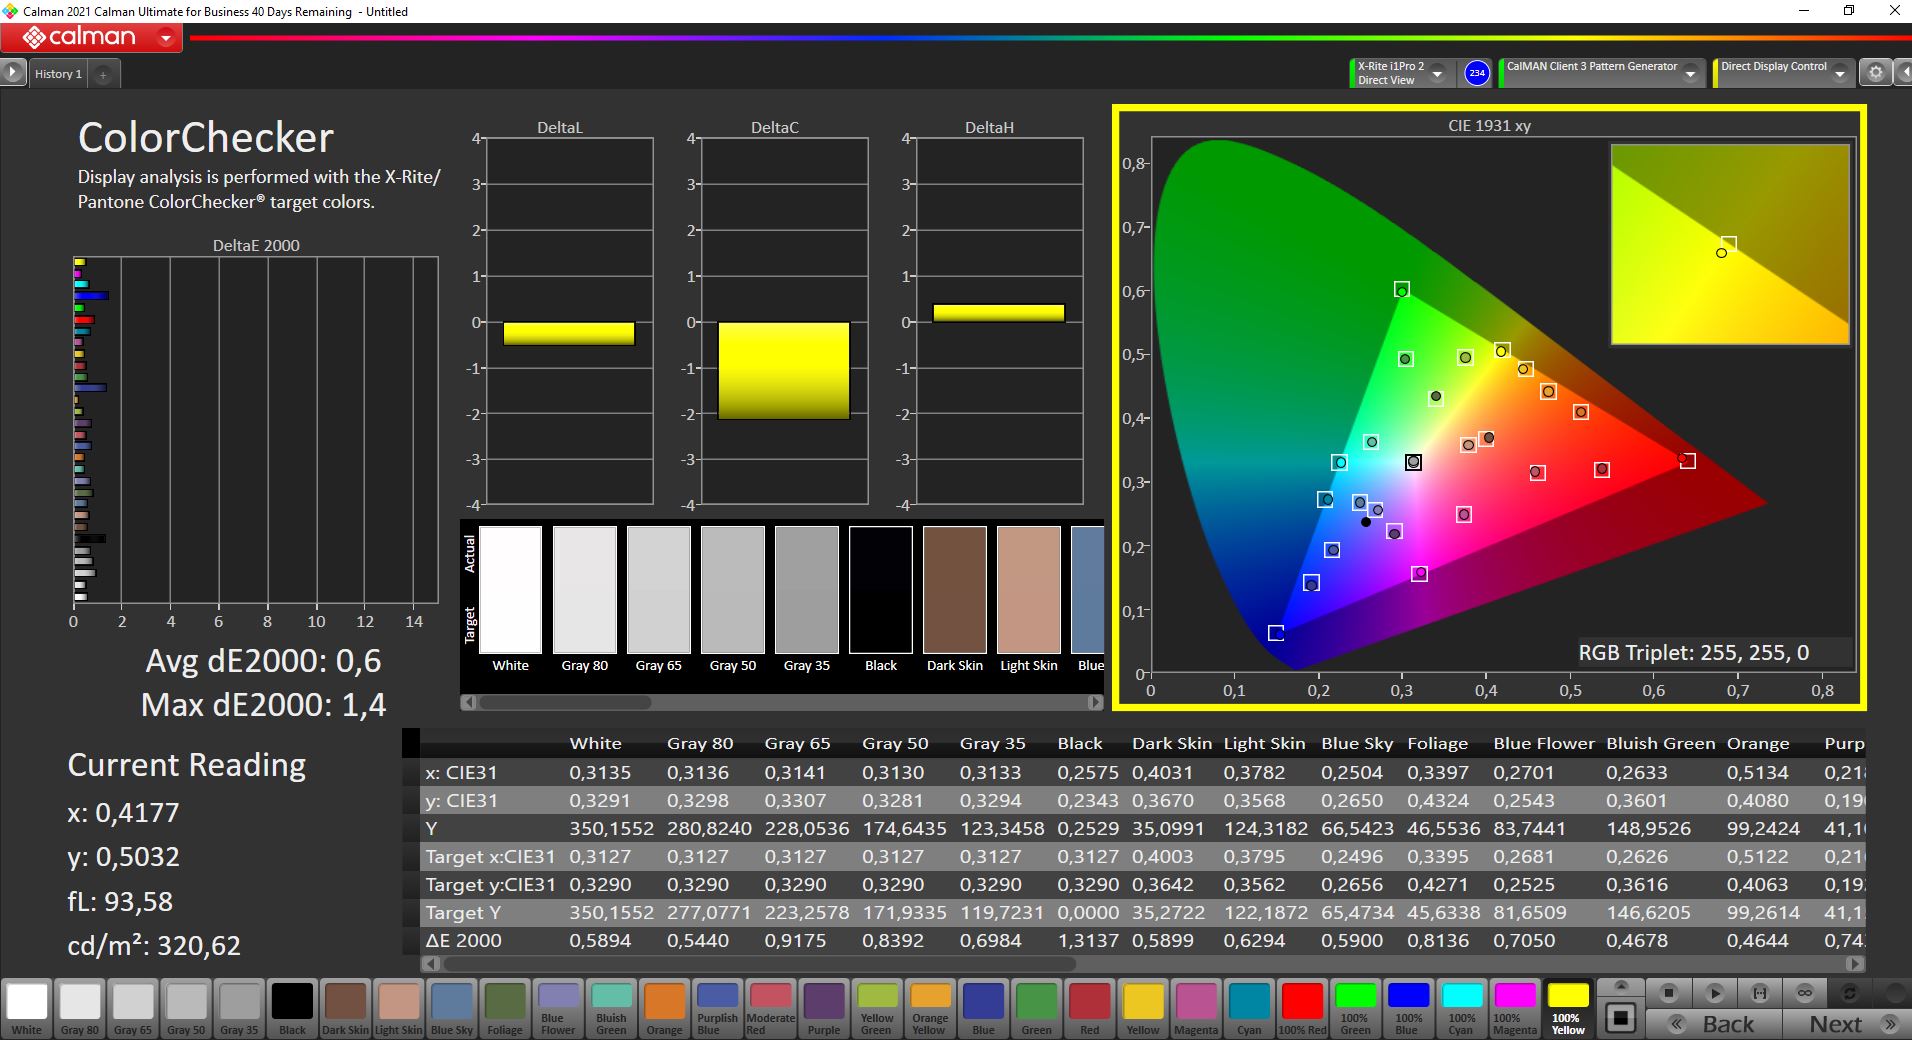
Our analysis (CalMAN Professional, X-Rite i1 Pro 2) has shown that the panel is already well calibrated ex-works. The grayscales have a slight blue cast, but this isn't visible to the eye. The colors are all within the ideal range and do not require additional calibration. Our own calibration only minimally improved the display (link available in the information box above). The colors cover the smaller sRGB color space almost entirely, which makes the panel suitable for editing images and video.

Display Response Times
| ↔ Response Time Black to White | ||
|---|---|---|
| 26.4 ms ... rise ↗ and fall ↘ combined | ↗ 14 ms rise | 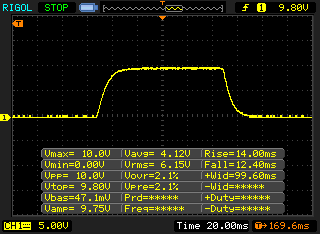 |
| ↘ 12.4 ms fall | ||
| The screen shows relatively slow response rates in our tests and may be too slow for gamers. In comparison, all tested devices range from 0.1 (minimum) to 240 (maximum) ms. » 66 % of all devices are better. This means that the measured response time is worse than the average of all tested devices (19.8 ms). | ||
| ↔ Response Time 50% Grey to 80% Grey | ||
| 41.2 ms ... rise ↗ and fall ↘ combined | ↗ 19.2 ms rise | 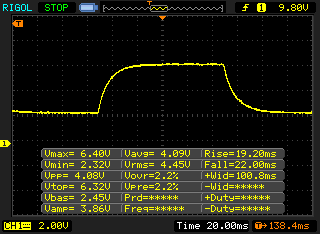 |
| ↘ 22 ms fall | ||
| The screen shows slow response rates in our tests and will be unsatisfactory for gamers. In comparison, all tested devices range from 0.165 (minimum) to 636 (maximum) ms. » 66 % of all devices are better. This means that the measured response time is worse than the average of all tested devices (31 ms). | ||
Screen Flickering / PWM (Pulse-Width Modulation)
| Screen flickering / PWM not detected | 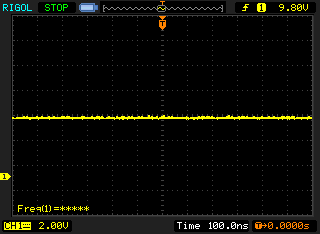 | ||
In comparison: 52 % of all tested devices do not use PWM to dim the display. If PWM was detected, an average of 7750 (minimum: 5 - maximum: 343500) Hz was measured. | |||
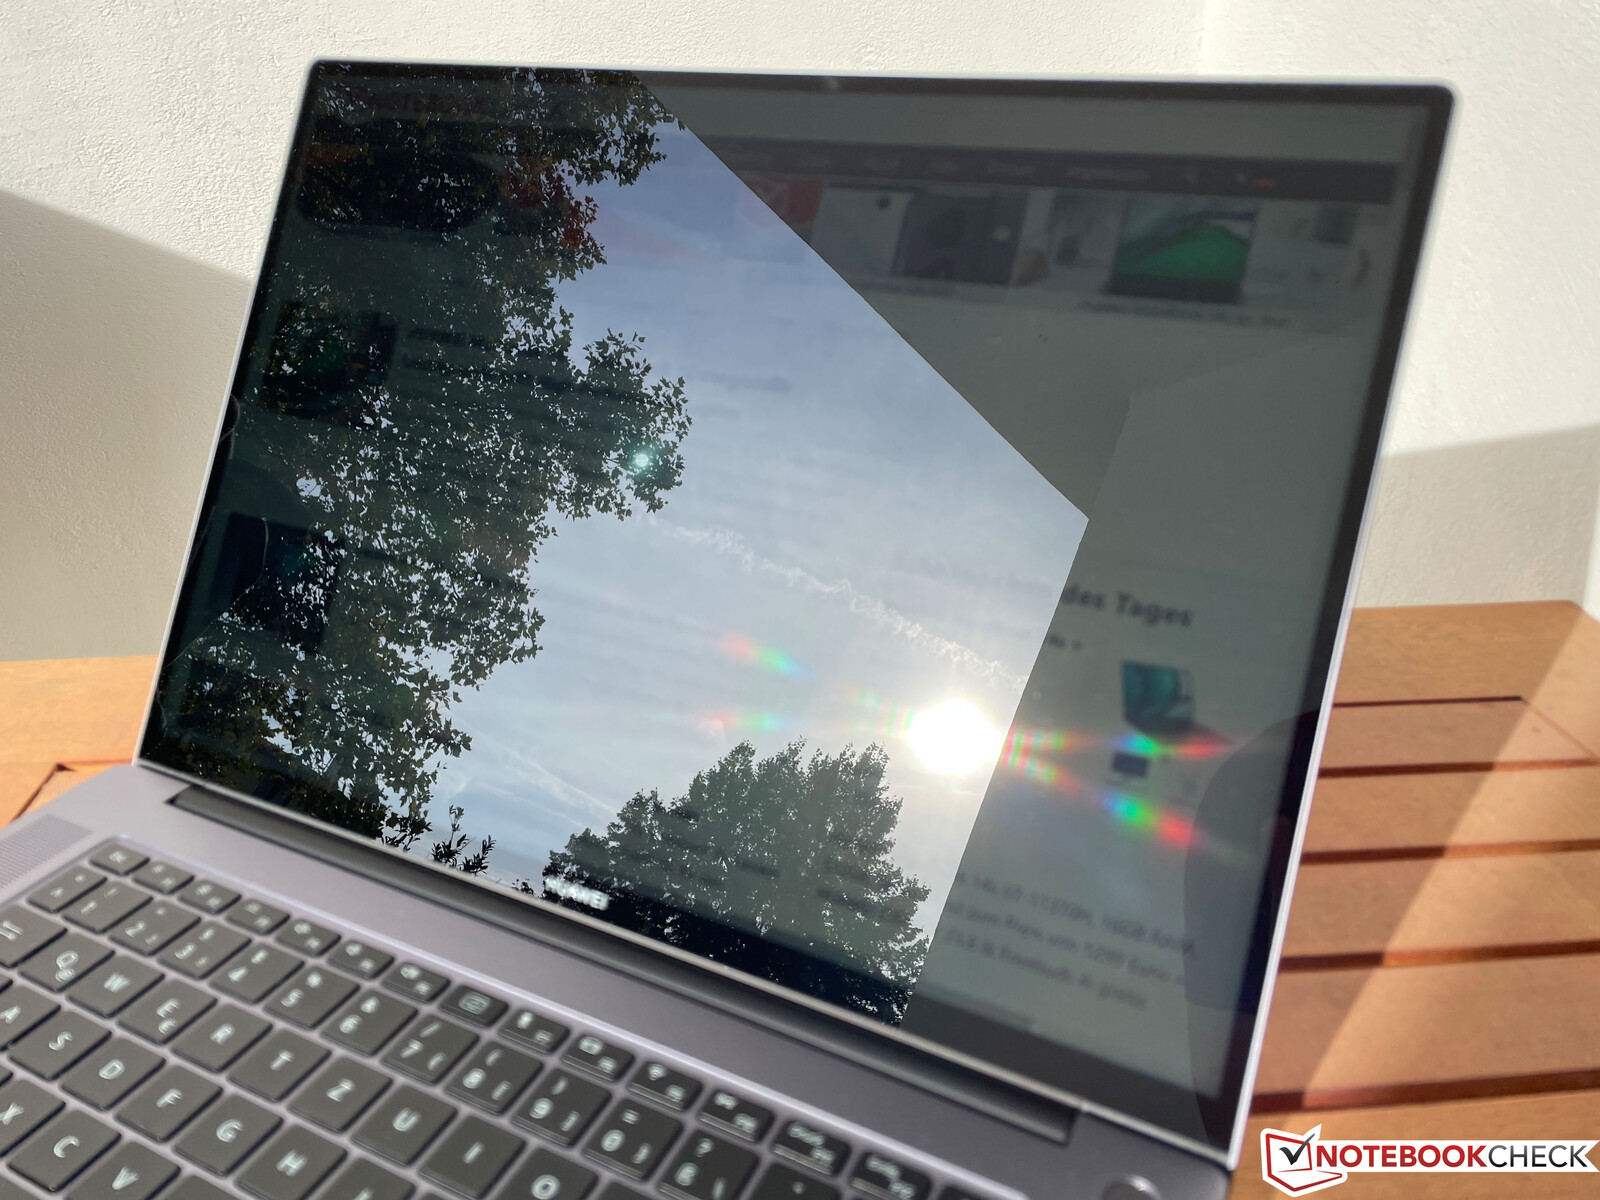
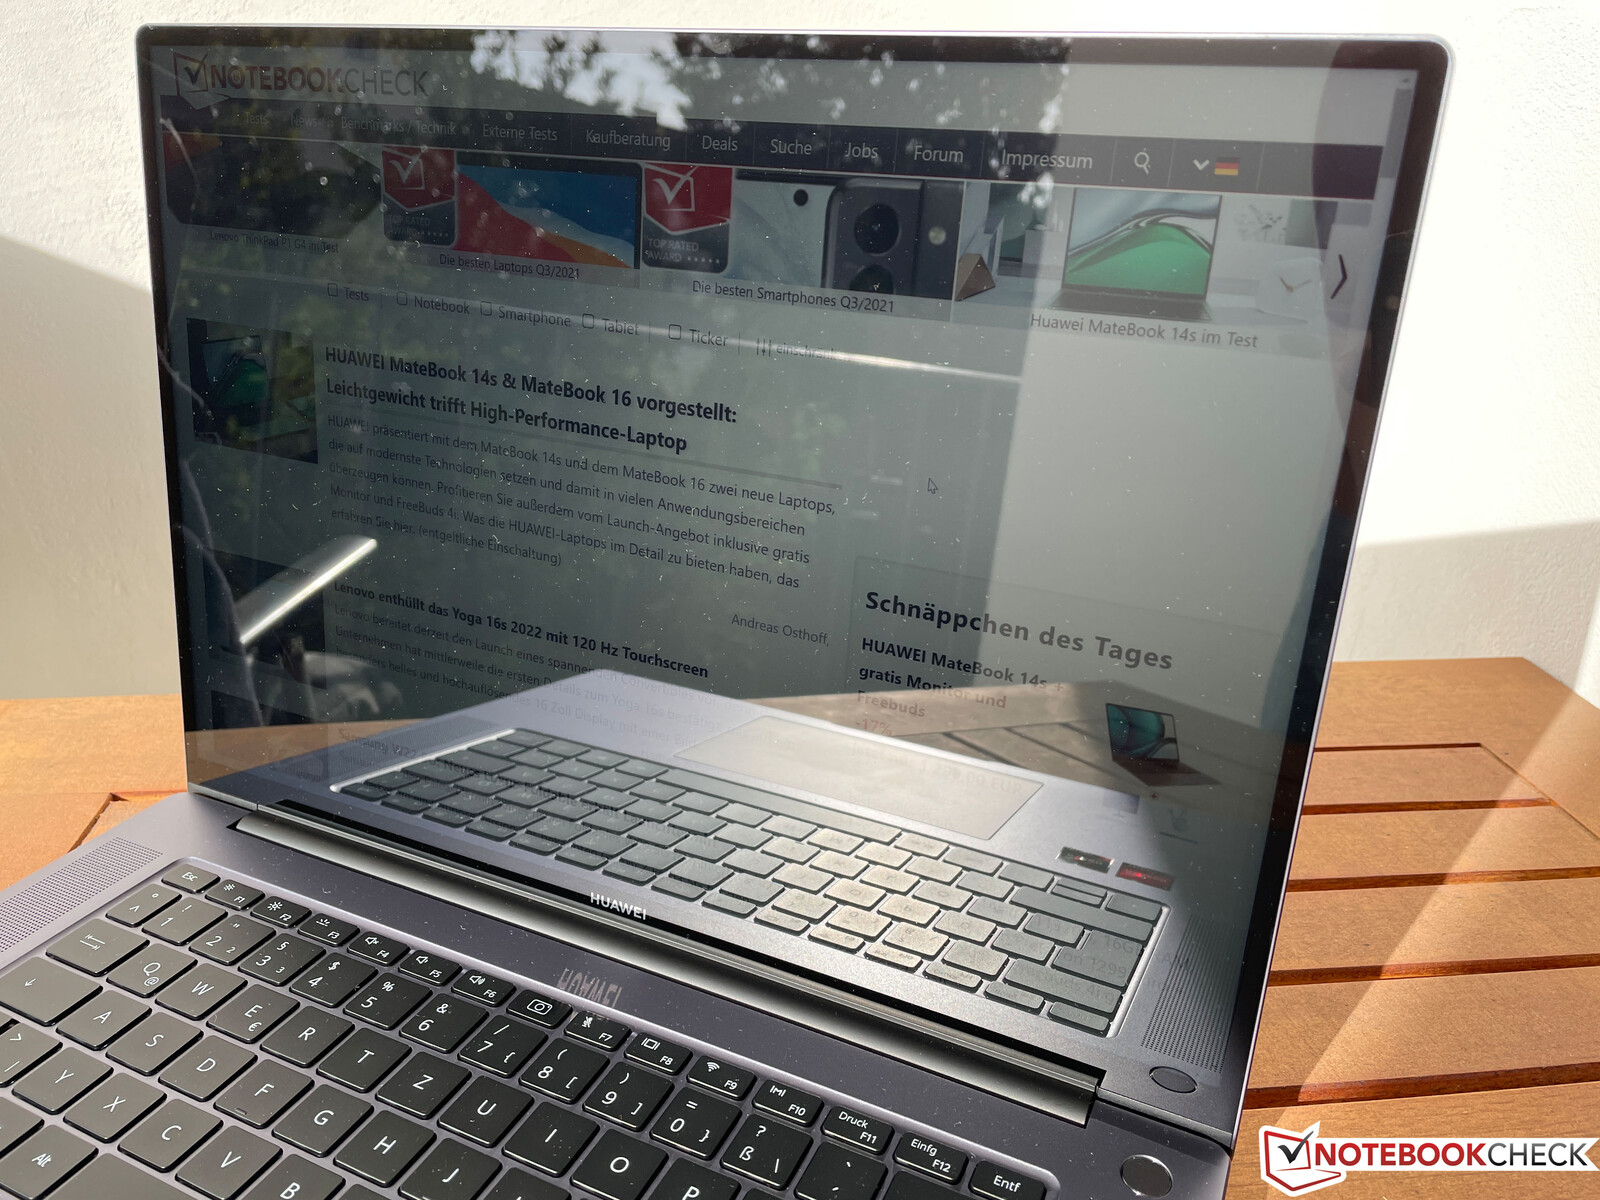
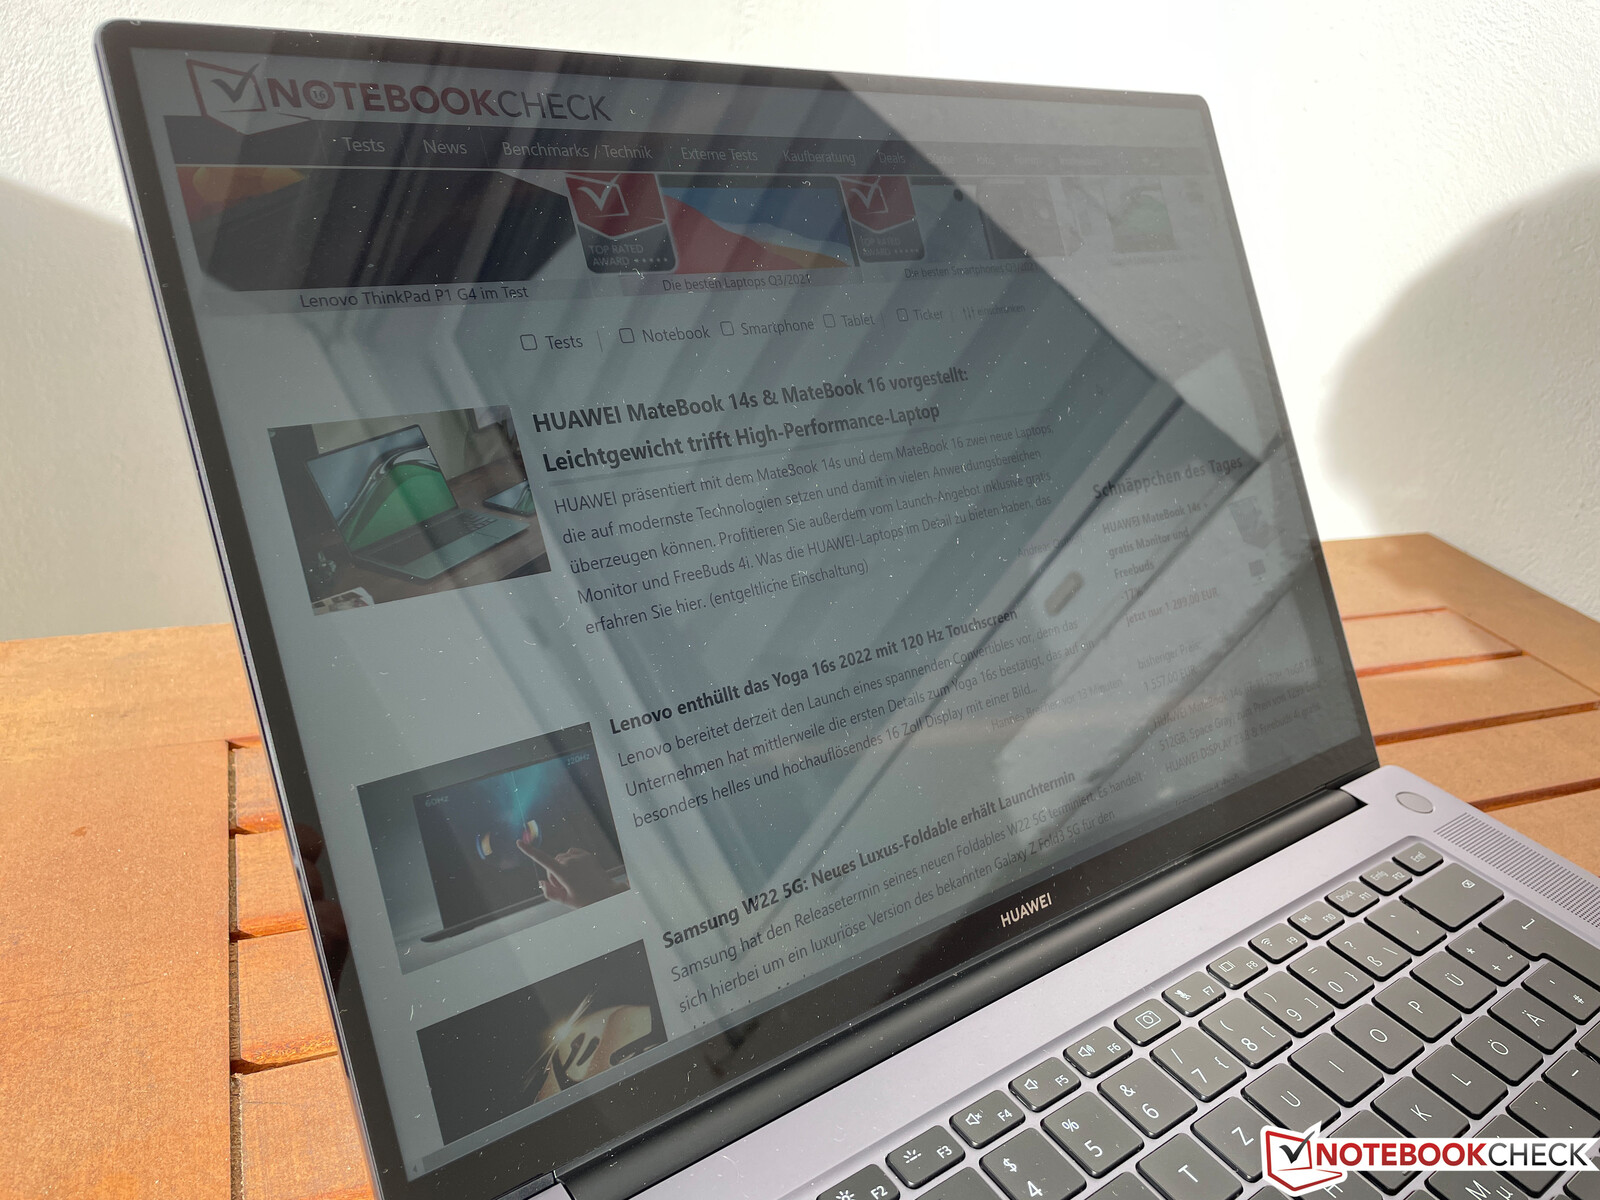
The display's only real weakness is the extremely reflective surface, as is illustrated by the pictures shown below. It is almost impossible to use the device outdoors on a sunny day and reflections can even be a slight problem when working indoors.
Performance - Zen 3 and good cooling
The MateBook 16 is available with the AMD Ryzen 5 5600H (6 Zen-3 cores) or the Ryzen 7 5800H (8 Zen-3 cores) for a surcharge of 100 Euro. The remaining features of the two configurations are identical with 16 GB of RAM and a 512 GB PCIe-SSD.
The key combination Fn+P allows users to switch between balanced and performance mode, but we did not measure a difference in CPU or iGPU performance.
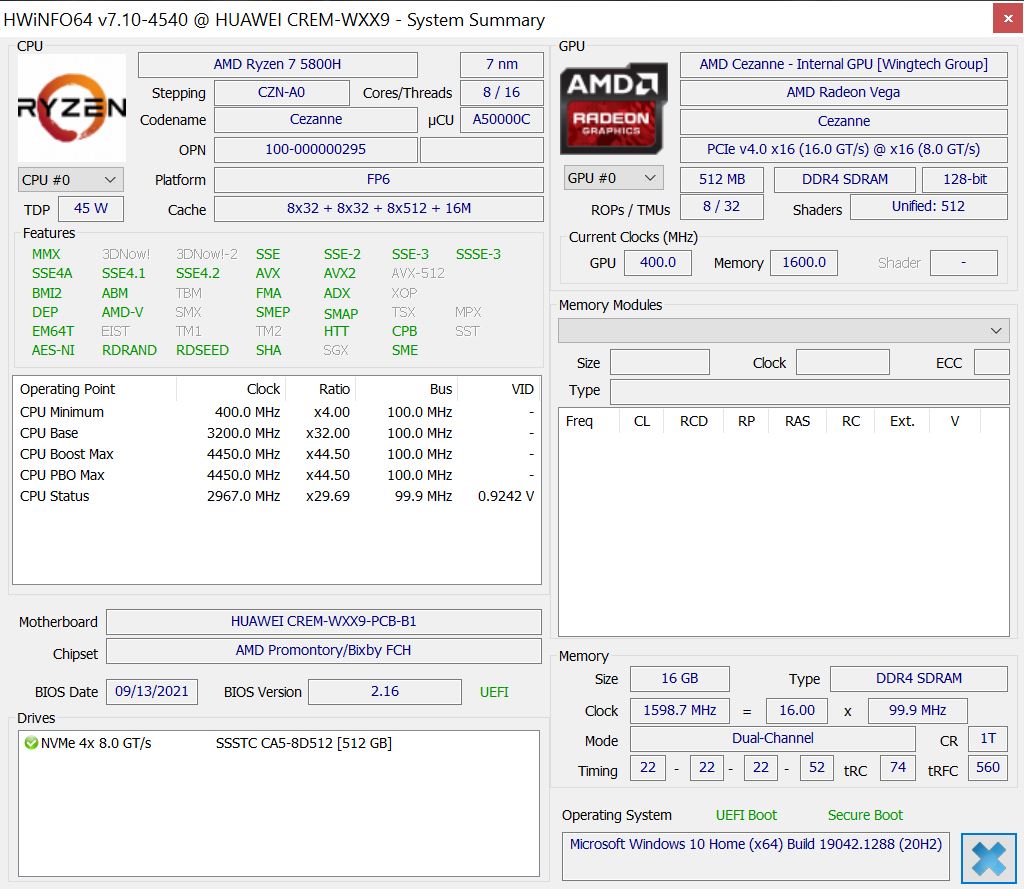
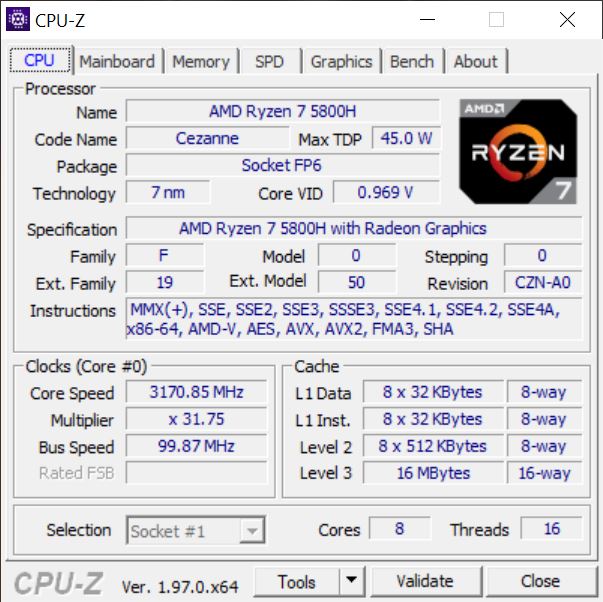
Processor - Ryzen 7 5800H with 54 Watt continuous load
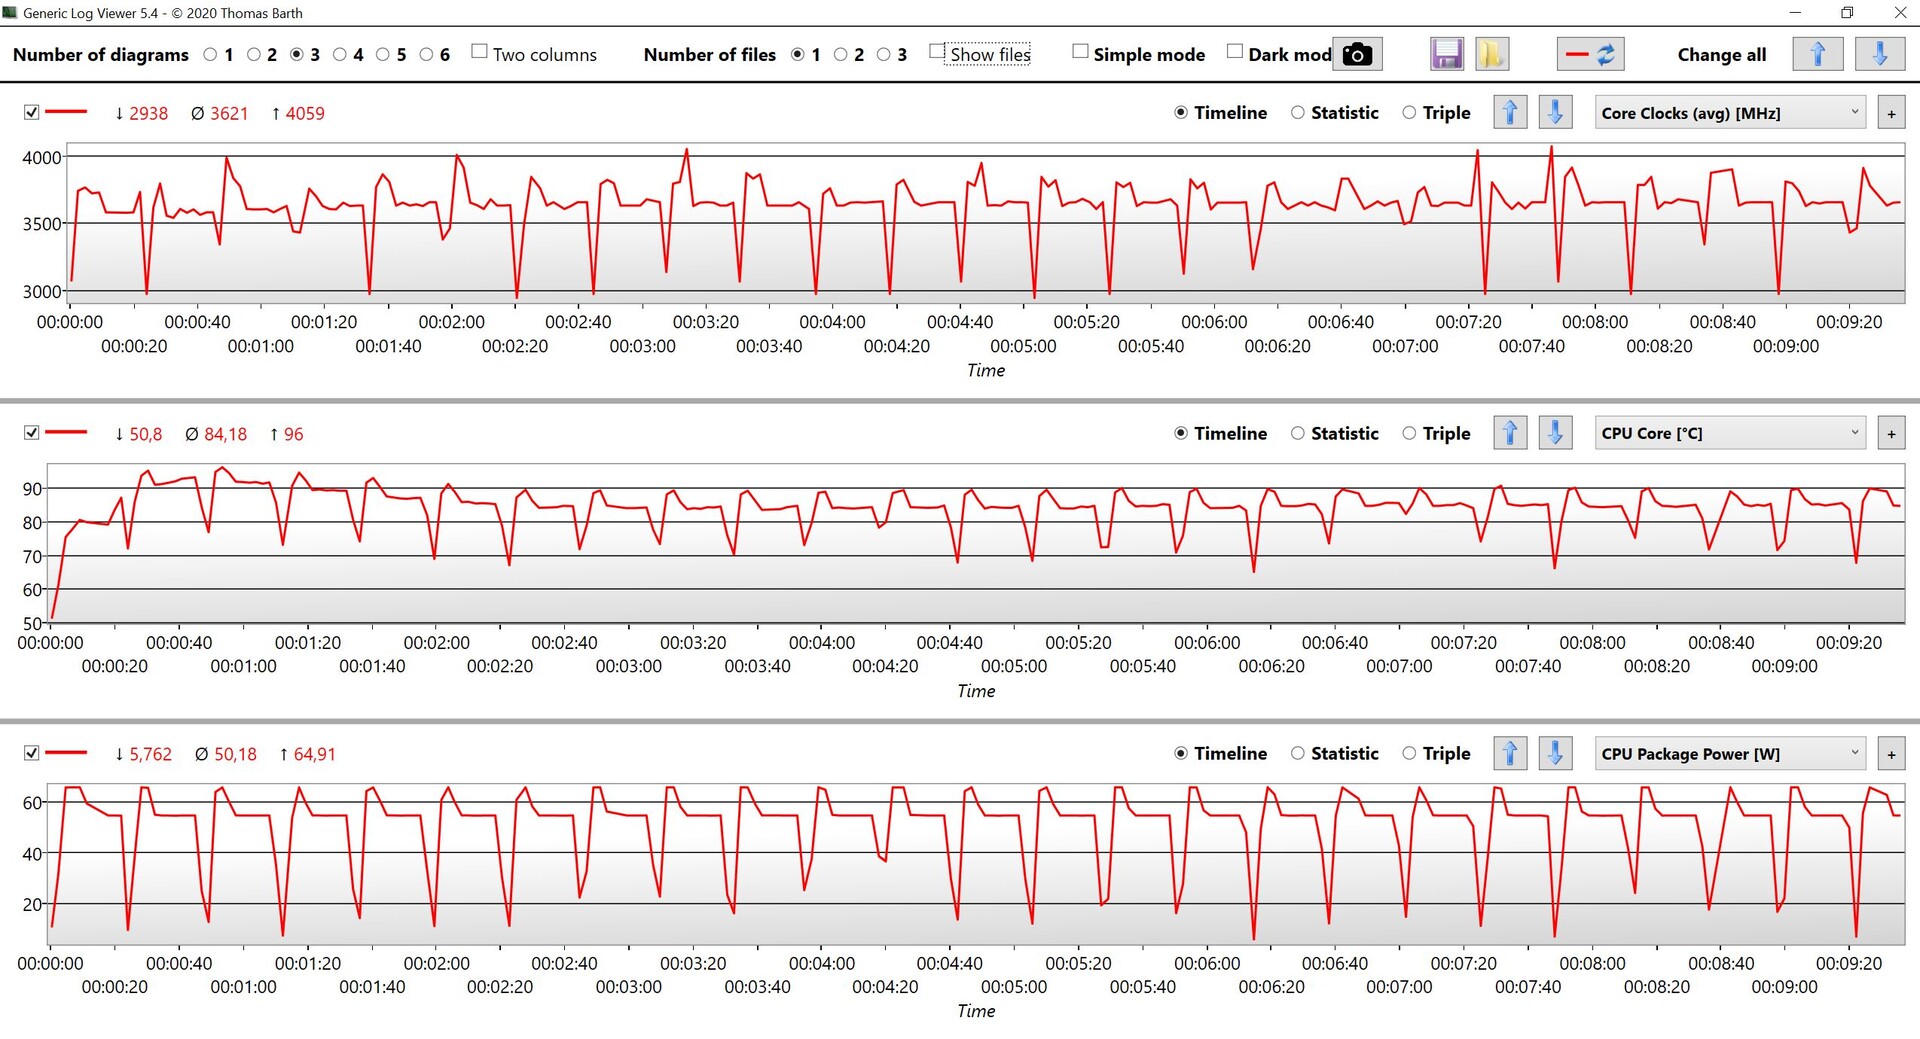
The AMD Ryzen 7 5800H has 8 fast Zen-3 cores (16 threads) and reaches a maximum of 4.4 GHz. The chip is produced using the 7-nm process, which has a positive effect on efficiency. The Ryzen 7 5800H currently is one of the fastest 45-Watt mobile processors, as the impressive benchmarks below show. The processor's power consumption peaks at 65 Watt and then immediately stabilizes at around 54 Watt, which leads to very stable performance.
The IdeaPad Pro, equipped with the same processor, offers comparable performance while the other models, equipped with Intel chips, do not stand a chance against the AMD processor in Multi or Single Core tests. To be fair, these devices are not equipped with the fastest processors. But the results remain similar when looking at some (significantly more expensive) mobile workstations such as the Dell Precision 5560 or the ThinkPad P1 G4 (the high-end version with Vapor Chamber) equipped with the Intel Core i7-11850H. There are implementations of the Core i7-11800H that provide even more performance (in some gaming laptops, for example), but only combined with very high levels of power consumption (~100 Watt in the case of the Alienware x17). All this illustrates the notable improvement in efficiency of the current AMD chips and the fact that the MateBook 16 can even keep up with models of a much higher price range.
When running on battery, the processor consumes 54 Watt for a few seconds and is then limited to 35 Watt. This only leads to a loss of around 10 percent in the Multi Core test (1793 points in CBR15 Multi). For more information on CPU benchmarks, please visit our Tech page.
Cinebench R15 Multi loop
Cinebench R23: Multi Core | Single Core
Cinebench R20: CPU (Multi Core) | CPU (Single Core)
Cinebench R15: CPU Multi 64Bit | CPU Single 64Bit
Blender: v2.79 BMW27 CPU
7-Zip 18.03: 7z b 4 | 7z b 4 -mmt1
Geekbench 5.5: Multi-Core | Single-Core
HWBOT x265 Benchmark v2.2: 4k Preset
LibreOffice : 20 Documents To PDF
R Benchmark 2.5: Overall mean
| CPU Performance rating | |
| Average of class Multimedia | |
| Lenovo IdeaPad 5 Pro 16ACH | |
| Huawei MateBook 16 R7 5800H | |
| Average AMD Ryzen 7 5800H | |
| Acer Swift 3 SF316-51 | |
| Dell XPS 15 9510 i5 11400H FHD | |
| Huawei MateBook D 16-53011VFJ | |
| Schenker Vision 15 | |
| Cinebench R23 / Multi Core | |
| Average of class Multimedia (4861 - 33362, n=78, last 2 years) | |
| Average AMD Ryzen 7 5800H (8812 - 13214, n=29) | |
| Lenovo IdeaPad 5 Pro 16ACH | |
| Huawei MateBook 16 R7 5800H | |
| Huawei MateBook D 16-53011VFJ | |
| Dell XPS 15 9510 i5 11400H FHD | |
| Acer Swift 3 SF316-51 | |
| Schenker Vision 15 | |
| Cinebench R23 / Single Core | |
| Average of class Multimedia (1128 - 2459, n=70, last 2 years) | |
| Acer Swift 3 SF316-51 | |
| Average AMD Ryzen 7 5800H (1294 - 1441, n=29) | |
| Lenovo IdeaPad 5 Pro 16ACH | |
| Dell XPS 15 9510 i5 11400H FHD | |
| Huawei MateBook 16 R7 5800H | |
| Schenker Vision 15 | |
| Huawei MateBook D 16-53011VFJ | |
| Cinebench R20 / CPU (Multi Core) | |
| Average of class Multimedia (1887 - 12912, n=61, last 2 years) | |
| Lenovo IdeaPad 5 Pro 16ACH | |
| Average AMD Ryzen 7 5800H (3430 - 5020, n=31) | |
| Huawei MateBook 16 R7 5800H | |
| Huawei MateBook D 16-53011VFJ | |
| Dell XPS 15 9510 i5 11400H FHD | |
| Acer Swift 3 SF316-51 | |
| Schenker Vision 15 | |
| Cinebench R20 / CPU (Single Core) | |
| Average of class Multimedia (425 - 853, n=61, last 2 years) | |
| Acer Swift 3 SF316-51 | |
| Dell XPS 15 9510 i5 11400H FHD | |
| Average AMD Ryzen 7 5800H (502 - 560, n=30) | |
| Lenovo IdeaPad 5 Pro 16ACH | |
| Schenker Vision 15 | |
| Huawei MateBook 16 R7 5800H | |
| Huawei MateBook D 16-53011VFJ | |
| Cinebench R15 / CPU Multi 64Bit | |
| Average of class Multimedia (856 - 5224, n=65, last 2 years) | |
| Huawei MateBook 16 R7 5800H | |
| Lenovo IdeaPad 5 Pro 16ACH | |
| Average AMD Ryzen 7 5800H (1487 - 2119, n=28) | |
| Huawei MateBook D 16-53011VFJ | |
| Dell XPS 15 9510 i5 11400H FHD | |
| Dell XPS 15 9510 i5 11400H FHD | |
| Schenker Vision 15 | |
| Acer Swift 3 SF316-51 | |
| Cinebench R15 / CPU Single 64Bit | |
| Average of class Multimedia (184.8 - 326, n=63, last 2 years) | |
| Acer Swift 3 SF316-51 | |
| Huawei MateBook 16 R7 5800H | |
| Schenker Vision 15 | |
| Average AMD Ryzen 7 5800H (209 - 234, n=29) | |
| Lenovo IdeaPad 5 Pro 16ACH | |
| Dell XPS 15 9510 i5 11400H FHD | |
| Huawei MateBook D 16-53011VFJ | |
| Blender / v2.79 BMW27 CPU | |
| Schenker Vision 15 | |
| Acer Swift 3 SF316-51 | |
| Dell XPS 15 9510 i5 11400H FHD | |
| Huawei MateBook D 16-53011VFJ | |
| Lenovo IdeaPad 5 Pro 16ACH | |
| Average AMD Ryzen 7 5800H (237 - 340, n=29) | |
| Huawei MateBook 16 R7 5800H | |
| Average of class Multimedia (100 - 557, n=62, last 2 years) | |
| 7-Zip 18.03 / 7z b 4 | |
| Average of class Multimedia (26062 - 130368, n=59, last 2 years) | |
| Average AMD Ryzen 7 5800H (45773 - 59986, n=28) | |
| Huawei MateBook 16 R7 5800H | |
| Lenovo IdeaPad 5 Pro 16ACH | |
| Huawei MateBook D 16-53011VFJ | |
| Dell XPS 15 9510 i5 11400H FHD | |
| Acer Swift 3 SF316-51 | |
| Schenker Vision 15 | |
| 7-Zip 18.03 / 7z b 4 -mmt1 | |
| Average of class Multimedia (3666 - 7545, n=60, last 2 years) | |
| Huawei MateBook 16 R7 5800H | |
| Average AMD Ryzen 7 5800H (5038 - 5632, n=29) | |
| Acer Swift 3 SF316-51 | |
| Lenovo IdeaPad 5 Pro 16ACH | |
| Schenker Vision 15 | |
| Dell XPS 15 9510 i5 11400H FHD | |
| Huawei MateBook D 16-53011VFJ | |
| Geekbench 5.5 / Multi-Core | |
| Average of class Multimedia (4652 - 20422, n=60, last 2 years) | |
| Average AMD Ryzen 7 5800H (6551 - 9062, n=28) | |
| Huawei MateBook 16 R7 5800H | |
| Lenovo IdeaPad 5 Pro 16ACH | |
| Acer Swift 3 SF316-51 | |
| Huawei MateBook D 16-53011VFJ | |
| Dell XPS 15 9510 i5 11400H FHD | |
| Schenker Vision 15 | |
| Geekbench 5.5 / Single-Core | |
| Average of class Multimedia (805 - 2974, n=60, last 2 years) | |
| Acer Swift 3 SF316-51 | |
| Schenker Vision 15 | |
| Dell XPS 15 9510 i5 11400H FHD | |
| Huawei MateBook 16 R7 5800H | |
| Average AMD Ryzen 7 5800H (1336 - 1505, n=28) | |
| Lenovo IdeaPad 5 Pro 16ACH | |
| Huawei MateBook D 16-53011VFJ | |
| HWBOT x265 Benchmark v2.2 / 4k Preset | |
| Average of class Multimedia (5.26 - 36.1, n=60, last 2 years) | |
| Average AMD Ryzen 7 5800H (11.6 - 16.1, n=29) | |
| Huawei MateBook 16 R7 5800H | |
| Lenovo IdeaPad 5 Pro 16ACH | |
| Huawei MateBook D 16-53011VFJ | |
| Dell XPS 15 9510 i5 11400H FHD | |
| Acer Swift 3 SF316-51 | |
| Schenker Vision 15 | |
| LibreOffice / 20 Documents To PDF | |
| Average AMD Ryzen 7 5800H (47.4 - 113, n=29) | |
| Huawei MateBook D 16-53011VFJ | |
| Huawei MateBook 16 R7 5800H | |
| Average of class Multimedia (23.9 - 146.7, n=61, last 2 years) | |
| Lenovo IdeaPad 5 Pro 16ACH | |
| Dell XPS 15 9510 i5 11400H FHD | |
| Schenker Vision 15 | |
| Acer Swift 3 SF316-51 | |
| R Benchmark 2.5 / Overall mean | |
| Huawei MateBook D 16-53011VFJ | |
| Dell XPS 15 9510 i5 11400H FHD | |
| Schenker Vision 15 | |
| Acer Swift 3 SF316-51 | |
| Lenovo IdeaPad 5 Pro 16ACH | |
| Average AMD Ryzen 7 5800H (0.511 - 0.559, n=28) | |
| Huawei MateBook 16 R7 5800H | |
| Average of class Multimedia (0.3604 - 0.947, n=60, last 2 years) | |
* ... smaller is better
AIDA64: FP32 Ray-Trace | FPU Julia | CPU SHA3 | CPU Queen | FPU SinJulia | FPU Mandel | CPU AES | CPU ZLib | FP64 Ray-Trace | CPU PhotoWorxx
| Performance rating | |
| Average of class Multimedia | |
| Huawei MateBook 16 R7 5800H | |
| Average AMD Ryzen 7 5800H | |
| Lenovo IdeaPad 5 Pro 16ACH | |
| Huawei MateBook D 16-53011VFJ | |
| Schenker Vision 15 | |
| Dell XPS 15 9510 i5 11400H FHD -9! | |
| AIDA64 / FP32 Ray-Trace | |
| Average of class Multimedia (2214 - 50388, n=57, last 2 years) | |
| Huawei MateBook 16 R7 5800H | |
| Average AMD Ryzen 7 5800H (10349 - 15169, n=29) | |
| Lenovo IdeaPad 5 Pro 16ACH | |
| Huawei MateBook D 16-53011VFJ | |
| Schenker Vision 15 | |
| AIDA64 / FPU Julia | |
| Huawei MateBook 16 R7 5800H | |
| Lenovo IdeaPad 5 Pro 16ACH | |
| Average AMD Ryzen 7 5800H (63663 - 95954, n=29) | |
| Average of class Multimedia (12867 - 201874, n=58, last 2 years) | |
| Huawei MateBook D 16-53011VFJ | |
| Schenker Vision 15 | |
| AIDA64 / CPU SHA3 | |
| Average of class Multimedia (626 - 8623, n=58, last 2 years) | |
| Huawei MateBook 16 R7 5800H | |
| Lenovo IdeaPad 5 Pro 16ACH | |
| Average AMD Ryzen 7 5800H (2096 - 3287, n=29) | |
| Schenker Vision 15 | |
| Huawei MateBook D 16-53011VFJ | |
| AIDA64 / CPU Queen | |
| Average AMD Ryzen 7 5800H (91846 - 99215, n=29) | |
| Huawei MateBook 16 R7 5800H | |
| Lenovo IdeaPad 5 Pro 16ACH | |
| Average of class Multimedia (13483 - 181505, n=45, last 2 years) | |
| Huawei MateBook D 16-53011VFJ | |
| Schenker Vision 15 | |
| AIDA64 / FPU SinJulia | |
| Huawei MateBook 16 R7 5800H | |
| Average AMD Ryzen 7 5800H (9962 - 11871, n=29) | |
| Lenovo IdeaPad 5 Pro 16ACH | |
| Huawei MateBook D 16-53011VFJ | |
| Average of class Multimedia (886 - 28794, n=58, last 2 years) | |
| Schenker Vision 15 | |
| AIDA64 / FPU Mandel | |
| Huawei MateBook 16 R7 5800H | |
| Lenovo IdeaPad 5 Pro 16ACH | |
| Average AMD Ryzen 7 5800H (36083 - 52732, n=29) | |
| Average of class Multimedia (6395 - 105740, n=57, last 2 years) | |
| Huawei MateBook D 16-53011VFJ | |
| Schenker Vision 15 | |
| AIDA64 / CPU AES | |
| Huawei MateBook 16 R7 5800H | |
| Lenovo IdeaPad 5 Pro 16ACH | |
| Average AMD Ryzen 7 5800H (50226 - 127832, n=29) | |
| Schenker Vision 15 | |
| Average of class Multimedia (8171 - 126790, n=58, last 2 years) | |
| Huawei MateBook D 16-53011VFJ | |
| AIDA64 / CPU ZLib | |
| Average of class Multimedia (143.8 - 2022, n=58, last 2 years) | |
| Lenovo IdeaPad 5 Pro 16ACH | |
| Huawei MateBook 16 R7 5800H | |
| Average AMD Ryzen 7 5800H (591 - 828, n=29) | |
| Huawei MateBook D 16-53011VFJ | |
| Schenker Vision 15 | |
| Dell XPS 15 9510 i5 11400H FHD | |
| AIDA64 / FP64 Ray-Trace | |
| Average of class Multimedia (1014 - 26875, n=58, last 2 years) | |
| Huawei MateBook 16 R7 5800H | |
| Lenovo IdeaPad 5 Pro 16ACH | |
| Average AMD Ryzen 7 5800H (5457 - 7884, n=29) | |
| Huawei MateBook D 16-53011VFJ | |
| Schenker Vision 15 | |
| AIDA64 / CPU PhotoWorxx | |
| Average of class Multimedia (8187 - 88154, n=58, last 2 years) | |
| Schenker Vision 15 | |
| Huawei MateBook D 16-53011VFJ | |
| Average AMD Ryzen 7 5800H (14445 - 25421, n=29) | |
| Lenovo IdeaPad 5 Pro 16ACH | |
| Huawei MateBook 16 R7 5800H | |
System Performance
Despite the lack of a dedicated GPU, the MateBook 16 achieves excellent results in the synthetic PCMark 10 and easily reaches the top of our comparison table. Our subjective impression was equally good. We found the MateBook 16 to be a particularly fast and responsive companion during everyday use.
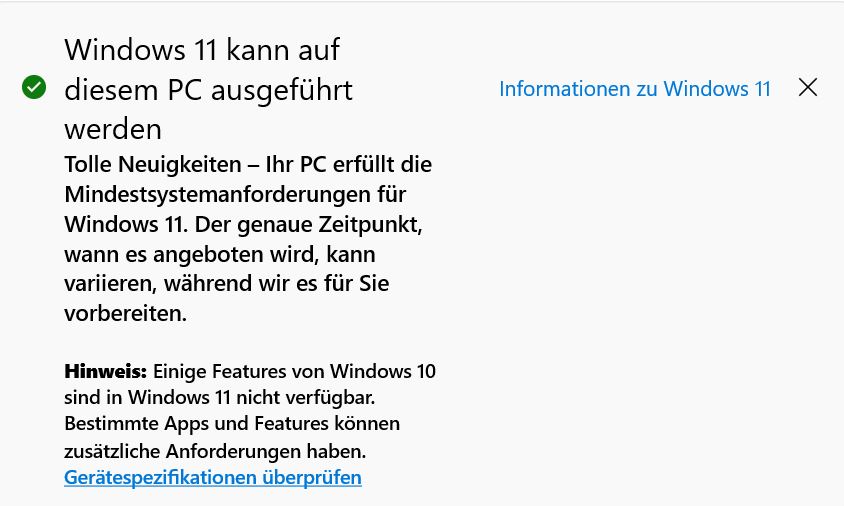
The MateBook 16 supports the upgrade to Windows 11, which makes the Huawei notebook future-proof. Huawei Share enables users to easily share files between various Huawei devices such as tablets and smartphones and even to use a tablet as a second screen (mirrored or expanded display). This worked very well in our test with a MatePad Pro (from 2020) and we did not encounter any issues or delays.
| PCMark 10 / Score | |
| Average of class Multimedia (4325 - 10386, n=56, last 2 years) | |
| Huawei MateBook 16 R7 5800H | |
| Average AMD Ryzen 7 5800H, AMD Radeon RX Vega 8 (Ryzen 4000/5000) (5989 - 6365, n=5) | |
| Lenovo IdeaPad 5 Pro 16ACH | |
| Acer Swift 3 SF316-51 | |
| Schenker Vision 15 | |
| Huawei MateBook D 16-53011VFJ | |
| Dell XPS 15 9510 i5 11400H FHD | |
| PCMark 10 / Essentials | |
| Huawei MateBook 16 R7 5800H | |
| Schenker Vision 15 | |
| Average of class Multimedia (8025 - 11664, n=55, last 2 years) | |
| Average AMD Ryzen 7 5800H, AMD Radeon RX Vega 8 (Ryzen 4000/5000) (10112 - 10690, n=5) | |
| Acer Swift 3 SF316-51 | |
| Lenovo IdeaPad 5 Pro 16ACH | |
| Dell XPS 15 9510 i5 11400H FHD | |
| Huawei MateBook D 16-53011VFJ | |
| PCMark 10 / Productivity | |
| Average of class Multimedia (7323 - 18233, n=55, last 2 years) | |
| Huawei MateBook 16 R7 5800H | |
| Average AMD Ryzen 7 5800H, AMD Radeon RX Vega 8 (Ryzen 4000/5000) (9198 - 9729, n=5) | |
| Lenovo IdeaPad 5 Pro 16ACH | |
| Huawei MateBook D 16-53011VFJ | |
| Acer Swift 3 SF316-51 | |
| Schenker Vision 15 | |
| Dell XPS 15 9510 i5 11400H FHD | |
| PCMark 10 / Digital Content Creation | |
| Average of class Multimedia (3651 - 16240, n=55, last 2 years) | |
| Huawei MateBook 16 R7 5800H | |
| Lenovo IdeaPad 5 Pro 16ACH | |
| Average AMD Ryzen 7 5800H, AMD Radeon RX Vega 8 (Ryzen 4000/5000) (6236 - 6730, n=5) | |
| Acer Swift 3 SF316-51 | |
| Huawei MateBook D 16-53011VFJ | |
| Schenker Vision 15 | |
| Dell XPS 15 9510 i5 11400H FHD | |
| PCMark 10 Score | 6365 points | |
Help | ||
| AIDA64 / Memory Copy | |
| Average of class Multimedia (11299 - 132135, n=58, last 2 years) | |
| Schenker Vision 15 | |
| Average AMD Ryzen 7 5800H (34964 - 44180, n=29) | |
| Lenovo IdeaPad 5 Pro 16ACH | |
| Huawei MateBook 16 R7 5800H | |
| Huawei MateBook D 16-53011VFJ | |
| AIDA64 / Memory Read | |
| Average of class Multimedia (11624 - 174586, n=58, last 2 years) | |
| Schenker Vision 15 | |
| Average AMD Ryzen 7 5800H (39548 - 47260, n=29) | |
| Lenovo IdeaPad 5 Pro 16ACH | |
| Huawei MateBook 16 R7 5800H | |
| Huawei MateBook D 16-53011VFJ | |
| AIDA64 / Memory Write | |
| Average of class Multimedia (11755 - 134998, n=58, last 2 years) | |
| Schenker Vision 15 | |
| Average AMD Ryzen 7 5800H (28456 - 47022, n=29) | |
| Huawei MateBook D 16-53011VFJ | |
| Huawei MateBook 16 R7 5800H | |
| Lenovo IdeaPad 5 Pro 16ACH | |
| AIDA64 / Memory Latency | |
| Average of class Multimedia (7 - 535, n=57, last 2 years) | |
| Schenker Vision 15 | |
| Average AMD Ryzen 7 5800H (76.3 - 105.1, n=29) | |
| Huawei MateBook D 16-53011VFJ | |
| Huawei MateBook 16 R7 5800H | |
| Lenovo IdeaPad 5 Pro 16ACH | |
| Dell XPS 15 9510 i5 11400H FHD | |
* ... smaller is better
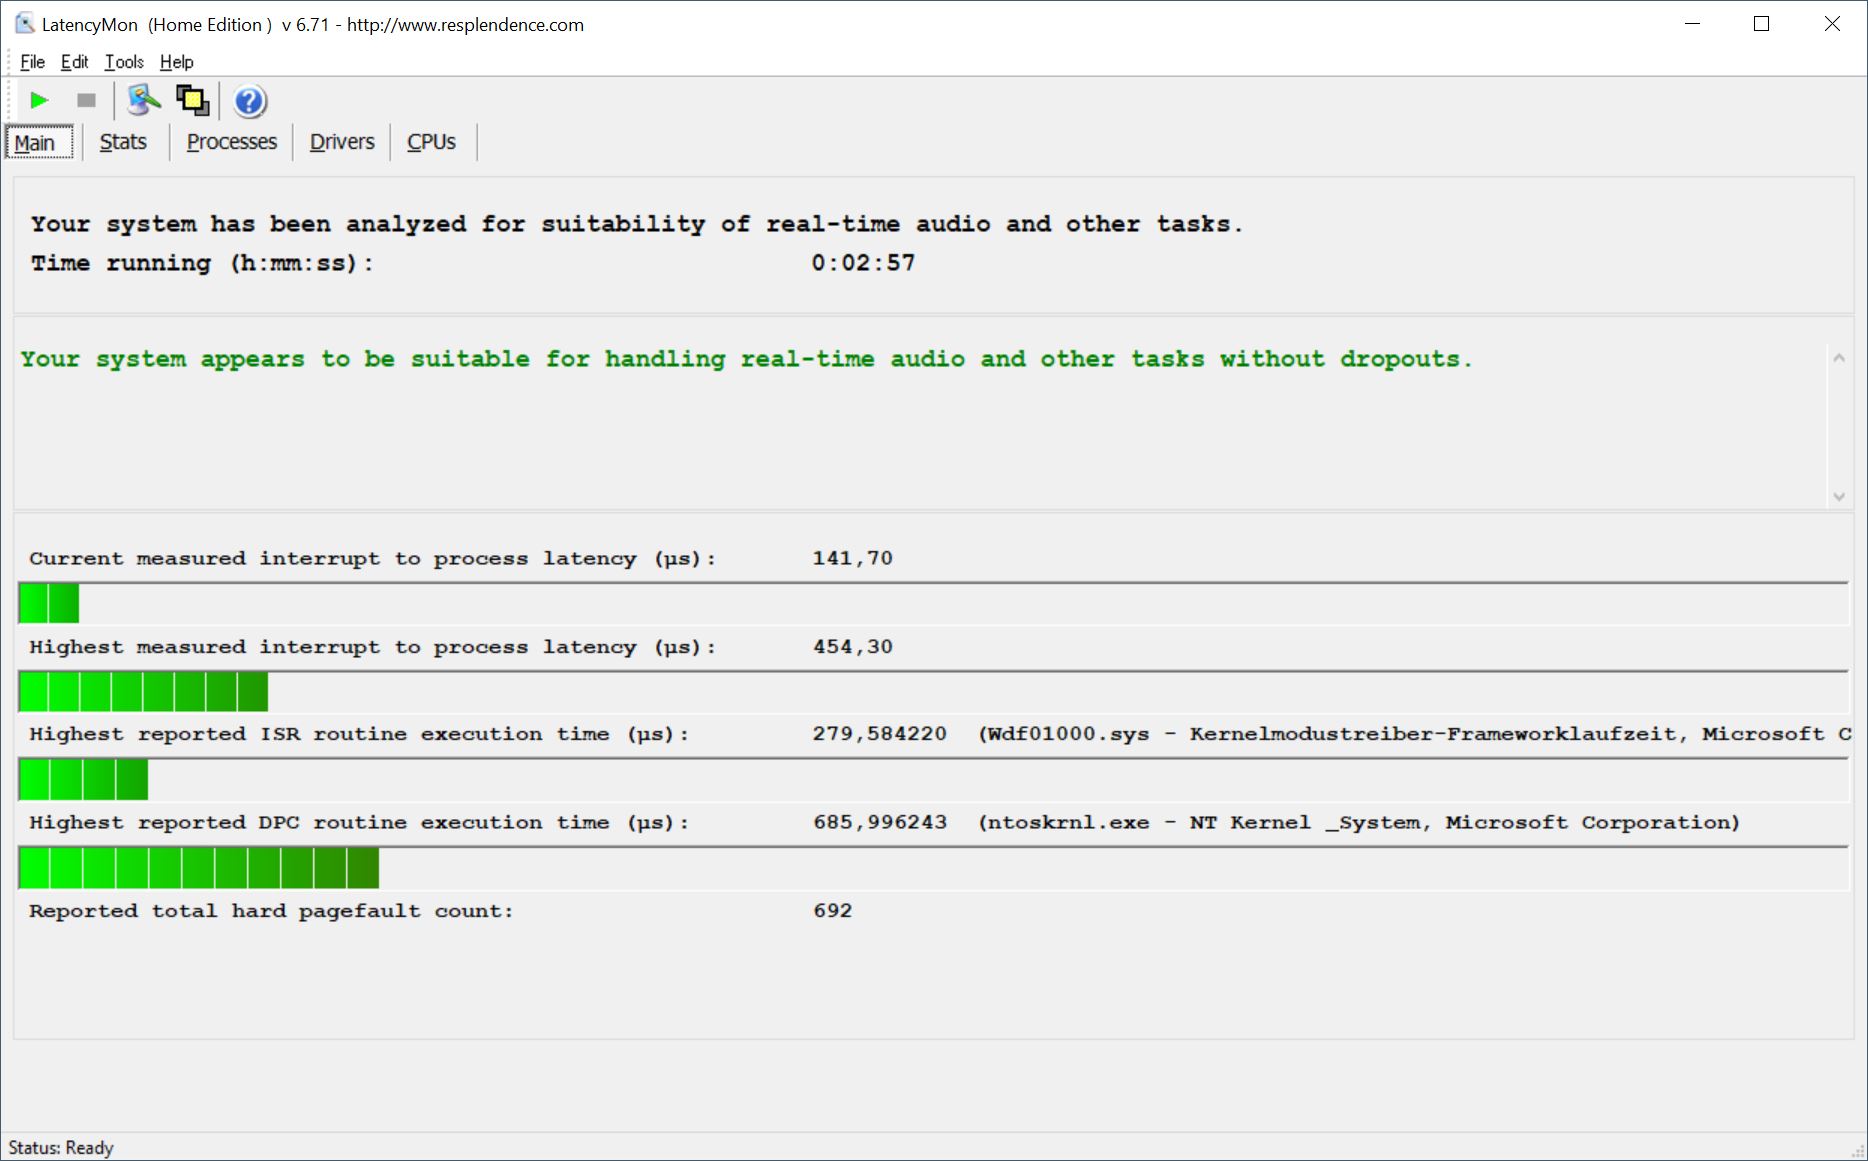
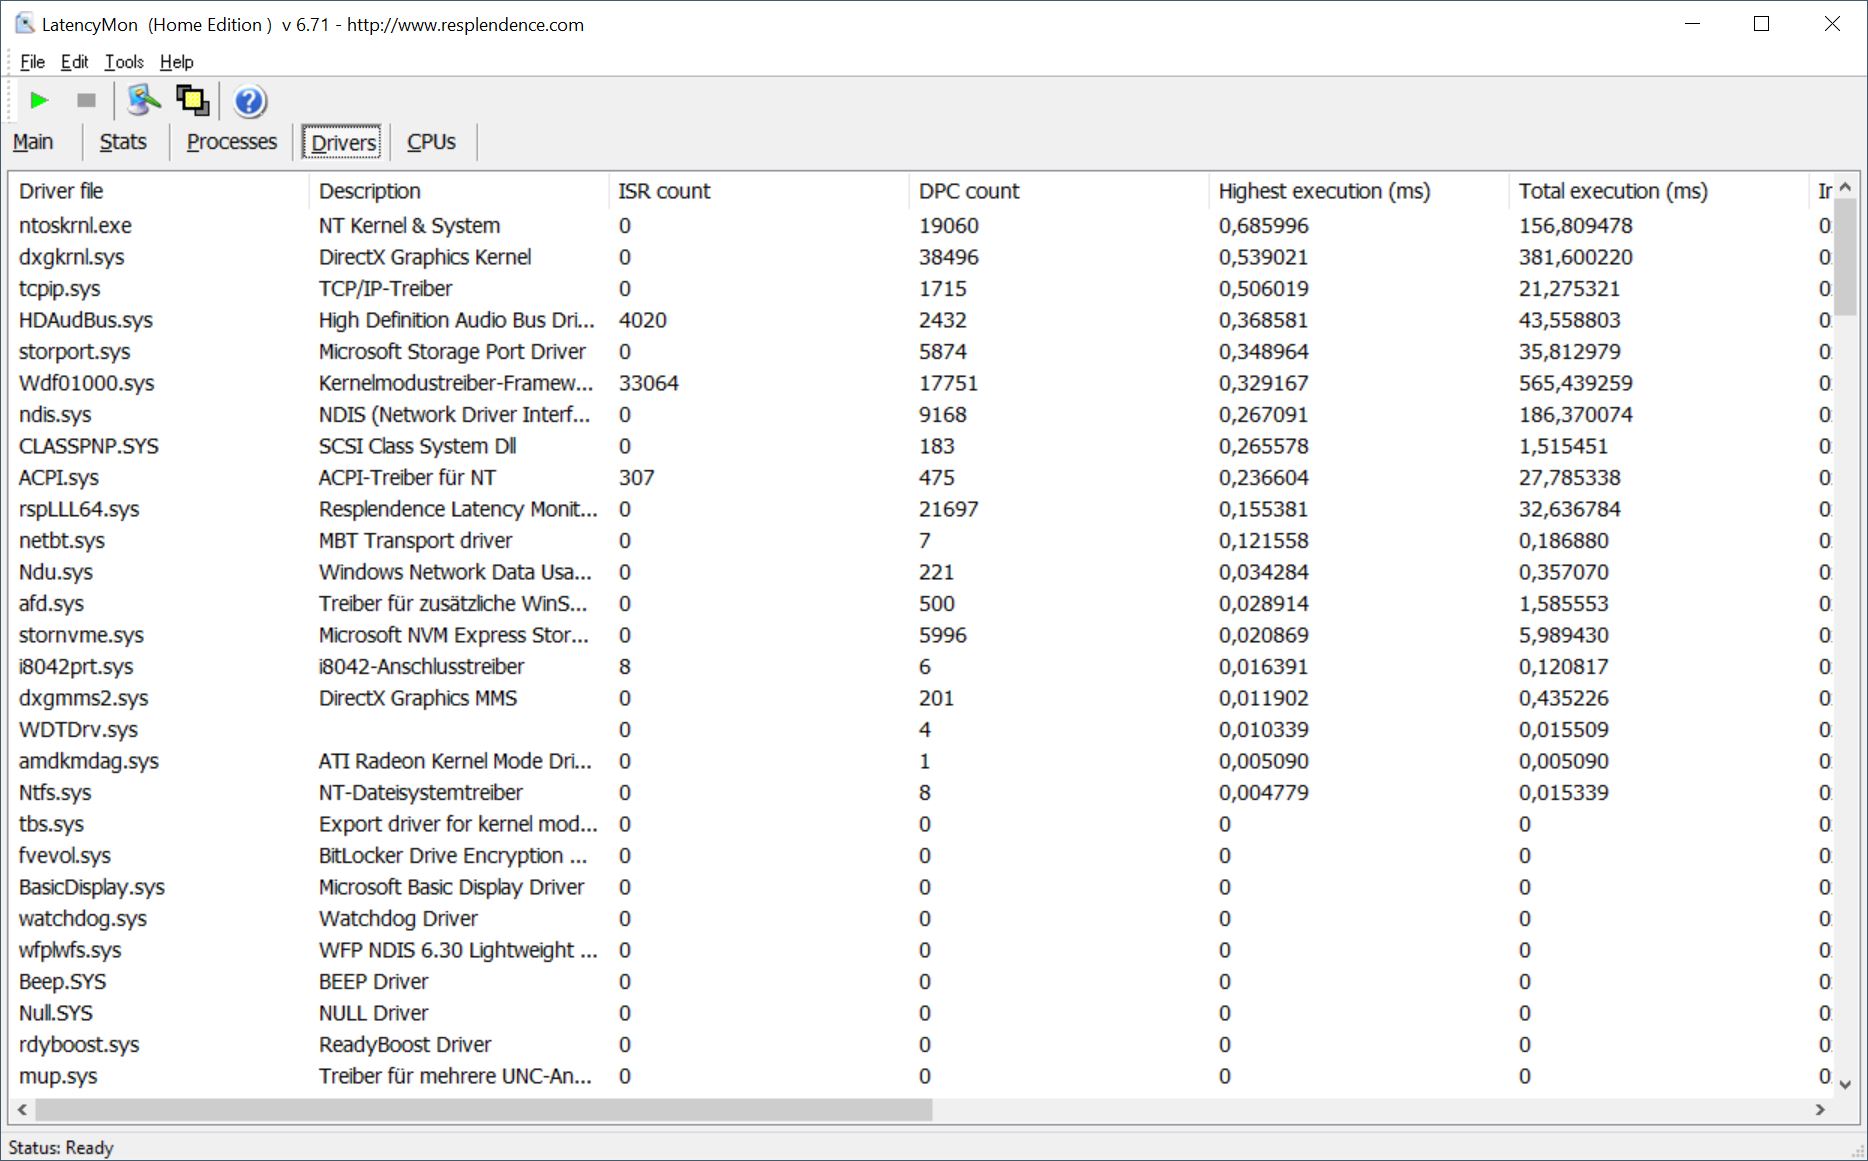
DPC Latencies
Our standardized latency test (browsing the web with several browser tabs open, playing a 4K video on YouTube, CPU load) did not indicate any issues with our test unit, which makes it suitable for the use of applications with real-time audio.
| DPC Latencies / LatencyMon - interrupt to process latency (max), Web, Youtube, Prime95 | |
| Schenker Vision 15 | |
| Dell XPS 15 9510 i5 11400H FHD | |
| Huawei MateBook D 16-53011VFJ | |
| Lenovo IdeaPad 5 Pro 16ACH | |
| Huawei MateBook 16 R7 5800H | |
| Acer Swift 3 SF316-51 | |
* ... smaller is better
Storage Devices
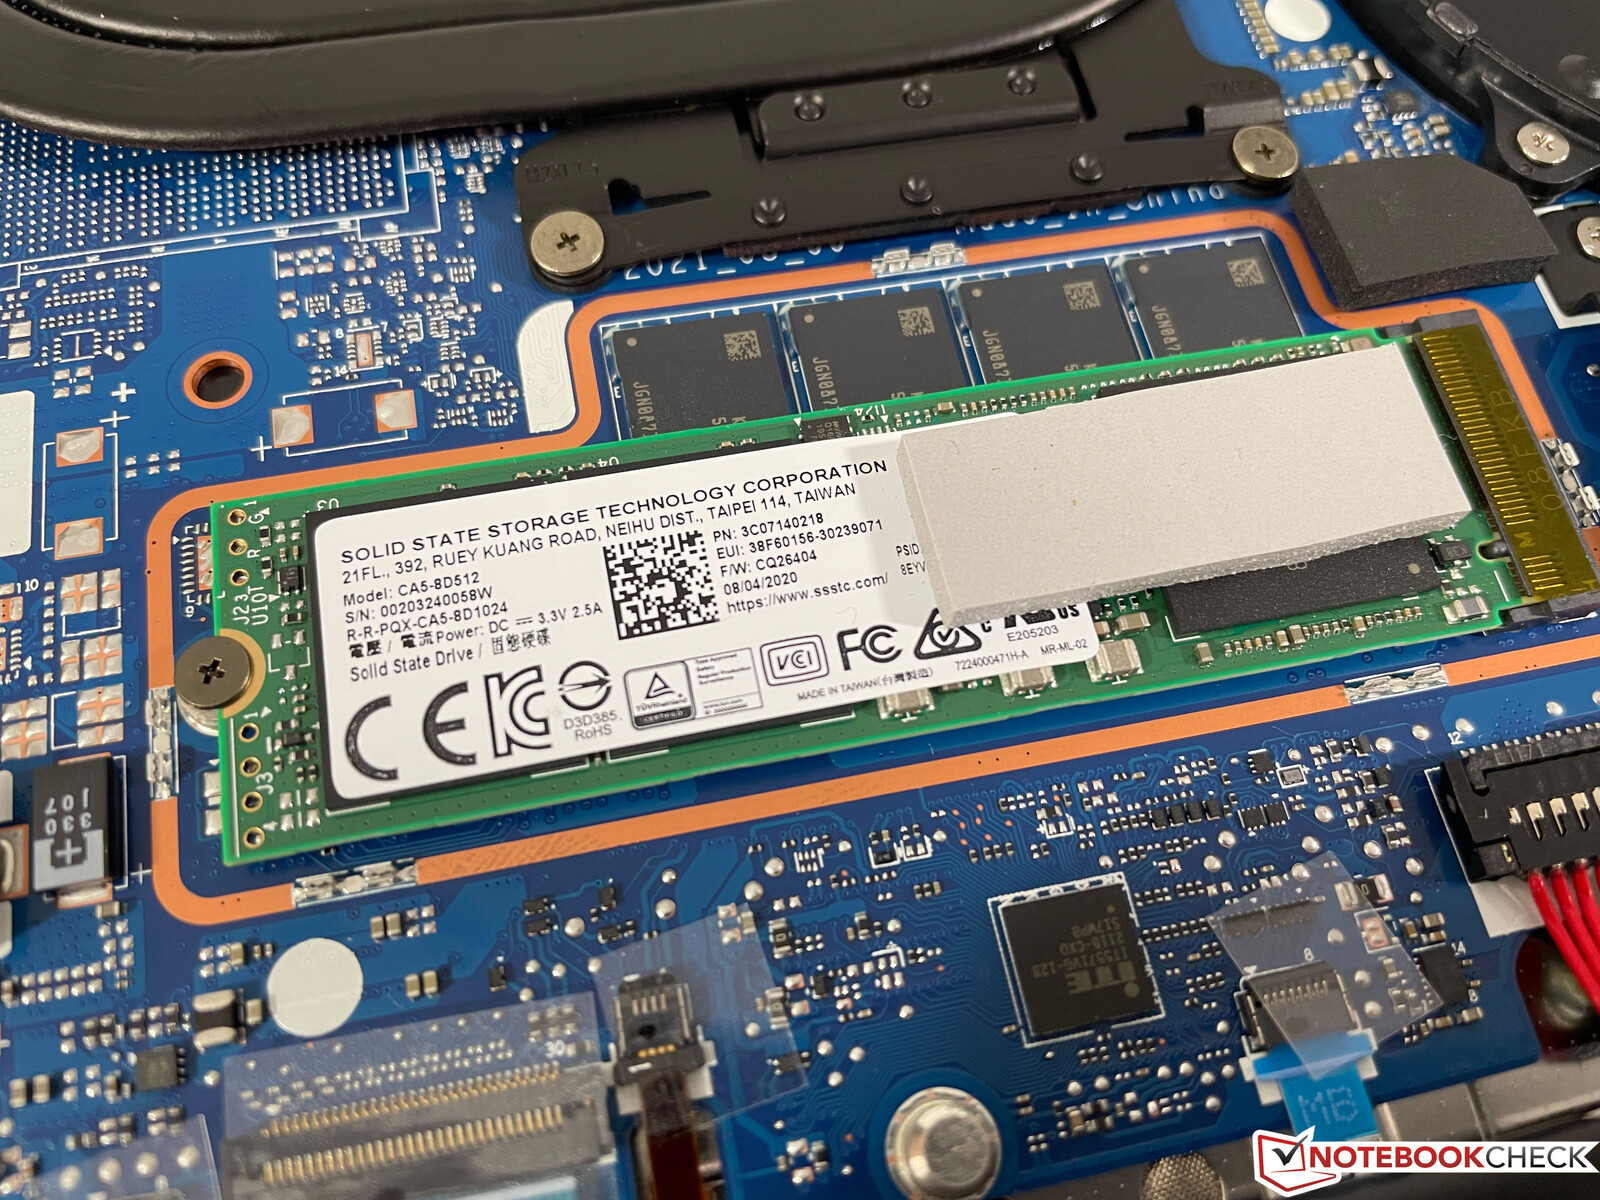
The individual 512-GB M.2 2280 SSD from Lite-On is connected via PCIe 3.0 x4. The transfer rates are excellent and at the limit of what the PCIe 3.0 interface is capable of, so upgrading the storage device only makes sense if you need more storage space. As with other Huawei laptops, the SSD is already partitioned ex-works, which is rather unnecessary and can actually lead to problems. The system drive only has 71 GB available after the initial startup, so some users might soon reach a limit if they aren't careful about downloading and installing files and programs. The remaining 337 GB are available on the Data (D) partition. Find out more about SSD benchmarks here.
* ... smaller is better

Disk Throttling: DiskSpd Read Loop, Queue Depth 8
Graphics
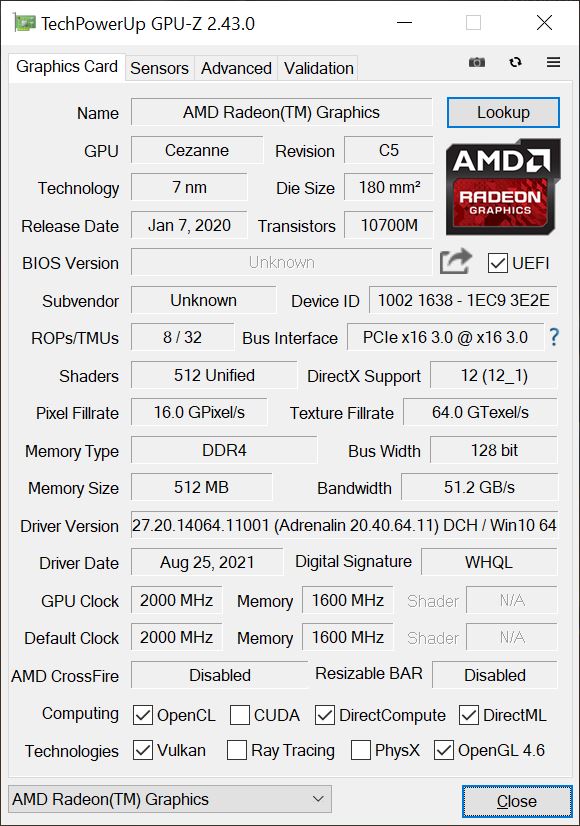
The processor's Radeon RX Vega 8 is responsible for displaying graphics. Its raw performance is about 20 - 30 percent (depending on the benchmark) below the fastest models of Intel's current Iris Xe Graphics G7 with 96 EUs and about 30 percent faster than the old Vega 8 in the Ryzen 4000 generation. The big advantage of the current Vega 8 is its significantly improved video decoder has become a lot more efficient and can now beat the Intel Iris Xe (about 8 percent vs. 32 percent GPU load when playing 4K video).
The MateBook 16 easily passed the demanding 3DMark Time Spy stress test (99.6 percent) and the graphics performance remains stable when running on battery. Find out more about GPU benchmarks here.
| 3DMark 11 Performance | 6278 points | |
| 3DMark Ice Storm Standard Score | 164152 points | |
| 3DMark Cloud Gate Standard Score | 25813 points | |
| 3DMark Fire Strike Score | 3441 points | |
| 3DMark Time Spy Score | 1357 points | |
Help | ||
Gaming Performance
The gaming performance of the MateBook 16 is limited due to the missing dedicated GPU. Users can nonetheless play some older or less demanding titles such as the new FIFA 22 or DOTA 2 at high settings. Performance remains stable even during long gaming sessions. Find out more about the Vega 8's gaming benchmarks here.
Witcher 3 FPS diagram
| low | med. | high | ultra | |
|---|---|---|---|---|
| GTA V (2015) | 112 | 103 | 26.3 | 10.5 |
| The Witcher 3 (2015) | 72 | 22 | 14.6 | |
| Dota 2 Reborn (2015) | 124 | 95.5 | 53.7 | 50.8 |
| Final Fantasy XV Benchmark (2018) | 37.2 | 18.1 | 12.1 | |
| X-Plane 11.11 (2018) | 53.2 | 41.7 | 36.8 | |
| Far Cry 5 (2018) | 22 | 21 | 20 | |
| Strange Brigade (2018) | 85 | 33 | 29 | 25 |
| F1 2020 (2020) | 94 | 44 | 33 | 24 |
| F1 2021 (2021) | 96.7 | 40.3 | 30.9 | 21.4 |
| FIFA 22 (2021) | 166 | 106 | 89 | 78 |
Emissions - MateBook remains very quiet in everyday use
System Noise
The cooling system seems to work very well despite the device's high performance as it remains virtually silent most of the time when surfing the web or playing high-resolution videos. The first fan stage (at around 27 dB(A)) is only slightly audible in silent surroundings. The fan remains calm even when gaming; we measured a maximum of 32 dB(A) during Witcher 3. Games with a heavy load on the CPU do cause the fans to turn up slightly but not loud enough to make it difficult to use the internal speakers.
Only when the CPU is under continuous full load will the fans become very audible, although it takes about a minute before you start hearing them even then. The fans reach their maximum volume of around 42 dB(A) after several minutes. Fortunately, the frequency of the fan noise isn't particularly high. We did not notice any other electronic noises such as coil whine.
| Huawei MateBook 16 R7 5800H Vega 8, R7 5800H, Lite-On CA5-8D512 | Acer Swift 3 SF316-51 Iris Xe G7 96EUs, i7-11370H, Micron 2210 MTFDHBA512QFD | Huawei MateBook D 16-53011VFJ Vega 6, R5 4600H, Samsung SSD PM981a MZVLB512HBJQ | Lenovo IdeaPad 5 Pro 16ACH GeForce GTX 1650 Mobile, R7 5800H, Micron 2300 512GB MTFDHBA512TDV | Schenker Vision 15 Iris Xe G7 96EUs, i7-1165G7, Samsung SSD 980 Pro 1TB MZ-V8P1T0BW | Dell XPS 15 9510 i5 11400H FHD UHD Graphics Xe 16EUs, i5-11400H, Micron 2300 512GB MTFDHBA512TDV | |
|---|---|---|---|---|---|---|
| Noise | -2% | -1% | -13% | -18% | 6% | |
| off / environment * (dB) | 24.8 | 26 -5% | 25.5 -3% | 24.04 3% | 29.8 -20% | 24.4 2% |
| Idle Minimum * (dB) | 24.8 | 26 -5% | 25.5 -3% | 24.04 3% | 29.8 -20% | 24.4 2% |
| Idle Average * (dB) | 24.8 | 26 -5% | 25.5 -3% | 24.04 3% | 29.8 -20% | 24.4 2% |
| Idle Maximum * (dB) | 26.7 | 27.7 -4% | 25.5 4% | 24.04 10% | 31.1 -16% | 24.4 9% |
| Load Average * (dB) | 32 | 32.7 -2% | 33 -3% | 41.3 -29% | 40.5 -27% | 26.1 18% |
| Witcher 3 ultra * (dB) | 32 | 49.21 -54% | 40.5 -27% | 33.2 -4% | ||
| Load Maximum * (dB) | 42.4 | 39 8% | 42.1 1% | 52.93 -25% | 40.5 4% | 37.7 11% |
* ... smaller is better
Noise level
| Idle |
| 24.8 / 24.8 / 26.7 dB(A) |
| Load |
| 32 / 42.4 dB(A) |
 | ||
30 dB silent 40 dB(A) audible 50 dB(A) loud |
||
min: | ||
Temperature
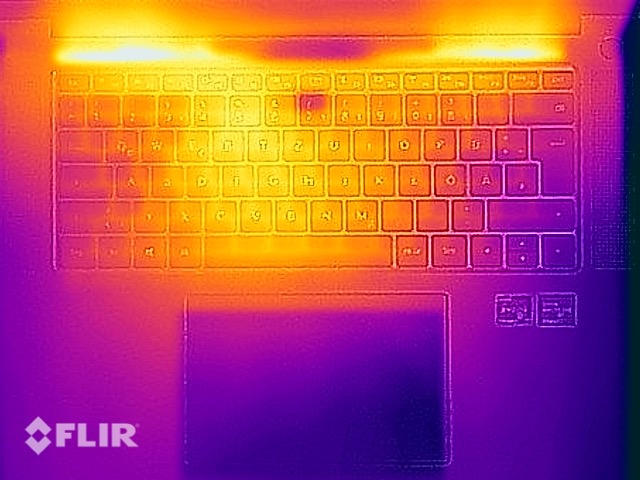
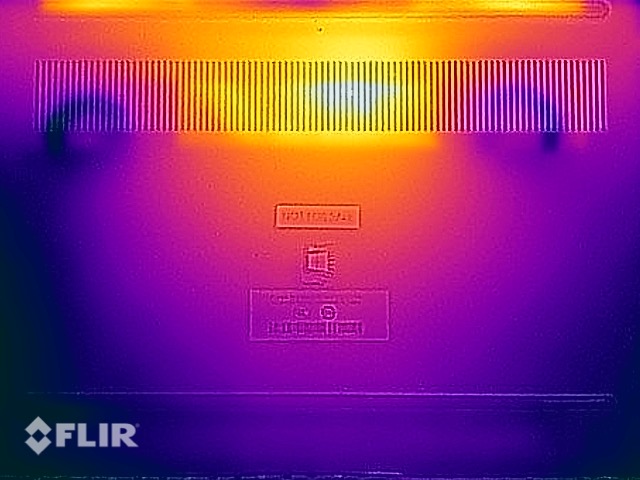
The case of the MateBook 16 hardly heats up during everyday tasks/low loads. When the device is put under load, the heat development is mainly contained to the back center area of the bottom of the base unit where we measured a hotspot of 50 °C. The device can still be used on the lap, even under these conditions, as this area of the device usually isn't in direct contact with your body. On the top of the base unit, users will feel the keyboard heat up slightly during the stress test, but this won't really lead to any restrictions.
The MateBook 16 impresses with a very stable performance and a total CPU consumption of 54 Watt during the stress test. The processor clocks at an average of 8 x 2.8 GHz and the iGPU clocks at 1,750 MHz.

(±) The maximum temperature on the upper side is 40.2 °C / 104 F, compared to the average of 36.8 °C / 98 F, ranging from 21 to 71 °C for the class Multimedia.
(-) The bottom heats up to a maximum of 49.7 °C / 121 F, compared to the average of 39.1 °C / 102 F
(+) In idle usage, the average temperature for the upper side is 25.6 °C / 78 F, compared to the device average of 31.3 °C / 88 F.
(+) Playing The Witcher 3, the average temperature for the upper side is 30.3 °C / 87 F, compared to the device average of 31.3 °C / 88 F.
(+) The palmrests and touchpad are cooler than skin temperature with a maximum of 28 °C / 82.4 F and are therefore cool to the touch.
(±) The average temperature of the palmrest area of similar devices was 28.7 °C / 83.7 F (+0.7 °C / 1.3 F).
Speaker
The sound created by the two stereo speakers next to the keyboard is surprisingly loud and full-bodied. The bass is missing, of course, but both videos and music sound quite good on the device. While the competing Dell XPS 15 has slightly better speakers, these also tend to overdrive in certain cases.
Huawei MateBook 16 R7 5800H audio analysis
(+) | speakers can play relatively loud (86 dB)
Bass 100 - 315 Hz
(±) | reduced bass - on average 6.5% lower than median
(±) | linearity of bass is average (7.3% delta to prev. frequency)
Mids 400 - 2000 Hz
(±) | higher mids - on average 7.2% higher than median
(+) | mids are linear (4.5% delta to prev. frequency)
Highs 2 - 16 kHz
(+) | balanced highs - only 4.6% away from median
(+) | highs are linear (5.2% delta to prev. frequency)
Overall 100 - 16.000 Hz
(+) | overall sound is linear (12.1% difference to median)
Compared to same class
» 22% of all tested devices in this class were better, 3% similar, 76% worse
» The best had a delta of 5%, average was 17%, worst was 45%
Compared to all devices tested
» 10% of all tested devices were better, 2% similar, 88% worse
» The best had a delta of 4%, average was 23%, worst was 134%
Dell XPS 15 9510 i5 11400H FHD audio analysis
(+) | speakers can play relatively loud (88.8 dB)
Bass 100 - 315 Hz
(±) | reduced bass - on average 5.6% lower than median
(+) | bass is linear (4.3% delta to prev. frequency)
Mids 400 - 2000 Hz
(+) | balanced mids - only 3.9% away from median
(+) | mids are linear (4.1% delta to prev. frequency)
Highs 2 - 16 kHz
(+) | balanced highs - only 2.4% away from median
(+) | highs are linear (4.9% delta to prev. frequency)
Overall 100 - 16.000 Hz
(+) | overall sound is linear (8.4% difference to median)
Compared to same class
» 9% of all tested devices in this class were better, 2% similar, 89% worse
» The best had a delta of 5%, average was 17%, worst was 45%
Compared to all devices tested
» 2% of all tested devices were better, 1% similar, 97% worse
» The best had a delta of 4%, average was 23%, worst was 134%
Power Consumption - Long battery life
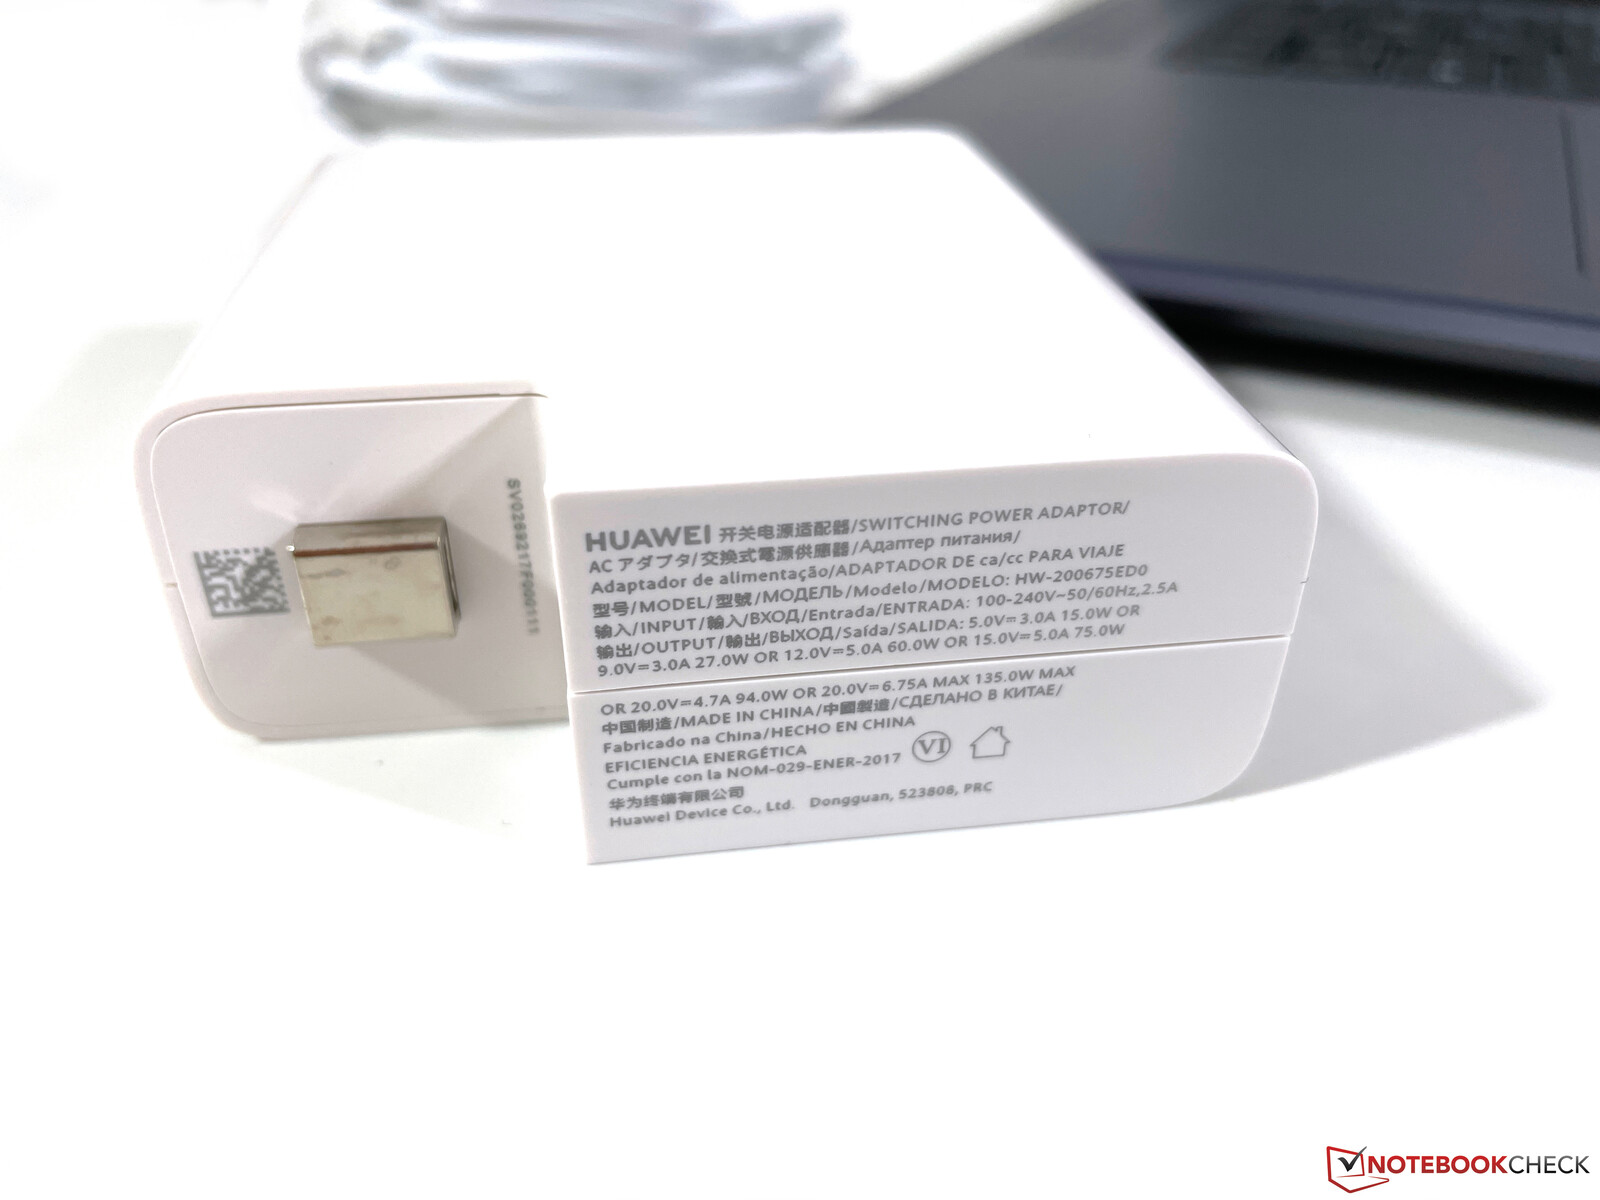
The high-resolution display consumes a fair amount of power in general and the MateBook 16 has the highest power consumption of all comparison devices with an iGPU when under load. The maximum power consumption under load is 100 Watt, which then settles down to 90 Watt. The included 135-Watt AC adapter is sufficient and can continue to recharge the device while under heavy load.
| Off / Standby | |
| Idle | |
| Load |
|
Key:
min: | |
| Huawei MateBook 16 R7 5800H R7 5800H, Vega 8, Lite-On CA5-8D512, , 2520x1680, 16" | Acer Swift 3 SF316-51 i7-11370H, Iris Xe G7 96EUs, Micron 2210 MTFDHBA512QFD, IPS, 1920x1080, 16.1" | Huawei MateBook D 16-53011VFJ R5 4600H, Vega 6, Samsung SSD PM981a MZVLB512HBJQ, IPS, 1920x1080, 16.1" | Lenovo IdeaPad 5 Pro 16ACH R7 5800H, GeForce GTX 1650 Mobile, Micron 2300 512GB MTFDHBA512TDV, IPS LED, 2560x1600, 16" | Schenker Vision 15 i7-1165G7, Iris Xe G7 96EUs, Samsung SSD 980 Pro 1TB MZ-V8P1T0BW, IPS, 1920x1080, 15.6" | Dell XPS 15 9510 i5 11400H FHD i5-11400H, UHD Graphics Xe 16EUs, Micron 2300 512GB MTFDHBA512TDV, IPS, 1920x1200, 15.6" | Average AMD Radeon RX Vega 8 (Ryzen 4000/5000) | Average of class Multimedia | |
|---|---|---|---|---|---|---|---|---|
| Power Consumption | 29% | 20% | -24% | 29% | 22% | 18% | -11% | |
| Idle Minimum * (Watt) | 4.6 | 4.8 -4% | 5.2 -13% | 5.7 -24% | 3.5 24% | 5.3 -15% | 5.3 ? -15% | 5.67 ? -23% |
| Idle Average * (Watt) | 10.5 | 7.4 30% | 8.2 22% | 9.3 11% | 6.3 40% | 9 14% | 7.85 ? 25% | 10.1 ? 4% |
| Idle Maximum * (Watt) | 11.2 | 9 20% | 9.4 16% | 11 2% | 6.8 39% | 9.7 13% | 9.31 ? 17% | 12.3 ? -10% |
| Load Average * (Watt) | 59.1 | 34.9 41% | 40 32% | 83.4 -41% | 43.2 27% | 30.3 49% | 44.2 ? 25% | 65.6 ? -11% |
| Witcher 3 ultra * (Watt) | 58.6 | 34.9 40% | 40.5 31% | 94.4 -61% | 52 11% | 30.6 48% | ||
| Load Maximum * (Watt) | 98.3 | 51.4 48% | 67 32% | 128.7 -31% | 67.7 31% | 76.2 22% | 58.9 ? 40% | 113.2 ? -15% |
* ... smaller is better
Power Consumption Witcher 3 / Stress test
Battery Life
The 84-Wh battery provides a very good battery life. We reached 13 hours in our video test and 11 hours in our Wi-Fi test, both with a brightness of 150 nits (around 46 percent of maximum brightness). The Wi-Fi battery life is still good at maximum brightness and reaches 8.5 hours. The battery drains within 1.5 hours under load.
Despite the promoted SuperCharge technology, we weren't able to get the quick charging function to work (there were no settings in the PC Manager either). After about 65 minutes, the battery reached 50 percent capacity. Fully recharging the battery took about 150 minutes in our test with the device turned on.
| Huawei MateBook 16 R7 5800H R7 5800H, Vega 8, 84 Wh | Acer Swift 3 SF316-51 i7-11370H, Iris Xe G7 96EUs, 56 Wh | Huawei MateBook D 16-53011VFJ R5 4600H, Vega 6, 56 Wh | Lenovo IdeaPad 5 Pro 16ACH R7 5800H, GeForce GTX 1650 Mobile, 75 Wh | Schenker Vision 15 i7-1165G7, Iris Xe G7 96EUs, 73 Wh | Dell XPS 15 9510 i5 11400H FHD i5-11400H, UHD Graphics Xe 16EUs, 56 Wh | Average of class Multimedia | |
|---|---|---|---|---|---|---|---|
| Battery runtime | -3% | -24% | 5% | 28% | -42% | 21% | |
| H.264 (h) | 10.9 | 10.3 -6% | 8.5 -22% | 10.4 -5% | 18.7 72% | 16.3 ? 50% | |
| WiFi v1.3 (h) | 12.8 | 9.8 -23% | 9 -30% | 12.6 -2% | 15.2 19% | 7.4 -42% | 12.1 ? -5% |
| Load (h) | 1.4 | 1.7 21% | 1.1 -21% | 1.7 21% | 1.3 -7% | 1.654 ? 18% | |
| Reader / Idle (h) | 20.1 | 11.8 | 25.2 ? | ||||
| Witcher 3 ultra (h) | 2.2 | 1 |
Pros
Cons
Verdict - MateBook 16 without significant weaknesses
The new MateBook 16 gave a very good impression in our test - particularly considering its price. The device can easily keep up with the significantly more expensive Dell XPS 15 in terms of quality and also stands out from the crowd of competitors wrapped in plastic. While the MateBook 16 isn't the lightest or slimmest notebook, this has a positive impact on its rigidity and thermal characteristics as well as fan noise. Thinner isn't always better.
Huawei has decided to equip its MateBook with a powerful Ryzen 5000 processor with 45 W that can stand up to continuous load without its performance suffering. Although Intel's current Tiger Lake processors (such as the i7-11800H) also offer performance on this level, they require a lot more power to do so. As a consequence, the MateBook 16 offers more CPU performance than most current workstations, which are almost exclusively still all based on Intel CPUs. AMD has also optimized the power consumption of the CPUs and the device's battery life is very good.
The MateBook 16 is not equipped with a dedicated GPU, so users looking to play new games on their device will have to look elsewhere. Other than that, the iGPU is very well suited for everyday applications and displaying high-resolution video, which is further supported by good loudspeakers. The new 3:2 display does a good job in most areas, but it is very reflective, which could sometimes lead to difficulties reading the screen.
The MateBook 16 is a good multimedia notebook without any serious weaknesses. Its high CPU performance beats most mobile workstations and the display is good. Not to mention the excellent price-to-performance ratio.
Of course there are several areas that could still be improved, such as the position and quality of the webcam, switching to a plugged RAM module und integrating USB 4, although at least the latter point should be resolved with the next generation of AMD CPUs. The slightly limited connectivity (no SD card reader) also had a small impact on our rating. Nonetheless, we can definitely recommend the MateBook 16, not least because of its affordable price. Our review has shown what the XPS 15 with an iGPU could look like if it were finally equipped with an AMD CPU. Users that are interested in more gaming performance should take a look at the IdeaPad 5 Pro, which combines the fast Ryzen 7 processor with the GeForce GTX 1650. The Schenker Vision 15 ,on the other hand, is a lot more portable and offers slightly more graphics performance.
Price and availability
The MateBook 16 is only available in Asia and Europe at the time of writing, but it is expected to become available in the UK and the US in the near future.
Huawei MateBook 16 R7 5800H
- 10/21/2021 v7 (old)
Andreas Osthoff
Price comparison

