Acer Swift 3 SF316-51 in review: Does the laptop do its name justice?

Acer offers the Swift 3 in different versions. For the 16.1-inch models, we have the SF316-51-75MK flagship model in for review. It comes with the Intel Core i7-11370H and its onboard Intel Iris Xe Graphics G7 96EUs, paired with 16 GB of LPDDR4x RAM in quad-channel mode and a 512 GB SSD.
Not only does the Acer Swift 3 SF316-51-75MK have to prove its worth in various categories in our test, but it also has to face the competition. Our review shows how the device compares with the Xiaomi RedmiBook Pro 15 with the same CPU, or with the Lenovo IdeaPad 5 Pro 16IHU6 with a weaker i5-11300H, both of which are equipped with a GeForce MX450.
Possible contenders in comparison
Rating | Date | Model | Weight | Height | Size | Resolution | Price |
|---|---|---|---|---|---|---|---|
| 86.4 % v7 (old) | 10 / 2021 | Acer Swift 3 SF316-51 i7-11370H, Iris Xe G7 96EUs | 1.7 kg | 15.9 mm | 16.10" | 1920x1080 | |
| 83.2 % v7 (old) | 06 / 2021 | Xiaomi RedmiBook Pro 15 i7-11370H, GeForce MX450 | 1.7 kg | 16 mm | 15.60" | 3200x2000 | |
| 82.3 % v7 (old) | 09 / 2021 | Dell Inspiron 15 5518-2X3JR i5-11300H, GeForce MX450 | 1.8 kg | 18 mm | 15.60" | 1920x1080 | |
| 86 % v7 (old) | 08 / 2021 | Lenovo IdeaPad 5 Pro 16IHU6 i5-11300H, GeForce MX450 | 1.9 kg | 18.4 mm | 16.00" | 2560x1600 | |
| 82.1 % v7 (old) | 07 / 2021 | Asus VivoBook S15 D533UA R7 5700U, Vega 8 | 1.8 kg | 16.1 mm | 15.60" | 1920x1080 | |
| 86 % v7 (old) | 04 / 2021 | Huawei MateBook D 16-53011VFJ R5 4600H, Vega 6 | 1.7 kg | 18.4 mm | 16.10" | 1920x1080 |
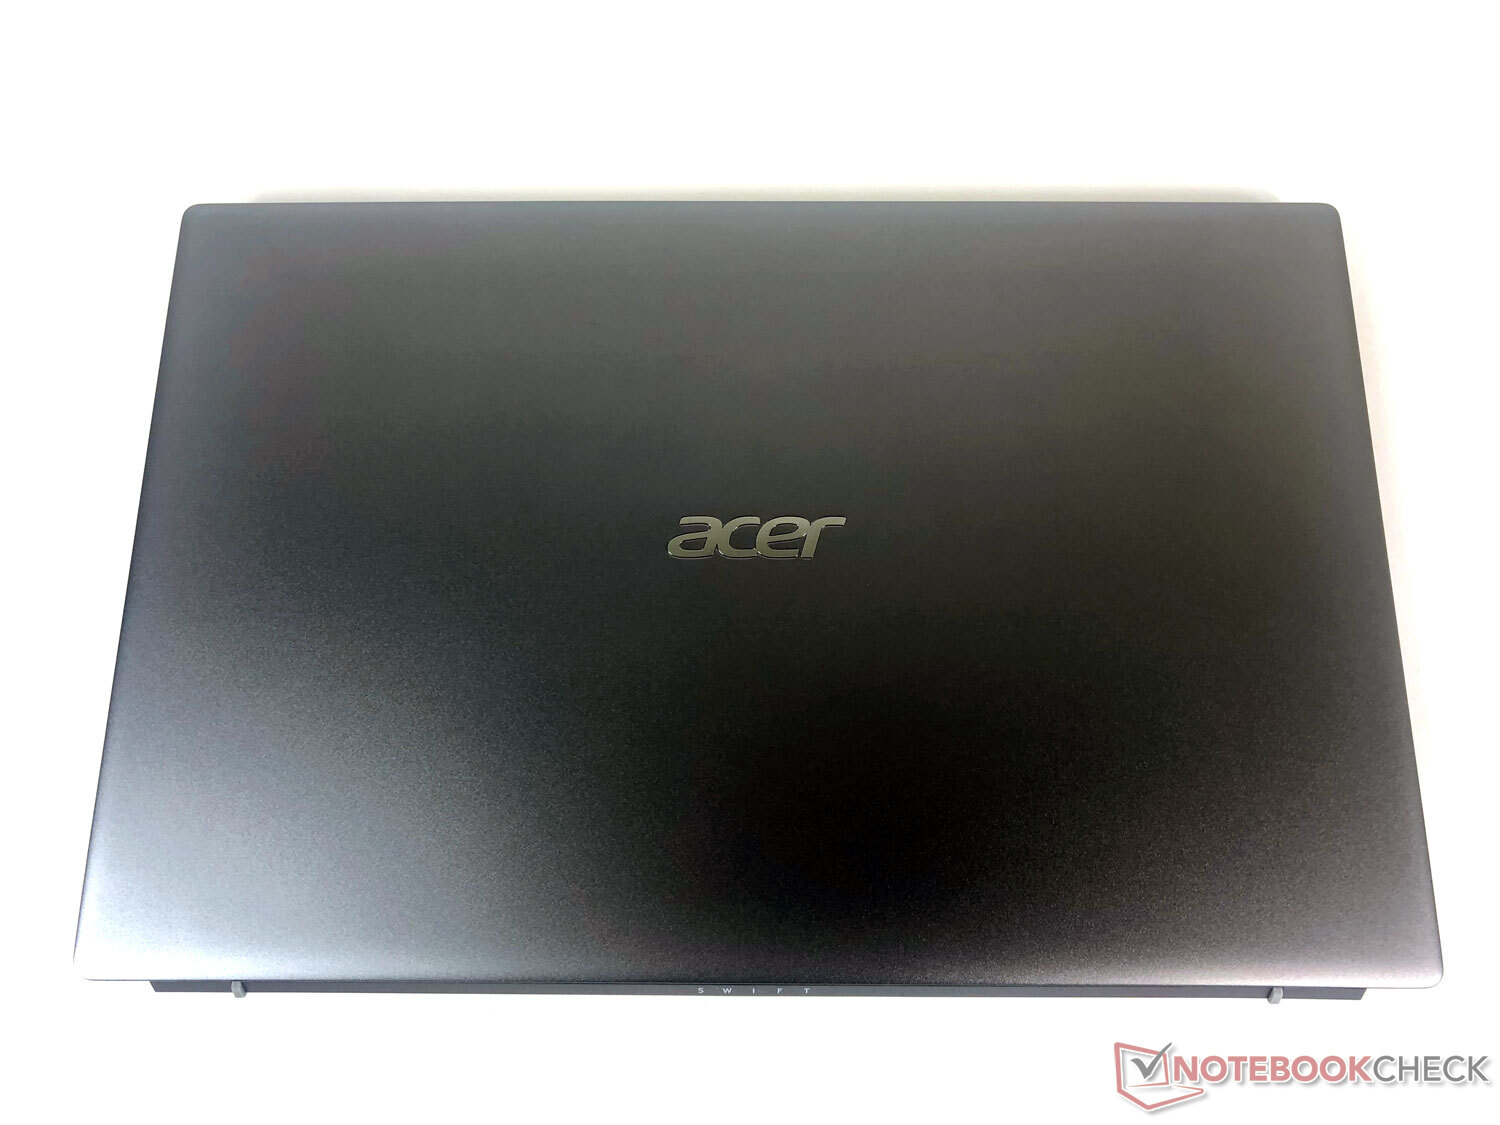
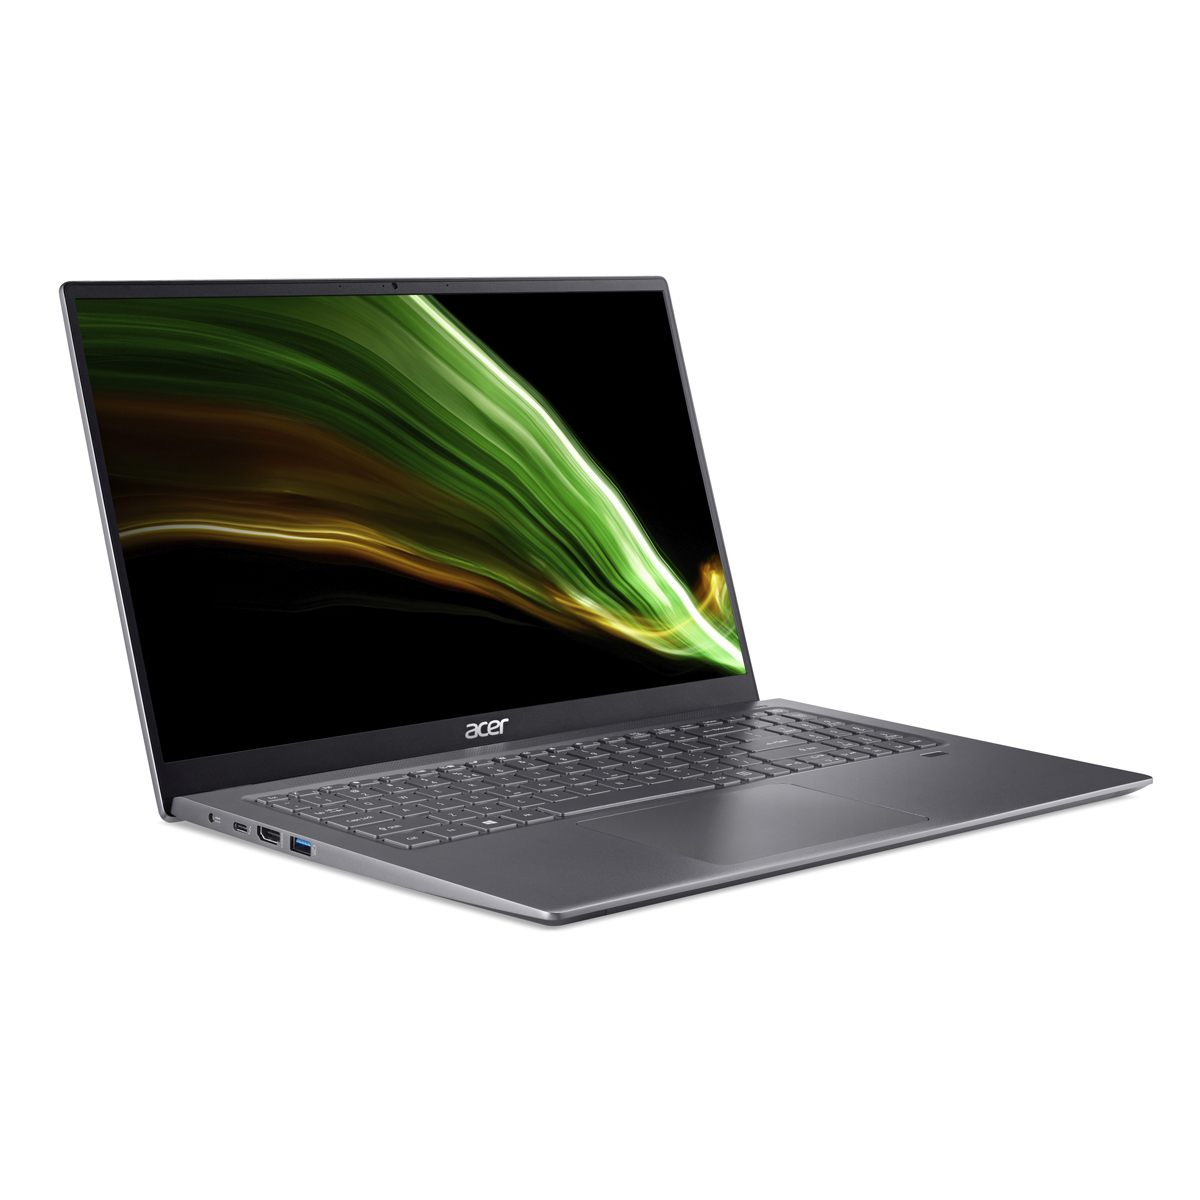
Metal housing scores points in the test
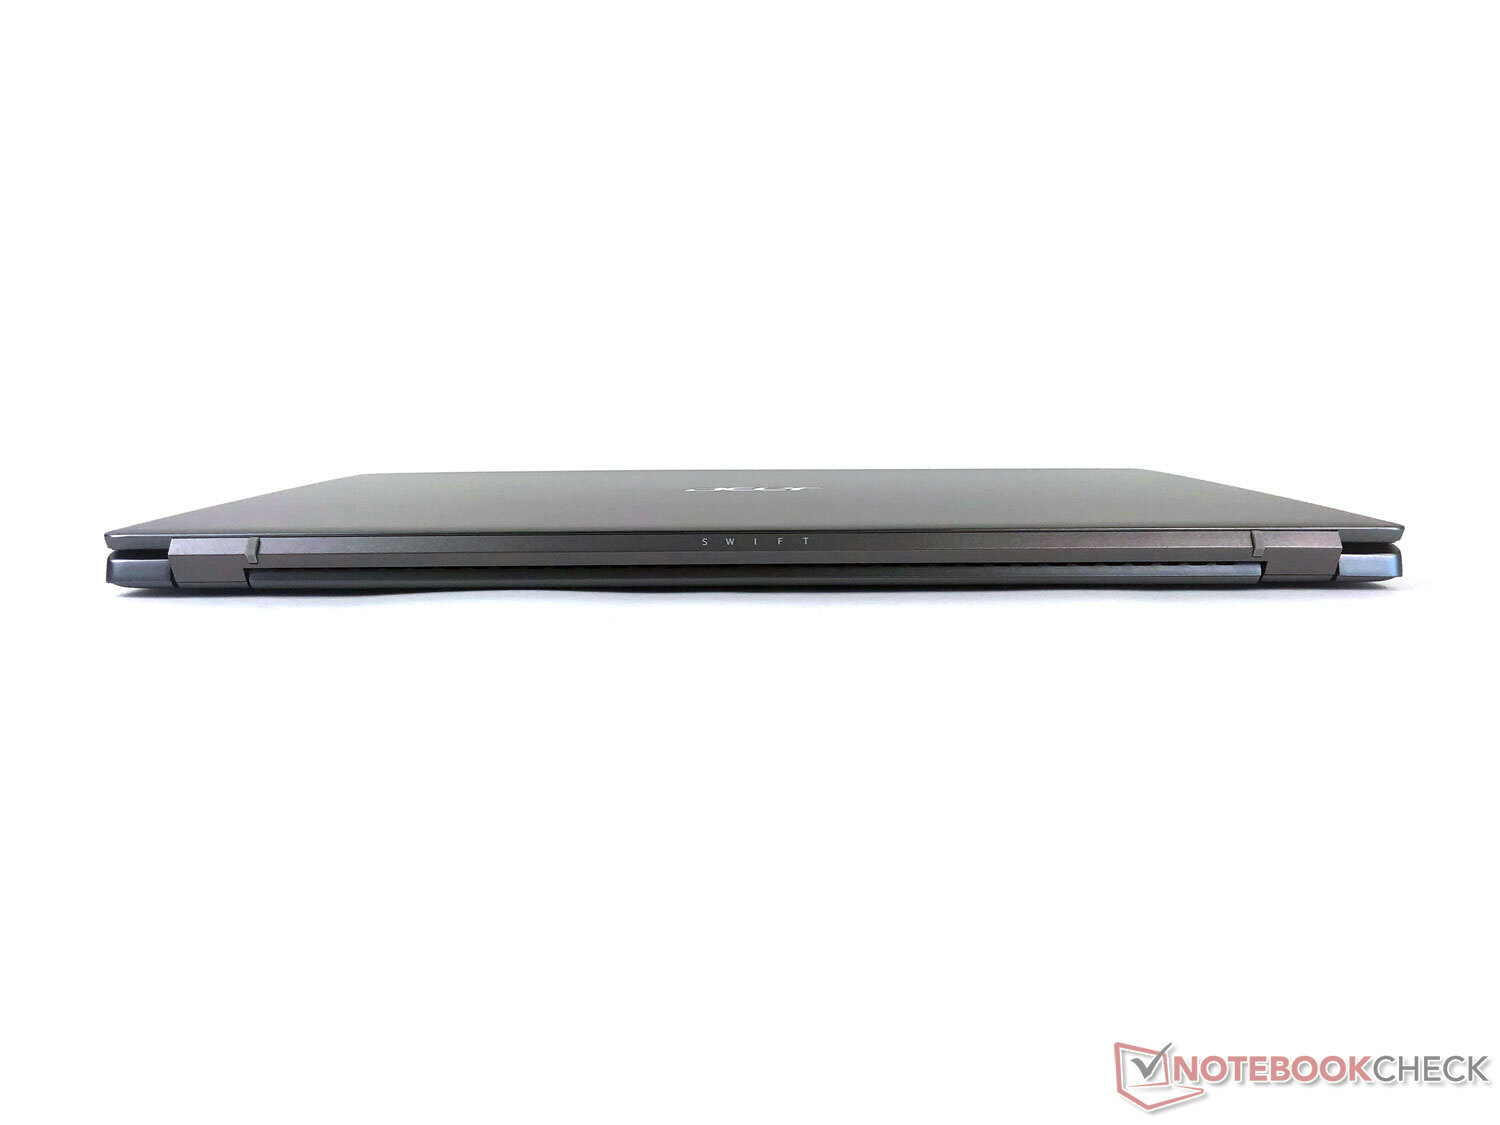
The Acer Swift 3 SF316-51 features a gray metal case that leaves a high-quality and elegant impression, while also being pleasant to the touch.
The two hinges that hold the screen in place have been adjusted pretty tightly. As a result, the opened screen wobbles a bit with movement, but it can still be opened and positioned with one hand.
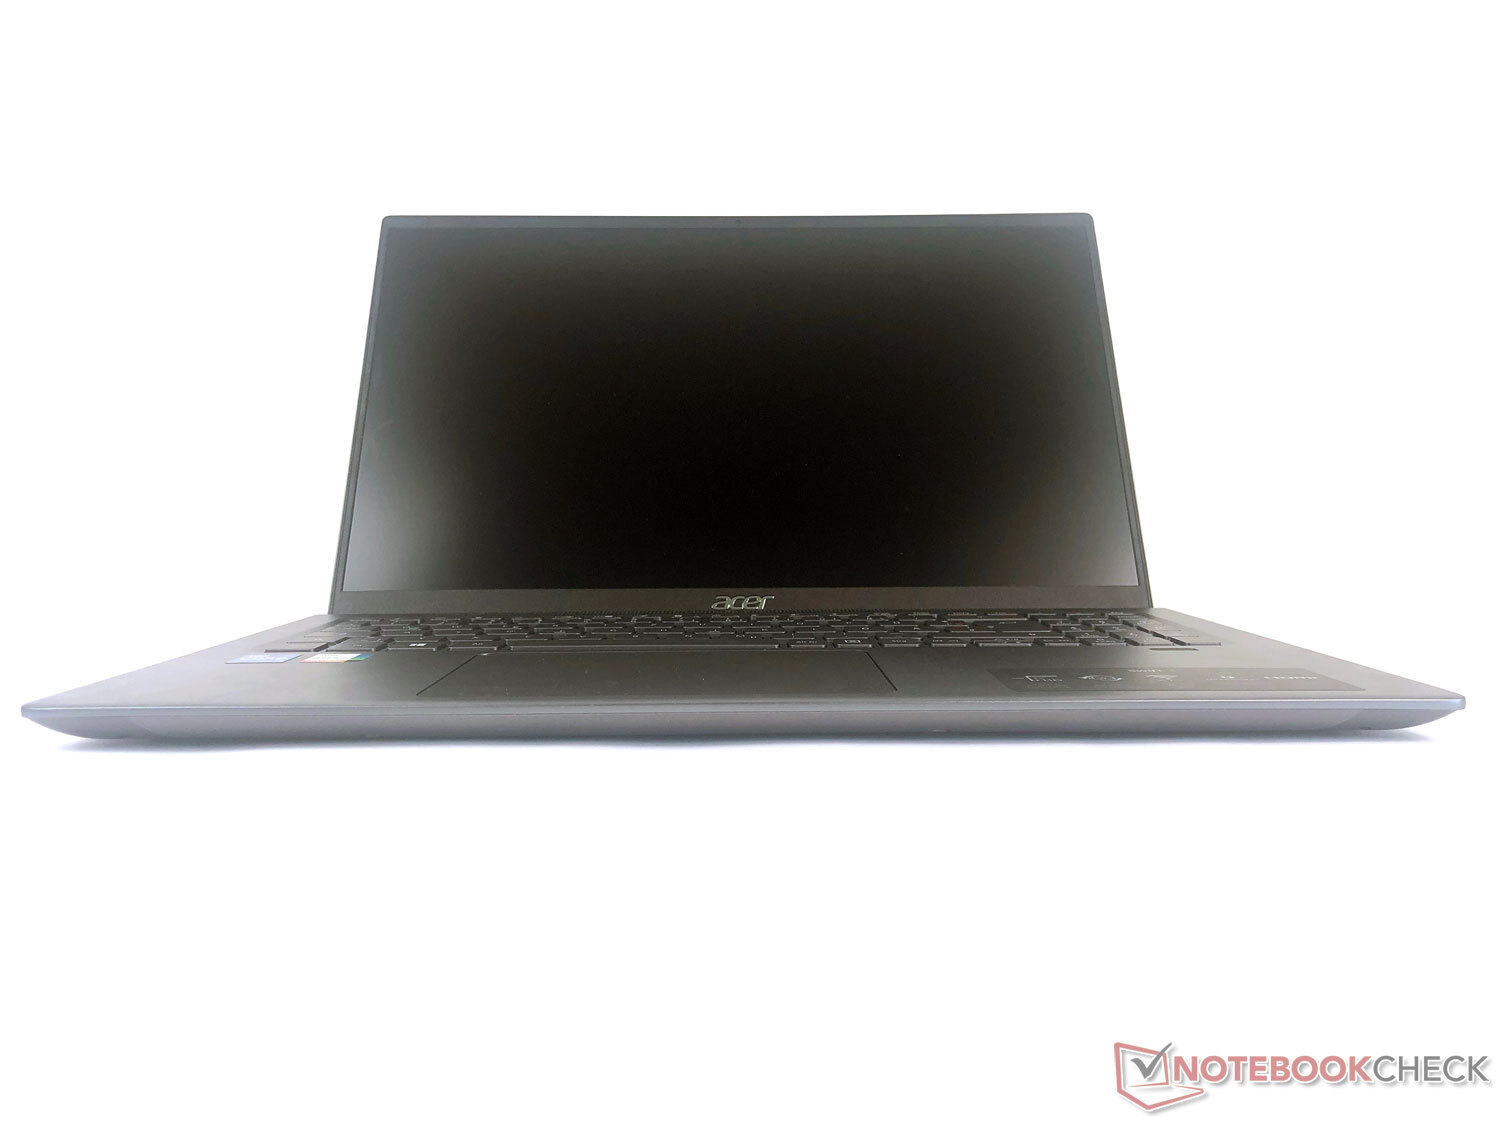
Most comparison models are equipped with a 15.6-inch display, which is marginally smaller than the 16.1-inch display of the Acer Swift 3 SF316-51-75MK. Nevertheless, thanks to the narrow display bezels, the device is barely larger apart from a few millimeters.
Our review sample doesn't need not shy away from facing the Huawei MateBook D 16-53011VFJ and the Lenovo IdeaPad 5 Pro 16IHU6, both of which have 16-inch displays as well. The MateBook D 16 is almost the same size, but it's a bit thicker and weighs the same at around 1.7 kg. The IdeaPad 5 is a bit narrower, but longer and thicker in return. Consequently, the Swift 3 leaves a good impression, scoring points with compact dimensions and a pleasantly light weight that even the 15.6-inch comparison devices can't beat. It weighs less than 2 kg including the power adapter.
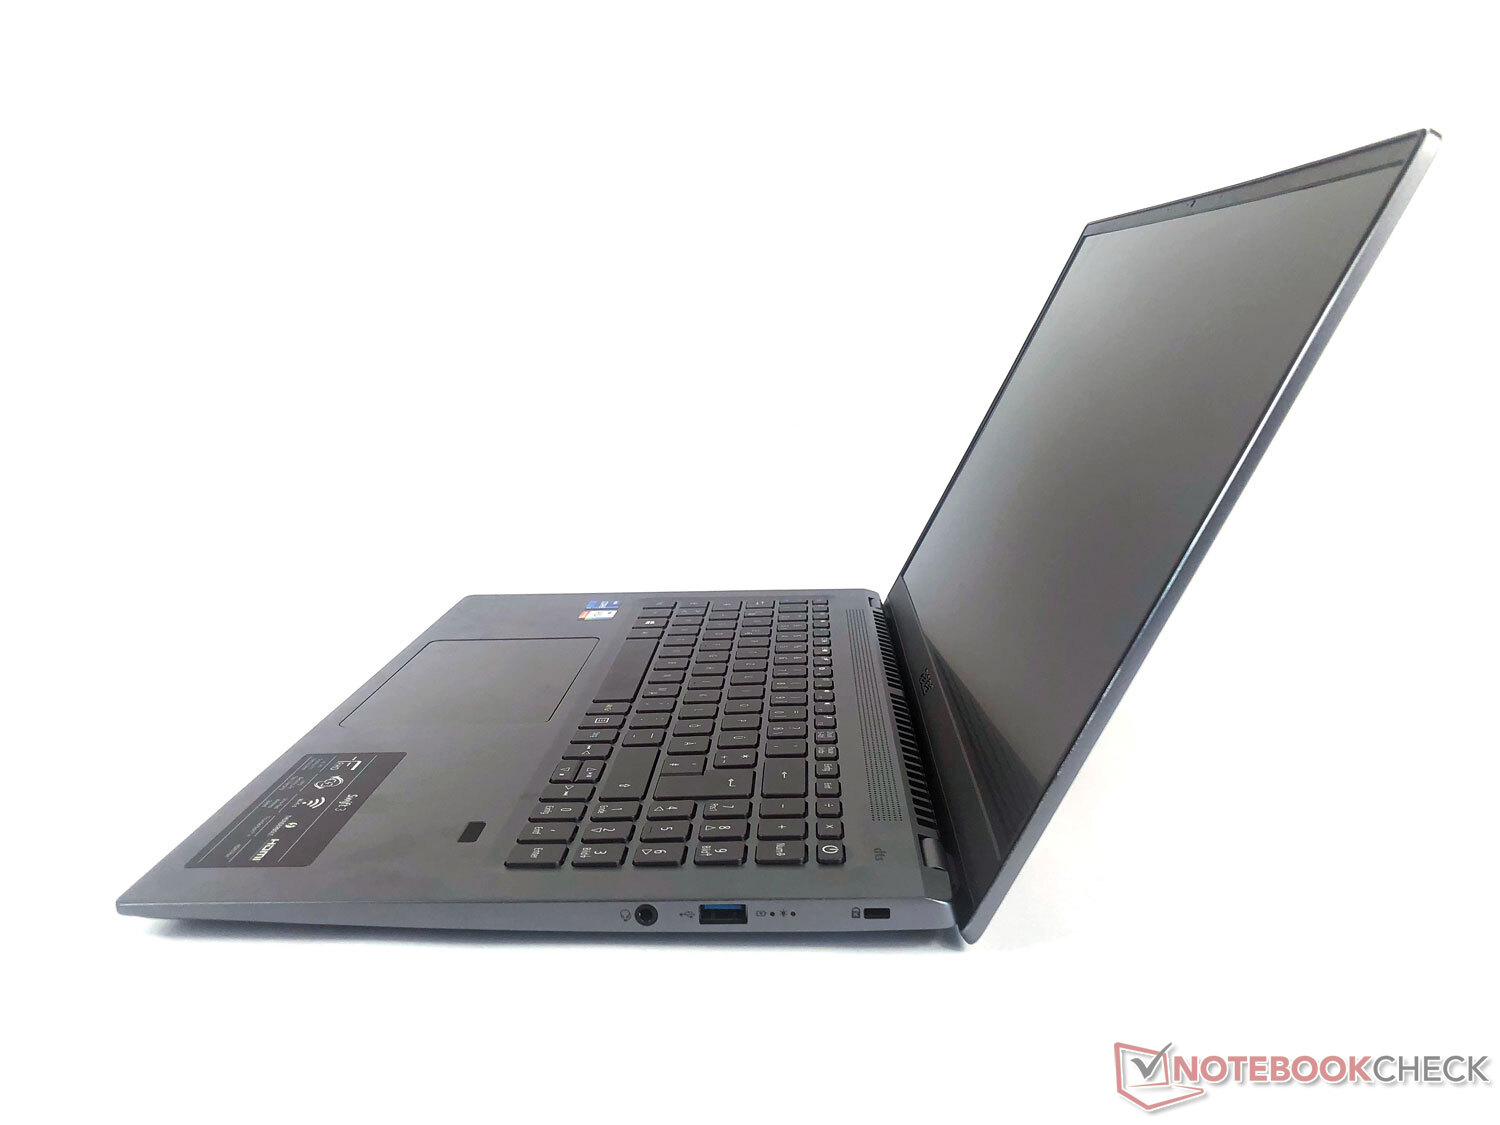
Connectivity: Laptop with Thunderbolt 4, but no SD reader
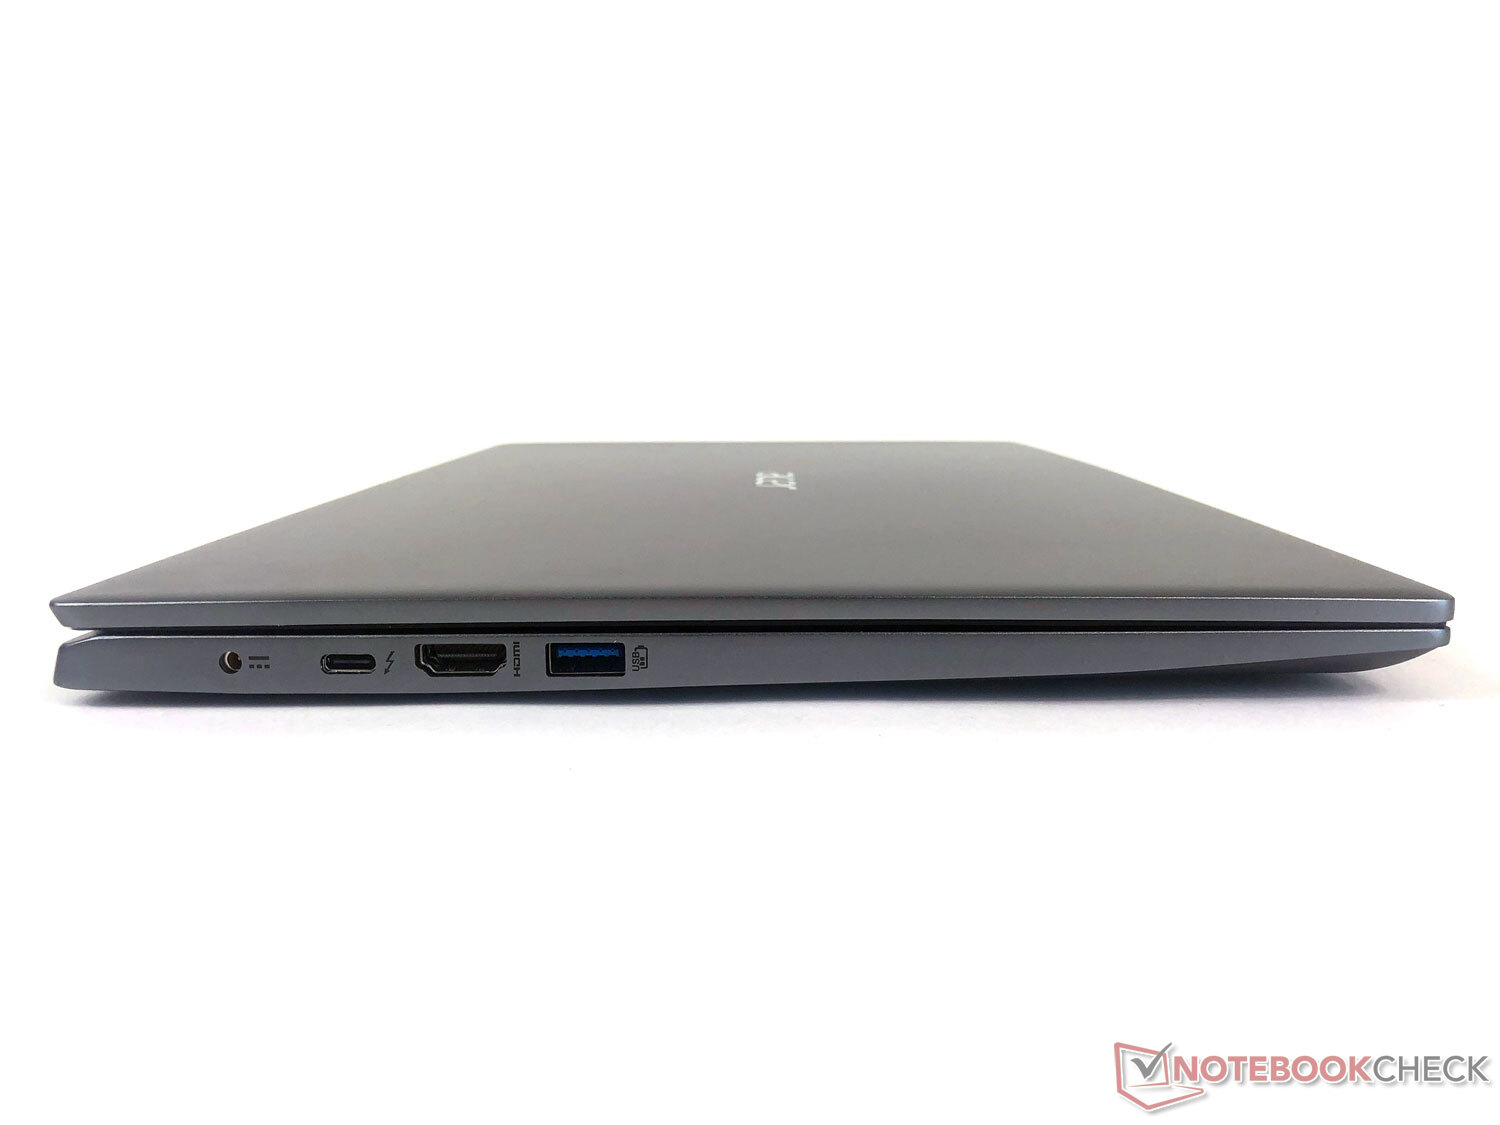
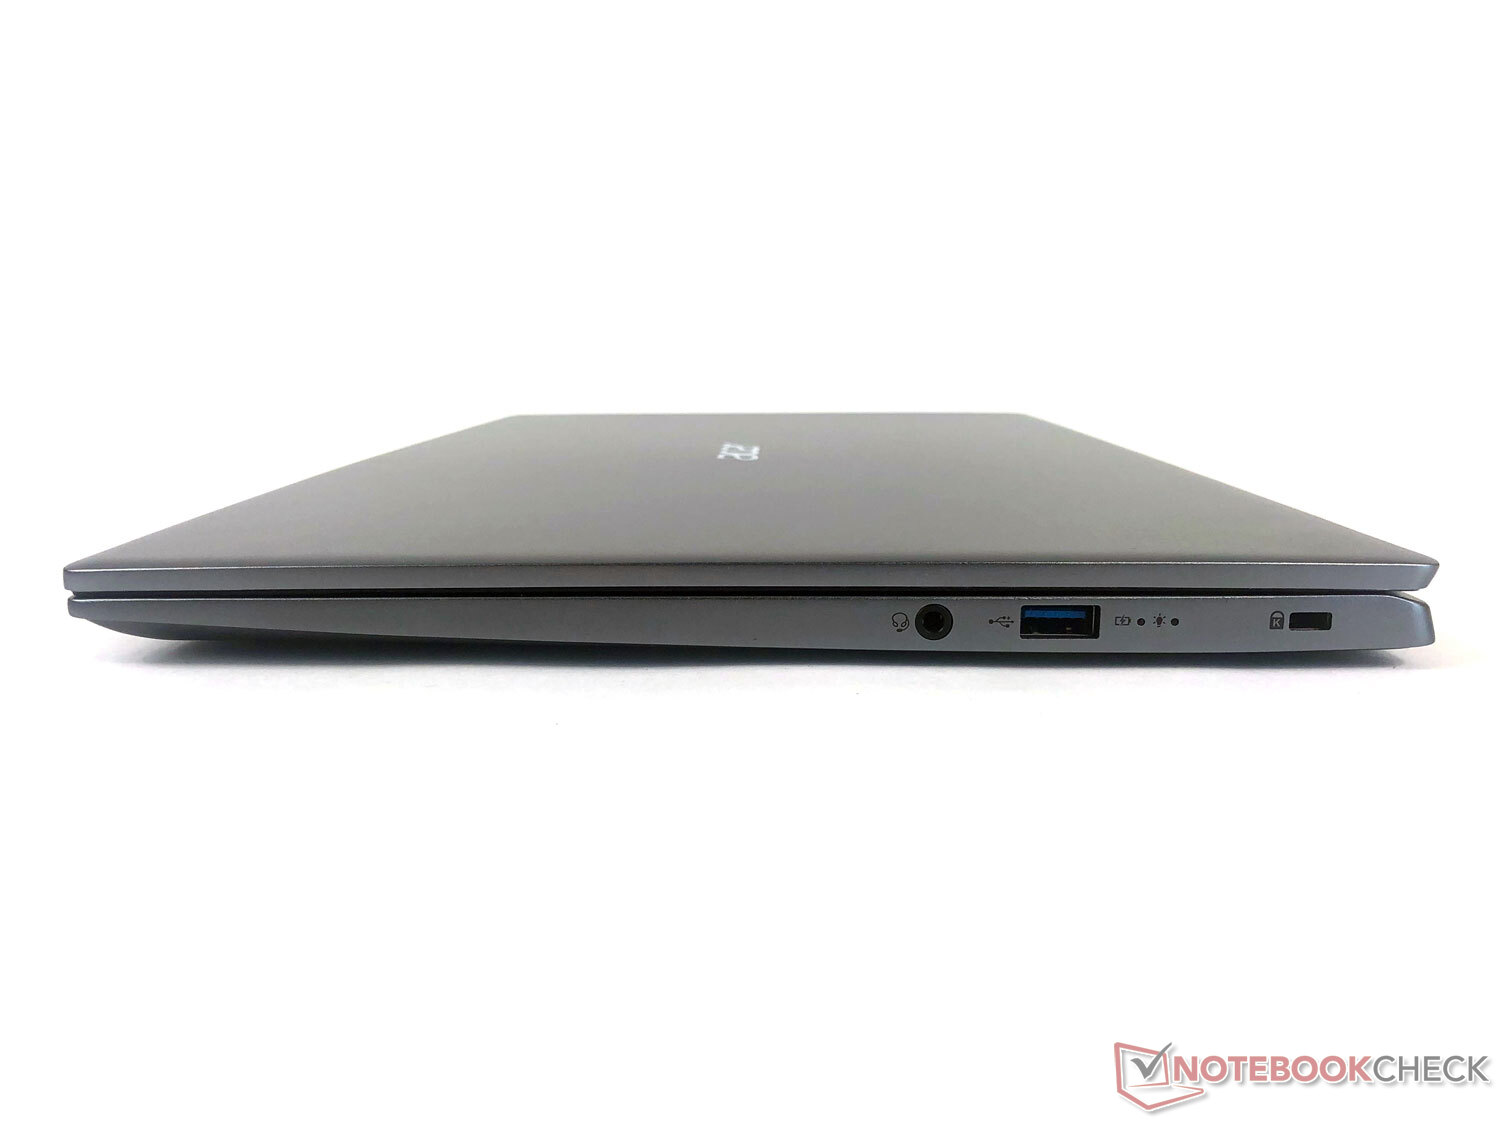
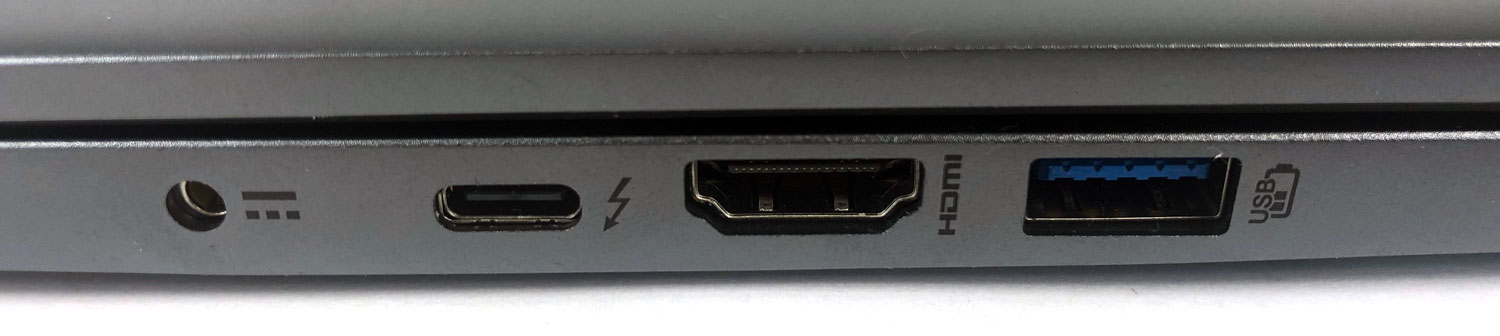
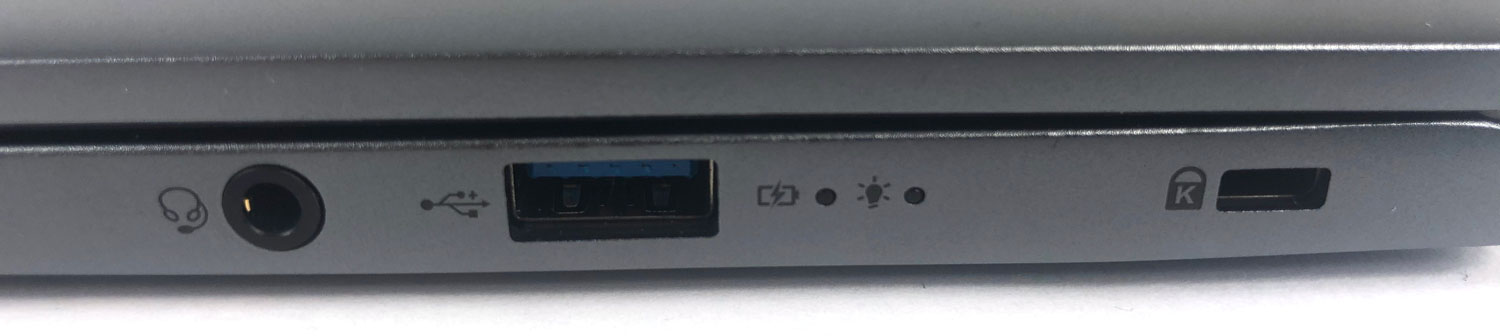
All ports are distributed between the left and right sides of the case. The ports are all located in the rear area due to the shape of the sides, which are narrower towards the front. However, there's enough space between them, so that they don't interfere with each other.
There's an HDMI output as well as a Thunderbolt 4 port available via USB Type-C for connecting external monitors. However, there is no network connection.
Communication
The built-in Intel Wi-Fi 6 AX201 performs solidly in the test, but it remains below average when sending data. Bluetooth version 5.1 is available for additional wireless connections.
Webcam
With an average DeltaE of 10.6, the 720p webcam performs decently in terms of color reproduction. It's definitely sufficient for video calls and the like.


Security
A slot for a Kensington Lock is integrated into the right side of the device. There are no additional security features.
Accessories
Only the adequately sized 65-watt charger is included in the box. Further accessories aren't included, but they can be purchased directly from the manufacturer in the form of universal cases, adapters, and more.
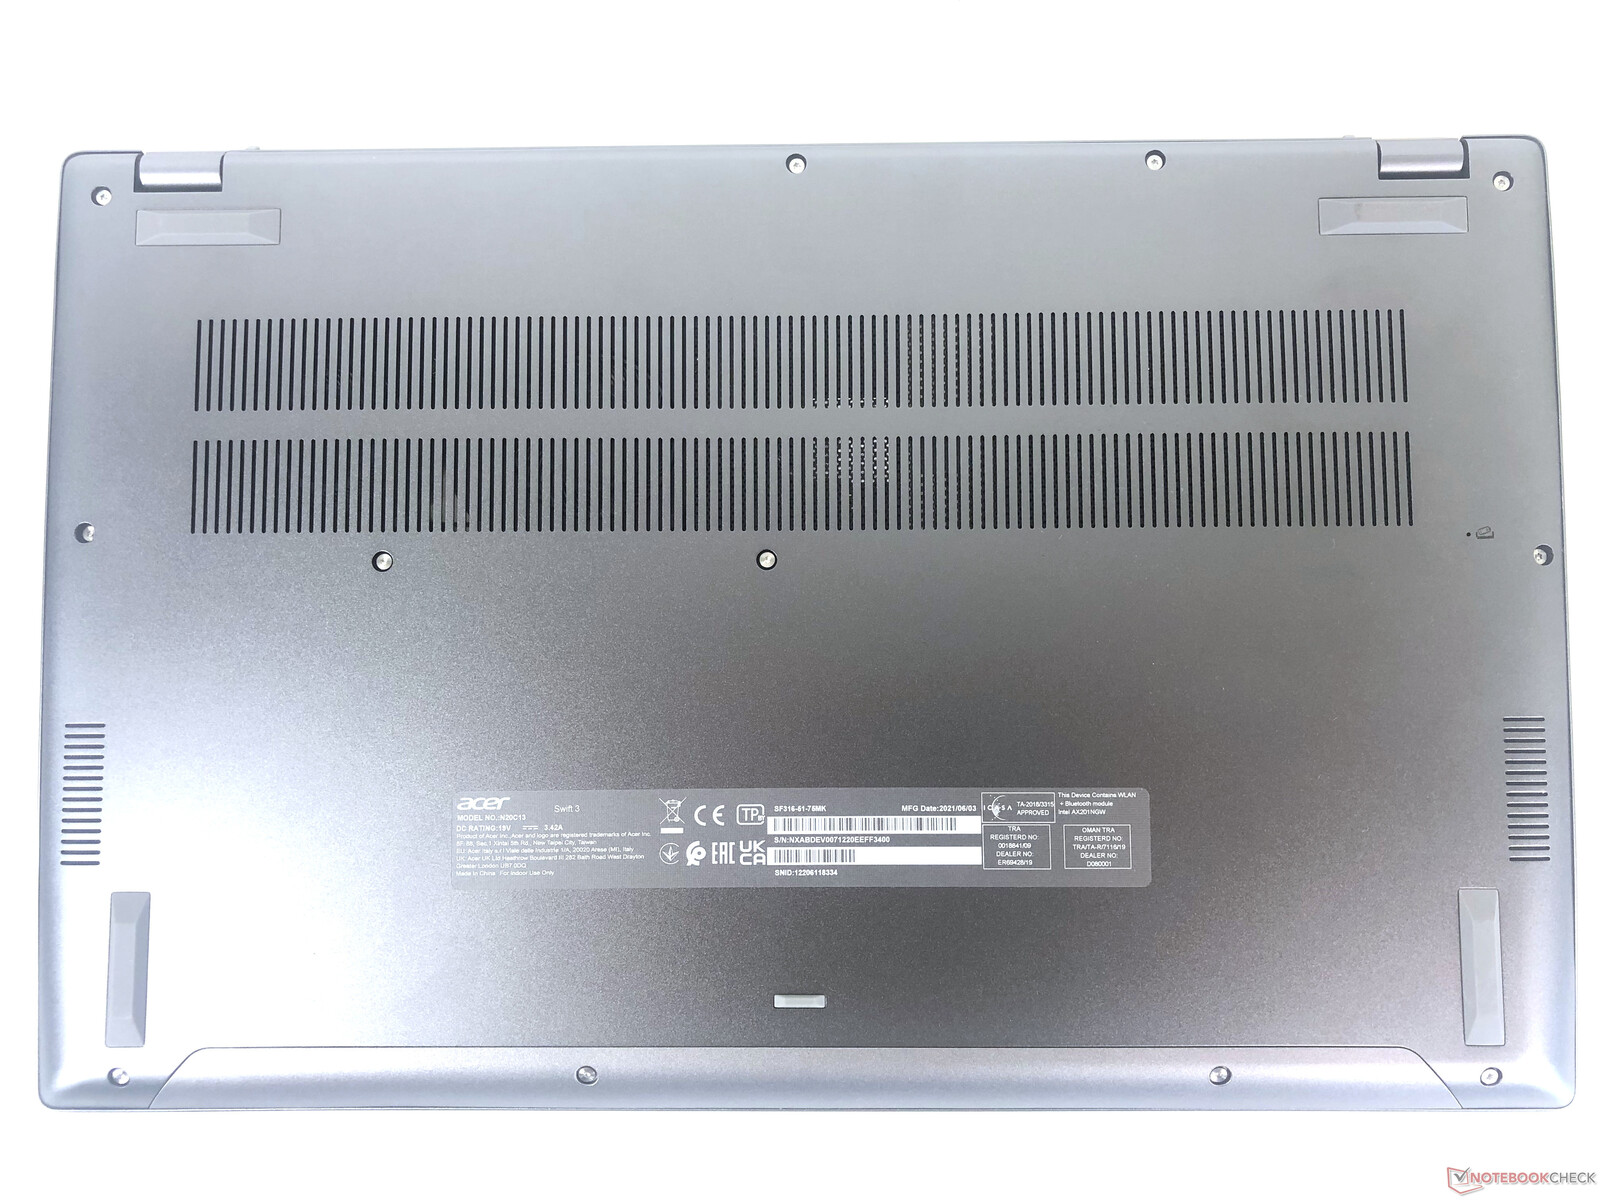
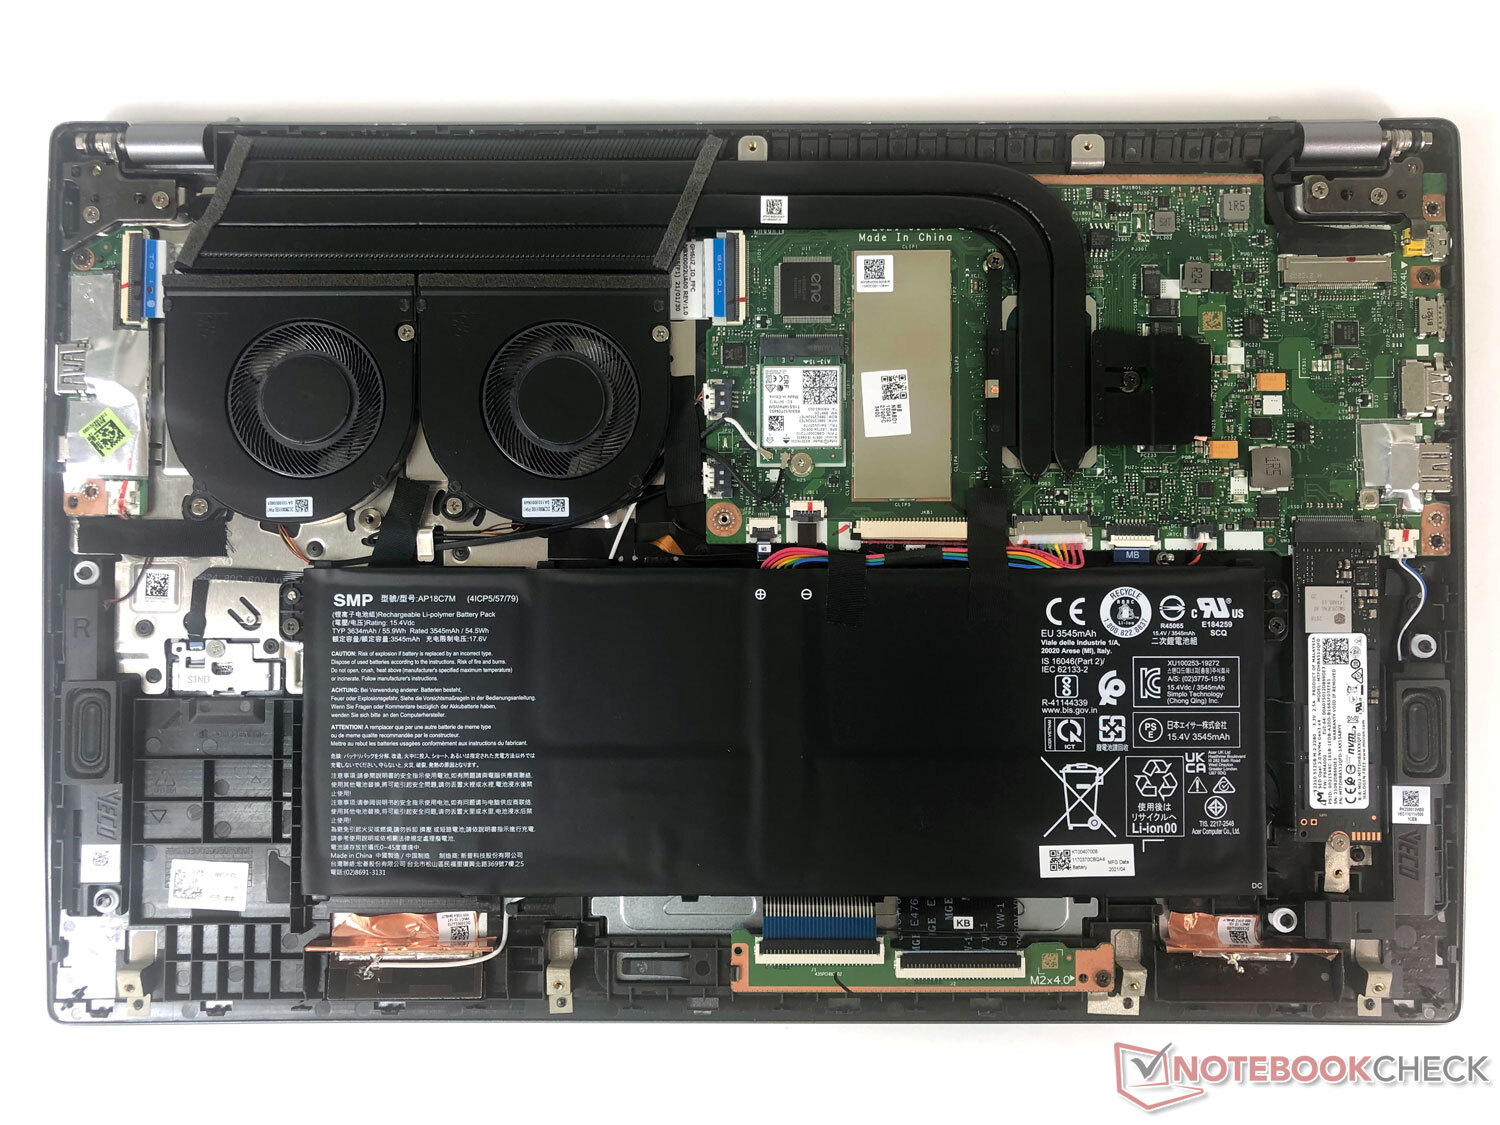
Maintenance
The access to the interior is blocked by 12 small Torx screws. Cleaning the two fans, installing a different SSD, or replacing the battery can all be done with ease.
Warranty
Acer provides the usual 24-month manufacturer's warranty with send-in and return service for the Swift laptops in Germany. Optionally, it's possible to purchase service extensions for a third year in exchange for 50 to 150 Euros (~$58 to ~$173).
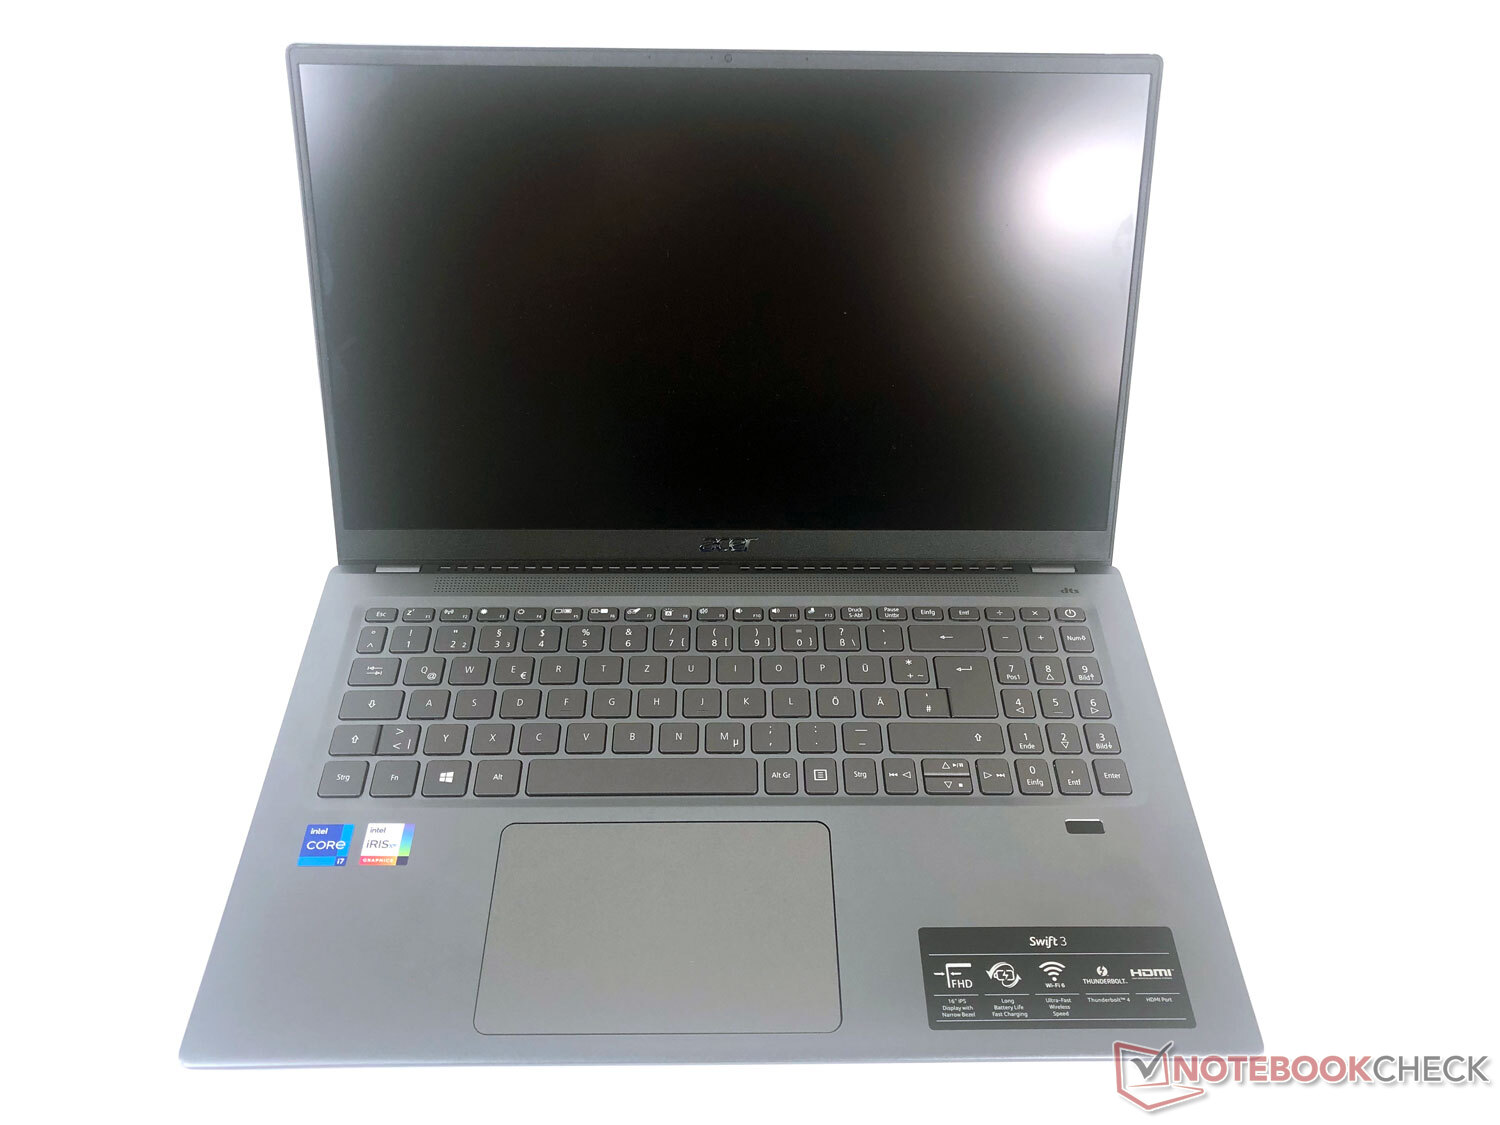
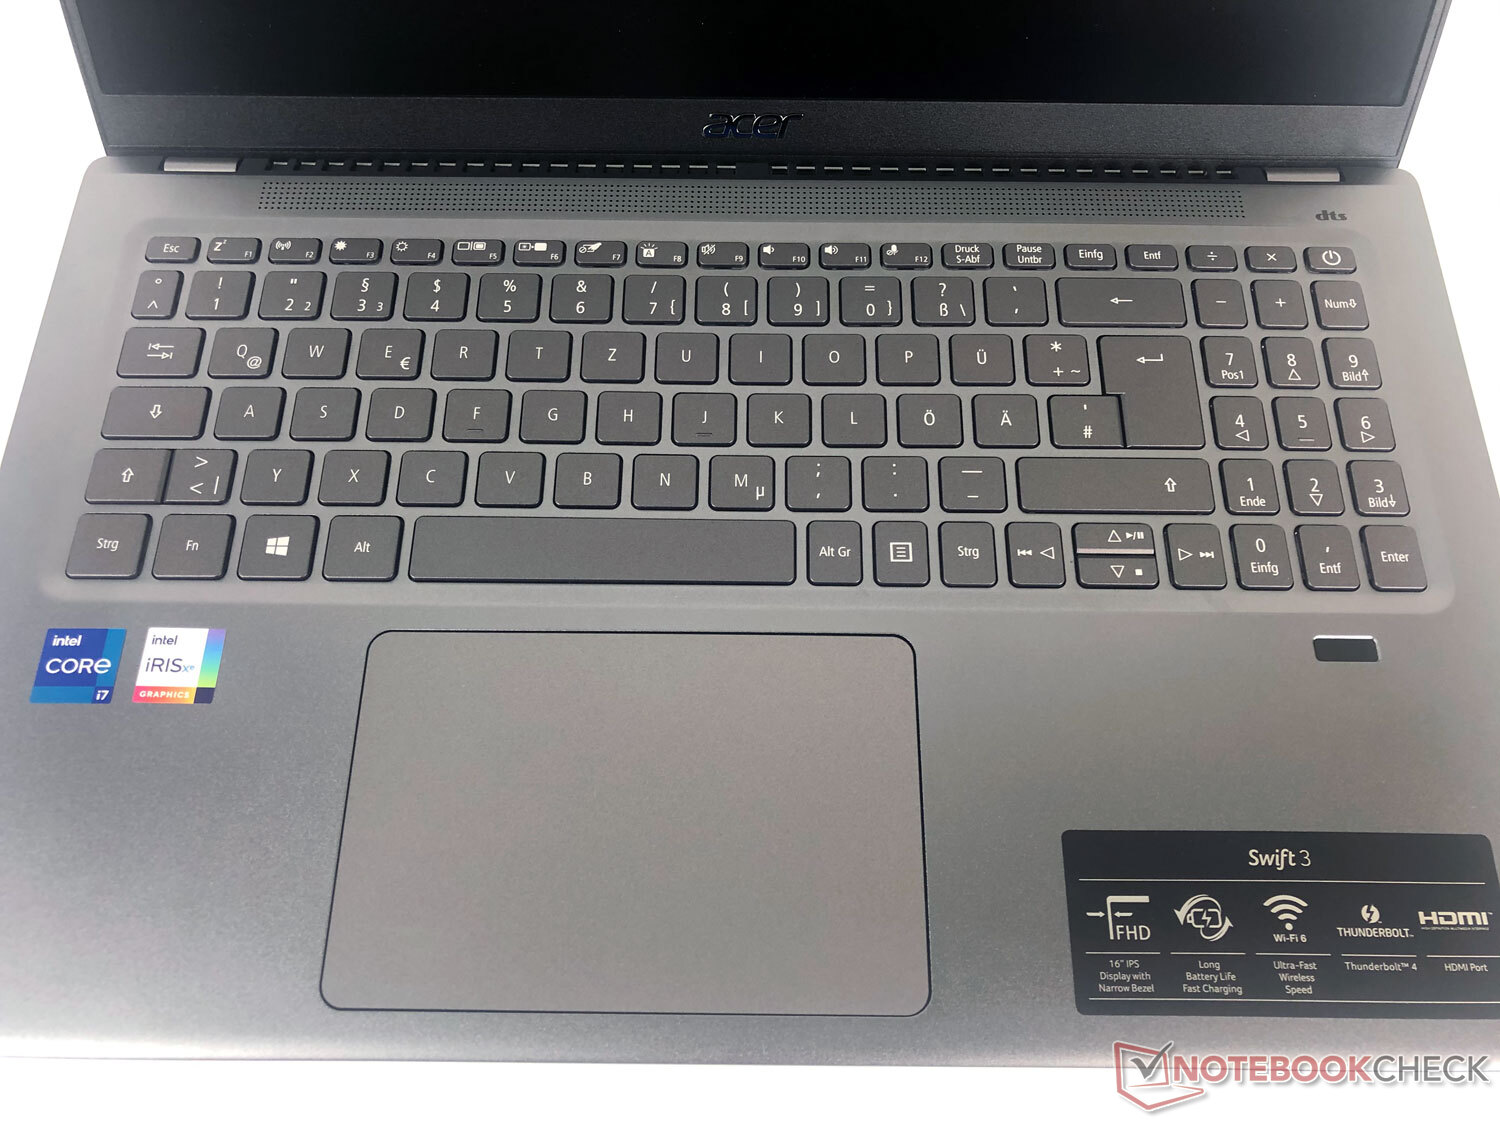
Input devices: The Acer Swift 3 is good to type on
Keyboard
In addition to the keyboard with a solid key size, Acer has also integrated an extremely compact numeric keypad into the 16.1-inch case. Apart from the 2 cm wide borders to the left and right, the manufacturer makes use of the entire width of the device.
The typing experience is good, and noise development is moderate. This makes it easy to type quickly, especially since the keys are very legible even in the dark thanks to the backlight.
The fingerprint sensor's placement is a bit uninspired; it's located in the center below the numpad, on the top edge of the palm rest. It's rather hard to reach with the thumb, but it can be used comfortably with the middle finger.
Touchpad
The touchpad is slightly offset to the left of the case, below the space bar. It's very large at around 12.5 x 8 cm. There are no complaints regarding haptics and functionality. The only thing we could criticize is the click noise of the two "mouse buttons" that don't show a tangible separation, since they could be a bit quieter and sound more high-quality.
The display of the Swift 3 is the best among the comparison laptops

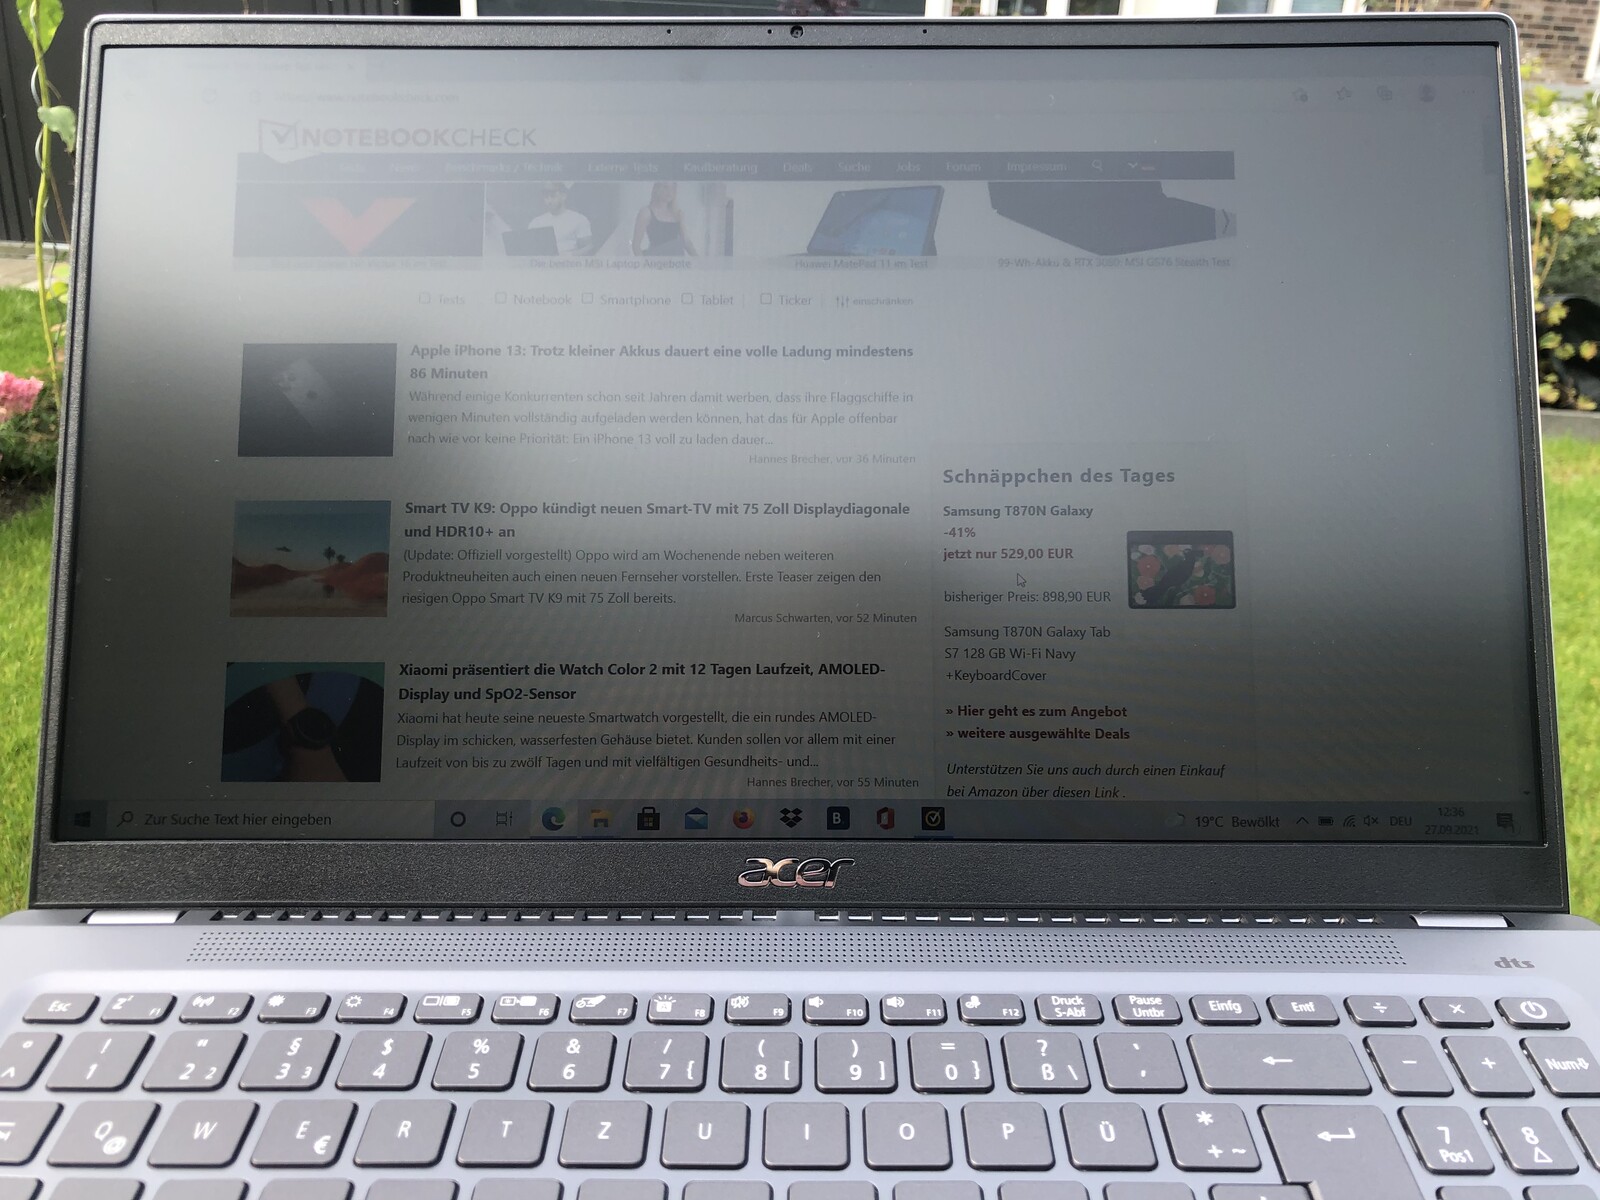
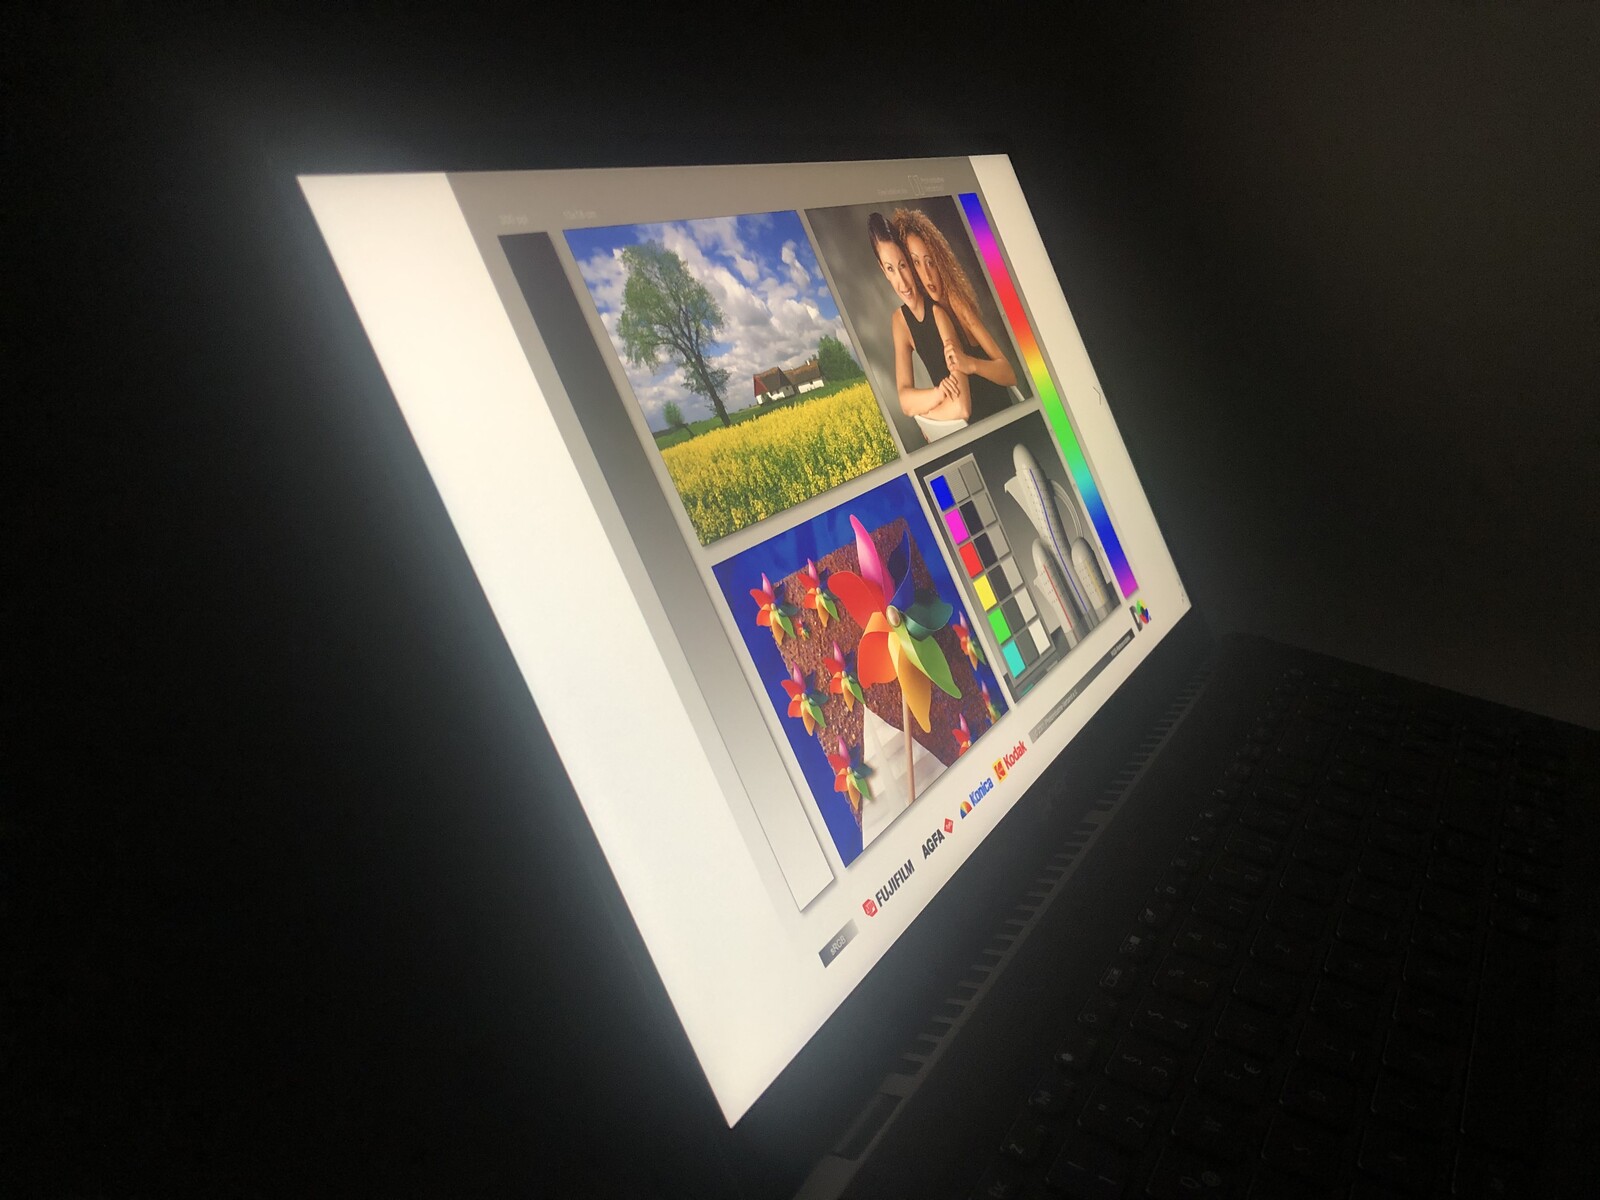
Acer installs a matte 16.1-inch IPS panel with an LED backlight in the Swift 3 SF316-51-75MK. The panel in our review sample is from Chi Mei. The resolution is 1920x1080 pixels, corresponding to Full HD. A higher resolution would be desirable at this size, as the image looks slightly washed out at times. That said, Full HD is the usual standard in this price range.
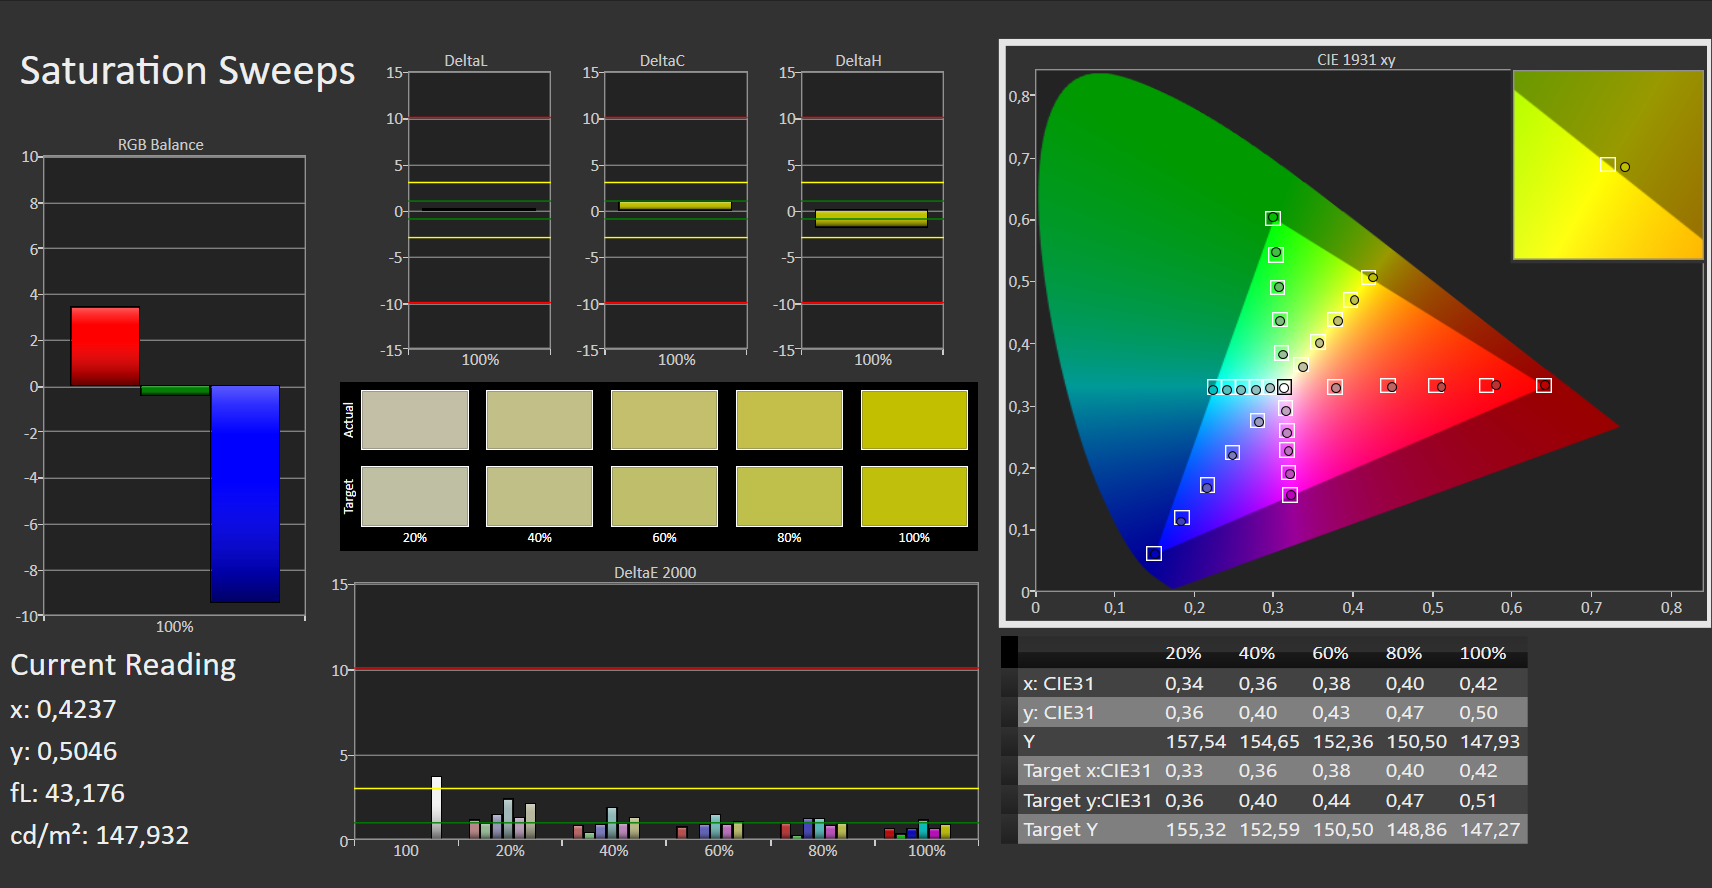
Otherwise, the display scores many plus points when compared directly with the chosen contenders. It outperforms the competition in many measurements. Only when it comes to its brightness of just under 300 cd/m² and its response times does it have to give way to some competitors. In return, there's virtually no screen bleeding.
| |||||||||||||||||||||||||
Brightness Distribution: 88 %
Center on Battery: 257 cd/m²
Contrast: 1842:1 (Black: 0.165 cd/m²)
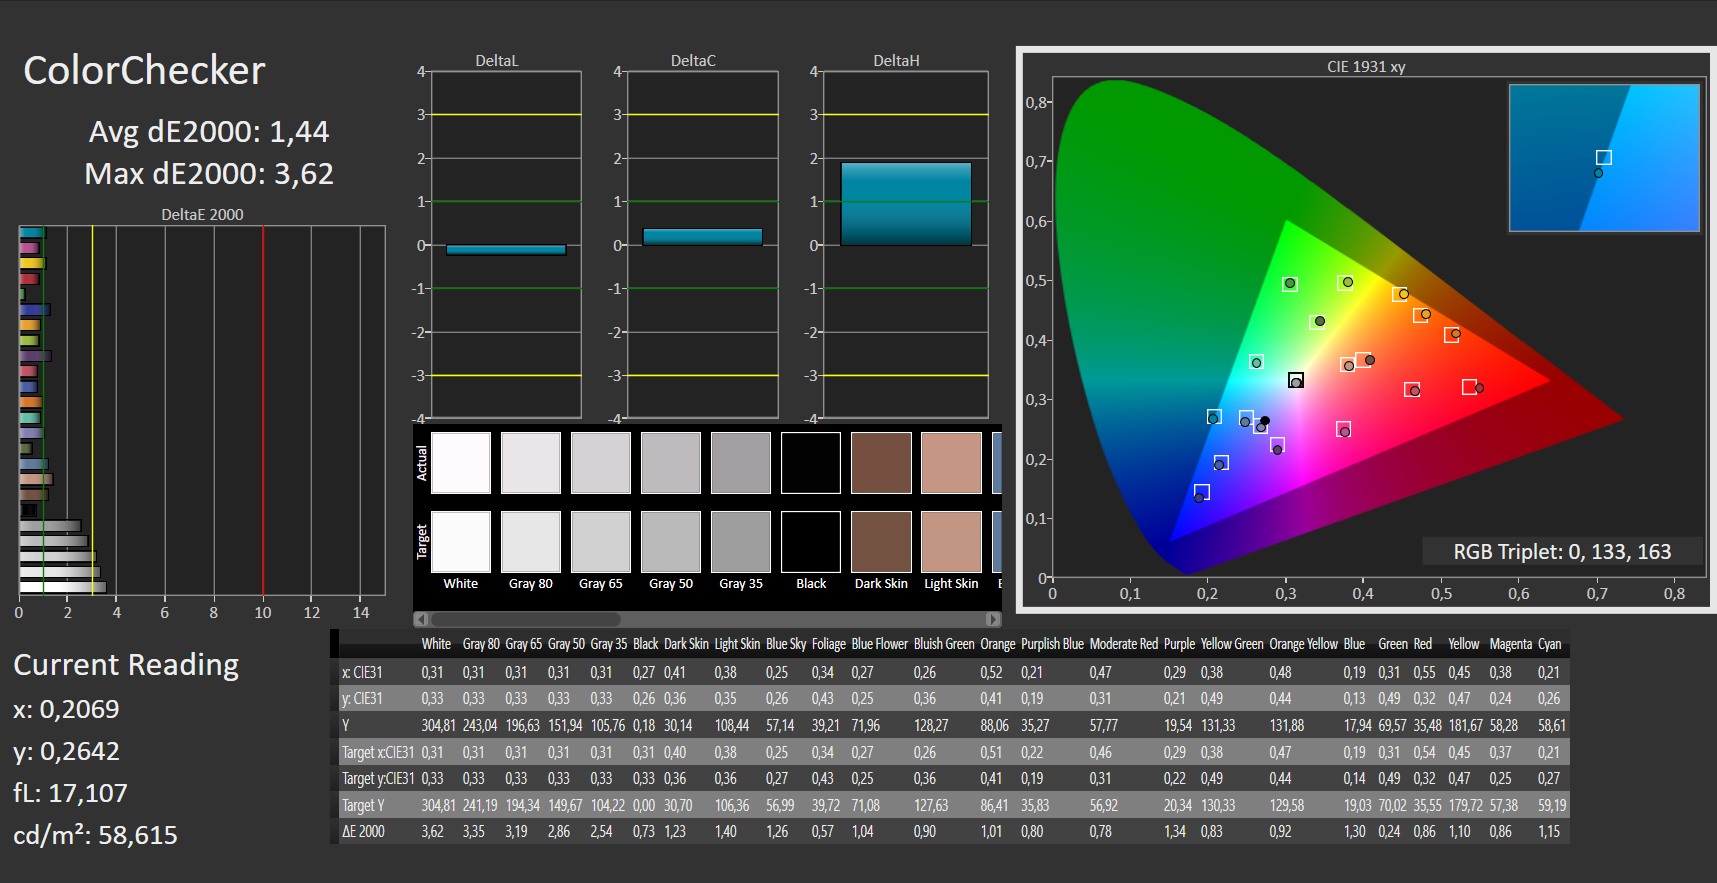
ΔE ColorChecker Calman: 1.44 | ∀{0.5-29.43 Ø4.72}
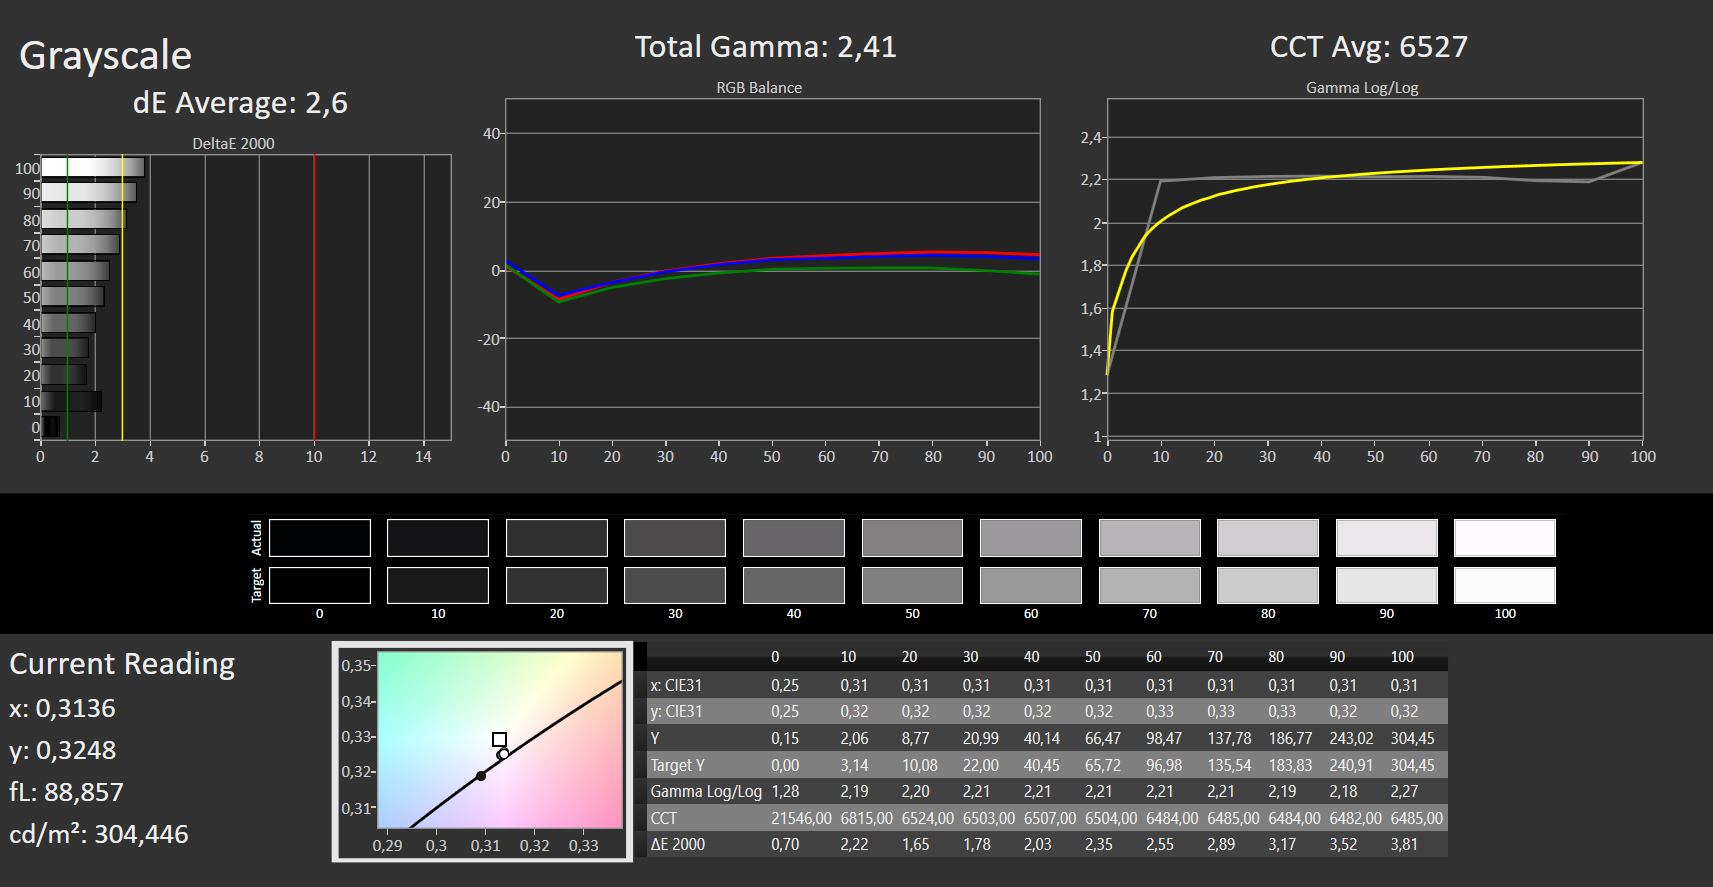
ΔE Greyscale Calman: 2.6 | ∀{0.09-98 Ø4.97}
99.5% sRGB (Argyll 1.6.3 3D)
68.5% AdobeRGB 1998 (Argyll 1.6.3 3D)
68.5% AdobeRGB 1998 (Argyll 3D)
99.5% sRGB (Argyll 3D)
66.6% Display P3 (Argyll 3D)
Gamma: 2.41
CCT: 6527 K
| Acer Swift 3 SF316-51 Chi Mei CMN160B, IPS, 1920x1080, 16.1" | Xiaomi RedmiBook Pro 15 IPS, 3200x2000, 15.6" | Dell Inspiron 15 5518-2X3JR BOE NV15N4V, IPS, 1920x1080, 15.6" | Lenovo IdeaPad 5 Pro 16IHU6 Lenovo LEN160WQXGA, IPS, 2560x1600, 16" | Asus VivoBook S15 D533UA Chi Mei N156HCA-EAB, IPS, 1920x1080, 15.6" | Huawei MateBook D 16-53011VFJ N161HCA-EA3, IPS, 1920x1080, 16.1" | |
|---|---|---|---|---|---|---|
| Display | -1% | -40% | 6% | -34% | 0% | |
| Display P3 Coverage (%) | 66.6 | 66.7 0% | 39.92 -40% | 74 11% | 43.6 -35% | 66.8 0% |
| sRGB Coverage (%) | 99.5 | 96.3 -3% | 58.8 -41% | 98.7 -1% | 65.2 -34% | 99 -1% |
| AdobeRGB 1998 Coverage (%) | 68.5 | 68.5 0% | 41.24 -40% | 74.5 9% | 45 -34% | 69 1% |
| Response Times | -15% | -42% | 60% | 25% | 6% | |
| Response Time Grey 50% / Grey 80% * (ms) | 32 ? | 34.8 ? -9% | 41 ? -28% | 13 ? 59% | 18 ? 44% | 25 ? 22% |
| Response Time Black / White * (ms) | 20 ? | 24 ? -20% | 31 ? -55% | 8 ? 60% | 19 ? 5% | 22 ? -10% |
| PWM Frequency (Hz) | 2500 ? | 1000 ? | 2500 ? | |||
| Screen | -60% | -55% | -21% | -69% | -2% | |
| Brightness middle (cd/m²) | 304 | 312 3% | 286 -6% | 356 17% | 289 -5% | 352 16% |
| Brightness (cd/m²) | 284 | 298 5% | 268 -6% | 322 13% | 267 -6% | 330 16% |
| Brightness Distribution (%) | 88 | 87 -1% | 87 -1% | 80 -9% | 85 -3% | 89 1% |
| Black Level * (cd/m²) | 0.165 | 0.18 -9% | 0.275 -67% | 0.27 -64% | 0.56 -239% | 0.28 -70% |
| Contrast (:1) | 1842 | 1733 -6% | 1040 -44% | 1319 -28% | 516 -72% | 1257 -32% |
| Colorchecker dE 2000 * | 1.44 | 5.39 -274% | 4.74 -229% | 2.4 -67% | 3.96 -175% | 1.35 6% |
| Colorchecker dE 2000 max. * | 3.62 | 9.95 -175% | 8.27 -128% | 4.42 -22% | 6.76 -87% | 2.58 29% |
| Greyscale dE 2000 * | 2.6 | 6.3 -142% | 1.57 40% | 2.81 -8% | 3.43 -32% | 2.02 22% |
| Gamma | 2.41 91% | 2.192 100% | 2.24 98% | 2.4 92% | 2.28 96% | 2.49 88% |
| CCT | 6527 100% | 7473 87% | 6348 102% | 6294 103% | 7191 90% | 6445 101% |
| Color Space (Percent of AdobeRGB 1998) (%) | 68.5 | 69 1% | 42 -39% | 63 -8% | ||
| Color Space (Percent of sRGB) (%) | 99.5 | 96 -4% | 65 -35% | 99 -1% | ||
| Colorchecker dE 2000 calibrated * | 3.15 | |||||
| Total Average (Program / Settings) | -25% /
-42% | -46% /
-50% | 15% /
-2% | -26% /
-50% | 1% /
-1% |
* ... smaller is better
The display covers the smaller sRGB color space almost completely with 99.5%. The larger AdobeRGB is still covered by almost 69%. However, this isn't sufficient for professional graphics editing. But the Acer Swift 3 is not aimed at this target group.
In terms of DeltaE, contrast, and black level, our review sample significantly surpasses some of its competitors in some cases. Overall, the device is equipped with a good display, but we would've liked it to be a bit brighter.
This would make the device even more suitable for outdoor use. However, the Acer Swift 3 can also be used well outdoors with its brightness of just under 260 cd/m² on battery power and especially thanks to the matte display, as long as the sun doesn't hit the display fully. In addition, the image is very viewing-angle stable, which is generally true for all IPS panels, though.
Display Response Times
| ↔ Response Time Black to White | ||
|---|---|---|
| 20 ms ... rise ↗ and fall ↘ combined | ↗ 11 ms rise |  |
| ↘ 9 ms fall | ||
| The screen shows good response rates in our tests, but may be too slow for competitive gamers. In comparison, all tested devices range from 0.1 (minimum) to 240 (maximum) ms. » 44 % of all devices are better. This means that the measured response time is similar to the average of all tested devices (19.8 ms). | ||
| ↔ Response Time 50% Grey to 80% Grey | ||
| 32 ms ... rise ↗ and fall ↘ combined | ↗ 15 ms rise |  |
| ↘ 17 ms fall | ||
| The screen shows slow response rates in our tests and will be unsatisfactory for gamers. In comparison, all tested devices range from 0.165 (minimum) to 636 (maximum) ms. » 43 % of all devices are better. This means that the measured response time is similar to the average of all tested devices (31 ms). | ||
Screen Flickering / PWM (Pulse-Width Modulation)
| Screen flickering / PWM detected | 2500 Hz | ≤ 10 % brightness setting |  |
The display backlight flickers at 2500 Hz (worst case, e.g., utilizing PWM) Flickering detected at a brightness setting of 10 % and below. There should be no flickering or PWM above this brightness setting. The frequency of 2500 Hz is quite high, so most users sensitive to PWM should not notice any flickering. In comparison: 52 % of all tested devices do not use PWM to dim the display. If PWM was detected, an average of 7747 (minimum: 5 - maximum: 343500) Hz was measured. | |||
Performance: Fast quad-core CPU with integrated GPU
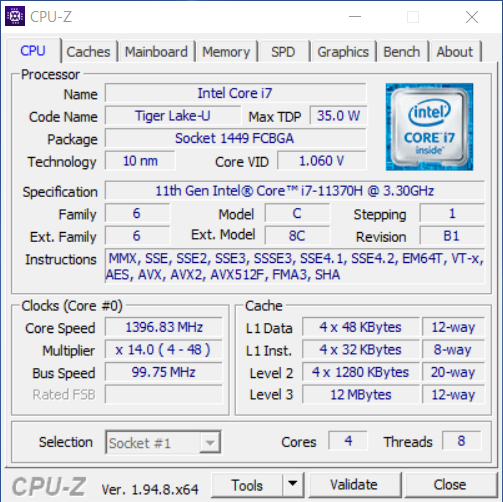
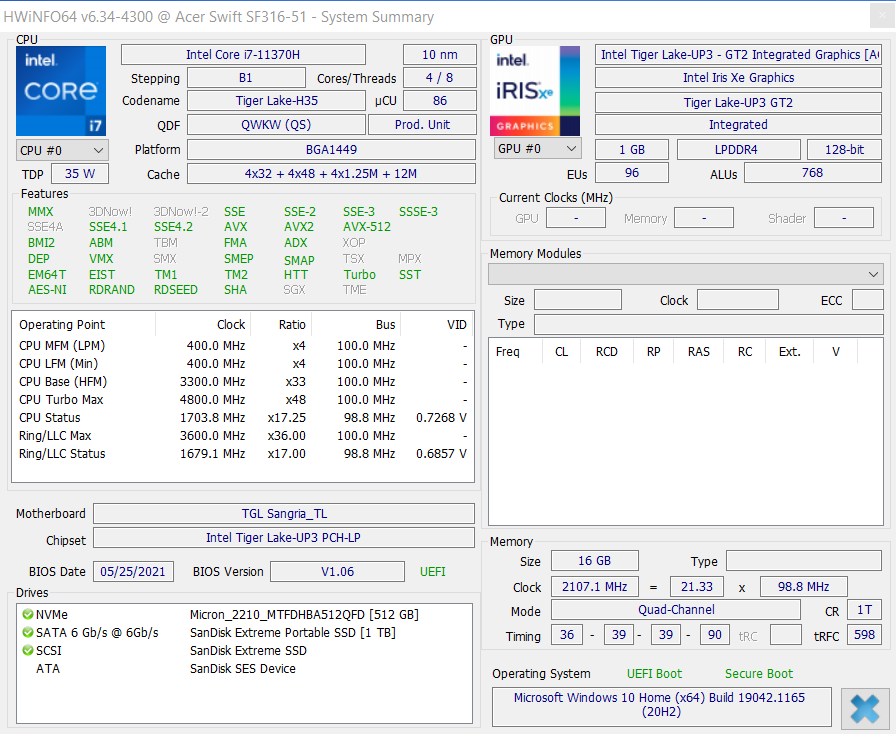
This Acer Swift 3 with the model number SF316-51-75MK is equipped with the powerful Intel Core i7-11370H and its integrated Intel Iris Xe Graphics G7 96EUs. Furthermore, the manufacturer has equipped it with 16 GB of LPDDR4x RAM in quad-channel mode along with a 512 GB SSD connected via PCI Express.
Alternatively to the configuration with the model number SF316-51-75MK (NX.ABDEV.007), Acer also offers the Swift 3 with the Intel Core i5-11300H and 8 GB LPDDR4x of RAM in the form of the SF316-51-54R8 (NX.ABDEG.002). The recommended retail price of this less powerful version is 899 Euros (~$1,039), which is 100 Euros (~$116) less than the price of our test model.
Processor
The built-in Intel Core i7-11370H is from Intel's current Tiger Lake series and was only introduced this year. At the moment, it can only be found in relatively few devices, such as the RedmiBook Pro 15 comparison model. The CPU is largely identical to the more widespread Intel Core i7-1185G7, but it allows manufacturers to set a TDP between 28 and 35 watts. In this case, Acer opted for 35 watts, thereby taking full advantage of the CPU's performance. In Boost mode, the quad-core processor operates at up to 4.8 GHz, while the base clock speed is 3.3 GHz.
Thanks to the high TDP configuration, the Intel Core i7-11370H behaves aggressively in the benchmarks and takes the lead in Cinebench's single-core scores. As usual, it has to give way to the contenders based on AMD's latest Ryzen CPUs in multi-core tests.
After a short initial drop, the processor performed consistently over time in the endurance test, matching the level of the Xiaomi RedmiBook Pro 15 equipped with the same CPU (with a variable PL1).
Cinebench R15 Multi endurance test
Cinebench R20: CPU (Single Core) | CPU (Multi Core)
Cinebench R15: CPU Single 64Bit | CPU Multi 64Bit
Blender: v2.79 BMW27 CPU
7-Zip 18.03: 7z b 4 -mmt1 | 7z b 4
Geekbench 5.5: Single-Core | Multi-Core
HWBOT x265 Benchmark v2.2: 4k Preset
LibreOffice : 20 Documents To PDF
R Benchmark 2.5: Overall mean
| Cinebench R23 / Single Core | |
| Average of class Multimedia (1128 - 2459, n=69, last 2 years) | |
| Acer Swift 3 SF316-51 | |
| Xiaomi RedmiBook Pro 15 | |
| Average Intel Core i7-11370H (1081 - 1556, n=11) | |
| Lenovo IdeaPad 5 Pro 16IHU6 | |
| Dell Inspiron 15 5518-2X3JR | |
| Asus VivoBook S15 D533UA | |
| Huawei MateBook D 16-53011VFJ | |
| Cinebench R23 / Multi Core | |
| Average of class Multimedia (4861 - 33362, n=77, last 2 years) | |
| Asus VivoBook S15 D533UA | |
| Huawei MateBook D 16-53011VFJ | |
| Lenovo IdeaPad 5 Pro 16IHU6 | |
| Acer Swift 3 SF316-51 | |
| Xiaomi RedmiBook Pro 15 | |
| Xiaomi RedmiBook Pro 15 | |
| Average Intel Core i7-11370H (3696 - 6646, n=12) | |
| Dell Inspiron 15 5518-2X3JR | |
| Cinebench R20 / CPU (Single Core) | |
| Average of class Multimedia (425 - 853, n=60, last 2 years) | |
| Acer Swift 3 SF316-51 | |
| Xiaomi RedmiBook Pro 15 | |
| Average Intel Core i7-11370H (475 - 601, n=11) | |
| Lenovo IdeaPad 5 Pro 16IHU6 | |
| Dell Inspiron 15 5518-2X3JR | |
| Asus VivoBook S15 D533UA | |
| Huawei MateBook D 16-53011VFJ | |
| Cinebench R20 / CPU (Multi Core) | |
| Average of class Multimedia (1887 - 12912, n=60, last 2 years) | |
| Asus VivoBook S15 D533UA | |
| Huawei MateBook D 16-53011VFJ | |
| Lenovo IdeaPad 5 Pro 16IHU6 | |
| Acer Swift 3 SF316-51 | |
| Xiaomi RedmiBook Pro 15 | |
| Average Intel Core i7-11370H (1438 - 2578, n=11) | |
| Dell Inspiron 15 5518-2X3JR | |
| Cinebench R15 / CPU Single 64Bit | |
| Average of class Multimedia (184.8 - 326, n=62, last 2 years) | |
| Xiaomi RedmiBook Pro 15 | |
| Xiaomi RedmiBook Pro 15 | |
| Acer Swift 3 SF316-51 | |
| Average Intel Core i7-11370H (162.9 - 233, n=15) | |
| Asus VivoBook S15 D533UA | |
| Huawei MateBook D 16-53011VFJ | |
| Lenovo IdeaPad 5 Pro 16IHU6 | |
| Dell Inspiron 15 5518-2X3JR | |
| Cinebench R15 / CPU Multi 64Bit | |
| Average of class Multimedia (856 - 5224, n=64, last 2 years) | |
| Asus VivoBook S15 D533UA | |
| Huawei MateBook D 16-53011VFJ | |
| Xiaomi RedmiBook Pro 15 | |
| Xiaomi RedmiBook Pro 15 | |
| Xiaomi RedmiBook Pro 15 | |
| Acer Swift 3 SF316-51 | |
| Lenovo IdeaPad 5 Pro 16IHU6 | |
| Average Intel Core i7-11370H (606 - 1086, n=17) | |
| Dell Inspiron 15 5518-2X3JR | |
| Blender / v2.79 BMW27 CPU | |
| Dell Inspiron 15 5518-2X3JR | |
| Lenovo IdeaPad 5 Pro 16IHU6 | |
| Xiaomi RedmiBook Pro 15 | |
| Average Intel Core i7-11370H (432 - 762, n=11) | |
| Acer Swift 3 SF316-51 | |
| Huawei MateBook D 16-53011VFJ | |
| Asus VivoBook S15 D533UA | |
| Average of class Multimedia (100 - 557, n=61, last 2 years) | |
| 7-Zip 18.03 / 7z b 4 -mmt1 | |
| Average of class Multimedia (3666 - 7545, n=59, last 2 years) | |
| Xiaomi RedmiBook Pro 15 | |
| Acer Swift 3 SF316-51 | |
| Average Intel Core i7-11370H (5074 - 5550, n=11) | |
| Lenovo IdeaPad 5 Pro 16IHU6 | |
| Dell Inspiron 15 5518-2X3JR | |
| Asus VivoBook S15 D533UA | |
| Huawei MateBook D 16-53011VFJ | |
| 7-Zip 18.03 / 7z b 4 | |
| Average of class Multimedia (26062 - 130368, n=58, last 2 years) | |
| Asus VivoBook S15 D533UA | |
| Huawei MateBook D 16-53011VFJ | |
| Acer Swift 3 SF316-51 | |
| Xiaomi RedmiBook Pro 15 | |
| Lenovo IdeaPad 5 Pro 16IHU6 | |
| Average Intel Core i7-11370H (18961 - 28520, n=11) | |
| Dell Inspiron 15 5518-2X3JR | |
| Geekbench 5.5 / Single-Core | |
| Average of class Multimedia (805 - 2974, n=59, last 2 years) | |
| Acer Swift 3 SF316-51 | |
| Xiaomi RedmiBook Pro 15 | |
| Average Intel Core i7-11370H (1376 - 1607, n=10) | |
| Lenovo IdeaPad 5 Pro 16IHU6 | |
| Dell Inspiron 15 5518-2X3JR | |
| Asus VivoBook S15 D533UA | |
| Huawei MateBook D 16-53011VFJ | |
| Geekbench 5.5 / Multi-Core | |
| Average of class Multimedia (4652 - 20422, n=59, last 2 years) | |
| Asus VivoBook S15 D533UA | |
| Acer Swift 3 SF316-51 | |
| Huawei MateBook D 16-53011VFJ | |
| Average Intel Core i7-11370H (3828 - 6115, n=10) | |
| Xiaomi RedmiBook Pro 15 | |
| Lenovo IdeaPad 5 Pro 16IHU6 | |
| Dell Inspiron 15 5518-2X3JR | |
| HWBOT x265 Benchmark v2.2 / 4k Preset | |
| Average of class Multimedia (5.26 - 36.1, n=59, last 2 years) | |
| Asus VivoBook S15 D533UA | |
| Huawei MateBook D 16-53011VFJ | |
| Acer Swift 3 SF316-51 | |
| Average Intel Core i7-11370H (4.98 - 8.82, n=11) | |
| Lenovo IdeaPad 5 Pro 16IHU6 | |
| Xiaomi RedmiBook Pro 15 | |
| Dell Inspiron 15 5518-2X3JR | |
| LibreOffice / 20 Documents To PDF | |
| Huawei MateBook D 16-53011VFJ | |
| Asus VivoBook S15 D533UA | |
| Lenovo IdeaPad 5 Pro 16IHU6 | |
| Average of class Multimedia (23.9 - 146.7, n=60, last 2 years) | |
| Xiaomi RedmiBook Pro 15 | |
| Dell Inspiron 15 5518-2X3JR | |
| Average Intel Core i7-11370H (23.6 - 56.5, n=11) | |
| Acer Swift 3 SF316-51 | |
| R Benchmark 2.5 / Overall mean | |
| Dell Inspiron 15 5518-2X3JR | |
| Huawei MateBook D 16-53011VFJ | |
| Lenovo IdeaPad 5 Pro 16IHU6 | |
| Asus VivoBook S15 D533UA | |
| Average Intel Core i7-11370H (0.544 - 0.596, n=11) | |
| Xiaomi RedmiBook Pro 15 | |
| Acer Swift 3 SF316-51 | |
| Average of class Multimedia (0.3604 - 0.947, n=59, last 2 years) | |
* ... smaller is better
System performance
In the practical test, the system runs pleasantly smooth even under heavy load. The various PCMark 10 benchmarks reveal a good performance, in which the Acer Swift 3 SF316-51 is usually positioned at the top, competing directly with the RedmiBook Pro 15. The opponents equipped with the Core i5-11300H and similar CPUs generally don't stand a chance of coming close to this performance level.
PCMark 8: Storage Score v2 | Work Score Accelerated v2 | Creative Score Accelerated v2 | Home Score Accelerated v2
| PCMark 10 / Score | |
| Average of class Multimedia (4325 - 10386, n=55, last 2 years) | |
| Xiaomi RedmiBook Pro 15 | |
| Acer Swift 3 SF316-51 | |
| Asus VivoBook S15 D533UA | |
| Average Intel Core i7-11370H, Intel Iris Xe Graphics G7 96EUs (5199 - 5459, n=6) | |
| Lenovo IdeaPad 5 Pro 16IHU6 | |
| Huawei MateBook D 16-53011VFJ | |
| Dell Inspiron 15 5518-2X3JR | |
| PCMark 10 / Essentials | |
| Average of class Multimedia (8025 - 11664, n=54, last 2 years) | |
| Average Intel Core i7-11370H, Intel Iris Xe Graphics G7 96EUs (9996 - 10650, n=6) | |
| Acer Swift 3 SF316-51 | |
| Asus VivoBook S15 D533UA | |
| Huawei MateBook D 16-53011VFJ | |
| Lenovo IdeaPad 5 Pro 16IHU6 | |
| Xiaomi RedmiBook Pro 15 | |
| Dell Inspiron 15 5518-2X3JR | |
| PCMark 10 / Productivity | |
| Average of class Multimedia (7323 - 18233, n=54, last 2 years) | |
| Xiaomi RedmiBook Pro 15 | |
| Lenovo IdeaPad 5 Pro 16IHU6 | |
| Dell Inspiron 15 5518-2X3JR | |
| Asus VivoBook S15 D533UA | |
| Huawei MateBook D 16-53011VFJ | |
| Acer Swift 3 SF316-51 | |
| Average Intel Core i7-11370H, Intel Iris Xe Graphics G7 96EUs (6911 - 7388, n=6) | |
| PCMark 10 / Digital Content Creation | |
| Average of class Multimedia (3651 - 16240, n=54, last 2 years) | |
| Xiaomi RedmiBook Pro 15 | |
| Acer Swift 3 SF316-51 | |
| Average Intel Core i7-11370H, Intel Iris Xe Graphics G7 96EUs (5483 - 5838, n=6) | |
| Asus VivoBook S15 D533UA | |
| Lenovo IdeaPad 5 Pro 16IHU6 | |
| Huawei MateBook D 16-53011VFJ | |
| Dell Inspiron 15 5518-2X3JR | |
| PCMark 8 / Storage Score v2 | |
| Huawei MateBook D 16-53011VFJ | |
| Xiaomi RedmiBook Pro 15 | |
| Acer Swift 3 SF316-51 | |
| Average Intel Core i7-11370H, Intel Iris Xe Graphics G7 96EUs (n=1) | |
| PCMark 8 / Work Score Accelerated v2 | |
| Xiaomi RedmiBook Pro 15 | |
| Asus VivoBook S15 D533UA | |
| Huawei MateBook D 16-53011VFJ | |
| Lenovo IdeaPad 5 Pro 16IHU6 | |
| Acer Swift 3 SF316-51 | |
| Average Intel Core i7-11370H, Intel Iris Xe Graphics G7 96EUs (2996 - 3234, n=2) | |
| PCMark 8 / Creative Score Accelerated v2 | |
| Xiaomi RedmiBook Pro 15 | |
| Acer Swift 3 SF316-51 | |
| Average Intel Core i7-11370H, Intel Iris Xe Graphics G7 96EUs (n=1) | |
| Huawei MateBook D 16-53011VFJ | |
| Lenovo IdeaPad 5 Pro 16IHU6 | |
| Asus VivoBook S15 D533UA | |
| PCMark 8 / Home Score Accelerated v2 | |
| Acer Swift 3 SF316-51 | |
| Average of class Multimedia (n=1last 2 years) | |
| Average Intel Core i7-11370H, Intel Iris Xe Graphics G7 96EUs (5025 - 5575, n=2) | |
| Xiaomi RedmiBook Pro 15 | |
| Huawei MateBook D 16-53011VFJ | |
| Asus VivoBook S15 D533UA | |
| Lenovo IdeaPad 5 Pro 16IHU6 | |
| PCMark 8 Home Score Accelerated v2 | 5575 points | |
| PCMark 8 Creative Score Accelerated v2 | 7666 points | |
| PCMark 8 Work Score Accelerated v2 | 3234 points | |
| PCMark 10 Score | 5459 points | |
Help | ||
DPC latencies
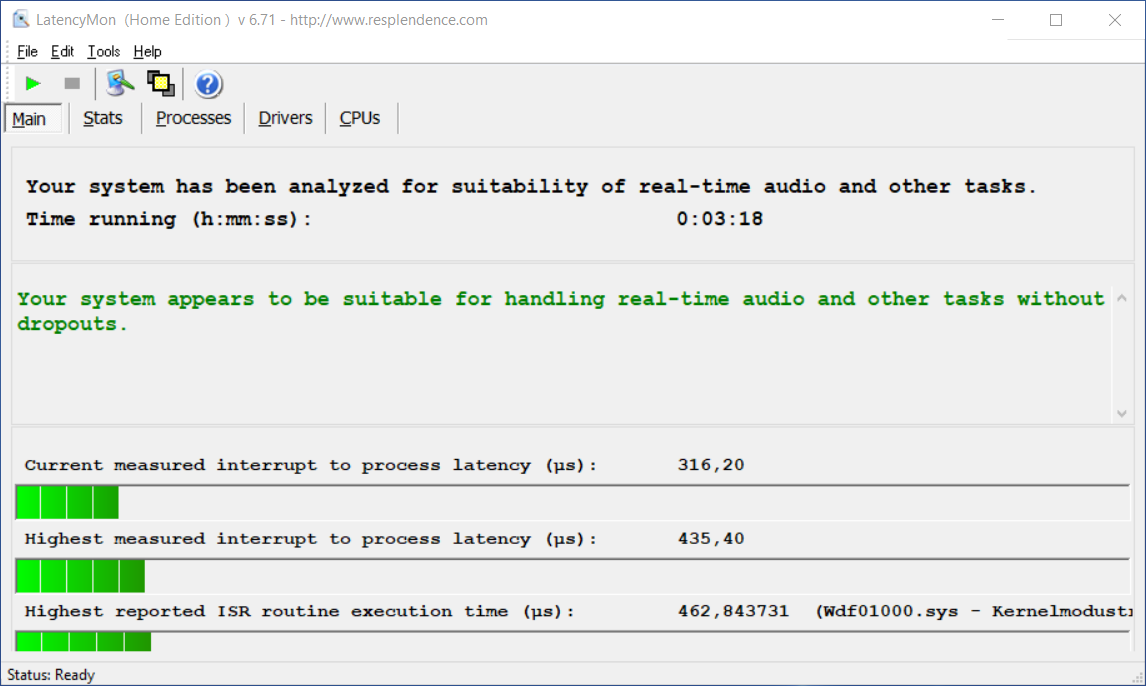
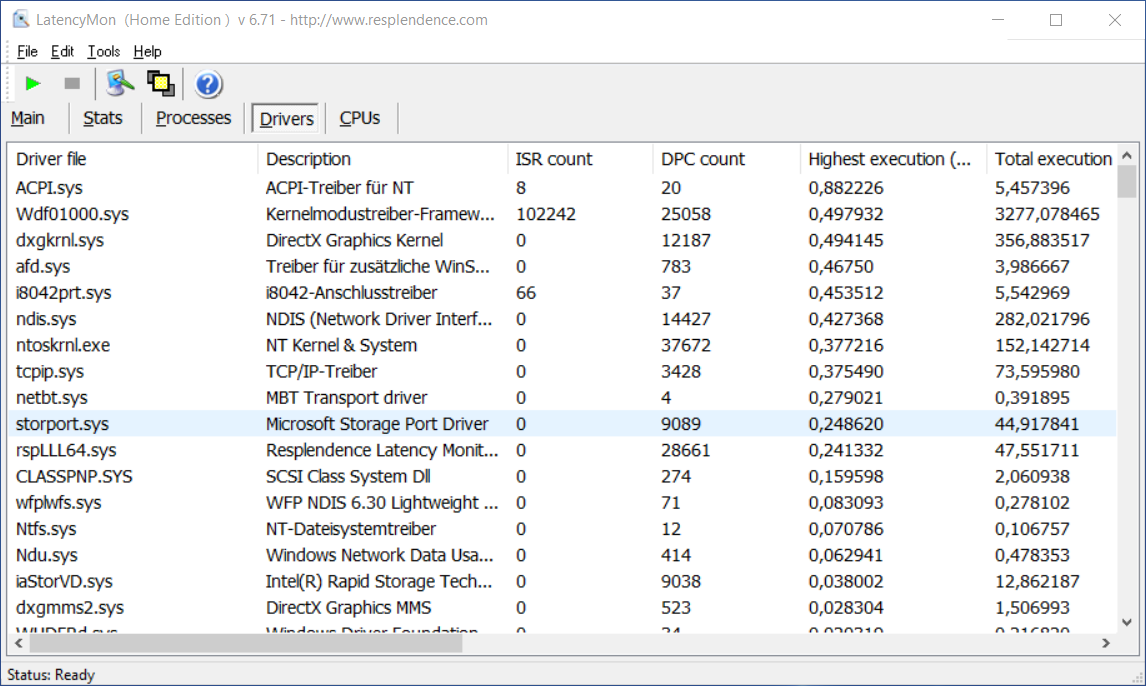
The Swift 3 performs very well in our latency test, which is a task that every laptop being reviewed has to face. It has the lowest latency among all the mentioned comparison models. Therefore, problems with real-time audio and video editing shouldn't arise in this regard, even though this is always only a momentary snapshot.
| DPC Latencies / LatencyMon - interrupt to process latency (max), Web, Youtube, Prime95 | |
| Xiaomi RedmiBook Pro 15 | |
| Dell Inspiron 15 5518-2X3JR | |
| Huawei MateBook D 16-53011VFJ | |
| Lenovo IdeaPad 5 Pro 16IHU6 | |
| Asus VivoBook S15 D533UA | |
| Acer Swift 3 SF316-51 | |
* ... smaller is better
Storage
Calling the 512 GB SSD an Achilles' heel might be a bit exaggerated. But overall, most other comparison devices show better results in the various read and write benchmarks. As such, it comes in last in the long-term read test, among other categories.
However, since SSDs, which are quite fast by default, are usually no longer the big bottleneck in a PC system that HDDs were at the time, this is only a side note in the end, as no issues are noticeable in daily work. After all, the device still manages to get ahead of the average of devices equipped with the same SSD.
| Acer Swift 3 SF316-51 Micron 2210 MTFDHBA512QFD | Xiaomi RedmiBook Pro 15 Toshiba KBG40ZNV512G | Dell Inspiron 15 5518-2X3JR Toshiba KBG40ZNS512G NVMe | Lenovo IdeaPad 5 Pro 16IHU6 Samsung SSD PM981a MZVLB512HBJQ | Asus VivoBook S15 D533UA WDC PC SN530 SDBPNPZ-1T00 | Huawei MateBook D 16-53011VFJ Samsung SSD PM981a MZVLB512HBJQ | Average Micron 2210 MTFDHBA512QFD | |
|---|---|---|---|---|---|---|---|
| CrystalDiskMark 5.2 / 6 | 1% | 13% | 48% | 10% | 46% | -8% | |
| Write 4K (MB/s) | 171.8 | 136 -21% | 207.3 21% | 203 18% | 116.8 -32% | 147 -14% | 153.1 ? -11% |
| Read 4K (MB/s) | 79.4 | 60.4 -24% | 61.3 -23% | 52.3 -34% | 43.92 -45% | 65.5 -18% | 64.6 ? -19% |
| Write Seq (MB/s) | 1099 | 1447 32% | 1499 36% | 2138 95% | 1990 81% | 2680 144% | 1125 ? 2% |
| Read Seq (MB/s) | 1847 | 1507 -18% | 1858 1% | 1974 7% | 1959 6% | 2556 38% | 1808 ? -2% |
| Write 4K Q32T1 (MB/s) | 539 | 235.6 -56% | 510 -5% | 640 19% | 373.3 -31% | 413.4 -23% | 367 ? -32% |
| Read 4K Q32T1 (MB/s) | 555 | 737 33% | 640 15% | 707 27% | 524 -6% | 500 -10% | 507 ? -9% |
| Write Seq Q32T1 (MB/s) | 1095 | 1529 40% | 1521 39% | 2973 172% | 1985 81% | 2978 172% | 1138 ? 4% |
| Read Seq Q32T1 (MB/s) | 1988 | 2357 19% | 2316 16% | 3559 79% | 2456 24% | 3567 79% | 1997 ? 0% |
| AS SSD | -100% | -36% | 56% | 15% | 39% | -15% | |
| Seq Read (MB/s) | 2015 | 1972 -2% | 2086 4% | 2541 26% | 2082 3% | 2829 40% | 1885 ? -6% |
| Seq Write (MB/s) | 1055 | 981 -7% | 1124 7% | 2555 142% | 1844 75% | 2423 130% | 998 ? -5% |
| 4K Read (MB/s) | 73.9 | 55.8 -24% | 54.1 -27% | 56 -24% | 44.33 -40% | 42.06 -43% | 62.2 ? -16% |
| 4K Write (MB/s) | 223.2 | 133.5 -40% | 138.1 -38% | 129.6 -42% | 157.5 -29% | 126.1 -44% | 162 ? -27% |
| 4K-64 Read (MB/s) | 589 | 1277 117% | 1295 120% | 1633 177% | 1039 76% | 1481 151% | 585 ? -1% |
| 4K-64 Write (MB/s) | 1029 | 313.9 -69% | 750 -27% | 1863 81% | 1556 51% | 2009 95% | 863 ? -16% |
| Access Time Read * (ms) | 0.056 | 0.15 -168% | 0.141 -152% | 0.077 -38% | 0.05 11% | 0.079 -41% | 0.07329 ? -31% |
| Access Time Write * (ms) | 0.039 | 0.513 -1215% | 0.169 -333% | 0.029 26% | 0.065 -67% | 0.029 26% | 0.04957 ? -27% |
| Score Read (Points) | 865 | 1530 77% | 1558 80% | 1944 125% | 1292 49% | 1806 109% | 836 ? -3% |
| Score Write (Points) | 1358 | 546 -60% | 1001 -26% | 2248 66% | 1898 40% | 2377 75% | 1125 ? -17% |
| Score Total (Points) | 2644 | 2819 7% | 3316 25% | 5192 96% | 3845 45% | 5087 92% | 2366 ? -11% |
| Copy ISO MB/s (MB/s) | 1186 | 1105 -7% | 678 -43% | 2246 89% | 1441 22% | 1358 15% | 1191 ? 0% |
| Copy Program MB/s (MB/s) | 782 | 799 2% | 364.8 -53% | 861 10% | 484.9 -38% | 407.1 -48% | 477 ? -39% |
| Copy Game MB/s (MB/s) | 1028 | 957 -7% | 557 -46% | 1552 51% | 1098 7% | 918 -11% | 857 ? -17% |
| Total Average (Program / Settings) | -50% /
-63% | -12% /
-19% | 52% /
53% | 13% /
13% | 43% /
42% | -12% /
-13% |
* ... smaller is better

Continuous load read: DiskSpd Read Loop, Queue Depth 8
Graphics card
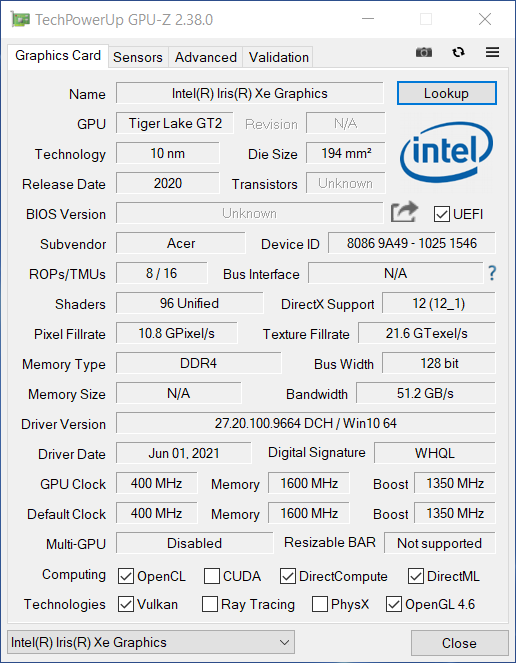
Acer refrains from implementing a dedicated graphics solution in the Swift 3. Instead, it relies on the processor's capable Intel Iris Xe Graphics G7 96EUs GPU. The base clock speed of the graphics engine, which is equipped with 1 GB of RAM, is 400 MHz. When it's under load, it can run at up to 1,350 MHz in Boost mode.
An advantage of not having a separate graphics card is that the device consumes less energy as we'll see in more detail below. Nevertheless, the GPU offers sufficient performance for many application purposes. After all, it's known to be on par with the GeForce MX350 laptop in many aspects, and it can even keep up with the GeForce MX450 in some cases.
The device achieves a score of 6,436 points in 3DMark 11 on battery power. This means that the performance available when the power adapter is not connected is only about 5% lower than with an external power supply.
| 3DMark 11 Performance | 7431 points | |
| 3DMark Cloud Gate Standard Score | 22314 points | |
| 3DMark Fire Strike Score | 5300 points | |
| 3DMark Time Spy Score | 1917 points | |
Help | ||
Gaming performance
The Acer Swift 3 at hand is definitely not a gaming device, which is evident by the lack of a dedicated graphics solution alone. Nevertheless, it performs more than adequately in benchmarks, especially when it comes to older games. The Witcher 3, for example, can be played without issues at medium graphics settings, and even at high graphics settings with slight limitations.
Overall, the device ranks in the middle of the test field - and this despite the fact that most of the other comparison models are equipped with a dedicated GPU. For instance, the Dell Inspiron 15 5518-2X3JR with the Nvidia GeForce MX450 lags behind. In addition, the Swift 3 always performs well above the average Intel Iris Xe Graphics G7 96EUs GPU.
The CPU's integrated graphics show that they're capable of quite a bit, so the occasional gaming session shouldn't be a problem for the review sample. That is, of course, provided that the user's performance and graphics expectations aren't too high.
| Rise of the Tomb Raider | |
| 1024x768 Lowest Preset | |
| Acer Swift 3 SF316-51 | |
| Average Intel Iris Xe Graphics G7 96EUs (46 - 85.5, n=5) | |
| 1366x768 Medium Preset AF:2x | |
| Acer Swift 3 SF316-51 | |
| Average Intel Iris Xe Graphics G7 96EUs (35.1 - 49, n=5) | |
| 1920x1080 High Preset AA:FX AF:4x | |
| Acer Swift 3 SF316-51 | |
| Average Intel Iris Xe Graphics G7 96EUs (19.9 - 28.2, n=5) | |
| 1920x1080 Very High Preset AA:FX AF:16x | |
| Acer Swift 3 SF316-51 | |
| Average Intel Iris Xe Graphics G7 96EUs (16.4 - 22.7, n=5) | |
| low | med. | high | ultra | |
|---|---|---|---|---|
| The Witcher 3 (2015) | 101 | 62.6 | 33.3 | 17 |
| Dota 2 Reborn (2015) | 139 | 87.1 | 59 | 55.6 |
| Rise of the Tomb Raider (2016) | 81.1 | 49 | 28.2 | 22.7 |
| X-Plane 11.11 (2018) | 46.4 | 38.2 | 35.7 | |
| Strange Brigade (2018) | 90.8 | 40.3 | 32.5 | 26.4 |
Emissions: Pleasantly quiet laptop only gets a bit warmer under full load
Noise emissions
In idle usage, the Acer Swift 3 is virtually inaudible at 26 dB(A) and normal ambient noise levels. Even under full load, the device doesn't even exceed the 40 dB(A) mark, so it can rightfully be described as quiet considering it's a device with an active fan. Other noises, such as coil whine or the like, did not develop in our test device.
Noise level
| Idle |
| 26 / 26 / 27.7 dB(A) |
| Load |
| 32.7 / 39 dB(A) |
 | ||
30 dB silent 40 dB(A) audible 50 dB(A) loud |
||
min: | ||
Temperature
Despite the low noise development, temperatures remain relatively moderate. All top and bottom areas remain at a maximum of 32 °C (~90 °F) in idle usage. And even under full load, temperatures only rise to 40 °C (~104 °F) on the top, with the warmest area being right in front of the display, as is often the case. The areas of the touchpad and palm rest, on the other hand, are barely warmer than during idle usage.
The only real area of concern is the right corner of the underside, since it can become a bit more uncomfortable when placed directly on the lap at temperatures of up to 47 °C (~117 °F). However, this is really only the case under full load, which should rarely be one of the typical uses of this device.
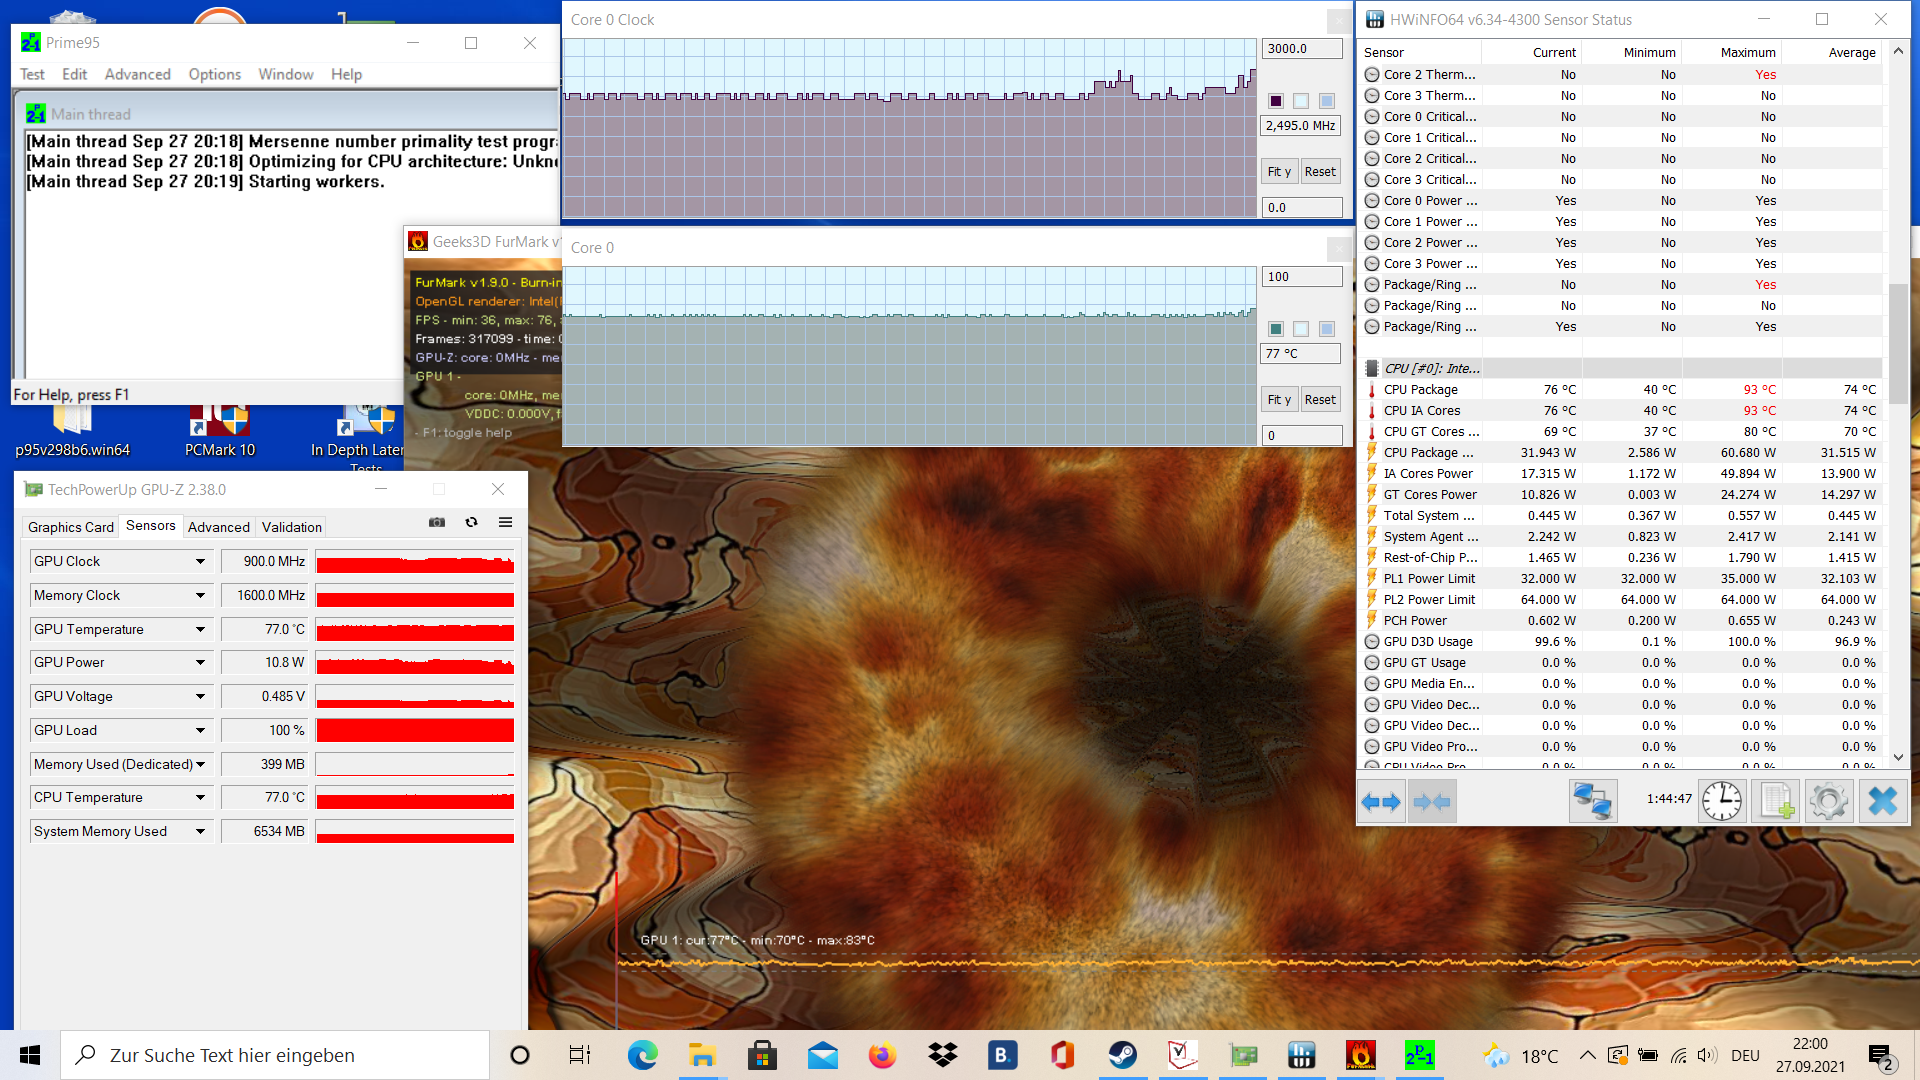
The Acer Swift 3 didn't show any irregularities in our standardized stress test. After a short boost, the CPU settled at a clock rate of around 2,000 MHz and a temperature of just over 70 °C (~158 °F). The GPU also stays within this temperature range and runs constantly at around 1,100 MHz. No throttling occurred in the test, so there are no performance losses to complain about here. Furthermore, the fan remained pleasantly quiet even during the stress test.
(±) The maximum temperature on the upper side is 40 °C / 104 F, compared to the average of 36.8 °C / 98 F, ranging from 21 to 71 °C for the class Multimedia.
(-) The bottom heats up to a maximum of 47 °C / 117 F, compared to the average of 39.1 °C / 102 F
(+) In idle usage, the average temperature for the upper side is 28.2 °C / 83 F, compared to the device average of 31.3 °C / 88 F.
(+) The palmrests and touchpad are reaching skin temperature as a maximum (32.6 °C / 90.7 F) and are therefore not hot.
(-) The average temperature of the palmrest area of similar devices was 28.7 °C / 83.7 F (-3.9 °C / -7 F).
Speakers
The Acer Swift 3 reveals a somewhat thin sound in the audio test. This is mainly due to the relatively weak bass, which is clearly below the average of all laptops tested. In contrast, the device reproduces mids and highs in a very balanced way, so that there's no audible distortion at least.
In short: A bit of punch is missing for music. The use of headphones via the audio jack or Bluetooth is recommended here. Otherwise, sound reproduction is pleasing due to its balance, and it's also sufficient for video calls and the like.
Acer Swift 3 SF316-51 audio analysis
(±) | speaker loudness is average but good (75.2 dB)
Bass 100 - 315 Hz
(-) | nearly no bass - on average 25.5% lower than median
(±) | linearity of bass is average (12.1% delta to prev. frequency)
Mids 400 - 2000 Hz
(+) | balanced mids - only 2.7% away from median
(+) | mids are linear (5.2% delta to prev. frequency)
Highs 2 - 16 kHz
(+) | balanced highs - only 3.8% away from median
(+) | highs are linear (2.9% delta to prev. frequency)
Overall 100 - 16.000 Hz
(±) | linearity of overall sound is average (17.7% difference to median)
Compared to same class
» 51% of all tested devices in this class were better, 7% similar, 42% worse
» The best had a delta of 5%, average was 17%, worst was 45%
Compared to all devices tested
» 35% of all tested devices were better, 8% similar, 57% worse
» The best had a delta of 4%, average was 23%, worst was 134%
Apple MacBook 12 (Early 2016) 1.1 GHz audio analysis
(+) | speakers can play relatively loud (83.6 dB)
Bass 100 - 315 Hz
(±) | reduced bass - on average 11.3% lower than median
(±) | linearity of bass is average (14.2% delta to prev. frequency)
Mids 400 - 2000 Hz
(+) | balanced mids - only 2.4% away from median
(+) | mids are linear (5.5% delta to prev. frequency)
Highs 2 - 16 kHz
(+) | balanced highs - only 2% away from median
(+) | highs are linear (4.5% delta to prev. frequency)
Overall 100 - 16.000 Hz
(+) | overall sound is linear (10.2% difference to median)
Compared to same class
» 7% of all tested devices in this class were better, 2% similar, 90% worse
» The best had a delta of 5%, average was 18%, worst was 53%
Compared to all devices tested
» 5% of all tested devices were better, 1% similar, 94% worse
» The best had a delta of 4%, average was 23%, worst was 134%
Energy management: Frugal laptop with long battery life
Energy consumption
The Acer Swift 3 excels in terms of energy consumption. It can more or less set itself apart from all comparison devices in this regard. Thanks to its internal GPU, it consumes an average of 5% to 60% less than the competition, and it's also just below the GPU average. The 65-watt power adapter is more than adequately sized with a maximum consumption of just over 50 watts.
| Off / Standby | |
| Idle | |
| Load |
|
Key:
min: | |
| Acer Swift 3 SF316-51 i7-11370H, Iris Xe G7 96EUs, Micron 2210 MTFDHBA512QFD, IPS, 1920x1080, 16.1" | Xiaomi RedmiBook Pro 15 i7-11370H, GeForce MX450, Toshiba KBG40ZNV512G, IPS, 3200x2000, 15.6" | Dell Inspiron 15 5518-2X3JR i5-11300H, GeForce MX450, Toshiba KBG40ZNS512G NVMe, IPS, 1920x1080, 15.6" | Lenovo IdeaPad 5 Pro 16IHU6 i5-11300H, GeForce MX450, Samsung SSD PM981a MZVLB512HBJQ, IPS, 2560x1600, 16" | Asus VivoBook S15 D533UA R7 5700U, Vega 8, WDC PC SN530 SDBPNPZ-1T00, IPS, 1920x1080, 15.6" | Huawei MateBook D 16-53011VFJ R5 4600H, Vega 6, Samsung SSD PM981a MZVLB512HBJQ, IPS, 1920x1080, 16.1" | Average Intel Iris Xe Graphics G7 96EUs | Average of class Multimedia | |
|---|---|---|---|---|---|---|---|---|
| Power Consumption | -62% | -18% | -56% | -18% | -14% | -23% | -60% | |
| Idle Minimum * (Watt) | 4.8 | 6 -25% | 4 17% | 5 -4% | 5 -4% | 5.2 -8% | 5.51 ? -15% | 5.68 ? -18% |
| Idle Average * (Watt) | 7.4 | 9 -22% | 7.6 -3% | 9 -22% | 7.7 -4% | 8.2 -11% | 8.66 ? -17% | 10.2 ? -38% |
| Idle Maximum * (Watt) | 9 | 12 -33% | 10.2 -13% | 9.4 -4% | 12.2 -36% | 9.4 -4% | 10.9 ? -21% | 12.4 ? -38% |
| Load Average * (Watt) | 34.9 | 74 -112% | 49.4 -42% | 71 -103% | 41 -17% | 40 -15% | 45.6 ? -31% | 65.4 ? -87% |
| Witcher 3 ultra * (Watt) | 34.9 | 70.7 -103% | 49.4 -42% | 72.4 -107% | 43 -23% | 40.5 -16% | ||
| Load Maximum * (Watt) | 51.4 | 91 -77% | 63.4 -23% | 99 -93% | 65 -26% | 67 -30% | 67.8 ? -32% | 113.3 ? -120% |
* ... smaller is better
Energy consumption during The Witcher 3 / stress test
Battery life
The Acer Swift 3 SF316-51 actually has a weaker position on paper versus the selected comparison models. Apart from the Asus VivoBook S15, it has the smallest battery.
However, the device still manages to leave all rivals behind in terms of battery runtimes due to the already mentioned low consumption. The device lasts almost 10 hours in our Wi-Fi browsing test, and it even lasts a good 10 hours when watching a locally stored video. Even under full load, the device runs for over 1.5 hours without needing an external power source.
| Acer Swift 3 SF316-51 i7-11370H, Iris Xe G7 96EUs, 56 Wh | Xiaomi RedmiBook Pro 15 i7-11370H, GeForce MX450, 70 Wh | Dell Inspiron 15 5518-2X3JR i5-11300H, GeForce MX450, 54 Wh | Lenovo IdeaPad 5 Pro 16IHU6 i5-11300H, GeForce MX450, 75 Wh | Asus VivoBook S15 D533UA R7 5700U, Vega 8, 50 Wh | Huawei MateBook D 16-53011VFJ R5 4600H, Vega 6, 56 Wh | Average of class Multimedia | |
|---|---|---|---|---|---|---|---|
| Battery runtime | -35% | -4% | -7% | -8% | -31% | 27% | |
| Reader / Idle (h) | 20.1 | 10.8 -46% | 19.4 -3% | 11.8 -41% | 25.2 ? 25% | ||
| H.264 (h) | 10.3 | 5.4 -48% | 10.4 1% | 8.5 -17% | 16.4 ? 59% | ||
| WiFi v1.3 (h) | 9.8 | 8.2 -16% | 9.4 -4% | 9.1 -7% | 9 -8% | 9 -8% | 12.2 ? 24% |
| Witcher 3 ultra (h) | 2.2 | 1 -55% | |||||
| Load (h) | 1.7 | 1.2 -29% | 1.4 -18% | 1.1 -35% | 1.662 ? -2% |
Pros
Cons
Verdict: The Acer Swift 3 impressed us in the test

The Acer Swift 3 SF316-51-75MK leaves a well-rounded impression in our test.
The Acer Swift 3's performance is more than sufficient for common applications of laptops in this class, such as web browsing, office tasks, and streaming. The CPU also handles somewhat more demanding applications. You can also play some games, even if it's only at medium graphics settings most of the time.
The Swift 3 proved to have outstanding properties in terms of energy consumption and therefore also in terms of battery life - despite its rather small battery. Our chosen competition barely stood a chance in this regard. The high-contrast and vivid display is also appealing, but it could've been a bit brighter.
For around 1,000 Euros (~$1,116), buyers will receive a well-balanced laptop that doesn't show any major weaknesses in the test, and that doesn't need to shy away from its competitors in this price range. It's a good all-rounder that is suitable for both work and entertainment.
It offers the best performance among the comparison models listed, but it's also 100 to 200 Euros (~$116 to ~$231) more expensive than the competition in some cases. Some alternatives that are close in terms of performance are the Xiaomi RedmiBook Pro 15 with the same CPU, or the Lenovo IdeaPad 5 Pro 16IHU6 with a weaker i5-11300H, both of which are equipped with a GeForce MX450 as their dedicated graphics solution.
Price and availability
At the time of writing, you can find the Acer Swift 3 (Intel Core i7-11370H, Intel Iris Xe Graphics G7 96EUs, 16 GB DDR4x RAM, 512 GB SSD) on Amazon for around $999.
Acer Swift 3 SF316-51
- 10/01/2021 v7 (old)
Marcus Schwarten
Price comparison

