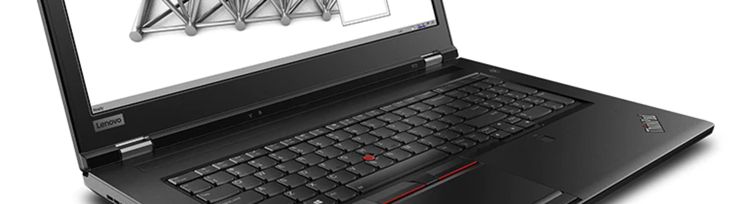
Lenovo ThinkPad P73 Review - Mobile Workstation with Core i9, RTX 4000 and 4K
The ThinkPad P73 is Lenovo's biggest mobile workstation, but it struggled with the performance. Especially the powerful Nvidia Quadro RTX GPUs did not utilize their full potential. Lenovo had to launch some BIOS updates to improve the situation. Lenovo has already launched the successor ThinkPad P17 by now, bit the components are still pretty much the same. You now get Intel 10th generation chips, which do not offer any noticeable performance gains, and even the identical Nvidia Quadro GPUs. With the P73 equipped with a Core i9 and the RTX 4000, we once again want to check whether the performance now meets the expectations. Please see our comprehensive review of the ThinkPad P73 with the RTX 3000 for more information on the case, ports, input devices, and the speakers:
Possible competitors in comparison
Rating | Date | Model | Weight | Height | Size | Resolution | Price |
|---|---|---|---|---|---|---|---|
| 88.2 % v7 (old) | 01 / 2021 | Lenovo ThinkPad P73-20QR0030GE i9-9880H, Quadro RTX 4000 (Laptop) | 3.5 kg | 31 mm | 17.30" | 3840x2160 | |
| 86.2 % v7 (old) | 03 / 2020 | Acer ConceptD 9 Pro i9-9980HK, Quadro RTX 5000 (Laptop) | 4.5 kg | 26.5 mm | 17.30" | 3840x2160 | |
| 86.4 % v7 (old) | 05 / 2020 | Asus ProArt StudioBook Pro 17 W700G3T i7-9750H, Quadro RTX 3000 Max-Q | 2.5 kg | 18.4 mm | 17.00" | 1920x1200 | |
| 84.8 % v7 (old) | 11 / 2019 | MSI WE75 9TK i7-9750H, Quadro RTX 3000 (Laptop) | 2.6 kg | 27.5 mm | 17.30" | 1920x1080 | |
| 86.6 % v7 (old) | 12 / 2019 | Lenovo ThinkPad P73-20QR002DGE i7-9850H, Quadro RTX 3000 (Laptop) | 3.5 kg | 31 mm | 17.30" | 1920x1080 |
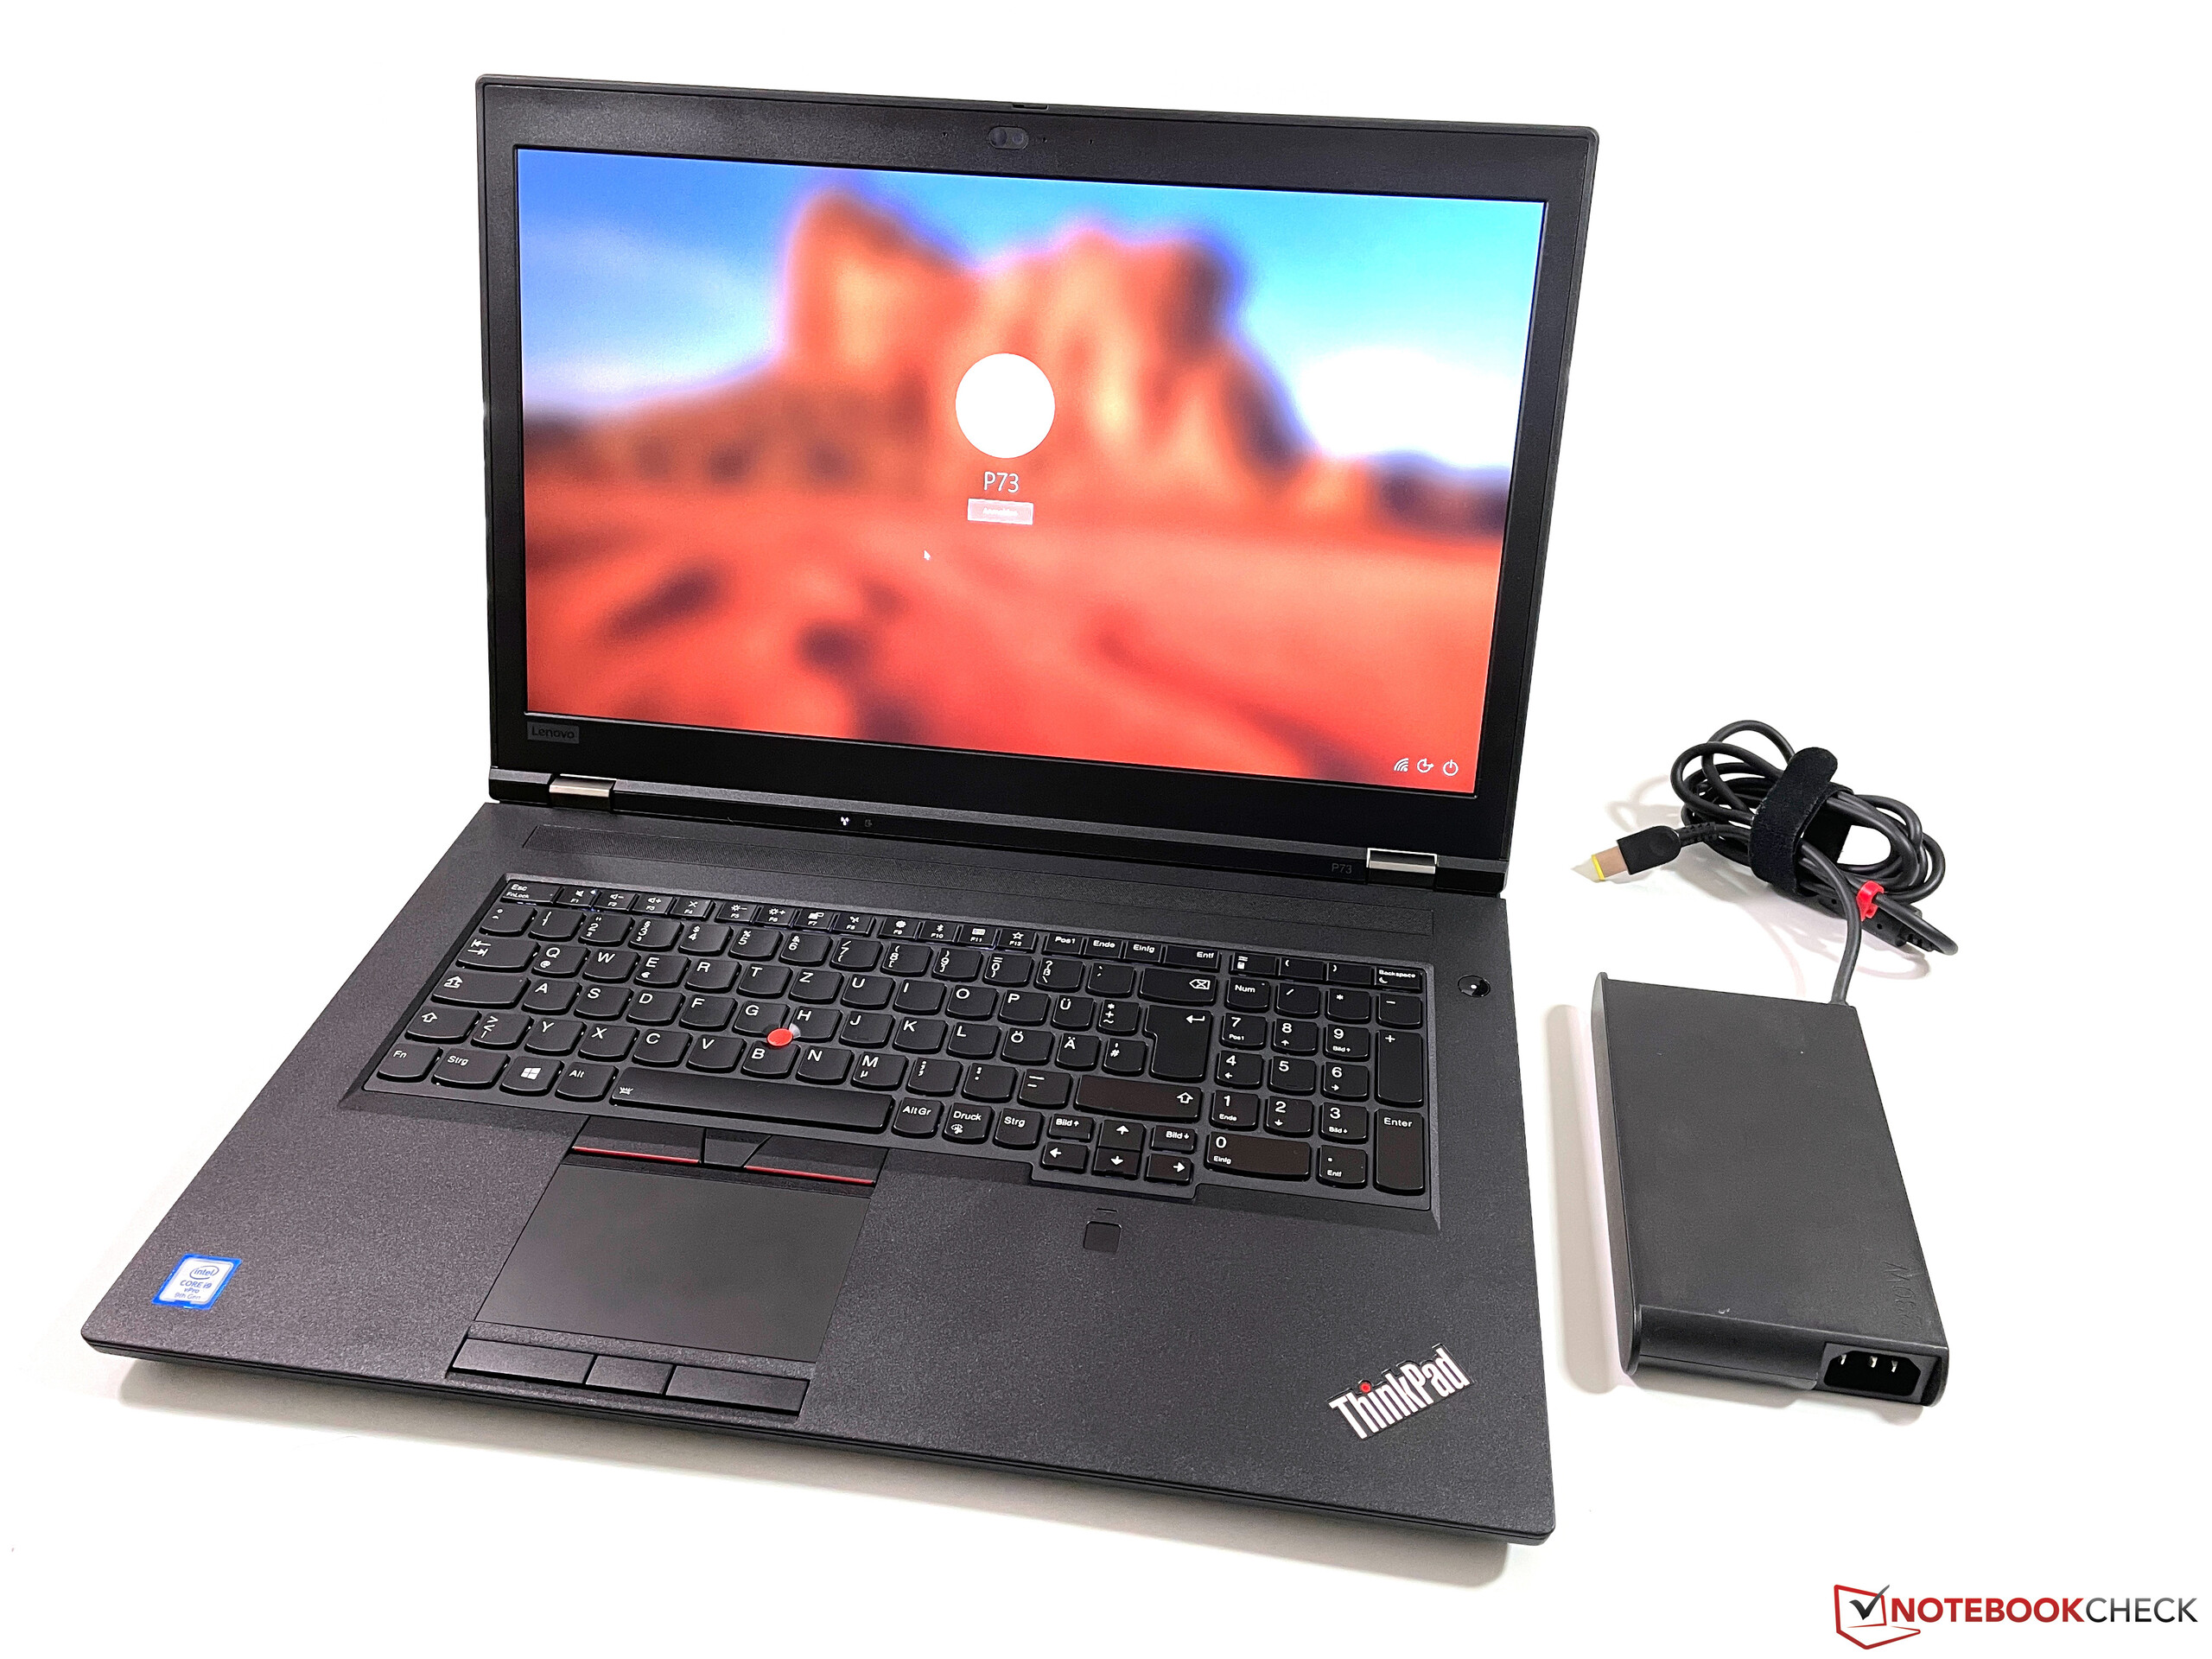
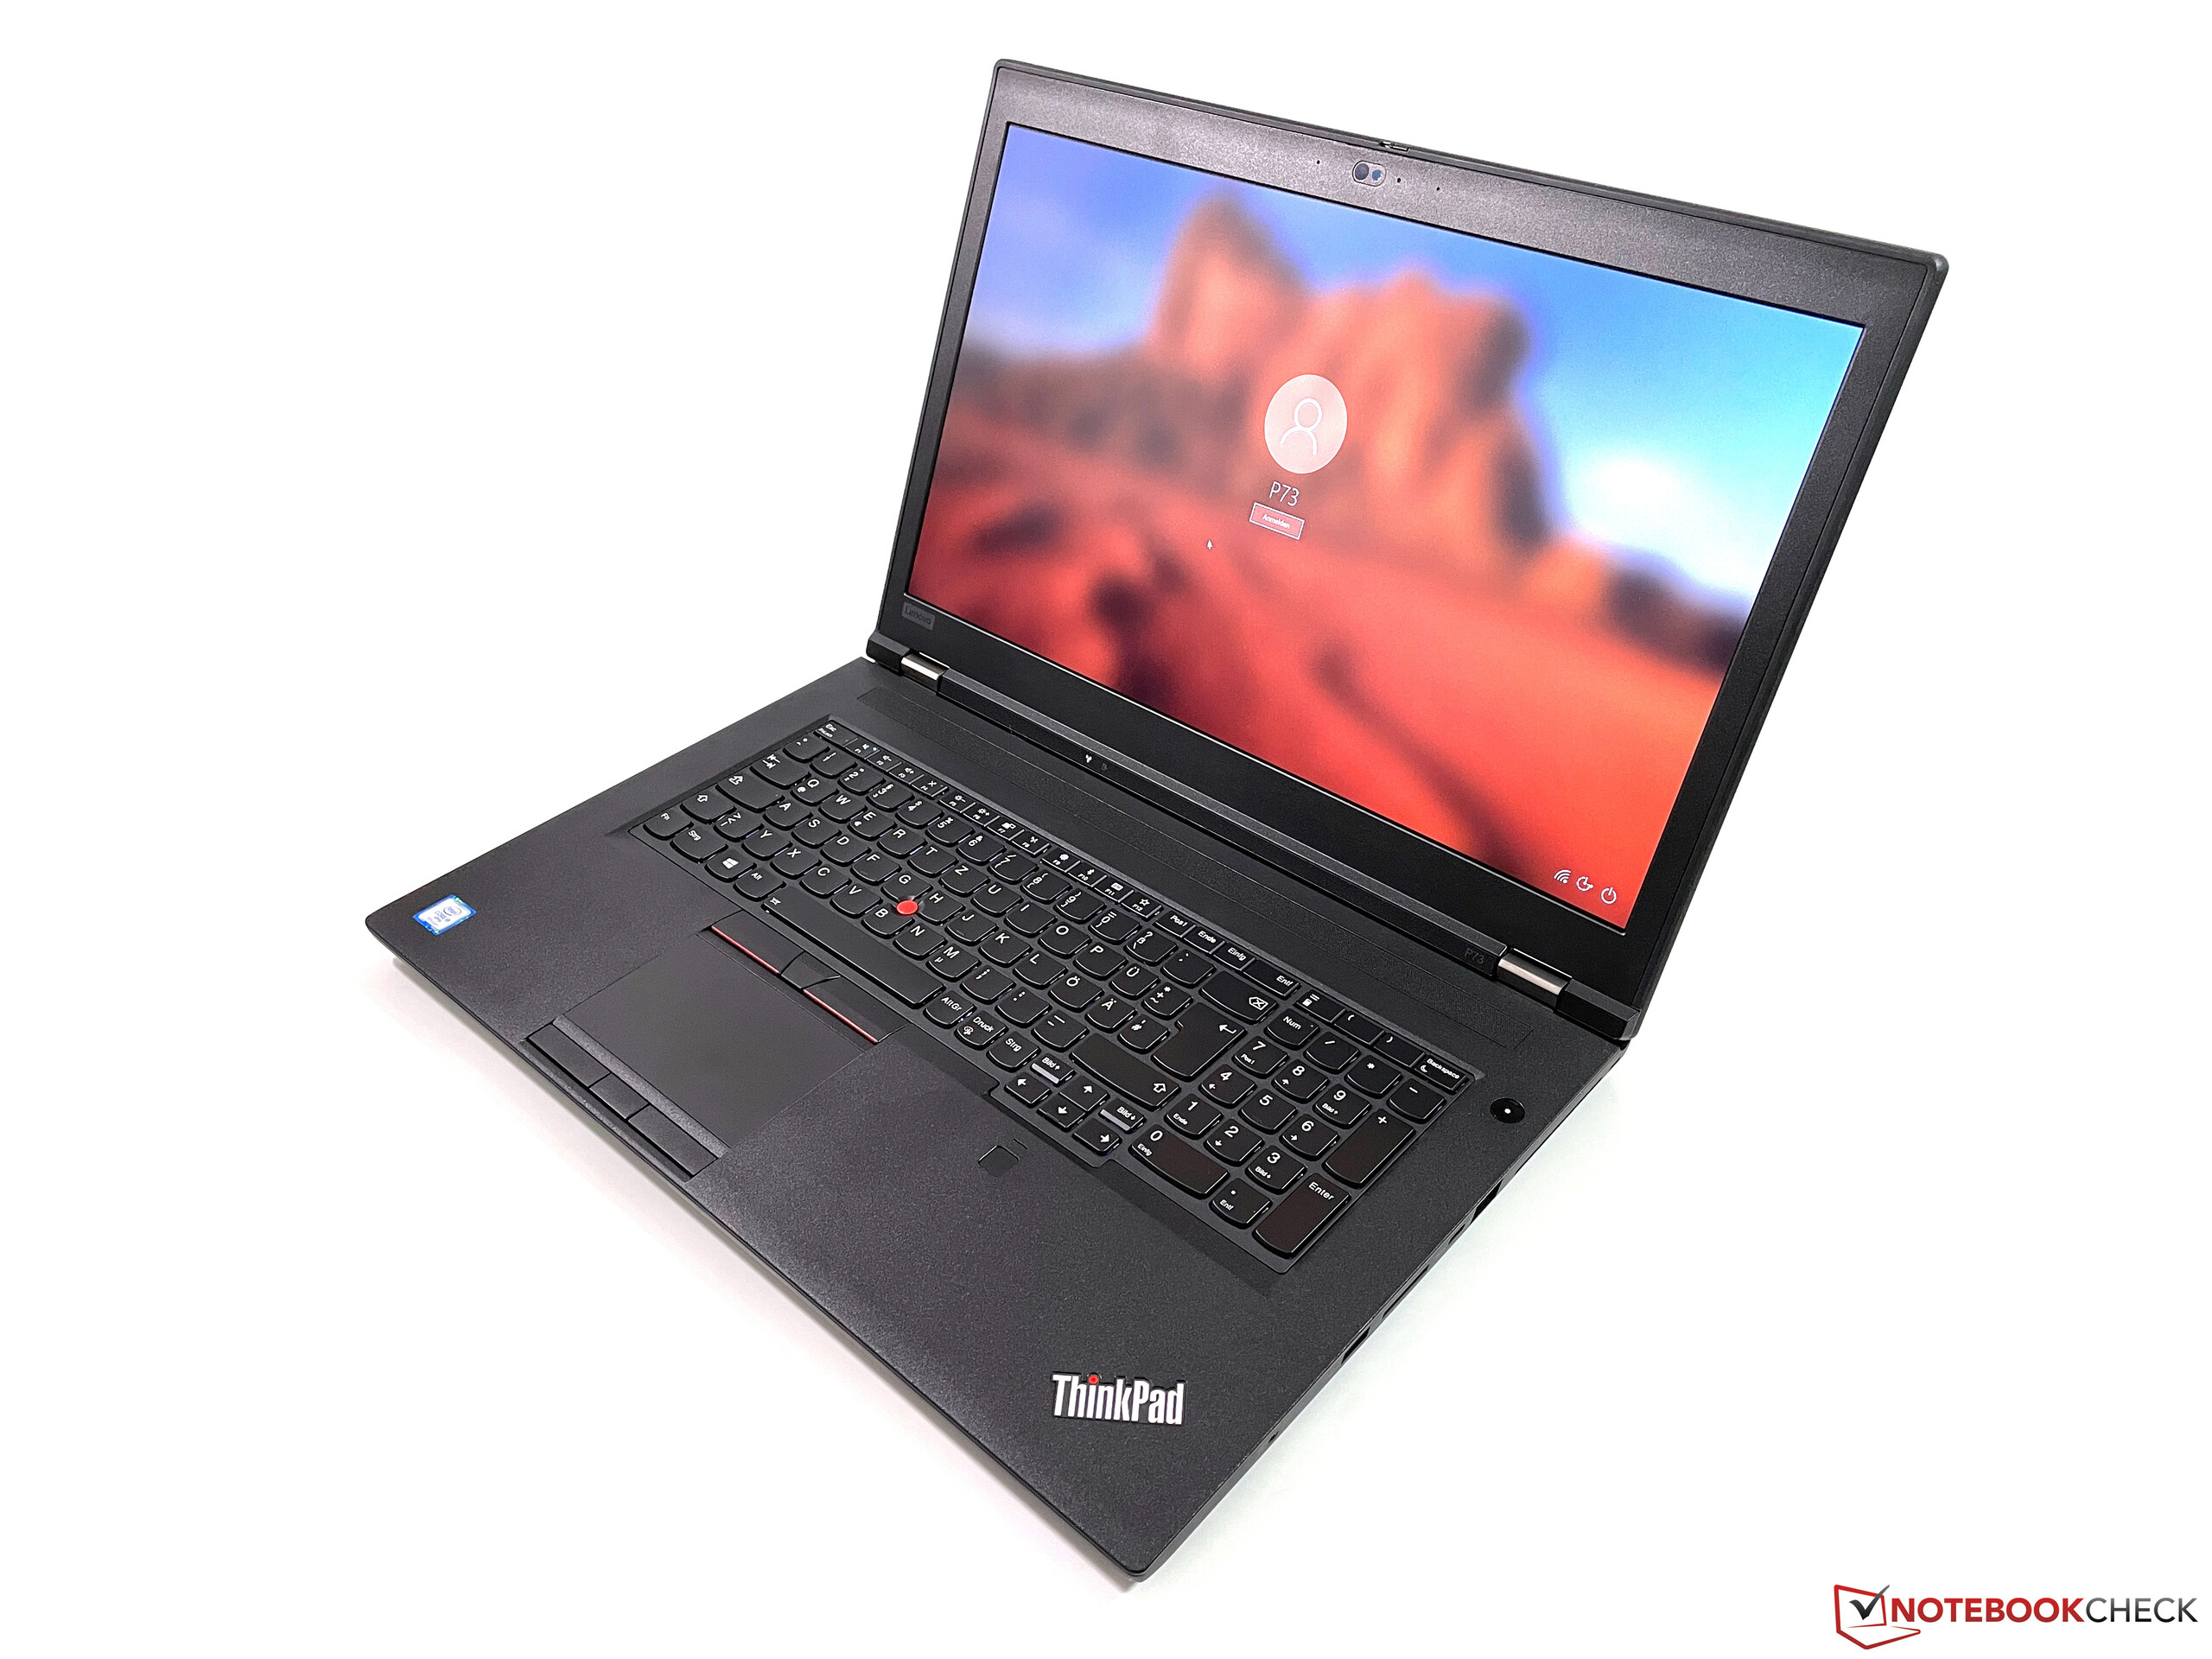
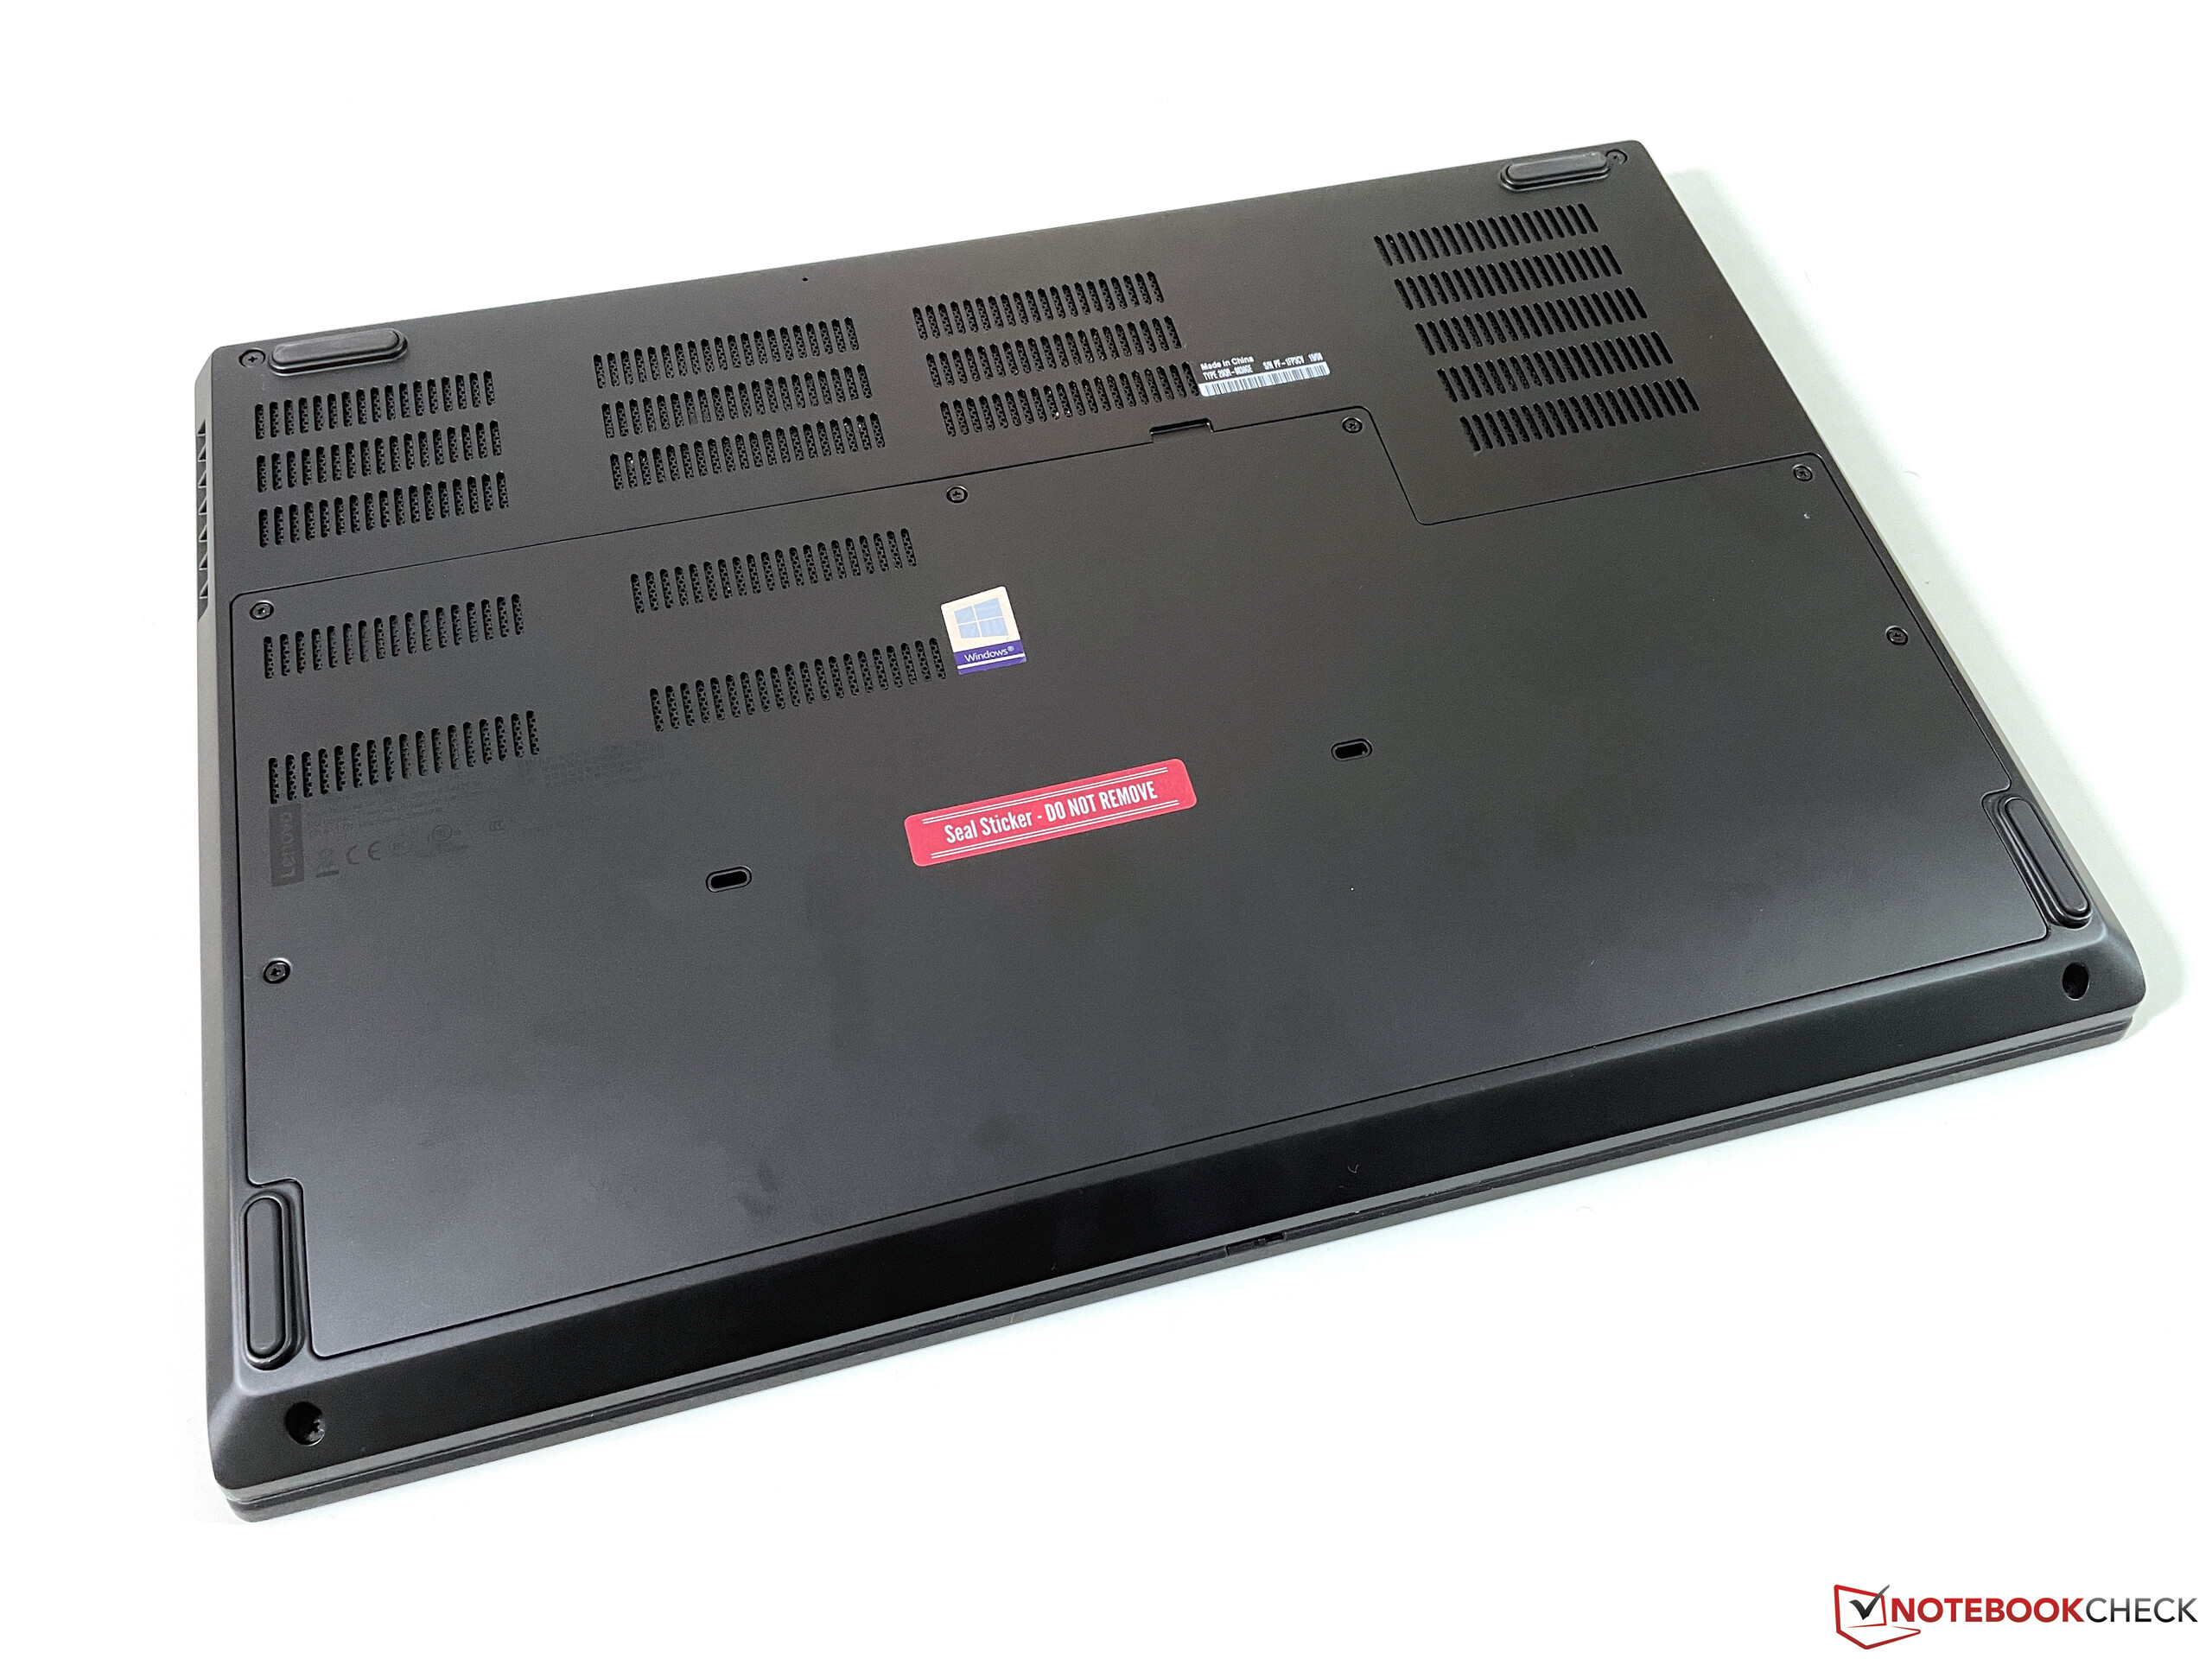
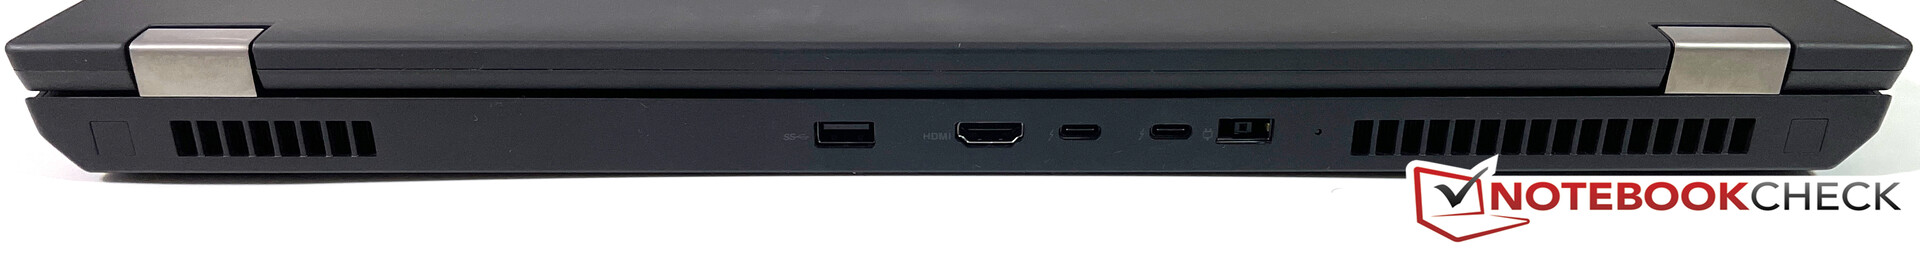
Case & Connectivity
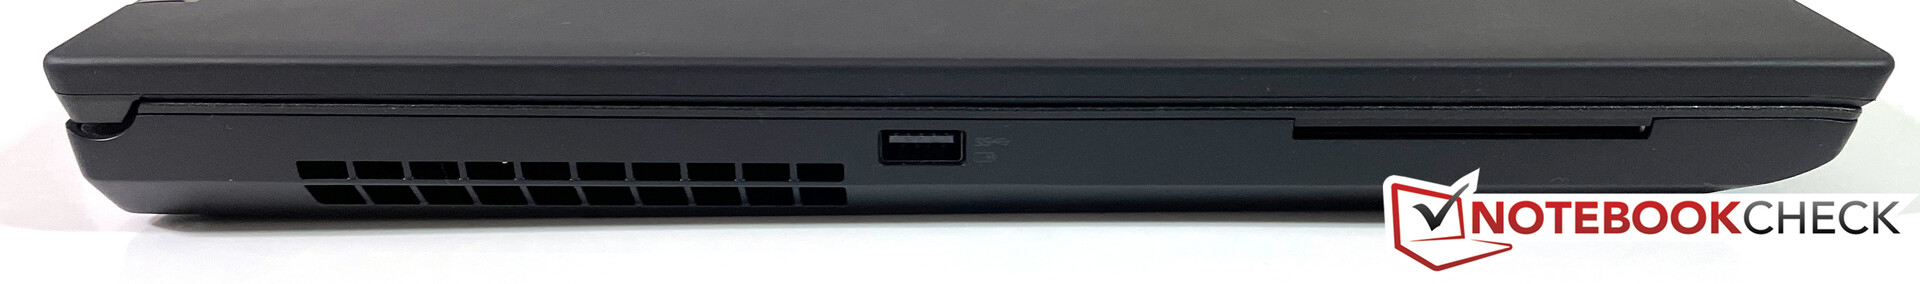
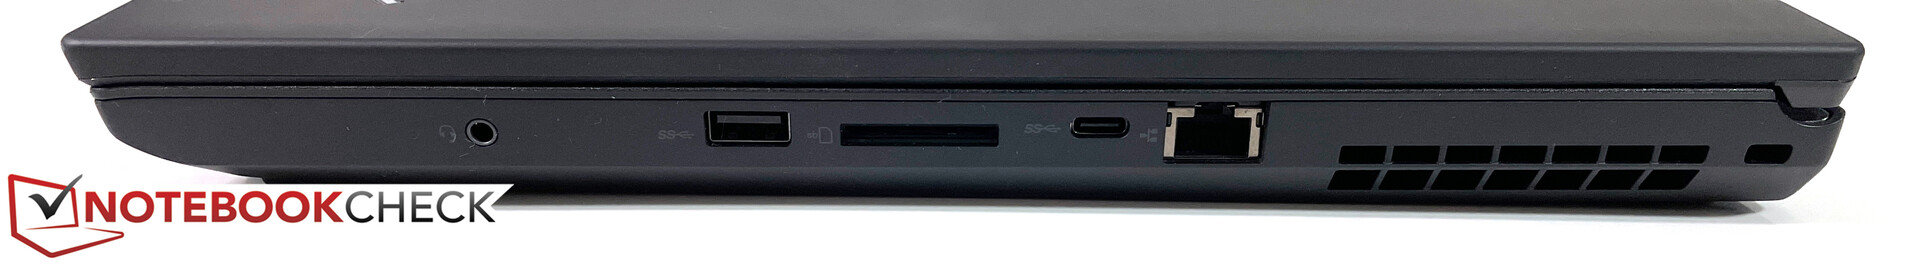
| SD Card Reader | |
| average JPG Copy Test (av. of 3 runs) | |
| Lenovo ThinkPad P73-20QR002DGE (Toshiba Exceria Pro SDXC 64 GB UHS-II) | |
| Lenovo ThinkPad P73-20QR0030GE (Toshiba Exceria Pro SDXC 64 GB UHS-II) | |
| Asus ProArt StudioBook Pro 17 W700G3T (Toshiba Exceria Pro SDXC 64 GB UHS-II) | |
| Average of class Workstation (49.6 - 681, n=14, last 2 years) | |
| MSI WE75 9TK (Toshiba Exceria Pro SDXC 64 GB UHS-II) | |
| maximum AS SSD Seq Read Test (1GB) | |
| Asus ProArt StudioBook Pro 17 W700G3T (Toshiba Exceria Pro SDXC 64 GB UHS-II) | |
| Average of class Workstation (87.6 - 1455, n=14, last 2 years) | |
| Lenovo ThinkPad P73-20QR002DGE (Toshiba Exceria Pro SDXC 64 GB UHS-II) | |
| Lenovo ThinkPad P73-20QR0030GE (Toshiba Exceria Pro SDXC 64 GB UHS-II) | |
| MSI WE75 9TK (Toshiba Exceria Pro SDXC 64 GB UHS-II) | |

, i9-9880H, Samsung PM981a MZVLB1T0HBLR")
, i9-9880H, Samsung PM981a MZVLB1T0HBLR")
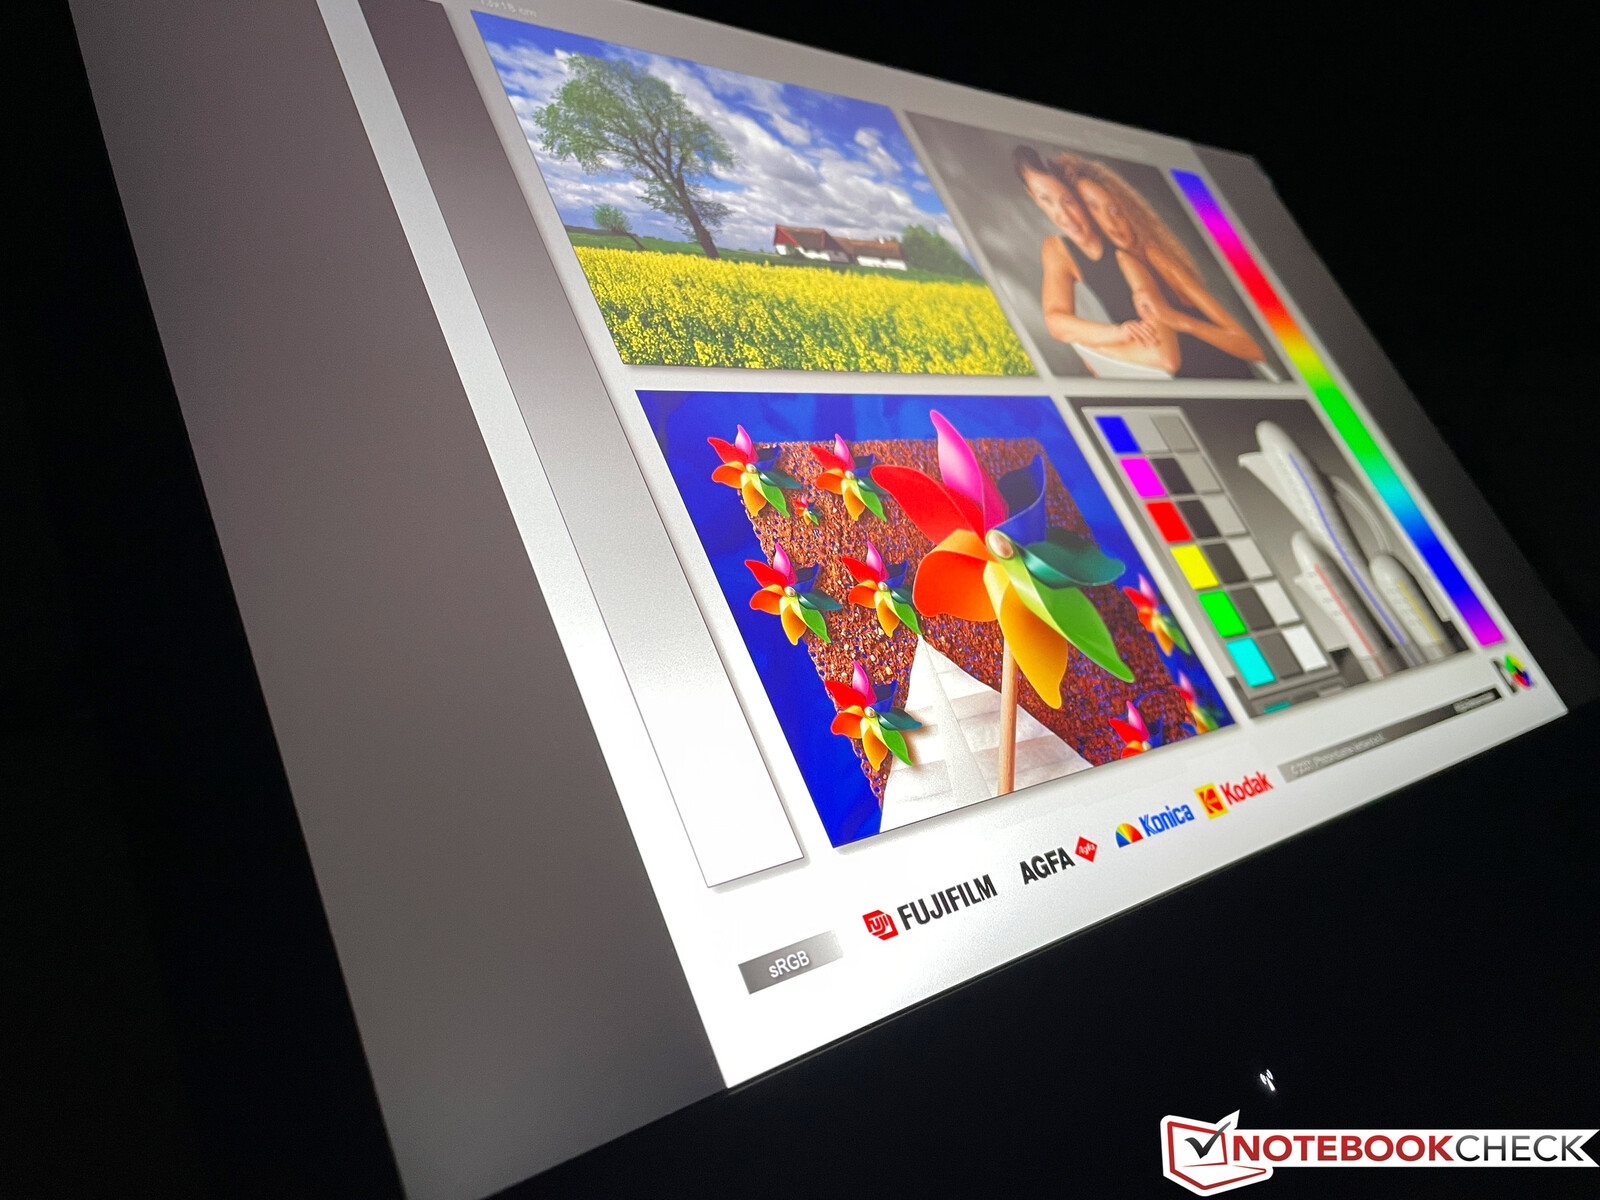
Display - 4K panel with drawbacks
Our test unit is equipped with the matte 4K panel. We cannot confirm the advertised brightness of 400 nits at any measuring spot. Lenovo still uses 16:9 panels for the successor ThinkPad P17, but the brightness of the 4K screen is now rated at around 500 nits.
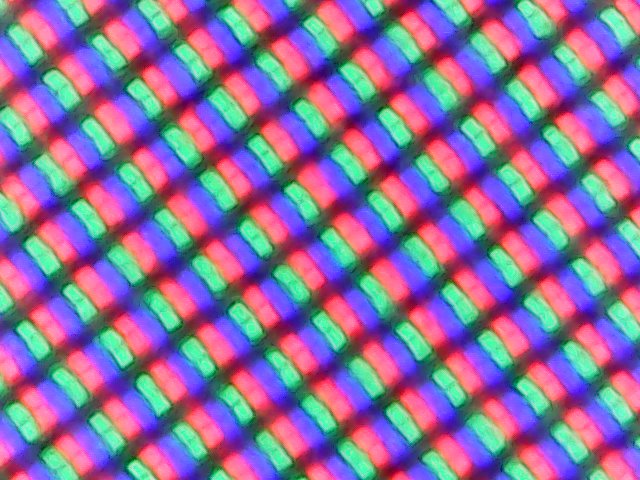
The subjective picture impression is decent, but not great. Bright surfaces look a bit grainy and the contrast ratio is lower than 1000:1 due to the high black value (0.38 cd/m²). This panel from AU Optronics (B173ZAN01.0) does not use PWM. Our test unit suffers from clearly visible backlight bleeding, especially at the lower edge, which is also noticeable on dark surfaces in everyday scenarios.

| |||||||||||||||||||||||||
Brightness Distribution: 88 %
Center on Battery: 363 cd/m²
Contrast: 963:1 (Black: 0.38 cd/m²)
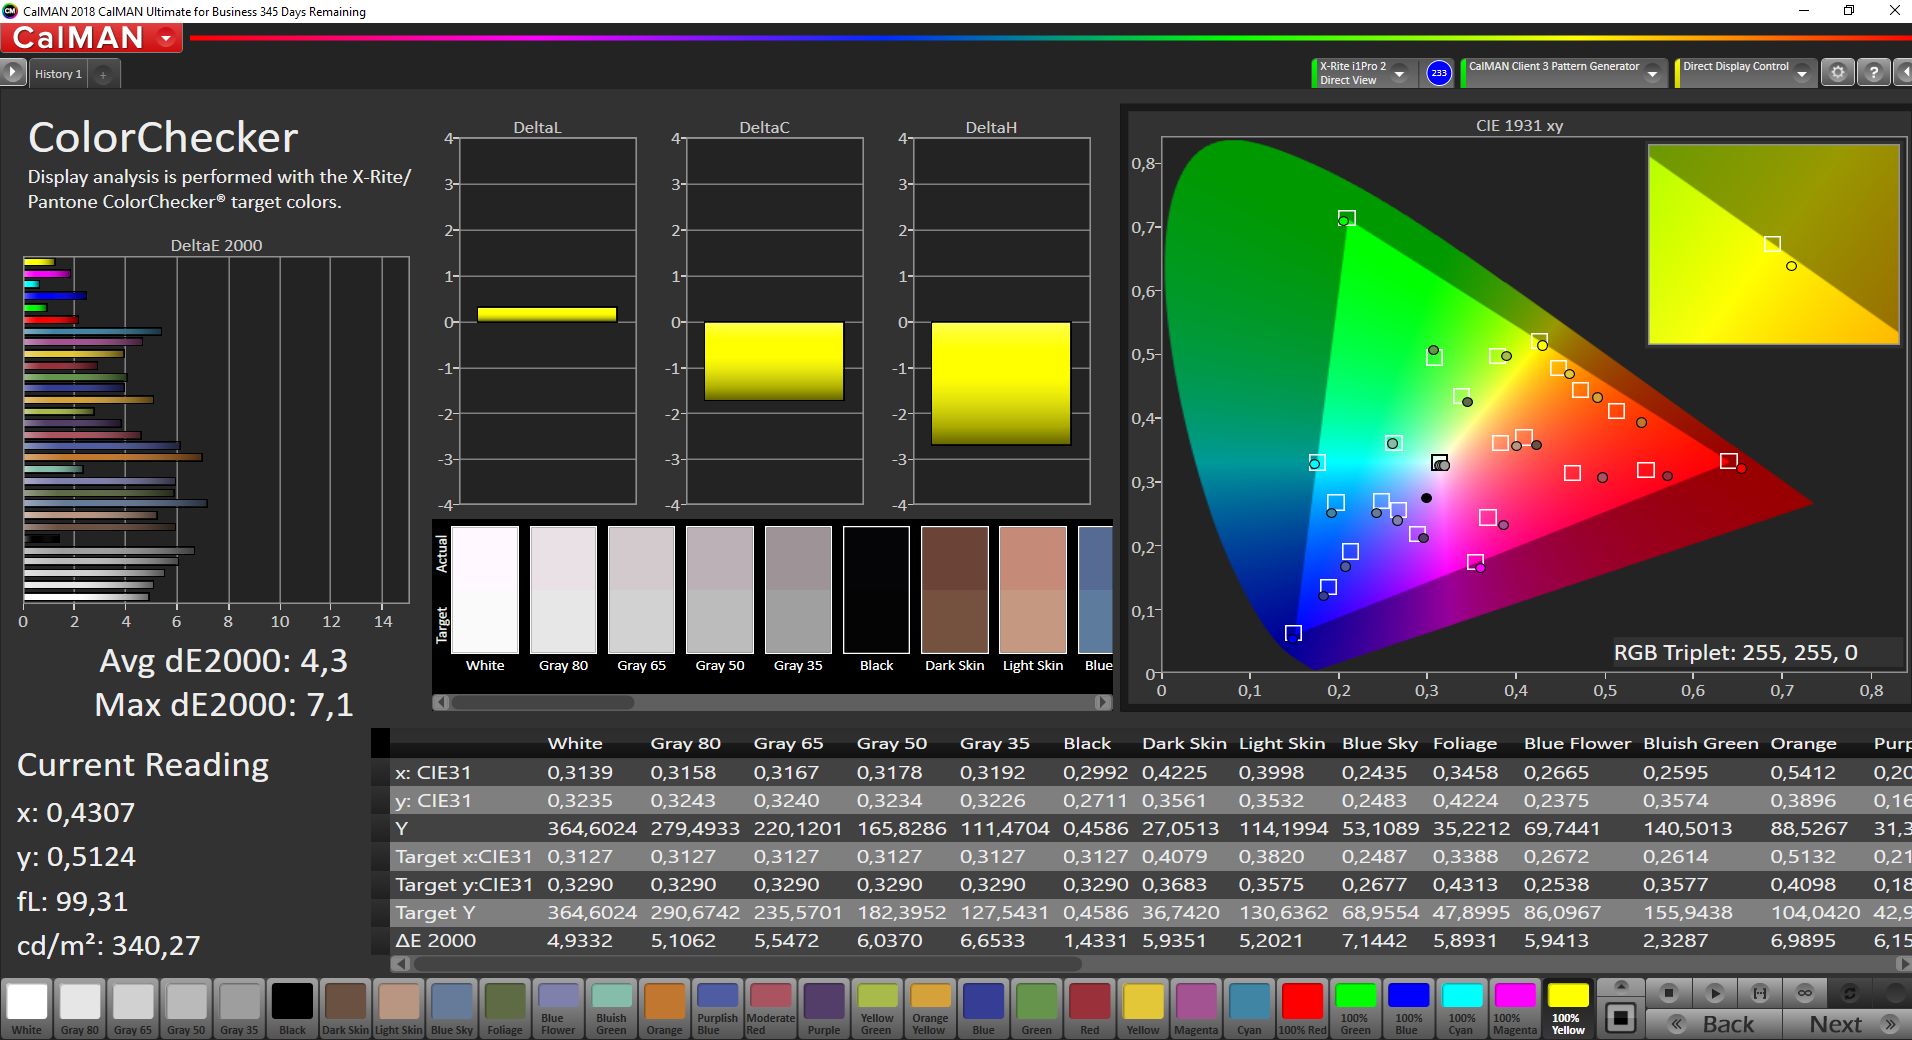
ΔE ColorChecker Calman: 4.3 | ∀{0.5-29.43 Ø4.71}
calibrated: 1.1
ΔE Greyscale Calman: 5.5 | ∀{0.09-98 Ø4.96}
100% sRGB (Argyll 1.6.3 3D)
86% AdobeRGB 1998 (Argyll 1.6.3 3D)
98.8% AdobeRGB 1998 (Argyll 3D)
100% sRGB (Argyll 3D)
86.8% Display P3 (Argyll 3D)
Gamma: 2.47
CCT: 6281 K
| Lenovo ThinkPad P73-20QR0030GE B173ZAN01.0, IPS, 3840x2160, 17.3" | Acer ConceptD 9 Pro AU Optronics B173ZAN03.1, IPS, 3840x2160, 17.3" | Asus ProArt StudioBook Pro 17 W700G3T 170PUW1-A00, IPS, 1920x1200, 17" | MSI WE75 9TK AU Optronics B173HAN04.2, IPS, 1920x1080, 17.3" | Lenovo ThinkPad P73-20QR002DGE N173HCE-E31, IPS LED, 1920x1080, 17.3" | |
|---|---|---|---|---|---|
| Display | -4% | -1% | -24% | -20% | |
| Display P3 Coverage (%) | 86.8 | 80.9 -7% | 96.2 11% | 63.2 -27% | 67.5 -22% |
| sRGB Coverage (%) | 100 | 97.9 -2% | 99.8 0% | 89.9 -10% | 94.2 -6% |
| AdobeRGB 1998 Coverage (%) | 98.8 | 95.1 -4% | 84.7 -14% | 64.3 -35% | 67.8 -31% |
| Response Times | -30% | -3% | 6% | 2% | |
| Response Time Grey 50% / Grey 80% * (ms) | 44 ? | 53 ? -20% | 41.2 ? 6% | 30.8 ? 30% | 40 ? 9% |
| Response Time Black / White * (ms) | 26.4 ? | 37 ? -40% | 29.6 ? -12% | 31.2 ? -18% | 28 ? -6% |
| PWM Frequency (Hz) | 25000 ? | ||||
| Screen | 9% | 18% | -10% | -14% | |
| Brightness middle (cd/m²) | 366 | 377 3% | 323 -12% | 287.3 -22% | 333 -9% |
| Brightness (cd/m²) | 349 | 368 5% | 308 -12% | 280 -20% | 310 -11% |
| Brightness Distribution (%) | 88 | 83 -6% | 88 0% | 89 1% | 83 -6% |
| Black Level * (cd/m²) | 0.38 | 0.37 3% | 0.36 5% | 0.26 32% | 0.39 -3% |
| Contrast (:1) | 963 | 1019 6% | 897 -7% | 1105 15% | 854 -11% |
| Colorchecker dE 2000 * | 4.3 | 2.52 41% | 1.1 74% | 2.98 31% | 4.4 -2% |
| Colorchecker dE 2000 max. * | 7.1 | 5.55 22% | 3.3 54% | 5.08 28% | 7.5 -6% |
| Colorchecker dE 2000 calibrated * | 1.1 | 1.08 2% | 0.8 27% | 3.06 -178% | 2 -82% |
| Greyscale dE 2000 * | 5.5 | 3.83 30% | 0.8 85% | 3 45% | 5.1 7% |
| Gamma | 2.47 89% | 2.19 100% | 2.23 99% | 2.28 96% | 2.39 92% |
| CCT | 6281 103% | 6323 103% | 6479 100% | 6993 93% | 7061 92% |
| Color Space (Percent of AdobeRGB 1998) (%) | 86 | 84 -2% | 75.7 -12% | 58.1 -32% | 61.1 -29% |
| Color Space (Percent of sRGB) (%) | 100 | 98 -2% | 99.8 0% | 89.5 -10% | 94 -6% |
| Total Average (Program / Settings) | -8% /
2% | 5% /
12% | -9% /
-11% | -11% /
-13% |
* ... smaller is better
We use the professional CalMAN software in combination with the X-Rite i1 Pro 2 spectrophotometer for the display analysis. The factory calibration is not great, because both the grayscale as well as the colors show significant deviations from the AdobeRGB reference. The grayscale also shows a slight color cast towards red. Contrary to the recently reviewed ThinkPad P15s with the 4K screen, the P73 does not support pre-installed color profiles to switch the between color spaces.
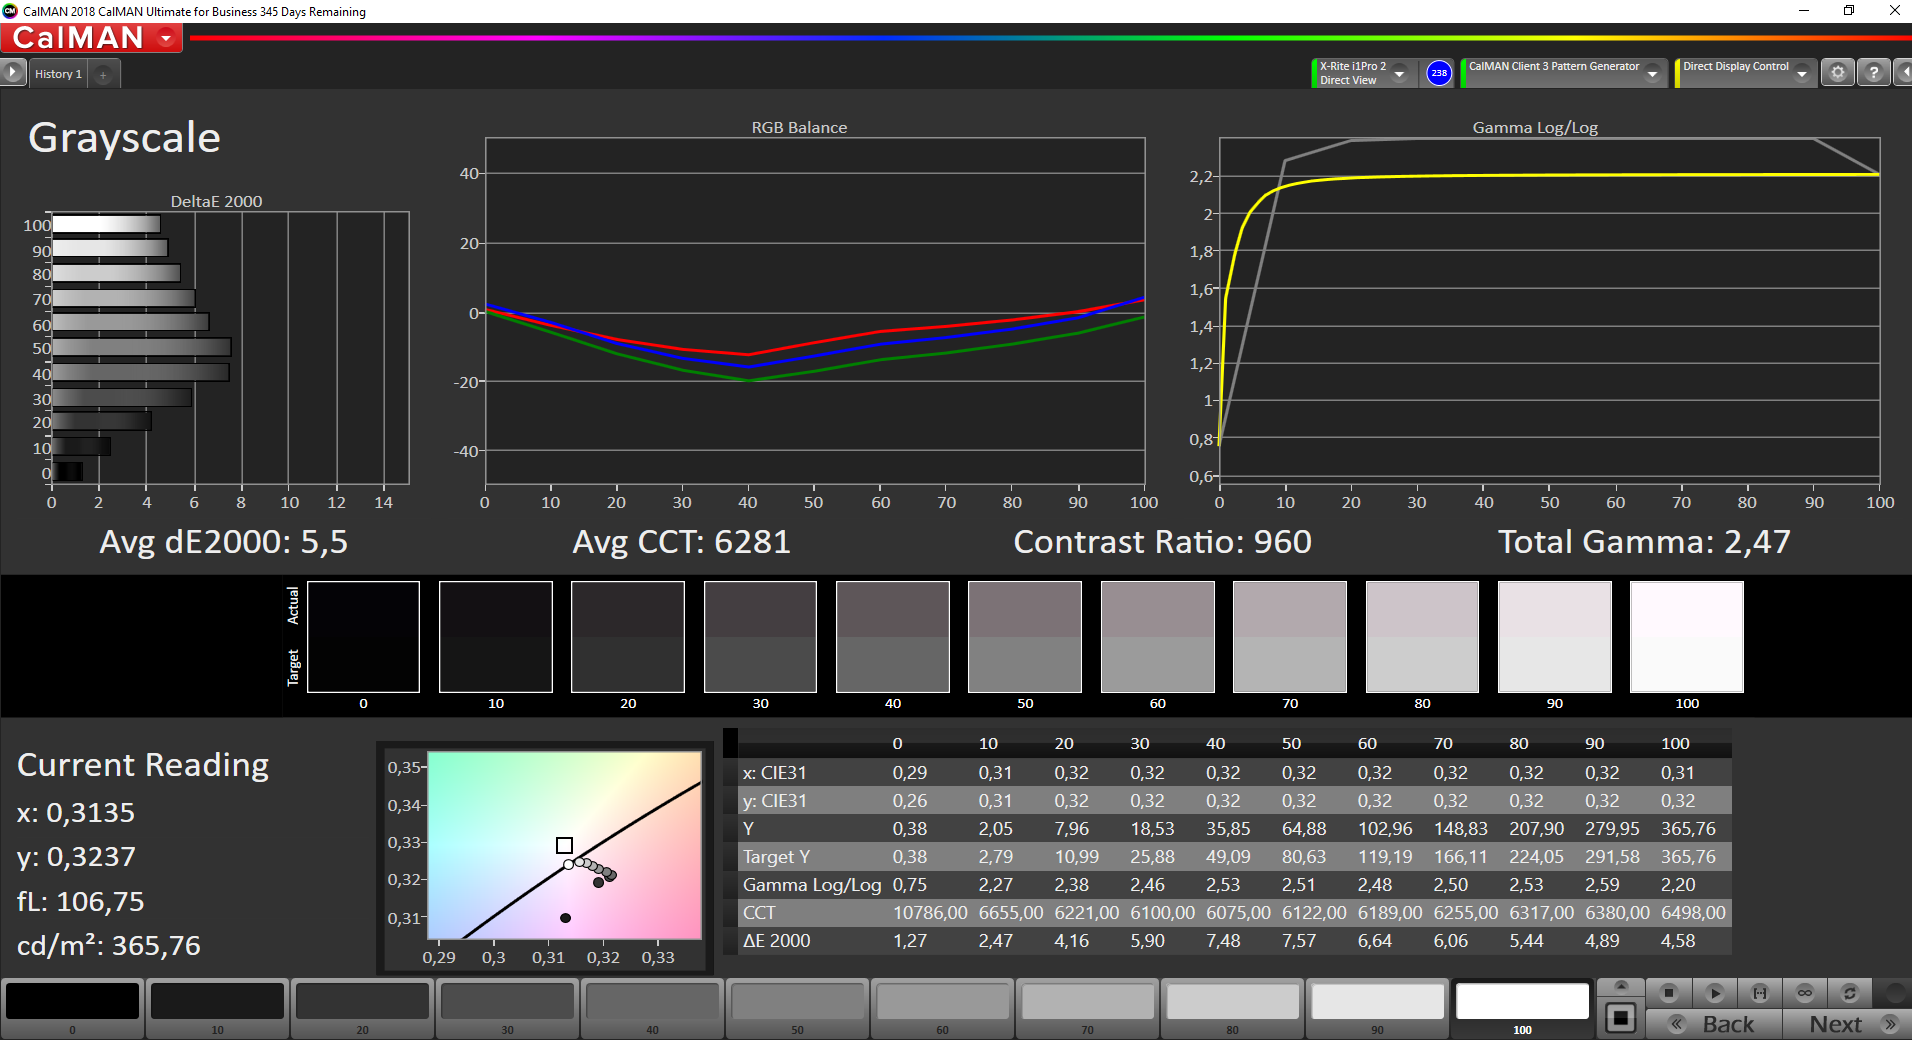
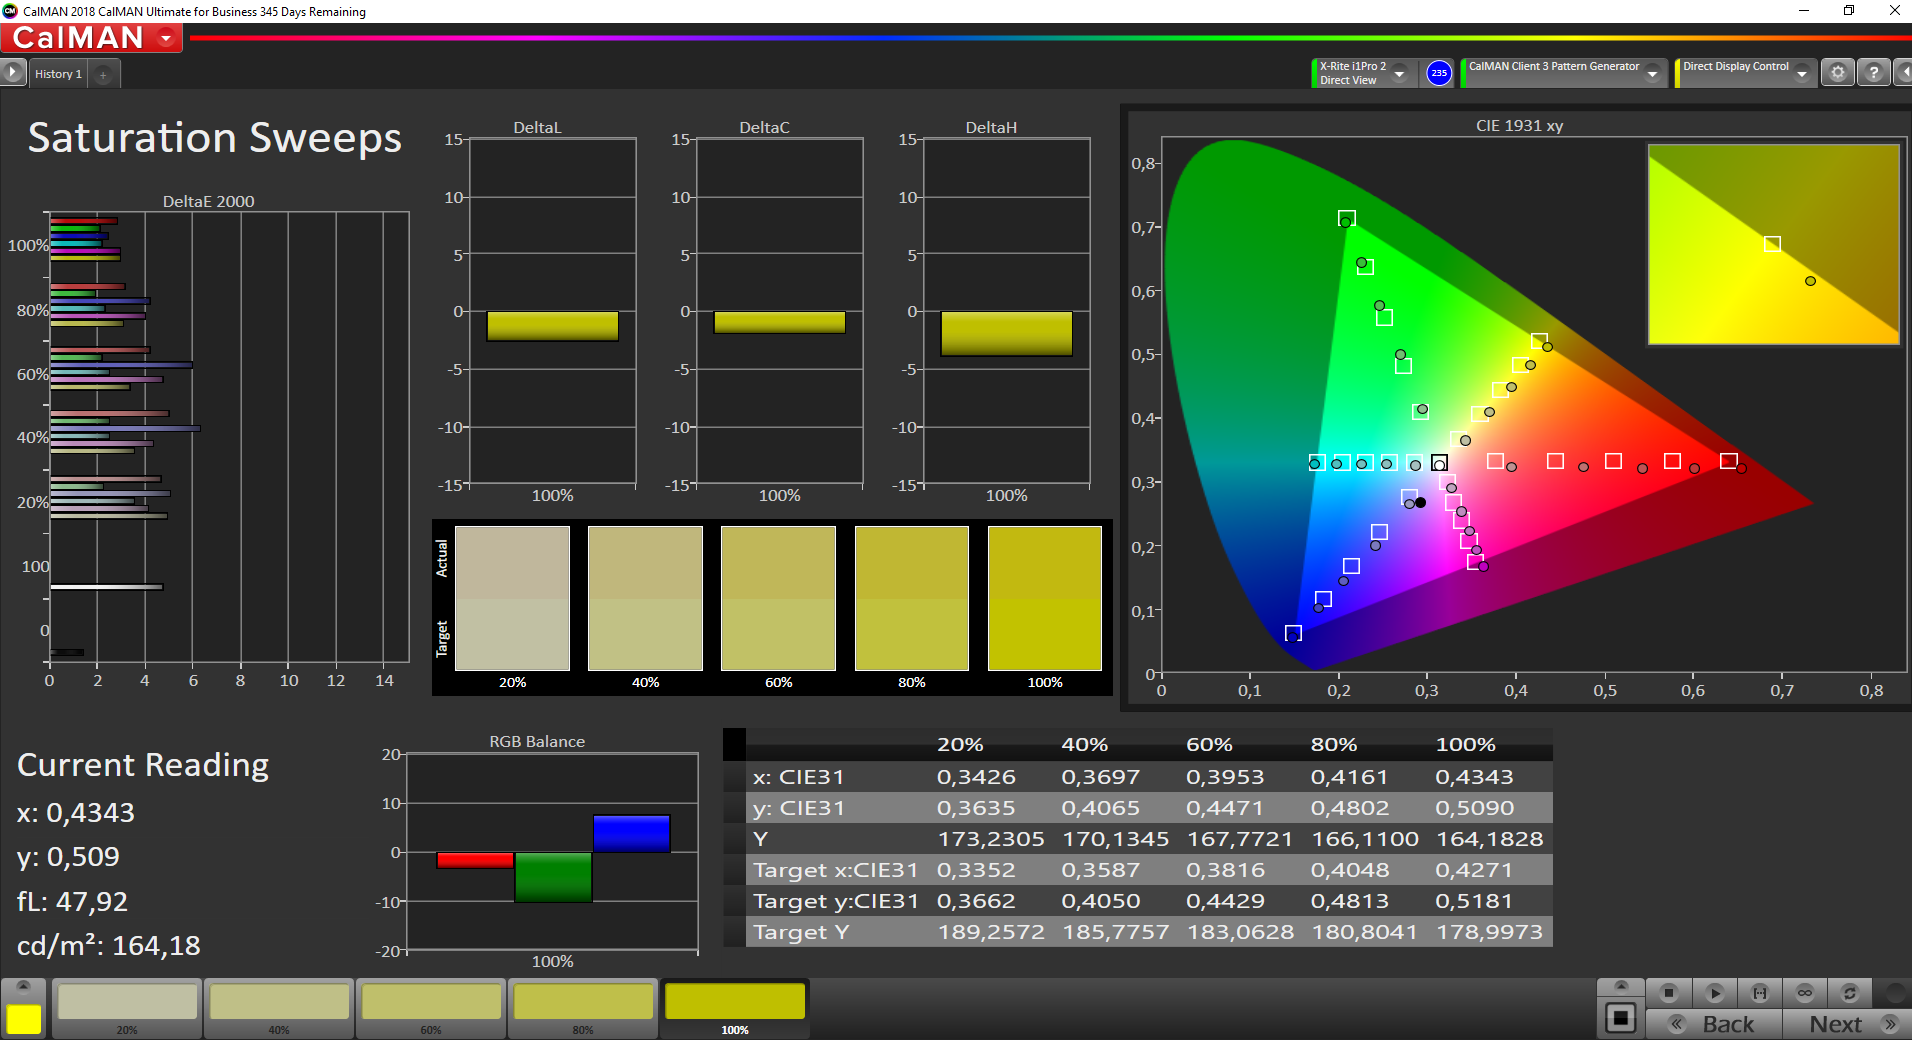
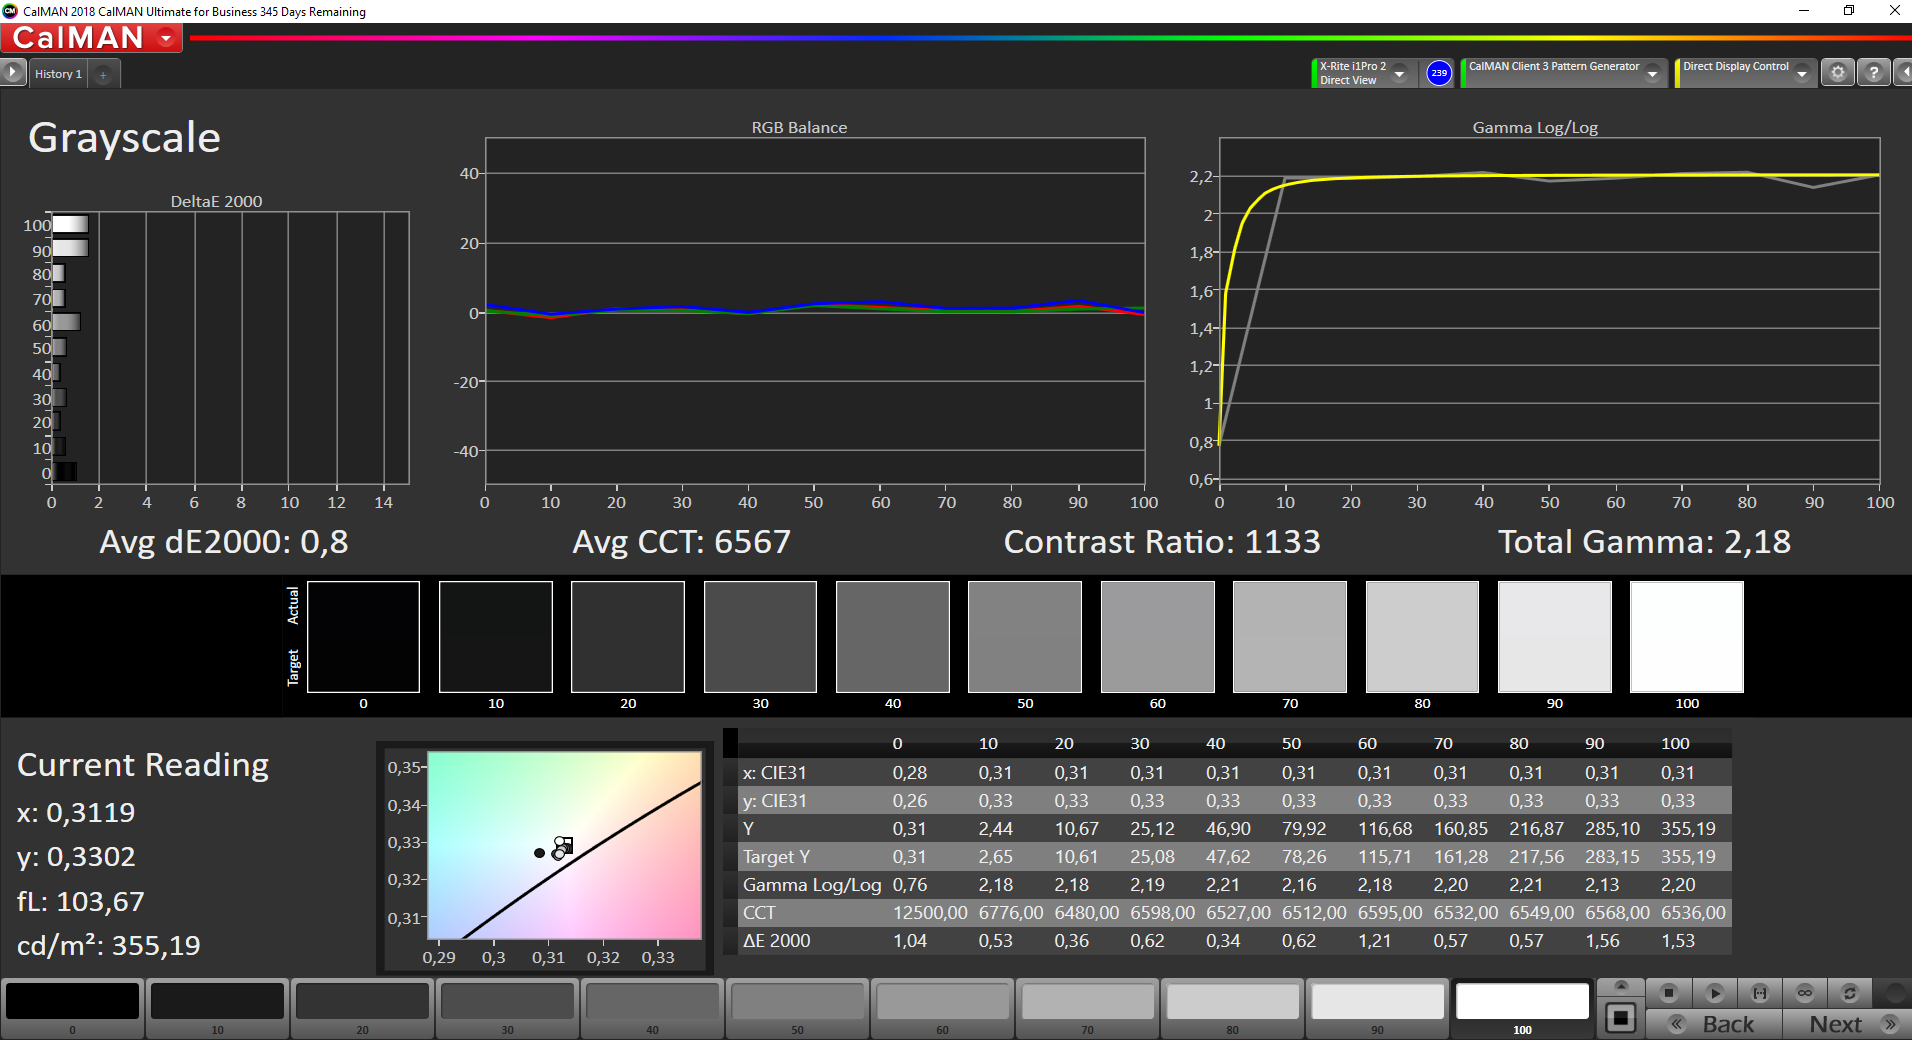
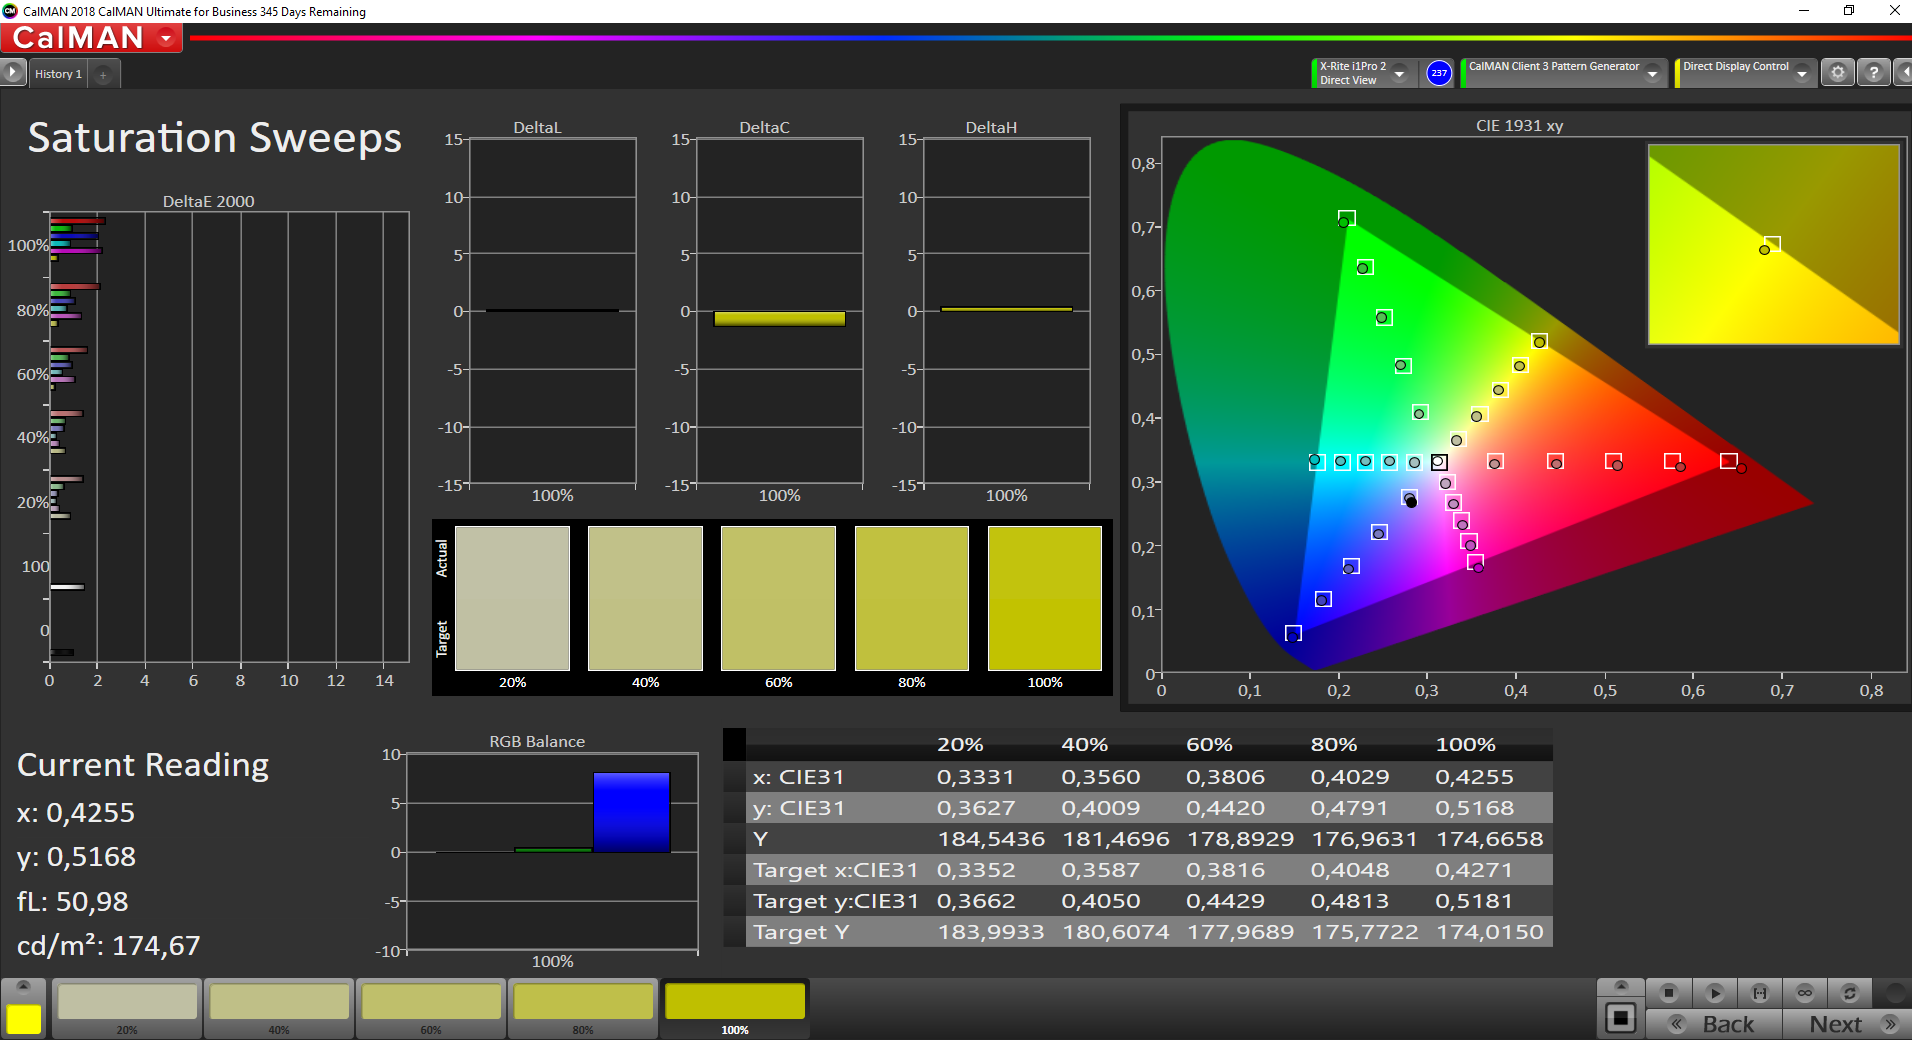
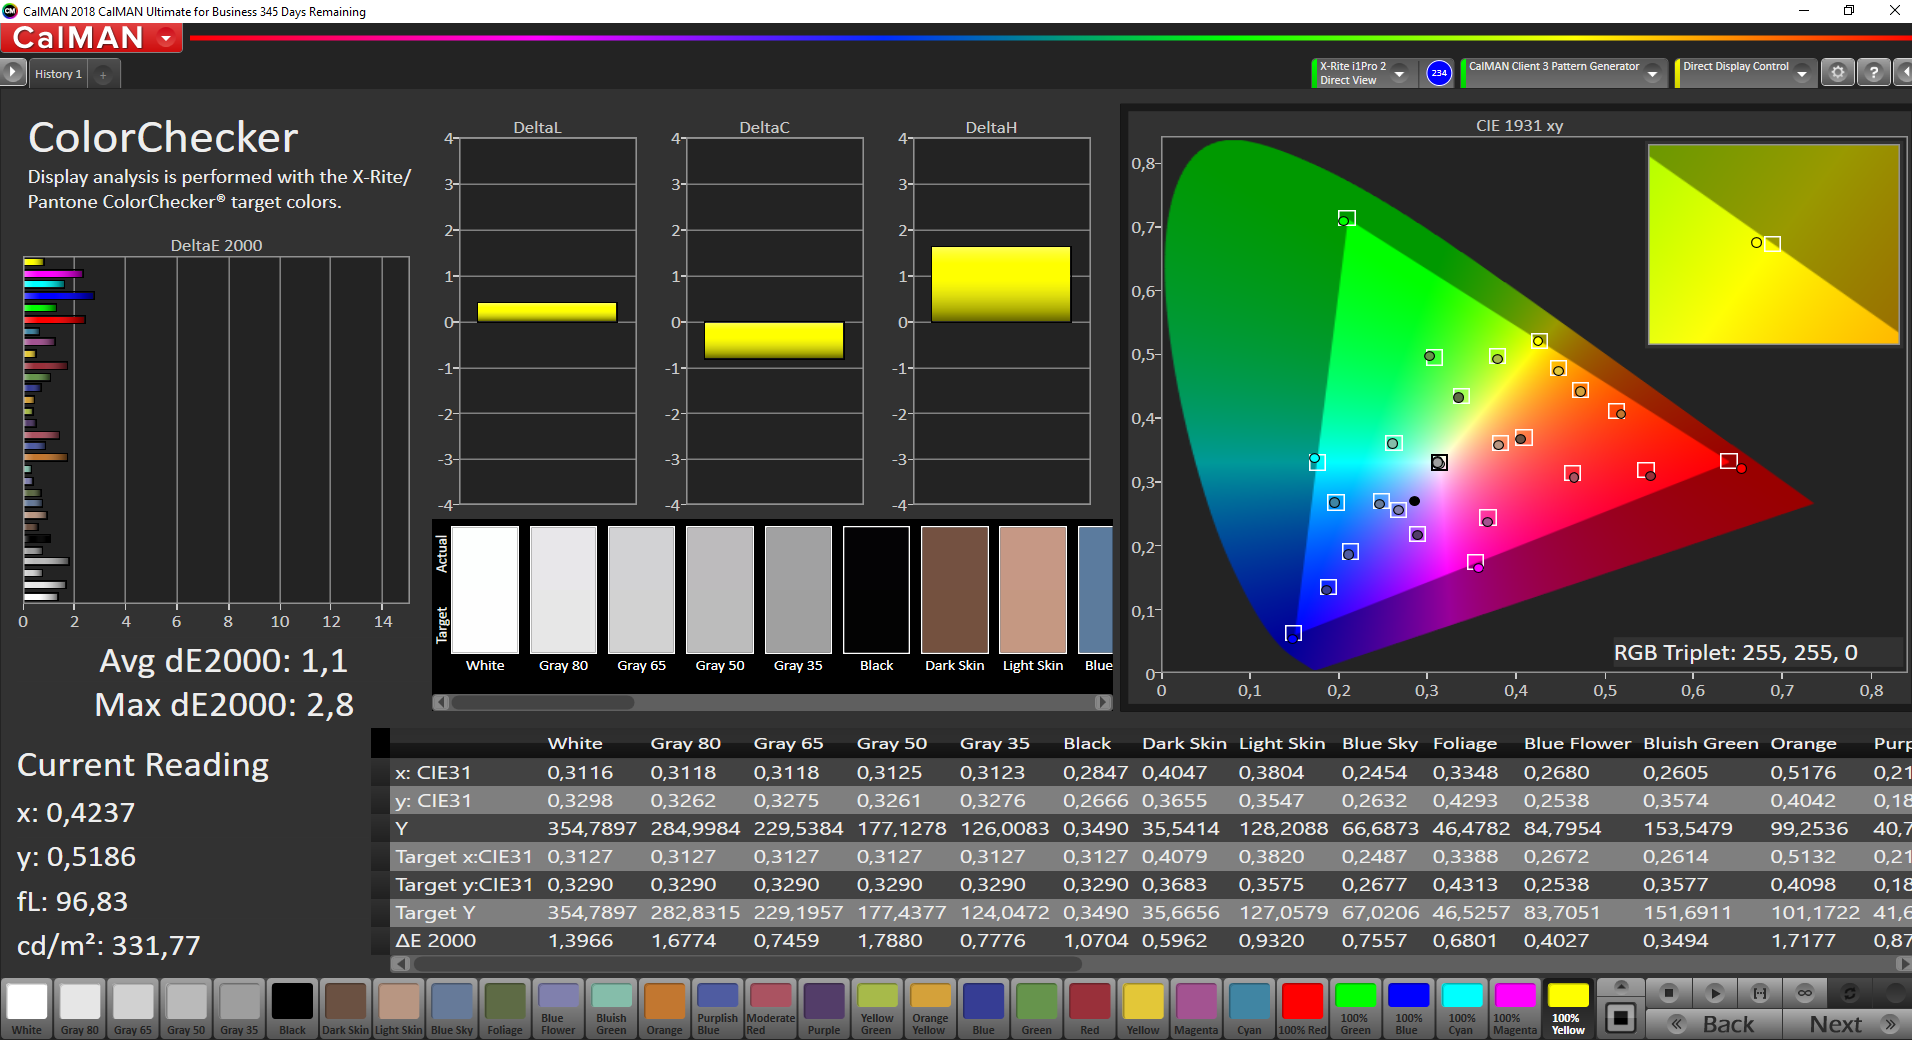
The situation is much better after our calibration (the profile can be downloaded for free in the box above), and both the grayscale as well as the color deviations are below the important mark of 3. The wide AdobeRGB color gamut is almost covered completely (88 %), which means the calibrated panel is suited for picture/video editing.
Display Response Times
| ↔ Response Time Black to White | ||
|---|---|---|
| 26.4 ms ... rise ↗ and fall ↘ combined | ↗ 14 ms rise | 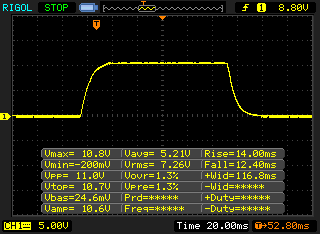 |
| ↘ 12.4 ms fall | ||
| The screen shows relatively slow response rates in our tests and may be too slow for gamers. In comparison, all tested devices range from 0.1 (minimum) to 240 (maximum) ms. » 66 % of all devices are better. This means that the measured response time is worse than the average of all tested devices (19.8 ms). | ||
| ↔ Response Time 50% Grey to 80% Grey | ||
| 44 ms ... rise ↗ and fall ↘ combined | ↗ 22 ms rise | 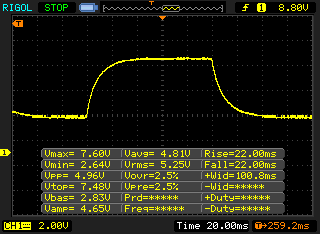 |
| ↘ 22 ms fall | ||
| The screen shows slow response rates in our tests and will be unsatisfactory for gamers. In comparison, all tested devices range from 0.165 (minimum) to 636 (maximum) ms. » 73 % of all devices are better. This means that the measured response time is worse than the average of all tested devices (30.9 ms). | ||
Screen Flickering / PWM (Pulse-Width Modulation)
| Screen flickering / PWM not detected | 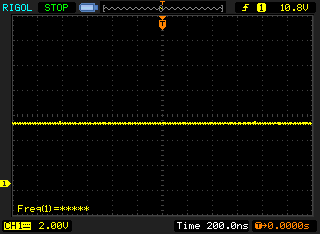 | ||
In comparison: 52 % of all tested devices do not use PWM to dim the display. If PWM was detected, an average of 7744 (minimum: 5 - maximum: 343500) Hz was measured. | |||
You can only use the P73 comfortable outdoors when you can avoid reflections from light sources and brighter environments. The large panel is matte, but it could have been much brighter. The viewing angle stability of the IPS panel is good.
Performance - ThinkPad P73 with Core i9 and RTX4000
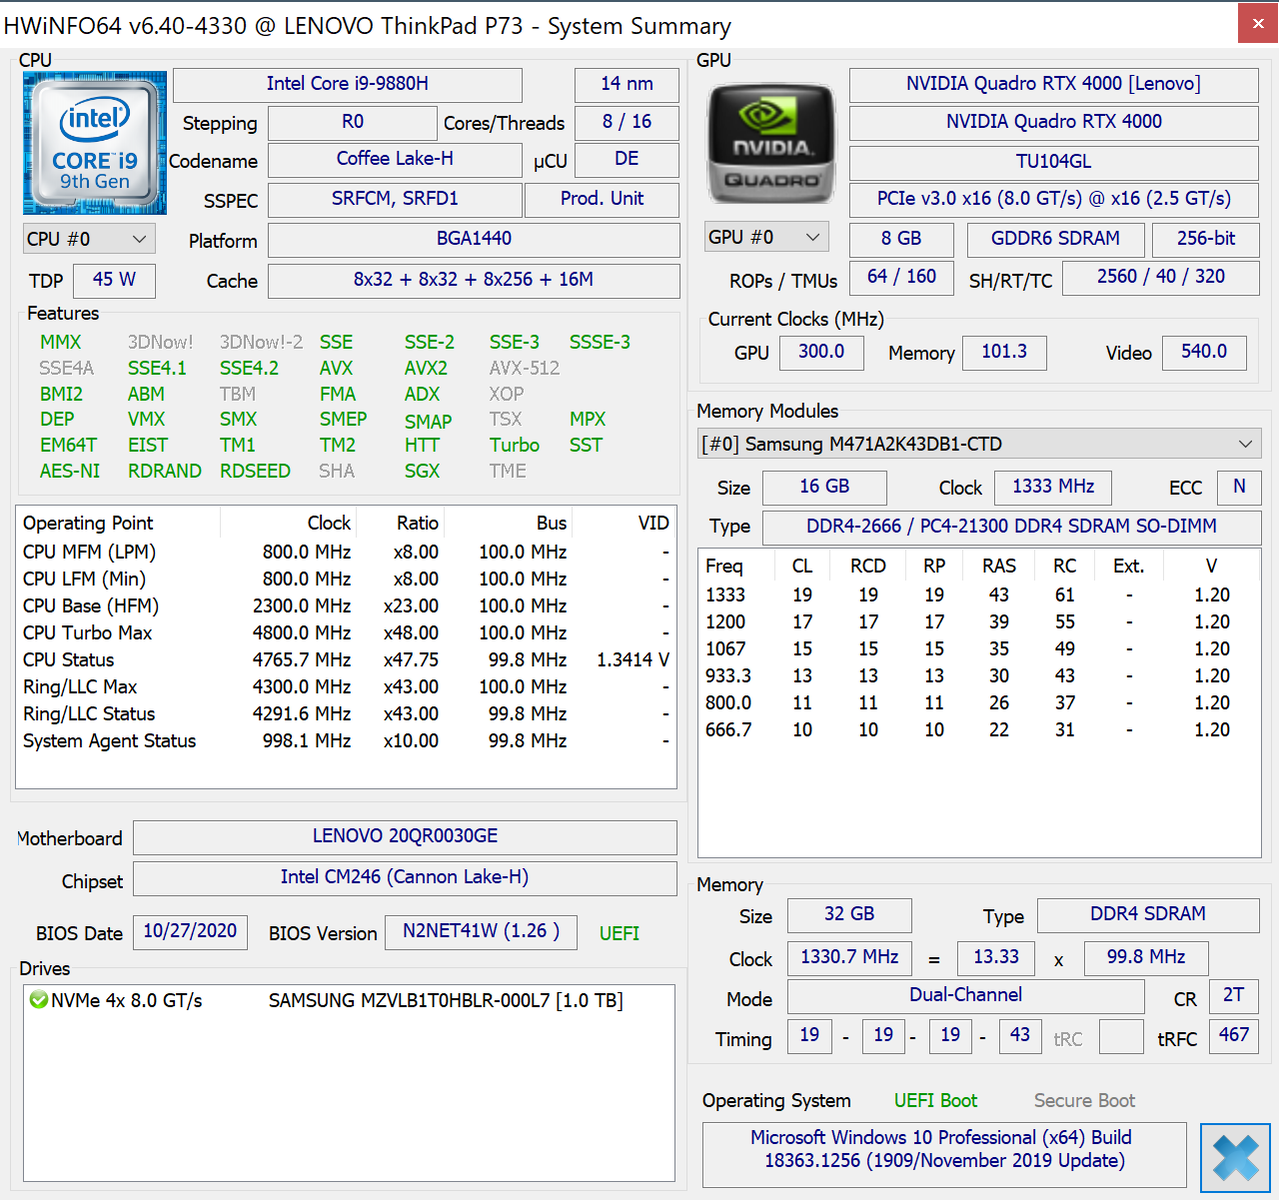
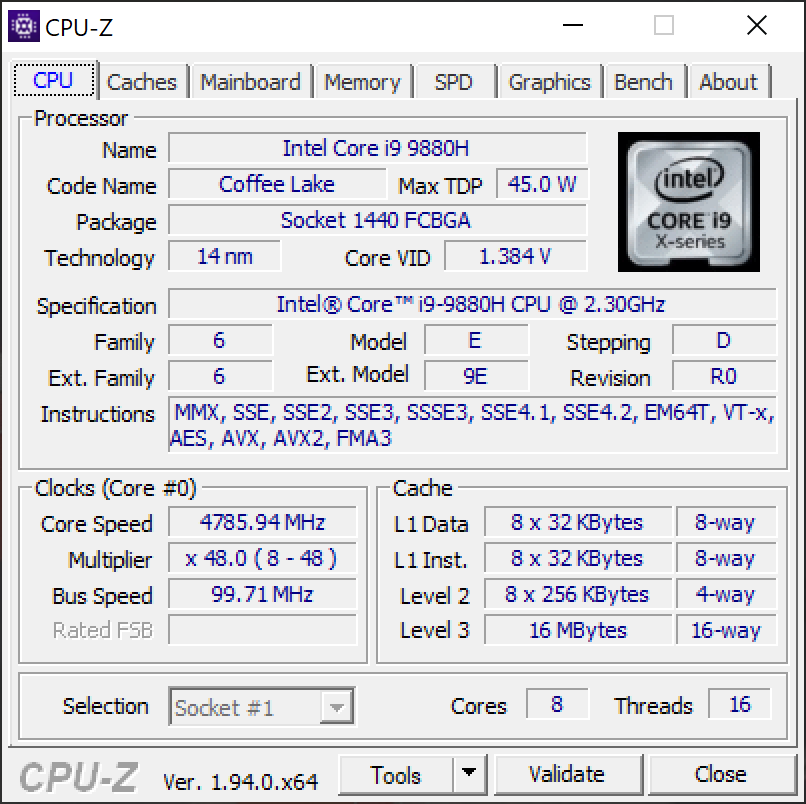
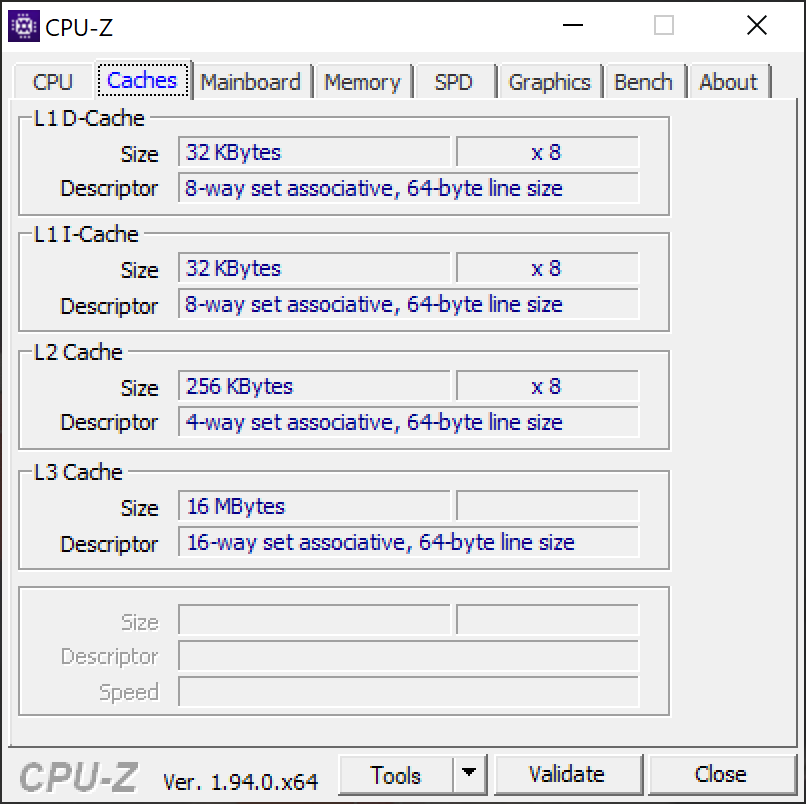
Processor - Intel Core i9-9880H
The Core i9-9880H (Coffee Lake-H) has 8 cores (16 threads) and can reach up to 4.8 GHz (1 or 2 cores) or up to 4.1 GHz on all eight cores, respectively. As expected for a large mobile workstation, Lenovo implements generous TDP limitations at 70/107 Watts.
We can still not see the maximum clock of 4.1 GHz on all cores in the benchmarks, but "only" 8x 3.8 GHz (102 W) and then 8x 3.1 GHz under sustained workloads. This value can be maintained and the overall performance in the comparison group is good, even though current mobile workstations still waive AMD's CPU options.
The TDP limitations are a bit lower on battery power (51/60 W), so the performance drops by around 20 %.
Cinebench R15: CPU Single 64Bit | CPU Multi 64Bit
Blender: v2.79 BMW27 CPU
7-Zip 18.03: 7z b 4 -mmt1 | 7z b 4
Geekbench 5.5: Single-Core | Multi-Core
HWBOT x265 Benchmark v2.2: 4k Preset
LibreOffice : 20 Documents To PDF
R Benchmark 2.5: Overall mean
| Cinebench R20 / CPU (Single Core) | |
| Average of class Workstation (671 - 857, n=23, last 2 years) | |
| Acer ConceptD 9 Pro | |
| Lenovo ThinkPad P73-20QR0030GE | |
| MSI WE75 9TK | |
| Asus ProArt StudioBook Pro 17 W700G3T | |
| Average Intel Core i9-9880H (441 - 474, n=7) | |
| Lenovo ThinkPad P73-20QR002DGE | |
| Cinebench R20 / CPU (Multi Core) | |
| Average of class Workstation (5760 - 15043, n=23, last 2 years) | |
| Average Intel Core i9-9880H (2953 - 3712, n=7) | |
| Lenovo ThinkPad P73-20QR0030GE | |
| Acer ConceptD 9 Pro | |
| Asus ProArt StudioBook Pro 17 W700G3T | |
| MSI WE75 9TK | |
| Lenovo ThinkPad P73-20QR002DGE | |
| Cinebench R15 / CPU Single 64Bit | |
| Average of class Workstation (191.4 - 328, n=23, last 2 years) | |
| Acer ConceptD 9 Pro | |
| Lenovo ThinkPad P73-20QR002DGE | |
| Lenovo ThinkPad P73-20QR0030GE | |
| Asus ProArt StudioBook Pro 17 W700G3T | |
| MSI WE75 9TK | |
| Average Intel Core i9-9880H (181 - 198, n=11) | |
| Cinebench R15 / CPU Multi 64Bit | |
| Average of class Workstation (2489 - 5810, n=23, last 2 years) | |
| Acer ConceptD 9 Pro | |
| Lenovo ThinkPad P73-20QR0030GE | |
| Average Intel Core i9-9880H (1317 - 1721, n=11) | |
| Lenovo ThinkPad P73-20QR002DGE | |
| Asus ProArt StudioBook Pro 17 W700G3T | |
| Asus ProArt StudioBook Pro 17 W700G3T | |
| MSI WE75 9TK | |
| Blender / v2.79 BMW27 CPU | |
| Lenovo ThinkPad P73-20QR002DGE | |
| Asus ProArt StudioBook Pro 17 W700G3T | |
| Average Intel Core i9-9880H (293 - 384, n=4) | |
| Lenovo ThinkPad P73-20QR0030GE | |
| Average of class Workstation (91 - 222, n=23, last 2 years) | |
| 7-Zip 18.03 / 7z b 4 -mmt1 | |
| Average of class Workstation (5126 - 6960, n=23, last 2 years) | |
| Acer ConceptD 9 Pro | |
| Lenovo ThinkPad P73-20QR0030GE | |
| Lenovo ThinkPad P73-20QR002DGE | |
| Average Intel Core i9-9880H (4837 - 5068, n=3) | |
| Asus ProArt StudioBook Pro 17 W700G3T | |
| 7-Zip 18.03 / 7z b 4 | |
| Average of class Workstation (60489 - 116969, n=23, last 2 years) | |
| Average Intel Core i9-9880H (39455 - 46591, n=3) | |
| Lenovo ThinkPad P73-20QR0030GE | |
| Acer ConceptD 9 Pro | |
| Asus ProArt StudioBook Pro 17 W700G3T | |
| Lenovo ThinkPad P73-20QR002DGE | |
| Geekbench 5.5 / Single-Core | |
| Average of class Workstation (1783 - 2183, n=23, last 2 years) | |
| Acer ConceptD 9 Pro | |
| Lenovo ThinkPad P73-20QR0030GE | |
| Asus ProArt StudioBook Pro 17 W700G3T | |
| Average Intel Core i9-9880H (1115 - 1237, n=2) | |
| Lenovo ThinkPad P73-20QR002DGE | |
| Geekbench 5.5 / Multi-Core | |
| Average of class Workstation (11542 - 25554, n=23, last 2 years) | |
| Acer ConceptD 9 Pro | |
| Lenovo ThinkPad P73-20QR0030GE | |
| Average Intel Core i9-9880H (7109 - 7353, n=2) | |
| Asus ProArt StudioBook Pro 17 W700G3T | |
| Lenovo ThinkPad P73-20QR002DGE | |
| HWBOT x265 Benchmark v2.2 / 4k Preset | |
| Average of class Workstation (17.8 - 40.5, n=23, last 2 years) | |
| Average Intel Core i9-9880H (10.6 - 11.9, n=3) | |
| Lenovo ThinkPad P73-20QR0030GE | |
| Lenovo ThinkPad P73-20QR002DGE | |
| Asus ProArt StudioBook Pro 17 W700G3T | |
| LibreOffice / 20 Documents To PDF | |
| Asus ProArt StudioBook Pro 17 W700G3T | |
| Acer ConceptD 9 Pro | |
| Lenovo ThinkPad P73-20QR0030GE | |
| Average of class Workstation (37.1 - 74.7, n=23, last 2 years) | |
| Average Intel Core i9-9880H (16.5 - 58.9, n=3) | |
| R Benchmark 2.5 / Overall mean | |
| Average Intel Core i9-9880H (0.621 - 0.69, n=3) | |
| Asus ProArt StudioBook Pro 17 W700G3T | |
| Lenovo ThinkPad P73-20QR0030GE | |
| Average of class Workstation (0.3825 - 0.603, n=23, last 2 years) | |
* ... smaller is better
System Performance
The ThinkPad P73 is only beaten by the Acer ConceptD 9 Pro with the more powerful Quadro RTX 5000 GPU in some categories of the synthetic PCMark, but all other comparison devices are beaten. Our subjective performance impression supports the results, because the mobile workstation is just a very powerful and responsive device in practice.
| PCMark 10 Score | 6491 points | |
Help | ||
DPC Latency
| DPC Latencies / LatencyMon - interrupt to process latency (max), Web, Youtube, Prime95 | |
| Acer ConceptD 9 Pro | |
| Lenovo ThinkPad P73-20QR0030GE | |
* ... smaller is better
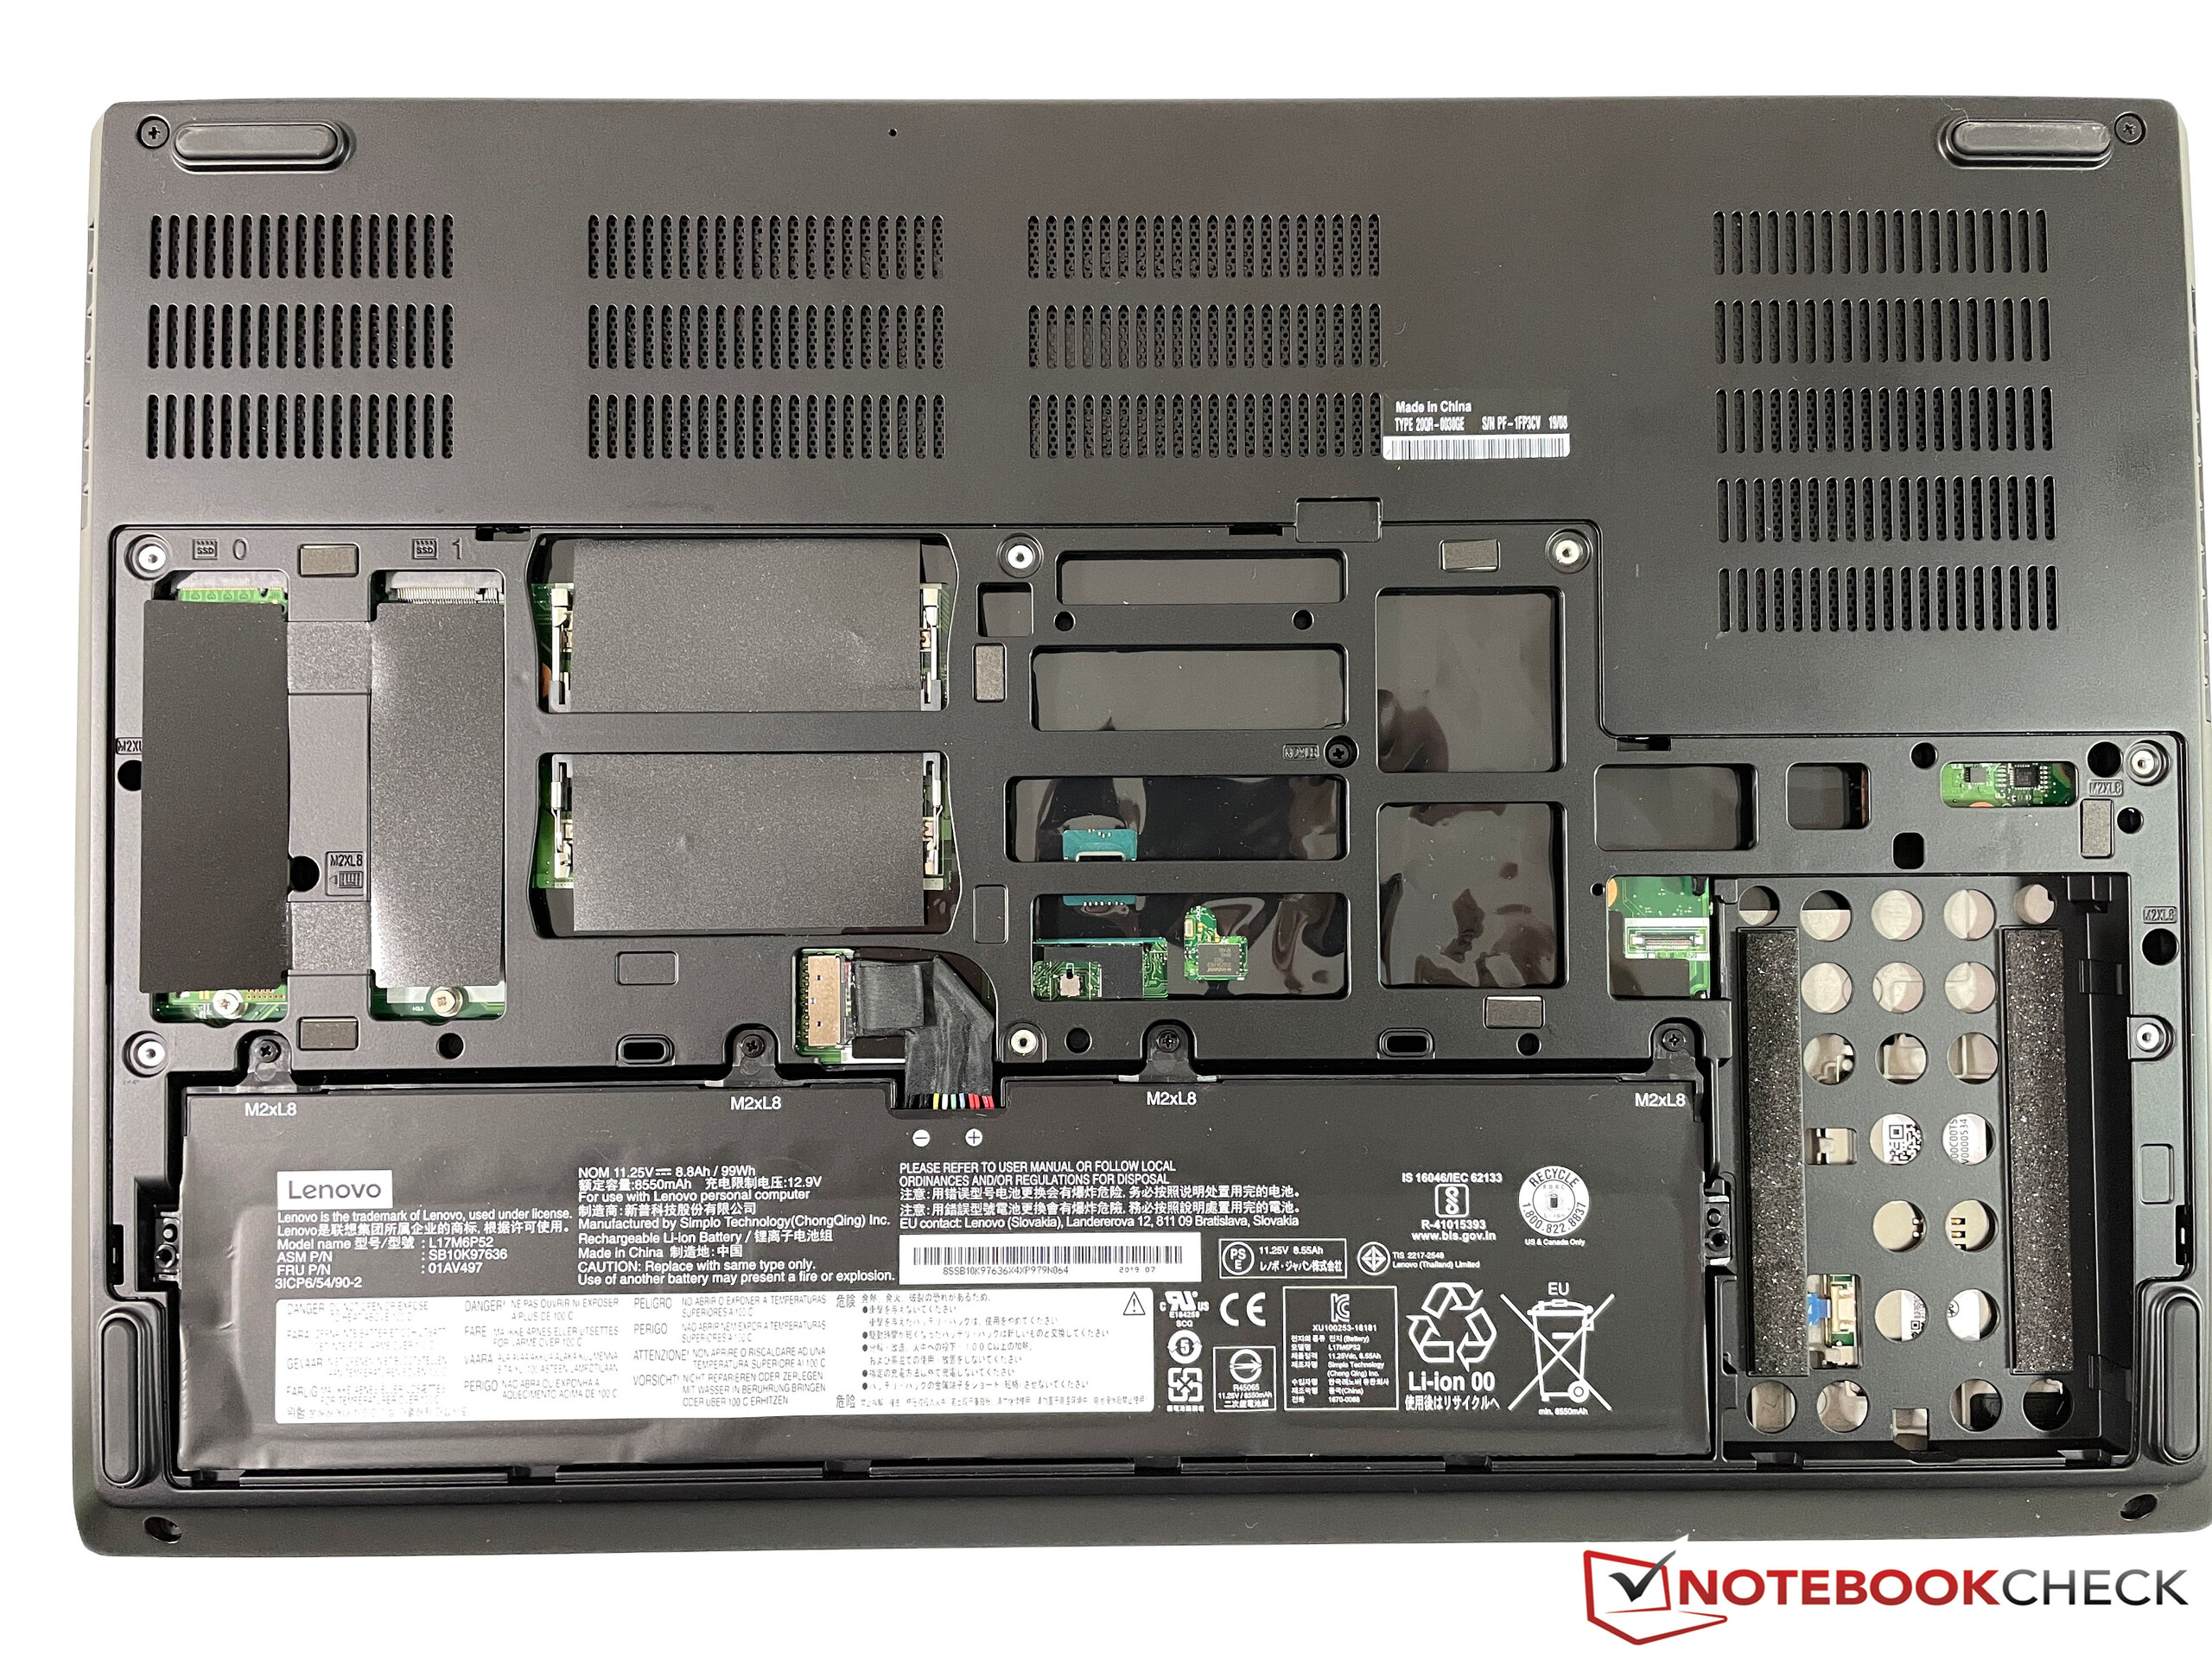
Storage Devices - 2x PCIe-SSD
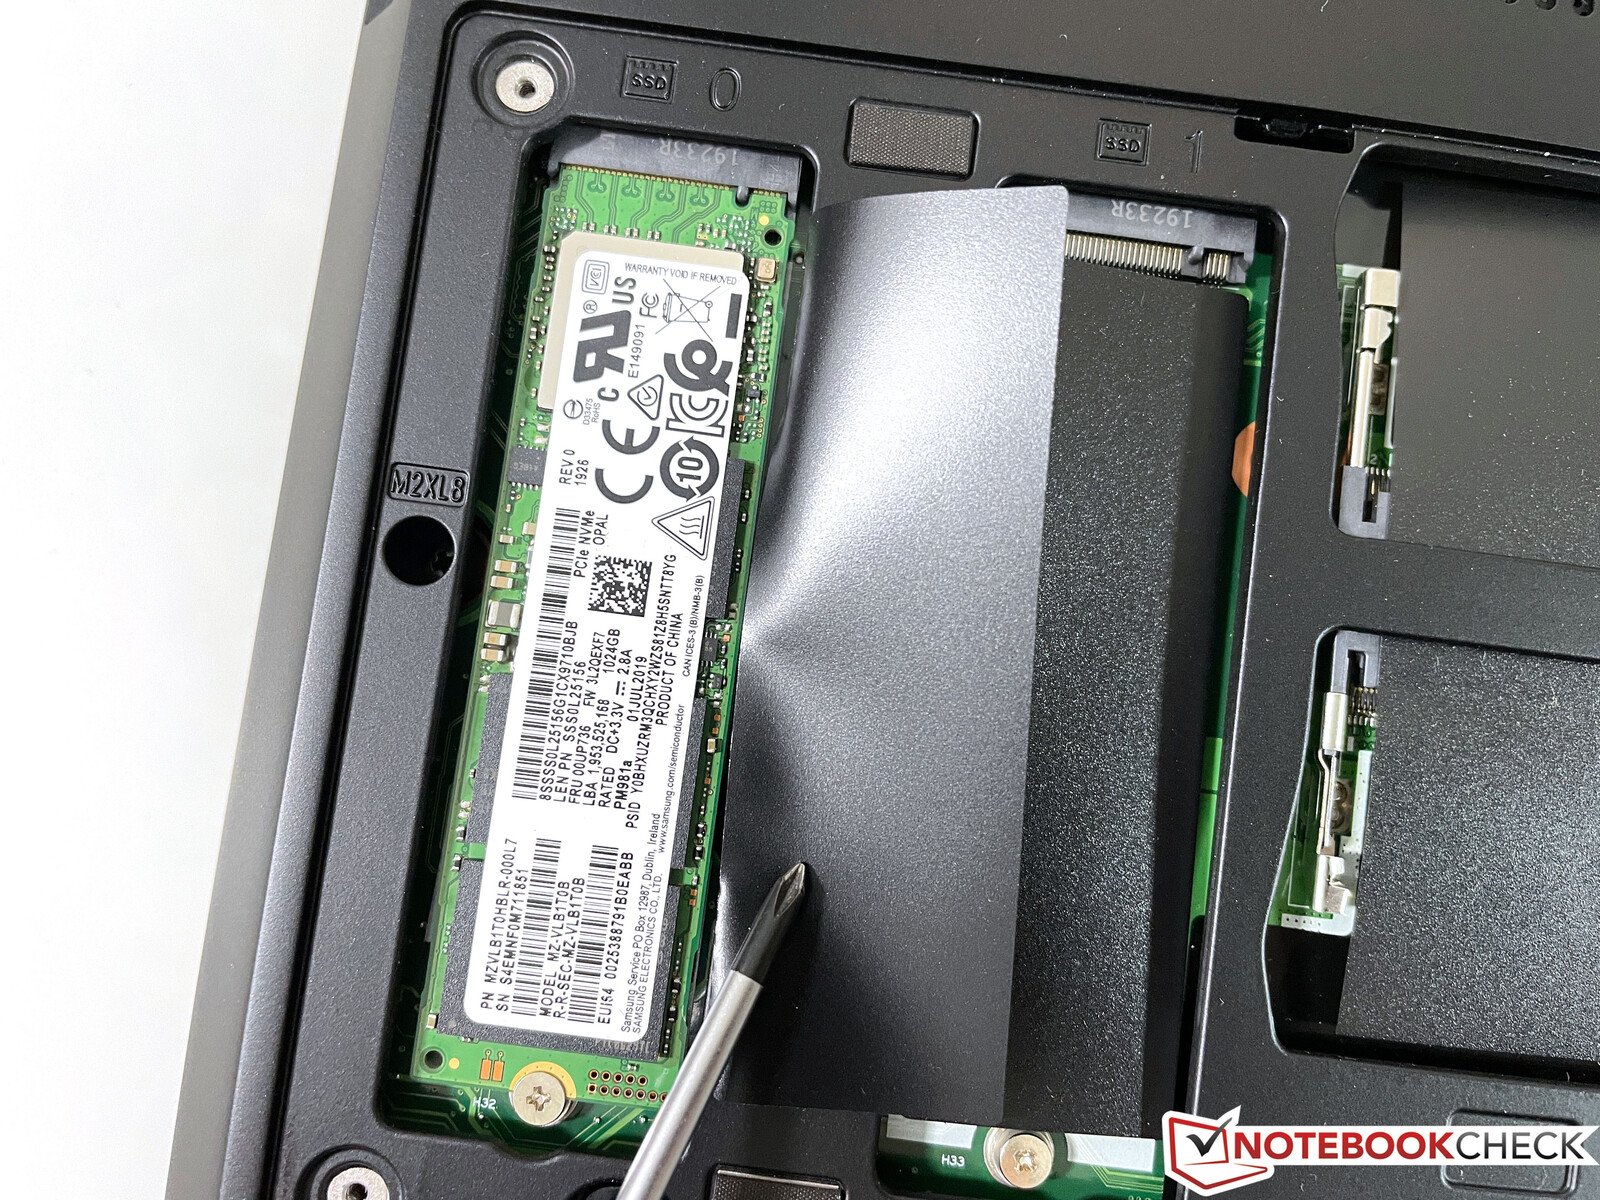
The ThinkPad P73 offers two slots for M.2-2282 SSDs with fast PCIe-x4-3.0 interface. Our test unit is equipped with a single PM981a drive from Samsung with a storage capacity of 1 TB, and you can use 900 GB after the initial setup. The performance of the NVMe SSD is very good in all tests.
The chassis has space for an additional 2.5-inch drive, but the required cables and assembly tools are not provided.
| Lenovo ThinkPad P73-20QR0030GE Samsung PM981a MZVLB1T0HBLR | Acer ConceptD 9 Pro WDC PC SN720 SDAQNTW-1T00 | Asus ProArt StudioBook Pro 17 W700G3T Samsung SSD PM981 MZVLB1T0HALR | MSI WE75 9TK Samsung SSD PM981 MZVLB512HAJQ | Lenovo ThinkPad P73-20QR002DGE Intel SSD Pro 7600p SSDPEKKF512G8L | Average Samsung PM981a MZVLB1T0HBLR | |
|---|---|---|---|---|---|---|
| CrystalDiskMark 5.2 / 6 | 21% | 16% | 13% | 10% | 12% | |
| Write 4K (MB/s) | 150.1 | 176 17% | 147.6 -2% | 135.4 -10% | 154.3 3% | 139.7 ? -7% |
| Read 4K (MB/s) | 48.48 | 48.06 -1% | 47.57 -2% | 56.6 17% | 66.4 37% | 49.9 ? 3% |
| Write Seq (MB/s) | 1414 | 2736 93% | 2222 57% | 1972 39% | 1561 10% | 2036 ? 44% |
| Read Seq (MB/s) | 1262 | 2381 89% | 2543 102% | 2101 66% | 2460 95% | 2014 ? 60% |
| Write 4K Q32T1 (MB/s) | 430.7 | 418.6 -3% | 459.2 7% | 527 22% | 438 2% | 461 ? 7% |
| Read 4K Q32T1 (MB/s) | 539 | 460.8 -15% | 515 -4% | 578 7% | 568 5% | 499 ? -7% |
| Write Seq Q32T1 (MB/s) | 2983 | 2791 -6% | 2167 -27% | 1985 -33% | 1581 -47% | 2903 ? -3% |
| Read Seq Q32T1 (MB/s) | 3549 | 3430 -3% | 3430 -3% | 3358 -5% | 2724 -23% | 3479 ? -2% |
| Write 4K Q8T8 (MB/s) | 1000 | 1491 ? | ||||
| Read 4K Q8T8 (MB/s) | 928 | 1499 ? | ||||
| AS SSD | -15% | -6% | -41% | -31% | -13% | |
| Seq Read (MB/s) | 2627 | 2995 14% | 2958 13% | 1308 -50% | 2693 3% | 2553 ? -3% |
| Seq Write (MB/s) | 2375 | 2640 11% | 2350 -1% | 1871 -21% | 1542 -35% | 2084 ? -12% |
| 4K Read (MB/s) | 53.5 | 22.54 -58% | 56.6 6% | 48.35 -10% | 62.6 17% | 53.1 ? -1% |
| 4K Write (MB/s) | 139.4 | 103.2 -26% | 106.1 -24% | 106.6 -24% | 149.5 7% | 131.2 ? -6% |
| 4K-64 Read (MB/s) | 1779 | 1570 -12% | 1836 3% | 1510 -15% | 871 -51% | 1477 ? -17% |
| 4K-64 Write (MB/s) | 1955 | 1540 -21% | 1789 -8% | 1715 -12% | 1006 -49% | 1805 ? -8% |
| Access Time Read * (ms) | 0.055 | 0.061 -11% | 0.103 -87% | 0.058 -5% | 0.04983 ? 9% | |
| Access Time Write * (ms) | 0.027 | 0.036 -33% | 0.036 -33% | 0.106 -293% | 0.067 -148% | 0.04222 ? -56% |
| Score Read (Points) | 2095 | 1892 -10% | 2189 4% | 1689 -19% | 1203 -43% | 1786 ? -15% |
| Score Write (Points) | 2332 | 1907 -18% | 2130 -9% | 2008 -14% | 1309 -44% | 2144 ? -8% |
| Score Total (Points) | 5489 | 4739 -14% | 5411 -1% | 4594 -16% | 3088 -44% | 4826 ? -12% |
| Copy ISO MB/s (MB/s) | 2932 | 2212 -25% | 2343 -20% | 1716 -41% | 2098 ? -28% | |
| Copy Program MB/s (MB/s) | 595 | 537 -10% | 526 -12% | 542 -9% | 500 ? -16% | |
| Copy Game MB/s (MB/s) | 1264 | 1335 6% | 1506 19% | 1375 9% | 1132 ? -10% | |
| Total Average (Program / Settings) | 3% /
-1% | 5% /
4% | -14% /
-21% | -11% /
-16% | -1% /
-4% |
* ... smaller is better

DiskSpd Read Loop, Queue Depth 8
GPU Performance - Quadro RTX 4000 with 8 GB VRAM

Lenovo does not use the integrated graphics adapter of the processor. Instead, the dedicated Nvidia Quadro RTX 4000 takes care of the graphics calculations all the time. The RTX 4000 has been around since-mid 2019, but it is still a high-end GPU.
A couple of BIOS updates were necessary, but the P73 can now utilize the full potential of the RTX 4000 and the results are also slightly better than the average values for other RTX 4000 devices in our database. As expected, the performance is pretty much right in the middle between the RTX 3000 and the RTX 5000, although there can be differences depending on the individual versions. This is not only the case for the 3DMark tests, but also professional scenarios that we test with SPECviewperf.
We also checked the performance under sustained workloads with the demanding 3DMark Time Spy stress test, and the P73 passed the test (98.3 %). The performance is, however, significantly lower on battery power, and you have to expect a deficit of ~70 %.
| 3DMark 11 Performance | 23310 points | |
| 3DMark Fire Strike Score | 17894 points | |
| 3DMark Time Spy Score | 7901 points | |
Help | ||
Gaming Performance
The performance of the Quadro RTX 4000 is roughly comparable with a GeForce RTX 2070 or 2080 Max-Q. The Quadro drivers work really well with games for the last couple of years, only brand-new titles might show a warning message for the drivers (but the games usually still run). We did not experience any problems and the gaming performance is, as expected, very good. Many games can be played in the native 4K resolution and maximum details; only very demanding titles require a reduction of the resolution or the settings.
| low | med. | high | ultra | QHD | 4K | |
|---|---|---|---|---|---|---|
| The Witcher 3 (2015) | 345 | 254 | 153 | 79 | 56 | |
| Dota 2 Reborn (2015) | 146 | 135 | 130 | 124 | 111 | |
| X-Plane 11.11 (2018) | 122 | 110 | 90.2 | 76.6 | ||
| Far Cry New Dawn (2019) | 118 | 104 | 103 | 94 | 82 | 46 |
| F1 2020 (2020) | 283 | 207 | 171 | 121 | 89 | 50 |
Emissions - Quiet fans
System Noise
The fans stay pretty quiet under load at around 40 dB(A) when you consider the performance. The murmur of the fans is hardly annoying or high-pitched. In practice, you can notice the lack of the iGPU, because one of the fans often starts spinning when you stress the Nvidia GPU a bit, which would not be the case with an efficient iGPU.
The fans were quieter in general before the BIOS updates, but this obviously affected the performance. We did not notice any electronic sounds or coil whine during our review period.
Noise level
| Idle |
| 29.5 / 29.5 / 30.2 dB(A) |
| Load |
| 36.5 / 39.6 dB(A) |
 | ||
30 dB silent 40 dB(A) audible 50 dB(A) loud |
||
min: | ||
| Lenovo ThinkPad P73-20QR0030GE Quadro RTX 4000 (Laptop), i9-9880H, Samsung PM981a MZVLB1T0HBLR | Acer ConceptD 9 Pro Quadro RTX 5000 (Laptop), i9-9980HK, WDC PC SN720 SDAQNTW-1T00 | Asus ProArt StudioBook Pro 17 W700G3T Quadro RTX 3000 Max-Q, i7-9750H, Samsung SSD PM981 MZVLB1T0HALR | MSI WE75 9TK Quadro RTX 3000 (Laptop), i7-9750H, Samsung SSD PM981 MZVLB512HAJQ | Lenovo ThinkPad P73-20QR002DGE Quadro RTX 3000 (Laptop), i7-9850H, Intel SSD Pro 7600p SSDPEKKF512G8L | |
|---|---|---|---|---|---|
| Noise | -9% | 8% | -6% | 9% | |
| off / environment * (dB) | 29.5 | 30.8 -4% | 29.4 -0% | 28.5 3% | 29.3 1% |
| Idle Minimum * (dB) | 29.5 | 31.6 -7% | 29.4 -0% | 29 2% | 29.3 1% |
| Idle Average * (dB) | 29.5 | 31.6 -7% | 29.9 -1% | 29 2% | 29.3 1% |
| Idle Maximum * (dB) | 30.2 | 31.9 -6% | 29.9 1% | 31.5 -4% | 29.3 3% |
| Load Average * (dB) | 36.5 | 41.2 -13% | 31.6 13% | 32 12% | 30.2 17% |
| Witcher 3 ultra * (dB) | 39.6 | 44.6 -13% | 31.6 20% | 44.7 -13% | 30.7 22% |
| Load Maximum * (dB) | 39.6 | 44.1 -11% | 31.6 20% | 56.5 -43% | 33.1 16% |
* ... smaller is better
Temperature
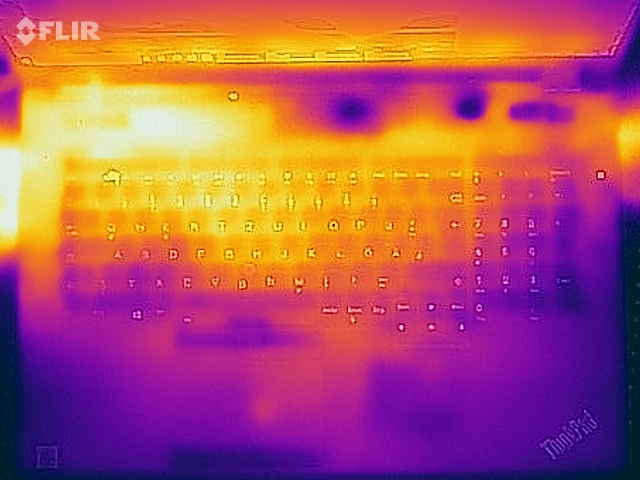
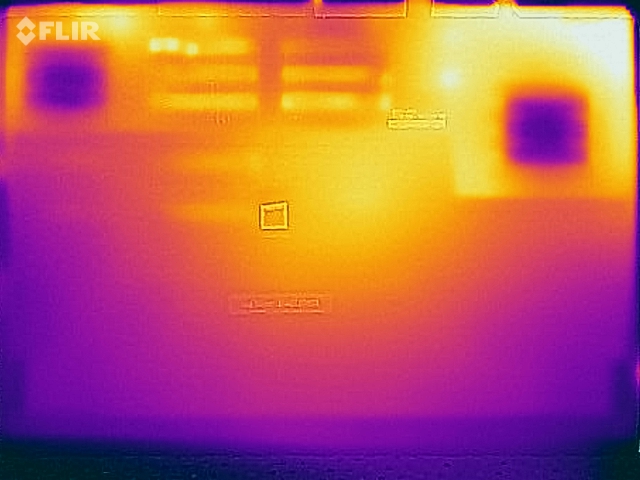
Lenovo does a good job with the surface temperatures, because you could still put the device on your lap during the stress test (even though this is improbable due to the dimensions of the notebook). It is interesting that the top left corner on top of the base unit is quite a bit warmer at almost 50 °C, but the hotspot is located above the keyboard, so there are no limitations. The rear portion of the notebook also warms up noticeably while idling, which is once again caused by the lack of the iGPU.
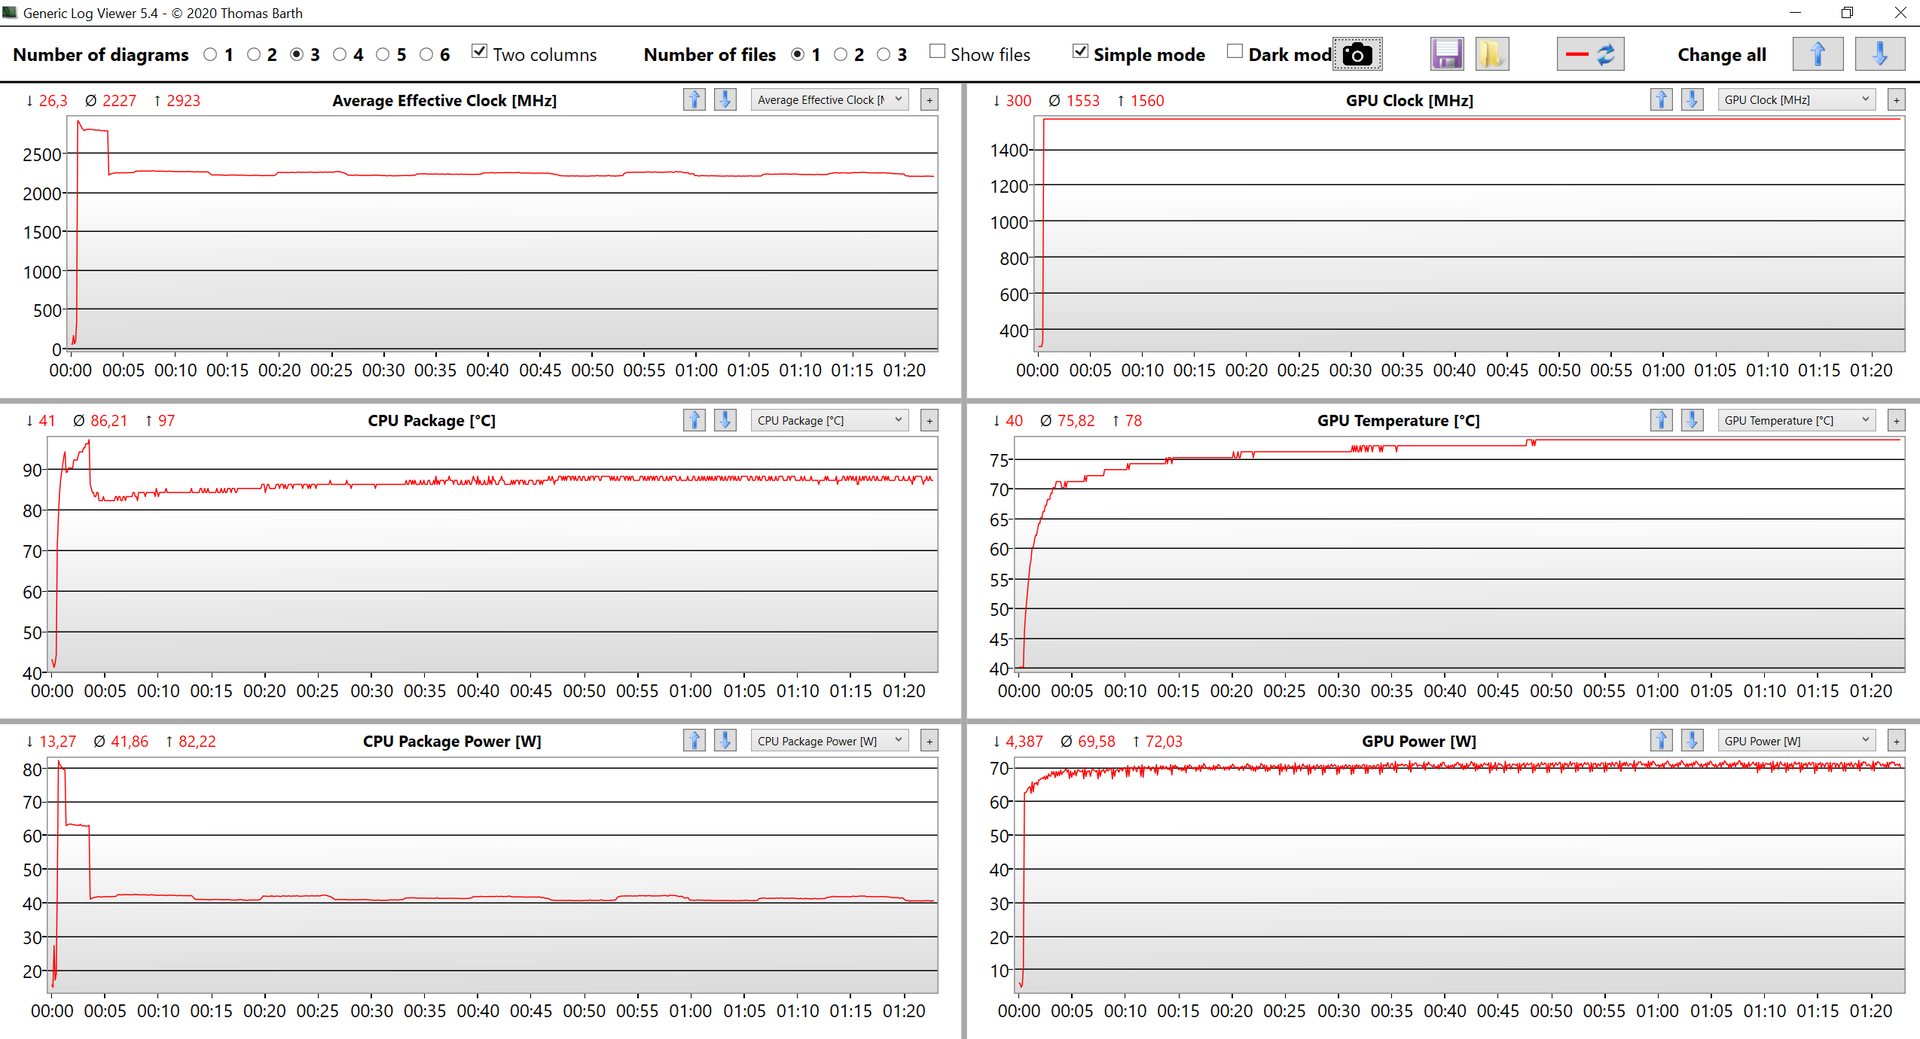
Our stress test shows that the performance of the graphics cards is stable, even in combined workload scenarios. The CPU performance, however, is reduced, and the 70 W we saw during CPU load only cannot be maintained. A look at the following diagram shows the CPU consumption drops to around 42 W and 8x ~2.2 GHz after a few minutes. There are no performance limitations immediately after the stress test.
(-) The maximum temperature on the upper side is 49.2 °C / 121 F, compared to the average of 38.2 °C / 101 F, ranging from 22.2 to 69.8 °C for the class Workstation.
(-) The bottom heats up to a maximum of 45.2 °C / 113 F, compared to the average of 41.1 °C / 106 F
(+) In idle usage, the average temperature for the upper side is 30.5 °C / 87 F, compared to the device average of 32 °C / 90 F.
(+) The palmrests and touchpad are reaching skin temperature as a maximum (32.6 °C / 90.7 F) and are therefore not hot.
(-) The average temperature of the palmrest area of similar devices was 27.8 °C / 82 F (-4.8 °C / -8.7 F).
Speakers
Lenovo ThinkPad P73-20QR0030GE audio analysis
(±) | speaker loudness is average but good (72.1 dB)
Bass 100 - 315 Hz
(-) | nearly no bass - on average 16.2% lower than median
(±) | linearity of bass is average (13% delta to prev. frequency)
Mids 400 - 2000 Hz
(±) | higher mids - on average 5.4% higher than median
(+) | mids are linear (5.6% delta to prev. frequency)
Highs 2 - 16 kHz
(+) | balanced highs - only 4.9% away from median
(+) | highs are linear (6.2% delta to prev. frequency)
Overall 100 - 16.000 Hz
(±) | linearity of overall sound is average (25.8% difference to median)
Compared to same class
» 87% of all tested devices in this class were better, 6% similar, 7% worse
» The best had a delta of 7%, average was 17%, worst was 35%
Compared to all devices tested
» 79% of all tested devices were better, 4% similar, 17% worse
» The best had a delta of 4%, average was 23%, worst was 134%
Acer ConceptD 9 Pro audio analysis
(-) | not very loud speakers (69.9 dB)
Bass 100 - 315 Hz
(-) | nearly no bass - on average 22.1% lower than median
(±) | linearity of bass is average (11.8% delta to prev. frequency)
Mids 400 - 2000 Hz
(+) | balanced mids - only 3.4% away from median
(±) | linearity of mids is average (7.2% delta to prev. frequency)
Highs 2 - 16 kHz
(+) | balanced highs - only 3.3% away from median
(±) | linearity of highs is average (10.1% delta to prev. frequency)
Overall 100 - 16.000 Hz
(±) | linearity of overall sound is average (20.8% difference to median)
Compared to same class
» 75% of all tested devices in this class were better, 6% similar, 18% worse
» The best had a delta of 7%, average was 17%, worst was 35%
Compared to all devices tested
» 56% of all tested devices were better, 8% similar, 36% worse
» The best had a delta of 4%, average was 23%, worst was 134%
Energy Management - Lack of iGPU hurts battery runtime
Power Consumption

We have already mentioned the deactivated iGPU of the processor. The constant utilization of the dedicated Quadro GPU in combination with the 4K panel increases the power consumption in idle scenarios noticeably. Depending on the brightness level, we can measure between 21-36 W, and therefore nearly twice as much as the previous review unit of the ThinkPad P73.
The maximum consumption is around 215 W, but this value will level off at around 170 W. This means the provided 230 W power adapter is completely sufficient. by the way, it is not possible to charge the device via USB-C.
| Off / Standby | |
| Idle | |
| Load |
|
Key:
min: | |
| Lenovo ThinkPad P73-20QR0030GE i9-9880H, Quadro RTX 4000 (Laptop), Samsung PM981a MZVLB1T0HBLR, IPS, 3840x2160, 17.3" | Acer ConceptD 9 Pro i9-9980HK, Quadro RTX 5000 (Laptop), WDC PC SN720 SDAQNTW-1T00, IPS, 3840x2160, 17.3" | Asus ProArt StudioBook Pro 17 W700G3T i7-9750H, Quadro RTX 3000 Max-Q, Samsung SSD PM981 MZVLB1T0HALR, IPS, 1920x1200, 17" | MSI WE75 9TK i7-9750H, Quadro RTX 3000 (Laptop), Samsung SSD PM981 MZVLB512HAJQ, IPS, 1920x1080, 17.3" | Lenovo ThinkPad P73-20QR002DGE i7-9850H, Quadro RTX 3000 (Laptop), Intel SSD Pro 7600p SSDPEKKF512G8L, IPS LED, 1920x1080, 17.3" | Average NVIDIA Quadro RTX 4000 (Laptop) | Average of class Workstation | |
|---|---|---|---|---|---|---|---|
| Power Consumption | 1% | 36% | 29% | 35% | 12% | 38% | |
| Idle Minimum * (Watt) | 21 | 18.8 10% | 11.3 46% | 12.1 42% | 8.9 58% | 18.7 ? 11% | 9.11 ? 57% |
| Idle Average * (Watt) | 30.4 | 25 18% | 16 47% | 18.4 39% | 12.8 58% | 26 ? 14% | 13.8 ? 55% |
| Idle Maximum * (Watt) | 35.8 | 30 16% | 16.8 53% | 18.8 47% | 16.4 54% | 29.3 ? 18% | 17.9 ? 50% |
| Load Average * (Watt) | 110 | 116 -5% | 93.6 15% | 95.1 14% | 108.4 1% | 99 ? 10% | 96 ? 13% |
| Witcher 3 ultra * (Watt) | 182 | 221 -21% | 106 42% | 135.5 26% | 153 16% | ||
| Load Maximum * (Watt) | 215.4 | 241 -12% | 186.6 13% | 203.7 5% | 166 23% | 204 ? 5% | 180.3 ? 16% |
* ... smaller is better
Battery Runtime - P73 with 99 Wh battery
Lenovo integrates a large 99 Wh battery, but the runtimes are still pretty short due to the high power consumption. It is obviously questionable how often you will really use such a big device like the P73 without a power a adapter. You can expect between 3-4 hours in practice depending on the brightness, which should be sufficient for the many of meetings. If you really stress the device, the battery will last little more than 70 minutes.
| Lenovo ThinkPad P73-20QR0030GE i9-9880H, Quadro RTX 4000 (Laptop), 99 Wh | Acer ConceptD 9 Pro i9-9980HK, Quadro RTX 5000 (Laptop), 71.9 Wh | Asus ProArt StudioBook Pro 17 W700G3T i7-9750H, Quadro RTX 3000 Max-Q, 57 Wh | MSI WE75 9TK i7-9750H, Quadro RTX 3000 (Laptop), 65 Wh | Lenovo ThinkPad P73-20QR002DGE i7-9850H, Quadro RTX 3000 (Laptop), 99 Wh | Average of class Workstation | |
|---|---|---|---|---|---|---|
| Battery runtime | -16% | 54% | 5% | 114% | 95% | |
| H.264 (h) | 4.1 | 3.5 -15% | 6.9 68% | 9.8 139% | 10.1 ? 146% | |
| WiFi v1.3 (h) | 3.9 | 3.6 -8% | 5.9 51% | 4.9 26% | 11.1 185% | 8.55 ? 119% |
| Load (h) | 1.2 | 0.9 -25% | 1.7 42% | 1 -17% | 1.4 17% | 1.441 ? 20% |
Pros
Cons
Verdict - Performance was improved

The performance utilization was the biggest drawback in our initial review of the ThinkPad P73. It took a couple of months and a number of BIOS updates, but the performance of the dedicated Quadro graphics card is now on the expected level.
The new ThinkPad P17 does not offer any noticeable improvements in terms of raw component power, so the performance of the P73 is actually still competitive. The Core i9 processor benefits from the high TDP limits and offers stable performance, just like the Quadro RTX 4000 from Nvidia. No problems here.
Lenovo managed to improve the performance utilization of the components thanks to several BIOS updates. Equipped with the Core i9 (9th generation) and the Nvidia Quadro RTX 4000, the ThinkPad P73 is still a very competitive mobile workstation.
We are not completely convinced by the 4K panel. The subjective picture quality is good in general, but our review unit suffered from visible backlight bleeding and the factory calibration is not great, either. The brightness is also lower than advertised. Lenovo wants to address the latter with the successor ThinkPad P17, but we obviously still have to test that.
Lenovo ThinkPad P73-20QR0030GE
- 01/20/2021 v7 (old)
Andreas Osthoff
Price comparison
