Asus ProArt StudioBook Pro X W730G5T laptop review: Too expensive for a hexa-core workstation

The market for workstation laptops has grown in recent years. In absolute terms, it is a small segment of the PC market, but growth is arousing desires. Asus was not a major player in this area until recently. With the ProArt StudioBook workstation series Asus wants to secure a piece of the cake.
The Asus ProArt StudioBook Pro X W730 is a mobile workstation with a 17-inch display, Intel CPUs and Nvidia Quadro GPUs - the latter is made clear by the additional "Pro" in the model name. Asus StudioBooks without Pro in the name contain GeForce chips. Our test device contains the Intel Xeon E-2276M, the Nvidia Quadro RTX 5000, 64 GB RAM and a 1 TB SSD.
For our comparisons we take other workstations in the 17-inch class: The Lenovo ThinkPad P73, Dell Precision 5750 and the MSI WE75 9TK. One thing these workstations have in common is that they are less expensive than the Asus notebook, which costs around 6,500 Euros (~$7,697) in the tested configuration.
Rating | Date | Model | Weight | Height | Size | Resolution | Price |
|---|---|---|---|---|---|---|---|
| 88.4 % v7 (old) | 11 / 2020 | Asus StudioBook Pro X W730G5T-H8050T E-2276M, Quadro RTX 5000 (Laptop) | 2.9 kg | 28.2 mm | 17.00" | 1920x1200 | |
| 86.6 % v7 (old) | 12 / 2019 | Lenovo ThinkPad P73-20QR002DGE i7-9850H, Quadro RTX 3000 (Laptop) | 3.5 kg | 31 mm | 17.30" | 1920x1080 | |
| 87 % v7 (old) | 09 / 2020 | Dell Precision 5000 5750 P92F W-10885M, Quadro RTX 3000 Max-Q | 2.5 kg | 19.5 mm | 17.00" | 3840x2400 | |
| 84.8 % v7 (old) | 11 / 2019 | MSI WE75 9TK i7-9750H, Quadro RTX 3000 (Laptop) | 2.6 kg | 27.5 mm | 17.30" | 1920x1080 |
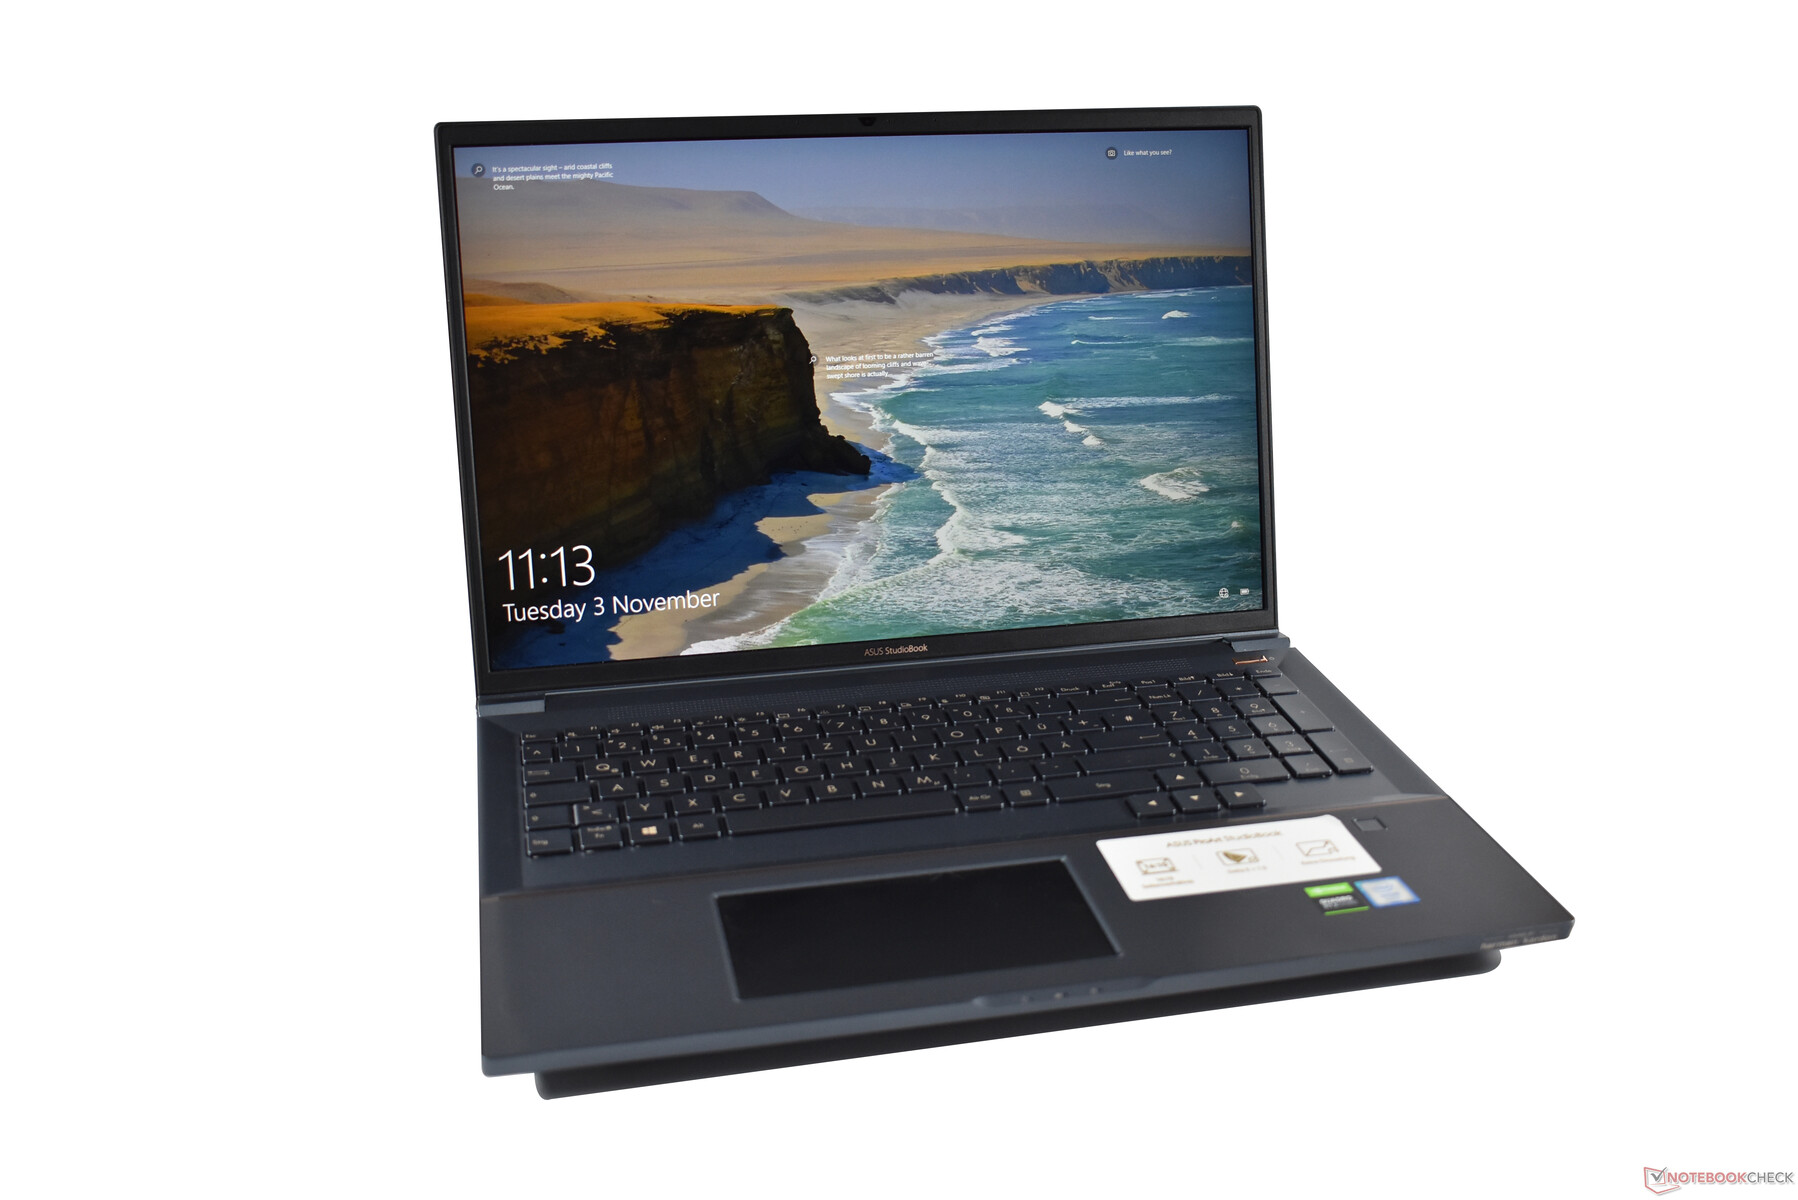
StudioBook Pro X with stable case
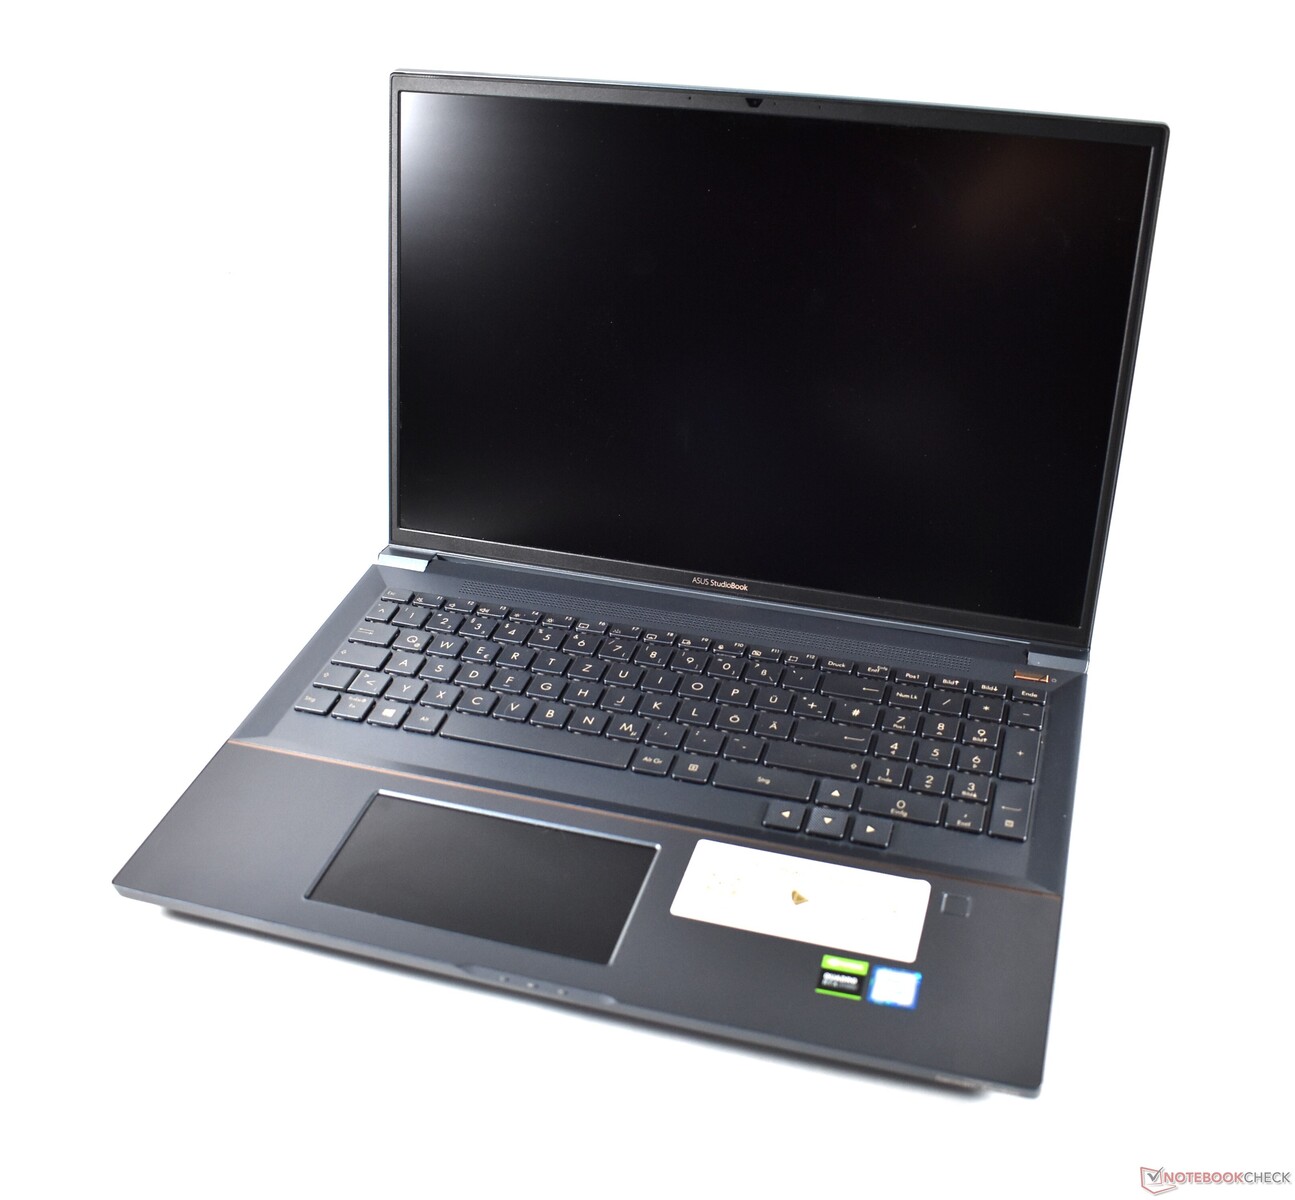
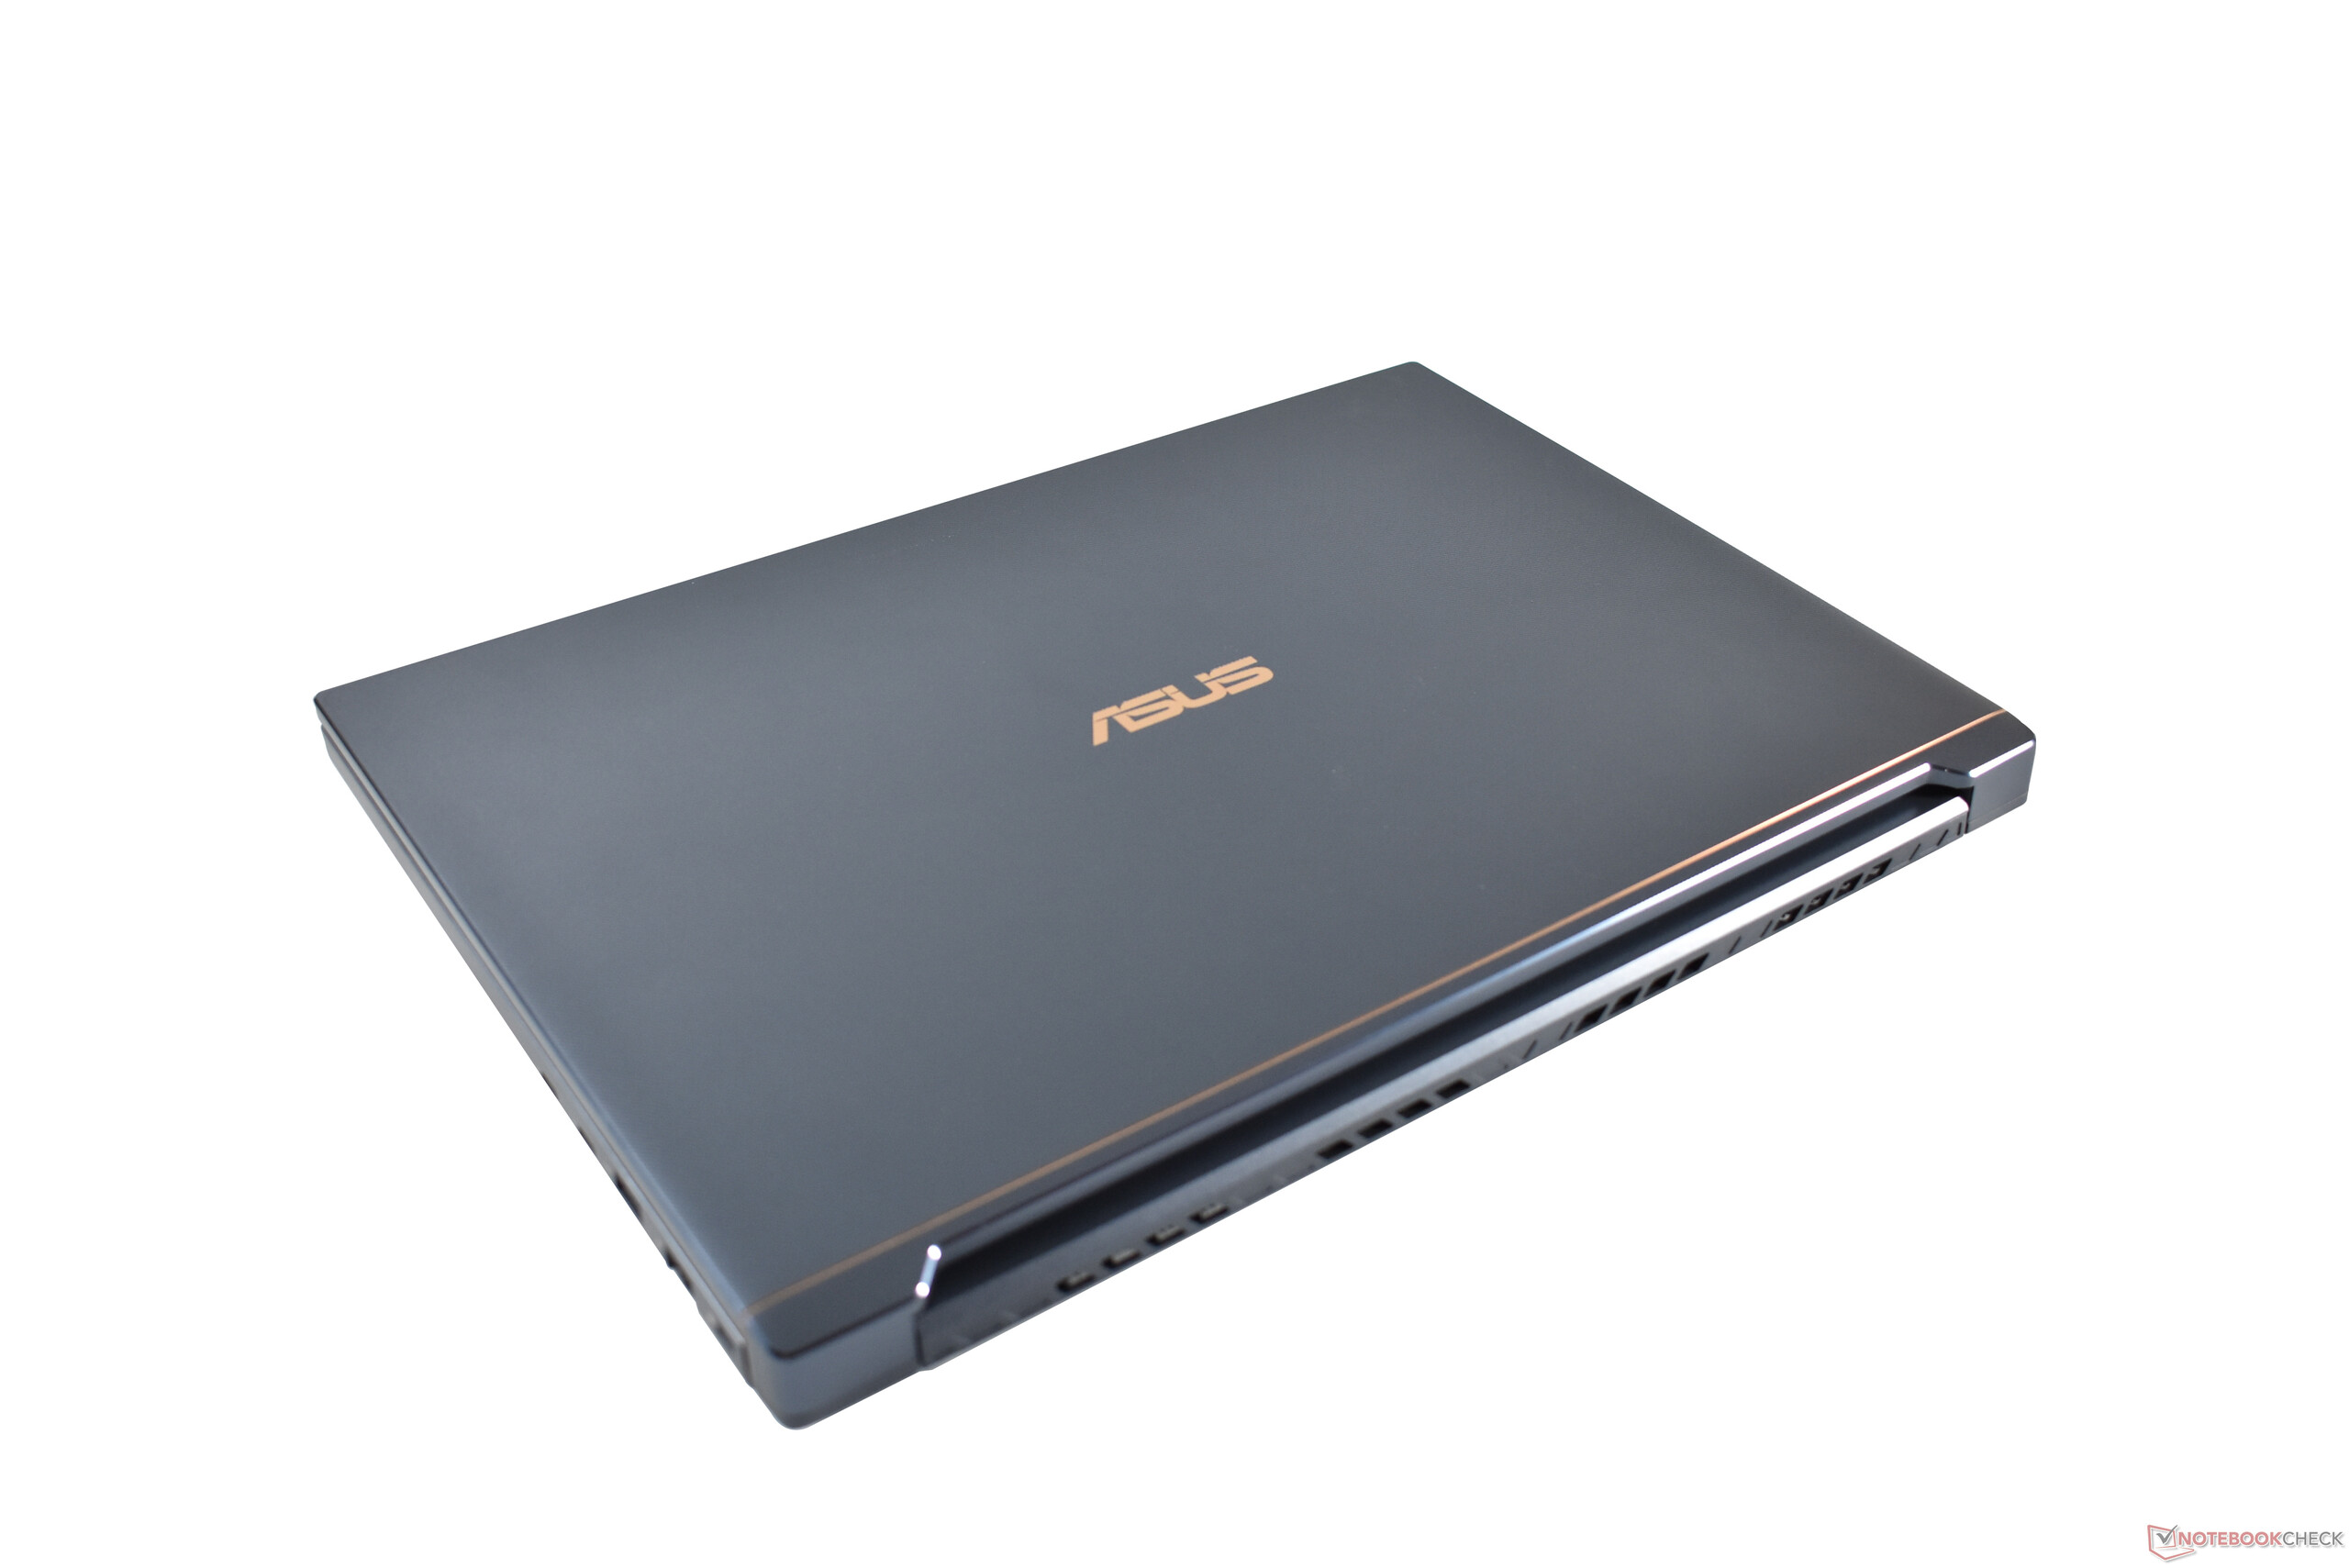
"Turquoise Grey" - that's the name Asus gave to the grey-blue case color of the StudioBook Pro X W730G5T. Alternatively, the Asus laptop is also available in the darker "Star Grey". All models have the same contrasting copper-colored elements like the Asus logo on the lid. Together with the jagged keyboard frame and the striking hinges, the Asus workstation doesn't look as minimalistic as other modern workstations.
The lid and palm rest of the test model have a grooved plastic surface. The model in "Star Grey" has a brushed aluminum look. However, this only affects the surface: The chunky housing is made of a coated magnesium alloy, which ensures high stability. Especially in the area of the base, the ProArt StudioBook Pro X W730G5T doesn't give way anywhere and can't be twisted at all. The display lid is more stable than on thinner laptops and the workmanship is perfect. Haptically, the Asus laptop doesn't have to hide from Lenovo and Dell's workstations in any case.
The very good impression continues with the hinges. They not only control the lid, but they also allow opening it up to 180 degrees as well as unfolding the Asus laptop with one finger.
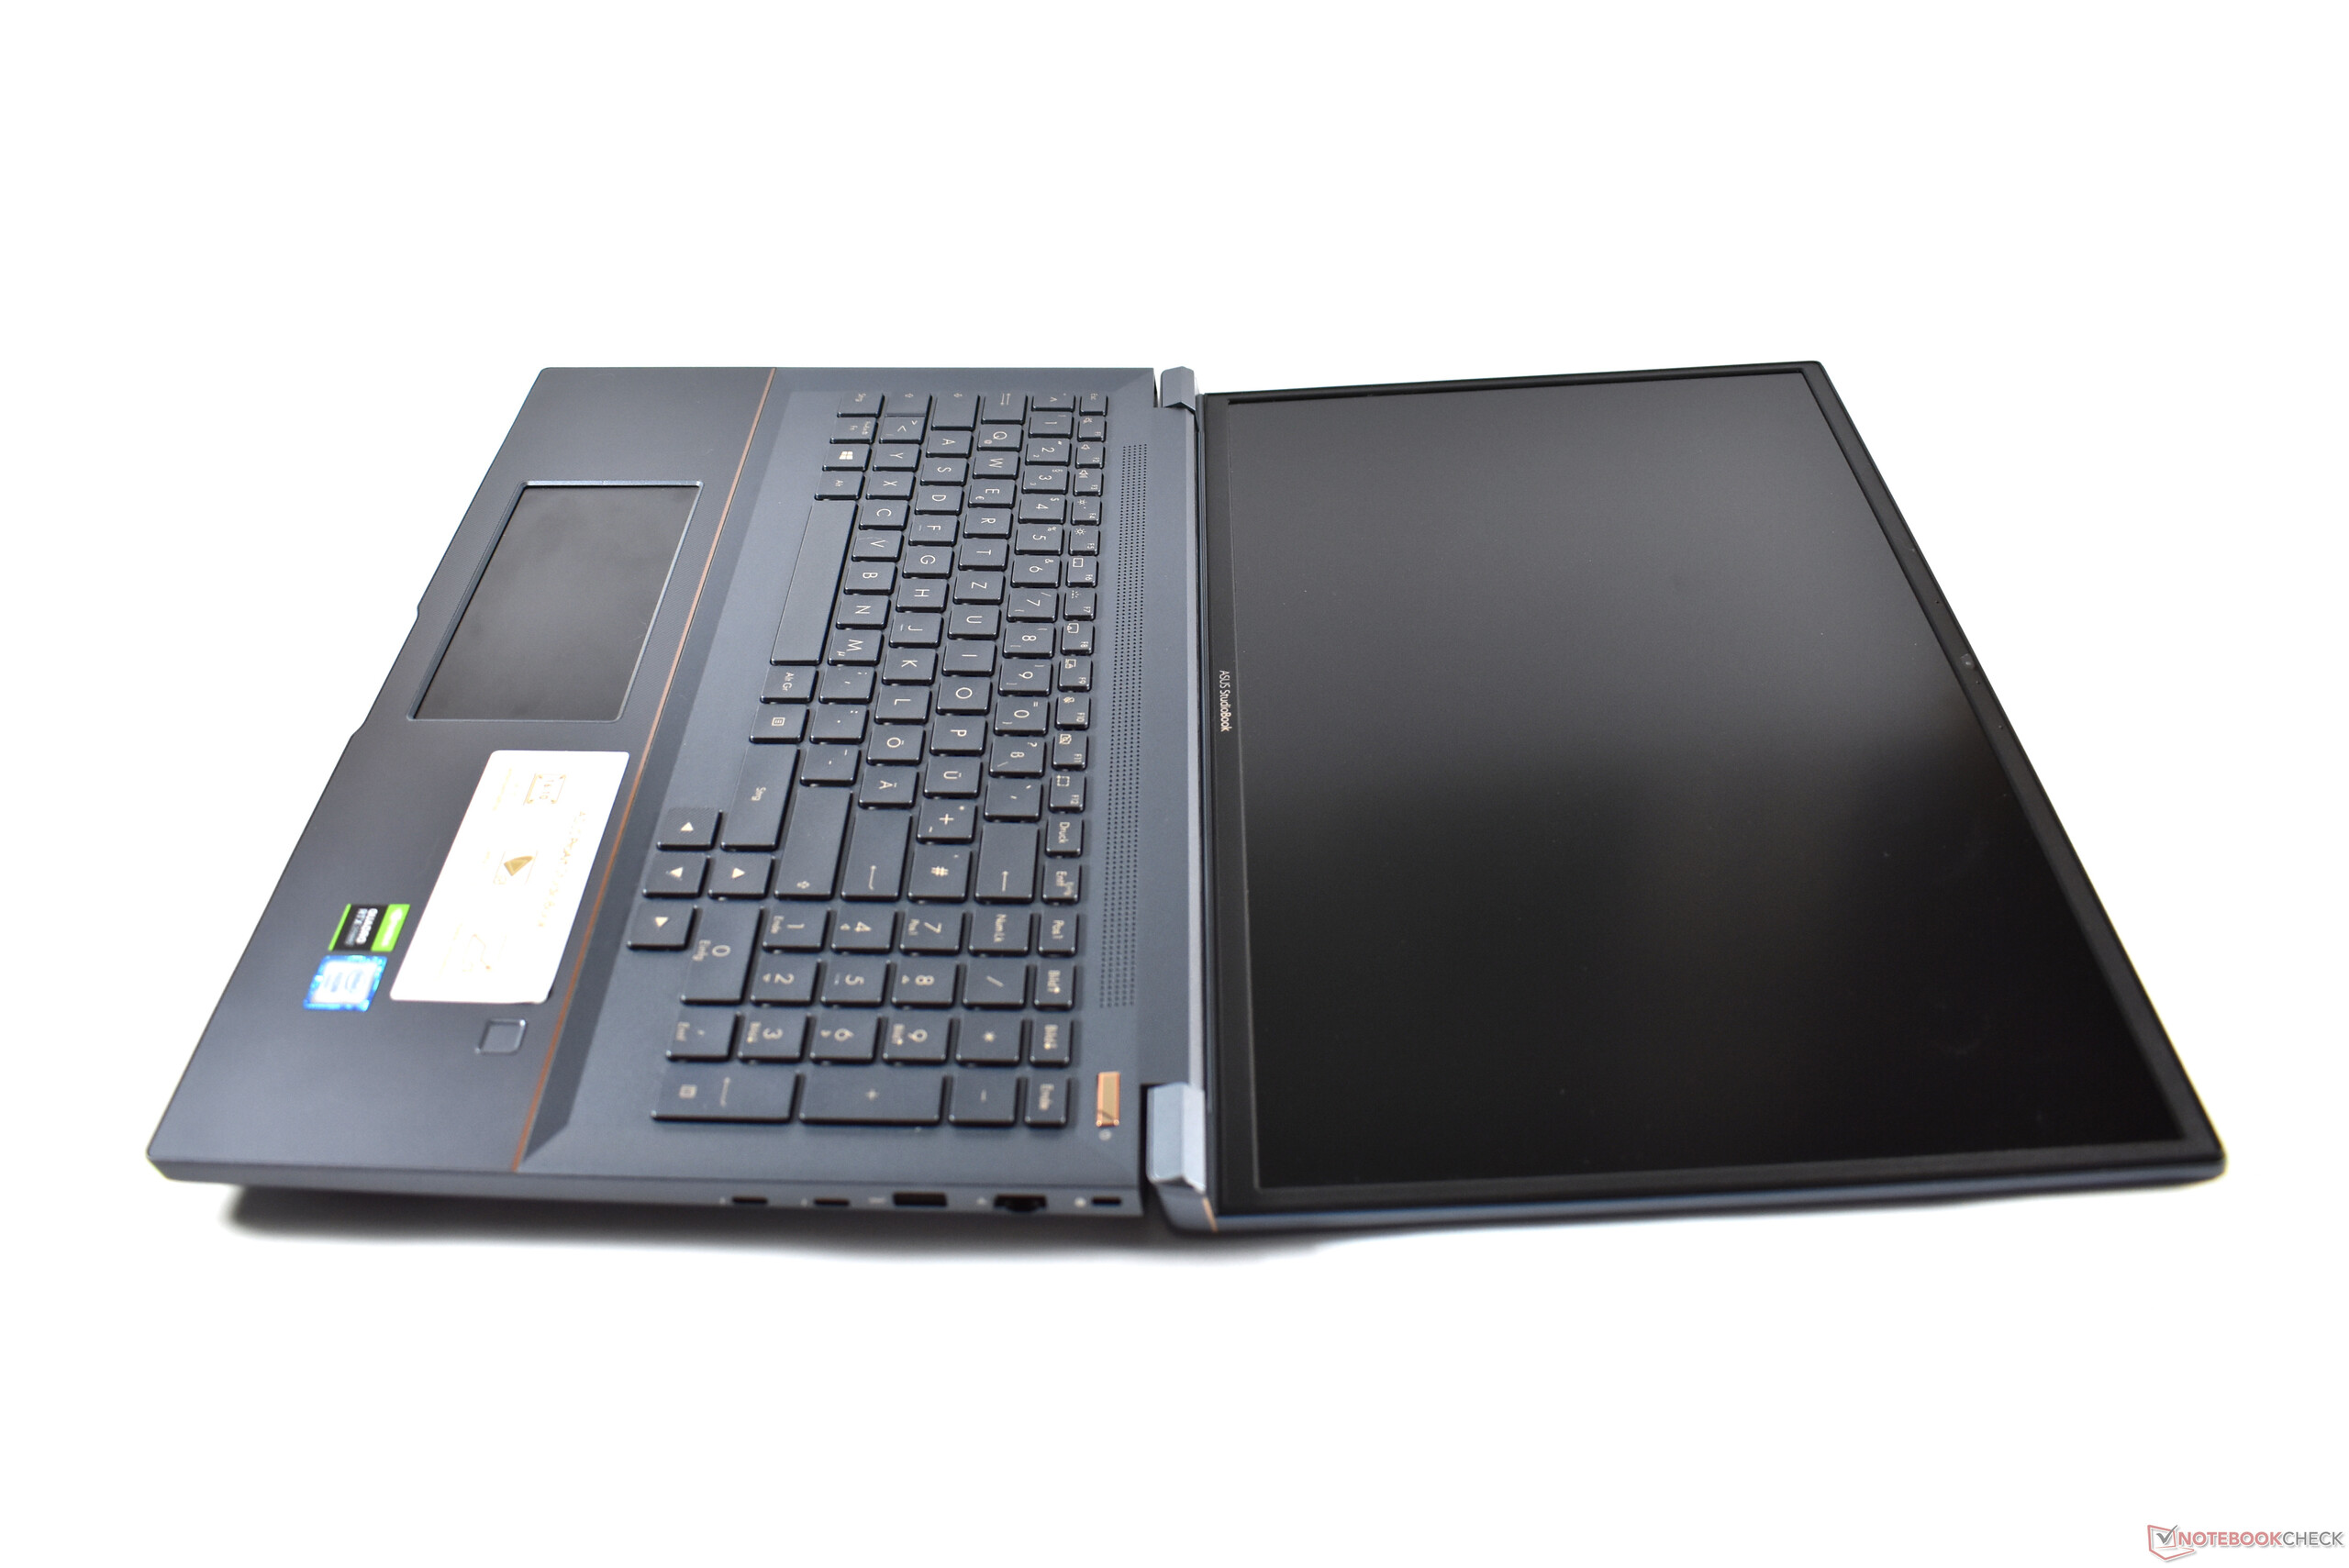
As a traditional workstation, the Asus StudioBook Pro X W730G5T is thick. But it is not as thick as the Lenovo ThinkPad P73. The Asus StudioBook W730G5T is still far away from a model with an Ultrabook-like design like the Dell Precision 5750. At least the display edges are pleasantly slim.
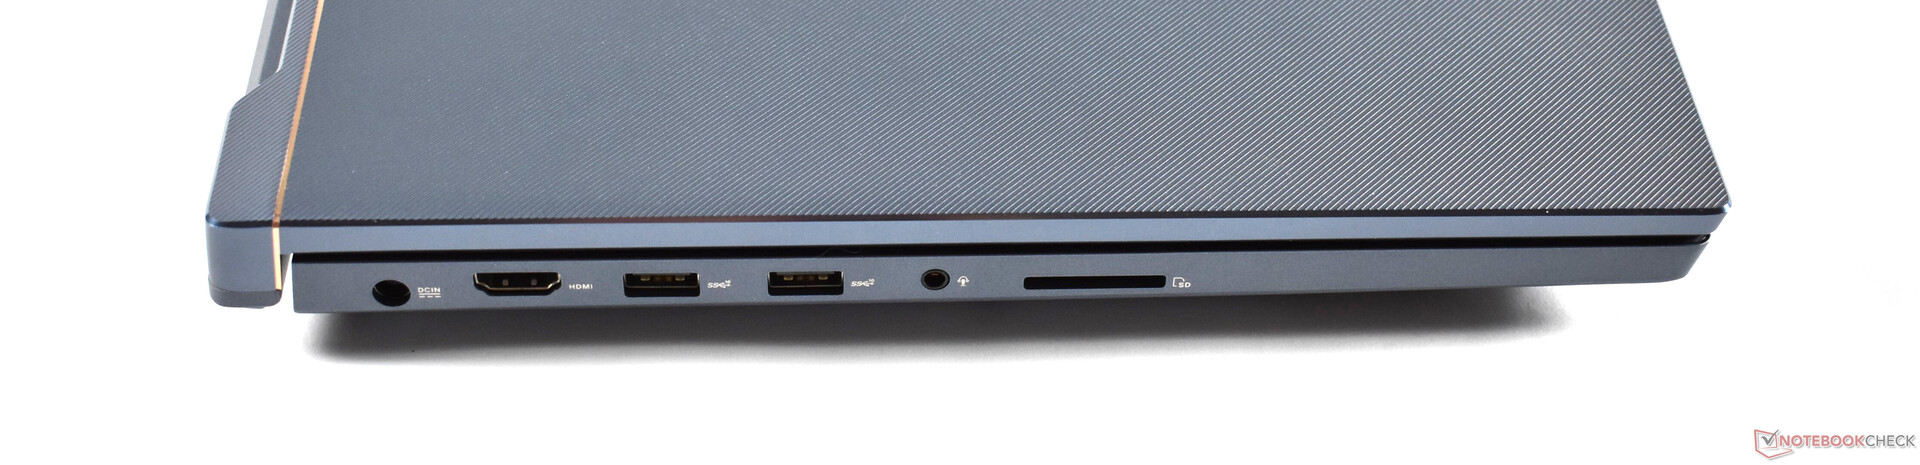
Features: Asus laptop has numerous ports
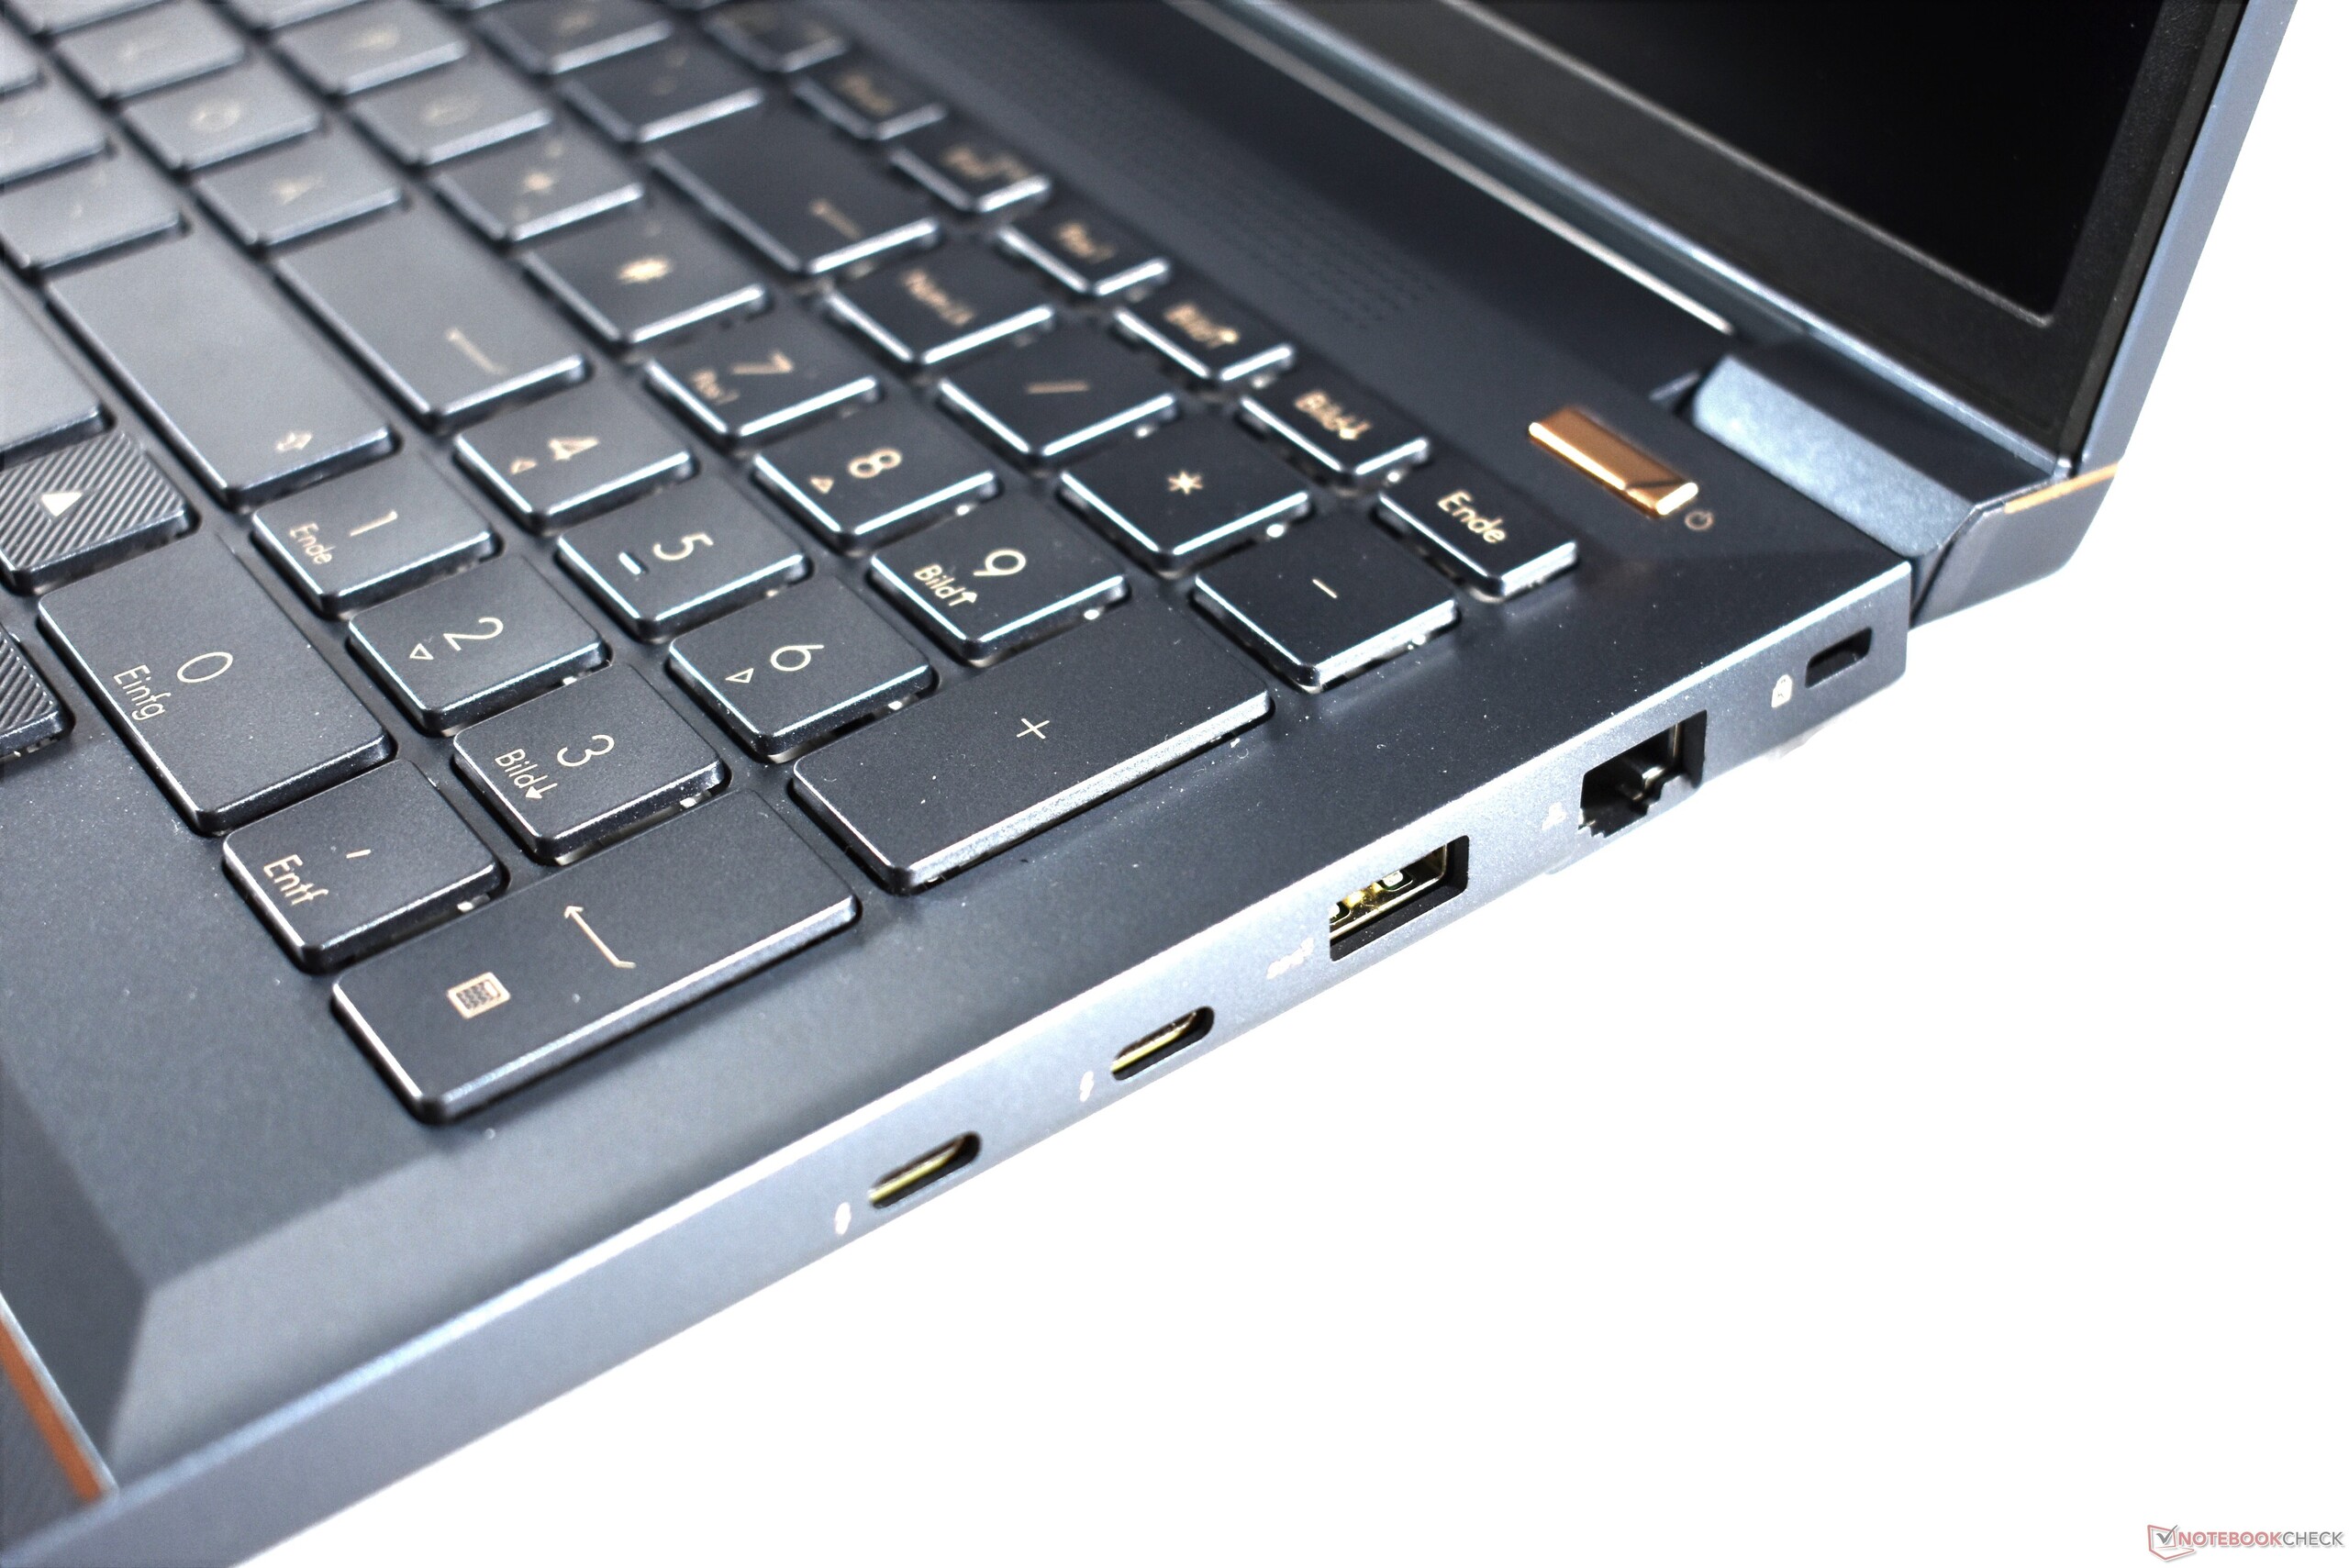
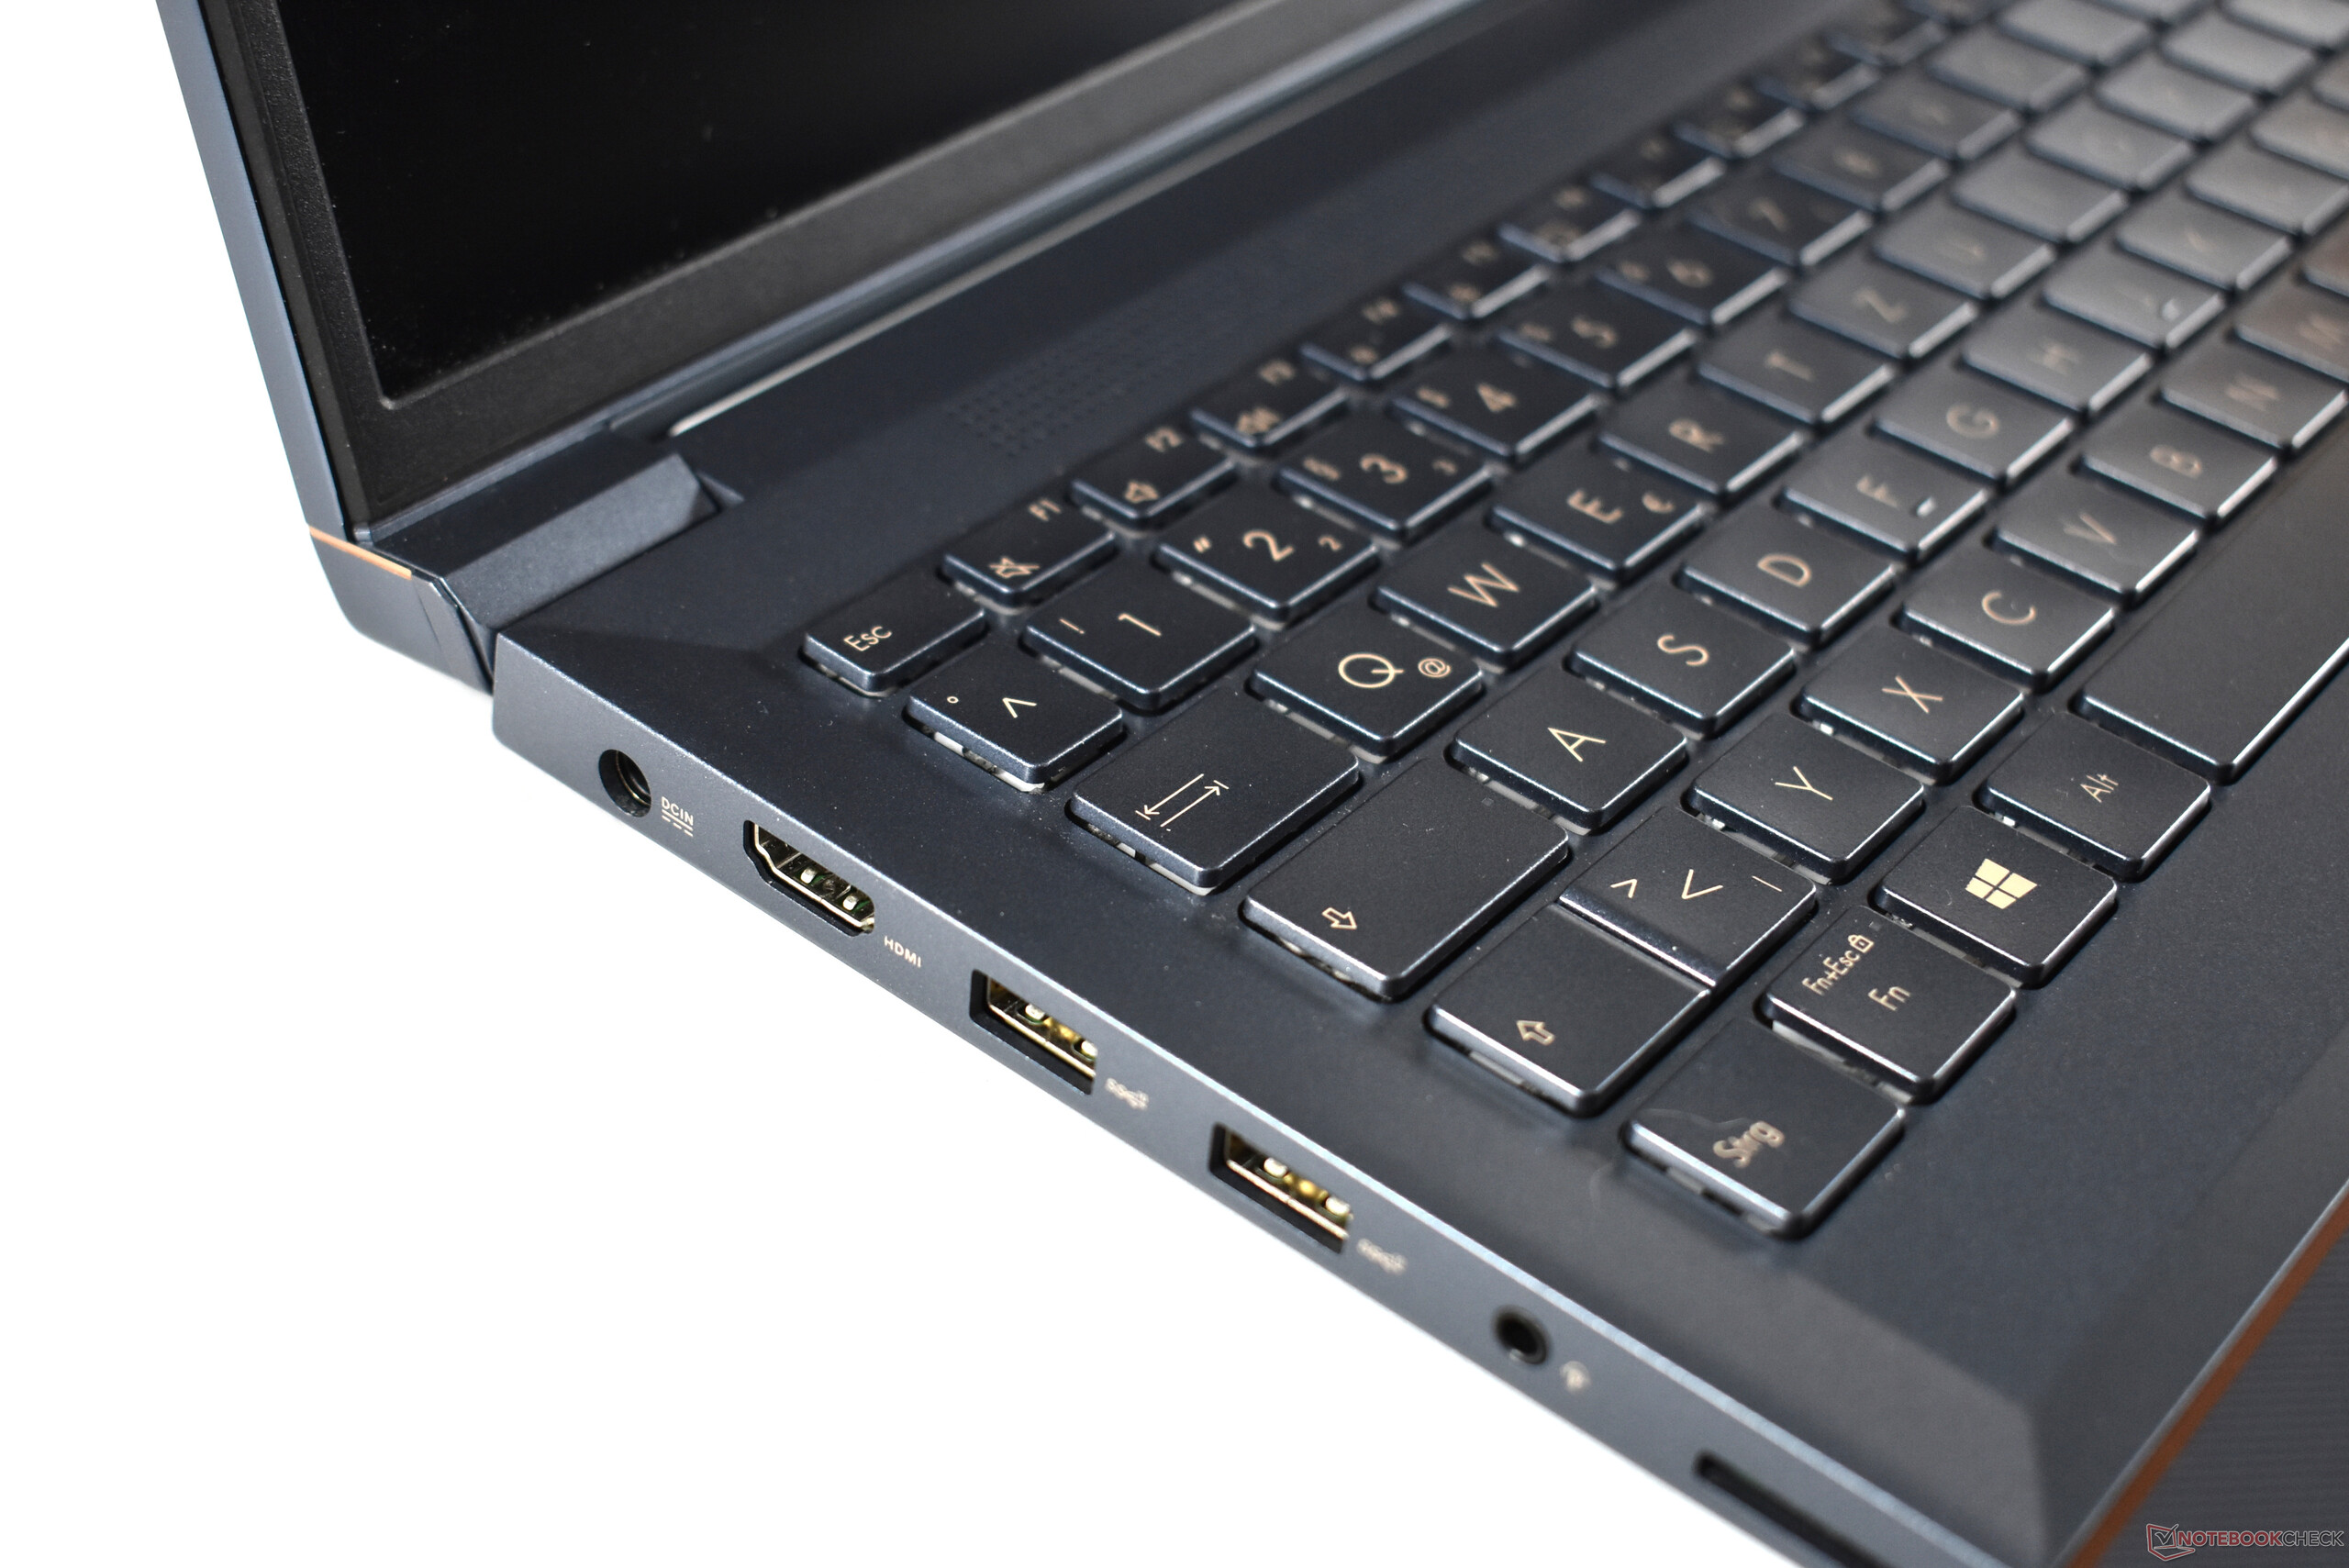
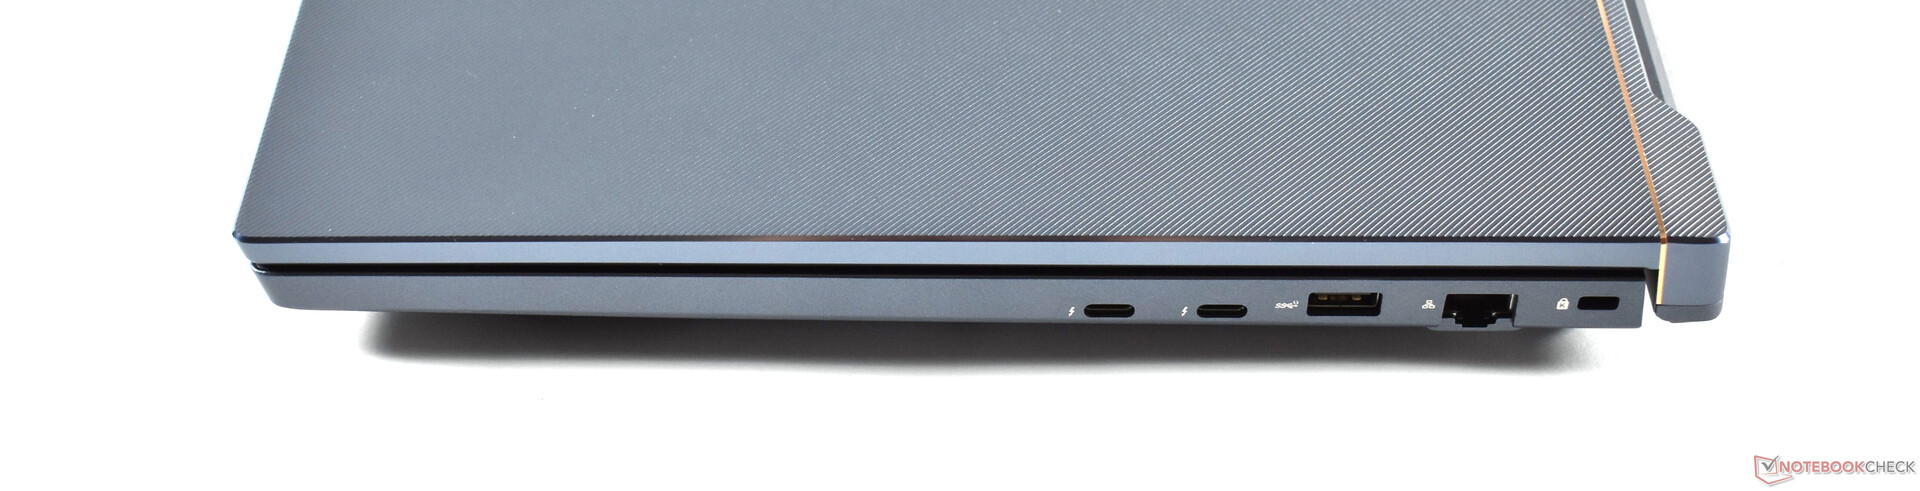
The Asus ProArt StudioBook has a rich connectivity as one would expect from a full-size workstation. Thus, the equipment is better than for example in the Dell Precision 5750, which only has USB-C/Thunderbolt 3 ports, apart from the SD card reader.
SD card reader
A very fast card reader, like in the Asus ProArt StudioBook Pro X W730G5T, isn't wrong for a workstation. We carried out our benchmarks with the Toshiba Exceria Pro SDXC 64 GB UHS-II reference memory card.
| SD Card Reader | |
| average JPG Copy Test (av. of 3 runs) | |
| Lenovo ThinkPad P73-20QR002DGE (Toshiba Exceria Pro SDXC 64 GB UHS-II) | |
| Asus StudioBook Pro X W730G5T-H8050T (Toshiba Exceria Pro SDXC 64 GB UHS-II) | |
| Dell Precision 5000 5750 P92F (Toshiba Exceria Pro SDXC 64 GB UHS-II) | |
| Average of class Workstation (49.6 - 681, n=14, last 2 years) | |
| MSI WE75 9TK (Toshiba Exceria Pro SDXC 64 GB UHS-II) | |
| maximum AS SSD Seq Read Test (1GB) | |
| Asus StudioBook Pro X W730G5T-H8050T (Toshiba Exceria Pro SDXC 64 GB UHS-II) | |
| Average of class Workstation (87.6 - 1455, n=14, last 2 years) | |
| Lenovo ThinkPad P73-20QR002DGE (Toshiba Exceria Pro SDXC 64 GB UHS-II) | |
| Dell Precision 5000 5750 P92F (Toshiba Exceria Pro SDXC 64 GB UHS-II) | |
| MSI WE75 9TK (Toshiba Exceria Pro SDXC 64 GB UHS-II) | |
Communication
The Intel Wireless AX200 may no longer be the latest Wi-Fi solution, but the 2x2 card still delivers very good performance. The Wi-Fi 6 module does not expose itself either when sending or receiving data.
Webcam

, E-2276M, Intel SSD 760p SSDPEKKW010T8")
, E-2276M, Intel SSD 760p SSDPEKKW010T8")
Security
The fingerprint reader is located in the right area of the palm rest, and the Asus laptop also has a Kensington lock slot. There aren't any more hardware features in the security area. Other workstations have smart card readers, infrared cameras and privacy screens for the webcam.
Accessories
Only the 280 watt power supply with a proprietary adapter is included in the Asus laptop's box.
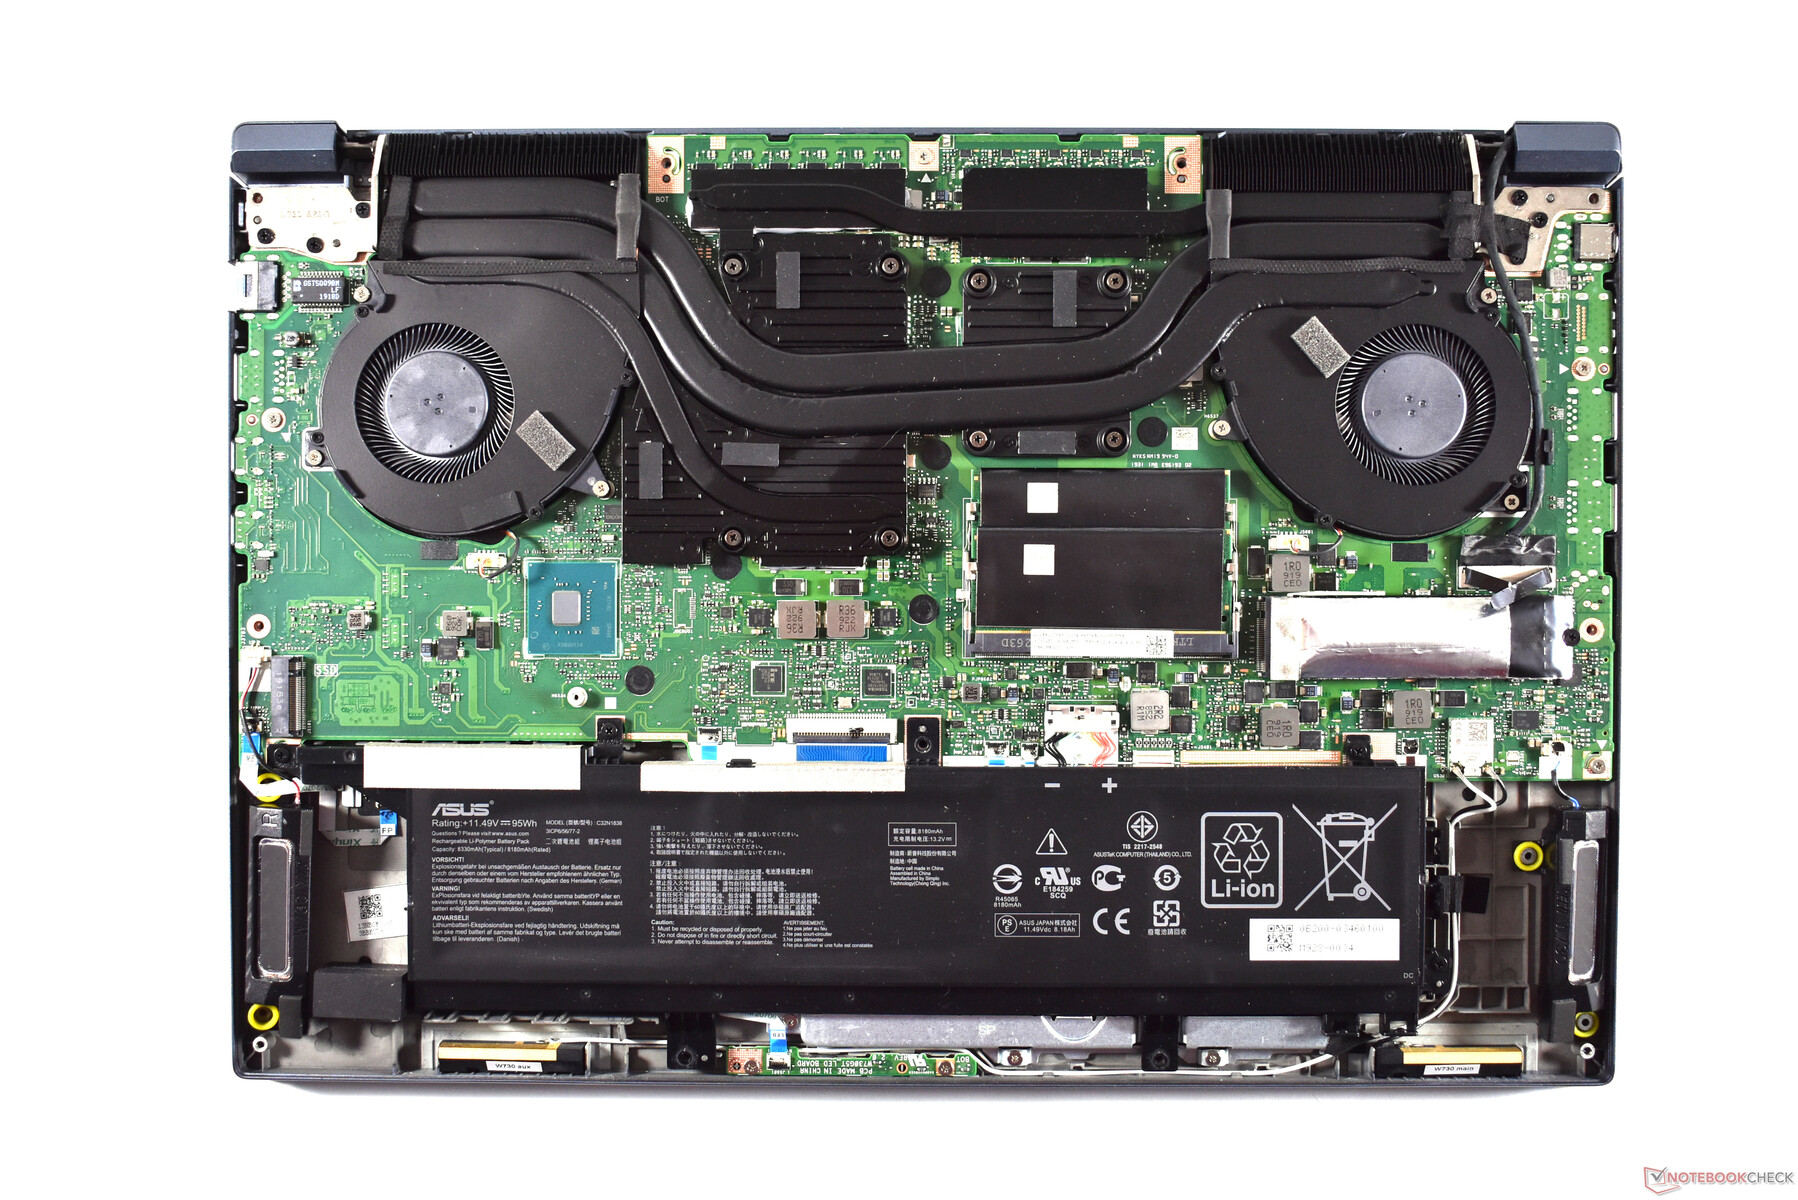
Maintenance
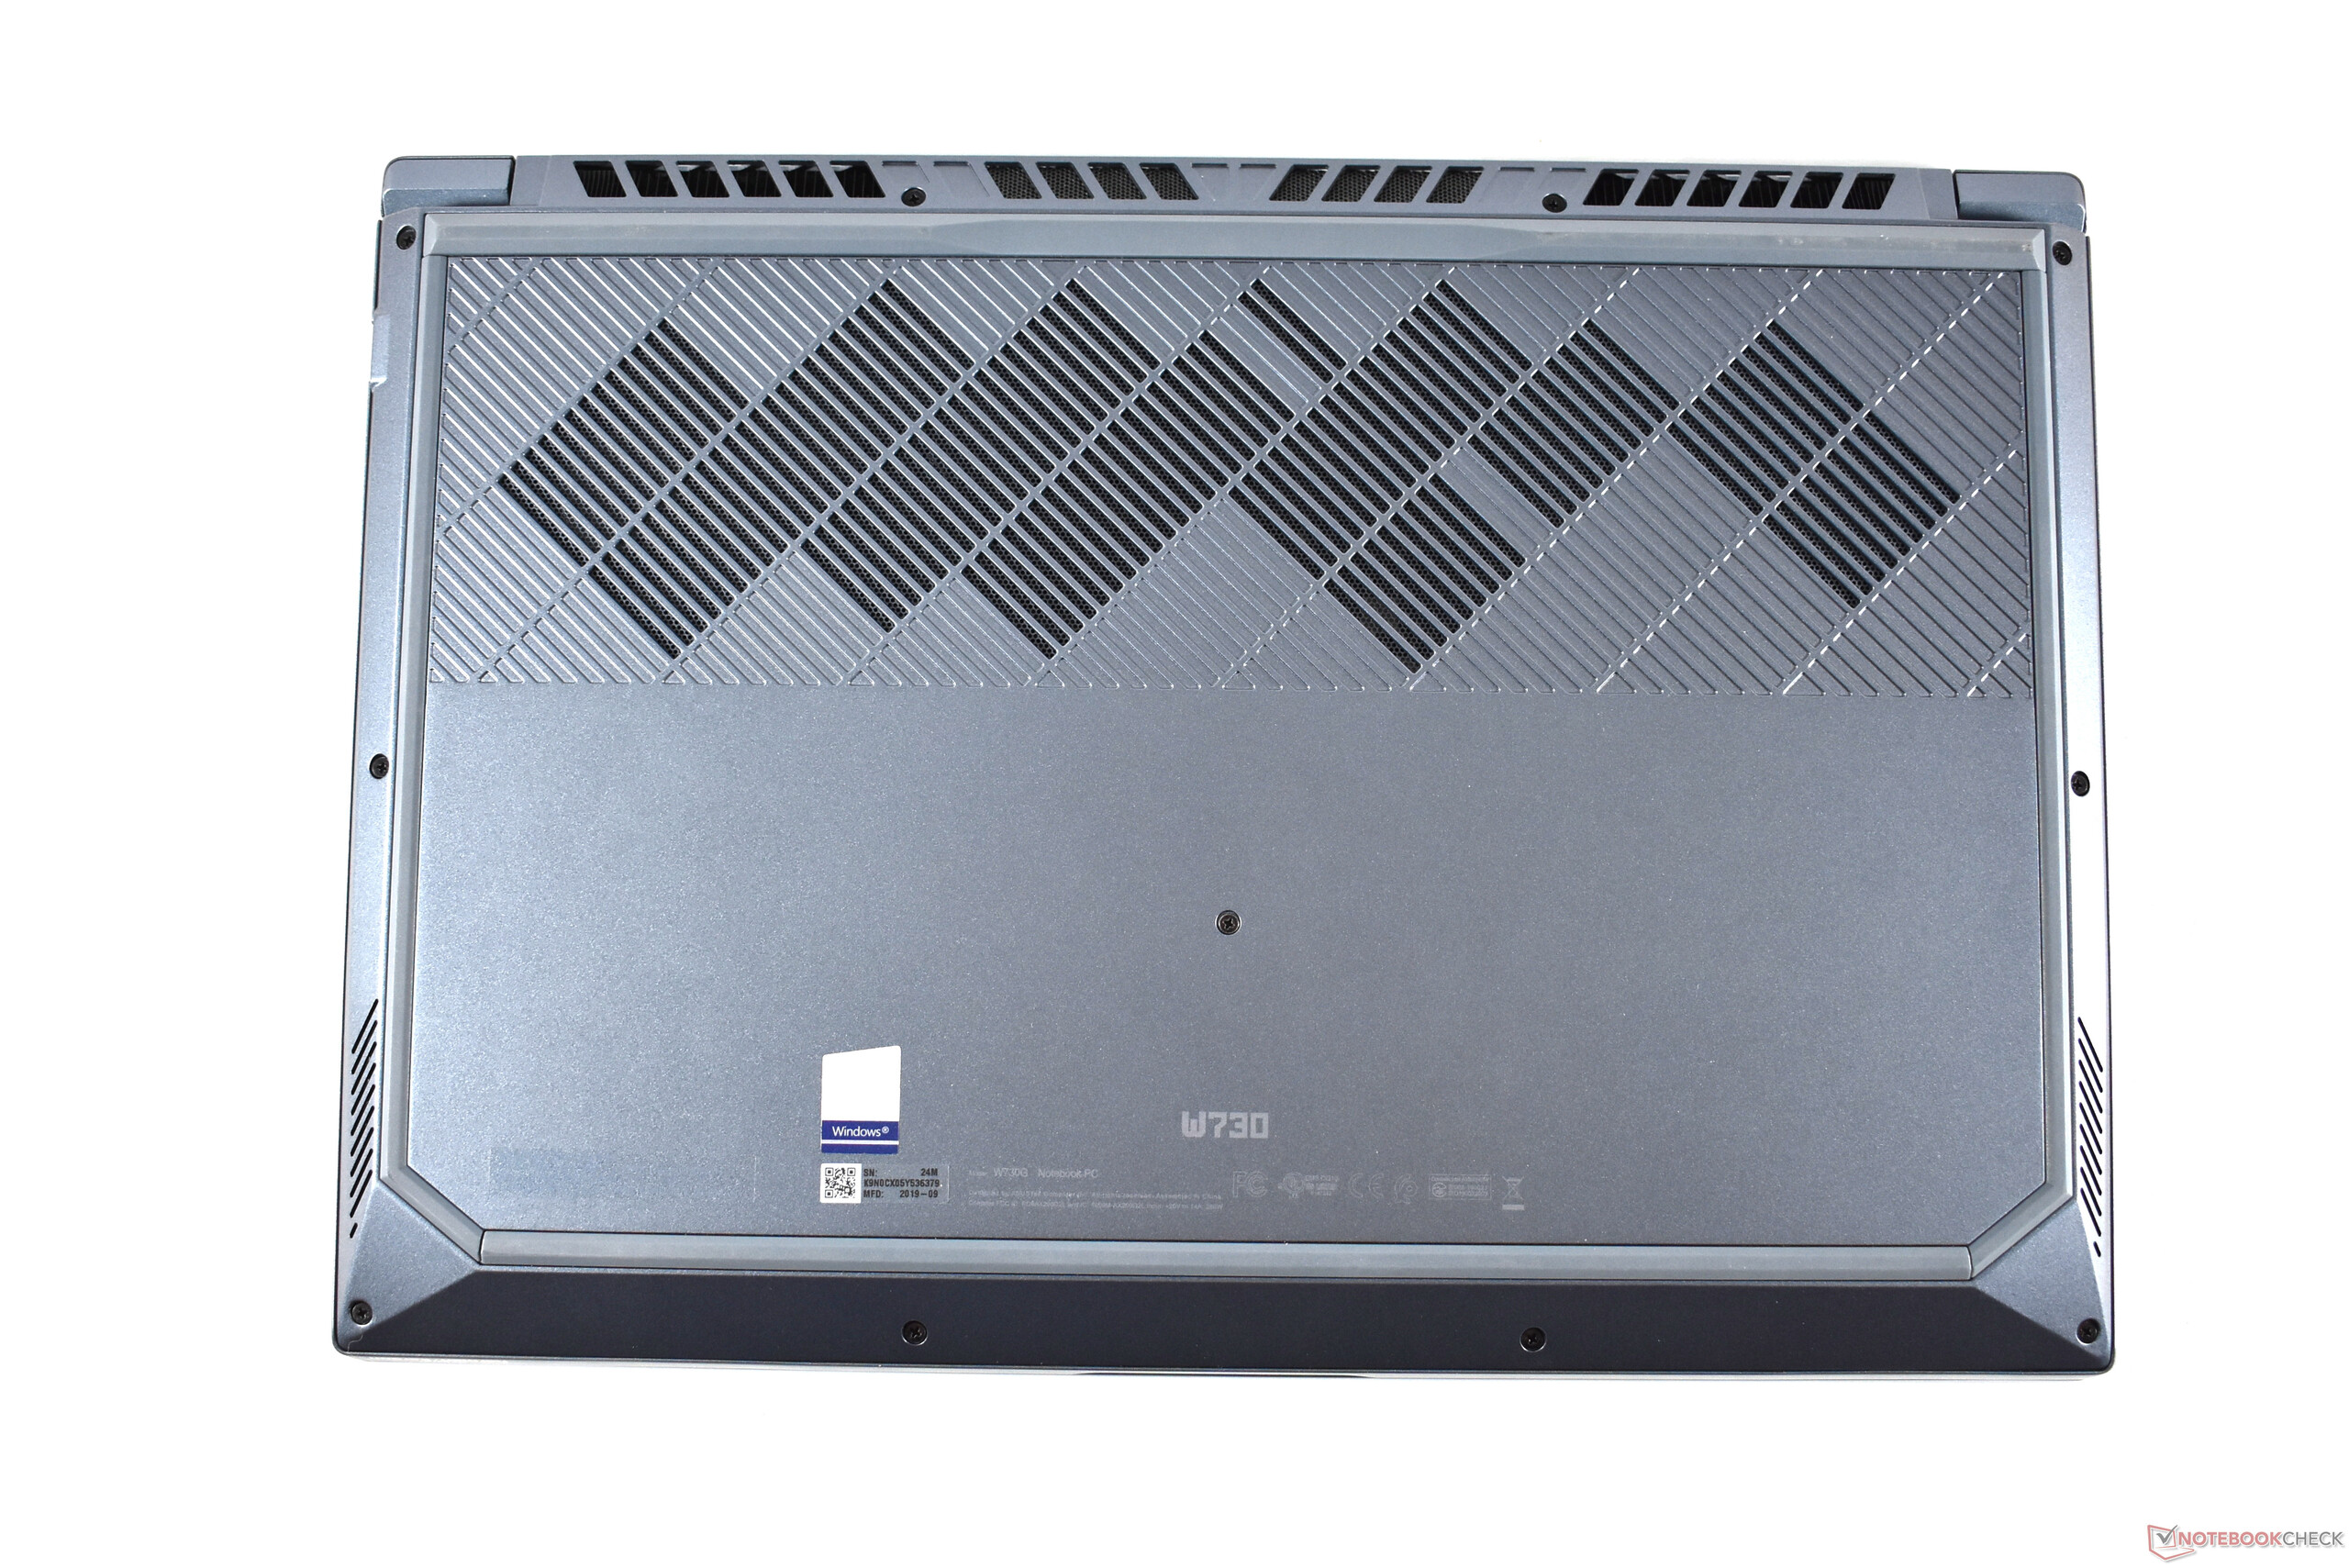
Eleven cross-head screws must be loosened. Caution: The screws do not get stuck in the housing and could get lost. They also have different lengths. So you have to be careful to assign the screws to the correct openings.
With the underside removed, you have access to components like the fans and the battery. The primary M.2-2280 SSD is also placed here, just like another free M.2-2280 slot and two of the four SO-DIMM slots. The other two M.2 slots and RAM banks are probably located under the keyboard and are not accessible - the keyboard is firmly integrated into the palm rest. You can still upgrade the RAM to up to 128 GB in our test device. However, if you buy a model with only 32 GB ex factory, this would not be possible.
Warranty
A purchase price of well over 6,000 Euros (~$7,105) and only a two-year guarantee? That's far too little for such an expensive workstation. Workstation competitors like the ThinkPad P73 have a three-year warranty.
The factory warranty is not an on-site service. If the worst comes to the worst, Asus will pick up the laptop for repair. The warranty scope can be optionally extended.
Input devices: Asus ScreenPad meets great keyboard
Keyboard
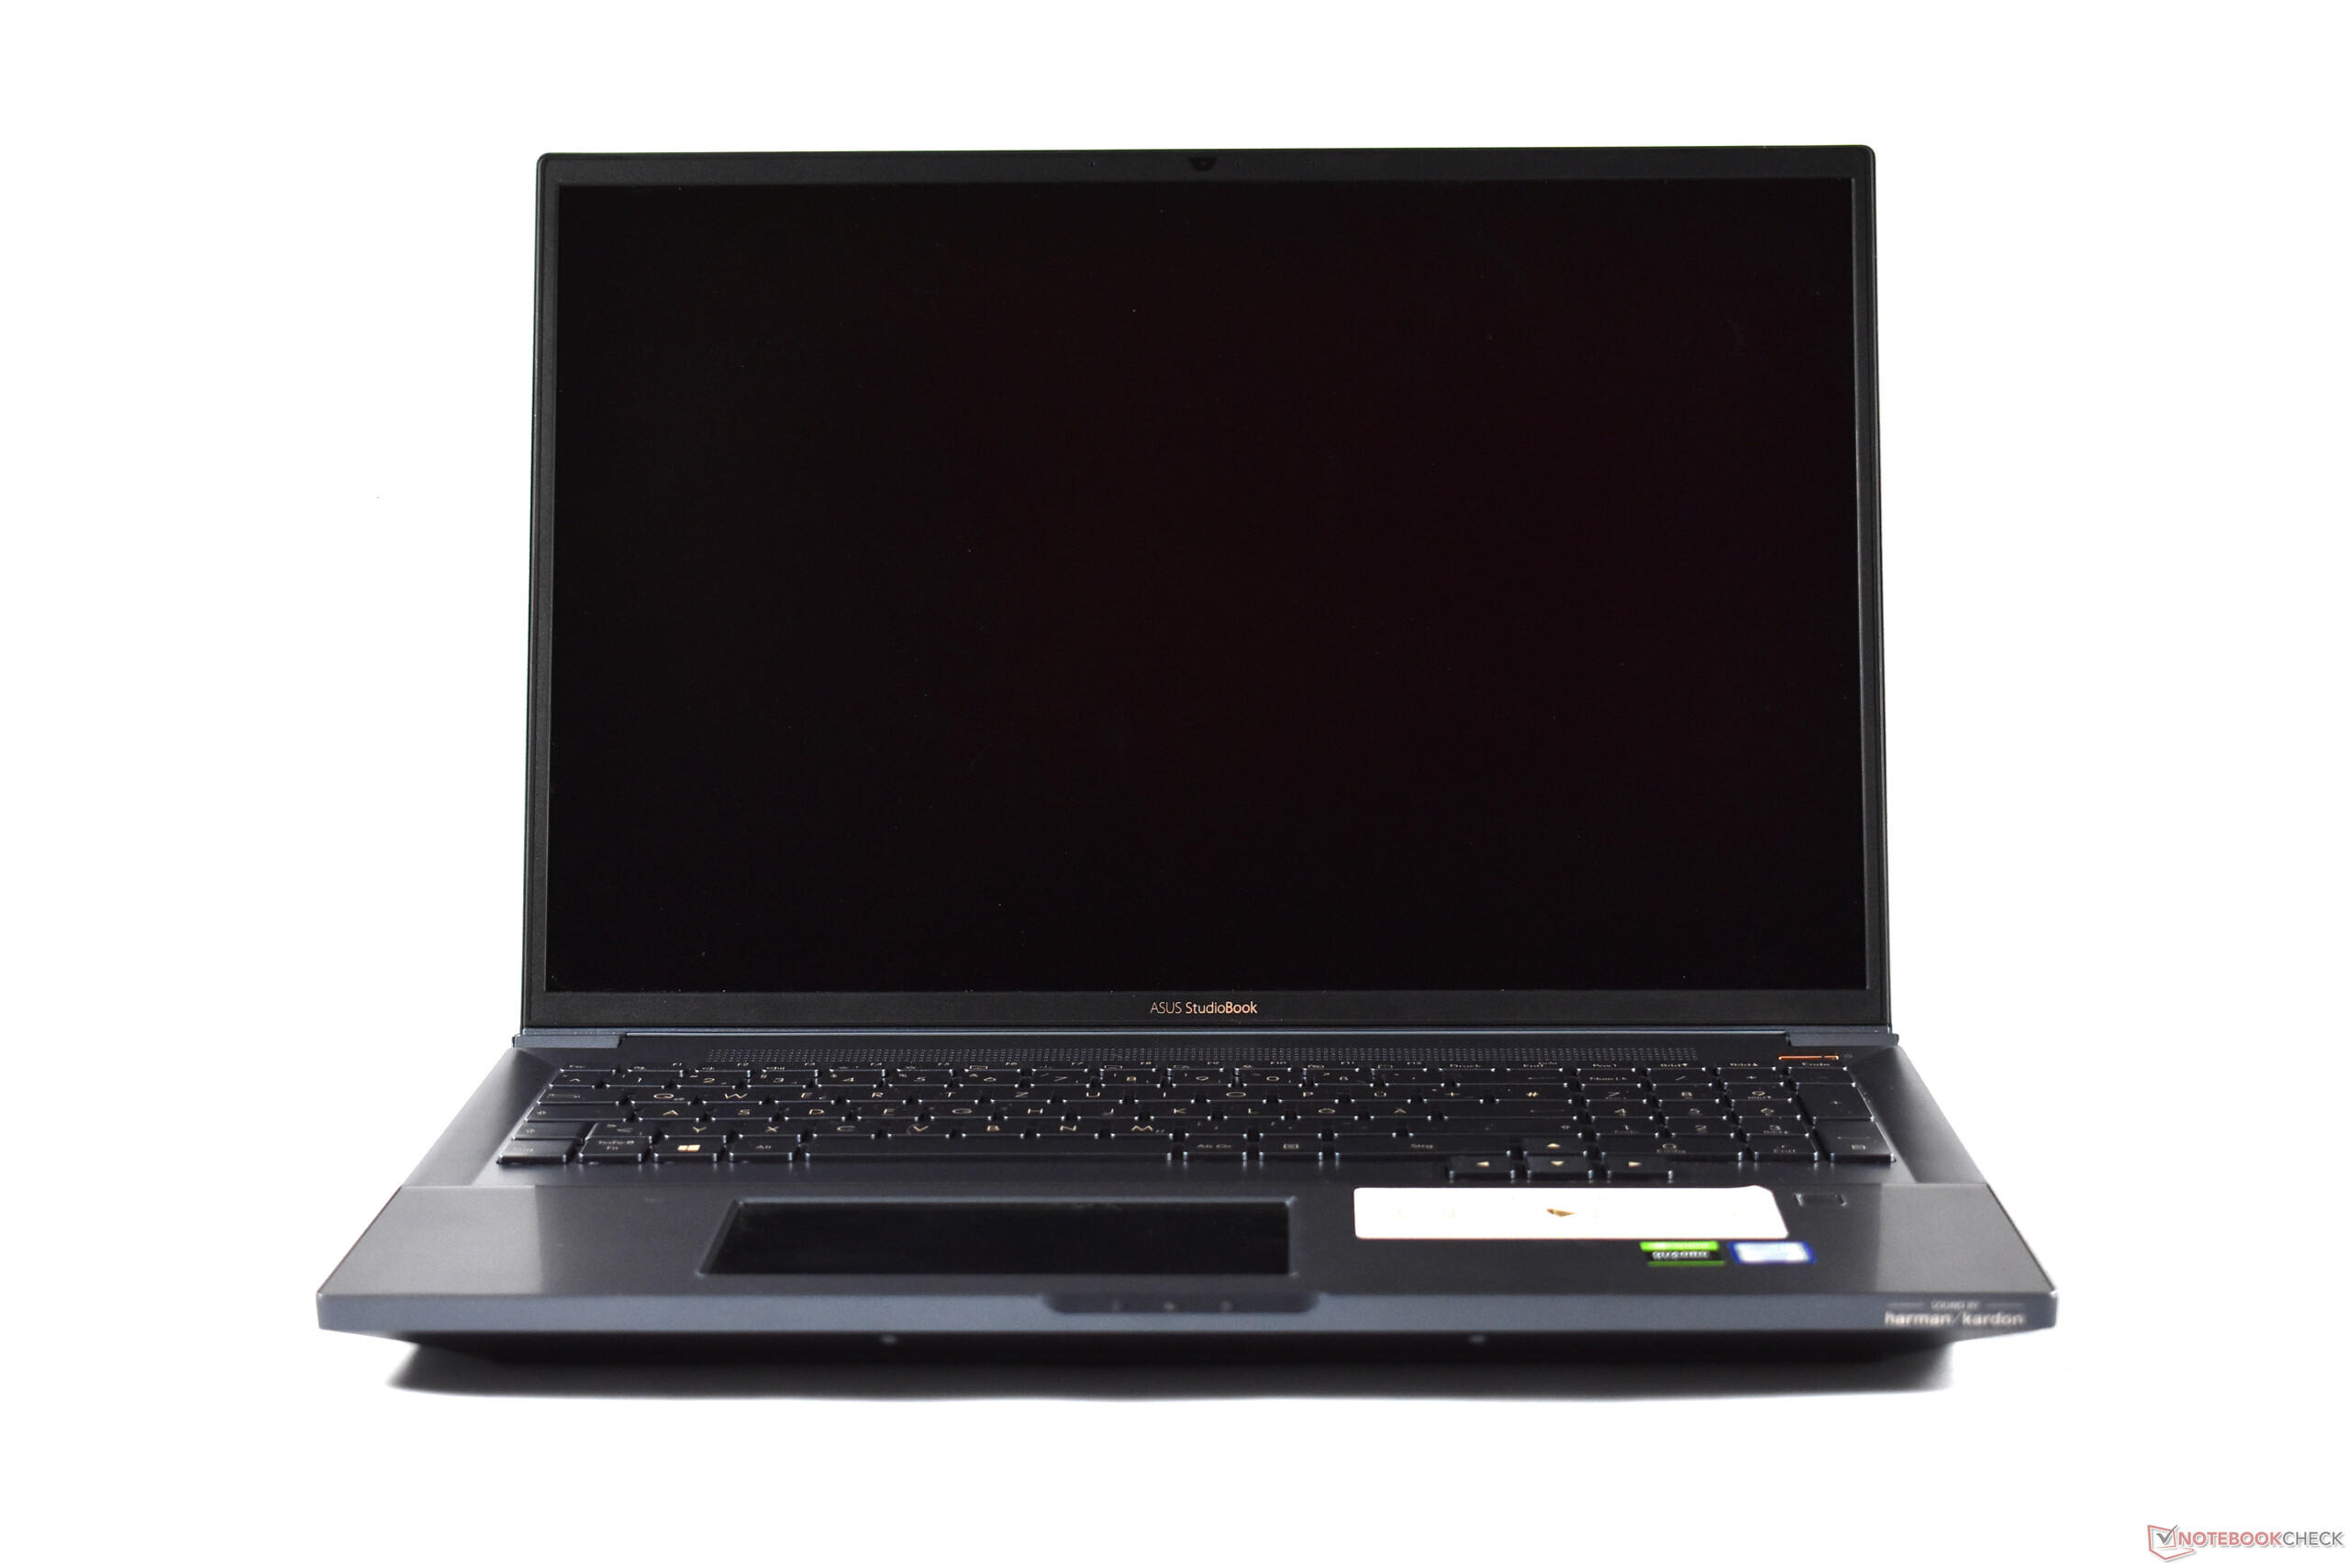
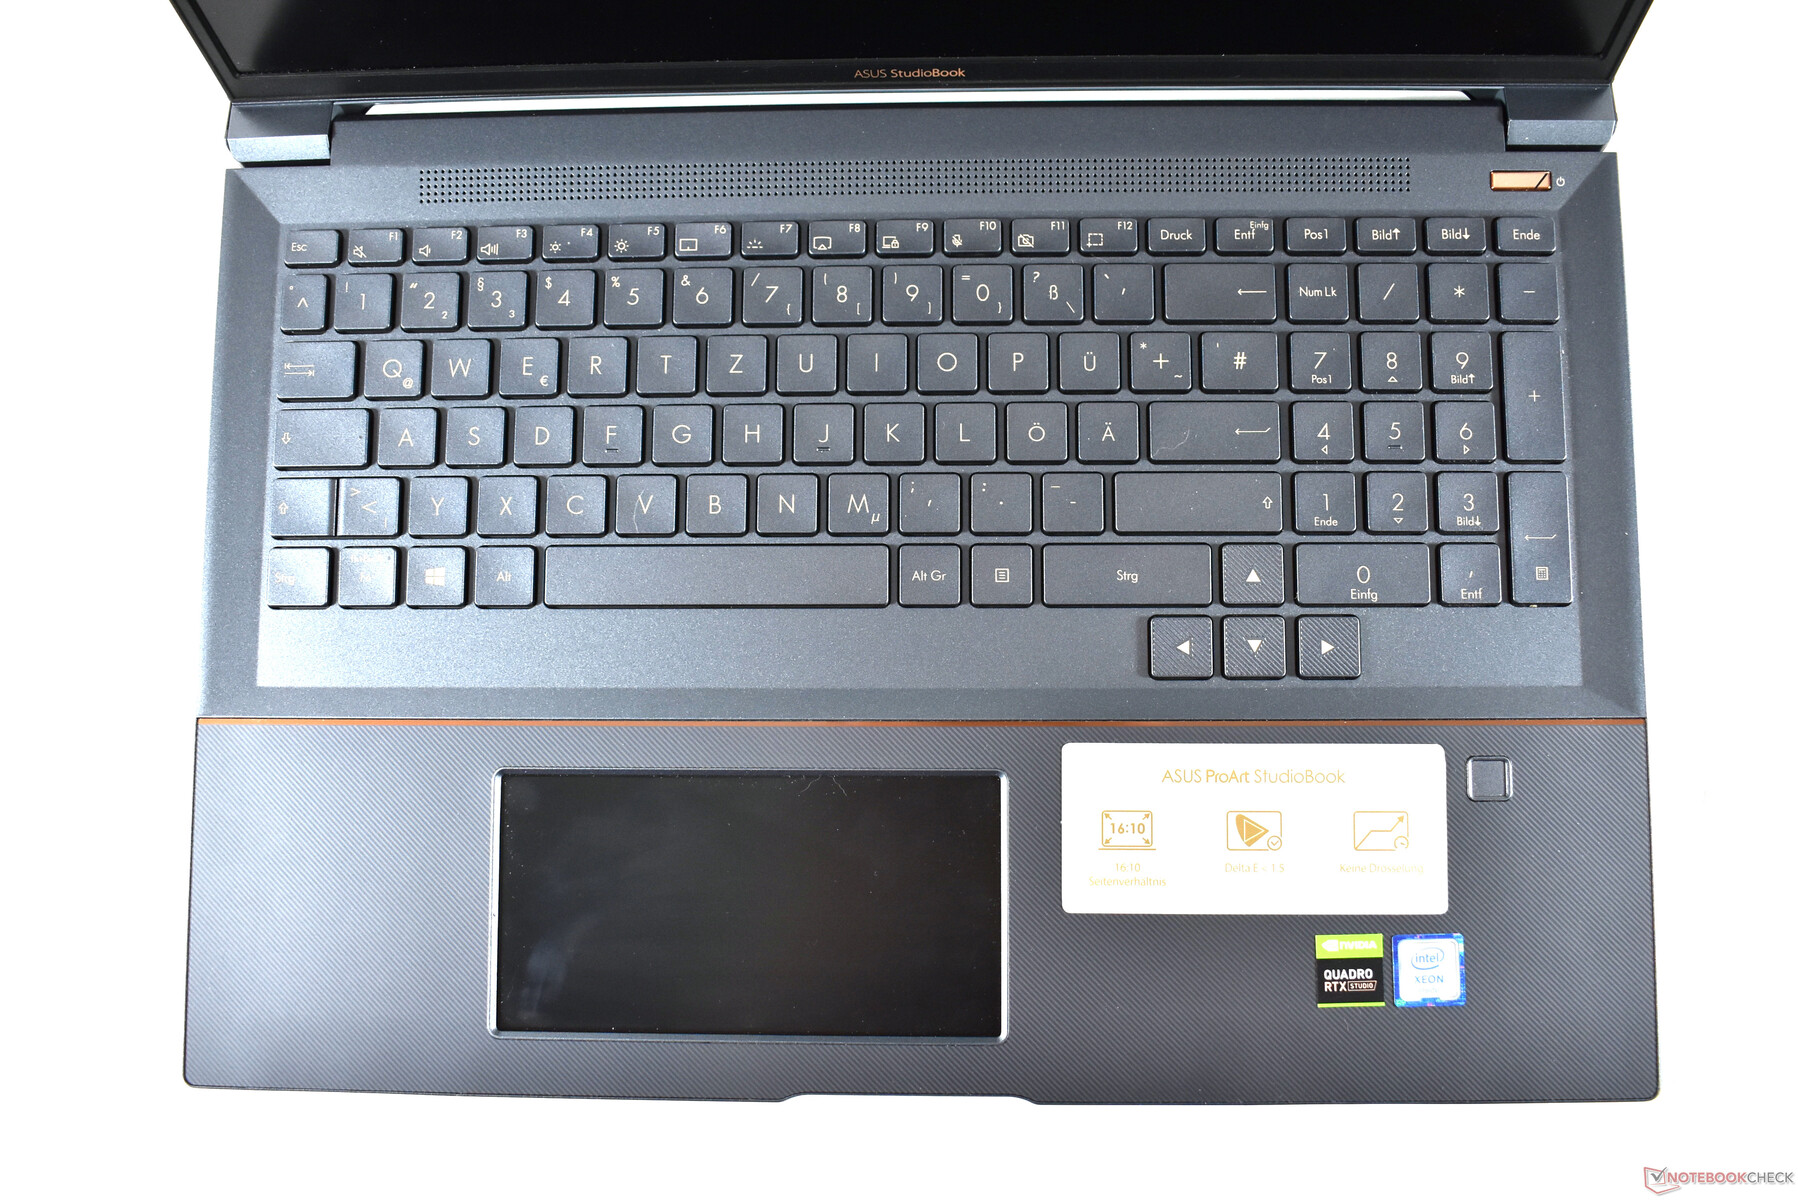
Despite the large display, Asus uses a keyboard that doesn't have the full standard width. But that's not too bad and isn't really noticeable, also because of the ANSI layout with a narrow enter key, which is unusual for Germany. The arrow keys have the full key size, which are also set off by their ribbed surface - a very pleasant design.
The keys have a backlight with three levels. Their stroke is quite long at 2 mm and the keys have a pleasant pressure point and resistance. Since the keyboard, just like the case, does not give way anywhere, this results in a typing feel at a very high level. Working with the keyboard of this workstation is very easy.
Touchpad
The touchpad of the Asus ProArt StudioBook Pro X W730G5T measures 13 by 6.5 centimeters. When in use, the glass surface feels very high-quality and allows the finger to glide smoothly over it. In combination with the Microsoft Precision driver, the mouse pointer can be moved quickly and precisely, and gestures such as zoom work perfectly. Because there are no dedicated buttons, it is a ClickPad with integrated click function. The mechanism has a crisp pressure point but is relatively loud.
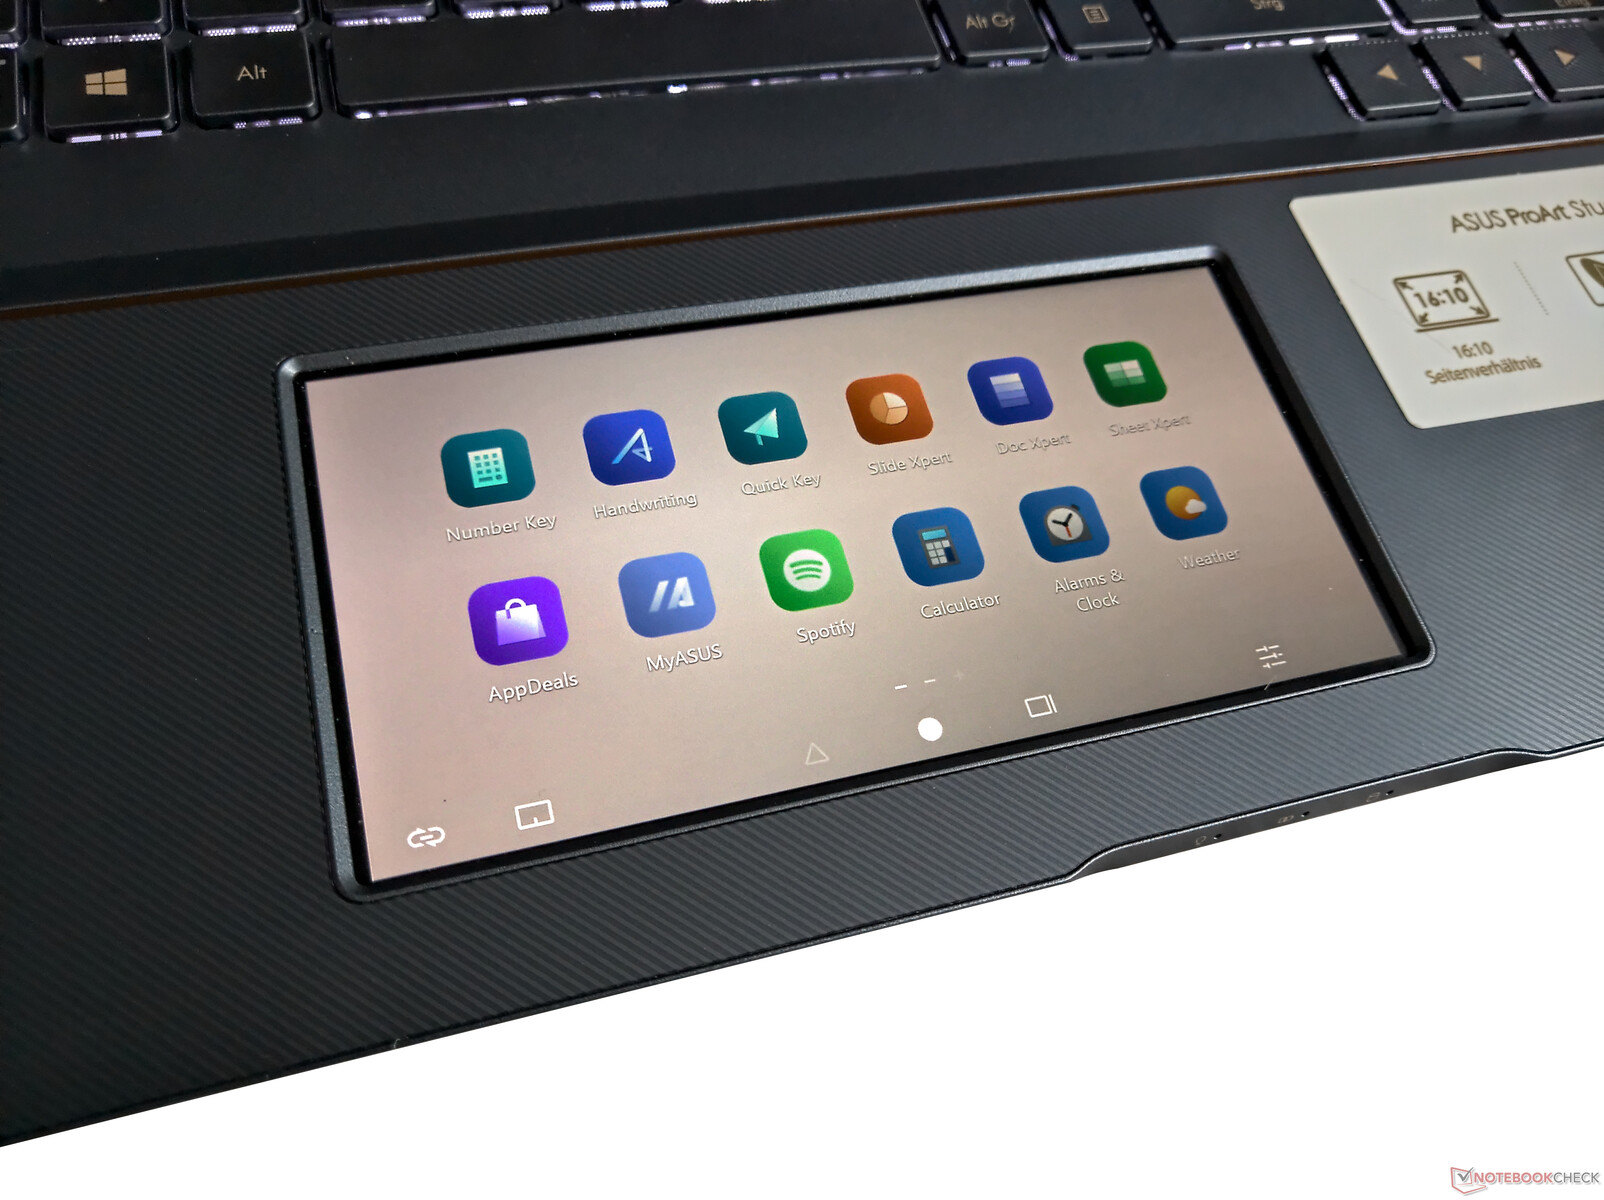
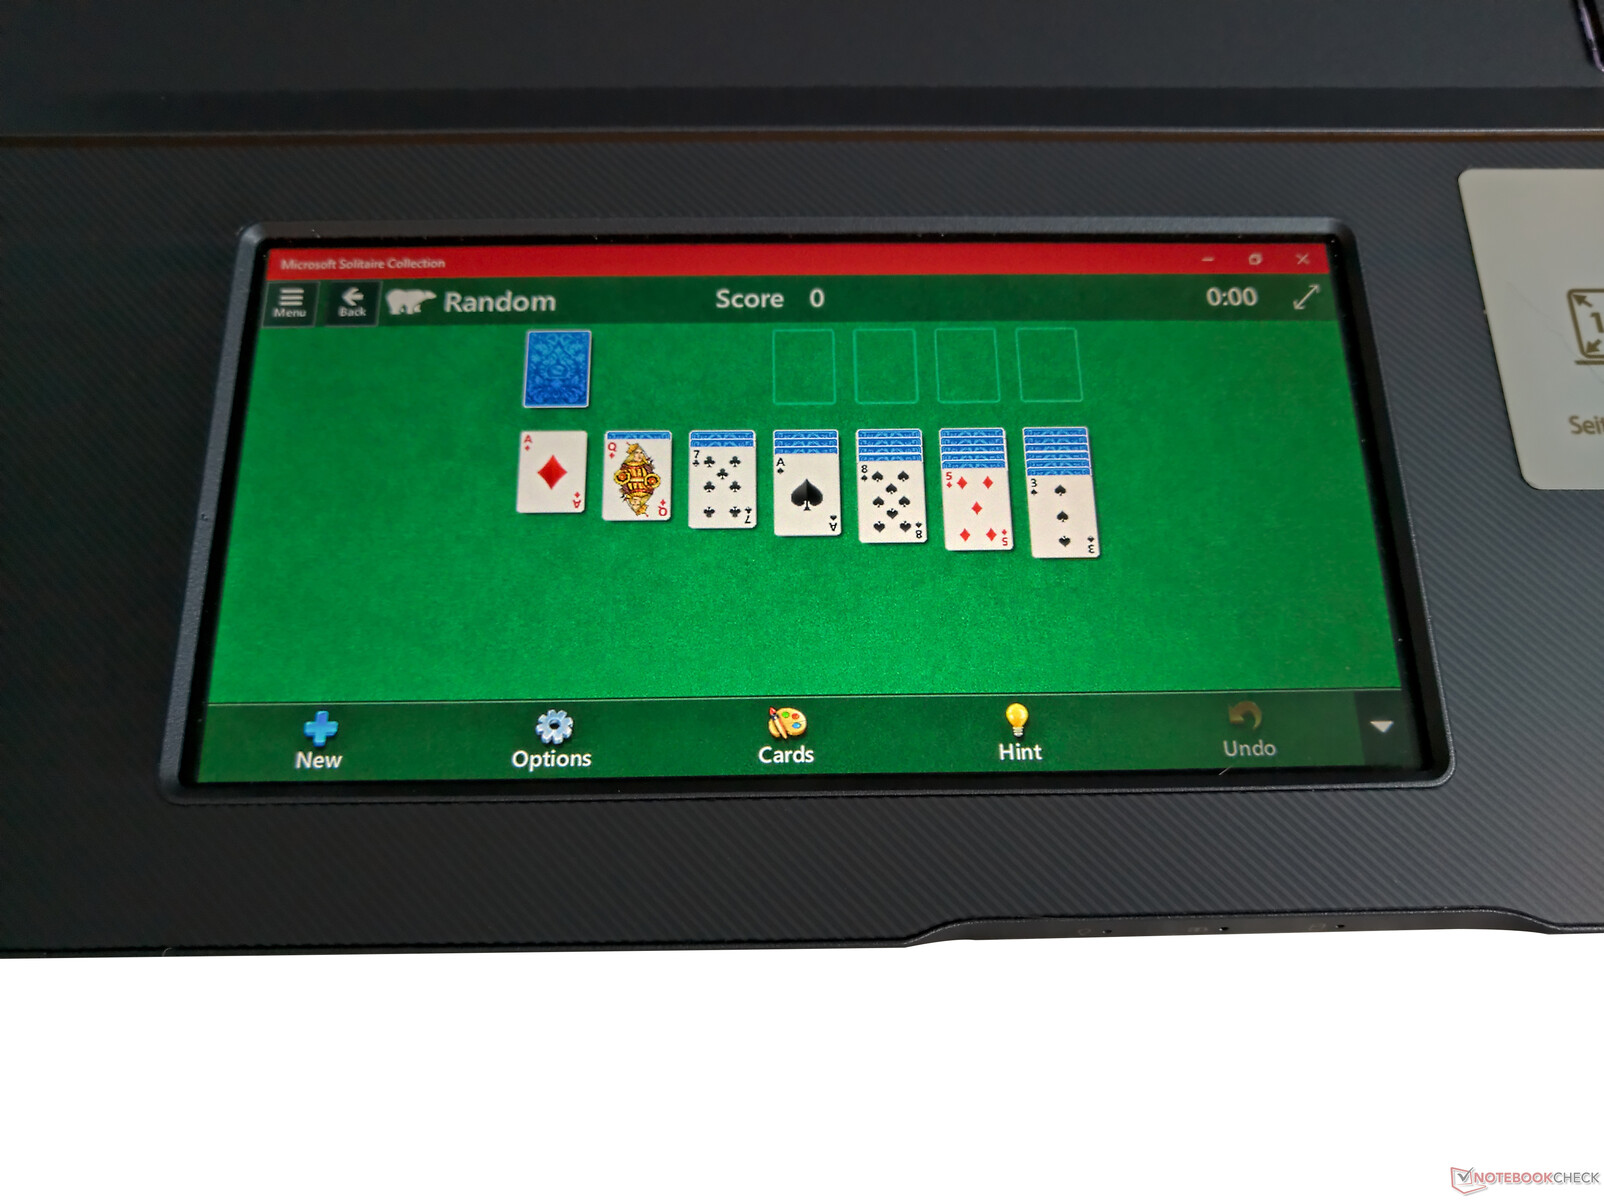
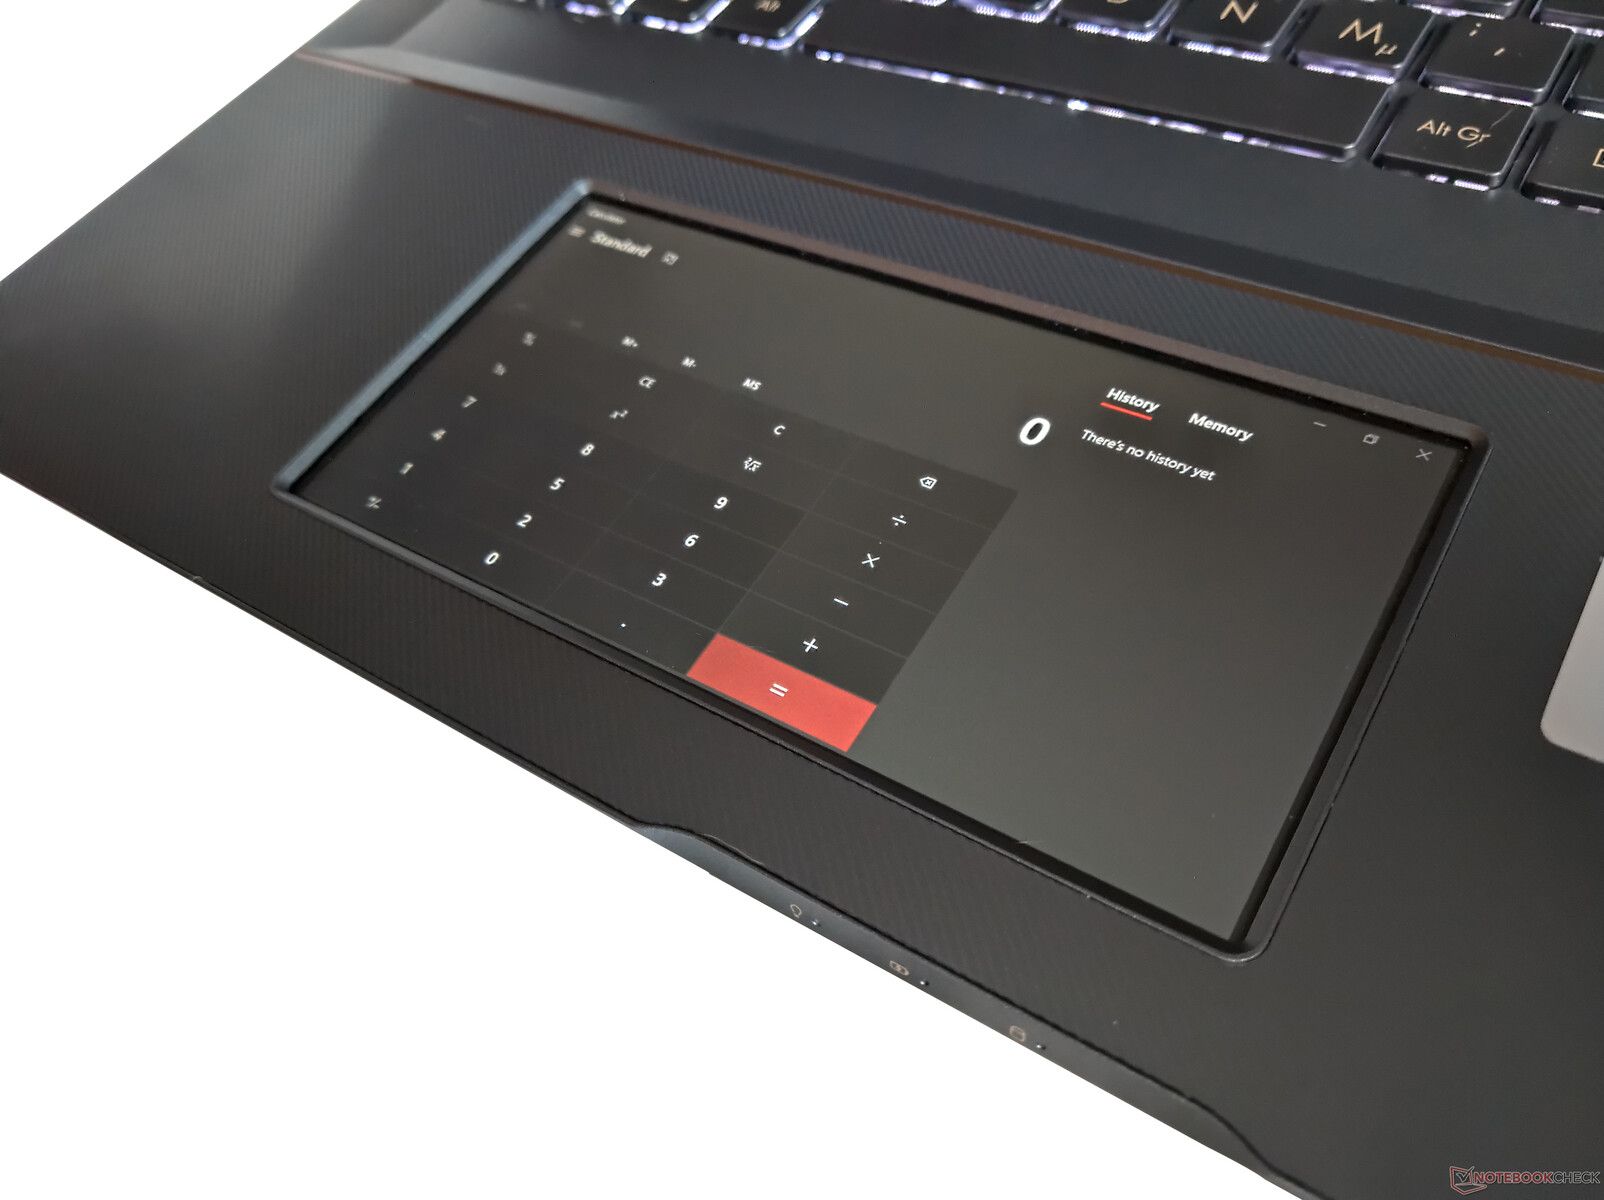
There is no trackpoint on this Asus workstation. It has another extra for this: The ScreenPad, because the touchpad is also a screen as an option. There are various functions for this, for example playful ones like the movie app or solitaire and also productive ones like the calculator and special office apps from Asus.
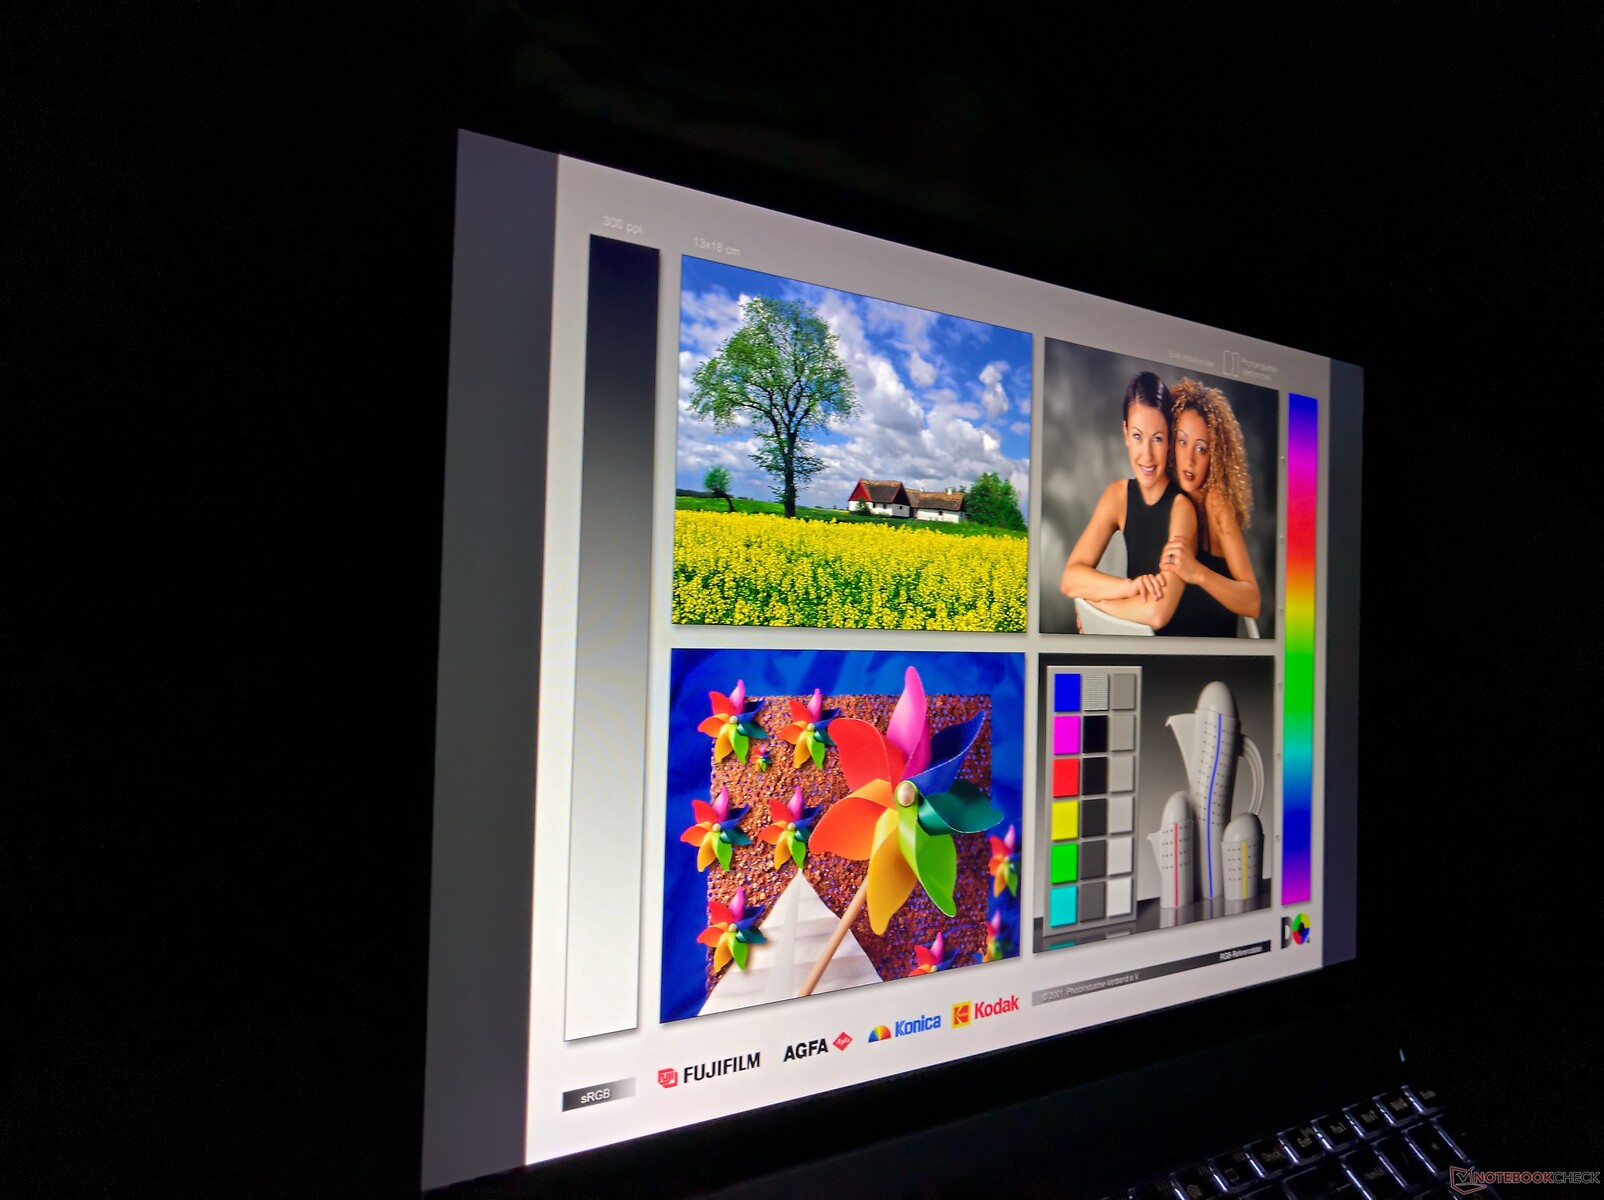
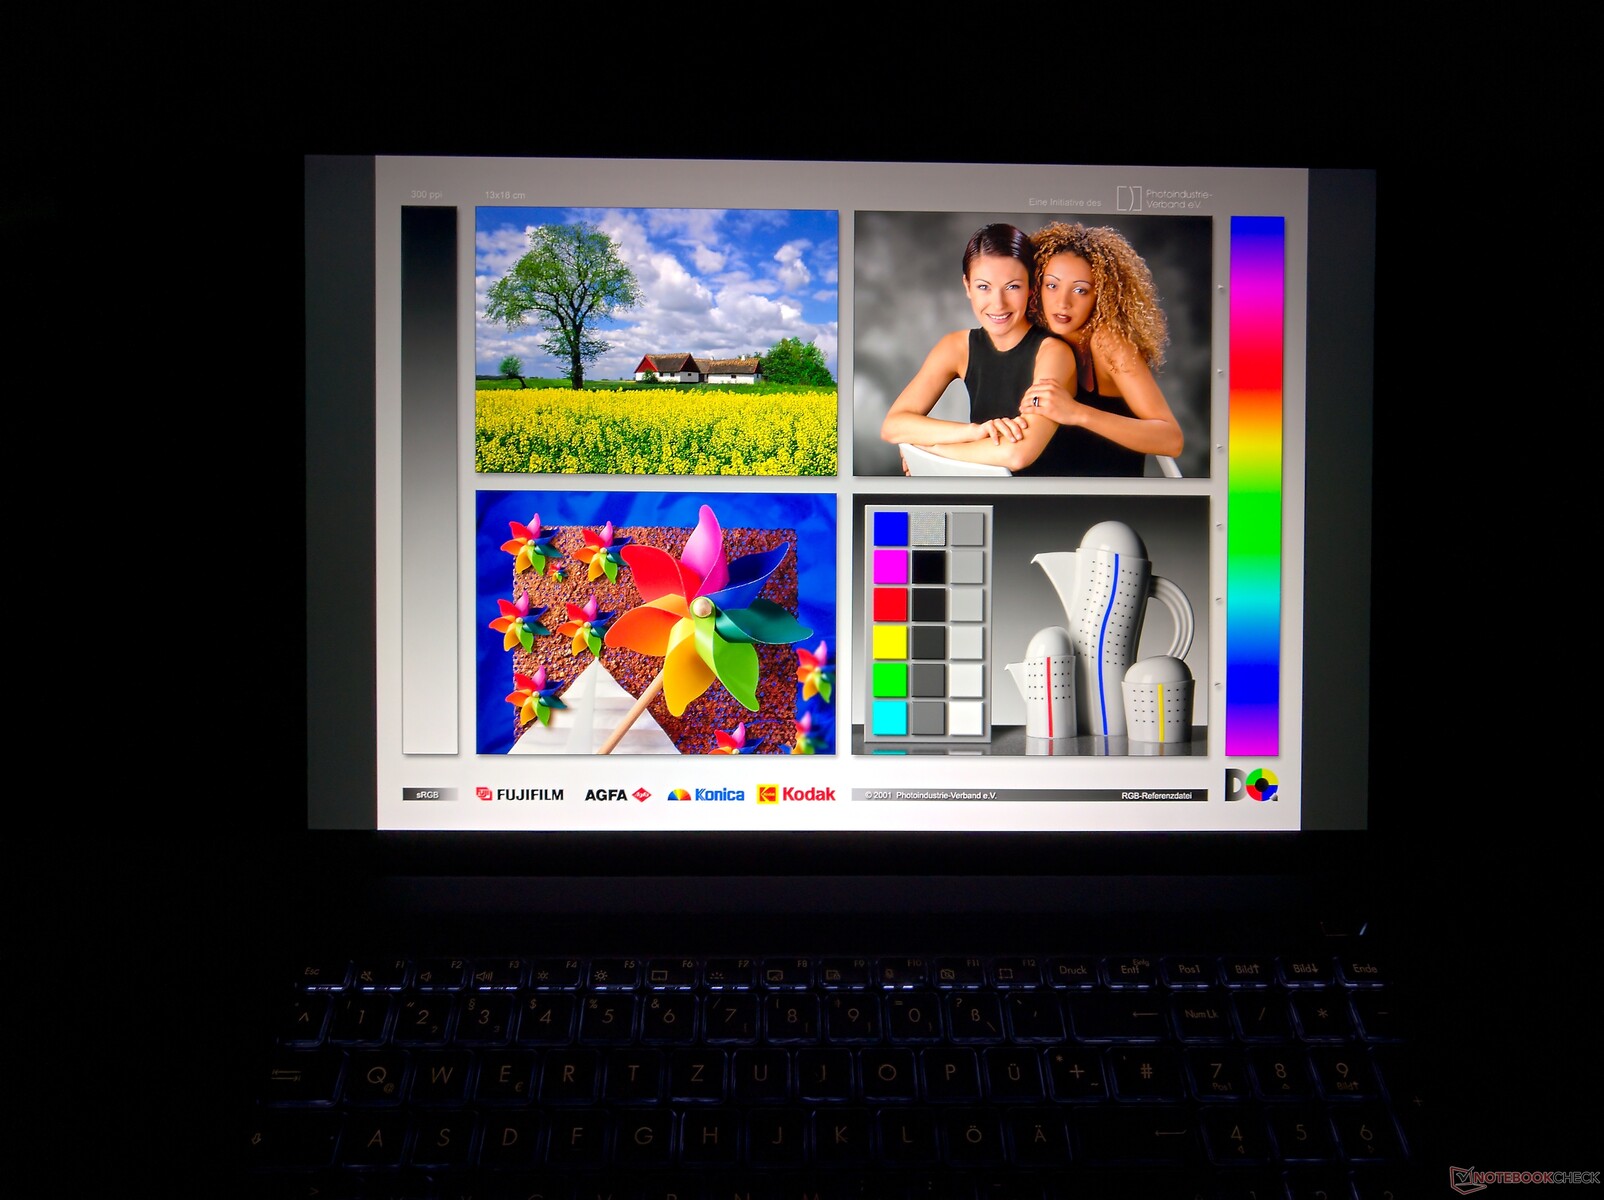
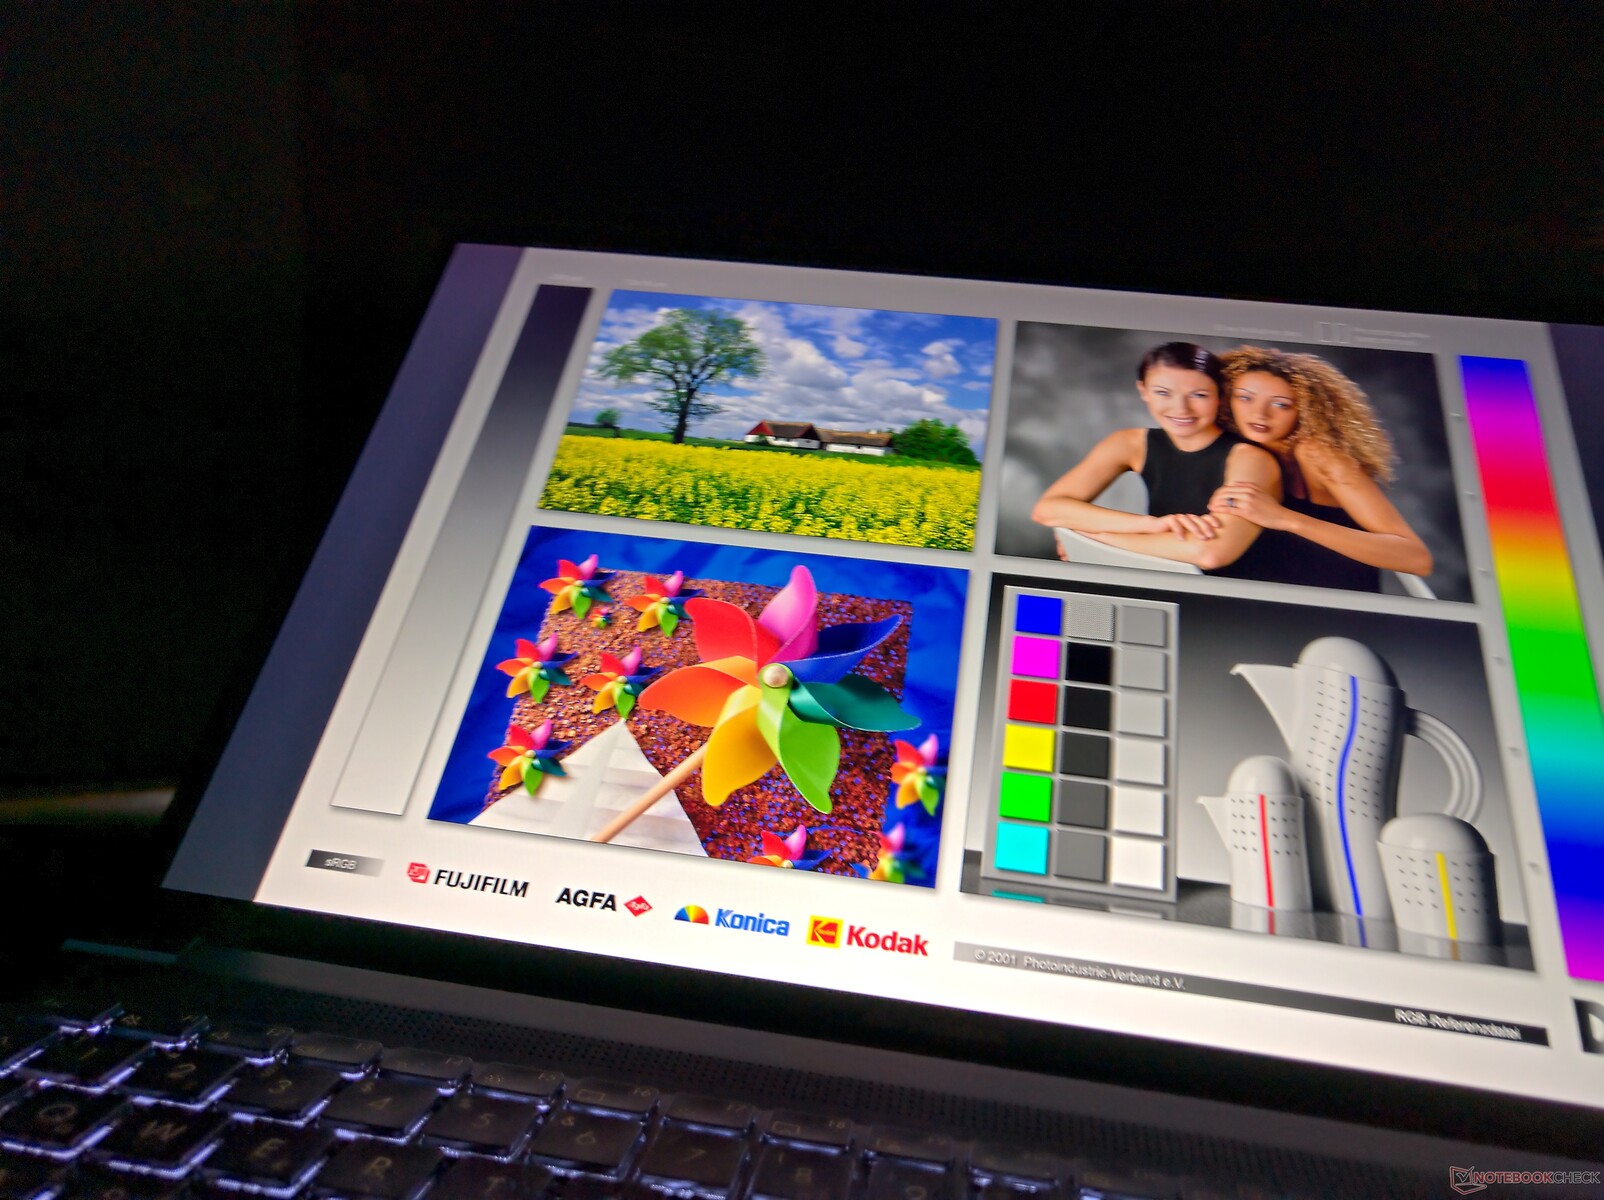
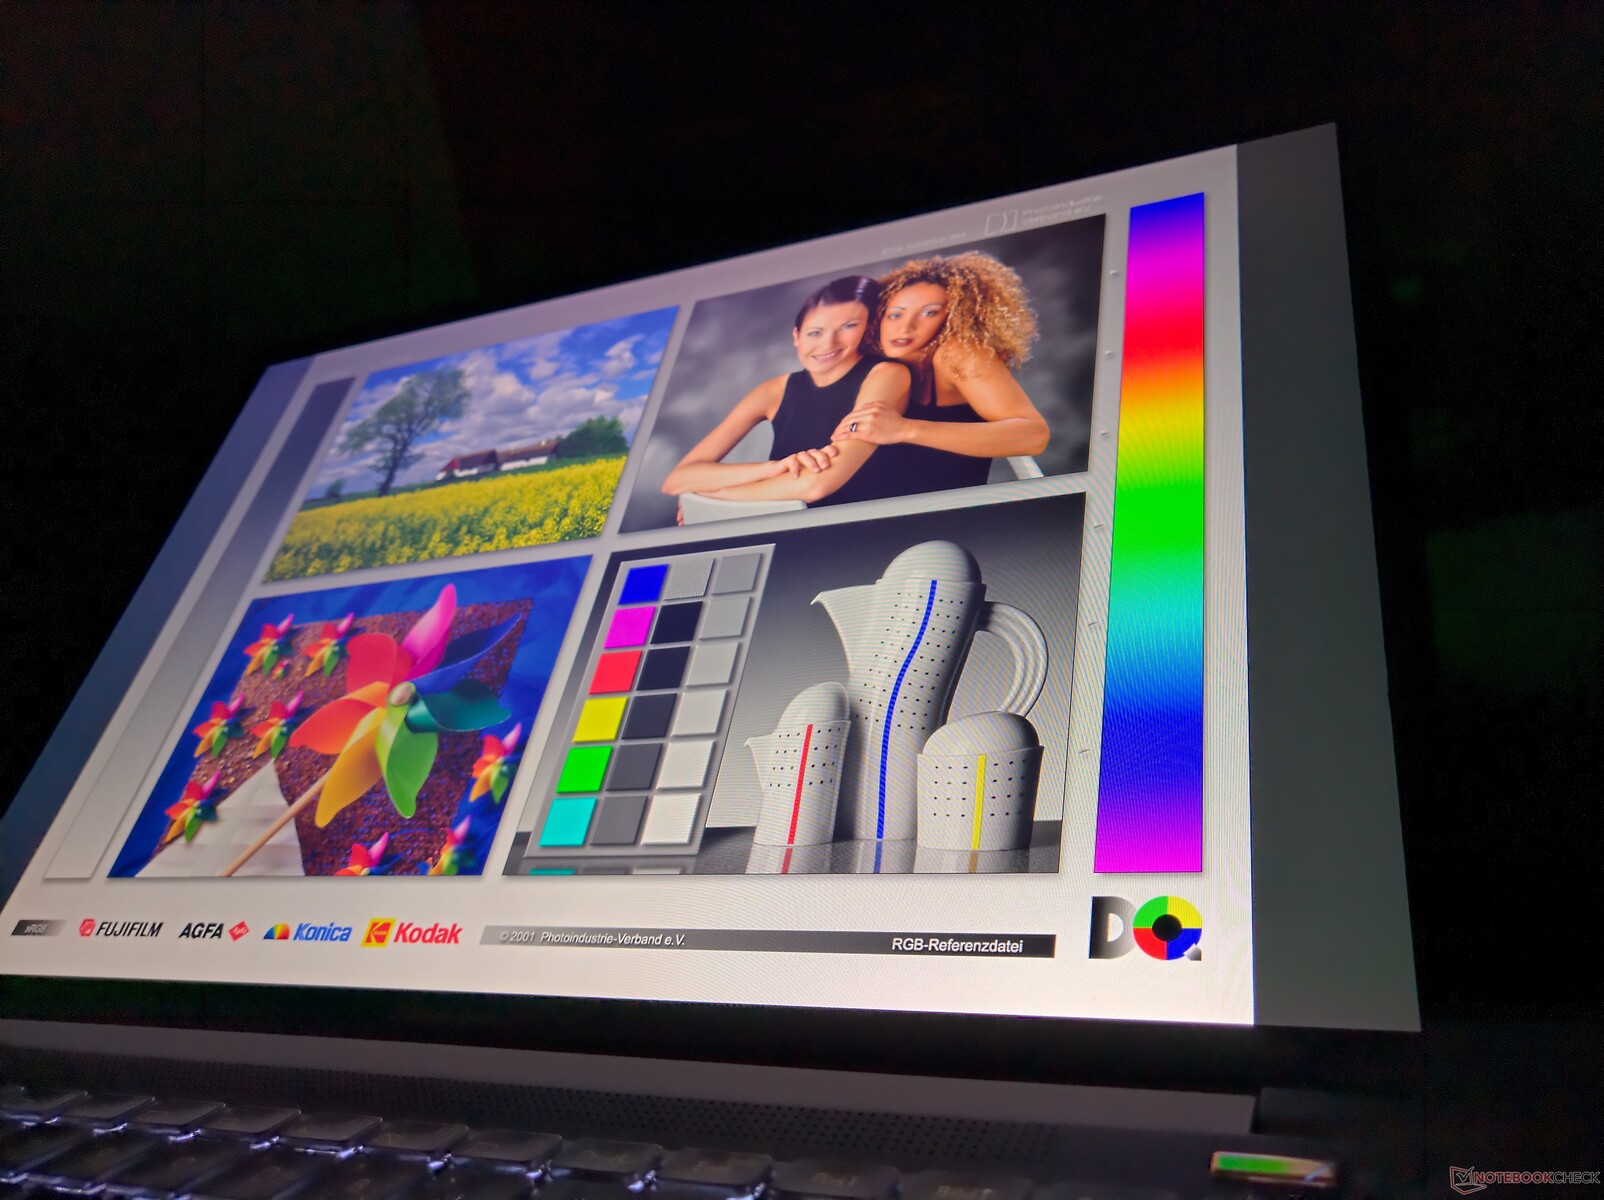
16:10 display of the Asus PC could be better

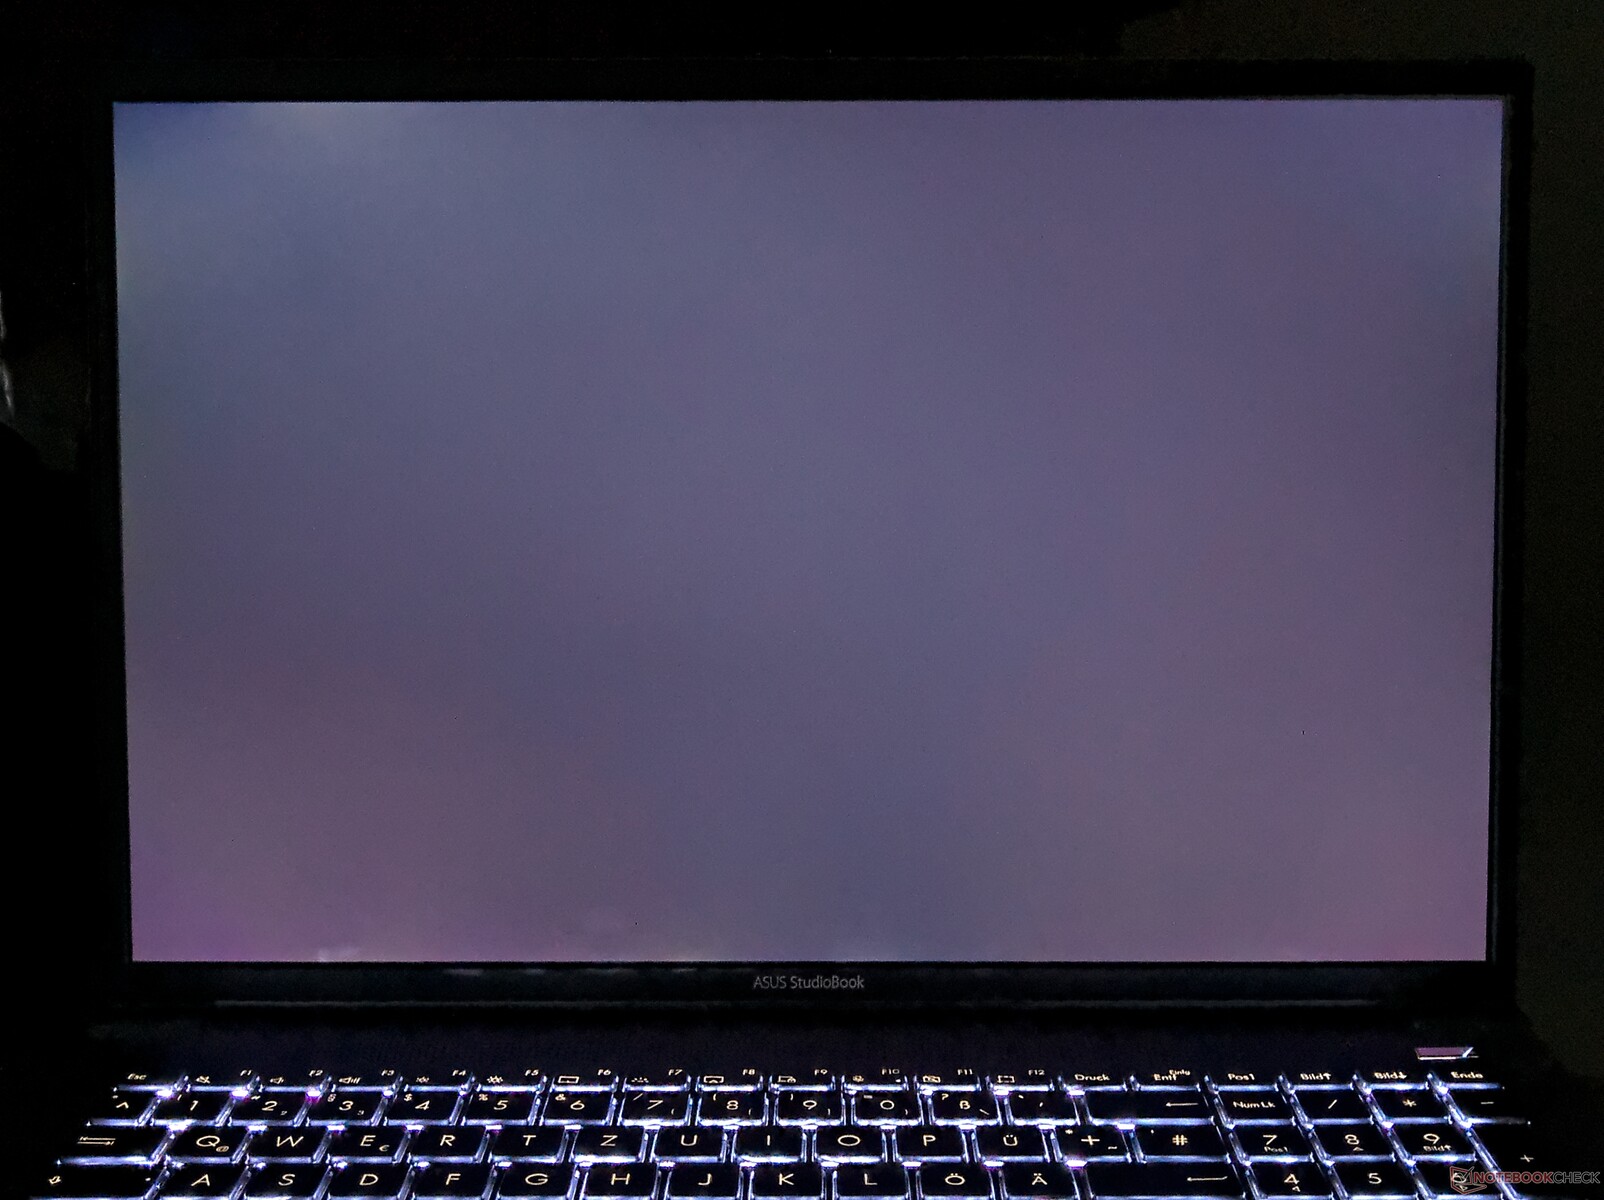
Asus doesn't leave the customer any choice when it comes to the display; there is only a matte IPS LCD panel. This, however, is quite something, because 17-inch displays in 16:10 format are still a rarity. It's a pity that only WUXGA/FHD (1920x1200) is offered as resolution. Especially for such a large workstation QHD (2560x1600) or 4K-UHD (3840x2400) would be more appropriate. In terms of resolution, the Asus ProArt StudioBook Pro X beats the Lenovo ThinkPad P73 because the FHD display in 16:9 format (1920x1080) offers fewer vertical pixels. You can buy the ThinkPad optionally with a 4K UHD display in 16:9 format (3840x2160).
The screen of the Asus laptop should reach 300 cd/m², and we measured 319 cd/m² on average. Thus, the screen is somewhat brighter compared to the Lenovo ThinkPad P73 and much brighter than the MSI WE75 9TK. In return, the panel of the Dell Precision 5750 is brighter. The 4K UHD monitor in the ThinkPad laptop should also provide more brightness. Such an option isn't available from Asus.
| |||||||||||||||||||||||||
Brightness Distribution: 80 %
Center on Battery: 336 cd/m²
Contrast: 793:1 (Black: 0.43 cd/m²)
ΔE ColorChecker Calman: 1.5 | ∀{0.5-29.43 Ø4.72}
calibrated: 0.8
ΔE Greyscale Calman: 2.1 | ∀{0.09-98 Ø4.97}
99.8% sRGB (Argyll 1.6.3 3D)
75.6% AdobeRGB 1998 (Argyll 1.6.3 3D)
84.5% AdobeRGB 1998 (Argyll 3D)
99.8% sRGB (Argyll 3D)
96% Display P3 (Argyll 3D)
Gamma: 2.27
CCT: 6281 K
| Asus StudioBook Pro X W730G5T-H8050T 17PUW1-B00, IPS LED, 1920x1200, 17" | Lenovo ThinkPad P73-20QR002DGE N173HCE-E31, IPS LED, 1920x1080, 17.3" | Dell Precision 5000 5750 P92F Sharp LQ170R1, IPS, 3840x2400, 17" | MSI WE75 9TK AU Optronics B173HAN04.2, IPS, 1920x1080, 17.3" | |
|---|---|---|---|---|
| Display | -19% | 1% | -23% | |
| Display P3 Coverage (%) | 96 | 67.5 -30% | 83.6 -13% | 63.2 -34% |
| sRGB Coverage (%) | 99.8 | 94.2 -6% | 99.7 0% | 89.9 -10% |
| AdobeRGB 1998 Coverage (%) | 84.5 | 67.8 -20% | 97.7 16% | 64.3 -24% |
| Response Times | 7% | -5% | 13% | |
| Response Time Grey 50% / Grey 80% * (ms) | 41.6 ? | 40 ? 4% | 41.2 ? 1% | 30.8 ? 26% |
| Response Time Black / White * (ms) | 30.8 ? | 28 ? 9% | 34 ? -10% | 31.2 ? -1% |
| PWM Frequency (Hz) | 25000 ? | |||
| Screen | -60% | -61% | -43% | |
| Brightness middle (cd/m²) | 341 | 333 -2% | 483.8 42% | 287.3 -16% |
| Brightness (cd/m²) | 319 | 310 -3% | 457 43% | 280 -12% |
| Brightness Distribution (%) | 80 | 83 4% | 90 13% | 89 11% |
| Black Level * (cd/m²) | 0.43 | 0.39 9% | 0.37 14% | 0.26 40% |
| Contrast (:1) | 793 | 854 8% | 1308 65% | 1105 39% |
| Colorchecker dE 2000 * | 1.5 | 4.4 -193% | 4.27 -185% | 2.98 -99% |
| Colorchecker dE 2000 max. * | 2.8 | 7.5 -168% | 8.78 -214% | 5.08 -81% |
| Colorchecker dE 2000 calibrated * | 0.8 | 2 -150% | 4.01 -401% | 3.06 -283% |
| Greyscale dE 2000 * | 2.1 | 5.1 -143% | 3.5 -67% | 3 -43% |
| Gamma | 2.27 97% | 2.39 92% | 2.43 91% | 2.28 96% |
| CCT | 6281 103% | 7061 92% | 1741 373% | 6993 93% |
| Color Space (Percent of AdobeRGB 1998) (%) | 75.6 | 61.1 -19% | 86.7 15% | 58.1 -23% |
| Color Space (Percent of sRGB) (%) | 99.8 | 94 -6% | 99.9 0% | 89.5 -10% |
| Total Average (Program / Settings) | -24% /
-44% | -22% /
-43% | -18% /
-33% |
* ... smaller is better
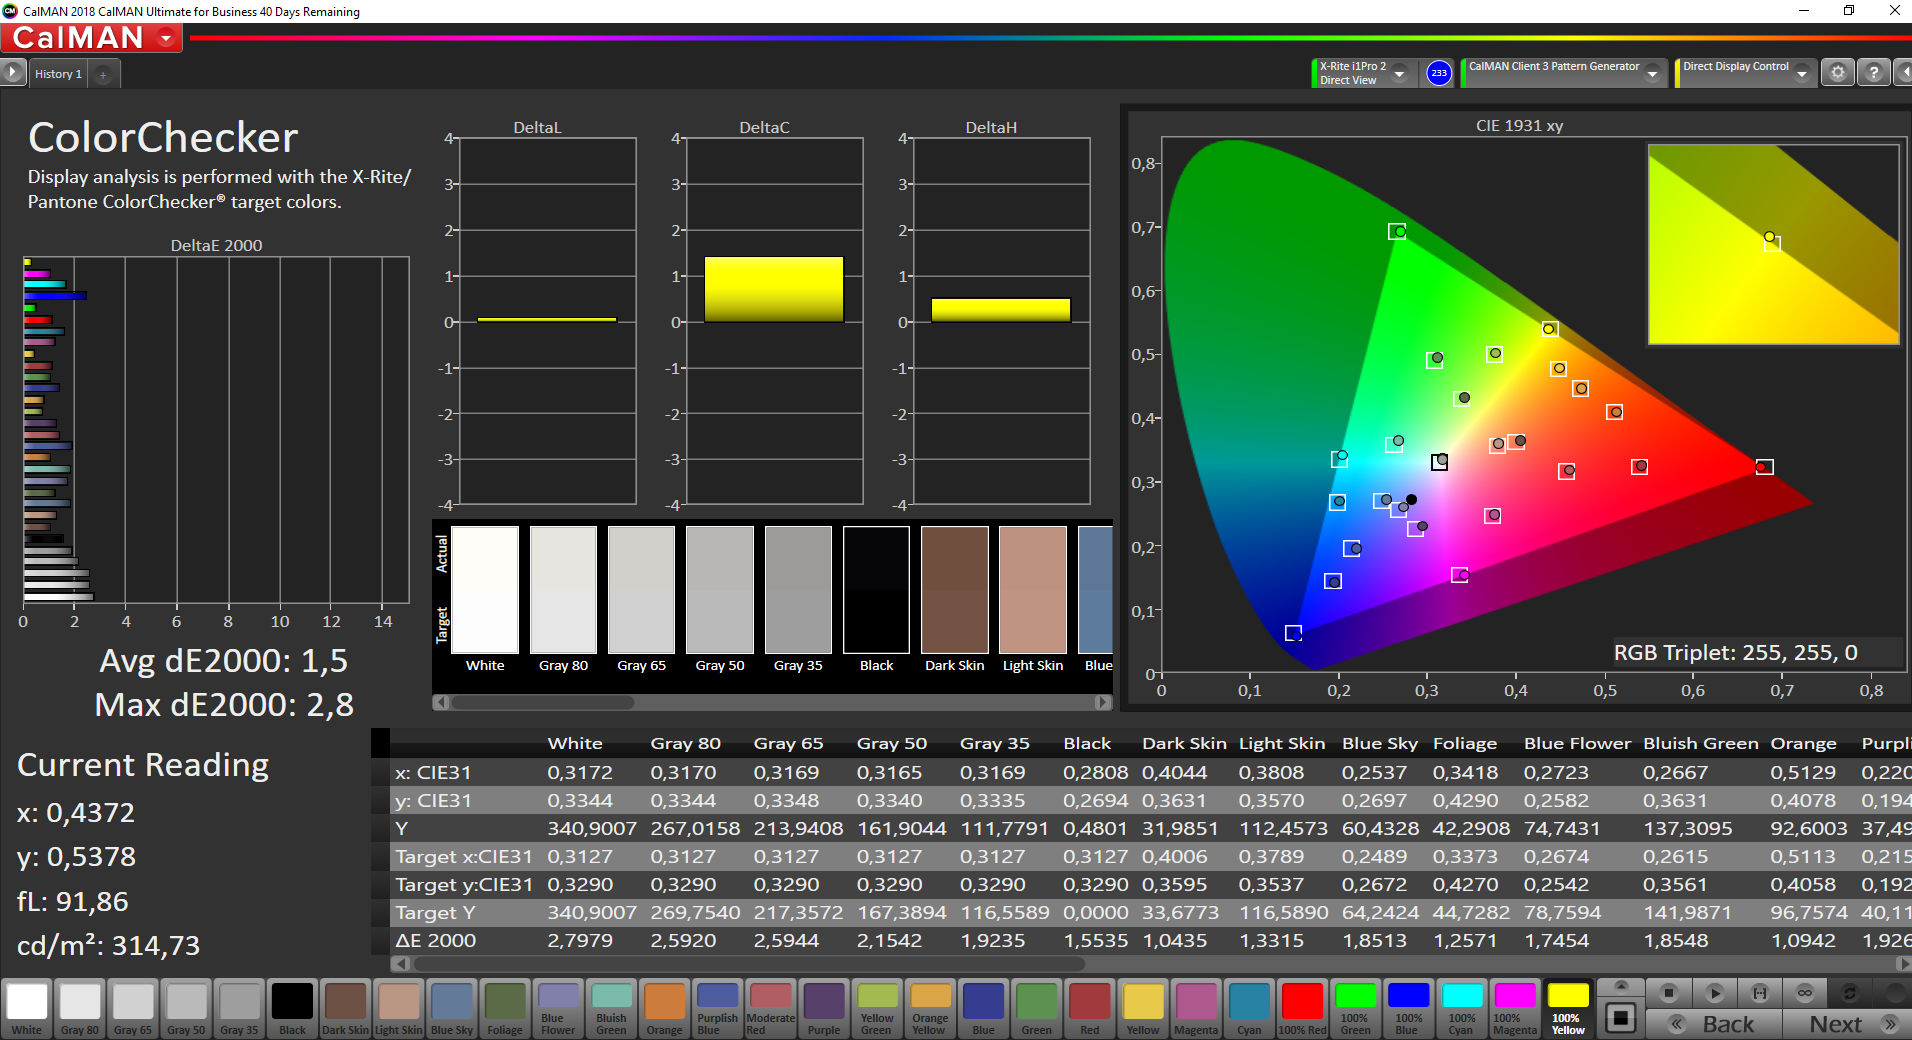
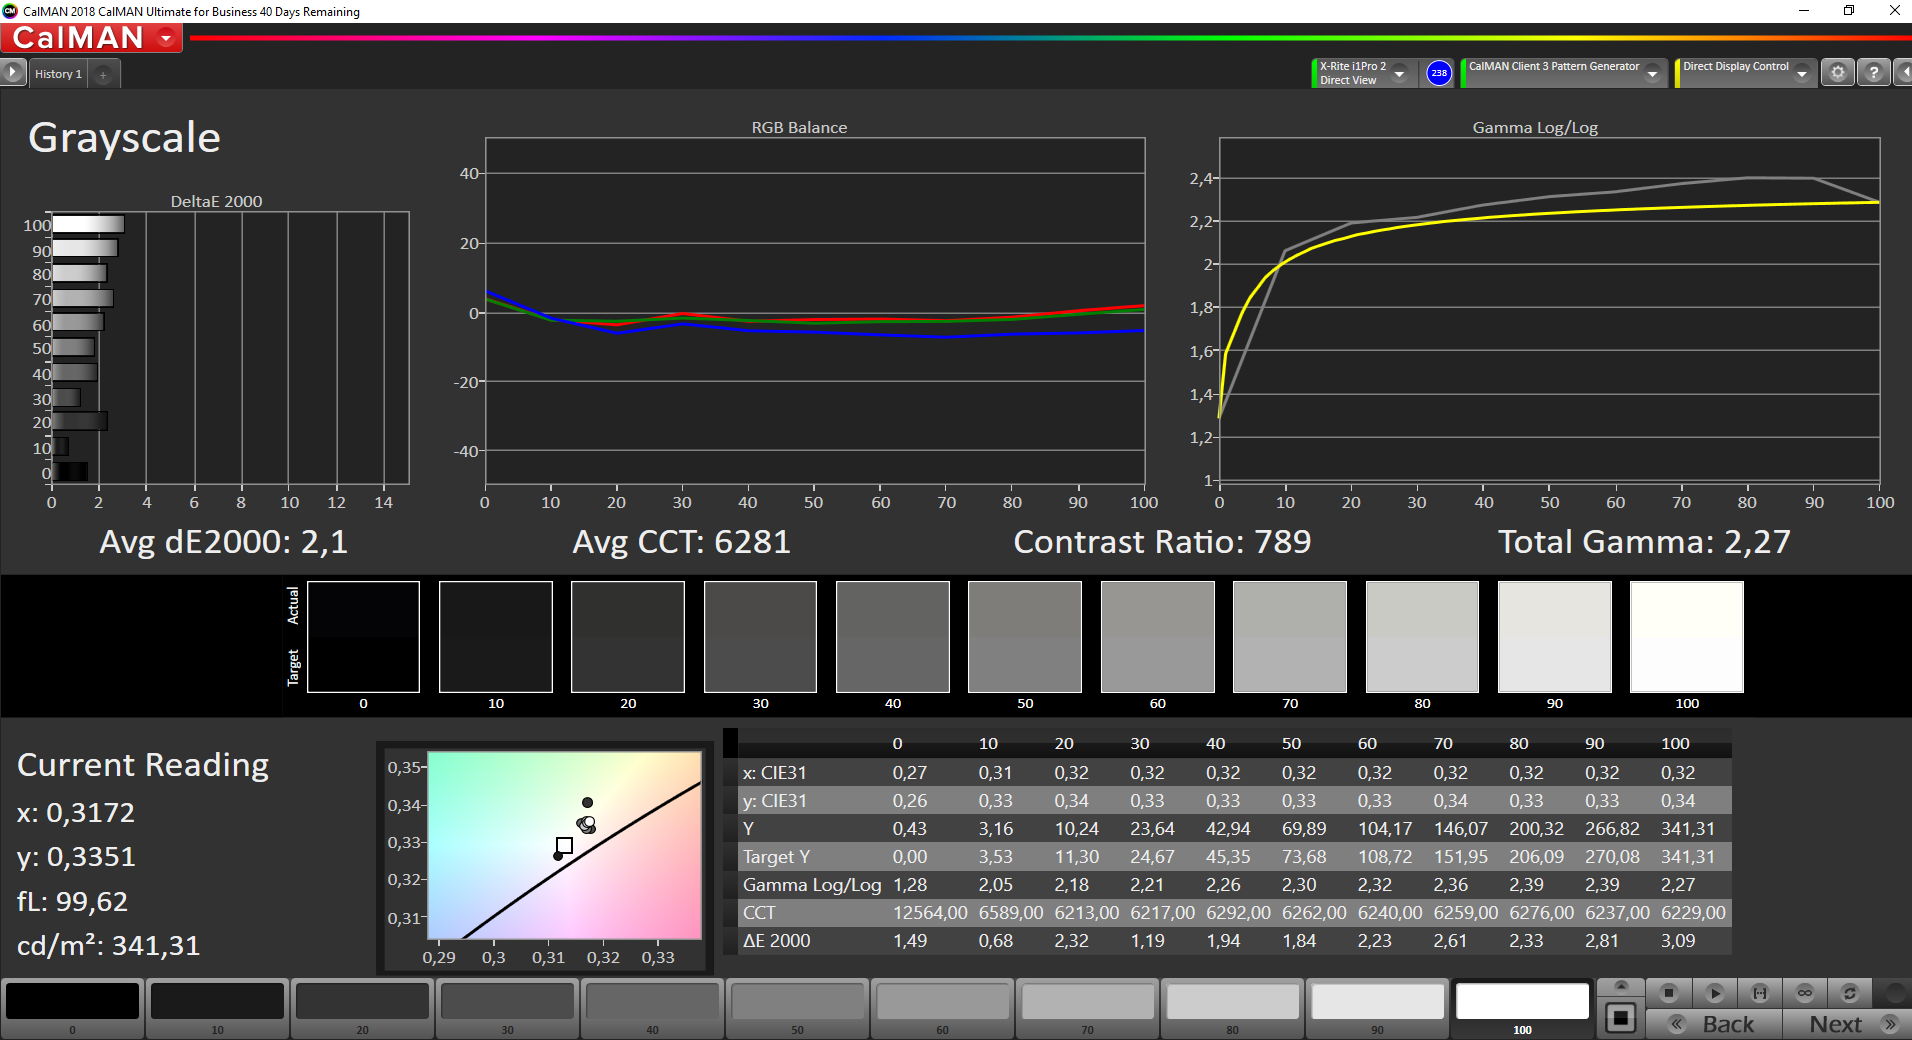
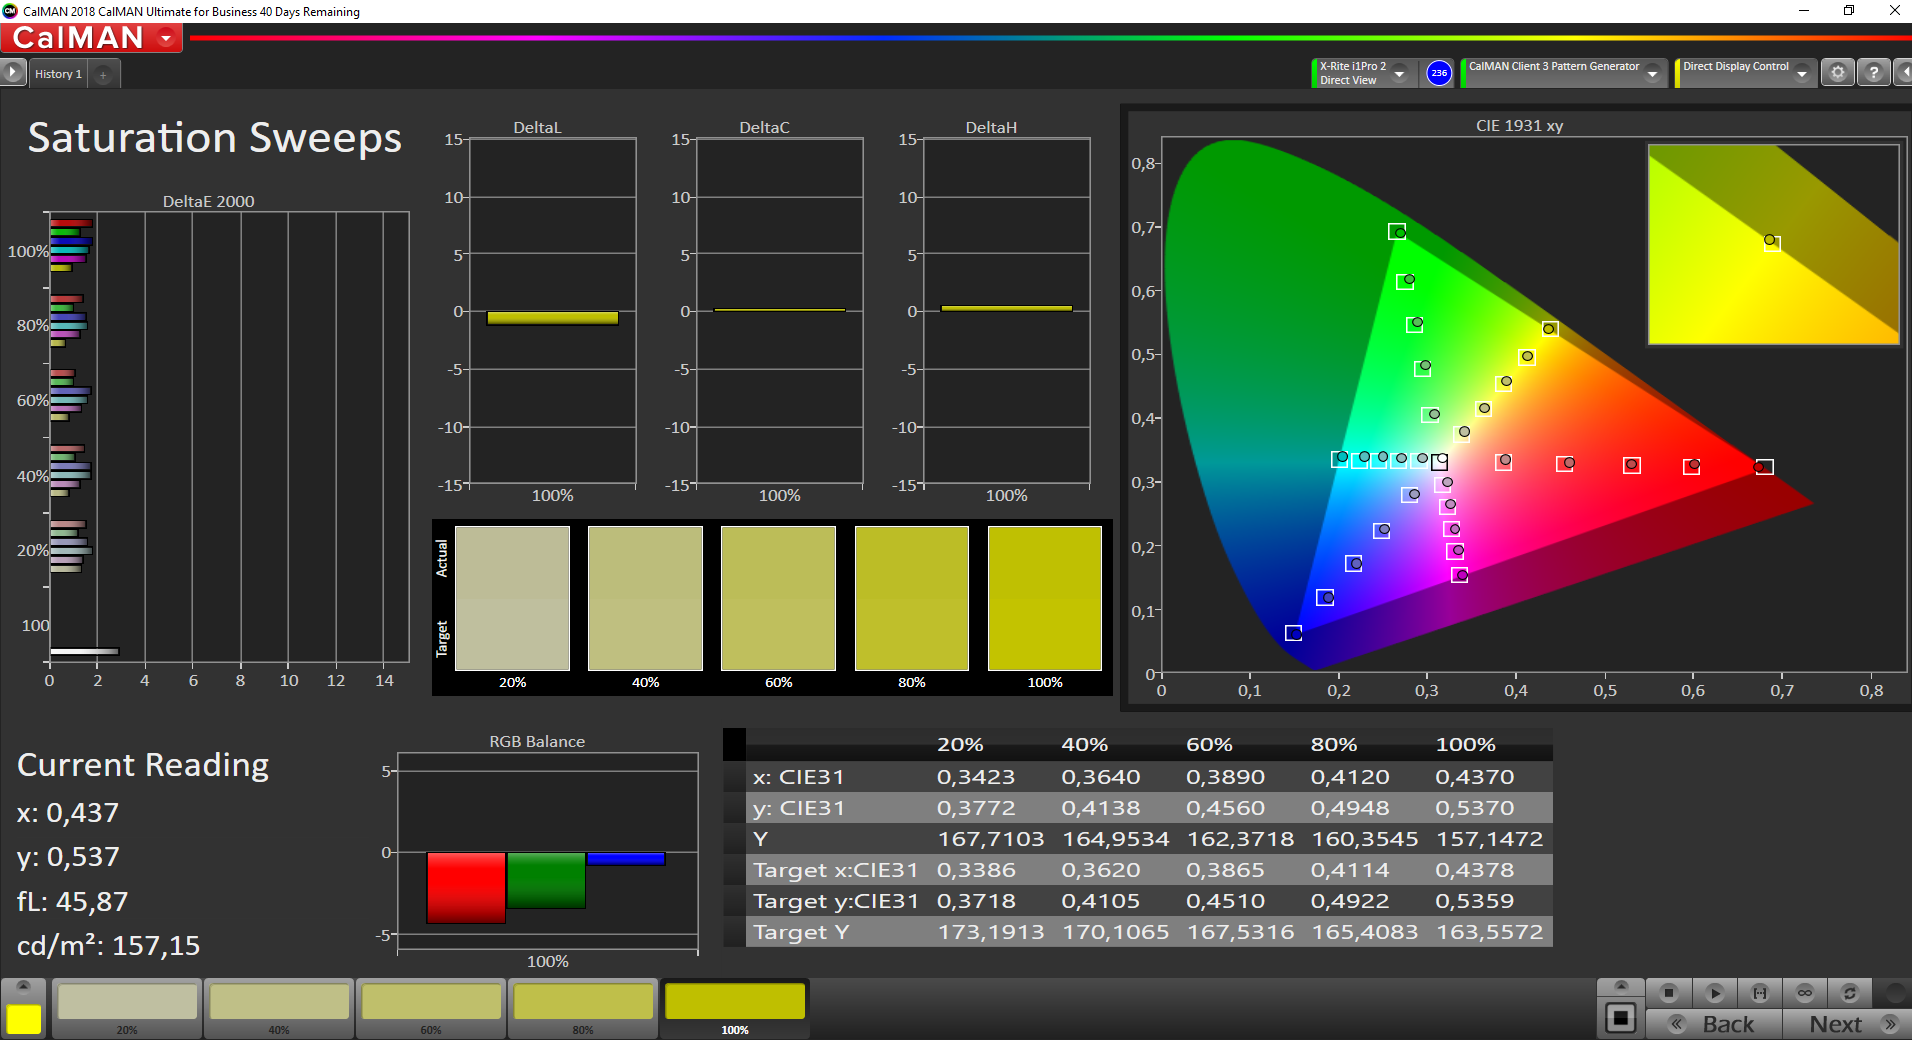
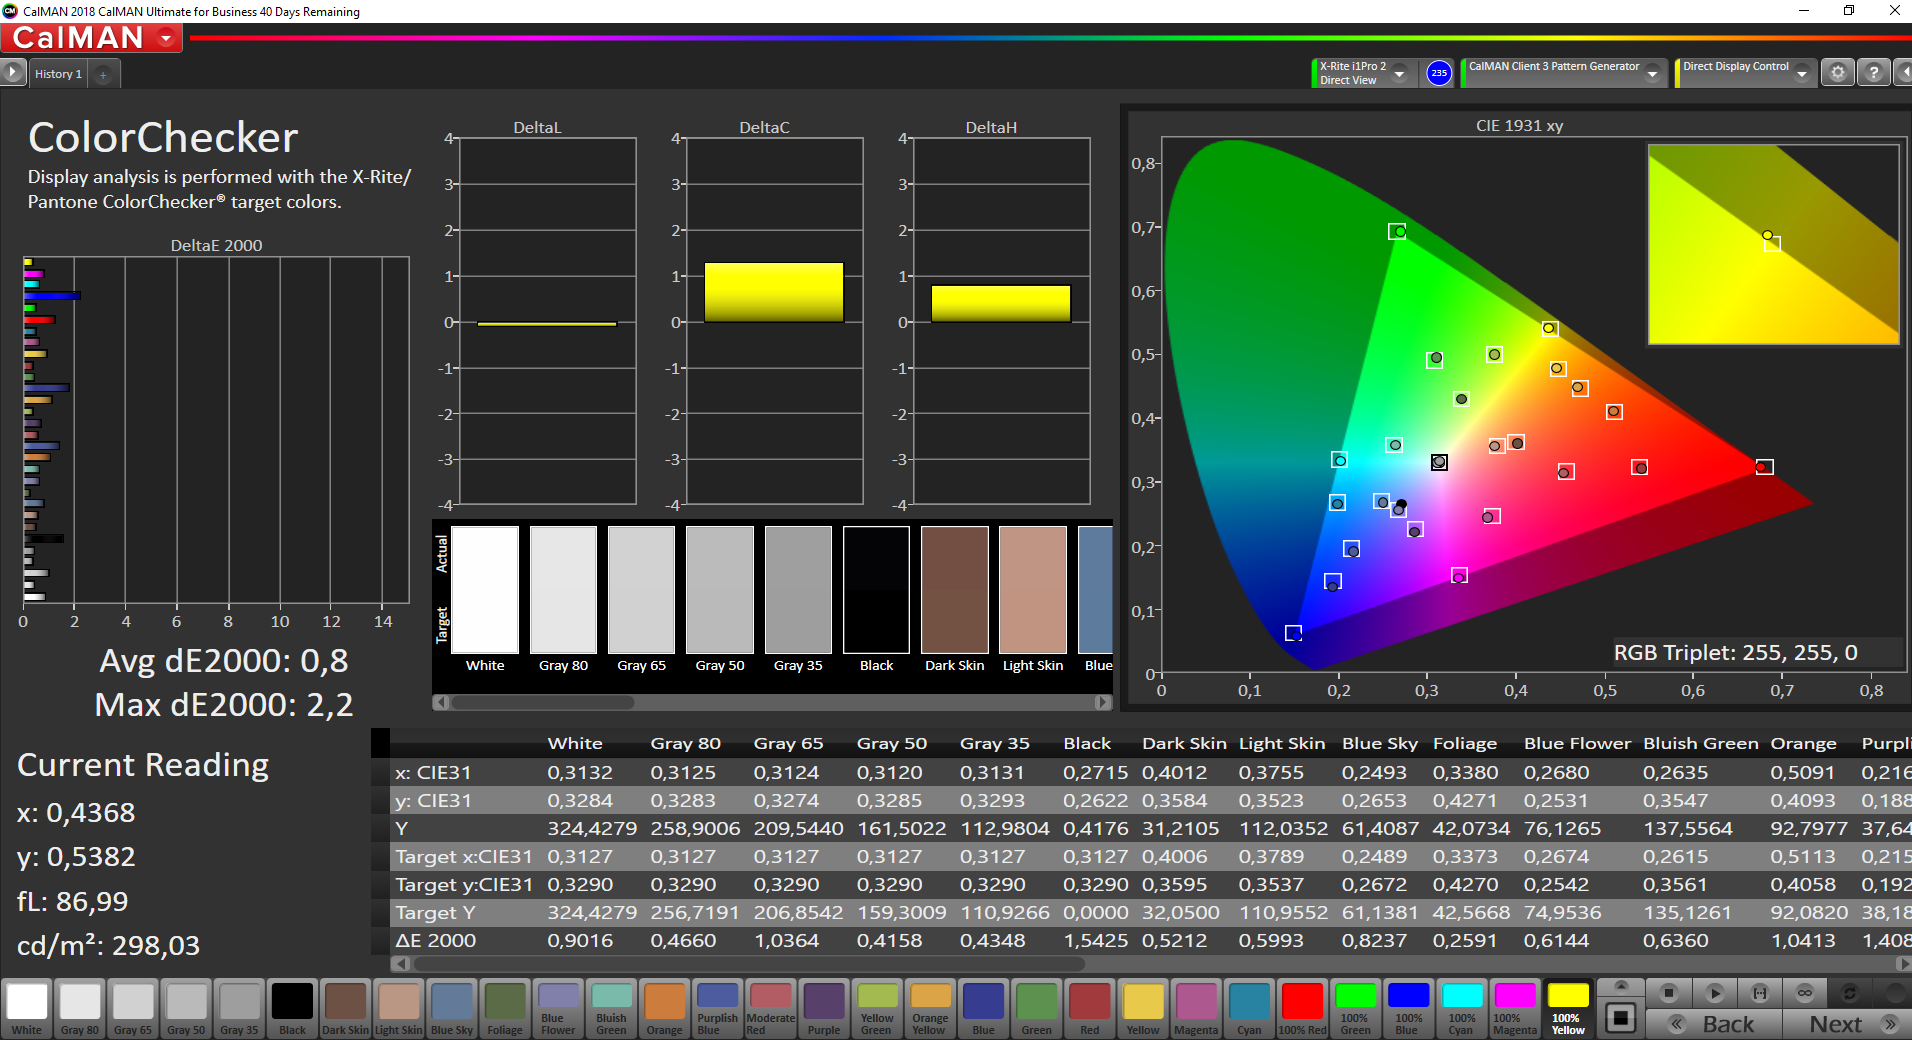
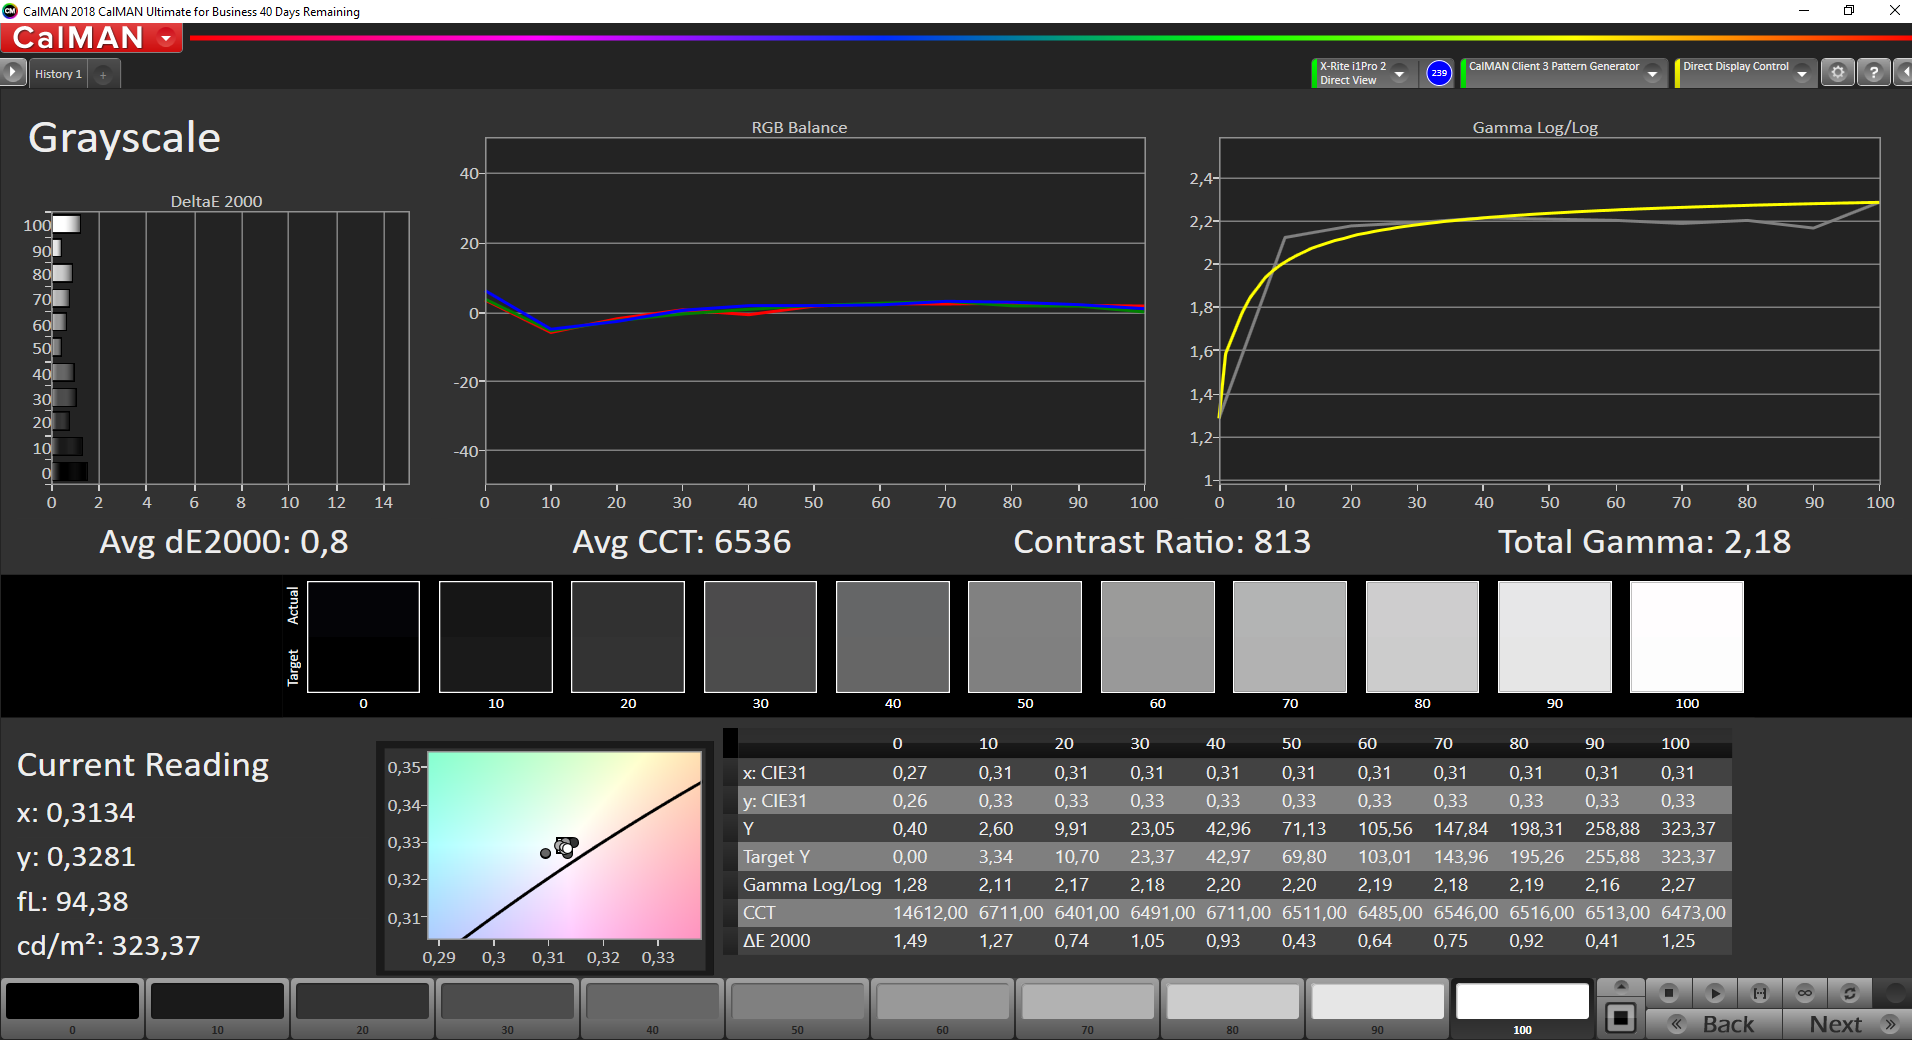
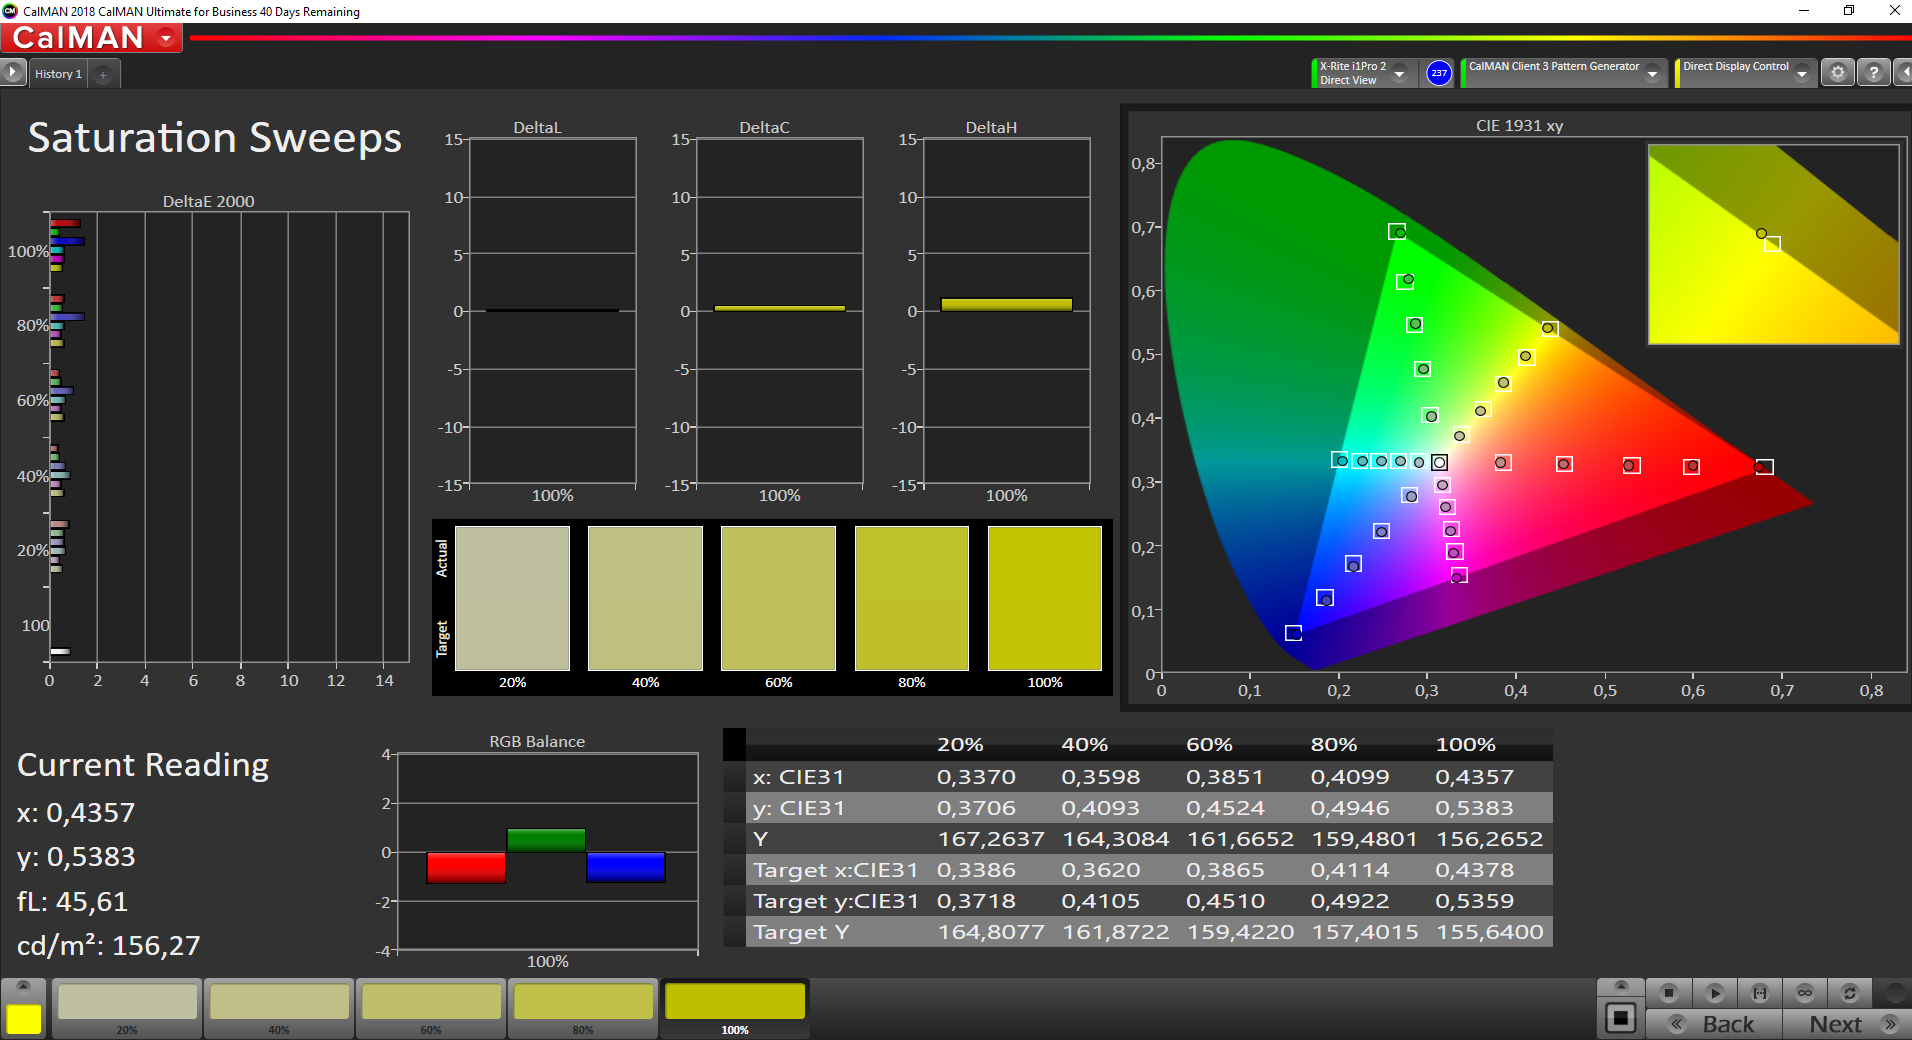
Even in the factory settings, the deviations from the ideal in terms of colors, saturation and gray levels are minimal. Accordingly, calibration with CalMAN and the X-Rite i1Pro 2 does not bring phenomenal improvements. The display is good overall, but we would have expected a bit more in terms of contrast - 793:1 is not much for a laptop in this price range. This makes black appear a little brighter than on other screens.
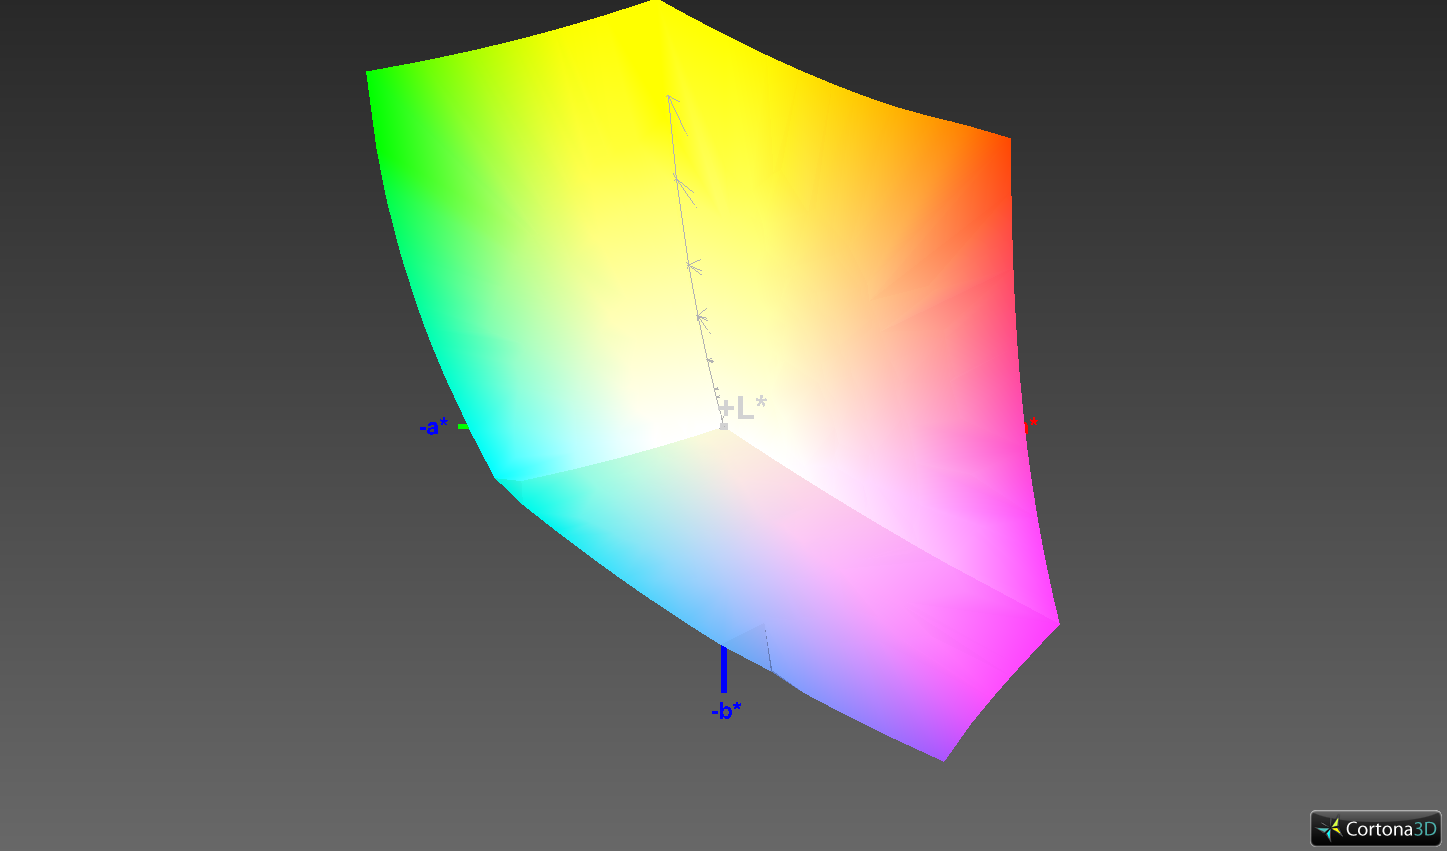
The color-space coverage looks better than the contrast. The smaller sRGB color space is completely covered, and AdobeRGB by at least 75%. Thus, you can definitely use the panel of this Asus ProArt StudioBook Pro X for image-editing.

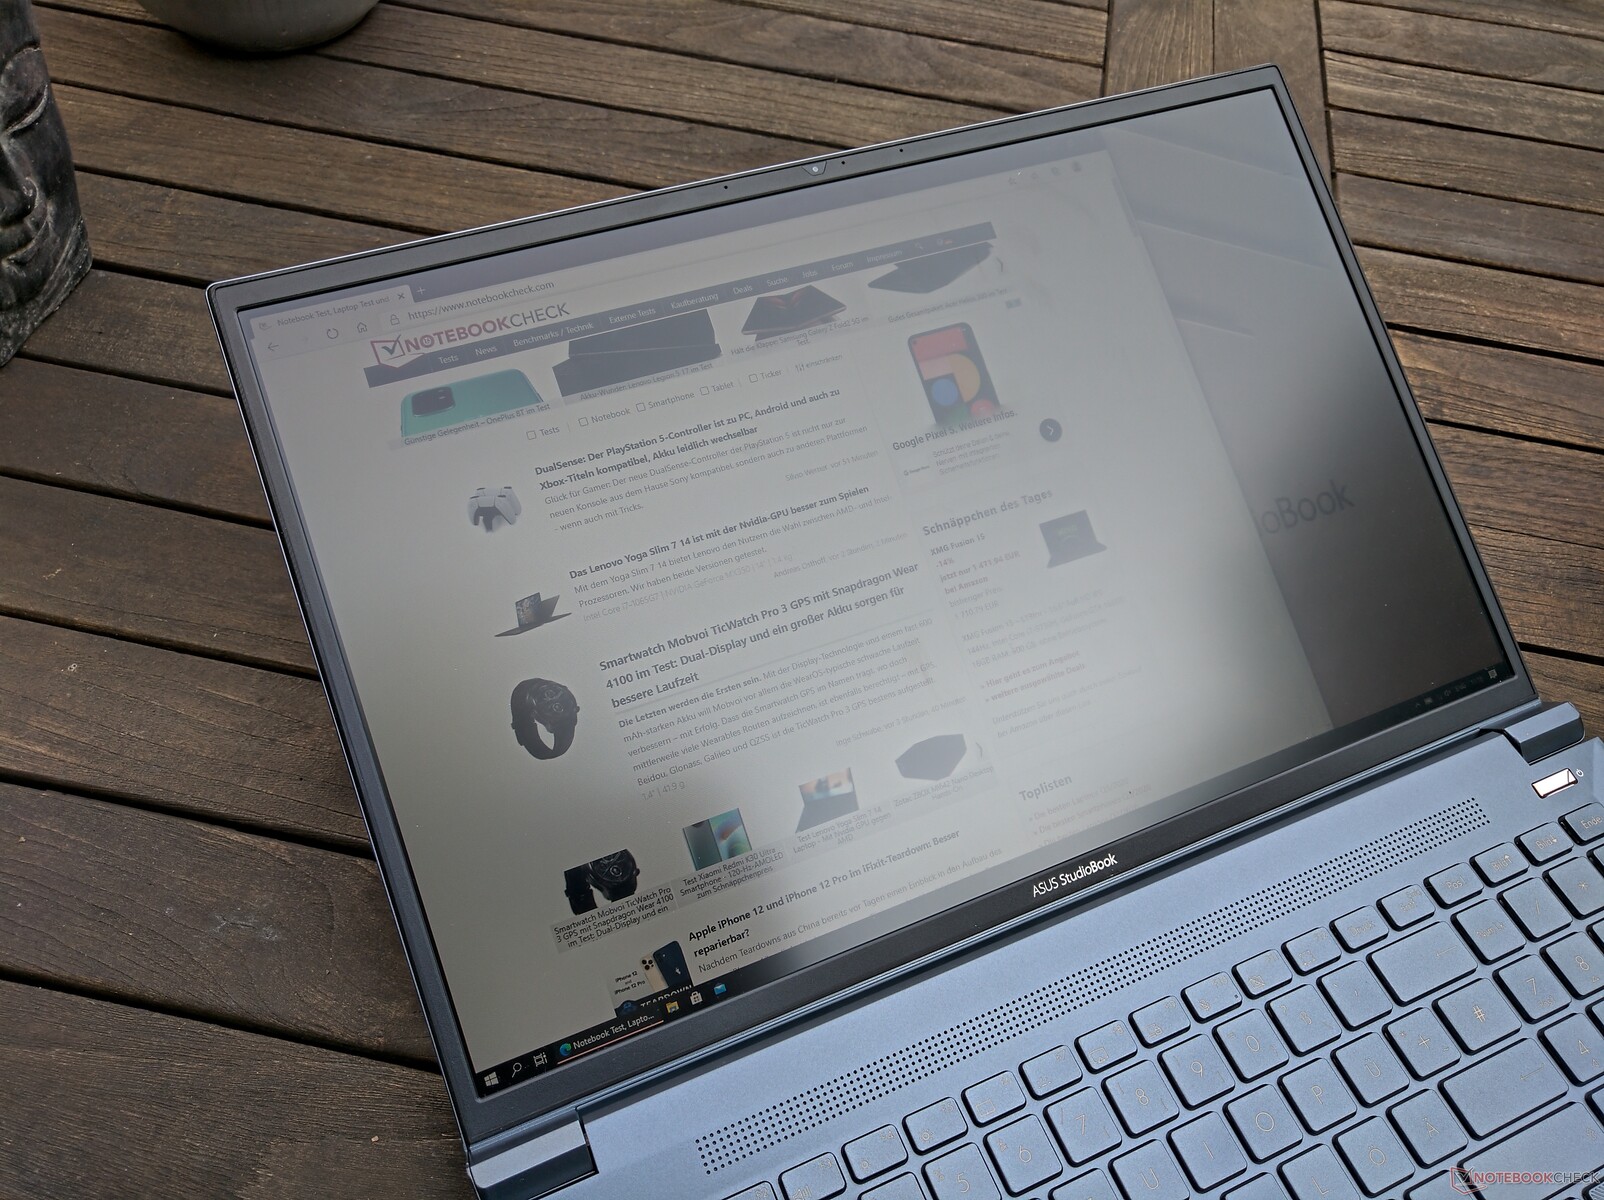
With an average brightness of 319 cd/m² and the matte surface, the Asus laptop can also be used outdoors. You have to stay in the shade, though.
Display Response Times
| ↔ Response Time Black to White | ||
|---|---|---|
| 30.8 ms ... rise ↗ and fall ↘ combined | ↗ 16.8 ms rise | 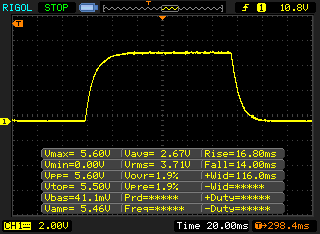 |
| ↘ 14 ms fall | ||
| The screen shows slow response rates in our tests and will be unsatisfactory for gamers. In comparison, all tested devices range from 0.1 (minimum) to 240 (maximum) ms. » 83 % of all devices are better. This means that the measured response time is worse than the average of all tested devices (19.8 ms). | ||
| ↔ Response Time 50% Grey to 80% Grey | ||
| 41.6 ms ... rise ↗ and fall ↘ combined | ↗ 22.8 ms rise | 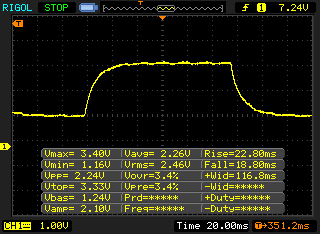 |
| ↘ 18.8 ms fall | ||
| The screen shows slow response rates in our tests and will be unsatisfactory for gamers. In comparison, all tested devices range from 0.165 (minimum) to 636 (maximum) ms. » 67 % of all devices are better. This means that the measured response time is worse than the average of all tested devices (31 ms). | ||
Screen Flickering / PWM (Pulse-Width Modulation)
| Screen flickering / PWM not detected | 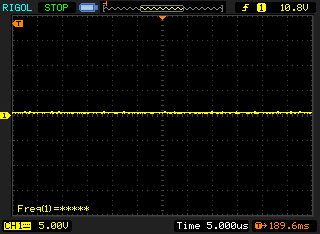 | ||
In comparison: 52 % of all tested devices do not use PWM to dim the display. If PWM was detected, an average of 7750 (minimum: 5 - maximum: 343500) Hz was measured. | |||
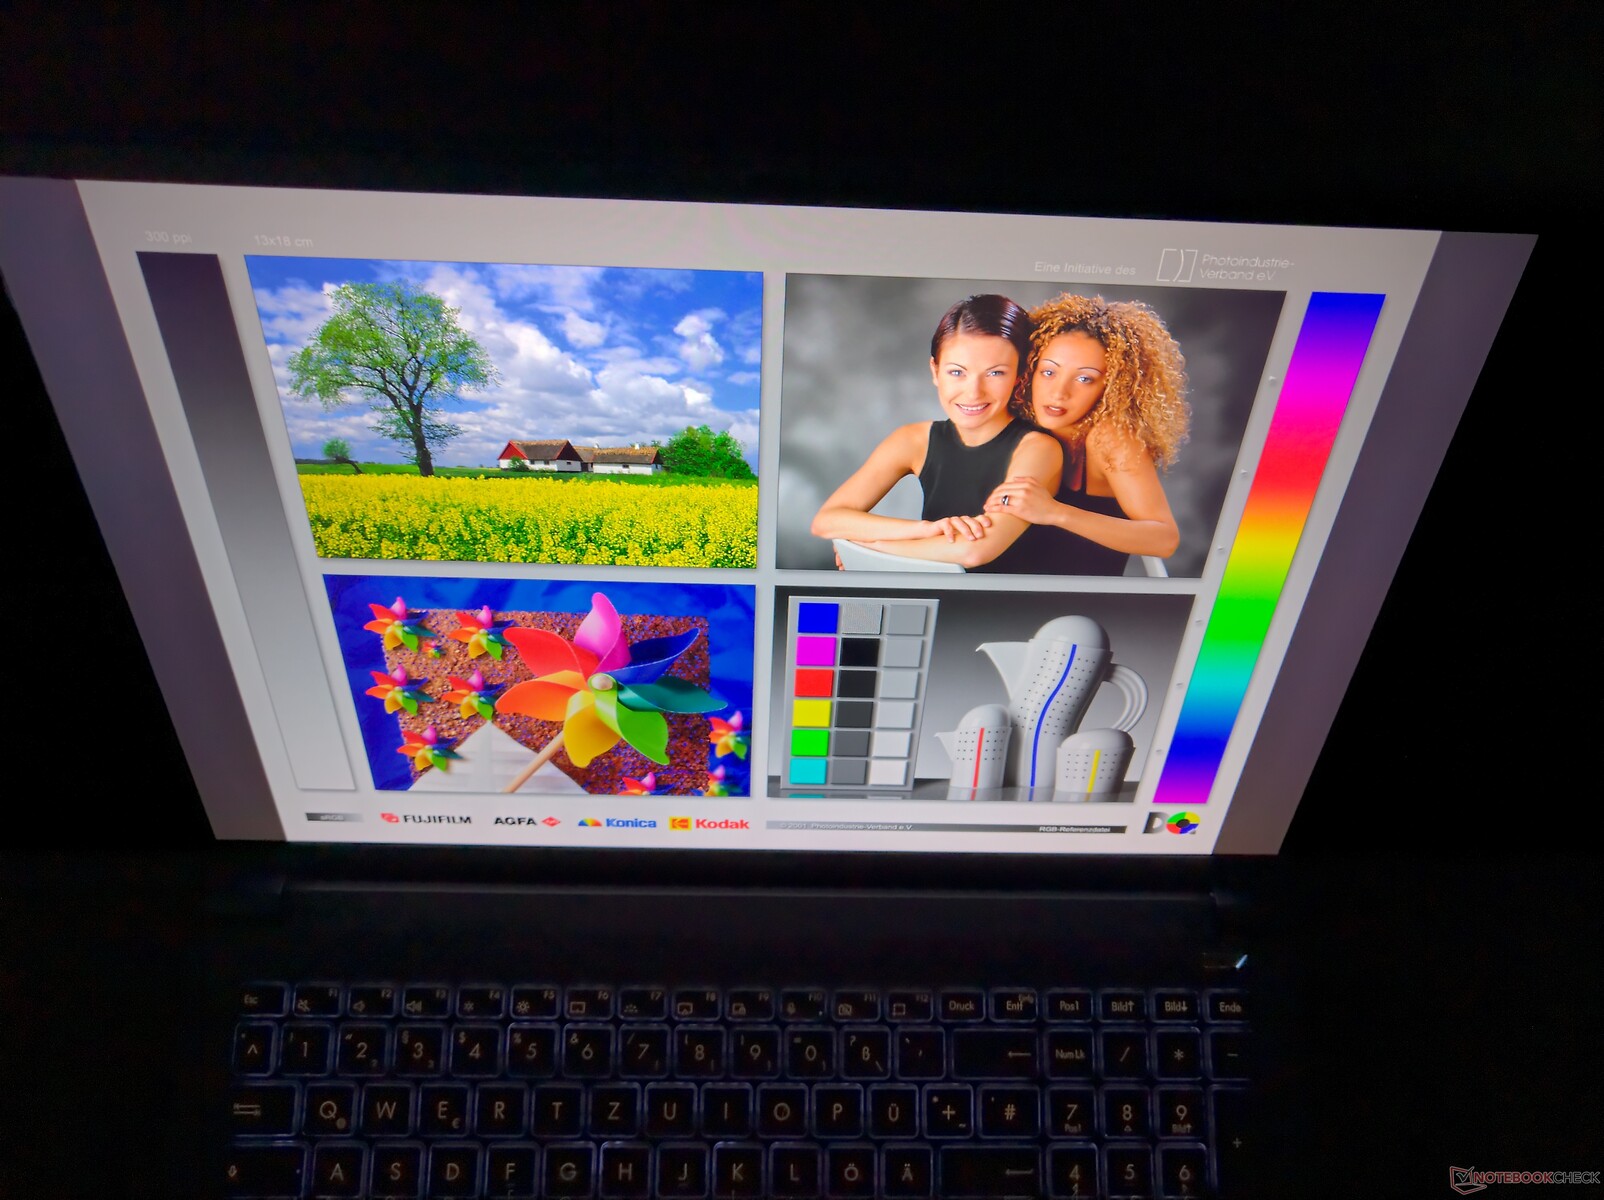
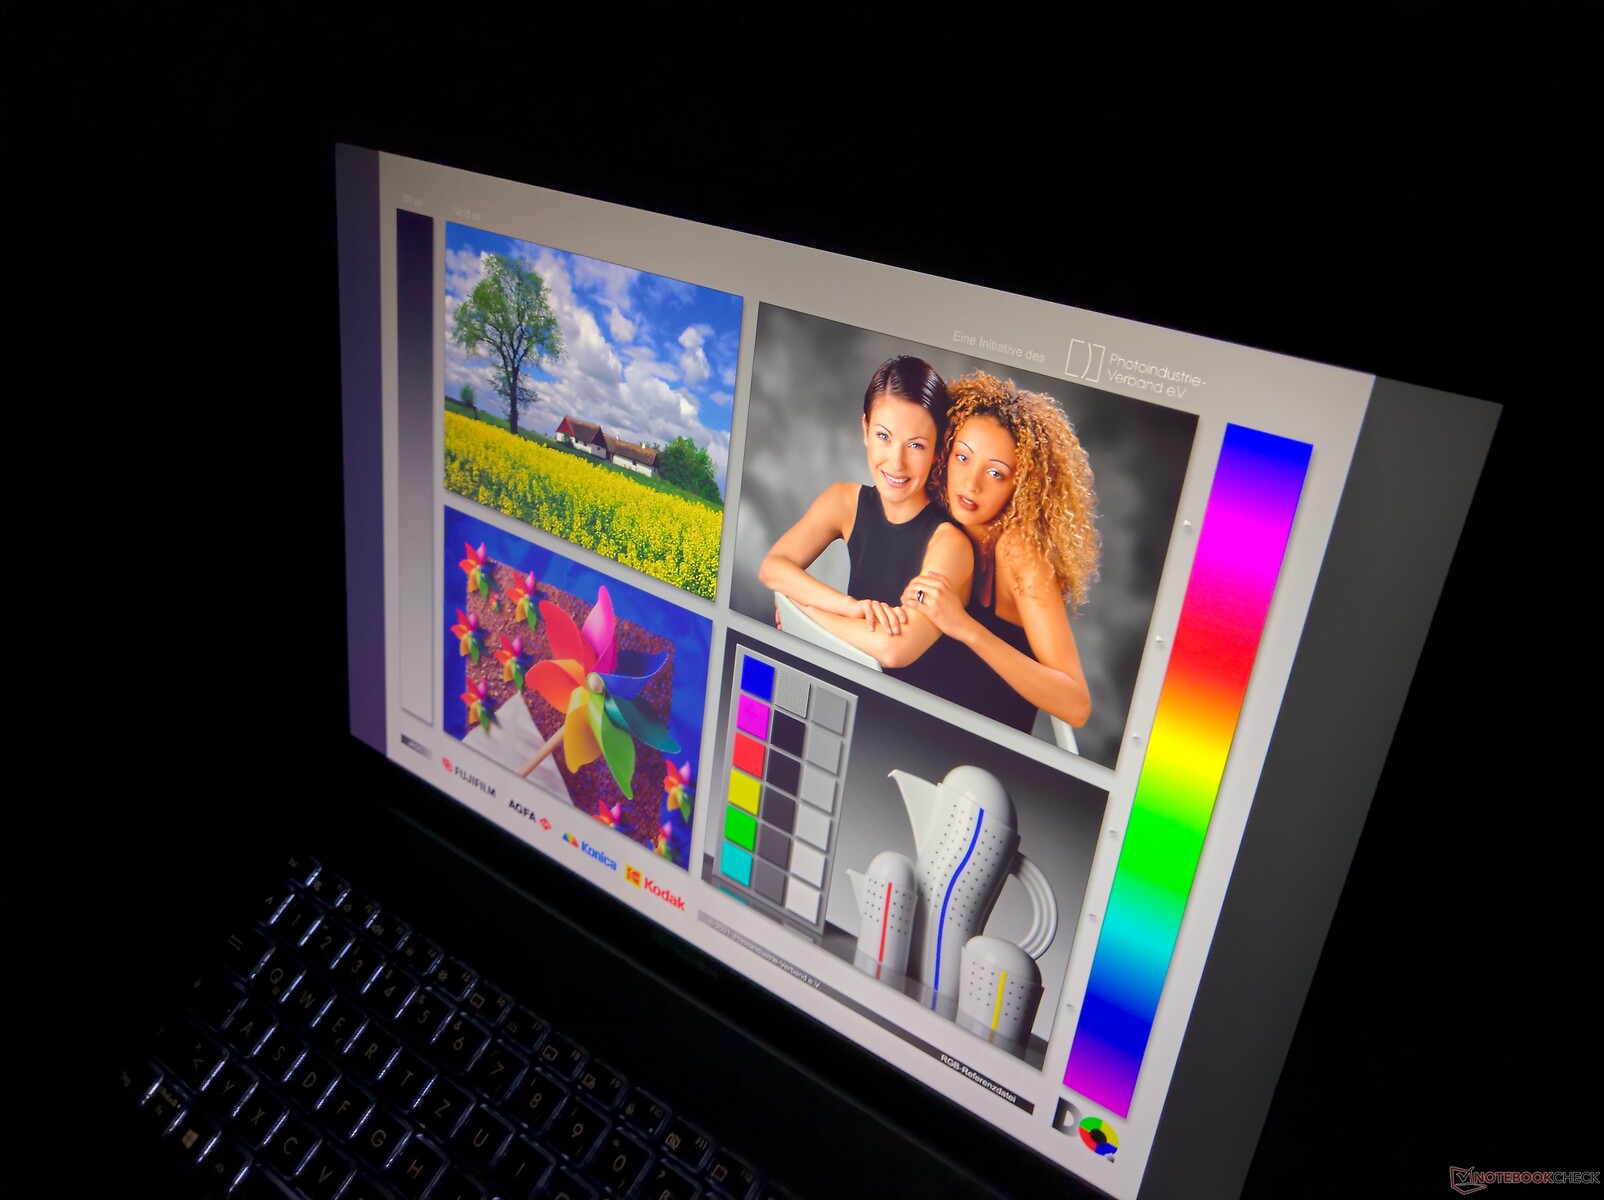
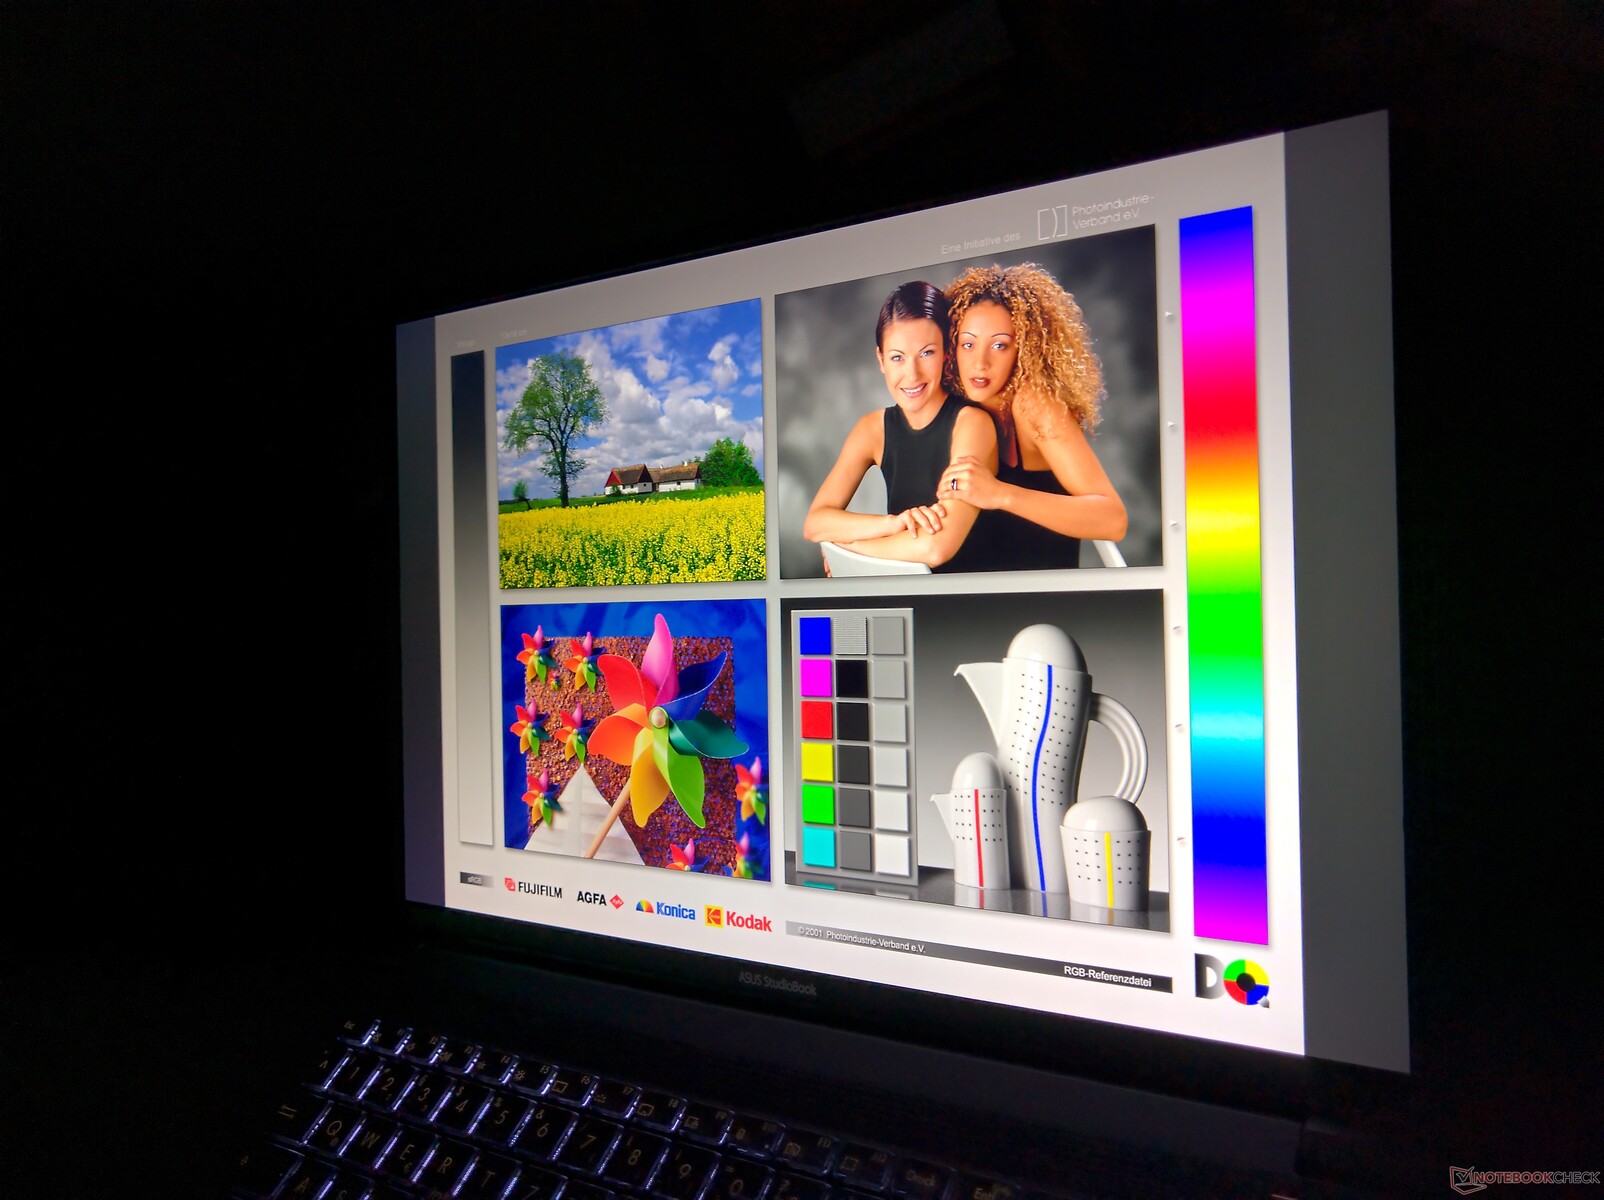
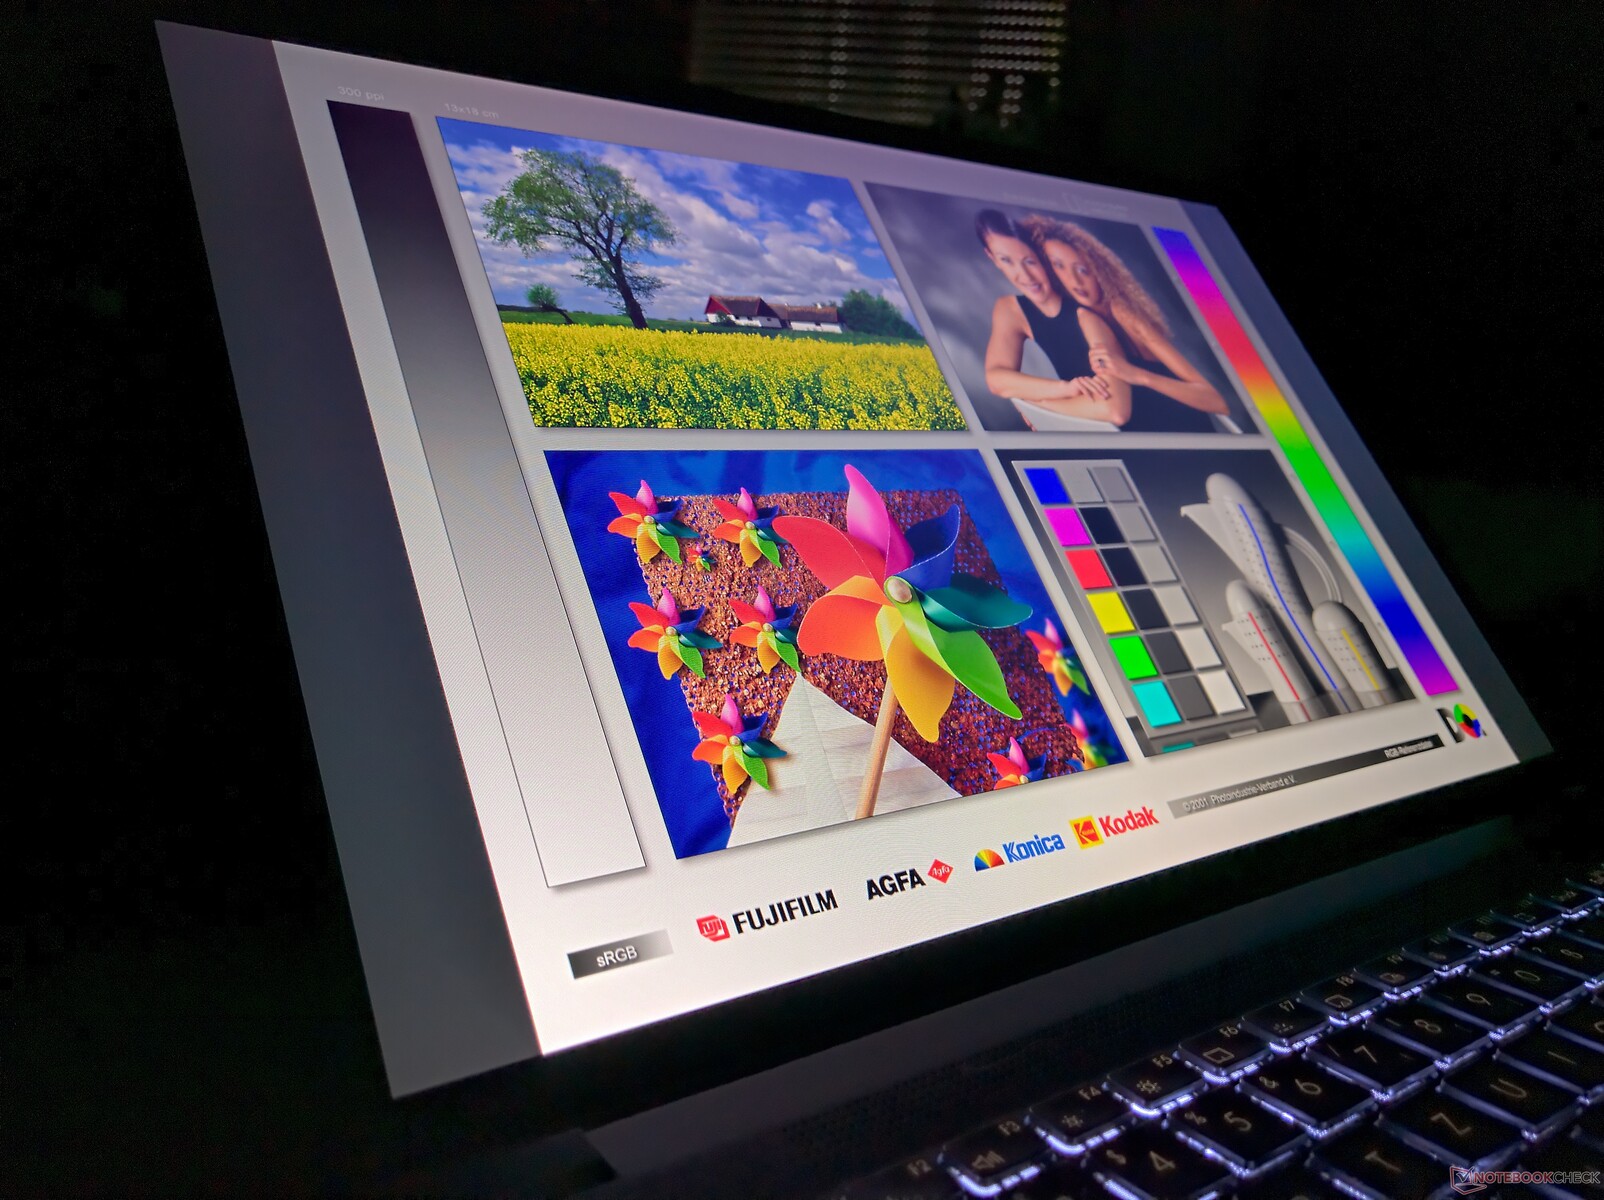
The panel is an IPS LCD, which is why the viewing-angle stability is flawless. Colors do not flip over and the display is also readable from the side or top.

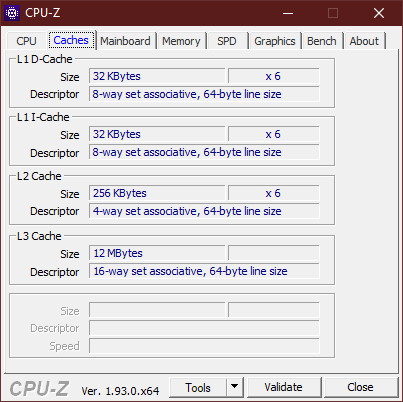
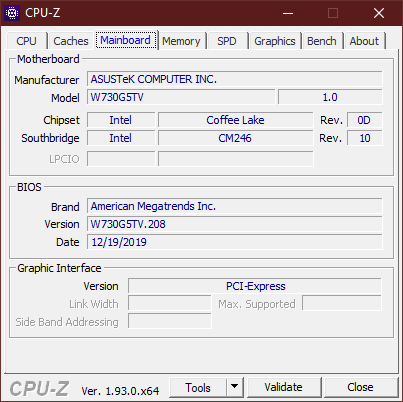
Performance: Six-core is not enough for the Asus StudioBook Pro X W730G5T
Intel's Coffee-Lake-Refresh always serves as a basis for the CPUs used. You can choose between the Intel Core i7-9750H and the Intel Xeon E-2276M, two processors with six cores. It's a pity that Asus doesn't use processors with eight cores. An AMD option would certainly have suited the Asus StudioBook well, too. There's a bit more choice in the GPUs: There are three different Nvidia chips with the Nvidia Quadro T1000, Quadro T2000 and Quadro RTX 5000.
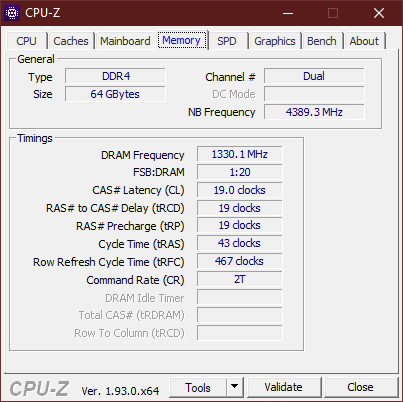
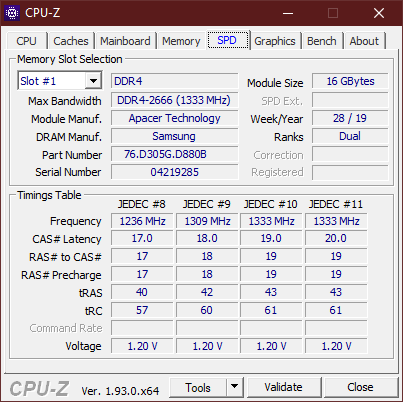
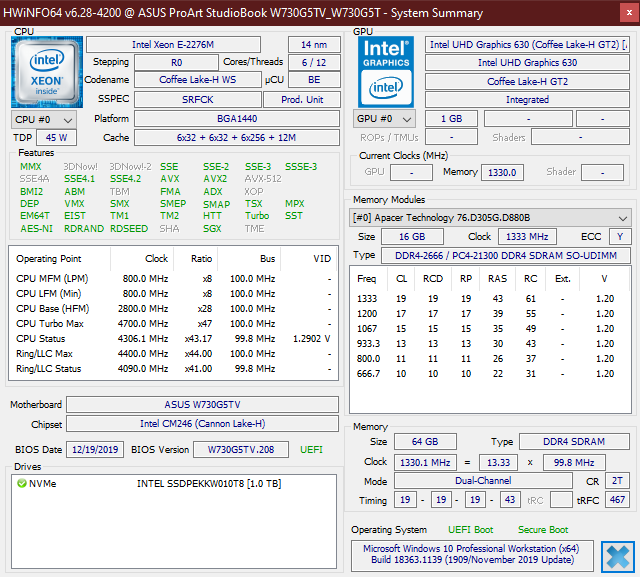
The main difference between Xeon and Core: Xeon CPUs use ECC-RAM, and Core processors do not. A maximum of 128 GB DDR4-2666 RAM is possible, since there are four RAM slots. Asus uses up to four M.2-2280 SSDs (PCIE-NVMe) for mass storage. However, the data sheet also lists a 2.5-inch HDD option.
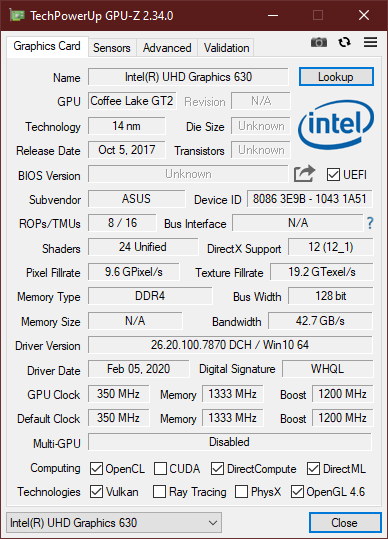
Processor
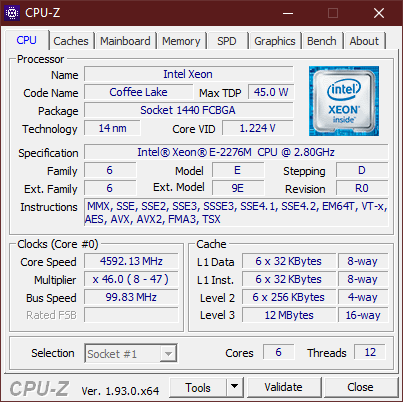
The Intel Xeon E-2276M is a special workstation processor with six cores, up to 12 threads and vPro. This "Coffee Lake Refresh" processor can typically consume up to 45 watts and achieves clock rates of up to 4.7 GHz with a base clock of 2.8 GHz. With our CPU comparison list you can compare the processor with other CPUs.
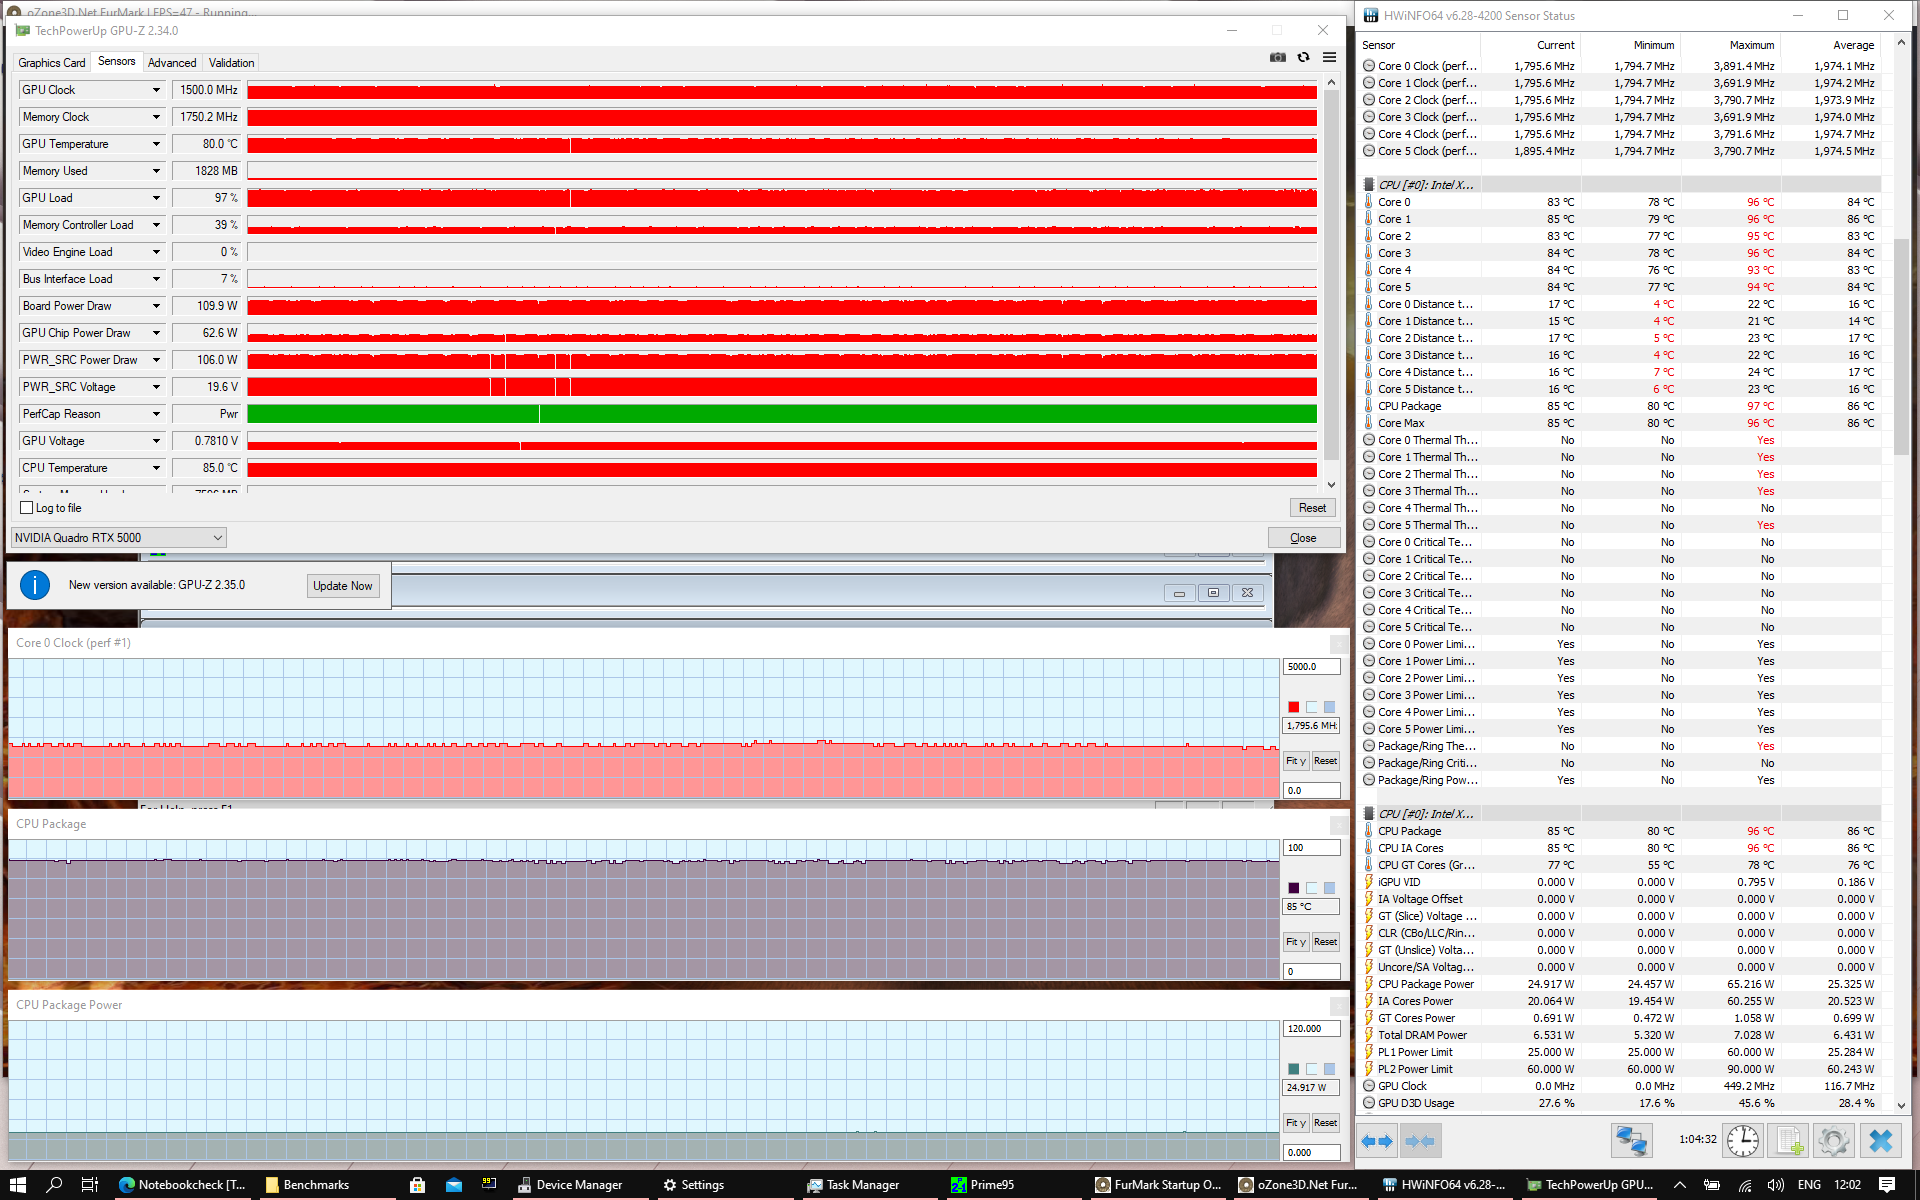
A maximum consumption of 80 watts is possible in the Asus ProArt StudioBook Pro X W730G5T. However, this is only at the beginning of the Cinebench multicore loop, after which the consumption is limited to about 60 watts. This results in clock rates of 3.6 GHz and temperatures of over 90 °C.
With this performance, the Asus notebook lies above the Lenovo ThinkPad P73 with a six-core chip. Nevertheless, the performance is disappointing: The significantly thinner Dell Precision 5750 with the newer eight-core Intel Xeon W-10885M processor is considerably faster. The same applies to the Asus Zephyrus G15 with AMD Ryzen 7 4800HS. Asus's decision to go without eight-core processor choices really starts to show here.
CPU limitation in battery mode was not detected.
Cinebench R15: CPU Multi 64Bit | CPU Single 64Bit
Blender: v2.79 BMW27 CPU
7-Zip 18.03: 7z b 4 -mmt1 | 7z b 4
Geekbench 5.5: Single-Core | Multi-Core
HWBOT x265 Benchmark v2.2: 4k Preset
LibreOffice : 20 Documents To PDF
R Benchmark 2.5: Overall mean
| Cinebench R20 / CPU (Multi Core) | |
| Average of class Workstation (5760 - 15043, n=23, last 2 years) | |
| Dell Precision 5000 5750 P92F | |
| Asus StudioBook Pro X W730G5T-H8050T | |
| Average Intel Xeon E-2276M (2700 - 2865, n=2) | |
| MSI WE75 9TK | |
| Lenovo ThinkPad P73-20QR002DGE | |
| Cinebench R20 / CPU (Single Core) | |
| Average of class Workstation (671 - 857, n=23, last 2 years) | |
| Dell Precision 5000 5750 P92F | |
| Asus StudioBook Pro X W730G5T-H8050T | |
| Average Intel Xeon E-2276M (n=1) | |
| MSI WE75 9TK | |
| Lenovo ThinkPad P73-20QR002DGE | |
| Cinebench R15 / CPU Multi 64Bit | |
| Average of class Workstation (2489 - 5810, n=23, last 2 years) | |
| Dell Precision 5000 5750 P92F | |
| Asus StudioBook Pro X W730G5T-H8050T | |
| Lenovo ThinkPad P73-20QR002DGE | |
| Average Intel Xeon E-2276M (1205 - 1280, n=2) | |
| MSI WE75 9TK | |
| Cinebench R15 / CPU Single 64Bit | |
| Average of class Workstation (191.4 - 328, n=23, last 2 years) | |
| Dell Precision 5000 5750 P92F | |
| Asus StudioBook Pro X W730G5T-H8050T | |
| Average Intel Xeon E-2276M (189 - 201, n=2) | |
| Lenovo ThinkPad P73-20QR002DGE | |
| MSI WE75 9TK | |
| Blender / v2.79 BMW27 CPU | |
| Lenovo ThinkPad P73-20QR002DGE | |
| Asus StudioBook Pro X W730G5T-H8050T | |
| Average Intel Xeon E-2276M (n=1) | |
| Dell Precision 5000 5750 P92F | |
| Average of class Workstation (91 - 222, n=23, last 2 years) | |
| 7-Zip 18.03 / 7z b 4 -mmt1 | |
| Average of class Workstation (5126 - 6960, n=23, last 2 years) | |
| Dell Precision 5000 5750 P92F | |
| Asus StudioBook Pro X W730G5T-H8050T | |
| Average Intel Xeon E-2276M (n=1) | |
| Lenovo ThinkPad P73-20QR002DGE | |
| 7-Zip 18.03 / 7z b 4 | |
| Average of class Workstation (60489 - 116969, n=23, last 2 years) | |
| Dell Precision 5000 5750 P92F | |
| Asus StudioBook Pro X W730G5T-H8050T | |
| Average Intel Xeon E-2276M (n=1) | |
| Lenovo ThinkPad P73-20QR002DGE | |
| Geekbench 5.5 / Single-Core | |
| Average of class Workstation (1783 - 2183, n=23, last 2 years) | |
| Dell Precision 5000 5750 P92F | |
| Asus StudioBook Pro X W730G5T-H8050T | |
| Average Intel Xeon E-2276M (n=1) | |
| Lenovo ThinkPad P73-20QR002DGE | |
| Geekbench 5.5 / Multi-Core | |
| Average of class Workstation (11542 - 25554, n=23, last 2 years) | |
| Dell Precision 5000 5750 P92F | |
| Asus StudioBook Pro X W730G5T-H8050T | |
| Average Intel Xeon E-2276M (n=1) | |
| Lenovo ThinkPad P73-20QR002DGE | |
| HWBOT x265 Benchmark v2.2 / 4k Preset | |
| Average of class Workstation (17.8 - 40.5, n=23, last 2 years) | |
| Dell Precision 5000 5750 P92F | |
| Asus StudioBook Pro X W730G5T-H8050T | |
| Average Intel Xeon E-2276M (n=1) | |
| Lenovo ThinkPad P73-20QR002DGE | |
| LibreOffice / 20 Documents To PDF | |
| Asus StudioBook Pro X W730G5T-H8050T | |
| Average Intel Xeon E-2276M (n=1) | |
| Average of class Workstation (37.1 - 74.7, n=23, last 2 years) | |
| Dell Precision 5000 5750 P92F | |
| R Benchmark 2.5 / Overall mean | |
| Asus StudioBook Pro X W730G5T-H8050T | |
| Average Intel Xeon E-2276M (n=1) | |
| Dell Precision 5000 5750 P92F | |
| Average of class Workstation (0.3825 - 0.603, n=23, last 2 years) | |
* ... smaller is better
System Performance
The Asus StudioBook Pro X W730 performs strongly in the PCMark benchmarks. Accordingly, the performance in everyday use also turns out to be good.
| PCMark 8 Home Score Accelerated v2 | 4256 points | |
| PCMark 8 Creative Score Accelerated v2 | 4171 points | |
| PCMark 8 Work Score Accelerated v2 | 5370 points | |
| PCMark 10 Score | 5239 points | |
Help | ||
DPC latencies
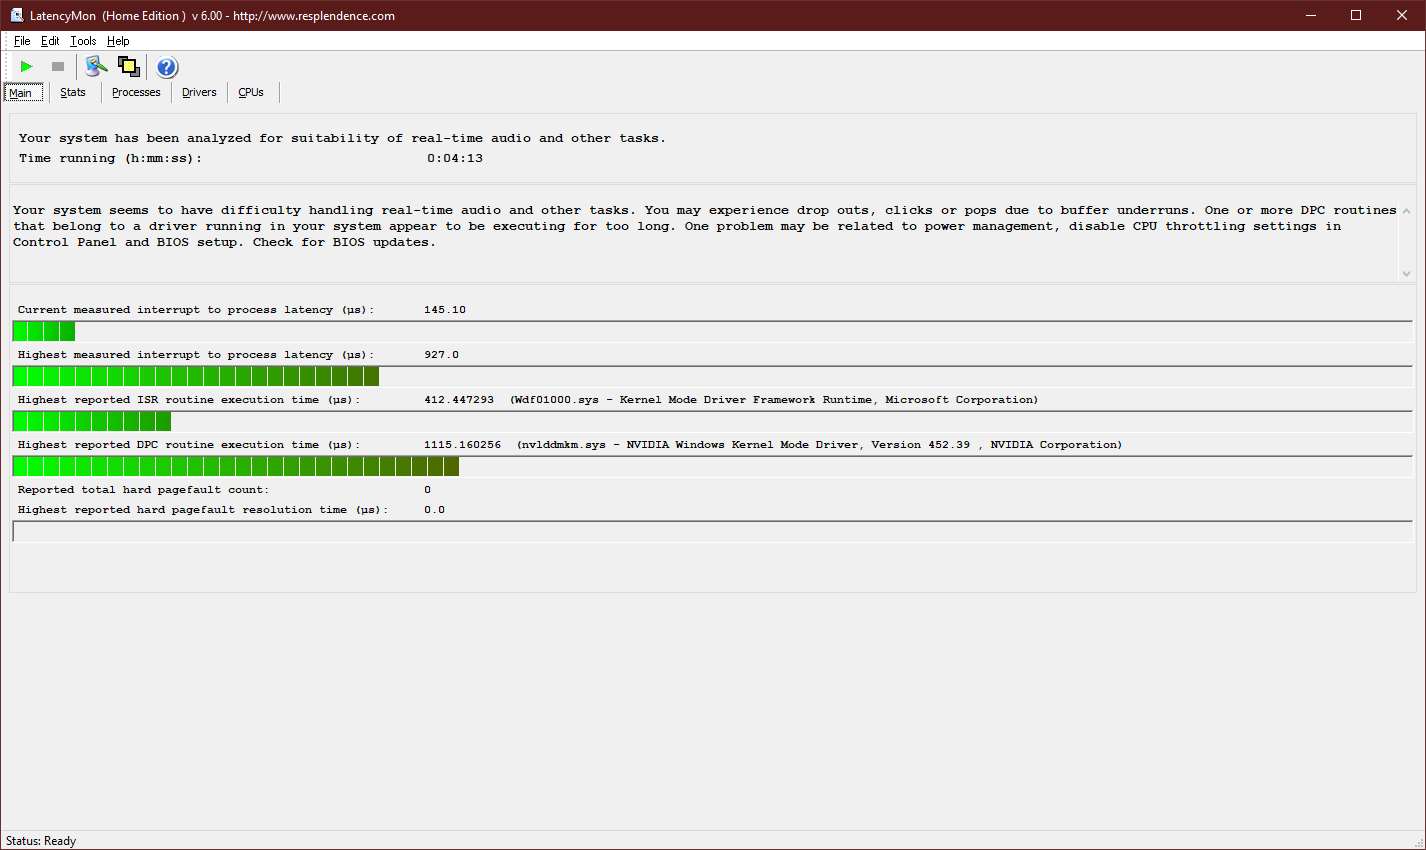
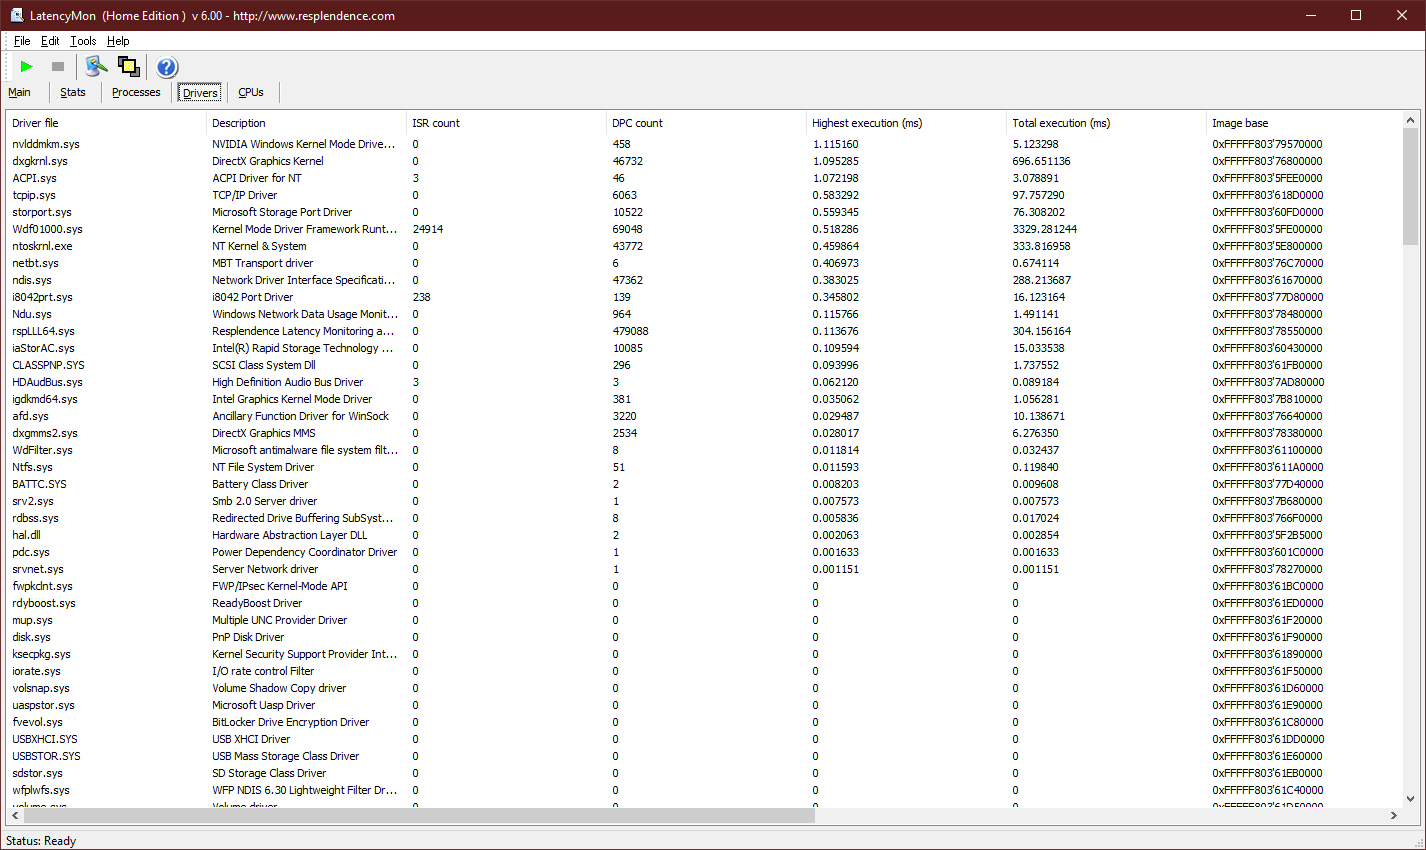
| DPC Latencies / LatencyMon - interrupt to process latency (max), Web, Youtube, Prime95 | |
| Asus StudioBook Pro X W730G5T-H8050T | |
* ... smaller is better
Mass Storage
Not only the CPU is from Intel but also the M.2-2280-SSD was made by this manufacturer. It is a very fast PCIe-NVMe-SSD with 1 TB capacity. In our benchmarks the performance is excellent.
| Asus StudioBook Pro X W730G5T-H8050T Intel SSD 760p SSDPEKKW010T8 | Lenovo ThinkPad P73-20QR002DGE Intel SSD Pro 7600p SSDPEKKF512G8L | Dell Precision 5000 5750 P92F Toshiba Kioxia XG6 KXG60PNV1T02 | MSI WE75 9TK Samsung SSD PM981 MZVLB512HAJQ | Average Intel SSD 760p SSDPEKKW010T8 | |
|---|---|---|---|---|---|
| CrystalDiskMark 5.2 / 6 | -2% | 0% | 6% | -6% | |
| Write 4K (MB/s) | 228.9 | 154.3 -33% | 103.5 -55% | 135.4 -41% | 155.2 ? -32% |
| Read 4K (MB/s) | 74.1 | 66.4 -10% | 44.56 -40% | 56.6 -24% | 63.6 ? -14% |
| Write Seq (MB/s) | 1510 | 1561 3% | 1934 28% | 1972 31% | 1536 ? 2% |
| Read Seq (MB/s) | 2340 | 2460 5% | 1937 -17% | 2101 -10% | 2389 ? 2% |
| Write 4K Q32T1 (MB/s) | 447.1 | 438 -2% | 372.9 -17% | 527 18% | 414 ? -7% |
| Read 4K Q32T1 (MB/s) | 552 | 568 3% | 358.9 -35% | 578 5% | 504 ? -9% |
| Write Seq Q32T1 (MB/s) | 1198 | 1581 32% | 2894 142% | 1985 66% | 1435 ? 20% |
| Read Seq Q32T1 (MB/s) | 3204 | 2724 -15% | 3082 -4% | 3358 5% | 2879 ? -10% |

Continuous read: DiskSpd Read Loop, Queue Depth 8
Graphics card
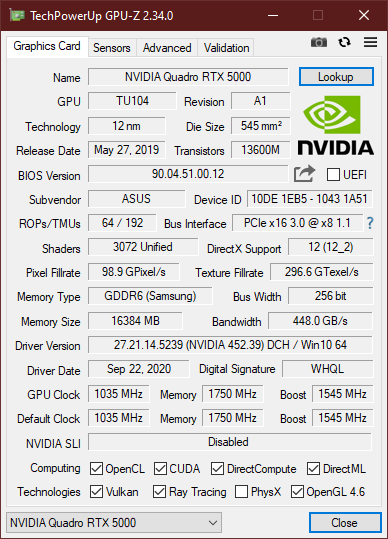
Asus uses the normal version of the Nvidia Quadro RTX 5000 in the ProArt StudioBook Pro X, not the Max-Q model. However, this is not the maximum variant for laptops with 150 watts, but the model with 110 watts TDP. You can compare the Quadro with other graphics chips via the GPU comparison list.
In the 3DMark tests as well as in the workstation-specific SPECviewperf, the RTX 5000 is significantly faster than the Quadro RTX 3000 of its competitors. That it is slower than the average Quadro RTX 5000 is due to the fact that we could test the normal model of this GPU so far only in the Acer ConceptD 9 Pro in the 150 watt version.
In battery operation we could determine a reduction in power. The StudioBook Pro X W730G5T only achieved 18,233 points in the graphics score in 3DMark 11. In mains operation the result was about 60% better.
| 3DMark 11 Performance | 20552 points | |
| 3DMark Cloud Gate Standard Score | 34501 points | |
| 3DMark Fire Strike Score | 17512 points | |
| 3DMark Time Spy Score | 8246 points | |
Help | ||
Gaming Performance
With the Quadro RTX 5000 the latest games can be played at the highest quality level and are represented smoothly - 4K-UHD should also be possible with this GPU.
In our The Witcher 3-loop test, the Asus ProArt StudioBook Pro X W730G5T wasn't able to keep the performance stable at 90 FPS, but the performance drop under load is kept within limits, and it stays at 85 to 90 FPS except for a few frame drops.
| The Witcher 3 - 1920x1080 High Graphics & Postprocessing (Nvidia HairWorks Off) | |
| Acer ConceptD 9 Pro | |
| Average NVIDIA Quadro RTX 5000 (Laptop) (163 - 198.6, n=2) | |
| Asus Strix Scar 17 G732LXS | |
| Asus StudioBook Pro X W730G5T-H8050T | |
| Average of class Workstation (n=1last 2 years) | |
| MSI WE75 9TK | |
| Dell Precision 5000 5750 P92F | |
| Lenovo ThinkPad P73-20QR002DGE | |
| low | med. | high | ultra | |
|---|---|---|---|---|
| The Witcher 3 (2015) | 235 | 217 | 163 | 90.4 |
| Dota 2 Reborn (2015) | 144 | 132 | 97.5 | 92 |
| X-Plane 11.11 (2018) | 110 | 84.5 | 76.5 | |
| Shadow of the Tomb Raider (2018) | 102 | 78.6 | 76.9 | 73.1 |
| Total War: Three Kingdoms (2019) | 173 | 132 | 98 | 71.1 |
Emissions: Asus computer's fan annoys under load
Noise emissions
Even in idle, the Asus laptop's cooling system isn't completely silent, but it is at least quiet. The ProArt StudioBook Pro X W730G5T already becomes clearly audibly loud with 39 dB(A) under load. More serious than the volume itself is the fact that the fans are high-frequency and also pulsate under load. This makes the Asus PC quite annoying under load.
We could hear a coil whistle, but it was so quiet that you could only hear it on the keyboard. Sensitive ears could still be disturbed by it, though.
Noise level
| Idle |
| 29.4 / 29.4 / 30.4 dB(A) |
| Load |
| 32.6 / 39 dB(A) |
 | ||
30 dB silent 40 dB(A) audible 50 dB(A) loud |
||
min: | ||
Temperature
Interestingly, the Asus StudioBook runs less hot under load than in the The Witcher 3 stress test. We measured a maximum of 56.2 °C on the bottom - already a high value, but use on the lap is probably going to be rare with the StudioBook Pro X. Especially since this value is only reached when the cooling system is loaded.
The stress test shows that the GPU clearly has priority in cooling. While it can maintain a continuous consumption of around 110 watts, the CPU is throttled down to 25 watts. In everyday life, however, the CPU throttling doesn't make itself felt in the stress test, and the 3DMark 11 run after the load test achieved a normal result.
(±) The maximum temperature on the upper side is 44 °C / 111 F, compared to the average of 38.2 °C / 101 F, ranging from 22.2 to 69.8 °C for the class Workstation.
(-) The bottom heats up to a maximum of 55.6 °C / 132 F, compared to the average of 41.1 °C / 106 F
(+) In idle usage, the average temperature for the upper side is 25 °C / 77 F, compared to the device average of 32 °C / 90 F.
(±) Playing The Witcher 3, the average temperature for the upper side is 37.6 °C / 100 F, compared to the device average of 32 °C / 90 F.
(+) The palmrests and touchpad are reaching skin temperature as a maximum (35.8 °C / 96.4 F) and are therefore not hot.
(-) The average temperature of the palmrest area of similar devices was 27.8 °C / 82 F (-8 °C / -14.4 F).
Speakers
The boxes above the keyboard don't have to hide from the Dell Precision 5750 's speakers. The volume isn't quite as high, but otherwise the stereo loudspeakers of the Asus StudioBook Pro X W730 are very balanced. Bass is also present.
With the 3.5 mm connection an even better result can be achieved. Sound is outputted in perfect quality to external speakers or headphones.
Asus StudioBook Pro X W730G5T-H8050T audio analysis
(±) | speaker loudness is average but good (72.8 dB)
Bass 100 - 315 Hz
(±) | reduced bass - on average 9.4% lower than median
(±) | linearity of bass is average (12.3% delta to prev. frequency)
Mids 400 - 2000 Hz
(+) | balanced mids - only 3.6% away from median
(+) | mids are linear (5.6% delta to prev. frequency)
Highs 2 - 16 kHz
(+) | balanced highs - only 3.4% away from median
(±) | linearity of highs is average (7.2% delta to prev. frequency)
Overall 100 - 16.000 Hz
(±) | linearity of overall sound is average (16.7% difference to median)
Compared to same class
» 46% of all tested devices in this class were better, 9% similar, 45% worse
» The best had a delta of 7%, average was 17%, worst was 35%
Compared to all devices tested
» 29% of all tested devices were better, 7% similar, 64% worse
» The best had a delta of 4%, average was 23%, worst was 134%
Dell Precision 5000 5750 P92F audio analysis
(+) | speakers can play relatively loud (85.6 dB)
Bass 100 - 315 Hz
(±) | reduced bass - on average 7.4% lower than median
(±) | linearity of bass is average (8.7% delta to prev. frequency)
Mids 400 - 2000 Hz
(+) | balanced mids - only 3.6% away from median
(+) | mids are linear (3.8% delta to prev. frequency)
Highs 2 - 16 kHz
(±) | higher highs - on average 5.3% higher than median
(+) | highs are linear (5.6% delta to prev. frequency)
Overall 100 - 16.000 Hz
(+) | overall sound is linear (10.5% difference to median)
Compared to same class
» 7% of all tested devices in this class were better, 6% similar, 87% worse
» The best had a delta of 7%, average was 17%, worst was 35%
Compared to all devices tested
» 5% of all tested devices were better, 1% similar, 93% worse
» The best had a delta of 4%, average was 23%, worst was 134%
Large battery can't compensate for bad power management of the Asus laptop
Energy consumption
Unfortunately, the Asus notebook runs inefficiently because the energy consumption is higher than on comparable workstations. The idle values weigh especially heavily here - with 14.3 watts the minimal consumption is relatively extreme.
However, the 280-watt power supply is not challenged by the maximum consumption of 223 watts.
| Off / Standby | |
| Idle | |
| Load |
|
Key:
min: | |
| Asus StudioBook Pro X W730G5T-H8050T E-2276M, Quadro RTX 5000 (Laptop), Intel SSD 760p SSDPEKKW010T8, IPS LED, 1920x1200, 17" | Lenovo ThinkPad P73-20QR002DGE i7-9850H, Quadro RTX 3000 (Laptop), Intel SSD Pro 7600p SSDPEKKF512G8L, IPS LED, 1920x1080, 17.3" | Dell Precision 5000 5750 P92F W-10885M, Quadro RTX 3000 Max-Q, Toshiba Kioxia XG6 KXG60PNV1T02, IPS, 3840x2400, 17" | MSI WE75 9TK i7-9750H, Quadro RTX 3000 (Laptop), Samsung SSD PM981 MZVLB512HAJQ, IPS, 1920x1080, 17.3" | Average NVIDIA Quadro RTX 5000 (Laptop) | Average of class Workstation | |
|---|---|---|---|---|---|---|
| Power Consumption | 27% | 33% | 18% | -8% | 28% | |
| Idle Minimum * (Watt) | 14.3 | 8.9 38% | 6.3 56% | 12.1 15% | 16.6 ? -16% | 9.11 ? 36% |
| Idle Average * (Watt) | 19.2 | 12.8 33% | 14.2 26% | 18.4 4% | 22.1 ? -15% | 13.8 ? 28% |
| Idle Maximum * (Watt) | 24.6 | 16.4 33% | 17.3 30% | 18.8 24% | 27.3 ? -11% | 17.9 ? 27% |
| Load Average * (Watt) | 133 | 108.4 18% | 121.2 9% | 95.1 28% | 124.5 ? 6% | 96 ? 28% |
| Witcher 3 ultra * (Watt) | 181 | 153 15% | 115.4 36% | 135.5 25% | ||
| Load Maximum * (Watt) | 223 | 166 26% | 130.7 41% | 203.7 9% | 232 ? -4% | 180.3 ? 19% |
* ... smaller is better
Battery life
Despite the impressive capacity of the internal battery, the Asus ProArt StudioBook Pro X W730G5T can't keep up with the competition in terms of battery life. The high energy consumption has a negative impact here. In comparison to the Lenovo ThinkPad P73 and the Dell Precision 5750, the battery life is more than two hours worse in the Wi-Fi test (150 cd/m² brightness). In absolute terms, 8 hours and 30 minutes is not a low value. You should get through the workday.
| Asus StudioBook Pro X W730G5T-H8050T E-2276M, Quadro RTX 5000 (Laptop), 95 Wh | Lenovo ThinkPad P73-20QR002DGE i7-9850H, Quadro RTX 3000 (Laptop), 99 Wh | Dell Precision 5000 5750 P92F W-10885M, Quadro RTX 3000 Max-Q, 97 Wh | MSI WE75 9TK i7-9750H, Quadro RTX 3000 (Laptop), 65 Wh | Average of class Workstation | |
|---|---|---|---|---|---|
| Battery runtime | 13% | 43% | -36% | 5% | |
| H.264 (h) | 9.1 | 9.8 8% | 10.1 ? 11% | ||
| WiFi v1.3 (h) | 8.5 | 11.1 31% | 10.9 28% | 4.9 -42% | 8.55 ? 1% |
| Load (h) | 1.4 | 1.4 0% | 2.2 57% | 1 -29% | 1.441 ? 3% |
Pros
Cons
Verdict: Asus ProArt StudioBook Pro X W730G5T is a great workstation, but...
A mobile workstation for around 6,500 Euros (~$7,697) - quite an announcement that puts Asus under pressure to justify itself. Is the Asus ProArt StudioBook Pro X W730G5T really worth its money?
First of all, you have to note that Asus definitely supplies a good case - the StudioBook Pro X, which is made of aluminum and magnesium, is extremely stable and has a high-quality finish. The keyboard has more stroke than most competitors' keyboards and is very multi-typing capable. Asus doesn't install a point stick, but its innovative "ScreenPad" touchpad helps. Also part of the package: Numerous connections and the above-average fast SD card reader.
Our impression of the display is mixed: 16:10 format and color-space coverage are positive, but the contrast and brightness should be higher. We would also like a higher resolution screen. Also the CPUs lack selection: Asus shoots itself in the foot by doing without eight-core CPUs. Thus, the Asus laptop is only competitive in terms of GPU performance. Annoying: Although there are four RAM and M.2 SSD slots, they are only half accessible. The fan, which pulsates at a high level, also hits our nerves. The comparatively good loudspeakers are to be rated positively, but the short warranty and the poor business features are clearly negative points.
Too expensive: The Asus ProArt StudioBook Pro X W730G5T doesn't deliver the perfect performance that would be needed to justify the high price.
In the end we have to answer the introductory question with no. Not that the Asus ProArt StudioBook Pro X W730G5T isn't a good workstation - but for this price you simply have to deliver in all areas. The Asus ProArt StudioBook Pro X unfortunately doesn't do that, especially with the CPU. Nevertheless, it is recommendable if you are looking for a combination of 16:10, a comfortable keyboard and good connectivity, for example.
Asus StudioBook Pro X W730G5T-H8050T
- 11/10/2020 v7 (old)
Benjamin Herzig
Price comparison

