Lenovo ThinkPad T14s Review: Business laptop is better with AMD
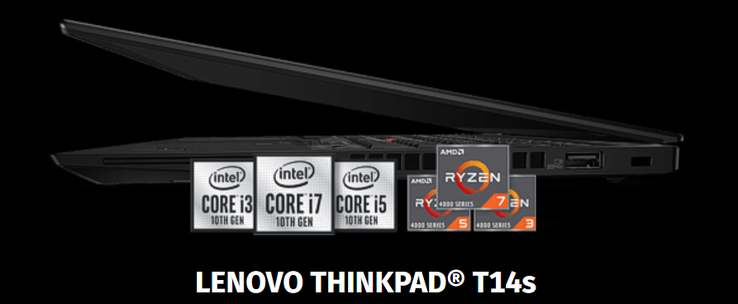
The ThinkPad T14s is the successor to the T490s/T495s and we have already reviewed the Intel version. Now it is time for the T14s with the AMD processor. Our test unit is an education model with very good specs. For 1,399 Euros (~$1,657), eligible users get a Ryzen 7 Pro 4750U with 8 cores, the RX Vega 7 iGPU, a LowPower 1080p screen, 32 GB RAM, and a 1 TB NVMe-SSD. There is currently no comparable model for regular users. Lenovo's online shop does not list all options yet and the most comparable TopSeller unit for 1,575 Euros (~$1,865) comes with Windows 10 Pro but is only equipped with 16 GB RAM and a 512 GB SSD.
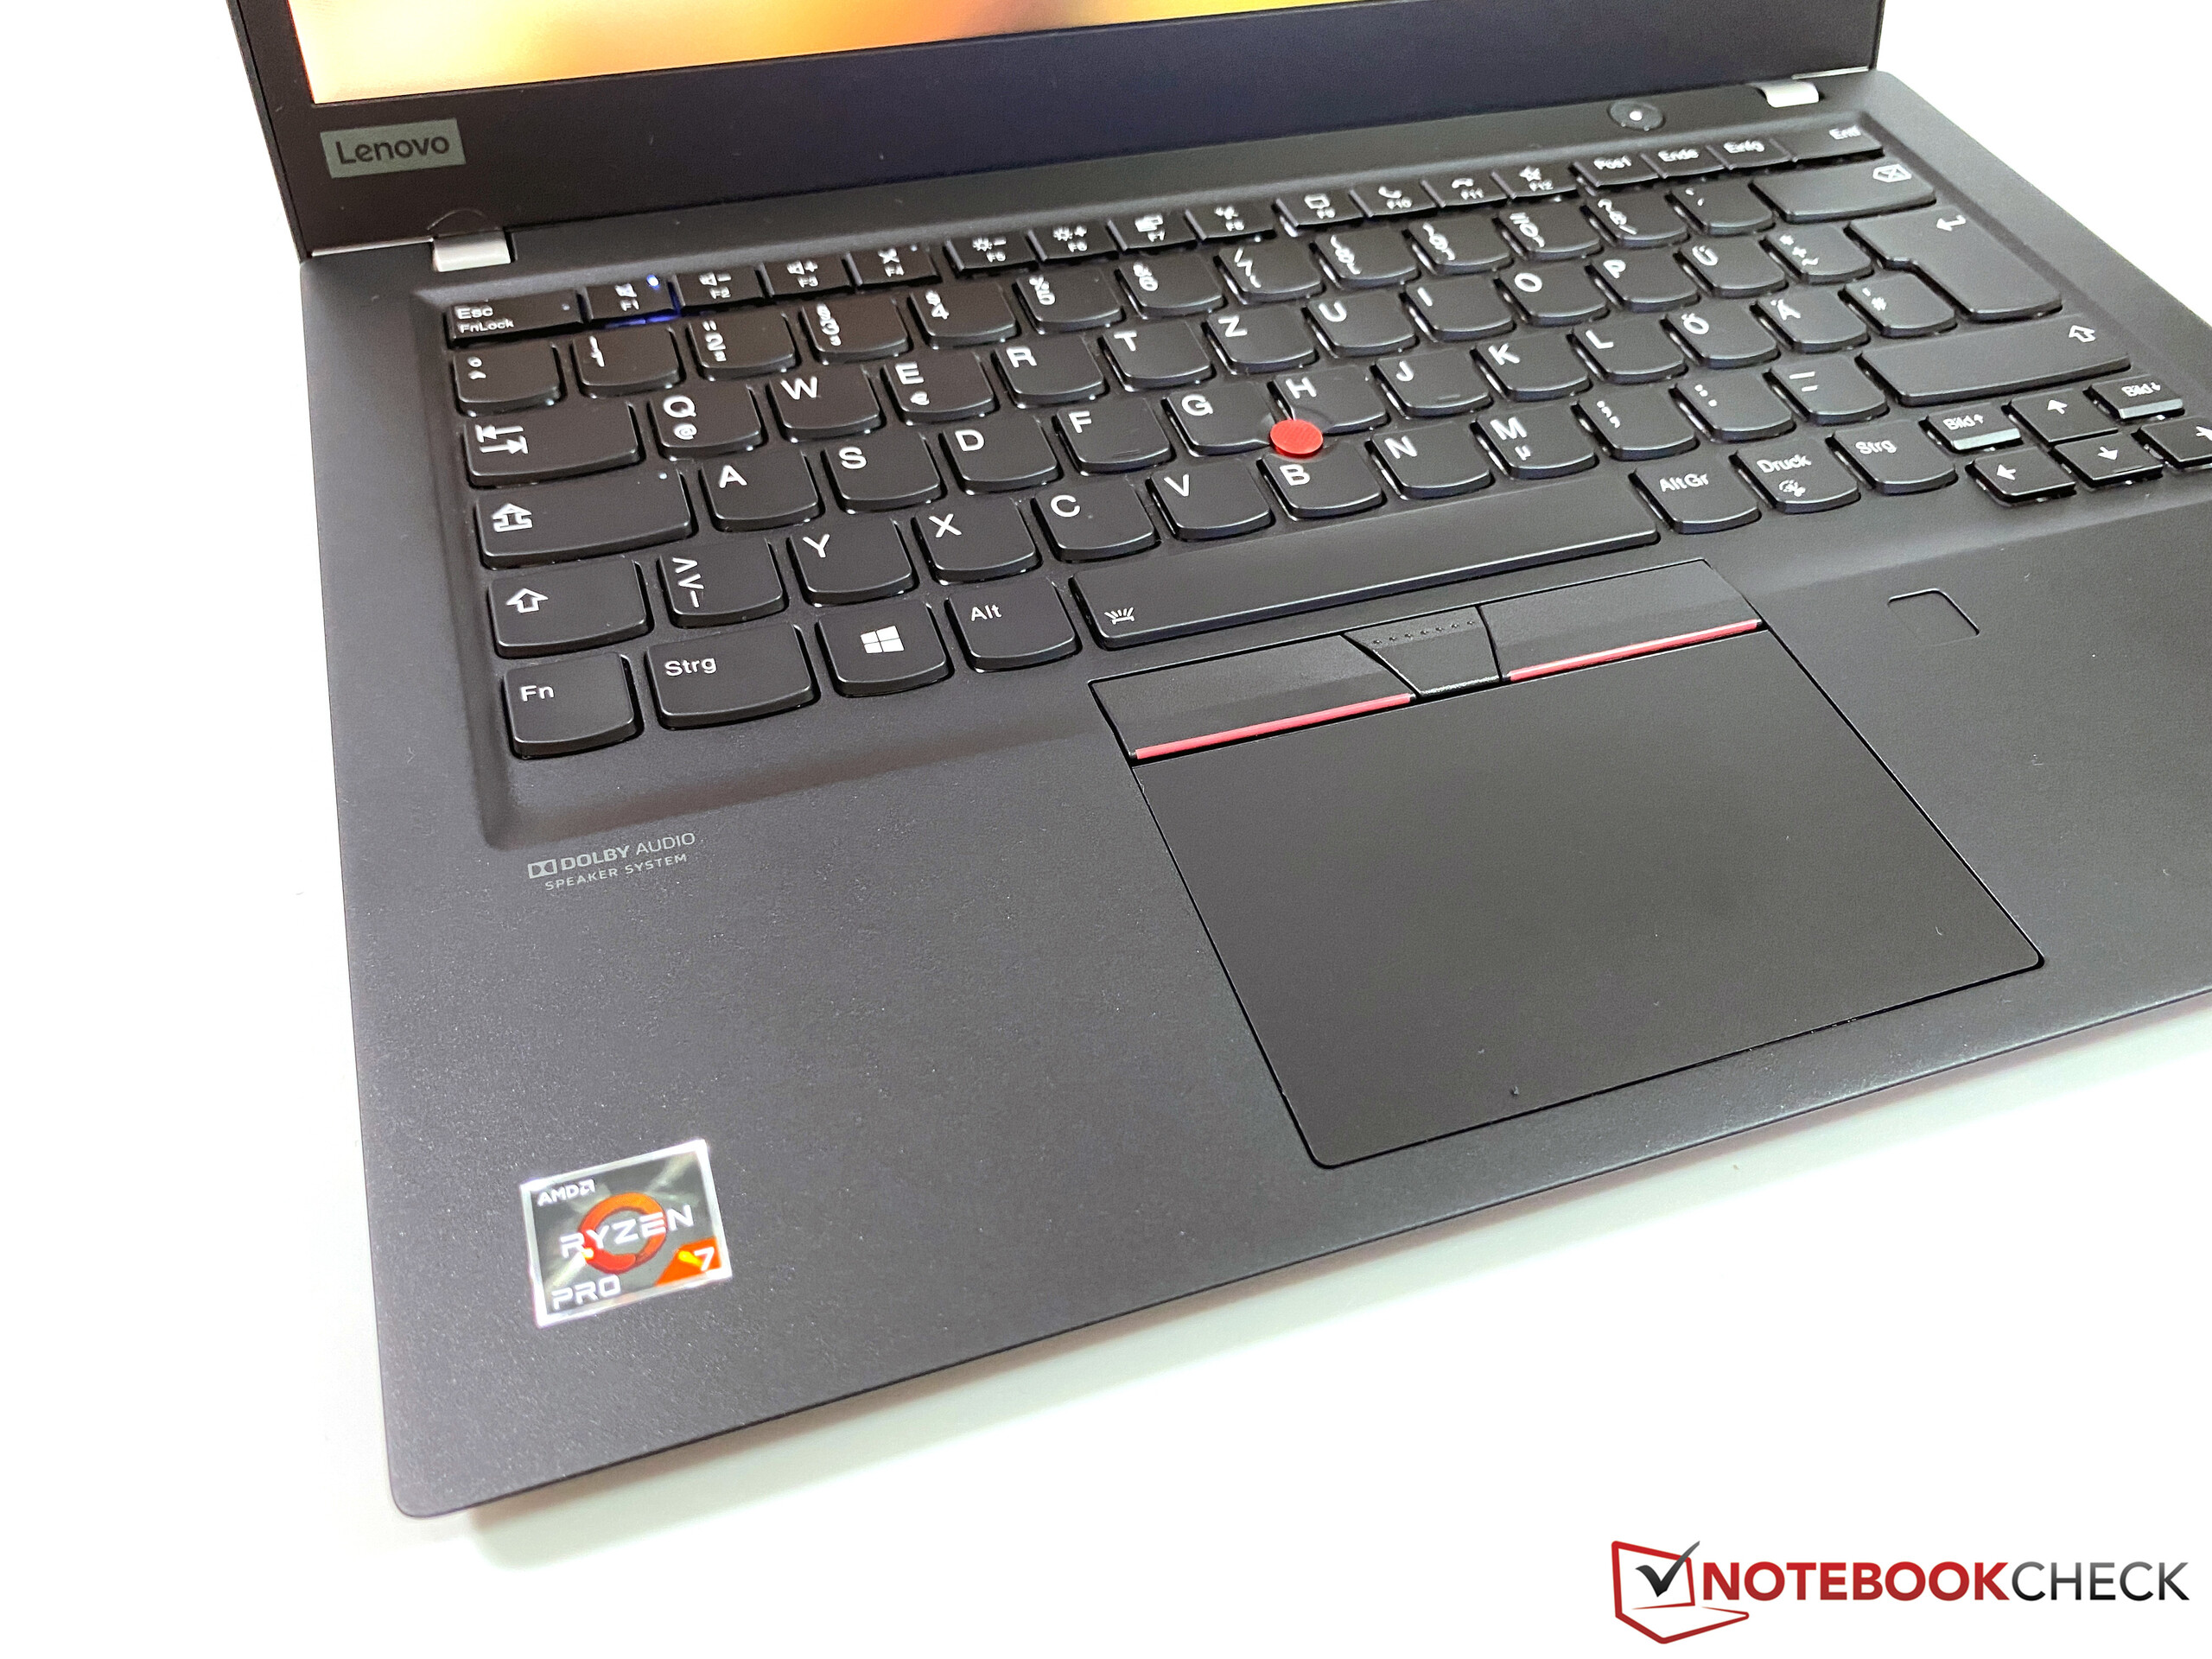
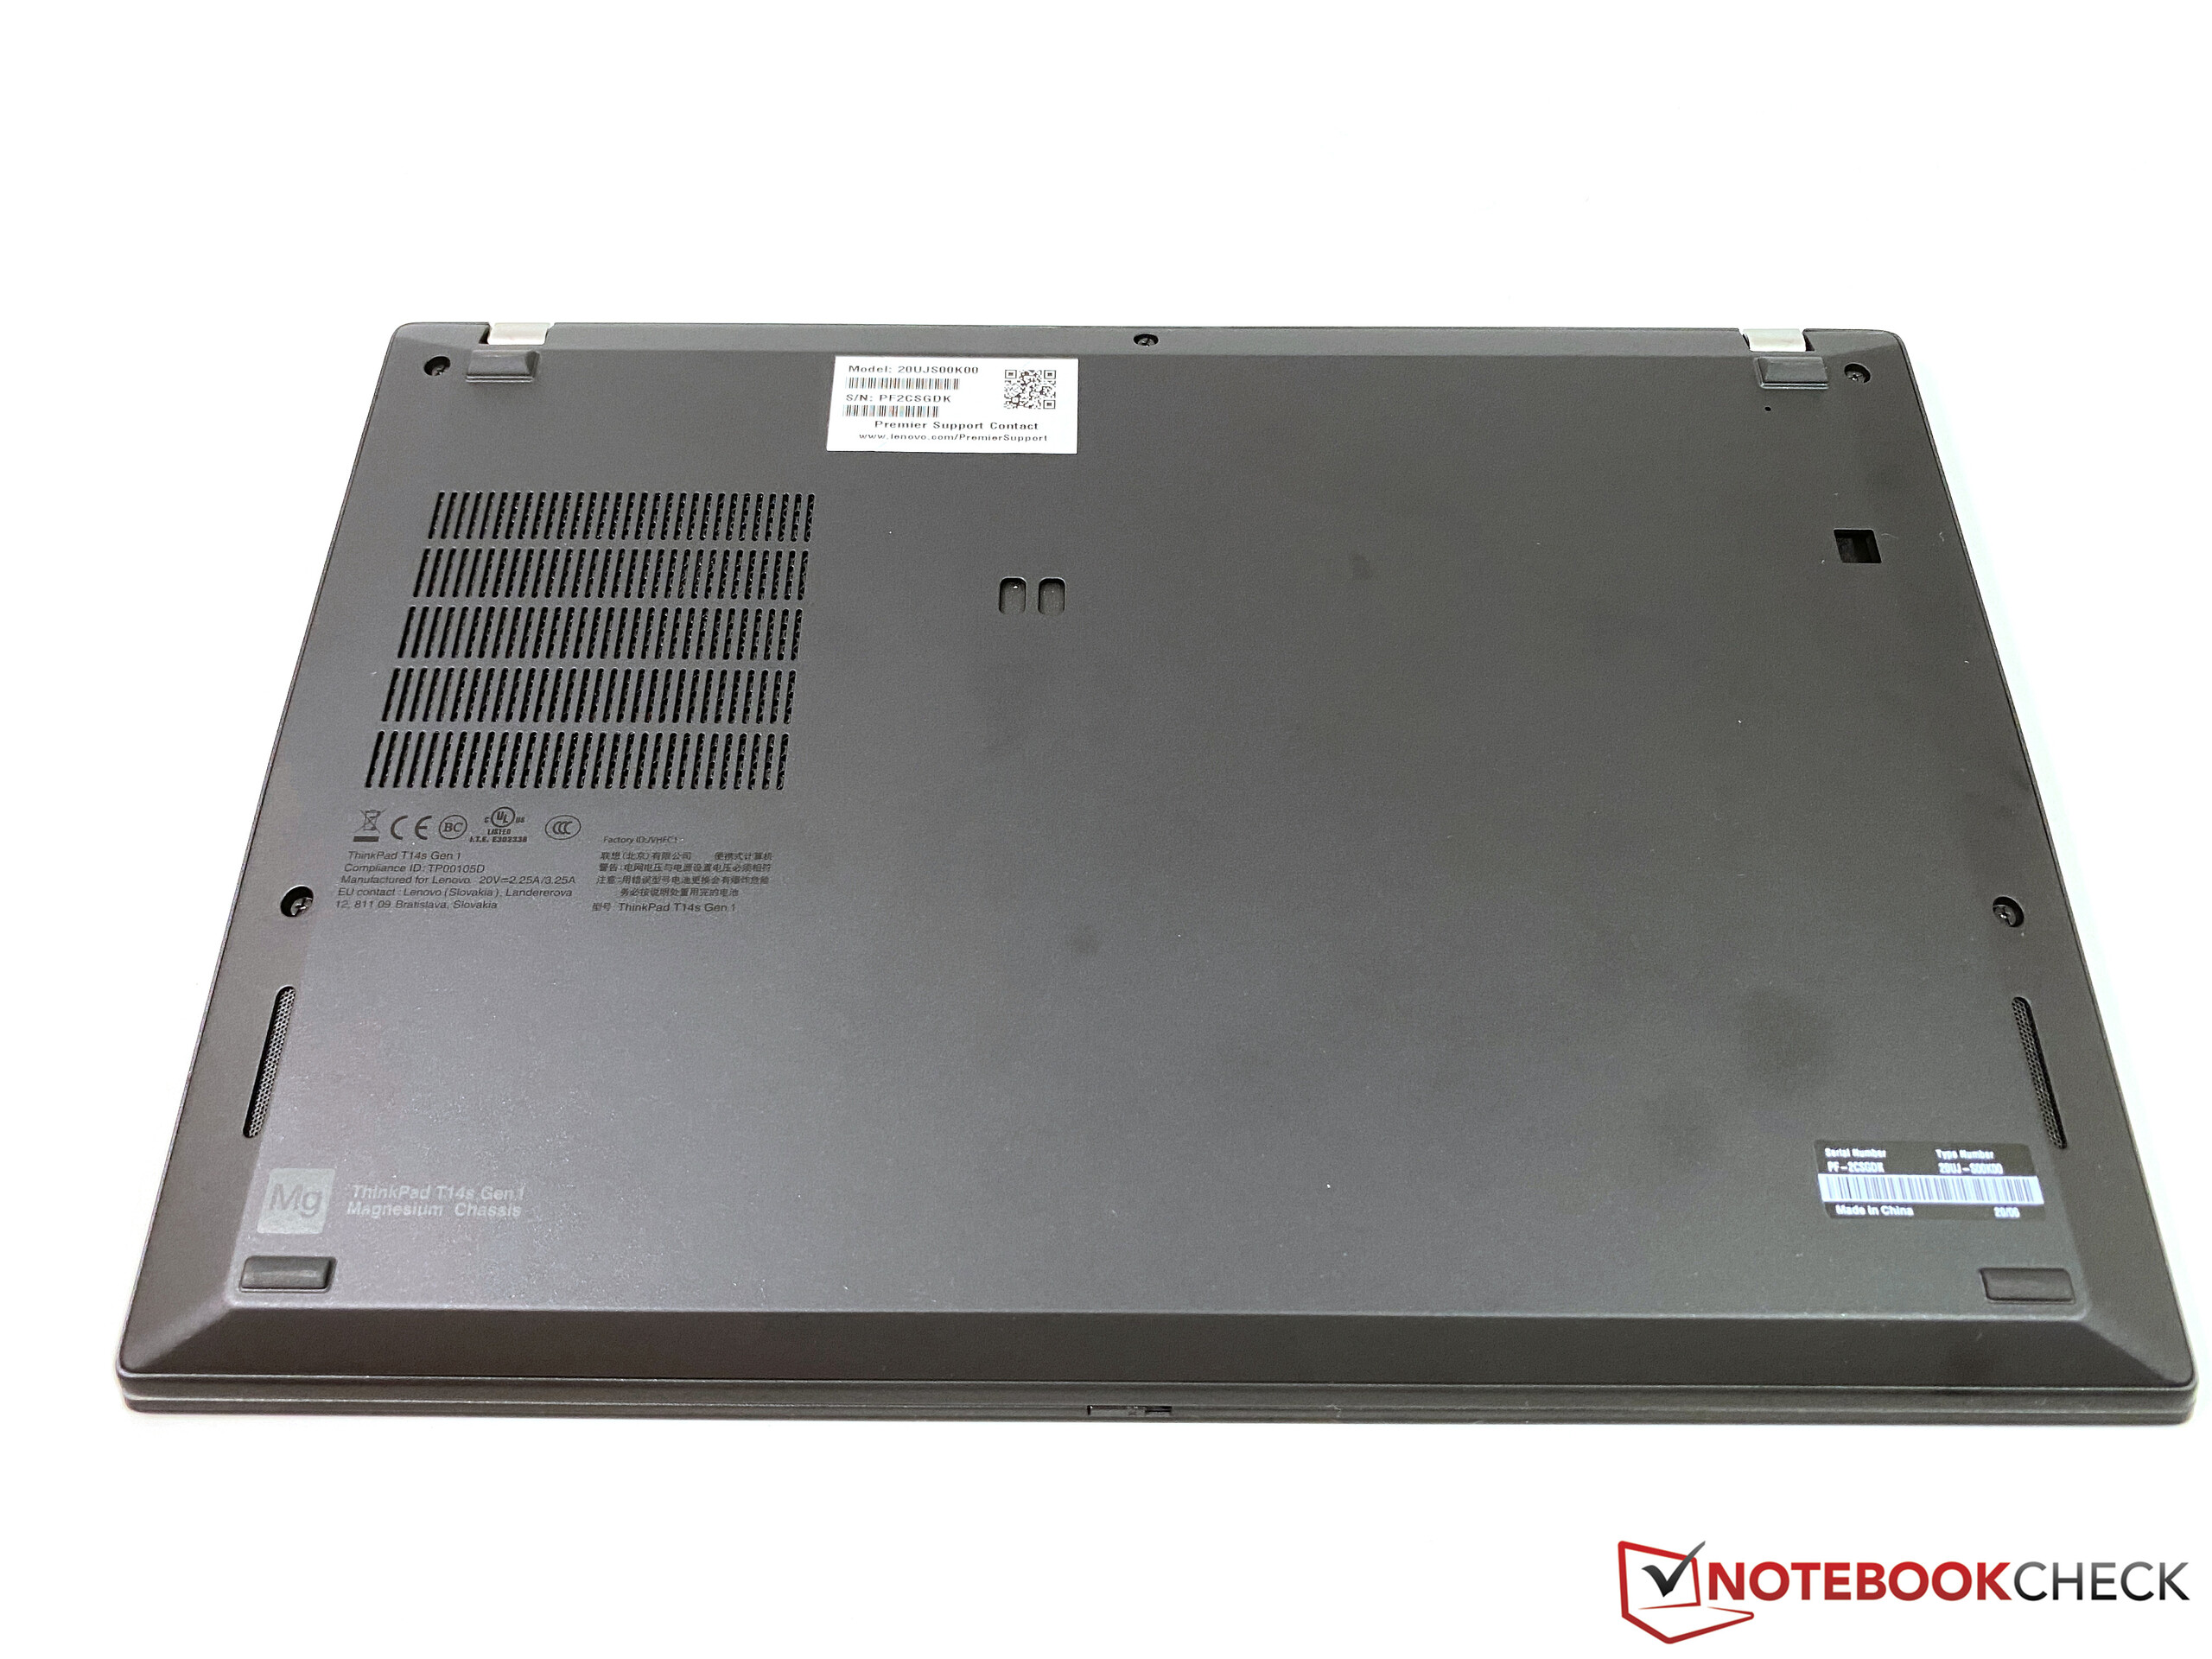
The chassis construction is identical to the ThinkPad T14s and the previous model T490s/T495s, so we will focus on the differences of the two models and obviously the new AMD processor. Please see our previous reviews for more information on the case, the input devices, and the speakers:
Rating | Date | Model | Weight | Height | Size | Resolution | Price |
|---|---|---|---|---|---|---|---|
| 90.5 % v7 (old) | 08 / 2020 | Lenovo ThinkPad T14s-20UJS00K00 R7 PRO 4750U, Vega 7 | 1.3 kg | 16.1 mm | 14.00" | 1920x1080 | |
| 88.8 % v7 (old) | 07 / 2020 | Lenovo ThinkPad T14s-20T00044GE i5-10210U, UHD Graphics 620 | 1.3 kg | 16.1 mm | 14.00" | 1920x1080 | |
| 88.4 % v7 (old) | 09 / 2019 | Lenovo ThinkPad T495s-20QKS01E00 R7 PRO 3700U, Vega 10 | 1.3 kg | 16.1 mm | 14.00" | 1920x1080 | |
| 88.9 % v7 (old) | 07 / 2020 | Dell Latitude 7410 i7-10610U, UHD Graphics 620 | 1.4 kg | 19.3 mm | 14.00" | 3840x2160 | |
| 90.2 % v7 (old) | 07 / 2020 | Lenovo ThinkPad X1 Carbon 2020-20UAS04T00 i7-10510U, UHD Graphics 620 | 1.1 kg | 14.9 mm | 14.00" | 1920x1080 |
Case - Identical with the Intel T14s


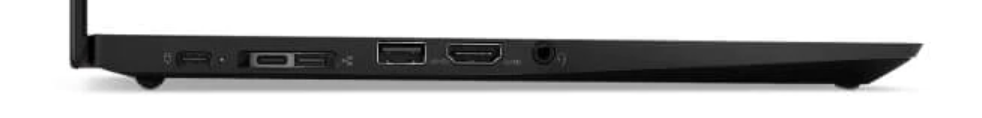
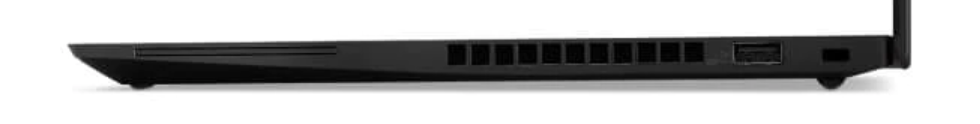
Connectivity - T14s AMD without Thunderbolt 3
Similar to the predecessor ThinkPad T495s, the port situation is very similar to the Intel version, but you do not get Thunderbolt 3 on the AMD SKU. Instead, there are two regular USB-C ports (USB 3.1 Gen.2), which can be used for charging as well as the attachment of external displays (DisplayPort 1.4 Alt mode). Speaking of external screens: The integrated Vega GPU can drive a total of four screens (internal + three external), while the Intel model is limited to three in total (internal + two external). The AMD SKU also features an HDMI 2.0 output, so you can drive a 4K screen at 60 Hz.
SD Card Reader
There is a combined tray for a nano-SIM and a microSD card at the rear of the device. The access is tricky, because you need a SIM tool (or a paper clip) to remove the tray. This is not great if you want to change the card quickly, but at least there is a card reader. We determine a maximum transfer rate of 85 MB/s with our reference card from Toshiba (Exceria Pro M501 64 GB UHS-II), which is similar to the previous model. The card reader of the T14s with the Intel processor was surprisingly slower.
| SD Card Reader | |
| average JPG Copy Test (av. of 3 runs) | |
| Dell Latitude 7410 (Toshiba Exceria Pro M501 64 GB UHS-II) | |
| Lenovo ThinkPad T495s-20QKS01E00 (Toshiba Exceria Pro M501 64 GB UHS-II) | |
| Lenovo ThinkPad T14s-20UJS00K00 (Toshiba Exceria Pro M501 64 GB UHS-II) | |
| Average of class Office (19.8 - 198.5, n=22, last 2 years) | |
| Lenovo ThinkPad T14s-20T00044GE (Toshiba Exceria Pro M501 64 GB UHS-II) | |
| maximum AS SSD Seq Read Test (1GB) | |
| Dell Latitude 7410 (Toshiba Exceria Pro M501 64 GB UHS-II) | |
| Lenovo ThinkPad T495s-20QKS01E00 (Toshiba Exceria Pro M501 64 GB UHS-II) | |
| Lenovo ThinkPad T14s-20UJS00K00 (Toshiba Exceria Pro M501 64 GB UHS-II) | |
| Average of class Office (27.4 - 249, n=21, last 2 years) | |
| Lenovo ThinkPad T14s-20T00044GE (Toshiba Exceria Pro M501 64 GB UHS-II) | |
Communication - Fast Wi-Fi 6 and optional LTE
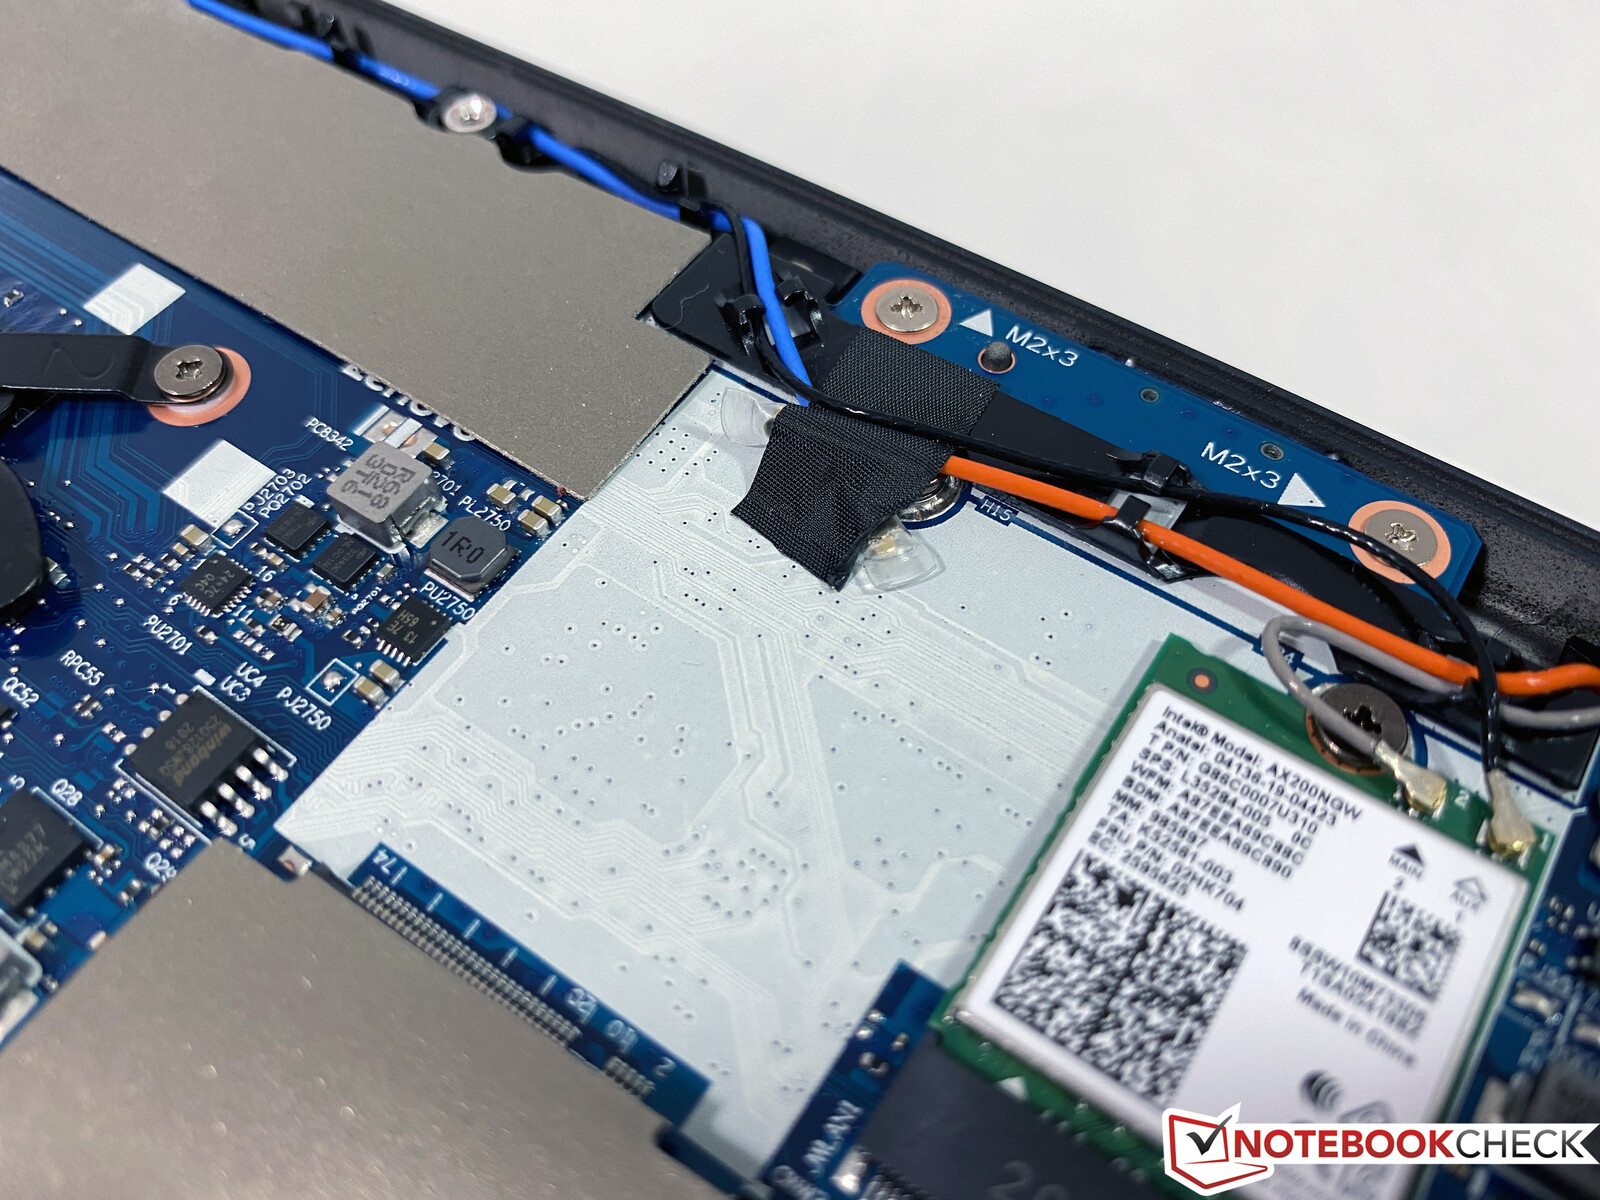
The ThinkPad T14s is WWAN-ready, which means the antennas for an LTE modem are already integrated into the case. Wireless connections are handled by a fast Wi-Fi 6 module from Intel. The AX200 manages excellent transfer rates of more than 1 Gb/s in our standardized test with the Netgear router (Nighthawk RAX120). If you own a fast router, you can utilize its potential with the T14s. We did not experience any connectivity issues with the router from Netgear or an AVM Fritz!Box 7490. Compared to the Intel model (Bluetooth 5.0), the AMD model supports Bluetooth 5.1.
Webcam


Display - AMD ThinkPad is limited to 1080p
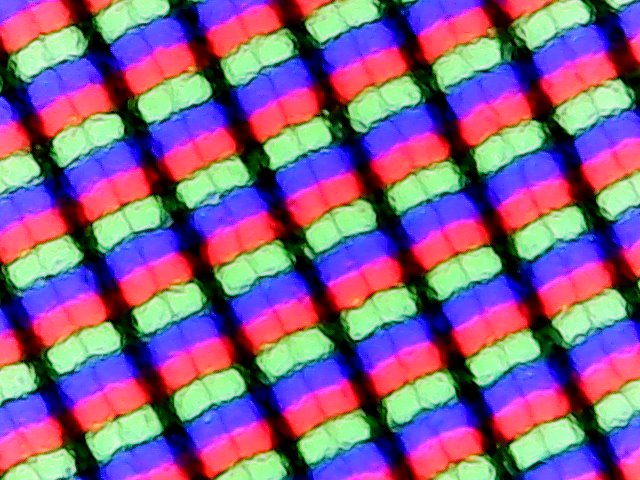
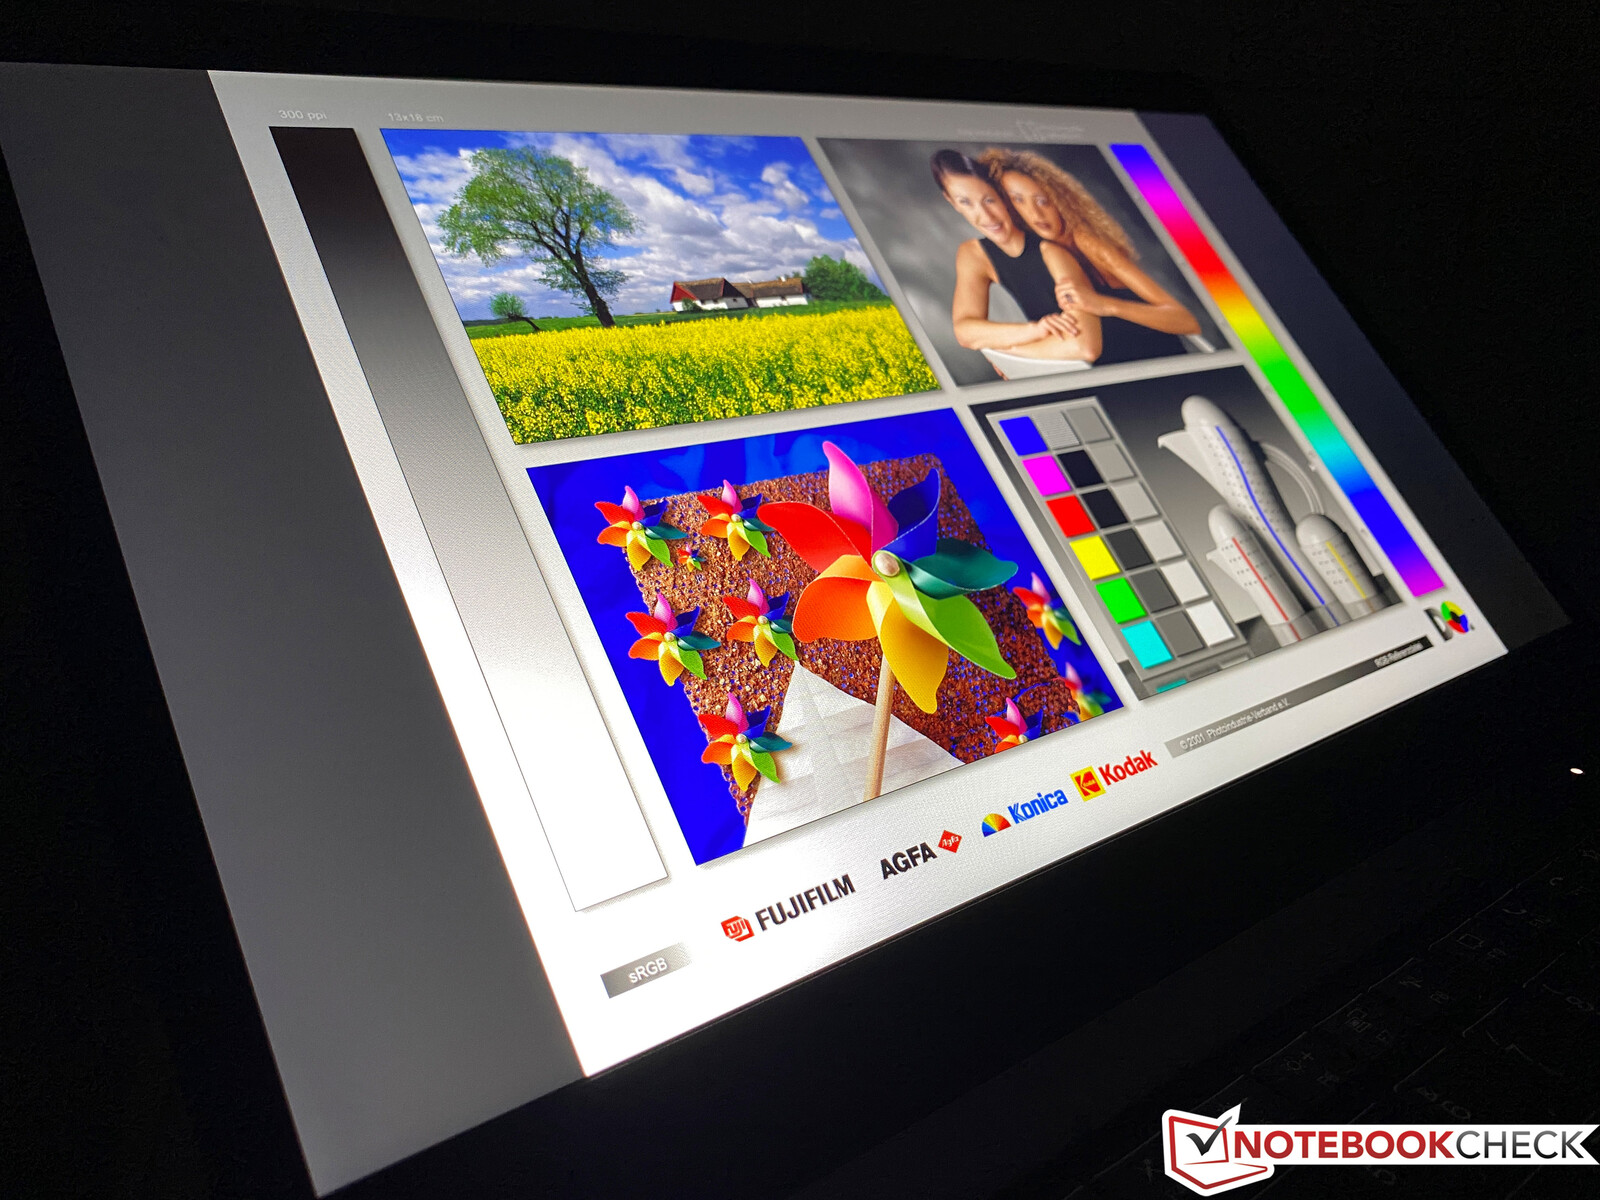
Customers of the AMD T14s do not get the optional 4K screen, so your choice is limited to one of the four 1080p screens. Our test unit was equipped with the popular LowPower Full HD screen. However, you will have to accept Lenovo's panel lottery, because the manufacturer uses four different suppliers. Our big comparison already showed that there are noticeable differences, for example in terms of PWM.
Our test unit uses the panel from Innolux (N140HCG-GQ2), which uses PWM, but the frequency is extremely high at 26 kHz and should not cause any problems. The low response times are another big advantage compared to the panels from BOE or AU Optronics, so there are no problems with ghosting. The subjective picture quality is very good. All the contents are crisp and there is no grainy picture impression on bright surfaces, despite the matte panel surface. Our unit did not suffer from any major backlight bleeding, and we only noticed one brighter spot at the bottom edge. The display once again supports AMD's FreeSync technology with frequencies between 48 Hz and 60 Hz.
| |||||||||||||||||||||||||
Brightness Distribution: 88 %
Center on Battery: 403 cd/m²
Contrast: 1188:1 (Black: 0.34 cd/m²)
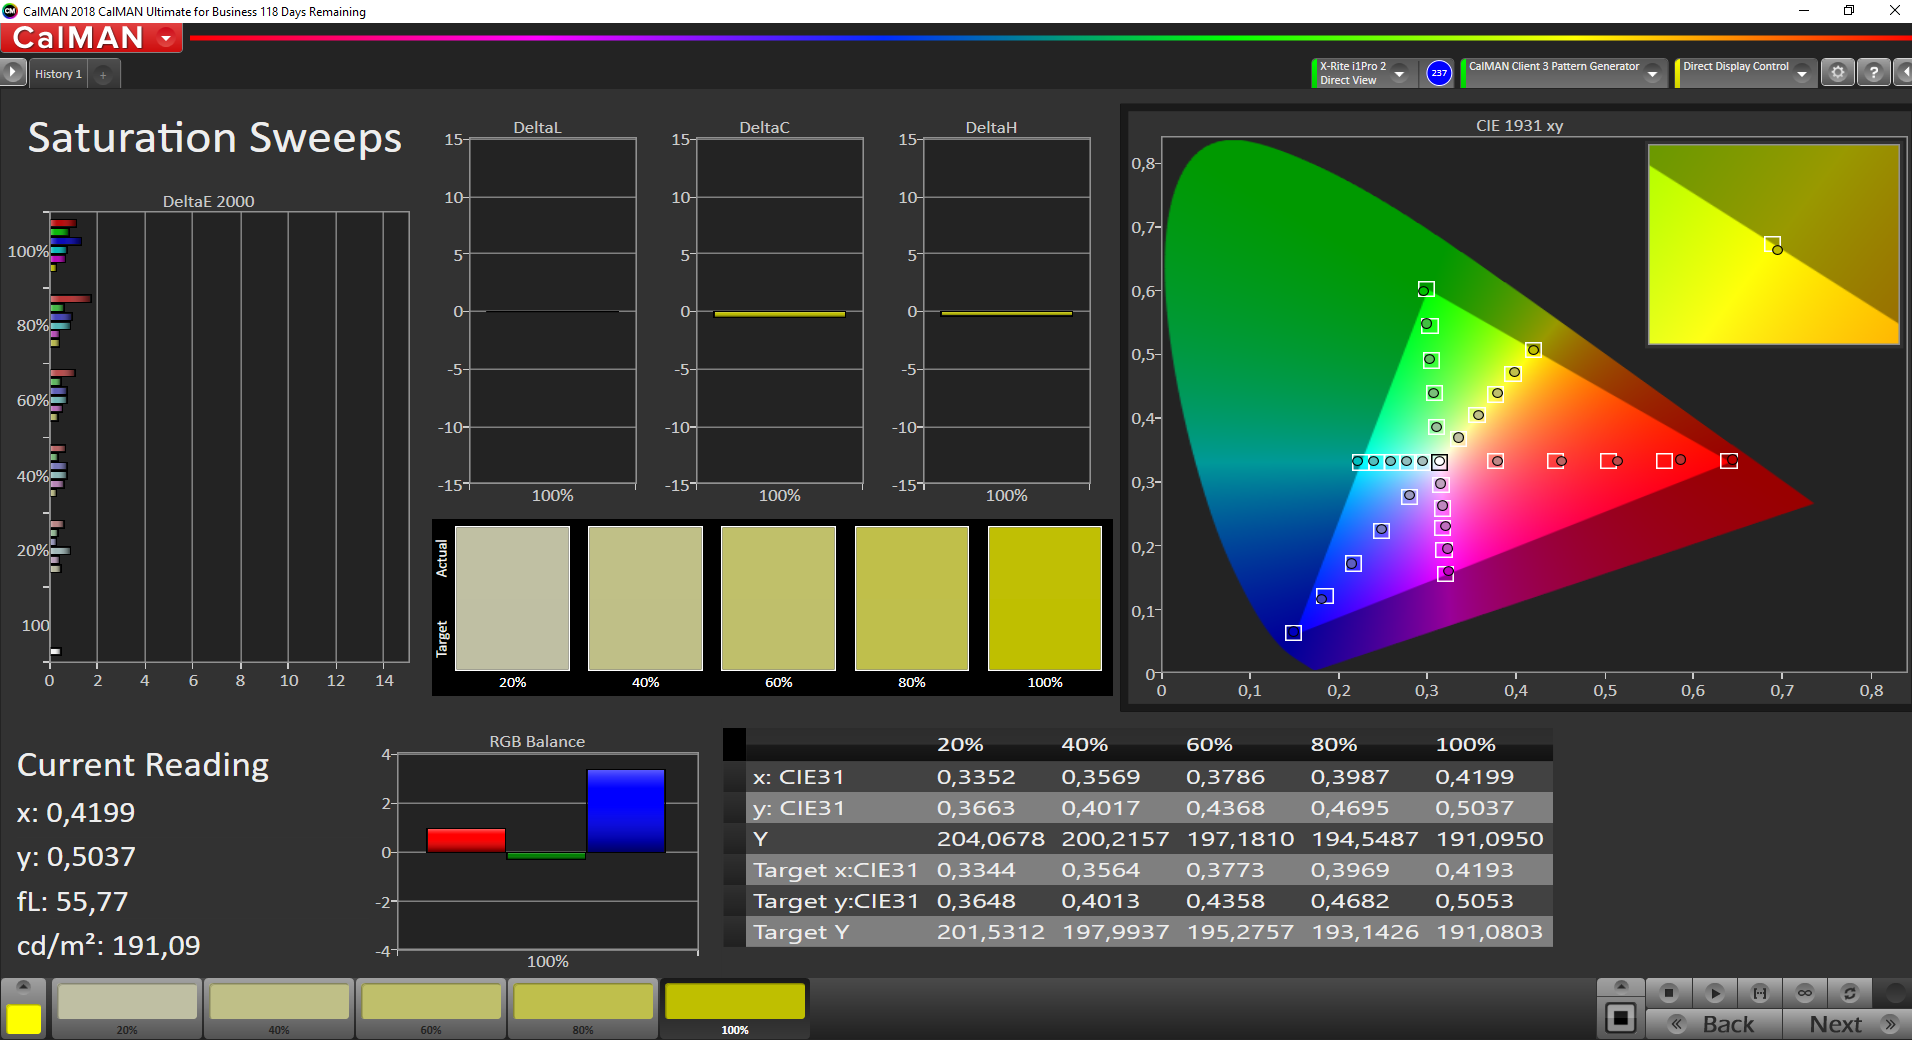
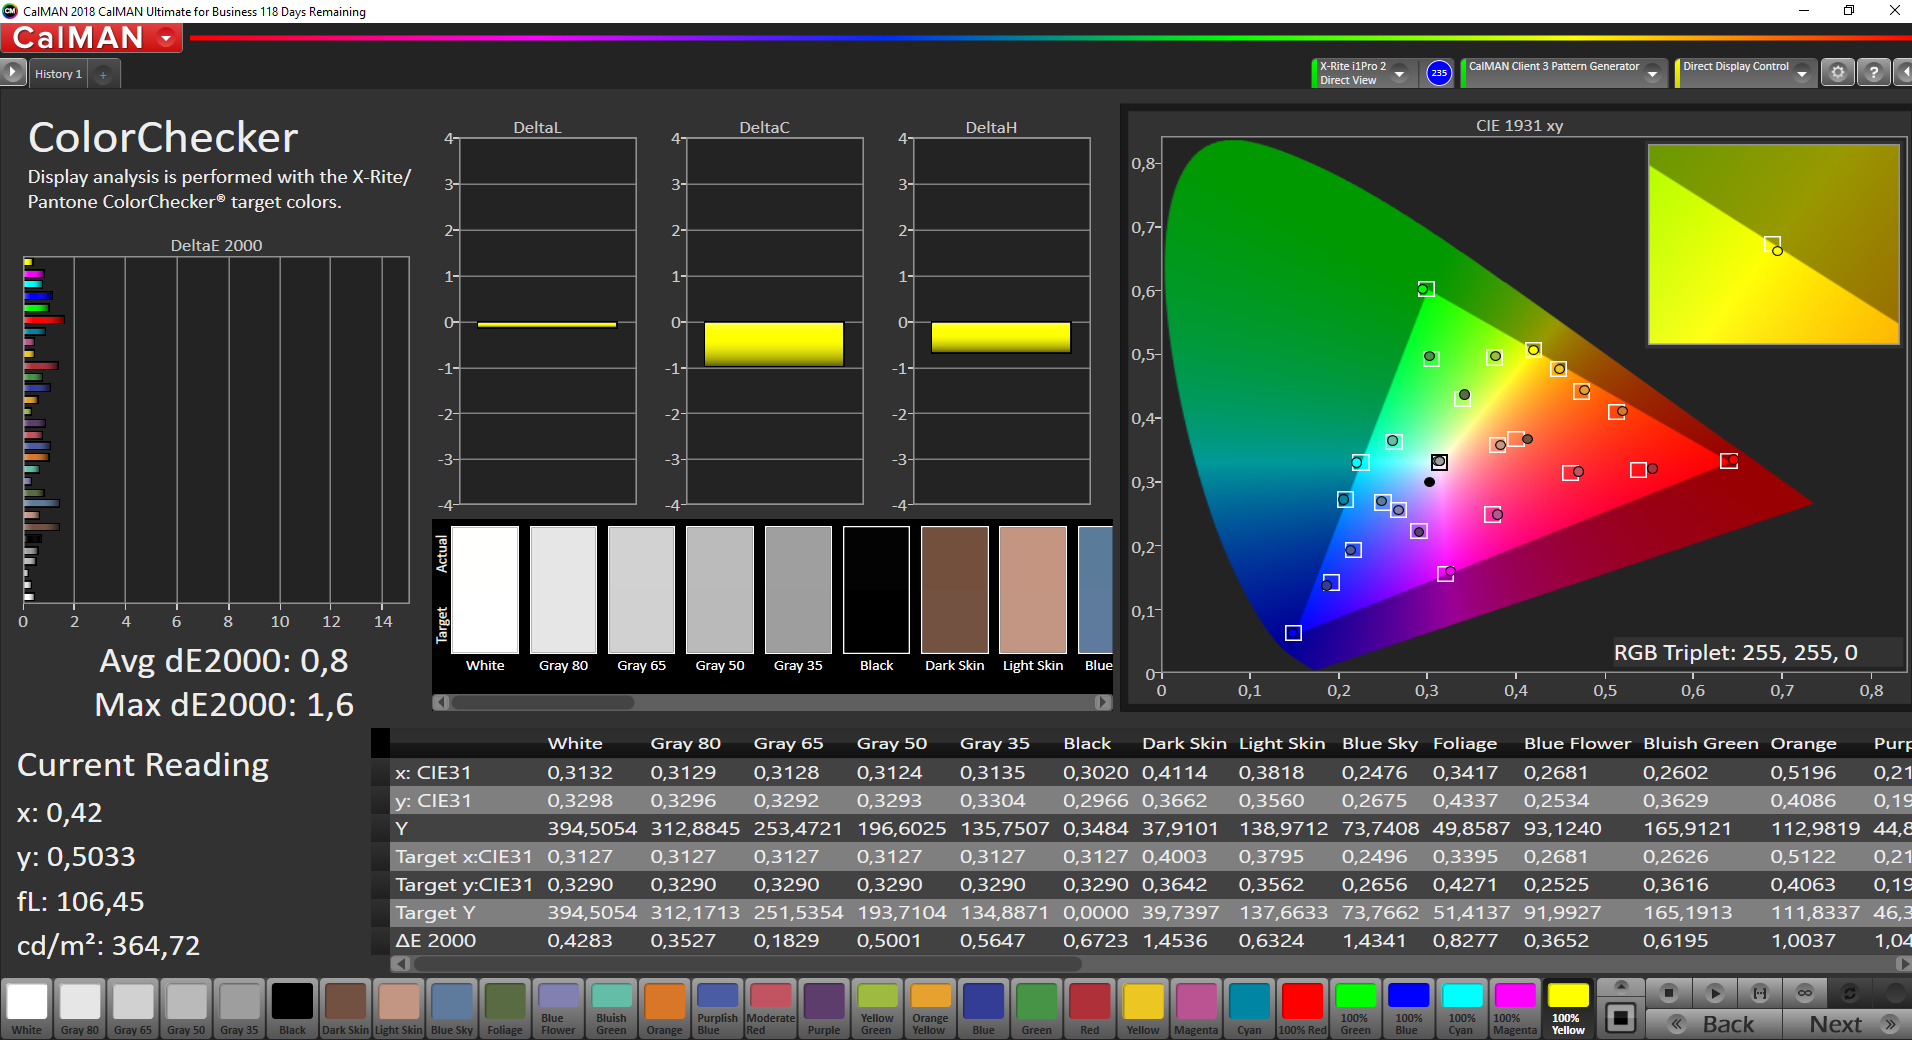
ΔE ColorChecker Calman: 1.4 | ∀{0.5-29.43 Ø4.71}
calibrated: 0.8
ΔE Greyscale Calman: 1.6 | ∀{0.09-98 Ø4.96}
97.9% sRGB (Argyll 1.6.3 3D)
63% AdobeRGB 1998 (Argyll 1.6.3 3D)
69% AdobeRGB 1998 (Argyll 3D)
97.9% sRGB (Argyll 3D)
66.8% Display P3 (Argyll 3D)
Gamma: 2.13
CCT: 6480 K
| Lenovo ThinkPad T14s-20UJS00K00 N140HCG-GQ2, IPS , 1920x1080, 14" | Lenovo ThinkPad T14s-20T00044GE B140HAN05.7, LTPS AHVA-IPS LED, 1920x1080, 14" | Lenovo ThinkPad T495s-20QKS01E00 B140HAN05.7, IPS, 1920x1080, 14" | Dell Latitude 7410 AU Optronics B140ZAN, IPS, 3840x2160, 14" | Lenovo ThinkPad X1 Carbon 2020-20UAS04T00 BOE NE140FHM-N61, IPS, 1920x1080, 14" | |
|---|---|---|---|---|---|
| Display | -1% | -1% | 4% | -2% | |
| Display P3 Coverage (%) | 66.8 | 66.6 0% | 67 0% | 71.8 7% | 68.9 3% |
| sRGB Coverage (%) | 97.9 | 96.8 -1% | 96.8 -1% | 99.3 1% | 91.6 -6% |
| AdobeRGB 1998 Coverage (%) | 69 | 67.6 -2% | 68.3 -1% | 72.4 5% | 67.1 -3% |
| Response Times | -90% | -118% | -34% | -100% | |
| Response Time Grey 50% / Grey 80% * (ms) | 32.4 ? | 63.2 ? -95% | 60.8 ? -88% | 39.2 ? -21% | 64.8 ? -100% |
| Response Time Black / White * (ms) | 15.2 ? | 28 ? -84% | 37.6 ? -147% | 22.4 ? -47% | 30.4 ? -100% |
| PWM Frequency (Hz) | 26040 ? | 2404 ? | |||
| Screen | -21% | -38% | -68% | -77% | |
| Brightness middle (cd/m²) | 404 | 404 0% | 380 -6% | 388.6 -4% | 422 4% |
| Brightness (cd/m²) | 371 | 397 7% | 381 3% | 365 -2% | 395 6% |
| Brightness Distribution (%) | 88 | 92 5% | 87 -1% | 82 -7% | 90 2% |
| Black Level * (cd/m²) | 0.34 | 0.21 38% | 0.22 35% | 0.35 -3% | 0.27 21% |
| Contrast (:1) | 1188 | 1924 62% | 1727 45% | 1110 -7% | 1563 32% |
| Colorchecker dE 2000 * | 1.4 | 3.1 -121% | 4 -186% | 4.04 -189% | 4.7 -236% |
| Colorchecker dE 2000 max. * | 3.2 | 4.7 -47% | 5.7 -78% | 9.2 -187% | 10 -213% |
| Colorchecker dE 2000 calibrated * | 0.8 | 1.3 -63% | 1.2 -50% | 1.25 -56% | 2 -150% |
| Greyscale dE 2000 * | 1.6 | 3.4 -113% | 4.4 -175% | 6.4 -300% | 6.4 -300% |
| Gamma | 2.13 103% | 2.38 92% | 2.54 87% | 2.3 96% | 2.12 104% |
| CCT | 6480 100% | 7070 92% | 6963 93% | 6957 93% | 7106 91% |
| Color Space (Percent of AdobeRGB 1998) (%) | 63 | 61.8 -2% | 62.2 -1% | 66.4 5% | 59.5 -6% |
| Color Space (Percent of sRGB) (%) | 97.9 | 96.6 -1% | 96.6 -1% | 99.4 2% | 91.5 -7% |
| Total Average (Program / Settings) | -37% /
-26% | -52% /
-41% | -33% /
-50% | -60% /
-66% |
* ... smaller is better
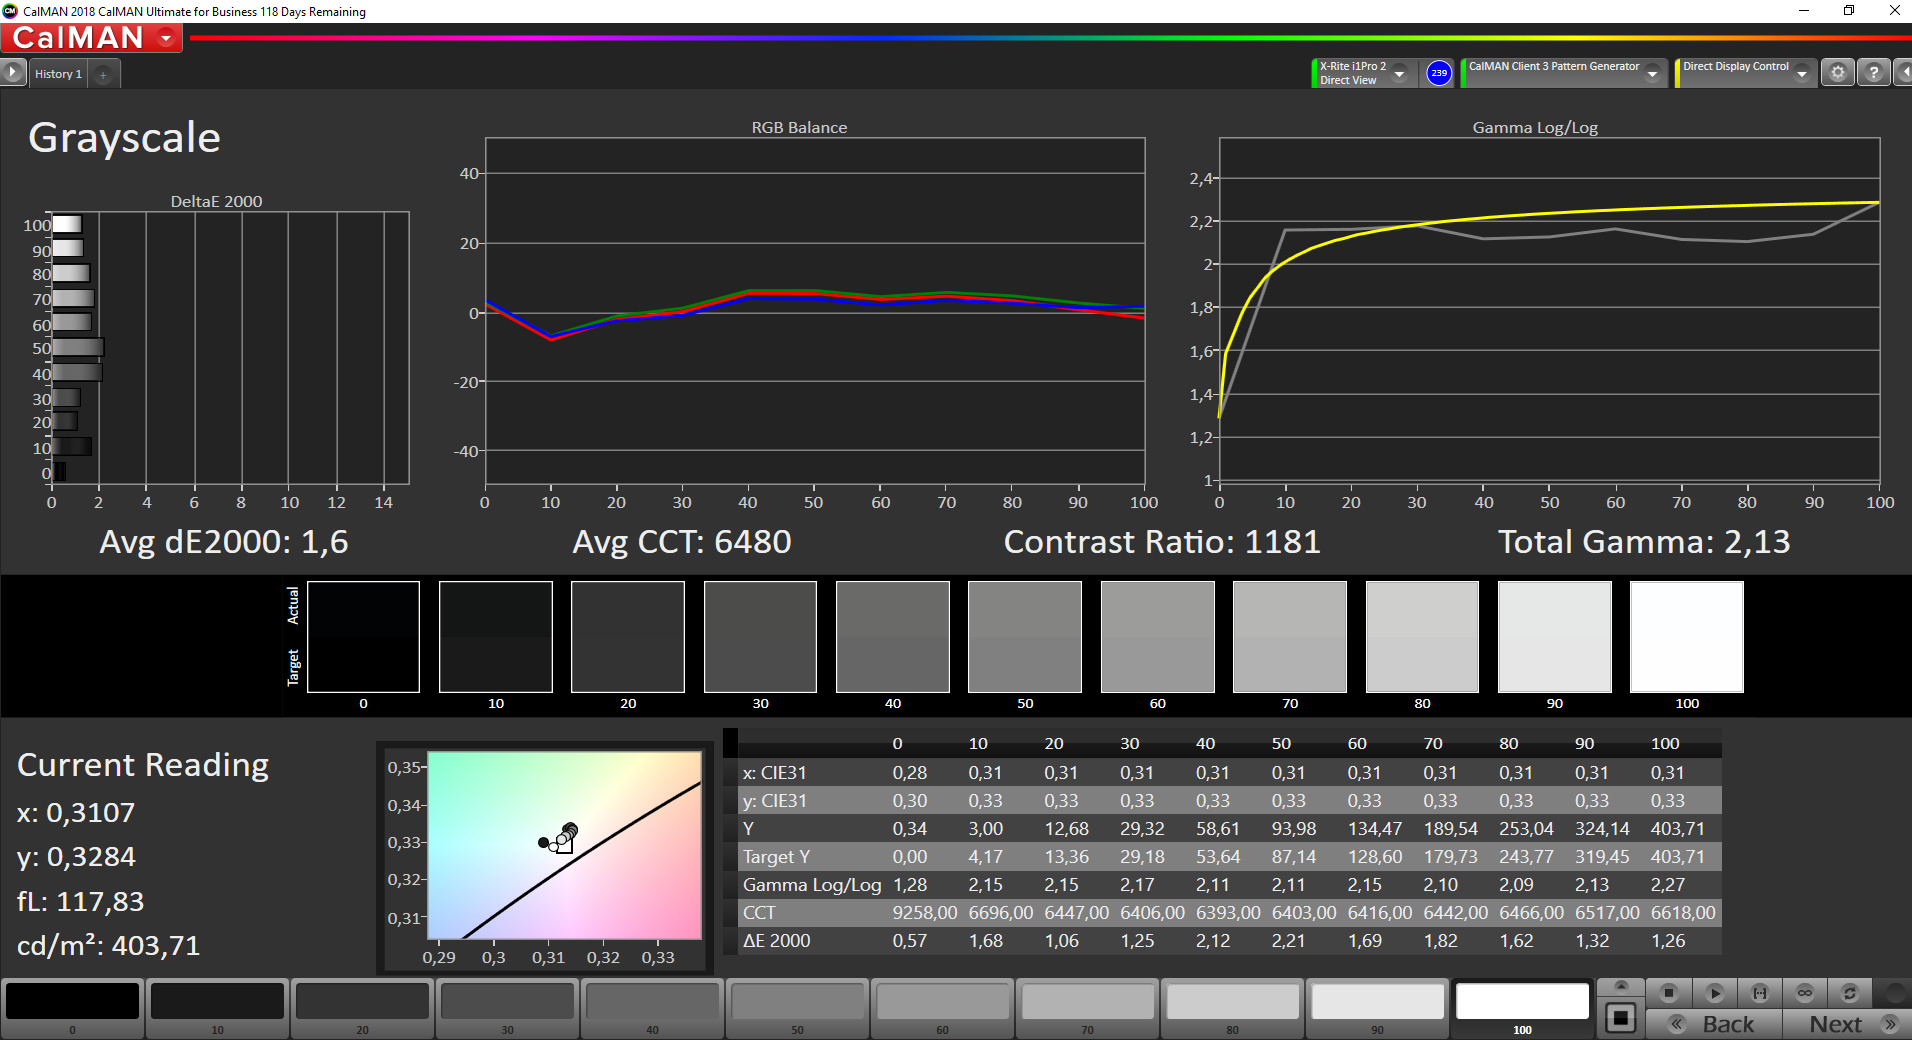

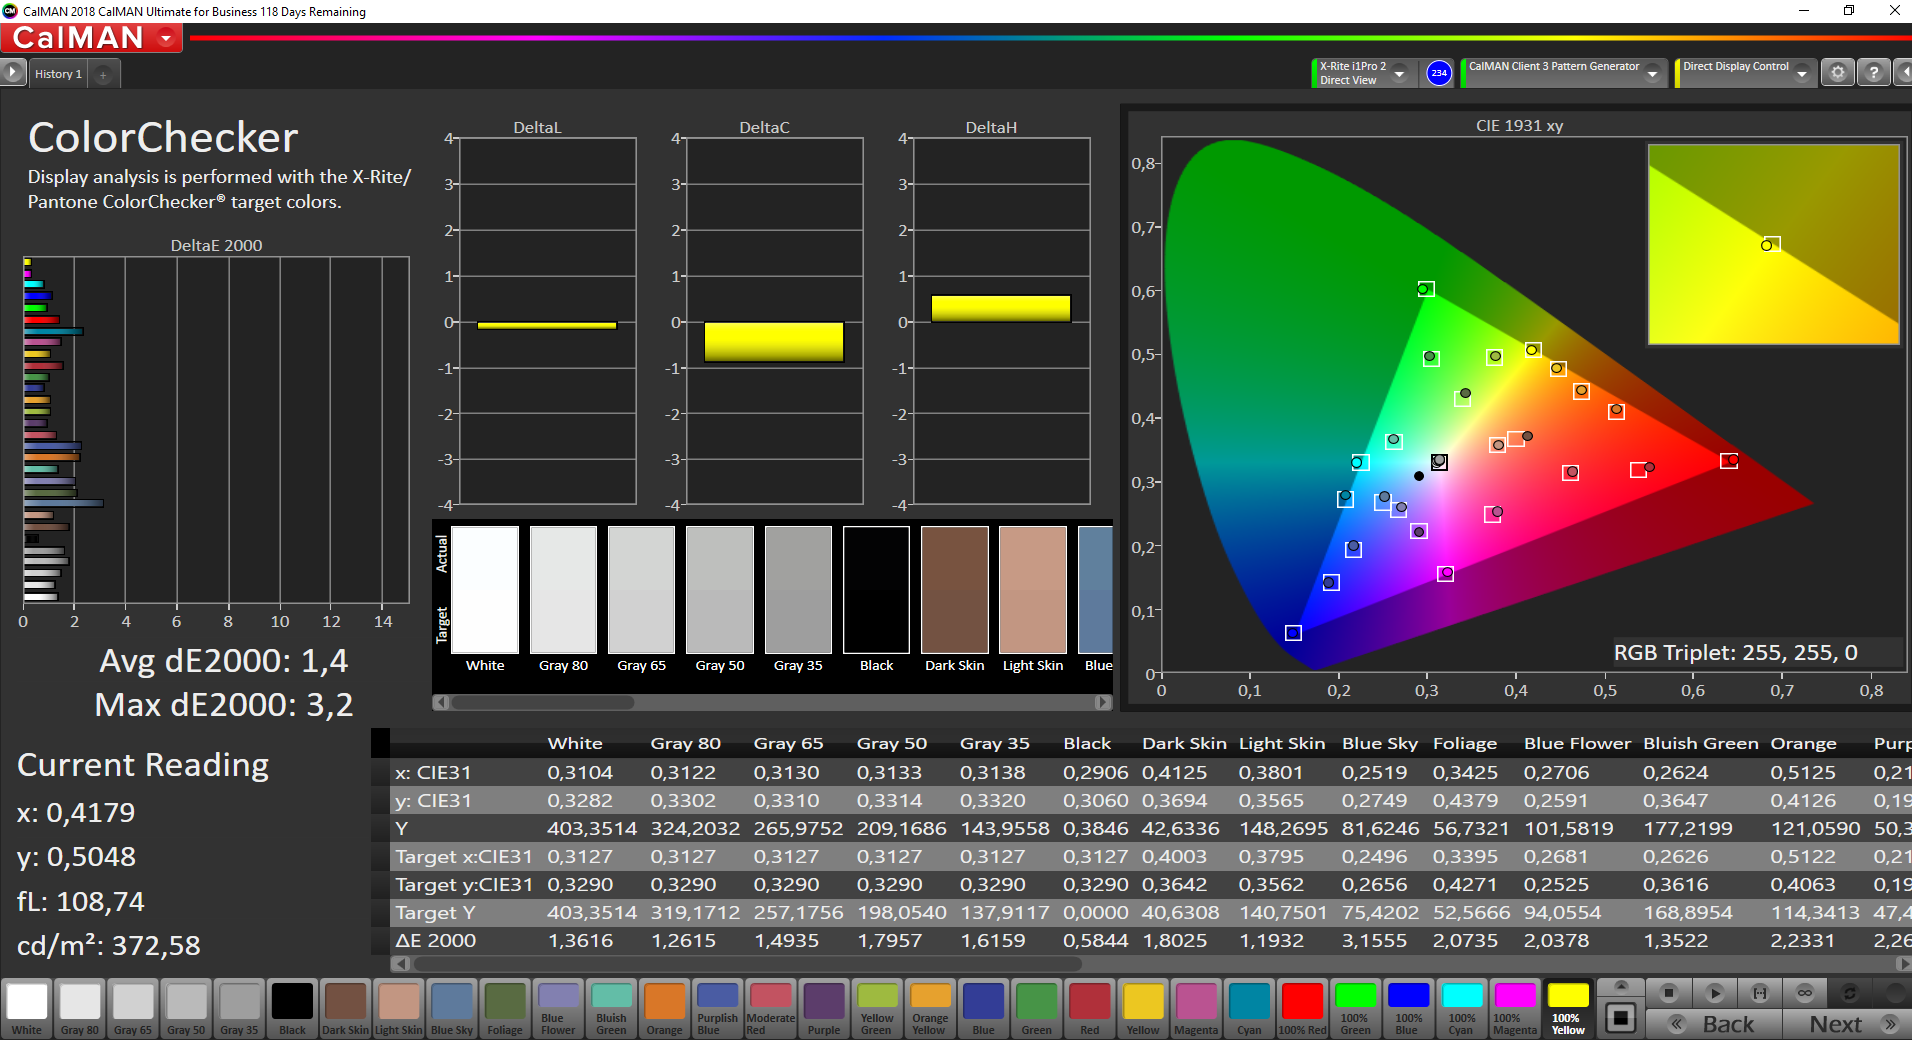
The display calibration is already very good out of the box. Almost all the grayscale and color deviations are already below the important value of 3 and there is no color cast, either. This means it is not necessary to calibrate this panel.
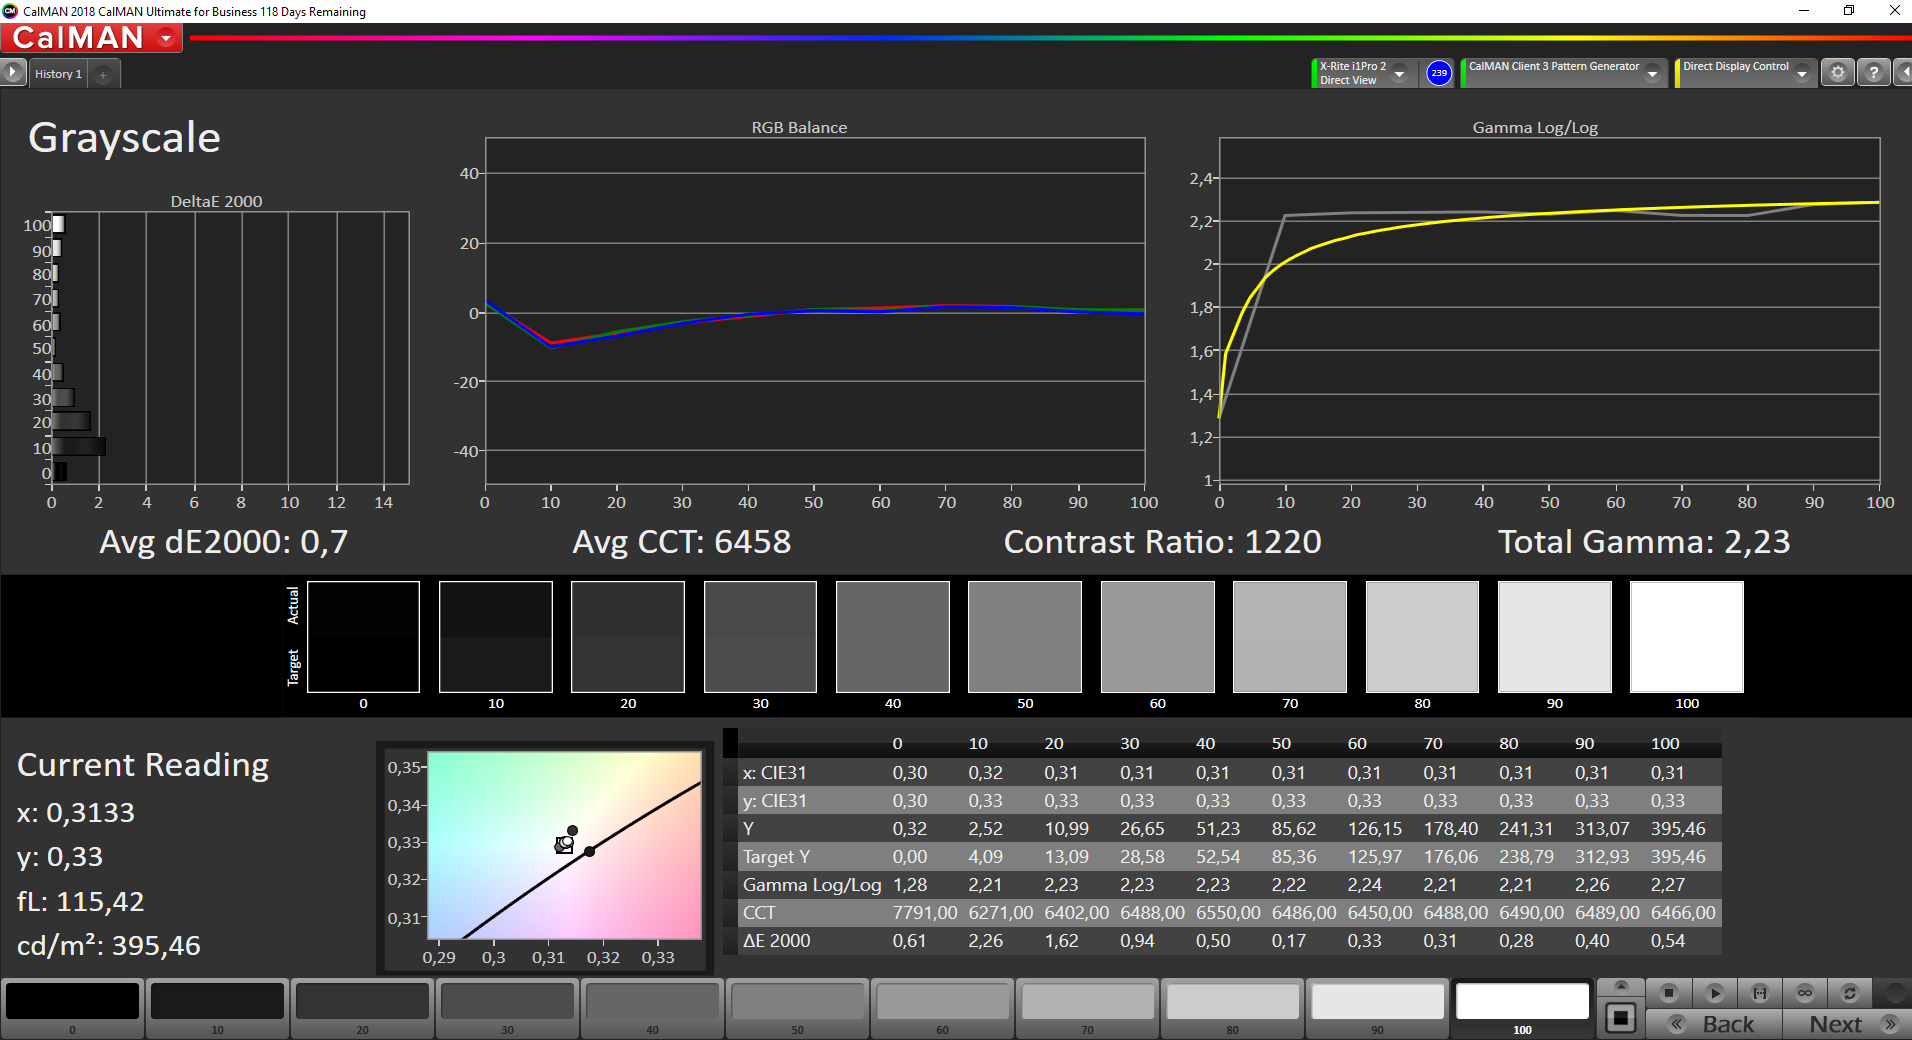
We tested it anyway (CalMAN Business & X-Rite i1 Pro 2) and managed to improve the results even further. The panel also supports almost the full sRGB color gamut, so you can use it to edit pictures or videos.
Display Response Times
| ↔ Response Time Black to White | ||
|---|---|---|
| 15.2 ms ... rise ↗ and fall ↘ combined | ↗ 6.8 ms rise | 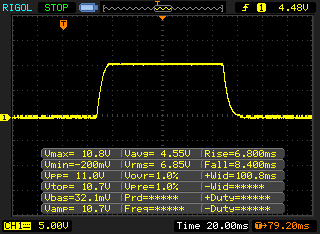 |
| ↘ 8.4 ms fall | ||
| The screen shows good response rates in our tests, but may be too slow for competitive gamers. In comparison, all tested devices range from 0.1 (minimum) to 240 (maximum) ms. » 37 % of all devices are better. This means that the measured response time is better than the average of all tested devices (19.8 ms). | ||
| ↔ Response Time 50% Grey to 80% Grey | ||
| 32.4 ms ... rise ↗ and fall ↘ combined | ↗ 16.4 ms rise | 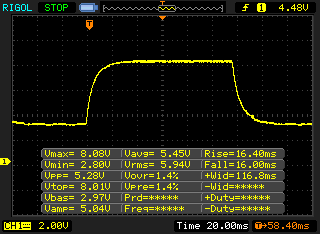 |
| ↘ 16 ms fall | ||
| The screen shows slow response rates in our tests and will be unsatisfactory for gamers. In comparison, all tested devices range from 0.165 (minimum) to 636 (maximum) ms. » 44 % of all devices are better. This means that the measured response time is similar to the average of all tested devices (31 ms). | ||
Screen Flickering / PWM (Pulse-Width Modulation)
| Screen flickering / PWM detected | 26040 Hz | ≤ 50 % brightness setting | 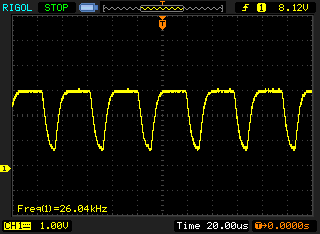 |
The display backlight flickers at 26040 Hz (worst case, e.g., utilizing PWM) Flickering detected at a brightness setting of 50 % and below. There should be no flickering or PWM above this brightness setting. The frequency of 26040 Hz is quite high, so most users sensitive to PWM should not notice any flickering. In comparison: 52 % of all tested devices do not use PWM to dim the display. If PWM was detected, an average of 7757 (minimum: 5 - maximum: 343500) Hz was measured. | |||
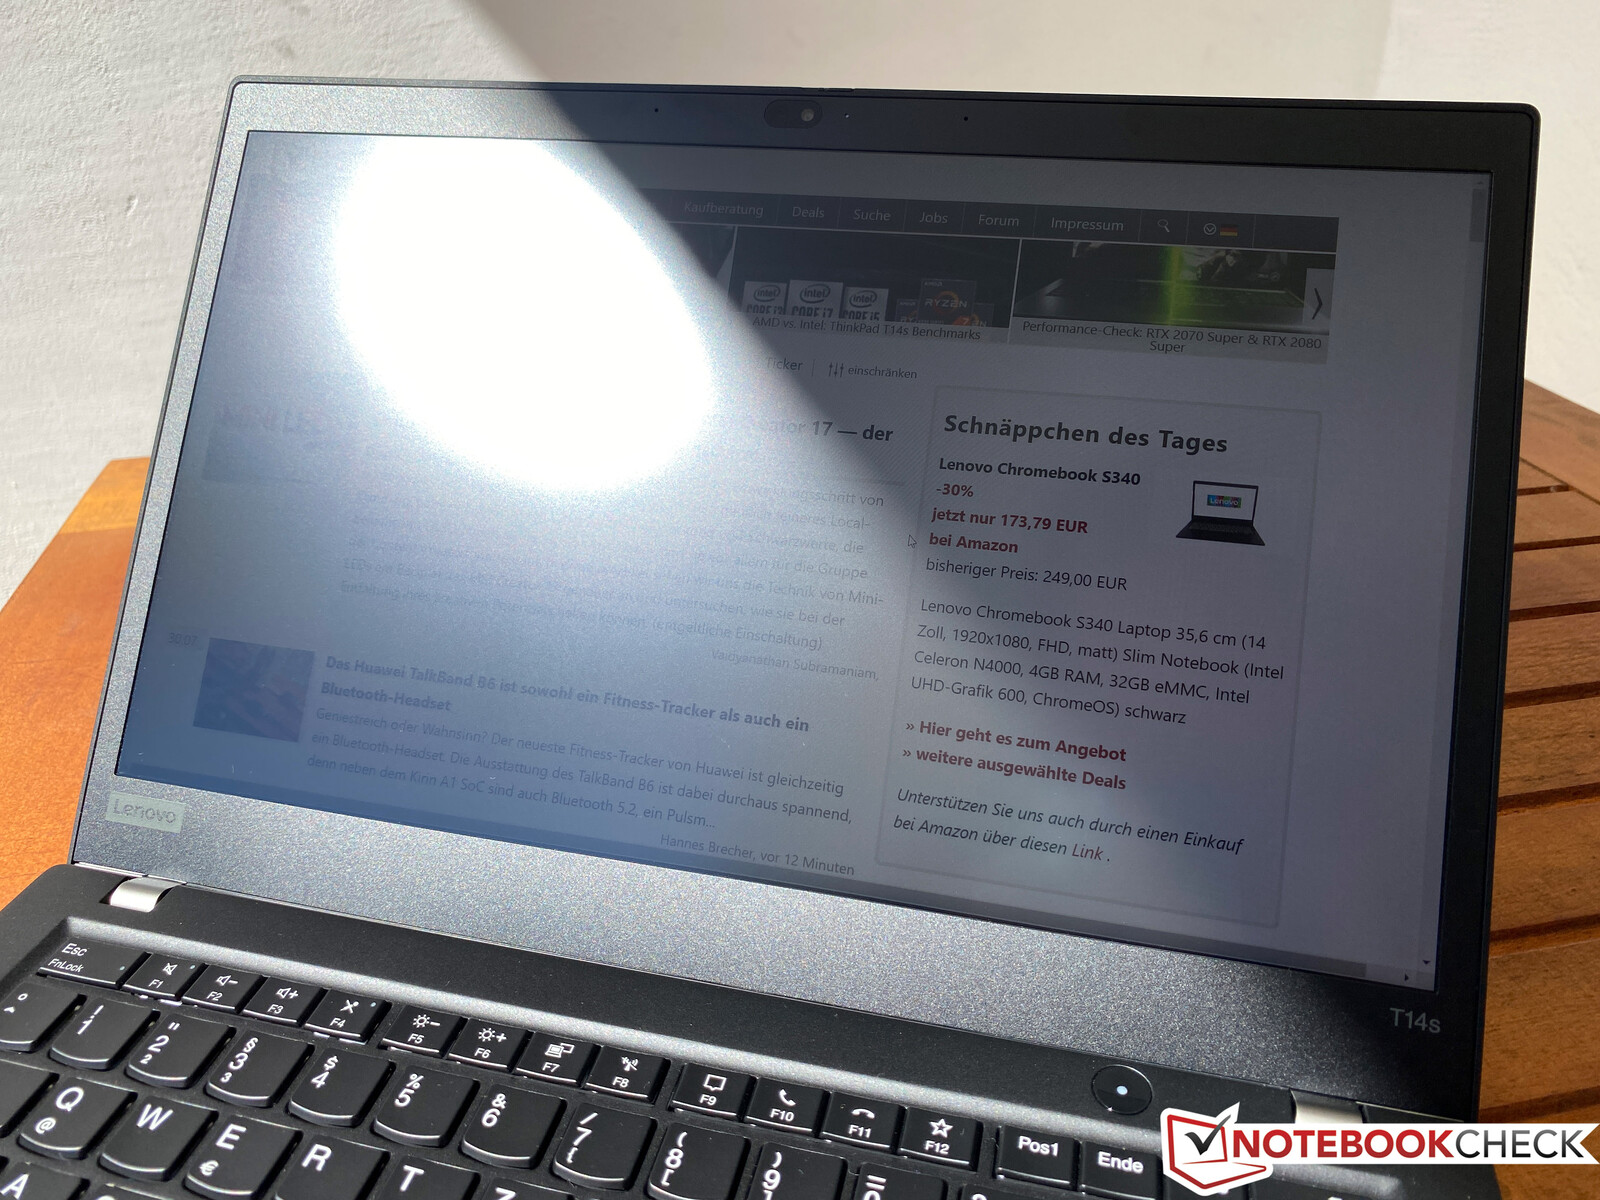
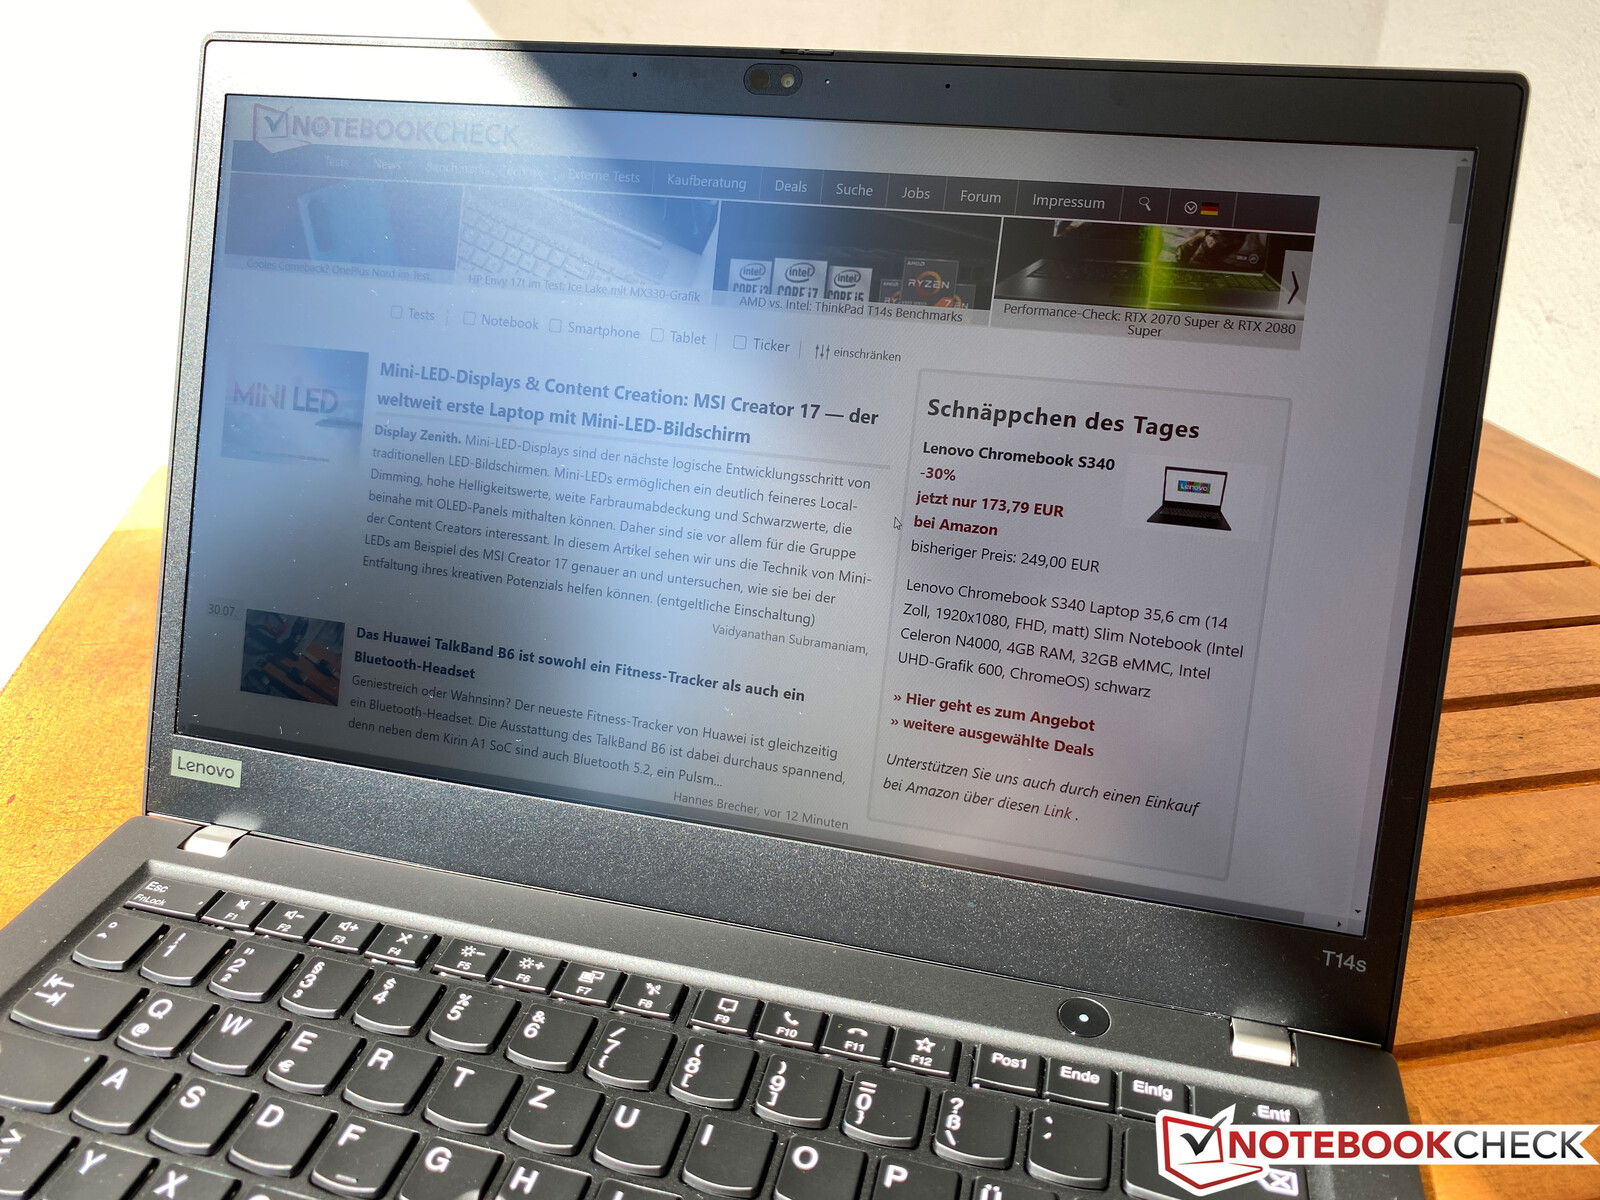
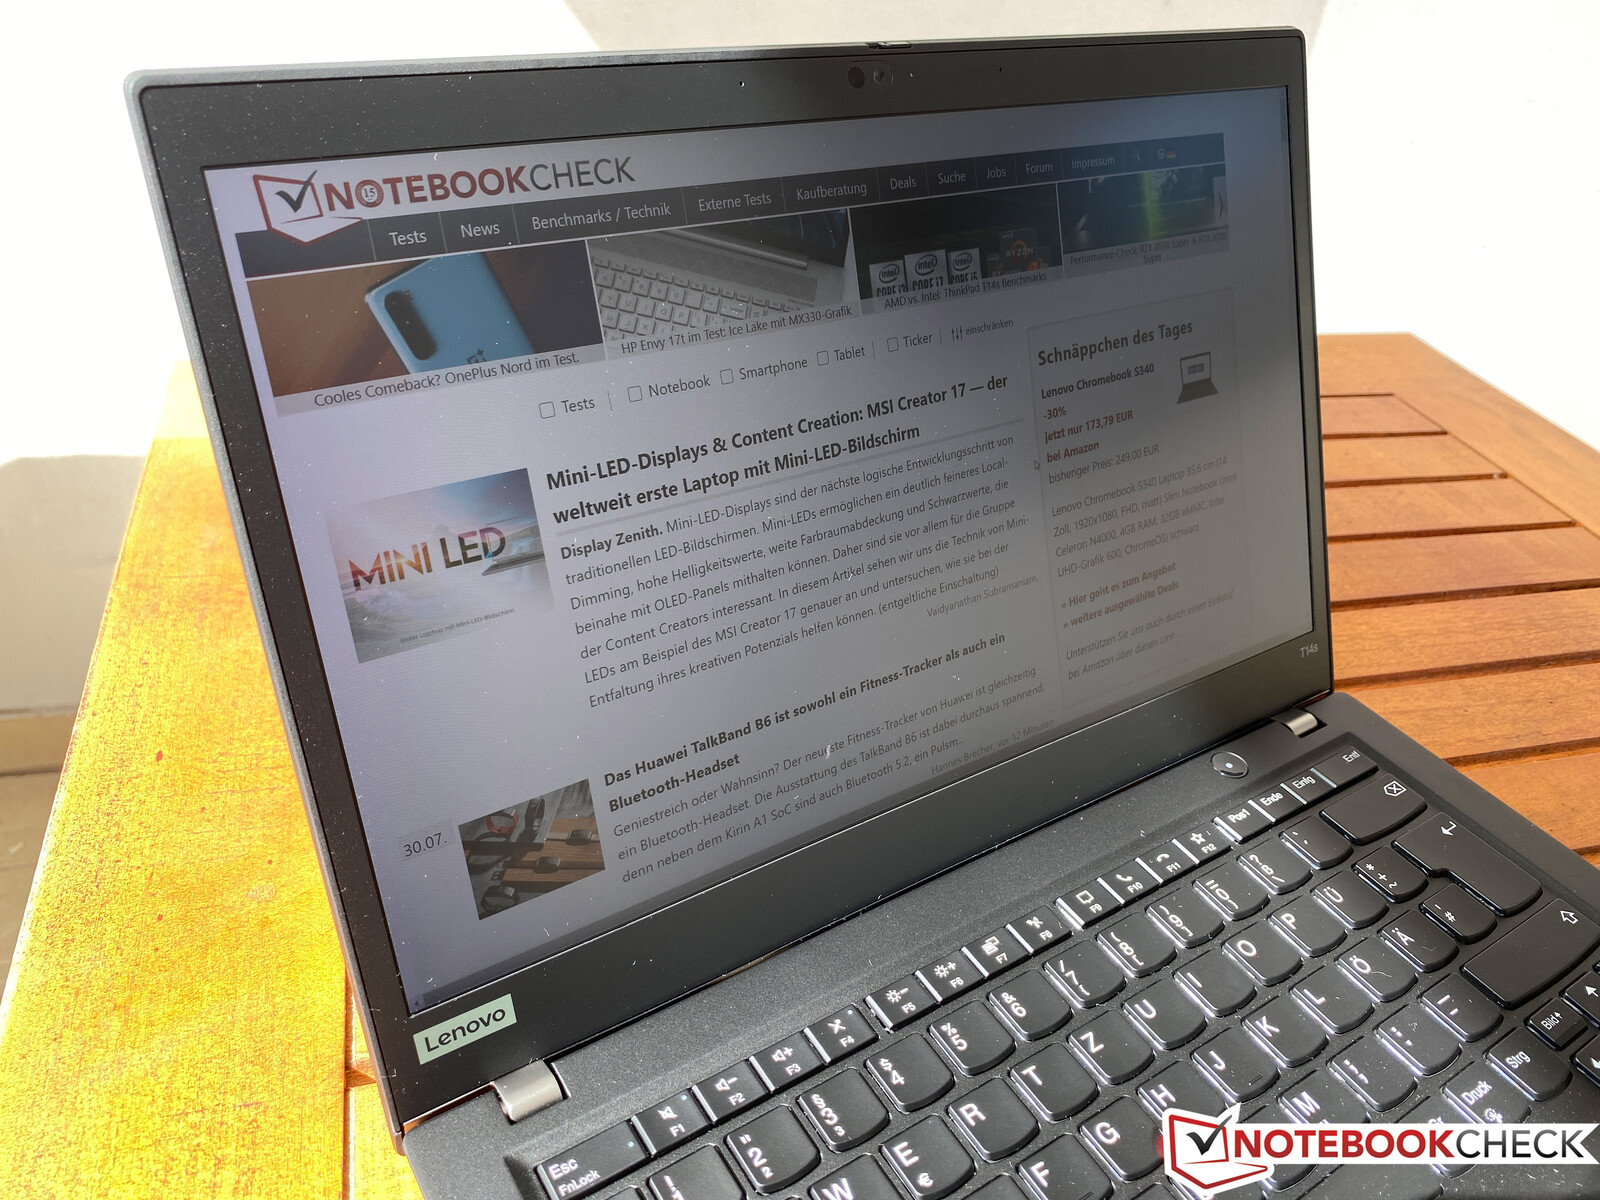
There is no criticism for the viewing-angle stability of the IPS screen. Outdoors, the matte 1080p screen also performs very well. Our test shots were taken in full sunlight. As long as you can avoid direct reflections from the sun, you can see the display content, and you can work pretty comfortably if you turn the screen away from the sunlight.
Performance - T14s with 8-core CPU
Processor - AMD Ryzen Pro with 6 or 8 cores
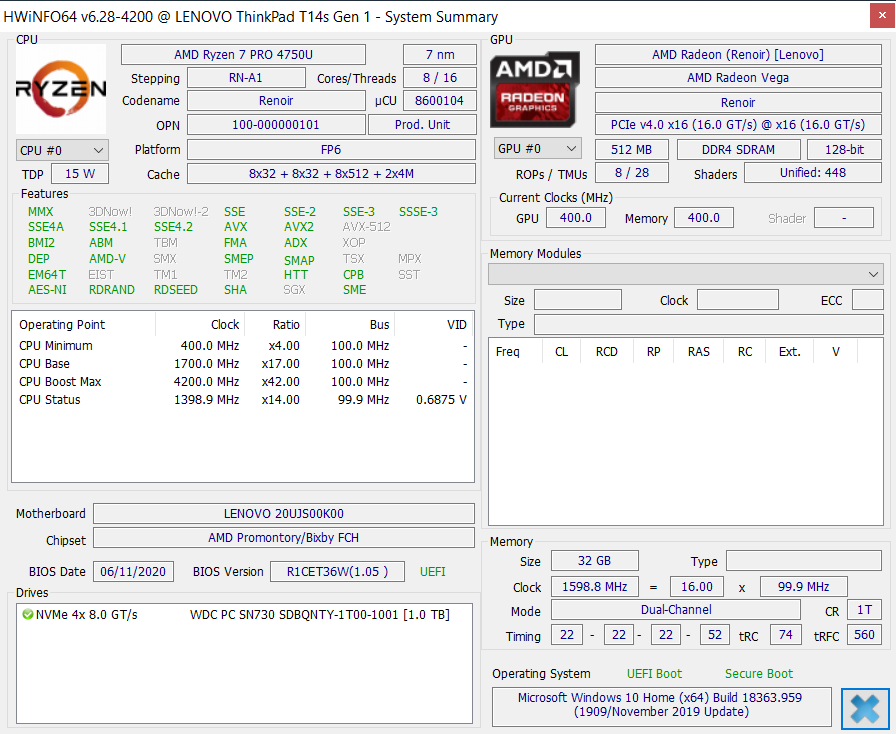
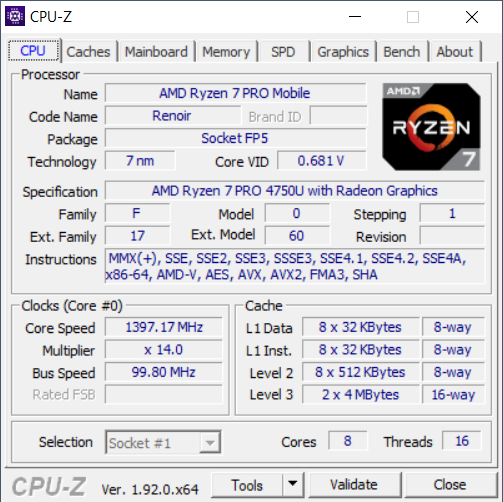
Lenovo offers two different Ryzen Pro CPUs from AMD for the ThinkPad T14s: The Ryzen 5 Pro 4650U with 6 cores (12 threads) and the Ryzen 7 Pro 4750U in our test unit with 8 cores (16 threads). It reaches up to 4.1 GHz via Turbo with a base frequency of 1.7 GHz. Please see our tech section for more details on the Ryzen 7 Pro 4750U.
The comparison of the two T14s model (Intel & AMD) is very interesting because Lenovo uses the same TDP limits. However, the Intel model even has a slight advantage, because the Core i5-10210U can consume up to 45 W for a few seconds before the regular limits set in at 25 W (PL2) and 18 W (PL1). The AMD model can consume 25 W at the beginning and then quickly drops to 18 W after a couple of seconds. This means both chips consume pretty much the same amount of power. The Ryzen 7 Pro 4750U obviously benefits from its 8 cores /16 threads in the multi-core tests and can easily beat all the Intel rivals.
To get a better perspective, we have also included the brand-new Dell XPS 17 with the Intel Core i7-10875H (also 8C/16T) in the comparison chart. This 45 W processor is just slightly faster than the Ryzen 7 Pro 4750U in all the benchmarks, despite the much higher power consumption. The single-core performance is the only thing where Intel's i7 chips still have an advantage, but the differences are very small. The improvements compared to the previous Ryzen 7 Pro 3700U are not bad, either. The CPU performance is not reduced on battery power.
Cinebench R15: CPU Single 64Bit | CPU Multi 64Bit
Blender: v2.79 BMW27 CPU
7-Zip 18.03: 7z b 4 -mmt1 | 7z b 4
Geekbench 5.5: Single-Core | Multi-Core
HWBOT x265 Benchmark v2.2: 4k Preset
LibreOffice : 20 Documents To PDF
R Benchmark 2.5: Overall mean
| Cinebench R20 / CPU (Single Core) | |
| Average of class Office (345 - 816, n=74, last 2 years) | |
| Average AMD Ryzen 7 PRO 4750U (461 - 479, n=5) | |
| Lenovo ThinkPad T14s-20UJS00K00 | |
| Lenovo ThinkPad X1 Carbon 2020-20UAS04T00 | |
| Lenovo ThinkPad T14s-20T00044GE | |
| Dell Latitude 7410 | |
| Cinebench R20 / CPU (Multi Core) | |
| Average of class Office (648 - 8840, n=74, last 2 years) | |
| Average AMD Ryzen 7 PRO 4750U (2935 - 3302, n=5) | |
| Lenovo ThinkPad T14s-20UJS00K00 | |
| Lenovo ThinkPad X1 Carbon 2020-20UAS04T00 | |
| Lenovo ThinkPad T14s-20T00044GE | |
| Dell Latitude 7410 | |
| Cinebench R15 / CPU Single 64Bit | |
| Average of class Office (99.5 - 316, n=76, last 2 years) | |
| Lenovo ThinkPad X1 Carbon 2020-20UAS04T00 | |
| Average AMD Ryzen 7 PRO 4750U (180 - 184, n=5) | |
| Lenovo ThinkPad T14s-20UJS00K00 | |
| Dell Latitude 7410 | |
| Lenovo ThinkPad T14s-20T00044GE | |
| Lenovo ThinkPad T495s-20QKS01E00 | |
| Cinebench R15 / CPU Multi 64Bit | |
| Average of class Office (250 - 3380, n=76, last 2 years) | |
| Average AMD Ryzen 7 PRO 4750U (1287 - 1417, n=5) | |
| Lenovo ThinkPad T14s-20UJS00K00 | |
| Lenovo ThinkPad X1 Carbon 2020-20UAS04T00 | |
| Lenovo ThinkPad T495s-20QKS01E00 | |
| Lenovo ThinkPad T14s-20T00044GE | |
| Dell Latitude 7410 | |
| Blender / v2.79 BMW27 CPU | |
| Dell Latitude 7410 | |
| Lenovo ThinkPad T14s-20T00044GE | |
| Lenovo ThinkPad T495s-20QKS01E00 | |
| Lenovo ThinkPad X1 Carbon 2020-20UAS04T00 | |
| Lenovo ThinkPad T14s-20UJS00K00 | |
| Average AMD Ryzen 7 PRO 4750U (340 - 403, n=5) | |
| Average of class Office (158 - 1940, n=75, last 2 years) | |
| 7-Zip 18.03 / 7z b 4 -mmt1 | |
| Average of class Office (3387 - 6469, n=76, last 2 years) | |
| Dell Latitude 7410 | |
| Lenovo ThinkPad X1 Carbon 2020-20UAS04T00 | |
| Lenovo ThinkPad T14s-20UJS00K00 | |
| Average AMD Ryzen 7 PRO 4750U (4413 - 4467, n=5) | |
| Lenovo ThinkPad T14s-20T00044GE | |
| Lenovo ThinkPad T495s-20QKS01E00 | |
| 7-Zip 18.03 / 7z b 4 | |
| Average of class Office (7098 - 76886, n=76, last 2 years) | |
| Average AMD Ryzen 7 PRO 4750U (37081 - 42173, n=5) | |
| Lenovo ThinkPad T14s-20UJS00K00 | |
| Lenovo ThinkPad X1 Carbon 2020-20UAS04T00 | |
| Lenovo ThinkPad T14s-20T00044GE | |
| Dell Latitude 7410 | |
| Lenovo ThinkPad T495s-20QKS01E00 | |
| Geekbench 5.5 / Single-Core | |
| Average of class Office (811 - 2175, n=72, last 2 years) | |
| Dell Latitude 7410 | |
| Lenovo ThinkPad X1 Carbon 2020-20UAS04T00 | |
| Lenovo ThinkPad T14s-20UJS00K00 | |
| Average AMD Ryzen 7 PRO 4750U (1117 - 1157, n=5) | |
| Lenovo ThinkPad T14s-20T00044GE | |
| Geekbench 5.5 / Multi-Core | |
| Average of class Office (1483 - 16999, n=72, last 2 years) | |
| Lenovo ThinkPad T14s-20UJS00K00 | |
| Average AMD Ryzen 7 PRO 4750U (5456 - 6609, n=5) | |
| Lenovo ThinkPad X1 Carbon 2020-20UAS04T00 | |
| Lenovo ThinkPad T14s-20T00044GE | |
| Dell Latitude 7410 | |
| HWBOT x265 Benchmark v2.2 / 4k Preset | |
| Average of class Office (2.21 - 26, n=75, last 2 years) | |
| Lenovo ThinkPad T14s-20UJS00K00 | |
| Average AMD Ryzen 7 PRO 4750U (8.33 - 10.3, n=5) | |
| Lenovo ThinkPad X1 Carbon 2020-20UAS04T00 | |
| Lenovo ThinkPad T14s-20T00044GE | |
| Dell Latitude 7410 | |
| Lenovo ThinkPad T495s-20QKS01E00 | |
| LibreOffice / 20 Documents To PDF | |
| Average AMD Ryzen 7 PRO 4750U (58.4 - 73.4, n=5) | |
| Lenovo ThinkPad T14s-20UJS00K00 | |
| Average of class Office (39.9 - 102.3, n=75, last 2 years) | |
| Dell Latitude 7410 | |
| Lenovo ThinkPad T14s-20T00044GE | |
| Lenovo ThinkPad X1 Carbon 2020-20UAS04T00 | |
| R Benchmark 2.5 / Overall mean | |
| Lenovo ThinkPad T14s-20T00044GE | |
| Lenovo ThinkPad X1 Carbon 2020-20UAS04T00 | |
| Dell Latitude 7410 | |
| Lenovo ThinkPad T14s-20UJS00K00 | |
| Average AMD Ryzen 7 PRO 4750U (0.61 - 0.621, n=5) | |
| Average of class Office (0.393 - 0.888, n=75, last 2 years) | |
* ... smaller is better
System Performance
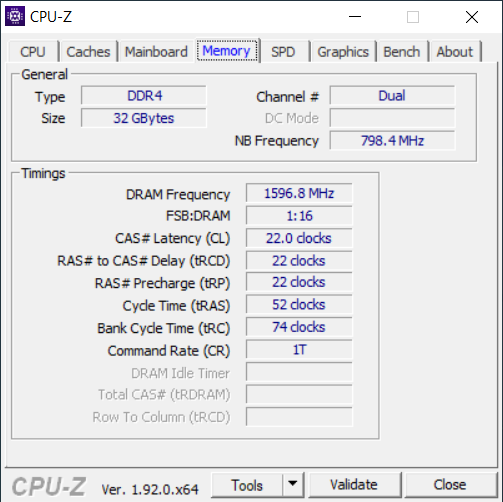
The ThinkPad T14s is a very responsive notebook and has plenty of performance for all common office tasks. There are no bottlenecks and there is also sufficient memory (32 GB DDR4-3200). Our synthetic PCMark benchmarks also determine very good results, and it is even at the top of the comparison group in some tests.
| PCMark 8 Home Score Accelerated v2 | 4640 points | |
| PCMark 8 Creative Score Accelerated v2 | 5813 points | |
| PCMark 8 Work Score Accelerated v2 | 5570 points | |
| PCMark 10 Score | 4890 points | |
Help | ||
DPC Latency
Our standardized latency test (YouTube 4K, web browsing, Prime95) shows slightly increased latency figures. The AMD SKU performs better than the Intel model, but there can be problems when you use real-time audio applications.
| DPC Latencies / LatencyMon - interrupt to process latency (max), Web, Youtube, Prime95 | |
| Lenovo ThinkPad T14s-20T00044GE | |
| Lenovo ThinkPad T14s-20UJS00K00 | |
| Dell Latitude 7410 | |
| Lenovo ThinkPad X1 Carbon 2020-20UAS04T00 | |
* ... smaller is better
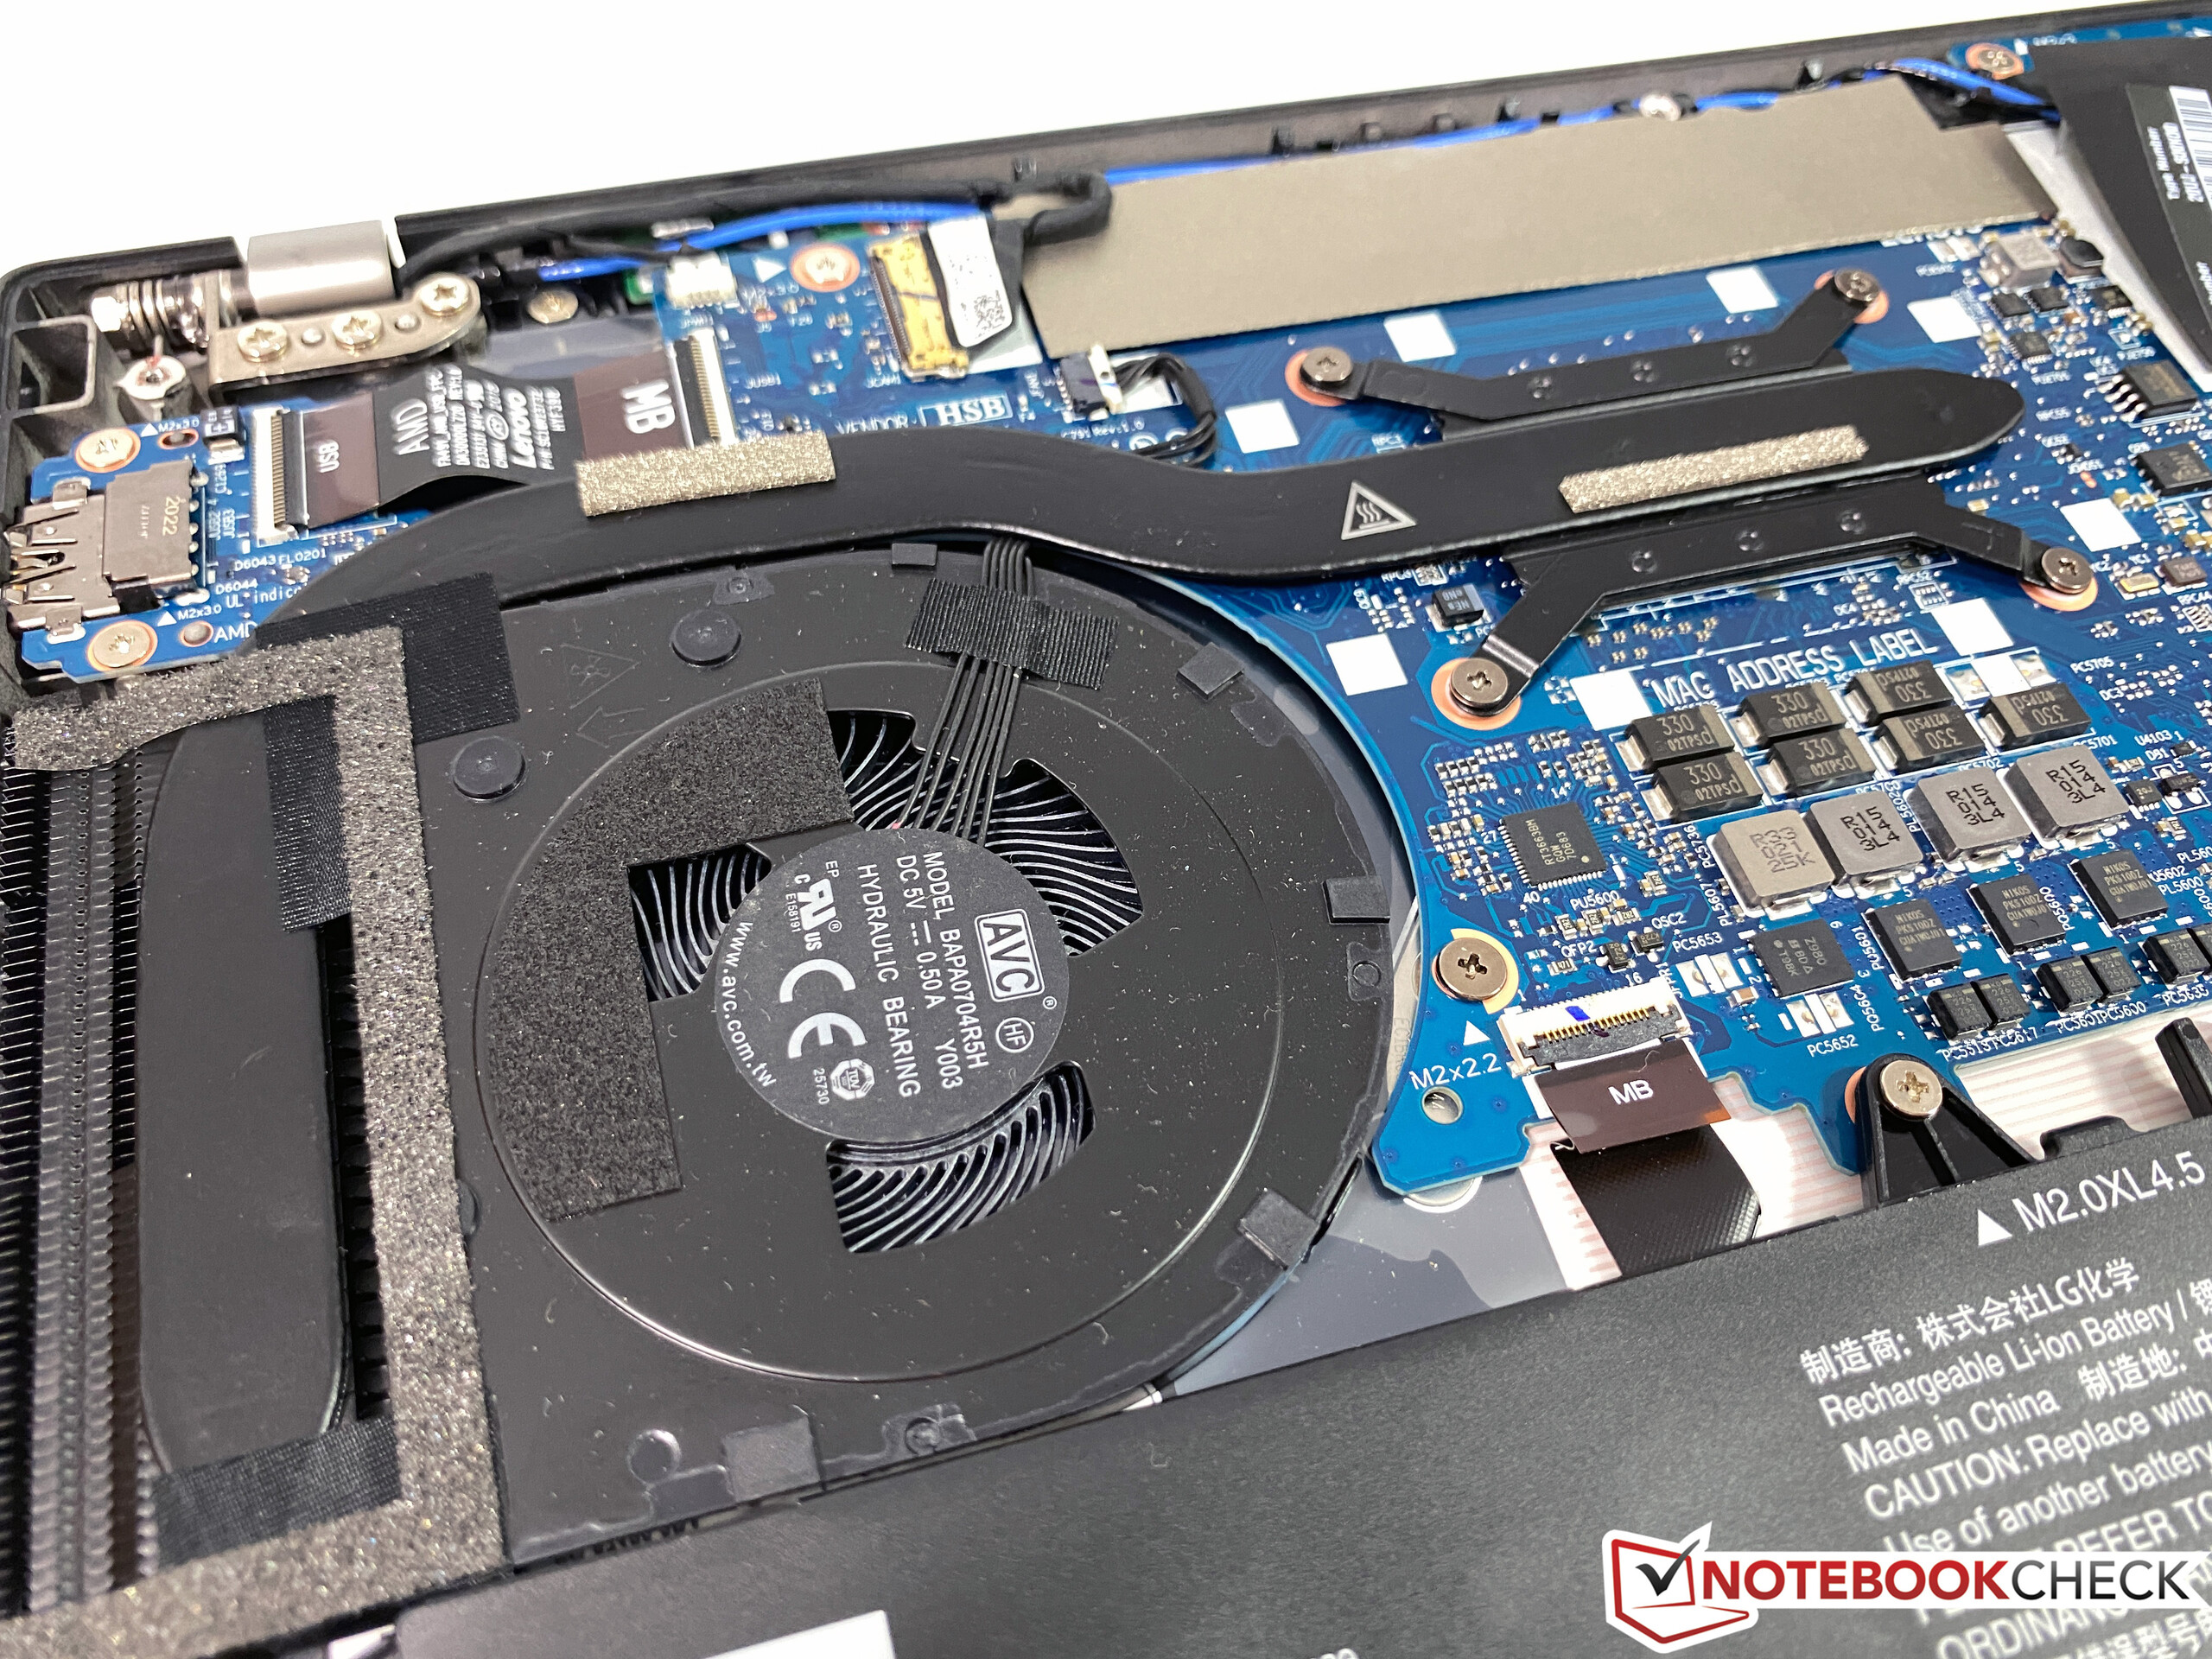
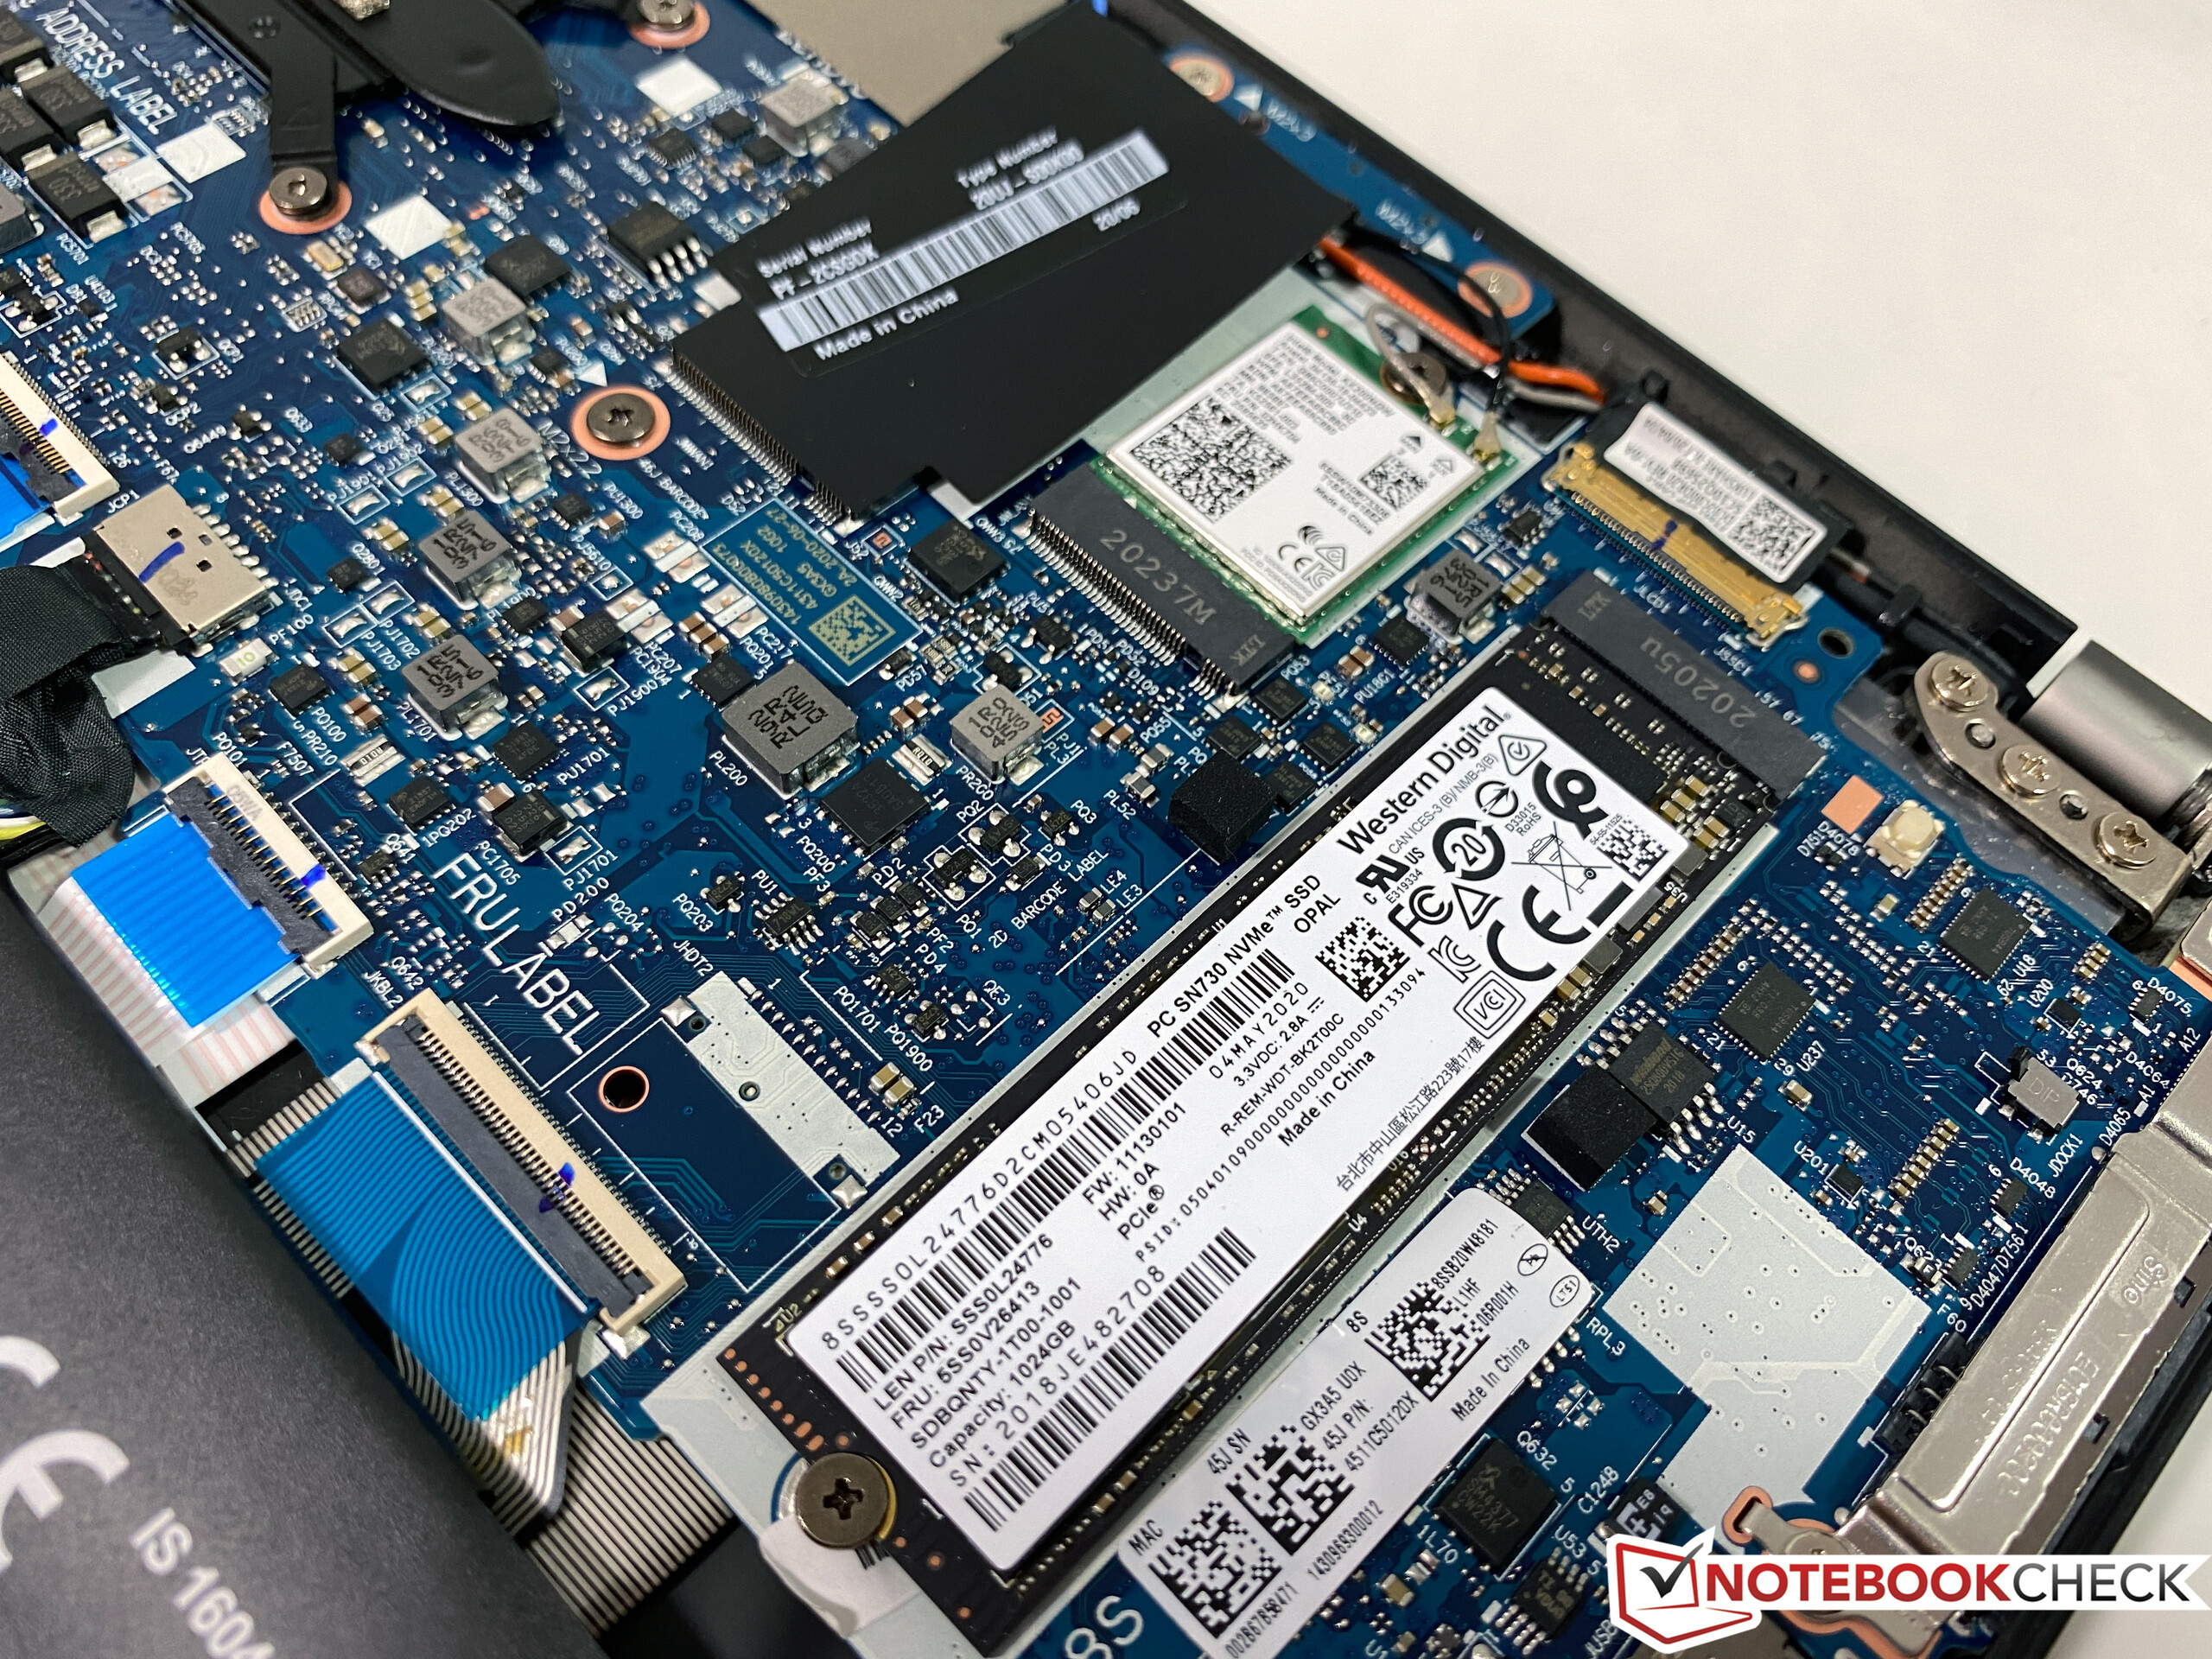
Storage Devices - ThinkPad with NVMe-SSD
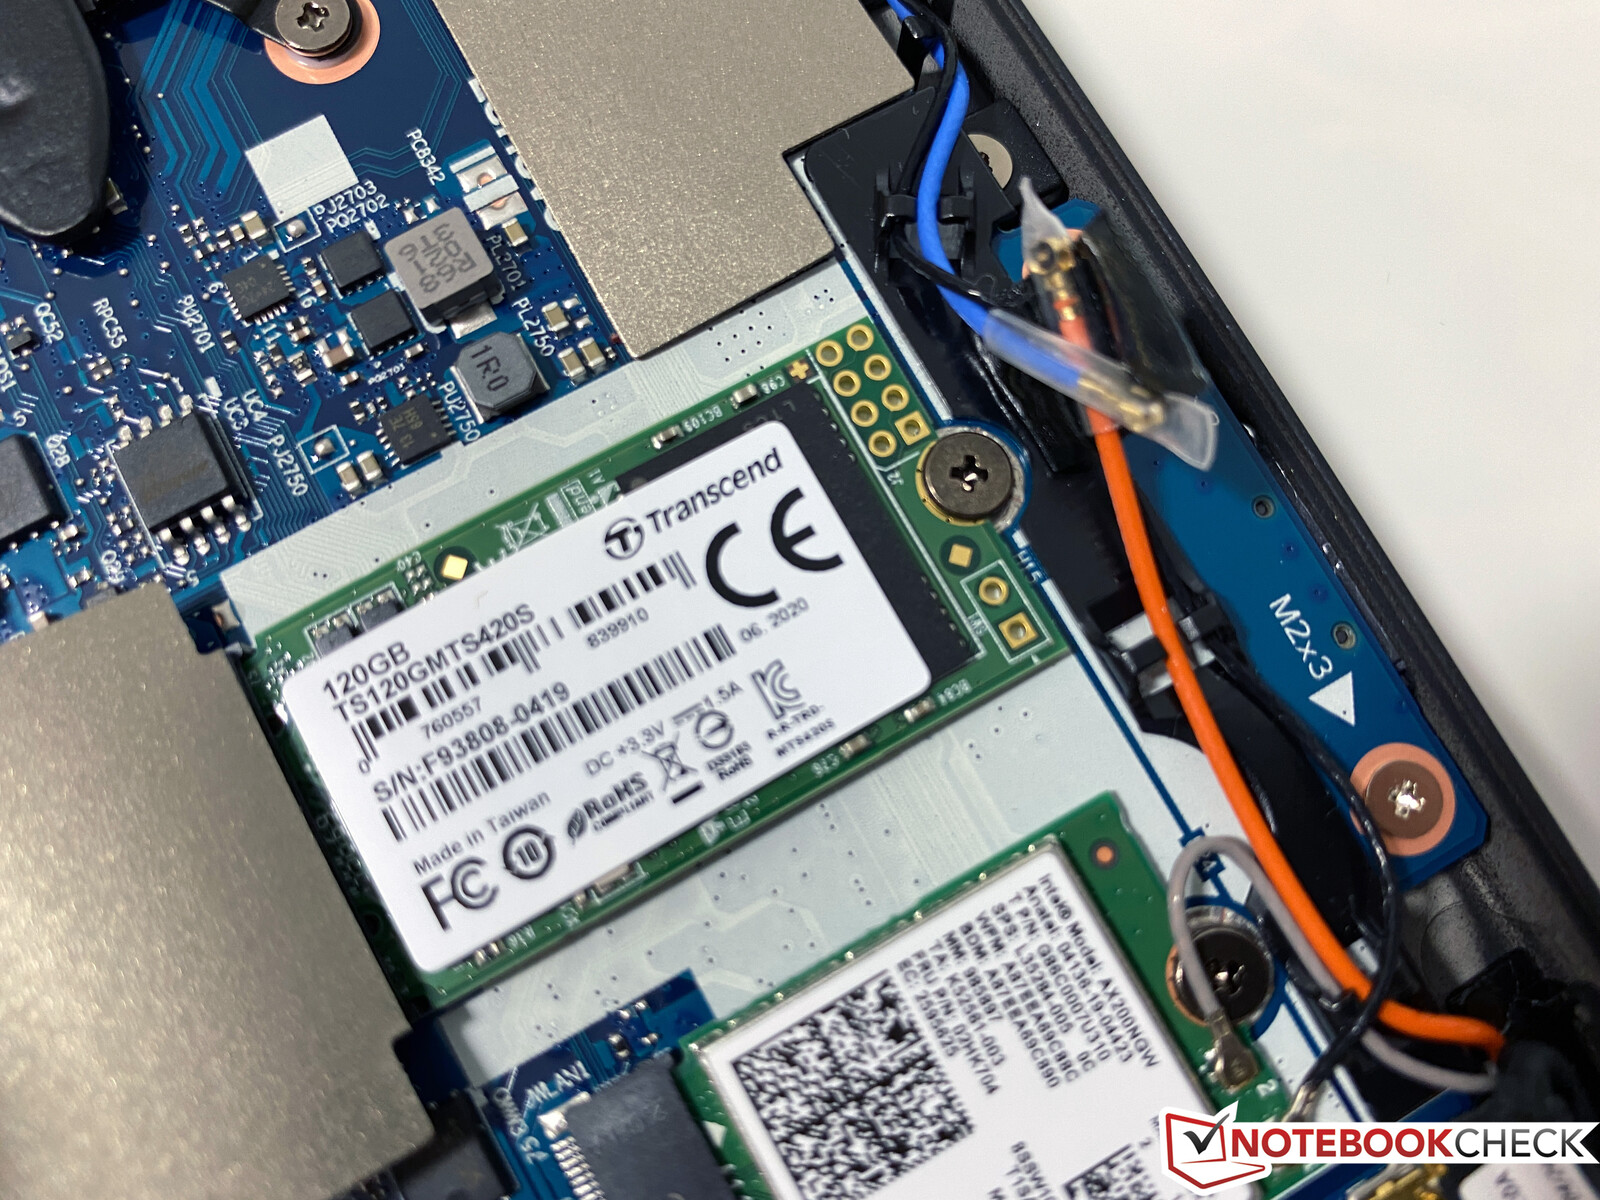
Similar to the displays, there are also different suppliers for the fast PCIe-NVMe-SSDs (M.2-2280). Our test unit is equipped with a drive from WDC and we determine very good transfer rates, so there is no reason to change the drive. You can use around 909 GB after the initial set-up.
We have also tried to use an additional M.2-2242 SSD in the slot for the WWAN module, but the drive was not recognized by the laptop.
| Lenovo ThinkPad T14s-20UJS00K00 WDC PC SN730 SDBPNTY-1T00 | Lenovo ThinkPad T14s-20T00044GE Samsung SSD PM981a MZVLB256HBHQ | Lenovo ThinkPad T495s-20QKS01E00 Samsung PM981a MZVLB1T0HBLR | Dell Latitude 7410 Toshiba XG6 KXG60ZNV512G | Lenovo ThinkPad X1 Carbon 2020-20UAS04T00 Samsung SSD PM981a MZVLB512HBJQ | Average WDC PC SN730 SDBPNTY-1T00 | |
|---|---|---|---|---|---|---|
| CrystalDiskMark 5.2 / 6 | -7% | 1% | 2% | 14% | 10% | |
| Write 4K (MB/s) | 108 | 117.5 9% | 142.3 32% | 133.4 24% | 185 71% | 139.9 ? 30% |
| Read 4K (MB/s) | 39.82 | 40.81 2% | 46.69 17% | 51.3 29% | 50.6 27% | 44.5 ? 12% |
| Write Seq (MB/s) | 2028 | 2031 0% | 1897 -6% | 1543 -24% | 2346 ? 16% | |
| Read Seq (MB/s) | 1826 | 1970 8% | 2202 21% | 1509 -17% | 2102 ? 15% | |
| Write 4K Q32T1 (MB/s) | 570 | 395.5 -31% | 268.3 -53% | 384.9 -32% | 488.8 -14% | 442 ? -22% |
| Read 4K Q32T1 (MB/s) | 401.5 | 361.4 -10% | 359.6 -10% | 318.7 -21% | 579 44% | 460 ? 15% |
| Write Seq Q32T1 (MB/s) | 3091 | 2330 -25% | 3033 -2% | 2866 -7% | 2986 -3% | 3049 ? -1% |
| Read Seq Q32T1 (MB/s) | 2872 | 2530 -12% | 3561 24% | 3122 9% | 3555 24% | 3285 ? 14% |
| Write 4K Q8T8 (MB/s) | 1491 | 1012 ? | ||||
| Read 4K Q8T8 (MB/s) | 1499 | 1300 ? | ||||
| AS SSD | -20% | 8% | -28% | 23% | 2% | |
| Seq Read (MB/s) | 2291 | 2631 15% | 2661 16% | 1837 -20% | 2659 16% | 2606 ? 14% |
| Seq Write (MB/s) | 1343 | 1191 -11% | 2314 72% | 1438 7% | 2551 90% | 1935 ? 44% |
| 4K Read (MB/s) | 42.56 | 44.76 5% | 45.52 7% | 48.1 13% | 56.4 33% | 42.9 ? 1% |
| 4K Write (MB/s) | 132.2 | 124.7 -6% | 105.3 -20% | 132.1 0% | 158 20% | 129.1 ? -2% |
| 4K-64 Read (MB/s) | 850 | 756 -11% | 1806 112% | 660 -22% | 1317 55% | 1361 ? 60% |
| 4K-64 Write (MB/s) | 2262 | 1300 -43% | 1650 -27% | 1163 -49% | 1786 -21% | 1920 ? -15% |
| Access Time Read * (ms) | 0.05 | 0.089 -78% | 0.04 20% | 0.059 -18% | 0.047 6% | 0.0689 ? -38% |
| Access Time Write * (ms) | 0.028 | 0.03 -7% | 0.041 -46% | 0.096 -243% | 0.024 14% | 0.06215 ? -122% |
| Score Read (Points) | 1121 | 1064 -5% | 2118 89% | 891 -21% | 1640 46% | 1664 ? 48% |
| Score Write (Points) | 2529 | 1544 -39% | 1986 -21% | 1439 -43% | 2199 -13% | 2242 ? -11% |
| Score Total (Points) | 4185 | 3090 -26% | 5169 24% | 2780 -34% | 4682 12% | 4726 ? 13% |
| Copy ISO MB/s (MB/s) | 2546 | 1813 -29% | 1131 -56% | 2089 -18% | 2041 ? -20% | |
| Copy Program MB/s (MB/s) | 428.6 | 524 22% | 267.1 -38% | 548 28% | 552 ? 29% | |
| Copy Game MB/s (MB/s) | 943 | 350.5 -63% | 691 -27% | 1226 30% | 1183 ? 25% | |
| Total Average (Program / Settings) | -14% /
-15% | 5% /
6% | -13% /
-17% | 19% /
19% | 6% /
5% |
* ... smaller is better

Continuous Performance Read: DiskSpd Read Loop, Queue Depth 8
GPU Performance - T14s with fast Vega iGPU
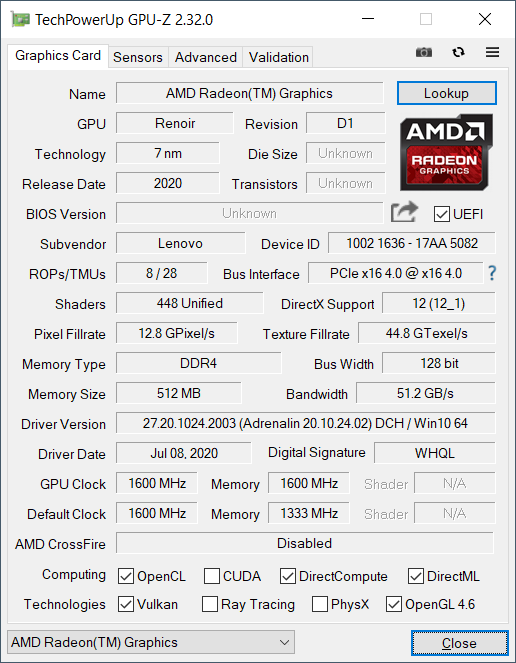
The Ryzen 7 Pro 4750U also features the fast RX Vega 7 iGPU, which benefits from the dual-channel memory configuration. It is much faster than the predecessor Vega 10 (between 30% and 50% depending on the benchmark) and the smaller RX Vega 6 is also 10-20% slower. The integrated GPUs from Intel are beaten: The old HD Graphics from the Comet Lake chips (like on the Intel T14s) is 50-60% slower; the Iris Plus Graphics G7 from the Ice Lake CPUs is 15-20% slower. The GPU performance is not reduced on battery power.
| 3DMark Vantage P Result | 17399 points | |
| 3DMark 11 Performance | 5705 points | |
| 3DMark Fire Strike Score | 3267 points | |
Help | ||
Gaming Performance
The integrated RX Vega 7 offers sufficient performance even for modern titles at low details. Older or less-demanding games (like DOTA 2) will run smoothly on high details. Compared to some other iGPUs, the performance is also stable, which is shown by the 3DMark stress test. The Fire Strike scenario is successfully completed at 99%.
| low | med. | high | ultra | |
|---|---|---|---|---|
| The Witcher 3 (2015) | 64.9 | 20.7 | ||
| Dota 2 Reborn (2015) | 100 | 82.7 | 52.5 | 48.9 |
| Rise of the Tomb Raider (2016) | 68.2 | 21.8 | ||
| X-Plane 11.11 (2018) | 42.4 | 34.1 | 29.8 | |
| Far Cry 5 (2018) | 37 | 18 | 17 | |
| F1 2020 (2020) | 81 | 40 | 30 | 21 |
Emissions - The fan is louder compared to the Intel SKU
System Noise
The cooling solution with the individual fan is basically identical between the two models, but the AMD T14s is a bit louder. We can measure up to 32.3 dB(A) under maximum CPU load and during the stress test, so the ThinkPad is still very quiet overall. The first fan stage is only audible in a completely silent environment, and you can expect between 30 and 31 dB(A) under medium workloads. Compared to the T14s with the Intel CPU, we cannot hear any coil whine on our test unit.
Noise level
| Idle |
| 29.2 / 29.2 / 29.6 dB(A) |
| Load |
| 30.2 / 32.3 dB(A) |
 | ||
30 dB silent 40 dB(A) audible 50 dB(A) loud |
||
min: | ||
| Lenovo ThinkPad T14s-20UJS00K00 Vega 7, R7 PRO 4750U, WDC PC SN730 SDBPNTY-1T00 | Lenovo ThinkPad T14s-20T00044GE UHD Graphics 620, i5-10210U, Samsung SSD PM981a MZVLB256HBHQ | Lenovo ThinkPad T495s-20QKS01E00 Vega 10, R7 PRO 3700U, Samsung PM981a MZVLB1T0HBLR | Dell Latitude 7410 UHD Graphics 620, i7-10610U, Toshiba XG6 KXG60ZNV512G | Lenovo ThinkPad X1 Carbon 2020-20UAS04T00 UHD Graphics 620, i7-10510U, Samsung SSD PM981a MZVLB512HBJQ | |
|---|---|---|---|---|---|
| Noise | 2% | -1% | -1% | -2% | |
| off / environment * (dB) | 29.2 | 29.3 -0% | 28.9 1% | 28.1 4% | 29.5 -1% |
| Idle Minimum * (dB) | 29.2 | 29.3 -0% | 28.9 1% | 28.1 4% | 29.5 -1% |
| Idle Average * (dB) | 29.2 | 29.3 -0% | 28.9 1% | 28.1 4% | 29.5 -1% |
| Idle Maximum * (dB) | 29.6 | 29.3 1% | 28.9 2% | 28.1 5% | 29.5 -0% |
| Load Average * (dB) | 30.2 | 30 1% | 31.5 -4% | 30 1% | 31.6 -5% |
| Witcher 3 ultra * (dB) | 32.3 | ||||
| Load Maximum * (dB) | 32.3 | 30 7% | 33.8 -5% | 39.3 -22% | 33.9 -5% |
* ... smaller is better
Temperature
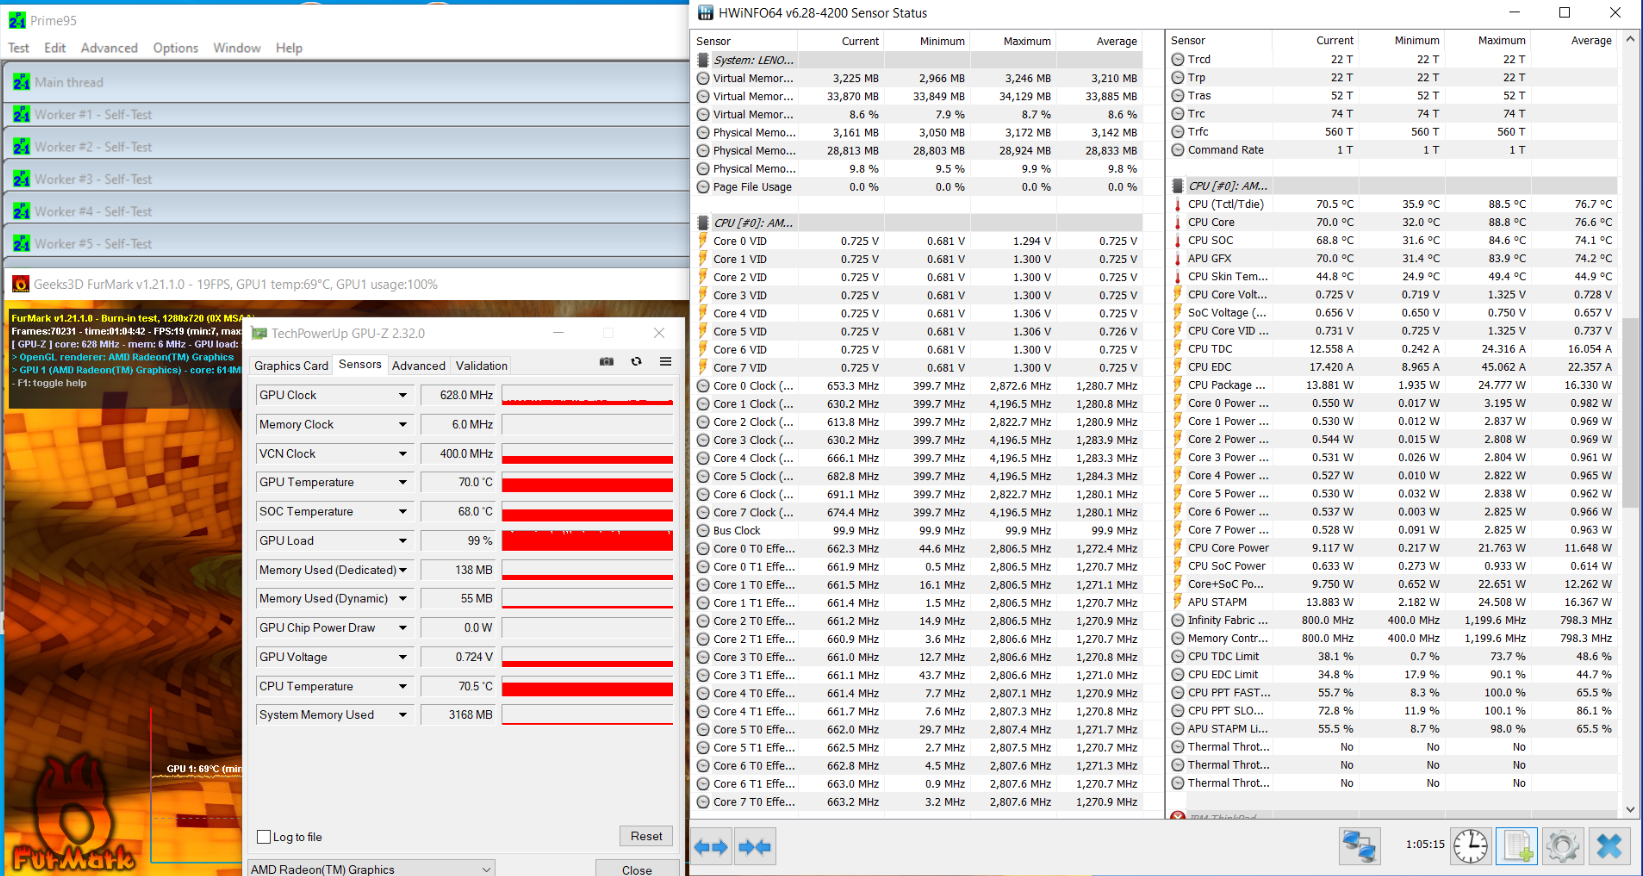
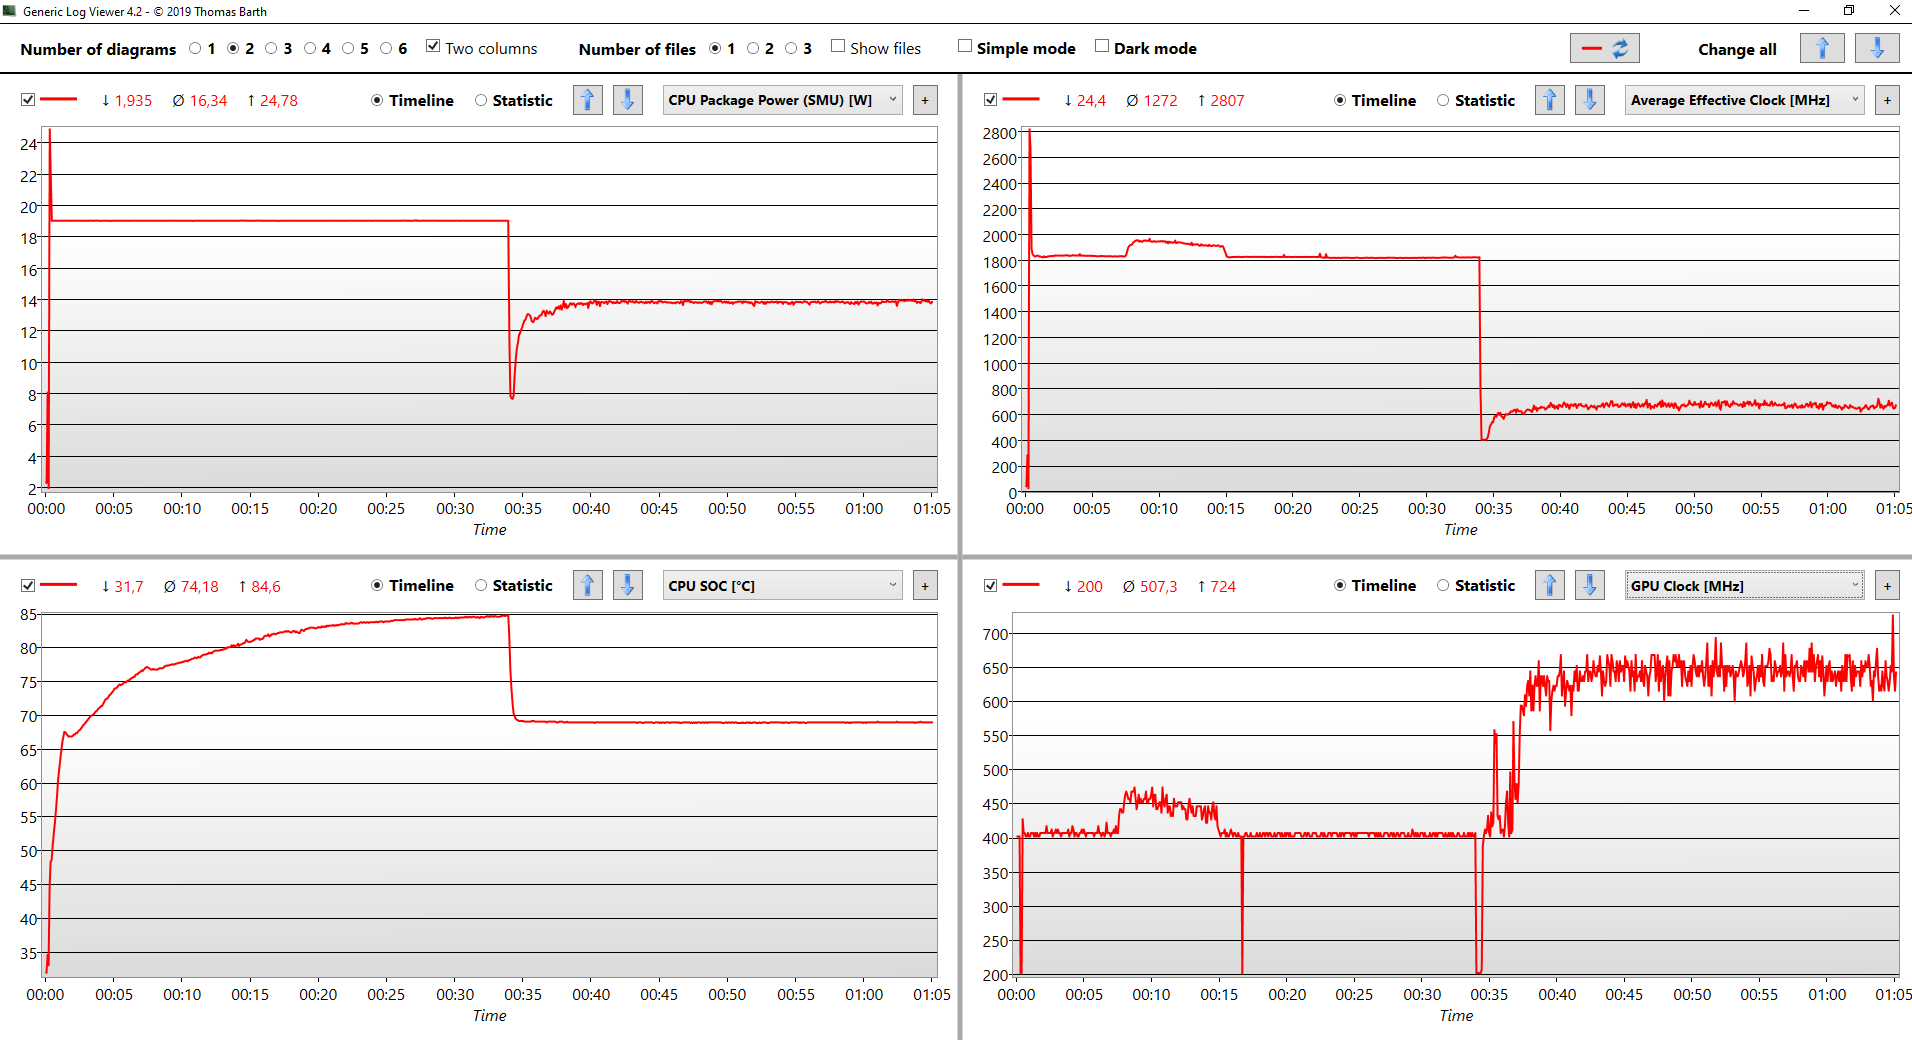
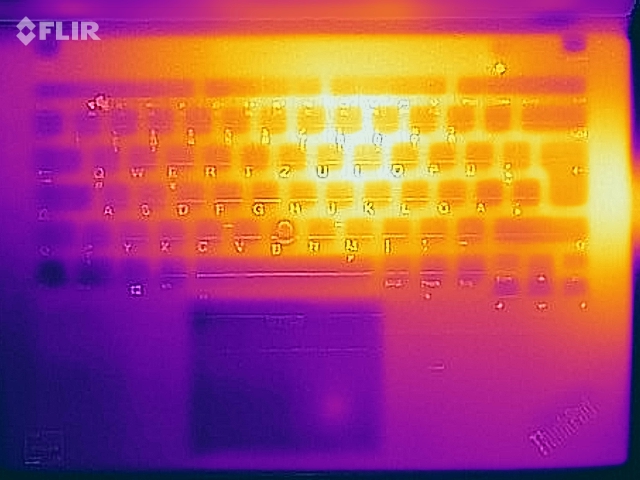
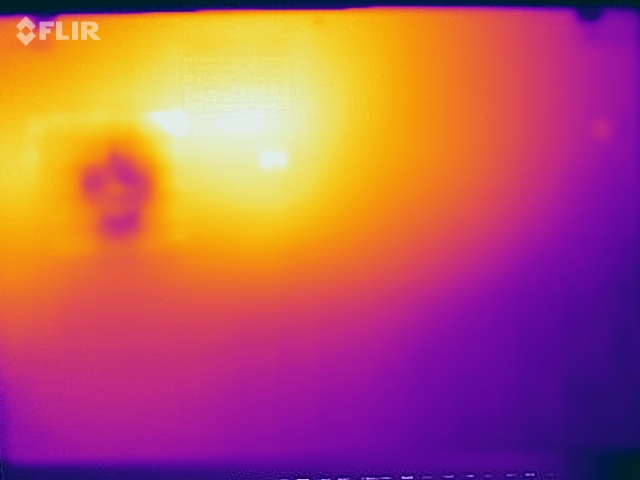
Due to the identical cooling solution, the temperature development is very similar between the two T14s models, but the AMD model is a bit cooler thanks to the higher fan speed we just talked about. We can measure almost 45 °C at three spots, which is no problem at all. The temperatures stay very low while idling and under light workloads.
The TDP figure levels off at 18 W during the stress test at first, but the combined CPU/GPU load results in another drop after about 30 minutes, because the chip temperature is close to 90 °C. After that, the TDP is steady at 13 W and the CPU performance is much lower, while the clock of the iGPU is even a bit higher. A 3DMark 11 run immediately after the stress test did not show a performance reduction.
(±) The maximum temperature on the upper side is 44.7 °C / 112 F, compared to the average of 34.3 °C / 94 F, ranging from 21.2 to 62.5 °C for the class Office.
(±) The bottom heats up to a maximum of 44.6 °C / 112 F, compared to the average of 36.8 °C / 98 F
(+) In idle usage, the average temperature for the upper side is 24.5 °C / 76 F, compared to the device average of 29.5 °C / 85 F.
(+) The palmrests and touchpad are cooler than skin temperature with a maximum of 31.3 °C / 88.3 F and are therefore cool to the touch.
(-) The average temperature of the palmrest area of similar devices was 27.5 °C / 81.5 F (-3.8 °C / -6.8 F).
Energy Management - Higher Consumption for AMD
Power Consumption
The idle consumption measurements show slightly higher values for the AMD T14s, even compared to the predecessor ThinkPad T495s. This was a bit surprising for us and we re-checked the values multiple times. It seems the 8-core CPU just needs a bit more power, and the different panel might have an effect as well. The maximum idle value also includes the maximum keyboard illumination, which consumes around 1.5 W (or 0.8 W at stage 1/2, respectively).
The maximum power consumption drops from 40 to around 31 Watts during the stress test. The included power adapter rated at 65 W is therefore completely sufficient.
| Off / Standby | |
| Idle | |
| Load |
|
Key:
min: | |
| Lenovo ThinkPad T14s-20UJS00K00 R7 PRO 4750U, Vega 7, WDC PC SN730 SDBPNTY-1T00, IPS , 1920x1080, 14" | Lenovo ThinkPad T14s-20T00044GE i5-10210U, UHD Graphics 620, Samsung SSD PM981a MZVLB256HBHQ, LTPS AHVA-IPS LED, 1920x1080, 14" | Lenovo ThinkPad T495s-20QKS01E00 R7 PRO 3700U, Vega 10, Samsung PM981a MZVLB1T0HBLR, IPS, 1920x1080, 14" | Dell Latitude 7410 i7-10610U, UHD Graphics 620, Toshiba XG6 KXG60ZNV512G, IPS, 3840x2160, 14" | Lenovo ThinkPad X1 Carbon 2020-20UAS04T00 i7-10510U, UHD Graphics 620, Samsung SSD PM981a MZVLB512HBJQ, IPS, 1920x1080, 14" | Average AMD Radeon RX Vega 7 | Average of class Office | |
|---|---|---|---|---|---|---|---|
| Power Consumption | 20% | 4% | 3% | 5% | 3% | -2% | |
| Idle Minimum * (Watt) | 5.7 | 2.6 54% | 4.7 18% | 3.7 35% | 2.96 48% | 4.79 ? 16% | 4.3 ? 25% |
| Idle Average * (Watt) | 8.9 | 5.5 38% | 7.28 18% | 6.2 30% | 5.9 34% | 7.72 ? 13% | 7.35 ? 17% |
| Idle Maximum * (Watt) | 11 | 7.5 32% | 9.48 14% | 7 36% | 9.1 17% | 9.12 ? 17% | 8.6 ? 22% |
| Load Average * (Watt) | 38.2 | 28.2 26% | 35.3 8% | 43.2 -13% | 42.1 -10% | 38.4 ? -1% | 43.9 ? -15% |
| Load Maximum * (Watt) | 40.2 | 59.6 -48% | 55.5 -38% | 68.6 -71% | 65.1 -62% | 51.7 ? -29% | 64.5 ? -60% |
* ... smaller is better
Battery Runtime
The consumption figures already suggested that the battery runtime is worse compared to the Intel model of the T14s. However, 13 hours in the video test and 10 hours in our Wi-Fi test are still very good results and should suffice for most usage scenarios. If you use the maximum panel brightness, the Wi-Fi runtime drops to almost 8 hours. All in all, the ThinkPad T14s with the AMD processor is very competitive within the comparison group.
| Lenovo ThinkPad T14s-20UJS00K00 R7 PRO 4750U, Vega 7, 57 Wh | Lenovo ThinkPad T14s-20T00044GE i5-10210U, UHD Graphics 620, 57 Wh | Lenovo ThinkPad T495s-20QKS01E00 R7 PRO 3700U, Vega 10, 57 Wh | Dell Latitude 7410 i7-10610U, UHD Graphics 620, 68 Wh | Lenovo ThinkPad X1 Carbon 2020-20UAS04T00 i7-10510U, UHD Graphics 620, 51 Wh | Average of class Office | |
|---|---|---|---|---|---|---|
| Battery runtime | 7% | 3% | 23% | -9% | 10% | |
| H.264 (h) | 13.2 | 14.7 11% | 12.5 -5% | 12.8 -3% | 15.5 ? 17% | |
| WiFi v1.3 (h) | 10.2 | 13.2 29% | 11.3 11% | 11 8% | 10.1 -1% | 13 ? 27% |
| Load (h) | 2.1 | 1.7 -19% | 2.9 38% | 1.6 -24% | 1.808 ? -14% | |
| Reader / Idle (h) | 31.3 | 24.5 ? |
Pros
Cons
Verdict - AMD with many advantages
Lenovo's ThinkPad T14s now comes with AMD and Intel processors, so it is very interesting to compare the devices. The case and the (very good) input devices are identical on both machines, just like the good LowPower 1080p screen. However, we once again have to mention that Lenovo uses four different suppliers for the display and you do not know which one you will get. The 4K screen on the other hand is limited for Intel models.
There are also differences in terms of ports, because the AMD SKU lacks Thunderbolt 3. However, this should only be important if you want to use an external graphics card. The AMD model has some advantages in terms of features like HDMI 2.0, Bluetooth 5.1, and faster RAM.
The biggest difference is the performance. Business laptops are still using Intel's Comet-Lake-U chips due to the support for vPro, so neither the CPU nor the integrated GPUs stand a chance against AMDs new mobile CPUs. You get almost twice the CPU performance and even some gaming is possible on the ThinkPad.
Much more performance and less expensive: The ThinkPad T14s with the AMD processor leaves a better overall impression. The education model in particular is extremely well equipped and offers a great price-performance ratio.
There are two more drawbacks compared to the Intel model: The fan is slightly louder under load, and the idle consumption is also a bit higher. Maybe the AMD T14s still needs some optimization, which could be achieved by upcoming BIOS updates. Still, the battery runtime is not bad by any means. Then there is the price, and this is where AMD definitely has the edge. The least-expensive TopSeller units have a price difference of 150 Euros (~$178), and the gap gets bigger when you want to get a Core i7 SKU. The education model we reviewed with the Ryzen 7 Pro, 32 GB RAM, and a 1 TB PCIe-SSD, offers an excellent price-performance ratio for 1,399 Euros (~$1,657).
If you do not need Thunderbolt 3 and you can live with a battery runtime of 10 hours, you are better off with the AMD-based ThinkPad T14s. Thanks to the slightly better keyboard and the much higher performance, we also prefer the T14s AMD over the current-generation ThinkPad X1 Carbon.
Lenovo ThinkPad T14s-20UJS00K00
- 08/11/2020 v7 (old)
Andreas Osthoff
