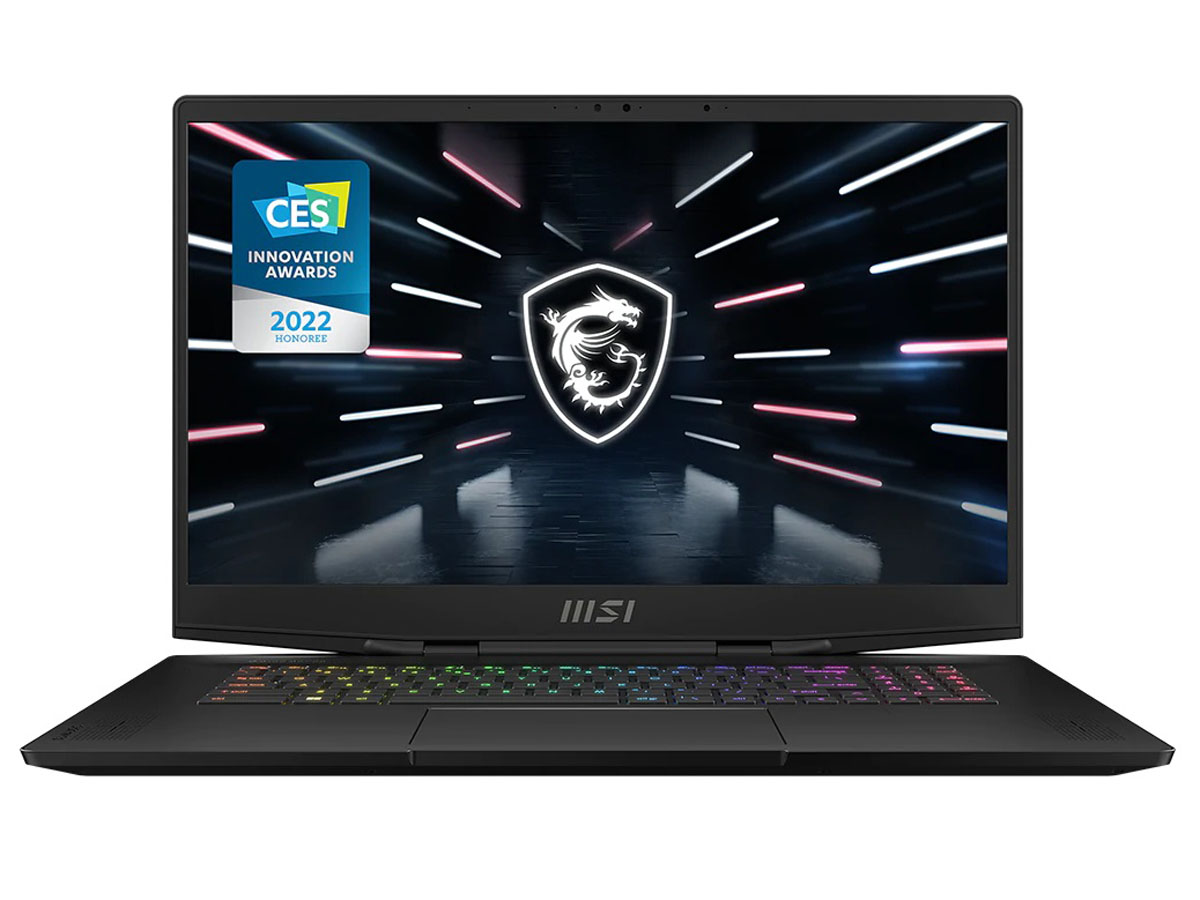
MSI Stealth GS77 laptop review: A good Razer Blade 17 alternative?
When MSI introduced the GS76 with 11th gen Intel last year, the model would utilize a completely different chassis design from the preceding GS75. For 2022, the GS77 with 12th gen Intel has arrived to replace the GS76 with yet another fresh chassis redesign. We're definitely surprised to see a new look so soon for the MSI GS series especially since most other laptops would use the same chassis skeleton for at least a few years in a row before eventually receiving a facelift.
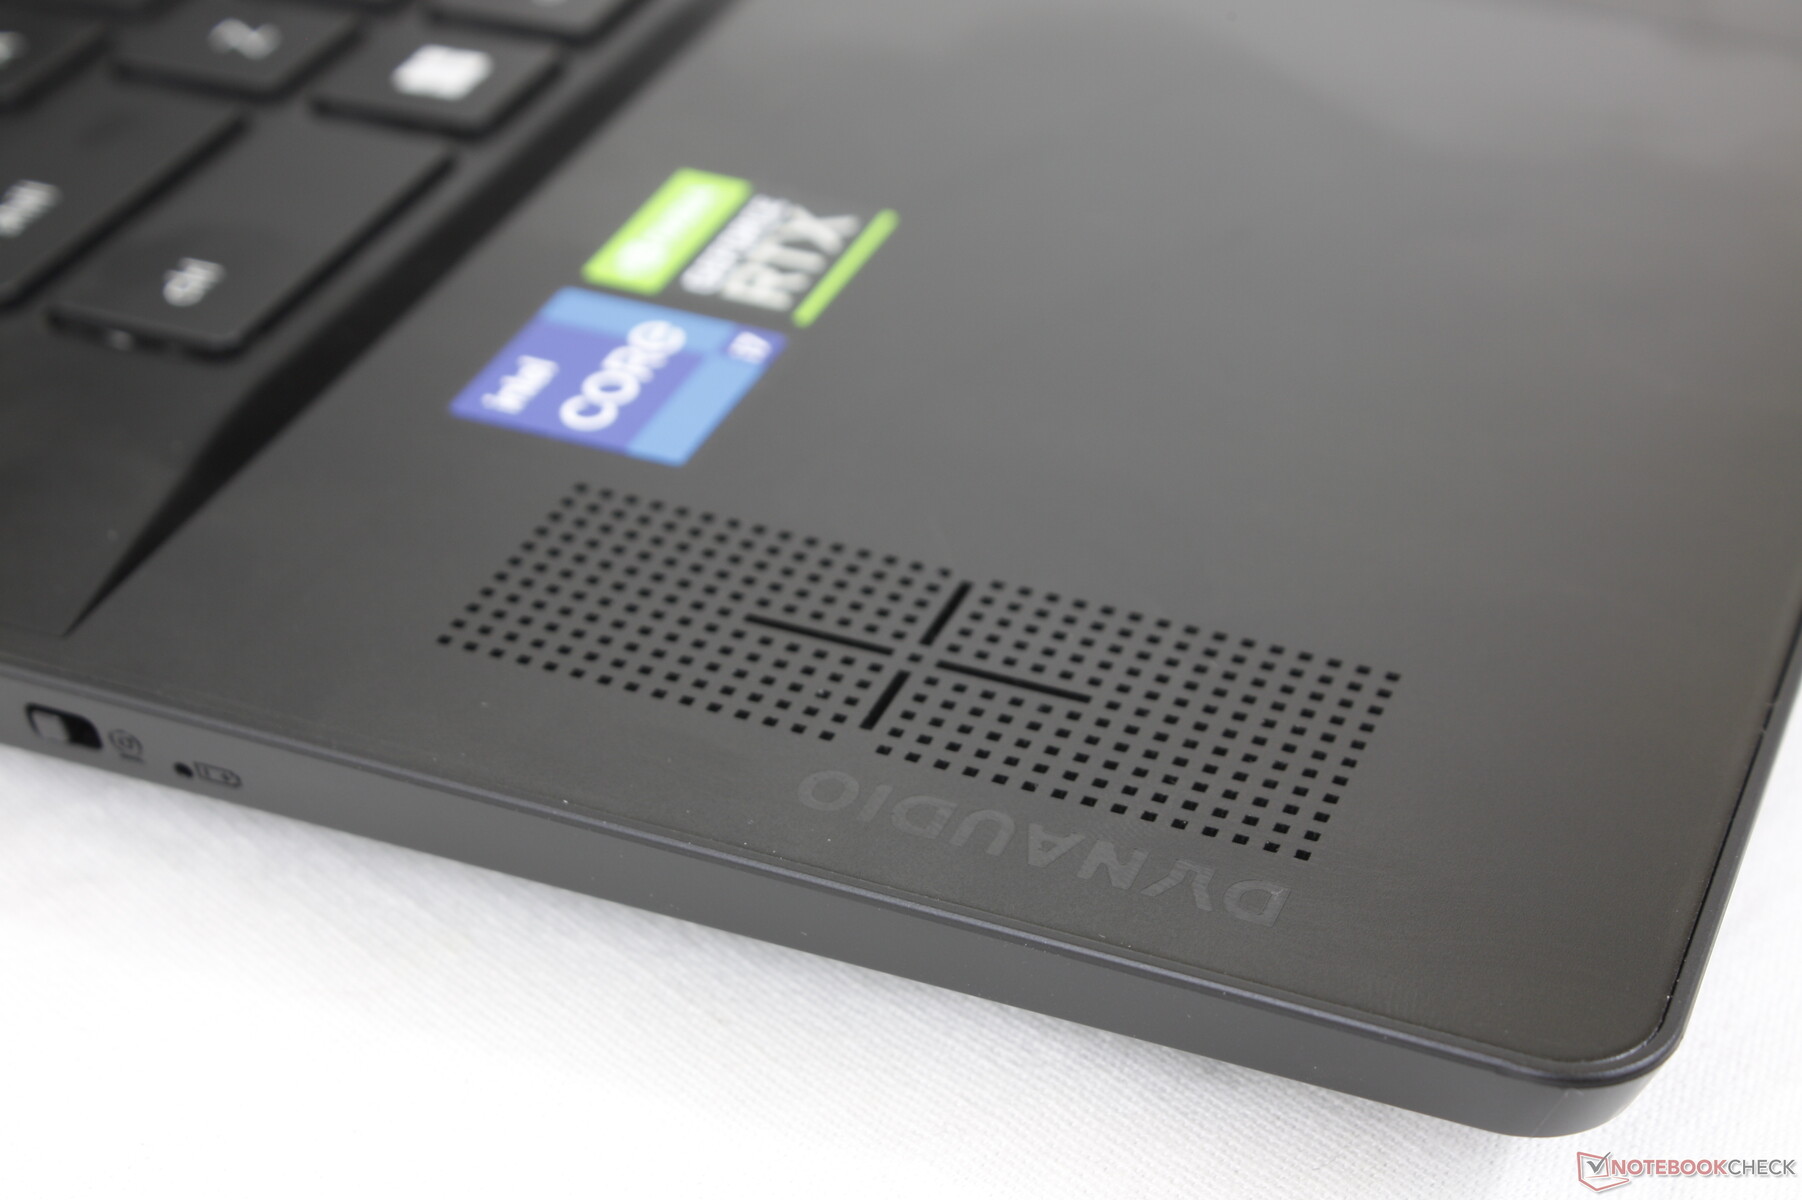
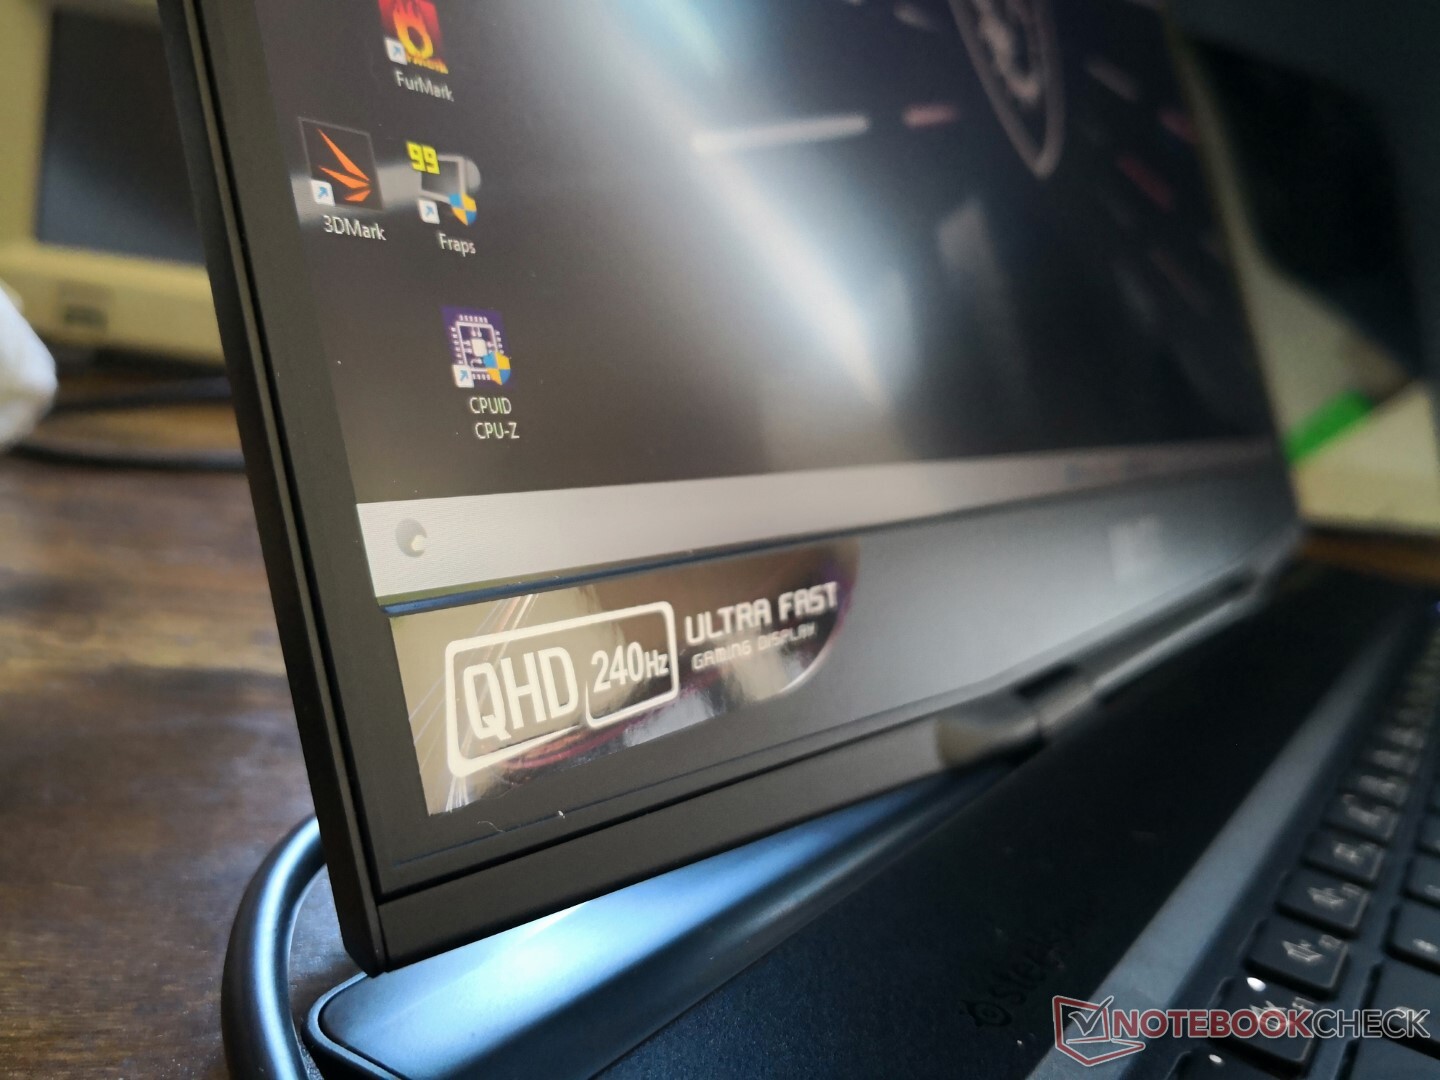
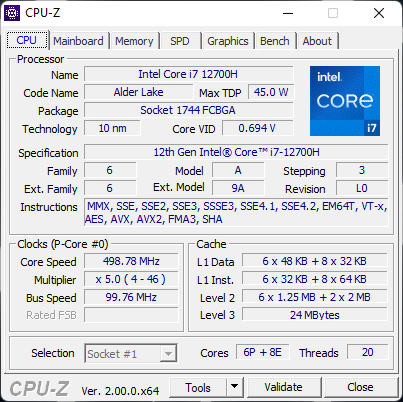
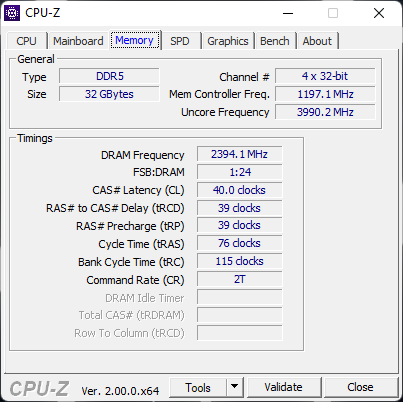
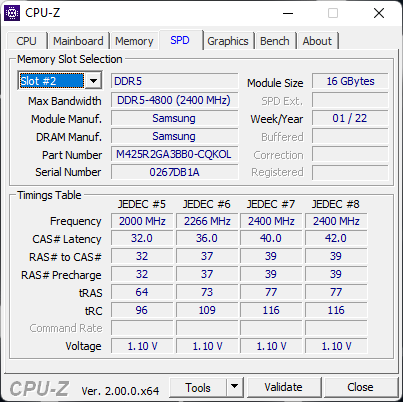
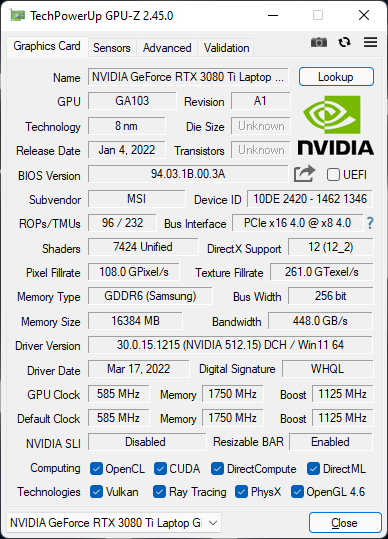
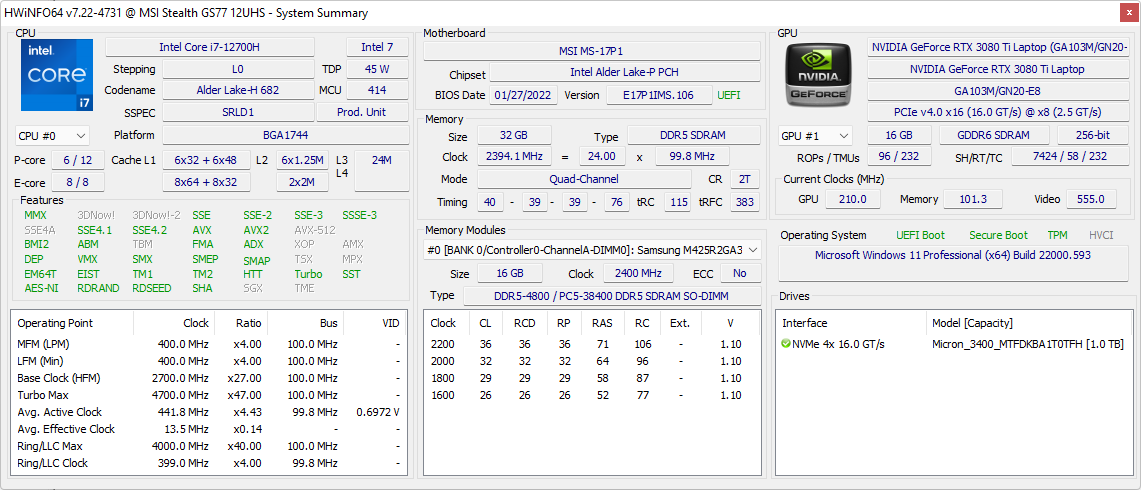
Our configuration in review comes courtesy of Xotic PC with a 12th gen Core i7-12700H CPU, 105 W TGP GeForce RTX 3080 Ti GPU, 32 GB of DDR5-4800 RAM, 240 Hz 1440p IPS display, and a 1 TB PCIe4 x4 NVMe SSD for approximately $3700 USD retail. Other SKUs are available with the Core i9-12900H, RTX 3070 Ti, RTX 3080, 360 Hz FHD, or 120 Hz UHD panels instead.
Competing models include other ultrathin the Razer Blade 17, Dell Alienware x17, Asus ROG Zephyrus S17, and Gigabyte Aorus 17 series.
More MSI reviews:
Potential Competitors in Comparison
Rating | Date | Model | Weight | Height | Size | Resolution | Price |
|---|---|---|---|---|---|---|---|
| 87.2 % v7 (old) | 04 / 2022 | MSI Stealth GS77 12UHS-083US i7-12700H, GeForce RTX 3080 Ti Laptop GPU | 2.9 kg | 20.8 mm | 17.30" | 2560x1440 | |
| 86.2 % v7 (old) | 09 / 2021 | MSI GS76 Stealth 11UH i9-11900H, GeForce RTX 3080 Laptop GPU | 2.4 kg | 20 mm | 17.30" | 3840x2160 | |
| 91.2 % v7 (old) | 03 / 2022 | Razer Blade 17 RTX 3080 Ti i7-12800H, GeForce RTX 3080 Ti Laptop GPU | 2.7 kg | 19.9 mm | 17.30" | 2560x1440 | |
| 87.5 % v7 (old) | 01 / 2022 | MSI GE76 Raider i9-12900HK, GeForce RTX 3080 Ti Laptop GPU | 3 kg | 26 mm | 17.30" | 1920x1080 | |
| 89 % v7 (old) | 09 / 2021 | Alienware x17 RTX 3080 P48E i7-11800H, GeForce RTX 3080 Laptop GPU | 3.2 kg | 21.4 mm | 17.30" | 3840x2160 | |
| 90.1 % v7 (old) | 07 / 2021 | Asus ROG Zephyrus S17 GX703HSD i9-11900H, GeForce RTX 3080 Laptop GPU | 2.8 kg | 19.9 mm | 17.30" | 2560x1440 |
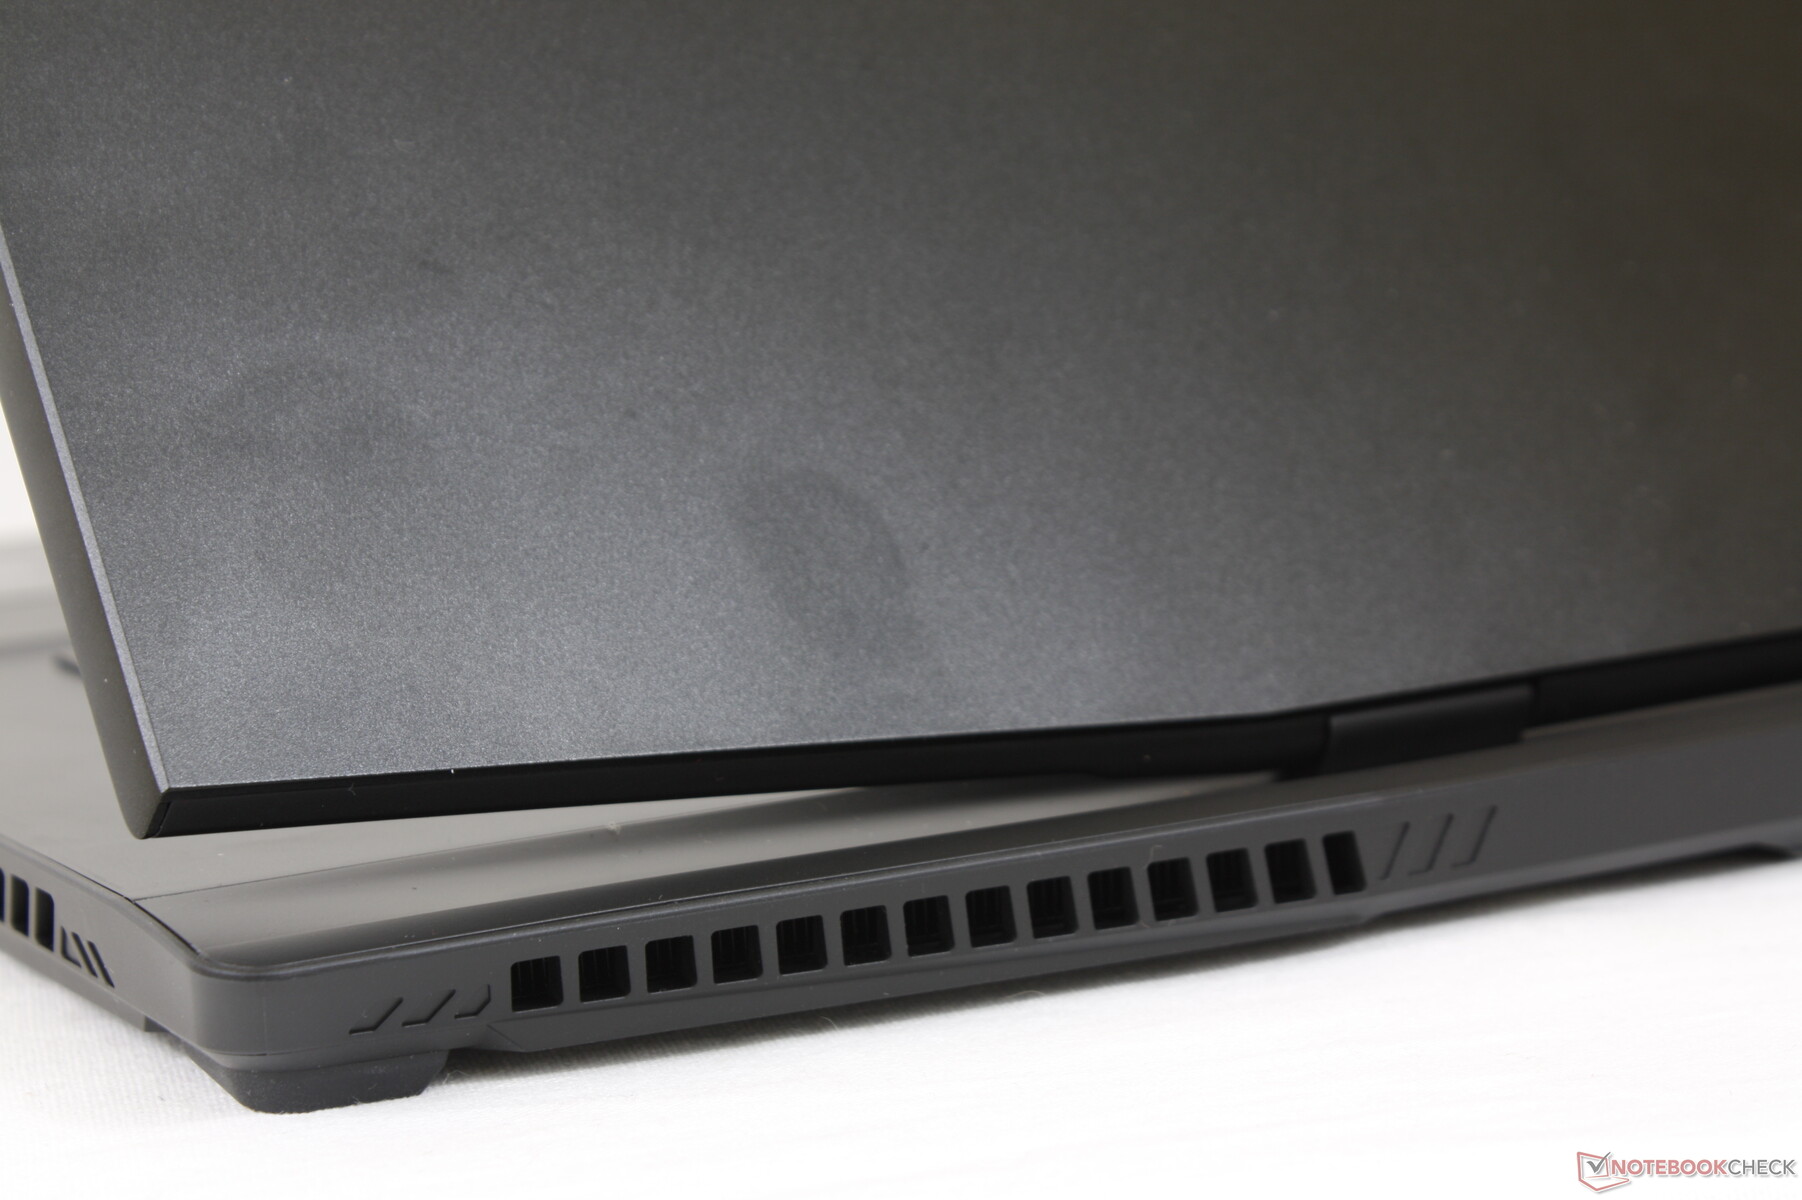
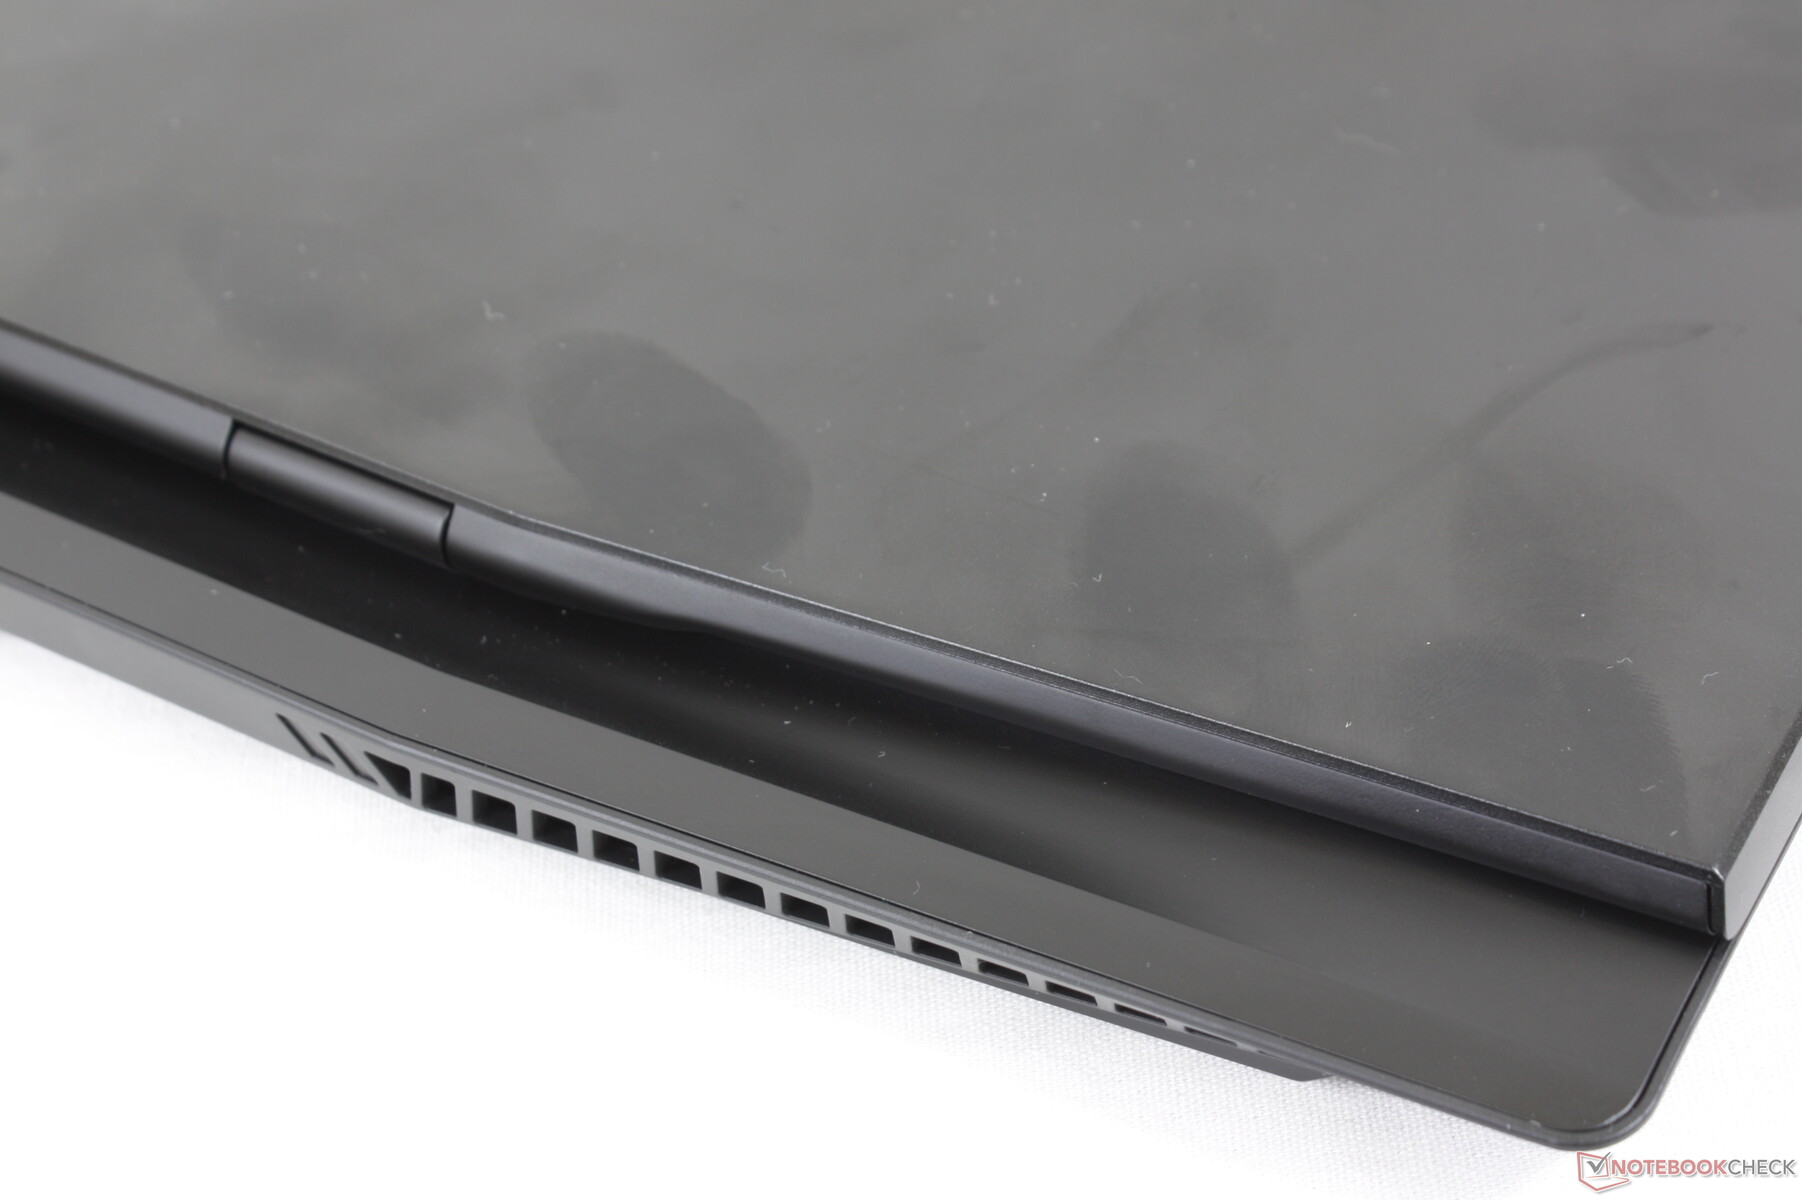
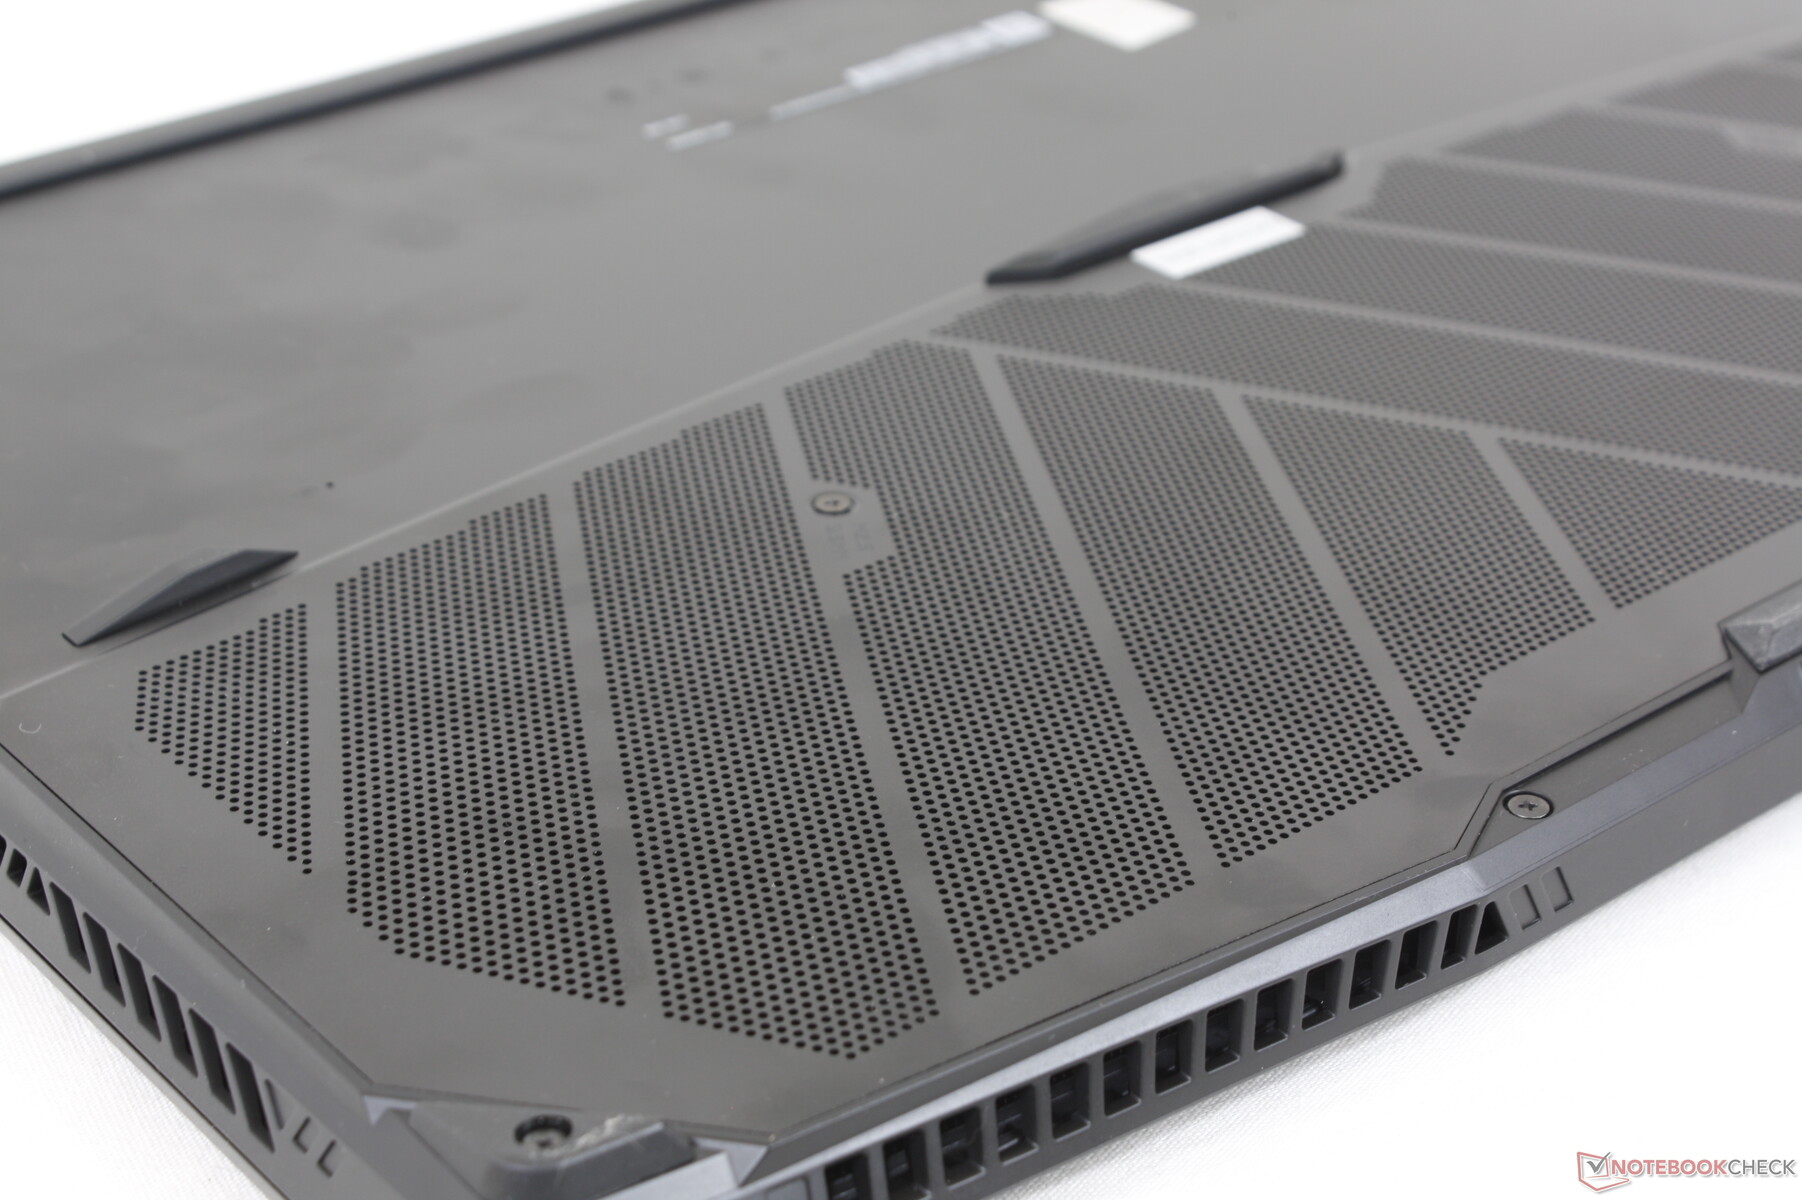
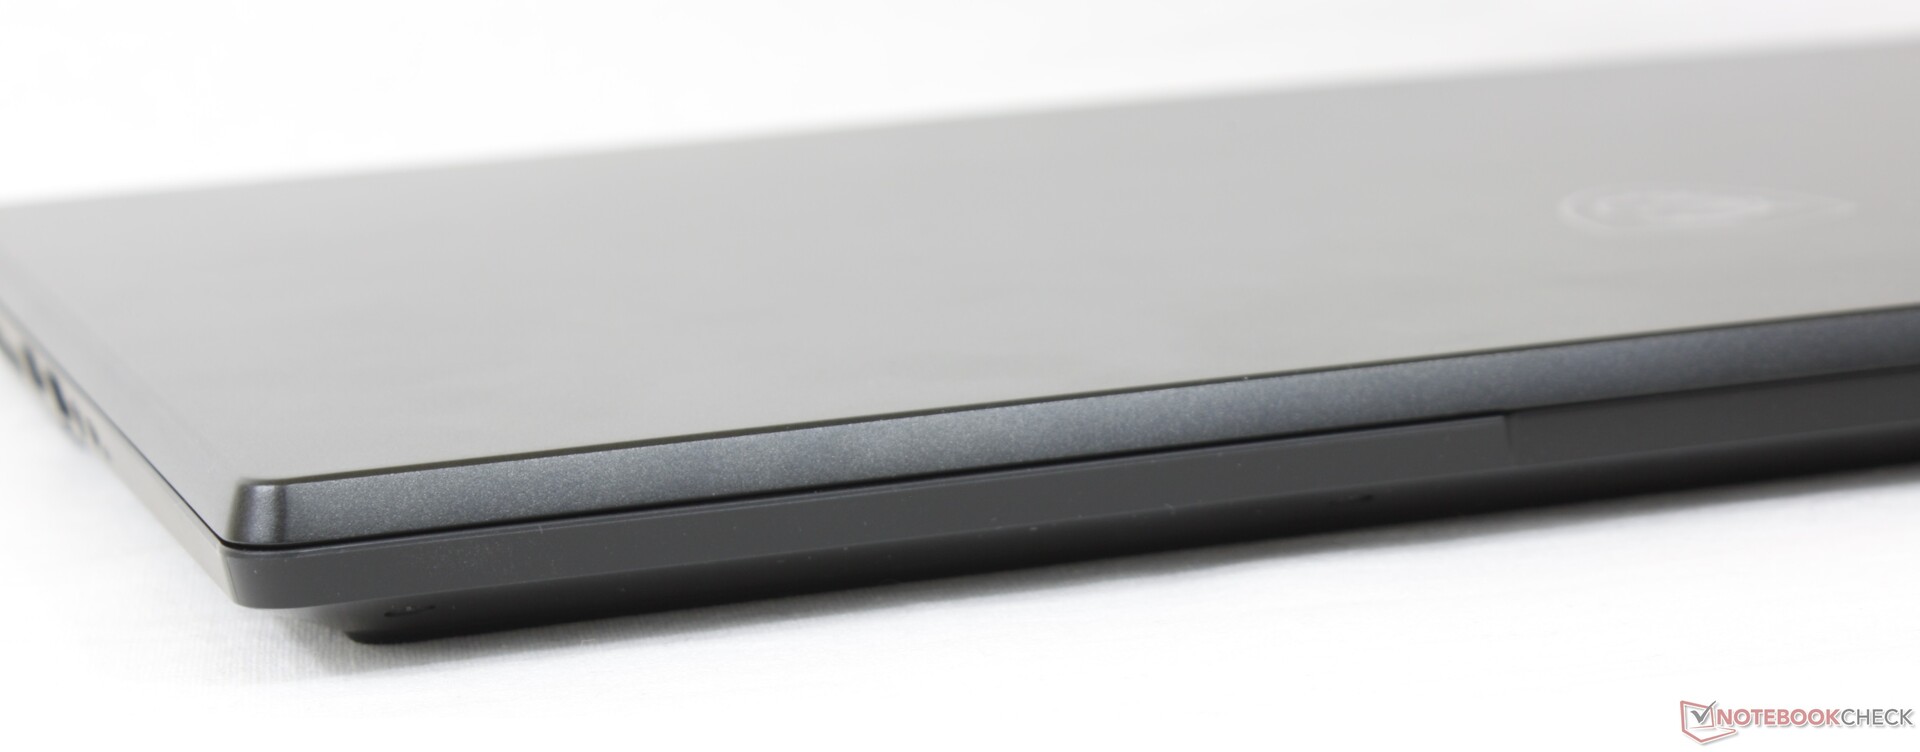
Case — Bigger, Heavier, Tougher
One of our biggest complaints about the GS76 was that it sacrificed too much performance for a slimmer and lighter form factor. The redesigned GS77 has addressed this by introducing a protruding jet-engine rear much like on the Alienware x17 or MSI GT series. We're happy to see that chassis rigidity has also improved as both the base and lid are more unyielding to any twists or depressions than before.
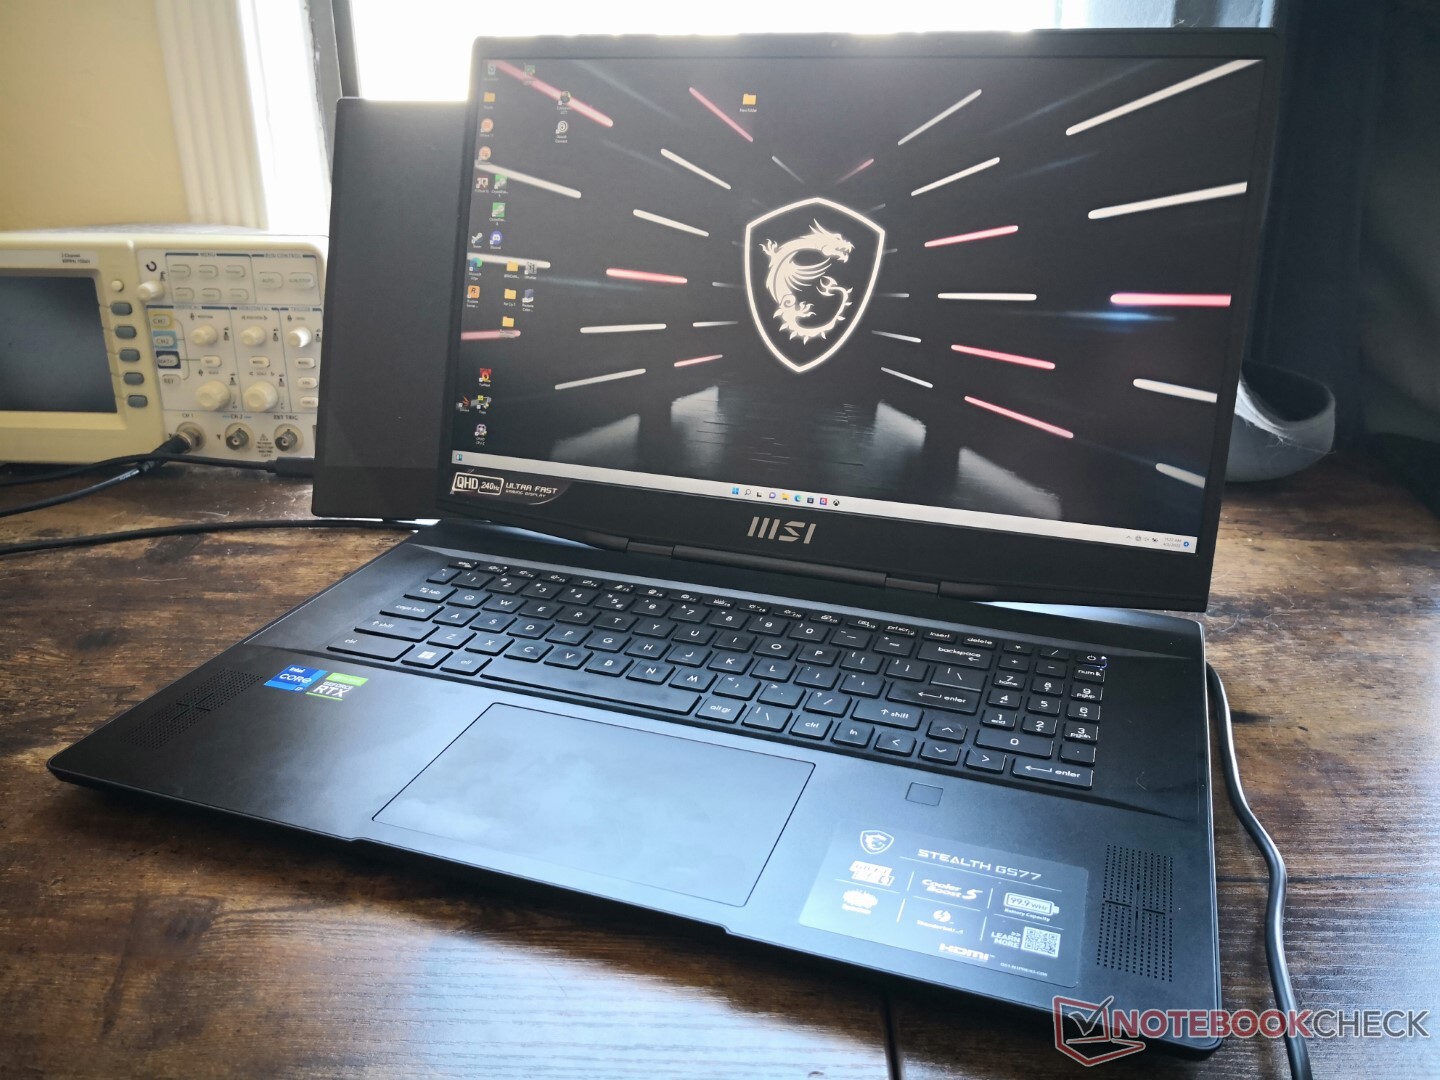
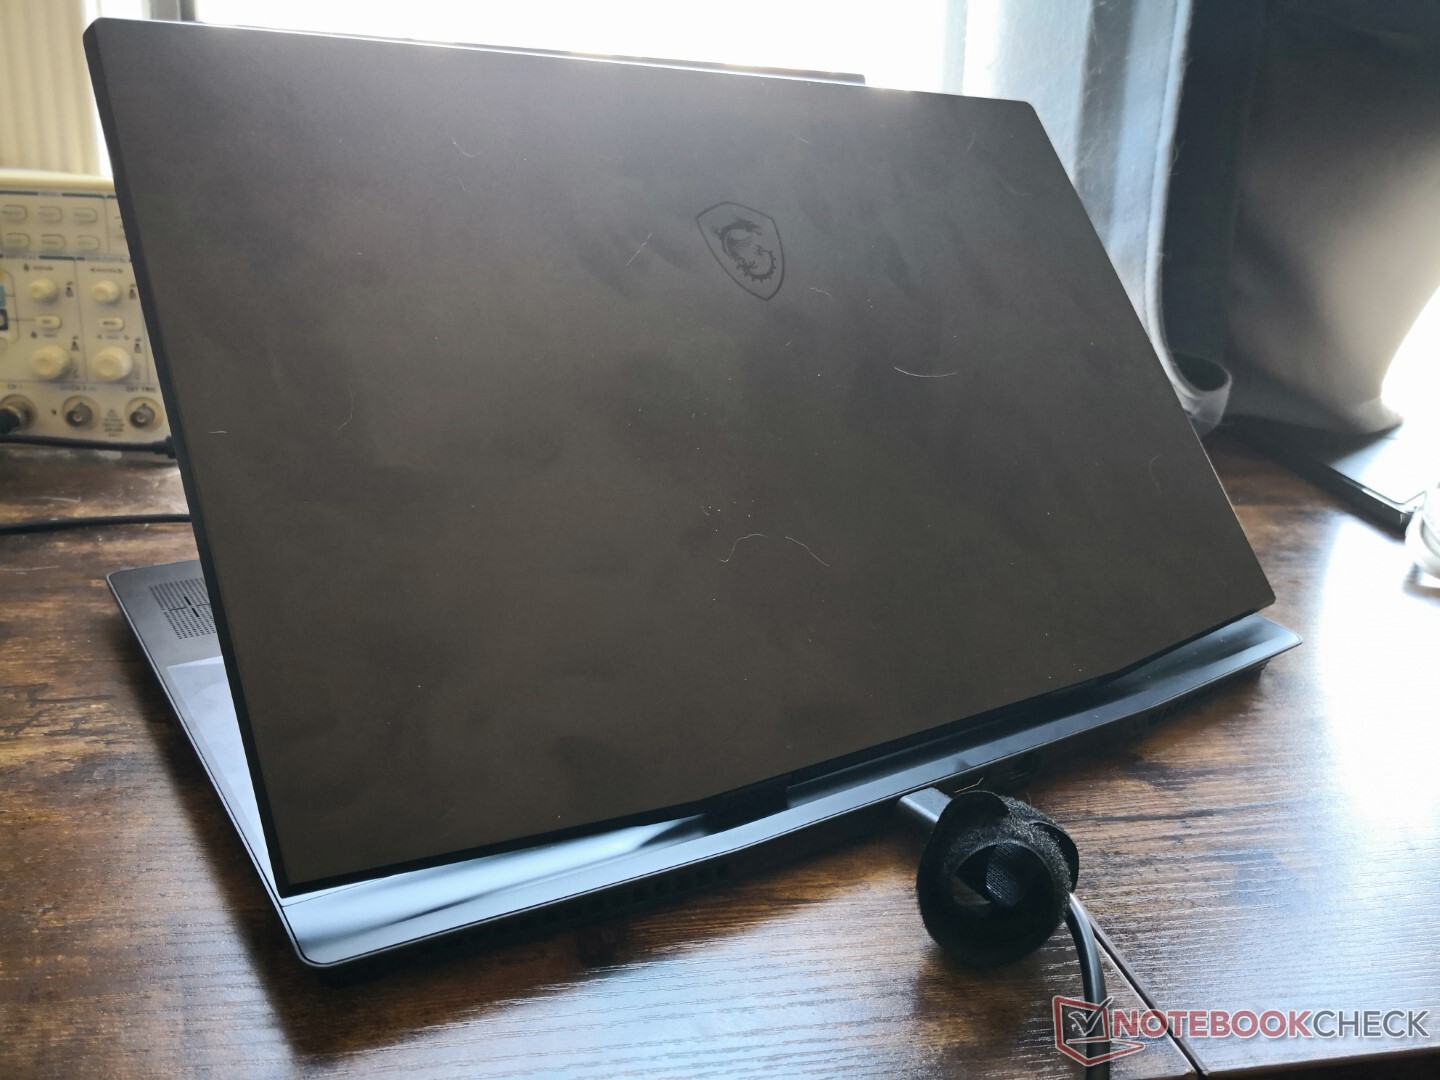
In an interesting twist of events, the GS77 is noticeably larger and heavier than the older GS76 by 14 percent and 21 percent, respectively. The increased size and weight can be mostly attributed to the aforementioned larger rear of the GS77 and overall thicker skeleton. The model sits in between the Blade 17 and Alienware x17 in both size and weight as a result. In comparison, the older GS75 was significantly lighter by over 600 grams.
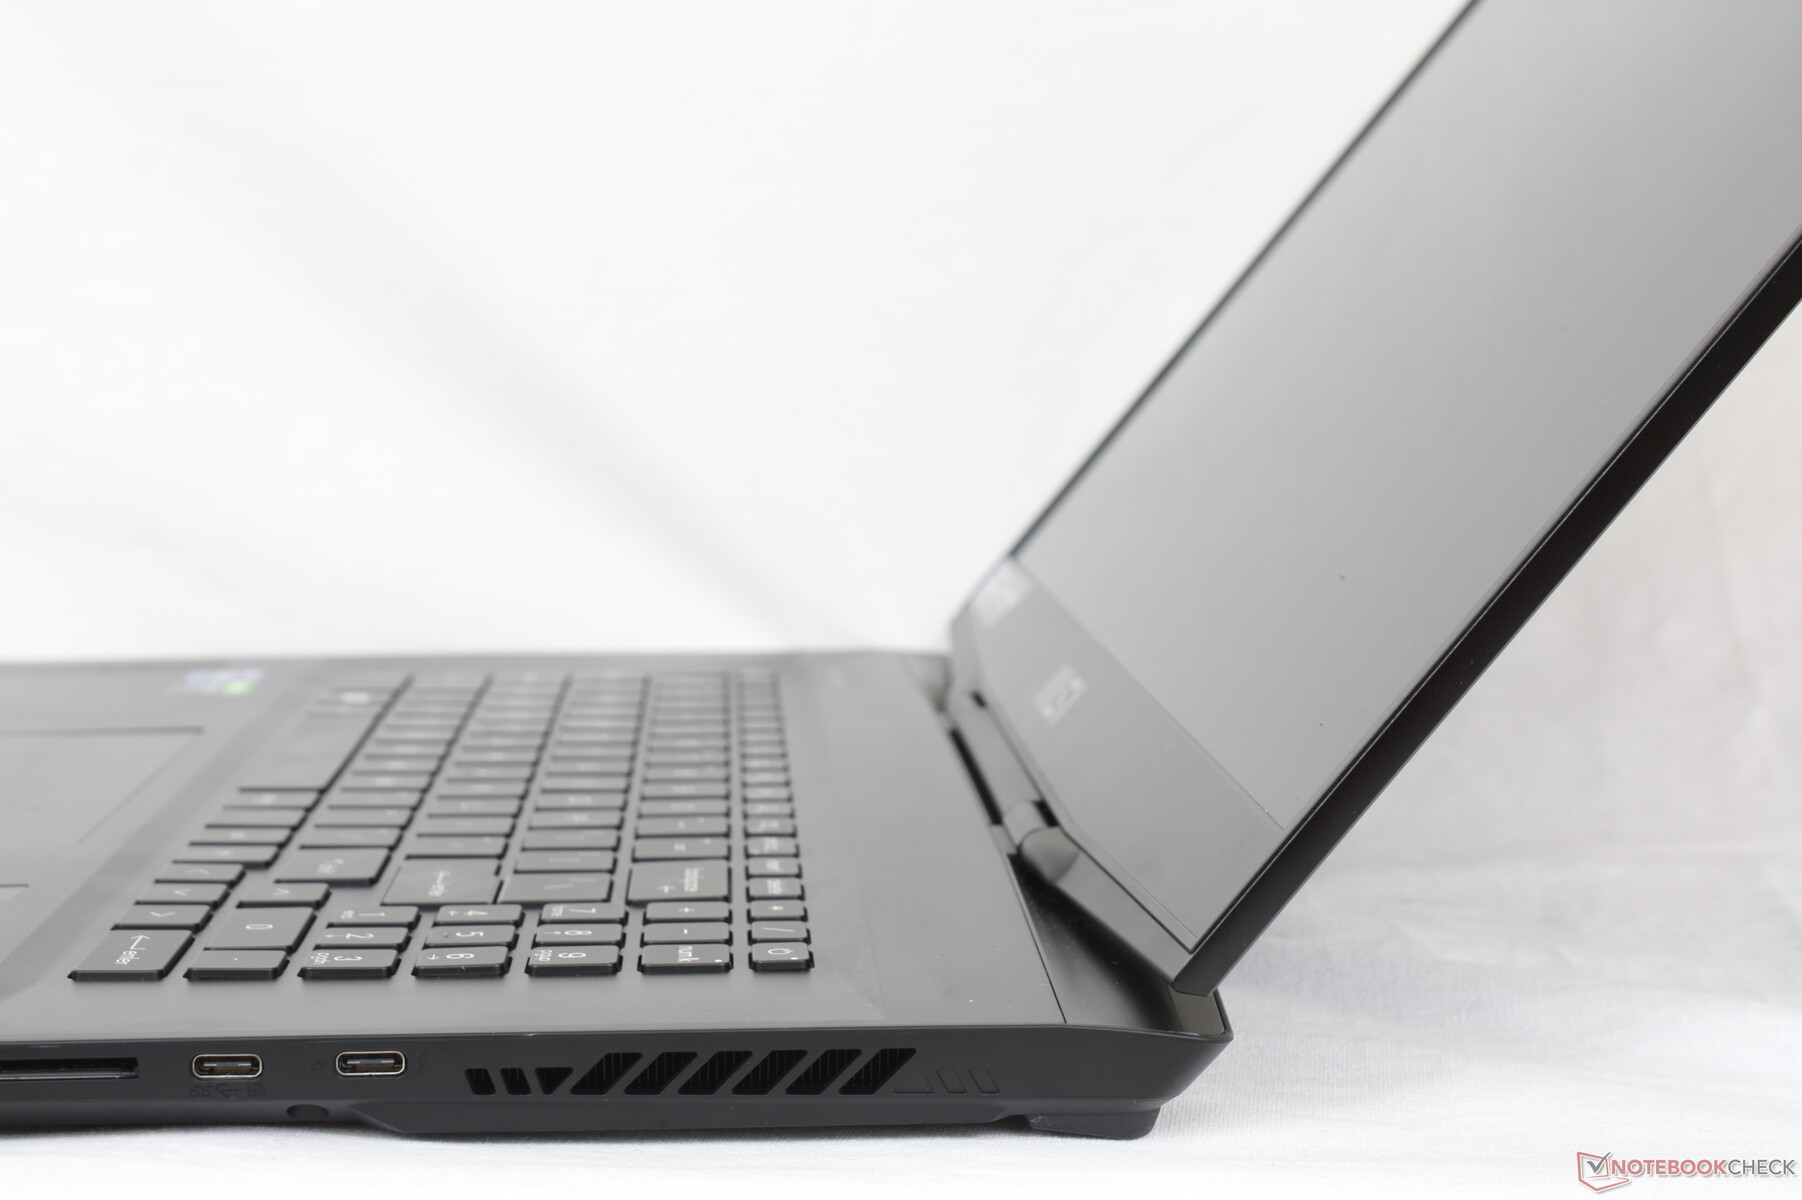
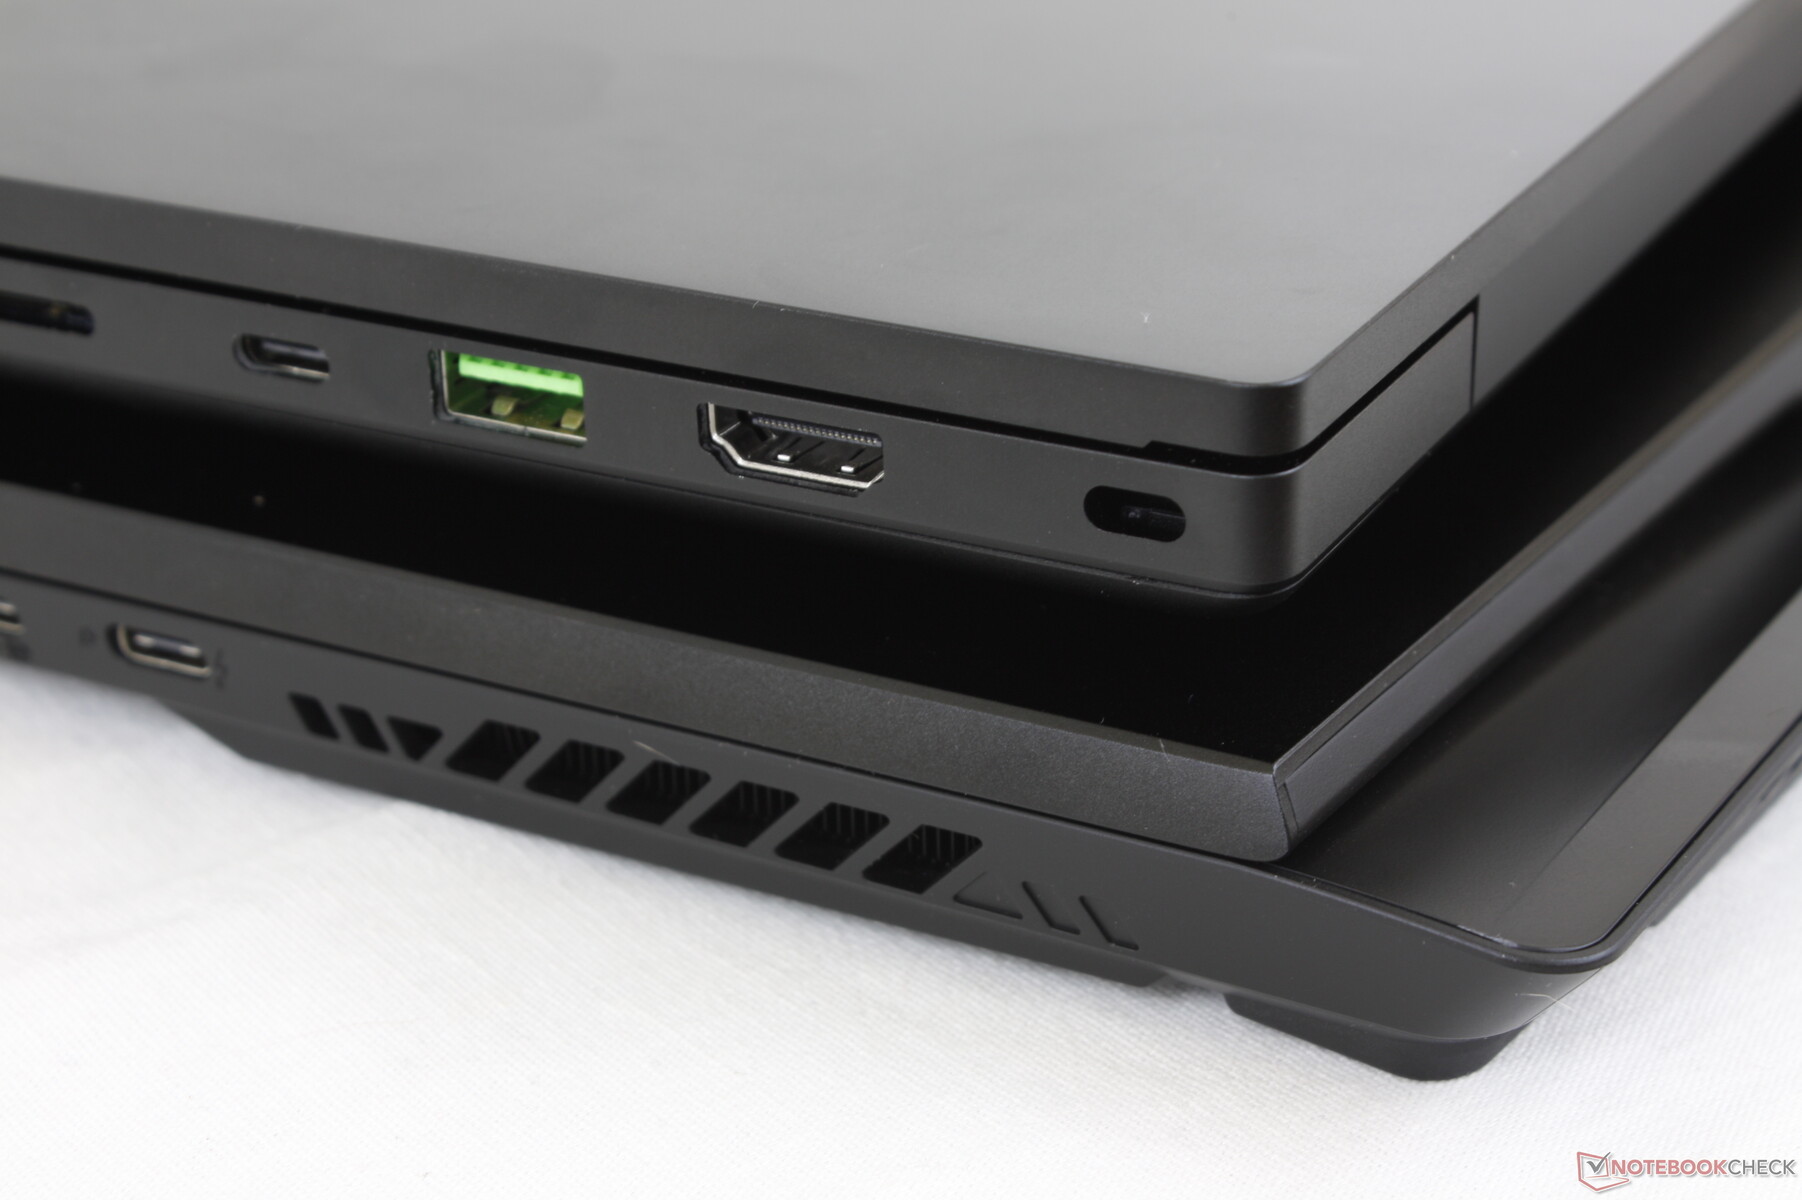
Connectivity — Same As Before
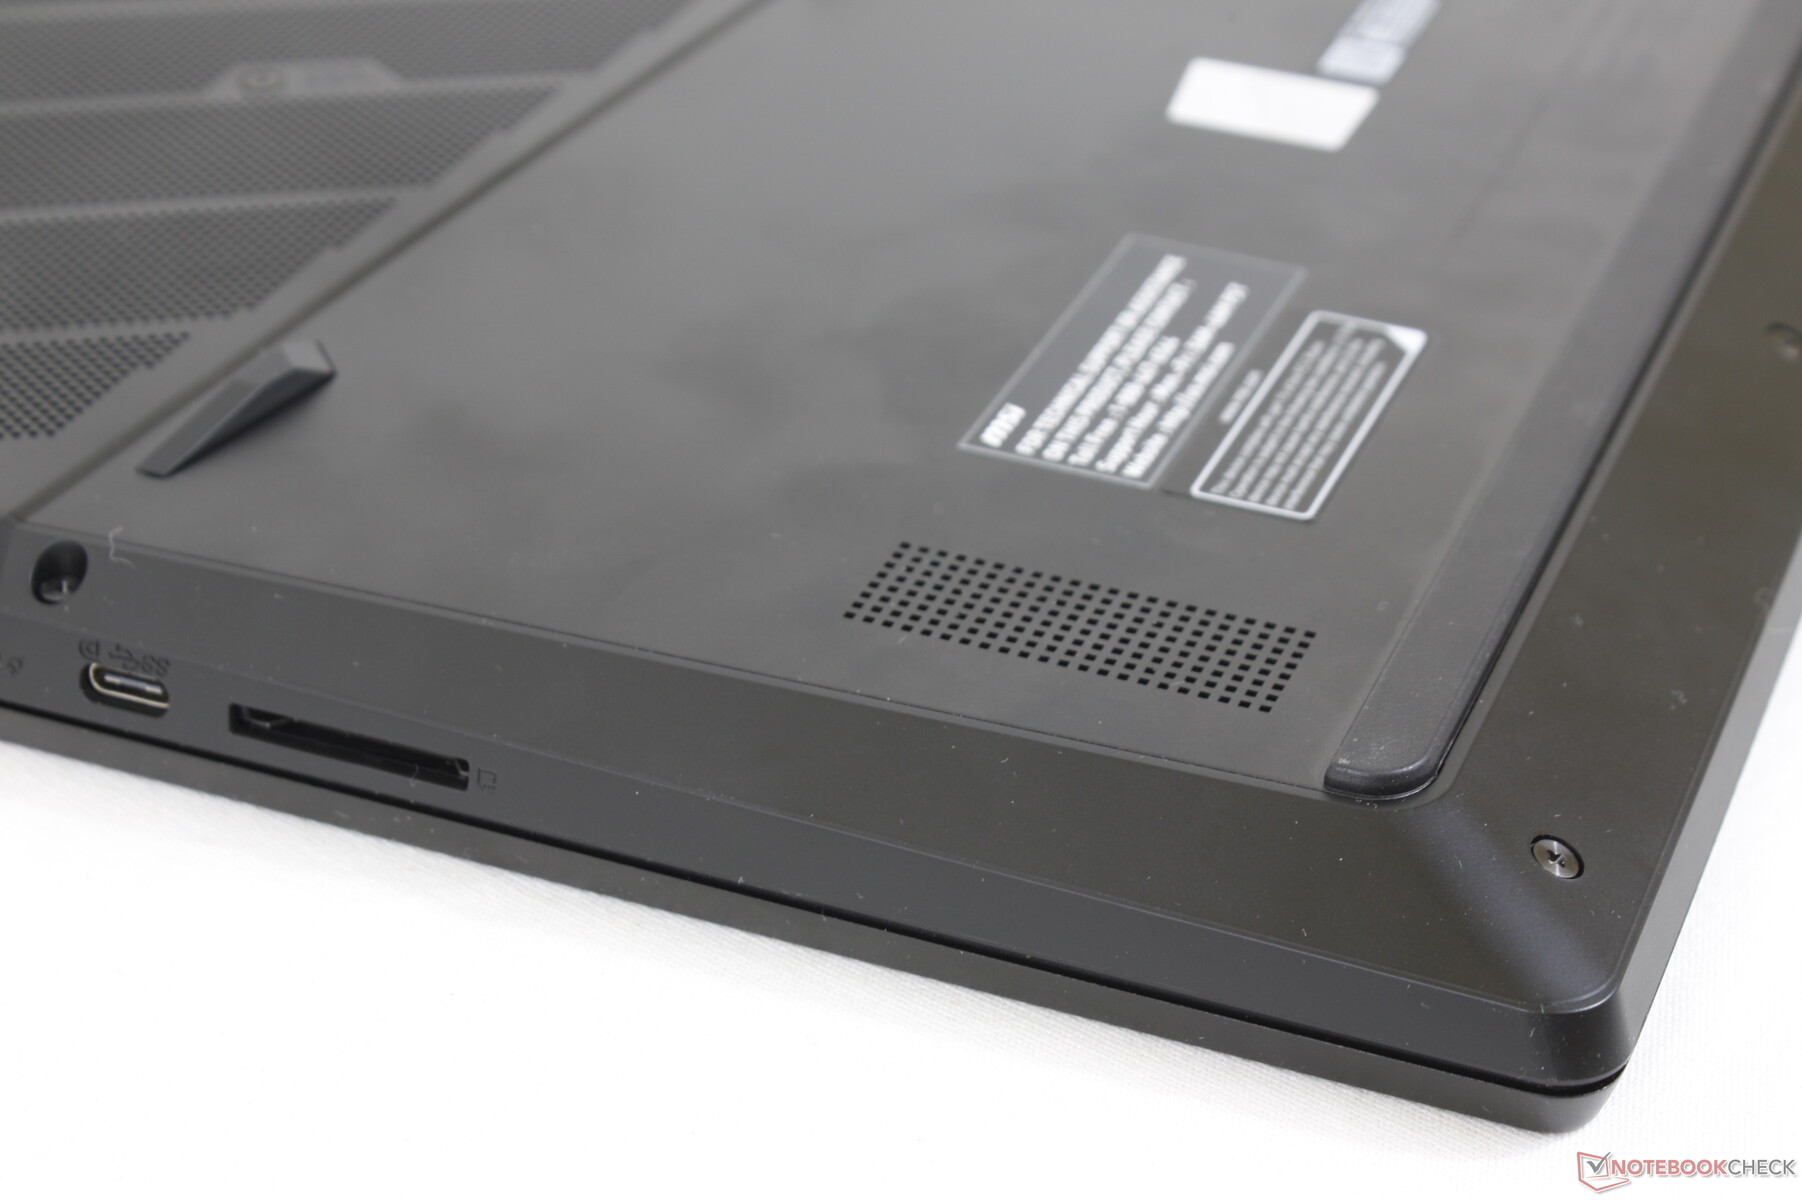
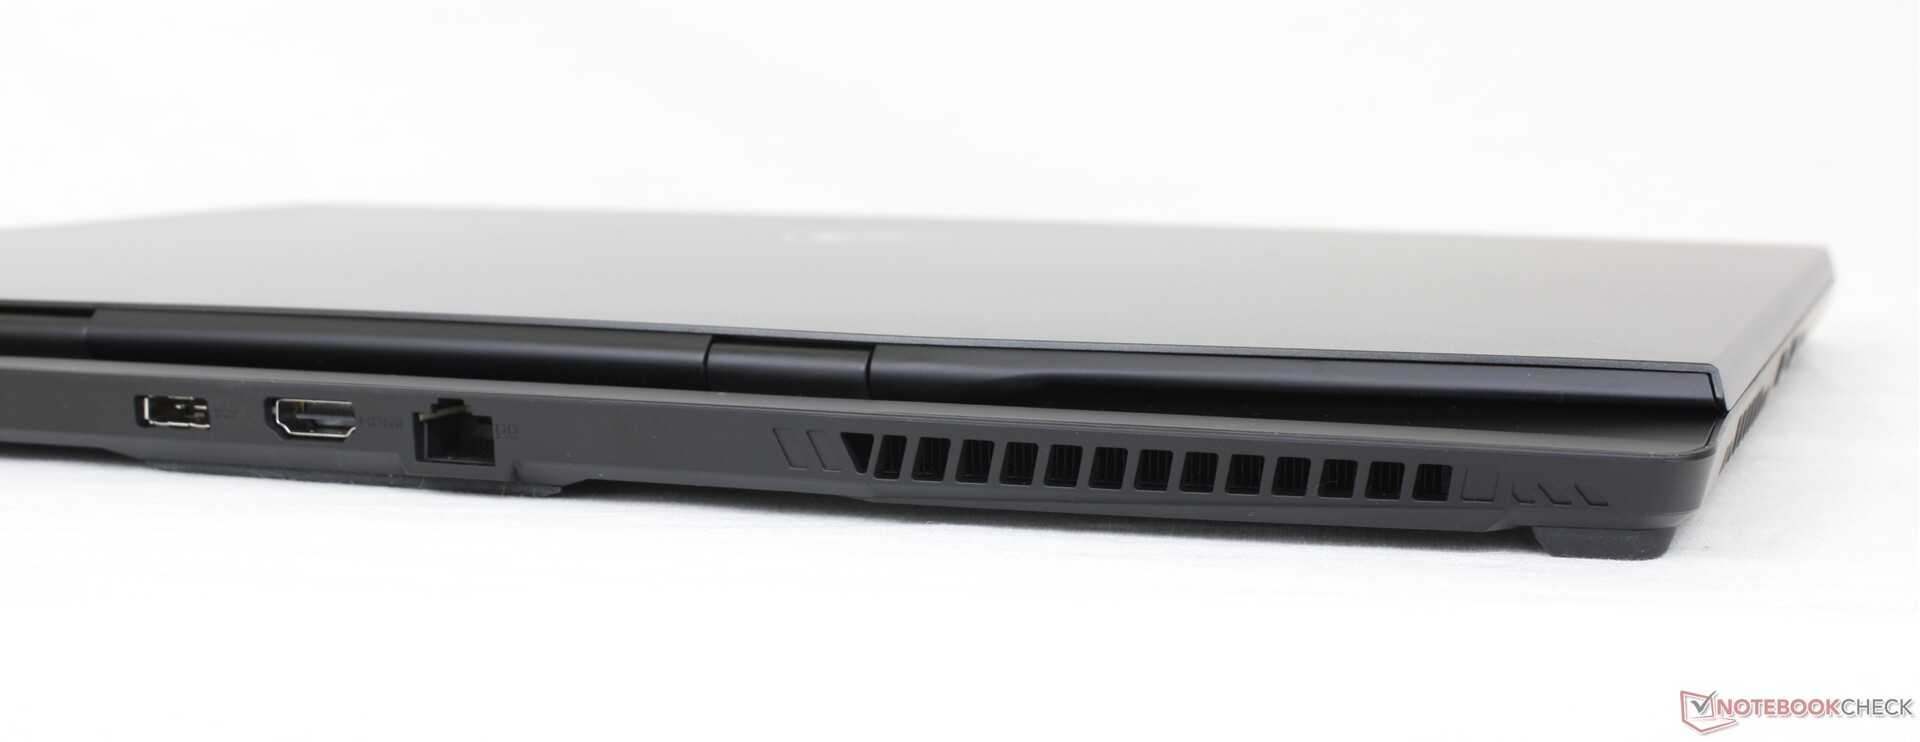
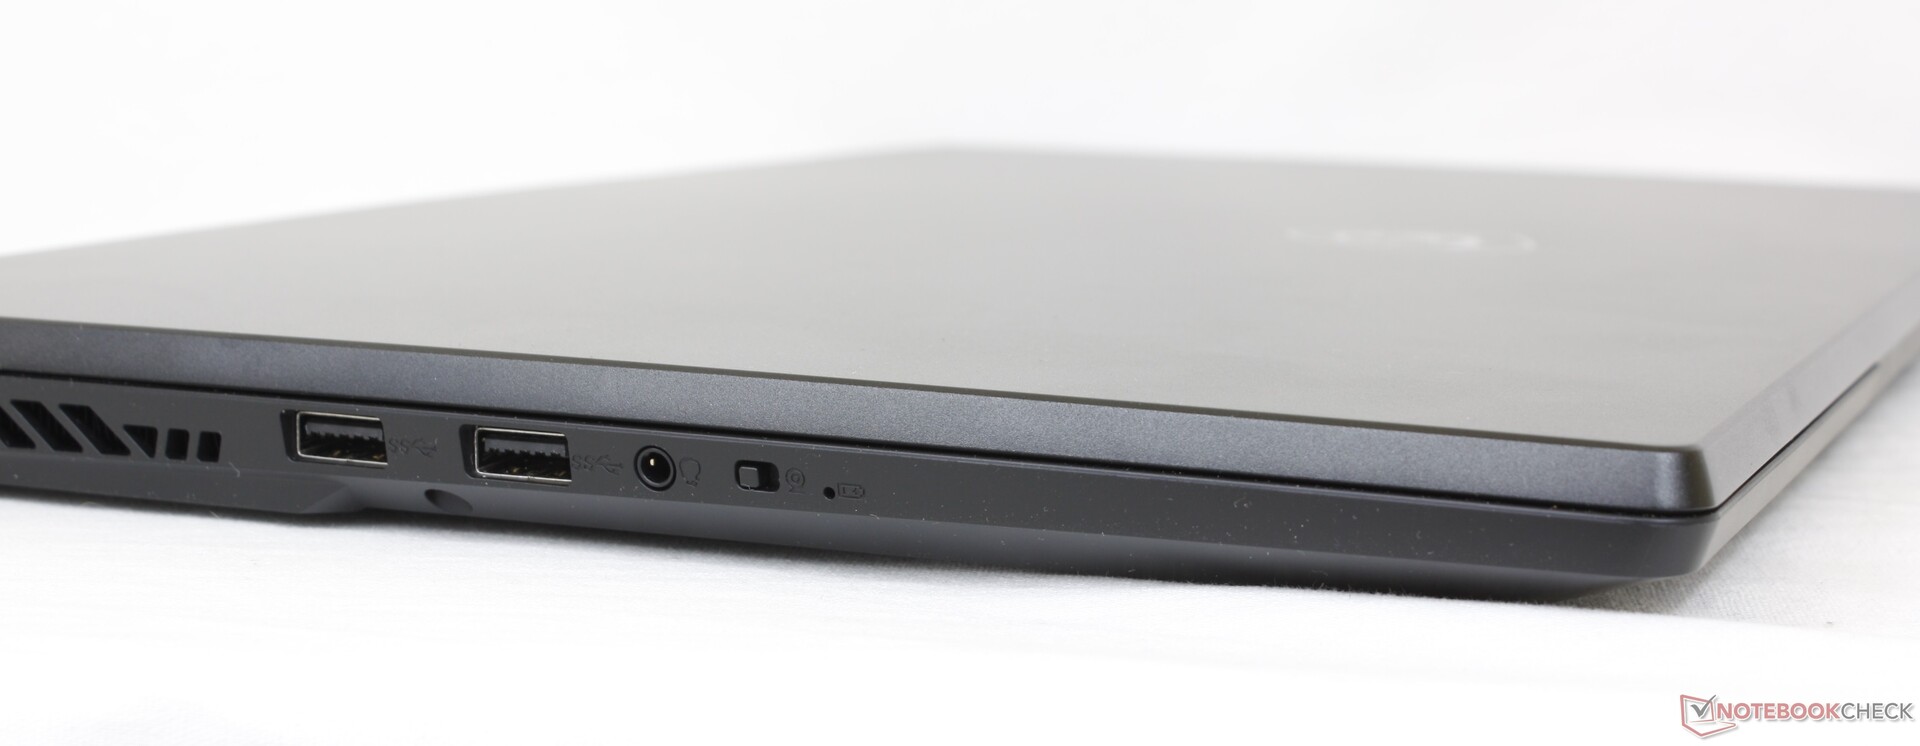
Port options are identical to the GS76 albeit rearranged. Whereas the GS76 had no ports along its rear, the GS77 has a more even spread: 3 along the left, 3 along the right, and 3 along the back.
Users should take note that only one of the two USB-C ports along the right edge supports Thunderbolt much like on the GS76. Additionally, the AC adapter port has changed and so older AC adapters are not compatible.
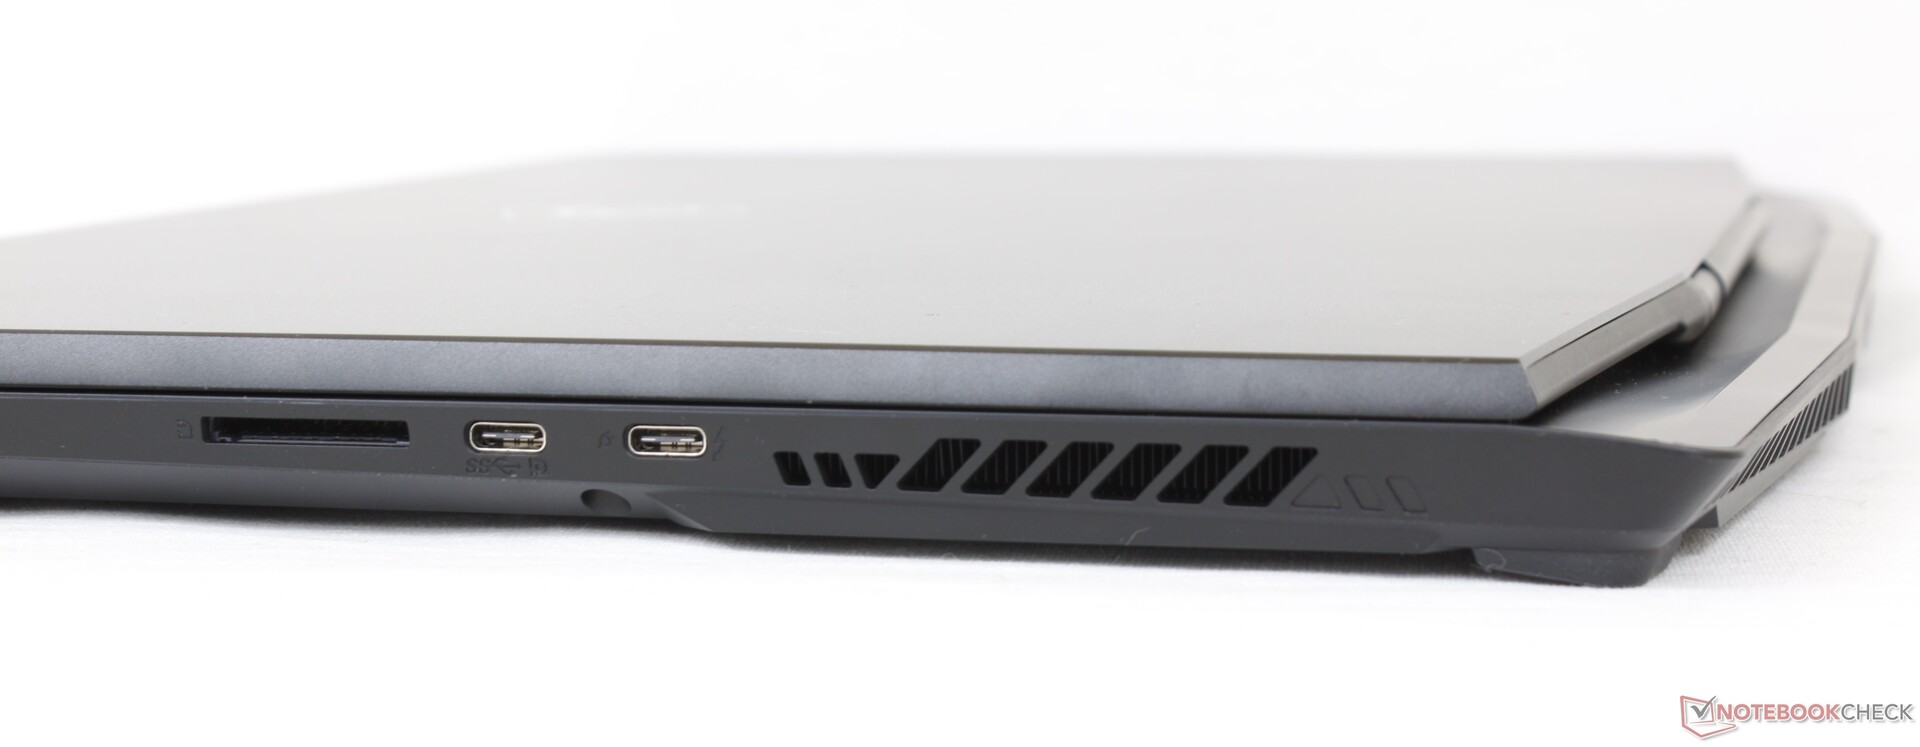
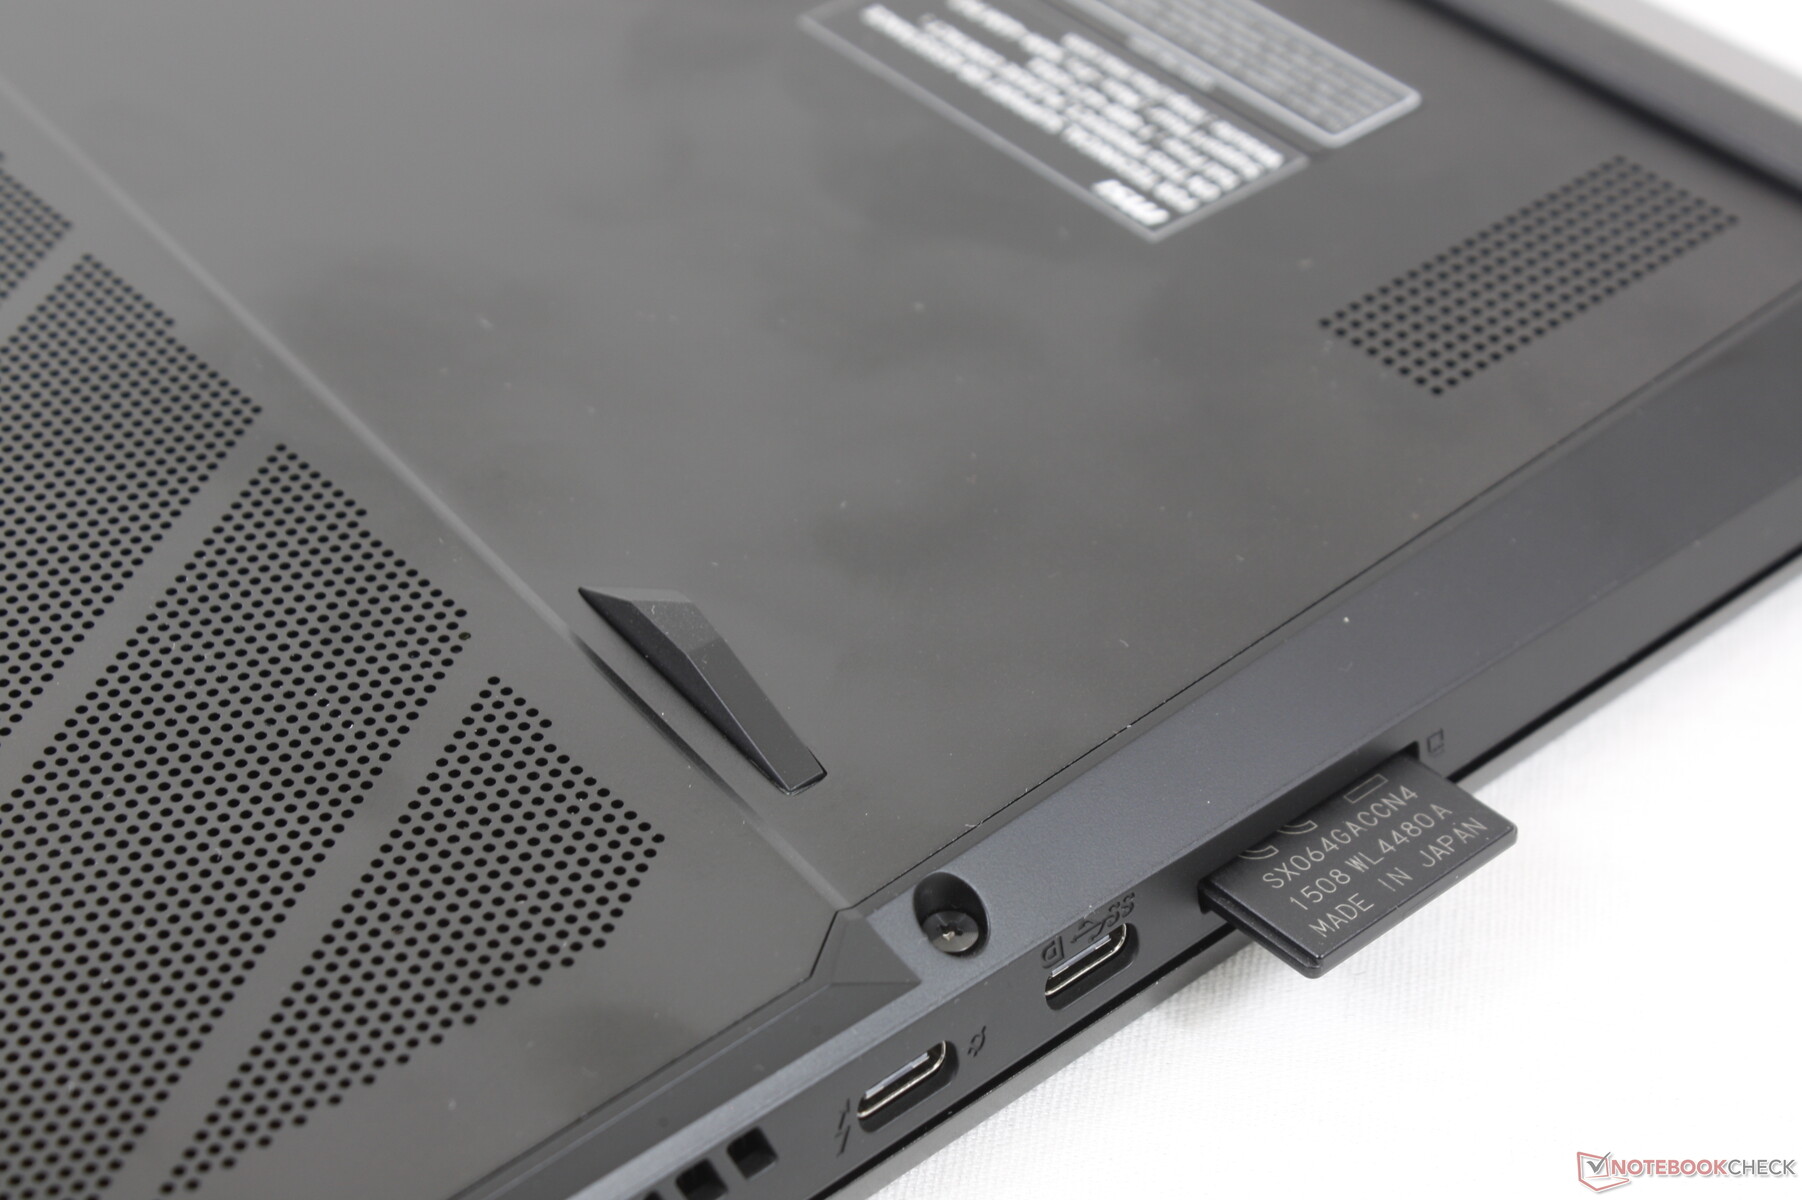
SD Card Reader
MSI has more than halved the speed of its integrated SD reader from the last generation GS76. Moving 1 GB of pictures from our UHS-II test card to desktop on our GS77 takes about 14 seconds compared to just 5 to 6 seconds on the GS76. Users who frequently rely on the SD reader may be disappointed by this downgrade.
| SD Card Reader | |
| average JPG Copy Test (av. of 3 runs) | |
| MSI GS76 Stealth 11UH (AV PRO microSD 128 GB V60) | |
| Asus ROG Zephyrus S17 GX703HSD | |
| Alienware x17 RTX 3080 P48E (AV Pro V60) | |
| Razer Blade 17 RTX 3080 Ti (AV Pro V60) | |
| MSI Stealth GS77 12UHS-083US (AV Pro V60) | |
| maximum AS SSD Seq Read Test (1GB) | |
| Asus ROG Zephyrus S17 GX703HSD | |
| Alienware x17 RTX 3080 P48E (AV Pro V60) | |
| MSI GS76 Stealth 11UH (AV PRO microSD 128 GB V60) | |
| Razer Blade 17 RTX 3080 Ti (AV Pro V60) | |
| MSI Stealth GS77 12UHS-083US (AV Pro V60) | |
Communication
Webcam
The webcam has been upgraded from 720p on the GS76 to 1080p on the GS77 for a sharper picture overall. IR is supported for Windows Hello and an electronic shutter is accessible along the left edge.


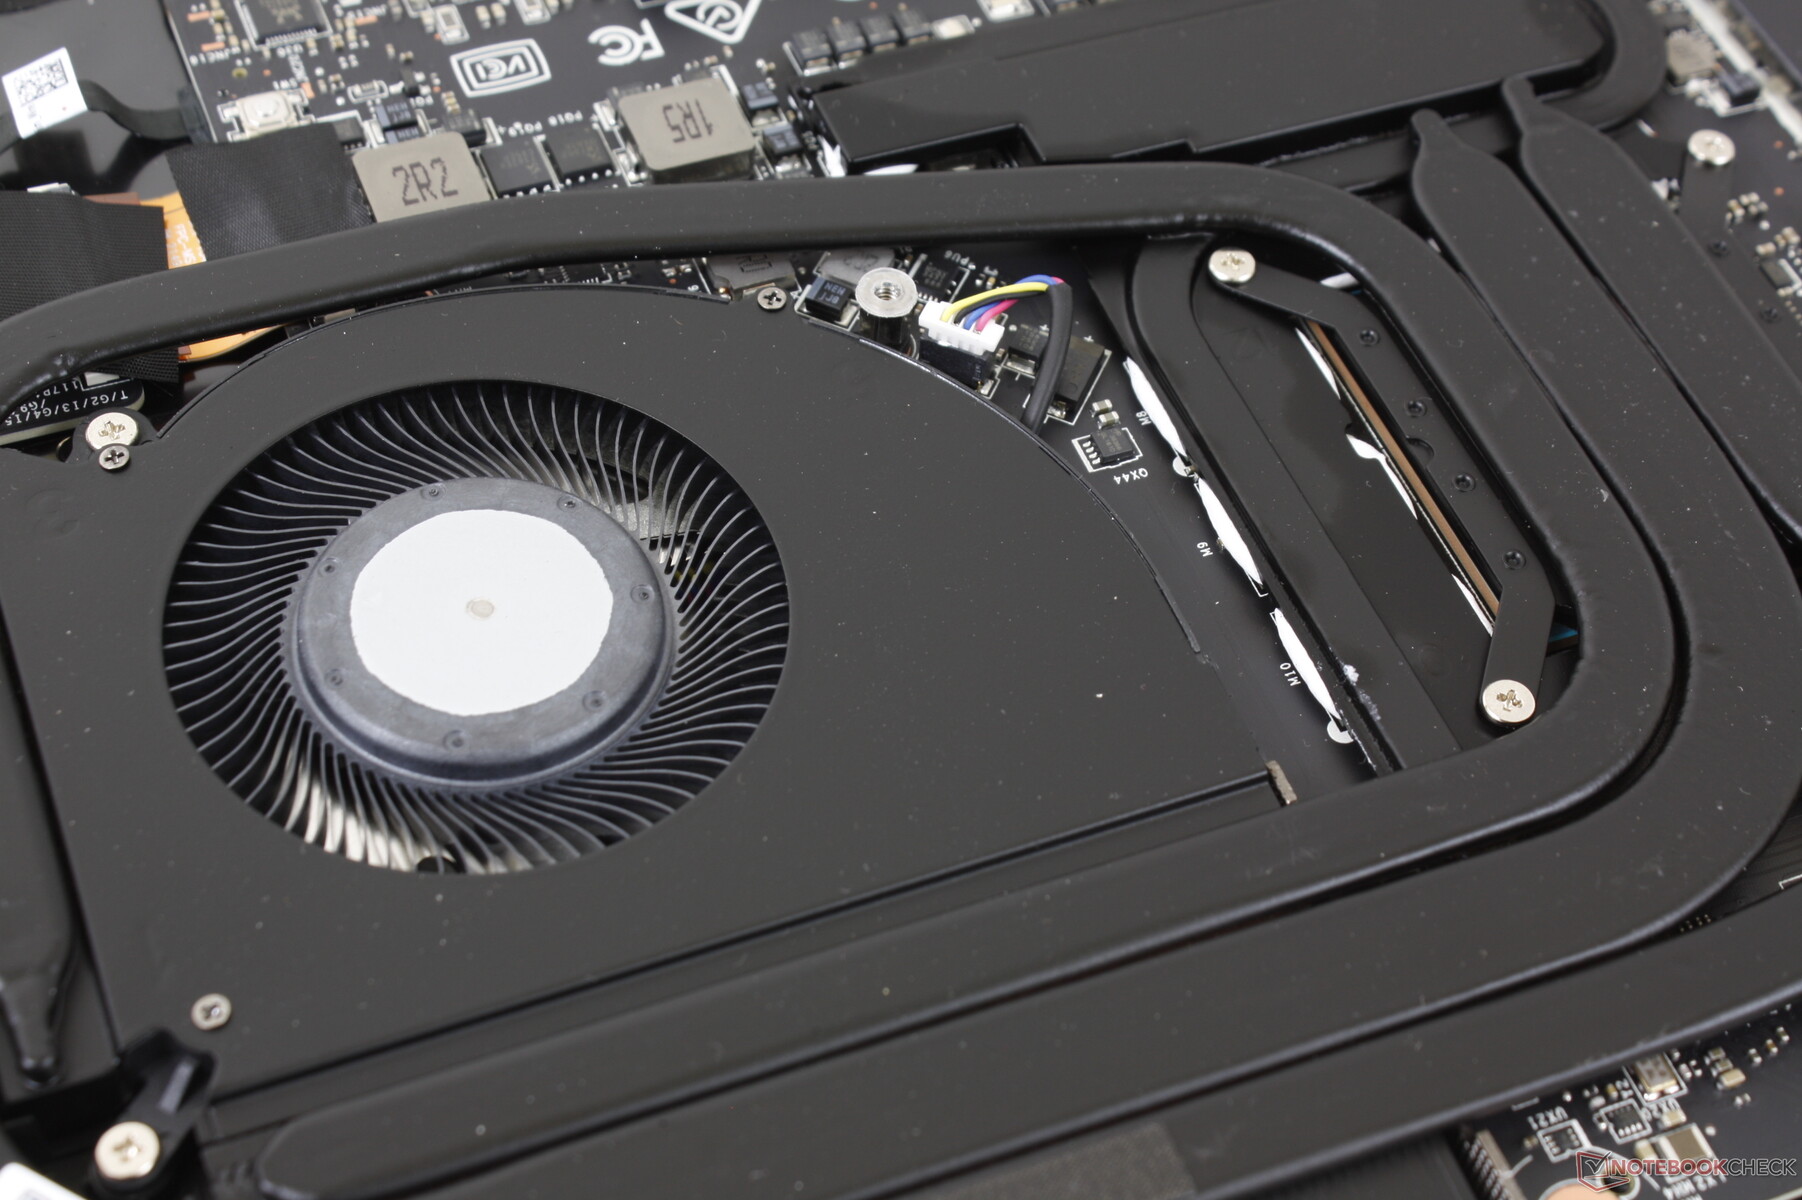
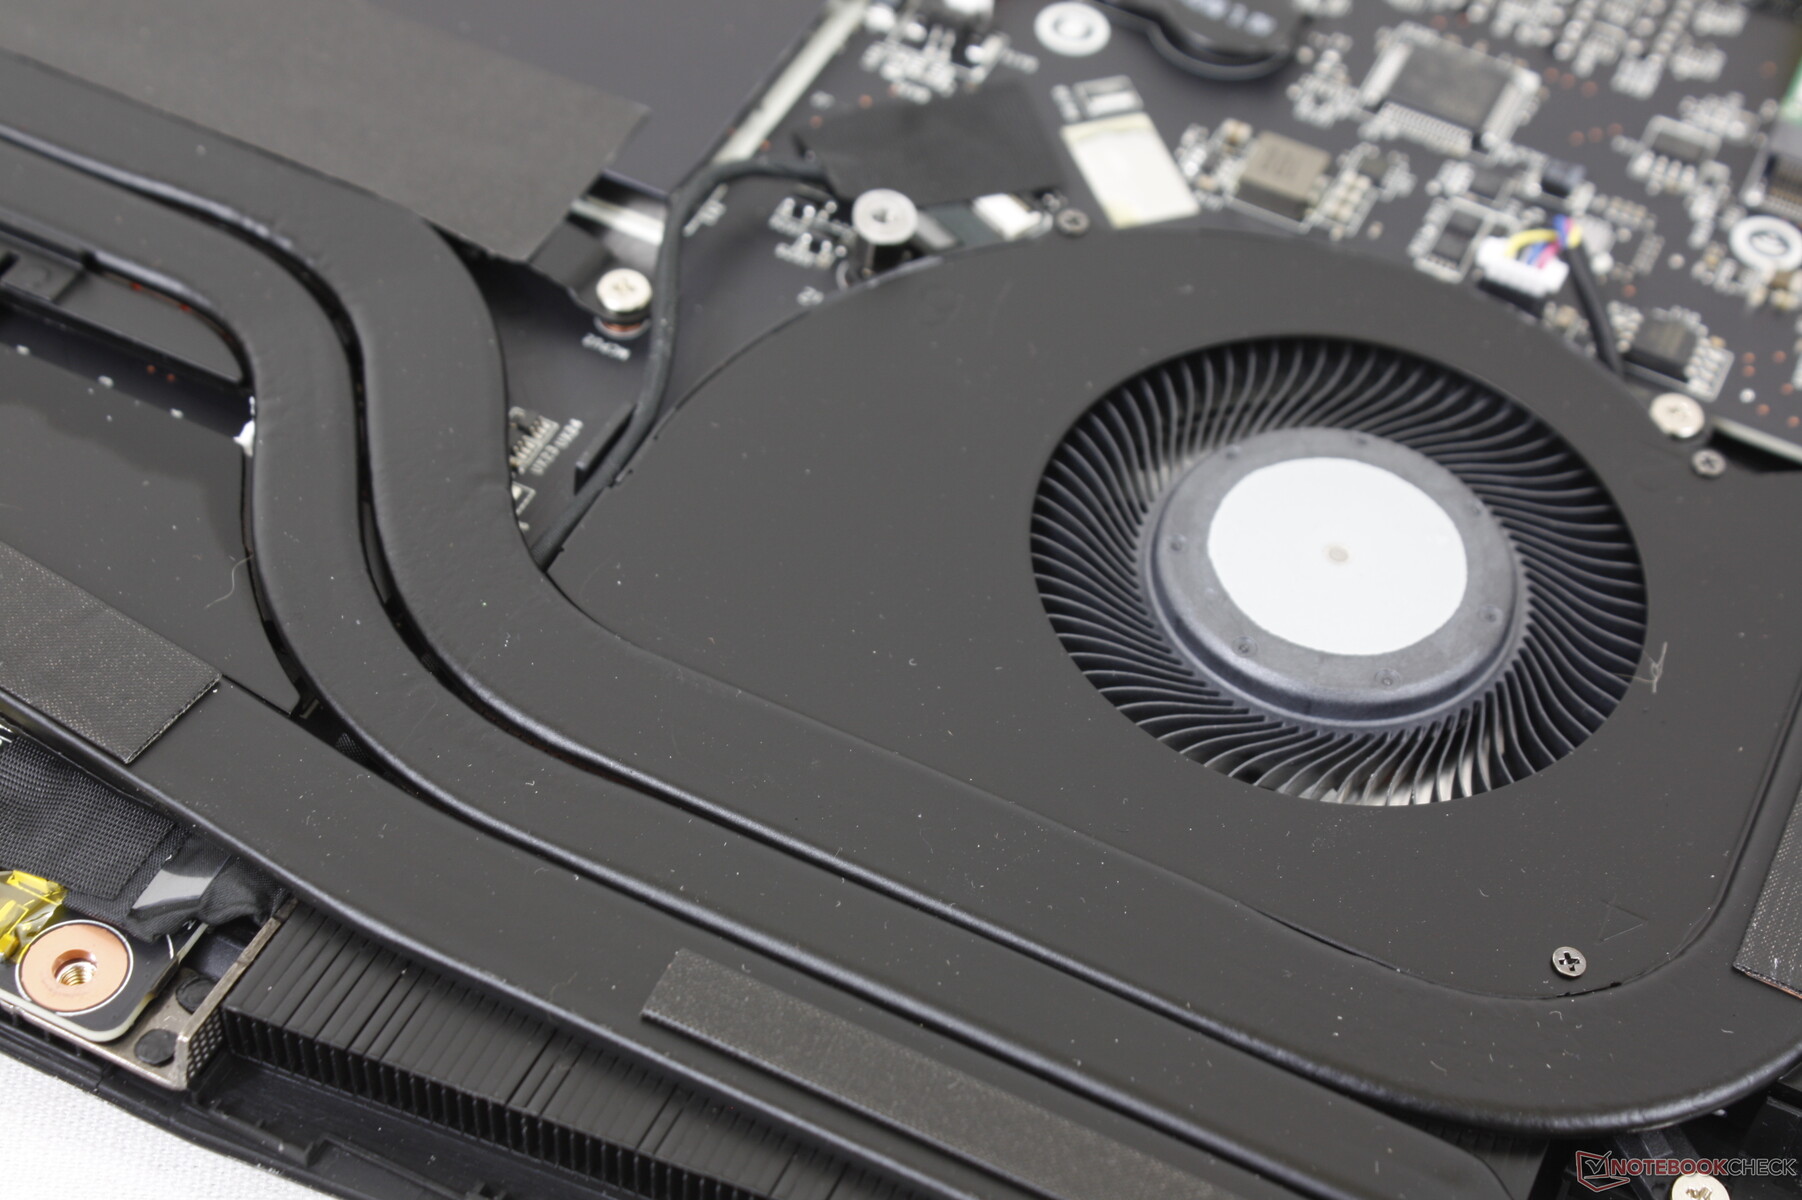
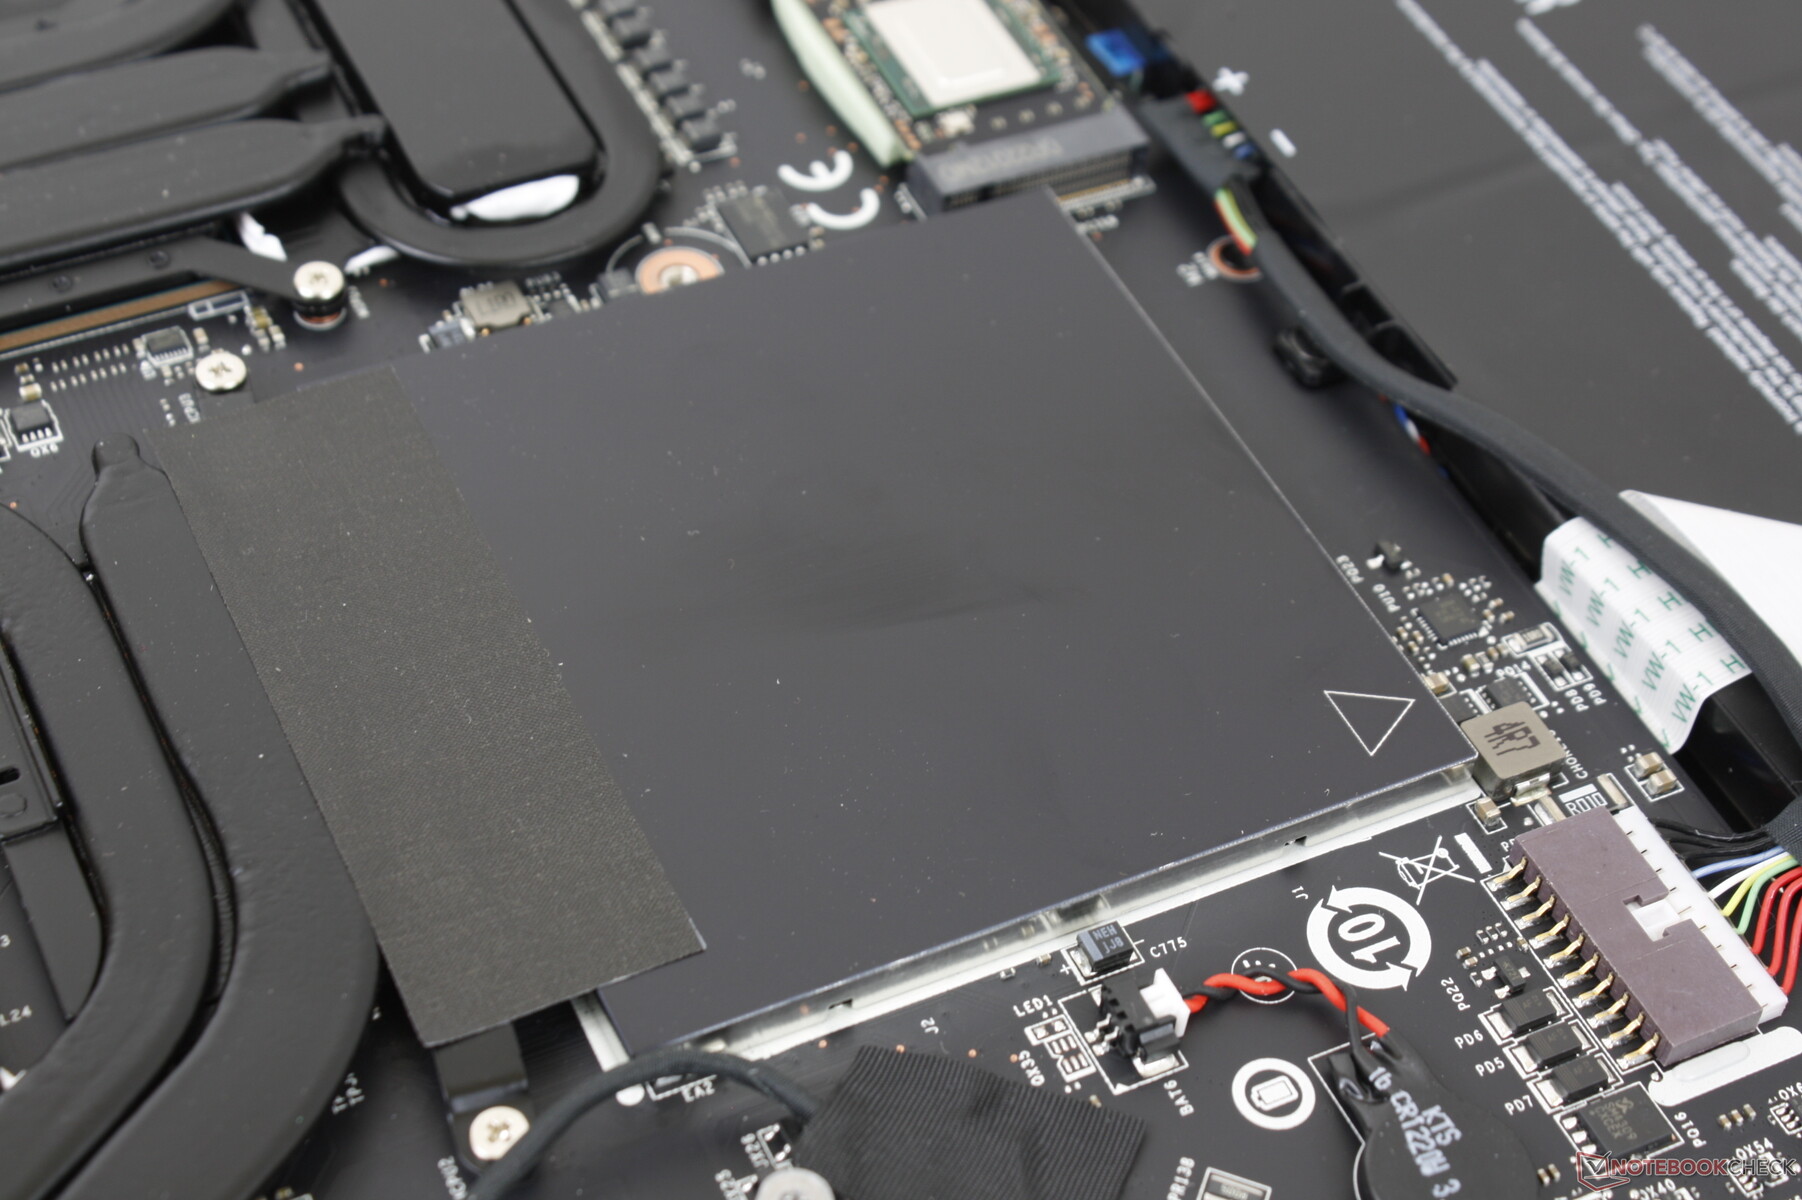
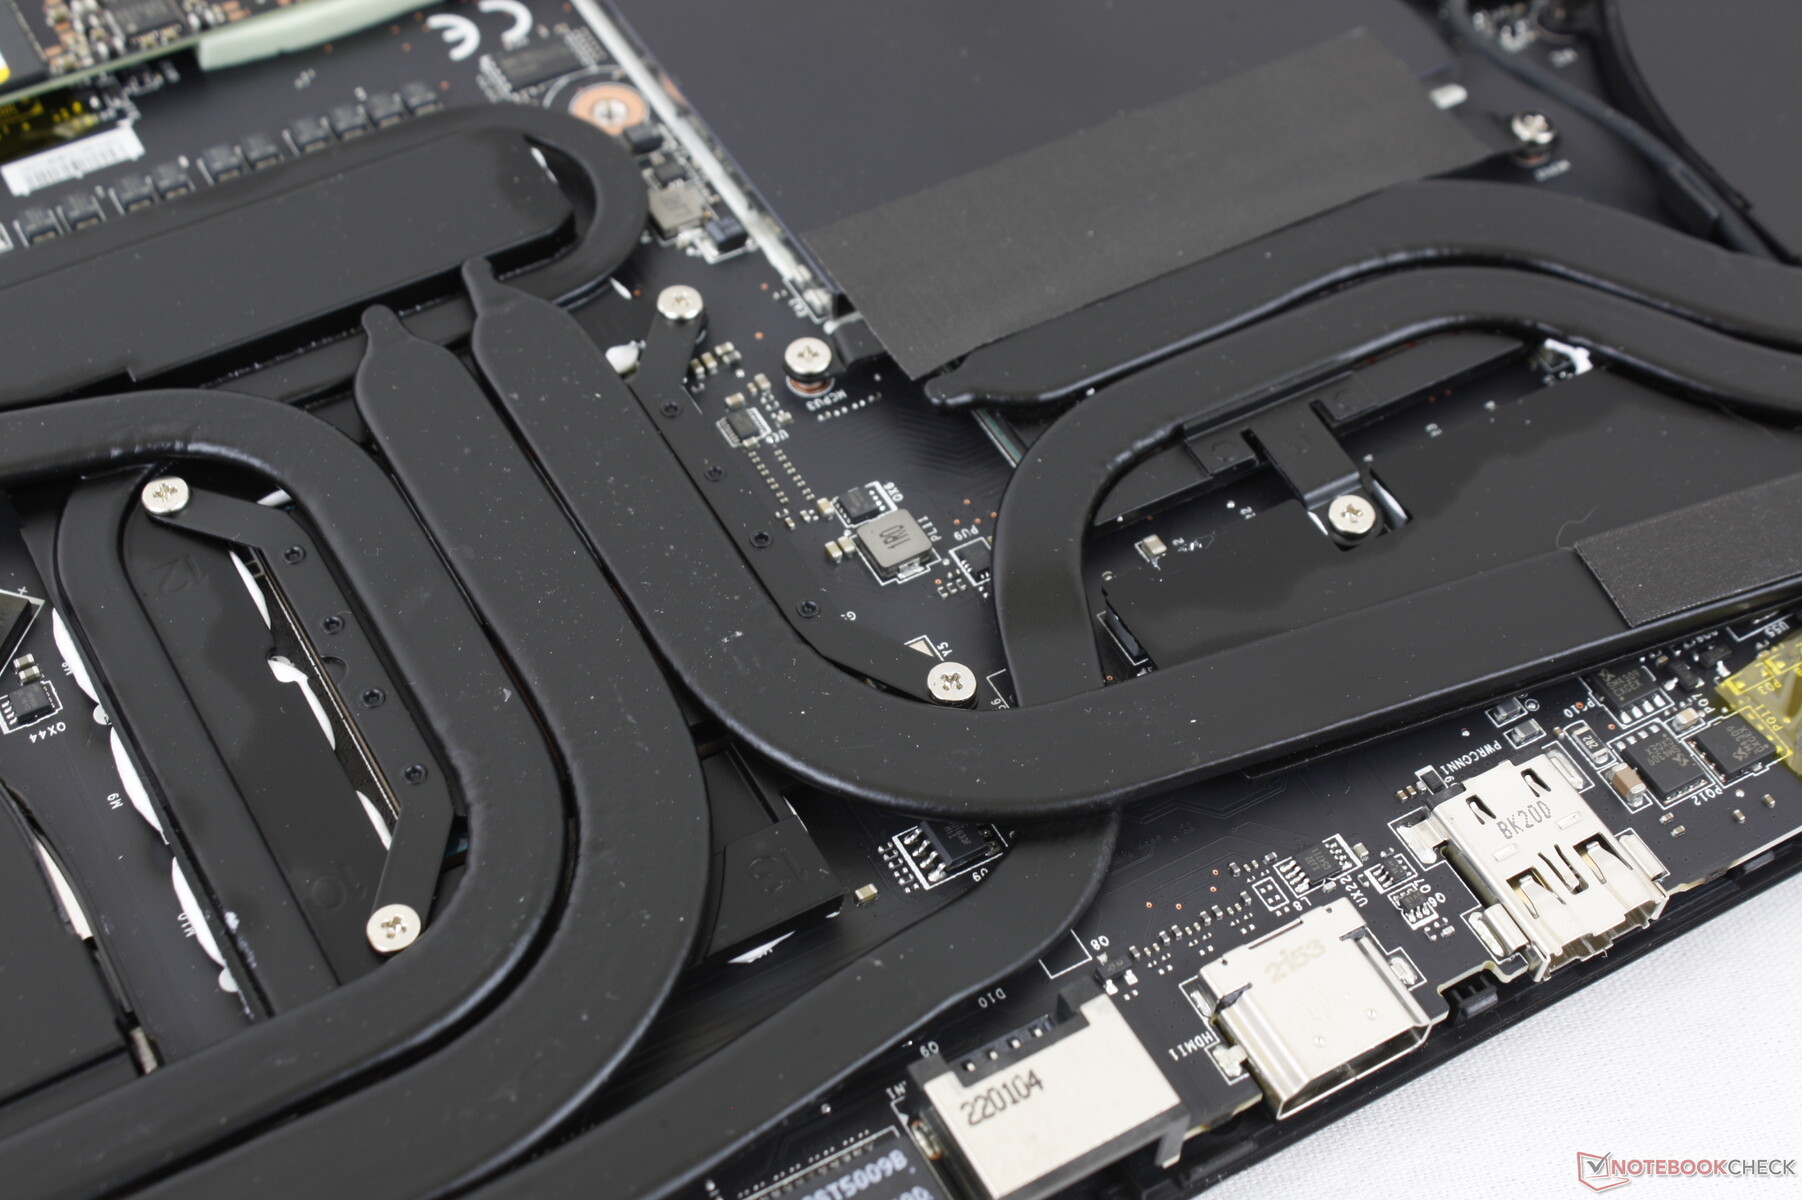
Maintenance
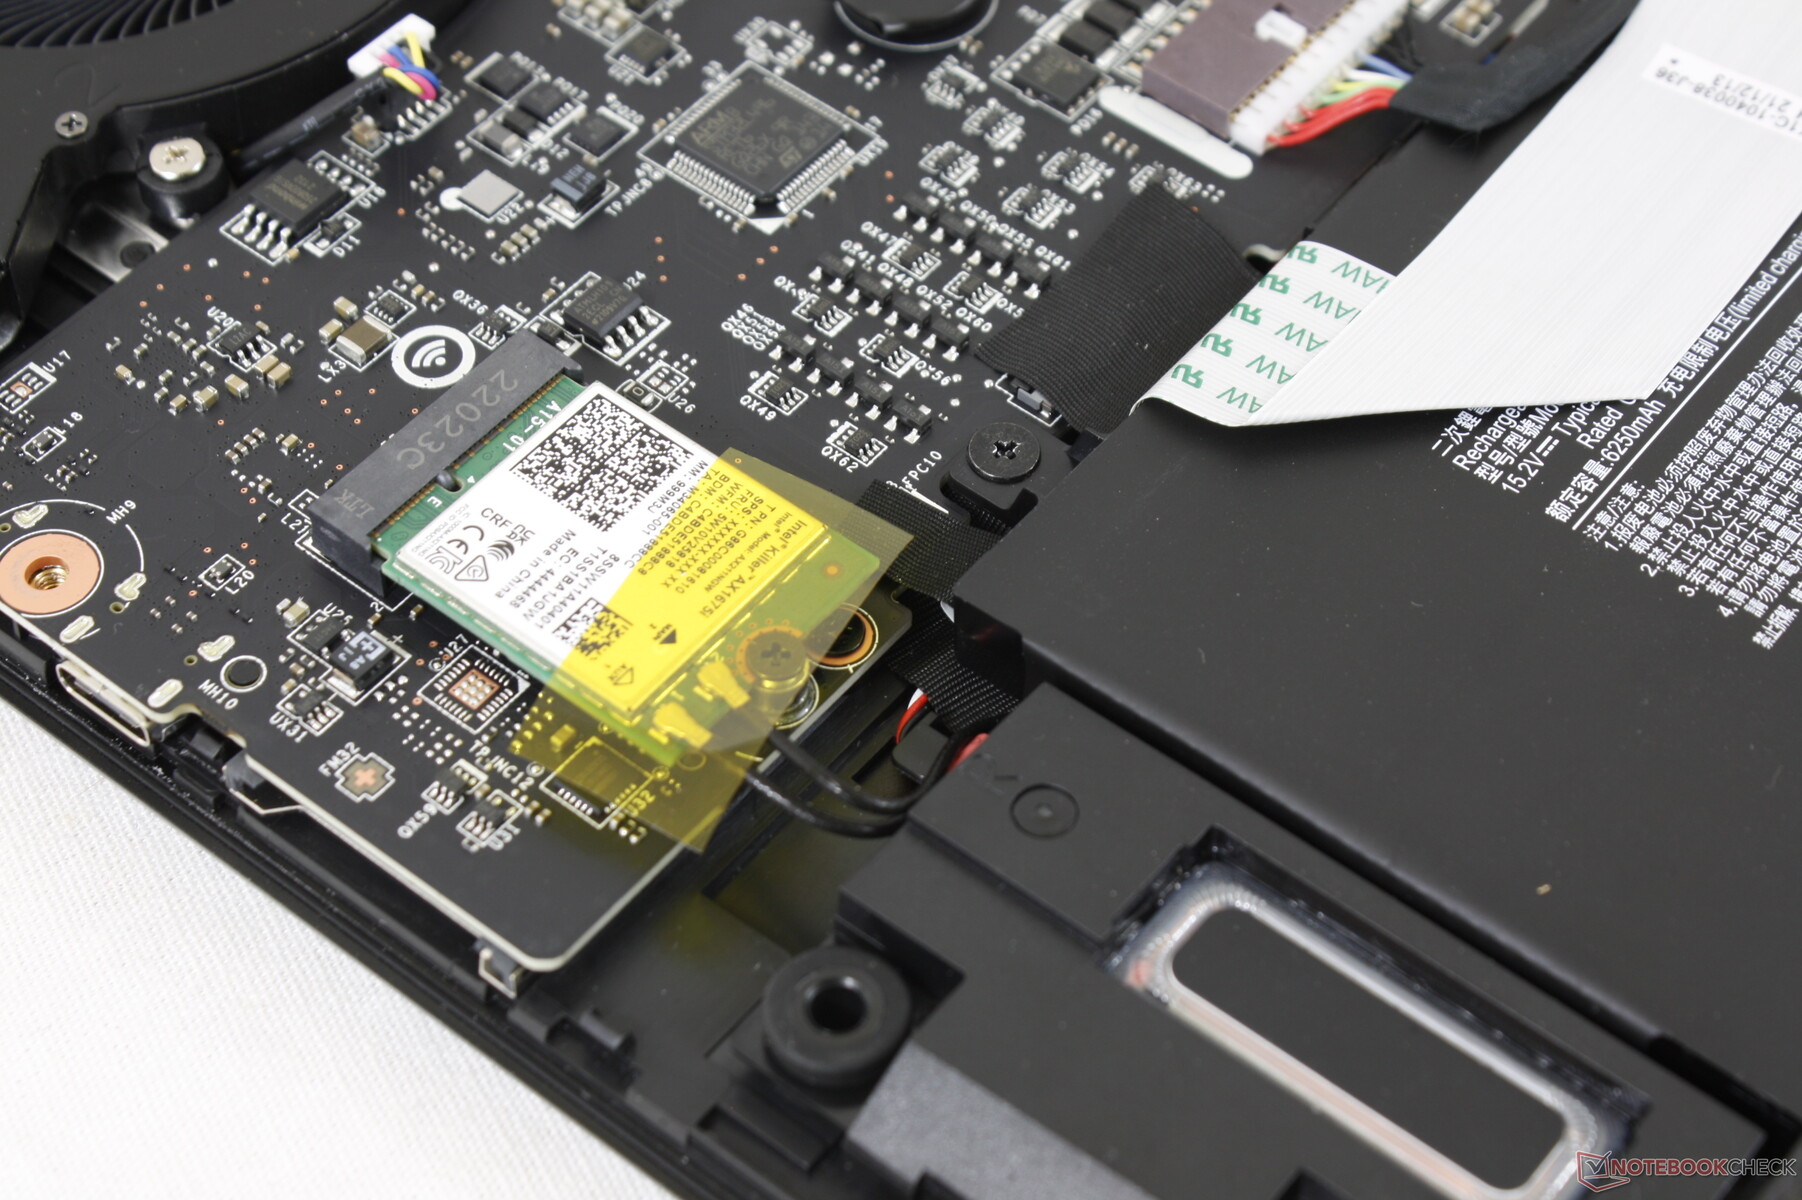
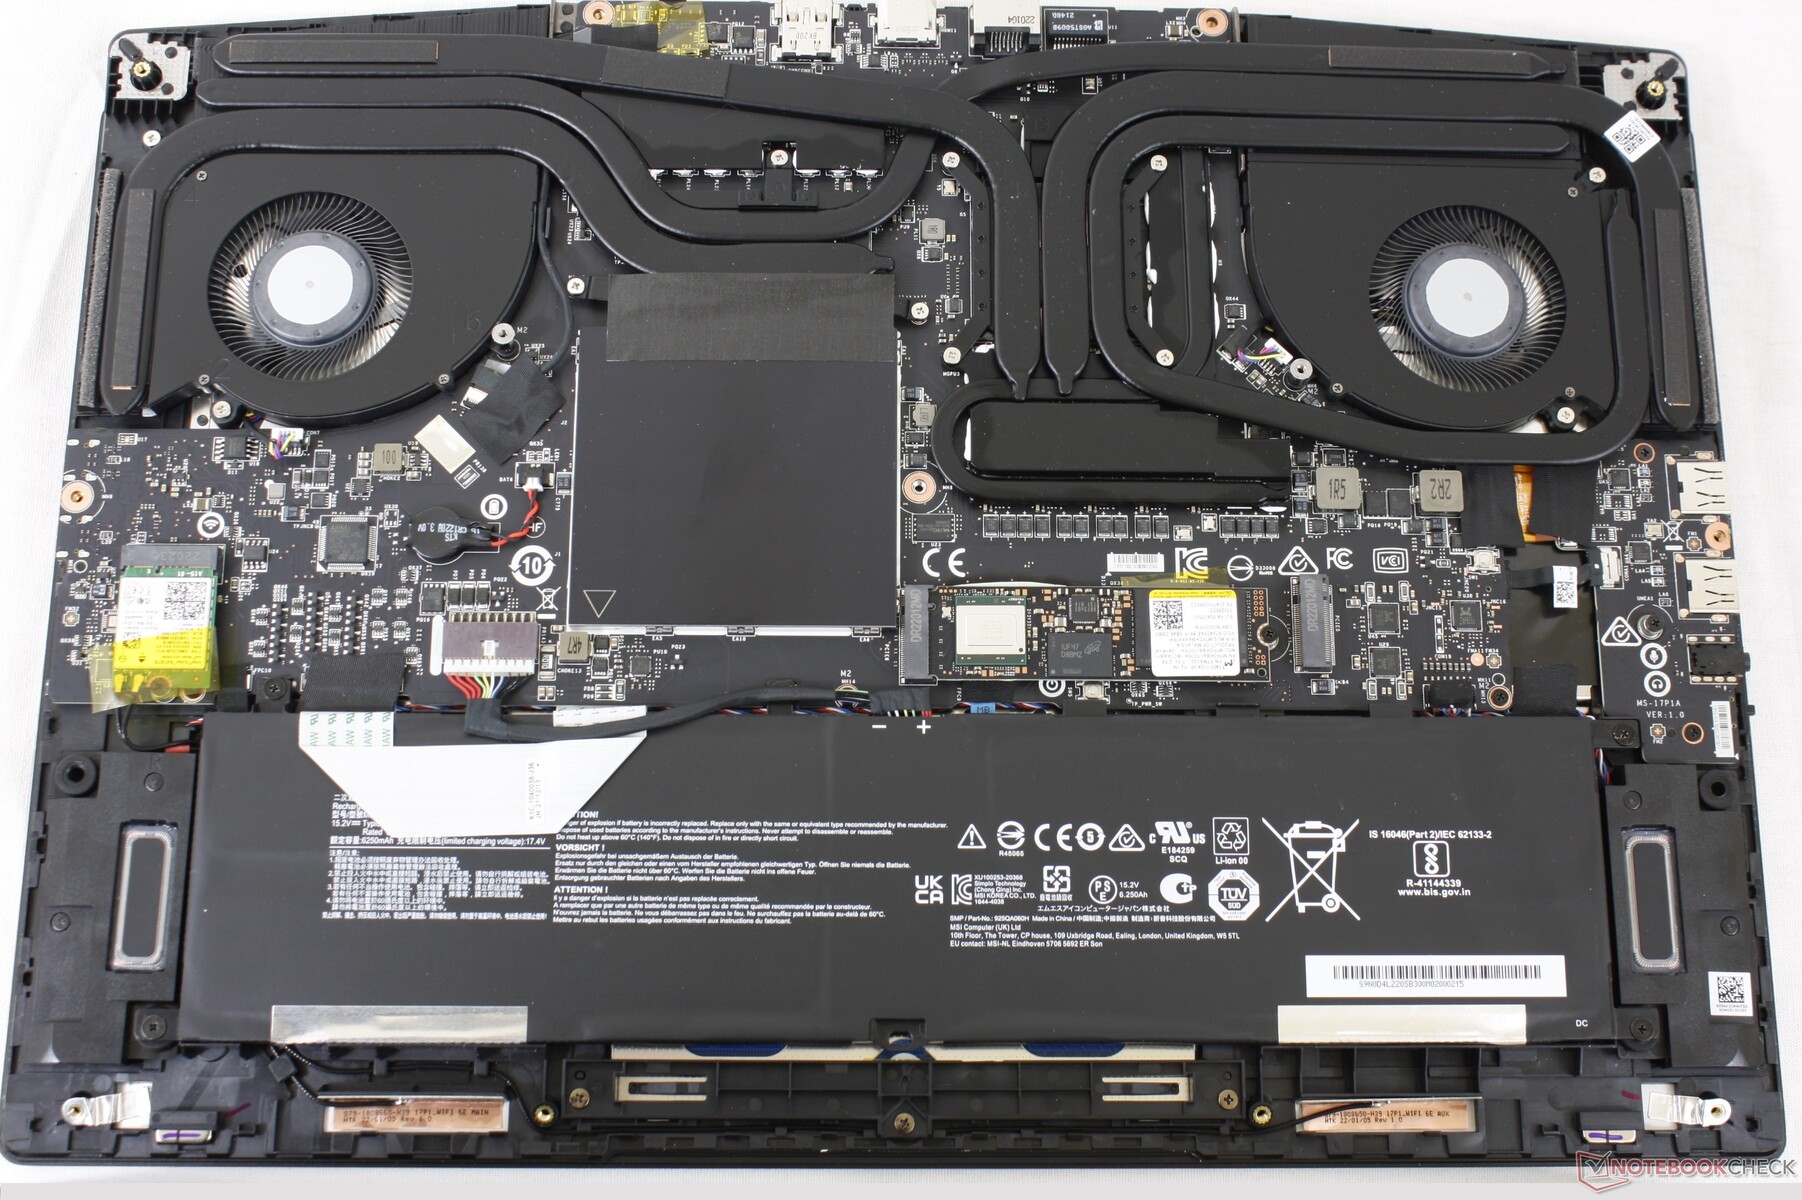
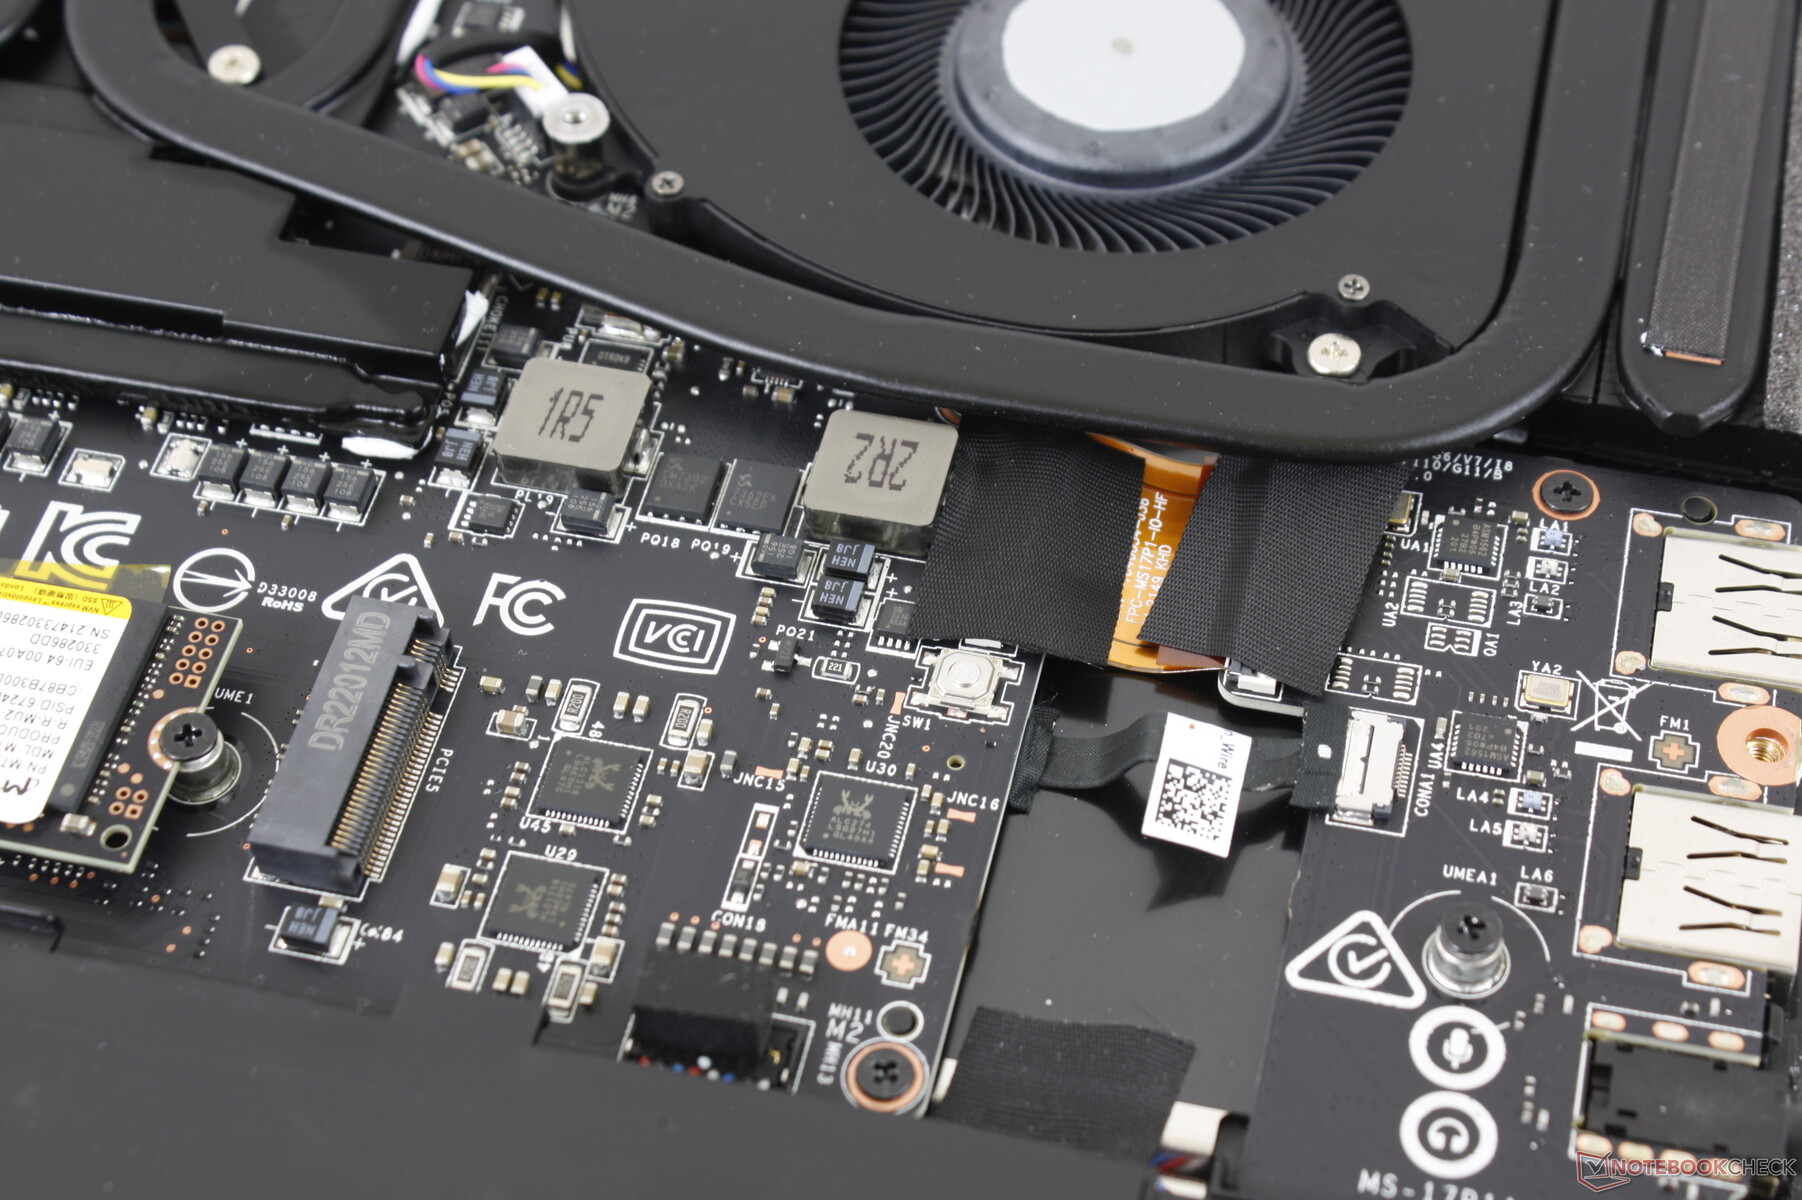
The bottom panel comes off fairly easily after removing the 11 Philips screws underneath. Keep in mind that a factory seal sticker must be broken unlike on most other gaming laptops from competing manufacturers.
Once inside, users will have access to 2x SODIMM slots, 2x PCIe4 x4 2280 SSD slots, and the removable WLAN module. The two SODIMM slots are protected by their own aluminum cover.
Accessories and Warranty
The retail box includes a velvet screen wipe in addition to the paperwork and AC adapter. A one-year manufacturer warranty applies with extension options if purchased from Xotic PC.
Input Devices — Sideways Step
Keyboard
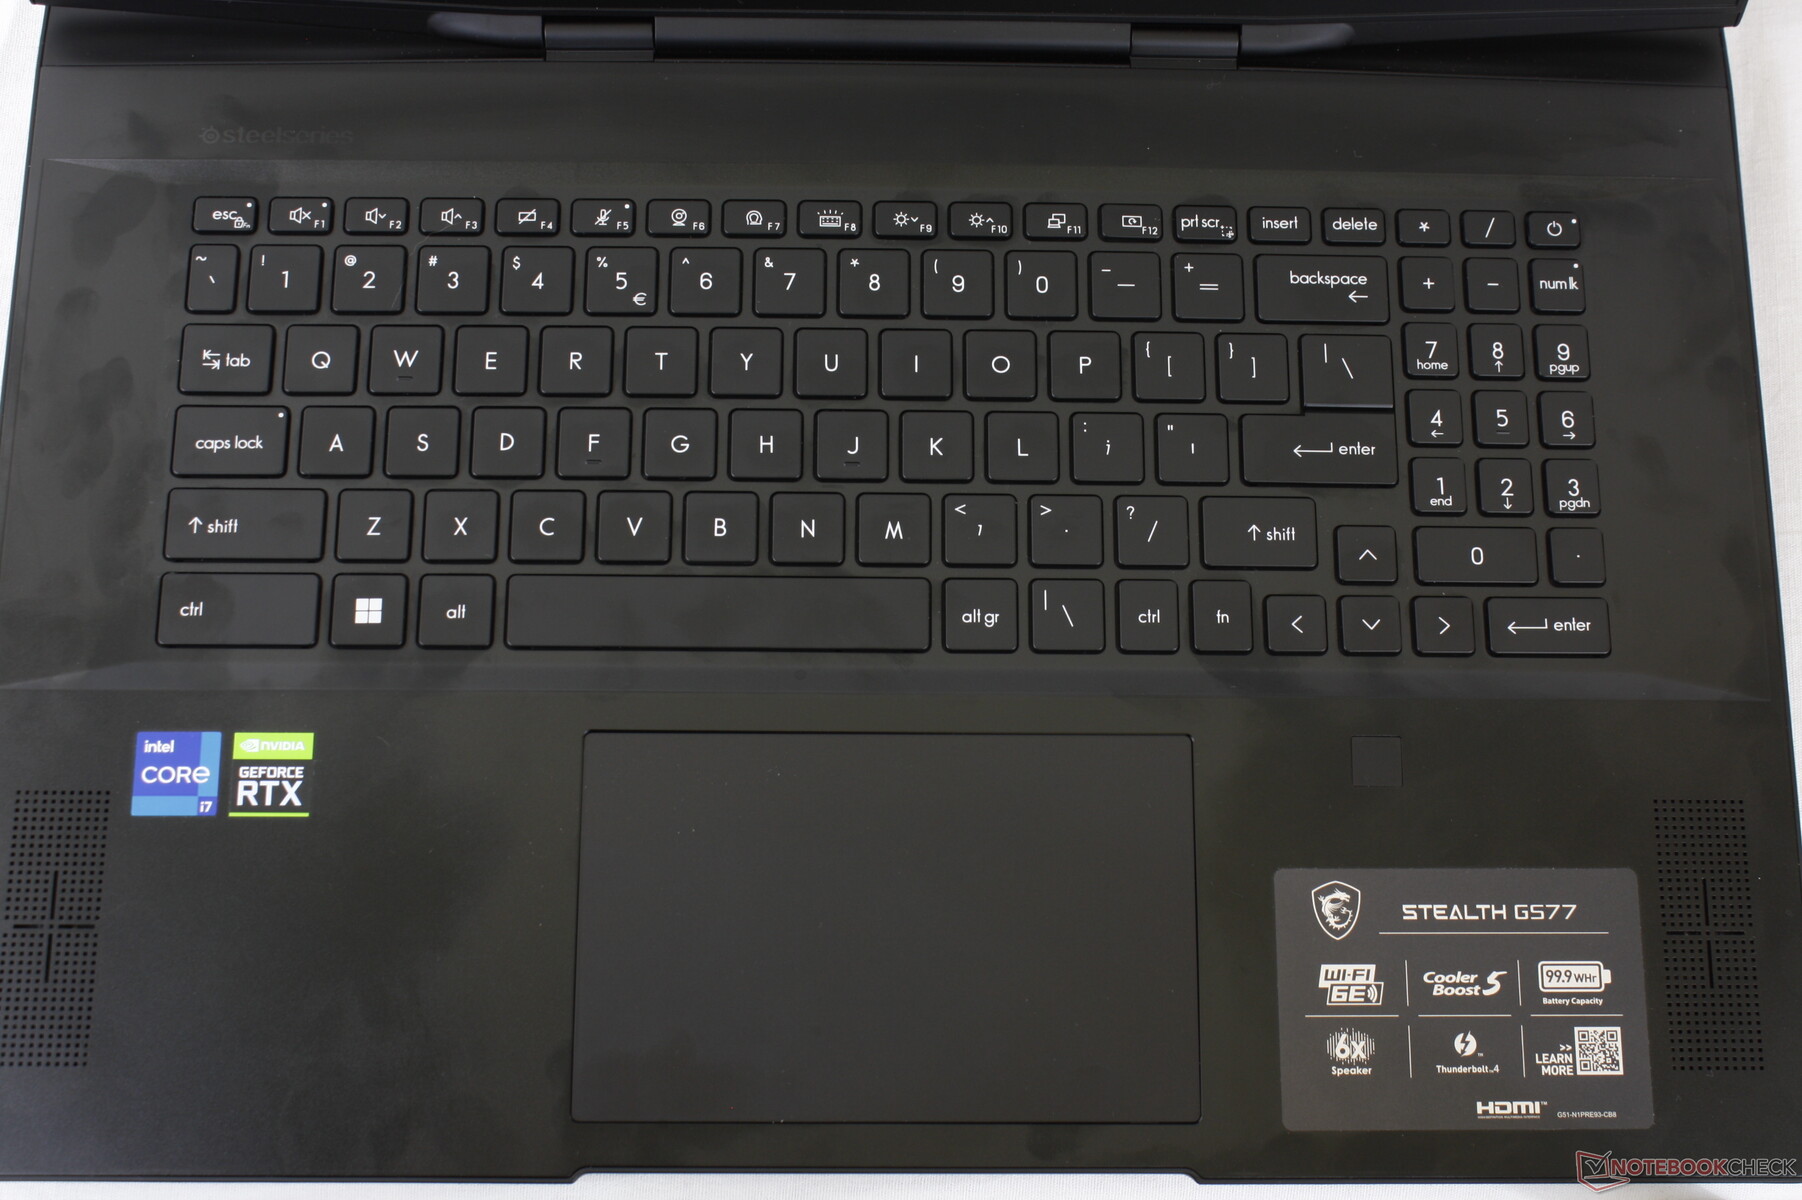
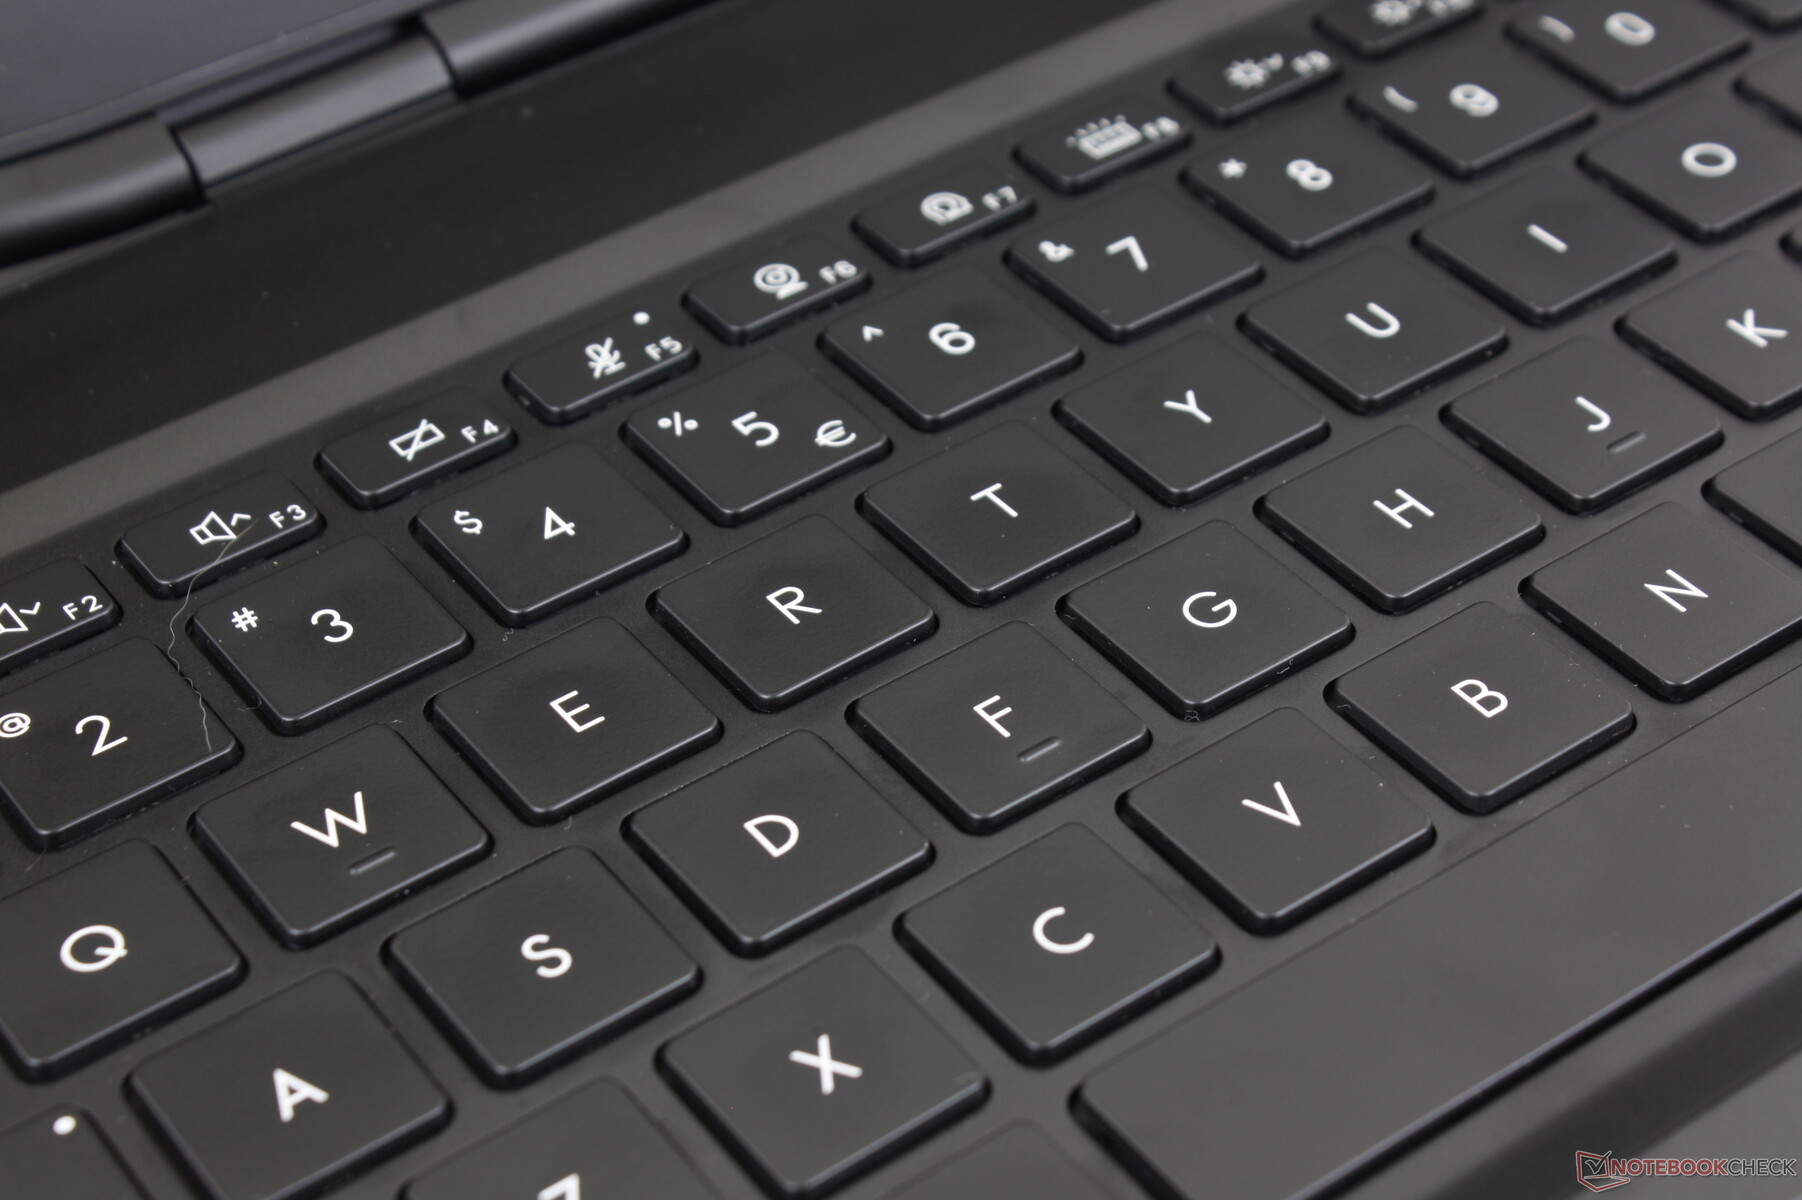
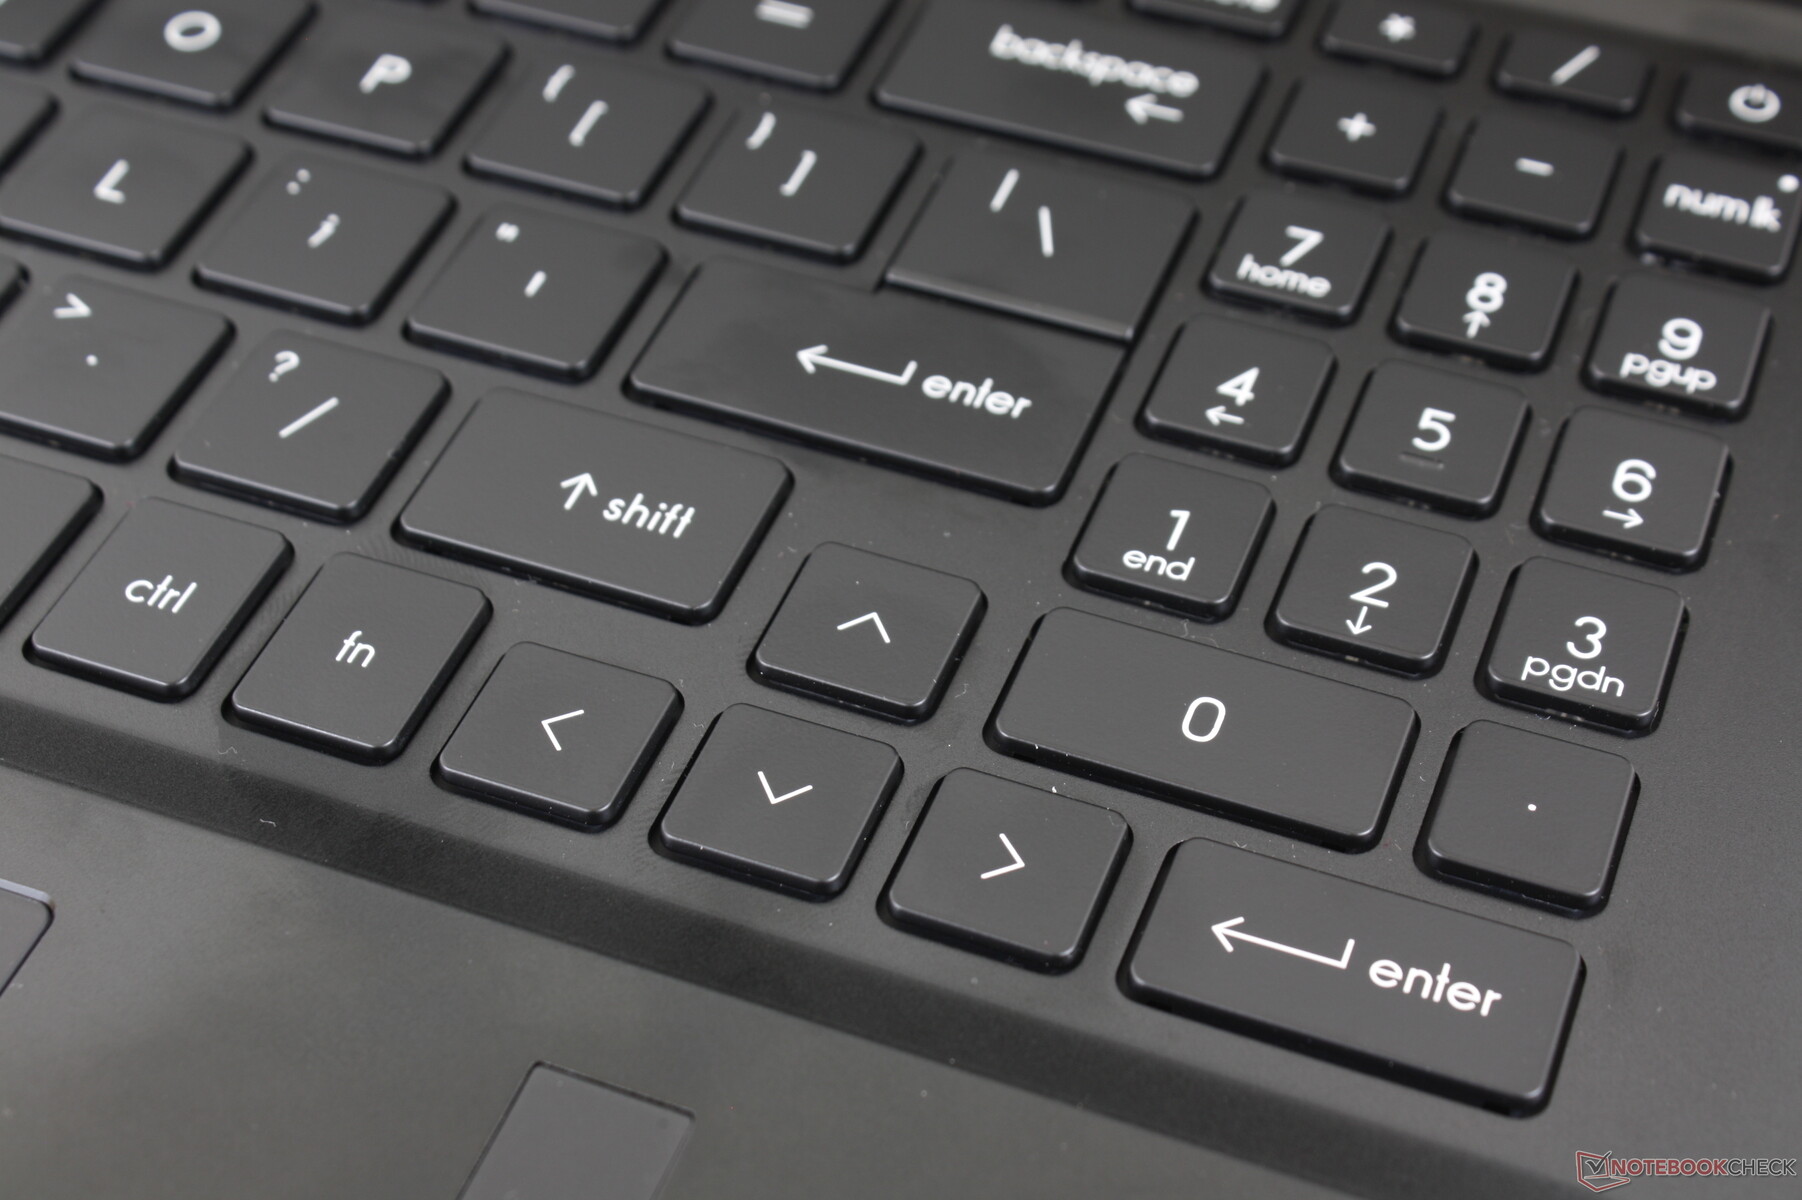
The keyboard keys are slightly softer and quieter than the keys on the Blade 17. Thus, it's not necessarily better or worse as some users may prefer a quieter typing experience even if it means having slightly spongier feedback. The GS77 even integrates a dedicated numpad whereas the Blade does not.
Key size is the one major drawback to the GS77 keyboard. In particular, the numpad, arrow keys, and top row of function keys are all much smaller than the main QWERTY keys and so they are therefore noticeably spongier and weaker in feedback. At least the function keys on the Blade 17 are of the same size as the main QWERTY keys for better uniformity.
Touchpad
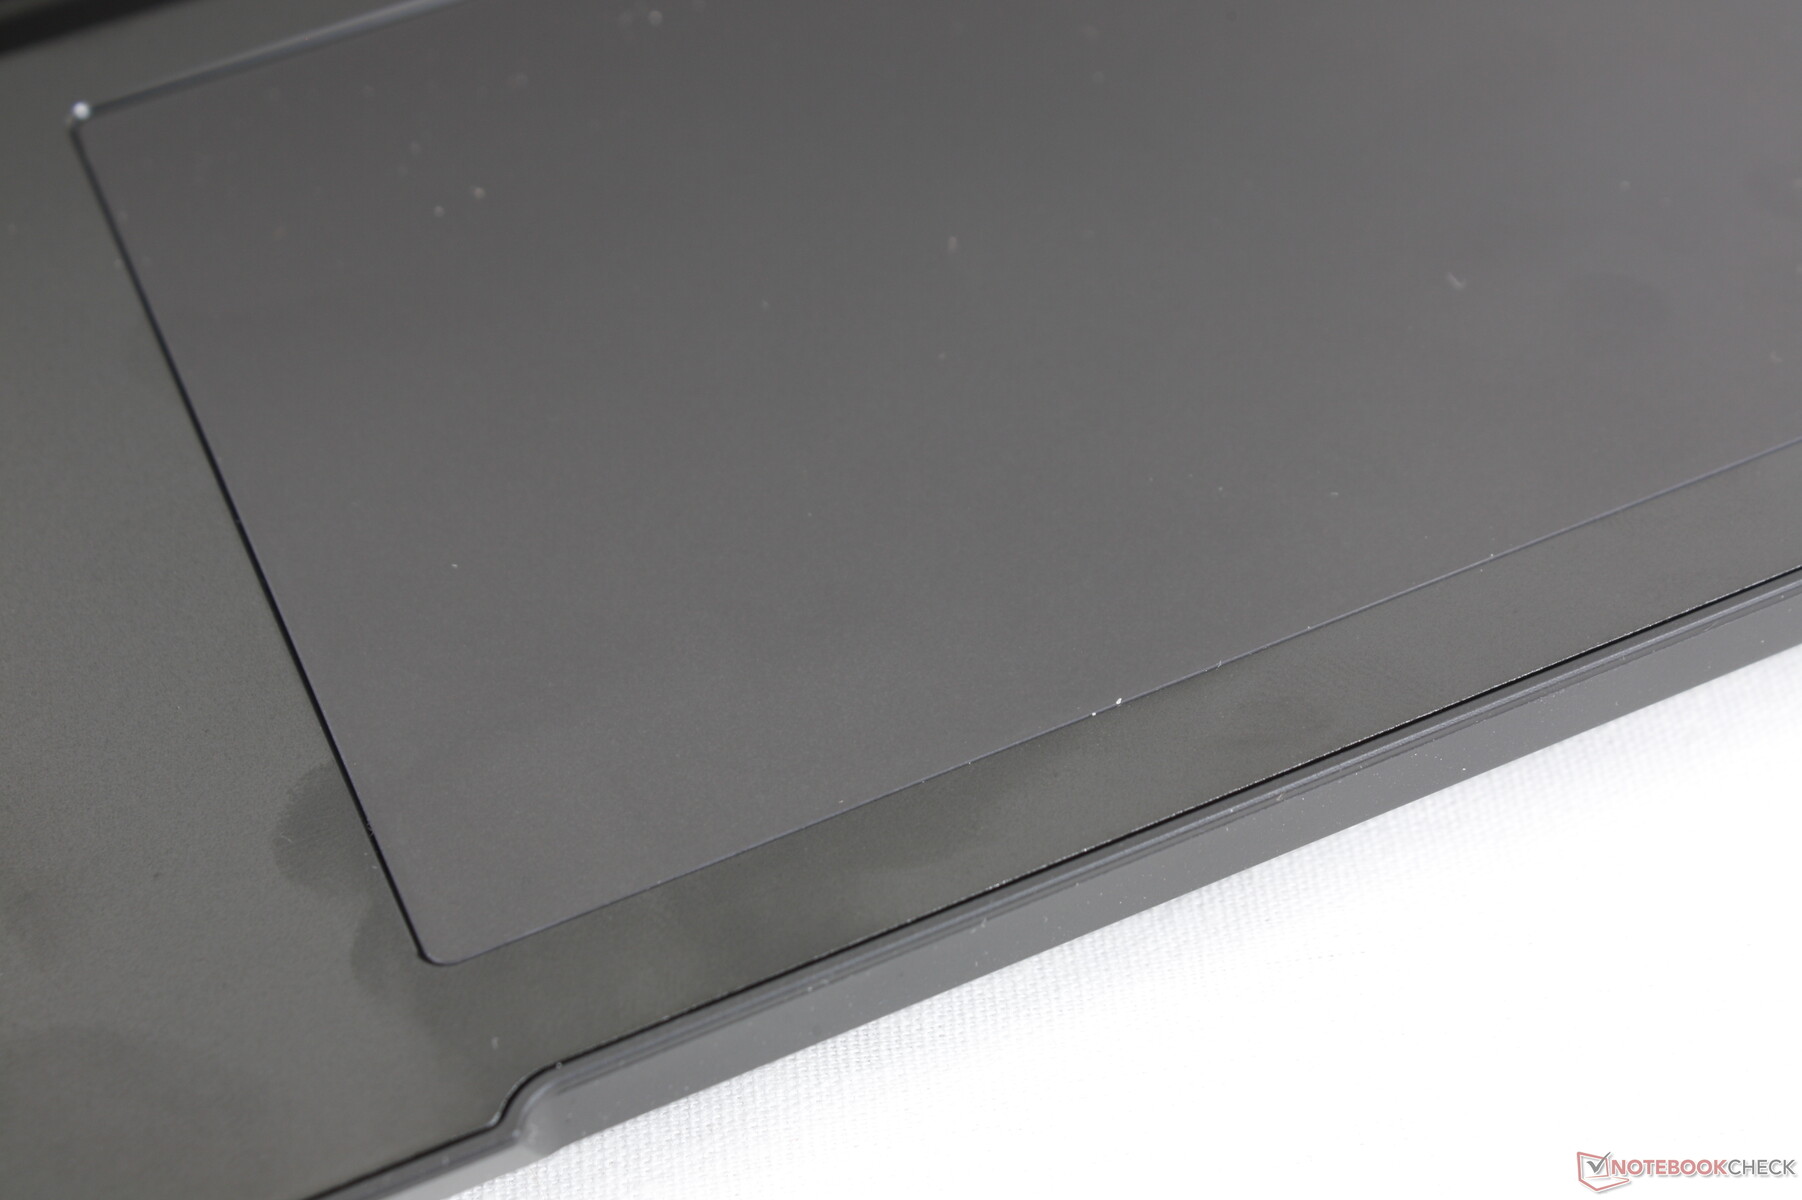
The clickpad is ever-so-slightly larger than the one on the Blade 17 (13.2 x 8.2 cm vs. 13 x 8 cm). Traction is very smooth even when gliding at slow speeds for a very similar feel to the Blade 17 clickpad. Instead, the biggest difference between them is their respective feedback as clicking on the GS77 clickpad is both firmer and louder than on the Razer.
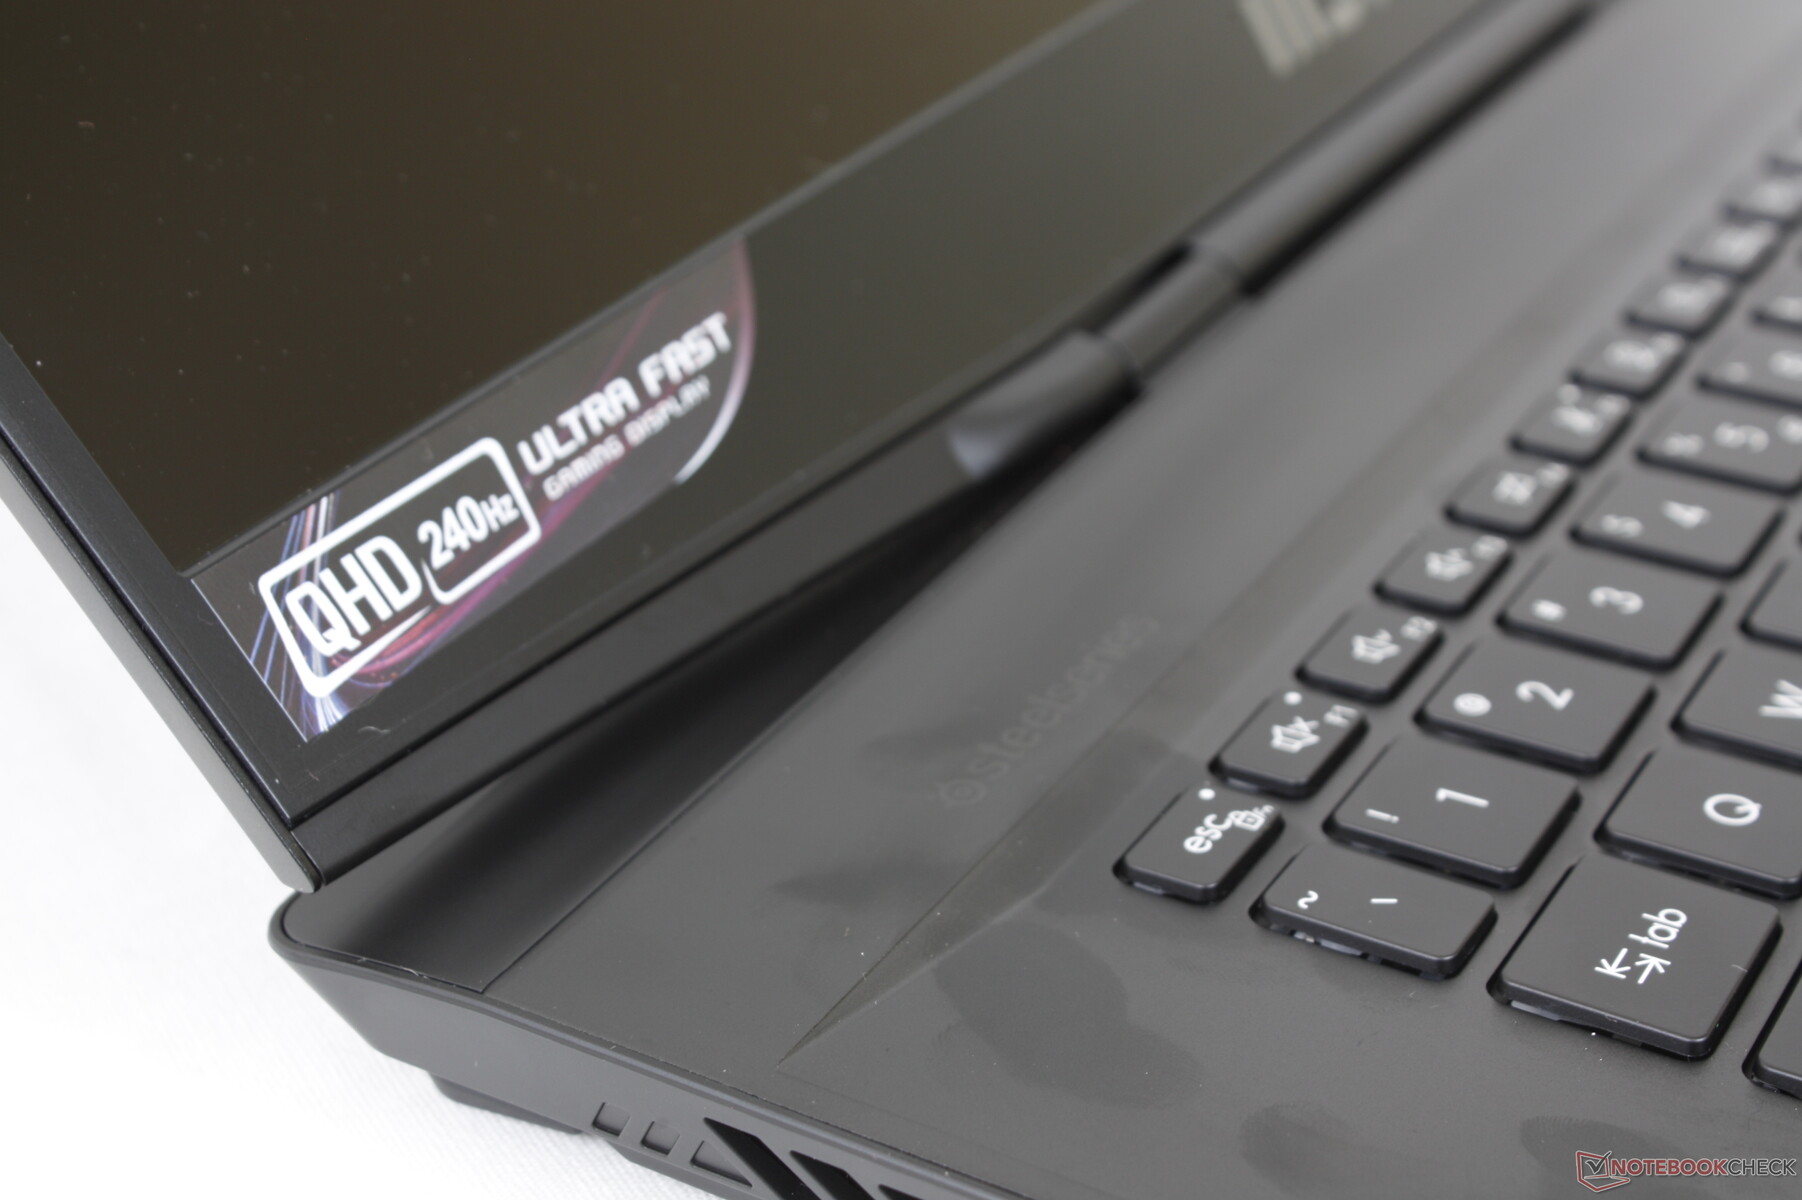
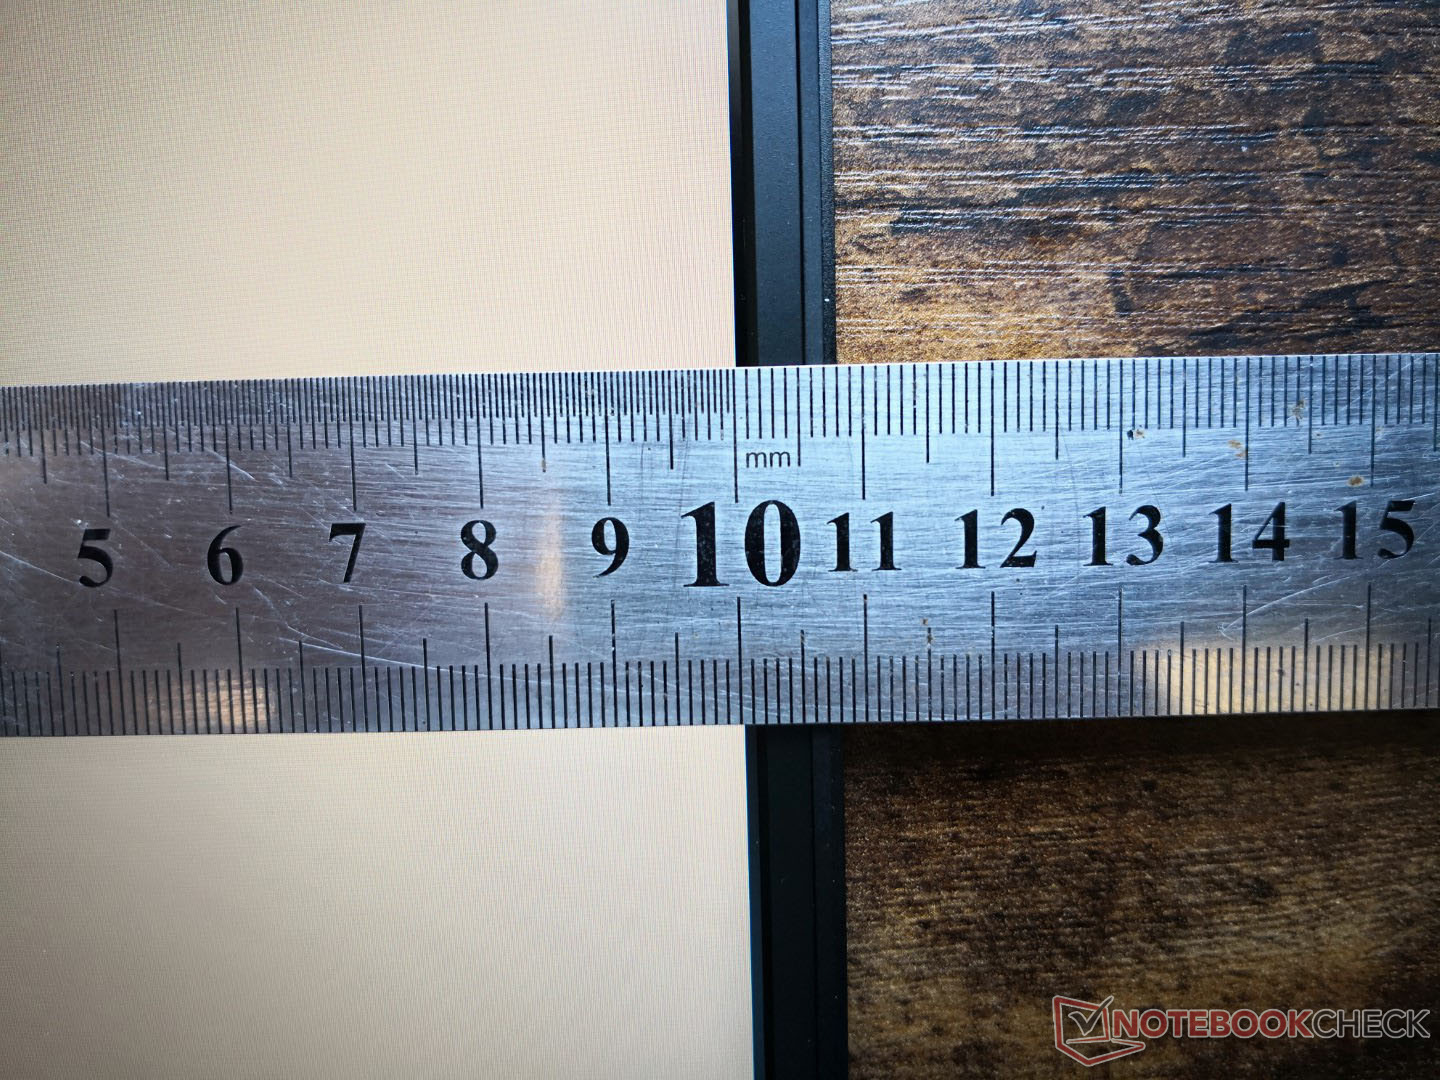
Display — High Refresh Rate As Standard
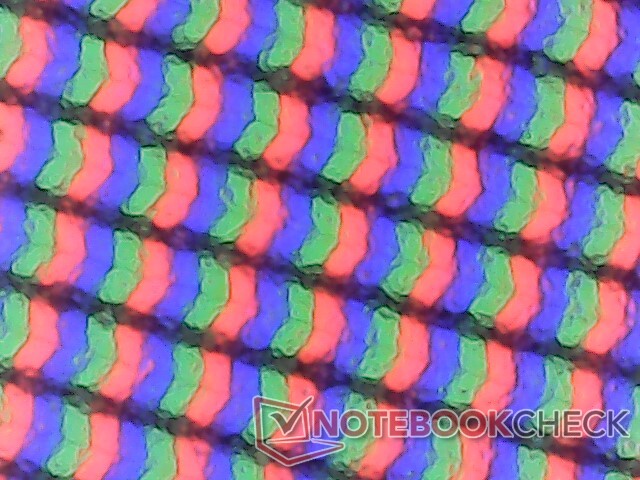
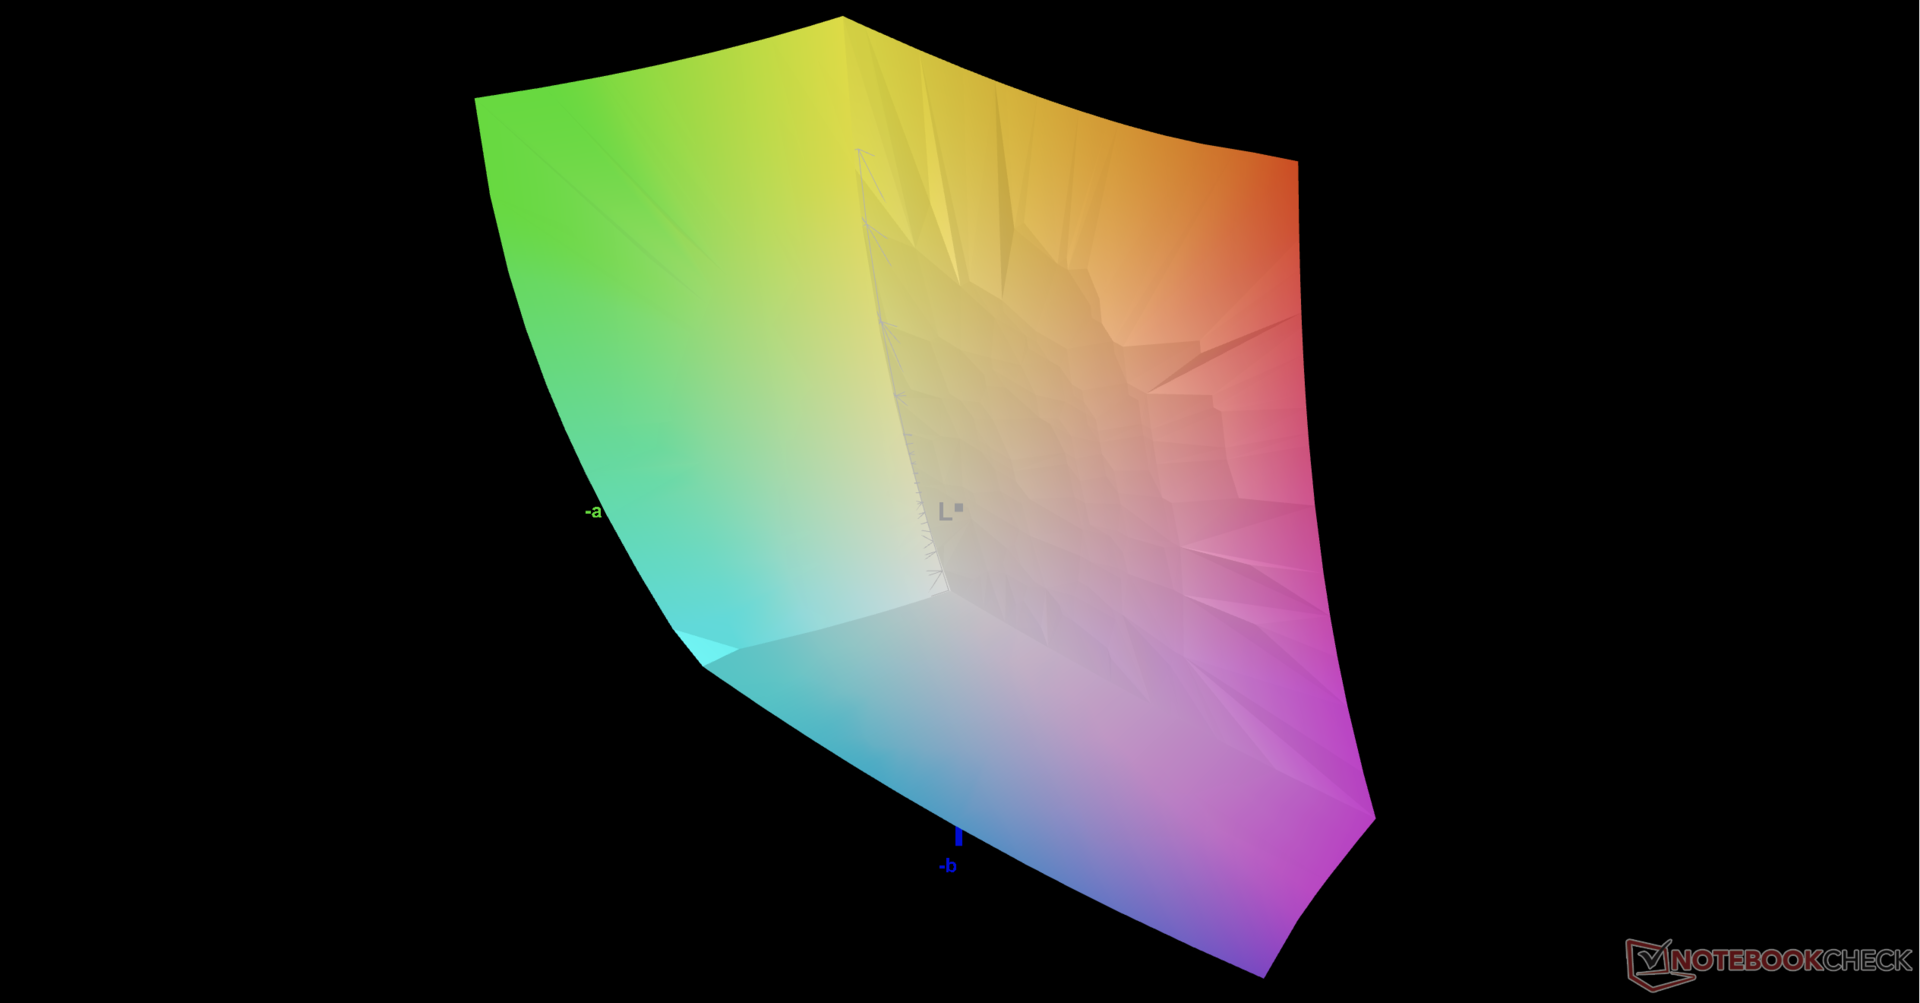
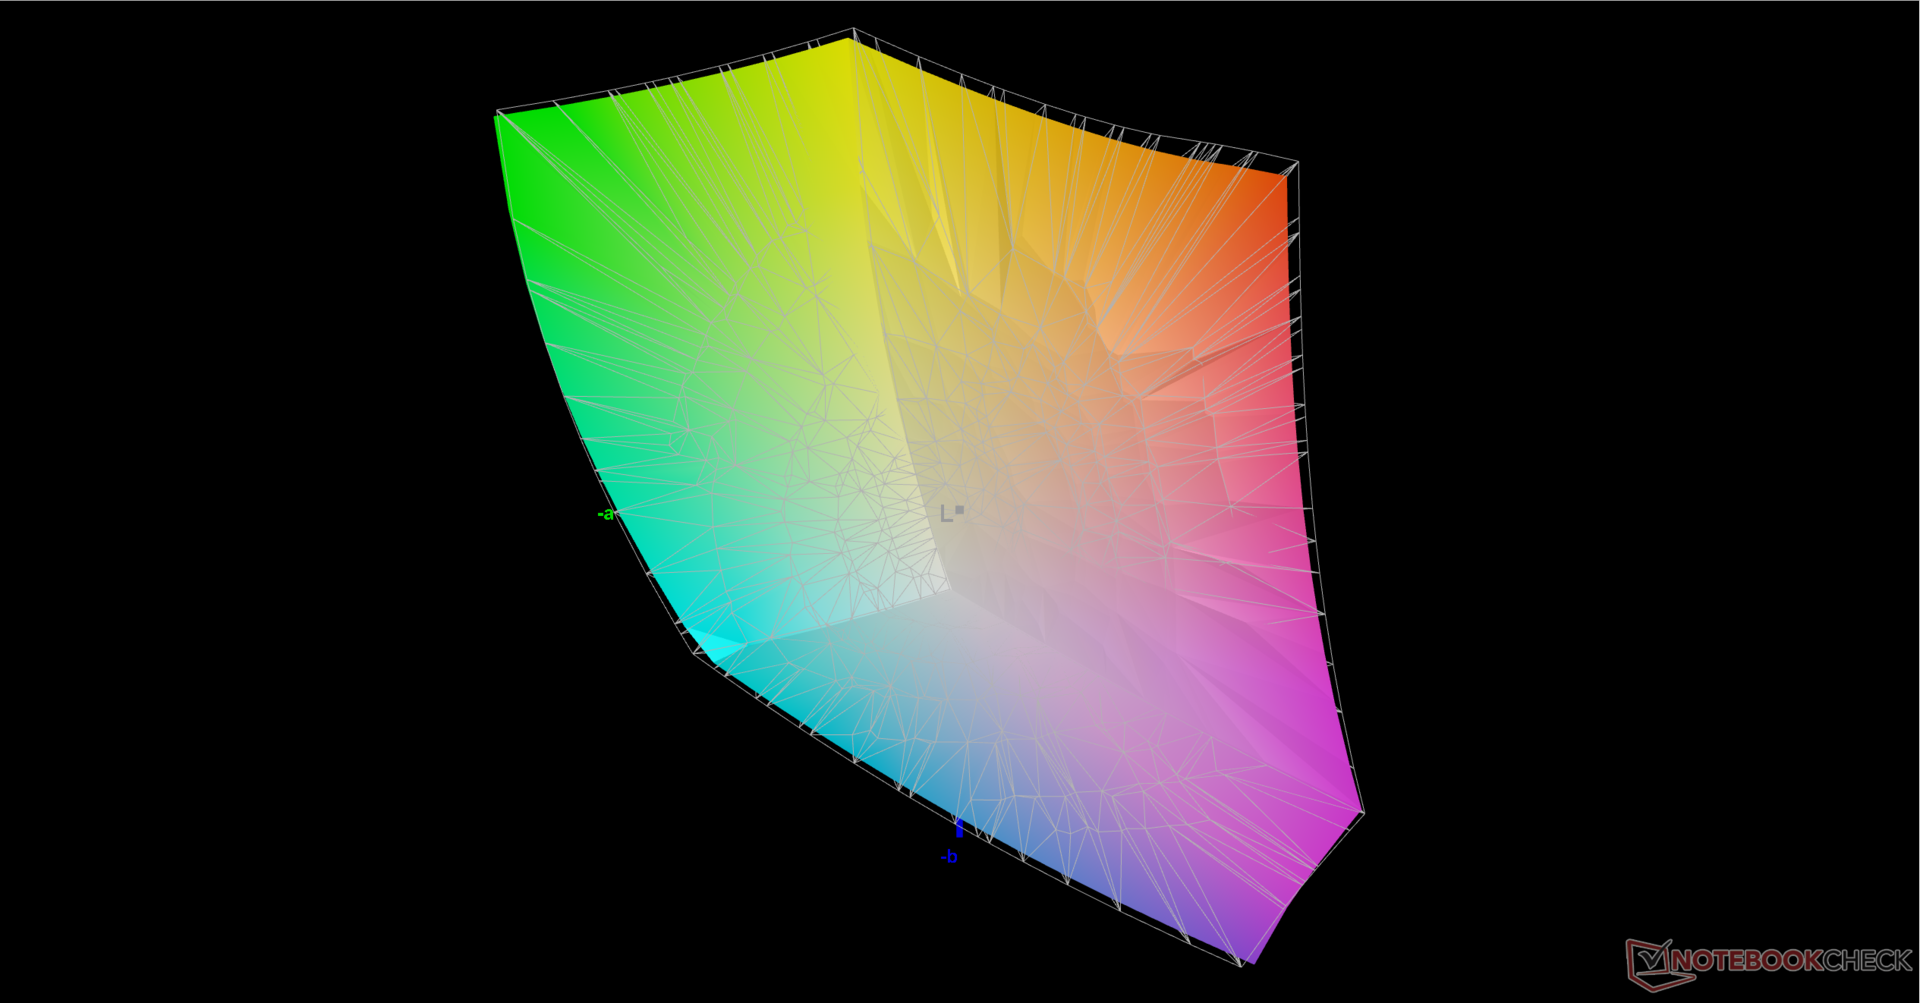
The GS77 is using the exact same high quality BOE NE173QHM-NZ1 1440p IPS panel that Razer is using for its Blade 17. Thus, core attributes like the native 240 Hz refresh rate, fast response times, decent ~1000:1 contrast ratio, and full DCI-P3 coverage are identical between the two competing 17.3-inch laptops.
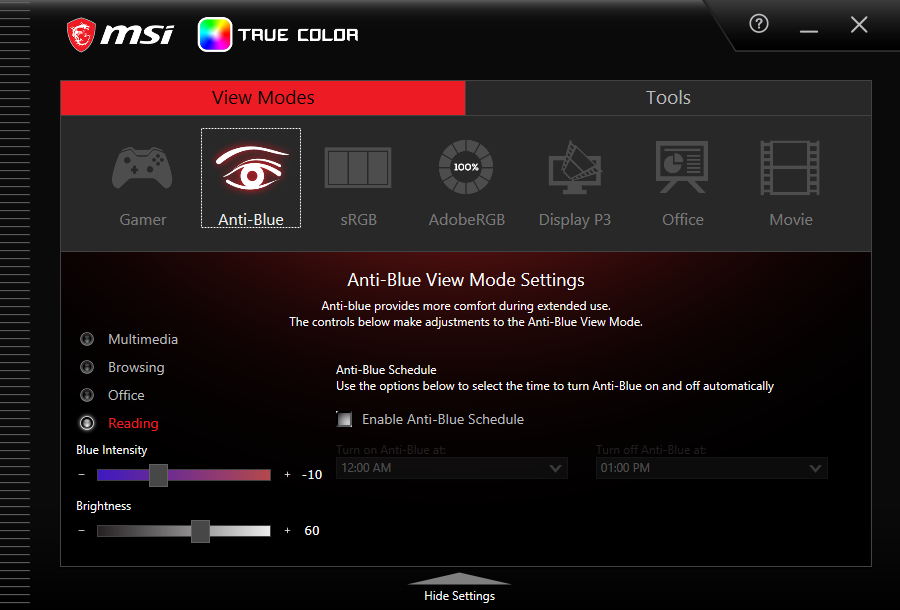
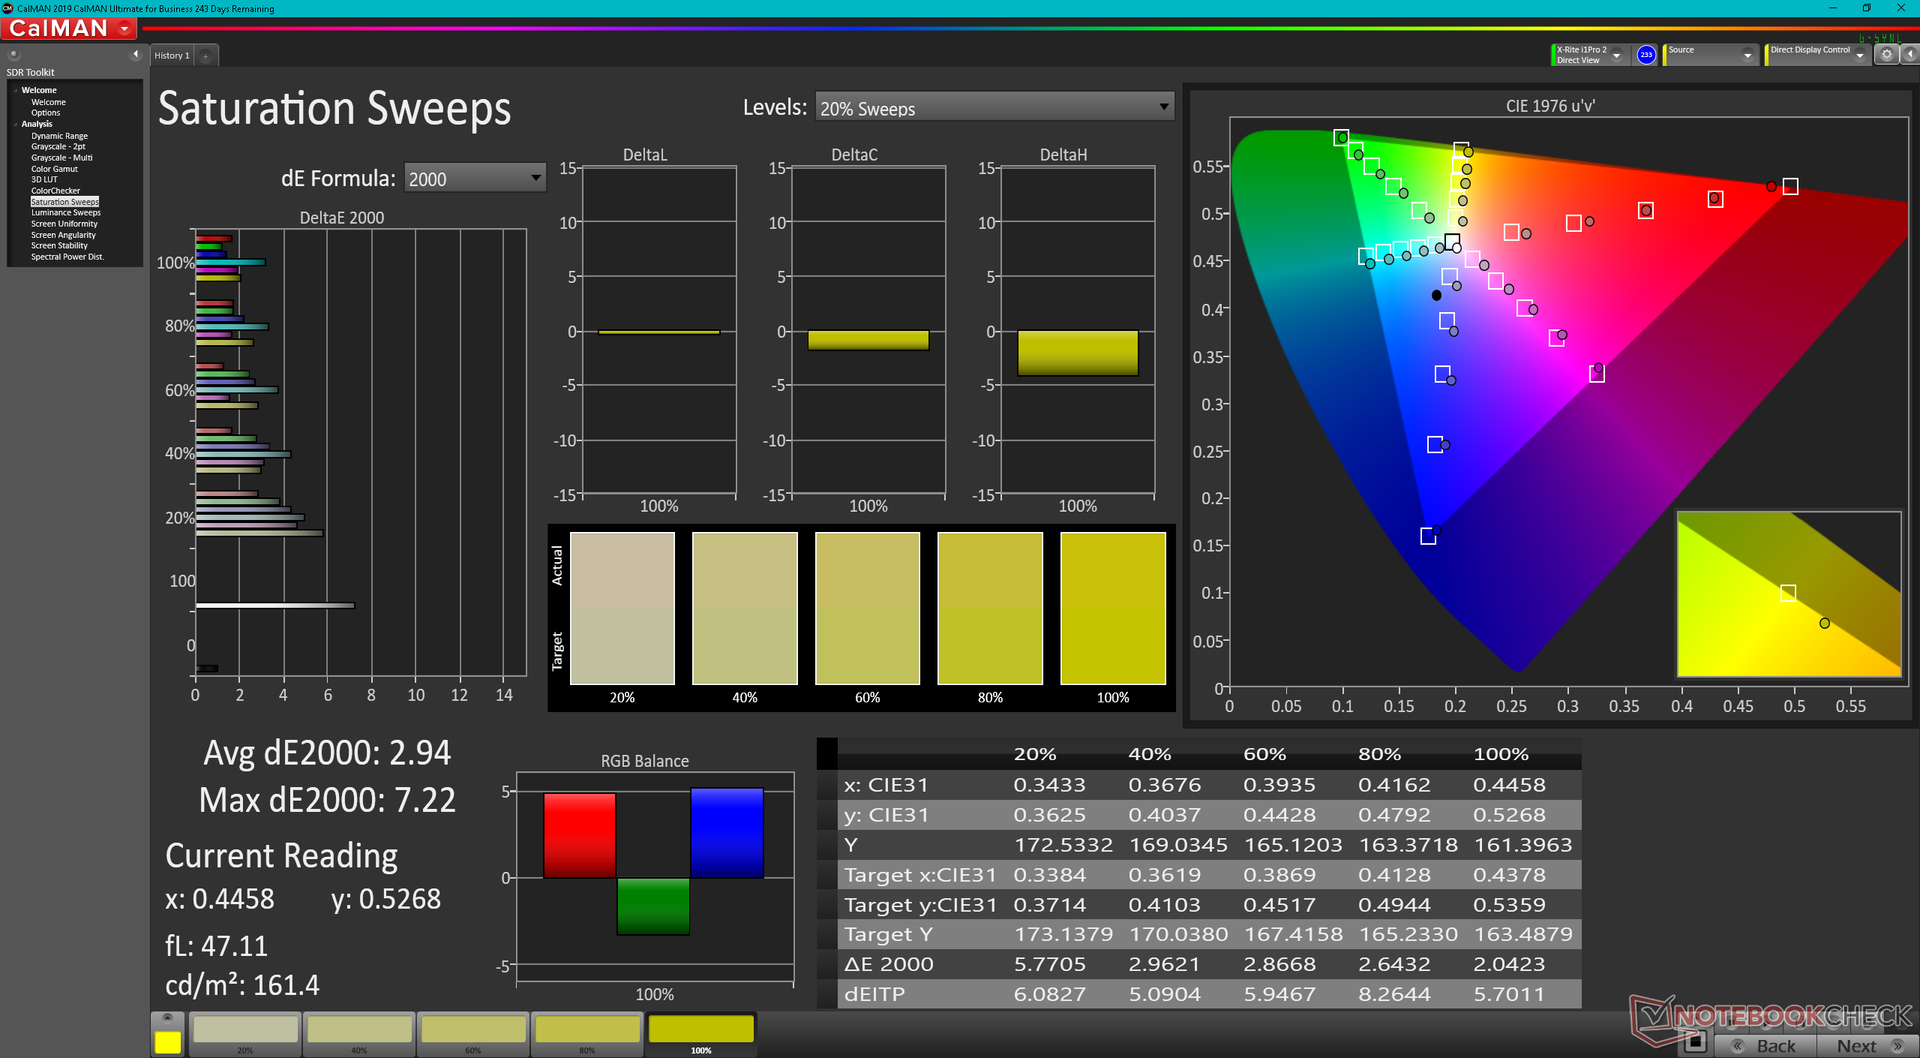
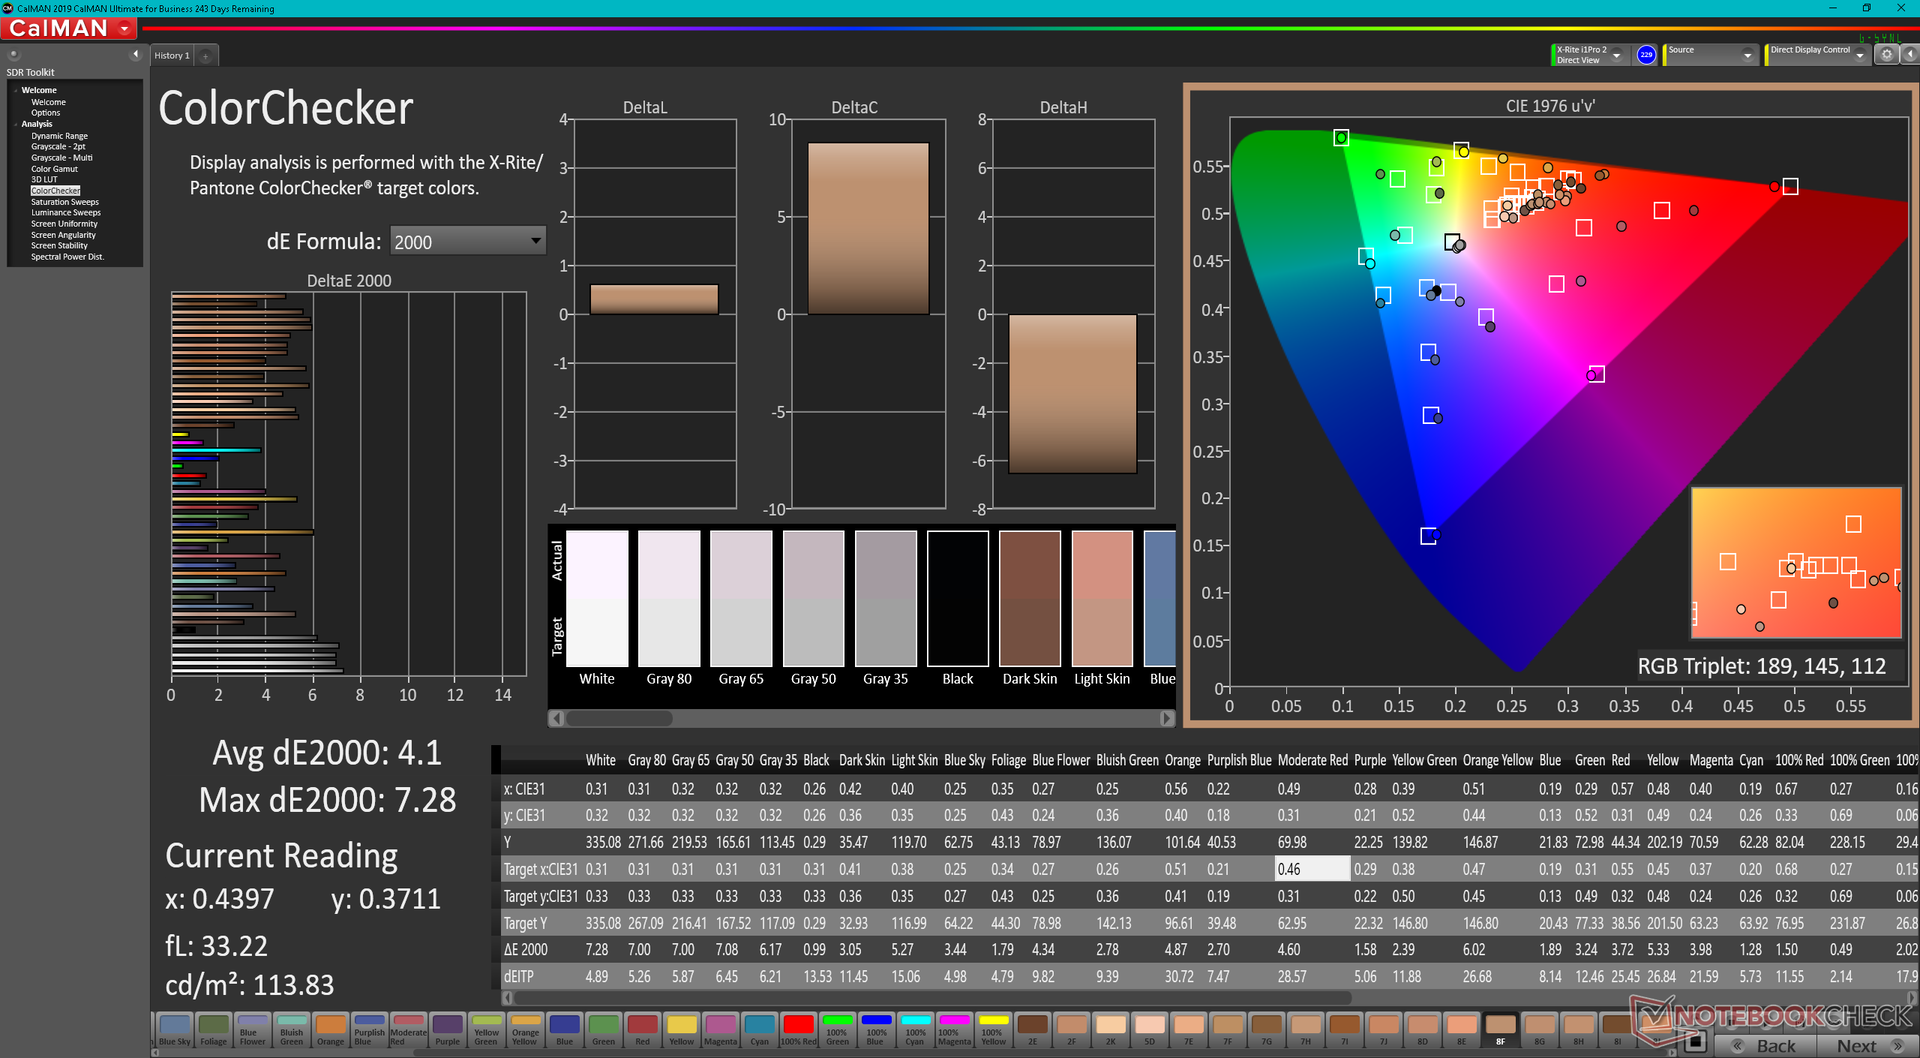
There are nonetheless two major differences between the GS77 display and Blade 17 display. Firstly, the GS77 display does not support G-Sync or adaptive sync due to the fact that the model does not support Advanced Optimus or MUX. Secondly, the panel on the GS77 is not factory calibrated and so colors are noticeably off even when the profile is set to DCI-P3.

| |||||||||||||||||||||||||
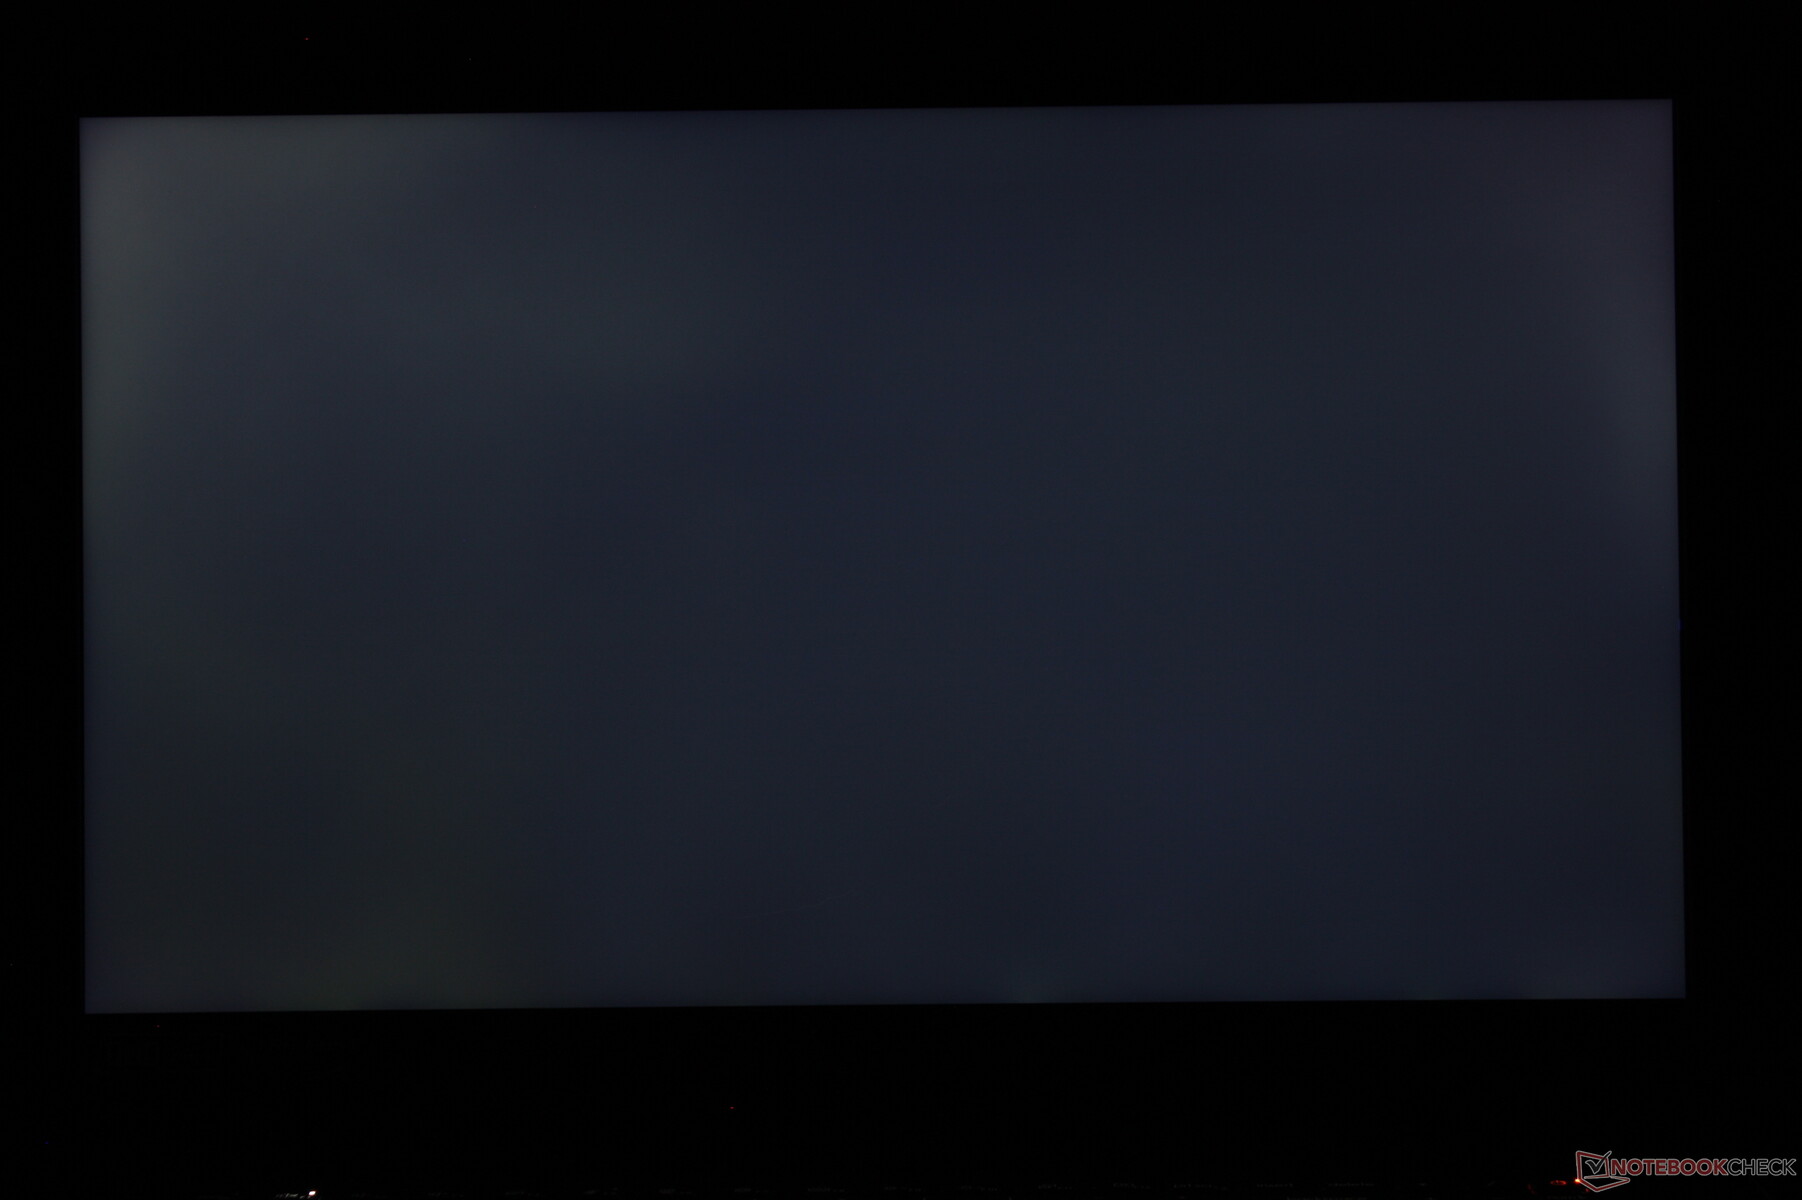
Brightness Distribution: 79 %
Center on Battery: 334.8 cd/m²
Contrast: 985:1 (Black: 0.34 cd/m²)
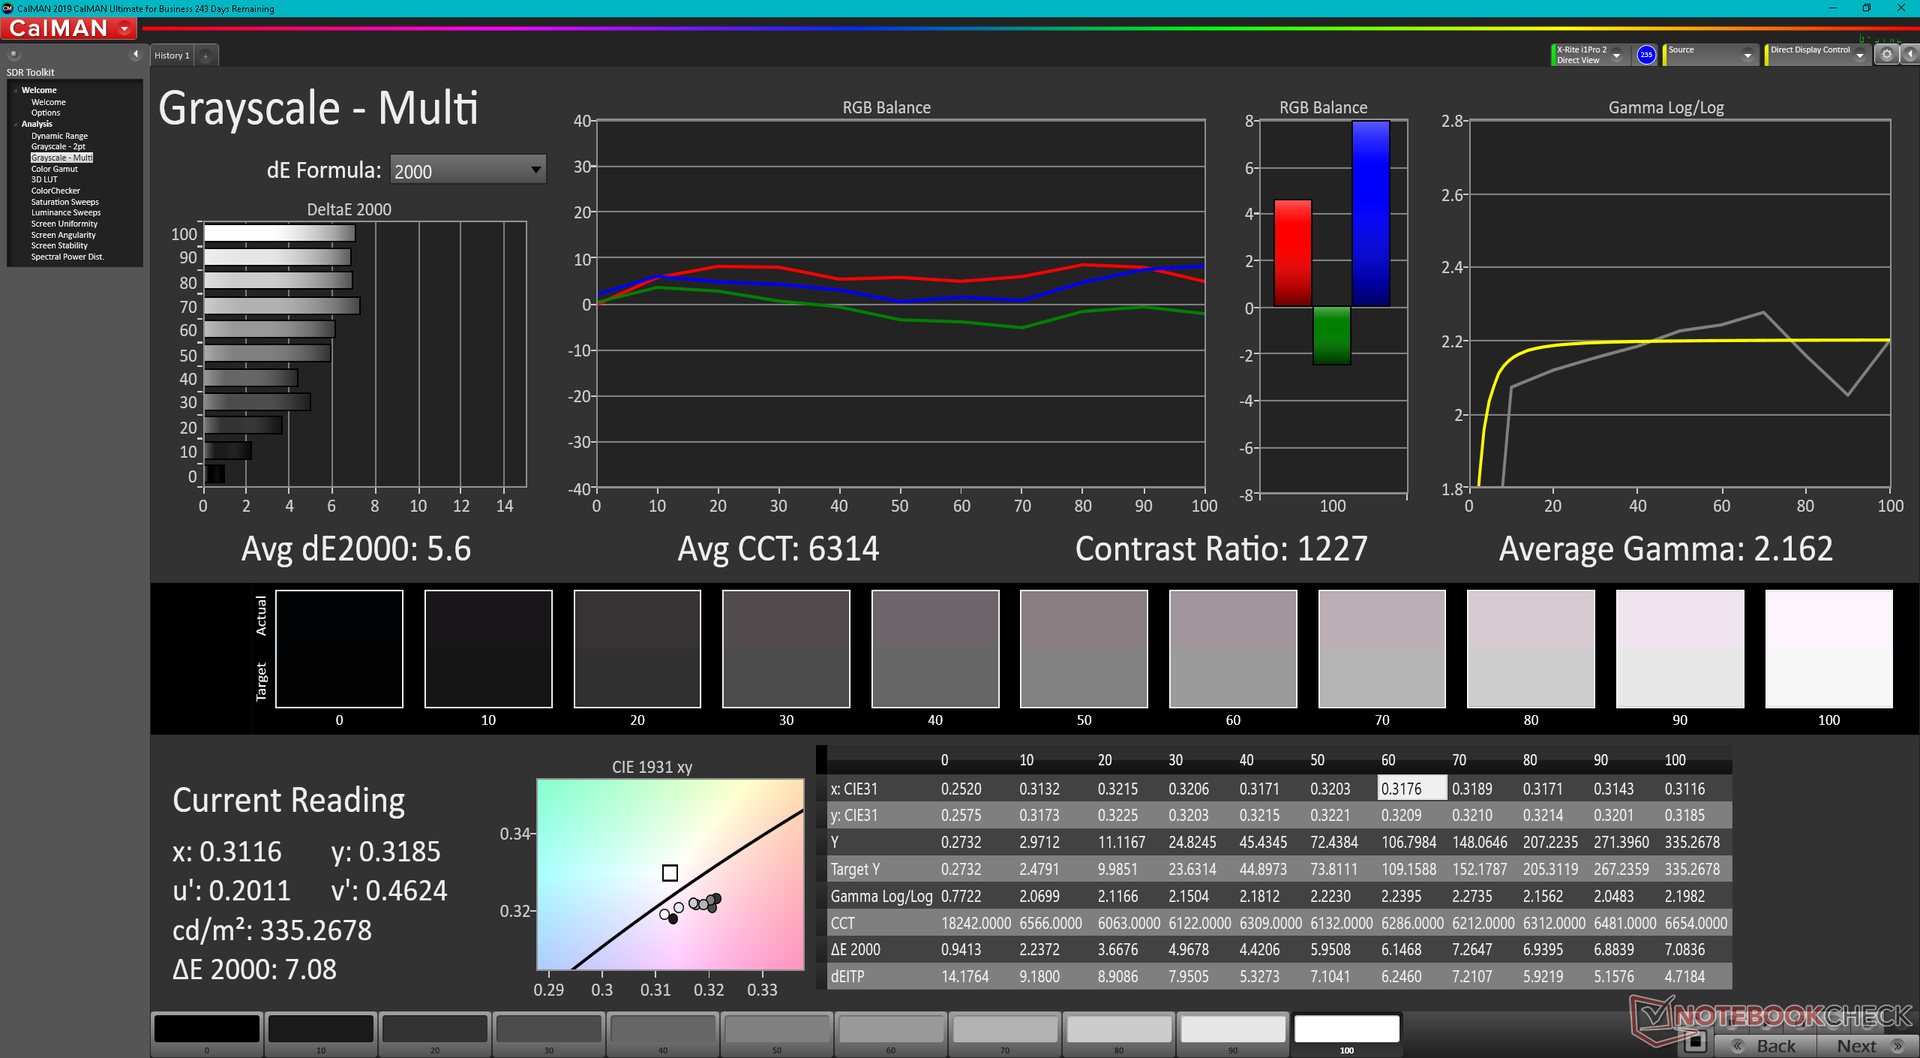
ΔE ColorChecker Calman: 4.1 | ∀{0.5-29.43 Ø4.71}
ΔE Greyscale Calman: 5.6 | ∀{0.09-98 Ø4.96}
85.8% AdobeRGB 1998 (Argyll 3D)
99.7% sRGB (Argyll 3D)
96.2% Display P3 (Argyll 3D)
Gamma: 2.16
CCT: 6314 K
| MSI Stealth GS77 12UHS-083US BOE NE173QHM-NZ1, IPS, 2560x1440, 17.3" | MSI GS76 Stealth 11UH AUO B173ZAN06.1 (AUODE95), IPS, 3840x2160, 17.3" | Razer Blade 17 RTX 3080 Ti BOE NE173QHM-NZ1, IPS, 2560x1440, 17.3" | MSI GE76 Raider AU Optronics B173HAN05.4 (AUOE295), IPS-Level, 1920x1080, 17.3" | Alienware x17 RTX 3080 P48E AU Optronics B173ZAN, IPS, 3840x2160, 17.3" | Asus ROG Zephyrus S17 GX703HSD BOE099D (BOE CQ NE173QHM-NY3), IPS, 2560x1440, 17.3" | |
|---|---|---|---|---|---|---|
| Display | -21% | 1% | -21% | 3% | -2% | |
| Display P3 Coverage (%) | 96.2 | 63 -35% | 98.7 3% | 63.1 -34% | 88.3 -8% | 94.2 -2% |
| sRGB Coverage (%) | 99.7 | 94.8 -5% | 99.9 0% | 94 -6% | 100 0% | 98.7 -1% |
| AdobeRGB 1998 Coverage (%) | 85.8 | 65 -24% | 86.2 0% | 65.2 -24% | 100 17% | 84.4 -2% |
| Response Times | 50% | 6% | 47% | 19% | 55% | |
| Response Time Grey 50% / Grey 80% * (ms) | 17.6 ? | 8.8 ? 50% | 17.6 ? -0% | 5.6 ? 68% | 14.4 ? 18% | 4.8 73% |
| Response Time Black / White * (ms) | 12.8 ? | 6.4 ? 50% | 11.4 ? 11% | 9.6 ? 25% | 10.4 ? 19% | 8 37% |
| PWM Frequency (Hz) | ||||||
| Screen | 26% | 13% | 30% | 12% | 13% | |
| Brightness middle (cd/m²) | 334.8 | 474 42% | 335.9 0% | 290 -13% | 438.7 31% | 322 -4% |
| Brightness (cd/m²) | 305 | 454 49% | 294 -4% | 290 -5% | 435 43% | 288 -6% |
| Brightness Distribution (%) | 79 | 88 11% | 75 -5% | 96 22% | 91 15% | 72 -9% |
| Black Level * (cd/m²) | 0.34 | 0.46 -35% | 0.38 -12% | 0.23 32% | 0.48 -41% | 0.3 12% |
| Contrast (:1) | 985 | 1030 5% | 884 -10% | 1261 28% | 914 -7% | 1073 9% |
| Colorchecker dE 2000 * | 4.1 | 1.5 63% | 2.82 31% | 1.59 61% | 4.34 -6% | 3.05 26% |
| Colorchecker dE 2000 max. * | 7.28 | 5.59 23% | 5.04 31% | 3.17 56% | 7.3 -0% | 5.23 28% |
| Greyscale dE 2000 * | 5.6 | 2.8 50% | 1.7 70% | 2.5 55% | 2.4 57% | 3.11 44% |
| Gamma | 2.16 102% | 2.158 102% | 2.14 103% | 2.253 98% | 2.09 105% | 2.13 103% |
| CCT | 6314 103% | 6597 99% | 6382 102% | 6640 98% | 6413 101% | 6553 99% |
| Colorchecker dE 2000 calibrated * | 0.86 | 0.87 | 0.72 | 1.92 | ||
| Color Space (Percent of AdobeRGB 1998) (%) | 84 | |||||
| Color Space (Percent of sRGB) (%) | 99 | |||||
| Total Average (Program / Settings) | 18% /
19% | 7% /
9% | 19% /
20% | 11% /
11% | 22% /
16% |
* ... smaller is better
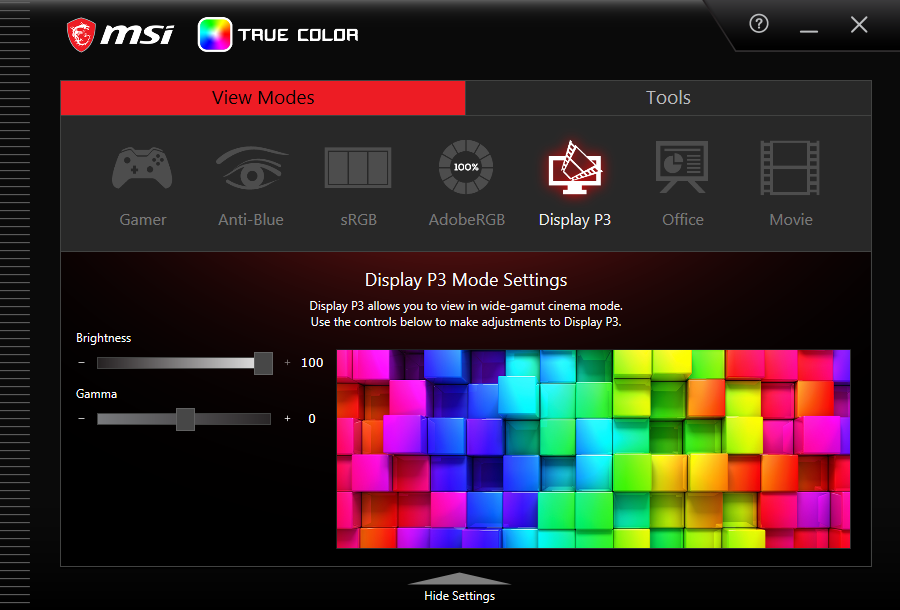
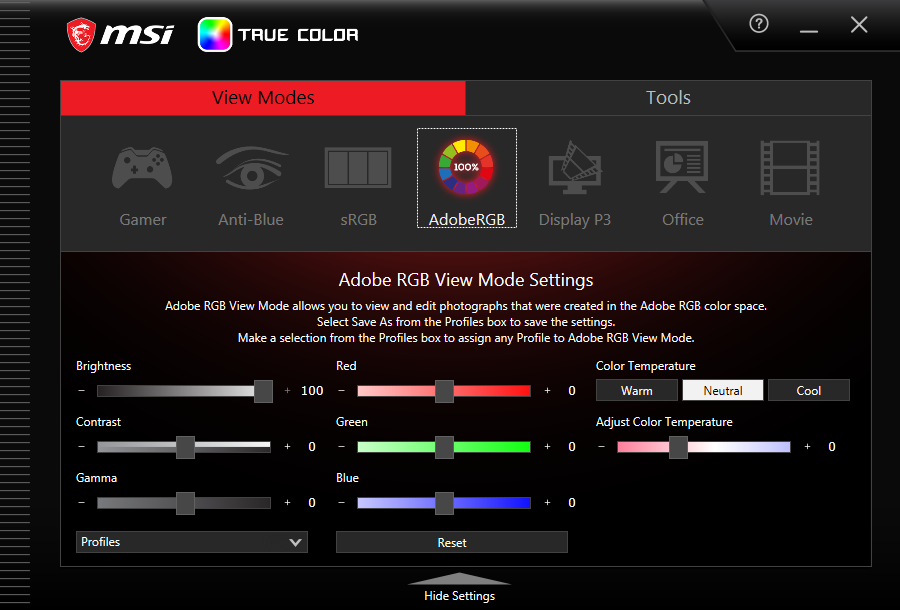
As mentioned above, MSI doesn't calibrate each panel at factory and this shows with our X-Rite colorimeter. Color temperature is too warm out of the box and so average DeltaE values are relatively high on the GS77 as a result. Thankfully, users can manually adjust the color temperature and RGB values via the pre-installed MSI True Color software without much trouble.
Display Response Times
| ↔ Response Time Black to White | ||
|---|---|---|
| 12.8 ms ... rise ↗ and fall ↘ combined | ↗ 7.6 ms rise | 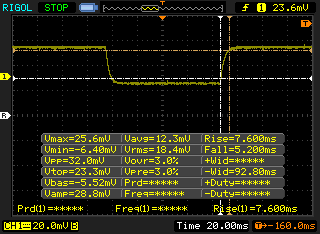 |
| ↘ 5.2 ms fall | ||
| The screen shows good response rates in our tests, but may be too slow for competitive gamers. In comparison, all tested devices range from 0.1 (minimum) to 240 (maximum) ms. » 33 % of all devices are better. This means that the measured response time is better than the average of all tested devices (19.8 ms). | ||
| ↔ Response Time 50% Grey to 80% Grey | ||
| 17.6 ms ... rise ↗ and fall ↘ combined | ↗ 10 ms rise | 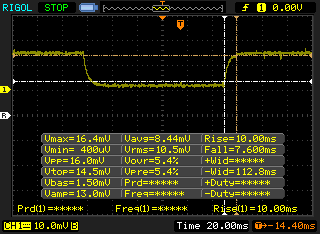 |
| ↘ 7.6 ms fall | ||
| The screen shows good response rates in our tests, but may be too slow for competitive gamers. In comparison, all tested devices range from 0.165 (minimum) to 636 (maximum) ms. » 32 % of all devices are better. This means that the measured response time is better than the average of all tested devices (31 ms). | ||
Screen Flickering / PWM (Pulse-Width Modulation)
| Screen flickering / PWM not detected | 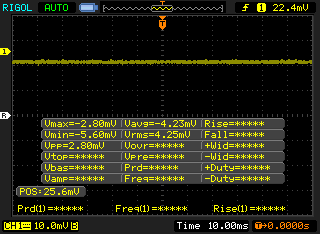 | ||
In comparison: 52 % of all tested devices do not use PWM to dim the display. If PWM was detected, an average of 7747 (minimum: 5 - maximum: 343500) Hz was measured. | |||

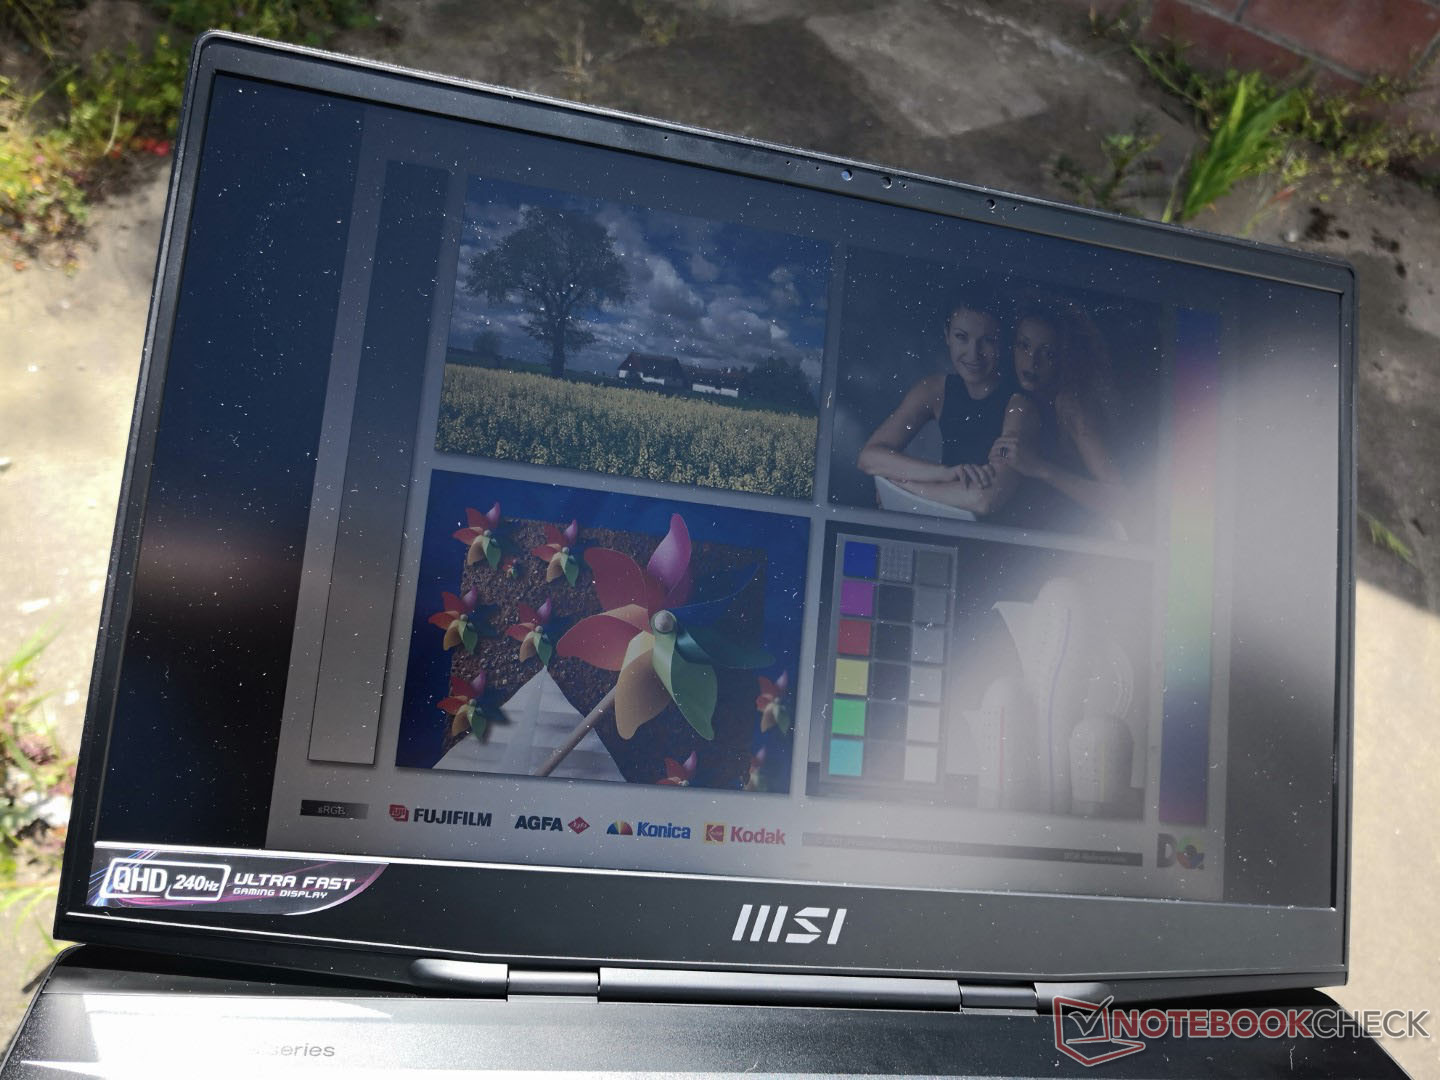
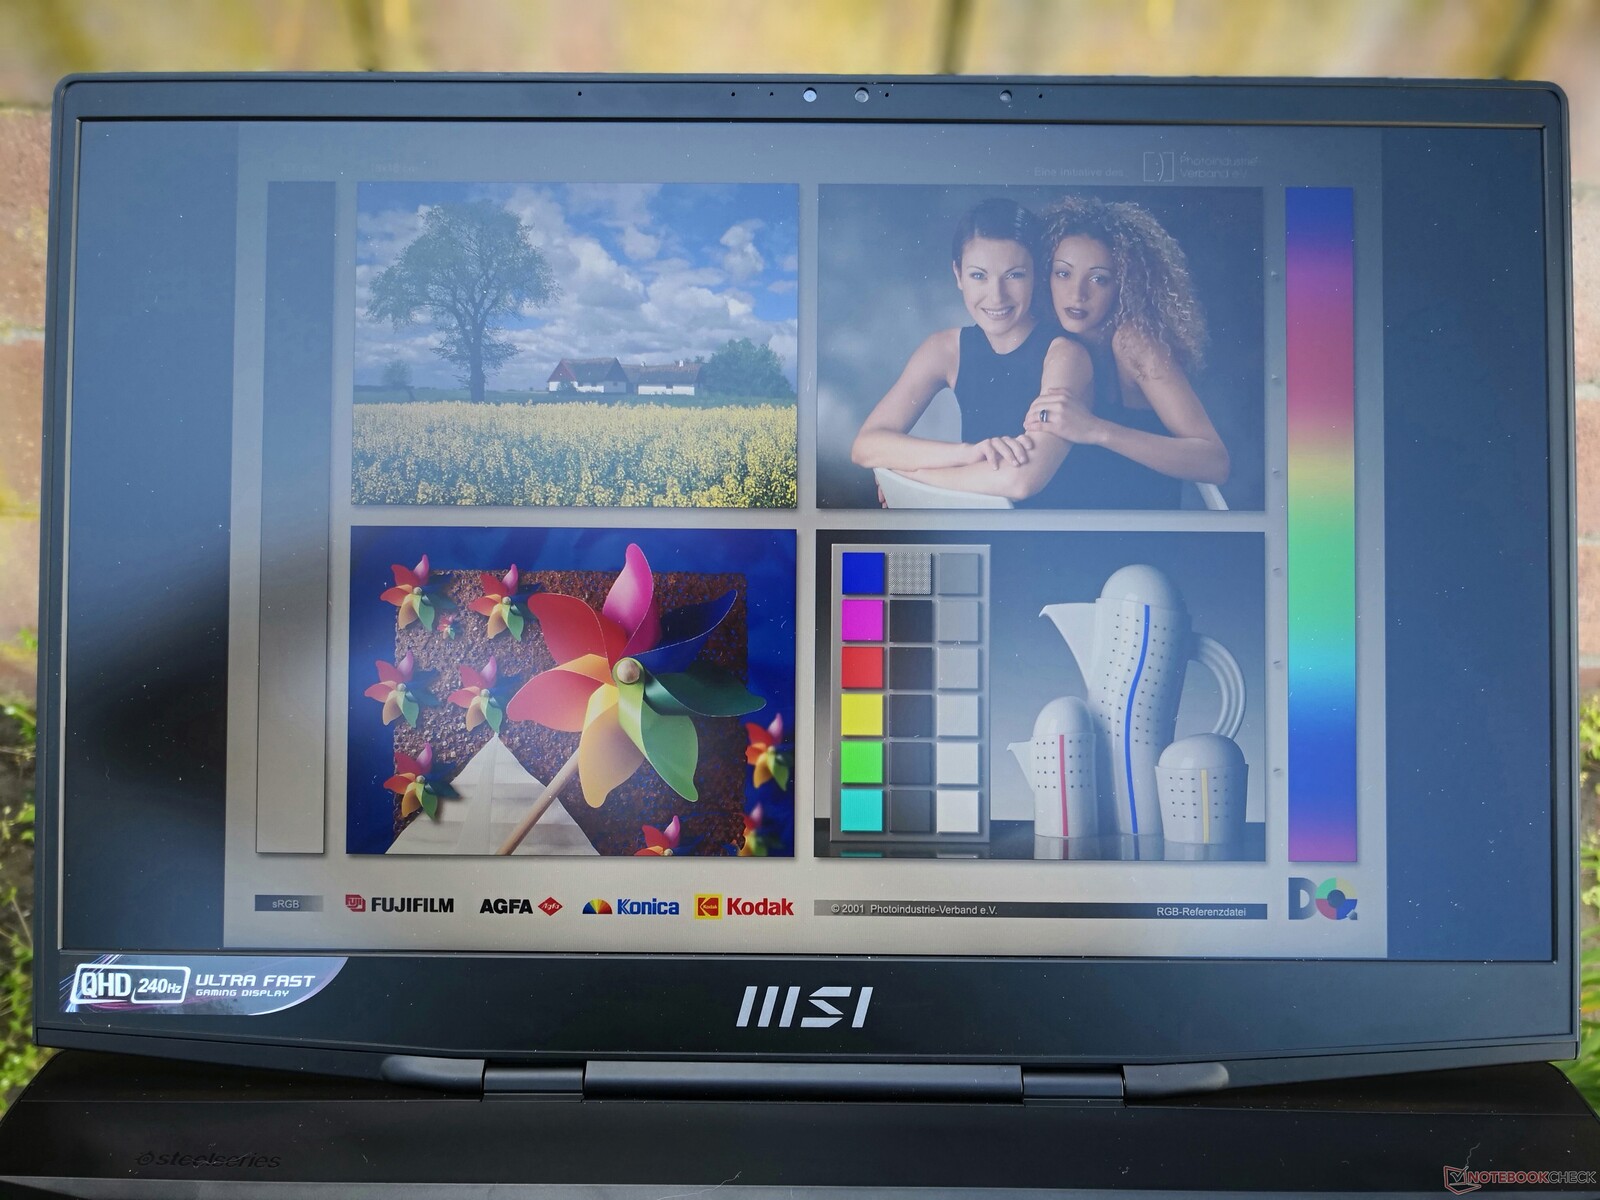
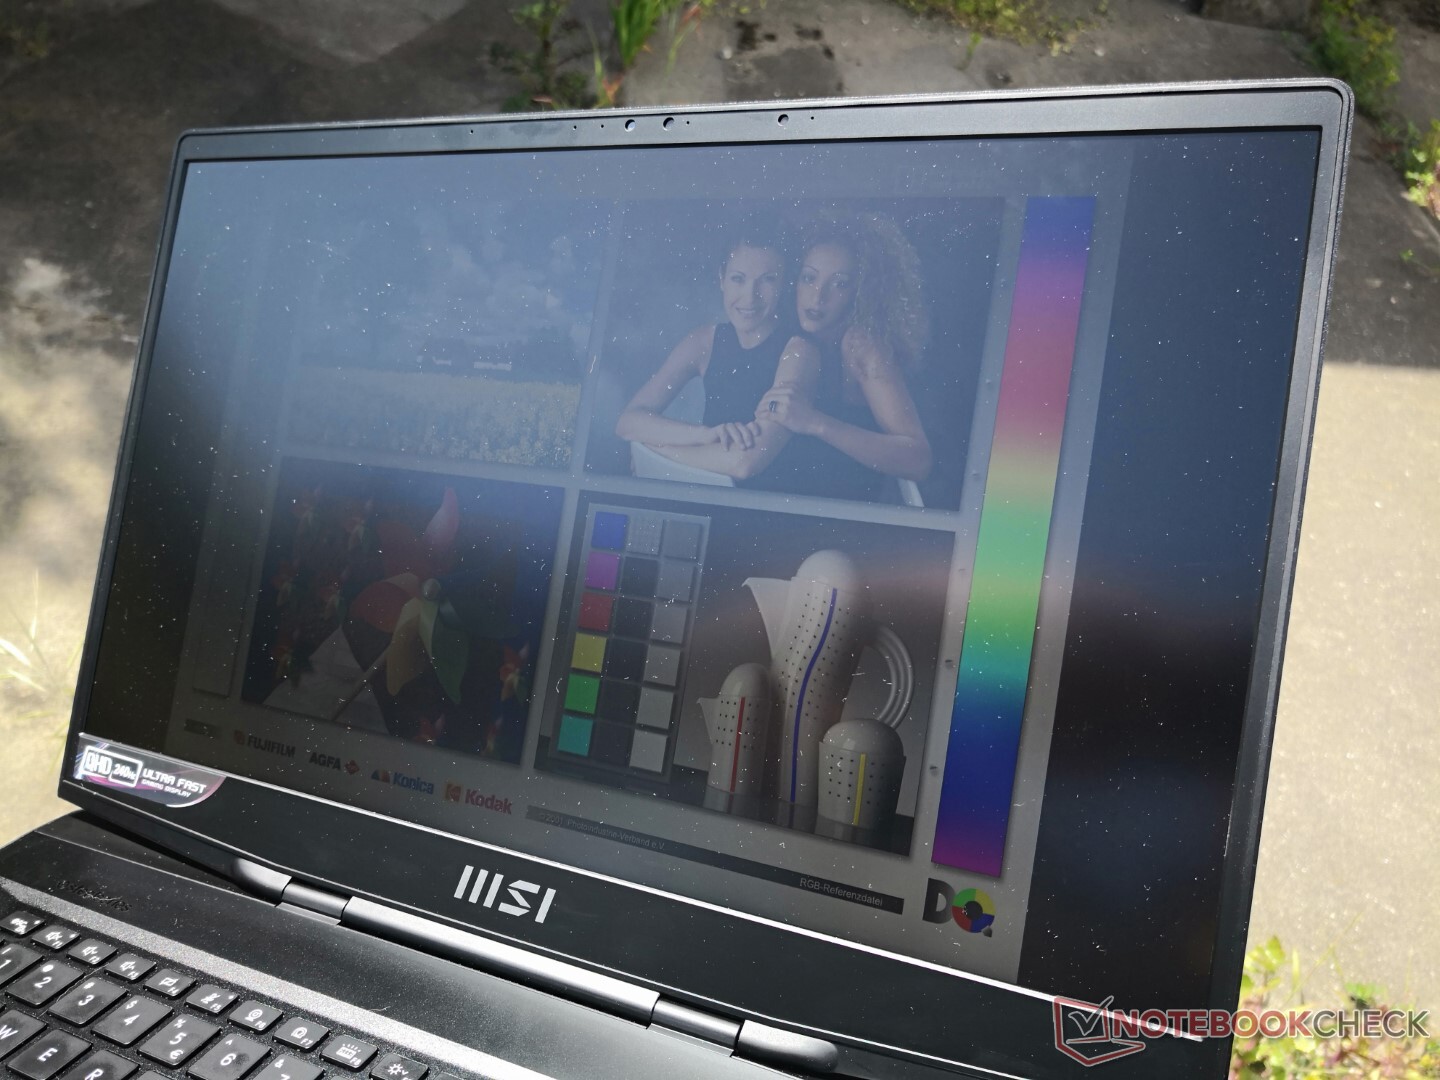
Our 1440p display is almost 30 percent dimmer than what we recorded on the 4K GS76 to be on a more similar level to the Blade 17. Outdoor visibility is subsequently not as good as on last year's model.
Performance — 12th Gen Intel With 105 W TGP Graphics
Testing Conditions
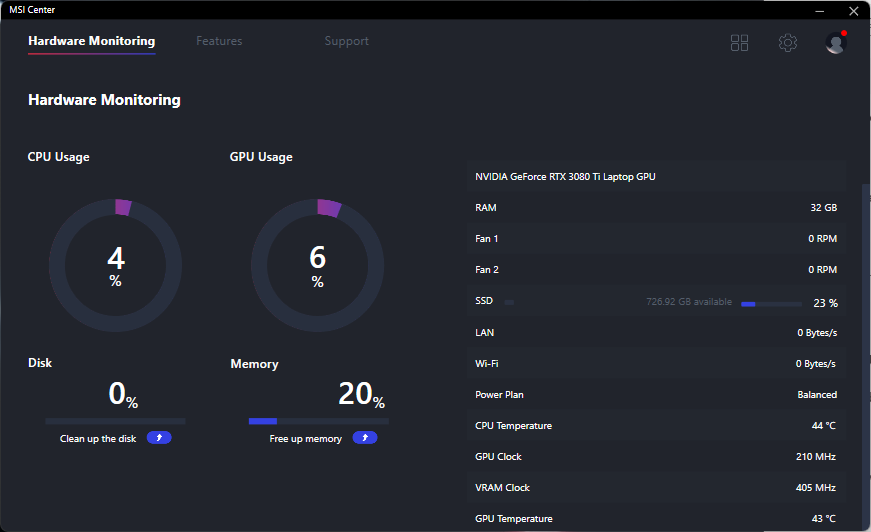
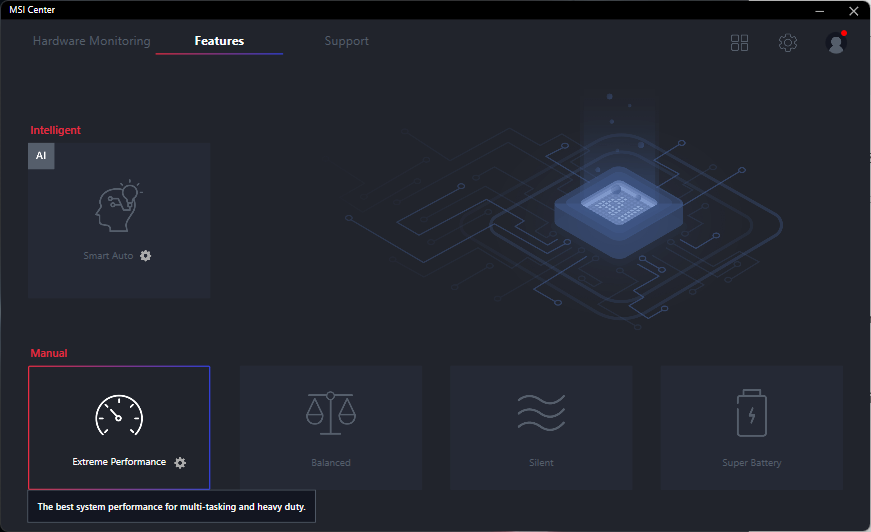
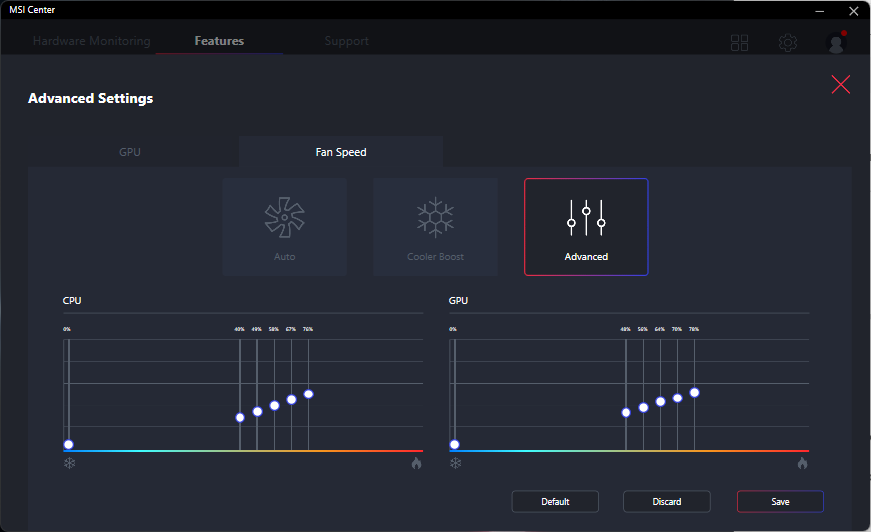
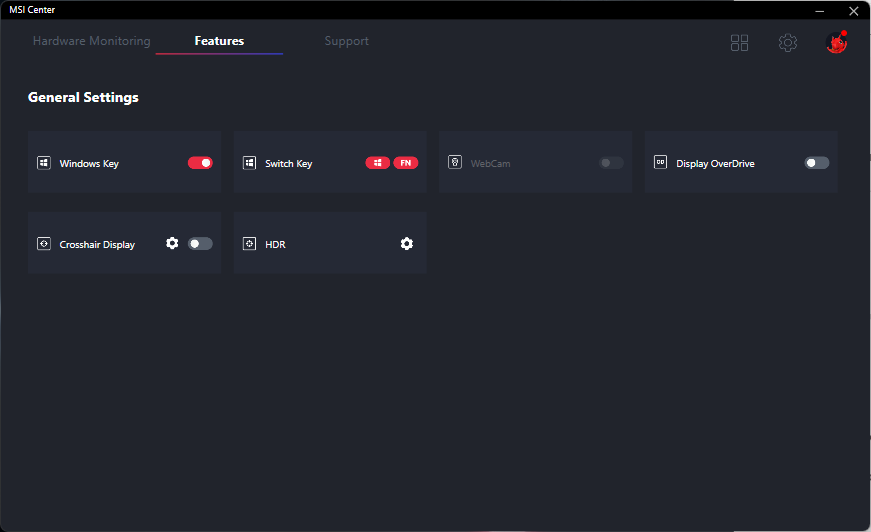
We set our unit to Extreme Performance mode via the pre-installed MSI Control Center software prior to running any benchmarks below. We recommend users become familiar with this software as key system features are toggled here.
Processor — Big Year-to-Year Gains
CPU performance is excellent with results that are within one or two percentage points of the average laptop in our database equipped with the same Core i7-12700H CPU. Multi-thread performance is even consistently faster than the Core i7-12800H in the Blade 17 by 6 to 8 percent. Though the advantage is relatively minor, it does explain the slightly higher frame rates when gaming at lower resolutions on the GS77 versus on the Blade 17.
The GS77 comes with a pricier Core i9-12900H option, but the performance uptick should only be a few percentage points over our Core i7-12700H based on our experience with a handful of Core i9-12900H laptops already in market.
The year-over-year performance upgrade over Intel's 11th gen Tiger Lake-H series is more significant. When compared to the Core i9-11900H in last year's GS76, our Core i7-12700H is about 15 percent and 25 to 30 percent faster in single-thread and multi-thread operations, respectively.
Cinebench R15 Multi Loop
Cinebench R23: Multi Core | Single Core
Cinebench R15: CPU Multi 64Bit | CPU Single 64Bit
Blender: v2.79 BMW27 CPU
7-Zip 18.03: 7z b 4 | 7z b 4 -mmt1
Geekbench 5.5: Multi-Core | Single-Core
HWBOT x265 Benchmark v2.2: 4k Preset
LibreOffice : 20 Documents To PDF
R Benchmark 2.5: Overall mean
Cinebench R23: Multi Core | Single Core
Cinebench R15: CPU Multi 64Bit | CPU Single 64Bit
Blender: v2.79 BMW27 CPU
7-Zip 18.03: 7z b 4 | 7z b 4 -mmt1
Geekbench 5.5: Multi-Core | Single-Core
HWBOT x265 Benchmark v2.2: 4k Preset
LibreOffice : 20 Documents To PDF
R Benchmark 2.5: Overall mean
* ... smaller is better
AIDA64: FP32 Ray-Trace | FPU Julia | CPU SHA3 | CPU Queen | FPU SinJulia | FPU Mandel | CPU AES | CPU ZLib | FP64 Ray-Trace | CPU PhotoWorxx
| Performance rating | |
| MSI GE76 Raider | |
| Average Intel Core i7-12700H | |
| MSI Stealth GS77 12UHS-083US | |
| Razer Blade 17 RTX 3080 Ti | |
| AIDA64 / FP32 Ray-Trace | |
| Average Intel Core i7-12700H (2585 - 17957, n=64) | |
| MSI GE76 Raider | |
| MSI Stealth GS77 12UHS-083US | |
| Razer Blade 17 RTX 3080 Ti | |
| AIDA64 / FPU Julia | |
| Average Intel Core i7-12700H (12439 - 90760, n=64) | |
| MSI GE76 Raider | |
| MSI Stealth GS77 12UHS-083US | |
| Razer Blade 17 RTX 3080 Ti | |
| AIDA64 / CPU SHA3 | |
| MSI GE76 Raider | |
| MSI Stealth GS77 12UHS-083US | |
| Average Intel Core i7-12700H (833 - 4242, n=64) | |
| Razer Blade 17 RTX 3080 Ti | |
| AIDA64 / CPU Queen | |
| MSI GE76 Raider | |
| Razer Blade 17 RTX 3080 Ti | |
| MSI Stealth GS77 12UHS-083US | |
| Average Intel Core i7-12700H (57923 - 103202, n=63) | |
| AIDA64 / FPU SinJulia | |
| MSI GE76 Raider | |
| MSI Stealth GS77 12UHS-083US | |
| Razer Blade 17 RTX 3080 Ti | |
| Average Intel Core i7-12700H (3249 - 9939, n=64) | |
| AIDA64 / FPU Mandel | |
| Average Intel Core i7-12700H (7135 - 44760, n=64) | |
| MSI GE76 Raider | |
| MSI Stealth GS77 12UHS-083US | |
| Razer Blade 17 RTX 3080 Ti | |
| AIDA64 / CPU AES | |
| MSI GE76 Raider | |
| MSI Stealth GS77 12UHS-083US | |
| Average Intel Core i7-12700H (31839 - 144360, n=64) | |
| Razer Blade 17 RTX 3080 Ti | |
| AIDA64 / CPU ZLib | |
| MSI GE76 Raider | |
| MSI Stealth GS77 12UHS-083US | |
| Average Intel Core i7-12700H (305 - 1171, n=64) | |
| Razer Blade 17 RTX 3080 Ti | |
| AIDA64 / FP64 Ray-Trace | |
| Average Intel Core i7-12700H (1437 - 9692, n=64) | |
| MSI GE76 Raider | |
| MSI Stealth GS77 12UHS-083US | |
| Razer Blade 17 RTX 3080 Ti | |
| AIDA64 / CPU PhotoWorxx | |
| Razer Blade 17 RTX 3080 Ti | |
| MSI GE76 Raider | |
| MSI Stealth GS77 12UHS-083US | |
| Average Intel Core i7-12700H (12863 - 52207, n=64) | |
System Performance
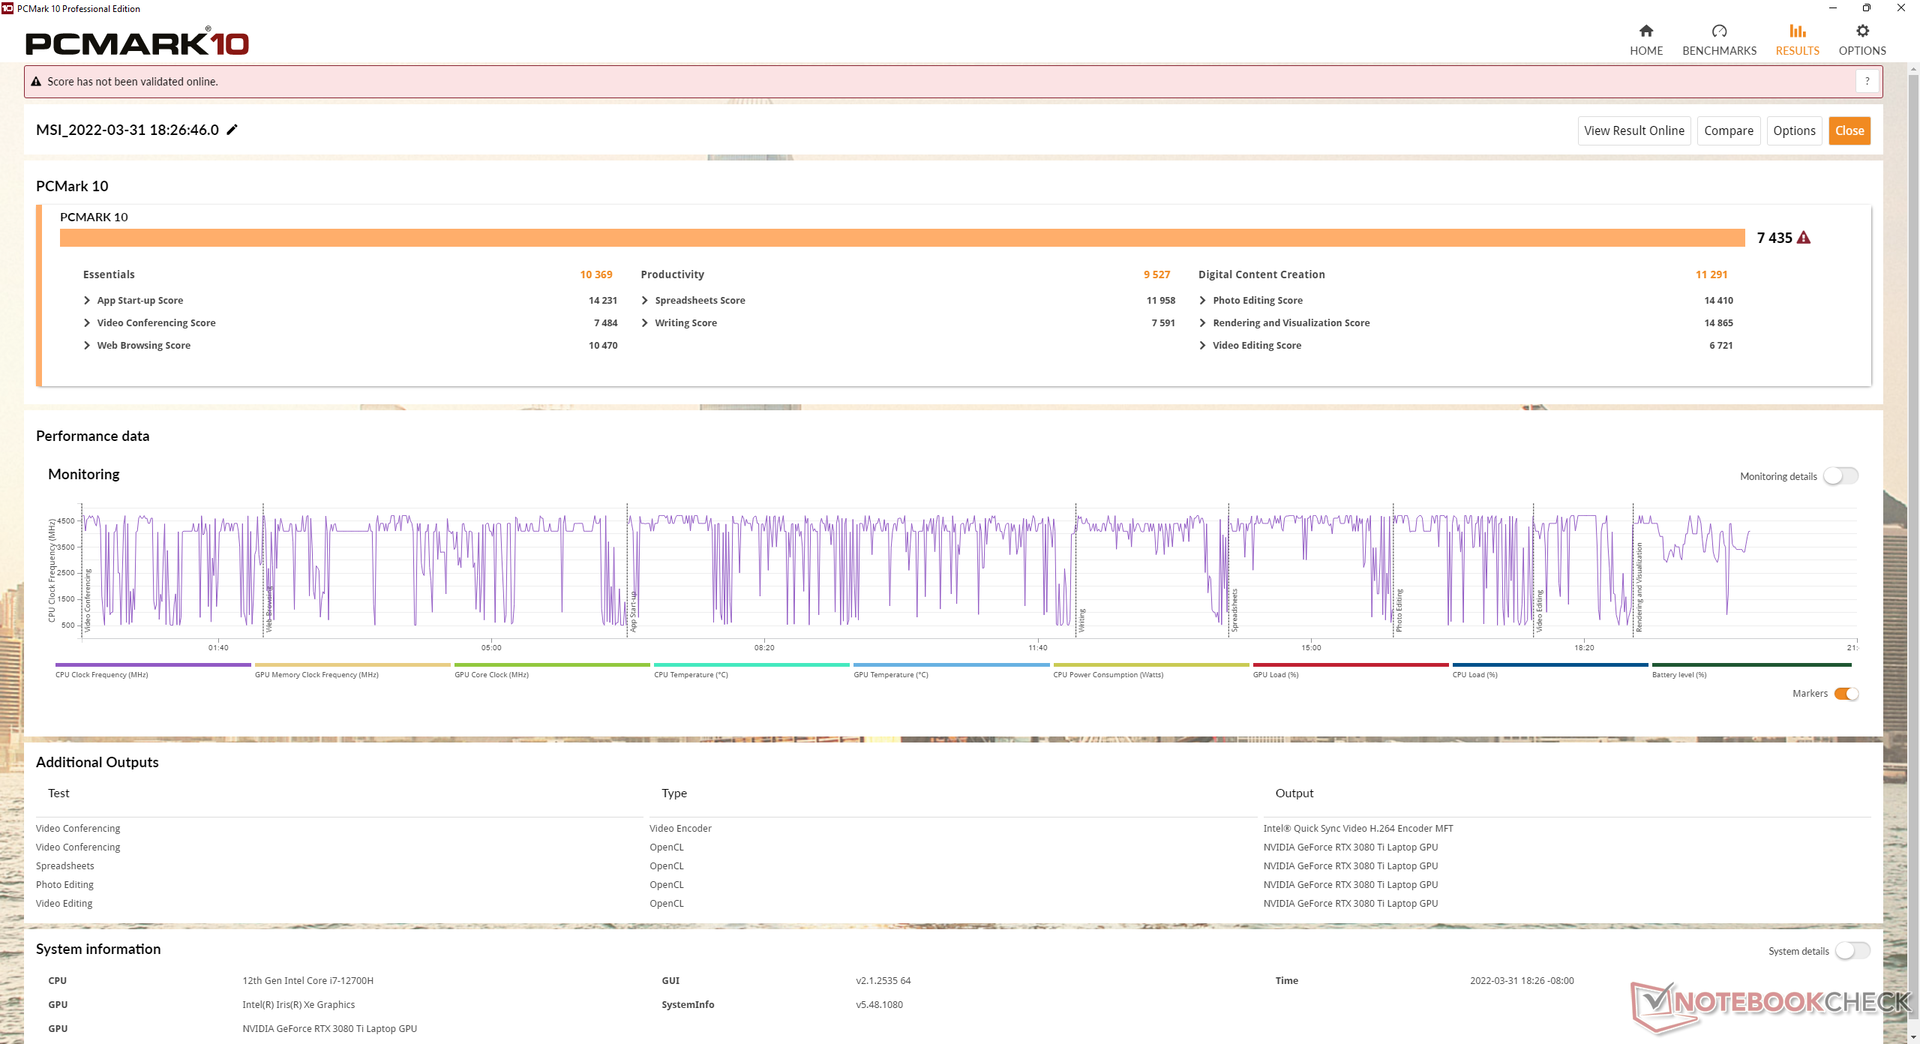
PCMark results are consistently ahead of last year's GS76 but slightly behind the latest Blade 17.
We experienced a couple of issues related to Sleep mode and refresh rate worth mentioning on our review unit. When putting the system to sleep, power consumption would sometimes be abnormally high and with very warm surface temperatures. Meanwhile, certain games including Witcher 3, Far Cry 5, and Strange Brigade would turn to black when the native refresh rate of the display was set to 240 Hz instead of 60 Hz. None of these issues appeared on our Blade 17 unit even though both laptops are using the same 240 Hz panels from BOE.
| PCMark 10 / Score | |
| MSI GE76 Raider | |
| Razer Blade 17 RTX 3080 Ti | |
| Alienware x17 RTX 3080 P48E | |
| MSI Stealth GS77 12UHS-083US | |
| Average Intel Core i7-12700H, NVIDIA GeForce RTX 3080 Ti Laptop GPU (6868 - 7638, n=7) | |
| Asus ROG Zephyrus S17 GX703HSD | |
| MSI GS76 Stealth 11UH | |
| PCMark 10 / Essentials | |
| Razer Blade 17 RTX 3080 Ti | |
| MSI GE76 Raider | |
| Asus ROG Zephyrus S17 GX703HSD | |
| Average Intel Core i7-12700H, NVIDIA GeForce RTX 3080 Ti Laptop GPU (9987 - 11318, n=7) | |
| MSI Stealth GS77 12UHS-083US | |
| Alienware x17 RTX 3080 P48E | |
| MSI GS76 Stealth 11UH | |
| PCMark 10 / Productivity | |
| MSI GE76 Raider | |
| Alienware x17 RTX 3080 P48E | |
| MSI Stealth GS77 12UHS-083US | |
| Average Intel Core i7-12700H, NVIDIA GeForce RTX 3080 Ti Laptop GPU (8944 - 10726, n=7) | |
| Razer Blade 17 RTX 3080 Ti | |
| Asus ROG Zephyrus S17 GX703HSD | |
| MSI GS76 Stealth 11UH | |
| PCMark 10 / Digital Content Creation | |
| MSI GE76 Raider | |
| Razer Blade 17 RTX 3080 Ti | |
| Alienware x17 RTX 3080 P48E | |
| MSI Stealth GS77 12UHS-083US | |
| Average Intel Core i7-12700H, NVIDIA GeForce RTX 3080 Ti Laptop GPU (8956 - 12249, n=7) | |
| Asus ROG Zephyrus S17 GX703HSD | |
| MSI GS76 Stealth 11UH | |
| PCMark 10 Score | 7435 points | |
Help | ||
| AIDA64 / Memory Copy | |
| MSI GE76 Raider | |
| Razer Blade 17 RTX 3080 Ti | |
| MSI Stealth GS77 12UHS-083US | |
| Average Intel Core i7-12700H (25615 - 80511, n=64) | |
| AIDA64 / Memory Read | |
| Razer Blade 17 RTX 3080 Ti | |
| MSI GE76 Raider | |
| MSI Stealth GS77 12UHS-083US | |
| Average Intel Core i7-12700H (25586 - 79442, n=64) | |
| AIDA64 / Memory Write | |
| Razer Blade 17 RTX 3080 Ti | |
| MSI Stealth GS77 12UHS-083US | |
| MSI GE76 Raider | |
| Average Intel Core i7-12700H (23679 - 88660, n=64) | |
| AIDA64 / Memory Latency | |
| MSI Stealth GS77 12UHS-083US | |
| MSI GE76 Raider | |
| Average Intel Core i7-12700H (76.2 - 133.9, n=62) | |
| Asus ROG Zephyrus S17 GX703HSD | |
| Alienware x17 RTX 3080 P48E | |
| Razer Blade 17 RTX 3080 Ti | |
* ... smaller is better
DPC Latency
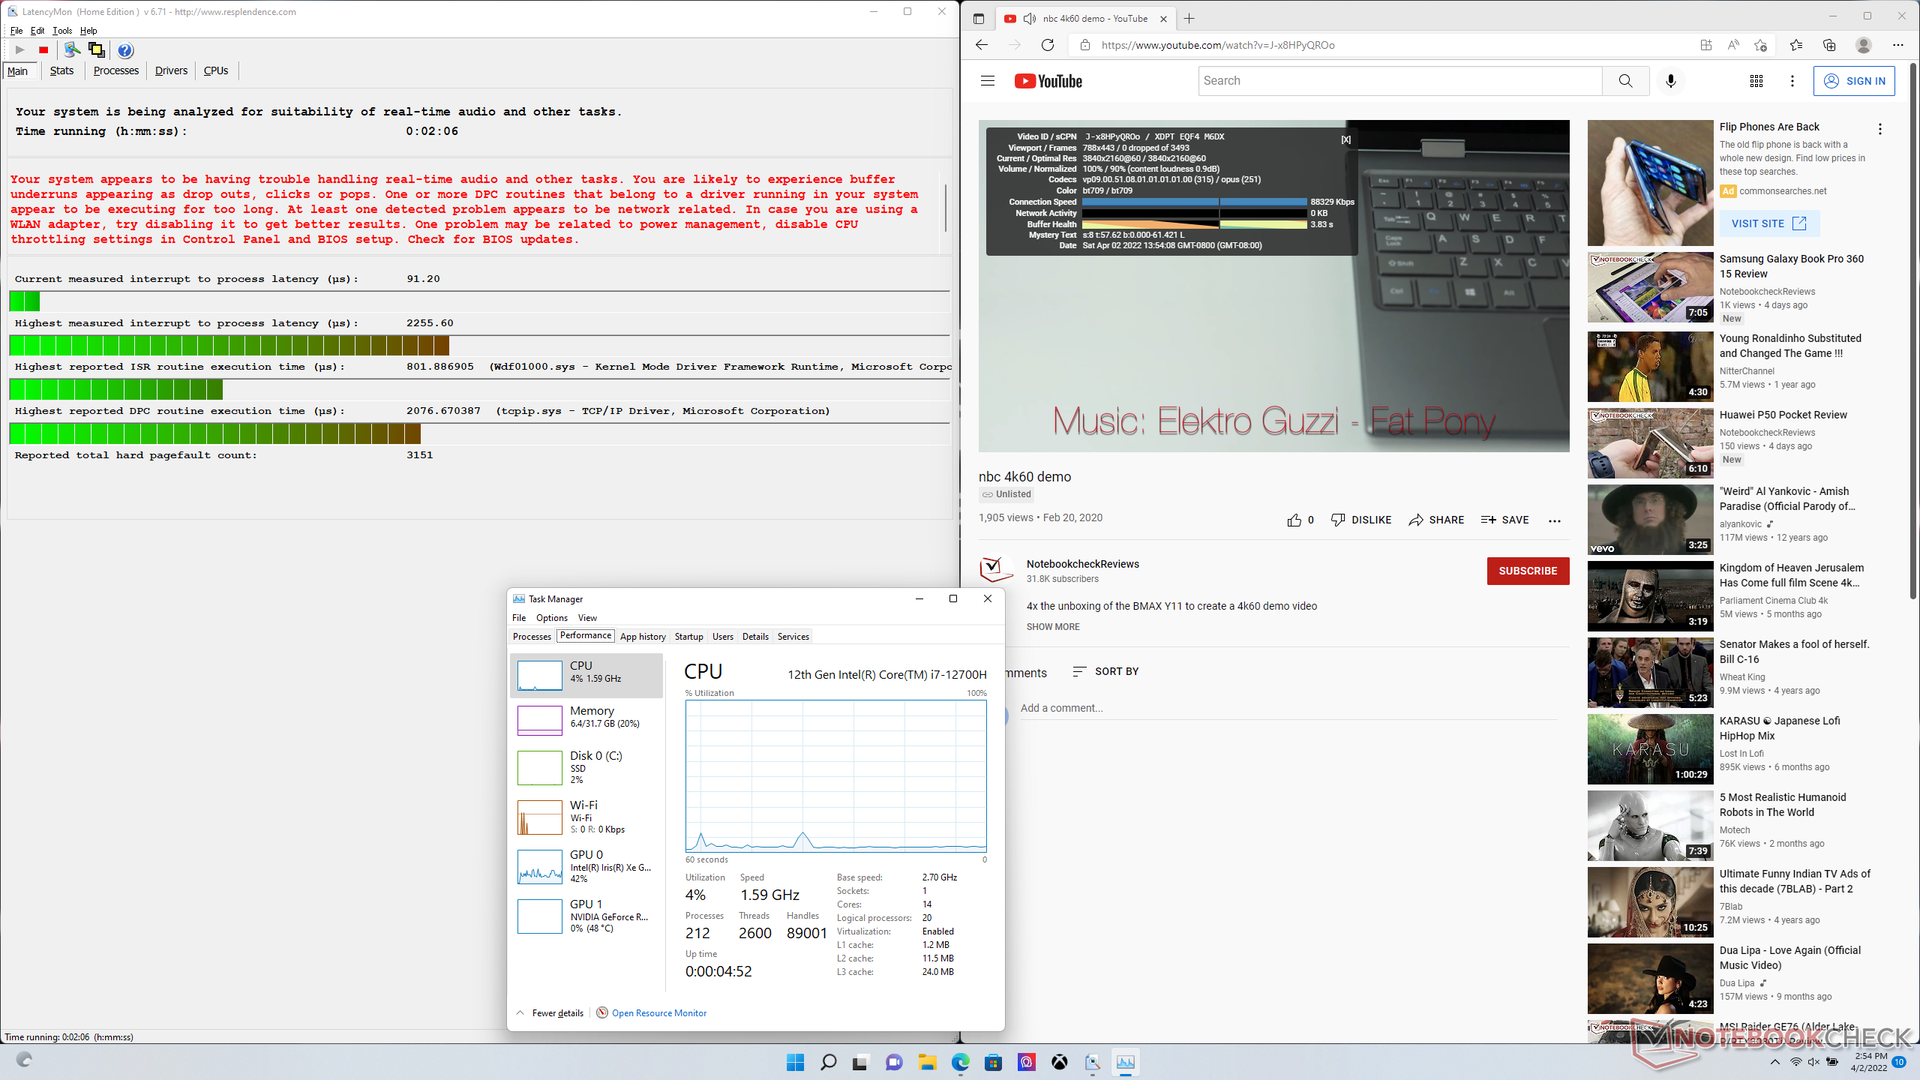
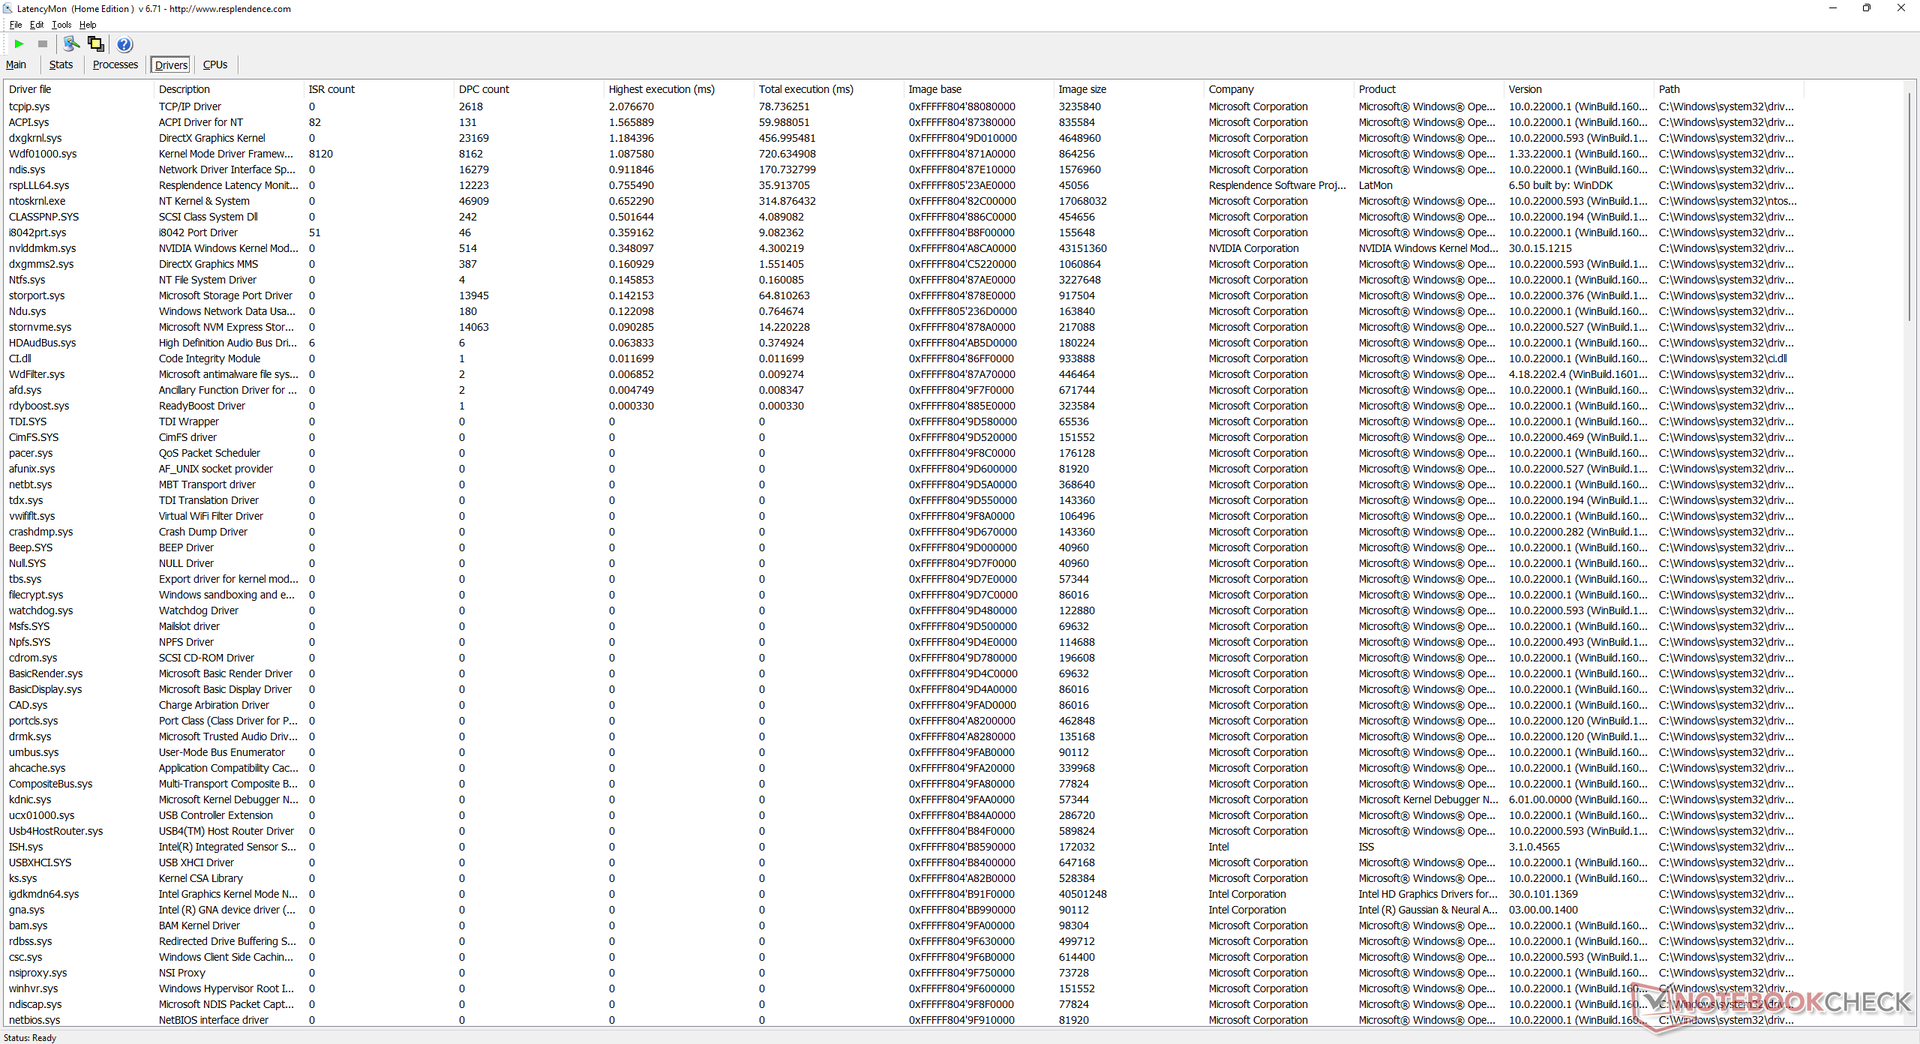
LatencyMon shows DPC issues when opening multiple browser tabs on our homepage. 4K video playback at 60 FPS is otherwise completely smooth and with no dropped frames during our tests on the iGPU.
| DPC Latencies / LatencyMon - interrupt to process latency (max), Web, Youtube, Prime95 | |
| Alienware x17 RTX 3080 P48E | |
| MSI Stealth GS77 12UHS-083US | |
| MSI GE76 Raider | |
| Asus ROG Zephyrus S17 GX703HSD | |
| Razer Blade 17 RTX 3080 Ti | |
| MSI GS76 Stealth 11UH | |
* ... smaller is better
Storage Devices — Up To 2x PCIe4 x4 NVMe SSDs
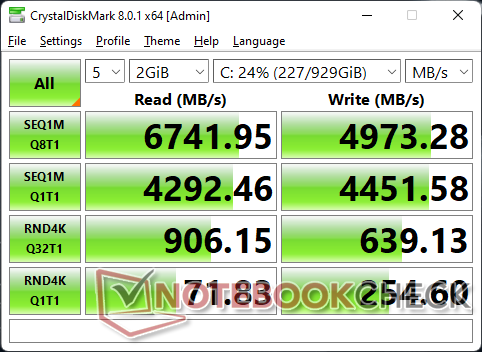
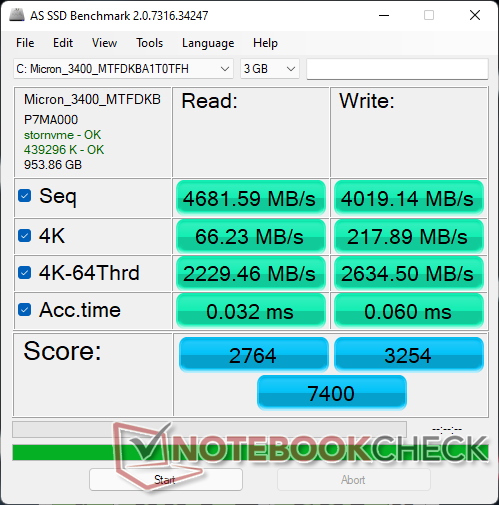
Our test unit shipped with a Micron 3400 PCIe4 x4 NVMe SSD. Though it's a high-end drive, performance appears to be consistently slower than the Samsung PM9A1 that comes standard on most flagship gaming laptops. Performance sustainability is nonetheless excellent when subjected to our DiskSpd loop test.


| Drive Performance rating - Percent | |
| Asus ROG Zephyrus S17 GX703HSD | |
| MSI GE76 Raider | |
| Razer Blade 17 RTX 3080 Ti | |
| MSI GS76 Stealth 11UH | |
| MSI Stealth GS77 12UHS-083US | |
| Alienware x17 RTX 3080 P48E | |
* ... smaller is better
Disk Throttling: DiskSpd Read Loop, Queue Depth 8
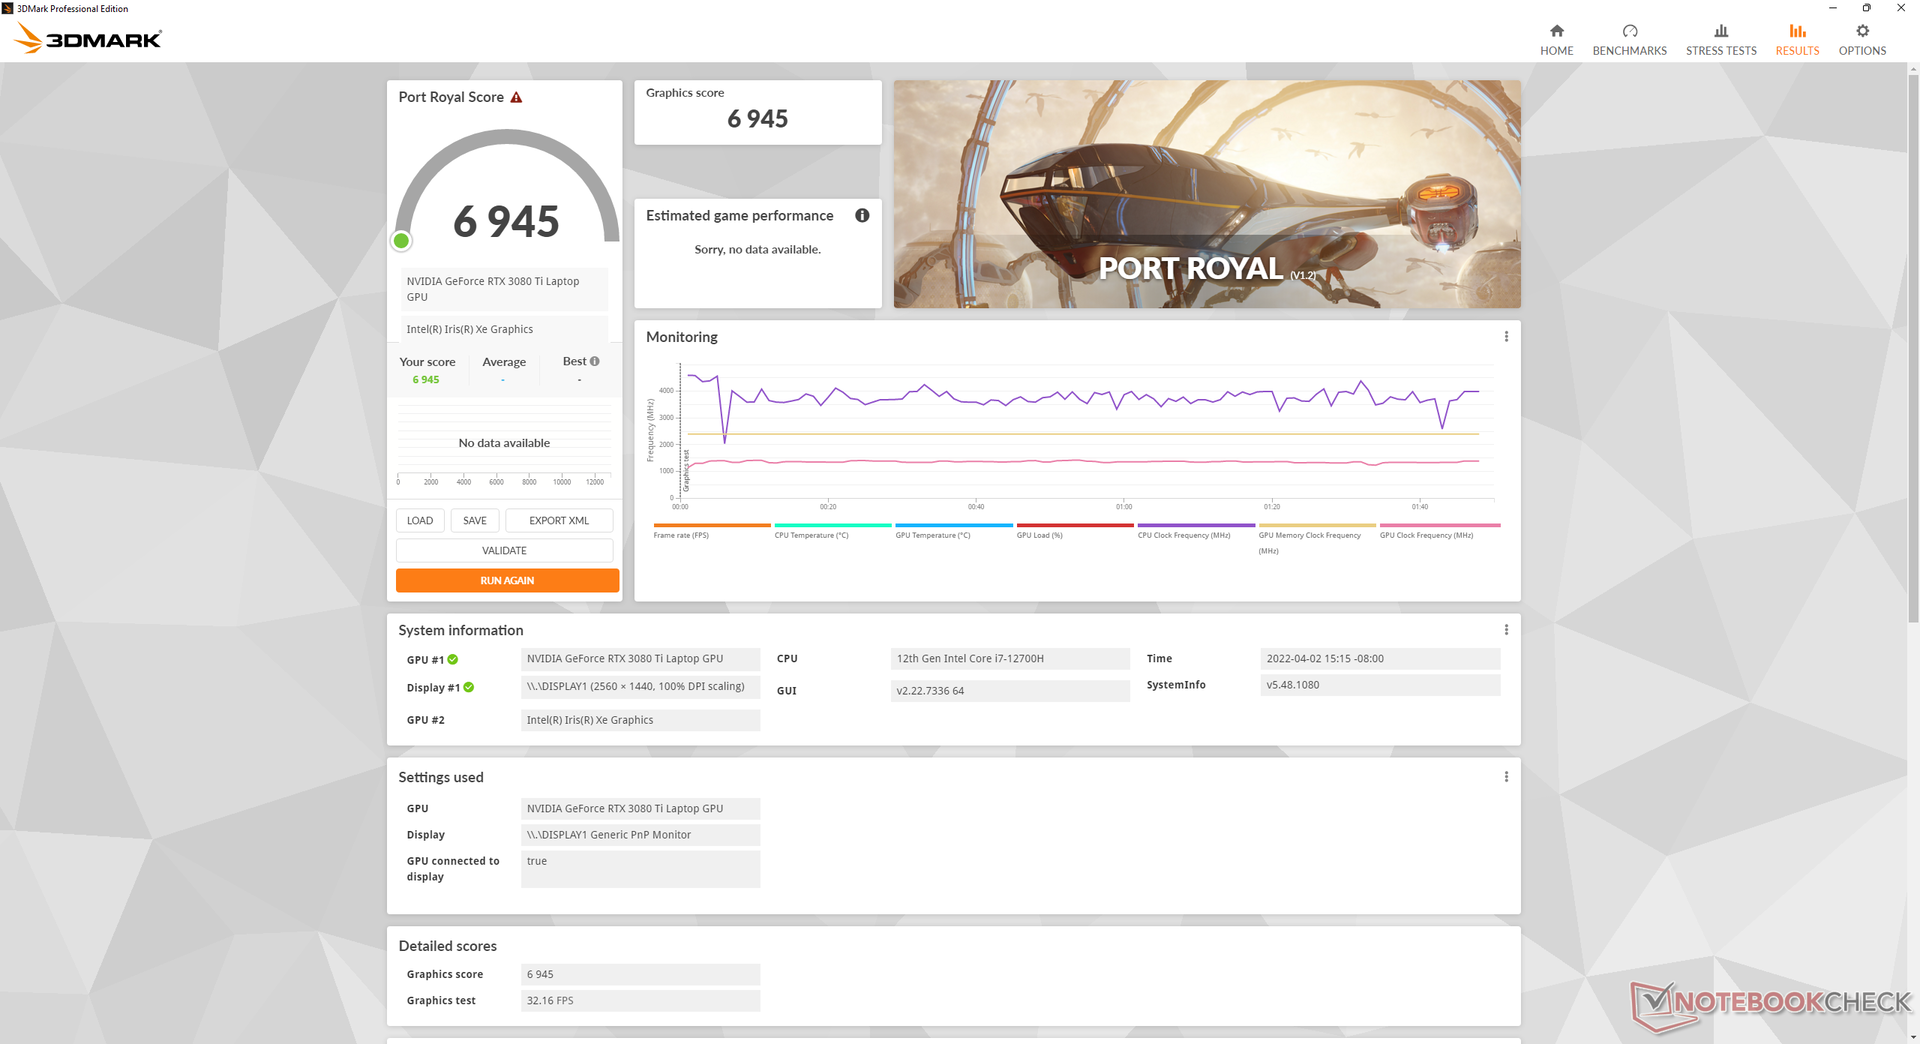
GPU Performance — Slightly Faster Than The RTX 3080
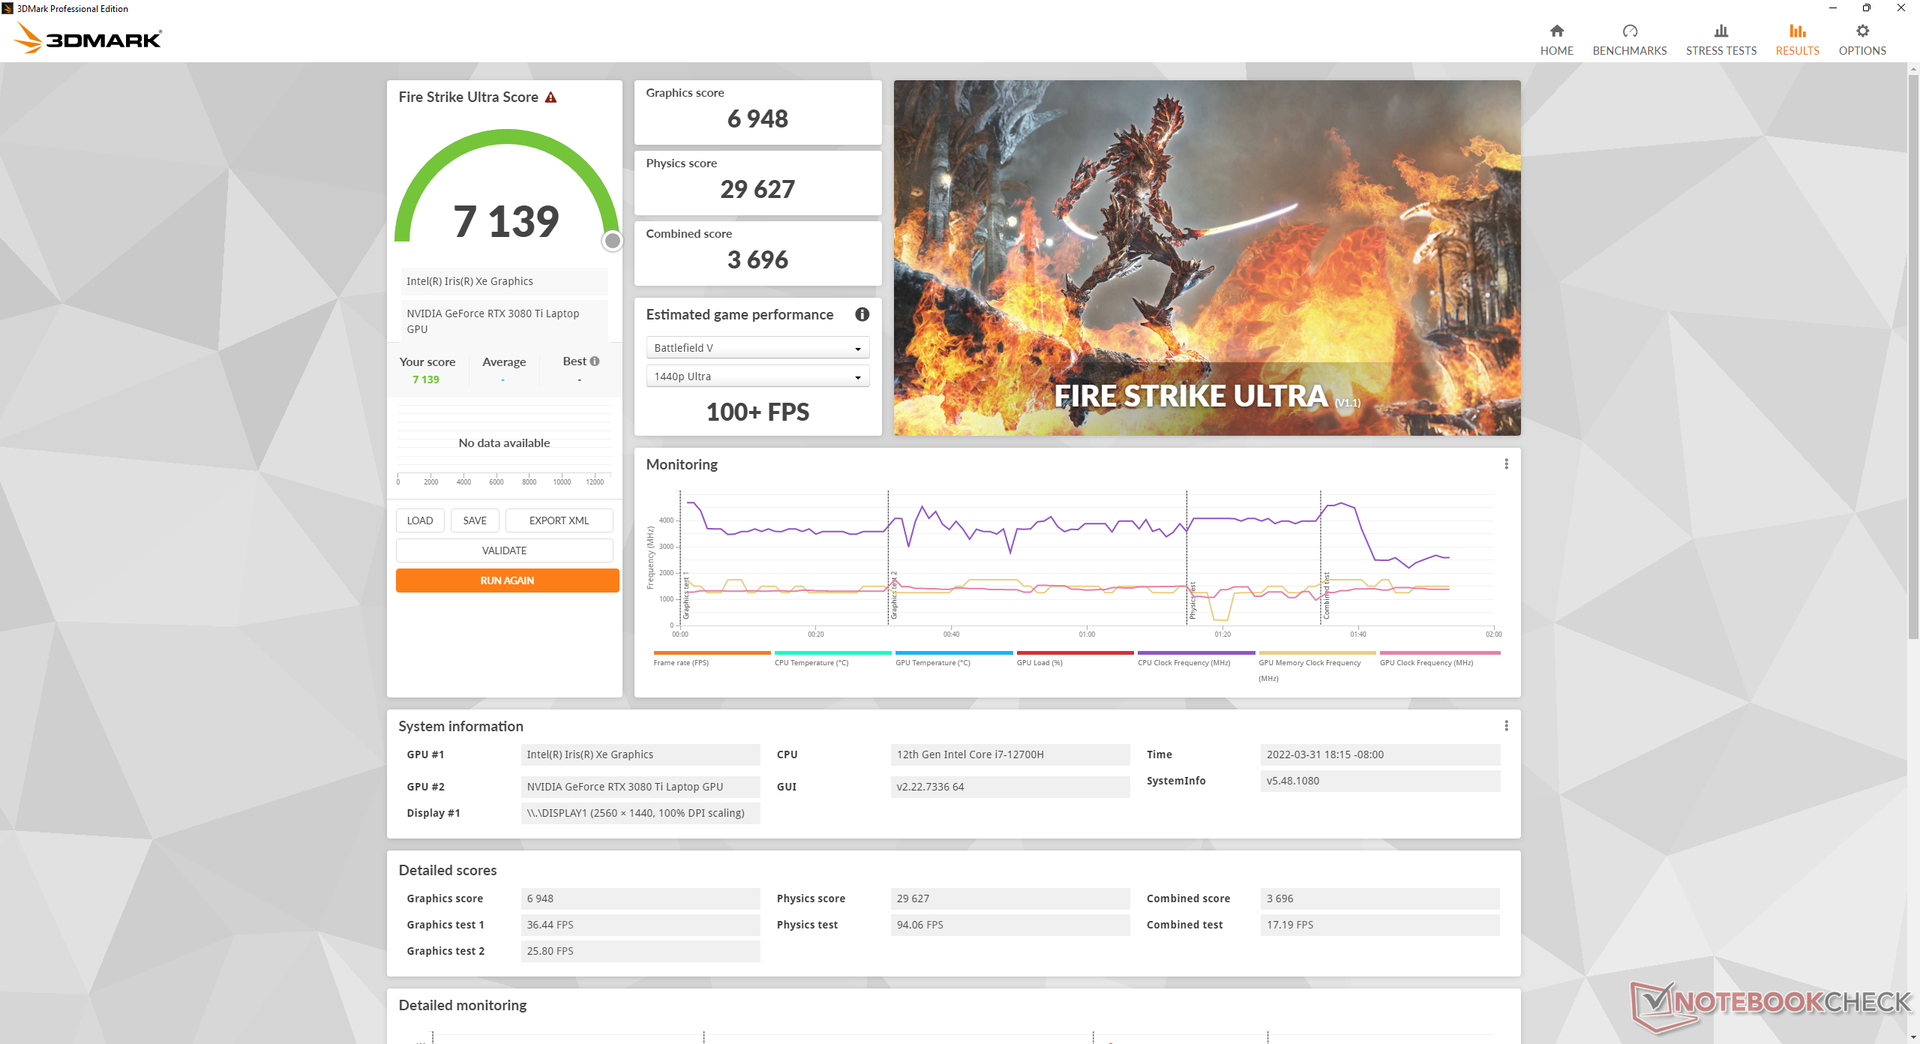
The GeForce RTX 3080 Ti in the GS77 offers a 12 to 15 percent performance uptick over the RTX 3080 in last year's GS76. When compared to the 165 W RTX 3080 Ti in the Blade 17, however, our 105 W RTX 3080 Ti is about 13 to 18 percent slower. This performance delta is most visible when gaming on higher resolutions where our GS77 would consistently fall behind the Razer alternative. Otherwise, the performance difference between a 105 W RTX 3080 Ti and 165 W RTX 3080 Ti will be much more minor at 1080p or lower resolutions where titles are likely to be CPU-bound.
Running the GS77 on the Balanced power profile instead of Extreme Performance will cut GPU performance by about 12 percent.
The desktop GeForce RTX 3080 Ti is still significantly faster than our mobile version by about 65 to 80 percent.
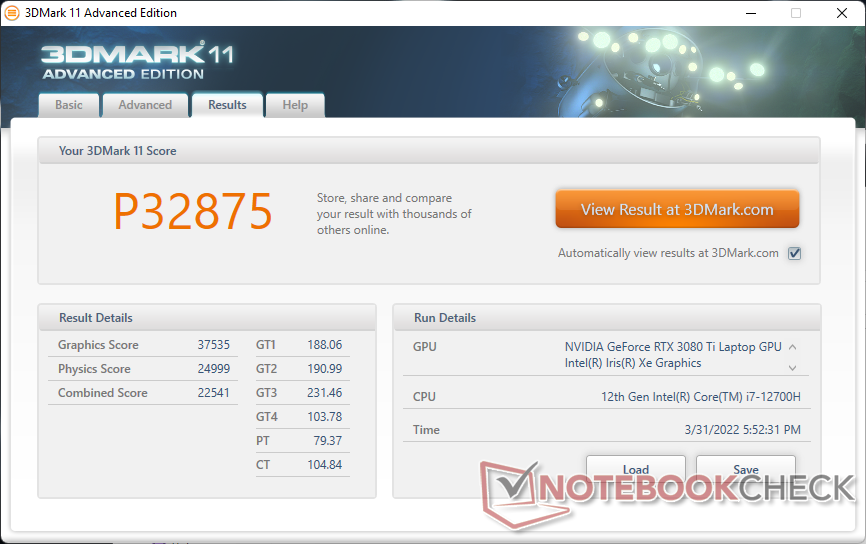
| 3DMark 11 Performance | 32875 points | |
| 3DMark Cloud Gate Standard Score | 55980 points | |
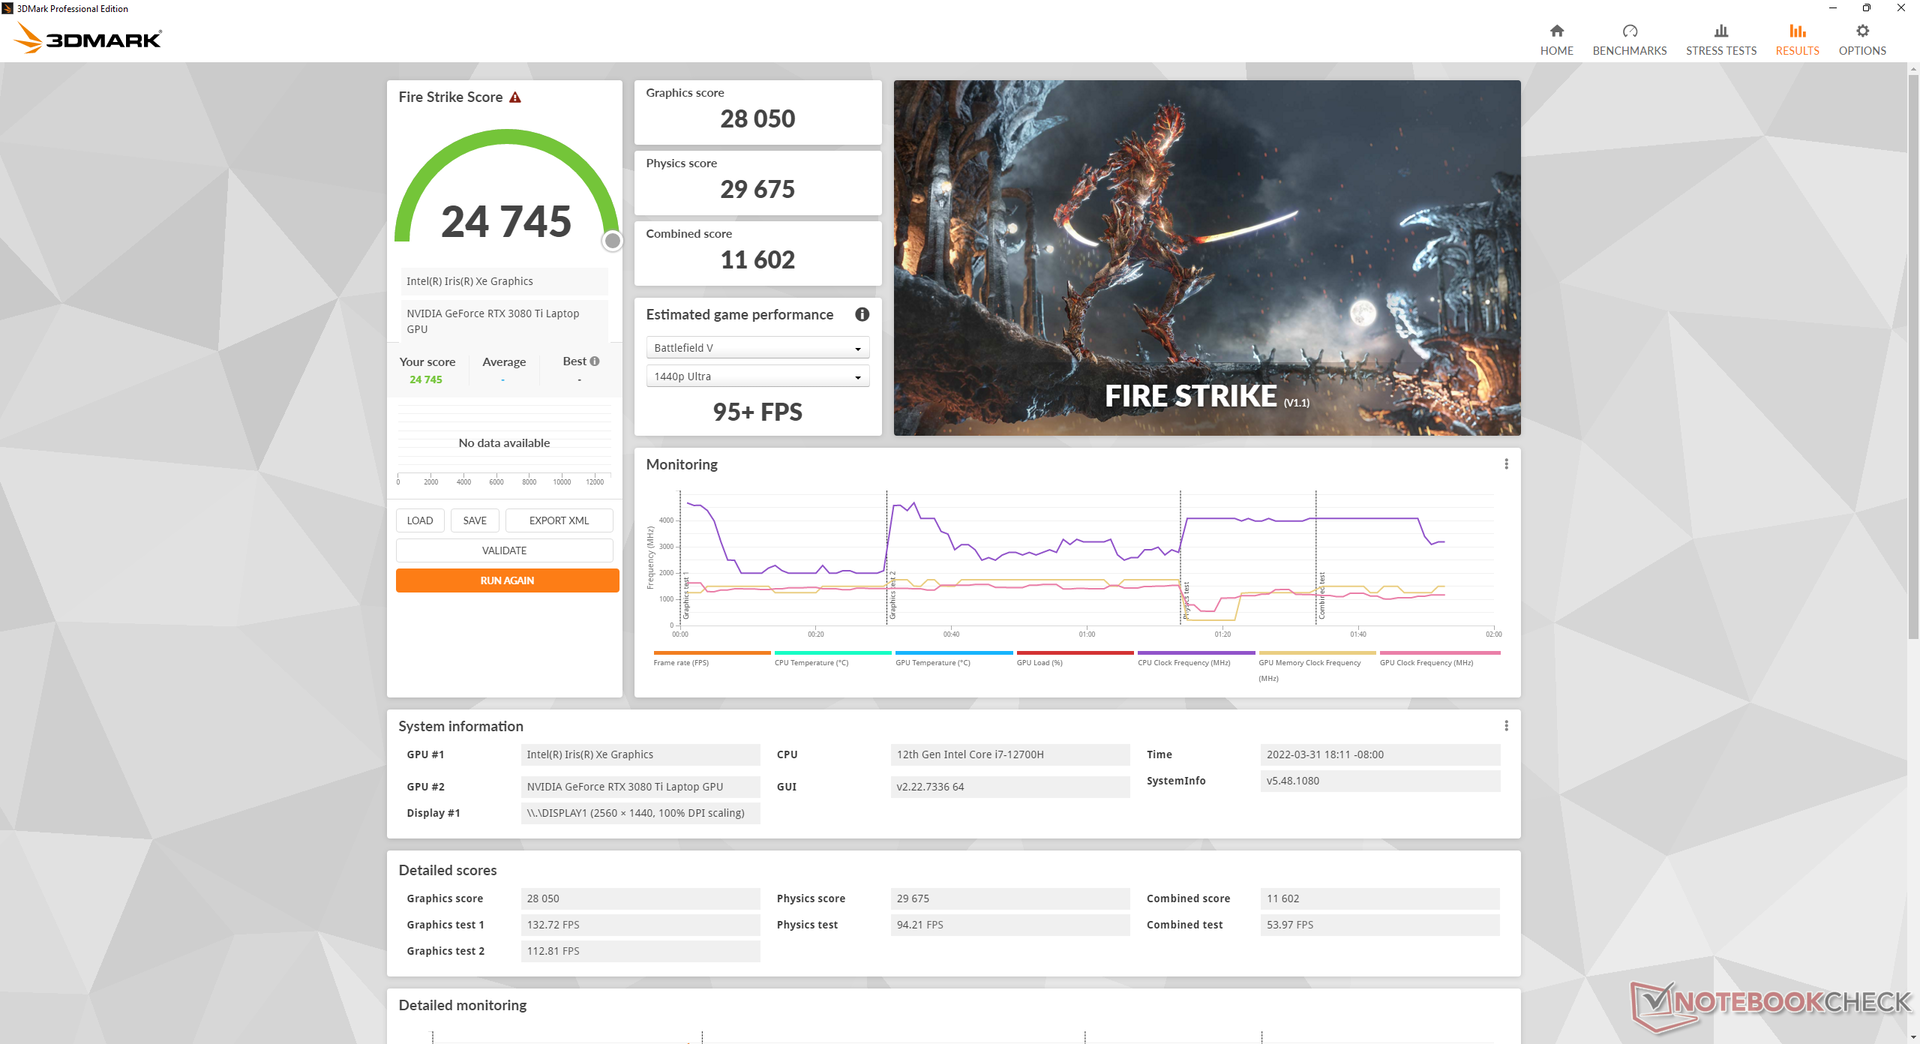
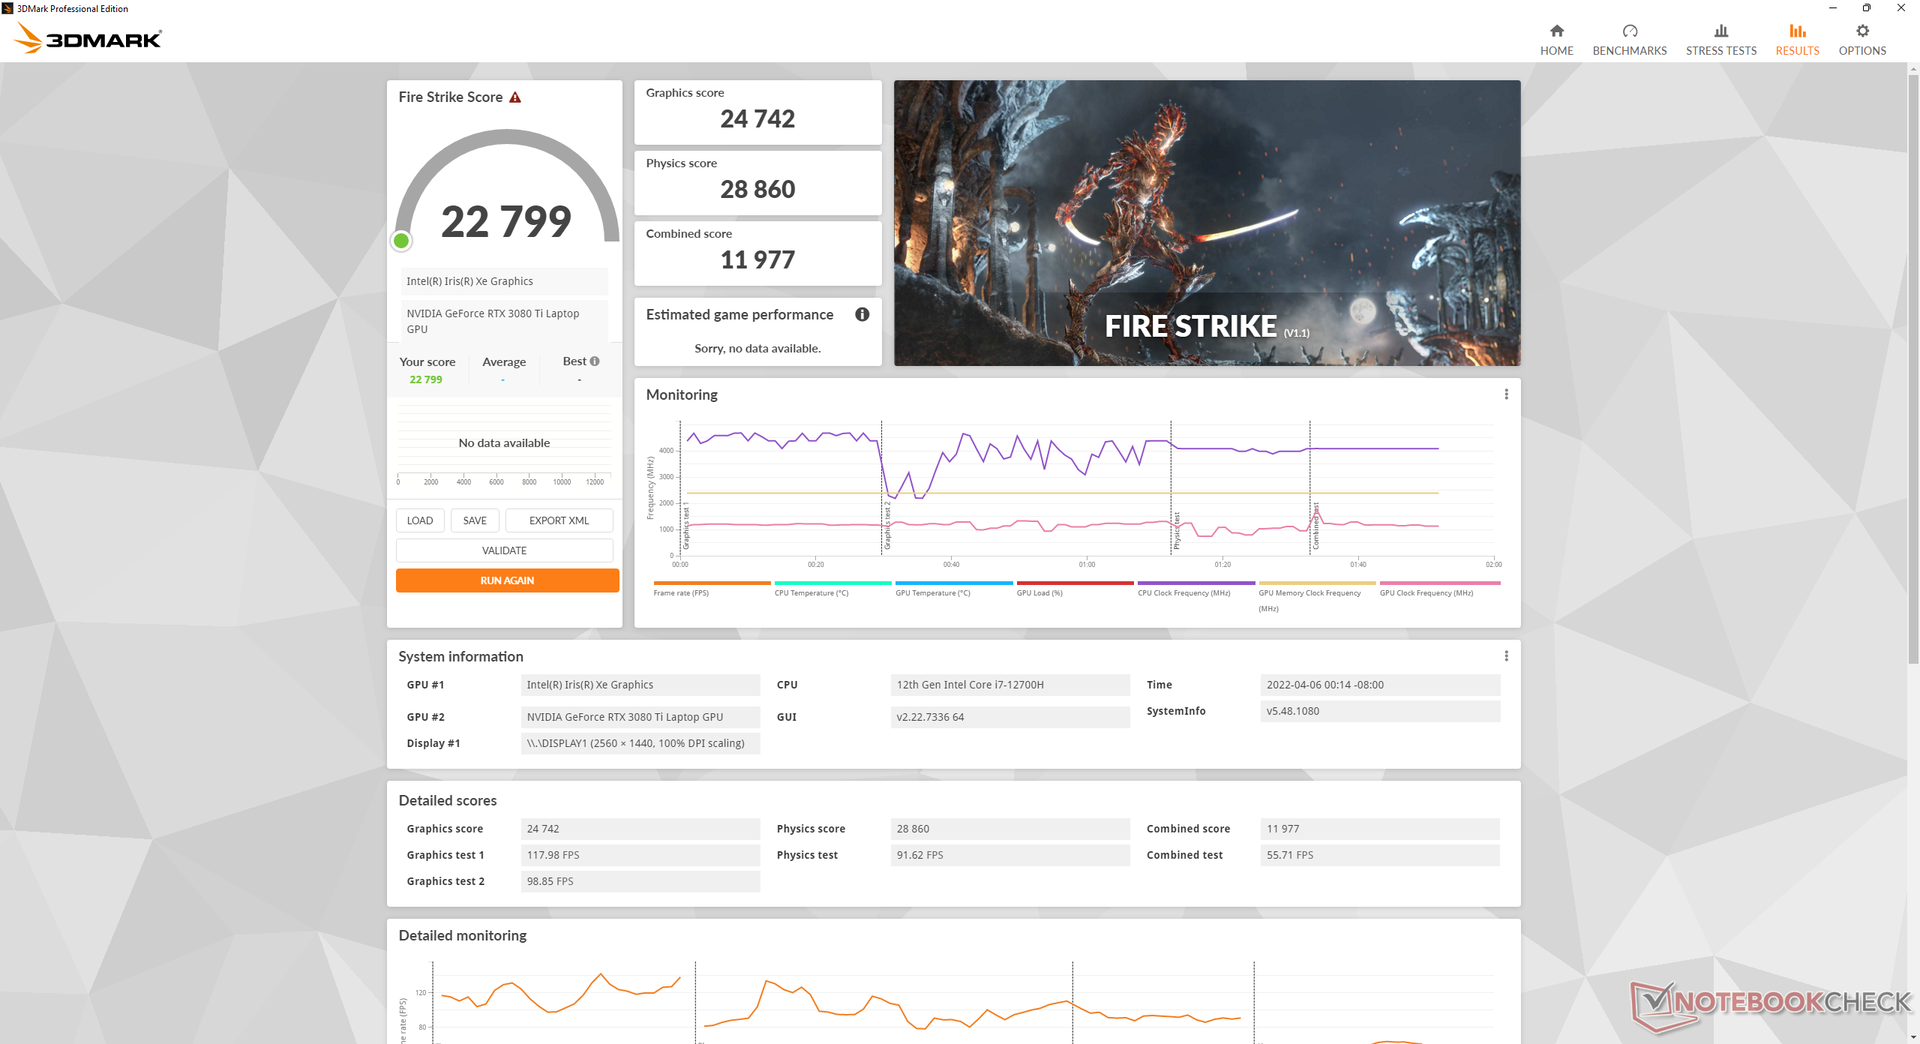
| 3DMark Fire Strike Score | 24745 points | |
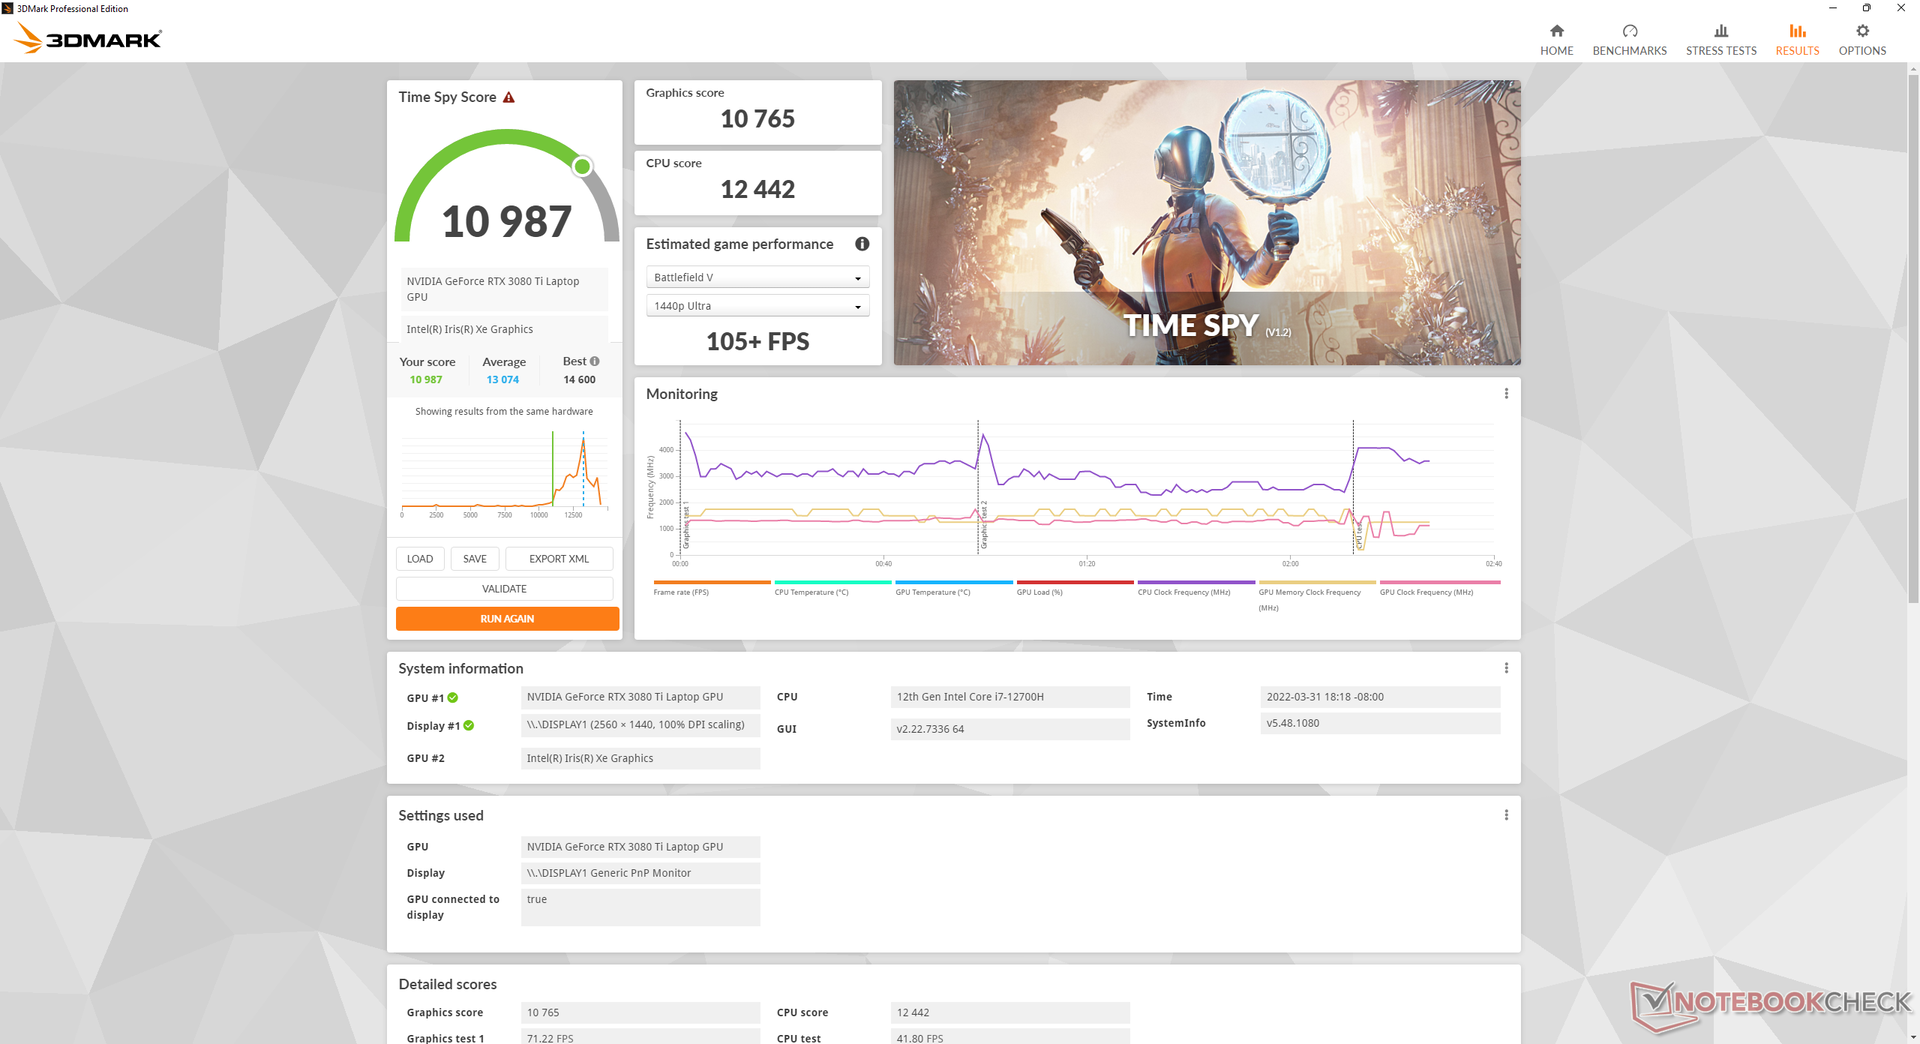
| 3DMark Time Spy Score | 10987 points | |
Help | ||
Witcher 3 FPS Chart
| low | med. | high | ultra | QHD | |
|---|---|---|---|---|---|
| GTA V (2015) | 186 | 185 | 175 | 113 | 94.2 |
| The Witcher 3 (2015) | 447.2 | 298.8 | 206.8 | 109.1 | |
| Dota 2 Reborn (2015) | 182 | 169 | 161 | 154 | |
| Final Fantasy XV Benchmark (2018) | 196 | 130 | 101 | 79.5 | |
| X-Plane 11.11 (2018) | 146 | 126 | 103 | ||
| Far Cry 5 (2018) | 190 | 145 | 136 | 129 | 101 |
| Strange Brigade (2018) | 447 | 239 | 196 | 177 | 126 |
| Cyberpunk 2077 1.6 (2022) | 133.2 | 113.6 | 92.9 | 92.8 | 49.7 |
Emissions
System Noise — No More Triple Fans
The internal fans do a good job at remaining quiet when set to Battery Saver or Silent modes. Fan noise may occasionally pop to 31 dB(A) against a silent background of 24.5 dB(A) when browsing or video streaming to be audible but not distracting.
Fan noise when running Witcher 3 on Extreme Performance mode is significantly quieter than on the Blade 17 (46 dB(A) vs. 51 dB(A)). If Cooler Boost mode is enabled, however, the GS77 becomes the noisier laptop at 57 dB(A). Thankfully, Cooler Boost mode is not needed to extract the full performance of the laptop.
Running the same game on Balanced mode instead of Extreme Performance mode would result in a slightly quieter fan noise of 44.1 dB(A) albeit for a graphics performance dip of 12 percent as mentioned earlier. Users concerned about fan noise may want to consider gaming on these lower power profiles instead.
Noise level
| Idle |
| 24.5 / 24.5 / 30.8 dB(A) |
| Load |
| 34.6 / 56.8 dB(A) |
 | ||
30 dB silent 40 dB(A) audible 50 dB(A) loud |
||
min: | ||
| MSI Stealth GS77 12UHS-083US GeForce RTX 3080 Ti Laptop GPU, i7-12700H, Micron 3400 1TB MTFDKBA1T0TFH | MSI GS76 Stealth 11UH GeForce RTX 3080 Laptop GPU, i9-11900H, Samsung PM9A1 MZVL22T0HBLB | Razer Blade 17 RTX 3080 Ti GeForce RTX 3080 Ti Laptop GPU, i7-12800H, Samsung PM9A1 MZVL21T0HCLR | MSI GE76 Raider GeForce RTX 3080 Ti Laptop GPU, i9-12900HK, Samsung PM9A1 MZVL22T0HBLB | Alienware x17 RTX 3080 P48E GeForce RTX 3080 Laptop GPU, i7-11800H, 2x WDC PC SN730 SDBPNTY-1T00 (RAID 0) | Asus ROG Zephyrus S17 GX703HSD GeForce RTX 3080 Laptop GPU, i9-11900H, Samsung PM9A1 MZVL22T0HBLB | |
|---|---|---|---|---|---|---|
| Noise | -8% | 3% | -15% | 1% | 5% | |
| off / environment * (dB) | 24.5 | 24 2% | 23.3 5% | 26 -6% | 24.9 -2% | 23 6% |
| Idle Minimum * (dB) | 24.5 | 24 2% | 23.3 5% | 26 -6% | 24.9 -2% | 23 6% |
| Idle Average * (dB) | 24.5 | 25 -2% | 23.3 5% | 27 -10% | 24.9 -2% | 23 6% |
| Idle Maximum * (dB) | 30.8 | 42 -36% | 26.3 15% | 40 -30% | 29.6 4% | 23 25% |
| Load Average * (dB) | 34.6 | 46 -33% | 38.2 -10% | 50 -45% | 31.1 10% | 41 -18% |
| Witcher 3 ultra * (dB) | 46.2 | 48 -4% | 50.9 -10% | 53 -15% | 49.7 -8% | 45 3% |
| Load Maximum * (dB) | 56.8 | 48 15% | 49.1 14% | 53 7% | 54.8 4% | 52 8% |
* ... smaller is better
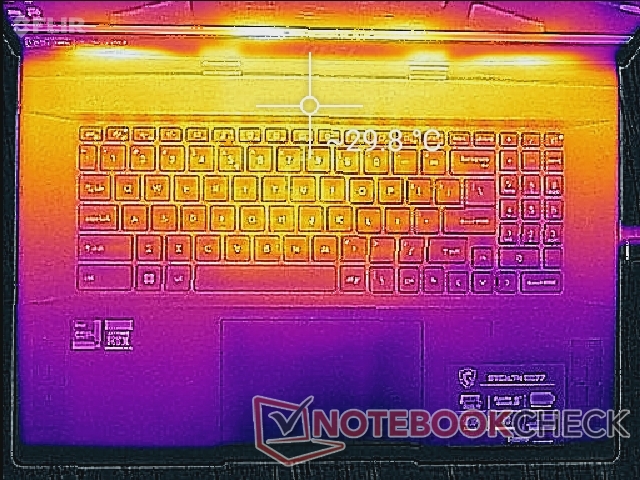
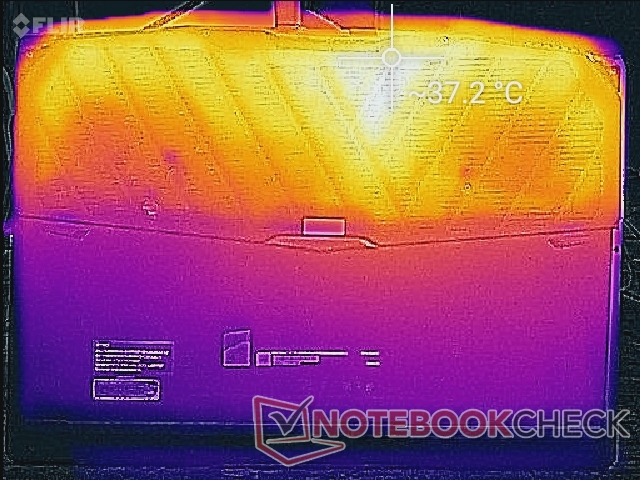
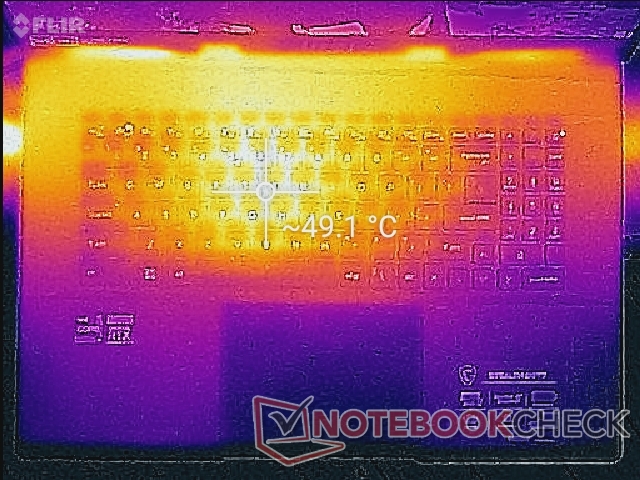
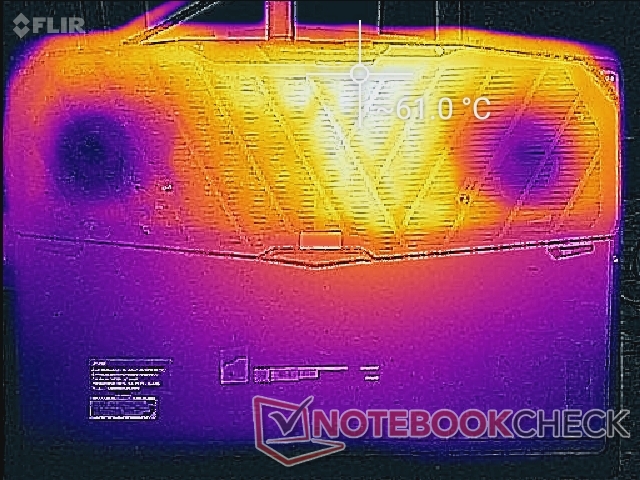
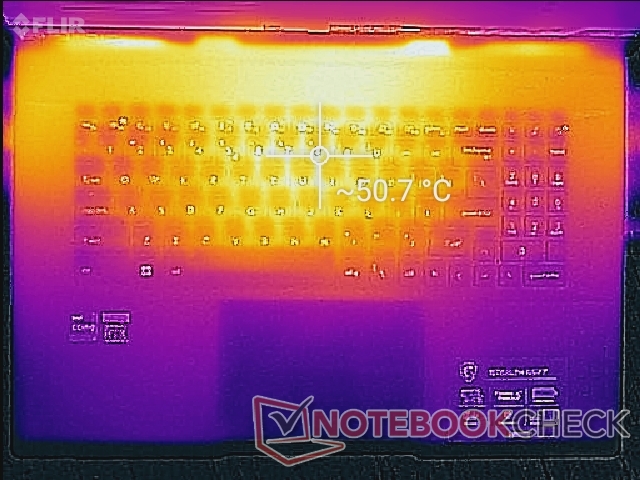
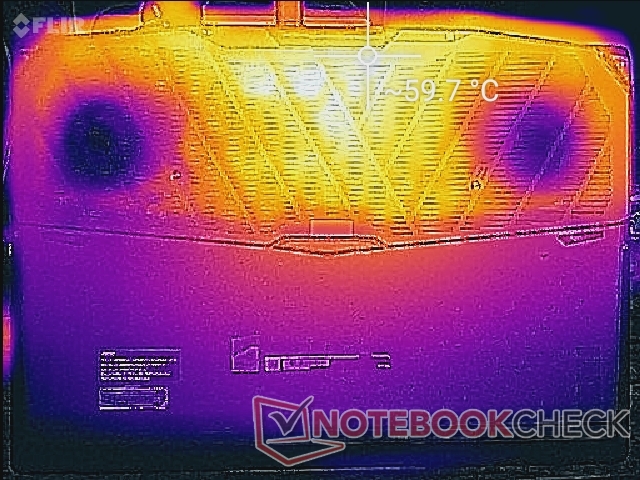
Temperature
Surface hot spots when gaming are about the same as what we recorded on the GS76 at around 49 C near the keyboard center and 61 C on the bottom. Temperature distribution is better on the newer model, however, as the palm rests are now much cooler at under 30 C compared to 35 C or higher on the GS76.
The Blade 17 has cooler WASD keys than on the GS77 since the Razer model draws in cool air from its WASD keys. This can be seen when comparing the temperature maps between the GS77 and Blade 17.
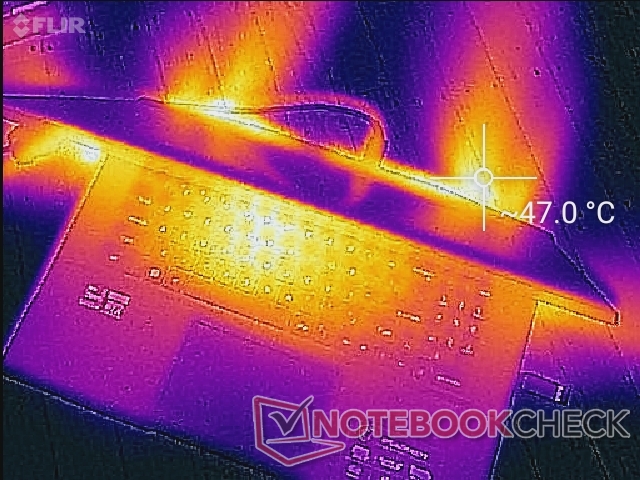
(-) The maximum temperature on the upper side is 50.6 °C / 123 F, compared to the average of 40.4 °C / 105 F, ranging from 21.2 to 68.8 °C for the class Gaming.
(-) The bottom heats up to a maximum of 59.6 °C / 139 F, compared to the average of 43.2 °C / 110 F
(+) In idle usage, the average temperature for the upper side is 26.9 °C / 80 F, compared to the device average of 33.9 °C / 93 F.
(±) Playing The Witcher 3, the average temperature for the upper side is 36.2 °C / 97 F, compared to the device average of 33.9 °C / 93 F.
(+) The palmrests and touchpad are cooler than skin temperature with a maximum of 30 °C / 86 F and are therefore cool to the touch.
(±) The average temperature of the palmrest area of similar devices was 28.8 °C / 83.8 F (-1.2 °C / -2.2 F).
| MSI Stealth GS77 12UHS-083US Intel Core i7-12700H, NVIDIA GeForce RTX 3080 Ti Laptop GPU | MSI GS76 Stealth 11UH Intel Core i9-11900H, NVIDIA GeForce RTX 3080 Laptop GPU | Razer Blade 17 RTX 3080 Ti Intel Core i7-12800H, NVIDIA GeForce RTX 3080 Ti Laptop GPU | MSI GE76 Raider Intel Core i9-12900HK, NVIDIA GeForce RTX 3080 Ti Laptop GPU | Alienware x17 RTX 3080 P48E Intel Core i7-11800H, NVIDIA GeForce RTX 3080 Laptop GPU | Asus ROG Zephyrus S17 GX703HSD Intel Core i9-11900H, NVIDIA GeForce RTX 3080 Laptop GPU | |
|---|---|---|---|---|---|---|
| Heat | 9% | 2% | 7% | -1% | -4% | |
| Maximum Upper Side * (°C) | 50.6 | 49 3% | 46 9% | 43 15% | 58.4 -15% | 59 -17% |
| Maximum Bottom * (°C) | 59.6 | 57 4% | 46.8 21% | 47 21% | 49 18% | 53 11% |
| Idle Upper Side * (°C) | 30 | 28 7% | 36.2 -21% | 33 -10% | 33.6 -12% | 35 -17% |
| Idle Bottom * (°C) | 37.4 | 30 20% | 38.6 -3% | 37 1% | 34.6 7% | 35 6% |
* ... smaller is better
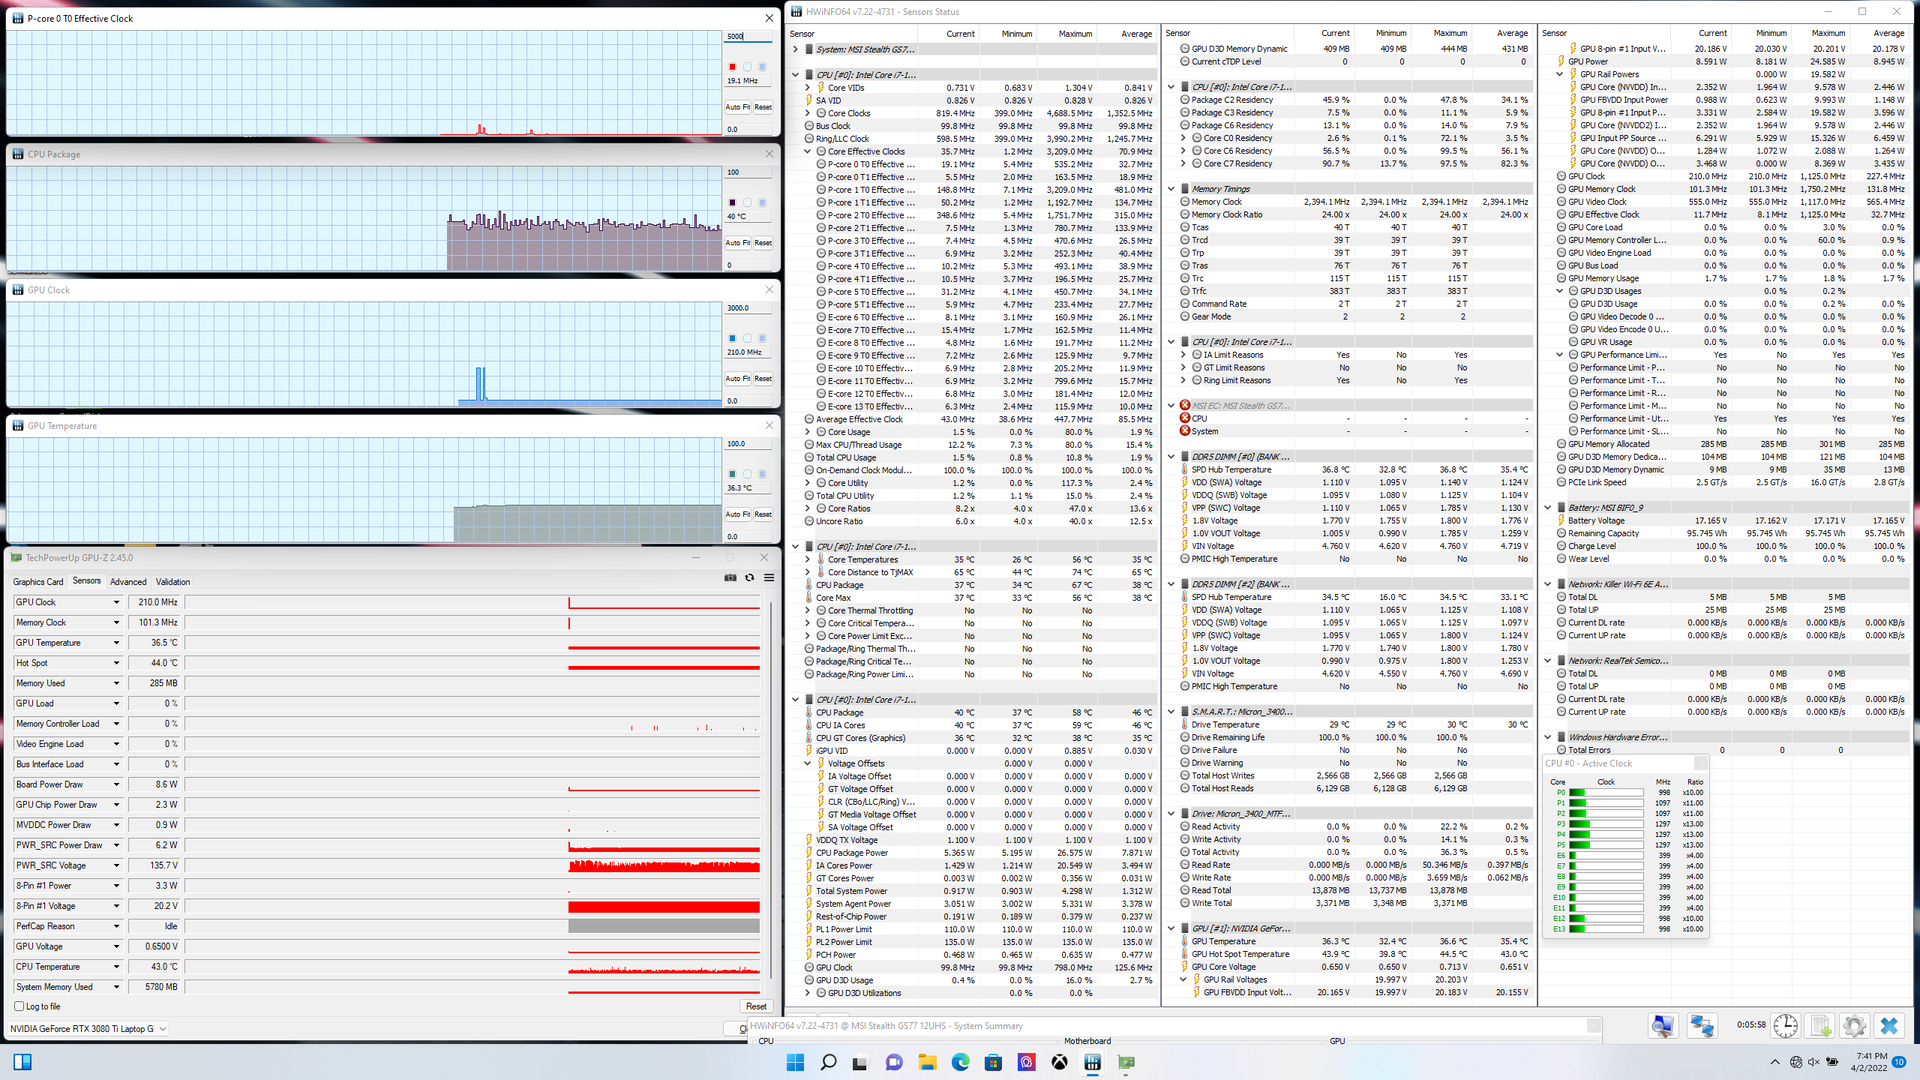
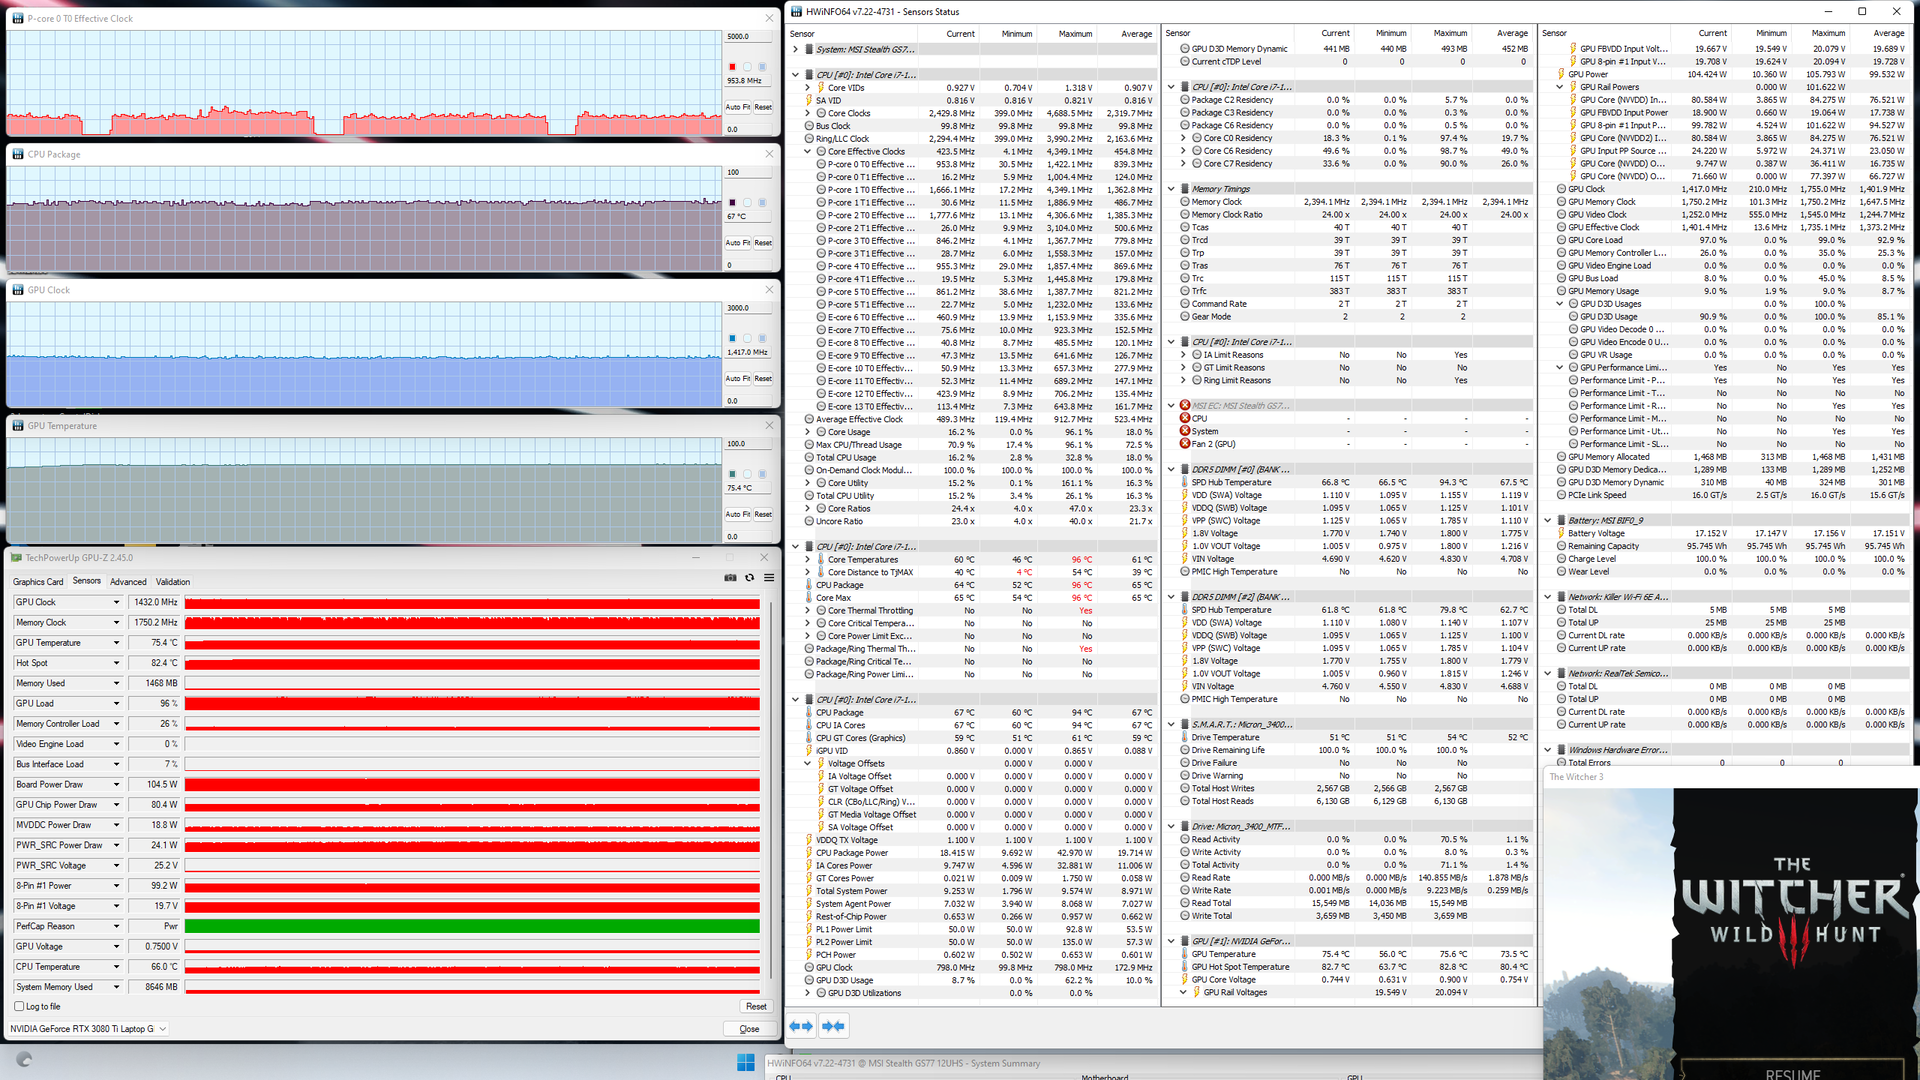
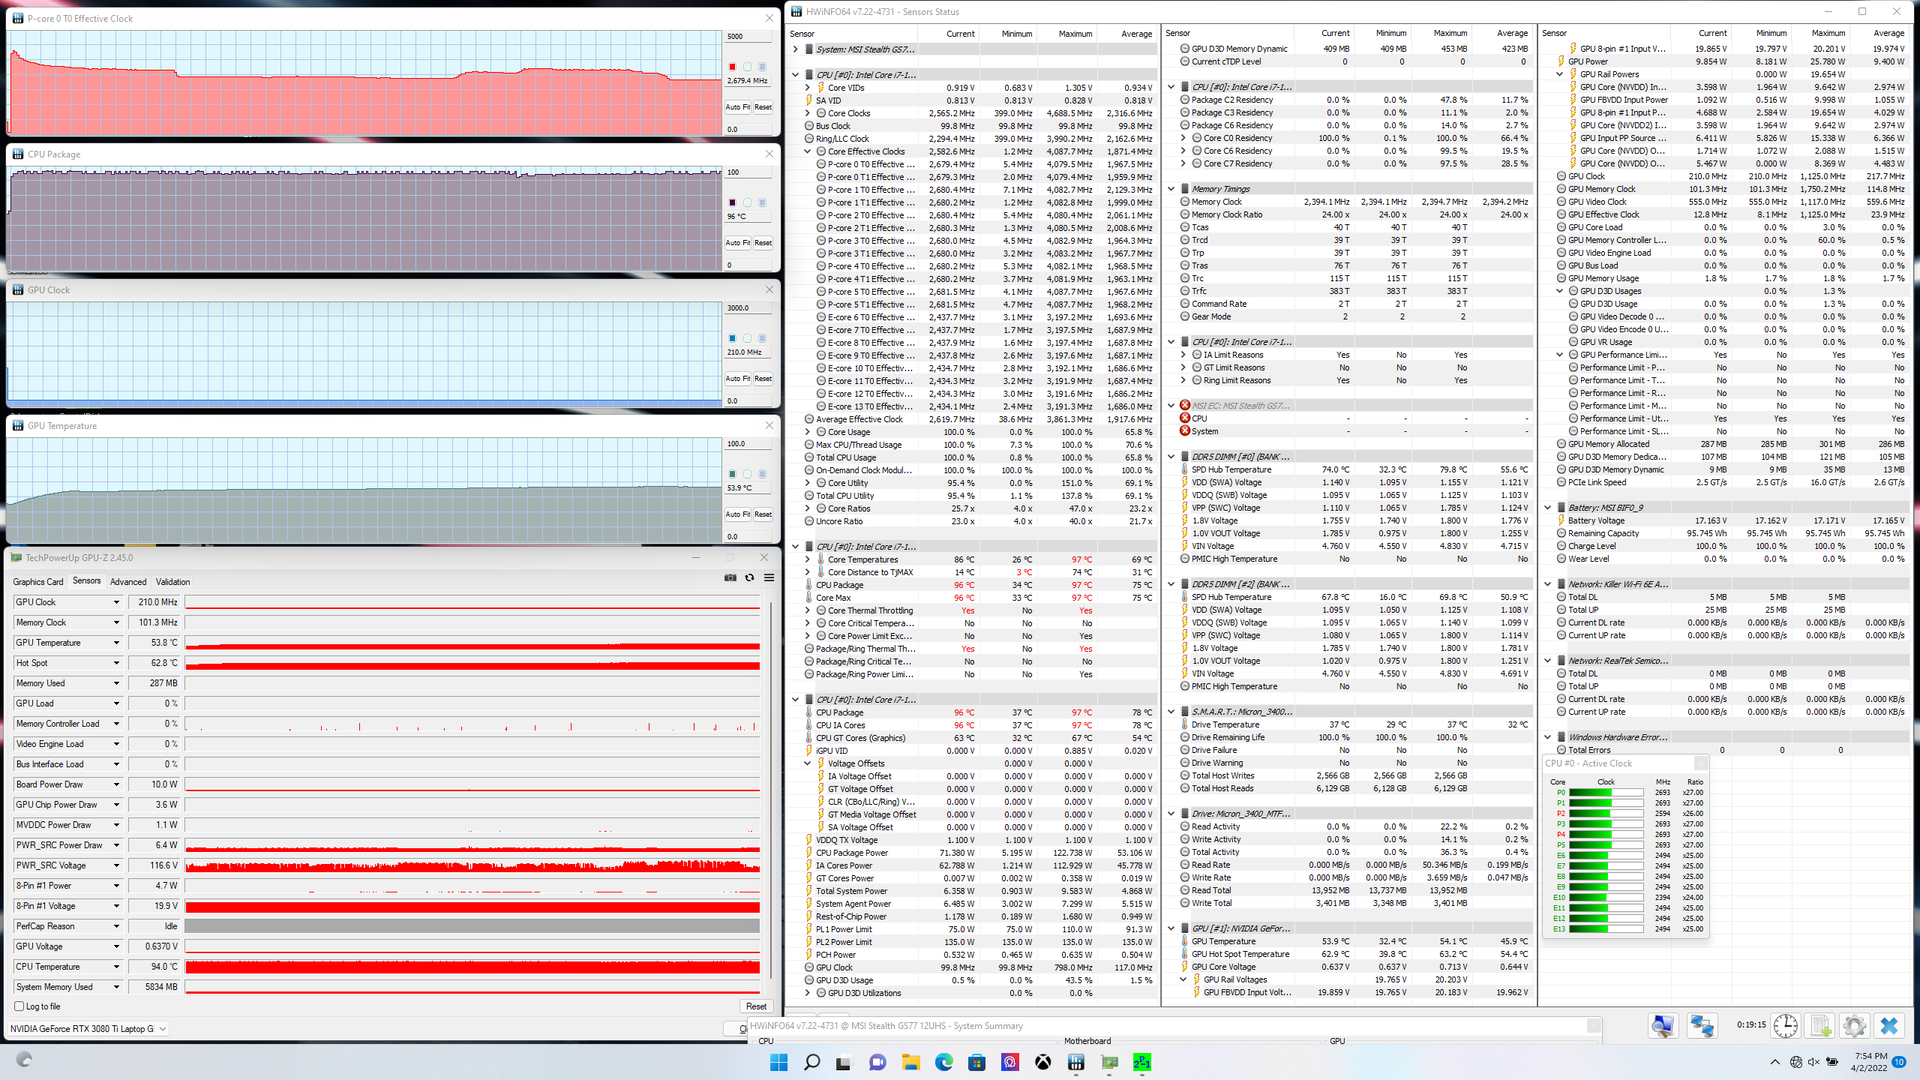
Stress Test
When running Prime95 to stress the CPU, clock rates and core temperature would boost to 4 GHz and 95 C for the first couple of seconds before stabilizing in the 2.7 to 3 GHz range in order to prevent the processor from getting any warmer. In comparison, the Core i7-12800H in the Blade 17 would run slower and cooler at 2.4 to 2.6 GHz and 71 C, respectively, when subjected to similar Prime95 conditions. MSI is therefore pushing its CPU much warmer in order to maximize processor performance. CPU package power on the GS77 would be as high as 122.7 W during the start of the test before stabilizing at around 71 W which is again higher than the 61 W we recorded on the Razer.
GPU clock, memory clock, and temperature would stabilize at 1432 MHz, 1750 MHz, and 75 C, respectively, when running Witcher 3. Running this same test on the Blade 17 would result in a GPU clock, memory clock, and temperature of 1597 MHz, 2000 MHz, and 77 C, respectively. The faster GPU performance of the Razer can be mostly attributed to its much higher TGP target compared to our MSI (165 W vs. 105 W). Indeed, GPU-Z would record a consistent GPU board power draw of 104.5 W when running the game.
Running on battery power limits performance. A Fire Strike test on batteries would return Physics and Graphics scores 29675 and 28050 points, respectively, compared to 14170 and 6220 points when on mains.
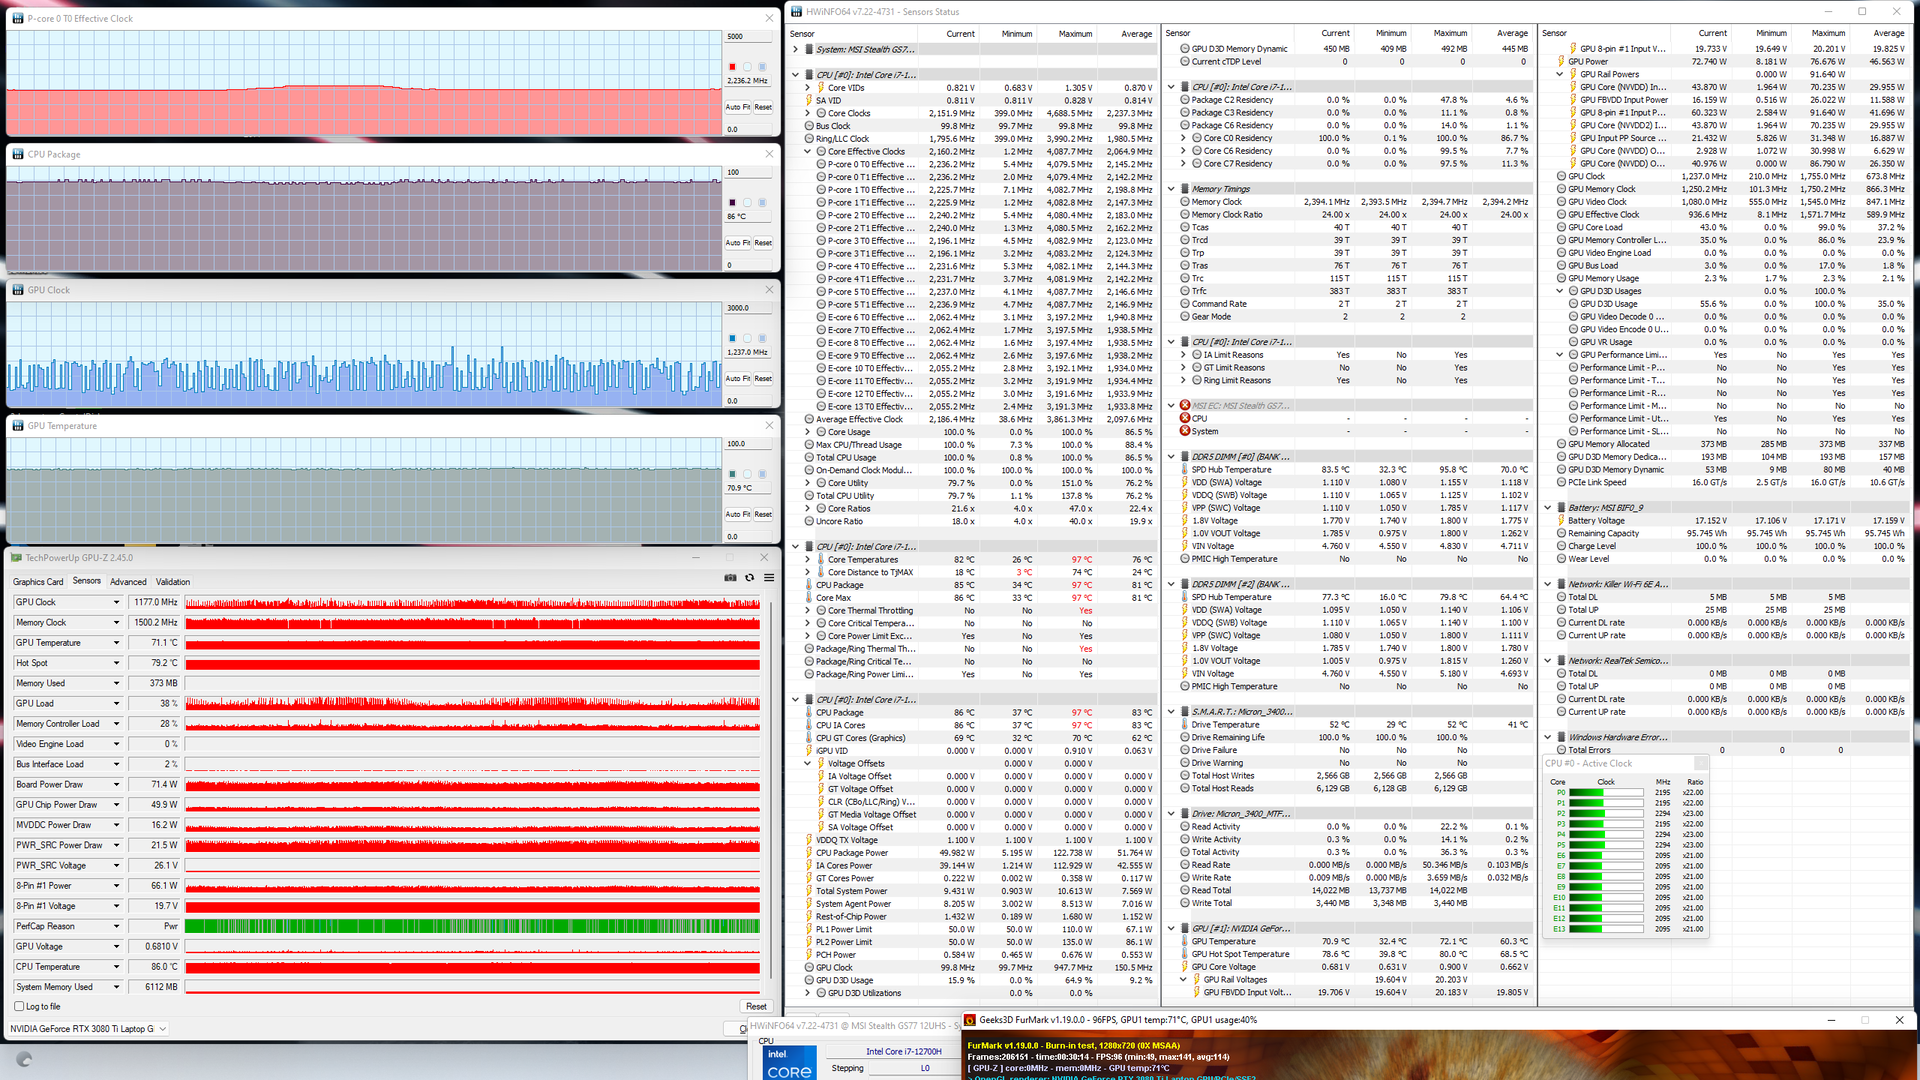
| CPU Clock (GHz) | GPU Clock (MHz) | Average CPU Temperature (°C) | Average GPU Temperature (°C) | |
| System Idle | -- | -- | 40 | 37 |
| Prime95 Stress | 2.7 - 3.0 | -- | 96 | 54 |
| Prime95 + FurMark Stress | 2.2 | 430 - 1237 | 86 | 71 |
| Witcher 3 Stress | ~1.0 | 1432 | 67 | 75 |
Speakers

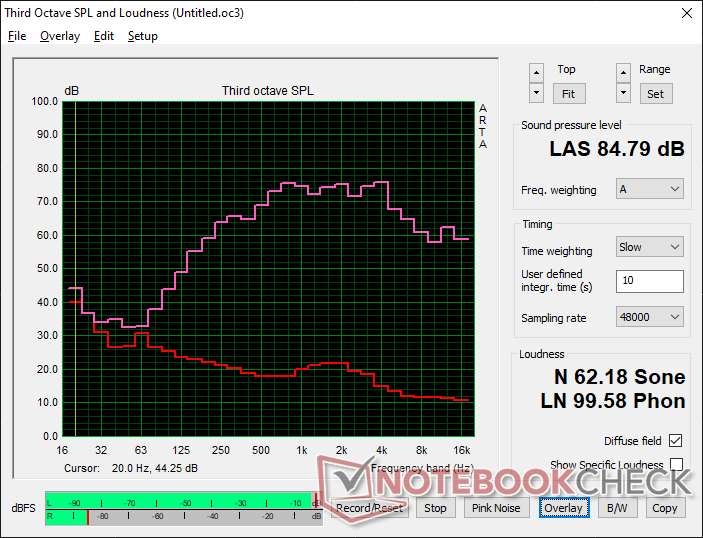
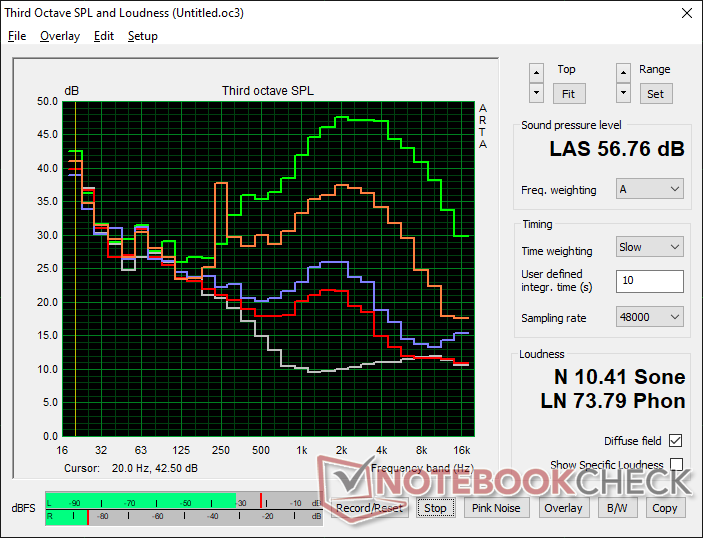
MSI Stealth GS77 12UHS-083US audio analysis
(+) | speakers can play relatively loud (84.8 dB)
Bass 100 - 315 Hz
(±) | reduced bass - on average 9.4% lower than median
(±) | linearity of bass is average (9.8% delta to prev. frequency)
Mids 400 - 2000 Hz
(±) | higher mids - on average 7% higher than median
(+) | mids are linear (4.9% delta to prev. frequency)
Highs 2 - 16 kHz
(±) | higher highs - on average 5.8% higher than median
(±) | linearity of highs is average (7.9% delta to prev. frequency)
Overall 100 - 16.000 Hz
(±) | linearity of overall sound is average (15.9% difference to median)
Compared to same class
» 38% of all tested devices in this class were better, 7% similar, 56% worse
» The best had a delta of 6%, average was 18%, worst was 132%
Compared to all devices tested
» 25% of all tested devices were better, 5% similar, 70% worse
» The best had a delta of 4%, average was 23%, worst was 134%
Apple MacBook Pro 16 2021 M1 Pro audio analysis
(+) | speakers can play relatively loud (84.7 dB)
Bass 100 - 315 Hz
(+) | good bass - only 3.8% away from median
(+) | bass is linear (5.2% delta to prev. frequency)
Mids 400 - 2000 Hz
(+) | balanced mids - only 1.3% away from median
(+) | mids are linear (2.1% delta to prev. frequency)
Highs 2 - 16 kHz
(+) | balanced highs - only 1.9% away from median
(+) | highs are linear (2.7% delta to prev. frequency)
Overall 100 - 16.000 Hz
(+) | overall sound is linear (4.6% difference to median)
Compared to same class
» 0% of all tested devices in this class were better, 0% similar, 100% worse
» The best had a delta of 5%, average was 17%, worst was 45%
Compared to all devices tested
» 0% of all tested devices were better, 0% similar, 100% worse
» The best had a delta of 4%, average was 23%, worst was 134%
Energy Management
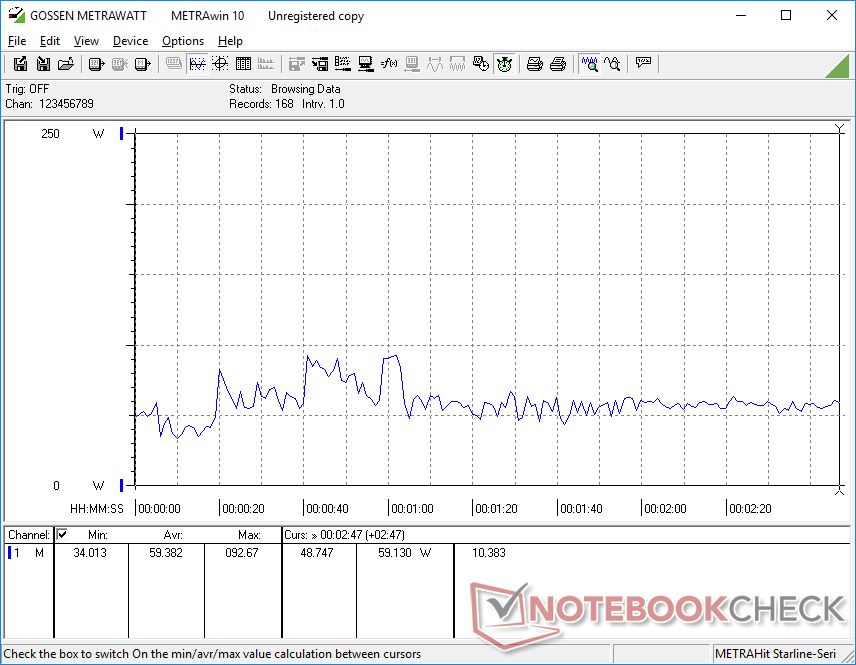
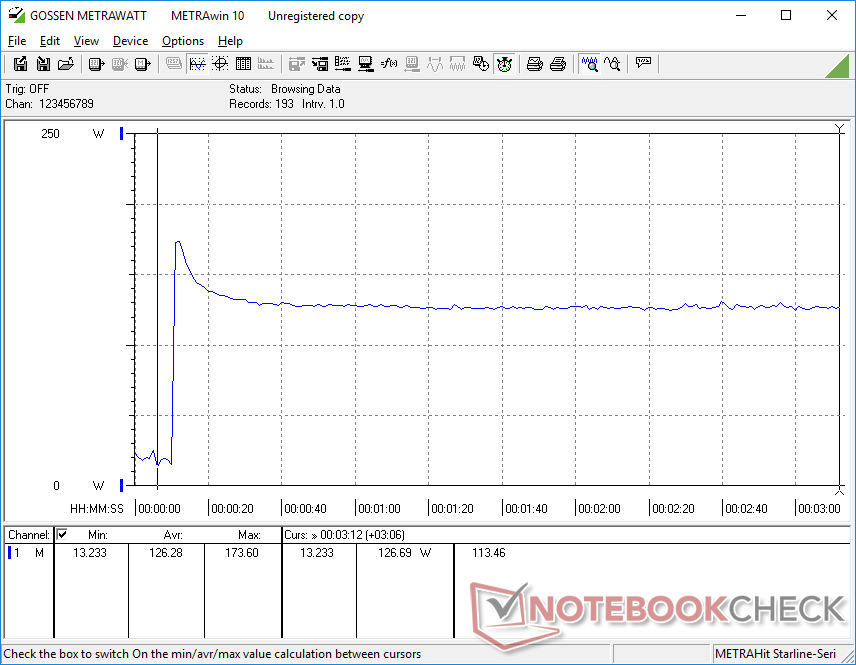
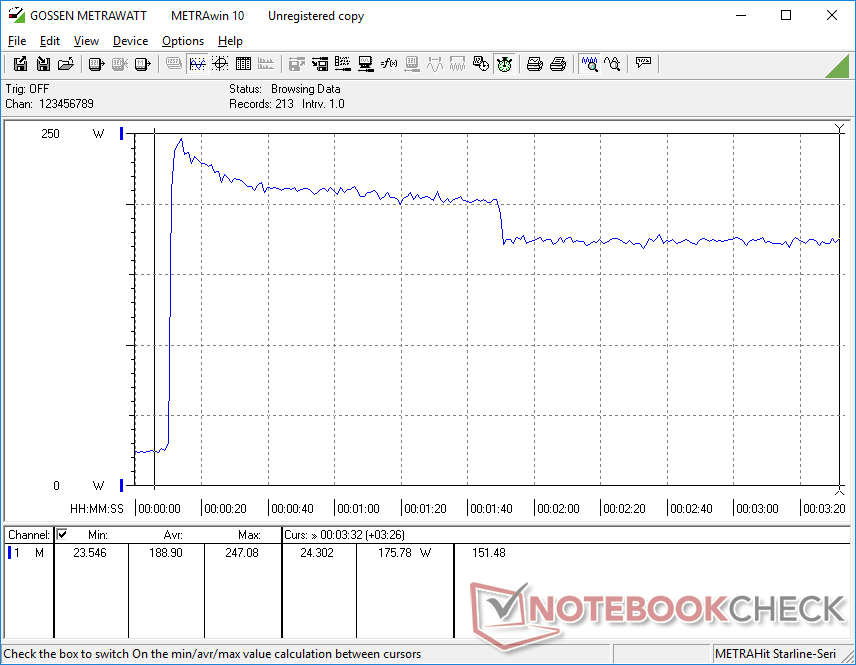
Power Consumption — A Bit More Power-Hungry
The GS77 is not all that more demanding that last year's GS76 despite the performance uptick. Running Witcher 3, for example, takes only 5 percent more power for an aforementioned 12 to 15 percent boost in graphics performance over the RTX 3080. The small power consumption difference can be attributed to the CPU and GPU in the GS77 aiming for relatively similar TDP and TGP levels than the processors in the GS76. In contrast, the TGP target between the 2021 and 2022 Blade 17 models has increased substantially from 100 W to 165 W leading to significantly higher power consumption levels for the Blade 17 when compared to the GS77 as shown by the table below.
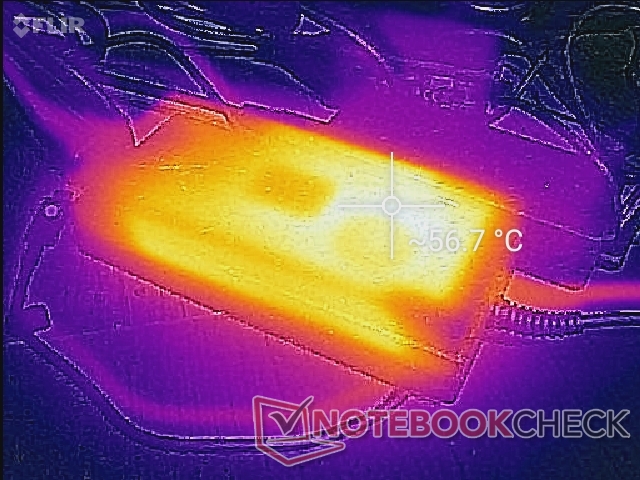
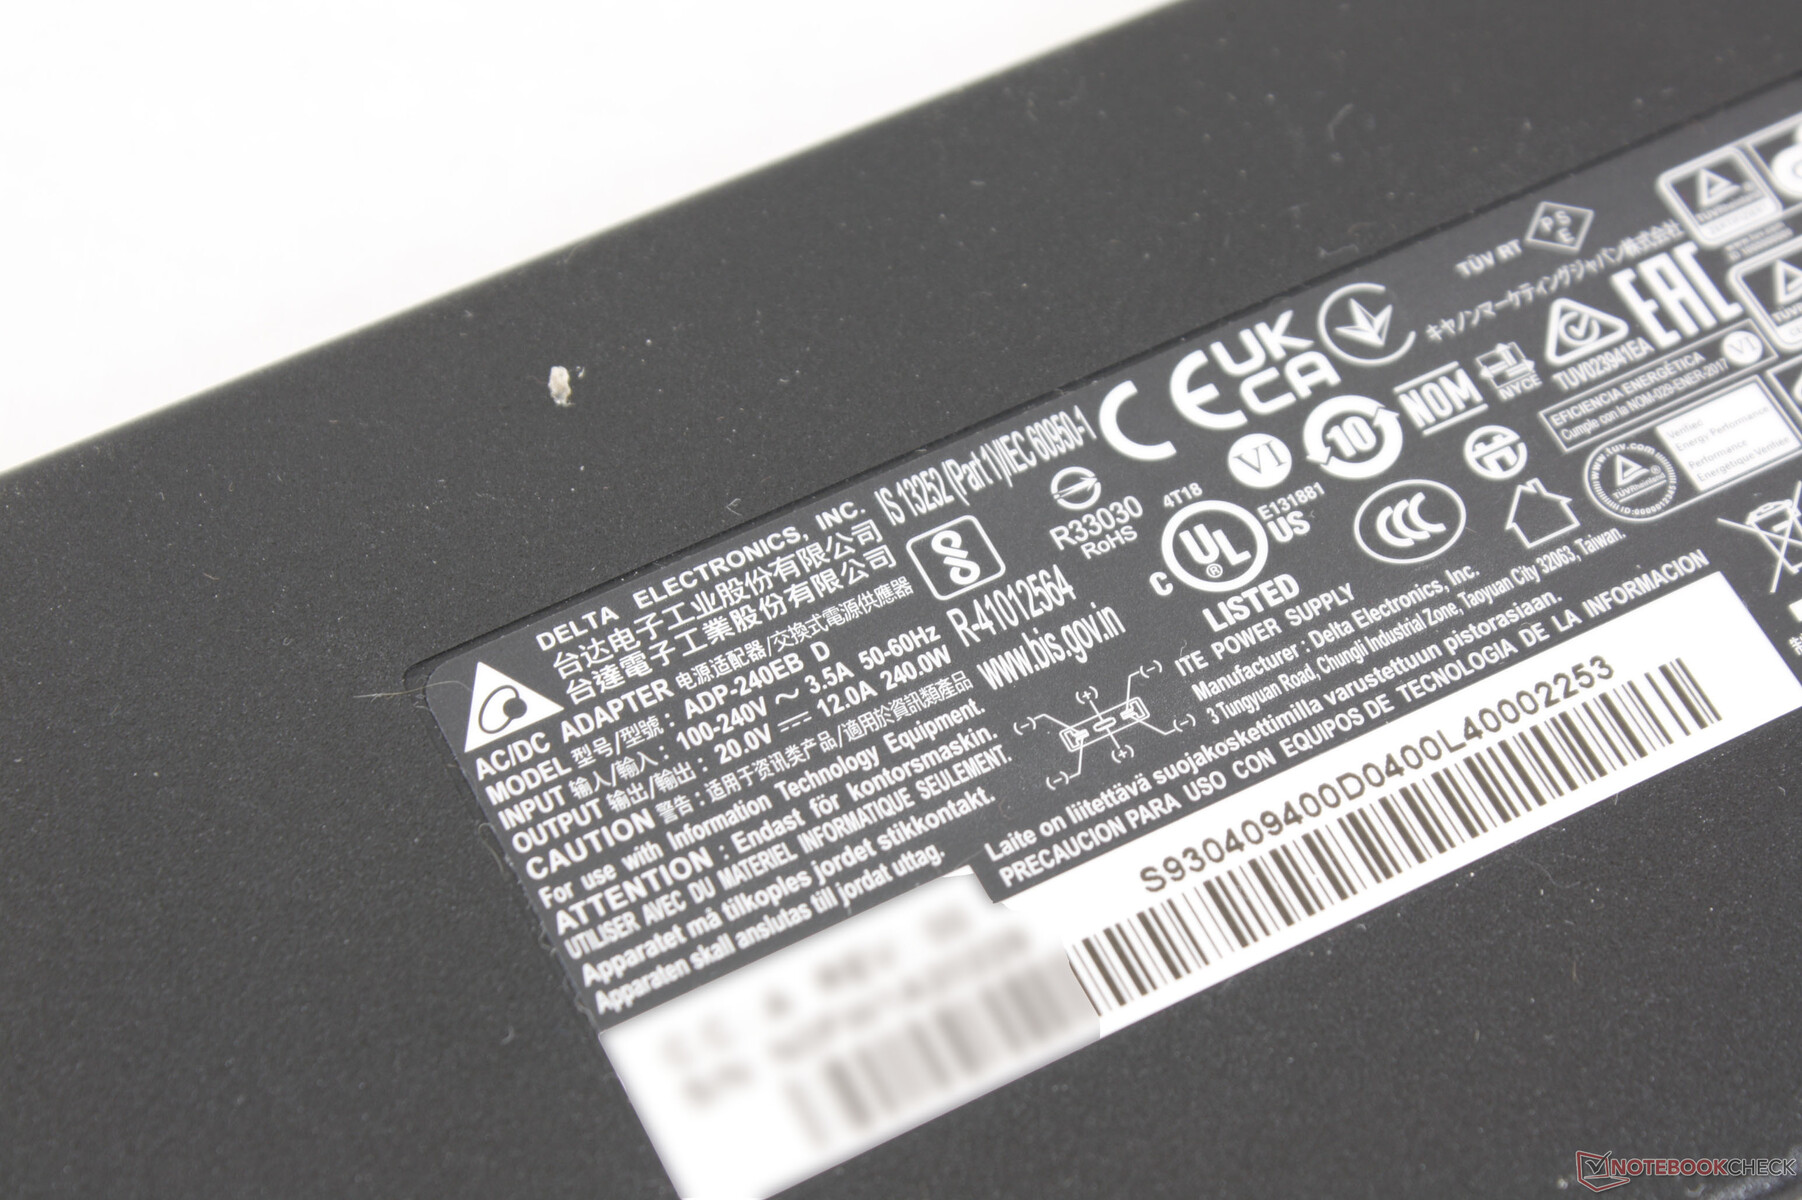
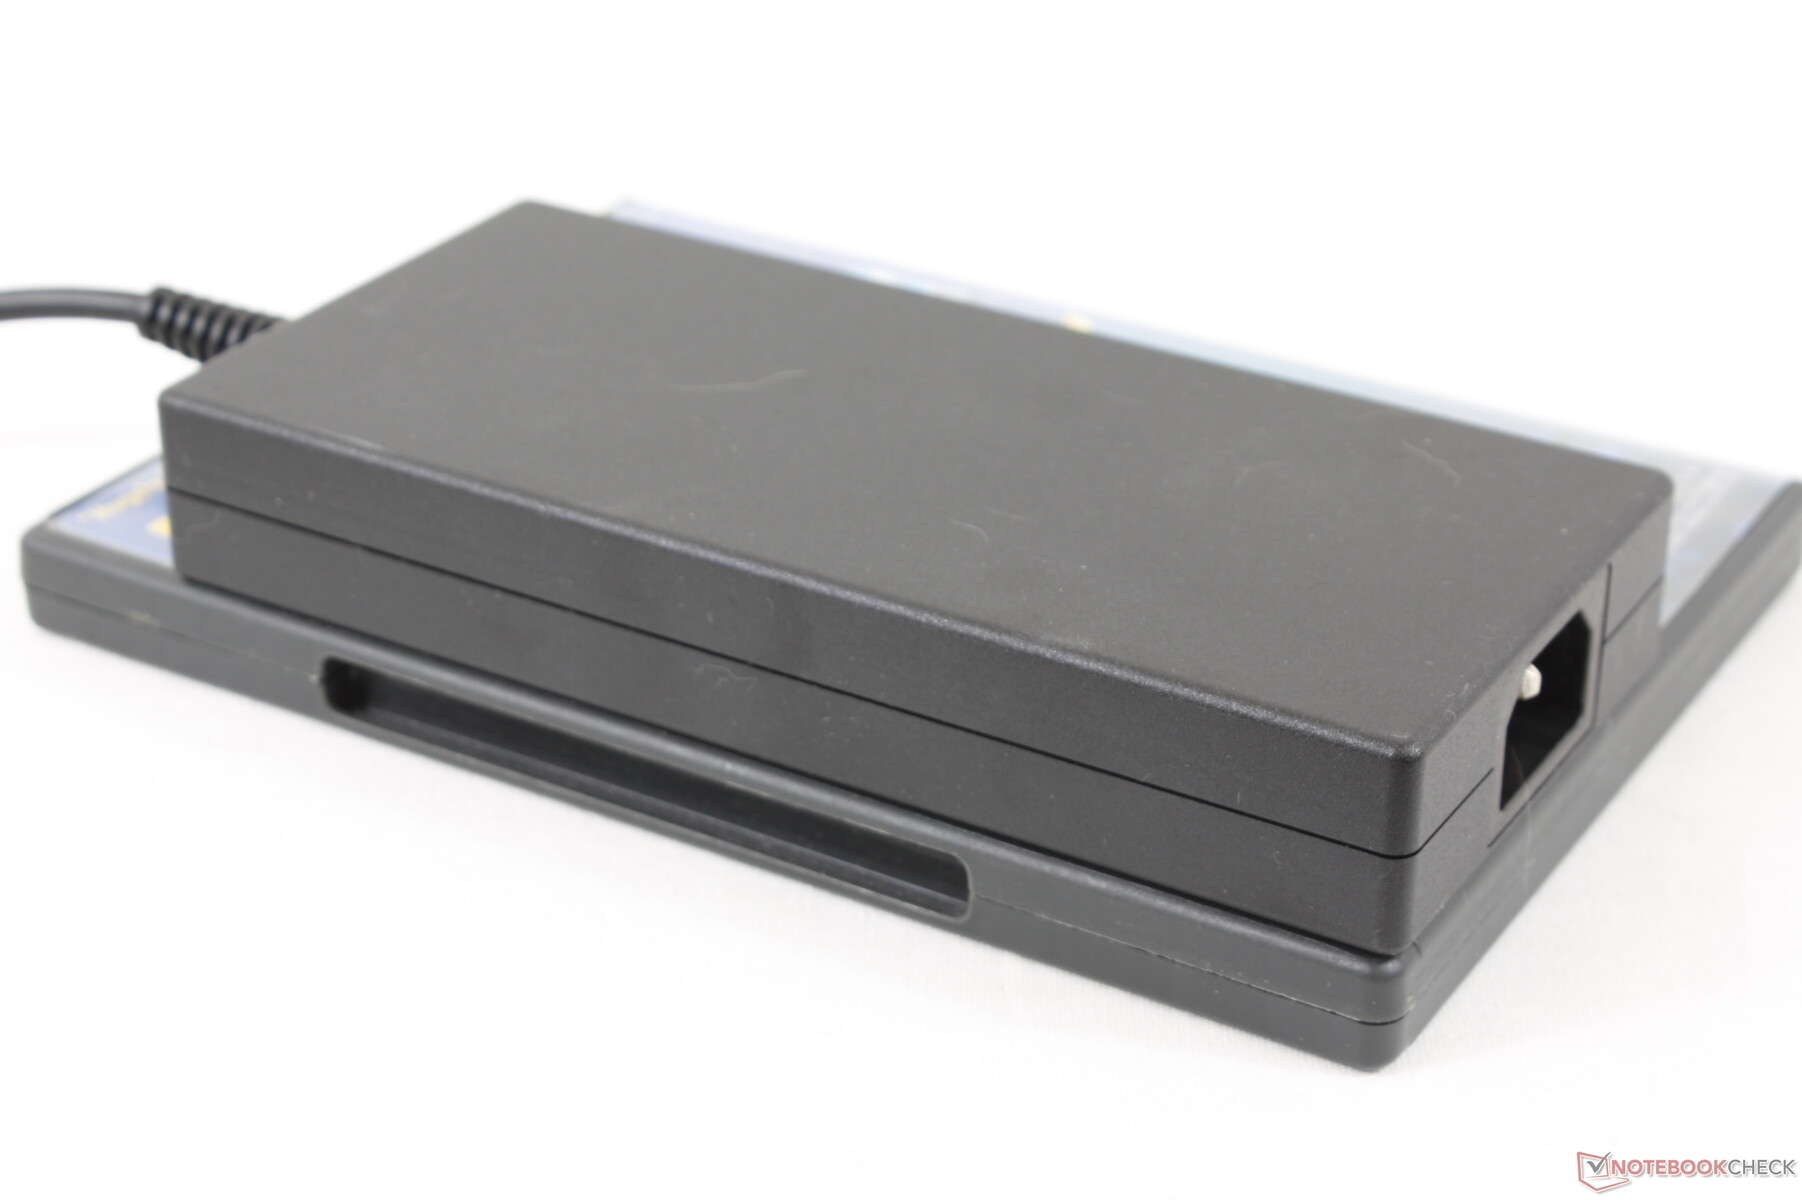
A 240 W AC adapter comes standard whereas the Blade 17 ships with a higher-capacity 280 W adapter. One might expect the Razer adapter to be larger, but the 240 W adapter from MSI is actually the slightly larger one (~16.4 x 7.5 x 2.5 cm vs. ~16.4 x 7 x 2.5 cm).

| Off / Standby | |
| Idle | |
| Load |
|
Key:
min: | |
| MSI Stealth GS77 12UHS-083US i7-12700H, GeForce RTX 3080 Ti Laptop GPU, Micron 3400 1TB MTFDKBA1T0TFH, IPS, 2560x1440, 17.3" | MSI GS76 Stealth 11UH i9-11900H, GeForce RTX 3080 Laptop GPU, Samsung PM9A1 MZVL22T0HBLB, IPS, 3840x2160, 17.3" | Razer Blade 17 RTX 3080 Ti i7-12800H, GeForce RTX 3080 Ti Laptop GPU, Samsung PM9A1 MZVL21T0HCLR, IPS, 2560x1440, 17.3" | MSI GE76 Raider i9-12900HK, GeForce RTX 3080 Ti Laptop GPU, Samsung PM9A1 MZVL22T0HBLB, IPS-Level, 1920x1080, 17.3" | Alienware x17 RTX 3080 P48E i7-11800H, GeForce RTX 3080 Laptop GPU, 2x WDC PC SN730 SDBPNTY-1T00 (RAID 0), IPS, 3840x2160, 17.3" | Asus ROG Zephyrus S17 GX703HSD i9-11900H, GeForce RTX 3080 Laptop GPU, Samsung PM9A1 MZVL22T0HBLB, IPS, 2560x1440, 17.3" | |
|---|---|---|---|---|---|---|
| Power Consumption | 7% | -57% | -4% | -17% | -11% | |
| Idle Minimum * (Watt) | 20 | 14 30% | 29.8 -49% | 12 40% | 10.2 49% | 21.7 -9% |
| Idle Average * (Watt) | 21.4 | 19 11% | 37.1 -73% | 17 21% | 21.2 1% | 27 -26% |
| Idle Maximum * (Watt) | 27 | 31 -15% | 60.8 -125% | 28 -4% | 48.4 -79% | 33 -22% |
| Load Average * (Watt) | 100.5 | 97 3% | 135.3 -35% | 118 -17% | 118.7 -18% | 108 -7% |
| Witcher 3 ultra * (Watt) | 165 | 156 5% | 243 -47% | 252 -53% | 249 -51% | 195 -18% |
| Load Maximum * (Watt) | 247.1 | 231 7% | 273.1 -11% | 272 -10% | 262 -6% | 210 15% |
* ... smaller is better
Power Consumption Witcher 3 / Stresstest
Power Consumption external Monitor
Battery Life — 99 Wh To The Rescue
Runtimes are nearly identical to what we recorded on last year's GS76 and slightly longer than what we recorded on the new Blade 17. The latest GS models are notable for their large 99 Wh battery compared to 90 Wh or less on most other gaming laptops.
Charging from empty to full capacity takes almost 2.5 hours our about 1 hour longer than most other laptops. The system can also be recharged via USB-C through its single Thunderbolt 4 port.
| MSI Stealth GS77 12UHS-083US i7-12700H, GeForce RTX 3080 Ti Laptop GPU, 99 Wh | MSI GS76 Stealth 11UH i9-11900H, GeForce RTX 3080 Laptop GPU, 99.9 Wh | Razer Blade 17 RTX 3080 Ti i7-12800H, GeForce RTX 3080 Ti Laptop GPU, 82 Wh | MSI GE76 Raider i9-12900HK, GeForce RTX 3080 Ti Laptop GPU, 99.99 Wh | Alienware x17 RTX 3080 P48E i7-11800H, GeForce RTX 3080 Laptop GPU, 87 Wh | Asus ROG Zephyrus S17 GX703HSD i9-11900H, GeForce RTX 3080 Laptop GPU, 90 Wh | |
|---|---|---|---|---|---|---|
| Battery runtime | -4% | -19% | -18% | -28% | 57% | |
| Reader / Idle (h) | 10.8 | 9.9 -8% | 8 -26% | 7 -35% | ||
| WiFi v1.3 (h) | 6.2 | 6.4 3% | 5.5 -11% | 5.1 -18% | 5.9 -5% | 7.5 21% |
| Load (h) | 1.4 | 1.3 -7% | 1.1 -21% | 0.8 -43% | 2.7 93% | |
| H.264 (h) | 7.2 | |||||
| Witcher 3 ultra (h) | 1 |
Pros
Cons
Verdict — Better Than The GS76... Mostly

The GS77 is a few steps forward and a few steps back from the GS76. Improvements are numerous including the stronger and more rigid skeleton, higher resolution webcam, larger clickpad, easier serviceability, relatively similar battery runtimes, newer display options, and higher performance at about the same TDP and TGP levels as before. CPU performance is better than expected even when compared to other laptops with Core i7 or Core i9 processors. The newer model feels more substantial than the outgoing one for higher quality impressions as well.
On the other hand, the GS77 has regressed in some key aspects. Chassis size and weight in particular are noticeably larger and heavier than the GS76 meaning that the GS77 isn't as travel-friendly as its predecessor. The 240 Hz QHD panel isn't as bright as the GS76 4K panel, either, while the the SD card reader is now more than two times slower. The maximum angle of the hinges are much narrower this time as well for less freedom of movement.
Overall, the newer model is a general step up for the GS series despite some unfortunate setbacks. The 105 W TGP GPU is somewhat worrying, however, as it may suggest that future SKUs will also be locked into ~100 W GPUs while the vapor chamber-cooled Blade 17 can utilize higher-power 165 W versions. MSI missed its opportunity to add additional desirable features to the GS77 including a MUX switch, factory calibrated display, or internal G-Sync support all of which are available on the smaller Razer Blade 17.
Price and Availability
MSI Stealth GS77 12UHS-083US
- 04/07/2022 v7 (old)
Allen Ngo
Price comparison
