Eluktronics Matrix RP-17 Laptop Review: Core i9 Performance Without The Core i9 Price
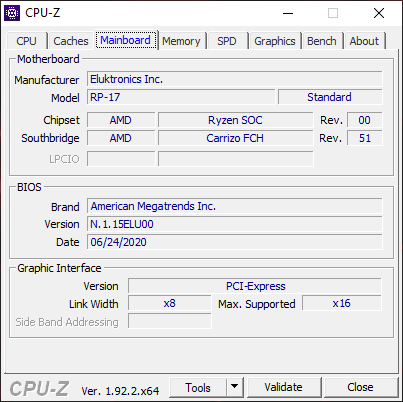
Following on the footsteps of the 15.6-inch Eluktronics RP-15 is the 17.3-inch RP-17. The larger model carries many of the same features as its smaller version including the Ryzen 7 4800H CPU and GeForce RTX 2060 GPU alongside similar chassis materials and ports. It also has a lot in common with the Walmart EVOO Gaming 17, Schenker XMG Neo 17, or XMG Core 17 as all of these models utilize white label Tongfang chassis designs.
Eluktronics is planning to ship the RP-17 starting this September for about $1100 USD to compete against other mid-range gaming laptops like the Asus ROG Strix series, Dell G7 17 series, MSI GL75/GE75. or the Lenovo Legion Y740.
More Eluktronics reviews:
Rating | Date | Model | Weight | Height | Size | Resolution | Price |
|---|---|---|---|---|---|---|---|
| 84.3 % v7 (old) | 08 / 2020 | Eluktronics RP-17 R7 4800H, GeForce RTX 2060 Mobile | 2.6 kg | 30 mm | 17.30" | 1920x1080 | |
| 85.1 % v7 (old) | 07 / 2020 | MSI GE75 Raider 10SE-008US i7-10750H, GeForce RTX 2060 Mobile | 2.6 kg | 27.5 mm | 17.30" | 1920x1080 | |
| 87.4 % v7 (old) | 06 / 2020 | Razer Blade Pro 17 RTX 2070 Max-Q 300 Hz i7-10875H, GeForce RTX 2070 Max-Q | 2.7 kg | 19.9 mm | 17.30" | 1920x1080 | |
| 82.9 % v7 (old) | 05 / 2020 | Asus TUF A17 FA706IU-AS76 R7 4800H, GeForce GTX 1660 Ti Mobile | 2.6 kg | 26 mm | 17.30" | 1920x1080 | |
| 84.5 % v7 (old) | 12 / 2019 | Walmart EVOO Gaming 17 i7-9750H, GeForce RTX 2060 Mobile | 2.5 kg | 27.5 mm | 17.30" | 1920x1080 | |
| 82.4 % v7 (old) | 12 / 2019 | Aorus 17 YA i9-9980HK, GeForce RTX 2080 Mobile | 3.8 kg | 38 mm | 17.30" | 1920x1080 |
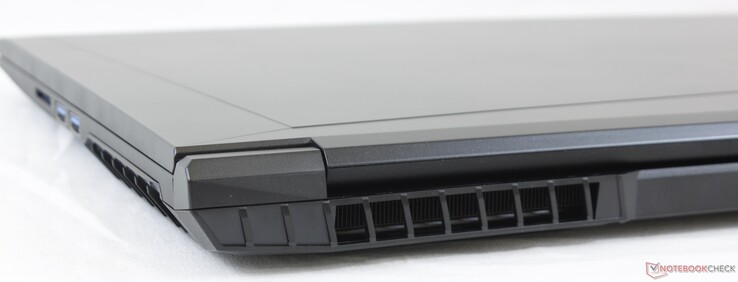
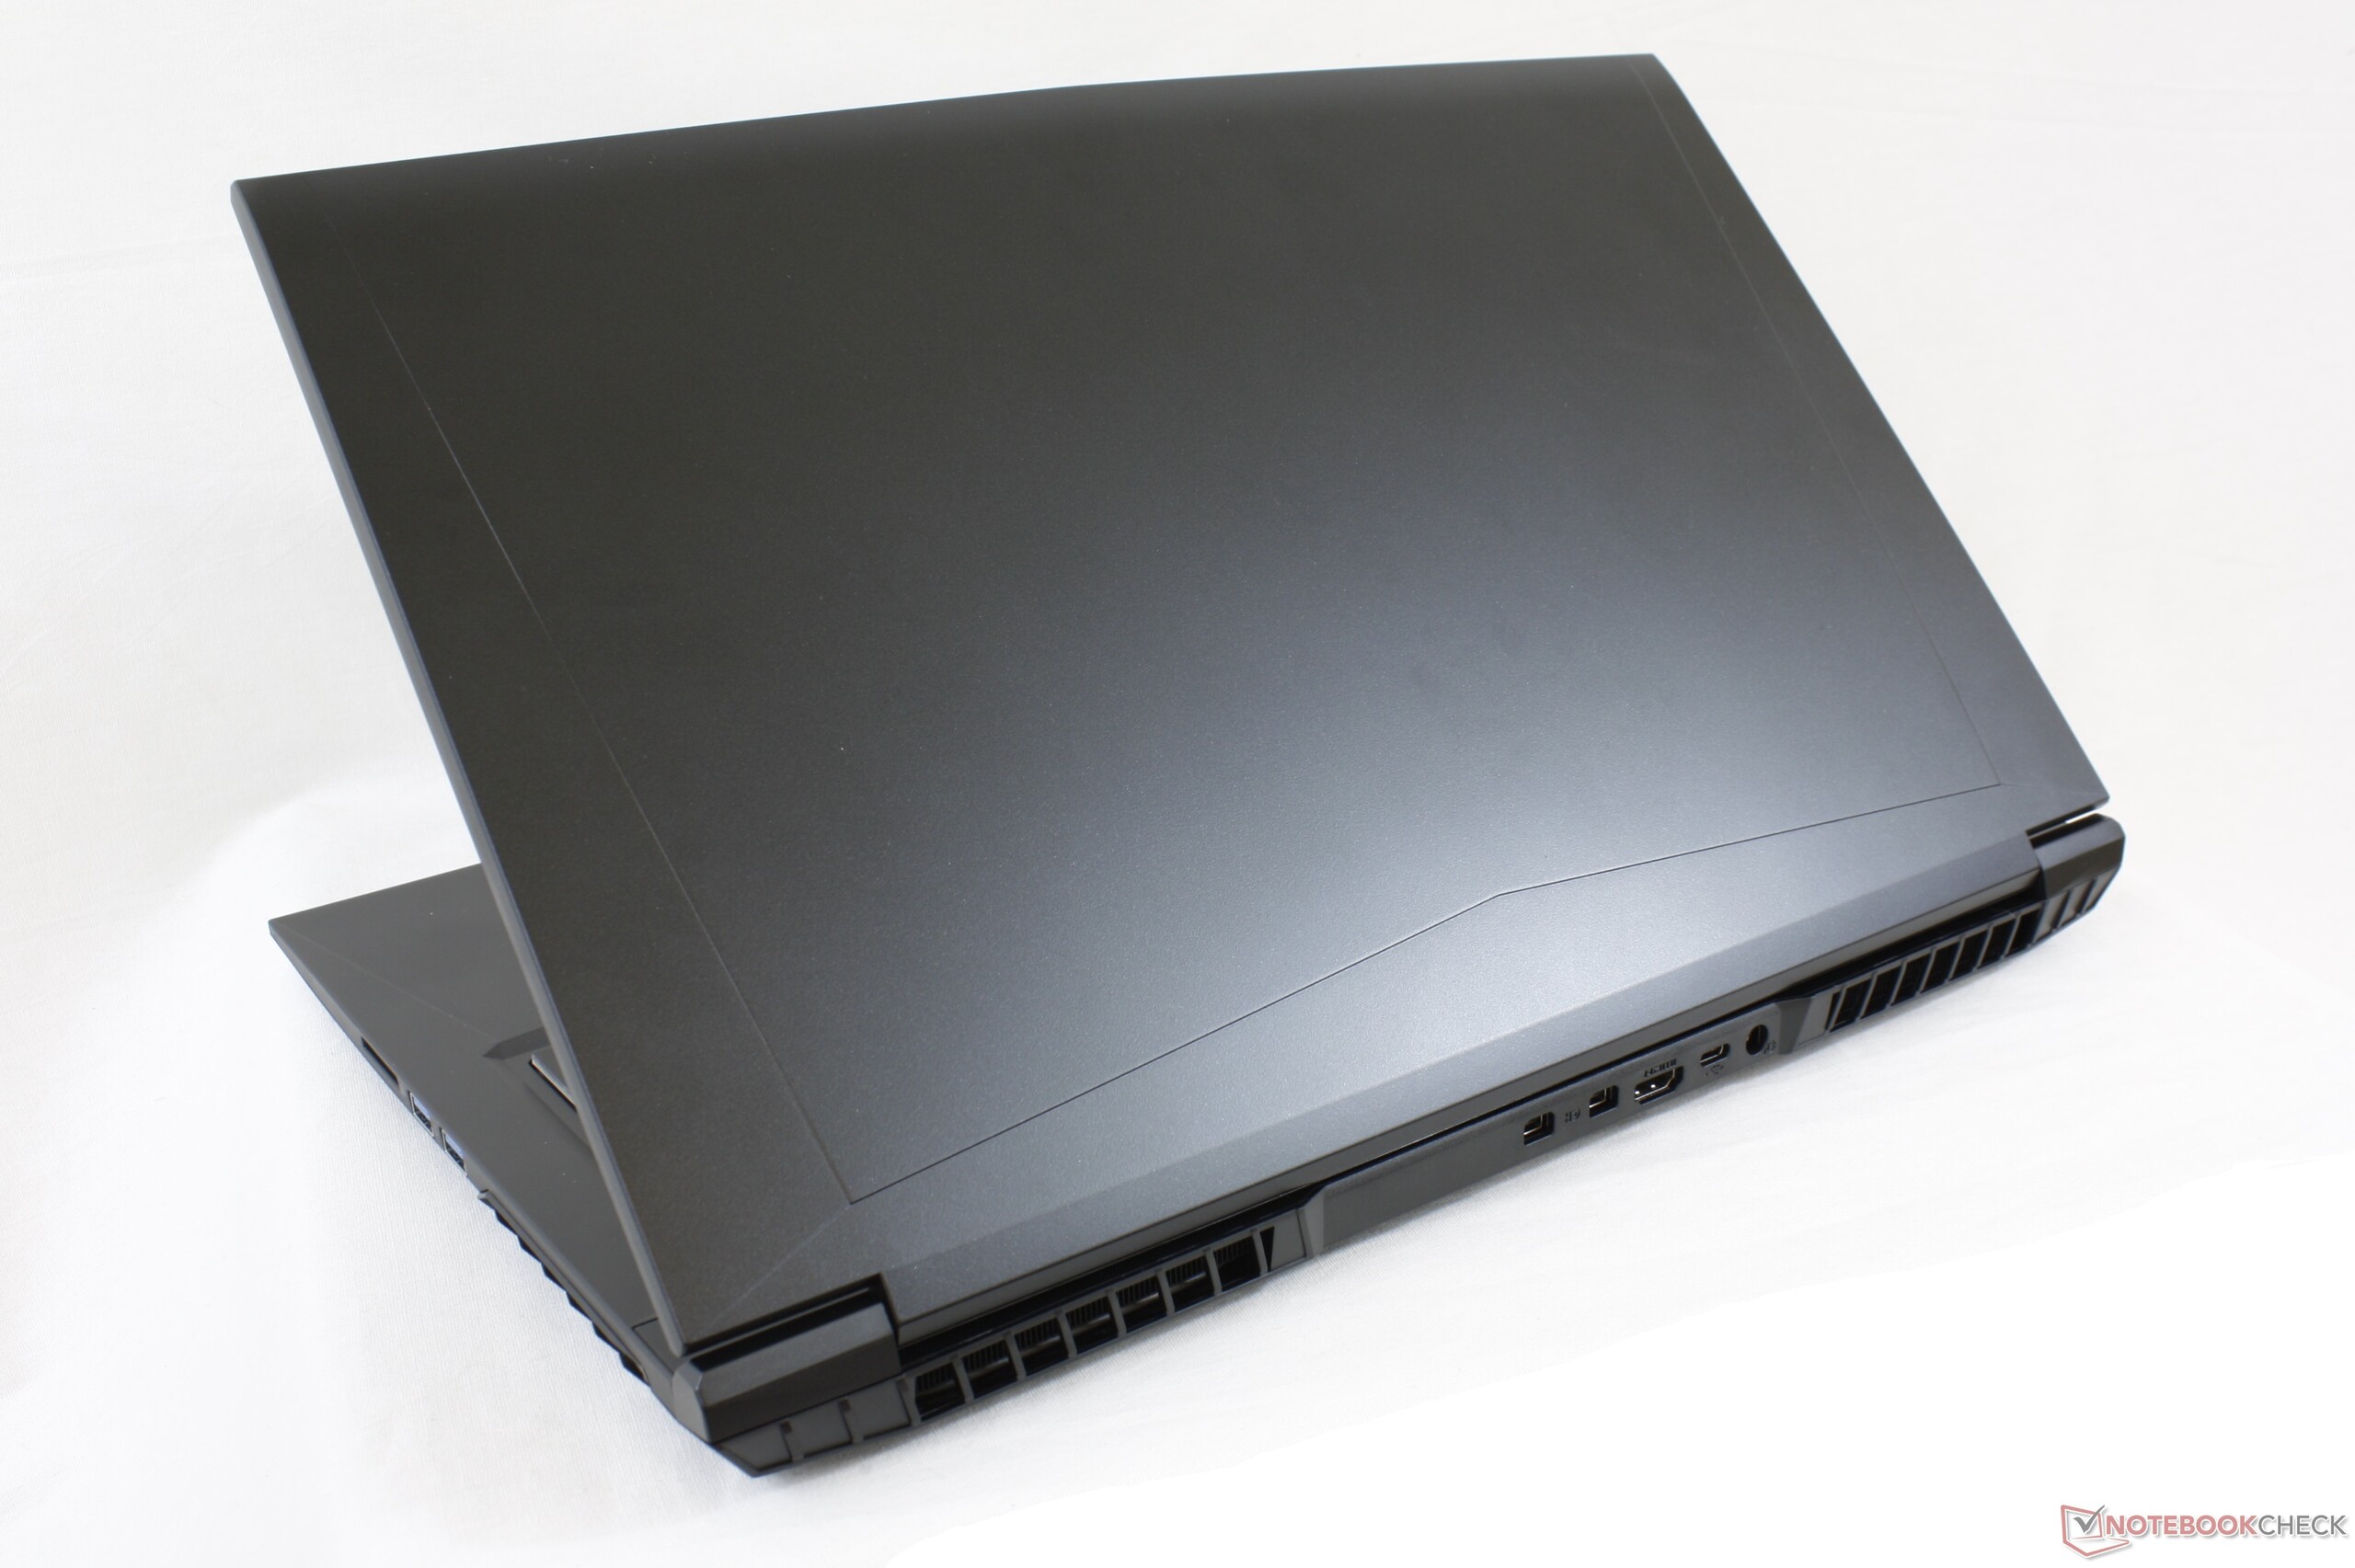
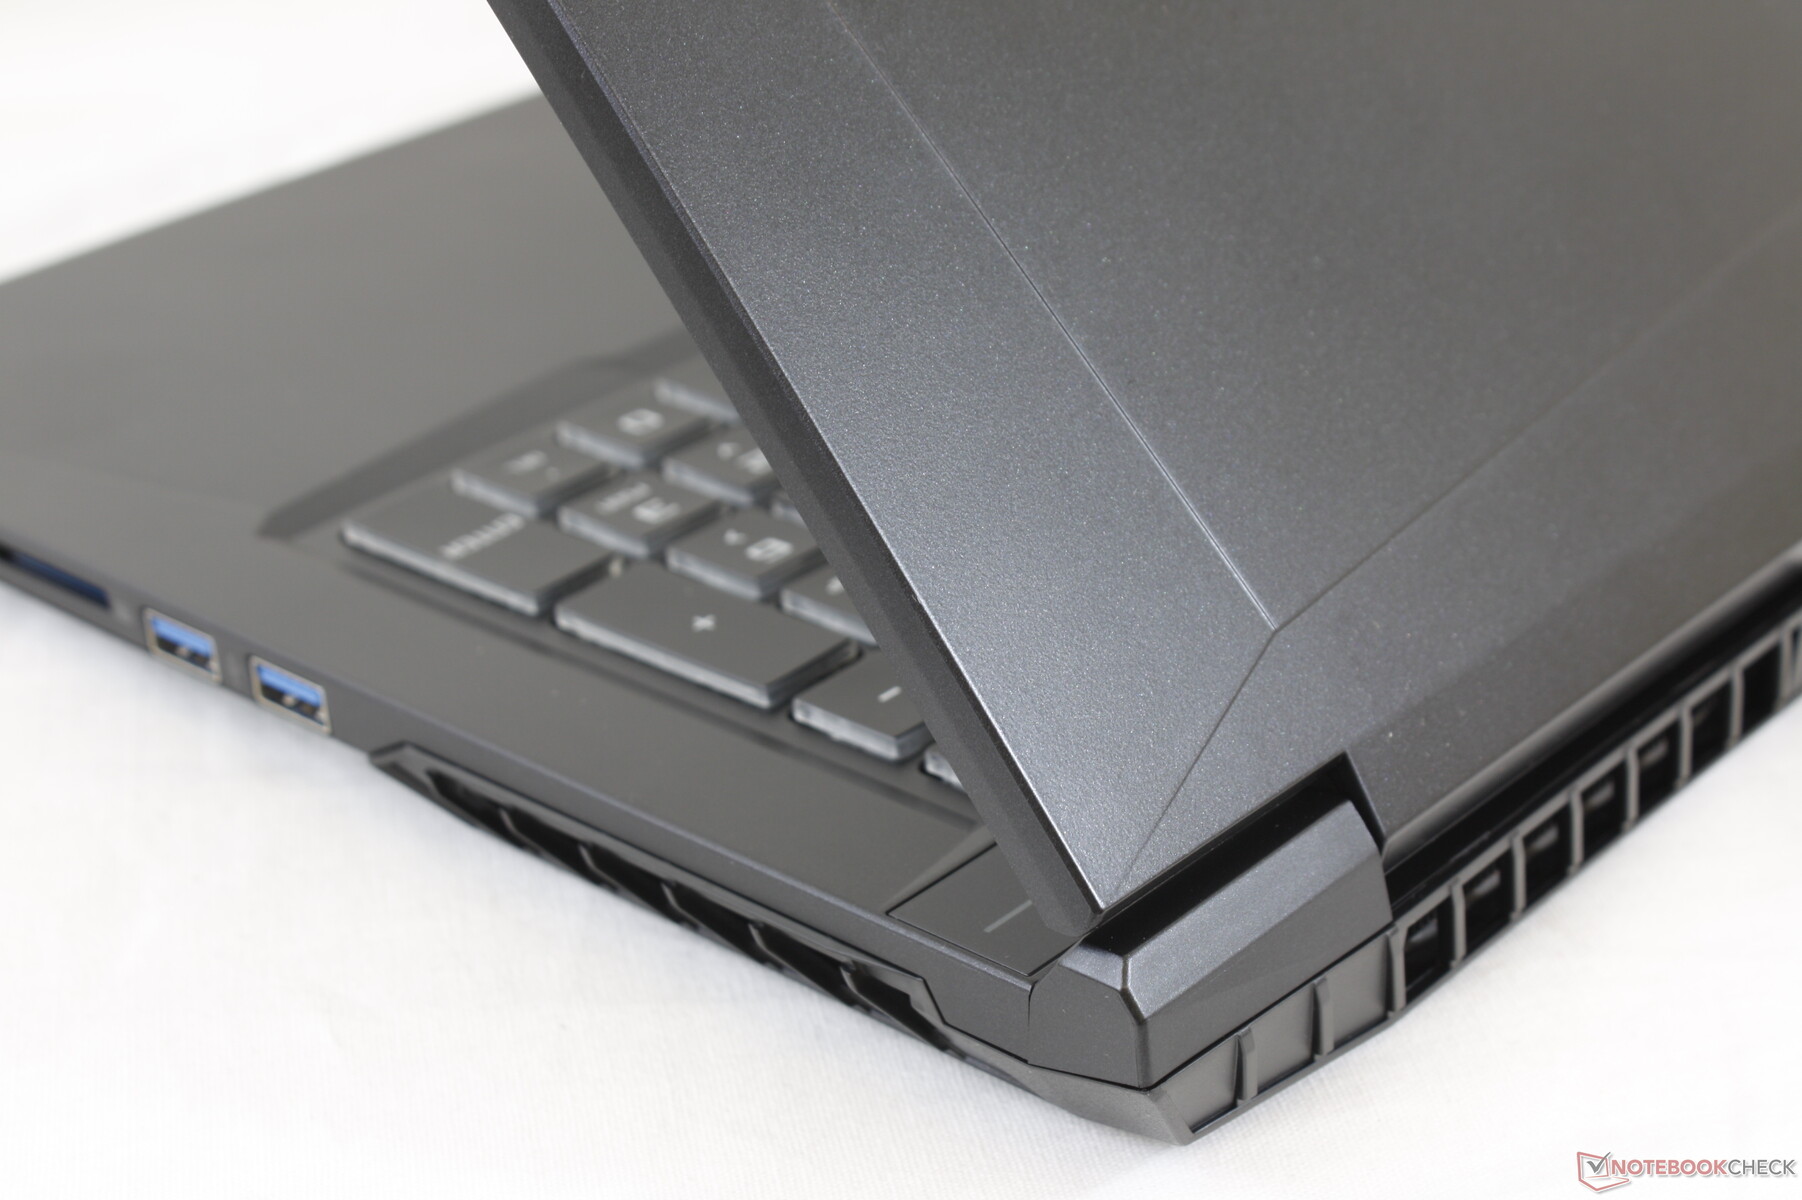
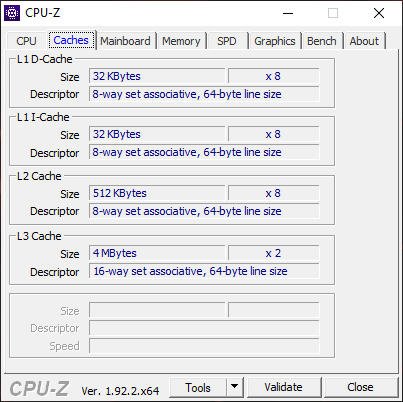
Case
Many of our comments on the aforementioned Walmart or Schenker laptops apply here because their similar materials and Tongfang ODM. The distinguishing feature of the Eluktronics version is that users can configure with no logo or branding on the outer lid for a cleaner look. One can argue that it looks uninspired, but we like the modest option especially when considering that there are so many exuberant LED-centric gaming laptops out there.


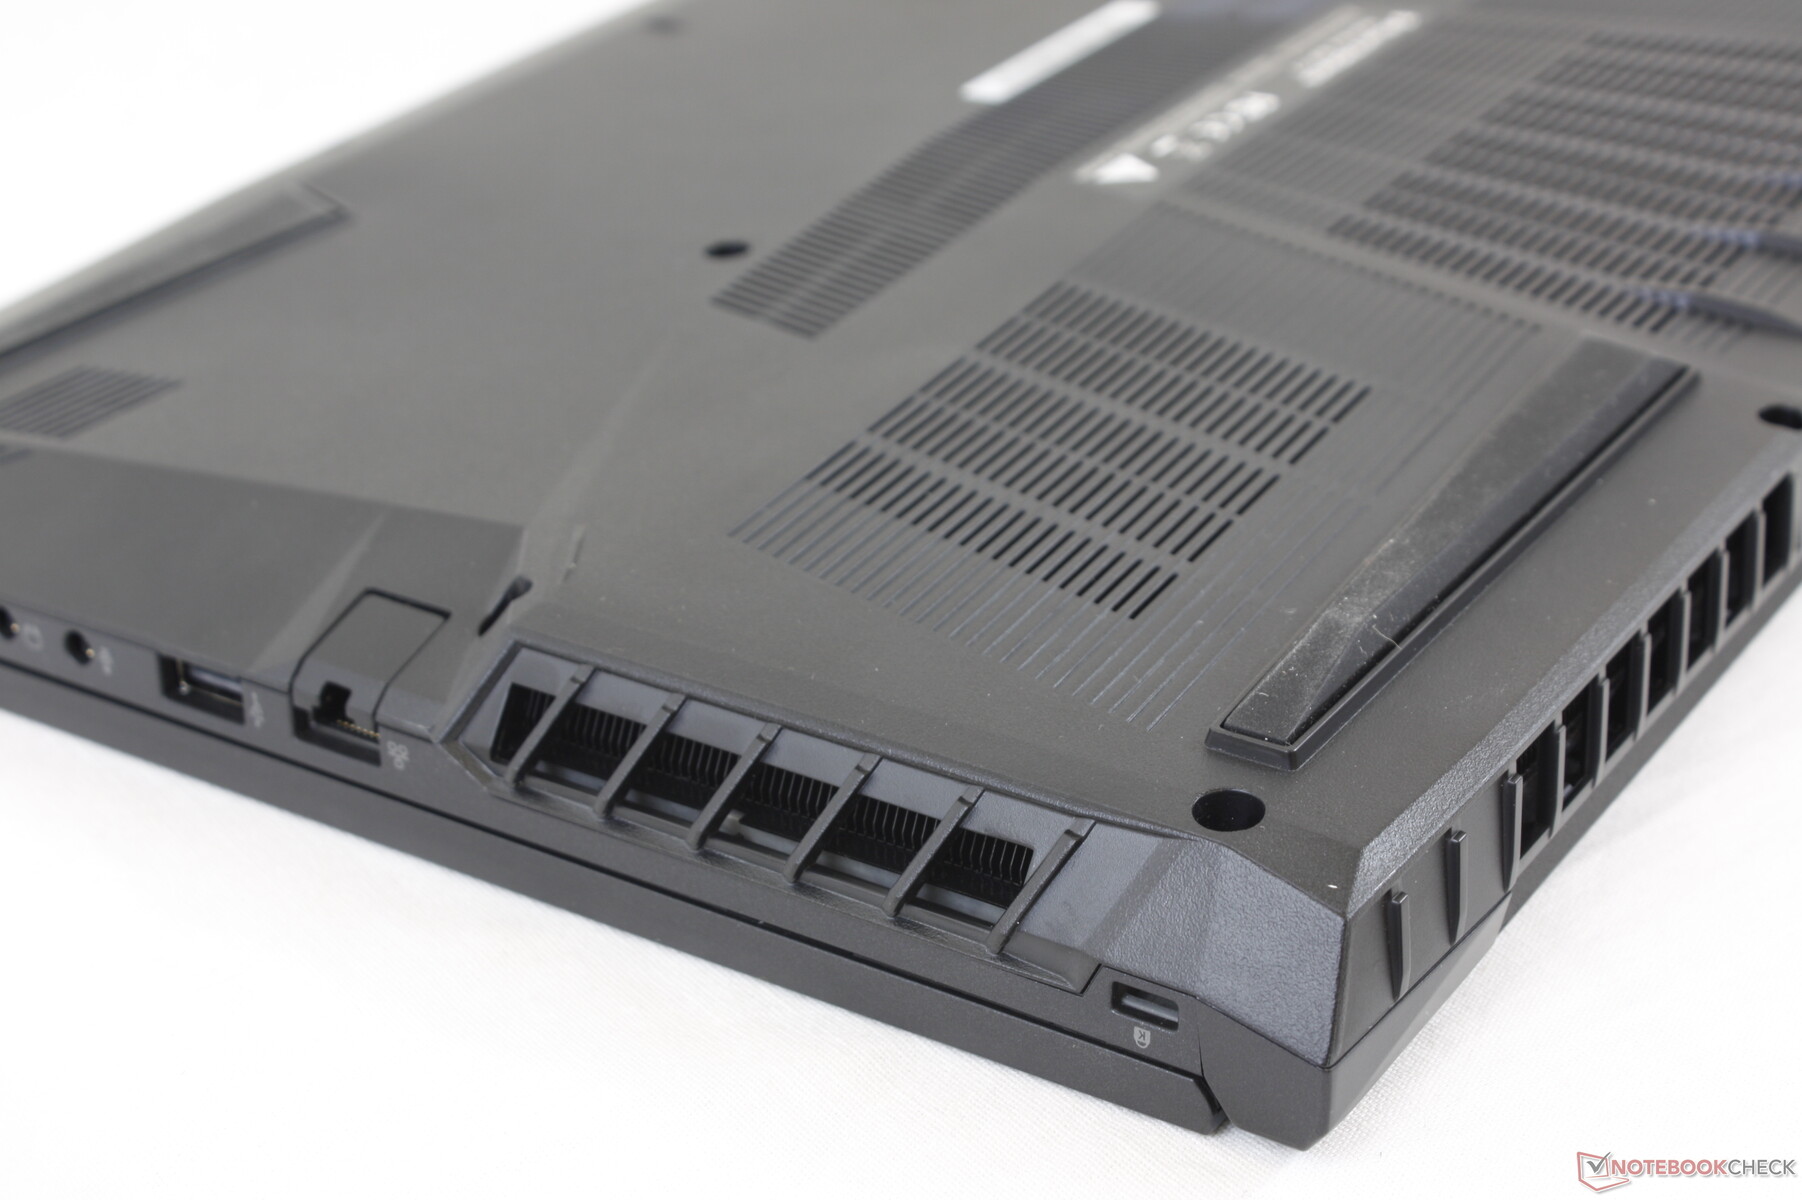
Connectivity
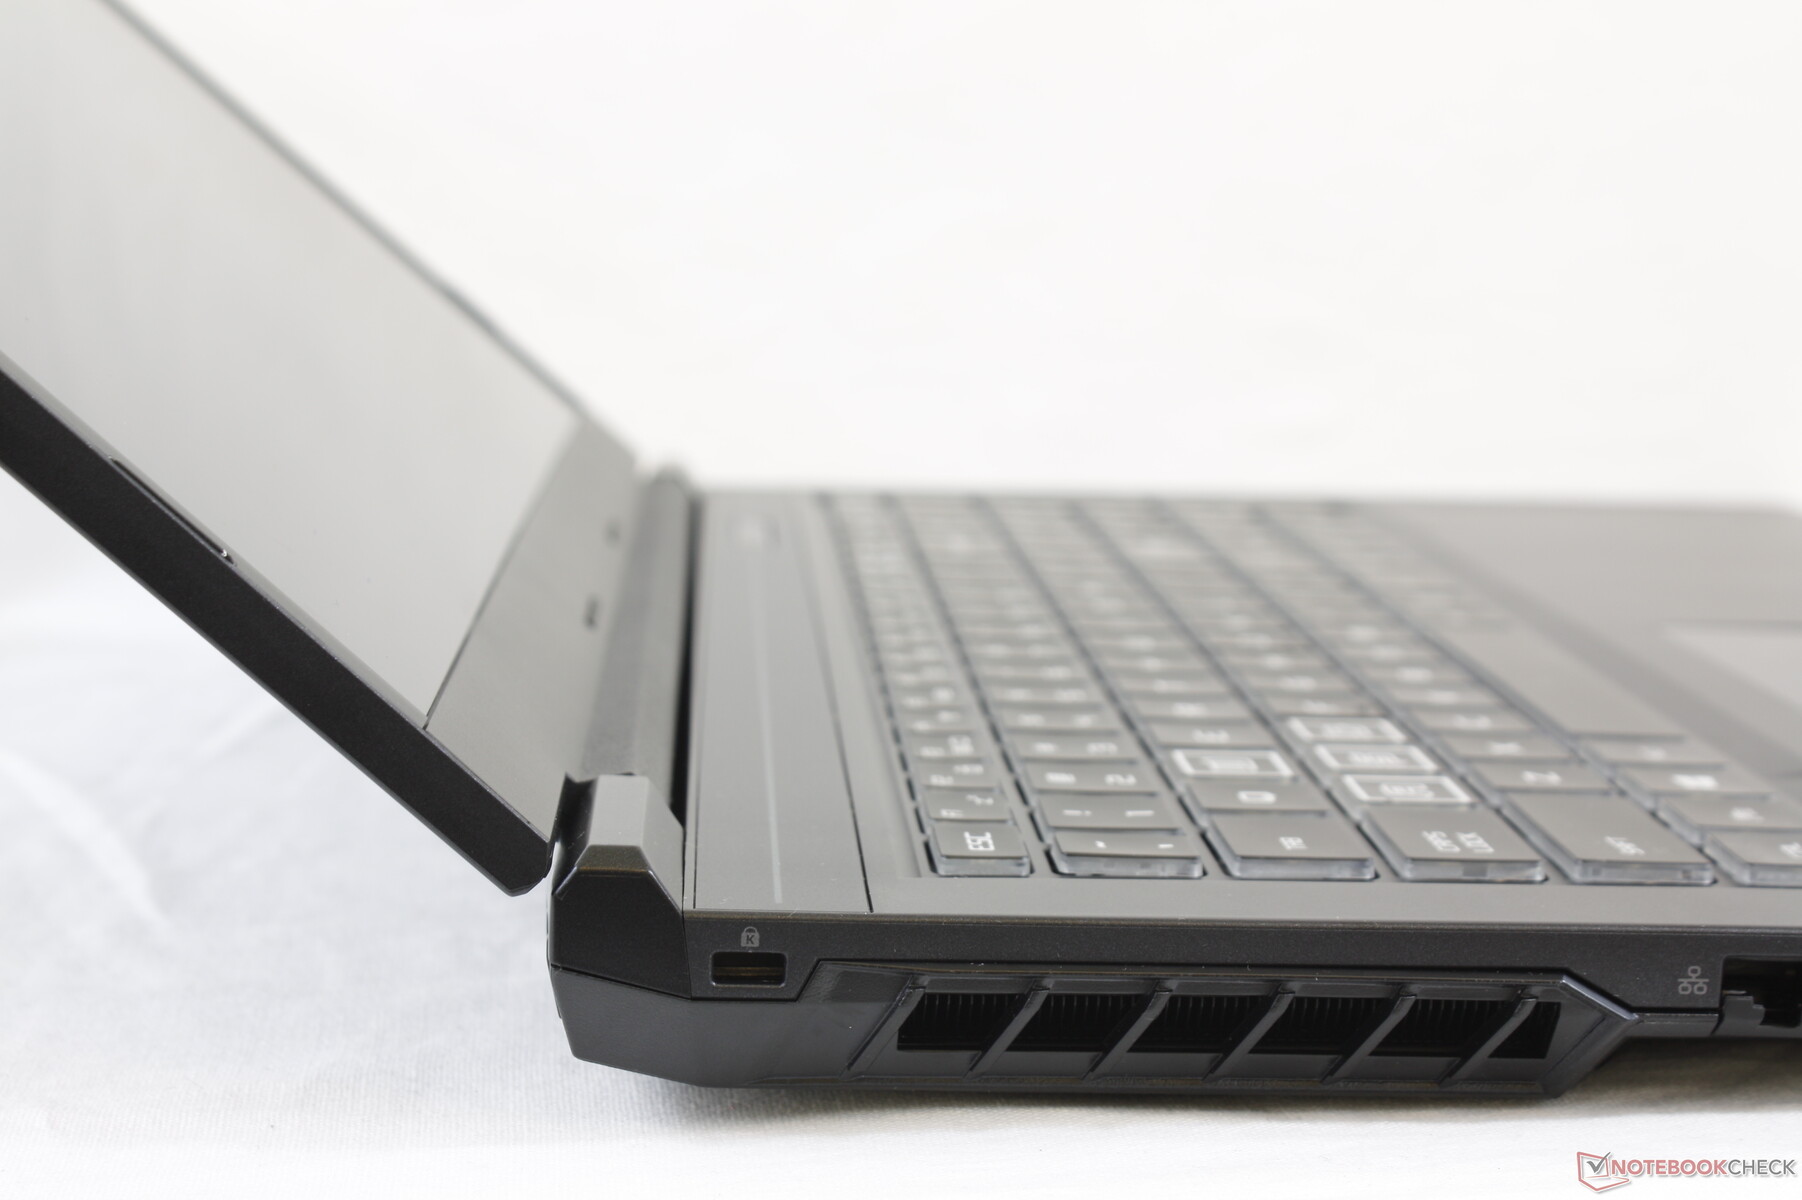
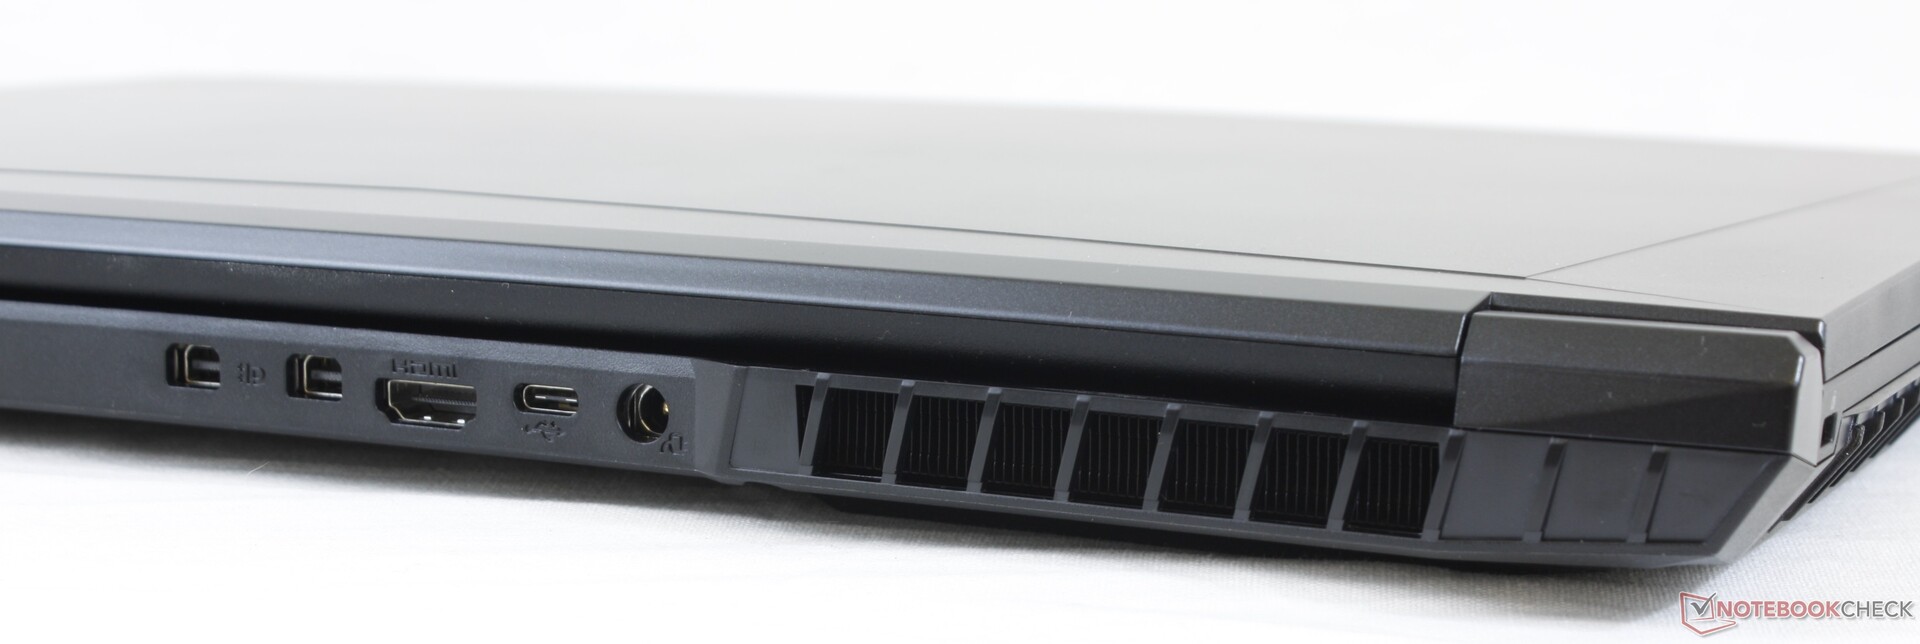
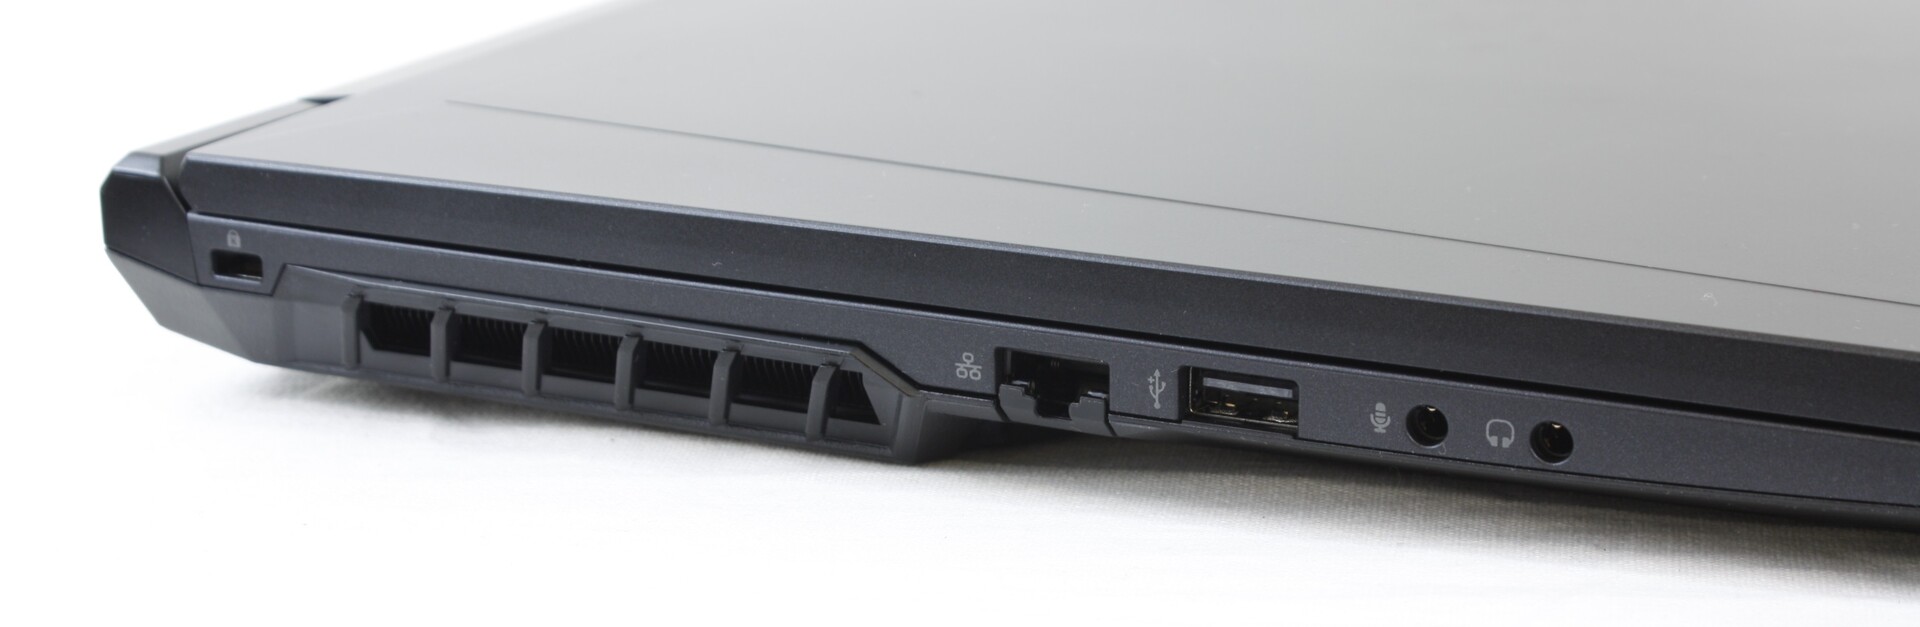
Port options are identical to the RP-15 despite the larger 17.3-inch screen size. The two mini-DisplayPort ports are notable as is the USB 2.0 port which most other gaming laptops in this price range do not carry.
The sole USB-C port does not support DisplayPort-out nor can it be used to recharge the laptop.
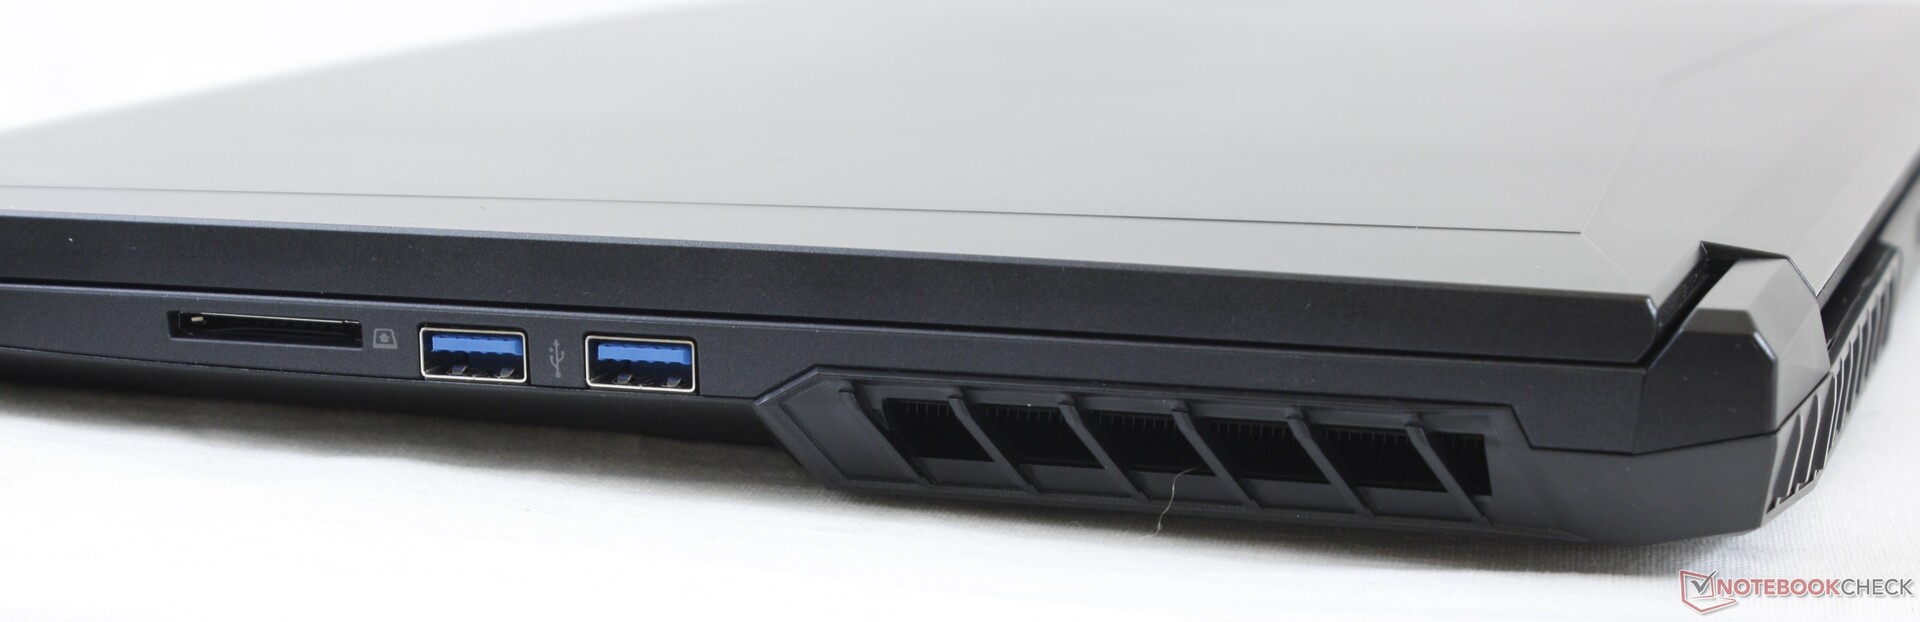
SD Card Reader
Transfer rates from the SD card reader are slow at just 37 Mbps. Moving 1 GB of pictures from our UHS-II test card to desktop takes about 28 seconds compared to just 6 to 7 seconds on the Aorus 17.
| SD Card Reader | |
| average JPG Copy Test (av. of 3 runs) | |
| Razer Blade Pro 17 RTX 2070 Max-Q 300 Hz (Toshiba Exceria Pro SDXC 64 GB UHS-II) | |
| Aorus 17 YA (Toshiba Exceria Pro SDXC 64 GB UHS-II) | |
| Walmart EVOO Gaming 17 (Toshiba Exceria Pro SDXC 64 GB UHS-II) | |
| Eluktronics RP-17 (Toshiba Exceria Pro SDXC 64 GB UHS-II) | |
| MSI GE75 Raider 10SE-008US (Toshiba Exceria Pro SDXC 64 GB UHS-II) | |
| maximum AS SSD Seq Read Test (1GB) | |
| Aorus 17 YA (Toshiba Exceria Pro SDXC 64 GB UHS-II) | |
| Razer Blade Pro 17 RTX 2070 Max-Q 300 Hz (Toshiba Exceria Pro SDXC 64 GB UHS-II) | |
| Walmart EVOO Gaming 17 (Toshiba Exceria Pro SDXC 64 GB UHS-II) | |
| Eluktronics RP-17 (Toshiba Exceria Pro SDXC 64 GB UHS-II) | |
| MSI GE75 Raider 10SE-008US (Toshiba Exceria Pro SDXC 64 GB UHS-II) | |
Communication
Webcam


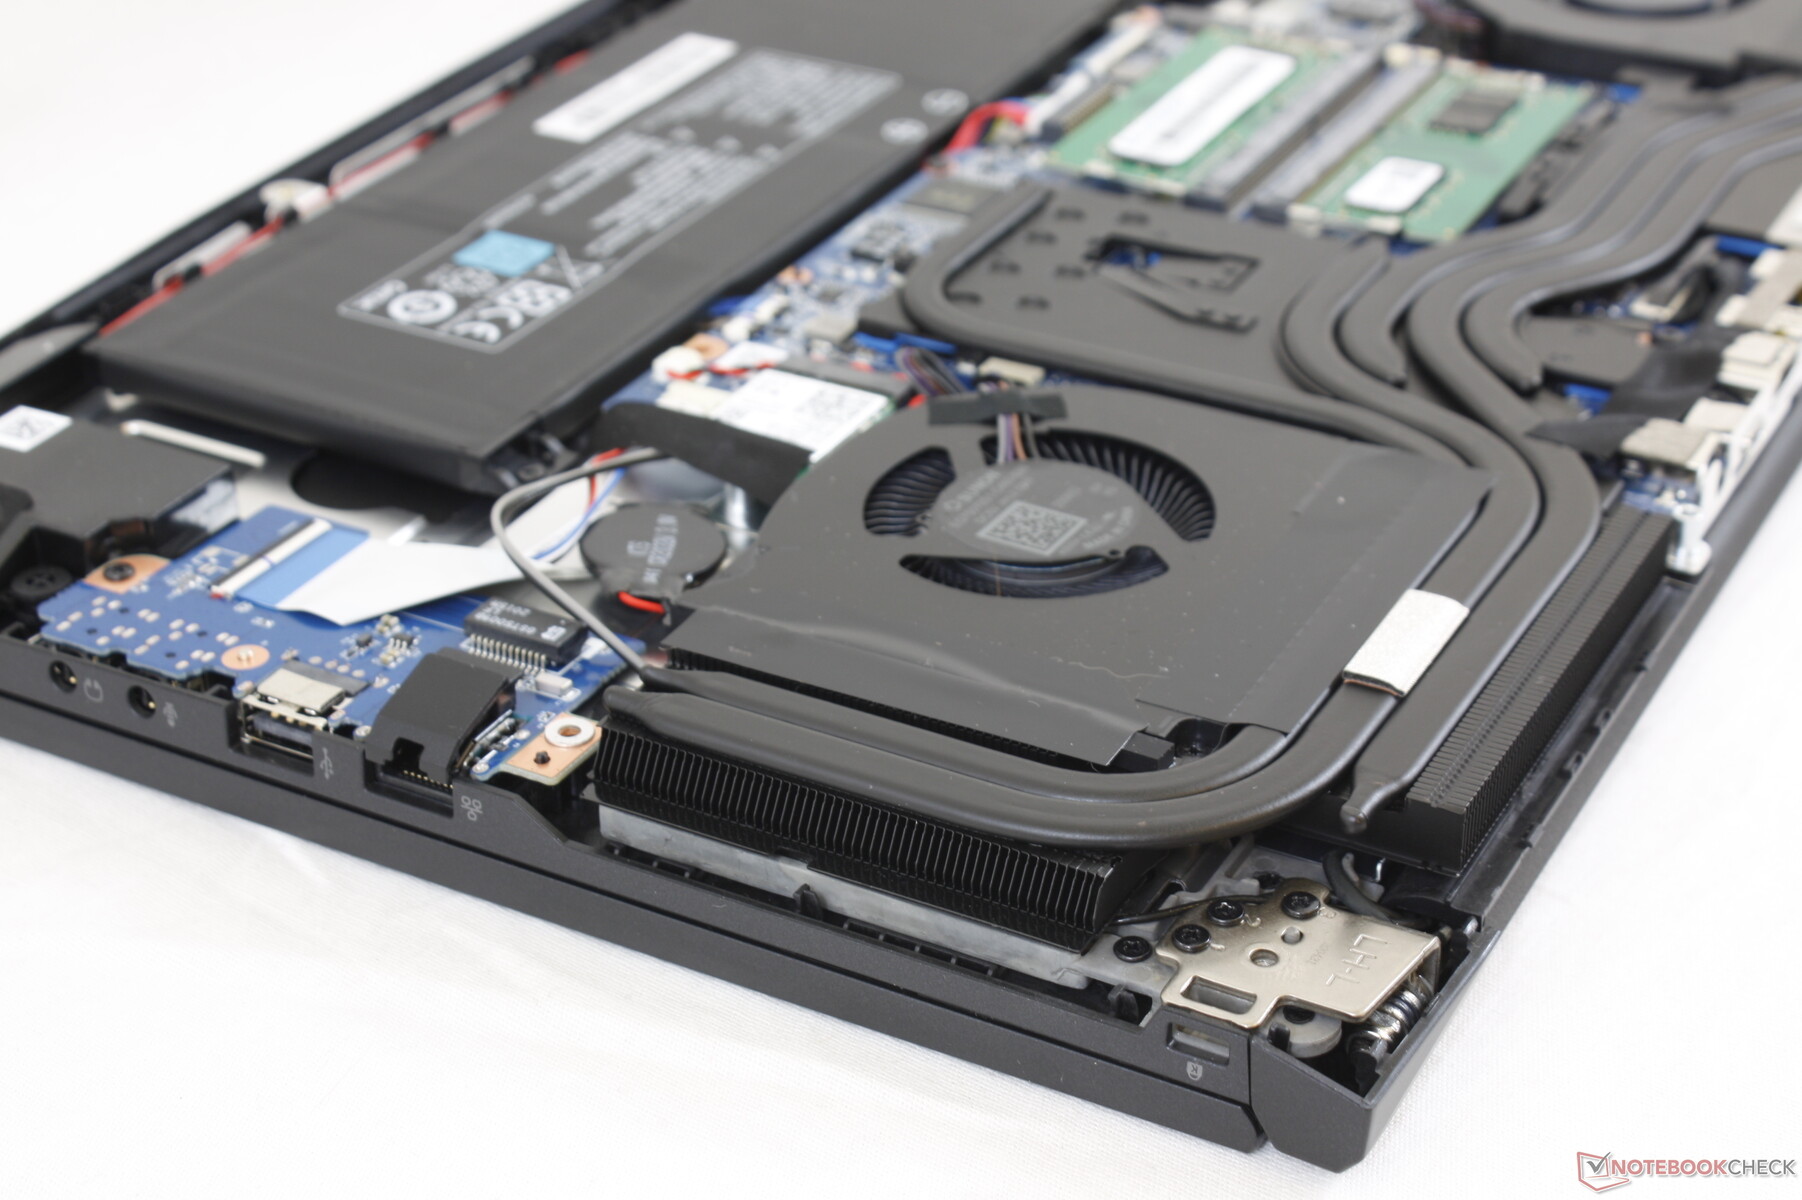
Maintenance
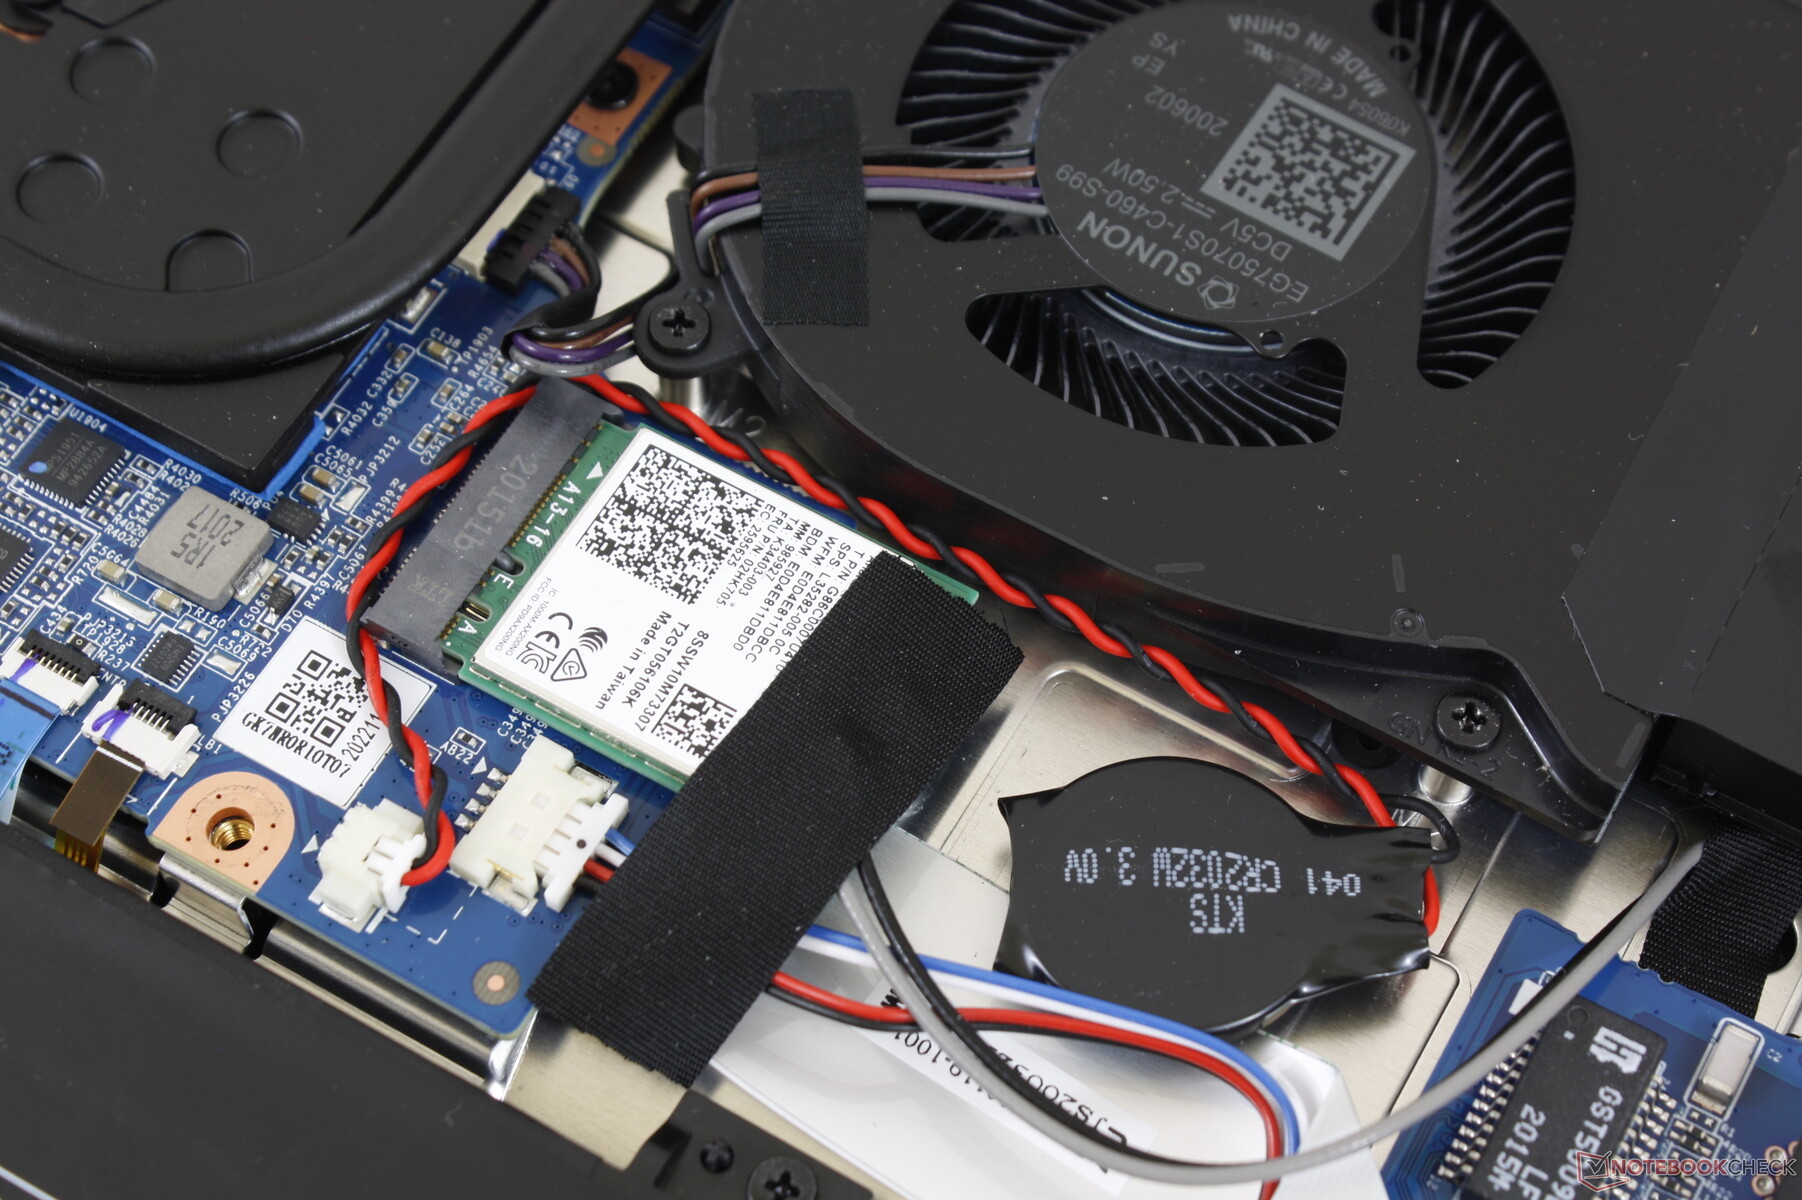
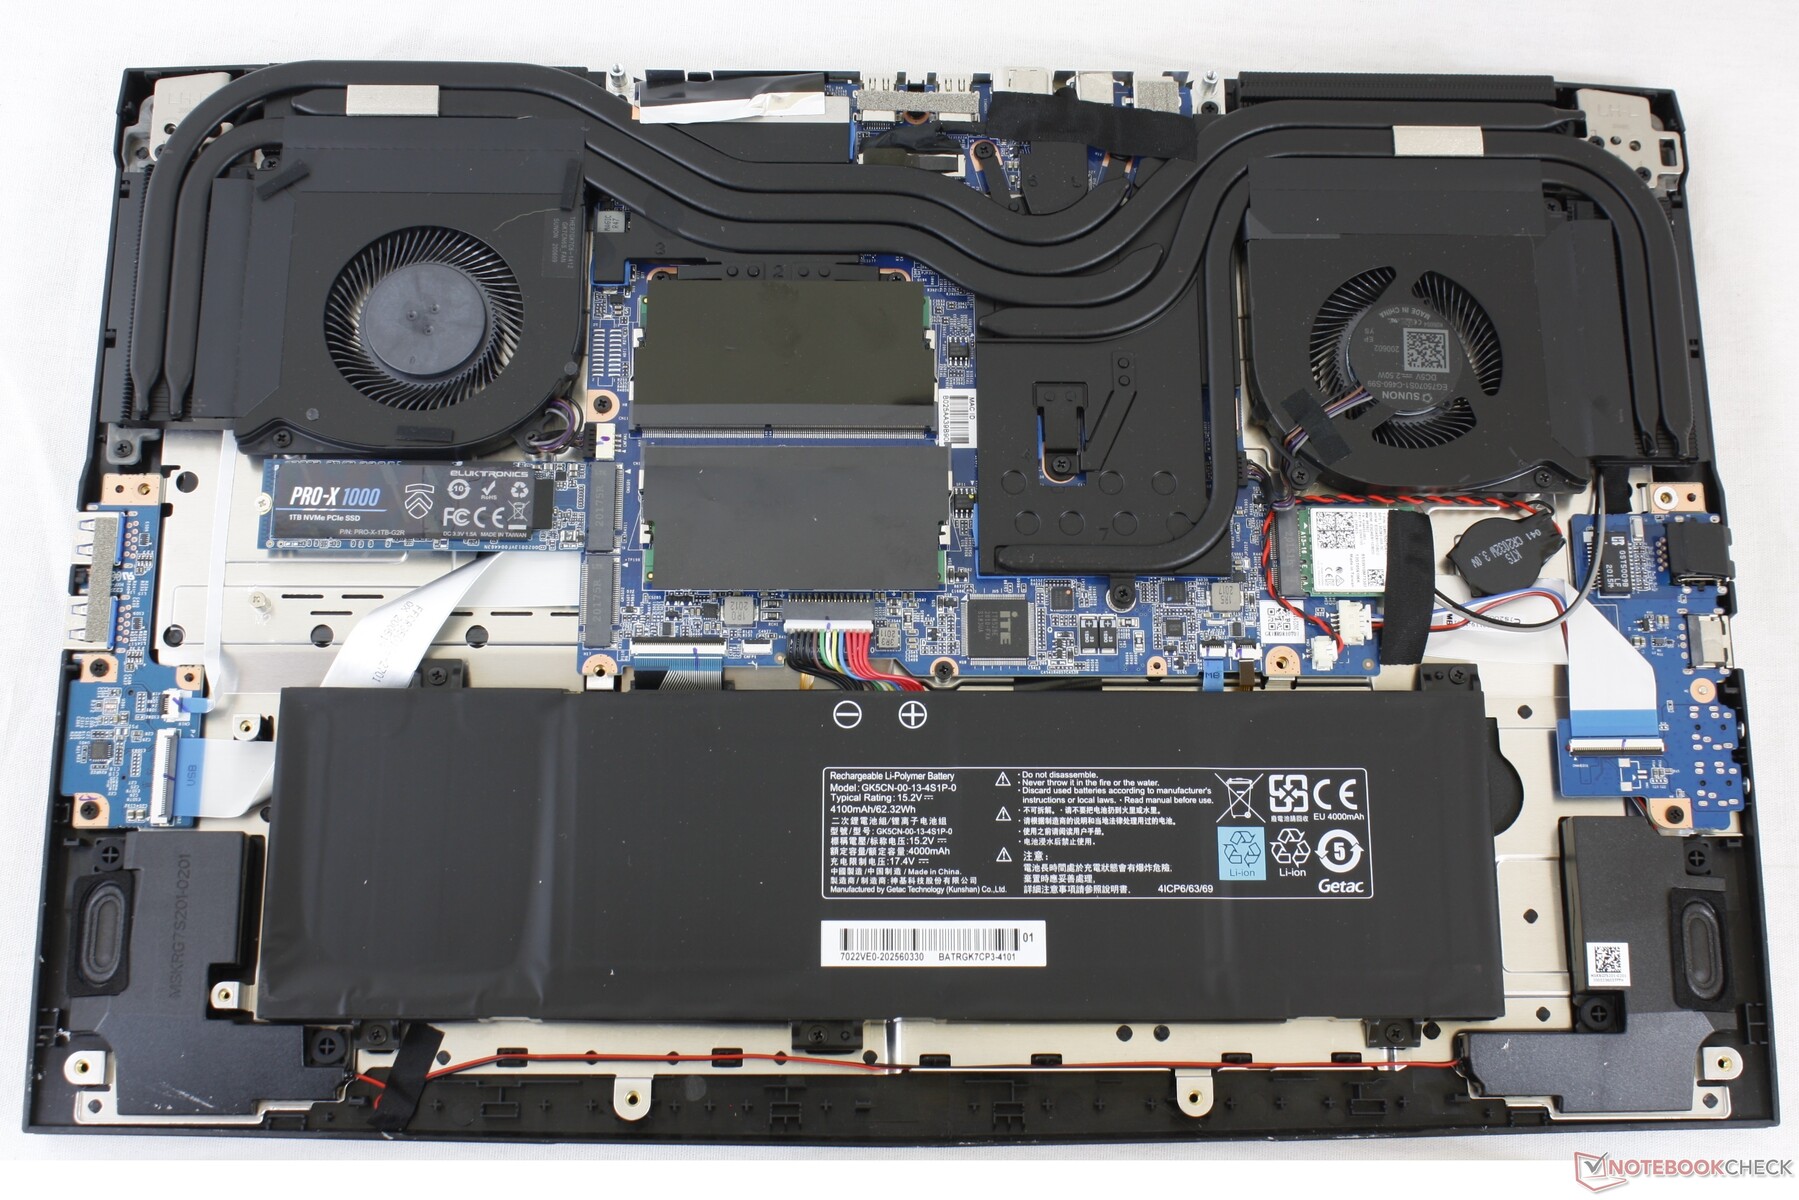
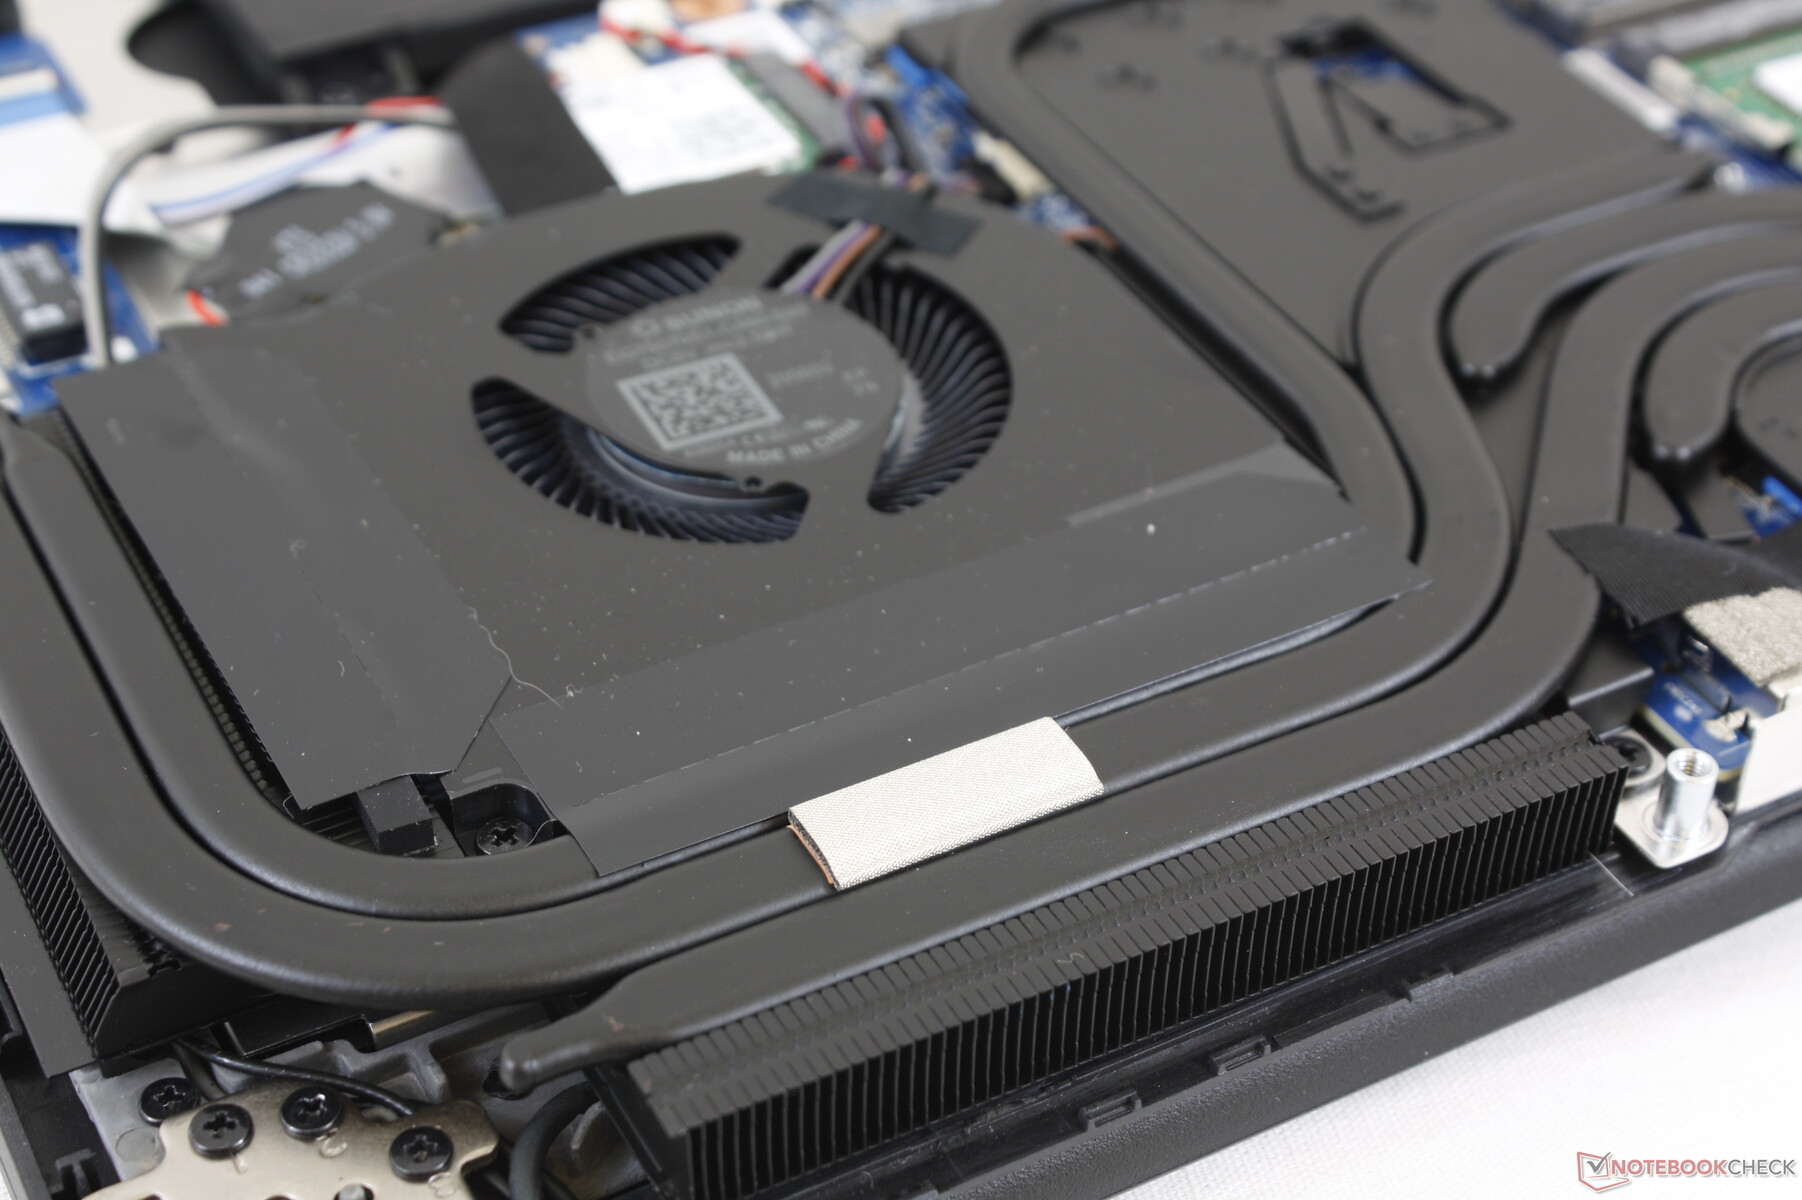
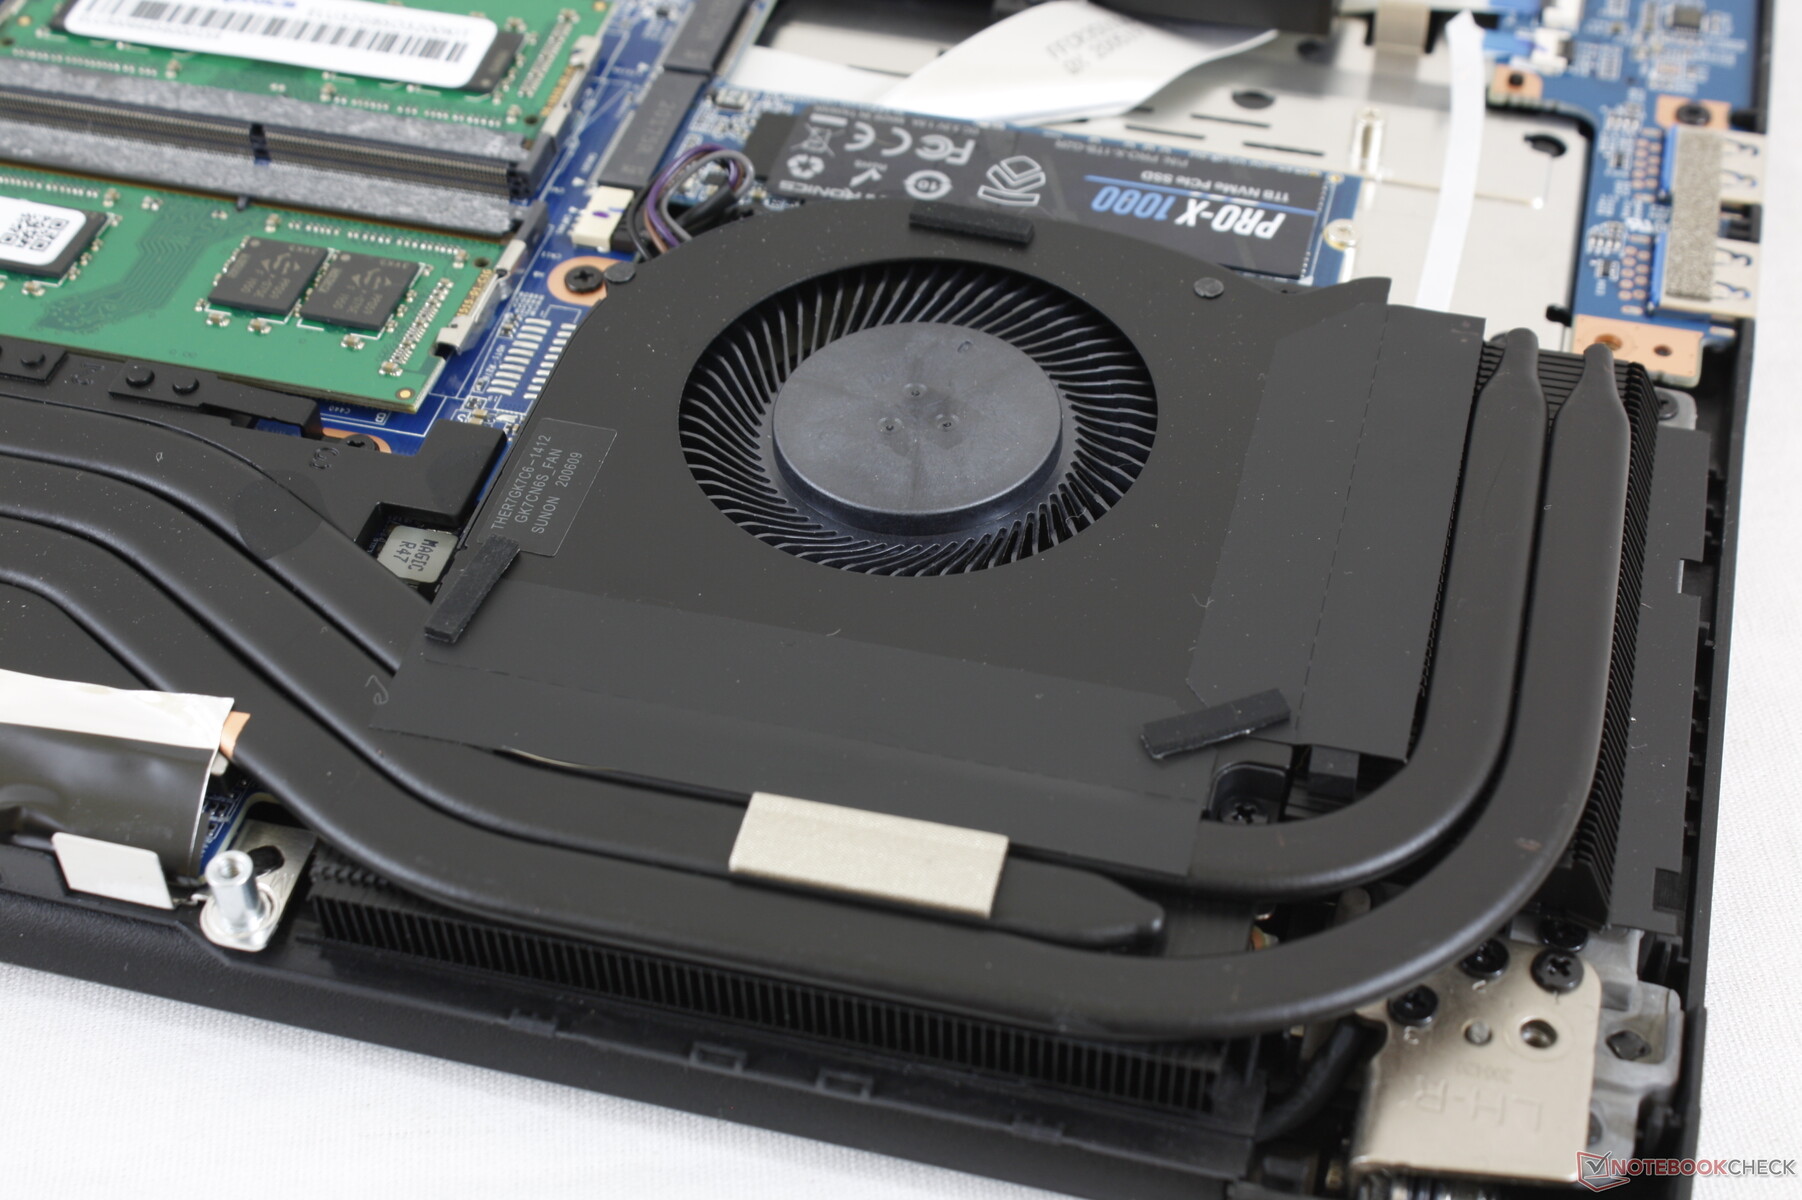
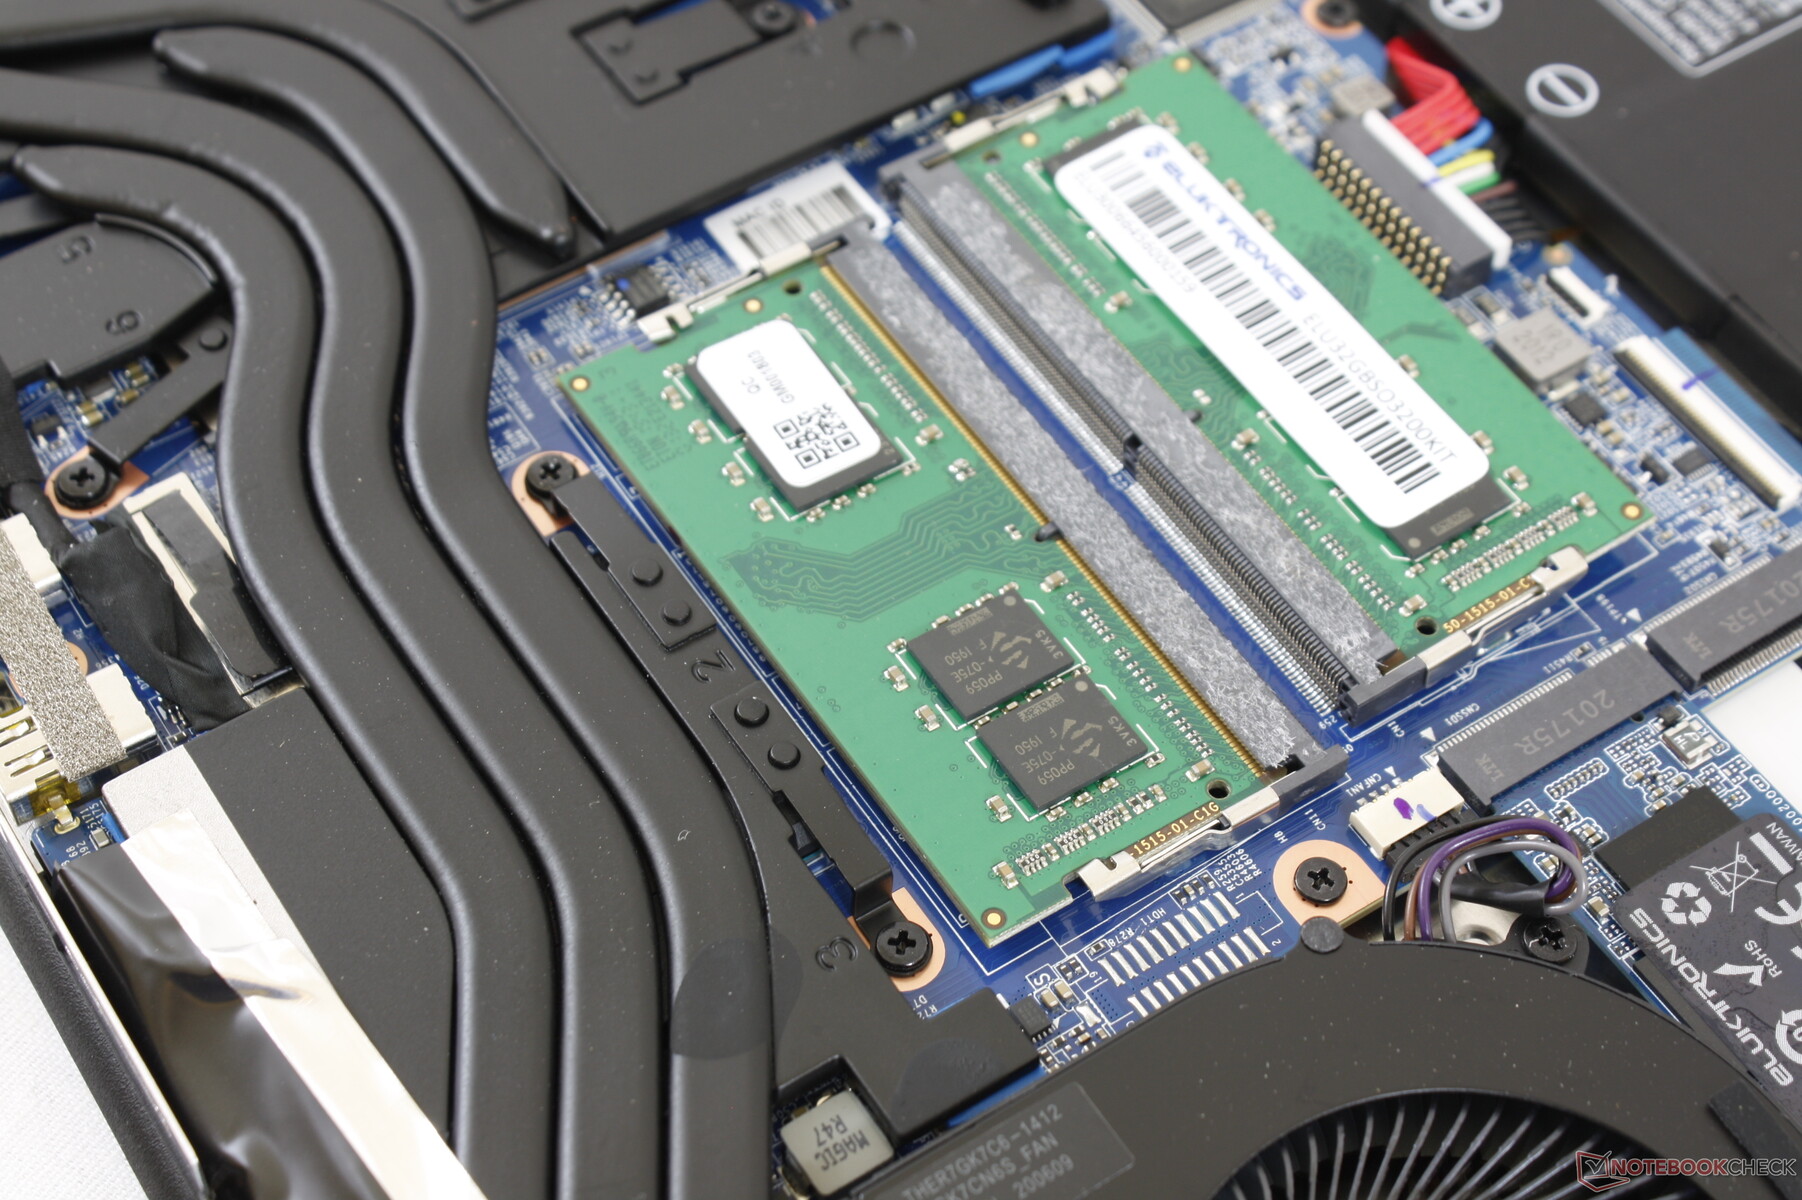
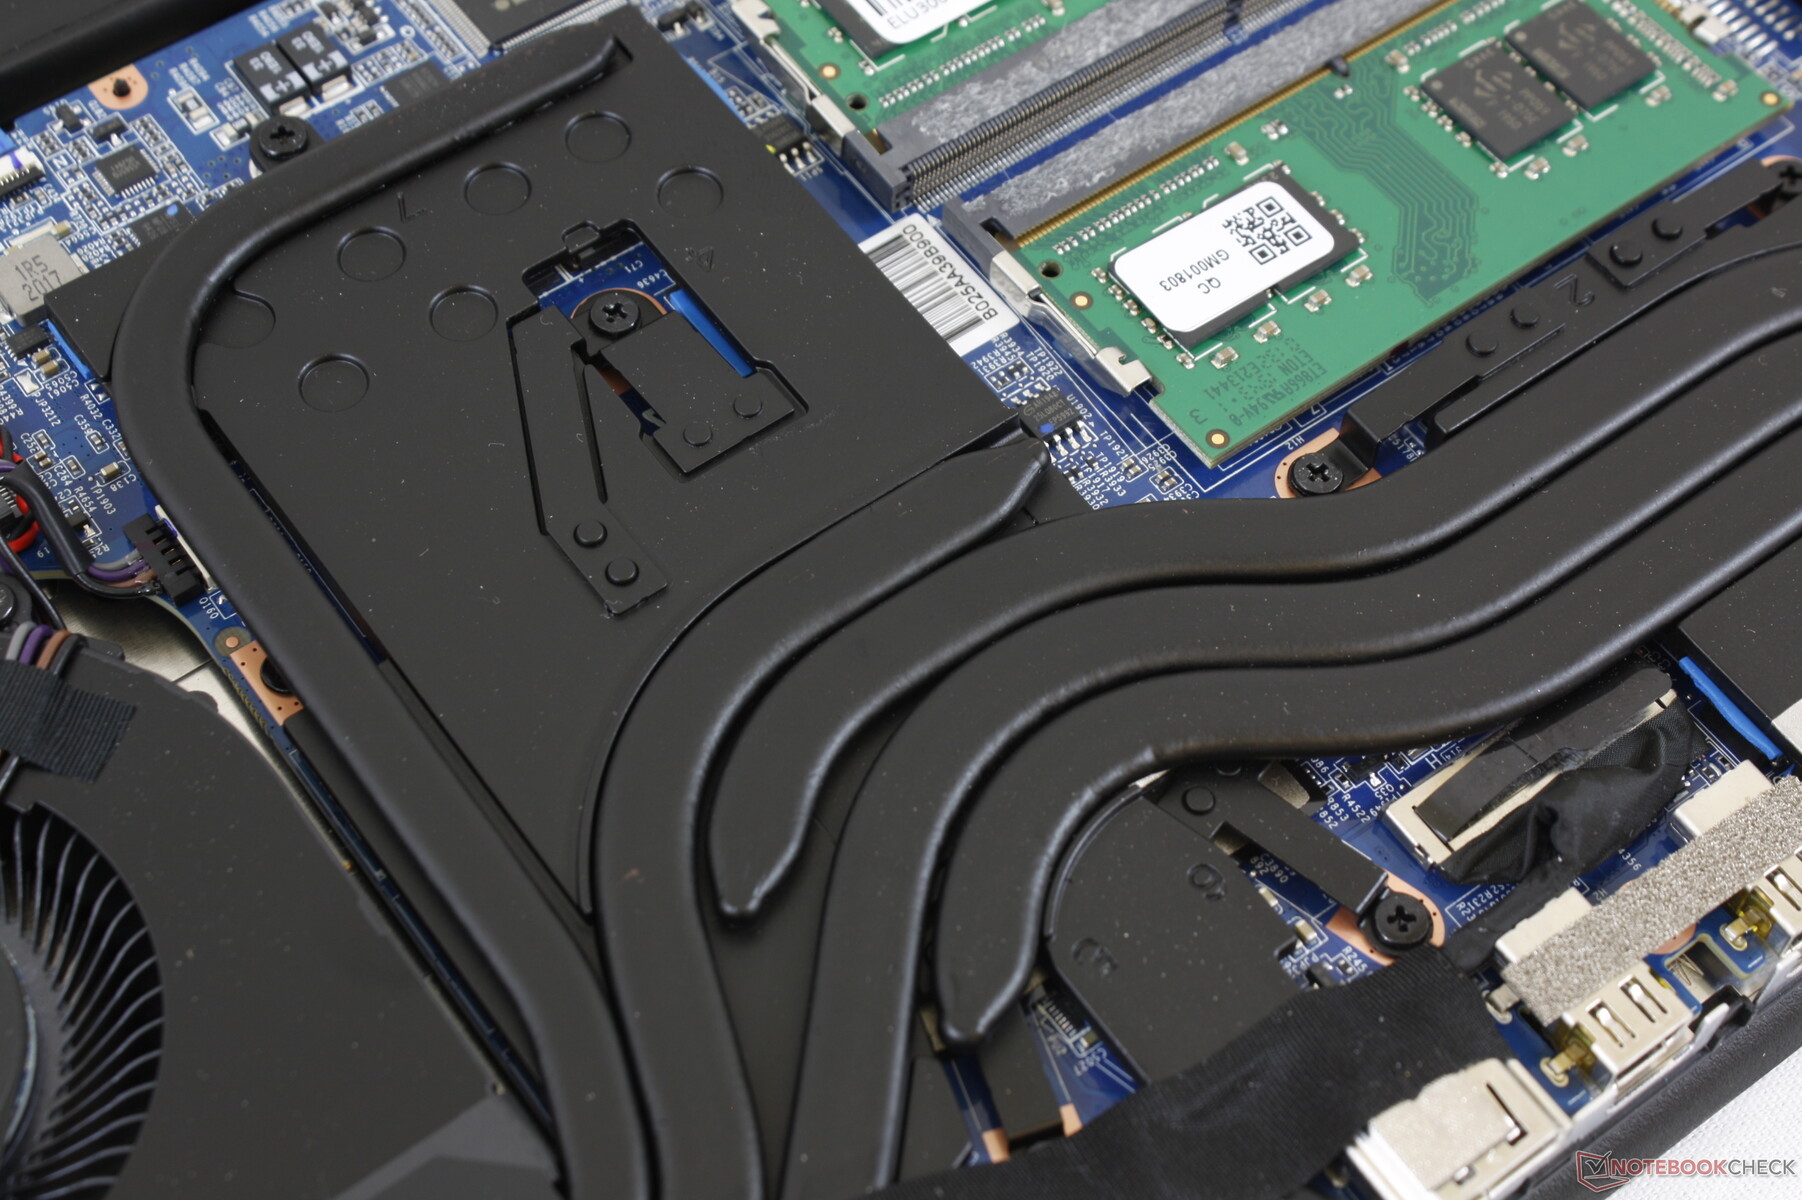
The bottom panel requires only a Philips screwdriver to remove. Users have direct access to all storage bays, SODIMM slots, battery, and the WLAN module which is more than what we can say for the MSI GS75.
Accessories and Warranty
There are no extras in the box other than the usual paperwork and AC adapter. The standard one-year limited warranty applies with options to extend up to three years.
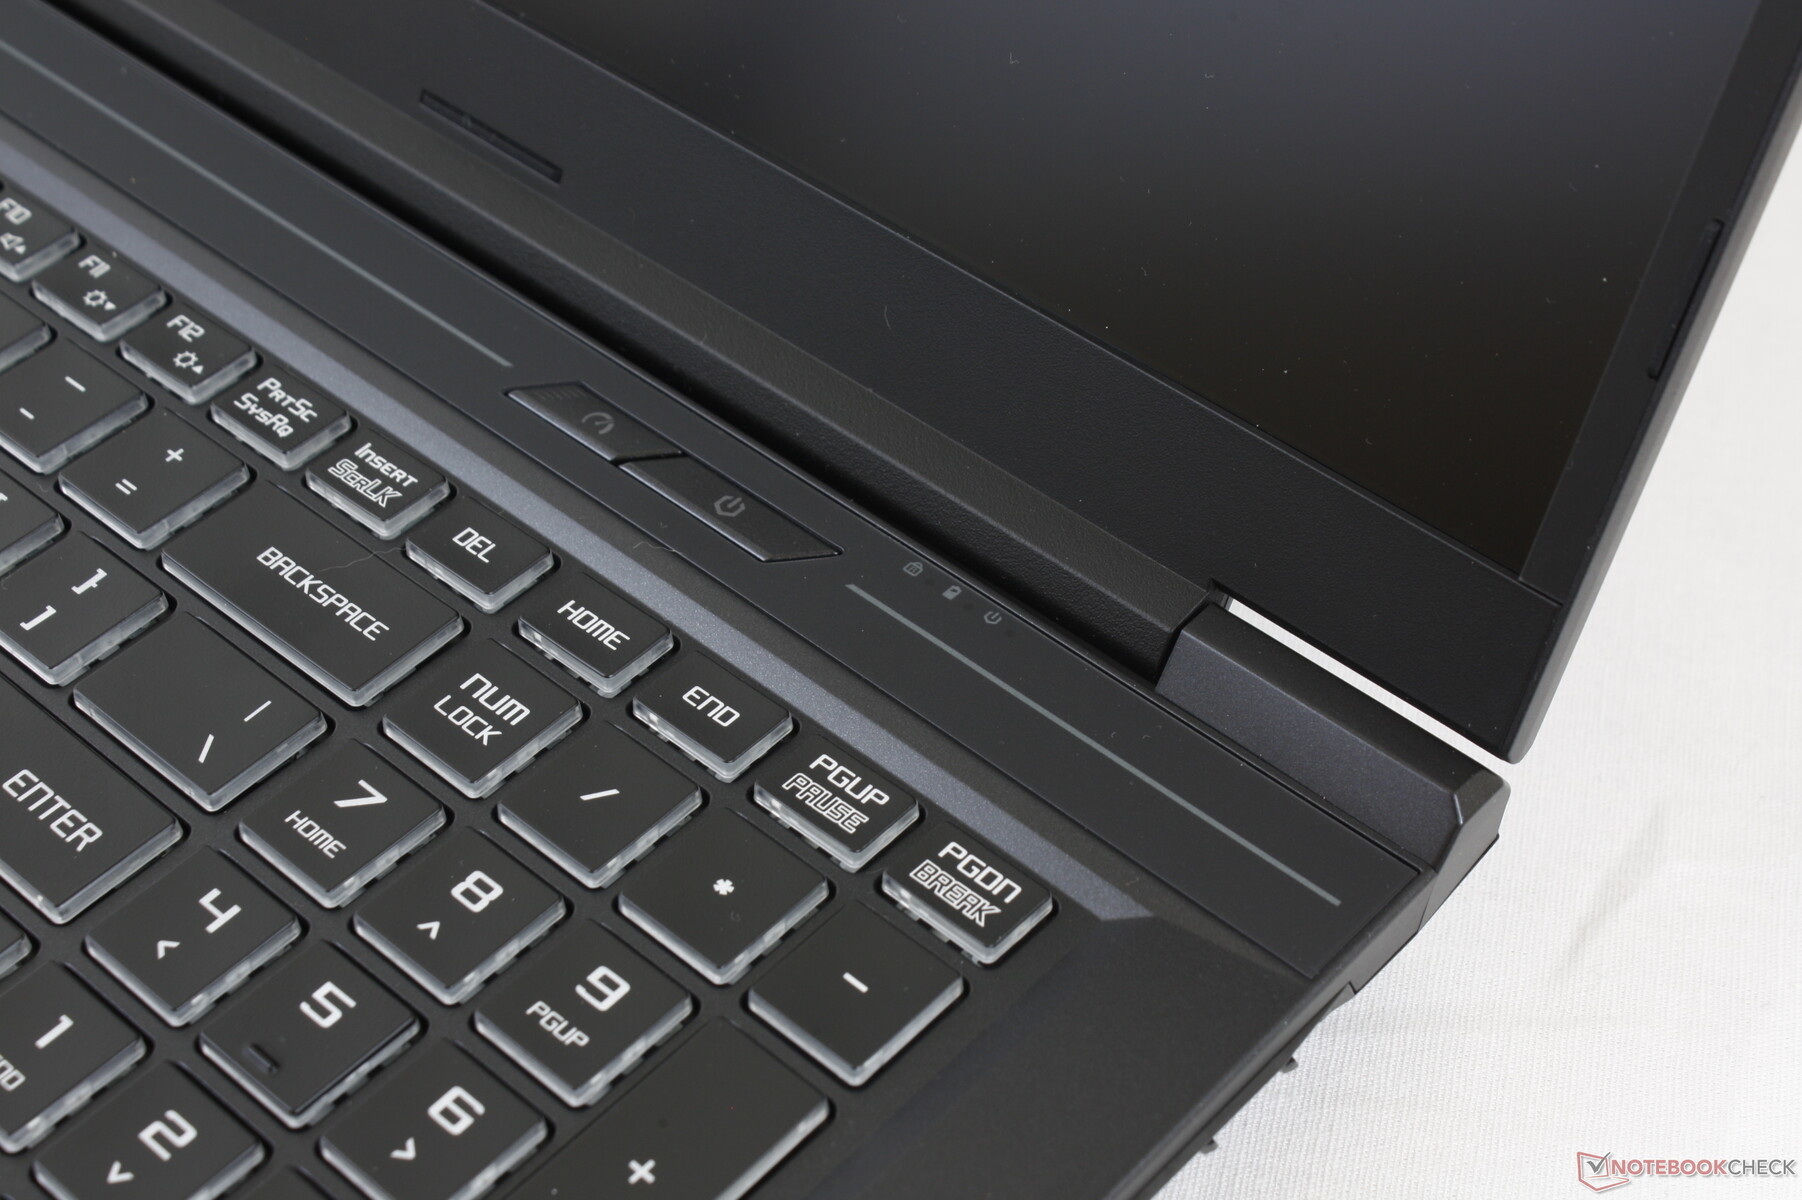
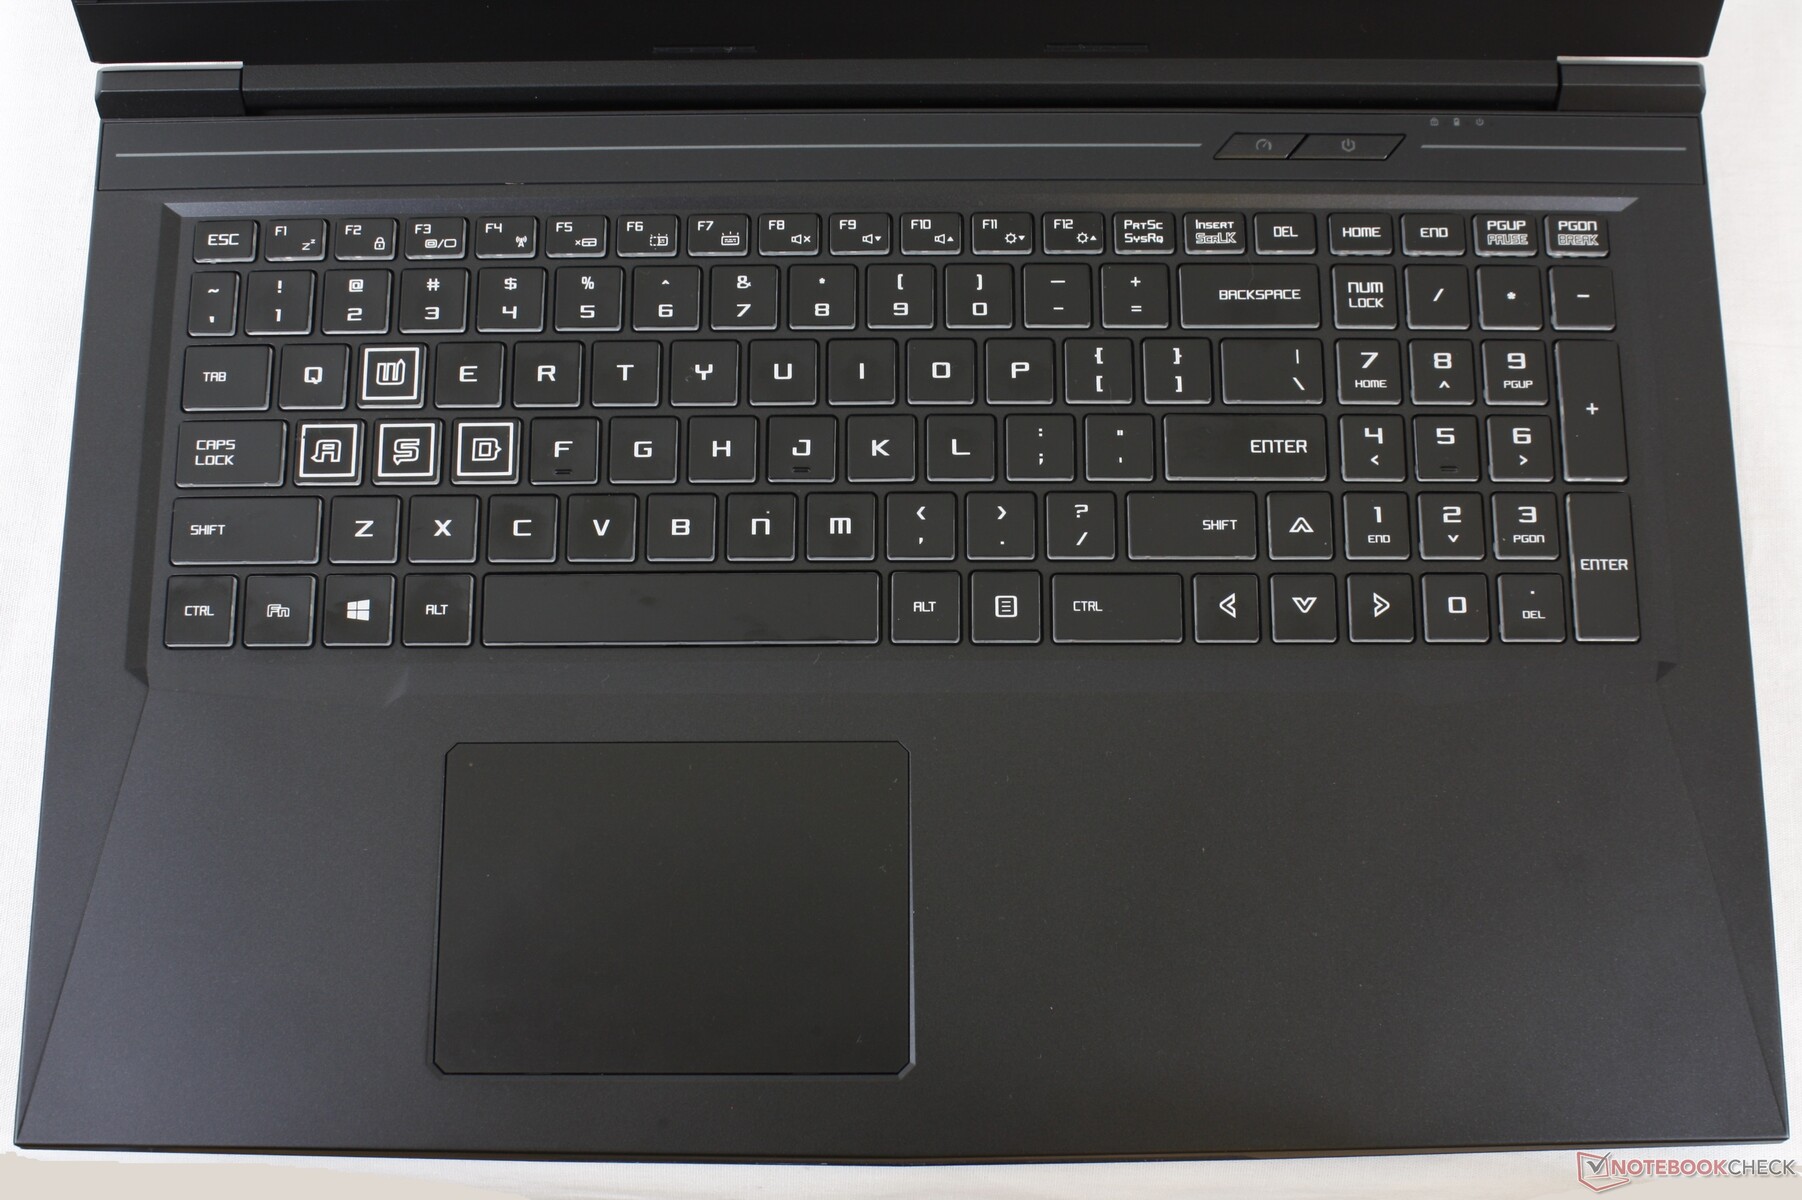
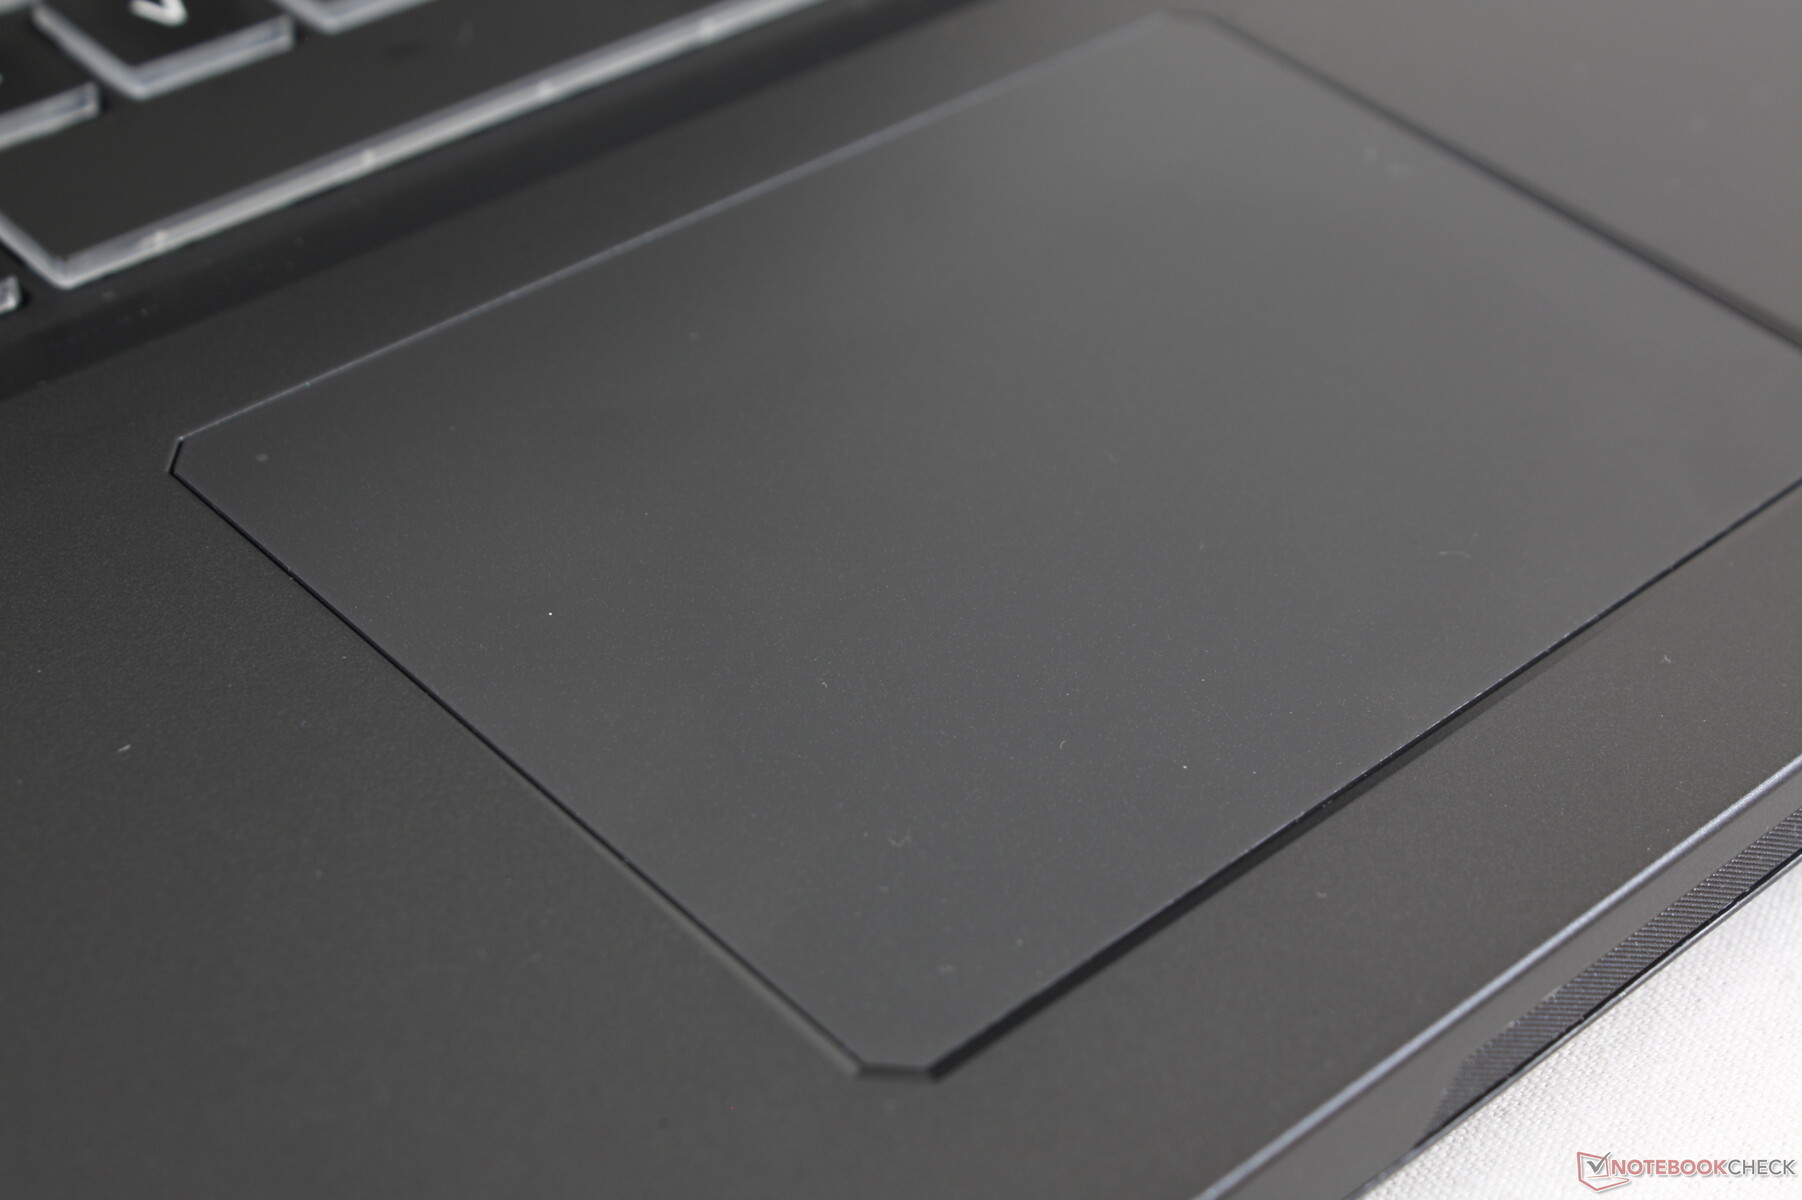
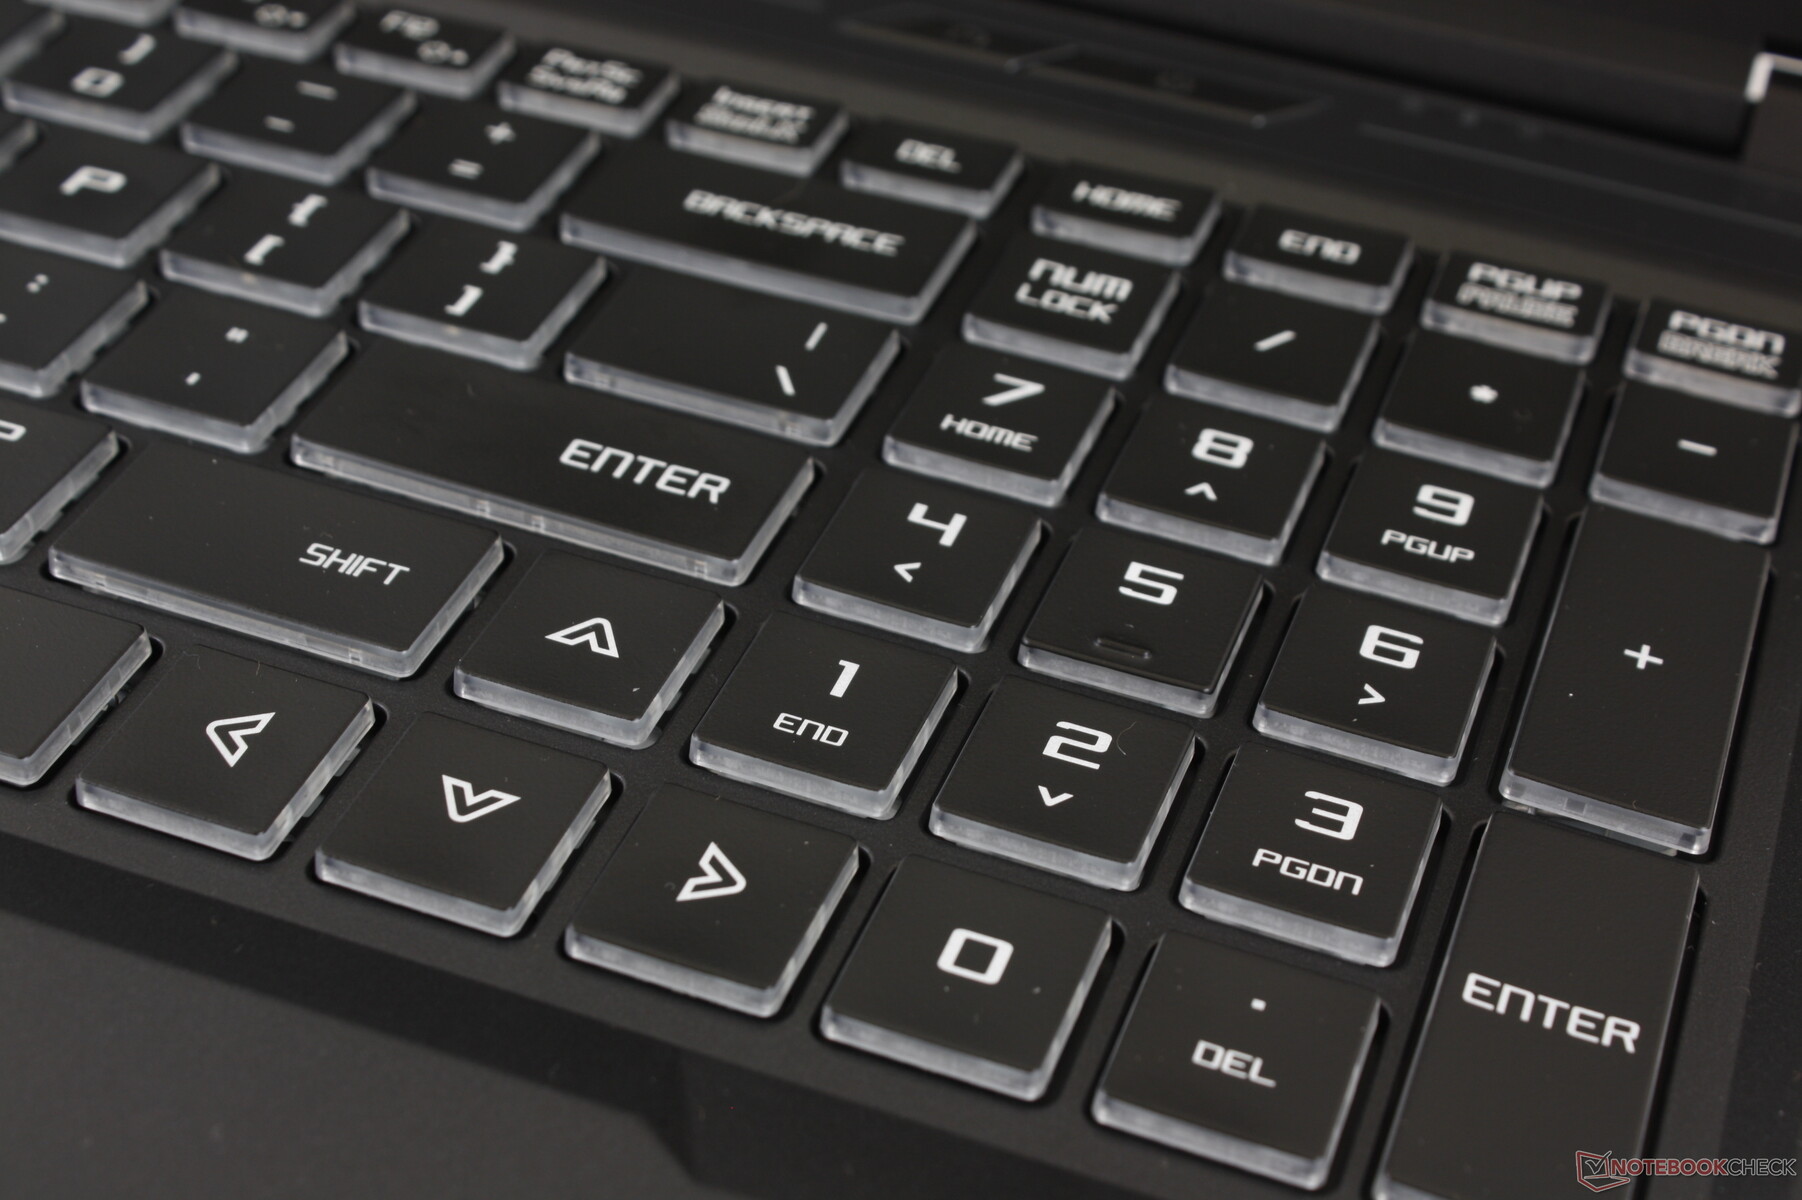
Input Devices

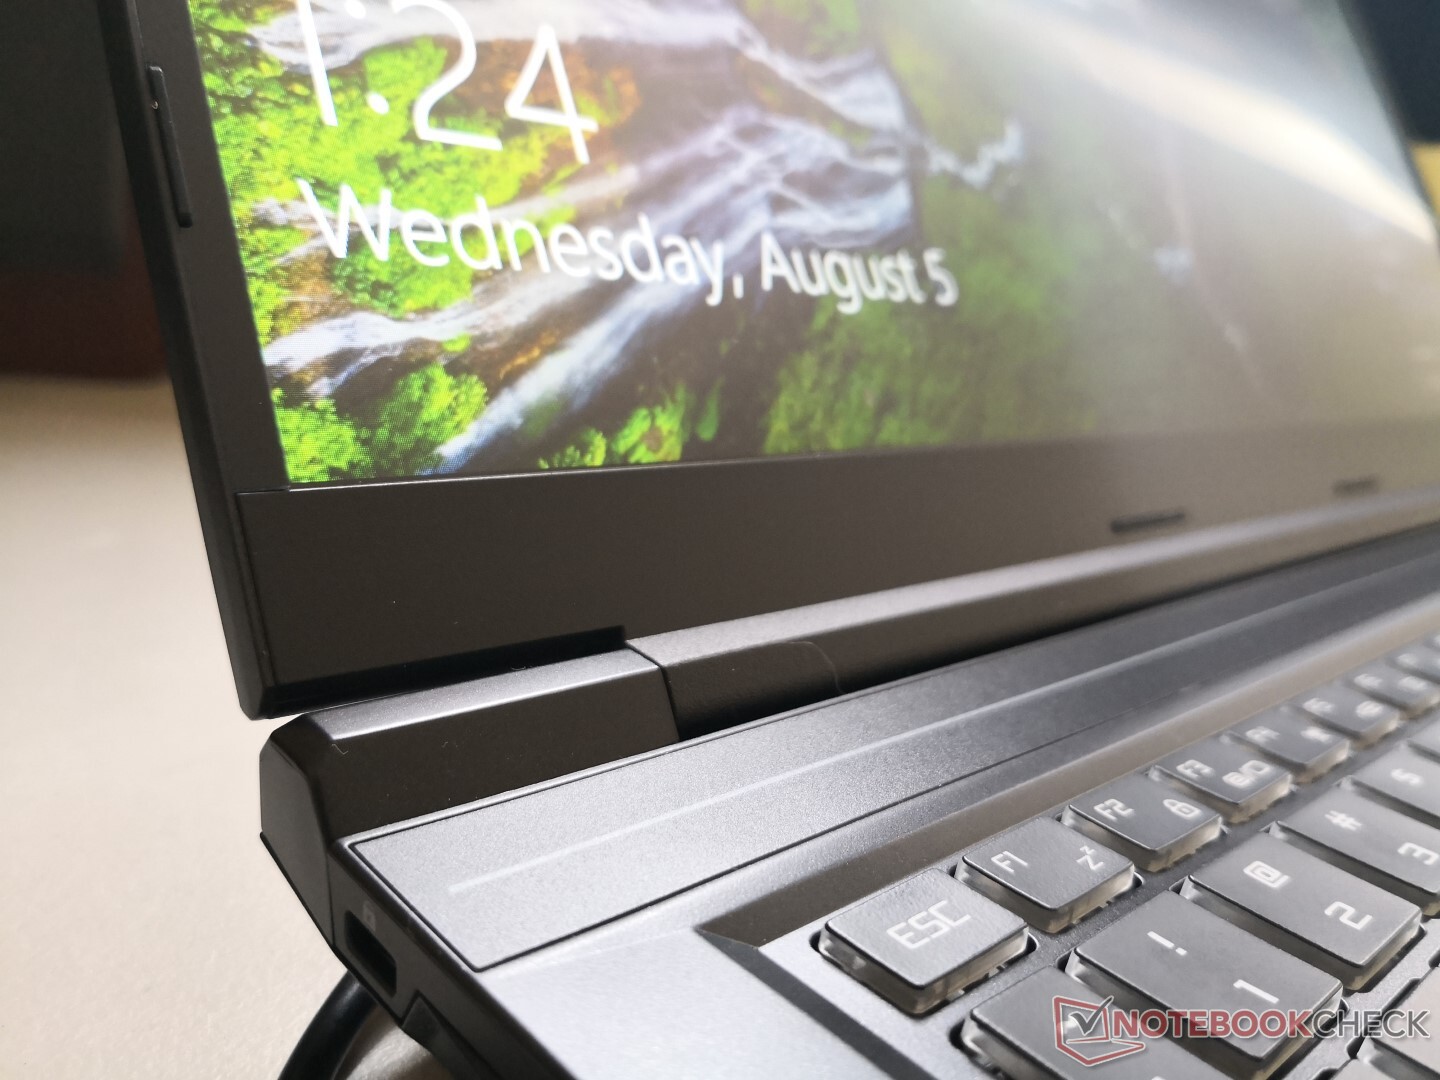
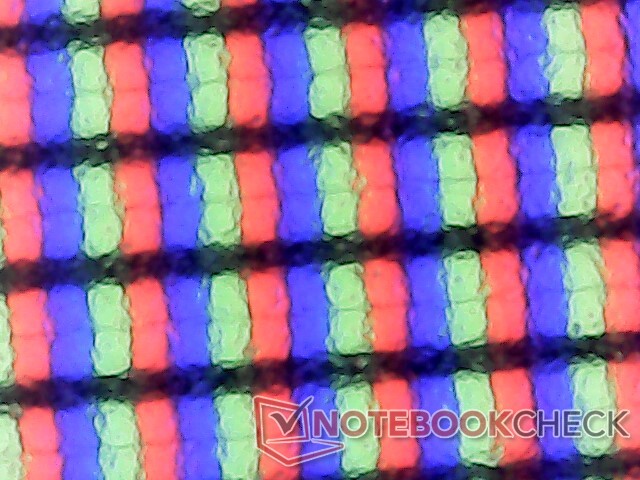
Display
The RP-17 uses the same high quality 144 Hz BOE NV173FHM-N44 IPS panel as found on the Eurocom Nightsky RX17 or Schenker XMG Neo 17. Response times are fast with respectable contrast ratio for reduced ghosting and good black levels, respectively. Eluktronics doesn't offer any 240 Hz, 300 Hz, or 4K options here which is fine considering the price point.
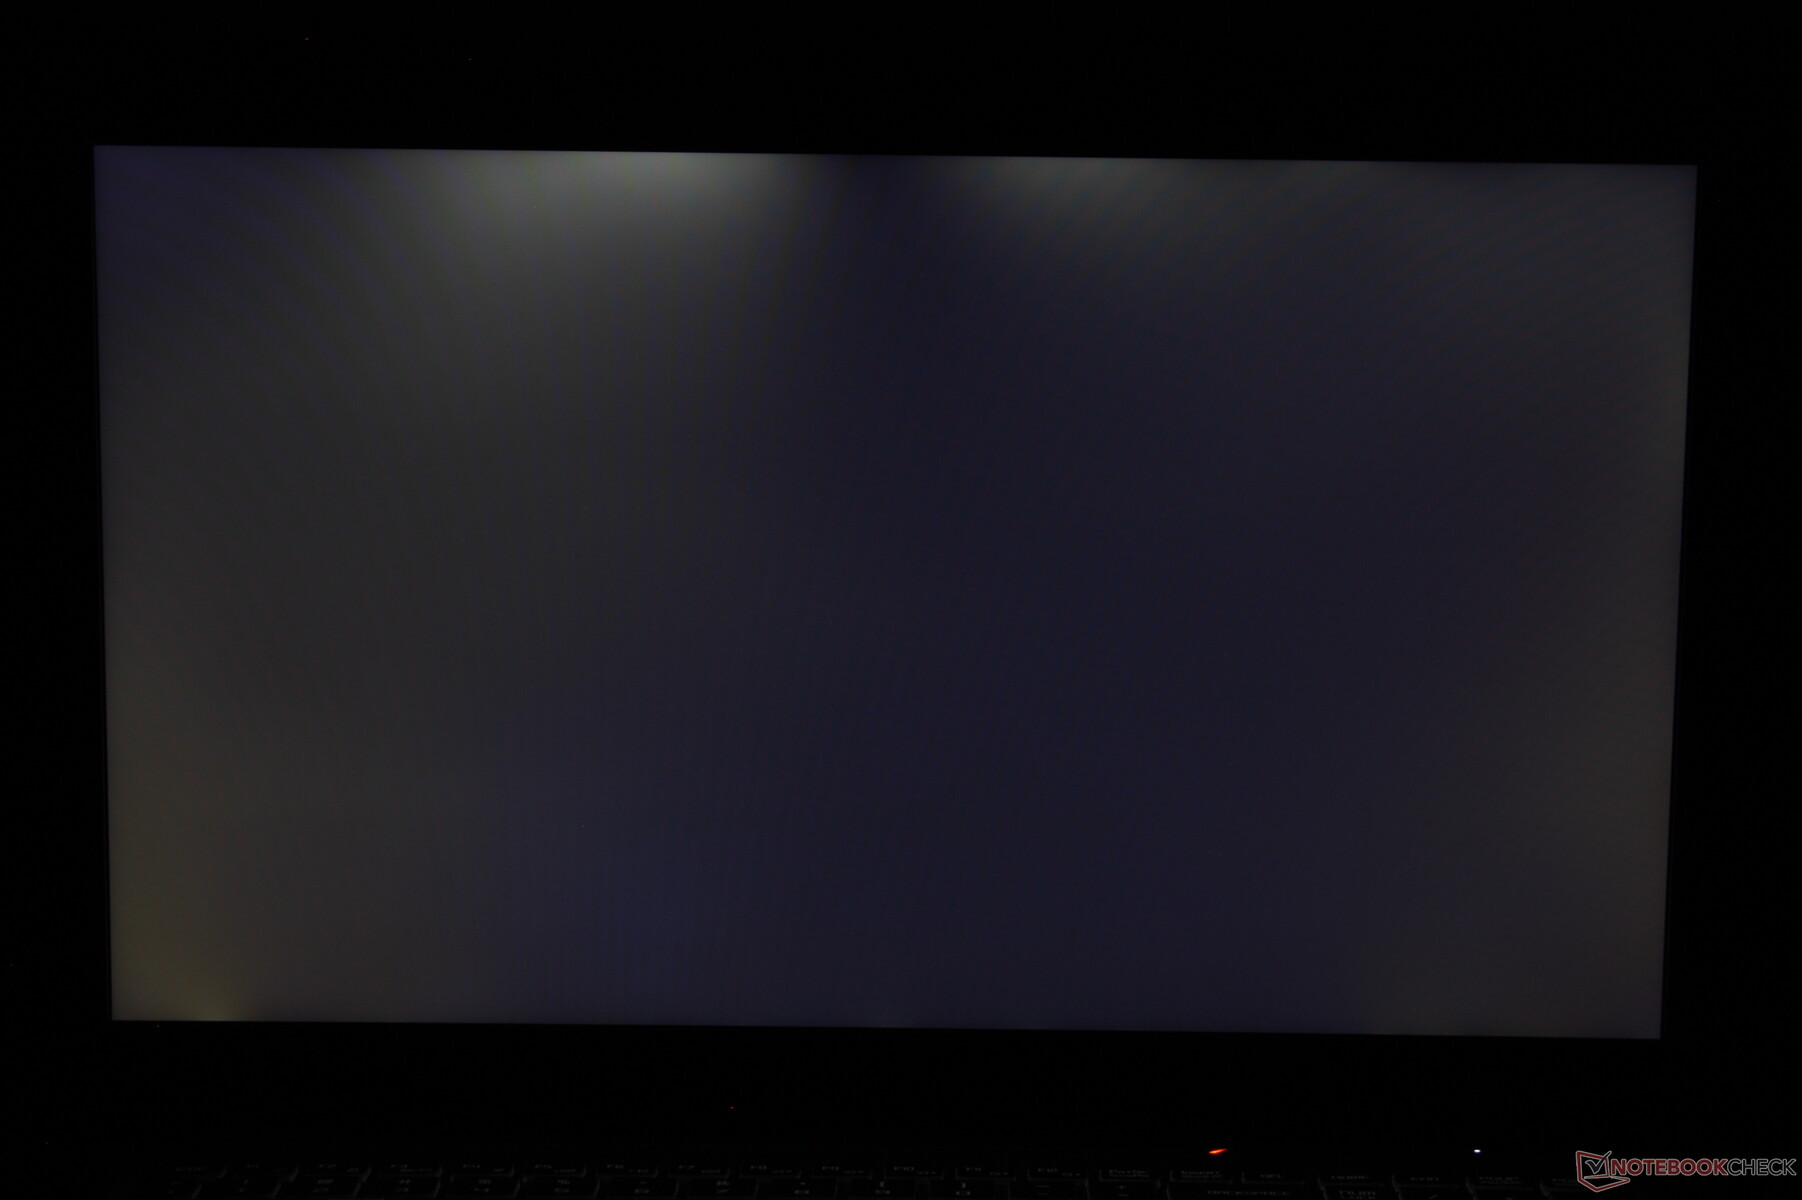
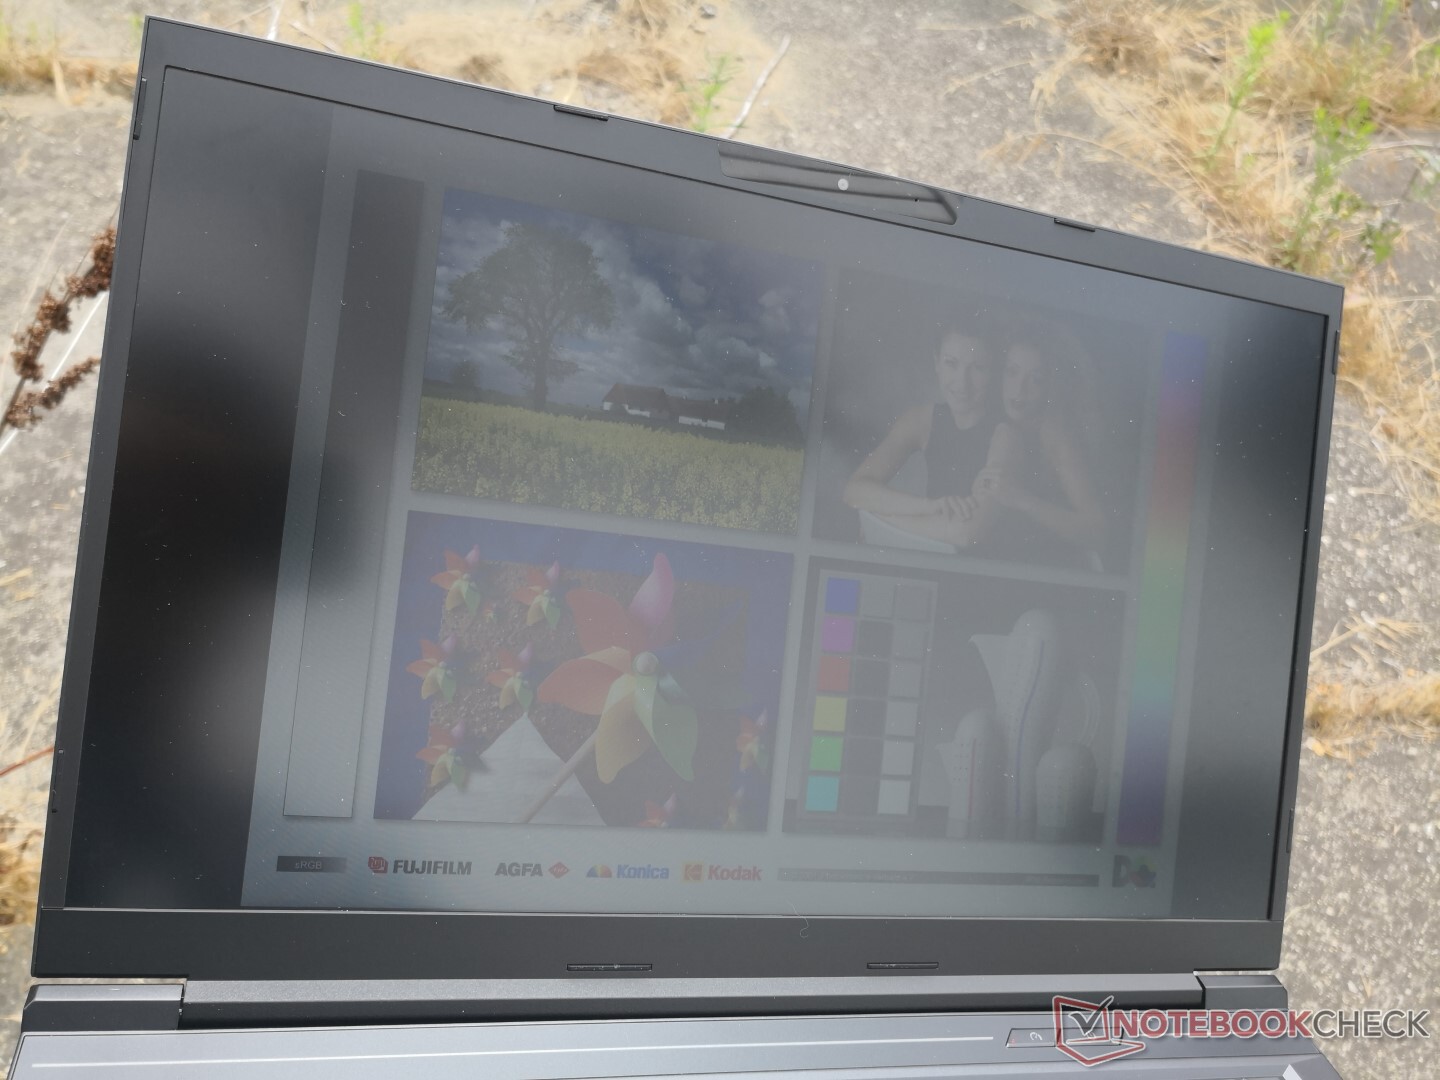
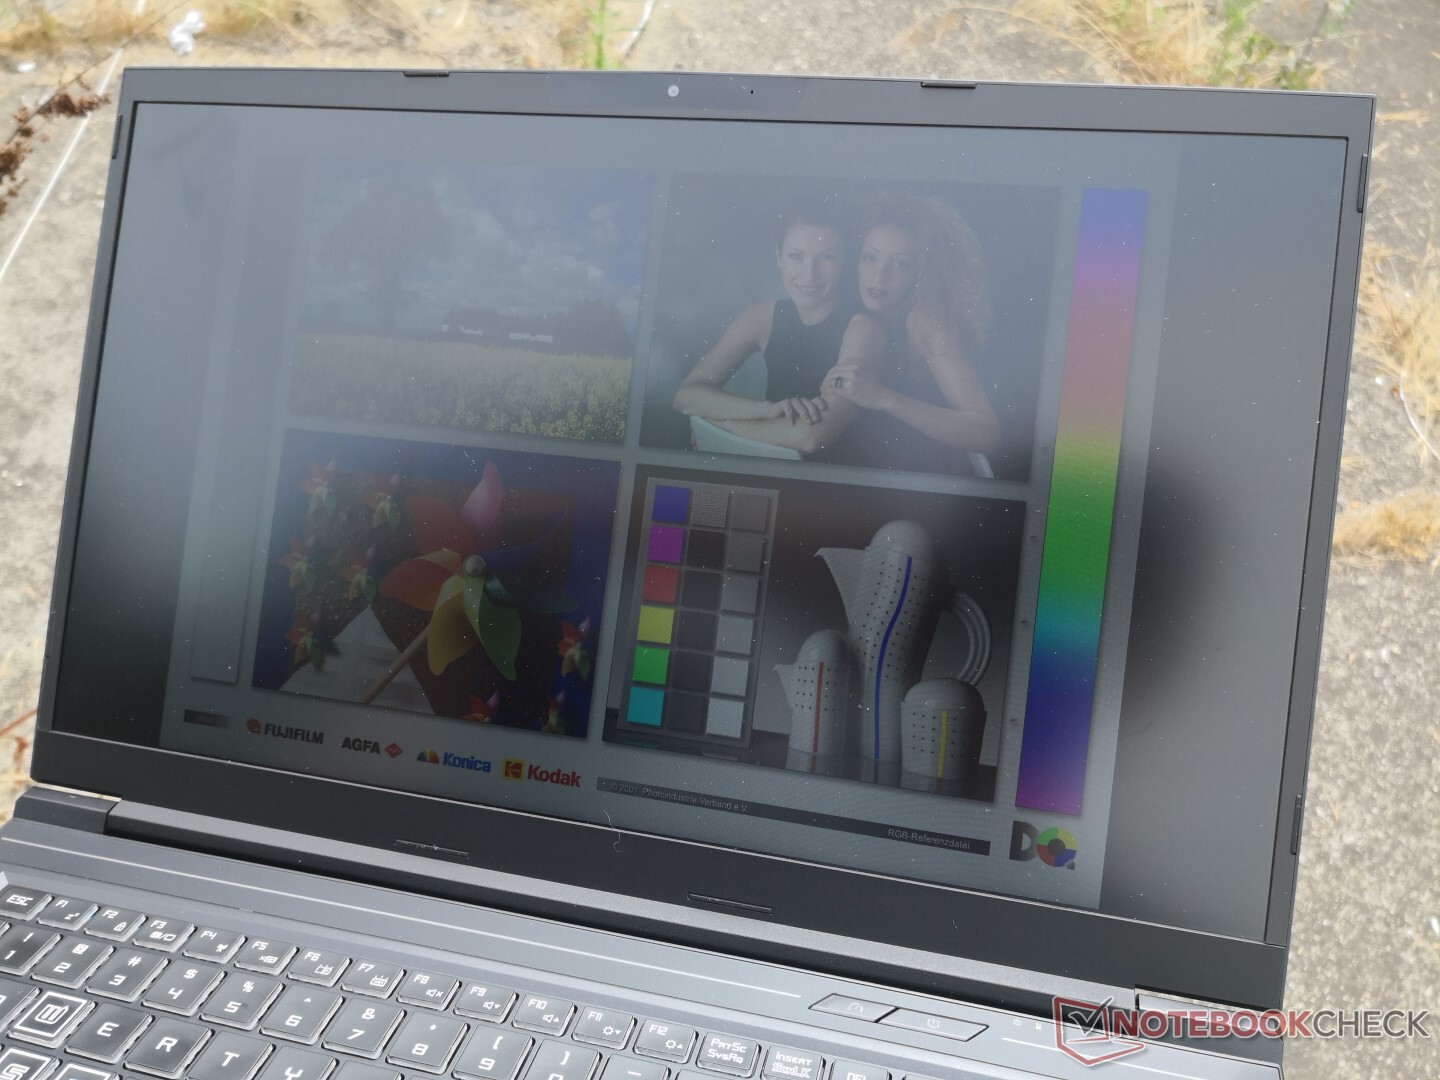
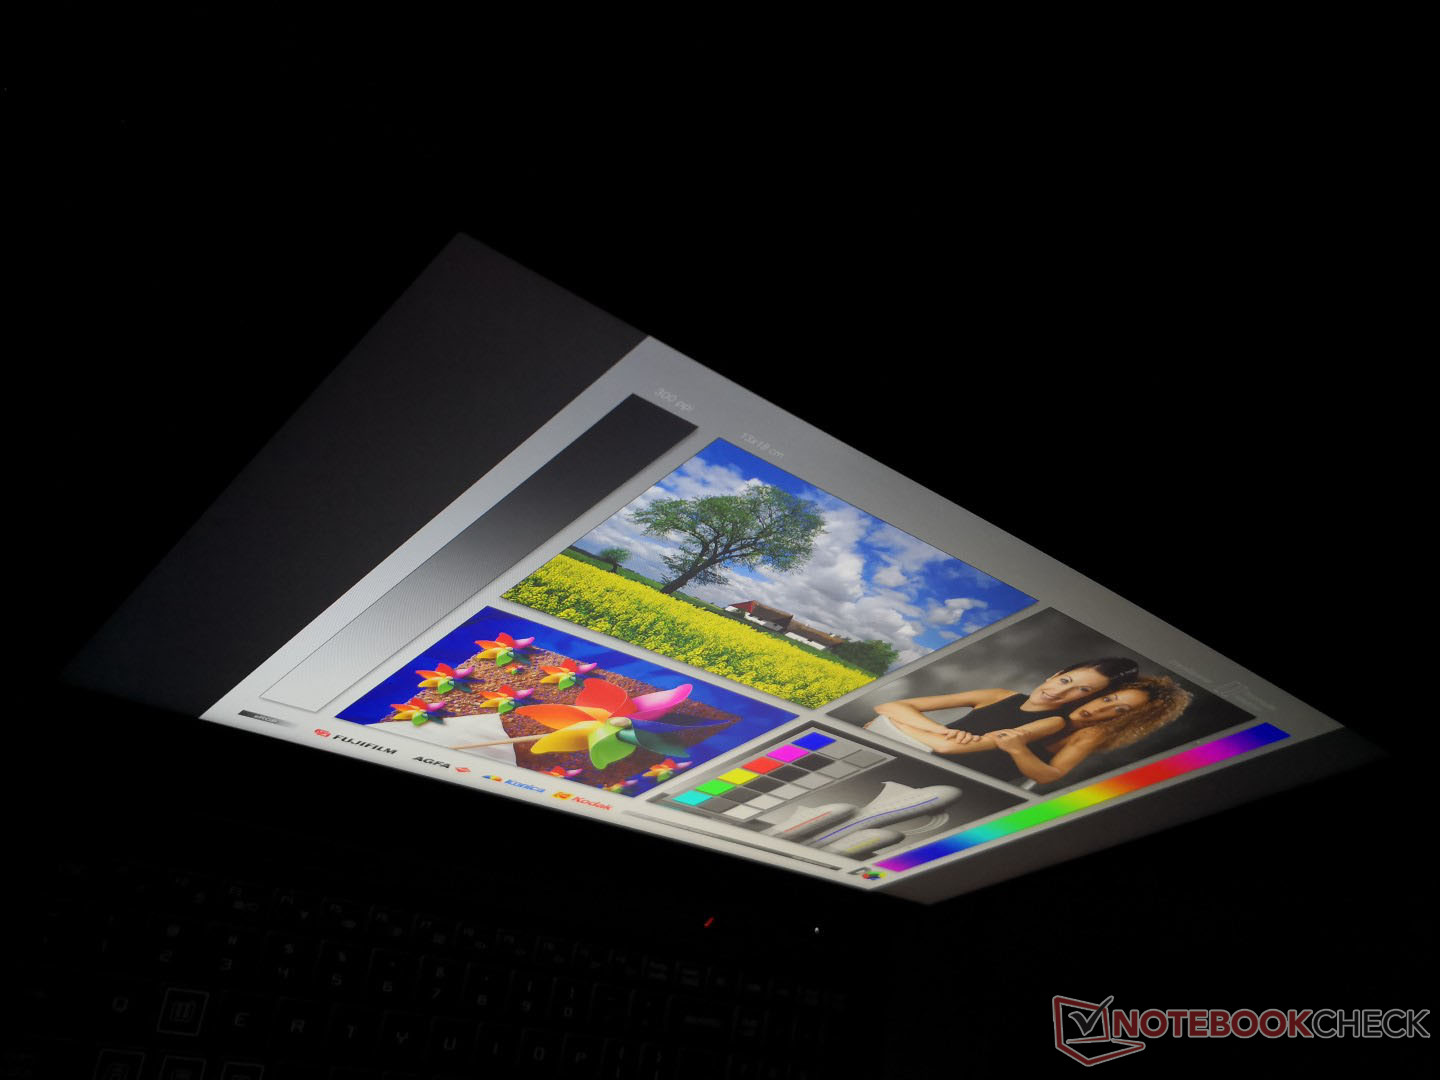
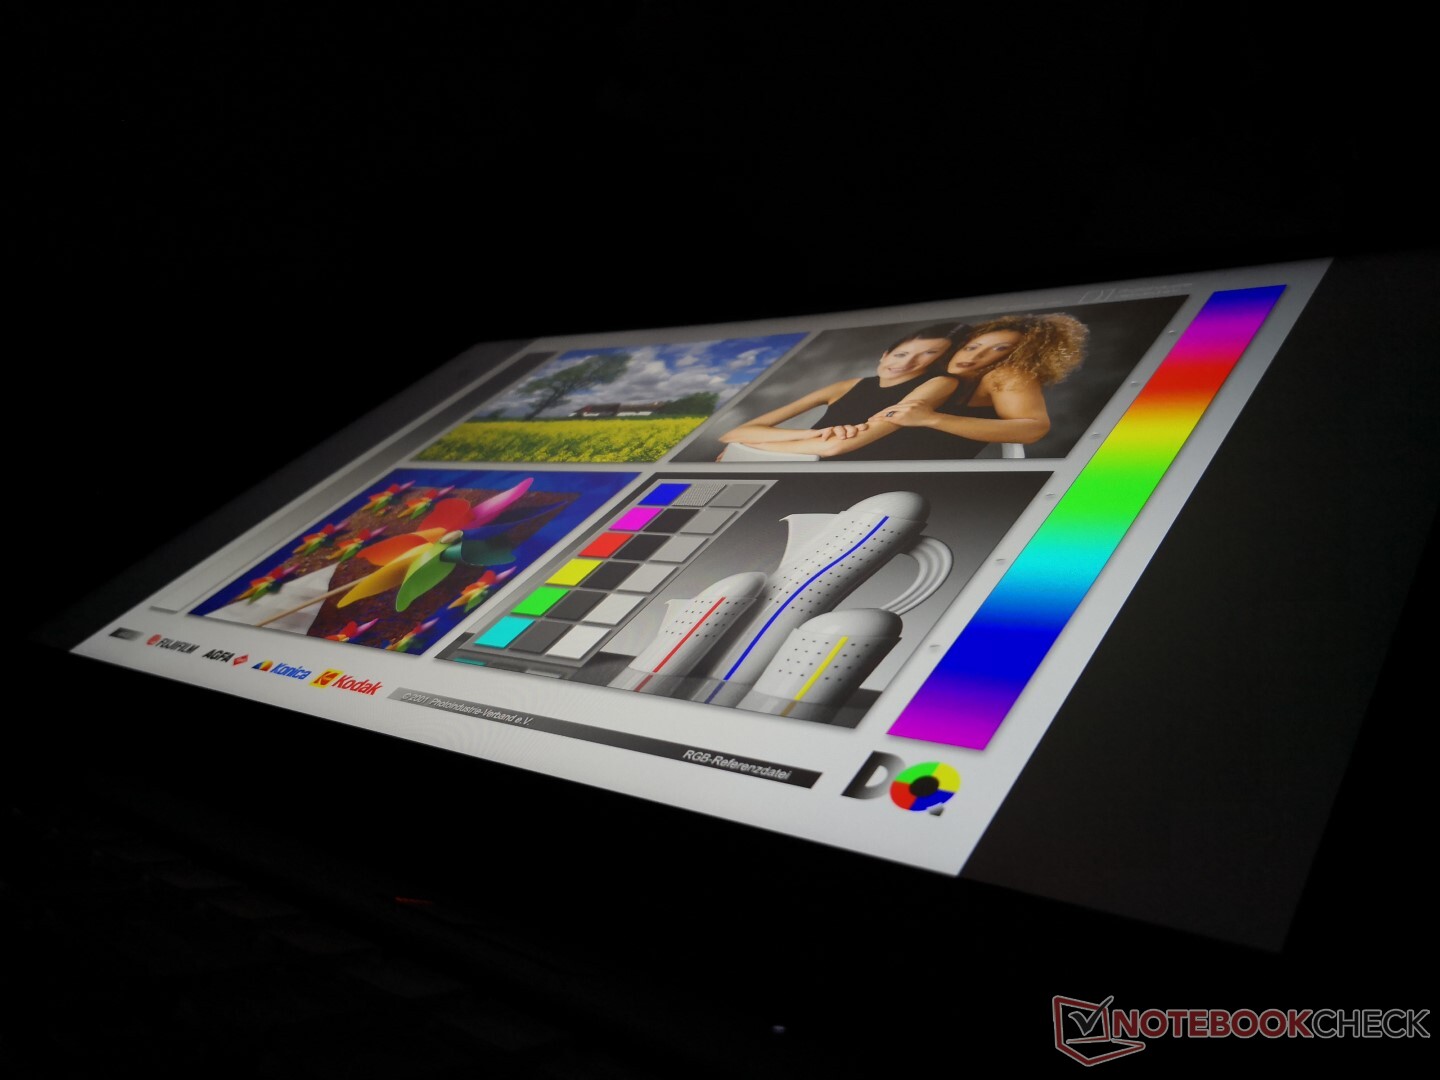
The one aspect that's not fine is the heavy uneven backlight bleeding on our test unit as shown by the picture below. Minor or even moderate bleeding is acceptable, but this is too noticeable when gaming or watching movies with black borders. We see this more often on white label laptops like those from Clevo when compared to systems from Lenovo, HP, or Dell.

| |||||||||||||||||||||||||
Brightness Distribution: 91 %
Center on Battery: 311.5 cd/m²
Contrast: 1005:1 (Black: 0.31 cd/m²)
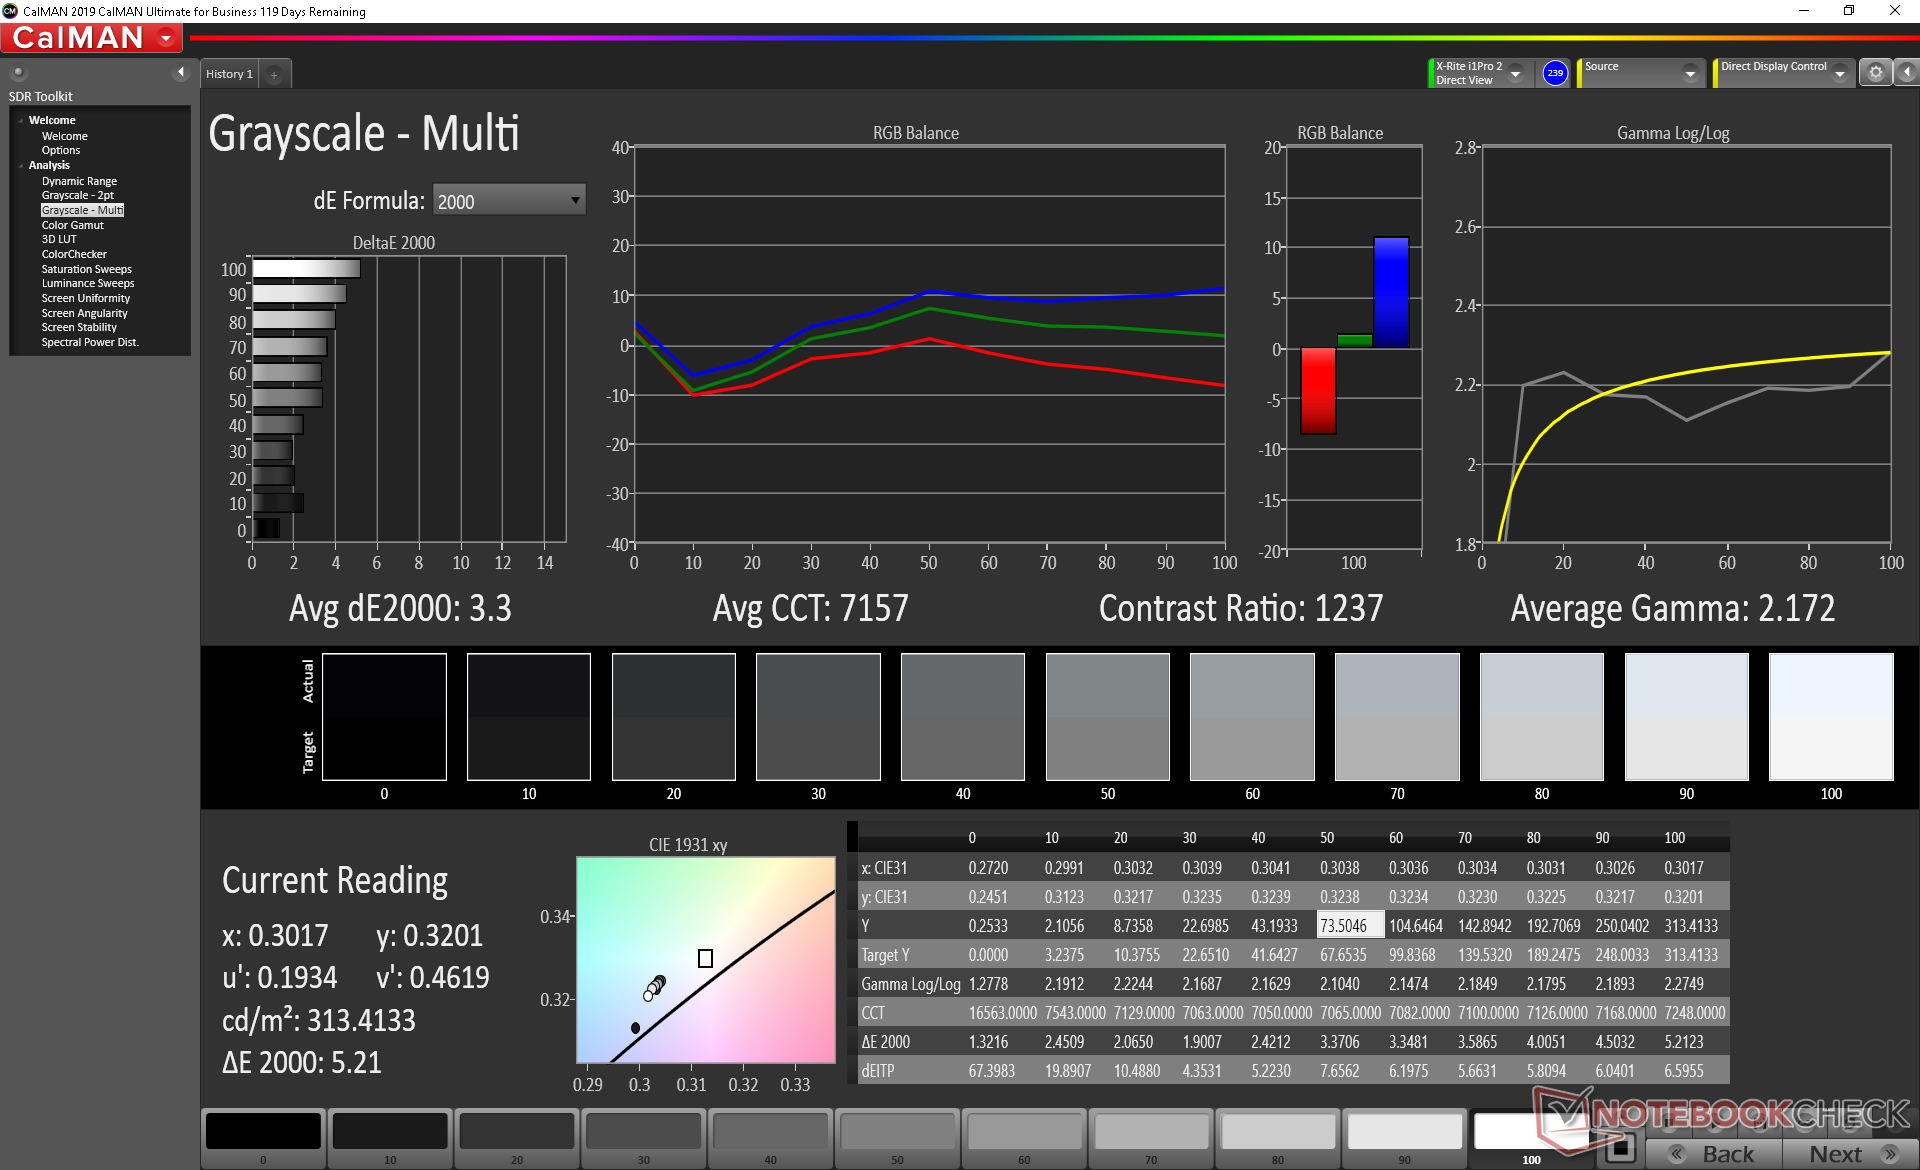
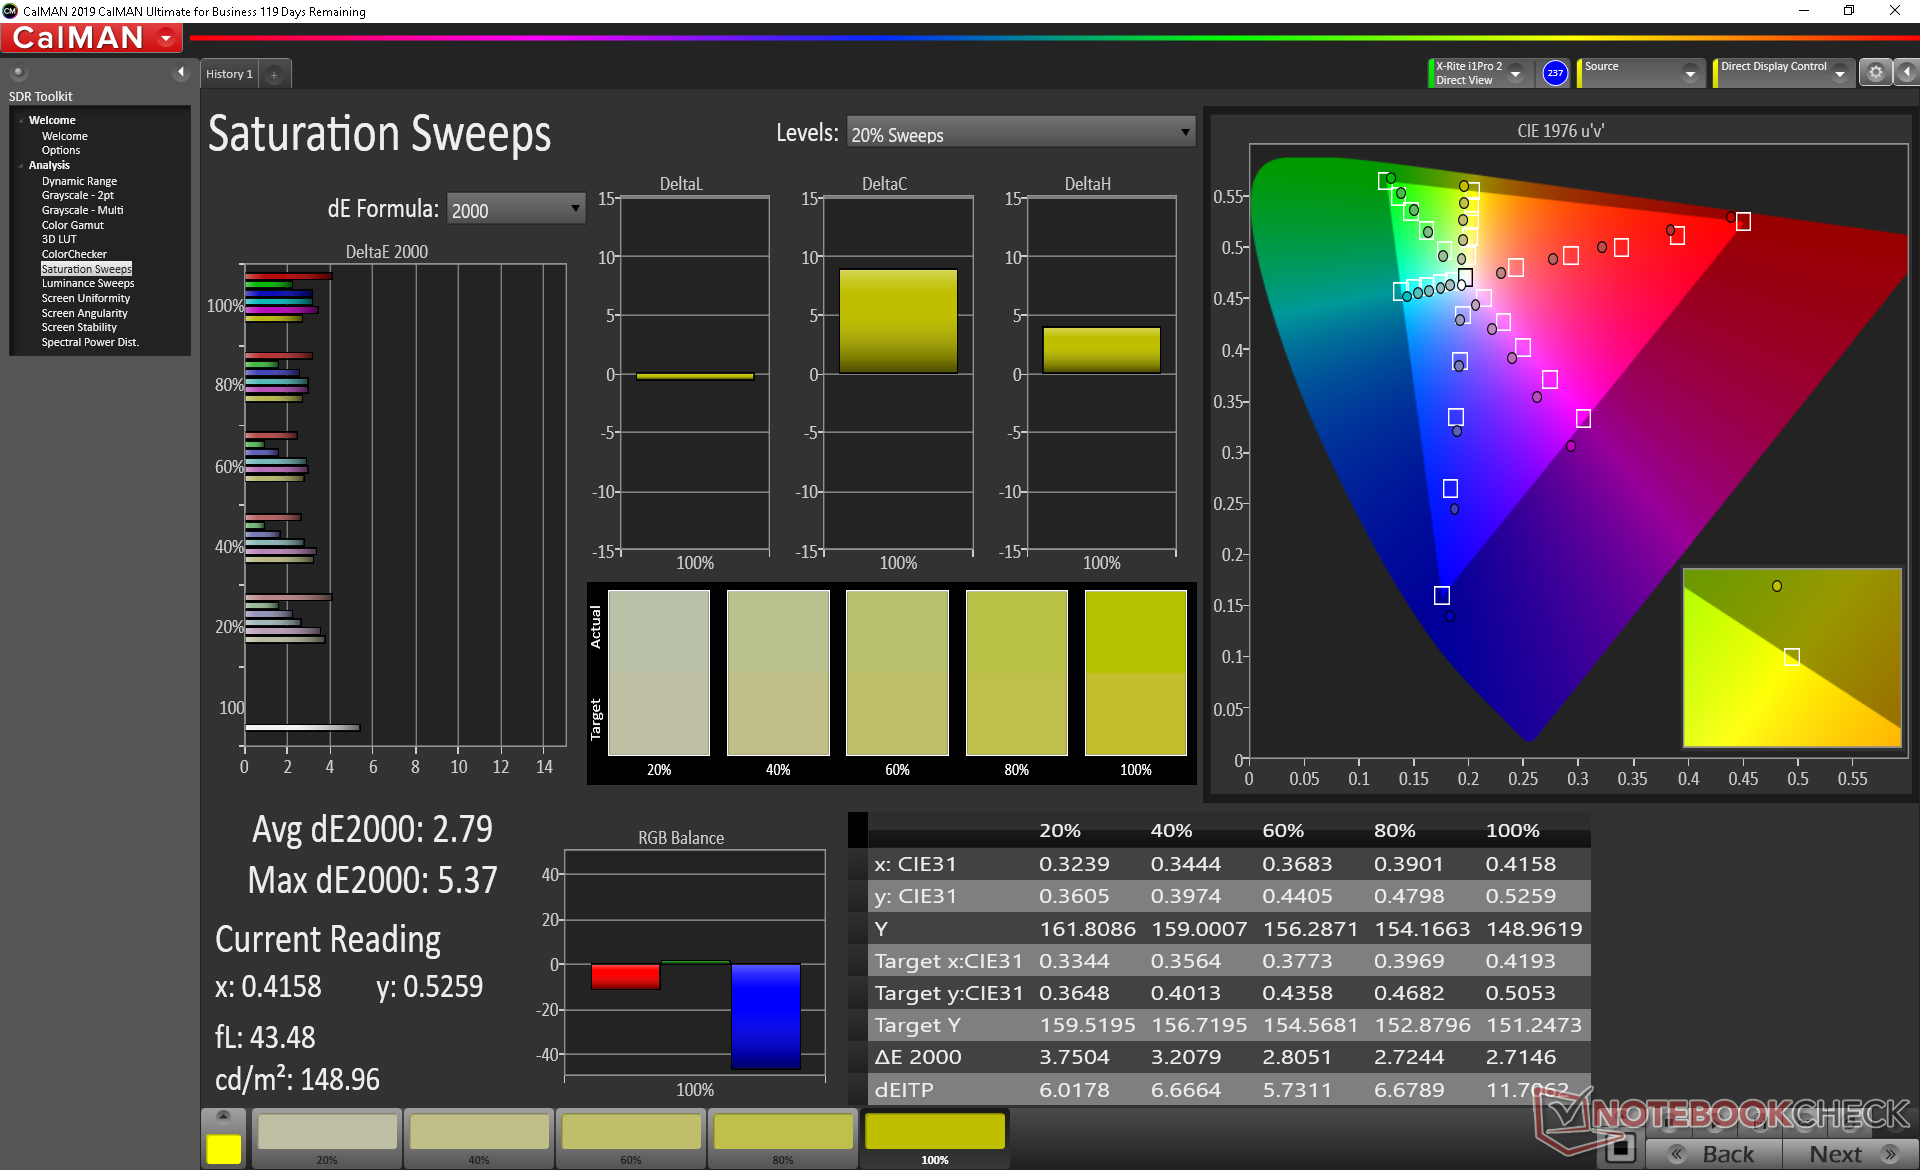
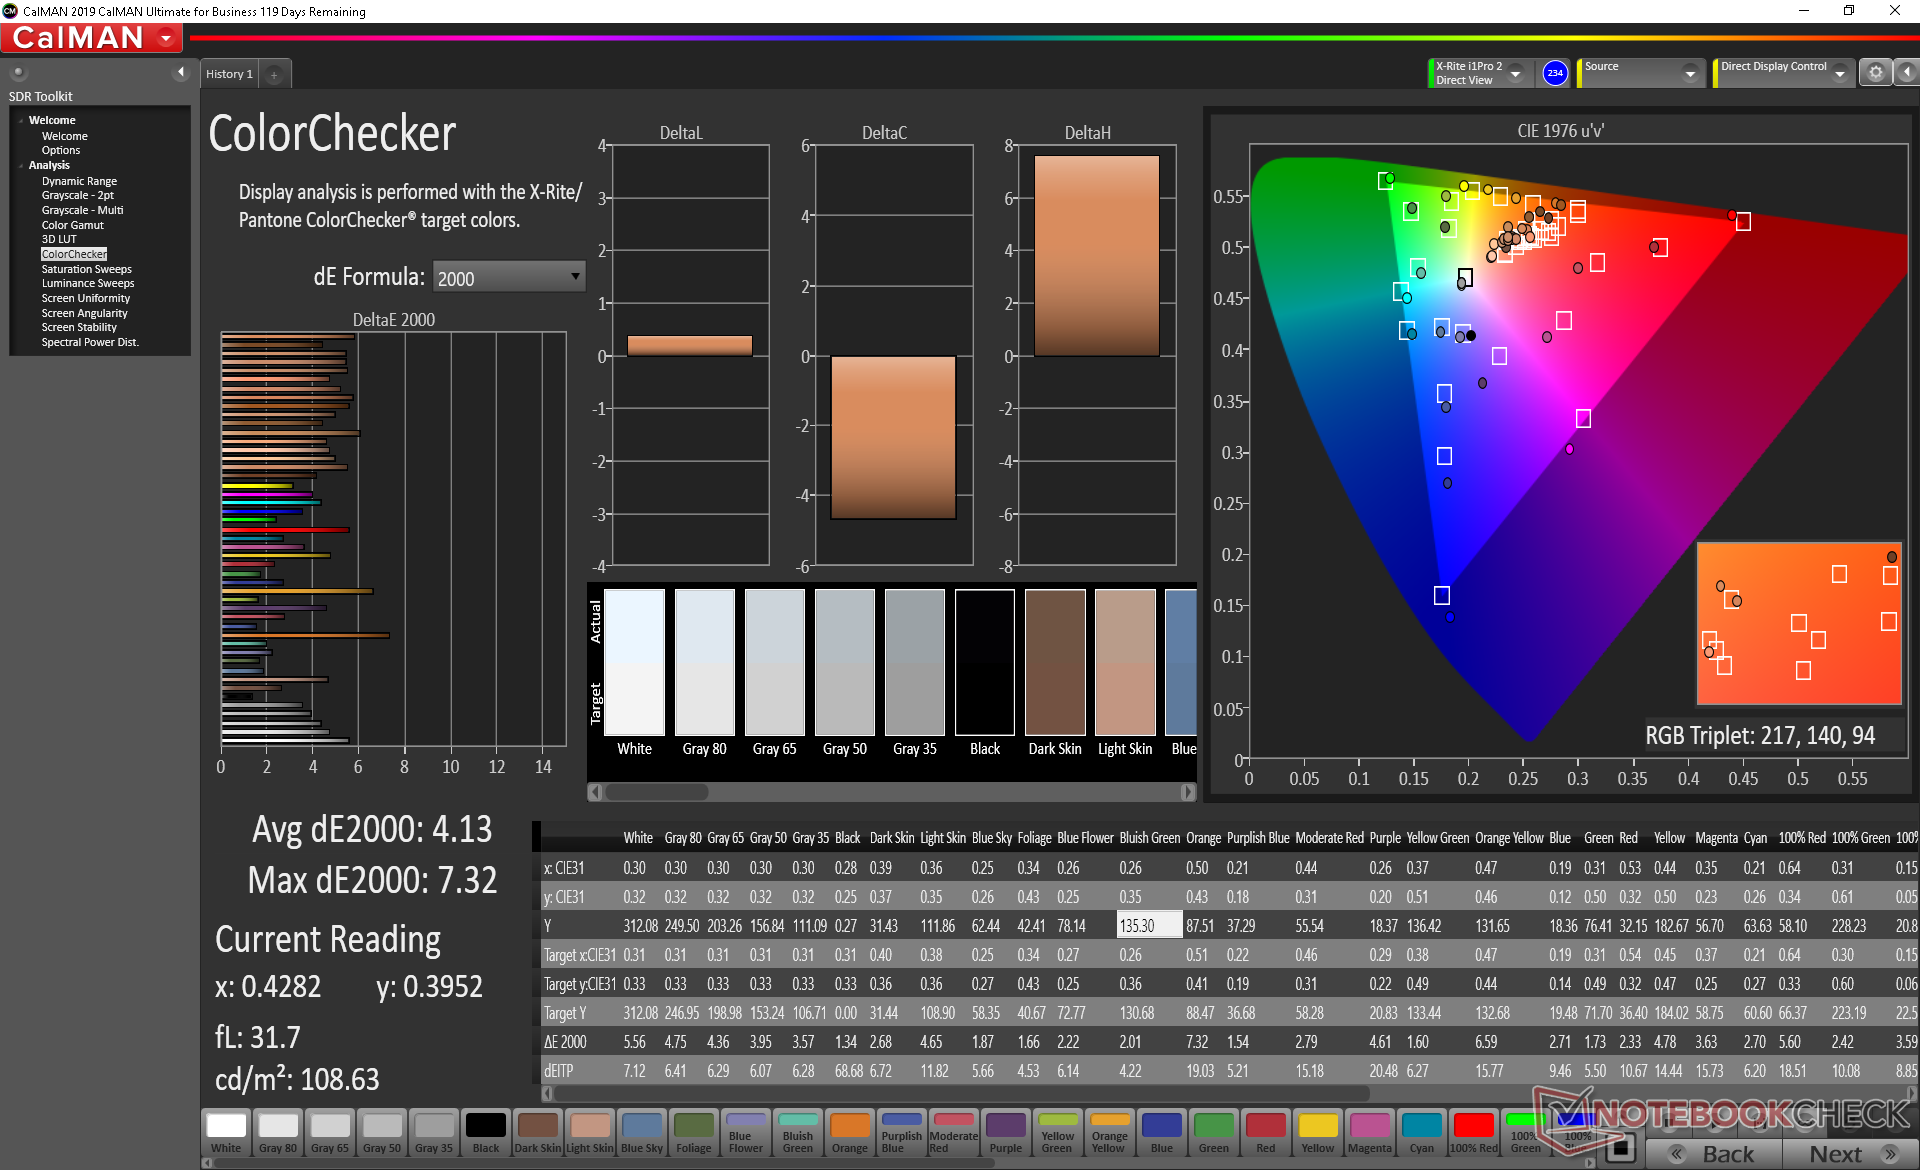
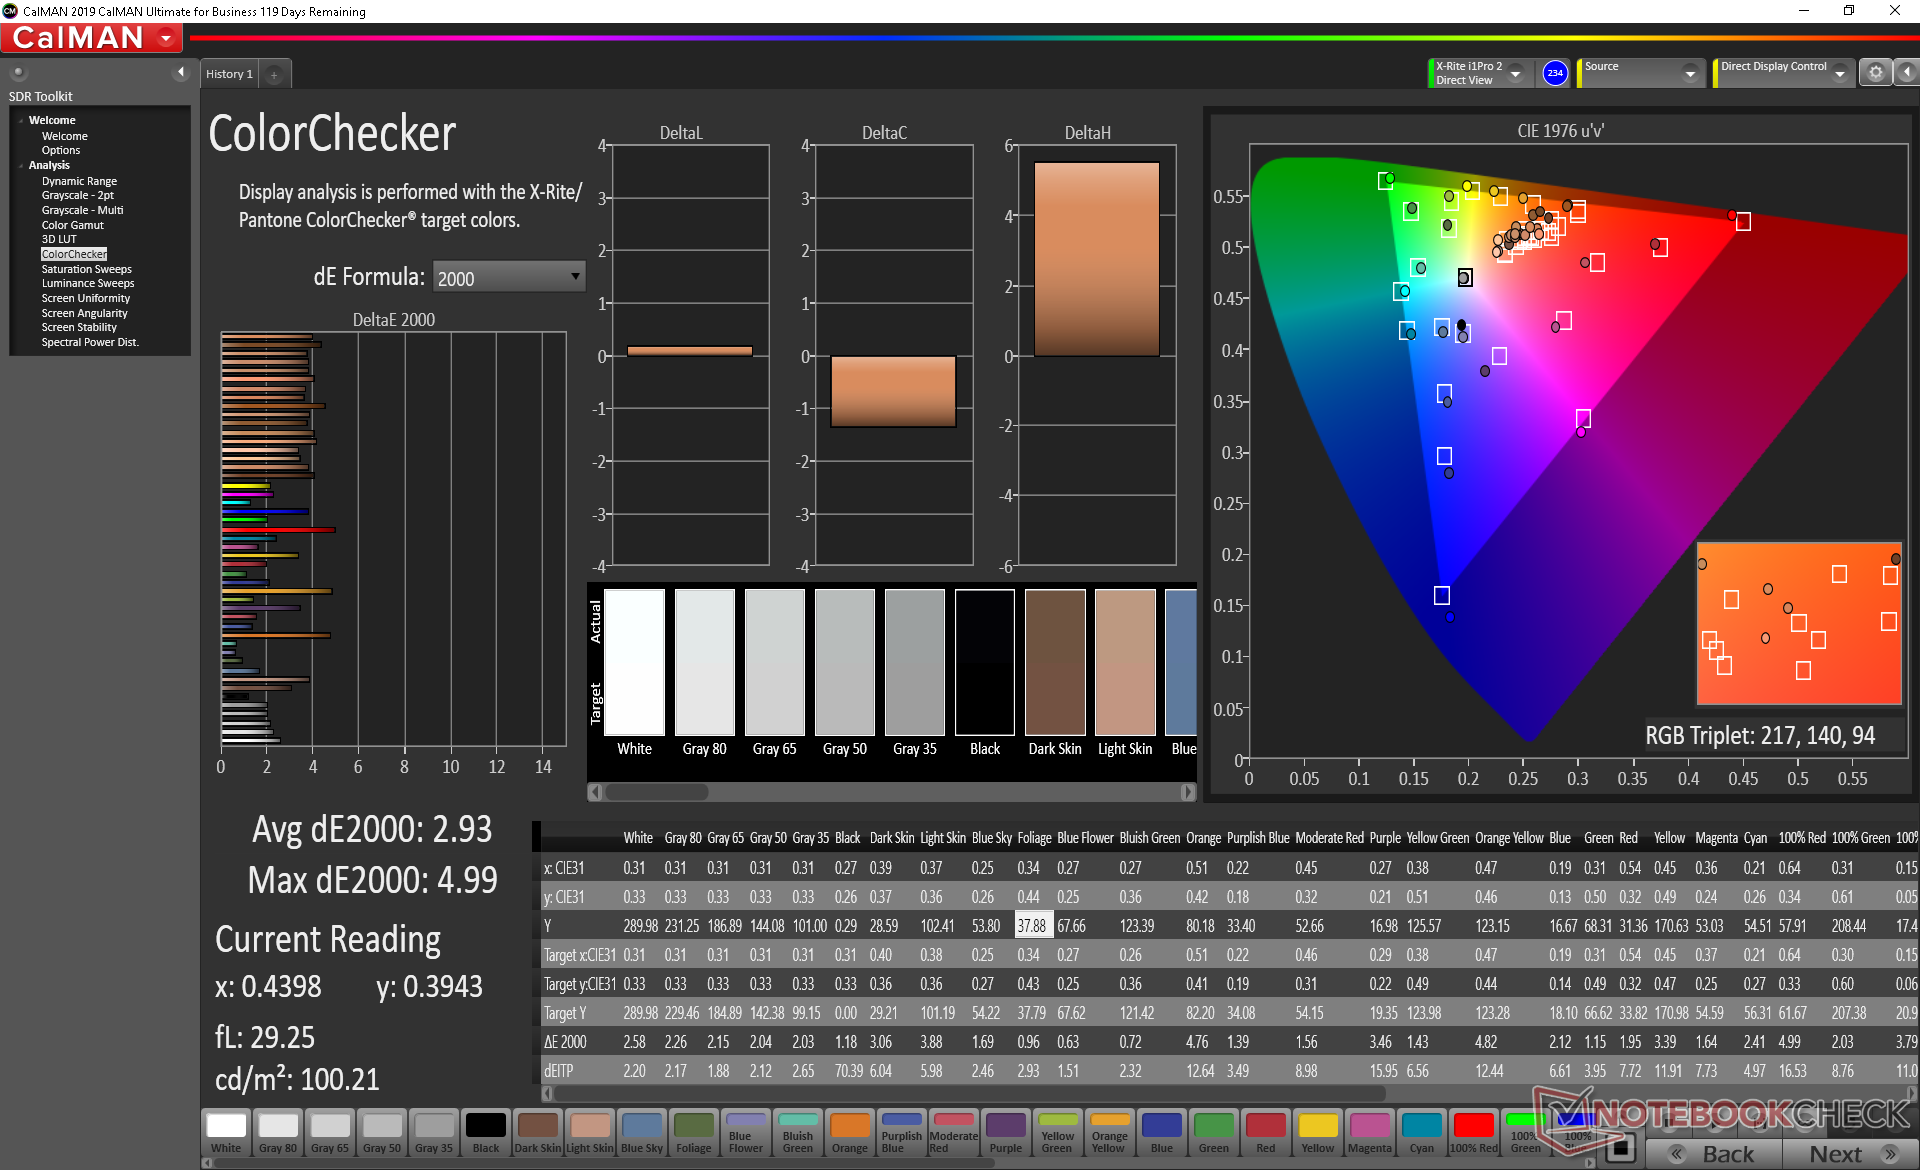
ΔE ColorChecker Calman: 4.13 | ∀{0.5-29.43 Ø4.72}
calibrated: 2.93
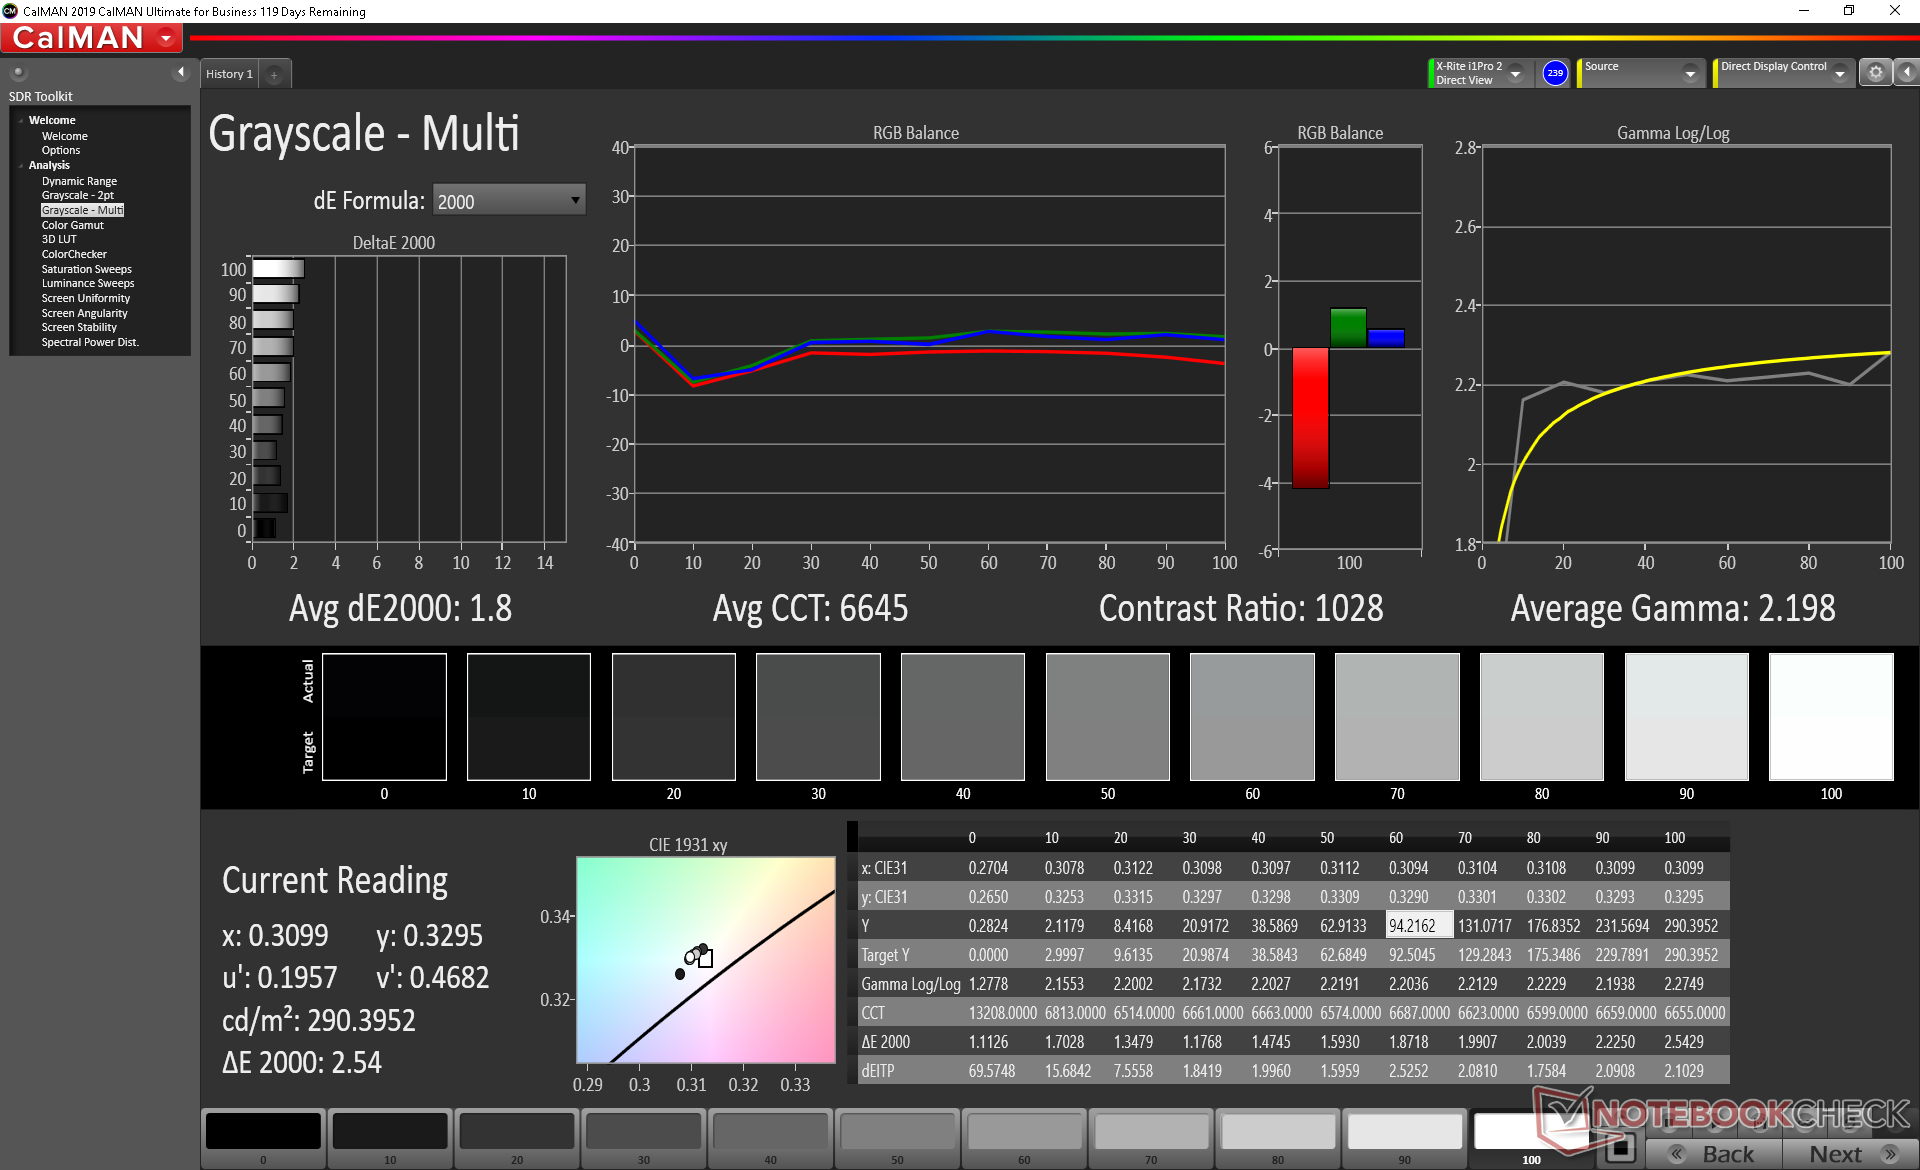
ΔE Greyscale Calman: 3.3 | ∀{0.09-98 Ø4.97}
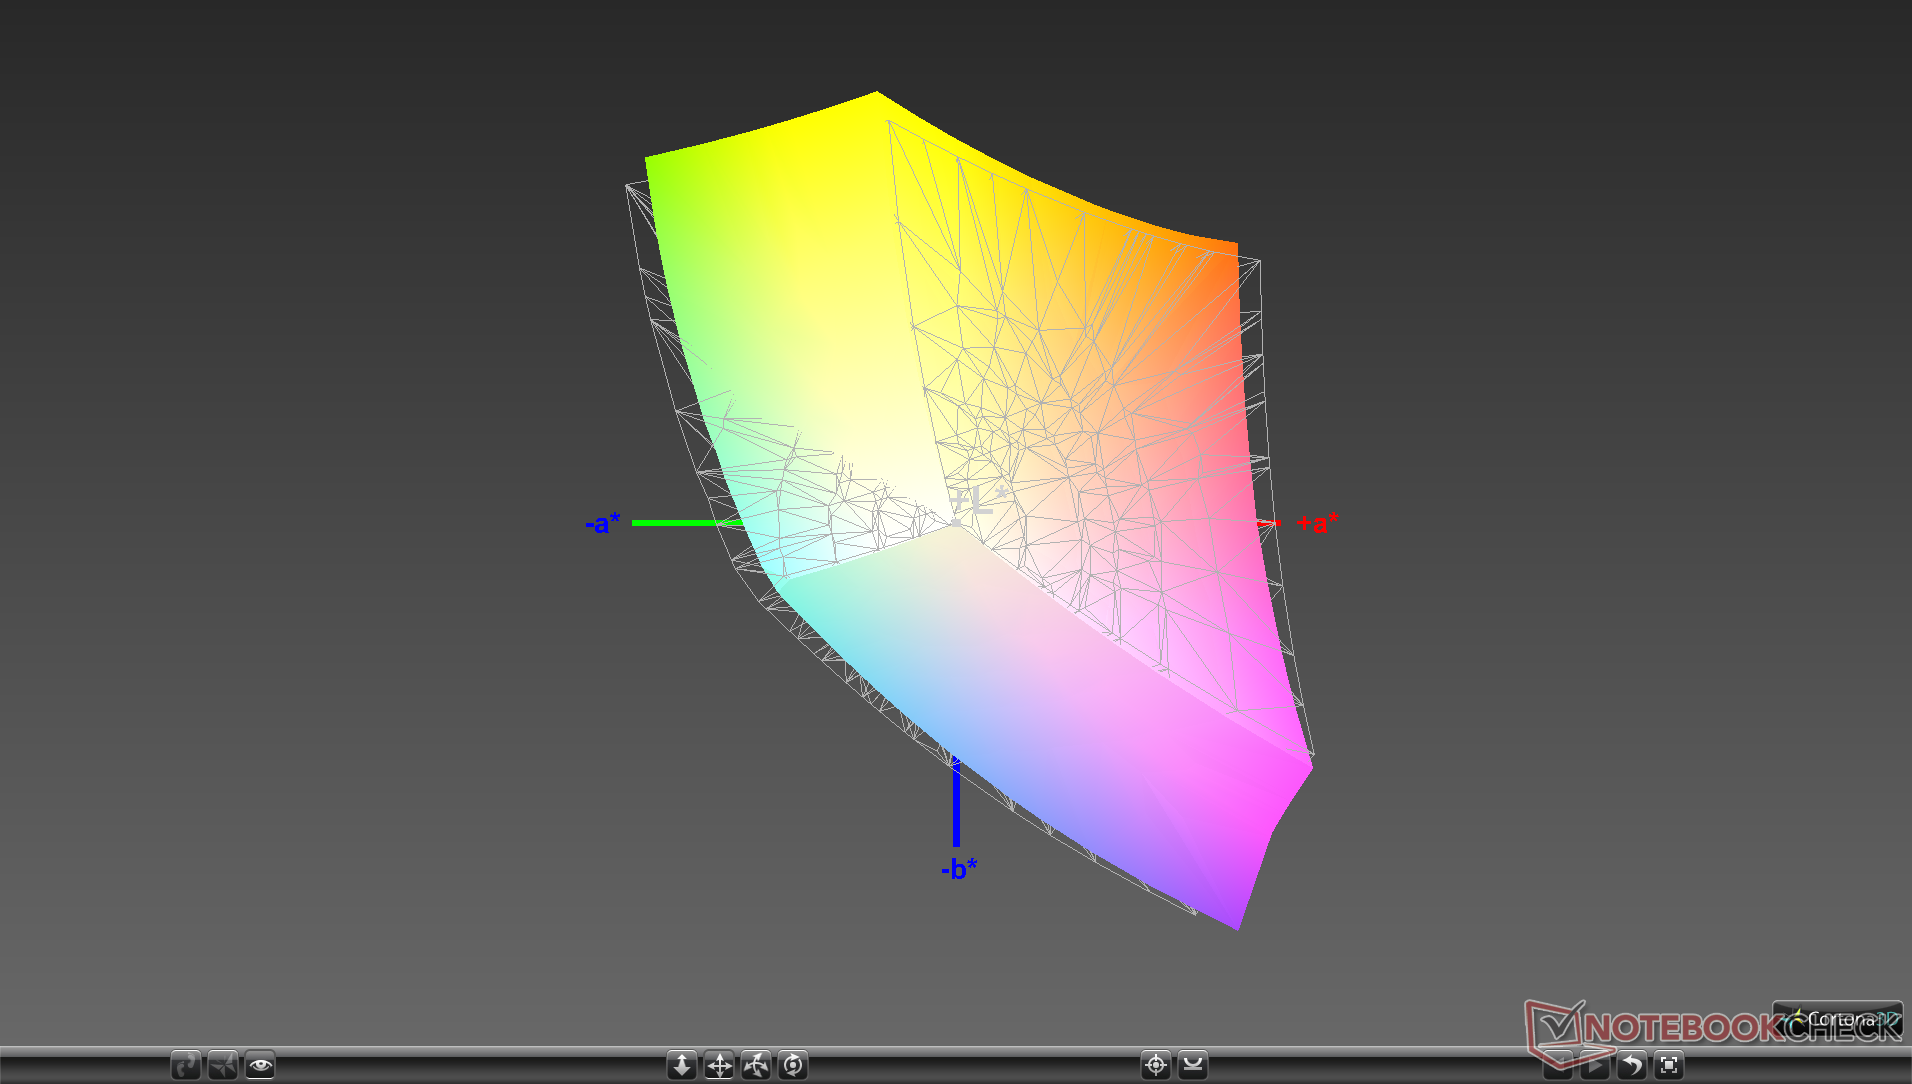
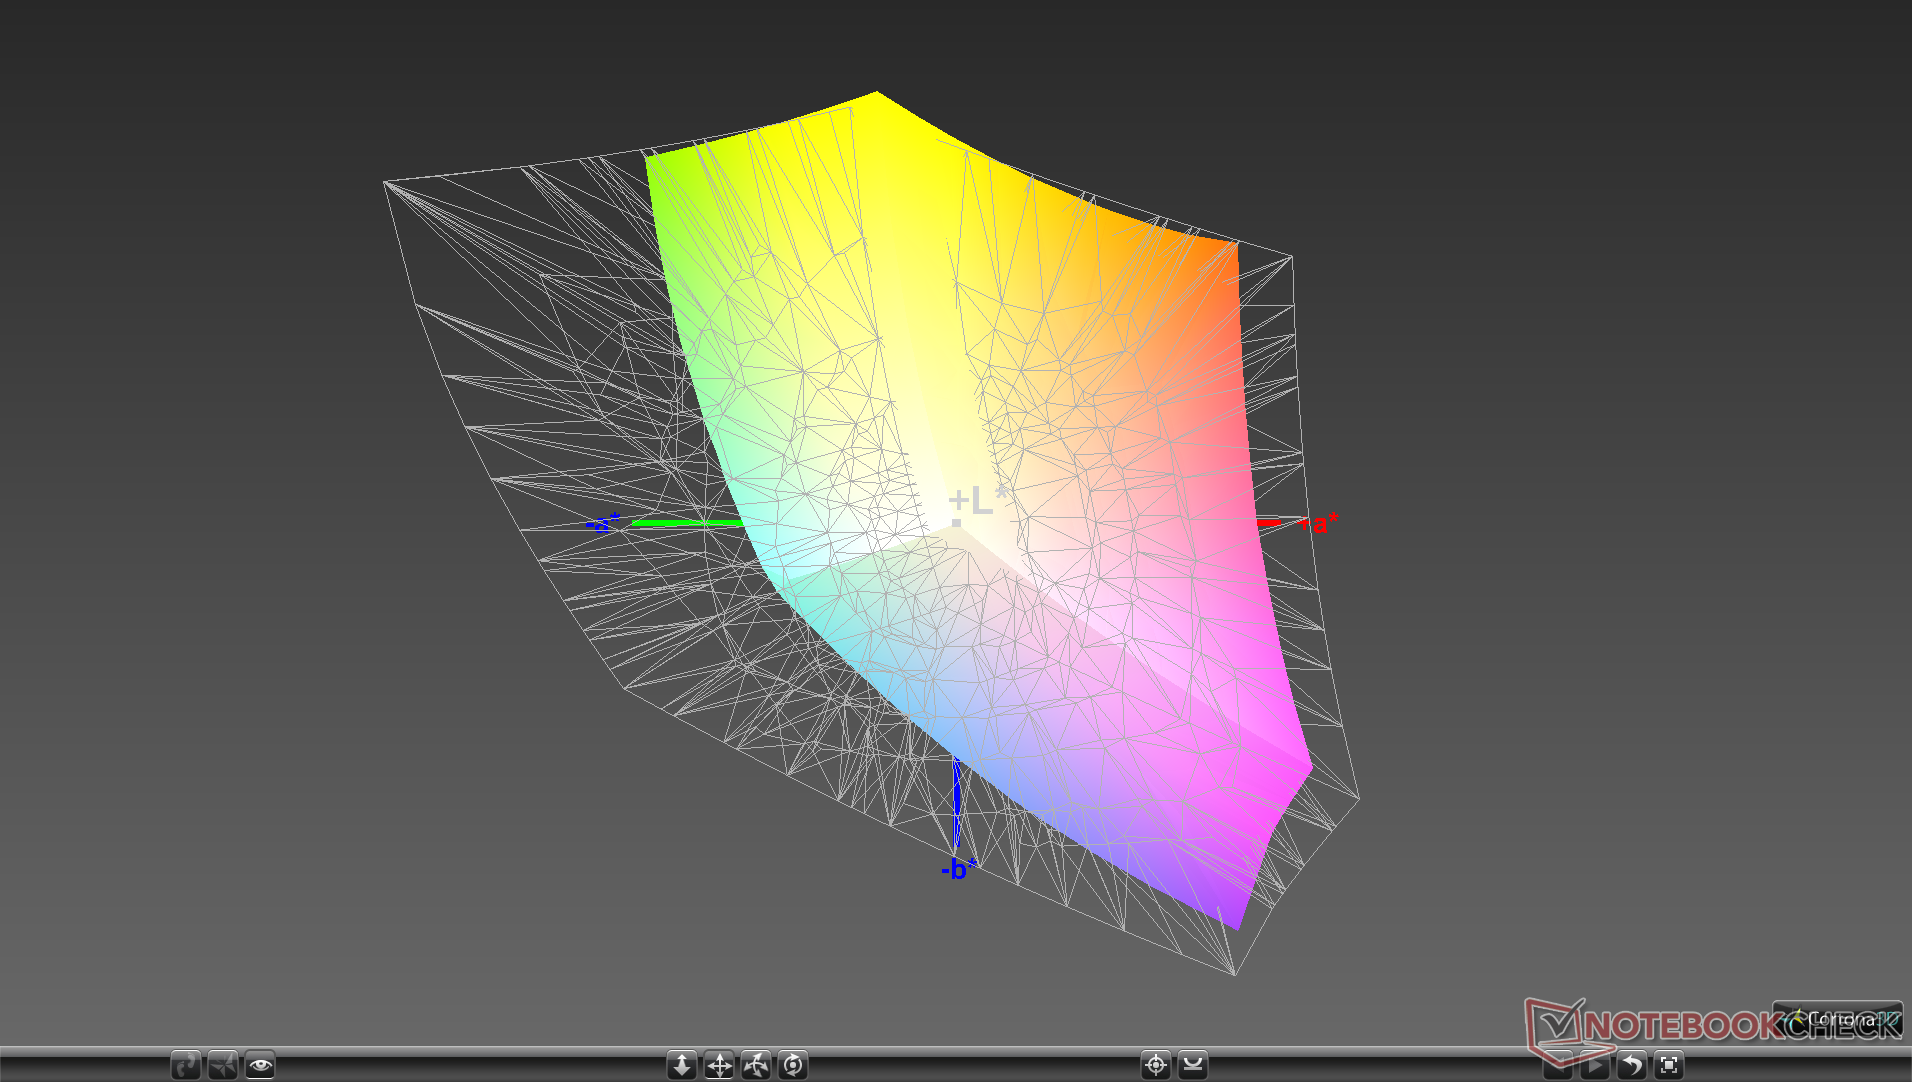
91.6% sRGB (Argyll 1.6.3 3D)
59.5% AdobeRGB 1998 (Argyll 1.6.3 3D)
65.8% AdobeRGB 1998 (Argyll 3D)
92% sRGB (Argyll 3D)
64.7% Display P3 (Argyll 3D)
Gamma: 2.17
CCT: 7157 K
| Eluktronics RP-17 BOE NV173FHM-N44, IPS, 17.3", 1920x1080 | MSI GE75 Raider 10SE-008US Chi Mei N173HCE-G33, IPS, 17.3", 1920x1080 | Razer Blade Pro 17 RTX 2070 Max-Q 300 Hz Sharp LQ173M1JW02, IPS, 17.3", 1920x1080 | Asus TUF A17 FA706IU-AS76 BOE NV173FHM-NX1, IPS, 17.3", 1920x1080 | Walmart EVOO Gaming 17 BOE HF N173FHM-N44, IPS, 17.3", 1920x1080 | Aorus 17 YA AU Optronics B173HAN05.0 (AUO509D), IPS, 17.3", 1920x1080 | |
|---|---|---|---|---|---|---|
| Display | 4% | 10% | -36% | 1% | 8% | |
| Display P3 Coverage (%) | 64.7 | 65.6 1% | 72.2 12% | 40.55 -37% | 65.5 1% | 70.1 8% |
| sRGB Coverage (%) | 92 | 98.1 7% | 98.5 7% | 59.7 -35% | 92.2 0% | 98 7% |
| AdobeRGB 1998 Coverage (%) | 65.8 | 67.8 3% | 73 11% | 41.89 -36% | 66.7 1% | 72.4 10% |
| Response Times | 49% | 48% | -30% | 7% | 18% | |
| Response Time Grey 50% / Grey 80% * (ms) | 22.4 ? | 6.8 ? 70% | 5.6 ? 75% | 22.4 ? -0% | 17.6 ? 21% | 16 ? 29% |
| Response Time Black / White * (ms) | 12 ? | 8.8 ? 27% | 9.6 ? 20% | 19.2 ? -60% | 12.8 ? -7% | 11.2 ? 7% |
| PWM Frequency (Hz) | 943 | 25000 ? | 980 ? | |||
| Screen | 19% | -11% | -26% | 11% | 29% | |
| Brightness middle (cd/m²) | 311.5 | 337.9 8% | 328 5% | 264.8 -15% | 314.2 1% | 253 -19% |
| Brightness (cd/m²) | 301 | 305 1% | 329 9% | 253 -16% | 307 2% | 252 -16% |
| Brightness Distribution (%) | 91 | 81 -11% | 78 -14% | 90 -1% | 92 1% | 93 2% |
| Black Level * (cd/m²) | 0.31 | 0.29 6% | 0.35 -13% | 0.31 -0% | 0.26 16% | 0.2 35% |
| Contrast (:1) | 1005 | 1165 16% | 937 -7% | 854 -15% | 1208 20% | 1265 26% |
| Colorchecker dE 2000 * | 4.13 | 2.18 47% | 4.74 -15% | 4.73 -15% | 3.15 24% | 1.14 72% |
| Colorchecker dE 2000 max. * | 7.32 | 3.9 47% | 8.99 -23% | 18.89 -158% | 5.4 26% | 2.01 73% |
| Colorchecker dE 2000 calibrated * | 2.93 | 0.69 76% | 2.12 28% | 4.64 -58% | 2.74 6% | 1.01 66% |
| Greyscale dE 2000 * | 3.3 | 3.1 6% | 6.8 -106% | 1.4 58% | 2.6 21% | 1.12 66% |
| Gamma | 2.17 101% | 2.07 106% | 2.2 100% | 2.16 102% | 2.31 95% | 2.43 91% |
| CCT | 7157 91% | 6882 94% | 6446 101% | 6641 98% | 6928 94% | 6366 102% |
| Color Space (Percent of AdobeRGB 1998) (%) | 59.5 | 62 4% | 64.8 9% | 38.4 -35% | 59.6 0% | 66 11% |
| Color Space (Percent of sRGB) (%) | 91.6 | 98.2 7% | 98.6 8% | 59.3 -35% | 91.8 0% | 98 7% |
| Total Average (Program / Settings) | 24% /
20% | 16% /
0% | -31% /
-29% | 6% /
8% | 18% /
24% |
* ... smaller is better
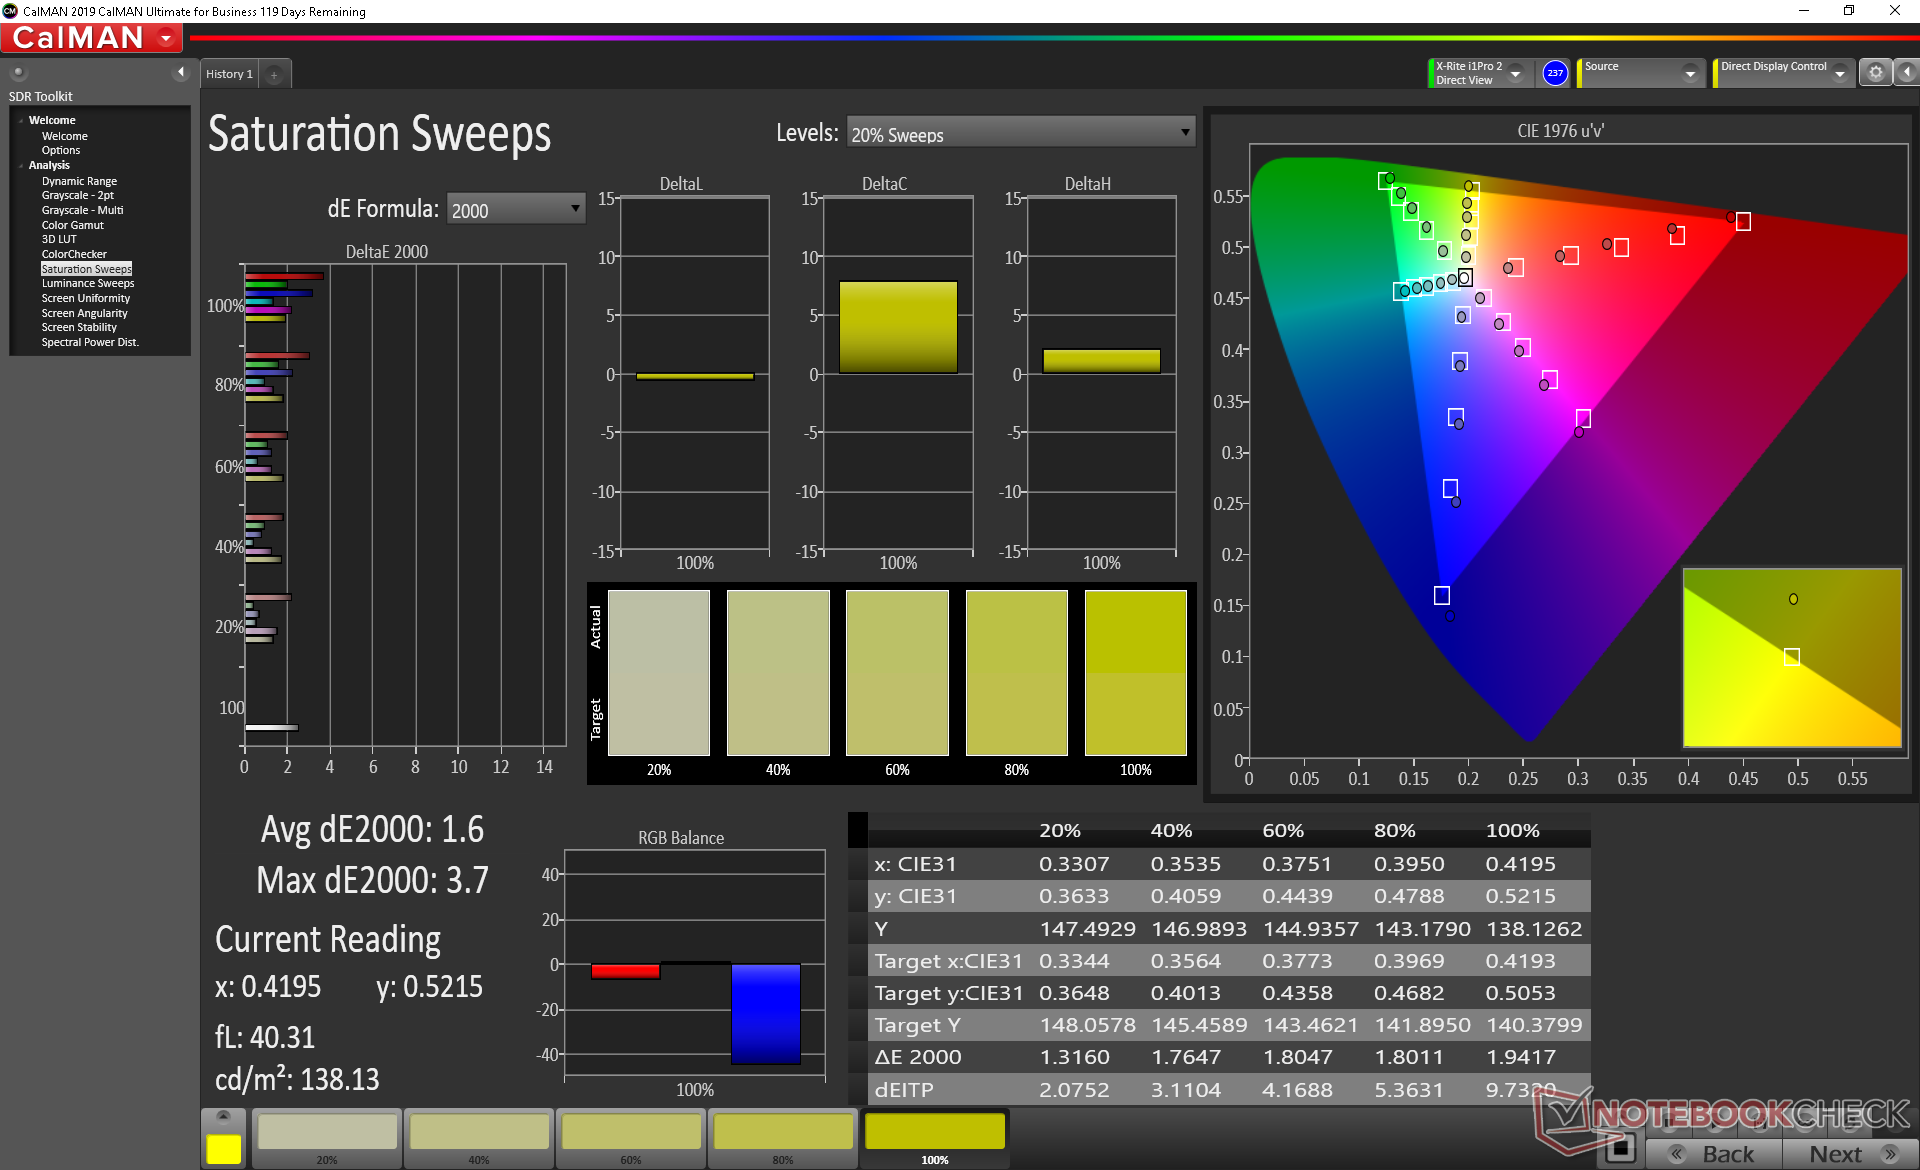
Color space covers over 90 percent of sRGB and approximately 60 percent of AdobeRGB to be similar to most other high refresh rate panels or Ultrabook laptops in the market. Laptops that cater more towards creators or content creators, like the Dell XPS, Razer Blade 15 Studio, or Asus ZenBook Pro may have OLED options that can offer even deeper and more accurate colors.
Colorimeter measurements show a decently calibrated display out of the box with grayscale and color DeltaE averages of 3.3 and 4.13, respectively. Color temperature is slightly too cool which an end-user calibration easily fixes. There are measurable improvements across the board after calibrating the display ourselves, but we wouldn't call it significant or vital for gaming.
Display Response Times
| ↔ Response Time Black to White | ||
|---|---|---|
| 12 ms ... rise ↗ and fall ↘ combined | ↗ 7.2 ms rise |  |
| ↘ 4.8 ms fall | ||
| The screen shows good response rates in our tests, but may be too slow for competitive gamers. In comparison, all tested devices range from 0.1 (minimum) to 240 (maximum) ms. » 32 % of all devices are better. This means that the measured response time is better than the average of all tested devices (19.8 ms). | ||
| ↔ Response Time 50% Grey to 80% Grey | ||
| 22.4 ms ... rise ↗ and fall ↘ combined | ↗ 10.8 ms rise | 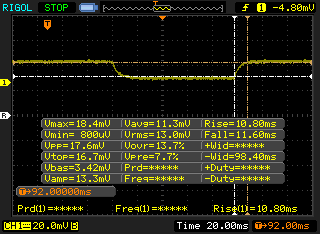 |
| ↘ 11.6 ms fall | ||
| The screen shows good response rates in our tests, but may be too slow for competitive gamers. In comparison, all tested devices range from 0.165 (minimum) to 636 (maximum) ms. » 34 % of all devices are better. This means that the measured response time is better than the average of all tested devices (31 ms). | ||
Screen Flickering / PWM (Pulse-Width Modulation)
| Screen flickering / PWM detected | 943 Hz | 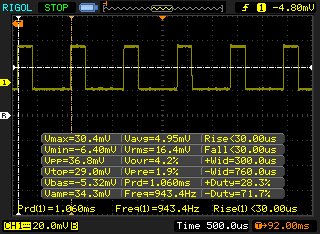 | |
The display backlight flickers at 943 Hz (worst case, e.g., utilizing PWM) . The frequency of 943 Hz is quite high, so most users sensitive to PWM should not notice any flickering. In comparison: 52 % of all tested devices do not use PWM to dim the display. If PWM was detected, an average of 7750 (minimum: 5 - maximum: 343500) Hz was measured. | |||

Performance
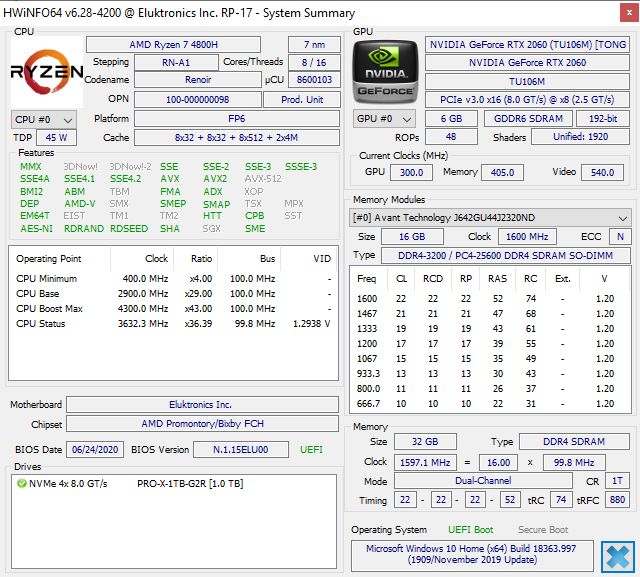
There are no other CPU, GPU, or display options available for the RP-17 at the moment outside of the configuration we have in review. Though this will probably upset users who wish to configure different processors, the move will likely save on costs.
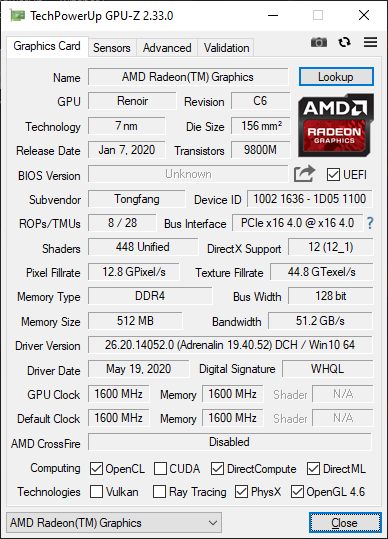
Graphics switching to the integrated Radeon GPU is available. We recommend installing AMD's Radeon software for additional graphics and display settings not found on the pre-installed Eluktronics Control Center including AMD Vari-Bright to increase brightness when on battery power.
Unless otherwise stated, all benchmarks below were performed on Turbo fan mode to get the best possible scores out of the laptop.
Processor
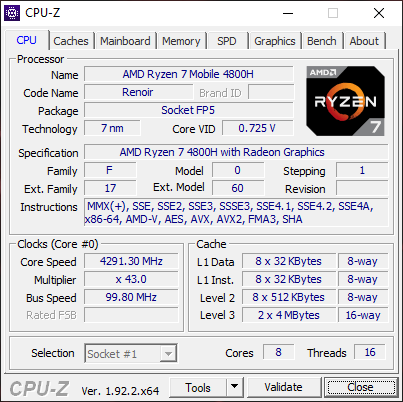
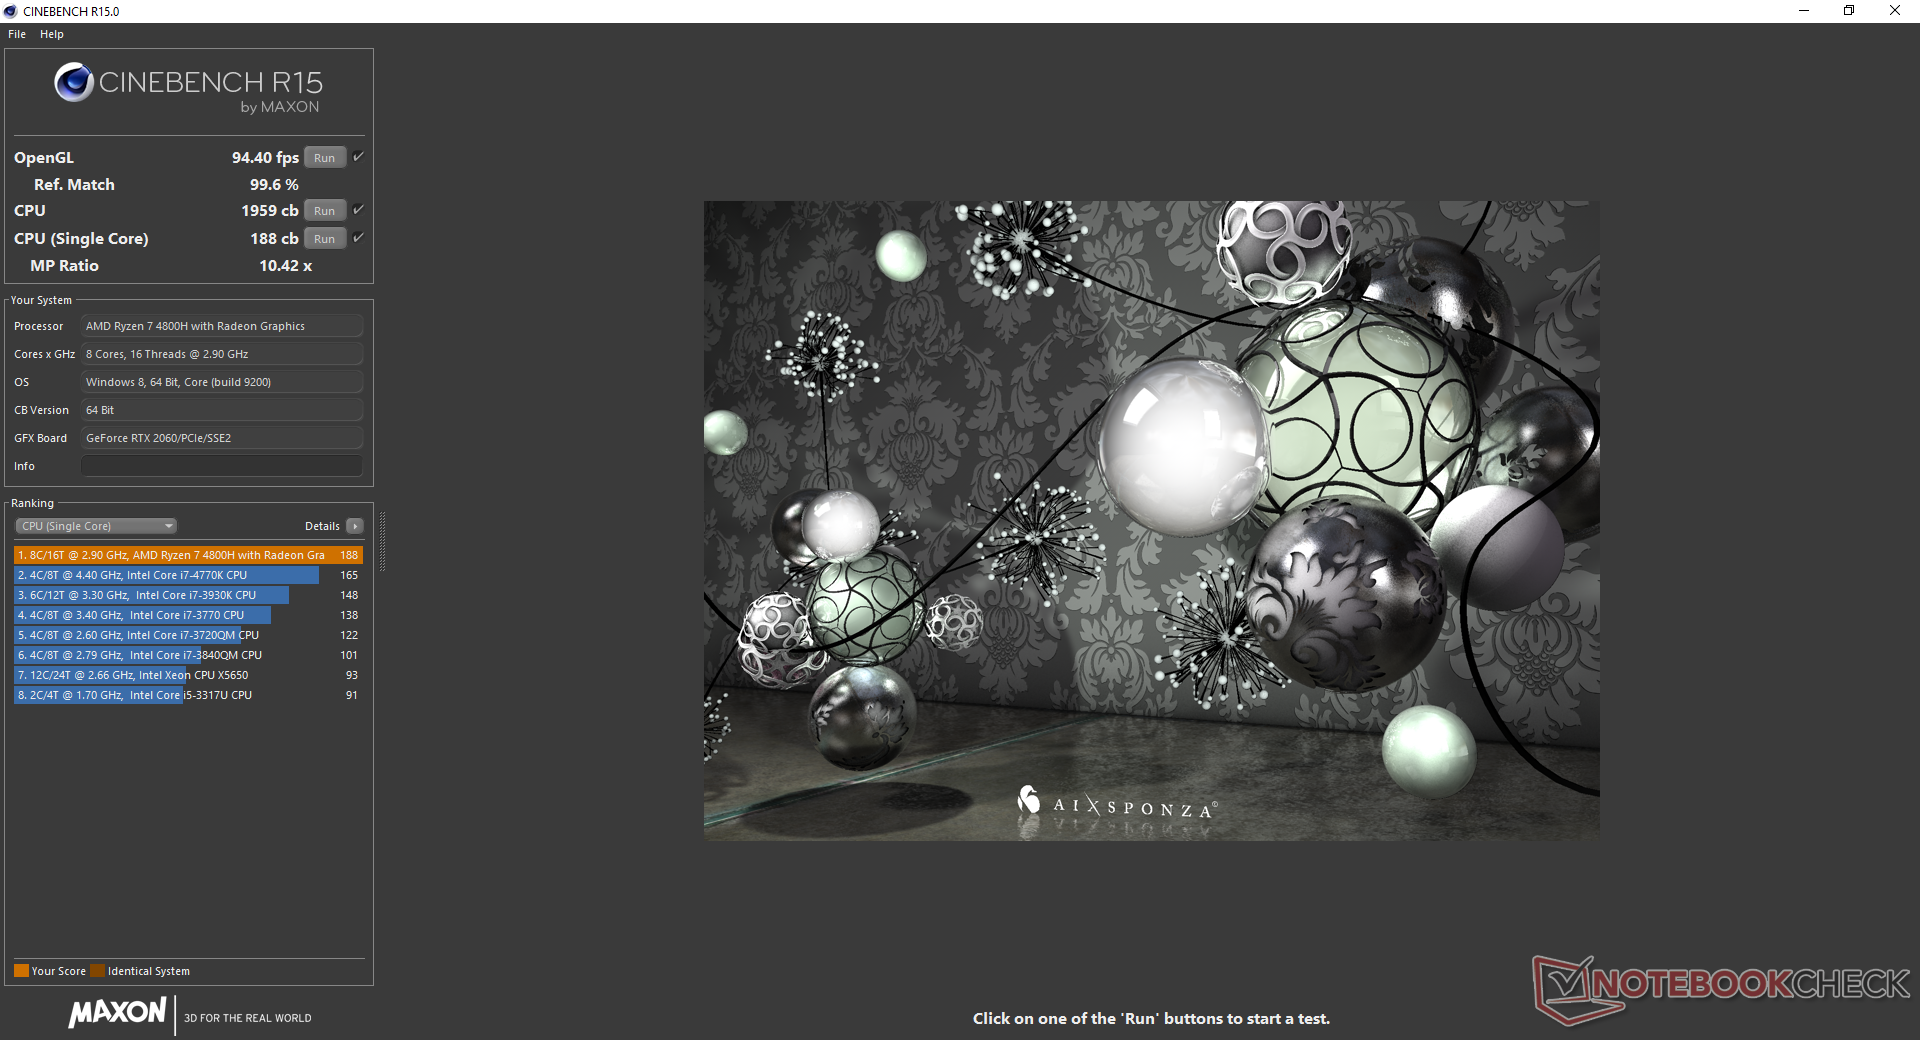
Raw multi-thread performance is about 15 to 20 percent faster than the competing Core i7-10875H to be even faster than some pricier Core i9 laptops like the Asus Strix Scar 17 G732LXS. Performance sustainability is especially excellent with no major dips over time even when subjected to extreme processing loads as shown by our CineBench R15 xT loop test results below. Most Core i7 or Core i9 laptops would experience noticeable drops in performance over time in comparison.
See our dedicated page on the Ryzen 7 4800H for more technical information and benchmark comparisons.
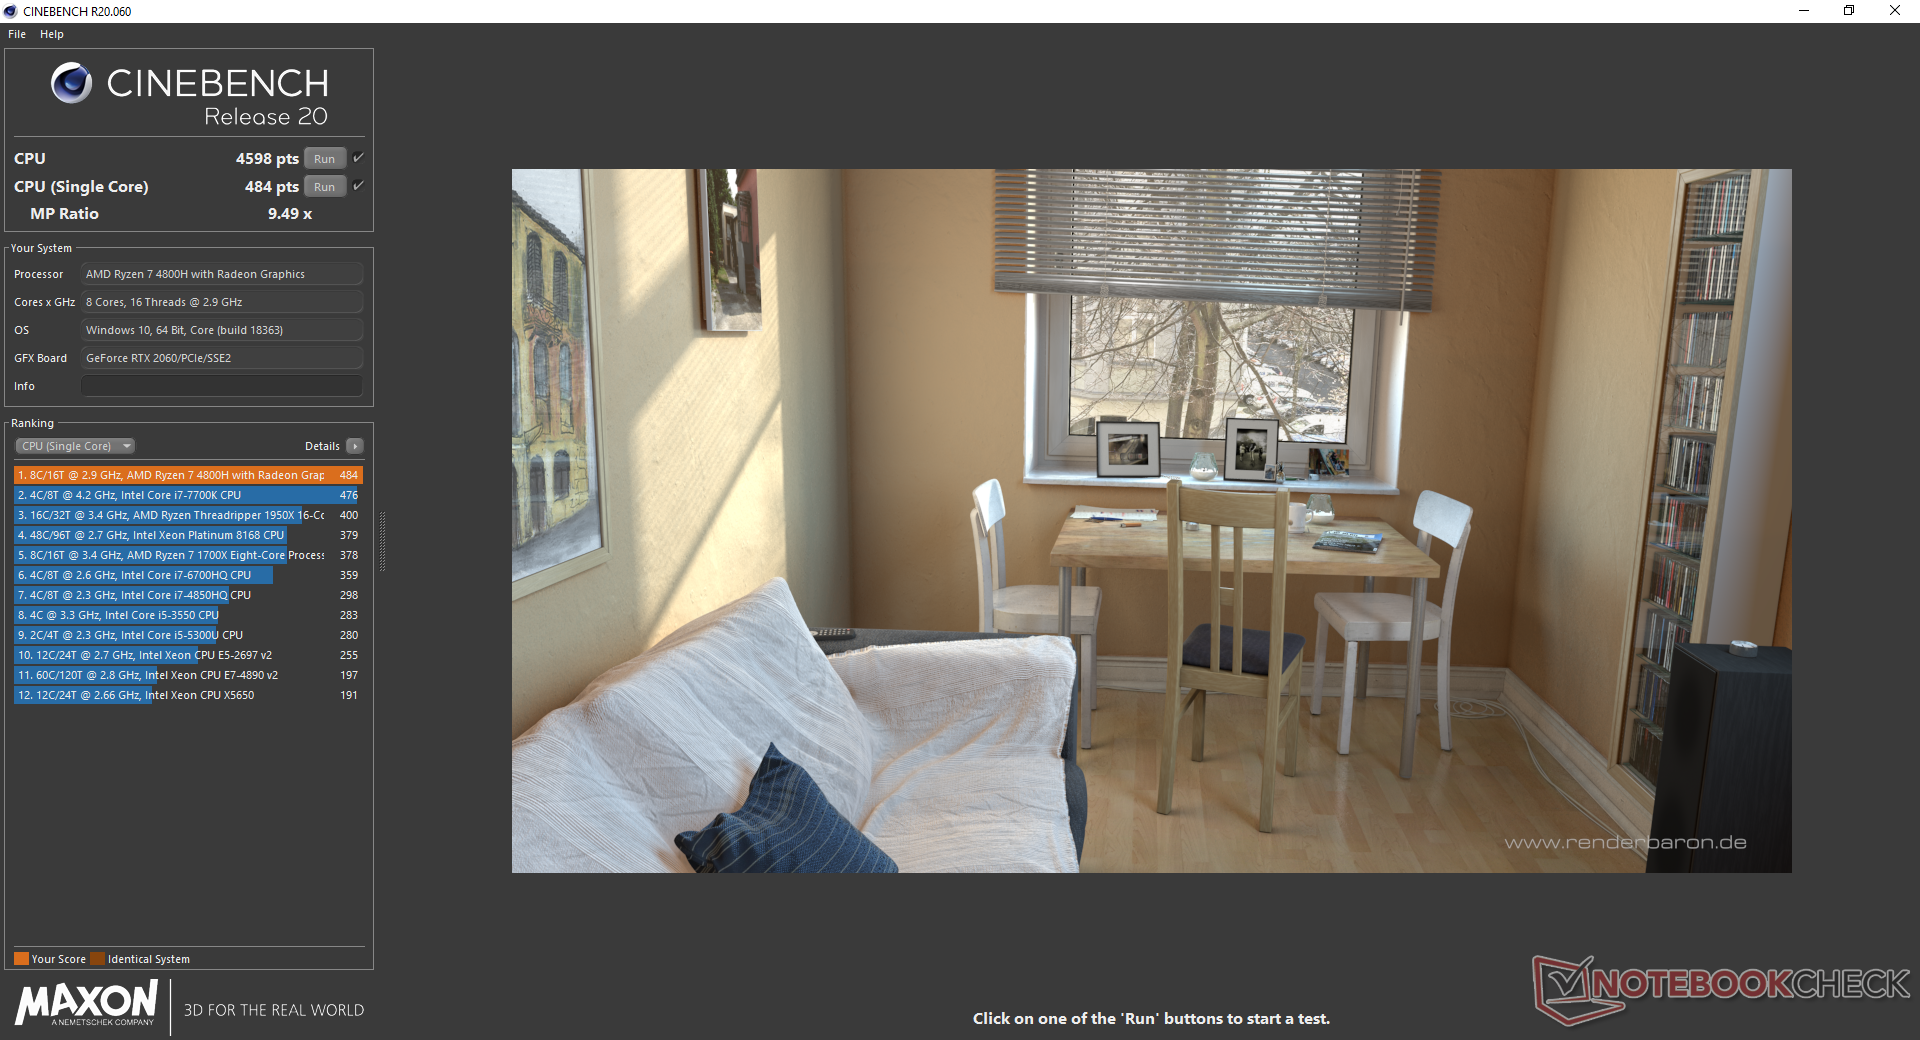
Cinebench R15: CPU Multi 64Bit | CPU Single 64Bit
Blender: v2.79 BMW27 CPU
7-Zip 18.03: 7z b 4 -mmt1 | 7z b 4
Geekbench 5.5: Single-Core | Multi-Core
HWBOT x265 Benchmark v2.2: 4k Preset
LibreOffice : 20 Documents To PDF
R Benchmark 2.5: Overall mean
| Cinebench R20 / CPU (Multi Core) | |
| Intel Core i9-10900K | |
| MSI GT76 Titan DT 9SG | |
| Eluktronics RP-17 | |
| Asus Zephyrus G14 GA401IV | |
| Average AMD Ryzen 7 4800H (3692 - 4663, n=18) | |
| MSI GS75 10SF-609US | |
| Asus Strix Scar 17 G732LXS | |
| MSI GE75 9SG | |
| Acer Nitro 5 AN515-44-R5FT | |
| MSI GE75 Raider 10SE-008US | |
| Schenker XMG Pro 17 PB71RD-G | |
| Cinebench R20 / CPU (Single Core) | |
| Intel Core i9-10900K | |
| MSI GT76 Titan DT 9SG | |
| Asus Zephyrus G14 GA401IV | |
| Asus Strix Scar 17 G732LXS | |
| Eluktronics RP-17 | |
| Average AMD Ryzen 7 4800H (462 - 491, n=17) | |
| MSI GS75 10SF-609US | |
| MSI GE75 Raider 10SE-008US | |
| MSI GE75 9SG | |
| Acer Nitro 5 AN515-44-R5FT | |
| Schenker XMG Pro 17 PB71RD-G | |
| Cinebench R15 / CPU Multi 64Bit | |
| Intel Core i9-10900K | |
| MSI GT76 Titan DT 9SG | |
| Eluktronics RP-17 | |
| Asus Zephyrus G14 GA401IV | |
| Average AMD Ryzen 7 4800H (1652 - 1995, n=21) | |
| Asus Strix Scar 17 G732LXS | |
| MSI GE75 9SG | |
| MSI GS75 10SF-609US | |
| Acer Nitro 5 AN515-44-R5FT | |
| MSI GE75 Raider 10SE-008US | |
| Schenker XMG Pro 17 PB71RD-G | |
| Cinebench R15 / CPU Single 64Bit | |
| Intel Core i9-10900K | |
| MSI GT76 Titan DT 9SG | |
| Asus Strix Scar 17 G732LXS | |
| MSI GS75 10SF-609US | |
| Asus Zephyrus G14 GA401IV | |
| MSI GE75 9SG | |
| MSI GE75 Raider 10SE-008US | |
| Average AMD Ryzen 7 4800H (186 - 191, n=15) | |
| Eluktronics RP-17 | |
| Acer Nitro 5 AN515-44-R5FT | |
| Schenker XMG Pro 17 PB71RD-G | |
| Blender / v2.79 BMW27 CPU | |
| Schenker XMG Pro 17 PB71RD-G | |
| MSI GE75 Raider 10SE-008US | |
| Acer Nitro 5 AN515-44-R5FT | |
| Asus Zephyrus G14 GA401IV | |
| MSI GE75 9SG | |
| Asus Strix Scar 17 G732LXS | |
| MSI GS75 10SF-609US | |
| Average AMD Ryzen 7 4800H (248 - 299, n=15) | |
| Eluktronics RP-17 | |
| Intel Core i9-10900K | |
| 7-Zip 18.03 / 7z b 4 -mmt1 | |
| Intel Core i9-10900K | |
| Asus Strix Scar 17 G732LXS | |
| MSI GS75 10SF-609US | |
| MSI GE75 Raider 10SE-008US | |
| MSI GE75 9SG | |
| Average AMD Ryzen 7 4800H (4575 - 4743, n=15) | |
| Asus Zephyrus G14 GA401IV | |
| Eluktronics RP-17 | |
| Schenker XMG Pro 17 PB71RD-G | |
| Acer Nitro 5 AN515-44-R5FT | |
| HWBOT x265 Benchmark v2.2 / 4k Preset | |
| Intel Core i9-10900K | |
| Eluktronics RP-17 | |
| MSI GS75 10SF-609US | |
| Average AMD Ryzen 7 4800H (10.8 - 14.1, n=16) | |
| Asus Strix Scar 17 G732LXS | |
| Asus Zephyrus G14 GA401IV | |
| MSI GE75 9SG | |
| MSI GE75 Raider 10SE-008US | |
| Acer Nitro 5 AN515-44-R5FT | |
| Schenker XMG Pro 17 PB71RD-G | |
| LibreOffice / 20 Documents To PDF | |
| Intel Core i9-10900K | |
| Acer Nitro 5 AN515-44-R5FT | |
| Average AMD Ryzen 7 4800H (28.6 - 95.8, n=14) | |
| Eluktronics RP-17 | |
| MSI GE75 Raider 10SE-008US | |
| Asus Strix Scar 17 G732LXS | |
| MSI GS75 10SF-609US | |
| R Benchmark 2.5 / Overall mean | |
| Schenker XMG Pro 17 PB71RD-G | |
| Acer Nitro 5 AN515-44-R5FT | |
| MSI GE75 Raider 10SE-008US | |
| MSI GS75 10SF-609US | |
| Eluktronics RP-17 | |
| Asus Strix Scar 17 G732LXS | |
| Average AMD Ryzen 7 4800H (0.562 - 0.603, n=15) | |
| Intel Core i9-10900K | |
* ... smaller is better
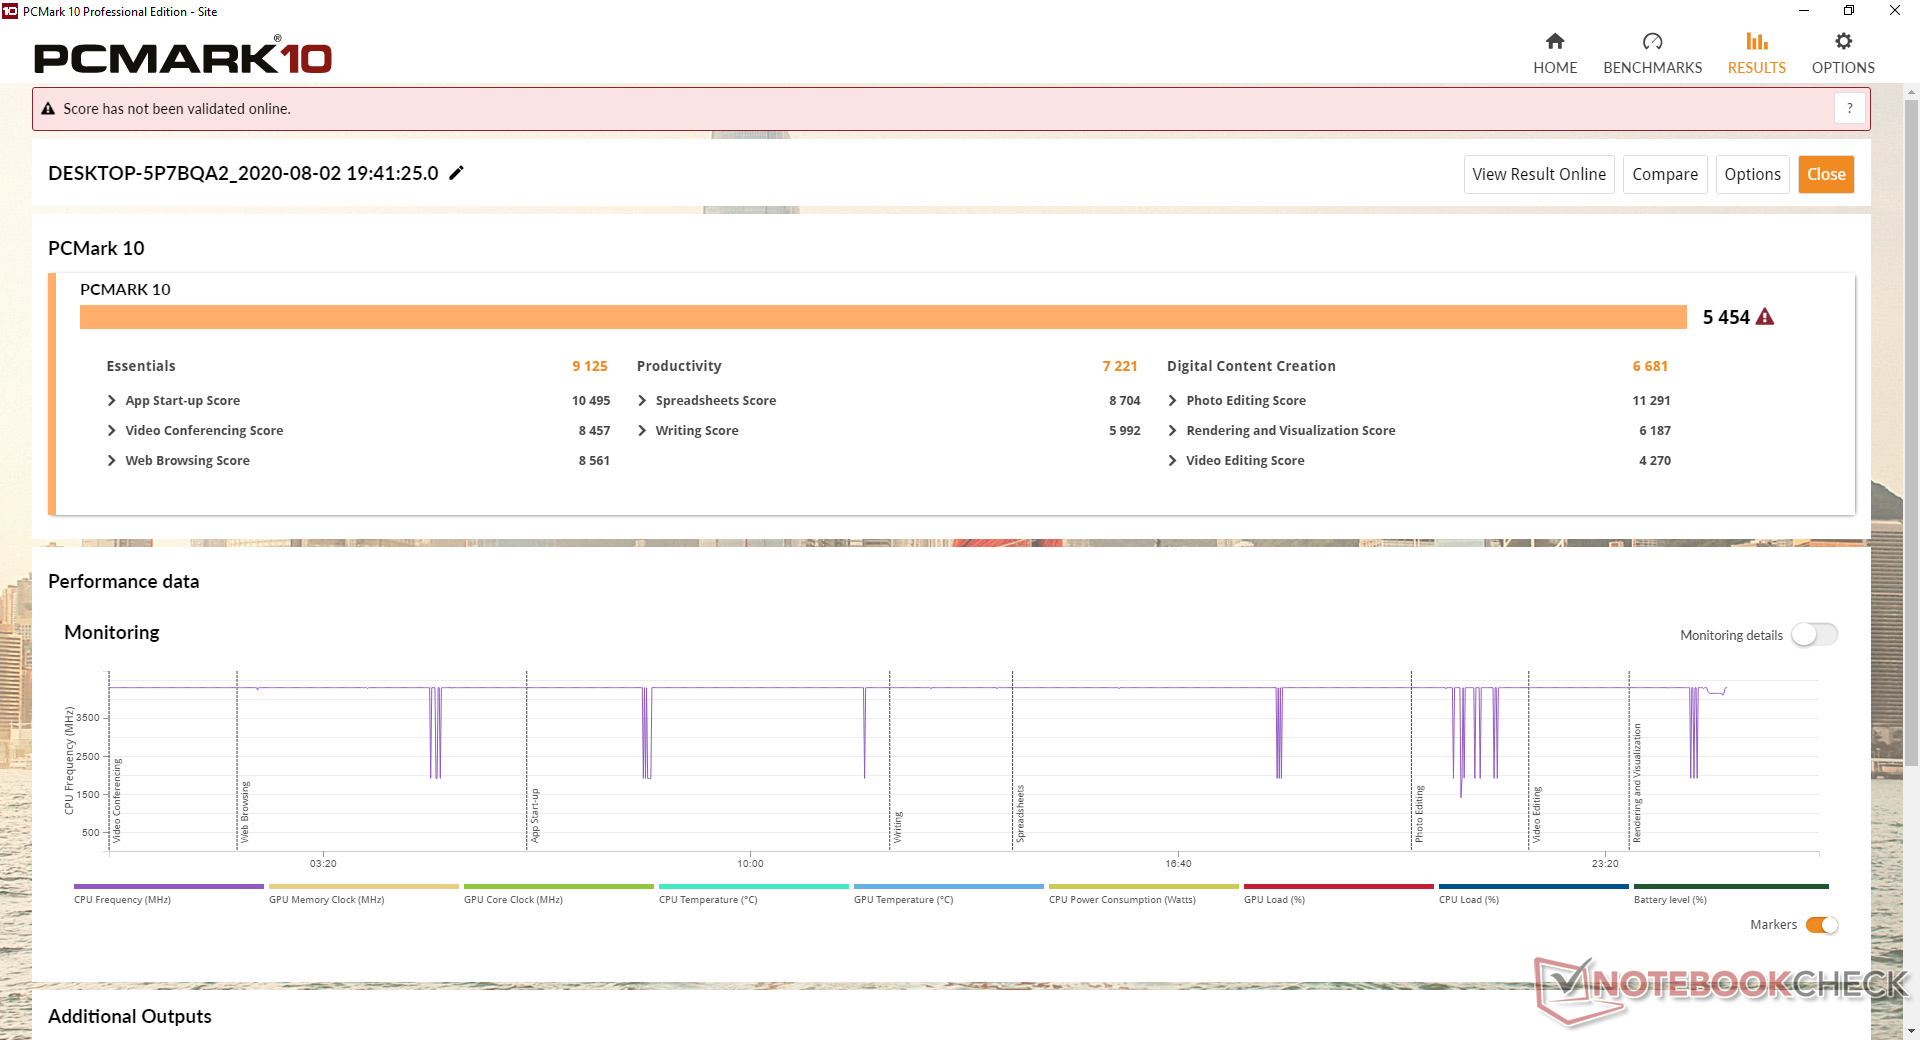
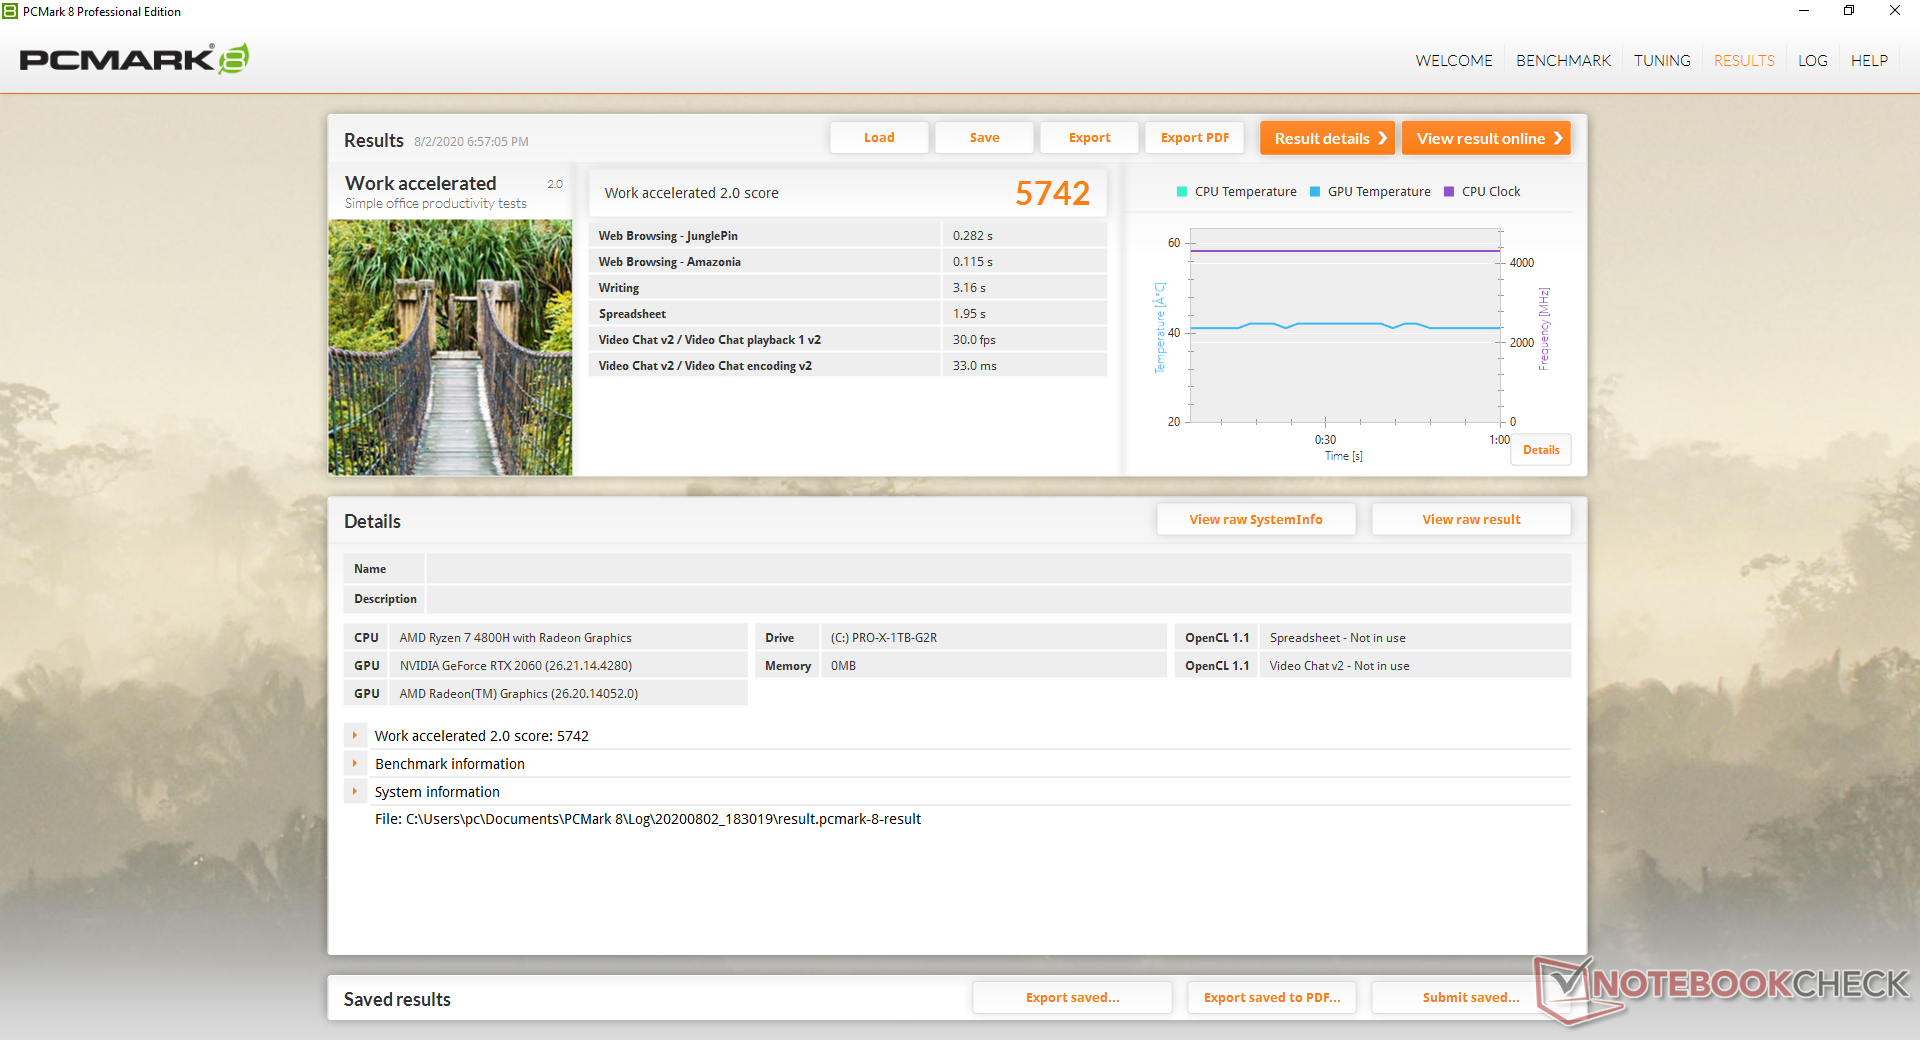
System Performance
PCMark benchmarks are in the same ballpark as Intel Core i7 gaming laptops powered by the same GeForce RTX 2060. We highly recommend becoming familiar with the Eluktronics Control Center software as its settings directly impact performance and fan behavior.
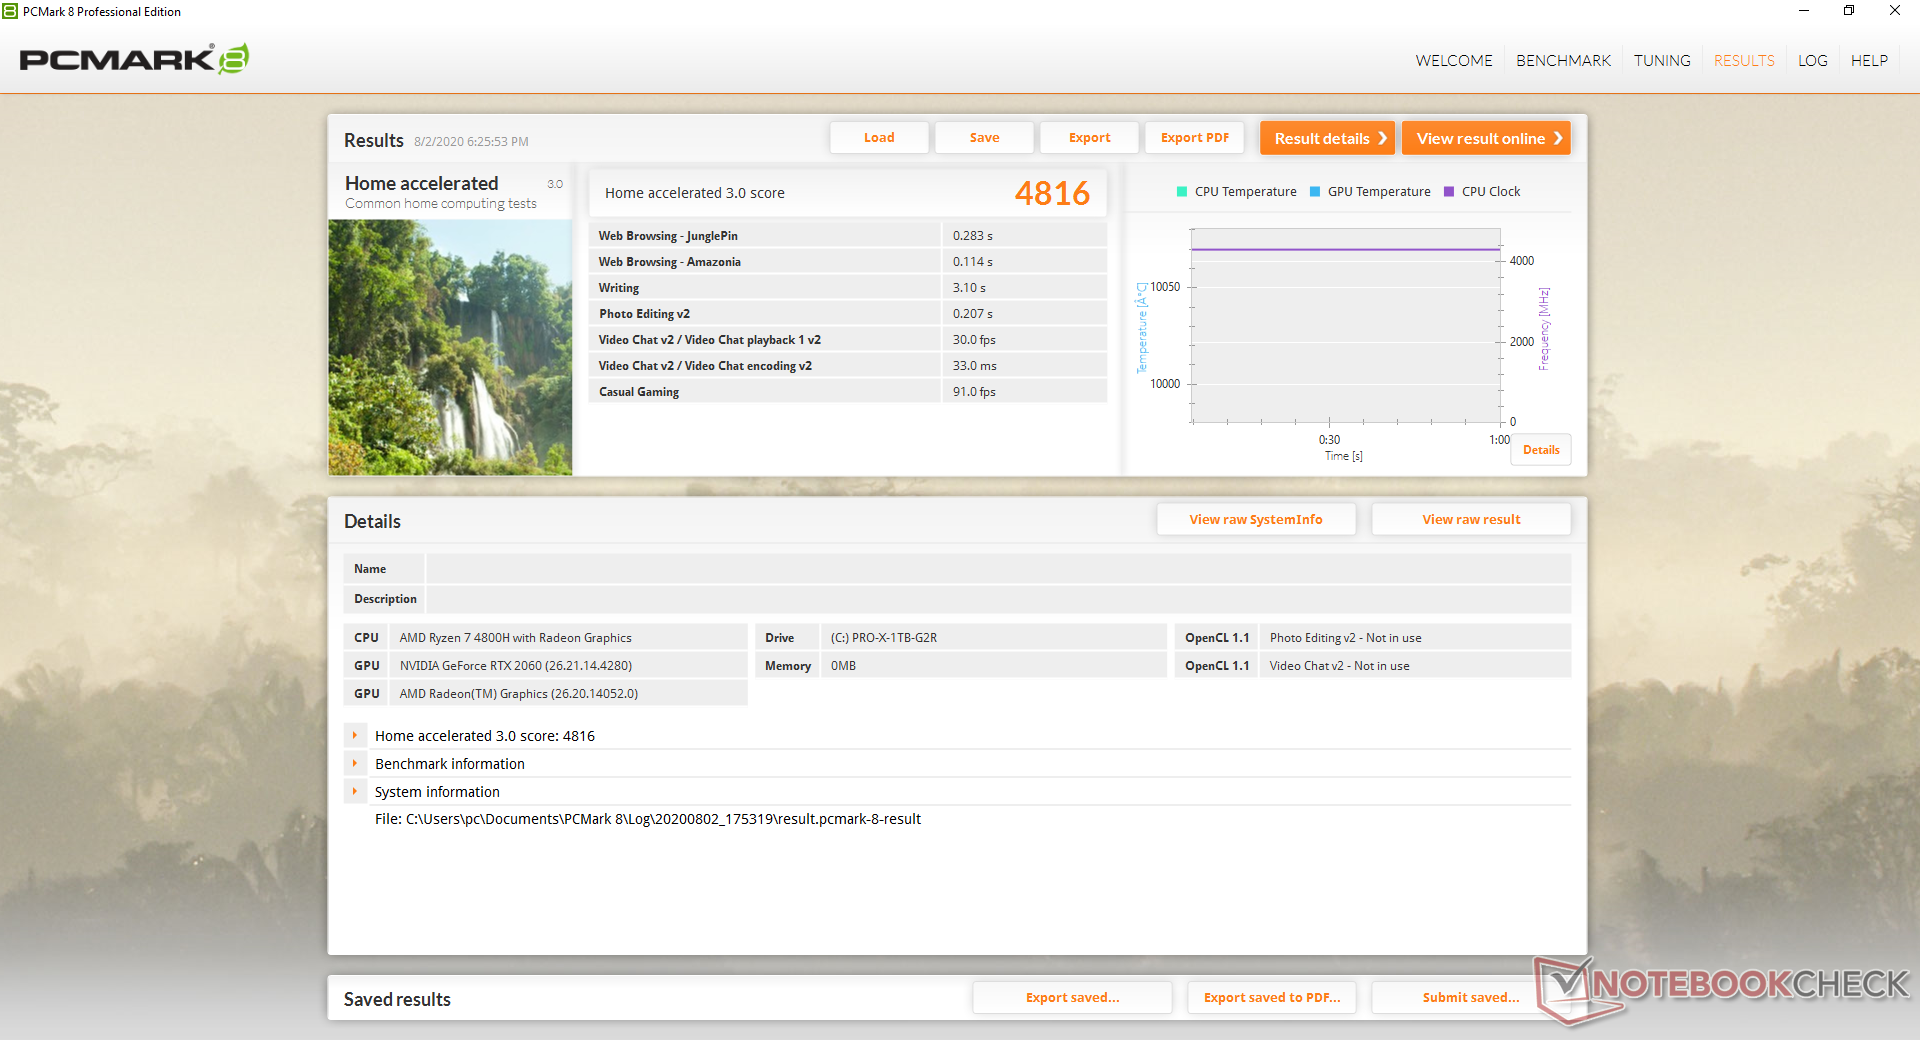
| PCMark 8 Home Score Accelerated v2 | 4816 points | |
| PCMark 8 Work Score Accelerated v2 | 5742 points | |
| PCMark 10 Score | 5454 points | |
Help | ||
DPC Latency
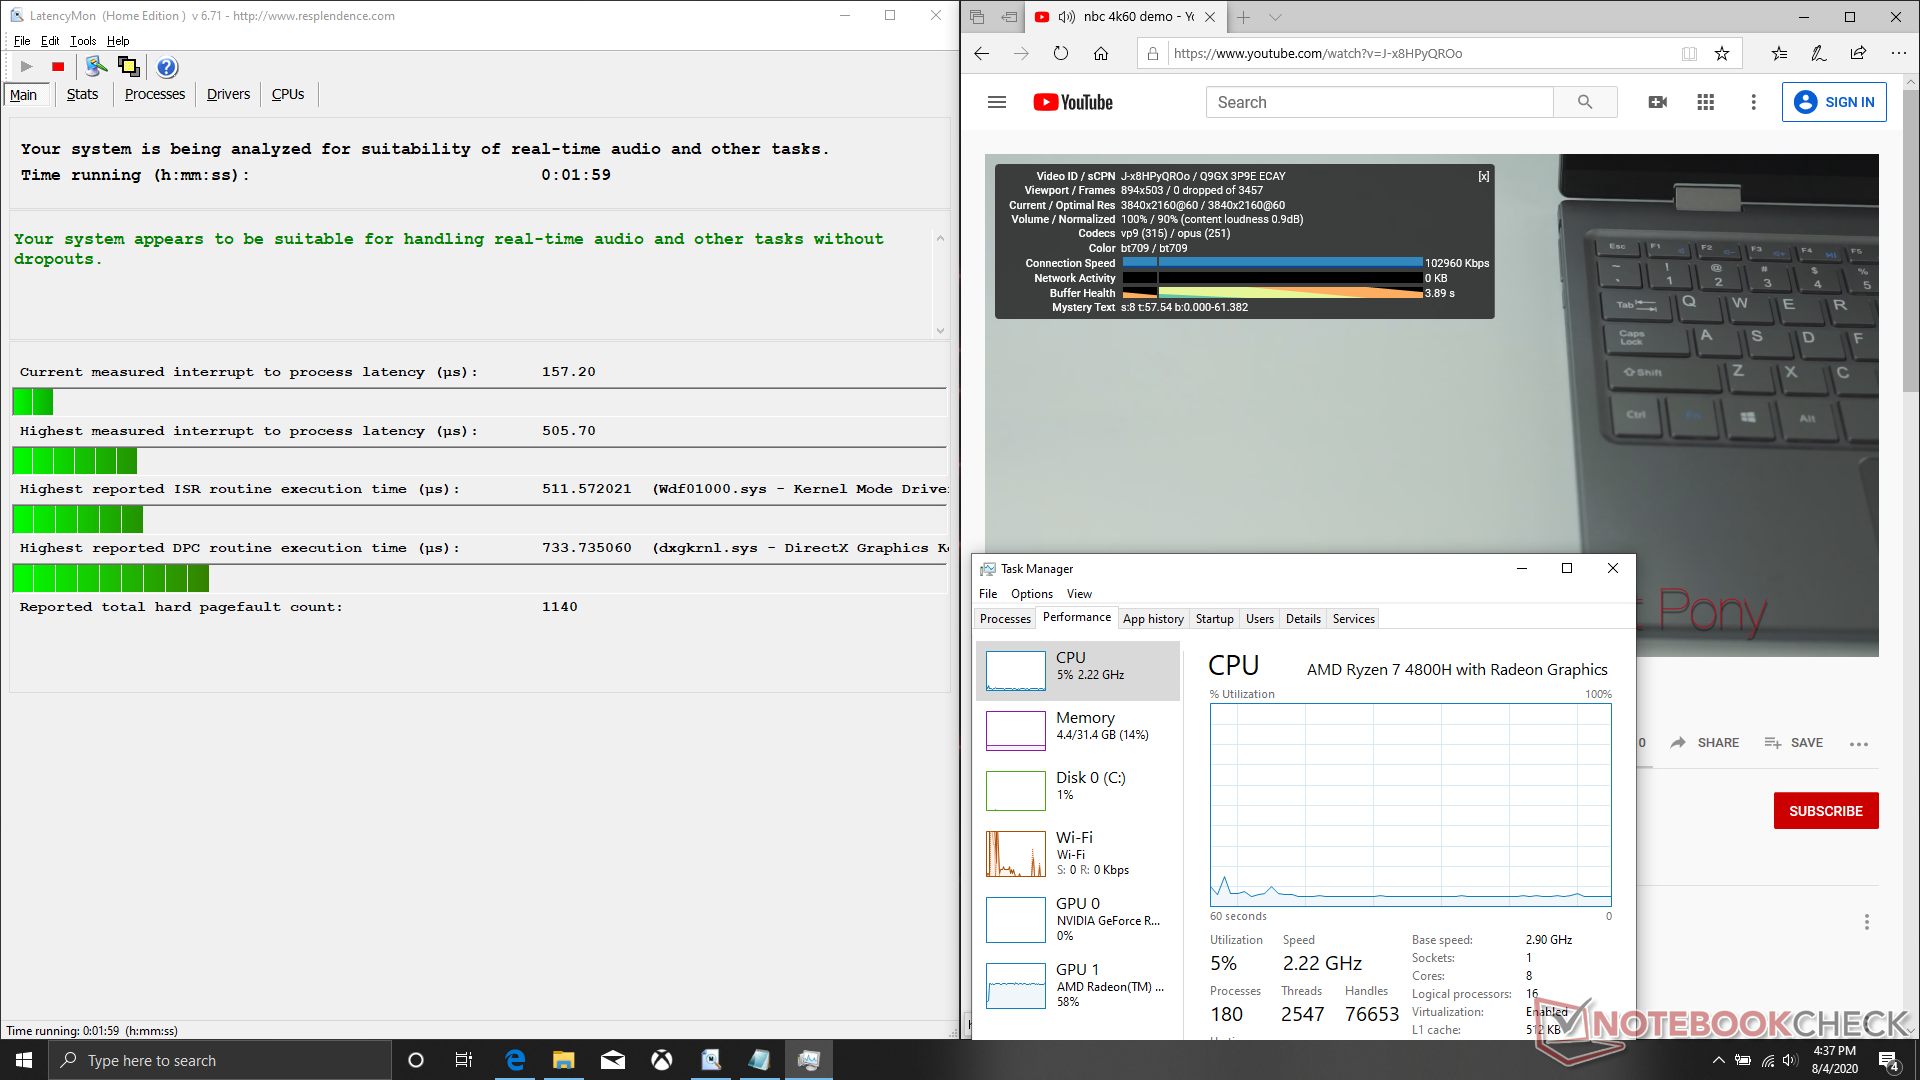
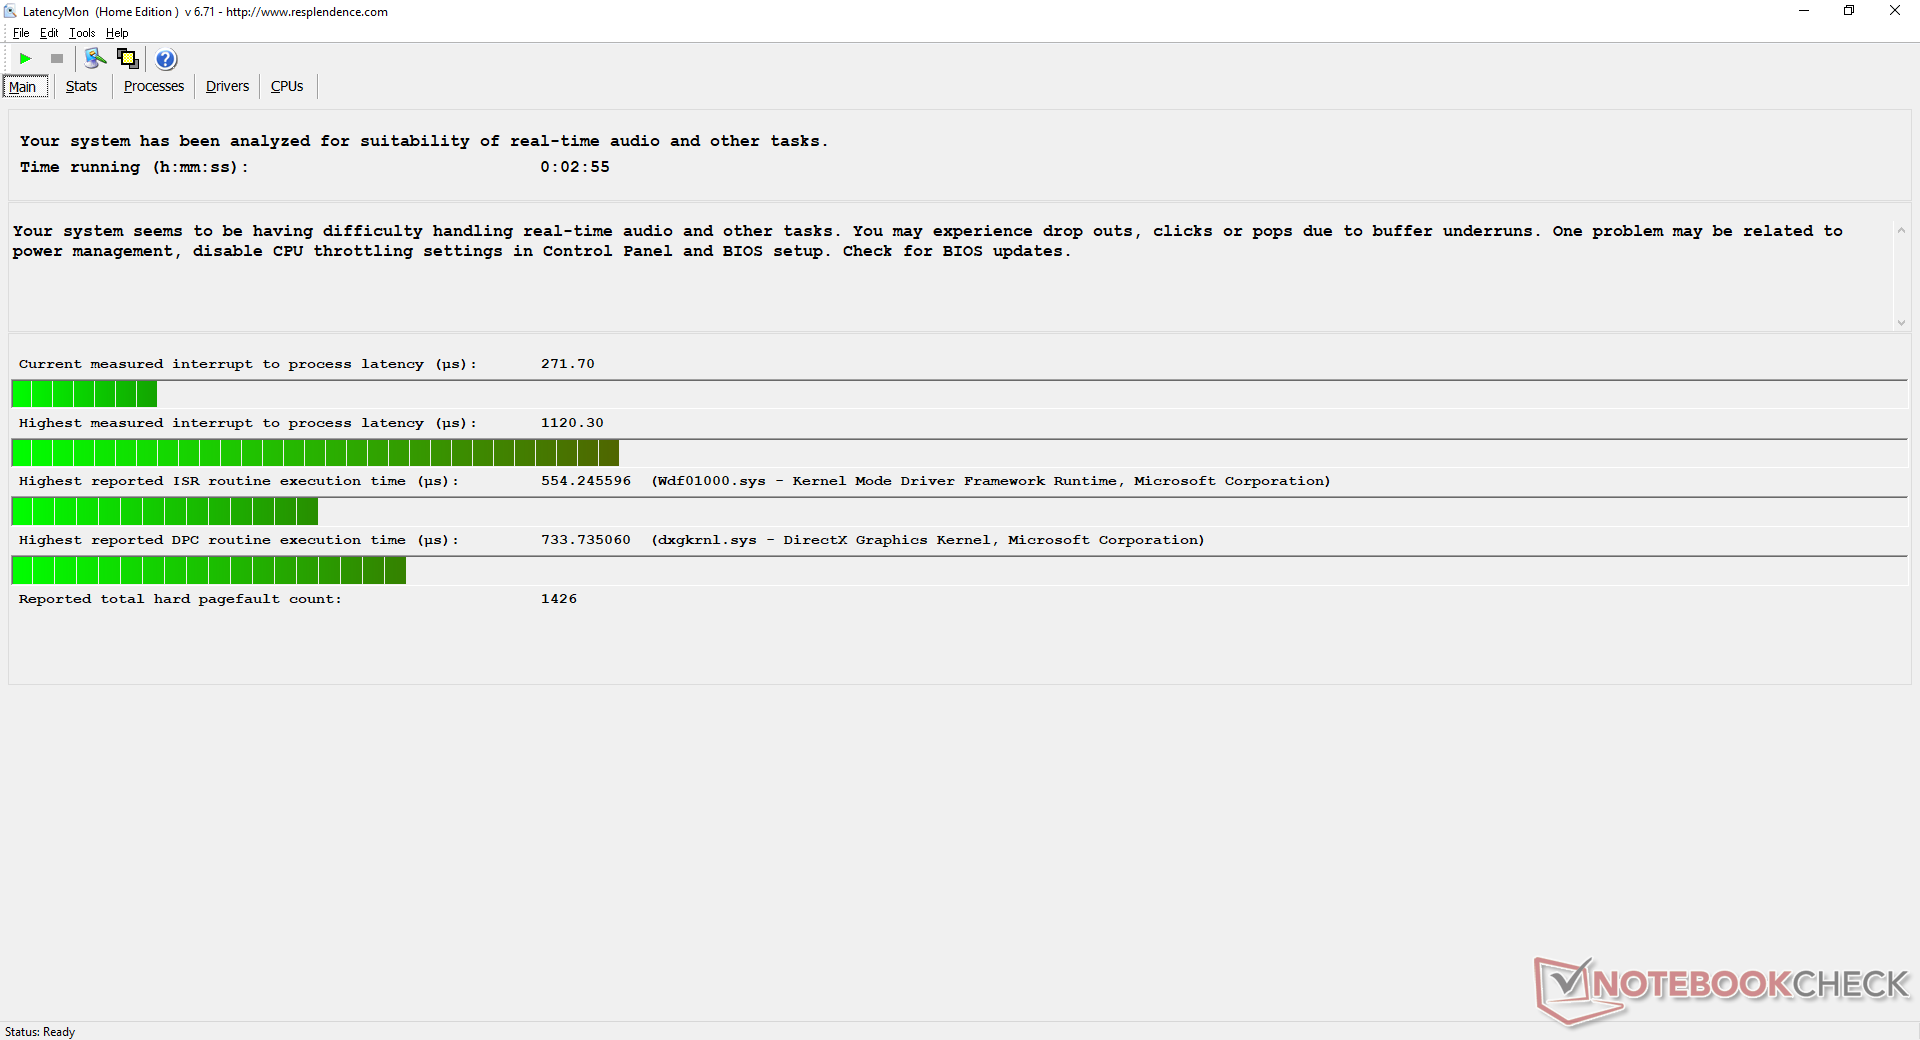
LatencyMon shows no DPC latency issues when opening multiple browser tabs on our home page until we initiated Prime95 to stress the CPU. 4K UHD playback is otherwise smooth and with no dropped frames during testing.

| DPC Latencies / LatencyMon - interrupt to process latency (max), Web, Youtube, Prime95 | |
| Asus TUF A17 FA706IU-AS76 | |
| MSI GE75 Raider 10SE-008US | |
| Eluktronics RP-17 | |
| Razer Blade Pro 17 RTX 2070 Max-Q 300 Hz | |
* ... smaller is better
Storage Devices
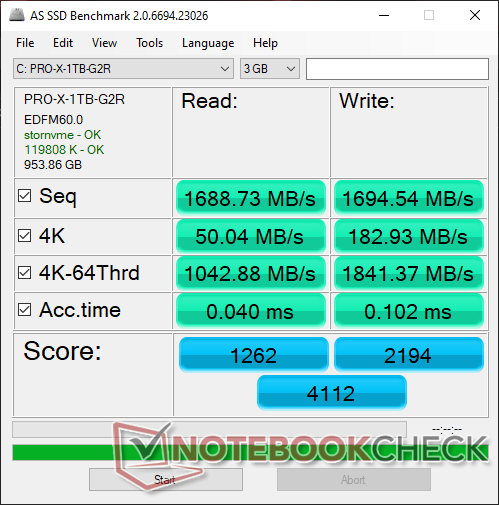
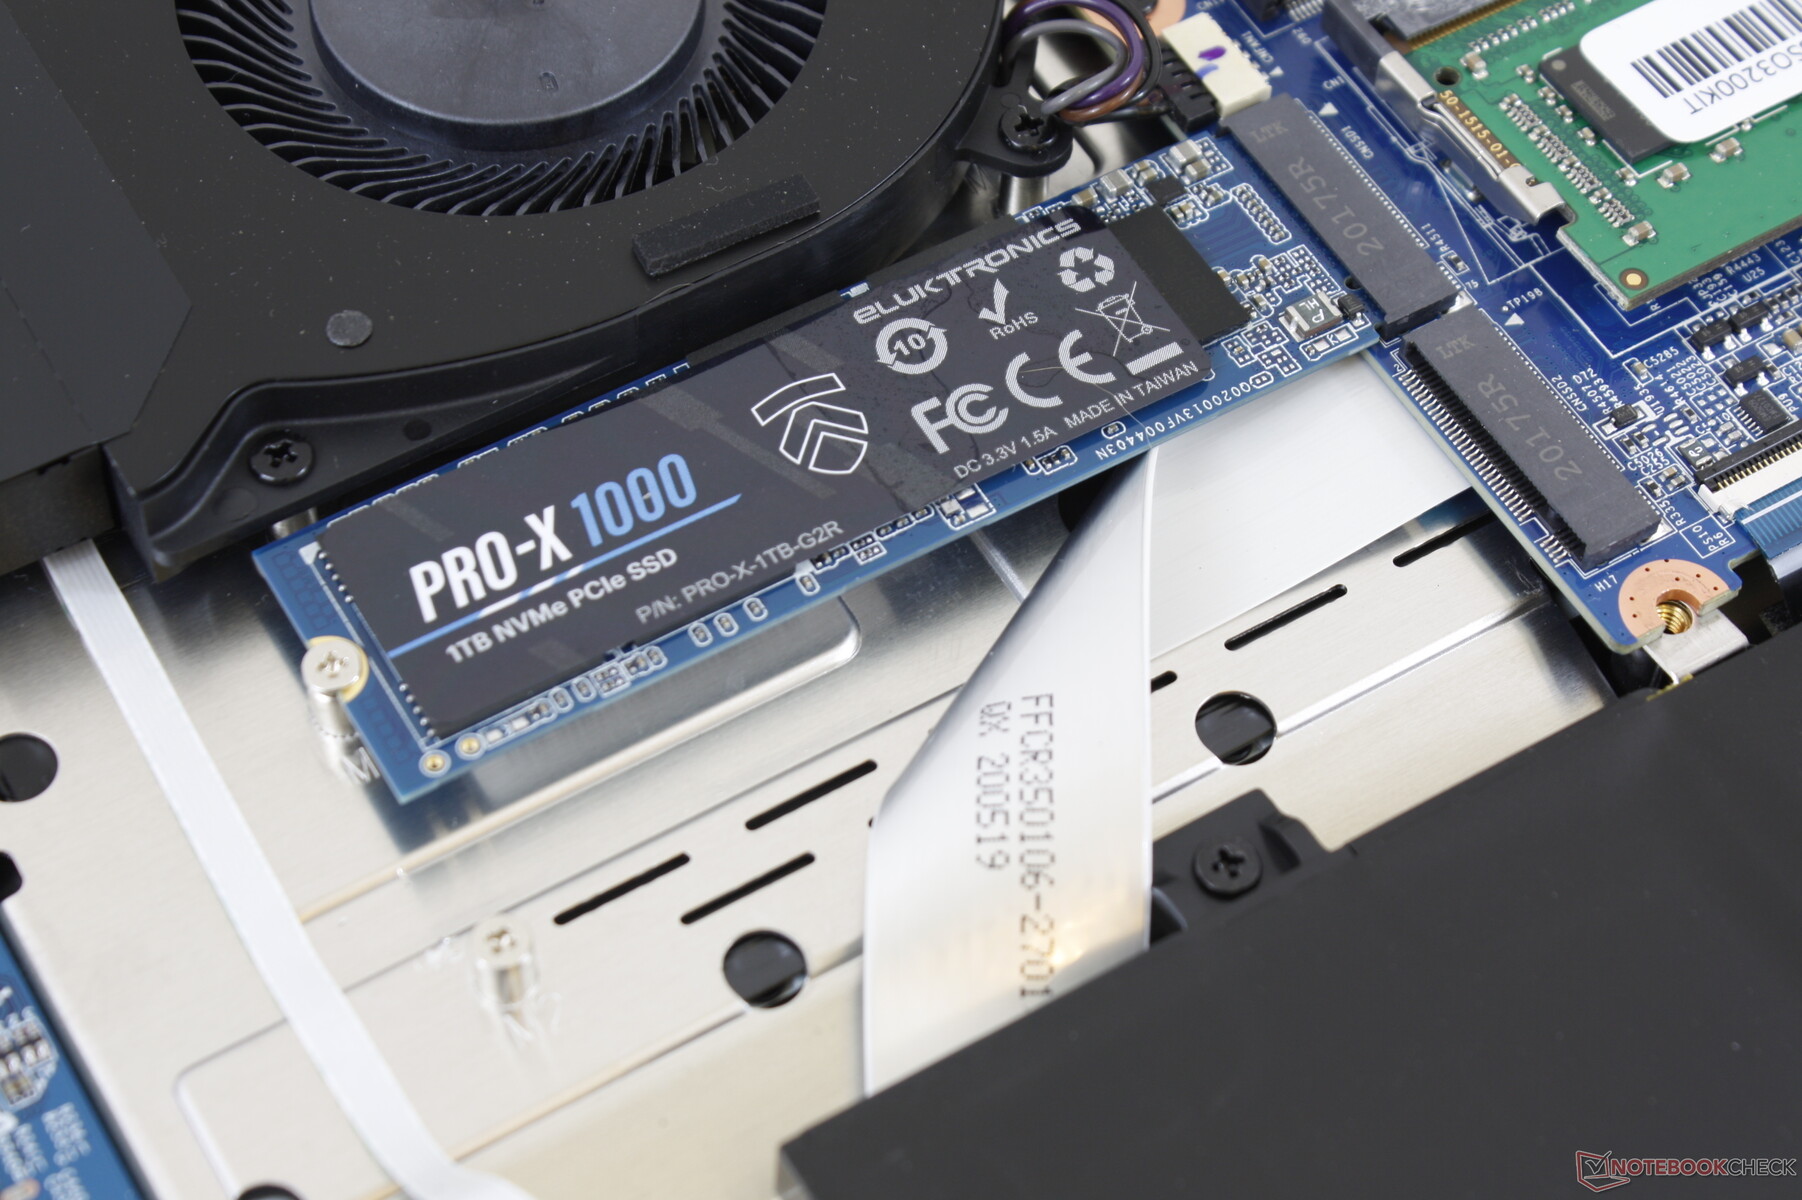
| Eluktronics RP-17 Phison PS5013 PRO-X-1TB-G2R NVMe SSD | MSI GE75 Raider 10SE-008US Samsung SSD PM981 MZVLB512HAJQ | Razer Blade Pro 17 RTX 2070 Max-Q 300 Hz Lite-On CA5-8D512 | Asus TUF A17 FA706IU-AS76 Intel SSD 660p 1TB SSDPEKNW010T8 | Walmart EVOO Gaming 17 Intel SSD 660p 1TB SSDPEKNW010T8 | Aorus 17 YA Intel SSD 760p SSDPEKKW010T8 | |
|---|---|---|---|---|---|---|
| AS SSD | 3% | -27% | -22% | -29% | -9% | |
| Seq Read (MB/s) | 1689 | 2036 21% | 2019 20% | 1320 -22% | 1038 -39% | 2716 61% |
| Seq Write (MB/s) | 1695 | 1835 8% | 1314 -22% | 1539 -9% | 1604 -5% | 1561 -8% |
| 4K Read (MB/s) | 50 | 60.6 21% | 46.61 -7% | 56.3 13% | 42.9 -14% | 34.96 -30% |
| 4K Write (MB/s) | 182.9 | 127.2 -30% | 90.2 -51% | 158.5 -13% | 107.4 -41% | 118.9 -35% |
| 4K-64 Read (MB/s) | 1043 | 1601 53% | 665 -36% | 586 -44% | 583 -44% | 926 -11% |
| 4K-64 Write (MB/s) | 1841 | 1734 -6% | 813 -56% | 820 -55% | 725 -61% | 979 -47% |
| Access Time Read * (ms) | 0.04 | 0.049 -23% | 0.058 -45% | 0.043 -8% | 0.045 -13% | 0.052 -30% |
| Access Time Write * (ms) | 0.102 | 0.09 12% | 0.167 -64% | 0.113 -11% | 0.127 -25% | 0.03 71% |
| Score Read (Points) | 1262 | 1865 48% | 913 -28% | 775 -39% | 730 -42% | 1232 -2% |
| Score Write (Points) | 2194 | 2045 -7% | 1034 -53% | 1132 -48% | 992 -55% | 1254 -43% |
| Score Total (Points) | 4112 | 4863 18% | 2392 -42% | 2333 -43% | 2137 -48% | 3062 -26% |
| Copy ISO MB/s (MB/s) | 2124 | 1900 -11% | 1715 -19% | 1736 -18% | 1612 -24% | |
| Copy Program MB/s (MB/s) | 579 | 205.5 -65% | 622 7% | 553 -4% | 564 -3% | |
| Copy Game MB/s (MB/s) | 1304 | 1419 9% | 1506 15% | 1264 -3% | 1328 2% | |
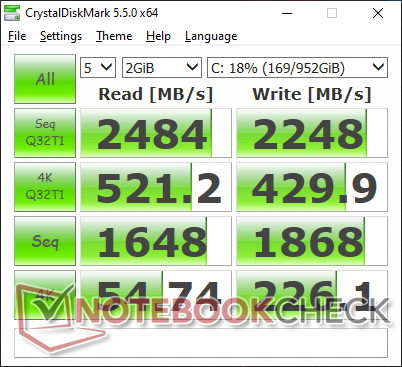
| CrystalDiskMark 5.2 / 6 | 4% | 7% | -6% | -12% | 8% | |
| Write 4K (MB/s) | 226.1 | 139.2 -38% | 119 -47% | 189.7 -16% | 134 -41% | 139.6 -38% |
| Read 4K (MB/s) | 54.7 | 53 -3% | 51.9 -5% | 62.3 14% | 55.5 1% | 62.9 15% |
| Write Seq (MB/s) | 1868 | 1950 4% | 2258 21% | 1681 -10% | 1292 -31% | 1573 -16% |
| Read Seq (MB/s) | 1648 | 2328 41% | 2283 39% | 1608 -2% | 1476 -10% | 2808 70% |
| Write 4K Q32T1 (MB/s) | 429.9 | 408.9 -5% | 491 14% | 468.6 9% | 545 27% | 509 18% |
| Read 4K Q32T1 (MB/s) | 521 | 551 6% | 540 4% | 541 4% | 582 12% | 639 23% |
| Write Seq Q32T1 (MB/s) | 2248 | 1938 -14% | 2253 0% | 1770 -21% | 1746 -22% | 1573 -30% |
| Read Seq Q32T1 (MB/s) | 2484 | 3467 40% | 3172 28% | 1898 -24% | 1793 -28% | 3082 24% |
| Total Average (Program / Settings) | 4% /
4% | -10% /
-15% | -14% /
-16% | -21% /
-23% | -1% /
-2% |
* ... smaller is better

Disk Throttling: DiskSpd Read Loop, Queue Depth 8
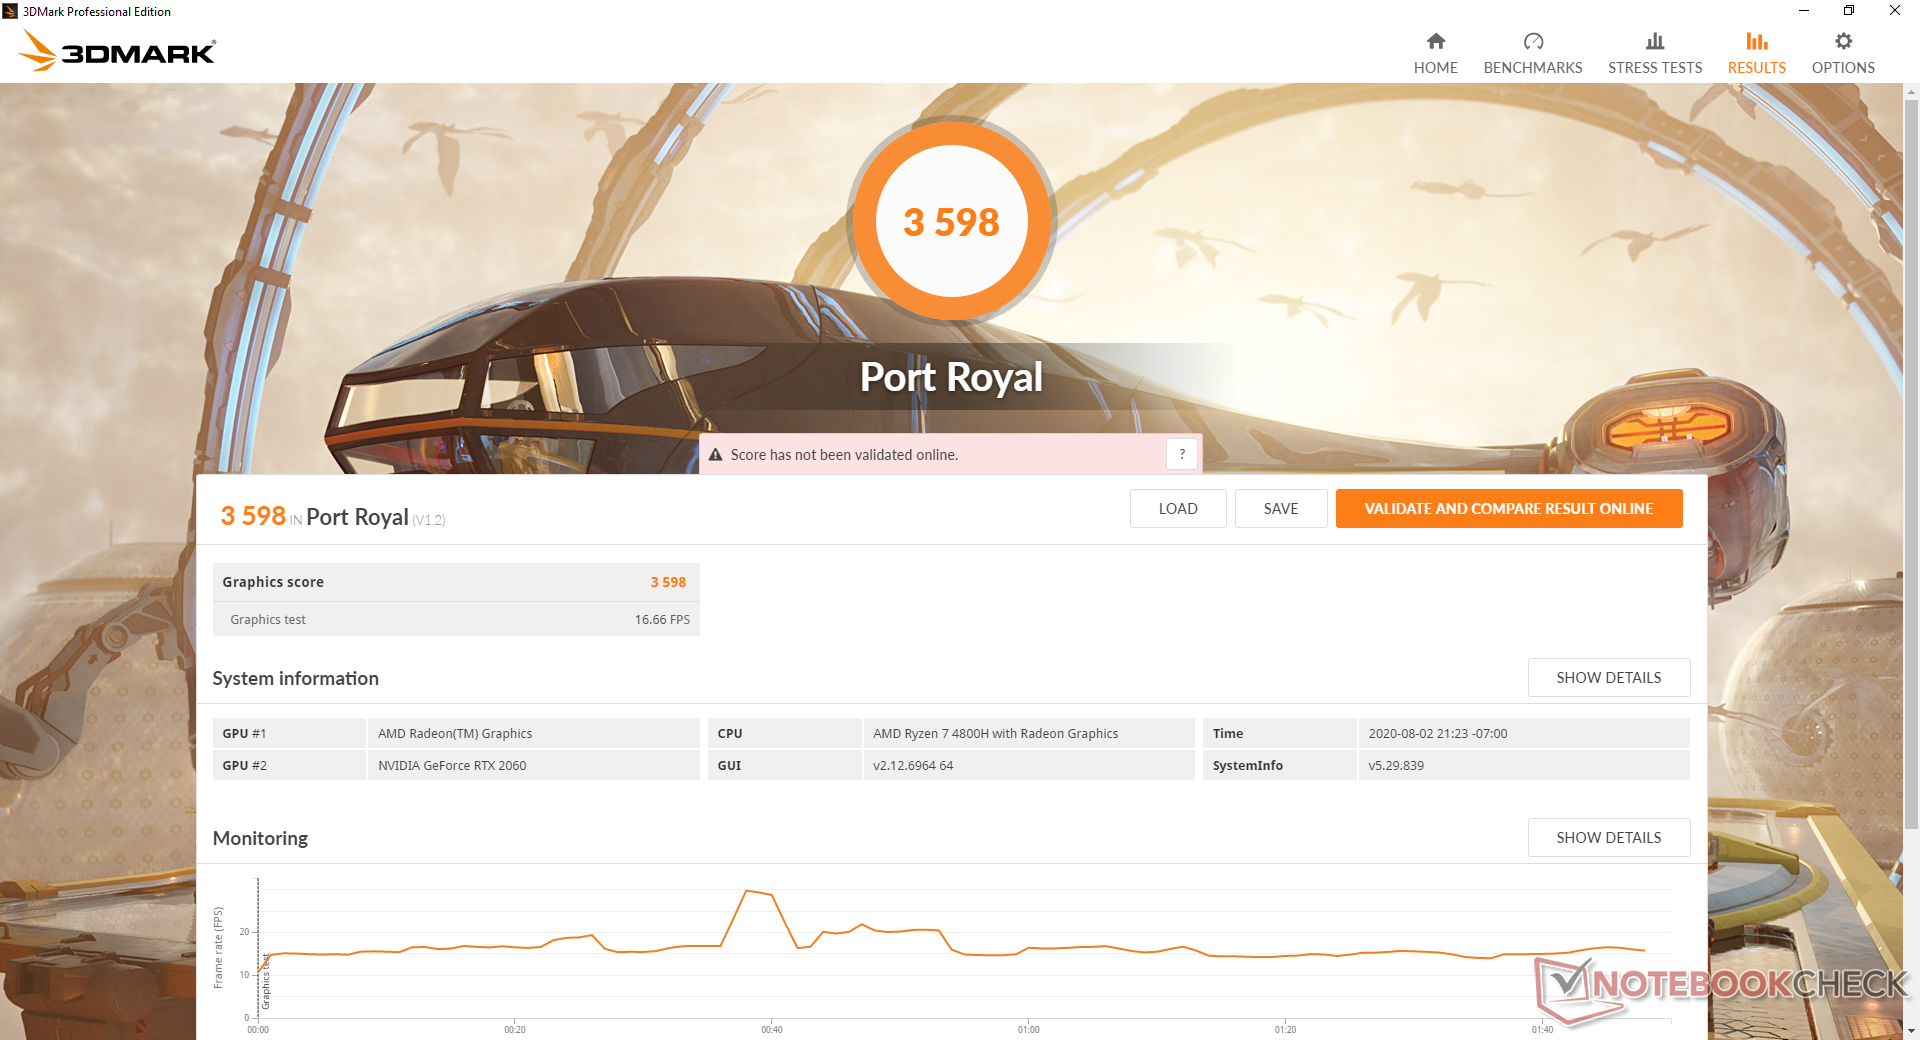
GPU Performance
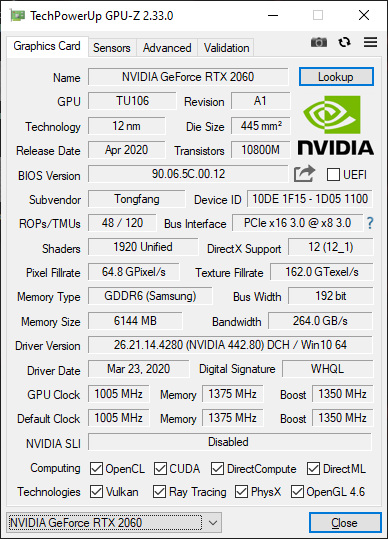
The mobile GeForce RTX 2060 is performing where we expect it to be relative to other laptops with the same GPU. Users can expect about 10 to 15 percent faster performance than the GeForce GTX 1660 Ti on top of the added support for RTX-specific features. The regular desktop GeForce RTX 2060 is roughly 15 to 20 percent faster than our mobile RTX 2060 version.
Keep in mind that gaming performance isn't necessarily faster than laptops powered by 10th gen Core i7 CPUs despite the faster Ryzen 7 since most games are GPU bound.
See our dedicated page on the mobile GeForce RTX 2060 for more technical information and benchmark comparisons.
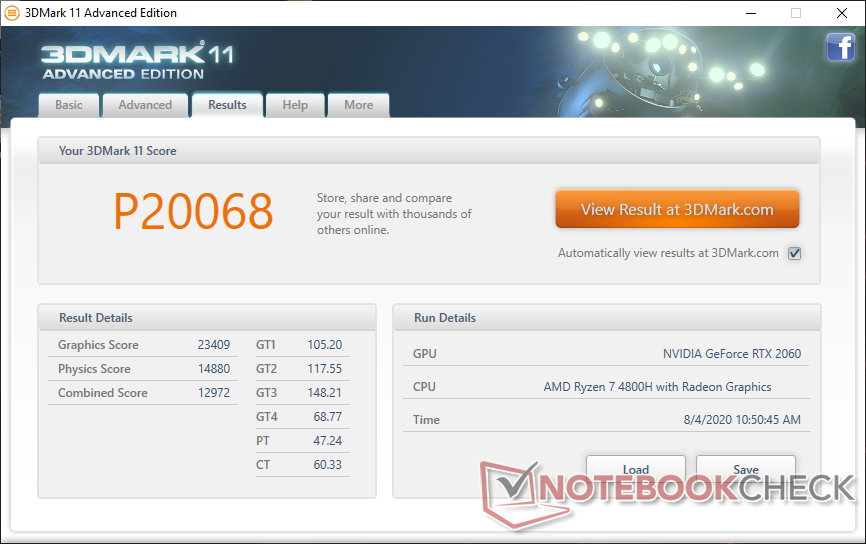
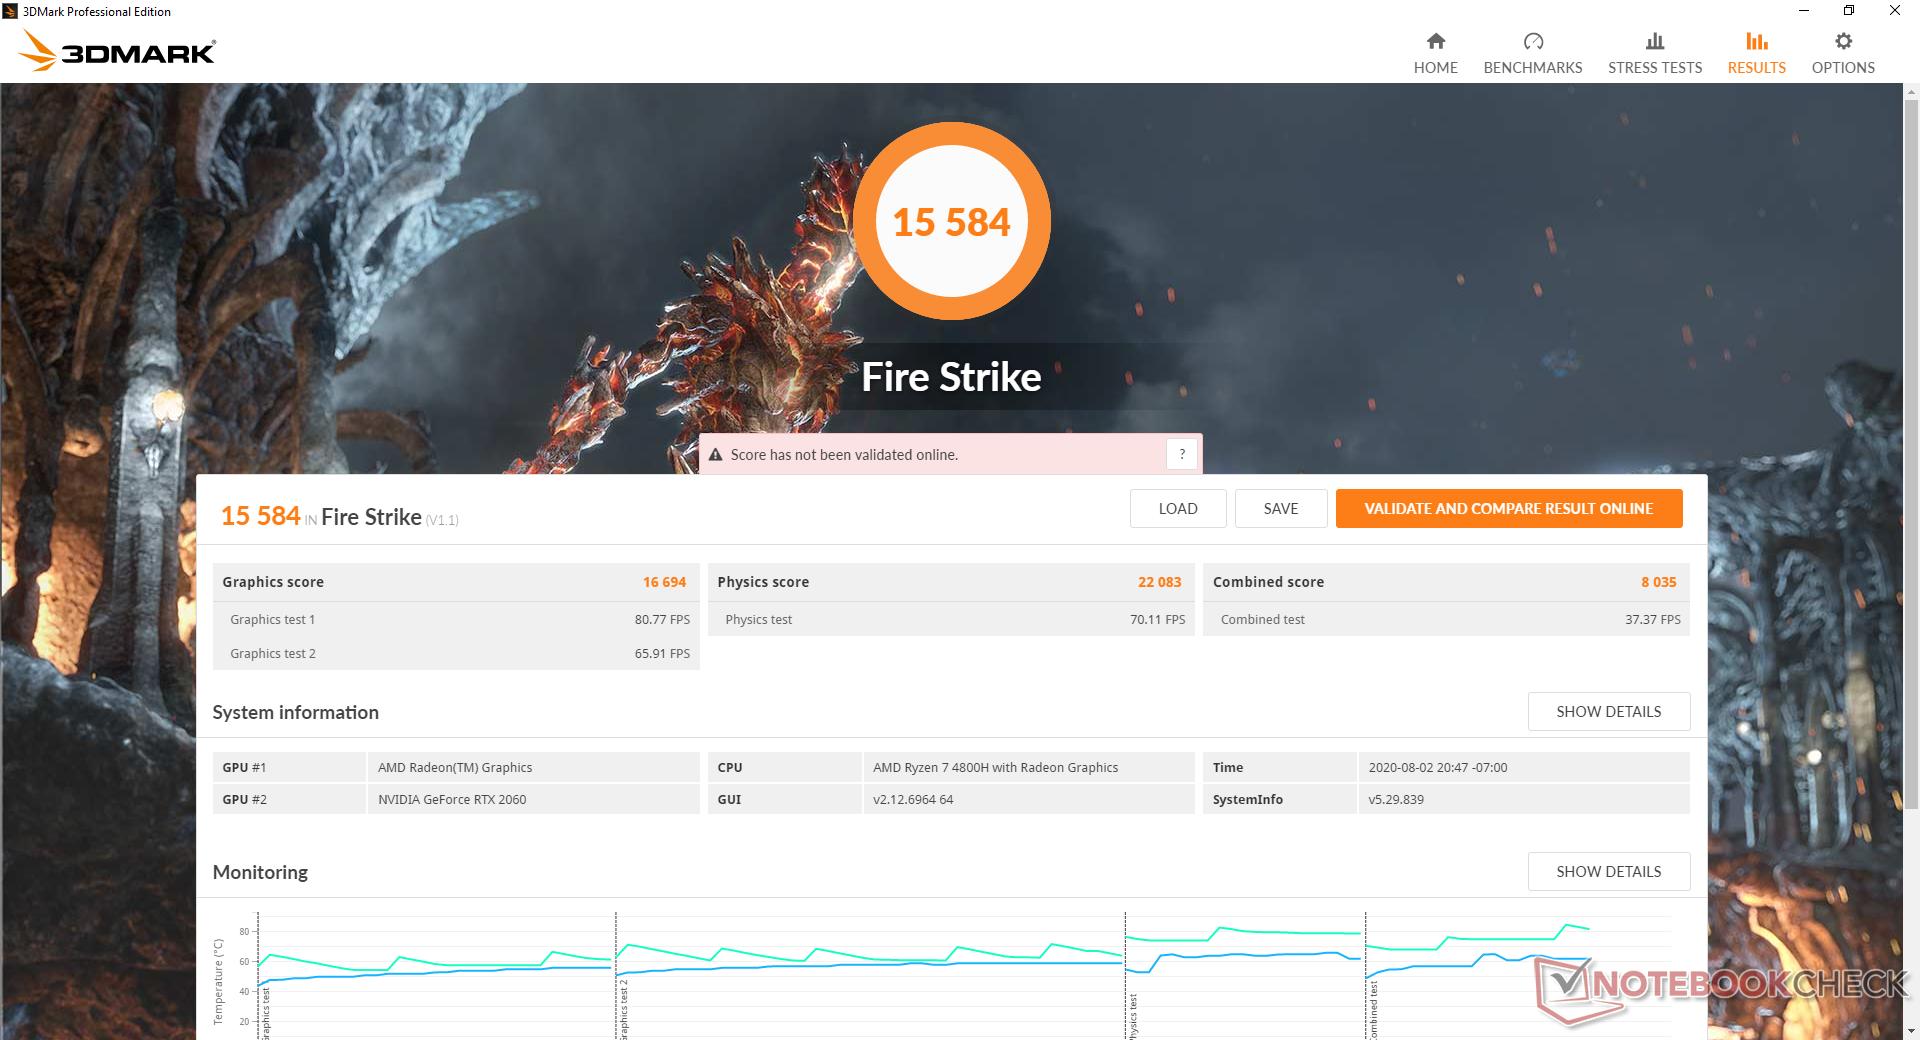
| 3DMark 11 Performance | 20068 points | |
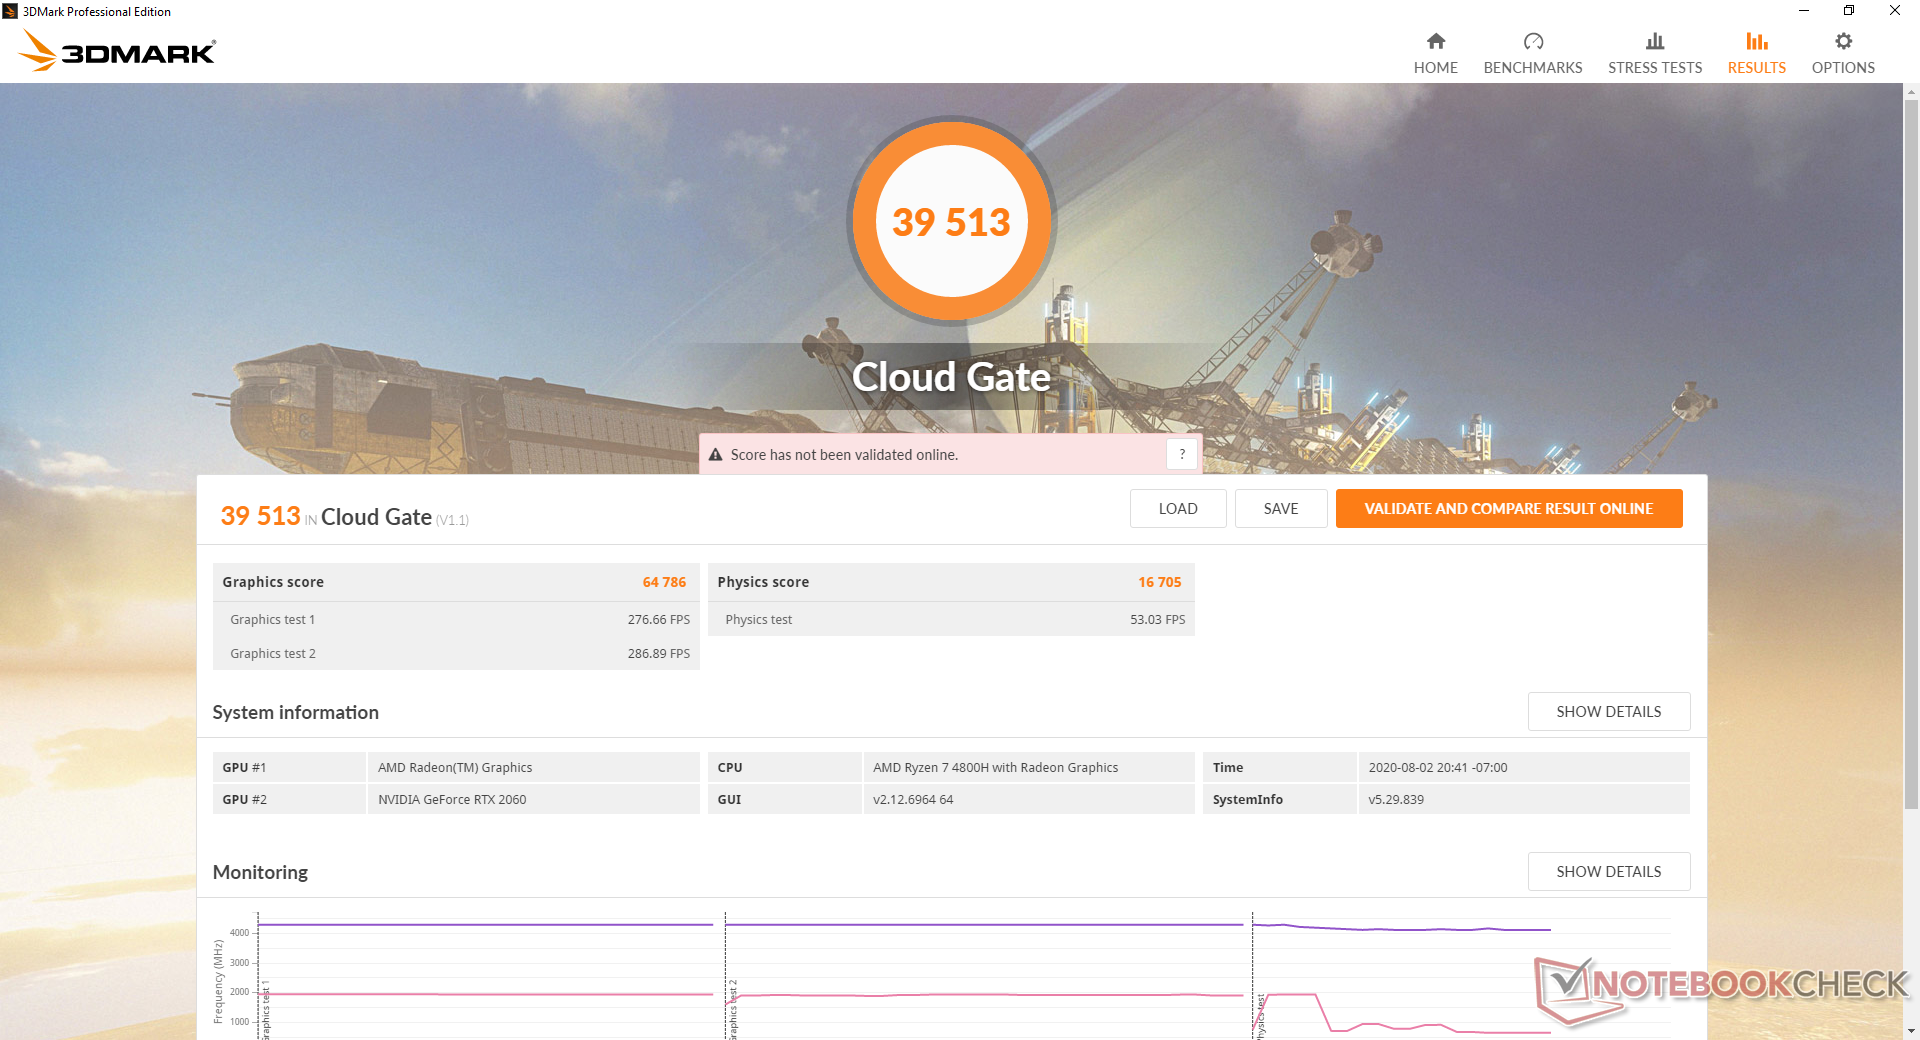
| 3DMark Cloud Gate Standard Score | 39513 points | |
| 3DMark Fire Strike Score | 15584 points | |
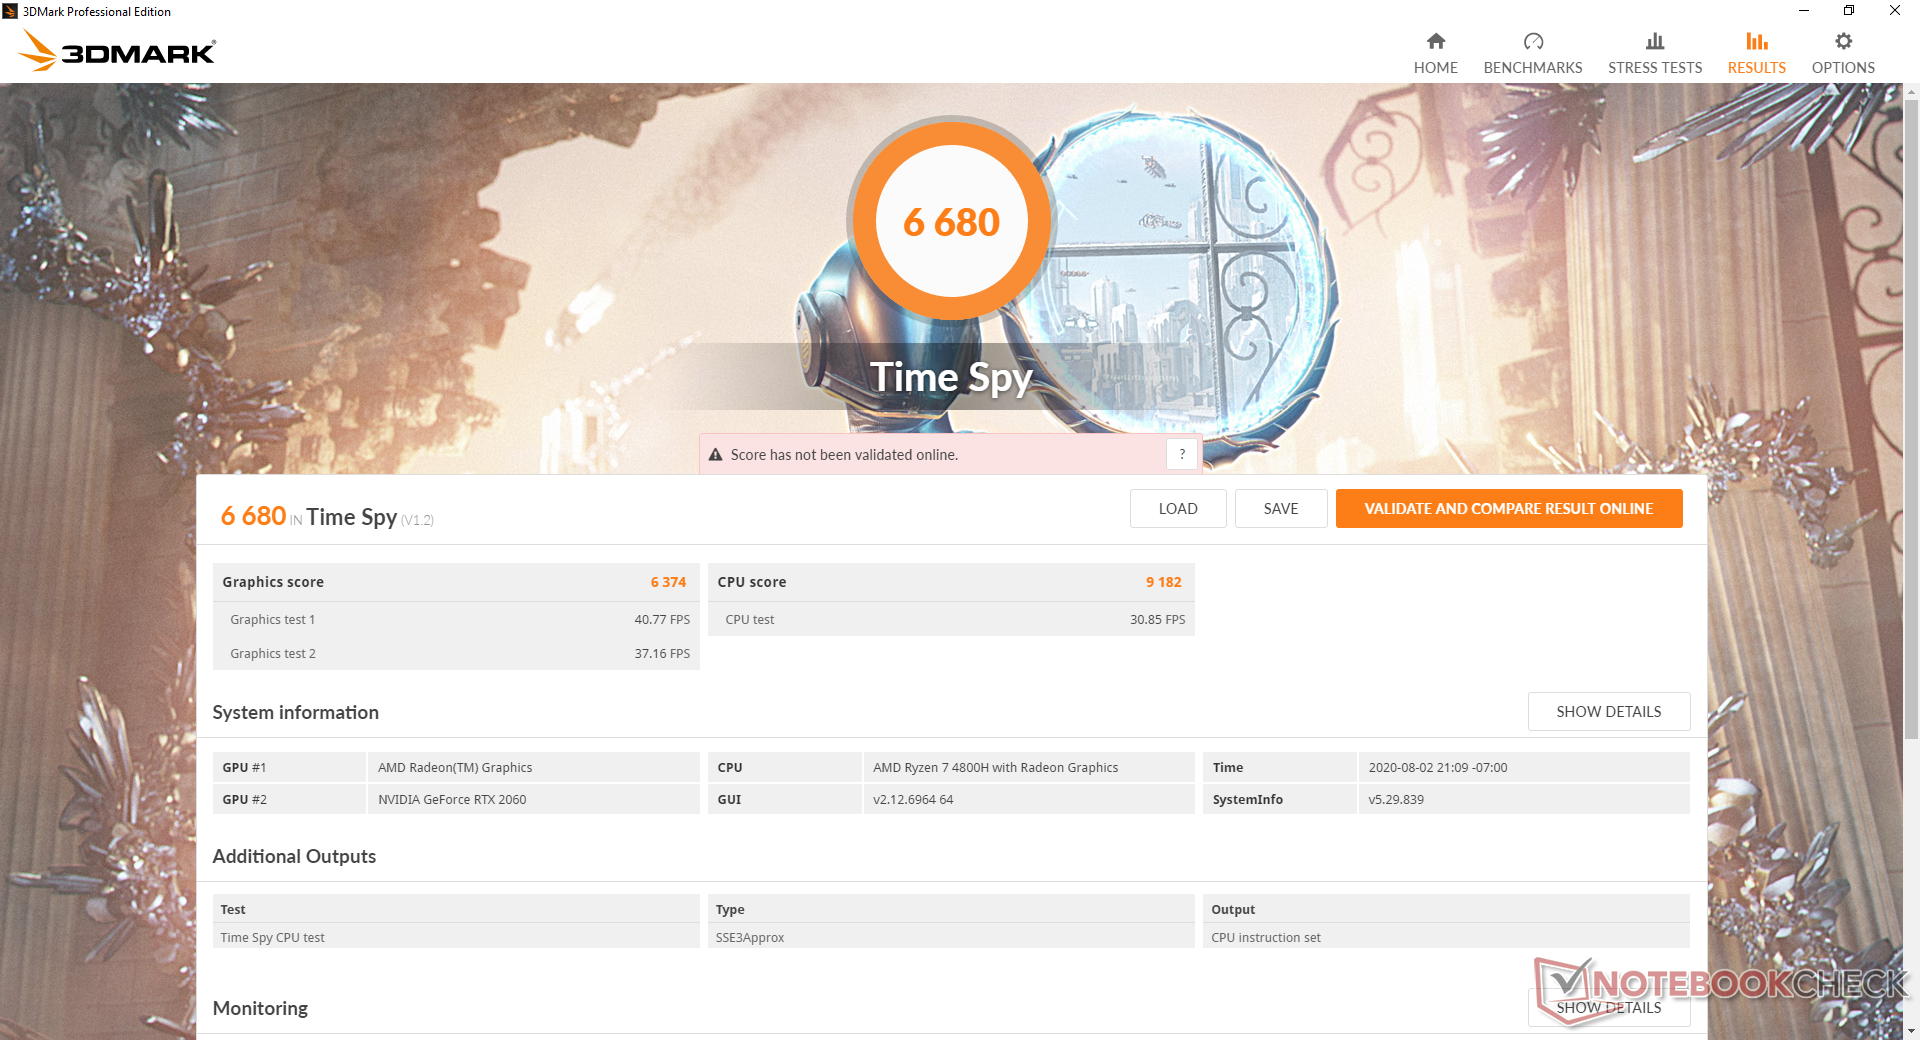
| 3DMark Time Spy Score | 6680 points | |
Help | ||
| Final Fantasy XV Benchmark - 1920x1080 High Quality | |
| Intel Core i9-10900K | |
| Asus Strix Scar 17 G732LXS | |
| MSI RTX 2060 Gaming Z 6G | |
| Eluktronics RP-17 | |
| Asus Zephyrus G14 GA401IV | |
| Average NVIDIA GeForce RTX 2060 Mobile (52 - 67.5, n=7) | |
| Acer Nitro 5 AN515-44-R5FT | |
| Asus TUF FX705DT-AU068T | |
| low | med. | high | ultra | 4K | |
|---|---|---|---|---|---|
| The Witcher 3 (2015) | 266.5 | 121.9 | 62.1 | ||
| Dota 2 Reborn (2015) | 118 | 113 | 105 | 101 | 87 |
| Final Fantasy XV Benchmark (2018) | 144 | 85.6 | 66.1 | ||
| X-Plane 11.11 (2018) | 92.1 | 81.8 | 68.8 |
Emissions
System Noise
Fan noise is tied closely to the Eluktronics Control Center software. If simply web browsing or video streaming, users should set the system to Office mode so the fans will remain below 30 dB(A) most of the time and avoid pulsing as frequently.
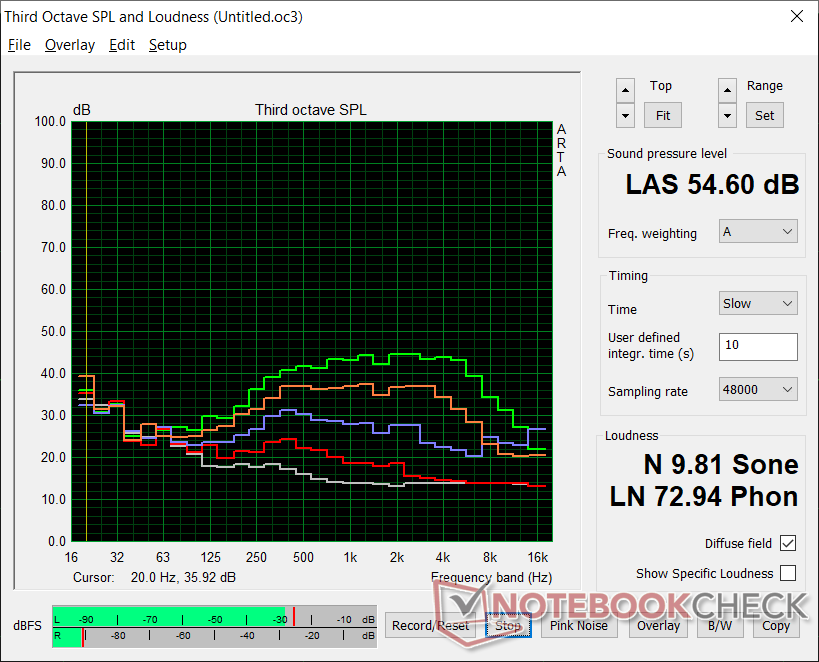
Gaming on Balanced mode or High Performance would induce a steady fan noise of 47.2 dB(A) to be quieter than many other high-power 17.3-inch gaming laptops including the MSI GE75 or Razer Blade Pro 17. Enabling Turbo mode will bump fan noise up to 54.6 dB(A) to match those aforementioned laptops.
| Eluktronics RP-17 GeForce RTX 2060 Mobile, R7 4800H, Phison PS5013 PRO-X-1TB-G2R NVMe SSD | MSI GE75 Raider 10SE-008US GeForce RTX 2060 Mobile, i7-10750H, Samsung SSD PM981 MZVLB512HAJQ | Razer Blade Pro 17 RTX 2070 Max-Q 300 Hz GeForce RTX 2070 Max-Q, i7-10875H, Lite-On CA5-8D512 | Asus TUF A17 FA706IU-AS76 GeForce GTX 1660 Ti Mobile, R7 4800H, Intel SSD 660p 1TB SSDPEKNW010T8 | Walmart EVOO Gaming 17 GeForce RTX 2060 Mobile, i7-9750H, Intel SSD 660p 1TB SSDPEKNW010T8 | Aorus 17 YA GeForce RTX 2080 Mobile, i9-9980HK, Intel SSD 760p SSDPEKKW010T8 | |
|---|---|---|---|---|---|---|
| Noise | -7% | -7% | -8% | -0% | -44% | |
| off / environment * (dB) | 26.2 | 28.4 -8% | 28.2 -8% | 28.7 -10% | 28.7 -10% | 30 -15% |
| Idle Minimum * (dB) | 26.2 | 30.2 -15% | 28.2 -8% | 28.7 -10% | 28.7 -10% | 42 -60% |
| Idle Average * (dB) | 26.2 | 30.2 -15% | 28.2 -8% | 30.5 -16% | 28.7 -10% | 44 -68% |
| Idle Maximum * (dB) | 30 | 32 -7% | 30.5 -2% | 32.5 -8% | 29.5 2% | 52 -73% |
| Load Average * (dB) | 38.5 | 33.2 14% | 42.2 -10% | 42.5 -10% | 31.4 18% | 56 -45% |
| Witcher 3 ultra * (dB) | 47.2 | 55 -17% | 53 -12% | 50.1 -6% | 44.5 6% | 60 -27% |
| Load Maximum * (dB) | 54.6 | 55 -1% | 55.5 -2% | 53.4 2% | 54 1% | 64 -17% |
* ... smaller is better
Noise level
| Idle |
| 26.2 / 26.2 / 30 dB(A) |
| Load |
| 38.5 / 54.6 dB(A) |
 | ||
30 dB silent 40 dB(A) audible 50 dB(A) loud |
||
min: | ||
Temperature
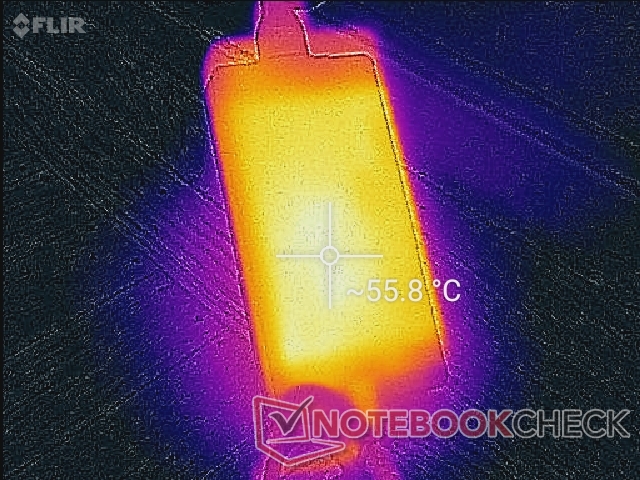
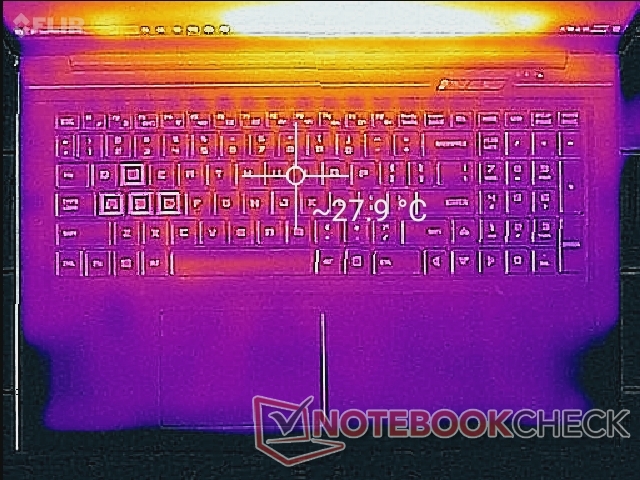
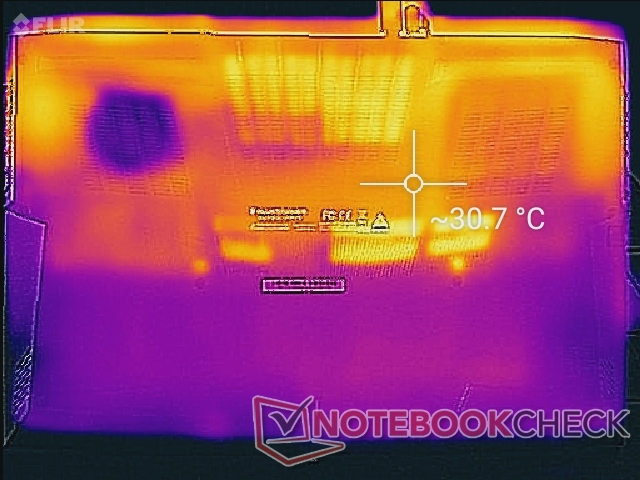
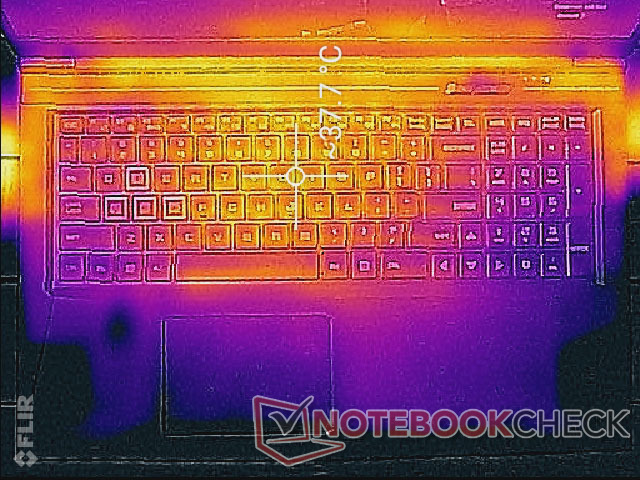
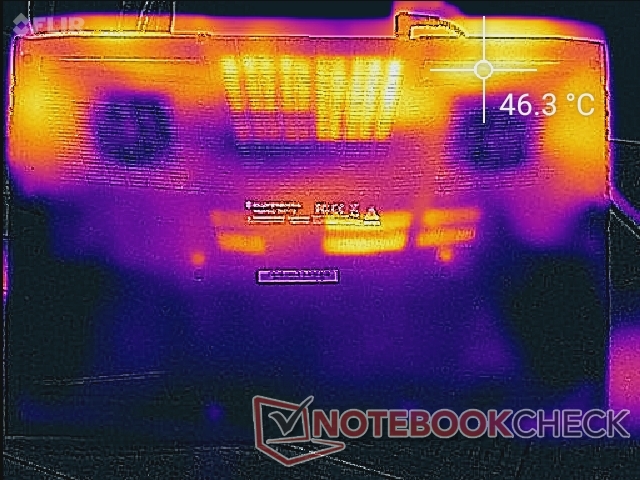
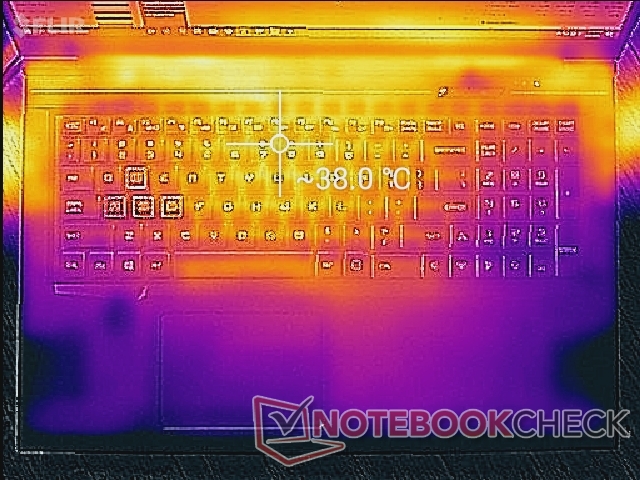
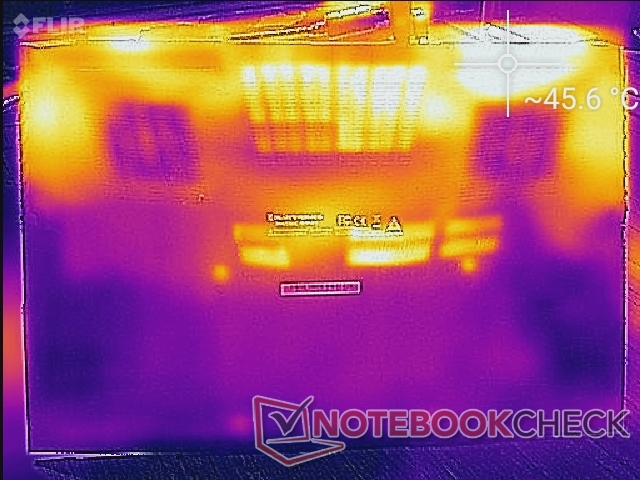
Surface hot spots when gaming reach about 38 C to 46 C on the top and bottom sides, respectively, to be cooler than what we recorded on the MSI GS75 when under similar conditions. The palm rests, WASD keys, and arrow keys remain relatively cool for comfortable gaming.
The back half of the chassis dedicates a lot of space for ventilation which users should be careful to not block or impede.
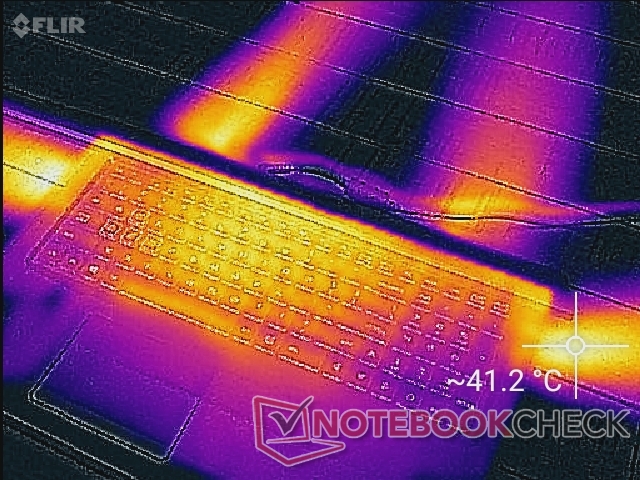
(+) The maximum temperature on the upper side is 38.8 °C / 102 F, compared to the average of 40.4 °C / 105 F, ranging from 21.2 to 68.8 °C for the class Gaming.
(-) The bottom heats up to a maximum of 45.8 °C / 114 F, compared to the average of 43.2 °C / 110 F
(+) In idle usage, the average temperature for the upper side is 26.7 °C / 80 F, compared to the device average of 33.9 °C / 93 F.
(+) Playing The Witcher 3, the average temperature for the upper side is 31.7 °C / 89 F, compared to the device average of 33.9 °C / 93 F.
(+) The palmrests and touchpad are cooler than skin temperature with a maximum of 27.6 °C / 81.7 F and are therefore cool to the touch.
(±) The average temperature of the palmrest area of similar devices was 28.8 °C / 83.8 F (+1.2 °C / 2.1 F).
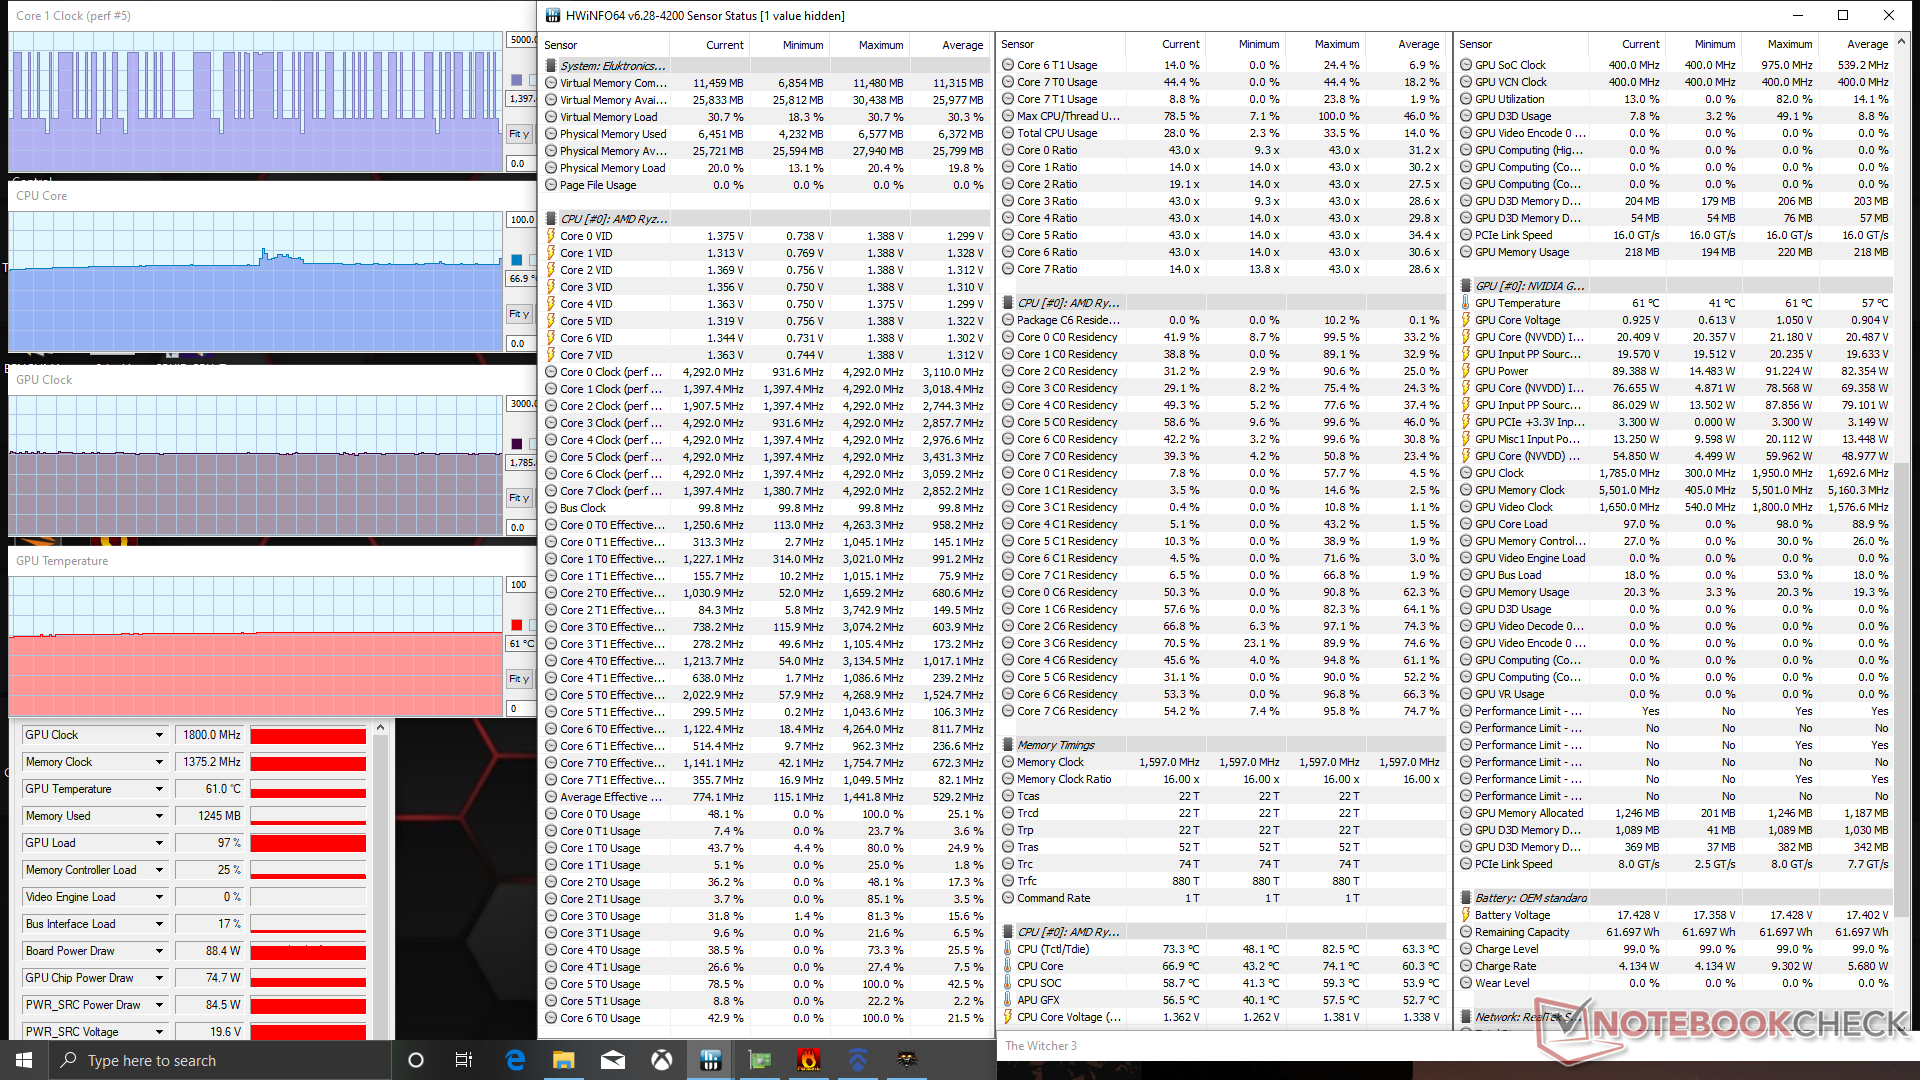
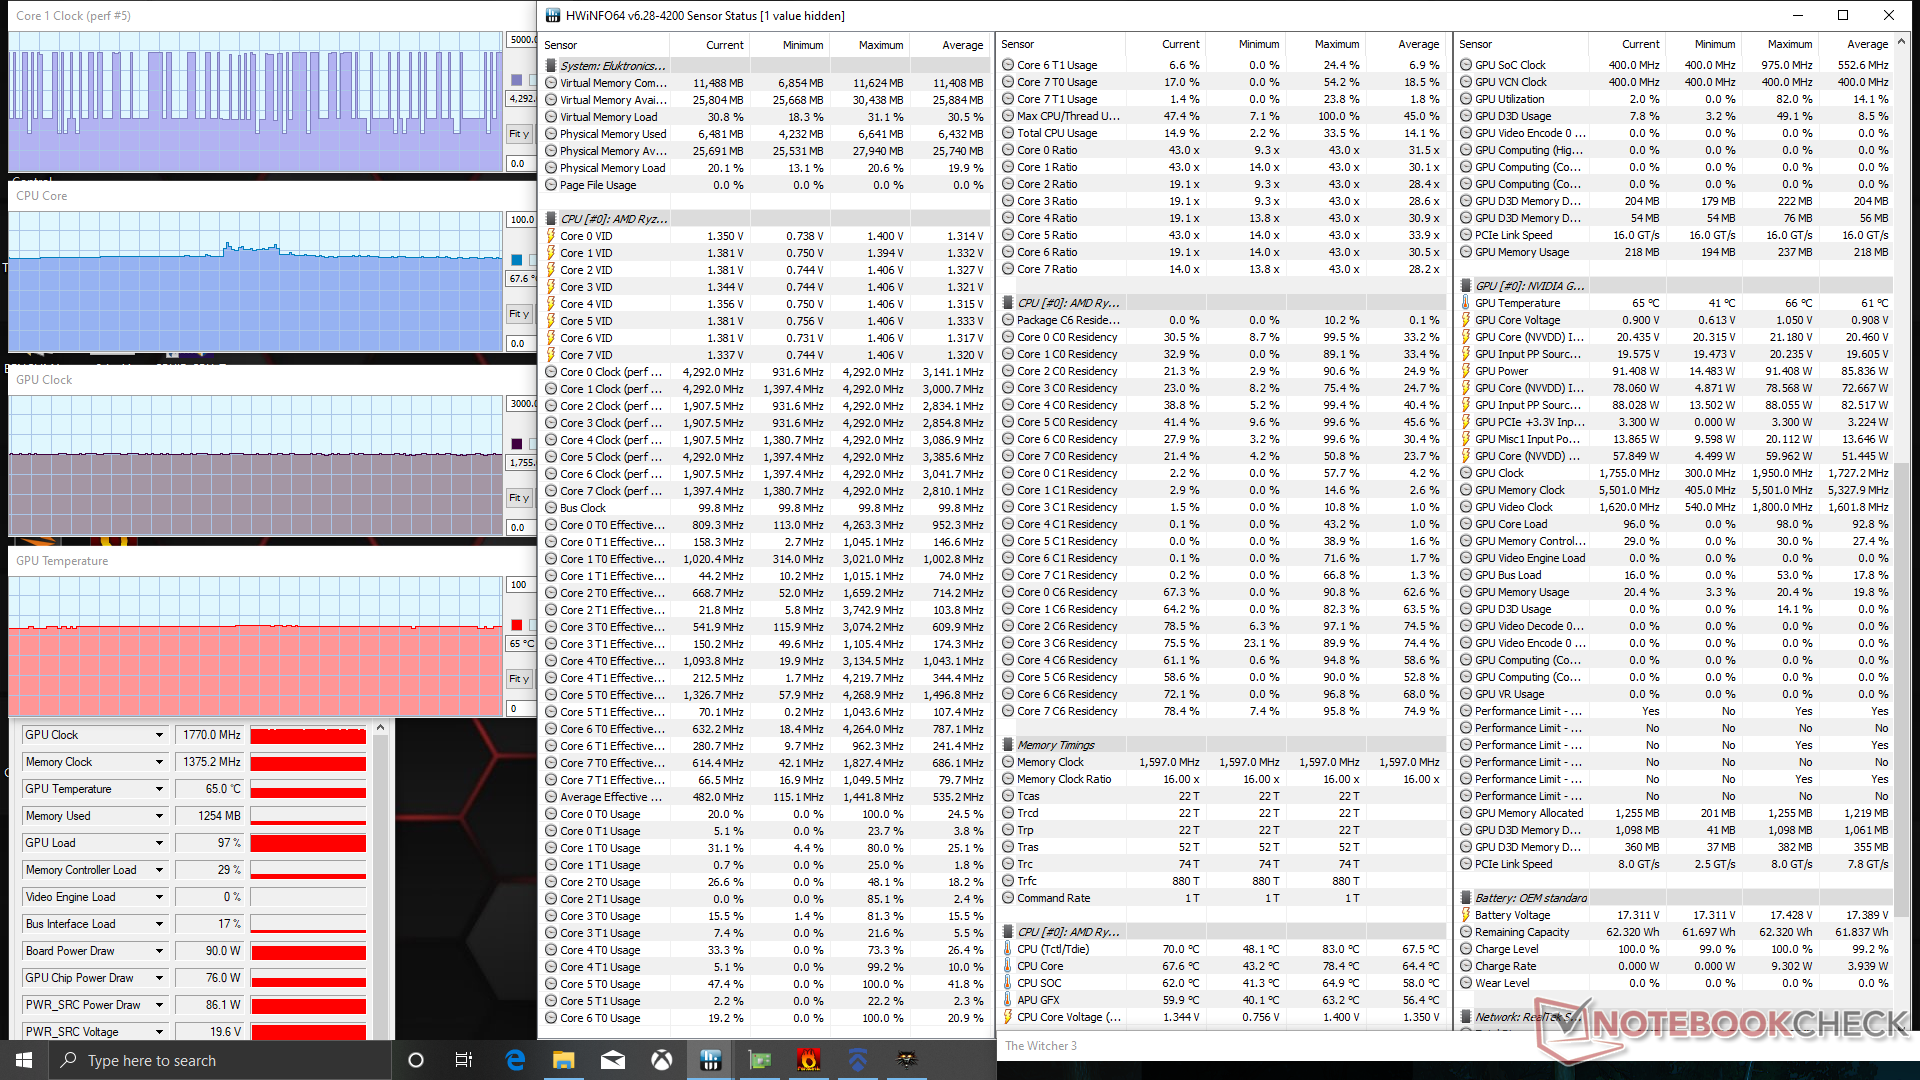
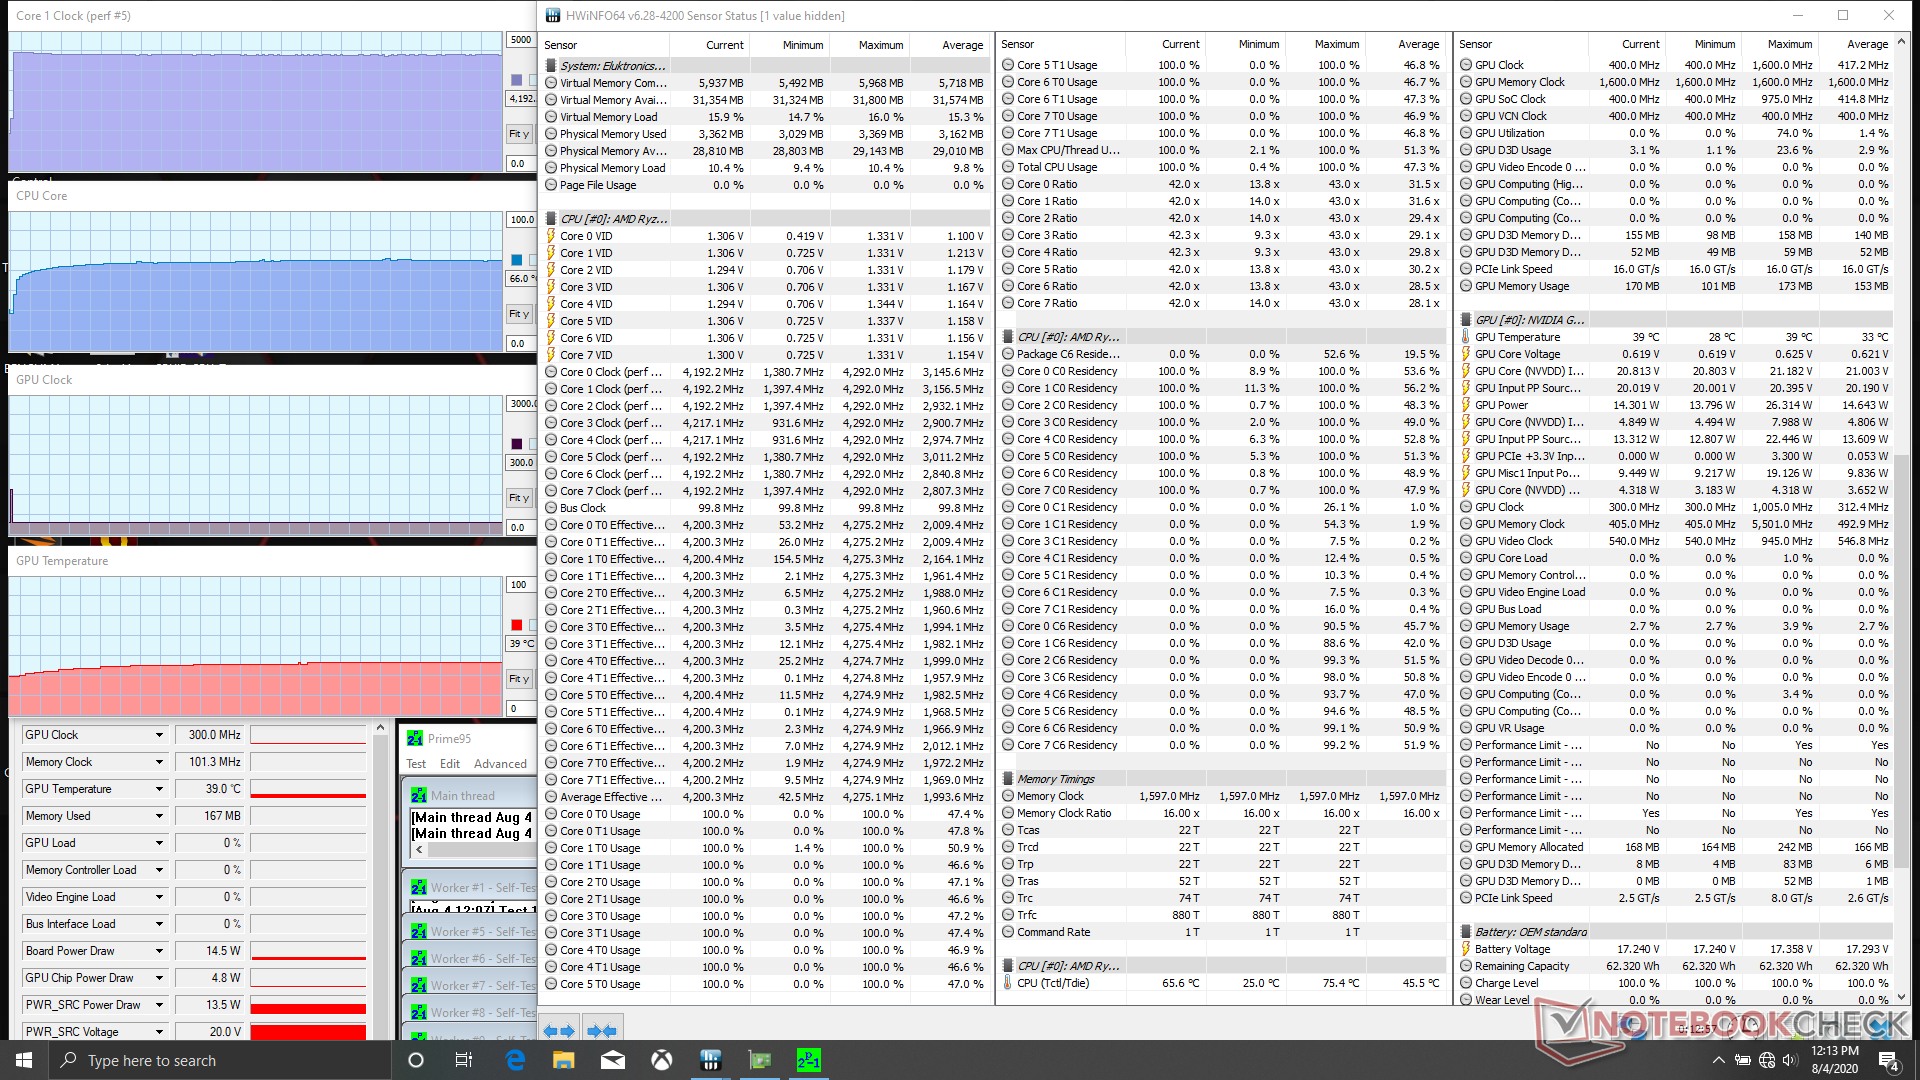
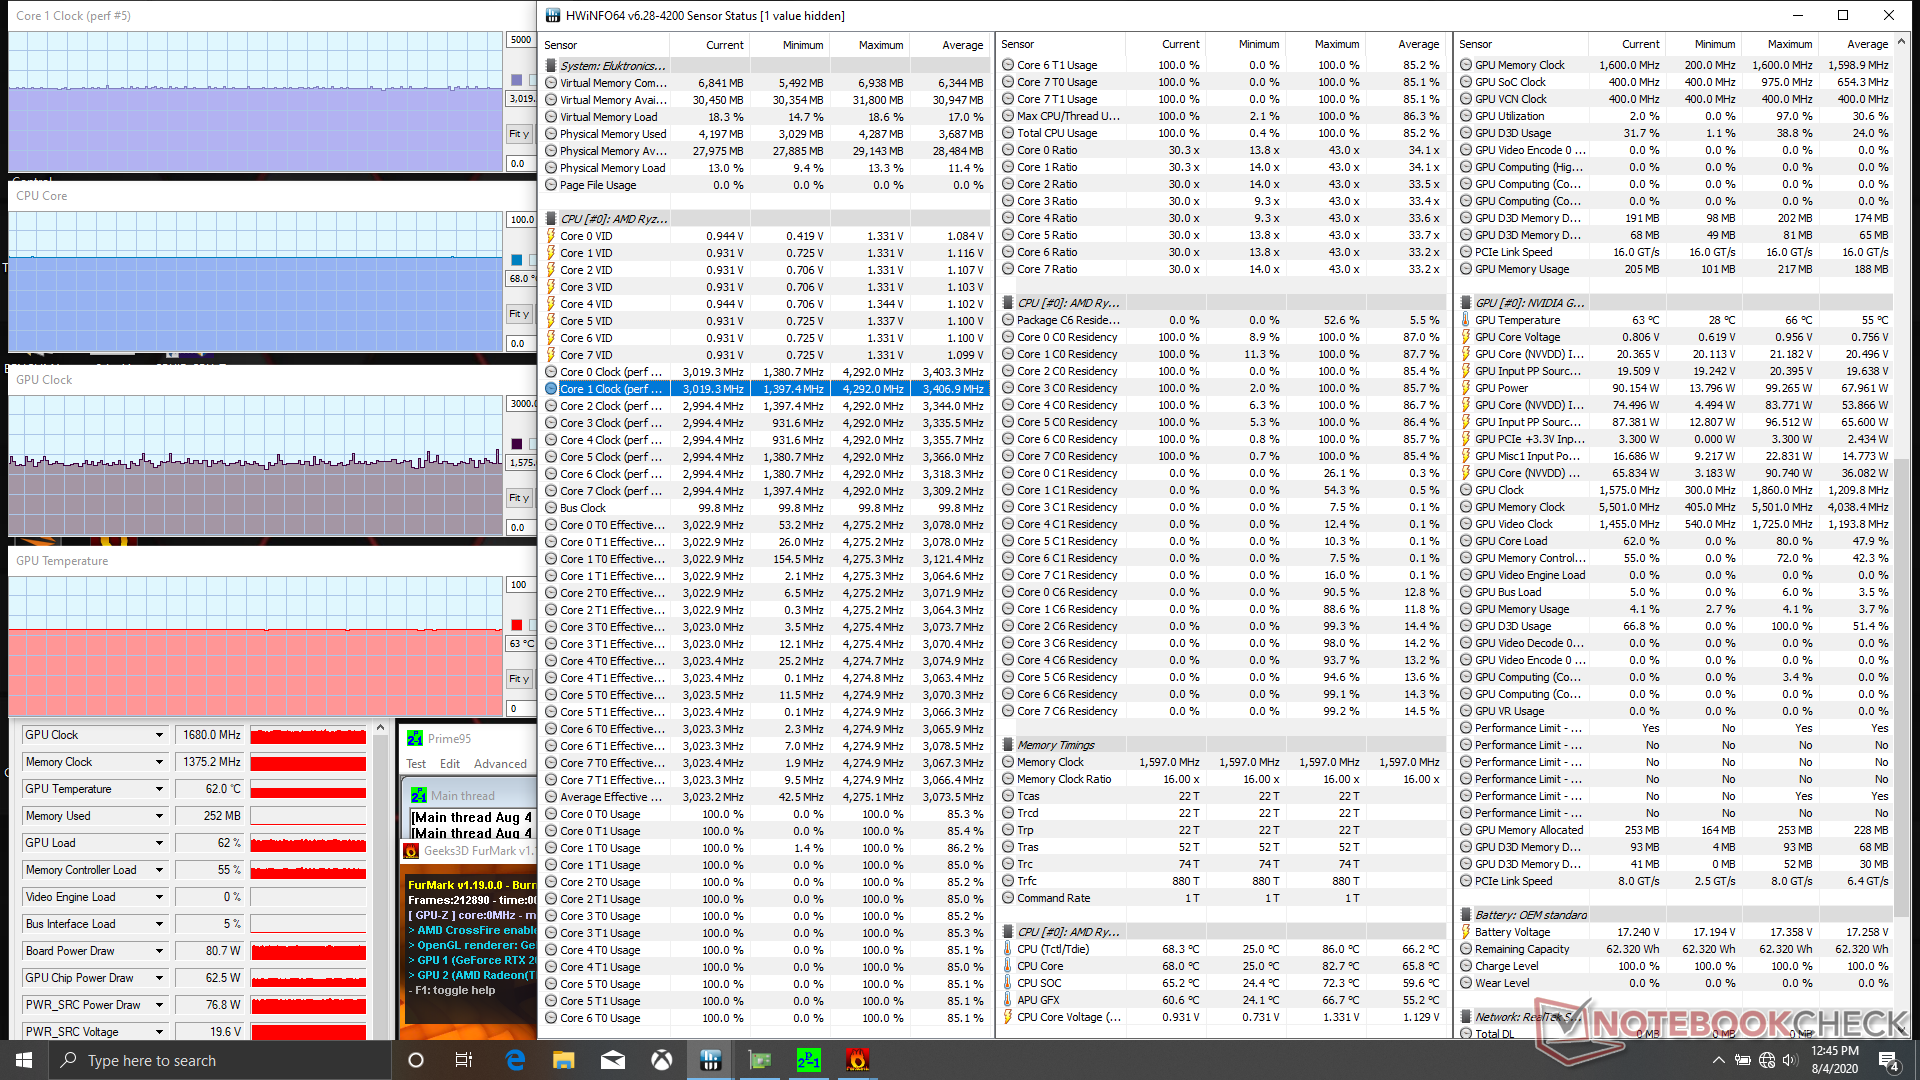
Stress Test
When under Prime95 stress, the CPU would boost to 4.3 GHz for the first few seconds before dipping just slightly to stabilize at 4.2 GHz. The excellent clock rate sustainability can be observed during our CineBench loop test above as well.
When gaming on Turbo fan mode, the CPU and GPU would stabilize at 64 C and 61 C, respectively, compared to 68 C and 65 C when Turbo is off. Clock rates barely change meaning that the biggest advantage of enabling Turbo fan mode is for the cooler core temperatures rather than maximizing performance. Temperatures are already excellent even without Turbo mode.
Running on batteries will limit performance. A Fire Strike run on battery power would return Physics and Graphics scores of 17046 and 4039 points, respectively, compared to 22083 and 16694 points when on mains. Turbo fan mode is disabled when on battery power.
| CPU Clock (GHz) | GPU Clock (MHz) | Average CPU Temperature (°C) | Average GPU Temperature (°C) | |
| System Idle (Turbo fan on) | -- | -- | 25 | 28 |
| Prime95 Stress (Turbo fan on) | 4.2 | -- | 66 | 39 |
| Prime95 + FurMark Stress (Turbo fan on) | 3.0 | 1680 | 68 | 63 |
| Witcher 3 Stress (Turbo fan on) | 1.4 - 4.3 | 1800 | 64 | 61 |
| Witcher 3 Stress (Turbo fan off) | 1.4 - 4.3 | 1770 | 68 | 65 |
Speakers


Eluktronics RP-17 audio analysis
(±) | speaker loudness is average but good (78 dB)
Bass 100 - 315 Hz
(-) | nearly no bass - on average 22.3% lower than median
(±) | linearity of bass is average (12.8% delta to prev. frequency)
Mids 400 - 2000 Hz
(+) | balanced mids - only 4.6% away from median
(±) | linearity of mids is average (7.9% delta to prev. frequency)
Highs 2 - 16 kHz
(+) | balanced highs - only 1.2% away from median
(+) | highs are linear (3.2% delta to prev. frequency)
Overall 100 - 16.000 Hz
(±) | linearity of overall sound is average (19.9% difference to median)
Compared to same class
» 70% of all tested devices in this class were better, 6% similar, 24% worse
» The best had a delta of 6%, average was 18%, worst was 132%
Compared to all devices tested
» 51% of all tested devices were better, 7% similar, 42% worse
» The best had a delta of 4%, average was 23%, worst was 134%
Apple MacBook 12 (Early 2016) 1.1 GHz audio analysis
(+) | speakers can play relatively loud (83.6 dB)
Bass 100 - 315 Hz
(±) | reduced bass - on average 11.3% lower than median
(±) | linearity of bass is average (14.2% delta to prev. frequency)
Mids 400 - 2000 Hz
(+) | balanced mids - only 2.4% away from median
(+) | mids are linear (5.5% delta to prev. frequency)
Highs 2 - 16 kHz
(+) | balanced highs - only 2% away from median
(+) | highs are linear (4.5% delta to prev. frequency)
Overall 100 - 16.000 Hz
(+) | overall sound is linear (10.2% difference to median)
Compared to same class
» 7% of all tested devices in this class were better, 2% similar, 91% worse
» The best had a delta of 5%, average was 18%, worst was 53%
Compared to all devices tested
» 5% of all tested devices were better, 1% similar, 94% worse
» The best had a delta of 4%, average was 23%, worst was 134%
Energy Management
Power Consumption
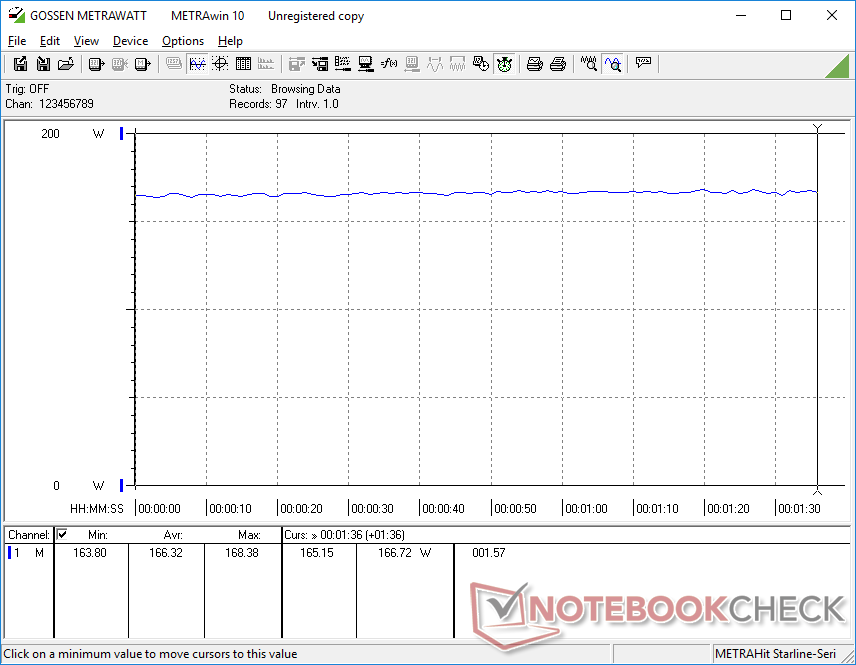
Running Witcher 3 to represent gaming loads result in a steady consumption of about 166 W to be less than what we recorded on the MSI GE75 or Walmart EVOO each with the same GeForce RTX 2060 GPU. Performance-per-watt is greater for the RP-17 when factoring in the superior CPU performance.
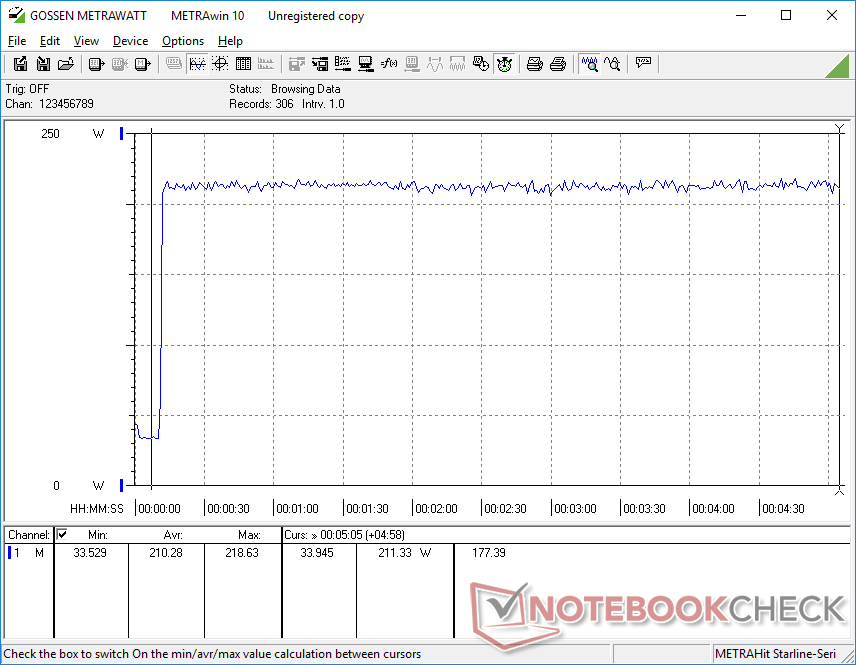
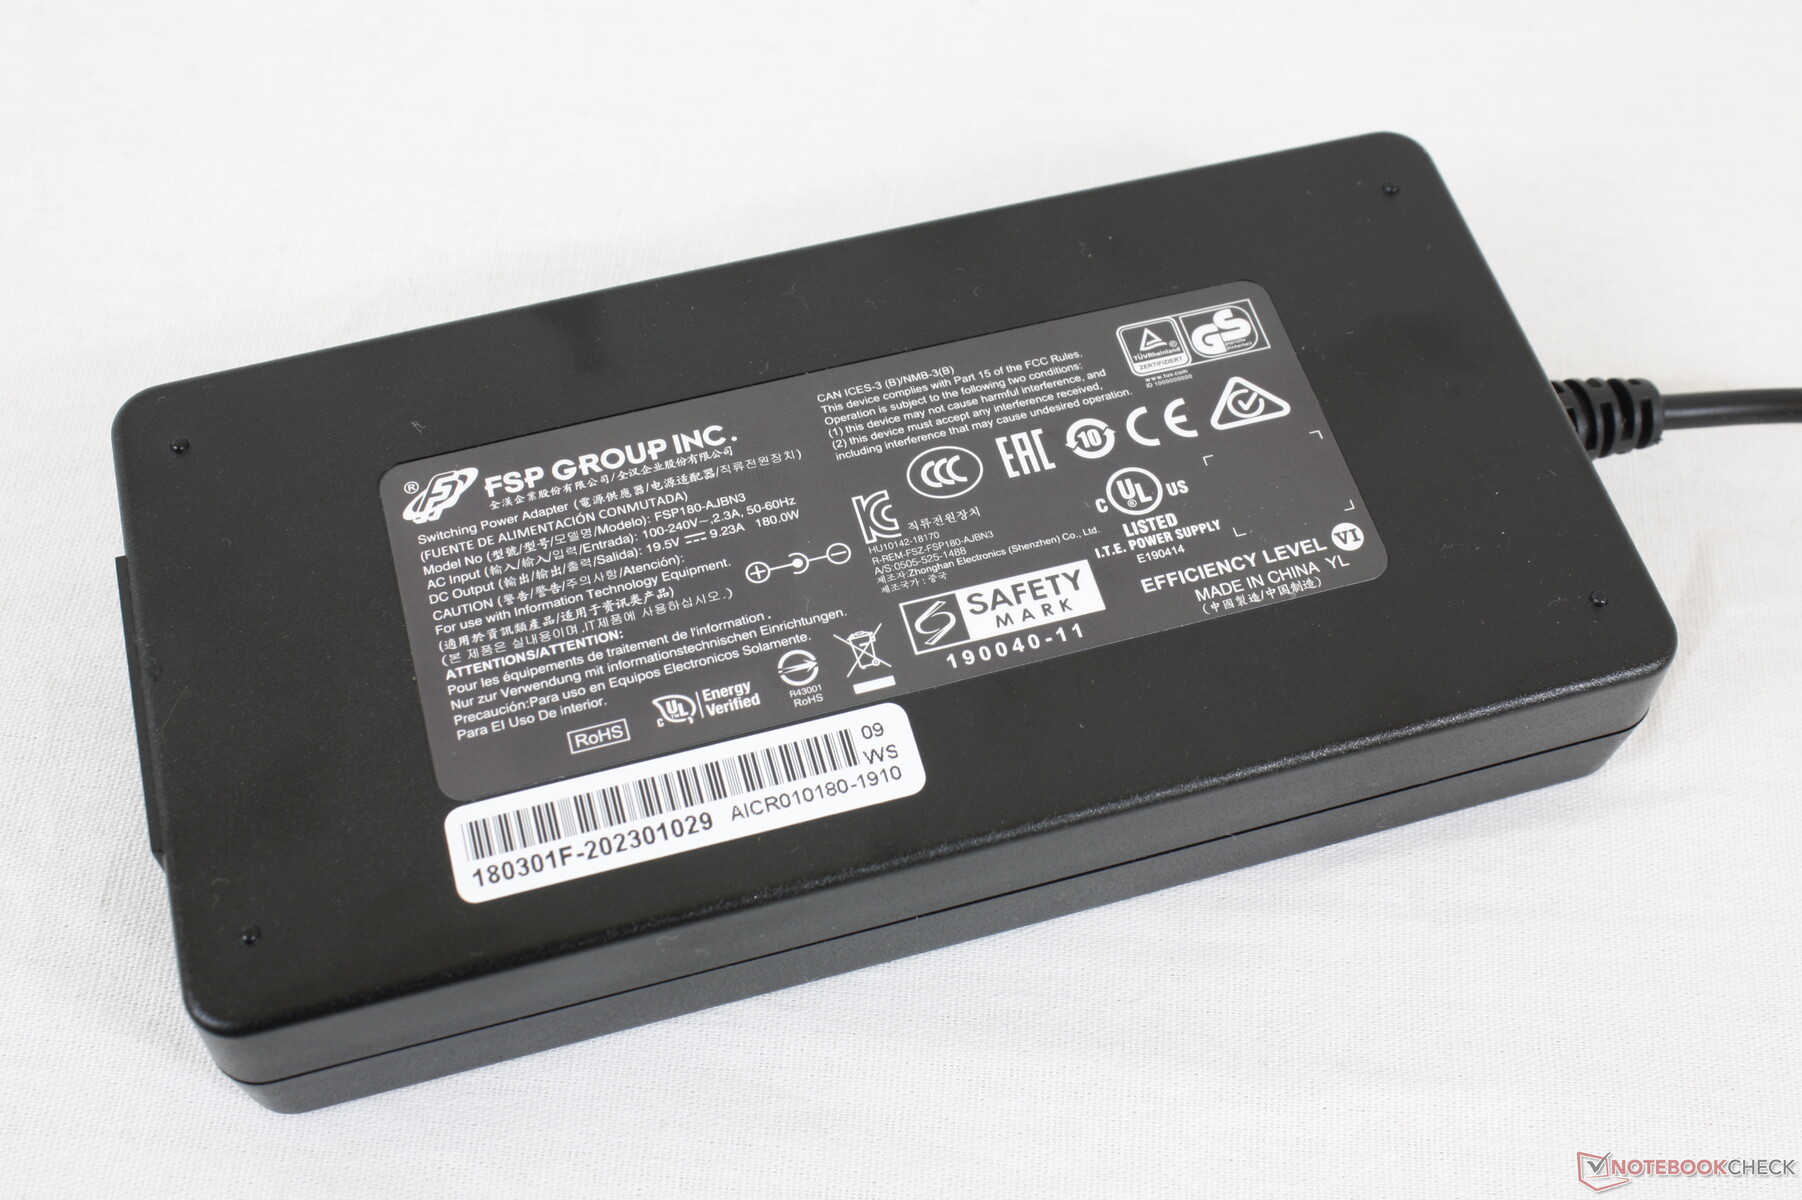
Interestingly, power consumption can be as high as 210 W even though the medium-sized (~15 x 7.5 x 2.5 cm) AC adapter is labeled 180 W. We're not able to notice any slow battery drain issues despite the discrepancy.


| Off / Standby | |
| Idle | |
| Load |
|
Key:
min: | |
| Eluktronics RP-17 R7 4800H, GeForce RTX 2060 Mobile, Phison PS5013 PRO-X-1TB-G2R NVMe SSD, IPS, 1920x1080, 17.3" | MSI GE75 Raider 10SE-008US i7-10750H, GeForce RTX 2060 Mobile, Samsung SSD PM981 MZVLB512HAJQ, IPS, 1920x1080, 17.3" | Razer Blade Pro 17 RTX 2070 Max-Q 300 Hz i7-10875H, GeForce RTX 2070 Max-Q, Lite-On CA5-8D512, IPS, 1920x1080, 17.3" | Asus TUF A17 FA706IU-AS76 R7 4800H, GeForce GTX 1660 Ti Mobile, Intel SSD 660p 1TB SSDPEKNW010T8, IPS, 1920x1080, 17.3" | Walmart EVOO Gaming 17 i7-9750H, GeForce RTX 2060 Mobile, Intel SSD 660p 1TB SSDPEKNW010T8, IPS, 1920x1080, 17.3" | Aorus 17 YA i9-9980HK, GeForce RTX 2080 Mobile, Intel SSD 760p SSDPEKKW010T8, IPS, 1920x1080, 17.3" | |
|---|---|---|---|---|---|---|
| Power Consumption | 8% | -2% | 34% | 11% | -50% | |
| Idle Minimum * (Watt) | 20.2 | 14.7 27% | 19.6 3% | 7.4 63% | 11.4 44% | 34 -68% |
| Idle Average * (Watt) | 24.5 | 20.4 17% | 21.7 11% | 10.5 57% | 16.3 33% | 37 -51% |
| Idle Maximum * (Watt) | 28.7 | 26.9 6% | 36.1 -26% | 17 41% | 31.8 -11% | 41 -43% |
| Load Average * (Watt) | 110.4 | 93.2 16% | 115.6 -5% | 103.7 6% | 92.9 16% | 123 -11% |
| Witcher 3 ultra * (Watt) | 166.3 | 185.4 -11% | 157 6% | 128.1 23% | 171.5 -3% | 250 -50% |
| Load Maximum * (Watt) | 217.4 | 237.8 -9% | 219.9 -1% | 183.2 16% | 243.3 -12% | 386 -78% |
* ... smaller is better
Battery Life
Runtimes from the 62 Wh internal battery are decent for the category at about 4.5 hours of real-world WLAN use when set to the Balanced performance profile. The Asus TUF A17, which integrates a much larger 90 Wh battery, is able to last almost two times longer when under similar testing conditions. Recharging from empty to full capacity takes about 2 hours.

| Eluktronics RP-17 R7 4800H, GeForce RTX 2060 Mobile, 62 Wh | MSI GE75 Raider 10SE-008US i7-10750H, GeForce RTX 2060 Mobile, 65 Wh | Razer Blade Pro 17 RTX 2070 Max-Q 300 Hz i7-10875H, GeForce RTX 2070 Max-Q, 70 Wh | Asus TUF A17 FA706IU-AS76 R7 4800H, GeForce GTX 1660 Ti Mobile, 90 Wh | Walmart EVOO Gaming 17 i7-9750H, GeForce RTX 2060 Mobile, 46 Wh | Aorus 17 YA i9-9980HK, GeForce RTX 2080 Mobile, 94.24 Wh | |
|---|---|---|---|---|---|---|
| Battery runtime | -16% | 11% | 147% | -5% | 31% | |
| WiFi v1.3 (h) | 4.4 | 3.7 -16% | 4.9 11% | 8.5 93% | 4.2 -5% | 3.9 -11% |
| Load (h) | 1.1 | 3.3 200% | 1.9 73% | |||
| Reader / Idle (h) | 9.1 |
Pros
Cons
Verdict
Much like for the 15.6-inch Eluktronics RP-15, the 17.3-inch RP-17 is attractive for its no-frills design, 144 Hz display, easy upgradeability, and Zen 2 Ryzen 7 CPU for the same price as most Core i7 alternatives equipped with the same GeForce RTX 2060 GPU. Core temperatures when gaming are also cooler than expected likely because the chassis itself can support even faster GPU options that Eluktronics is unfortunately not offering at the moment. Turbo fan mode isn't really needed to maximize frame rates and so users can game with the feature turned off for quieter fans. The chassis feels longer-lasting than the MSI GF75 even though it doesn't quite reach the same heights as the pricier MSI GT series or Asus ROG Strix series.
The noticeable backlight bleeding and slightly thicker chassis are the main drawbacks to the system. Don't expect the super-sleek photogenic experience out of the RP-17 as you would from an MSI GS66, Asus Zephyrus, or Razer Blade.
Perhaps the closest competitor is the Asus TUF A17 which can be configured with the exact same CPU and GPU options for about $100 to $200 USD more. The Asus system runs warmer and louder when gaming due in part to it being the thinner machine.
The Eluktronics RP-17 focuses on the core gaming experience without any visual distractions that tend to bump up the price. The base 144 Hz panel is notable compared to other gaming laptops in this price range where lesser 60 Hz or 120 Hz panels are common.
Eluktronics RP-17
- 08/09/2020 v7 (old)
Allen Ngo
Price comparison
