Eluktronics Mech-17 GP2 laptop review: MSI GT77 Titan performance without the size
The Eluktronics Mech-17 GP2 replaces last year's Mech-17 GP by swapping out the Intel 12th gen and Nvidia Ampere options for Intel 13th gen and Nvidia Ada Lovelace, respectively. It's notable for offering Core HX-series CPUs and 175 W GeForce RTX 4090 graphics despite the small footprint relative to other 17-inch gaming laptops.
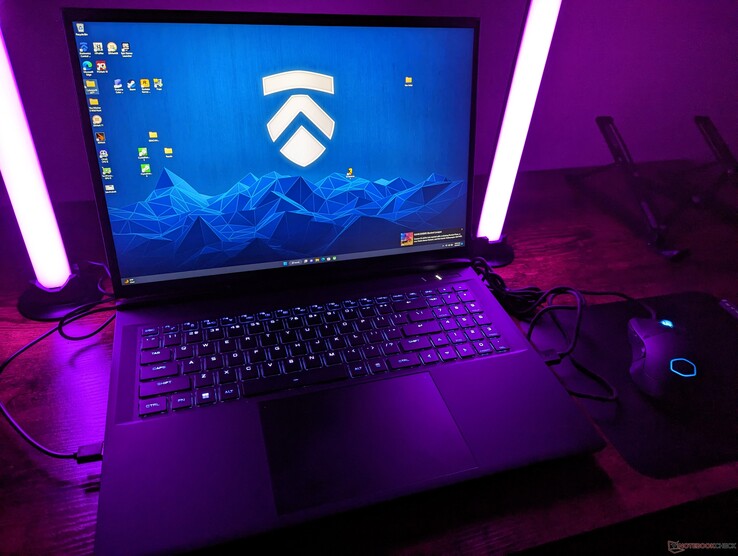
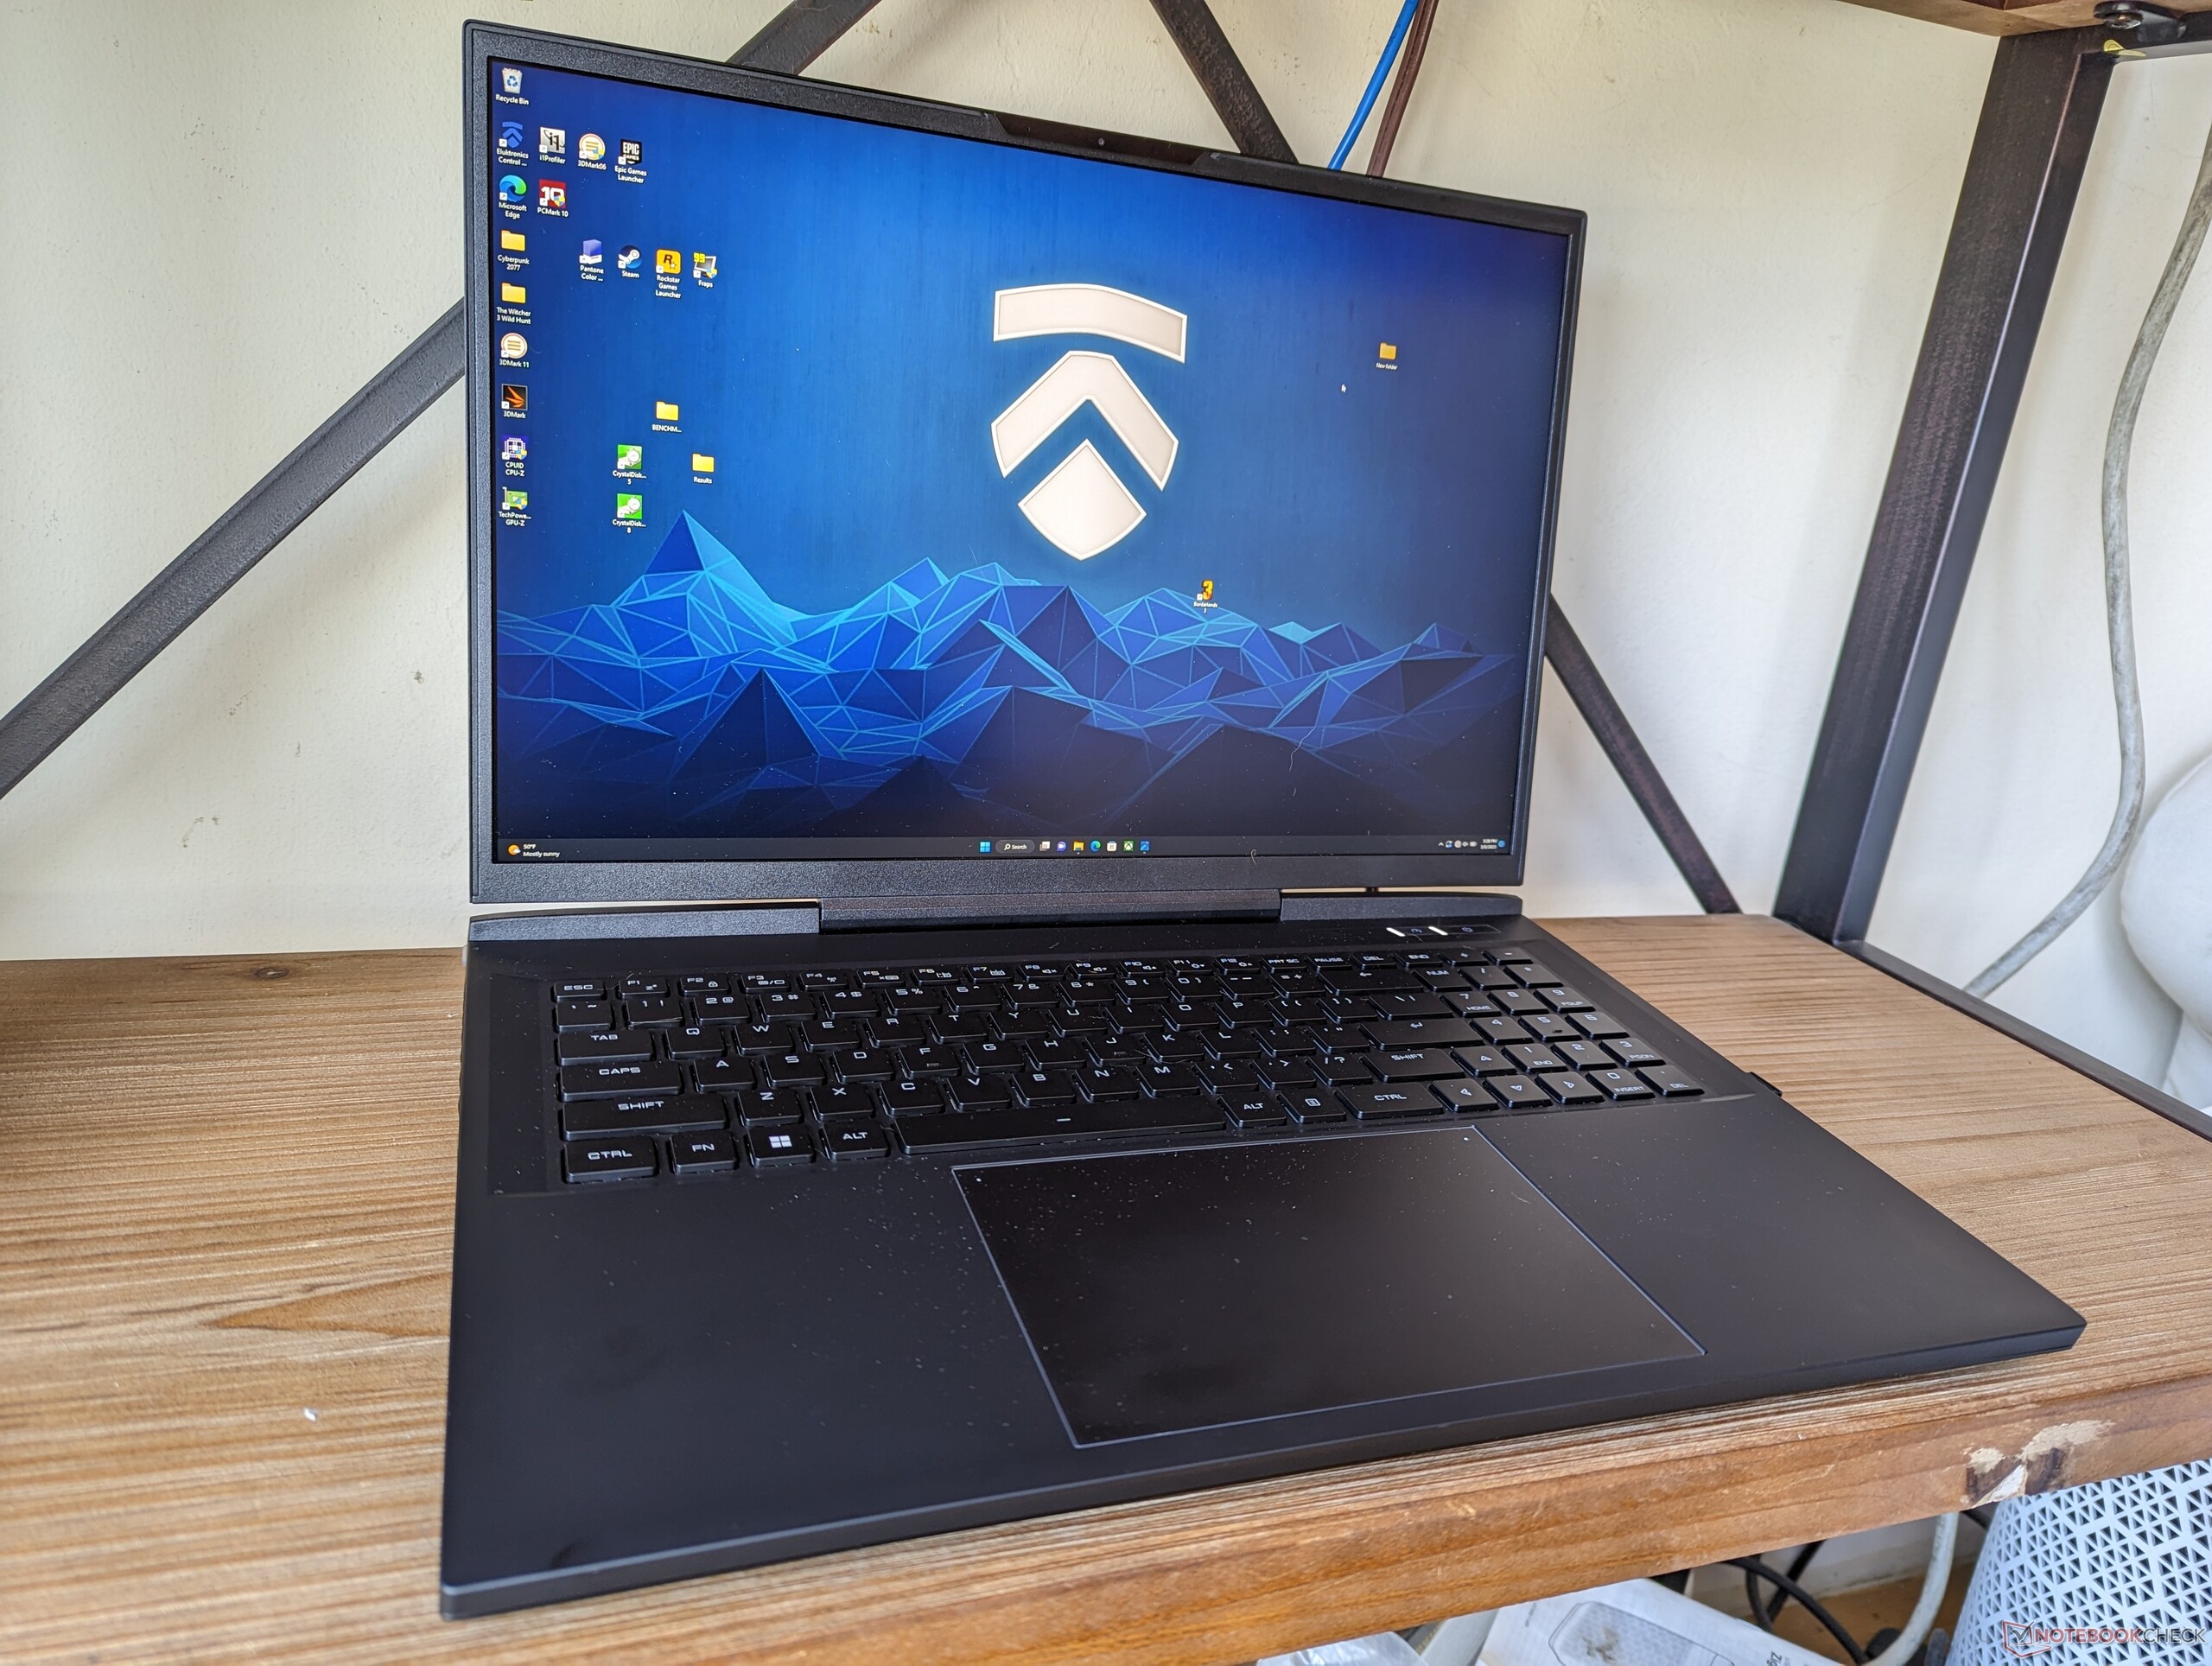
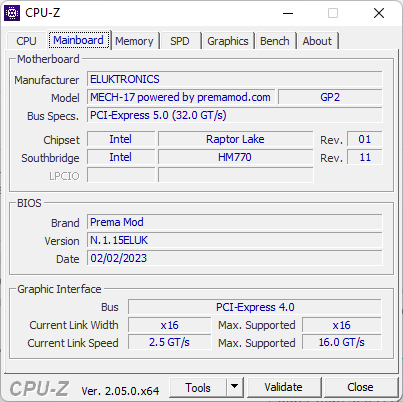
The Mech-17 GP2 is based on an updated version of last year's Uniwill-designed Schenker Neo 17 M22. It is essentially the Neo 17 E23 albeit under the Eluktronics branding. There are several important changes to the motherboard this year which we will detail in our analyses below. Otherwise, their exterior designs remain identical and so we recommend checking out our existing review on the Schenker Neo 17 M22 to learn more about the physical features of the Mech-17 GP2.
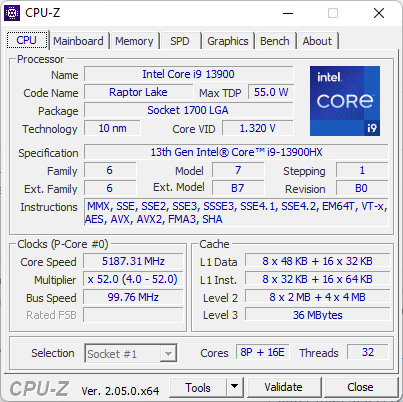
Our configuration in review has been fully configured with the Core i9-13900HX and RTX 4090 for approximately $3400 USD. Lesser SKUs are available down to the RTX 4070, but all options otherwise come with the same CPU and 240 Hz 2560 x 1600 IPS display.
Alternatives to the Mech-17 GP2 include other high-end 17-inch gaming laptops like the Razer Blade 17, Alienware m17 R5, Asus Zephyrus S17, or the MSI Titan GT77.
More Eluktronics reviews:
Potential Competitors in Comparison
Rating | Date | Model | Weight | Height | Size | Resolution | Price |
|---|---|---|---|---|---|---|---|
| 89.9 % v7 (old) | 03 / 2023 | Eluktronics Mech-17 GP2 i9-13900HX, GeForce RTX 4090 Laptop GPU | 2.9 kg | 27 mm | 17.00" | 2560x1600 | |
| 87.6 % v7 (old) | 08 / 2022 | Schenker XMG Neo 17 M22 R9 6900HX, GeForce RTX 3080 Ti Laptop GPU | 2.8 kg | 27 mm | 17.00" | 2560x1600 | |
| 82.1 % v7 (old) | 02 / 2023 | MSI Katana 17 B13VFK i7-13620H, GeForce RTX 4060 Laptop GPU | 2.8 kg | 25.2 mm | 17.30" | 1920x1080 | |
| 89 % v7 (old) | 02 / 2023 | MSI Titan GT77 HX 13VI i9-13950HX, GeForce RTX 4090 Laptop GPU | 3.5 kg | 23 mm | 17.30" | 3840x2160 | |
| 86.1 % v7 (old) | 01 / 2023 | Alienware m17 R5 (R9 6900HX, RX 6850M XT) R9 6900HX, Radeon RX 6850M XT | 3.4 kg | 26.7 mm | 17.00" | 3840x2160 | |
| 91.4 % v7 (old) | 02 / 2023 | Razer Blade 18 RTX 4070 i9-13950HX, GeForce RTX 4070 Laptop GPU | 3 kg | 21.9 mm | 18.00" | 2560x1600 |
Case
SD Card Reader
The SD card reader is slow relative to the high price point of the model. The Razer Blade 18 and Dell XPS series have 2x to 3x faster card readers.
| SD Card Reader | |
| average JPG Copy Test (av. of 3 runs) | |
| Razer Blade 18 RTX 4070 (Angelibird AV Pro V60) | |
| MSI Titan GT77 HX 13VI (Angelibird AV Pro V60) | |
| Eluktronics Mech-17 GP2 (Angelibird AV Pro V60) | |
| Schenker XMG Neo 17 M22 (AV PRO microSD 128 GB V60) | |
| maximum AS SSD Seq Read Test (1GB) | |
| Razer Blade 18 RTX 4070 (Angelibird AV Pro V60) | |
| Eluktronics Mech-17 GP2 (Angelibird AV Pro V60) | |
| MSI Titan GT77 HX 13VI (Angelibird AV Pro V60) | |
Communication
An Intel AX201 comes standard for Wi-Fi 6 and Bluetooth 5.2 connectivity. Nonetheless, we were expecting an AX210/211 for faster Wi-Fi 6E speeds considering the price of the system.
| Networking | |
| iperf3 transmit AXE11000 | |
| MSI Titan GT77 HX 13VI | |
| MSI Katana 17 B13VFK | |
| Eluktronics Mech-17 GP2 | |
| Razer Blade 18 RTX 4070 | |
| Alienware m17 R5 (R9 6900HX, RX 6850M XT) | |
| Schenker XMG Neo 17 M22 | |
| iperf3 receive AXE11000 | |
| MSI Katana 17 B13VFK | |
| MSI Titan GT77 HX 13VI | |
| Razer Blade 18 RTX 4070 | |
| Eluktronics Mech-17 GP2 | |
| Alienware m17 R5 (R9 6900HX, RX 6850M XT) | |
| Schenker XMG Neo 17 M22 | |
| iperf3 transmit AXE11000 6GHz | |
| Razer Blade 18 RTX 4070 | |
| iperf3 receive AXE11000 6GHz | |
| Razer Blade 18 RTX 4070 | |
Webcam
The 2 MP FHD webcam and IR come standard for Hello support. There is no privacy switch or shutter option, however.


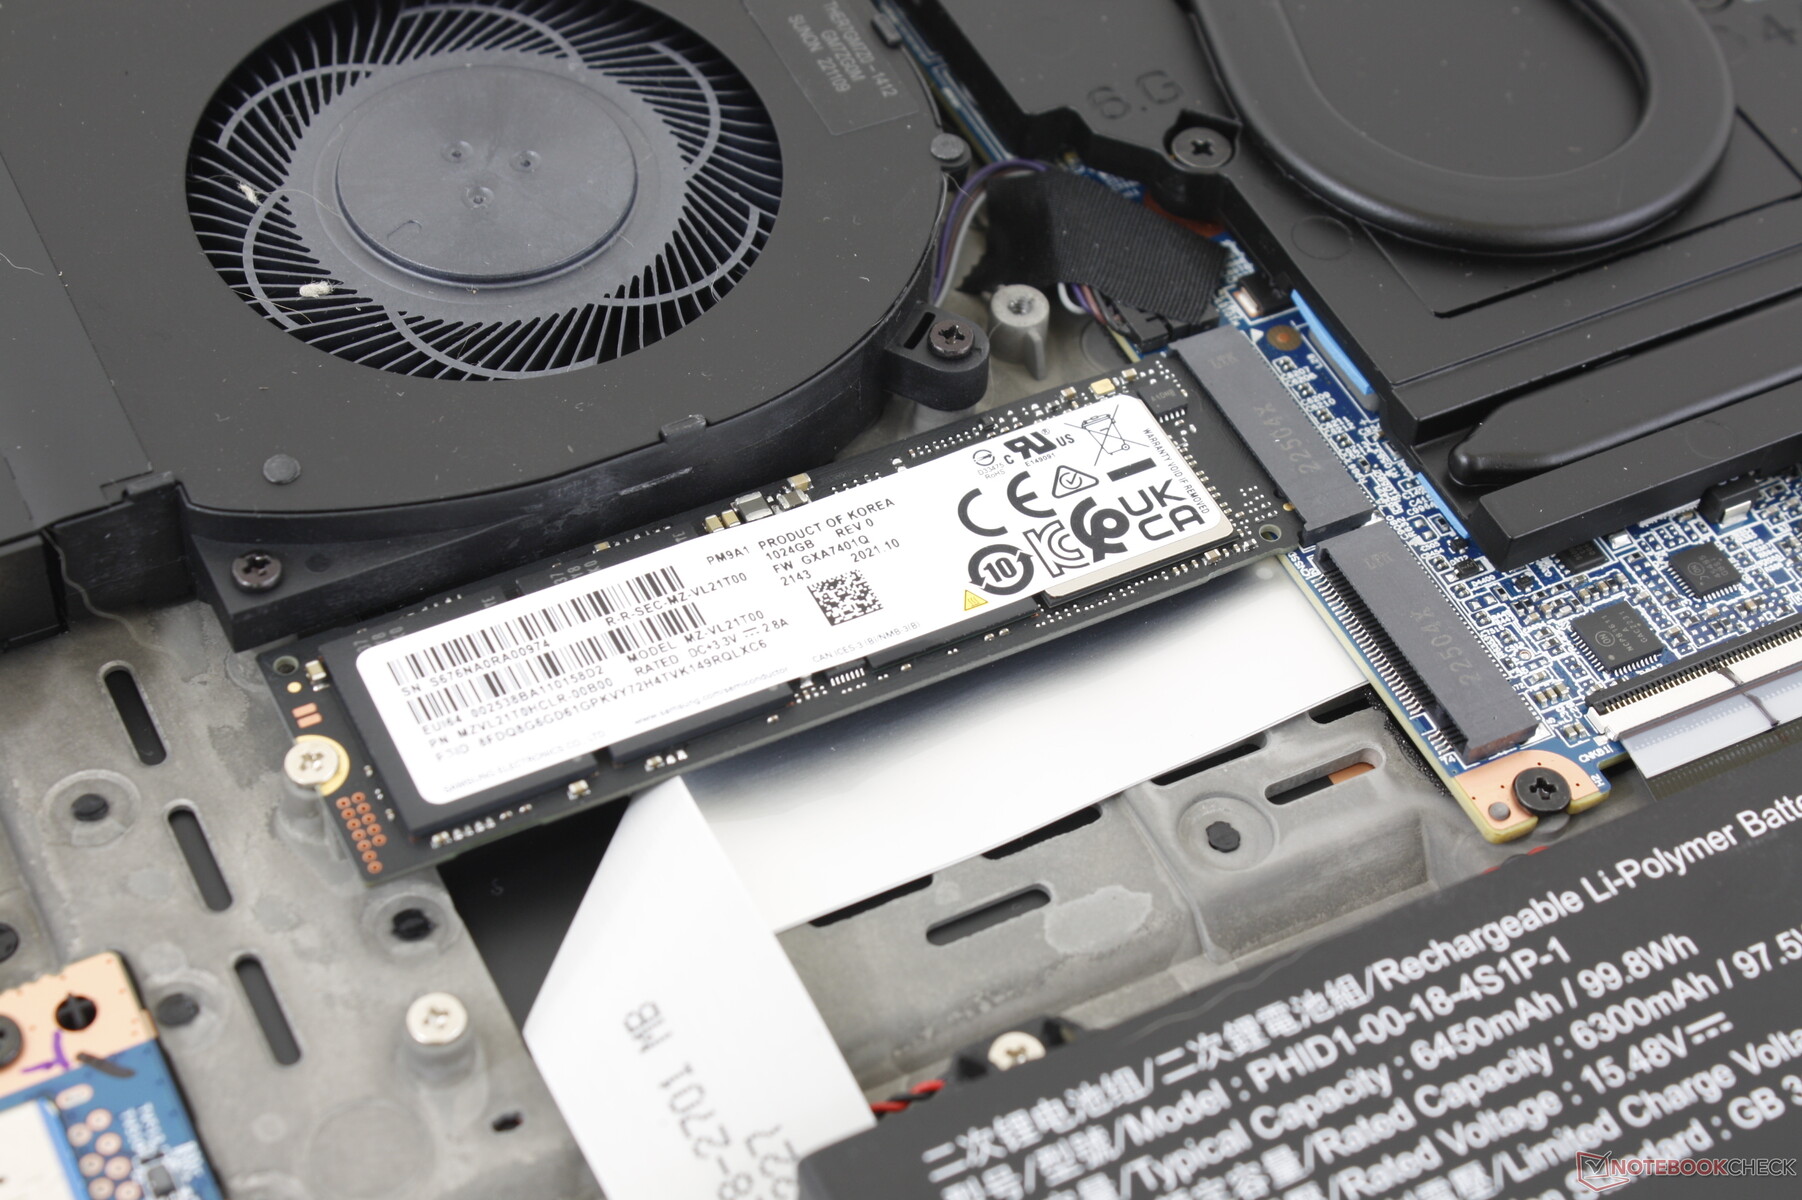
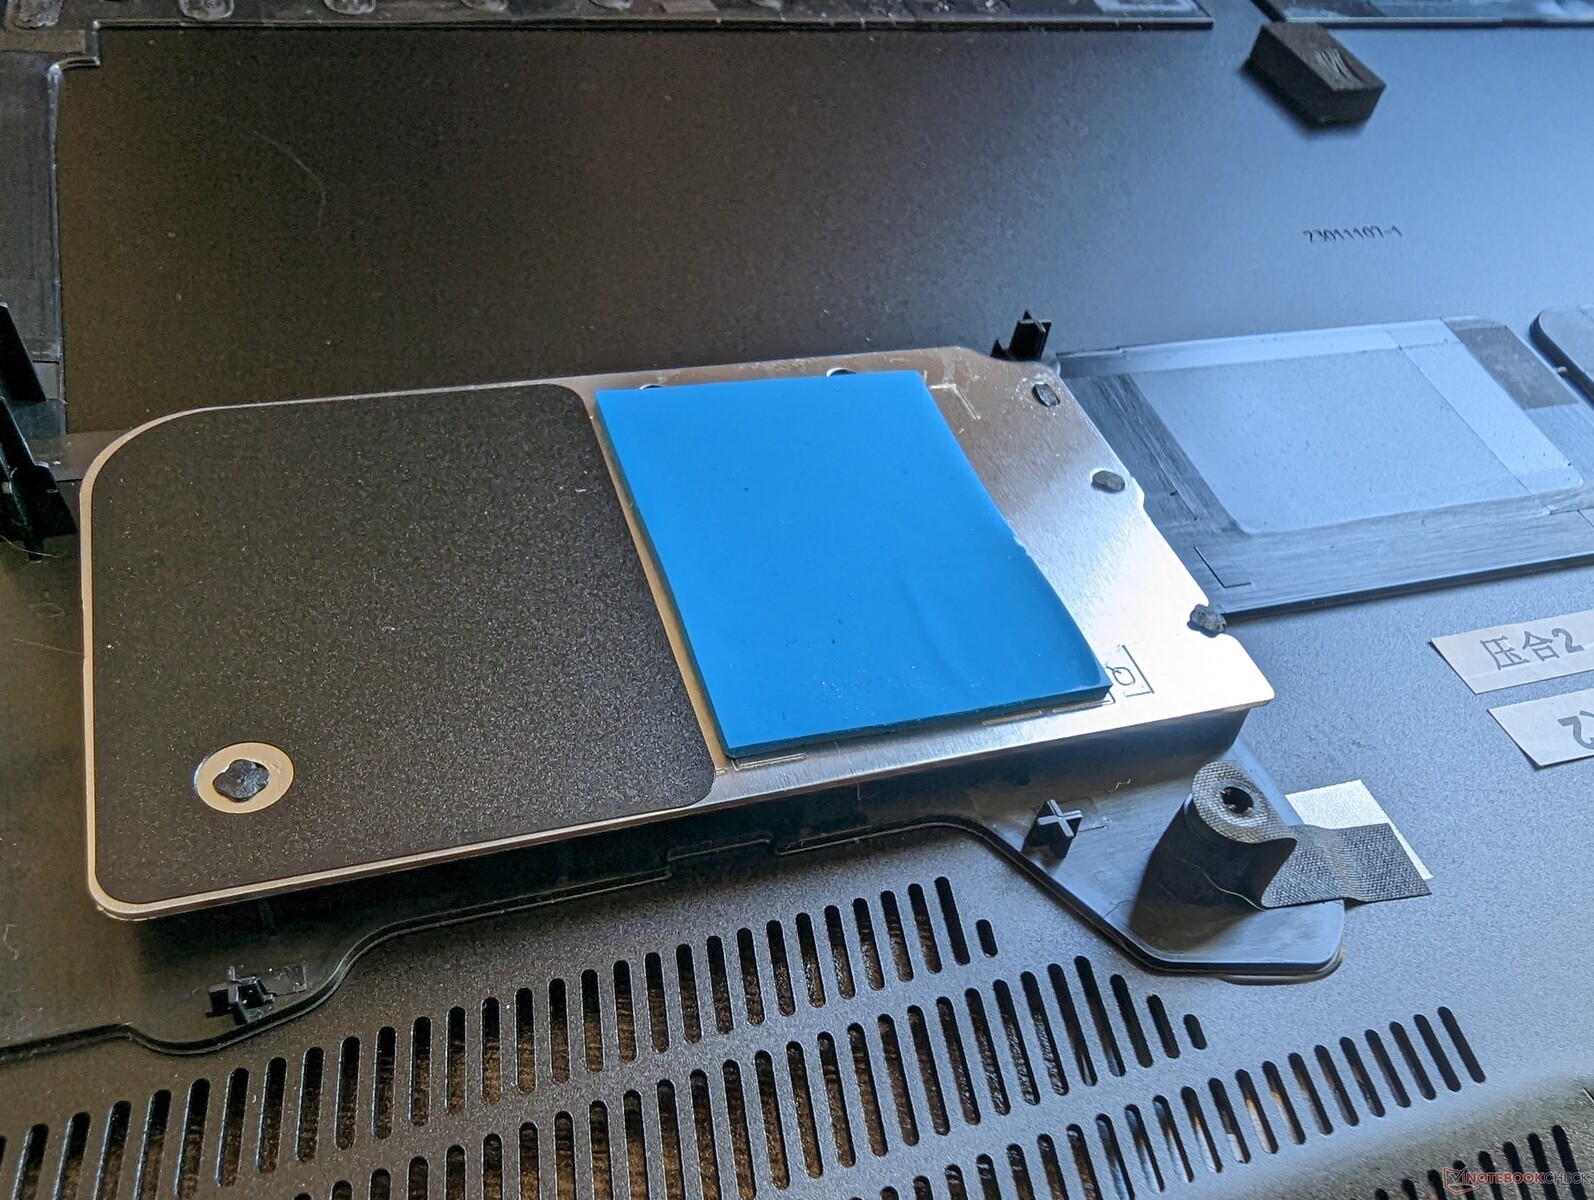
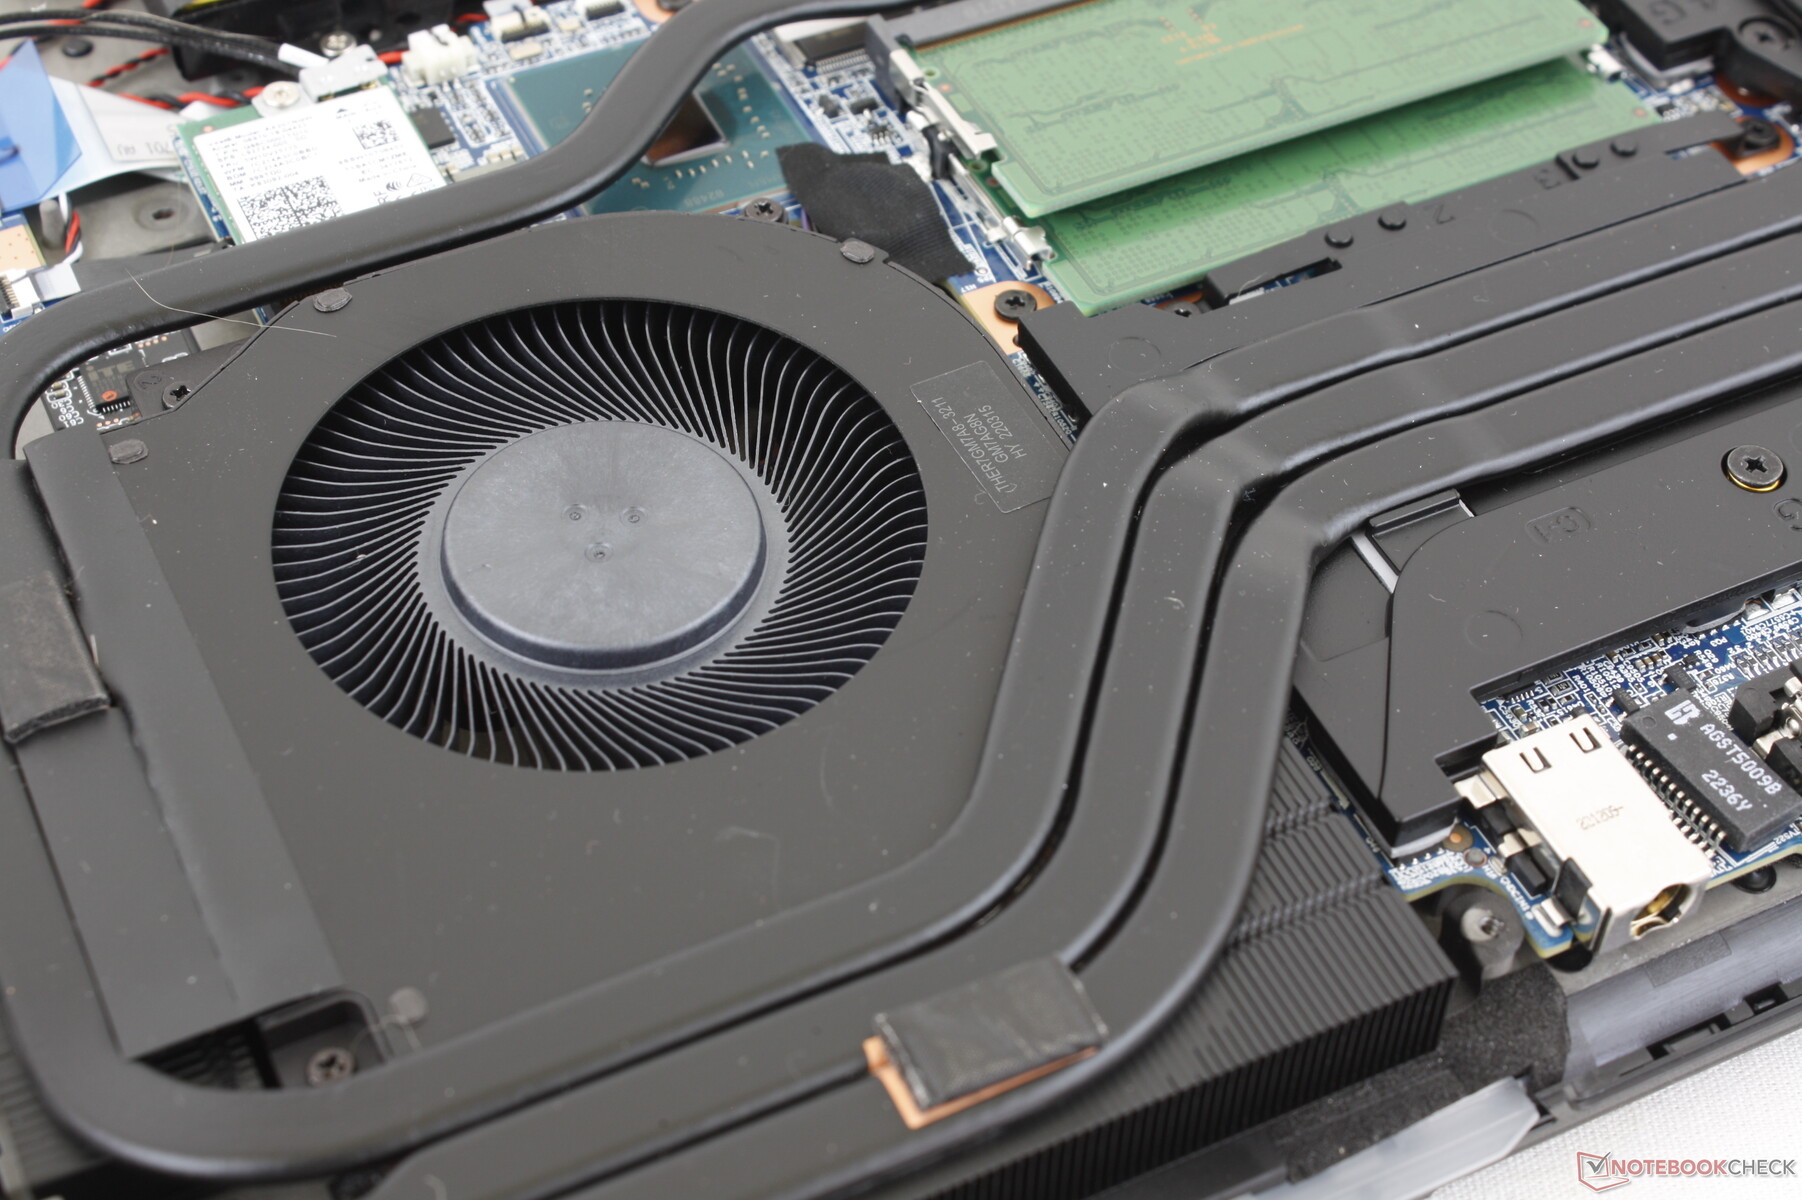
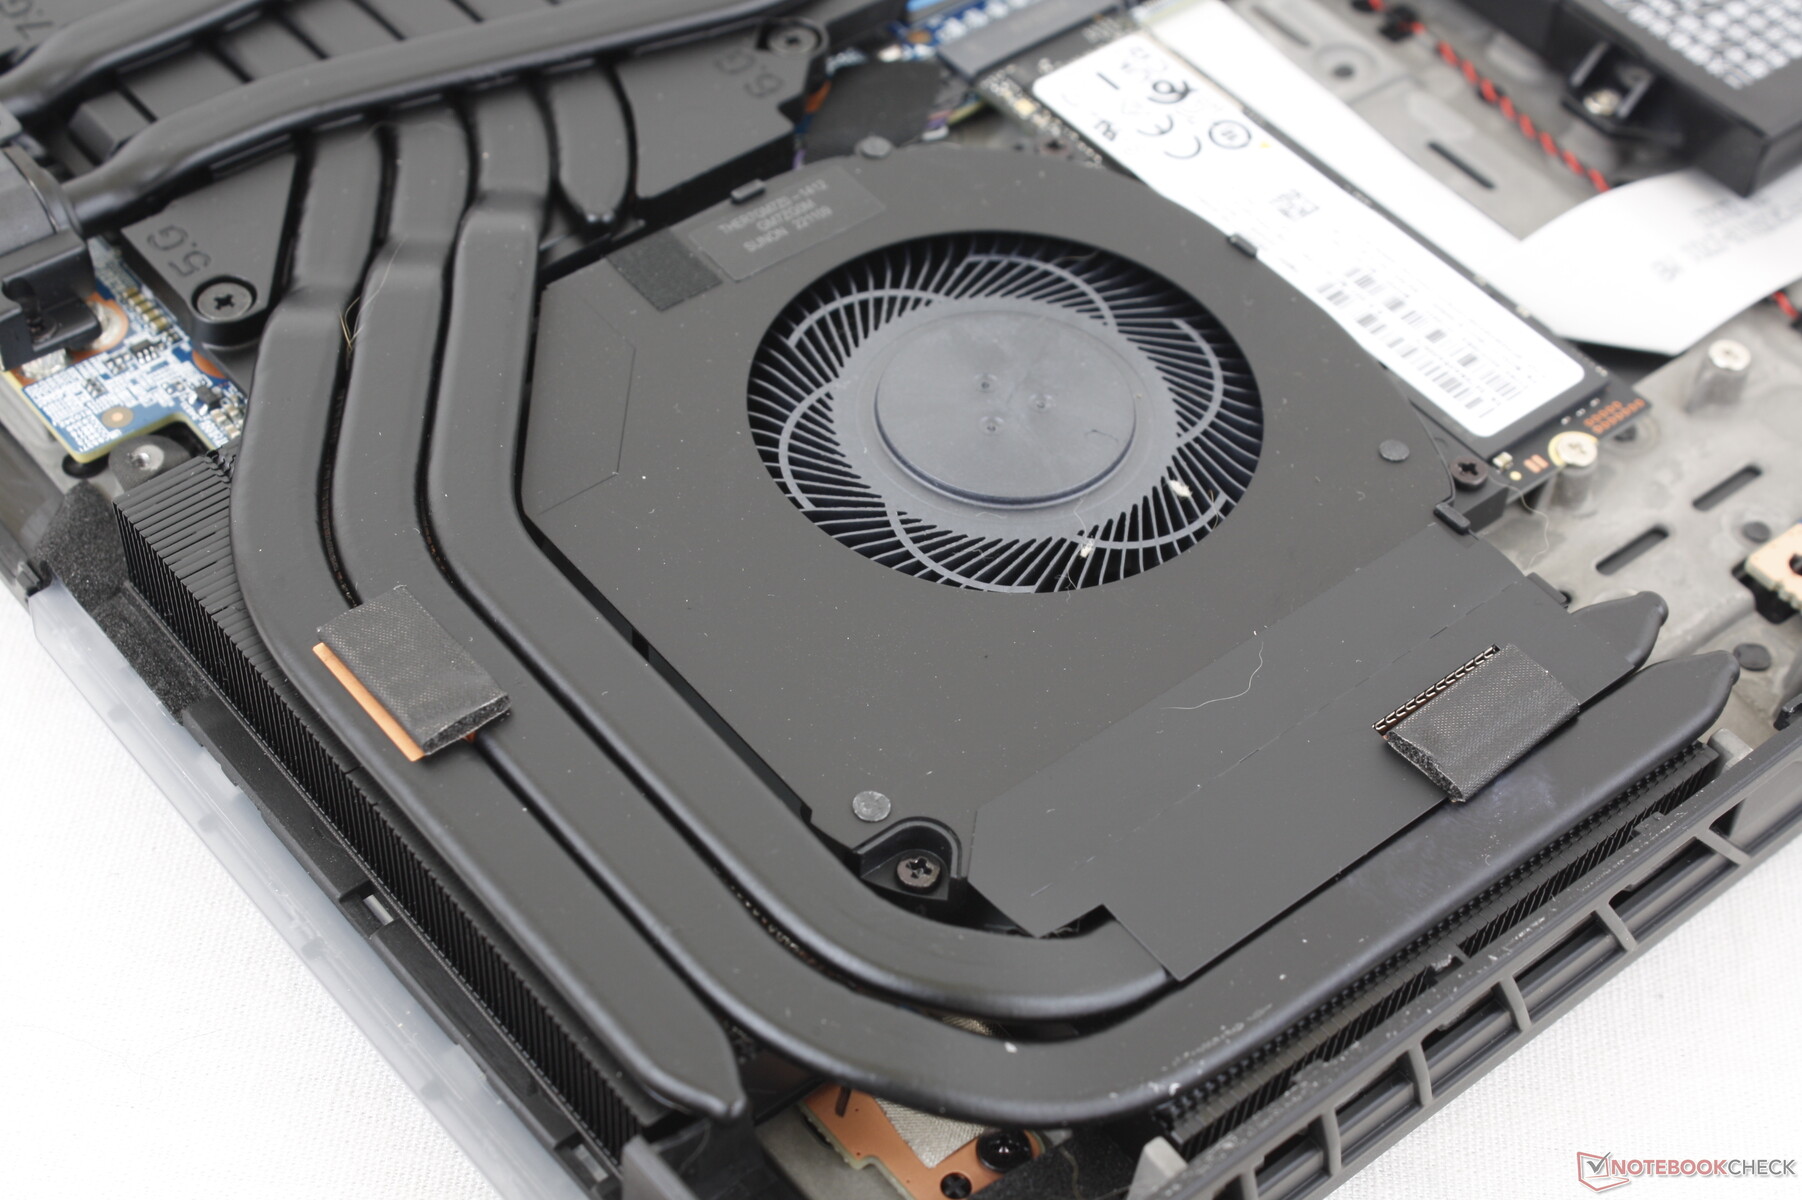
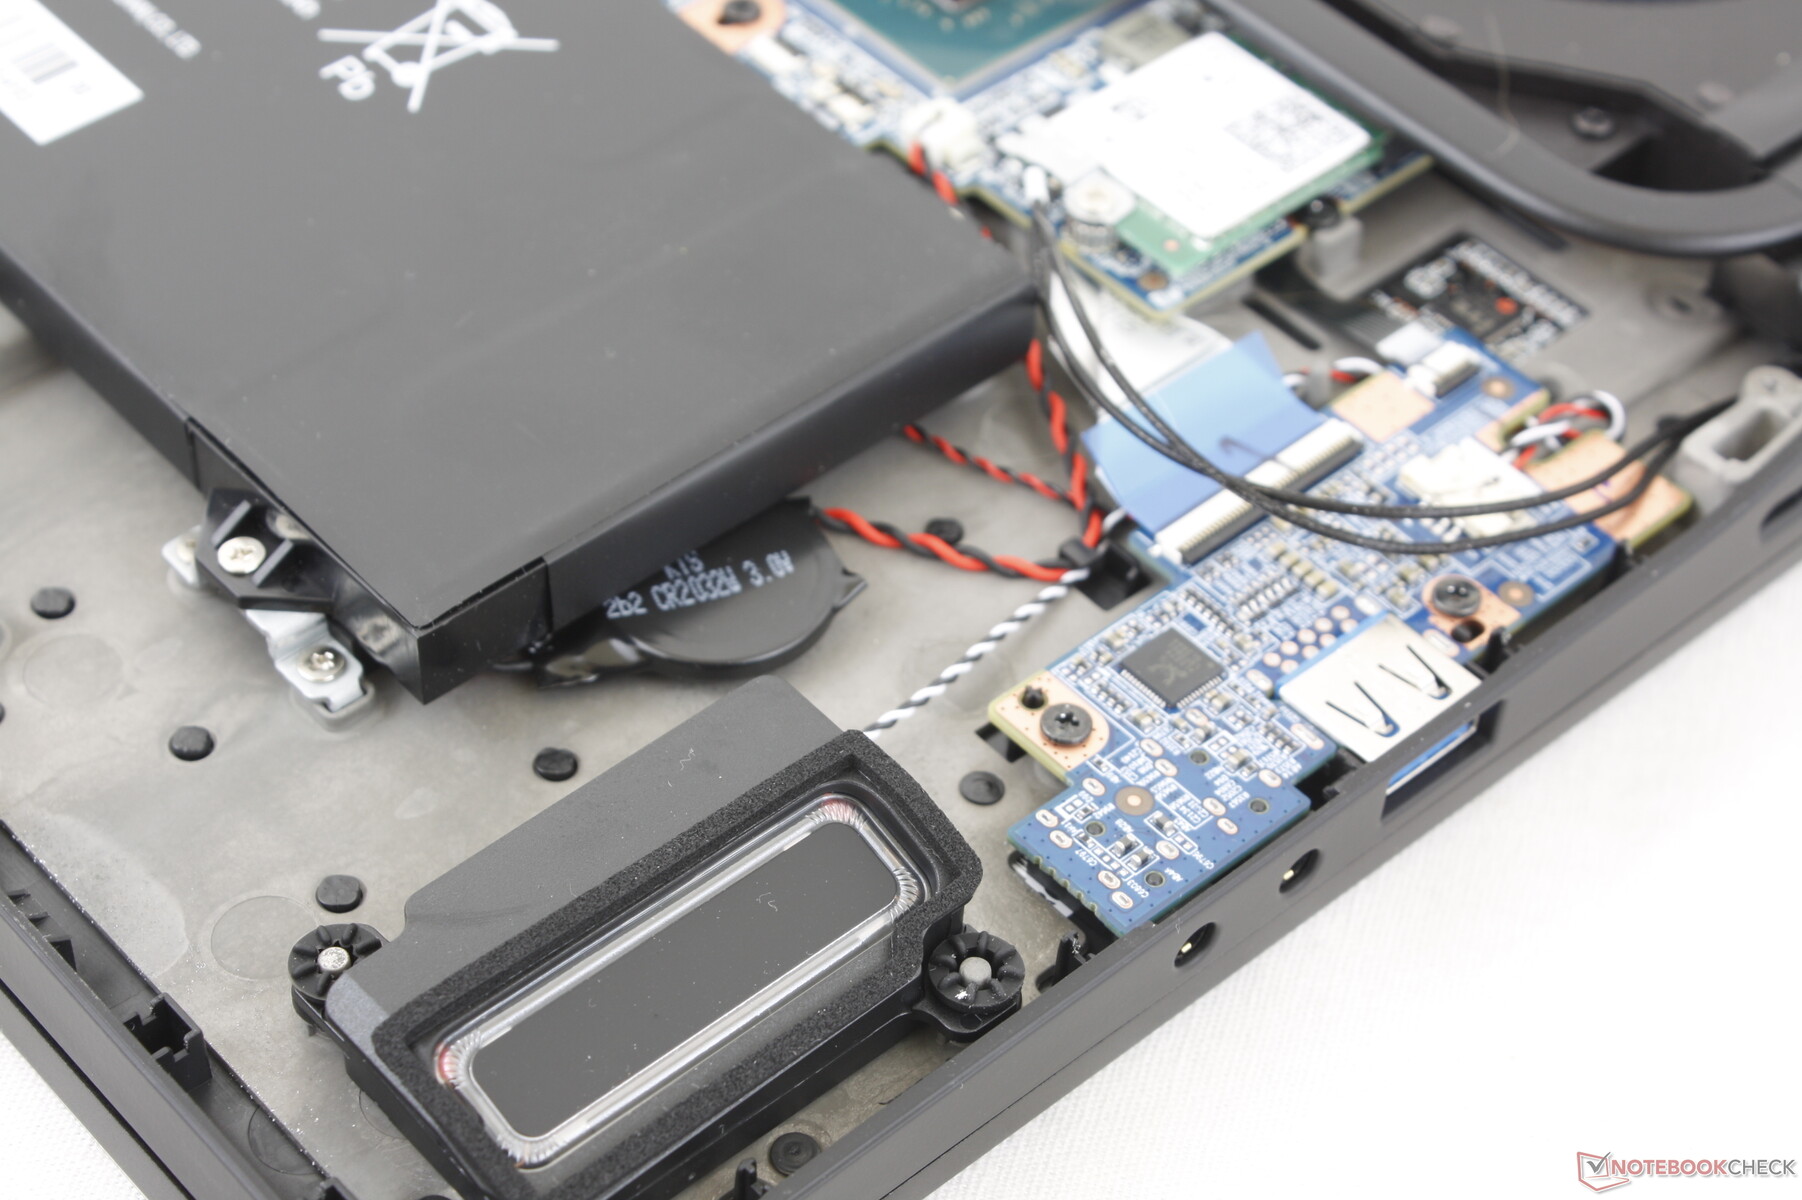
Maintenance
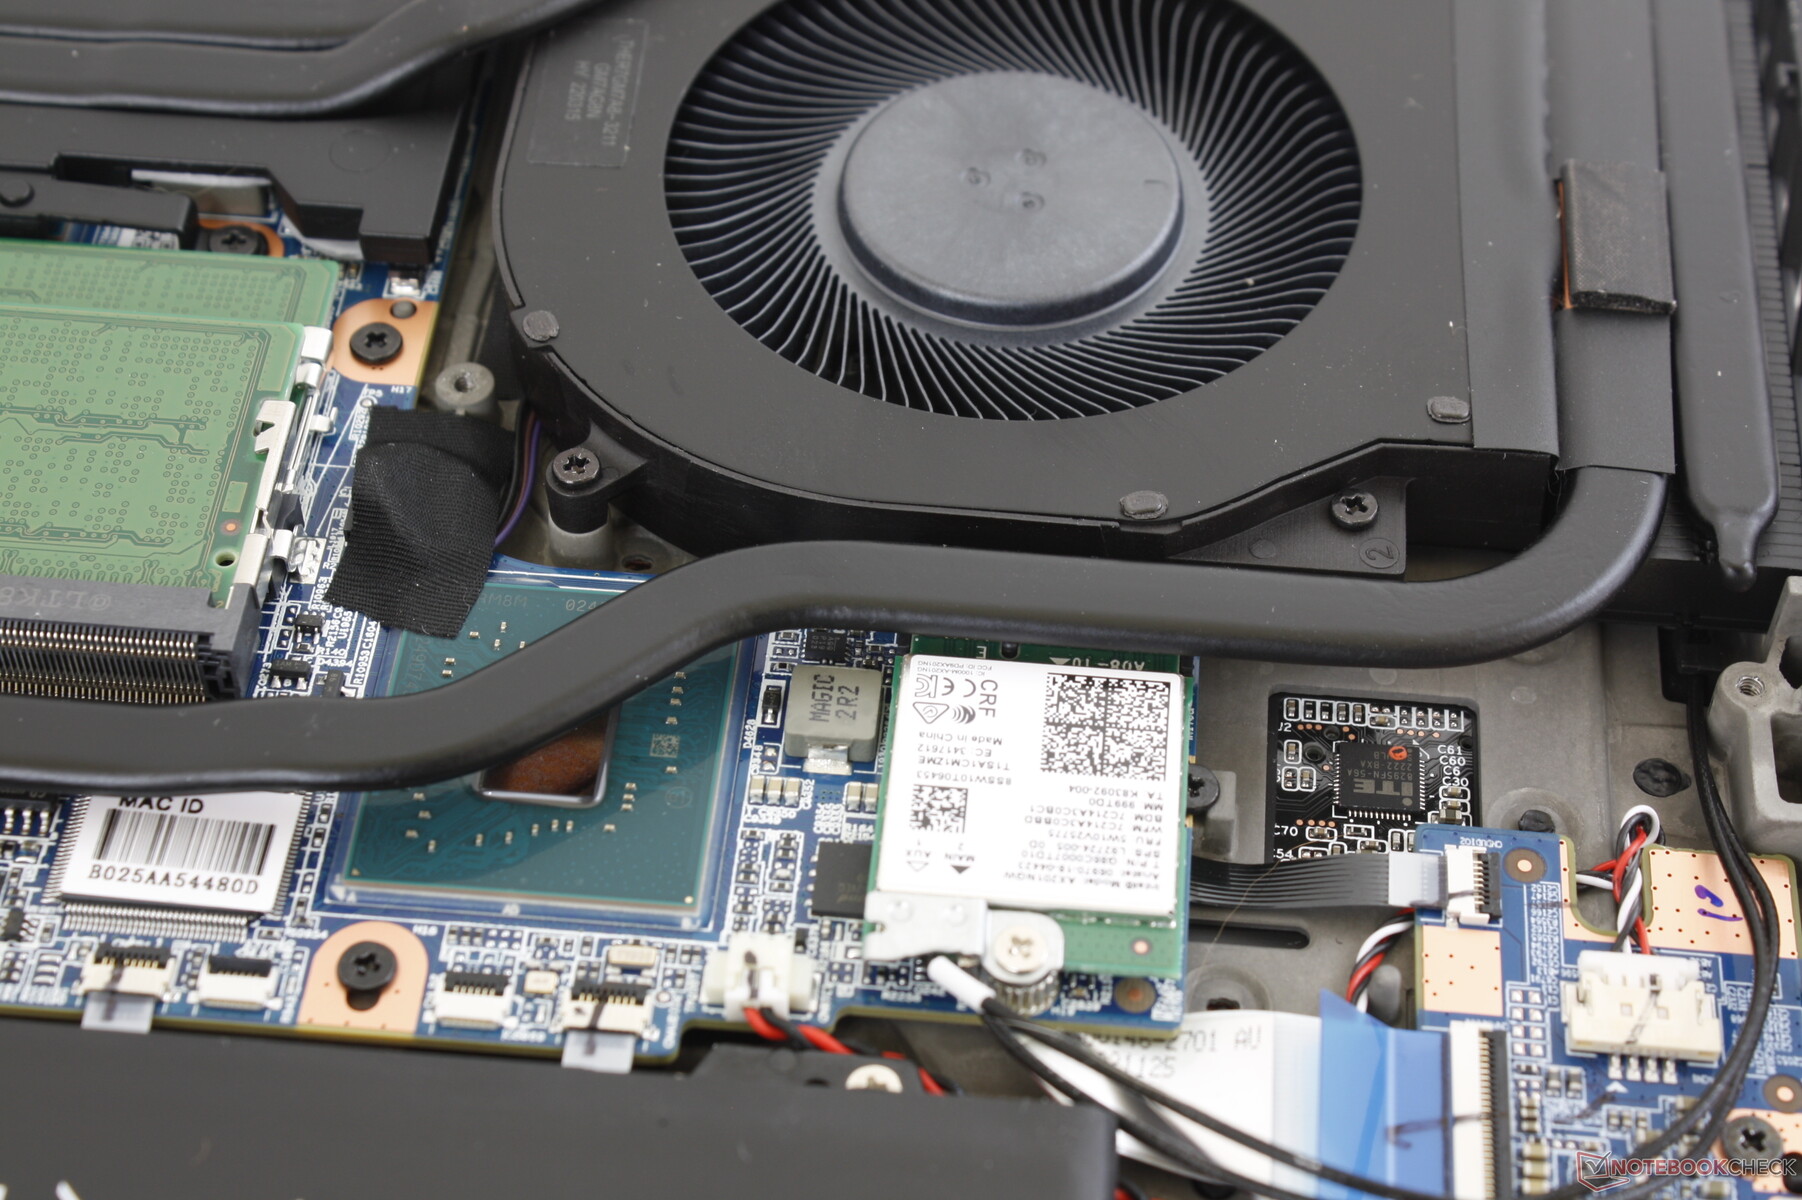
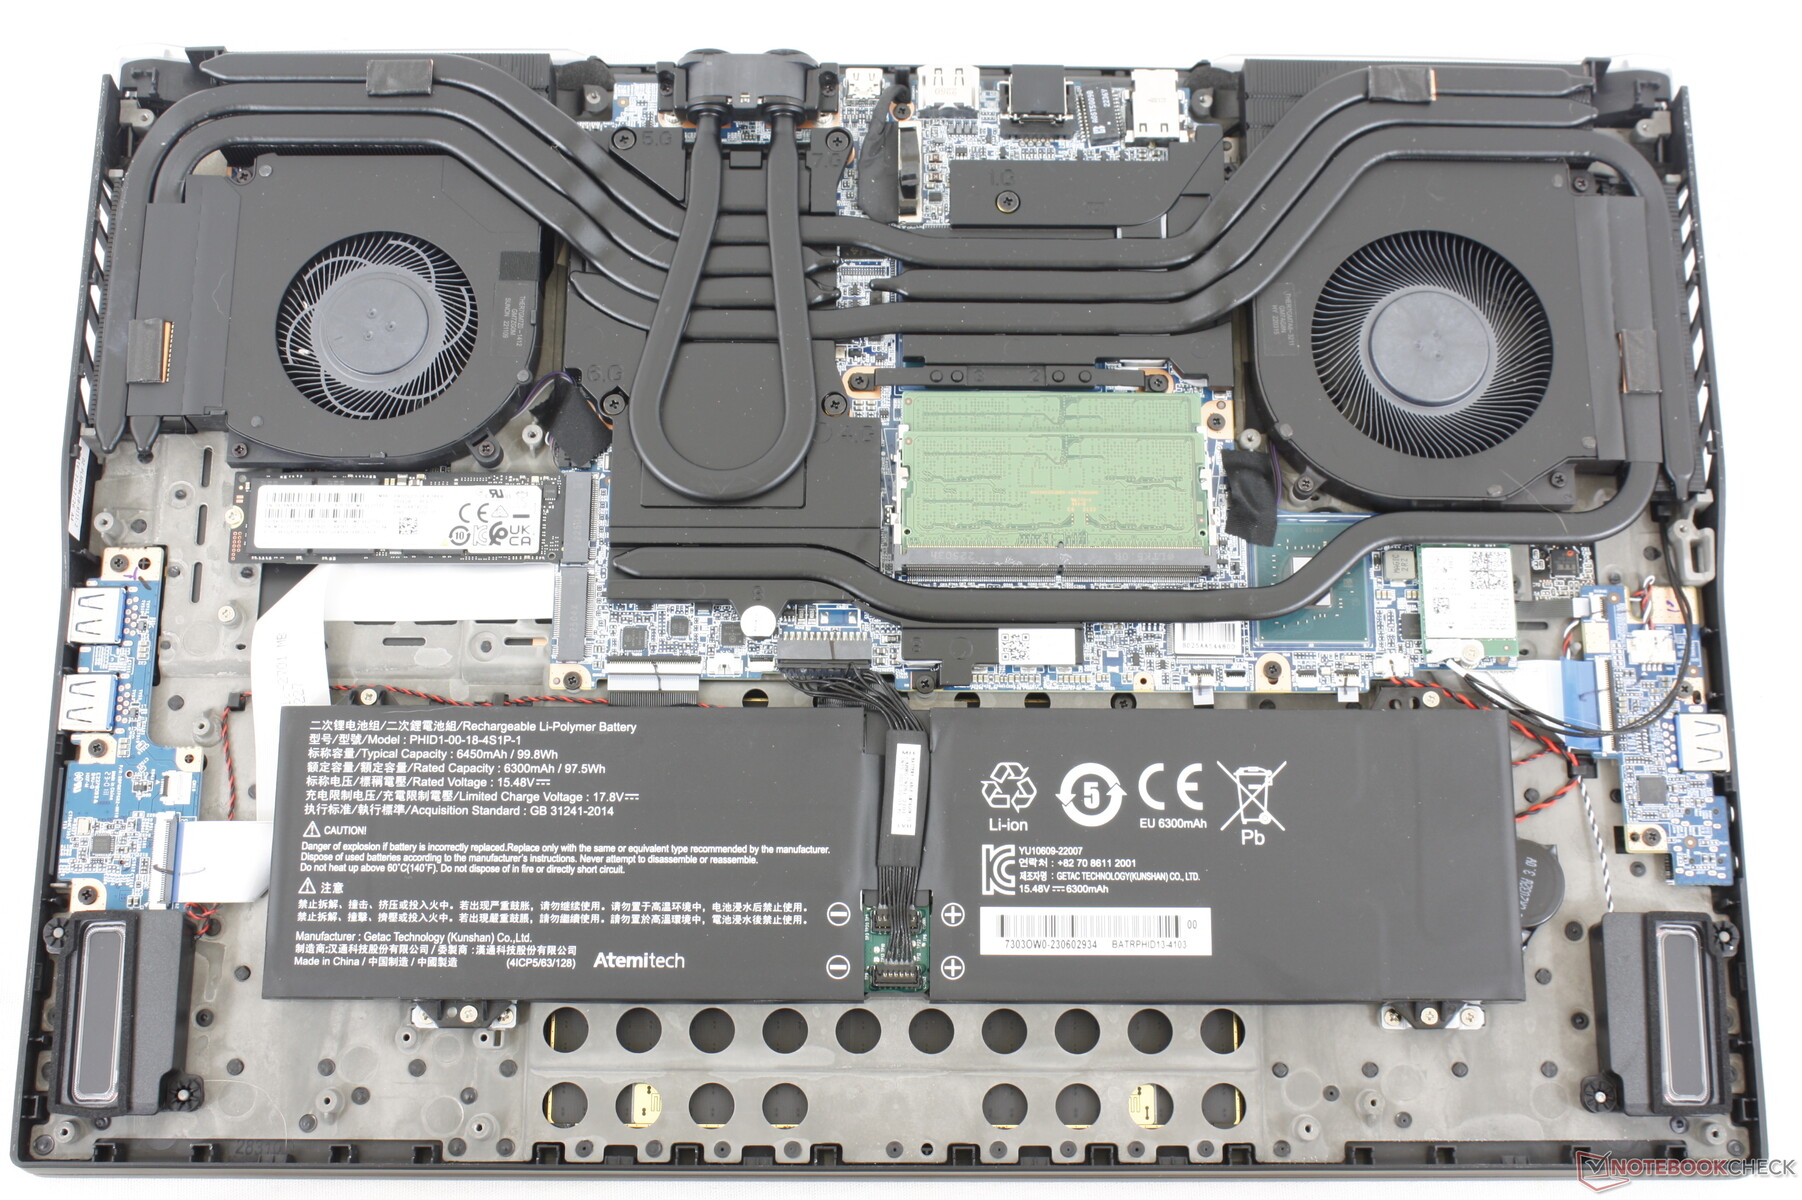
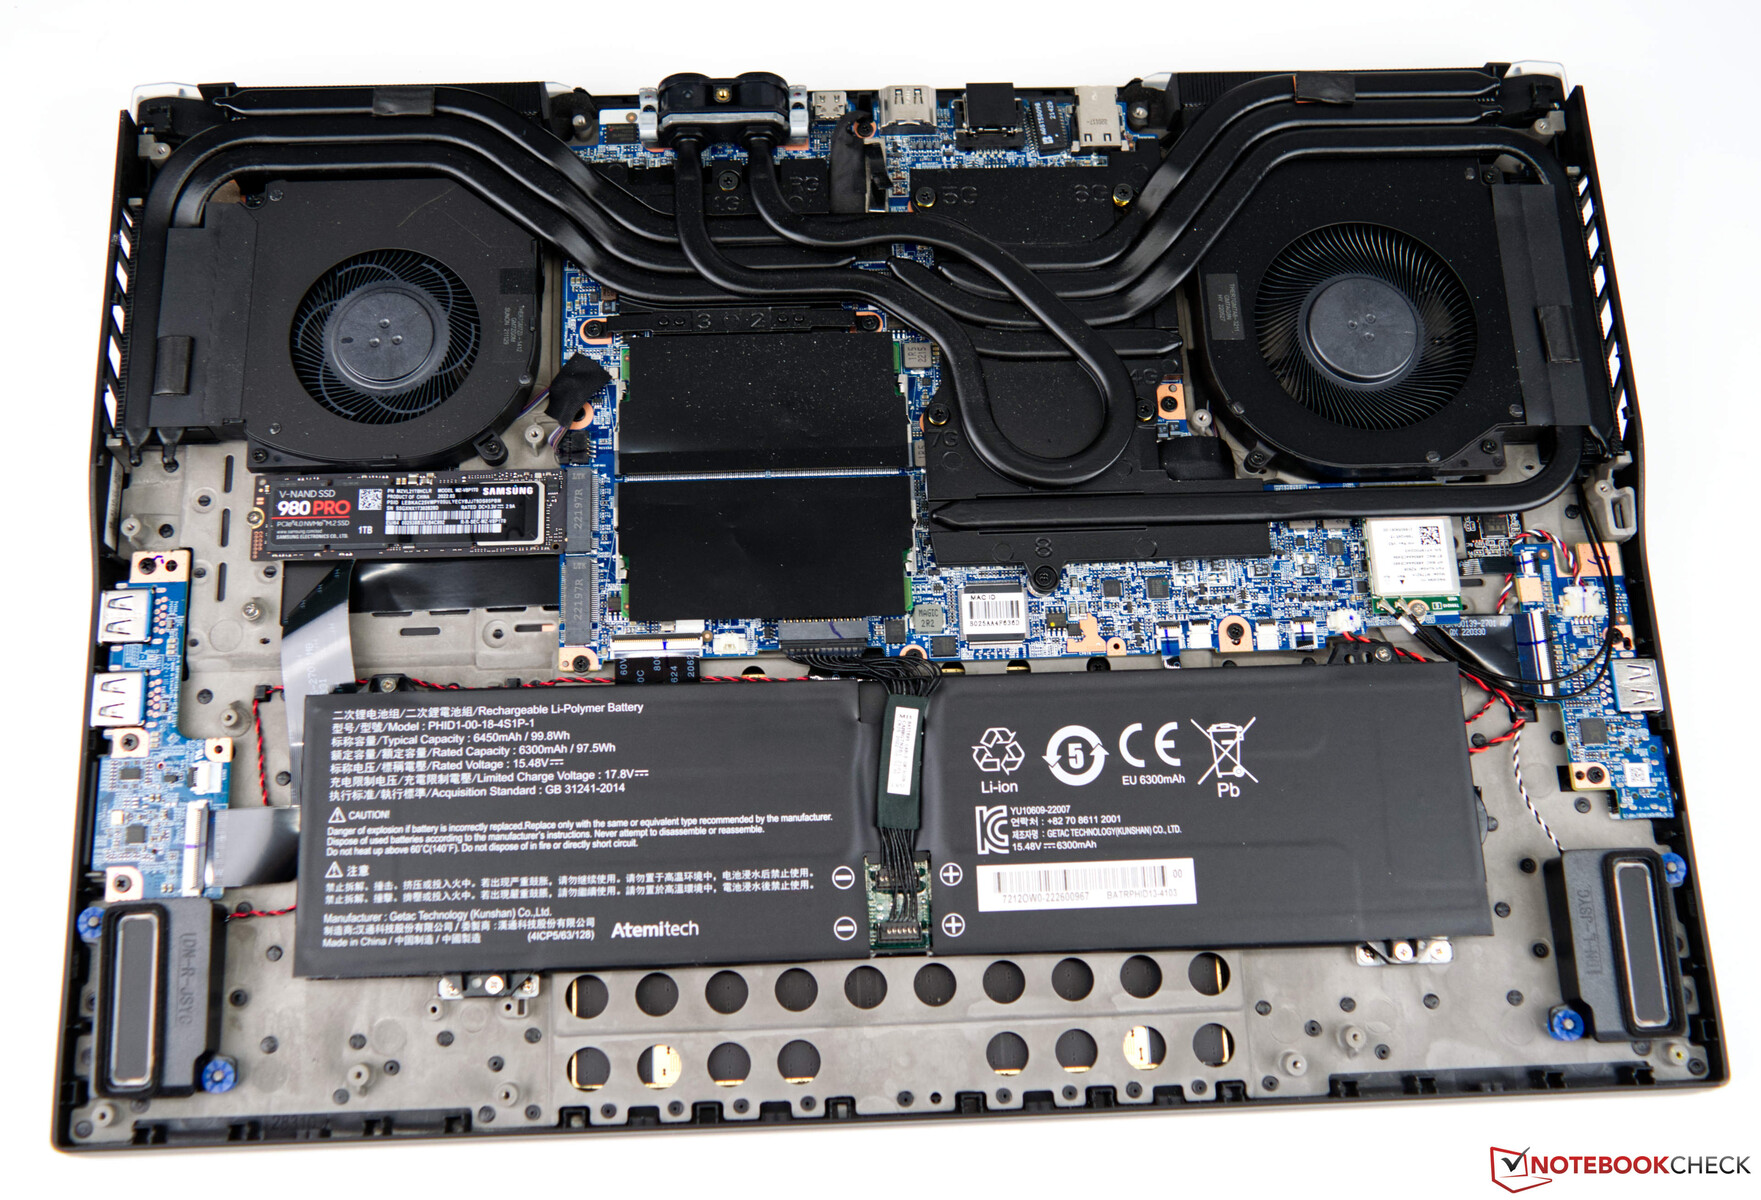
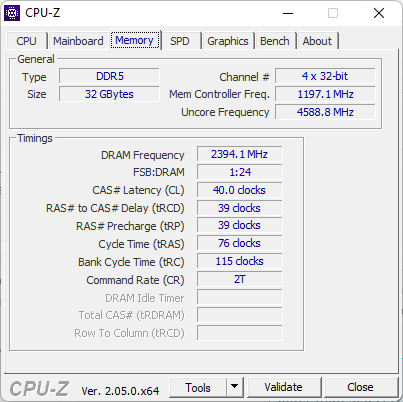
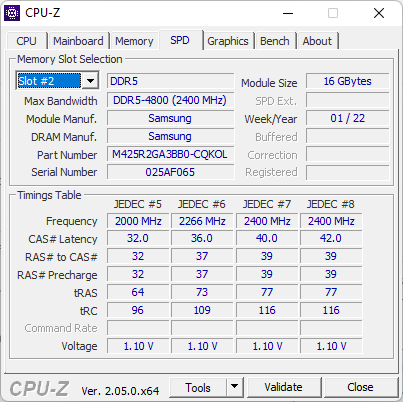
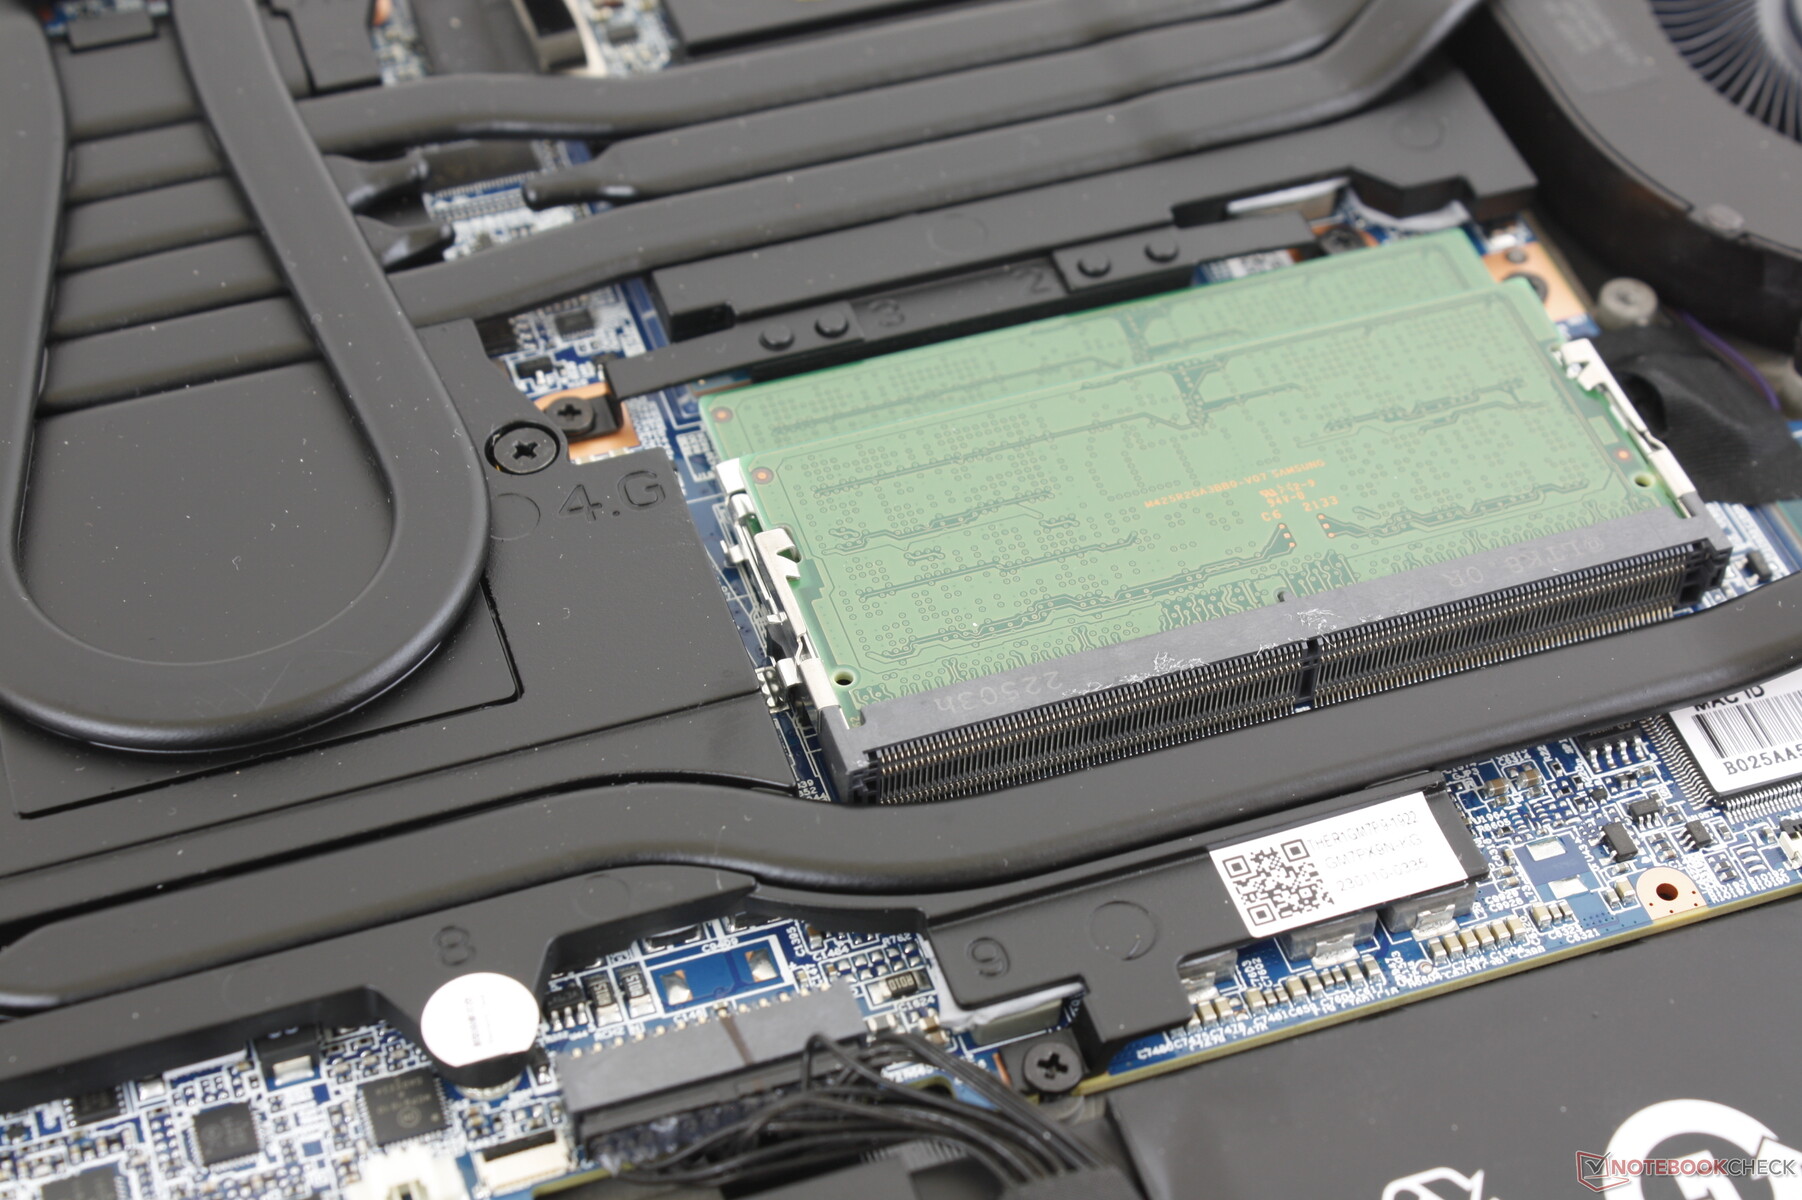
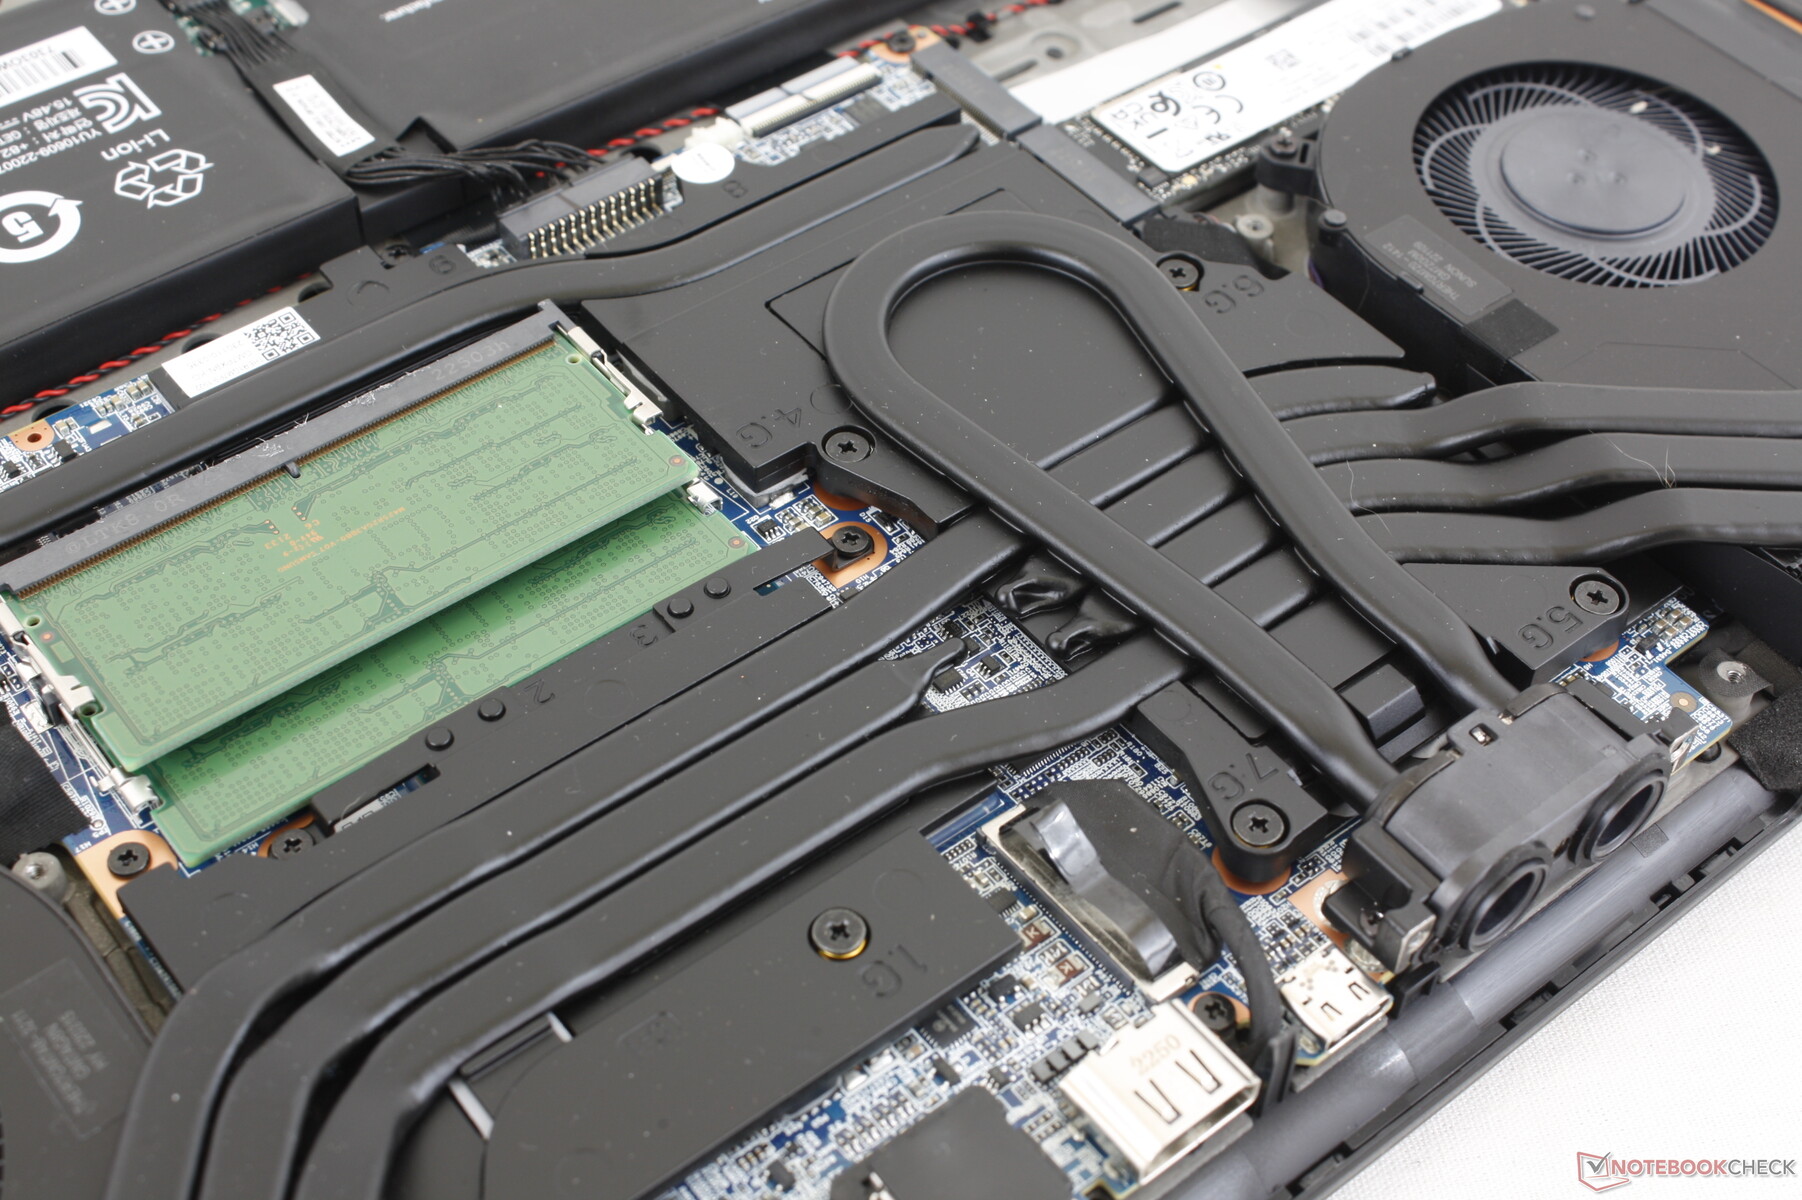
The bottom panel is secured by 14 Philips screws for relatively easy servicing. The manufacturer has revised the internals when compared to last year's model as shown below even though their external designs remain identical. The two RAM modules are now stacked to save space on the motherboard while the CPU and GPU have swapped positions.
Accessories and Warranty
There are no extras in the retail box other than the AC adapter and paperwork. The model is compatible with the optional second generation Liquid Propulsion Package (LPP G2) external cooler.
The standard one-year limited manufacturer warranty applies. An upgrade to three years is available for an extra $250.
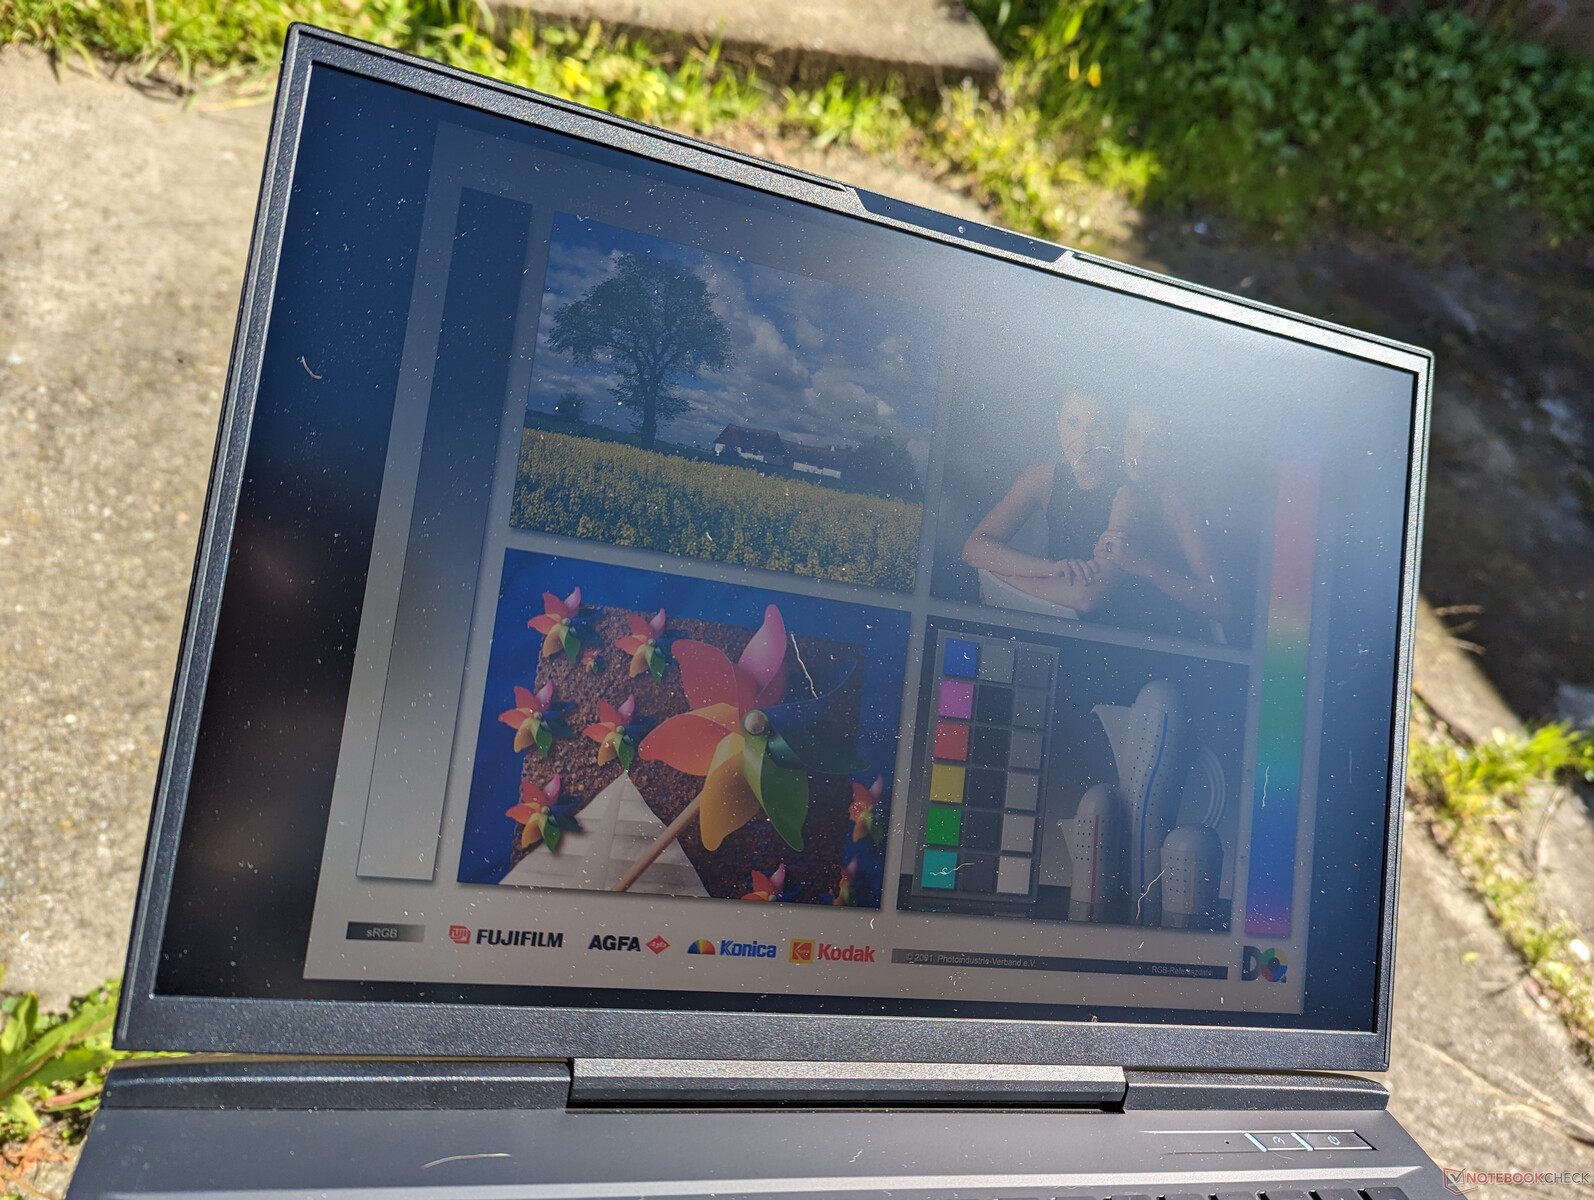
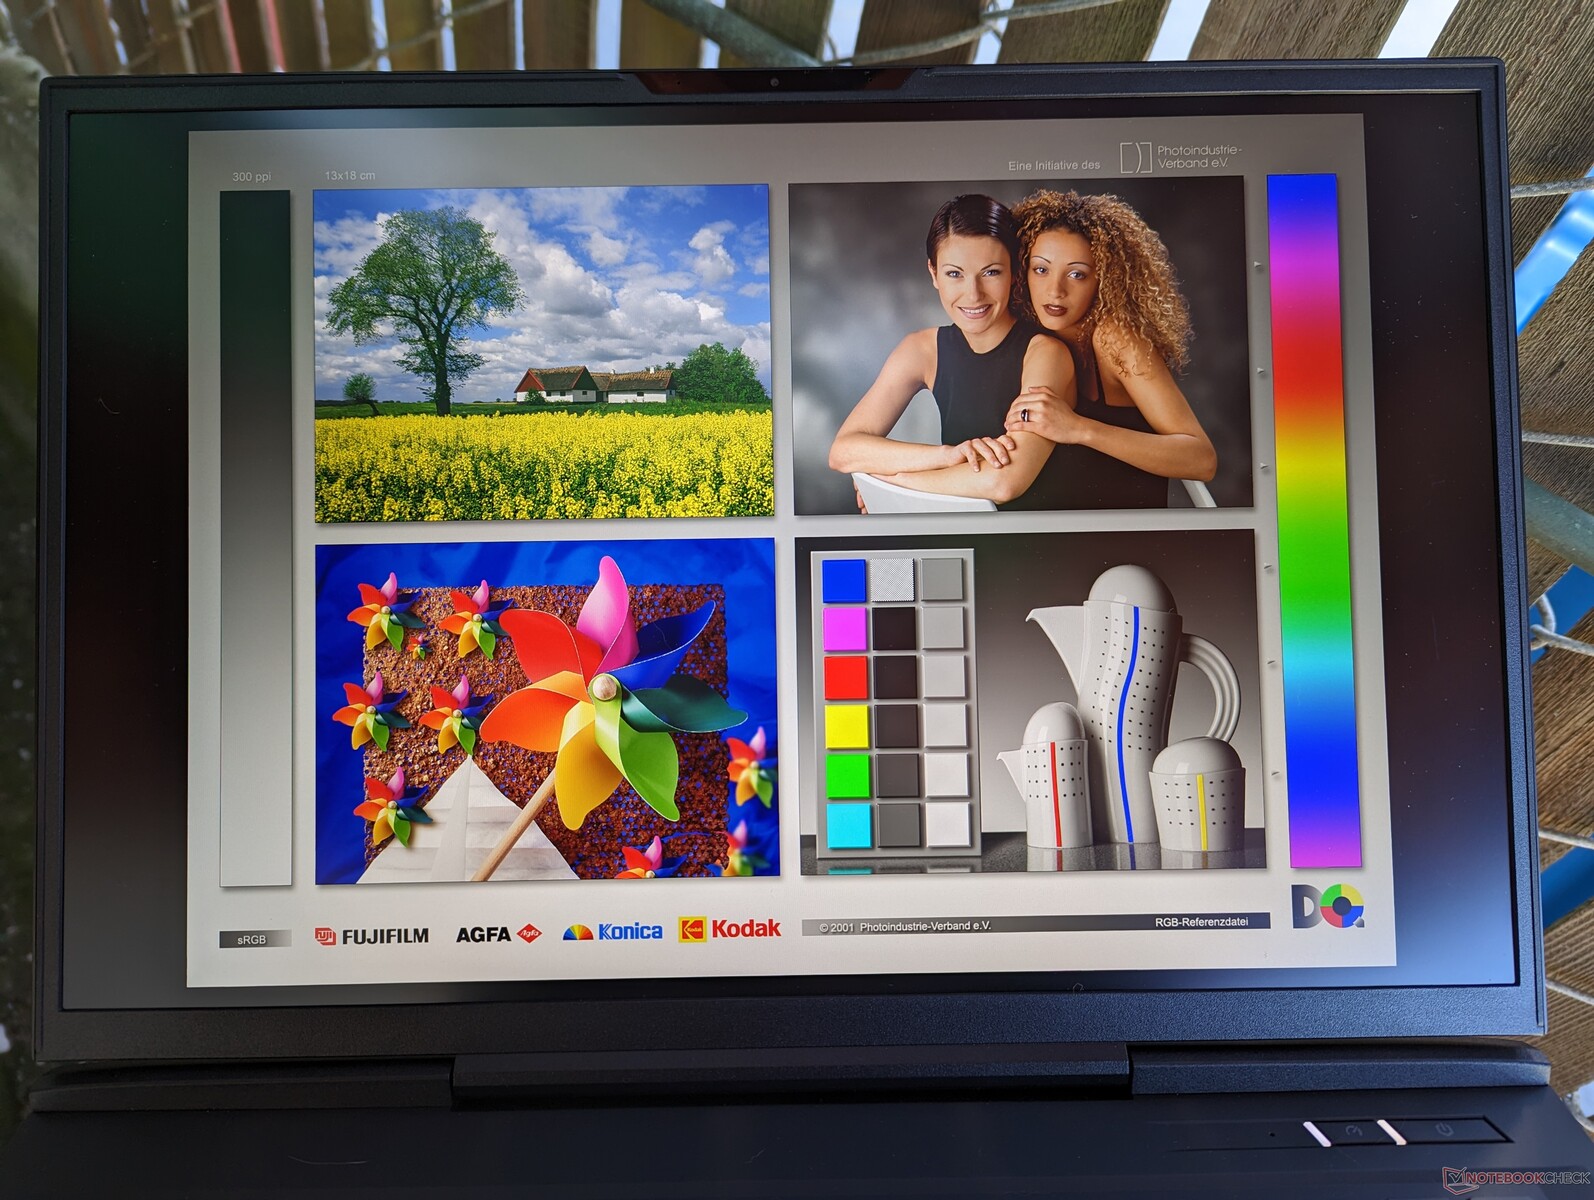
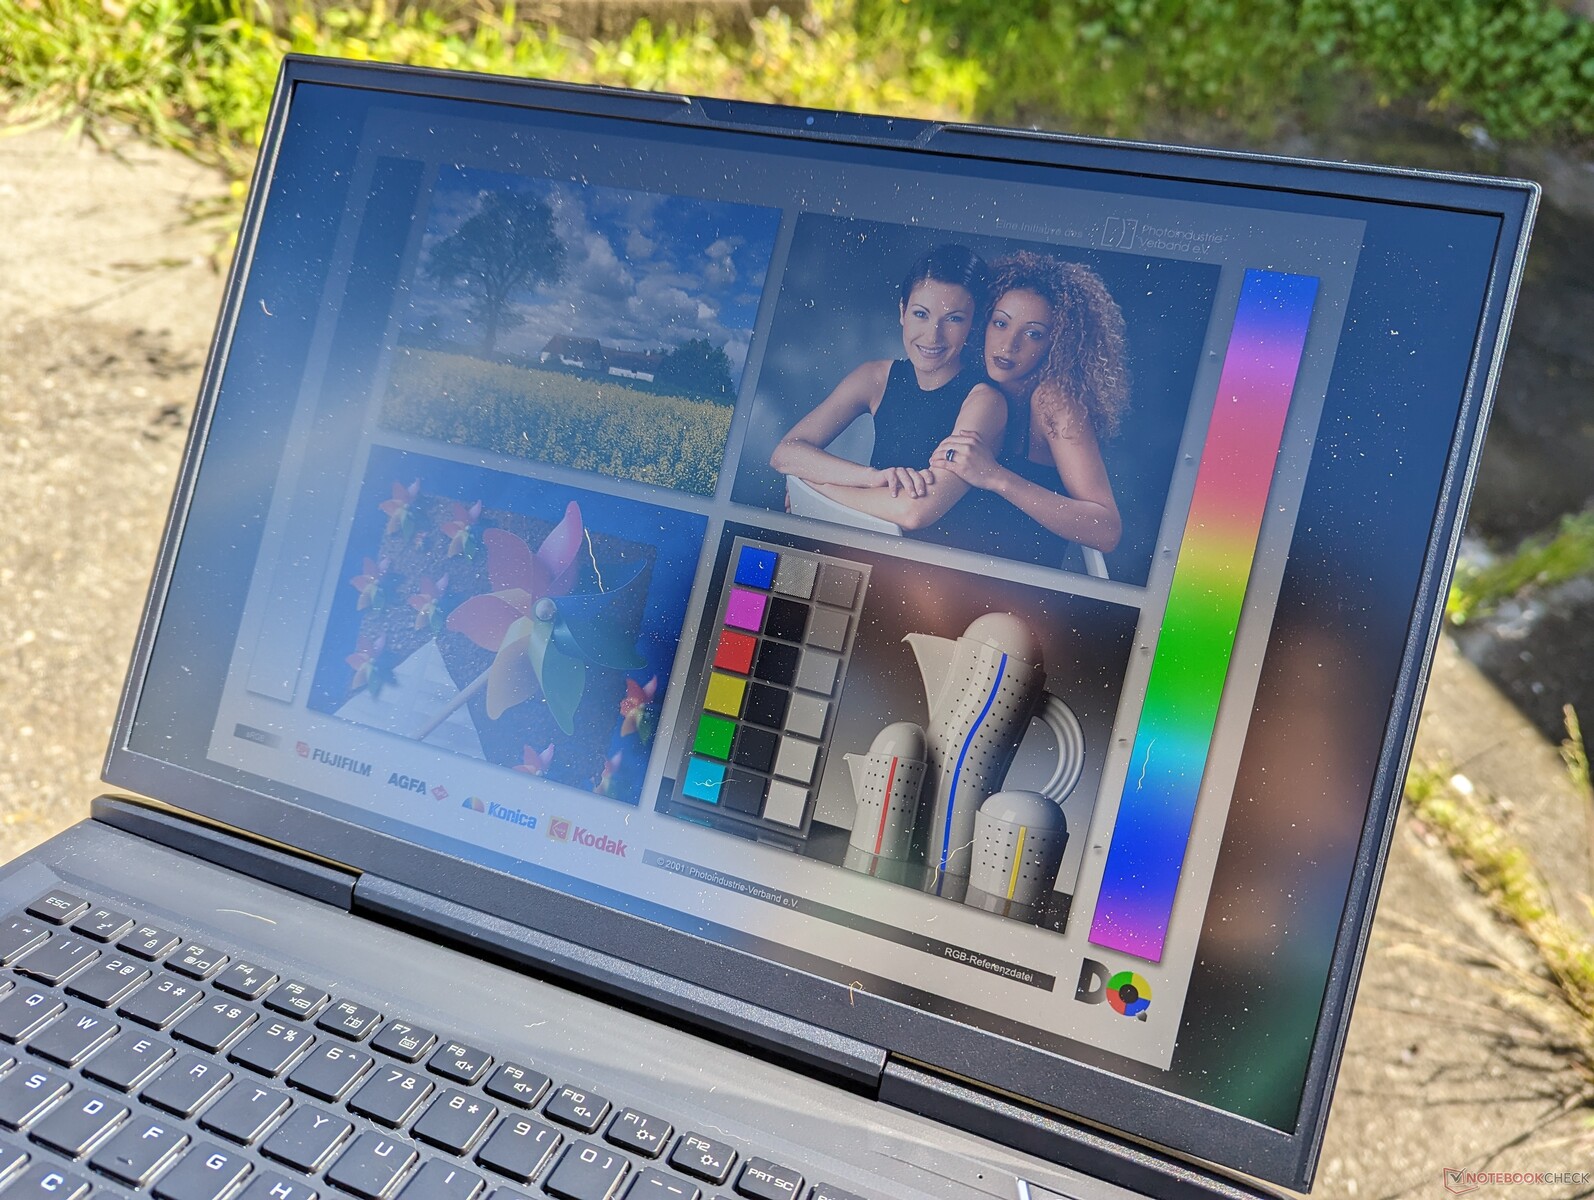
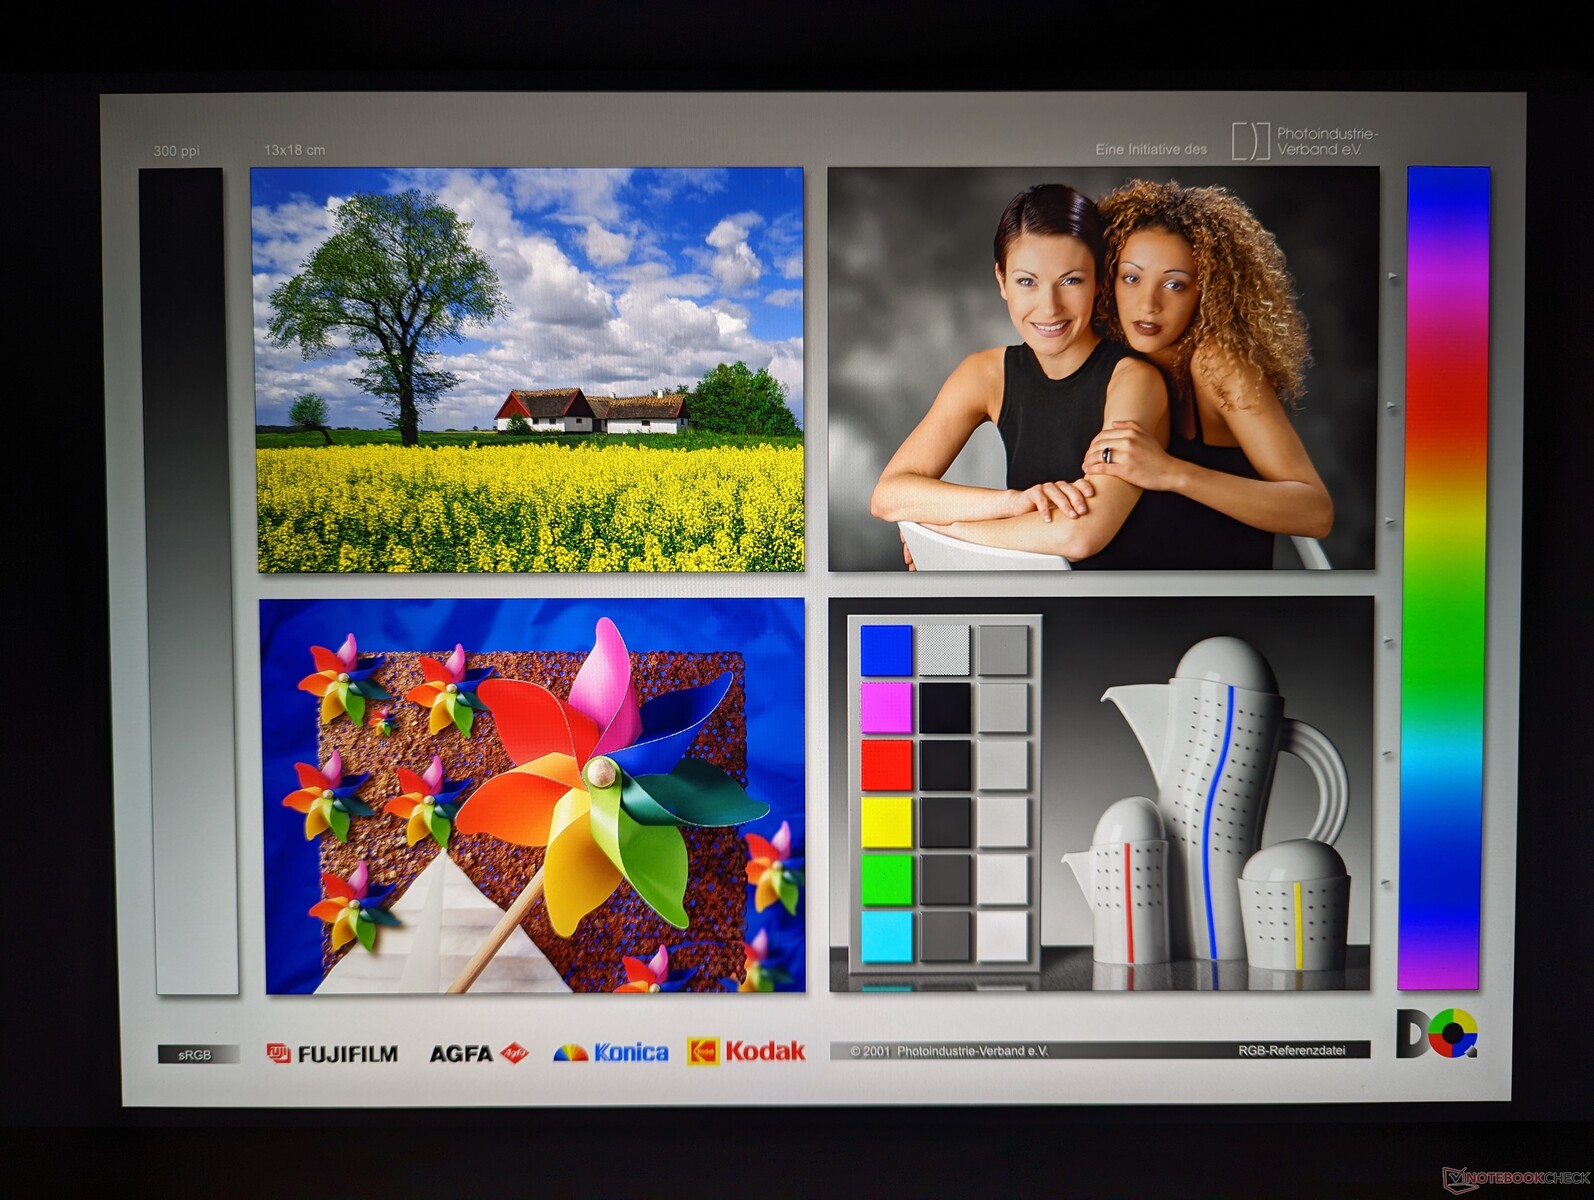
Display
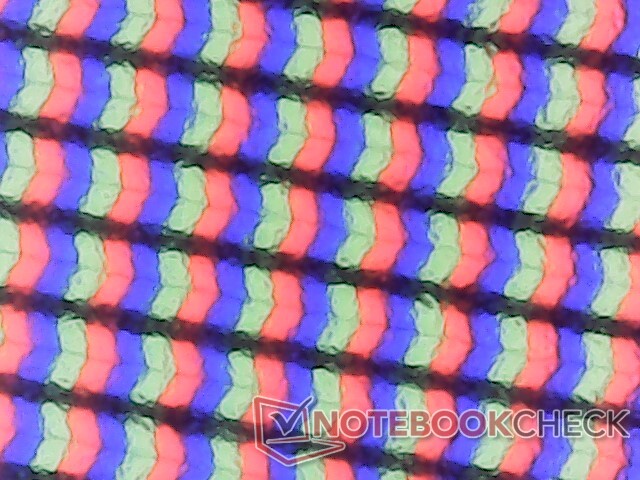
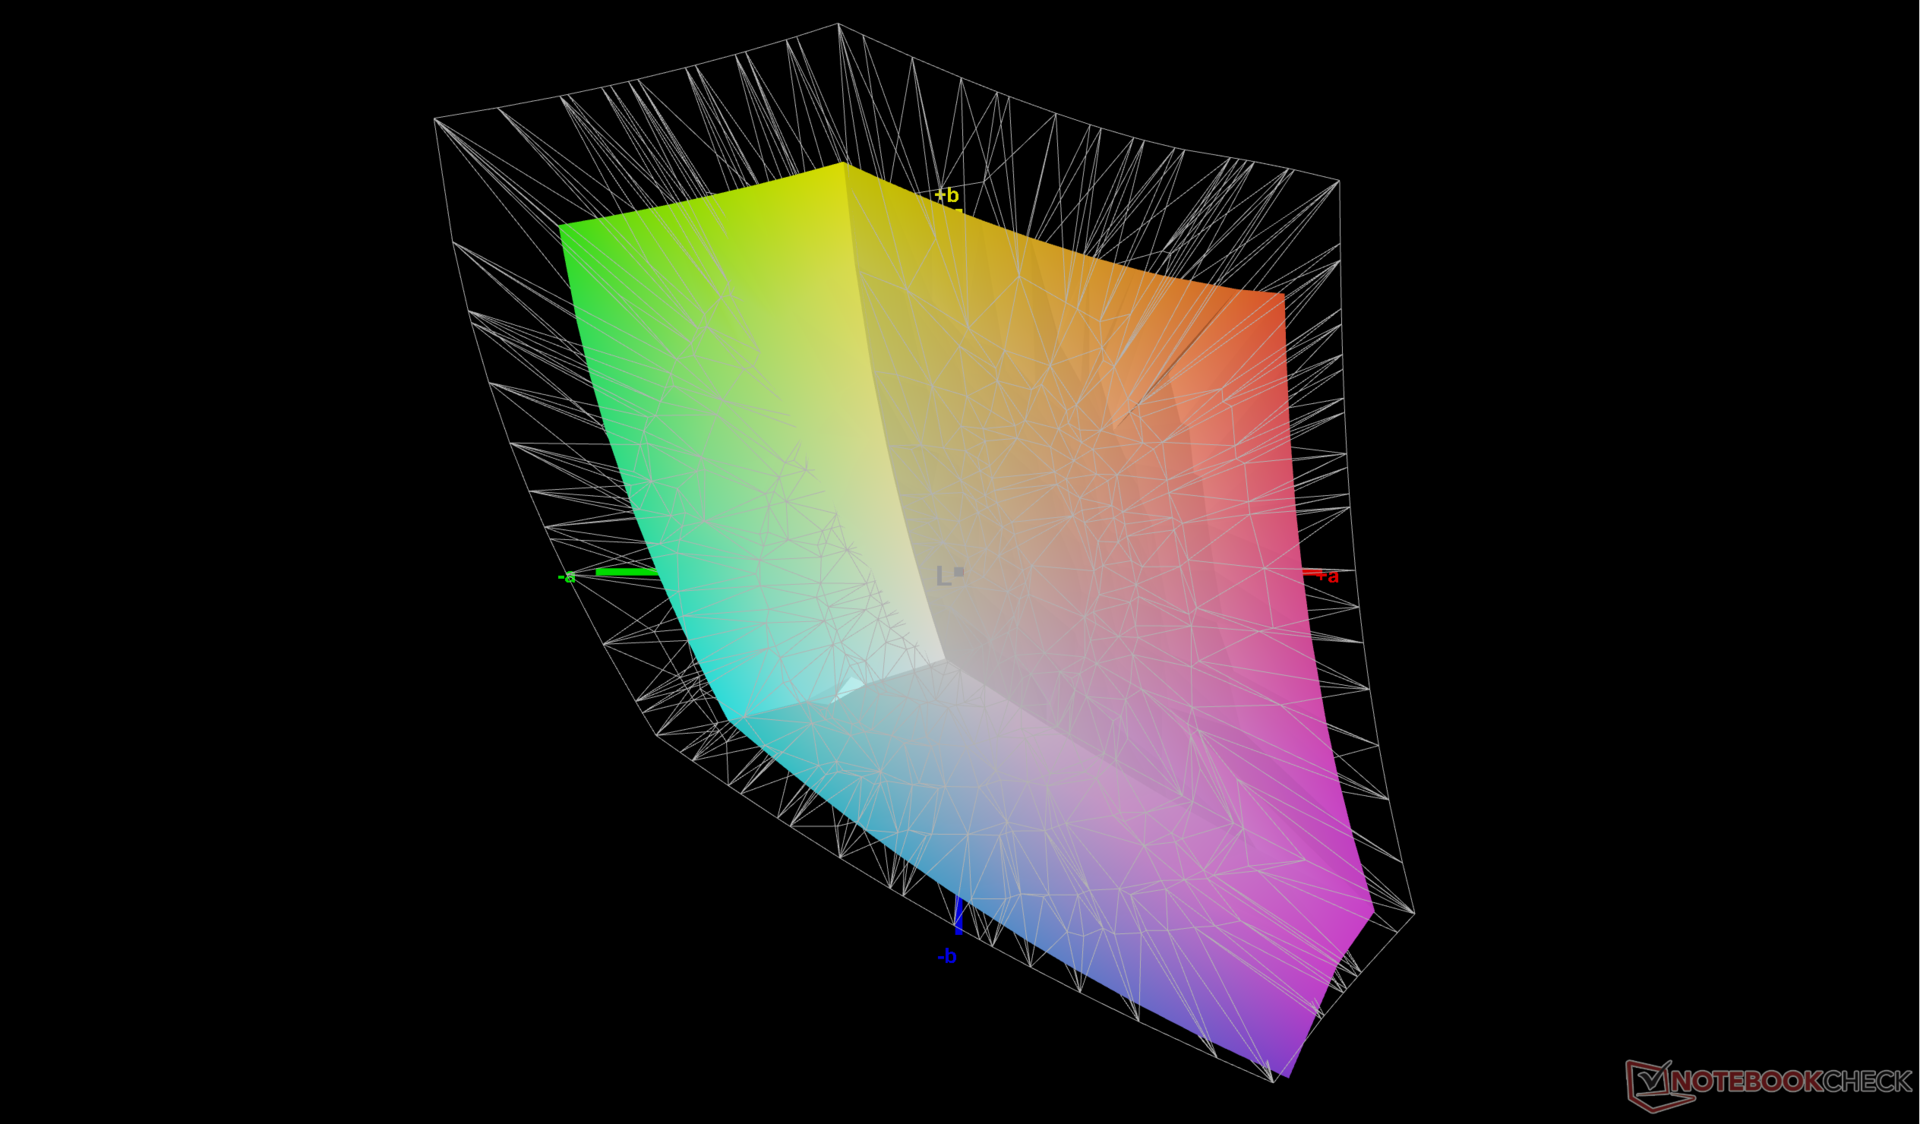
Our early 2023 model utilizes the same BOE NE170QDM-NZ1 panel and BOE0A99 controller as on the 2022 model meaning that the visual experience is no different year-over-year. Our measurements below are consequently almost identical between the 2022 and 2023 models. This is hardly a complaint though as the panel offers almost everything we've come to expect from a high-end gaming laptop including fast refresh rates, fast response times, full sRGB coverage, and G-Sync support. For higher resolutions and even deeper P3 colors, however, you'll have to look elsewhere instead like the MSI GT77 or Razer Blade 18.
| |||||||||||||||||||||||||
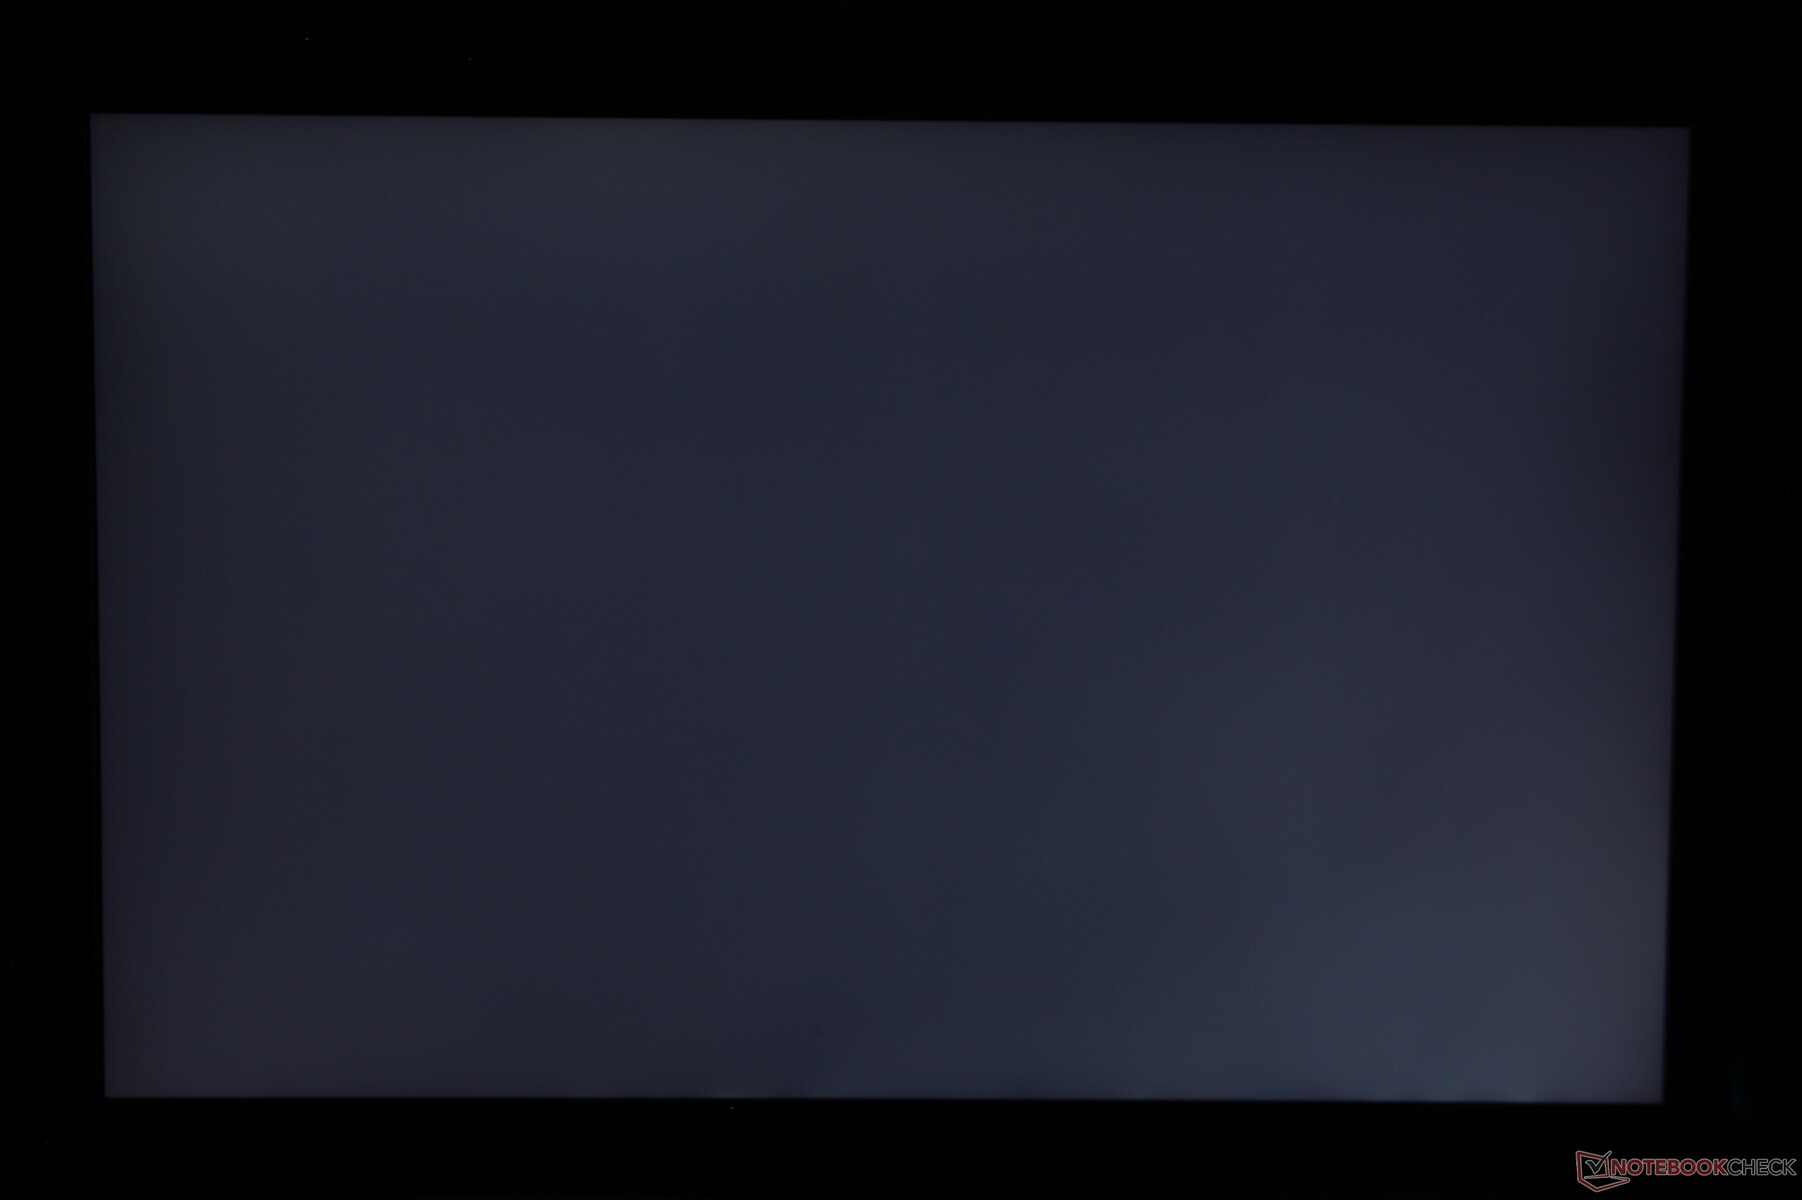
Brightness Distribution: 87 %
Center on Battery: 417.3 cd/m²
Contrast: 994:1 (Black: 0.42 cd/m²)
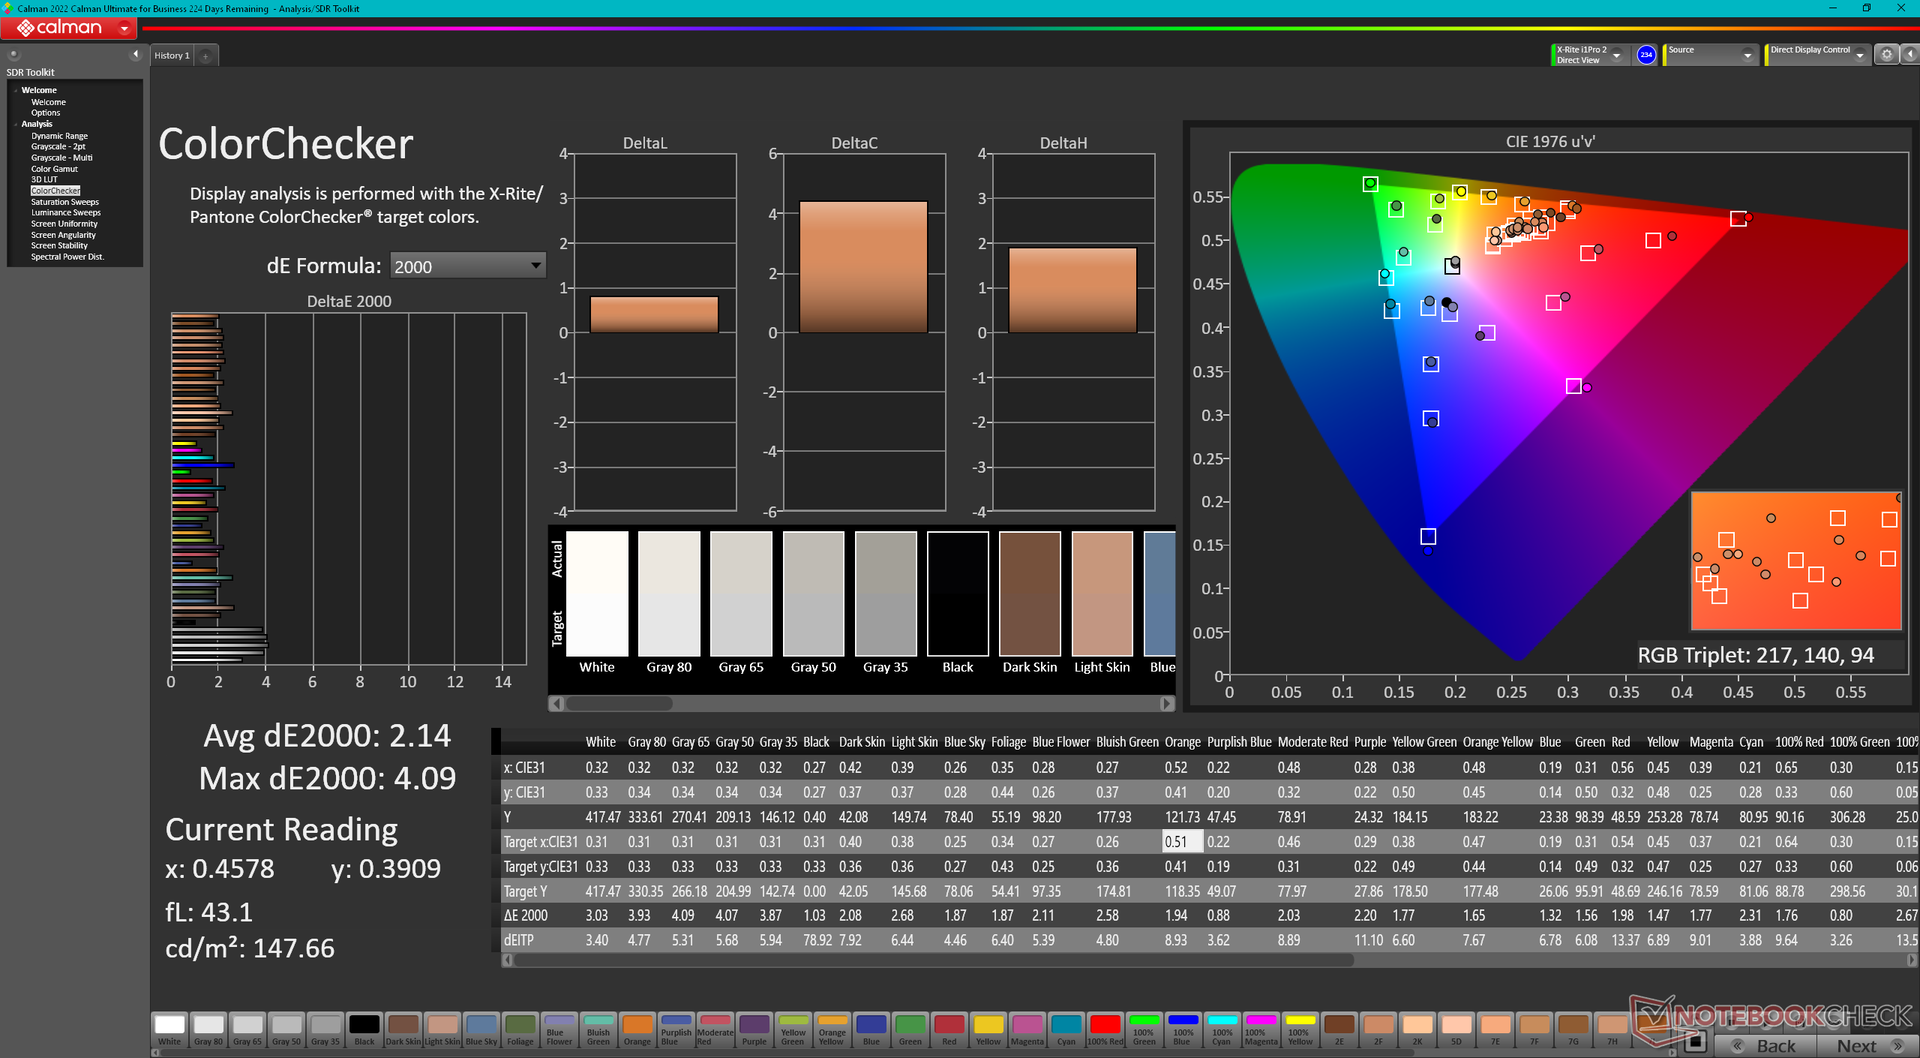
ΔE ColorChecker Calman: 2.14 | ∀{0.5-29.43 Ø4.73}
calibrated: 0.42
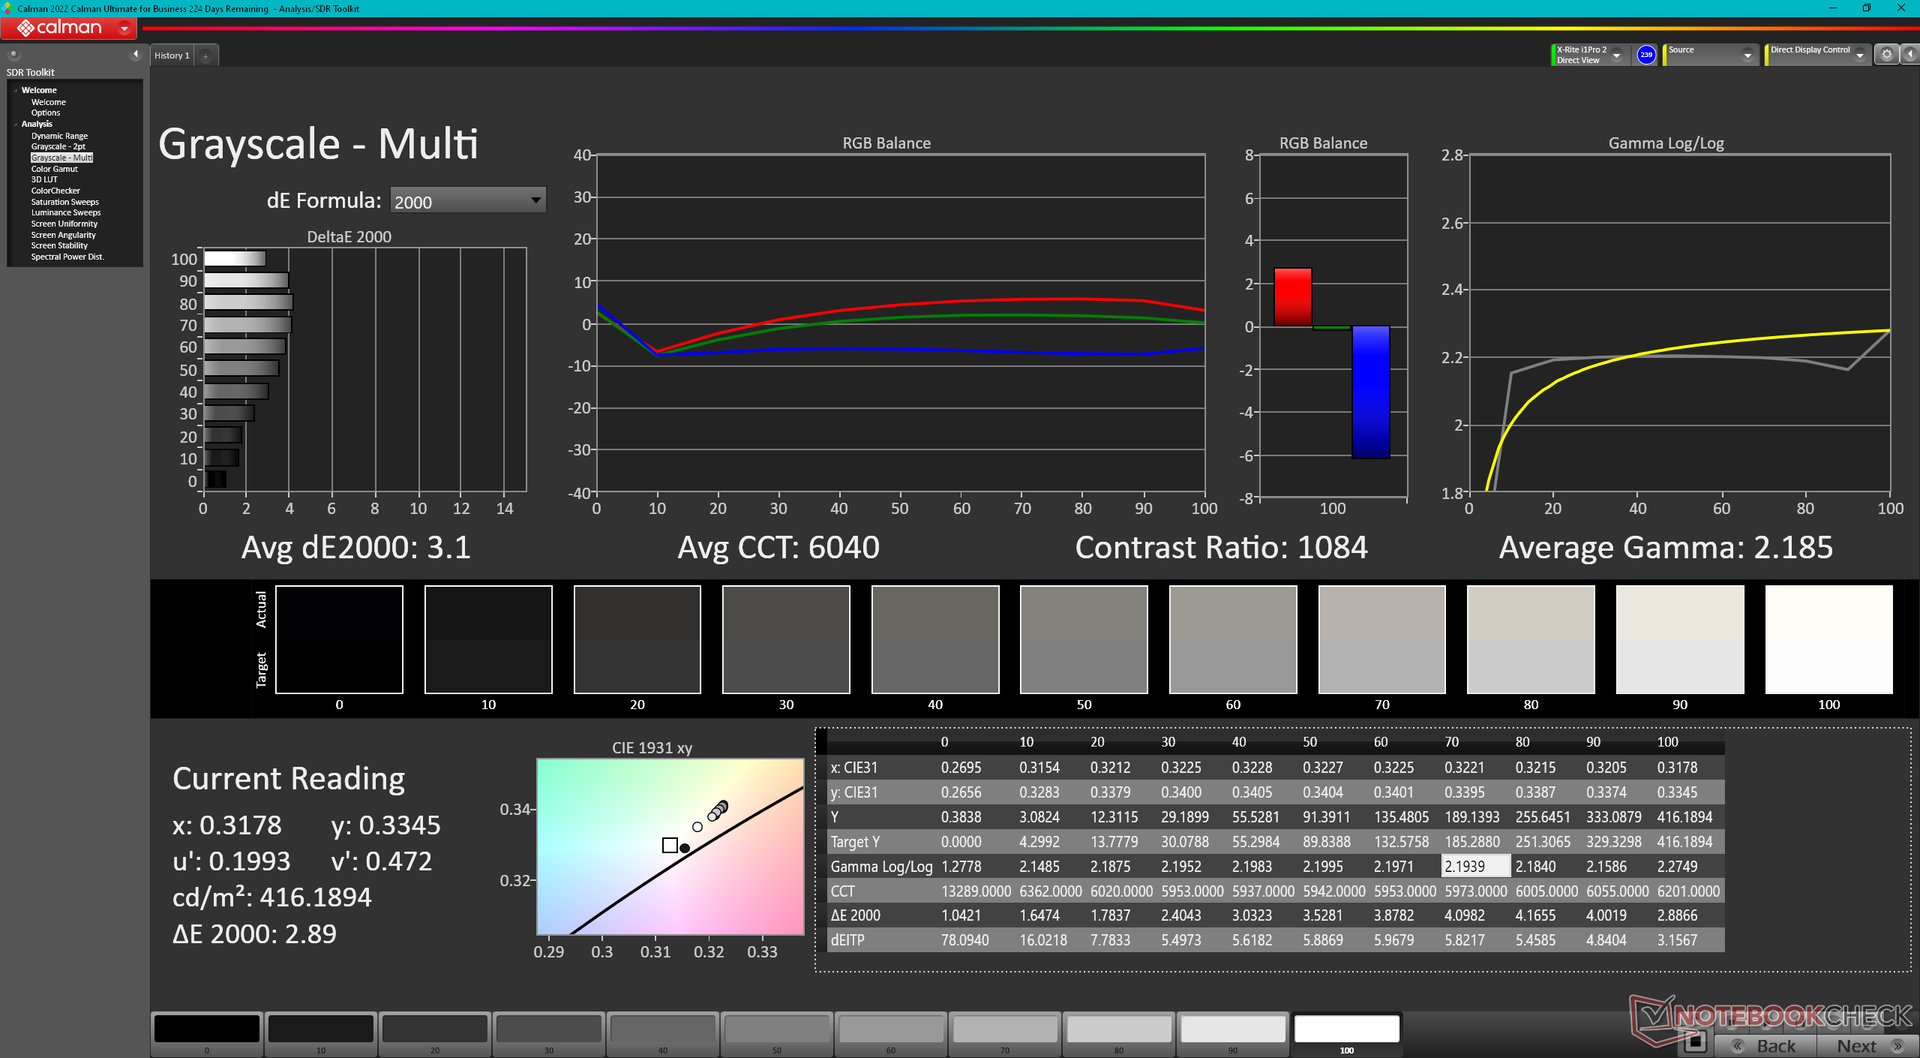
ΔE Greyscale Calman: 3.1 | ∀{0.09-98 Ø4.97}
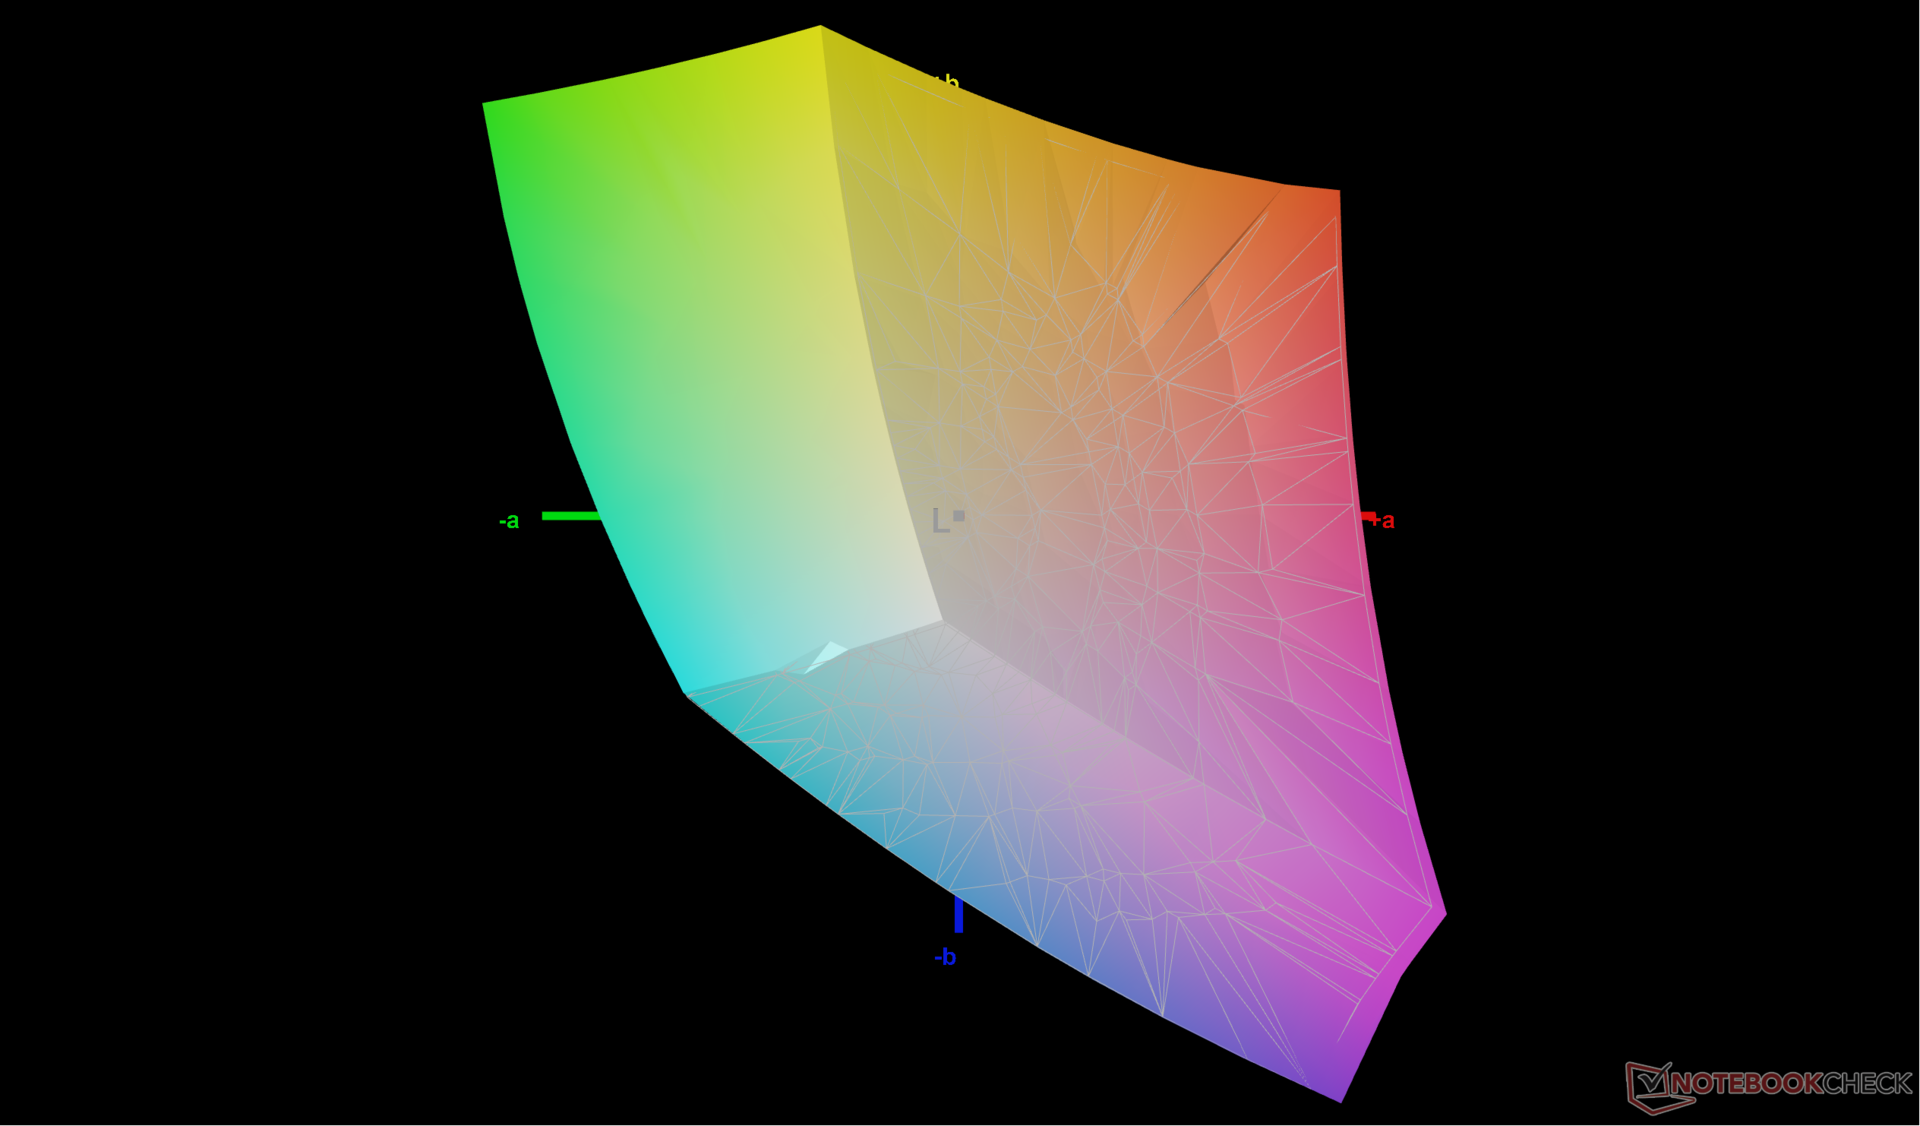
69.8% AdobeRGB 1998 (Argyll 3D)
99.7% sRGB (Argyll 3D)
69.1% Display P3 (Argyll 3D)
Gamma: 2.19
CCT: 6040 K
| Eluktronics Mech-17 GP2 BOE NE170QDM-NZ1, IPS, 2560x1600, 17" | Schenker XMG Neo 17 M22 BOE0A99, IPS, 2560x1600, 17" | MSI Katana 17 B13VFK B173HAN04.9, IPS LED, 1920x1080, 17.3" | MSI Titan GT77 HX 13VI B173ZAN06.C, Mini-LED, 3840x2160, 17.3" | Alienware m17 R5 (R9 6900HX, RX 6850M XT) AU Optronics AUODBA3, IPS, 3840x2160, 17" | Razer Blade 18 RTX 4070 AU Optronics B180QAN01.0, IPS, 2560x1600, 18" | |
|---|---|---|---|---|---|---|
| Display | 0% | -40% | 23% | 23% | 21% | |
| Display P3 Coverage (%) | 69.1 | 69 0% | 40.8 -41% | 94.9 37% | 97.2 41% | 96.9 40% |
| sRGB Coverage (%) | 99.7 | 99.8 0% | 61 -39% | 99.9 0% | 99.6 0% | 99.8 0% |
| AdobeRGB 1998 Coverage (%) | 69.8 | 69.6 0% | 42.2 -40% | 92.4 32% | 88.4 27% | 85.3 22% |
| Response Times | 23% | -176% | -202% | -30% | 40% | |
| Response Time Grey 50% / Grey 80% * (ms) | 12 ? | 10.8 ? 10% | 33 ? -175% | 38.4 ? -220% | 16.4 ? -37% | 4.2 ? 65% |
| Response Time Black / White * (ms) | 9.4 ? | 6.1 ? 35% | 26 ? -177% | 26.6 ? -183% | 11.6 ? -23% | 8 ? 15% |
| PWM Frequency (Hz) | 2380 ? | |||||
| Screen | 1% | -158% | 67678% | -147% | -64% | |
| Brightness middle (cd/m²) | 417.3 | 415 -1% | 267 -36% | 606 45% | 484 16% | 549.6 32% |
| Brightness (cd/m²) | 387 | 399 3% | 256 -34% | 602 56% | 449 16% | 524 35% |
| Brightness Distribution (%) | 87 | 90 3% | 93 7% | 93 7% | 87 0% | 89 2% |
| Black Level * (cd/m²) | 0.42 | 0.43 -2% | 0.21 50% | 0.0001 100% | 0.55 -31% | 0.53 -26% |
| Contrast (:1) | 994 | 965 -3% | 1271 28% | 6060000 609558% | 880 -11% | 1037 4% |
| Colorchecker dE 2000 * | 2.14 | 1.44 33% | 4.7 -120% | 4.8 -124% | 4.8 -124% | 3.32 -55% |
| Colorchecker dE 2000 max. * | 4.09 | 2.33 43% | 20.4 -399% | 8.2 -100% | 7.48 -83% | 6.63 -62% |
| Colorchecker dE 2000 calibrated * | 0.42 | 0.89 -112% | 4.5 -971% | 1.8 -329% | 4.74 -1029% | 2.7 -543% |
| Greyscale dE 2000 * | 3.1 | 1.8 42% | 1.5 52% | 6.5 -110% | 5.5 -77% | 2 35% |
| Gamma | 2.19 100% | 2.132 103% | 2.12 104% | 2.63 84% | 2.42 91% | 2.29 96% |
| CCT | 6040 108% | 6327 103% | 6552 99% | 6596 99% | 6148 106% | 6319 103% |
| Total Average (Program / Settings) | 8% /
4% | -125% /
-135% | 22500% /
43484% | -51% /
-94% | -1% /
-31% |
* ... smaller is better
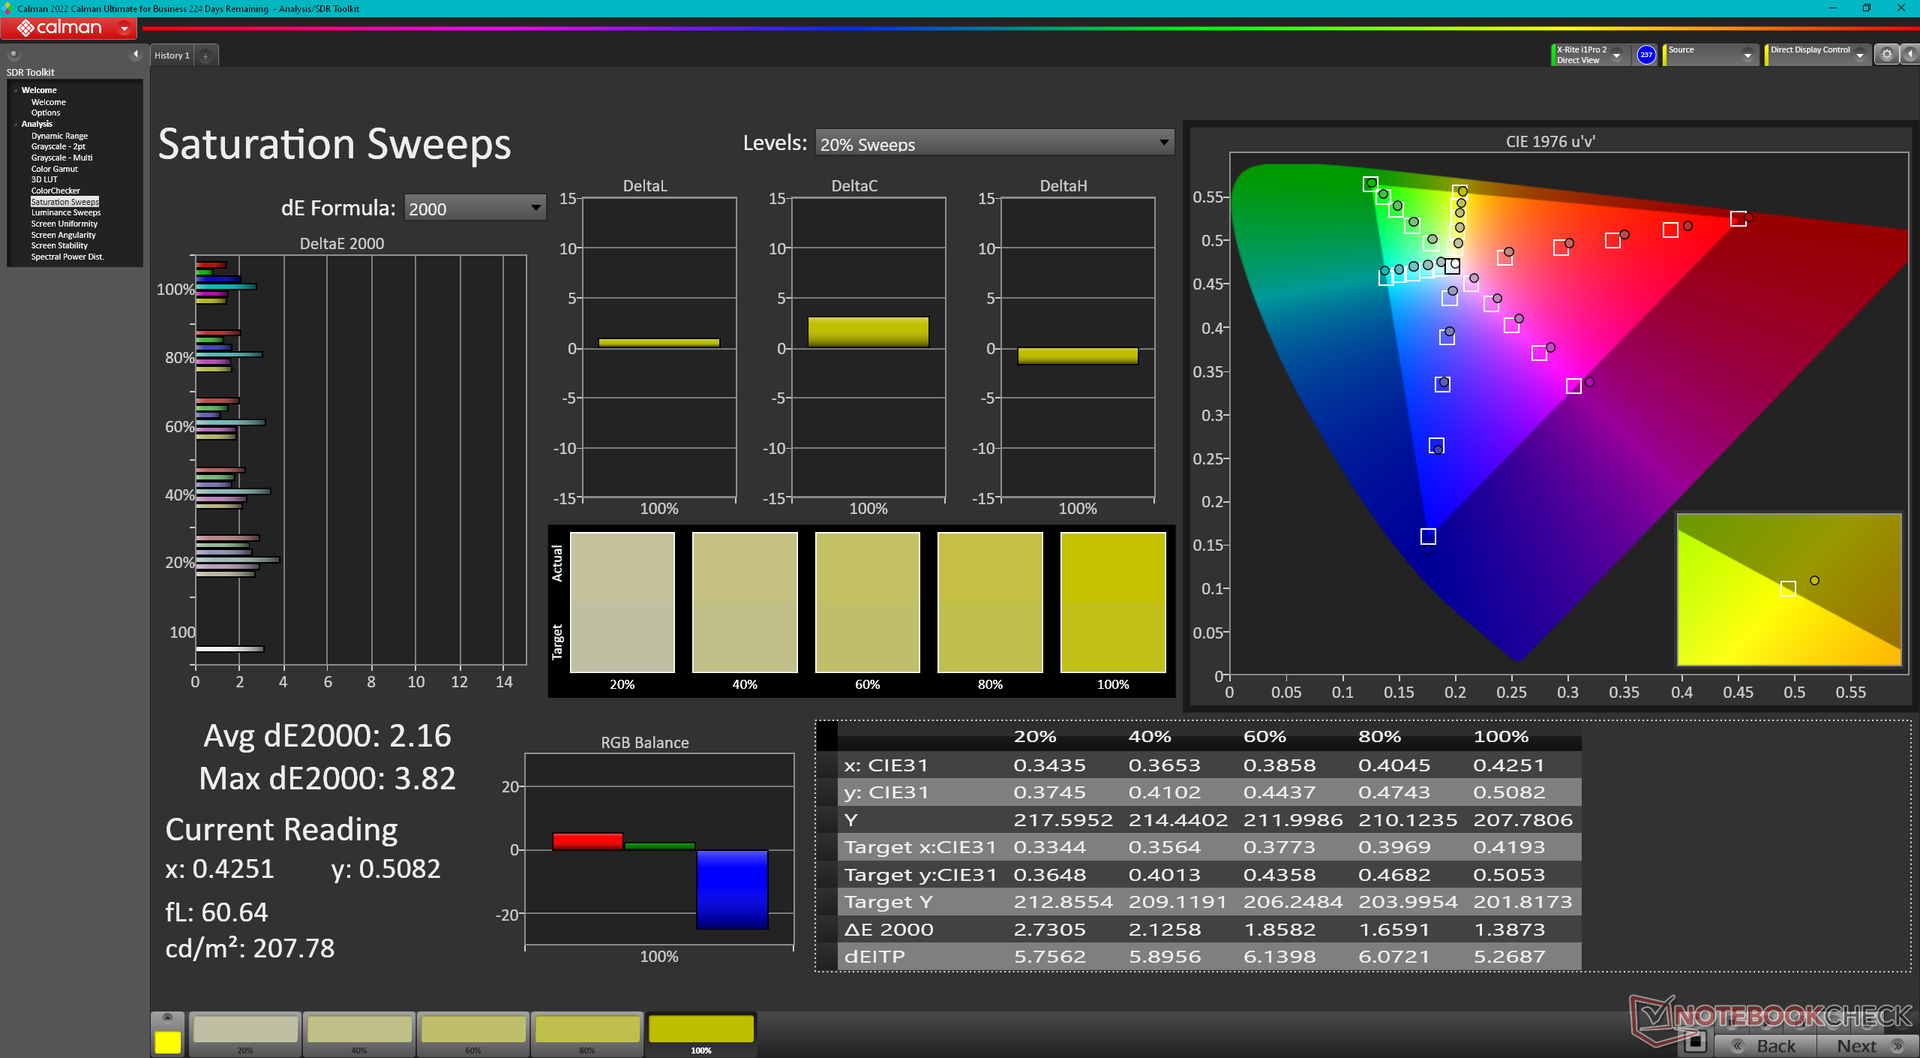
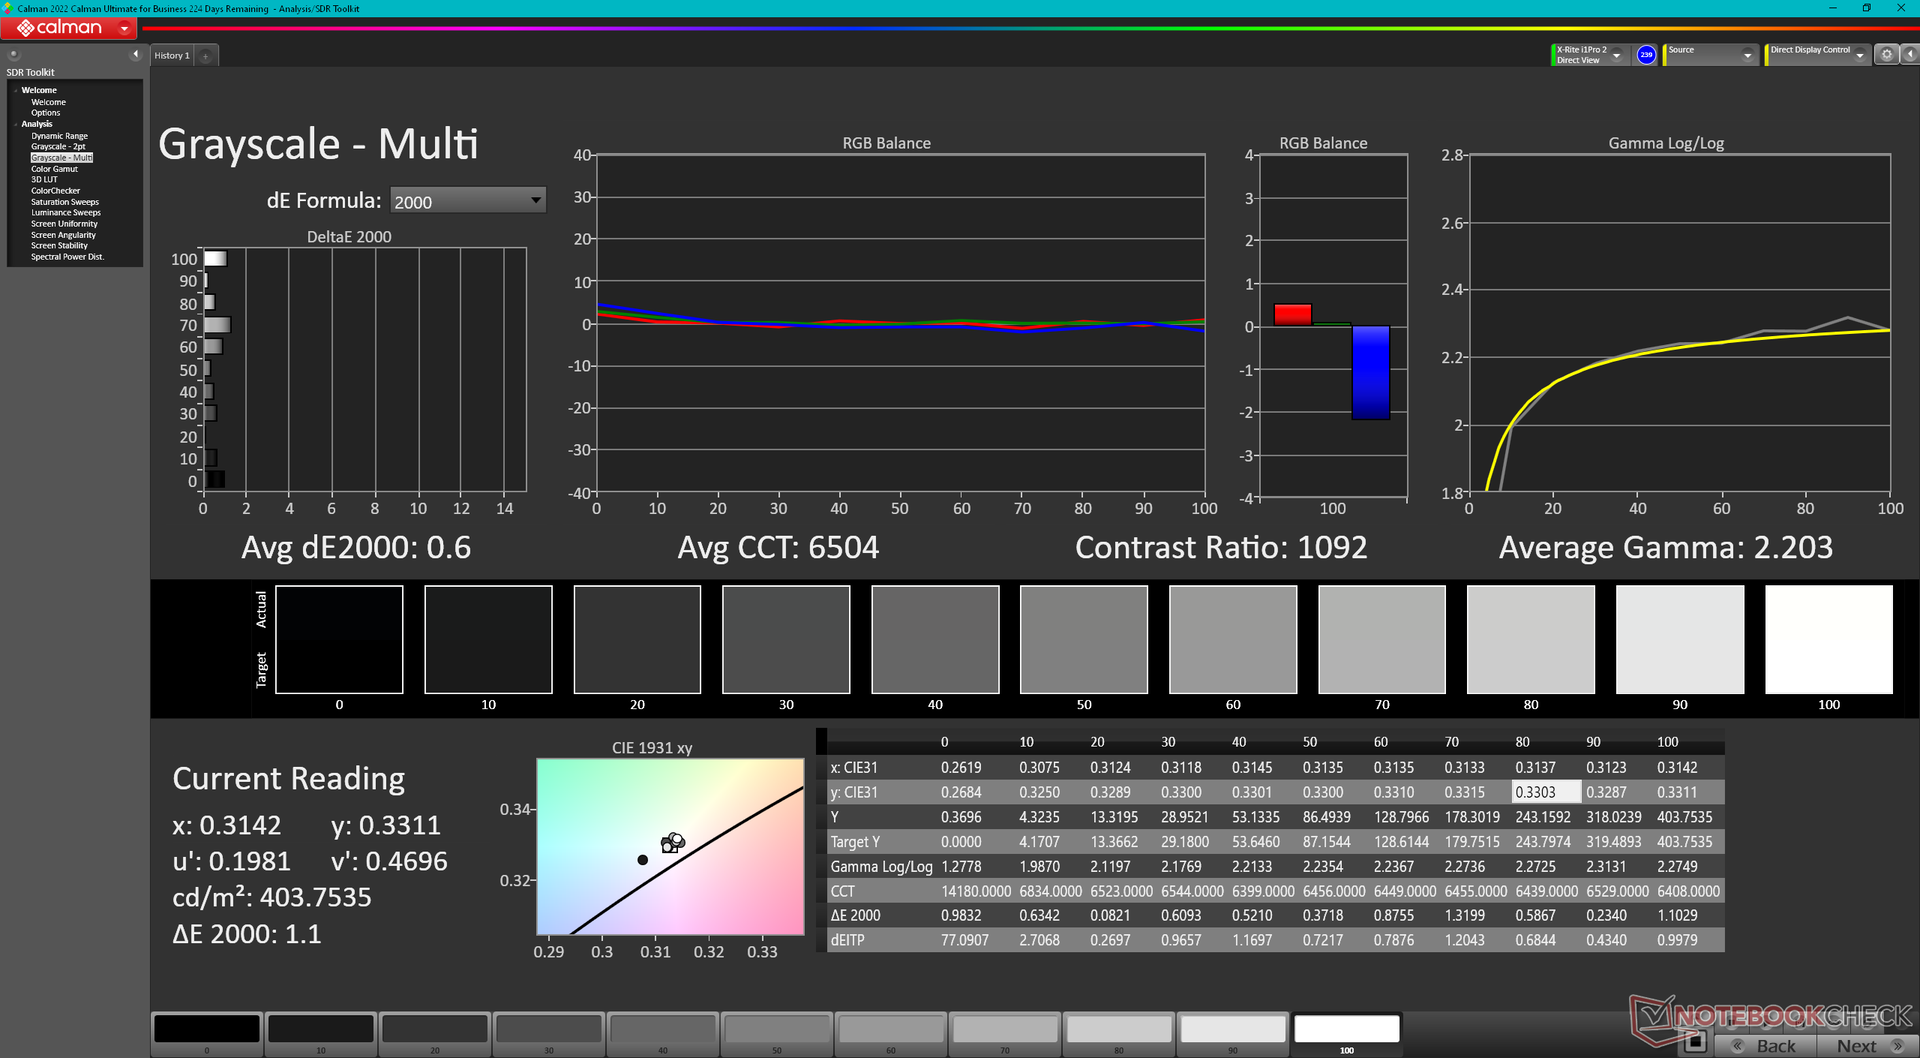
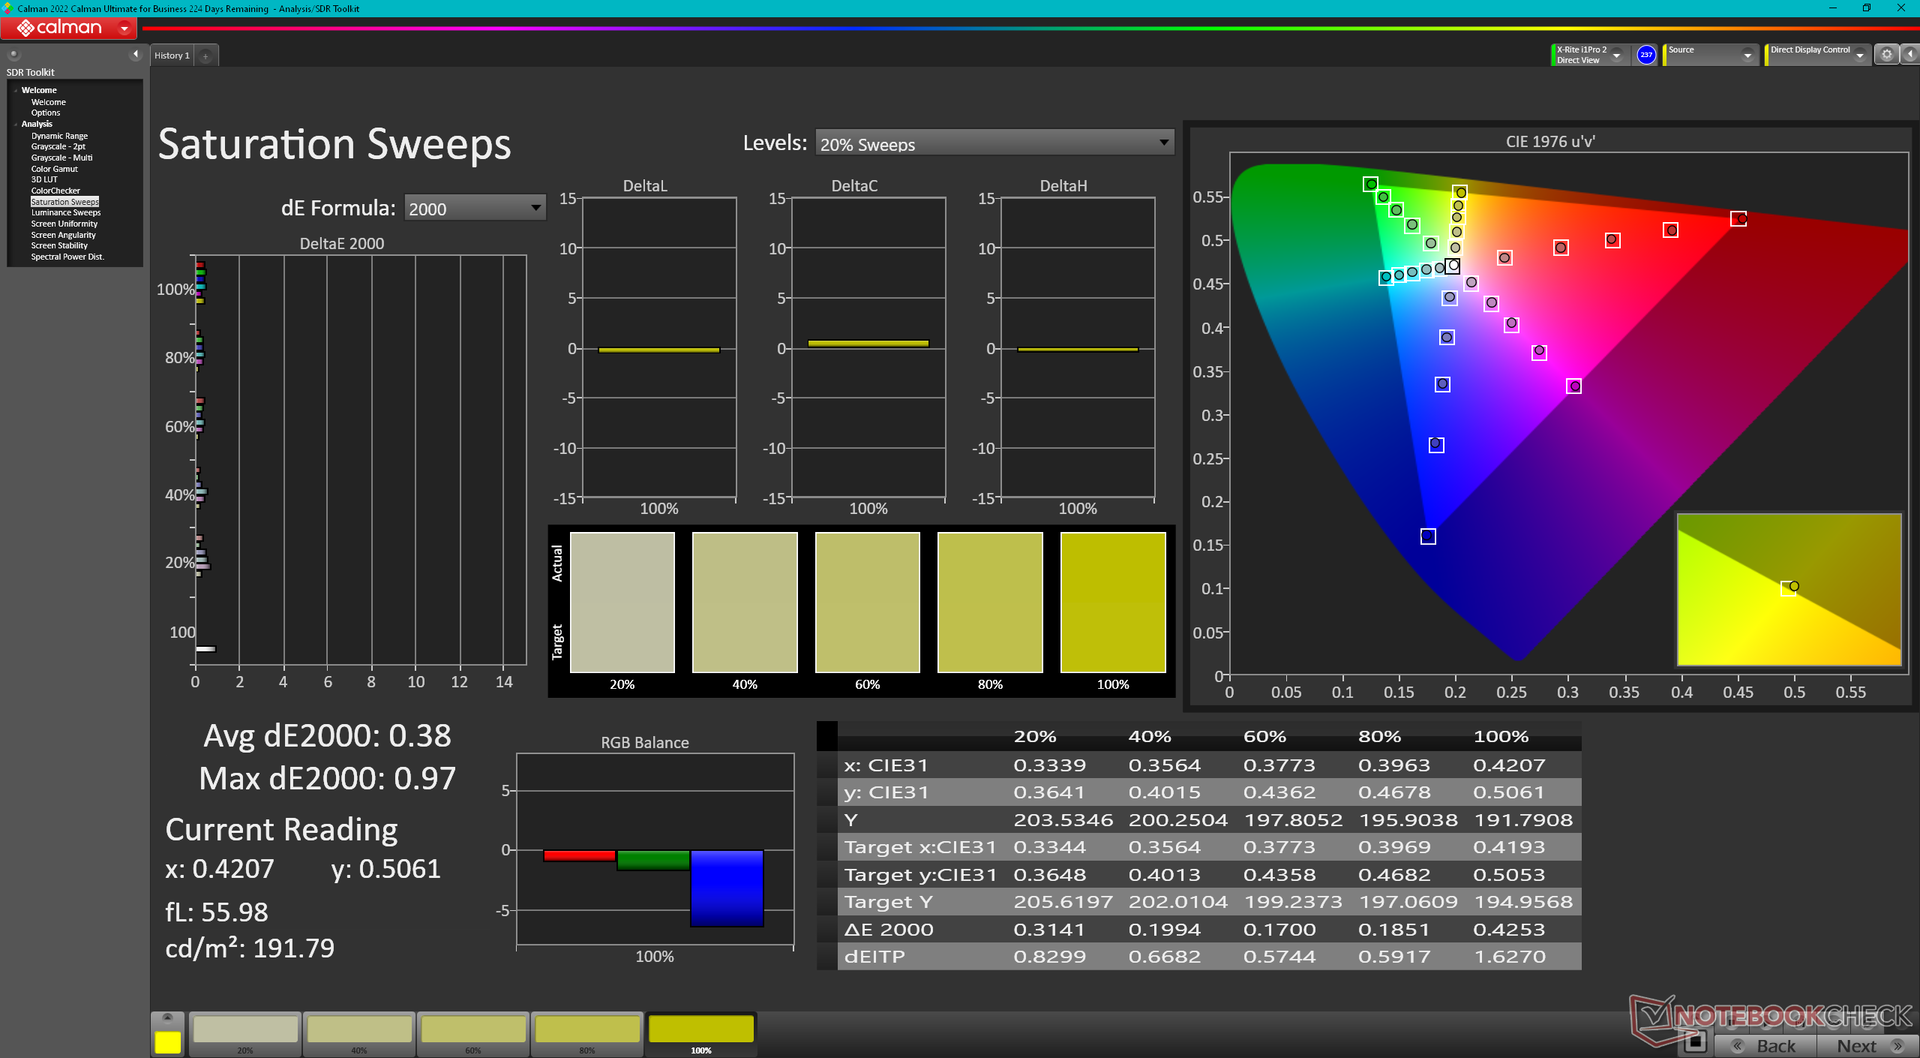
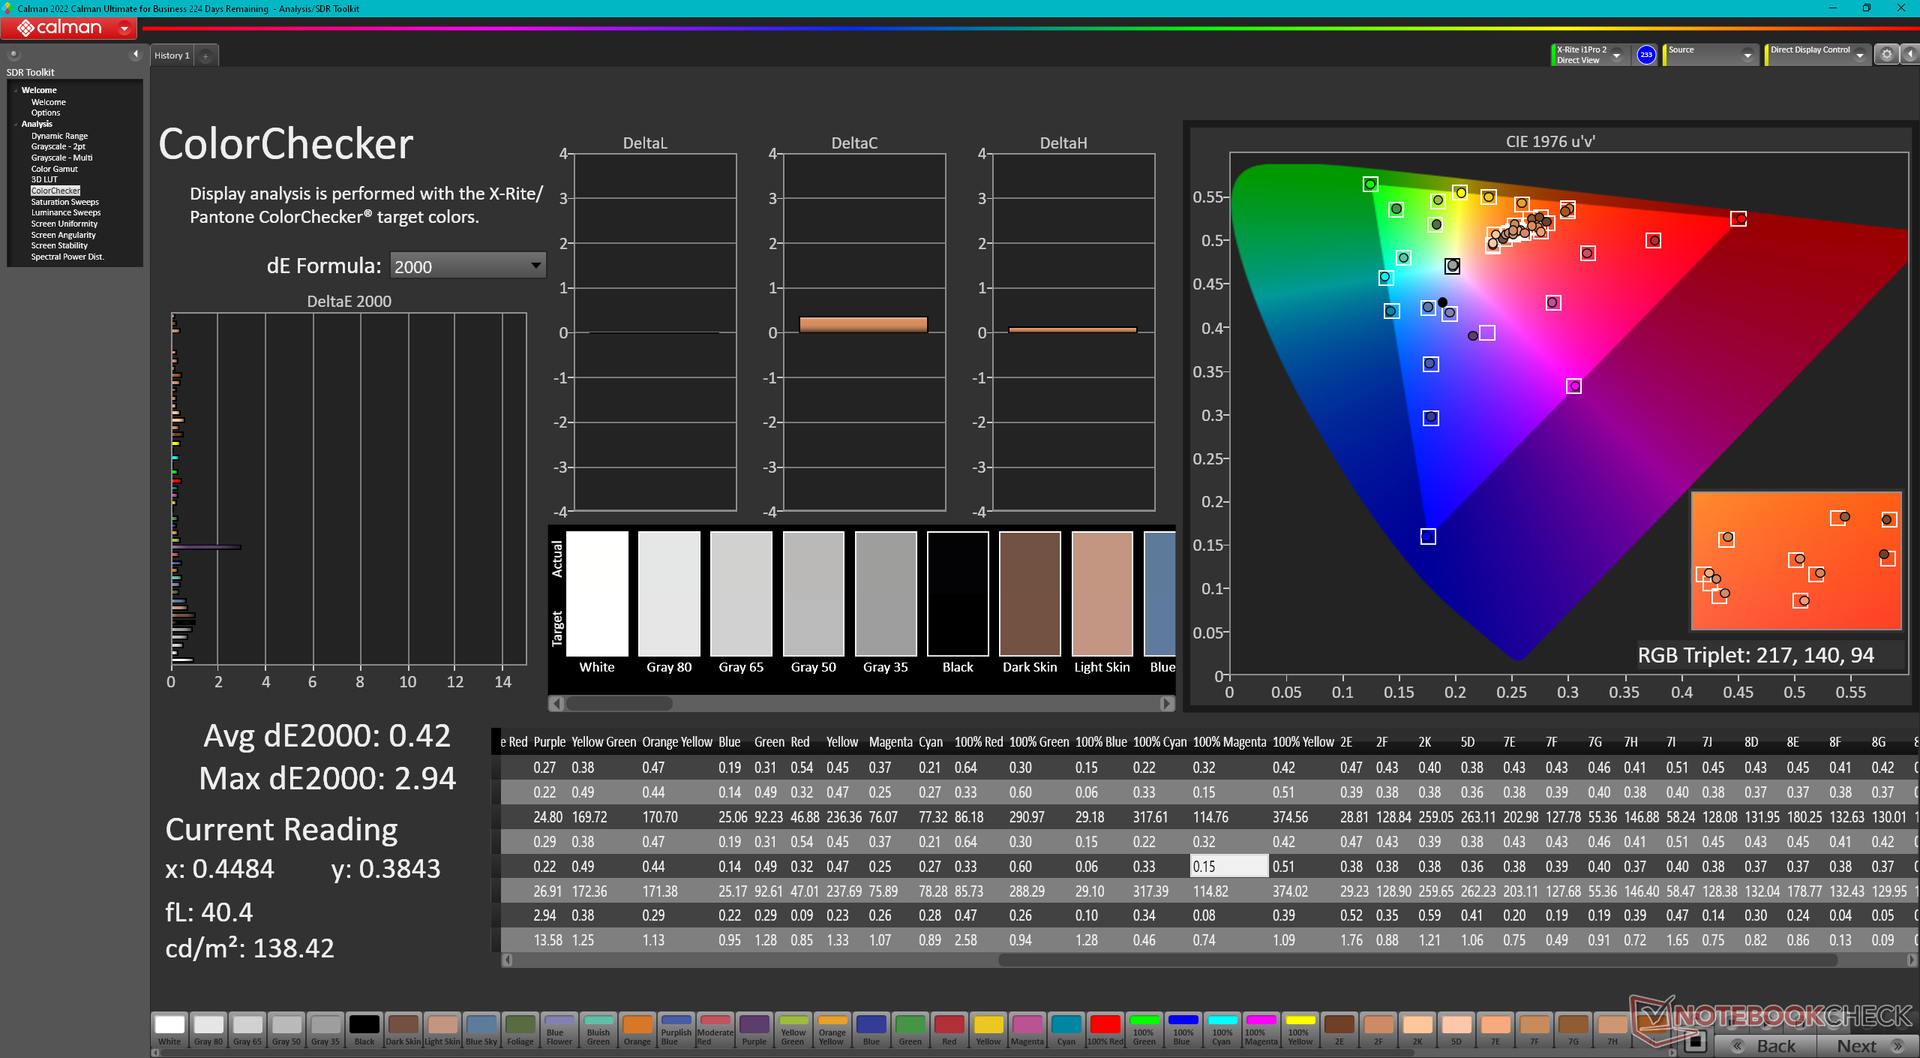
The display is well-calibrated out of the box with average grayscale and color deltaE values of just 3.1 and 2.14, respectively. Calibrating it ourselves would improve the deltaE averages even further to just 0.6 and 0.42 against the sRGB standard. Our calibrated ICM profile above is available to download for free.
Display Response Times
| ↔ Response Time Black to White | ||
|---|---|---|
| 9.4 ms ... rise ↗ and fall ↘ combined | ↗ 4.9 ms rise | 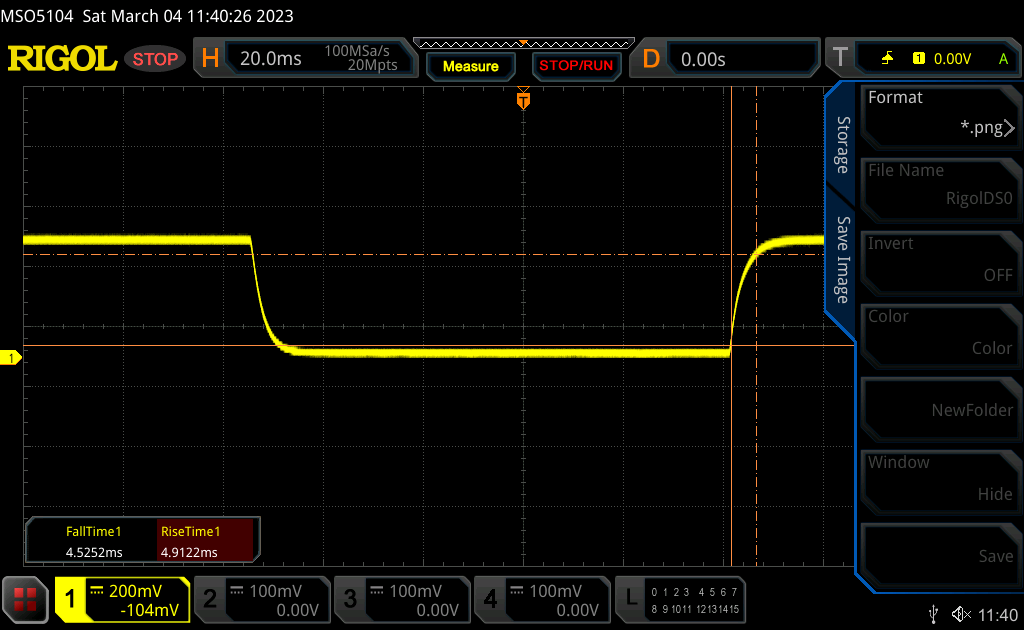 |
| ↘ 4.5 ms fall | ||
| The screen shows fast response rates in our tests and should be suited for gaming. In comparison, all tested devices range from 0.1 (minimum) to 240 (maximum) ms. » 26 % of all devices are better. This means that the measured response time is better than the average of all tested devices (19.9 ms). | ||
| ↔ Response Time 50% Grey to 80% Grey | ||
| 12 ms ... rise ↗ and fall ↘ combined | ↗ 5.4 ms rise | 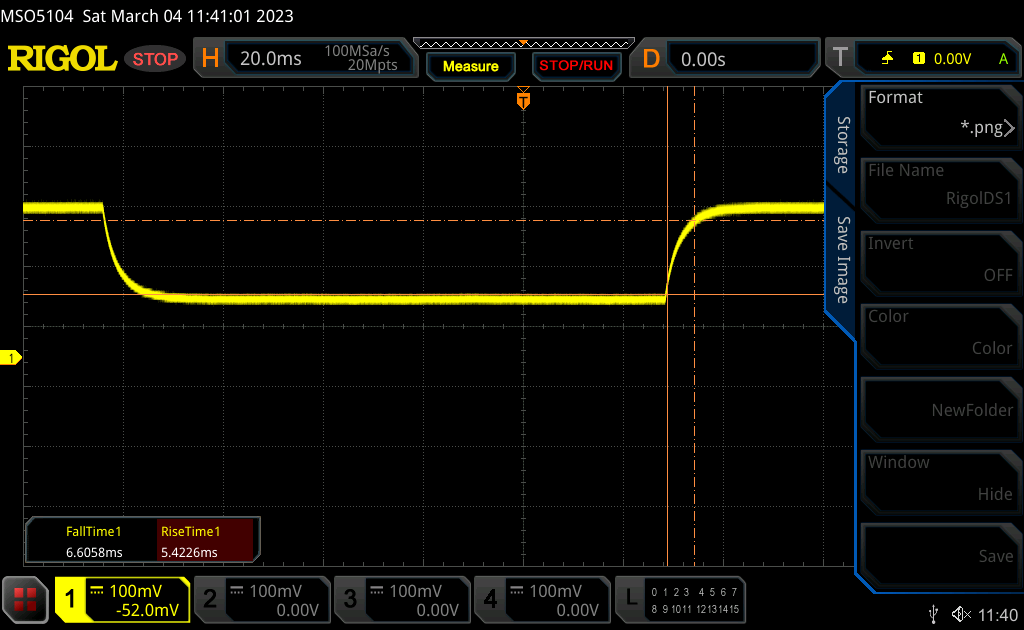 |
| ↘ 6.6 ms fall | ||
| The screen shows good response rates in our tests, but may be too slow for competitive gamers. In comparison, all tested devices range from 0.165 (minimum) to 636 (maximum) ms. » 25 % of all devices are better. This means that the measured response time is better than the average of all tested devices (31.1 ms). | ||
Screen Flickering / PWM (Pulse-Width Modulation)
| Screen flickering / PWM not detected | 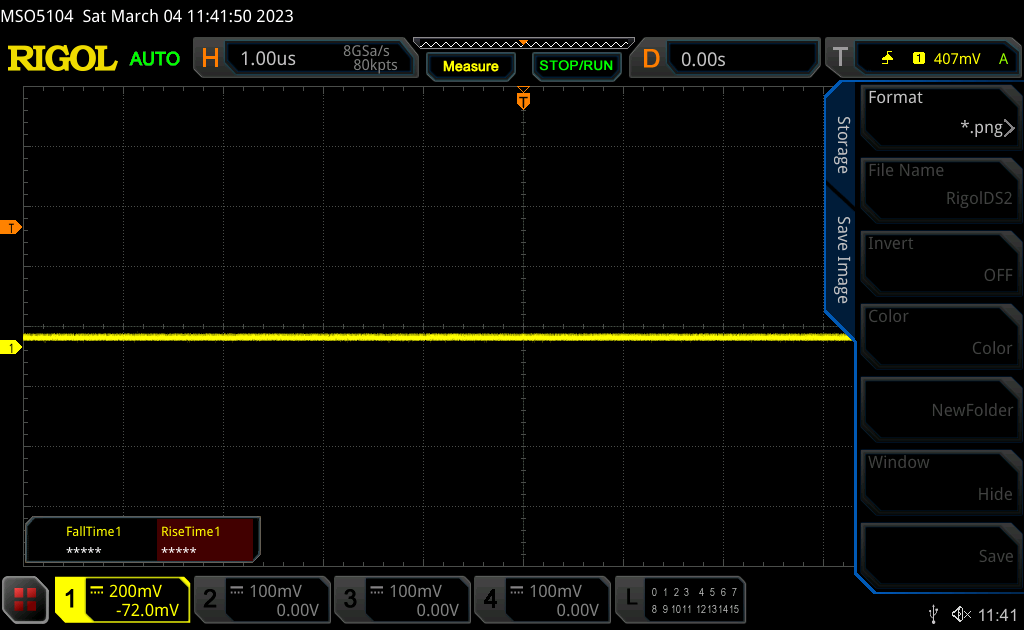 | ||
In comparison: 52 % of all tested devices do not use PWM to dim the display. If PWM was detected, an average of 7798 (minimum: 5 - maximum: 343500) Hz was measured. | |||
Performance
Testing Conditions
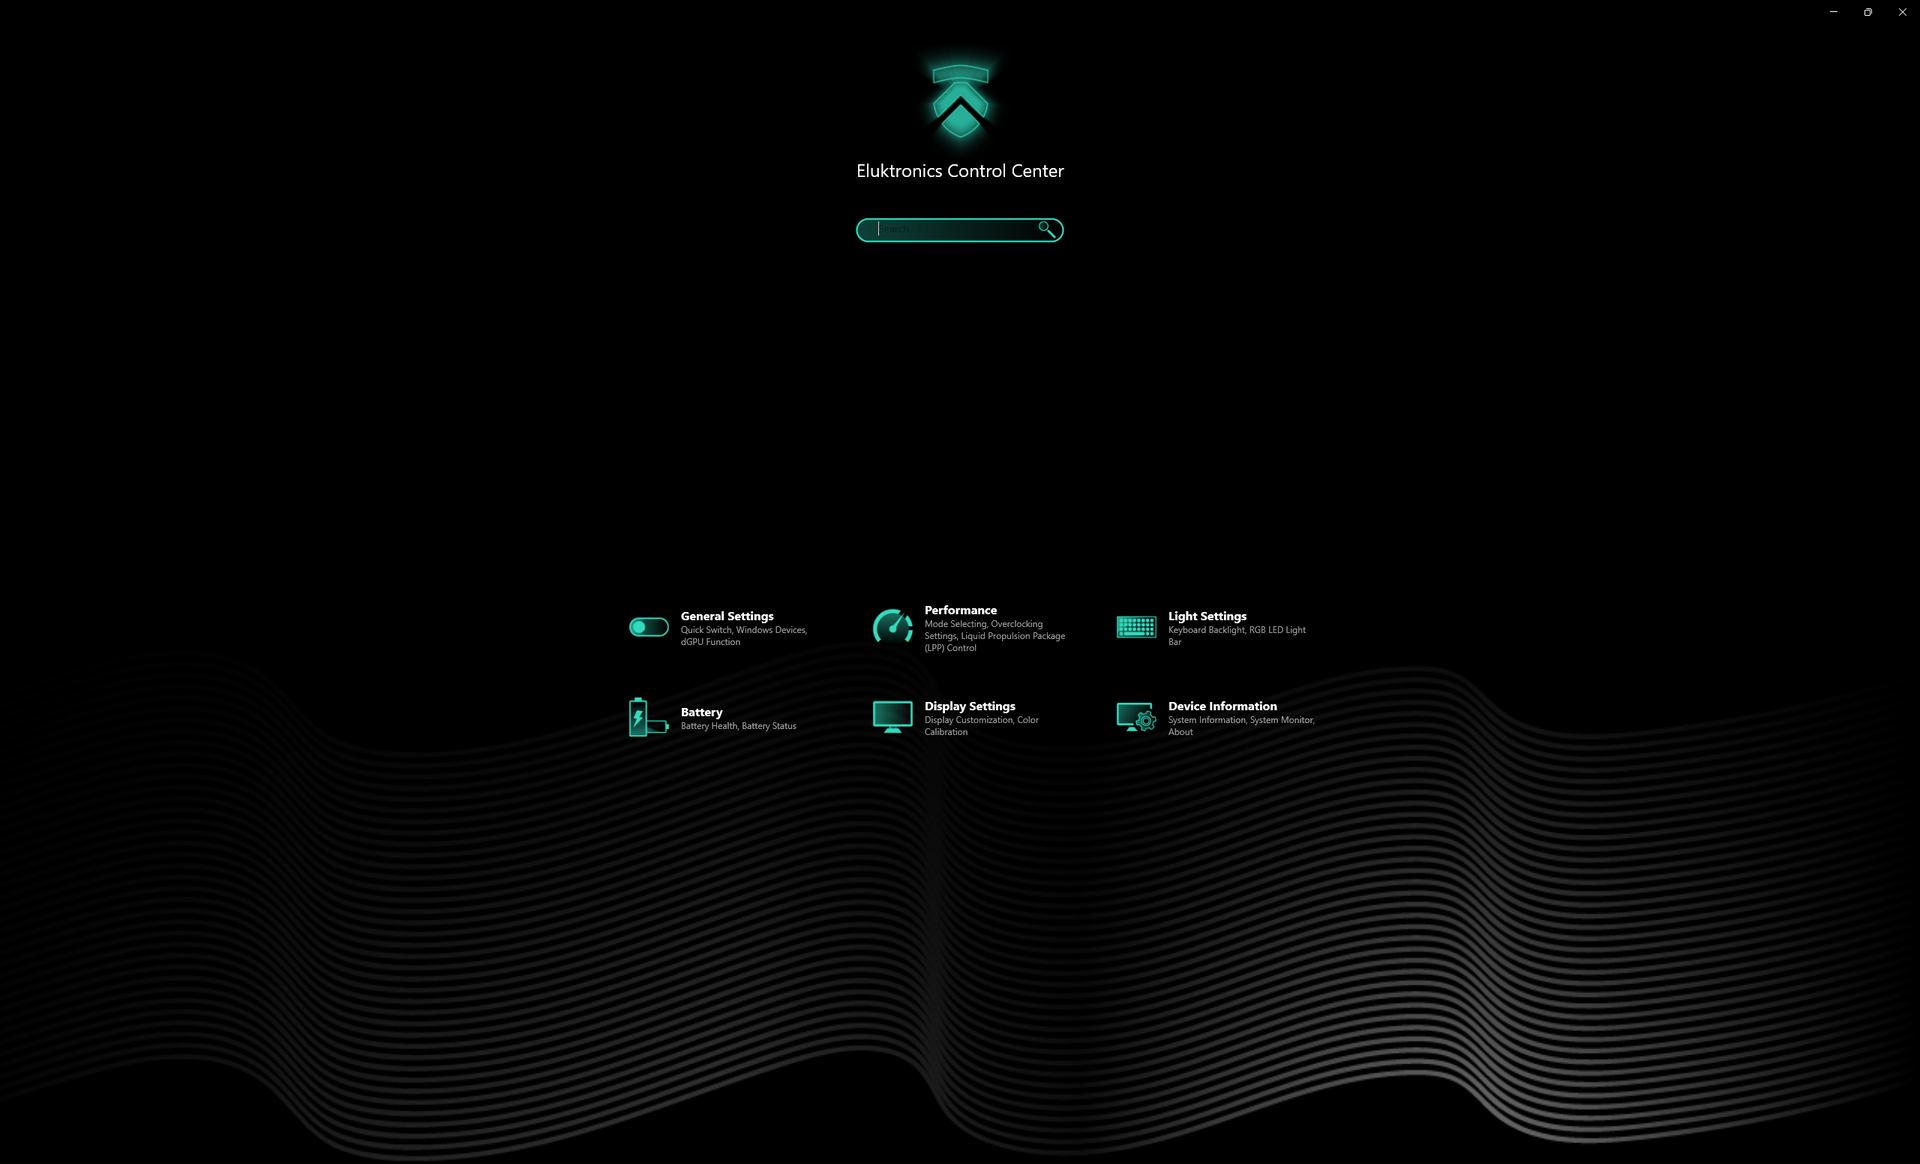
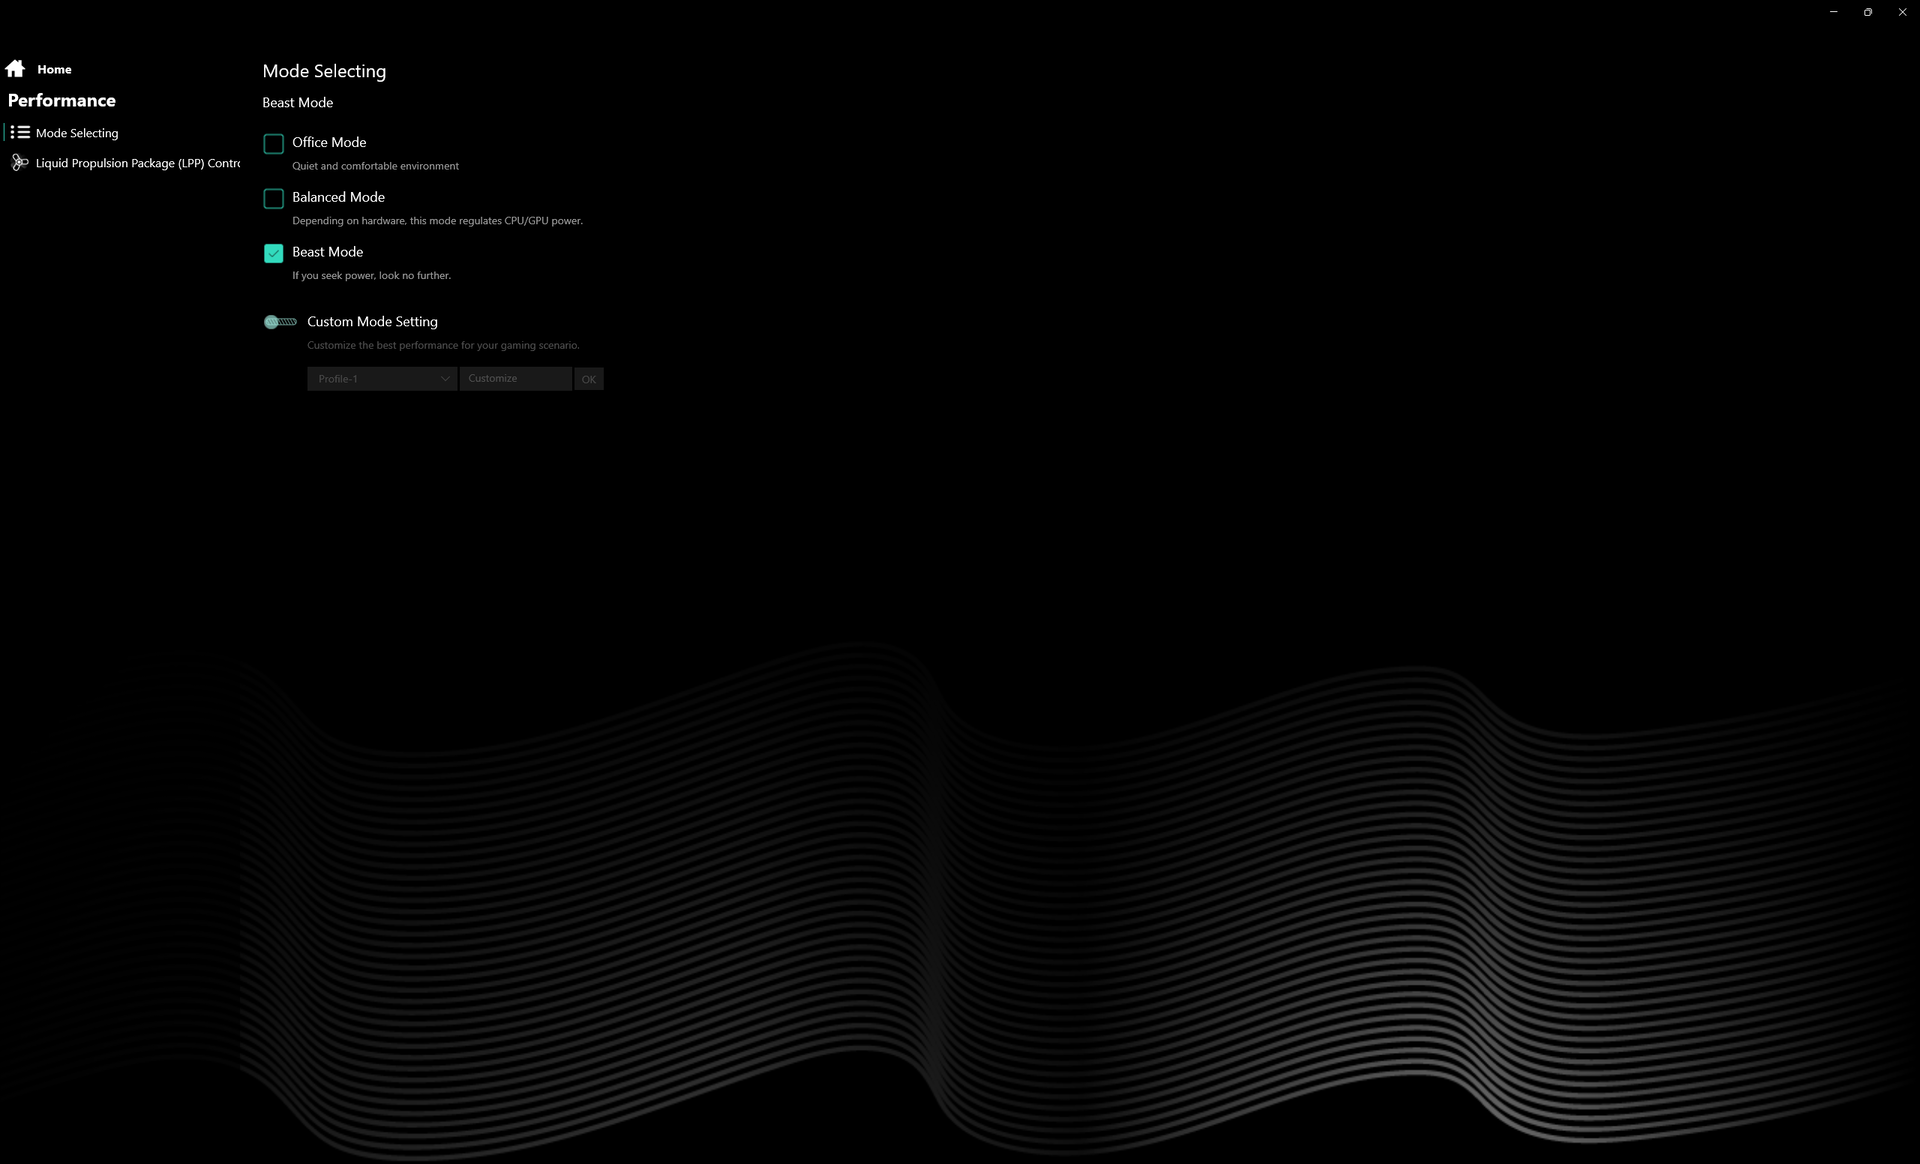
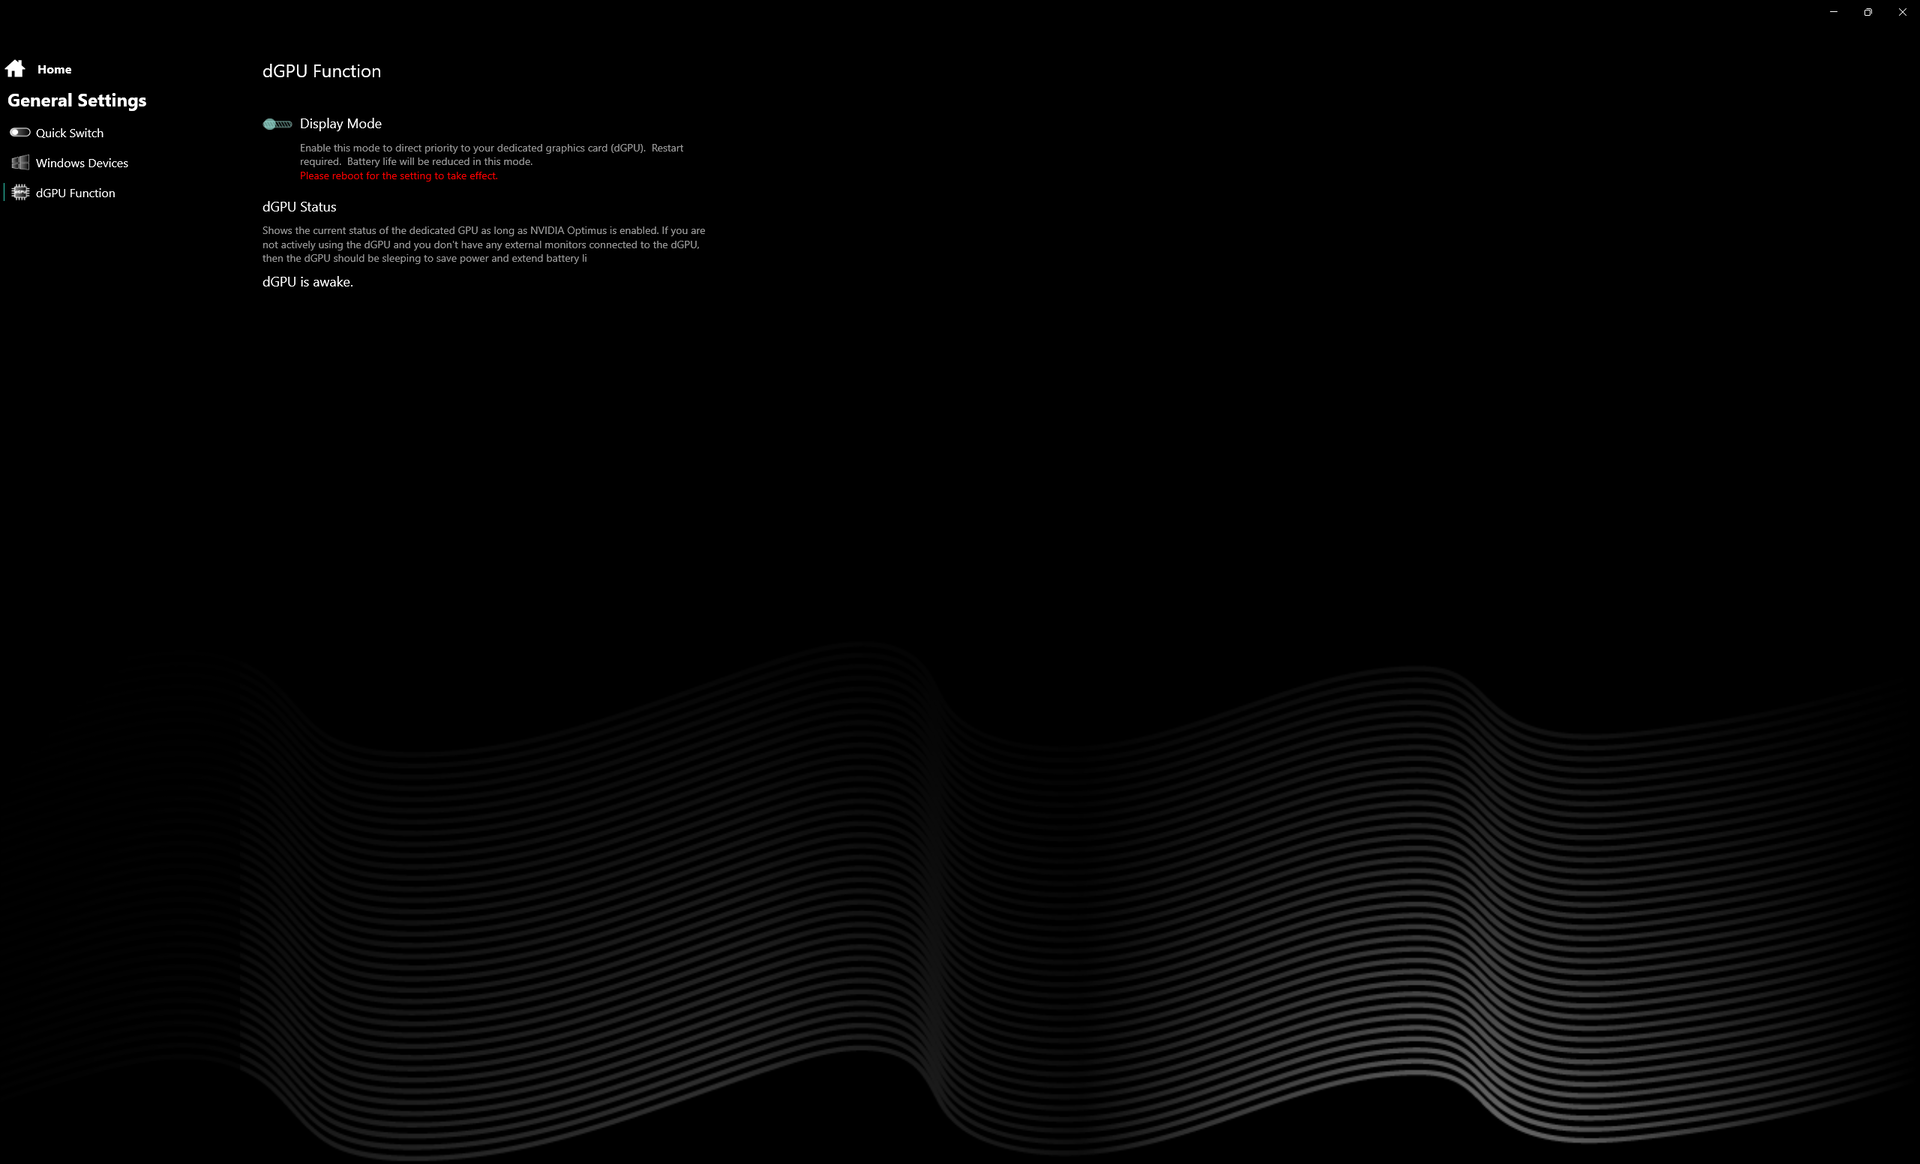
We set our unit to Performance mode via Windows and "Beast Mode" via the pre-installed Eluktronics Control Center software prior to running any benchmarks below. We also set the system to dGPU mode via the Nvidia control panel. Owners should become familiar with Control Center as it is the hub for toggling model-specific features like RGB, battery charge modes, performance modes, liquid cooling mode, and more. Advanced Optimus (MUX) is supported.
We experienced a handful of issues on our test unit including blank boot up screens, at least one system freeze when gaming, and automatic reboots when the CPU and GPU are at maximum utilization for extended periods. We addressed the first issue by disabling Quick Boot in the BIOS menu, but such issues should not be present in the first place.
Processor
Raw CPU performance is just 1 to 2 percent behind the 13th gen Core i9-13950HX in the MSI Titan GT77 and so they may as well be equivalent in most scenarios. Jumping from the Ryzen 9 6900HX to our Core i9-13900HX boosts multi-thread performance by an extraordinary 2x to 2.5x. The 12th gen Core i7-12700H, which is still common on many upper mid-range gaming laptops, is approximately 50 percent slower.
Performance sustainability is excellent with no major performance dips or cycling behavior over time.
Cinebench R15 Multi Loop
Cinebench R23: Multi Core | Single Core
Cinebench R20: CPU (Multi Core) | CPU (Single Core)
Cinebench R15: CPU Multi 64Bit | CPU Single 64Bit
Blender: v2.79 BMW27 CPU
7-Zip 18.03: 7z b 4 | 7z b 4 -mmt1
Geekbench 5.5: Multi-Core | Single-Core
HWBOT x265 Benchmark v2.2: 4k Preset
LibreOffice : 20 Documents To PDF
R Benchmark 2.5: Overall mean
| Cinebench R20 / CPU (Multi Core) | |
| MSI Titan GT77 HX 13VI | |
| Eluktronics Mech-17 GP2 | |
| Razer Blade 18 RTX 4070 | |
| Average Intel Core i9-13900HX (9152 - 12541, n=21) | |
| Corsair One i300 | |
| MSI Titan GT77 12UHS | |
| MSI Pulse GL76 12UGK | |
| MSI Katana 17 B13VFK | |
| Schenker XMG Neo 17 M22 | |
| HP Omen 16-n0033dx | |
| MSI GS76 Stealth 11UH | |
| Schenker XMG Core 17 (Early 2021) | |
| Cinebench R20 / CPU (Single Core) | |
| MSI Titan GT77 HX 13VI | |
| Eluktronics Mech-17 GP2 | |
| Razer Blade 18 RTX 4070 | |
| Average Intel Core i9-13900HX (722 - 810, n=21) | |
| Corsair One i300 | |
| MSI Titan GT77 12UHS | |
| MSI Katana 17 B13VFK | |
| MSI Pulse GL76 12UGK | |
| MSI GS76 Stealth 11UH | |
| Schenker XMG Neo 17 M22 | |
| HP Omen 16-n0033dx | |
| Schenker XMG Core 17 (Early 2021) | |
| Cinebench R15 / CPU Multi 64Bit | |
| MSI Titan GT77 HX 13VI | |
| Eluktronics Mech-17 GP2 | |
| Average Intel Core i9-13900HX (3913 - 4970, n=22) | |
| Razer Blade 18 RTX 4070 | |
| MSI Titan GT77 12UHS | |
| Corsair One i300 | |
| MSI Pulse GL76 12UGK | |
| MSI Katana 17 B13VFK | |
| Schenker XMG Neo 17 M22 | |
| HP Omen 16-n0033dx | |
| MSI GS76 Stealth 11UH | |
| Schenker XMG Core 17 (Early 2021) | |
| Cinebench R15 / CPU Single 64Bit | |
| MSI Titan GT77 HX 13VI | |
| Eluktronics Mech-17 GP2 | |
| Razer Blade 18 RTX 4070 | |
| Corsair One i300 | |
| Average Intel Core i9-13900HX (247 - 304, n=22) | |
| MSI Titan GT77 12UHS | |
| MSI Katana 17 B13VFK | |
| MSI Pulse GL76 12UGK | |
| Schenker XMG Neo 17 M22 | |
| HP Omen 16-n0033dx | |
| MSI GS76 Stealth 11UH | |
| Schenker XMG Core 17 (Early 2021) | |
| HWBOT x265 Benchmark v2.2 / 4k Preset | |
| Eluktronics Mech-17 GP2 | |
| MSI Titan GT77 HX 13VI | |
| Razer Blade 18 RTX 4070 | |
| Average Intel Core i9-13900HX (23.5 - 34.4, n=22) | |
| Corsair One i300 | |
| MSI Titan GT77 12UHS | |
| MSI Pulse GL76 12UGK | |
| Schenker XMG Neo 17 M22 | |
| MSI Katana 17 B13VFK | |
| HP Omen 16-n0033dx | |
| MSI GS76 Stealth 11UH | |
| Schenker XMG Core 17 (Early 2021) | |
| LibreOffice / 20 Documents To PDF | |
| HP Omen 16-n0033dx | |
| MSI Katana 17 B13VFK | |
| Schenker XMG Core 17 (Early 2021) | |
| Schenker XMG Neo 17 M22 | |
| MSI GS76 Stealth 11UH | |
| MSI Titan GT77 HX 13VI | |
| MSI Pulse GL76 12UGK | |
| Razer Blade 18 RTX 4070 | |
| Average Intel Core i9-13900HX (32.8 - 51.1, n=21) | |
| MSI Titan GT77 12UHS | |
| Corsair One i300 | |
| Eluktronics Mech-17 GP2 | |
* ... smaller is better
AIDA64: FP32 Ray-Trace | FPU Julia | CPU SHA3 | CPU Queen | FPU SinJulia | FPU Mandel | CPU AES | CPU ZLib | FP64 Ray-Trace | CPU PhotoWorxx
| Performance rating | |
| Eluktronics Mech-17 GP2 | |
| MSI Titan GT77 HX 13VI | |
| Razer Blade 18 RTX 4070 | |
| Average Intel Core i9-13900HX | |
| Schenker XMG Neo 17 M22 | |
| Alienware m17 R5 (R9 6900HX, RX 6850M XT) | |
| MSI Katana 17 B13VFK | |
| AIDA64 / FP32 Ray-Trace | |
| MSI Titan GT77 HX 13VI | |
| Eluktronics Mech-17 GP2 | |
| Razer Blade 18 RTX 4070 | |
| Average Intel Core i9-13900HX (17589 - 27615, n=22) | |
| Alienware m17 R5 (R9 6900HX, RX 6850M XT) | |
| Schenker XMG Neo 17 M22 | |
| MSI Katana 17 B13VFK | |
| AIDA64 / FPU Julia | |
| MSI Titan GT77 HX 13VI | |
| Eluktronics Mech-17 GP2 | |
| Razer Blade 18 RTX 4070 | |
| Average Intel Core i9-13900HX (88686 - 137015, n=22) | |
| Alienware m17 R5 (R9 6900HX, RX 6850M XT) | |
| Schenker XMG Neo 17 M22 | |
| MSI Katana 17 B13VFK | |
| AIDA64 / CPU SHA3 | |
| MSI Titan GT77 HX 13VI | |
| Eluktronics Mech-17 GP2 | |
| Razer Blade 18 RTX 4070 | |
| Average Intel Core i9-13900HX (4362 - 7029, n=22) | |
| Alienware m17 R5 (R9 6900HX, RX 6850M XT) | |
| Schenker XMG Neo 17 M22 | |
| MSI Katana 17 B13VFK | |
| AIDA64 / CPU Queen | |
| Eluktronics Mech-17 GP2 | |
| MSI Titan GT77 HX 13VI | |
| Razer Blade 18 RTX 4070 | |
| Average Intel Core i9-13900HX (125644 - 141385, n=22) | |
| Alienware m17 R5 (R9 6900HX, RX 6850M XT) | |
| Schenker XMG Neo 17 M22 | |
| MSI Katana 17 B13VFK | |
| AIDA64 / FPU SinJulia | |
| Eluktronics Mech-17 GP2 | |
| MSI Titan GT77 HX 13VI | |
| Razer Blade 18 RTX 4070 | |
| Average Intel Core i9-13900HX (12334 - 17179, n=22) | |
| Alienware m17 R5 (R9 6900HX, RX 6850M XT) | |
| Schenker XMG Neo 17 M22 | |
| MSI Katana 17 B13VFK | |
| AIDA64 / FPU Mandel | |
| MSI Titan GT77 HX 13VI | |
| Eluktronics Mech-17 GP2 | |
| Razer Blade 18 RTX 4070 | |
| Average Intel Core i9-13900HX (43850 - 69202, n=22) | |
| Alienware m17 R5 (R9 6900HX, RX 6850M XT) | |
| Schenker XMG Neo 17 M22 | |
| MSI Katana 17 B13VFK | |
| AIDA64 / CPU AES | |
| Eluktronics Mech-17 GP2 | |
| Average Intel Core i9-13900HX (89413 - 237881, n=22) | |
| MSI Titan GT77 HX 13VI | |
| Schenker XMG Neo 17 M22 | |
| Razer Blade 18 RTX 4070 | |
| MSI Katana 17 B13VFK | |
| Alienware m17 R5 (R9 6900HX, RX 6850M XT) | |
| AIDA64 / CPU ZLib | |
| MSI Titan GT77 HX 13VI | |
| Eluktronics Mech-17 GP2 | |
| Razer Blade 18 RTX 4070 | |
| Average Intel Core i9-13900HX (1284 - 1958, n=22) | |
| Alienware m17 R5 (R9 6900HX, RX 6850M XT) | |
| Schenker XMG Neo 17 M22 | |
| MSI Katana 17 B13VFK | |
| AIDA64 / FP64 Ray-Trace | |
| MSI Titan GT77 HX 13VI | |
| Eluktronics Mech-17 GP2 | |
| Razer Blade 18 RTX 4070 | |
| Average Intel Core i9-13900HX (9481 - 15279, n=22) | |
| Alienware m17 R5 (R9 6900HX, RX 6850M XT) | |
| Schenker XMG Neo 17 M22 | |
| MSI Katana 17 B13VFK | |
| AIDA64 / CPU PhotoWorxx | |
| Razer Blade 18 RTX 4070 | |
| Average Intel Core i9-13900HX (42994 - 51994, n=22) | |
| Eluktronics Mech-17 GP2 | |
| MSI Titan GT77 HX 13VI | |
| MSI Katana 17 B13VFK | |
| Alienware m17 R5 (R9 6900HX, RX 6850M XT) | |
| Schenker XMG Neo 17 M22 | |
System Performance
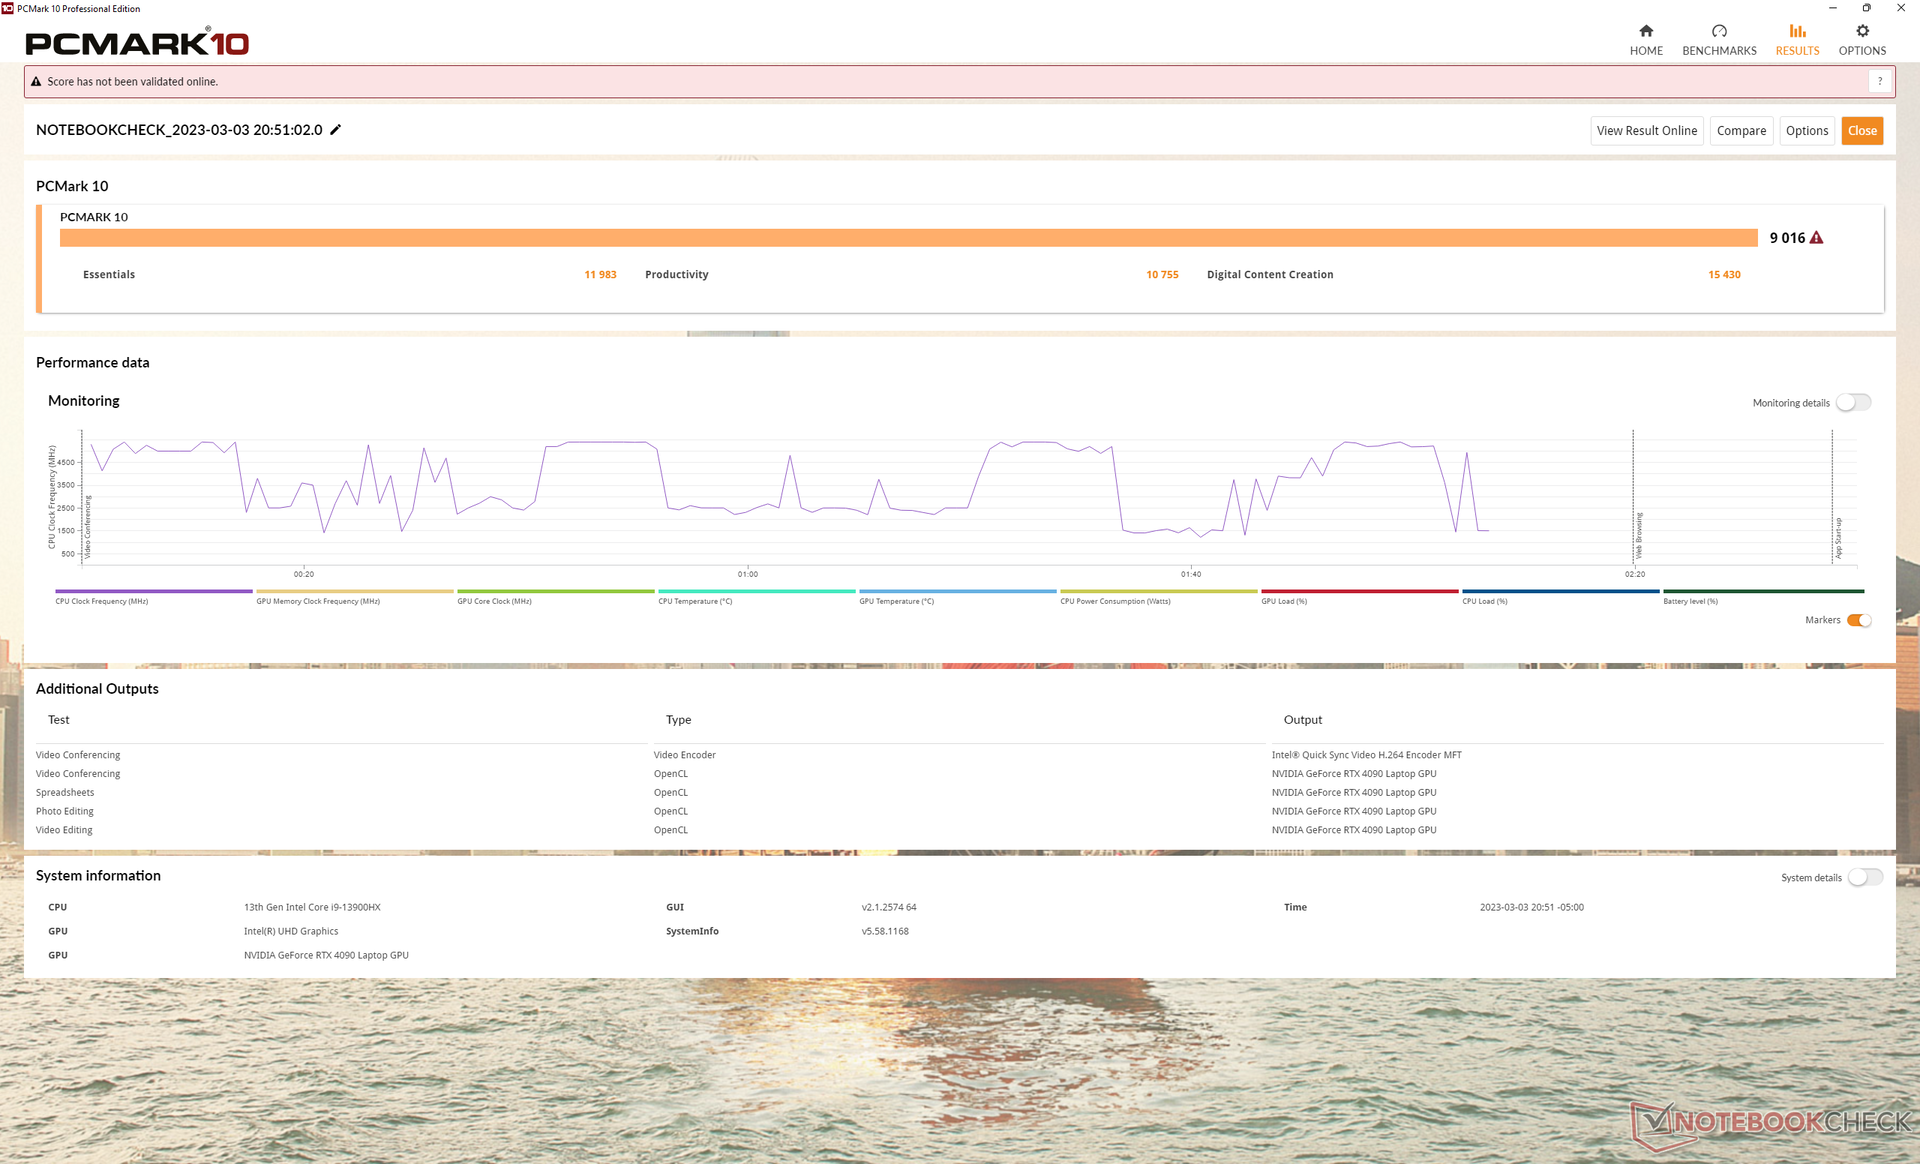
PCMark scores are some of the highest in our database rivaling the MSI Titan GT77. Its Digital Content Creation score in particular is almost 70 percent higher than on last year's RTX 3080 Ti model due to the increase in graphics performance.
CrossMark: Overall | Productivity | Creativity | Responsiveness
| PCMark 10 / Score | |
| Eluktronics Mech-17 GP2 | |
| MSI Titan GT77 HX 13VI | |
| Average Intel Core i9-13900HX, NVIDIA GeForce RTX 4090 Laptop GPU (7690 - 9331, n=8) | |
| Razer Blade 18 RTX 4070 | |
| Alienware m17 R5 (R9 6900HX, RX 6850M XT) | |
| MSI Katana 17 B13VFK | |
| Schenker XMG Neo 17 M22 | |
| PCMark 10 / Essentials | |
| Eluktronics Mech-17 GP2 | |
| MSI Titan GT77 HX 13VI | |
| Razer Blade 18 RTX 4070 | |
| Average Intel Core i9-13900HX, NVIDIA GeForce RTX 4090 Laptop GPU (10972 - 11983, n=8) | |
| MSI Katana 17 B13VFK | |
| Alienware m17 R5 (R9 6900HX, RX 6850M XT) | |
| Schenker XMG Neo 17 M22 | |
| PCMark 10 / Productivity | |
| Eluktronics Mech-17 GP2 | |
| Average Intel Core i9-13900HX, NVIDIA GeForce RTX 4090 Laptop GPU (9038 - 11680, n=8) | |
| MSI Titan GT77 HX 13VI | |
| Razer Blade 18 RTX 4070 | |
| Schenker XMG Neo 17 M22 | |
| MSI Katana 17 B13VFK | |
| Alienware m17 R5 (R9 6900HX, RX 6850M XT) | |
| PCMark 10 / Digital Content Creation | |
| MSI Titan GT77 HX 13VI | |
| Eluktronics Mech-17 GP2 | |
| Average Intel Core i9-13900HX, NVIDIA GeForce RTX 4090 Laptop GPU (10605 - 16395, n=8) | |
| Alienware m17 R5 (R9 6900HX, RX 6850M XT) | |
| Razer Blade 18 RTX 4070 | |
| MSI Katana 17 B13VFK | |
| Schenker XMG Neo 17 M22 | |
| CrossMark / Overall | |
| Eluktronics Mech-17 GP2 | |
| MSI Titan GT77 HX 13VI | |
| Razer Blade 18 RTX 4070 | |
| Average Intel Core i9-13900HX, NVIDIA GeForce RTX 4090 Laptop GPU (1825 - 2295, n=8) | |
| MSI Katana 17 B13VFK | |
| Schenker XMG Neo 17 M22 | |
| Alienware m17 R5 (R9 6900HX, RX 6850M XT) | |
| CrossMark / Productivity | |
| Eluktronics Mech-17 GP2 | |
| MSI Titan GT77 HX 13VI | |
| Razer Blade 18 RTX 4070 | |
| Average Intel Core i9-13900HX, NVIDIA GeForce RTX 4090 Laptop GPU (1666 - 2166, n=8) | |
| MSI Katana 17 B13VFK | |
| Schenker XMG Neo 17 M22 | |
| Alienware m17 R5 (R9 6900HX, RX 6850M XT) | |
| CrossMark / Creativity | |
| Eluktronics Mech-17 GP2 | |
| MSI Titan GT77 HX 13VI | |
| Razer Blade 18 RTX 4070 | |
| Average Intel Core i9-13900HX, NVIDIA GeForce RTX 4090 Laptop GPU (2162 - 2514, n=8) | |
| MSI Katana 17 B13VFK | |
| Schenker XMG Neo 17 M22 | |
| Alienware m17 R5 (R9 6900HX, RX 6850M XT) | |
| CrossMark / Responsiveness | |
| Razer Blade 18 RTX 4070 | |
| MSI Titan GT77 HX 13VI | |
| Eluktronics Mech-17 GP2 | |
| Average Intel Core i9-13900HX, NVIDIA GeForce RTX 4090 Laptop GPU (1441 - 2275, n=8) | |
| MSI Katana 17 B13VFK | |
| Schenker XMG Neo 17 M22 | |
| Alienware m17 R5 (R9 6900HX, RX 6850M XT) | |
| PCMark 10 Score | 9016 points | |
Help | ||
| AIDA64 / Memory Copy | |
| Razer Blade 18 RTX 4070 | |
| Average Intel Core i9-13900HX (67716 - 79193, n=22) | |
| Eluktronics Mech-17 GP2 | |
| MSI Titan GT77 HX 13VI | |
| MSI Katana 17 B13VFK | |
| Alienware m17 R5 (R9 6900HX, RX 6850M XT) | |
| Schenker XMG Neo 17 M22 | |
| AIDA64 / Memory Read | |
| Razer Blade 18 RTX 4070 | |
| Average Intel Core i9-13900HX (73998 - 88462, n=22) | |
| Eluktronics Mech-17 GP2 | |
| MSI Titan GT77 HX 13VI | |
| MSI Katana 17 B13VFK | |
| Schenker XMG Neo 17 M22 | |
| Alienware m17 R5 (R9 6900HX, RX 6850M XT) | |
| AIDA64 / Memory Write | |
| Razer Blade 18 RTX 4070 | |
| Average Intel Core i9-13900HX (65472 - 77045, n=22) | |
| Eluktronics Mech-17 GP2 | |
| MSI Titan GT77 HX 13VI | |
| Schenker XMG Neo 17 M22 | |
| Alienware m17 R5 (R9 6900HX, RX 6850M XT) | |
| MSI Katana 17 B13VFK | |
| AIDA64 / Memory Latency | |
| MSI Katana 17 B13VFK | |
| Alienware m17 R5 (R9 6900HX, RX 6850M XT) | |
| MSI Titan GT77 HX 13VI | |
| Schenker XMG Neo 17 M22 | |
| Eluktronics Mech-17 GP2 | |
| Average Intel Core i9-13900HX (75.3 - 91.1, n=22) | |
| Razer Blade 18 RTX 4070 | |
* ... smaller is better
DPC Latency
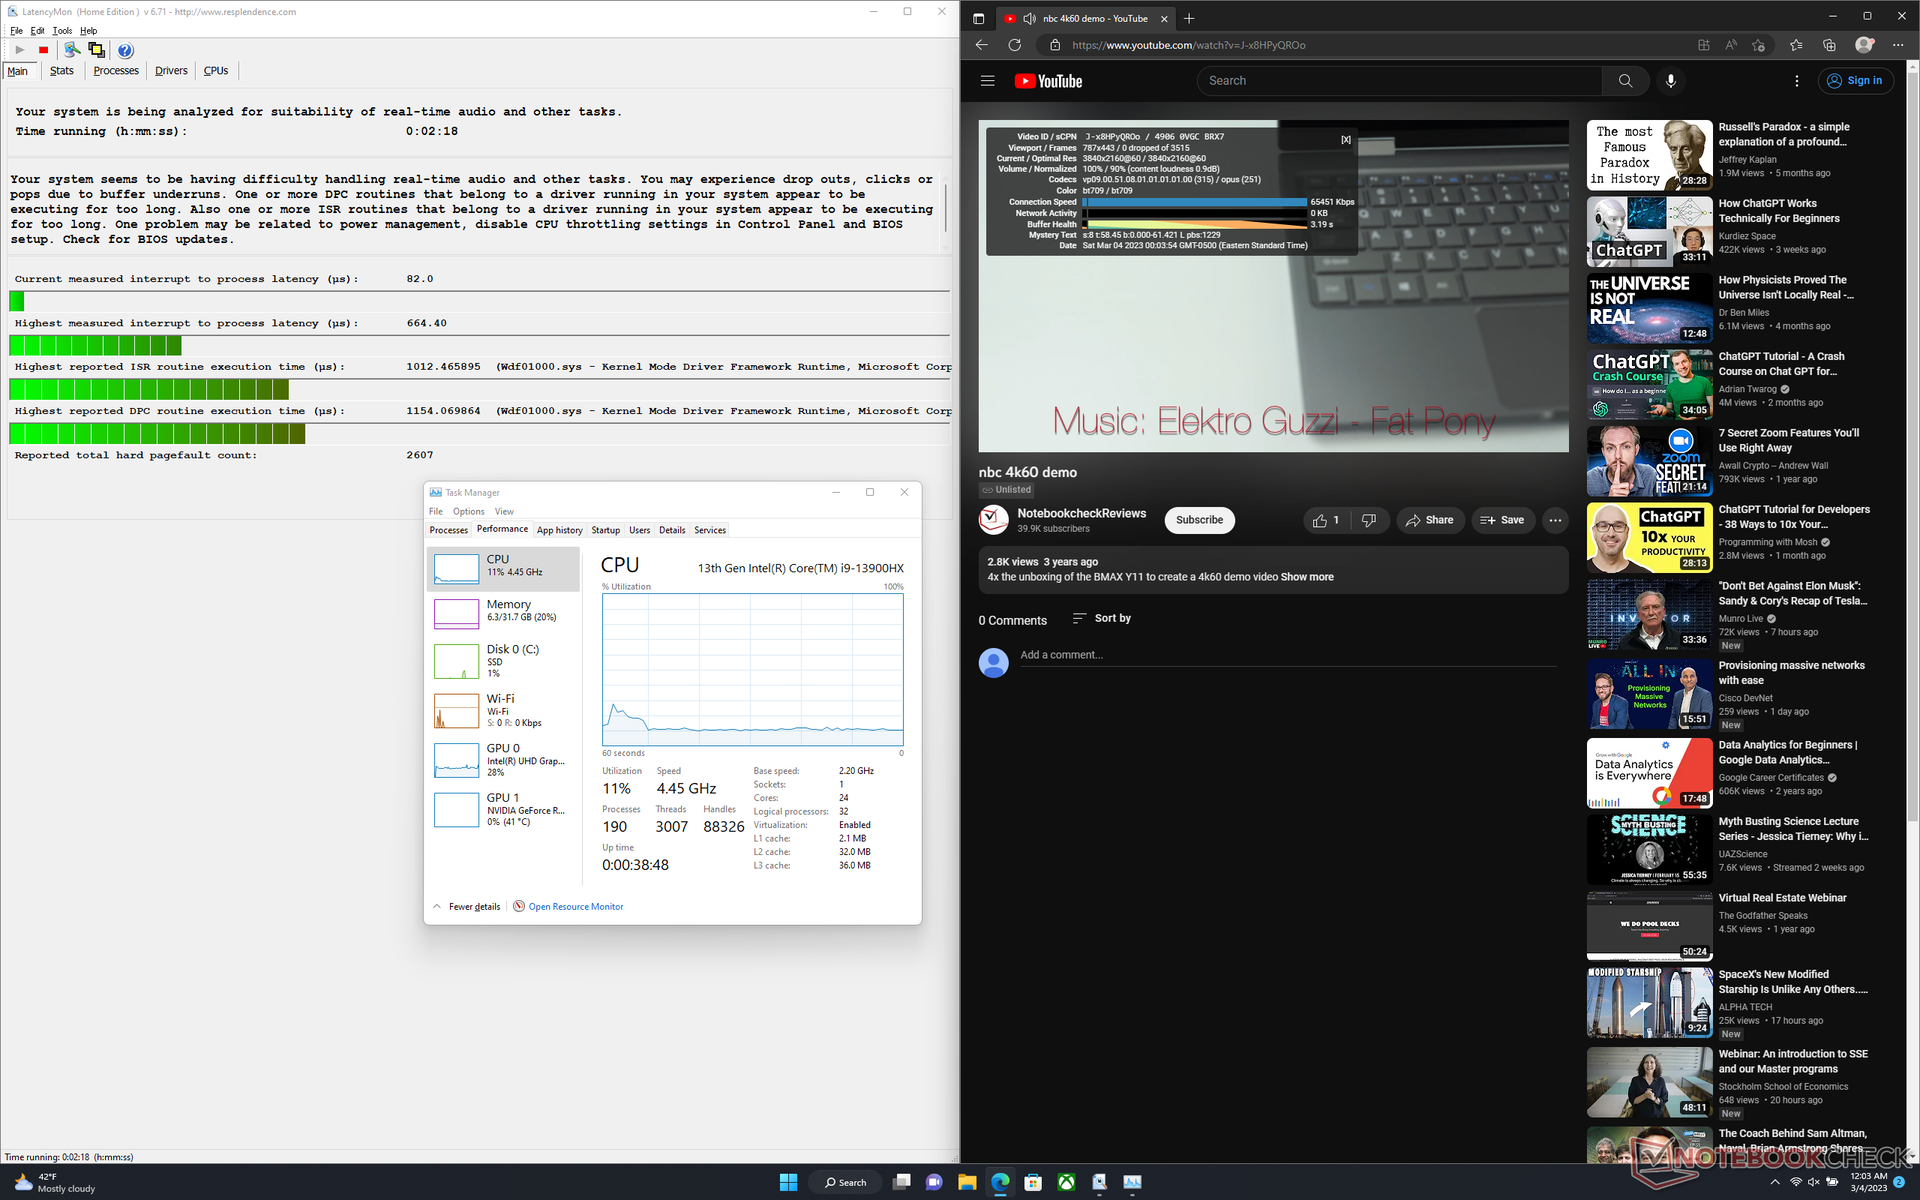
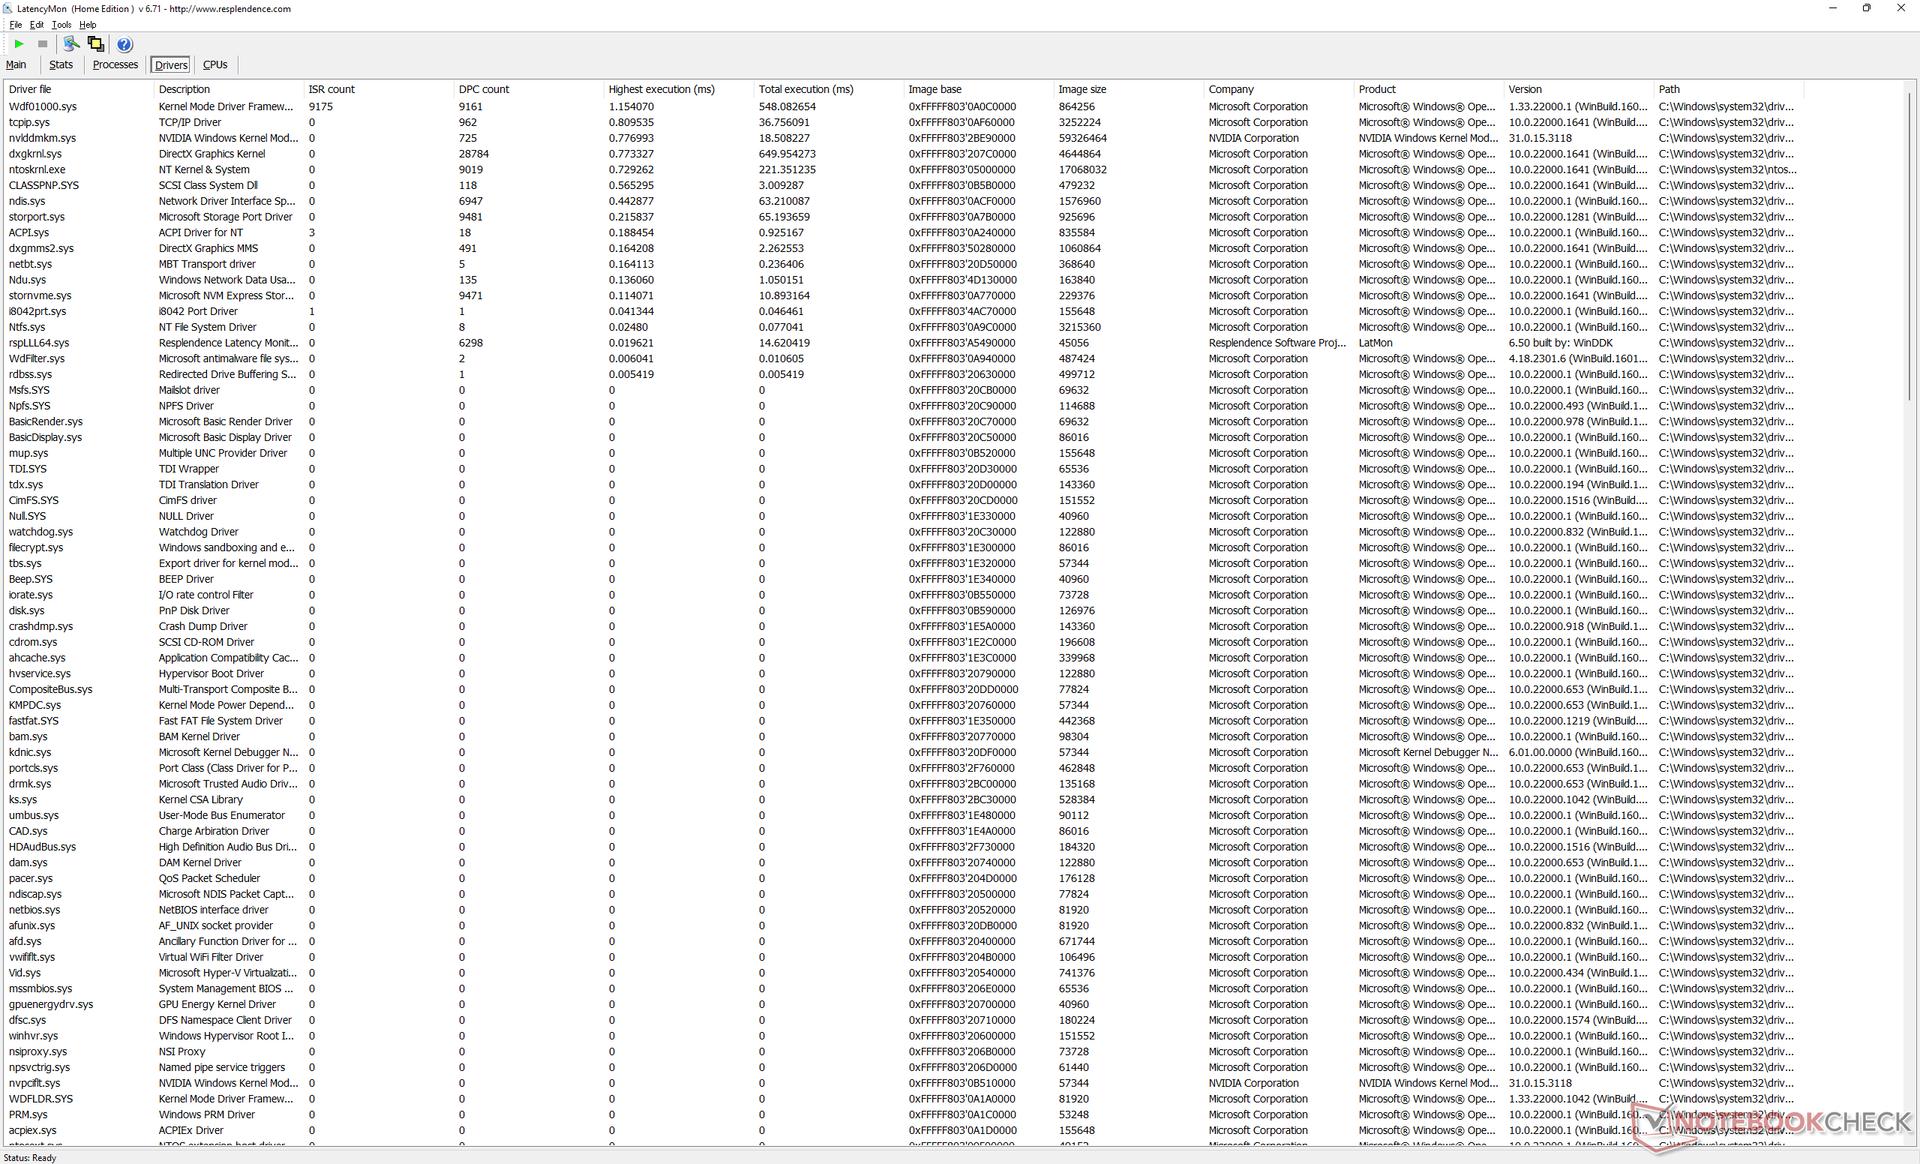
LatencyMon reveals minor DPC issues when opening multiple browser tabs of our homepage. 4K video playback at 60 FPS is otherwise perfect with no dropped frames.
| DPC Latencies / LatencyMon - interrupt to process latency (max), Web, Youtube, Prime95 | |
| MSI Titan GT77 HX 13VI | |
| Schenker XMG Neo 17 M22 | |
| MSI Katana 17 B13VFK | |
| Alienware m17 R5 (R9 6900HX, RX 6850M XT) | |
| Razer Blade 18 RTX 4070 | |
| Eluktronics Mech-17 GP2 | |
* ... smaller is better
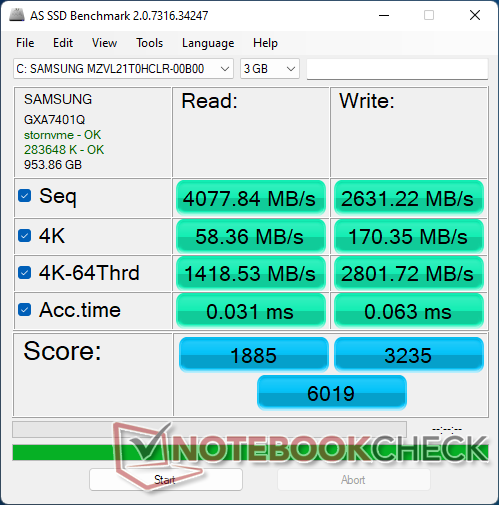
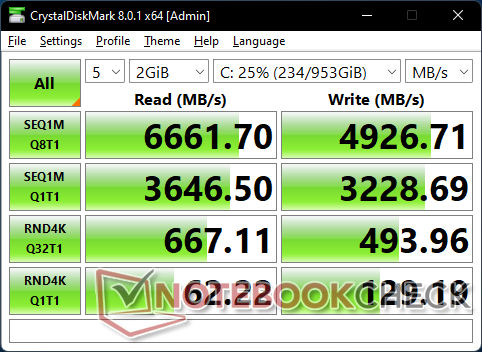
Storage Devices
Our unit ships with a 1 TB Samsung PM9A1 MZVL21T0HCLR which is one of the fastest consumer-based PCIe4 x4 NVMe SSDs currently available. Unfortunately, the drive in our unit exhibits issues maintaining maximum transfer rates for extended periods as shown by our stress test graph below. In comparison, the Razer Blade 15 with the same Samsung drive is able to sustain transfer rates of 6700 MB/s without any issues.

| Drive Performance rating - Percent | |
| Schenker XMG Neo 17 M22 | |
| MSI Titan GT77 HX 13VI | |
| Razer Blade 18 RTX 4070 | |
| MSI Katana 17 B13VFK | |
| Eluktronics Mech-17 GP2 | |
| Alienware m17 R5 (R9 6900HX, RX 6850M XT) | |
* ... smaller is better
Disk Throttling: DiskSpd Read Loop, Queue Depth 8
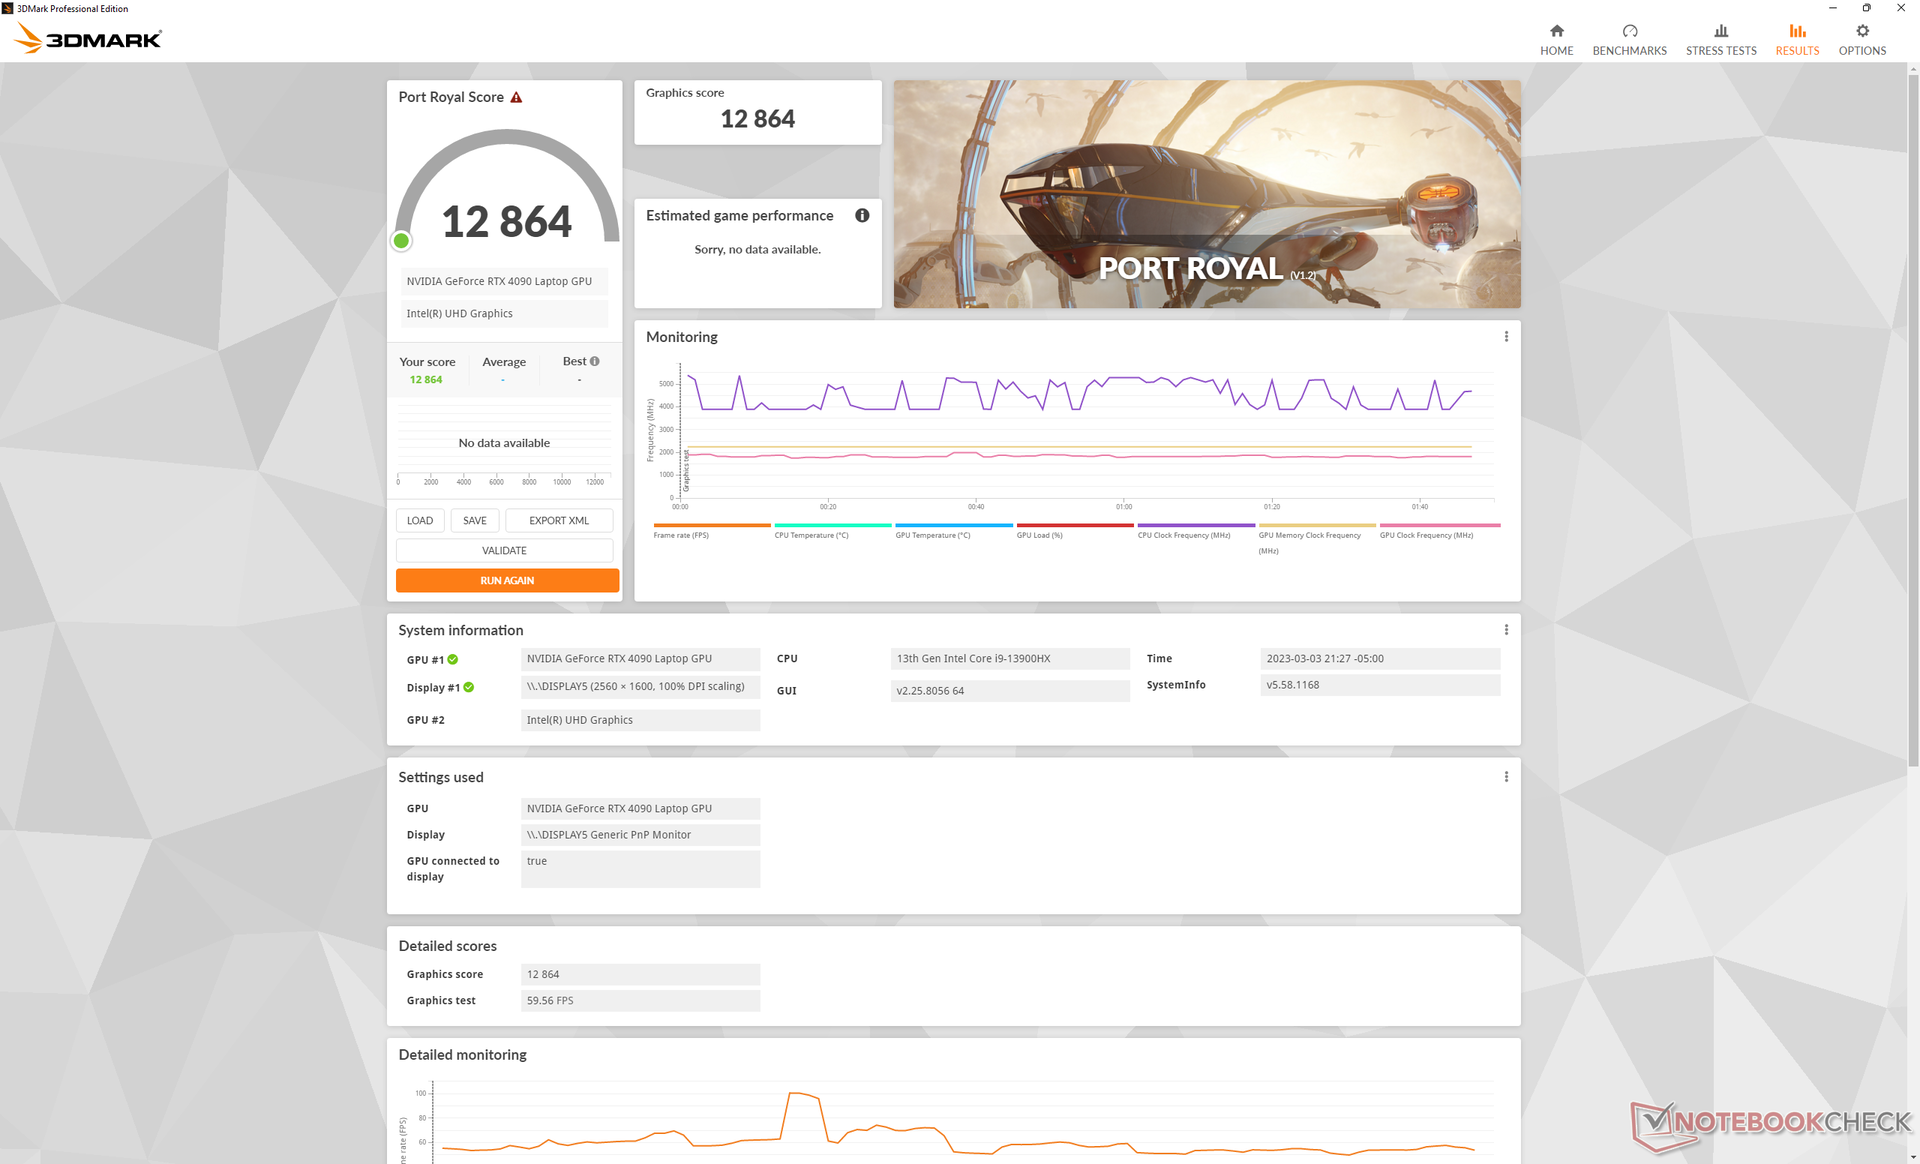
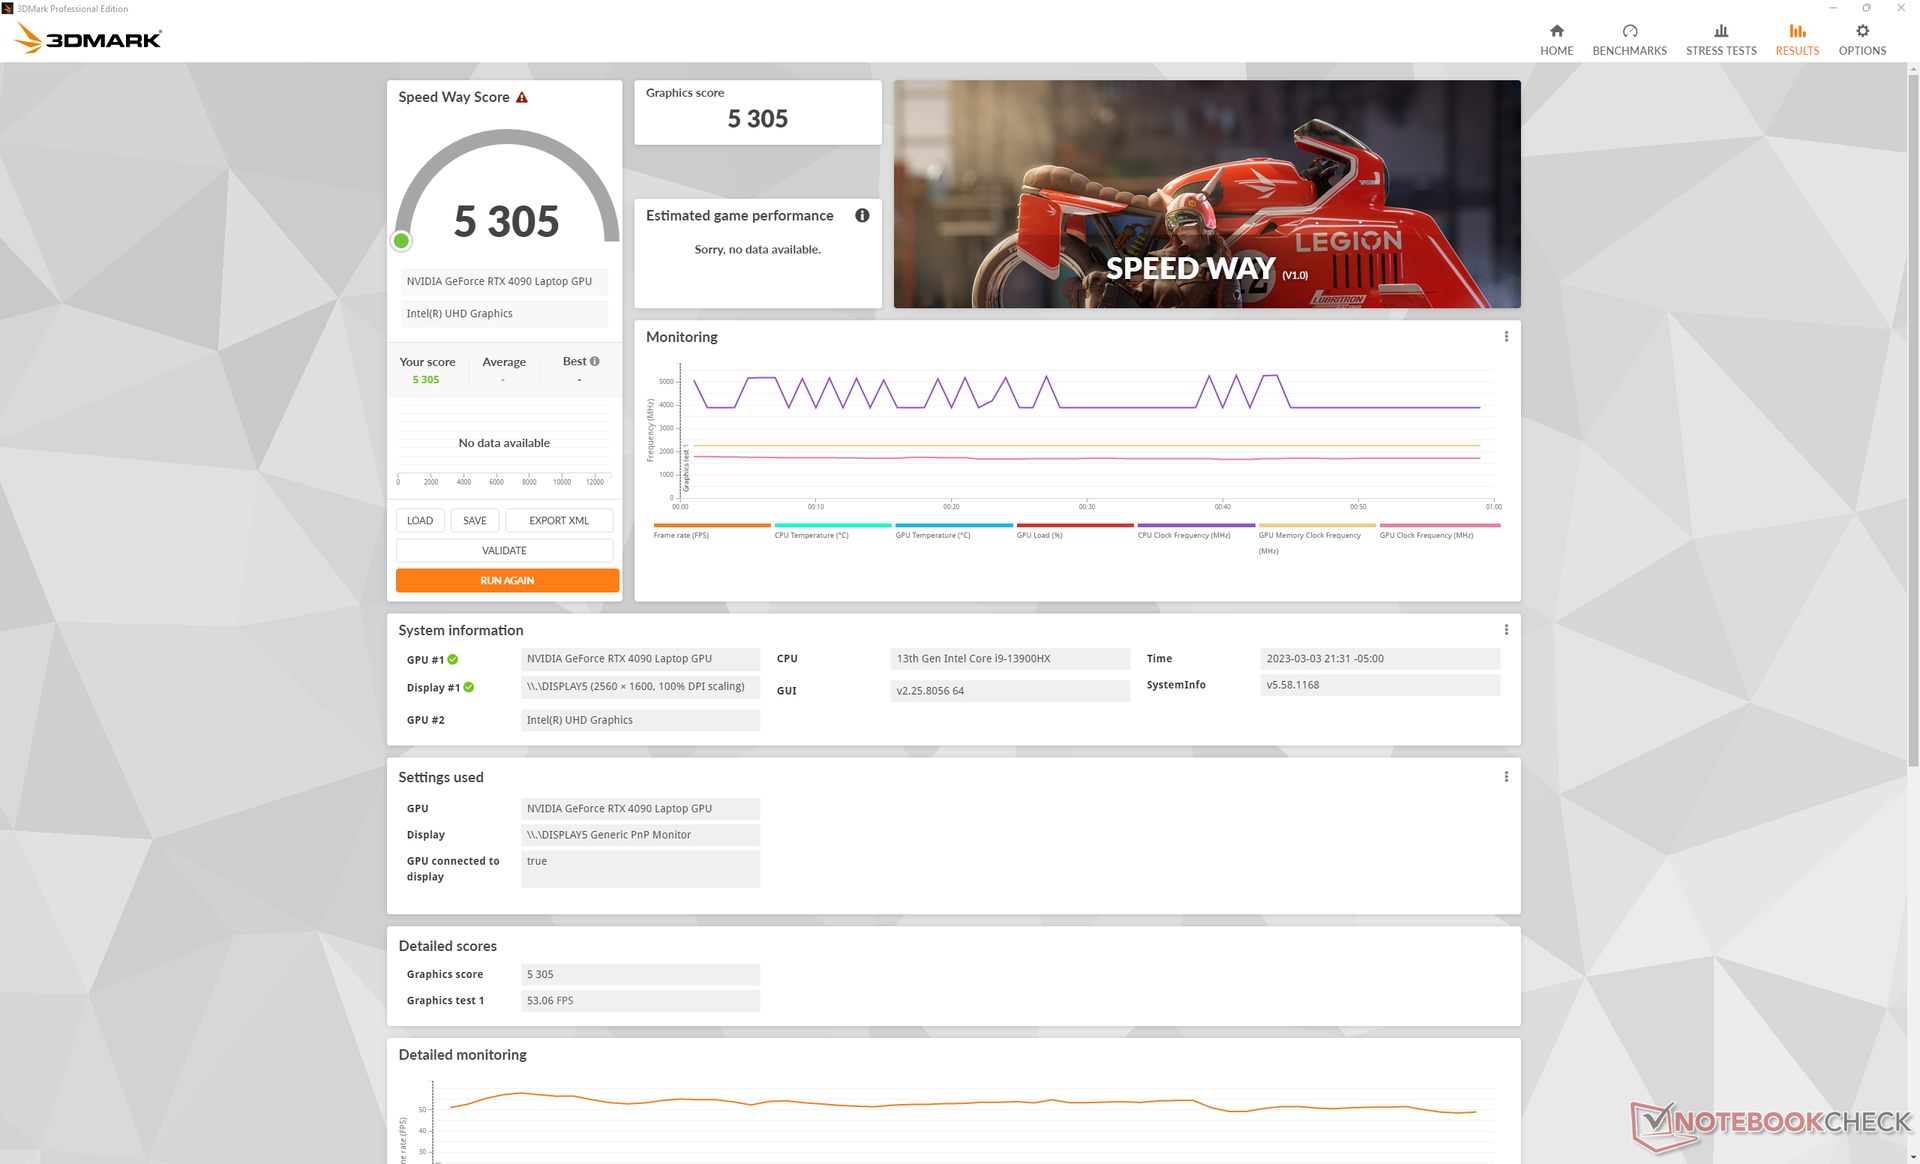
GPU Performance
Overall performance is about 40 to 60 percent faster than the mobile RTX 3080 Ti to be roughly on par with the desktop RTX 3080 Ti. Enabling DLSS 3 on supported titles boosts performance even higher by 2x to 3x albeit with potential graphical artefacts.
Most games can run at native 4K and 60 FPS if RT effects are not supported or are disabled. Exceptions include very demanding titles like Cyberpunk 2077 or F1 22 where frame rates would instead hover in the 40 to 50 FPS range. In this case, G-Sync and DLSS can come in handy to reduce tearing and boost performance, respectively.
Opting for the RTX 4080 or RTX 4070 configuration instead of the RTX 4090 will reduce graphics performance by 10 to 15 percent and 40 to 45 percent, respectively. Thus, the performance delta between the 4090 and 4080 is much smaller than the performance delta between the 4080 and 4070 even though the price difference is a fixed $500 between each step.
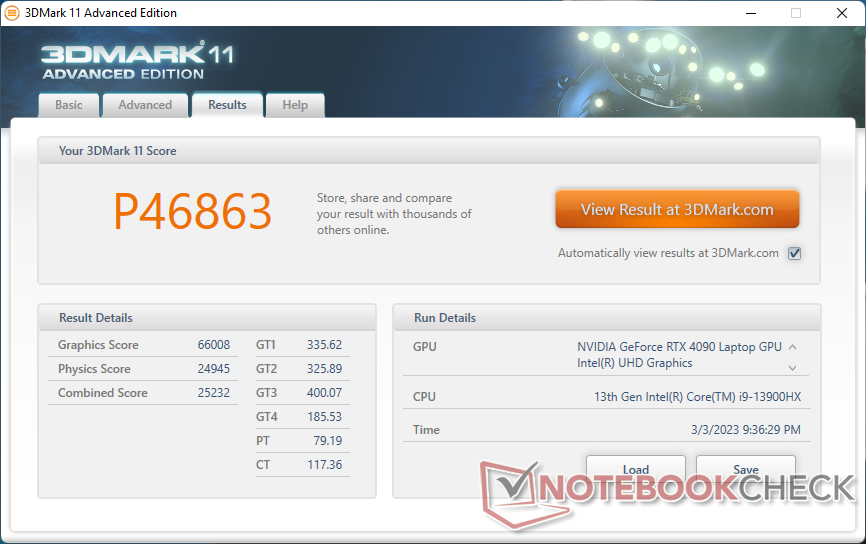
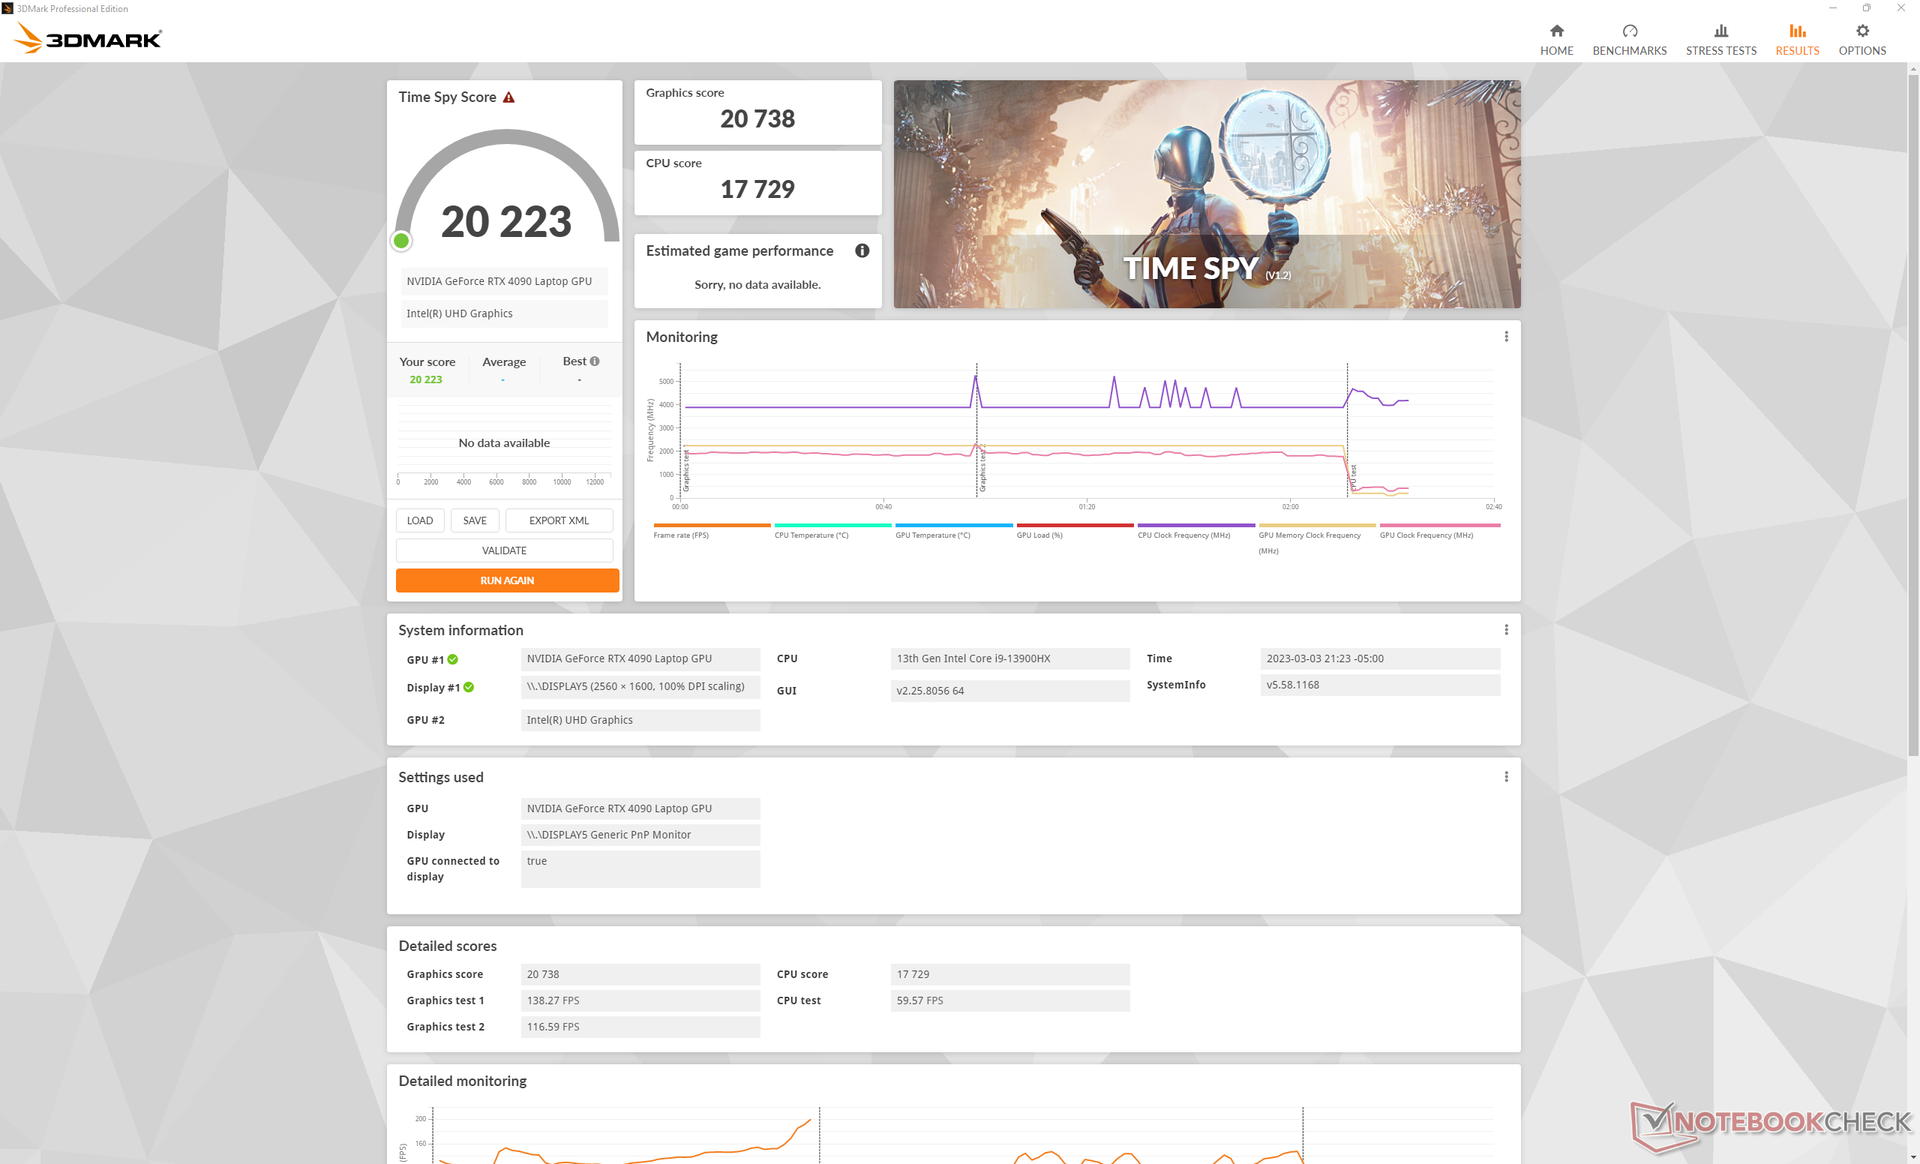
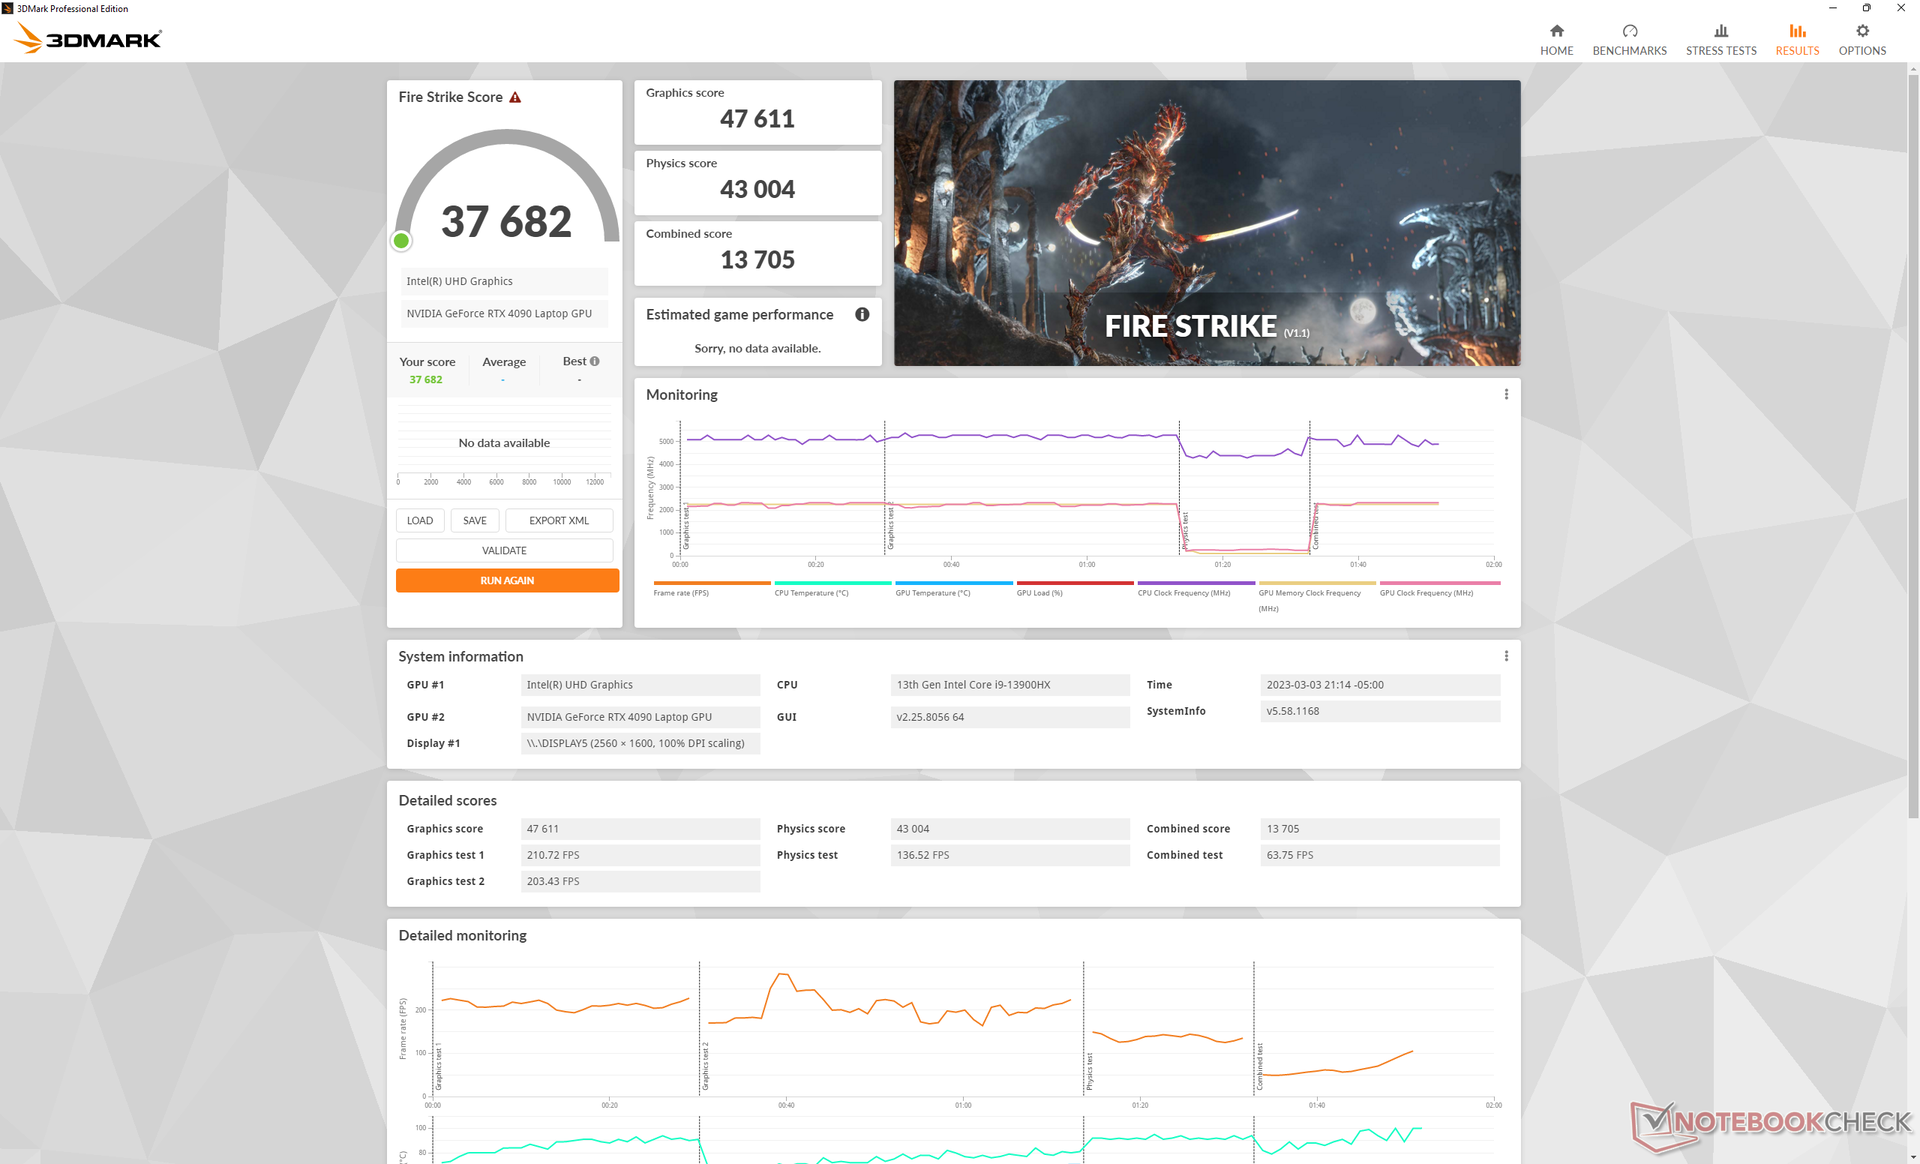
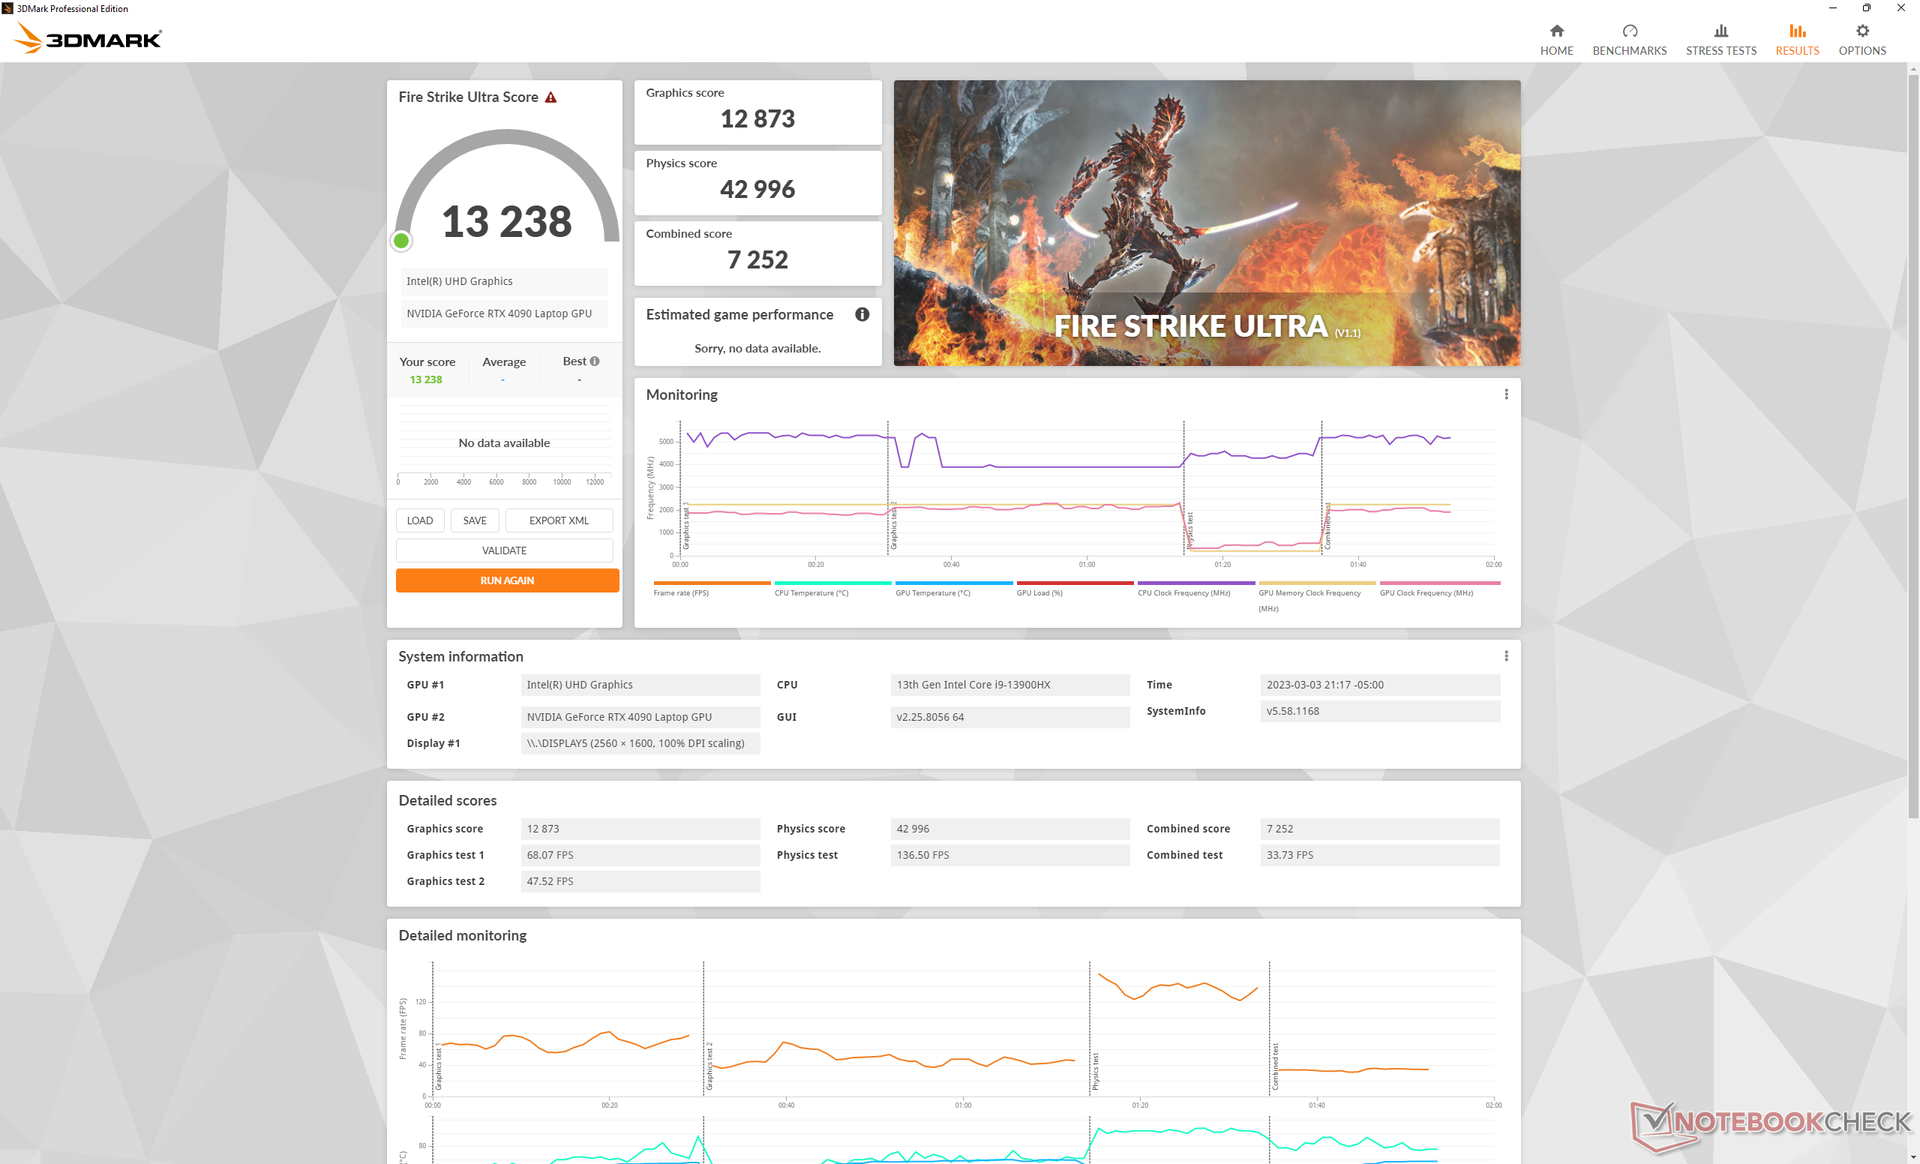
| 3DMark 11 Performance | 46863 points | |
| 3DMark Fire Strike Score | 37682 points | |
| 3DMark Time Spy Score | 20223 points | |
Help | ||
* ... smaller is better
| The Witcher 3 - 1920x1080 Ultra Graphics & Postprocessing (HBAO+) | |
| Schenker XMG SECTOR, i9 13900K, RTX 4090 | |
| Eluktronics Mech-17 GP2 | |
| Corsair One i300 | |
| MSI Titan GT77 12UHS | |
| Schenker XMG Neo 17 M22 | |
| Razer Blade 18 RTX 4070 | |
| MSI Katana 17 B13VFK | |
| MSI GS76 Stealth 11UH | |
| MSI Pulse GL76 12UGK | |
| HP Omen 16-n0033dx | |
| Schenker XMG Core 17 (Early 2021) | |
| Cyberpunk 2077 1.6 - 1920x1080 Ultra Preset | |
| Schenker XMG SECTOR, i9 13900K, RTX 4090 | |
| Eluktronics Mech-17 GP2 | |
| MSI Titan GT77 12UHS | |
| Razer Blade 18 RTX 4070 | |
| MSI Katana 17 B13VFK | |
| MSI Pulse GL76 12UGK | |
| HP Omen 16-n0033dx | |
Witcher 3 FPS Chart
| low | med. | high | ultra | QHD | 4K | |
|---|---|---|---|---|---|---|
| GTA V (2015) | 187.5 | 187.2 | 186.5 | 149.8 | 146.3 | 180.2 |
| The Witcher 3 (2015) | 717.7 | 617.3 | 449 | 216.3 | 167.6 | |
| Dota 2 Reborn (2015) | 243 | 216 | 205 | 192.5 | 186.7 | |
| Final Fantasy XV Benchmark (2018) | 233 | 230 | 194.9 | 157.1 | 90.8 | |
| X-Plane 11.11 (2018) | 212 | 188.8 | 146.4 | 124.7 | ||
| Strange Brigade (2018) | 656 | 508 | 465 | 421 | 315 | 163.4 |
| Metro Exodus (2019) | 240.1 | 207.1 | 173.8 | 146.5 | 127.7 | 82.1 |
| Borderlands 3 (2019) | 284.2 | 269.7 | 238.5 | 179.7 | 129.4 | 72.2 |
| Cyberpunk 2077 1.6 (2022) | 191.1 | 178.6 | 166.9 | 159.7 | 101.3 | 47.8 |
| F1 22 (2022) | 375 | 358 | 322 | 140.6 | 91.8 | 45.3 |
Emissions
System Noise
Though there have been adjustments to the cooling solution when compared to last year's model, overall fan noise remains about the same. The internal fans are always active no matter the setting or onscreen load. We recommend Office mode or Balanced mode if not running any intensive applications as the fans become noticeably quieter and more lethargic.
When gaming on Performance mode or "Beast" mode, fan noise would settle between 50 and 52 dB(A) which is similar to the Alienware m17 R5 or Razer Blade 18 when under similar conditions. Headphones are almost a necessity for fan noise above 50 dB(A) when gaming.
Thermal Grizzly liquid metal comes standard on all configurations.
Noise level
| Idle |
| 28 / 28 / 30.4 dB(A) |
| Load |
| 41 / 52.6 dB(A) |
 | ||
30 dB silent 40 dB(A) audible 50 dB(A) loud |
||
min: | ||
| Eluktronics Mech-17 GP2 GeForce RTX 4090 Laptop GPU, i9-13900HX, Samsung PM9A1 MZVL21T0HCLR | Schenker XMG Neo 17 M22 GeForce RTX 3080 Ti Laptop GPU, R9 6900HX, Samsung SSD 980 Pro 1TB MZ-V8P1T0BW | MSI Katana 17 B13VFK GeForce RTX 4060 Laptop GPU, i7-13620H, Micron 2400 MTFDKBA1T0QFM | MSI Titan GT77 HX 13VI GeForce RTX 4090 Laptop GPU, i9-13950HX, Samsung PM9A1 MZVL22T0HBLB | Alienware m17 R5 (R9 6900HX, RX 6850M XT) Radeon RX 6850M XT, R9 6900HX, SSSTC CA6-8D1024 | Razer Blade 18 RTX 4070 GeForce RTX 4070 Laptop GPU, i9-13950HX, SSSTC CA6-8D1024 | |
|---|---|---|---|---|---|---|
| Noise | -8% | -6% | -7% | 10% | 9% | |
| off / environment * (dB) | 25.2 | 26 -3% | 24.5 3% | 24.6 2% | 23 9% | 23.5 7% |
| Idle Minimum * (dB) | 28 | 26 7% | 24.5 12% | 29.2 -4% | 23 18% | 23.8 15% |
| Idle Average * (dB) | 28 | 29 -4% | 24.5 12% | 29.2 -4% | 28.11 -0% | 23.8 15% |
| Idle Maximum * (dB) | 30.4 | 40 -32% | 40 -32% | 29.2 4% | 28.11 8% | 26.8 12% |
| Load Average * (dB) | 41 | 47 -15% | 48.3 -18% | 50.7 -24% | 30.62 25% | 37.3 9% |
| Witcher 3 ultra * (dB) | 50.7 | 52 -3% | 56 -10% | 53.3 -5% | 49.75 2% | 48 5% |
| Load Maximum * (dB) | 52.6 | 54 -3% | 59.1 -12% | 61 -16% | 50.17 5% | 53.5 -2% |
* ... smaller is better
Temperature
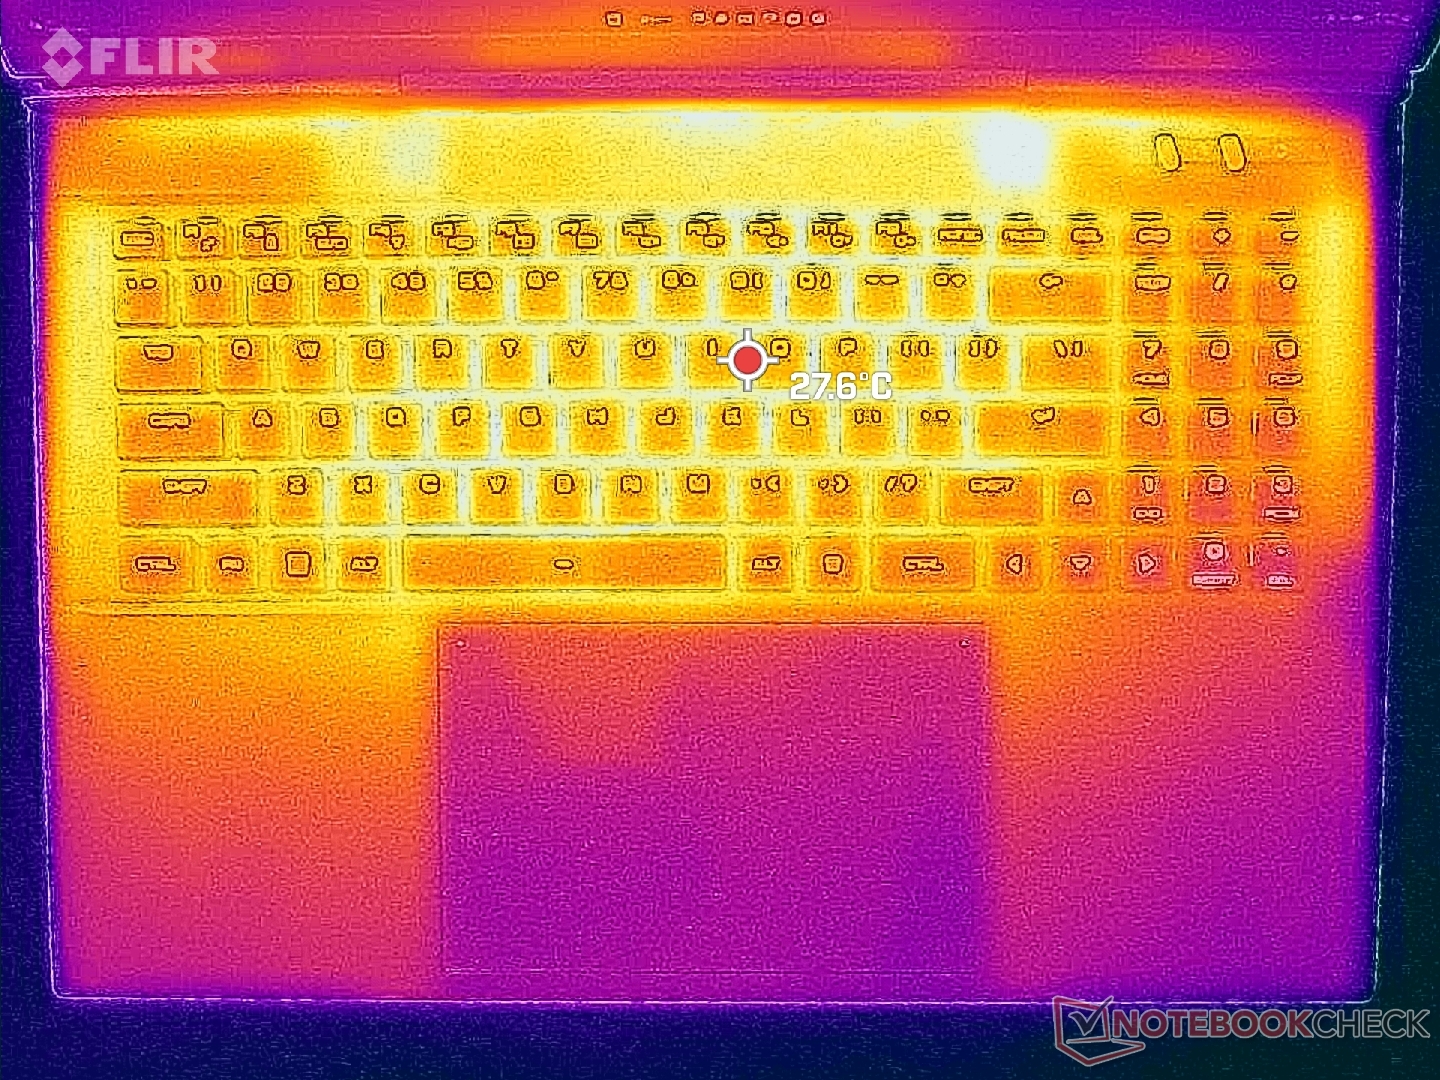
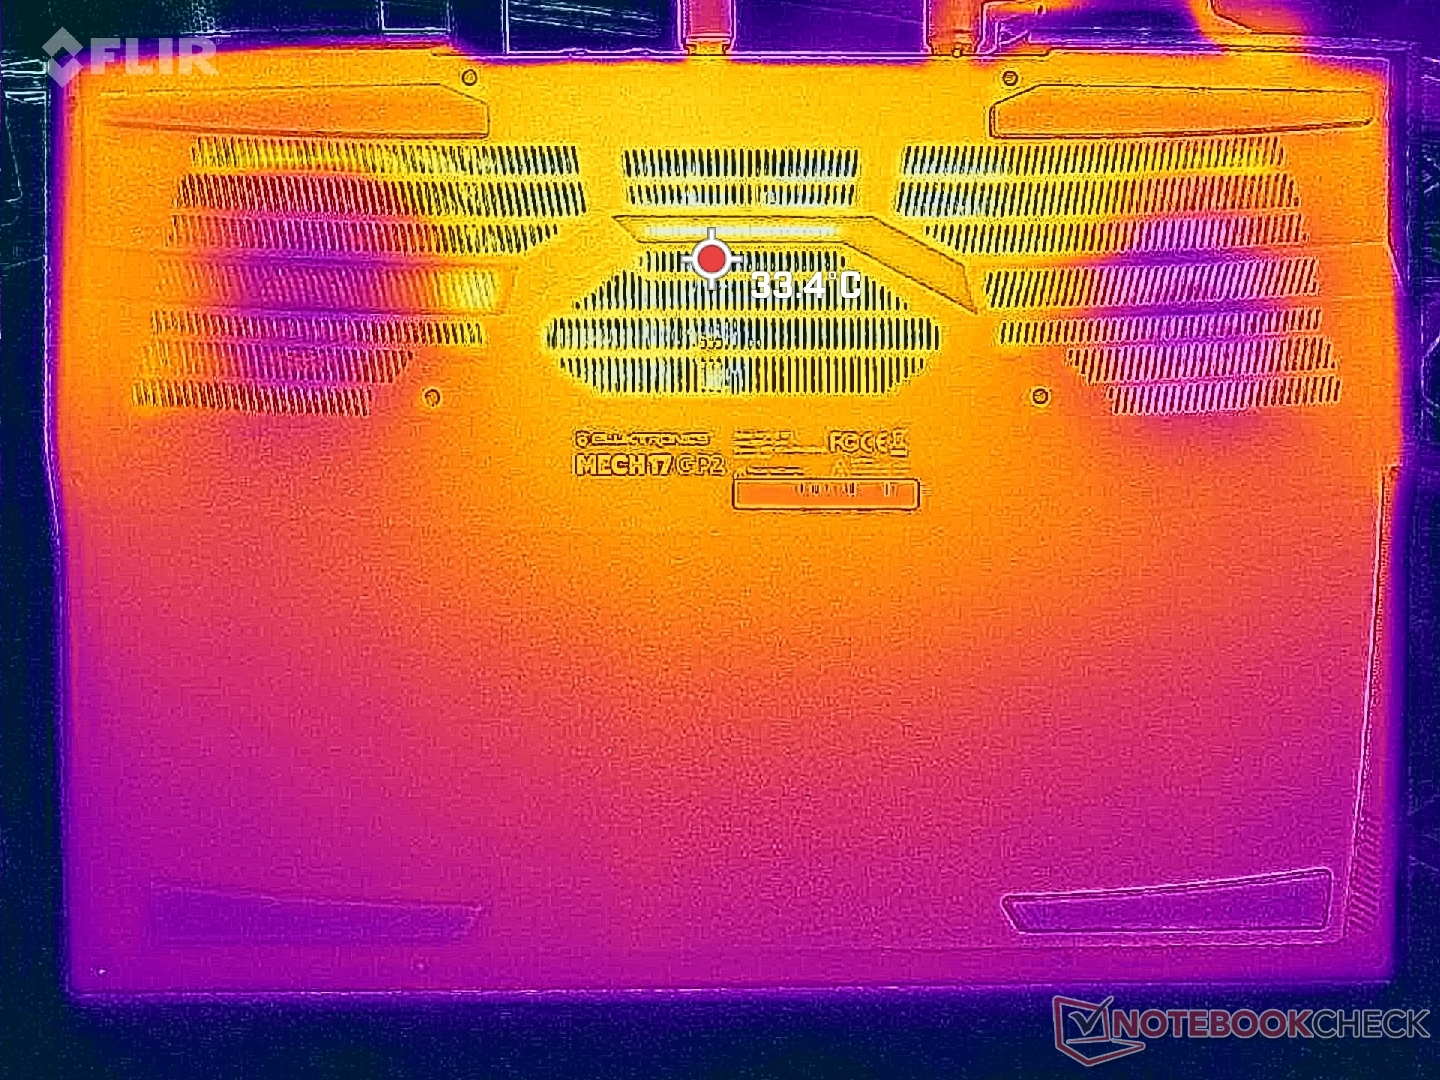
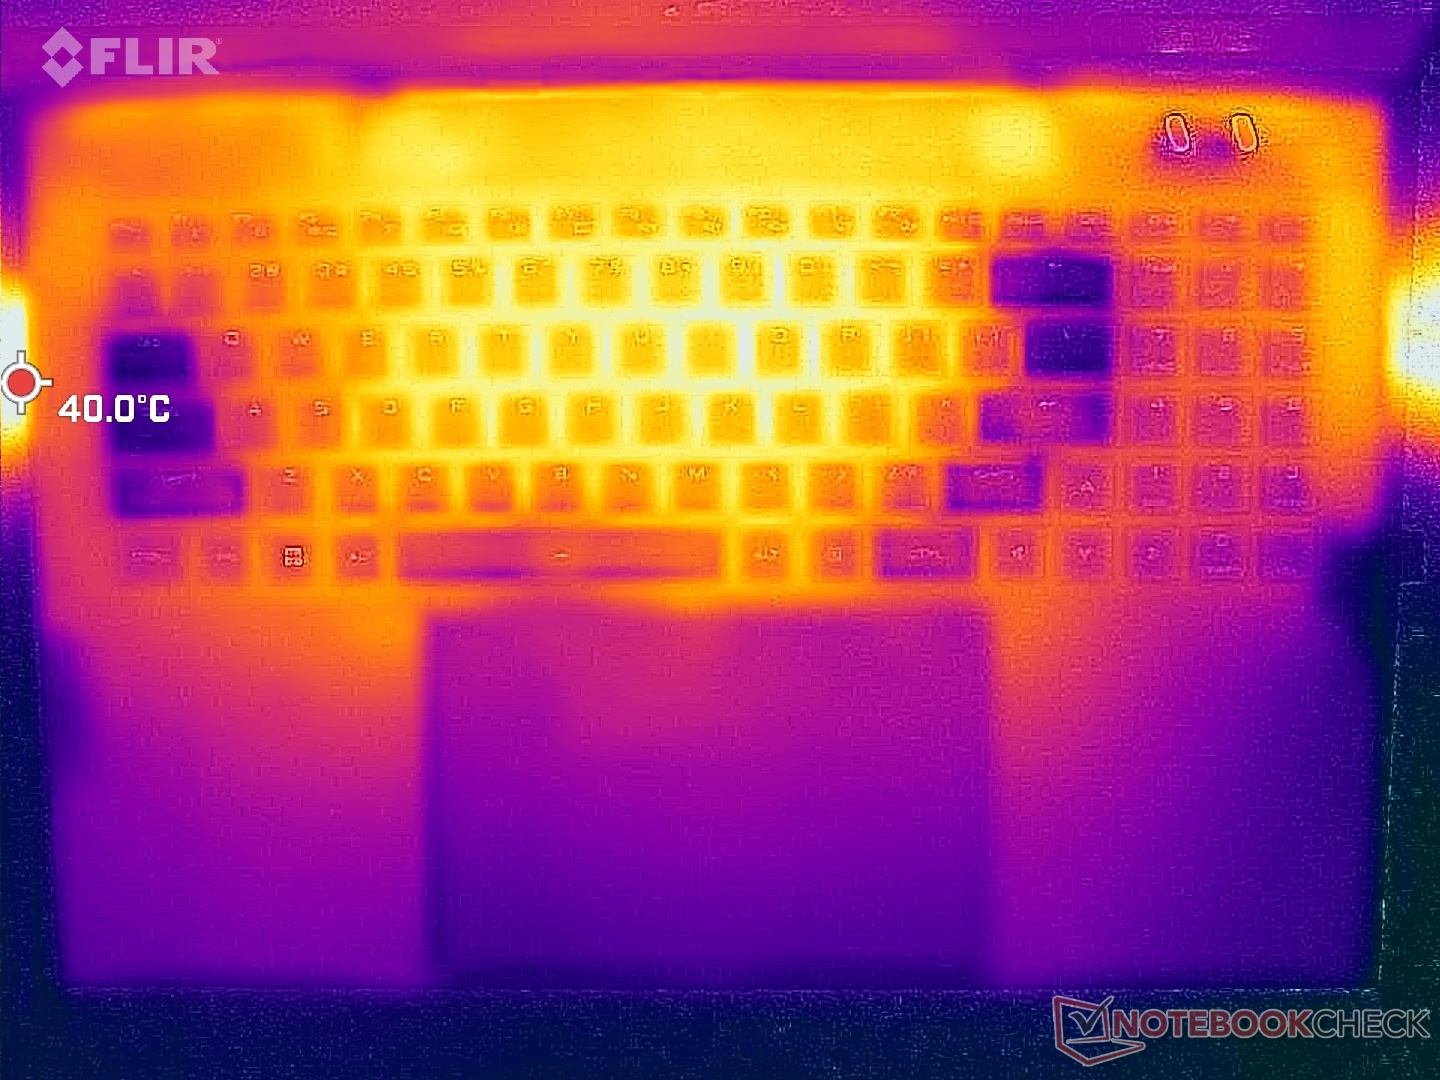
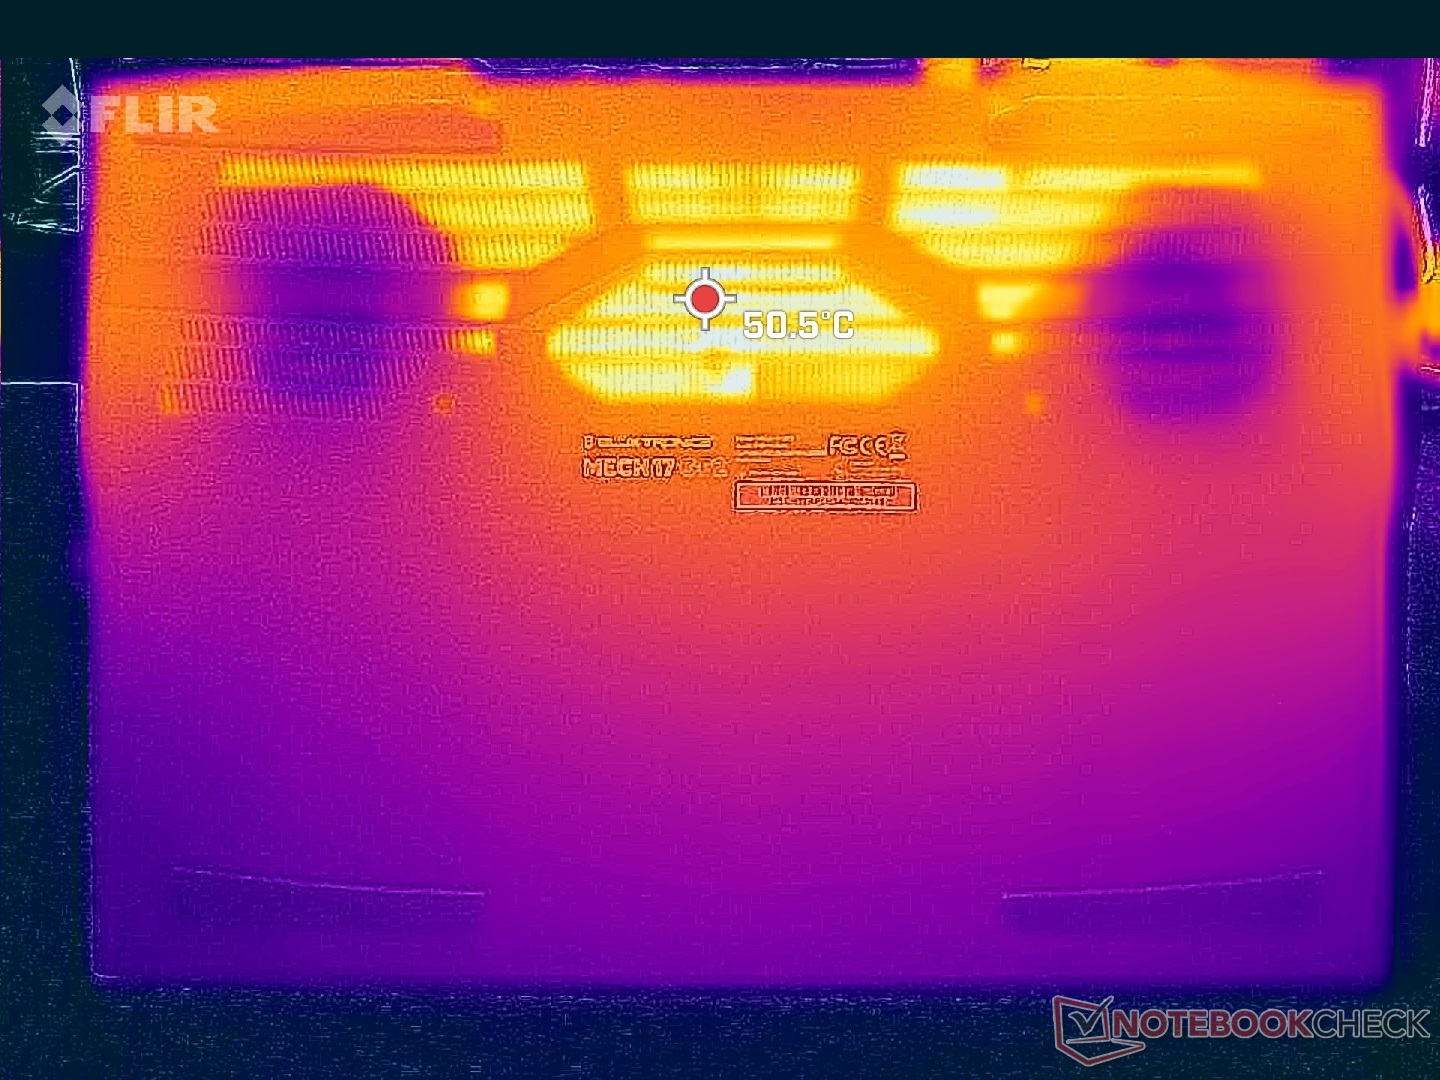
Surface temperatures are warmest toward the center and coolest along the sides of the keyboard and the palm rests. Fresh air enters through the WASD keys to keep fingers cool while gaming. The hot spots of 39 C to 44 C is cooler than what we recorded on the Alienware m17 R5 where hot spots can reach 50 C to 57 C when under similar gaming conditions.
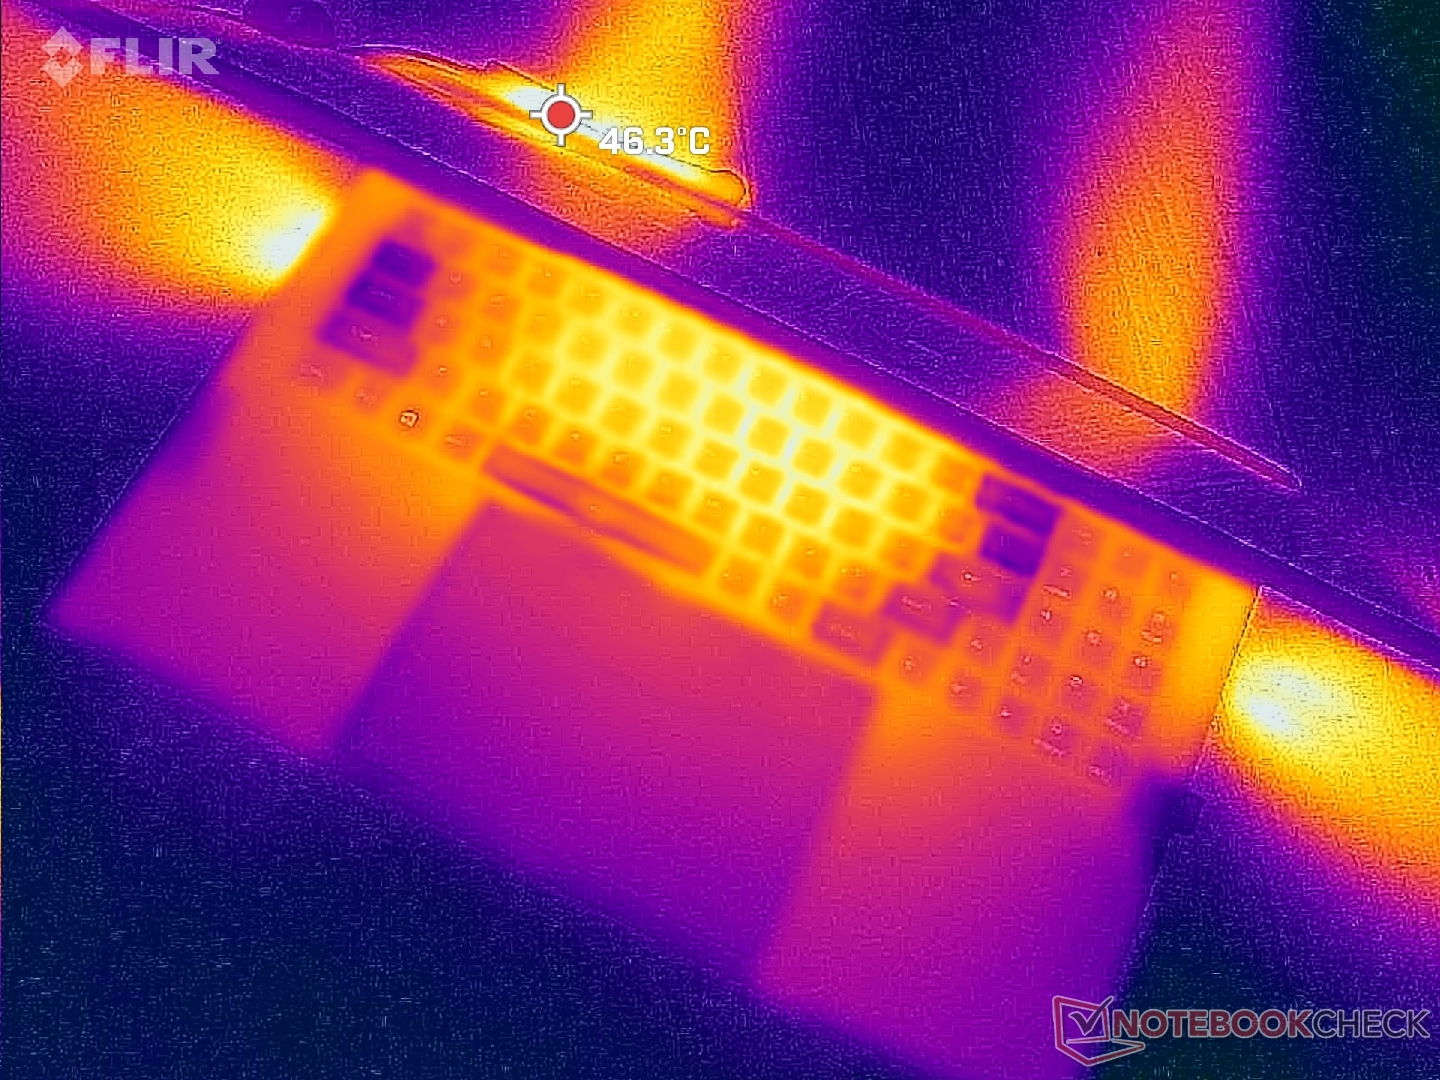
(+) The maximum temperature on the upper side is 39 °C / 102 F, compared to the average of 40.4 °C / 105 F, ranging from 21.2 to 68.8 °C for the class Gaming.
(±) The bottom heats up to a maximum of 44 °C / 111 F, compared to the average of 43.2 °C / 110 F
(+) In idle usage, the average temperature for the upper side is 27.5 °C / 82 F, compared to the device average of 33.9 °C / 93 F.
(+) The palmrests and touchpad are cooler than skin temperature with a maximum of 25 °C / 77 F and are therefore cool to the touch.
(+) The average temperature of the palmrest area of similar devices was 28.8 °C / 83.8 F (+3.8 °C / 6.8 F).
| Eluktronics Mech-17 GP2 Intel Core i9-13900HX, NVIDIA GeForce RTX 4090 Laptop GPU | Schenker XMG Neo 17 M22 AMD Ryzen 9 6900HX, NVIDIA GeForce RTX 3080 Ti Laptop GPU | MSI Katana 17 B13VFK Intel Core i7-13620H, NVIDIA GeForce RTX 4060 Laptop GPU | MSI Titan GT77 HX 13VI Intel Core i9-13950HX, NVIDIA GeForce RTX 4090 Laptop GPU | Alienware m17 R5 (R9 6900HX, RX 6850M XT) AMD Ryzen 9 6900HX, AMD Radeon RX 6850M XT | Razer Blade 18 RTX 4070 Intel Core i9-13950HX, NVIDIA GeForce RTX 4070 Laptop GPU | |
|---|---|---|---|---|---|---|
| Heat | -13% | -7% | 4% | -14% | 1% | |
| Maximum Upper Side * (°C) | 39 | 49 -26% | 41.6 -7% | 40.6 -4% | 53 -36% | 39.2 -1% |
| Maximum Bottom * (°C) | 44 | 52 -18% | 43.1 2% | 41.1 7% | 56 -27% | 35.6 19% |
| Idle Upper Side * (°C) | 31 | 30 3% | 32 -3% | 26.2 15% | 30 3% | 31.8 -3% |
| Idle Bottom * (°C) | 29.8 | 33 -11% | 35.8 -20% | 30.3 -2% | 29 3% | 33.2 -11% |
* ... smaller is better
Stress Test
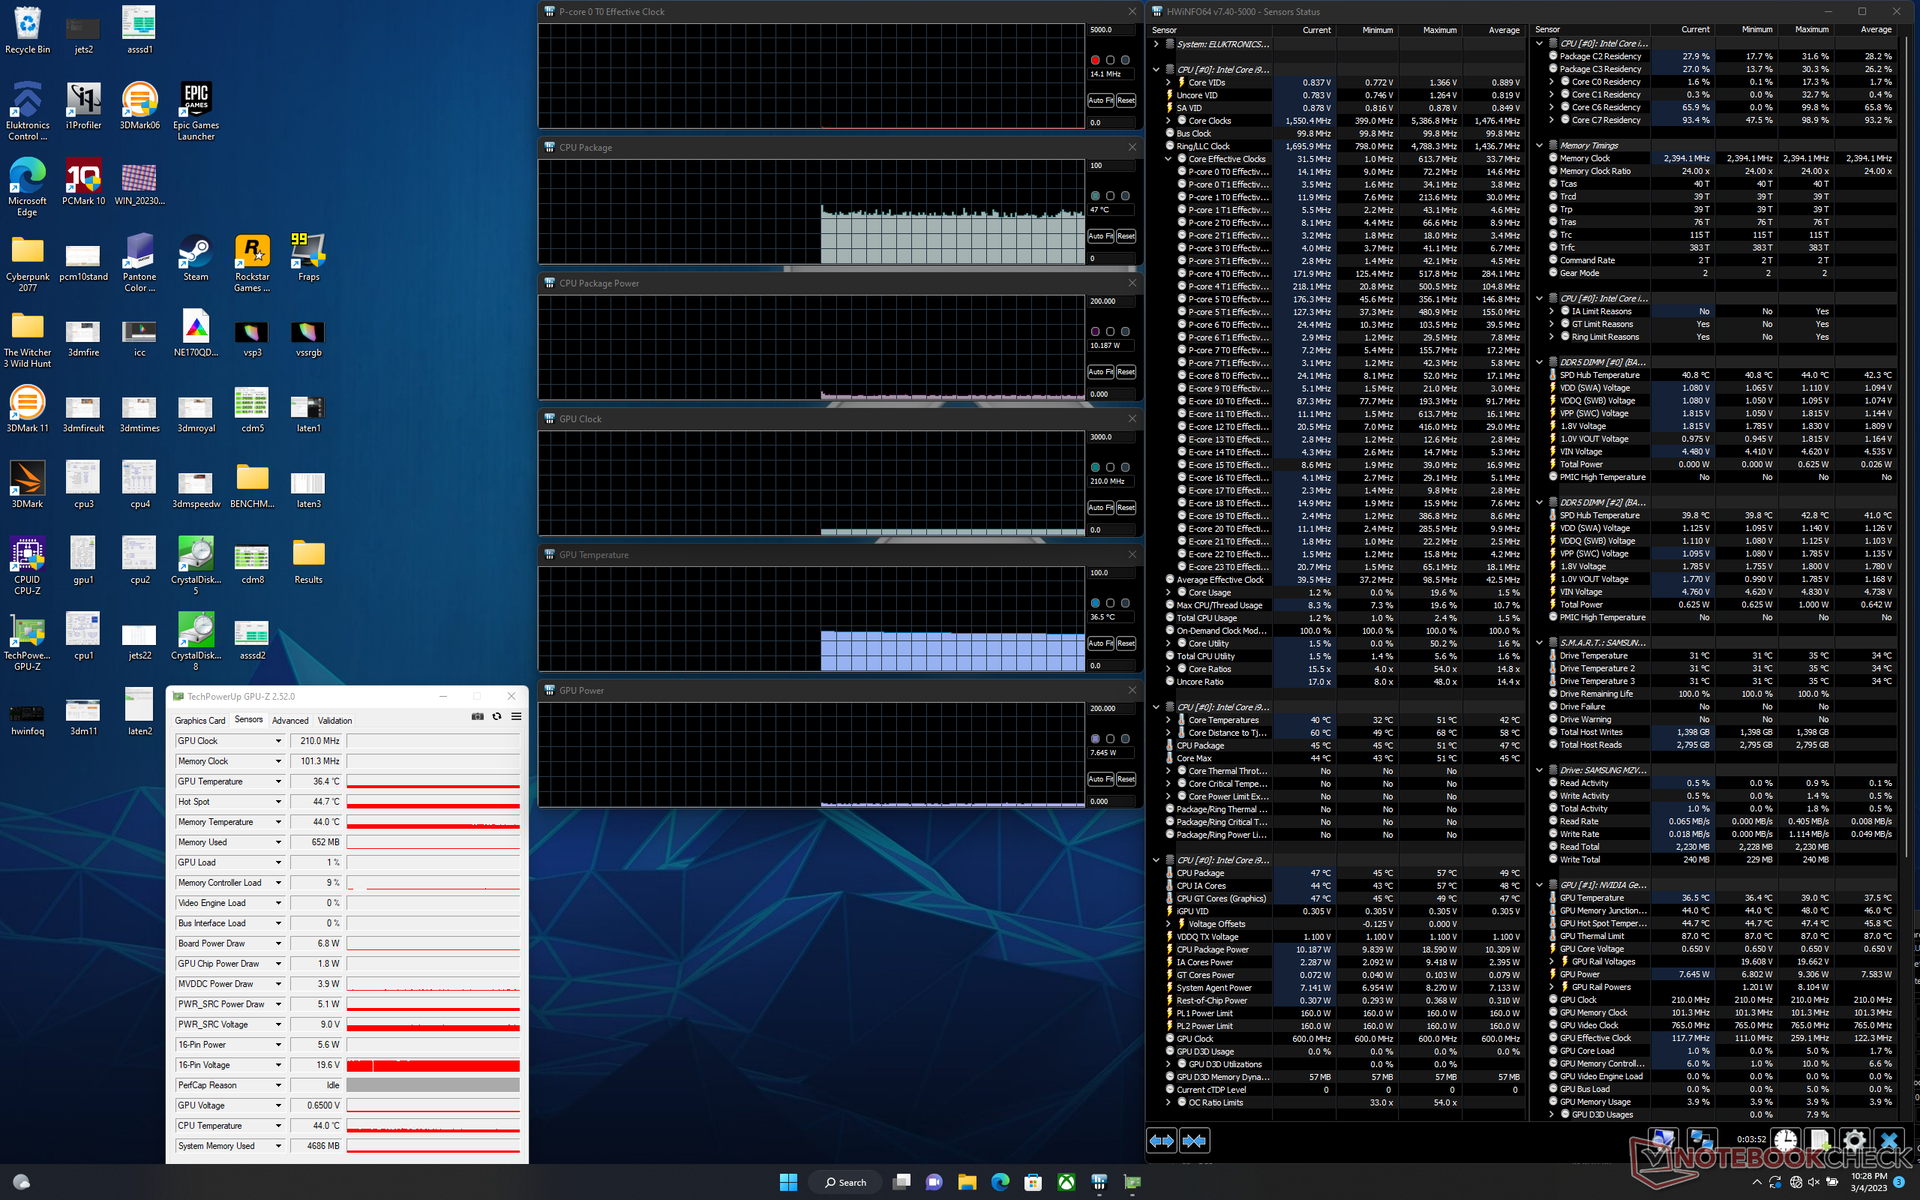
When stressed under Prime95, the CPU would boost to 4.7 GHz, 160 W, and 96 C for only a second or two before immediately falling to 4.1 GHz and 107 W. Core temperature, however, would remain very high at 96 C. After a few more minutes, clock rates would drop further to 3.4 GHz with just minimal changes to temperature and board power draw.
GPU clock rate, temperature, and power draw would stabilize at 2310 MHz, 80 C, and 169 W, respectively, when running Witcher 3. The GPU is rated for a 175 W TGP and so the real-world draw of 169 W comes very close. CPU temperature would unfortunately remain high at 96 C compared to 85 C or 66 C on the Razer Blade 18 (RTX 4070) or MSI GT77, respectively.
Running Prime95 and FurMark simultaneously for more than several minutes will crash our unit each and every time. We suspect that the high core temperatures are responsible for the automatic shutdown and restart. Most other laptops would throttle performance when under such extreme loads in order to prevent crashing.
Running on battery power severely limits performance. A Fire Strike test on batteries would return Physics and Graphics scores of 11430 and 11496 points, respectively, compared to 43004 and 47611 points when on mains.
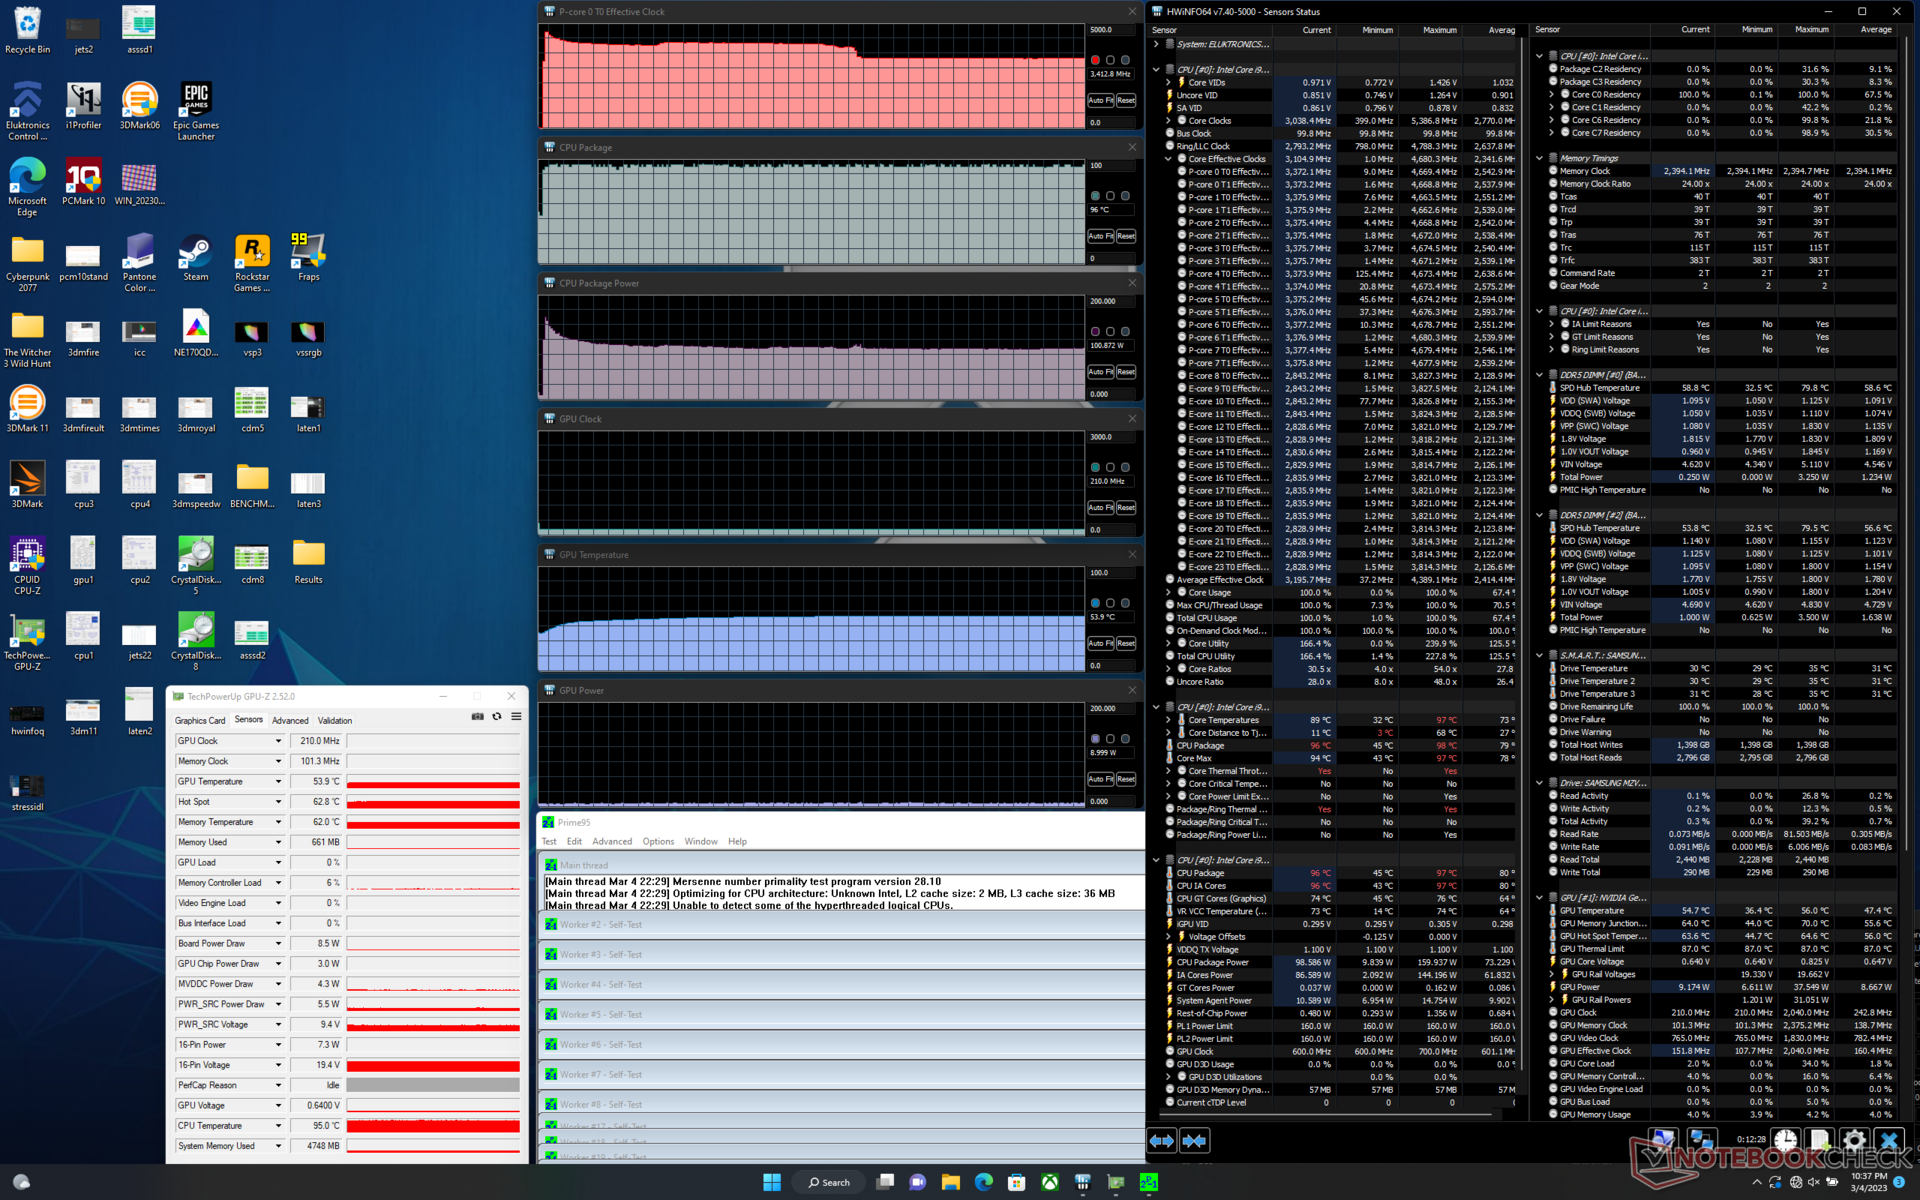
| CPU Clock (GHz) | GPU Clock (MHz) | Average CPU Temperature (°C) | Average GPU Temperature (°C) | |
| System Idle | -- | -- | 47 | 37 |
| Prime95 Stress | 3.4 | -- | 96 | 54 |
| Witcher 3 Stress | ~0.7 | 2310 | 97 | 80 |
Speakers
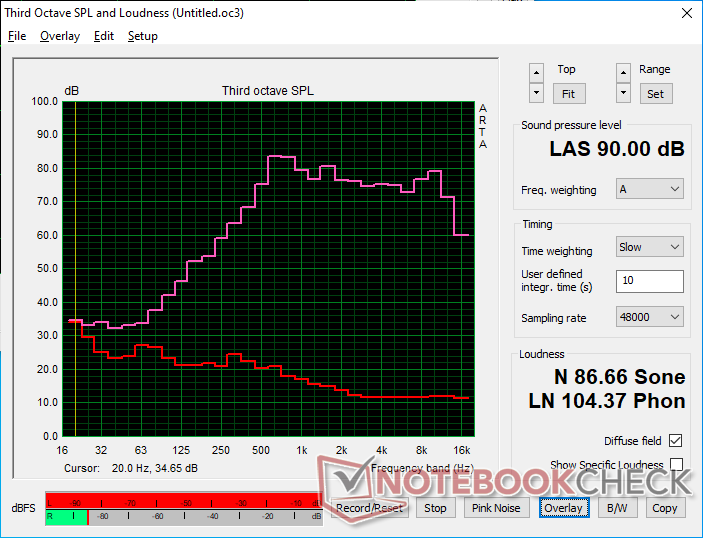
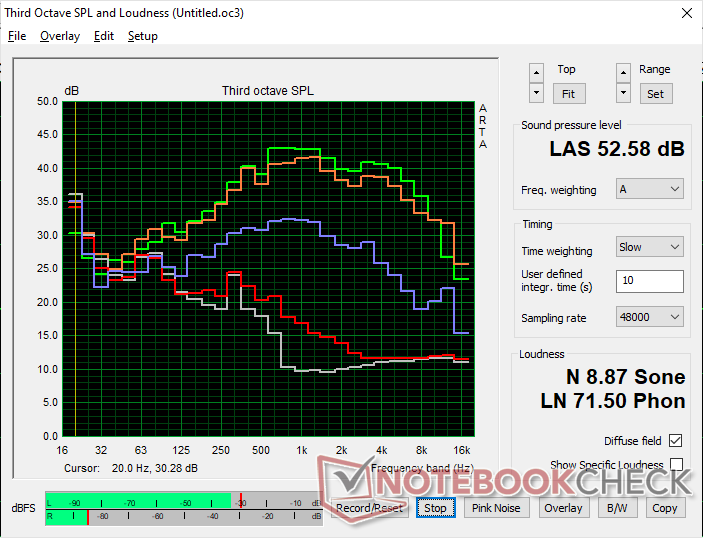
Eluktronics Mech-17 GP2 audio analysis
(+) | speakers can play relatively loud (90 dB)
Bass 100 - 315 Hz
(-) | nearly no bass - on average 22.5% lower than median
(±) | linearity of bass is average (7.3% delta to prev. frequency)
Mids 400 - 2000 Hz
(+) | balanced mids - only 4.4% away from median
(±) | linearity of mids is average (7.4% delta to prev. frequency)
Highs 2 - 16 kHz
(+) | balanced highs - only 1.3% away from median
(+) | highs are linear (2.7% delta to prev. frequency)
Overall 100 - 16.000 Hz
(±) | linearity of overall sound is average (15% difference to median)
Compared to same class
» 32% of all tested devices in this class were better, 6% similar, 62% worse
» The best had a delta of 6%, average was 18%, worst was 132%
Compared to all devices tested
» 20% of all tested devices were better, 4% similar, 75% worse
» The best had a delta of 4%, average was 24%, worst was 134%
Apple MacBook Pro 16 2021 M1 Pro audio analysis
(+) | speakers can play relatively loud (84.7 dB)
Bass 100 - 315 Hz
(+) | good bass - only 3.8% away from median
(+) | bass is linear (5.2% delta to prev. frequency)
Mids 400 - 2000 Hz
(+) | balanced mids - only 1.3% away from median
(+) | mids are linear (2.1% delta to prev. frequency)
Highs 2 - 16 kHz
(+) | balanced highs - only 1.9% away from median
(+) | highs are linear (2.7% delta to prev. frequency)
Overall 100 - 16.000 Hz
(+) | overall sound is linear (4.6% difference to median)
Compared to same class
» 0% of all tested devices in this class were better, 0% similar, 100% worse
» The best had a delta of 5%, average was 17%, worst was 45%
Compared to all devices tested
» 0% of all tested devices were better, 0% similar, 100% worse
» The best had a delta of 4%, average was 24%, worst was 134%
Energy Management
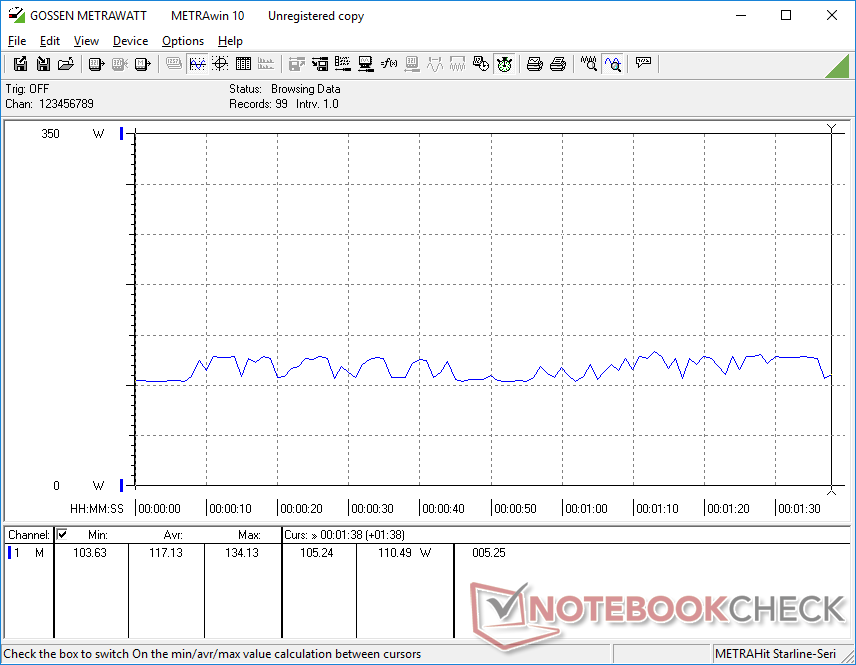
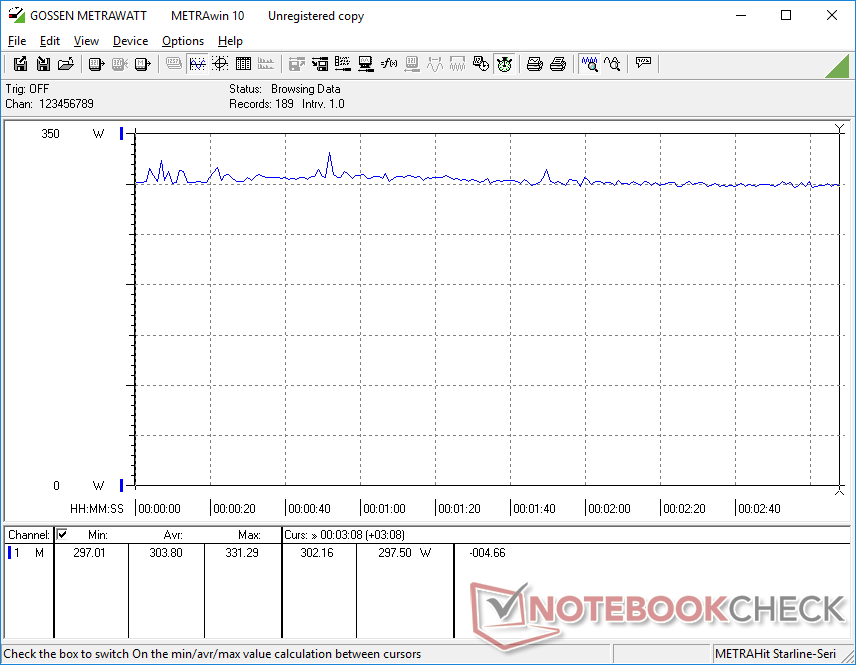
Power Consumption
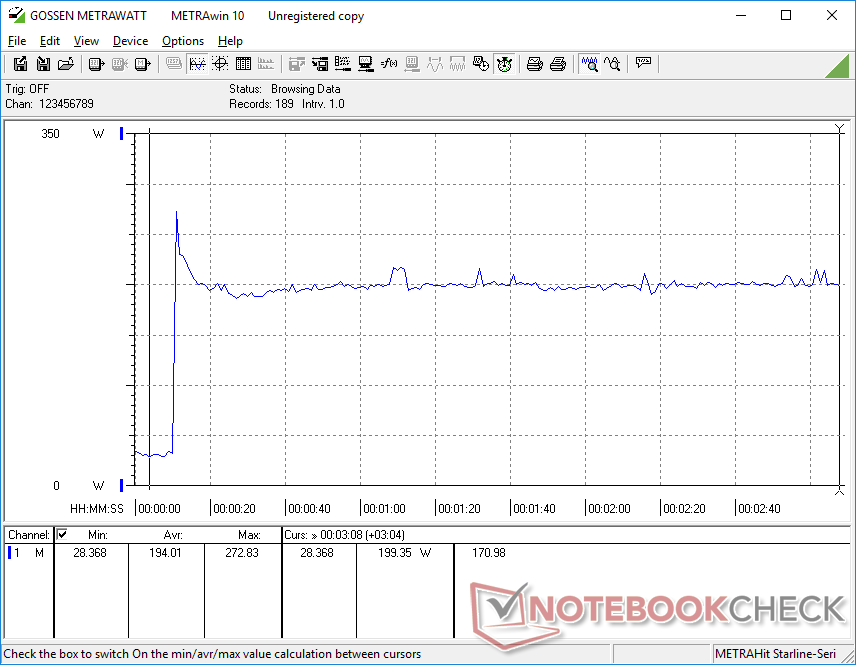
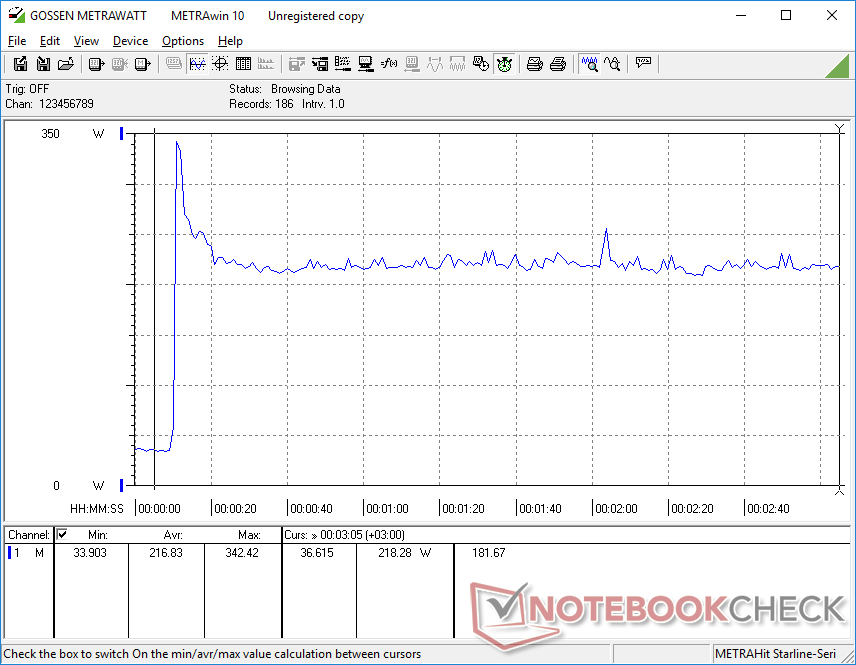
Overall power consumption is markedly higher across the board than what we recorded on the 2022 AMD-Ampere model. For example, simply idling on desktop would consume between 14 W and 37 W compared to just 7 W to 17 W on the 2022 version. Gaming demands 37 percent more power on our 2023 unit, but performance-per-watt is still very good as users are getting 40 to 60 percent more graphics performance over the mobile RTX 3080 Ti.
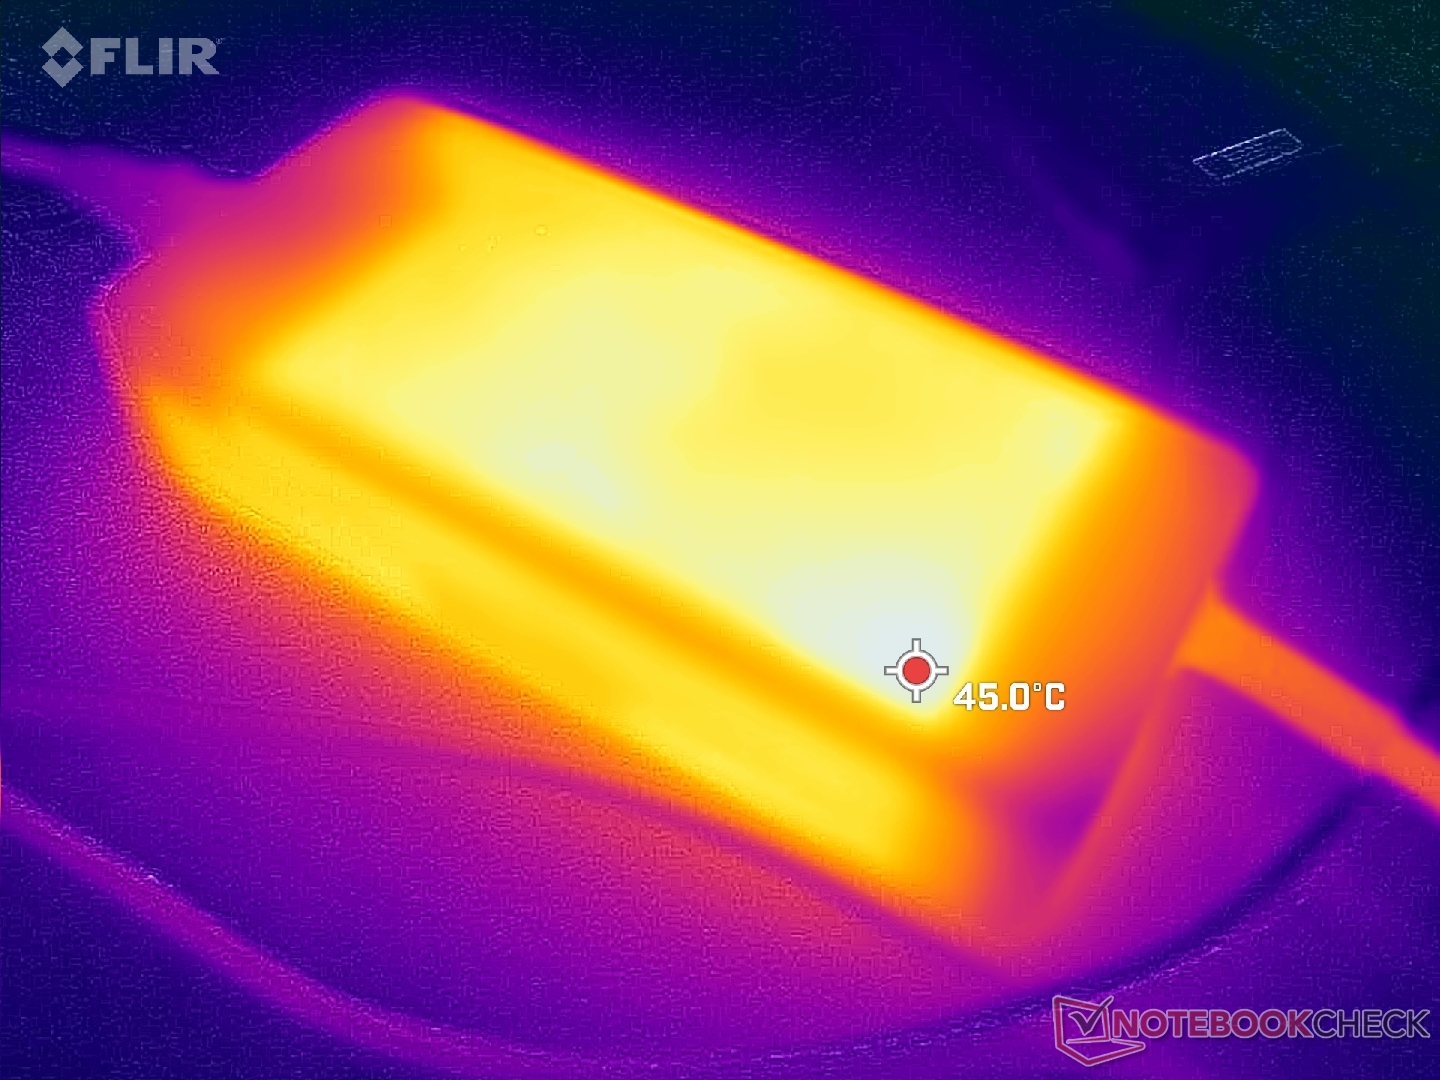
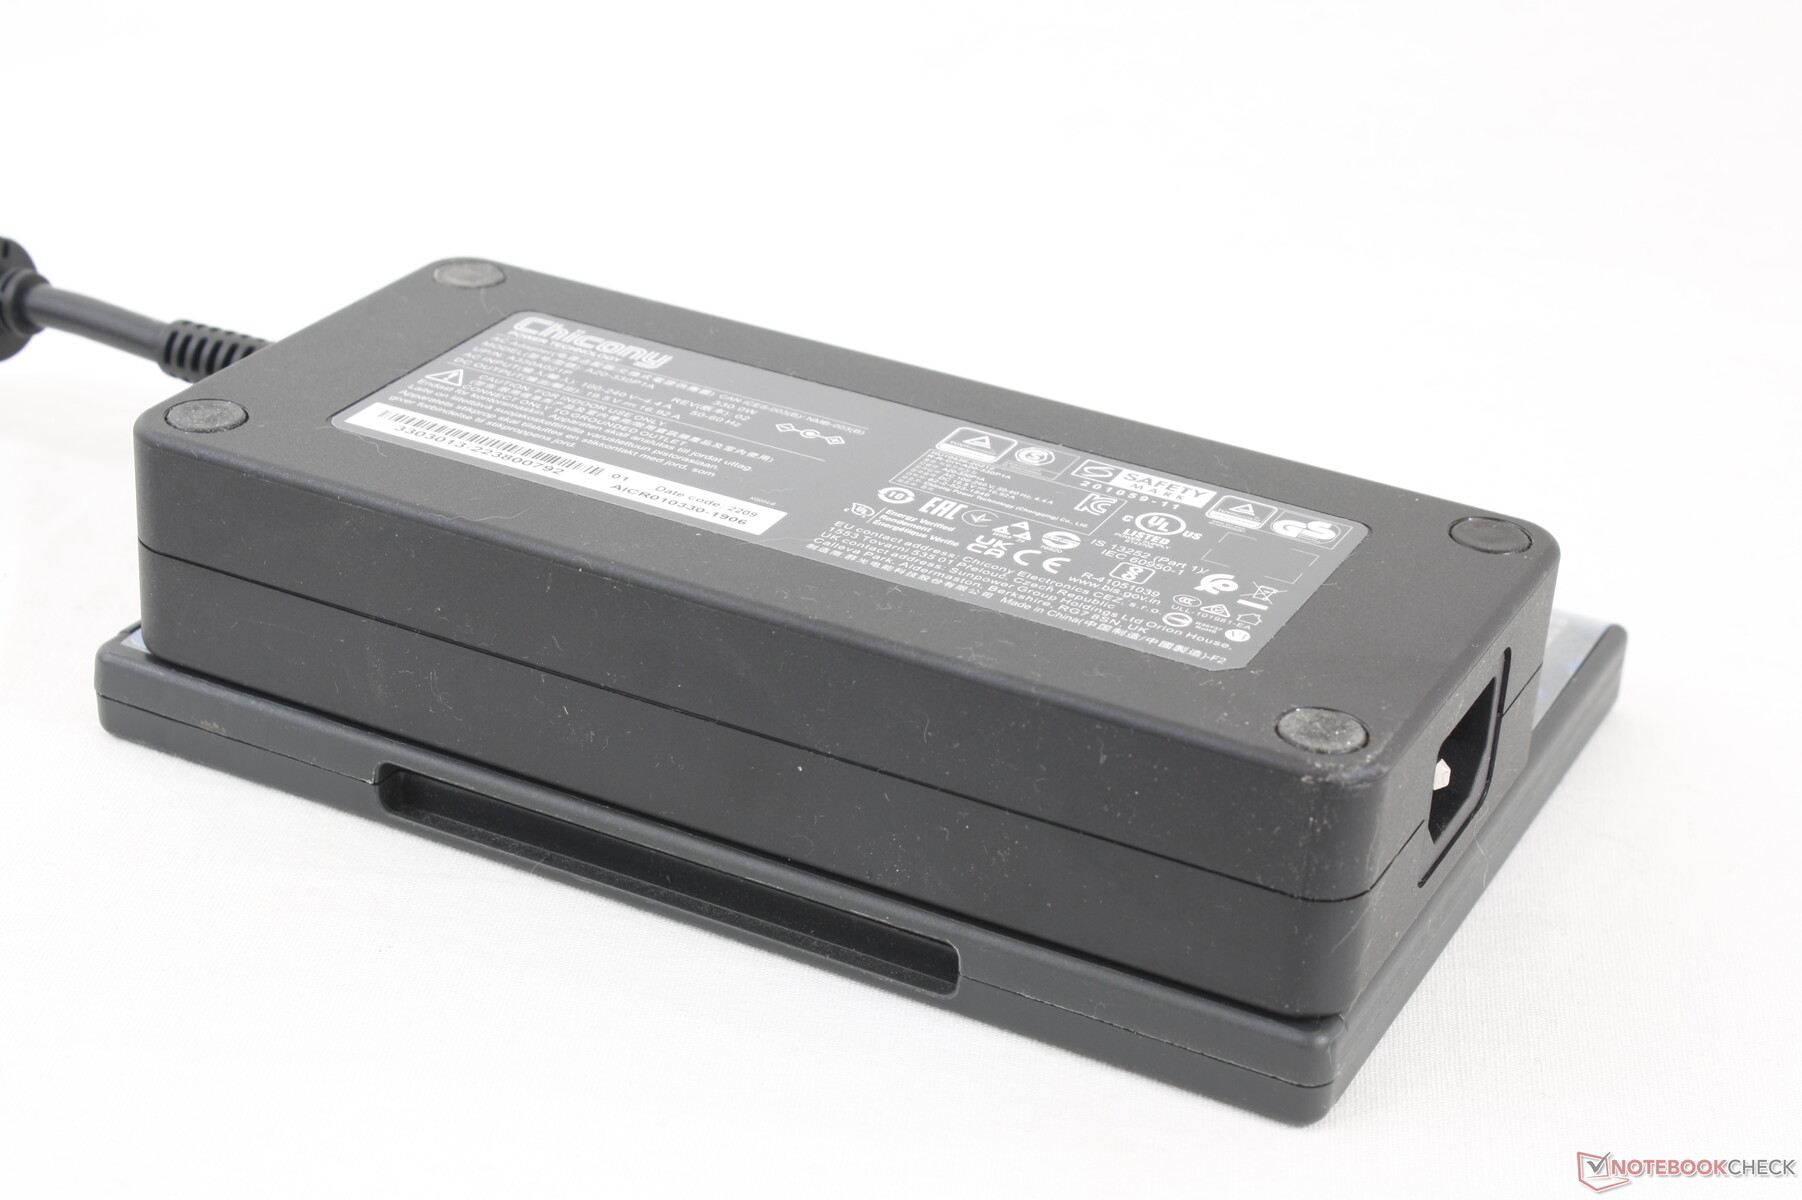
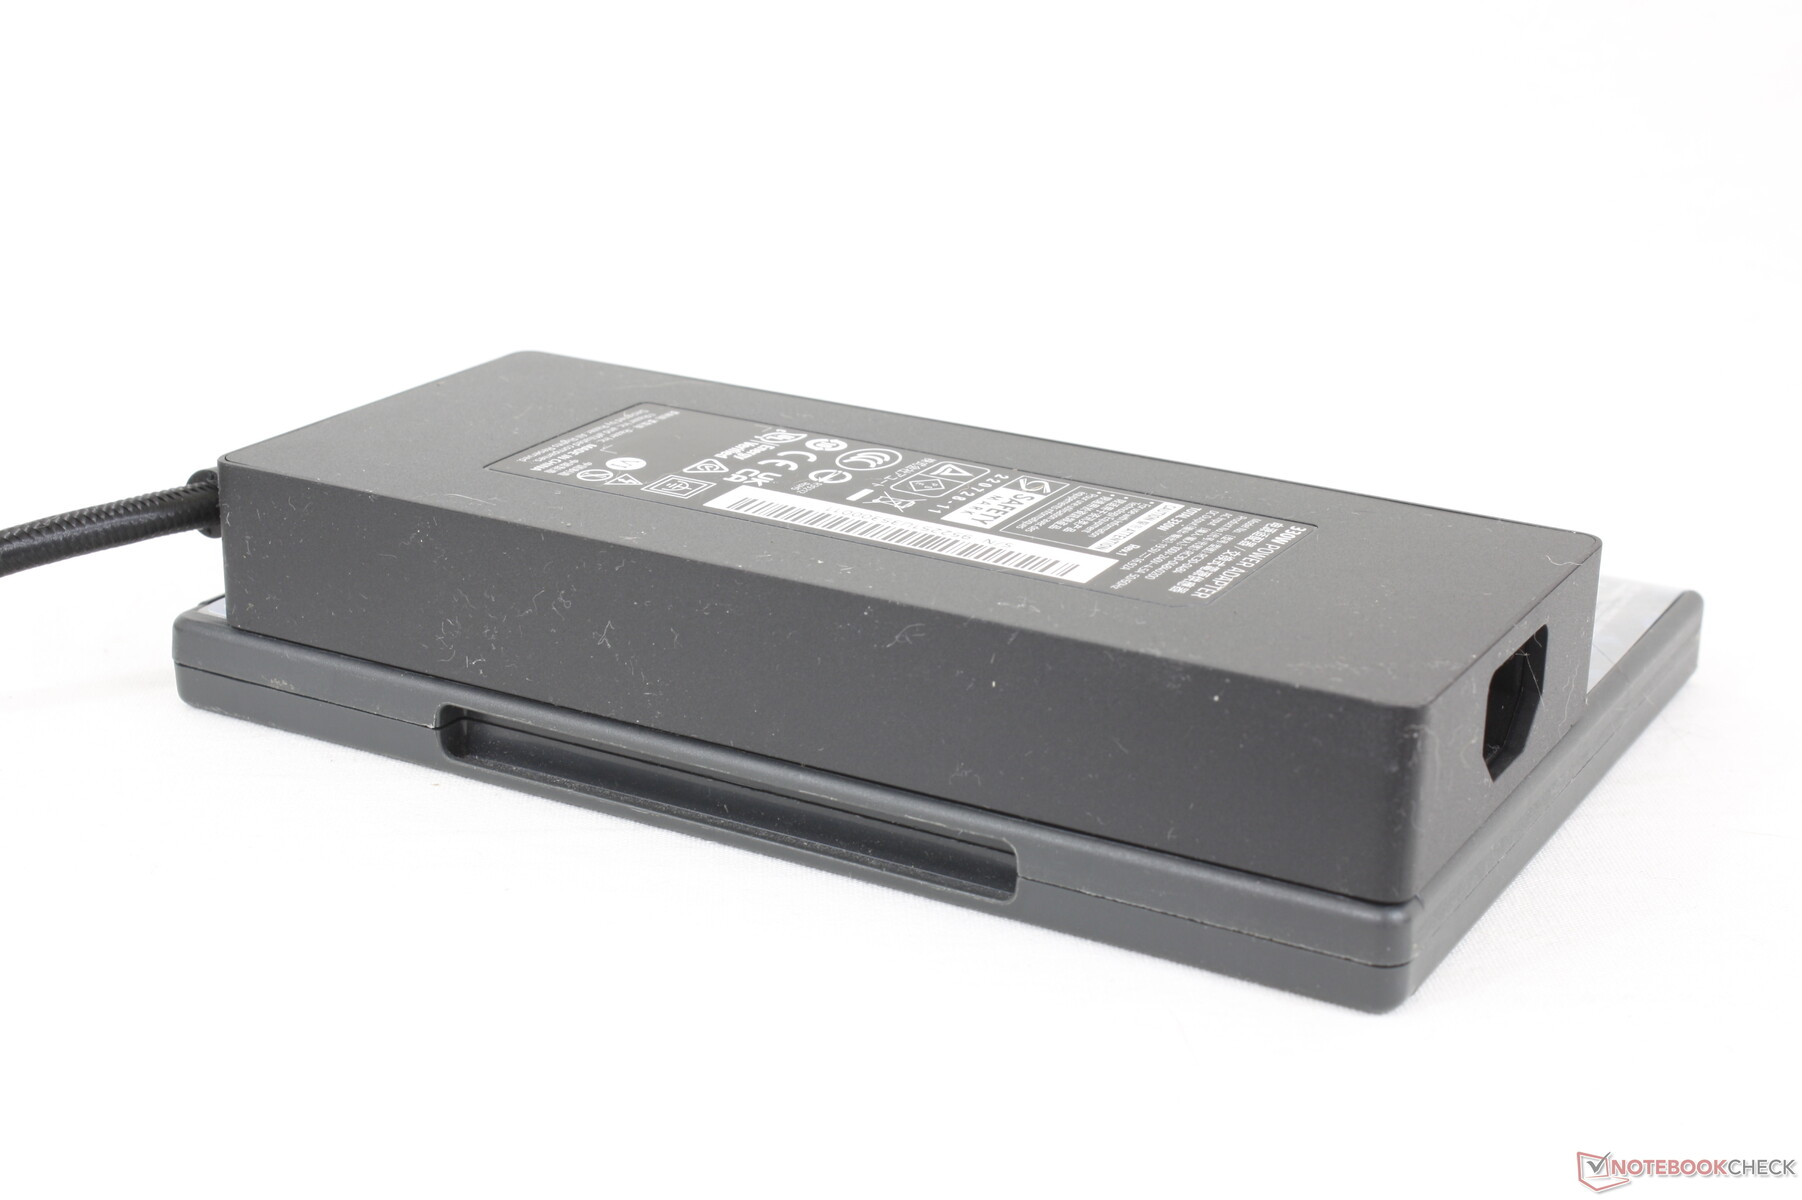
The 330 W AC adapter is larger than the 330 W AC adapter for the new Razer Blade (~18.5 x 8.5 x 3.6 cm vs. ~18 x 7.5 x 2.5 cm) since Eluktronics and Uniwill have not yet moved to GaN charging. We're able to record a temporary maximum consumption of 343 W when the CPU and GPU are each at 100 percent utilization.
| Off / Standby | |
| Idle | |
| Load |
|
Key:
min: | |
| Eluktronics Mech-17 GP2 i9-13900HX, GeForce RTX 4090 Laptop GPU, Samsung PM9A1 MZVL21T0HCLR, IPS, 2560x1600, 17" | Schenker XMG Neo 17 M22 R9 6900HX, GeForce RTX 3080 Ti Laptop GPU, Samsung SSD 980 Pro 1TB MZ-V8P1T0BW, IPS, 2560x1600, 17" | MSI Katana 17 B13VFK i7-13620H, GeForce RTX 4060 Laptop GPU, Micron 2400 MTFDKBA1T0QFM, IPS LED, 1920x1080, 17.3" | MSI Titan GT77 HX 13VI i9-13950HX, GeForce RTX 4090 Laptop GPU, Samsung PM9A1 MZVL22T0HBLB, Mini-LED, 3840x2160, 17.3" | Alienware m17 R5 (R9 6900HX, RX 6850M XT) R9 6900HX, Radeon RX 6850M XT, SSSTC CA6-8D1024, IPS, 3840x2160, 17" | Razer Blade 18 RTX 4070 i9-13950HX, GeForce RTX 4070 Laptop GPU, SSSTC CA6-8D1024, IPS, 2560x1600, 18" | |
|---|---|---|---|---|---|---|
| Power Consumption | 35% | 35% | 1% | 24% | -24% | |
| Idle Minimum * (Watt) | 14 | 7 50% | 12.2 13% | 14 -0% | 13 7% | 24.5 -75% |
| Idle Average * (Watt) | 19.3 | 11 43% | 14.9 23% | 21.6 -12% | 16.5 15% | 34.1 -77% |
| Idle Maximum * (Watt) | 36.8 | 17 54% | 15.8 57% | 24.8 33% | 17 54% | 47.7 -30% |
| Load Average * (Watt) | 117.2 | 92 22% | 85.22 27% | 122.5 -5% | 93 21% | 140 -19% |
| Witcher 3 ultra * (Watt) | 304 | 221 27% | 151.1 50% | 265 13% | 239 21% | 202 34% |
| Load Maximum * (Watt) | 342.5 | 306 11% | 212.8 38% | 418 -22% | 251 27% | 261 24% |
* ... smaller is better
Power Consumption Witcher 3 / Stresstest
Power Consumption external Monitor
Battery Life
WLAN runtime is shorter than on last year's AMD-powered Neo 17 M22 by several hours for a total of just over 5 hours. Both test units would be set to the Balanced power profile with Optimus active on the iGPU.
Charging from empty to full capacity takes between 2 and 2.5 hours. The system cannot be recharged via USB-C.
| Eluktronics Mech-17 GP2 i9-13900HX, GeForce RTX 4090 Laptop GPU, 99 Wh | Schenker XMG Neo 17 M22 R9 6900HX, GeForce RTX 3080 Ti Laptop GPU, 99 Wh | MSI Katana 17 B13VFK i7-13620H, GeForce RTX 4060 Laptop GPU, 53.5 Wh | MSI Titan GT77 HX 13VI i9-13950HX, GeForce RTX 4090 Laptop GPU, 99.9 Wh | Alienware m17 R5 (R9 6900HX, RX 6850M XT) R9 6900HX, Radeon RX 6850M XT, 97 Wh | Razer Blade 18 RTX 4070 i9-13950HX, GeForce RTX 4070 Laptop GPU, 91.7 Wh | |
|---|---|---|---|---|---|---|
| Battery runtime | 76% | -43% | 4% | -6% | -22% | |
| WiFi v1.3 (h) | 5.1 | 9 76% | 2.9 -43% | 5.3 4% | 4.8 -6% | 4 -22% |
| Reader / Idle (h) | 12 | 7 | ||||
| H.264 (h) | 6.6 | 6 | 4.9 | |||
| Load (h) | 1.8 | 1 | 1.4 | 1.8 | 1.3 |
Pros
Cons
Verdict — Turning Up The Heat A Bit Too Literally
The Mech-17 GP2 is 7 percent smaller and 17 percent lighter than the MSI GT77 HX Titan while offering very nearly the same performance. It's densely packed as a result, but perhaps by a little too much. CPU temperatures are extremely high even for a gaming laptop when running games. Though the ~97 C range is technically "safe" for the Intel processor, it is nonetheless warmer than on last year's model and not exactly comforting for the end-user. The high core temperature can perhaps be alleviated by utilizing the external water cooler docking station, but a laptop shouldn't have to rely on an optional accessory for optimal cooling.
High performance at the cost of high core temperatures.
Aside from its high performance-per-volume, price is also a distinguishing factor of the model. The Mech-17 GP2 is one of the few GeForce 40 laptops to ship with a barebones option meaning you can save several hundred dollars if you can supply your own RAM, SSD, and OS. $2999 USD for one of the fastest gaming laptops in the market isn't half bad; just be sure to keep a close eye on those core temperatures.
Price and Availability
Amazon is now shipping the Mech-17 GP2 with the RTX 4090 for $4400 USD complete with RAM and storage. Alternatively, users can purchase directly from Eluktronics for more configurable options.
Eluktronics Mech-17 GP2
- 03/08/2023 v7 (old)
Allen Ngo
Transparency
The selection of devices to be reviewed is made by our editorial team. The test sample was provided to the author as a loan by the manufacturer or retailer for the purpose of this review. The lender had no influence on this review, nor did the manufacturer receive a copy of this review before publication. There was no obligation to publish this review. As an independent media company, Notebookcheck is not subjected to the authority of manufacturers, retailers or publishers.
This is how Notebookcheck is testing
Every year, Notebookcheck independently reviews hundreds of laptops and smartphones using standardized procedures to ensure that all results are comparable. We have continuously developed our test methods for around 20 years and set industry standards in the process. In our test labs, high-quality measuring equipment is utilized by experienced technicians and editors. These tests involve a multi-stage validation process. Our complex rating system is based on hundreds of well-founded measurements and benchmarks, which maintains objectivity. Further information on our test methods can be found here.
Price comparison
