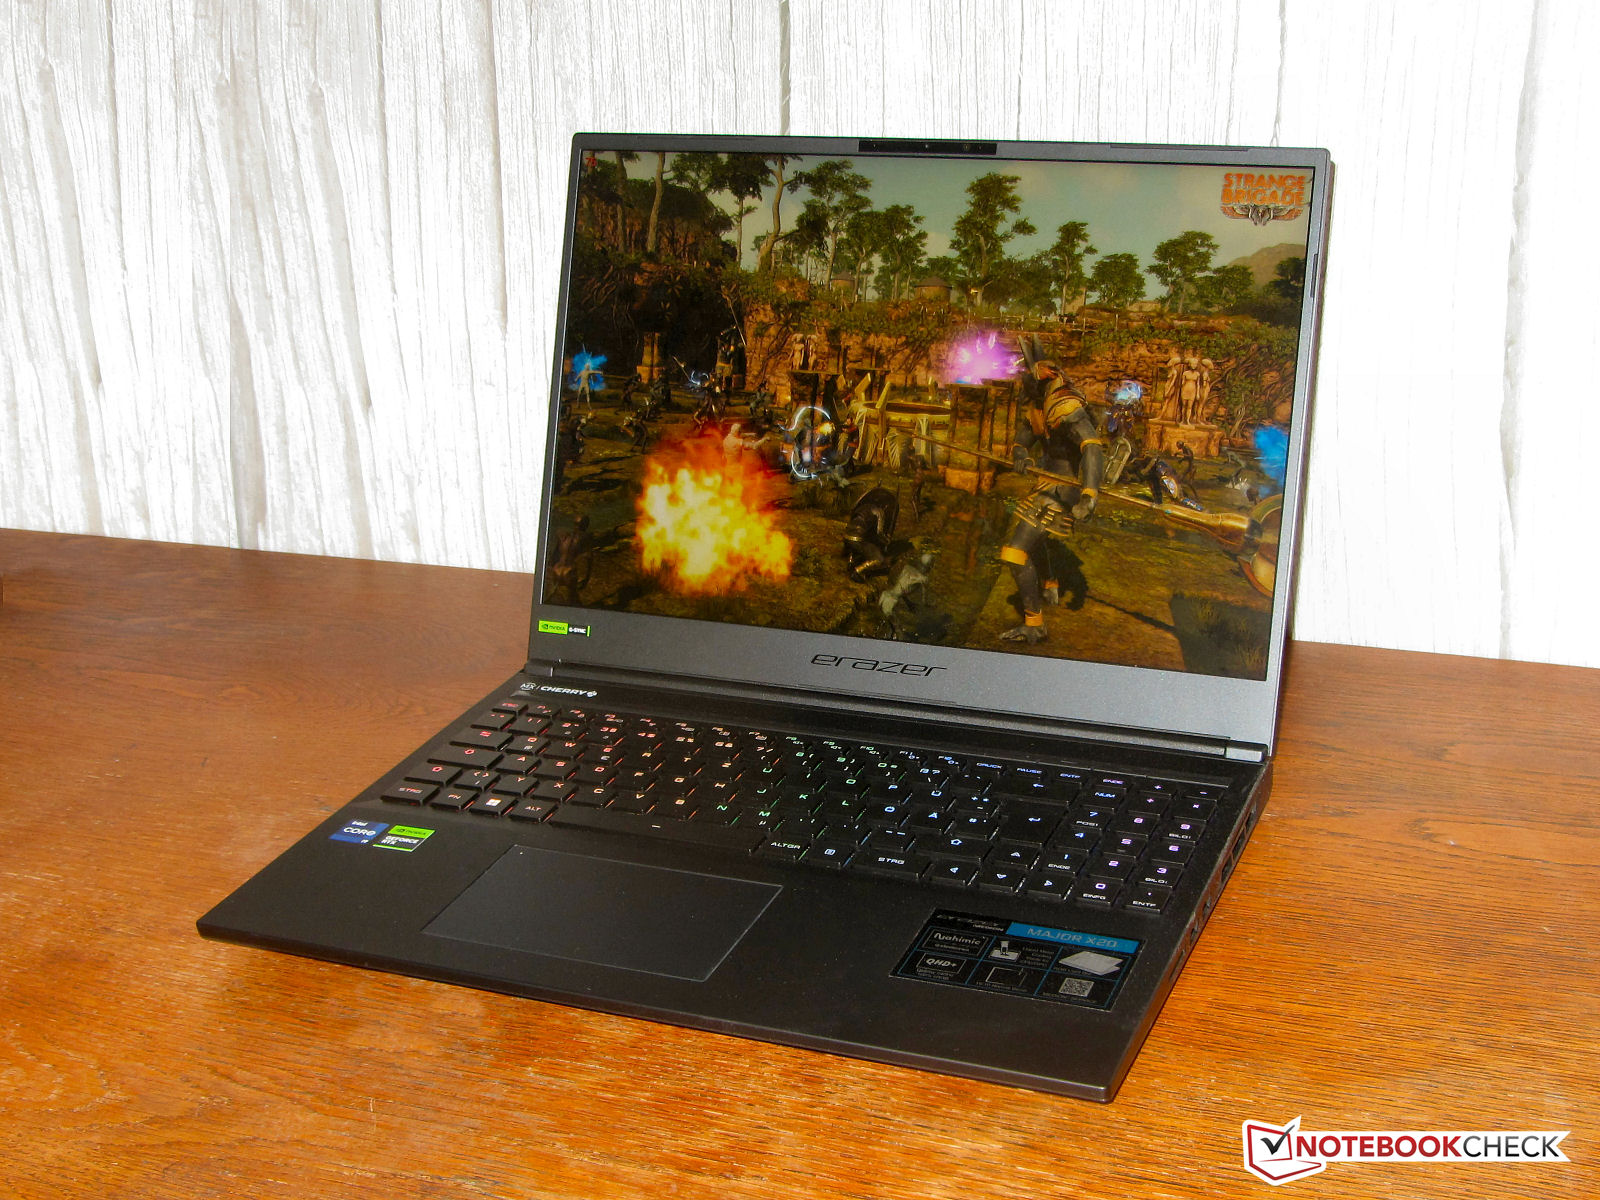
Medion Erazer Major X20 review: Gaming notebook with RTX 4070 and solid hardware

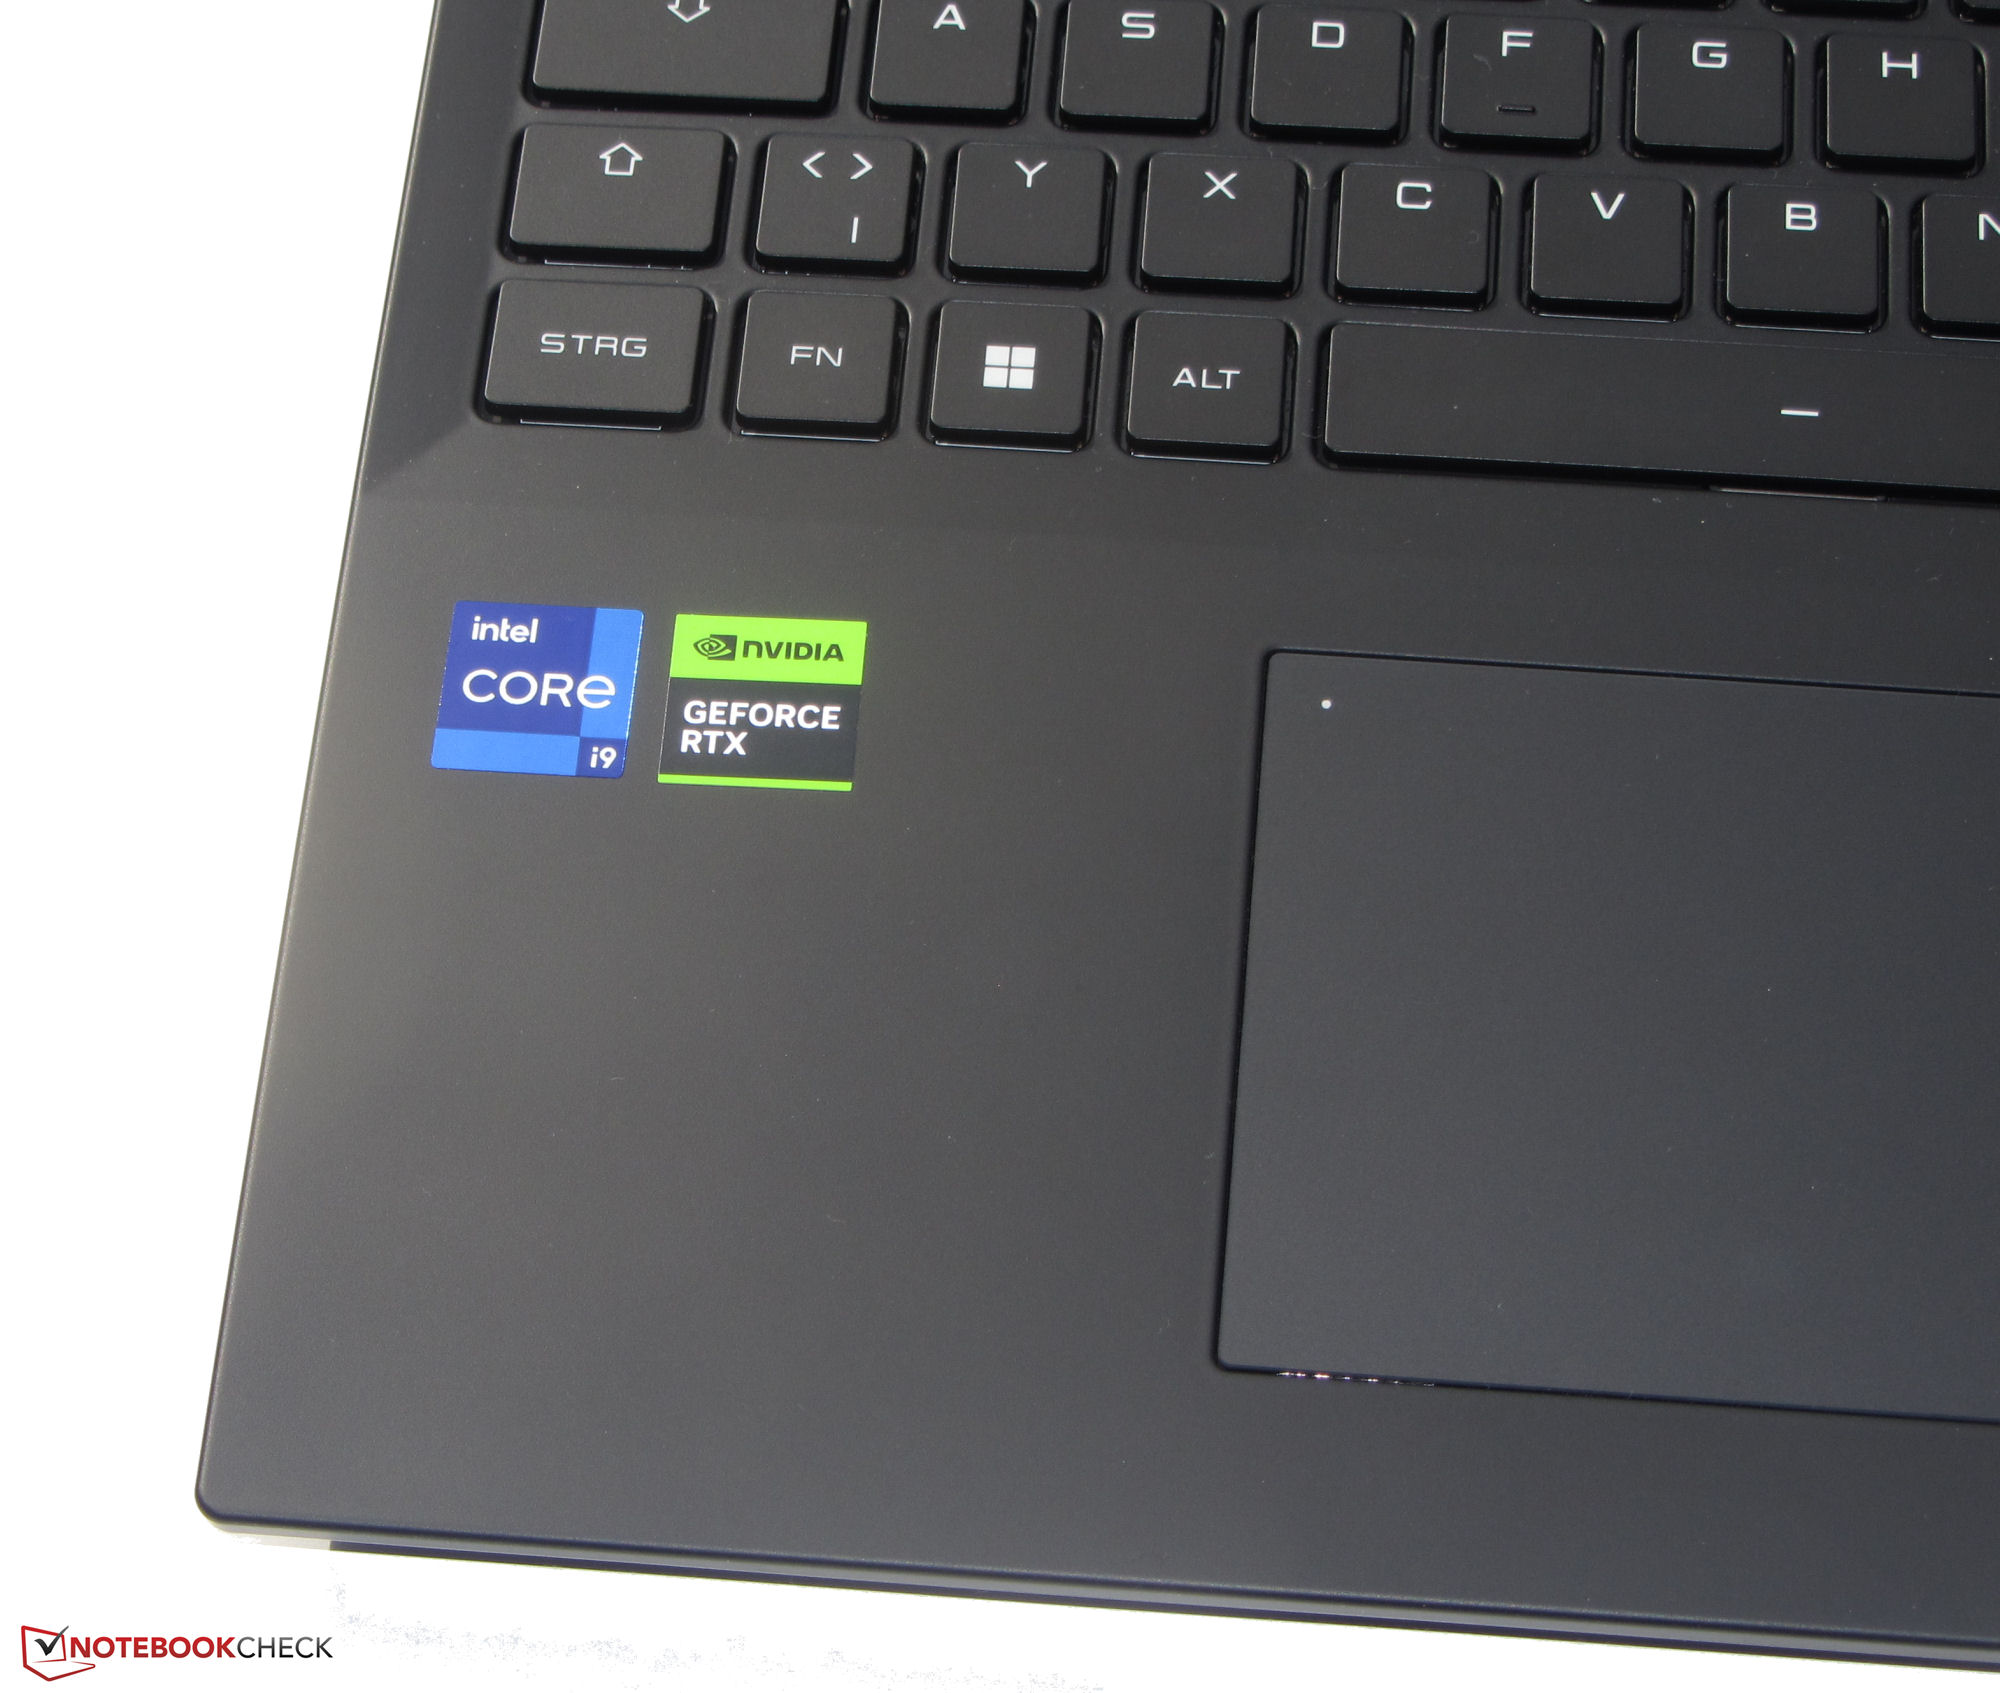
The Medion Erazer Major X20 is primarily a gaming notebook, but is also made for other computing-intensive application scenarios. Compared to its predecessor, the X20 has received some useful upgrades: the Arc A730M graphics core has given way to a significantly more powerful GeForce RTX 4070. Furthermore, a mechanical keyboard replaces the chiclet model, while one of the two USB-C ports (USB 3.2 Gen 2) has been removed and the remaining one has been upgraded to a Thunderbolt 4 port.
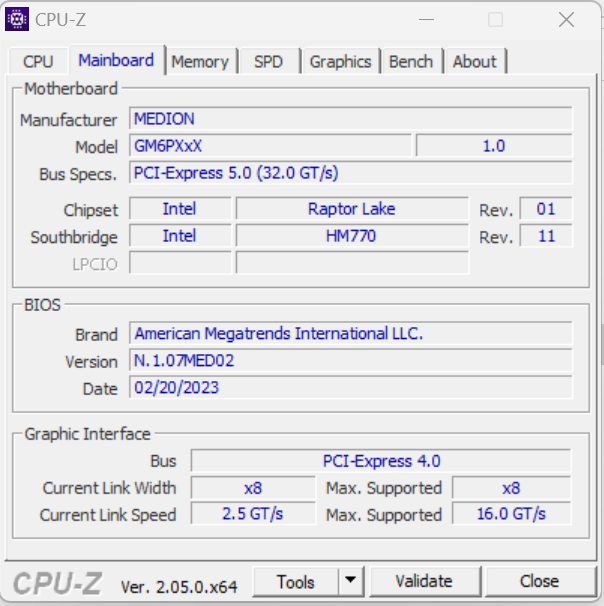
The X20 is based on a Tongfang barebone (GM6PX7X), which is largely similar to the model known from the XMG Neo 16, but the port for the water cooling is missing. Competitors include laptops such as the Aorus 15X ASF, the Razer Blade 15 OLED (Early 22) and the Asus ROG Strix G17 G713PI.
Possible competitors in comparison
Rating | Date | Model | Weight | Height | Size | Resolution | Price |
|---|---|---|---|---|---|---|---|
| 89 % v7 (old) | 04 / 2023 | Medion Erazer Major X20 i9-13900HX, GeForce RTX 4070 Laptop GPU | 2.4 kg | 29 mm | 16.00" | 2560x1600 | |
| 86.2 % v7 (old) | 04 / 2023 | Aorus 15X ASF i7-13700HX, GeForce RTX 4070 Laptop GPU | 2.3 kg | 19.7 mm | 15.60" | 2560x1440 | |
| 89.9 % v7 (old) | 03 / 2023 | Razer Blade 15 OLED (Early 2022) i9-12900H, GeForce RTX 3070 Ti Laptop GPU | 2 kg | 16.99 mm | 15.60" | 2560x1440 | |
| 88.4 % v7 (old) | 04 / 2023 | Asus ROG Strix G17 G713PI R9 7945HX, GeForce RTX 4070 Laptop GPU | 2.8 kg | 30.7 mm | 17.30" | 2560x1440 |
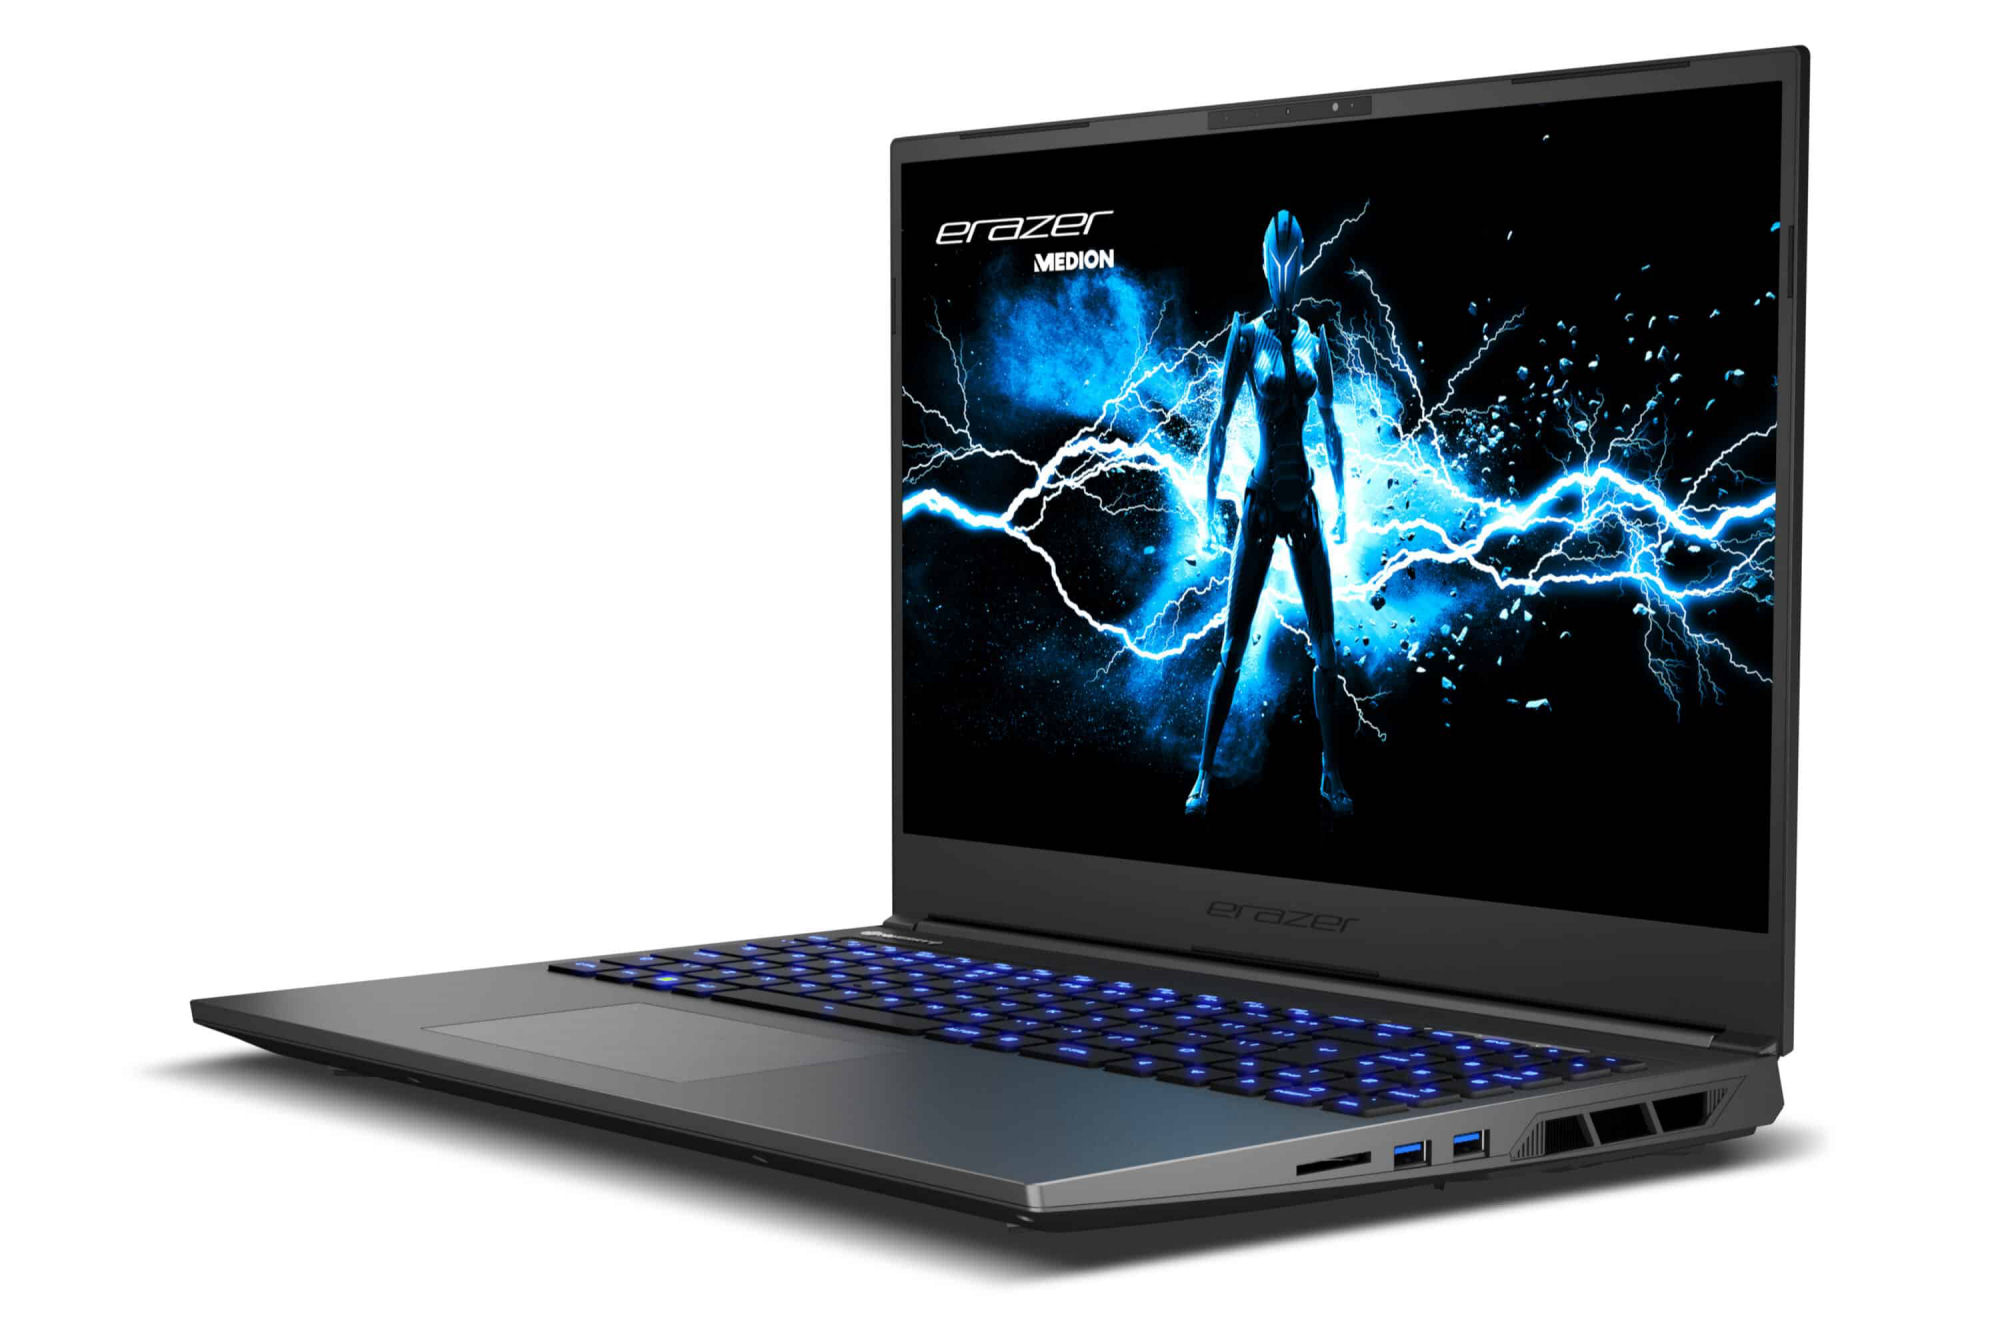
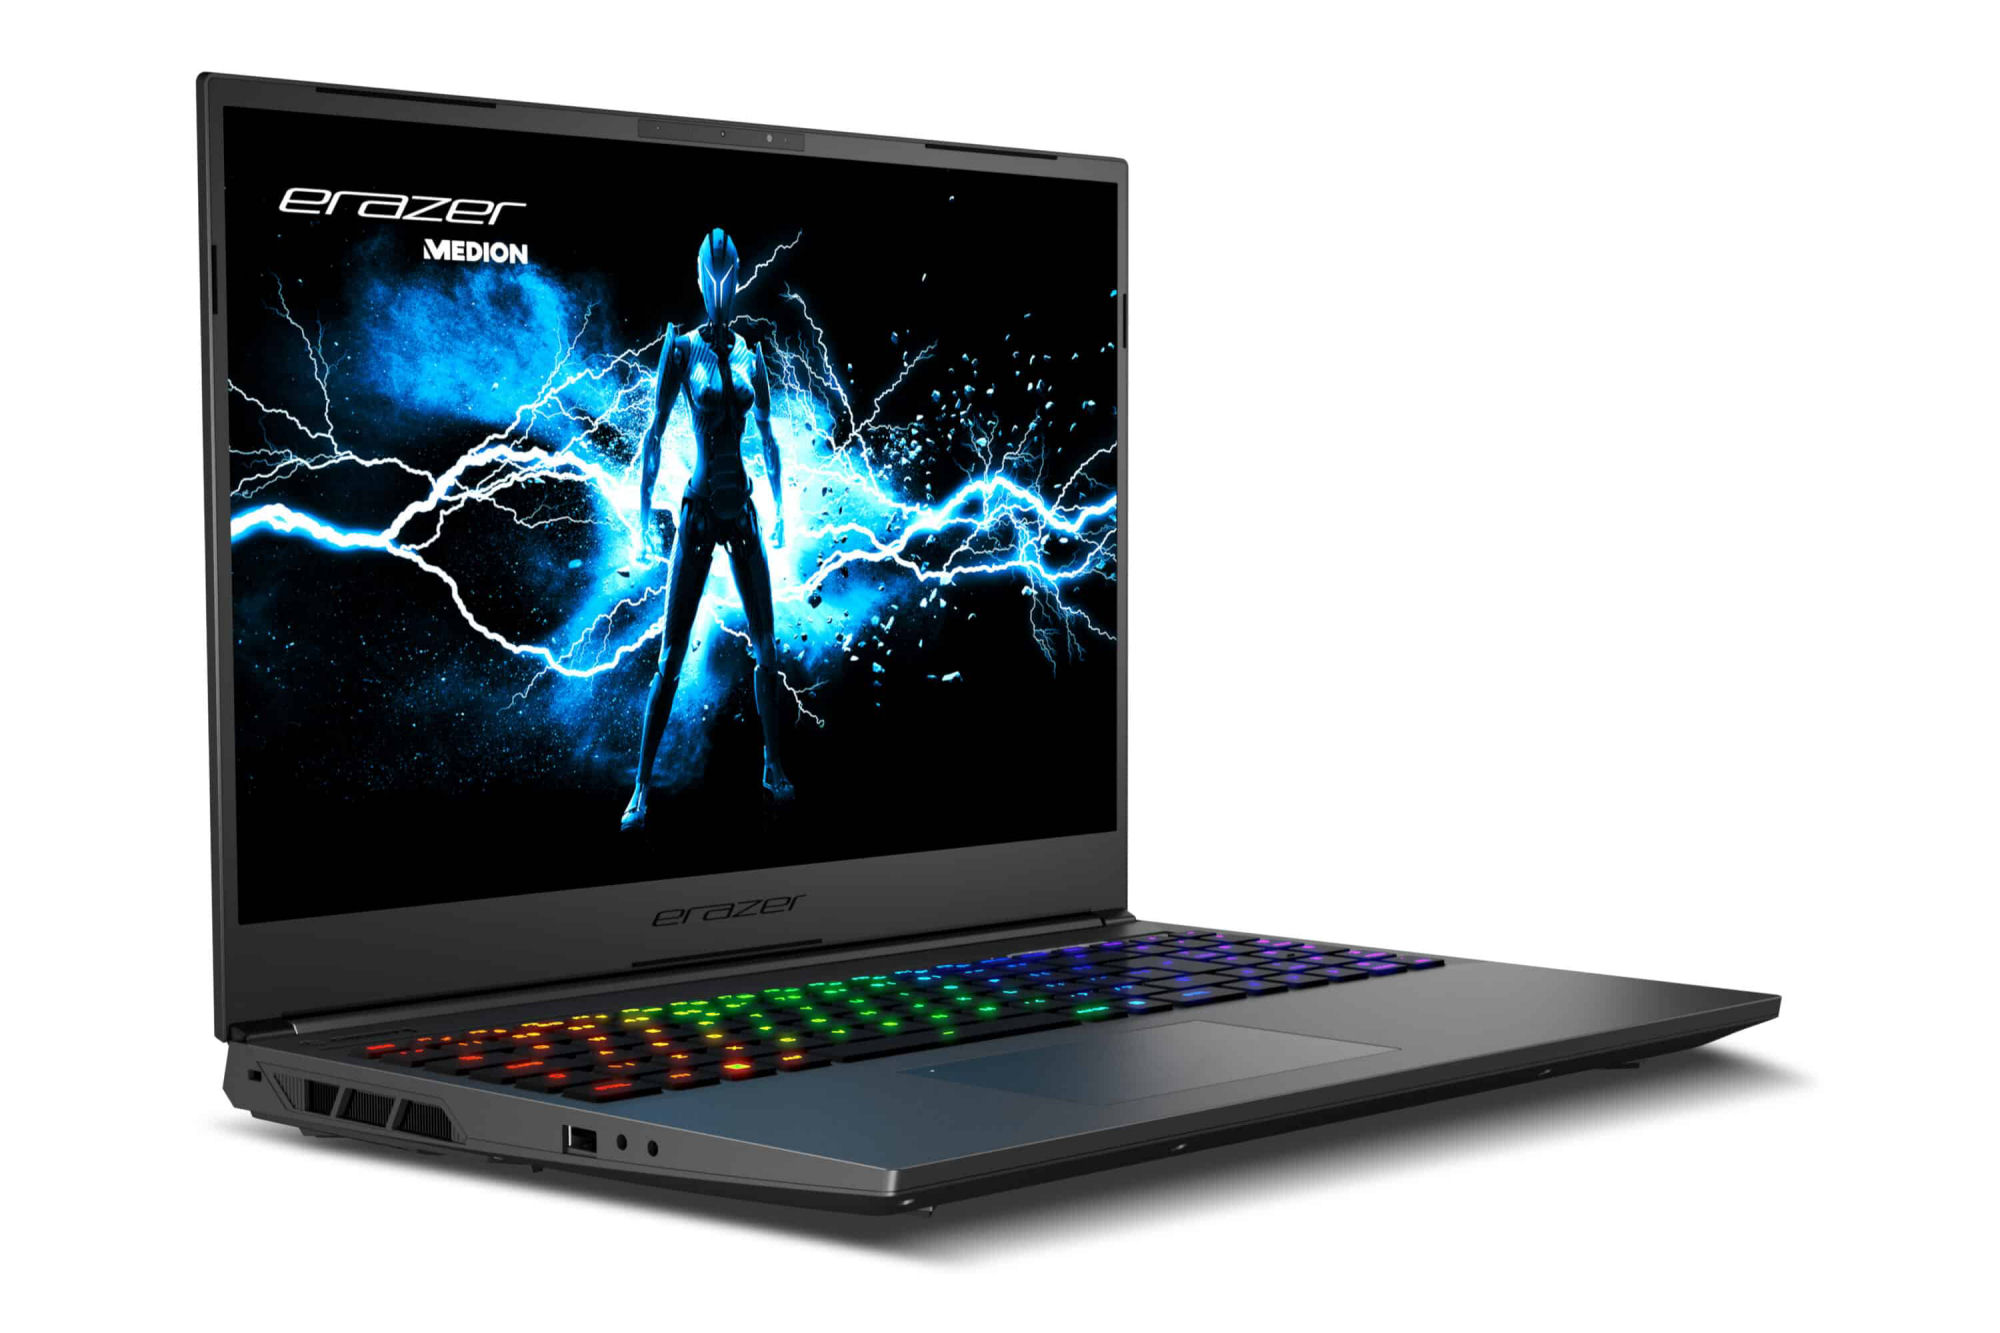
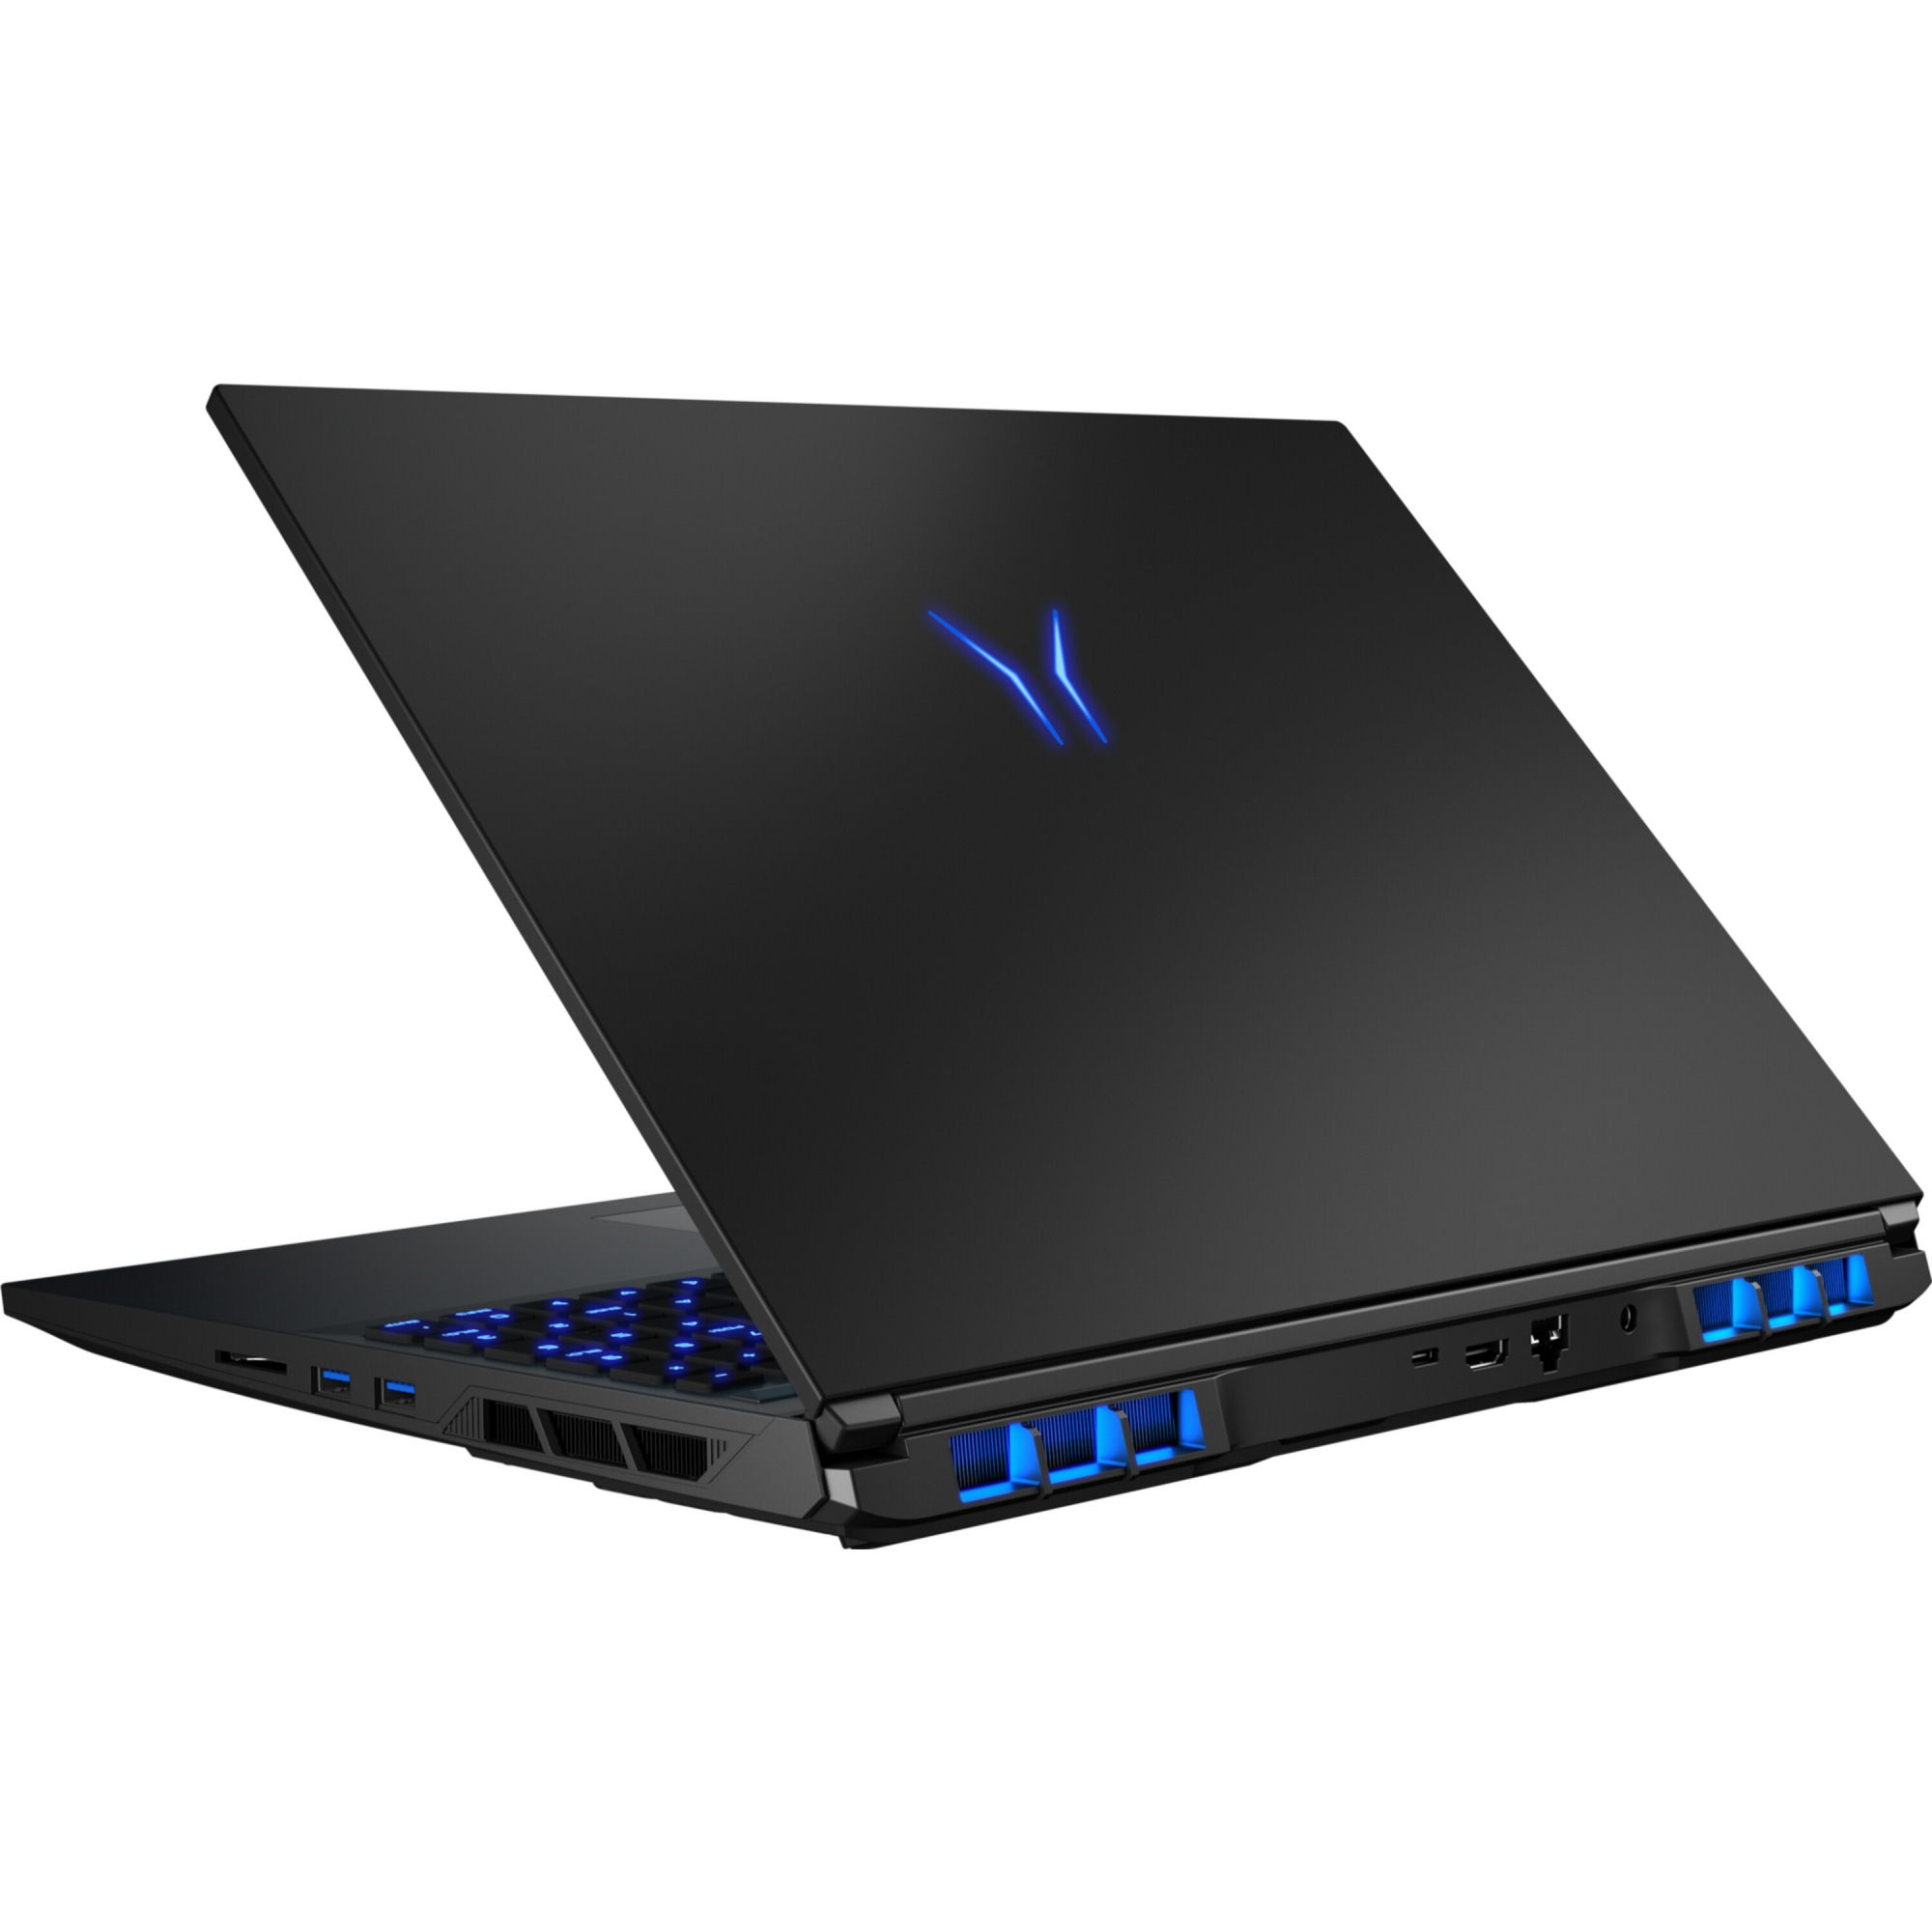
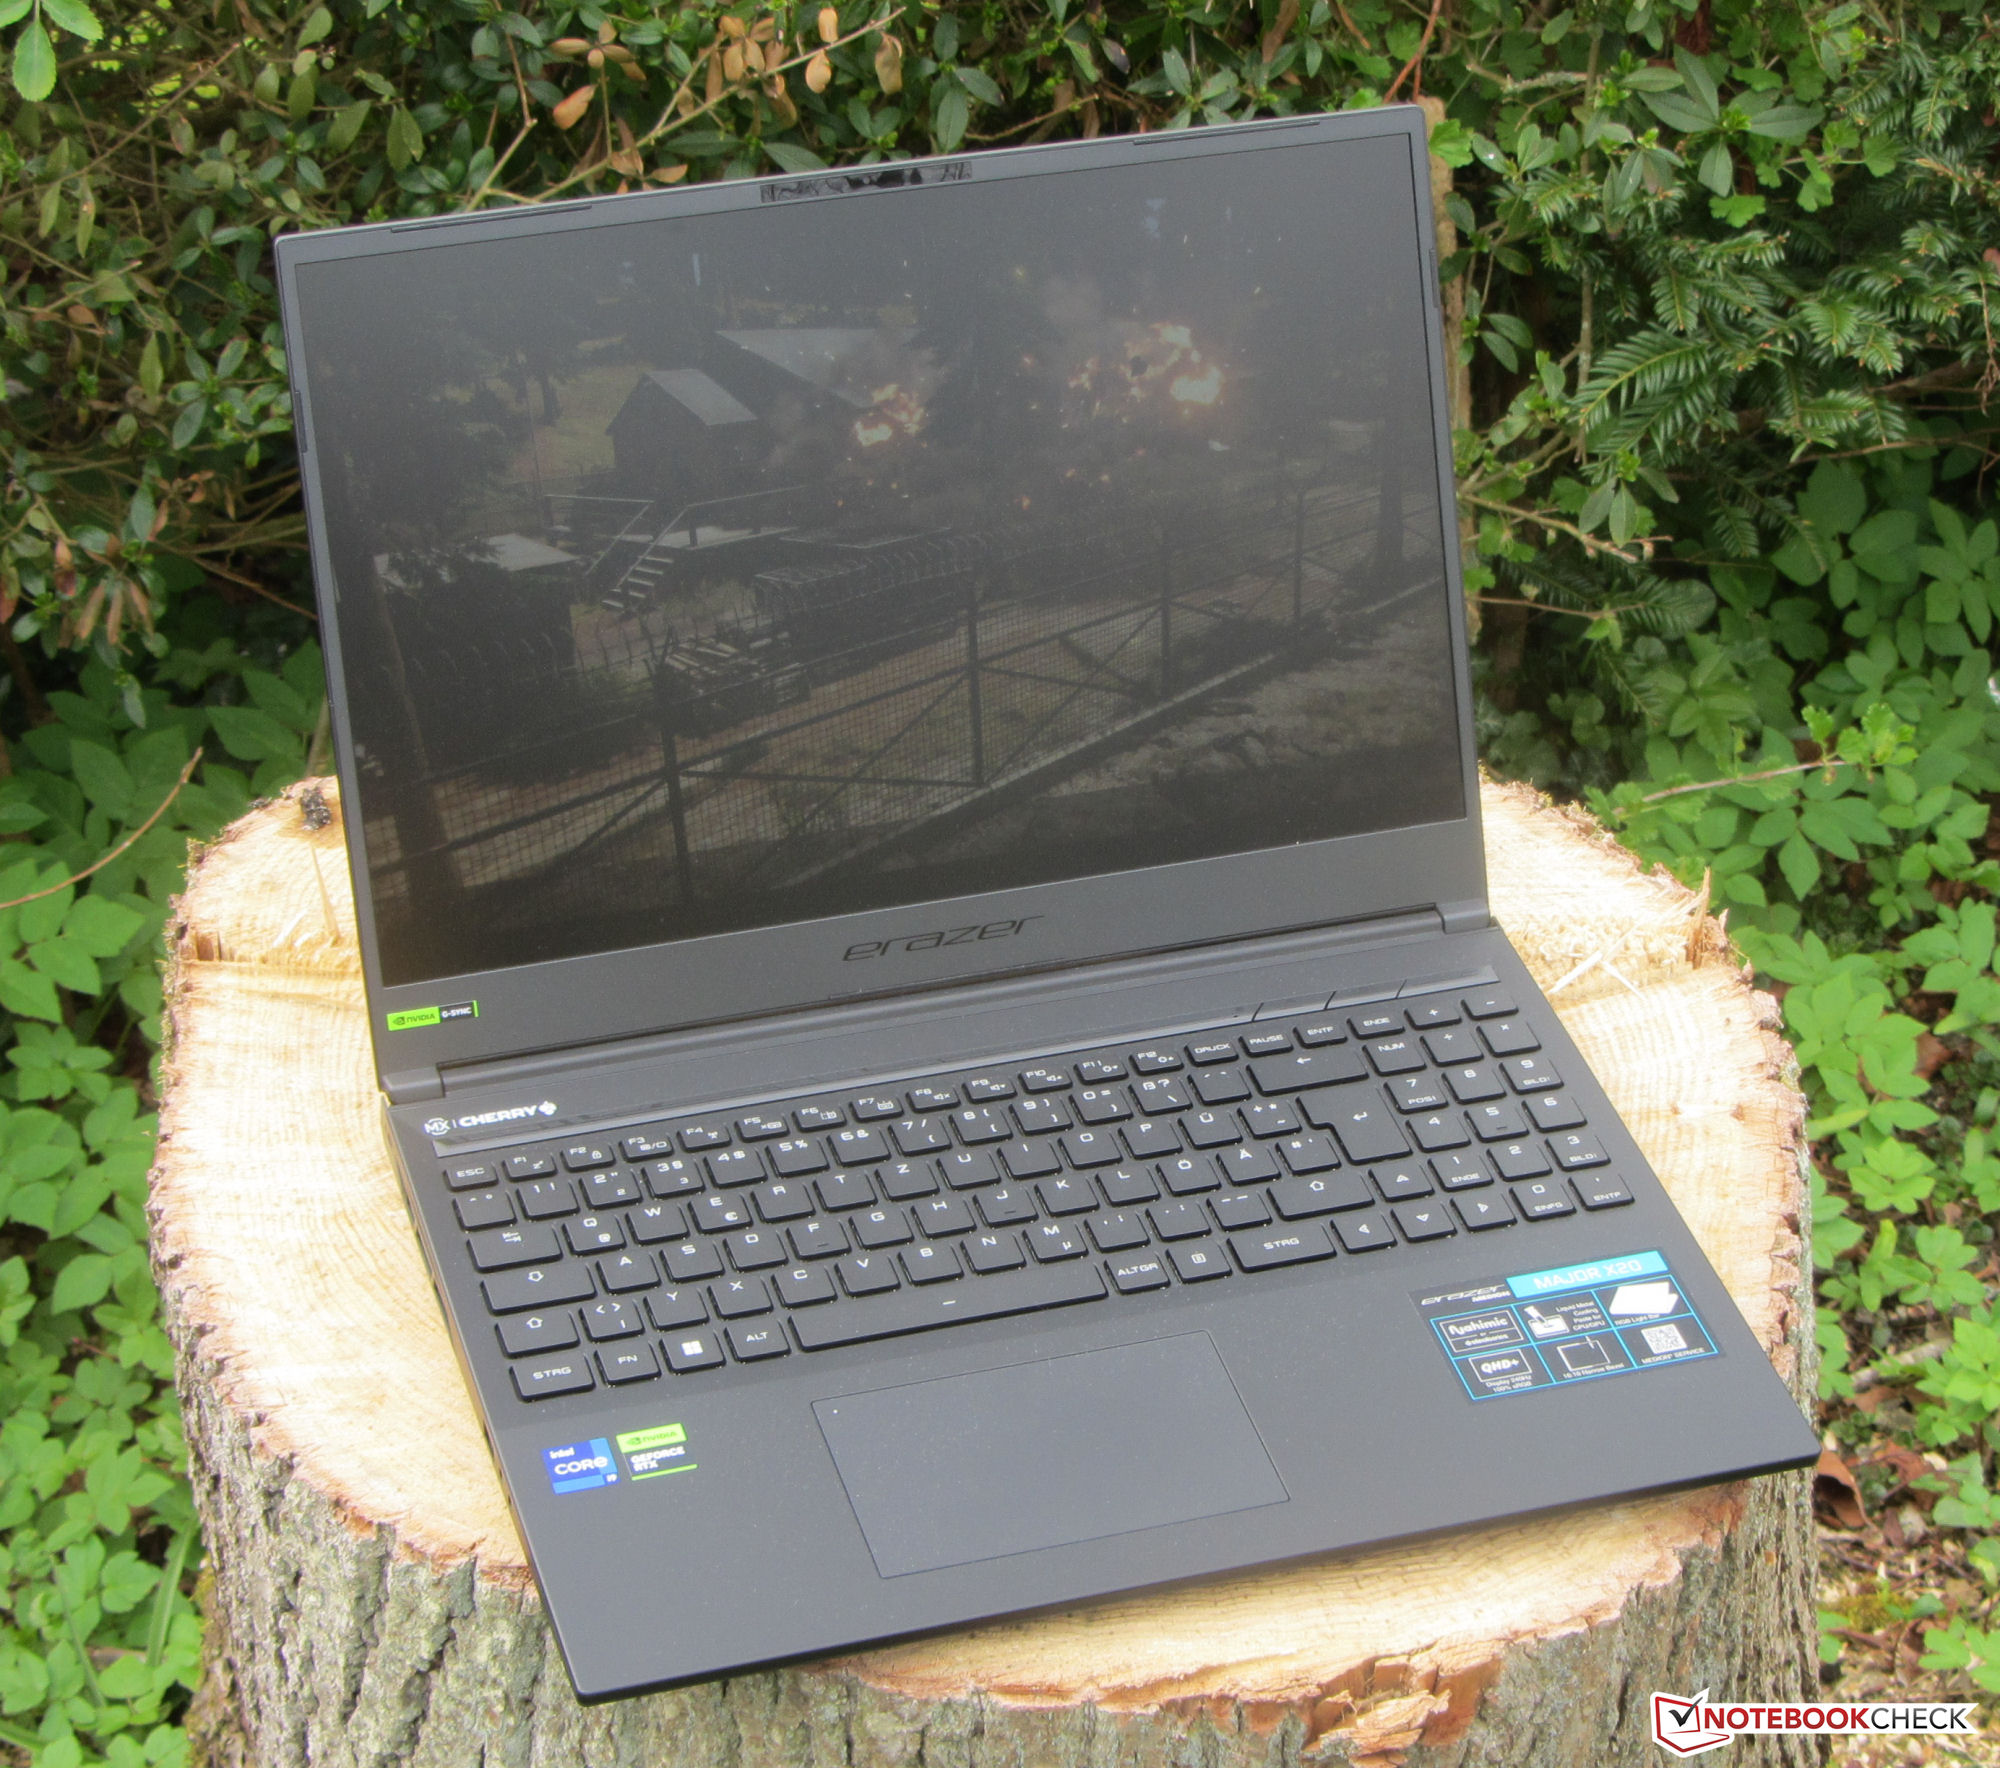
Case - A discreet exterior for the Medion laptop
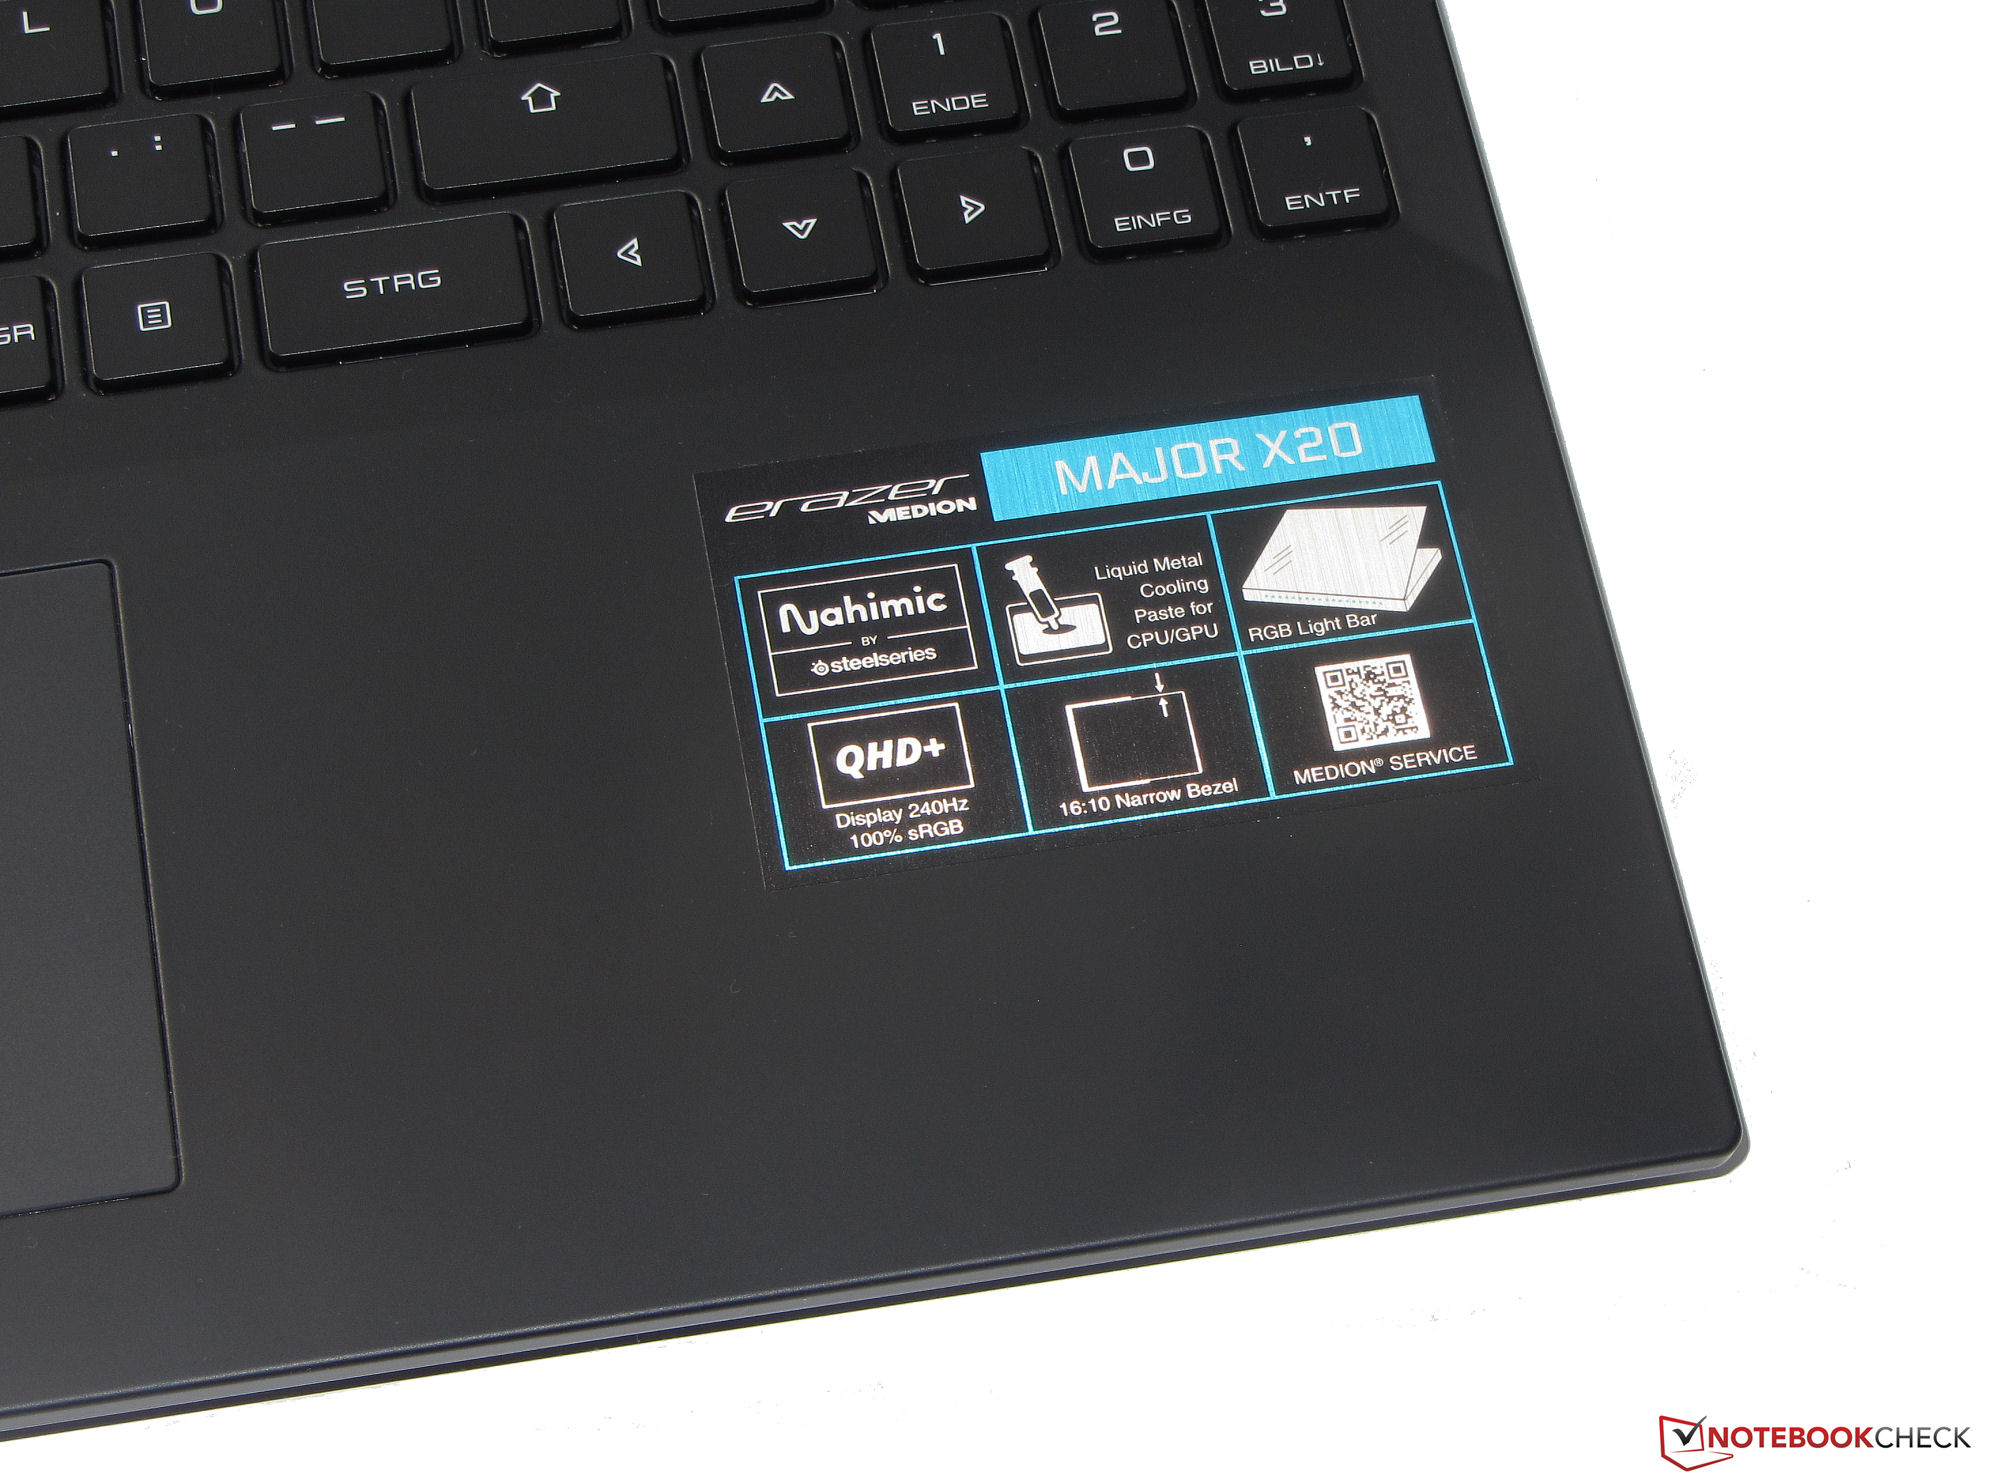
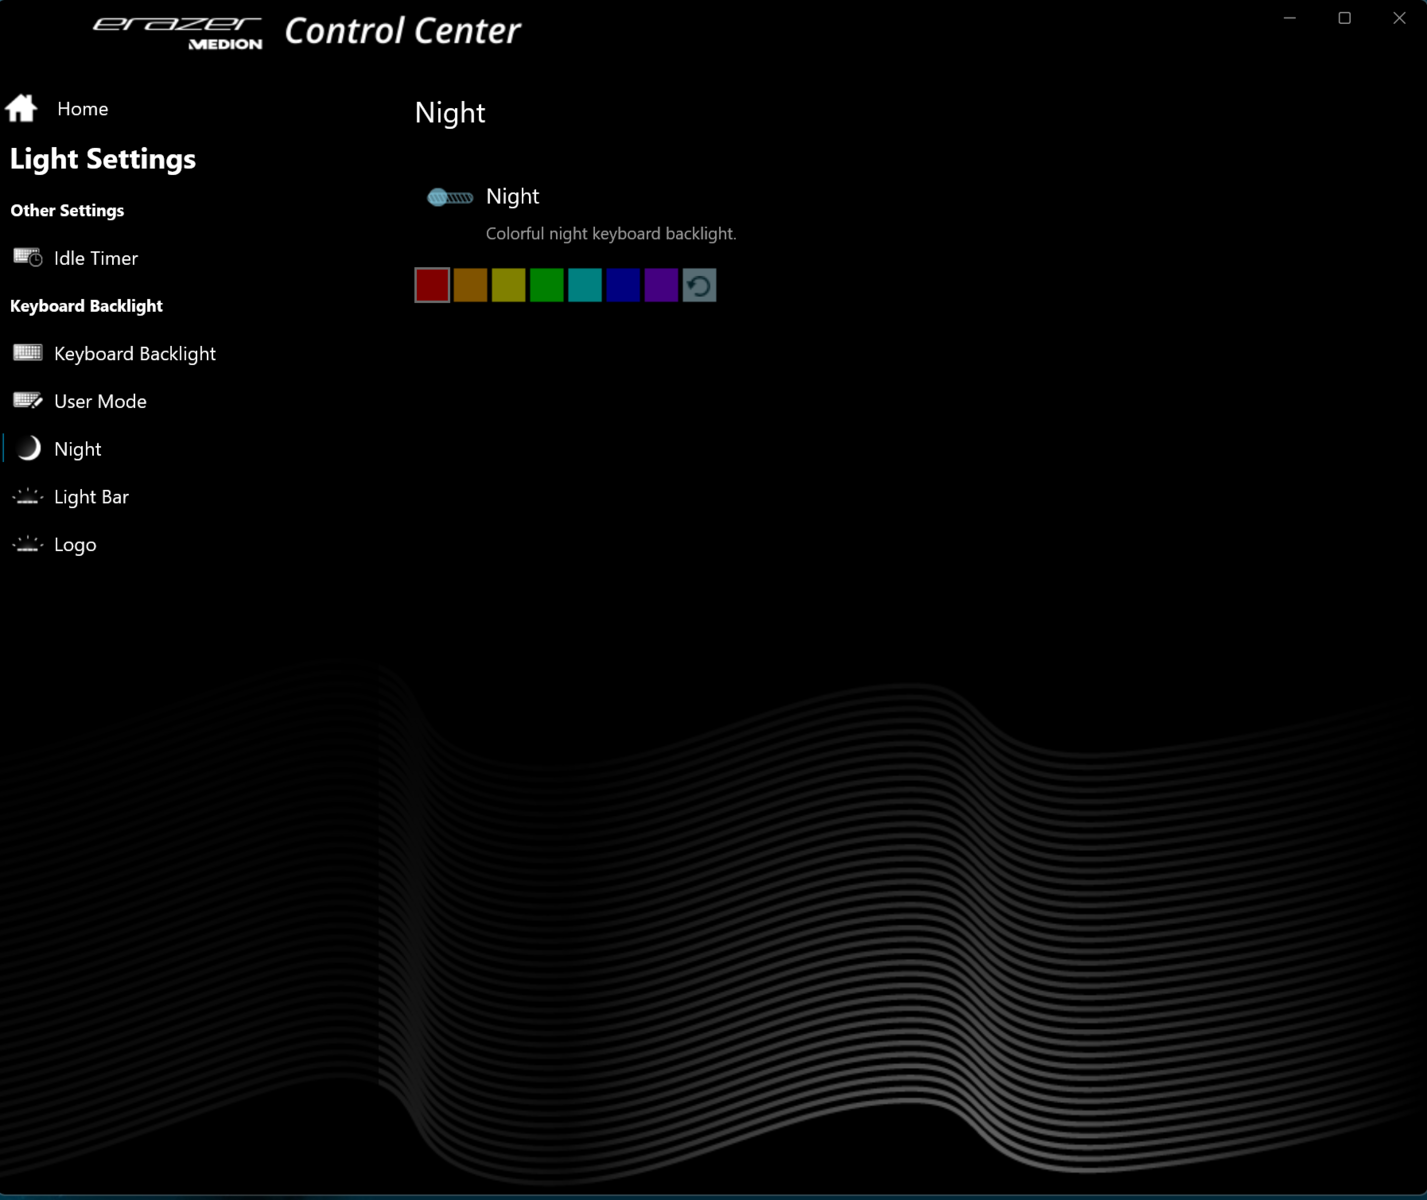
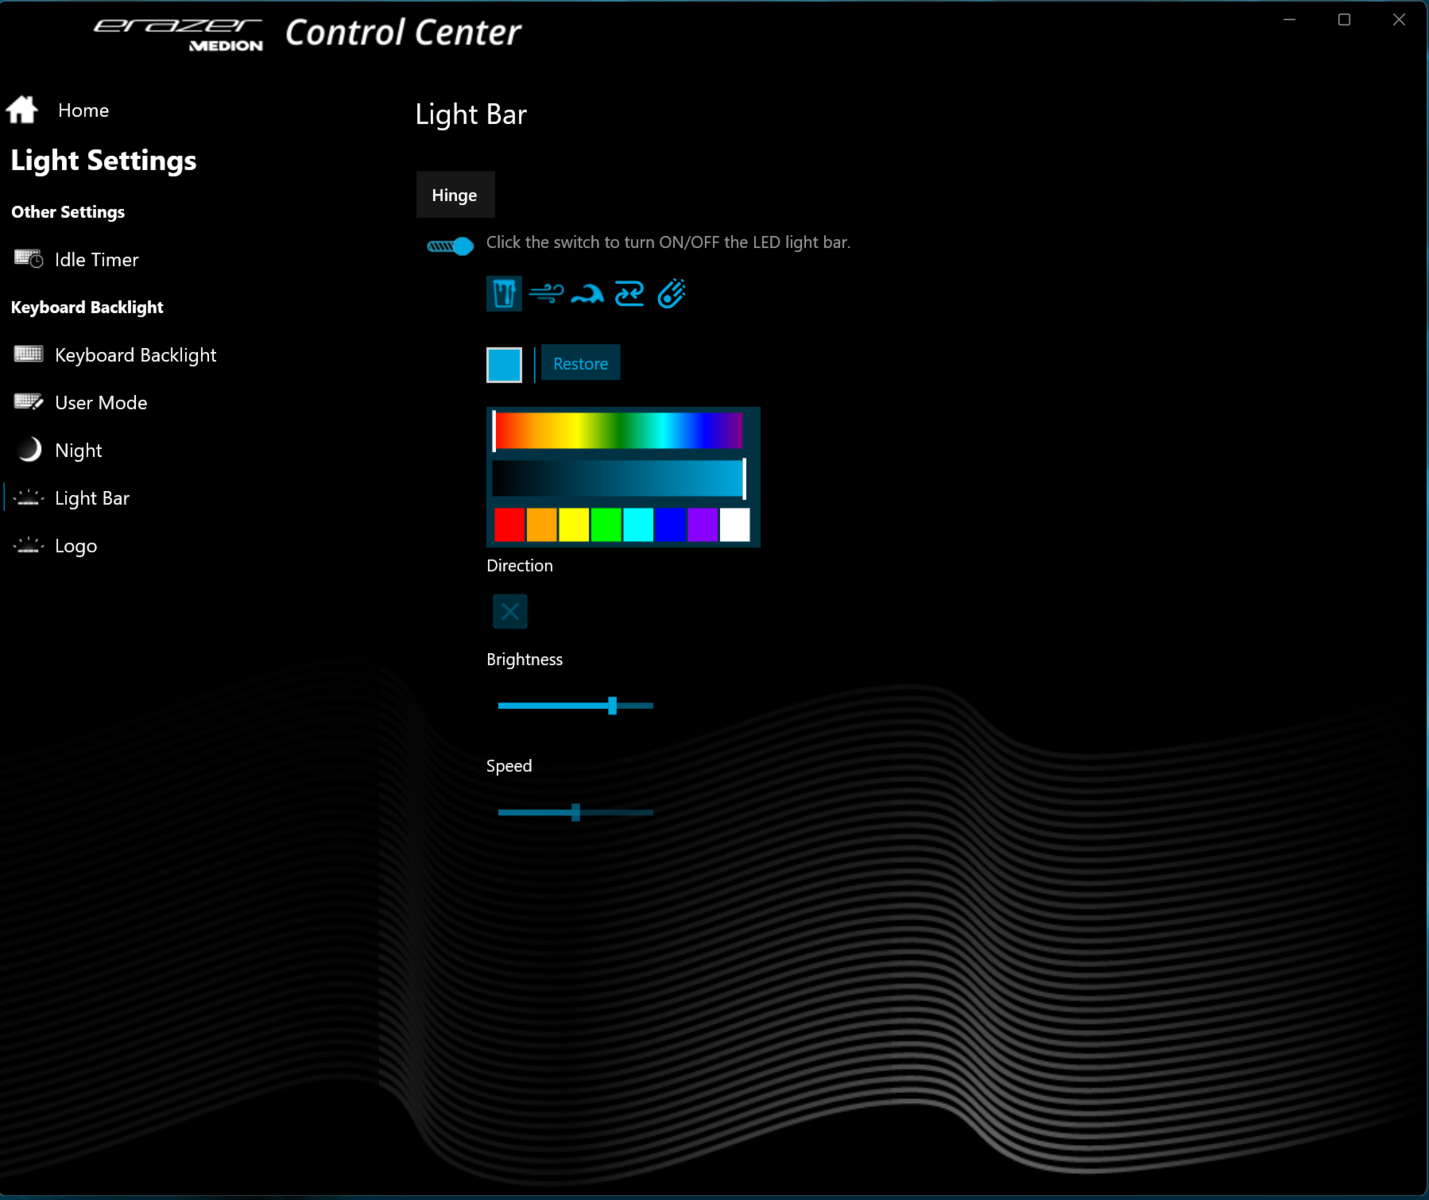
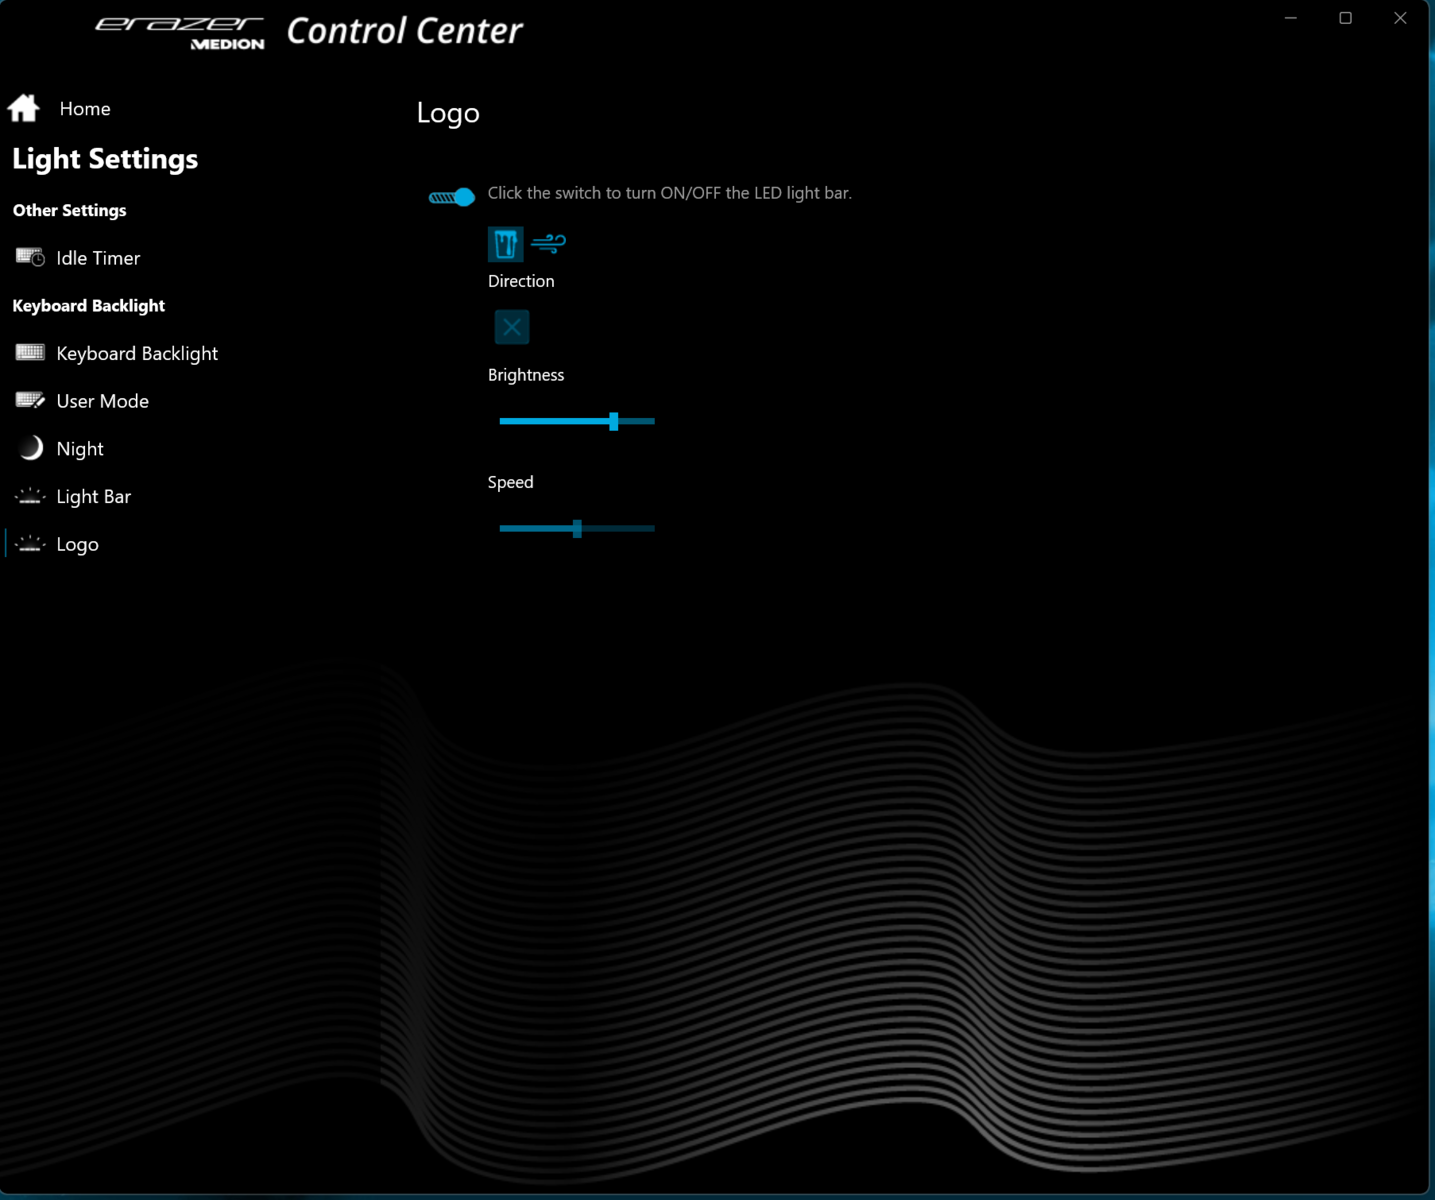
Medion uses a chic, sober chassis that does not stand out, even in a professional environment. The back of the lid of the matte black case is made of aluminum, the base unit of plastic. A non-slip rubber coating covers the base unit's upper side. In addition to the key backlight (RGB), two freely configurable LED strips (RGB) inside the rear air vents and the illuminated Erazer logo on the lid loosen up the otherwise serious-looking case.
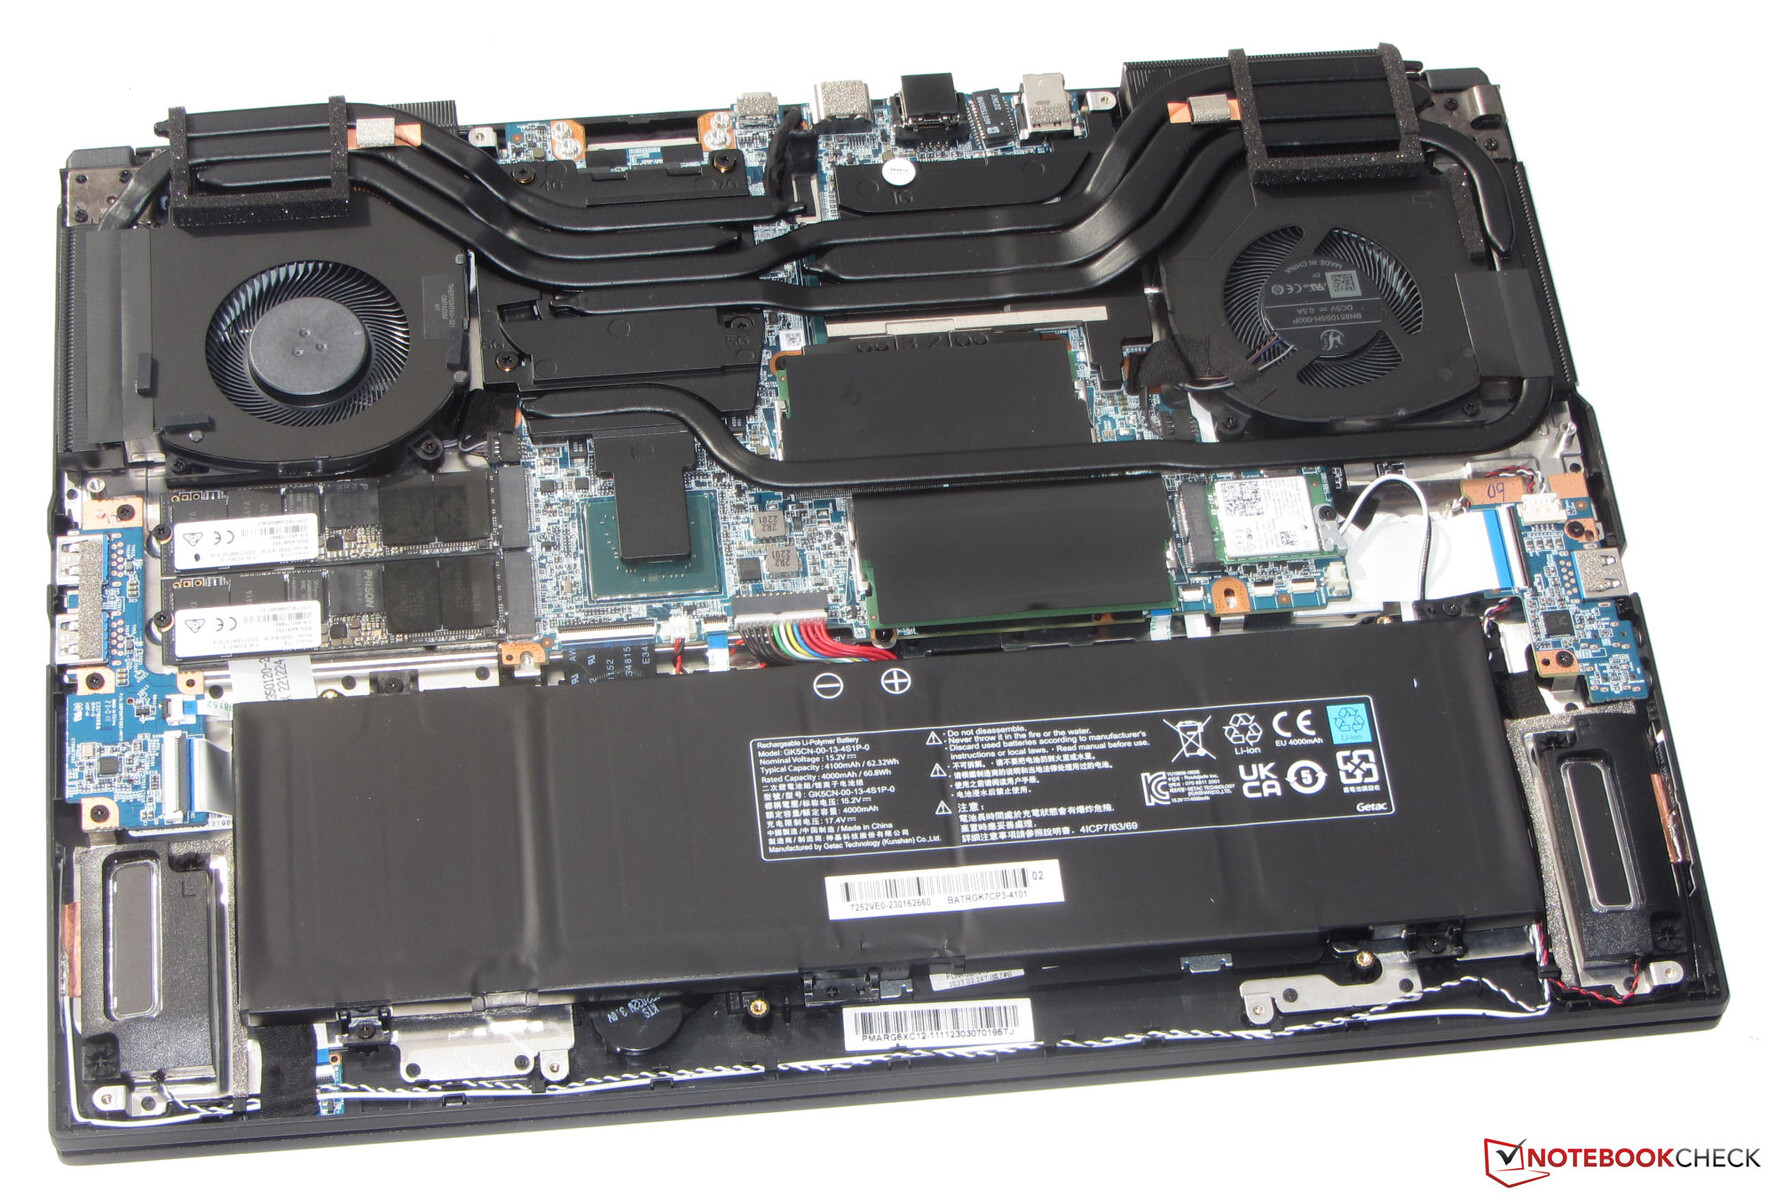
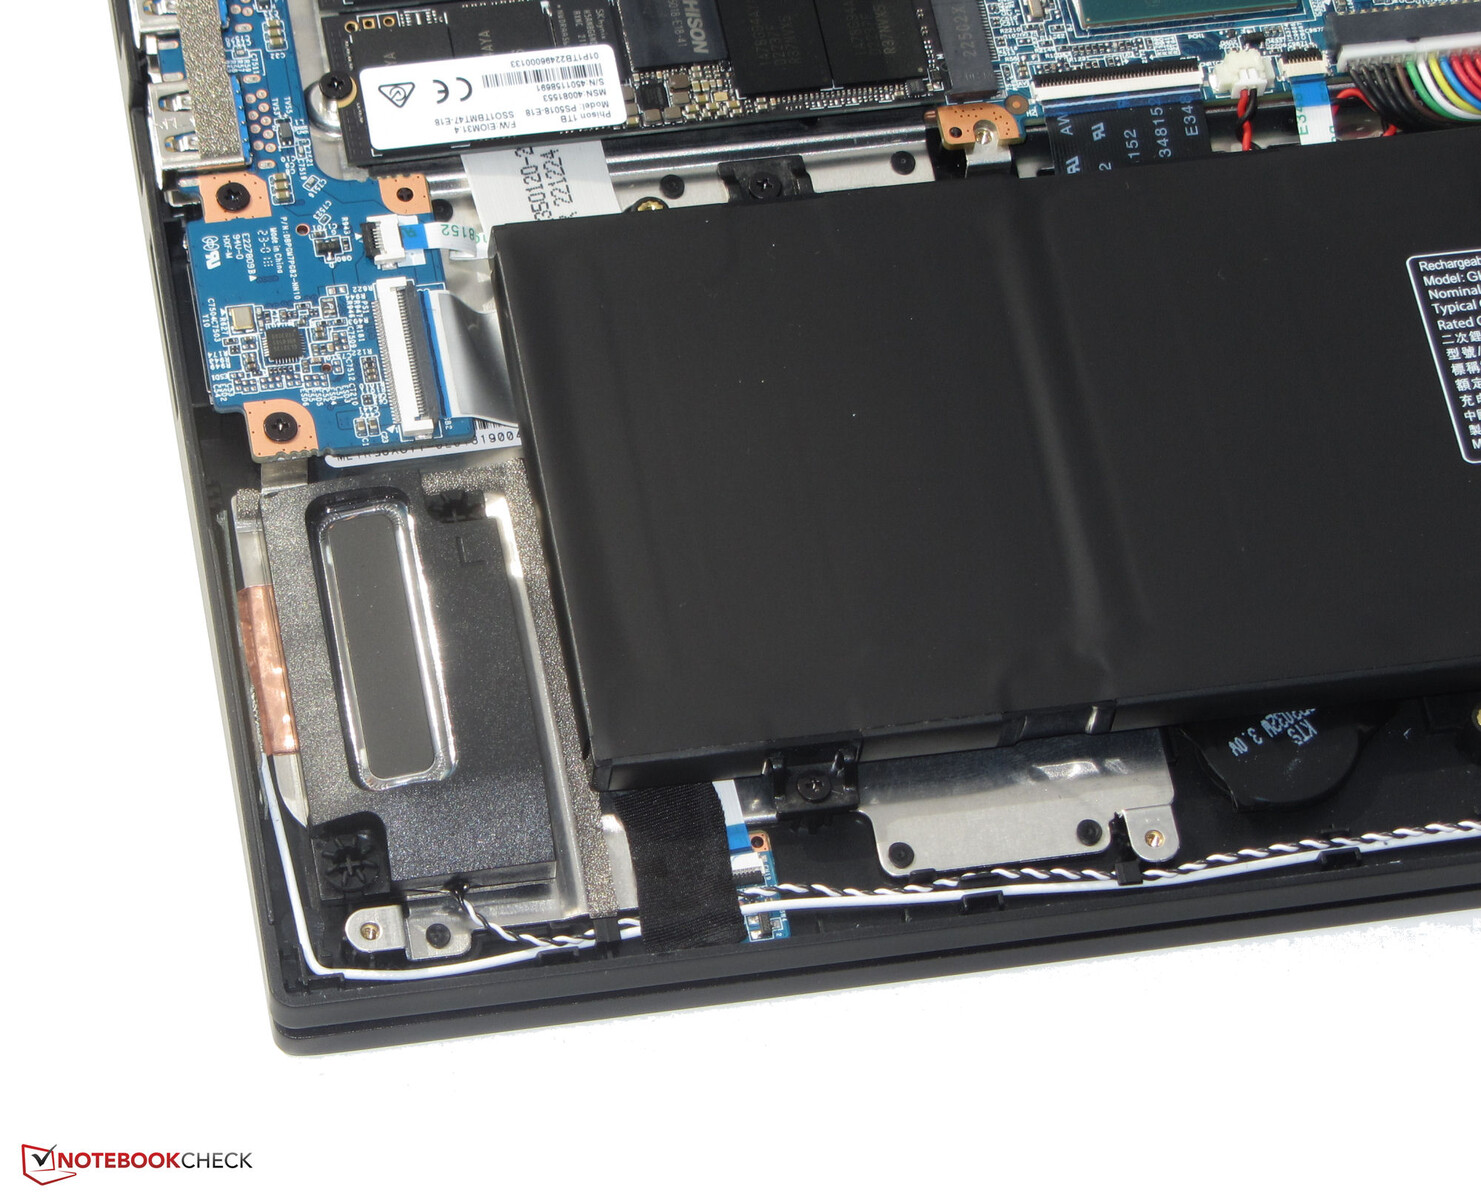
The 16 incher reveals no manufacturing flaws. Gap dimensions are even and there are no material protrusions. The base unit can only be twisted slightly, the lid more clearly, but the entire device is within reasonable limits. The battery (screwed, not glued) and other internal components are accessible after removing the bottom shell. The hinges keep the lid firmly in position and the maximum opening angle is about 130 degrees. One-hand opening of the lid is possible.
In the comparison field, the Medion laptop is one of the devices with the thickest build. In terms of weight, it lands in the middle field.
Equipment - Major X20 offers Thunderbolt 4
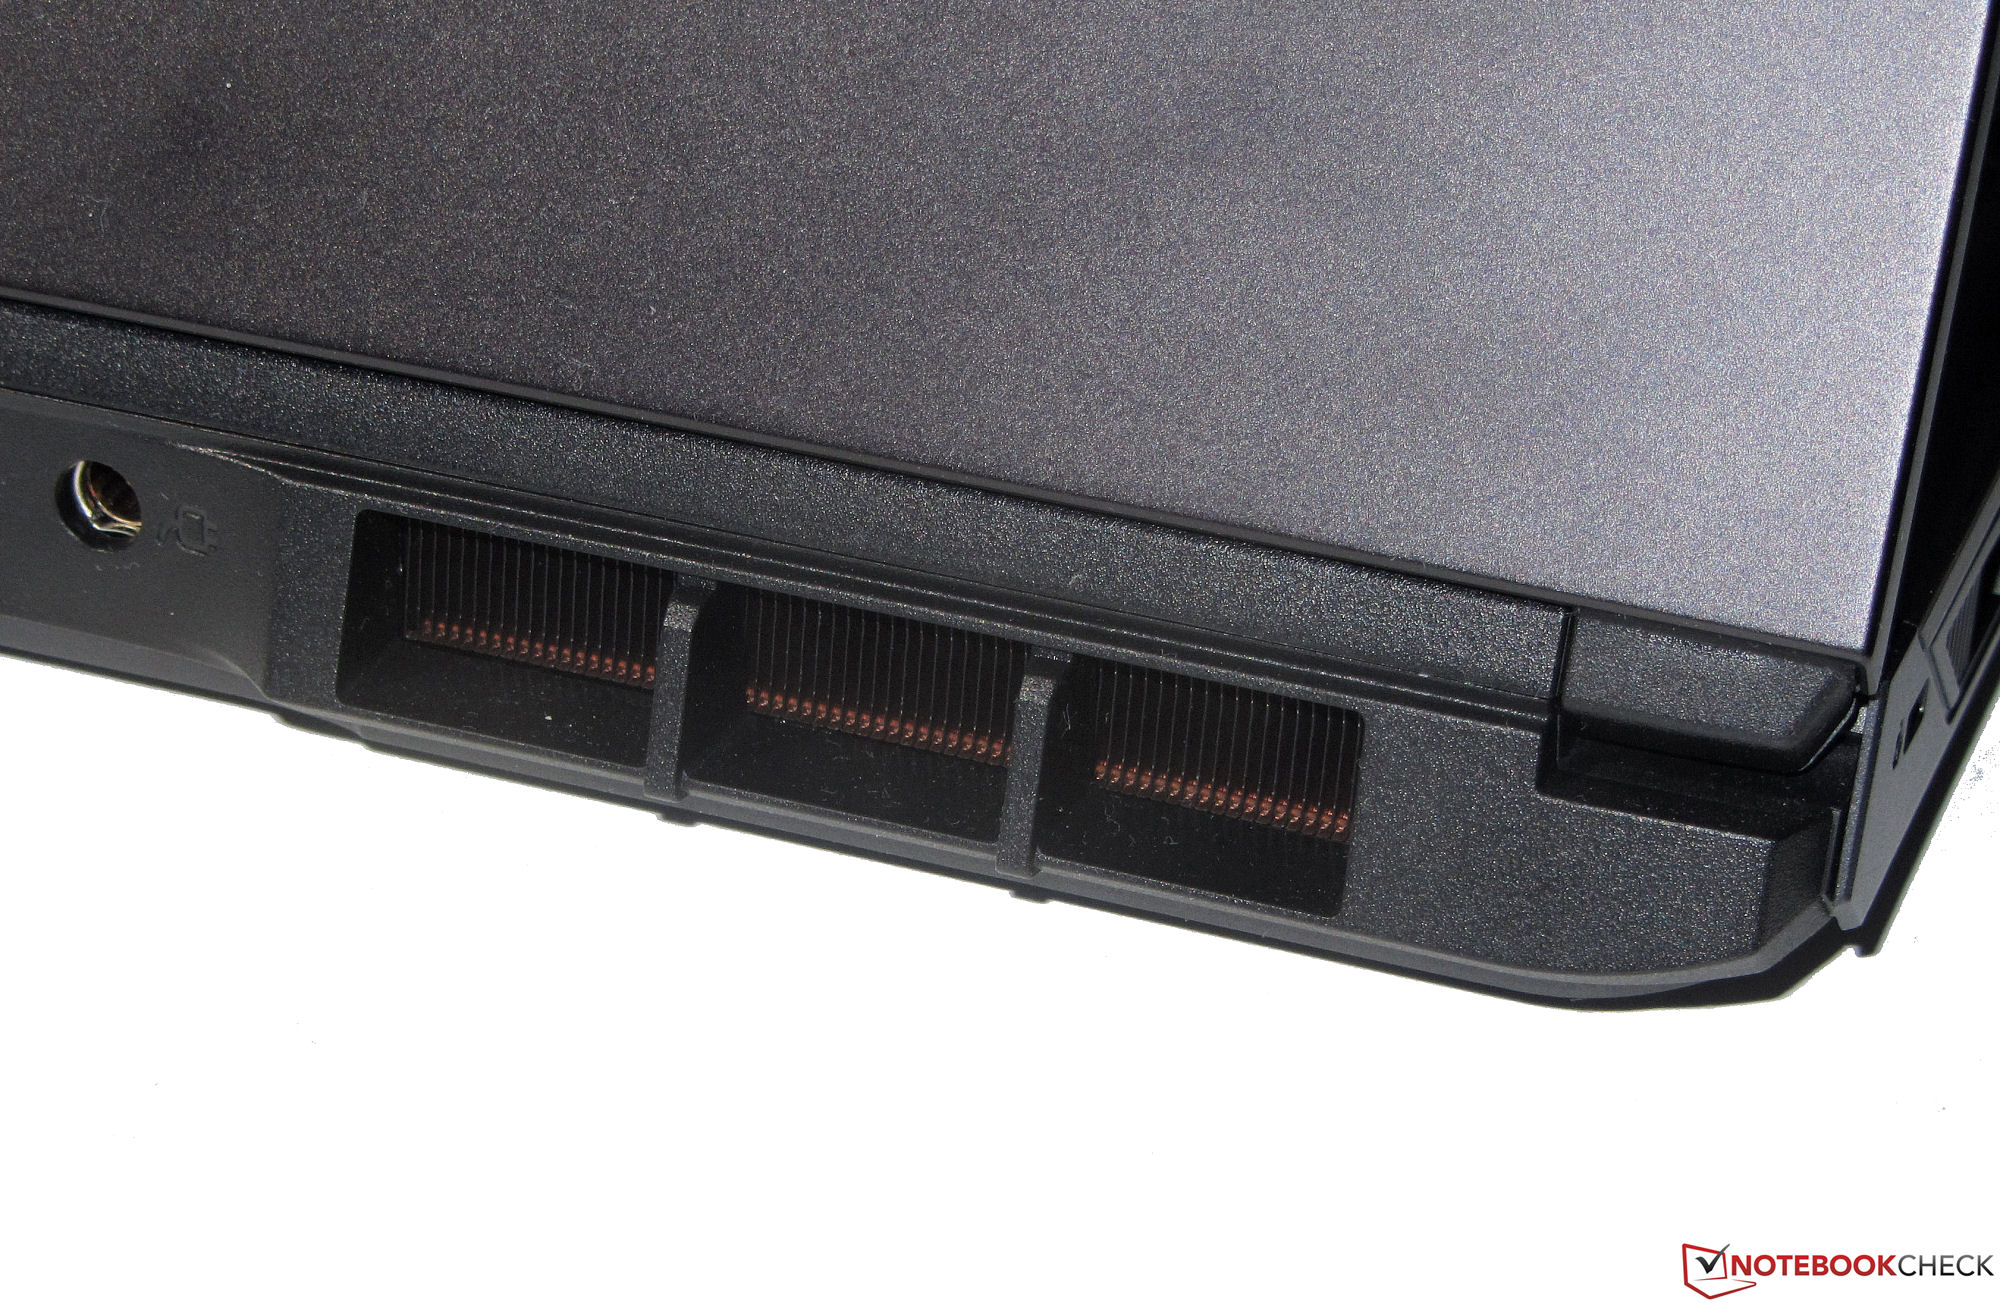
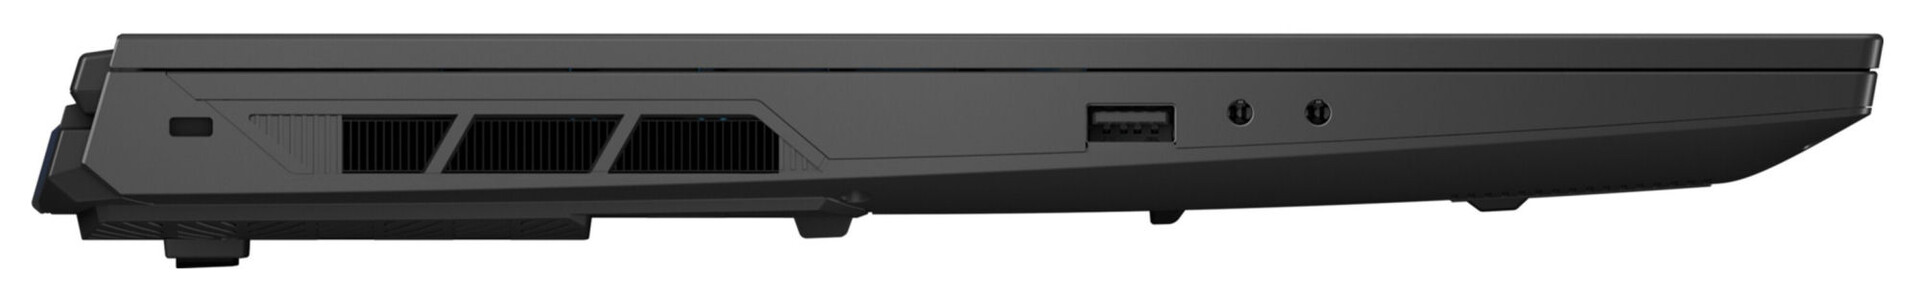
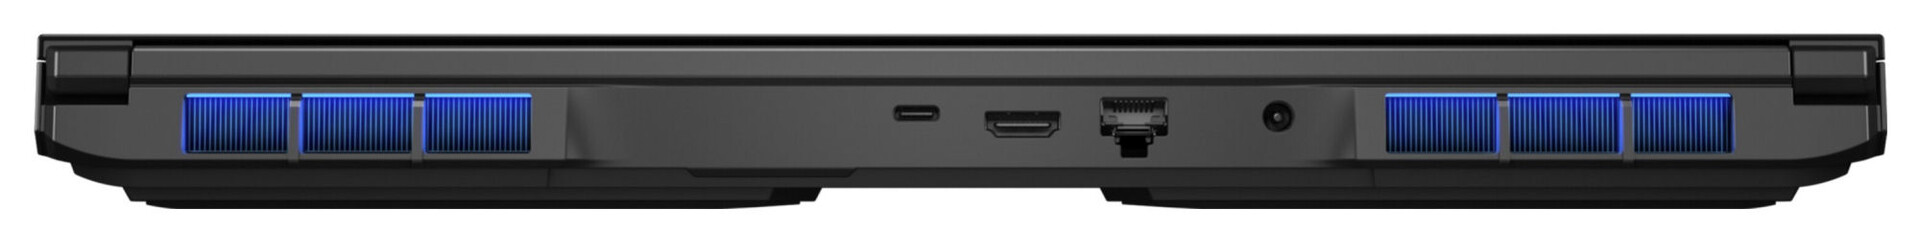
The Erazer has three USB-A ports (1x USB 3.2 Gen 1, 2x USB 3.2 Gen 2) and one USB-C port (Thunderbolt 4). The latter outputs a DisplayPort signal, but does not provide any Power Delivery support. The Major X20 also boasts a total of two video outputs (HDMI 2.1, DP). Further connections include a slot for a cable lock, two audio jacks and a Gigabit Ethernet port (2.5 Gbps).
Video outputs, the power slot and the network port are located on the back of the device. The corresponding cables thus run from the back and do not get in the way.
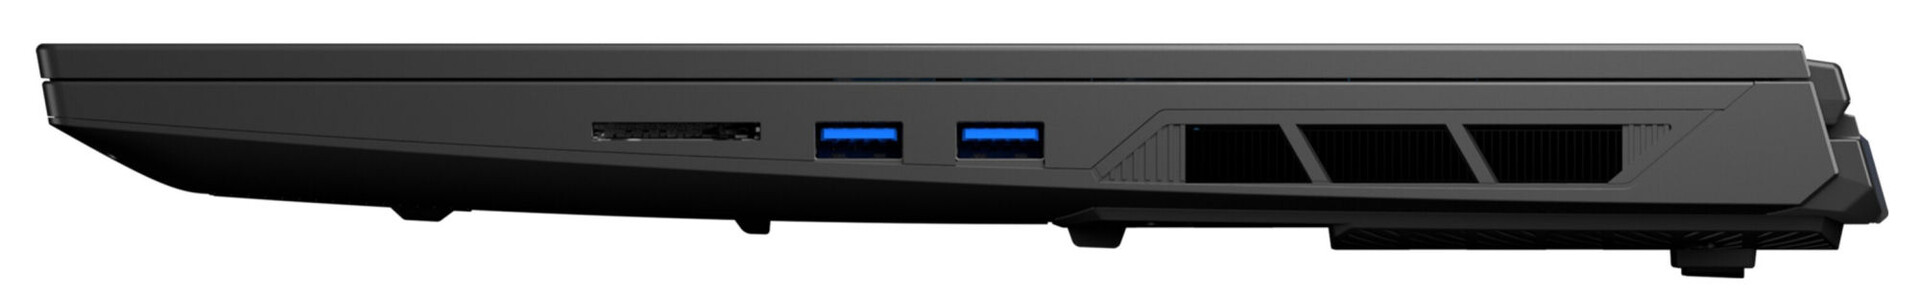
SD Card Reader
The microSD memory card reader (reference card: AV PRO microSD 128 GB V60) is among the medium-fast models with maximum transfer rates of 78 MB/s (transfer of 250 jpg image files with around 5 MB each) and 88 MB/s (copying of large data blocks).
| SD Card Reader | |
| average JPG Copy Test (av. of 3 runs) | |
| Average of class Gaming (20.9 - 210, n=54, last 2 years) | |
| Razer Blade 15 OLED (Early 2022) (AV Pro SD microSD 128 GB V60) | |
| Medion Erazer Major X20 (AV PRO microSD 128 GB V60) | |
| maximum AS SSD Seq Read Test (1GB) | |
| Average of class Gaming (25.5 - 261, n=51, last 2 years) | |
| Medion Erazer Major X20 (AV PRO microSD 128 GB V60) | |
| Razer Blade 15 OLED (Early 2022) (AV Pro SD microSD 128 GB V60) | |
Communication
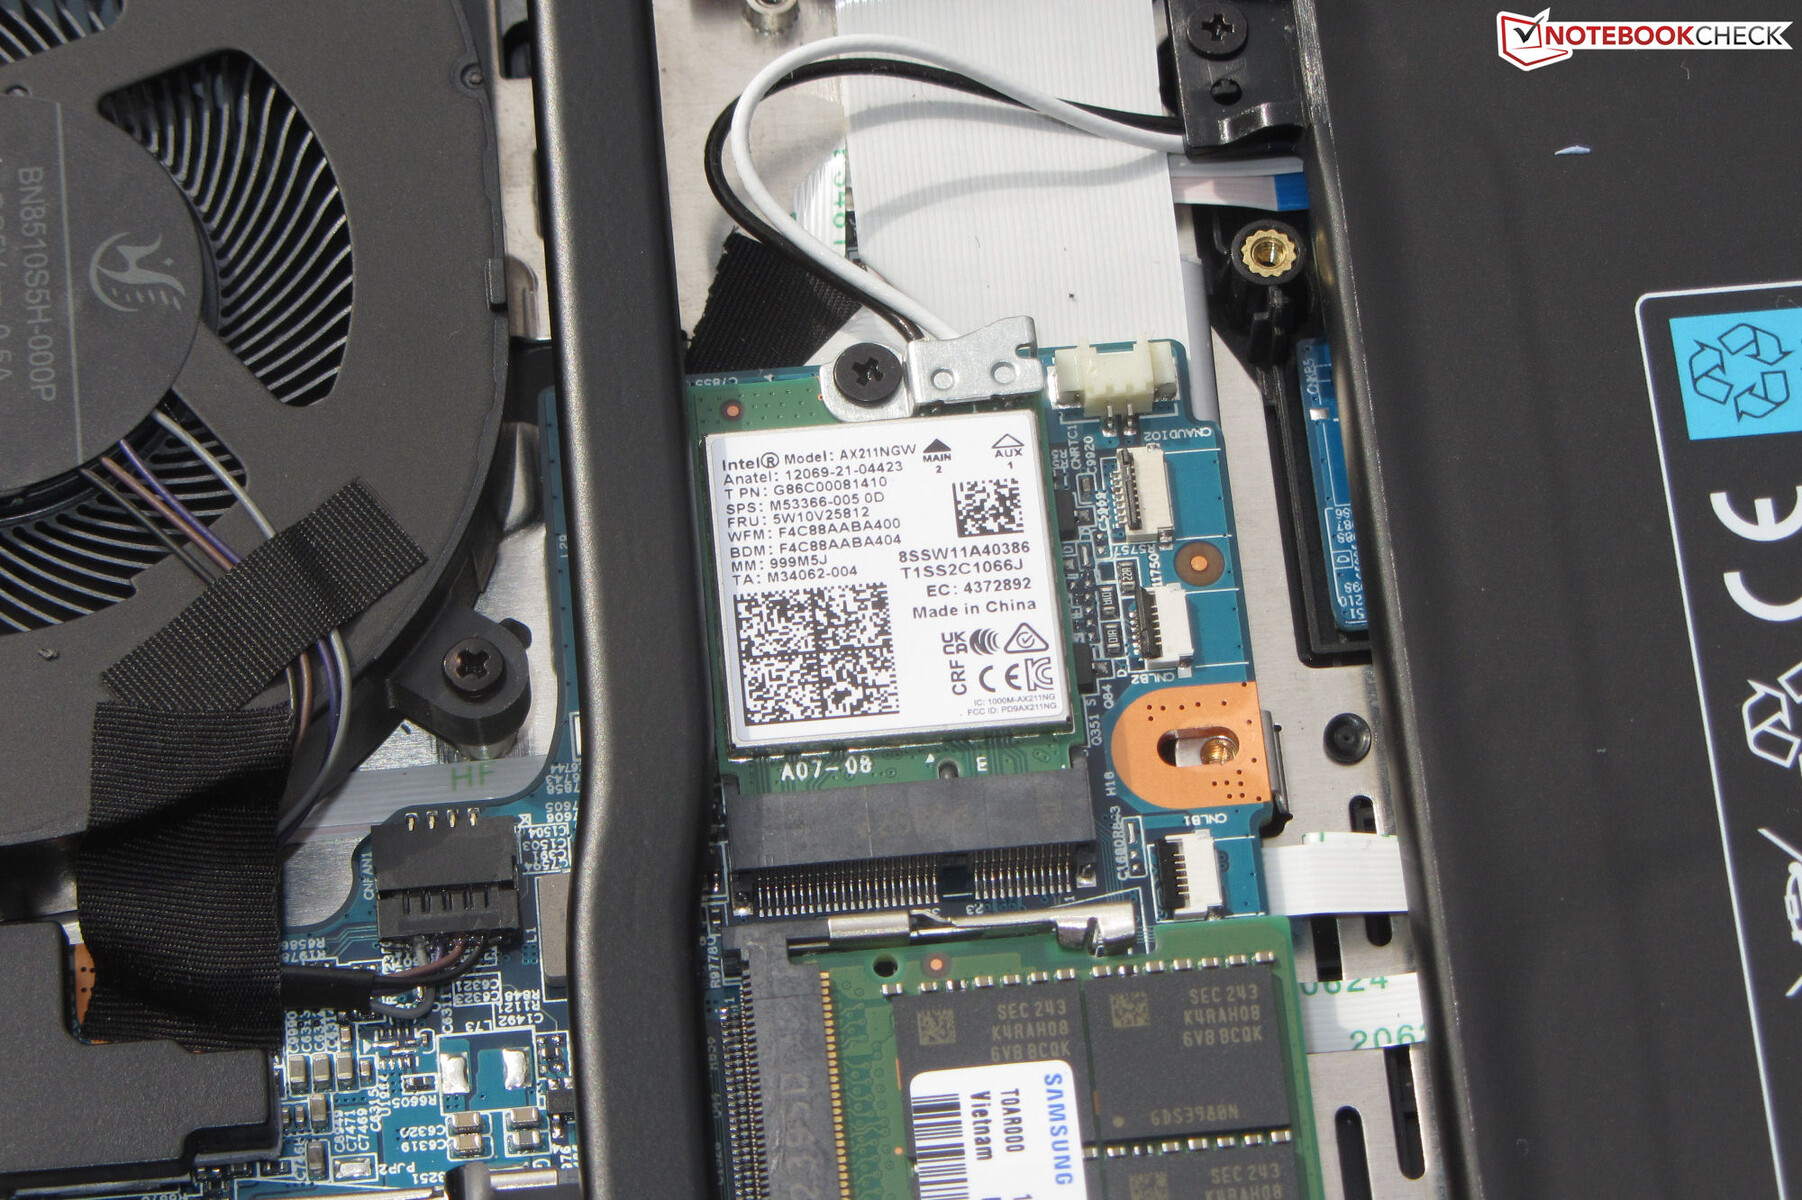
WiFi data rates are excellent under optimal conditions (no WLAN devices in the immediate vicinity, small distance between laptop and server PC). The X20 has a WiFi 6E chip (Intel AX211) on board. Wired connections are handled by a chip (RTL8125; 2.5 GBit/s) from Realtek.
Webcam
The webcam (2.1 MP, max. 1,920 x 1,080) delivers standard quality. Color accuracy is lacking: at a color deviation of about 11, the target (DeltaE less than 3) is missed. No mechanical shutter is on board.


Accessories
Apart from the usual documents (quick start guide and warranty information), no other accessories are included with the notebook.
Maintenance
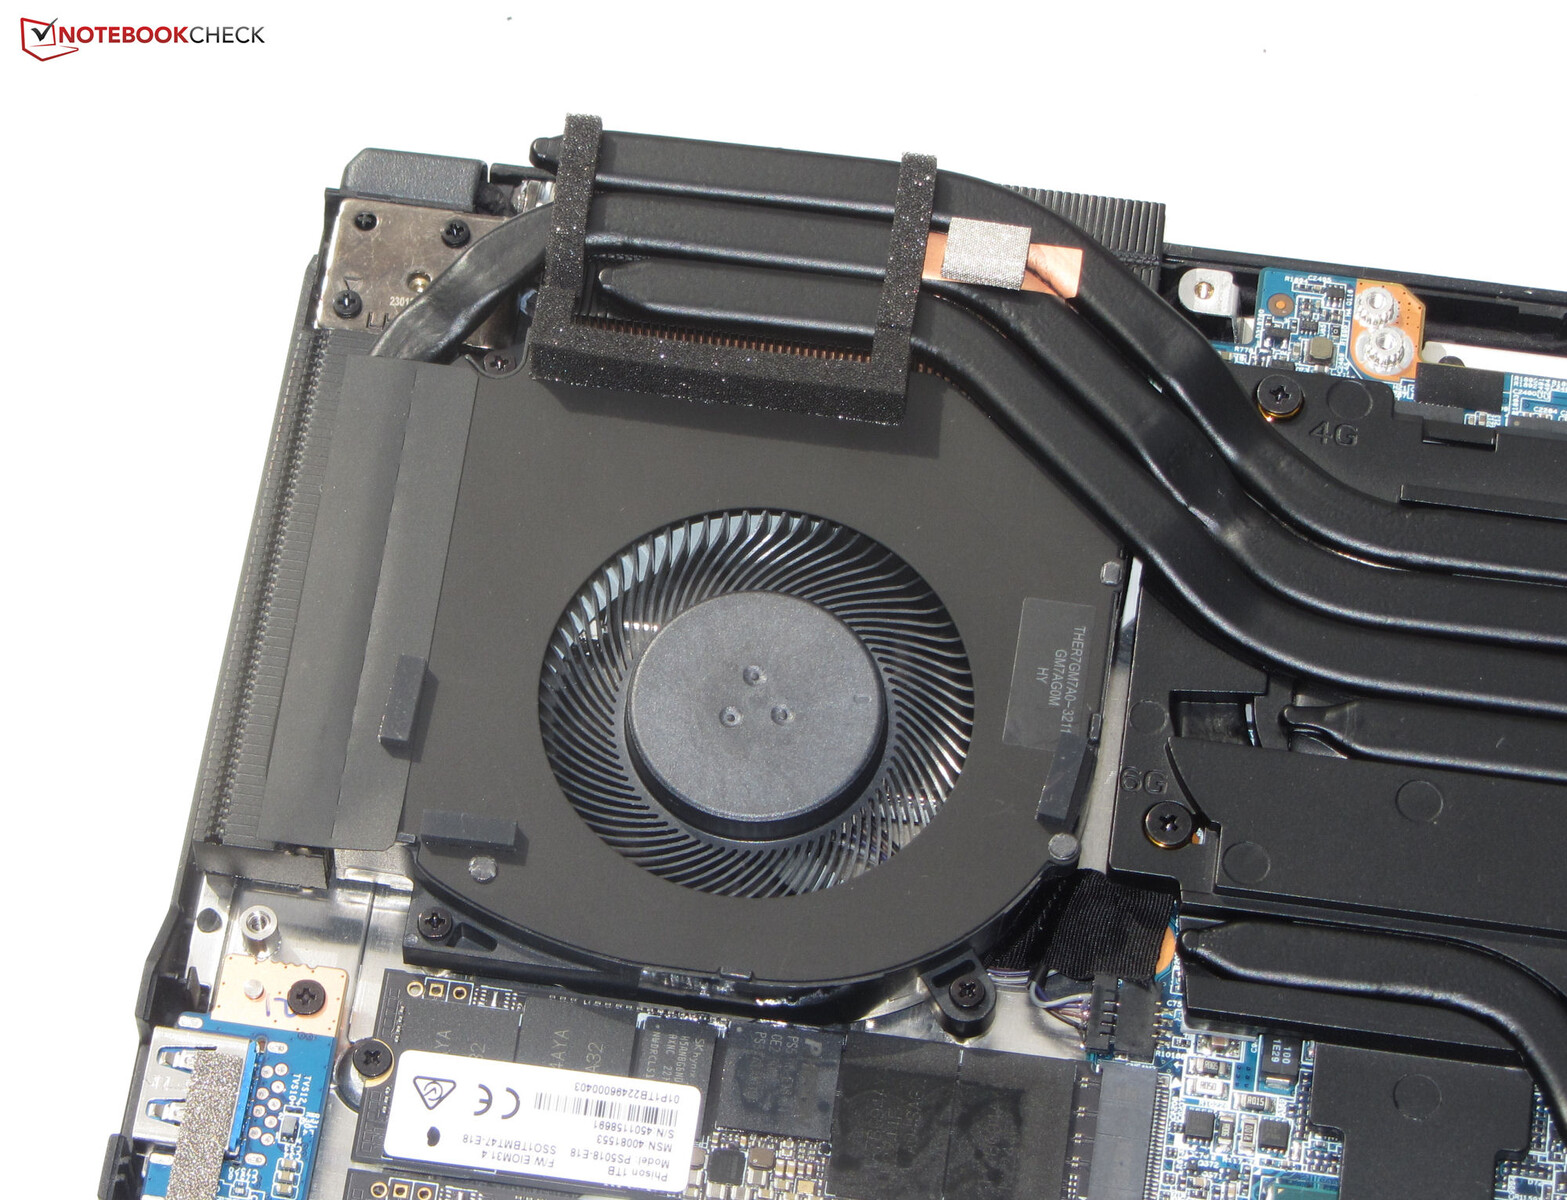
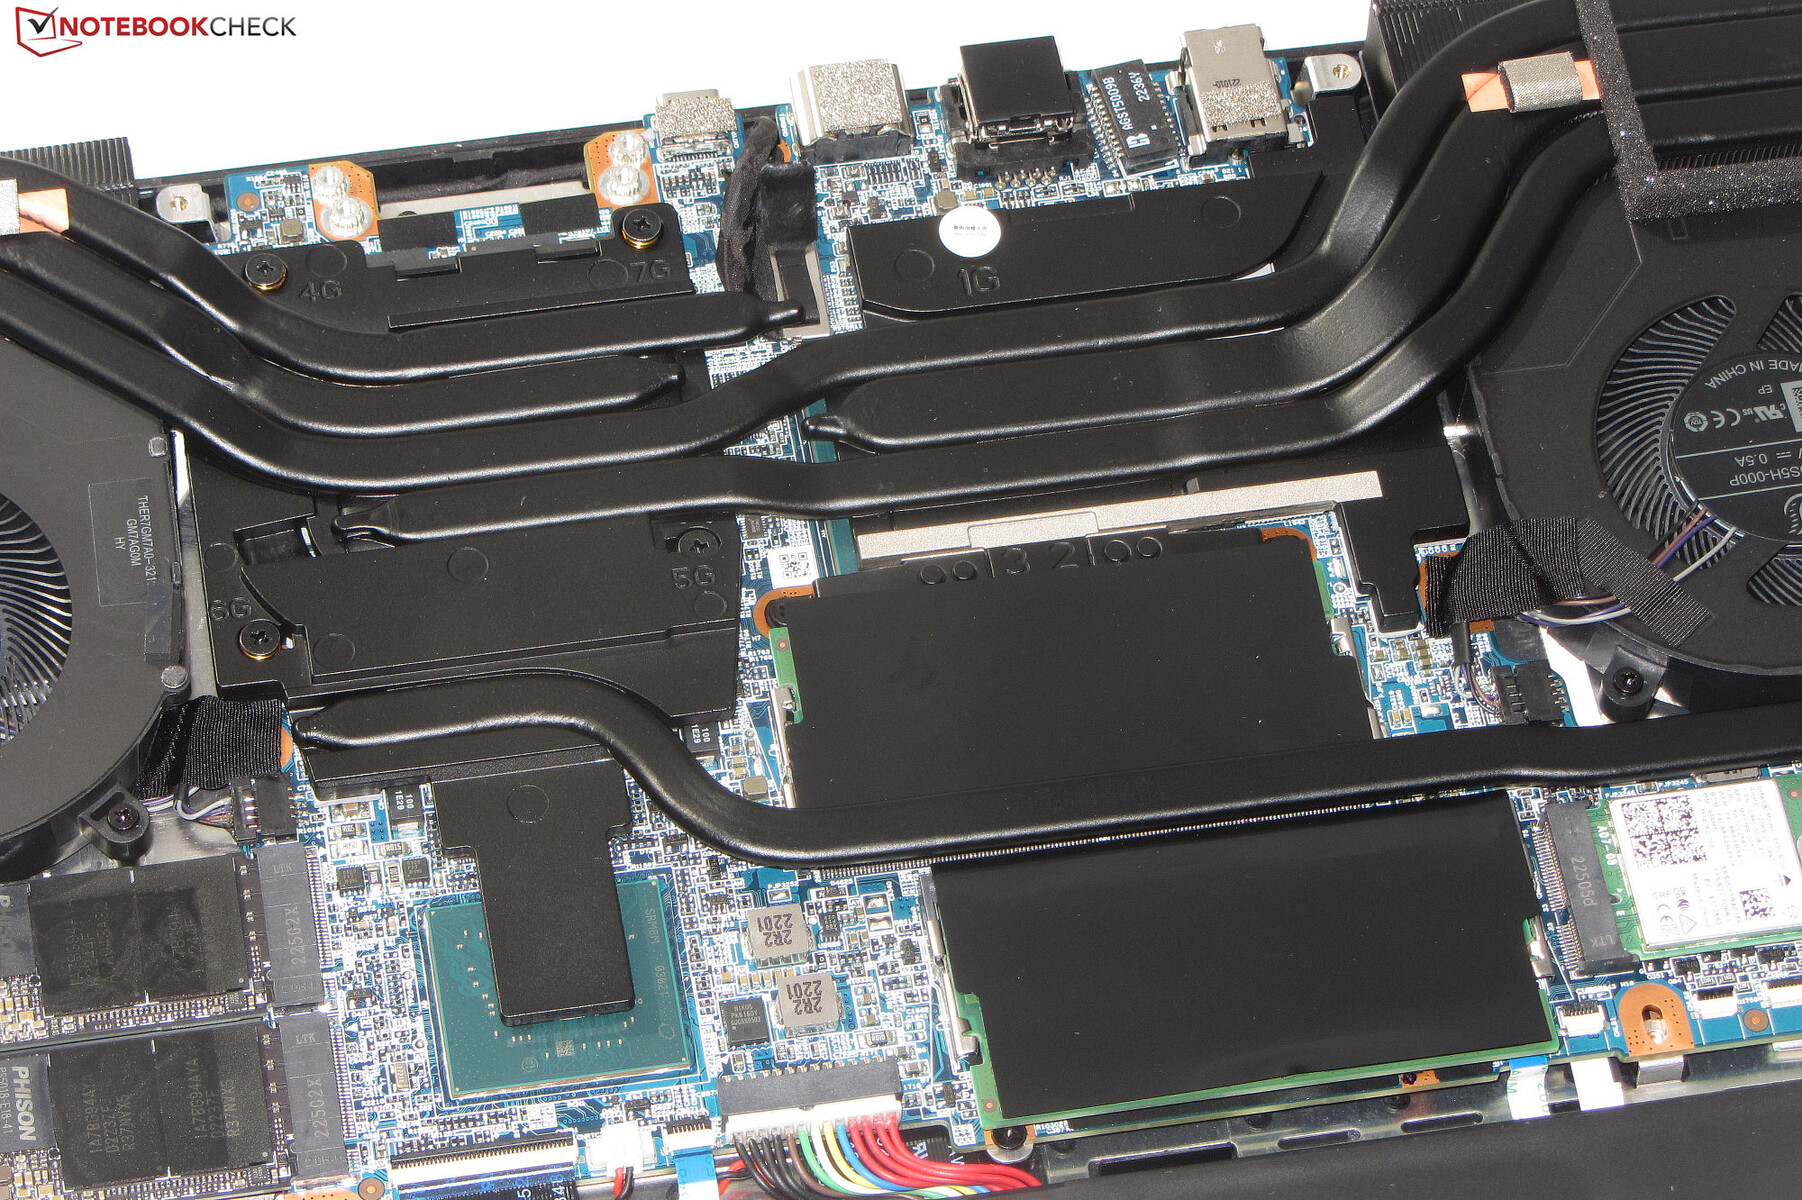
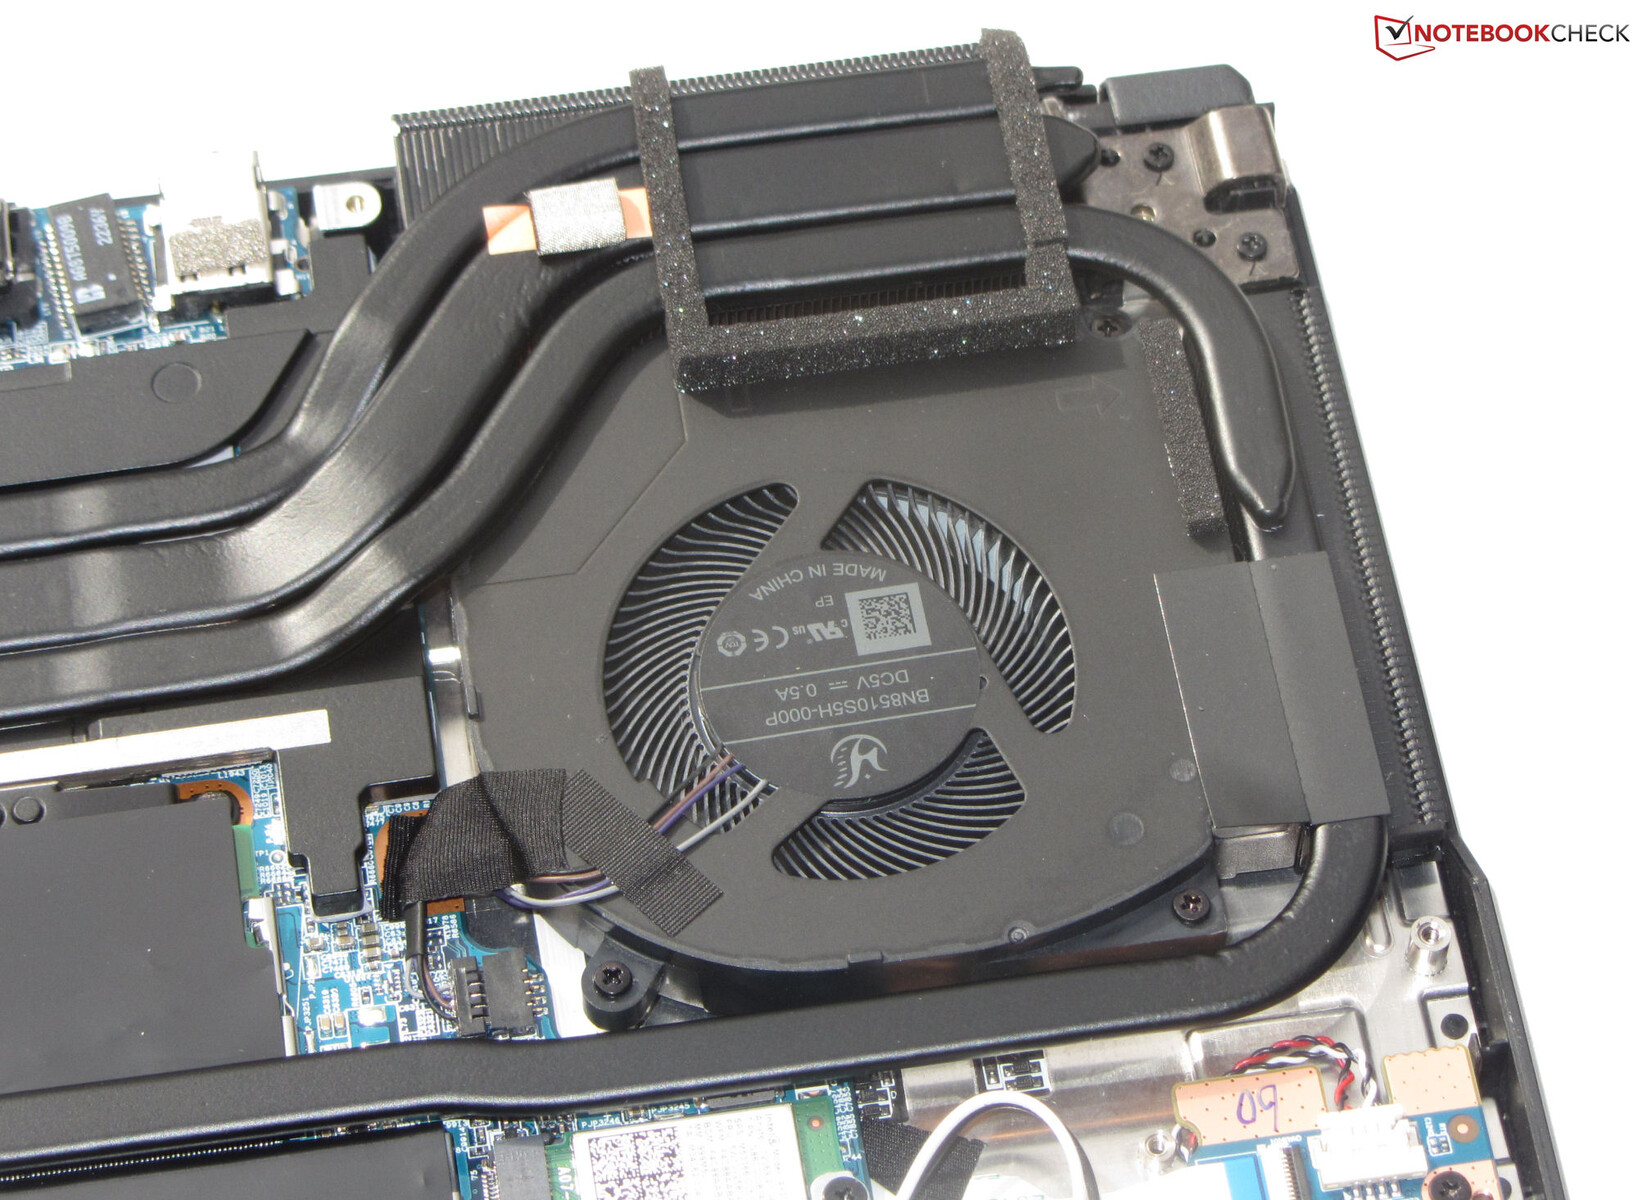
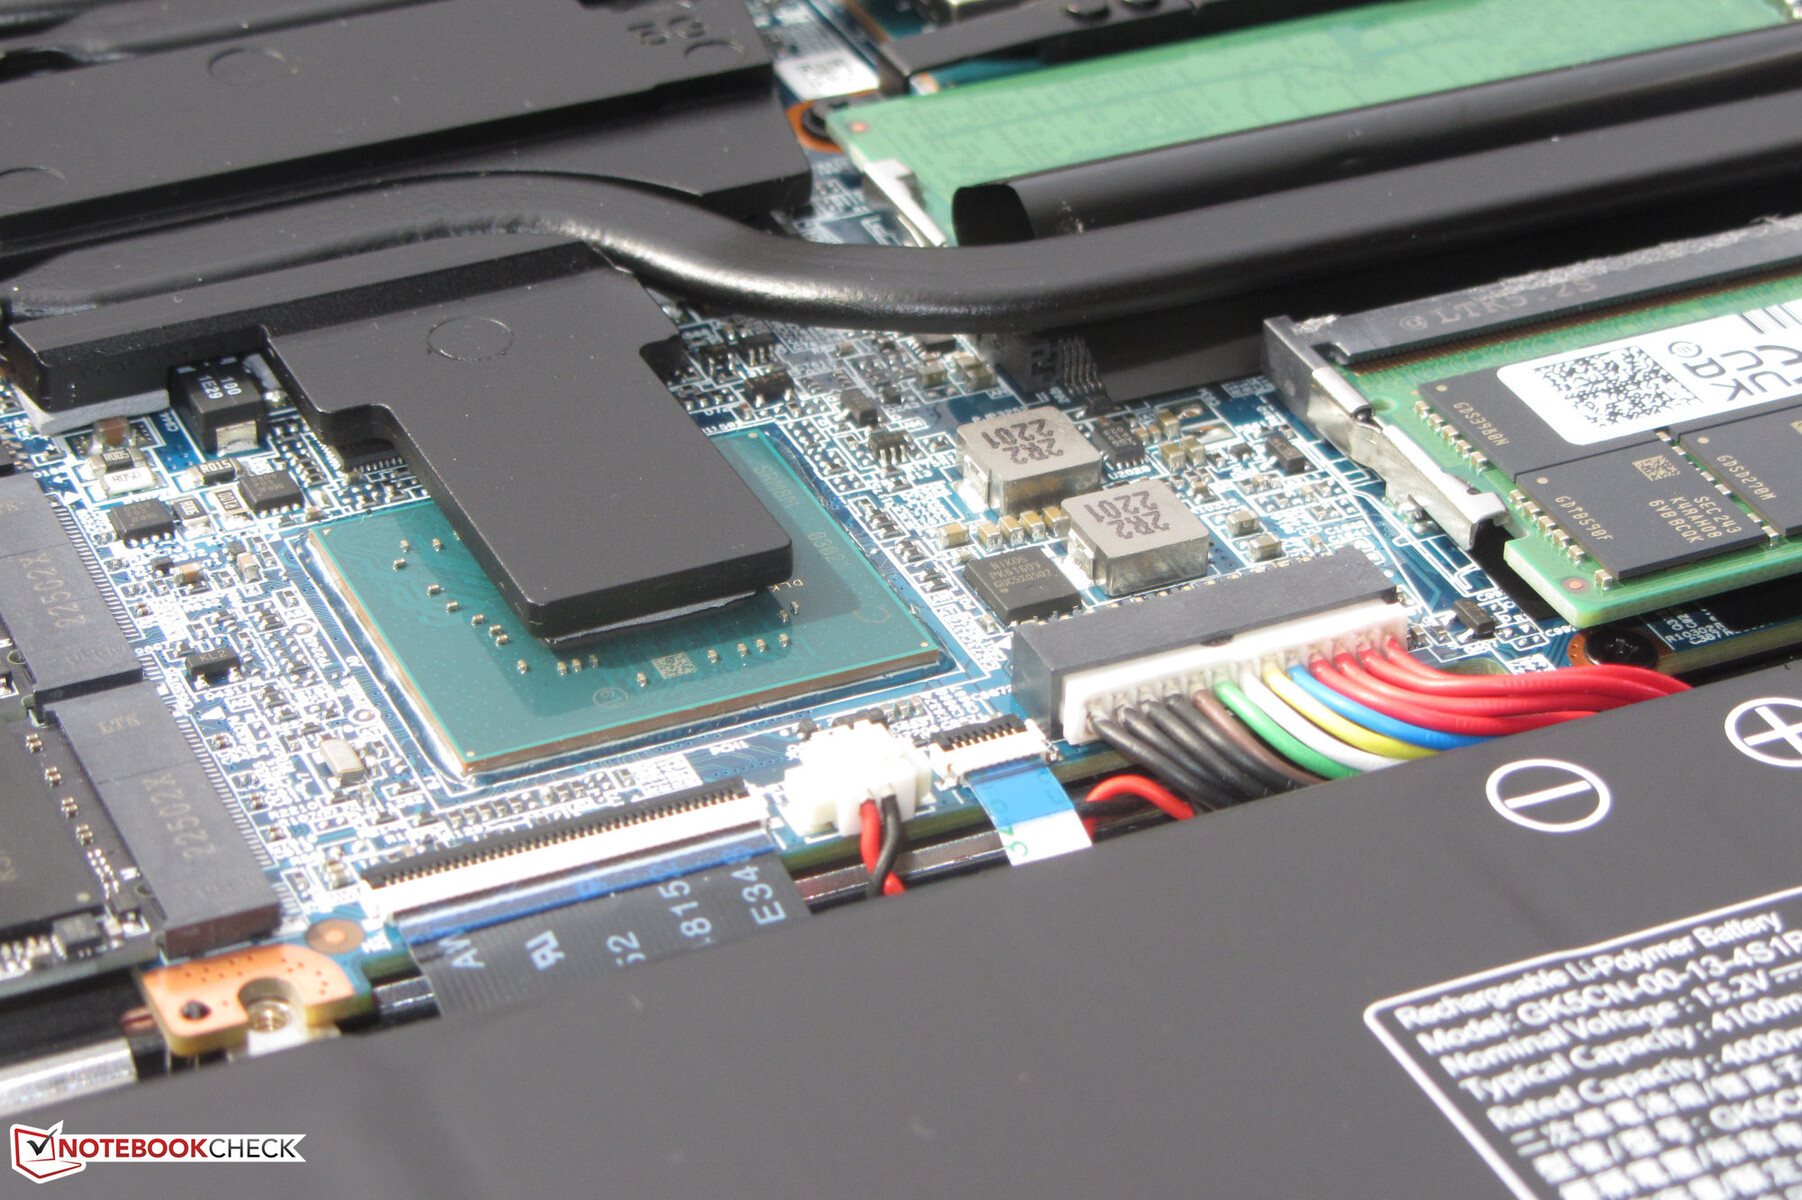
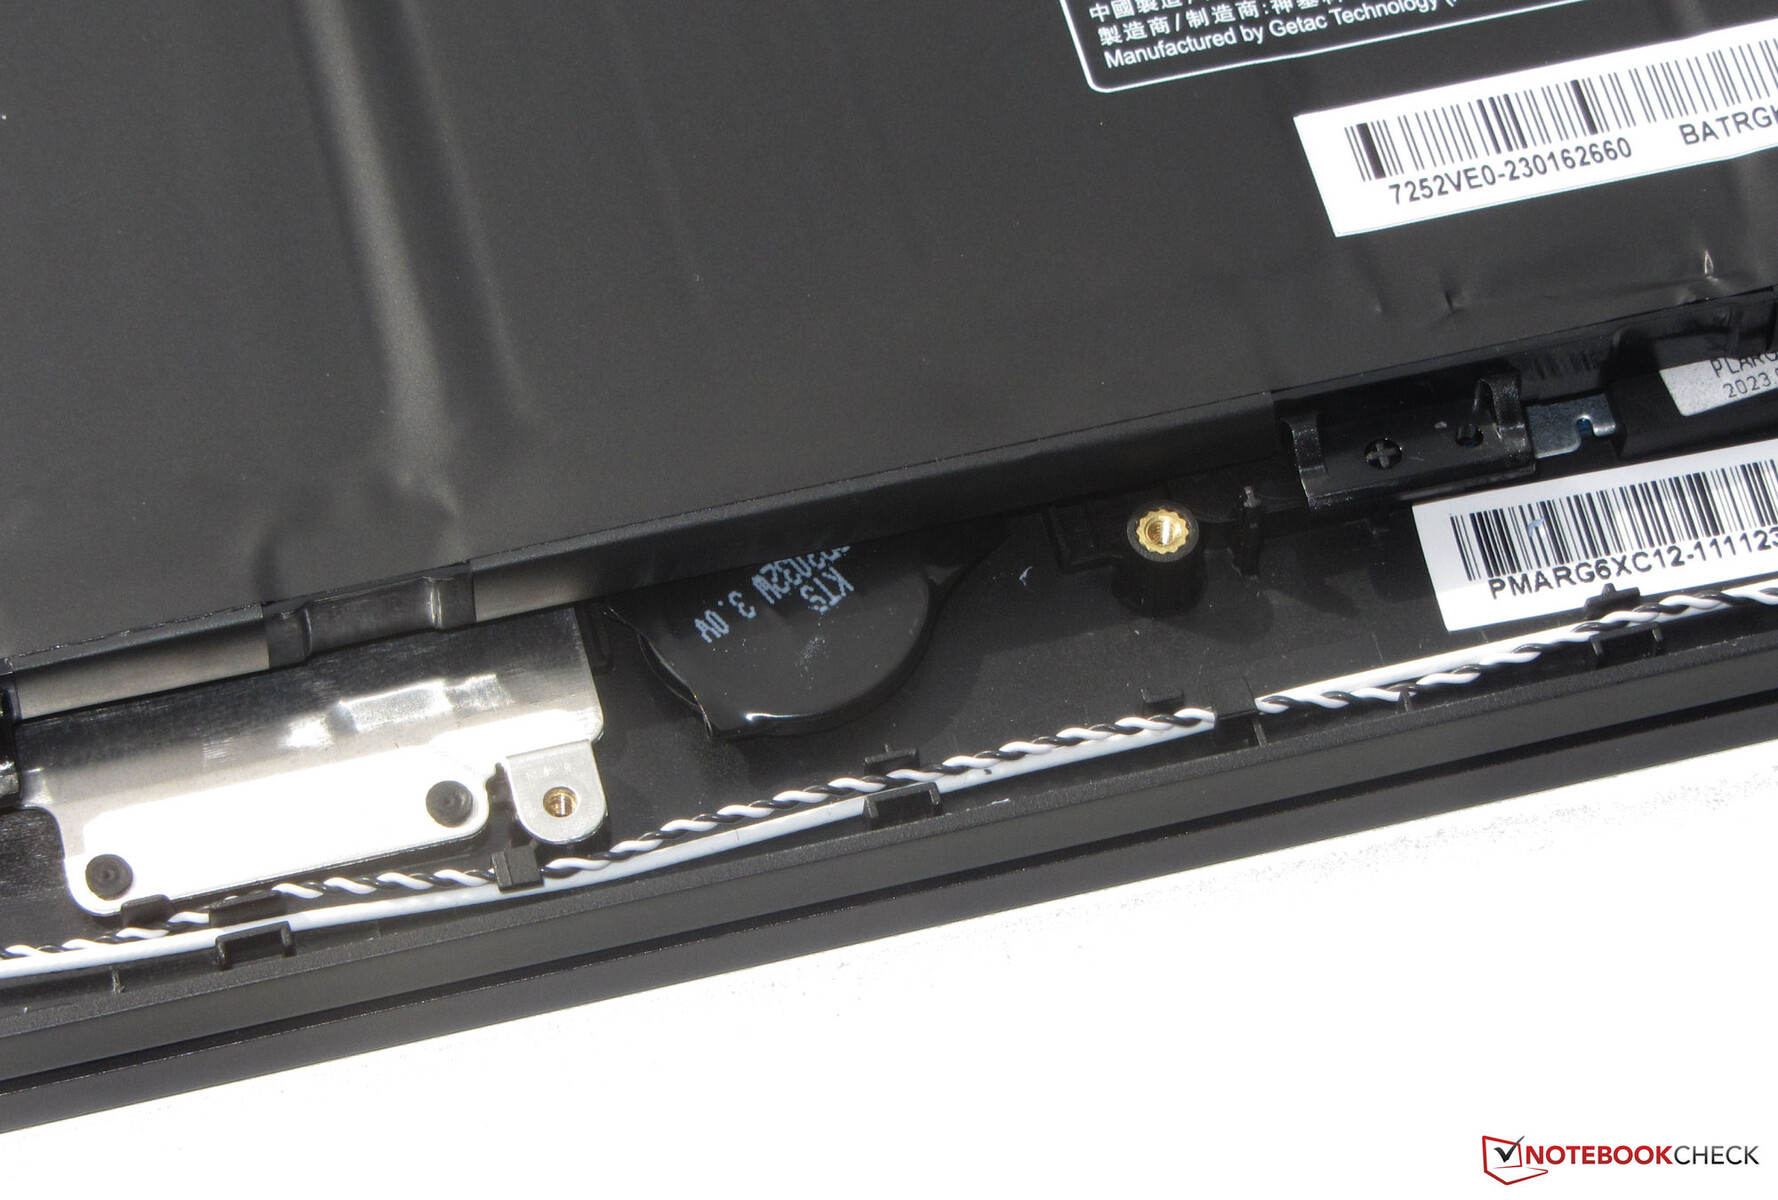
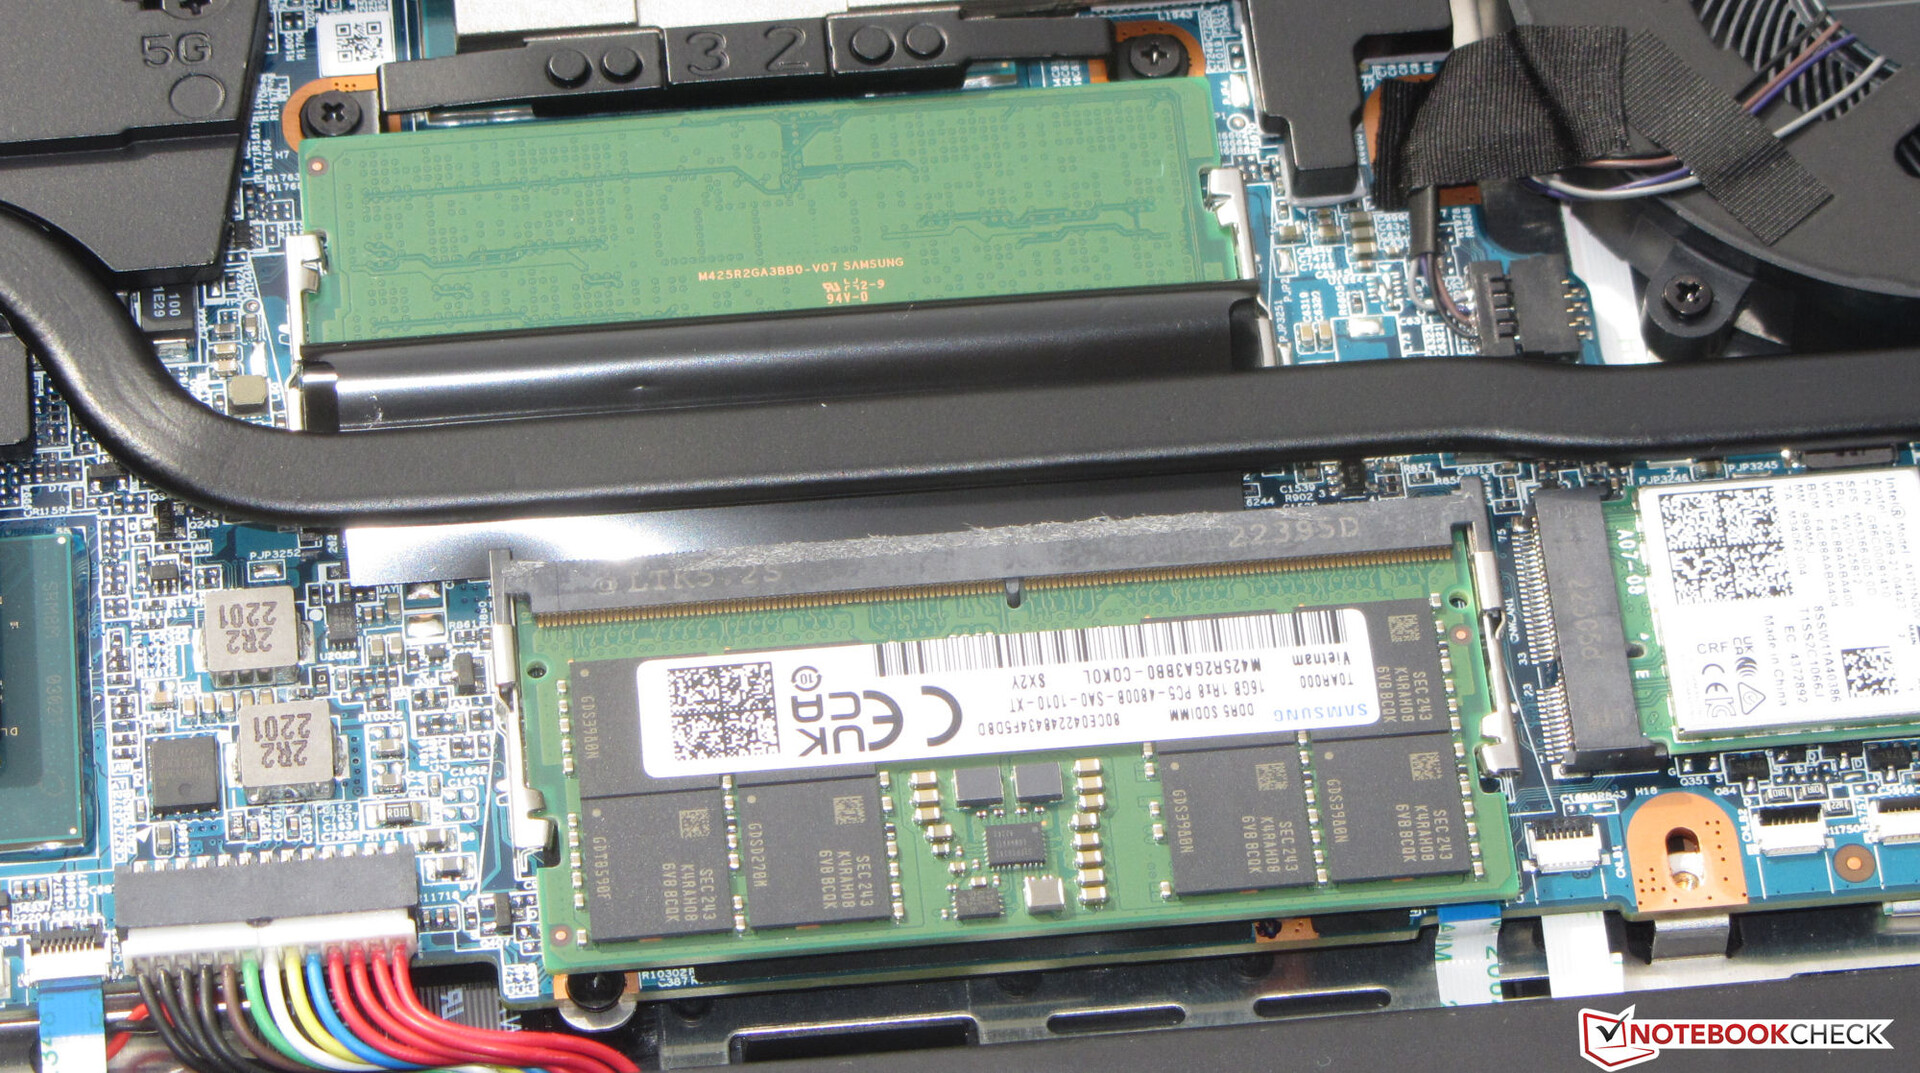
After removing all screws on the underside of the device, the bottom shell can be detached using a flat spatula or a joint smoother. You then have access to the two RAM slots (both occupied), the two SSDs (PCIe 4, M.2-2280), the WLAN module, the fans, the BIOS battery and the laptop battery.
Warranty
Medion provides a two-year warranty on the Erazer in Germany. This may differ in other countries, so buyers should double check before purchasing.
Warranty extensions are available but have to be purchased together with the notebook in Medion's online store. A subsequent purchase is not possible.
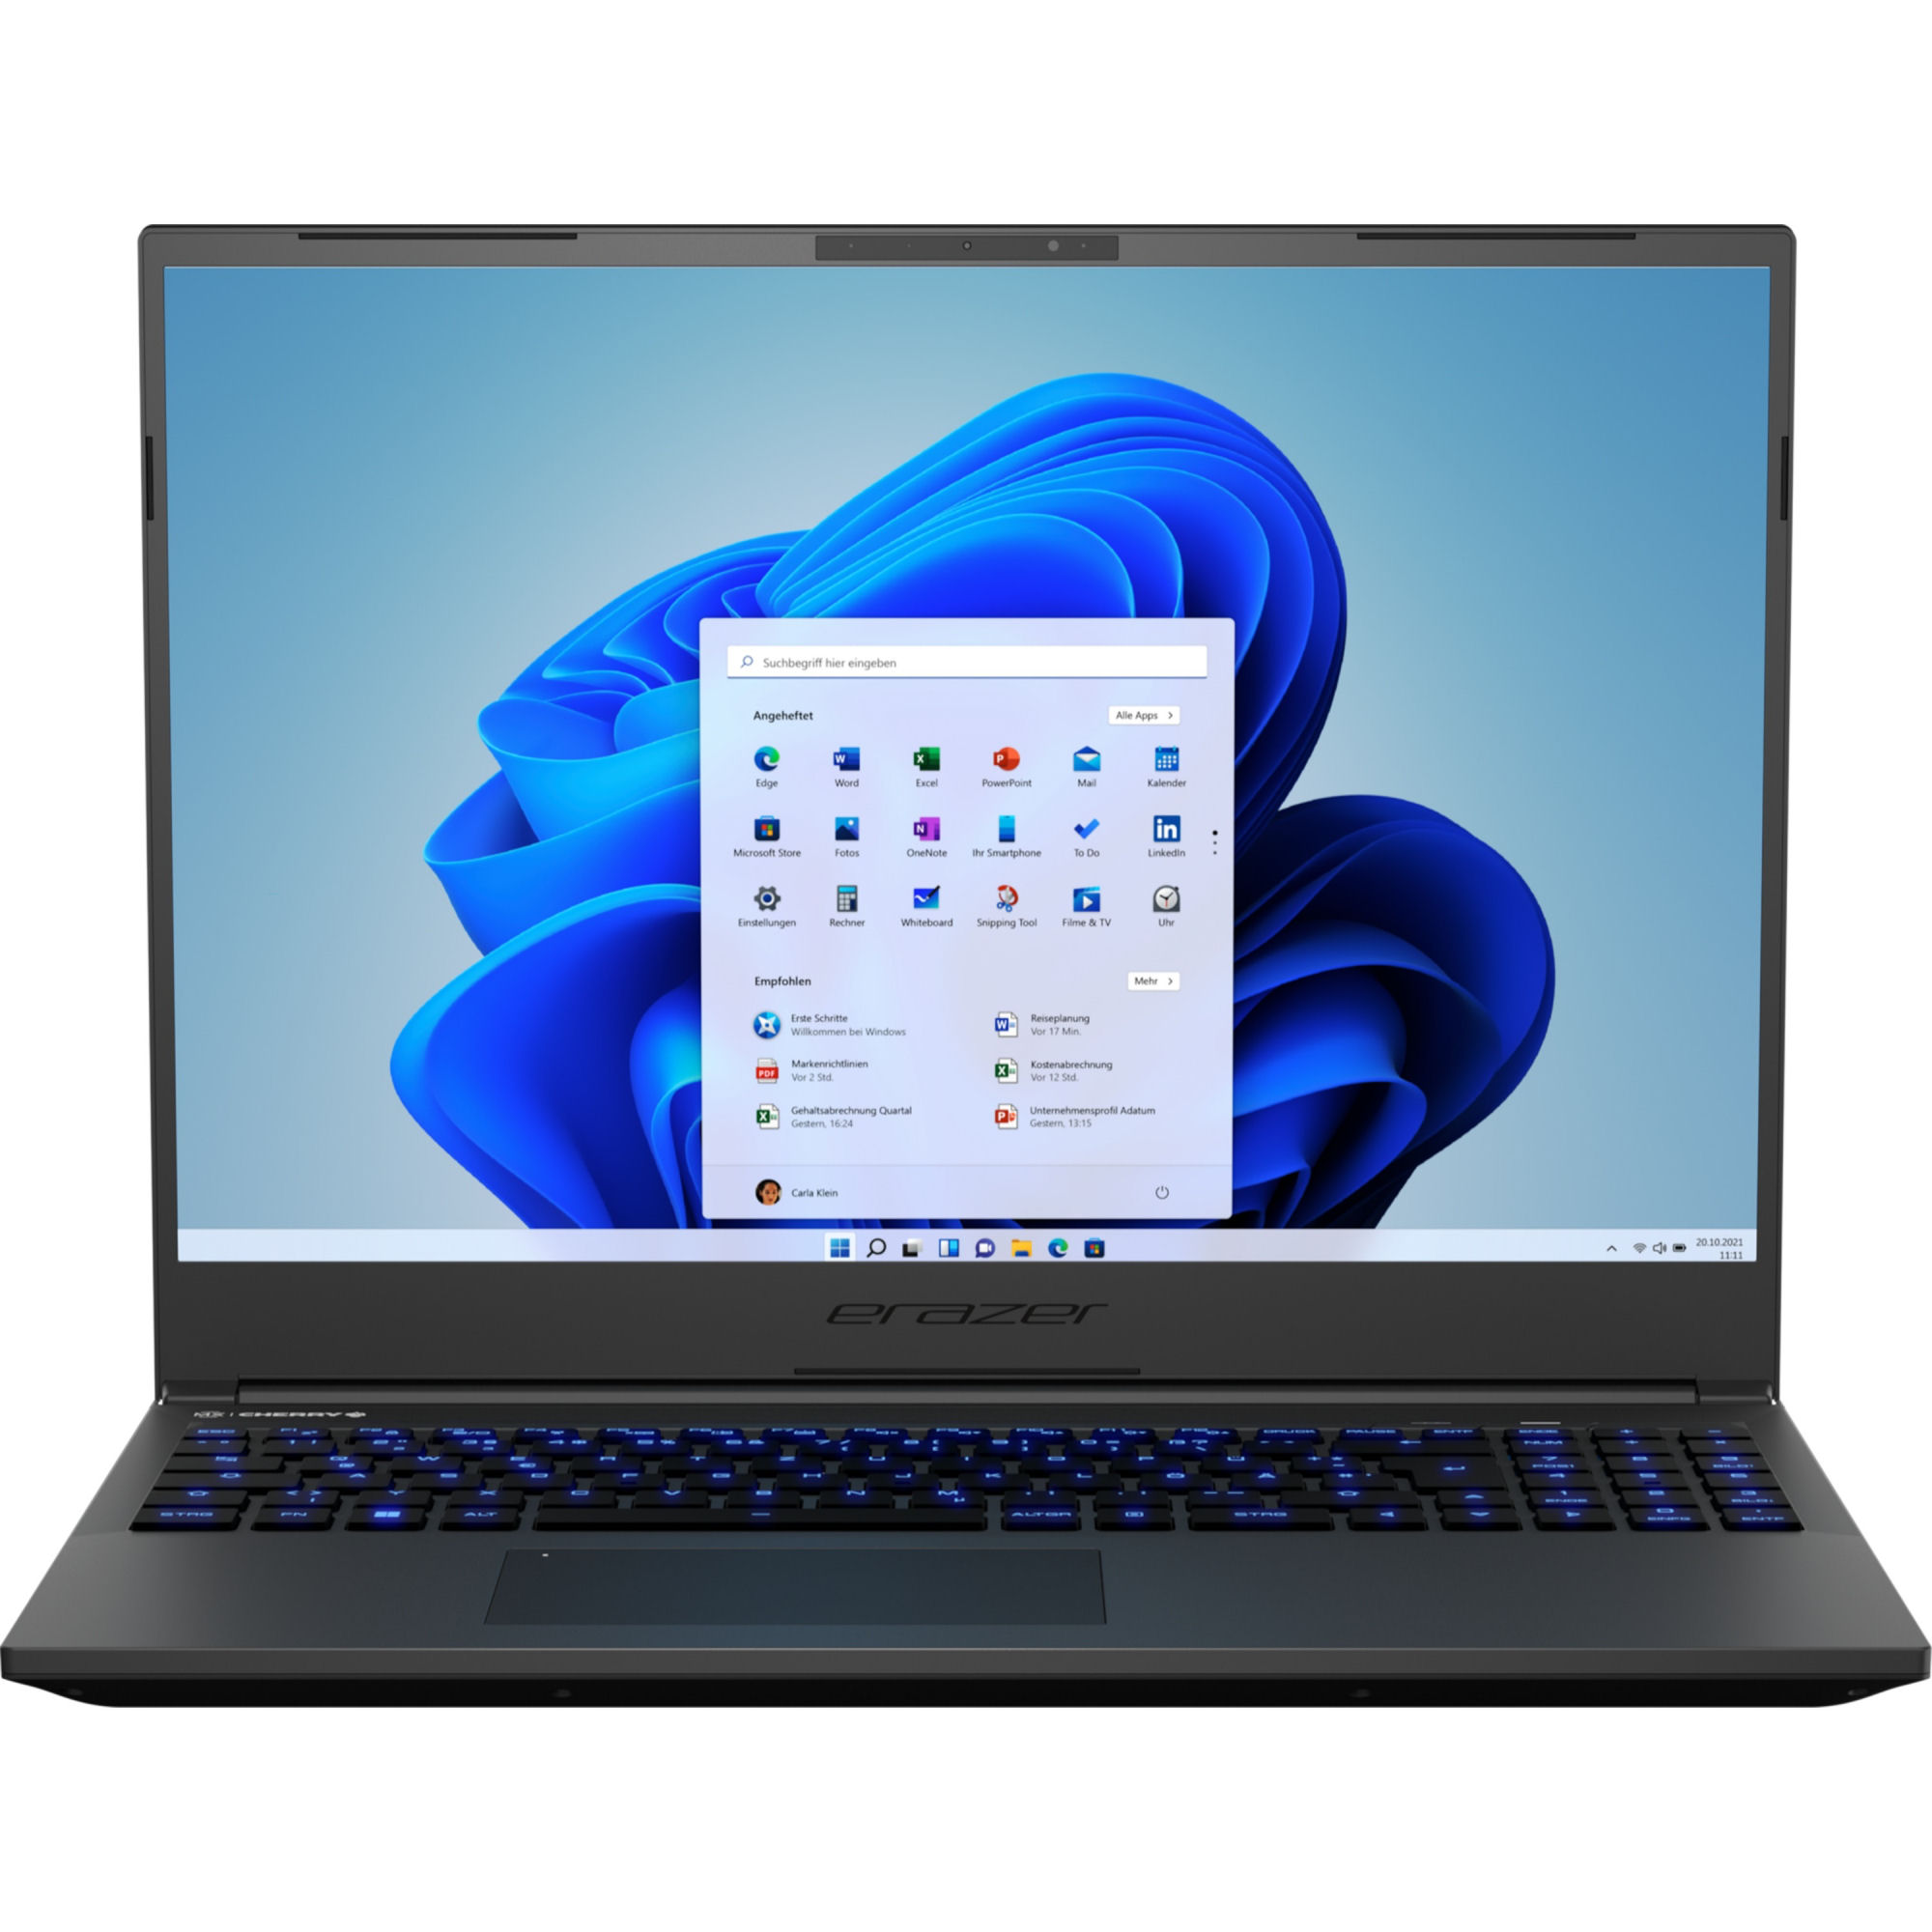
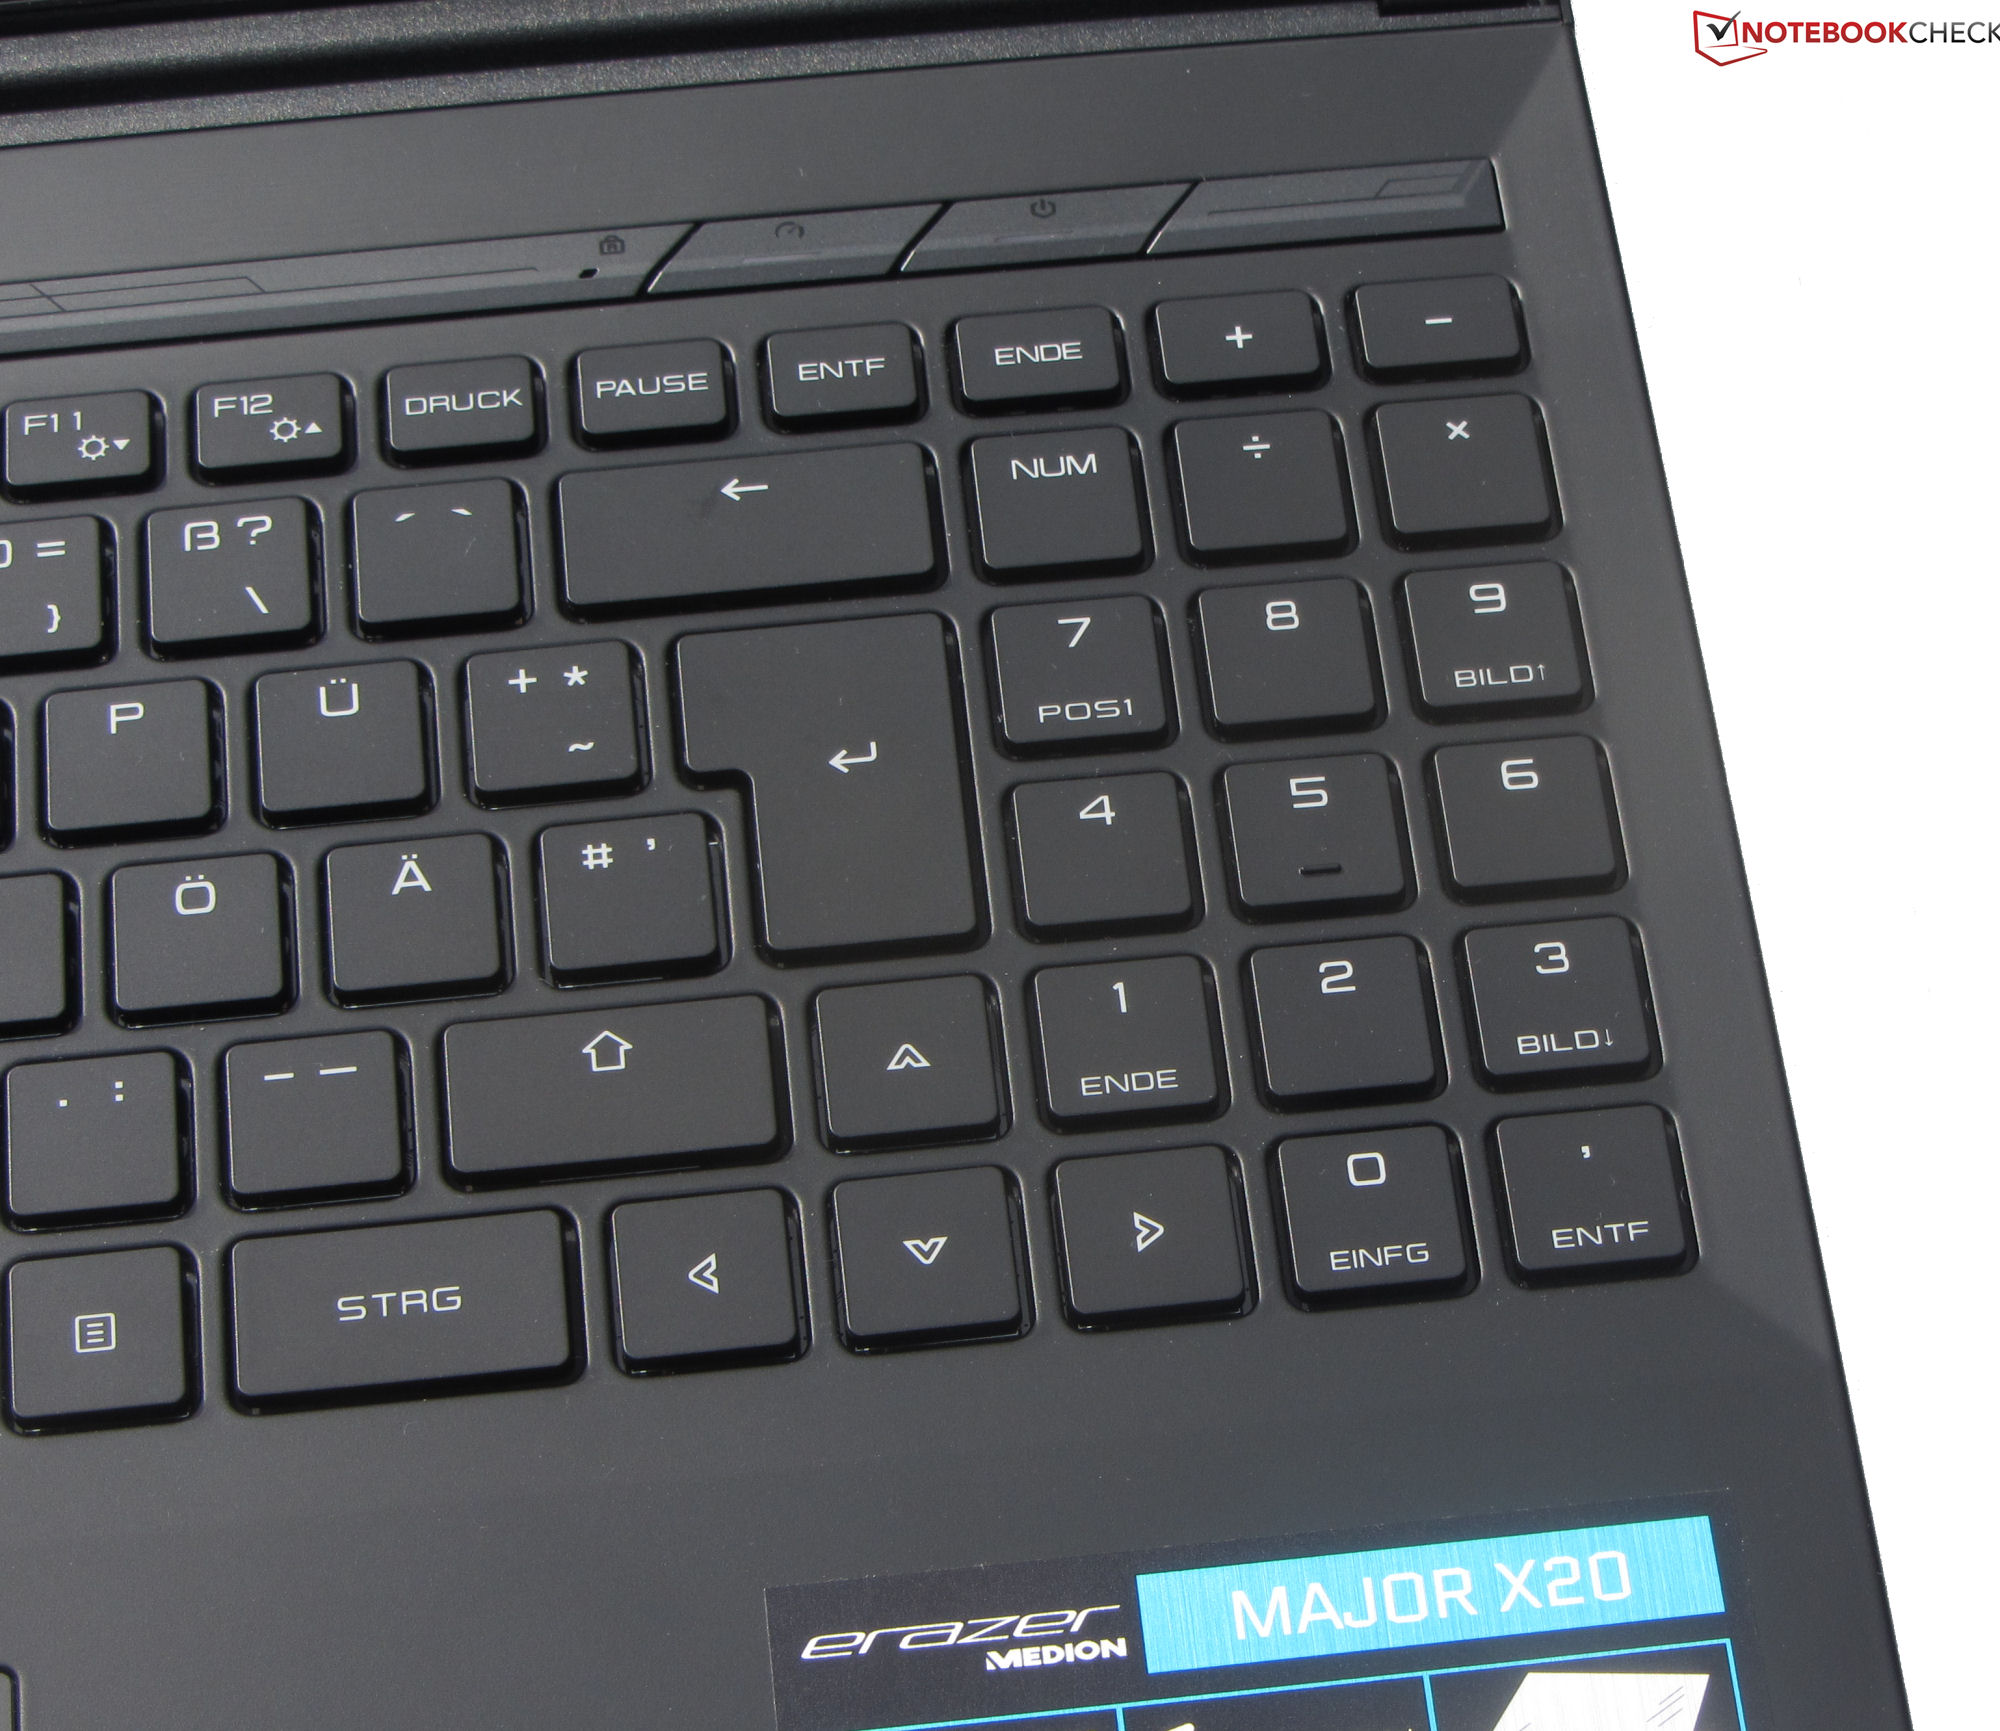
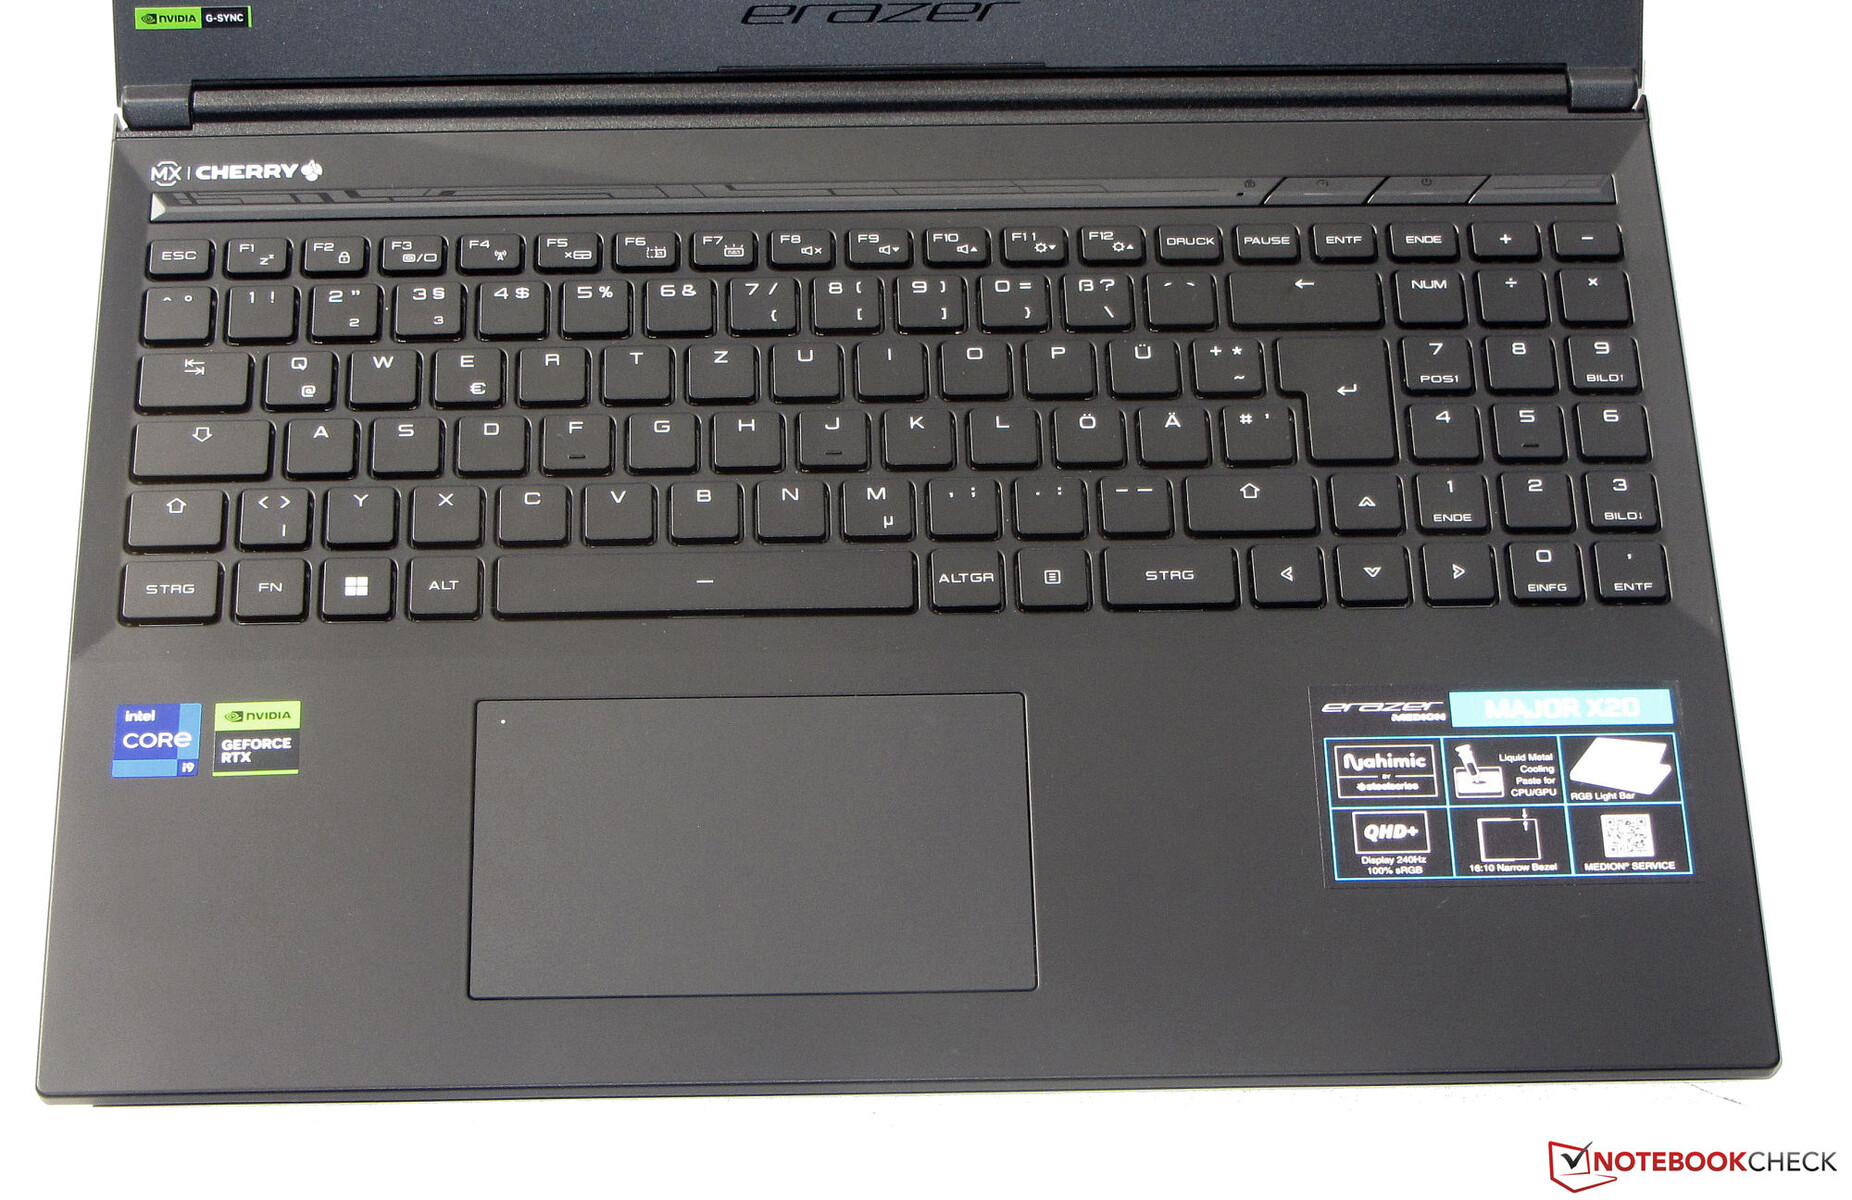
Input Devices - Mechanical keyboard with Cherry MX switches
Keyboard
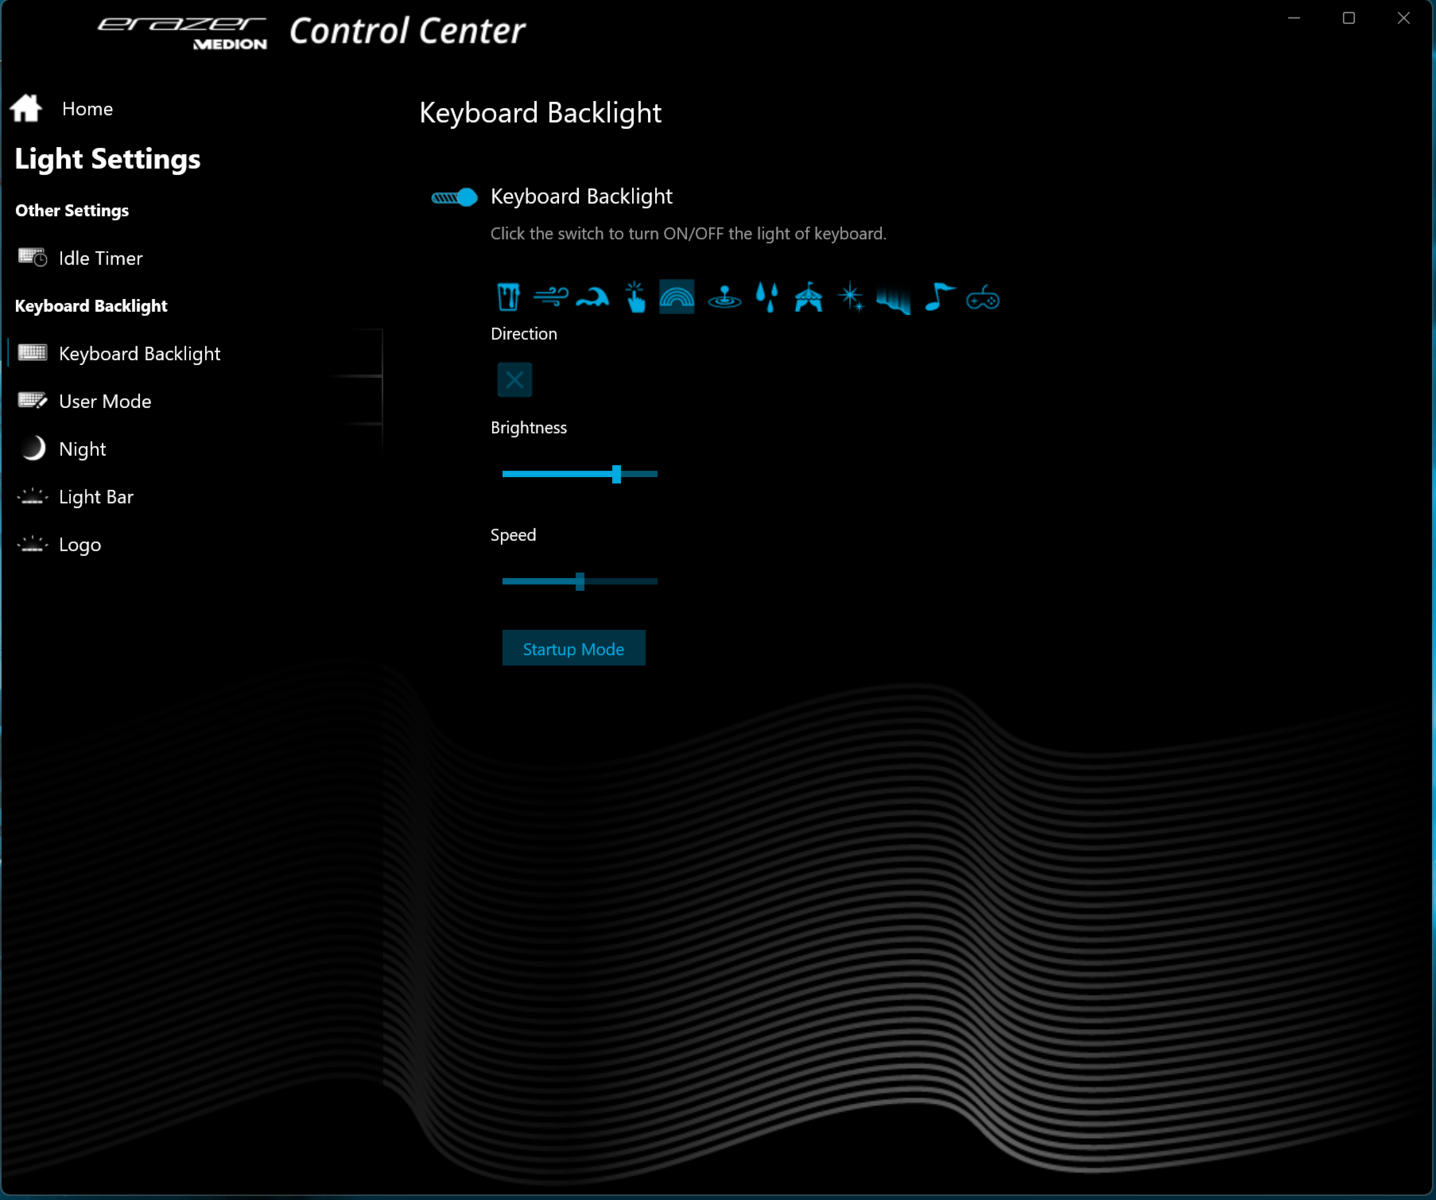
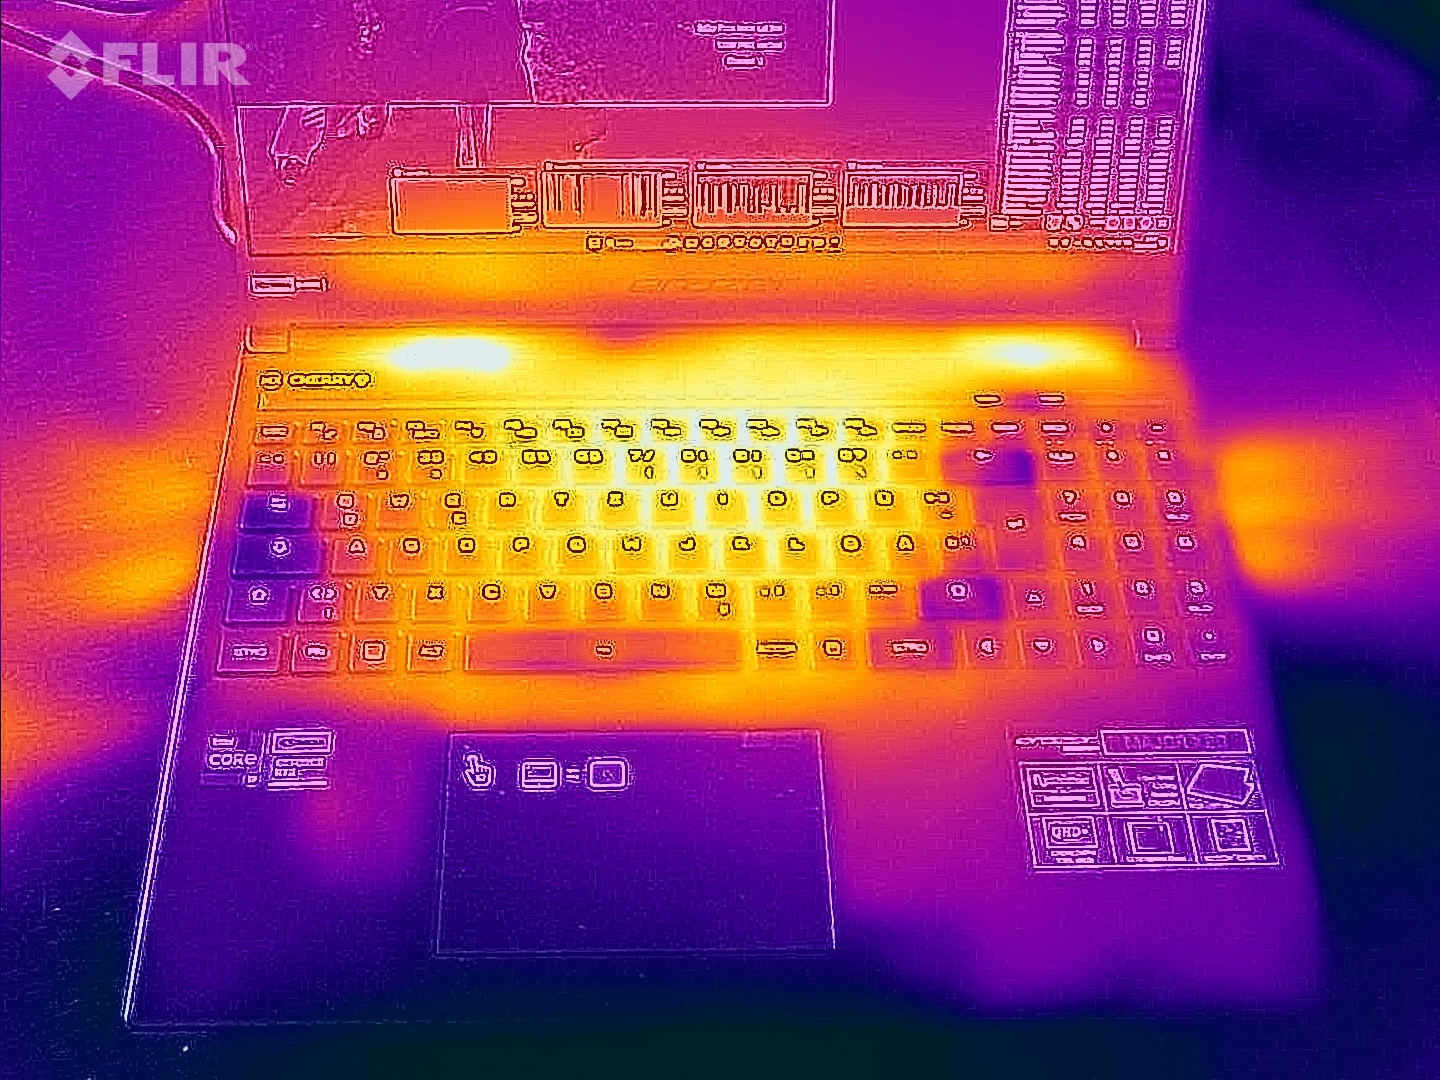
Instead of a chiclet keyboard, Medion has installed a mechanical keyboard into the X20. The Cherry MX switches have a medium travel and a clearly audible and noticeable pressure point. The user is spoiled with a rich typing feel and precise feedback, and the keyboard does not yield during typing. Two function keys regulate the brightness of the four-stage individual key illumination (RGB). Overall, we can speak of a solid keyboard here.
Touchpad
A multi-touch capable clickpad (approx. 11.6 x 7.2 cm) serves as a mouse replacement. Its smooth surface makes finger gliding easy. It offers short travel and a clear pressure point. A finger tap on the LED in the upper left corner turns the entire pad on or off.
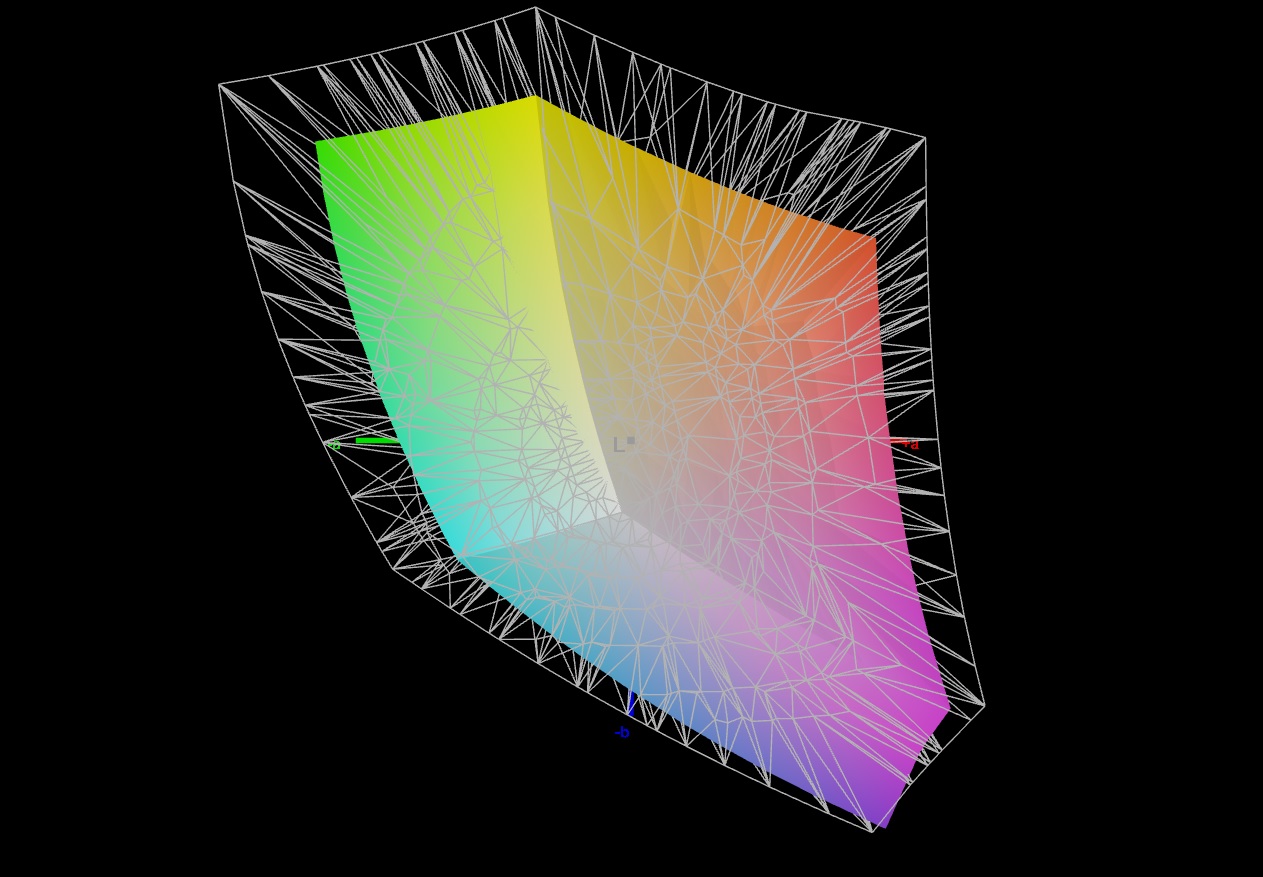
Display - QHD+ in 16:10-Format
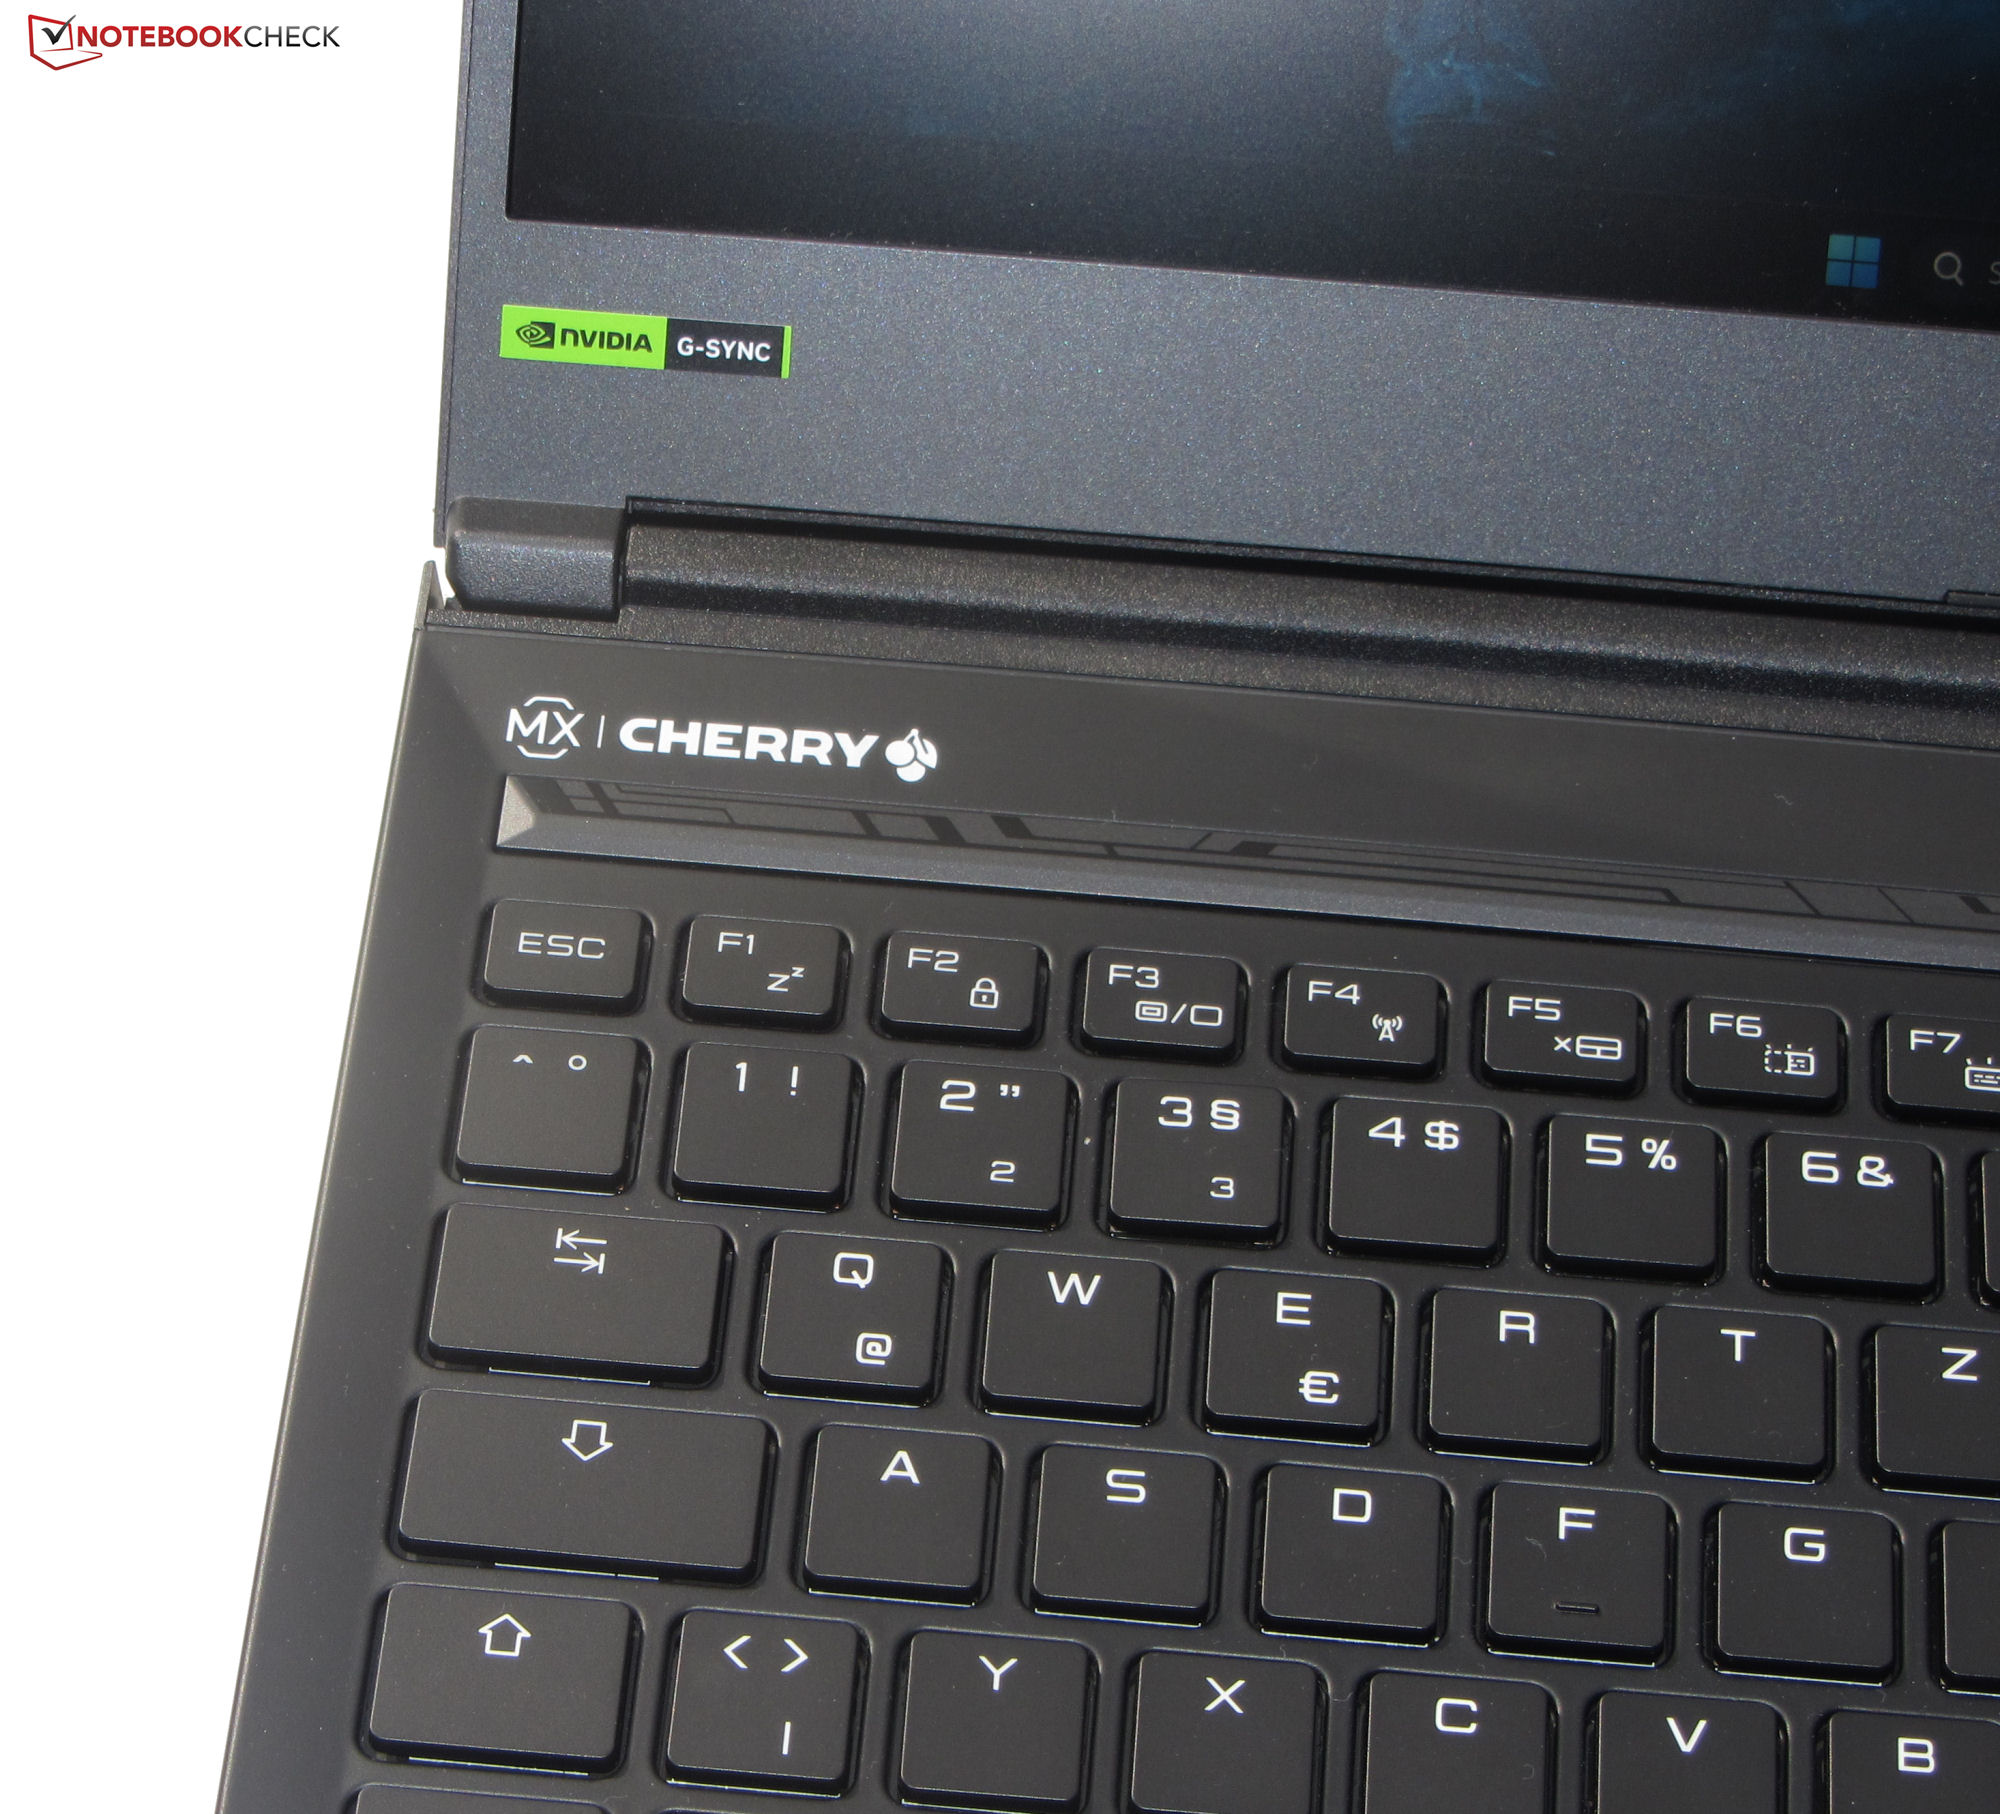
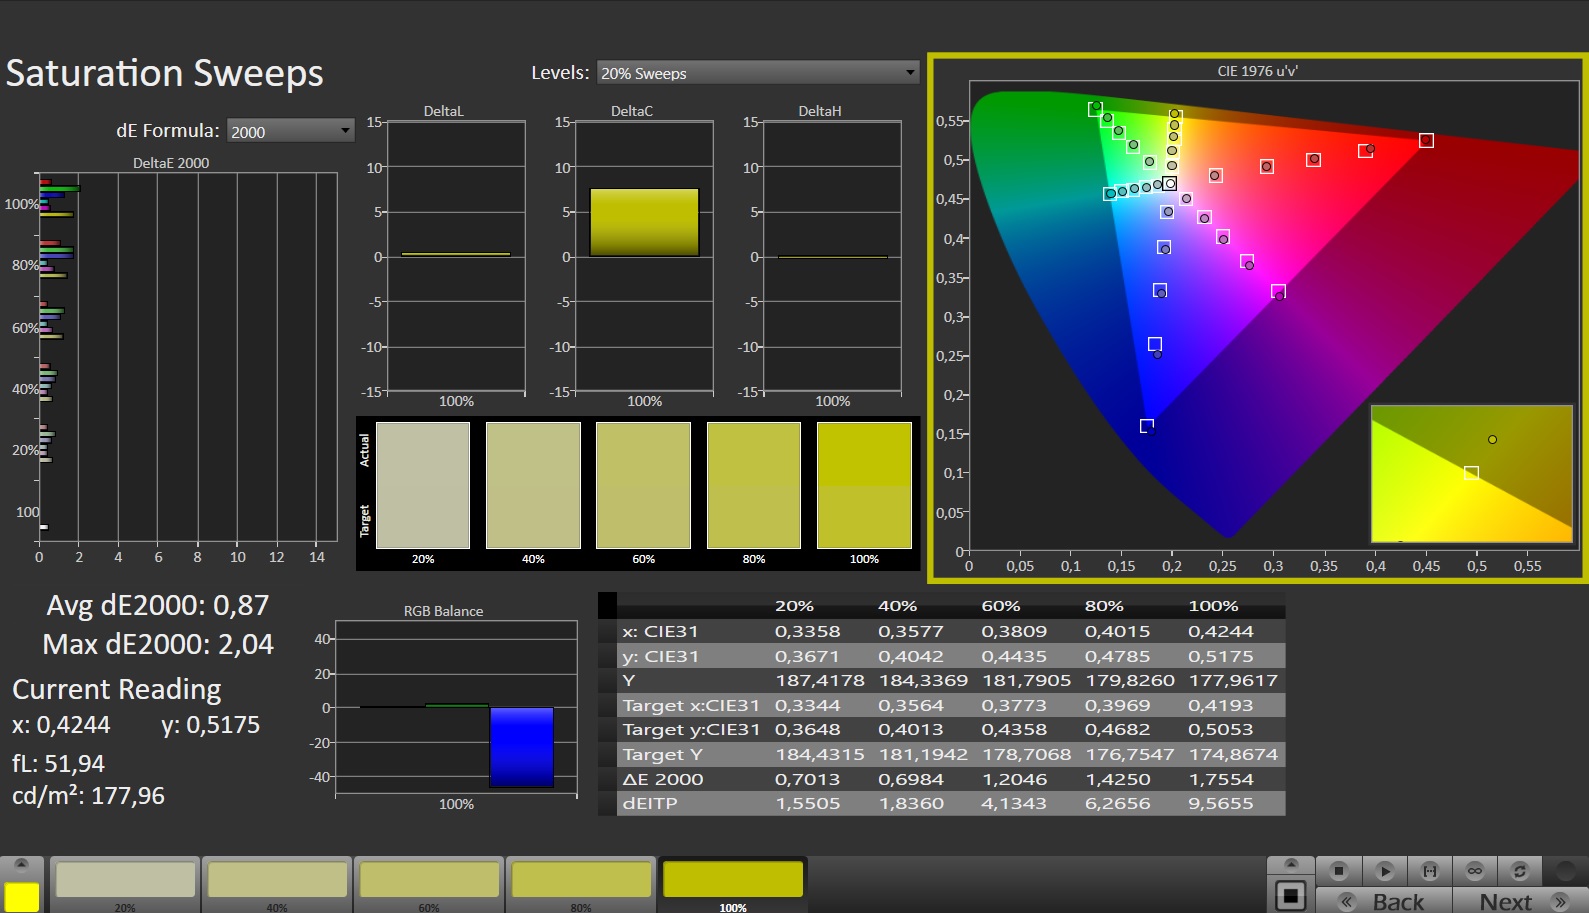
Medion installs a 240 Hz panel with G-Sync support. The latter dynamically adjusts the refresh rates of the display and GPU to create the smoothest possible picture quality - particularly when gaming.
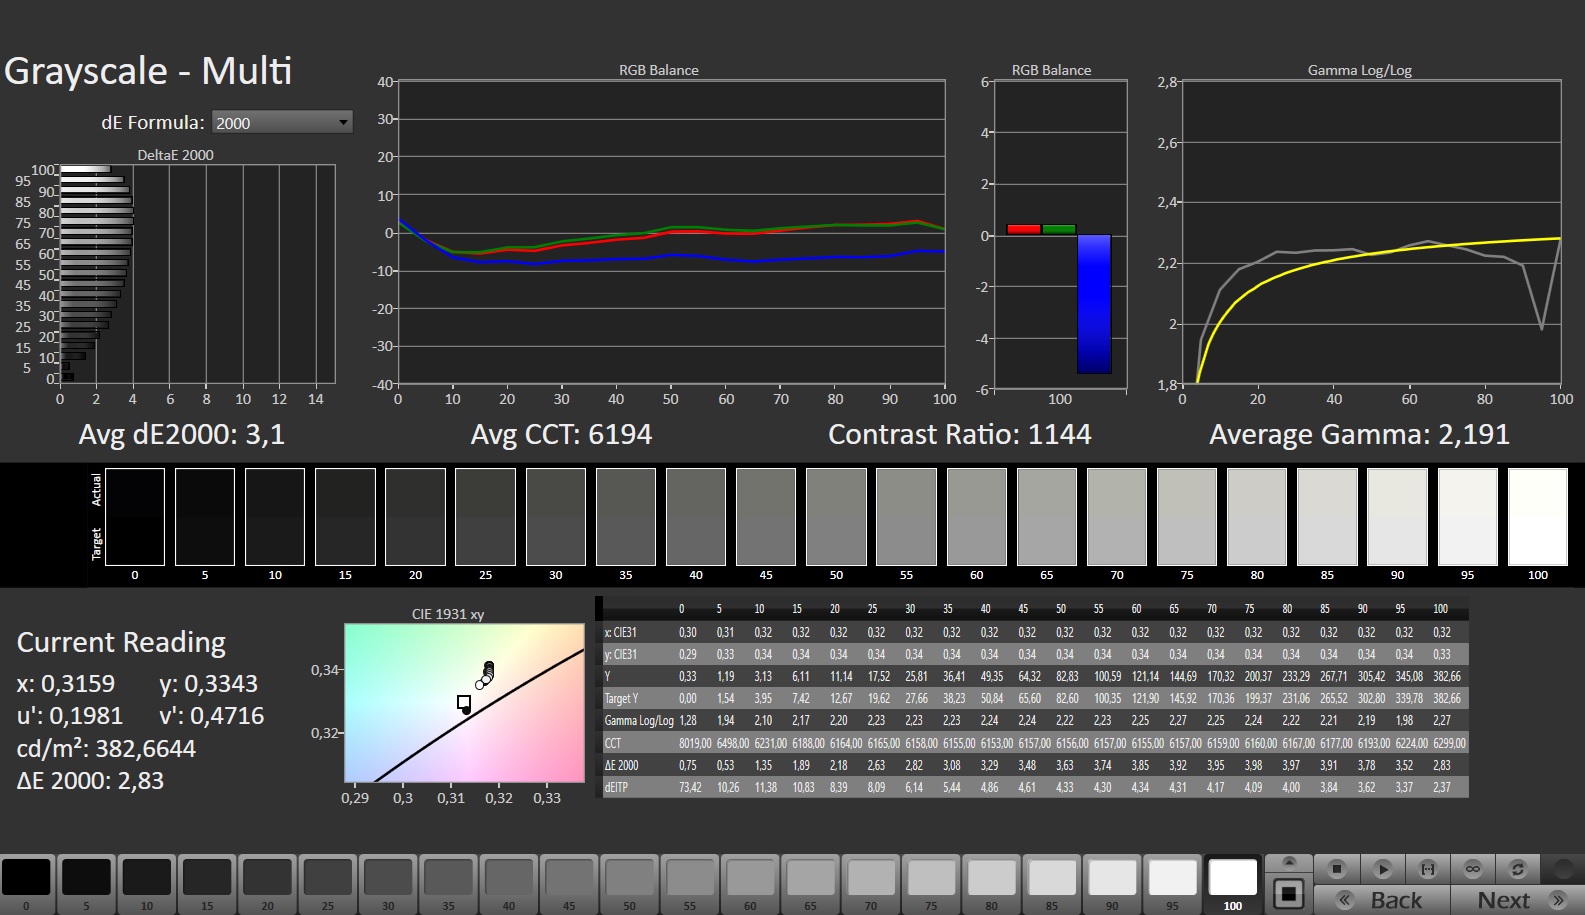
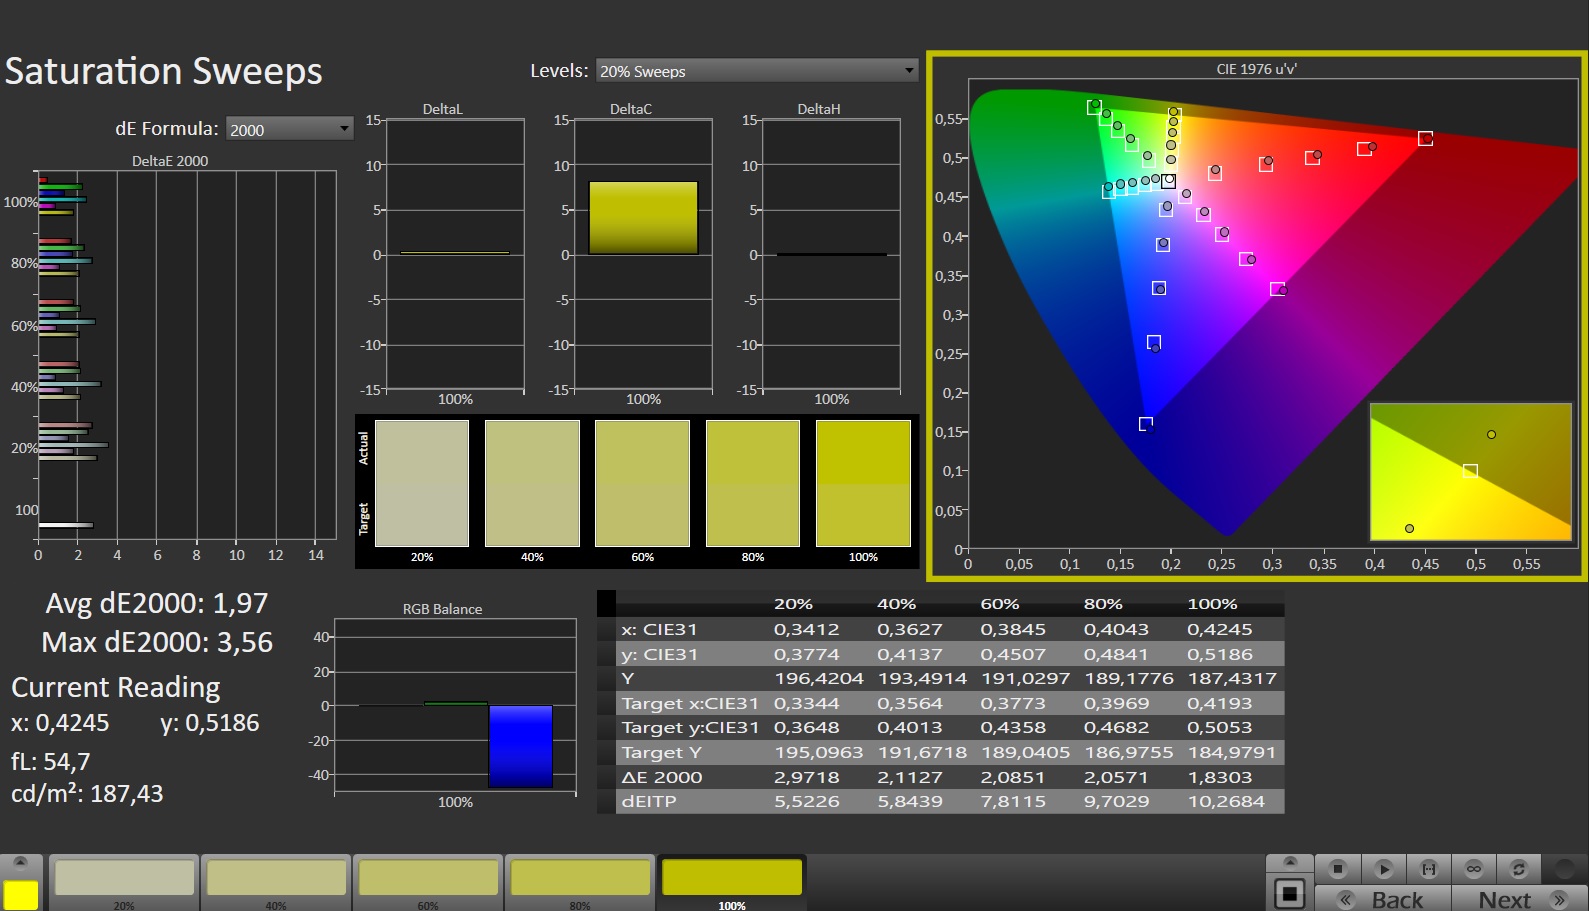
PWM flickering is not present at any brightness setting. The brightness and contrast of the matte 16-inch panel (2560x1600) in the work-friendly 16:10 format reach the respective target (> 300 cd/m² or 1000:1).
| |||||||||||||||||||||||||
Brightness Distribution: 92 %
Center on Battery: 374 cd/m²
Contrast: 1133:1 (Black: 0.33 cd/m²)
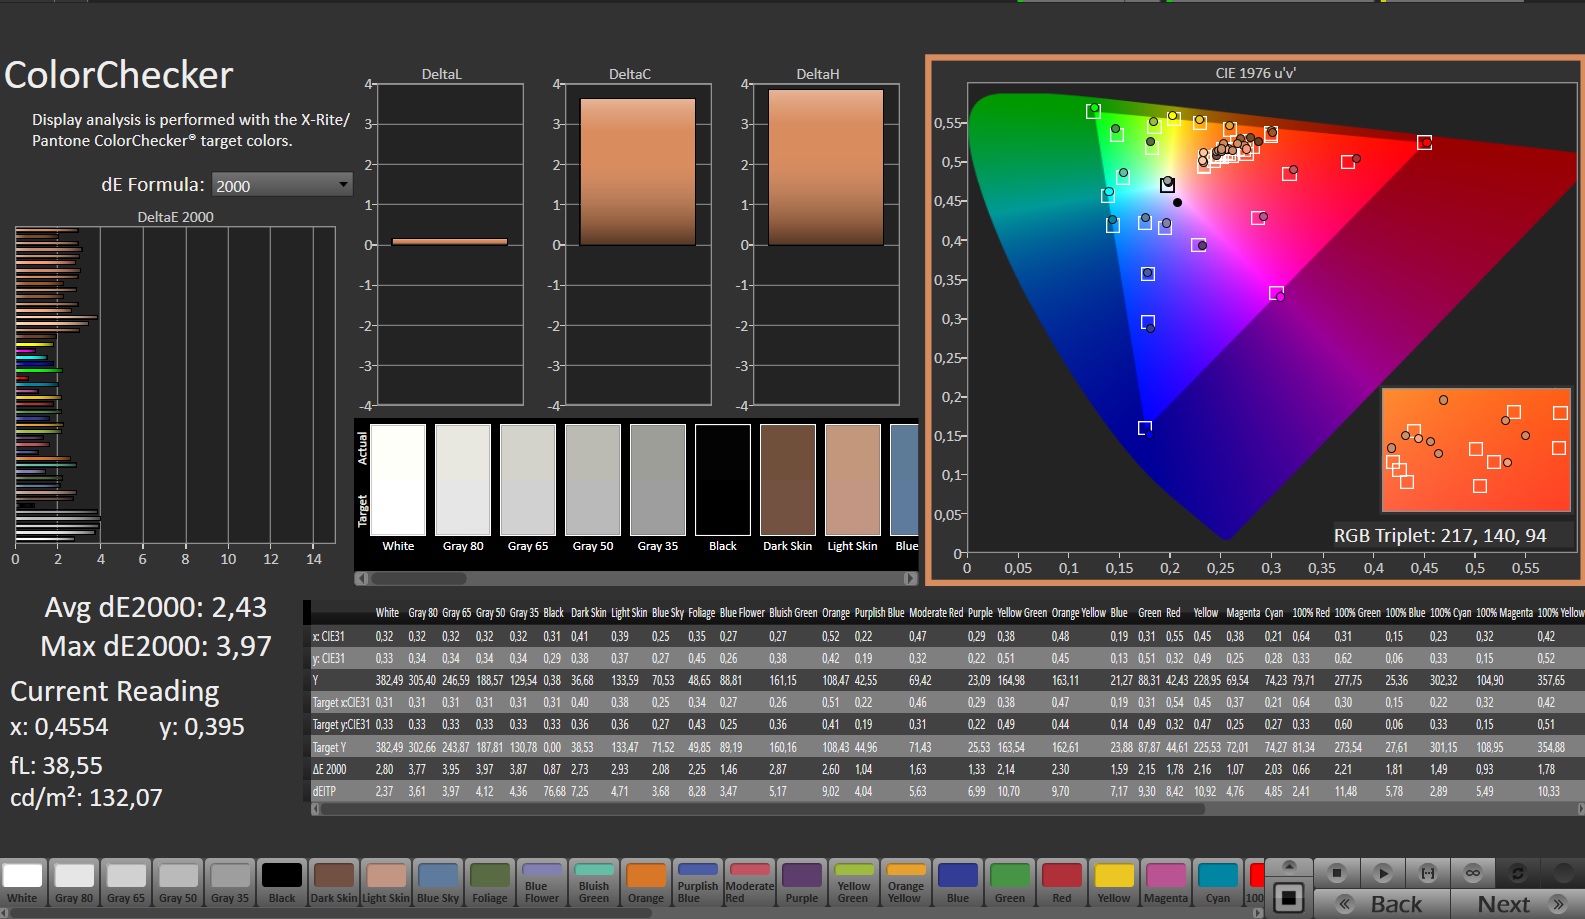
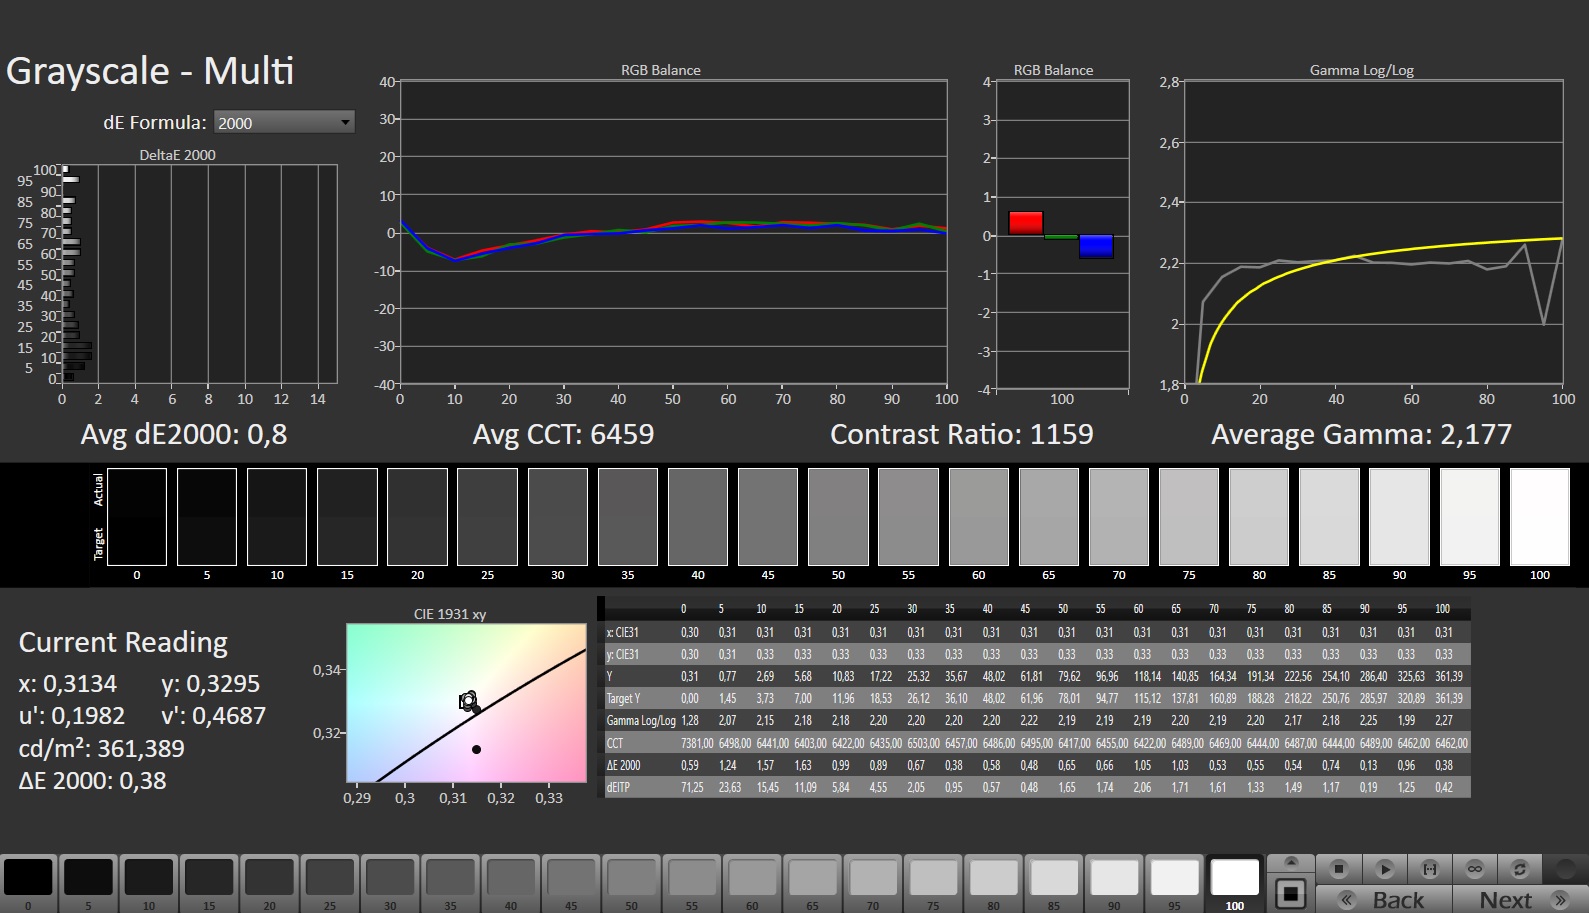
ΔE ColorChecker Calman: 2.43 | ∀{0.5-29.43 Ø4.71}
calibrated: 1.4
ΔE Greyscale Calman: 3.1 | ∀{0.09-98 Ø4.96}
70.9% AdobeRGB 1998 (Argyll 3D)
98% sRGB (Argyll 3D)
69.4% Display P3 (Argyll 3D)
Gamma: 2.191
CCT: 6194 K
| Medion Erazer Major X20 BOE CQ NE160QDM-NZ1, IPS, 2560x1600, 16" | Aorus 15X ASF BOE CQ NE156QHM-NZ1, IPS, 2560x1440, 15.6" | Razer Blade 15 OLED (Early 2022) Samsung ATNA562P02-0, OLED, 2560x1440, 15.6" | Asus ROG Strix G17 G713PI BOE0B69, IPS, 2560x1440, 17.3" | |
|---|---|---|---|---|
| Display | -0% | 25% | 22% | |
| Display P3 Coverage (%) | 69.4 | 69.3 0% | 97.6 41% | 98.3 42% |
| sRGB Coverage (%) | 98 | 98.2 0% | 99.4 1% | 100 2% |
| AdobeRGB 1998 Coverage (%) | 70.9 | 70.5 -1% | 94 33% | 85.9 21% |
| Response Times | -12% | 79% | 21% | |
| Response Time Grey 50% / Grey 80% * (ms) | 13.1 ? | 12.4 ? 5% | 2 ? 85% | 5.3 ? 60% |
| Response Time Black / White * (ms) | 7.3 ? | 9.4 ? -29% | 2 ? 73% | 8.6 ? -18% |
| PWM Frequency (Hz) | 500 ? | |||
| Screen | 14% | 126% | 12% | |
| Brightness middle (cd/m²) | 374 | 316 -16% | 383 2% | 327 -13% |
| Brightness (cd/m²) | 357 | 301 -16% | 384 8% | 320 -10% |
| Brightness Distribution (%) | 92 | 90 -2% | 99 8% | 89 -3% |
| Black Level * (cd/m²) | 0.33 | 0.28 15% | 0.03 91% | 0.38 -15% |
| Contrast (:1) | 1133 | 1129 0% | 12767 1027% | 861 -24% |
| Colorchecker dE 2000 * | 2.43 | 1.54 37% | 1.89 22% | 1.01 58% |
| Colorchecker dE 2000 max. * | 3.97 | 2.46 38% | 3.76 5% | 4.01 -1% |
| Colorchecker dE 2000 calibrated * | 1.4 | 1.21 14% | 2.67 -91% | 0.41 71% |
| Greyscale dE 2000 * | 3.1 | 1.3 58% | 1.26 59% | 1.6 48% |
| Gamma | 2.191 100% | 2.307 95% | 2.41 91% | 2.168 101% |
| CCT | 6194 105% | 6456 101% | 6386 102% | 6659 98% |
| Total Average (Program / Settings) | 1% /
7% | 77% /
97% | 18% /
16% |
* ... smaller is better
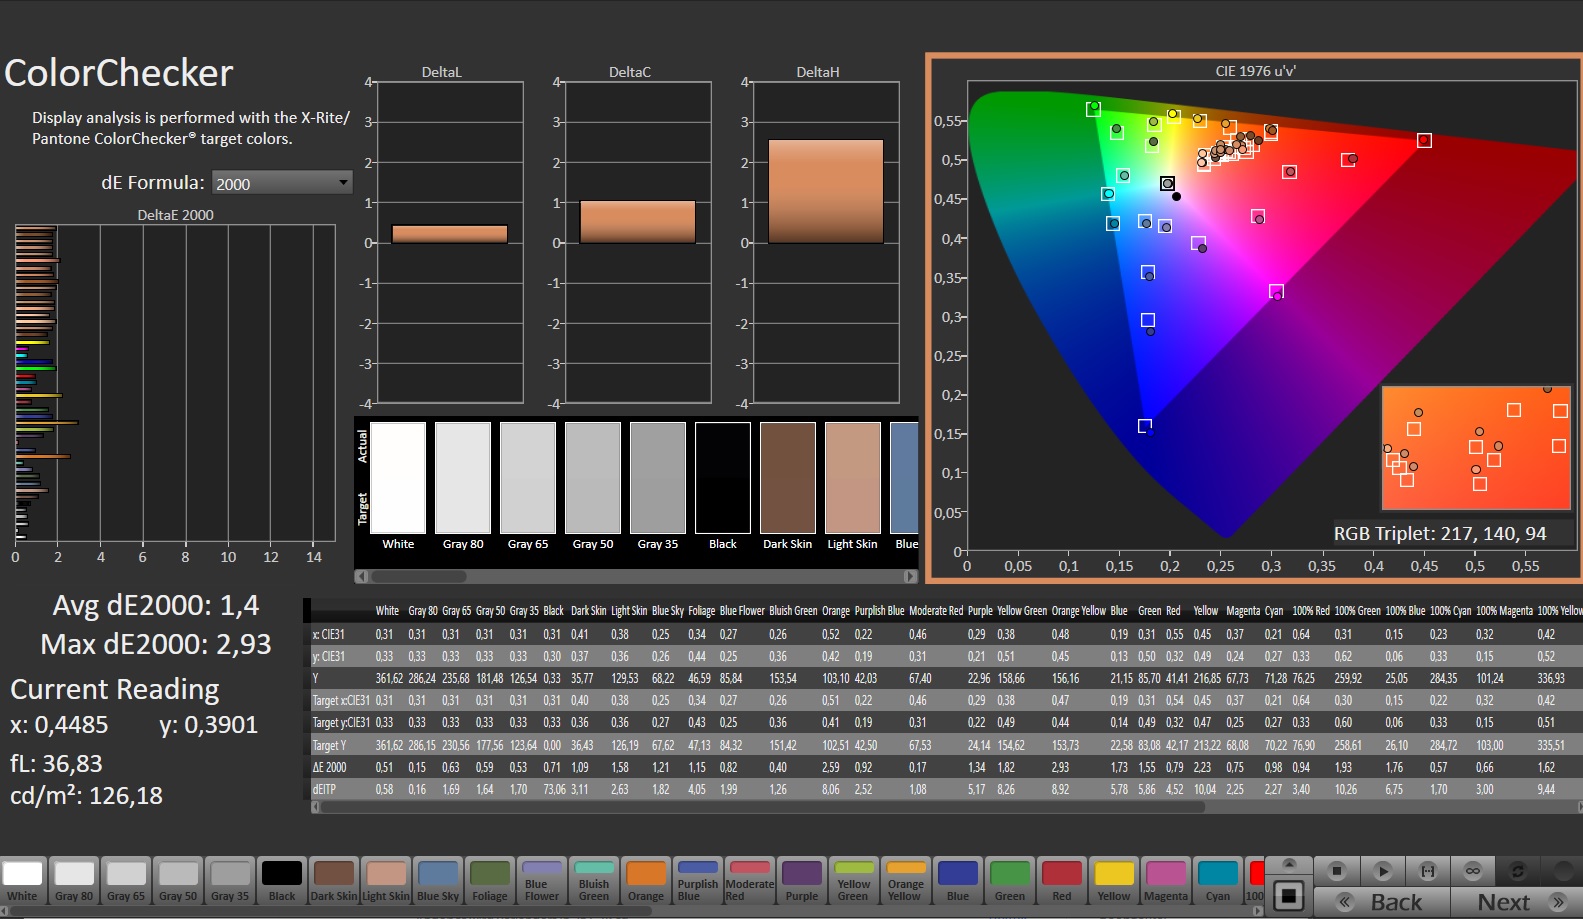
The screen produces good color representation in the delivery state: The target (DeltaE < 3) is reached with a deviation of about 2.4. Manual calibration reduces the deviation to 1.4 and ensures a more balanced grayscale.
The panel completely covers the sRGB color space, but not the AdobeRGB and DCI-P3 color spaces. If all three color spaces are required, there is no way around the Blade 15's OLED screen.
Display Response Times
| ↔ Response Time Black to White | ||
|---|---|---|
| 7.3 ms ... rise ↗ and fall ↘ combined | ↗ 3.1 ms rise | 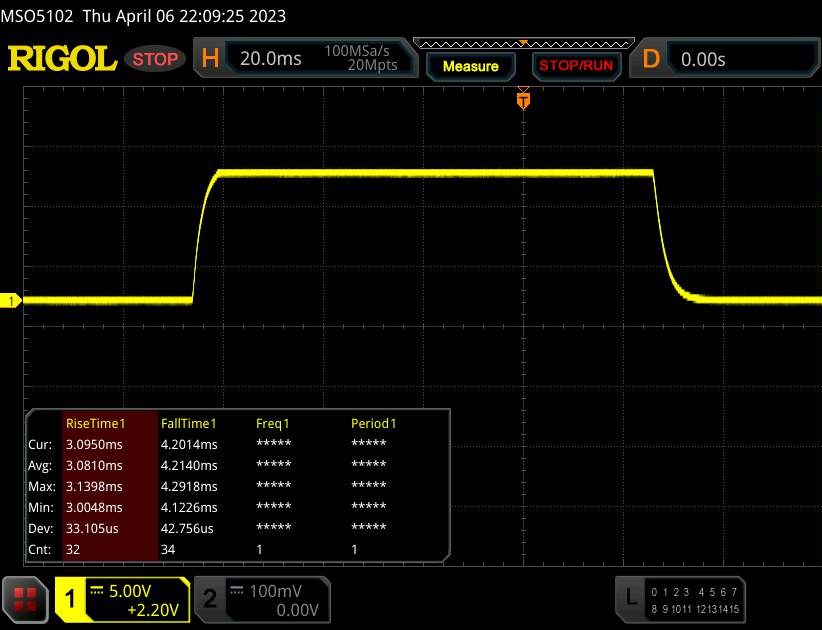 |
| ↘ 4.2 ms fall | ||
| The screen shows very fast response rates in our tests and should be very well suited for fast-paced gaming. In comparison, all tested devices range from 0.1 (minimum) to 240 (maximum) ms. » 22 % of all devices are better. This means that the measured response time is better than the average of all tested devices (19.8 ms). | ||
| ↔ Response Time 50% Grey to 80% Grey | ||
| 13.1 ms ... rise ↗ and fall ↘ combined | ↗ 6 ms rise | 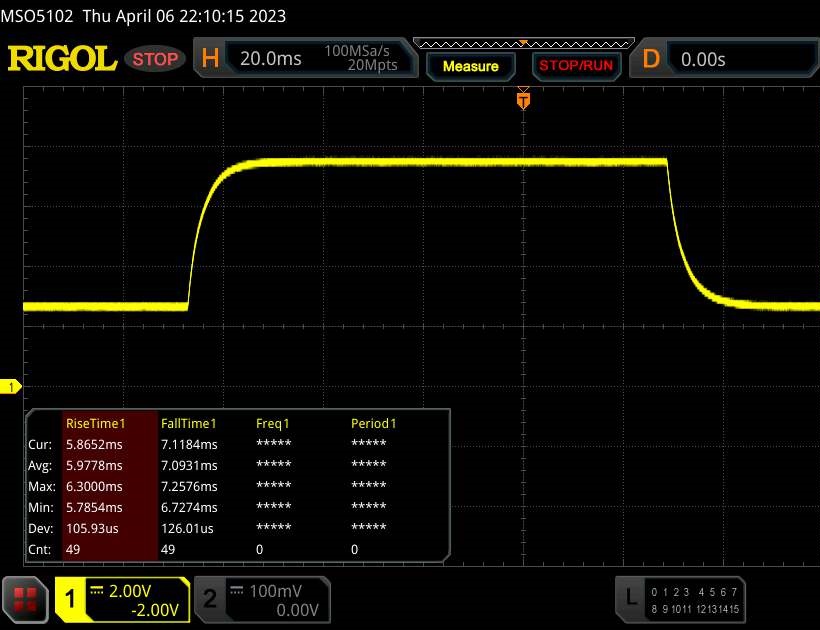 |
| ↘ 7.1 ms fall | ||
| The screen shows good response rates in our tests, but may be too slow for competitive gamers. In comparison, all tested devices range from 0.165 (minimum) to 636 (maximum) ms. » 27 % of all devices are better. This means that the measured response time is better than the average of all tested devices (31 ms). | ||
Screen Flickering / PWM (Pulse-Width Modulation)
| Screen flickering / PWM not detected | 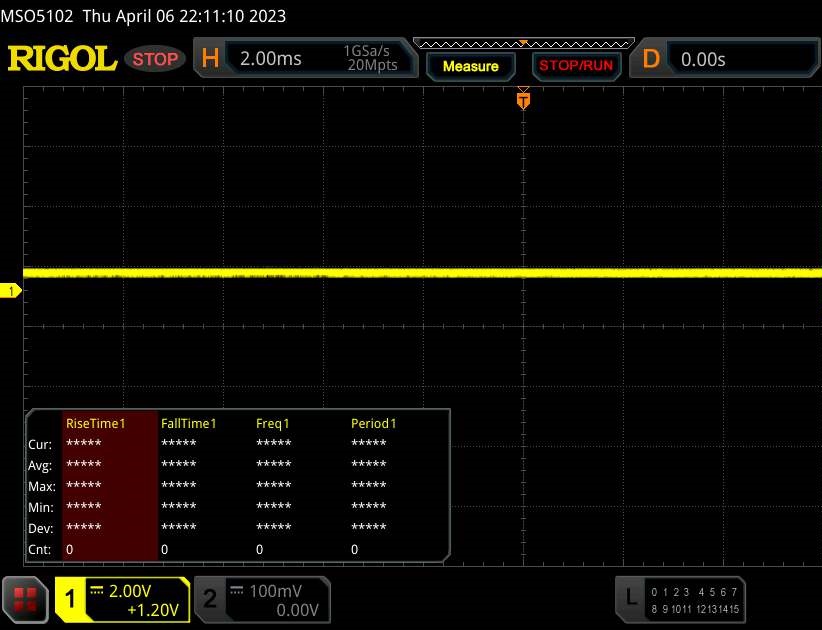 | ||
In comparison: 52 % of all tested devices do not use PWM to dim the display. If PWM was detected, an average of 7757 (minimum: 5 - maximum: 343500) Hz was measured. | |||
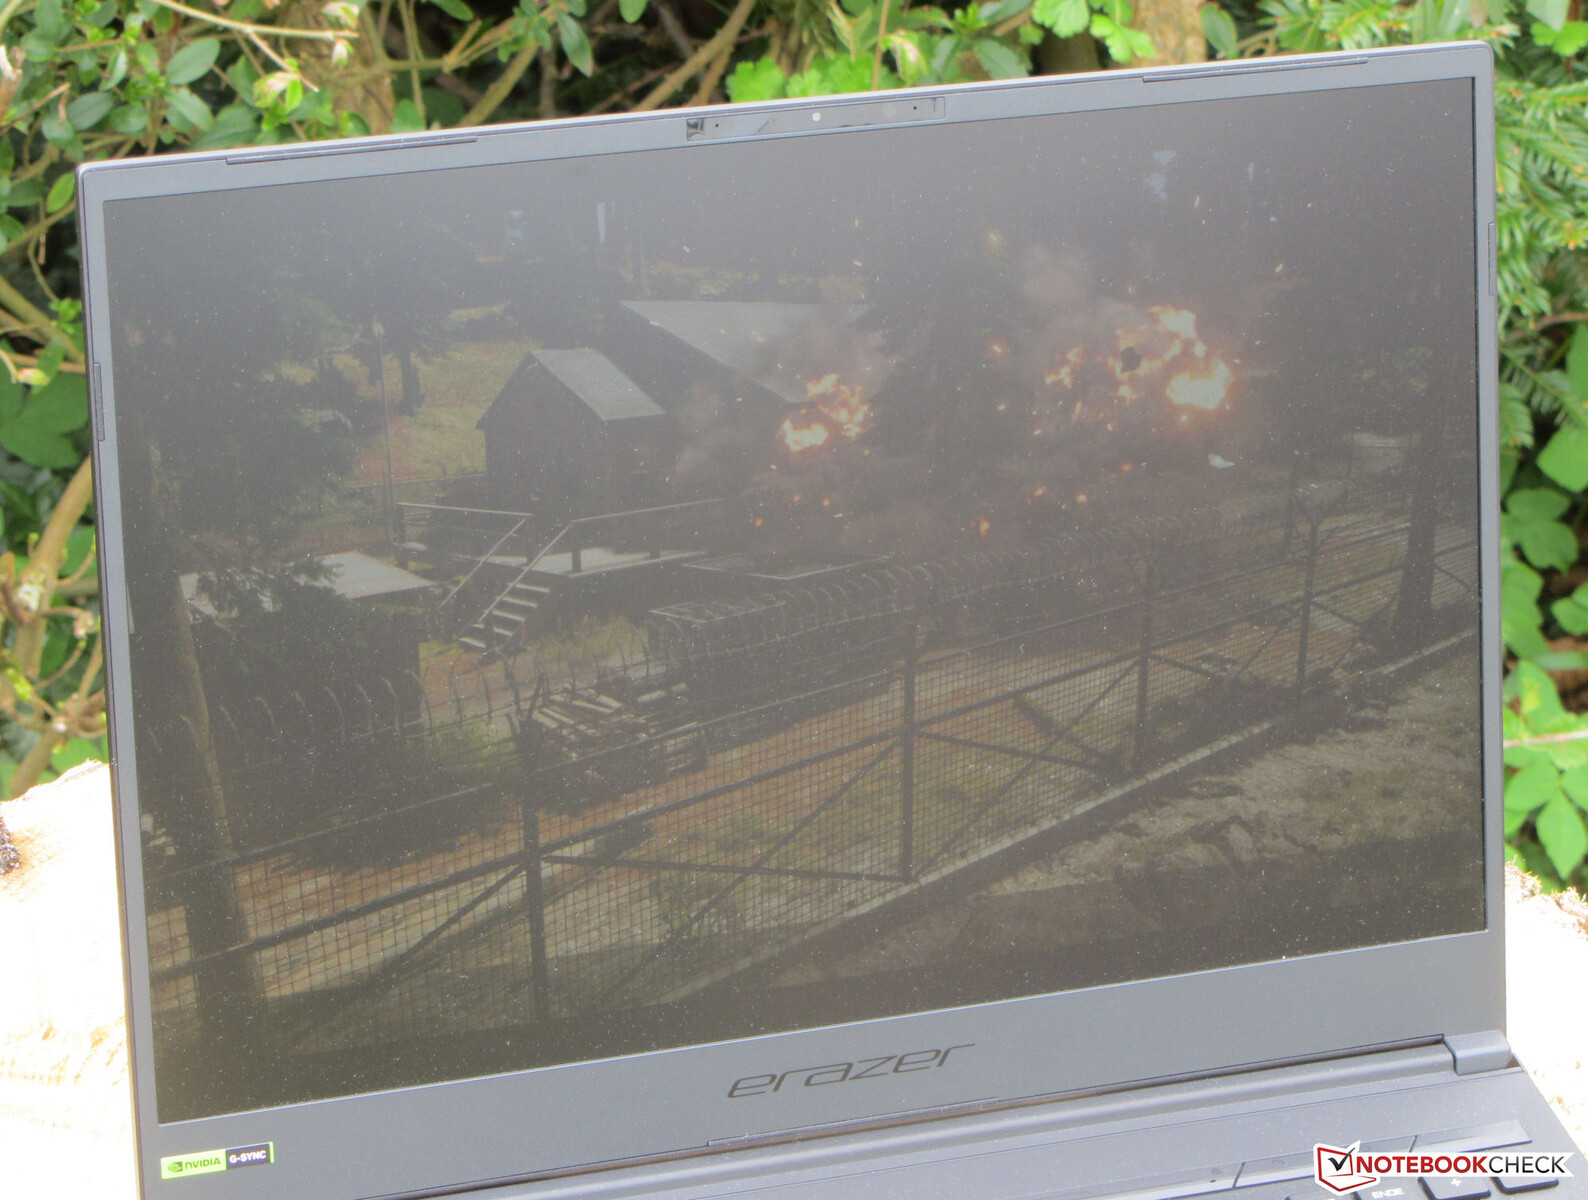
The viewing-angle stable IPS panel can be read from any position. Reading the screen outdoors is possible if the sun is not too strong.

Performance - Raptor Lake and Ada Lovelace power the gaming notebook
Gaming, rendering, and generally all performance demanding application areas count among the Erazer Major X20's application scenarios. Raptor Lake and Ada Lovelace provide the necessary computing power. This model is available for around EUR 2,500 (~US$2,500).
Testing Conditions
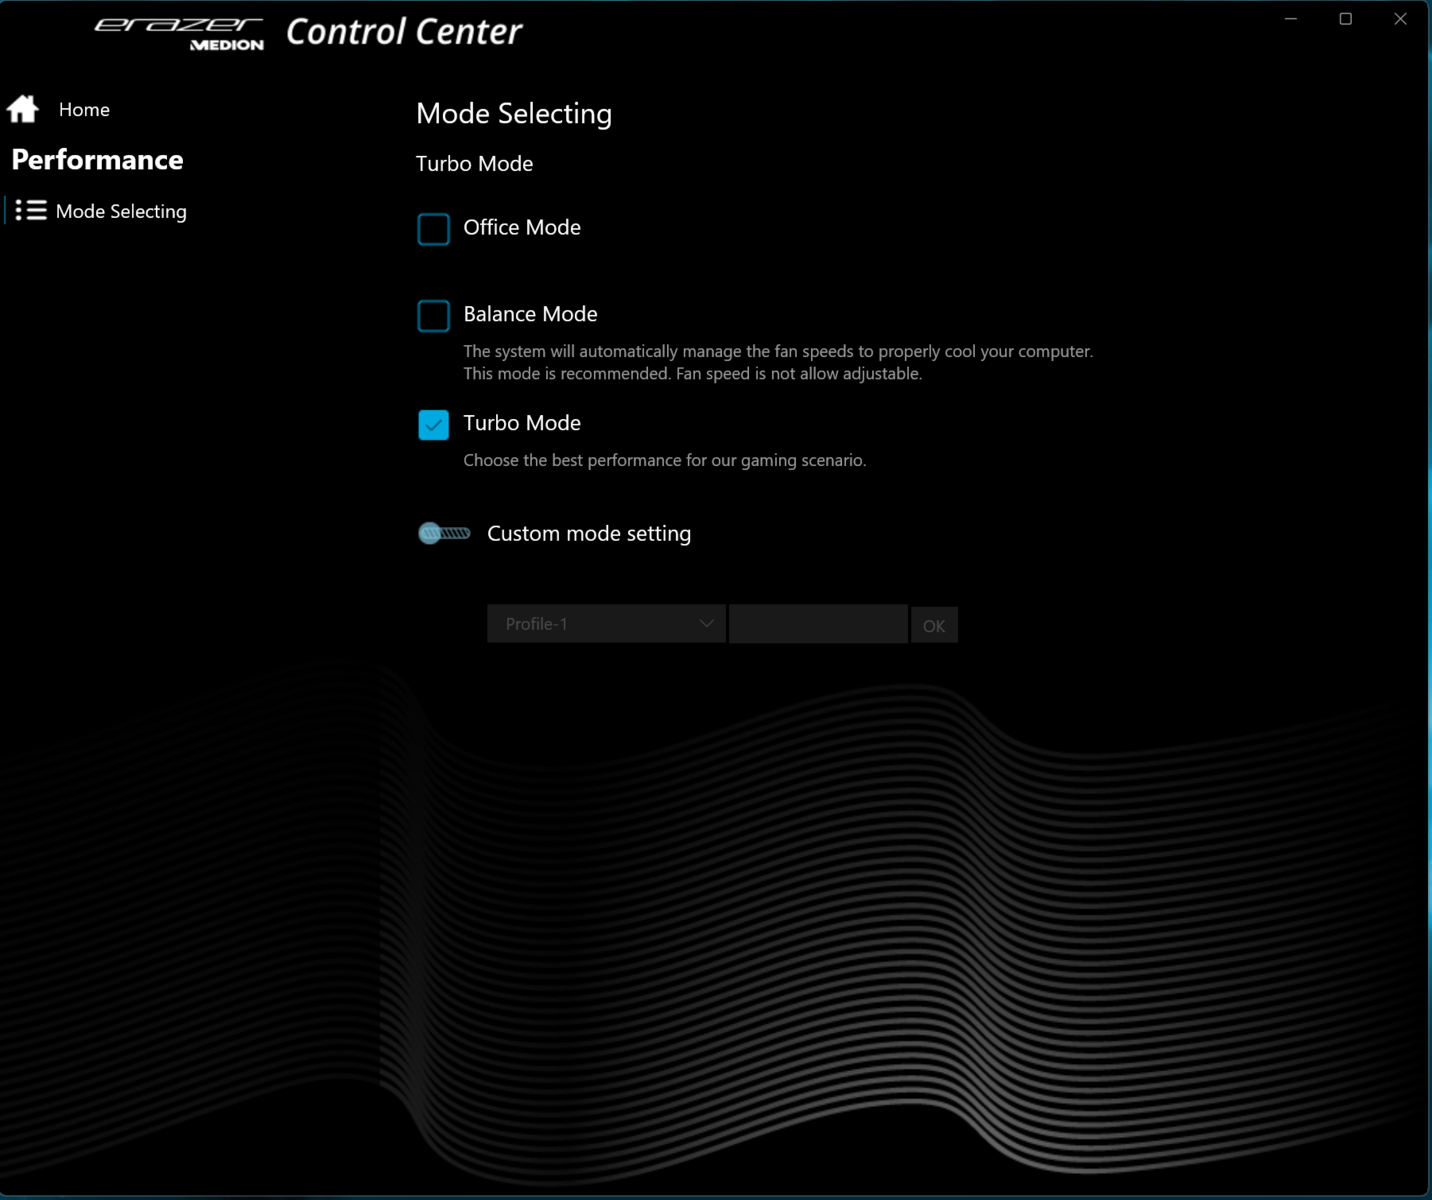
The X20 offers three manufacturer-specific power modes (see table), which you can select via a separate button (next to the power button). A status LED reveals which mode is active. "Turbo Mode" (benchmarks) and "Office Mode" (battery tests) were used. Optimus was active.
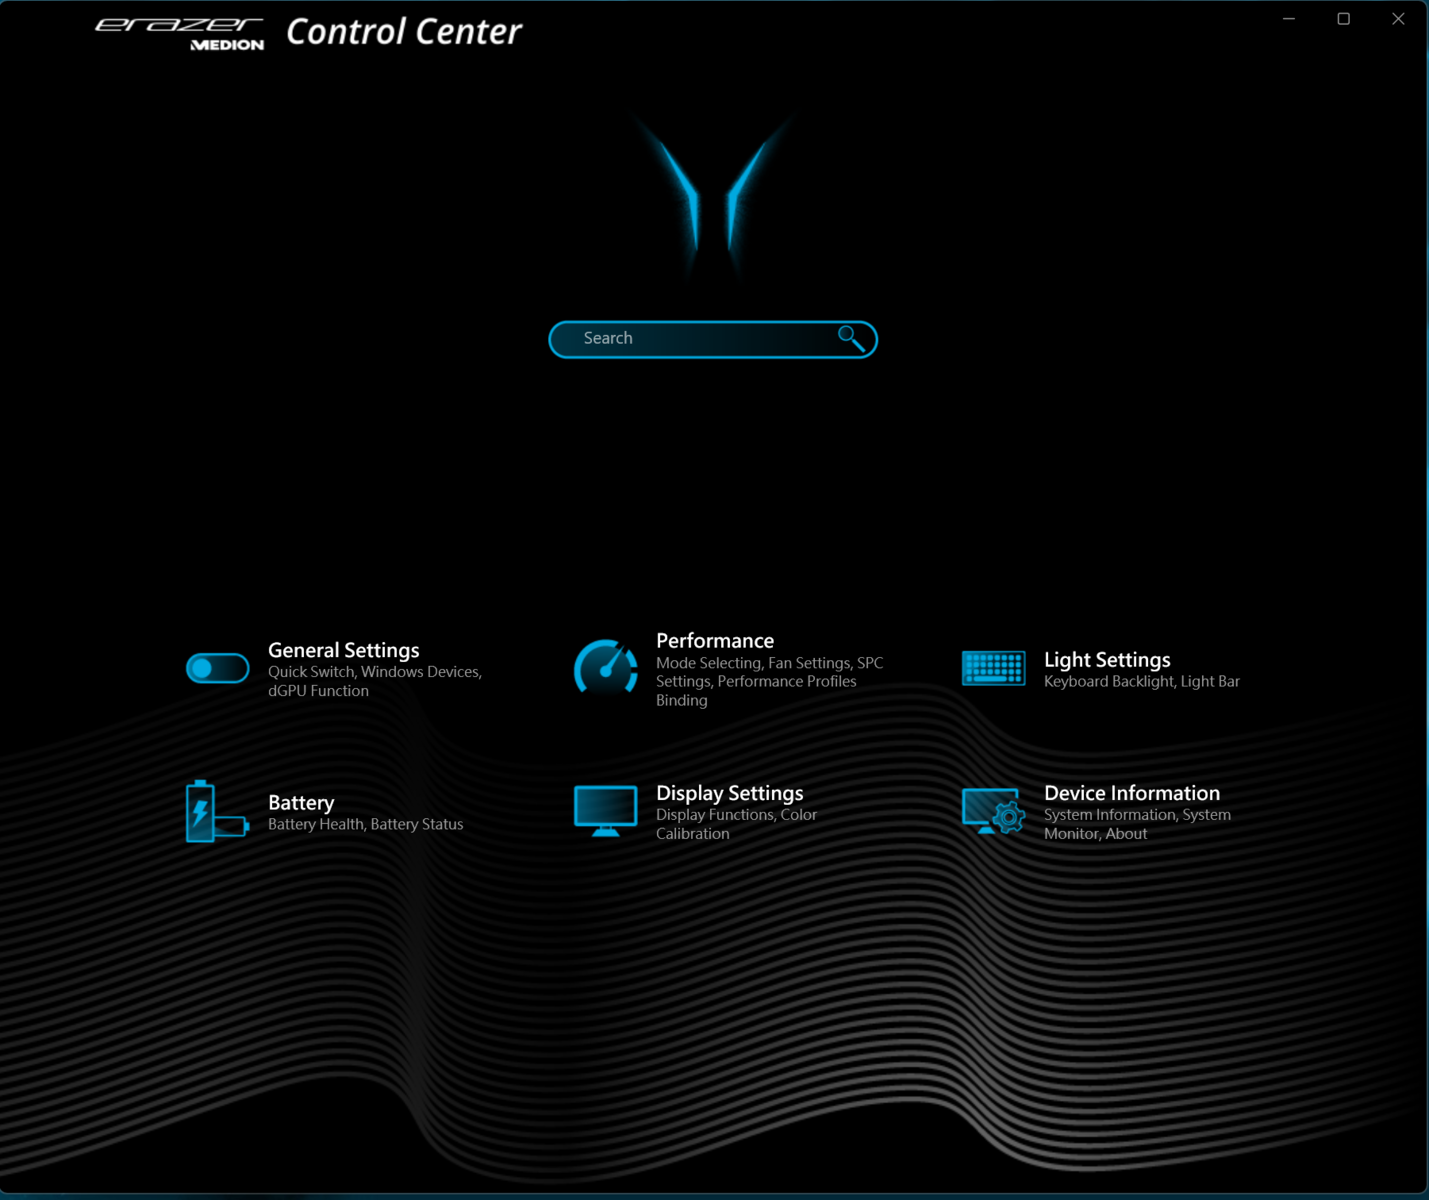
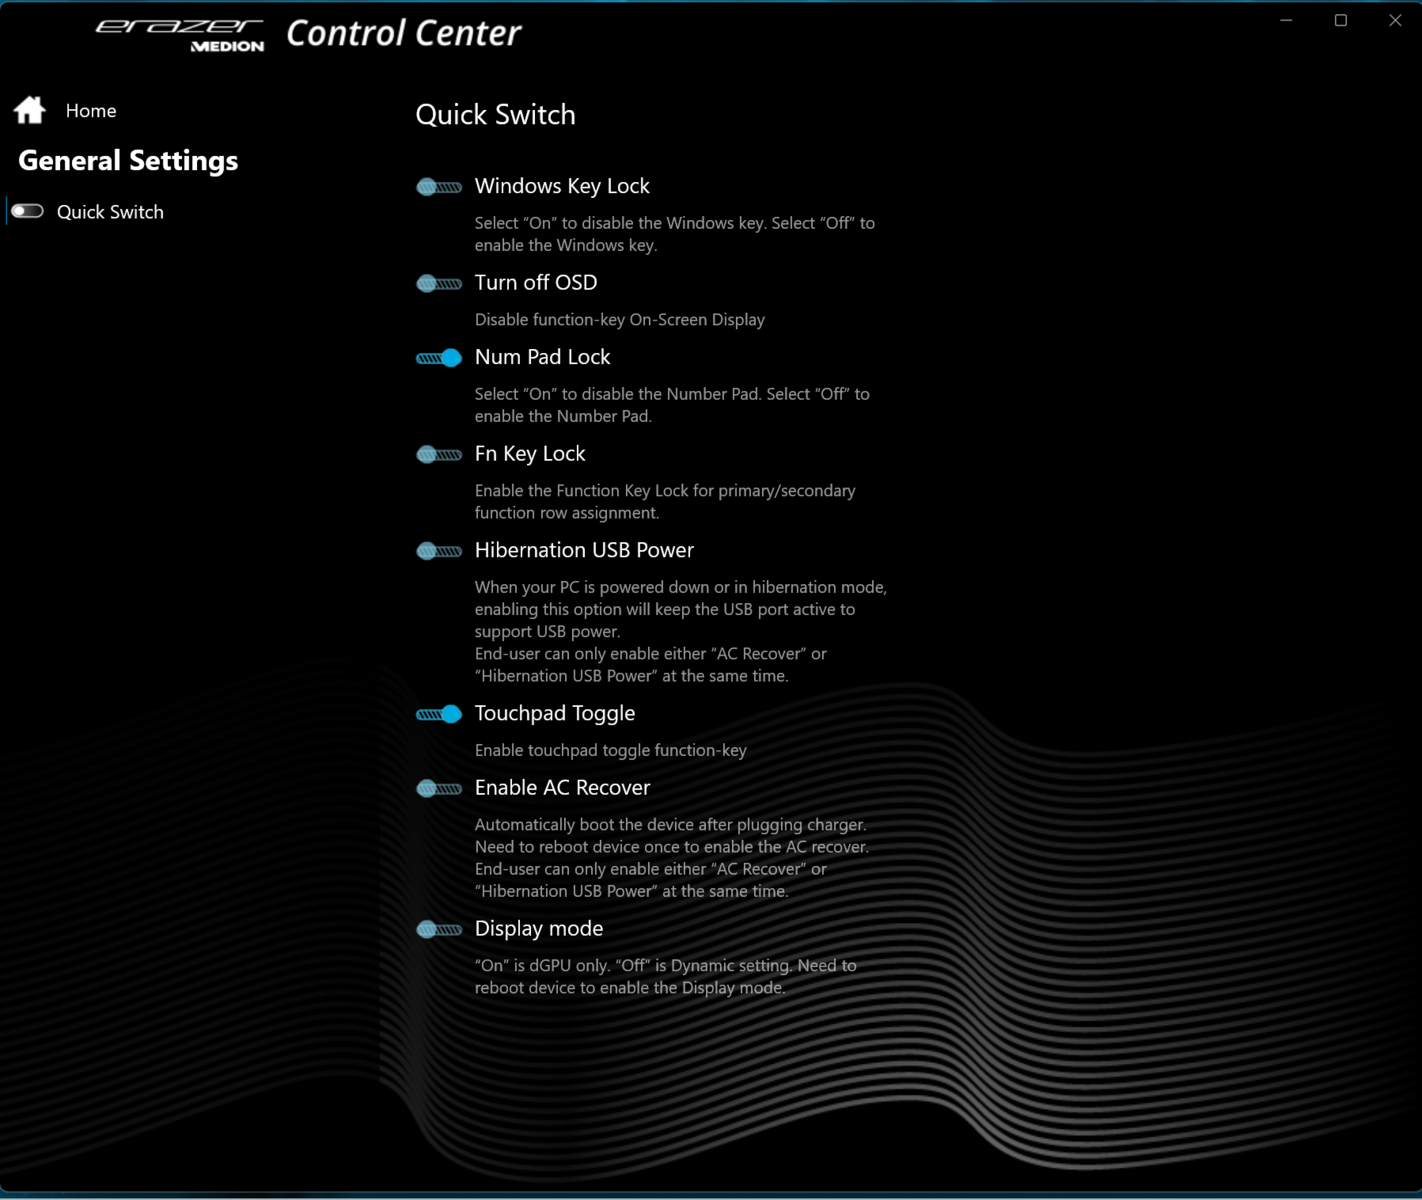
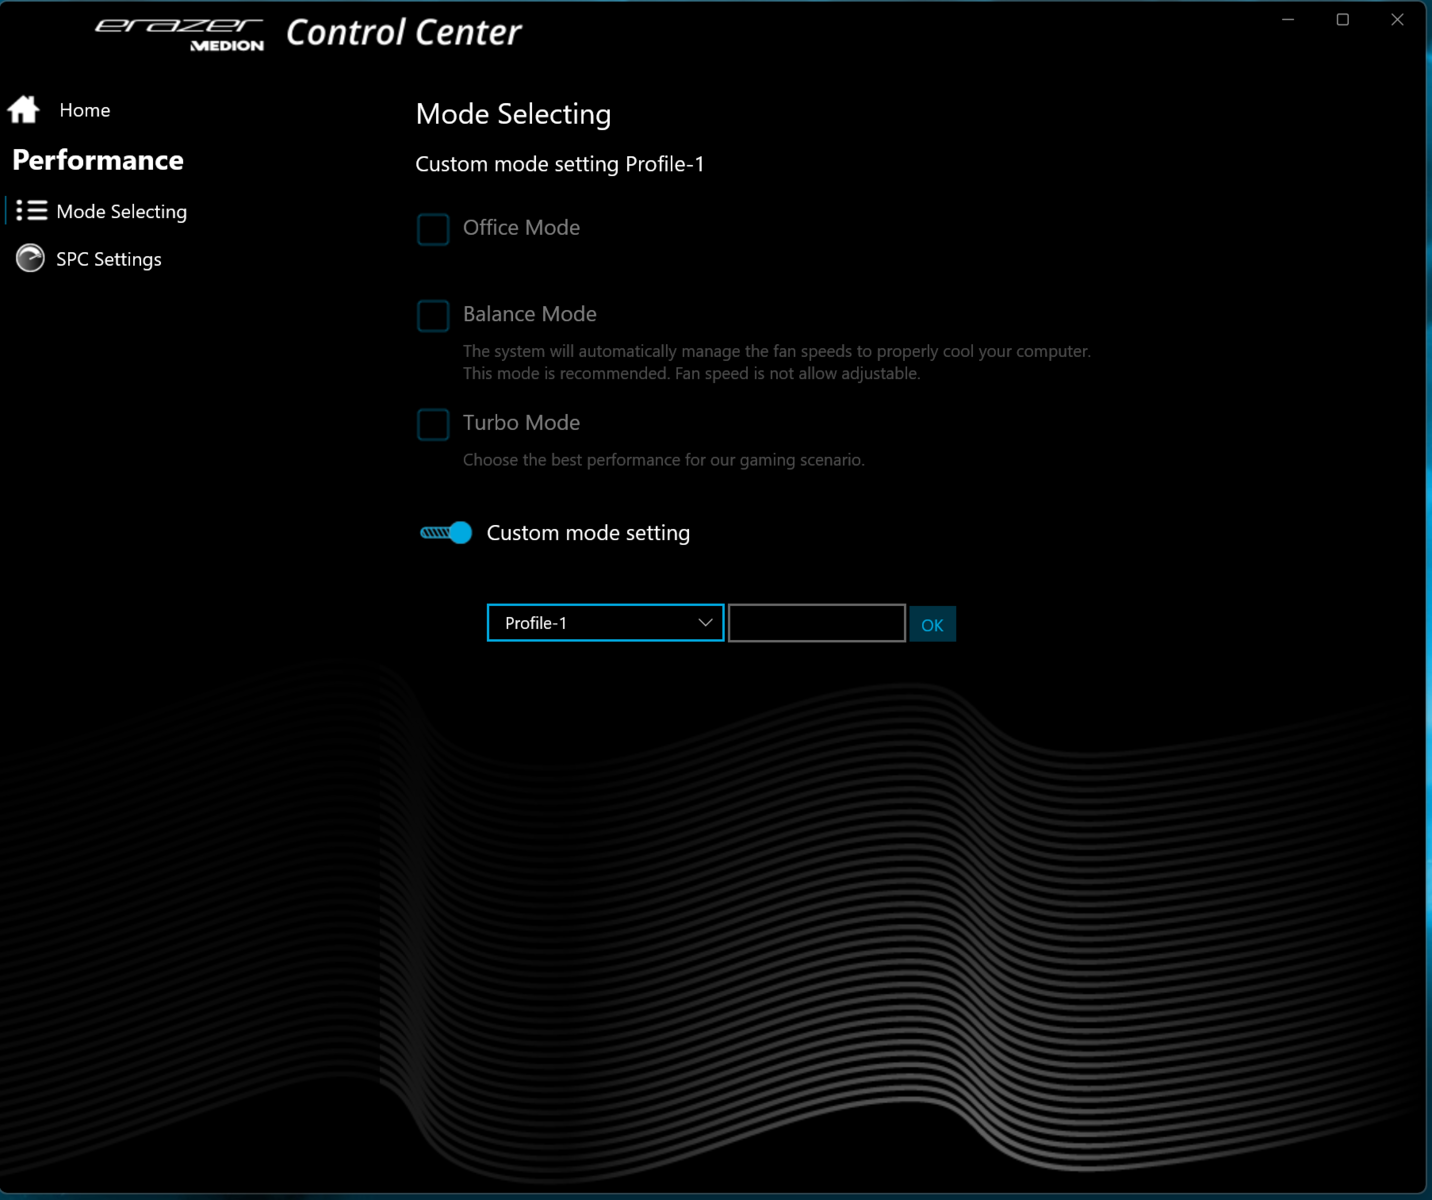
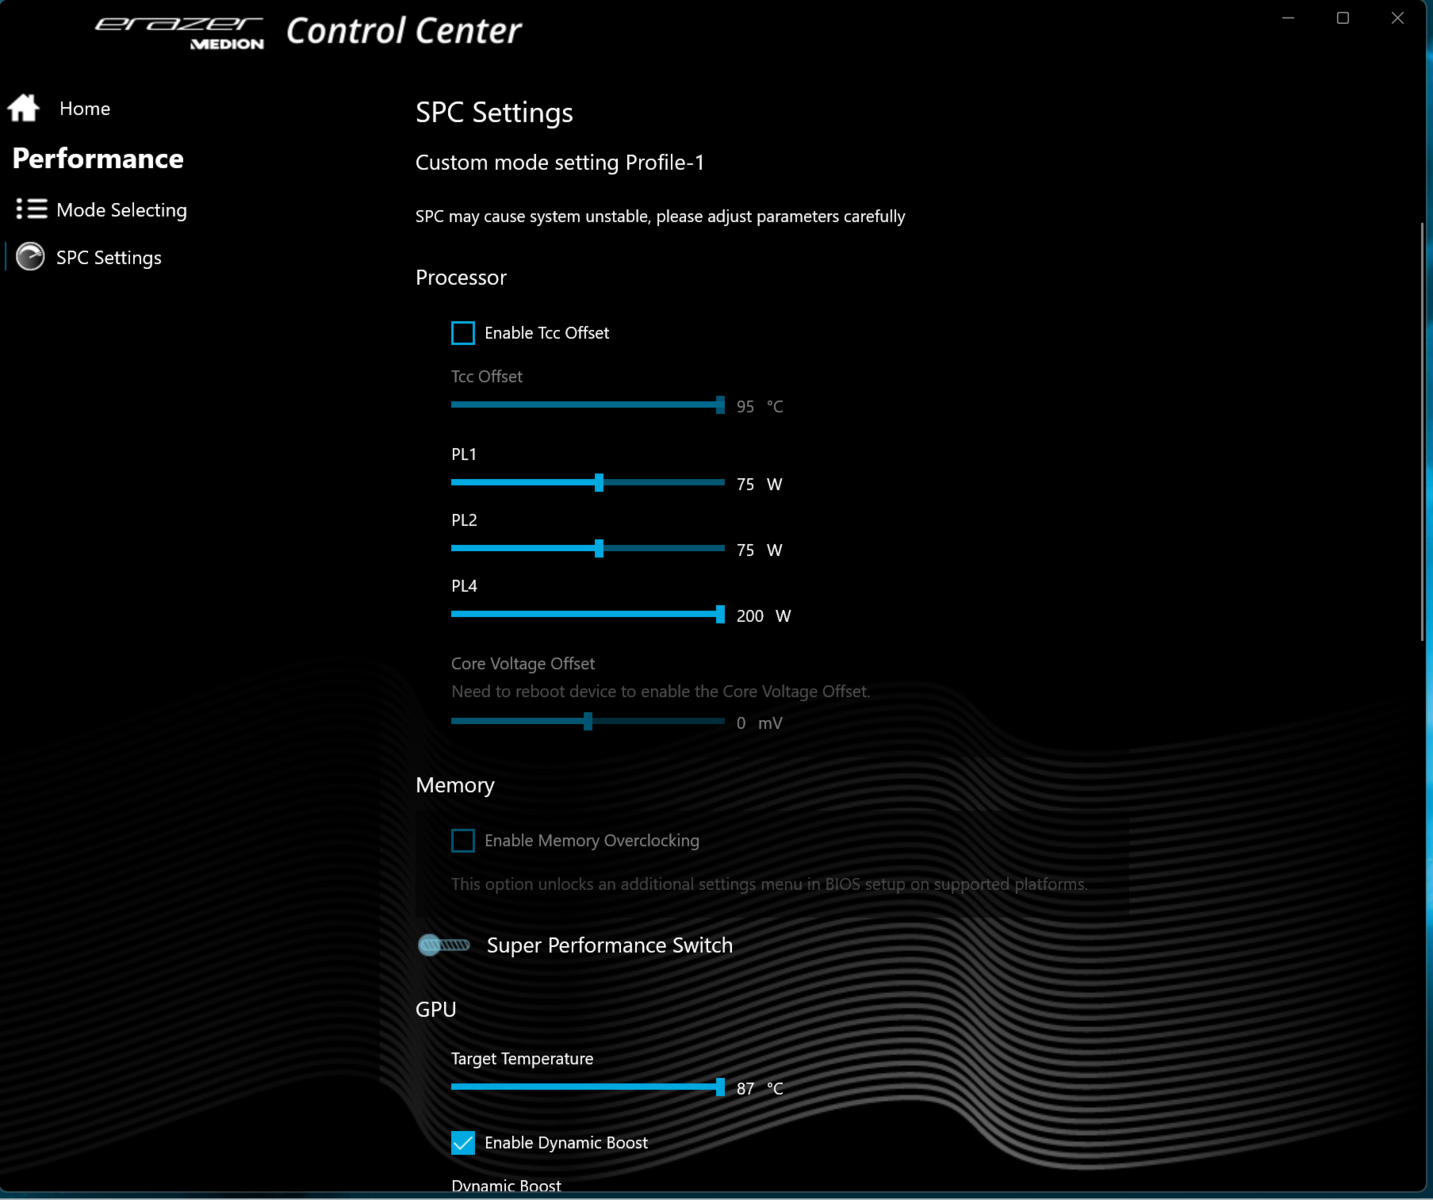
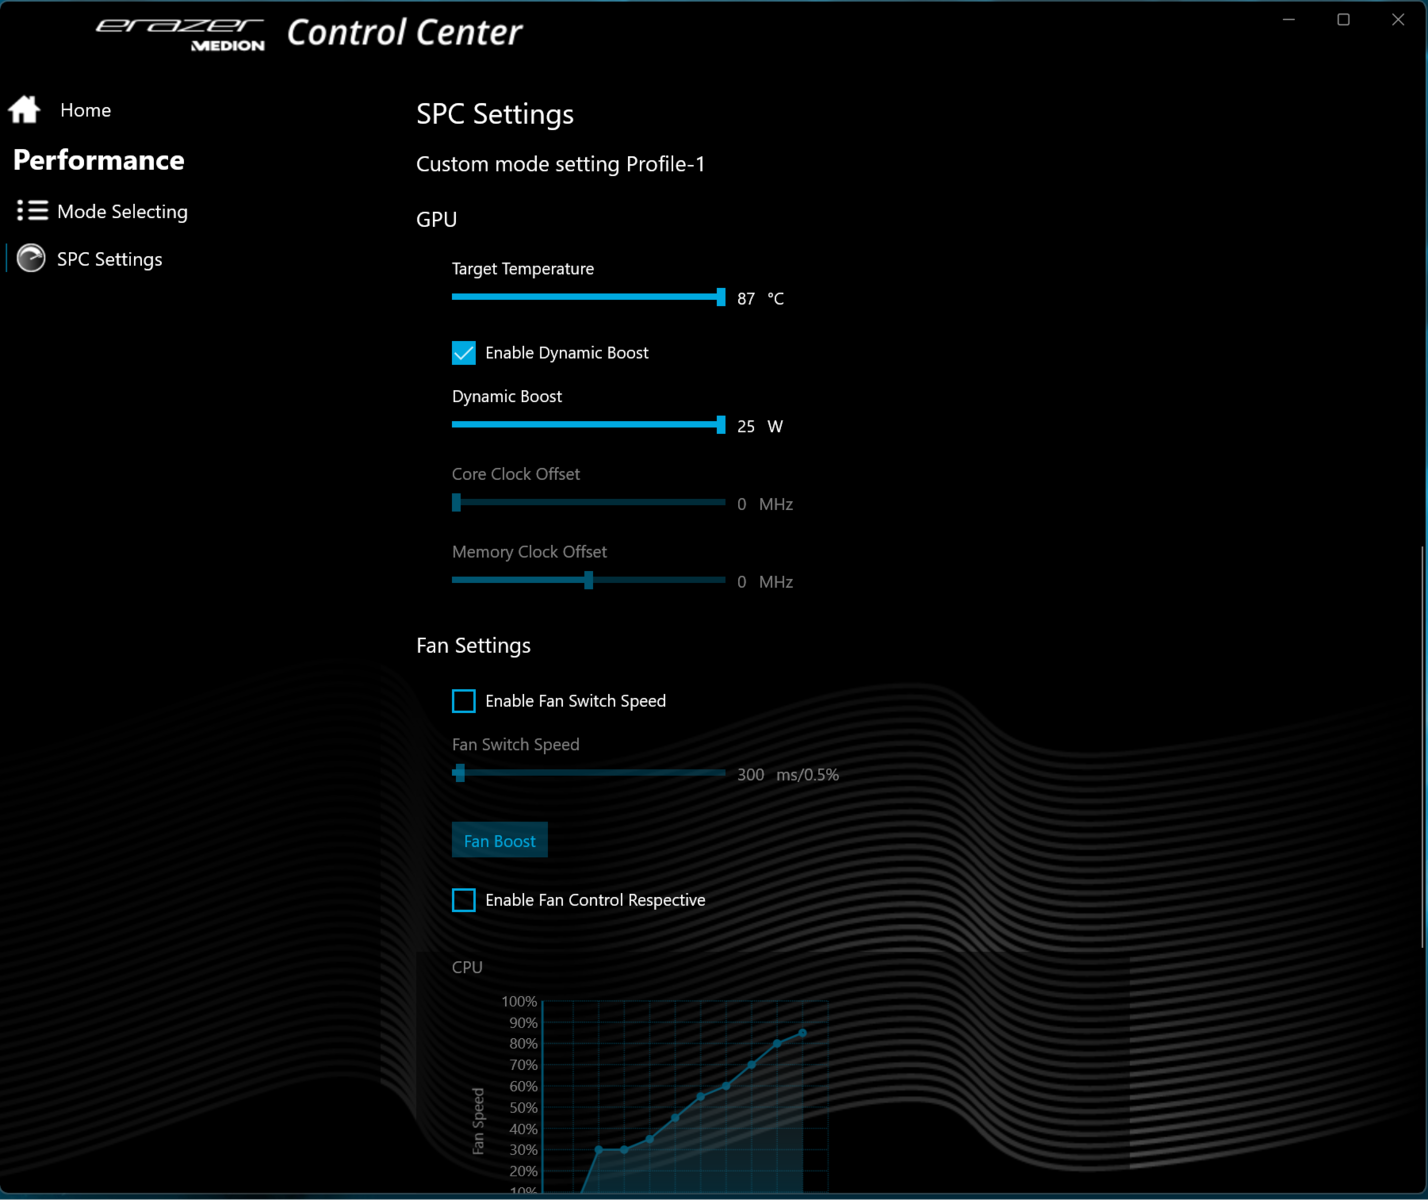
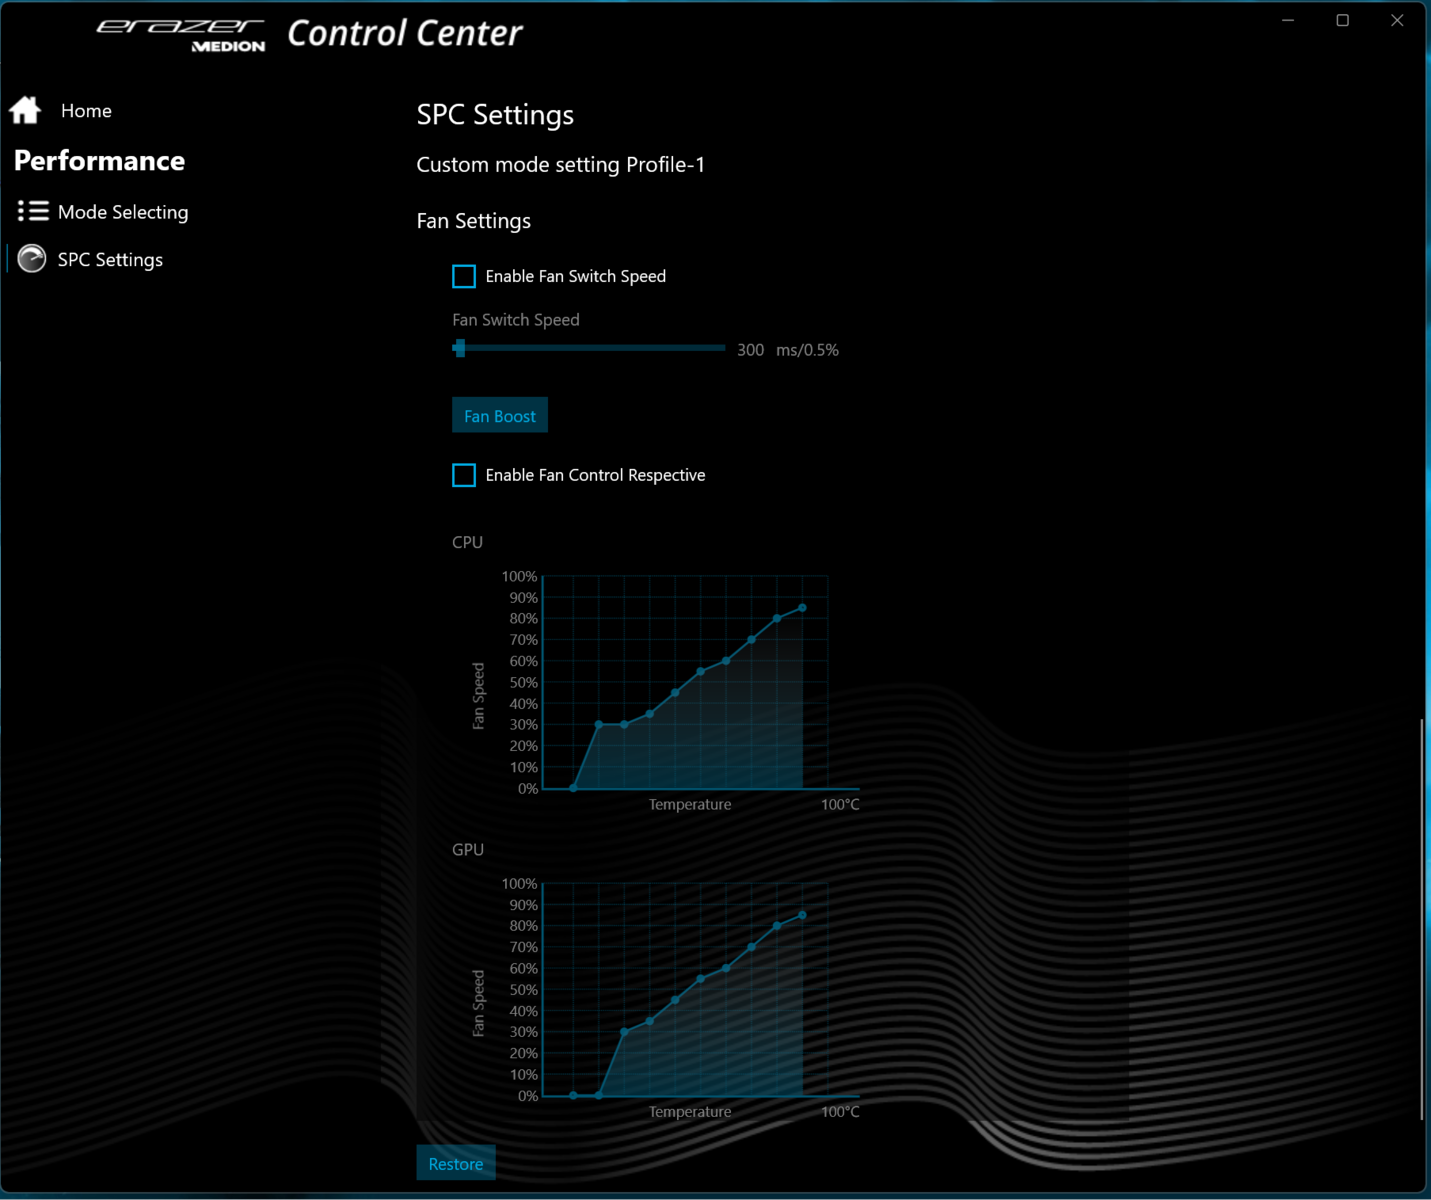
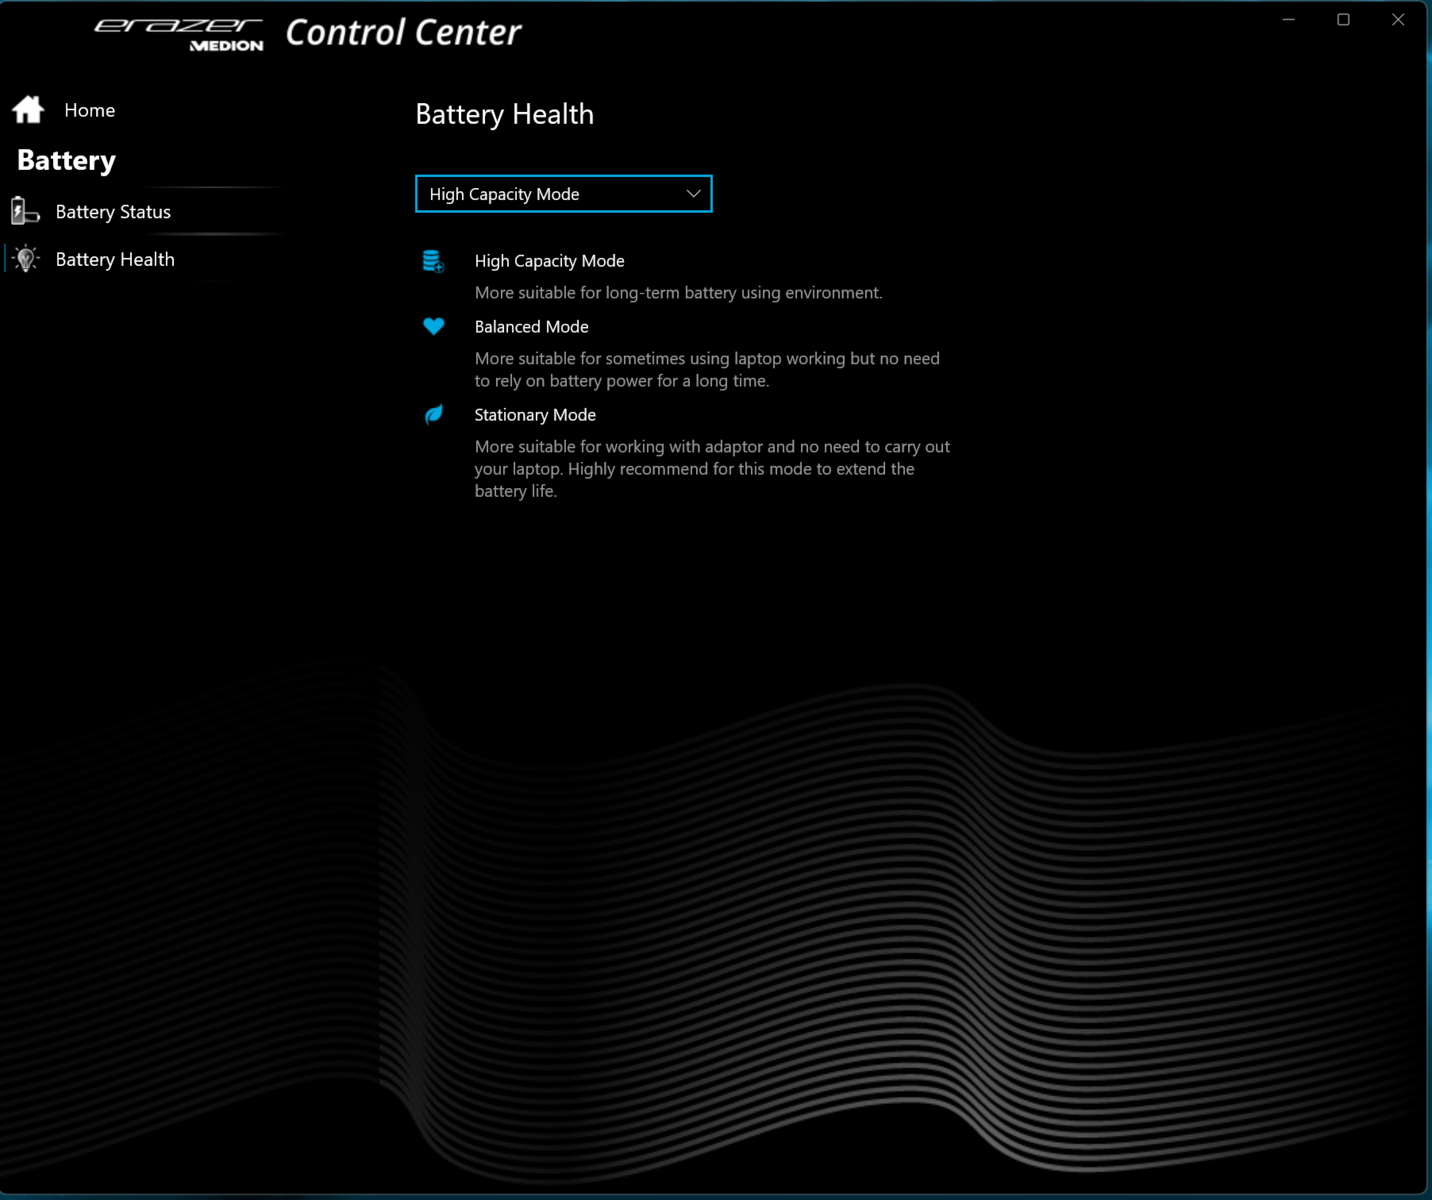
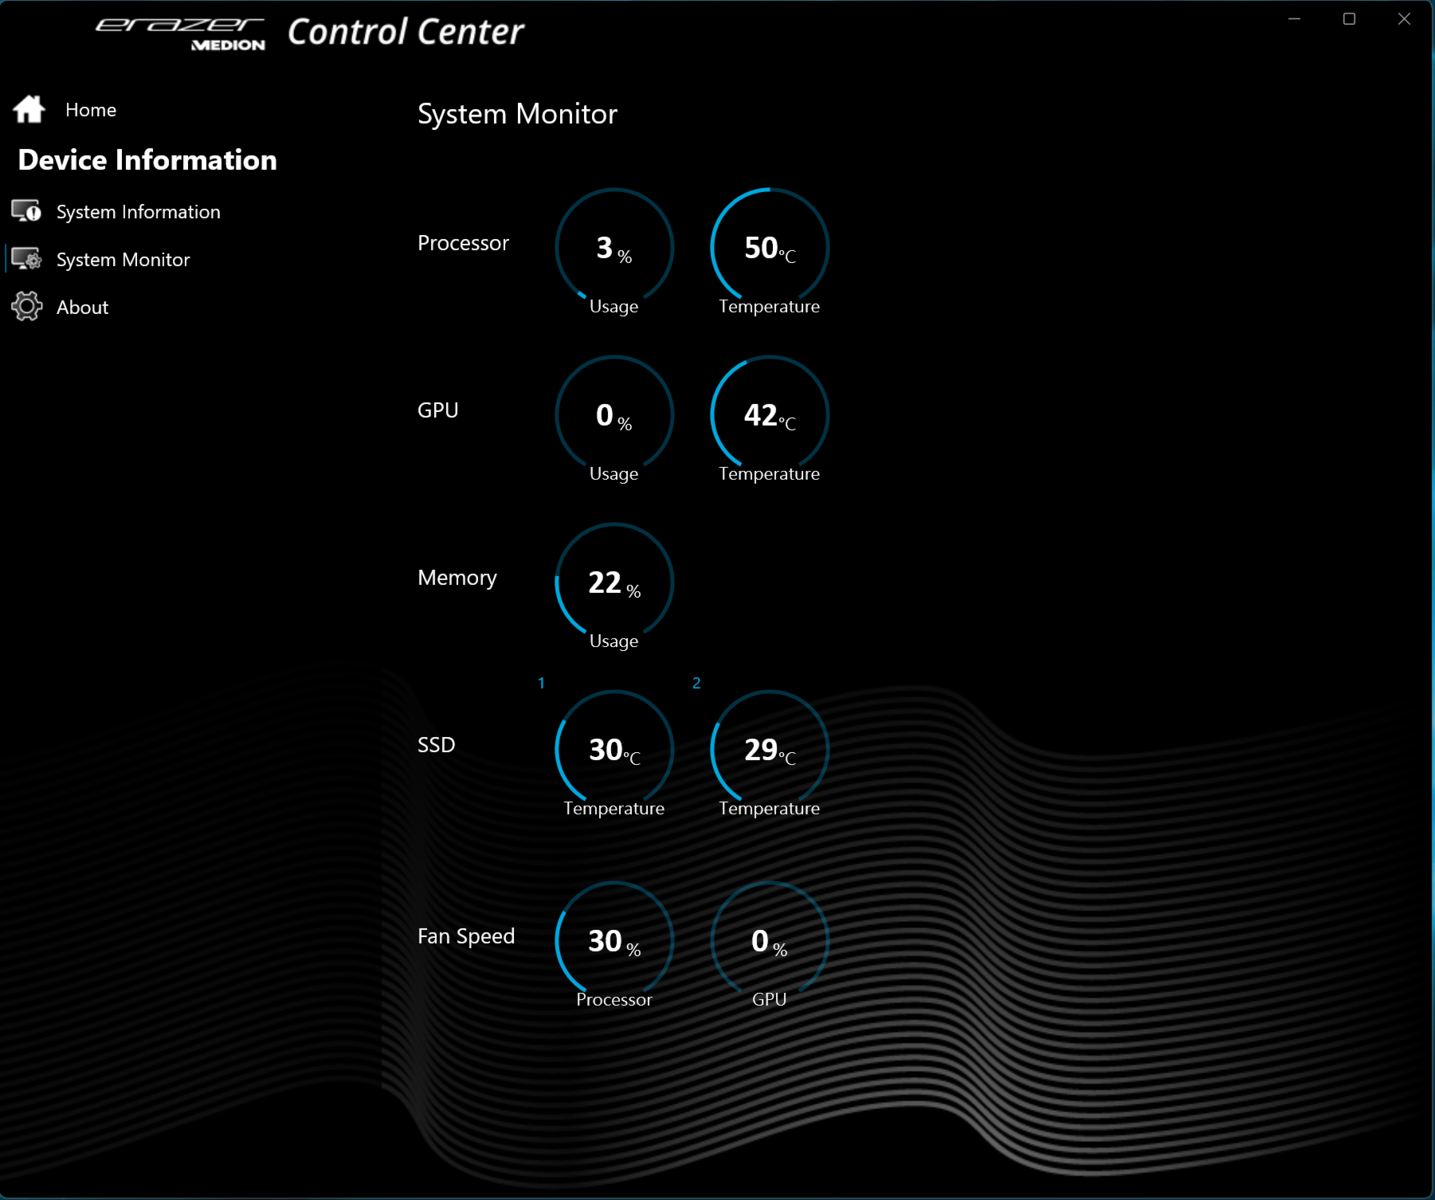
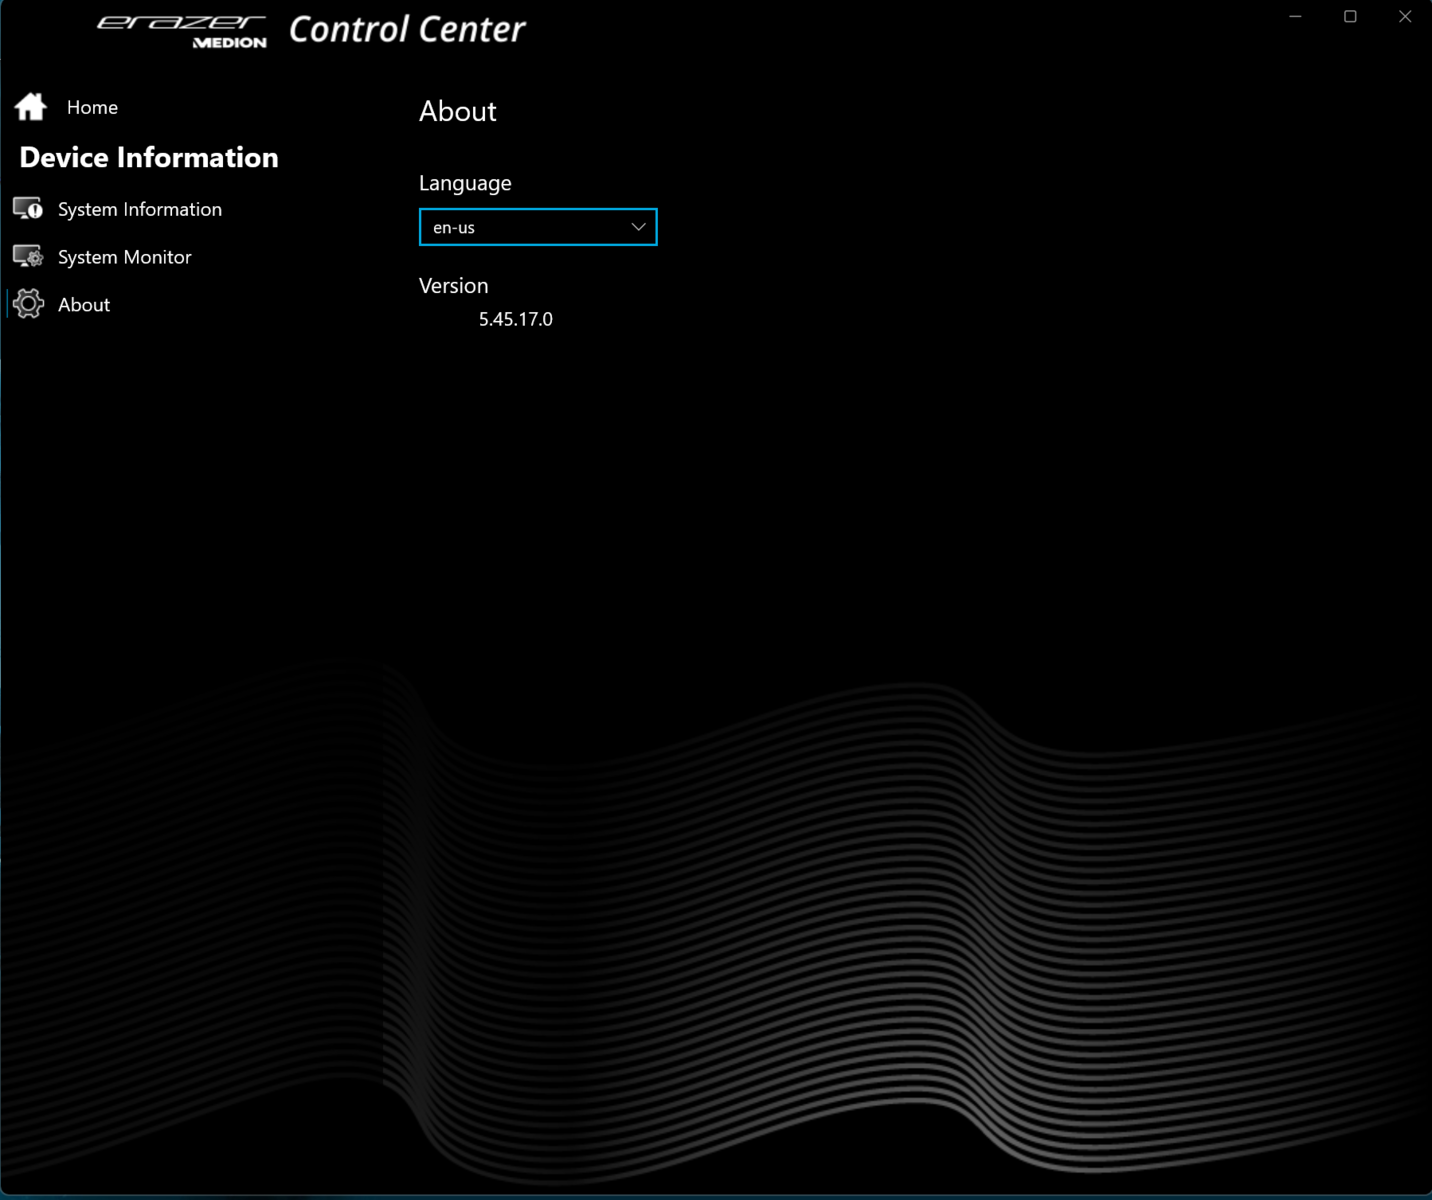
Individual profiles can be created using the preinstalled Control Center software. For example, the power limits of the CPU, the TGP of the GPU and/or the upper temperature limits can be adjusted.
We used the English-language interface of the CC software because the German translation was partially unsuccessful. You can switch between the two languages.
| Turbo Mode (dt: Overboost) | Balance Mode (dt: Balanced) | Office Mode (dt: Balanced) | |
|---|---|---|---|
| CPU PL1 (HWInfo) | 140 watts | 140 watts | 140 watts |
| CPU PL2 (HWInfo) | 140 watts | 140 watts | 140 watts |
| Noise (Witcher 3) | 50-53 dB(A) | 48-51 dB(A) | 36-43 dB(A), later 32-34 dB(A) |
| Performance (Witcher 3) | 124 fps | 118 fps | 114-118 fps, later 30 fps lock |
Processor
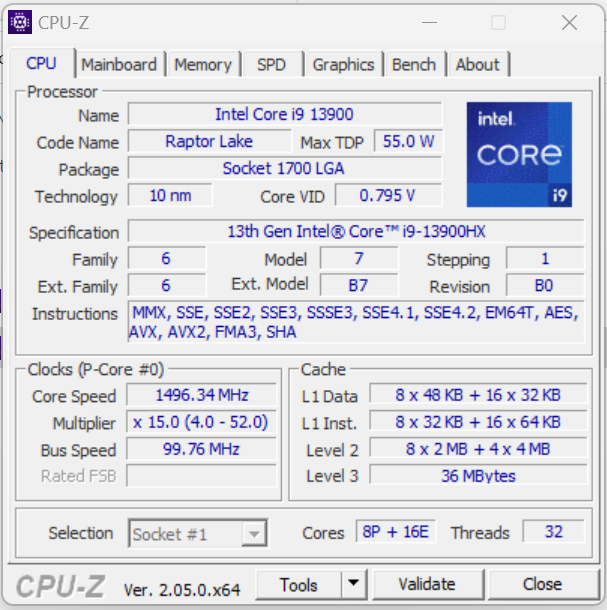
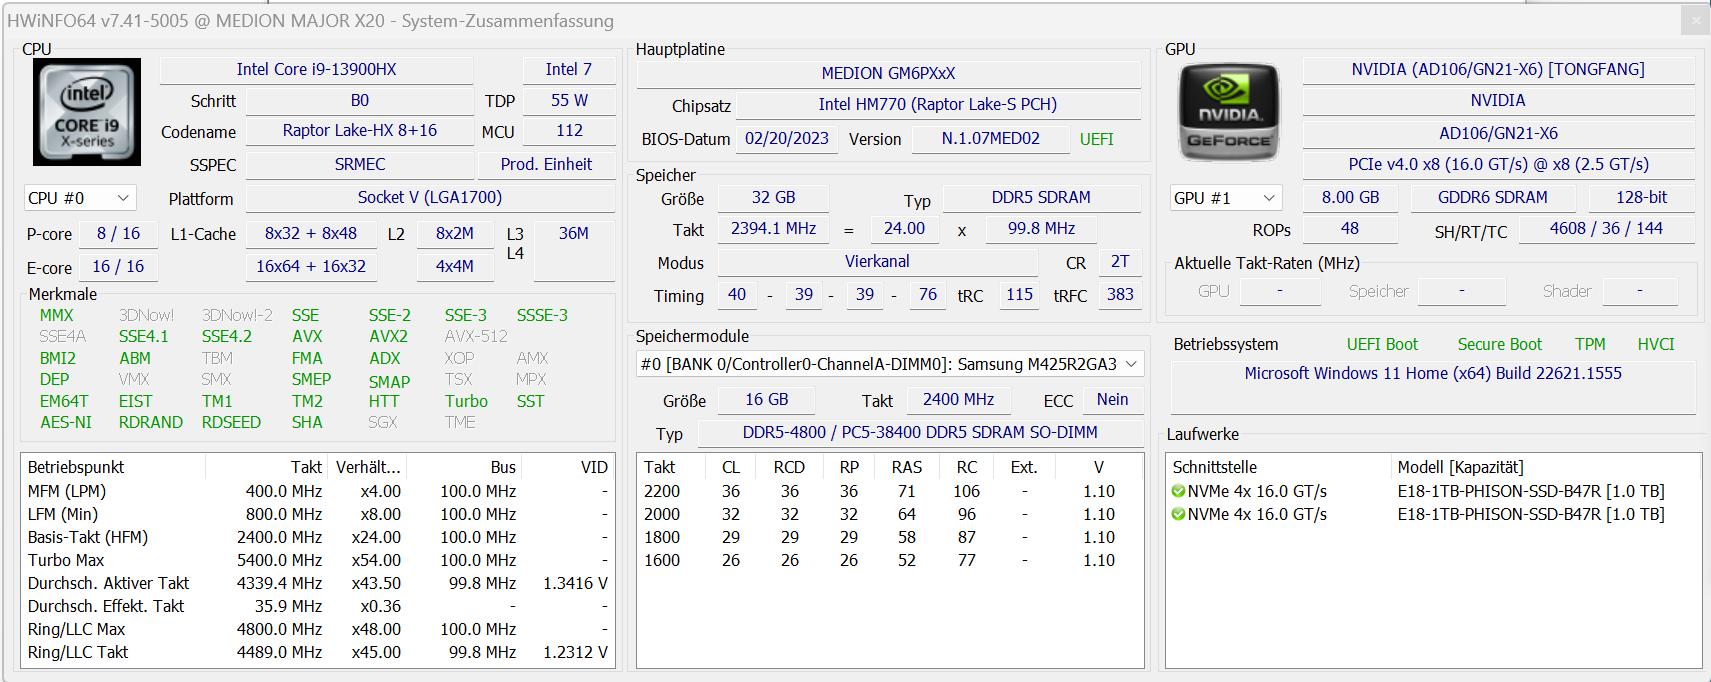
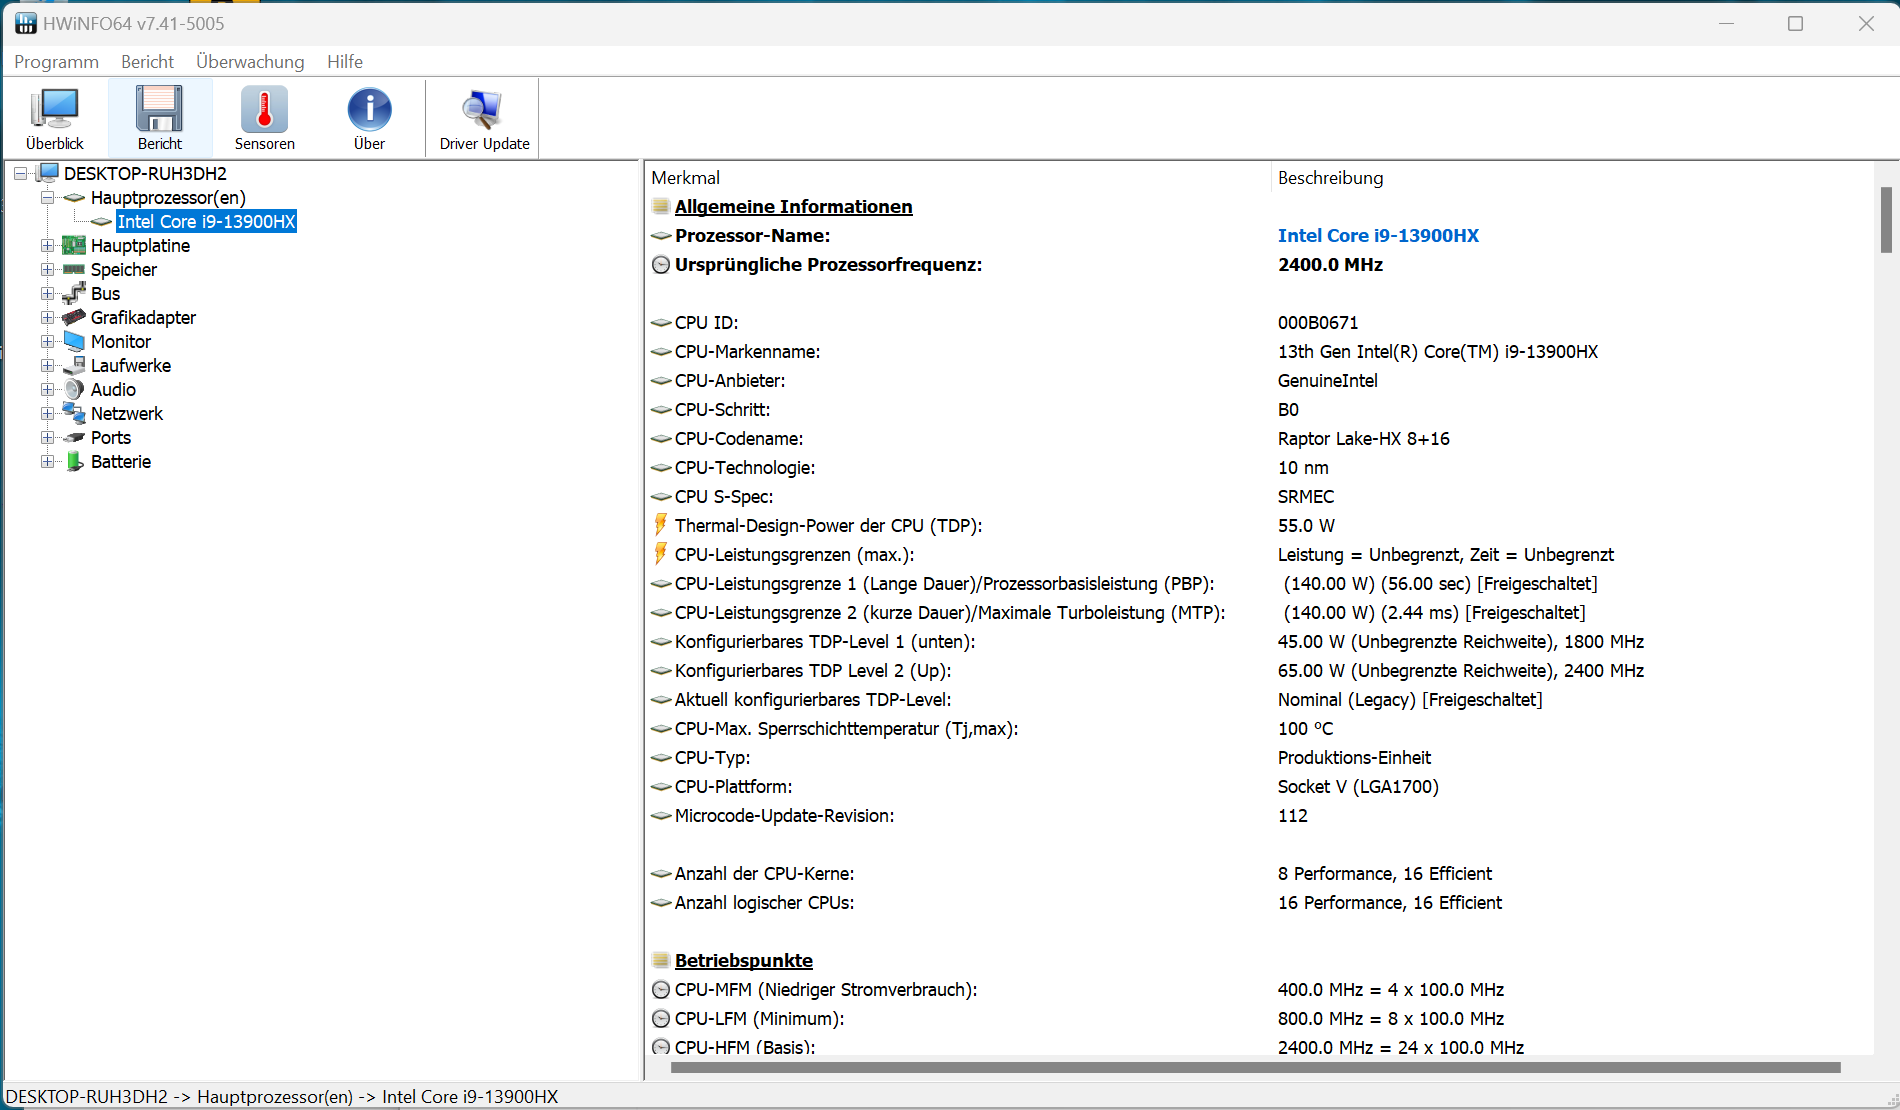
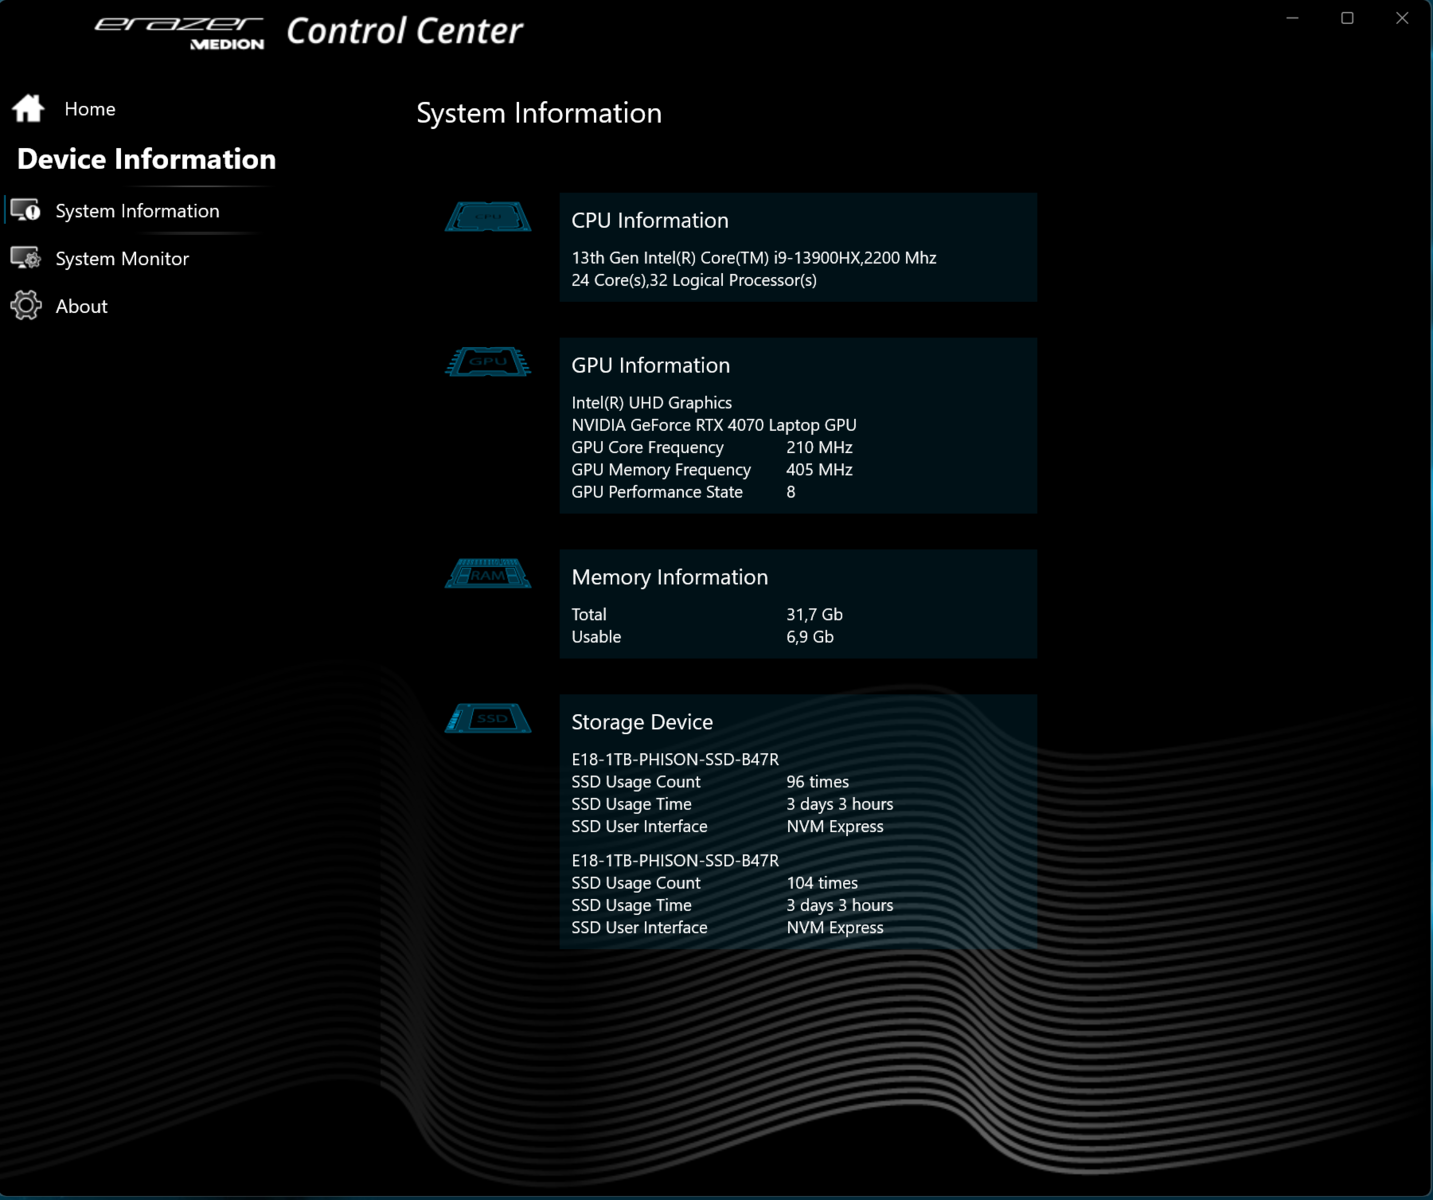
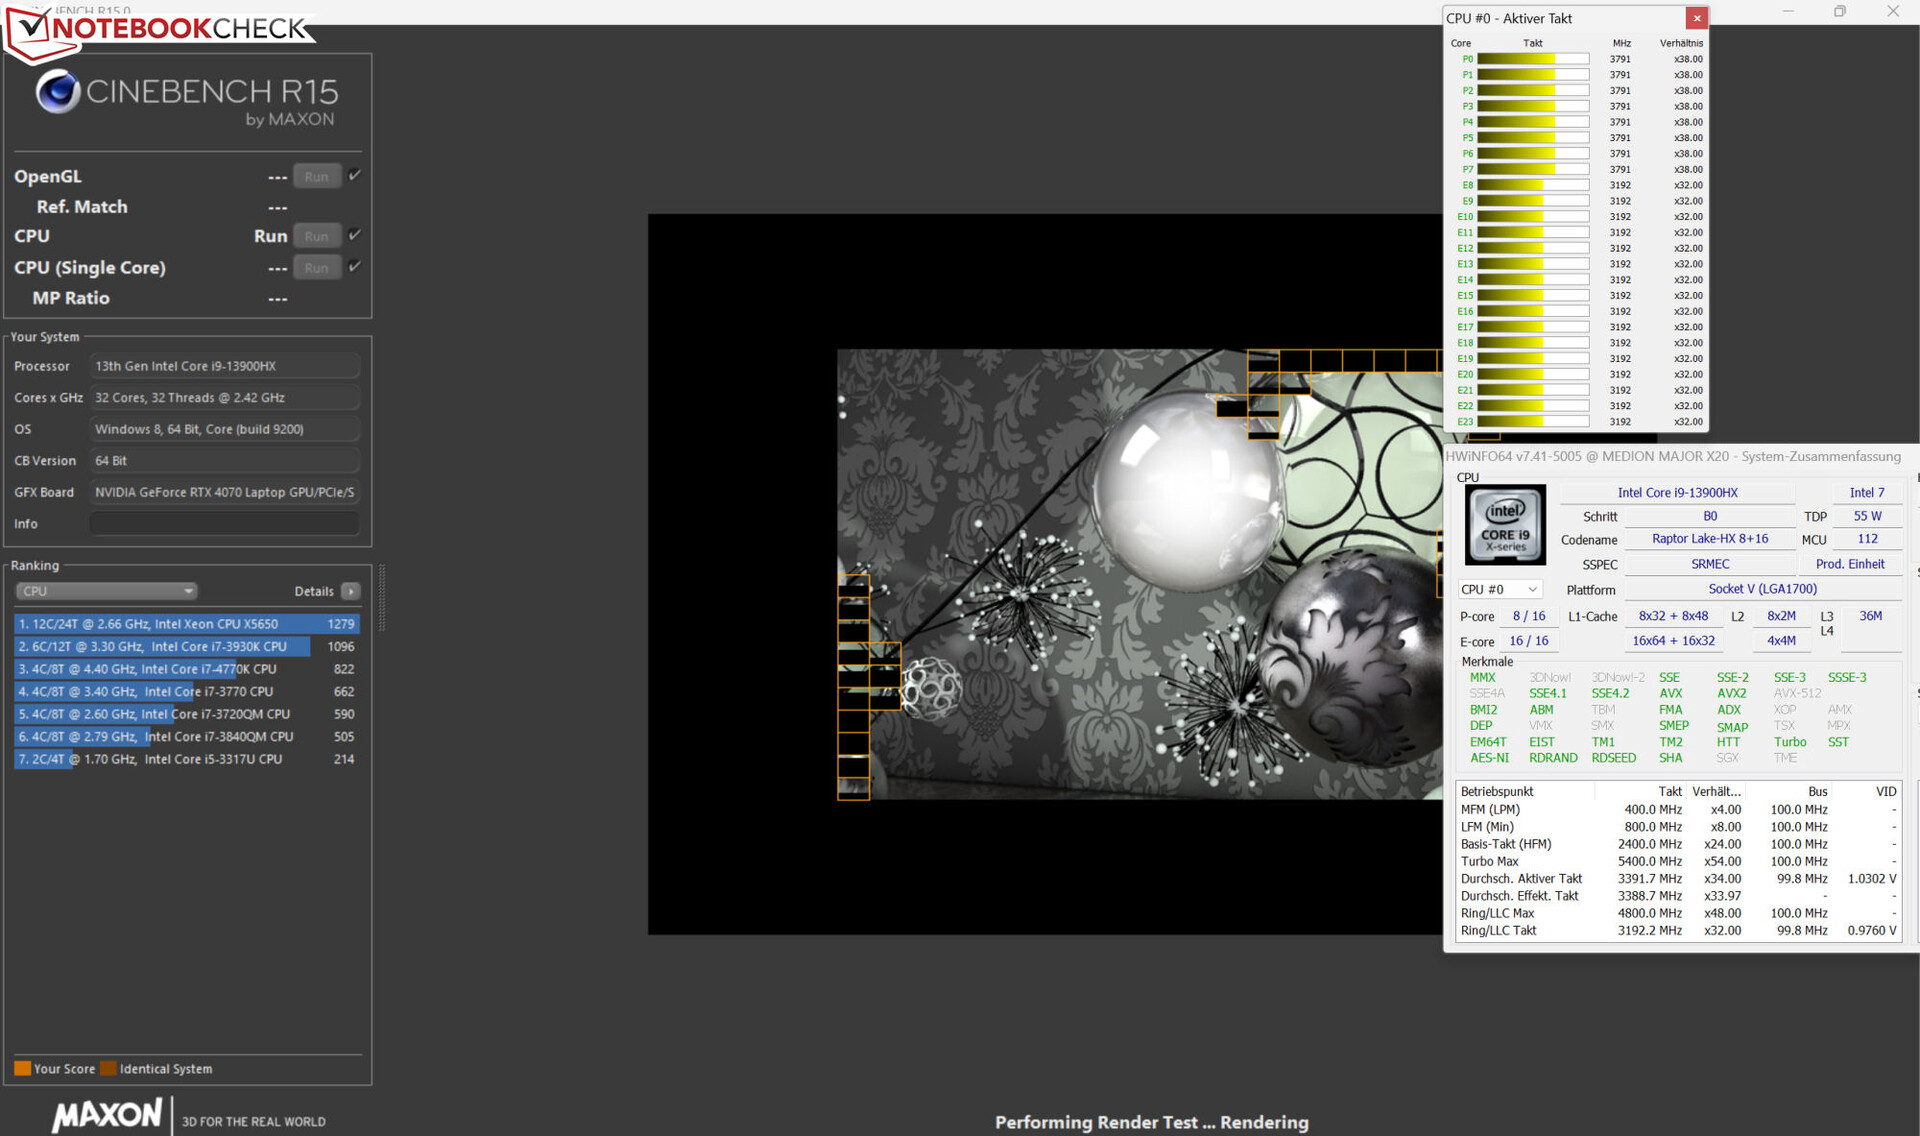
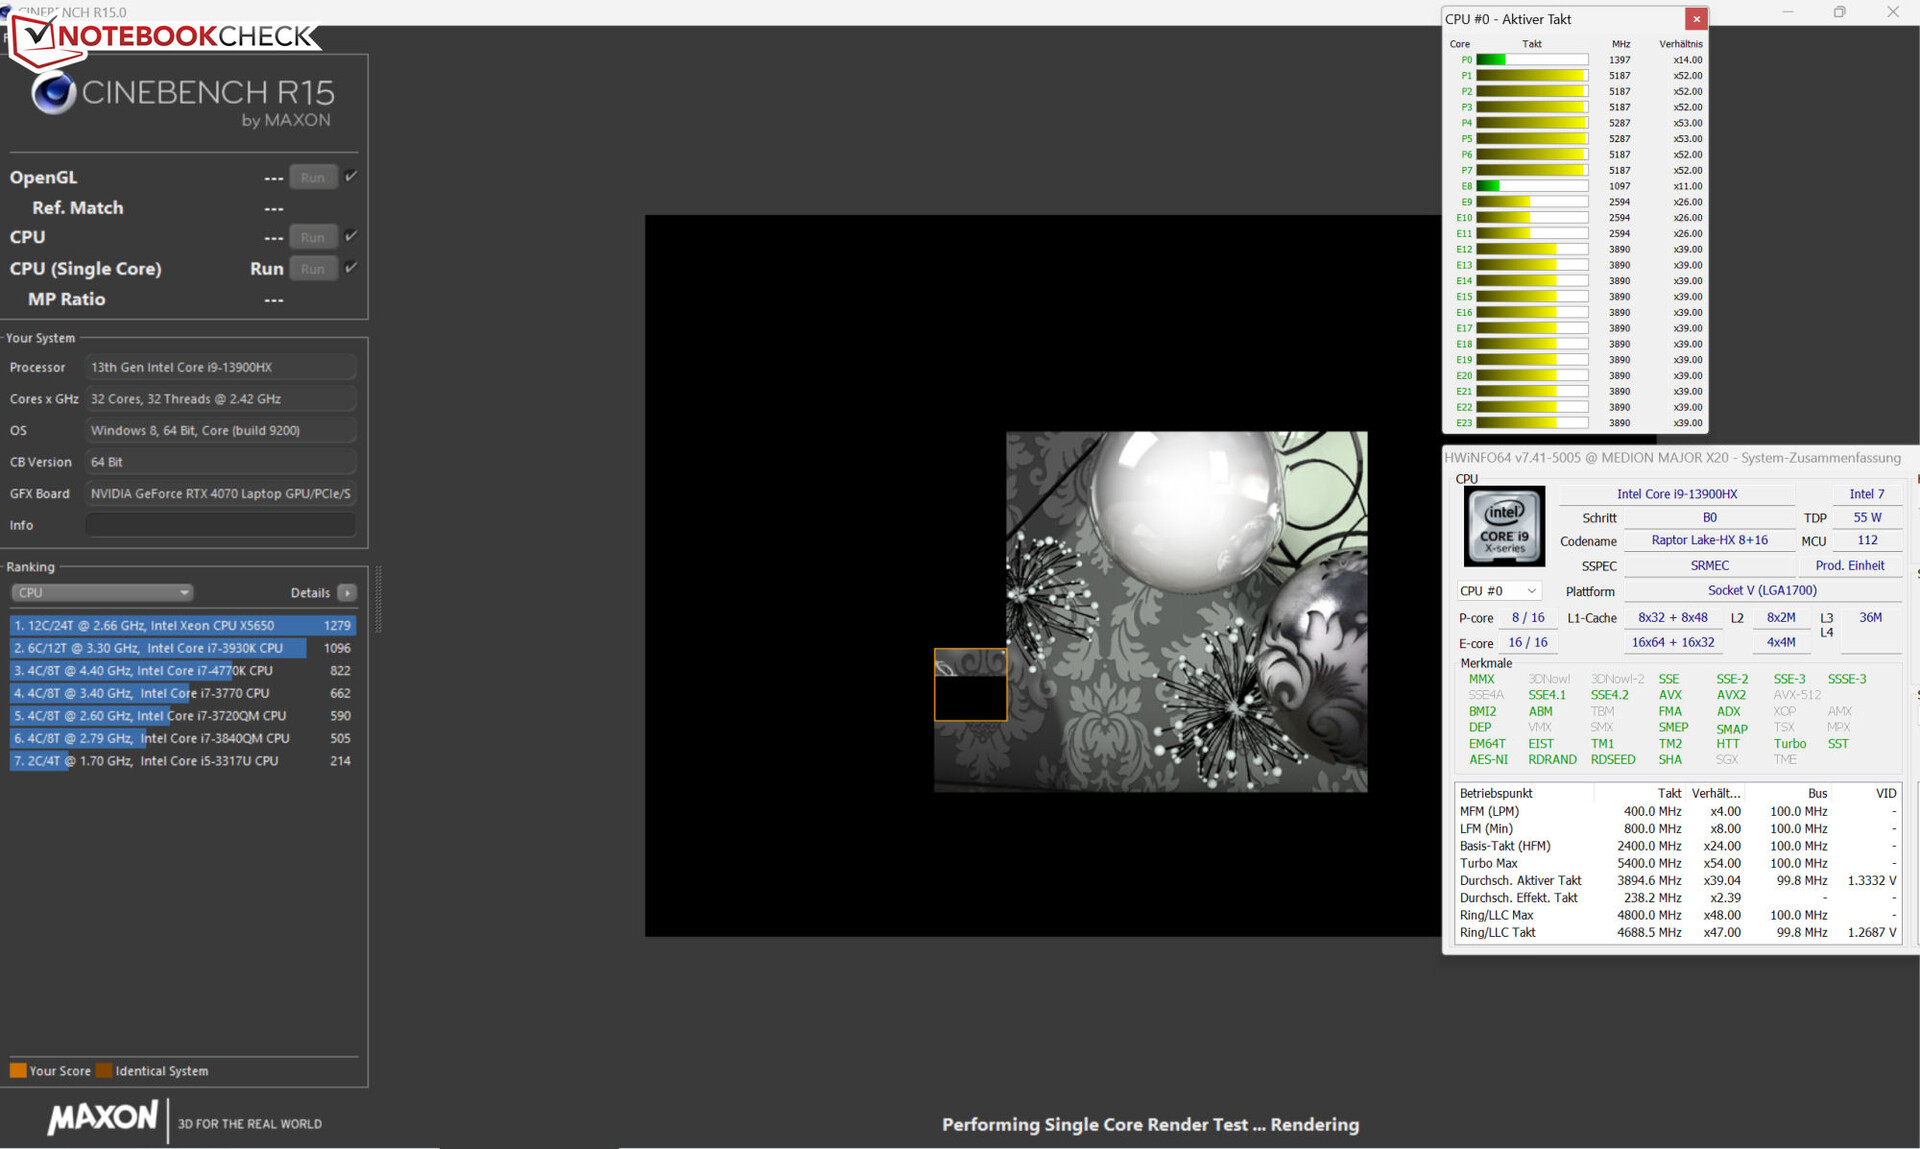
The Core-i9-13900HX processor (Raptor Lake) consists of eight performance cores (hyperthreading, 2.2 to 5.4 GHz) and sixteen efficiency cores (no hyperthreading, 1.6 to 3.9 GHz). In total, there are 32 logical CPU cores. The benchmark results are on par with the CPU's average rates.
The CPU tests of the Cinebench R15 benchmark were run at high to maximum clock rates in mains operation. Single-thread performance (222 points), which is relevant to everyday use, drops significantly less in battery mode than multi-thread performance (1025 points).
The CB15 loop test reveals that a high turbo clock is consistently sustained under multi-thread load in mains operation. The clock rate only drops minimally over the course of the test.
Cinebench R15 Multi Sustained Load

| CPU Performance rating - Percent | |
| Asus ROG Strix G17 G713PI | |
| Average Intel Core i9-13900HX | |
| Medion Erazer Major X20 | |
| Average of class Gaming | |
| Aorus 15X ASF | |
| Razer Blade 15 OLED (Early 2022) | |
* ... smaller is better
AIDA64: FP32 Ray-Trace | FPU Julia | CPU SHA3 | CPU Queen | FPU SinJulia | FPU Mandel | CPU AES | CPU ZLib | FP64 Ray-Trace | CPU PhotoWorxx
| Performance rating | |
| Asus ROG Strix G17 G713PI | |
| Average of class Gaming | |
| Average Intel Core i9-13900HX | |
| Medion Erazer Major X20 | |
| Aorus 15X ASF | |
| Razer Blade 15 OLED (Early 2022) | |
| AIDA64 / FP32 Ray-Trace | |
| Asus ROG Strix G17 G713PI | |
| Average of class Gaming (10227 - 85542, n=105, last 2 years) | |
| Medion Erazer Major X20 | |
| Average Intel Core i9-13900HX (17589 - 27615, n=22) | |
| Aorus 15X ASF | |
| Razer Blade 15 OLED (Early 2022) | |
| AIDA64 / FPU Julia | |
| Asus ROG Strix G17 G713PI | |
| Average of class Gaming (51376 - 238426, n=105, last 2 years) | |
| Medion Erazer Major X20 | |
| Average Intel Core i9-13900HX (88686 - 137015, n=22) | |
| Aorus 15X ASF | |
| Razer Blade 15 OLED (Early 2022) | |
| AIDA64 / CPU SHA3 | |
| Asus ROG Strix G17 G713PI | |
| Average of class Gaming (2180 - 10115, n=105, last 2 years) | |
| Medion Erazer Major X20 | |
| Average Intel Core i9-13900HX (4362 - 7029, n=22) | |
| Aorus 15X ASF | |
| Razer Blade 15 OLED (Early 2022) | |
| AIDA64 / CPU Queen | |
| Asus ROG Strix G17 G713PI | |
| Medion Erazer Major X20 | |
| Average Intel Core i9-13900HX (125644 - 141385, n=22) | |
| Average of class Gaming (49785 - 173351, n=90, last 2 years) | |
| Aorus 15X ASF | |
| Razer Blade 15 OLED (Early 2022) | |
| AIDA64 / FPU SinJulia | |
| Asus ROG Strix G17 G713PI | |
| Medion Erazer Major X20 | |
| Average Intel Core i9-13900HX (12334 - 17179, n=22) | |
| Average of class Gaming (4424 - 33636, n=105, last 2 years) | |
| Aorus 15X ASF | |
| Razer Blade 15 OLED (Early 2022) | |
| AIDA64 / FPU Mandel | |
| Asus ROG Strix G17 G713PI | |
| Average of class Gaming (25115 - 128721, n=105, last 2 years) | |
| Medion Erazer Major X20 | |
| Average Intel Core i9-13900HX (43850 - 69202, n=22) | |
| Aorus 15X ASF | |
| Razer Blade 15 OLED (Early 2022) | |
| AIDA64 / CPU AES | |
| Asus ROG Strix G17 G713PI | |
| Aorus 15X ASF | |
| Average Intel Core i9-13900HX (89413 - 237881, n=22) | |
| Medion Erazer Major X20 | |
| Average of class Gaming (39258 - 247074, n=105, last 2 years) | |
| Razer Blade 15 OLED (Early 2022) | |
| AIDA64 / CPU ZLib | |
| Asus ROG Strix G17 G713PI | |
| Medion Erazer Major X20 | |
| Average Intel Core i9-13900HX (1284 - 1958, n=22) | |
| Average of class Gaming (574 - 2531, n=105, last 2 years) | |
| Aorus 15X ASF | |
| Razer Blade 15 OLED (Early 2022) | |
| AIDA64 / FP64 Ray-Trace | |
| Asus ROG Strix G17 G713PI | |
| Average of class Gaming (5509 - 45446, n=105, last 2 years) | |
| Medion Erazer Major X20 | |
| Average Intel Core i9-13900HX (9481 - 15279, n=22) | |
| Aorus 15X ASF | |
| Razer Blade 15 OLED (Early 2022) | |
| AIDA64 / CPU PhotoWorxx | |
| Average Intel Core i9-13900HX (42994 - 51994, n=22) | |
| Average of class Gaming (12271 - 89891, n=105, last 2 years) | |
| Medion Erazer Major X20 | |
| Aorus 15X ASF | |
| Razer Blade 15 OLED (Early 2022) | |
| Razer Blade 15 OLED (Early 2022) | |
| Asus ROG Strix G17 G713PI | |
System Performance
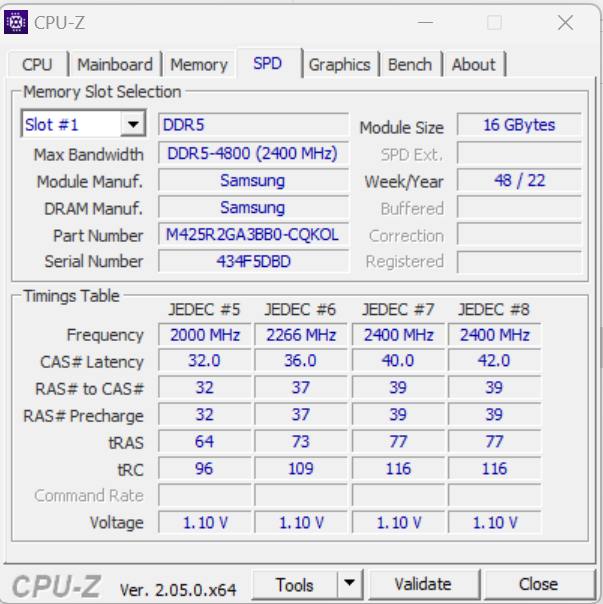
The smoothly running system does not lack computing power. The laptop handles gaming, rendering, and video editing without issue, as confirmed by the good PCMark results. The transfer rates of the RAM are on a normal level for DDR5-4800 memory.
CrossMark: Overall | Productivity | Creativity | Responsiveness
| PCMark 10 / Score | |
| Average of class Gaming (5828 - 12414, n=93, last 2 years) | |
| Medion Erazer Major X20 | |
| Average Intel Core i9-13900HX, NVIDIA GeForce RTX 4070 Laptop GPU (6956 - 8153, n=3) | |
| Asus ROG Strix G17 G713PI | |
| Razer Blade 15 OLED (Early 2022) | |
| Aorus 15X ASF | |
| PCMark 10 / Essentials | |
| Medion Erazer Major X20 | |
| Asus ROG Strix G17 G713PI | |
| Average Intel Core i9-13900HX, NVIDIA GeForce RTX 4070 Laptop GPU (9865 - 11653, n=3) | |
| Aorus 15X ASF | |
| Average of class Gaming (8810 - 11935, n=97, last 2 years) | |
| Razer Blade 15 OLED (Early 2022) | |
| PCMark 10 / Productivity | |
| Average of class Gaming (6845 - 25323, n=95, last 2 years) | |
| Asus ROG Strix G17 G713PI | |
| Razer Blade 15 OLED (Early 2022) | |
| Medion Erazer Major X20 | |
| Average Intel Core i9-13900HX, NVIDIA GeForce RTX 4070 Laptop GPU (9470 - 9850, n=3) | |
| Aorus 15X ASF | |
| PCMark 10 / Digital Content Creation | |
| Average of class Gaming (7602 - 19954, n=95, last 2 years) | |
| Average Intel Core i9-13900HX, NVIDIA GeForce RTX 4070 Laptop GPU (9776 - 13370, n=3) | |
| Razer Blade 15 OLED (Early 2022) | |
| Medion Erazer Major X20 | |
| Aorus 15X ASF | |
| Asus ROG Strix G17 G713PI | |
| CrossMark / Overall | |
| Aorus 15X ASF | |
| Asus ROG Strix G17 G713PI | |
| Average of class Gaming (1366 - 2409, n=94, last 2 years) | |
| Average Intel Core i9-13900HX, NVIDIA GeForce RTX 4070 Laptop GPU (1842 - 2029, n=3) | |
| Medion Erazer Major X20 | |
| Razer Blade 15 OLED (Early 2022) | |
| CrossMark / Productivity | |
| Aorus 15X ASF | |
| Asus ROG Strix G17 G713PI | |
| Average of class Gaming (1386 - 2254, n=94, last 2 years) | |
| Average Intel Core i9-13900HX, NVIDIA GeForce RTX 4070 Laptop GPU (1700 - 1872, n=3) | |
| Medion Erazer Major X20 | |
| Razer Blade 15 OLED (Early 2022) | |
| CrossMark / Creativity | |
| Asus ROG Strix G17 G713PI | |
| Average of class Gaming (1343 - 2786, n=94, last 2 years) | |
| Average Intel Core i9-13900HX, NVIDIA GeForce RTX 4070 Laptop GPU (2088 - 2316, n=3) | |
| Aorus 15X ASF | |
| Medion Erazer Major X20 | |
| Razer Blade 15 OLED (Early 2022) | |
| CrossMark / Responsiveness | |
| Aorus 15X ASF | |
| Average of class Gaming (1226 - 2334, n=94, last 2 years) | |
| Asus ROG Strix G17 G713PI | |
| Average Intel Core i9-13900HX, NVIDIA GeForce RTX 4070 Laptop GPU (1557 - 1752, n=3) | |
| Medion Erazer Major X20 | |
| Razer Blade 15 OLED (Early 2022) | |
| PCMark 8 Home Score Accelerated v2 | 4889 points | |
| PCMark 8 Work Score Accelerated v2 | 6067 points | |
| PCMark 10 Score | 7575 points | |
Help | ||
| AIDA64 / Memory Copy | |
| Average Intel Core i9-13900HX (67716 - 79193, n=22) | |
| Average of class Gaming (21750 - 129946, n=105, last 2 years) | |
| Medion Erazer Major X20 | |
| Aorus 15X ASF | |
| Razer Blade 15 OLED (Early 2022) | |
| Asus ROG Strix G17 G713PI | |
| AIDA64 / Memory Read | |
| Average Intel Core i9-13900HX (73998 - 88462, n=22) | |
| Average of class Gaming (22956 - 118858, n=105, last 2 years) | |
| Medion Erazer Major X20 | |
| Aorus 15X ASF | |
| Razer Blade 15 OLED (Early 2022) | |
| Asus ROG Strix G17 G713PI | |
| AIDA64 / Memory Write | |
| Average of class Gaming (22297 - 135096, n=105, last 2 years) | |
| Average Intel Core i9-13900HX (65472 - 77045, n=22) | |
| Medion Erazer Major X20 | |
| Asus ROG Strix G17 G713PI | |
| Razer Blade 15 OLED (Early 2022) | |
| Aorus 15X ASF | |
| AIDA64 / Memory Latency | |
| Average of class Gaming (75.3 - 259, n=105, last 2 years) | |
| Razer Blade 15 OLED (Early 2022) | |
| Medion Erazer Major X20 | |
| Asus ROG Strix G17 G713PI | |
| Aorus 15X ASF | |
| Average Intel Core i9-13900HX (75.3 - 91.1, n=22) | |
* ... smaller is better
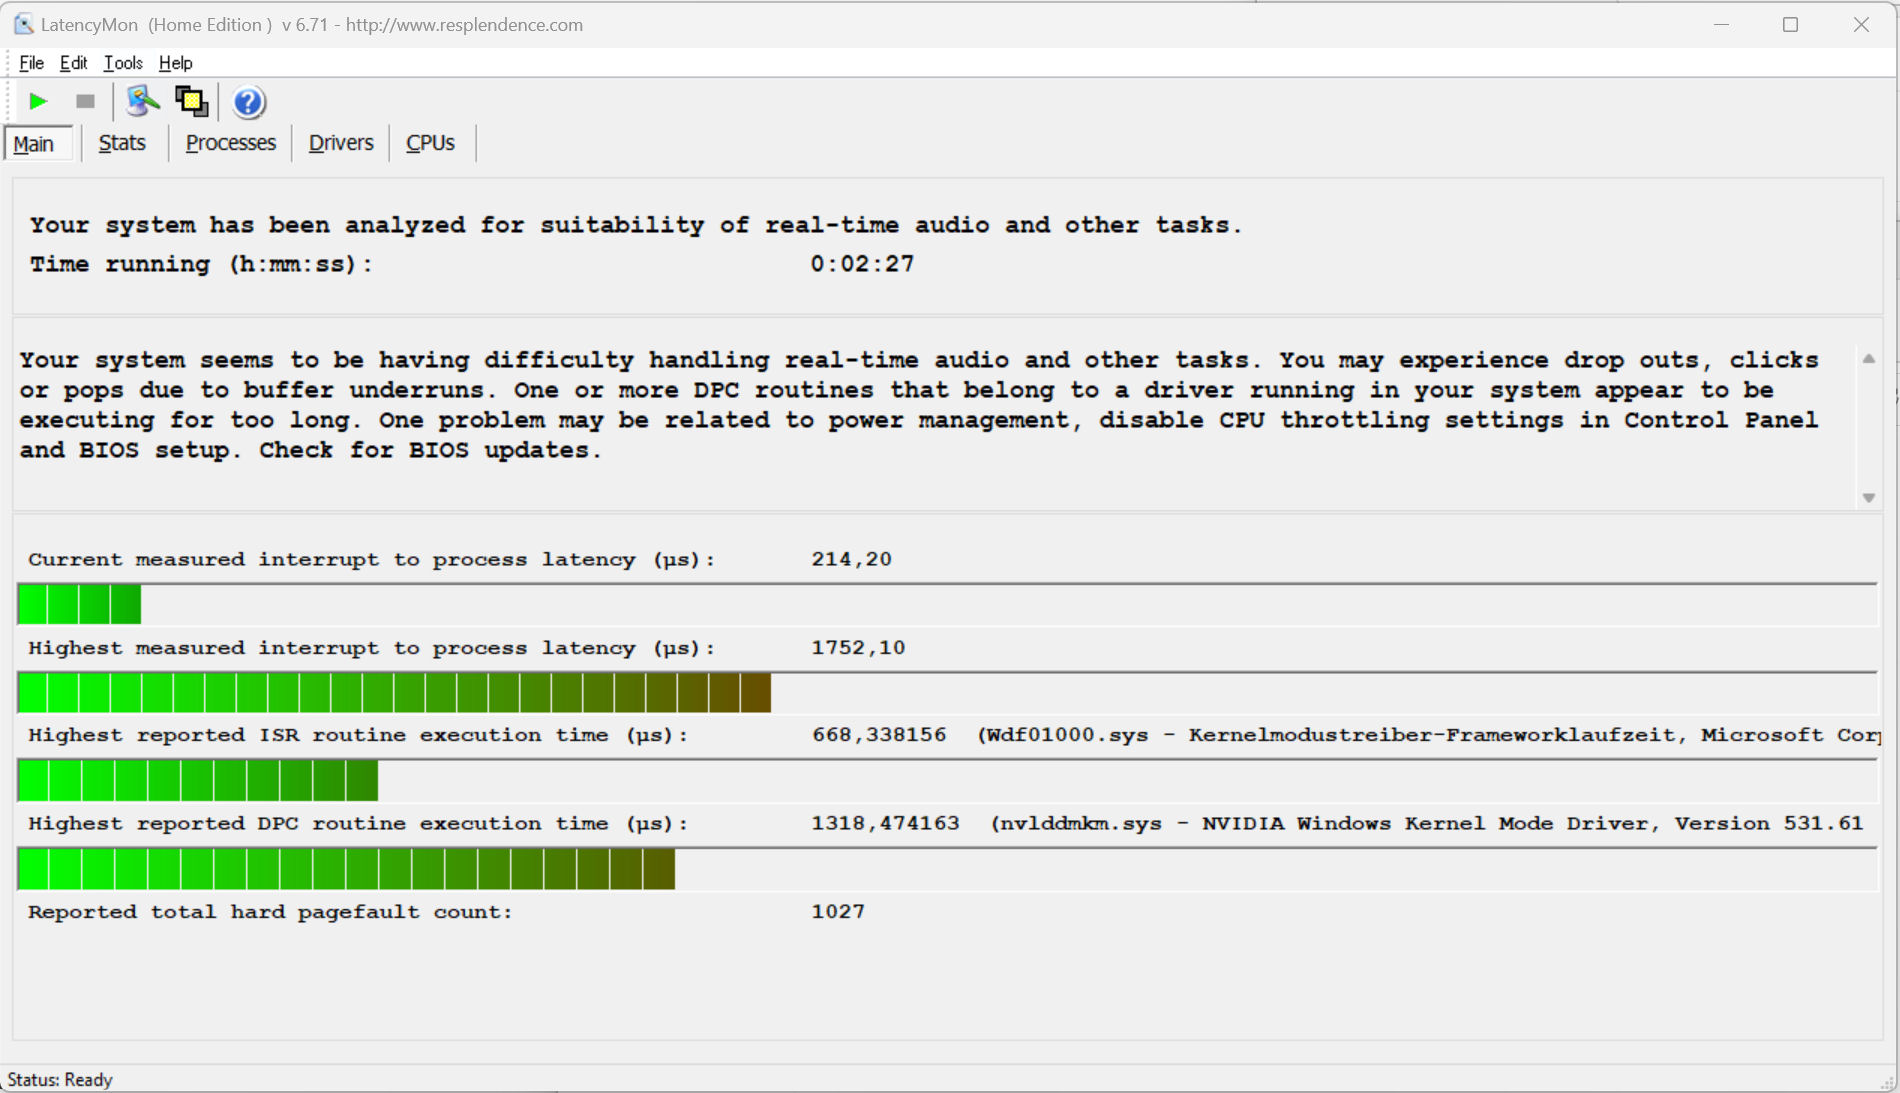
DPC Latency
The standardized latency monitor test (web surfing, 4k video playback, Prime95 high-load) revealed anomalies. The system does not seem to be suitable for real-time video and audio editing. Future software updates may improve this or lead to further deterioration.
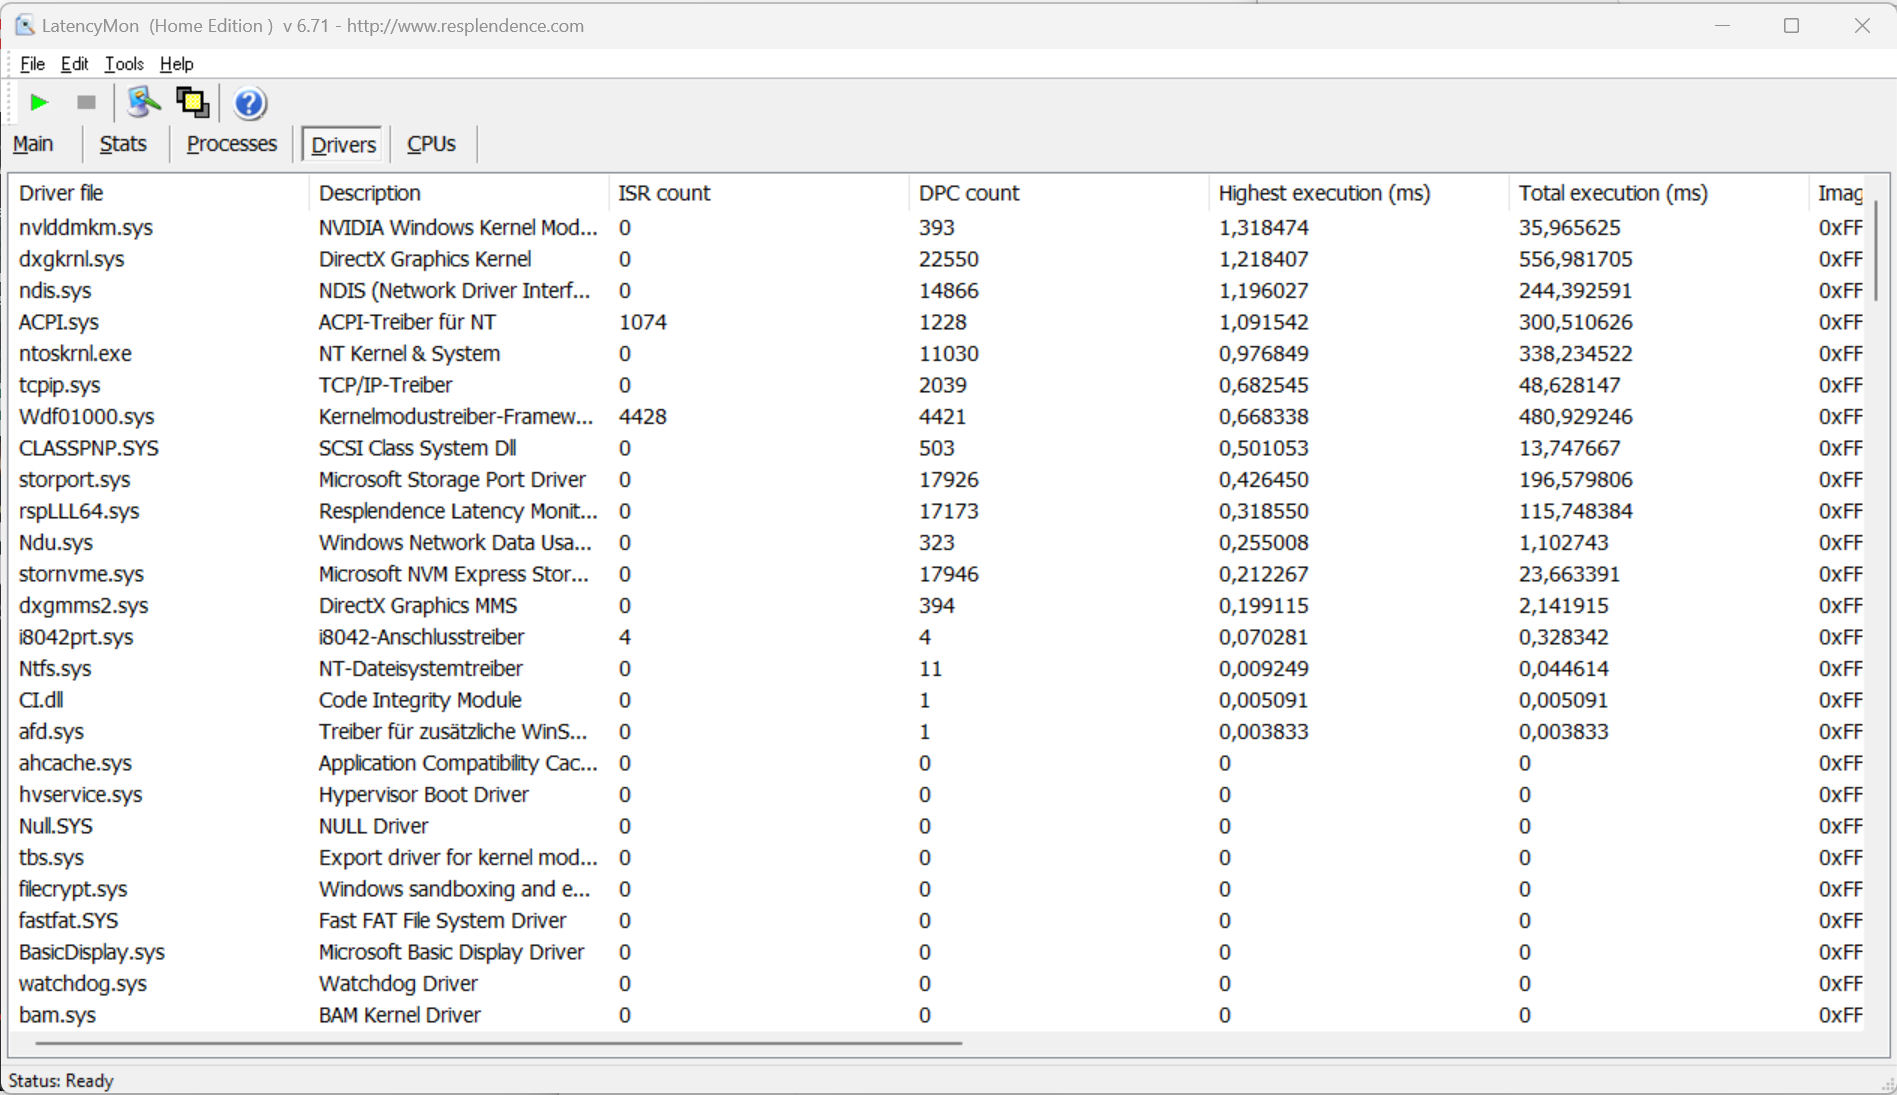
| DPC Latencies / LatencyMon - interrupt to process latency (max), Web, Youtube, Prime95 | |
| Aorus 15X ASF | |
| Medion Erazer Major X20 | |
| Asus ROG Strix G17 G713PI | |
| Razer Blade 15 OLED (Early 2022) | |
* ... smaller is better
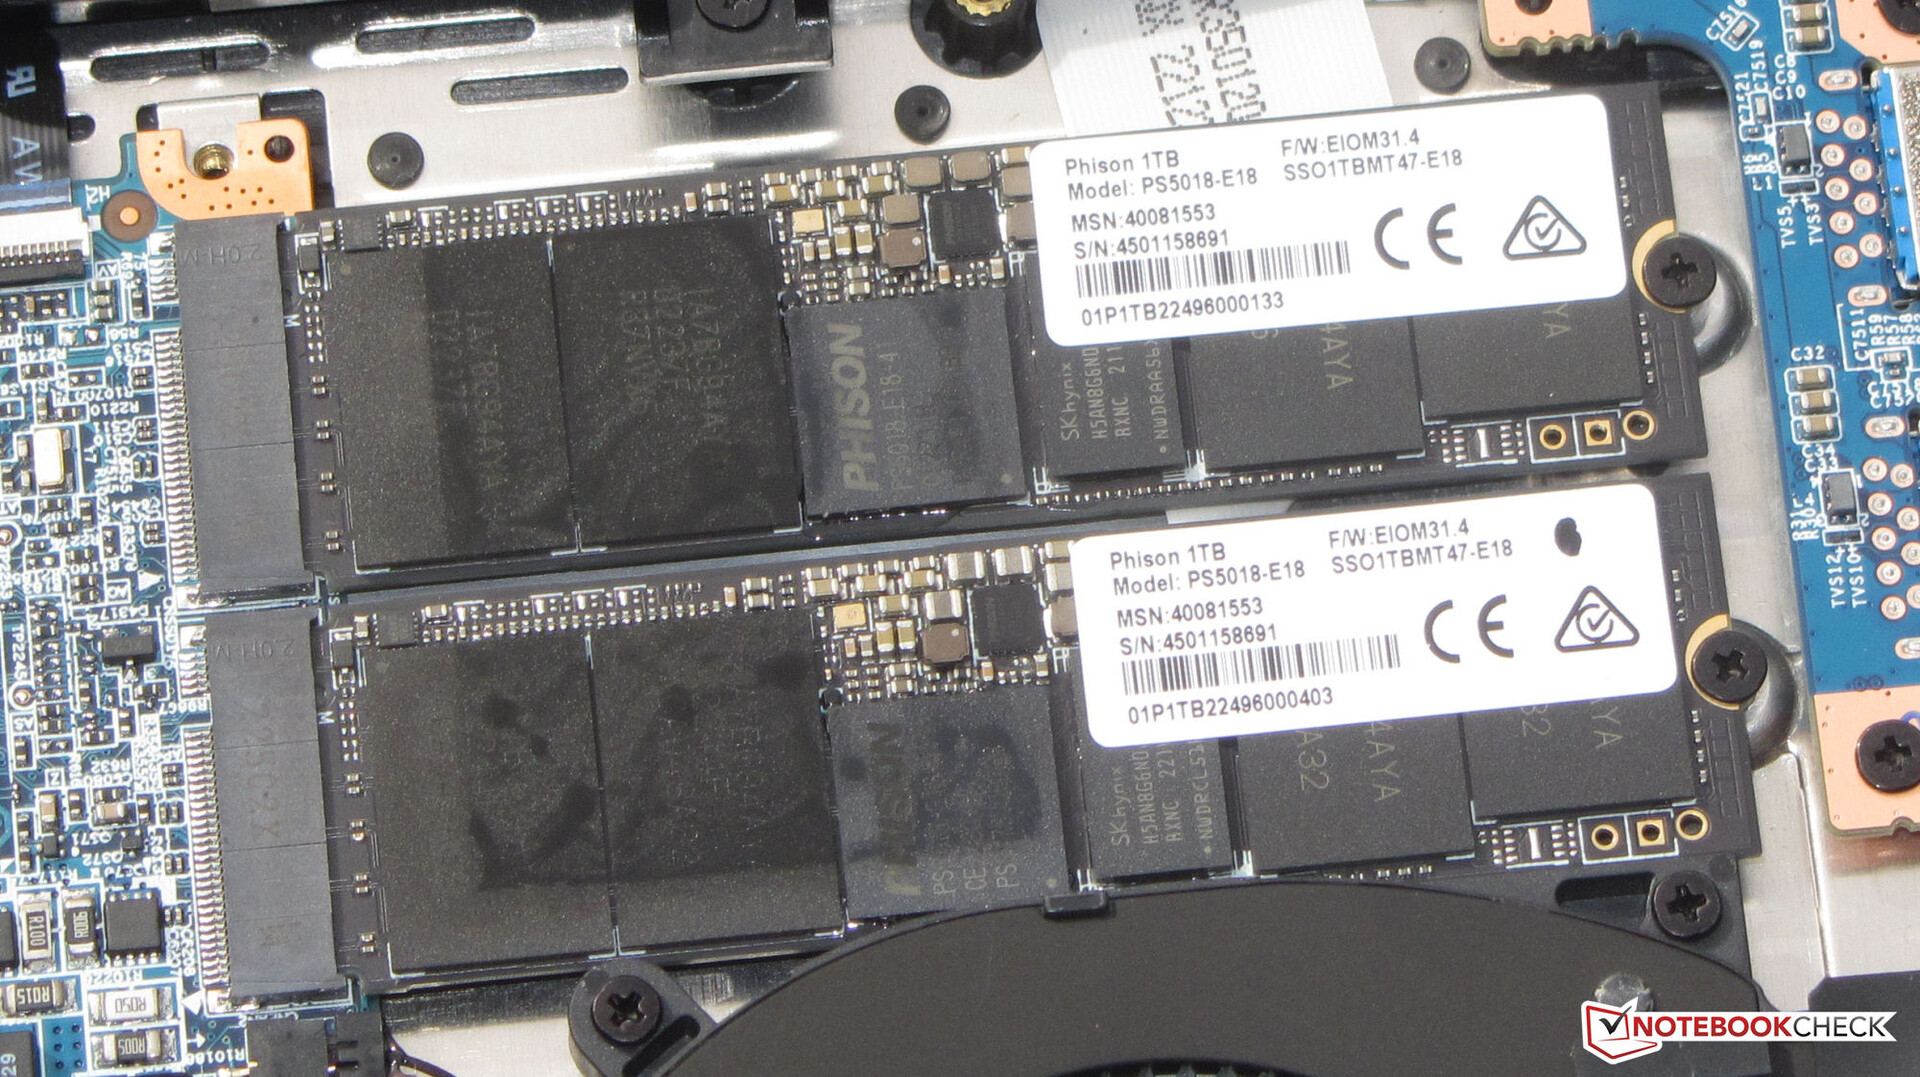
Storage Devices
The Erazer houses two 1 TB SSDs (PCIe 4, M.2-2280) from Phison, which deliver good performance rates overall. The SSDs do not form a RAID array, nor does the X20 offer RAID support - one SSD serves as the system drive, the other as data storage. A positive aspect: thermal throttling was not observed.

| Drive Performance rating - Percent | |
| Aorus 15X ASF | |
| Average Phison E18-1TB-PHISON-SSD-B47R | |
| Medion Erazer Major X20 | |
| Razer Blade 15 OLED (Early 2022) | |
| Average of class Gaming | |
| Asus ROG Strix G17 G713PI | |
* ... smaller is better
Sustained Read Performance: DiskSpd Read Loop, Queue Depth 8
Graphics Card
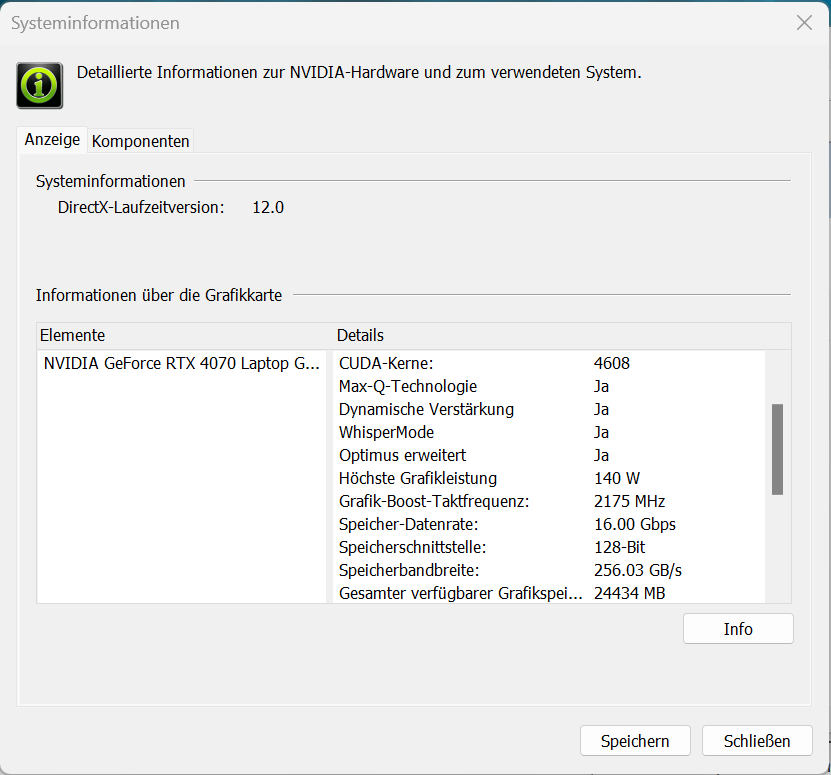
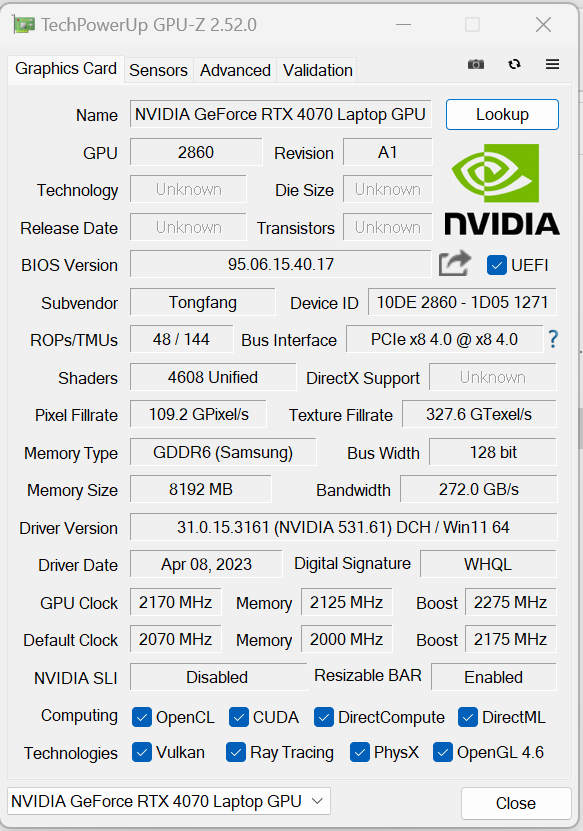
No (more) experiments: While Medion installed one of the then-new Arc GPUs from Intel into the Major X10, the X20 comes with a GeForce RTX 4070 laptop card (VRAM: 8,192 GB GDDR6) from Nvidia. This has a maximum possible TGP of 140 watts (115 watts + 25 watts Dynamic Boost) at its disposal, which is not fully utilized according to the Witcher 3 test.
The benchmark results are above the previous RTX 4070 average - a significant performance increase is noticed compared to the Arc A730M GPU of the Major X10. dGPU mode does not bring any improvements. Switching between dGPU and Optimus does not require a reboot - Advanced Optimus is supported.
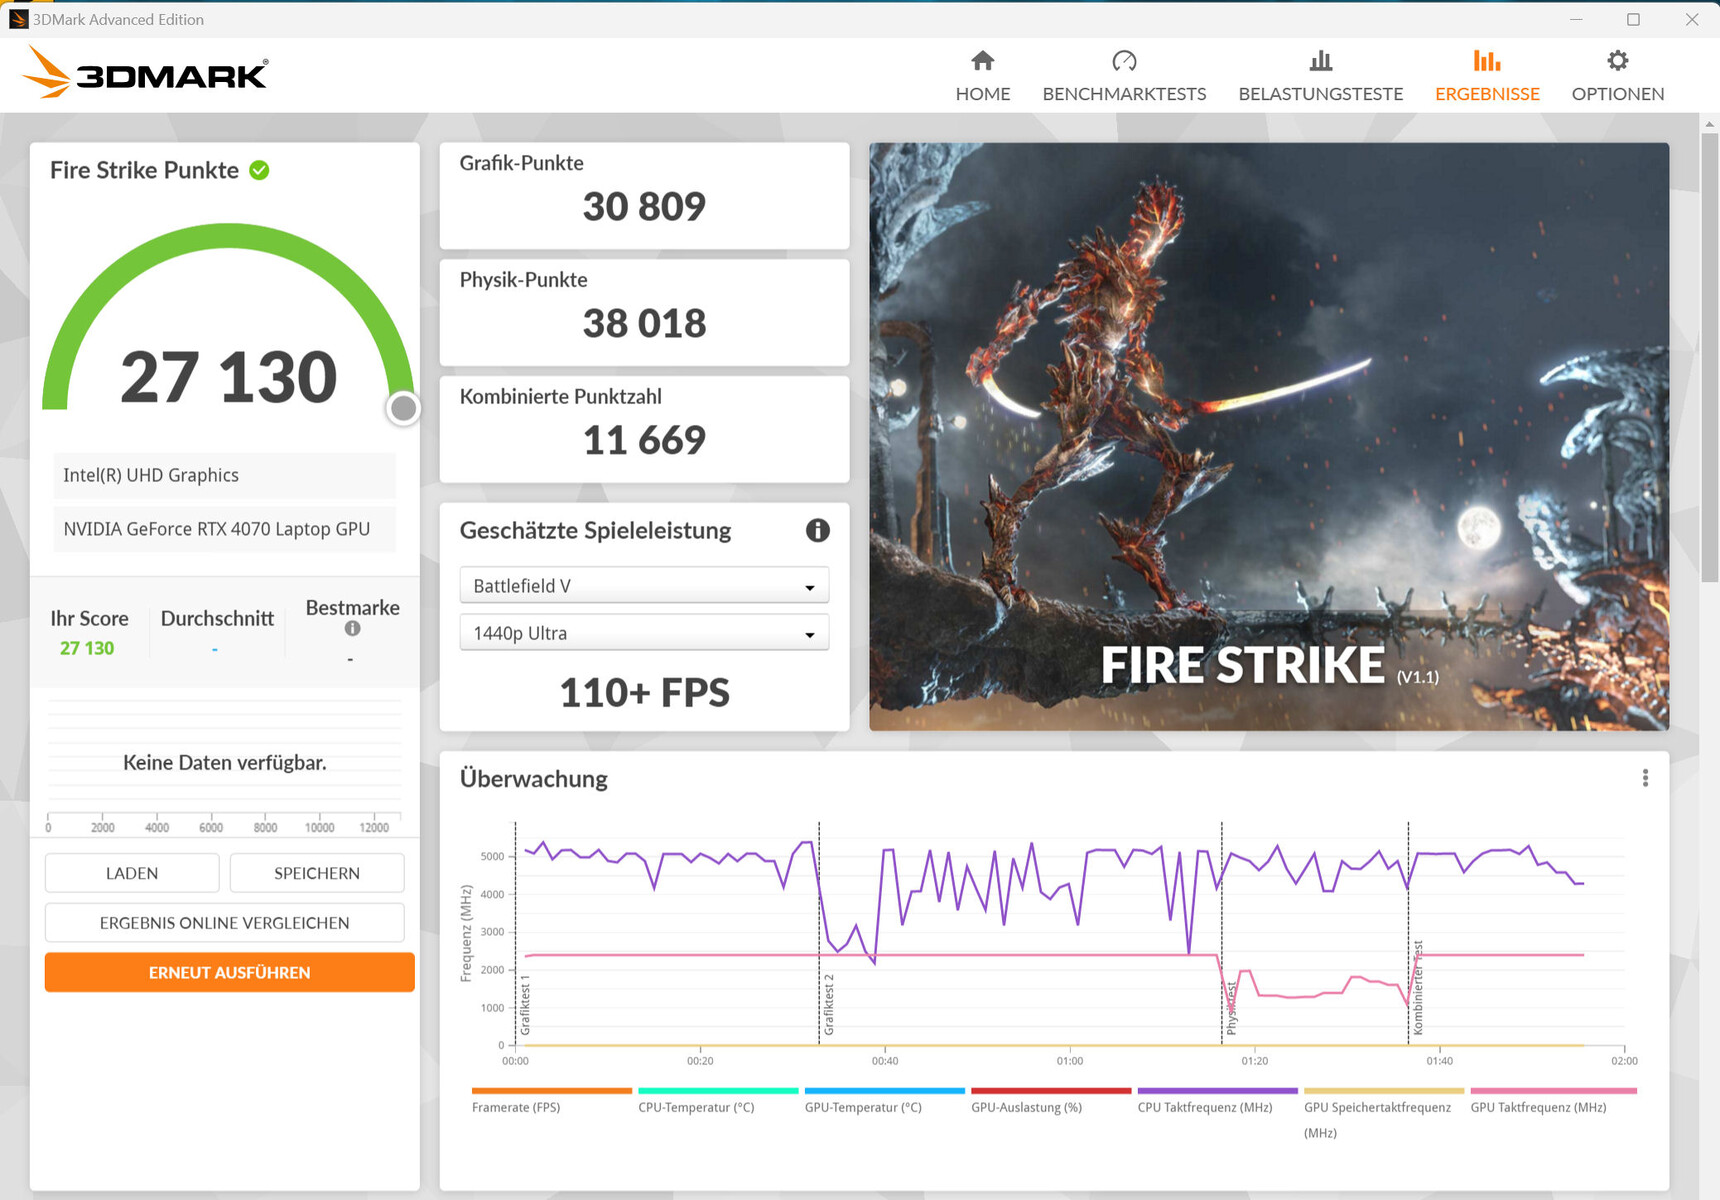


| 3DMark 06 Standard Score | 60496 points | |
| 3DMark 11 Performance | 35727 points | |
| 3DMark Cloud Gate Standard Score | 66380 points | |
| 3DMark Fire Strike Score | 27130 points | |
| 3DMark Time Spy Score | 12846 points | |
Help | ||
* ... smaller is better
Gaming Performance
The notebook allows for QHD gaming at high to maximum settings. Higher resolutions would be possible when using an external monitor - at possibly reduced settings. The frame rates of the tested titles are above the determined RTX 4070 average. dGPU mode may increase the frame rates of some games to a small extent.
| The Witcher 3 - 1920x1080 Ultra Graphics & Postprocessing (HBAO+) | |
| Average of class Gaming (104.7 - 240, n=7, last 2 years) | |
| Medion Erazer Major X20 | |
| Asus ROG Strix G17 G713PI | |
| Aorus 15X ASF | |
| Average NVIDIA GeForce RTX 4070 Laptop GPU (69.8 - 133.7, n=57) | |
| Razer Blade 15 OLED (Early 2022) | |
| Medion Erazer Major X10 | |
| Final Fantasy XV Benchmark - 1920x1080 High Quality | |
| Average of class Gaming (41 - 215, n=95, last 2 years) | |
| Medion Erazer Major X20 | |
| Aorus 15X ASF | |
| Asus ROG Strix G17 G713PI | |
| Average NVIDIA GeForce RTX 4070 Laptop GPU (41 - 131.9, n=65) | |
| Razer Blade 15 OLED (Early 2022) | |
| Medion Erazer Major X10 | |
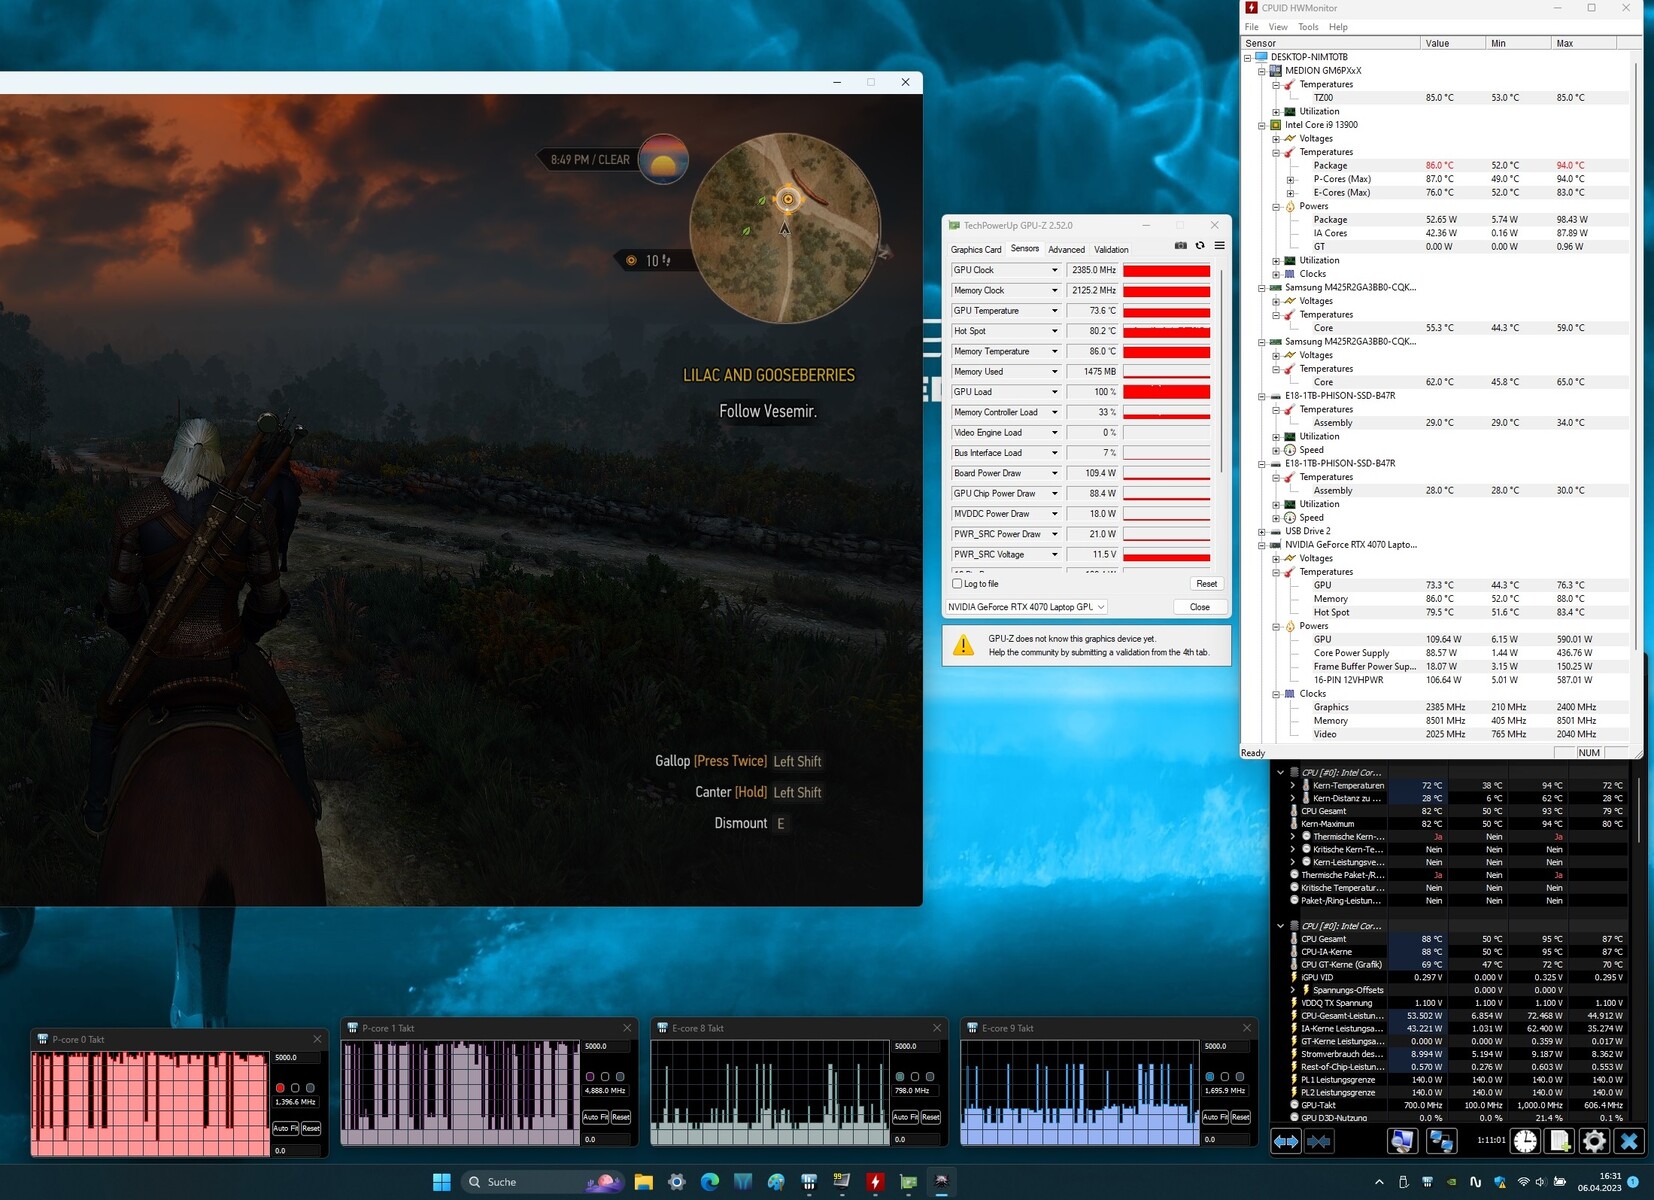
To check whether the frame rate remains largely constant over a longer period, we ran the game "The Witcher 3" for around 60 minutes in Full HD resolution and at maximum quality settings. The game character was not moved. A drop in frame rates was not registered.
Witcher 3 FPS chart

| low | med. | high | ultra | QHD | |
|---|---|---|---|---|---|
| GTA V (2015) | 187.3 | 187.2 | 183.8 | 128 | 72.6 |
| The Witcher 3 (2015) | 545 | 391.4 | 242.3 | 127 | |
| Dota 2 Reborn (2015) | 205 | 183.3 | 169.9 | 158.8 | |
| Final Fantasy XV Benchmark (2018) | 220 | 175.2 | 121.2 | 88.4 | |
| X-Plane 11.11 (2018) | 182.3 | 155.9 | 120.8 | ||
| Far Cry 5 (2018) | 188 | 161 | 153 | 144 | 122 |
| Strange Brigade (2018) | 490 | 310 | 244 | 208 | 131.4 |
| F1 22 (2022) | 262 | 264 | 206 | 83.9 | 53.3 |
Emissions - The Erazer laptop can produce a lot of noise
Noise
The X20 can produce a lot of noise under load: peak values of up to 57 dB(A) are reached when "Turbo Mode" is active. Background noise is something akin to a hissing sound. No bothersome background noise is emitted by the fans. An overall lower noise level can be brought about by using the other two performance profiles - at the expense of computing power.
Emissions during idling and in everyday use (office, internet) are pleasing: the fans operate at very low speeds and are often idle - in all three performance profiles.
| Turbo Mode (dt: Overboost) | Balanced Mode (dt: Balanced) | Office Mode (dt: Balanced) | |
|---|---|---|---|
| CPU PL1 (HWInfo) | 140 watts | 140 watts | 140 watts |
| CPU PL2 (HWInfo) | 140 watts | 140 watts | 140 watts |
| Noise (Witcher 3) | 50-53 dB(A) | 48-51 dB(A) | 36-43 dB(A) later 32-34 dB(A) |
| Performance (Witcher 3) | 124 fps | 118 fps | 114-118 fps later 30 fps Lock |
Noise level
| Idle |
| 25 / 29 / 31 dB(A) |
| Load |
| 50 / 57 dB(A) |
 | ||
30 dB silent 40 dB(A) audible 50 dB(A) loud |
||
min: | ||
| Medion Erazer Major X20 i9-13900HX, GeForce RTX 4070 Laptop GPU | Aorus 15X ASF i7-13700HX, GeForce RTX 4070 Laptop GPU | Razer Blade 15 OLED (Early 2022) i9-12900H, GeForce RTX 3070 Ti Laptop GPU | Asus ROG Strix G17 G713PI R9 7945HX, GeForce RTX 4070 Laptop GPU | |
|---|---|---|---|---|
| Noise | -5% | 7% | 5% | |
| off / environment * (dB) | 24 | 25 -4% | 26 -8% | 25 -4% |
| Idle Minimum * (dB) | 25 | 28 -12% | 28 -12% | 26 -4% |
| Idle Average * (dB) | 29 | 29 -0% | 28 3% | 29 -0% |
| Idle Maximum * (dB) | 31 | 36 -16% | 28 10% | 30 3% |
| Load Average * (dB) | 50 | 50 -0% | 38.5 23% | 46 8% |
| Witcher 3 ultra * (dB) | 53 | 54 -2% | 46 13% | |
| Load Maximum * (dB) | 57 | 58 -2% | 43.9 23% | 47 18% |
* ... smaller is better
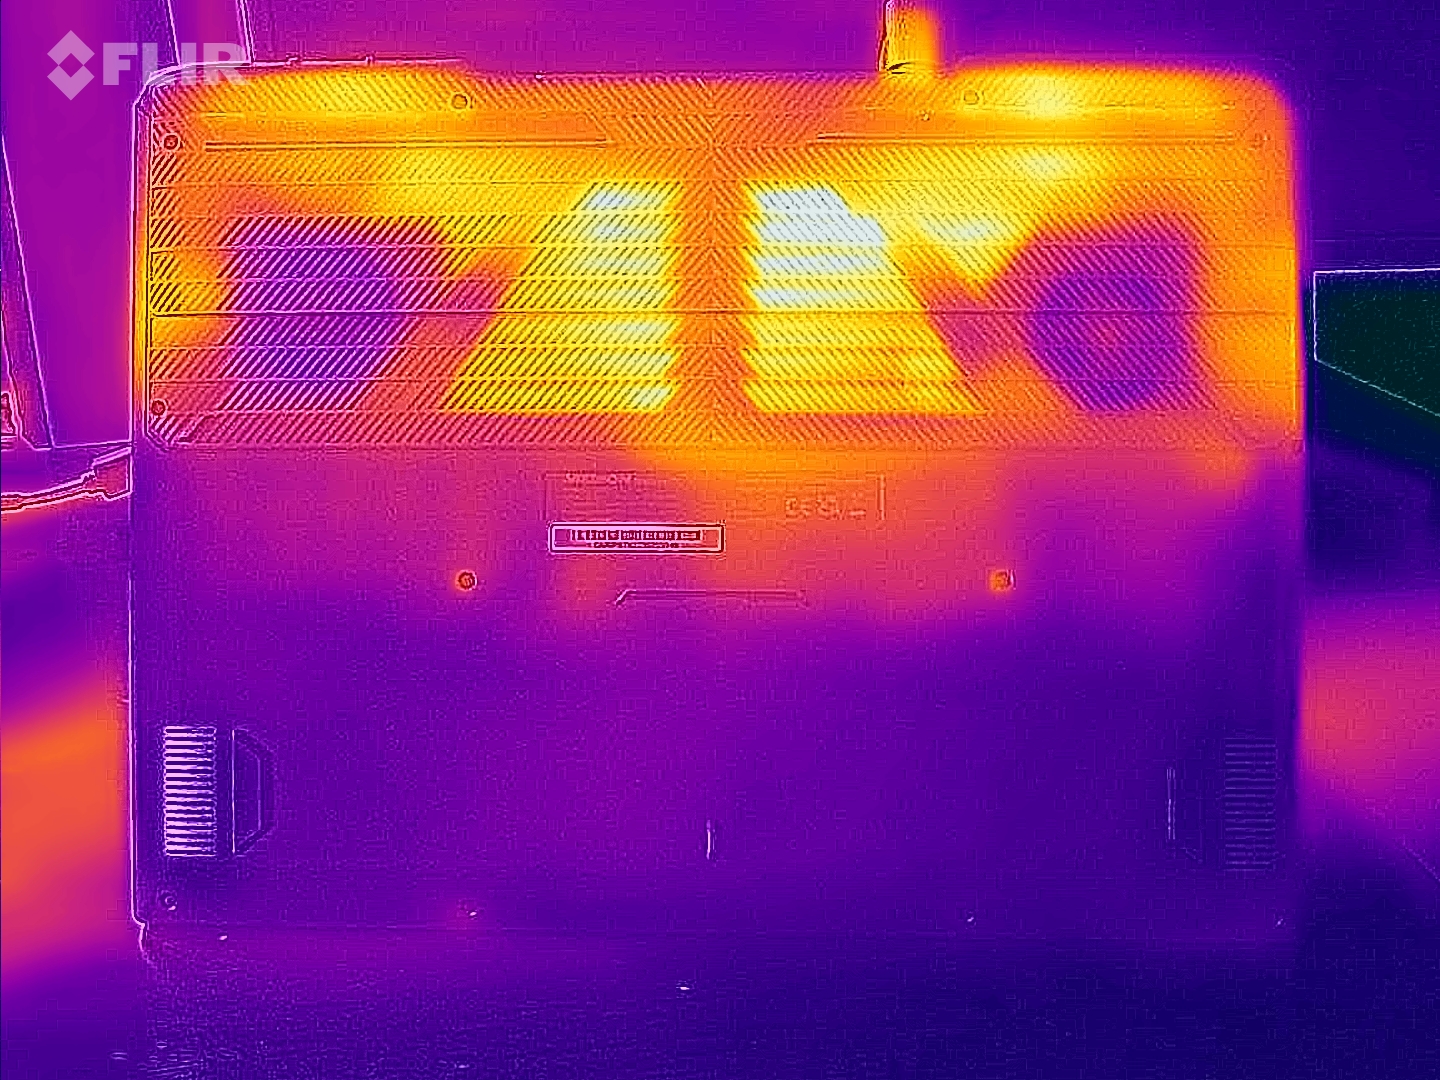
Temperature
In everyday use (office, internet), laptop temperatures remain within the green range. The notebook heats up noticeably under load (stress test, Witcher 3 test), but not excessively. The CPU temperatures are nothing to worry about.
(-) The maximum temperature on the upper side is 46 °C / 115 F, compared to the average of 40.4 °C / 105 F, ranging from 21.2 to 68.8 °C for the class Gaming.
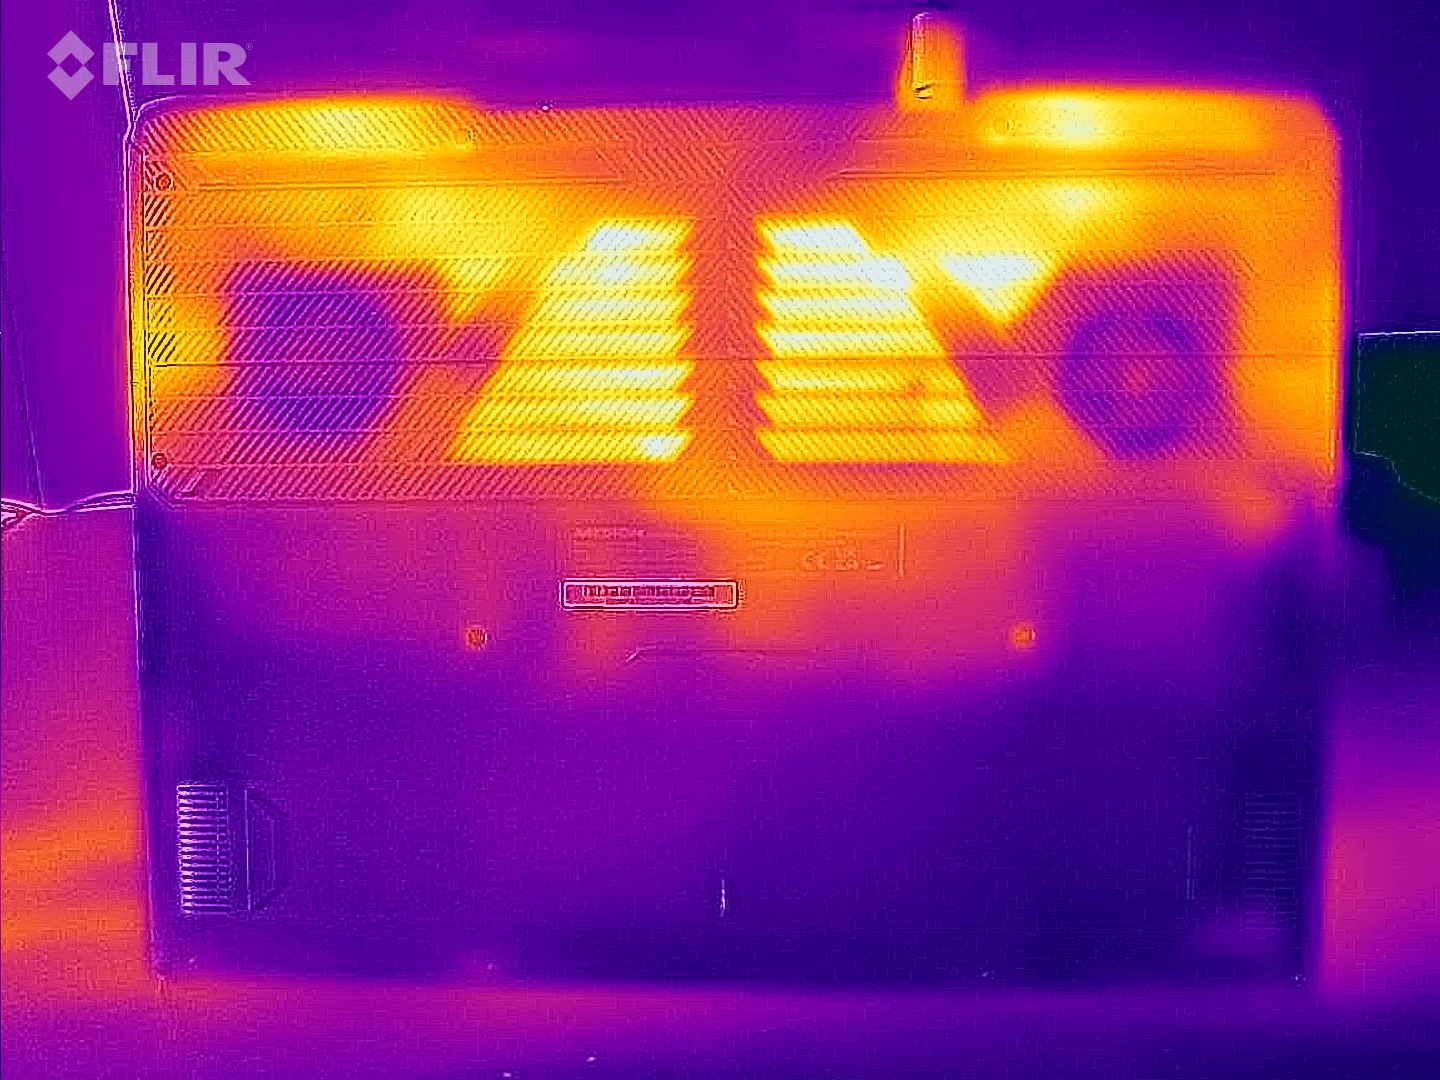
(-) The bottom heats up to a maximum of 49 °C / 120 F, compared to the average of 43.2 °C / 110 F
(±) In idle usage, the average temperature for the upper side is 32 °C / 90 F, compared to the device average of 33.9 °C / 93 F.
(±) Playing The Witcher 3, the average temperature for the upper side is 37 °C / 99 F, compared to the device average of 33.9 °C / 93 F.
(+) The palmrests and touchpad are cooler than skin temperature with a maximum of 31 °C / 87.8 F and are therefore cool to the touch.
(-) The average temperature of the palmrest area of similar devices was 28.8 °C / 83.8 F (-2.2 °C / -4 F).
| Medion Erazer Major X20 Intel Core i9-13900HX, NVIDIA GeForce RTX 4070 Laptop GPU | Aorus 15X ASF Intel Core i7-13700HX, NVIDIA GeForce RTX 4070 Laptop GPU | Razer Blade 15 OLED (Early 2022) Intel Core i9-12900H, NVIDIA GeForce RTX 3070 Ti Laptop GPU | Asus ROG Strix G17 G713PI AMD Ryzen 9 7945HX, NVIDIA GeForce RTX 4070 Laptop GPU | |
|---|---|---|---|---|
| Heat | 16% | 3% | 12% | |
| Maximum Upper Side * (°C) | 46 | 42 9% | 49.5 -8% | 42 9% |
| Maximum Bottom * (°C) | 49 | 51 -4% | 47.5 3% | 41 16% |
| Idle Upper Side * (°C) | 37 | 27 27% | 33.4 10% | 33 11% |
| Idle Bottom * (°C) | 38 | 26 32% | 35 8% | 34 11% |
* ... smaller is better
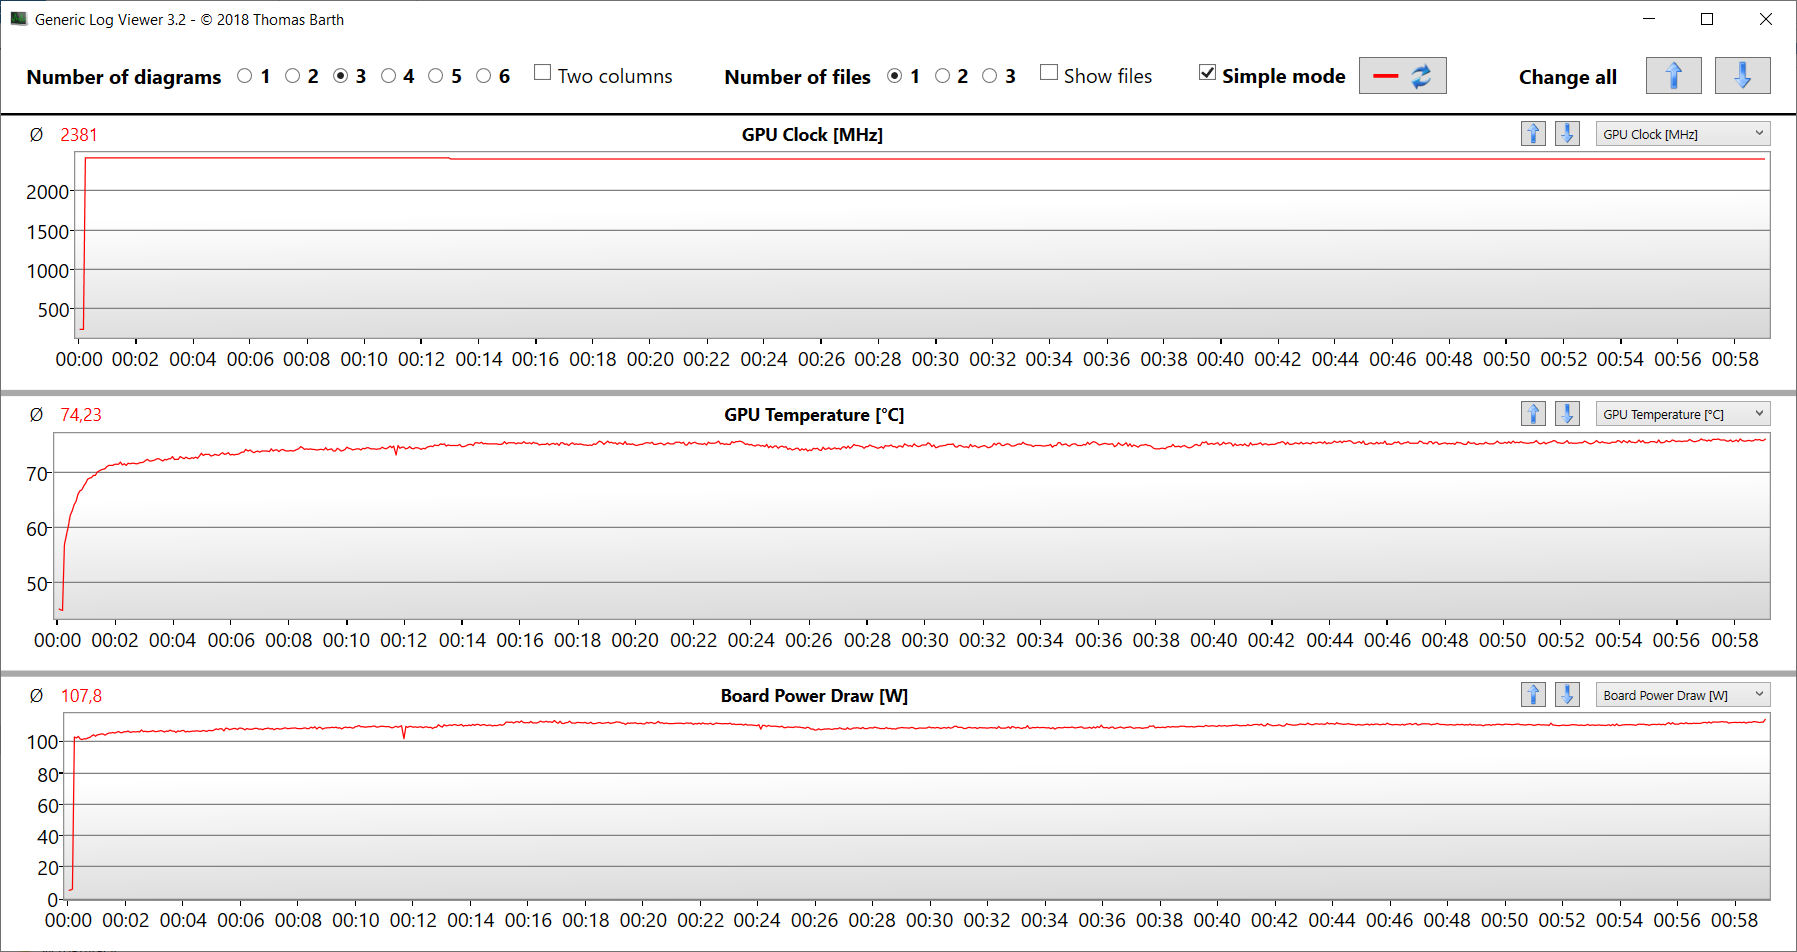
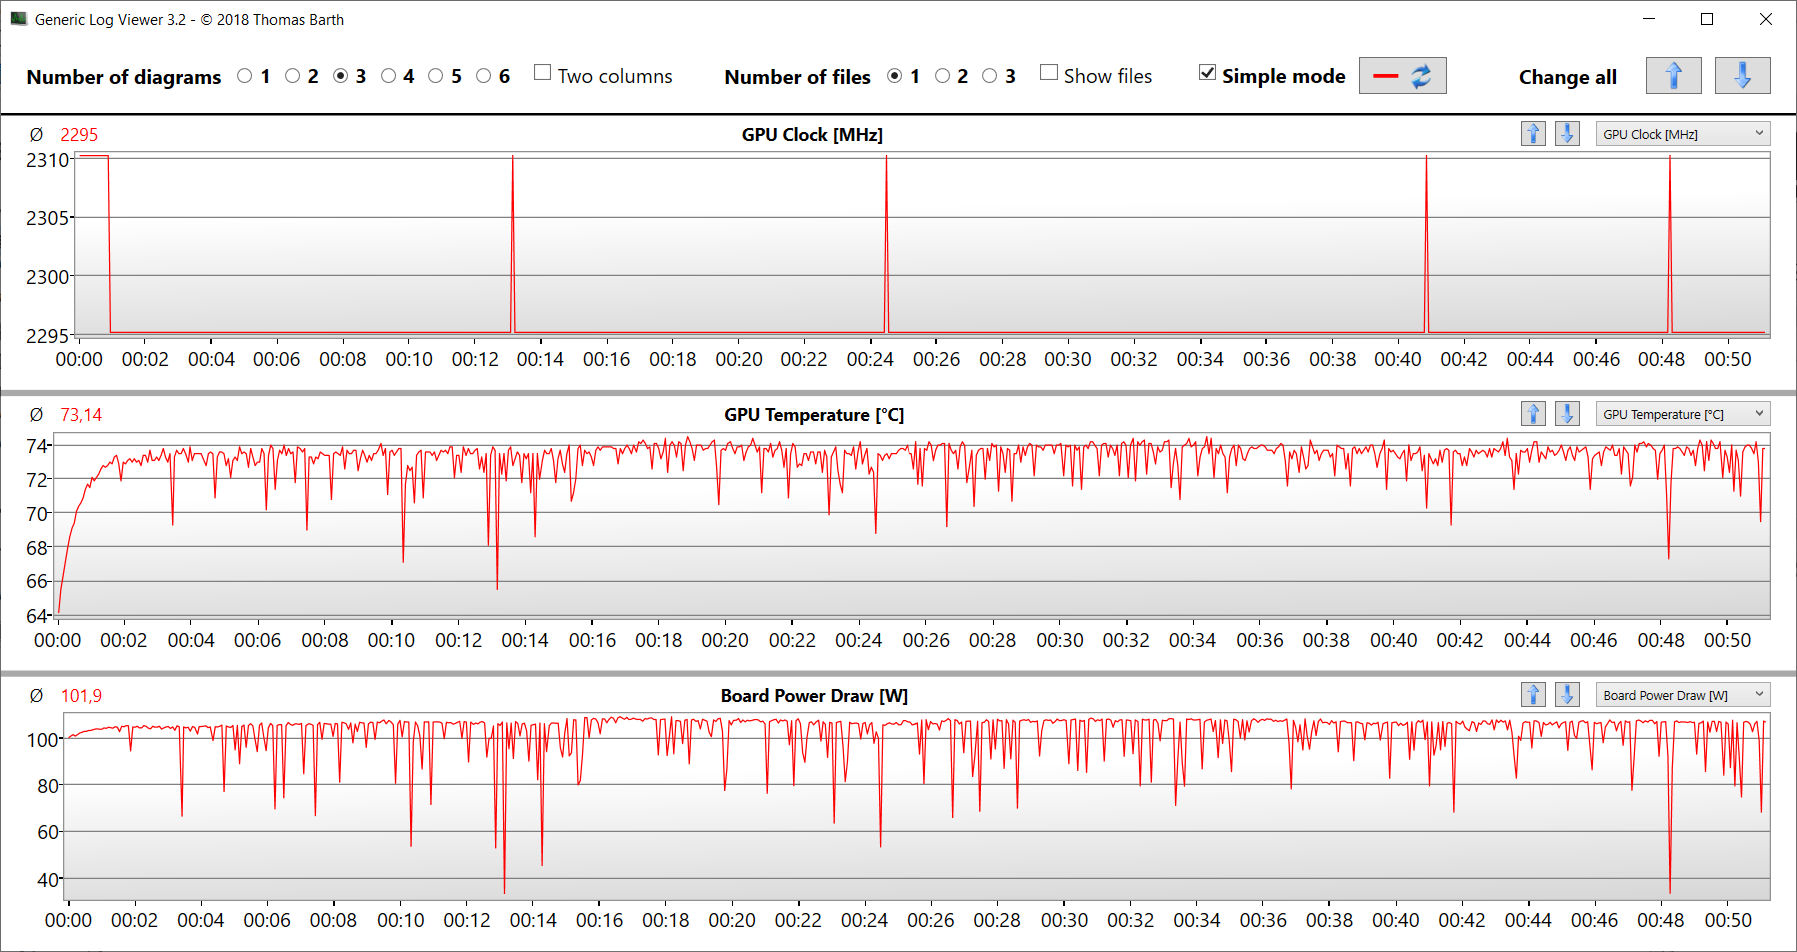
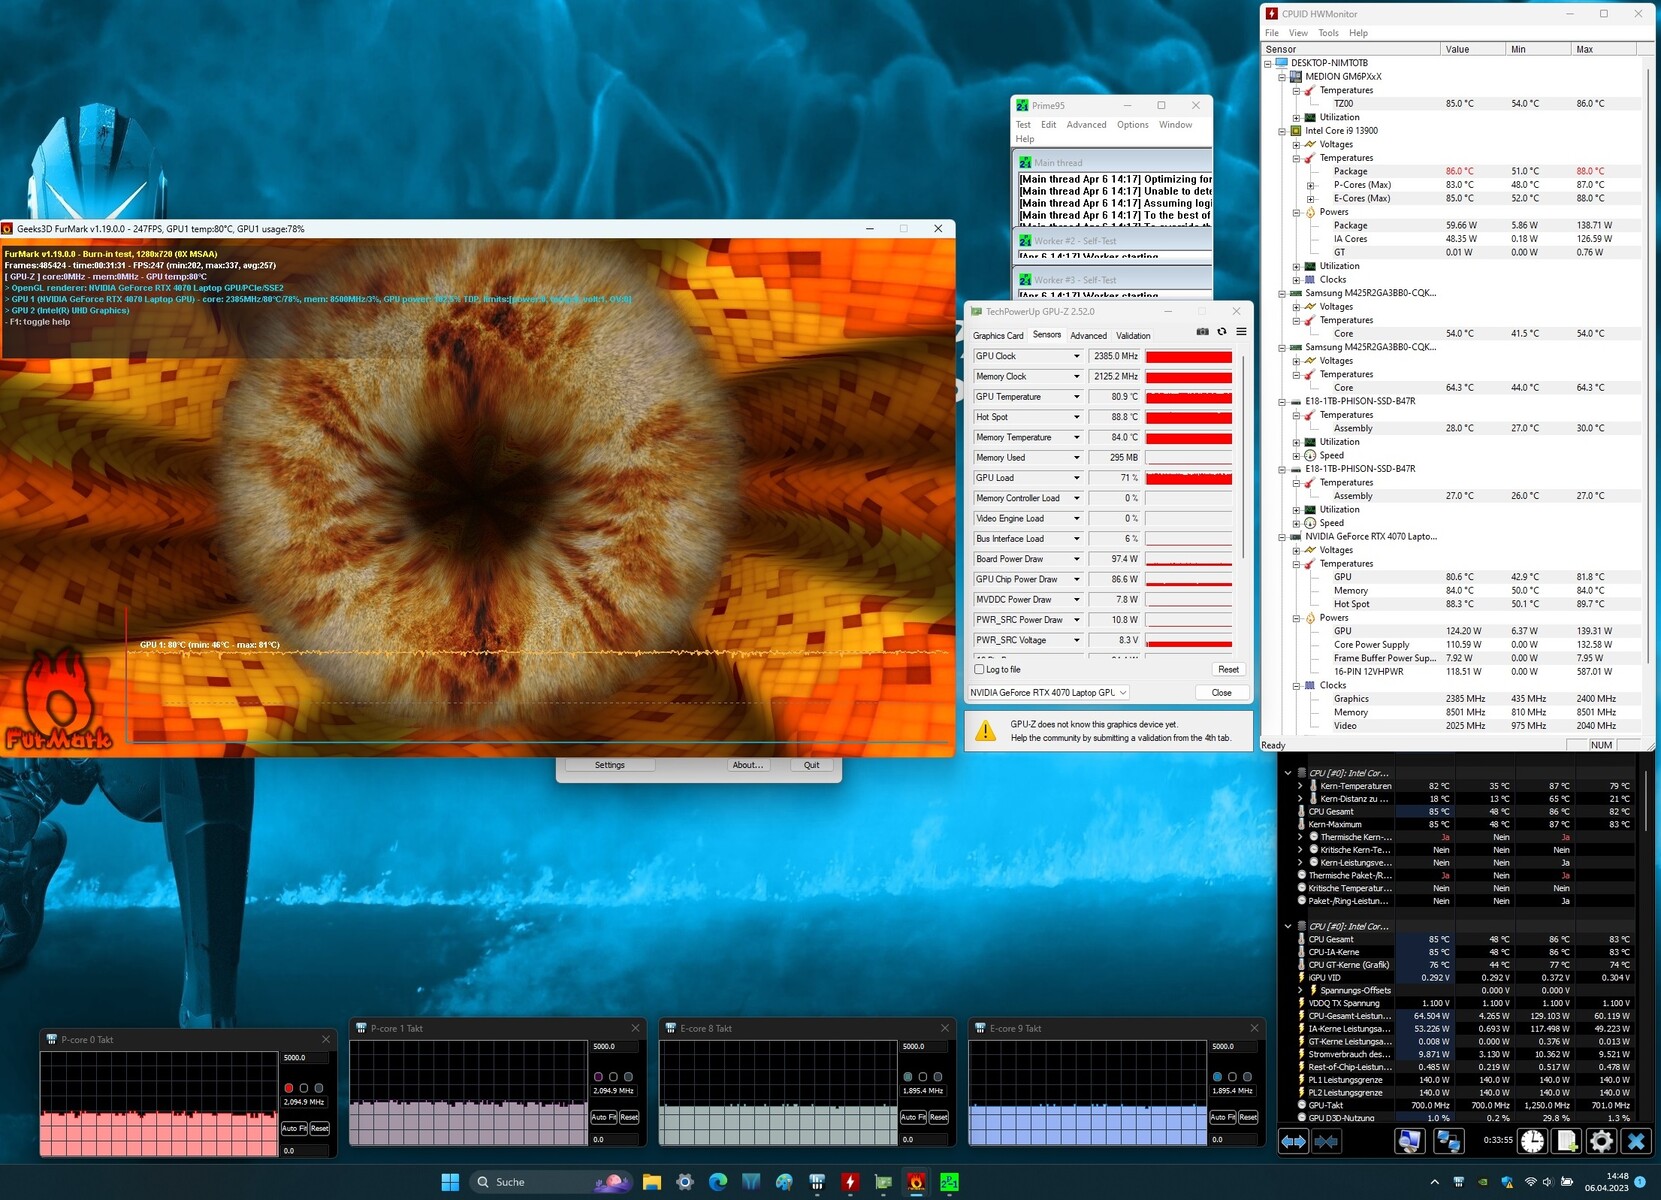
Stress Test
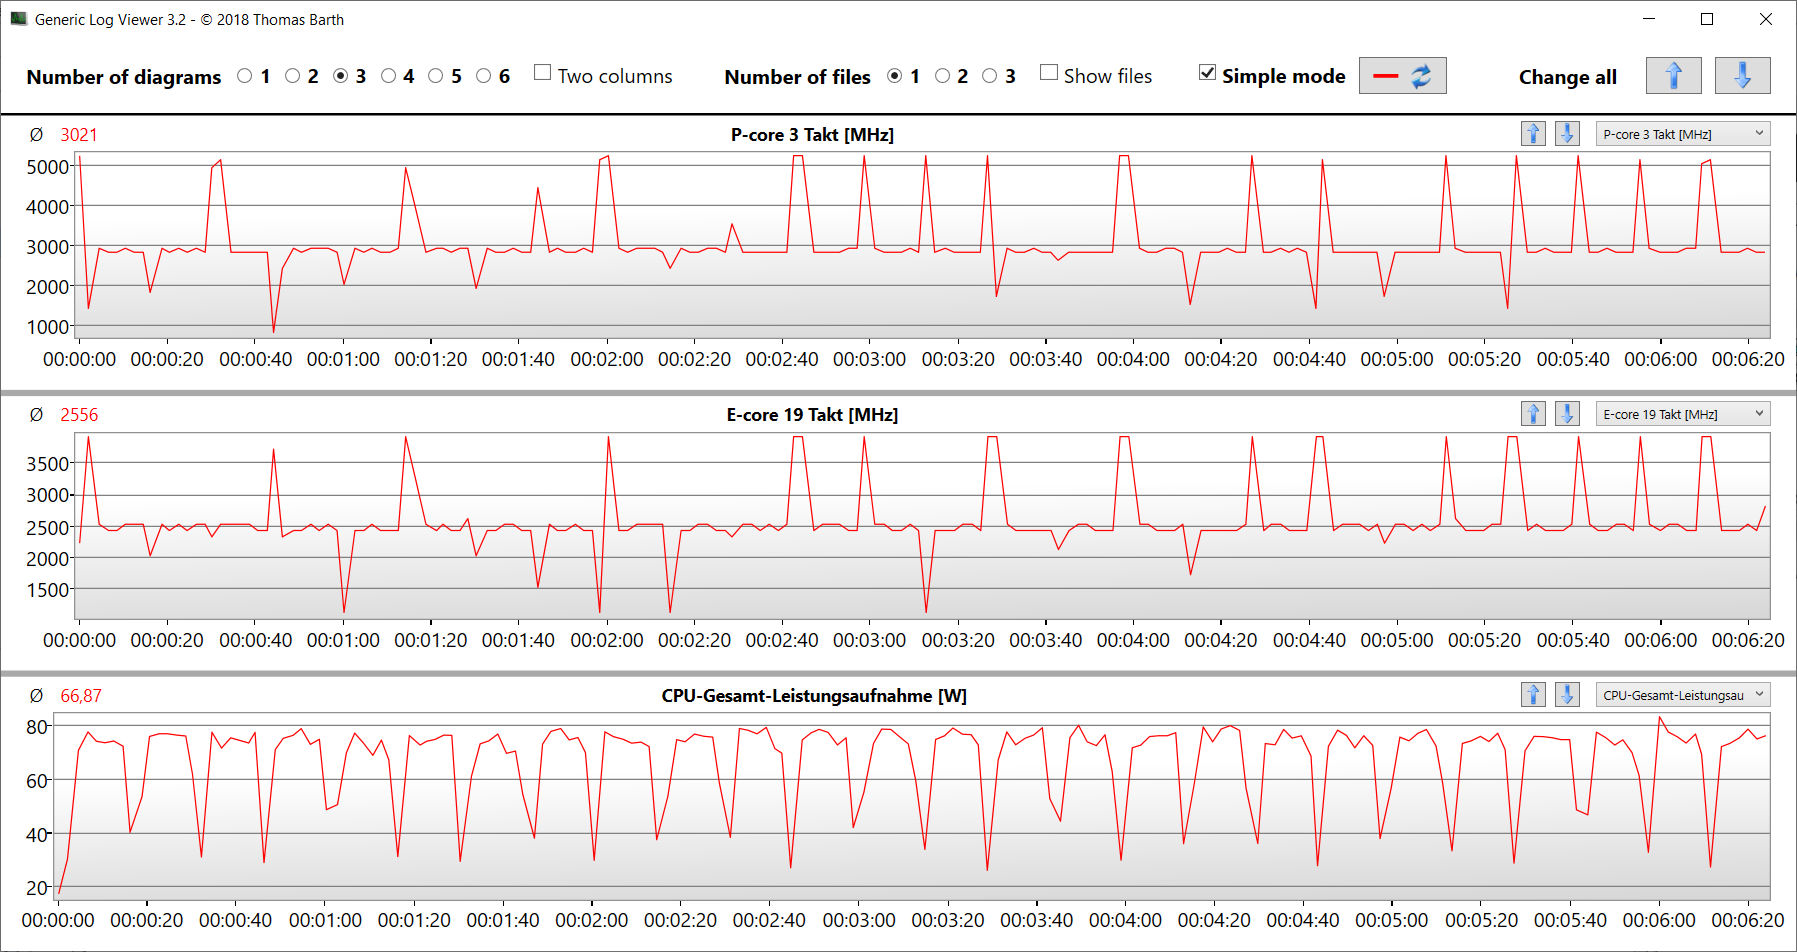
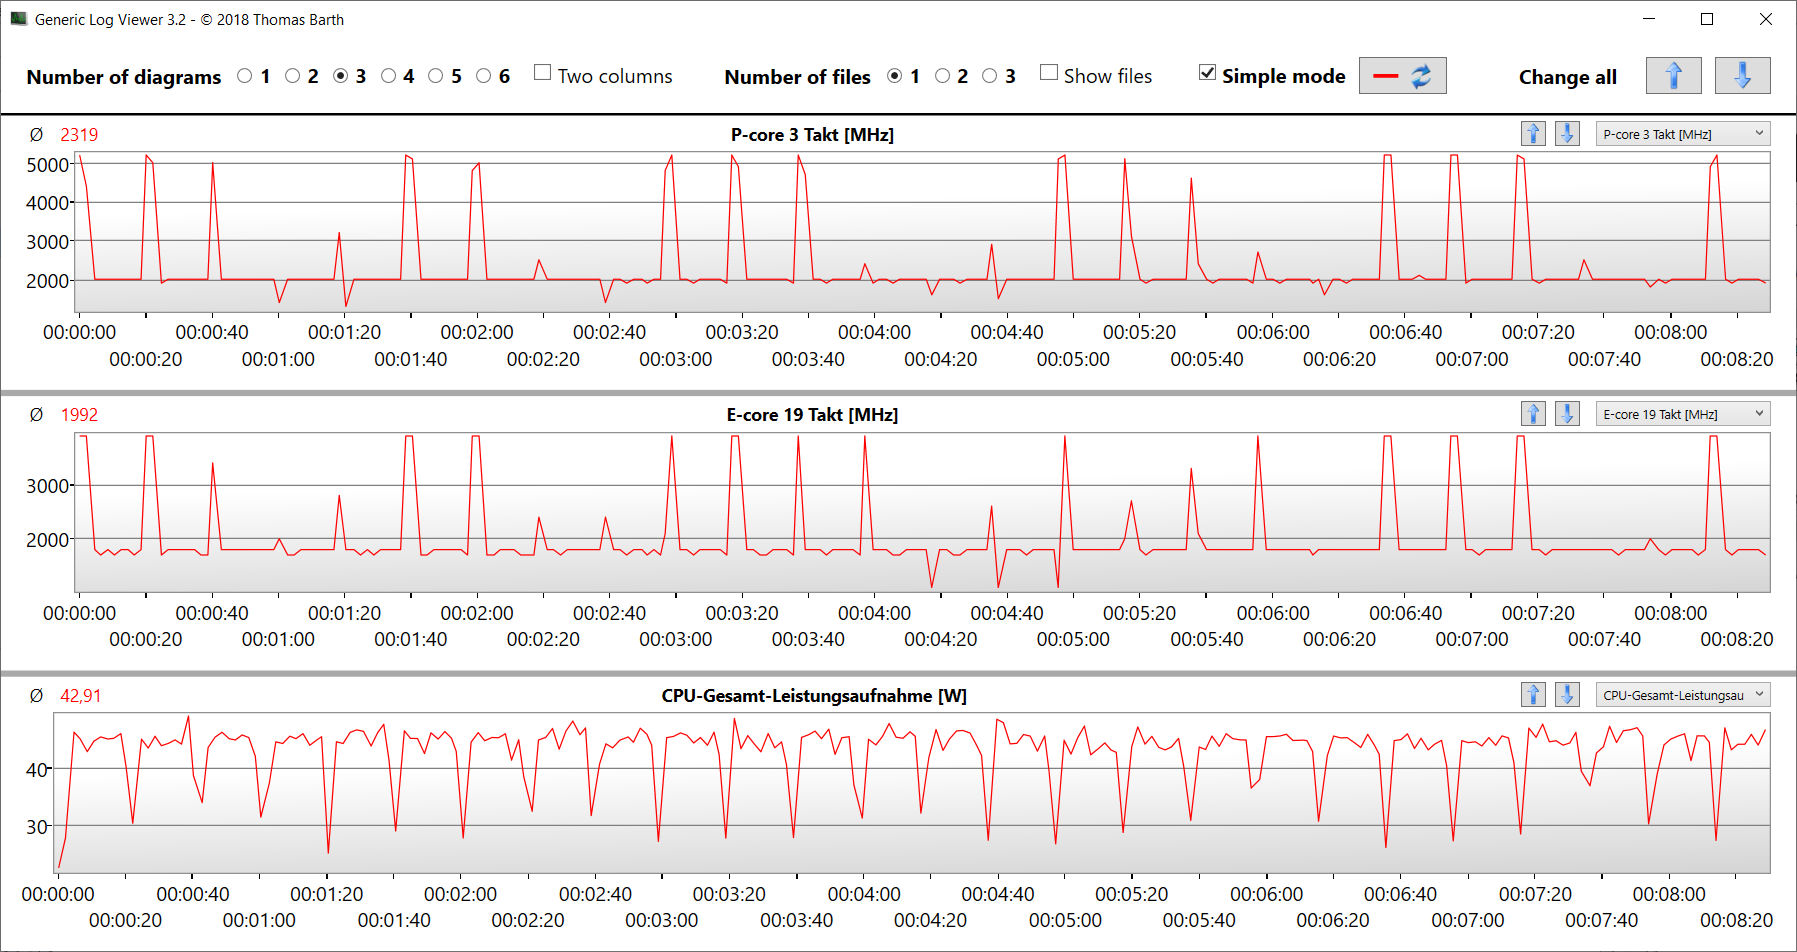
The stress test (Prime95 and Furmark in continuous operation) represents an extreme scenario for testing system stability under full load. The CPU starts the test at high clock rates (P: 4 GHz, E: 3.3 GHz), while the GPU fires up at 1.5 to 2 GHz. Within the first 5 minutes, the CPU clock gradually drops to 2 to 2.4 GHz (P cores) and 1.9 to 2.1 GHz (E cores). At the same time, the GPU clock increases to 2.3 to 2.4 GHz.

Speakers
The stereo speakers produce very decent sound, but could use more bass. Headphones or external speakers are recommended for better sound quality.
Medion Erazer Major X20 audio analysis
(+) | speakers can play relatively loud (86 dB)
Bass 100 - 315 Hz
(±) | reduced bass - on average 11.9% lower than median
(±) | linearity of bass is average (9.7% delta to prev. frequency)
Mids 400 - 2000 Hz
(+) | balanced mids - only 3.7% away from median
(+) | mids are linear (4.7% delta to prev. frequency)
Highs 2 - 16 kHz
(+) | balanced highs - only 2.3% away from median
(+) | highs are linear (3.4% delta to prev. frequency)
Overall 100 - 16.000 Hz
(+) | overall sound is linear (10.4% difference to median)
Compared to same class
» 6% of all tested devices in this class were better, 2% similar, 92% worse
» The best had a delta of 6%, average was 18%, worst was 132%
Compared to all devices tested
» 5% of all tested devices were better, 1% similar, 93% worse
» The best had a delta of 4%, average was 23%, worst was 134%
Aorus 15X ASF audio analysis
(+) | speakers can play relatively loud (83 dB)
Bass 100 - 315 Hz
(-) | nearly no bass - on average 27.3% lower than median
(-) | bass is not linear (15.1% delta to prev. frequency)
Mids 400 - 2000 Hz
(±) | higher mids - on average 5.8% higher than median
(+) | mids are linear (4.8% delta to prev. frequency)
Highs 2 - 16 kHz
(+) | balanced highs - only 3.1% away from median
(+) | highs are linear (6.3% delta to prev. frequency)
Overall 100 - 16.000 Hz
(±) | linearity of overall sound is average (20.1% difference to median)
Compared to same class
» 71% of all tested devices in this class were better, 6% similar, 23% worse
» The best had a delta of 6%, average was 18%, worst was 132%
Compared to all devices tested
» 52% of all tested devices were better, 8% similar, 40% worse
» The best had a delta of 4%, average was 23%, worst was 134%
Energy Management - The Medion X20 delivers meager runtimes
Power Consumption
The Medion notebook does not show any abnormalities in terms of energy consumption. The rates are on a normal level for the installed hardware. The Witcher 3 test and stress test ran with relatively constant power consumption rates. The power supply (330 watts) is thus sufficiently sized.
| Off / Standby | |
| Idle | |
| Load |
|
Key:
min: | |
| Medion Erazer Major X20 i9-13900HX, GeForce RTX 4070 Laptop GPU | Aorus 15X ASF i7-13700HX, GeForce RTX 4070 Laptop GPU | Razer Blade 15 OLED (Early 2022) i9-12900H, GeForce RTX 3070 Ti Laptop GPU | Asus ROG Strix G17 G713PI R9 7945HX, GeForce RTX 4070 Laptop GPU | Average NVIDIA GeForce RTX 4070 Laptop GPU | Average of class Gaming | |
|---|---|---|---|---|---|---|
| Power Consumption | 7% | -46% | -6% | 6% | 1% | |
| Idle Minimum * (Watt) | 12 | 11 8% | 31.6 -163% | 15 -25% | 13.2 ? -10% | 13 ? -8% |
| Idle Average * (Watt) | 16 | 16 -0% | 33.3 -108% | 20 -25% | 18.2 ? -14% | 18.7 ? -17% |
| Idle Maximum * (Watt) | 26 | 24 8% | 38.6 -48% | 29 -12% | 24.6 ? 5% | 24.3 ? 7% |
| Load Average * (Watt) | 115 | 104 10% | 149 -30% | 121 -5% | 97 ? 16% | 110.2 ? 4% |
| Witcher 3 ultra * (Watt) | 191.6 | 185.4 3% | 149.6 22% | 179.8 6% | ||
| Load Maximum * (Watt) | 319 | 272 15% | 160 50% | 246 23% | 221 ? 31% | 258 ? 19% |
* ... smaller is better
Energieaufnahme Witcher 3 / Stresstest
Power consumption with an external monitor
Battery Life
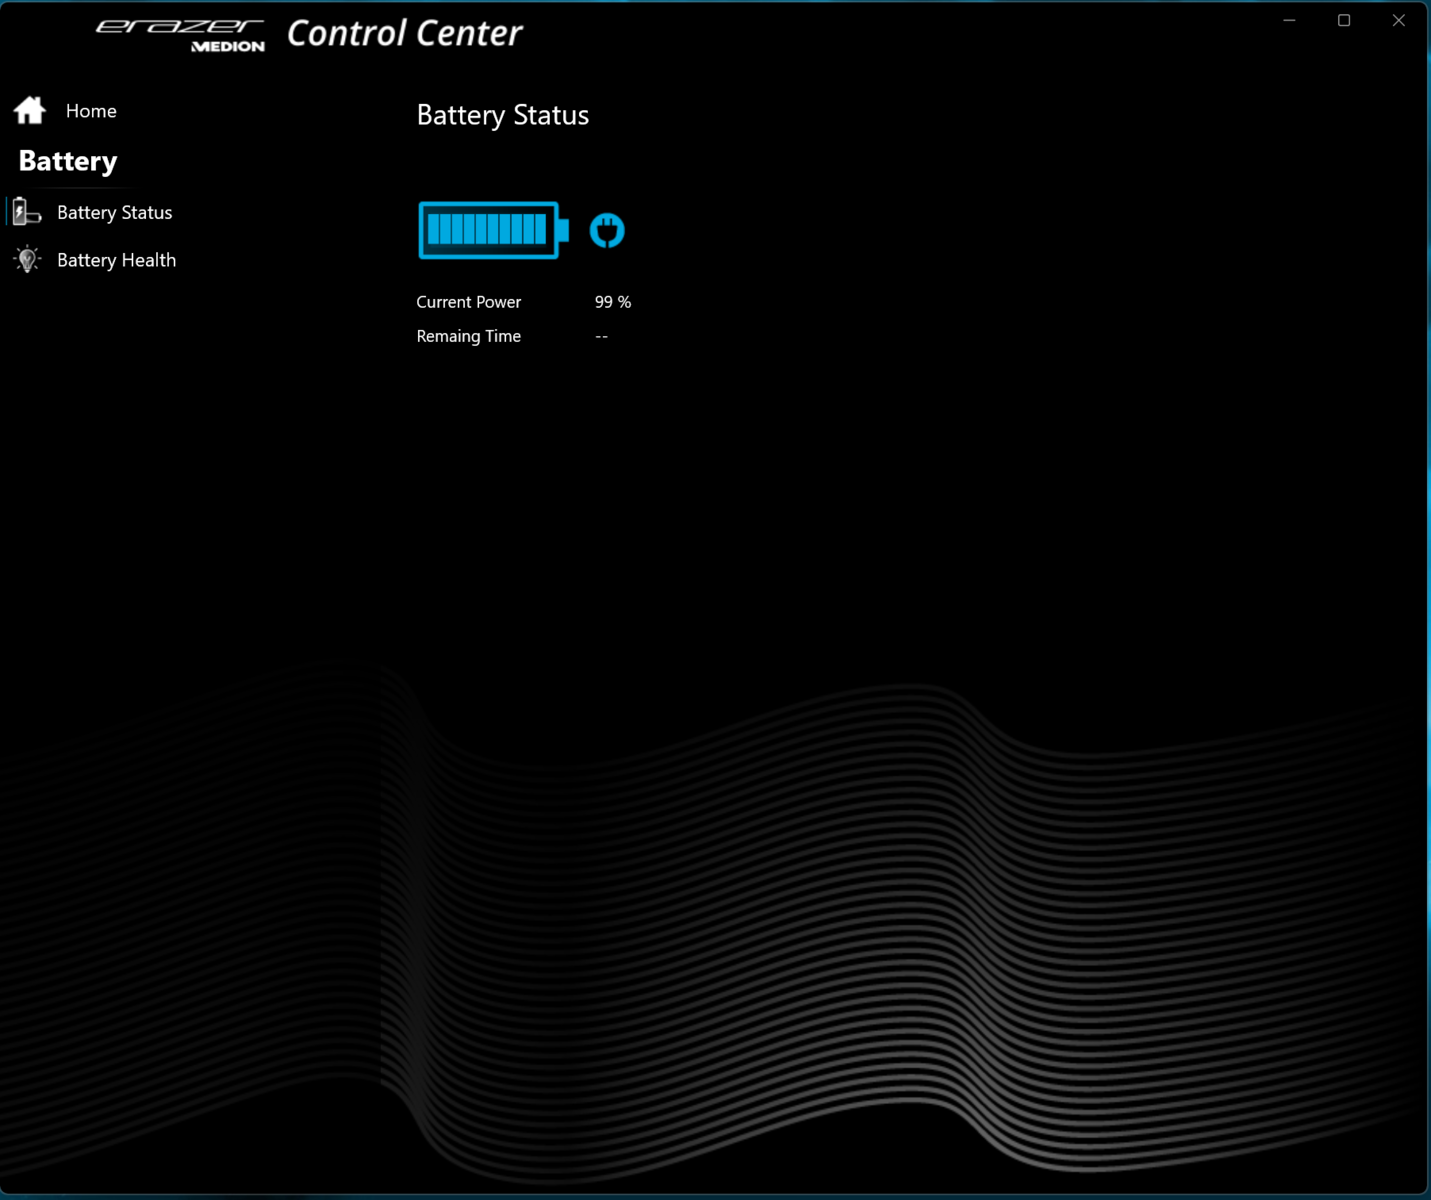
In the WLAN test, the 16-incher achieves runtimes of 3:52 h and 4:12 h (loading websites using a script) and video test (short film Big Buck Bunny, H.264 coding, FHD, in a loop), respectively. The notebook's energy-saving functions were deactivated during both tests and the display brightness set to around 150 cd/m². The radio modules were also deactivated for the video test.
The overall below-average runtimes are due to the low battery capacity (62.3 Wh) for a gaming notebook. More would have been possible with the 80 Wh battery of the predecessor.

| Medion Erazer Major X20 i9-13900HX, GeForce RTX 4070 Laptop GPU, 62.3 Wh | Aorus 15X ASF i7-13700HX, GeForce RTX 4070 Laptop GPU, 99 Wh | Razer Blade 15 OLED (Early 2022) i9-12900H, GeForce RTX 3070 Ti Laptop GPU, 80 Wh | Asus ROG Strix G17 G713PI R9 7945HX, GeForce RTX 4070 Laptop GPU, 90 Wh | Average of class Gaming | |
|---|---|---|---|---|---|
| Battery runtime | 80% | 26% | -20% | 54% | |
| Reader / Idle (h) | 5.8 | 11.3 95% | 6.7 16% | 8.16 ? 41% | |
| H.264 (h) | 4.2 | 7.9 88% | 5.9 40% | 2.8 -33% | 8.32 ? 98% |
| WiFi v1.3 (h) | 3.9 | 8.2 110% | 4.6 18% | 4.3 10% | 7.11 ? 82% |
| Load (h) | 1.6 | 2 25% | 2.1 31% | 1 -37% | 1.502 ? -6% |
| Witcher 3 ultra (h) | 1.1 |
Pros
Cons
Verdict: Lots of equipment
This powerful notebook enables QHD+ gaming, but also shines in other areas. A Core i9-13900HX and a GeForce RTX 4070 operate at consistently high clock rates, two 1 TB SSDs ensure short loading times and sufficient storage space. Noise and heat development are in the high range, typical for this notebook class.
In the Erazer Major X20, Medion presents a well-equipped mid-range gaming notebook without any serious weaknesses.
The chiclet keyboard of the previous model has given way to a mechanical model (Cherry MX switches, RGB individual key lighting) - a significant improvement. Users unfamiliar with such a keyboard will discover a new typing experience.
The matte 16-inch screen (QHD+, IPS, 240 Hz, G-Sync, sRGB) in a work-friendly 16:10 format gives a good impression overall. A Thunderbolt 4 port ensures expansion options (external GPU, docking solution, display), but does not support Power Delivery. The battery runtimes are also unimpressive.
The Aorus 15X ASF is an alternative with significantly better runtimes. It offers the same graphics performance as the X20, but less CPU power.
Price and Availability
The reviewed configuration of the Medion Erazer Major X20 is listed in Medion's online store at a price of just under EUR 2,500, but is currently sold out. Availability of the model appears to be limited outside Germany at present.
Medion Erazer Major X20
- 04/20/2023 v7 (old)
Sascha Mölck
Transparency
The selection of devices to be reviewed is made by our editorial team. The test sample was provided to the author as a loan by the manufacturer or retailer for the purpose of this review. The lender had no influence on this review, nor did the manufacturer receive a copy of this review before publication. There was no obligation to publish this review. As an independent media company, Notebookcheck is not subjected to the authority of manufacturers, retailers or publishers.
This is how Notebookcheck is testing
Every year, Notebookcheck independently reviews hundreds of laptops and smartphones using standardized procedures to ensure that all results are comparable. We have continuously developed our test methods for around 20 years and set industry standards in the process. In our test labs, high-quality measuring equipment is utilized by experienced technicians and editors. These tests involve a multi-stage validation process. Our complex rating system is based on hundreds of well-founded measurements and benchmarks, which maintains objectivity. Further information on our test methods can be found here.
Price comparison

