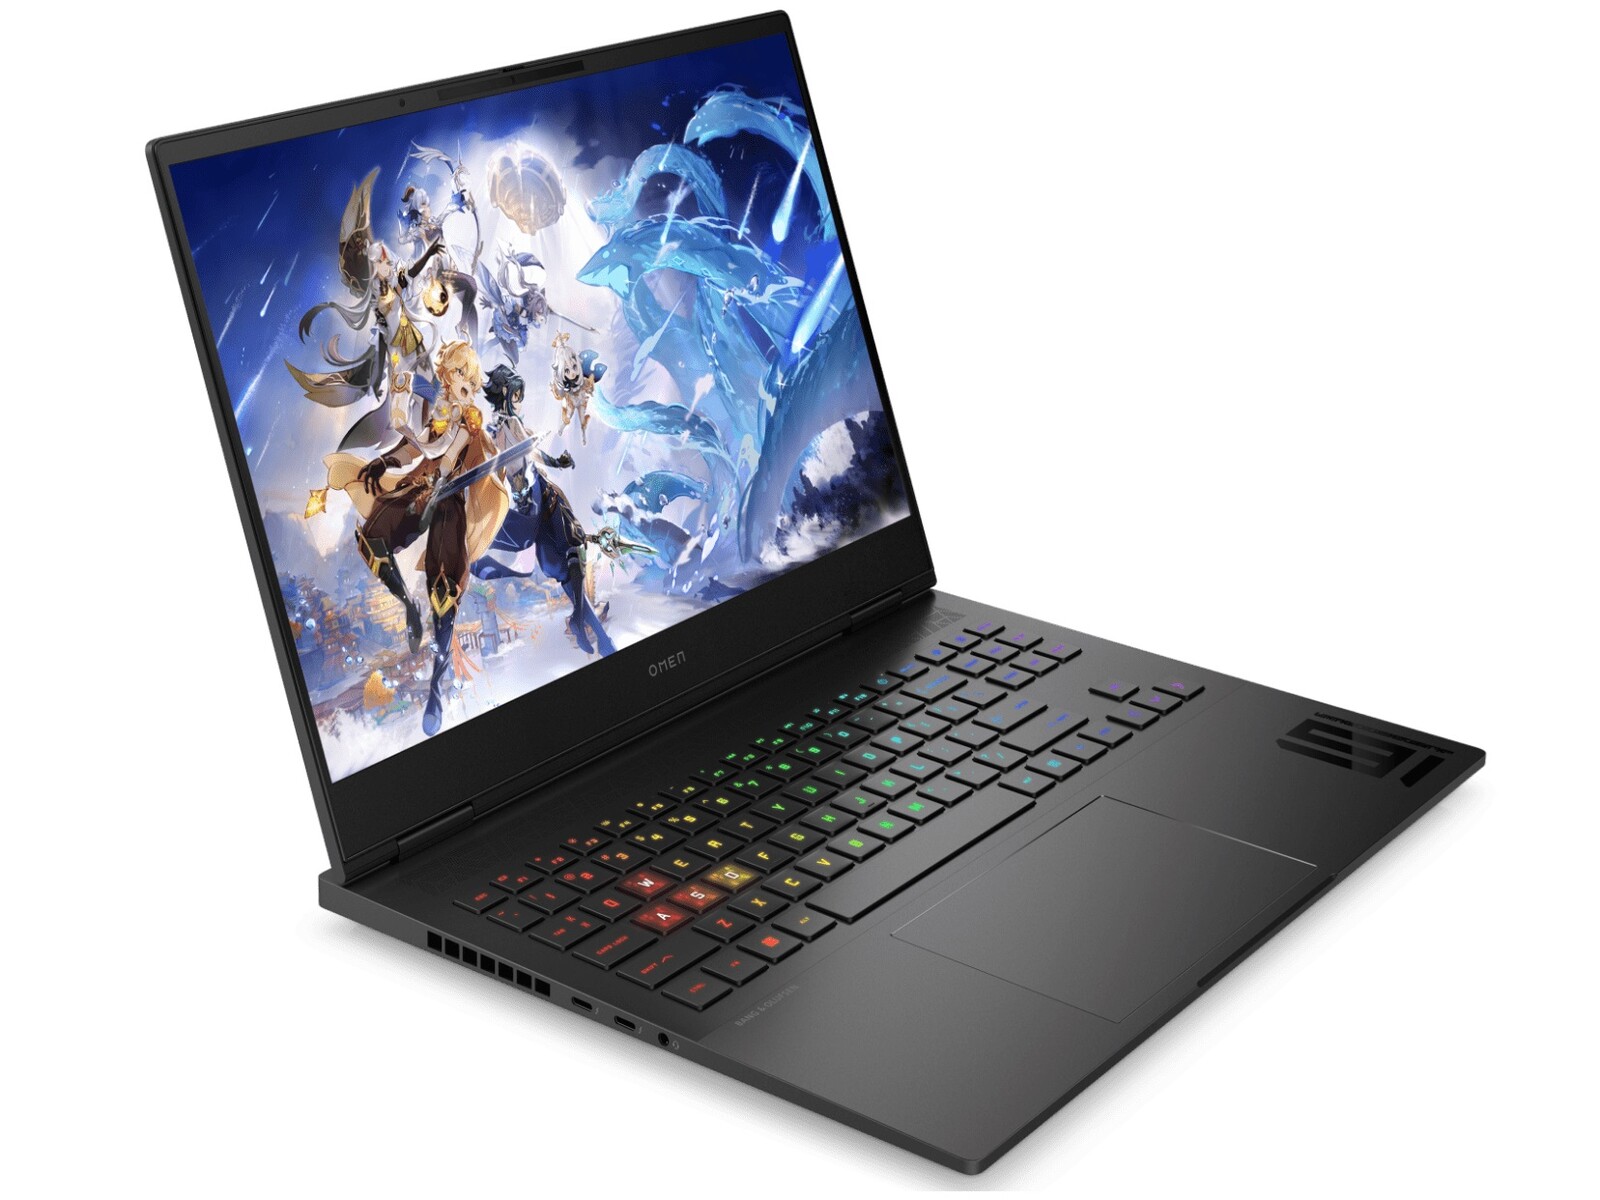
HP Omen Transcend 16 (2024) laptop review: An RTX 4070 gaming machine with an OLED display

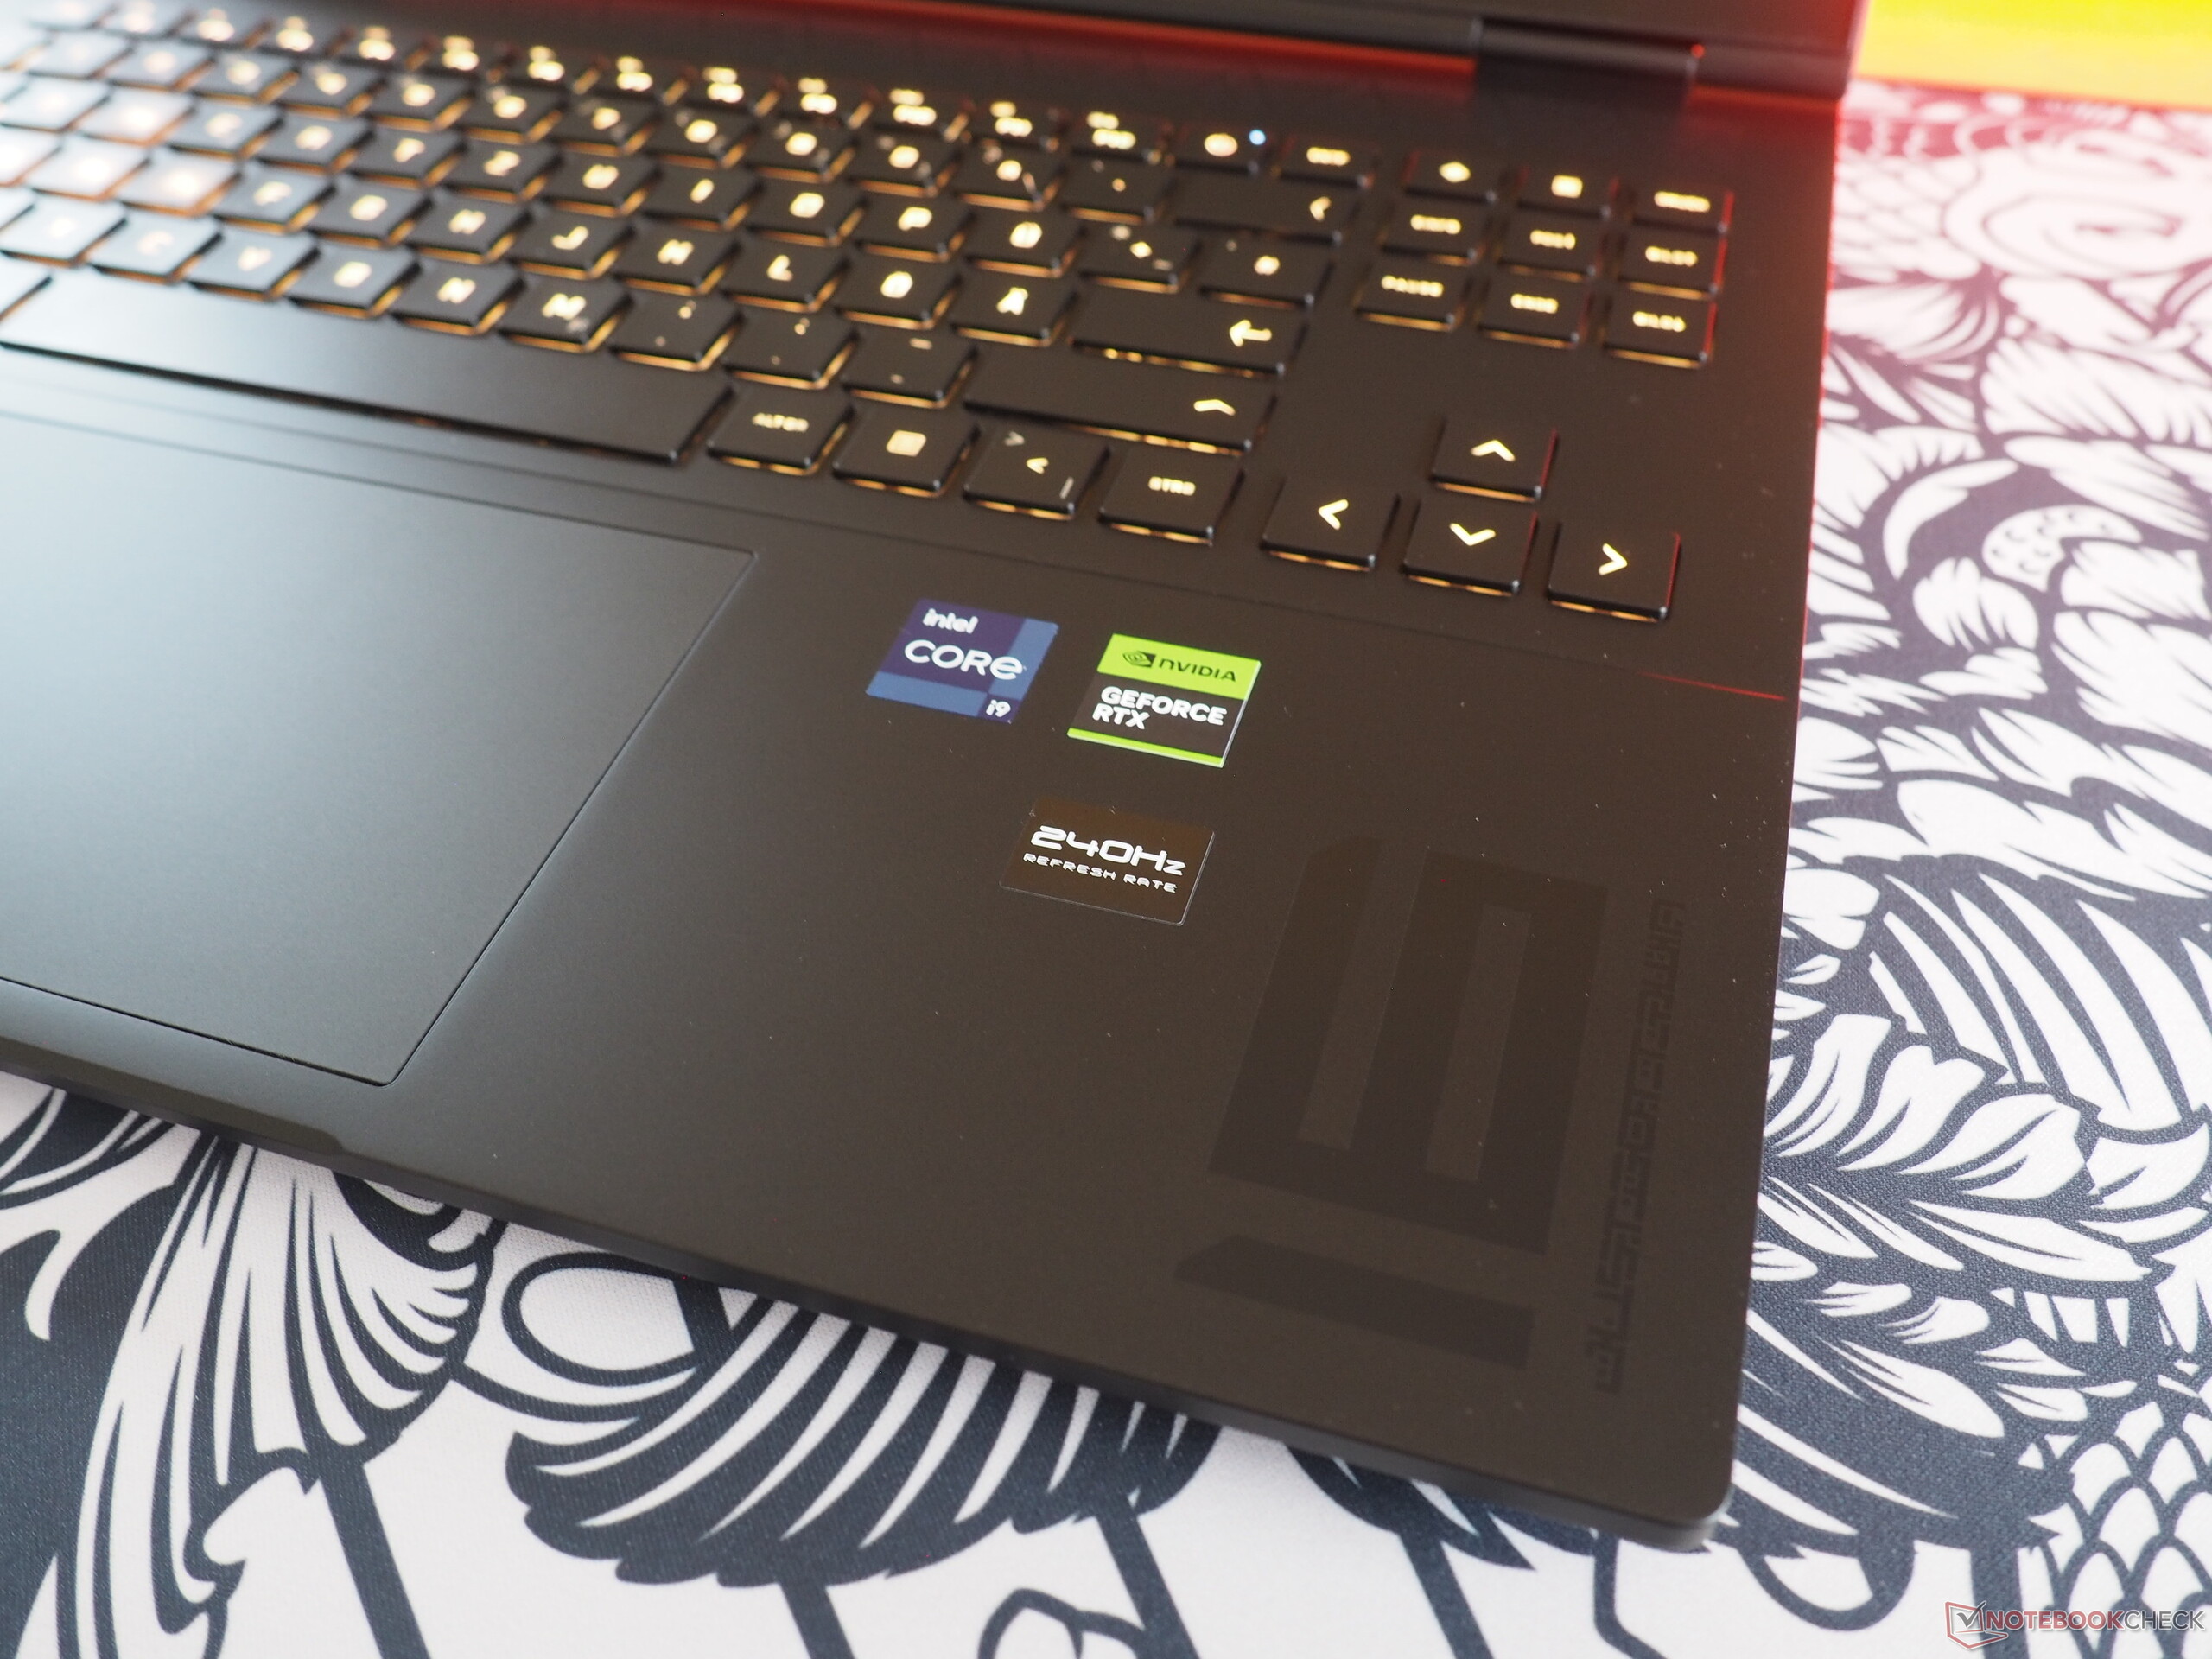
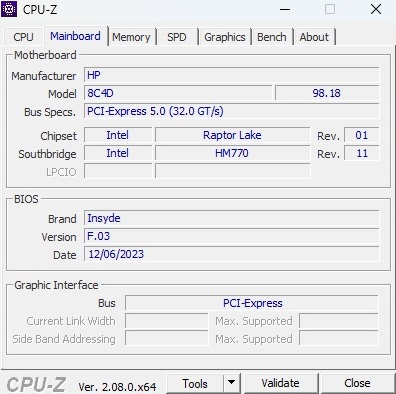
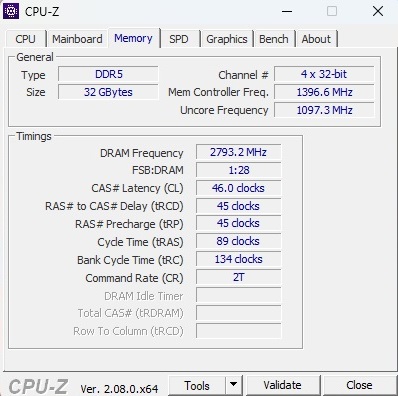
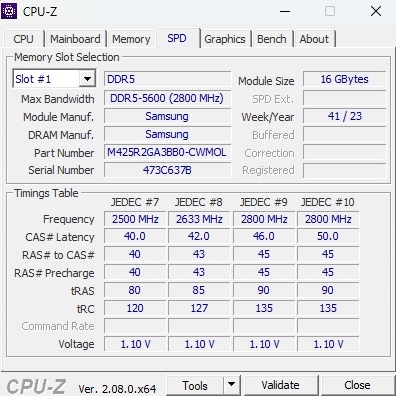
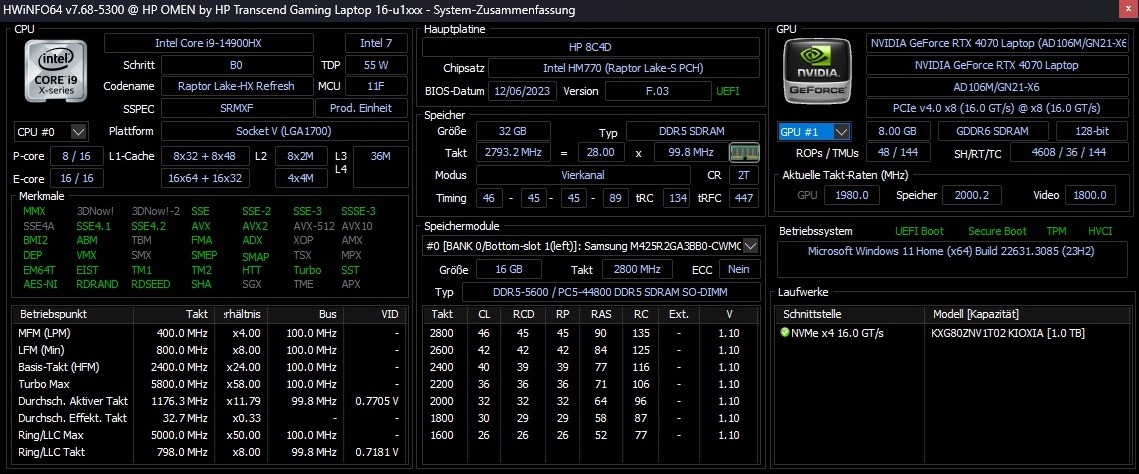
The Omen Transcend 16 review model - ending in u1095ng - can currently be had for just under $3,000. For this price, the buyer gets a Core i9-14900HX combined with a GeForce RTX 4070 that tends to belong more to the mid-range and not the high-end category due to its rather meagre 8 GB of VRAM. This is joined by 32 GB of DDR5-5600 RAM (2x 16 GB SO-DIMM) and a 1 TB M.2 NVMe SSD. The highlight is the vibrant OLED panel that is said to have 2,560 x 1,600 pixels, 240 Hz, 400 cd/m² and 100 % DCI P3. The package is rounded off with Windows 11 Home.
Omen Transcend 16 competitor can be found in the form of other 16-inch gamers equipped with the GeForce RTX 4070 as well as the Asus ROG Zephyrus G16 2024 (Ultra 7 155H), the Schenker XMG Core 16 L23 (Ryzen 7 7840HS) and the Lenovo Legion Pro 5 16ARX8 (Ryzen 7 7745HX) all of which appear in our comparison device table.
Since the chassis is mostly identical to the predecessor which had a Core i9-13900HX (see our review), we will only briefly go into the case, features and input device categories.
Possible competitors compared
Rating | Date | Model | Weight | Height | Size | Resolution | Price |
|---|---|---|---|---|---|---|---|
| 88.4 % v7 (old) | 02 / 2024 | HP Omen Transcend 16-u1095ng i9-14900HX, GeForce RTX 4070 Laptop GPU | 2.3 kg | 20 mm | 16.00" | 2560x1600 | |
| 87.9 % v7 (old) | 08 / 2023 | HP Omen Transcend 16 i9-13900HX, GeForce RTX 4070 Laptop GPU | 2.3 kg | 19.8 mm | 16.00" | 2560x1600 | |
| 92.3 % v7 (old) | 02 / 2024 | Asus ROG Zephyrus G16 2024 GU605M Ultra 7 155H, GeForce RTX 4070 Laptop GPU | 1.8 kg | 16.4 mm | 16.00" | 2560x1600 | |
| 89.2 % v7 (old) | 10 / 2023 | Schenker XMG CORE 16 (L23) R7 7840HS, GeForce RTX 4070 Laptop GPU | 2.4 kg | 26.1 mm | 16.00" | 2560x1600 | |
| 88.4 % v7 (old) | 05 / 2023 | Lenovo Legion Pro 5 16ARX8 R7 7745HX, GeForce RTX 4070 Laptop GPU | 2.5 kg | 26.8 mm | 16.00" | 2560x1600 |
Case
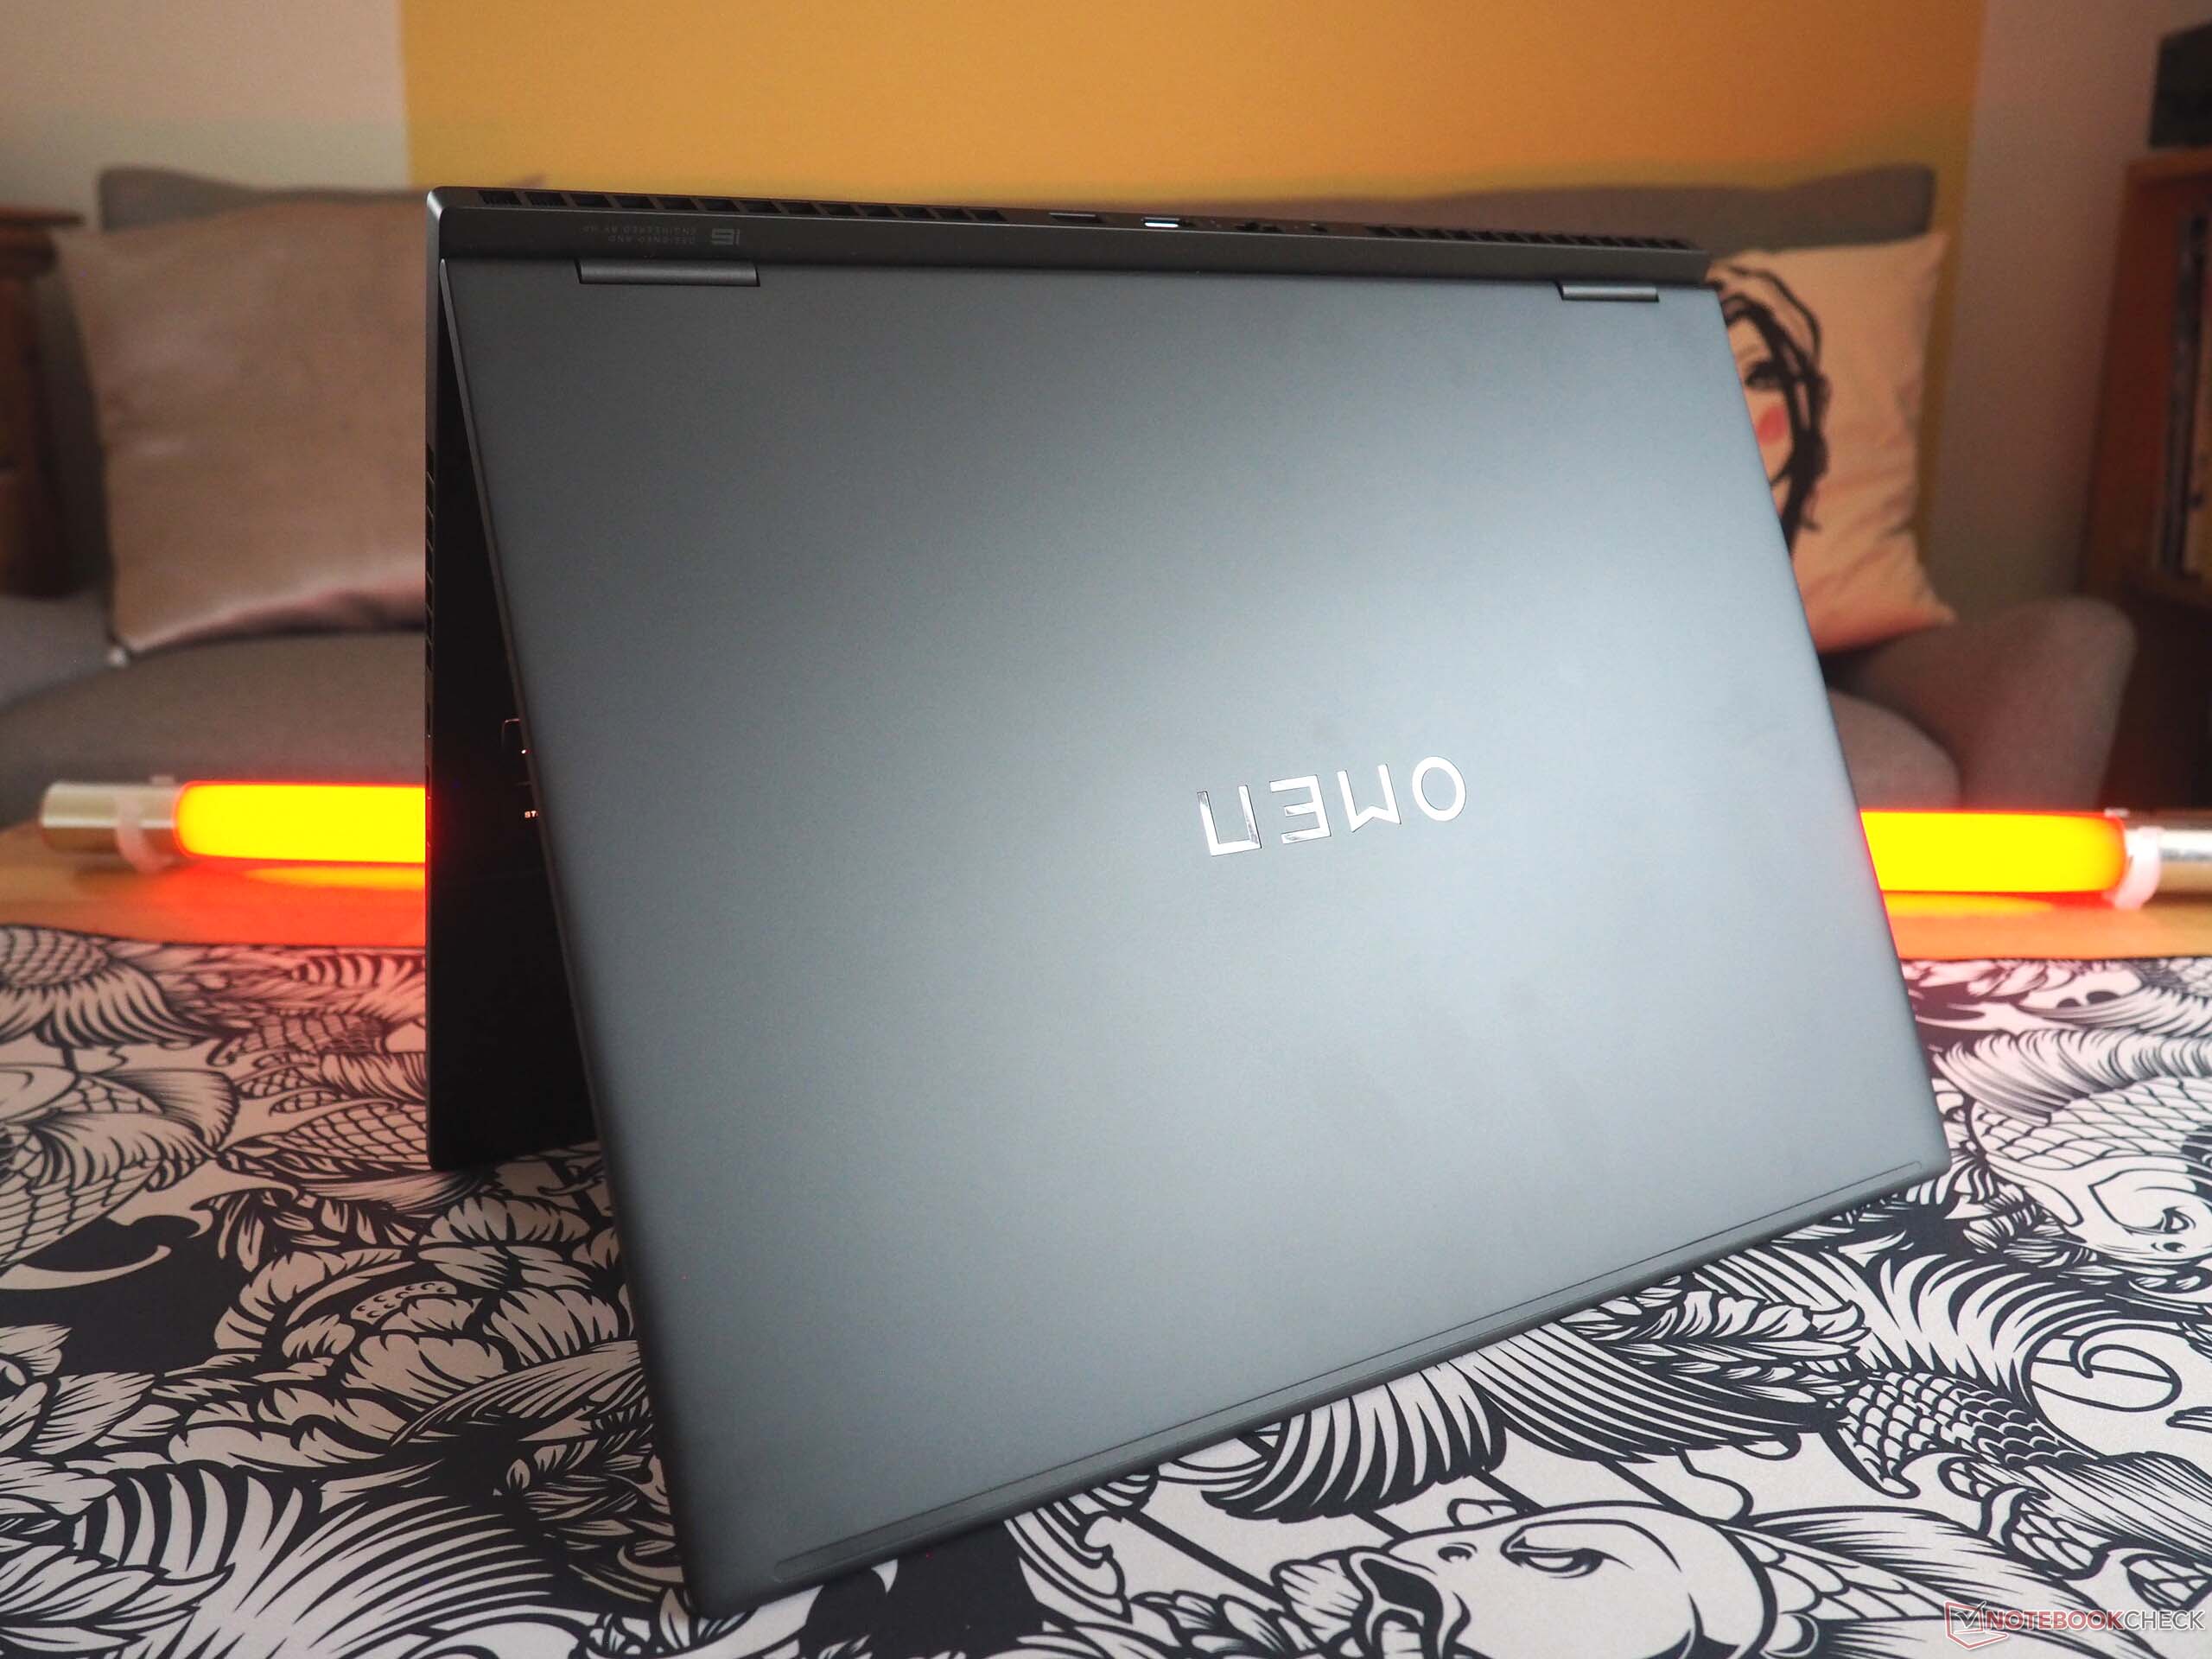
The Transcend 16 offers an eye-catching design and, from a visual point of view, it cuts an impressively slim figure (all of the competing devices are thicker apart from the Zephyrus G16). When it comes to stability, the base unit at least manages to deliver solid performance. By contrast, the lid – as with so many devices – could have done with better torsional rigidity. At first glance, the matte surface has a premium look, however, HP has mostly only used plastic. No complaints can be made in terms of build quality. The manufacturer deserves praise for the generous 180° opening angle although the hinges could be stronger. When it comes to weight, at 2.3 kg, the device sits in the middle of the pack and this makes the 16-incher neither particularly light nor heavy.


Features
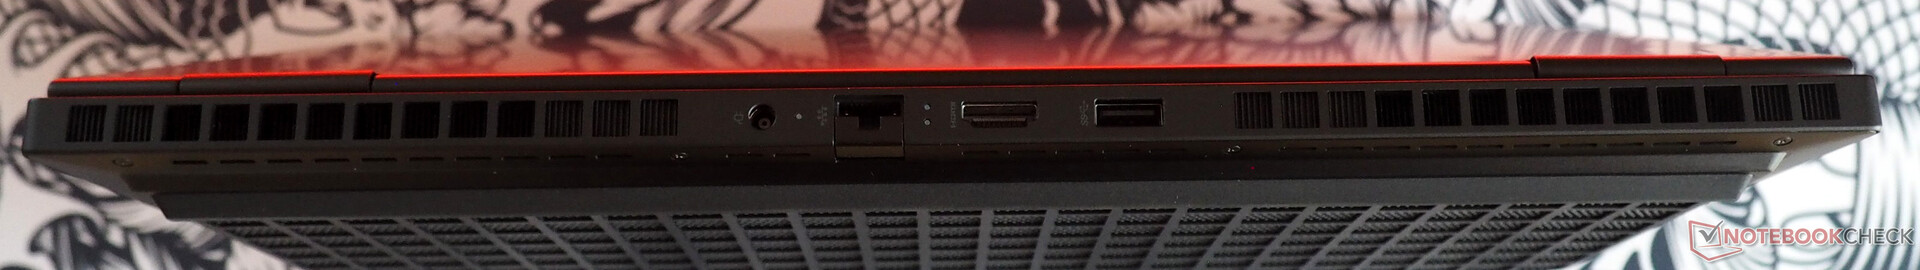
The port selection can be described as very modern. While the rear houses an RJ45 port (unfortunately not 2.5 Gbit LAN), an HDMI 2.1 output and a USB 3.0 port (type A), the left side is home to two Thunderbolt 4 ports (including Power Delivery) and an audio jack. On the right-hand side, there is only one lonely USB 3.0 port (type A). Buyers have to make do without a Kensington lock and a card reader.


Communication
The Wi-Fi performance is at a high level and with a send speed of almost 1,400 Mbit/s and around 1,700 Mbit/s when it comes to receiving data (1 m distance from the reference router) the performance is somewhere between good and very good. With the Wi-Fi 6E AX211, HP has installed an up-to-date Intel wireless module.
Webcam
We have mixed feelings regarding the 2 MP webcam. While the image sharpness is above average, the color accuracy leaves a lot to be desired. What is good is the manual shutter for privacy.


Accessories
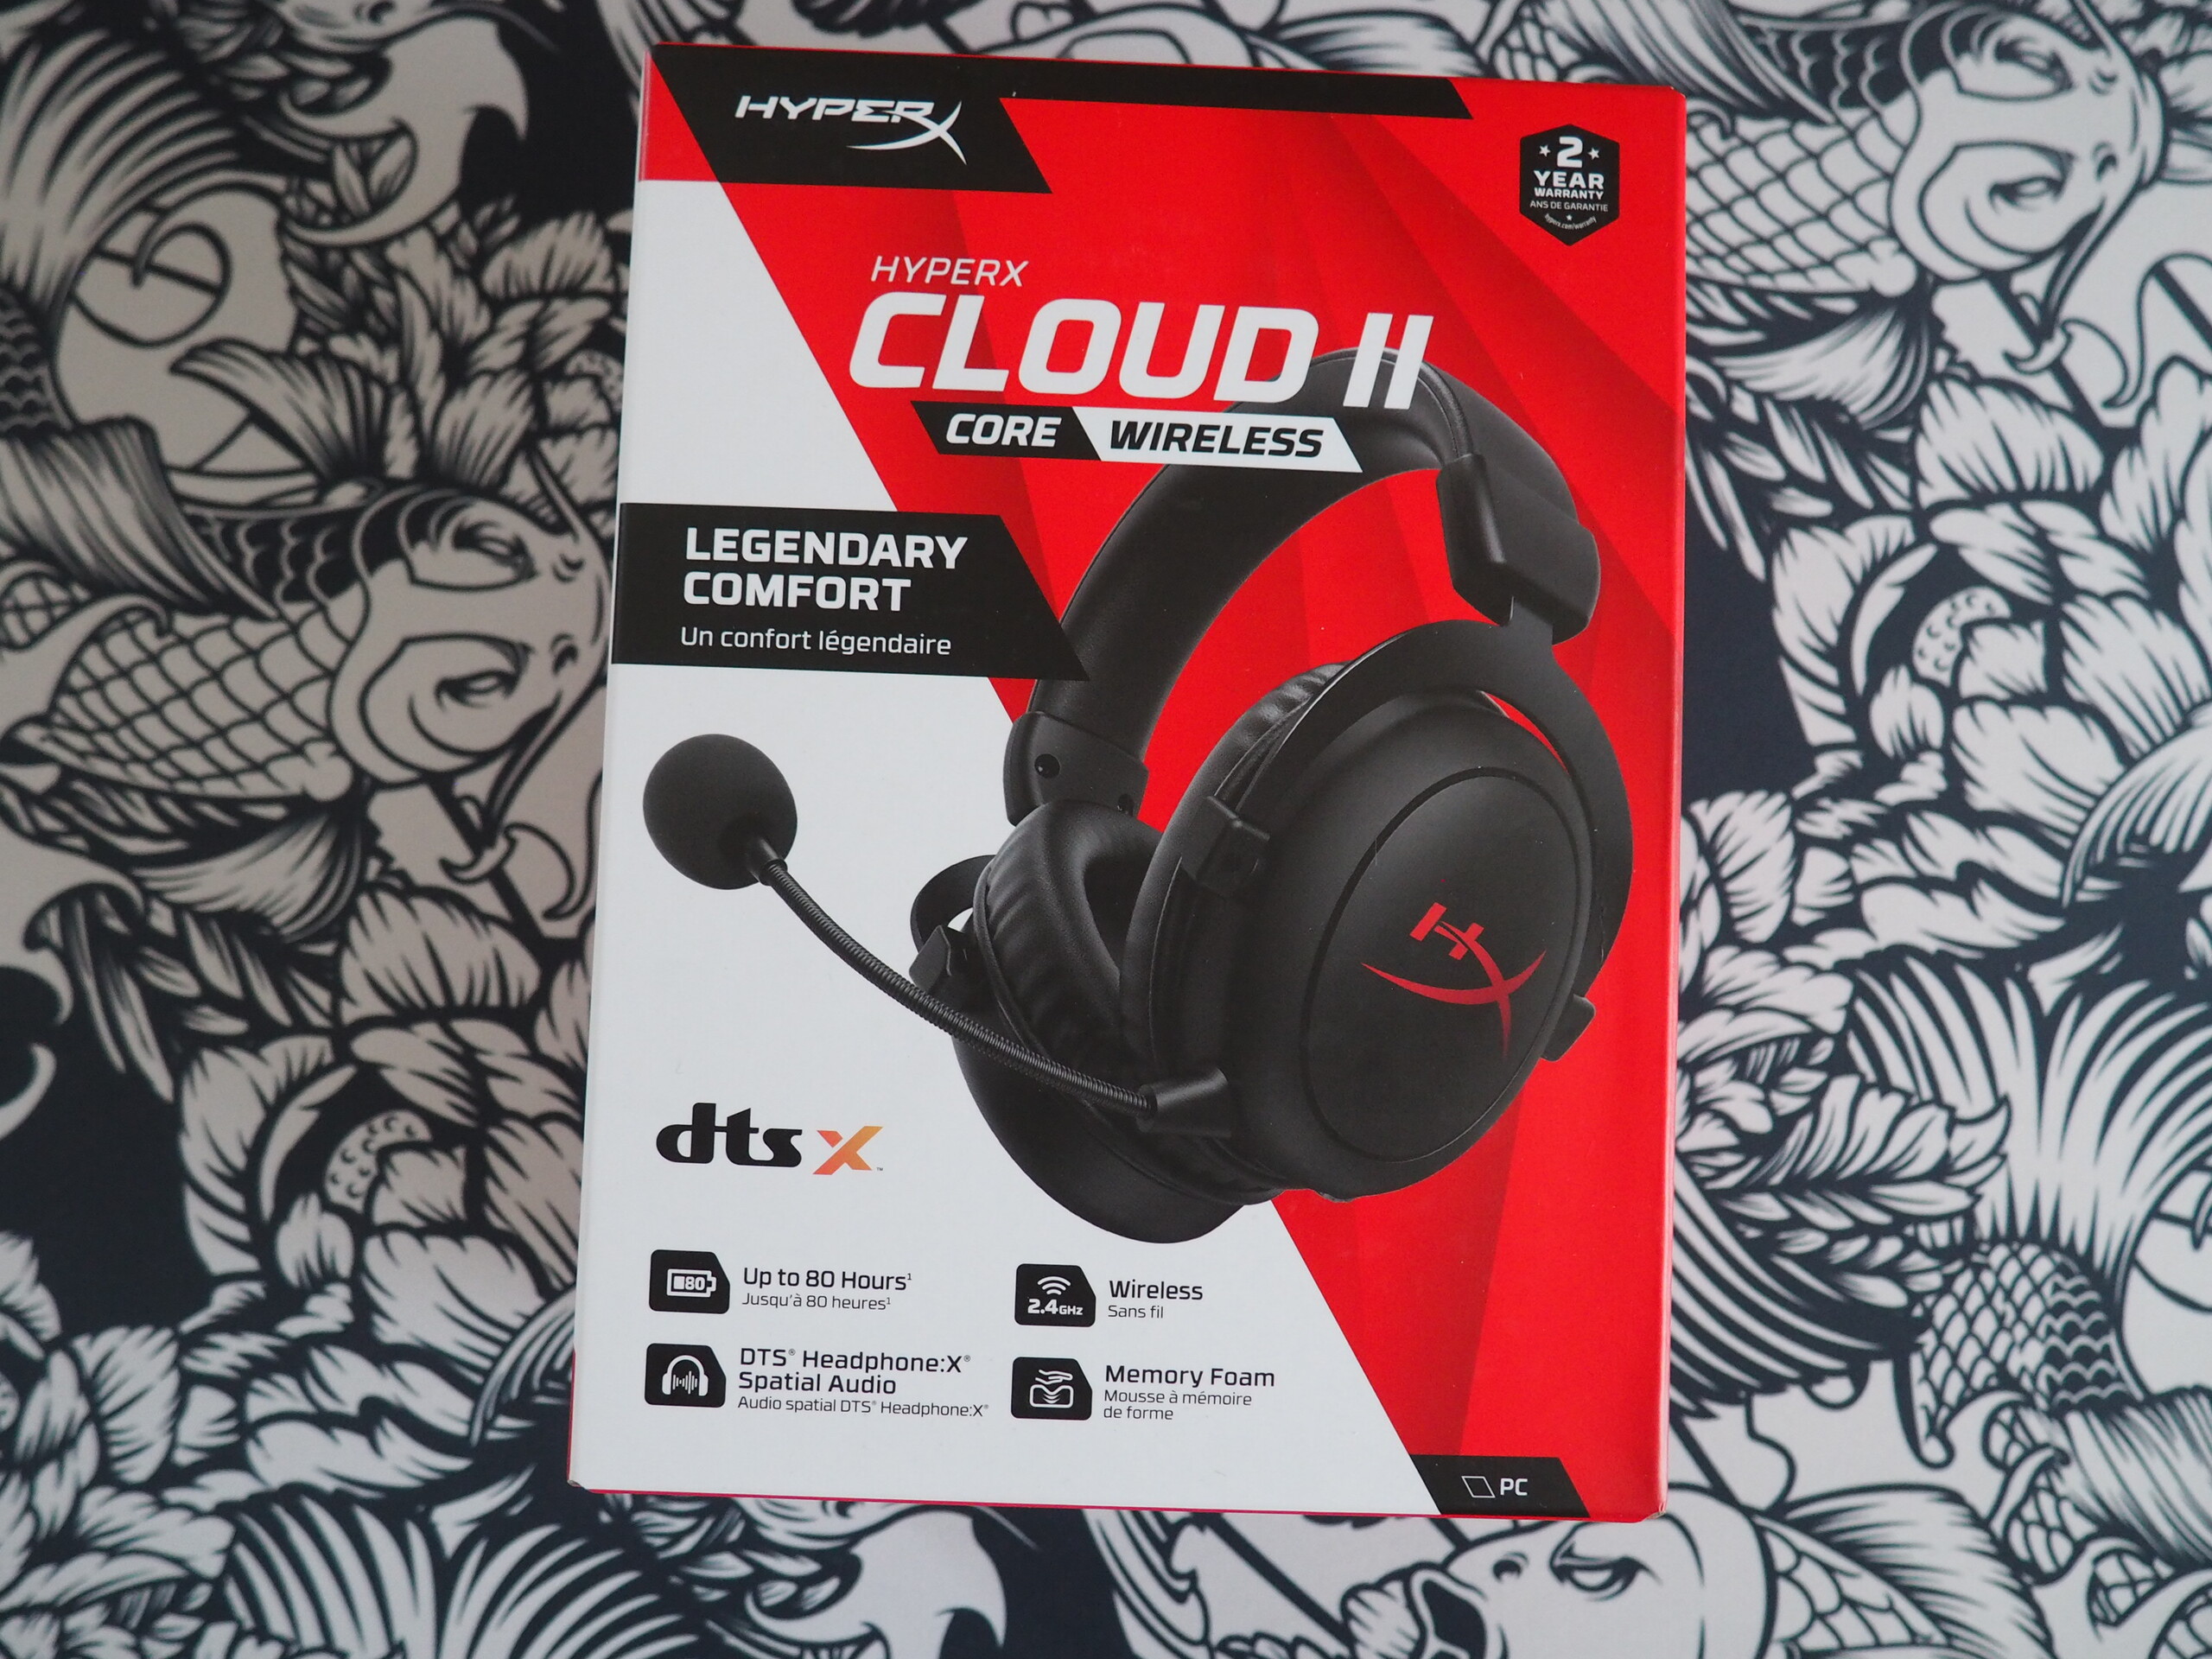
Our review device also came with a very slim 230-watt PSU as well as a HyperX headset (Cloud II Core wireless).
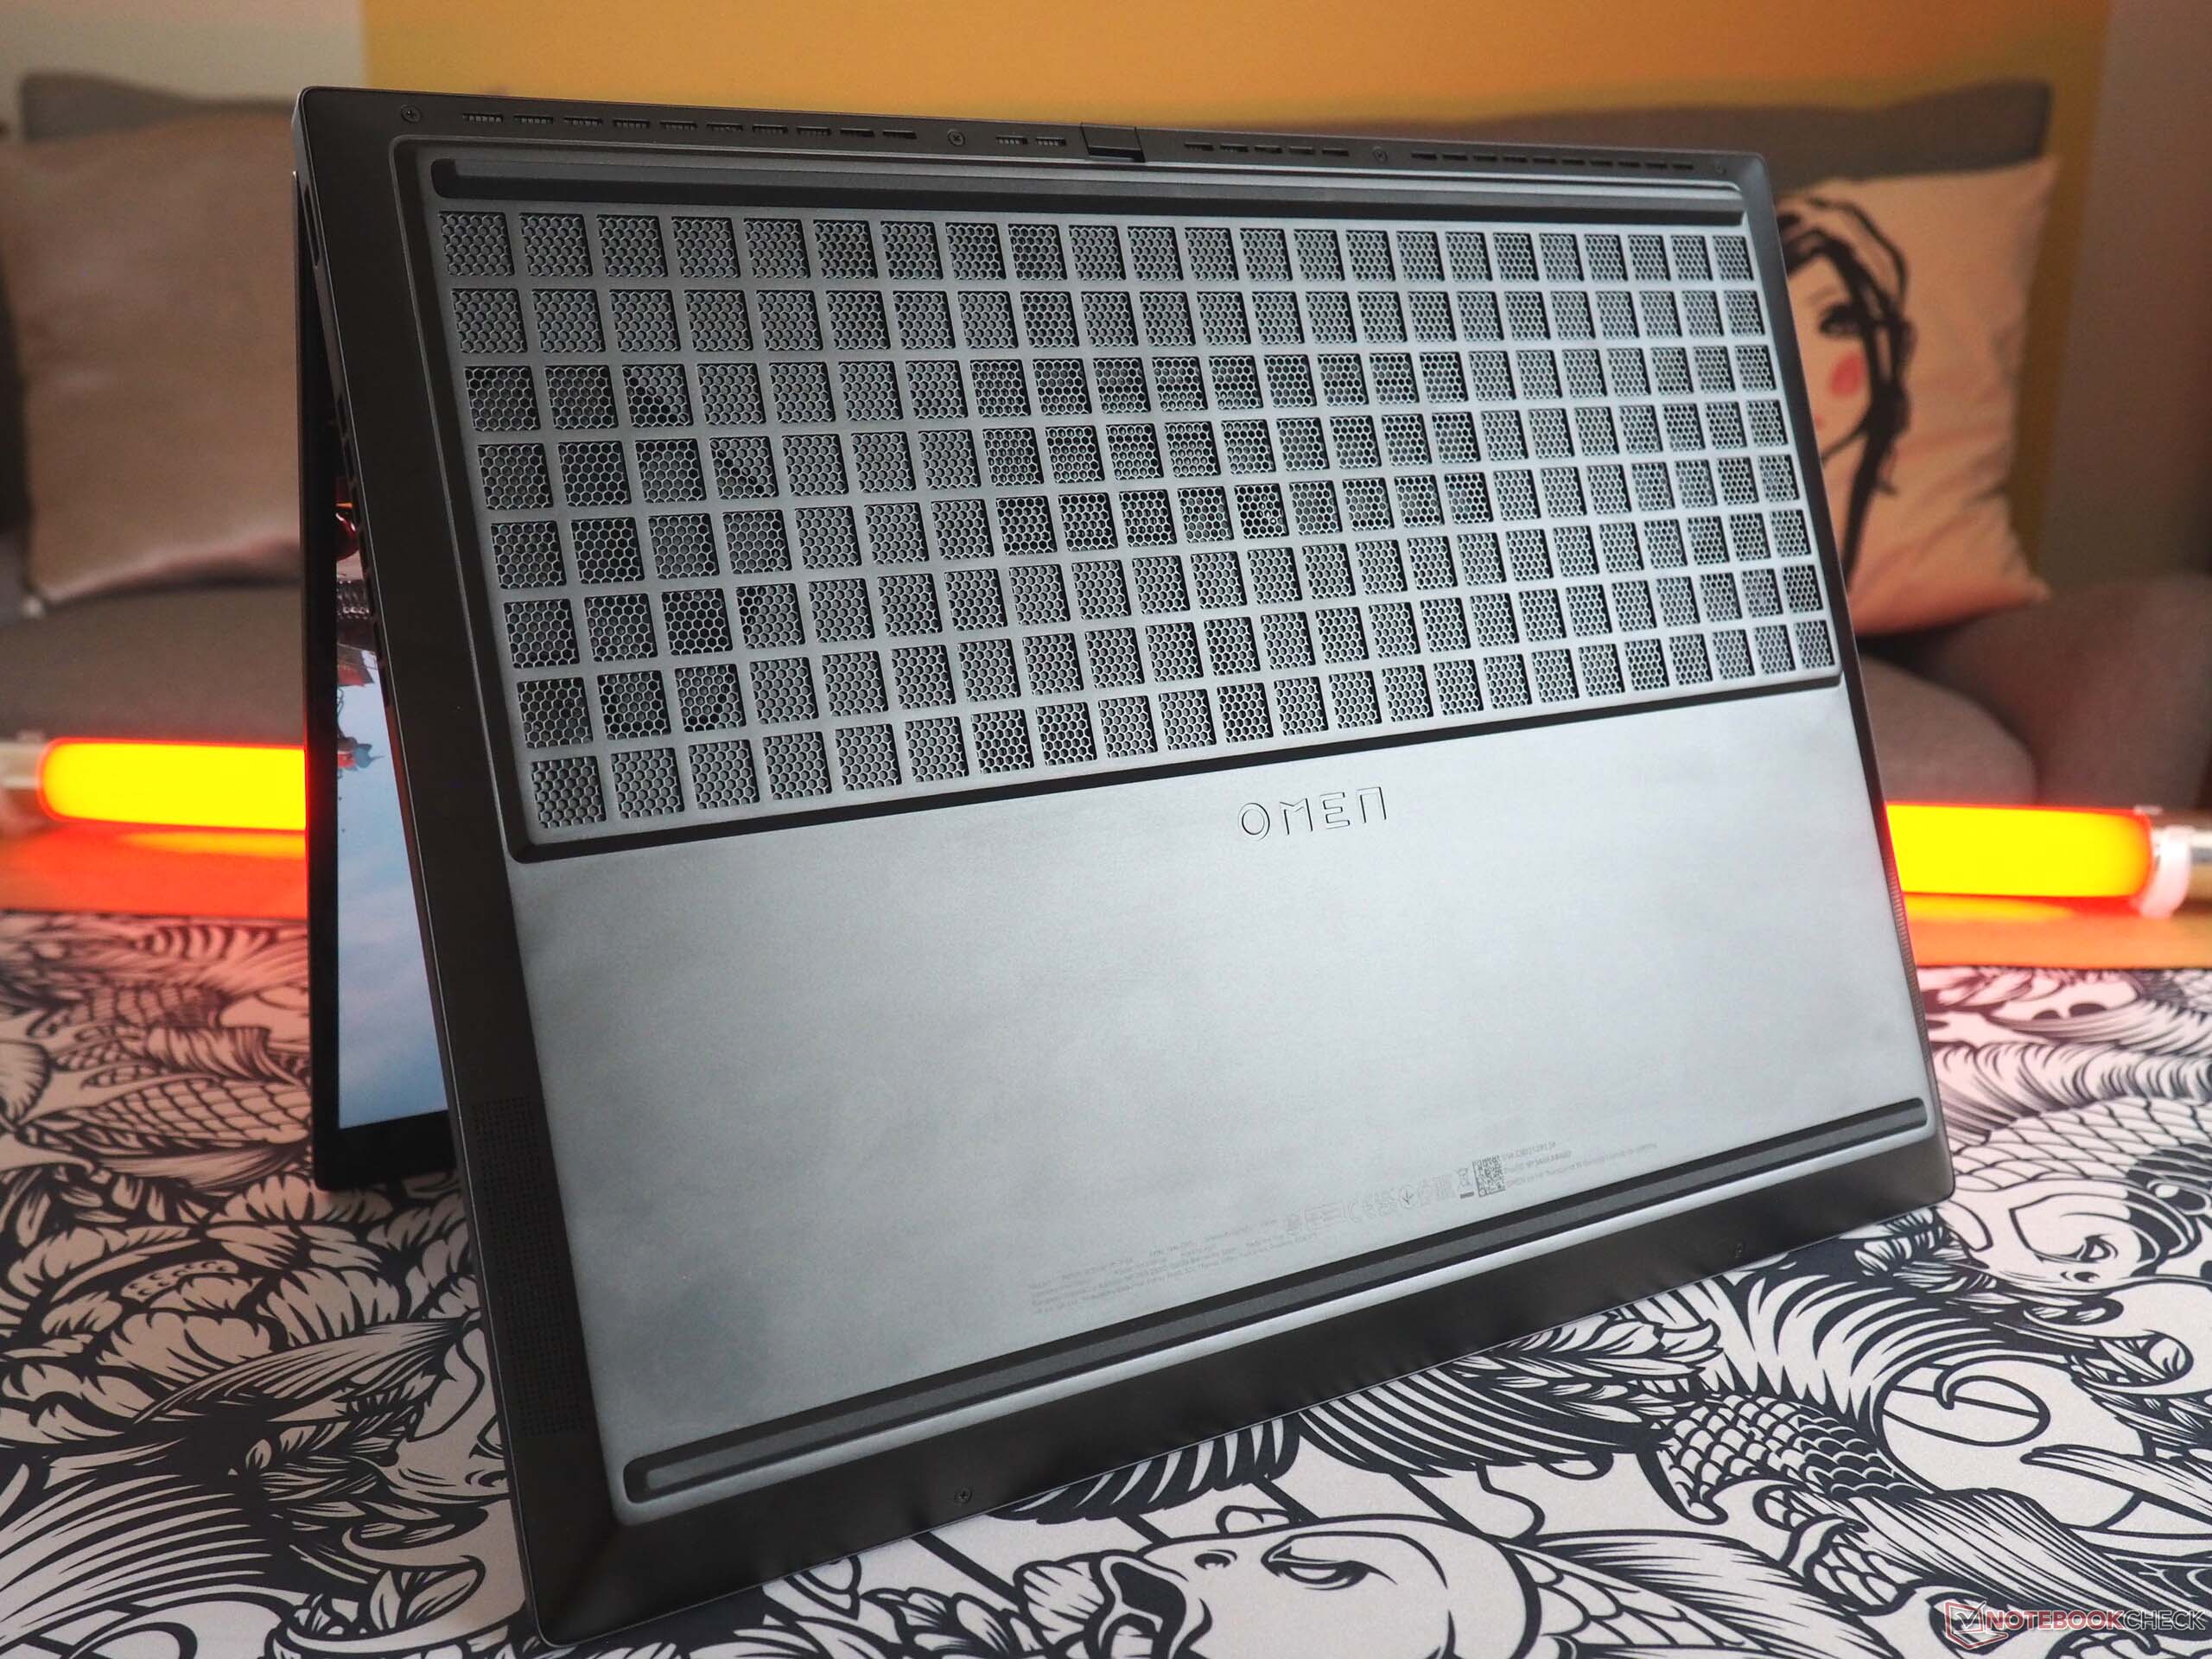
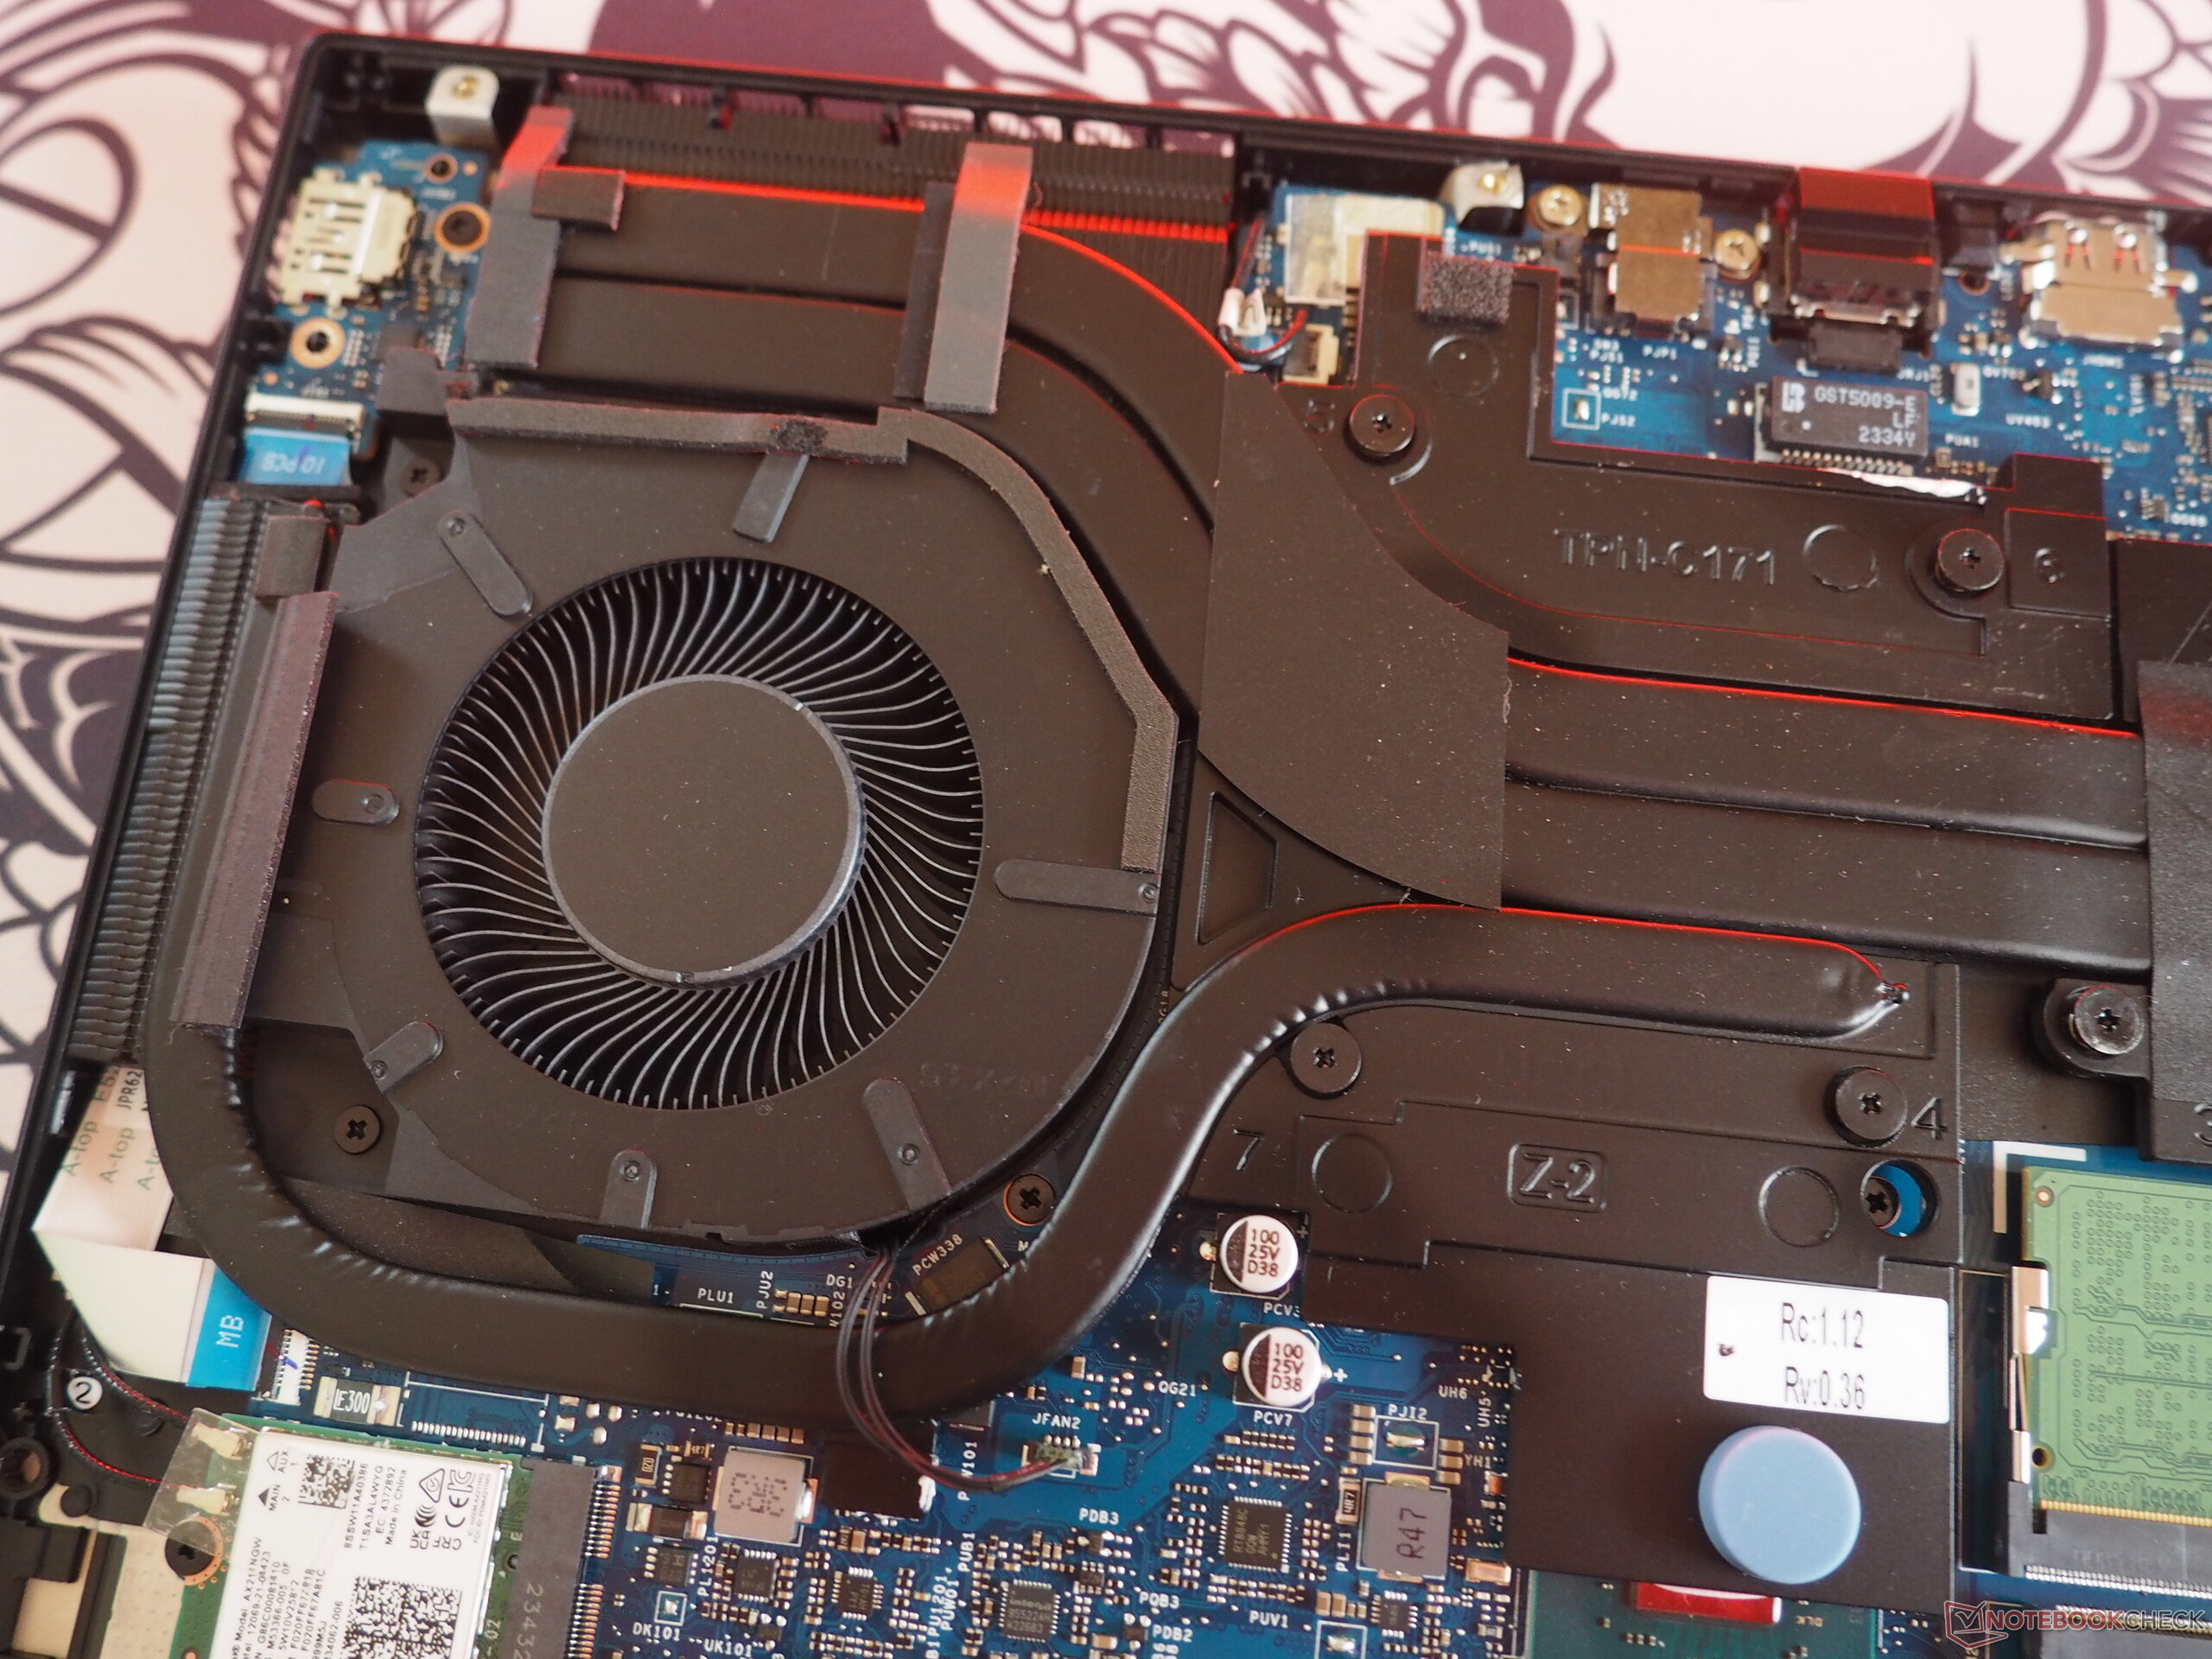
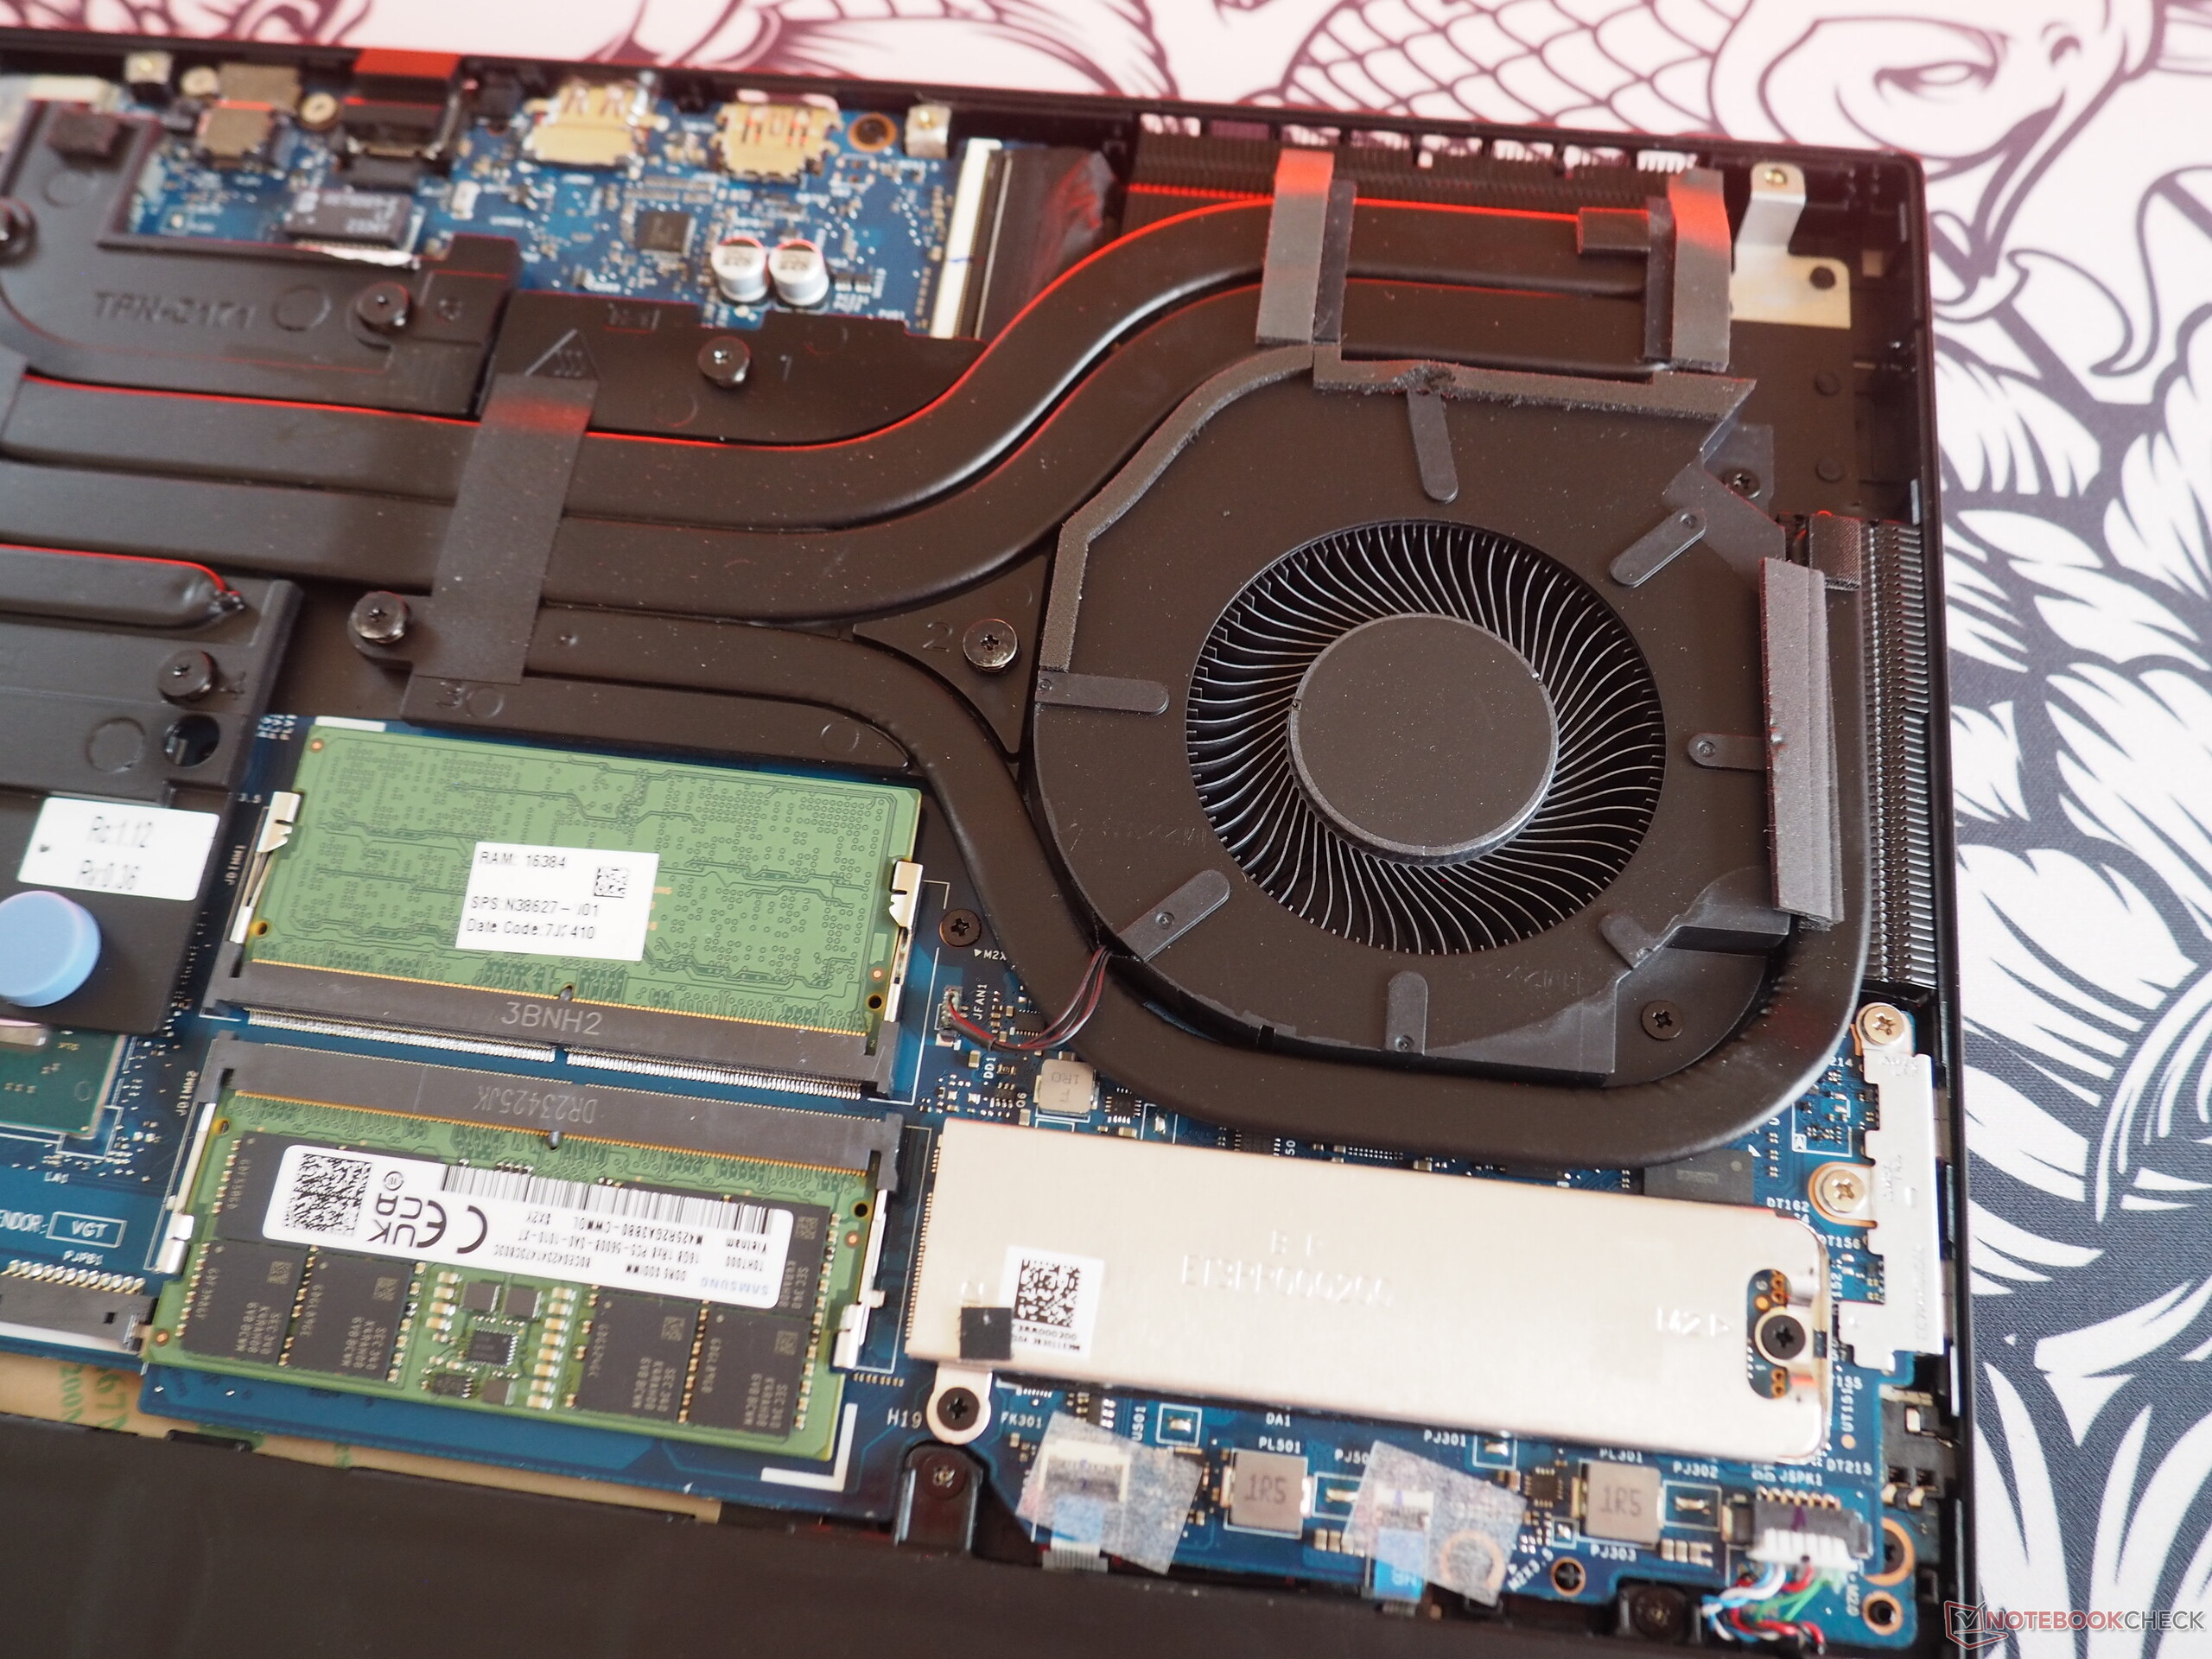
Maintenance
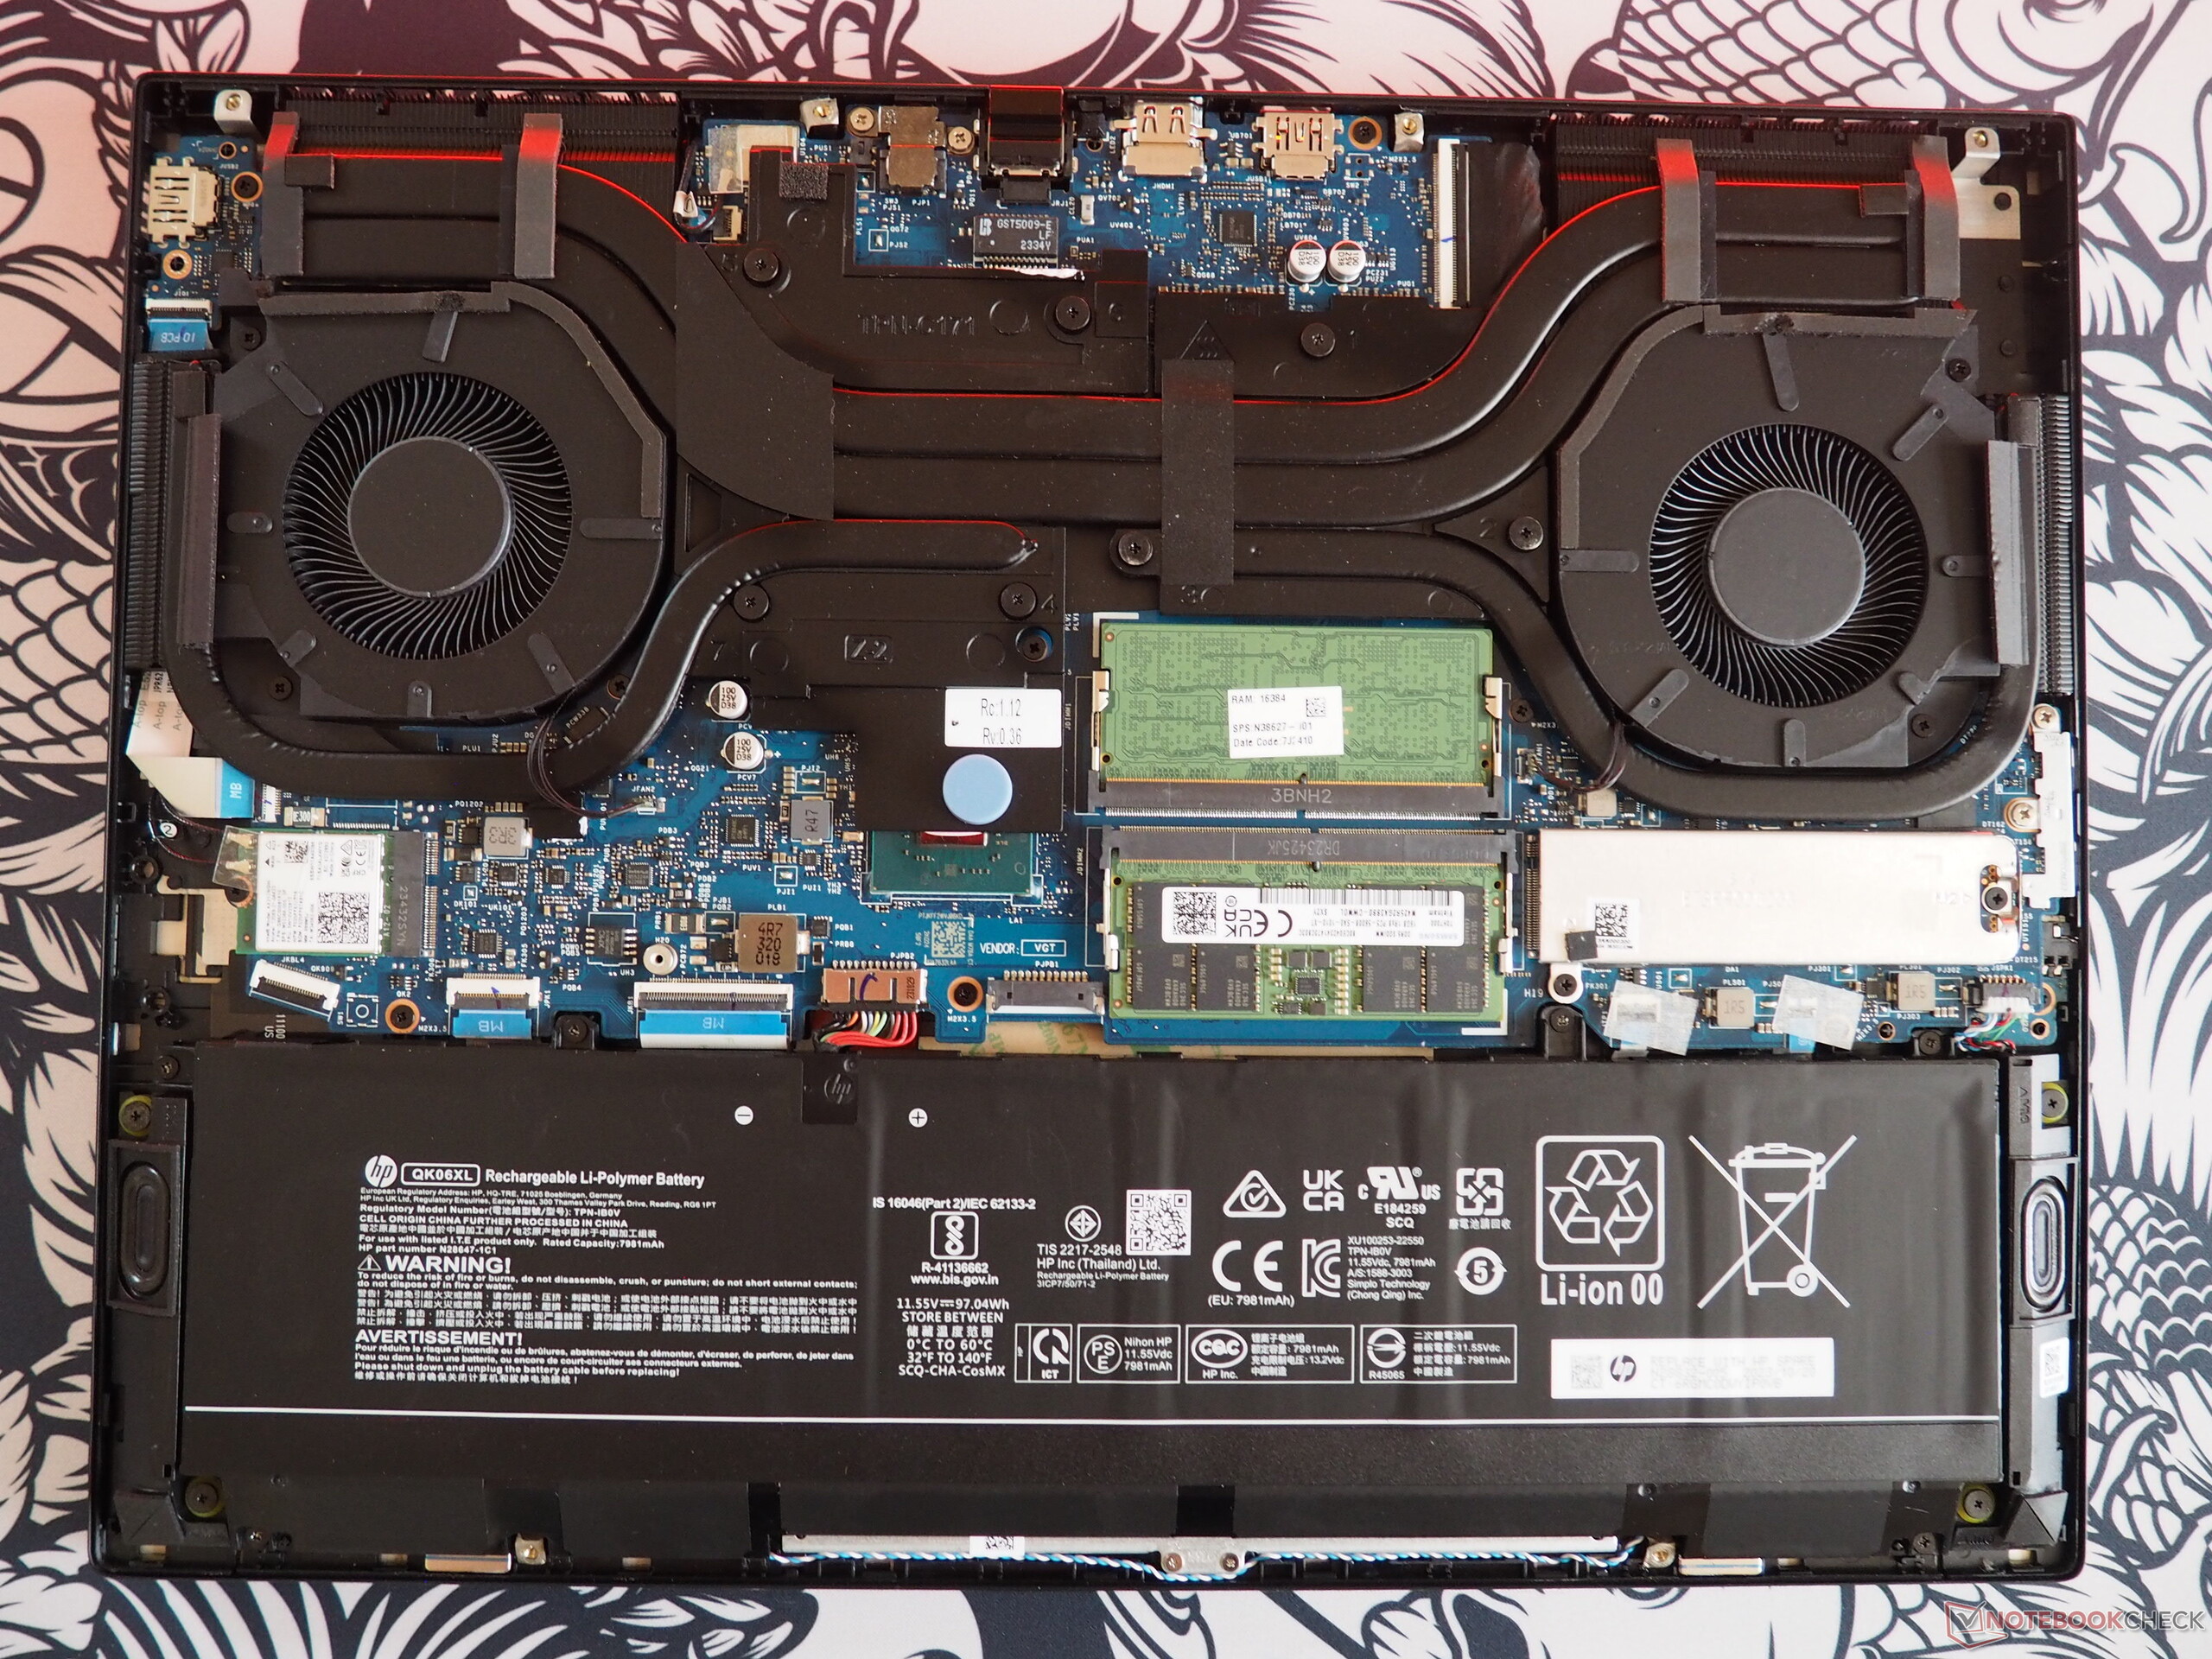
In terms of maintenance, the Omen 16 is not particularly complicated. After taking care of six, small, cross-headed screws, the base plate can be lifted from its anchored position with the help of a flat tool. Inside the device, all of the important components are accessible, be it the RAM banks, battery, M.2 slot, fans or the wireless module.
Warranty
The warranty is for 24 months.
Input devices
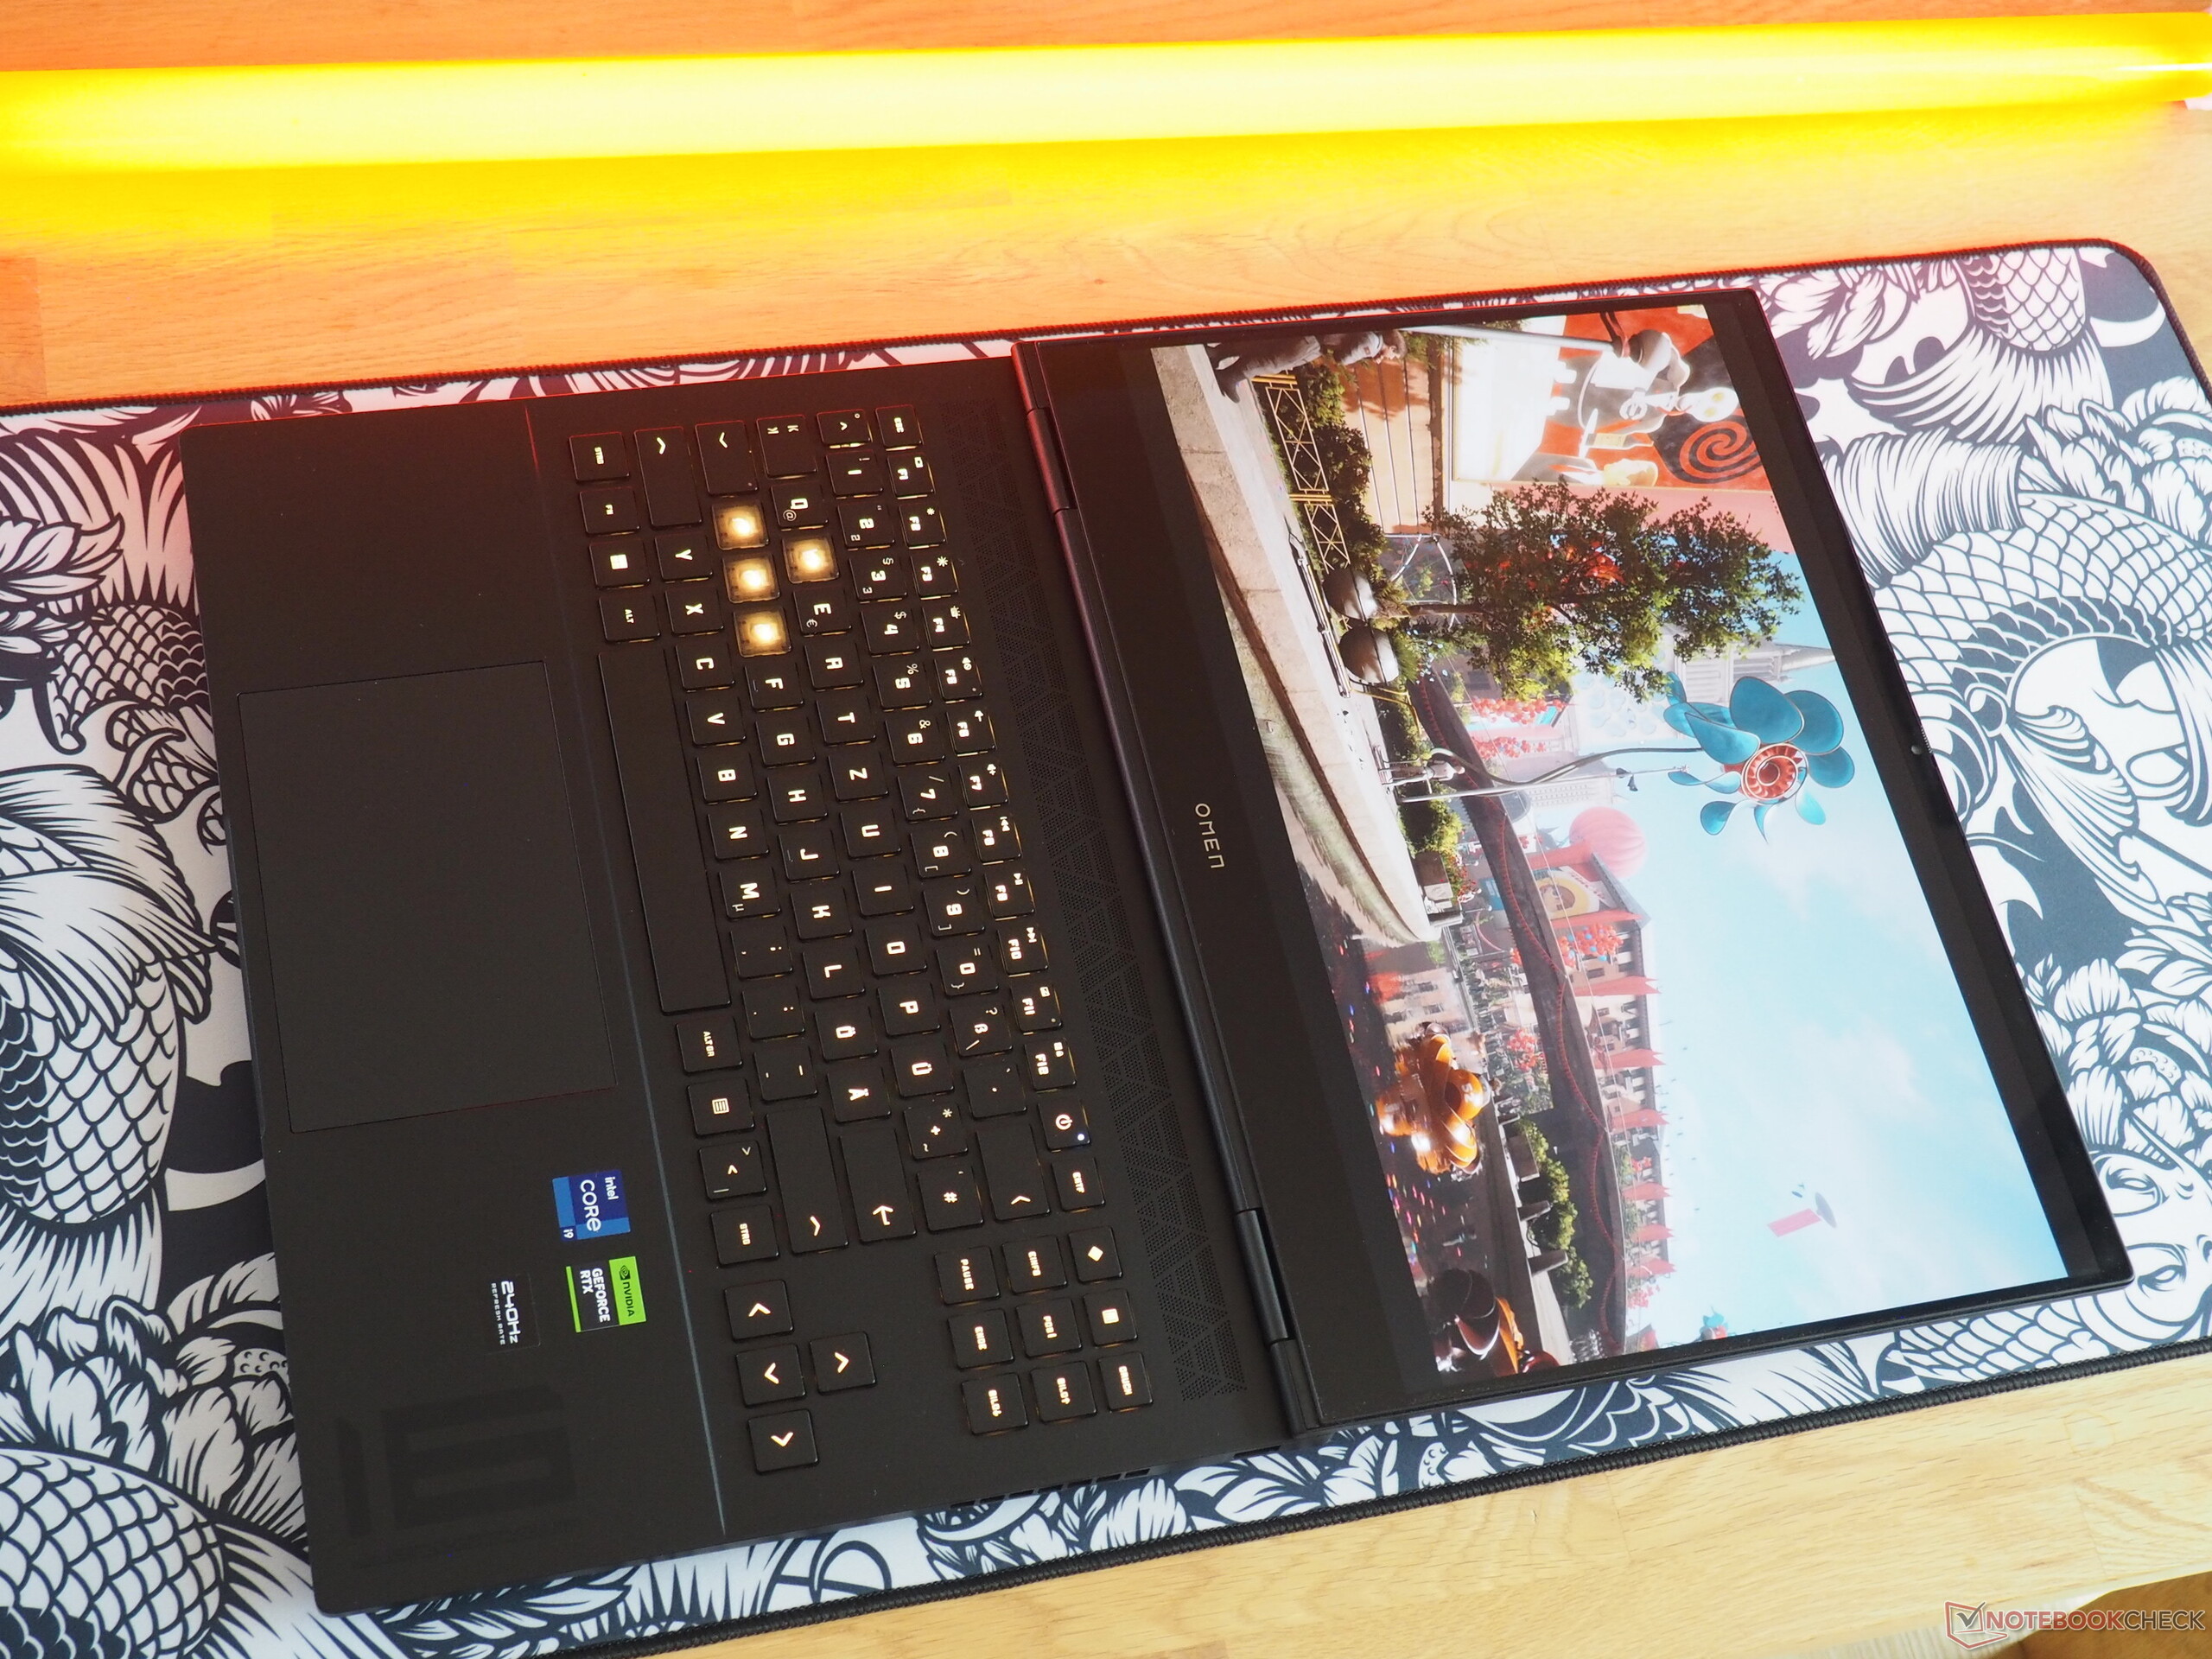
Keyboard
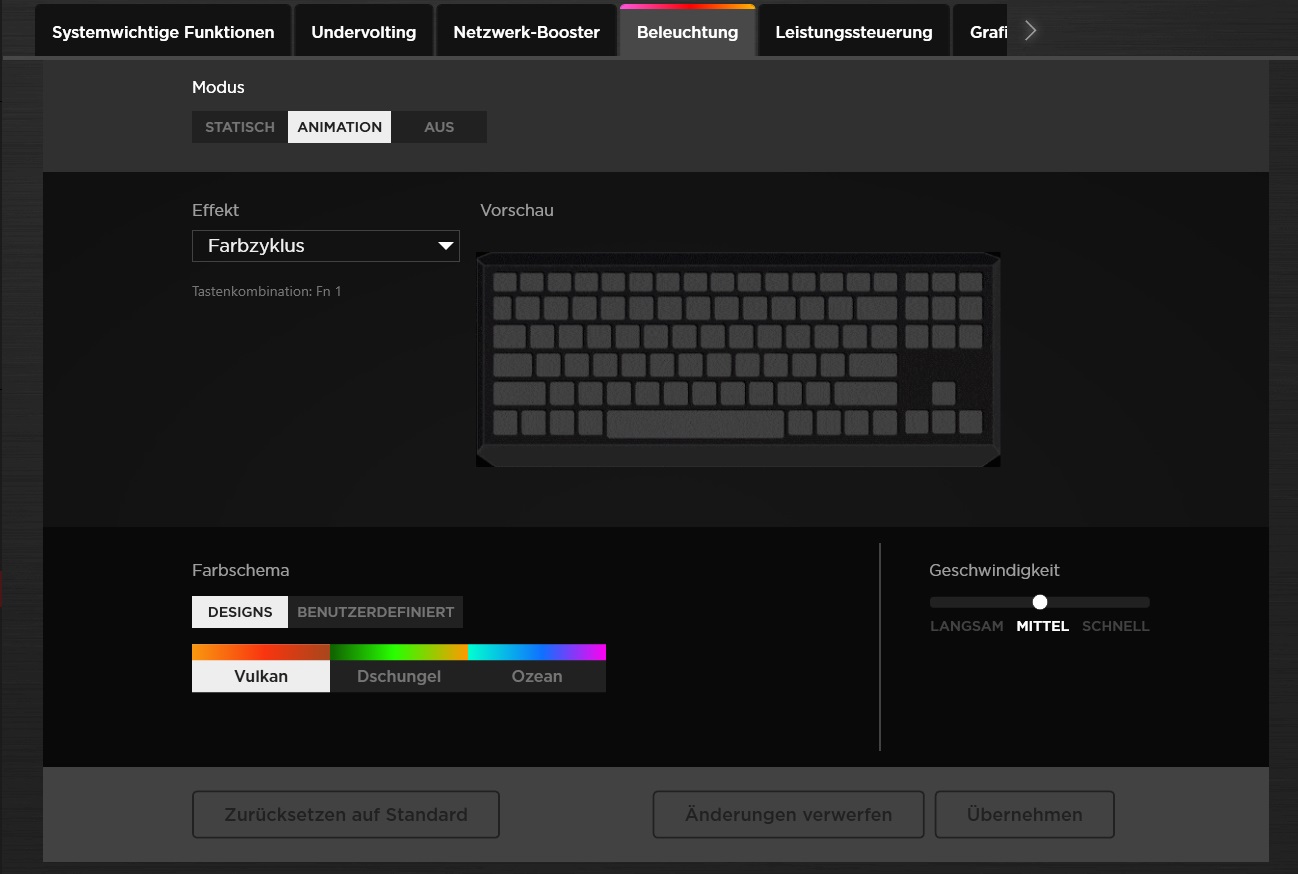
With its transparent WASD keys, HP has gone for a certain gamer look. The layout is very unique, and even takes some getting used to. The manufacturer has opted against installing a numerical keypad and, instead, it has given the 16-inch device separate, well-sized arrow keys. Other decisions (for example, the location of the power button) are really difficult to get your head around. The typing experience is mediocre and HP has had to use a mechanical model for better feedback. Fans of backlit keys can look forward to multiple colors.
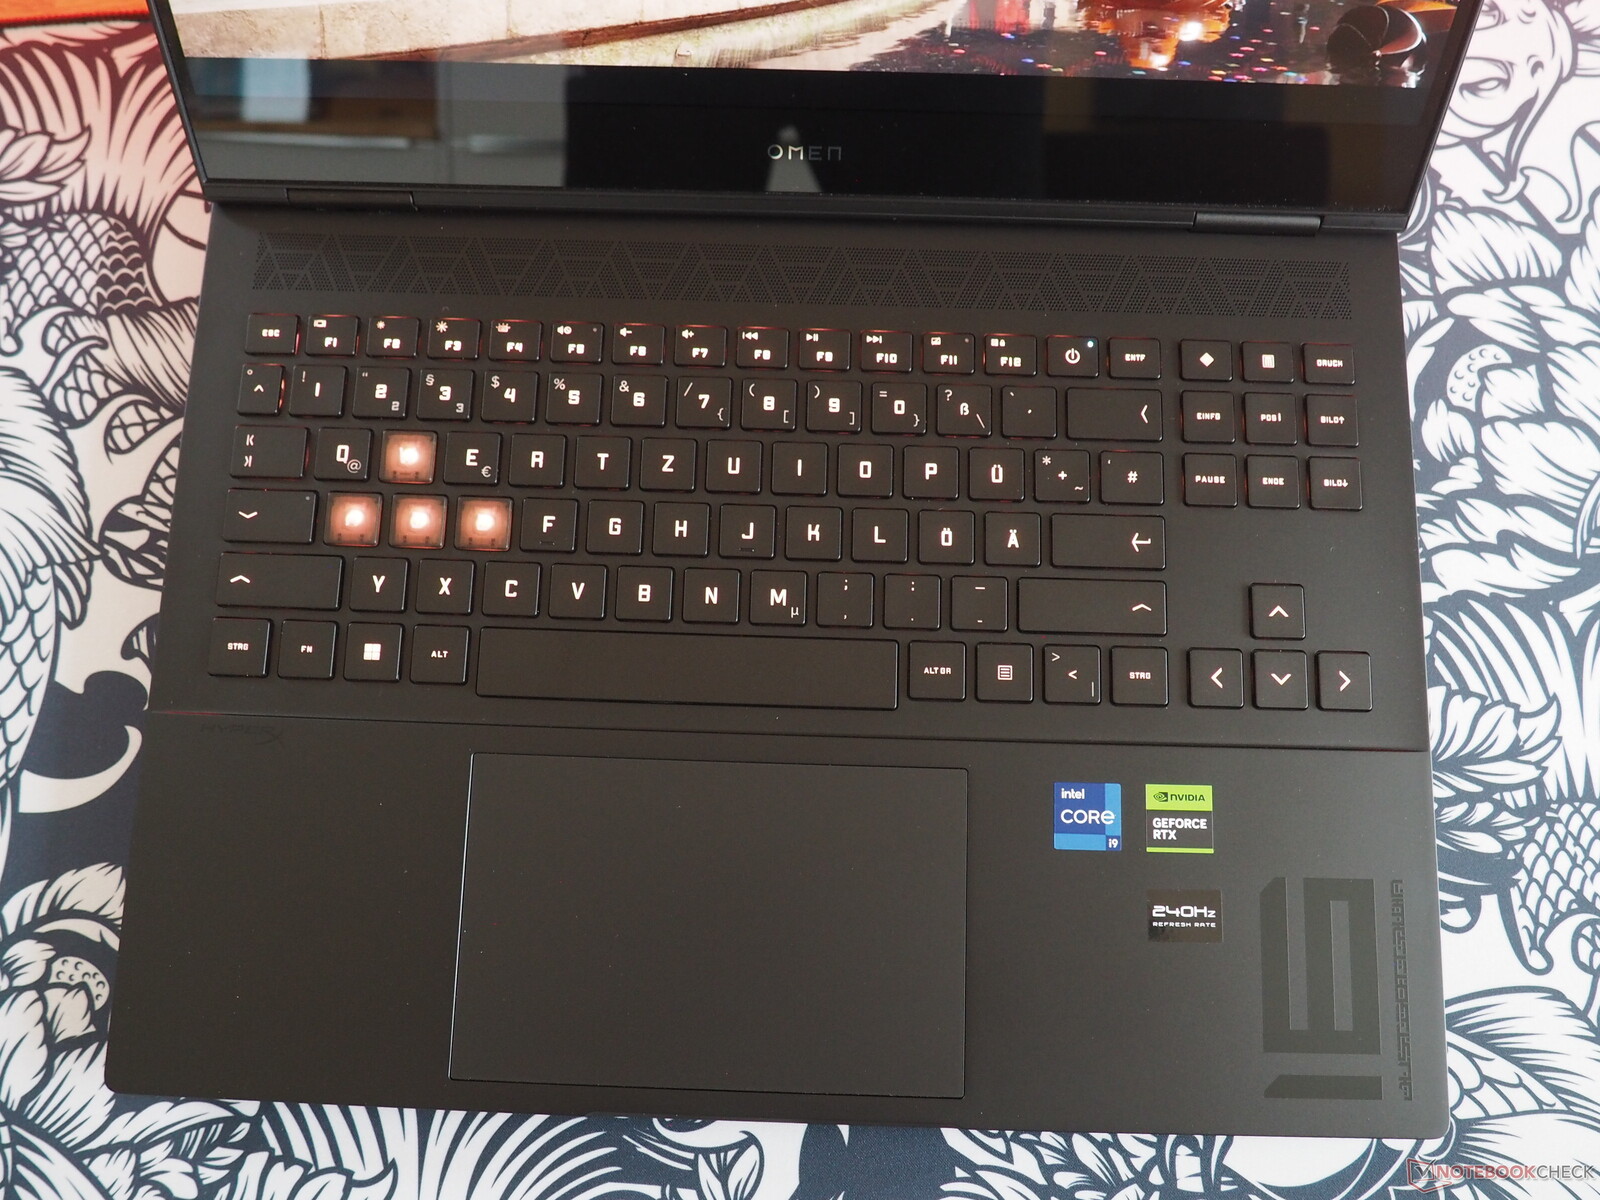
Touchpad
At around 13.5 x 8.5 cm, the pleasingly large touchpad can be described as unassuming, when it comes to precision, smoothness, and click areas. Likewise, the gesture support is intuitive.
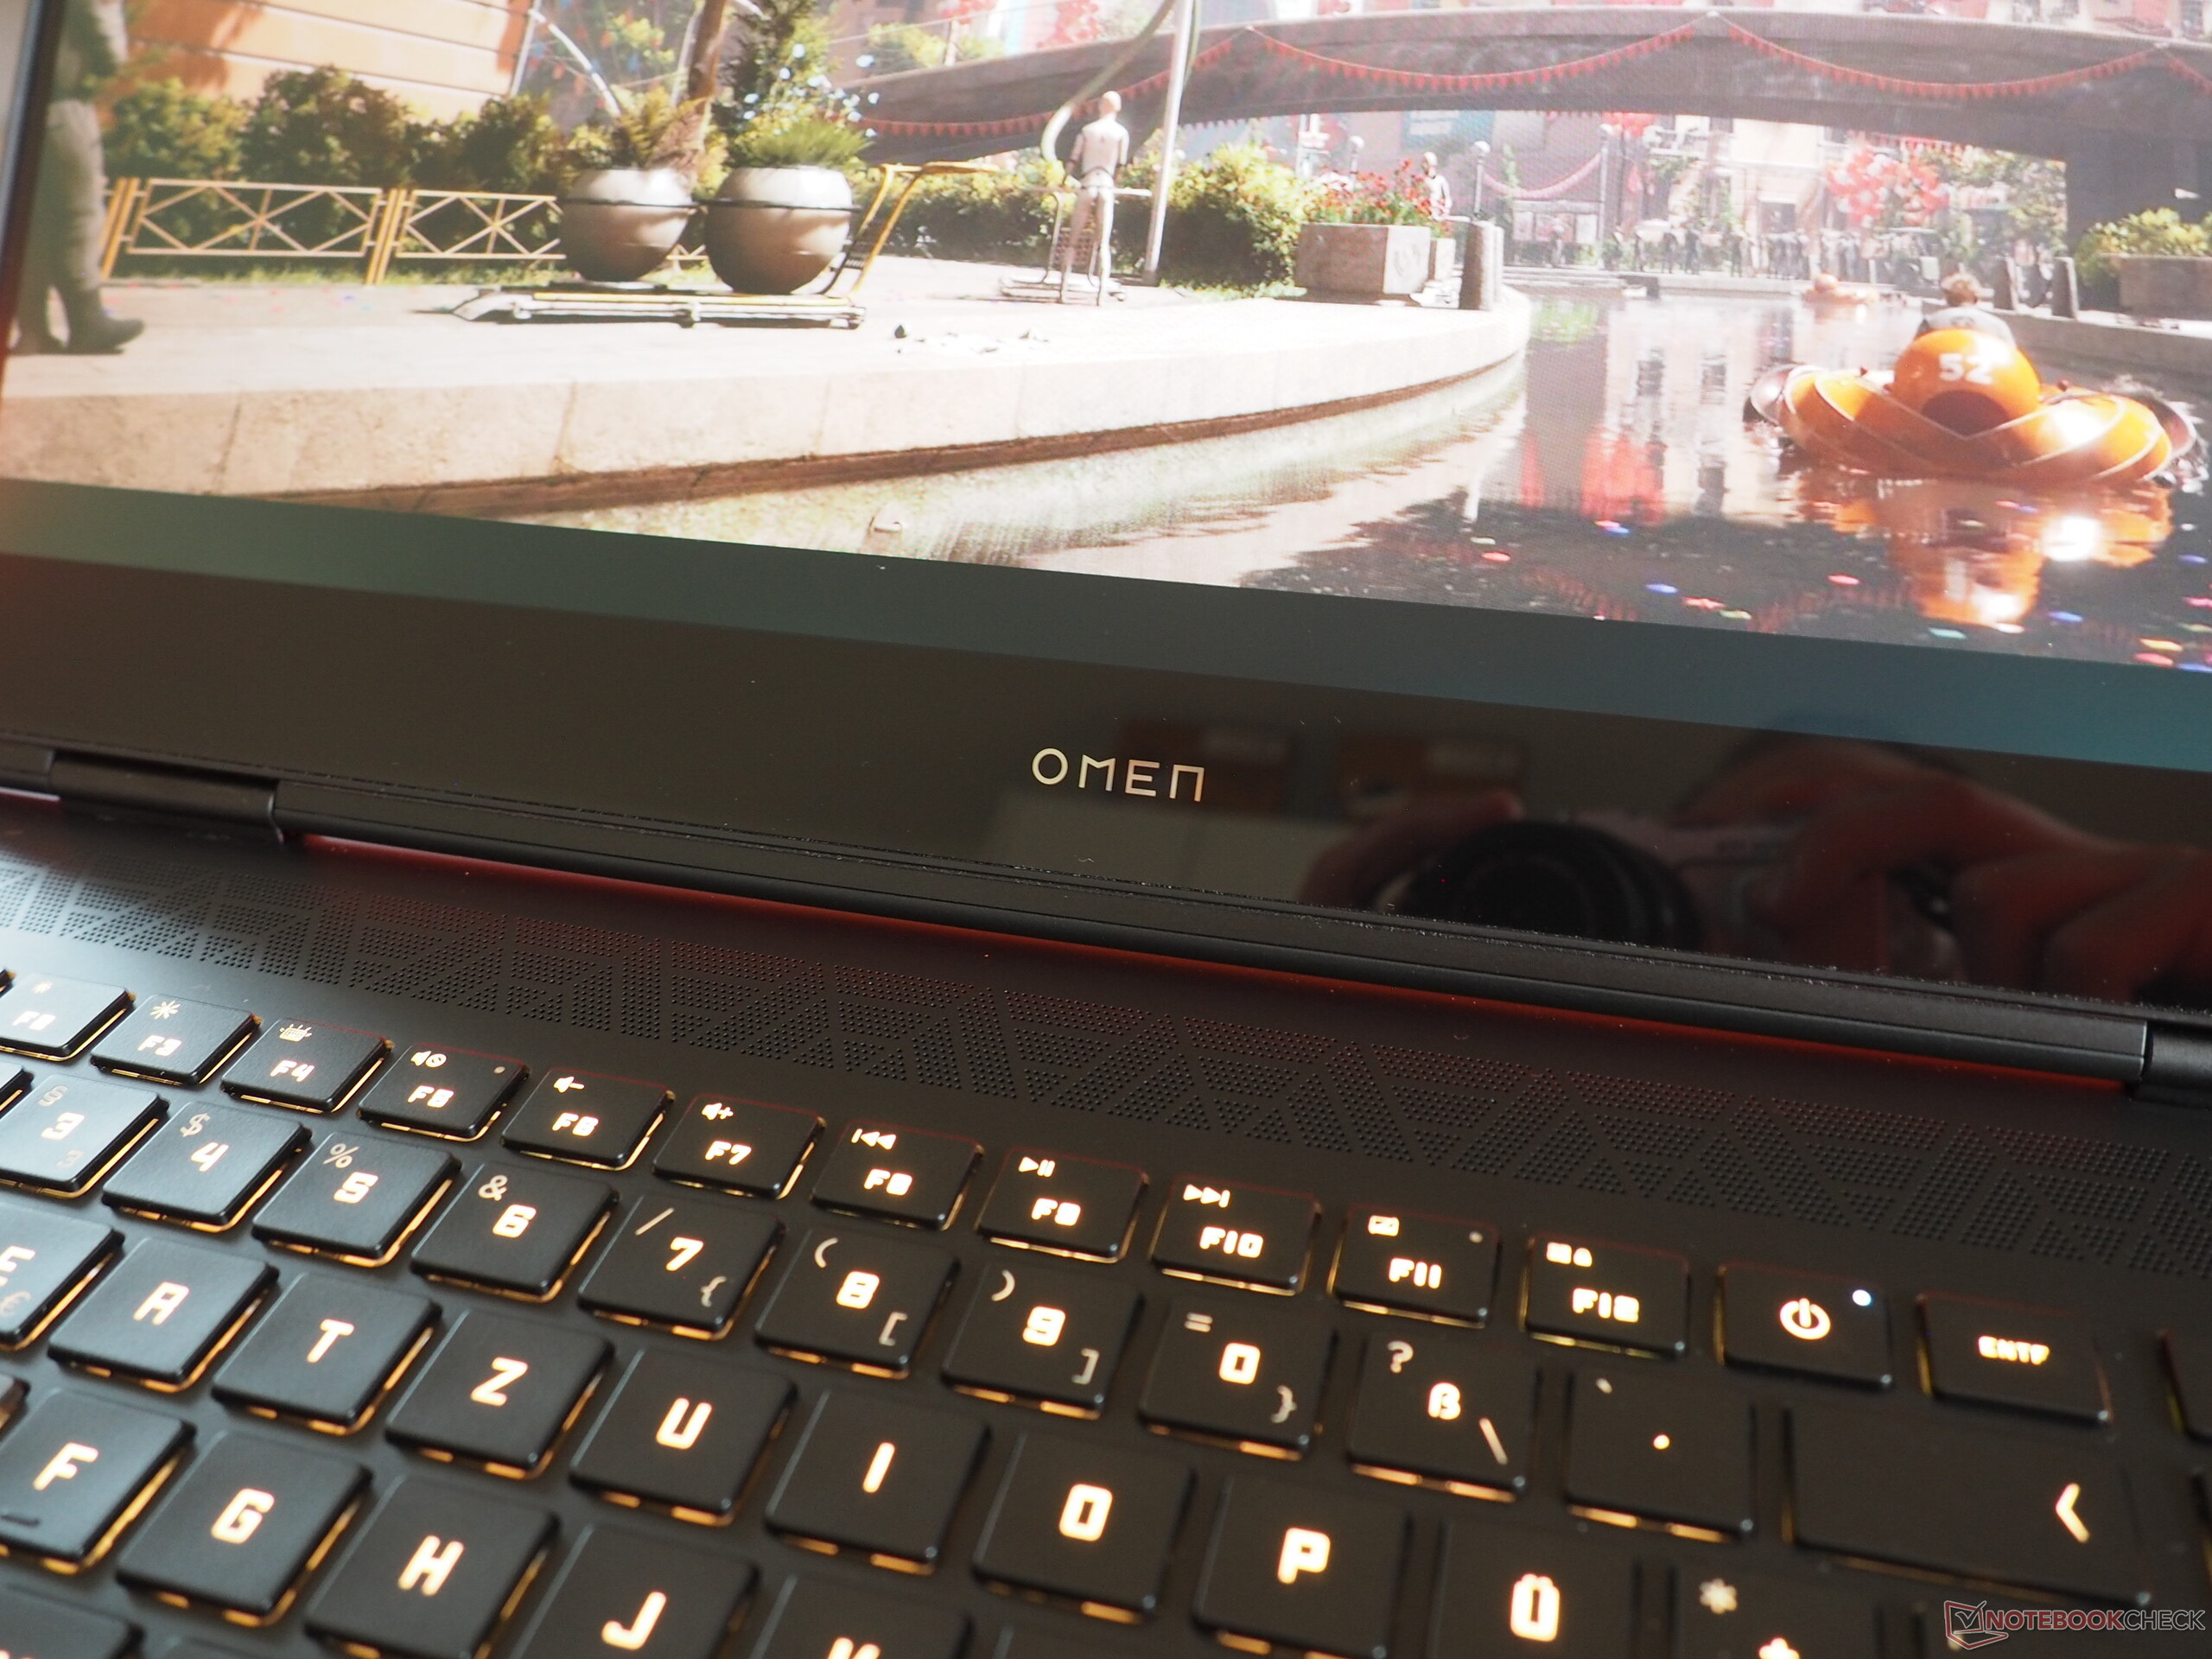
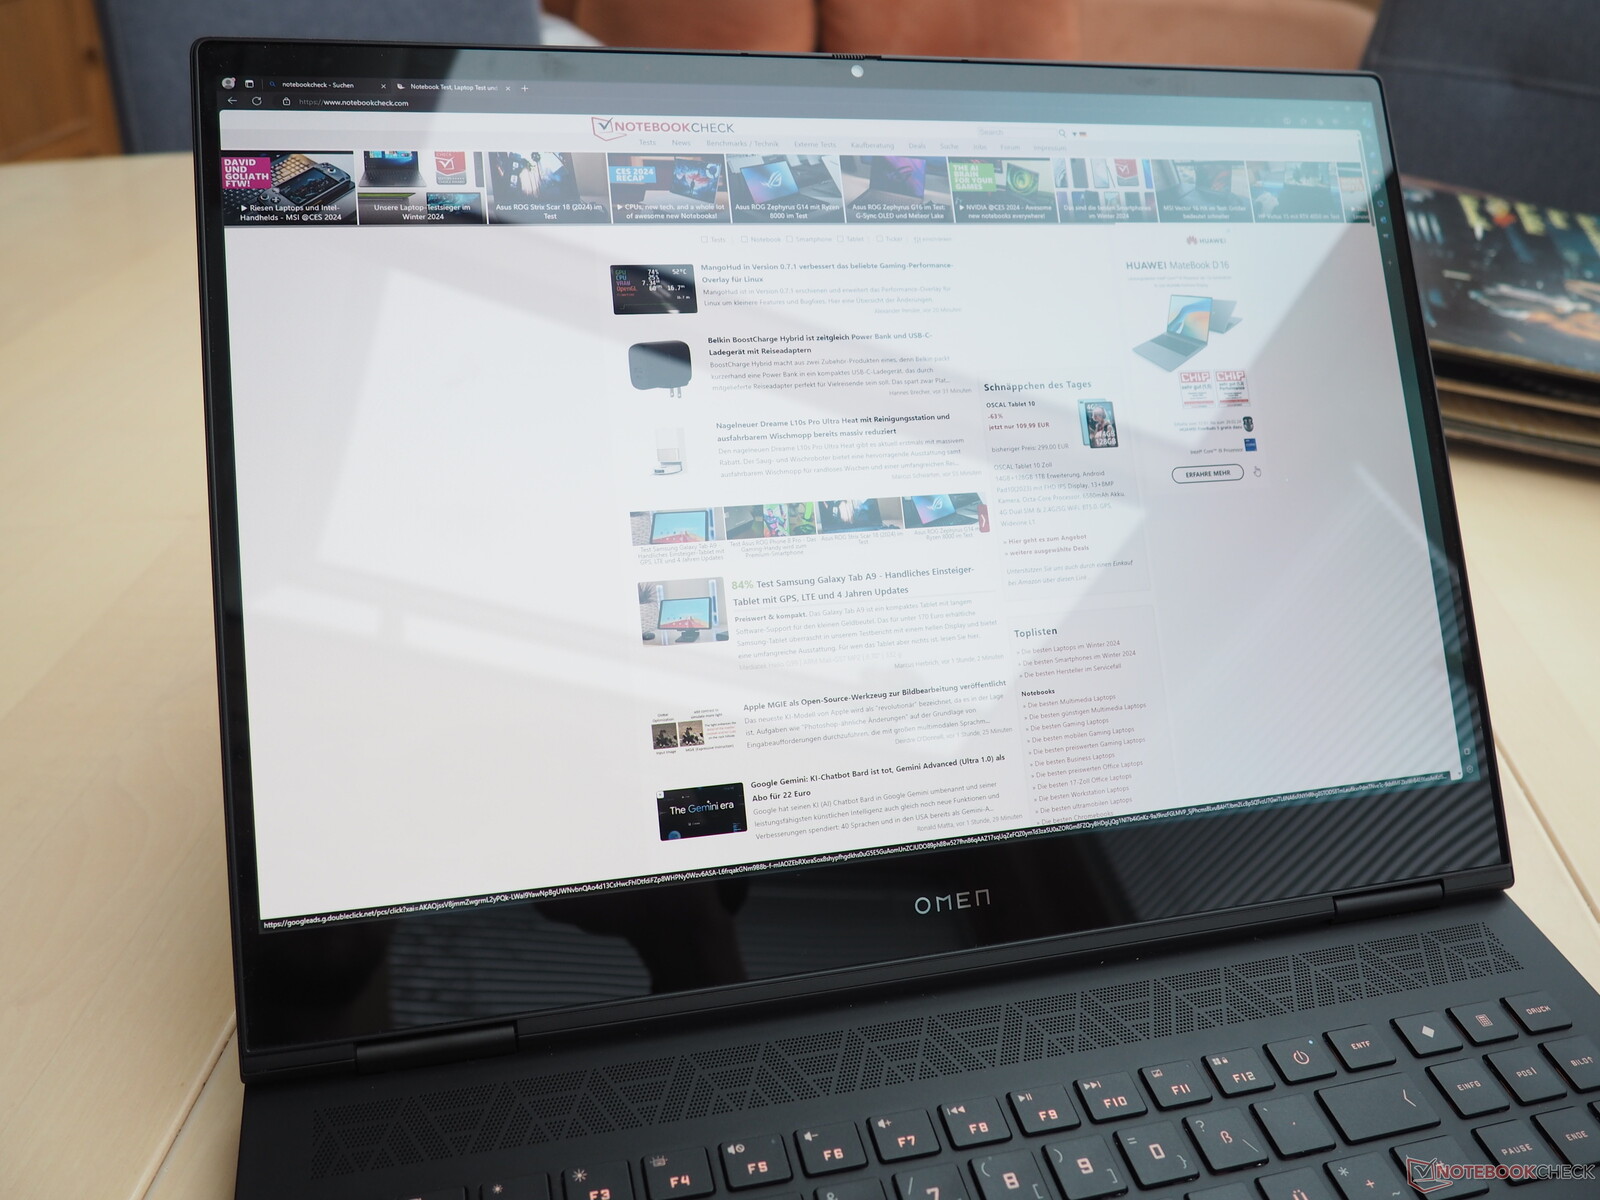
Display
Opinions differ when it comes to OLED panels. On the negative side, a few problems are the very reflective surfaces (which can make outdoor use tortuous), the screen flickering on every brightness level and the issue of potential burn-in.
| |||||||||||||||||||||||||
Brightness Distribution: 98 %
Center on Battery: 390 cd/m²
Contrast: 19500:1 (Black: 0.02 cd/m²)
ΔE ColorChecker Calman: 1.94 | ∀{0.5-29.43 Ø4.71}
calibrated: 4.21
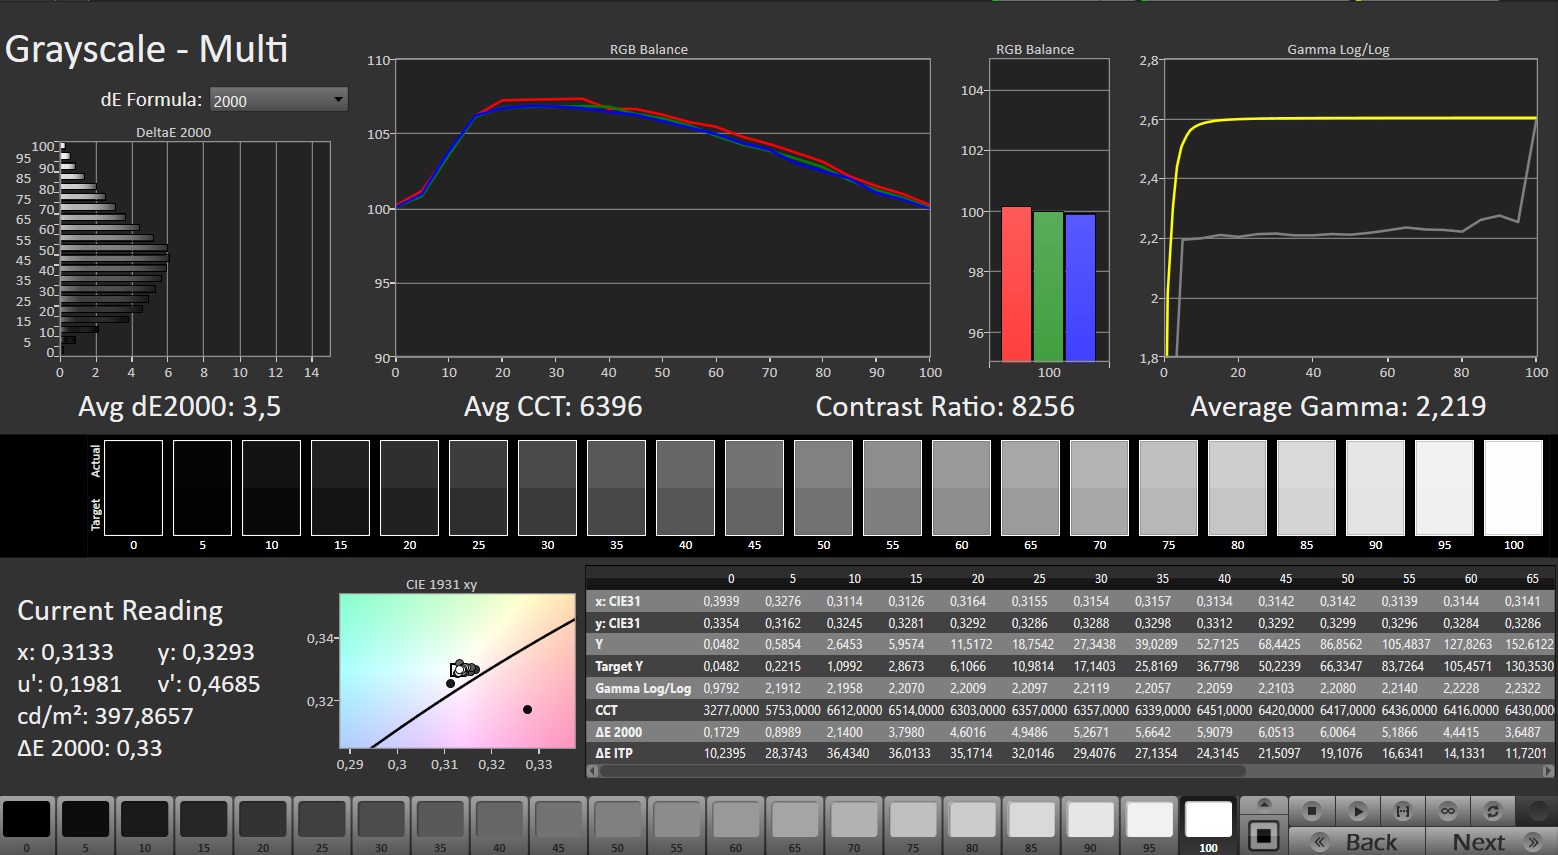
ΔE Greyscale Calman: 1.5 | ∀{0.09-98 Ø4.96}
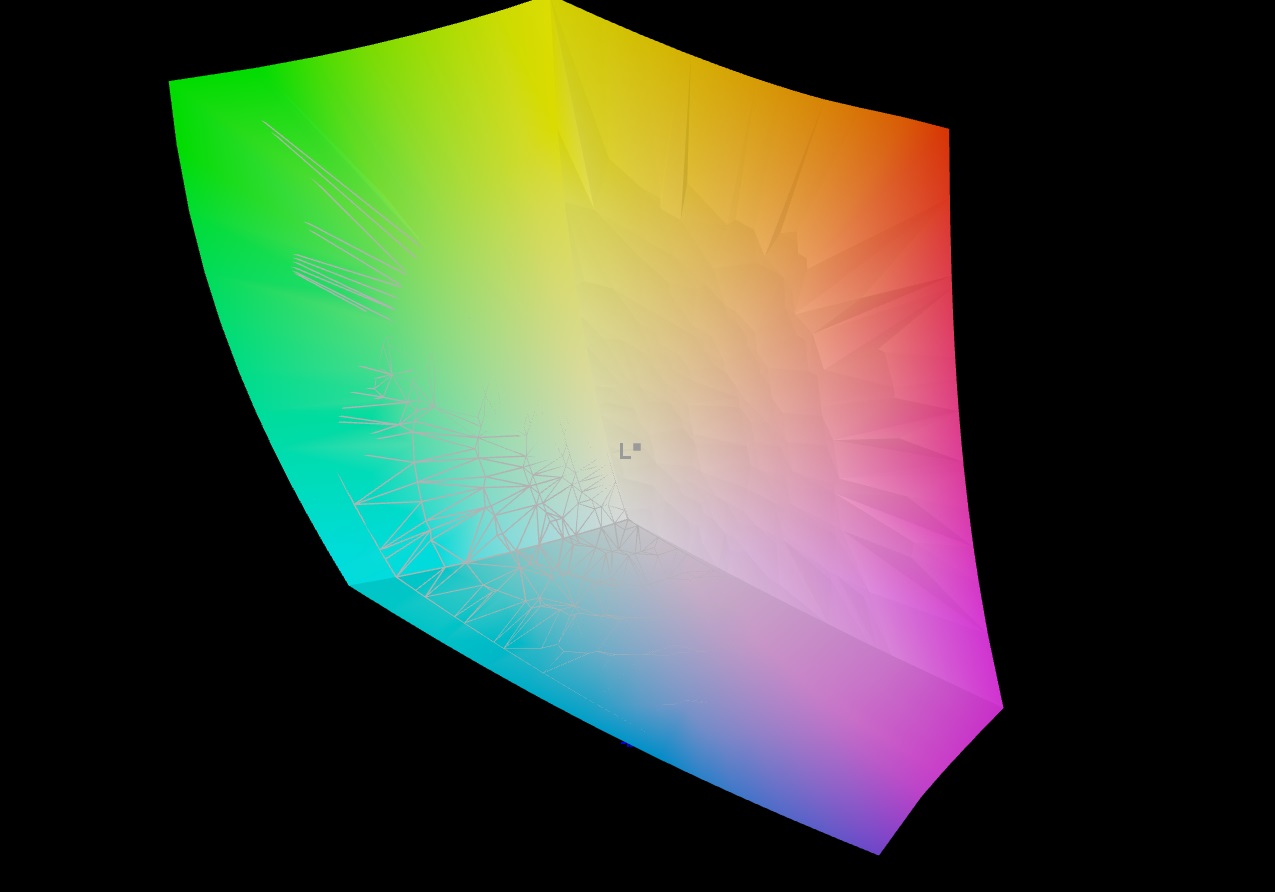
97% AdobeRGB 1998 (Argyll 3D)
100% sRGB (Argyll 3D)
99.8% Display P3 (Argyll 3D)
Gamma: 2.221
CCT: 6395 K
| HP Omen Transcend 16-u1095ng ATNA60DL02-0 (SDC41A4), OLED, 2560x1600, 16" | HP Omen Transcend 16 AUOA3A6, Mini-LED, 2560x1600, 16" | Asus ROG Zephyrus G16 2024 GU605M ATNA60DL01-0, OLED, 2560x1600, 16" | Schenker XMG CORE 16 (L23) BOE0AF0 (), IPS, 2560x1600, 16" | Lenovo Legion Pro 5 16ARX8 CSOT T3 MNG007DA1-Q, IPS, 2560x1600, 16" | |
|---|---|---|---|---|---|
| Display | -4% | 0% | -20% | -18% | |
| Display P3 Coverage (%) | 99.8 | 99.2 -1% | 99.9 0% | 68.3 -32% | 70.4 -29% |
| sRGB Coverage (%) | 100 | 100 0% | 100 0% | 98.6 -1% | 99.6 0% |
| AdobeRGB 1998 Coverage (%) | 97 | 87.6 -10% | 96.9 0% | 69.6 -28% | 72.6 -25% |
| Response Times | -13550% | -18% | -4850% | -3925% | |
| Response Time Grey 50% / Grey 80% * (ms) | 0.2 ? | 26.4 ? -13100% | 0.22 ? -10% | 13.2 ? -6500% | 7 ? -3400% |
| Response Time Black / White * (ms) | 0.2 ? | 28.2 ? -14000% | 0.25 ? -25% | 6.6 ? -3200% | 9.1 ? -4450% |
| PWM Frequency (Hz) | 120 ? | 3506 ? | 960 ? | ||
| Screen | -47% | 0% | -203% | -161% | |
| Brightness middle (cd/m²) | 390 | 791.1 103% | 416 7% | 376 -4% | 355.3 -9% |
| Brightness (cd/m²) | 392 | 800 104% | 418 7% | 358 -9% | 340 -13% |
| Brightness Distribution (%) | 98 | 95 -3% | 96 -2% | 88 -10% | 91 -7% |
| Black Level * (cd/m²) | 0.02 | 0.04 -100% | 0.33 -1550% | 0.32 -1500% | |
| Contrast (:1) | 19500 | 19778 1% | 1139 -94% | 1110 -94% | |
| Colorchecker dE 2000 * | 1.94 | 4.37 -125% | 1.6 18% | 2.74 -41% | 1.13 42% |
| Colorchecker dE 2000 max. * | 4.26 | 10.39 -144% | 2.1 51% | 6.78 -59% | 2.78 35% |
| Colorchecker dE 2000 calibrated * | 4.21 | 1.04 75% | 0.88 79% | 0.32 92% | |
| Greyscale dE 2000 * | 1.5 | 6.5 -333% | 2.7 -80% | 3.57 -138% | 1.4 7% |
| Gamma | 2.221 99% | 2.28 96% | 2.16 102% | 2.4 92% | 2.24 98% |
| CCT | 6395 102% | 6000 108% | 6331 103% | 7246 90% | 6372 102% |
| Total Average (Program / Settings) | -4534% /
-1967% | -6% /
-3% | -1691% /
-828% | -1368% /
-668% |
* ... smaller is better
In return, the OLED technology scores well with wonderful black levels (almost 0.0 cd/m²) which leads to an excellent contrast ratio that IPS panels don't come close to. The same applies to the viewing angle stability.
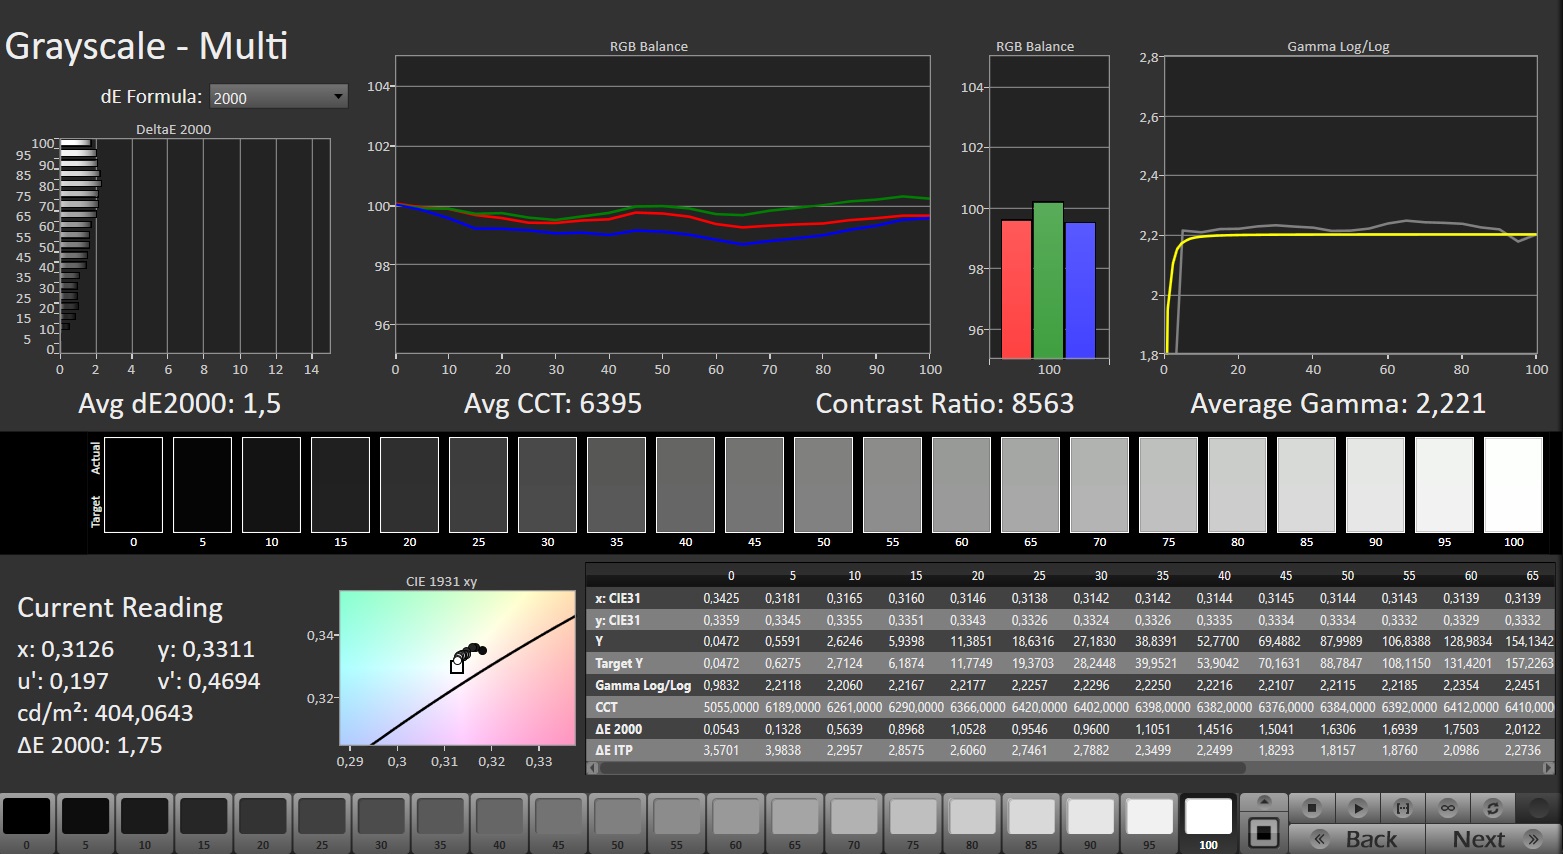
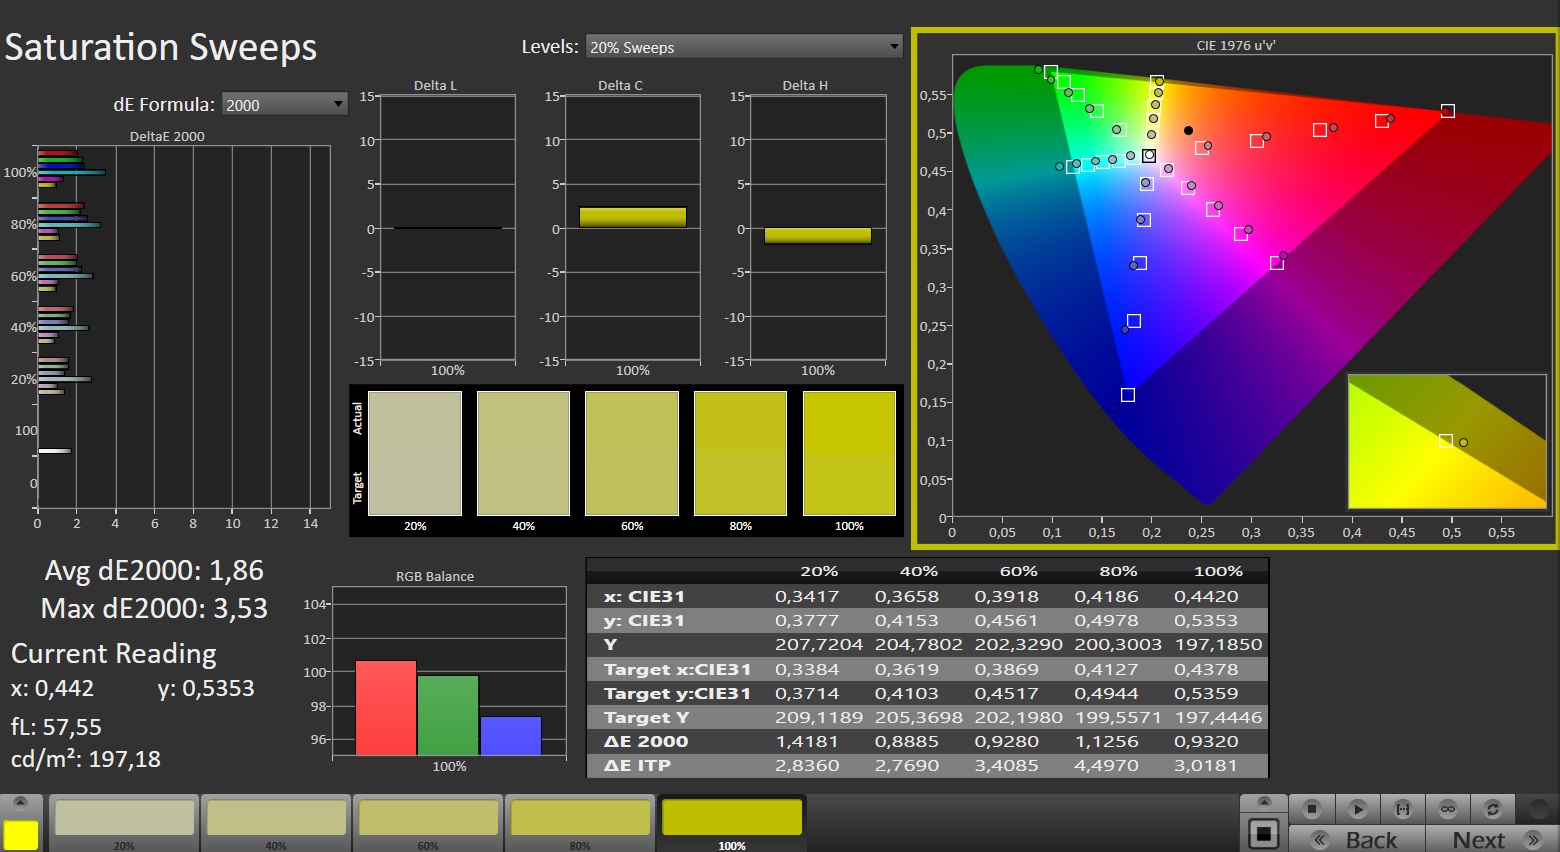
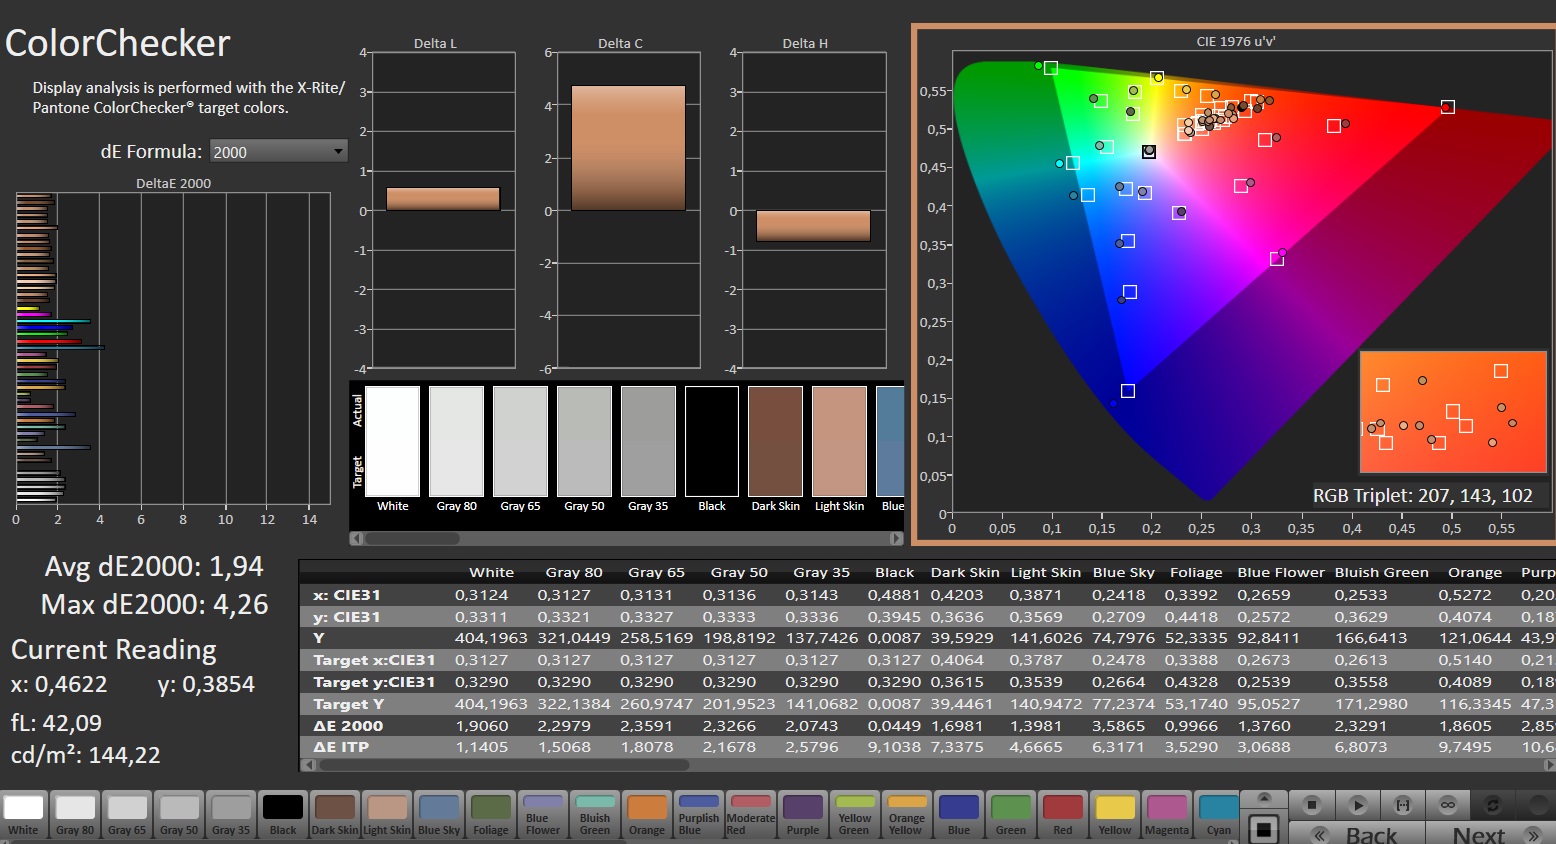
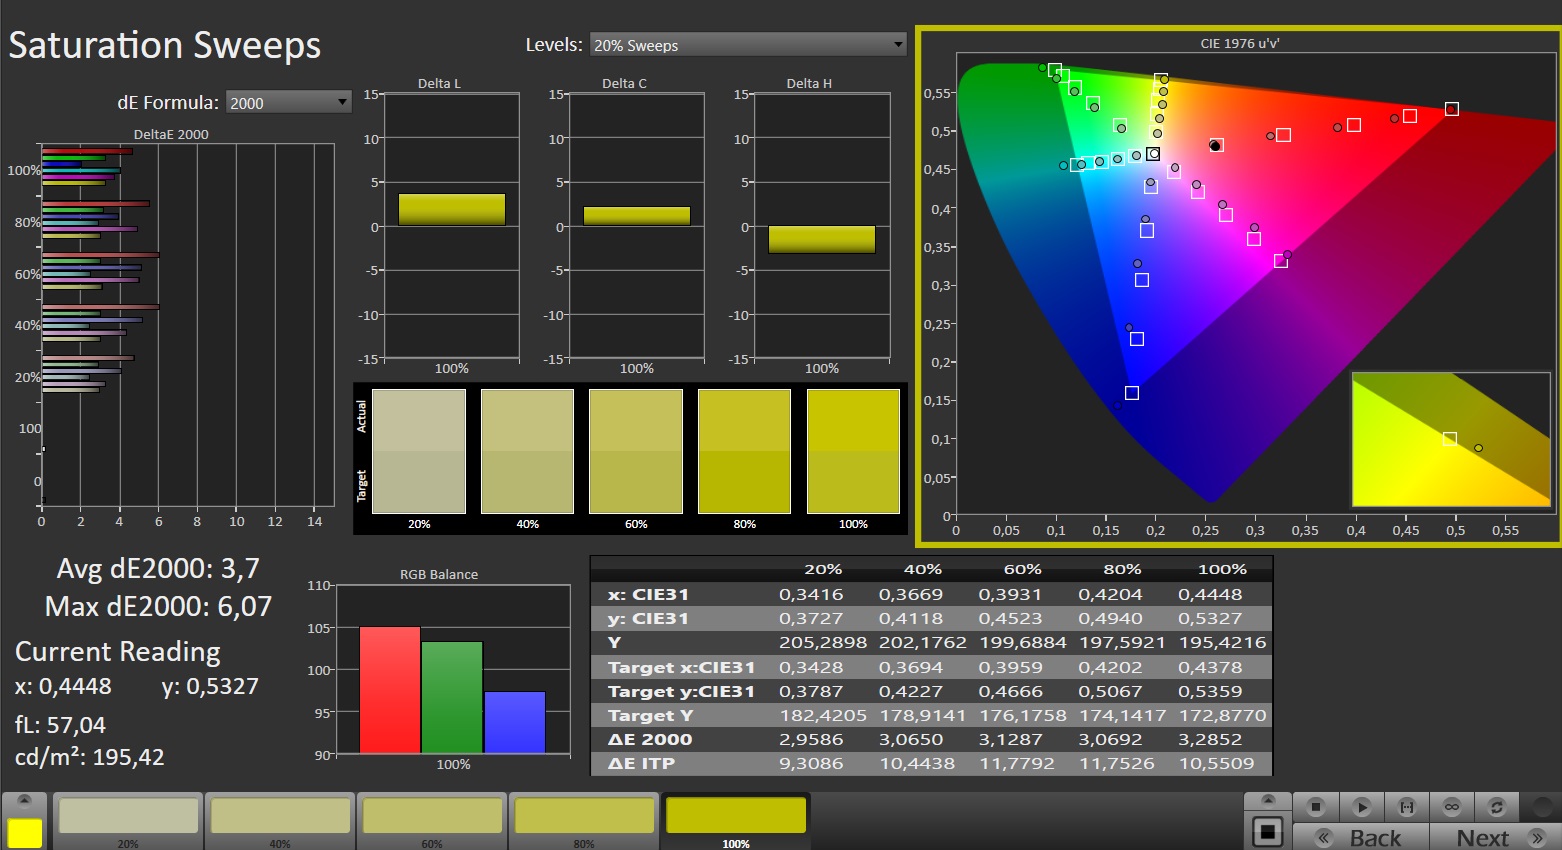
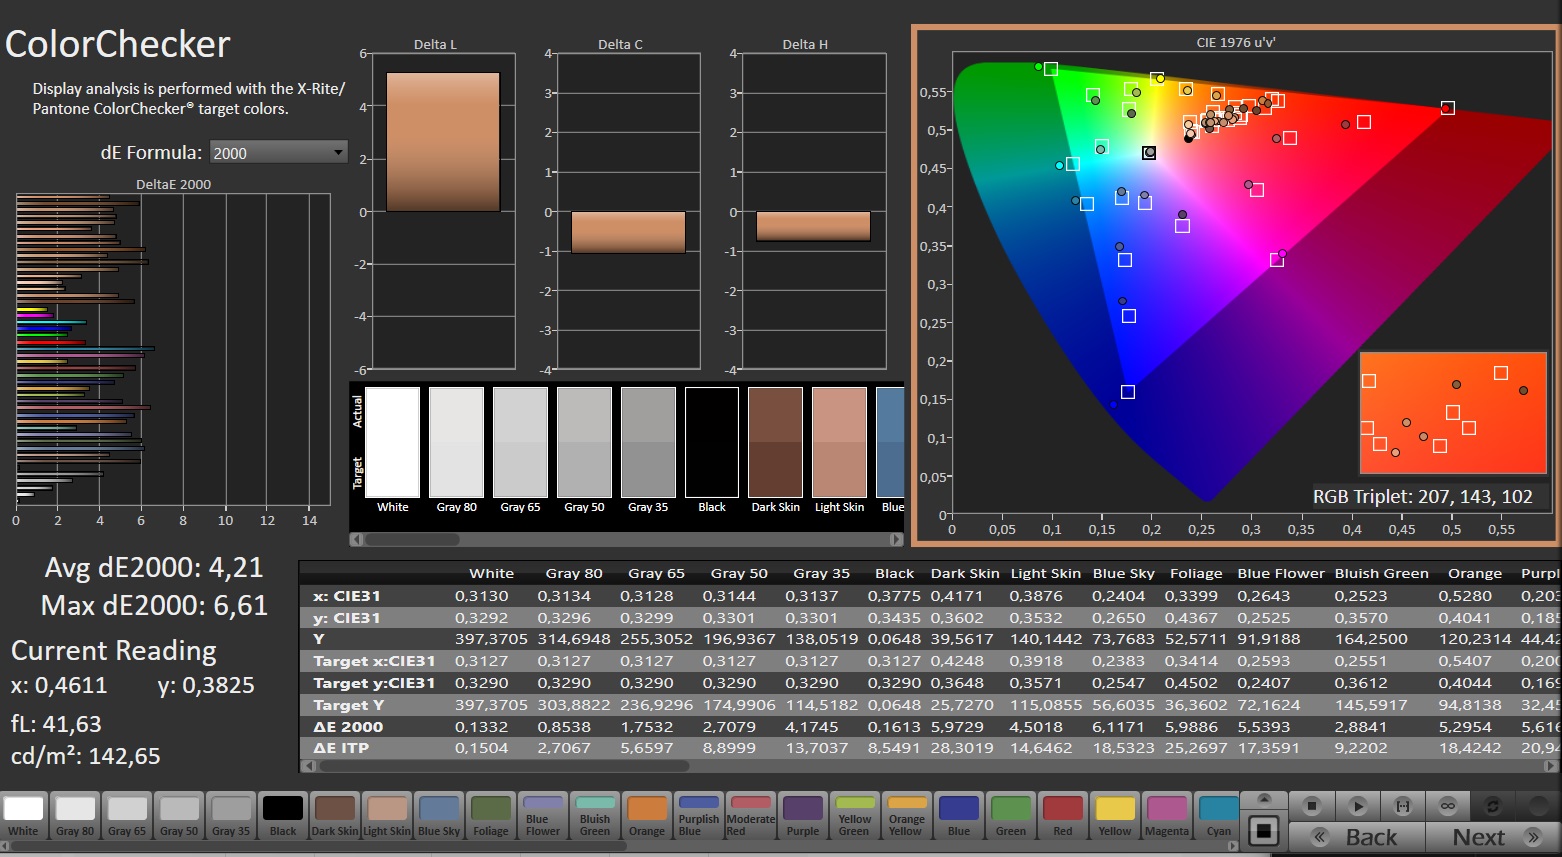
An additional highlight is the rich color space: 100 % DCI P3 and 97 % AdobeRGB are not something to be taken for granted in the gaming world. Things are similar in the area of color accuracy which was already impressive before calibration.


Praise is also reserved for the short response times: Classic IPS panels can only dream of 0.2 ms. The predecessor's mini LED display was considerably brighter (800 vs. 392 cd/m²) but also significantly slower.

Display Response Times
| ↔ Response Time Black to White | ||
|---|---|---|
| 0.2 ms ... rise ↗ and fall ↘ combined | ↗ 0.1 ms rise | 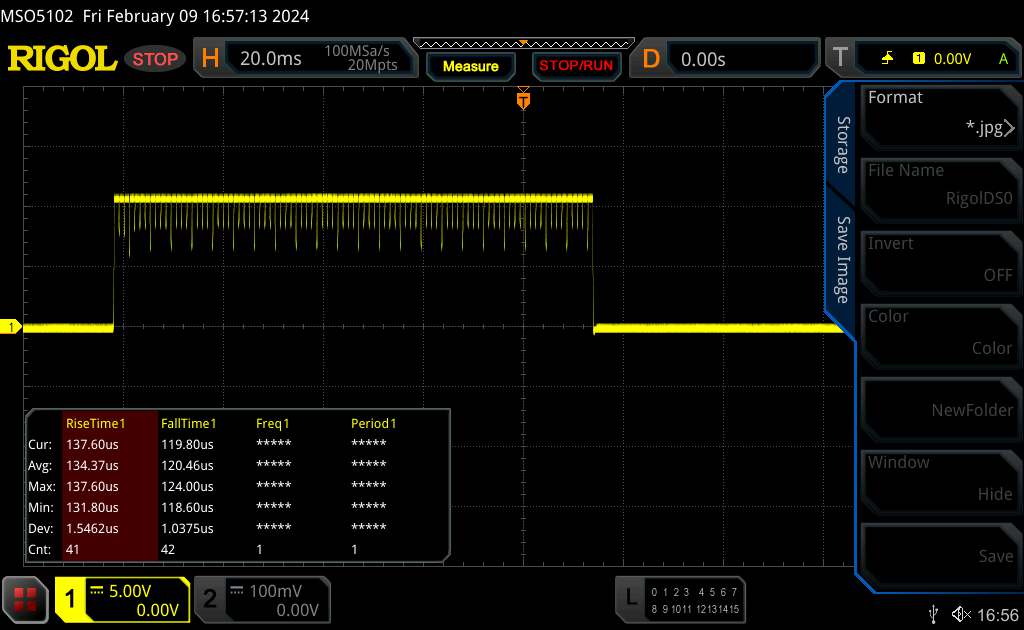 |
| ↘ 0.1 ms fall | ||
| The screen shows very fast response rates in our tests and should be very well suited for fast-paced gaming. In comparison, all tested devices range from 0.1 (minimum) to 240 (maximum) ms. » 0 % of all devices are better. This means that the measured response time is better than the average of all tested devices (19.8 ms). | ||
| ↔ Response Time 50% Grey to 80% Grey | ||
| 0.2 ms ... rise ↗ and fall ↘ combined | ↗ 0.1 ms rise | 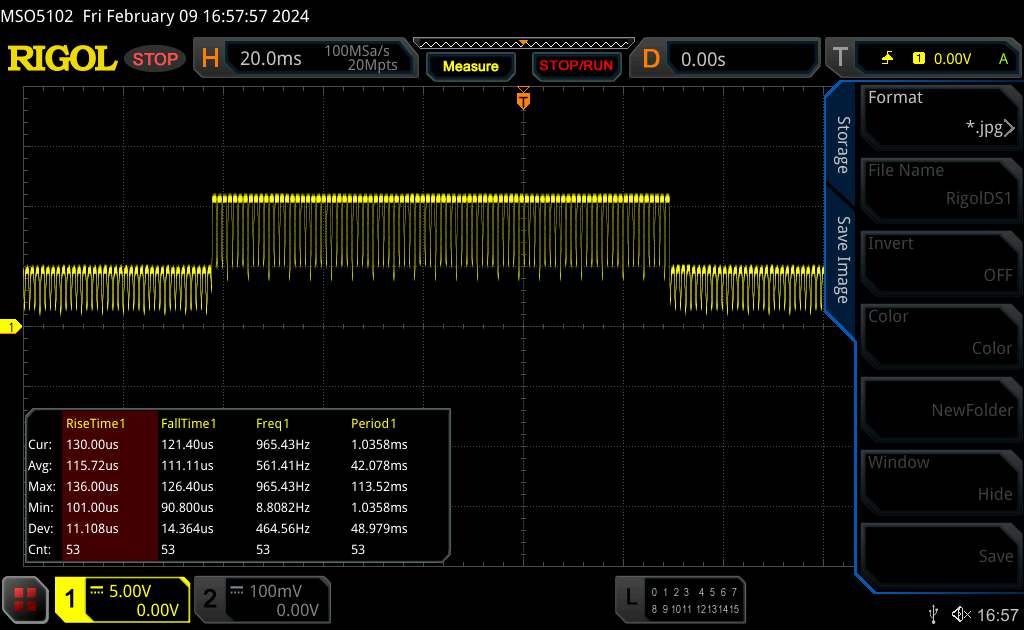 |
| ↘ 0.1 ms fall | ||
| The screen shows very fast response rates in our tests and should be very well suited for fast-paced gaming. In comparison, all tested devices range from 0.165 (minimum) to 636 (maximum) ms. » 0 % of all devices are better. This means that the measured response time is better than the average of all tested devices (31 ms). | ||
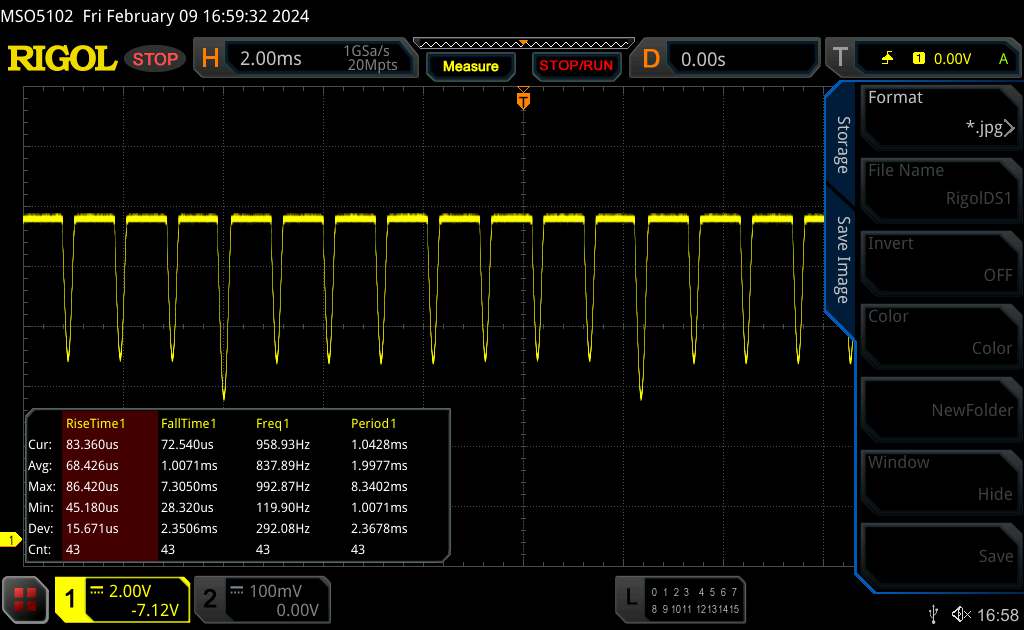
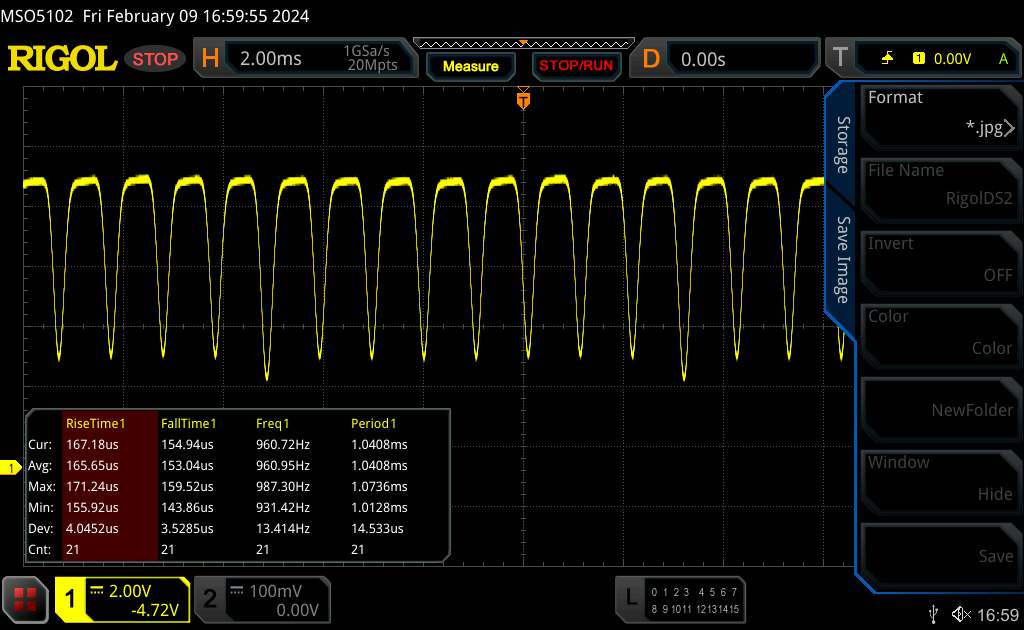
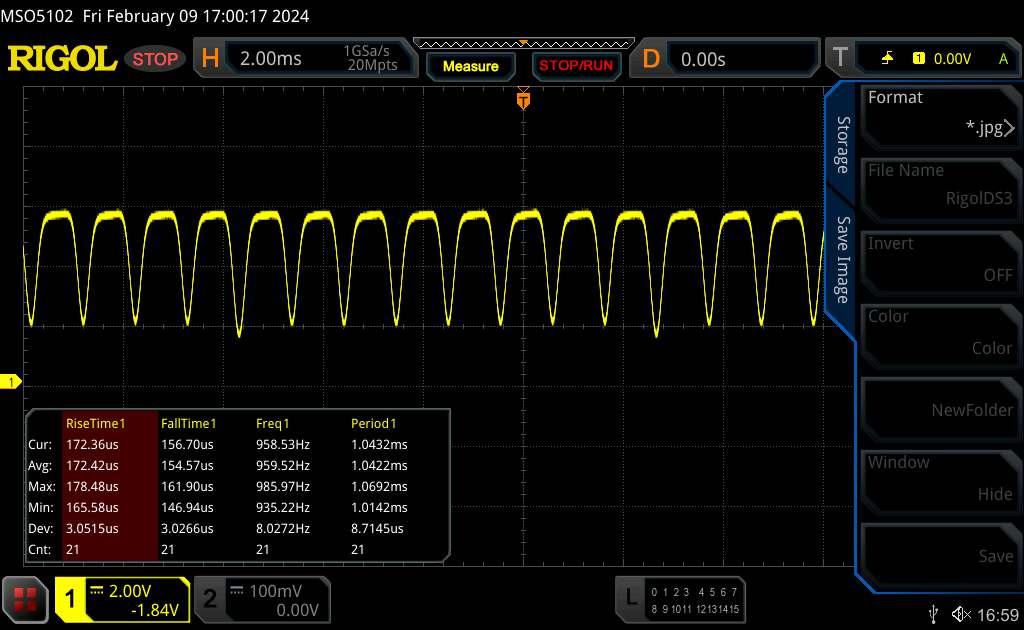
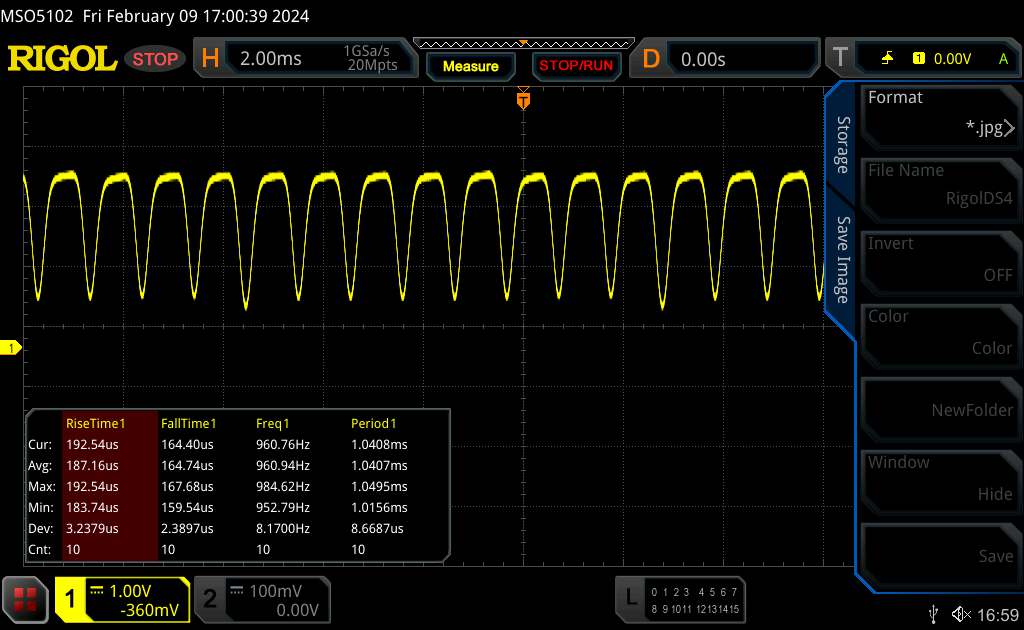
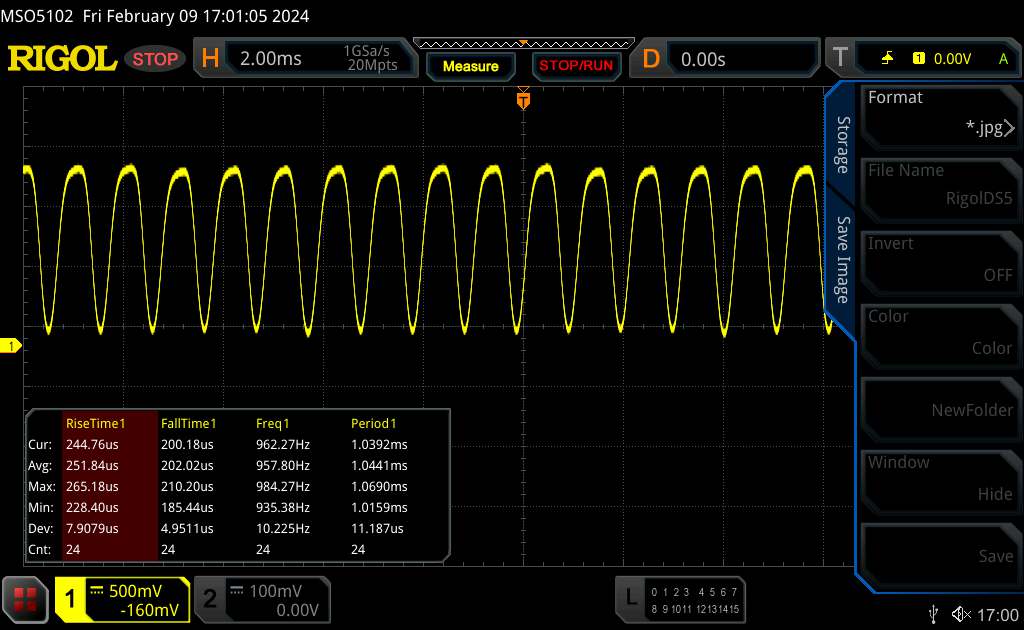
Screen Flickering / PWM (Pulse-Width Modulation)
| Screen flickering / PWM detected | 120 Hz | ≤ 100 % brightness setting | 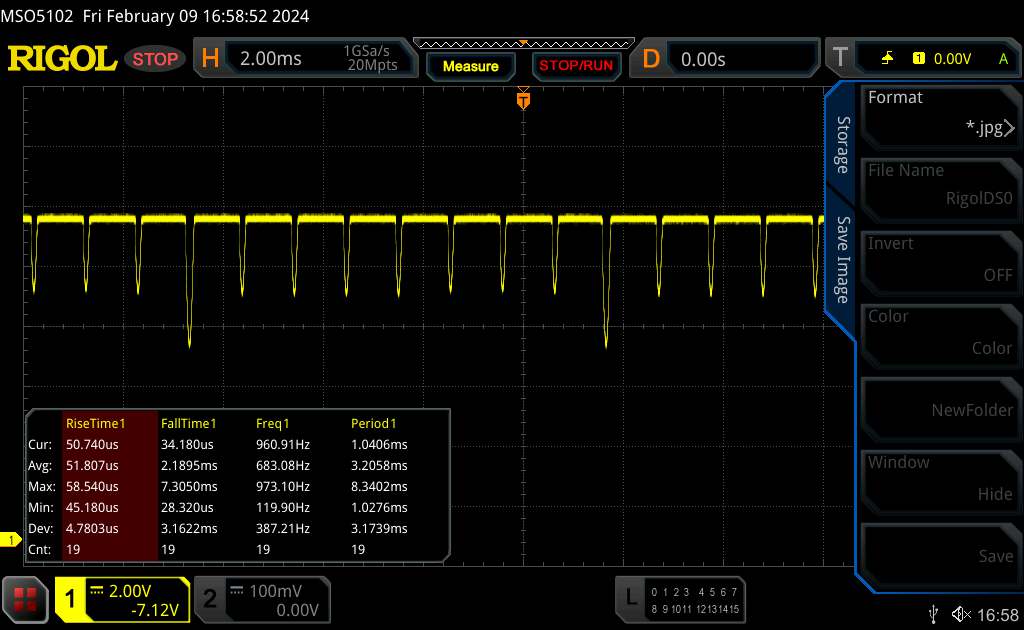 |
The display backlight flickers at 120 Hz (worst case, e.g., utilizing PWM) Flickering detected at a brightness setting of 100 % and below. There should be no flickering or PWM above this brightness setting. The frequency of 120 Hz is very low, so the flickering may cause eyestrain and headaches after extended use. In comparison: 52 % of all tested devices do not use PWM to dim the display. If PWM was detected, an average of 7747 (minimum: 5 - maximum: 343500) Hz was measured. | |||
Performance
Price-wise the Omen Transcend 16 starts at around $1,600. The entry-level variant is equipped with a Core i7-13700HX, a GeForce RTX 4060, 16 GB of RAM and a poor-resolution IPS display. Our review model finds itself more at the upper end of the price and specification scale.
Test conditions
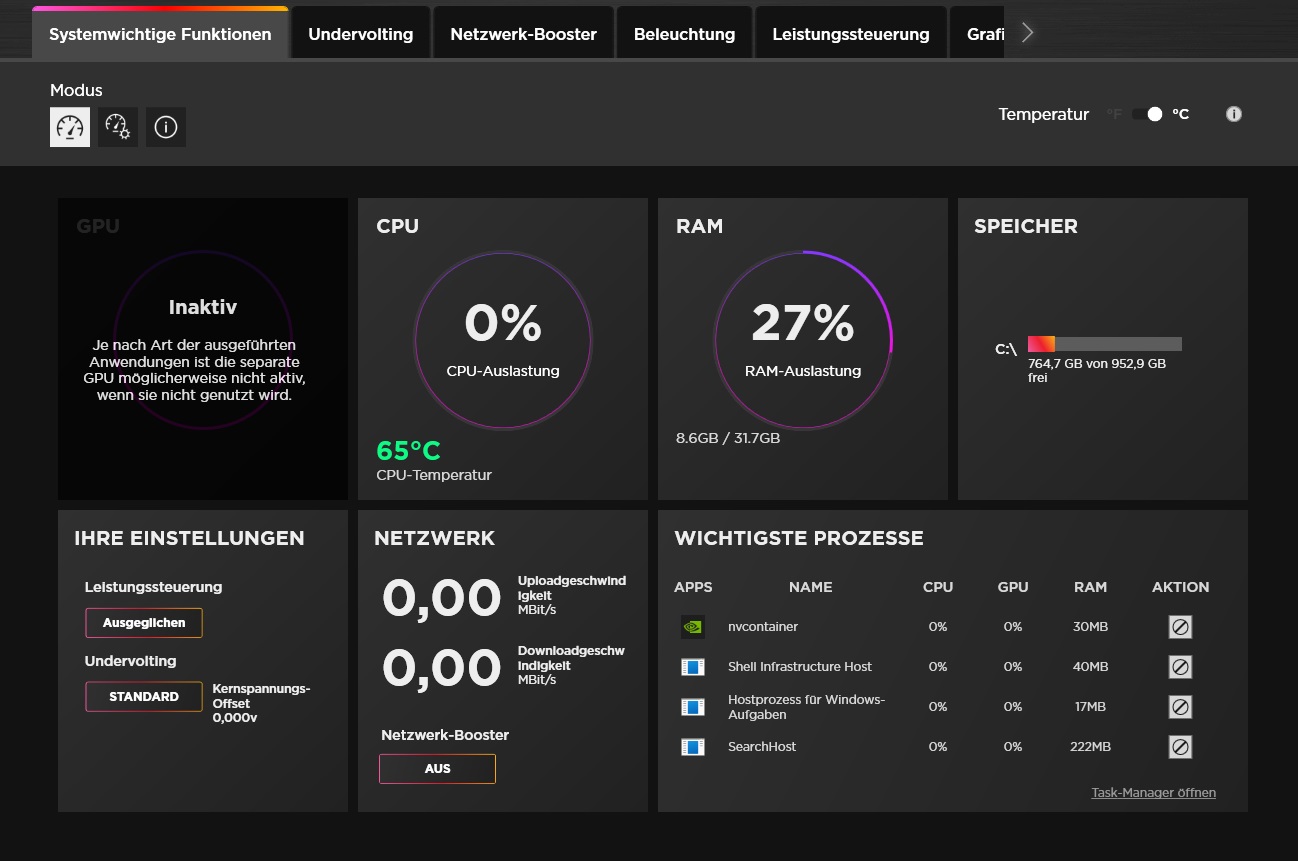
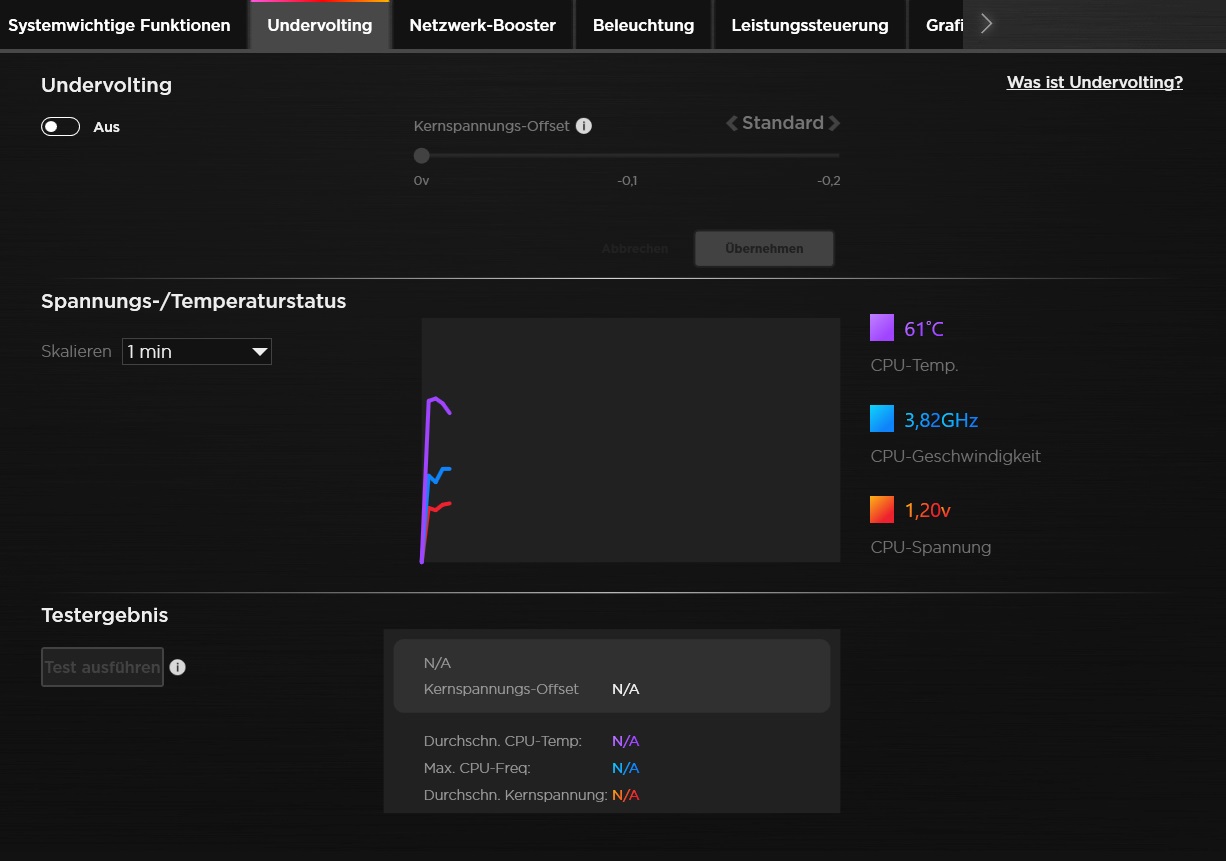
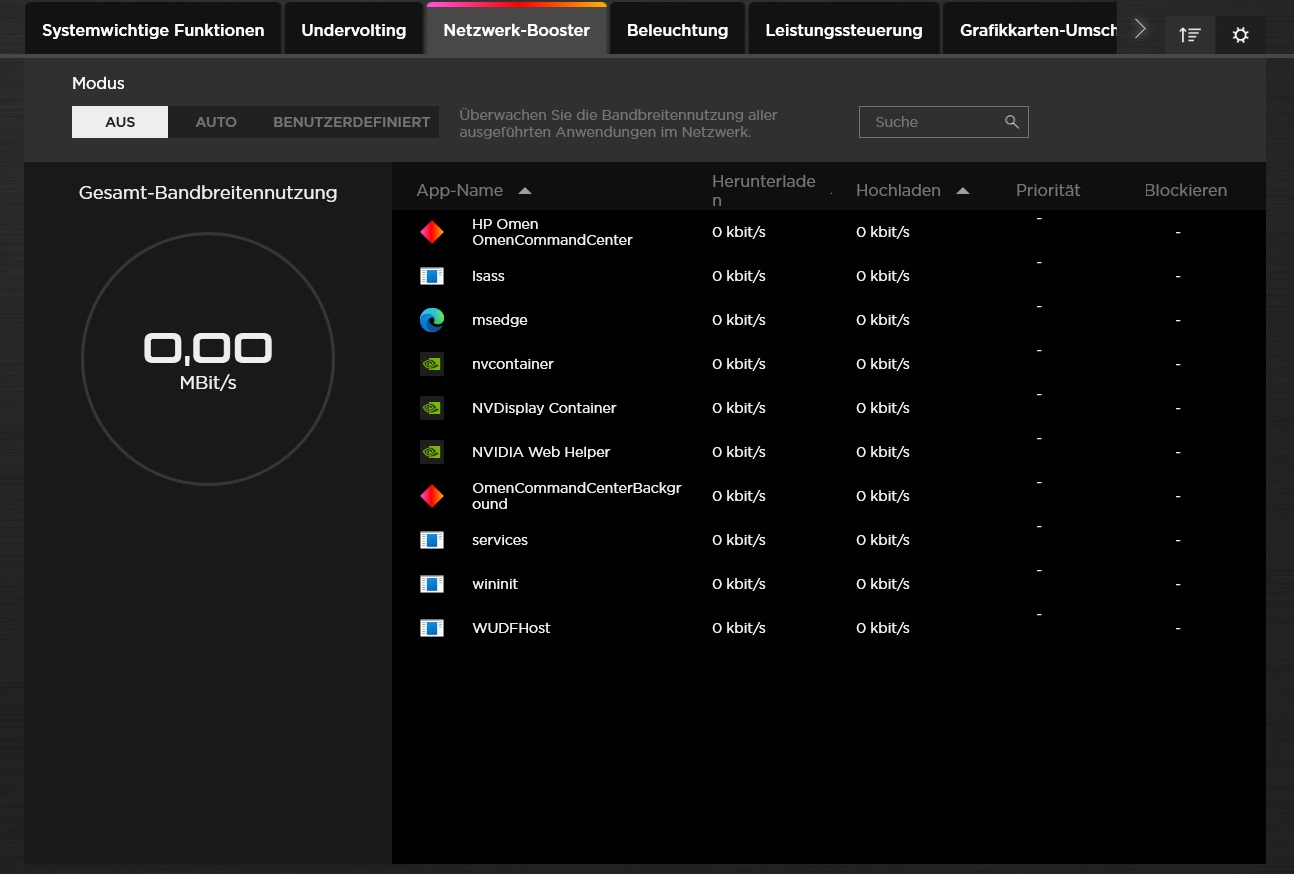
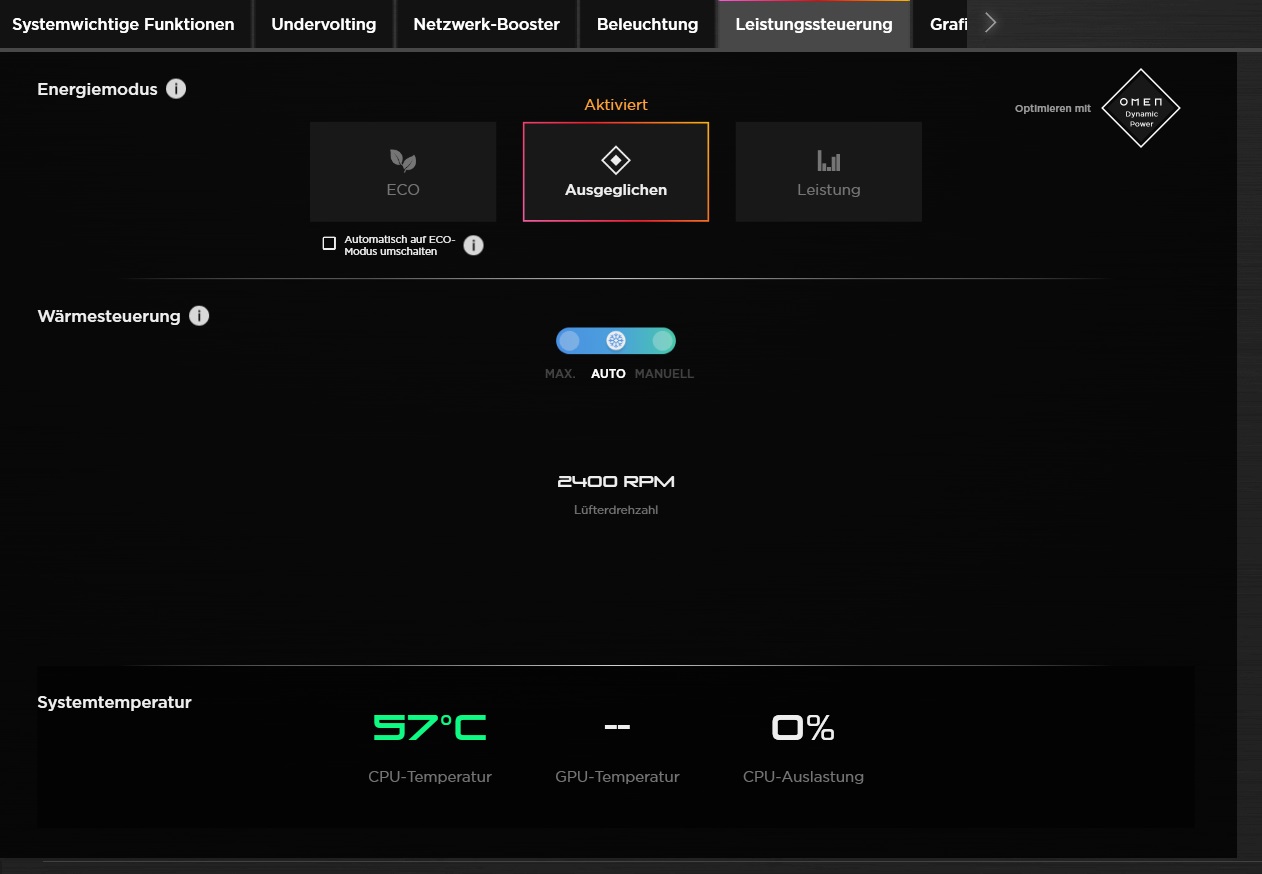
The preinstalled gaming hub's performance management is somewhat difficult to access. In the according menu, three energy modes and a heat manager await. Since the performance mode – analogous to most gaming laptops – ensures both better performance but also disproportionate noise production, all of the measurements were carried out using the balanced mode. Therefore, the determined values can only be compared to the predecessor to a limited extent. On top of this, the automatic fan control and automatic graphics switching were both active.

| Witcher 3 (FHD/Ultra) | Eco | Ausgegleichen | Leistung |
| Noise | 39 dB(A) | 44 dB(A) | 53 dB(A) |
| Performance | 60 fps lock | 114 fps | 126 fps |
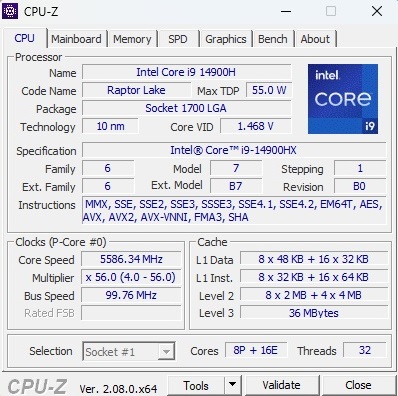
Processor
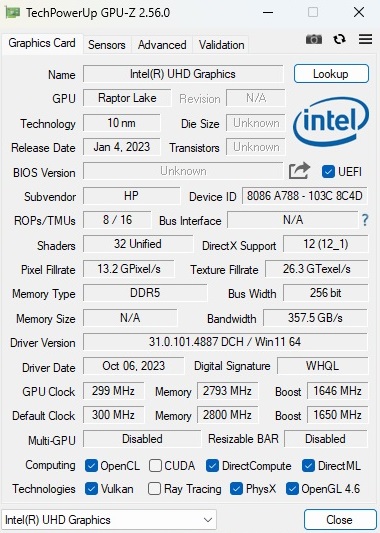
The Core i9-14900HX is almost outsized compared to the GPU power and case thickness. The Raptor Lake series 10 nm model offers 8 performance cores with hyper threading and 16 efficiency cores without HT which results in a total of 32 threads. In the balanced mode, the CPU only reaches its potential to a limited extent. The best example is our Cinebench loop: Although the performance was relatively high in the first few runs, after a short time, the score dropped quite sharply (but then it remained on a constant level). All in all, it is only sufficient to reach the level of the Ultra 7 155H (ROG Zephyrus G16) or the Ryzen 7 7840HS (Schenker XMG Core 16).
Cinebench R15 Multi Continuous Test
* ... smaller is better
AIDA64: FP32 Ray-Trace | FPU Julia | CPU SHA3 | CPU Queen | FPU SinJulia | FPU Mandel | CPU AES | CPU ZLib | FP64 Ray-Trace | CPU PhotoWorxx
| Performance rating | |
| Average of class Gaming | |
| Average Intel Core i9-14900HX | |
| HP Omen Transcend 16 | |
| Lenovo Legion Pro 5 16ARX8 | |
| Schenker XMG CORE 16 (L23) | |
| HP Omen Transcend 16-u1095ng | |
| Asus ROG Zephyrus G16 2024 GU605M | |
| AIDA64 / FP32 Ray-Trace | |
| Average of class Gaming (10227 - 85542, n=105, last 2 years) | |
| Lenovo Legion Pro 5 16ARX8 | |
| Schenker XMG CORE 16 (L23) | |
| Average Intel Core i9-14900HX (13098 - 33474, n=36) | |
| HP Omen Transcend 16 | |
| HP Omen Transcend 16-u1095ng | |
| Asus ROG Zephyrus G16 2024 GU605M | |
| AIDA64 / FPU Julia | |
| Average of class Gaming (51376 - 238426, n=105, last 2 years) | |
| Average Intel Core i9-14900HX (67573 - 166040, n=36) | |
| Lenovo Legion Pro 5 16ARX8 | |
| Schenker XMG CORE 16 (L23) | |
| HP Omen Transcend 16 | |
| HP Omen Transcend 16-u1095ng | |
| Asus ROG Zephyrus G16 2024 GU605M | |
| AIDA64 / CPU SHA3 | |
| Average of class Gaming (2180 - 10115, n=105, last 2 years) | |
| Average Intel Core i9-14900HX (3589 - 7979, n=36) | |
| HP Omen Transcend 16 | |
| Lenovo Legion Pro 5 16ARX8 | |
| Schenker XMG CORE 16 (L23) | |
| HP Omen Transcend 16-u1095ng | |
| Asus ROG Zephyrus G16 2024 GU605M | |
| AIDA64 / CPU Queen | |
| Average Intel Core i9-14900HX (118405 - 148966, n=36) | |
| Lenovo Legion Pro 5 16ARX8 | |
| HP Omen Transcend 16 | |
| HP Omen Transcend 16-u1095ng | |
| Average of class Gaming (49785 - 173351, n=90, last 2 years) | |
| Schenker XMG CORE 16 (L23) | |
| Asus ROG Zephyrus G16 2024 GU605M | |
| AIDA64 / FPU SinJulia | |
| Lenovo Legion Pro 5 16ARX8 | |
| Average Intel Core i9-14900HX (10475 - 18517, n=36) | |
| Schenker XMG CORE 16 (L23) | |
| Average of class Gaming (4424 - 33636, n=105, last 2 years) | |
| HP Omen Transcend 16 | |
| HP Omen Transcend 16-u1095ng | |
| Asus ROG Zephyrus G16 2024 GU605M | |
| AIDA64 / FPU Mandel | |
| Average of class Gaming (25115 - 128721, n=105, last 2 years) | |
| Lenovo Legion Pro 5 16ARX8 | |
| Schenker XMG CORE 16 (L23) | |
| Average Intel Core i9-14900HX (32543 - 83662, n=36) | |
| HP Omen Transcend 16 | |
| HP Omen Transcend 16-u1095ng | |
| Asus ROG Zephyrus G16 2024 GU605M | |
| AIDA64 / CPU AES | |
| Average Intel Core i9-14900HX (86964 - 241777, n=36) | |
| HP Omen Transcend 16 | |
| Average of class Gaming (39258 - 247074, n=105, last 2 years) | |
| Schenker XMG CORE 16 (L23) | |
| HP Omen Transcend 16-u1095ng | |
| Asus ROG Zephyrus G16 2024 GU605M | |
| Lenovo Legion Pro 5 16ARX8 | |
| AIDA64 / CPU ZLib | |
| Average Intel Core i9-14900HX (1054 - 2292, n=36) | |
| HP Omen Transcend 16 | |
| Average of class Gaming (574 - 2531, n=105, last 2 years) | |
| HP Omen Transcend 16-u1095ng | |
| Lenovo Legion Pro 5 16ARX8 | |
| Asus ROG Zephyrus G16 2024 GU605M | |
| Schenker XMG CORE 16 (L23) | |
| AIDA64 / FP64 Ray-Trace | |
| Average of class Gaming (5509 - 45446, n=105, last 2 years) | |
| Lenovo Legion Pro 5 16ARX8 | |
| Schenker XMG CORE 16 (L23) | |
| Average Intel Core i9-14900HX (6809 - 18349, n=36) | |
| HP Omen Transcend 16 | |
| HP Omen Transcend 16-u1095ng | |
| Asus ROG Zephyrus G16 2024 GU605M | |
| AIDA64 / CPU PhotoWorxx | |
| HP Omen Transcend 16 | |
| HP Omen Transcend 16-u1095ng | |
| Asus ROG Zephyrus G16 2024 GU605M | |
| Average Intel Core i9-14900HX (23903 - 54702, n=36) | |
| Average of class Gaming (12271 - 89891, n=105, last 2 years) | |
| Schenker XMG CORE 16 (L23) | |
| Lenovo Legion Pro 5 16ARX8 | |
System performance
The system performance cuts a good figure without being amongst the front runners. When it comes to the RAM speed, the Transcend secures second spot in the comparison field.
CrossMark: Overall | Productivity | Creativity | Responsiveness
WebXPRT 3: Overall
WebXPRT 4: Overall
Mozilla Kraken 1.1: Total
| PCMark 10 / Score | |
| Average of class Gaming (5828 - 12414, n=93, last 2 years) | |
| Lenovo Legion Pro 5 16ARX8 | |
| Average Intel Core i9-14900HX, NVIDIA GeForce RTX 4070 Laptop GPU (7768 - 8550, n=8) | |
| Schenker XMG CORE 16 (L23) | |
| HP Omen Transcend 16 | |
| HP Omen Transcend 16-u1095ng | |
| Asus ROG Zephyrus G16 2024 GU605M | |
| PCMark 10 / Essentials | |
| HP Omen Transcend 16 | |
| Lenovo Legion Pro 5 16ARX8 | |
| Schenker XMG CORE 16 (L23) | |
| Average Intel Core i9-14900HX, NVIDIA GeForce RTX 4070 Laptop GPU (10104 - 11815, n=8) | |
| Average of class Gaming (8810 - 11935, n=97, last 2 years) | |
| HP Omen Transcend 16-u1095ng | |
| Asus ROG Zephyrus G16 2024 GU605M | |
| PCMark 10 / Productivity | |
| Average of class Gaming (6845 - 25323, n=95, last 2 years) | |
| Schenker XMG CORE 16 (L23) | |
| Average Intel Core i9-14900HX, NVIDIA GeForce RTX 4070 Laptop GPU (9577 - 11103, n=8) | |
| HP Omen Transcend 16-u1095ng | |
| Lenovo Legion Pro 5 16ARX8 | |
| HP Omen Transcend 16 | |
| Asus ROG Zephyrus G16 2024 GU605M | |
| PCMark 10 / Digital Content Creation | |
| Average of class Gaming (7602 - 19954, n=95, last 2 years) | |
| HP Omen Transcend 16 | |
| Lenovo Legion Pro 5 16ARX8 | |
| Average Intel Core i9-14900HX, NVIDIA GeForce RTX 4070 Laptop GPU (12114 - 14827, n=8) | |
| Schenker XMG CORE 16 (L23) | |
| HP Omen Transcend 16-u1095ng | |
| Asus ROG Zephyrus G16 2024 GU605M | |
| CrossMark / Overall | |
| Average Intel Core i9-14900HX, NVIDIA GeForce RTX 4070 Laptop GPU (2002 - 2312, n=7) | |
| Lenovo Legion Pro 5 16ARX8 | |
| Average of class Gaming (1366 - 2409, n=94, last 2 years) | |
| HP Omen Transcend 16 | |
| Asus ROG Zephyrus G16 2024 GU605M | |
| Schenker XMG CORE 16 (L23) | |
| CrossMark / Productivity | |
| Average Intel Core i9-14900HX, NVIDIA GeForce RTX 4070 Laptop GPU (1827 - 2191, n=7) | |
| Lenovo Legion Pro 5 16ARX8 | |
| Average of class Gaming (1386 - 2254, n=94, last 2 years) | |
| HP Omen Transcend 16 | |
| Schenker XMG CORE 16 (L23) | |
| Asus ROG Zephyrus G16 2024 GU605M | |
| CrossMark / Creativity | |
| Average Intel Core i9-14900HX, NVIDIA GeForce RTX 4070 Laptop GPU (2258 - 2458, n=7) | |
| HP Omen Transcend 16 | |
| Average of class Gaming (1343 - 2786, n=94, last 2 years) | |
| Lenovo Legion Pro 5 16ARX8 | |
| Asus ROG Zephyrus G16 2024 GU605M | |
| Schenker XMG CORE 16 (L23) | |
| CrossMark / Responsiveness | |
| Average Intel Core i9-14900HX, NVIDIA GeForce RTX 4070 Laptop GPU (1734 - 2330, n=7) | |
| Lenovo Legion Pro 5 16ARX8 | |
| Average of class Gaming (1226 - 2334, n=94, last 2 years) | |
| HP Omen Transcend 16 | |
| Schenker XMG CORE 16 (L23) | |
| Asus ROG Zephyrus G16 2024 GU605M | |
| WebXPRT 3 / Overall | |
| Lenovo Legion Pro 5 16ARX8 | |
| HP Omen Transcend 16-u1095ng | |
| HP Omen Transcend 16 | |
| Average Intel Core i9-14900HX, NVIDIA GeForce RTX 4070 Laptop GPU (269 - 342, n=8) | |
| Average of class Gaming (220 - 532, n=98, last 2 years) | |
| Schenker XMG CORE 16 (L23) | |
| Asus ROG Zephyrus G16 2024 GU605M | |
| WebXPRT 4 / Overall | |
| HP Omen Transcend 16 | |
| Average Intel Core i9-14900HX, NVIDIA GeForce RTX 4070 Laptop GPU (291 - 304, n=6) | |
| Average of class Gaming (165 - 354, n=98, last 2 years) | |
| Lenovo Legion Pro 5 16ARX8 | |
| Asus ROG Zephyrus G16 2024 GU605M | |
| Mozilla Kraken 1.1 / Total | |
| Asus ROG Zephyrus G16 2024 GU605M | |
| Schenker XMG CORE 16 (L23) | |
| Lenovo Legion Pro 5 16ARX8 | |
| Average of class Gaming (391 - 590, n=100, last 2 years) | |
| HP Omen Transcend 16 | |
| Average Intel Core i9-14900HX, NVIDIA GeForce RTX 4070 Laptop GPU (431 - 469, n=8) | |
| HP Omen Transcend 16-u1095ng | |
* ... smaller is better
| PCMark 10 Score | 7866 points | |
Help | ||
| AIDA64 / Memory Copy | |
| Asus ROG Zephyrus G16 2024 GU605M | |
| HP Omen Transcend 16-u1095ng | |
| HP Omen Transcend 16 | |
| Average Intel Core i9-14900HX (38028 - 83392, n=36) | |
| Average of class Gaming (21750 - 129946, n=105, last 2 years) | |
| Schenker XMG CORE 16 (L23) | |
| Lenovo Legion Pro 5 16ARX8 | |
| AIDA64 / Memory Read | |
| Asus ROG Zephyrus G16 2024 GU605M | |
| HP Omen Transcend 16-u1095ng | |
| HP Omen Transcend 16 | |
| Average Intel Core i9-14900HX (43306 - 87568, n=36) | |
| Average of class Gaming (22956 - 118858, n=105, last 2 years) | |
| Schenker XMG CORE 16 (L23) | |
| Lenovo Legion Pro 5 16ARX8 | |
| AIDA64 / Memory Write | |
| Schenker XMG CORE 16 (L23) | |
| HP Omen Transcend 16-u1095ng | |
| Average of class Gaming (22297 - 135096, n=105, last 2 years) | |
| HP Omen Transcend 16 | |
| Asus ROG Zephyrus G16 2024 GU605M | |
| Average Intel Core i9-14900HX (37146 - 80589, n=36) | |
| Lenovo Legion Pro 5 16ARX8 | |
| AIDA64 / Memory Latency | |
| Asus ROG Zephyrus G16 2024 GU605M | |
| Average of class Gaming (75.3 - 259, n=105, last 2 years) | |
| Schenker XMG CORE 16 (L23) | |
| HP Omen Transcend 16 | |
| Lenovo Legion Pro 5 16ARX8 | |
| HP Omen Transcend 16-u1095ng | |
| Average Intel Core i9-14900HX (76.1 - 105, n=36) | |
* ... smaller is better
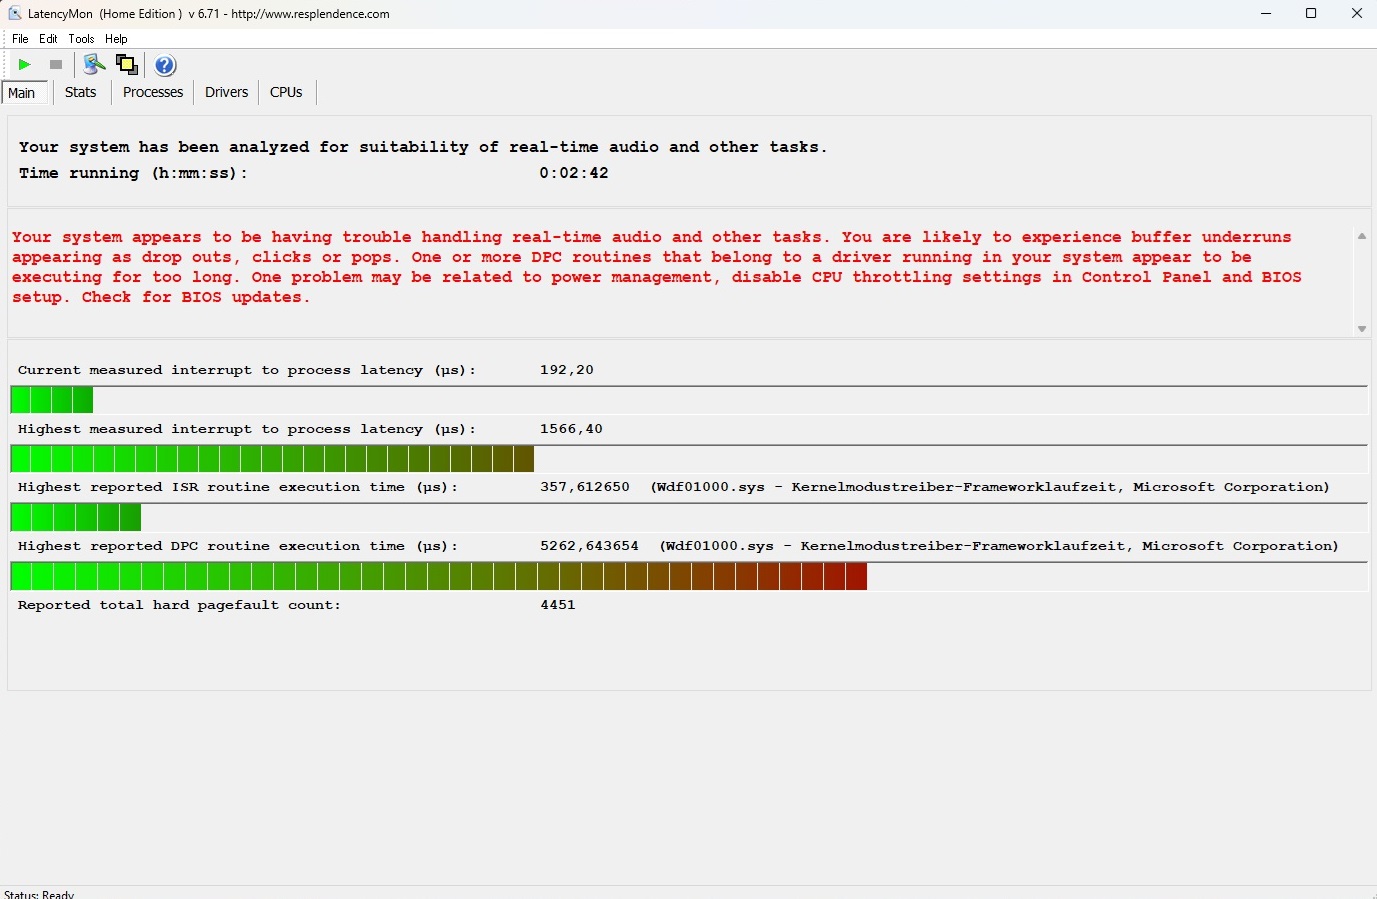
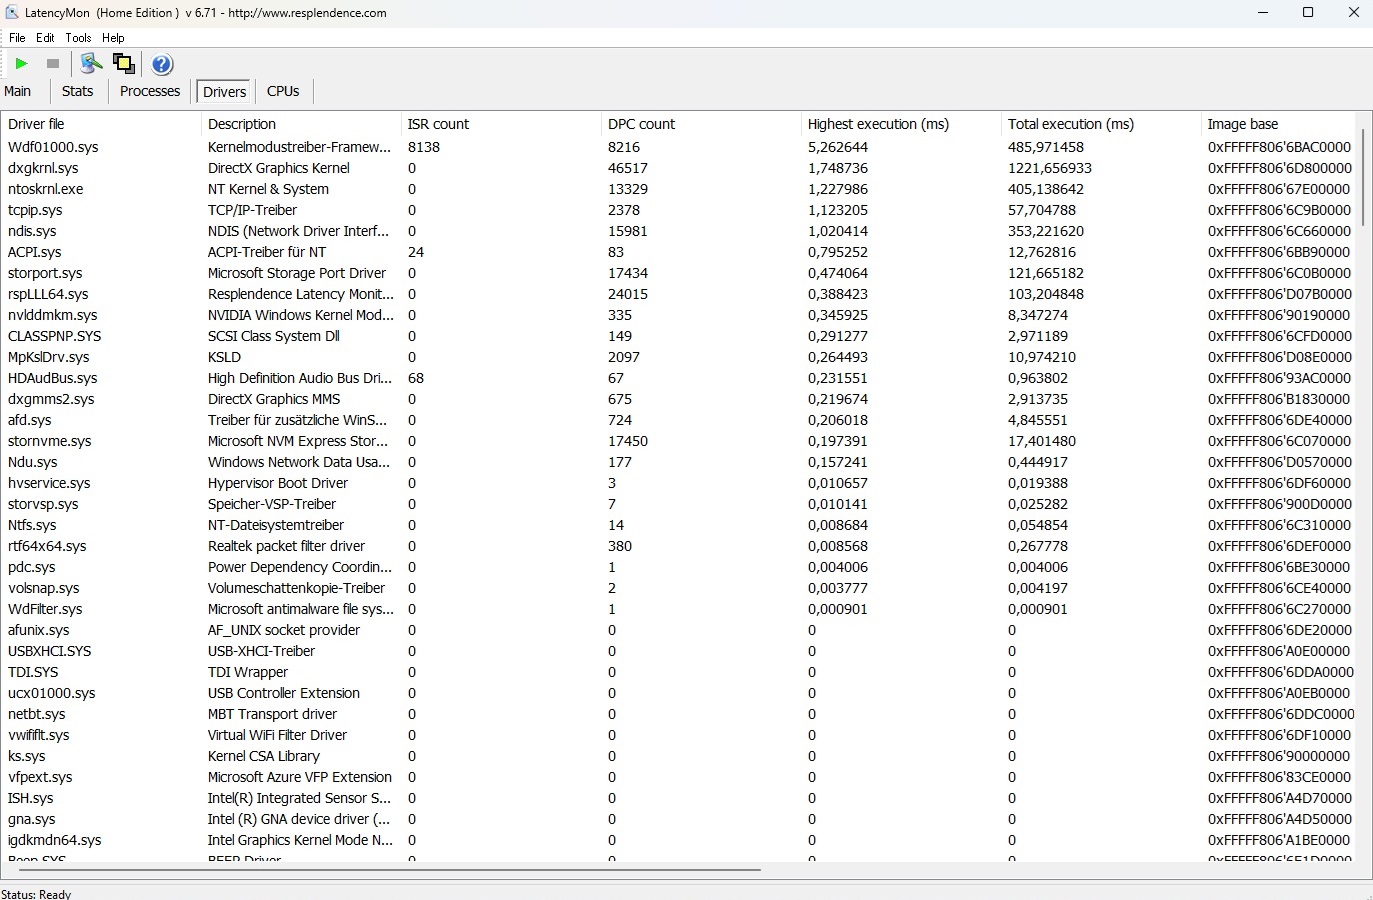
DPC latencies
As with the predecessor, the new Omen 16 also has to battle with relatively high latencies and this could lead to problems in some application scenarios (for example, processing audio and video in real time).
| DPC Latencies / LatencyMon - interrupt to process latency (max), Web, Youtube, Prime95 | |
| Asus ROG Zephyrus G16 2024 GU605M | |
| HP Omen Transcend 16-u1095ng | |
| HP Omen Transcend 16 | |
| Schenker XMG CORE 16 (L23) | |
| Lenovo Legion Pro 5 16ARX8 | |
* ... smaller is better
Mass storage
Compared to the CPU performance, we observed no dips in the SSD's performance. The installed Kioxia drive is a little slower than the SK hynix drive found in the old Transcend but, despite this, it delivers sufficiently high speeds. What is a pity is that the 16-incher only has one M.2 slot and this means the built-in SSD will have to be replaced to expand the storage.

* ... smaller is better
Continuous Performance Read: DiskSpd Read Loop, Queue Depth 8
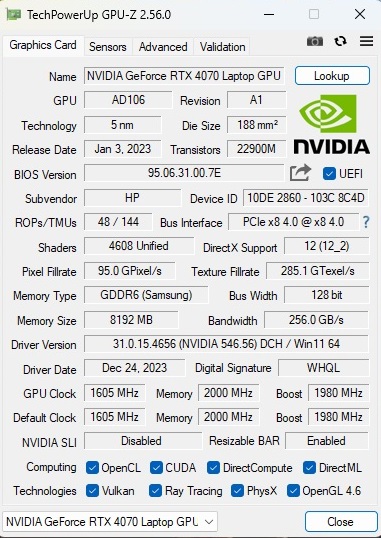
Graphics card
The GeForce RTX 4070 is based on the Ada Lovelace architecture and, performance-wise, it positions itself closer to the RTX 4060 than the RTX 4080. Despite the generous 130-watt TGP, the Omen 16 navigated our benchmark course in a slightly below-average manner although the difference to the competition is sometimes very small. The RTX 4070's future-proofing is rather poor due to the low amount of VRAM. In some games, 8 GB could already become a limiting factor. In our eyes, Nvidia should have given the GPU at least 12 GB, especially since laptops of this kind aren't exactly cheap.
| 3DMark Performance rating - Percent | |
| Average of class Gaming | |
| Schenker XMG CORE 16 (L23) | |
| Lenovo Legion Pro 5 16ARX8 -1! | |
| Average NVIDIA GeForce RTX 4070 Laptop GPU | |
| HP Omen Transcend 16 -1! | |
| HP Omen Transcend 16-u1095ng | |
| Asus ROG Zephyrus G16 2024 GU605M -1! | |
| 3DMark 11 Performance | 32528 points | |
| 3DMark Cloud Gate Standard Score | 53528 points | |
| 3DMark Fire Strike Score | 23683 points | |
| 3DMark Time Spy Score | 11682 points | |
Help | ||
* ... smaller is better
Gaming performance
The Transcend 16 is fast enough to be able to play almost all games at its native 2,560 x 1,600 resolution and at high to maximum settings. Things only get problematic in very demanding or poorly optimized games such as Enshrouded. For 4K monitors, we recommend at least an RTX 4080.
| The Witcher 3 - 1920x1080 Ultra Graphics & Postprocessing (HBAO+) | |
| Average of class Gaming (104.7 - 240, n=6, last 2 years) | |
| Schenker XMG CORE 16 (L23) | |
| Lenovo Legion Pro 5 16ARX8 | |
| HP Omen Transcend 16-u1095ng | |
| Average NVIDIA GeForce RTX 4070 Laptop GPU (69.8 - 133.7, n=57) | |
| HP Omen Transcend 16 | |
| Asus ROG Zephyrus G16 2024 GU605M | |
| Final Fantasy XV Benchmark - 1920x1080 High Quality | |
| Average of class Gaming (41 - 215, n=95, last 2 years) | |
| Schenker XMG CORE 16 (L23) | |
| Lenovo Legion Pro 5 16ARX8 | |
| Average NVIDIA GeForce RTX 4070 Laptop GPU (41 - 131.9, n=65) | |
| HP Omen Transcend 16-u1095ng | |
| Asus ROG Zephyrus G16 2024 GU605M | |
| Enshrouded - 2560x1440 Max. Quality AA:FX | |
| HP Omen Transcend 16-u1095ng | |
| Average NVIDIA GeForce RTX 4070 Laptop GPU (38.9 - 42.3, n=2) | |
| XMG Pro 15 E23 | |
| Palworld - 2560x1440 Epic Preset AA:TSR | |
| XMG Pro 15 E23 | |
| Average NVIDIA GeForce RTX 4070 Laptop GPU (69.1 - 81.3, n=2) | |
| HP Omen Transcend 16-u1095ng | |
| Prince of Persia The Lost Crown - 2560x1440 Ultra Preset AA:SM | |
| Average of class Gaming (352 - 357, n=4, last 2 years) | |
| XMG Pro 15 E23 | |
| Average NVIDIA GeForce RTX 4070 Laptop GPU (325 - 354, n=2) | |
| HP Omen Transcend 16-u1095ng | |
| Ready or Not - 2560x1440 Epic Preset | |
| XMG Pro 15 E23 | |
| Average NVIDIA GeForce RTX 4070 Laptop GPU (84.8 - 95.6, n=2) | |
| HP Omen Transcend 16-u1095ng | |
| The Finals - 2560x1440 Epic Preset | |
| XMG Pro 15 E23 | |
| Average NVIDIA GeForce RTX 4070 Laptop GPU (82.8 - 94.6, n=3) | |
| HP Omen Transcend 16-u1095ng | |
| Average of class Gaming (n=1last 2 years) | |
We used the role-playing game, The Witcher 3 (FHD/Ultra) to see how the 3D performance fares over a longer period of time and even after roughly one hour, the frame rate remained very stable.
Witcher 3 FPS diagram
| low | med. | high | ultra | QHD | |
|---|---|---|---|---|---|
| GTA V (2015) | 181.2 | 175.3 | 115.8 | ||
| The Witcher 3 (2015) | 114 | ||||
| Dota 2 Reborn (2015) | 202 | 178.9 | 167 | 154.1 | |
| Final Fantasy XV Benchmark (2018) | 147.5 | 108.3 | |||
| X-Plane 11.11 (2018) | 166.6 | 141.7 | 114.9 | ||
| Strange Brigade (2018) | 272 | 220 | 194.2 | ||
| The Finals (2023) | 168 | 130.2 | 82.8 | ||
| Ready or Not (2023) | 194.2 | 134 | 84.8 | ||
| Prince of Persia The Lost Crown (2024) | 358 | 358 | 325 | ||
| Palworld (2024) | 102.2 | 96.6 | 69.1 | ||
| Enshrouded (2024) | 66.6 | 56.5 | 42.3 | ||
| Helldivers 2 (2024) | 91.5 | 91.1 | 69.2 |
Emissions
Noise emissions
If you restrict yourself to using balanced mode, the 16-inch device doesn't get too loud. The 3D noise level of 44 to 47 dB(A) is audible but not annoying (the latter would apply to the performance mode with a recording of 50+ dB). In idle mode, the fans are continually active and run at an audible 29 to 31 dB(A) which is not quite optimal.
Noise level
| Idle |
| 29 / 30 / 31 dB(A) |
| Load |
| 45 / 47 dB(A) |
 | ||
30 dB silent 40 dB(A) audible 50 dB(A) loud |
||
min: | ||
| HP Omen Transcend 16-u1095ng i9-14900HX, GeForce RTX 4070 Laptop GPU | HP Omen Transcend 16 i9-13900HX, GeForce RTX 4070 Laptop GPU | Asus ROG Zephyrus G16 2024 GU605M Ultra 7 155H, GeForce RTX 4070 Laptop GPU | Schenker XMG CORE 16 (L23) R7 7840HS, GeForce RTX 4070 Laptop GPU | Lenovo Legion Pro 5 16ARX8 R7 7745HX, GeForce RTX 4070 Laptop GPU | |
|---|---|---|---|---|---|
| Noise | -4% | 7% | 5% | 10% | |
| off / environment * (dB) | 24 | 22.9 5% | 23.9 -0% | 23 4% | 23.2 3% |
| Idle Minimum * (dB) | 29 | 29.1 -0% | 23.9 18% | 23 21% | 23.2 20% |
| Idle Average * (dB) | 30 | 29.1 3% | 27.8 7% | 28.48 5% | 23.2 23% |
| Idle Maximum * (dB) | 31 | 29.1 6% | 30.1 3% | 28.48 8% | 26.2 15% |
| Load Average * (dB) | 45 | 45.7 -2% | 34.2 24% | 30 33% | 31.4 30% |
| Witcher 3 ultra * (dB) | 44 | 54.3 -23% | 46.4 -5% | 54.12 -23% | 48.4 -10% |
| Load Maximum * (dB) | 47 | 54.3 -16% | 46.4 1% | 54.12 -15% | 53.8 -14% |
* ... smaller is better
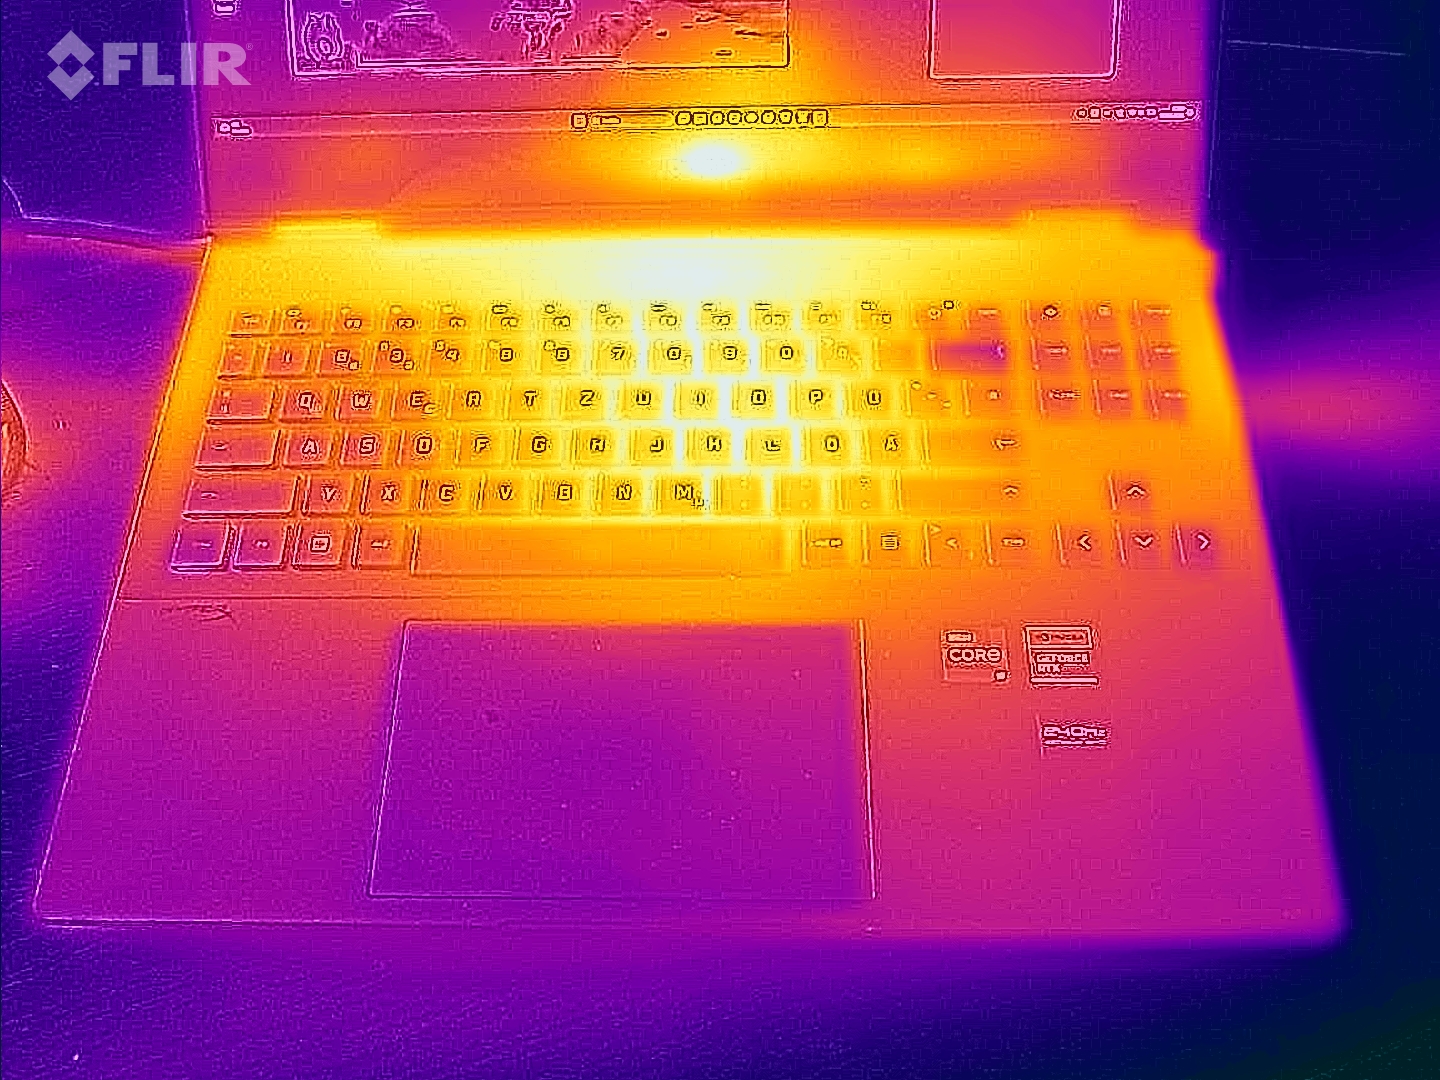
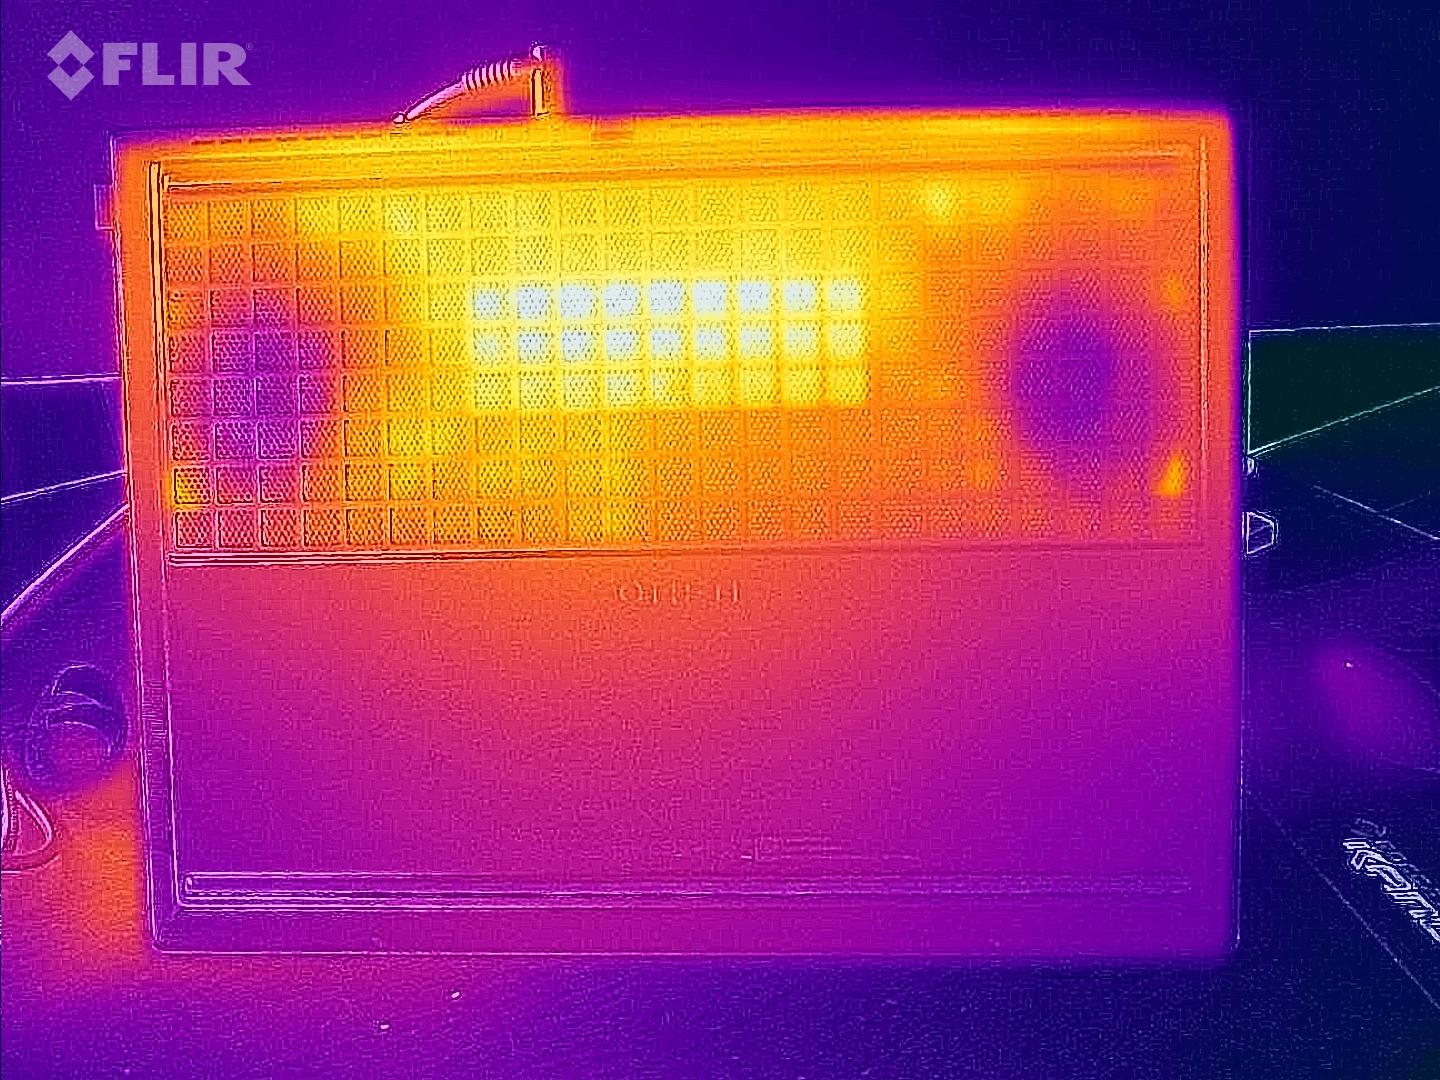
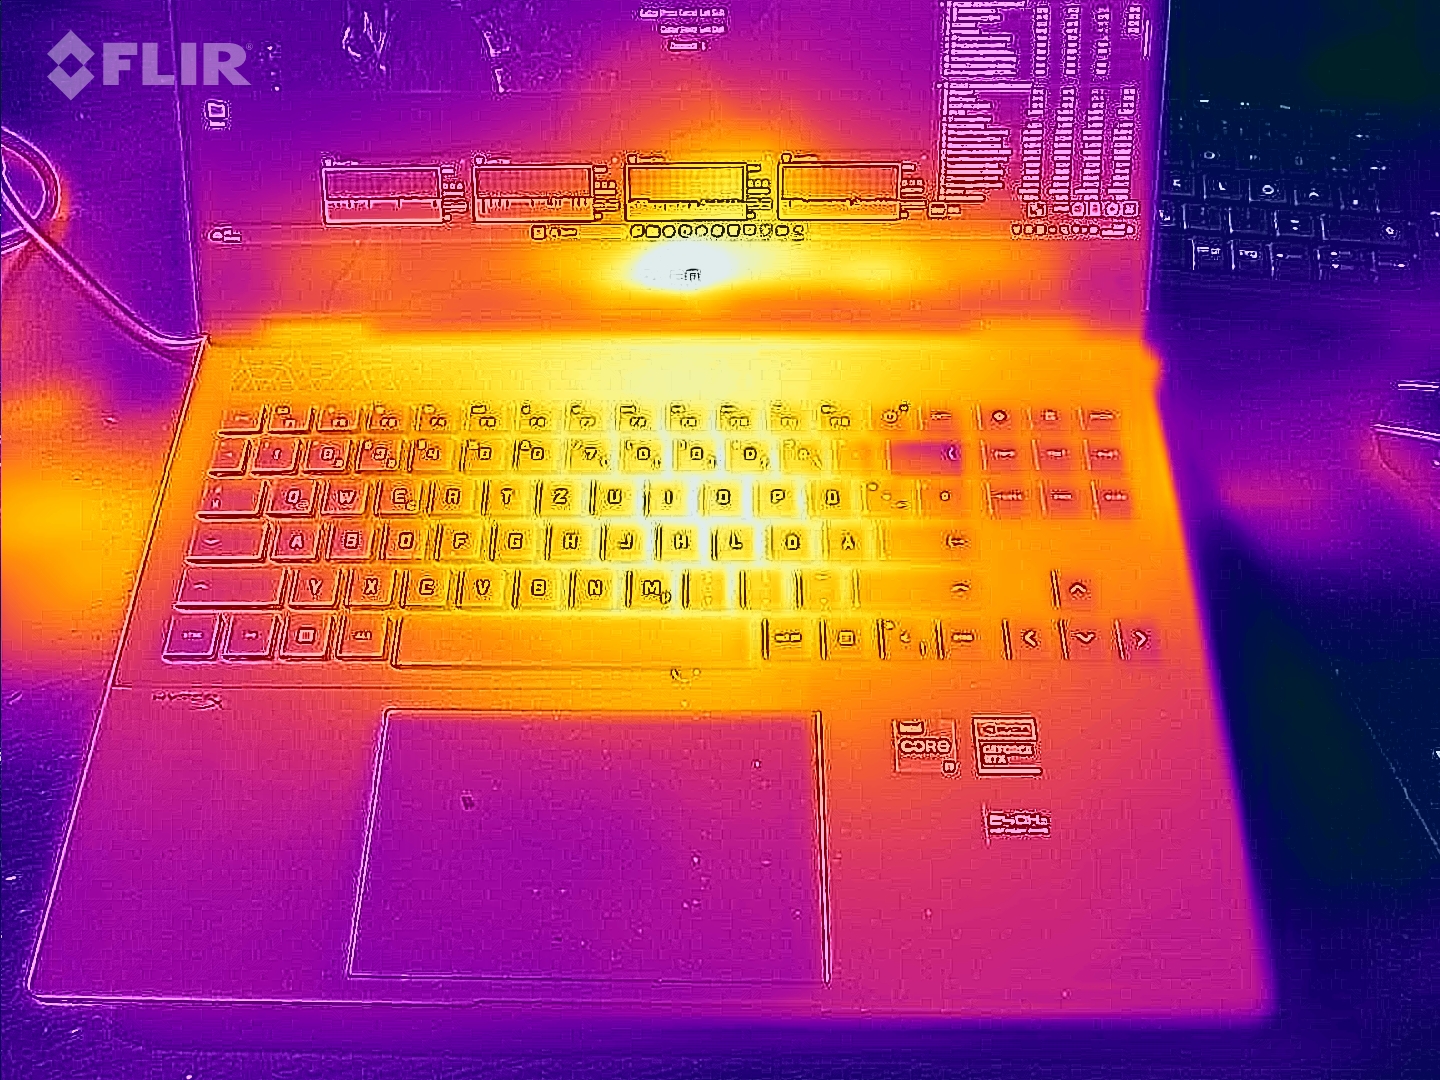
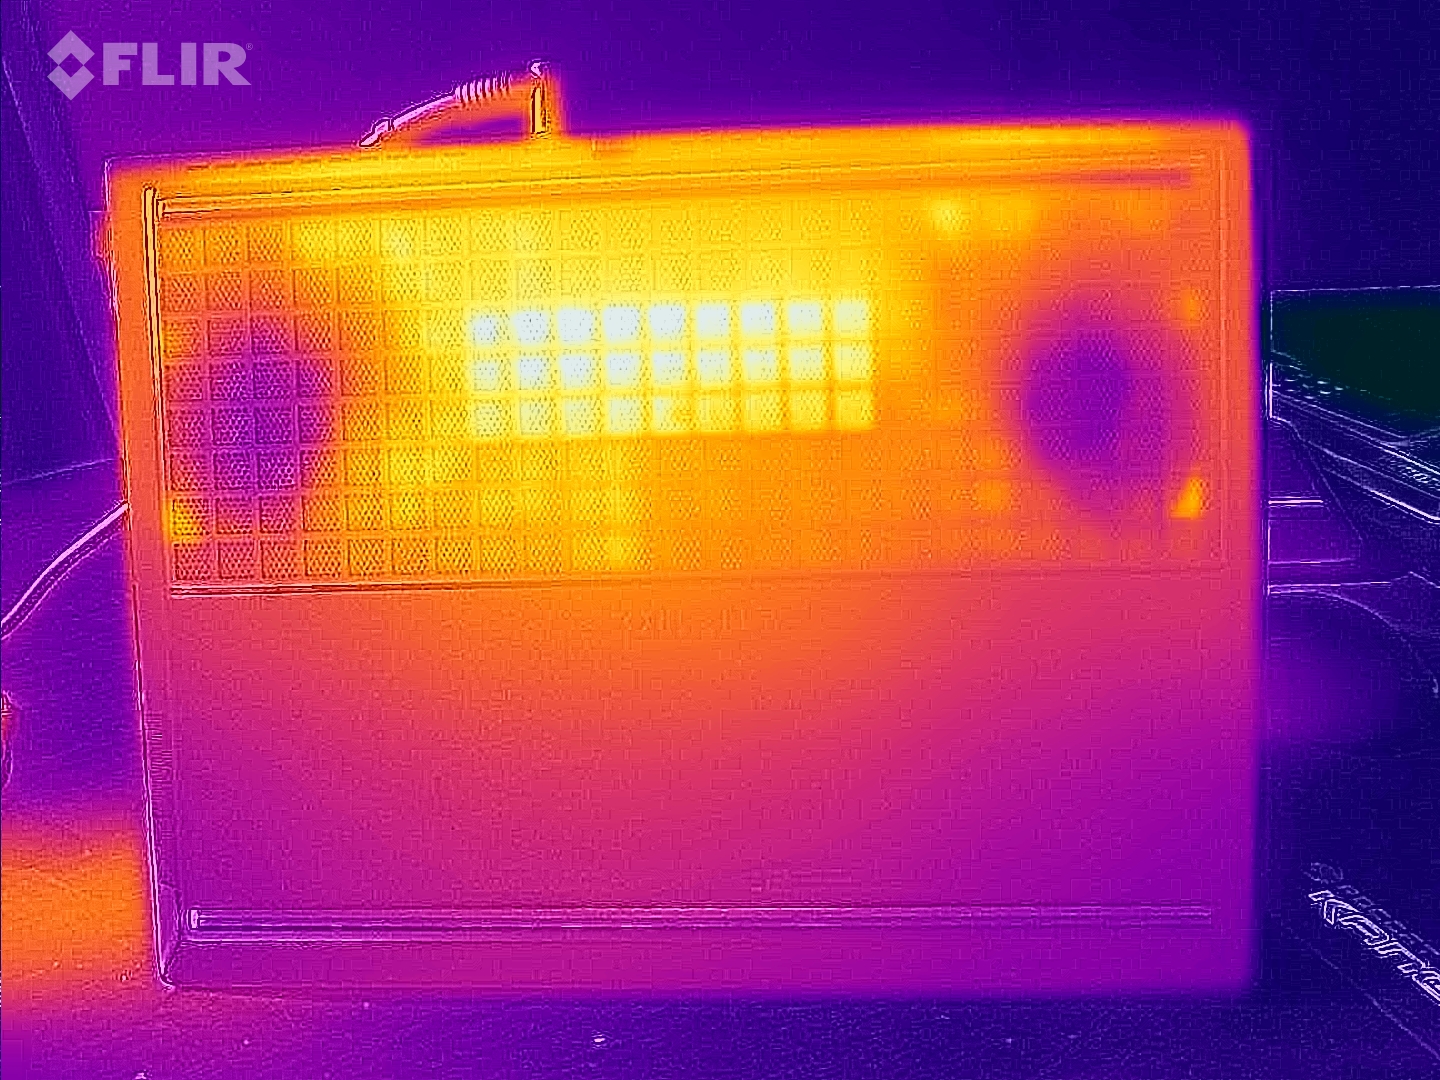
Temperature
While the temperatures on the top of the laptop sit in the middle of the pack, the base of the case gets warmer than the competition under load. A maximum of 63 °C (when gaming) will prevent users from using the device placed on their lap. In idle operation, the situation is significantly more comfortable with the chassis remaining pleasantly cool at a maximum of 30 °C.
(-) The maximum temperature on the upper side is 49 °C / 120 F, compared to the average of 40.4 °C / 105 F, ranging from 21.2 to 68.8 °C for the class Gaming.
(-) The bottom heats up to a maximum of 63 °C / 145 F, compared to the average of 43.2 °C / 110 F
(+) In idle usage, the average temperature for the upper side is 26.6 °C / 80 F, compared to the device average of 33.9 °C / 93 F.
(-) Playing The Witcher 3, the average temperature for the upper side is 40.3 °C / 105 F, compared to the device average of 33.9 °C / 93 F.
(+) The palmrests and touchpad are reaching skin temperature as a maximum (35 °C / 95 F) and are therefore not hot.
(-) The average temperature of the palmrest area of similar devices was 28.8 °C / 83.8 F (-6.2 °C / -11.2 F).
| HP Omen Transcend 16-u1095ng i9-14900HX, GeForce RTX 4070 Laptop GPU | HP Omen Transcend 16 i9-13900HX, GeForce RTX 4070 Laptop GPU | Asus ROG Zephyrus G16 2024 GU605M Ultra 7 155H, GeForce RTX 4070 Laptop GPU | Schenker XMG CORE 16 (L23) R7 7840HS, GeForce RTX 4070 Laptop GPU | Lenovo Legion Pro 5 16ARX8 R7 7745HX, GeForce RTX 4070 Laptop GPU | |
|---|---|---|---|---|---|
| Heat | 5% | 6% | 4% | 12% | |
| Maximum Upper Side * (°C) | 49 | 47.4 3% | 50.3 -3% | 46 6% | 41.8 15% |
| Maximum Bottom * (°C) | 63 | 54.4 14% | 48 24% | 44 30% | 41.4 34% |
| Idle Upper Side * (°C) | 30 | 28.4 5% | 28.8 4% | 32 -7% | 29 3% |
| Idle Bottom * (°C) | 29 | 29.2 -1% | 29.8 -3% | 33 -14% | 30.4 -5% |
* ... smaller is better
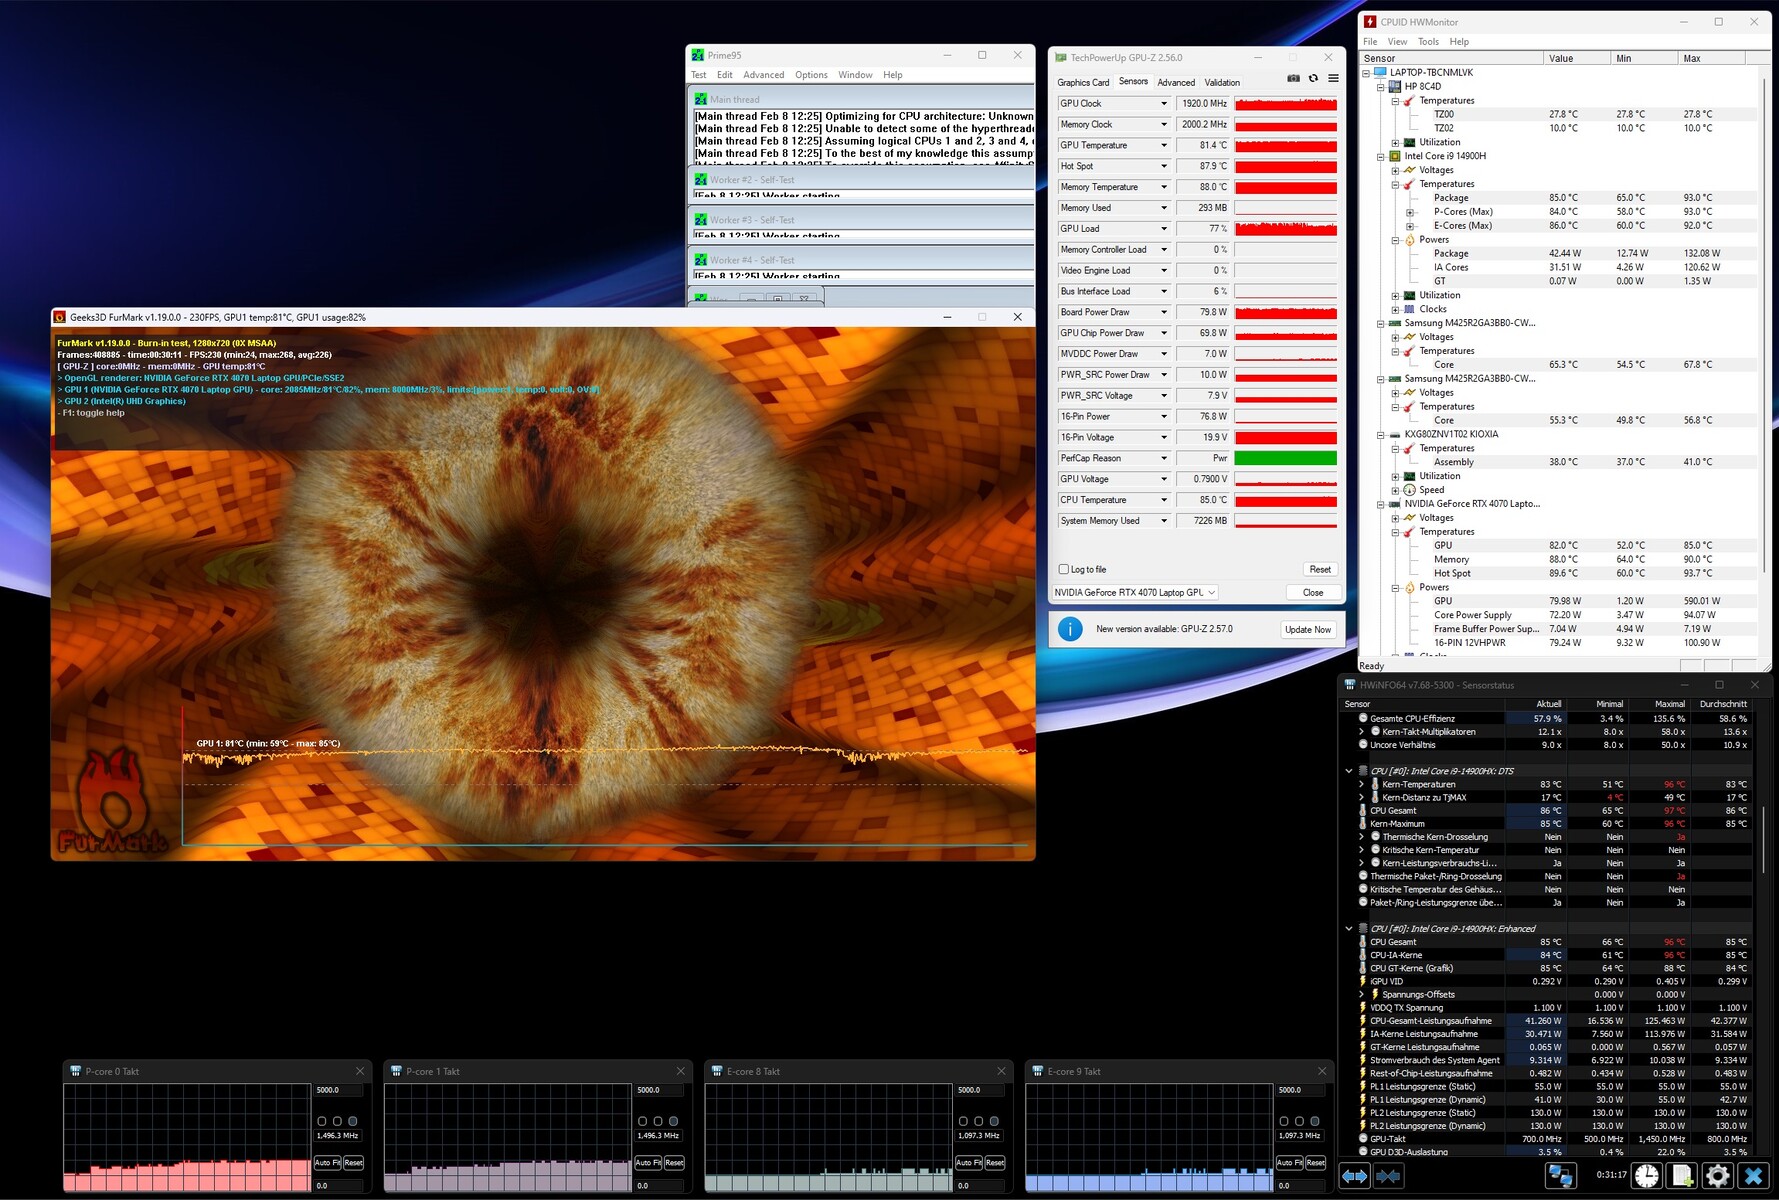
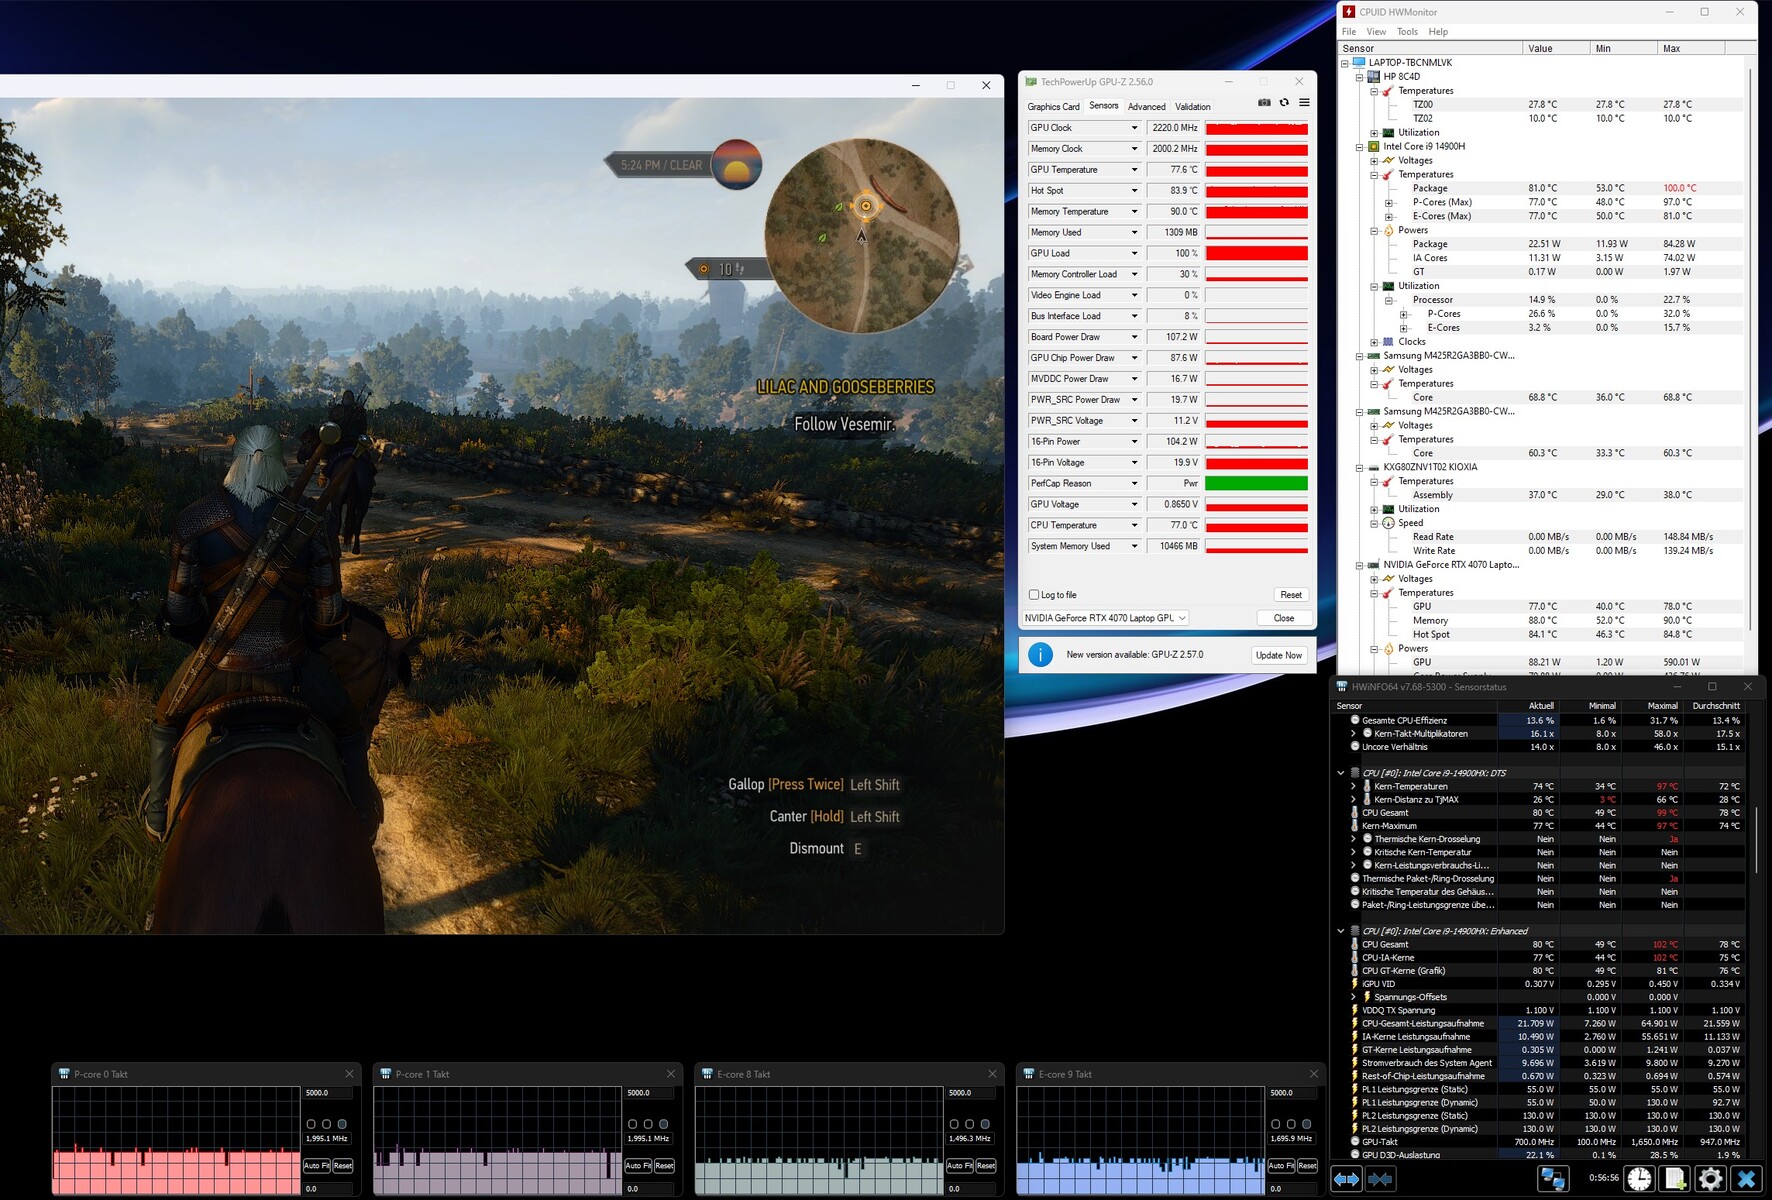
Stress test
In the stress test using the Furmark and Prime95 tools, after 60 minutes, the CPU settled to around 85 °C, whereas the GPU hit 81 °C (a hotspot of 88 °C) – both relatively high but harmless values.
Speakers
The sound quality is somewhat better than the overall gaming laptop average, although, as is often the case, the bass struggles and it could be more powerful and precise. The maximum volume of 82 dB(A) is more than decent.
HP Omen Transcend 16-u1095ng audio analysis
(+) | speakers can play relatively loud (82 dB)
Bass 100 - 315 Hz
(-) | nearly no bass - on average 21.9% lower than median
(±) | linearity of bass is average (11% delta to prev. frequency)
Mids 400 - 2000 Hz
(+) | balanced mids - only 3.2% away from median
(+) | mids are linear (5.3% delta to prev. frequency)
Highs 2 - 16 kHz
(+) | balanced highs - only 1.4% away from median
(+) | highs are linear (5.2% delta to prev. frequency)
Overall 100 - 16.000 Hz
(+) | overall sound is linear (14.5% difference to median)
Compared to same class
» 27% of all tested devices in this class were better, 7% similar, 66% worse
» The best had a delta of 6%, average was 18%, worst was 132%
Compared to all devices tested
» 18% of all tested devices were better, 4% similar, 77% worse
» The best had a delta of 4%, average was 23%, worst was 134%
Asus ROG Zephyrus G16 2024 GU605M audio analysis
(+) | speakers can play relatively loud (83.3 dB)
Bass 100 - 315 Hz
(+) | good bass - only 3.8% away from median
(±) | linearity of bass is average (8.1% delta to prev. frequency)
Mids 400 - 2000 Hz
(+) | balanced mids - only 3.5% away from median
(+) | mids are linear (2.4% delta to prev. frequency)
Highs 2 - 16 kHz
(+) | balanced highs - only 2.2% away from median
(+) | highs are linear (3.7% delta to prev. frequency)
Overall 100 - 16.000 Hz
(+) | overall sound is linear (7.3% difference to median)
Compared to same class
» 1% of all tested devices in this class were better, 0% similar, 99% worse
» The best had a delta of 6%, average was 18%, worst was 132%
Compared to all devices tested
» 1% of all tested devices were better, 0% similar, 99% worse
» The best had a delta of 4%, average was 23%, worst was 134%
Energy management
Power consumption
The energy requirements are similar to the standard values found in this performance category. 10 to 32 watts idle consumption and 128 to 242 watts consumption under load is neither particularly high nor low.
| Off / Standby | |
| Idle | |
| Load |
|
Key:
min: | |
| HP Omen Transcend 16-u1095ng i9-14900HX, GeForce RTX 4070 Laptop GPU | HP Omen Transcend 16 i9-13900HX, GeForce RTX 4070 Laptop GPU | Asus ROG Zephyrus G16 2024 GU605M Ultra 7 155H, GeForce RTX 4070 Laptop GPU | Schenker XMG CORE 16 (L23) R7 7840HS, GeForce RTX 4070 Laptop GPU | Lenovo Legion Pro 5 16ARX8 R7 7745HX, GeForce RTX 4070 Laptop GPU | Average of class Gaming | |
|---|---|---|---|---|---|---|
| Power Consumption | -42% | 33% | 12% | 1% | -1% | |
| Idle Minimum * (Watt) | 10 | 19.2 -92% | 8.3 17% | 11 -10% | 8.1 19% | 13 ? -30% |
| Idle Average * (Watt) | 18 | 22.7 -26% | 12.5 31% | 15.2 16% | 15.9 12% | 18.7 ? -4% |
| Idle Maximum * (Watt) | 32 | 55.4 -73% | 12.8 60% | 16 50% | 37.2 -16% | 24.3 ? 24% |
| Load Average * (Watt) | 128 | 128.4 -0% | 71.3 44% | 64 50% | 90.9 29% | 110.2 ? 14% |
| Witcher 3 ultra * (Watt) | 148.4 | 206 -39% | 127.5 14% | 179 -21% | 189.6 -28% | |
| Load Maximum * (Watt) | 242 | 292 -21% | 169.1 30% | 280 -16% | 263.5 -9% | 258 ? -7% |
* ... smaller is better
Power consumption Witcher 3 / stress test
Power consumption with an external monitor
Battery life
When it comes to the energy requirements in battery mode, HP still has some work to do. Despite the powerful 97 Wh battery, the 16-inch machine only managed to last just short of 5 hours in our Wi-Fi test at a reduced brightness of 150 cd/m². As a comparison: The ROG Zyphrus G16 managed over 7 hours and the XMG Core 16 even lasted over 8 hours.
| HP Omen Transcend 16-u1095ng i9-14900HX, GeForce RTX 4070 Laptop GPU, 97 Wh | HP Omen Transcend 16 i9-13900HX, GeForce RTX 4070 Laptop GPU, 97 Wh | Asus ROG Zephyrus G16 2024 GU605M Ultra 7 155H, GeForce RTX 4070 Laptop GPU, 90 Wh | Schenker XMG CORE 16 (L23) R7 7840HS, GeForce RTX 4070 Laptop GPU, 99 Wh | Lenovo Legion Pro 5 16ARX8 R7 7745HX, GeForce RTX 4070 Laptop GPU, 80 Wh | Average of class Gaming | |
|---|---|---|---|---|---|---|
| Battery runtime | -14% | 49% | 71% | -18% | 45% | |
| WiFi v1.3 (h) | 4.9 | 4.2 -14% | 7.3 49% | 8.4 71% | 4 -18% | 7.11 ? 45% |
| Reader / Idle (h) | 6.3 | 6.5 | 8.71 ? | |||
| Load (h) | 1.2 | 1.2 | 2.4 | 1 | 1.502 ? | |
| H.264 (h) | 11.2 | 10.2 | 8.64 ? |
Pros
Cons
Verdict
First and foremost, the Omen Transcend 16-u1095ng tries to draw in potential customers with a brilliant OLED display that speaks to both gamers and creators.
If you can deal with a very reflective screen and don't have a problem with flickering, you get a colourful display with an excellent contrast ratio and great response times, on top of superb black levels and viewing angles.
There are some minus points for emissions and speed. While the 16-inch machine gets unpleasantly loud in performance mode, the balanced mode's performance seems somewhat below average. Apart from that, the Omen Transcend 16 is similar to other gaming laptops regarding case quality, input devices and port selection.
Overall, the total score is comparable to that of the XMG Core 16 L23 or the Legion Pro 5 16ARX8. Anyone looking for an especially light and compact device in the 16-inch category should look at the new ROG Zeyphrus G16.
Price and availability
At the time of our review, the HP Omen Transcend 16-u1095ng with the Core i9-14900HX and the GeForce RTX 4070 is currently unavailable on HP's online store, Amazon or Best Buy.
HP Omen Transcend 16-u1095ng
- 02/12/2024 v7 (old)
Florian Glaser
Transparency
The selection of devices to be reviewed is made by our editorial team. The test sample was provided to the author as a loan by the manufacturer or retailer for the purpose of this review. The lender had no influence on this review, nor did the manufacturer receive a copy of this review before publication. There was no obligation to publish this review. As an independent media company, Notebookcheck is not subjected to the authority of manufacturers, retailers or publishers.
This is how Notebookcheck is testing
Every year, Notebookcheck independently reviews hundreds of laptops and smartphones using standardized procedures to ensure that all results are comparable. We have continuously developed our test methods for around 20 years and set industry standards in the process. In our test labs, high-quality measuring equipment is utilized by experienced technicians and editors. These tests involve a multi-stage validation process. Our complex rating system is based on hundreds of well-founded measurements and benchmarks, which maintains objectivity. Further information on our test methods can be found here.
Price comparison

