Verdict
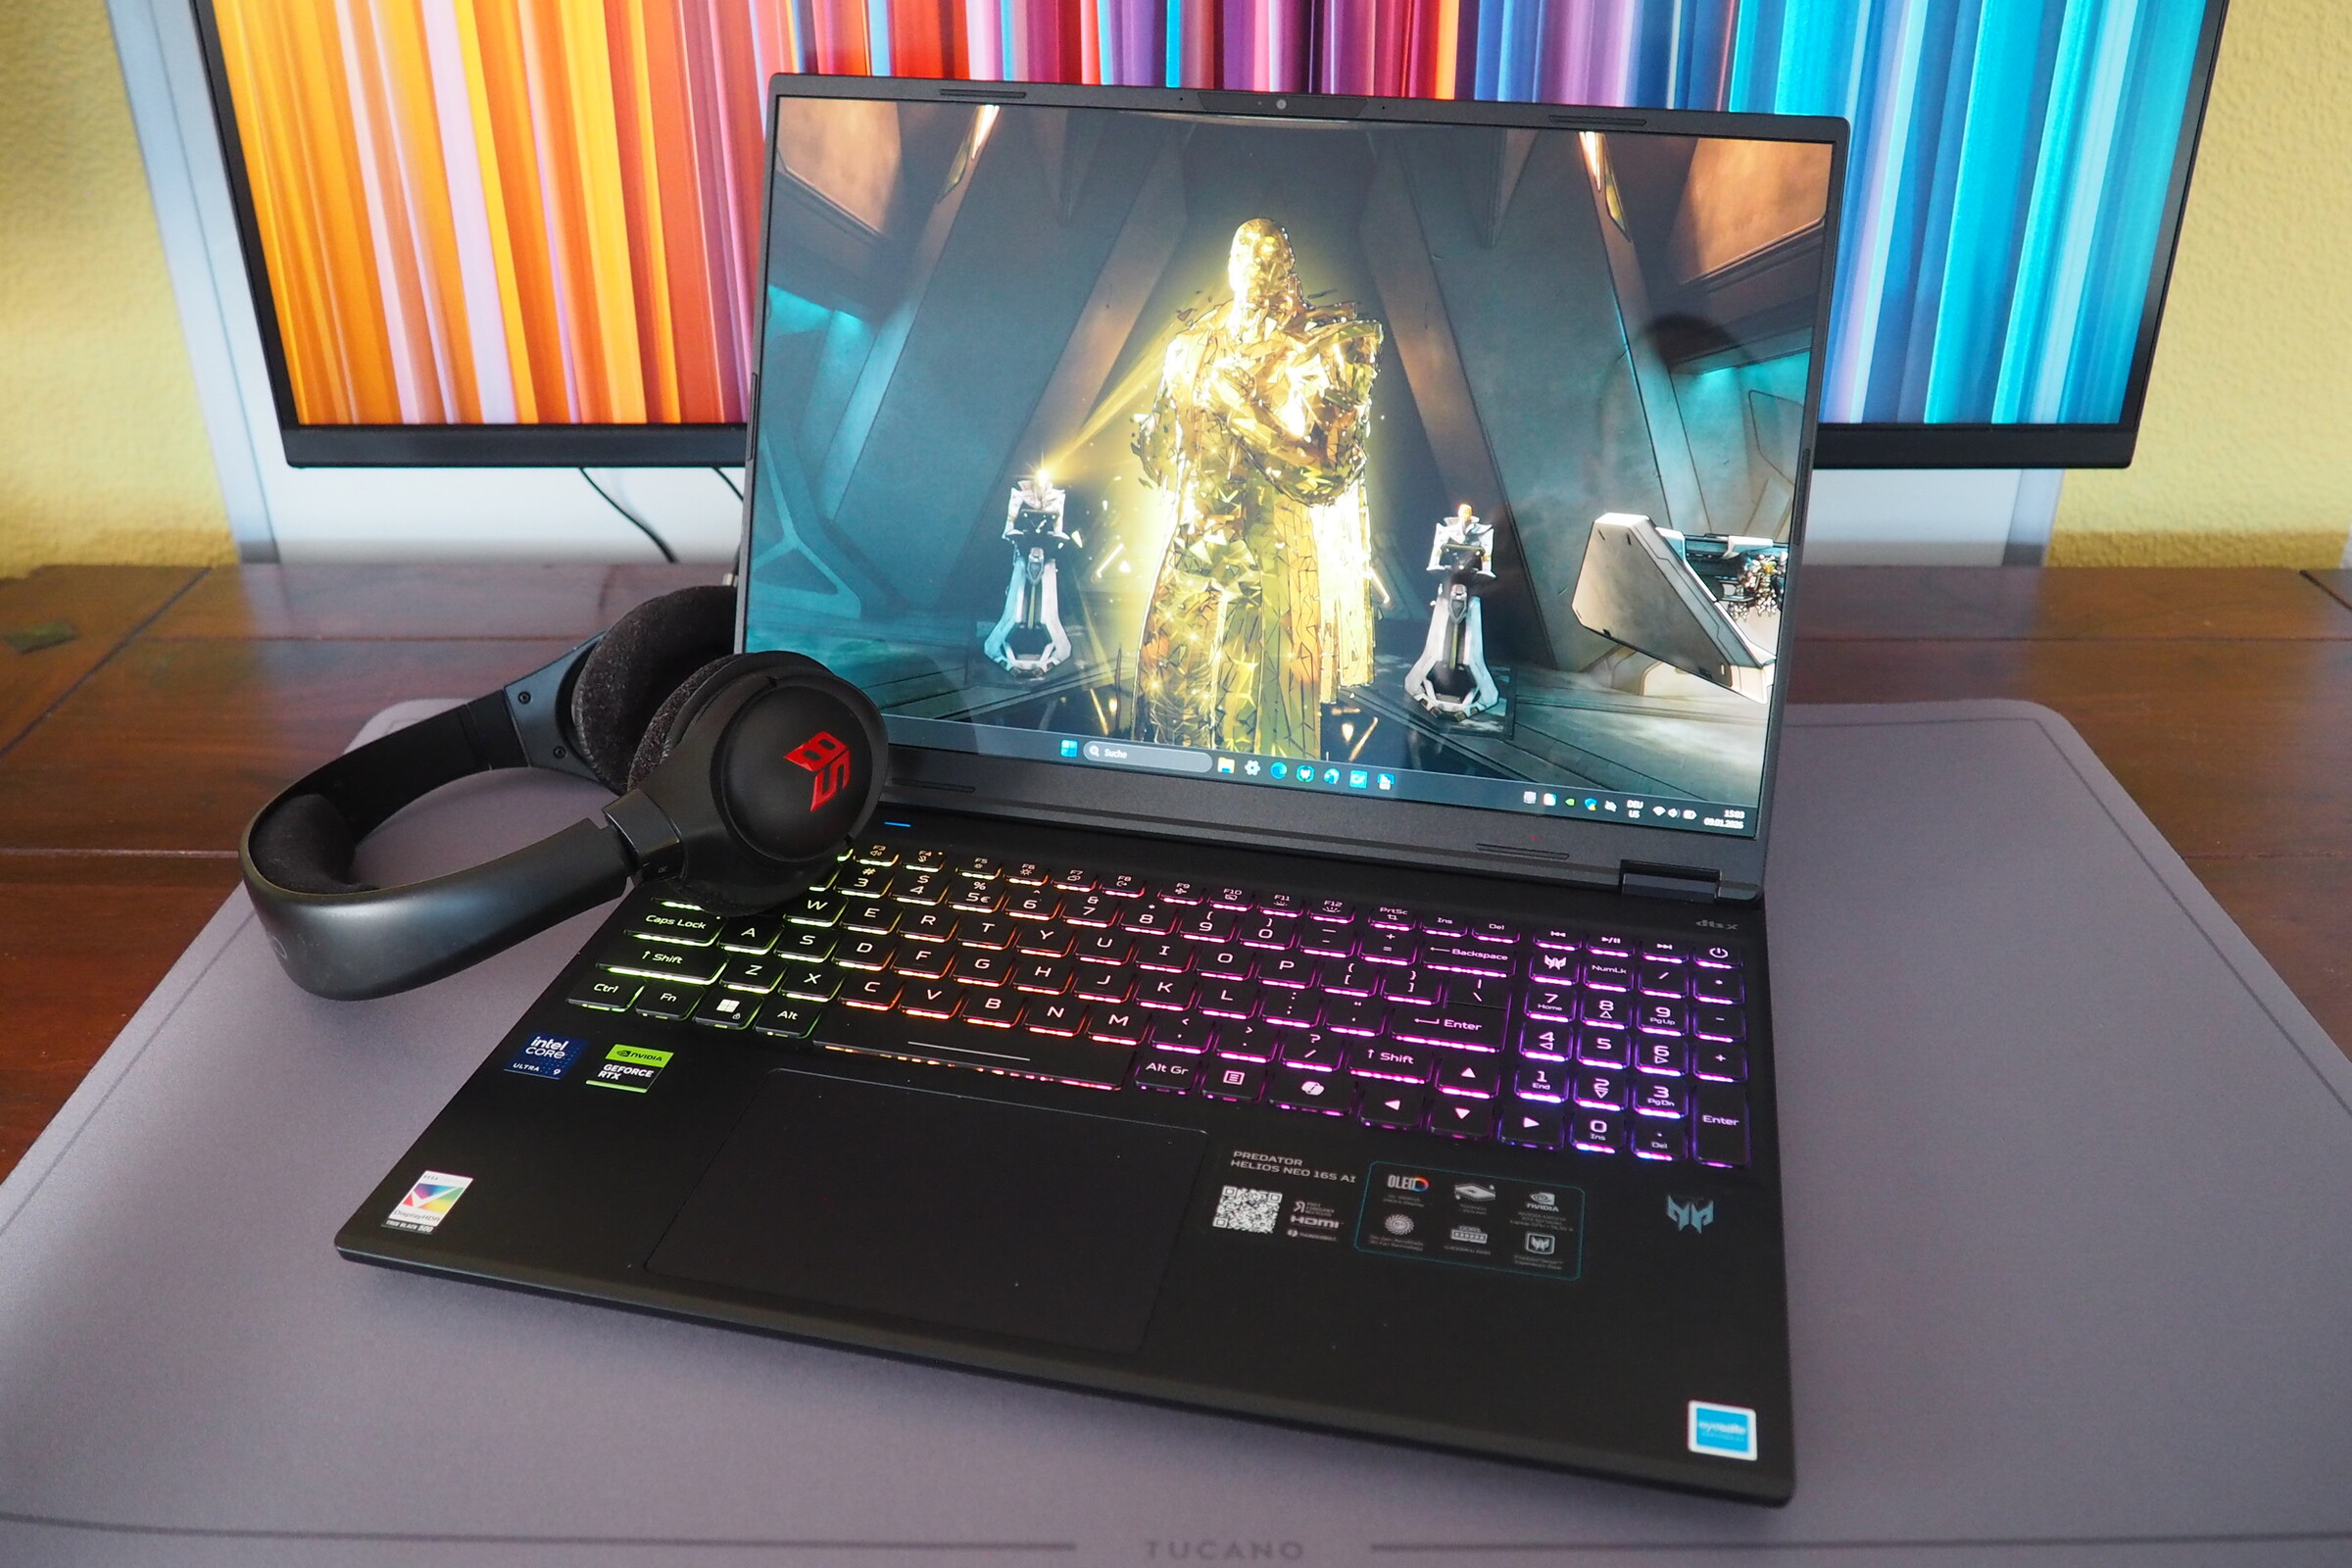
With a height of just under 2 cm, the Predator Helios Neo 16S AI is one of the thinner representatives among gaming laptops. While the 16-inch laptop scores with a colorful OLED display, a wide range of connectivity including Thunderbolt 4 and two RAM and SSD slots, other aspects are not quite as optimal. Last but not least, the battery life and performance could be better (the SSD tends to fluctuate in performance over time).
How the 16-incher performs against direct competitors such as the MSI Vector 16 HX AI, the Lenovo Legion 5 Pro 16 and, above all, the Asus ROG Zephyrus G16 (although the latter is more expensive) will be shown in the course of the article. A notebook with an RTX 5070 or RTX 5080 is also included in the comparison tables for better classification.
Pros
Cons
Price and availability
The Acer Predator Helios Neo 16S AI with Core Ultra 9 275HX, RTX 5070 Ti laptop and 32 GB RAM is available from around 2,400 euros (approximately US$2700) from various online stores (e.g. galaxus.de).
- $1,959.99Acer Predator Helios Neo 16S AI Gaming Laptop, Intel Ultra 9 275HX Up to 5.4 GHz, NVIDIA RTX 5060, 16" OLED 240Hz, 32GB DDR5, 1TB SSD, RGB Backlit KB, Thunderbolt, Windows 11 Pro, Headset & Mouse Set
- $50.00New GPU Fan for ACER Predator Helios NEO 16S AI PHN16S-71-98RF | NH.U0KAA.001 Black Compatible Laptop
- $1,948.15Acer Predator Helios Neo 16S AI Gaming Laptop, 16 240Hz 2.5K OLED, Intel Core Ultra 9 275HX, NVIDIA GeForce RTX 5060, VR Ready, Copilot, Liquid Cooling, Black, Windows 11 Home(16GB DDR5 RAM | 1TB SSD)
Specifications
Case
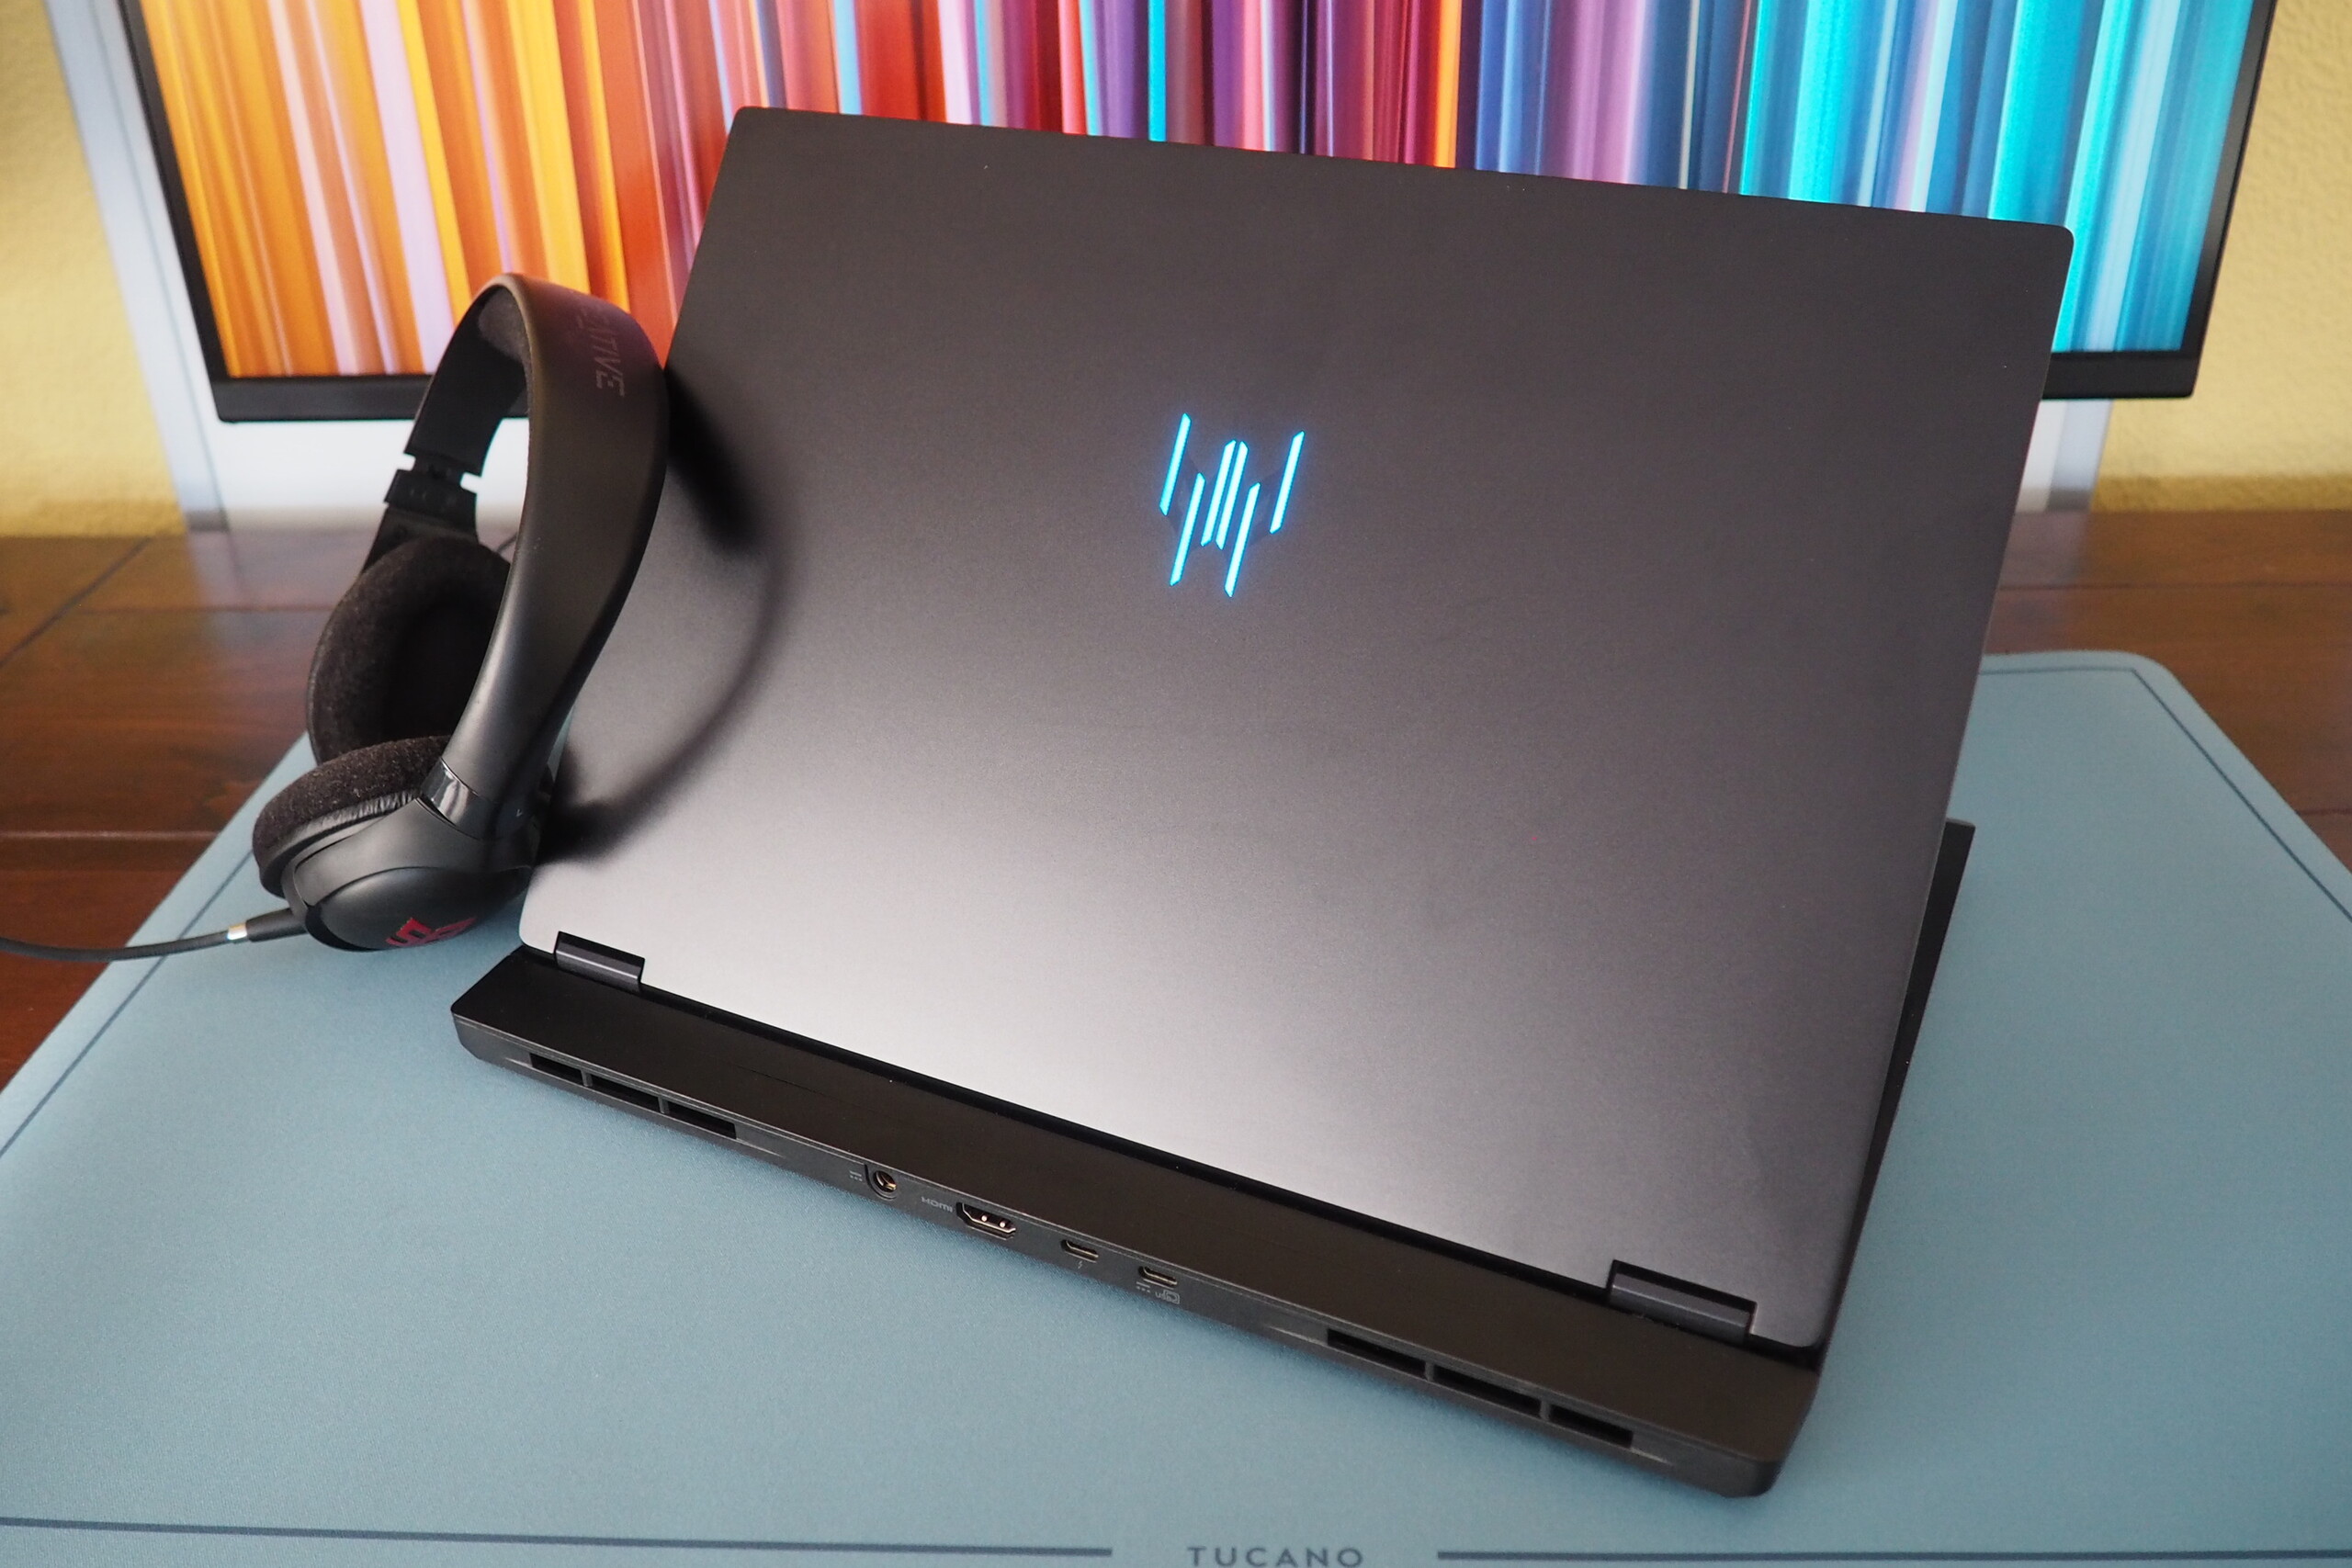
The 16-inch device looks neither cheap nor particularly elegant. While the lid is made of metal, the base unit has to make do with plastic. As usual, the dark surfaces are prone to fingerprints, and the maximum opening angle is a decent 145°. The 2.2 kg weight is roughly in line with the competition, which ranges from 1.9 to 2.6 kg.
Equipment
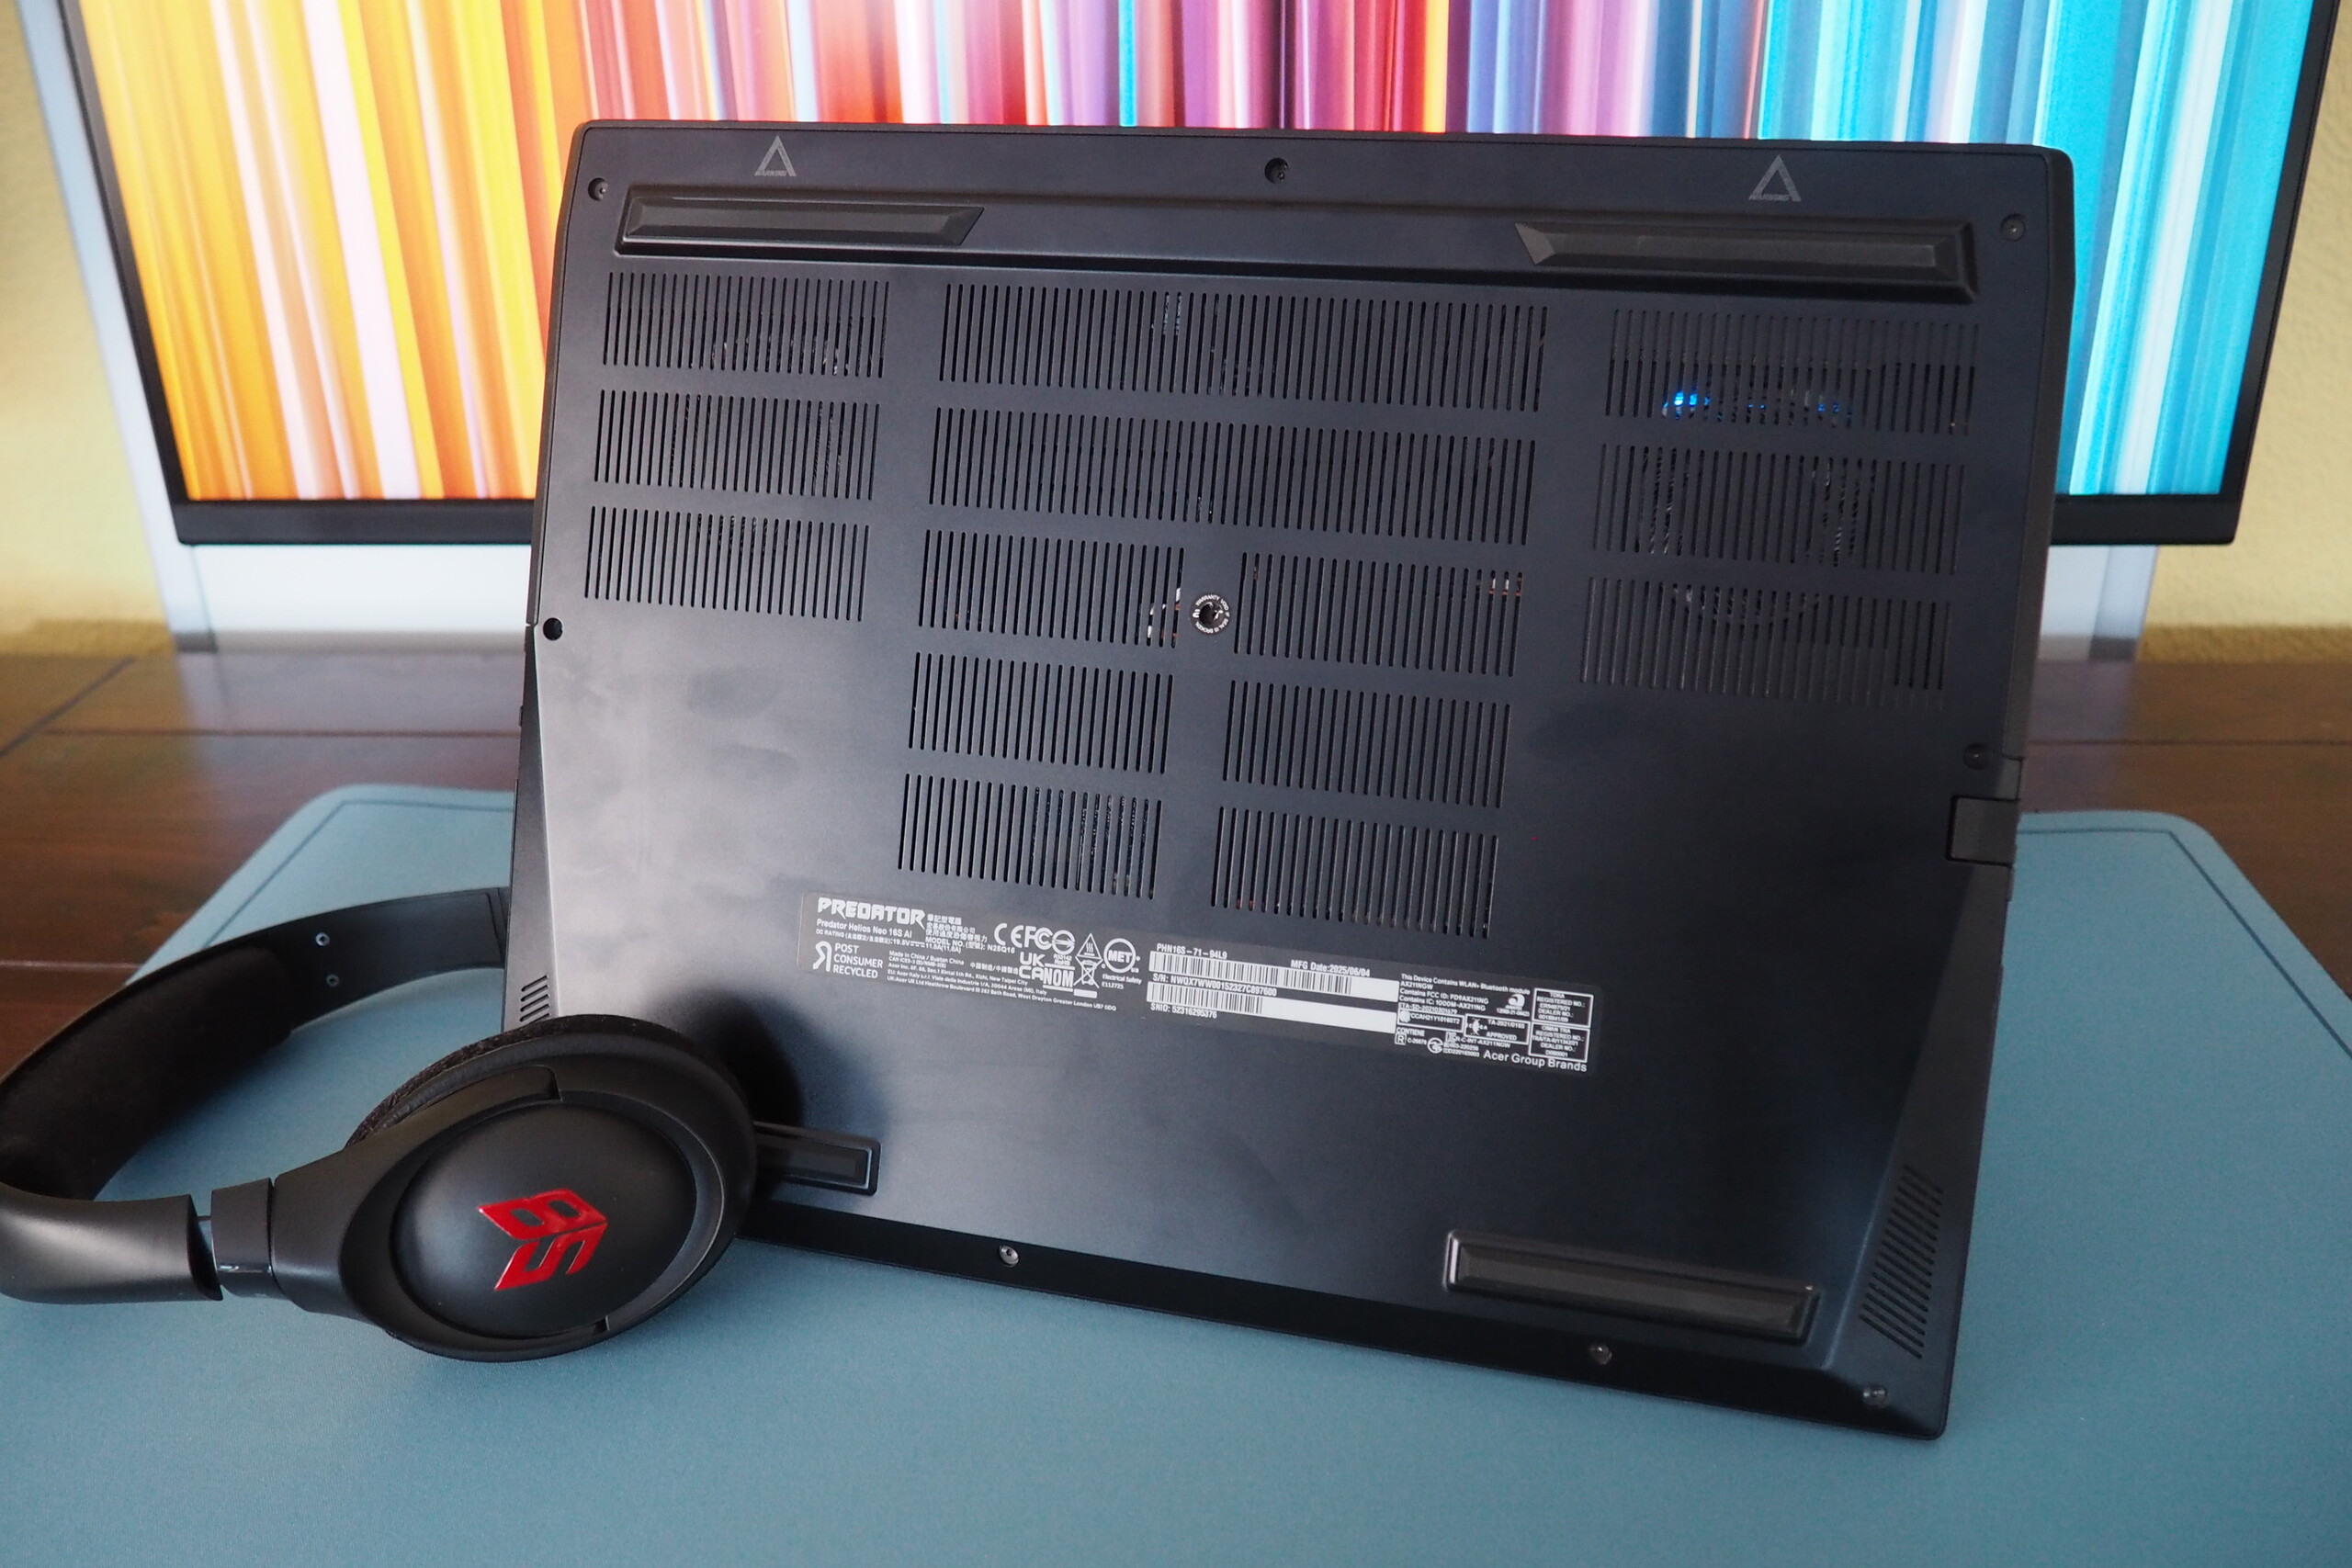
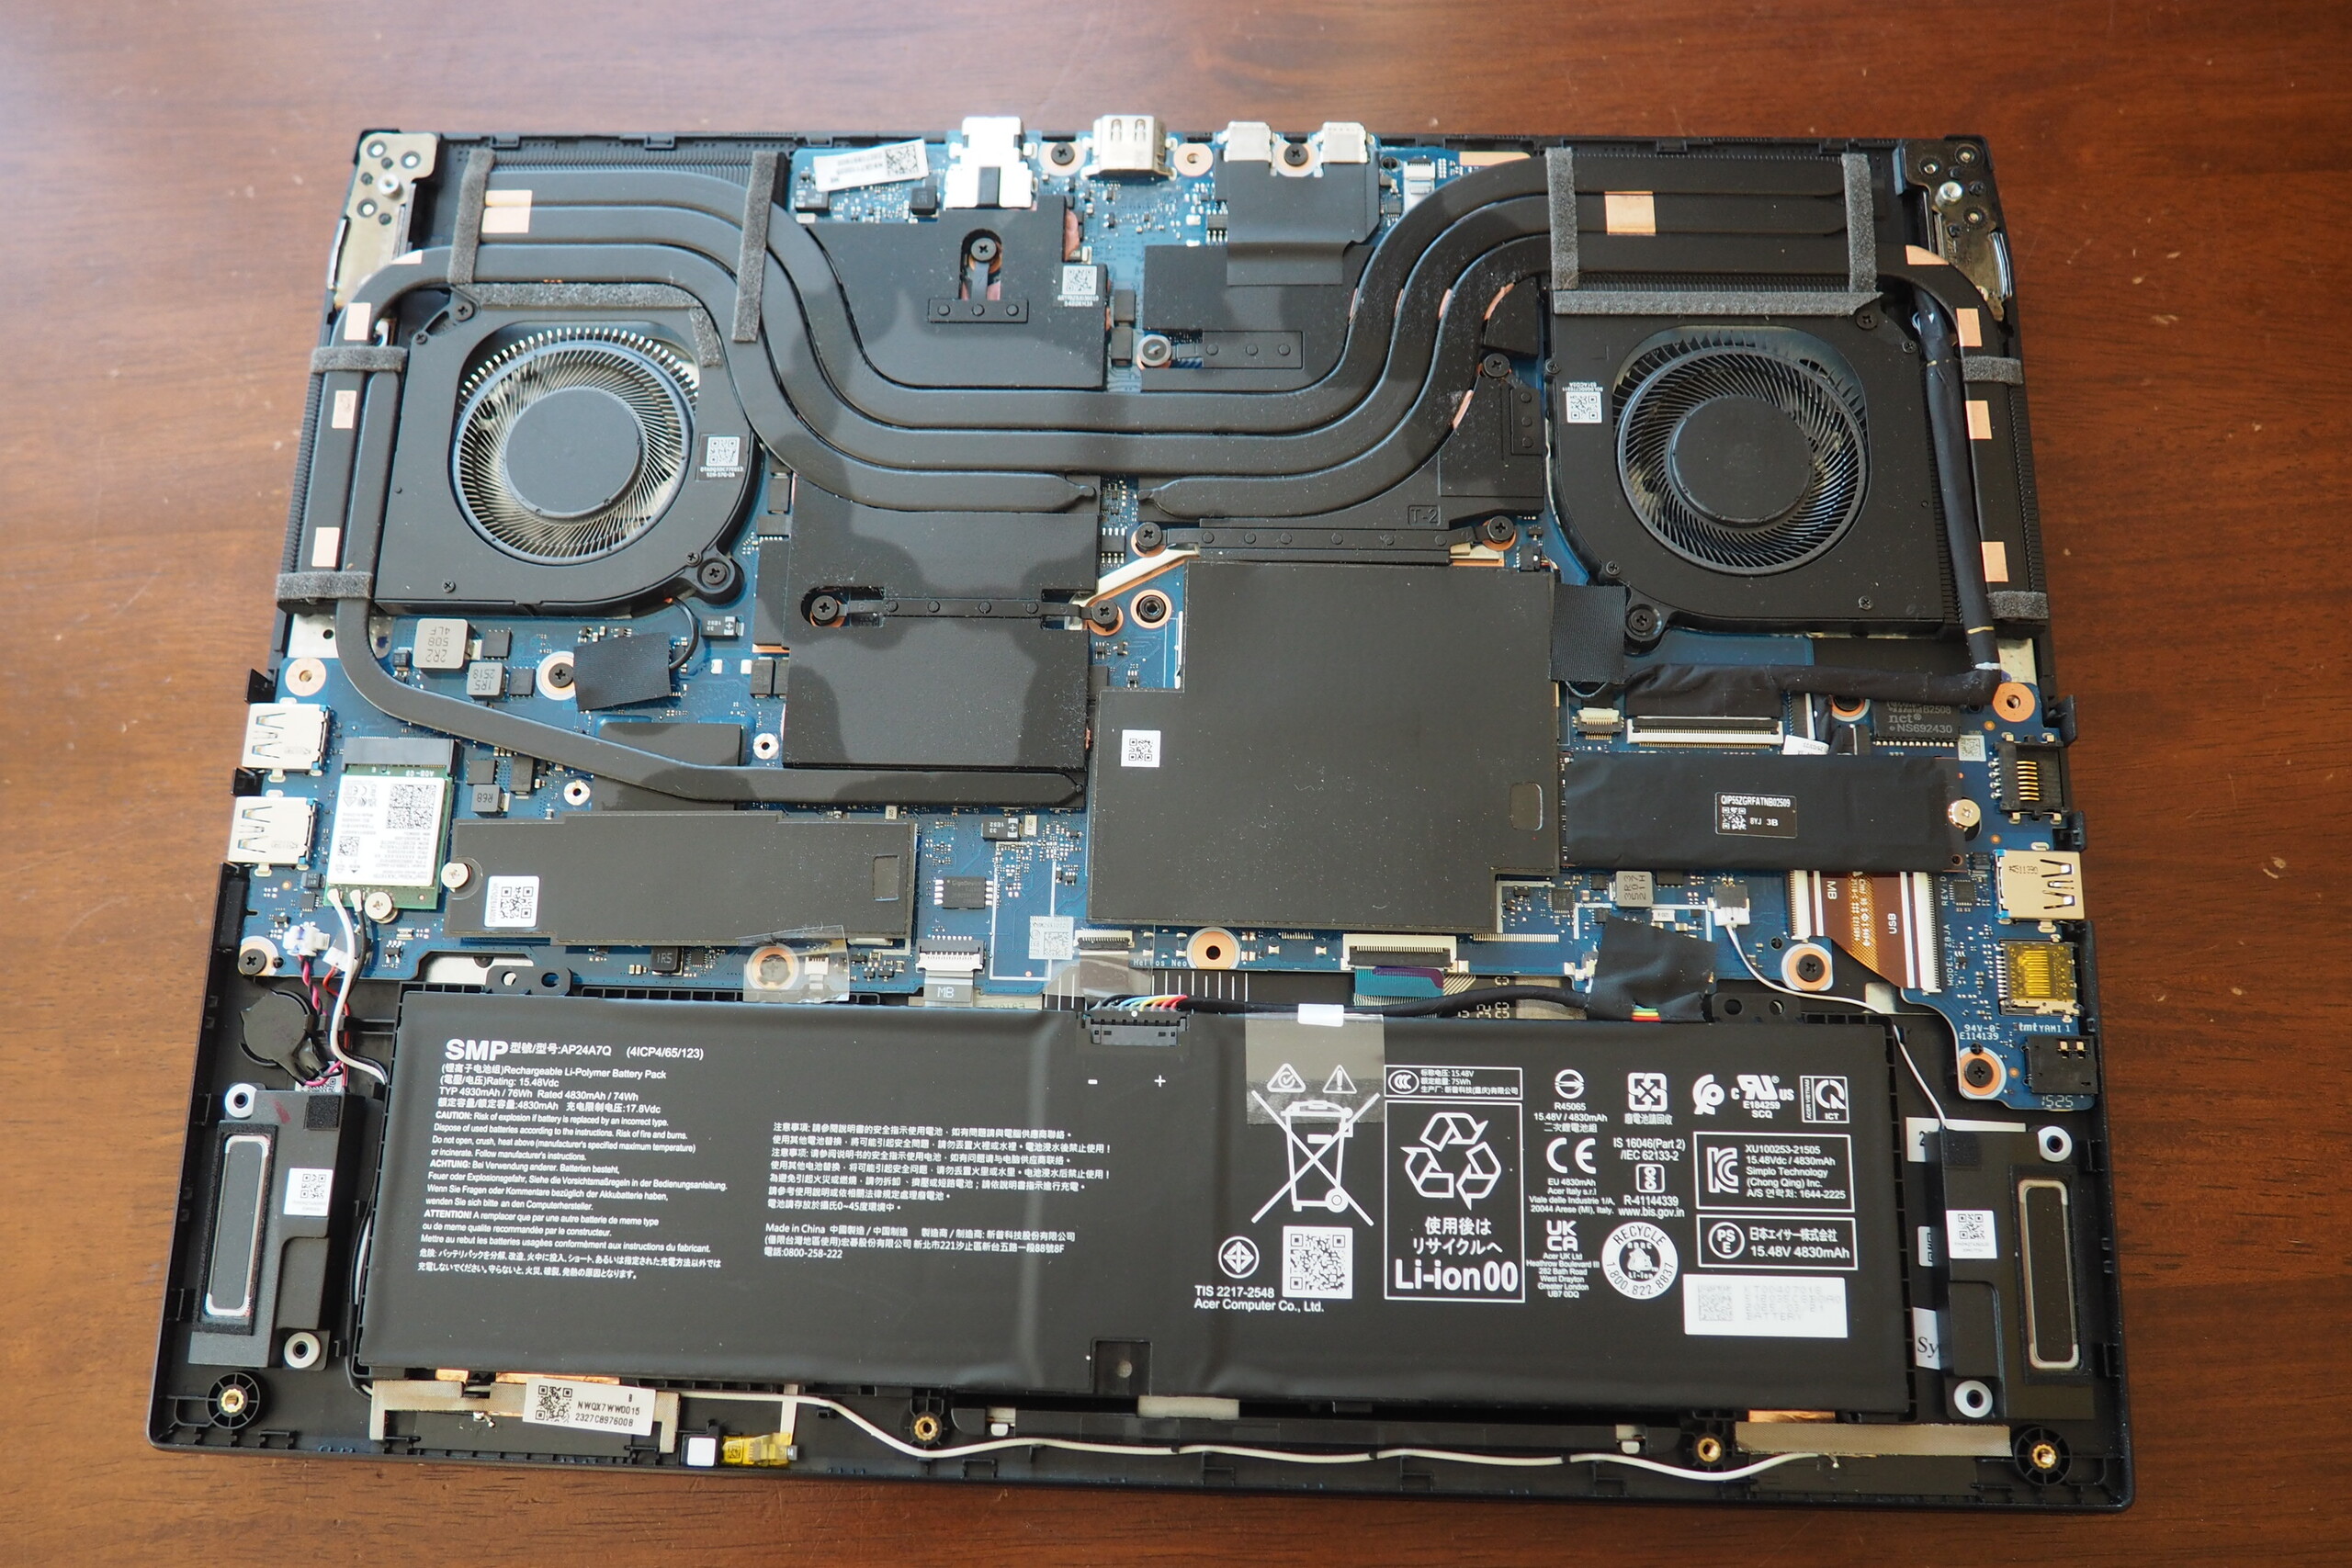
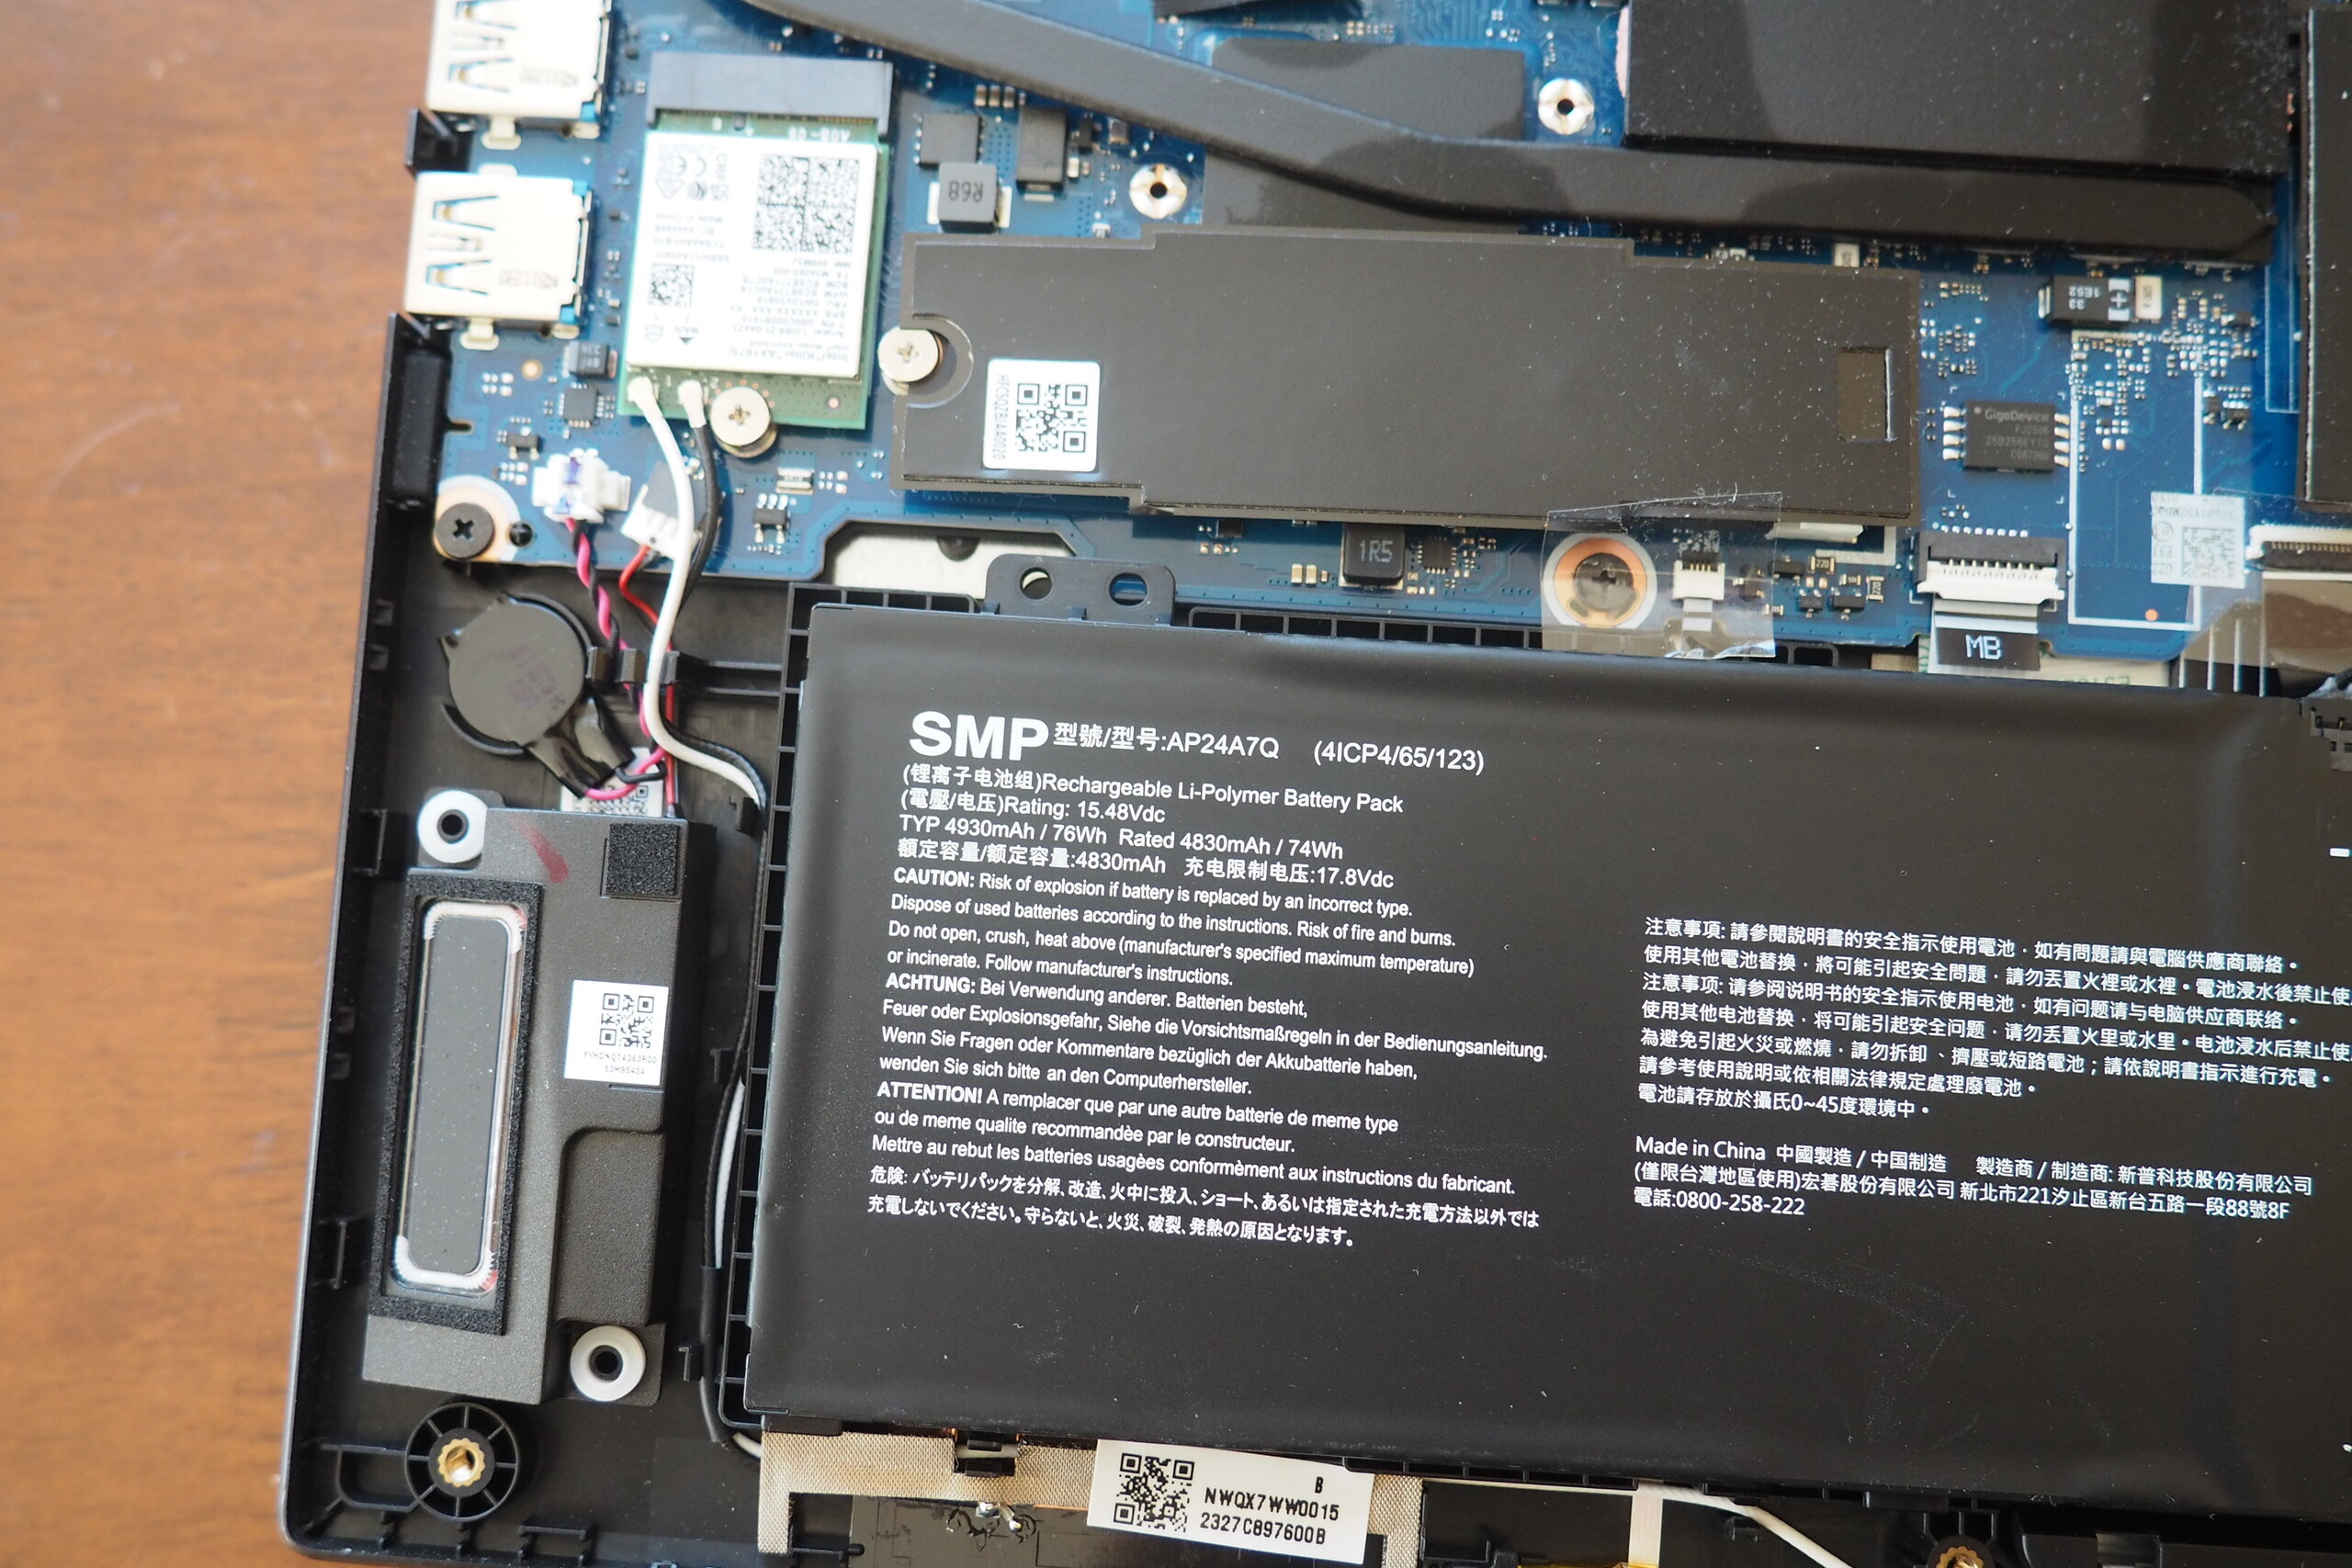
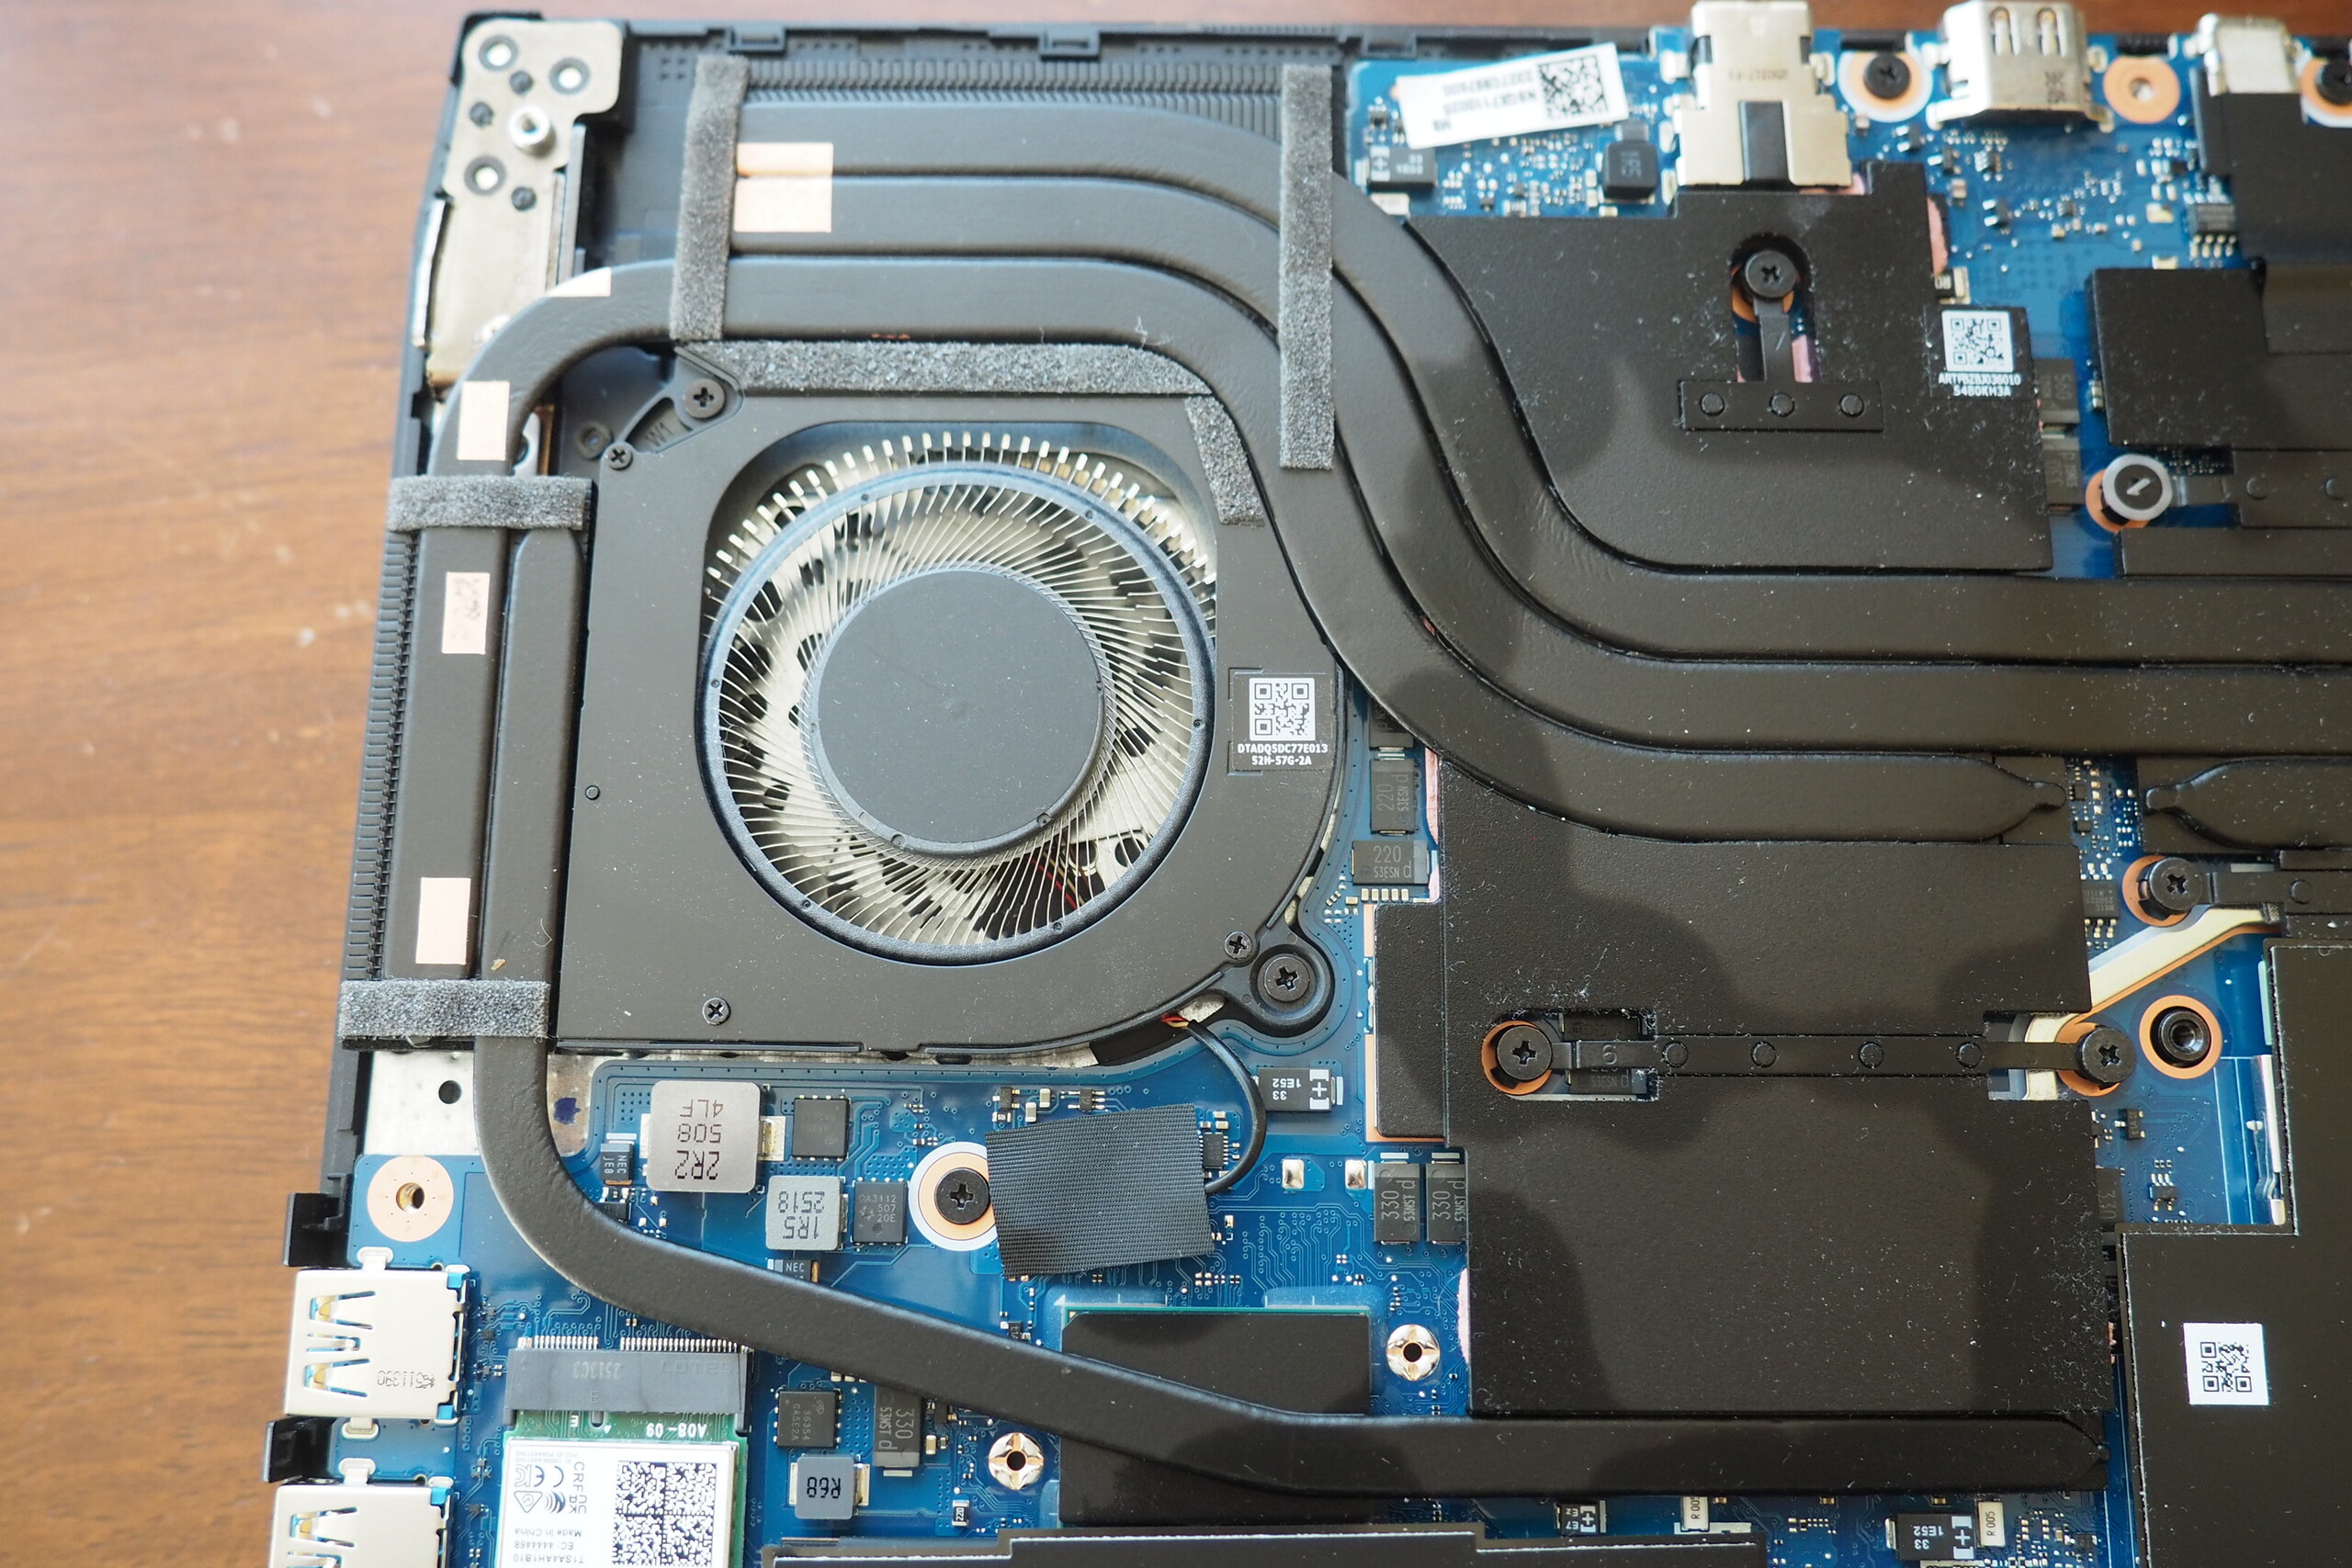
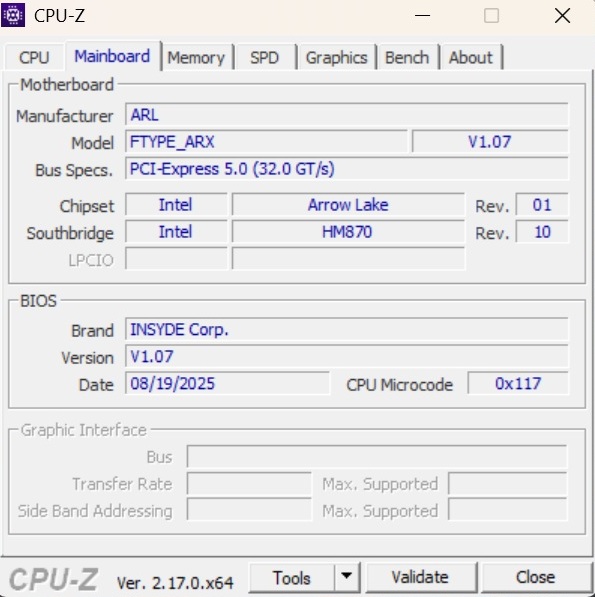
The Neo 16S AI offers a total of five USB ports, of which the two Type-C ports support Thunderbolt 4. There is also an HDMI output, a LAN port, an audio socket, and a medium-fast card reader. The Wi-Fi 6E module's speed varies between decent (sending) and very good (receiving). The quality of the Full HD webcam turns out to be slightly above average in terms of image sharpness and color accuracy. The base plate can be removed after loosening 10 Torx screws (one screw is covered by a warranty seal).


SD Card Reader
| SD Card Reader | |
| average JPG Copy Test (av. of 3 runs) | |
| Razer Blade 16 RTX 5080 (Toshiba Exceria Pro SDXC 64 GB UHS-II) | |
| Average of class Gaming (20.9 - 210, n=53, last 2 years) | |
| MSI Vector 16 HX AI A2XWHG (AV PRO microSD 128 GB V60) | |
| Acer Predator Helios Neo 16S AI PHN16S-71-94L9 (AV PRO microSD 128 GB V60) | |
| Schenker XMG FUSION 16 (M25) (Angelbird AV Pro V60) | |
| maximum AS SSD Seq Read Test (1GB) | |
| Razer Blade 16 RTX 5080 (Toshiba Exceria Pro SDXC 64 GB UHS-II) | |
| Average of class Gaming (25.5 - 261, n=50, last 2 years) | |
| MSI Vector 16 HX AI A2XWHG (AV PRO microSD 128 GB V60) | |
| Schenker XMG FUSION 16 (M25) (Angelbird AV Pro V60) | |
| Acer Predator Helios Neo 16S AI PHN16S-71-94L9 (AV PRO microSD 128 GB V60) | |
Communication
Webcam


Maintenance

Input devices
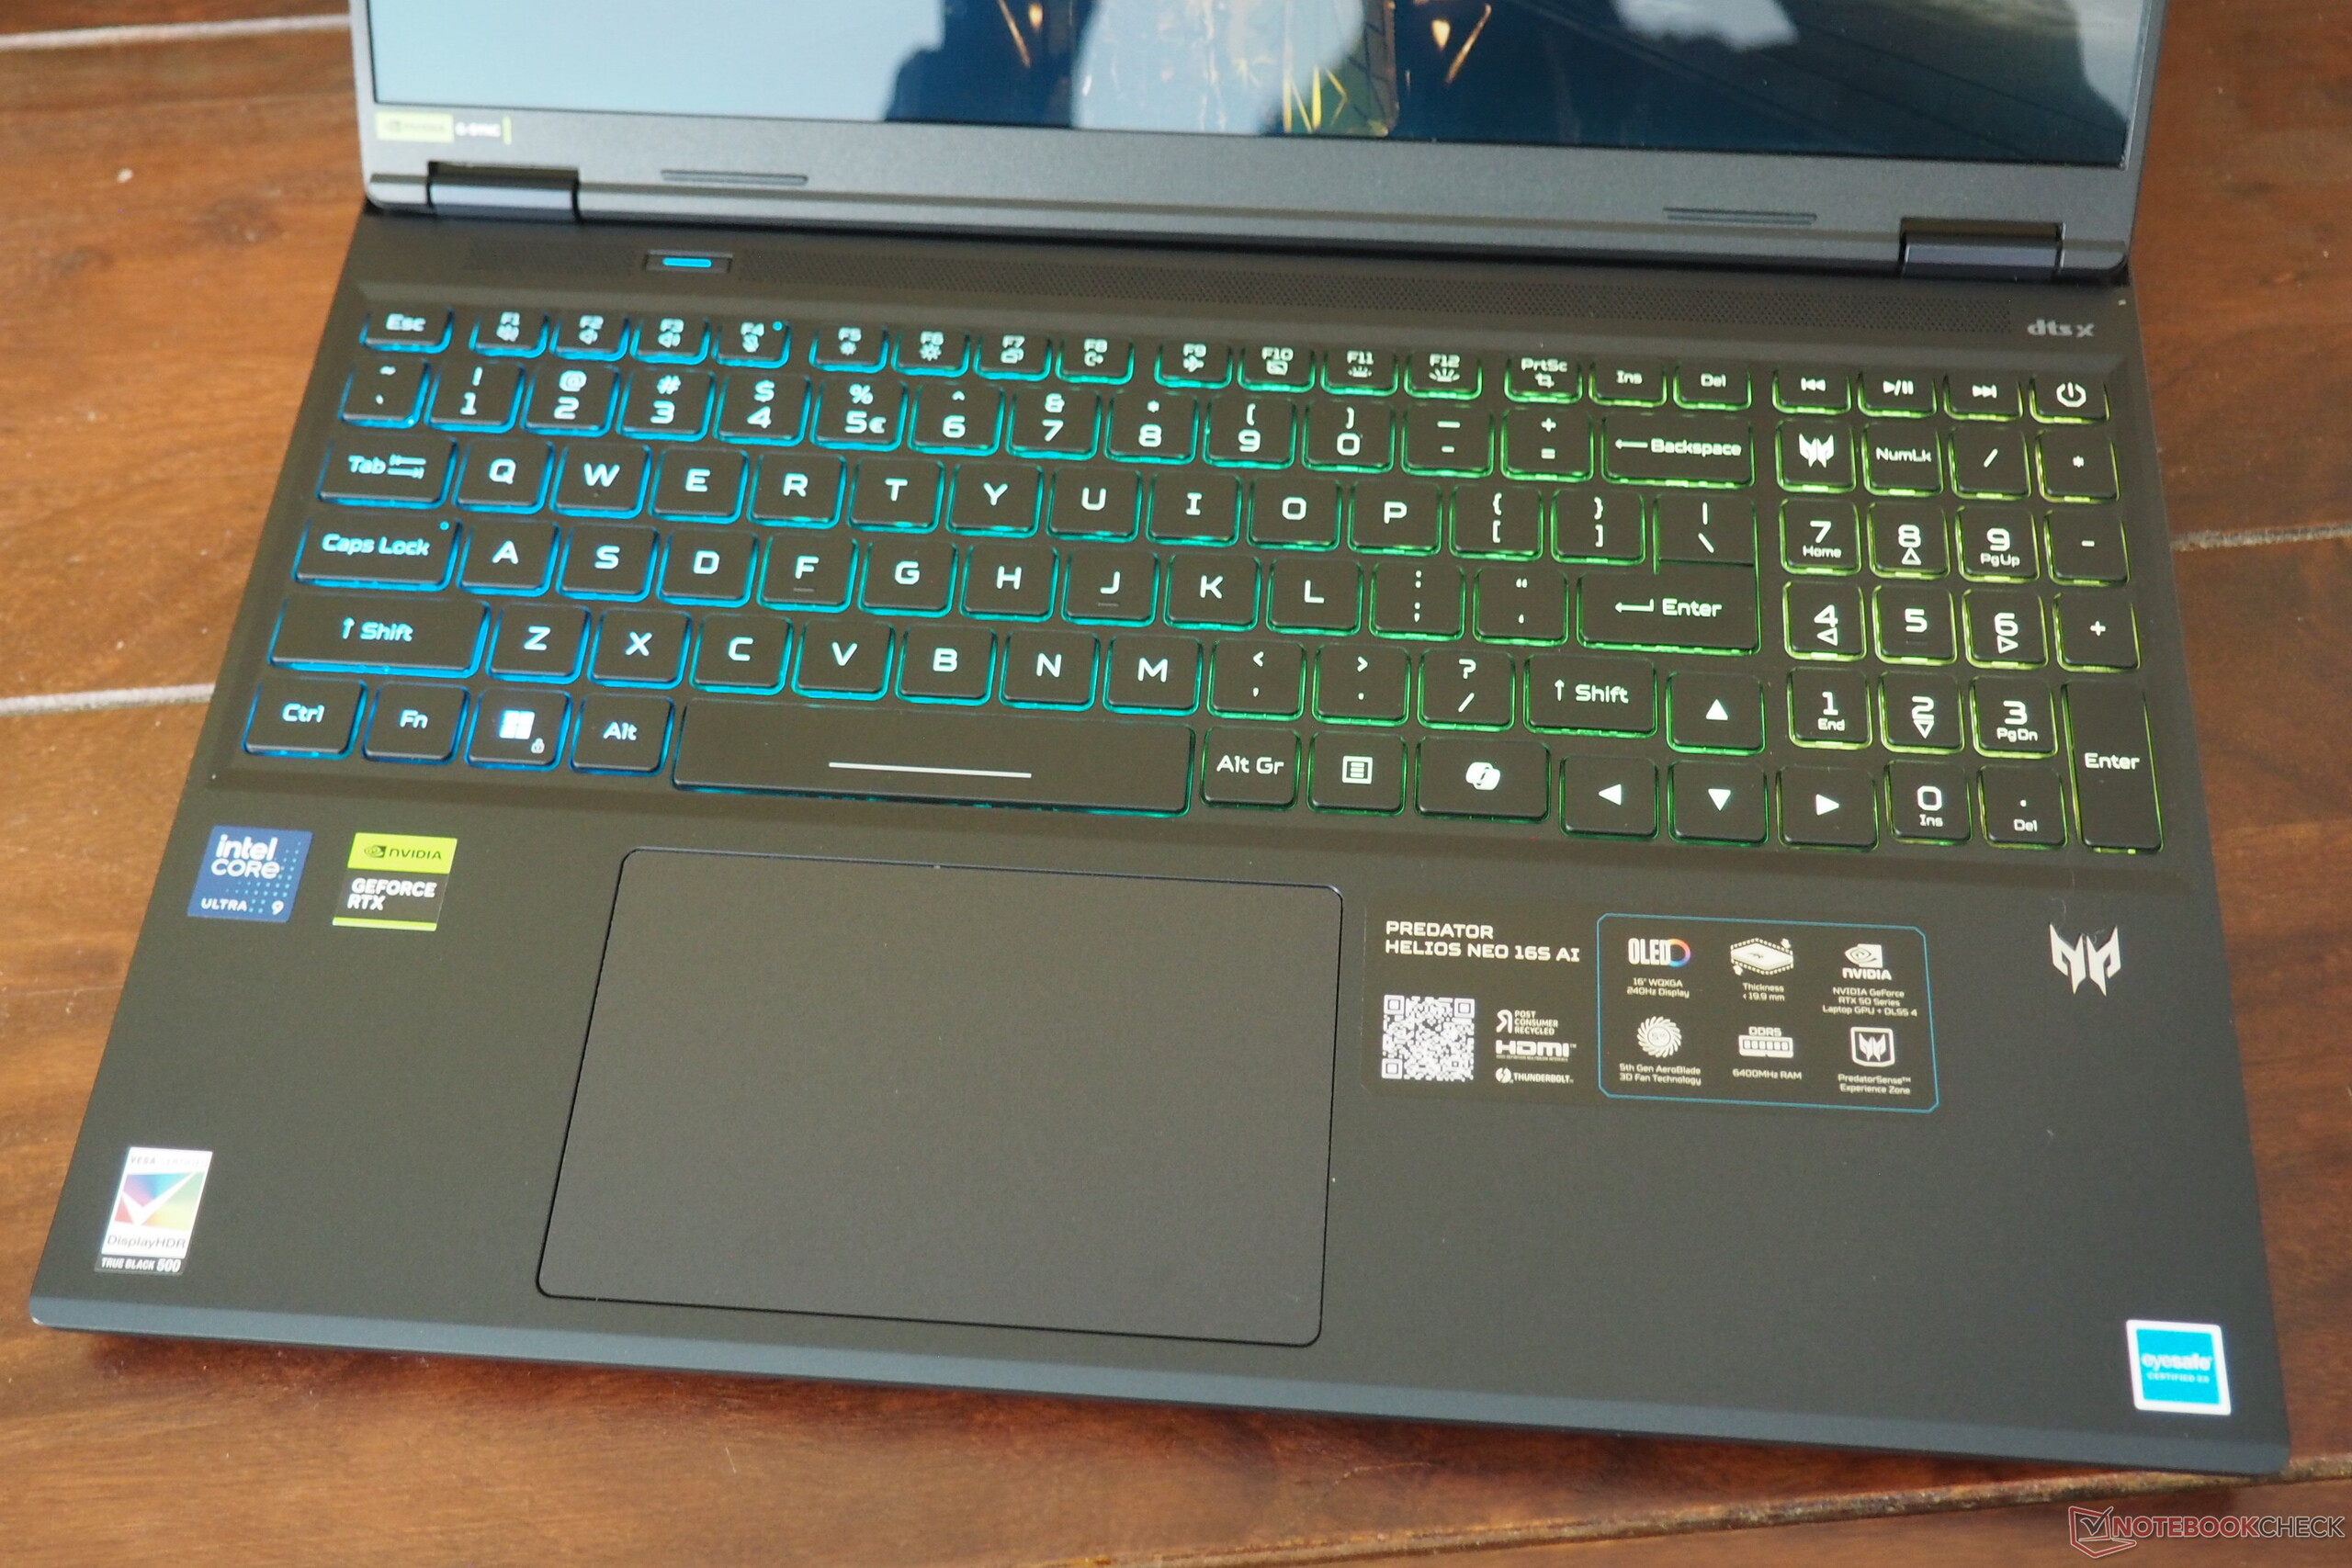
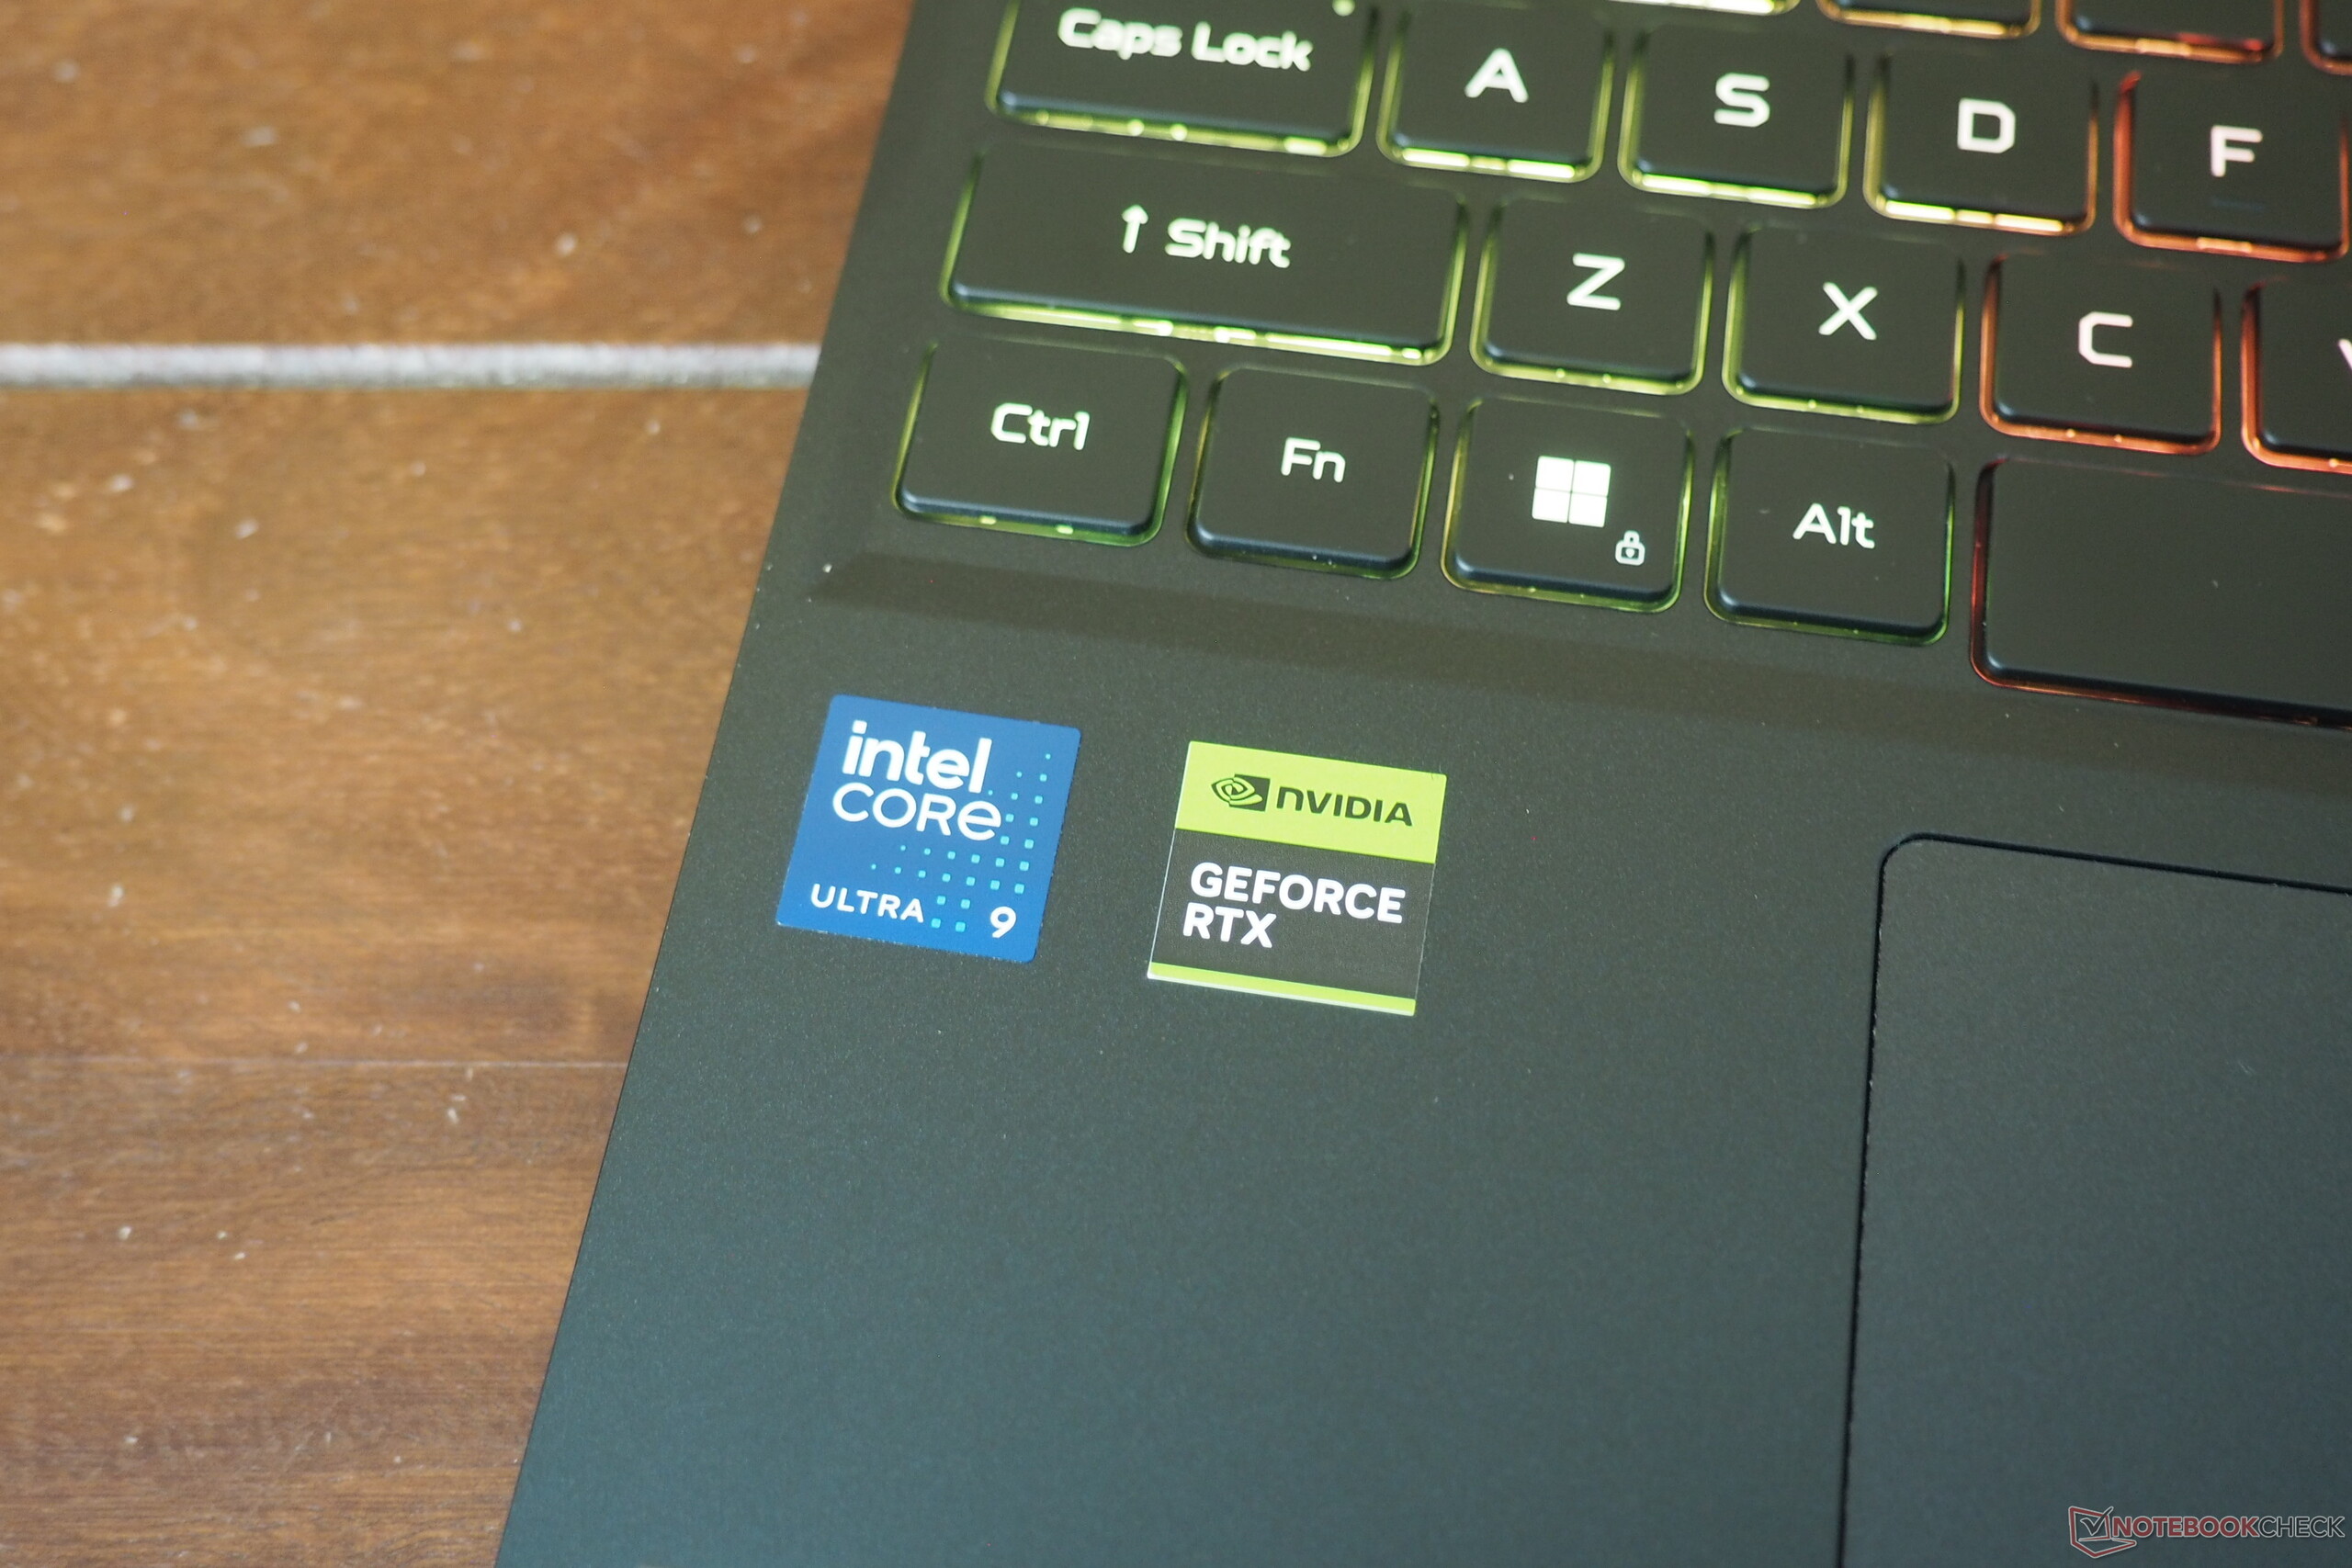
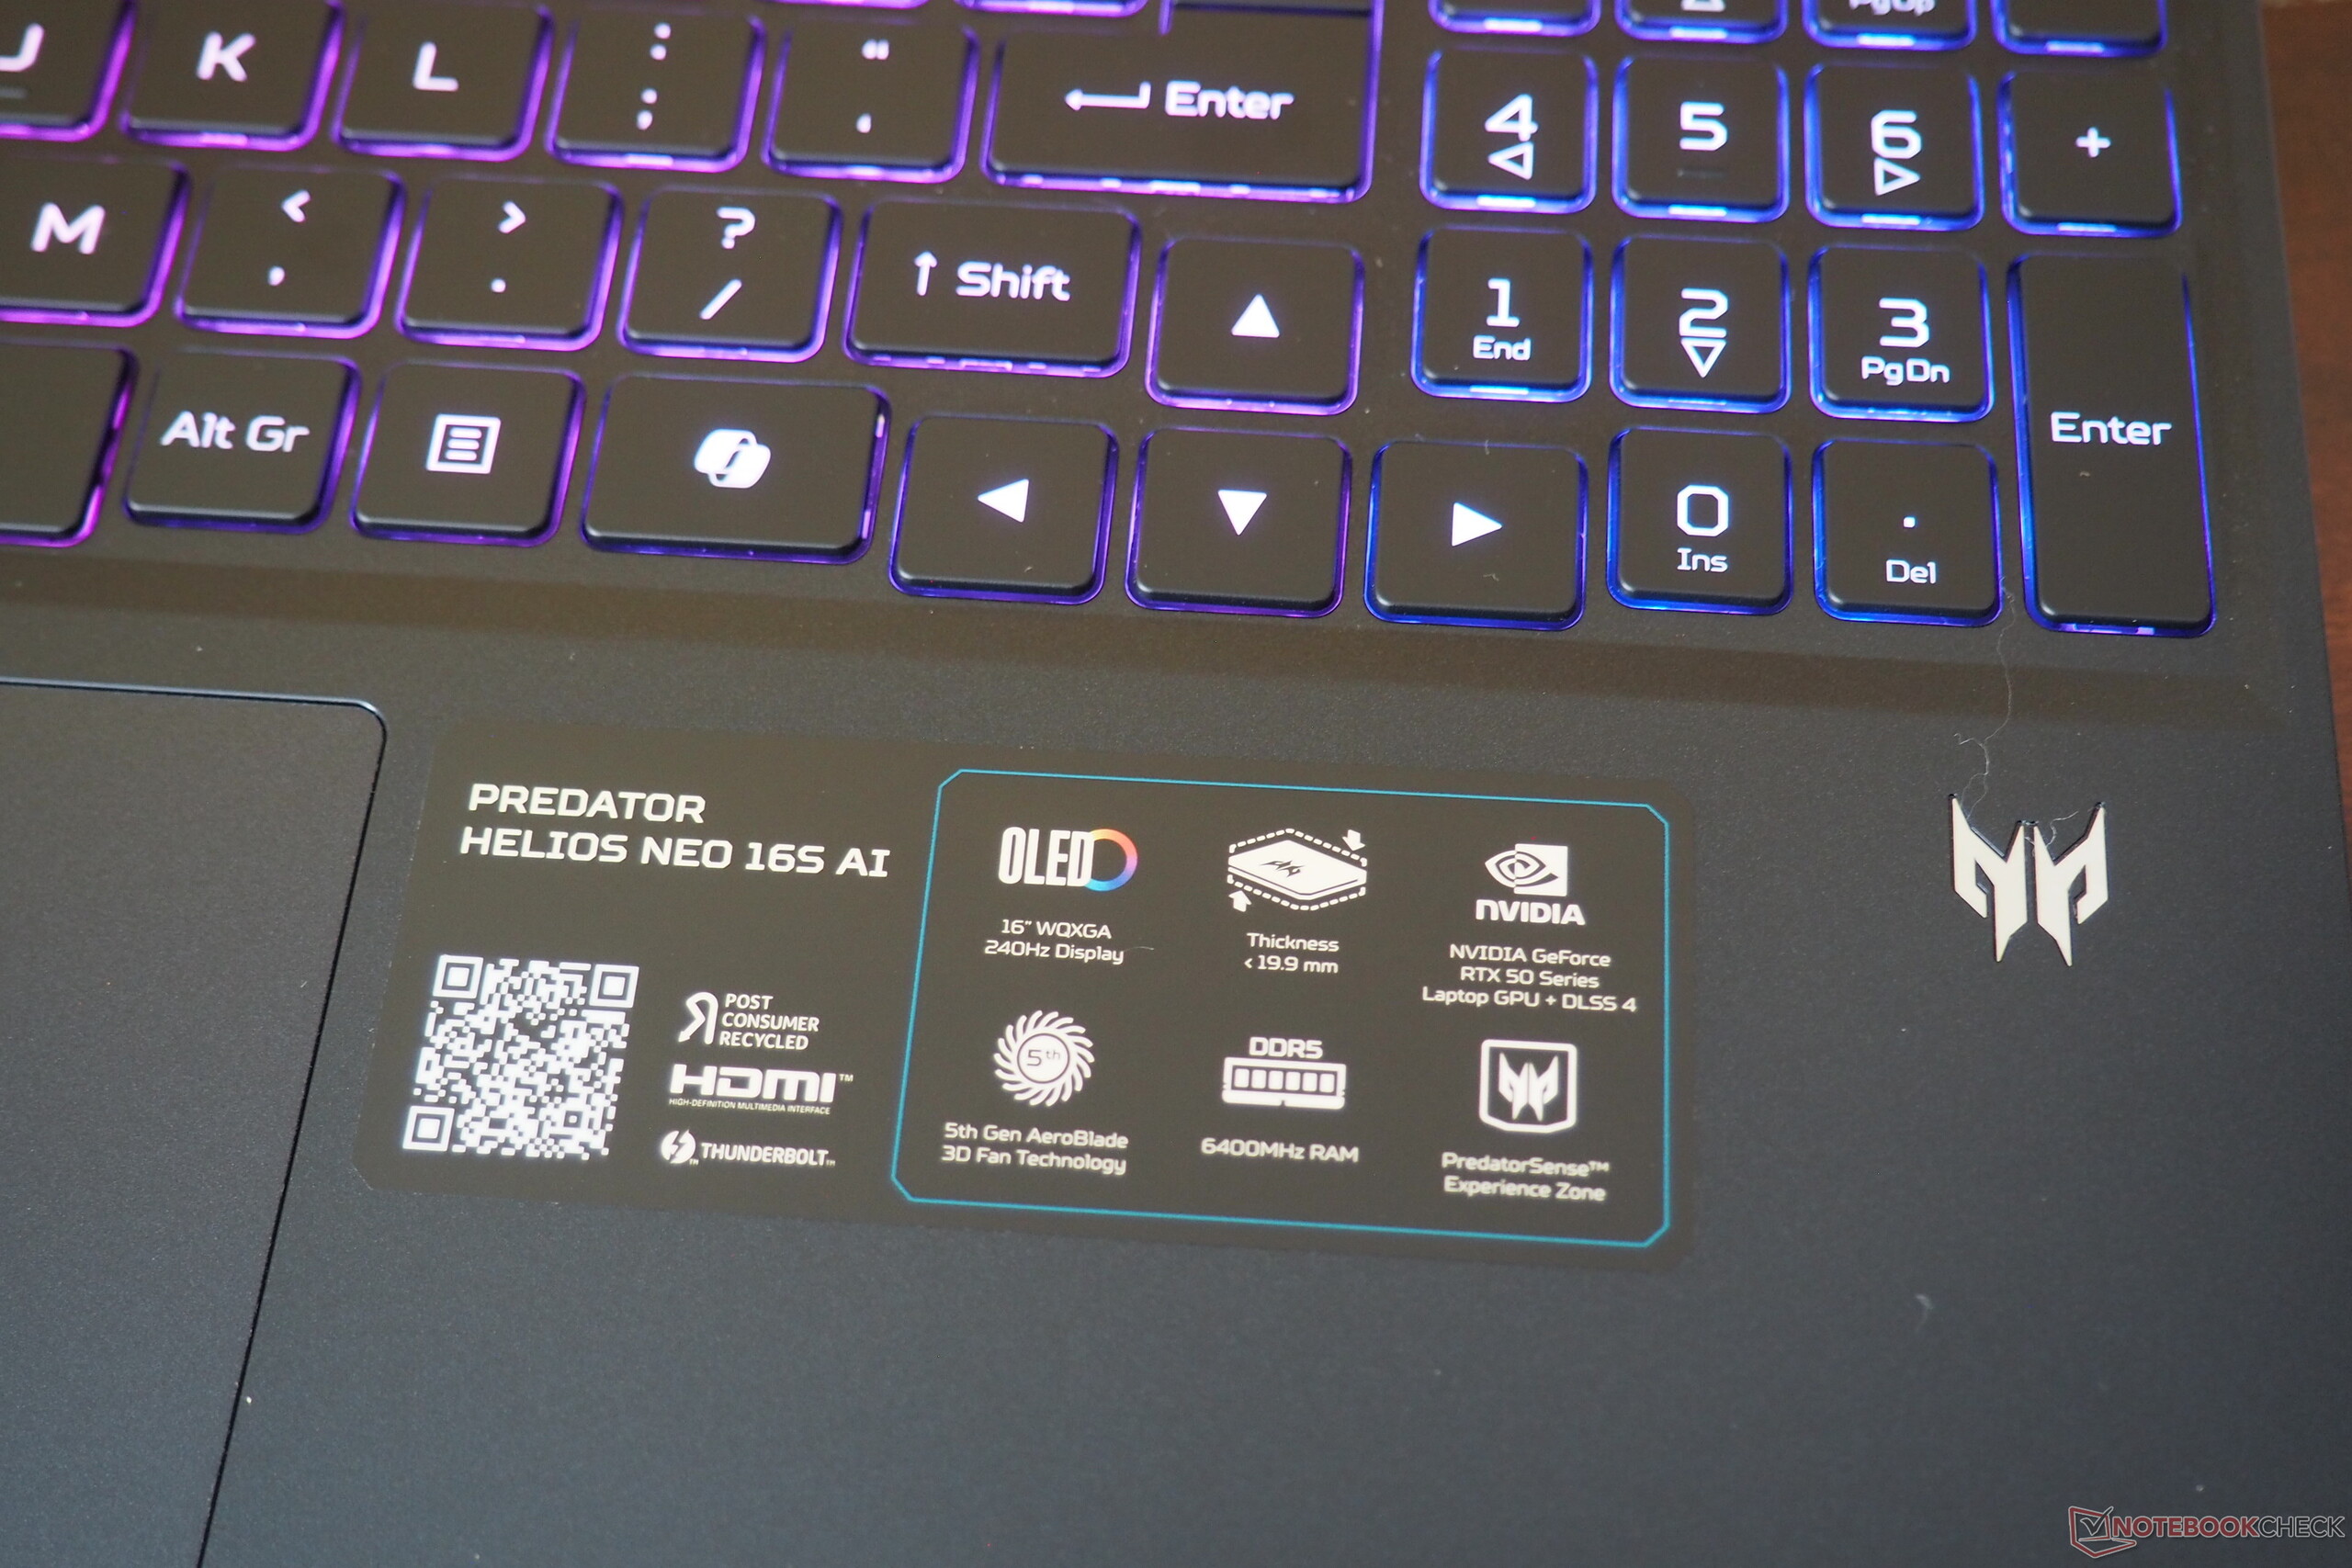
The input devices are reasonably good without being top-tier. The keyboard impresses with its stylish RGB lighting and solid key feedback. We liked the layout for the most part (there are normal-sized directional arrows, for example), although we would have liked a separate power button. The touchpad has a surface area of 12.6 x 8.3 cm and pleases with good precision and acceptable gliding properties. As with many laptops, the click areas rattle a little, but otherwise feel usable.

Display
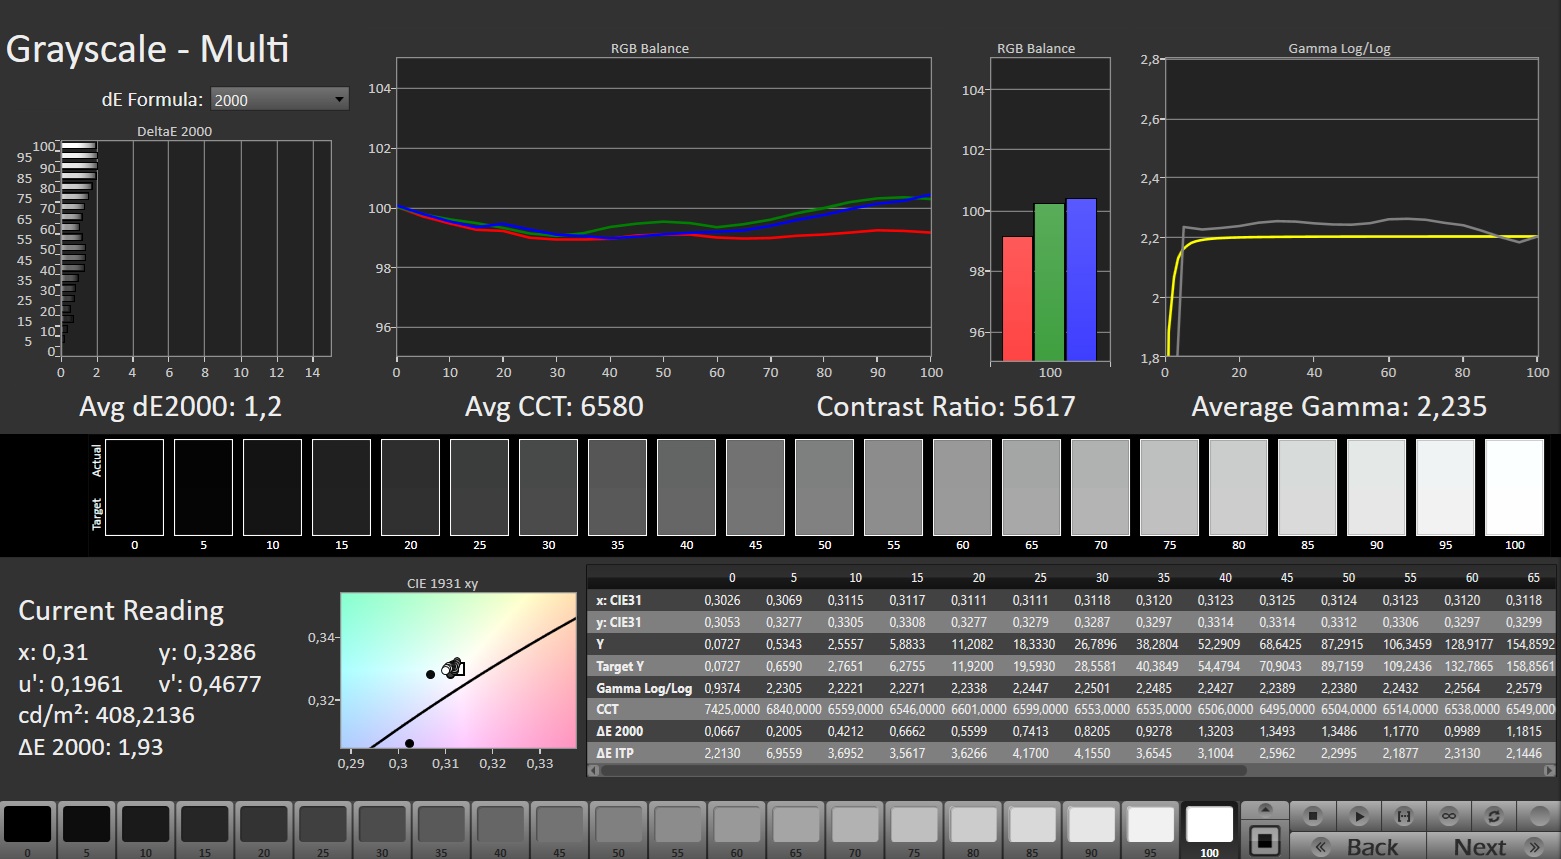
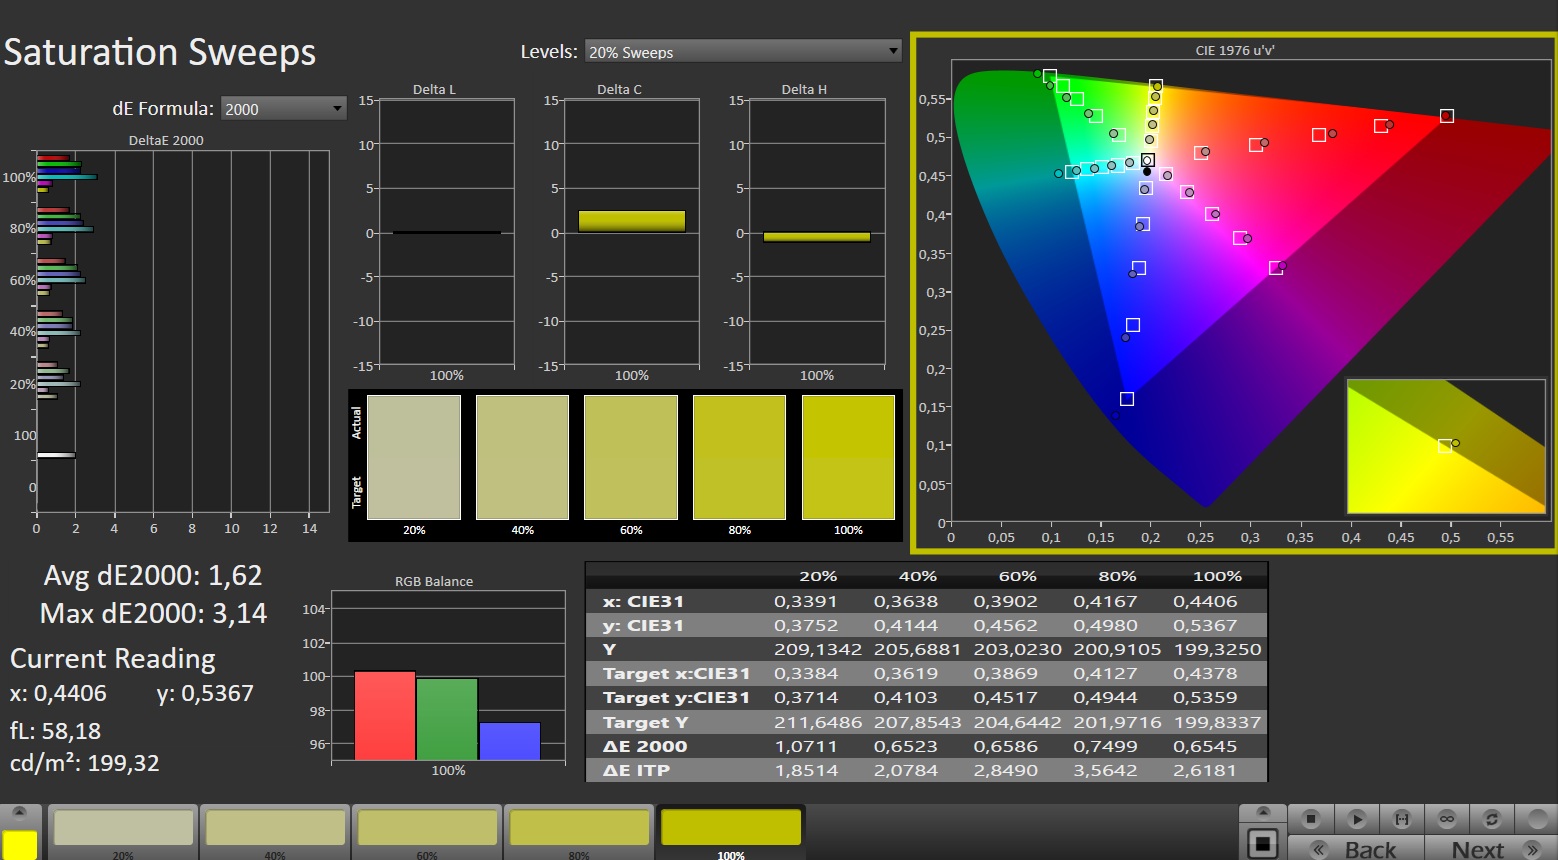
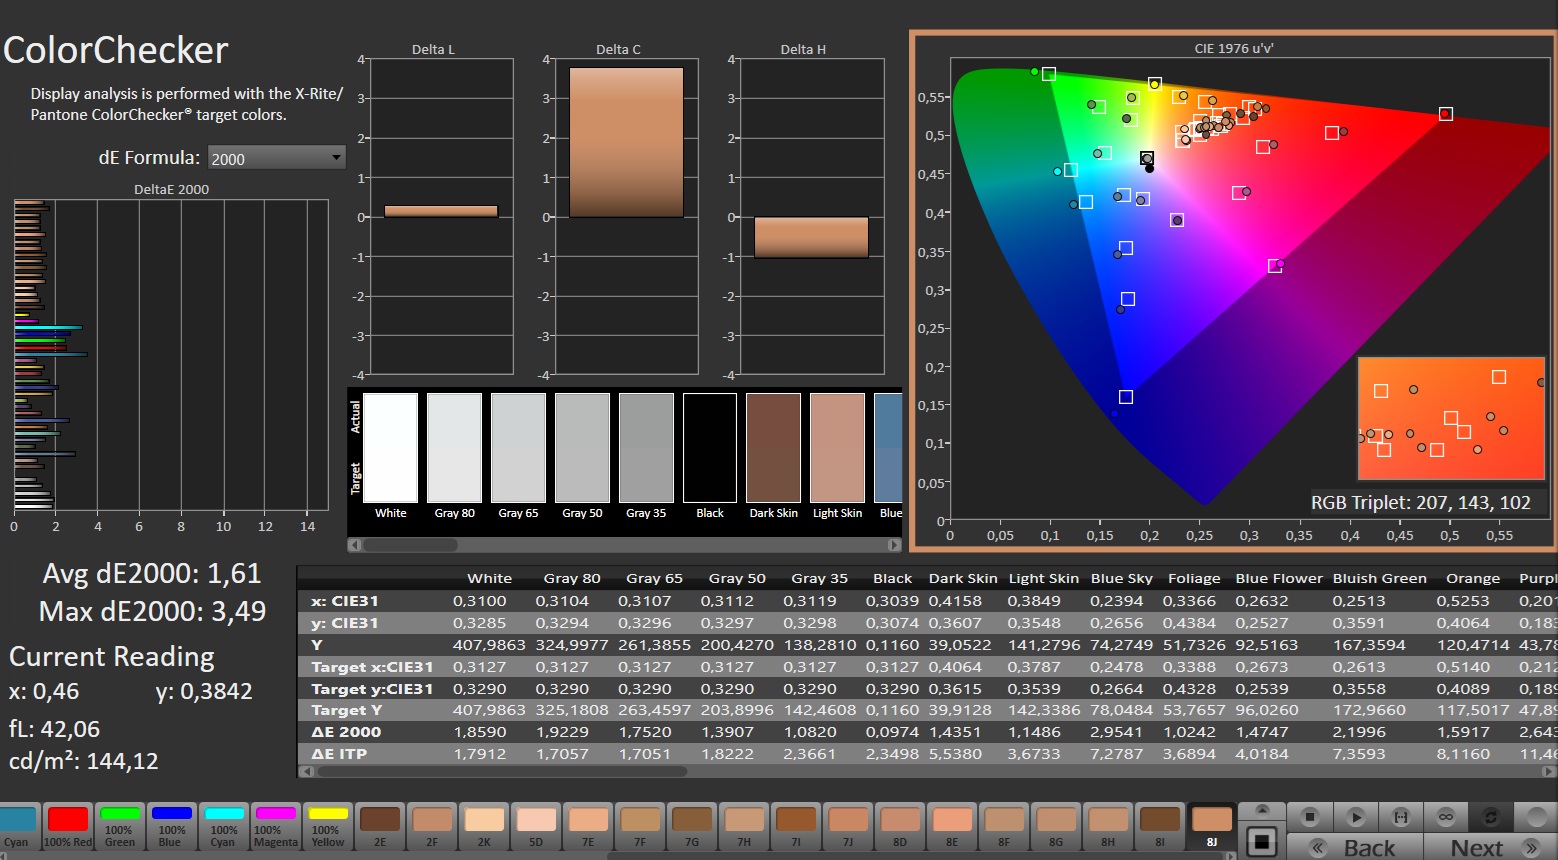
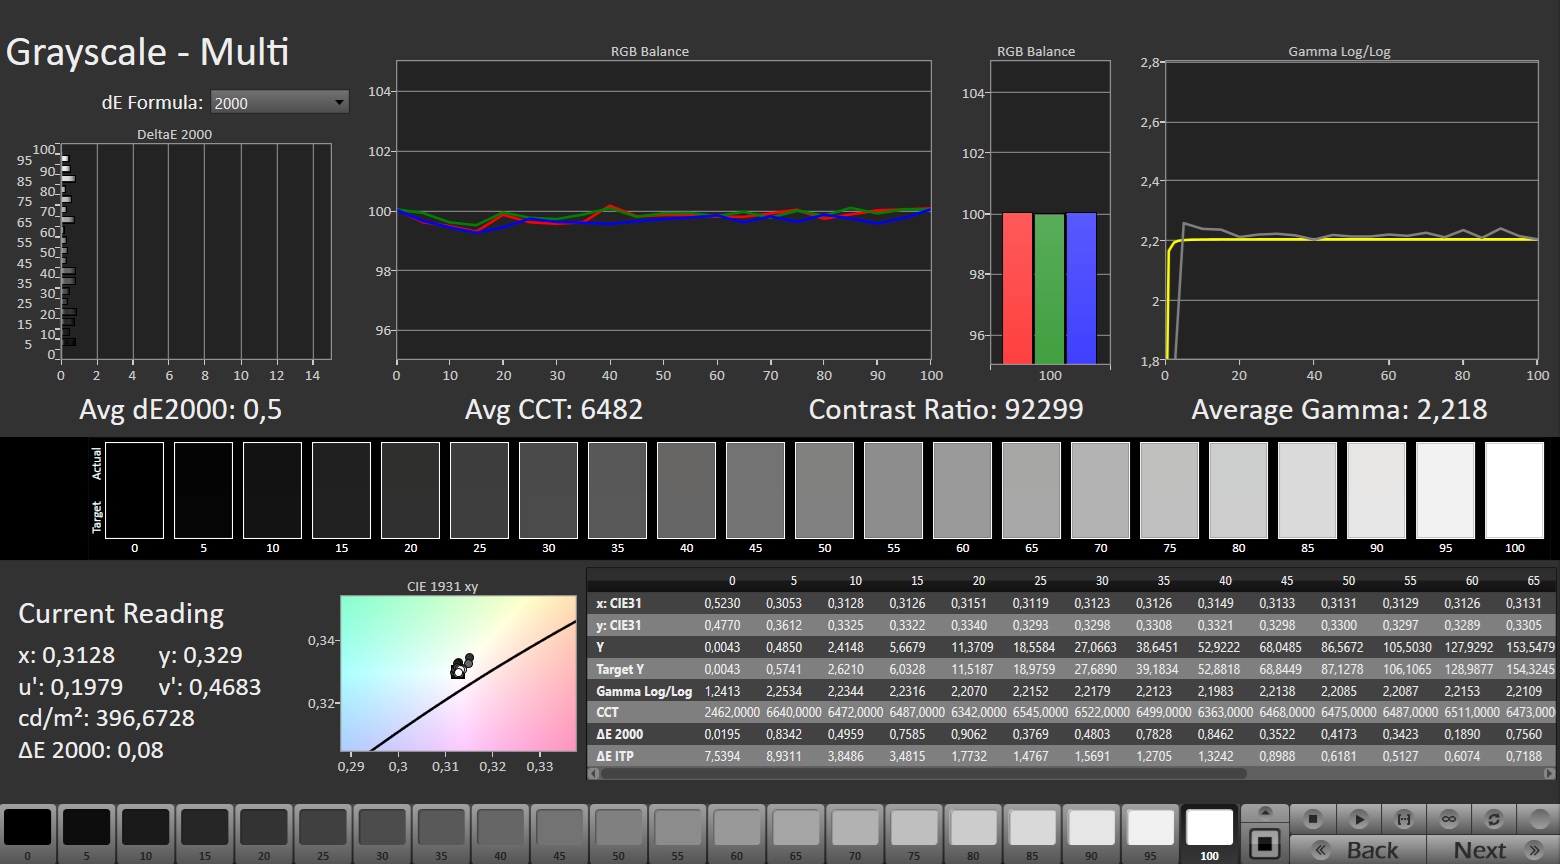
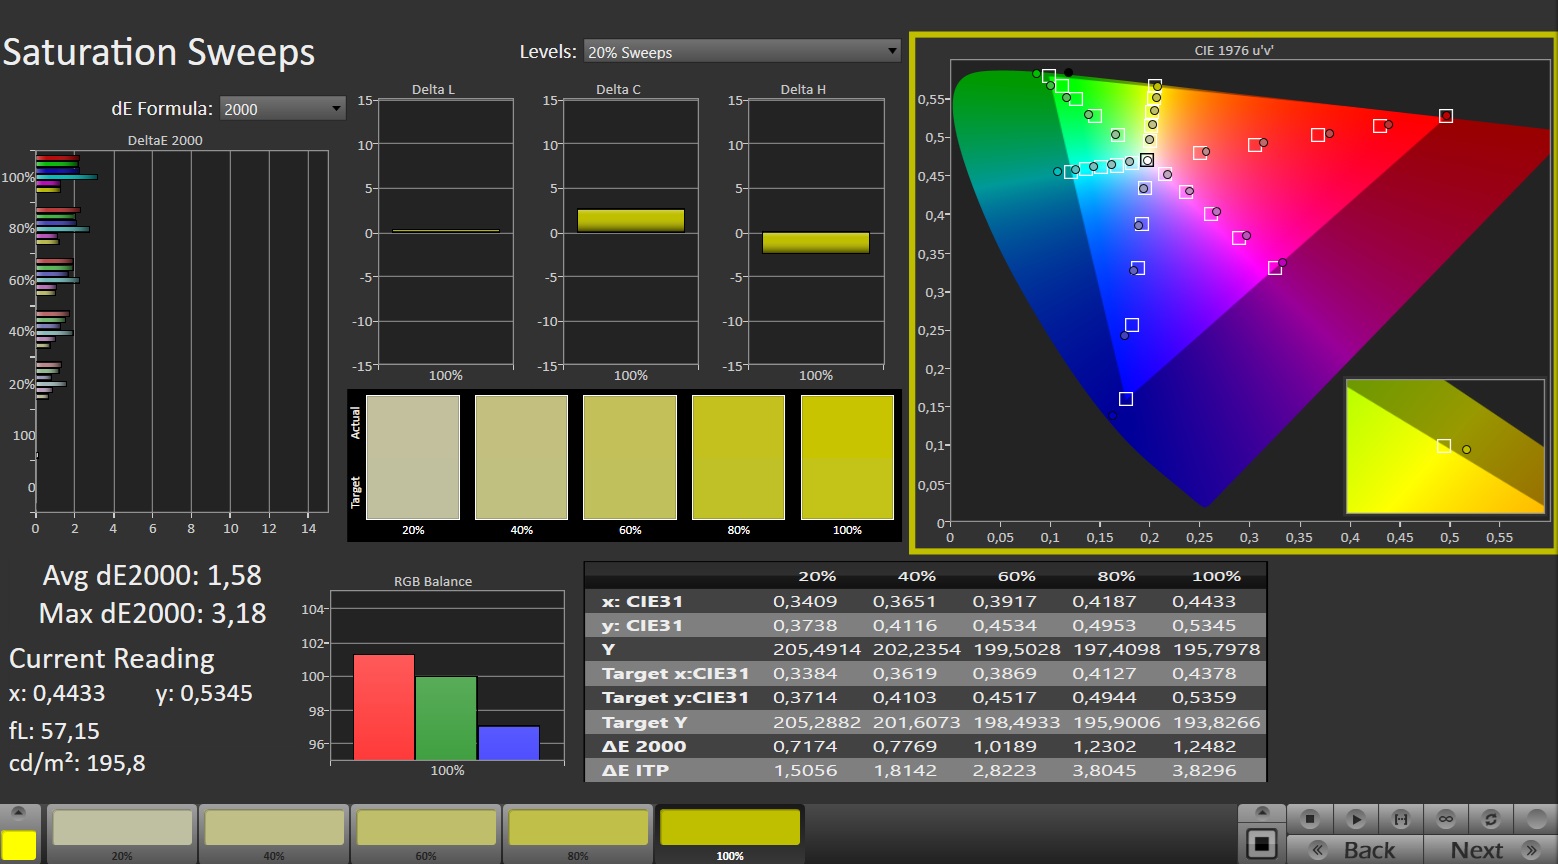
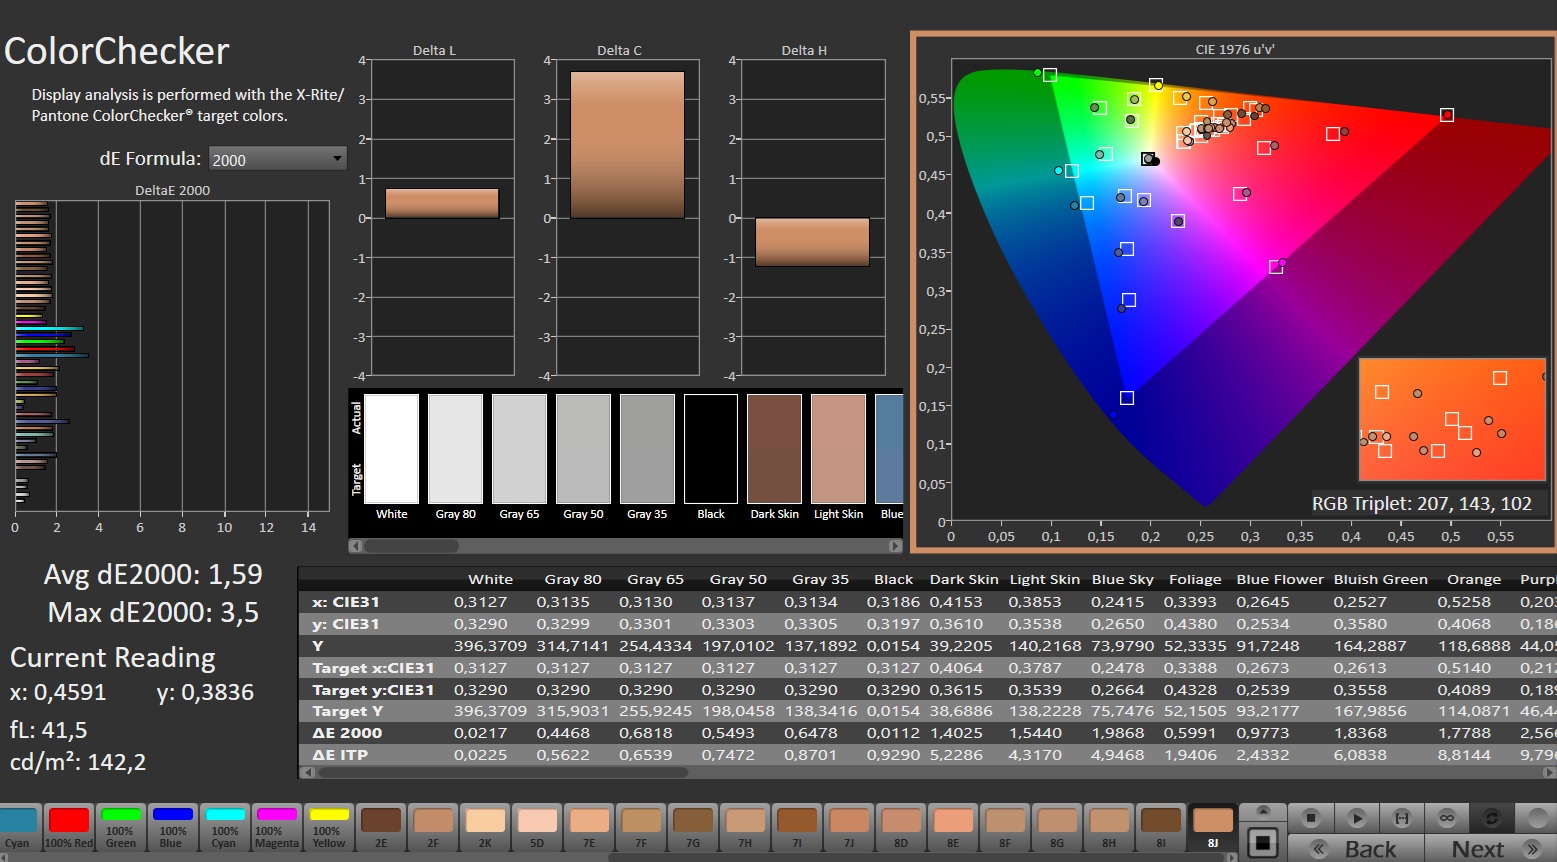
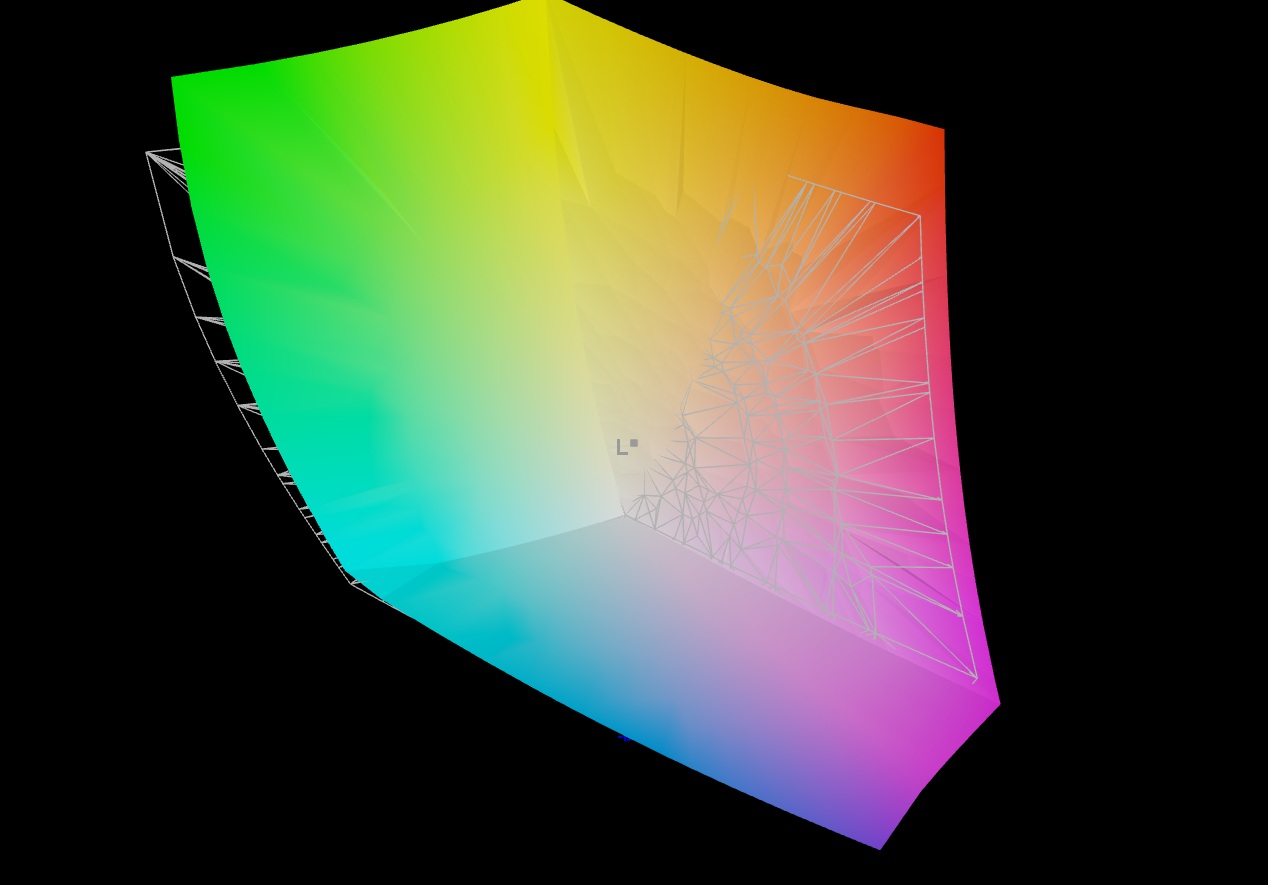
The built-in OLED panel has the usual advantages and disadvantages. While outdoor use is rather difficult due to the highly reflective surface and every brightness level has to contend with image flickering (although the frequency is quite high), the response time, black level, contrast and color reproduction, among other things, are impressive. In addition to the sRGB space, DCI-P3 and AdobeRGB are also almost completely covered. There is also nothing to complain about in terms of color fidelity and viewing angles. Acer has opted for a resolution of 2,560 x 1,600 pixels. The display is also specified with 240 Hz.
| |||||||||||||||||||||||||
Brightness Distribution: 98 %
Center on Battery: 390 cd/m²
Contrast: 9750:1 (Black: 0.04 cd/m²)
ΔE ColorChecker Calman: 1.61 | ∀{0.5-29.43 Ø4.72}
calibrated: 1.59
ΔE Greyscale Calman: 1.2 | ∀{0.09-98 Ø4.97}
96.5% AdobeRGB 1998 (Argyll 3D)
100% sRGB (Argyll 3D)
99.9% Display P3 (Argyll 3D)
Gamma: 2.235
CCT: 6580 K
| Acer Predator Helios Neo 16S AI PHN16S-71-94L9 Samsung ATNA60DL03-0, OLED, 2560x1600, 16", 240 Hz | Schenker XMG FUSION 16 (M25) ATNA60CL10_0, OLED, 2880x1800, 16", 120 Hz | MSI Vector 16 HX AI A2XWHG B160QAN02.3 (AUO7DB2), IPS, 2560x1600, 16", 240 Hz | Lenovo Legion 5 Pro 16IAX10H ATNA60HS01-0 (Samsung SDC420A), OLED, 2560x1600, 16", 165 Hz | Razer Blade 16 RTX 5080 ATNA60DL04-0, OLED, 2560x1600, 16", 240 Hz | |
|---|---|---|---|---|---|
| Display | -1% | -5% | -1% | 0% | |
| Display P3 Coverage (%) | 99.9 | 99.9 0% | 96.6 -3% | 99.9 0% | 99.3 -1% |
| sRGB Coverage (%) | 100 | 100 0% | 99.8 0% | 100 0% | 100 0% |
| AdobeRGB 1998 Coverage (%) | 96.5 | 93.3 -3% | 84.4 -13% | 94.1 -2% | 97.8 1% |
| Response Times | -88% | -2175% | -431% | -31% | |
| Response Time Grey 50% / Grey 80% * (ms) | 0.2 ? | 0.56 ? -180% | 4.3 ? -2050% | 2 ? -900% | 0.29 ? -45% |
| Response Time Black / White * (ms) | 0.25 ? | 0.58 ? -132% | 6 ? -2300% | 1.4 ? -460% | 0.4 ? -60% |
| PWM Frequency (Hz) | 960 | 480 ? | 1300 | 960 ? | |
| PWM Amplitude * (%) | 50 | 26 48% | 16.7 67% | 44 12% | |
| Screen | -40% | -154% | -33% | 13% | |
| Brightness middle (cd/m²) | 390 | 434 11% | 473 21% | 518 33% | 394.4 1% |
| Brightness (cd/m²) | 394 | 433 10% | 426 8% | 522 32% | 401 2% |
| Brightness Distribution (%) | 98 | 99 1% | 85 -13% | 97 -1% | 97 -1% |
| Black Level * (cd/m²) | 0.04 | 0.42 -950% | |||
| Contrast (:1) | 9750 | 1126 -88% | |||
| Colorchecker dE 2000 * | 1.61 | 3 -86% | 3.47 -116% | 2.49 -55% | 0.82 49% |
| Colorchecker dE 2000 max. * | 3.49 | 5.1 -46% | 7.24 -107% | 5.25 -50% | 2.82 19% |
| Colorchecker dE 2000 calibrated * | 1.59 | 1.4 12% | 1.36 14% | 2.15 -35% | |
| Greyscale dE 2000 * | 1.2 | 3.4 -183% | 3.1 -158% | 3.02 -152% | 1.1 8% |
| Gamma | 2.235 98% | 2.47 89% | 2.486 88% | 2.37 93% | 2.2 100% |
| CCT | 6580 99% | 6452 101% | 6832 95% | 6426 101% | 6424 101% |
| Total Average (Program / Settings) | -43% /
-42% | -778% /
-411% | -155% /
-117% | -6% /
-1% |
* ... smaller is better


Display Response Times
| ↔ Response Time Black to White | ||
|---|---|---|
| 0.25 ms ... rise ↗ and fall ↘ combined | ↗ 0.13 ms rise | 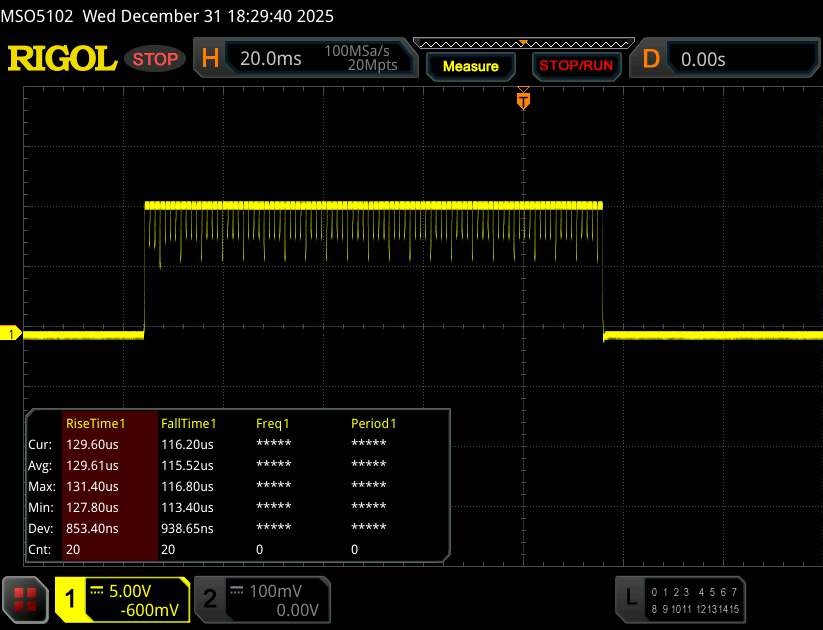 |
| ↘ 0.12 ms fall | ||
| The screen shows very fast response rates in our tests and should be very well suited for fast-paced gaming. In comparison, all tested devices range from 0.1 (minimum) to 240 (maximum) ms. » 0 % of all devices are better. This means that the measured response time is better than the average of all tested devices (19.8 ms). | ||
| ↔ Response Time 50% Grey to 80% Grey | ||
| 0.2 ms ... rise ↗ and fall ↘ combined | ↗ 0.1 ms rise | 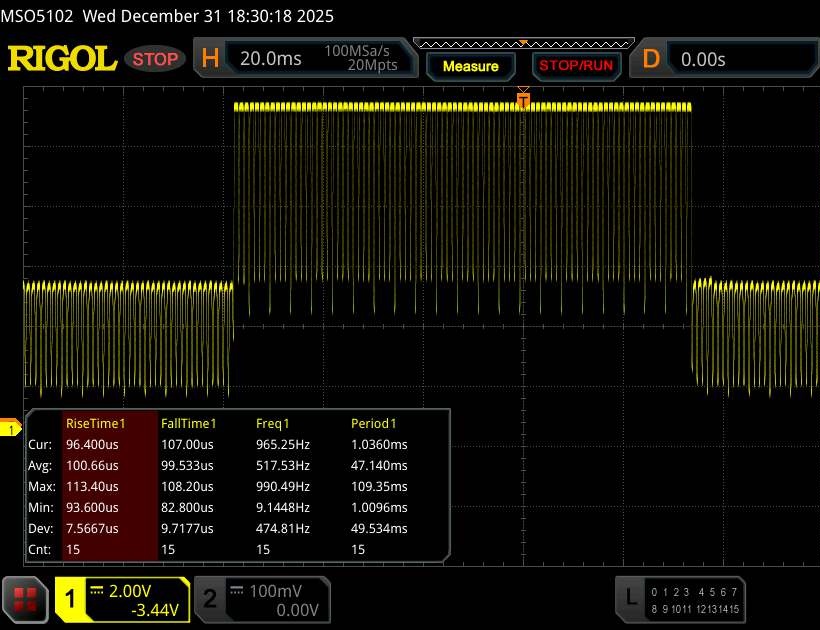 |
| ↘ 0.1 ms fall | ||
| The screen shows very fast response rates in our tests and should be very well suited for fast-paced gaming. In comparison, all tested devices range from 0.165 (minimum) to 636 (maximum) ms. » 0 % of all devices are better. This means that the measured response time is better than the average of all tested devices (31 ms). | ||
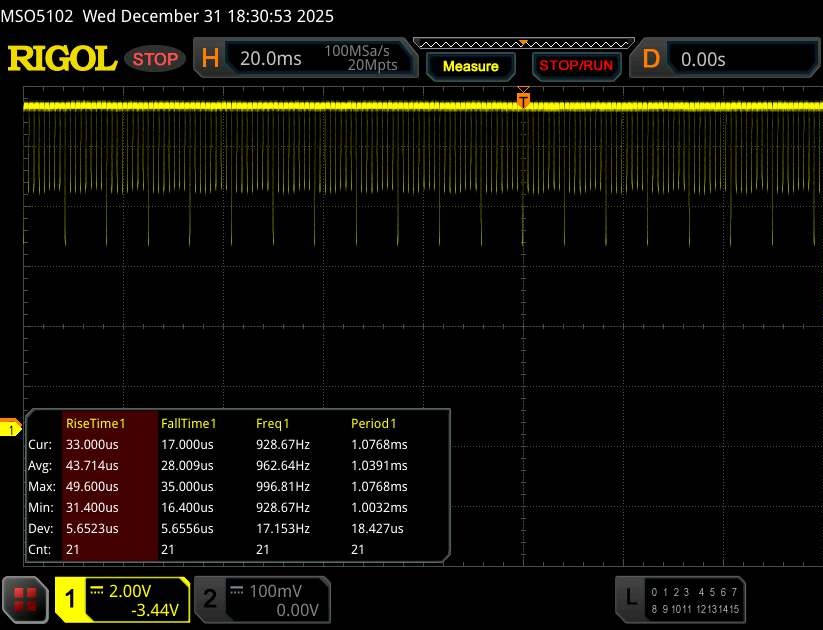
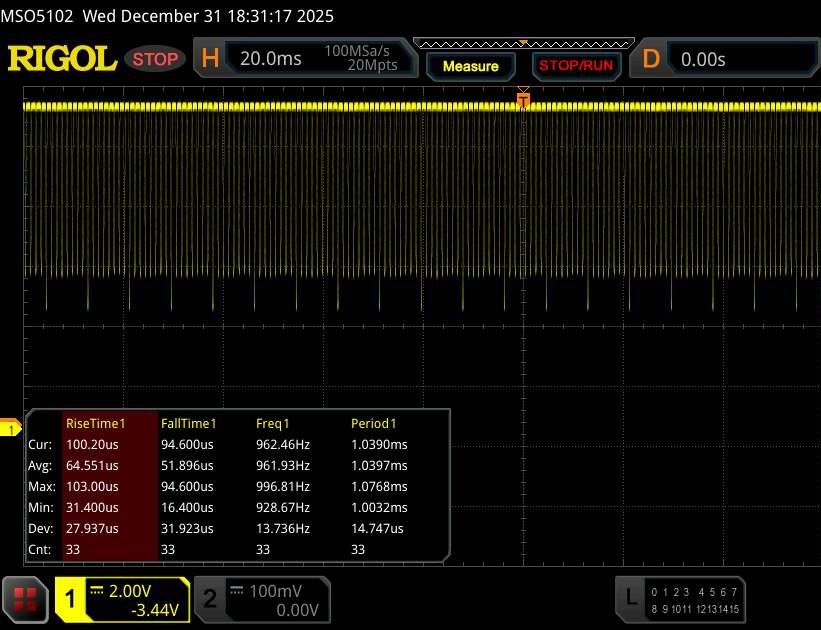
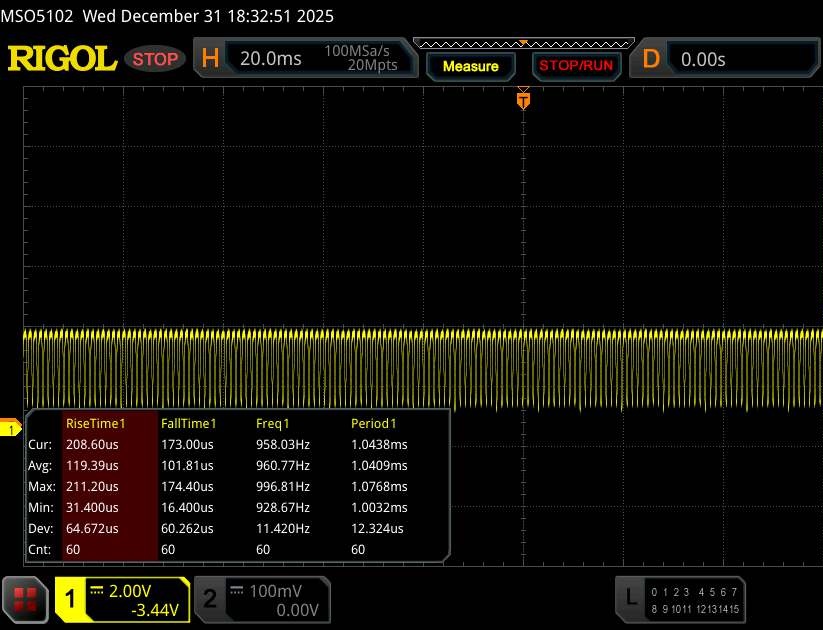
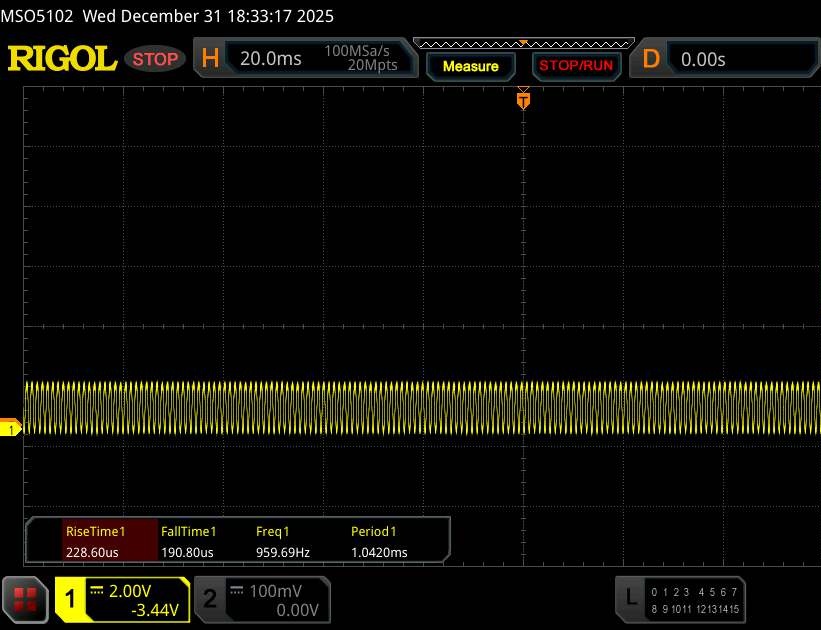
Screen Flickering / PWM (Pulse-Width Modulation)
| Screen flickering / PWM detected | 960 Hz Amplitude: 50 % | 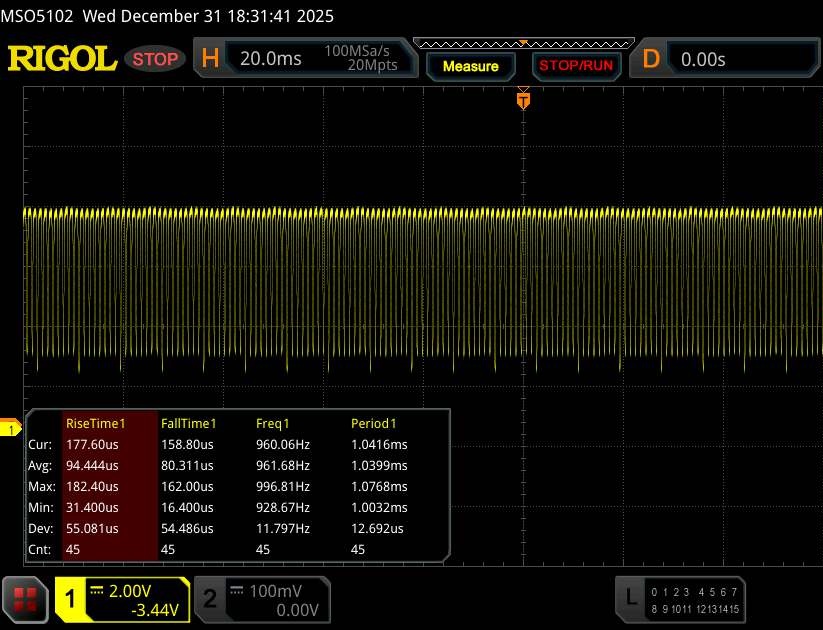 | |
The display backlight flickers at 960 Hz (worst case, e.g., utilizing PWM) . The frequency of 960 Hz is quite high, so most users sensitive to PWM should not notice any flickering. In comparison: 52 % of all tested devices do not use PWM to dim the display. If PWM was detected, an average of 7753 (minimum: 5 - maximum: 343500) Hz was measured. | |||
Performance
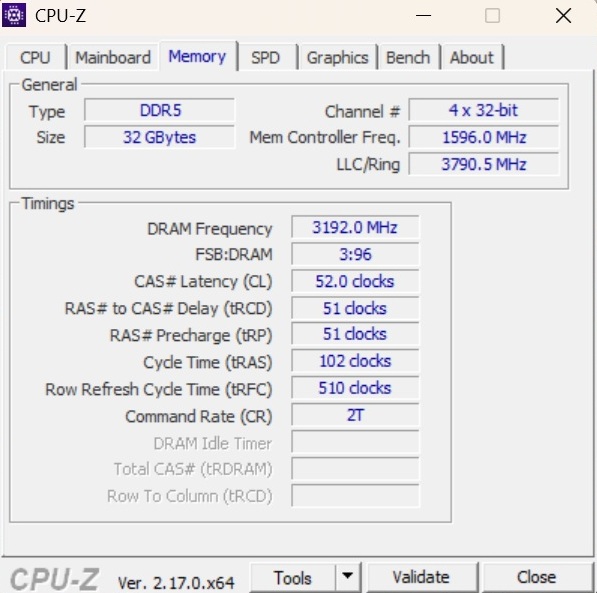
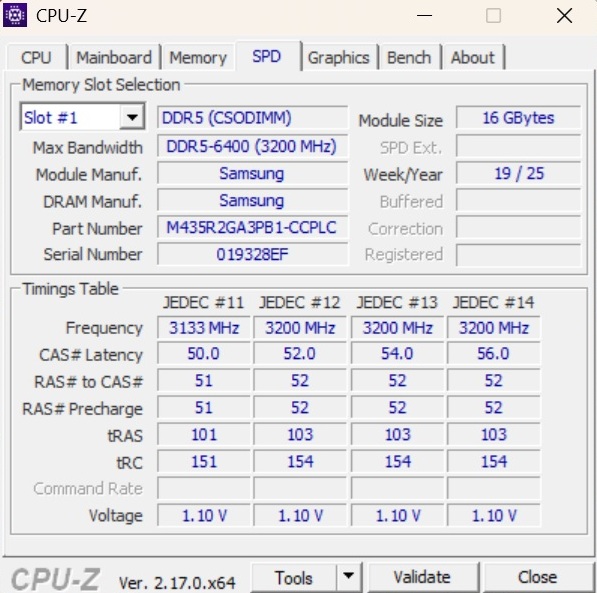
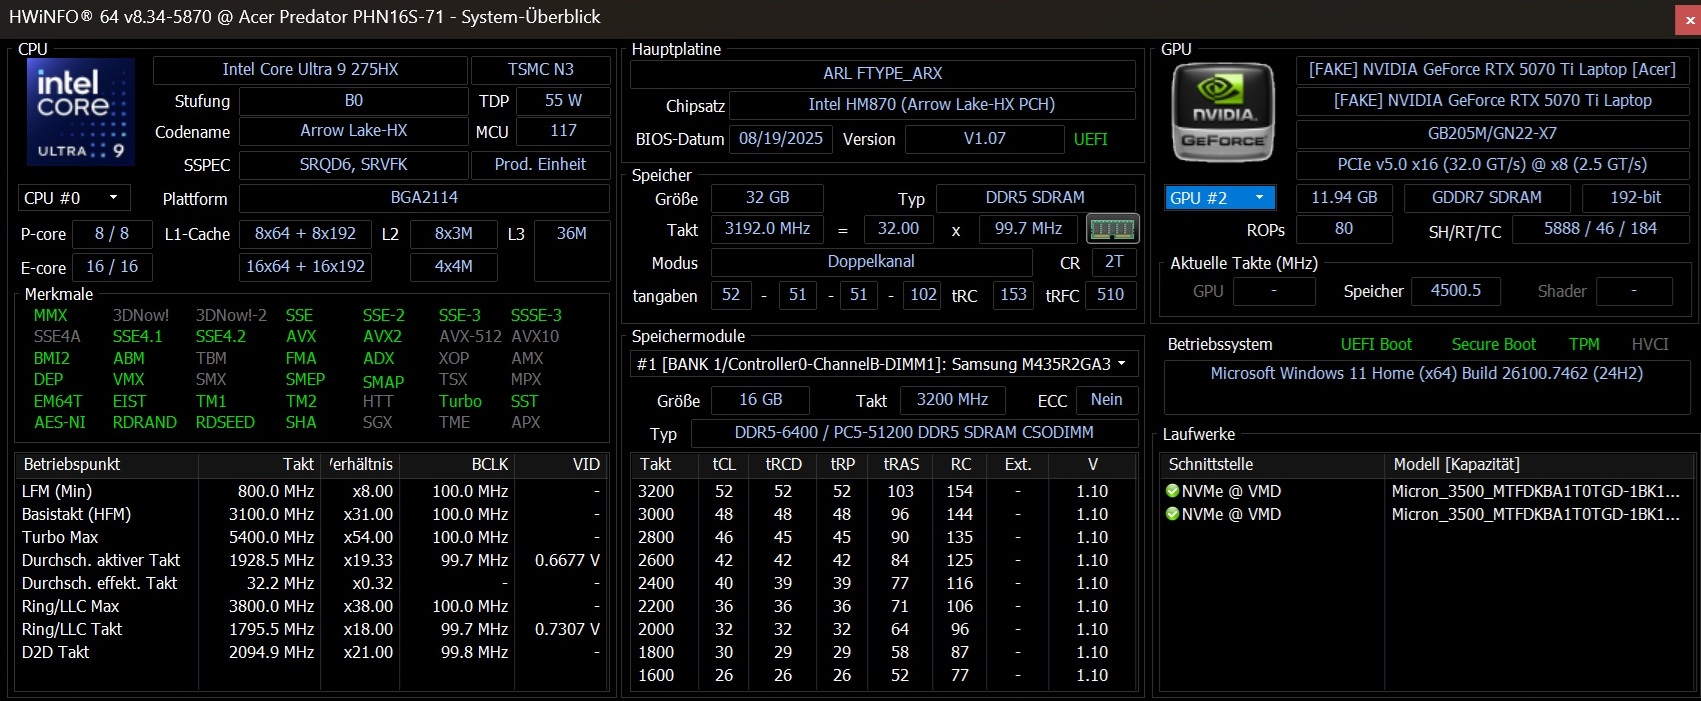
The Predator Helios Neo 16S AI is available from around 1,700 euros, although the cheapest version is "only" equipped with Core Ultra 7 255HX, GeForce RTX 5060 and 16 GB RAM. Our test sample, on the other hand, boasts 32 GB RAM (2x 16 GB DDR-6400) and two 1 TB SSDs.
Test conditions
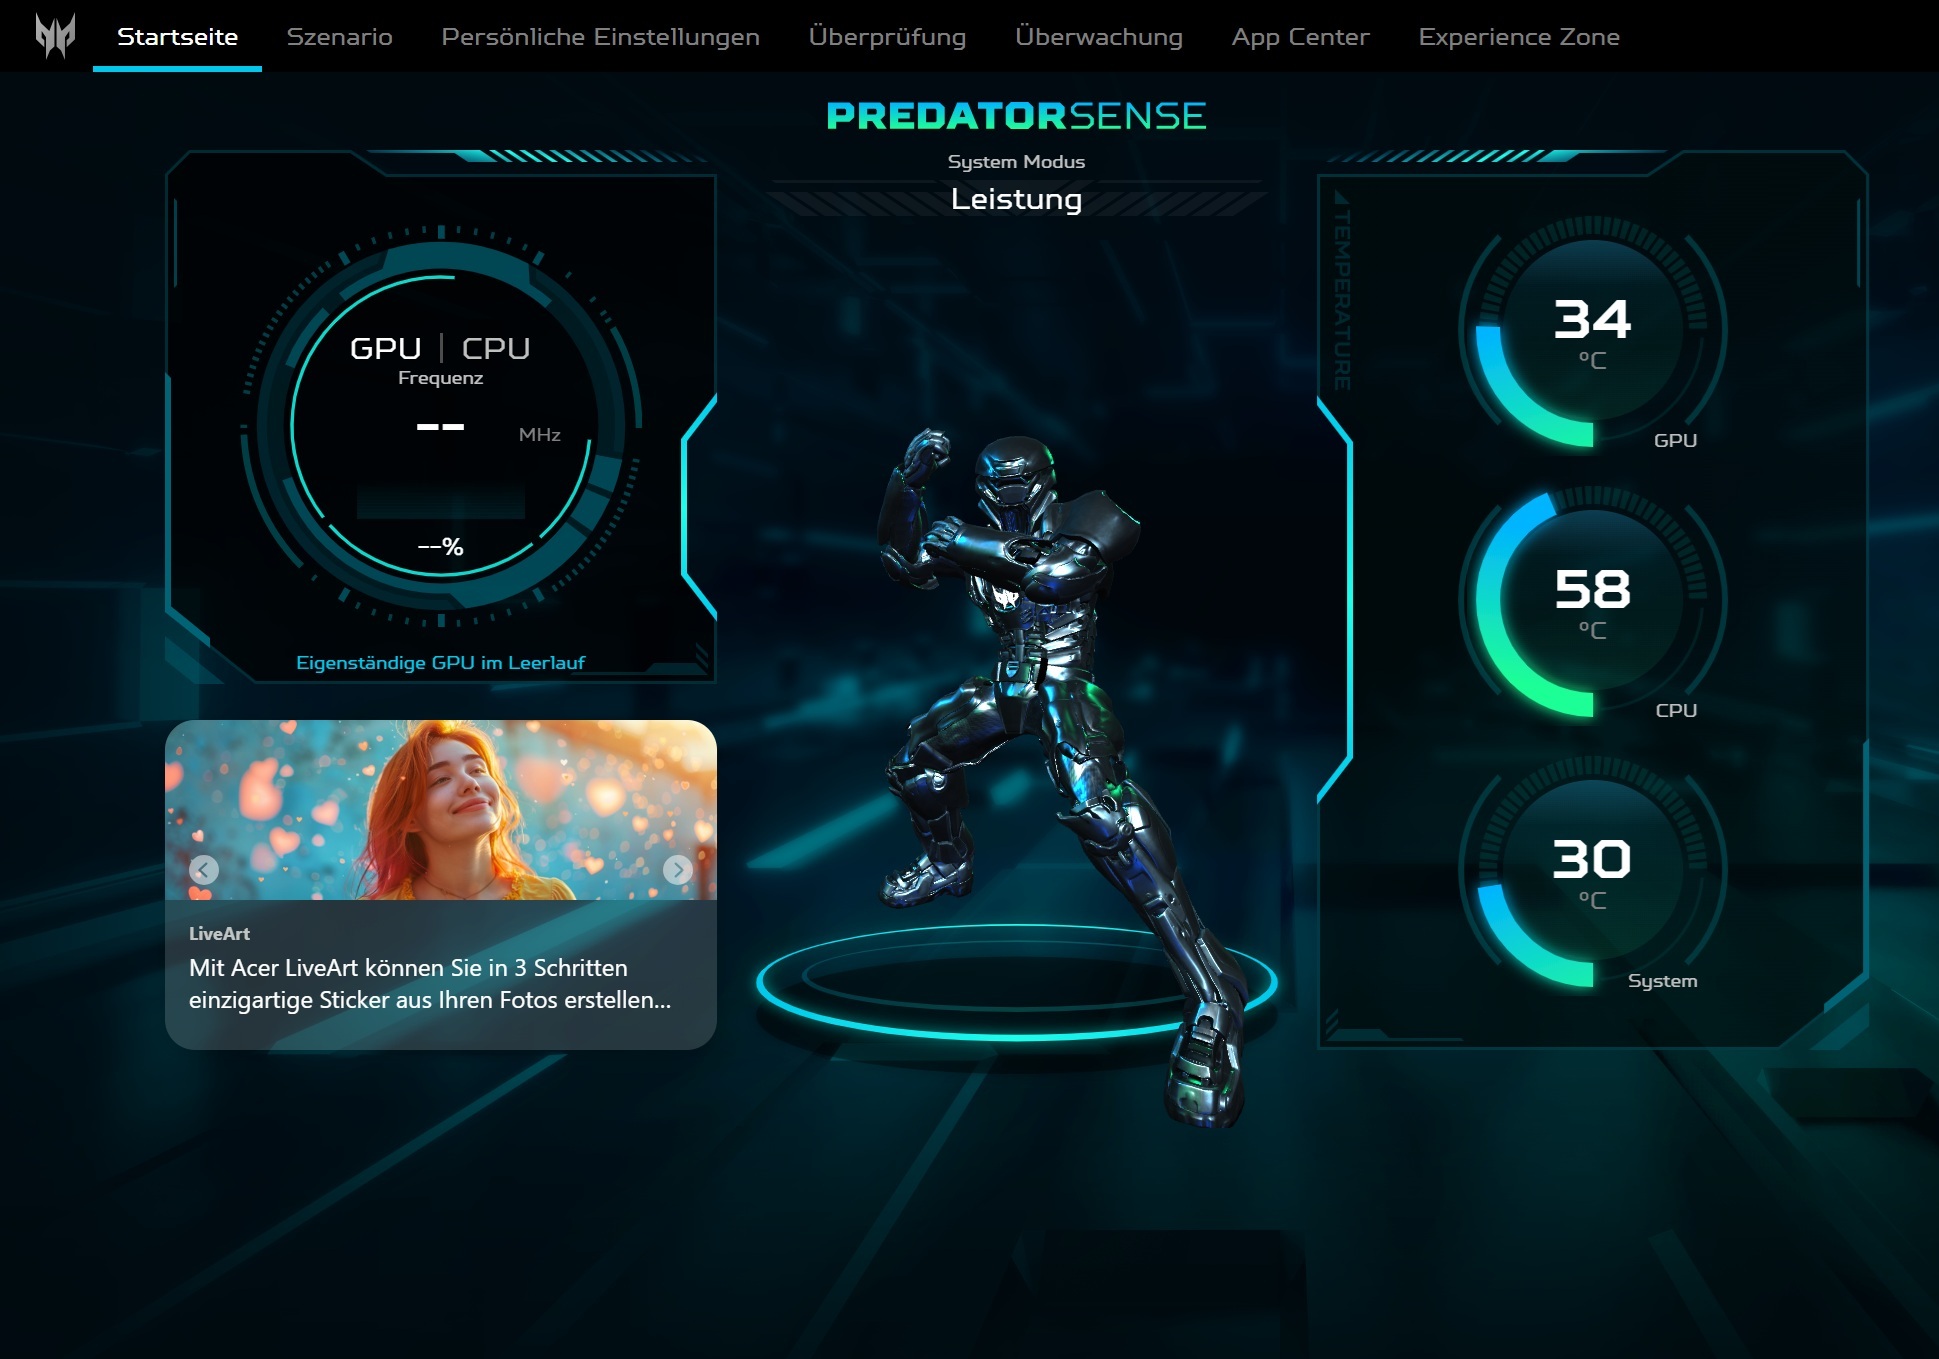
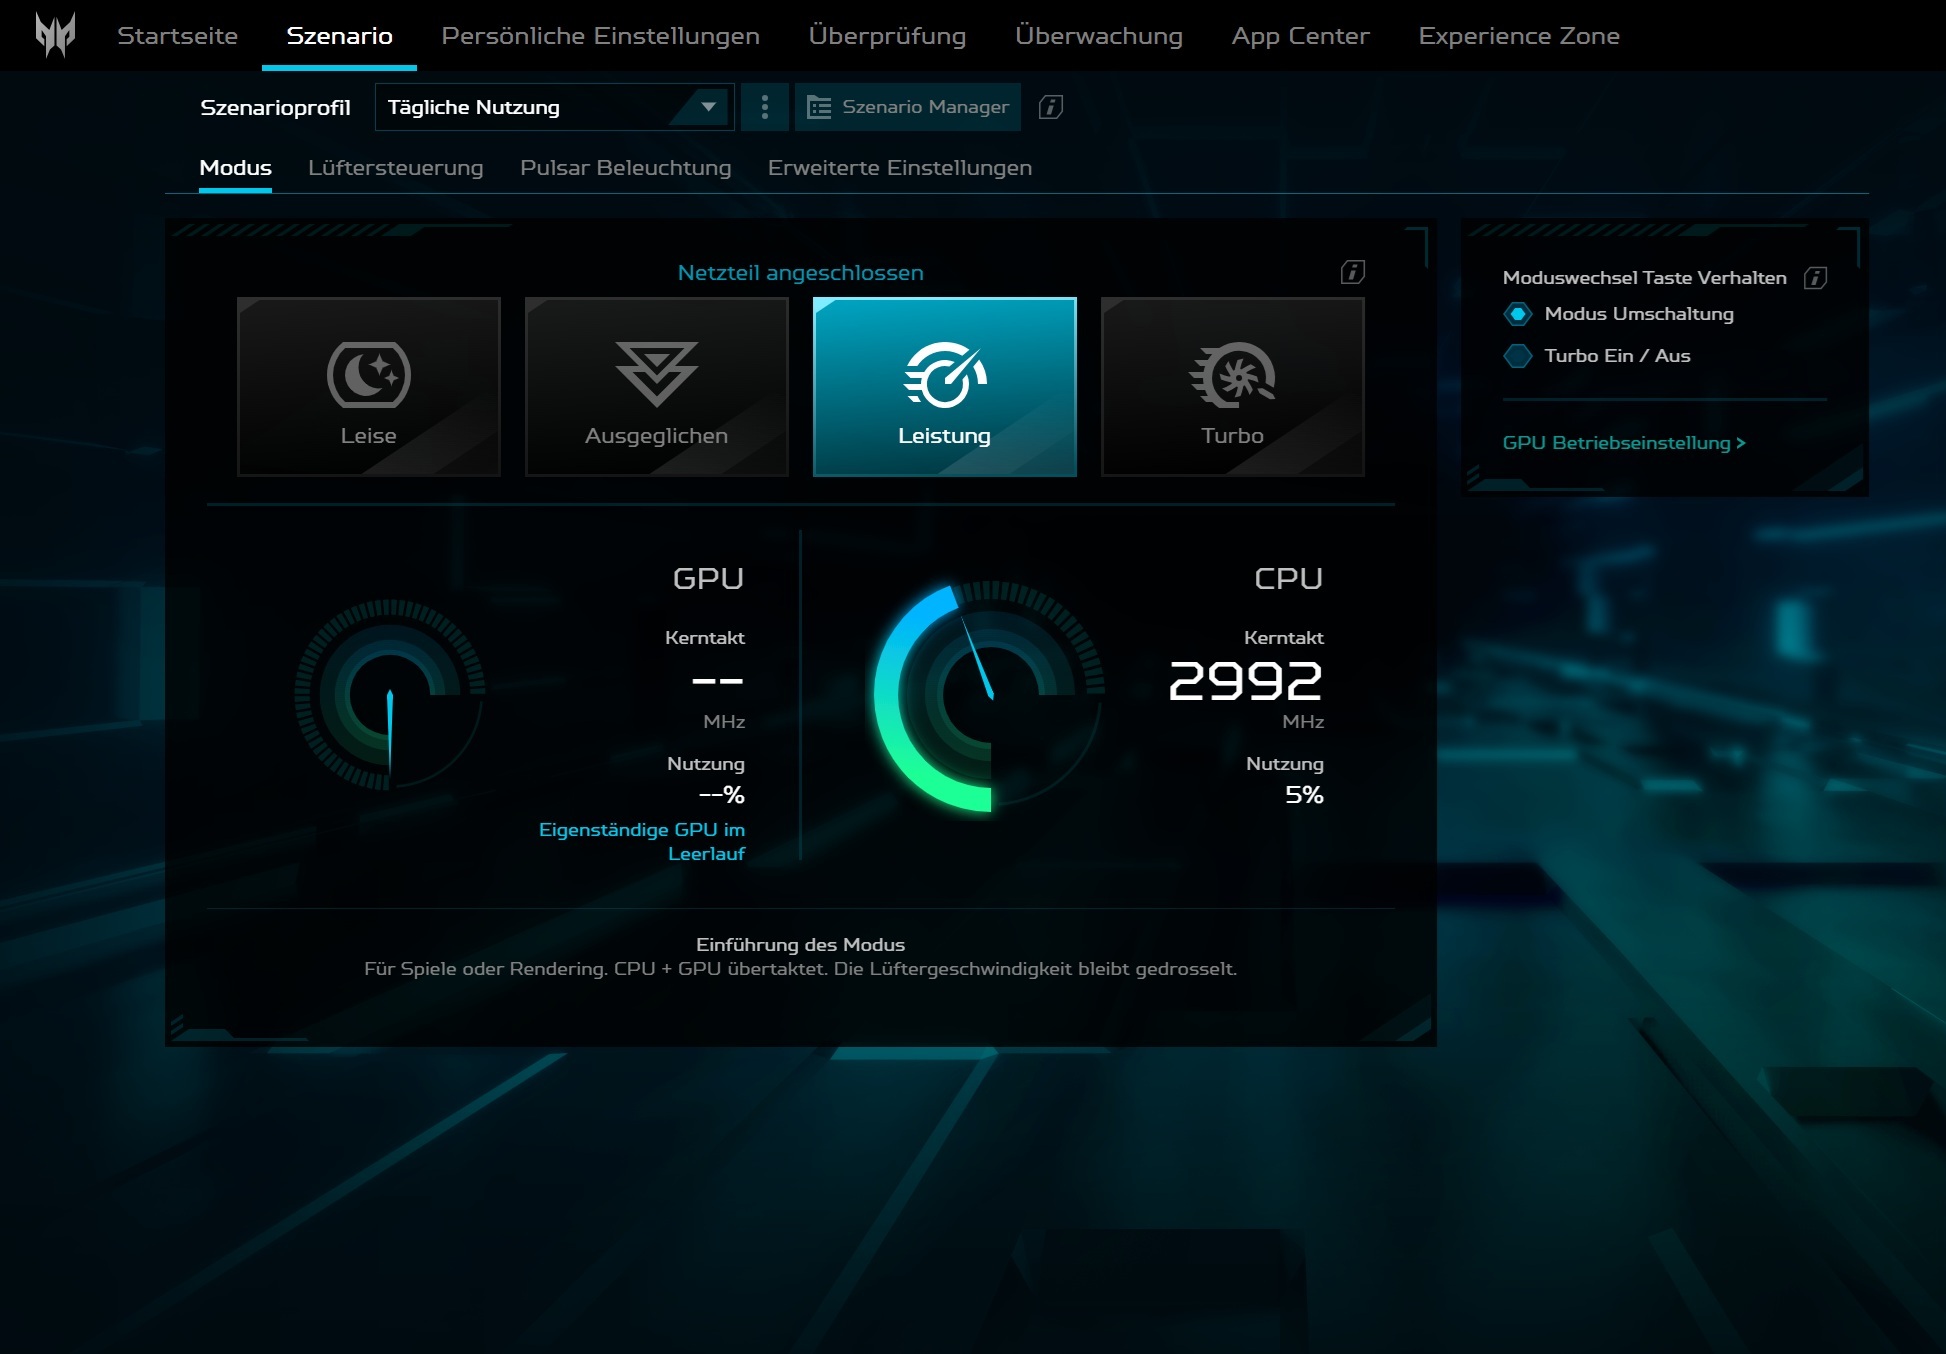
In the pre-installed PredatorSense software, you can choose between four operating modes, which differ both in terms of noise and CPU or GPU power. Apart from the battery test, our measurements were all carried out in Performance mode.
| Mode | Silent | Balanced | Performance | Turbo |
| Cyberpunk 2077 Noise | 38 dB(A) | 45 dB(A) | 52 dB(A) | 57 dB(A) |
| Cyberpunk 2077 frame rate (FHD/Ultra) | 85.8 fps | 91.3 fps | 100.8 fps | 109.7 fps |
| GPU Power Draw | ~60 W | ~70 W | ~90 W | ~100 W |
| CPU PL1 | 55 W | 65 W | 75 W | 85 W |
| CPU PL2 | 140 W | 140 W | 140 W | 140 W |
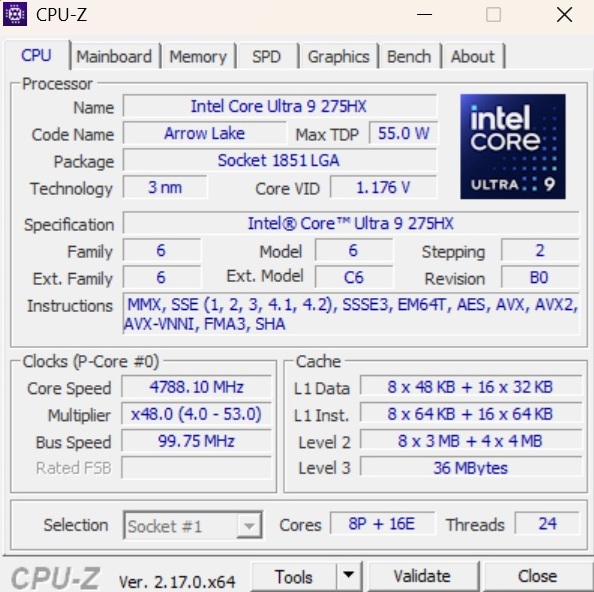
Processor
The Core Ultra 9 275HX is currently one of the most popular processors for high-end laptops. The 3 nm model consists of 8 performance cores and 16 efficiency cores, which, however, cannot develop their performance in our benchmark course quite as well as, for example, the Legion 5 Pro 16, especially as the speed drops slightly after a few runs (see Cinebench loop) and then tends to level off at the level of the Core Ultra 7 255HX. The Ryzen AI 9 365 of the Razer Blade 16 is clearly beaten.
Cinebench R15 Multi loop
* ... smaller is better
AIDA64: FP32 Ray-Trace | FPU Julia | CPU SHA3 | CPU Queen | FPU SinJulia | FPU Mandel | CPU AES | CPU ZLib | FP64 Ray-Trace | CPU PhotoWorxx
| Performance rating | |
| Lenovo Legion 5 Pro 16IAX10H | |
| Average Intel Core Ultra 9 275HX | |
| Schenker XMG FUSION 16 (M25) | |
| Average of class Gaming | |
| Acer Predator Helios Neo 16S AI PHN16S-71-94L9 | |
| Razer Blade 16 RTX 5080 | |
| MSI Vector 16 HX AI A2XWHG | |
| AIDA64 / FP32 Ray-Trace | |
| Average Intel Core Ultra 9 275HX (28039 - 39895, n=30) | |
| Lenovo Legion 5 Pro 16IAX10H | |
| Schenker XMG FUSION 16 (M25) | |
| Razer Blade 16 RTX 5080 | |
| Average of class Gaming (10227 - 85542, n=104, last 2 years) | |
| Acer Predator Helios Neo 16S AI PHN16S-71-94L9 | |
| MSI Vector 16 HX AI A2XWHG | |
| AIDA64 / FPU Julia | |
| Lenovo Legion 5 Pro 16IAX10H | |
| Average Intel Core Ultra 9 275HX (140254 - 200744, n=30) | |
| Schenker XMG FUSION 16 (M25) | |
| Acer Predator Helios Neo 16S AI PHN16S-71-94L9 | |
| MSI Vector 16 HX AI A2XWHG | |
| Average of class Gaming (51376 - 238426, n=104, last 2 years) | |
| Razer Blade 16 RTX 5080 | |
| AIDA64 / CPU SHA3 | |
| Average Intel Core Ultra 9 275HX (6710 - 9817, n=30) | |
| Lenovo Legion 5 Pro 16IAX10H | |
| Schenker XMG FUSION 16 (M25) | |
| Acer Predator Helios Neo 16S AI PHN16S-71-94L9 | |
| MSI Vector 16 HX AI A2XWHG | |
| Average of class Gaming (2180 - 9817, n=104, last 2 years) | |
| Razer Blade 16 RTX 5080 | |
| AIDA64 / CPU Queen | |
| Lenovo Legion 5 Pro 16IAX10H | |
| Average Intel Core Ultra 9 275HX (113887 - 140937, n=30) | |
| Schenker XMG FUSION 16 (M25) | |
| Acer Predator Helios Neo 16S AI PHN16S-71-94L9 | |
| Average of class Gaming (49785 - 173351, n=91, last 2 years) | |
| MSI Vector 16 HX AI A2XWHG | |
| Razer Blade 16 RTX 5080 | |
| AIDA64 / FPU SinJulia | |
| Razer Blade 16 RTX 5080 | |
| Average of class Gaming (4424 - 33636, n=104, last 2 years) | |
| Lenovo Legion 5 Pro 16IAX10H | |
| Average Intel Core Ultra 9 275HX (11172 - 14425, n=30) | |
| Schenker XMG FUSION 16 (M25) | |
| Acer Predator Helios Neo 16S AI PHN16S-71-94L9 | |
| MSI Vector 16 HX AI A2XWHG | |
| AIDA64 / FPU Mandel | |
| Average Intel Core Ultra 9 275HX (72596 - 104508, n=30) | |
| Lenovo Legion 5 Pro 16IAX10H | |
| Schenker XMG FUSION 16 (M25) | |
| Acer Predator Helios Neo 16S AI PHN16S-71-94L9 | |
| MSI Vector 16 HX AI A2XWHG | |
| Average of class Gaming (25115 - 128721, n=104, last 2 years) | |
| Razer Blade 16 RTX 5080 | |
| AIDA64 / CPU AES | |
| Lenovo Legion 5 Pro 16IAX10H | |
| Average Intel Core Ultra 9 275HX (105608 - 247074, n=30) | |
| Schenker XMG FUSION 16 (M25) | |
| Average of class Gaming (39258 - 247074, n=104, last 2 years) | |
| Acer Predator Helios Neo 16S AI PHN16S-71-94L9 | |
| MSI Vector 16 HX AI A2XWHG | |
| Razer Blade 16 RTX 5080 | |
| AIDA64 / CPU ZLib | |
| Lenovo Legion 5 Pro 16IAX10H | |
| Average Intel Core Ultra 9 275HX (1582 - 2263, n=30) | |
| Schenker XMG FUSION 16 (M25) | |
| Acer Predator Helios Neo 16S AI PHN16S-71-94L9 | |
| Average of class Gaming (574 - 2531, n=104, last 2 years) | |
| MSI Vector 16 HX AI A2XWHG | |
| Razer Blade 16 RTX 5080 | |
| AIDA64 / FP64 Ray-Trace | |
| Average Intel Core Ultra 9 275HX (14847 - 21854, n=30) | |
| Lenovo Legion 5 Pro 16IAX10H | |
| Schenker XMG FUSION 16 (M25) | |
| Razer Blade 16 RTX 5080 | |
| Average of class Gaming (5509 - 45446, n=104, last 2 years) | |
| Acer Predator Helios Neo 16S AI PHN16S-71-94L9 | |
| MSI Vector 16 HX AI A2XWHG | |
| AIDA64 / CPU PhotoWorxx | |
| Acer Predator Helios Neo 16S AI PHN16S-71-94L9 | |
| Razer Blade 16 RTX 5080 | |
| Schenker XMG FUSION 16 (M25) | |
| Average Intel Core Ultra 9 275HX (37482 - 62916, n=30) | |
| Lenovo Legion 5 Pro 16IAX10H | |
| Average of class Gaming (12271 - 89891, n=104, last 2 years) | |
| MSI Vector 16 HX AI A2XWHG | |
System performance
In terms of system performance, the Acer notebook takes a place in the midfield of the comparison devices. Subjectively, the system acts and reacts pleasantly quickly.
PCMark 10: Score | Essentials | Productivity | Digital Content Creation
CrossMark: Overall | Productivity | Creativity | Responsiveness
WebXPRT 3: Overall
WebXPRT 4: Overall
Mozilla Kraken 1.1: Total
| Performance rating | |
| Lenovo Legion 5 Pro 16IAX10H | |
| Schenker XMG FUSION 16 (M25) | |
| Average Intel Core Ultra 9 275HX, NVIDIA GeForce RTX 5070 Ti Laptop | |
| Acer Predator Helios Neo 16S AI PHN16S-71-94L9 | |
| Average of class Gaming | |
| MSI Vector 16 HX AI A2XWHG | |
| Razer Blade 16 RTX 5080 -4! | |
| PCMark 10 / Score | |
| Schenker XMG FUSION 16 (M25) | |
| Razer Blade 16 RTX 5080 | |
| Average Intel Core Ultra 9 275HX, NVIDIA GeForce RTX 5070 Ti Laptop (8297 - 8550, n=3) | |
| Average of class Gaming (5828 - 11574, n=93, last 2 years) | |
| Acer Predator Helios Neo 16S AI PHN16S-71-94L9 | |
| Lenovo Legion 5 Pro 16IAX10H | |
| MSI Vector 16 HX AI A2XWHG | |
| PCMark 10 / Essentials | |
| Average Intel Core Ultra 9 275HX, NVIDIA GeForce RTX 5070 Ti Laptop (10738 - 11290, n=3) | |
| Acer Predator Helios Neo 16S AI PHN16S-71-94L9 | |
| Razer Blade 16 RTX 5080 | |
| Lenovo Legion 5 Pro 16IAX10H | |
| MSI Vector 16 HX AI A2XWHG | |
| Average of class Gaming (8810 - 11935, n=97, last 2 years) | |
| Schenker XMG FUSION 16 (M25) | |
| PCMark 10 / Productivity | |
| Schenker XMG FUSION 16 (M25) | |
| Average of class Gaming (6845 - 21327, n=95, last 2 years) | |
| Razer Blade 16 RTX 5080 | |
| Acer Predator Helios Neo 16S AI PHN16S-71-94L9 | |
| Lenovo Legion 5 Pro 16IAX10H | |
| Average Intel Core Ultra 9 275HX, NVIDIA GeForce RTX 5070 Ti Laptop (9591 - 9771, n=3) | |
| MSI Vector 16 HX AI A2XWHG | |
| PCMark 10 / Digital Content Creation | |
| Razer Blade 16 RTX 5080 | |
| Average Intel Core Ultra 9 275HX, NVIDIA GeForce RTX 5070 Ti Laptop (14812 - 15662, n=3) | |
| Lenovo Legion 5 Pro 16IAX10H | |
| Acer Predator Helios Neo 16S AI PHN16S-71-94L9 | |
| Schenker XMG FUSION 16 (M25) | |
| Average of class Gaming (7602 - 19657, n=95, last 2 years) | |
| MSI Vector 16 HX AI A2XWHG | |
| CrossMark / Overall | |
| Lenovo Legion 5 Pro 16IAX10H | |
| Average Intel Core Ultra 9 275HX, NVIDIA GeForce RTX 5070 Ti Laptop (2116 - 2193, n=3) | |
| Acer Predator Helios Neo 16S AI PHN16S-71-94L9 | |
| Schenker XMG FUSION 16 (M25) | |
| Average of class Gaming (1366 - 2409, n=93, last 2 years) | |
| MSI Vector 16 HX AI A2XWHG | |
| CrossMark / Productivity | |
| Lenovo Legion 5 Pro 16IAX10H | |
| Average Intel Core Ultra 9 275HX, NVIDIA GeForce RTX 5070 Ti Laptop (1967 - 2038, n=3) | |
| Acer Predator Helios Neo 16S AI PHN16S-71-94L9 | |
| Schenker XMG FUSION 16 (M25) | |
| Average of class Gaming (1386 - 2254, n=93, last 2 years) | |
| MSI Vector 16 HX AI A2XWHG | |
| CrossMark / Creativity | |
| Average Intel Core Ultra 9 275HX, NVIDIA GeForce RTX 5070 Ti Laptop (2430 - 2531, n=3) | |
| Lenovo Legion 5 Pro 16IAX10H | |
| Schenker XMG FUSION 16 (M25) | |
| Acer Predator Helios Neo 16S AI PHN16S-71-94L9 | |
| MSI Vector 16 HX AI A2XWHG | |
| Average of class Gaming (1343 - 2729, n=93, last 2 years) | |
| CrossMark / Responsiveness | |
| Lenovo Legion 5 Pro 16IAX10H | |
| Average Intel Core Ultra 9 275HX, NVIDIA GeForce RTX 5070 Ti Laptop (1740 - 1844, n=3) | |
| Schenker XMG FUSION 16 (M25) | |
| Acer Predator Helios Neo 16S AI PHN16S-71-94L9 | |
| Average of class Gaming (1226 - 2334, n=93, last 2 years) | |
| MSI Vector 16 HX AI A2XWHG | |
| WebXPRT 3 / Overall | |
| Lenovo Legion 5 Pro 16IAX10H | |
| Average Intel Core Ultra 9 275HX, NVIDIA GeForce RTX 5070 Ti Laptop (328 - 532, n=3) | |
| Schenker XMG FUSION 16 (M25) | |
| Razer Blade 16 RTX 5080 | |
| Acer Predator Helios Neo 16S AI PHN16S-71-94L9 | |
| MSI Vector 16 HX AI A2XWHG | |
| Average of class Gaming (220 - 532, n=98, last 2 years) | |
| WebXPRT 4 / Overall | |
| Lenovo Legion 5 Pro 16IAX10H | |
| Average Intel Core Ultra 9 275HX, NVIDIA GeForce RTX 5070 Ti Laptop (306 - 341, n=3) | |
| Acer Predator Helios Neo 16S AI PHN16S-71-94L9 | |
| MSI Vector 16 HX AI A2XWHG | |
| Schenker XMG FUSION 16 (M25) | |
| Average of class Gaming (165 - 354, n=98, last 2 years) | |
| Razer Blade 16 RTX 5080 | |
| Mozilla Kraken 1.1 / Total | |
| Average of class Gaming (391 - 590, n=101, last 2 years) | |
| Razer Blade 16 RTX 5080 | |
| Schenker XMG FUSION 16 (M25) | |
| MSI Vector 16 HX AI A2XWHG | |
| Lenovo Legion 5 Pro 16IAX10H | |
| Average Intel Core Ultra 9 275HX, NVIDIA GeForce RTX 5070 Ti Laptop (405 - 414, n=3) | |
| Acer Predator Helios Neo 16S AI PHN16S-71-94L9 | |
* ... smaller is better
| PCMark 10 Score | 8332 points | |
Help | ||
| AIDA64 / Memory Copy | |
| Razer Blade 16 RTX 5080 | |
| Acer Predator Helios Neo 16S AI PHN16S-71-94L9 | |
| Schenker XMG FUSION 16 (M25) | |
| Average Intel Core Ultra 9 275HX (56003 - 94460, n=30) | |
| Lenovo Legion 5 Pro 16IAX10H | |
| Average of class Gaming (21750 - 129946, n=104, last 2 years) | |
| MSI Vector 16 HX AI A2XWHG | |
| AIDA64 / Memory Read | |
| Razer Blade 16 RTX 5080 | |
| Acer Predator Helios Neo 16S AI PHN16S-71-94L9 | |
| Schenker XMG FUSION 16 (M25) | |
| Lenovo Legion 5 Pro 16IAX10H | |
| Average Intel Core Ultra 9 275HX (55795 - 97151, n=30) | |
| MSI Vector 16 HX AI A2XWHG | |
| Average of class Gaming (22956 - 118858, n=104, last 2 years) | |
| AIDA64 / Memory Write | |
| Acer Predator Helios Neo 16S AI PHN16S-71-94L9 | |
| Razer Blade 16 RTX 5080 | |
| Schenker XMG FUSION 16 (M25) | |
| Average Intel Core Ultra 9 275HX (55663 - 116129, n=30) | |
| Lenovo Legion 5 Pro 16IAX10H | |
| Average of class Gaming (22297 - 135096, n=104, last 2 years) | |
| MSI Vector 16 HX AI A2XWHG | |
| AIDA64 / Memory Latency | |
| Average Intel Core Ultra 9 275HX (105.8 - 161.6, n=30) | |
| Lenovo Legion 5 Pro 16IAX10H | |
| Schenker XMG FUSION 16 (M25) | |
| Acer Predator Helios Neo 16S AI PHN16S-71-94L9 | |
| Average of class Gaming (75.3 - 259, n=104, last 2 years) | |
| MSI Vector 16 HX AI A2XWHG | |
| Razer Blade 16 RTX 5080 | |
* ... smaller is better
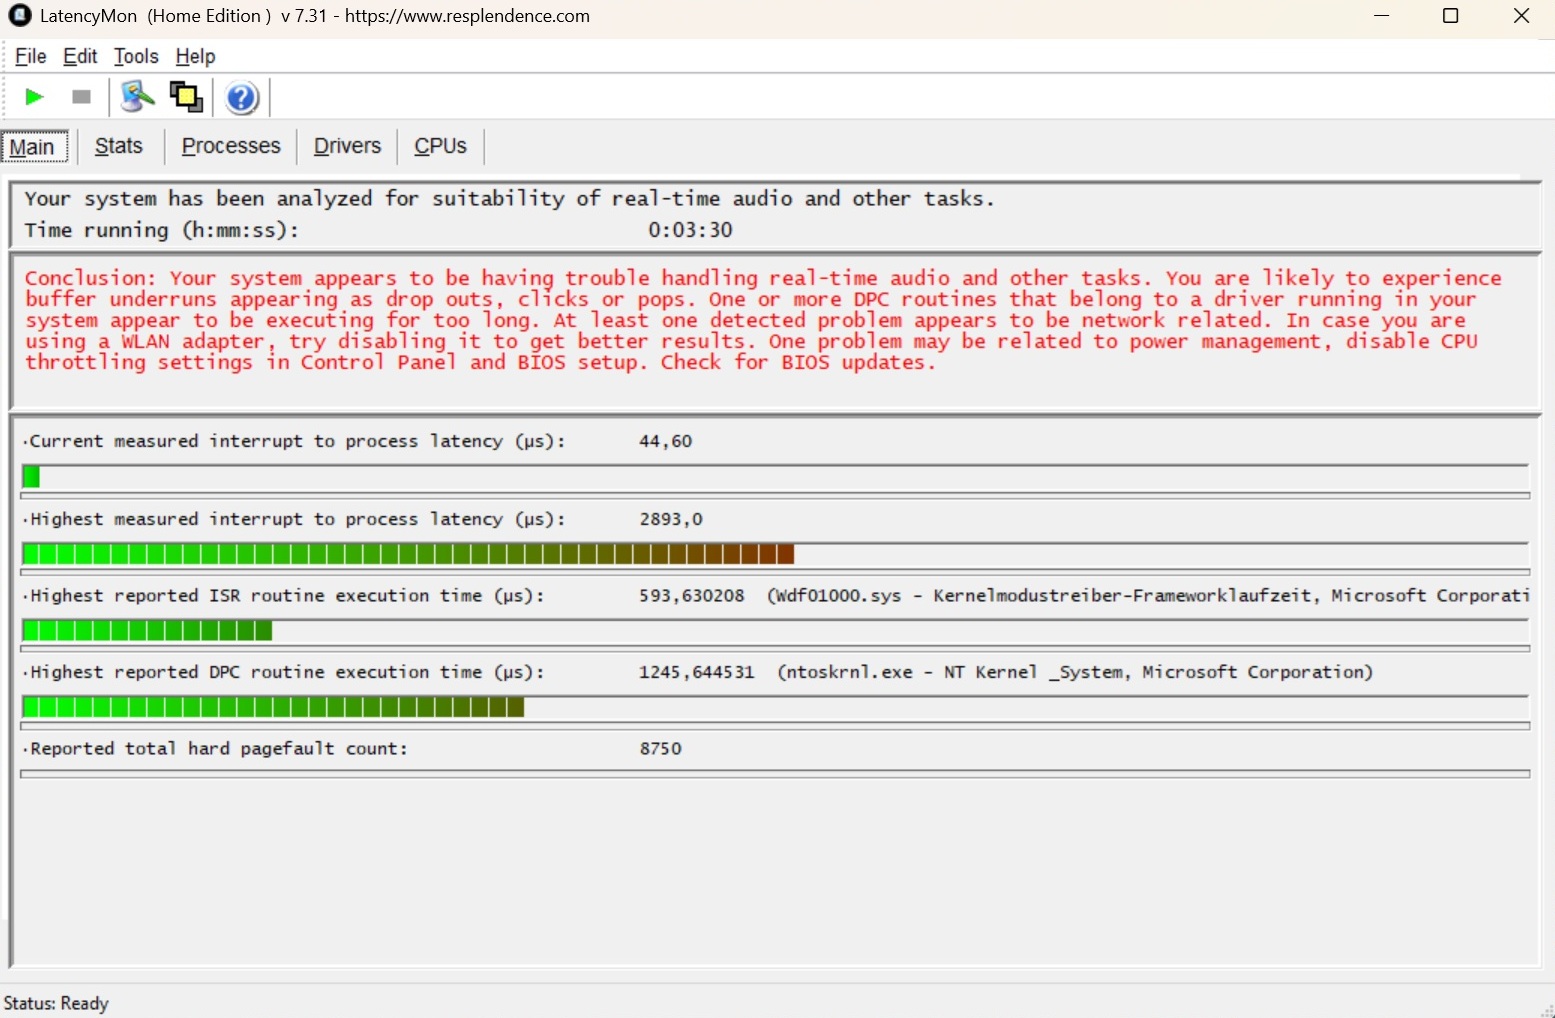
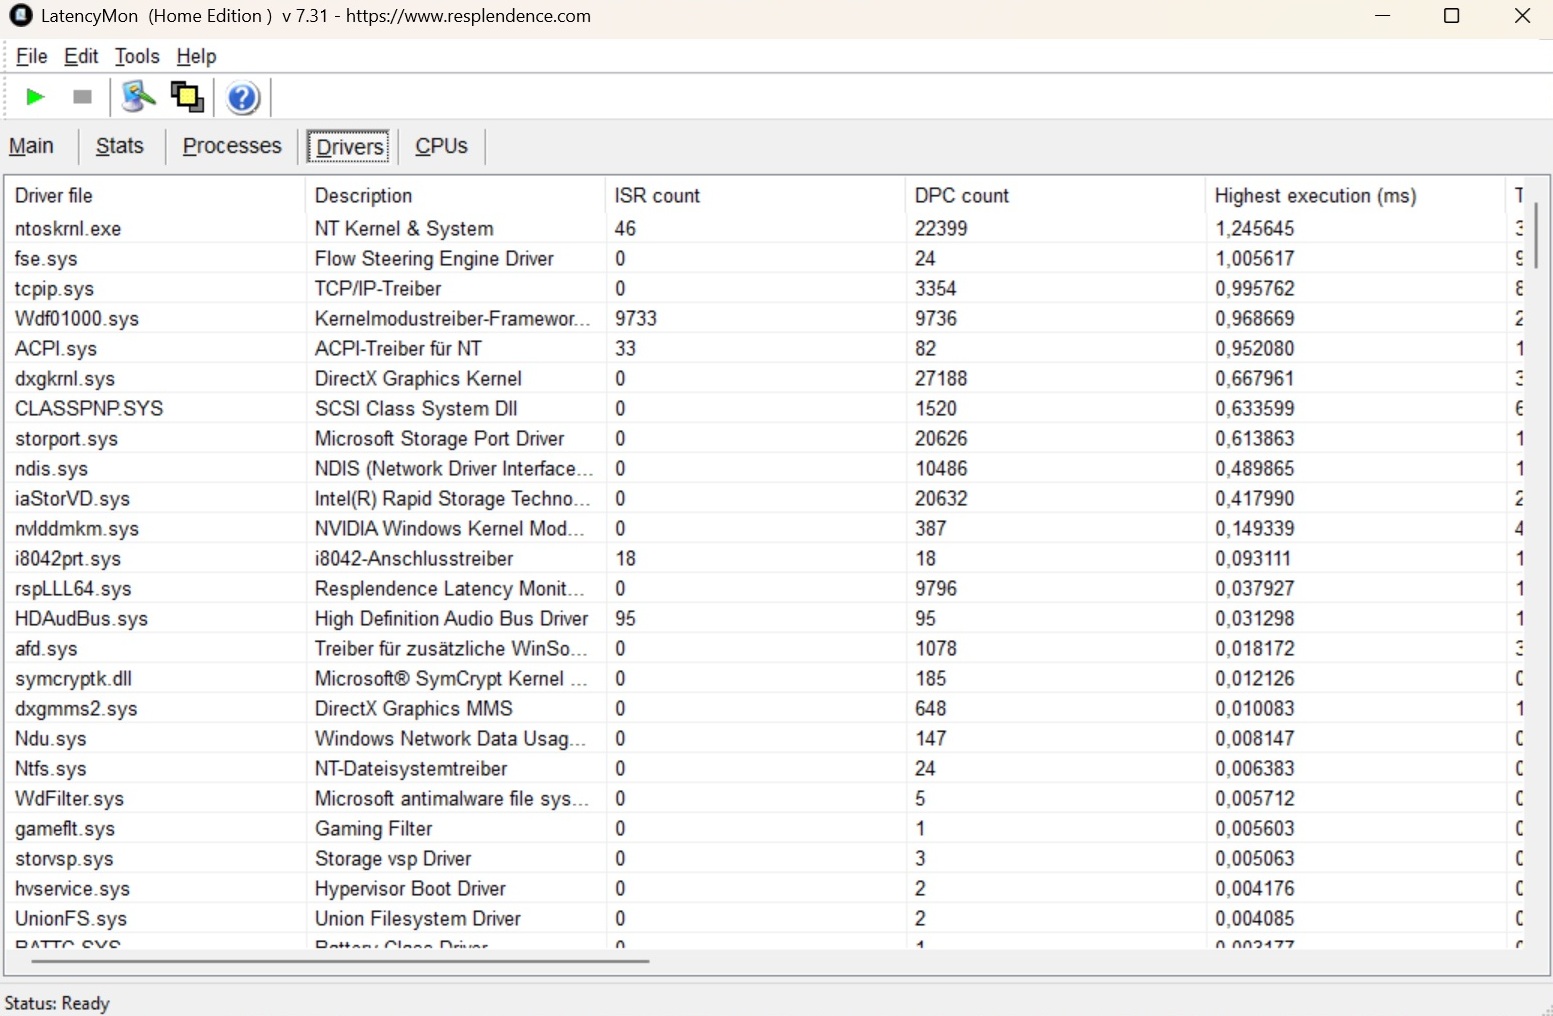
DPC latencies
Unfortunately, as with many notebooks, the latencies are not perfect, so that problems such as short hangs could occur in certain application scenarios.
| DPC Latencies / LatencyMon - interrupt to process latency (max), Web, Youtube, Prime95 | |
| MSI Vector 16 HX AI A2XWHG | |
| Acer Predator Helios Neo 16S AI PHN16S-71-94L9 | |
| Razer Blade 16 RTX 5080 | |
| Lenovo Legion 5 Pro 16IAX10H | |
| Schenker XMG FUSION 16 (M25) | |
* ... smaller is better
Storage devices
Acer has chosen a medium-speed M.2 drive for the mass storage. Similar to the CPU, performance is not quite constant after prolonged use, though dips are often limited.

* ... smaller is better
Read continuous performance: DiskSpd Read Loop, Queue Depth 8
GPU performance
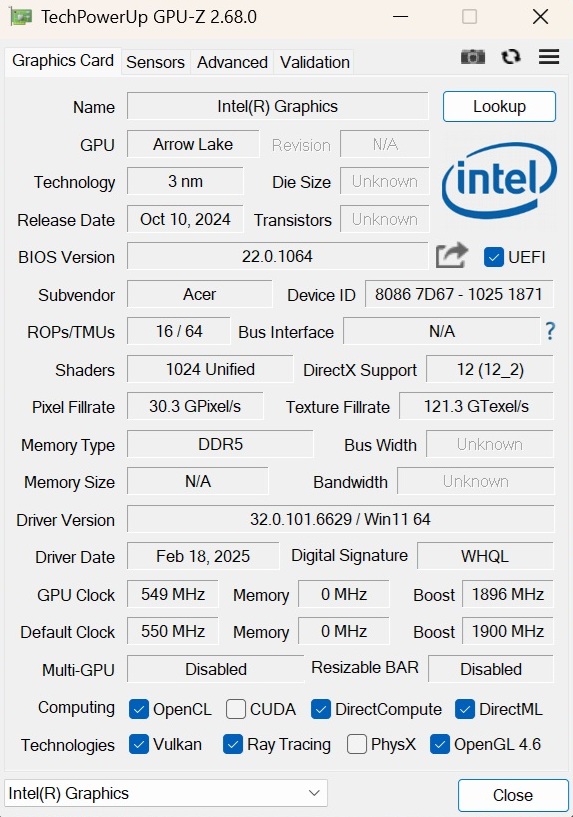
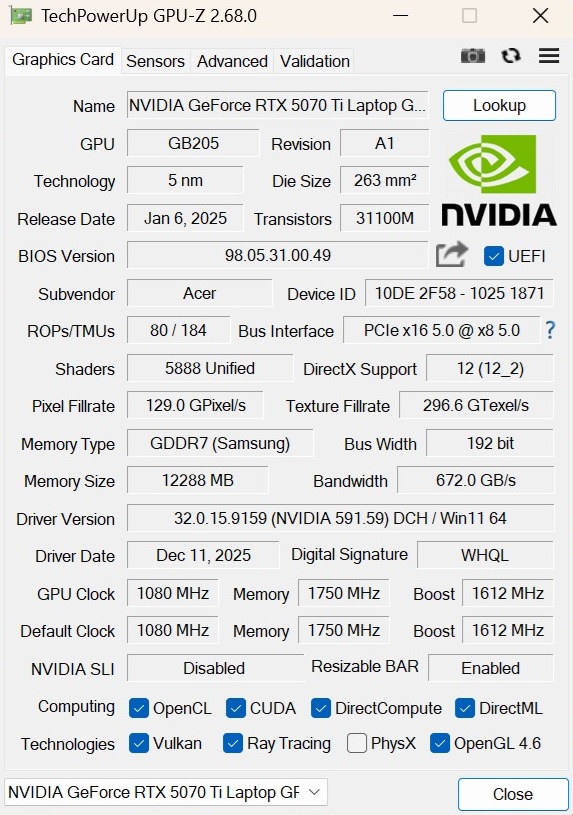
With the GeForce RTX 5070 Ti, Nvidia closes the gap between the mid-range segment and the upper class. The Blackwell model contains 5,888 shader units and has access to 12 GB of GDDR7 VRAM, which is now sorely needed in some games (at least at higher resolutions and settings). In the GPU benchmarks, the Neo 16S AI performs unspectacularly and is just under 10% below the previously determined average for this graphics card. One reason for this is the TGP (theoretically up to 115 watts), which is often not fully utilized even in Turbo mode.
| 3DMark 11 Performance | 40569 points | |
| 3DMark Cloud Gate Standard Score | 65305 points | |
| 3DMark Fire Strike Score | 30864 points | |
| 3DMark Time Spy Score | 14888 points | |
Help | ||
* ... smaller is better
Gaming performance
If you do without modern features such as upscaling, the RTX 5070 Ti reaches its limits in the QHD range (2,560x1,600 or 2,560x1,440 pixels), at least with more demanding games. Besides Borderlands 4 and The Outer Worlds 2, Anno 117 and Black Ops 7 also do not run completely smoothly with maximum details. This is remedied by DLSS, for example, which increases the frame rate in the latest Call of Duty game from 31 to 48 FPS. Including quadruple frame generation, it is even 131 FPS, although the figures on paper do not necessarily correspond 1:1 with the subjective flow of the game.
| low | med. | high | ultra | QHD | |
|---|---|---|---|---|---|
| GTA V (2015) | 186.6 | 182.8 | 147 | ||
| Dota 2 Reborn (2015) | 199.9 | 192.5 | 176.4 | ||
| X-Plane 11.11 (2018) | 135.3 | 109.4 | |||
| Baldur's Gate 3 (2023) | 147.9 | 129.8 | 122.8 | ||
| Cyberpunk 2077 (2023) | 127.3 | 112 | 100.8 | ||
| Borderlands 4 (2025) | 54.7 | 51.8 | 31.1 | 22.4 | |
| The Outer Worlds 2 (2025) | 100.5 | 82.3 | 49.9 | 33.4 | |
| ARC Raiders (2025) | 142.3 | 114.5 | 79.8 | 58 | |
| Anno 117: Pax Romana (2025) | 107.4 | 78.3 | 41.7 | 29.3 | |
| Call of Duty Black Ops 7 (2025) | 138 | 123 | 47 | 31 |
| Call of Duty Black Ops 7 | |
| 1920x1080 Extreme Preset + Raytracing | |
| Average NVIDIA GeForce RTX 5070 Ti Laptop (47 - 60, n=4) | |
| Acer Predator Helios Neo 16S AI PHN16S-71-94L9 | |
| Schenker XMG FUSION 16 (M25) | |
| Average of class Gaming (24 - 60, n=11, last 2 years) | |
| 2560x1440 Extreme Preset + Raytracing | |
| Average NVIDIA GeForce RTX 5070 Ti Laptop (31 - 39, n=4) | |
| Acer Predator Helios Neo 16S AI PHN16S-71-94L9 | |
| Average of class Gaming (18 - 39, n=7, last 2 years) | |
| Schenker XMG FUSION 16 (M25) | |
| Anno 117: Pax Romana | |
| 1920x1080 Ultra High AA:T | |
| Average NVIDIA GeForce RTX 5070 Ti Laptop (41.7 - 49, n=4) | |
| Acer Predator Helios Neo 16S AI PHN16S-71-94L9 | |
| Average of class Gaming (20.2 - 56.9, n=14, last 2 years) | |
| 2560x1440 Ultra High AA:T | |
| Average NVIDIA GeForce RTX 5070 Ti Laptop (29.3 - 34.3, n=4) | |
| Average of class Gaming (23.4 - 40.9, n=9, last 2 years) | |
| Acer Predator Helios Neo 16S AI PHN16S-71-94L9 | |
| ARC Raiders | |
| 1920x1080 Epic Preset + Epic Raytracing AA:TSR | |
| Average NVIDIA GeForce RTX 5070 Ti Laptop (79.8 - 98.6, n=3) | |
| Acer Predator Helios Neo 16S AI PHN16S-71-94L9 | |
| Average of class Gaming (43.5 - 98.6, n=11, last 2 years) | |
| 2560x1440 Epic Preset + Epic Raytracing AA:TSR | |
| Average NVIDIA GeForce RTX 5070 Ti Laptop (58 - 68.3, n=3) | |
| Average of class Gaming (47.8 - 68.3, n=5, last 2 years) | |
| Acer Predator Helios Neo 16S AI PHN16S-71-94L9 | |
| The Outer Worlds 2 | |
| 1920x1080 Very High Preset AA:T | |
| Average NVIDIA GeForce RTX 5070 Ti Laptop (49.9 - 58.4, n=3) | |
| Acer Predator Helios Neo 16S AI PHN16S-71-94L9 | |
| Average of class Gaming (26.4 - 58.4, n=11, last 2 years) | |
| 2560x1440 Very High Preset AA:T | |
| Average NVIDIA GeForce RTX 5070 Ti Laptop (33.4 - 37.8, n=3) | |
| Acer Predator Helios Neo 16S AI PHN16S-71-94L9 | |
| Average of class Gaming (21.5 - 37.8, n=6, last 2 years) | |
| Borderlands 4 | |
| 1920x1080 Badass Preset AA:FX | |
| Average NVIDIA GeForce RTX 5070 Ti Laptop (31.1 - 44.5, n=3) | |
| Acer Predator Helios Neo 16S AI PHN16S-71-94L9 | |
| Average of class Gaming (16 - 54, n=13, last 2 years) | |
| 2560x1440 Badass Preset AA:FX | |
| Average NVIDIA GeForce RTX 5070 Ti Laptop (22.4 - 31.4, n=3) | |
| Acer Predator Helios Neo 16S AI PHN16S-71-94L9 | |
| Average of class Gaming (7.97 - 37.1, n=6, last 2 years) | |
Cyberpunk 2077 Ultra FPS chart
Emissions
Noise emissions
While the 16-incher is rather restrained when idling - apart from temporary revving phases - it can get quite loud under load. In Cyberpunk 2077, for example, our device emitted a clearly audible 52 dB(A) (in balanced mode, it is only 45 dB), which is only surpassed by the Legion 5 Pro in the test field.
Noise level
| Idle |
| 24 / 30 / 35 dB(A) |
| Load |
| 53 / 54 dB(A) |
 | ||
30 dB silent 40 dB(A) audible 50 dB(A) loud |
||
min: | ||
| Acer Predator Helios Neo 16S AI PHN16S-71-94L9 Ultra 9 275HX, GeForce RTX 5070 Ti Laptop | Schenker XMG FUSION 16 (M25) Ultra 9 275HX, GeForce RTX 5070 Laptop | MSI Vector 16 HX AI A2XWHG Ultra 7 255HX, GeForce RTX 5070 Ti Laptop | Lenovo Legion 5 Pro 16IAX10H Ultra 9 275HX, GeForce RTX 5070 Ti Laptop | Razer Blade 16 RTX 5080 Ryzen AI 9 365, GeForce RTX 5080 Laptop | |
|---|---|---|---|---|---|
| Noise | 8% | -5% | 2% | 11% | |
| off / environment * (dB) | 24 | 25.7 -7% | 25 -4% | 24 -0% | 23 4% |
| Idle Minimum * (dB) | 24 | 25.7 -7% | 33 -38% | 24 -0% | 23.1 4% |
| Idle Average * (dB) | 30 | 25.7 14% | 34 -13% | 24 20% | 23.1 23% |
| Idle Maximum * (dB) | 35 | 28 20% | 38 -9% | 30.9 12% | 29.2 17% |
| Load Average * (dB) | 53 | 38.9 27% | 46 13% | 55.9 -5% | 43 19% |
| Cyberpunk 2077 ultra * (dB) | 52 | 49.7 4% | 47 10% | 56.72 -9% | 50.1 4% |
| Load Maximum * (dB) | 54 | 49.7 8% | 49 9% | 56.72 -5% | 52.4 3% |
* ... smaller is better
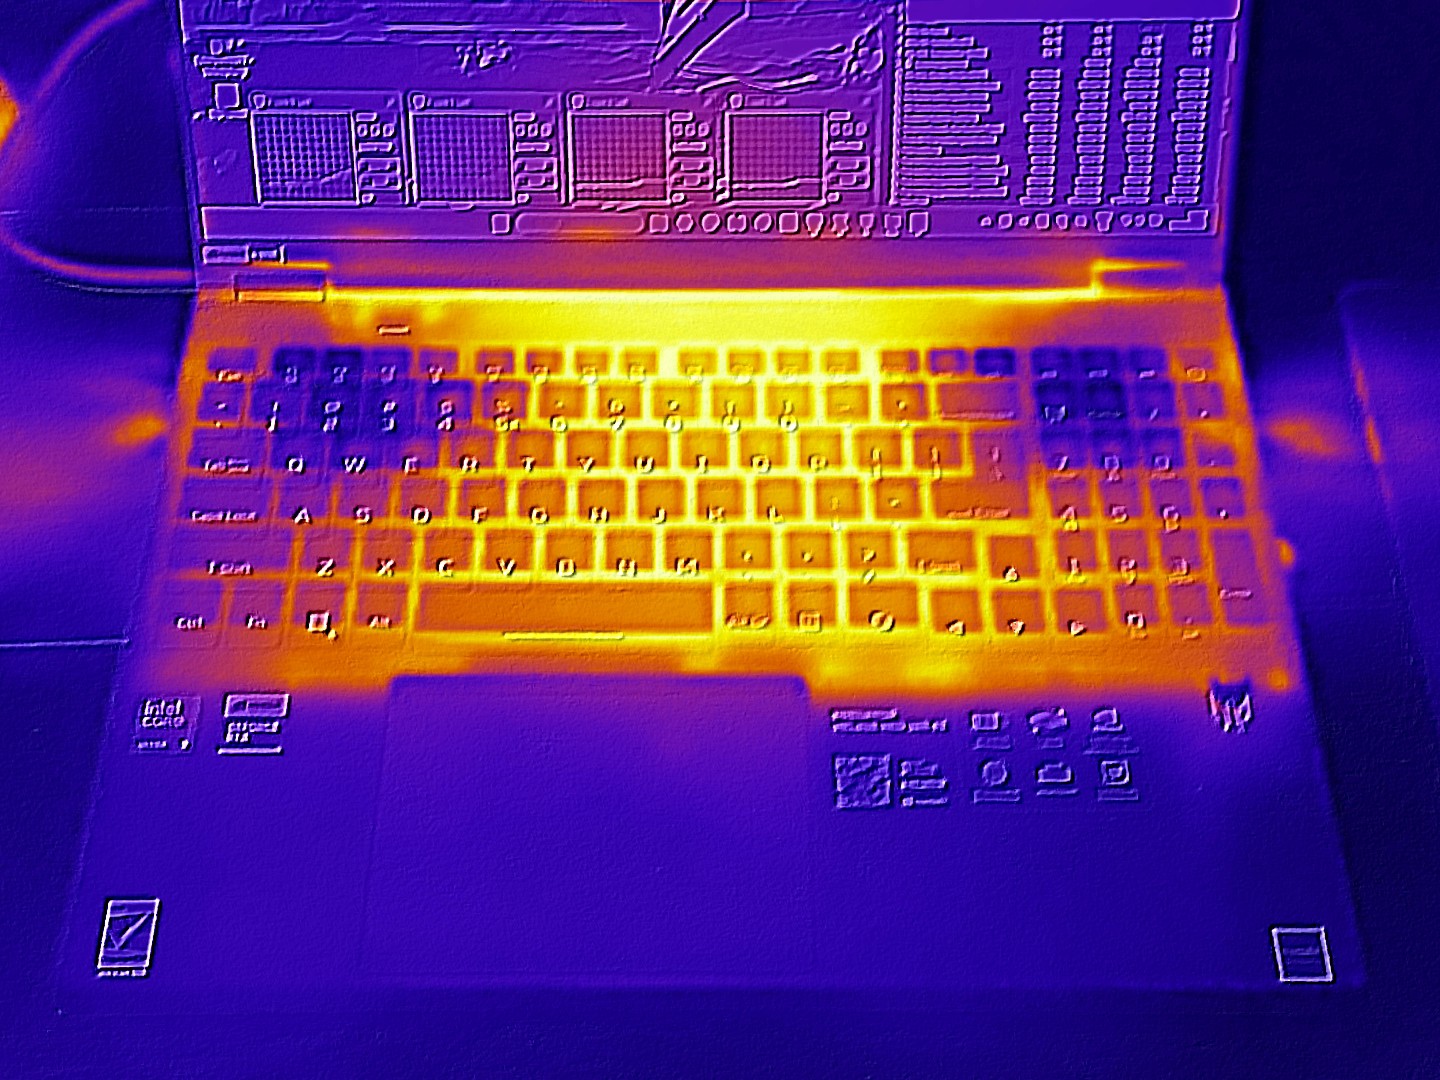
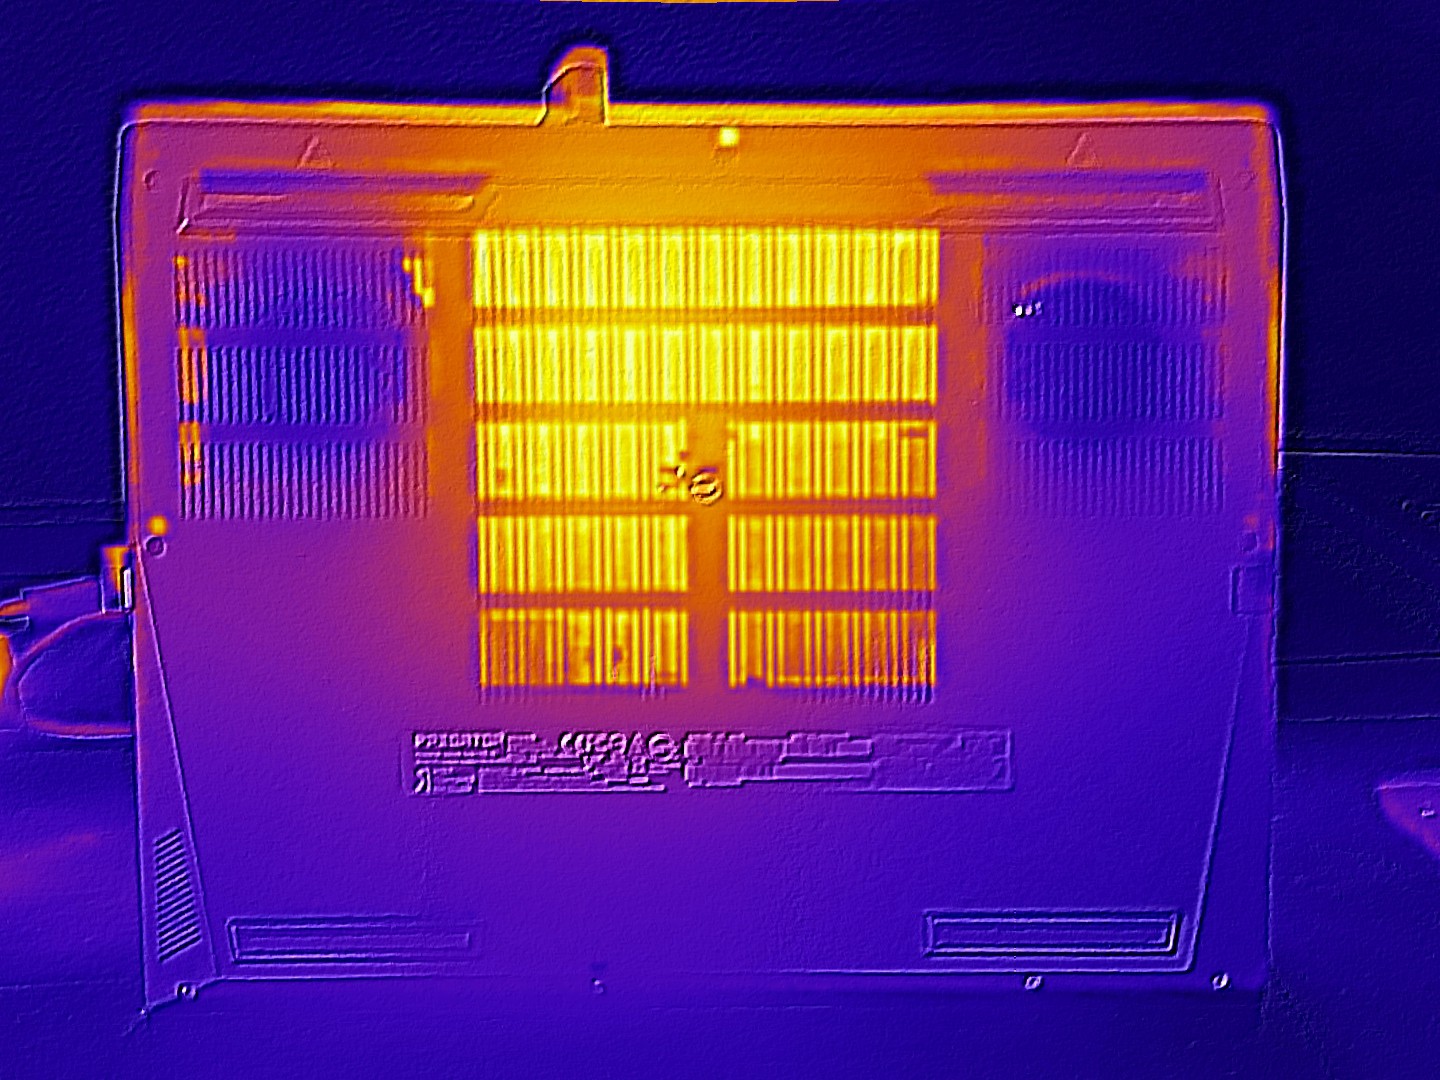
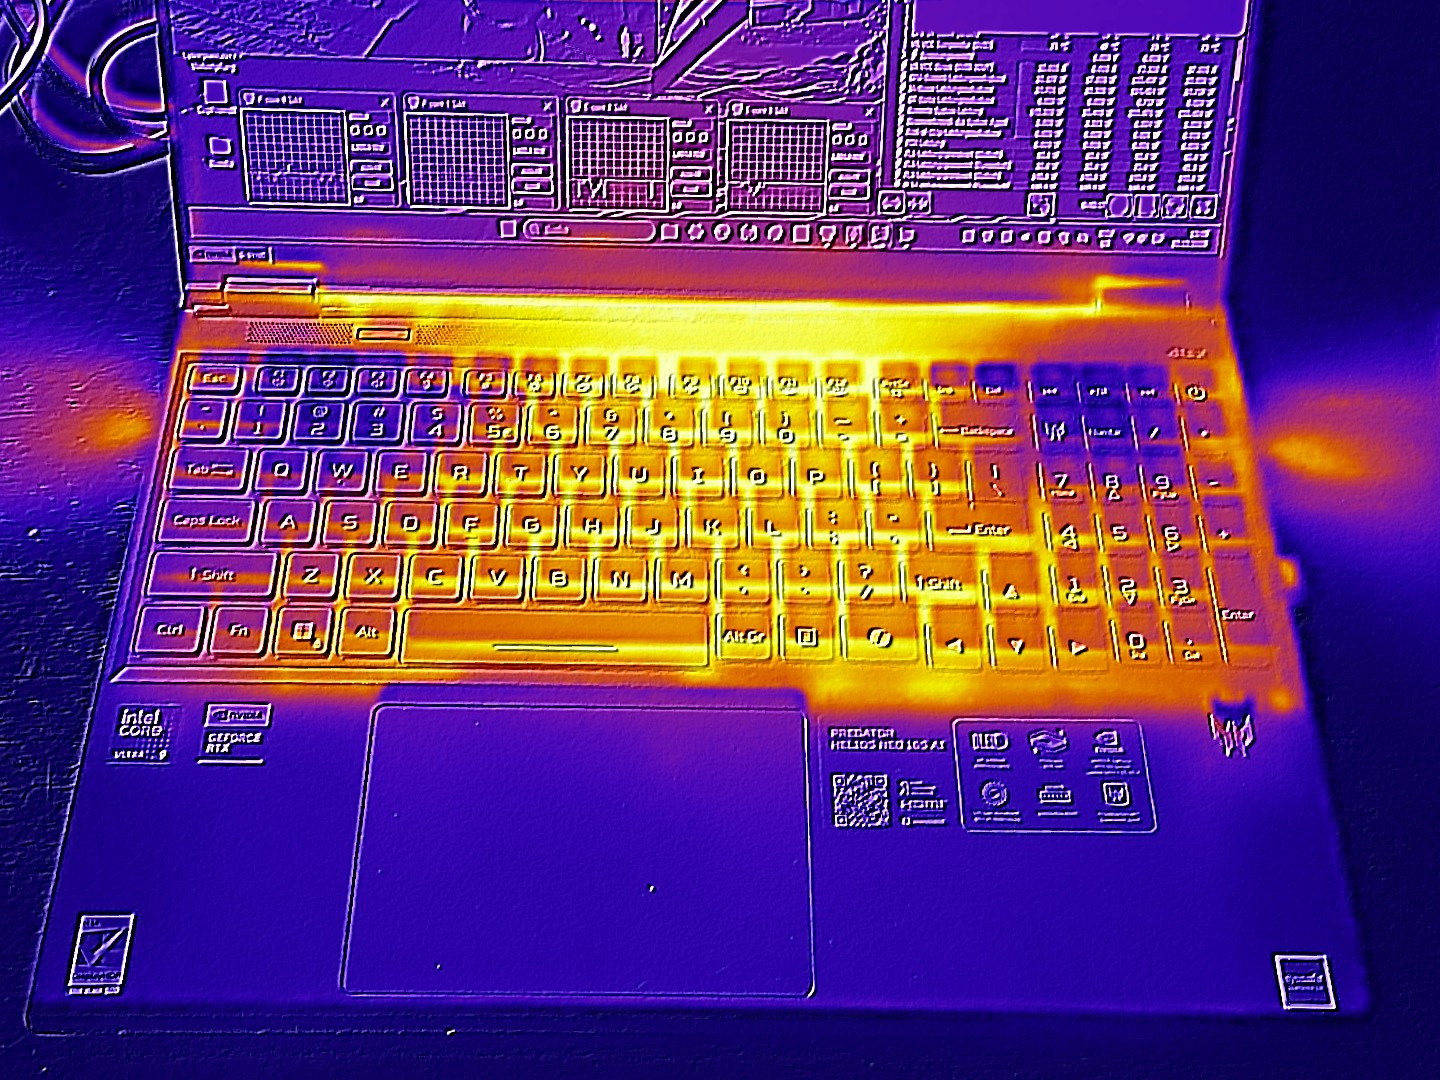
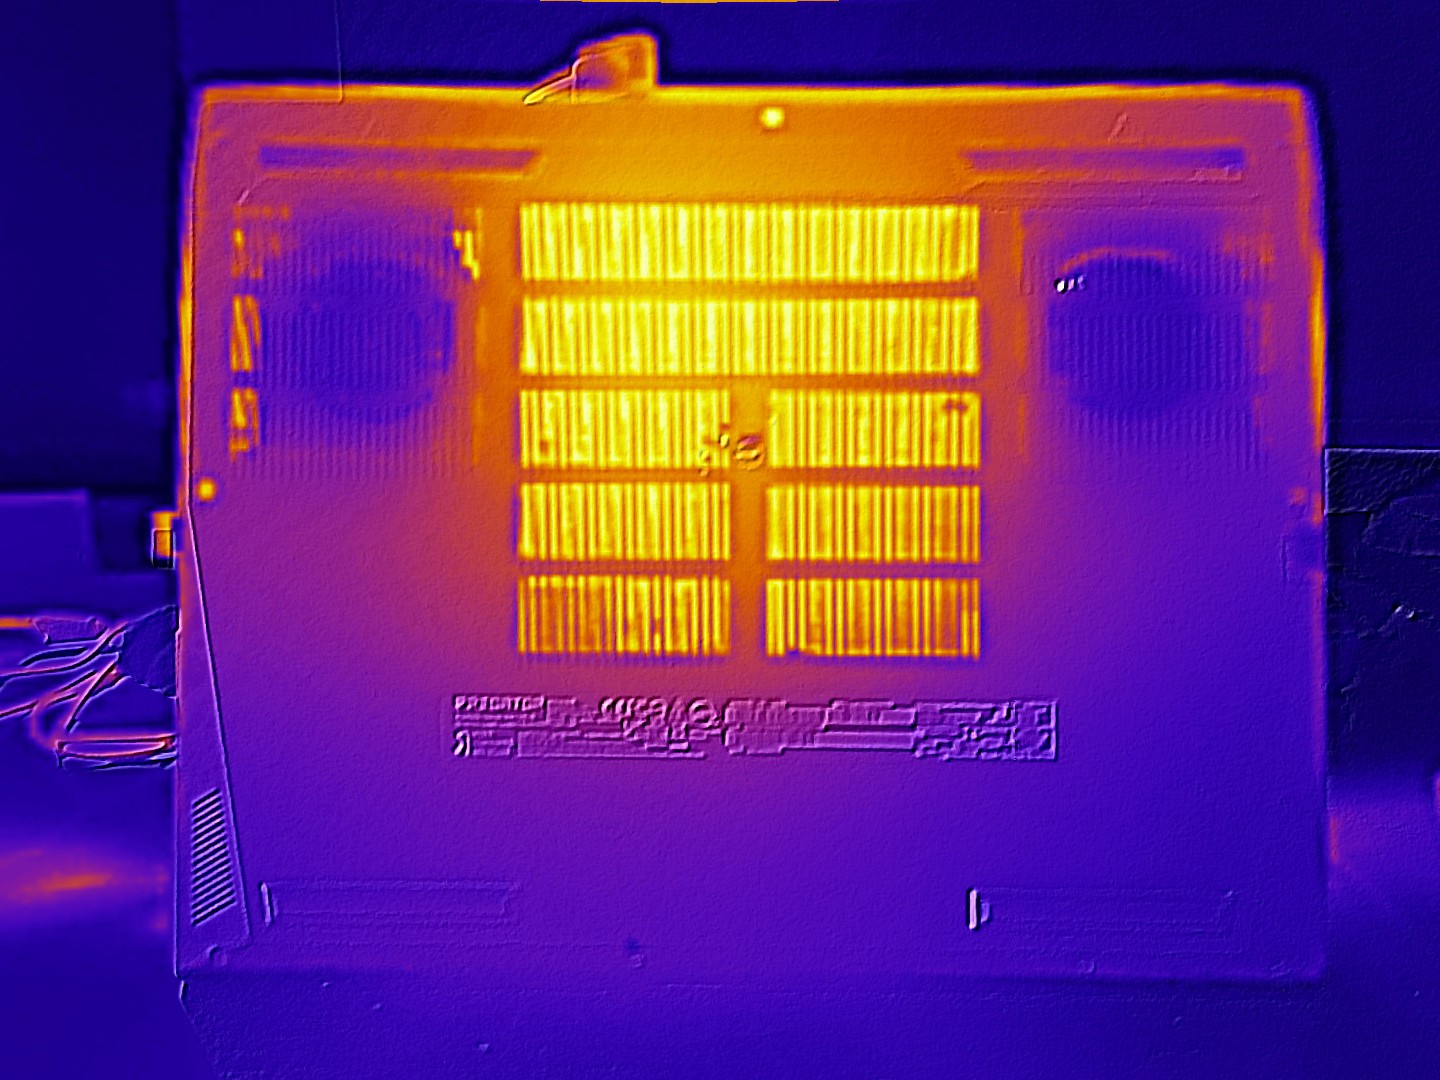
Temperature
The conclusion regarding temperature development is similar. As long as the notebook is idling, the surfaces remain pleasantly cool and stay below 30 °C. In 3D mode, the bottom of the case, in particular, reaches much higher temperatures: a maximum of 55 °C argues against gaming sessions on the lap. The temperature at the top is more moderate, with a maximum of 47 °C.
(-) The maximum temperature on the upper side is 47 °C / 117 F, compared to the average of 40.4 °C / 105 F, ranging from 21.2 to 68.8 °C for the class Gaming.
(-) The bottom heats up to a maximum of 55 °C / 131 F, compared to the average of 43.2 °C / 110 F
(+) In idle usage, the average temperature for the upper side is 26 °C / 79 F, compared to the device average of 33.9 °C / 93 F.
(-) 3: The average temperature for the upper side is 40.1 °C / 104 F, compared to the average of 33.9 °C / 93 F for the class Gaming.
(+) The palmrests and touchpad are cooler than skin temperature with a maximum of 31 °C / 87.8 F and are therefore cool to the touch.
(-) The average temperature of the palmrest area of similar devices was 28.8 °C / 83.8 F (-2.2 °C / -4 F).
| Acer Predator Helios Neo 16S AI PHN16S-71-94L9 Ultra 9 275HX, GeForce RTX 5070 Ti Laptop | Schenker XMG FUSION 16 (M25) Ultra 9 275HX, GeForce RTX 5070 Laptop | MSI Vector 16 HX AI A2XWHG Ultra 7 255HX, GeForce RTX 5070 Ti Laptop | Lenovo Legion 5 Pro 16IAX10H Ultra 9 275HX, GeForce RTX 5070 Ti Laptop | Razer Blade 16 RTX 5080 Ryzen AI 9 365, GeForce RTX 5080 Laptop | |
|---|---|---|---|---|---|
| Heat | 8% | -7% | -19% | -13% | |
| Maximum Upper Side * (°C) | 47 | 43.2 8% | 53 -13% | 48 -2% | 50.6 -8% |
| Maximum Bottom * (°C) | 55 | 48 13% | 52 5% | 50 9% | 48.6 12% |
| Idle Upper Side * (°C) | 28 | 26.6 5% | 33 -18% | 38 -36% | 35.2 -26% |
| Idle Bottom * (°C) | 29 | 27.6 5% | 29 -0% | 42 -45% | 37 -28% |
* ... smaller is better
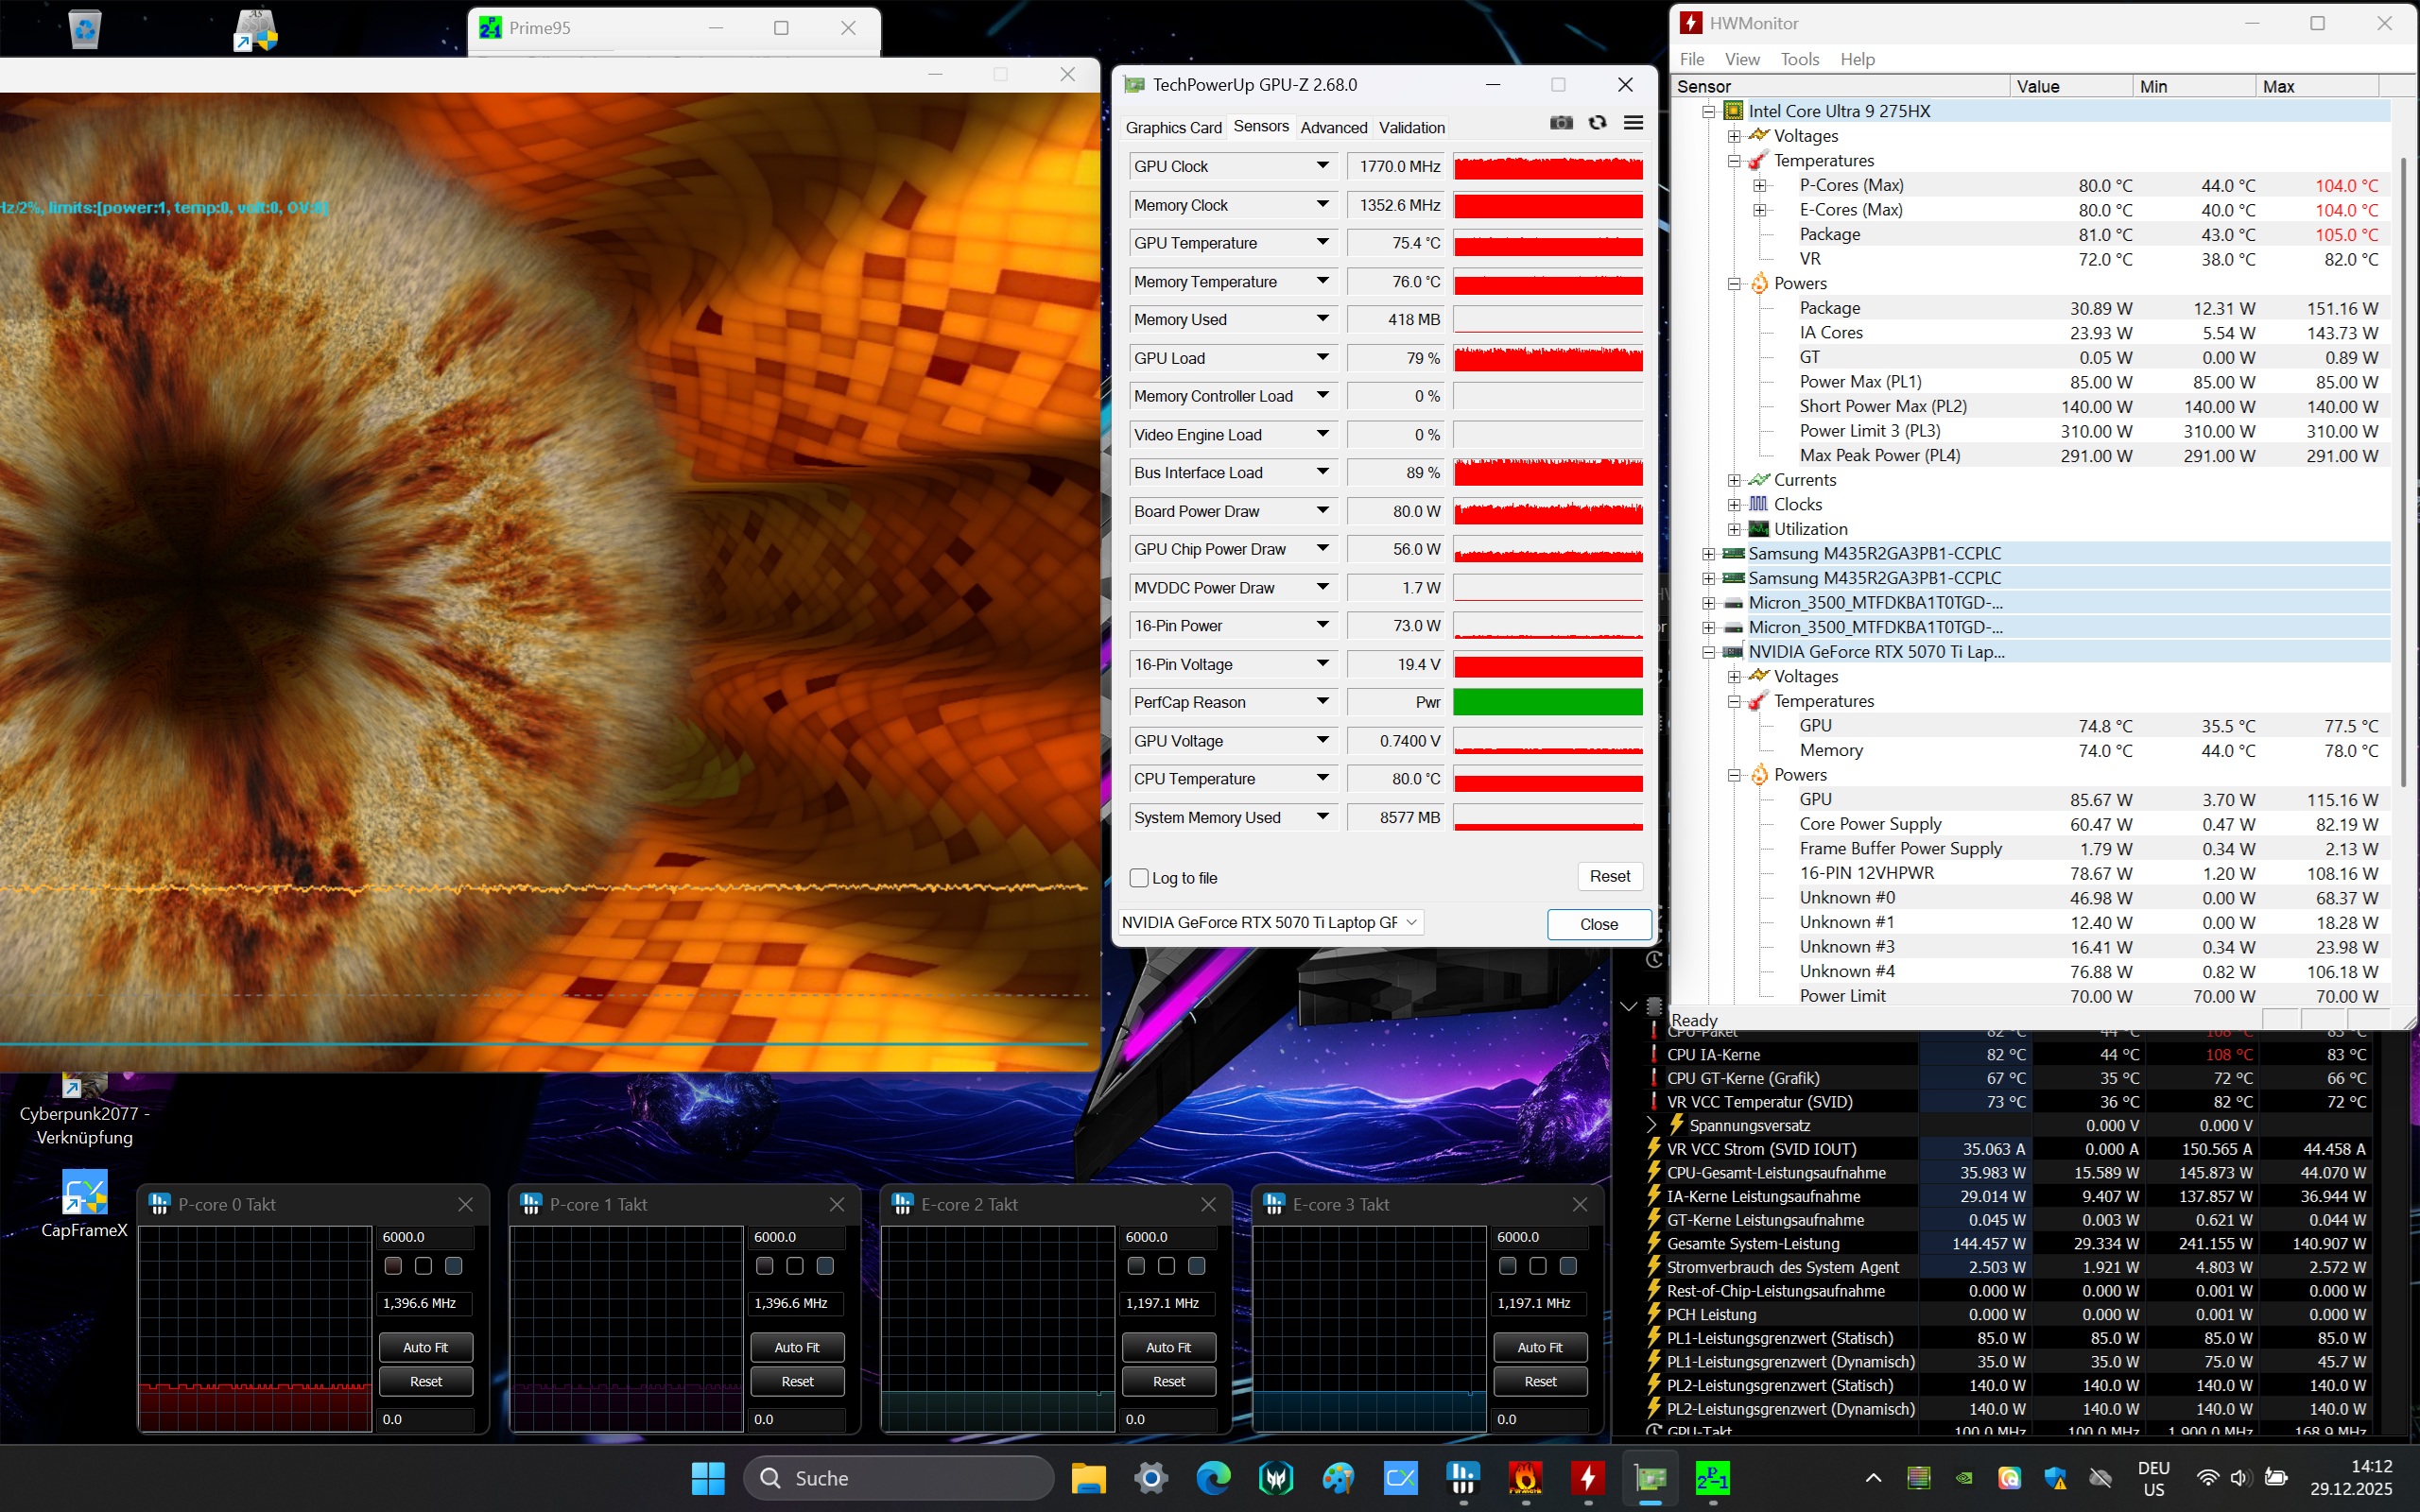
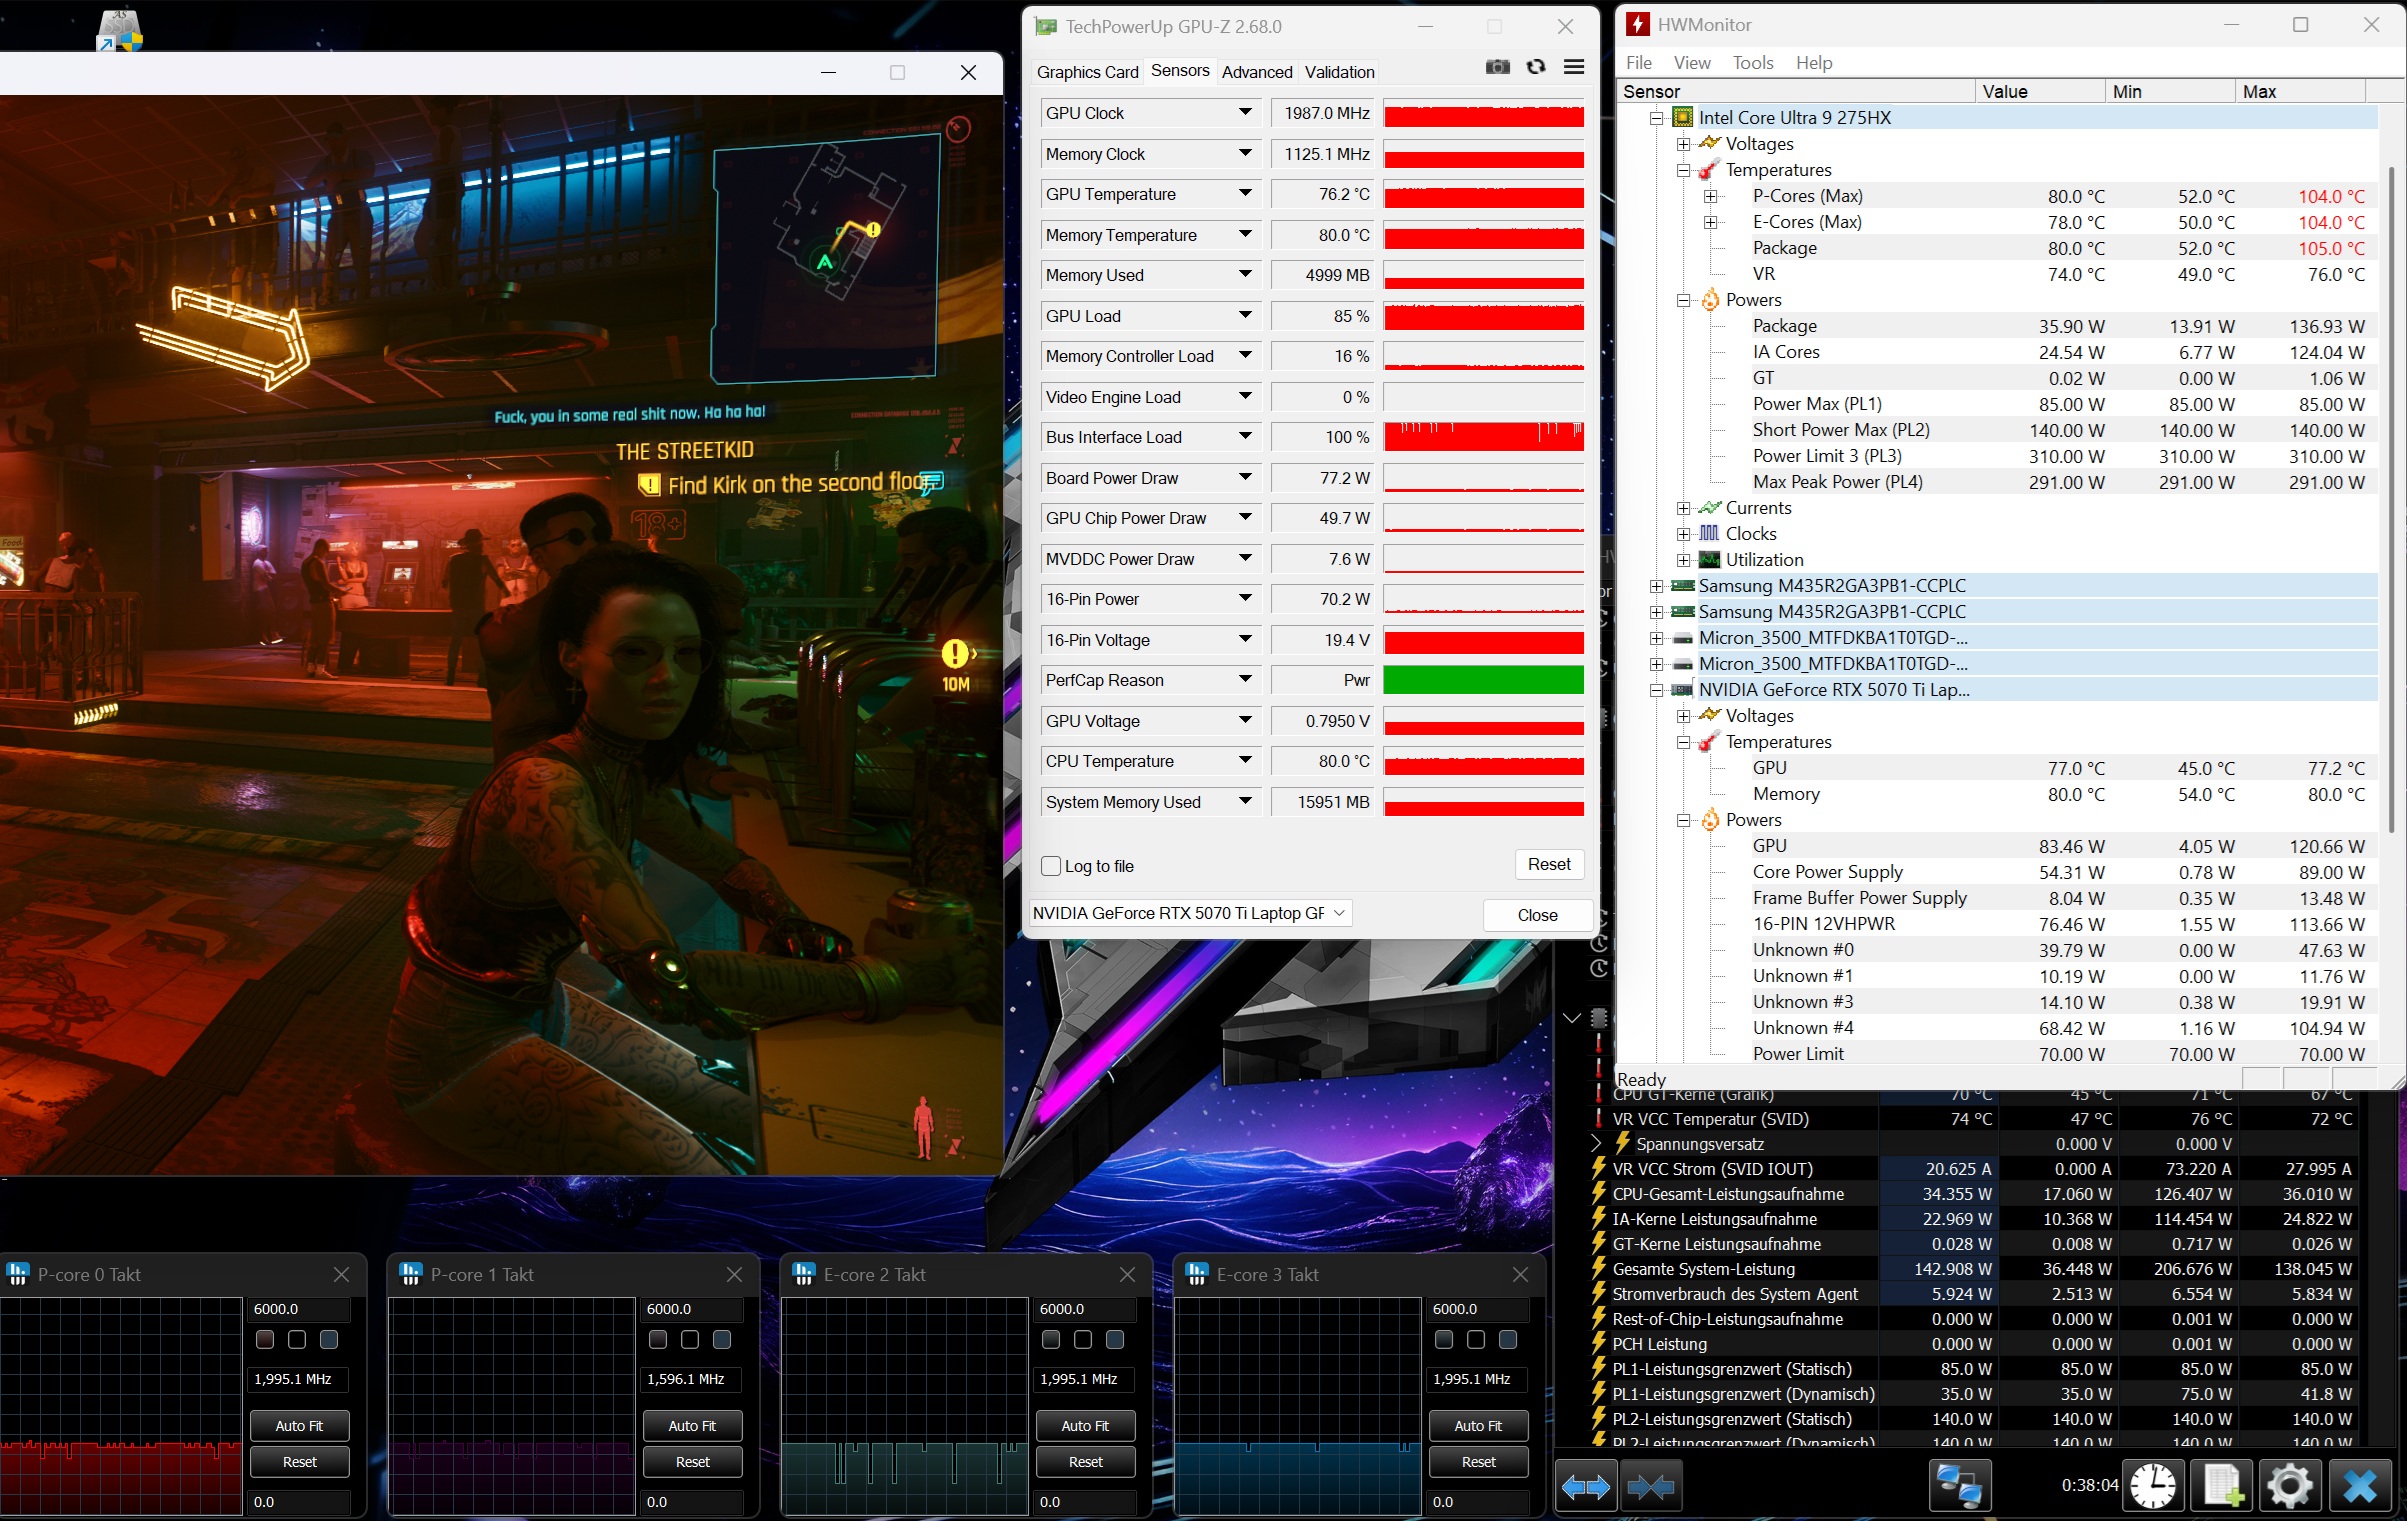
Stress test
In the stress test with the Furmark and Prime95 tools, the CPU in particular worked up quite a sweat. After briefly exceeding 100 °C, the temperature leveled off at an acceptable 80 °C. Meanwhile, the GPU settled in at around 75 °C.
Speakers
The sound quality is in the mid-range of the test devices. While the maximum volume is quite convincing, the bass could, as so often, be even more powerful.
Acer Predator Helios Neo 16S AI PHN16S-71-94L9 audio analysis
(+) | speakers can play relatively loud (86 dB)
Bass 100 - 315 Hz
(-) | nearly no bass - on average 24.8% lower than median
(±) | linearity of bass is average (12.6% delta to prev. frequency)
Mids 400 - 2000 Hz
(±) | higher mids - on average 5.9% higher than median
(+) | mids are linear (6.4% delta to prev. frequency)
Highs 2 - 16 kHz
(+) | balanced highs - only 2.8% away from median
(+) | highs are linear (5.9% delta to prev. frequency)
Overall 100 - 16.000 Hz
(±) | linearity of overall sound is average (17.3% difference to median)
Compared to same class
» 47% of all tested devices in this class were better, 12% similar, 41% worse
» The best had a delta of 6%, average was 18%, worst was 132%
Compared to all devices tested
» 32% of all tested devices were better, 8% similar, 59% worse
» The best had a delta of 4%, average was 23%, worst was 134%
Lenovo Legion 5 Pro 16IAX10H audio analysis
(±) | speaker loudness is average but good (78.2 dB)
Bass 100 - 315 Hz
(-) | nearly no bass - on average 21.1% lower than median
(±) | linearity of bass is average (8% delta to prev. frequency)
Mids 400 - 2000 Hz
(±) | higher mids - on average 6.3% higher than median
(+) | mids are linear (6.5% delta to prev. frequency)
Highs 2 - 16 kHz
(+) | balanced highs - only 1.6% away from median
(+) | highs are linear (4.9% delta to prev. frequency)
Overall 100 - 16.000 Hz
(±) | linearity of overall sound is average (18.3% difference to median)
Compared to same class
» 58% of all tested devices in this class were better, 9% similar, 33% worse
» The best had a delta of 6%, average was 18%, worst was 132%
Compared to all devices tested
» 40% of all tested devices were better, 8% similar, 52% worse
» The best had a delta of 4%, average was 23%, worst was 134%
Energy management
Power consumption
As the TGP and TDP are kept within limits, the energy requirement is lower than that of other devices in this performance class, both in idle and under load. This also explains the relatively low 230-watt power supply unit.
| Off / Standby | |
| Idle | |
| Load |
|
Key:
min: | |
| Acer Predator Helios Neo 16S AI PHN16S-71-94L9 Ultra 9 275HX, GeForce RTX 5070 Ti Laptop | Schenker XMG FUSION 16 (M25) Ultra 9 275HX, GeForce RTX 5070 Laptop | MSI Vector 16 HX AI A2XWHG Ultra 7 255HX, GeForce RTX 5070 Ti Laptop | Lenovo Legion 5 Pro 16IAX10H Ultra 9 275HX, GeForce RTX 5070 Ti Laptop | Razer Blade 16 RTX 5080 Ryzen AI 9 365, GeForce RTX 5080 Laptop | Average of class Gaming | |
|---|---|---|---|---|---|---|
| Power Consumption | -54% | -49% | -75% | -24% | -69% | |
| Idle Minimum * (Watt) | 3.9 | 15.3 -292% | 7.1 -82% | 14 -259% | 7 -79% | 13 ? -233% |
| Idle Average * (Watt) | 11 | 16.8 -53% | 15.9 -45% | 14.3 -30% | 15 -36% | 18.6 ? -69% |
| Idle Maximum * (Watt) | 16.9 | 17.3 -2% | 29.5 -75% | 20.1 -19% | 15.4 9% | 24.2 ? -43% |
| Load Average * (Watt) | 123 | 94.7 23% | 124 -1% | 177 -44% | 108.5 12% | 108.7 ? 12% |
| Cyberpunk 2077 ultra * (Watt) | 152.7 | 185.3 -21% | 222 -45% | 255 -67% | 195.2 -28% | |
| Cyberpunk 2077 ultra external monitor * (Watt) | 144.9 | 180.9 -25% | 217 -50% | 255 -76% | 194.8 -34% | |
| Load Maximum * (Watt) | 229 | 242.7 -6% | 336 -47% | 294 -28% | 254.1 -11% | 255 ? -11% |
* ... smaller is better
Power consumption Cyberpunk / Stress test
Power consumption with external monitor
Battery life
Despite the moderate energy consumption, the runtimes are rather poor (Acer may still have to work on the power-saving mechanisms in battery mode). Around 5 hours in our WLAN test (brightness reduced to 150 cd/m²) was only just undercut by the Legion 5 Pro 16 in the test field. The other contenders achieve significantly better, 7 to 10 hours.
| Acer Predator Helios Neo 16S AI PHN16S-71-94L9 Ultra 9 275HX, GeForce RTX 5070 Ti Laptop, 76 Wh | Schenker XMG FUSION 16 (M25) Ultra 9 275HX, GeForce RTX 5070 Laptop, 99.8 Wh | MSI Vector 16 HX AI A2XWHG Ultra 7 255HX, GeForce RTX 5070 Ti Laptop, 90 Wh | Lenovo Legion 5 Pro 16IAX10H Ultra 9 275HX, GeForce RTX 5070 Ti Laptop, 80 Wh | Razer Blade 16 RTX 5080 Ryzen AI 9 365, GeForce RTX 5080 Laptop, 90 Wh | Average of class Gaming | |
|---|---|---|---|---|---|---|
| Battery runtime | 106% | 40% | -2% | 60% | 41% | |
| WiFi v1.3 (h) | 5 | 10.3 106% | 7 40% | 4.9 -2% | 8 60% | 7.07 ? 41% |
| H.264 (h) | 4.8 | 8.64 ? | ||||
| Load (h) | 1.7 | 1.502 ? |
Notebookcheck overall rating
The Predator Helios Neo 16S AI does not stand out from the crowd in terms of quality or performance. Nevertheless, buyers get a good high-end gaming laptop.
Acer Predator Helios Neo 16S AI PHN16S-71-94L9
- 01/05/2026 v8
Florian Glaser
 Total Sustainability Score:
 Possible alternatives in comparison
Image | Model / Review | Price | Weight | Height | Display |
|---|---|---|---|---|---|
1. 82%  | Acer Predator Helios Neo 16S AI PHN16S-71-94L9 Intel Core Ultra 9 275HX ⎘ NVIDIA GeForce RTX 5070 Ti Laptop ⎘ 32 GB Memory, 1024 GB SSD | Amazon: List Price: 2400 EUR | 2.2 kg | 19.9 mm | 16.00" 2560x1600 189 PPI OLED |
2. 87.5%  | Schenker XMG FUSION 16 (M25) Intel Core Ultra 9 275HX ⎘ NVIDIA GeForce RTX 5070 Laptop ⎘ 64 GB Memory, 2048 GB SSD | Amazon: List Price: 2700€ | 2.1 kg | 23 mm | 16.00" 2880x1800 212 PPI OLED |
3. 84%  | MSI Vector 16 HX AI A2XWHG Intel Core Ultra 7 255HX ⎘ NVIDIA GeForce RTX 5070 Ti Laptop ⎘ 16 GB Memory, 512 GB SSD | Amazon: List Price: 2000 EUR | 2.6 kg | 28.6 mm | 16.00" 2560x1600 189 PPI IPS |
4. 84.5%  | Lenovo Legion 5 Pro 16IAX10H Intel Core Ultra 9 275HX ⎘ NVIDIA GeForce RTX 5070 Ti Laptop ⎘ 32 GB Memory, 1024 GB SSD | Amazon: 1. $2,449.00 Lenovo Legion Pro 5i Gen 10 ... 2. $2,602.46 Lenovo Legion Pro 7 16IAX10H... 3. $1,779.00 Lenovo Legion Pro 5 16" WQXG... List Price: 2500 Euro | 2.4 kg | 25.95 mm | 16.00" 2560x1600 189 PPI OLED |
5. 89.9%  | Asus ROG Zephyrus G16 2025 5070 Ti Intel Core Ultra 9 285H ⎘ NVIDIA GeForce RTX 5070 Ti Laptop ⎘ 32 GB Memory, 1024 GB SSD | Amazon: List Price: 3399€ | 1.9 kg | 17.4 mm | 16.00" 2560x1600 189 PPI |
6. 87.2%  | Razer Blade 16 RTX 5080 AMD Ryzen AI 9 365 ⎘ NVIDIA GeForce RTX 5080 Laptop ⎘ 32 GB Memory, 1024 GB SSD | Amazon: List Price: 3500 USD | 2.1 kg | 17.4 mm | 16.00" 2560x1600 189 PPI OLED |
Transparency
The selection of devices to be reviewed is made by our editorial team. The test sample was provided to the author as a loan by the manufacturer or retailer for the purpose of this review. The lender had no influence on this review, nor did the manufacturer receive a copy of this review before publication. There was no obligation to publish this review. As an independent media company, Notebookcheck is not subjected to the authority of manufacturers, retailers or publishers.
This is how Notebookcheck is testing
Every year, Notebookcheck independently reviews hundreds of laptops and smartphones using standardized procedures to ensure that all results are comparable. We have continuously developed our test methods for around 20 years and set industry standards in the process. In our test labs, high-quality measuring equipment is utilized by experienced technicians and editors. These tests involve a multi-stage validation process. Our complex rating system is based on hundreds of well-founded measurements and benchmarks, which maintains objectivity. Further information on our test methods can be found here.

