Verdict - The XMG Fusion 16 with OLED is worth considering
With the Fusion 16, XMG offers a slightly more powerful version of the well-known Core 16. The standout feature is the new OLED panel, which delivers outstanding image quality and noticeably more vibrant visuals than the IPS version. Only the HDR brightness could be a bit higher. That said, the IPS panel with a 300 Hz refresh rate remains a solid alternative and does not suffer from PWM issues.
The faster Intel HX processor delivers significantly higher raw CPU performance, but its impact on gaming is limited. Overall, the fans remain somewhat quieter than those of the competition, and XMG offers greater control over configuration options, including up to 128 GB of RAM and 16 TB of SSD storage.
Overall, the new XMG Fusion 16 is a very strong all-around package, and the OLED display is worth choosing if you want the best possible image quality. Battery life remains largely unchanged. However, if you prefer an IPS panel, the more affordable Core 16 is also a good option, as gaming performance with the AMD processor is only marginally lower.
Pros
Cons
Price and availability
The Fusion 16 can be ordered directly from XMG starting at €1,899. Our test configuration, which includes numerous upgrades, currently costs around €2,700.
Translator’s note: XMG laptops are not officially available in North America.
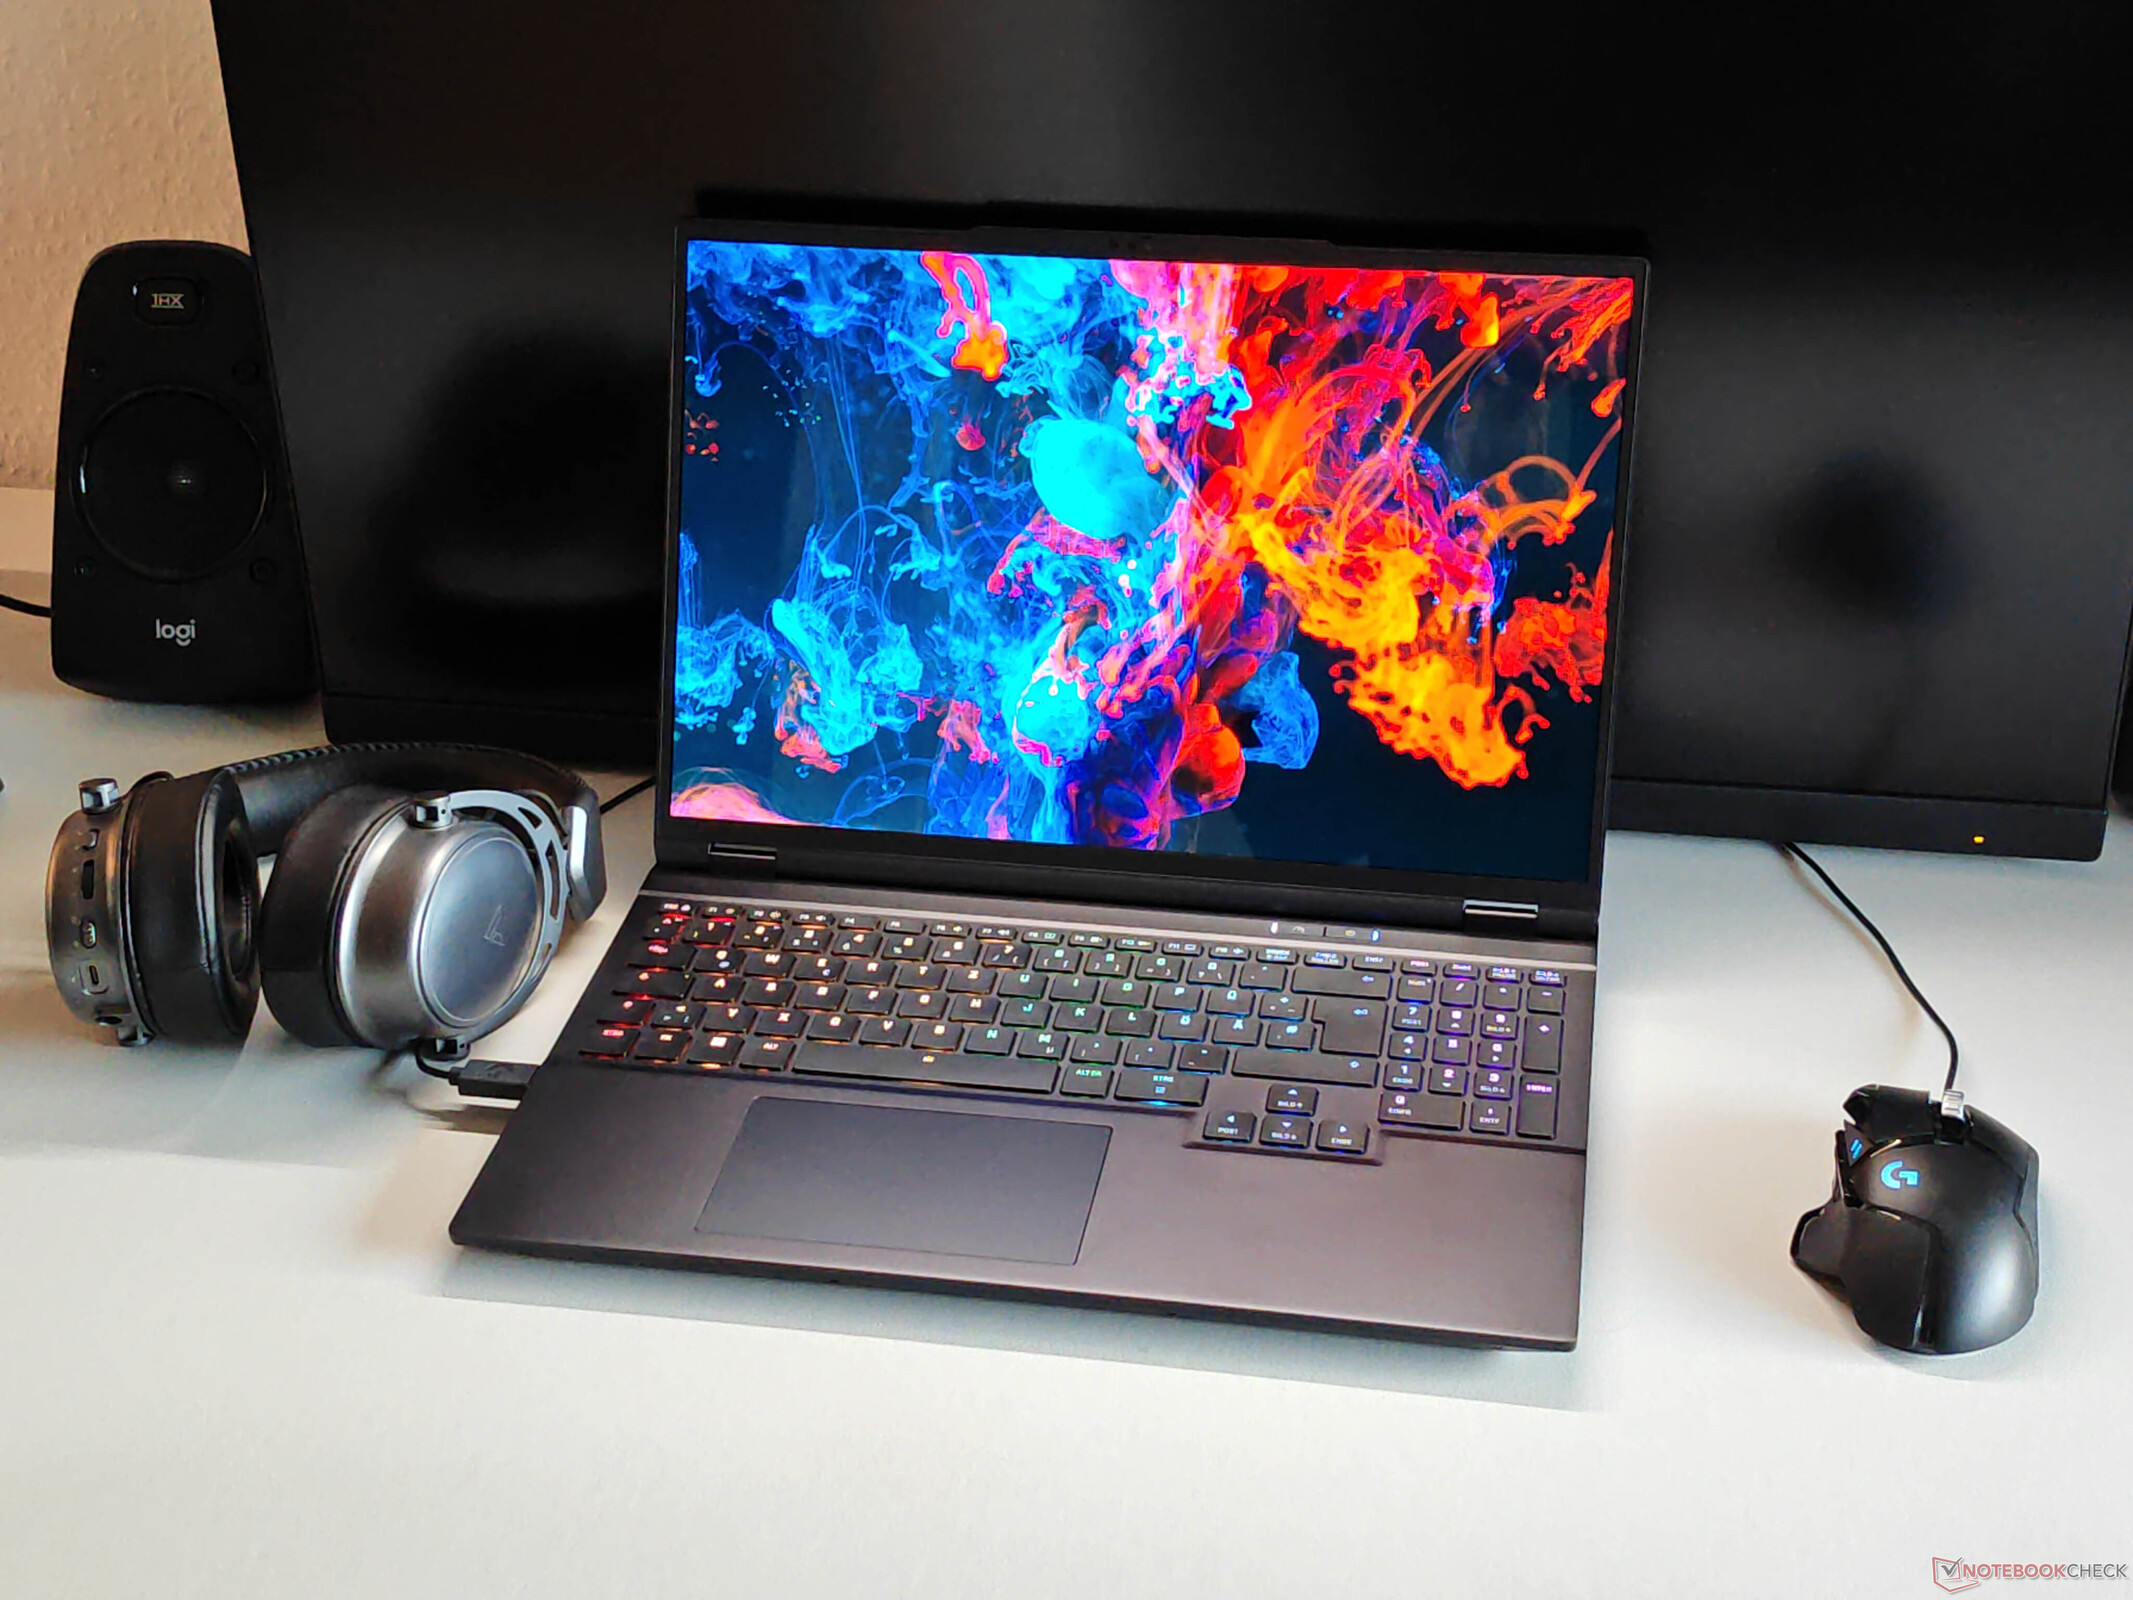
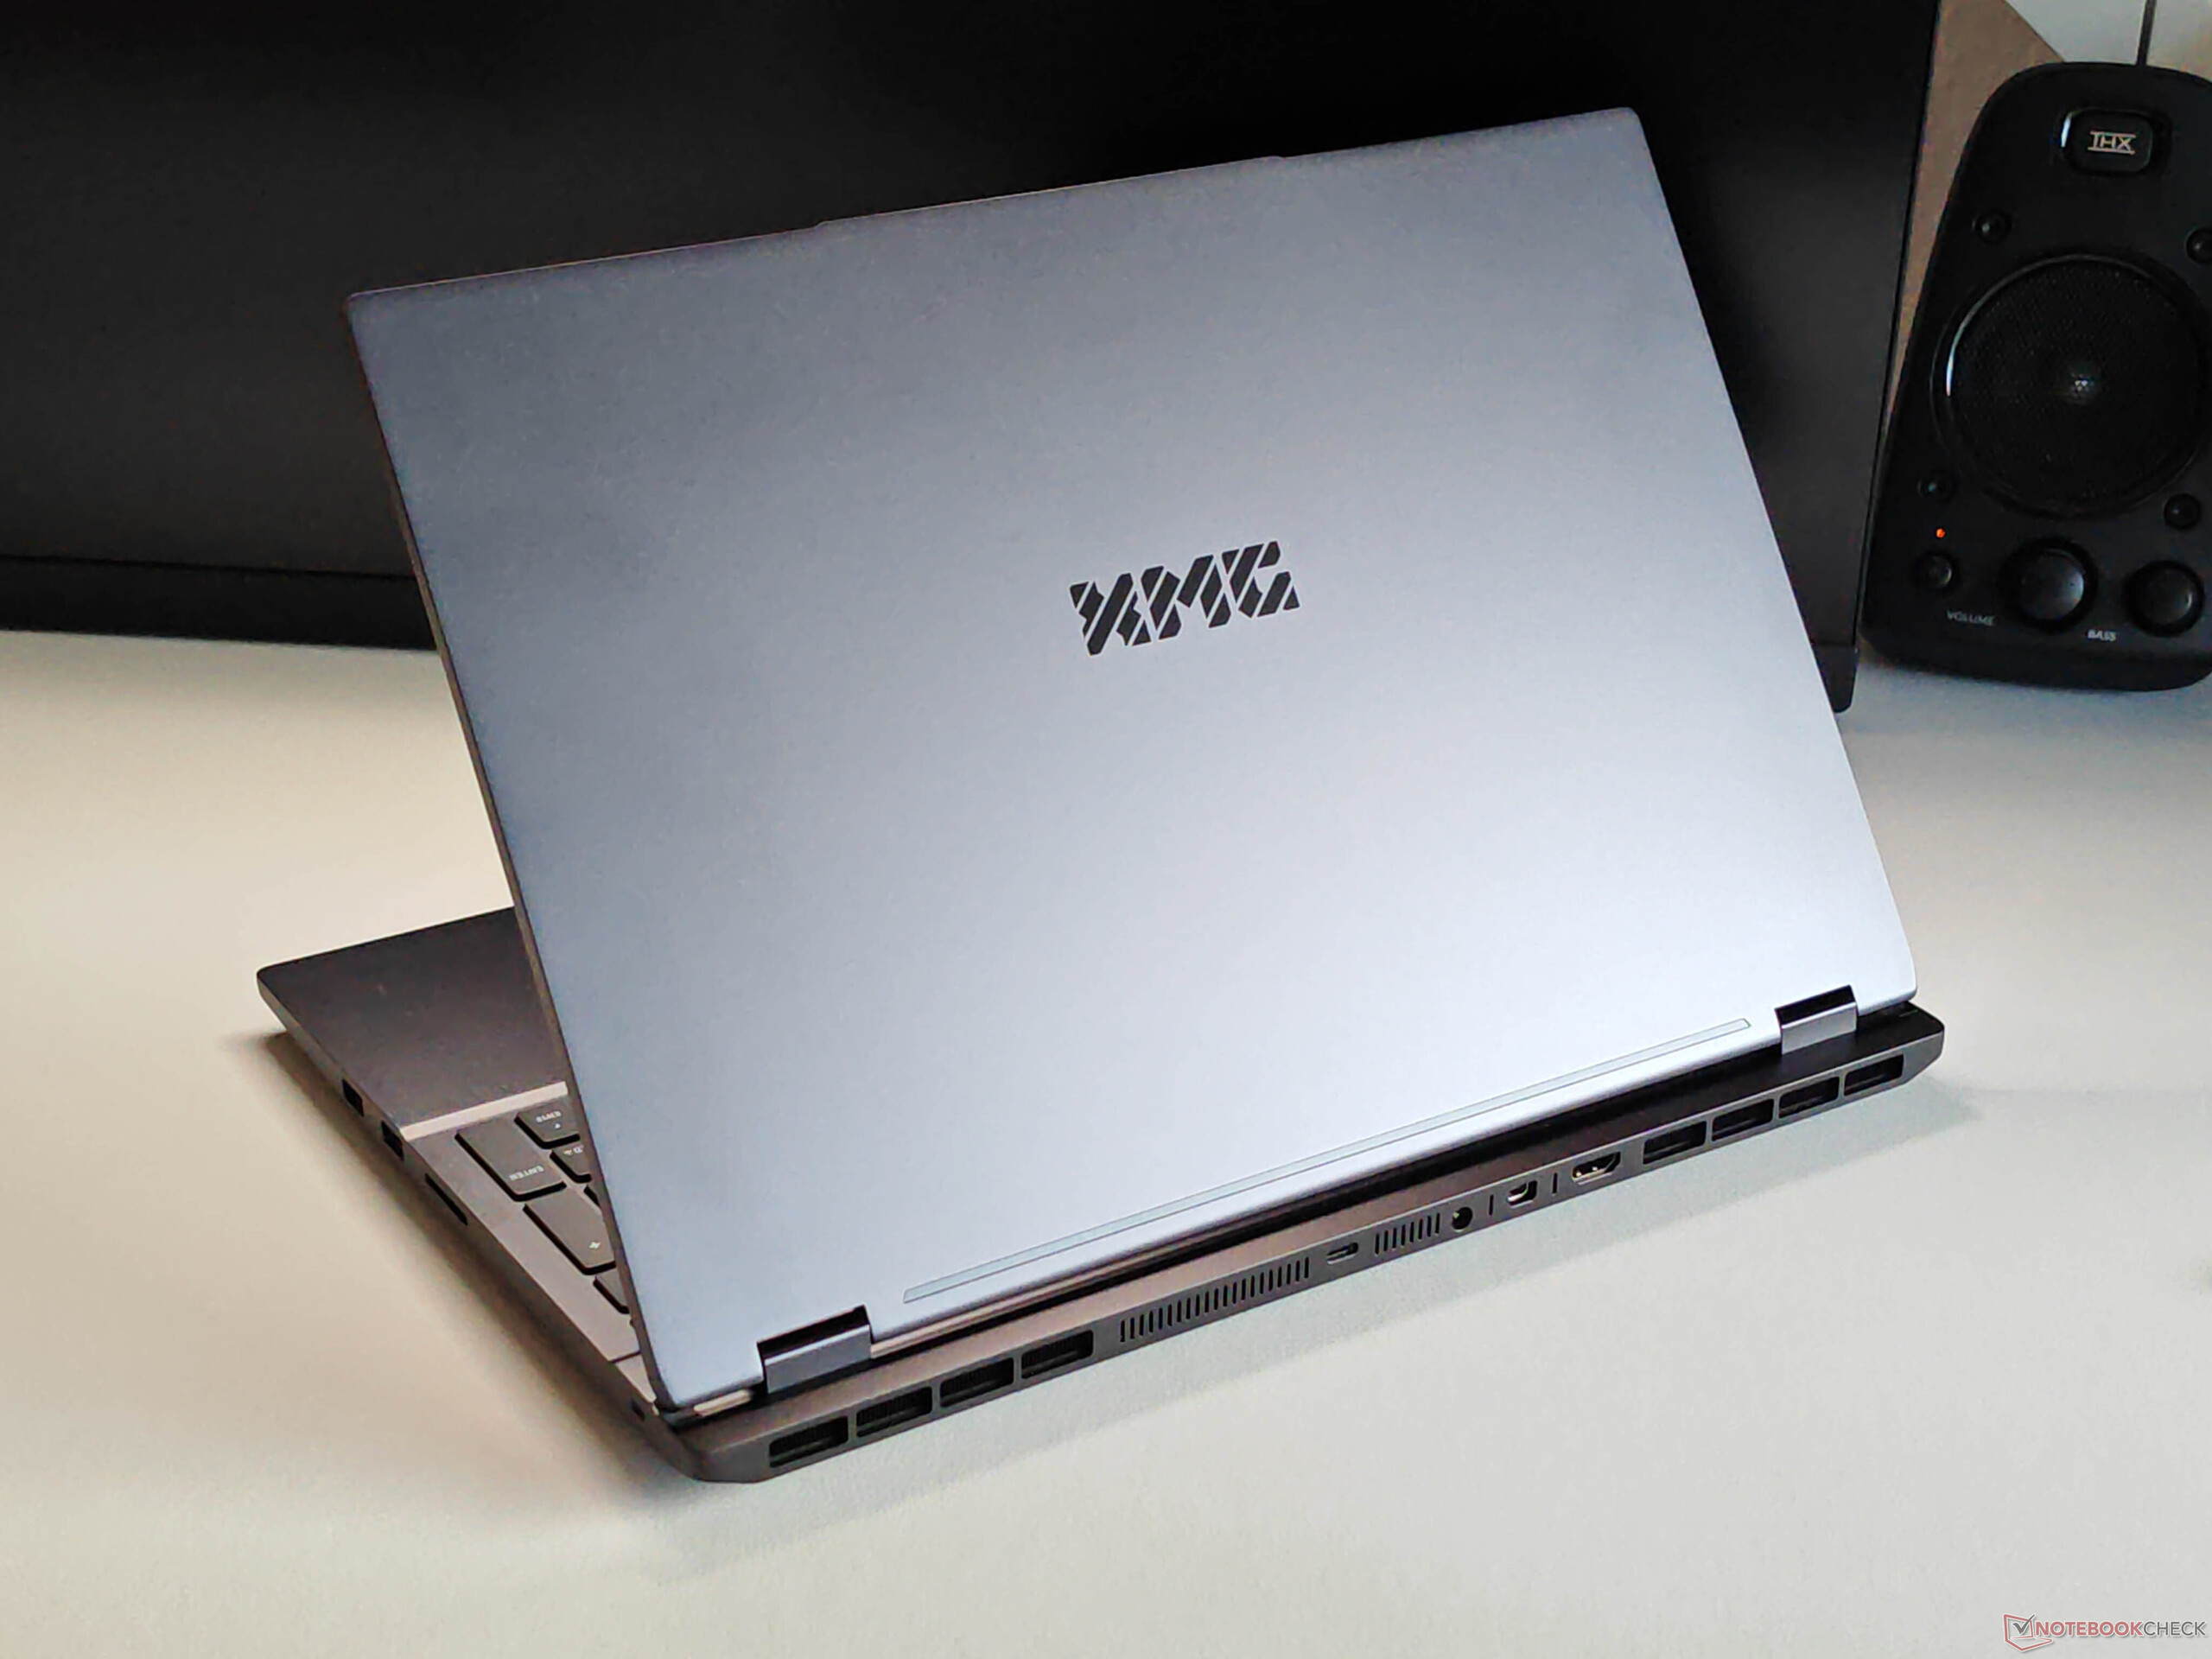
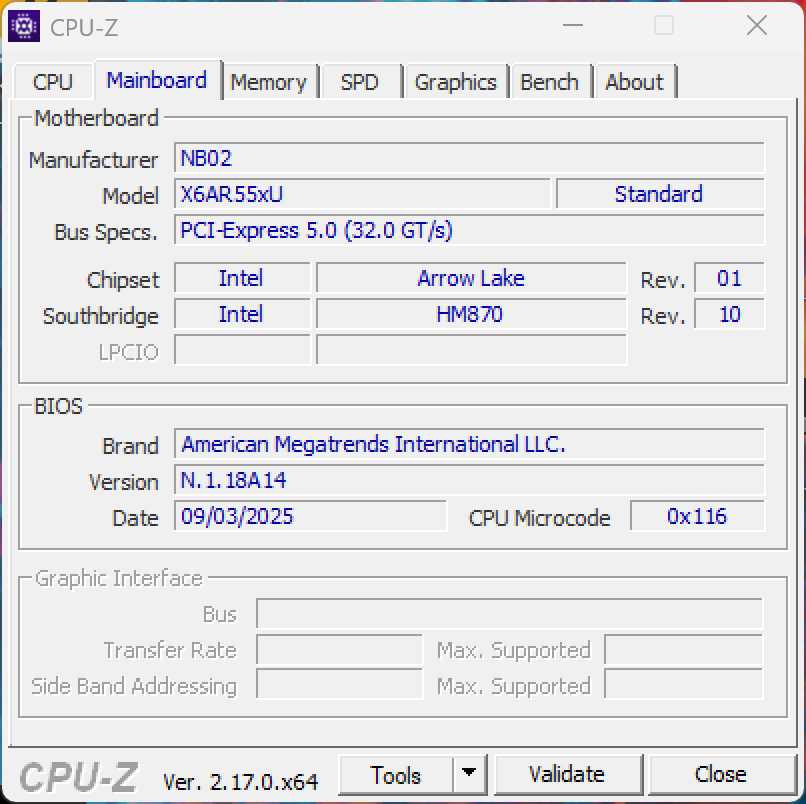
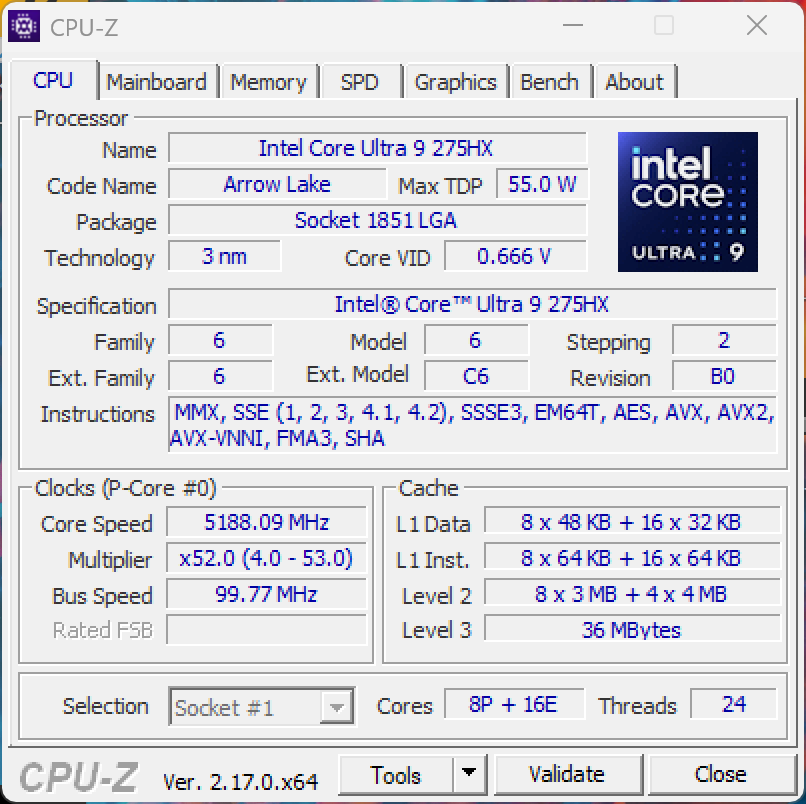
The Fusion 16 is XMG’s first gaming laptop to feature an OLED panel. The chassis is already familiar from the current XMG Core 16 (AMD Ryzen with IPS), but the Fusion 16 is powered by the high-performance Intel Core Ultra 9 275HX, the familiar GeForce RTX 5070 Laptop GPU, and a new 120 Hz OLED display.
Specifications
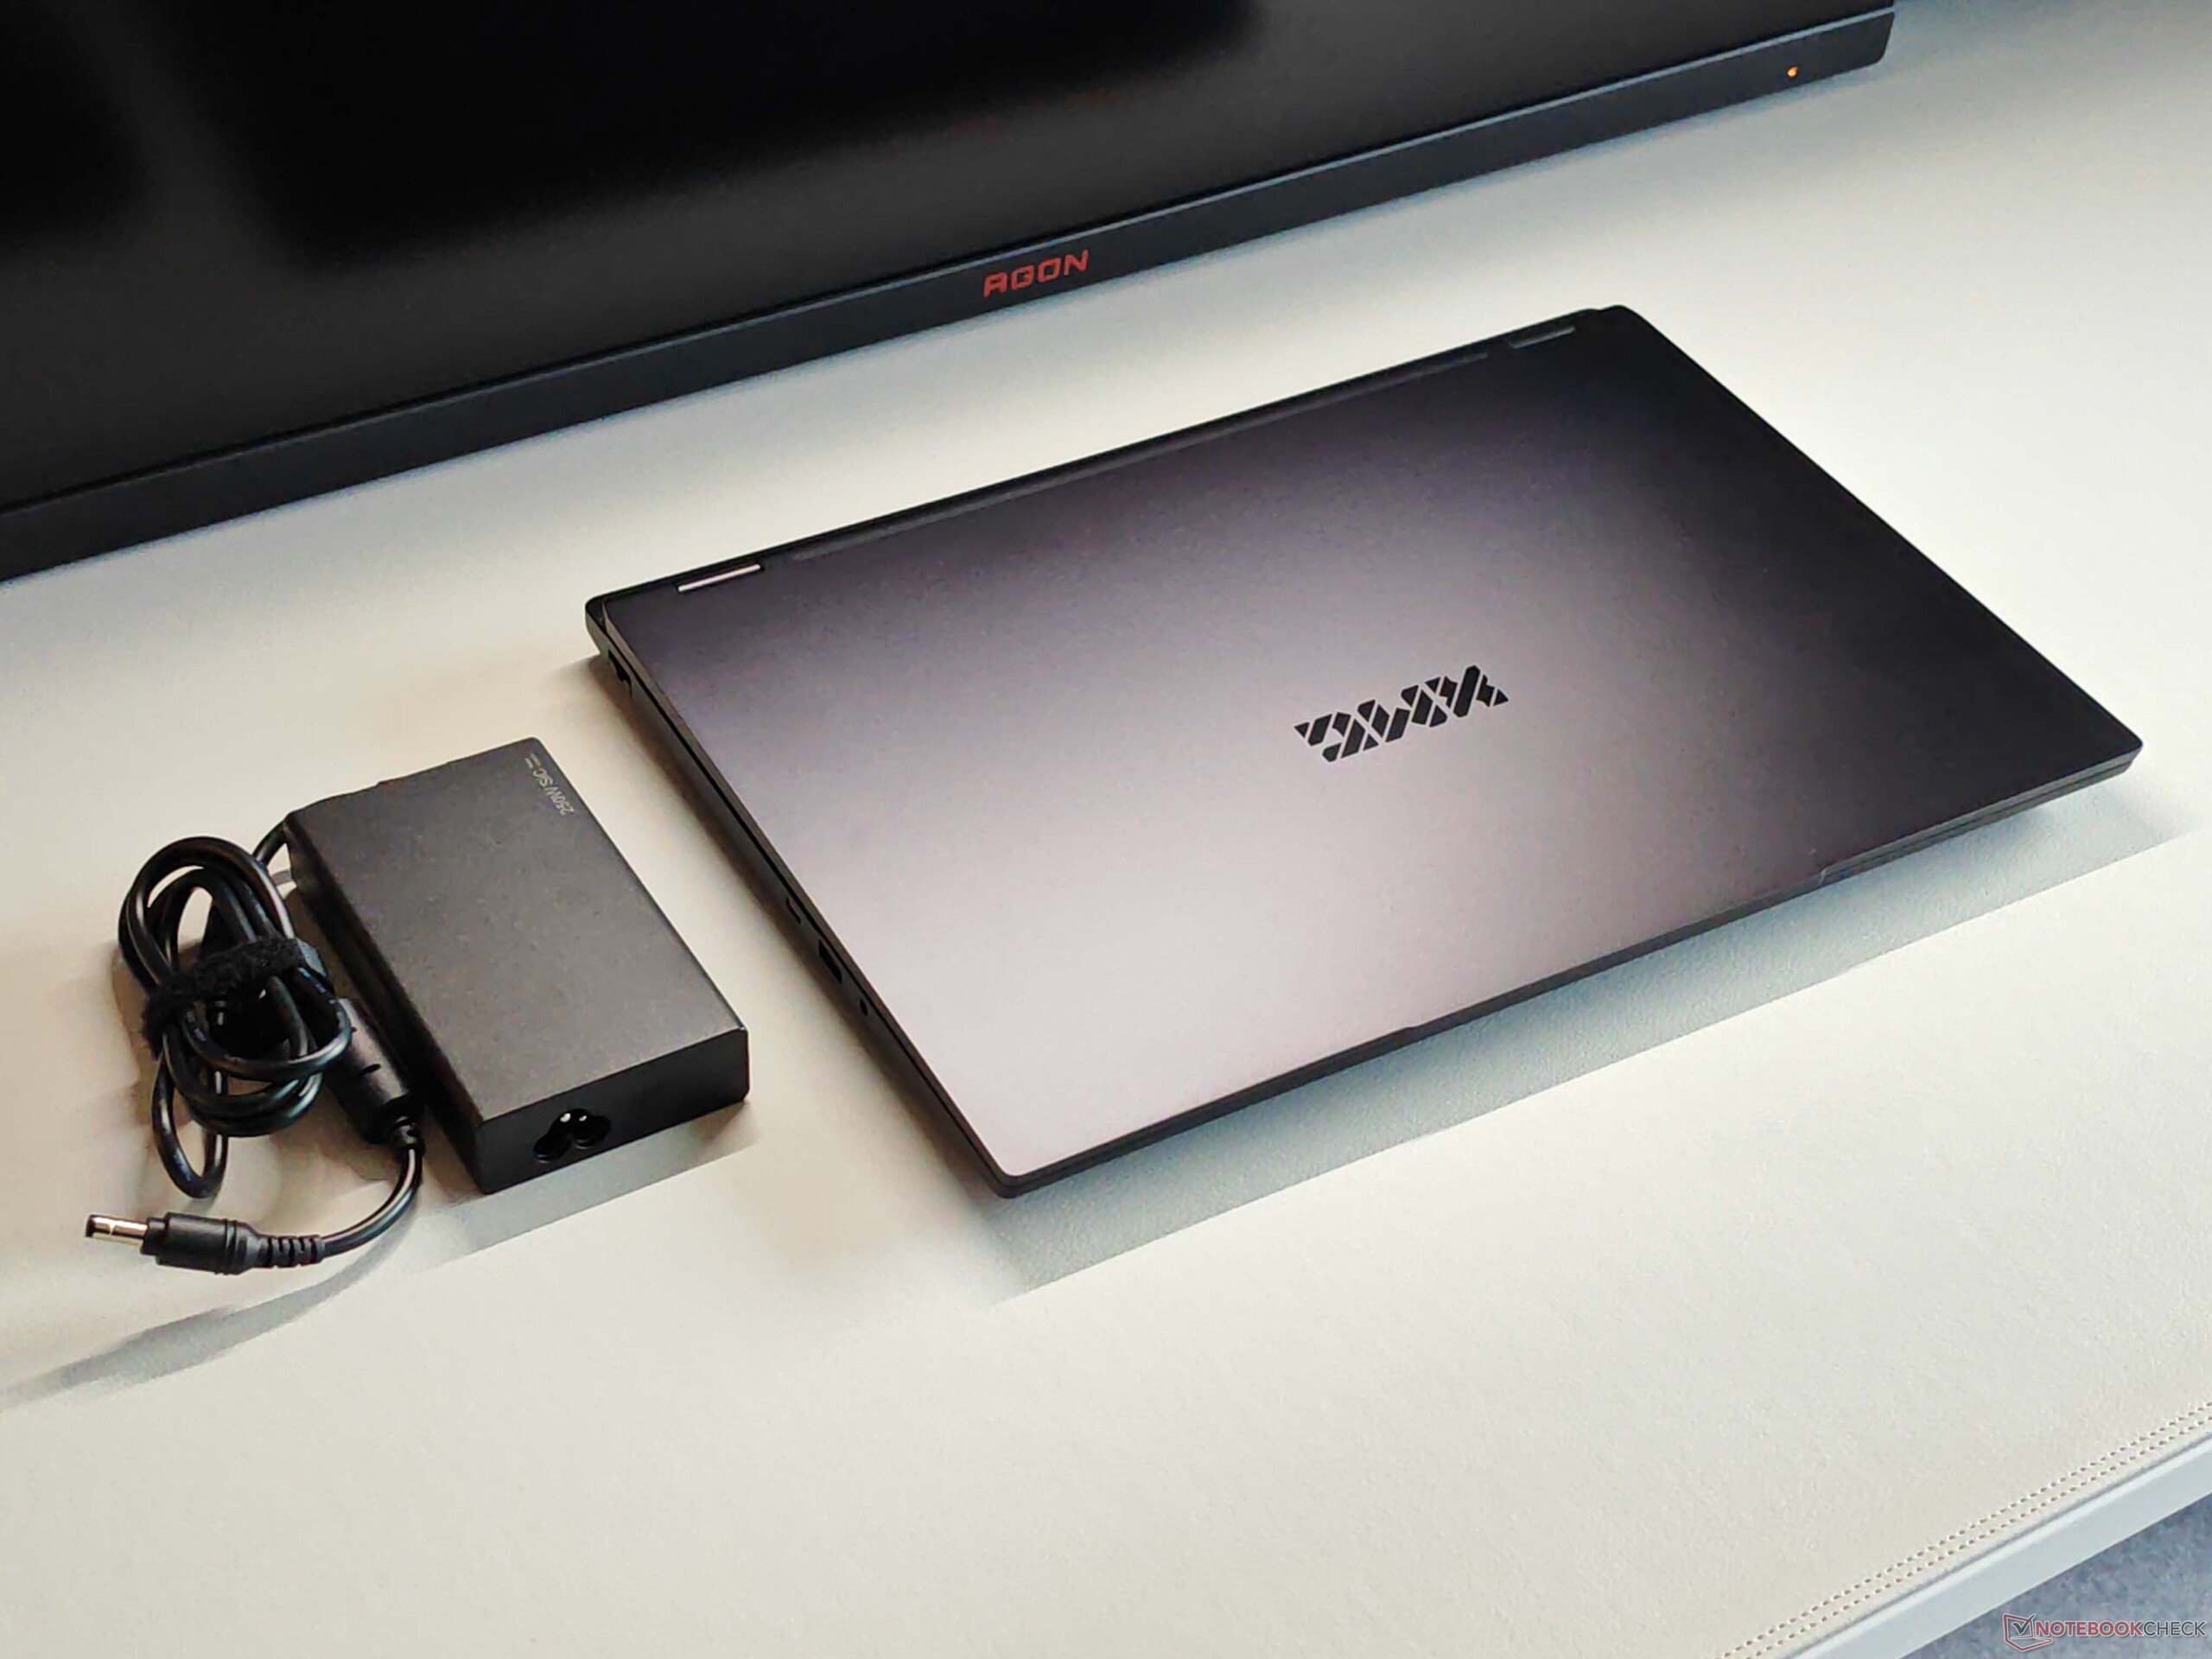
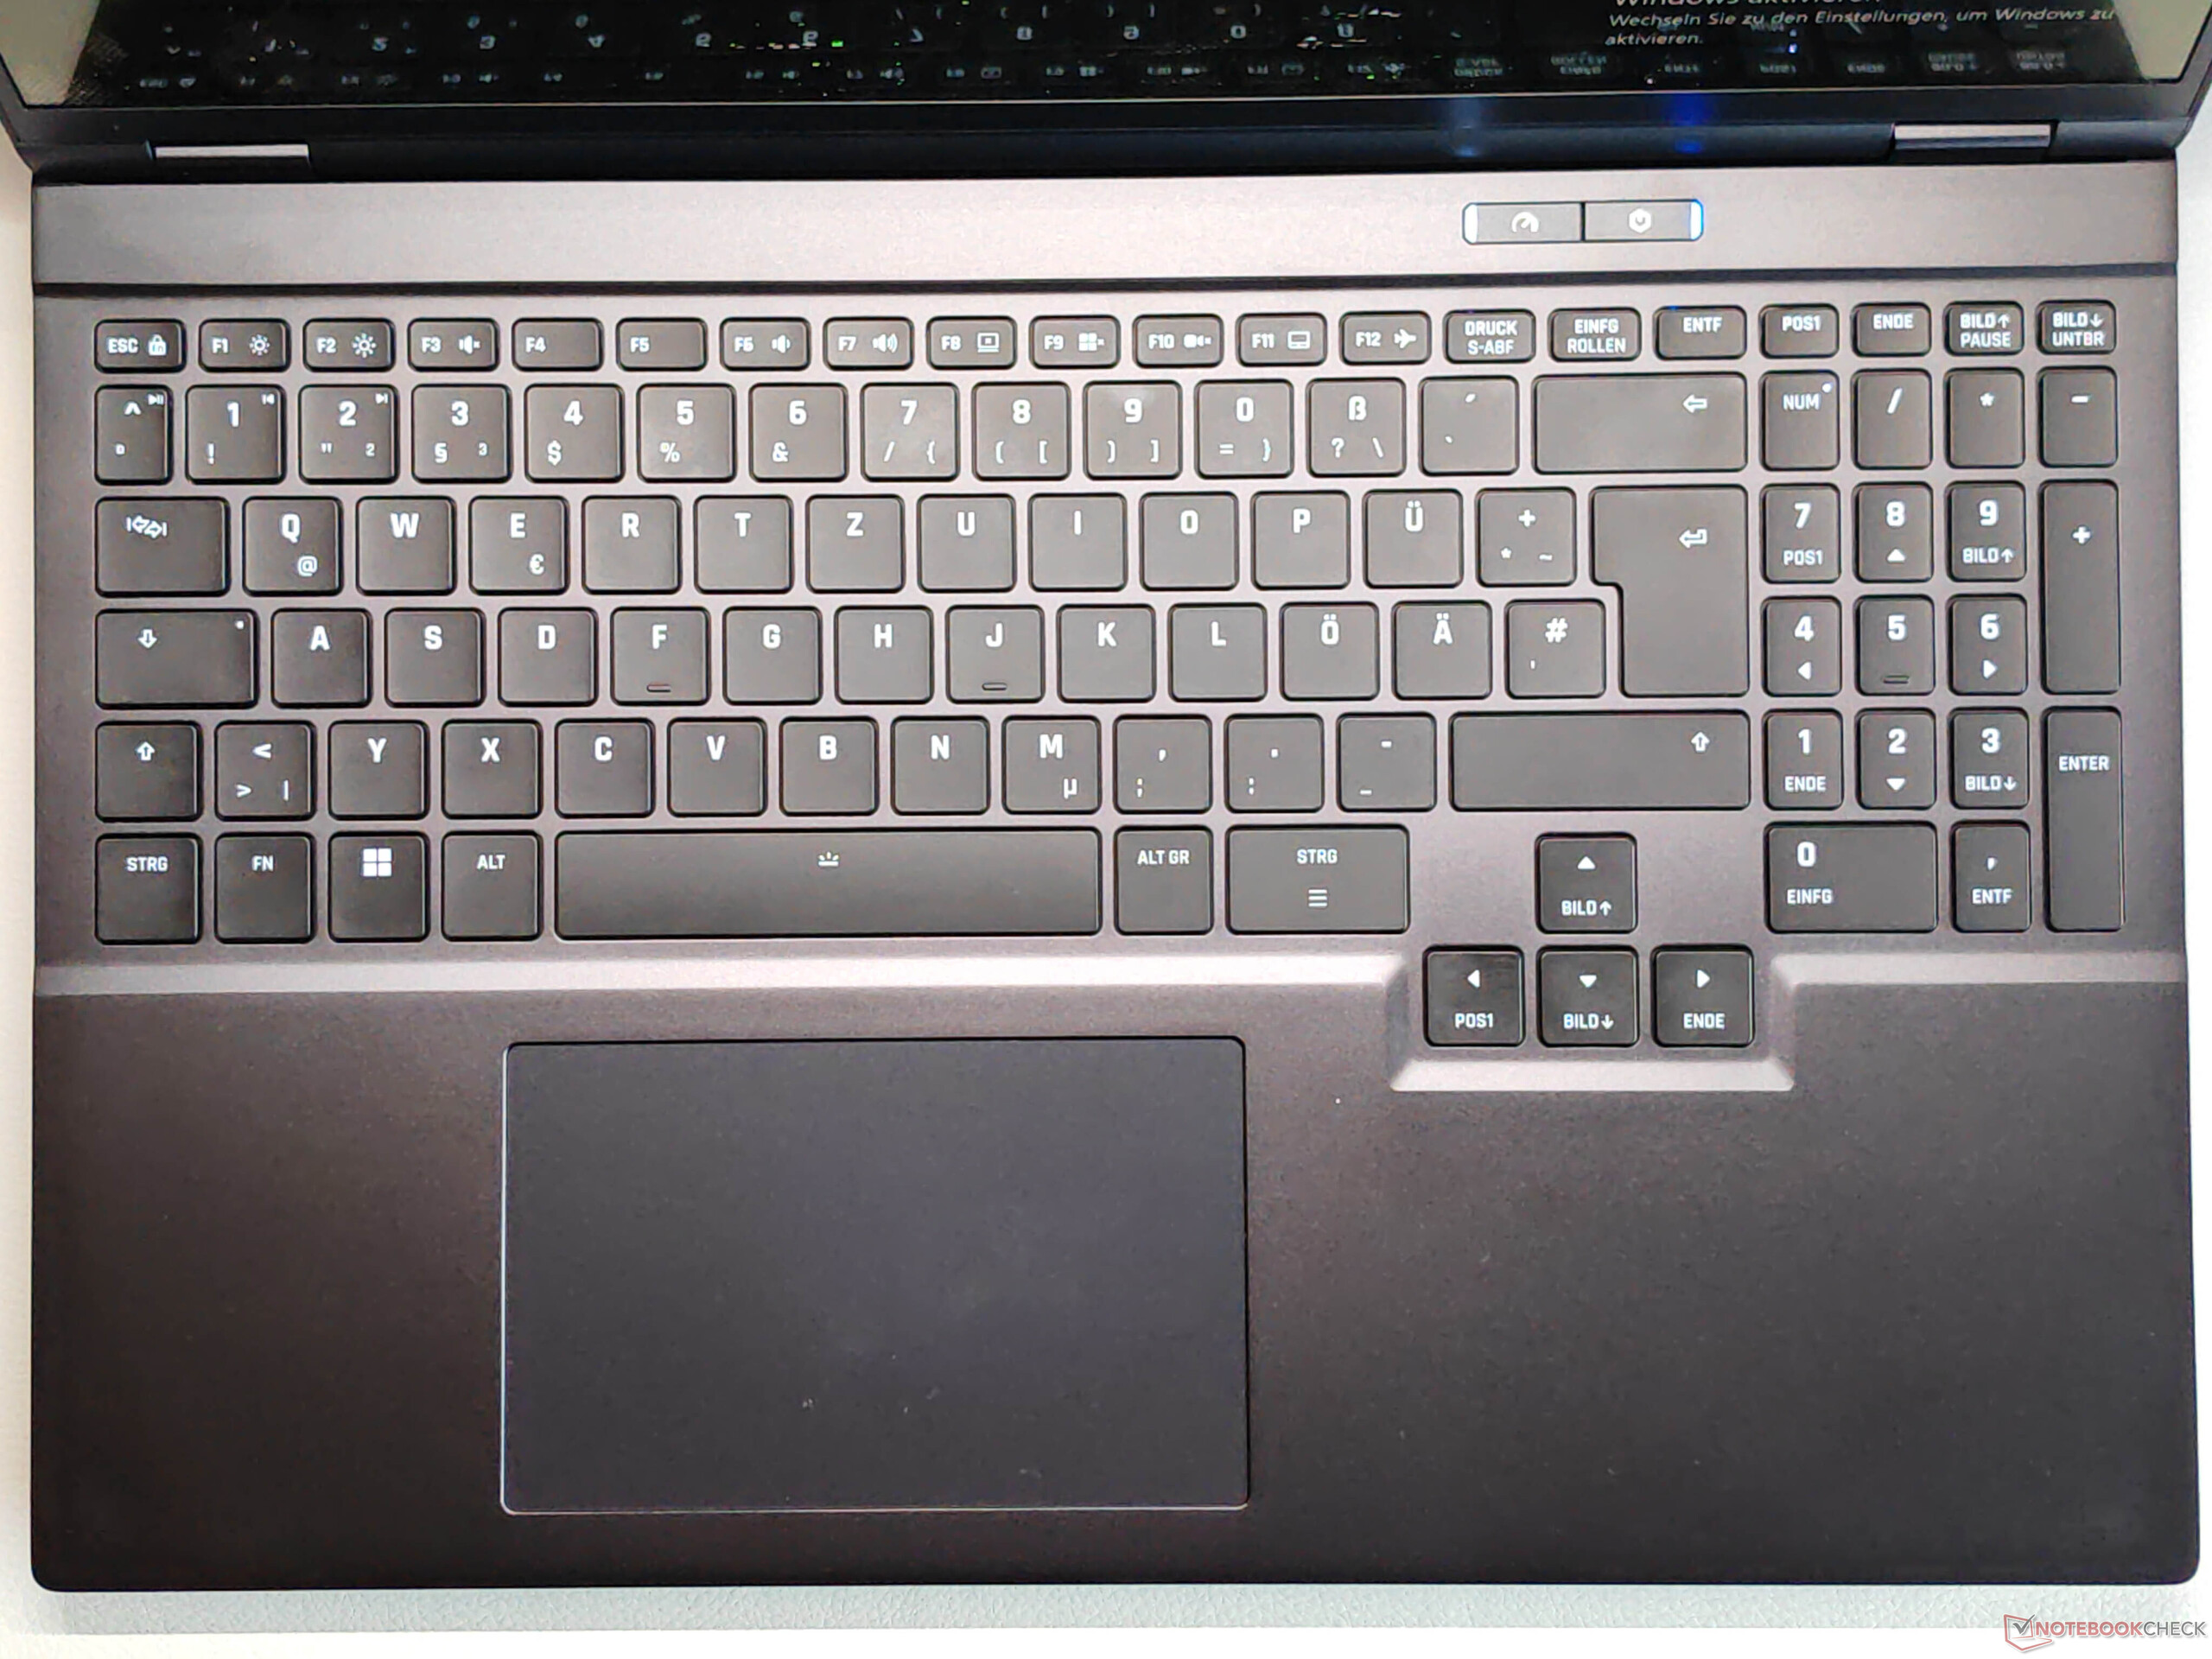
Case & equipment
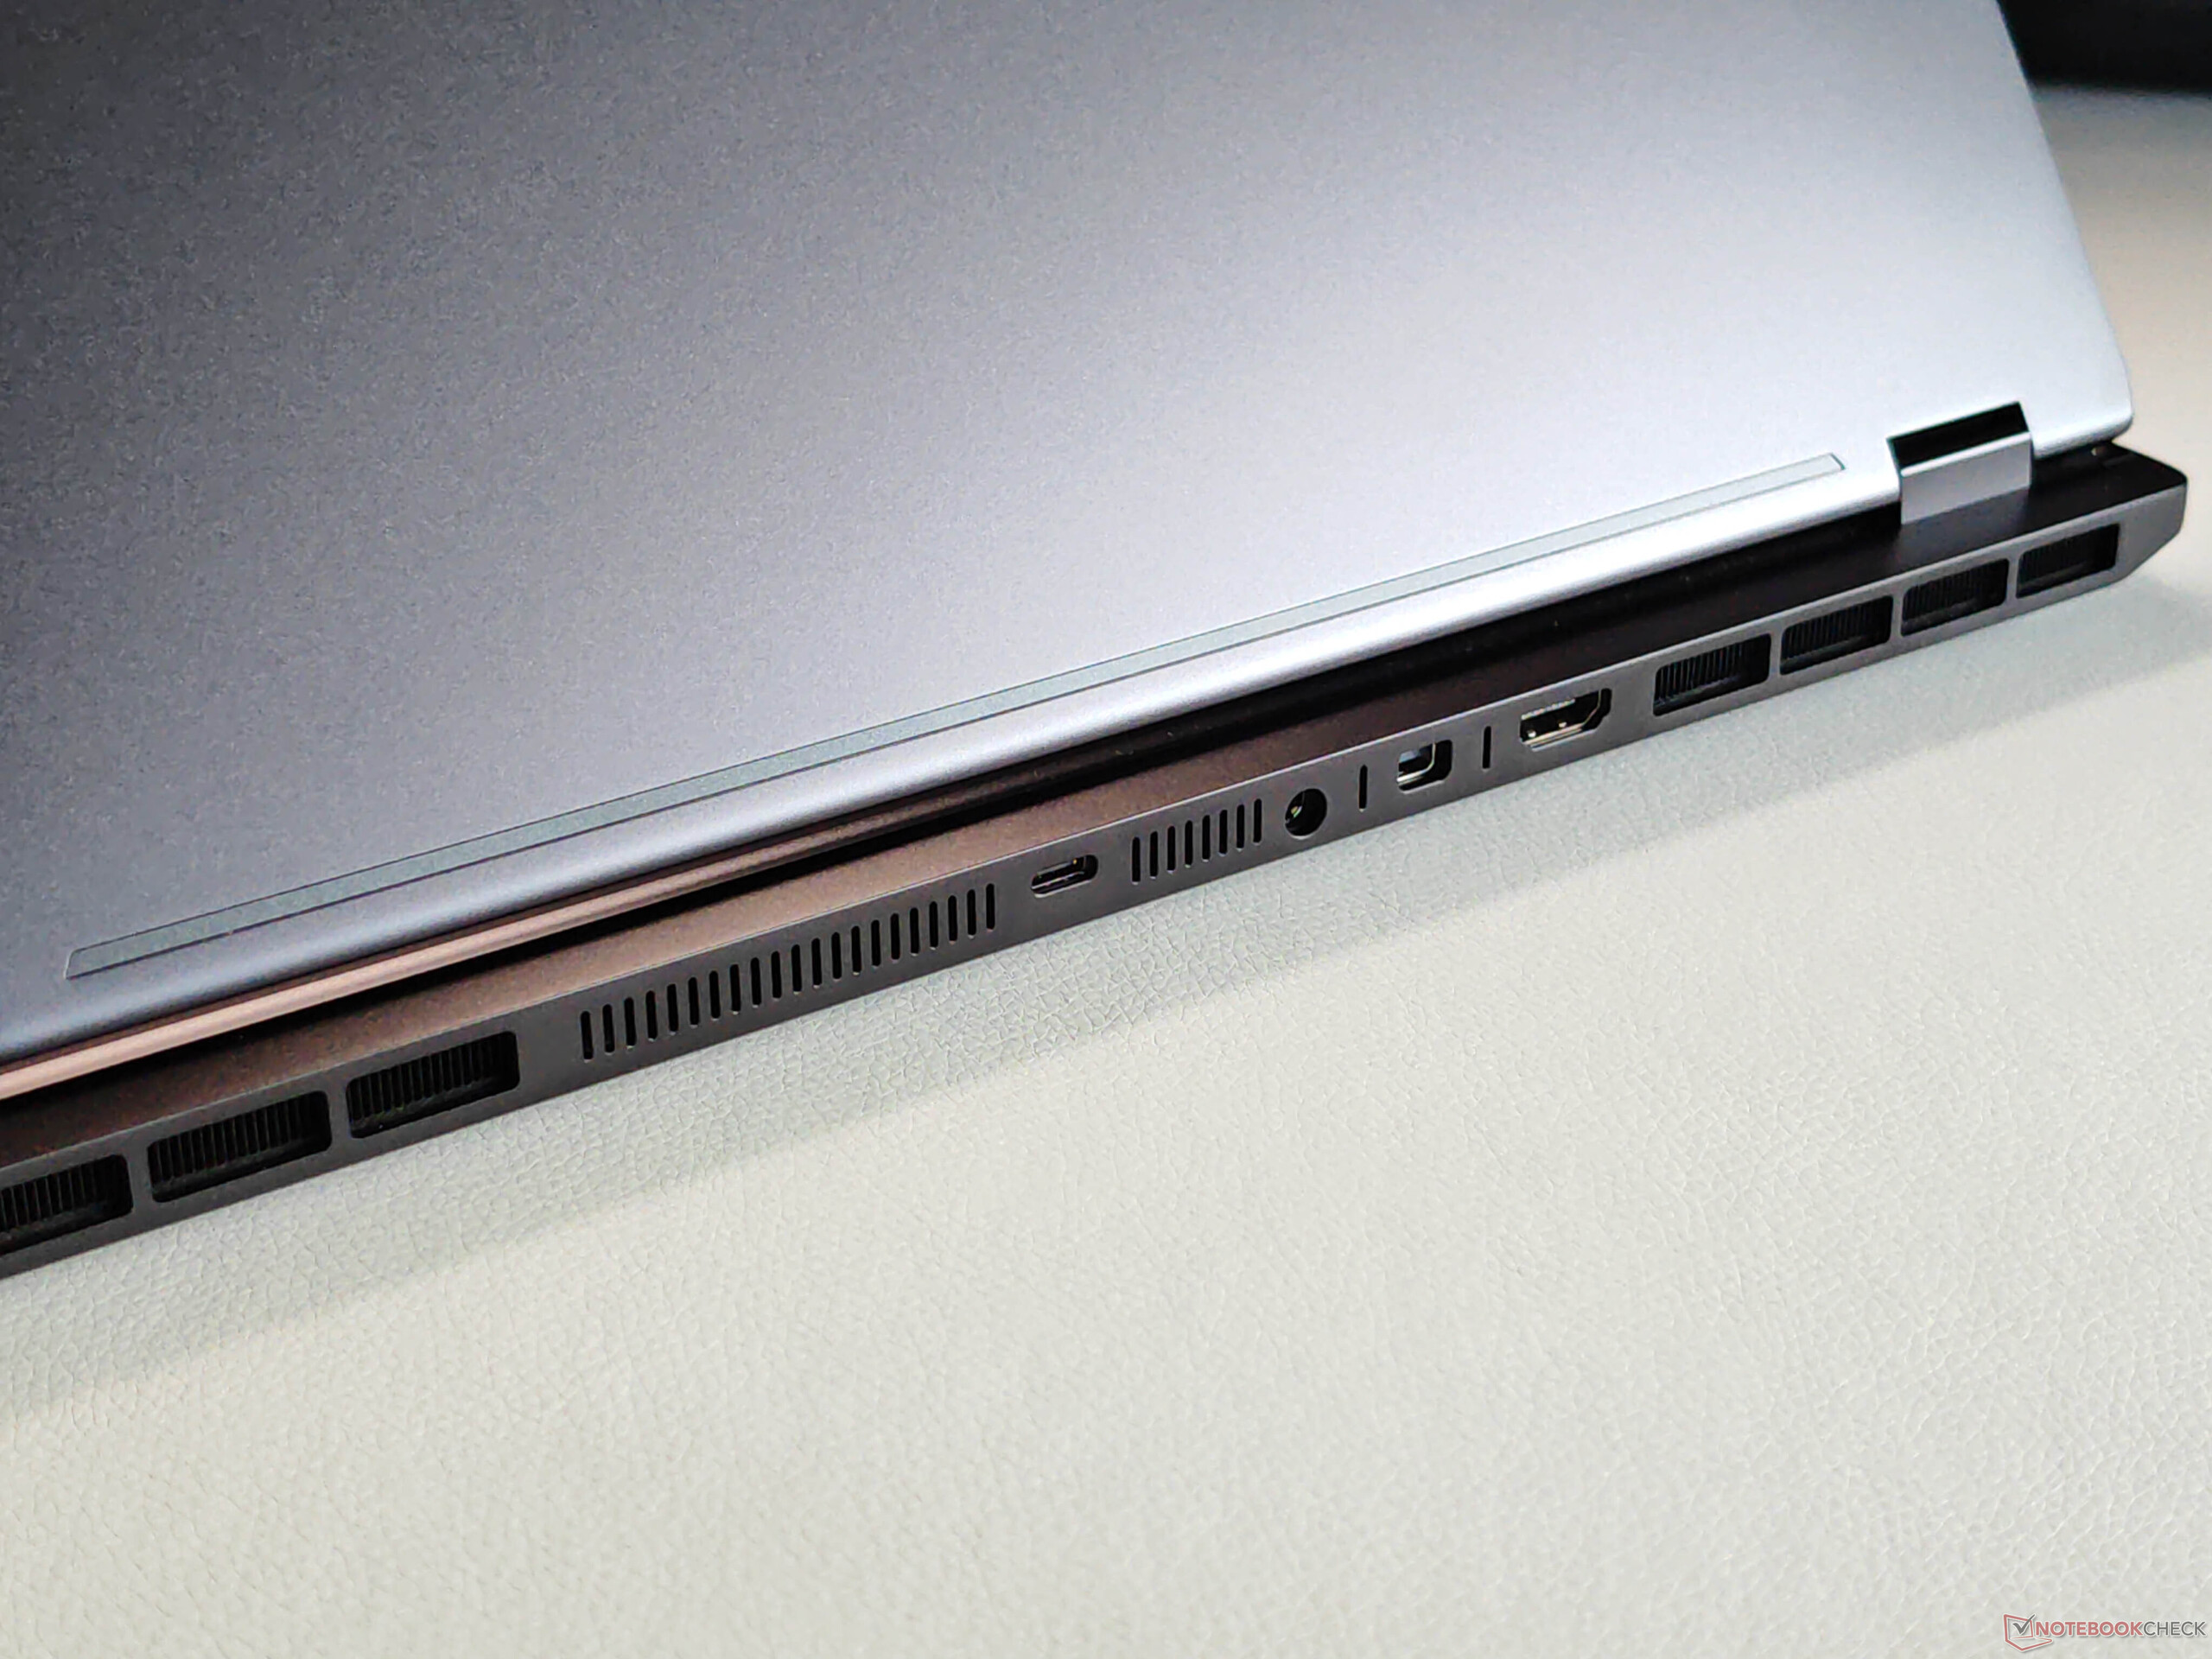
There are no differences in the case and input devices compared to the already tested XMG Core 16. The new OLED version is only a few grams lighter than the IPS model. However, the new Fusion 16 is equipped better, as a Thunderbolt 4 port is available here in addition to a Wi-Fi 7 module.


| SD Card Reader | |
| average JPG Copy Test (av. of 3 runs) | |
| Aorus Elite 16 AE6H (AV PRO microSD 128 GB V60) | |
| Schenker XMG Core 16 M25 (Angelbird AV Pro V60) | |
| Average of class Gaming (20.9 - 210, n=54, last 2 years) | |
| Schenker XMG FUSION 16 (M25) (Angelbird AV Pro V60) | |
| maximum AS SSD Seq Read Test (1GB) | |
| Schenker XMG Core 16 M25 (Angelbird AV Pro V60) | |
| Aorus Elite 16 AE6H (AV PRO microSD 128 GB V60) | |
| Average of class Gaming (25.5 - 261, n=51, last 2 years) | |
| Schenker XMG FUSION 16 (M25) (Angelbird AV Pro V60) | |
| Networking | |
| Schenker XMG FUSION 16 (M25) | |
| iperf3 transmit AXE11000 | |
| iperf3 receive AXE11000 | |
| Lenovo Legion Pro 5 16IAX10, RTX 5070 | |
| iperf3 transmit AXE11000 | |
| iperf3 receive AXE11000 | |
| iperf3 transmit AXE11000 6GHz | |
| Schenker XMG Core 16 M25 | |
| iperf3 transmit AXE11000 | |
| iperf3 receive AXE11000 | |
| Asus TUF Gaming A16 FA608UP | |
| iperf3 transmit AXE11000 | |
| iperf3 receive AXE11000 | |
| MSI Crosshair 16 HX AI D2XWGKG | |
| iperf3 transmit AXE11000 | |
| iperf3 receive AXE11000 | |
| iperf3 transmit AXE11000 6GHz | |
| iperf3 receive AXE11000 6GHz | |
| Aorus Elite 16 AE6H | |
| iperf3 transmit AXE11000 | |
| iperf3 receive AXE11000 | |
| Gigabyte Gaming A16 GA6H | |
| iperf3 transmit AXE11000 | |
| iperf3 receive AXE11000 | |

 GeForce RTX 5070 Laptop, Ultra 9 275HX, Samsung 9100 Pro 2 TB")
 GeForce RTX 5070 Laptop, Ultra 9 275HX, Samsung 9100 Pro 2 TB")
Display - 120 Hz OLED
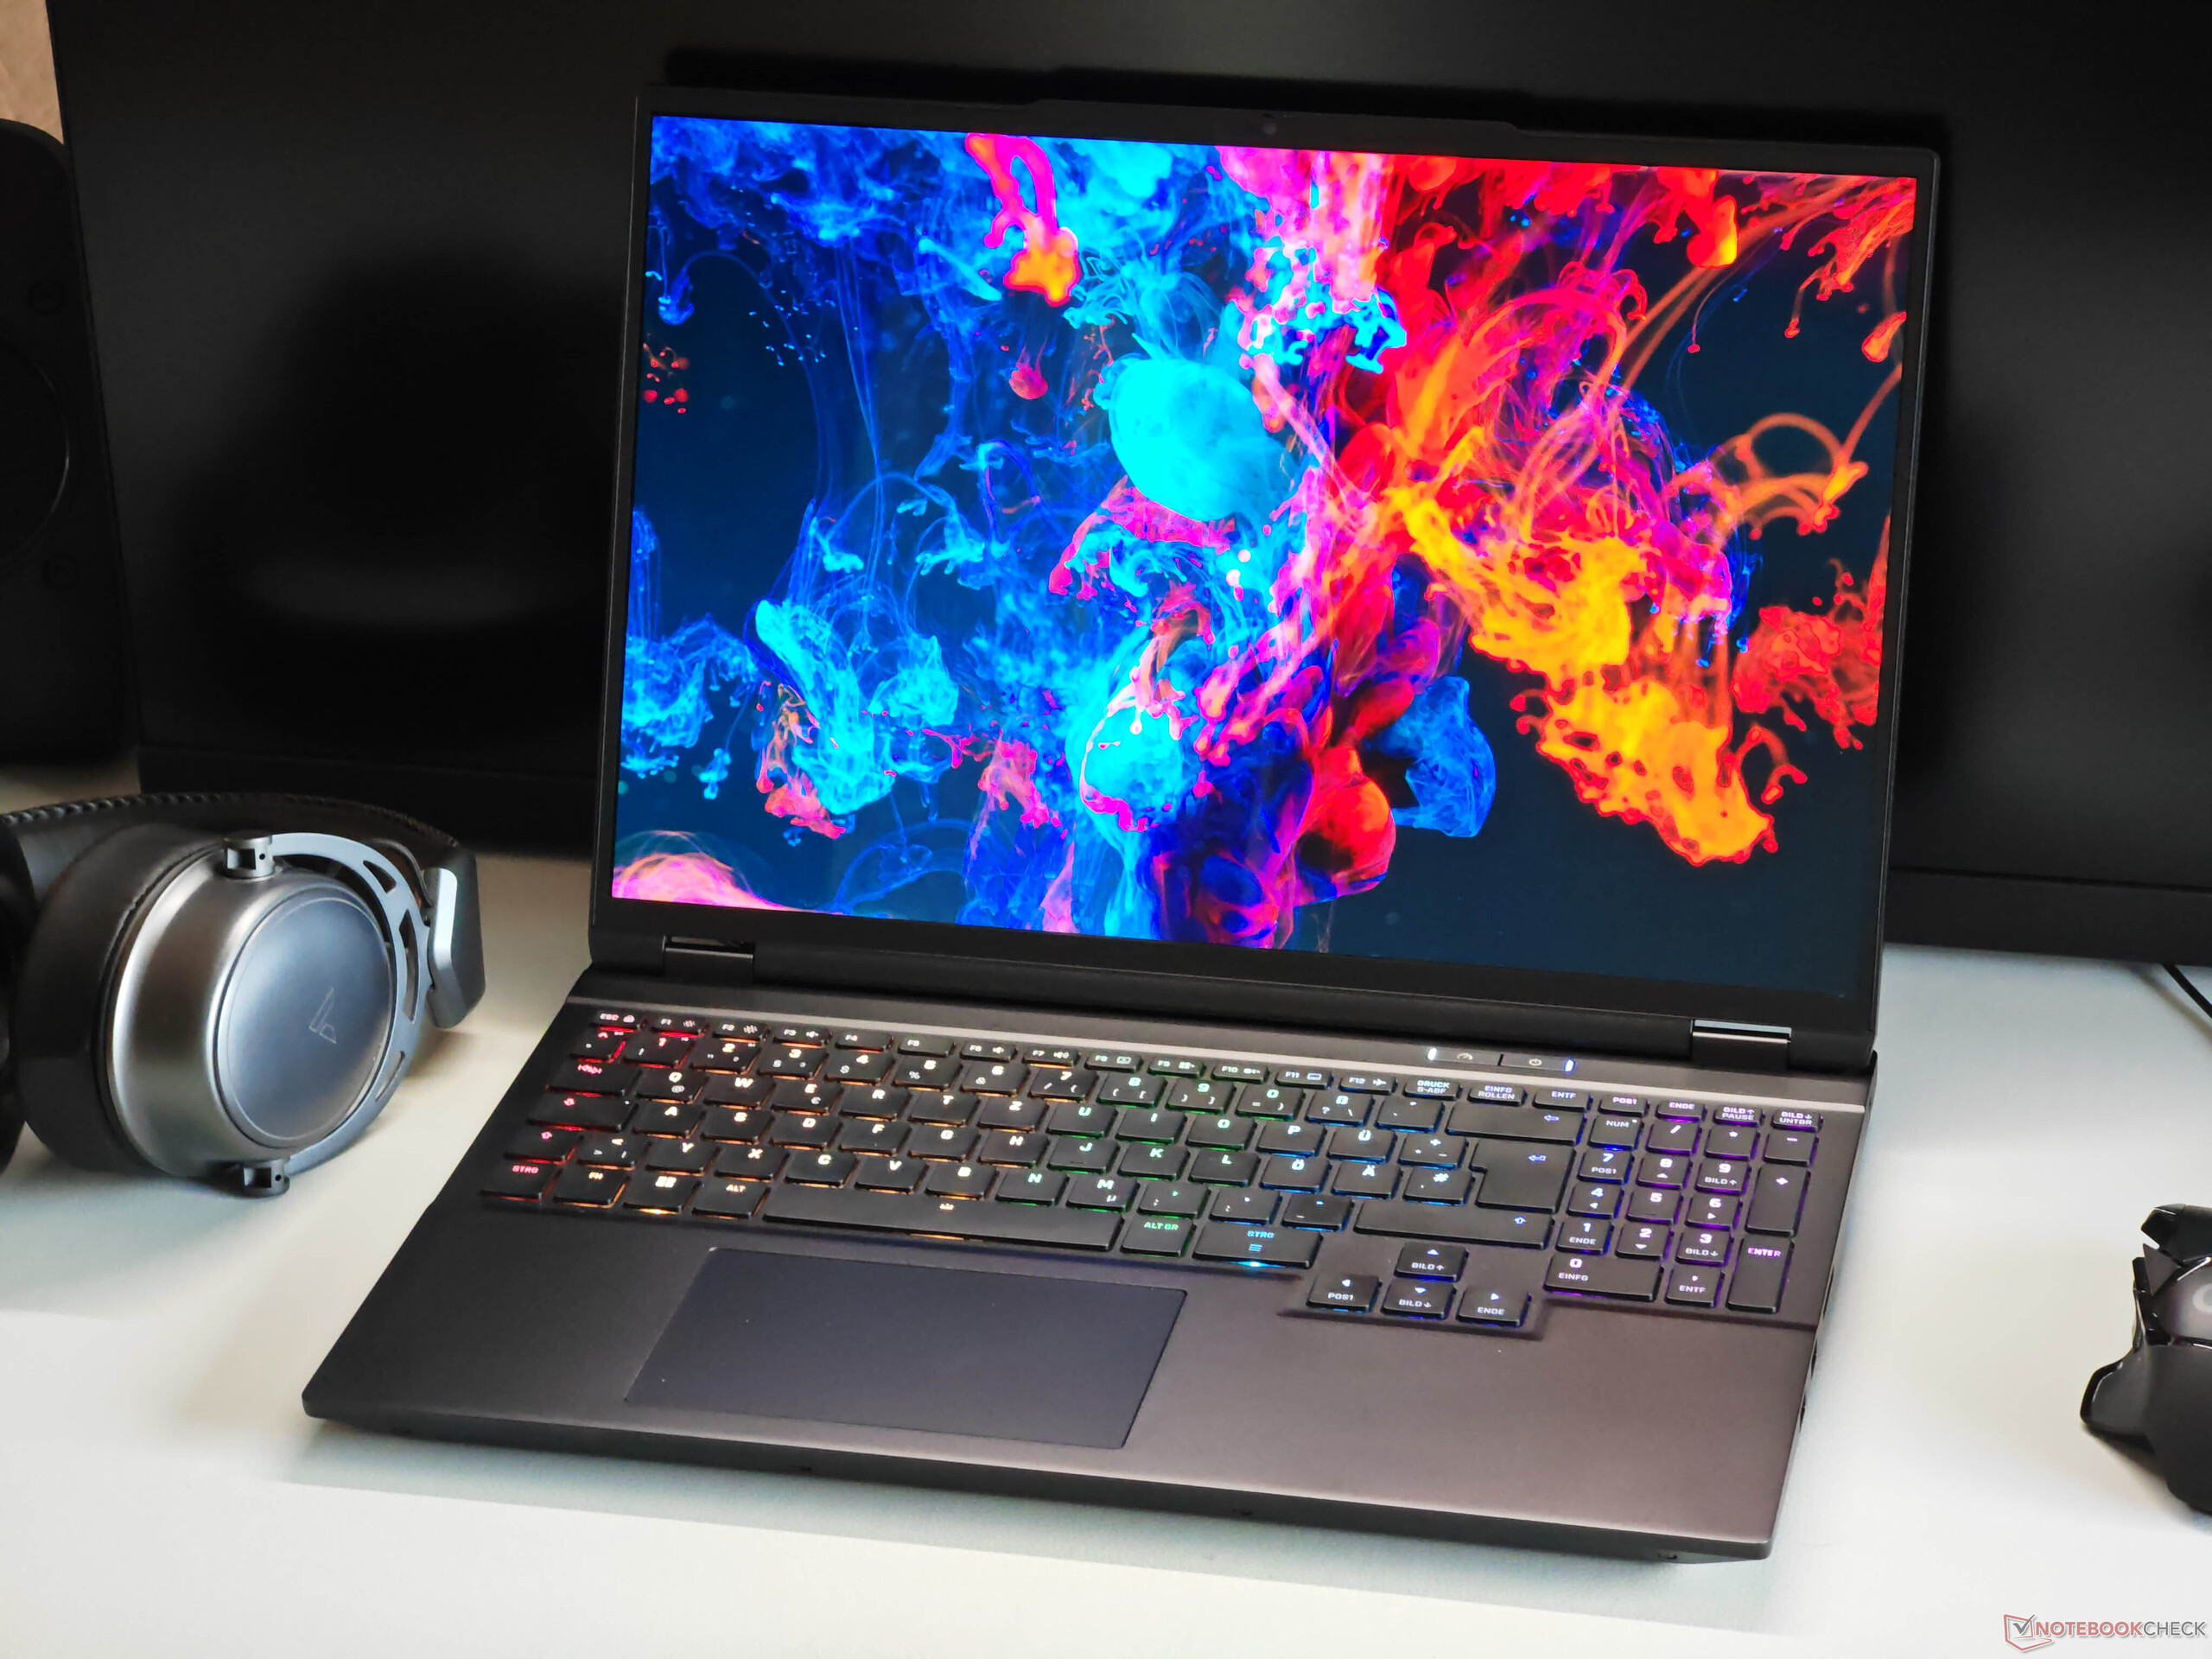
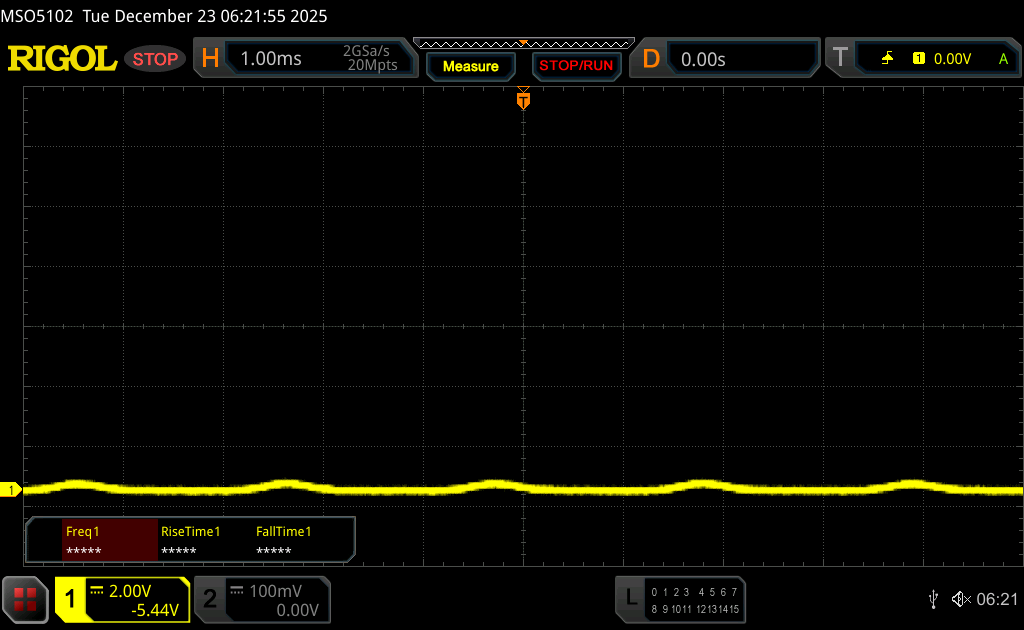
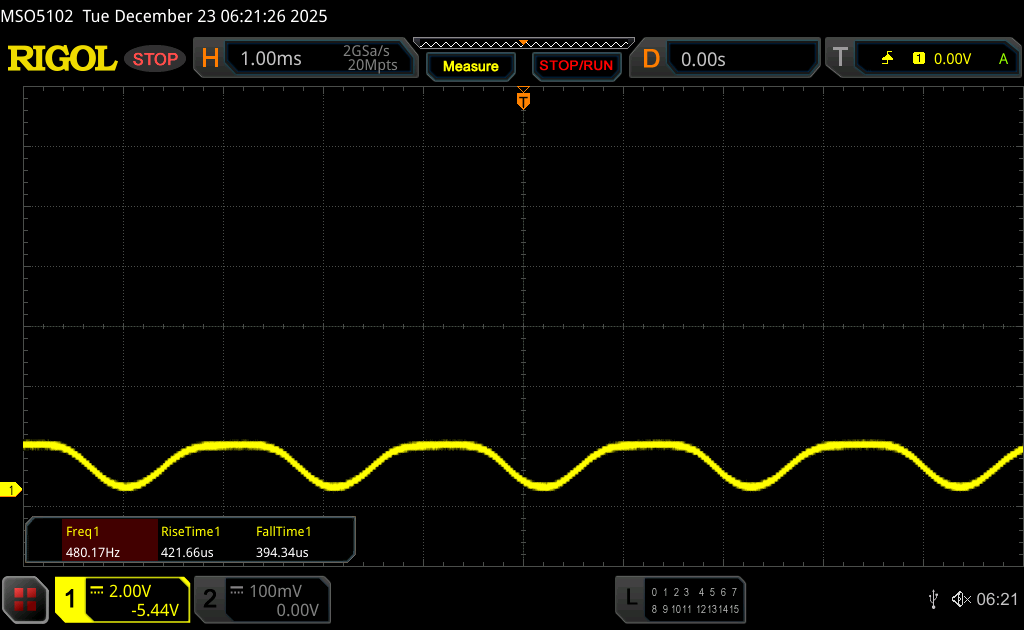
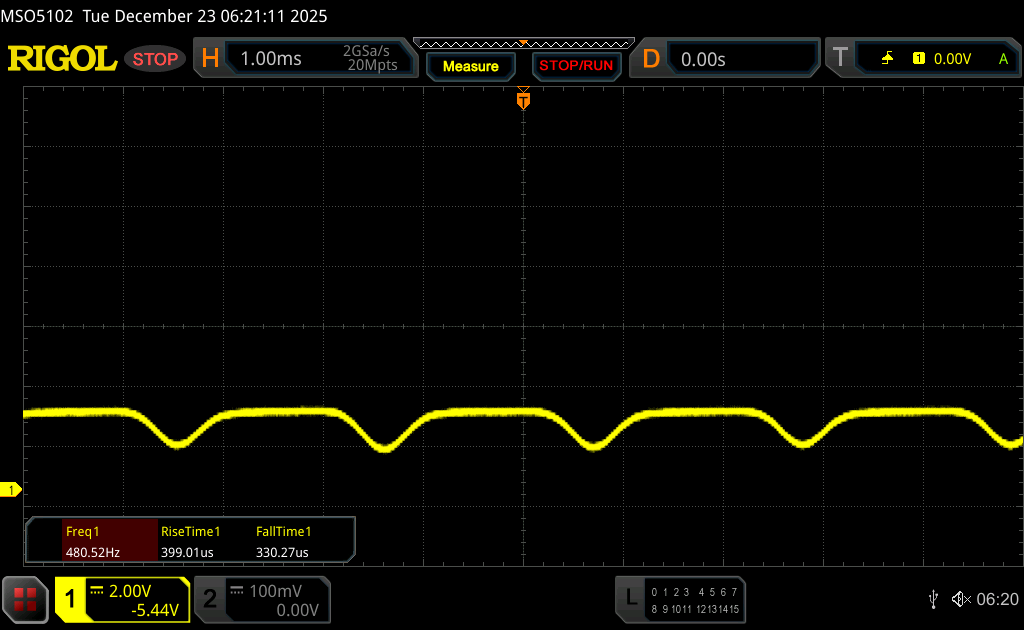
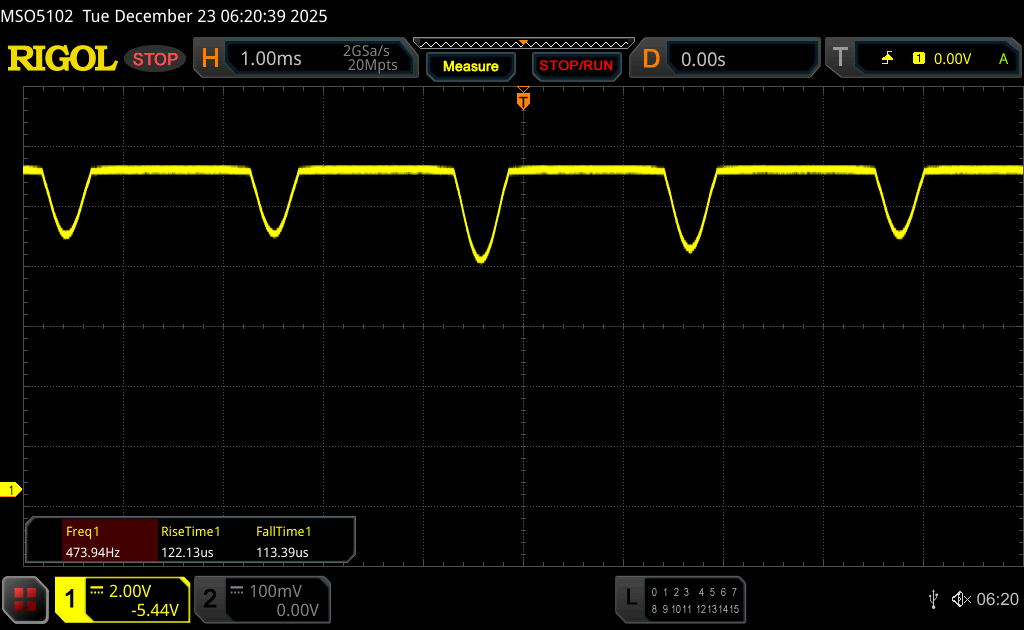
The Fusion 16 is available with either the familiar IPS panel (300 Hz) from the Core 16 or the new Samsung OLED panel (2,880 × 1,800 pixels, 16:10, 120 Hz, €130 surcharge). Image quality on the glossy OLED screen is excellent, offering vibrant colors, high contrast, and extremely fast response times. However, PWM flickering is present at 480 Hz, although the amplitude is relatively low.
Average brightness in SDR mode measures 433 cd/m² (with a black level of 0), while HDR brightness peaks at just under 500 cd/m². Higher brightness would have been desirable, especially in HDR mode. XMG provides several factory-calibrated profiles, but none are entirely convincing. In our analysis using professional CalMAN software, the sRGB profile delivers the best results. With our own calibration (the profile is available for free download in the box below), the display can be further improved, making the panel suitable for image editing as well.
| |||||||||||||||||||||||||
Brightness Distribution: 99 %
Center on Battery: 434 cd/m²
Contrast: ∞:1 (Black: 0 cd/m²)
ΔE ColorChecker Calman: 3 | ∀{0.5-29.43 Ø4.72}
calibrated: 1.4
ΔE Greyscale Calman: 3.4 | ∀{0.09-98 Ø4.97}
93.3% AdobeRGB 1998 (Argyll 3D)
100% sRGB (Argyll 3D)
99.9% Display P3 (Argyll 3D)
Gamma: 2.47
CCT: 6452 K
| Schenker XMG FUSION 16 (M25) ATNA60CL10_0, OLED, 2880x1800, 16", 120 Hz | Lenovo Legion Pro 5 16IAX10, RTX 5070 ATNA60HS01-0 (Samsung SDC420A), OLED, 2650x1600, 16", 165 Hz | Schenker XMG Core 16 M25 MNG007DA6-4, IPS, 2560x1600, 16", 300 Hz | Asus TUF Gaming A16 FA608UP MNG007DA5-3, IPS, 2560x1600, 16", 165 Hz | MSI Crosshair 16 HX AI D2XWGKG AUO B160QAN02.3, IPS, 2560x1600, 16", 240 Hz | Aorus Elite 16 AE6H NE160QDM-NYJ, IPS, 2560x1600, 16", 165 Hz | Gigabyte Gaming A16 GA6H NE160QDM-NYJ (BOE0C80), IPS, 2560x1600, 16", 165 Hz | |
|---|---|---|---|---|---|---|---|
| Display | 0% | -2% | -19% | -5% | -17% | -18% | |
| Display P3 Coverage (%) | 99.9 | 99.3 -1% | 98.8 -1% | 69.4 -31% | 95.5 -4% | 70.8 -29% | 69.4 -31% |
| sRGB Coverage (%) | 100 | 100 0% | 100 0% | 97.2 -3% | 99.7 0% | 99.8 0% | 99.5 0% |
| AdobeRGB 1998 Coverage (%) | 93.3 | 93.9 1% | 88.4 -5% | 71.9 -23% | 83.9 -10% | 72.6 -22% | 71.6 -23% |
| Response Times | -121% | -1278% | -877% | -832% | -2081% | -1781% | |
| Response Time Grey 50% / Grey 80% * (ms) | 0.56 ? | 2 ? -257% | 10.7 ? -1811% | 6.3 ? -1025% | 3.59 ? -541% | 16.8 ? -2900% | 14.3 ? -2454% |
| Response Time Black / White * (ms) | 0.58 ? | 1.4 ? -141% | 4.9 ? -745% | 4.8 ? -728% | 7.09 ? -1122% | 7.9 ? -1262% | 7 ? -1107% |
| PWM Frequency (Hz) | 480 ? | 1300 | |||||
| PWM Amplitude * (%) | 26 | 16.7 36% | |||||
| Screen | -2% | 16% | 26% | -49% | -20% | -29% | |
| Brightness middle (cd/m²) | 434 | 521 20% | 512 18% | 480 11% | 472 9% | 443 2% | 432 0% |
| Brightness (cd/m²) | 433 | 519 20% | 483 12% | 456 5% | 438 1% | 433 0% | 425 -2% |
| Brightness Distribution (%) | 99 | 98 -1% | 91 -8% | 91 -8% | 88 -11% | 90 -9% | 91 -8% |
| Black Level * (cd/m²) | 0.075 | 0.43 | 0.32 | 0.4 | 0.42 | 0.37 | |
| Colorchecker dE 2000 * | 3 | 2.5 17% | 2.4 20% | 1.4 53% | 6.07 -102% | 3.82 -27% | 4.76 -59% |
| Colorchecker dE 2000 max. * | 5.1 | 4.85 5% | 3.8 25% | 2.5 51% | 9.76 -91% | 7.61 -49% | 8.59 -68% |
| Colorchecker dE 2000 calibrated * | 1.4 | 2.5 -79% | 0.9 36% | 1.3 7% | 2.25 -61% | 1.33 5% | 1.18 16% |
| Greyscale dE 2000 * | 3.4 | 3.17 7% | 3.1 9% | 1.2 65% | 6.4 -88% | 5.5 -62% | 6.2 -82% |
| Gamma | 2.47 89% | 2.35 94% | 2.41 91% | 2.16 102% | 2.52 87% | 2.249 98% | 2.079 106% |
| CCT | 6452 101% | 6454 101% | 6534 99% | 6620 98% | 7987 81% | 6549 99% | 6690 97% |
| Contrast (:1) | 6947 | 1191 | 1500 | 1180 | 1055 | 1168 | |
| Total Average (Program / Settings) | -41% /
-29% | -421% /
-204% | -290% /
-136% | -295% /
-168% | -706% /
-363% | -609% /
-318% |
* ... smaller is better


Display Response Times
| ↔ Response Time Black to White | ||
|---|---|---|
| 0.58 ms ... rise ↗ and fall ↘ combined | ↗ 0.33 ms rise | 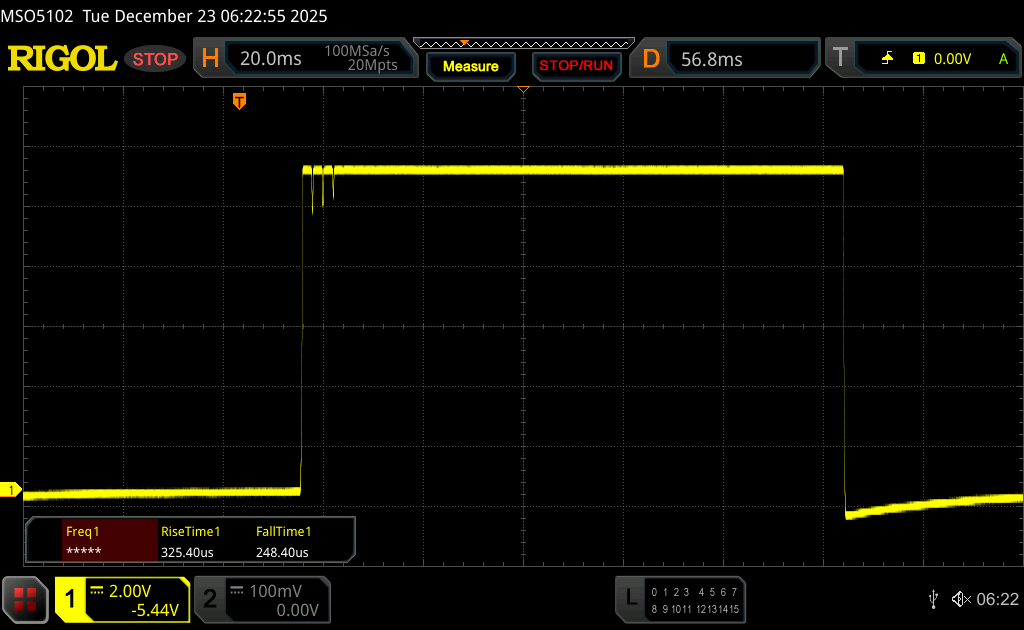 |
| ↘ 0.25 ms fall | ||
| The screen shows very fast response rates in our tests and should be very well suited for fast-paced gaming. In comparison, all tested devices range from 0.1 (minimum) to 240 (maximum) ms. » 1 % of all devices are better. This means that the measured response time is better than the average of all tested devices (19.8 ms). | ||
| ↔ Response Time 50% Grey to 80% Grey | ||
| 0.56 ms ... rise ↗ and fall ↘ combined | ↗ 0.3 ms rise | 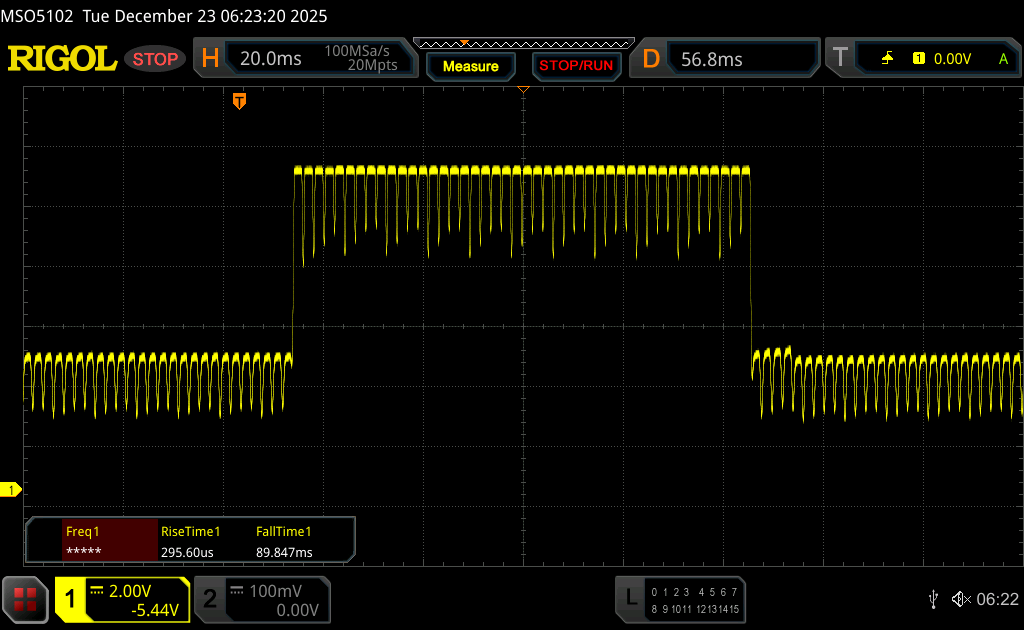 |
| ↘ 0.26 ms fall | ||
| The screen shows very fast response rates in our tests and should be very well suited for fast-paced gaming. In comparison, all tested devices range from 0.165 (minimum) to 636 (maximum) ms. » 1 % of all devices are better. This means that the measured response time is better than the average of all tested devices (31 ms). | ||
Screen Flickering / PWM (Pulse-Width Modulation)
| Screen flickering / PWM detected | 480 Hz Amplitude: 26 % | ≤ 92 % brightness setting | 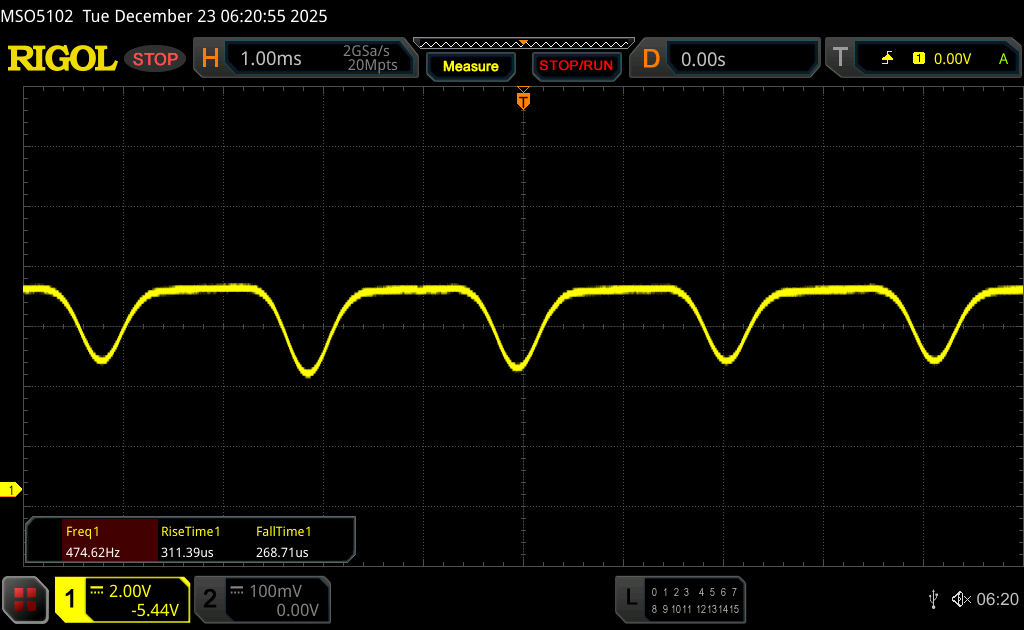 |
The display backlight flickers at 480 Hz (worst case, e.g., utilizing PWM) Flickering detected at a brightness setting of 92 % and below. There should be no flickering or PWM above this brightness setting. The frequency of 480 Hz is relatively high, so most users sensitive to PWM should not notice any flickering. However, there are reports that some users are still sensitive to PWM at 500 Hz and above, so be aware. In comparison: 52 % of all tested devices do not use PWM to dim the display. If PWM was detected, an average of 7781 (minimum: 5 - maximum: 343500) Hz was measured. | |||


Performance - Arrow Lake HX & Blackwell
Test conditions
XMG offers several power profiles, and we ran the benchmarks in Overboost - Normal mode. An Overboost - Extreme mode is also available, but it did not provide any additional performance gains in gaming.
Processor
The Intel Core Ultra 9 275HX can draw up to 150/140 watts in the Fusion 16 and delivers excellent overall performance. Compared to the AMD Ryzen AI 9 HX 370 in the XMG Core 16, the 275HX is on average 28% faster across all of our CPU benchmarks. When running on battery power, the processor is limited to 40 watts, resulting in a 35% drop in multi-core performance.
Cinebench R15 Multi endurance test
Cinebench 2024: CPU Multi Core | CPU Single Core
Cinebench R23: Multi Core | Single Core
Cinebench R20: CPU (Multi Core) | CPU (Single Core)
Cinebench R15: CPU Multi 64Bit | CPU Single 64Bit
Blender: v2.79 BMW27 CPU
7-Zip 18.03: 7z b 4 | 7z b 4 -mmt1
Geekbench 6.7: Multi-Core | Single-Core
Geekbench 5.5: Multi-Core | Single-Core
HWBOT x265 Benchmark v2.2: 4k Preset
LibreOffice : 20 Documents To PDF
R Benchmark 2.5: Overall mean
| CPU Performance rating | |
| Average Intel Core Ultra 9 275HX | |
| Aorus Elite 16 AE6H -1! | |
| MSI Crosshair 16 HX AI D2XWGKG | |
| Schenker XMG FUSION 16 (M25) | |
| Lenovo Legion Pro 5 16IAX10, RTX 5070 -2! | |
| Average of class Gaming | |
| Schenker XMG Core 16 M25 | |
| Asus TUF Gaming A16 FA608UP | |
| Gigabyte Gaming A16 GA6H | |
| Cinebench 2024 / CPU Multi Core | |
| Average Intel Core Ultra 9 275HX (1547 - 2288, n=27) | |
| Schenker XMG FUSION 16 (M25) | |
| Aorus Elite 16 AE6H | |
| MSI Crosshair 16 HX AI D2XWGKG | |
| Average of class Gaming (486 - 2298, n=91, last 2 years) | |
| Schenker XMG Core 16 M25 | |
| Asus TUF Gaming A16 FA608UP | |
| Gigabyte Gaming A16 GA6H | |
| Cinebench 2024 / CPU Single Core | |
| Schenker XMG FUSION 16 (M25) | |
| MSI Crosshair 16 HX AI D2XWGKG | |
| Average Intel Core Ultra 9 275HX (123.1 - 138.2, n=27) | |
| Aorus Elite 16 AE6H | |
| Average of class Gaming (95 - 138.2, n=91, last 2 years) | |
| Schenker XMG Core 16 M25 | |
| Gigabyte Gaming A16 GA6H | |
| Asus TUF Gaming A16 FA608UP | |
| Cinebench R23 / Multi Core | |
| Average Intel Core Ultra 9 275HX (30712 - 40970, n=31) | |
| MSI Crosshair 16 HX AI D2XWGKG | |
| Schenker XMG FUSION 16 (M25) | |
| Aorus Elite 16 AE6H | |
| Lenovo Legion Pro 5 16IAX10, RTX 5070 | |
| Average of class Gaming (10488 - 40970, n=110, last 2 years) | |
| Schenker XMG Core 16 M25 | |
| Asus TUF Gaming A16 FA608UP | |
| Gigabyte Gaming A16 GA6H | |
| Cinebench R23 / Single Core | |
| Schenker XMG FUSION 16 (M25) | |
| MSI Crosshair 16 HX AI D2XWGKG | |
| Average Intel Core Ultra 9 275HX (2009 - 2267, n=31) | |
| Lenovo Legion Pro 5 16IAX10, RTX 5070 | |
| Aorus Elite 16 AE6H | |
| Schenker XMG Core 16 M25 | |
| Average of class Gaming (1166 - 2356, n=110, last 2 years) | |
| Gigabyte Gaming A16 GA6H | |
| Asus TUF Gaming A16 FA608UP | |
| Cinebench R20 / CPU (Multi Core) | |
| Average Intel Core Ultra 9 275HX (12026 - 16108, n=30) | |
| MSI Crosshair 16 HX AI D2XWGKG | |
| Schenker XMG FUSION 16 (M25) | |
| Aorus Elite 16 AE6H | |
| Lenovo Legion Pro 5 16IAX10, RTX 5070 | |
| Average of class Gaming (4029 - 16108, n=109, last 2 years) | |
| Schenker XMG Core 16 M25 | |
| Asus TUF Gaming A16 FA608UP | |
| Gigabyte Gaming A16 GA6H | |
| Cinebench R20 / CPU (Single Core) | |
| Schenker XMG FUSION 16 (M25) | |
| MSI Crosshair 16 HX AI D2XWGKG | |
| Average Intel Core Ultra 9 275HX (774 - 870, n=30) | |
| Aorus Elite 16 AE6H | |
| Lenovo Legion Pro 5 16IAX10, RTX 5070 | |
| Schenker XMG Core 16 M25 | |
| Average of class Gaming (442 - 895, n=109, last 2 years) | |
| Gigabyte Gaming A16 GA6H | |
| Asus TUF Gaming A16 FA608UP | |
| Cinebench R15 / CPU Multi 64Bit | |
| Average Intel Core Ultra 9 275HX (4737 - 6271, n=30) | |
| MSI Crosshair 16 HX AI D2XWGKG | |
| Aorus Elite 16 AE6H | |
| Schenker XMG FUSION 16 (M25) | |
| Lenovo Legion Pro 5 16IAX10, RTX 5070 | |
| Average of class Gaming (1578 - 6271, n=109, last 2 years) | |
| Schenker XMG Core 16 M25 | |
| Asus TUF Gaming A16 FA608UP | |
| Gigabyte Gaming A16 GA6H | |
| Cinebench R15 / CPU Single 64Bit | |
| Schenker XMG FUSION 16 (M25) | |
| Average Intel Core Ultra 9 275HX (306 - 343, n=31) | |
| MSI Crosshair 16 HX AI D2XWGKG | |
| Lenovo Legion Pro 5 16IAX10, RTX 5070 | |
| Aorus Elite 16 AE6H | |
| Average of class Gaming (188.8 - 343, n=109, last 2 years) | |
| Asus TUF Gaming A16 FA608UP | |
| Gigabyte Gaming A16 GA6H | |
| Schenker XMG Core 16 M25 | |
| Blender / v2.79 BMW27 CPU | |
| Gigabyte Gaming A16 GA6H | |
| Asus TUF Gaming A16 FA608UP | |
| Average of class Gaming (80 - 330, n=107, last 2 years) | |
| Schenker XMG Core 16 M25 | |
| Lenovo Legion Pro 5 16IAX10, RTX 5070 | |
| Schenker XMG FUSION 16 (M25) | |
| MSI Crosshair 16 HX AI D2XWGKG | |
| Average Intel Core Ultra 9 275HX (82 - 116, n=29) | |
| 7-Zip 18.03 / 7z b 4 | |
| Average Intel Core Ultra 9 275HX (98236 - 124155, n=30) | |
| Schenker XMG FUSION 16 (M25) | |
| Aorus Elite 16 AE6H | |
| MSI Crosshair 16 HX AI D2XWGKG | |
| Lenovo Legion Pro 5 16IAX10, RTX 5070 | |
| Average of class Gaming (33491 - 148086, n=108, last 2 years) | |
| Schenker XMG Core 16 M25 | |
| Asus TUF Gaming A16 FA608UP | |
| Gigabyte Gaming A16 GA6H | |
| 7-Zip 18.03 / 7z b 4 -mmt1 | |
| Schenker XMG FUSION 16 (M25) | |
| MSI Crosshair 16 HX AI D2XWGKG | |
| Average Intel Core Ultra 9 275HX (6026 - 7149, n=30) | |
| Lenovo Legion Pro 5 16IAX10, RTX 5070 | |
| Schenker XMG Core 16 M25 | |
| Aorus Elite 16 AE6H | |
| Average of class Gaming (4199 - 7436, n=108, last 2 years) | |
| Asus TUF Gaming A16 FA608UP | |
| Gigabyte Gaming A16 GA6H | |
| Geekbench 6.7 / Multi-Core | |
| Lenovo Legion Pro 5 16IAX10, RTX 5070 | |
| Average Intel Core Ultra 9 275HX (16033 - 21668, n=33) | |
| Schenker XMG FUSION 16 (M25) | |
| Aorus Elite 16 AE6H | |
| MSI Crosshair 16 HX AI D2XWGKG | |
| Schenker XMG Core 16 M25 | |
| Average of class Gaming (6625 - 22104, n=109, last 2 years) | |
| Asus TUF Gaming A16 FA608UP | |
| Gigabyte Gaming A16 GA6H | |
| Geekbench 6.7 / Single-Core | |
| Schenker XMG FUSION 16 (M25) | |
| MSI Crosshair 16 HX AI D2XWGKG | |
| Average Intel Core Ultra 9 275HX (2843 - 3160, n=33) | |
| Lenovo Legion Pro 5 16IAX10, RTX 5070 | |
| Aorus Elite 16 AE6H | |
| Schenker XMG Core 16 M25 | |
| Average of class Gaming (1490 - 3259, n=109, last 2 years) | |
| Asus TUF Gaming A16 FA608UP | |
| Gigabyte Gaming A16 GA6H | |
| Geekbench 5.5 / Multi-Core | |
| Schenker XMG FUSION 16 (M25) | |
| Average Intel Core Ultra 9 275HX (19105 - 25855, n=31) | |
| Aorus Elite 16 AE6H | |
| MSI Crosshair 16 HX AI D2XWGKG | |
| Lenovo Legion Pro 5 16IAX10, RTX 5070 | |
| Average of class Gaming (6460 - 27010, n=108, last 2 years) | |
| Schenker XMG Core 16 M25 | |
| Asus TUF Gaming A16 FA608UP | |
| Gigabyte Gaming A16 GA6H | |
| Geekbench 5.5 / Single-Core | |
| Schenker XMG FUSION 16 (M25) | |
| MSI Crosshair 16 HX AI D2XWGKG | |
| Lenovo Legion Pro 5 16IAX10, RTX 5070 | |
| Average Intel Core Ultra 9 275HX (2033 - 2292, n=31) | |
| Aorus Elite 16 AE6H | |
| Schenker XMG Core 16 M25 | |
| Average of class Gaming (986 - 2474, n=108, last 2 years) | |
| Asus TUF Gaming A16 FA608UP | |
| Gigabyte Gaming A16 GA6H | |
| HWBOT x265 Benchmark v2.2 / 4k Preset | |
| Average Intel Core Ultra 9 275HX (30.7 - 43.8, n=30) | |
| Lenovo Legion Pro 5 16IAX10, RTX 5070 | |
| MSI Crosshair 16 HX AI D2XWGKG | |
| Aorus Elite 16 AE6H | |
| Schenker XMG FUSION 16 (M25) | |
| Schenker XMG Core 16 M25 | |
| Average of class Gaming (11.5 - 44.3, n=108, last 2 years) | |
| Asus TUF Gaming A16 FA608UP | |
| Gigabyte Gaming A16 GA6H | |
| LibreOffice / 20 Documents To PDF | |
| Asus TUF Gaming A16 FA608UP | |
| Gigabyte Gaming A16 GA6H | |
| Schenker XMG Core 16 M25 | |
| Schenker XMG FUSION 16 (M25) | |
| Average of class Gaming (19 - 88.8, n=108, last 2 years) | |
| Lenovo Legion Pro 5 16IAX10, RTX 5070 | |
| Average Intel Core Ultra 9 275HX (33.2 - 62.1, n=30) | |
| MSI Crosshair 16 HX AI D2XWGKG | |
| Aorus Elite 16 AE6H | |
| R Benchmark 2.5 / Overall mean | |
| Gigabyte Gaming A16 GA6H | |
| Asus TUF Gaming A16 FA608UP | |
| Average of class Gaming (0.3439 - 0.759, n=109, last 2 years) | |
| Aorus Elite 16 AE6H | |
| Lenovo Legion Pro 5 16IAX10, RTX 5070 | |
| Average Intel Core Ultra 9 275HX (0.3943 - 0.4568, n=30) | |
| Schenker XMG FUSION 16 (M25) | |
| MSI Crosshair 16 HX AI D2XWGKG | |
| Schenker XMG Core 16 M25 | |
* ... smaller is better
AIDA64: FP32 Ray-Trace | FPU Julia | CPU SHA3 | CPU Queen | FPU SinJulia | FPU Mandel | CPU AES | CPU ZLib | FP64 Ray-Trace | CPU PhotoWorxx
| Performance rating | |
| Average Intel Core Ultra 9 275HX | |
| MSI Crosshair 16 HX AI D2XWGKG | |
| Schenker XMG FUSION 16 (M25) | |
| Lenovo Legion Pro 5 16IAX10, RTX 5070 | |
| Aorus Elite 16 AE6H | |
| Schenker XMG Core 16 M25 | |
| Average of class Gaming | |
| Asus TUF Gaming A16 FA608UP | |
| Gigabyte Gaming A16 GA6H | |
| AIDA64 / FP32 Ray-Trace | |
| Schenker XMG Core 16 M25 | |
| MSI Crosshair 16 HX AI D2XWGKG | |
| Average Intel Core Ultra 9 275HX (28039 - 39895, n=30) | |
| Schenker XMG FUSION 16 (M25) | |
| Lenovo Legion Pro 5 16IAX10, RTX 5070 | |
| Aorus Elite 16 AE6H | |
| Average of class Gaming (10227 - 85542, n=107, last 2 years) | |
| Asus TUF Gaming A16 FA608UP | |
| Gigabyte Gaming A16 GA6H | |
| AIDA64 / FPU Julia | |
| MSI Crosshair 16 HX AI D2XWGKG | |
| Average Intel Core Ultra 9 275HX (140254 - 200744, n=30) | |
| Schenker XMG FUSION 16 (M25) | |
| Lenovo Legion Pro 5 16IAX10, RTX 5070 | |
| Aorus Elite 16 AE6H | |
| Schenker XMG Core 16 M25 | |
| Average of class Gaming (51376 - 238426, n=107, last 2 years) | |
| Asus TUF Gaming A16 FA608UP | |
| Gigabyte Gaming A16 GA6H | |
| AIDA64 / CPU SHA3 | |
| Average Intel Core Ultra 9 275HX (6710 - 9817, n=30) | |
| MSI Crosshair 16 HX AI D2XWGKG | |
| Schenker XMG FUSION 16 (M25) | |
| Aorus Elite 16 AE6H | |
| Lenovo Legion Pro 5 16IAX10, RTX 5070 | |
| Average of class Gaming (2180 - 9817, n=107, last 2 years) | |
| Schenker XMG Core 16 M25 | |
| Asus TUF Gaming A16 FA608UP | |
| Gigabyte Gaming A16 GA6H | |
| AIDA64 / CPU Queen | |
| Lenovo Legion Pro 5 16IAX10, RTX 5070 | |
| Average Intel Core Ultra 9 275HX (113887 - 140937, n=30) | |
| Aorus Elite 16 AE6H | |
| MSI Crosshair 16 HX AI D2XWGKG | |
| Schenker XMG FUSION 16 (M25) | |
| Asus TUF Gaming A16 FA608UP | |
| Average of class Gaming (49785 - 173351, n=98, last 2 years) | |
| Schenker XMG Core 16 M25 | |
| Gigabyte Gaming A16 GA6H | |
| AIDA64 / FPU SinJulia | |
| Schenker XMG Core 16 M25 | |
| Asus TUF Gaming A16 FA608UP | |
| Average of class Gaming (4424 - 33636, n=107, last 2 years) | |
| Average Intel Core Ultra 9 275HX (11172 - 14425, n=30) | |
| MSI Crosshair 16 HX AI D2XWGKG | |
| Aorus Elite 16 AE6H | |
| Schenker XMG FUSION 16 (M25) | |
| Lenovo Legion Pro 5 16IAX10, RTX 5070 | |
| Gigabyte Gaming A16 GA6H | |
| AIDA64 / FPU Mandel | |
| MSI Crosshair 16 HX AI D2XWGKG | |
| Average Intel Core Ultra 9 275HX (72596 - 104508, n=30) | |
| Schenker XMG FUSION 16 (M25) | |
| Lenovo Legion Pro 5 16IAX10, RTX 5070 | |
| Aorus Elite 16 AE6H | |
| Schenker XMG Core 16 M25 | |
| Average of class Gaming (25115 - 128721, n=107, last 2 years) | |
| Asus TUF Gaming A16 FA608UP | |
| Gigabyte Gaming A16 GA6H | |
| AIDA64 / CPU AES | |
| Average Intel Core Ultra 9 275HX (105608 - 247074, n=30) | |
| MSI Crosshair 16 HX AI D2XWGKG | |
| Schenker XMG FUSION 16 (M25) | |
| Schenker XMG Core 16 M25 | |
| Lenovo Legion Pro 5 16IAX10, RTX 5070 | |
| Aorus Elite 16 AE6H | |
| Average of class Gaming (39258 - 247074, n=107, last 2 years) | |
| Asus TUF Gaming A16 FA608UP | |
| Gigabyte Gaming A16 GA6H | |
| AIDA64 / CPU ZLib | |
| Average Intel Core Ultra 9 275HX (1582 - 2263, n=30) | |
| MSI Crosshair 16 HX AI D2XWGKG | |
| Schenker XMG FUSION 16 (M25) | |
| Aorus Elite 16 AE6H | |
| Lenovo Legion Pro 5 16IAX10, RTX 5070 | |
| Average of class Gaming (574 - 2531, n=107, last 2 years) | |
| Schenker XMG Core 16 M25 | |
| Asus TUF Gaming A16 FA608UP | |
| Gigabyte Gaming A16 GA6H | |
| AIDA64 / FP64 Ray-Trace | |
| Schenker XMG Core 16 M25 | |
| MSI Crosshair 16 HX AI D2XWGKG | |
| Average Intel Core Ultra 9 275HX (14847 - 21854, n=30) | |
| Schenker XMG FUSION 16 (M25) | |
| Lenovo Legion Pro 5 16IAX10, RTX 5070 | |
| Aorus Elite 16 AE6H | |
| Average of class Gaming (5509 - 45446, n=107, last 2 years) | |
| Asus TUF Gaming A16 FA608UP | |
| Gigabyte Gaming A16 GA6H | |
| AIDA64 / CPU PhotoWorxx | |
| Lenovo Legion Pro 5 16IAX10, RTX 5070 | |
| Schenker XMG Core 16 M25 | |
| Schenker XMG FUSION 16 (M25) | |
| Average Intel Core Ultra 9 275HX (37482 - 62916, n=30) | |
| Aorus Elite 16 AE6H | |
| Average of class Gaming (12271 - 89891, n=107, last 2 years) | |
| Asus TUF Gaming A16 FA608UP | |
| MSI Crosshair 16 HX AI D2XWGKG | |
| Gigabyte Gaming A16 GA6H | |
System performance
The subjective performance impression is excellent and the results in the synthetic benchmarks are also very good.
PCMark 10: Score | Essentials | Productivity | Digital Content Creation
CrossMark: Overall | Productivity | Creativity | Responsiveness
WebXPRT 3: Overall
WebXPRT 4: Overall
Mozilla Kraken 1.1: Total
| Performance rating | |
| Schenker XMG FUSION 16 (M25) | |
| Lenovo Legion Pro 5 16IAX10, RTX 5070 | |
| Average Intel Core Ultra 9 275HX, NVIDIA GeForce RTX 5070 Laptop | |
| Schenker XMG Core 16 M25 -4! | |
| MSI Crosshair 16 HX AI D2XWGKG | |
| Aorus Elite 16 AE6H | |
| Average of class Gaming | |
| Gigabyte Gaming A16 GA6H | |
| Asus TUF Gaming A16 FA608UP -4! | |
| PCMark 10 / Score | |
| Schenker XMG FUSION 16 (M25) | |
| Lenovo Legion Pro 5 16IAX10, RTX 5070 | |
| Average Intel Core Ultra 9 275HX, NVIDIA GeForce RTX 5070 Laptop (8018 - 9667, n=4) | |
| Average of class Gaming (5828 - 11574, n=95, last 2 years) | |
| MSI Crosshair 16 HX AI D2XWGKG | |
| Aorus Elite 16 AE6H | |
| Gigabyte Gaming A16 GA6H | |
| PCMark 10 / Essentials | |
| Lenovo Legion Pro 5 16IAX10, RTX 5070 | |
| Aorus Elite 16 AE6H | |
| MSI Crosshair 16 HX AI D2XWGKG | |
| Average Intel Core Ultra 9 275HX, NVIDIA GeForce RTX 5070 Laptop (10259 - 11025, n=4) | |
| Average of class Gaming (8810 - 12600, n=99, last 2 years) | |
| Schenker XMG FUSION 16 (M25) | |
| Gigabyte Gaming A16 GA6H | |
| PCMark 10 / Productivity | |
| Schenker XMG FUSION 16 (M25) | |
| Average Intel Core Ultra 9 275HX, NVIDIA GeForce RTX 5070 Laptop (8307 - 16716, n=4) | |
| Average of class Gaming (6845 - 18766, n=97, last 2 years) | |
| Lenovo Legion Pro 5 16IAX10, RTX 5070 | |
| Aorus Elite 16 AE6H | |
| MSI Crosshair 16 HX AI D2XWGKG | |
| Gigabyte Gaming A16 GA6H | |
| PCMark 10 / Digital Content Creation | |
| Lenovo Legion Pro 5 16IAX10, RTX 5070 | |
| MSI Crosshair 16 HX AI D2XWGKG | |
| Average Intel Core Ultra 9 275HX, NVIDIA GeForce RTX 5070 Laptop (13010 - 16417, n=4) | |
| Schenker XMG FUSION 16 (M25) | |
| Aorus Elite 16 AE6H | |
| Average of class Gaming (7602 - 19657, n=97, last 2 years) | |
| Gigabyte Gaming A16 GA6H | |
| CrossMark / Overall | |
| Average Intel Core Ultra 9 275HX, NVIDIA GeForce RTX 5070 Laptop (2084 - 2269, n=5) | |
| Aorus Elite 16 AE6H | |
| MSI Crosshair 16 HX AI D2XWGKG | |
| Schenker XMG FUSION 16 (M25) | |
| Lenovo Legion Pro 5 16IAX10, RTX 5070 | |
| Schenker XMG Core 16 M25 | |
| Average of class Gaming (1366 - 2409, n=96, last 2 years) | |
| Gigabyte Gaming A16 GA6H | |
| Asus TUF Gaming A16 FA608UP | |
| CrossMark / Productivity | |
| Aorus Elite 16 AE6H | |
| Average Intel Core Ultra 9 275HX, NVIDIA GeForce RTX 5070 Laptop (1931 - 2173, n=5) | |
| MSI Crosshair 16 HX AI D2XWGKG | |
| Schenker XMG FUSION 16 (M25) | |
| Lenovo Legion Pro 5 16IAX10, RTX 5070 | |
| Average of class Gaming (1386 - 2254, n=96, last 2 years) | |
| Schenker XMG Core 16 M25 | |
| Gigabyte Gaming A16 GA6H | |
| Asus TUF Gaming A16 FA608UP | |
| CrossMark / Creativity | |
| Schenker XMG Core 16 M25 | |
| Schenker XMG FUSION 16 (M25) | |
| Average Intel Core Ultra 9 275HX, NVIDIA GeForce RTX 5070 Laptop (2322 - 2430, n=5) | |
| MSI Crosshair 16 HX AI D2XWGKG | |
| Aorus Elite 16 AE6H | |
| Lenovo Legion Pro 5 16IAX10, RTX 5070 | |
| Average of class Gaming (1343 - 2729, n=96, last 2 years) | |
| Asus TUF Gaming A16 FA608UP | |
| Gigabyte Gaming A16 GA6H | |
| CrossMark / Responsiveness | |
| Aorus Elite 16 AE6H | |
| Average Intel Core Ultra 9 275HX, NVIDIA GeForce RTX 5070 Laptop (1754 - 2143, n=5) | |
| Gigabyte Gaming A16 GA6H | |
| MSI Crosshair 16 HX AI D2XWGKG | |
| Schenker XMG FUSION 16 (M25) | |
| Lenovo Legion Pro 5 16IAX10, RTX 5070 | |
| Average of class Gaming (1226 - 2334, n=96, last 2 years) | |
| Schenker XMG Core 16 M25 | |
| Asus TUF Gaming A16 FA608UP | |
| WebXPRT 3 / Overall | |
| Schenker XMG Core 16 M25 | |
| Schenker XMG FUSION 16 (M25) | |
| Lenovo Legion Pro 5 16IAX10, RTX 5070 | |
| Average Intel Core Ultra 9 275HX, NVIDIA GeForce RTX 5070 Laptop (309 - 364, n=5) | |
| MSI Crosshair 16 HX AI D2XWGKG | |
| Average of class Gaming (242 - 532, n=99, last 2 years) | |
| Aorus Elite 16 AE6H | |
| Asus TUF Gaming A16 FA608UP | |
| Gigabyte Gaming A16 GA6H | |
| WebXPRT 4 / Overall | |
| Schenker XMG Core 16 M25 | |
| Aorus Elite 16 AE6H | |
| Lenovo Legion Pro 5 16IAX10, RTX 5070 | |
| Average Intel Core Ultra 9 275HX, NVIDIA GeForce RTX 5070 Laptop (297 - 330, n=5) | |
| MSI Crosshair 16 HX AI D2XWGKG | |
| Schenker XMG FUSION 16 (M25) | |
| Average of class Gaming (176.4 - 354, n=99, last 2 years) | |
| Gigabyte Gaming A16 GA6H | |
| Asus TUF Gaming A16 FA608UP | |
| Mozilla Kraken 1.1 / Total | |
| Asus TUF Gaming A16 FA608UP | |
| Gigabyte Gaming A16 GA6H | |
| Average of class Gaming (391 - 590, n=104, last 2 years) | |
| Lenovo Legion Pro 5 16IAX10, RTX 5070 | |
| Schenker XMG FUSION 16 (M25) | |
| Aorus Elite 16 AE6H | |
| Average Intel Core Ultra 9 275HX, NVIDIA GeForce RTX 5070 Laptop (407 - 431, n=5) | |
| Schenker XMG Core 16 M25 | |
| MSI Crosshair 16 HX AI D2XWGKG | |
* ... smaller is better
| PCMark 10 Score | 9667 points | |
Help | ||
| AIDA64 / Memory Copy | |
| Lenovo Legion Pro 5 16IAX10, RTX 5070 | |
| Schenker XMG FUSION 16 (M25) | |
| Average Intel Core Ultra 9 275HX (56003 - 94460, n=30) | |
| Aorus Elite 16 AE6H | |
| Schenker XMG Core 16 M25 | |
| Average of class Gaming (21750 - 129946, n=107, last 2 years) | |
| MSI Crosshair 16 HX AI D2XWGKG | |
| Asus TUF Gaming A16 FA608UP | |
| Gigabyte Gaming A16 GA6H | |
| AIDA64 / Memory Read | |
| Lenovo Legion Pro 5 16IAX10, RTX 5070 | |
| Schenker XMG FUSION 16 (M25) | |
| Aorus Elite 16 AE6H | |
| Schenker XMG Core 16 M25 | |
| Average Intel Core Ultra 9 275HX (55795 - 97151, n=30) | |
| MSI Crosshair 16 HX AI D2XWGKG | |
| Average of class Gaming (22956 - 118858, n=107, last 2 years) | |
| Asus TUF Gaming A16 FA608UP | |
| Gigabyte Gaming A16 GA6H | |
| AIDA64 / Memory Write | |
| Aorus Elite 16 AE6H | |
| Asus TUF Gaming A16 FA608UP | |
| Lenovo Legion Pro 5 16IAX10, RTX 5070 | |
| Schenker XMG FUSION 16 (M25) | |
| Schenker XMG Core 16 M25 | |
| Average Intel Core Ultra 9 275HX (55663 - 116129, n=30) | |
| Average of class Gaming (22297 - 135096, n=107, last 2 years) | |
| MSI Crosshair 16 HX AI D2XWGKG | |
| Gigabyte Gaming A16 GA6H | |
| AIDA64 / Memory Latency | |
| Average Intel Core Ultra 9 275HX (105.8 - 161.6, n=30) | |
| Aorus Elite 16 AE6H | |
| MSI Crosshair 16 HX AI D2XWGKG | |
| Schenker XMG FUSION 16 (M25) | |
| Average of class Gaming (75.3 - 259, n=107, last 2 years) | |
| Lenovo Legion Pro 5 16IAX10, RTX 5070 | |
| Gigabyte Gaming A16 GA6H | |
| Asus TUF Gaming A16 FA608UP | |
| Schenker XMG Core 16 M25 | |
* ... smaller is better
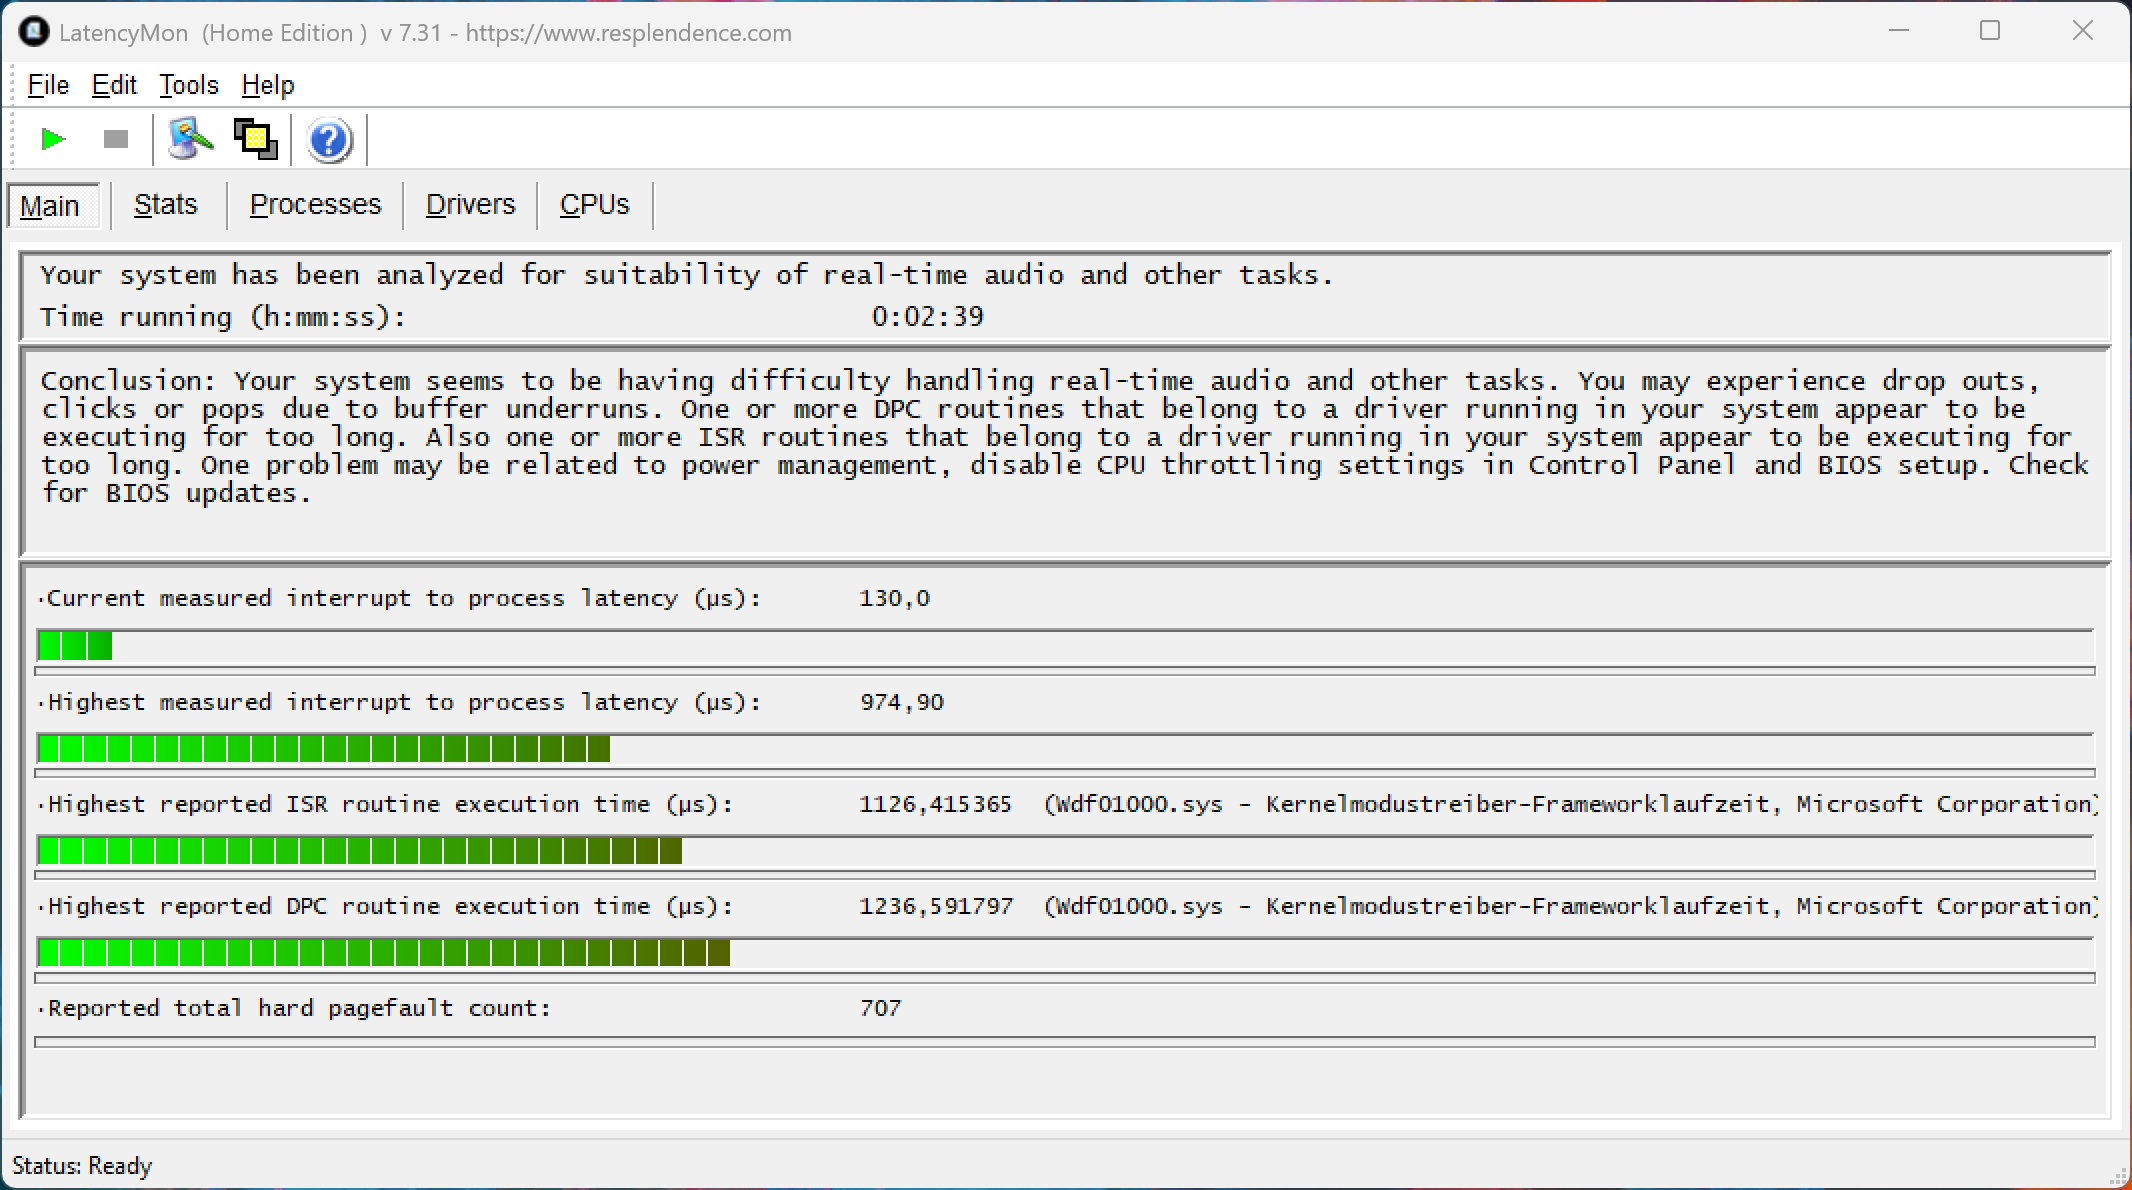
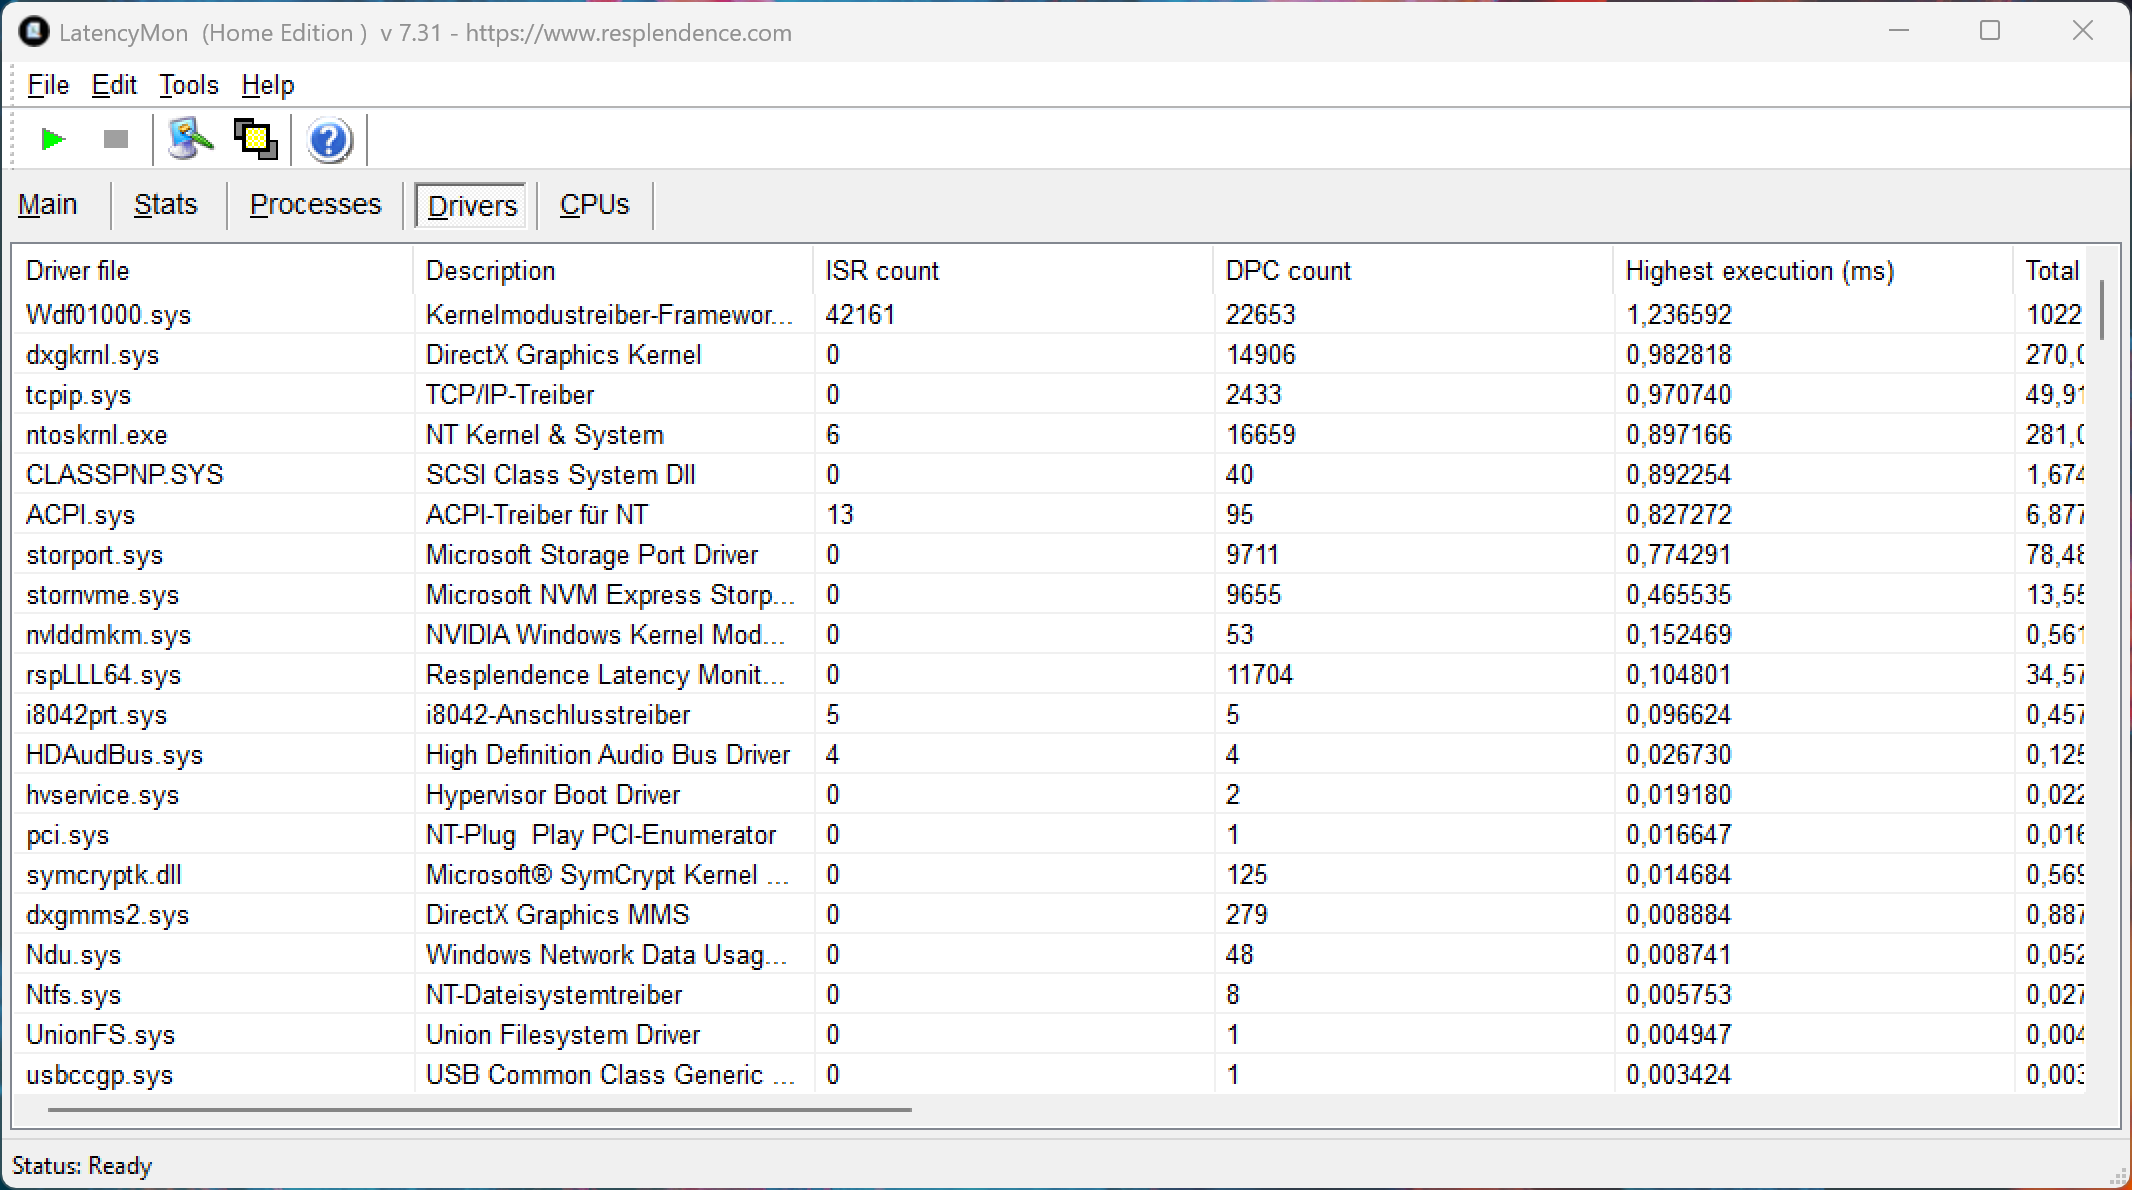
DPC latencies
In our standardized latency test, the review unit with the current BIOS version shows minor limitations when using real-time audio applications.
| DPC Latencies / LatencyMon - interrupt to process latency (max), Web, Youtube, Prime95 | |
| Gigabyte Gaming A16 GA6H | |
| MSI Crosshair 16 HX AI D2XWGKG | |
| Schenker XMG FUSION 16 (M25) | |
| Aorus Elite 16 AE6H | |
| Lenovo Legion Pro 5 16IAX10, RTX 5070 | |
| Schenker XMG Core 16 M25 | |
| Asus TUF Gaming A16 FA608UP | |
* ... smaller is better
Storage devices
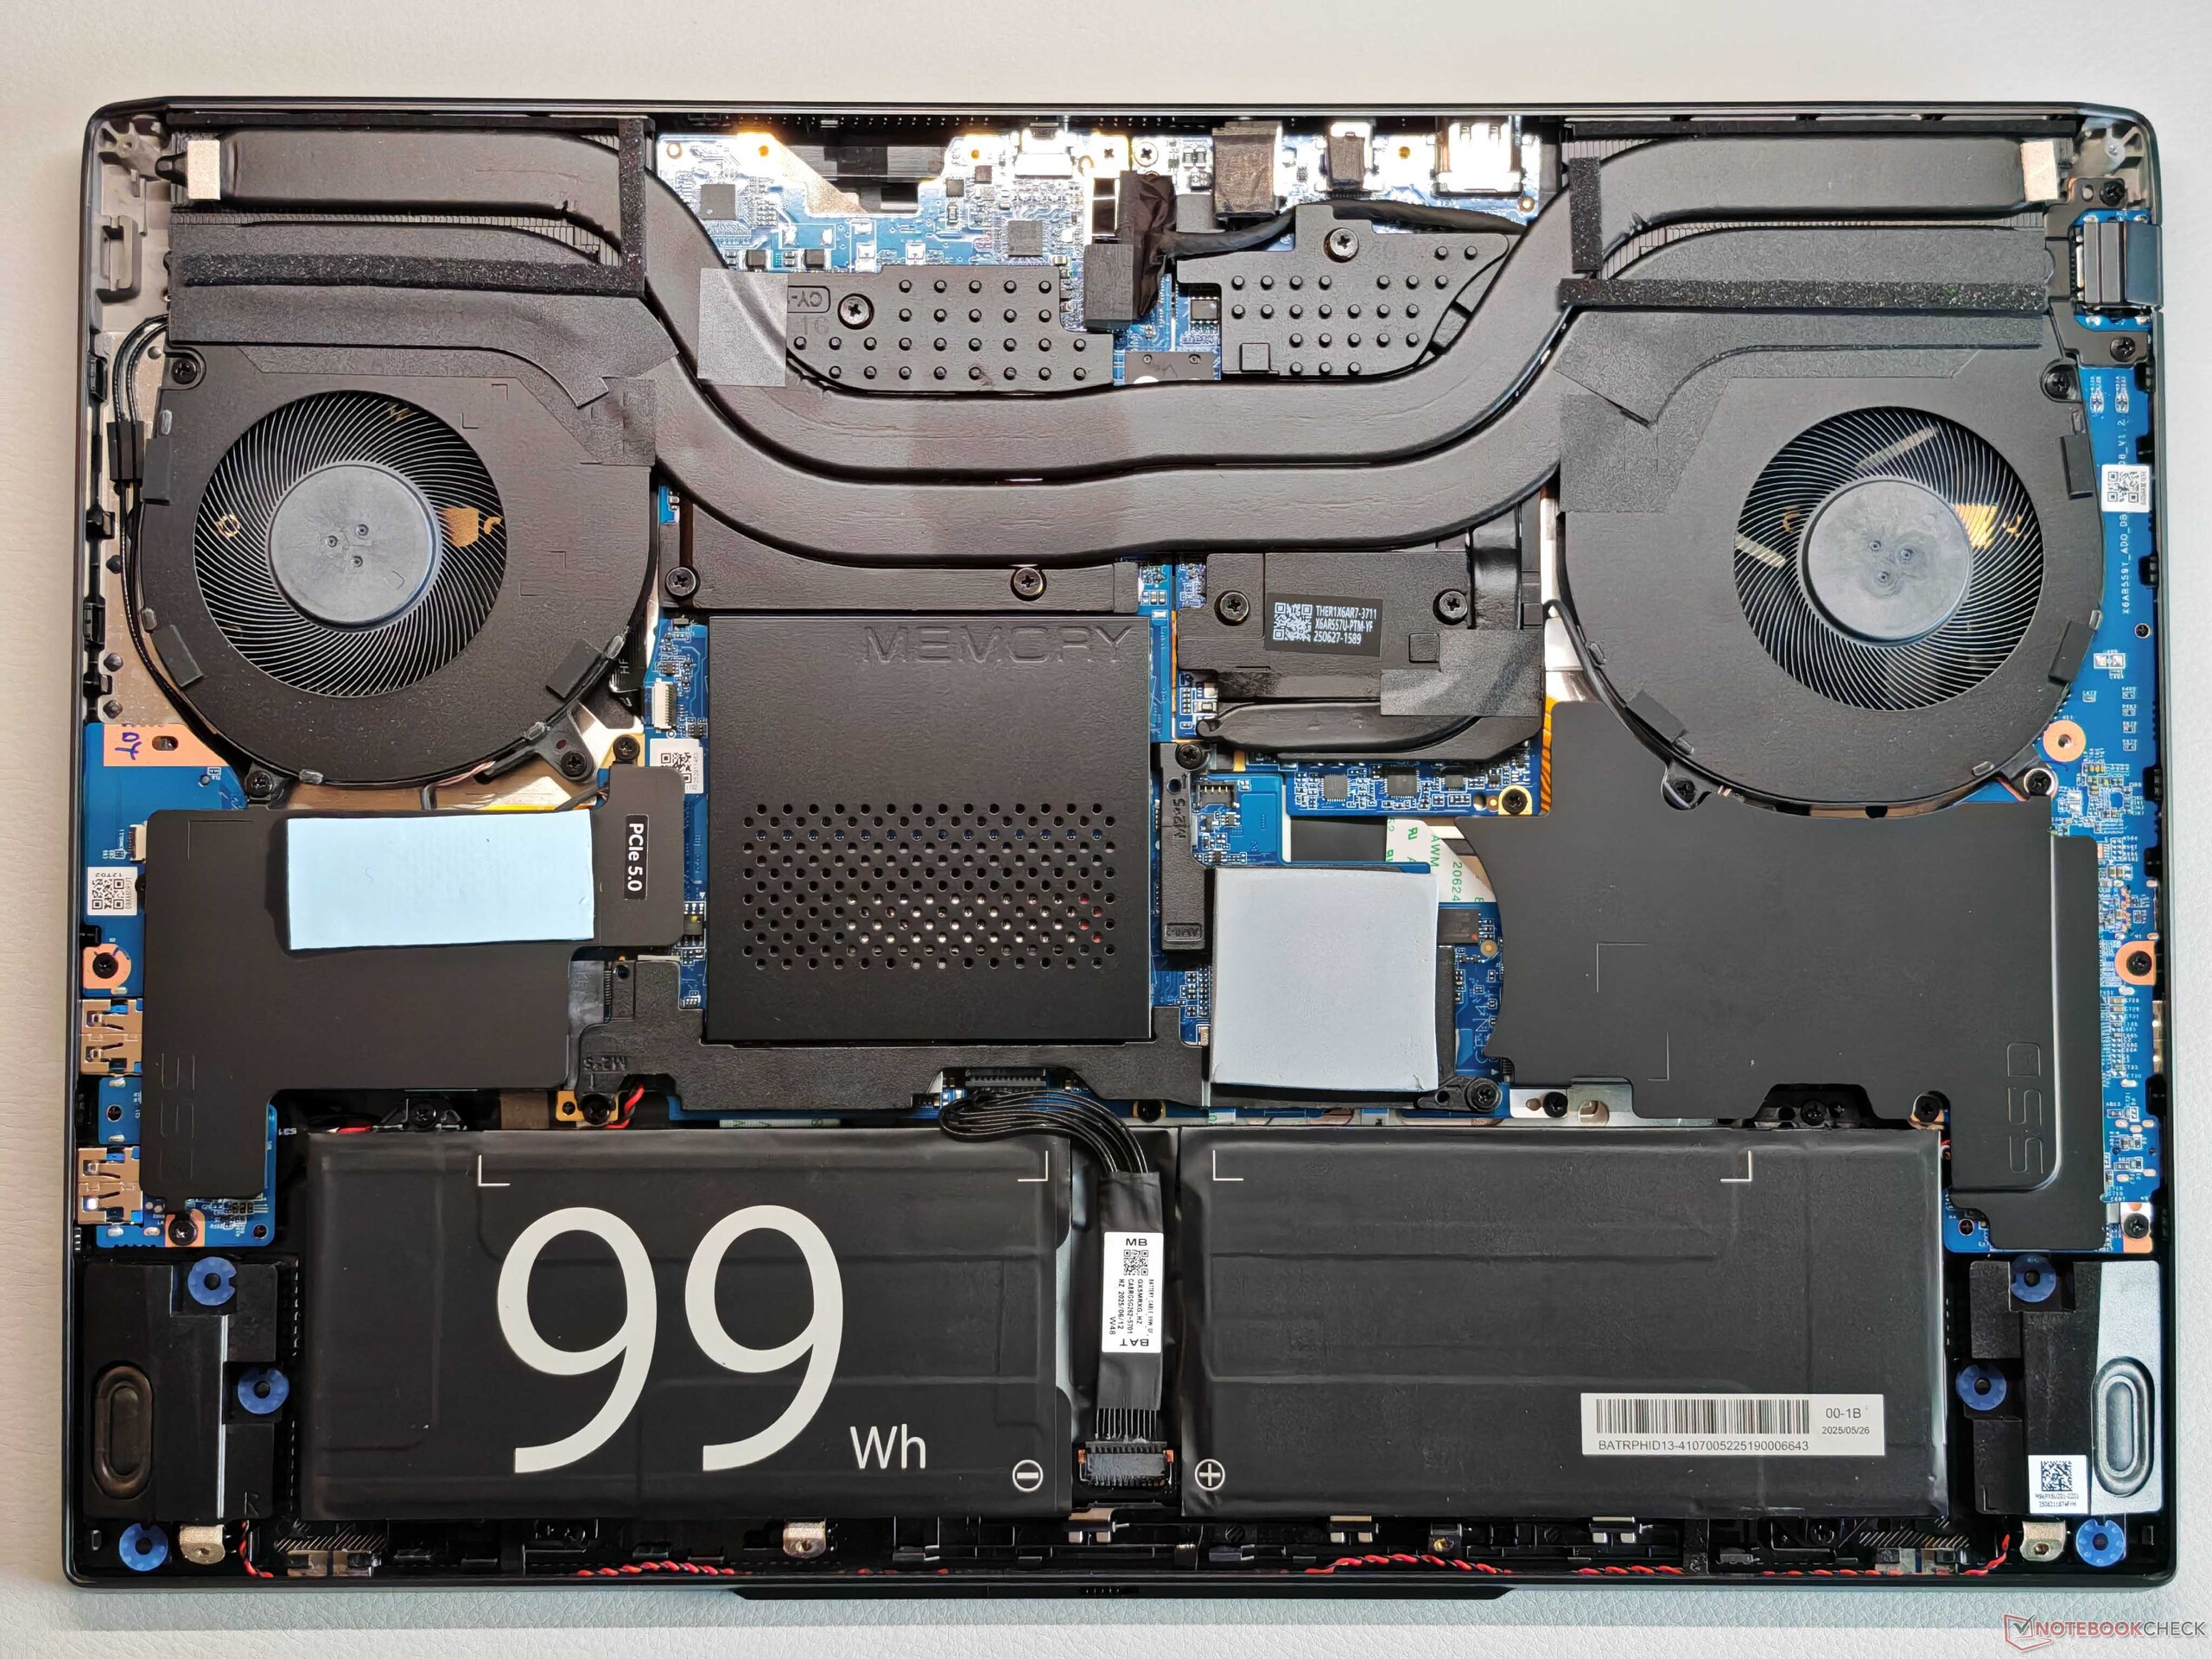
The Fusion 16 supports PCIe 5.0, and our test unit is equipped with a corresponding 2 TB Samsung 9100 Pro SSD (1.73 TB free). Performance is very good and remains stable even under sustained load.

* ... smaller is better
Disk Throttling: DiskSpd Read Loop, Queue Depth 8
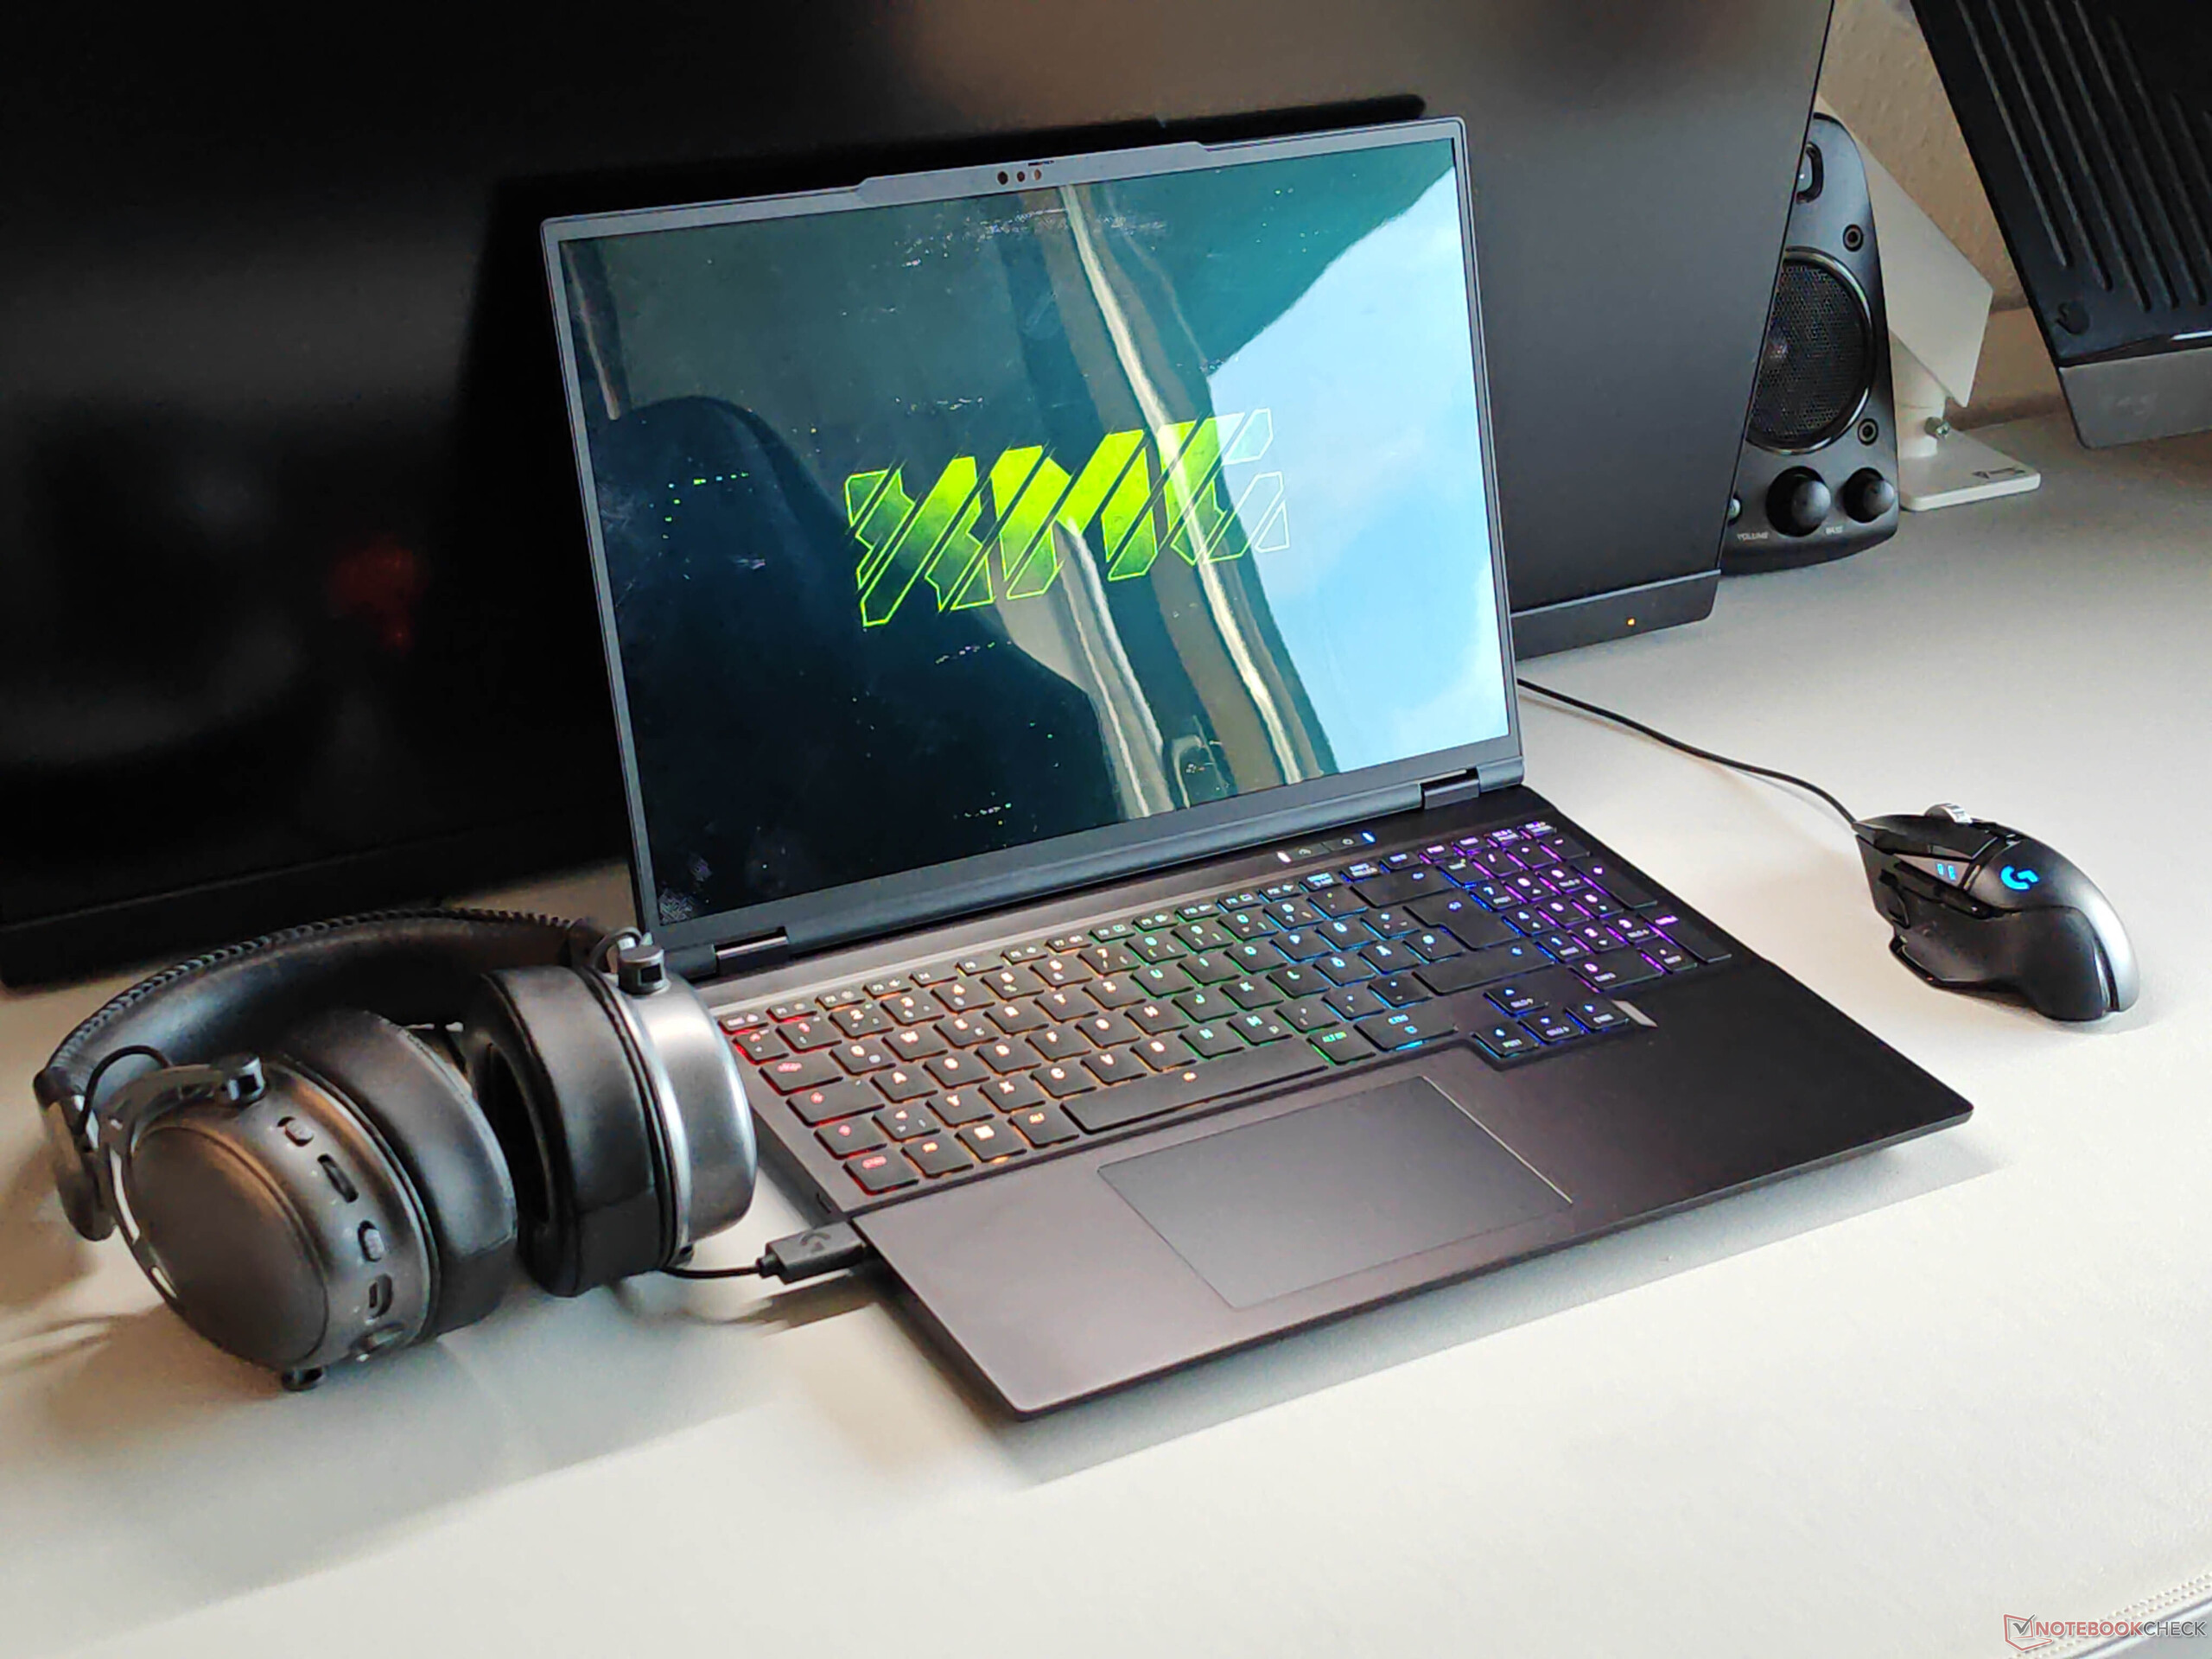
GPU performance
As with the Core 16, the fastest version of the RTX 5070 laptop GPU is installed (115 watts), and performance is in line with expectations. However, the faster Core Ultra 9 275HX does not offer a major advantage over the AMD processor in the Core 16. All modern games run smoothly at reasonable settings, though the 8 GB of VRAM can become a limitation at higher resolutions (more details are available here). When running on battery power, the GPU is limited to a maximum of 50 watts, roughly 50% less power.
| 3DMark 11 Performance | 37410 points | |
| 3DMark Fire Strike Score | 28680 points | |
| 3DMark Time Spy Score | 13439 points | |
| 3DMark Steel Nomad Score | 3075 points | |
| 3DMark Steel Nomad Light Score | 13426 points | |
Help | ||
| Blender / v3.3 Classroom OPTIX/RTX | |
| Schenker XMG Core 16 M25 | |
| Gigabyte Gaming A16 GA6H | |
| MSI Crosshair 16 HX AI D2XWGKG | |
| Asus TUF Gaming A16 FA608UP | |
| Schenker XMG FUSION 16 (M25) | |
| Average NVIDIA GeForce RTX 5070 Laptop (17 - 24, n=27) | |
| Aorus Elite 16 AE6H | |
| Average of class Gaming (9 - 32, n=109, last 2 years) | |
| Lenovo Legion Pro 5 16IAX10, RTX 5070 | |
| Blender / v3.3 Classroom CUDA | |
| Average NVIDIA GeForce RTX 5070 Laptop (29 - 228, n=28) | |
| Schenker XMG Core 16 M25 | |
| Schenker XMG FUSION 16 (M25) | |
| Gigabyte Gaming A16 GA6H | |
| Asus TUF Gaming A16 FA608UP | |
| Average of class Gaming (15 - 228, n=109, last 2 years) | |
| Aorus Elite 16 AE6H | |
| MSI Crosshair 16 HX AI D2XWGKG | |
| Lenovo Legion Pro 5 16IAX10, RTX 5070 | |
| Blender / v3.3 Classroom CPU | |
| Gigabyte Gaming A16 GA6H | |
| Asus TUF Gaming A16 FA608UP | |
| Average NVIDIA GeForce RTX 5070 Laptop (137 - 507, n=25) | |
| Average of class Gaming (122 - 565, n=105, last 2 years) | |
| Schenker XMG Core 16 M25 | |
| Lenovo Legion Pro 5 16IAX10, RTX 5070 | |
| MSI Crosshair 16 HX AI D2XWGKG | |
| Schenker XMG FUSION 16 (M25) | |
* ... smaller is better

Cyberpunk 2077 ultra FPS chart
| low | med. | high | ultra | QHD | |
|---|---|---|---|---|---|
| GTA V (2015) | 143.7 | 124.5 | |||
| Dota 2 Reborn (2015) | 211 | 185.7 | 177 | 164.3 | |
| Final Fantasy XV Benchmark (2018) | 231 | 179.7 | 136.2 | 97.4 | |
| X-Plane 11.11 (2018) | 142.4 | 117.4 | 99.3 | ||
| Strange Brigade (2018) | 519 | 335 | 278 | 242 | 165.7 |
| Baldur's Gate 3 (2023) | 179.1 | 142.7 | 123.4 | 121 | 84.1 |
| Cyberpunk 2077 (2023) | 164.9 | 137.6 | 115.3 | 103.8 | 65.2 |
| F1 24 (2024) | 296 | 291 | 241 | 86.4 | 55.2 |
| F1 25 (2025) | 243 | 218 | 172.3 | 27.7 | 15.5 |
| Call of Duty Black Ops 7 (2025) | 224 | 152 | 117 | 44 | 28 |
Emissions
System Noise
The fans remain very quiet during everyday use, and the Fusion 16 is also quieter than most competitors, reaching a maximum of 49.7 dB(A) while gaming. No other electronic noises were detected.
Noise level
| Idle |
| 25.7 / 25.7 / 28 dB(A) |
| Load |
| 38.9 / 49.7 dB(A) |
 | ||
30 dB silent 40 dB(A) audible 50 dB(A) loud |
||
min: | ||
| Schenker XMG FUSION 16 (M25) Ultra 9 275HX, GeForce RTX 5070 Laptop | Lenovo Legion Pro 5 16IAX10, RTX 5070 Ultra 7 255HX, GeForce RTX 5070 Laptop | Schenker XMG Core 16 M25 Ryzen AI 9 HX 370, GeForce RTX 5070 Laptop | Asus TUF Gaming A16 FA608UP R7 260, GeForce RTX 5070 Laptop | MSI Crosshair 16 HX AI D2XWGKG Ultra 9 275HX, GeForce RTX 5070 Laptop | Aorus Elite 16 AE6H Ultra 9 275HX, GeForce RTX 5070 Laptop | Gigabyte Gaming A16 GA6H i7-13620H, GeForce RTX 5070 Laptop | |
|---|---|---|---|---|---|---|---|
| Noise | 4% | 2% | -12% | -12% | -16% | -7% | |
| off / environment * (dB) | 25.7 | 23 11% | 24.8 4% | 25.1 2% | 25.56 1% | 24 7% | 24 7% |
| Idle Minimum * (dB) | 25.7 | 23 11% | 24.8 4% | 32.2 -25% | 28.3 -10% | 25 3% | 25 3% |
| Idle Average * (dB) | 25.7 | 23 11% | 24.8 4% | 32.2 -25% | 28.3 -10% | 29 -13% | 26 -1% |
| Idle Maximum * (dB) | 28 | 23 18% | 27.1 3% | 32.2 -15% | 28.3 -1% | 32 -14% | 27 4% |
| Load Average * (dB) | 38.9 | 43.85 -13% | 40.2 -3% | 38.1 2% | 50.26 -29% | 60 -54% | 54 -39% |
| Cyberpunk 2077 ultra * (dB) | 49.7 | 50.27 -1% | 49.2 1% | 53.9 -8% | 57.8 -16% | 59 -19% | 54 -9% |
| Load Maximum * (dB) | 49.7 | 52.9 -6% | 49.2 1% | 57.1 -15% | 57.95 -17% | 61 -23% | 55 -11% |
* ... smaller is better
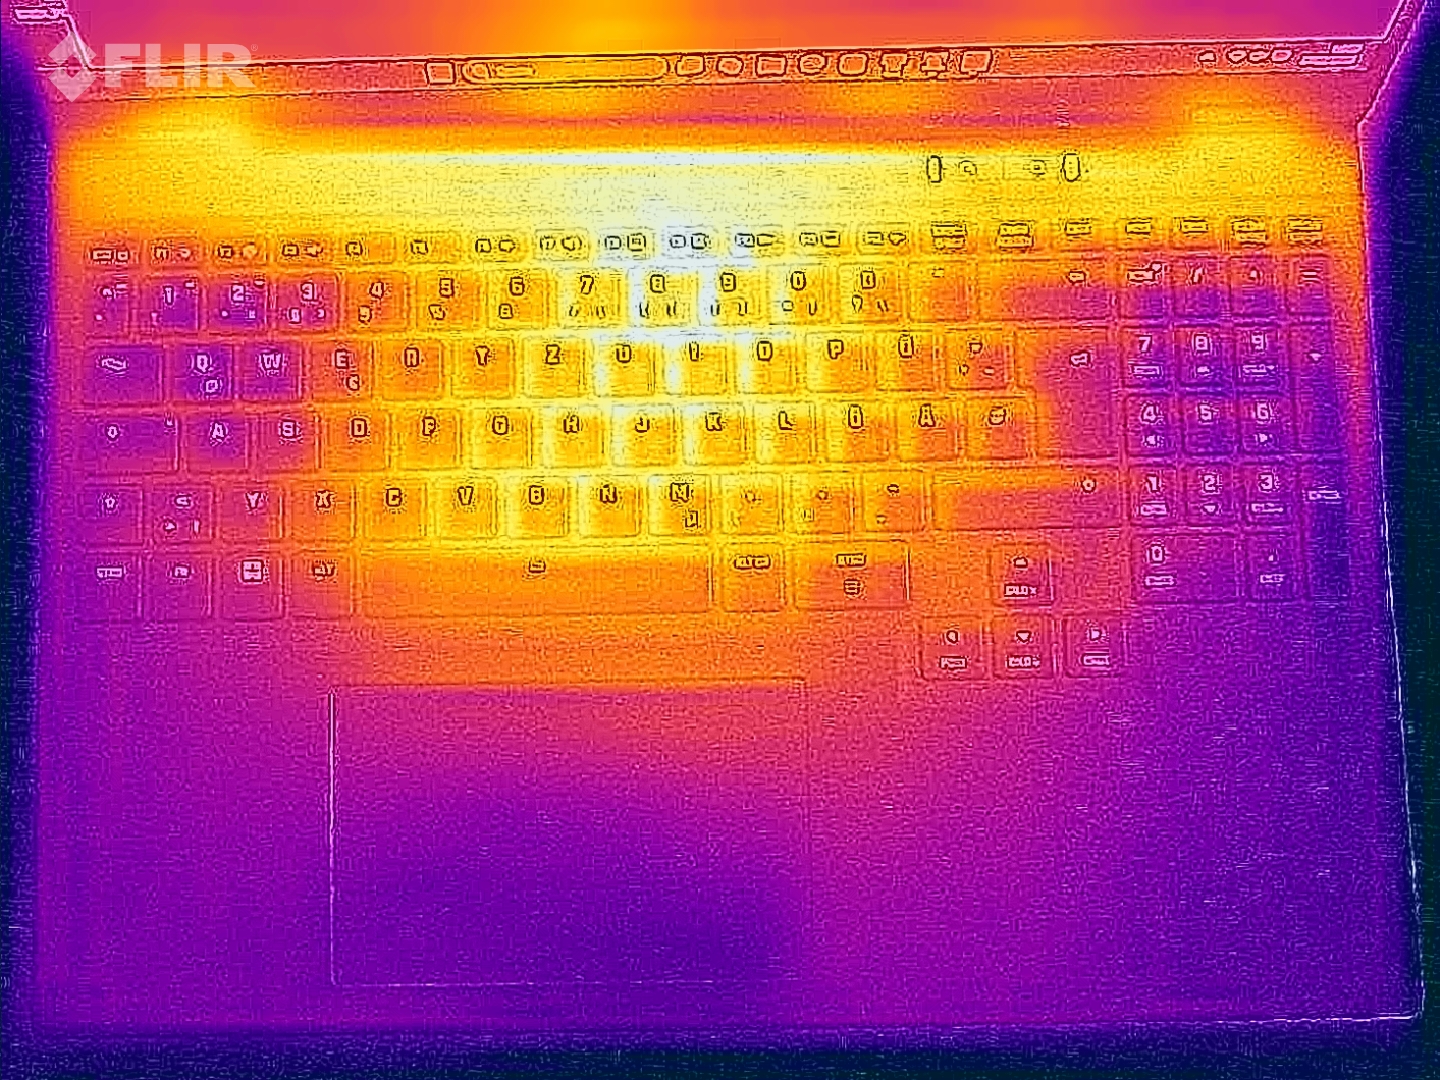
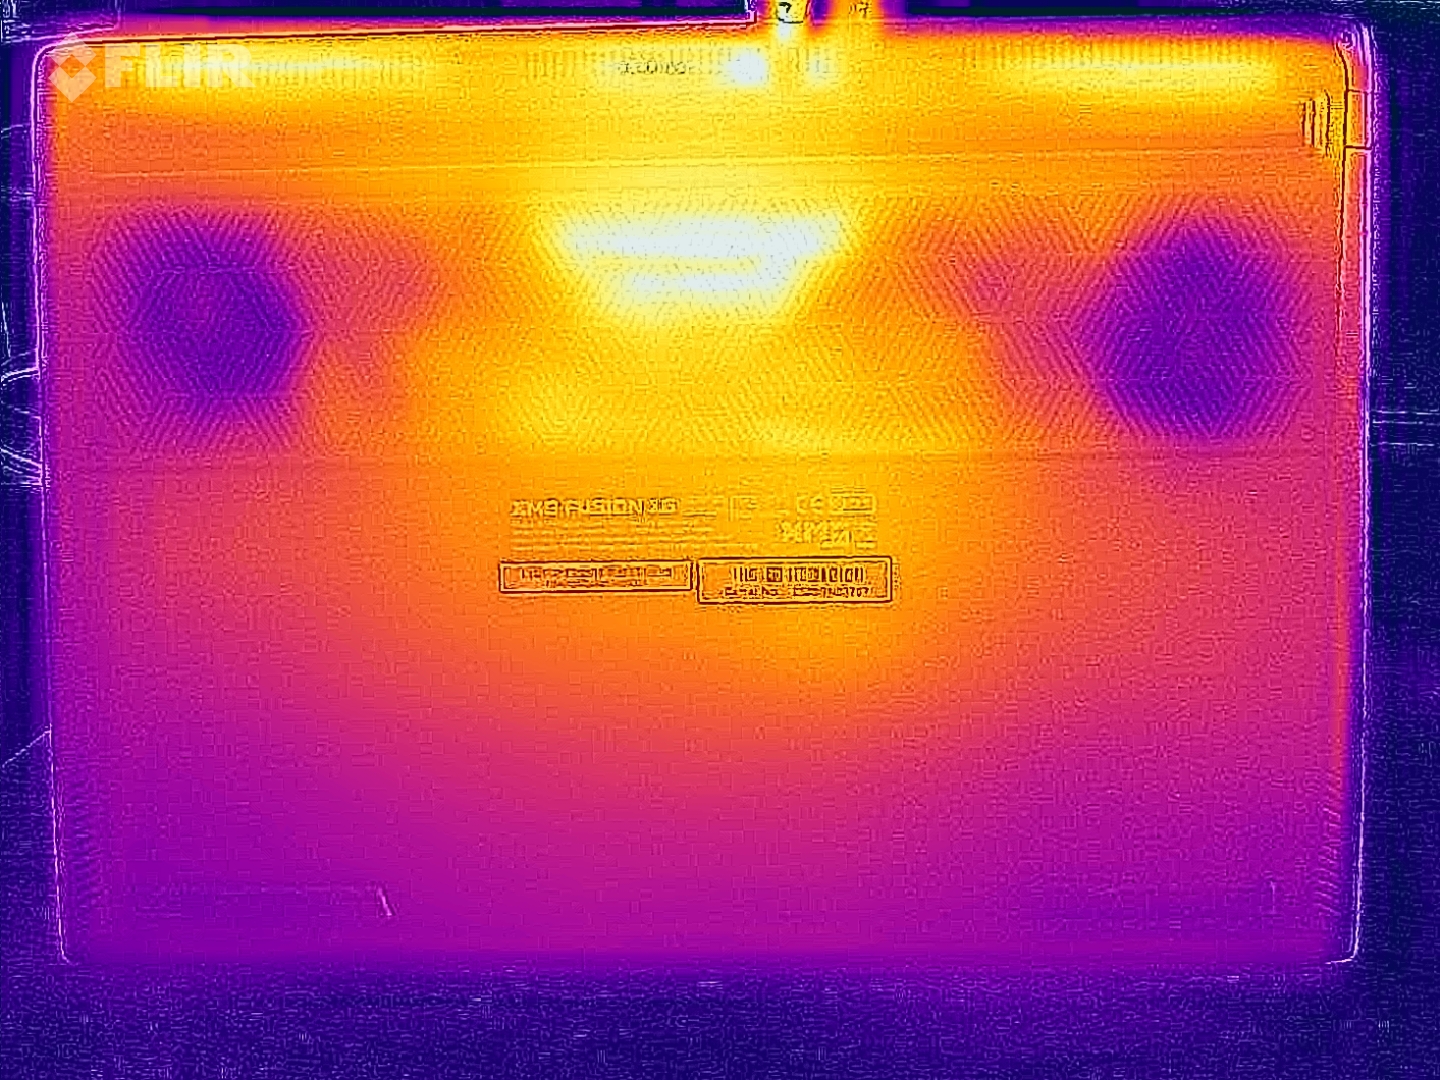
Temperature
The Fusion 16 remains unobtrusive in terms of temperatures, and a maximum of 48 °C on the underside is not critical during gaming.

(±) The maximum temperature on the upper side is 43.2 °C / 110 F, compared to the average of 40.4 °C / 105 F, ranging from 21.2 to 68.8 °C for the class Gaming.
(-) The bottom heats up to a maximum of 48 °C / 118 F, compared to the average of 43.2 °C / 110 F
(+) In idle usage, the average temperature for the upper side is 25.8 °C / 78 F, compared to the device average of 33.9 °C / 93 F.
(±) 3: The average temperature for the upper side is 36.6 °C / 98 F, compared to the average of 33.9 °C / 93 F for the class Gaming.
(+) The palmrests and touchpad are cooler than skin temperature with a maximum of 31.4 °C / 88.5 F and are therefore cool to the touch.
(-) The average temperature of the palmrest area of similar devices was 28.8 °C / 83.8 F (-2.6 °C / -4.7 F).
| Schenker XMG FUSION 16 (M25) Ultra 9 275HX, GeForce RTX 5070 Laptop | Lenovo Legion Pro 5 16IAX10, RTX 5070 Ultra 7 255HX, GeForce RTX 5070 Laptop | Schenker XMG Core 16 M25 Ryzen AI 9 HX 370, GeForce RTX 5070 Laptop | Asus TUF Gaming A16 FA608UP R7 260, GeForce RTX 5070 Laptop | MSI Crosshair 16 HX AI D2XWGKG Ultra 9 275HX, GeForce RTX 5070 Laptop | Aorus Elite 16 AE6H Ultra 9 275HX, GeForce RTX 5070 Laptop | Gigabyte Gaming A16 GA6H i7-13620H, GeForce RTX 5070 Laptop | |
|---|---|---|---|---|---|---|---|
| Heat | -9% | -11% | 7% | -4% | -13% | -18% | |
| Maximum Upper Side * (°C) | 43.2 | 42 3% | 46.7 -8% | 39.5 9% | 44.8 -4% | 41 5% | 50 -16% |
| Maximum Bottom * (°C) | 48 | 44 8% | 58.5 -22% | 45.1 6% | 43.4 10% | 45 6% | 49 -2% |
| Idle Upper Side * (°C) | 26.6 | 33 -24% | 28.3 -6% | 25.7 3% | 31.2 -17% | 35 -32% | 35 -32% |
| Idle Bottom * (°C) | 27.6 | 34 -23% | 29.9 -8% | 25.5 8% | 28.8 -4% | 36 -30% | 34 -23% |
* ... smaller is better
Speakers
Schenker XMG FUSION 16 (M25) audio analysis
(+) | speakers can play relatively loud (85.1 dB)
Bass 100 - 315 Hz
(-) | nearly no bass - on average 17.9% lower than median
(±) | linearity of bass is average (10.5% delta to prev. frequency)
Mids 400 - 2000 Hz
(±) | higher mids - on average 5.7% higher than median
(+) | mids are linear (4.6% delta to prev. frequency)
Highs 2 - 16 kHz
(+) | balanced highs - only 3.1% away from median
(+) | highs are linear (4.8% delta to prev. frequency)
Overall 100 - 16.000 Hz
(+) | overall sound is linear (14.8% difference to median)
Compared to same class
» 29% of all tested devices in this class were better, 7% similar, 64% worse
» The best had a delta of 6%, average was 18%, worst was 132%
Compared to all devices tested
» 20% of all tested devices were better, 4% similar, 76% worse
» The best had a delta of 4%, average was 24%, worst was 134%
Lenovo Legion Pro 5 16IAX10, RTX 5070 audio analysis
(±) | speaker loudness is average but good (75.73 dB)
Bass 100 - 315 Hz
(-) | nearly no bass - on average 20% lower than median
(±) | linearity of bass is average (9.3% delta to prev. frequency)
Mids 400 - 2000 Hz
(±) | higher mids - on average 6.1% higher than median
(±) | linearity of mids is average (7.9% delta to prev. frequency)
Highs 2 - 16 kHz
(+) | balanced highs - only 2.2% away from median
(+) | highs are linear (6.3% delta to prev. frequency)
Overall 100 - 16.000 Hz
(±) | linearity of overall sound is average (19.4% difference to median)
Compared to same class
» 67% of all tested devices in this class were better, 7% similar, 26% worse
» The best had a delta of 6%, average was 18%, worst was 132%
Compared to all devices tested
» 48% of all tested devices were better, 7% similar, 45% worse
» The best had a delta of 4%, average was 24%, worst was 134%
Asus TUF Gaming A16 FA608UP audio analysis
(±) | speaker loudness is average but good (80.2 dB)
Bass 100 - 315 Hz
(±) | reduced bass - on average 11.8% lower than median
(±) | linearity of bass is average (8.7% delta to prev. frequency)
Mids 400 - 2000 Hz
(+) | balanced mids - only 3% away from median
(+) | mids are linear (3% delta to prev. frequency)
Highs 2 - 16 kHz
(+) | balanced highs - only 4.4% away from median
(±) | linearity of highs is average (7.4% delta to prev. frequency)
Overall 100 - 16.000 Hz
(+) | overall sound is linear (12.6% difference to median)
Compared to same class
» 16% of all tested devices in this class were better, 3% similar, 81% worse
» The best had a delta of 6%, average was 18%, worst was 132%
Compared to all devices tested
» 11% of all tested devices were better, 2% similar, 86% worse
» The best had a delta of 4%, average was 24%, worst was 134%
MSI Crosshair 16 HX AI D2XWGKG audio analysis
(±) | speaker loudness is average but good (81.5 dB)
Bass 100 - 315 Hz
(-) | nearly no bass - on average 15.6% lower than median
(±) | linearity of bass is average (10.5% delta to prev. frequency)
Mids 400 - 2000 Hz
(±) | higher mids - on average 6.6% higher than median
(±) | linearity of mids is average (7.1% delta to prev. frequency)
Highs 2 - 16 kHz
(+) | balanced highs - only 1.6% away from median
(+) | highs are linear (5.8% delta to prev. frequency)
Overall 100 - 16.000 Hz
(+) | overall sound is linear (14.7% difference to median)
Compared to same class
» 28% of all tested devices in this class were better, 7% similar, 64% worse
» The best had a delta of 6%, average was 18%, worst was 132%
Compared to all devices tested
» 19% of all tested devices were better, 4% similar, 77% worse
» The best had a delta of 4%, average was 24%, worst was 134%
Aorus Elite 16 AE6H audio analysis
(+) | speakers can play relatively loud (87 dB)
Bass 100 - 315 Hz
(±) | reduced bass - on average 10.8% lower than median
(±) | linearity of bass is average (7.5% delta to prev. frequency)
Mids 400 - 2000 Hz
(+) | balanced mids - only 2.1% away from median
(+) | mids are linear (4.8% delta to prev. frequency)
Highs 2 - 16 kHz
(+) | balanced highs - only 2.5% away from median
(+) | highs are linear (4.3% delta to prev. frequency)
Overall 100 - 16.000 Hz
(+) | overall sound is linear (8.1% difference to median)
Compared to same class
» 1% of all tested devices in this class were better, 1% similar, 98% worse
» The best had a delta of 6%, average was 18%, worst was 132%
Compared to all devices tested
» 2% of all tested devices were better, 1% similar, 98% worse
» The best had a delta of 4%, average was 24%, worst was 134%
Energy Management
There are no surprises in terms of power consumption. We measured a peak of 243 watts during the stress test, but this quickly settles at around 170 watts. The compact 250-watt power adapter is therefore sufficient. Standby power consumption of 1.8 watts is relatively high.
| Off / Standby | |
| Idle | |
| Load |
|
Key:
min: | |
| Schenker XMG FUSION 16 (M25) Ultra 9 275HX, GeForce RTX 5070 Laptop, Samsung 9100 Pro 2 TB, OLED, 2880x1800, 16" | Lenovo Legion Pro 5 16IAX10, RTX 5070 Ultra 7 255HX, GeForce RTX 5070 Laptop, SK Hynix HFS001TEJ9X115N, OLED, 2650x1600, 16" | Schenker XMG Core 16 M25 Ryzen AI 9 HX 370, GeForce RTX 5070 Laptop, Samsung 990 Pro 2 TB MZVL72T0HDLB, IPS, 2560x1600, 16" | Asus TUF Gaming A16 FA608UP R7 260, GeForce RTX 5070 Laptop, Western Digital PC SN5000S SDEQNSJ-1T00, IPS, 2560x1600, 16" | MSI Crosshair 16 HX AI D2XWGKG Ultra 9 275HX, GeForce RTX 5070 Laptop, Micron 2500 1TB MTFDKBA1T0QGN, IPS, 2560x1600, 16" | Aorus Elite 16 AE6H Ultra 9 275HX, GeForce RTX 5070 Laptop, Gigabyte AG470S1TB-SI B10, IPS, 2560x1600, 16" | Gigabyte Gaming A16 GA6H i7-13620H, GeForce RTX 5070 Laptop, Kingston OM8PGP41024Q-A0, IPS, 2560x1600, 16" | Average NVIDIA GeForce RTX 5070 Laptop | Average of class Gaming | |
|---|---|---|---|---|---|---|---|---|---|
| Power Consumption | -2% | 9% | 23% | -51% | -4% | 20% | 6% | -11% | |
| Idle Minimum * (Watt) | 15.3 | 10.6 31% | 7.4 52% | 4.6 70% | 26.2 -71% | 8.5 44% | 9 41% | 10.7 ? 30% | 13.2 ? 14% |
| Idle Average * (Watt) | 16.8 | 12.3 27% | 14.9 11% | 9.8 42% | 33.8 -101% | 13.6 19% | 11 35% | 15.3 ? 9% | 18.9 ? -12% |
| Idle Maximum * (Watt) | 17.3 | 18.6 -8% | 15.2 12% | 10.2 41% | 34 -97% | 22 -27% | 23 -33% | 20.2 ? -17% | 24.3 ? -40% |
| Load Average * (Watt) | 94.7 | 104 -10% | 100.8 -6% | 76.1 20% | 112 -18% | 113 -19% | 91 4% | 97.5 ? -3% | 108.3 ? -14% |
| Cyberpunk 2077 ultra external monitor * (Watt) | 180.9 | 227 -25% | 181.4 -0% | 198.1 -10% | 220 -22% | 219 -21% | 130 28% | ||
| Cyberpunk 2077 ultra * (Watt) | 185.3 | 231 -25% | 184.8 -0% | 198.9 -7% | 224 -21% | 223 -20% | 132.5 28% | ||
| Load Maximum * (Watt) | 242.7 | 248 -2% | 251.1 -3% | 235.2 3% | 315 -30% | 257 -6% | 155 36% | 216 ? 11% | 254 ? -5% |
* ... smaller is better
Power consumption Cyberpunk / Stress test
Power consumption external monitor
Battery life
Despite the OLED panel, the battery life is basically very similar to the Core 16 with IPS display. In the Wi-Fi test with 150 cd/m², we measured 10:15 hours and 7:39 hours at full brightness.

| Schenker XMG FUSION 16 (M25) Ultra 9 275HX, GeForce RTX 5070 Laptop, 99.8 Wh | Lenovo Legion Pro 5 16IAX10, RTX 5070 Ultra 7 255HX, GeForce RTX 5070 Laptop, 80 Wh | Schenker XMG Core 16 M25 Ryzen AI 9 HX 370, GeForce RTX 5070 Laptop, 99.8 Wh | Asus TUF Gaming A16 FA608UP R7 260, GeForce RTX 5070 Laptop, 90 Wh | MSI Crosshair 16 HX AI D2XWGKG Ultra 9 275HX, GeForce RTX 5070 Laptop, 90 Wh | Aorus Elite 16 AE6H Ultra 9 275HX, GeForce RTX 5070 Laptop, 99 Wh | Gigabyte Gaming A16 GA6H i7-13620H, GeForce RTX 5070 Laptop, 76 Wh | Average of class Gaming | |
|---|---|---|---|---|---|---|---|---|
| Battery Runtime | -40% | -2% | 21% | 8% | -17% | -25% | -31% | |
| WiFi Websurfing (h) | 10.3 | 6.2 -40% | 10.9 6% | 13 26% | 11.1 8% | 8.5 -17% | 7.7 -25% | 7.04 ? -32% |
| WiFi Websurfing max. Brightness (h) | 7.7 | 7 -9% | 8.9 16% | 5.45 ? -29% |
Notebookcheck overall rating
Schenker XMG FUSION 16 (M25)
- 12/29/2025 v8
Andreas Osthoff
 Total Sustainability Score:
 Possible alternatives in comparison
Image | Model / Review | Price | Weight | Height | Display |
|---|---|---|---|---|---|
1. 87.5%  | Schenker XMG FUSION 16 (M25) Intel Core Ultra 9 275HX ⎘ NVIDIA GeForce RTX 5070 Laptop ⎘ 64 GB Memory, 2048 GB SSD | Amazon: List Price: 2700€ | 2.1 kg | 23 mm | 16.00" 2880x1800 212 PPI OLED |
2. 86.2%  | Lenovo Legion Pro 5 16IAX10, RTX 5070 Intel Core Ultra 7 255HX ⎘ NVIDIA GeForce RTX 5070 Laptop ⎘ 32 GB Memory, 1024 GB SSD | Amazon: List Price: 1800 Euro | 2.3 kg | 25.95 mm | 16.00" 2650x1600 189 PPI OLED |
3. 86.2%  | Schenker XMG Core 16 M25 AMD Ryzen AI 9 HX 370 ⎘ NVIDIA GeForce RTX 5070 Laptop ⎘ 64 GB Memory, 2048 GB SSD | Amazon: List Price: 2100€ | 2.1 kg | 23 mm | 16.00" 2560x1600 189 PPI IPS |
4. 83.8%  | Asus TUF Gaming A16 FA608UP AMD Ryzen 7 260 ⎘ NVIDIA GeForce RTX 5070 Laptop ⎘ 32 GB Memory, 1024 GB SSD | Amazon: List Price: 2199€ | 2.2 kg | 25.7 mm | 16.00" 2560x1600 189 PPI IPS |
5. 81.9%  | MSI Crosshair 16 HX AI D2XWGKG Intel Core Ultra 9 275HX ⎘ NVIDIA GeForce RTX 5070 Laptop ⎘ 16 GB Memory, 1024 GB SSD | Amazon: List Price: 2500 EUR | 2.5 kg | 27.9 mm | 16.00" 2560x1600 189 PPI IPS |
6. 84.4%  | Aorus Elite 16 AE6H Intel Core Ultra 9 275HX ⎘ NVIDIA GeForce RTX 5070 Laptop ⎘ 32 GB Memory, 1024 GB SSD | List Price: 2300 EUR | 2.4 kg | 26 mm | 16.00" 2560x1600 189 PPI IPS |
7. 80.1%  | Gigabyte Gaming A16 GA6H Intel Core i7-13620H ⎘ NVIDIA GeForce RTX 5070 Laptop ⎘ 16 GB Memory, 1024 GB SSD | Amazon: 1. $1,341.81 GIGABYTE - Gaming A16 Gaming... 2. $1,231.42 GIGABYTE - Gaming A16 Gaming... 3. $1,067.00 GIGABYTE - Gaming A16 Gaming... List Price: 1700 EUR | 2.3 kg | 23 mm | 16.00" 2560x1600 189 PPI IPS |
Transparency
The selection of devices to be reviewed is made by our editorial team. The test sample was provided to the author as a loan by the manufacturer or retailer for the purpose of this review. The lender had no influence on this review, nor did the manufacturer receive a copy of this review before publication. There was no obligation to publish this review. As an independent media company, Notebookcheck is not subjected to the authority of manufacturers, retailers or publishers.
This is how Notebookcheck is testing
Every year, Notebookcheck independently reviews hundreds of laptops and smartphones using standardized procedures to ensure that all results are comparable. We have continuously developed our test methods for around 20 years and set industry standards in the process. In our test labs, high-quality measuring equipment is utilized by experienced technicians and editors. These tests involve a multi-stage validation process. Our complex rating system is based on hundreds of well-founded measurements and benchmarks, which maintains objectivity. Further information on our test methods can be found here.

